
implications for multicultural counseling training: motivation


Proceedings of 4th
International Conference on Global Business Environment
(ICGBE-2014)
i
Proceedings
4th International Conference on Global Business Environment
(ICGBE-2014)
Bangkok, Thailand
01-02 February, 2014
ISSN: 2306-7500
Organized by
International Foundation for Research and Development (IFRD)

Proceedings of 4th
International Conference on Global Business Environment
(ICGBE-2014)
ii
Preface
Dear Distinguished Delegates and Guests, The Conference Committee warmly welcomes our distinguished delegates and guests to the 4th International Conference on Global Business Environment (ICGBE-2014), 2014 held on February 01–02 2014 in Bangkok. 4th ICGBE-2014 is organized by International Foundation for Research and Development (IFRD). The conference aims at discussing with all of you the wide range of problems encountered in present and future education, technologies and business. ICGBE-2014 is organized in collaboration with Yildirim Beyazit University, Turkey, Shinawatra International University, Thailand, PERTRE ANDERI of IASI, Romania and National Academy of Management, Ukraine where researchers from around the world presented their work. The conference committee is itself quite diverse and truly international, with membership around the world. The proceeding records the fully refereed papers presented at the conference. The main conference themes and tracks are Education, Information Management, and Business. The conference aims to bring together researchers, scientists, engineers and practitioners to exchange and share their experiences, new ideas and research results about all aspects of the main conference themes and tracks and discuss the practical challenges encountered and the solutions adopted. The main goal of the event is to provide a scientific forum for exchange of new ideas in a number of fields that interact in depth through discussions with their peers from around the world. The conference has solicited and gathered technical research submission related to all aspects of major conference themes and tracks. All the submitted papers have been peer reviewed by the reviewers drawn from the scientific committee, external reviewers and editorial board depending on the subject matter of the paper. Reviewing and initial selection were undertaken electronically. After the rigorous peer-review process, the submitted papers were selected based on originality, significance, and clarity for the purpose of the conference. The conference program is extremely rich, featuring high-impact presentations. The high quality of the program guaranteed by the presence of an unparalleled number of internationally recognized top experts. The conference will therefore be a unique event, where attendees will be able to appreciate the latest results in their field of expertise, and to acquire additional knowledge in other fields. The program has been strutted to favor interactions among attendees coming from many diverse horizons, scientifically, geographically, from academia and from industry. We would like to thank the program chairs, organization staff, and members of the program committee for their work. We are grateful to all those who have contributed to the success of ICGBE-2014 especially our partners. We hope that all participants and other interested readers benefit scientifically from the proceedings and find it stimulating in the process. Finally, we would like to wish you success in your technical presentations and social networking. We hope you have a unique, rewarding and enjoyable time at ICGBE-2014 in Bangkok. With our warmest regards, Conference Committee February 01–02, 2014 Bangkok, Thailand

Proceedings of 4th
International Conference on Global Business Environment
(ICGBE-2014)
iii
4th ICGBE 2014
Conference Committee Conference Chair John Walsh, Ph. D., Shinawatra International University, Bangkok, Thailand Conference Convener Thanet Wattanakul, Ph. D., Khon Kaen University, Nong Khai Campus, Thailand Members
Sisira R. N. Colombage, Ph. D., Monash University, Victoria, Australia
Alexandru Trifu, Ph. D., University, Petre Andrei, Iasi, Romania
Nek Kamal Yeop Yunus, Ph. D., Univerisiti Pendidikan Sultan Idris , Perak, Malaysia
Dileep Kumar, M., Ph. D., University Utara Malaysia, Malaysia
R K Uppal, Ph. D., DAV College, Punjab, India
Rishidaw Balkaran, Ph. D., Durban University of Technology, South Africa
Ayhan Kapusuzoglu, Ph. D., Yildirim Beyazit University, Turkey
Nasina Mat Desa, Ph. D., Universiti Sains Malaysia, Penang, Malaysia
M. Saman Dassanayake, Ph. D., University of Colombo, Colombo, Sri Lanka
Katalin Jackel, Ph. D., Budapest Business School, Budapest, Hungary
Wei-Bin Zhang, Ph. D., Ritsumeikan Asia Pacific University, Japan
Susantha Herath, Ph. D., St. Cloud State University, USA
Somnath Sen, Ph. D., University of Birmingham, United Kingdom
Kevin Feeney, Ph. D., American University in Bulgaria
Zulnaidi Yaacob, Ph. D., Universiti Sains Malaysia, Penang, Malaysia
Johan de Jager, Ph. D., Tshwane University of Technology, South Africa
José G. Vargas-Hernández, Ph. D., University of Guadalajara, Mexico
Izah Mohd Tahir, Ph. D., University Sultan Zainal Abidin, Terengganu, Malaysia
Chux Gervase Iwu, Ph. D., Cape Peninsula University of Technology, South Africa

Proceedings of 4th
International Conference on Global Business Environment
(ICGBE-2014)
iv
4th International Conference on Global Business Environment (ICGBE-2014)
Table of Contents Description Pages
Preface ivi
Conference Committee iv Table of Contents iv Papers iv
Image Tampering Detection Scheme Using Conflict Watermarks-Ching-Sheng HSU, Shu-Fen TU 1
An Empirical study to Investigate firm Physical and Financial Characteristics Factors towards
their Business Performance of Thai Manufacturing Public Firms-Janthorn Sinthupundaja,
Navee Chiadamrong
16
Achieving Developmental and Pro-Poor Trade in Africa: the Mauritian Transition-Emerging
Economy: Success Case Study-Rajendra Parsad GUNPUTH 13
Micro-Credit in Conventional Banking: Would Islamic Banking be the Golden Age for
Entrepreneurs? The Mauritius Case Study-Rajendra Parsad GUNPUTH 41
Performance of Investment Companies in Africa Stock Markets and Implications for Regulation with Emphasis on the Stock Exchange of Mauritius-Sunil Kumar Bundoo
50
Examining Perceived Value and Satisfaction of Penang Delicacies in Predicting Tourists’ Revisit Intention-A. Zainal, Y. Atikahambar, M. N. Mohd Hafiz, A.N. Zali & M.Z. Kutut
60
A Conceptual Framework of a Structural Equation Model of Green Supply Chain in Hotel
Industry in Thailand-Pruksapakorn Pratyameteetham, Walailak Atthirawong 64
A Correlational Study on Childbirth based on Location and its Concentration of Hospitals in
Chennai-Ashwin Kumar Basu.S, Arulrajan Kuppuswamy 71
An E-learning System for New Employees: A Case Study of Chain Drug Stores-Kuo-Hung
Huang, Li-Chen Chiu, Yi-Chun Lin, Ling-Yu Wei, Pei-Lin Hsueh, Ching-Ching Cheng 82
An Empirical Study of Environmental Awareness in the Malaysian Restaurant Industry-
Zahariah Mohd Zain, Jamaliah Mhd Khalili, Muna Wadhiha Mohd Fauzi, Nur Hanifah Ngah
Ramli
85
The effect of the incentive system on job performance for the employees of tourist hotel
industry in Taiwan-Su-Ming Huang, Wen-Hsiang Lai 91
The Mediating Effect of Supply Chain Integration on the Relationship between Information
Technology, Trust and Firm Performance: A Conceptual Framework, Mahdi Mohammad
Bagheri, Abu Bakar Abdul Hamid, Abbas Mardani, Ali Af. Asgari, Azam Haghkhah
96
Factors Influencing students’ to select B-School: a Study with reference to Coimbatore City,
India-Mahendran Sathish, Rengasamy Natarajan Balamurugan, Eason Yamalee 103
The Impact of Service Quality, Student Satisfaction, and University Reputation on Student
Loyalty: A Case Study of International Students in IIUM, Malaysia-Djafri Fares, Meguellati
Achour, Omar Kachkar
120
The Influence of Push and Pull Factors towards Tourists Consumption of Malay Food in
Malaysia-A. Zainal, M. N. Mohd Hafiz, Y. Atikahambar, A.N. Zali & I. Shahariah 126
Integrating CLMV into the ASEAN Economic Community: Challenges and Opportunities-Rakesh
Singh, Rusha Das 130

Proceedings of 4th
International Conference on Global Business Environment
(ICGBE-2014)
v
Effects of the triadic relationship among customers, service providers and the government on
brand loyalty in mobile telecommunications industry-Thu Nguyen Quach, Paramaporn
Thaichon
139
Could Integrated Marketing Communications be the answer to customer switching intention in
mobile services?-Paramaporn Thaichon, Thu Nguyen Quach 143
Incorporating Marketing Perspectives into Corporate Social Responsibility Programs (CSR)-
Charles Jebarajakirthy, Paramaporn Thaichon 148
Fragment Chain in Logistics: Empty Container Movement at the Off-Dock Depot-Rosmaizura
Mohd Zain, Mohd Nizam Ab Rahman, Zulkifli Mohd Nopiah 152
Reconnoitering and Fixing Variables through Qualitative Research: Precarious Working Conditions and Living Condition in Oil Palm Plantations-Dileep Kumar. M, Noor Azizi Ismail, Normala S Govindarajo
159
Engage or Disengage? Exploring Factors Leading to Employee Disengagement in Oil Palm Plantations-Normala S Govindarajo, Dileep Kumar. M, Subrahmanium Sri Ramulu, Noor Azizi Ismail
168
Identifying, Categorizing and Setting Variables on Ergonomics issues in Oil Palm Plantations-
Normala S Govindarajo, Dileep Kumar. M, Subrahmanium Sri Ramulu, Noor Azizi Ismail 177
Categorizing and Fixing Variables on Entrepreneurial Intention through Qualitative Research-Muh. Amsal. Sahban, Dileep Kumar, Subramaniam Sri Ramalu
184
Variable Analysis and Model Confirmation Using Delphi Technique-Muh. Amsal. Sahban, Dileep
Kumar, Subramaniam Sri Ramalu 194
The Positives of Cross-cultural Interactions in Multinational Companies and Multicultural
Groups-Małgorzata Rozkwitalska, Michał Chmielecki, Sylwia Przytuła, Łukasz Sułkowski 202
Trans Inguri Trade Partnership-Vakhtang Charaia 209
Street Food Vending and Hygiene Practices and Implications for Consumers-R. Kok, R.
Balkaran 212
A Comparative Analysis of the South African and Global Tourism Competitiveness Models with
the aim of Enhancing a Sustainable Model for South Africa-S. Maharaj, R. Balkaran 216
Health Care Management within the Health care System and its impact on Service delivery in
South Africa: A comparative case study of two public hospitals in Gauteng and KwaZulu Natal
Provinces-A. Deen, Dr R. Balkaran
223
The enhancement of Conference Tourism activities as a means to bolstering Business tourism
in South Africa: A case study of Conferences within KwaZulu-Natal, South Africa-Wayne B.
Tifflin, R. Balkaran
229
Religious Diversity and Political Change in Thailand-Petcharat Lovichakorntikul, John Walsh 234
Significance of Hotel Facebook Page as Hotel Marketing Communication: The Facebook Users
Perspective-Khanittha Prom-aksorn, PrateepWetprasit 237
Logistics Software from a Logistics Management and Management Information Systems (MIS)
Perspective-Hermann Gruenwald 242

Proceedings of 4th
International Conference on Global Business Environment
(ICGBE-2014)
vi
4th International Conference on Global Business Environment (ICGBE-2014)
PAPERS

Proceedings of 4th
International Conference on Global Business Environment
(ICGBE-2014)
1
Image Tampering Detection Scheme Using Conflict Watermarks
1Ching-Sheng HSU, 2Shu-Fen TU*
1Ming Chuan University, Taiwan 2Chinese Culture University, Taiwan
*[email protected] Abstract: This paper proposed a semi-fragile watermarking scheme for digital images. Our scheme embeds fragile and robust watermarks into the image simultaneously, and each watermark has its own way to detecting tampered area. Considering these two detection results comprehensively, we design a two-stage filtering mechanism to distinguish malicious attacks from common image processing and, moreover, decrease the false negative error. In addition, dynamic programming is used to optimize the watermarked image. The experimental results show that our scheme can successfully discriminate malicious attacks and common image processing. Besides, our scheme has good performance on the quality of the watermarked image and the authentication accuracy. Keywords: dynamic programming; integrity authentication; tampering detection; local binary pattern
1. Introduction Mobile phones deliver information more easily and instantly. More and more people communicate digital images with friends through mobile phone. Since the mobile phones had greatly advanced in the function of image processing, it is easy to add special effects in images. However, such convenient function can also be used to tamper images by people with bad intention. As we know that many rumors and confusion result from tampered images. Therefore, the integrity authentication is an important issue for digital images. There are two common ways to detecting tampering: one is digital signature, and the other is fragile watermarking (Hsu & Tu, 2010). Digital signature only can answer yes/no question; that is, it only can know whether an image is tampered or not, but it cannot know where the tampering area is. On the contrary, fragile watermarking cannot only know whether an image is tampered or not, but also can point out the tampering area within the image. Therefore, fragile watermarking is more useful than digital signature. The general framework of a fragile watermarking scheme includes two phases: one is watermark embedding, and the other is tampering detection. The job of the first phase is to embed a watermark into the image, where the watermark is sensible to modification. The so-called “embed” is to modify the pixels of original image so that the image can contain the information of watermark. In the second phase, the watermark is extracted to authenticate the image and find out the tampering area if necessary. As we know, some modification is malicious, but some modification is just a common image processing, such as contrast adjustment, lightening, darkening, …, etc. In view of this, some researchers proposed semi-fragile watermarking schemes, which attempt to make the watermark not so sensible to common image processing (Chamlawi & Khan, 2010; Liu, Yao & Huang, 2010; Preda, 2013; Qi & Xin, 2011; Wenyin & Shih, 2011). In 2011, Wenyin & Shih (2011) proposed a semi-fragile watermarking based on local binary pattern (LBP) operators (Ojala, Pietikäinen & Harwood, 1996). The experimental results show that their scheme is robust to some common image processing and, at the same time, is fragile to malicious attack, but the detection accuracy of their scheme is not satisfied. We found that approximate half pixels tampered by malicious attacks cannot be detected by their scheme. Generally speaking, an ideal fragile-watermarking scheme should be robust to common image processing while sensitive to malicious attacks with acceptable detection accuracy. The purpose of this paper is to propose a semi-fragile watermarking scheme to improve the detection accuracy of Wenyin and Shih’s scheme. For readers not familiar with Wenyin and Shih’s scheme, we briefly describe it in section 2. Then, we express the details of our prosed scheme in section 3 and show the experimental results in section 4. Finally, conclusions are given in section 5. Wenyin and Shih’s scheme: Supposed that the original image is a gray-level image and the watermark is a binary image. Preliminarily, the original image is divided into non-overlapping squared blocks. Each bit w of the watermark is embedded into one block according to the following steps: 1) The neighboring pixels (p1, p2, …, pn) within a block are encoded into binary pattern (s1, s2, …, sn) as follows.
wo
pps
ci
i/0
if1 (1)
where pc denotes the center pixel within a block, n denotes the number of neighboring pixels, and i = 1..n. 2) Let s = s1s2…sn, where denotes Exclusive OR (XOR) operator. If s = w, the block needs not to be modified. Otherwise, one of the neighboring pixels closest to pc is modified so that the bit corresponding to the modified pixel is flipped. The magnitude of modification is determined by a user-defined parameter . In summary, the above procedure ensures the result of the consecutive XOR performed on s1, s2, …, and sn is equal to w. To authenticate an image, the watermark extraction procedure is performed block by block. For each block, all pixels neighbored the center pixel are encoded into binary pattern according to Eq.(1). The extracted bit w is the result of XOR performed on the binary pattern. By doing so, one can reconstruct the watermark image. The block is marked as tampered if the corresponding watermark bit w is different to the original watermark bit w. The authors stated that the extracted watermark is robust against some common image processing. However, the authors did not clearly stated how to distinguish common image processing from malicious attacks by the extracted watermark image. In addition, since one bit is used to authenticate a block, the probability of detecting tampered blocks successfully is approximated to 0.5. The Proposed Scheme: The main idea of the proposed scheme is to embed two watermarks into the original image: one is robust watermark, and the other is fragile watermark. Note that the two watermarks are not embedded one by one and are not apart from the other, either. Through our elaborated algorithm, two watermarks are embedded at the same time and at the same place. When authenticating an image, both of the two watermarks are extracted and compared with original watermarks. The results authenticated by

Proceedings of 4th
International Conference on Global Business Environment
(ICGBE-2014)
2
fragile and robust watermarks are recorded respectively. The two results are combined and processed through our two-stage mechanism to filter out malicious attacks from common image processing and eliminate false negative errors. Watermark Embedding: Supposed that the original image is a gray-level image and the binary fragile and robust watermarks are randomly generated. At first, the image is divided into non-overlapping blocks containing n pixels, and each block contains n-bits fragile and one-bit robust watermarks simultaneously. Let x = (x1, x2, …, xn) denotes a vector of n pixel values of a block. Also let y = (y1, y2, …, yn), the revised version of x, denotes a vector of n revised pixel values. The objective is to find y = (y1, y2, …, yn) that minimize the sum of squared errors between x and y so that y contains both the fragile watermark w1 and the robust watermark w2. The corresponding mathematical model can be formulated as follows.
. ..., ,2 ,1for integer, is )(
, ..., ,2 ,1for 2550)(
,2 mod )(
, ..., ,2 ,1for ][)(
subject to
, Minimize
1
2
1
1
2
niyd
niyc
wdsb
niiwqsa
xyZ
i
i
n
i
i
i
n
i
ii
(2)
In Eq. (2), d, a positive integer, denotes a predefined divisor,
2 mod
d
yqs i
i
and
otherwise.1
, if0 ni
i
yyds
The objective of the above mathematical model can be achieved by the following recurrence equation (See Eq.(3)).
. if][,1,1,,,
,][,1,0,,,minmin
, if][min
),,,,,(
211
2
211
2
02
21
2
02
21
jiMdswqsiwjiwdxfxy
Mdswqsiwjiwdxfxy
jiMdswqsiwxy
jiwwdxf
iiii
iiii
utddty
iiiiutddty
i
i
(3)
where i, j, and t are natural numbers, w1 denotes an n-element vector whose element w1[k], for k = i, i + 1, …, j, is a binary value, w2 is binary, M denotes a big positive integer, and
d
d
u 2255
The function f will output the minimum value of the sum of squared errors
j
ik
kk xy2
between x and y that satisfies the constraints
qsk = w1[k] for k = i, i + 1, …, j and 22mod wdsj
ik
k
. Based on the overlapping sub-problem and optimal substructure properties of this
problem, it is suitable to solve the above recurrence by dynamic programming (Cormen, Leiserson, Rivest & Stein, 2009) in time complexity of (n). Tampering Detection: The tampering detection is done block by block, and if the extracted watermark is not the same as the original watermark, the block is judged as tampered (denoted as “1”); otherwise, it is judged as untampered (denoted as “0”). The detection decisions based on fragile and robust watermark are recorded by respective binary error maps E1 and E2. Through the following two-stage filtering mechanism, the final decision to tampering detection can be reached. Stage-1 Filtering: Let E = E1 OR E2. For each block b marked “1” in E, we define a detection region with center at b and count the following ratio F1:
)(1#
)(1# 21
E
EF (4)
where #1(E) denotes the number of the blocks within the region that are marked “1” in E, and similarly, #1(E2) denotes the number of the blocks within the region that are marked “1” in E2. The size of the detection region is (2R1 + 1)2, where R1 is a predefined radius. If the ratio F1 is smaller than a predefined threshold T, the block is recognized as tampered by a common image processing, instead of a malicious attack, and its mark is changed to “0”. Stage-2 Filtering: To eliminate the false negative errors as more as possible, the stage-1 result is processed again in stage-2. For each block b still marked “1” after stage-1, we define a detection region with center at b and of size (2R2 + 1)2, where R2 is a predefined radius. If less than half blocks within the region is marked as “1”, the mark of b is changed to “0”. Note that R1 and R2 are not necessary to be the same.

Proceedings of 4th
International Conference on Global Business Environment
(ICGBE-2014)
3
The experimental results and discussions: In this section, we demonstrate two kinds of experiments: one is contrast adjustment, which is usually recognized as common image processing, and the other is image synthesis, which is usually recognized as a malicious attack. The parameters set in this experiment are listed in Table 1. Table 1: Parameters of our Experiment
Item value image size
512 512 pixels
block size
4 4 pixels
divisor d 3 T 0.43 R1 12 R2 1
The indicator used to evaluate the watermarked image quality is as follows.
MSEPSNR
2255log10 dB (5)
where
M
i
N
j
jiji ppHW
MSE1 1
2
,, )(1 (6)
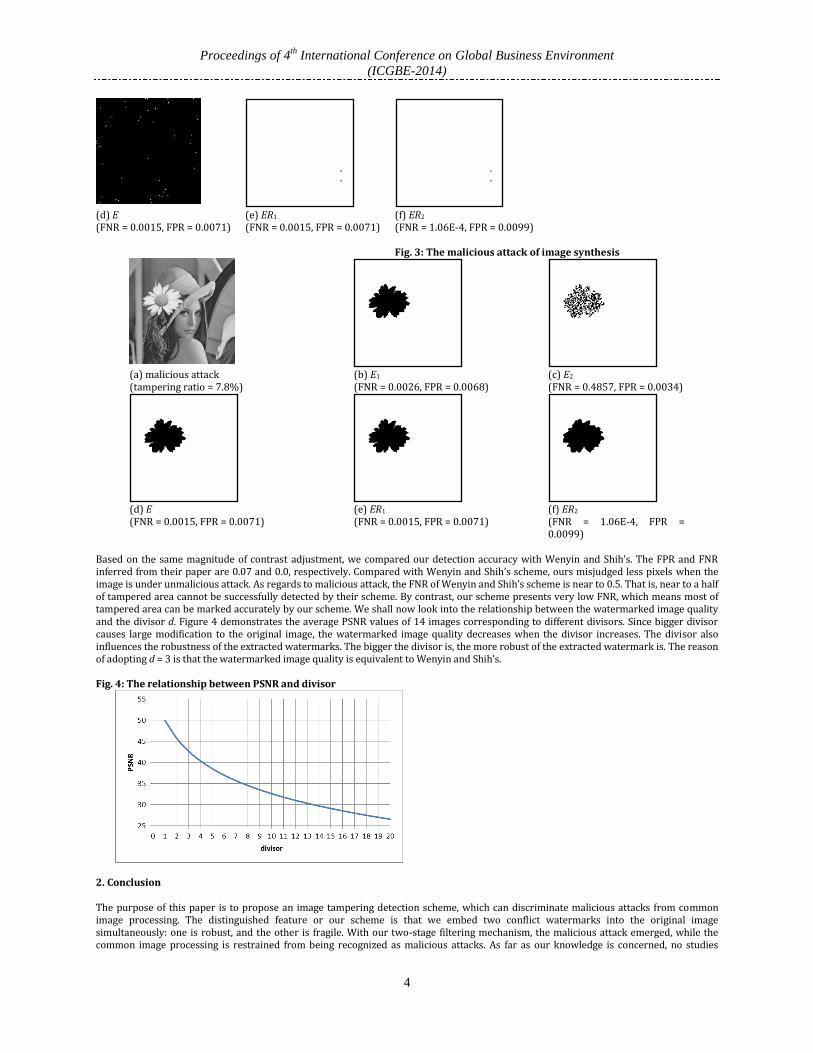
The notation W and H in Eq.(6) denote the width and height of image, respectively, and pi,j and pi,j denote the pixel of the original and watermarked image, respectively. The following are performance measurements related to detection accuracy (Hsu & Tu, 2010): FNR = FN/(FN + TP) (7) FPR = FP/(FP + TN) (8) where FN, FP, TN, and TP denote the number of pixels whose judgment on tampering is in fact false negative, false positive, true negative, and true positive, respectively. It is help to explain the above terms before moving on to the experiment results. There are two conclusions drew from tampering detection: one is positive, which means the pixel is judged tampered, and the other is negative, which means the pixel is judged untampered. The fact of tampering status is either tampered or untampered. The true positive and true negative means that the conclusion matches the fact; on the contrary, the false positive and false negative means that the conclusion does not match the fact. Figure 1(a) and 1(b) are the original image and the watermarked image, respectively. Subjectively, the watermarked image looks the same as the original image; objectively, the PSNR value is greater than 30, which means the difference between two images cannot be perceived by human eyes. Figure 2(a) and Figure 3(a) show the watermarked images modified by common image processing and malicious attack, respectively, and the error maps of tampering detection. Figure 2 shows that the error map contains almost no false judgment after two-stage filtering if the image is under common image processing. On the contrary, figure 3 shows that the error map can reveal the tampered area with low FNR after two-stage filtering if the image suffers malicious attack. Note that ER1 denotes the revised E after stage-1 filtering and ER2 denotes the revised ER1 after stage-2 filtering. Fig. 1: The original and watermarked image
(a) original image (b) watermarked image
(PSNR = 42.73) Fig.2: The unmalicious attack with contrast adjustment (+40)
(a) unmalicious attack (tampering ratio = 0.78)
(b) E1 (FNR = 0.0026, FPR = 0.0068)
(c) E2 (FNR = 0.4857, FPR = 0.0034)
Proceedings of 4th
International Conference on Global Business Environment
(ICGBE-2014)
4
(d) E (FNR = 0.0015, FPR = 0.0071)
(e) ER1 (FNR = 0.0015, FPR = 0.0071)
(f) ER2 (FNR = 1.06E-4, FPR = 0.0099) Fig. 3: The malicious attack of image synthesis
(a) malicious attack (tampering ratio = 7.8%)
(b) E1 (FNR = 0.0026, FPR = 0.0068)
(c) E2 (FNR = 0.4857, FPR = 0.0034)
(d) E (FNR = 0.0015, FPR = 0.0071)
(e) ER1 (FNR = 0.0015, FPR = 0.0071)
(f) ER2 (FNR = 1.06E-4, FPR = 0.0099)
Based on the same magnitude of contrast adjustment, we compared our detection accuracy with Wenyin and Shih’s. The FPR and FNR inferred from their paper are 0.07 and 0.0, respectively. Compared with Wenyin and Shih’s scheme, ours misjudged less pixels when the image is under unmalicious attack. As regards to malicious attack, the FNR of Wenyin and Shih’s scheme is near to 0.5. That is, near to a half of tampered area cannot be successfully detected by their scheme. By contrast, our scheme presents very low FNR, which means most of tampered area can be marked accurately by our scheme. We shall now look into the relationship between the watermarked image quality and the divisor d. Figure 4 demonstrates the average PSNR values of 14 images corresponding to different divisors. Since bigger divisor causes large modification to the original image, the watermarked image quality decreases when the divisor increases. The divisor also influences the robustness of the extracted watermarks. The bigger the divisor is, the more robust of the extracted watermark is. The reason of adopting d = 3 is that the watermarked image quality is equivalent to Wenyin and Shih’s. Fig. 4: The relationship between PSNR and divisor
2. Conclusion The purpose of this paper is to propose an image tampering detection scheme, which can discriminate malicious attacks from common image processing. The distinguished feature or our scheme is that we embed two conflict watermarks into the original image simultaneously: one is robust, and the other is fragile. With our two-stage filtering mechanism, the malicious attack emerged, while the common image processing is restrained from being recognized as malicious attacks. As far as our knowledge is concerned, no studies

Proceedings of 4th
International Conference on Global Business Environment
(ICGBE-2014)
5
propose similar ideas. Besides, our scheme also performs well on detection accuracy and the watermarked image quality. Except for recognizing malicious attacks, detection accuracy is also an important issue to a tampering detection scheme, especially when an image is under malicious attacks. If misjudgment occurs too often, the consequences would be very serious. The experiment results show that our scheme can not only recognize malicious attacks, but also can achieve high detection accuracy. Acknowledgment: This work was supported in part by a grant from National Science Council of the Republic of China under the projects NSC 102-2221-E-034 -011 -. References Chamlawi, R. & Khan, A. (2010). Digital image authentication and recovery: Employing integer transform based information embedding
and extraction. Information Sciences, 180, 4909-4928. Cormen, T.H, Leiserson, C.E., Rivest, R.L. & Stein, C. (2009). Introduction to Algorithms (3rd ed.), MIT Press & McGraw-Hill, 359–413. Hsu, C.S. & Tu, S.F. (2010). Probability-based Tampering Detection Scheme for Digital Images. Optics Communications, 283 (9), 1737-
1743. Liu, H,. Yao, X. & Huang, J. (2010). Semi-Fragile Zernike Moment-Based Image Watermarking for Authentication. EURASIP Journal on
Advances in Signal Processing, 2010. Available at http://asp.eurasipjournals.com/content/pdf/1687-6180-2010-341856.pdf Ojala, T., Pietikäinen, M. & Harwood, D. (1996). A comparative study of texture measures with classification based on feature
distributions. Pattern Recognition, 29, pp. 51-59. Preda, R.O. (2013). Semi-fragile watermarking for image authentication with sensitive tamper localization in the wavelet domain.
Measurement, 46, 367-373. Qi, X. & Xin, X. (2011). A quantization-based semi-fragile watermarking scheme for image content authentication. Journal of Visual
Communication and Image Representation, 22, 187-200. Wenyin, Z. & Shih, F.Y. (2011). Semi-fragile watermarking based on local binary pattern operators. Optics Communications, 284, 3904-
3912.

Proceedings of 4th
International Conference on Global Business Environment
(ICGBE-2014)
6
An Empirical study to Investigate firm Physical and Financial Characteristics Factors towards their Business Performance of Thai Manufacturing Public Firms
*Janthorn Sinthupundaja, NaveeChiadamrong Sirindhorn International Institute of Technology (SIIT), Thammasat University, Thailand
*[email protected] Abstract: There are a number of studies trying to identify potential factors affecting the firm’s business performance with various approaches. In this study, we used multiple regression analysis to examine the relationship between firm characteristics factors (both physical and financial factors) towards the firm’s business performance. Financial data from Thai public manufacturing firms listed in Stock Exchange of Thailand (SET) from 2006 to 2010, drawn from annual income statements and balance sheets were collected and analysed to identify these potential factors, which could affect the performance. Firm physical characteristics factors include growth, size, and age, while the financial characteristics include leverage and liquidity. Return on Assets (ROA) is used to be the important determinant to determine the firm’s business performance. The results show that except the factor of age, most factors appear to significantly affect our interested performance, which is ROA. All determinants of growth and leverage factors show to have a strong impact whereas only one determinant each from all size and liquidity factors have an effect on the business performance. Leverage and liquidity factors show negative impact while growth and size factors show positive impact. Keywords: Firm business performance, physical characteristics, financial characteristics, multiple regression, Stock Exchange of Thailand (SET)
1. Introduction Many factors have been used to study the determinants of firm performance such as growth, size, age, leverage, liquidity, asset structure, cash flow, and etc. (Liargovas & Skandalis, 2010)(Doan & Nguyen, 2011)(Muritala, 2012)(Almajali, Alamro, & Al-Soub, 2012)(Nawaz, Ali, & Naseem, 2011). In this study, we divide these factors into two groups: physical characteristic and financial characteristic factors. Physical characteristic factors describes the status of firms from their physical appearances. Physical characters somehow refer to uncontrollable factors or factors that are difficult to control since they are the consequence of the firm’s operations. In this study, we study physical characteristic factors of firms from their growth, size, and age. While financial characteristic factors emphasize on financial matters. They usually change with the firm’s financial policy. We examine financial characteristic factors through level of leverage and corporate liquidity. With physical characteristic factors (growth, size, and age), growth factors have been reported by several studies to affect the firm’s business performance (Almajali, Alamro, & Al-Soub, 2012)(Alzharani, Ahmad, & Aljaaidi, 2011)(Muritala, 2012). Firm growth can generate incomes (Zeitun & Tian, 2007). Growth also indicates that the firm has more opportunities to expand, survive, and improve (Almajali, Alamro, & Al-Soub, 2012). For the effect of size factor, there are two opposing arguments. Large firms tend to gain advantages of economies of scale with more bargaining power, and being more efficient than smaller firms (Almajali, Alamro, & Al-Soub, 2012). Ghosh (1998) stated that large firms have more abilities to diversify risk than small firms. On the other hand, when the firm is too large, the internal management becomes more difficult and sometimes results in inefficiency and high cost. Large firm may also suffer from being too large and ineffective(Loderer & Waelchli, 2010). Almajali, Alamro, & Al-Soub (2012), Loderer & Waelchli (2010), and Ghosh (1998) have studied the size effect to the firm’s performance. Ageof the firm can also affects the business performance in either positive or negative aspects. Age positively affects the firm’s financial performance because older firms tend to have more experience and enjoy benefit of learning, while, newer firms are normally lack of capital and reputation (Almajali, Alamro, & Al-Soub, 2012) . However, Loderer & Waelchli (2010) argued that when the firms get older, they suffer from inefficiency. Liargovas & Skandalis (2010) also mentioned the negative effect of age on the firm’s performance. They suggested that old firms might develop routines and are out of touch with new market conditions. Loderer & Waelchli (2010) have integrated the factor of age in their experiments. In this study, financial characteristic factors include the factor of leverage and liquidity. The level of leverageis one of the critical financial decisions for firms. It is the balancing between risk and return (Muritala, 2012). The firm must consider risk, tax, financial flexibility, and etc. The leverage is often used as one of the determinants for firm business performance(Doan & Nguyen, 2011)(Pratheepkanth, 2011). Muritala (2012) reported that higher level of leverage can improve the firm performance since higher leverage can lower agency cost and reduce inefficiency. Nimalathasan & Valeriu (2010) also supported that the debt ratio is positively and strongly associated to all profitability ratios (gross profit, operating profit, and net profit ratios). On the other hand, higher leverage means higher risk to the firms as well as higher financial cost. Regarding the factor of liquidity, this study refers the factor of liquidity as the corporate liquidity (not the equity liquidity). Corporate liquidity refers to the abilities to repay debt and other obligations. Liquidity always affects the firm business and has been studied for its impact by many studies(Owolabi & Ajao & Obida, 2012)(Liargovas & Skandalis, 2010)(Gurbuz, Aybars, & Kutlu , 2010). When firms show to have high liquidity, they are more capable of dealing with the uncertainty and unexpected contingencies (Liargovas & Skandalis, 2010). High level of liquidity sometimes causes a problem when the current assets are not well utilized. The firms would consequently suffer from the low rate of return (Gurbuz, Aybars, & Kutlu , 2010). The main objective of the paper is to investigate empirically physical and financial characteristics factors of the firm towards the business performance on the manufacturing public firms in Thailand during the 2006-2010. Having known the significance of these determinants, firms can then pay more attention to them as they play a major role in determining the success of the firms. Background of the problem and Research Design: Manufacturing industries in Thailand plays an important roles in Thai economics with a large proportion of the country Gross Domestic Product (GDP). It accounts for 39.2 percent of GDP according to the annual report 2012 of the Bank of Thailand. There are total eight industries listed in Stock Exchange of Thailand (SET), including Agro & Food Industry, Consumer Product, Consumer Product, Industrials, Property & Construction, Resources, Technology, Finance, and Services. In the study, the data is drawn from annual income statements and balance sheets from six industries because they are related to manufacturing fields in

Proceedings of 4th
International Conference on Global Business Environment
(ICGBE-2014)
7
which Finance and Services industries are excluded. The entire data of six industries consists of 354 firms. However, only 242 firms can be used in the analysis because of missing important financial data due to firms merging, suspension, and bankruptcy. As a result, there are altogether 1,210 observations in this study. Outliners have been identified during the analysis. Thus, ten per cent of the data at the top and the bottom have been eliminated. As a result, 1,184 observations remain for the analysis. From three main factors (physical characteristics, financial characteristics, and business performance), there are eleven variable (one dependent variable and ten independent variables). Explanation of these variables can be addressed as follows: Dependent variable: The dependent variable of the study is the firm’s business performance. We selected Return on Assets (ROA) to represent the firm’s business performance. ROA measures the effectiveness of economic unity to utilize the assets and efficiency in generating profits (Khalifa & Shafii, 2013) and is calculated by the net income divided by total assets (Doan & Nguyen, 2011), (Muritala, 2012), (Almajali, Alamro, & Al-Soub, 2012), and (Pratheepkanth, 2011) also employed ROA to represent the business performance in their studies. Independent variables: Our independent variables are divided to physical characteristic factors (growth, size, and age) and financial characteristic factors (leverage and liquidity). We used two variables to represent the effect of each factor. Growth is found to be one of the important factors that drive the firm’s business performance and is used to predict the firm expansion and opportunities. Two variables, which are used to measure the growth of firms, include: 1. Growth ratio of sales is the percentage changes of sales between years(Majumdar, 1997). 2. Growth ratio of total assets is the percentage changes of total assets of firms from year to year(Doan & Nguyen, 2011) in which
total assets include current assets and long-term assets. Size is related to the firm’s business performance in many ways and is considered to be an important determinant that influences the firm’s performance. As the data of the firm size (sales and market value) grow constantly along the time, we need take a natural logarithmic transformation to convert the data into linear function of time. Two variables selected to represent the firm size in this study consist of: 1. Natural logarithm of sales: Majumdar (1997) also used natural logarithm of sales to represent the size and be the determinantof
firm performance. 2. Natural logarithm of market value: Yang, Lee, Gu, & Lee (2010) used natural logarithm of market value to represent the size in
their study. Age is considered to be another factors that influences the firm business performance (Almajali, Alamro, & Al-Soub, 2012). Age can be measured through two variables, which are: 1. Established ageis the duration since firms have been established until the date of data collection. Islam, Khan, Obaidullah, & Alam
(2011) and Majumdar (1997) included the established age in their models to investigate its determinant towards the firm’s business performance.
2. Listed age is the duration since firms have been listed in Stock Exchange of Thailand (SET) until the date of data collection. Loderer & Waelchli (2010) used listed age to be a variable to represent the firm age. They also reported the relationship between listed age and business performance.
Leverage is one of the most important determinants of firm business performance. The level of leverage can be presented in terms of ratios. We selected two ratios to represent the level of leverage as follows: 1. Current liabilities/totalassets (CL/TA) is the ratio of current liabilities to total assets. Current liabilities are a firm’s debt or
obligations that are due within a year. Current liabilities include short-term debt, accounts payable, accrued liabilities and others. Total assets consist of both current assets and long-term assets. Doan & Nguyen (2011) used CL/TA to represent the leverage while testing its relationship with the firm performance.
2. Long-term liabilities/total assets (LL/TA) is the ratio of long-term liabilities to total assets. Long-term liabilities are a firm’s debt or obligations that are due beyond a year. Examples of long-term liabilities include long-term bank loan, mortgage loans and other kinds of loans. The higher the long-term liabilities to total assets ratio, the greater the long-term liabilities as compared to total assets. This represents the situation when the firm considers to use the loan rather than its own equity. Doan & Nguyen (2011) used LL/TA to represent the leverage and tested its relationship with the business performance.
Liquidity refers to the ability to deal with current debt obligations which can be paid by cash or other current assets.In this study, the factor of liquidity is represented by: 1. Inventory turnoveris calculated by sales over average inventories. Inventory turnover indicates an ability of a firm to convert
inventory into cash. It is commonly used to measure the firm’s operational efficiency in assets management. (Khalifa & Shafii, 2013). The inventory turnover ratio can be expressed as the number of times firms sell its inventory over a period.
2. Current ratiois calculated by dividing current assets by current liabilities. Current ratio indicates firm’s ability to pay short-term obligations. The higher value of current ratio, the more liquidity of the firm. Current ratio has been used as an independent variable to represent the level of liquidity by Khalifa & Shafii (2013) and Mohammad & Saad (2010).
2. Methodology In order to achieve the objectives of the study, the method of multiple regression model was used. Data are analysed with one dependent variable (ROA) and ten independent variables (growth ratio of sales, growth ratio of total assets, sales, market value, est. age, list age, CL/TA, LL/TA, inventory turnover, and current ratio). The conceptual framework of the study is shown in Figure 1. In the model, 𝛽0 is a constant, 𝛽1 to 𝛽10 are coefficients, and ε is an error term. The estimated model from the multiple regression analysis can be formulated as follows:

Proceedings of 4th
International Conference on Global Business Environment
(ICGBE-2014)
8
ROA = 𝛽0 + 𝛽1Growth ratio of sales +𝛽2Growth ratio of total assets + 𝛽3LnSales + 𝛽4LnMarket value + 𝛽5Est. Age + 𝛽6Listed Age + 𝛽7CL/TA + 𝛽8LL/TA + 𝛽9Inventory Turnover + 𝛽10Current ratio+ ε …………….(1) Figure 1: Framework of the study
Descriptive statistic: Descriptive statistic is conducted prior to the analysis of the multiple regression model. Descriptive studies produce minimum, maximum, mean, and standard deviation for each variable with both independent and dependent variables of every observation. There are total 1,184 observations. Dependent variable: Table 1 shows descriptive statistics of Return on Assets (ROA). The minimum value of ROA is -0.26. The maximum value of ROA is 0.27. The mean value of ROA is 0.05. Lastly, the standard deviation of ROA is 0.07. Table 2 also shows descriptive statistics of independent variables. Similarity, it shows minimum value, maximum value, mean, and standard deviation of each variable. Table 1: Descriptive statistics for dependent variable
Variables Minimum Maximum Mean Std. Deviation ROA -0.26 0.27 0.05 0.07
Table 2: Descriptive statistics for independent variables
Variables Minimum Maximum Mean Std. Deviation
Growth ratio of sales -0.98 11.20 0.10 0.51
Growth ratio of total assets -0.90 3.49 0.07 0.24
Ln(Sales) 9.15 21.42 15.06 1.50
Ln(Market value) 3.55 13.87 7.54 1.68
Established age 3.47 110.08 32.96 25.05
Listed age -5.75 34.71 13.19 7.92
Current liabilities/total assets 0.00 1.10 0.32 0.19
Long-term liabilities/total assets -0.05 0.67 0.10 0.13
Inventory turnover 0.01 958.56 11.72 38.02
Current ratio 0.16 175.43 2.64 7.47
Correlation test: Prior to fitting the regression model, it is important to check the correlation of variables between independent variables and dependent variable (ROA) and among independent variables themselves. Pearson’s correlation test was used in this analysis. Pearson’s correlation gives the scale ranges from -1 to +1. Positive values indicate positive correlation, while negative values indicate negative correlation. According to Table 3, the correlation coefficients between the dependent variable and independent variables present that ROA is significantly related with growth ratio of sales, growth ratio of total assets, Ln(Sales), Ln(Market value), CL/TA, and LL/TA under 95% confidence level. However, ROA is insignificantly correlated to established age, listed age, inventory turnover, and current ratio under 95% confidence level. Among independent variables, the correlation coefficients among independent variables are range from -0.240 to 0.802 as shown in Table 4. Except one correlation between Ln(sales) and Ln(Market value), Pearson’s correlation analysis indicates that these correlations are relatively low. This indicates that there is no multicollinearity problem.
Independent variables
Page
Growth ratio of sales
Growth ratio of totalassets
- Perceiv
ed Ease of Use
Growth - Hedoni
c
Needs
Size
Age
Leverag
e
- Evaluati
on
Liquidit
y
n
Internalization
Sales
Market value
Hotel Facebook
Page
Established age
Listed age
CL/TA
LL/TA
Usage
Inventory turnover
Current ratio
Business Performance
ROA
Dependent variable
Physical
Characteristic
Factors
Financial
Characteristic
Factors

Proceedings of 4th
International Conference on Global Business Environment
(ICGBE-2014)
9
However, further test to identify the tolerance value or Variance Inflation Factor (VIF) among independent variables will be required to check the multicollinearity effect. Table 3: Pearson’s correlation test of ROA to dependent variables
*Correlation is significant under 95% confidence level Table 4: Pearson’s correlation test among dependent variables
Variable Growth ratio of sales
Growth ratio of total assets
Ln (Sales)
Ln (Market Value) Est. Age
List. Age CL/TA LL/TA
Inventory Turnover
Current ratio
Growth ratio of sales
1
Growth ratio of total assets
0.193** 1
Ln(Sales) 0.017 0.043 1 Ln(Market value) 0.039 0.120** 0.802** 1 Est. age 0.032 -0.026 -0.033 -0.041 1 Listed age -0.023 -0.083** -0.006 0.002 0.202** 1 CL/TA 0.045 0.060* 0.103** -0.209** 0.006 -0.193** 1 LL/TA 0.022 0.031 0.253** 0.292** -0.101** -0.045 -0.180** 1 Inventory turnover
0.015 -0.018 0.027 0.055 0.040 -0.110** -0.031 0.036 1
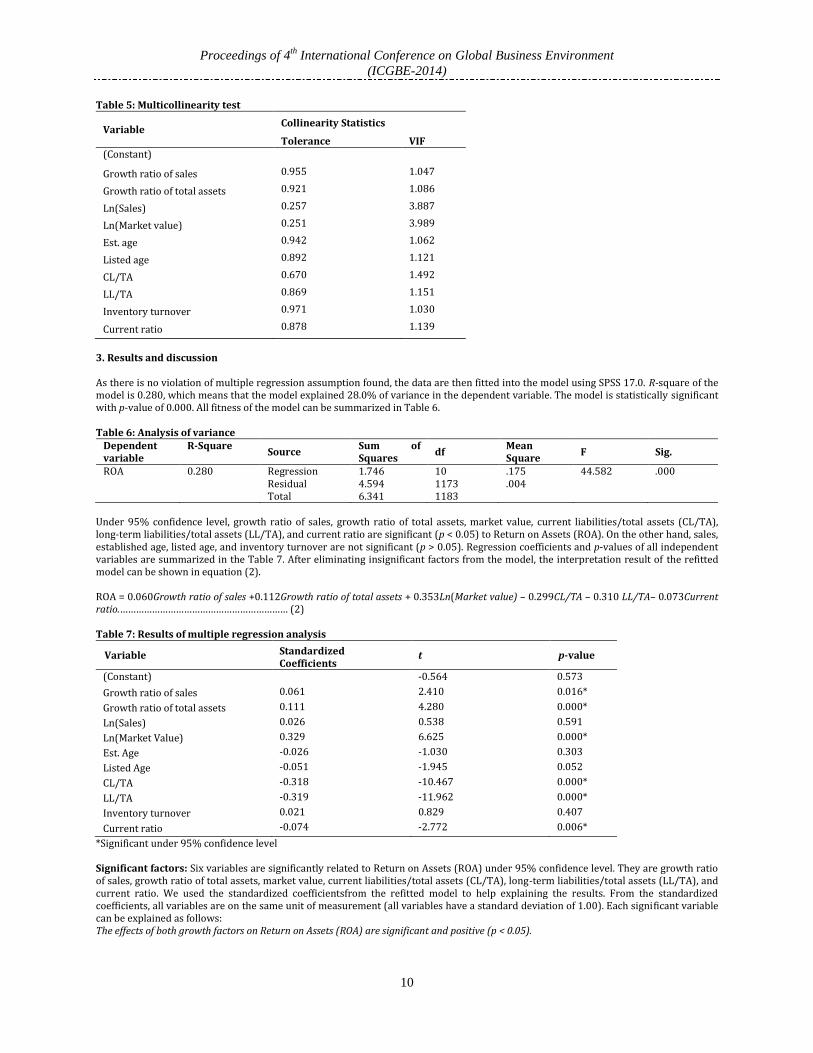
Current ratio -0.063* -0.021 -0.177** 0.001 -0.027 0.044 -0.240** -0.077** 0.075* 1 *Correlation is significant under 95% confidence level **Correlation is significant under 99% confidence level Multicollinearity test: Multicollinearity is a statistic problem when variables are highly correlated which resulted in inaccurate coefficient of multiple regression model. The problem of multicollinearity occurs when any variables with a tolerance value below 0.10 or Variance Inflation Factor (VIF) above 10.0 have a correlation more than 0.90 (Hair, Anderson, Tatham, & Black, 1995). This test is done to ensure that the problem of multicollinearity will not occur during the analysis. Table 5 shows that there is no violation of tolerance and variance inflation factor (VIF) from the analysis. For all independent variables, there is no tolerance values less than the recommended value (0.10). They are in range from 0.251 to 0.971. Similarly, there is no Variance Inflation Factor (VIF) above recommended value (10.0). They are in range from 1.047 to 3.989. Therefore, mullicollinearity does not exist among independent variables in the study.
Variable Correlation Coefficient
Growth ratio of sales 0.080*
Growth ratio of total assets 0.140*
Ln(Sales) 0.197*
Ln(Market value) 0.341*
Est. age -0.019
Listed age 0.004
CL/TA -0.290*
LL/TA -0.143*
Inventory turnover 0.036
Current ratio 0.017
Proceedings of 4th
International Conference on Global Business Environment
(ICGBE-2014)
10
Table 5: Multicollinearity test
Variable Collinearity Statistics
Tolerance VIF (Constant)
Growth ratio of sales 0.955 1.047
Growth ratio of total assets 0.921 1.086
Ln(Sales) 0.257 3.887
Ln(Market value) 0.251 3.989
Est. age 0.942 1.062
Listed age 0.892 1.121
CL/TA 0.670 1.492
LL/TA 0.869 1.151
Inventory turnover 0.971 1.030
Current ratio 0.878 1.139
3. Results and discussion As there is no violation of multiple regression assumption found, the data are then fitted into the model using SPSS 17.0. R-square of the model is 0.280, which means that the model explained 28.0% of variance in the dependent variable. The model is statistically significant with p-value of 0.000. All fitness of the model can be summarized in Table 6. Table 6: Analysis of variance
Dependent variable
R-Square Source
Sum of Squares
df Mean Square
F Sig.
ROA 0.280 Regression 1.746 10 .175 44.582 .000 Residual 4.594 1173 .004 Total 6.341 1183
Under 95% confidence level, growth ratio of sales, growth ratio of total assets, market value, current liabilities/total assets (CL/TA), long-term liabilities/total assets (LL/TA), and current ratio are significant (p < 0.05) to Return on Assets (ROA). On the other hand, sales, established age, listed age, and inventory turnover are not significant (p > 0.05). Regression coefficients and p-values of all independent variables are summarized in the Table 7. After eliminating insignificant factors from the model, the interpretation result of the refitted model can be shown in equation (2).
ROA = 0.060Growth ratio of sales +0.112Growth ratio of total assets + 0.353Ln(Market value) – 0.299CL/TA – 0.310 LL/TA– 0.073Current ratio.……………………………………………………… (2)
Table 7: Results of multiple regression analysis
Variable Standardized Coefficients
t p-value
(Constant)
-0.564 0.573
Growth ratio of sales 0.061 2.410 0.016*
Growth ratio of total assets 0.111 4.280 0.000*
Ln(Sales) 0.026 0.538 0.591
Ln(Market Value) 0.329 6.625 0.000*
Est. Age -0.026 -1.030 0.303
Listed Age -0.051 -1.945 0.052
CL/TA -0.318 -10.467 0.000*
LL/TA -0.319 -11.962 0.000*
Inventory turnover 0.021 0.829 0.407
Current ratio -0.074 -2.772 0.006*
*Significant under 95% confidence level Significant factors: Six variables are significantly related to Return on Assets (ROA) under 95% confidence level. They are growth ratio of sales, growth ratio of total assets, market value, current liabilities/total assets (CL/TA), long-term liabilities/total assets (LL/TA), and current ratio. We used the standardized coefficientsfrom the refitted model to help explaining the results. From the standardized coefficients, all variables are on the same unit of measurement (all variables have a standard deviation of 1.00). Each significant variable can be explained as follows: The effects of both growth factors on Return on Assets (ROA) are significant and positive (p < 0.05).

Proceedings of 4th
International Conference on Global Business Environment
(ICGBE-2014)
11
The standardized coefficient for the effect of growth ratio of sales on ROA is 0.060 (p=0.018). This means that there is an increase of 0.060 standard deviations in ROA for an increase of 1 standard deviation in growth ratio of sales. The standardized coefficient for the effect of growth ratio of total assets on ROA is 0.112 (p = 0.000). This means that there is an increase of 0.112 standard deviations in ROA for an increase of 1 standard deviation in growth ratio of total assets. Zeitun & Tian (2007) andMuritala (2012) reported a similar finding where the firm growth can improve business performance since the growth generates more income to the firms. The effect of size (LnMarket value) on Return on Assets (ROA) is significant and positive (p < 0.05). The standardized coefficient for the effect of Ln(Market value) on ROA is 0.353 (p = 0.000). This means that there is an increase of 0.353 standard deviations in ROA for an increase of 1 standard deviation in Ln(Market value). As firms become larger. They have gained advantages of economies of scale and bargaining power greater than small firms do. Ghosh (1998) also stated that larger firms have more ability to diversify risks. On the other hand, small firms tend to face more difficulty to access finance, legal system, or dealing with corruption (Beck, Dermirguc-Kunt, & Maksimovic, 2005). Moreover, this finding is consistent with the finding of Almajali, Alamro, & Al-Soub (2012) and Khalifa & Shafii (2013). The effects of both the leverage factors on Return on Assets (ROA) are significant and negative (p < 0.05). The standardized coefficient for the effect of CL/TA on ROA is -0.299 (p = 0.000). This means that there is a decrease of 0.299 standard deviations in ROA for an increase of 1 standard deviation in CL/TA. The standardized coefficient for the effect of LL/TA on ROA is -0.310 (p = 0.000). This means that there is a decrease of 0.310 standard deviations in ROA for an increase of 1 standard deviation in LL/TA. As this leverage factors state the liability proportion of the firms as compared to the total assets, liability portion is shown to deteriorate the firm performance since a high level of liability portion brings high financial cost to firms and hence impair their ROA. Similar finding were also reported by Doan & Nguyen (2011) and (Anjum & Malik (2013). The effect of liquidity (current ratio)on Return on Assets (ROA) is significant and negative (p < 0.05). The standardized coefficient for the effect of current ratio on ROA is -0.073 (p = 0.005). This means that there is a decrease of 0.073 standard deviations in ROA for an increase of 1 standard deviation in CL/TA. This finding suggests a negative relationship between the current ratio and ROA when the firm gains more liquidity (hence higher current ratio), it increases not only the current assets but also the total assets. Thus ROA, which is calculated by the income divided by total assets would be inversely affected. Gurbuz, Aybars, & Kutlu (2010) similarly reported the same finding. Insignificant factor: There is one factor with both of its variables showing insignificance in relation to the firm business performance. The effect of age (both established age and listed age) is found to be insignificant to ROA. This finding shows that no matter how long the firms have established or listed in the Stock Exchange of Thailand (SET), this duration does not influence their operations and performances. Their performances depend more on current operations and correct decision making than the duration of firm’s establishment. 4. Conclusion This study analysed physical and financial characteristic factors towards the firm’s business performance. With our interested factors only firm age appeared to show insignificant effect to the business performance, which is ROA. Except age factor, at least one variable from each factor somehow shows significant impact on ROA. Our interested physical characteristic factors (growth and size) show positive effect to ROA while the financial characteristic factors (leverage and liquidity) show negative effect. From their level of standardized coefficients, the factors of growth and liquidity show moderate impact while the factor of size and leverage show relatively significant impact. The factor of size depends very much on the firm’s operational track record, which is uncontrollable while the factor of leverage depends on the firm’s financial policy to control its proportion of debt to equity. So it is interesting to see that this financial decision policy plays an important role in determining the firm’s business success. However, further study may also be required to investigate deeper into the details of these effects. In addition, the effect of time and effect of different industries can also be studied to find out their impacts towards the firm’s business performance. Nevertheless, these initial finding can be used as a guideline for any firm in Thailand to identify potential factors for improvement providing that they cannot concentrate on all various possible factors under limitations of money and time. Acknowledgement: This work was supported by the research grant from BangchakPetroleam Public Company Limited. The authors are grateful for this financial support.
References Almajali, A. Y., Alamro, S. A., & Al-Soub, Y. Z. (2012). Factors affecting the financial performance of Jordanian insurance companies listed
at Amman Stock Exchange. Journal of Management Research, 4(2), 266-289. Alzharani, A. m., Ahmad, A. B., & Aljaaidi, K. S. (2011). An empirical investigation of factors associated with firm performance evidence
from Kingdom of Saudi Arabia. 2011 International Conference on E-business, Management and Economics, 25. Singapore. Anjum, S., & Malik, Q. A. (2013). Determinants of corporate liquidity - An analysis of cash holdings. Journal of Business and Management,
7(2), 94-100. Beck, T., Dermirguc-Kunt, A., & Maksimovic, V. (2005). Financial and legal constraints to growh: Does firm size matter? The Journal of
Finance, 60(1), 137-177. Brounen, D., Jong, A. d., & Koedijk, K. (2006). Capital structure policies in Europe: Survey evidence . Journal of Banking & Finance, 30(5),
1409-1442. Doan, N.-P.-A., & Nguyen, J. (2011). Firm Characteristics, capital structure and operational performance: A Vietnamese study. APEA 2011
Conference. Busan.

Proceedings of 4th
International Conference on Global Business Environment
(ICGBE-2014)
12
Ghosh, A. (1998). Does accounting base performance really improve following corporate acquisitions? New York: Zickling school of business, Baruch college (CU NY).
Gurbuz, A., Aybars, A., & Kutlu , O. (2010). Corporate governance and financial performance with a perspective on institutional ownership: Empirical evidence from Turkey. Journal of Applied Management Accounting Research, 8(2), 21-38.
Hair, J. J., Anderson, R., Tatham, R., & Black, W. (1995). Multivariate data analysis with reading (4th ed.). Eagelwood cliffs: Prentice Hall. Islam, M. A., Khan, M. A., Obaidullah, A. M., & Alam, S. (2011). Effect of enterpreneur and firm characteristics on the business success of
small and medium enterprises (SMEs) in Bangladesh. International Journal of Business and Management, 6(3), 289-300. Khalifa, K. M., & Shafii, Z. (2013). Finanical performance and identify affecting factors in this performance of non-oil manufacturing
companies listed on Libyan Stock Market (LSM). European Journal of Busines and Management, 5(12), 82-99. Liargovas, P., & Skandalis, K. (2010). Factor affecting firms financial performance: The case of Greece. Global Business and Management
Research: An International Journal, 2(2 & 3). Loderer, C., & Waelchli, U. (2010, Apr 10). Firm age and performance.MPRA Paper, Switzerland: Universität Bern, Institut für
Finanzmanagement . Majumdar, S. K. (1997). The impact of size and age on firm-level performance: Some evidence from India. Review of Industrial
Organiation, 12, 231-241. Mohammad, N. A., & Saad, N. B. (2010). Working capital management: The effect of market valuation and profitability in Malaysia.
International Journal of Business and Management, 5(11), 140-148. Muritala, T. A. (2012). An empirical analysis of capital structure on firm's performance in Nigeria. International Journal of Advances in
Management and Economics, 116-124. Nawaz, A., Ali, R., & Naseem, M. A. (2011). Relationship between capital structure and firms performance: A case of Textile sector in
Pakistan. Global Business and Management Research: International Journal, 3, 270-275. Nimalathasan, B., & Valeriu, B. (2010). Capital structure and its impact on profitability: A study of listed manufacturing companies in Sri
lanka. Revista Tinerilor Economisti: The Young Economists Journal, 13, 55-61. Owolabi, S., & Ajao & Obida, S. (2012). Liquidity management and corporate profitability: Case study of selected manufacturing
companies listed on the Nigerian Stock Exchange. Business Management Dynamics, 2(2), 10-25. Pratheepkanth, P. (2011). Capital structure and financial performance: Evidence from selected business companies in Colombo Stock
Exchange Sri Lanka. International Referred Research Journal, 2(2), 171-183. Woltman, H., Feldstain, A., MacKay, C. J., & Rocchi, M. (2012). An introductio to hierarchical linear modeling. Tutorials in Quantitative
Methods for Psychology, 8(1), 52-69. Yang, C.-C., Lee, C.-F., Gu, Y.-X., & Lee, Y.-W. (2010). Co-determination of capital structure and stock returns - A LISREL approach An
empirical test of Taiwan stock markets. The Quarterly Review of Economics and Finance, 50, 222-233. Zeitun, R., & Tian, G. (2007). Capital structure and corporate performance: Evidence from Jordan. Australasian Accounting, Business &
Finance Journal, 1(4), 40-61.
Proceedings of 4th
International Conference on Global Business Environment
(ICGBE-2014)
13
Achieving Developmental and Pro-Poor Trade in Africa: the Mauritian Transition-Emerging-Economy: Success Case Study
Rajendra Parsad GUNPUTH
University of Mauritius [email protected]
Abstract: In a contextualized approach the author explores development achievements in terms of pro-poor trade in Mauritius and to its transition-economy. Indeed, Mauritius is very notorious for its aggressive economic and financial lobbying specially on the African continent coupled to its openness strategy, easy-doing business with implementation of various national and strategic policies (development of its Freeport harbours and Export Processing Zone (EPZ), offshore sectors with massive foreign direct investment (FDI), development of the BPO and ICT sector in the Cyber City, diversification of the Mauritian export from sugar to industrial goods with major development in some emerging sectors such as trade in services through the tourism industry which is now contributing up to 8% of its GDP with massive employment in its hotels and construction, and Mauritius is actually targeting to exploit its exclusive economic zone) to increase both its imports of raw materials and exports of goods. Furthermore, it is a member of various regional economic blocks in the region (COMESA, SADC, IOR) to attract African investors and to bridge China and India to the African continent. All these strategies, factors and polices including strategic importance of Mauritius have contributed to trade diversification which in turn has created jobs to combat poverty eradication in a wealthier nation so far. Data to reflect and/or to prove same are borrowed mainly from the Central Statistics Office (CSO) in Mauritius, the Board of Investment in Mauritius (BOI), UNCTAD and the Bank of Mauritius Annual Reports principally during the period 2001-2012. The paper, with facts and figures, reflects to what extent achieving developmental and poor-trade is possible on the African continent. Is the Mauritian economy a reliable model? Why is it so wealthy actually or whether its economic miracle has been a mere luck up to now? Keywords: transition economy, Foreign Direct Investment, emerging sectors, financial sector
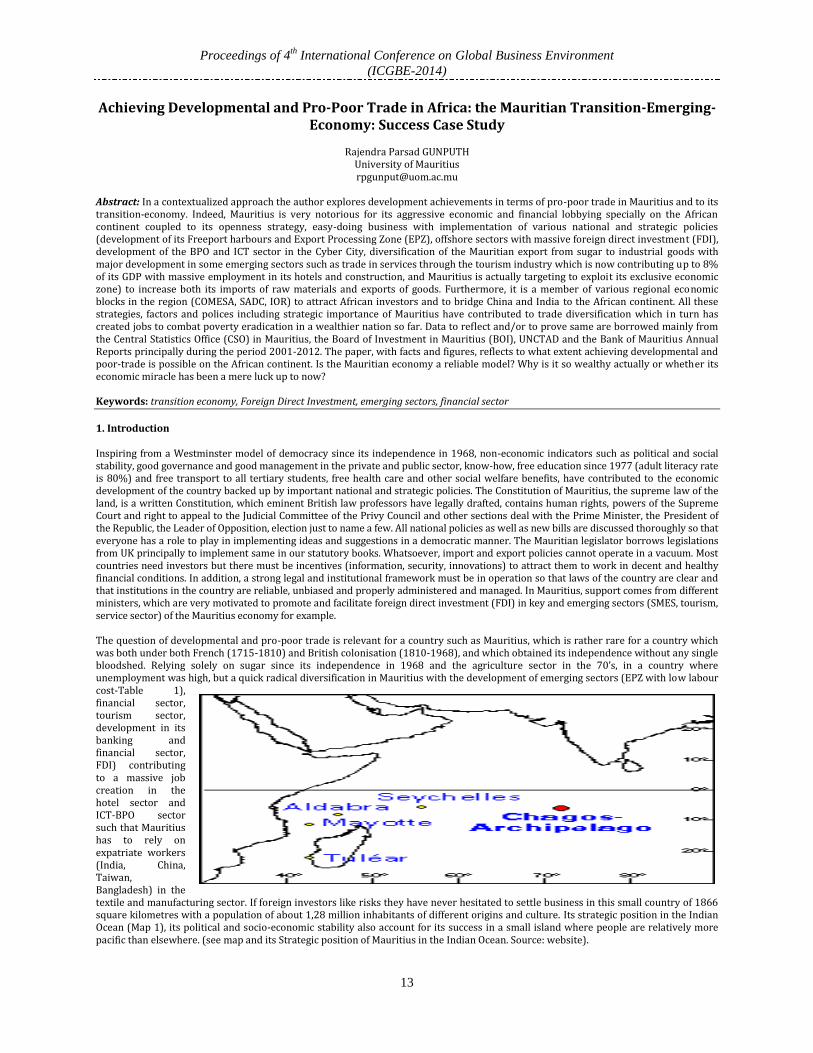
1. Introduction Inspiring from a Westminster model of democracy since its independence in 1968, non-economic indicators such as political and social stability, good governance and good management in the private and public sector, know-how, free education since 1977 (adult literacy rate is 80%) and free transport to all tertiary students, free health care and other social welfare benefits, have contributed to the economic development of the country backed up by important national and strategic policies. The Constitution of Mauritius, the supreme law of the land, is a written Constitution, which eminent British law professors have legally drafted, contains human rights, powers of the Supreme Court and right to appeal to the Judicial Committee of the Privy Council and other sections deal with the Prime Minister, the President of the Republic, the Leader of Opposition, election just to name a few. All national policies as well as new bills are discussed thoroughly so that everyone has a role to play in implementing ideas and suggestions in a democratic manner. The Mauritian legislator borrows legislations from UK principally to implement same in our statutory books. Whatsoever, import and export policies cannot operate in a vacuum. Most countries need investors but there must be incentives (information, security, innovations) to attract them to work in decent and healthy financial conditions. In addition, a strong legal and institutional framework must be in operation so that laws of the country are clear and that institutions in the country are reliable, unbiased and properly administered and managed. In Mauritius, support comes from different ministers, which are very motivated to promote and facilitate foreign direct investment (FDI) in key and emerging sectors (SMES, tourism, service sector) of the Mauritius economy for example. The question of developmental and pro-poor trade is relevant for a country such as Mauritius, which is rather rare for a country which was both under both French (1715-1810) and British colonisation (1810-1968), and which obtained its independence without any single bloodshed. Relying solely on sugar since its independence in 1968 and the agriculture sector in the 70’s, in a country where unemployment was high, but a quick radical diversification in Mauritius with the development of emerging sectors (EPZ with low labour cost-Table 1), financial sector, tourism sector, development in its banking and financial sector, FDI) contributing to a massive job creation in the hotel sector and ICT-BPO sector such that Mauritius has to rely on expatriate workers (India, China, Taiwan, Bangladesh) in the textile and manufacturing sector. If foreign investors like risks they have never hesitated to settle business in this small country of 1866 square kilometres with a population of about 1,28 million inhabitants of different origins and culture. Its strategic position in the Indian Ocean (Map 1), its political and socio-economic stability also account for its success in a small island where people are relatively more pacific than elsewhere. (see map and its Strategic position of Mauritius in the Indian Ocean. Source: website).

Proceedings of 4th
International Conference on Global Business Environment
(ICGBE-2014)
14
Major developments took place by the late 1980s and early 1990s: the Mauritian economy significantly reduced its dependence on agriculture and became more diversified with major developments in the services sector which has been earmarked as the area for economic development. To boost emerging sectors in Mauritius new legislations (The Banking Act was amended in 1988 to enable offshore banking to be carried out, establishment of the Stock Exchange Act 1988 to provide for the setup of a supervisory body and a private operating and management company, measures were therefore enacted to provide a new thrust to the development of financial services and economic development in Mauritius culminating in 1994 with the abolition of the exchange control, The Mauritius Offshore Business Activities Act and the Offshore Trusts Act were enacted in 1992 to deal with non-banking offshore business activities in Mauritius, and the establishment and the development of a Freeport in 1992 to follow the economic development strategy of Mauritius and to position it as a financial , business and trading hub in the Indian Ocean region). Mauritius is so successful in its export and import without any competitive devaluation, or a very small one to boost imports and importation of goods, of its national currency (rupees) to enhance trade while some African countries did a very aggressive use of devaluation (of the FCFA) as an export-enhancing device. Major events in its poor-trade development are: 1. 1968. Independence. Mauritius relies on sugar and agriculture to survive 2. 1970. Emergence of the EPZ sector with massive exportation of cloth to Europe until the African Growth and Opportunity Act (AGOA) came into operation to support this dying sector another boost 3. 1980. Double Taxation Avoidance Agreement (DTAA) with 34 countries to attracts FDI 4. 1990. Industrial Expansion Act 1993 came into force 5. Trade, business and investments need pillars to stand and in a nutshell the following pieces of legislations have been implemented to secure and encourage fair trade in the country with foreigners who wish to settle in the country: The Fair Trade Act, Business Registration Act 2002, Cooperatives Societies Act 1976, Investment Promotion Act 2000, Cooperatives Act 2005, Bills of Exchange Act 1914, Income Tax Act 2005, Companies Act 2001, Protection against Unfair Practices (Industry Property Rights) Act 2002, Prevention of Corruption Act 2000, Financial Intelligence and Anti-Money Laundering Act 2002, Prevention of Terrorism Act 2002, Financial Reporting Act 2004 just to name a few. The main Acts which are linked with trade in Mauritius are the Customs Tariff Act 1969, Customs Act 1988 and its regulations, Consumer Protection Price and Supplies Control Act 1988, Value Added Tax 1998 just to name a few. Under the aegis of the Mauritian Government various trade policies and institutions (Mauritius Revenue Authority, Export Processing Zone Development Authority, Industrial and Vocational Training Board, Mauritius Chamber of Commerce and Industry, Mauritius Export Development and investment Authority, Mauritius Processing Zone Association, Mauritius standard Bureau, Small and Medium Industries Development Organisation) /ministries (Ministry of Finance and Economic Development, Ministry of Foreign Affairs, International Trade and Cooperation) have been set up promptly to control trade and businesses in Mauritius so that everybody can trade free and fairly with equal treatment enhancing social and cultural integration. 6. In its 2006-2007 budget, Mauritius seems to be in line with its liberal investment policy and strategy avoiding economic or industrial strategies, which may eventually discriminate foreign investors. For example Mauritius has abolished exchange controls since 1994, 100% foreign ownership is allowed, registration duties are at 5% only, even one share holder company is permissible, a company may be incorporated in 24 hours, preferential market access in COMESA, SADC and AGOA, access to Double Tax Treaties (India), most of its institutions are empowered to take any administrative decision under an enactment and its judiciary is reliable and its decisions, totally impartial. 7. In 2009, introduction of an Act of Parliament The Corporate and Social Responsibility Act to encourage business organisation to give 2% of their dividends to contribute to sustainable economic development. As from 2010 Islamic banking became a new area for exploitation encouraging foreign investors to invest and to take loans without interest. In addition to existing institutions (supra), a large number of public institutions (Board of Investment, Bank of Mauritius, Business Parks of Mauritius Ltd, Development Bank of Mauritius, Mauritius Industrial Development Authority, Export Processing Zone Development Authority, Financial Services Commission, Mauritius Promotion Tourist Authority, Mauritius Revenue Authority, State Investment corporation, National Productivity and Competitiveness Council just to name a few) have been set up to give support to trade, promotion and facilitating foreign direct investment in most of the keys sectors of the Mauritian economy. The chart below shows the sectoral breakdown of the Mauritian economy.

Proceedings of 4th
International Conference on Global Business Environment
(ICGBE-2014)
15
Mauritius also has to be competitive with other neighbouring countries and which are also members of different regional economic partnership agreements (South Africa, Mozambique, Seychelles). True is it that South African products are less expensive and eventually more competitive on the Mauritian markets once the South African Rands are at its lowest rate. It has never been denied that volatility in exchange rate could dampen economic growth as it would raise the costs of transacting in international trade and capital flows. Exchange rate volatilities may have a domino effect generating large-scale crisis. The Mauritian rupee, too, has devaluated rather frequently but nonetheless it is stabilised by a permanent growth in its GDP and above all its EPZ sector, ICT-IBO sector, financial and banking and tourism sector are expanding exponentially (and by as from 2012 Mauritius shall be ready to welcome a quantum of 2 million tourists annually). In Mauritius, compared to some other African countries, the private sector also plays a very important role and various private institutions (Mauritius Chamber of Commerce and Industry, Mauritius Export Processing Zone Authority, Joint Economic Council) have improved the industry development and trade services in the country either by giving support to the public sector or by contributing financial services in the banking sector. The potential of Mauritius to export in the sub-Saharan region must not be overlooked. In fact, countries may exploit the knowledge based on its past and actual experiences and development in the region to achieve success. In a competitive world it is time for African countries, like the rest of the world, to be more performant in regional and international trade. The Mauritian success is not a miracle which other members of the African regional block would not able to achieve. They, too, they have potentials and goods and services to share and export to increase the goodwill of a country but the question is how? By the way are there other alternatives to neoclassic economics theories for Africa? Table 1 summarises the economic performance of Mauritius on the African continent. Table 1: Economic performance of Mauritius on the African continent
Performance Number of countries Africa Rank-Mauritius
Environmental Performance Index 2010 6 out of 163 countries 1st 2012 Heritage Foundation Index of Economic Freedom 8th out of 183 countries 1st Fraser Institute Economic Freedom 2011 9 out of 141 countries 1st Forbes Survey of Best Countries for Business 2011 19 out of 134 countries 1st World Bank Ease of Doing Business 2012 23rd out of 183 countries 1st Democracy Index 2010 Full Democracy 1st Global Enabling Trade Index 24th out of 167 1st Knowledge Economy Index 64 1st Mo Ibrahim Index of African Governance 2011 ---------------------- 1st International Property Rights Index 2011 38 out of 129 2nd Global Competitiveness Index 2011-2012 54 out of 142 countries 2nd Africa Competitiveness Index 2011 ---------------------- 2nd Corruption Perceptions Index 2010 (Transparency International) 39 out of 178 2nd ITU–United Nations Agency for Information and communications
62nd out of 178 ----
ITU’s Digital Access Index --------------------- 2nd Outsourcing Readiness Index (Africa) 2009 ----------------------- 2nd out of 15 Human Development Index 2011 77 out of 189 3rd The A.T. Kearney Global Services Location Index, 2011 36 out of 50 countries 4th
Source: author Rome was not built in one day and the Mauritius economic miracle cannot be summarised in a few lines. With facts and figures, and through various proposed alternatives, the author tries to explain the specificities of the small island nation which most African countries do not have the privilege to enjoy (Welfare State, low unemployment growth, good social security and lumped pensions, openness to the world, political and social stability, domestic market growth with improvement in the private sector and exponential growth of the informal sector such as small and medium enterprises-SMEs, intra-regional development, and with Mauritius being a member of most regional economic partnership agreements just to name a few). After an introduction (1), this paper is structured into five main parts. The second provides for the opening up of the financial sector especially of the Mauritian offshore banking to attract foreign direct invest (FDI) in the small island nation. The third part deals with regional integration of Mauritius in various economic regional partnerships agreements (REPAs) and various emerging economic blocks followed by some solutions against poverty eradication in Mauritius and the fourth and final section looks briefly in the development of Islamic banking in Mauritius. Some recommendations and a conclusion will finally close the chapter. A reference will list some authors and their books they have authored or co-authored to guide researchers in their work. Openness of the financial sector in Mauritius and its Role in Poverty Reduction Trade performances in the Emerging Sectors (EPZ, ICT-BPO, FDI): Radical diversification in Mauritius and its impact on its domestic financial sector: Trade performances have been achieved following a radical diversification in Mauritius that has provoked a shift from agriculture to its export processing zone through development in the openness of its financial sector with rather cheap labour costs (Table 2). In 1970, the Export Processing Zone Act came into force and the Export Processing Zone Programme spearheaded the favourable FDI flows in mid 1980’s attracting foreign investors (India, China) to use Mauritius as a platform (its relatively cheap labour force is accountable for this-Table 1.1 and Figure 2) locating both textile and garment manufacturing operations to benefit in return preferential access to European and United States markets. Countries with abundant cheap and skilled labour, electricity and energy with improved infrastructures such as road, port facilities, telephone and internet might significantly reduce the cost of doing business, as compared to if they had to bear the cost of improving infrastructure before setting up business in the country (Khondoker and Kaliappa, 2010). As Gilles

Proceedings of 4th
International Conference on Global Business Environment
(ICGBE-2014)
16
Joomun1 rightly pointed out: The success of the textile and clothing sector is partly attributed to factors besides the control of Mauritian authority. Some of the factors which have contributed positively to the Mauritian economy, in particular the textile and clothing sector are: the Multi-Fibre Agreement signed in 1982, which constrained several countries in their exports. It is in this context that investors from Hong Kong came to set up their firms in Mauritius. A combination of lower and falling oil prices together with a lower debt servicing arising due to the depreciation of the overvalued US dollar in 1984. An appreciation of the Taiwanese dollar and thereby a fall in Taiwan’s competitiveness on the world market led to Taiwanese investment in Mauritius. After 1984, the appreciation of the European currencies in relation to the Mauritian rupee resulted in Mauritian goods becoming more competitive. During the 1990s, political uncertainty over the future of Hong Kong’s reintegration into China encouraged investors to look for a safer haven and thus relocated to Mauritius bringing capital, market networks and technological know-how. Nobody would have expected that whilst the Mauritian economy was shifting swiftly and rapidly from an agricultural sector (sugar, tea, tobacco, coffee) to a very diversified economy including agro-industry, export-oriented manufacturing, construction, tourism, financial services (offshore and free port services) and the ICT-BPO sector the small island nation of Republic of Mauritius would be so successful with an outstanding economic performance creating jobs (Figure 4) for one and all and contributing to the welfare of the small island nation.
Source : Economist Intelligence Unit (2004) Figure 2: FDI and its contribution in emerging sectors
Source: CSO (2006-2012) Table 3: Inflation rate (%) of selected countries, year 2011
Country Inflation rate (%) Country Inflation rate (%)
France 2.3 Australia 3.4 United Kingdom 4.5 United States 3.1 China 5.4 Botswana 8.5 India 8.6 Mauritius 6.5 Japan -0.3 Seychelles 2.6 Singapore 5.2 South Africa 5.0
Source – World Economic Outlook database, April 2012 With fierce international (from Brazil, Bangladesh, Pakistan, India) and regional competition (from Mozambique) the textile and sugar sectors were not very competitive and Mauritius opened its gates to Indian offshore companies which were more specialized in the ICT-BPO sector (Figure 3) and other management companies which expanded very rapidly generating income. Very rapidly, the spectre of high rate unemployment slowed down showing significant progress in the Mauritian government to fight against unemployment and poverty eradication (Table 1.1, Table 1.2 and Figure 3). The sustainability of moderate or low inflation tells investors how successful the host government is, which means that, the lower the average inflation rate is in the host country, the more FDI will be attracted to the country (Yuko and Nauro, 2002). According to the Central Statistics Office of Mauritius, the Consumer Price Index stood at 130.4 in December 2011 against 124.4 in December 2010 that is a 6.0 point increase or 4.8% increase. The headline inflation rate (that is the
1 Joomun G. 2006. ‘Textile and clothing industry in sub-Saharan Africa’, The future of the textile and clothing industry in sub-
Saharan Africa (Bonn: Friedrich-Ebert-Stiftung).

Proceedings of 4th
International Conference on Global Business Environment
(ICGBE-2014)
17
average inflation over the year) for the 2011 stood at 6.5% as compared to 2.9% in 2010 (Table 1.2). Despite this rise, the inflation rate remains below the 9.7 % peak registered over the decade (see also Table 2 and Figure 3). Figure 3: % change in CPI sub indices between March and June 2012
It is important to point out that for poor-trade development Mauritius remains a Welfare State where various institutions (hospitals, primary and secondary schools and transport companies) provide free services and the government is always ready to subsidize various products to maintain prices reasonable, unemployment rate Is kept low as well (Figure 4) and goods remain affordable to one and all in spite of inflation or in the event of any unexpected euro crisis. Figure 4 : Rate of employment and unemployment (2007-2012)
Source: CSO Over and above, it is also contributing to the welfare of other countries. For instance, Mauritius has signed and ratified double–taxation avoidance agreement (with India for example) to improve its financial sector contributing to 44% of India’s foreign direct investment amounting to 40 billion dollars! Mauritius has already signed and ratified some 34 Double Taxation Avoidance Treaties, and one very recently with Kenya, and is contributing to 44% of India’s foreign direct investment (FDI) accounting for 50 billion dollars. From the year 2000 to 2009, the largest source of FDI in India is from Mauritius, representing around 44% of total flows2. Prompted FDI stabilises not only the Mauritian EPZ but creates new avenues for development in other emerging sectors as well (Figure 5) such as the tourism sector.
2 Source: Department of Industrial Policy and Promotion of India, Ministry of Commerce. http://dipp.nic.in
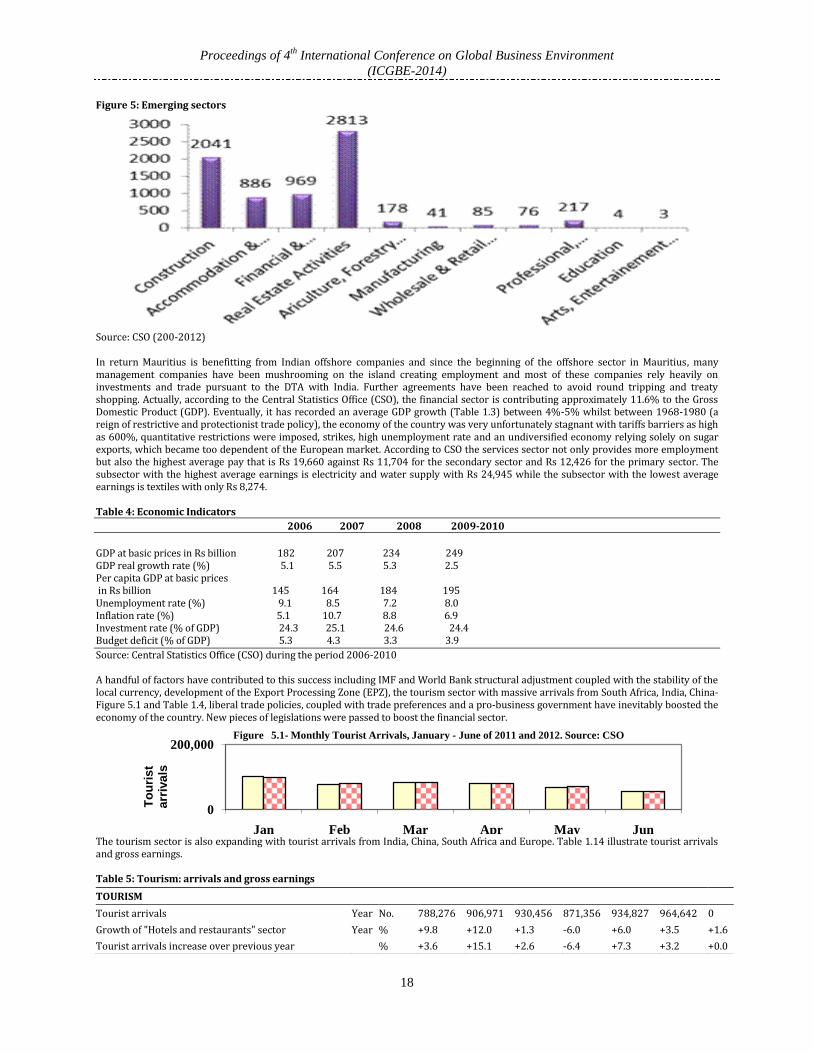
Proceedings of 4th
International Conference on Global Business Environment
(ICGBE-2014)
18
Figure 5: Emerging sectors
Source: CSO (200-2012) In return Mauritius is benefitting from Indian offshore companies and since the beginning of the offshore sector in Mauritius, many management companies have been mushrooming on the island creating employment and most of these companies rely heavily on investments and trade pursuant to the DTA with India. Further agreements have been reached to avoid round tripping and treaty shopping. Actually, according to the Central Statistics Office (CSO), the financial sector is contributing approximately 11.6% to the Gross Domestic Product (GDP). Eventually, it has recorded an average GDP growth (Table 1.3) between 4%-5% whilst between 1968-1980 (a reign of restrictive and protectionist trade policy), the economy of the country was very unfortunately stagnant with tariffs barriers as high as 600%, quantitative restrictions were imposed, strikes, high unemployment rate and an undiversified economy relying solely on sugar exports, which became too dependent of the European market. According to CSO the services sector not only provides more employment but also the highest average pay that is Rs 19,660 against Rs 11,704 for the secondary sector and Rs 12,426 for the primary sector. The subsector with the highest average earnings is electricity and water supply with Rs 24,945 while the subsector with the lowest average earnings is textiles with only Rs 8,274. Table 4: Economic Indicators
2006 2007 2008 2009-2010
GDP at basic prices in Rs billion 182 207 234 249 GDP real growth rate (%) 5.1 5.5 5.3 2.5 Per capita GDP at basic prices in Rs billion 145 164 184 195 Unemployment rate (%) 9.1 8.5 7.2 8.0 Inflation rate (%) 5.1 10.7 8.8 6.9 Investment rate (% of GDP) 24.3 25.1 24.6 24.4 Budget deficit (% of GDP) 5.3 4.3 3.3 3.9
Source: Central Statistics Office (CSO) during the period 2006-2010 A handful of factors have contributed to this success including IMF and World Bank structural adjustment coupled with the stability of the local currency, development of the Export Processing Zone (EPZ), the tourism sector with massive arrivals from South Africa, India, China- Figure 5.1 and Table 1.4, liberal trade policies, coupled with trade preferences and a pro-business government have inevitably boosted the economy of the country. New pieces of legislations were passed to boost the financial sector.
The tourism sector is also expanding with tourist arrivals from India, China, South Africa and Europe. Table 1.14 illustrate tourist arrivals and gross earnings. Table 5: Tourism: arrivals and gross earnings
0
200,000
Jan Feb Mar Apr May Jun
To
uri
st
arr
iva
ls
Figure 5.1- Monthly Tourist Arrivals, January - June of 2011 and 2012. Source: CSO
TOURISM
Tourist arrivals Year No. 788,276 906,971 930,456 871,356 934,827 964,642 0
Growth of "Hotels and restaurants" sector Year % +9.8 +12.0 +1.3 -6.0 +6.0 +3.5 +1.6
Tourist arrivals increase over previous year % +3.6 +15.1 +2.6 -6.4 +7.3 +3.2 +0.0

Proceedings of 4th
International Conference on Global Business Environment
(ICGBE-2014)
19
Source: Ministry of Finance and Economic Development. 2012 EPZ exports remain in Mauritius very promising (Table 1.5 and Table 1.6). By the end of December 2007, the number of enterprises in the EPZs totalled 404, employing 67,314 people among whom 32,973 were foreign workers from mainly China, India, Sri Lanka, and
Bangladesh3. Table 6: EPZ Exports. EPZ Exports and imports. 1985-1995. Source: Export Processing Zones Development Authority)
Source: CSO and Stock Exchange of Mauritius. 2001-2005) Trade Policies and policy making decisions to enhance the Mauritian economy: Mauritius has been exporting sugar since its independence in 1968. It has witnessed a very drastic reduction of 36% in price obtained for its sugar with the expiry of the Sugar Protocol under the LOME Convention. In fact it is the policy of the government to find new issues to new problems urgently and promptly in order to compensate for the loss.
Figure 6: Emerging trends of FDI-Emerging sectorsb
Source: CSO (2002-2009)
3 allAfrica.com
Gross earnings from Tourism Year Rs. mn 31,942 40,687 41,213 35,693 39,456 42,845 0
Gross earnings per tourist Year Rs. 40,521 44,860 44,293 40,963 42,207 44,415 0

Proceedings of 4th
International Conference on Global Business Environment
(ICGBE-2014)
20
Mauritius specificities for marketing in trade: In order for Mauritius to create jobs, establish schools and give education facilities to one and all in a country where primary education and secondary education is free as well as health services it needs money, funds and foreign investors. And relying on its specificities (small isolated island with no frontiers and borders, isolated island economy with diversified ethnic groups, small growing demography, landscapes which are ideal for tourism, low illiteracy and no natural resources such as gold and silver except to its blue economy) Mauritius opted for free and fair trade, regional trade, encouraged non-tariff barriers and import quotas and foreign exchange policing, lifted price controls, eliminated export licensing, abolition of export licensing just to name a few so that all Mauritians have each a share in the wealth of the country eliminating discrimination among the population when it is understood that the small island nation is rich in cultured diversity. Mauritius is not only a tourist destination. It is also classified as the Top 5 countries in the category Small Island Developing States (SIDS), regrouping 29 other countries, which is in line with expectations (UNCTAD FDI Attraction Index, 2011). It is observed that on the African continent, total FDI inflows (Figure 6) has declined in 2011 whereas inflows to Sub-Saharan Africa have improved from USD 30 billion in 2010 to USD 37 billion and that inflows to Mauritius amounted to USD 273 million with outflows of USD 89 million in 2011 (World Investment Report, 2012). Here, it is also important to note that both the public and the private sectors have also play an important role in building five stars hotels on the coast and have been able to integrate people living in the locality to have job opportunities in the manufacturing, tourist and hotel sector in full expansion. The public-private partnerships (PPP) working hands in hands may also account for this sudden economic development in Mauritius. However, after a recent lobbying in the tourism sector the EPZ sector (Table 1.5 and Table 1.6 supra) and the textile industry still remains an engine of growth and development in Mauritius (Table 1.6) though the Mauritian textiles and apparel industry faces serious obstacles because of global competitiveness. Minister Rajesh Jeetah4 rightly pointed out that: ‘The EPZ sector, as one of the major pillars of the economy, has been going through a difficult period during these last three years. It registered negative growth rates of 6%, 6% and 6.8% respectively in 2002, 2003 and 2004. This year too, the EPZ is expected to register a negative growth of 8%. The situation is therefore not rosy at all’. Table 8: FDI in EPZ Sector (1991-2000)
UNIT 1991 1998 1999 2000
FDI IN MAURITIUS EPZ RS MILLION 130 27 300 8
Source: Jeetah & Coughling P., SADC Study of Textile and Clothing Industry, Mauritius Country Report, 2001 However, there is no doubt that FDI has contributed significantly in the EPZ sector (Figure 6). According to UNCTAD (2007): ‘The volume of FDI that flows to Africa is not very low as a share of total global FDI flows or even as a share of FDI flows to developing countries, but also the share is on a steady downward trend for three decades. Africa accounts for just 2 to 3 % of global flows, down from a peak of 6 % in the mid-1970s, and less than 9 % of developing country flows compared to an earlier peak of 28% in 1976 (UNCTAD 2005). In 2006, FDI inflow to Africa rose by 20% to USD 36 billion, twice their 2004 level. Following substantial increases in commodity prices, many TNCs, particularly those from developed countries already operating in the region, significantly expanded their activities in oil, gas and mining industries’. Additional funds came from China and India to promote the tourism sector as well, a factor which is not to be neglected. According to the US International Trade Commission, Mauritius exports have increased by 12.6% from 140 million to 150 million only during the period 2002-2003. According to the Central Statistics Office (CSO), the economy of Mauritius has recorded an average GDP growth of 5% over the last 20 years (Figure 7), a good indicator of Mauritian excellent trade performance, and once more FDI accounts for this. According to CSO figures, GDP grew by 4.2% in 2010 which compares favourably with the 3.1% growth attained in 2009. Exclusive of sugar, the rate works out to 4.2% compared to 2.9% in 2009, GDP grew by 4.2% in 2010 which compares favourably with the 3.1% growth attained in 2009. Exclusive of sugar, the rate works out to 4.2% compared to 2.9% in 2009. Furthermore, facilities and opportunities are provided to encourage foreign investors to ‘stay’ in Mauritius. The Board of Investment (BOI) in collaboration with the Immigration Office and the Occupation Permit Unit issue permit for investors who can have a turnover exceeding 3 million rupees, to registered self employed provided he/she has an annual income exceeding 60,000 rupees; registered professionals shall be remunerated at Rs30, 000 or more, issue of residence permit to the registered retired non-citizen provided his/her annual transfer is of at least 40,000 US dollars. Advantage of its strategic position to enhance trade: Mauritius wished to take advantage of its excellent strategic position in the Indian Ocean, a stepping-stone for Asian markets to penetrate the African continent by relying on its various regional economic partnership agreements. It is in the spirit and policy of the government to develop Mauritius as a service hub for the region in order to better position it as a Centre for Capacity Building by supporting the operators of the Regional Multidisciplinary Centre for Excellence and the IMFs’ African Regional Technical Assistance Centres provided the region is free from terrorism and piracy. According to the Readers of Condé Nest Traveller Magazine 2008, Mauritius is ranked 19th among the best of Best Top 100 World Destination. Unlike many countries, Mauritius is gifted with natural reservoirs (Mare aux Vacoas, Mare-Longue, La Nicolière), natural indigenous forests (Macabé, Black River Gorges, Nature Park, Pétrin) and mountains (Moka Range, Piton du Milieu, Montagne Lion, Trois Mamelles), coastal reefs, unspoiled lagoons, dormant volcanoes (Trou aux Cerfs, Trou Kanaka) and unlimited beaches which are overcrowded with tourists and roamers on week-ends, and which have the merit to be protected. Rainfall is abundant and the sun shines all the year round. The tourism sector, as explained, is contributing to 8% of the local GDP. Various mechanisms are set up to scan local, domestic, regional and global markets to identify opportunities for the development of specific competitive sectors and products. L’Observatoire de l’Industrie will provide for economic intelligence and information dissemination to economic operator and policy-making. As an illustration, between the period 2007-2011, the National ICT Strategic Plan under the Competitiveness and Public Sector Efficiency Programme, which aims at sustaining growth and employment, shall be reviewed in order to address the impact of the global recession.
4 Jeetah R. 2005, Challenges facing the textile and apparel industry, Mauritius, workshop 2005

Proceedings of 4th
International Conference on Global Business Environment
(ICGBE-2014)
21
Importance of institutional and legal framework to enhance trade: Most African countries lack proper institutional and legal framework. There are local policies, which may only enhance trade and business in a country and for the country, but they are often overlooked or neglected. Local entrepreneurs in Africa very often have in-house training but with a view to combat poverty and unemployment it is important that there are regular in-house formal training programs (Figure 6.1). Indeed, who are these investors who wish to trade in a country where, for example, there is no proper institutional and legal framework to regulate investments at all or very few? Sometimes there is nothing new in these local policies because most of them have been inspired or borrowed elsewhere, because there is no need to invent the wheel once more, and implemented in ours for a wealthier nation. If these polices work elsewhere and have been proved to be efficient why should they not work in ours? Figure 6.1 Share of firms with in‐house formal training programs: Cross‐country comparisons. CSo. 2010-2012
Few countries have a road map to investment, trade and various policies. For Mauritius to trade properly and efficiently a very strong institutional and legal framework has been set up with a view to encourage, facilitate and promote investment. The settlement of a legal and institutional framework has been found to be very successful in emerging countries such as China, India and even South Africa. Free and fair election, democracy, wisdom and literacy, good and healthy political stability, healthy investment environment, high rate of employment, independent press, civil liberties and human rights, sustainable environment, productive labour force secure guarantees for foreign investors but over and above all there shall be a reliable institutional and legal framework to avoid mismanagement and popular injustice. New legislations are regularly implemented to improve good governance, ethics management and investment. An arsenal of legislation n has been drafted and implemented to safeguard the interest of everybody. According to S.Rosunee5: ‘‘Mauritius, therefore, urgently needs to translate this competitive advantage into substantial inflow of foreign investment and skilled job creation. In terms of trade, government policy is to defend acquired markets, as well as to vigorously seek new markets. It seeks to capitalise on all opportunities opened to it (such as through the Africa Growth and Opportunity Act), and has been active in pressing for the opening up of regional and sub-regional groups which it sees as providing opportunities for greater trade and investment. In addition, government, through appropriate legislation, has improved Mauritius’s reputation for homeland security an institutional fairness among potential investors’’. Termed as enabling bodies, these bodies (Board of Investment, Registrar of Companies, Bank of Mauritius) are operating night and day so that Mauritius; while taking benefits of all its qualities such as beaches, tourism, villas, strategic position in the Indian Ocean; becomes another ‘tiger’ in the Indian Ocean. However, all Mauritians must work hand in hand to fulfil this achievement because solidarity in what the government is open to avoid unnecessary strikes. The slogan of the government soon became ‘Unity in its Diversity’. And all citizens of this country have understood the message. Irrespective whether it is trade or not and for investors to be more secured there is not even one field where there is no legal and institutional framework. In addition, there are very attractive policies to encourage investors in the country. Indeed, the Mauritian Government has introduced new policies with effect from 1st October 2006 to attract foreign investors (in certain circumstances they can even acquire property but for business purposes only) and eventually encourage trade and business in the country. Foreign company are also encouraged to apply for acquisition of immoveable property and they can do so by registering with the Board of Investment (BOI) as an investor. Now an interesting issue is whether intellectual property may contribute to the economy of both developing and developed countries? Industries are more and more dependent on patent protection (computer, pharmaceutical products, aerospace, and semiconductor industries) and copyright (software, data processing, motion pictures, and publishing recording industries). In the USA, industries in the private sector that rely on intellectual property accounted for 40% of the total growth and are a source of job creation (18 million workers rely on intellectual property in the USA). In 2009, US receipts from cross-border trade in royalties and license fees (patent, trademark, copyright and other intangible rights) totalled 92 billion dollars, an increase of 9% as from 2007. If trade encourages investment it may also encourages passing off, counterfeiting, piracy, theft and even un manqué à gagner for local artists. Foreign products are invading local markets and trade could be out of control. The Mauritian Government reacted promptly and several legislations (Copyright Act 1977, Trade Mark Act, Business and Trade Names (Prohibition) Act 1988) have been promulgated. At international level, Mauritius is a member of several organisation namely the World Trade Organisation, TRIPS/OMPI and has ratified the Berne Convention, the Universal Copyright Convention, the Nice Convention 1957 (marques), Locarno Convention 1968 (desseins et modèles) and the Strasbourg Convention (brevets) to protect intellectual property rights. To fight against infringement to intellectual property rights on several and different products (logos, designs and models, patents and trade marks), the Ministry of International Trade with the assistance of other institutions (Mauritius Society of authors, Industrial Property Office) assure policy responsibility for intellectual property rights in the country. Mauritius is ranked 39th out of the 115 countries in the Intellectual Property Rights Index 2008.
5 Rosunee S. 1990, The Mauritian textile and clothing industry: facing t5he challenges associated with globalization,
infd.org/events/wfsids/virtual/papers.

Proceedings of 4th
International Conference on Global Business Environment
(ICGBE-2014)
22
SMEs in small economies: Indeed, various legislations have been promulgated to promote trade in the informal sector (Fair Trade Act, Business and Trade Names (Prohibition) Act 1988, The Business Registration Act 2007, The Consumer Protection (Price and Supplies Control) Act, Investment Promotion Act 2000, Small Enterprises and Handicraft Development Authority Act 2005 just to name a few), a sector which is properly managed by various institutions (Development Bank of Mauritius-DBM, State Bank of Mauritius-SBM, Small and Medium Industries Development Organisation, Small Enterprises and Handicraft Development Authority), which are ready to give financial (in contrast to other banks which are reluctant to lend money because entrepreneurs are undercapitalised and are viewed as credit risks the Development Bank of Mauritius (DBM) and State Bank of Mauritius (SBM) are two banks which are more than ready to lend money with low interest in order to encourage young entrepreneurs to start business promptly) and material/managerial (SMIDO, Export Processing Zone Development Authority encourages productivity, National Productivity and Competitiveness Council) support in a well planified and diversified economy. Young entrepreneurs usually face the same obstacle everywhere: how to raise funds and capital to run their business in Mauritius. In Mauritius, SMEs are contributing to the GDP and unemployment. In order for SMEs to flourish in the informal sector there must be a strong legal framework. The Mauritian legislature has promulgated The Industrial Expansion Act 1993 and the Small and Medium Industries Development Organisation (SMIDO) is also made statutory6. The Small Enterprises and Handicraft Development Authority Act (SEHDA 2005) came into operation. However, new pieces of legislations have also been promulgated to encourage entrepreneurship in Mauritius namely The Business and Trade Names (Prohibition) Act 1988, The Business Registration Act 2002 where a firm includes an unincorporated body consisting of one or more individuals, or of one or more corporations, having constituted a partnership with a view to carrying business; The Bills of Exchange Act 1914 facilitates negotiations; The Income Tax Act 2005 defines, inter alia, business7, relief for double taxation and non-resident who trades in Mauritius; The Borrower Protection Act 2007, The Companies Act 2001, The Consumer Protection (Price and Supplies Control ) Act, The Cooperative Societies Act 1976, The Investment Promotion Act 2000, The Cooperatives Act 2005 just to name a few. With such a legal framework for entrepreneurship, local SMEs in Mauritius have been mushrooming occupying 39% of the share of all employment contributing to 10-22.5 % of the GDP. According to the National Physical Development Plan, SMEs are contributing to 86 % in the sector employment, 75% in construction, 67 % in community and personal services, 65% in wholesale and retail, 13% in direct exports and around 50 % in transport, storage and communication. Mauritius is not the only success story. In Thailand, in 2004, textile and garment exports generated 6.4 billion dollars (4 % of the GDP), according to the Thai Customs Department. Despite African countries rely on the informal sector to survive young entrepreneurs need funds prior to commencement of business but which most African banks are reluctant to give because young entrepreneurs are risky clients and their firms and businesses may collapse unexpectedly. Institutions, when they are functioning properly and are made statutory, are capable of formulating comprehensive strategies including advice, finance, training, information, management and marketing support that firms eventually need and especially in the industrial sector. In Mauritius, the Small and Medium Industrial Development Organisation (SMIDO) is giving full support to SMEs and the Export Processing Zone Development Authority has improved quality and productivity. All initiatives by the Mauritian government were found to be fruitful investments. With a population of only 1.28 million inhabitants and its 1866 km square, there are some 2000 registered small and medium enterprises in Mauritius contributing to 10-23% of the GDP, had a workforce of 208,000 (41% of the total employment) generating a gross output worth Rs 42 billion (supra). According to a survey of the World Economic Forum’s African Competitiveness Report 1998 out of the 20 African economies, Mauritius is ranked 14th by its measure of procedural efficiency while it was only 23rd in the 2006 Doing Business Survey. And there is still room for improvement. There are young entrepreneurs in the country and they must be encouraged to trade within the country and with other countries. The SEHDA Act has established the Small Enterprises and Handicraft Development Agency (SEHDA) which encourages young entrepreneurs to set up their own business and to create jobs especially in the informal sector and they are given loans at low interest under the Empowerment Programme. Its latest figures reveal that there are around 90,000 small enterprises operating in the country of which 32% are operating in Trade and Commerce, around 16% in Leather and Garments, 13.2% in Food and Beverages and around 13% in Professional and Vocational Occupations. According to SEHDA8 which carries out a Survey Census of Economic Activity 2007 for small establishments every 5 years with the latest in 2007 it was revealed that: ‘In 2007, the number of small production units (establishments and itinerant units) operating in the Island of Mauritius and Island of Rodrigues was estimated at 91,980, compared to 74,930 in 2002, that is an increase of 23%. The total number of persons engaged in the small units was estimated at 208,800 (154,470 males and 54,330 females), around 19% higher than the figure of 175,790 (132.950 males and 42,840 females) in CEA Survey 2002(2002). The figures include both full-time and part-time workers, a part-time worker being counted as one person engaged. Total value added generated during 2007 by the small units covered was estimated to Rs 42,130 million, 82% higher than in 2002 when a value added of Rs 23,200 million was estimated. The contribution of the small units covered in the CEA 2007 to the economy worked out to 20% compared to 18% in 2002. Annual value added per unit increased by 48% to Rs 458,000 in 2007 from Rs 310,000 in 2002’. In the overall there are approximately 2000 registered SMEs actually in Mauritius contributing to 10-23% of the GDP as explained. As a result, Mauritius obtained the Award for the most improved Investment Climate at the 2009 African Business Awards held by African Business Magazine and Commonwealth Business Council. The Business Facilitation Miscellaneous Provisions Act 2006 has been introduced to facilitate the regulatory environment for the setting up of businesses. However, the main institution is the BOI as it controls most investments in Mauritius (Freeport activity). For example, the Integrated Resort Scheme (IRS) has been introduced to attract non-citizens who wish to purchase luxury villa, penthouse or apartment in Mauritius provided they are ready to invest a minimum of 500,000 US dollars in Mauritius and to contribute to the National Resident Property Tax creating job opportunities to the poor who are down the economic ladder. Similarly, an investor can purchase property for residential purposes provided he holds a permanent residence permit and that he intends to carry any economic activity with a turn over exceeding 3 million rupees and a non-citizen must first obtain a certificate from the Prime Minister’s Office in order to acquire shares in a company.
6 The SMIDO Act 1993 was repealed by Act No. 20 of 2005. 7 Section 2 of the Income Tax Act 2005 enacts that business:‘‘includes any trade, profession, vocation or occupation,
manufacture or undertaking, or nay other income earning activity, carried ou with a view to profit’’. 8 http://www.gov.mu/portal/goc/cso/list_1.htm

Proceedings of 4th
International Conference on Global Business Environment
(ICGBE-2014)
23
Development in the sector
Source: BOI) (Real State. Source: BOI)
Map 2: Source: internet
Mauritius is also exploiting its ‘blue economy’ as well. Indeed, its Exclusive Economic Zone (EEZ) covers 1.9 million square kilometres and the seafood sector is an emerging sector in the country with facts and figures which are found to be encouraging: the Mauritian Government has issued 235 licences to foreign fishing vessels (there are 500 fishing vessels for transhipment and bunkering) and some 113,000 tons of fish are caught annually and covers 23% of the global annual tuna catch originating only in the Indian Ocean (Map 2).The Seafood hub (aquaculture and fish farming are encouraged after the passing and promulgation of the Aquatic Business Act which is the relevant legal framework for fish farming activities) originated from an initiative of the government and is now contributing to Rs 4 billion accounting for 72% of the Mauritian exports and representing 18% of our total exports that is the second largest exports in Mauritius. As an incentive, tax for companies is still low (15%). However, it is also important to reveal that maritime piracy in the Indian Ocean is now a new scourge. Once more the Mauritian government reacted promptly with a strong collaboration with the government of Seychelles concerning extradition, deportation and sentencing of pirates in this part of the globe. The Mauritian Government will take more initiatives by elaborating much more on a Master Plan (a Rs 2 billion fund will be set up to encourage industrial fishing) and its terms of reference shall be the analysis of options for a comprehensive sustainable fisheries development and management plan for both Mauritius and Rodrigues. Entrepreneurs are also encouraged to raise their own private entrepreneurship contributing to job creation and poverty eradication in the country. Another initiative is the L’Institut de la Francophonie et de l’Entrepreneuriat (IFE) which is located on the campus of the University of Mauritius (UoM), lectures are delivered by specialists in this field to promote this area at the UoM and the Mauritian Government is very proactive, once more, to push the SME sector (infra) forward by its latest initiative known as ‘SMEase’ from the State Bank of Mauritius.
1980’s
Hotels
1990’s
Hotels
Commercial
Office
2000
Hotels
Commercial Office
IRS
RES
2010 onwards
Hotels
Commercial
Office
IRS
RES
Mixed Use
Invest Hotel
Real Estate
Commercial Property
Residential Property
IRS/RES/IHS

Proceedings of 4th
International Conference on Global Business Environment
(ICGBE-2014)
24
Table 9: Evolution of Small Businesses in Mauritius (1985-2007)
Years Number of firms Employment generated % of Labour force
1985 16000 47,608 22 1992 40,497 113, 274 24 2002 75, 267 200,000 36 2007 92,388 211,582 37
Source: CSO In 2007, there were 5 firms employing 747 persons and exporting 549 million rupees worth of goods (clock and watch making). This emerging sector, small businesses, has proved to be efficient against poverty alleviation in Mauritius. Actually, a large number of young entrepreneurs are able to survive with the SMEs they have created and some of them have encountered success in becoming leading entrepreneurs in the country attracting foreign investors in the Tuna industry.
Securities Law to pave an investment environment in Mauritius: Mauritius has experienced a real kick-off in Securities Laws in the year 2007 when the Securities Act 2005 was proclaimed on the 12th September 2007. At the same time, the country was internationally recognised as an active offshore financial sector, which paves the way for foreign investments into Africa and the Asian sub-continent. The Securities Act 2005 has indeed established a legal framework for the regulation of securities markets, depository, clearing and settlement facilities, securities exchange and intermediaries and provides for self-regulatory organisations and regulates the offering and trading of securities. At the 2009 African Business Awards held by African Business Magazine and Commonwealth Business Council Mauritius obtained the Award for the most improved Investment Climate and, according to the World Bank Doing Business Report 2009, Mauritius is ranked first in the African region and 24th out of the 181 countries for ease of doing business encouraging other countries to invest in Mauritius. At the same time foreign investors continue to invest in Mauritius (Table 1.9) Table 10: Foreign direct Investment by country of origin for the period 2004-2006 in million rupees
2004 2005 2006
China - 38 - France 492 427 41 Hong Kong 4 7 23 India 150 670 18 Reunion Island 5 30 53 South Africa 19 26 6 UK 143 578 79 USA 518 75 19
Offshore business activity was the term used to define foreign investments in Mauritius but without however having the right to carry out business in Mauritius but this expression is now termed as global business. The Finance (Miscellaneous Provisions) Act 2010 was adopted on the 17th December 2010. It now allows companies holding Category 1 Global Business Licences to conduct businesses in Mauritius. Investments from countries like UK, China, India, South Africa just to name a few suddenly took a new start with the socio-economic development in Mauritius in practically most sectors, emerging or not (Table 1.10 and Table 1.11). In 1988, a new Stock Exchange Act came into operation thus repealing Act 11 of 1987. The Securities (Central Depository, Clearing and Settlement) Act 1996 made provision for the establishment and regulation of a central depository, clearing and settlement service in order to facilitate dealings in securities. The Mauritius Offshore Business Activities Act (MOBAA) 1992 and the Financial Services Development Act 2001 were repealed and the Financial Services Act 2007 came into operation. The Financial Services Commission is empowered by the Financial Services Act 2007 to ensure the orderly administration of the financial services and global business activities, grant licences for securities exchanges; for deposit, clearing or settlement of securities transactions; trading securities systems, is responsible for inspecting and monitoring the financial standing and integrity of stock broking companies, ensuring compliances with the Act and ensure the fairness, efficiency and capital markets in Mauritius. Table 1.10 Foreign Direct Investment by sector in Mauritius (in USD million). Source: BoM)
Year/Sector 2007 2008 2009 2010 Manufacturing 8.5 5.0 15.0 32.6
Tourism 100.0 46.5 57.9 16.6
Financial 127.0 157.0 42.0 68.0
Real Estate 120.0 156.0 132.0 78.0
Health -------- 4.0 4.5 87.0
Other 4.5 26.0 20.0 53.0
Total 360.0 394.5 270.5 335.2

Proceedings of 4th
International Conference on Global Business Environment
(ICGBE-2014)
25
Figure 6.2 Source: BOI NEWSLETTER, December 2011, Issue No. 37
Securities are now construed as shares or stocks in the share capital of a local or a foreign company, other than a collective investment scheme, debentures, debenture stock, loan stock, bonds, convertible bonds or other similar instruments; rights warrants, options or interests in respect of securities mentioned above; treasury bills, loan stock and other instruments creating or acknowledging indebtness and issued by or on behalf or guaranteed by the Government of the Republic of Mauritius or the government of another country, a local authority or public authority, as may be prescribed; shares in, securities of, or rights to participate in, a collective investment scheme, depository receipts in similar instruments; options, futures, forwards and other derivatives whether on securities or commodities; any other transferable securities, interests or assets as may be approved by the Financial Services Commission; or any such instruments as may be prescribed. The provisions of the Securities Act govern the Stock Exchange of Mauritius. It is also an affiliation to the African Stock Exchange Association, Fédération Internationale des Bourses de Valeurs and World Federation of Exchange. Apart its regulatory functions and supervision of the market operations, the Stock Exchange of Mauritius is responsible for listing and monitoring trade data and to detect abnormal trading activity. It operates markets such as the Development and Enterprise Market (DEM) on which securities of listed companies are traded. The DEM is open to foreign investors with more than 43 companies representing a market capitalisation of about Rs 31 billion. Table 1.11 reveals market capitalisation by sector in 2005. Table 1.11 Market capitalisation in rupees by sector (2005)
Sector %
Banks and insurance 35 Leisure and hotels 22 Investments 15 Commerce 15 Sugar 8 Industry 5 Transport 3
SOURCE: THE STOCK EXCHANGE OF MAURITIUS LTD. ANNUAL REPORT 2005 The Financial Services Commission (FSC), a member of the International Organisation of Securities Commissions and of the Committee of Insurance, Securities and Non Bank Financial Authorities, is a financial institution and it emanates from the Financial Services Act 2007. By issuing licences for securities exchanges and ensuring that the criteria imposed are fully satisfied the FSC ensures the orderly administration of the financial services and global business activities and ensures the fairness, efficiency and transparency of financial and capital markets in Mauritius. Another important institution is the Central Depository and Settlement Co. Ltd, which is empowered by the Central Depository and Settlement Act 1996, to establish a clearing and Settlement Advisory Committee to review and make recommendations concerning system designs, operational procedures and problems and transferring the ownership of securities. Expansion in Mauritian trade services: Sugar is no more one of the pillars of the economy of the country. Recently, it has experienced a drastic cut of 36% in price obtained for its sugar with the expiry of the Sugar Protocol under the Lomé Convention. According to Rosunee9 both the African Growth and Opportunities Act (AGOA) and the Trade and Investment Framework Agreement (TIFA) were ratified at a ripe time but the AGOA was not so beneficial to most African countries because: ‘One of the objectives of the AGOA is to boost investment in textile manufacturing as after September 30, 2005 (following one-year extension), AGOA benefits will only be available to garments made up from materials made in the region or in North America. Hence, textile and garment manufacturers need to adapt their supply chain very fast to remain competitive, especially after elimination of quotas’. The TIFA is a bilateral cooperation agreement, which had been signed in 2006 with the US with a view to strengthening and expanding trade ties between the two countries. Well aware that there will be un manqué à gagner for the economy of the country the government reacted promptly to face new challenges with the development of SMEs (voiliers, belts, handbags, hats, fashion accessories) in regional trade was perceived as a good option. The tourism (this sector is contribution to 7.1%/ 8% to the GDP with more than 900,000 visitors in 2010 though the country was affected with international financial crisis and diseases such as Chikunguya) and the textile sectors (the textile sector is contributing to 6.5 % to GDP, accounts for almost 11% of total employment with a share of 52% of domestic exports) are bringing revenues as well to the country and
9 Rosunee S. 1990, The Mauritian textile and clothing industry: facing t5he challenges associated with globalization,
infd.org/events/wfsids/virtual/papers

Proceedings of 4th
International Conference on Global Business Environment
(ICGBE-2014)
26
should not be overlooked (Table 1.12 and Table 1.13). Once more, FDI from South Africa, India, UK and China gave a new boost to these emerging sectors. Table 1.12: Foreign Direct Investment by sector for 2004-2006 in rupees (millions)
Sector 2004 2005 2006
Export Processing Zone 248 106 11 Tourism 121 425 557 Banking 310 454 -
Source: Bank of Mauritius Report (2007) The Mauritian government found that for investors and tourists to invest and/or to stay in Mauritius security must be a priority. The local authority is laying much emphasis on investments prospects (big game fishing, dolphin watching, business tourism, beauty treatment, plastic surgery, construction of five stars hotels) and which shall be fruitful in the short run. To manage the tourism sector and to maintain sustainable development, licences and work permit are made compulsory in Mauritius. Legislations (Beach Authority Act, Dangerous Drugs Act 2000, Pas Géométriques Act) have been promulgated to punish violators (illegal big game fishing, overexploitation of catamaran without a licence, harassment of tourists on the beach, building near the beach and where nobody has no access to walk on the beach) of the tourism industry. The Police Force now includes a special department for the Police de Plage and a Drugs Department to combat illegal drug trafficking which transit through Mauritius. Table 1.13 Export Oriented Enterprises
Source : Mauritius Chamber of Commerce and Industry. 2011 It is the policy of the government to accelerate the process of regional integration (especially in the SADC-COMESA region with its half billion people), mobility of workers, cross-border initiatives in key sectors such as food security, climate change, infrastructure, ICT, renewable energy, maritime resources development such that Mauritius is committed to pursue an active international trade policy to fully integrate into the global economy. Development of SMEs offers all these good qualities. With a view to fight against poverty, the Mauritian government, through its corporate social responsibility (CSR) and empowerment programme, has been very supportive and proactive in launching various packages/incentives and plans (National Physical Development plan, National Human Resource Development Plan) to entrepreneurs to begin business as soon as possible provided there is a legal and institutional framework, which soon became the priority of the legislature. Table 1.14: External Trade by country in million rupees
2004 2005
Exports Europe 35,240 38,333 Asia 2276 7496 Africa 6473 7195 America 8048 5990 Imports Europe 21865 30270 Asia 35684 44347 Africa 11821 11292 America 3399 3807
SOURCE: THE MAURITIUS CHAMBER OF COMMERCE AND INDUSTRY (2006) With its constant, continuous and continuous lobbying, the Mauritian Government is attracting new countries for its export. Mauritian total exports are penetrating the European Union (67%) and, soon, Mauritius will enjoy the advantages of Third Country Fabric until 2015 but export in the SADC region is paradoxally low: a very poor 0.007% goes to the COMESA countries, 0.002% to the SADC members and only 5.89% to the ACP countries (Table 1.14). Under The Comprehensive Economic Cooperation and Partnership Agreement, Mauritius is now
Unit 2007 2008 2009 2010 2011
Value added at current basic prices Rs Bn 17.8 17.8 17.4 17.3 19.1
Value added/GDP % 8.3 7.3 6.9 6.5 6.6
No. of enterprises No. 404 412 413 372 360
Employment No. 67,314 62,276 58,566 55,828 55,740
Investment Rs Bn 4.5 2.2 1.1 0.9 1
Exports Rs Bn 37.8 35.1 36 40.1 41.6
Exports/total exports % 54.3 51.6 58.3 59.1 60.1
Imports Rs Bn 21 20.2 17.3 22.7 24.2
Imports of raw materials/Imports % 86.8 94.3 84.9 86.5 97.7

Proceedings of 4th
International Conference on Global Business Environment
(ICGBE-2014)
27
in a position to export to India 3 million pieces of textile and garments products on a duty-free basis. There is a bilateral trade agreement with Pakistan, which has agreed to offer preferential access to its market (26 garments products are enjoying duty free access). Table 1.15. Regional External Trade in million (rupees)
2004 2005
Exports ACP 4860 5488 COMESA 6623 4287 SADC 1551 1440 Imports ACP 11366 10570 COMESA 2350 2196 SADC 9706 9400
Source: The Mauritius Chamber of Commerce and Industry (2006) Products and innovations are one thing but penetrating foreign markets is another thing. Mauritius is a member of most Regional Economic Partnership Agreements (REPA) such as IOC, SADC, COMESA, EU just to name a few in order to extract all benefits and privileges (supra). With the REPA products from Mauritius are exempt from taxes for example with preferential access to EU, COMESA and SADC markets. The seafood industry is generating around Rs 4 billion to the country (supra) and there is still improvement to be made to this emerging sector. Mauritius is expanding its exports to potential markets such as China and Japan. Asiatics are very fond of seafood (tuna, seacocumber) and there have been major and important development for trade in the seafood sector but since overexploitation (unfortunately too many licenses have been issued and granted to EU companies and Japan Tuna Fisheries Cooperation Associations for fishing activities in the Indian Ocean) may jeopardized this sector. Consequently, shrimps, crayfish, crabs, eels, tuna fish are exploited and exported subject however to fish farming in unpolluted marine farms around the country. According to some latest incentives the Mauritian Government, which aims to increase its quality and quantity, there have been many developments in the seafood sector and no other sector has been able to have such financial support. Incentives and support are simple and unpretentious but their efficiency is not put into question: construction of cold warehouses, platform for transhipment, patrols to overcome illegal fishing in the Indian Ocean, fast track cargo release through the electronic clearance of goods just to name a few
Regional Integration: Mauritius is a member of most regional economic blocks (supra) in the region but being a member of a number of regional economic blocks (see map below) has not contributed for its economic success. Language barriers, competition without any single harmonisation for a common currency account for this.
Alternatives to regional integration: Are there alternatives to regional integration? Is there evidence to prove that the regional integration was successful or not to Mauritius and its economy. Except to some few exceptions (South Africa, Mauritius) most members of the regional blocks (COMESA, SADC) have not been able to export properly. Why? At domestic level there is still a lack of infrastructures, continuous devaluation of the local currency as wellon the African continent, very weak institutions and legal framework, political instability in some countries of the African continent and members of the REPAs, international crisis, lack of harmonisations in the regional economic partnership, inability to achieve a common currency, language barrier just to name a few may account for regional disintegration (infra). Even social security in Africa is weak (Table1.16). Again and once more Rosunee10 pointed out clearly in his research that: ‘In the regional level, Mauritius has done well with the share of manufacturing value added (MVA) in the GDP being about 19% while for most African countries MVA remains below the minimum 16% required on an ongoing basis for sustainable development.
Moreover, the African continent has seen its GDP per capita fall between 1990 and 2000, from USD 755 to USD 673’.
COMESA (source: website) SADC(source:website)
10 Rosunee S. 1990, The Mauritian textile and clothing industry: facing t5he challenges associated with globalization,
infd.org/events/wfsids/virtual/papers

Proceedings of 4th
International Conference on Global Business Environment
(ICGBE-2014)
28
Table 1.16: Social security in the SADC. Source: SADC (2011)
Most countries of the sub-Saharan region are still exporting raw materials to survive in a global world where competition is fierce. Developing countries, which are exporting electronic and electric devices and appliances, shall soon be more competitive than the USA, France or Britain. China (Greater Mekong Subregion, ASEAN Free Trade Area) and India are now potential leaders to challenge any competitor in the world actually. Their products are invading most markets in the world. The Asiatic know-how, trade liberalization, cooperation with most countries of the world, successful regional integration with all types of facilities (preferential trade agreements, free trade areas, customs unions, common markets, economic and monetary unions) and implementation of national policies are accountable for the Asian success. By invading the African market with products and goods China and India will eventually use Mauritius a stepping stone to conquer Africa
Regional integration or regional disintegration? The aims and objectives of Economic Partnership Agreements were to align bilateral arrangement between ACP countries and The European Union. Though member States enjoy duty free access to the SADC members and though Mauritius enjoys tariff-free trade with other eight African countries in the Common Market for Eastern and southern Africa (COMESA) trade in terms of import-export is still negligible in all its sense. To the exception of the Republic of South Africa, in terms of trade, import and export regional integration has never been beneficial to any country and even to Mauritius, though it has contributed a very influential role in the region. Table 1.17: Export in the SADC region (%)
Country 1980 1985 1990 1995 1999-2000
Angola 0.2 0 0 0 0.9 DRC 0.4 0.1 0.1 2.7 0.1 Malawi 11.1 6.1 0.5 1.9 2.3 Mauritius 2.2 0.1 1.4 0.6 0.6 Mozambique 1.8 0.1 0.1 1.4 0 South Africa 64.2 50.5 56.0 76.5 77.8 Seychelles 0.2 0 0 0 0.1 Tanzania 9.6 0.1 0.2 0.3 1.3 Zambia 4.4 4.1 1.0 1.3 2.0 Zimbabwe 6.0 38.9 40.7 15.4 14,9 Source: World Trade Analyzer Data (1999) In Mauritius, there is only one main harbour (Port-Louis, the capital of the country). It caters for harbour services and facilities, container handling, transhipment and manipulation of bulk commodities. The Freeport Unit of Board of Investment and the Mauritius Cargo community Services Ltd are two additional institutions, which promote and facilitate business in the Mauritius Freeport and cargo information. Table 1.20: Port Trade 2004
Traffic Million tons
Total traffic 5.85 Bulk traffic 3.22 Total container traffic 244
Source: Central Statistics Office -2005 For improvement in trade in import and export, there shall be reliable infrastructures and modern telecommunications. The Romans know it well and they had developed a network of roads and infrastructure from Rome to most remote regions of the old continent. Development in its harbours explains the South African’s success in the REPA and accounts for better trade in its exportation. Safe to some few exceptions, in most countries of the world shipping connections are still unexploited or underdeveloped. Containers are loaded manually. Countries of the SADC (South Africa is an exception) are still under exploiting their harbours. The Mauritian Government is encouraging Public Private Partnership (PPP) to promote new infrastructures (airport, roads, bridge, metro léger). According to Nurudeen (2010), private and public investments are closely related, governments should invest in infrastructure if they want to attract private investment and FDI. Language barriers, lack of harmonisation in terms of legislations, customs union, common market, economic union and a common currency just like the Euros in the Economic Union are major obstacles members of the regional Economic Partnership Agreement (EPA) are facing today. The Cotonou Agreement has come to an end (2007) and it is urgent to look for other trade agreements. A list, whether exhaustive or not, is not important but it shows to what extent the Mauritian Government is ready to extent its relations to other countries in order to achieve regional economic integration and international recognition both for its imports and exports.
SADC member Social Security Tanzania 5.98% Madagascar 14.9% Mauritius 85.6% Zambia 7%

Proceedings of 4th
International Conference on Global Business Environment
(ICGBE-2014)
29
Key factors to enhance trade in the Indian Ocean: the Asian Financial support: There are some key factors, which may enhance trade in the Indian Ocean and eventually in the sub-Saharan region. Mauritius took serious challenges in enhancing trade by encouraging the development of small and medium enterprises (supra) and eventually then to conclude bilateral agreements with some Asian countries. China and India are two greatest investors in Mauritius. The Comprehensive Economic Cooperation and Partnership Agreement between Mauritius and India covers areas of trade in services, investment and Economic cooperation. In addition to various types of assistance to Mauritius in agriculture, education and sports, China is financing the Mauritian Government to build airports and other infrastructures. As an illustration of India’s financial and economic support to Mauritius India has financed the Cyber City at Ebène. In return, imports from China grew from 10 billion rupees to 13.6 billion rupees from 2006 to 2007 but imports (fish) were around 121.1 billion accounting for 80.9% of our GDP. Mauritius is also purchasing oil directly from India in order to avoid paying additional taxes. Indian Oil Stations are mushrooming around the island creating jobs and employment and generating income to the country. Therefore, policy of the government is to trade and let others trade in the country as well. They need plots of land but who will lease or sell his/her plot of lands? The Integrated Resort Scheme (IRS) and the Real Estate Scheme (RES) were the answer: the Board of Investment (BOI) (Figure below) will issue an IRS certificate if the board approves the IRS project. A large number of investors have IRS certificate and they even benefit from the Morcellement Tax, Registration Duty and Land Transfer Tax.
(Source: BOI. Annual Report 2011)
The property industry is contributing to 11.9% (2009) of the GDP increasing from 10.5% in 2006 to 11.5 in 2008 and contribution to economic growth is around 0.7. Asian countries want to invest in Africa provided there is a good social and political environment in addition to its economic opportunities. While investing in Mauritius, these Asian countries may also benefit directly and indirectly from agreements Mauritius has signed or ratified (Mauritius has signed the ACP-EU Convention, of the European Free Trade Area, Interim Economic Partnership Agreement, Trade and Investment Framework Agreement, Bilateral Investment Treaty) without being a member of the Regional Economic Partnership Agreements (customs duties for COMESA is zero % and are very attractive indeed) at all. The Tianli Enterprise Group, a Chinese firm, is investing 100 million dollars in Mauritius to promote trade, infrastructural works and a spinning plant in the country (Figure 6.3). It will also provide headquarters for Chinese business after the establishment of a Trade and Economic Zone. It is estimated at about 530 million dollars and the Tianli enterprise will bring some 20 billion rupees of investment. In return, China will take benefit of the preferential market access Mauritius is enjoying from the African region (COMESA and SADC) and AGOA. It seems that Mauritius is enjoying the China-Africa Cooperation and its funds, which are generated by the China Development Bank. Up to now, it has provided one billion US dollars to develop cooperation with Africa. The China-Africa cooperation which was settled in October 2000 during the Forum On China Africa Cooperation and after the Beijing Summit, which was held in November 2006. Goods and various imports (machines and apparatuses) from China are invading the African market and China are exploiting natural resources such as Tuna fish in the Indian Ocean. Furthermore, Chinese goods and products can penetrate the COMESA (with its 380 million inhabitants with intra-trade exceeding US 120 billion dollars while customs duties is zero %0), SADC with its 230 million inhabitants generating a combined GDP of US 200 billion dollars, the AGOA and even the Indian Ocean Commission (IOC) which was set up in 1982.
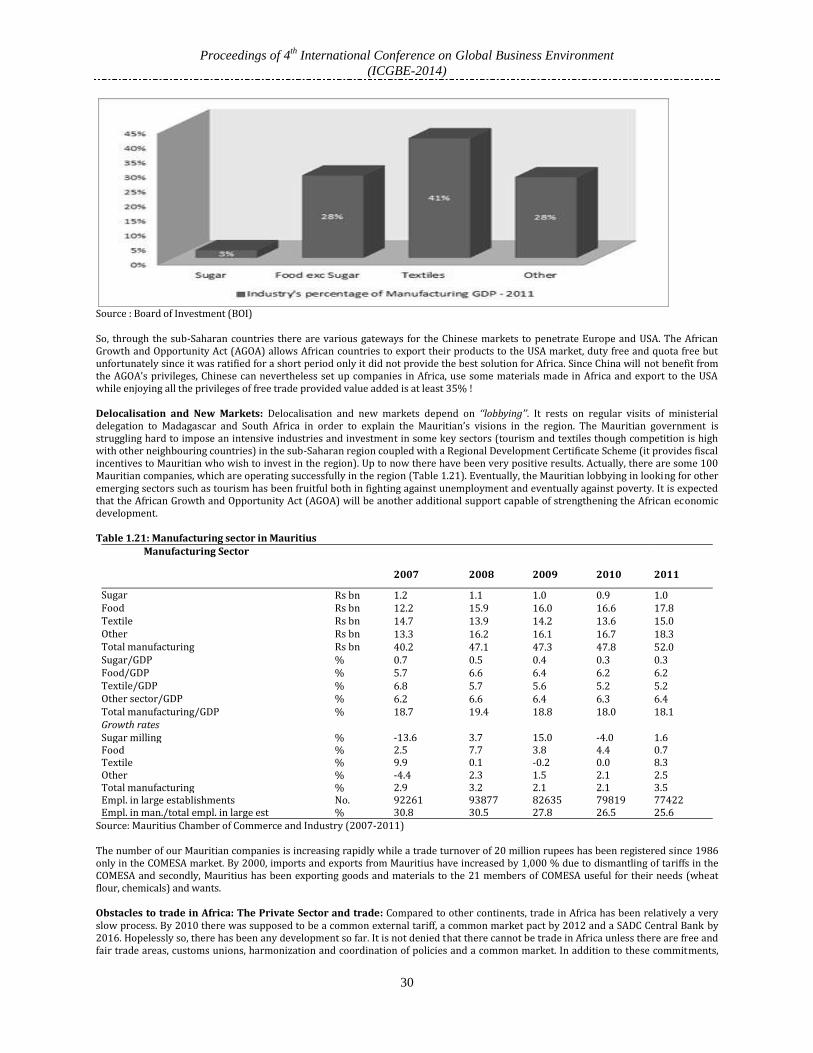
Proceedings of 4th
International Conference on Global Business Environment
(ICGBE-2014)
30
Source : Board of Investment (BOI) So, through the sub-Saharan countries there are various gateways for the Chinese markets to penetrate Europe and USA. The African Growth and Opportunity Act (AGOA) allows African countries to export their products to the USA market, duty free and quota free but unfortunately since it was ratified for a short period only it did not provide the best solution for Africa. Since China will not benefit from the AGOA’s privileges, Chinese can nevertheless set up companies in Africa, use some materials made in Africa and export to the USA while enjoying all the privileges of free trade provided value added is at least 35% ! Delocalisation and New Markets: Delocalisation and new markets depend on ‘‘lobbying’’. It rests on regular visits of ministerial delegation to Madagascar and South Africa in order to explain the Mauritian’s visions in the region. The Mauritian government is struggling hard to impose an intensive industries and investment in some key sectors (tourism and textiles though competition is high with other neighbouring countries) in the sub-Saharan region coupled with a Regional Development Certificate Scheme (it provides fiscal incentives to Mauritian who wish to invest in the region). Up to now there have been very positive results. Actually, there are some 100 Mauritian companies, which are operating successfully in the region (Table 1.21). Eventually, the Mauritian lobbying in looking for other emerging sectors such as tourism has been fruitful both in fighting against unemployment and eventually against poverty. It is expected that the African Growth and Opportunity Act (AGOA) will be another additional support capable of strengthening the African economic development. Table 1.21: Manufacturing sector in Mauritius
Manufacturing Sector
2007 2008 2009 2010 2011
Sugar Rs bn 1.2 1.1 1.0 0.9 1.0 Food Rs bn 12.2 15.9 16.0 16.6 17.8 Textile Rs bn 14.7 13.9 14.2 13.6 15.0 Other Rs bn 13.3 16.2 16.1 16.7 18.3 Total manufacturing Rs bn 40.2 47.1 47.3 47.8 52.0 Sugar/GDP % 0.7 0.5 0.4 0.3 0.3 Food/GDP % 5.7 6.6 6.4 6.2 6.2 Textile/GDP % 6.8 5.7 5.6 5.2 5.2 Other sector/GDP % 6.2 6.6 6.4 6.3 6.4 Total manufacturing/GDP % 18.7 19.4 18.8 18.0 18.1 Growth rates Sugar milling % -13.6 3.7 15.0 -4.0 1.6 Food % 2.5 7.7 3.8 4.4 0.7 Textile % 9.9 0.1 -0.2 0.0 8.3 Other % -4.4 2.3 1.5 2.1 2.5 Total manufacturing % 2.9 3.2 2.1 2.1 3.5 Empl. in large establishments No. 92261 93877 82635 79819 77422 Empl. in man./total empl. in large est % 30.8 30.5 27.8 26.5 25.6
Source: Mauritius Chamber of Commerce and Industry (2007-2011) The number of our Mauritian companies is increasing rapidly while a trade turnover of 20 million rupees has been registered since 1986 only in the COMESA market. By 2000, imports and exports from Mauritius have increased by 1,000 % due to dismantling of tariffs in the COMESA and secondly, Mauritius has been exporting goods and materials to the 21 members of COMESA useful for their needs (wheat flour, chemicals) and wants. Obstacles to trade in Africa: The Private Sector and trade: Compared to other continents, trade in Africa has been relatively a very slow process. By 2010 there was supposed to be a common external tariff, a common market pact by 2012 and a SADC Central Bank by 2016. Hopelessly so, there has been any development so far. It is not denied that there cannot be trade in Africa unless there are free and fair trade areas, customs unions, harmonization and coordination of policies and a common market. In addition to these commitments,

Proceedings of 4th
International Conference on Global Business Environment
(ICGBE-2014)
31
African officials shall now look upon additional cooperation with other countries, which have expertise in agriculture, finance, investment, human development and the important contribution of the private sector, which plays a very minor role in most African countries. The private sector (supra) plays an important role in Mauritius. The Joint Economic Council, which represents the private sector in Mauritius, encourages investment promotion, privatisations plans and mobilisation of private capital for infrastructure projects such as transport by land and sea, telecommunications (France Telecom became Mauritius Telecom) and even contribution in the settlement of tertiary intuitions in the country. Some schools even provide education and training in order to equip school leavers for a better quality service in our hotels. Solutions to stumbling blocks: One major obstacle to intra-Africa trade is lack of infrastructure, non-convertible currency, and political instability. Most regional blocks in the African region are stumbling blocks. Up to now, not all customs duties, tariffs and/or quotas have been removed properly. A common custom union is inexistent and there has not been complete trade integration, labour market integration, capital integration and a monetary integration like the European Union, which seems to be functioning rather well. Instead in Africa, funds are rare as there are fewer contributors for the European Development Fund and secondly, socio-economic development and political stability are both relatively different from one country to another accounting for an unequal economic and financial development in most countries of the REPAs. Since the regional economic partnership agreements may give very little hope to trade discussions must continue in the Agreement on Subsidies and the Countervailing Measures, which were raised from the CANCUN Agenda and the Doha Development Agenda. There are other factors that may cause regional blocks to be stumbling blocks thus affecting trade in Africa and members of regional blocks such as COMESA and SADC are inter alia :
Poor domestic legislations on trade. Sometime they may be inexistent or outdated Droughts and water scarcity are exciting farmers to kill each other. The African continent (Ethiopia, Namibia) is affected by
droughts. Impacts of climate change may change on the economy of a country. Floods ravaged Mozambique in 2000 and 2001 and Connie, a tropical cyclone, visited the eastern region of Africa and hit Mozambique. In case of tsunamis, cyclones or any natural disaster railways and crops will be damages and Africa shall be prepared to them. This growing vulnerability is intimately linked to development and trade patterns: population growth , massive displacement of people from rural to urban areas will create poverty and unemployment, social injustice and
short term economic vision are producing vulnerable societies Diseases affecting both animals and plants with loss of income Water must be stocked in reservoirs either natural or artificial
The creation of a large number of regional blocks is discriminating other African countries, which are not members to a block or configuration Members of the regional blocks are producing the same products (sugar, beer, poultry, fertiliser, cosmetics, steel, tobacco, tea, soap, detergents just to name a few) and are importing the same products. Markets are also saturated with the same products.
Trade diversion but a country must specialise in what it can do best African countries have different labour cost with Mozambique where the monthly salary is $ 44 whereas in South Africa, the
labour cost is around $ 284 per month. Mobility of workers and traders are discouraged eventually. Members of the SADC block may also be members of the COMESA block and it is hard to harmonise rules and regulations and is
consequently rather difficult to create a common dispute settlement body for countries of the African continent The economical impact on the African regional blocks: According to the South African Reserve Bank, the SADC countries host a small share of the total South African FDI. The main explanations are that there is limited investment in manufacturing (60% of South Africa investment in the SADC area is greenfield investments or expansion of existing capacity) and secondly South Africa is primarily exploiting the natural resource base of its host countries. For example, Mozambique is the most important recipient of South African investments followed by Zambia, Malawi and Zimbabwe. It is advisable for African countries to reduce their tariff trade and some are doing it more rapidly than others. Reducing tariff trade has proved to be successful to trade. Members (Canada, US and Mexico) of the Northern American Free Trade Agreement (NAFTA) have demonstrated that they are capable of eliminating tariff trade. In addition, there shall be more individual support between members of the same regional bloc. As from 2006, Mauritius has enjoyed a tariff preference of 40% in garments export to South Africa over non-SADC members. Furthermore, with the aim of attracting investment the European Development Fund has donated 13,5 billion for the ACP and the tandem EU-ACP arrangements will reduce tariff barriers reciprocally and progressively. However, there is food for thought: only a very few 6% of Africa trade with other countries of the continent while 60% of the total exports are concentrated only on a few products only. The African Growth and Opportunity Act (AGOA) has been more beneficial to the SADC members rather that the SADC itself. Products of the garment (jackets, dresses, skirts, clothes) industry have been invading the US market and again South Africa is leading the way with 69% of the share, Kenya with 44%, Lesotho with 18.5 and Mauritius is at 12%.
Mauritius: the African Cub-Tiger: Mauritius has tried to jump all obstacles on its way to progress and development at a time where most African countries had to face recessions, international financial crisis, droughts, climate change, political and social instability just to name a few. Mauritius has faced hard times as well. There were drastic cuts in sugar price, the Lomé Convention and its preferential trade agreements came to an end, phasing out of the Multi-Fiber Agreement in 2004 and increase in price of oil and other commodity prices. However, Mauritius stood firm to most international financial crises. If Mauritius wished to be the new ‘‘African Cub-Tiger’’, it has to invest, trade with a series of government poliices which are implemented coupled with fruitful lobbying in foreign countries (USA, India, Europe) to attract investors, businessmen and to enhance its tourism sector. Its economic, social and political stability also account for its progress and wealth. In addition, Mauritius has developed adequate market access, a good network for communication facilities, financial infrastructures to encourage and promote foreign investment, development of management skills and a sound macro-economic management, trade policies with foreign countries, adequate production base, development sufficient commercial and marketing skills to enhance trade with other countries and members of regional and international blocks. Mauritius shifted from an agricultural country to a modern country where there are inter and intranet facilities. For African countries to be able to trade prior to commencement in trade and

Proceedings of 4th
International Conference on Global Business Environment
(ICGBE-2014)
32
business they might be interested to inspire from Mauritius (however cyclones and brains running away from the country to settle abroad have negative impacts on its economy):
1. Development in emerging sectors such as tourism, service-oriented industries and SMEs. For trade to flourish, Mauritius has improved its services (tourism and offshore services). Actually, its service sector occupies 50% of its GDP and it accounts for 5% of its total trade. During the period 1990-1999; Mauritius, Botswana and Seychelles have successfully posted saving rate exceeding 25%.
2. Opening of its market to 400 million consumers through its membership to various regional blocks it belongs (COMESA, SADC and IOC)
3. It is still as a platform between the different continents and try to bridge Asia to Africa 4. Promotion of its business hub and an aggressive lobbying in the tourism sector capable of attracting tourist from Europe, Africa
and some islands in the Indian Ocean. 5. Bilateral cooperation between Mauritius and some giants such as China, India, France and the USA (AGOA). 6. Liberalisation of its air access to most lines of the world through mutual agreement between Air Mauritius and Air France,
British Airways just to name a few with the result that the local aviation company has no seat, or very few, to offer on its regular flights around the world and with a turnover of several millions of rupees
7. Continuous reforms in different sectors in order to be in line with modern views and ideas 8. New and stronger policies, which are launched by the Mauritian government to encourage trade, business and investments in
the country. There has been development of an Export Processing Zone (EPZ) for the local and foreign investments 9. Major developments in its banking sector. Most banks on the island have registered a net profit of billion of rupees. The
Mauritius Commercial Banks have a net profit of 2 billion rupees, an increase of 15,2%. Banks are important for trade (Singapore, China, Mauritius, India), financial investment and promotion of offshore companies in the country. In addition, they favour employment and the wealth of a country. China next objective is to conquer the African continent where labour market is good reliable and less expensive. May be China and India are the alternatives for African moves towards success and wealth.
10. The three necessities for any business entities are power, water and business friendly environment. 11. Mauritius has made remarkable progress in various sectors such as agriculture, manufacturing, services, logistics, and
infrastructure just to name a few. Education is of good quality and it enables citizens of Mauritius to trade efficiently with potential investors.
Poverty alleviation and trade Diversification of the economy: Again, compared to Africa and other regions of the world, Mauritius has its own specificities: low unemployment rate (5 %), low affected rate of HIV/AIDS, environment is clean and safe, political and social stability, no civil wars, the regime in place is safe and trusty, election is free and fair and there are no lord wars, guerrillas and other freedom fighters just to name a few to plunder the economy of a country. Indeed, unlike many other countries Mauritius is a Welfare State where education, health, dispensary and other facilities are free. But where the money comes from? Most emerging sectors (IRS, tourism and manufacturing) in Mauritius are attracting foreign direct investment giving a good boost to the small economy of Mauritius such that all citizens of this country can share but what is more important is that these sectors have created jobs pushing a little back every year poverty, unemployment rate and hunger. However, the greatest achievement in Mauritius to poverty eradication has been the implementation of Corporate Social Responsibility which is made statutory and its contribution in poverty eradication. The legislation came into force after the 2009 budget whereby companies, monitored by a National CSR Committee CSR projects, are required to use 2% of their book profits for the implementation of CSR projects such as socio-economic development, health, education and training, leisure and sports, environment and catastrophic interventions and support. Only in 2012, Rs 256 million representing about 63% of CSR funds have been dedicated to socio-economic development. Actually, unemployment is low (5%) and is a good blow against poverty. In addition, improvement of institutional and legal framework to give financial and educational support to local entrepreneurs to raise their own small enterprises, local strategies to improve environment and health against diseases such as HIV/AIDS, various Poverty Alleviation Programmes (Empowerment Programme, Decentralised Co-operation Programme, Trust Fund, Committee on Poverty Association of the President). Hurbungs11 (2008) found that: ‘A World Bank recent study has estimated 9.7% less than Rs 5000 per month. Poverty in Mauritius is localised rather than widespread. Based on relative development index by Central Statistics Office, a list of 53 deprived areas has been established. Adopting a targeted approach, the Trust Fund has indentified 229 pockets of poverty with an average of 50 households. The total number of households counted, as absolute poor is around 8000 and a population of 30,000 members’. The economy of a country must be well diversified and it should not be focused in one sector only. As a result Mauritius has succeeded with a well-planned and diversified economy including agriculture and agro-industry (sugar, tea, tobacco, coffee), construction, tourism, financial services and the ICT-BPO sector just to name a few. Had Mauritian been focusing on its agricultural sector only may be there could have been any economic boom in the country. Prior to diversification of the economy, it is important to note that Mauritius intended a reliable, safe, fruitful and stable political and economic environment to attract foreign investors and to trade with other countries and members of the region. This policy of long-tem development was rightly pointed out by Rosunee12: ‘With trade liberalisation, the Mauritius textile and clothing industry is now faced with a number of short and medium-term challenges, on both the internal and external fronts. These relate mainly to elimination of trade preferences, exchange rate fluctuations, relatively slow pace of restructuration and diversification, increased competition from low-cost manufacturers, rising costs of air and sea freight, and low penetration of new markets’. In Mauritius, to promote sustainable development especially neither the private sector nor NGOs are left on the bench. The private sector is not neglected and bodies such as the Joint
11
Hurbungs S. 2008, An evaluation of the different poverty alleviation programmes in Mauritius, Caslon Printing Ltd, Mauritius
12 Rosunee S. 1990, The Mauritian textile and clothing industry: facing t5he challenges associated with globalization,
infd.org/events/wfsids/virtual/papers

Proceedings of 4th
International Conference on Global Business Environment
(ICGBE-2014)
33
Economic Council, Mauritius Chamber of commerce and Industry, American Chamber of Commerce, Chinese Chamber of Commerce, Indian Traders’ Association, Mauritius Employers Federation and the Tamil Chamber of Commerce and Professionals which contribute to the economy of the country as well. As Padachi13 rightly pointed out in his research on SMEs in a small economy: ‘The world has become an increasingly interwoven place and according to Francis Fukuyamone, one of the greatest sociologist of our times- never before in human history so many nations moved together towards market economy and there is growing recognition worldwide that SMEs have an important role to play in the present circumstances (Bhargava, 2004) and small businesses are often seen as the backbone of the private sector in the developing world. The importance of the SMEs for future economic development has been lately mentioned at different levels and reinforced in the budget speech 2008/2009. The government is taking various measures and initiatives to better assist the SME sector’.
Source: BOI NEWSLETTER, December 2011, Issue No. 37
a) According to the United Kingdom’s Department for International Development:
b) ‘By following socially responsible practices, the growth generated by the private sector will be more inclusive, inequitable and poverty reducing’.
c) In its report the Mauritius Employers’ Federation (March 2011) declared that: ‘Private enterprises in Mauritius have a long culture and tradition of CSR, particularly in terms of voluntary social engagement in the communities where they operate and in the wider society. Mauritian enterprises, driven primarily by ethical considerations, employee motivation, brand positioning and company reputation, have been engaged in both internal CSR, undertaken for the benefits of employees, and external CSR initiatives, developing or supporting social and community related activities’.
d) In a recent study, Ragodoo14 (2011) explained that: ‘Business are very reluctant to provide funding to any NGO unless they are 100% confident that these NGOs are genuinely committed to serve. As a result, business generally opt to fund larger NGOs which have established procedures and a proper system of checks and balances that they trust rather than funding those who lack visibility. Inevitably, this is at the detriment of small NGOs which might be genuinely committed to help’.
e) It is undeniable that high and sustainable economic growth and pro-poor targets can be achieved provided a country is internationally competitive and is politically stable which is not the case of most African countries. Thus, trade performance is significantly important determinant to economic growth, employment and livelihood creation and ultimately poverty reduction. Thus is not surprising that Mauritius has taken key steps to ensure that intra-regional and international trade are strengthened through a relevant national policy framework (fiscal policy, Mauritius Duty Free Island, Mauritius Duty Free Paradise), new strategies, plans, innovations, legal and institutional frameworks (i.e. the Board of Investment, MEDIA for export promotion) have been earmarked for promoting business and trade. As Ali Mansoor15 rightly pointed out that: ‘In fact economic growth has enabled a number of countries like India, Uganda, Brazil, Vietnam and Tunisia to reduce their overall poverty levels and offer wider opportunities to the people. Over recent decades, China has experienced rapid growth of around 8% annually, resulting in a marked improvement in its Human Development Index, which has increased from a low of 0.560 in 1980 to 0.768 in 2004’. Is there a relation environment-trade and poverty? The relation environment-trade has long been forgotten though they have very strong links. Some African countries including Mauritius have implemented a large number of legislations and have ratified a large number of treaties and conventions to protect their environment for a better and a more appropriate sustainable development. They are
13 Padachi K. 2009, Accounting services among manufacturing SMEs: a neglected subject 14 Ragodoo J-F N. 2011, The Mauritian business sector and the fight against poverty: a NGO’s perspective. Social
Responsibility Journal , Vol. 7, No.2, pp.152-165 15 Mansoor A. 2008, Macro-economic policy-making and poverty in Mauritius in Poverty in Mauritius-An agenda for
reflection and action: articulating the local and the regional-conference papers, Caslon Printing Ltd, Republic of Mauritius
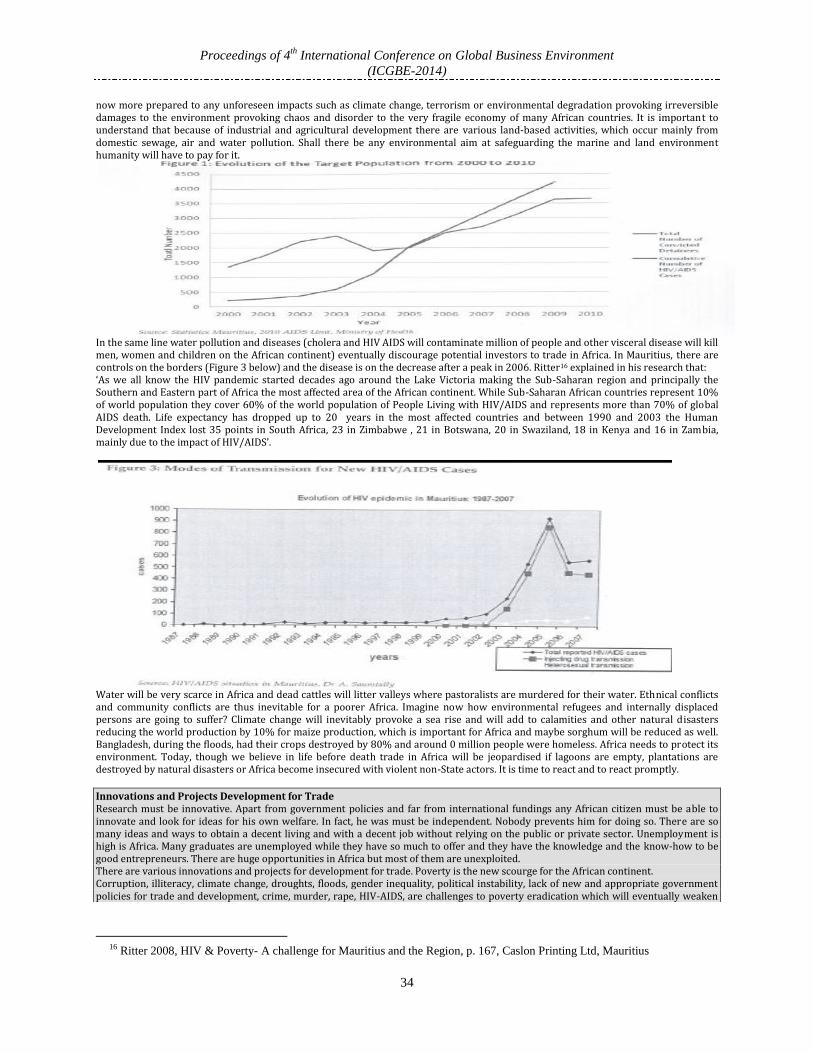
Proceedings of 4th
International Conference on Global Business Environment
(ICGBE-2014)
34
now more prepared to any unforeseen impacts such as climate change, terrorism or environmental degradation provoking irreversible damages to the environment provoking chaos and disorder to the very fragile economy of many African countries. It is important to understand that because of industrial and agricultural development there are various land-based activities, which occur mainly from domestic sewage, air and water pollution. Shall there be any environmental aim at safeguarding the marine and land environment humanity will have to pay for it.
In the same line water pollution and diseases (cholera and HIV AIDS will contaminate million of people and other visceral disease will kill men, women and children on the African continent) eventually discourage potential investors to trade in Africa. In Mauritius, there are controls on the borders (Figure 3 below) and the disease is on the decrease after a peak in 2006. Ritter16 explained in his research that: ‘As we all know the HIV pandemic started decades ago around the Lake Victoria making the Sub-Saharan region and principally the Southern and Eastern part of Africa the most affected area of the African continent. While Sub-Saharan African countries represent 10% of world population they cover 60% of the world population of People Living with HIV/AIDS and represents more than 70% of global AIDS death. Life expectancy has dropped up to 20 years in the most affected countries and between 1990 and 2003 the Human Development Index lost 35 points in South Africa, 23 in Zimbabwe , 21 in Botswana, 20 in Swaziland, 18 in Kenya and 16 in Zambia, mainly due to the impact of HIV/AIDS’.
Water will be very scarce in Africa and dead cattles will litter valleys where pastoralists are murdered for their water. Ethnical conflicts and community conflicts are thus inevitable for a poorer Africa. Imagine now how environmental refugees and internally displaced persons are going to suffer? Climate change will inevitably provoke a sea rise and will add to calamities and other natural disasters reducing the world production by 10% for maize production, which is important for Africa and maybe sorghum will be reduced as well. Bangladesh, during the floods, had their crops destroyed by 80% and around 0 million people were homeless. Africa needs to protect its environment. Today, though we believe in life before death trade in Africa will be jeopardised if lagoons are empty, plantations are destroyed by natural disasters or Africa become insecured with violent non-State actors. It is time to react and to react promptly.
Innovations and Projects Development for Trade Research must be innovative. Apart from government policies and far from international fundings any African citizen must be able to innovate and look for ideas for his own welfare. In fact, he was must be independent. Nobody prevents him for doing so. There are so many ideas and ways to obtain a decent living and with a decent job without relying on the public or private sector. Unemployment is high is Africa. Many graduates are unemployed while they have so much to offer and they have the knowledge and the know-how to be good entrepreneurs. There are huge opportunities in Africa but most of them are unexploited. There are various innovations and projects for development for trade. Poverty is the new scourge for the African continent. Corruption, illiteracy, climate change, droughts, floods, gender inequality, political instability, lack of new and appropriate government policies for trade and development, crime, murder, rape, HIV-AIDS, are challenges to poverty eradication which will eventually weaken
16 Ritter 2008, HIV & Poverty- A challenge for Mauritius and the Region, p. 167, Caslon Printing Ltd, Mauritius

Proceedings of 4th
International Conference on Global Business Environment
(ICGBE-2014)
35
trade and business in the country and with foreign countries. Motivated investors may found it difficult to invest in a country where there are such negative impacts on the economy of a country. Is the following list a sufficient food for thought? Fabrication of solar cells Fabrication of furniture for exportation (Gabon) Fabrication of CDs Fish farming and poultry farming must be encouraged to fight against unemployment, increase production, reduce competition and monopoly and a reduction of price shall be beneficial to one and all African government must control mining of precious metals and exportation. Illegal exportation is encouraging corruption among members of the government. Murder is frequent and there is a loss of income for the country. There are a lot of traffics in Africa across the borders. The exploitation of precious metals in ex Zaire has been a blunder and more than a massacre. Acres of land were given to any citizen who wants to dig and find precious metals while the ecosystem got very severe damages. Instead, exploitation of precious metals must have been under the control of the State just like in South Africa. African States must have a control their mines and to control their exportation for their own welfare. Illegal imports are overlooked on the frontiers by corrupted officers thus reducing the income of the country Encourage local entrepreneurs to merge for clustering. Their products may easily be patented and sold in other countries. African banks must provide loand to entrepreneurs to stimulate entrepreneurship. There is oil in Africa (Sahara desert, Nigeria, Niger) and is under exploited. Experts must be sent on the field to look for oil. Oil prices and its regular fluctuations are affecting the Mauritian economy. Air Mauritius, the national air company , spend some 7,7 billion Euros for its petrol. African countries must produce their oil and they have the potential to do better and the best is not yet to come. African brains are running away to settle abroad sharing their knowledge with rich and industrial countries. They must be encouraged to settle in their own countries after their studies. Pharmaceutical products and their exportation generate a lot of income for a country. However, none of the African countries are exporting pharmaceutical products. In fact they are importing expensive pharmaceutical products and the price is still climbing exponentially in many drug house. Now with HIVS AIDS, many African countries are spending a huge amount of money to treat patients. They must be treatedbut prevention is better than care. Mauritius is exporting medicine and other pharmaceutical products to some African countries (Madagasgar, Gabon, Cameroon, Mozambique, Rwanda, Burkina Faso) generating some Rs6 million to the country. The production is still on the increase. African countries must open their markets and to encourage trade liberalisation. A good model is China and it is still expanding. Textile, clothing, jewellery and fish processing. Mauritius is importing its beef from Australia and flour from China while some African countries could have been its producers. Islamic Banking. For trade and to encourage investors it is also recommended to create a banking sector. Wherever banking sectors have been created it is found that there are major developments. Islamic Banking (such as in Malaysia, Singapore, China) with its free interest may support African countries to development and trade African countries must try to develop key areas like the tourism sector and Freeport activities to support trade and business. To the exception of South Africa, most members of the SADV have not develop their harbours efficiently and consequently there is a lost of income. Modern hotels, Freeport and harbours need logistics and technology to survive in a global world. Most members of the SADC are still dependent on agricultural products. Agriculture contributes to 5% of its GDP and 70% of the SADC population still depends on this sector to have food, income and employment. African countries shall shift from primary and unfinished goods (90% of the SADC exports comprise of mineral and agricultural goods) to manufacturing, services and tourism sector. A reason why China is emerging in Asia is its ability to provide services and manufacturing goods. In addition to finished goods many spare parts are invading most markets of the world. They are sometime cheap but reliable. Africa must also rely on Africa. Mauritius has set up South African companies (supermarkets) in the country creating jobs and employment. As a result of trade with South Africa, the local economy envisaged a rapid boost in its financial and banking infrastructures. Many South African companies are mushrooming on the island. Banks must be able to give loans with low interest to promote trade and welfare of the citizens. In Mauritius, some banks have very low interest (5% for this year, 2011). There shall be regular job and trade fair in Africa. They must be encouraged with support from the private sector, which is quite inexistent or latent in most African countries. Infrastructures (hotels, golf, administrative building, harbours, fish farming) on the east coast of the African continent, a zone ideal for trade and business, are very still poor. Development of its airports and harbours to encourage the tourism industry and to facilitate trade with neighbouring African countries.
Trade and Islamic Banking: a hope for a struggling Africa: To trade, one needs money. It goes without saying that most countries of the African continent are among the least developed countries in the world. Most Africans are still poor but they are still motivated to trade but prior to commencement business they need at least a minimum fund. They need funds prior to begin business and for a decent living but banks and other financial institutions are very reluctant to give loans to borrowers who in return have no assets (or very few) and have no property to be mortgaged especially at a time where more and more banks are less flexible unless they have imposed fixed and floating charges on their borrowers. To any problem there is always a solution and Islamic banking is a salvation to Mauritius. To improve trade on the African continent, bank interests (especially when they are high) are a poison to social-economic development and Islamic banking is the antidote. Most African countries are pressurized by the World Bank, IMF, endless recessions, international financial crisis, unemployment and poverty, climate change just to name a few. Interest-free banking is surviving in Sudan, Benin,
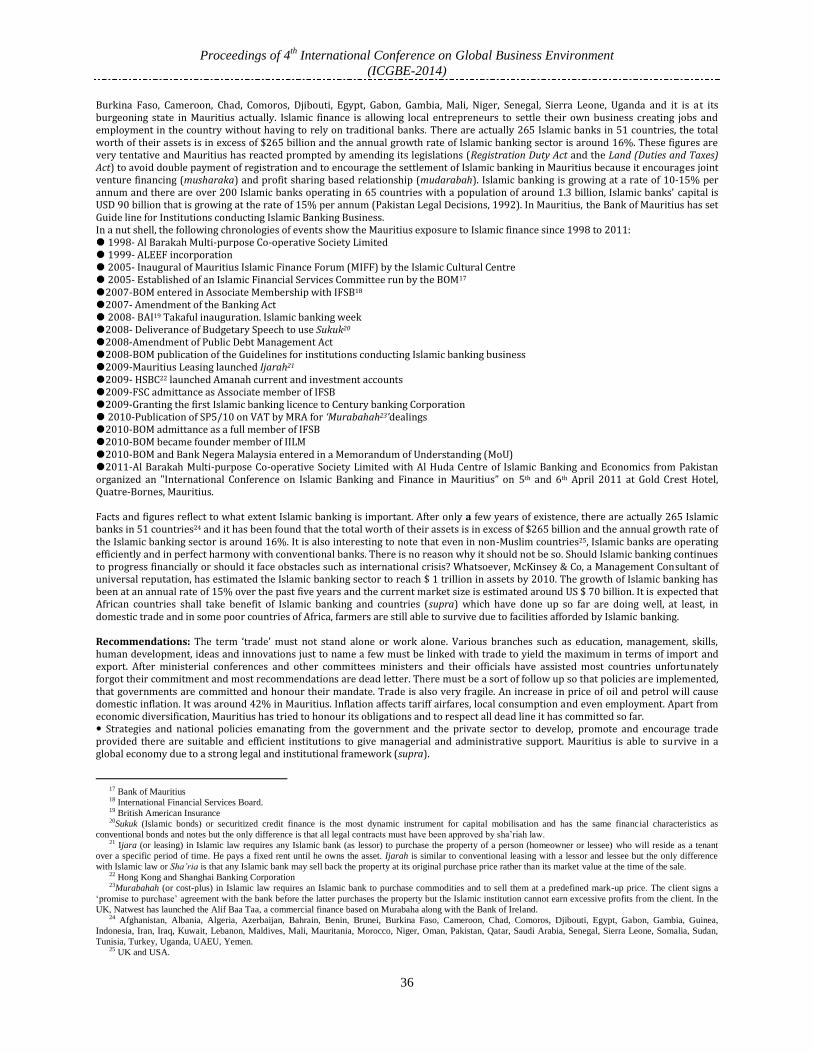
Proceedings of 4th
International Conference on Global Business Environment
(ICGBE-2014)
36
Burkina Faso, Cameroon, Chad, Comoros, Djibouti, Egypt, Gabon, Gambia, Mali, Niger, Senegal, Sierra Leone, Uganda and it is at its burgeoning state in Mauritius actually. Islamic finance is allowing local entrepreneurs to settle their own business creating jobs and employment in the country without having to rely on traditional banks. There are actually 265 Islamic banks in 51 countries, the total worth of their assets is in excess of $265 billion and the annual growth rate of Islamic banking sector is around 16%. These figures are very tentative and Mauritius has reacted prompted by amending its legislations (Registration Duty Act and the Land (Duties and Taxes) Act) to avoid double payment of registration and to encourage the settlement of Islamic banking in Mauritius because it encourages joint venture financing (musharaka) and profit sharing based relationship (mudarabah). Islamic banking is growing at a rate of 10-15% per annum and there are over 200 Islamic banks operating in 65 countries with a population of around 1.3 billion, Islamic banks’ capital is USD 90 billion that is growing at the rate of 15% per annum (Pakistan Legal Decisions, 1992). In Mauritius, the Bank of Mauritius has set Guide line for Institutions conducting Islamic Banking Business. In a nut shell, the following chronologies of events show the Mauritius exposure to Islamic finance since 1998 to 2011: 1998- Al Barakah Multi-purpose Co-operative Society Limited 1999- ALEEF incorporation 2005- Inaugural of Mauritius Islamic Finance Forum (MIFF) by the Islamic Cultural Centre 2005- Established of an Islamic Financial Services Committee run by the BOM17 2007-BOM entered in Associate Membership with IFSB18 2007- Amendment of the Banking Act 2008- BAI19 Takaful inauguration. Islamic banking week 2008- Deliverance of Budgetary Speech to use Sukuk20 2008-Amendment of Public Debt Management Act 2008-BOM publication of the Guidelines for institutions conducting Islamic banking business 2009-Mauritius Leasing launched Ijarah21 2009- HSBC22 launched Amanah current and investment accounts 2009-FSC admittance as Associate member of IFSB 2009-Granting the first Islamic banking licence to Century banking Corporation 2010-Publication of SP5/10 on VAT by MRA for ‘Murabahah23’dealings 2010-BOM admittance as a full member of IFSB 2010-BOM became founder member of IILM 2010-BOM and Bank Negera Malaysia entered in a Memorandum of Understanding (MoU) 2011-Al Barakah Multi-purpose Co-operative Society Limited with Al Huda Centre of Islamic Banking and Economics from Pakistan organized an "International Conference on Islamic Banking and Finance in Mauritius” on 5th and 6th April 2011 at Gold Crest Hotel, Quatre-Bornes, Mauritius. Facts and figures reflect to what extent Islamic banking is important. After only a few years of existence, there are actually 265 Islamic banks in 51 countries24 and it has been found that the total worth of their assets is in excess of $265 billion and the annual growth rate of the Islamic banking sector is around 16%. It is also interesting to note that even in non-Muslim countries25, Islamic banks are operating efficiently and in perfect harmony with conventional banks. There is no reason why it should not be so. Should Islamic banking continues to progress financially or should it face obstacles such as international crisis? Whatsoever, McKinsey & Co, a Management Consultant of universal reputation, has estimated the Islamic banking sector to reach $ 1 trillion in assets by 2010. The growth of Islamic banking has been at an annual rate of 15% over the past five years and the current market size is estimated around US $ 70 billion. It is expected that African countries shall take benefit of Islamic banking and countries (supra) which have done up so far are doing well, at least, in domestic trade and in some poor countries of Africa, farmers are still able to survive due to facilities afforded by Islamic banking. Recommendations: The term ‘trade’ must not stand alone or work alone. Various branches such as education, management, skills, human development, ideas and innovations just to name a few must be linked with trade to yield the maximum in terms of import and export. After ministerial conferences and other committees ministers and their officials have assisted most countries unfortunately forgot their commitment and most recommendations are dead letter. There must be a sort of follow up so that policies are implemented, that governments are committed and honour their mandate. Trade is also very fragile. An increase in price of oil and petrol will cause domestic inflation. It was around 42% in Mauritius. Inflation affects tariff airfares, local consumption and even employment. Apart from economic diversification, Mauritius has tried to honour its obligations and to respect all dead line it has committed so far. Strategies and national policies emanating from the government and the private sector to develop, promote and encourage trade provided there are suitable and efficient institutions to give managerial and administrative support. Mauritius is able to survive in a global economy due to a strong legal and institutional framework (supra).
17 Bank of Mauritius 18 International Financial Services Board. 19 British American Insurance 20Sukuk (Islamic bonds) or securitized credit finance is the most dynamic instrument for capital mobilisation and has the same financial characteristics as
conventional bonds and notes but the only difference is that all legal contracts must have been approved by sha’riah law. 21 Ijara (or leasing) in Islamic law requires any Islamic bank (as lessor) to purchase the property of a person (homeowner or lessee) who will reside as a tenant
over a specific period of time. He pays a fixed rent until he owns the asset. Ijarah is similar to conventional leasing with a lessor and lessee but the only difference
with Islamic law or Sha’ria is that any Islamic bank may sell back the property at its original purchase price rather than its market value at the time of the sale. 22 Hong Kong and Shanghai Banking Corporation 23Murabahah (or cost-plus) in Islamic law requires an Islamic bank to purchase commodities and to sell them at a predefined mark-up price. The client signs a
‘promise to purchase’ agreement with the bank before the latter purchases the property but the Islamic institution cannot earn excessive profits from the client. In the
UK, Natwest has launched the Alif Baa Taa, a commercial finance based on Murabaha along with the Bank of Ireland. 24 Afghanistan, Albania, Algeria, Azerbaijan, Bahrain, Benin, Brunei, Burkina Faso, Cameroon, Chad, Comoros, Djibouti, Egypt, Gabon, Gambia, Guinea,
Indonesia, Iran, Iraq, Kuwait, Lebanon, Maldives, Mali, Mauritania, Morocco, Niger, Oman, Pakistan, Qatar, Saudi Arabia, Senegal, Sierra Leone, Somalia, Sudan,
Tunisia, Turkey, Uganda, UAEU, Yemen. 25 UK and USA.

Proceedings of 4th
International Conference on Global Business Environment
(ICGBE-2014)
37
Trade requires less bureaucratic and structural bottlenecks especially when most African countries are relatively poor or least developed country in the world in terms of trade, importation, exportation of goods and materials capable of generating money in the country. In return they must have sufficient incentives to attract foreign investors but unfortunately this has not been the case in the last two decades. African countries shall promote the development of institutions to facilitate trade (such as the Board of Investment) Encourage clustering of SMEs in the sub-Saharan region African countries must improve their technology and logistics, which are important for the creation of new skills. Hire purchase, leasing and factoring are means where entrepreneurs may receive funds to begin business and purchase the materials they need Development in infrastructures focusing on primary, secondary and tertiary institutions, which are capable to do research, and innovations. The University of Mauritius is often contacted for researches in tourism, solar energy and sustainable development for a cleaner and better Mauritius. Most researches, which have been carried out by local academics, have been successful both locally and abroad Training of young entrepreneurs either to run their own businesses as SMEs or to join other entrepreneurs is important for Africa today. Clustering is encouraged The economic partnership agreements cover millions of people, it is easy to trade in an unfair manner at the expense of others inventions and to make money. Infringements to trade marks, patents and copyright destroy the good economy of a country. African countries should avoid focusing on too much trade. Instead, it is advisable to pin point specific areas and markets where a country is more performant. Mauritius is targeting three main industries actually (tourism, tuna and fish industry and the textile industry) with less interest in tobacco, tea or sugar. These industries are generating a large income to the country and SMEs seem to the next target. Members of the regional blocks shall not trade or live isolated. Though trade barriers have been removed exportation is relatively in the SADC/COMESA region. Mauritius has moved to a more outward-oriented policy, including trade liberalization. It is recommended that there are regular meetings between government officials to boost and enhance trade in the country. The Prime Minister of Mauritius has always been very active in promoting Mauritian’s know-how to other countries (China, India, Reunion Island, Madagascar, Seychelles, South Africa, USA, England, France), meeting officials and delegations accompanied by monitor progress made towards trade-hub. Most countries in the region are now looking to Mauritius with a view to trade. Exports in COMESA stood as Rs 15 million in 1985 and in 1998, Mauritius has been exporting goods worth some Rs 1.7 billion in that regional economic block. And there is more to come. There is development to be made urgently in the free port sector, offshore services sector and the tourism sector just to name a few. Apart from funds obtained from the government (the Developing Bank of Mauritius is very active in providing loans) businessmen and entrepreneurs must be capable of raising their own funds by creating public limited companies. The will for the EU-ACP to liberalize and enhance trade is here but the creation of various regional and sub-regional institutions may also provoke unnecessary and fair competition between the regional blocks, as there are unequal developments and capacity building in the sub-Saharan region and between members themselves Trade liberalization is a complexed puzzle. All different pieces related to each other must bring their personal support and issues such as ozone depletion, trade in hazardous waste, trade in commodities, development in foreign investment, regulation of multinational enterprises must be developed and mastered to ensure there is peace and security in the country Save to some few exceptions (Nigeria, Zambia) African country must improve their technology transactions and to prepare themselves to promote new legislations to regulate and control transfer of technological transactions. In India, a pioneer in regulating technological transfer, there are the Import-Export Regulations Act 1948, Monopolies and Restrictive Trade Practices Act 1963, Industrial Development and Regulations Act just to name a few. Pharmaceutical products are relatively very expensive. Mauritius has imported $ 650 million for the year 2002 whereas the pharmaceutical industry in Mauritius is still feasible in Mauritius and secondly African countries must import from China or India where expensive pharmaceutical products are less expensive. 2. Conclusion There is a ‘big’ hope to make Mauritius a ‘tiger’ in the Indian Ocean. Through curriculum development (in most modules in our tertiary institutions) the Mauritian government is also fighting hard to achieve sustainable development to preserve our fauna and flora, lagoons, natural reservoirs, wetlands just to name a few. It is also encouraging other African countries in trade with improvement in its textile and tourism sector. There is a massive redistribution of wealth, and unemployment (5% to 8% recently) is still low but there is room for improvement especially in the SMEs sector, empowerment programme and corporate social responsibility. As a Welfare State, every individual in this country has access to free education (primary and secondary institutions) and fees at tertiary level is also low in order to give access to education to everybody and that there is at least a graduate per family. This is the policy of the actual government. In addition, all tertiary students have access to free transport. All these facilities are available because Mauritius had its economic miracle and its exportation is reasonably high but costs of labour and higher productivity were also instrumental to our economic development. Mauritius, according to the Financial Services Commission, also succeeded in attracting multinationals in settling up their holding companies in the offshore sector though money laundering and illicit money may slow down this attraction in Mauritius. References Abor and Harvey (2008). Determinants of inward foreign direct investment in Ghana, Science Metapress, Published 2009 Abou-Gabal, Khwaja and Klinger (2011). Islamic Finance and Entrepreneurship: Challenges and Opportunities Ahead, Harvard Kennedy
School in cooperation with The Kuwait Foundation for the Advancement of Sciences Aggarwal and Yousef (2000). Journal of Money, Credit and Banking, Ohio State University Press, A Comparative Review of Incentives to
SMEs & Costs of Doing Business, SMIDO, June 2004, 53 p. Anganan V. (2003). Vers un nouveau partenariat économique Maurice-Madagascar, Business Magazine 2-8 July 2003 Ancharaz Vinaye Dey (2003). FDI and Export Performance of the Mauritius Manufacturing Sector, Department of Economics and Statistics,
Faculty of Social Studies and Humanities, University of Mauritius, Réduit, Mauritius.
Proceedings of 4th
International Conference on Global Business Environment
(ICGBE-2014)
38
Artige B. and Nicolini A. (2005). The evidence of the determinants of FDI: the case of three European regions. Unitat de Fonaments de l’Analisi Economica (UAB) and Institut d’Analist Economica (CSIC), UFAE and IAE working paper 655.05. http:pareto.uab.es/wp/2005/65505.pdf
Asiedu E. (2002). On the determinants of foreign direct investment to developing countries: is Africa different? World Development, vol. 30 (1), pp. 107-118
Asiedu (2004). The determinants of employment of affiliates of US multinational enterprises in Africa, Development Policy Review, No. 22 (4), pp. 371-379.
Baldwin (1995). The effects of trade and Foreign Direct Investment on employment and relative wages, OECD Economic studies, No. 23, Winter 1994
Blomstrom and Kokko (2003). Policies to encourage technology transfer through foreign multinational, World Development, 23 (3), 2003, pp.459-468
Blomstrom and Koko (2003). Polices to encourage technology transfer through foreign multinational, World Development, 23(3), 2003, pp.459-468.
Bosworth and al. (1999). Capital flows to developing economies: implications for saving and investment, Brooking Papers on Economic Activity, No. 1, pp. 143-169.
Barbé A. (2005). Textile, Tianli Spinning quintuple sa production de fil, L’Express 3rd August 2005 Bevan A. and Estrin S. (2000). The determinants of foreign direct investment in transition economics. Working Paper Number 342 Bende-Nabende S. and Slaughter R. (1998). European foreign direct investment determinants in the ASEAN manufacturing sectors: a
comparative case study for Thailand. Birmingham Business School, working Paper Series. Bevan A. and Estrin S. (2000). The determinants of foreign direct investment in transition economics. Working Paper Number 342 Bheemul H.C. Head of the Centre for Research and Consultancy at the Isitech Business School (2012): FDI national conference in Pailles,
Mauritius, in l’Express, 13 April 2012, p.35, (article of Jyoti Punjabi) Canning D. (1998). A database of world stocks of infrastructure 1950-95. The world Bank Economic Review, vol. 12 (3), pp. 529-47 Central Statistics Office (2010): Quarterly National Accounts, 2nd Quarter, Mauritius. Central Statistical Office, Economic and Social Indicators, http://statsmauritius.gov.mu/indicate.htm Central Statistical Office (CSO), Annual Digest of Statistics 2000, Ministry of Economic Development, Financial Services and Corporate
Affairs, July 2001 Chaumière J.F. Hon. Minister of Labour, Industrial Relations and Employment, Opening of new textile factory, Maza Athletic Performance
Wear Ltd, 11th January 2012 Chetel E. & Bhujun R., Ouvriers Chinois, un véritable casse-tête, l’Express 13 March 2005 Coughlin P. & Jeetah R., SADC Study of Textile and Clothing Industry, Mauritius Country Report, April 2001 Canning D. (1998). A database of world stocks of infrastructure 1950-95. The world Bank Economic Review, vol. 12 (3), pp. 529-47 Central Statistics Office (2010): Quarterly National Accounts, 2nd Quarter, Mauritius. Chihak and Hesse (2008): Islamic Banks and Financial Stability: An Empirical Analysis, IMF Working Paper 08/16 (Washington:
International Monetary Fund) Comola and Luiz de Mello (2009) : The determinants of employment and earnings in Indonesia: a multinational selection, Organisation for
economic co-operation and development, Economics department Working Paper no. 690 Consultancy and Contract Research Centre: Low rate of unionisation in Mauritius, Trade Union Trust Fund, Oct.2002, University of
Mauritius, p.47 Dunning (1981): Explaining the international direct investment position of countries towards a dynamic or development approach.
Weltwirtscchaftliches Archive, 117, 30-64 Department of Industrial Policy and Promotion of India, Ministry of Commerce. http://dipp.nic.in Department of Industrial Policy and Promotion of India, Ministry of Commerce. http://dipp.nic.in Dunning J.D. (1988). The eclectic paradigm of international production: a restatement and some possible extensions. Journal of
international Business Studies, 19 (1), 1-31 Export Processing Zone Development Authority, http://epzdanet.intnet.mu/main.htm Edwards S. (1990). Capital flows, Foreign direct Investment and Debt-Equity Swaps in Developing Countries. NBER Working Paper Number
3497 El-Hawary, Grais and Iqbal, Institute and the HKS Belfer Centre for Science and International Affairs Dubai Initiative,
http://www.cid.harvard.edu/eflri Feldein (1994): Productivity of foreign and domestic firms in Indian industries, Review of world Economies, Vol. 115, No.1 Financial Services Commission. Annual report 2007. Mauritius Gastanaga V., Nugent J. and Pashamiova B. (1998). Host country reforms and FDI inflows: how much difference do they make? World
Development 26 (7), 1299-1314 George A., Dimitrios A. and Papathoma K. (2006). The determinants of foreign direct investment: a panel data study for the OECD countries.
Discussion Paper Series No. 03/06. Goodspeed T., Martinez-Vasquez and Zhang L. (2006). Are government policies more important than taxation in attracting fdi? ISP
Working Paper Number 06-14, International studies Program Work in Paper Series Government Programme 2012-2015- Moving the nation forward. Address by the Acting President of the Republic of Mauritius, Monday
16th April 2012. Gunputh R.P. (2012). The contribution of domestic legislations to enhance Foreign Direct Investment (FDI) in some emerging sectors of
Mauritius, 2nd international Conference on International Trade and Investment, Financial Crisis and Trade and Investment in Developing Countries, 24-26 October 2012, Le Meridien Hotel , Mauritius
Gunputh R. P. (2012). Foreign Direct Investment: the Double Taxation Avoidance Agreement (DTAA) between India and Mauritius--From a Mauritian Perspective, Gujarat National Law University (GNLU), GNLU Centre for Banking Investment and Taxation, Conference on International Banking and Finance: Issues challenges and solutions, Sunday 22nd July 2012, Gujarat, India.
Proceedings of 4th
International Conference on Global Business Environment
(ICGBE-2014)
39
Gunputh R.P. (2012). Would non-equity modes of economic and financial development shape the future of industrial development, -The Mauritian Success Model-? First national conference on ‘‘Global Forces Shaping the Future of Business and Society’’, Nov. 30 to Dec. 1, 2012, Indore Institute of Management and Research, Indore, India.
Gunputh R.P. (2010). Enhancing the Entrepreneurial Minds In the Informal Sector -The Mauritian SMEs Case Study- MERI Journal, India Gunputh R.P. (2011). Some Innovations in Microcredit for Human Resource Development: Small and Medium Enterprises (SMEs) The
Mauritian Case Study- Conference Proceedings, International Conference, Grand Baie, 16-24 September 2011, Mauritius Gunputh R.P. (2012). A Contextual Approach to A Legal and Institutional Framework to Financing Problems of SMEs in Mauritius: The
Mauritian Success(What a Young Entrepreneur must Know prior to Commencement of Business and Investment?), 3rd International Conference on business and Economic Research,12-13 March, Bandung , Indonesia
Gunputh R.P. (2012). Would Islamic Banking enhance Banking Activities in Mauritius? The Mauritian Case Study.2nd Conference on International Trade and Investment, 24-26 Oct. 2012, Mauritius
Gershenberg (1987). The training and spread of managerial know-how, a comparative analysis of multinationals and other firms in Kenya, World development, 15(7); pp.931-9
Glickman and Woodward (1989): How foreign investors are changing in US economy, New York: Basic Books, 1989 Harper J. (2009). The Mauritius-India Double Tax Treaty without tears. http://www.mondaq.com Iqbal Munawar (2000) Islamic and commercial banking in the nineties: a comparative study in the proceedings of the fourth International
Conference on Islamic Economies and Banking, Loughborough University, August 13-15, pp.409-431 Iqbal Zamir (1997). Islamic Financial Systems. Finance and Development-World Bank Publications, pp.42-45 Imam and Kpodar (2010) IMF Working Paper African Department, Islamic Banking: How has it diffused? Jeetah R. Hon. Minister of Tertiary Education (2012): FDI national conference in Pailles, Mauritius, in l’Express, 13 April 2012, p.35,
(article of Jyoti Punjabi). Jeetah R., Honourable Minister of Industry, Small and Medium Enterprises, Commerce and Cooperatives, Speech of Workshop on textile
and apparel industry: meeting the challenges of a changing industry, University of Mauritius, August 2005, http://www.gov.mu/portal/site/industry-site/menuitem
Joomun J. (2006): The textile and clothing industry in Mauritius, in Herbert Jauch/Rudolf Traub-Merz, The future of the textile and clothing industry in the Sub-Saharan Africa, Bonn: Friedrich-Ebert-Stiftung
Jayaram (2007): Foreign Direct Investment and employment creation in pacific island countries, Asia-Pacific Research and Training Network on Trade, Working Paper Series, No. 35
Jenkins (2006). Globalization, FDI and employment in Viet-Nam, Transnational Corporations, Vol. 15, No. 1 Katz (1987): Technology creation in Latin American Manufacturing industries, St Martin’s Press, New York Karim, Tarazi and Reille (2008). Islamic microfinance: An emerging market niche. CGAP August 2008 No.49 King and Levine (1993) Finance and Growth: Schumpeter Might be Right, Quarterly Journal of Economics, Vol. 108, pp.717-38 Khondoker and Kaliappa (2010), Determinants of Foreign Direct Investment in developing countries: a comparative analysis, ASARC
working Paper 2010/13, pp.2-23 Kravis I and Lipsey R. (1982). Location of overseas production and production for exports by US multinational firms. Journal of
International Economics, vol. 12, pp. 201-223 Kuran T. (2008). The scale of entrepreneurship in middle eastern history: inhibitive roles of Islamic institutions, ERID Working Paper
Number 10, Duke University, Economic Research Initiatives at Duke working Papers Series, March 2008 L’Express, Filature de la compagnie mauricienne de textile, un investisseur à la volonté indomptable, 12 November 2004 Loree D. and Guisinger S. (1995). Policy and non-policy determinants of US equity foreign direct investment. Journal of International
Business Studies, 26 (2), 281-299. Lyanda (1999): The impact of multinational enterprises on employment, training and regional development in Namibia and Zimbabwe: a
preliminary assessment, Geneva: International Labour Mauritius Industrial Development Authority, http://ncb.intnet.mu/mida, 14 September 2005 Mauritius Industrial Development Authority, Subregional trade expansion in Southern Africa, Mauritius supply survey in textiles and
clothing, prepared for the International Trade Centre UNCTAD/WTO, November 2001 National Productivity and Competitiveness Council, http://www.npccmauritius.com/history, 17 September 2005 Narayan A. , Perumal S. and Kode C. (2010). Determinants of FDI in BRICS countries: a panel analysis. International Journal of Business
Science and Applied Management, Volume 5, Issue 3, 2010. Neerudeen O.G.W.A (2010), Government expenditure and economic growth in Nigeria, 1970-2008: a disaggregated analysis, http:
//www.getcited.org/pub/103480171 Neereedun O.G.W.A (2010). Determinants of FDI in Nigeria: an empirical analysis, Global Journal of Human Social Science, Vol.10 issue 1
(p.26-34) Nivana Abou-Cabal and al. (2011).Islamic Finance and Entrepreneurship-Challenges and Opportunities ahead, EFLRI Islamic Finance
Whitepaper, Harvard Kennedy School Middle East Pakistan Legal Decisions (1992) Federal Sharait Court Judgment on interest, Lahore PLD Purchasers Office, working Paper No.84 OECD. 2002. Foreign Direct Investment for Development: Overview. OECD Publication Service Opportunities For All, International Labour Organization 2004, p. 69, note 306 Prosper L: Coup d’oeil sur les fermetures d’usines, L’Express 08 August 2004 Pugel (1985). Multinational enterprises, economic structure and industrial competitiveness in the United States, John H.Dunning (ed.), New
York, John Wiley and Sons. Quazi R. (2005). Economic freedom and foreign direct investment in East Asia. College of business prairie view A & M University Prairie
View, Rexas 77446, USA International Academy of Business and Public Administration Disciplines (IABPAD) meetings. Ray S. (2011). A close look into Double Taxation Avoidance Agreements with India: some relevant issues in international taxation,
International Affairs and Global Strategy, Vol. 2, 2011 Ritter N. 2008. HIV & Poverty- A challenge for Mauritius and the Region, p. 167, Caslon Printing Ltd, Mauritius Ragodoo J-F N. 2011, The Mauritian business sector and the fight against poverty: a NGO’s perspective. Social Responsibility Journal , Vol. 7,
No.2, pp.152-165

Proceedings of 4th
International Conference on Global Business Environment
(ICGBE-2014)
40
Rosunee S. (1990).The Mauritian textile and clothing industry: facing the challenges associated with globalization, infd.org/events/wfsids/virtual/papers
Root F. and Ahmed A. (1979). Empirical determinants of manufacturing direct foreign investment in developing countries. Economic Development and Cultural change, Vol. 27, pp. 751-767.
Siera Vercilo: EPZs and lack of decent work- the feminisation of poverty within Mauritius, April 17, 2010 Schneider F. and Frey B. (1985). Economic and political determinants of foreign direct investment. World Development, Vol . 13 (2), pp.
161-175 Sithanen R. Formerly Minister of Finance, Chairman and Director of International Financial Services Ltd: FDI national conference in
Pailles, Mauritius, in l’Express, 13 April 2012, p.35, (article of Jyoti Punjabi). Tsai P. (1994). Determinants of foreign direct investment and its impact on economic growth. Journal of Economic Development, Vol. 19,
pp. 137-163. UNCTAD (1998). World Investment Reports. UNCTAD (2009): World Investment Report. Transnational Corporations, Agricultural Production and Development. United Nations
Conference on Trade and Development Vaitsos (1976). The indirect employment effects of multinational enterprises in developing countries, International Labour Office, working
Paper No. 3 Wang Yanzhong: Financing difficulties and structural characteristics of SMEs in China, Bureau of Scientific Research, Chine Academy of
Social Sciences. World Bank 2011. Malaysia Economic Monitor. Washington DC: World Bank Wheeler D. and Mody A. (1992). International Investment Location Decisions: the case of US firms. Journal of International Economics, Vol.
33, pp. 57-76 World Bank (2001). World Development Indicators World Investment Report (2012).Towards a New Generation of Investment Policies Yuko and Nauro (2002). The location determinants of foreign direct investment in transition economies, Department of Economics,
University of Michigan William Davidson Institute and CEPR, pp.7-13 Zafar A. (2011). Mauritius: An economic success story, African Success Stories Project, World Bank, Office of the Chief Economist, Africa
Region

Proceedings of 4th
International Conference on Global Business Environment
(ICGBE-2014)
41
Micro-Credit in Conventional Banking: Would Islamic Banking be the Golden Age for Entrepreneurs? The Mauritius Case Study
Rajendra Parsad GUNPUTH
University of Mauritius [email protected]
Abstract: The broad aim of this paper is to make an analogy between conventional banks and Islamic banking in micro-credit and the incentives they may provide for entrepreneurs and small and medium enterprises (SMEs) in a Mauritian perspective? Indeed, in Mauritius traditional or conventional banks are more and more reluctant to give loans to entrepreneurs who are considered as high risk investors (their fragile entrepreneurs may collapse unexpectedly) despite they create jobs and employment. In contrast, in most Islamic countries Islamic banks allow businessmen and investors among others to have loans without interest (or riba) according to sha’ria compliants and tailor made Islamic contracts (mudabara and musarakha) to support their innovations and proposals. Despite Islamic banking is at its burgeoning state it has expanded considerably in most Islamic and Arab countries. Would Islamic banks uproot conventional banks irrespective it is in Islamic countries or Western countries? This paper therefore adds to an already abundant literature on the subject-matter but it enlightens a central issue: would Islamic banking, sha’ria law and Islamic economies be the golden age for entrepreneurs and SMEs in Mauritius and worldwide? Keywords: Islamic banking, shar’ia. riba, ijara, mudabara and musarakha, Mauritius
1. Introduction Mauritius, located in the Indian Ocean with its 1.3 million inhabitants, and its 92,000 small units are one of the driving forces of the economy of the island creating jobs and employment (210,000), eradicating poverty and is a good support for the socio-economic development of the island especially when the price sugar has fallen down. The Mauritian legislator has passed a number of legislations and policies26 to support SMEs. The total value added generated by SMEs is estimated at Rs 45 million contributing to the gross domestic product. However, despite these figures, it has been found that conventional banks are still very reluctant to give loans to entrepreneurs and SMEs for them to start business. Traditional banks give loans to finance entrepreneurs and SMEs but how micro-finance works in Islamic banking? Originated from a number of surahs of the Holy Qur’an, the principal source of Islamic law, revealed through its Prophet Muhammad (pbuh) and hadiths mention business and trade and how they should be financed and managed by all Islamic employees who trust in their faith. In contrast, a number of facilities provided by conventional banks such as loans with interests are strictly prohibited by shar’ia law and Islamic banking and financing such that it meets the expectations of all Muslim community providing islamically acceptable financing modes, loans without interest (riba) in all its forms, Profit and Loss Sharing (PLS) methods (mudaraba), equitable and fair distribution of profits according to a predetermined ratio, profit returns for assuming risk undertaken, autonomous and independent entrepreneurs in the management of the affairs of their small and medium enterprises, microcredit facilities such that Islamic banks play a role of partner (shirkah) with its entrepreneurs in a very productive-direct investment. Since the mid-1940s, businessmen and investors worldwide discovered a paradigm shift from conventional banks to Islamic banks especially in most Islamic countries. How is it perceived when conventional banks are so deeply rooted in most non-Islamic countries? Islamic banking and Islamic banks are supporting entrepreneurs (Bangladesh, Pakistan and Malaysia) to take loans without interest on a PLS investment. Actually, millions of people in Islamic countries are relying on this type of financing to survive. After having cleared some technical issues on Islamic financial and business contracts (ijara, murabaha, bai’salalm, bai’muajjal, istisanaa, qard hasan), this study will certainly allow entrepreneurs in non-Muslim countries (Mauritius, India, Singapore, France, South Africa) to better understand Islamic concepts and practices, and facilities which are afforded by Islamic banking and new modes of financing with probably a real departure from conventional banks. However, the main objectives of this paper are to understand the concepts and the blessings of sha’ria law to SMEs. Whether Islamic banks would probably uproot conventional banks worldwide so that entrepreneurs and SMEs have an alternate route to do business, trade and investment through Islamic banking? The aims and objectives of this paper are focused essentially on the concepts of entrepreneurship and social contracts in Islamic banking and what shall come out of this paper would probably encourage any entrepreneur to have financial support from Islamic banking which blooms even in a period of crisis. The gist of this paper is how entrepreneurs in Islamic countries could obtain funds without interest (riba) to purchase goods and assets to run their trade and business? Finally, what shall come out of this paper must certainly encourage young entrepreneurs to understand the legal and social concepts of entrepreneurship provided by Islamic banks and shar’ia law and the advantages they would probably benefit from it. After an introduction (-I-), the structure of the paper follows a background to SMEs in conventional banking (II), a traditional literature review (-III-) to enlighten us on eminent experts views followed by an overview (-IV-) on the subject matter, a research methodology (-V-) will eventually pave the way for some concluding results (-VI-), a conclusion (-VII-) will close this paper followed by some references (-VIII-). Background to Conventional-Islamic Micro-Credits and Rationale of the Study: Though SMEs create jobs and employment traditional banks are more and more reluctant to fund entrepreneurs and SMEs whilst Islamic banks provide social contracts without loans but on the principle of PLS. In contrast, this paradigm shift from conventional banks to Islamic banks will definitely take some time. Worst, doing business are getting more expensive. Consequently entrepreneurs may be discouraged to open business. Would young and modern entrepreneurs in non-Islamic welcome Islamic banking and what is the cost to pay if they abide to shar’ia law? Despite the fact that there is a quite a number of legal materials on Islamic banking and finance authored by eminent scholars (infra) little is known about
26 The Borrower Protection Act 2007, Companies Act 2001, Consumer Protection (Price and Supplies Control) Act, Cooperative Societies Act 1976, The
Investment Promotion Act 2000, Business Registration Act 2002, Small Enterprises and Handicraft Development Authority Act 2005 (SEHDA 2005), Copyright Act
1997, Electronic Transactions Act 2000, Information and Communications Technologies Act 2001, Protection Against Unfair Practices (Industry Property Rights )
Act 2002; Patents, Industrial, Designs and Trademarks Act 2002

Proceedings of 4th
International Conference on Global Business Environment
(ICGBE-2014)
42
this emerging sector in most non-Islamic countries and especially how it may be beneficial to entrepreneurs who, inter alia, contribute to the welfare of a nation by improving the Gross Domestic Product (GDP). Probably Islamic finance and its legal and social contract model suffered from an absence of very high quality media and it may account for this. However, would Islamic banking survive in non-Islamic countries and to what extent they may cohabit with conventional banks and other well-implemented legislations borrowed and inspired form French Civil Law or Common Law are questions which are very often overlooked or ignored? Whatsoever, conventional banks are perceived as business institutions while Islamic banking tries to reconcile PLS first corporate social responsibility first into their aims and objectives coupled with material and spiritual satisfaction to all Muslim believers without any exception. Legal and social aspects of entrepreneurship are not well understood in the relation Islamic banking-conventional or traditional banking. Indeed, based on Islamic or shar’ia law and though Islamic banking is free-interest banking nonetheless this model is still unpopular in non-Islamic countries while there may be some facilities that it may provide to entrepreneurs. Indeed, how Islamic banking works on the basis of shar’ia law is easy to understand but is it as easy as it pretends for entrepreneurs to have access to it especially in non-Islamic countries (for example India, Mauritius, Singapore or South Africa)? A sound and plausible rationale to this question is that most entrepreneurs are used to traditional banks, loans and mortgages with its traditional fixed and floating charges while Islamic banking and financing is more or less than a commercial partner with entrepreneurs and which more oriented in PLS arrangements. Furthermore, in Islamic or non-Islamic countries whenever there is Islamic finance and conventional banks there is also a sort of harmonization between Civil Law and Islamic (shar’ia) law. Of divine inspiration, business and trade have therefore a different concept in Islamic law or shar’ia law such that what is allowed in conventional banking such as loans with interest is strictly prohibited in Islamic law (haram) and what is allowed in Islamic banking, as a partner in the transaction with entrepreneurs, such as PLS is still unknown oi inacceptable in conventional banking. Whatsoever, out of the two systems of financing would entrepreneurs benefit from one system or another or both? Facts and figures (infra) reveal to what extent Islamic banking is a booming industry in our business world today. Most Islamic countries (Bahrain, Malaysia, Pakistan) are really benefitting from this type of fundings as well and Islamic finance has been very successful in Bangladesh especially for women entrepreneurs. Based on the principle of ‘innovate or die’ microfinance in Bangladesh has been able to finance women entrepreneurs creating jobs, opportunities for one and all, fight against poverty and contributing to the GDP of the dying economy of this country. 2. Literature Review In business entrepreneurship there is nothing as revolutionary as Islamic banking and its modes of finance. According to sha’ria law there is a social contract between men and God and in any way there shall be interest or riba in any transaction irrespective it is between banks and its clients or between men. Furthermore, musharaka (joint venture) and mudharaba (financing) are tailor-made Islamic contracts which undeniably provide protection against interest rate (murabaha or mark-up). As stated, the main source of Islamic banking and finance is shari’ah law and contracts in addition to hadiths in the most prophetic tradition. The superiority of a loan (qard hasan) without interest (riba) over charity is also based on a hadith of Prophet Muhammad (pbuh): ‘‘O Jibril, why is a loan rewarded more than charity? The angel replied, ‘Because a person may ask for charity when he does not need it, but the borrower only borrows in case of desire need’’’. In rural areas (in Bangladesh around 40,000 women are selling telephone services and Nobel prize winner Muhammad Yunnus advocated lengthily on the importance of the Grameen Type Microcredit model) SMEs are creating employment in most slums whereas in urban zones (‘urban poverty’) entrepreneurs may enter a particular market (motorcycle repair workshops, bakery) and trade where large firms fear to invest (printing for example) thus reducing the mobility of workers from one zone to another27. A very large number of eminent authors have authored books, research articles and reports on Islamic banking concluding their assessment that in the overall Islamic banking was more efficient than conventional banks (Iqbal and Molyneux, 2005). Nonetheless, there are still some conflicting views and divergent opinions about riba because there is PLS between lender and borrower instead (Mirakhor, 1987). At least from the 19th century onward, certain observers have viewed Islam as a religion that discourages entrepreneurship by fostering fatalism, conformism, and conservatism but Islamism; which emerged through the work of Sayyid Abdul-Ala Mawdudi and Sayyid Qutb and Muhammad Baqir al-Sadr; generally agrees that Islam encourages entrepreneurship (Timor Kuran28, 2008). In fact, some authors (infra) have found that Islamic banking could complement conventional banks and thereby help diversify systemic risks: in conventional banks the entrepreneur or any borrower bears all risks and is liable for mismanagement while in Islamic banking both bank(s) and entrepreneur(s) share the rewards and failure. In many developing countries risk sharing might allow entrepreneurs with little savings to undertake projects they could not contemplate in an environment where all the risk lies on them. According to Khan and Mirakhor (1985) PLS arrangement eliminate the fixed cost of capital and may therefore tend to raise overall investment. In conventional banking, the creditworthiness of the borrower is the main determinant of the lending decision, banks are interested in the interest and principal on the loan while in Islamic banking, because profits and losses are shared, banks will receive a return only if a project is successful such that Islamic banks are more prone to finance sound projects, even if the entrepreneur has no credit history (Imam and Kpodar, 2010). However, the two respected authors referred to Cihak and Hesse (2008) and the research they have achieved demonstrating to what extent Islamic banks tend to be less stable when operating on a large scale, suggesting that: ‘‘under certain conditions, a growing Islamic banking sector might not be beneficial for economic growth if it weakens financial stability in countries where a proper prudential regulation is lacking. It is probably fair to say that the benefits in having banking systems that are diversified and include Islamic banks as a complement to conventional banks, is likely to be helpful for financial stability’’. Now, as far as Islamic issues are concerned, as mentioned earlier, riba is prohibited such that according to the Prophet Muhammad (pbuh): ‘‘riba has seventy segments, the least serious being equivalent to a man committing adultery with his own mother’’. The sin of all
27 Gunputh (20110. Enhancing the Entrepreneurial Minds In the Informal Sector -The Mauritian SMEs Case Study-. Journal MERI, India 28
Kuran T. (2008). The scale of entrepreneurship in middle eastern history: inhibitive roles of Islamic institutions, ERID Working Paper Number 10, Duke University,
Economic Research Initiatives at Duke working Papers Series, March 2008

Proceedings of 4th
International Conference on Global Business Environment
(ICGBE-2014)
43
Islamic banking is traditional interest and riba is strictly forbidden. ‘‘Trade is like usury. God allowed trading and forbid riba’’ (Quran 2:275).With the advent of Islam Islamic banking have been so successful that even conventional banks are offering shar’iah compliant financial products (Abou-Gabal, Khwaja and Klinger, 2011). To quote Janachi (1995): ‘‘Islamic banks have a major responsibility to shoulder all the staff of such banks and customers dealing with them must be reformed Islamically and act within the framework of an Islamic formula, so that any person approaching an Islamic bank should be given the impression that he is entering a sacred place to perform a religious ritual, that is the use and employment of capital for what is acceptable and satisfactory to God. The staff in an Islamic bank should, throughout their lives, be conducting in the Islamic way, whether at work or at leisure. Muslims who truly believe in their religion have a duty to prove, through their efforts in backing and supporting Islamic banks and financial institutions, that the Islamic economic system is an integral part of Islam and is indeed for all times through making legitimate and Halal profits’’. There is also the reverse of the medal. Many Islamic banking scholars (Chapra 1982 and Chapra, 1985; Ahmad 2000, Khan & Mirakhor 1987, Iqbal and Mirakhor (1986) have demonstrated that Islamic banks perform mostly the same functions as conventional banks but they do so in distinctly different ways. In one of his research papers, a very respected scholar (Asyraf Wajdi Dusuki) explained that the prevailing practice of interest in the conventional banking system involves injustice to the borrowers since the interest on their loans has to be paid irrespective of the outcomes of their businesses, similarly, interest contracts (infra) can be unjust to the lenders, especially when their returns on deposits that the banks channel to entrepreneurs are not commensurate with the actual performance of the investments. However, there is a strong analogy between conventional and Islamic banks: banks very often discriminate between the poor and the rich though Islamic and sha’ria law prohibits discrimination between Muslims. Thus, it can be said openly that: ‘‘Apparently, it is a matter of pleasure that global volume of Islamic finance industry has crossed $1.3trillion approximately, which is, definitely, providing the best and compatible sources of finance with interest free modes. According to a careful estimate, there are more than 2000 Islamic Financial Institutions offering Islamic Banking, Islamic Insurance (Takaful), Islamic Funds, Mudaraba, Islamic Bonds (sukuk), Islamic Microfinance and some other institutions actively providing Islamic financial services on different modes in adherence of Shari’a principles of Islamic Finance. If we look into the market share of above mentioned institutions, we get shocked and depressed for a while with the fact that Islamic Banking and Finance has been nearly confined to the rich people and as per the ideology of capitalism, the profit urge has captured the Islamic Financial Industry and discriminated against the underprivileged, leaving them deprived of Islamic financial services. In view of these facts, it should be said that commercialism has captured Islamic finance institutions in such a way that business with and financing to the poor have slipped from their agenda29’’. Islamic banking whether it is micro-finance is expanding fast. One author remembered that: ‘‘Just look at the mathematics. Islamic finance is growing 50 per cent faster than the traditional banking sector, and it has huge growth potential. A quarter of the world’s population is Muslim but only 1 per cent of the world’s financial assets are sharia-compliant. Across the Middle East and north Africa, less than 20 per cent of adults have a formal bank account. That gap presents a huge economic opportunity for the UK’’30. Overview of the Problem A tailor made concepts: Is Islamic banking a tailor-made concept? Having explained the main legal concepts of Islamic law, banking and finance through shar’iah law it is important to know how Islamic banking and its concepts are perceived worldwide coupled with a constant and persistent question: would Islamic banking be able to grow and expand in non-Islamic countries, in the interest of SMEs and entrepreneurs, where conventional banks are deeply rooted but is more and more reluctant to give loans? Islamic banking has been very fruitful in many Islamic countries but there some obstacles to Islamic banking and some legal concepts of sha’ria law are still either misunderstood or unknown in most (non-Islamic) countries. Islamic banks provide various contracts for entrepreneurs without interest with a profit-sharing devise instead. Shar’ia law remains inevitably the main source of Islamic law and it is strictly applied in Islamic banking law and all Islamic contracts such as, inter alia, ijara, mudabara and musarakha (infra) for instance. Today, all these legal and social contracts are pillars of Islam generating trillion of USD worldwide. Some major obstacles to Islamic Banking: Driving force in some sectors (business and transactions) of emerging economies (Malaysia with the Bank Islam Malaysia Berhad, Dubai with its Dubai Islamic Bank, Egypt and Sudan with Faisal Islamic Bank, Indonesia, Pakistan) small and medium enterprises create jobs and employment (Table 1) contributing to the national Gross Domestic Products (up to 37% of the Mauritian GDP). Table 1 - Distribution (%) of employed persons by employment status and sex, 2011
Employment Status Male Female
Employer 5.3 1.6
Own account worker 15.7 9.1
Employee 78.3 85.1
Contributing family worker 0.7 4.3
Total 100.0 100.0 Source: CSO This paradigm shift is also applicable in non-Islamic countries (Islamic Bank international of Danemark, The Islamic Bank of Britain in the Uk, Luxembourg with the Islamic Holdings System of Luxembourg, Australia, Netherlands, Hong-Kong) but is still unpopular in many countries (Mauritius, India, South Africa). Religion and language barrier, credit risk, benchmark risk, liquidity risk,operational risk, legal risk, withdrawal may account for this. Despite Islamic finance market has grown from 10% to 15% major obstacles persist worldwide. In some non-Islamic countries (Mauritius, India). Refer to Chart 1 (Source: alBaraka31) below which explains some major
29 Muhammad Zubair Mughal. Site: http://www.dailynewsegypt.com/2013/09/08/a-big-question-mark-on-the-islamic-finance-industry/ 30 George Osborne. Site: http://www.ft.com/intl/cms/s/0/42766334-3fc2-11e3-a890-00144feabdc0.html#axzz2jIqgdtKy 31 http://www.albaraka.com/default.asp?action=article&id=46

Proceedings of 4th
International Conference on Global Business Environment
(ICGBE-2014)
44
distinctions/differences (infra) between the two types of banking. Islamic banking is at its burgeoning stage in most non-Islamic countries including Mauritius. Any institution which is governed by shar’ia law and in the same way any Islamic institutions should depart from their conventional counterparts but would non-Islamic countries accept it? As there are both shar’ia law and Islamic finance is Islamic banking and entrepreneurship closely associated and/or to what extent they are performant? Islamic banking is growing at a rate of 10-15% per annum and there are over 200 Islamic banks operating in 65 countries with a population of around 1.3 billion, Islamic banks’ capital is USD 90 billion that is growing at the rate of 15% per annum (Pakistan Legal Decisions, 1992). These figures are not denied but apart from harmonization of Islamic law with domestic law there are some problems which may appear when a non-Islamic country (Mauritius, India, South Africa, England) wish to settle Islamic banks on its land. In Mauritius, the chronologies of events in the institutionalisation of Islamic banking are as follows: 1998- Al Barakah Multi-purpose Co-operative Society Limited 1999- ALEEF incorporation 2005- Inaugural of Mauritius Islamic Finance Forum (MIFF) by the Islamic Cultural Centre 2005- Established of an Islamic Financial Services Committee run by the BOM32 2007-BOM entered in Associate Membership with IFSB33 2007- Amendment of the Banking Act 2008- BAI34 Takaful inauguration. Islamic banking week 2008- Deliverance of Budgetary Speech to use Sukuk35 2008-Amendment of Public Debt Management Act 2008-BOM publication of the Guidelines for institutions conducting Islamic banking business 2009-Mauritius Leasing launched Ijarah36 2009- HSBC37 launched Amanah current and investment accounts 2009-FSC admittance as Associate member of IFSB 2009-Granting the first Islamic banking licence to Century banking Corporation 2010-Publication of SP5/10 on VAT by MRA for ‘Murabahah38’dealings 2010-BOM admittance as a full member of IFSB 2010-BOM became founder member of IILM 2010-BOM and Bank Negera Malaysia entered in a Memorandum of Understanding (MoU) 2011-Al Barakah Multi-purpose Co-operative Society Limited with Al Huda Centre of Islamic Banking and Economics from Pakistan organized an "International Conference on Islamic Banking and Finance in Mauritius” on 5th and 6th April 2011 at Gold Crest Hotel, Quatre-Bornes, Mauritius. Some pertinent legal issues: In Mauritius, the Bank of Mauritius has set Guidelines for Institutions conducting Islamic Banking Business. Very recently, the Kerala High Court, dismissing the petitions of Janata Party leader Subramanian Swamy and others against Al-Baraka Company, has ordered that companies which are registered under the tenets of shar’ia law to start operating a financial institution based on the principles of Islamic banking but through a separate legislation as the Banking Regulation Act provides for conventional banking which is also based on interest payment. Apart from shar’ia law, each and every Islamic country has its own Islamic Banking Act and Banking and Financial Institutions Act. In Arab-Malaysian Finance Berhard & Ors v. Taman Ihsan Jaya Sdn Bhd & Ors, the court was of the view that the sale of the properties between the bank and the customer was mala fide because the profits of Bai’ muajjal (infra) contravened the Islamic Banking Act 1983, which prevails in Malaysia. In Arab-Malaysian Merchant Bank Berhad v. Silver Concept the Court held that Bai’ muajjal were shariah compliant and that the sale was therefore bona fide between the bank and its customer. Whether developing or developed countries and standard of life is also different costs of doing business are relatively higher from one country to another. However, the main obstacle facing entrepreneurs is funding prior to start business and trade eventually, how to obtain it easily and without too much administrative hassle? The concepts of Islamic Banking: Businessmen and investors are not always verse with sha’ria law. The concepts of Islamic banking in the management of the affairs of the company is strictly limited compared to conventional banks: though Islamic banks share the risk as partners projects of entrepreneurship are managed by the client and not buy the bank. Islamic banks exercise monitoring, follow-up supervision and have a right to check books and other administrative records. Islamic banks are also popular for lesser financial stress than conventional banking. Indeed, since they are partners in mudaraba or musharaka contracts they are also conceived as financial intermediary mobilizing savings from the public and they may advance capital to entrepreneurs readily than any conventional bank. Islamic banks and modes of financing apply to all religions but commercial banking system is contrary to shar’ia law and its different sources (hadiths, sunna, ijdma numa, fiqh). In non-Islamic countries there are national policies and strategies to develop Islamic banking. However, Islamic finance is open to any entrepreneur even if they are not of Islamic faith or do not abide to the teaching of the Qur’an. Islamic banks are certainly not religious institutions. All what they do or perform as partners (supra) is that their clients and themselves abide to Islamic law without being a Muslim or not. Thus, there is ‘islamicity’ of banking and not ‘islamicity’ of entrepreneurs such that obligations and restrictions in shar’ia law are to be applied/interpreted stricto sensu with respect to:
32 Bank of Mauritius 33 International Financial Services Board. 34 British American Insurance 35Sukuk (Islamic bonds) or securitized credit finance is the most dynamic instrument for capital mobilisation and has the same financial characteristics as
conventional bonds and notes but the only difference is that all legal contracts must have been approved by sha’riah law. 36 Ijara (or leasing) in Islamic law requires any Islamic bank (as lessor) to purchase the property of a person (homeowner or lessee) who will reside as a tenant
over a specific period of time. He pays a fixed rent until he owns the asset. Ijarah is similar to conventional leasing with a lessor and lessee but the only difference
with Islamic law or Sha’ria is that any Islamic bank may sell back the property at its original purchase price rather than its market value at the time of the sale. 37 Hong Kong and Shanghai Banking Corporation 38Murabahah (or cost-plus) in Islamic law requires an Islamic bank to purchase commodities and to sell them at a predefined mark-up price. The client signs a
‘promise to purchase’ agreement with the bank before the latter purchases the property but the Islamic institution cannot earn excessive profits from the client. In the
UK, Natwest has launched the Alif Baa Taa, a commercial finance based on Murabaha along with the Bank of Ireland.

Proceedings of 4th
International Conference on Global Business Environment
(ICGBE-2014)
45
Prohibition of illegal activities (haram) Prohibition of games of chance (maysir) Prohibition of interest (riba) Prohibition of speculations and chance (gharar) Payment of Islamic tax (zakat) Acceptance and obligations of mudabara of profit-sharing contracts Acceptance and obligations to musharaka or partnership contracts Acceptance to shar’ia compliance Acceptance of savings, investment and zakat accounts
This list is certainly not exhaustive. There are indeed other obligations such as acceptance of safe keeping (wadiah) and Islamic bonds (sukuks). Another non-negligible issue is that non-Islamic countries are often scared of Islamic banking and it may be three-fold: first conventional banks are afraid that Islamic banks may capture most niches, second they may disappear and third there is too much Islamicity. Indeed, in most countries where Islamic banks have flourished shar’ia law must prevail and strong financial institutions (Islamic Development Bank, Financial Service board, International Association of Islamic banks) must be set up urgently to cope with Islamic finance. 3. Methodology The Mauritian experience is examined in the wider global context using a 20-year secondary data series over the period 1990-2012 periods, obtained from various sources. From information gathered from the Holy Quran, books, reports, websites39 it is possible to explain both the ideology of entrepreneurship and the techniques of fundings in Islamic banking. 4. Results and Discussion The ideology of entrepreneurship in Islamic banking: Islamic banks become an entrepreneur when they receive funds from depositors and as financiers (or a two-tiered mudaraba system where they act both as client or mudarib and owner of capital or rubbul-mal) when they provide funds to local entrepreneurs. However, over and above all Islamic banking provides funds relatively more easily than traditional banks do to local and young entrepreneurs because they themselves rely on transactional deposits and investment deposits provided of course there are no economic activities or speculations (ghirar), entrepreneurs accept an Islamic tax (zakat) and they prohibit the production of goods and services which are prohibited in Islamic law, customs and traditions (haram) or which go outside Islamic concept and patterns. Islamic banks do not interfere in the management of the company but has the right to determine the kind of activities and its locations, its duration of course and monitor the investments. In contrast with conventional banks which impose guarantees such as security to ensure its capital Islamic banking, on the other side, have a good reputation not to interfere with the management of the investment or anything which may eventually harms the performance of the entrepreneur (mudaraba). Nonetheless, Islamic banks have a right to check records and books, monitoring and regular supervision but entrepreneurs remain fully independent in conducting the affairs of their company or business. In return, it is implied that Islamic banks become a true partner in the process and the entrepreneur is under the obligation to share the net profit (mudharaba) under pre-agreed terms and conditions once all administrative costs, capital depreciation or Islamic tax have been deducted, and may even pay a salary to the entrepreneur in a win-win situation. In any event there are losses they shall be borne by the lender or capital provider. The entrepreneur shall lose time and effort invested in the enterprise, business and trade but at least he will bear no loss as he would have been in conventional banking where he may lose all his assets after his property has been mortgaged to pay back the loan with heavy interests. The techniques of funding for entrepreneurs based on shar’ia contracts: Mudaraba remains the main conduit for the outflow of funds from bank. Practically the same conditions apply to musharaka financing, which is a sort of joint venture, to the exception that profits and losses are borne proportionally to the capital contributed on agreed ratio. The bank may provide managerial expertise but each Islamic bank may have its own Shariah Advisory Council with a view to harmonise Islamic law, rules and principles. If mudharaba and
39 Central Statistics Office CSO Survey 2007
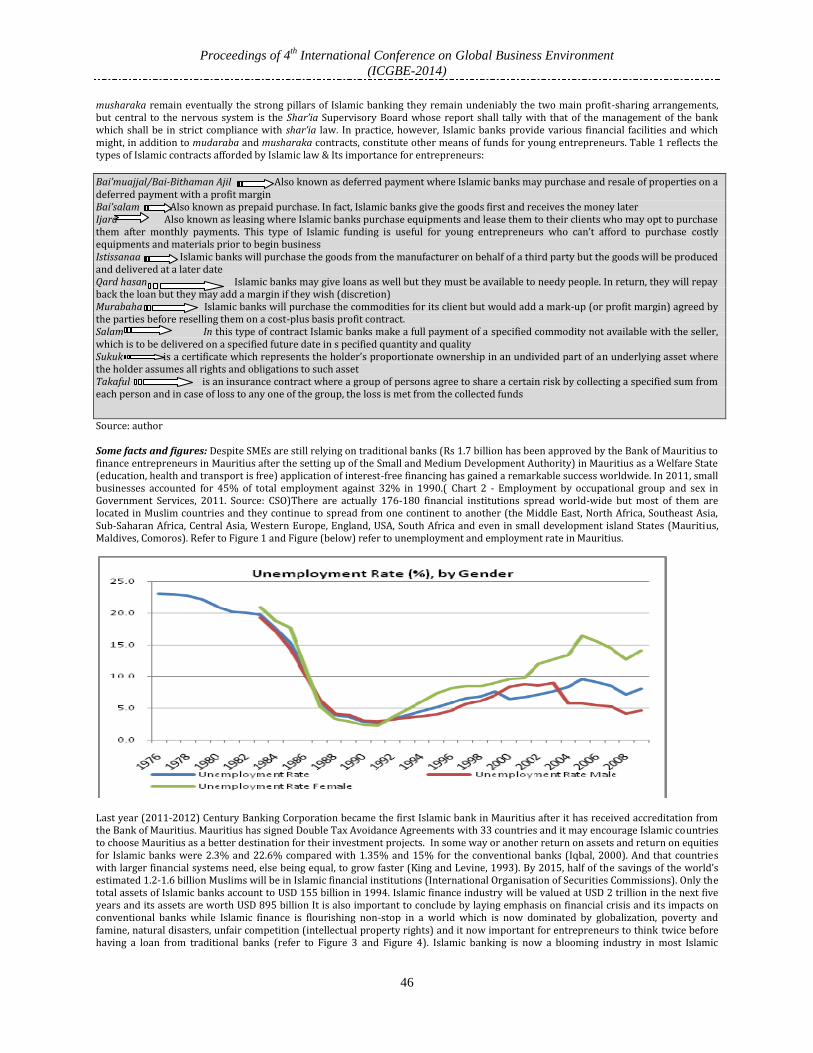
Proceedings of 4th
International Conference on Global Business Environment
(ICGBE-2014)
46
musharaka remain eventually the strong pillars of Islamic banking they remain undeniably the two main profit-sharing arrangements, but central to the nervous system is the Shar’ia Supervisory Board whose report shall tally with that of the management of the bank which shall be in strict compliance with shar’ia law. In practice, however, Islamic banks provide various financial facilities and which might, in addition to mudaraba and musharaka contracts, constitute other means of funds for young entrepreneurs. Table 1 reflects the types of Islamic contracts afforded by Islamic law & Its importance for entrepreneurs:
Bai’muajjal/Bai-Bithaman Ajil Also known as deferred payment where Islamic banks may purchase and resale of properties on a deferred payment with a profit margin Bai’salam Also known as prepaid purchase. In fact, Islamic banks give the goods first and receives the money later Ijara Also known as leasing where Islamic banks purchase equipments and lease them to their clients who may opt to purchase them after monthly payments. This type of Islamic funding is useful for young entrepreneurs who can’t afford to purchase costly equipments and materials prior to begin business Istissanaa Islamic banks will purchase the goods from the manufacturer on behalf of a third party but the goods will be produced and delivered at a later date Qard hasan Islamic banks may give loans as well but they must be available to needy people. In return, they will repay back the loan but they may add a margin if they wish (discretion) Murabaha Islamic banks will purchase the commodities for its client but would add a mark-up (or profit margin) agreed by the parties before reselling them on a cost-plus basis profit contract. Salam In this type of contract Islamic banks make a full payment of a specified commodity not available with the seller, which is to be delivered on a specified future date in s pecified quantity and quality Sukuk is a certificate which represents the holder’s proportionate ownership in an undivided part of an underlying asset where the holder assumes all rights and obligations to such asset Takaful is an insurance contract where a group of persons agree to share a certain risk by collecting a specified sum from each person and in case of loss to any one of the group, the loss is met from the collected funds
Source: author Some facts and figures: Despite SMEs are still relying on traditional banks (Rs 1.7 billion has been approved by the Bank of Mauritius to finance entrepreneurs in Mauritius after the setting up of the Small and Medium Development Authority) in Mauritius as a Welfare State (education, health and transport is free) application of interest-free financing has gained a remarkable success worldwide. In 2011, small businesses accounted for 45% of total employment against 32% in 1990.( Chart 2 - Employment by occupational group and sex in Government Services, 2011. Source: CSO)There are actually 176-180 financial institutions spread world-wide but most of them are located in Muslim countries and they continue to spread from one continent to another (the Middle East, North Africa, Southeast Asia, Sub-Saharan Africa, Central Asia, Western Europe, England, USA, South Africa and even in small development island States (Mauritius, Maldives, Comoros). Refer to Figure 1 and Figure (below) refer to unemployment and employment rate in Mauritius.
Last year (2011-2012) Century Banking Corporation became the first Islamic bank in Mauritius after it has received accreditation from the Bank of Mauritius. Mauritius has signed Double Tax Avoidance Agreements with 33 countries and it may encourage Islamic countries to choose Mauritius as a better destination for their investment projects. In some way or another return on assets and return on equities for Islamic banks were 2.3% and 22.6% compared with 1.35% and 15% for the conventional banks (Iqbal, 2000). And that countries with larger financial systems need, else being equal, to grow faster (King and Levine, 1993). By 2015, half of the savings of the world’s estimated 1.2-1.6 billion Muslims will be in Islamic financial institutions (International Organisation of Securities Commissions). Only the total assets of Islamic banks account to USD 155 billion in 1994. Islamic finance industry will be valued at USD 2 trillion in the next five years and its assets are worth USD 895 billion It is also important to conclude by laying emphasis on financial crisis and its impacts on conventional banks while Islamic finance is flourishing non-stop in a world which is now dominated by globalization, poverty and famine, natural disasters, unfair competition (intellectual property rights) and it now important for entrepreneurs to think twice before having a loan from traditional banks (refer to Figure 3 and Figure 4). Islamic banking is now a blooming industry in most Islamic

Proceedings of 4th
International Conference on Global Business Environment
(ICGBE-2014)
47
countries where they have achieved recognition and respect. Microfinance has been so successful in Bangladesh, Malaysia and even Singapore and there is no reason why non-Islamic countries might not take benefits of all facilities.
Figure 3: Global sukkuk issuance
Source: Islamic Financial Information Service 5. Conclusion and Recommendations Islamic banking could be the golden age for entrepreneurs and SMEs unless governments find policies to encourage conventional banks to give loans to finance entrepreneurs and SMEs in the form of micro-credits. The Mauritian government has passed several legislations40 to encourage the development of SMEs in Mauritius. They contribute to 37% (120 billion rupees) of the GDP, employing more than some 250,000 people and they are still mushrooming on the island. Government policies and loans (Rs 50,000), provided they have innovative proposals, with low interests from conventional banks (SMEase) may account for this. Since Islamic banking is at its burgeoning stage in Mauritius, and in many non-Islamic countries as well, there are hope and expectations that there shall be a real departure from conventional bank to Islamic banking soon. Non-Islamic countries shall legislate by passing appropriate law on Islamic banking in addition to various sources of Islamic law. Like in Mauritius, non-Islamic countries must allow Islamic banks to settle in their countries in accordance with sha’ria compliance creating jobs and employment (infra). In return, they would probably attract Foreign Direct Investment (FDI) as well as this reflects to what extent Mauritius has more than 30 double taxation avoidance agreement (DTAA) attracting billion of dollars encouraging foreign investors to invest in Mauritius in various emerging sectors (tourism and hotels, buildings and luxurious apartments).
40
Labour Act, Renumeration Orders, Companies Act, SMEDA Act, Business Facilitation Act , Business Registration Act Local Govt Act , Employment Relations
Act
0 5,000 10,000 15,000
Elementary occupations
Plant & machine operators
Craft & related trade workers
Skilled agricultural & fishery …
Service workers
Clerks
Technicians & associate …
Professionals
Legislators, senior officials & …
Number
Male

Proceedings of 4th
International Conference on Global Business Environment
(ICGBE-2014)
48
Figure 4: Muslim population in Africa and Islamic Finance
source: African Development Bank. 1980-2010 References Abou-Gabal, Khwaja and Klinger (2011). Islamic Finance and Entrepreneurship: Challenges and Opportunities Ahead, Harvard Kennedy
School in cooperation with The Kuwait Foundation for the Advancement of Sciences Adiilah Ibrahim (2010). Opportunities and challenges of Islamic banking in Mauritius, BSC (Hons) Finance (Minor Law), University of
Mauritius Aggarwal and Yousef (2000). Journal of Money, Credit and Banking, Ohio State University Press A Comparative Review of Incentives to SMEs & Costs of Doing Business, SMIDO, June 2004, 53 p. Ahmad A (2000). Instrument of regulation and control of Islamic banks by the central bank, Islamic Research and Training Institute,
Research Paper No. 10 Ariff Mohamed (1988). Islamic banking, Asian-Pacific Economic Literature, Vol. 2, No. 2, pp.48-64 Bank of Mauritius-Guideline for institutions conducting Islamic Banking business, June 2008 Chapra M.U (1982). Money and banking in an Islam economy: Monetary and fiscal policy of Islam, International Centre for Research in
Islamic Economics, Jeddah Chapra M.U (1985). Towards a just monetary system, The Islamic Foundation, UK Chihak and Hesse (2008). Islamic Banks and Financial Stability: An Empirical Analysis, IMF Working Paper 08/16 (Washington:
International Monetary Fund) Choong and Liu (2006). Islamic banking: interest-free or Interest-based? Working paper, Nanyang Business School Dusuki Asyraf Wajdi (2011). Ethical and social responsibility models for Islamic finance, international shar’aih Research Academy for
Islamic finance (ISRA)

Proceedings of 4th
International Conference on Global Business Environment
(ICGBE-2014)
49
El-Hawary, Grais and Iqbal. Institute and the HKS Belfer Centre for Science and International Affairs Dubai Initiative, http://www.cid.harvard.edu/eflri
Gunputh R.P. (2010). Enhancing the Entrepreneurial Minds In the Informal Sector -The Mauritian SMEs Case Study- MERI Journal, India Gunputh R.P. (2011). Some Innovations in Microcredit for Human Resource Development: Small and Medium Enterprises (SMEs) The
Mauritian Case Study- Conference Proceedings, International Conference, Grand Baie, 16-24 September 2011, Mauritius Gunputh R.P. (2012). A Contextual Approach to A Legal and Institutional Framework to Financing Problems of SMEs in Mauritius: The
Mauritian Success(What a Young Entrepreneur must Know prior to Commencement of Business and Investment?), 3rd International Conference on business and Economic Research,12-13 March, Bandung , Indonesia
Gunputh R.P. (2012). Would Islamic Banking enhance Banking Activities in Mauritius? The Mauritian Case Study.2nd Conference on International Trade and Investment, 24-26 Oct. 2012, Mauritius
Hassan (1999). Islamic banking in theory and practice: the Bangladesh experience. Managerial Finance, vo. 25, no.5, p.60 Henry and Wilson (2004). The politics of Islamic finance. Edinburgh University Press, Edinburg Hesse, Jobst and Sole (2008). Current trends in Islamic Structured Finance and Capital Markets. IMF paper Lee and Ullah (2007). Integration of Islamic and conventional finance. International Review of Business Research Papers, vol.3, no.5,
pp.241-265 Iqbal Munawar (2000). Islamic and commercial banking in the nineties: a comparative study in the proceedings of the Fourth
International Conference on Islamic Economies and Banking, Loughborough University, August 13-15, pp.409-431 Iqbal Zamir (1997). Islamic Financial Systems. Finance and Development-World Bank Publications, pp.42-45 Iqbal Z. & Mirakhor A. (1986). Islamic banking, IMF, Washington DC Khan M.S and Mirakhor (1985). The financial system and monetary policy in an Islamic economy, unpublished IMF paper Imam and Kpodar (2010). IMF Working Paper African Department, Islamic Banking: How has it diffused? Janachi (1995). Islamic Banking, Concept, Practice and future, 2nd edition. Manama: Bahrain Islamic Bank Karim, Tarazi and Reille (2008). Islamic microfinance: An emerging market niche. CGAP August 2008 No.49 King and Levine (1993). Finance and Growth: Schumpeter Might be Right, Quarterly Journal of Economics, Vol. 108, pp.717-38 Khan M.S & Mirakhor A. (1987). THe financial and monetary policy in an Islamic economy, Journal of King Abdul Aziz University: Islamic
Economics, Volume 1 Kuran T. (2008). The scale of entrepreneurship in middle eastern history: inhibitive roles of Islamic institutions, ERID Working Paper
Number 10, Duke University, Economic Research Initiatives at Duke working Papers Series, March 2008 Metwally (1996). Attitudes of Muslims towards Islamic Beliefs and Practice in a dual-banking system. American Journal of Islamic
Finance, vol. 6, no.1, pp.11-17 Muhamad Anwar (2000). Islamicity of banking and modes of Islamic Banking, International Islamic University of Malaysia, 31st Oct. 2000,
Banquet Hall, 18 p. Nivana Abou-Cabal and al. (2011). Islamic Finance and Entrepreneurship-Challenges and Opportunities ahead, EFLRI Islamic Finance
Whitepaper, Harvard Kennedy School Middle East. Pakistan Legal Decisions (1992). Federal Sharait Court Judgment on interest, Lahore PLD Purchasers Peeroo Beebee Nusayhah Naaz (2009). Exploring the avenues of Islamic banking in Mauritius, dissertation BSc (Hons) Accounting and
Finance, University of Mauritius Y. Sampat (2010). Can Islamic Banking integrate alongside the conventional banking system in Mauritius? Dissertation. BSc (Hons)
Accounting Minor Finance III Salaroo Mohammad Akhtar Nawaz (2008). Islamic Banking and products: an assessment of the awareness, attractiveness, attitudes and
perception of people in Mauritius, BSc (Hons) Financial Services, University of Mauritius Siddiqi M.N. (1982). Islamic approaches to money, banking and monetary policy: a review in Ariff M. Uzair, Mohammad (1955): An outline of interesting banking, Karachi: Raihan Publications Wilson R. (2002). Islamic Banking Reviews. The Economic Record Vol. 79, no. 22, pp.373-374 Wilson R.(2206). Islam and Business. Thunderbird International Business Review, 48 (I), pp.109-123 Yon Bahaih Wan Aris (2003). Takaful-an option to conventional insurance: a Malaysian Model. Paper 18

Proceedings of 4th
International Conference on Global Business Environment
(ICGBE-2014)
50
Performance of Investment Companies in Africa Stock Markets and Implications for Regulation with Emphasis on the Stock Exchange of Mauritius
Sunil Kumar Bundoo
University of Mauritius [email protected]
Abstract: The main objective of this project was to assess the performance of the listed investment companies on the Stock Exchange of Mauritius. This was done by analyzing the single parameter measures made up of the Sharpe ratio; the Treynor index and the Jensen’s alpha. Persistence in performance was also analysed. Last; the market-timing ability and stock selection ability of the fund mangers were investigated. The importance of performance evaluation and appropriate reporting standards were also discussed. Both the Sharpe ratios and the Treynor index compare unfavourably with similar ratios for the local market index (the SEMDEX). With respect to the Jensen’s alpha on average most of the funds underperform. The evidence is thus very much consistent with the findings in the empirical literature. A similar pattern is observed when using the African Financial Services Index (AFSI) and the EMSCI as benchmarks. Using the methodology of Goetzmann and Ibbotson (1994); there was no evidence of persistence in performance. We observed that the fund managers do not have market timing and stock picking abilities. Keywords: fund performance; Africa; Mauritius; stock market
1. Introduction and Background Equity investment inflows accounted for the bulk of private capital inflows in 2010. Portfolio equity inflows in particular are at a high level relative to their history. Growth in portfolio equity and bank inflows is expected to slow down in 2011 and 2012 as emerging equity markets weaken and capital controls and other policy measures slow credit growth. --Net private capital inflows to emerging economies are estimated to have been $908 billion in 2010, which is 50% higher than in 2009; --Private flows are expected to increase to $960 billion in 2011 and $1009 billion in 2012; --Rising flows are supported by strong emerging market fundamentals, long-term investor portfolio rebalancing and abundant global liquidity; --Strong capital inflows raise important policy issues; for instance, most emerging economies may need tighter monetary policy but would also benefit from tighter fiscal and macro prudential policies, and allowing more currency appreciation. Private capital flows to emerging economies have surged since early 2009, encouraged by positive growth and risk perceptions of emerging markets and easy money in the G3. Net private inflows to emerging economies are now estimated to have been $908 billion in 2010, up from $602 billion in 2009. Private inflows picked up in all regions in 2010 and flows to China reached an all-time high of $227 billion. With favorable conditions in most emerging markets likely to persist, net private capital flows are projected to increase to just over $1 trillion in 2012. When assessing the forces underlying capital flows’ movements, the empirical literature distinguishes between country-specific factors that pull capital towards emerging markets and global factors that push capital out of mature markets. The pull factors include: Emerging Market output growth, Diversification benefits Sound macroeconomic policies, Financial and trade liberalization, and Strong institutions. The push factors include: global risk appetite; diversification benefits and mature economy monetary policy. An important cyclical push factor for capital flows to emerging markets is global risk appetite. Although risk perceptions of emerging markets have improved, they are still considered a higher-risk asset class; whenever global risk aversion increases, investors tend to pull funds out of emerging markets. During the crisis in 2008, global risk aversion skyrocketed, resulting in a sharp withdrawal of funds from emerging markets. Since then, risk appetite has gradually recovered. A further improvement in risk appetite is expected over the next year, which should support flows to emerging markets (EM). The exceptionally low interest rate environment in mature economies is another push factor supporting flows to EMs. Near-zero policy interest rates in the G3 economies have been in place since mid-2009 and no change is expected until at least 2012. At the same time, monetary policy is gradually tightening in an increasing number of emerging economies. The widening interest rate differential is supporting short-term flows chasing higher EM yields. In recent years, international portfolio managers have allocated Emerging Markets, an increasing weight in global equity and fixed income funds. In 2003, the weight of EM equities was 4.5 % in the MSCI’s all country world index (ACWI), a benchmark for global portfolio allocations. By the end of 2009, that share had increased by 2.5-fold, to 13 %. It is forecast that this decade will see further portfolio reallocation towards EM assets. Net private capital flows to the Africa and Middle East region recovered in 2010 following a sharp decline in 2009. With the turmoil in the Middle East countries; re-allocation towards other emerging markets including Africa are expected. In fact, African stock markets have attracted a record of USD 660 million in investments for 2009, according to EPER Global. It reported that African equity funds have had positive net flows last year. EPER Global also added that through the first 7 months of 2010, equity flows into African regional funds are about 4 times higher than their last peak in 2007. Coupled with that; since the beginning of the year 2011, African stock markets showed superior performance compared to the major global stock markets and have attracted increasingly large amounts of foreign portfolio investments. At the same time; the mutual fund industry has experienced a dramatic growth on a global basis during the last two decades. Mutual funds are now the preferred investment vehicle for individuals. Their outstanding popularity is due to the fact that they provide access to professional management and a highly diversified portfolio even for investors with low initial capital. In a world of perfect competition and symmetric information, investing in actively managed mutual funds is

Proceedings of 4th
International Conference on Global Business Environment
(ICGBE-2014)
51
Pareto-efficient from a welfare point of view. Portfolio performance evaluation has thus become one of the most interesting topics in finance. Having not only attracted the attention of practitioners, this field has also motivated many studies in the academic literature. Besides being relevant, this issue is also controversial since it raises some complex questions related to capital market efficiency, a concept that is central to asset pricing theory. The value of active management has been a source of debate for decades. The majority of US studies conclude that actively managed portfolios, on average, under-perform market indices. The efficient market hypothesis implies among other that past performance is no guarantee of future performance. The average manager will not be able to beat a passive strategy, and top managers will not be expected to outperform in future. Excess performance is the result of luck, not skill. However, given the delegated nature of active fund management, a series of problems related to asymmetric information may occur. Asymmetric information between the mutual fund shareholder and the manager can arise in three stages. First, there is the possibility of adverse selection. The most capable managers are more likely to be employed in different types of investment vehicles, where the compensation structure is more directly linked to their performance. Secondly, there is a moral hazard problem. Once investment has taken place, the manager could attempt to expropriate wealth from the investors, most commonly by charging a high expense ratio. Thirdly, there is the issue of ex-post verification; that is; of fairly evaluating the investment outcome. The problems arising from asymmetric information are even more severe in small and emerging markets with oligopolistic fund industries and vertically integrated financial systems. In such markets, managers are more likely to obtain insider information which they can exploit in their own interest. Furthermore, high expense ratios are often observed, given the lack of transparency and competition between fund companies. The insufficient regulatory framework and financial education of investors, common features of emerging markets, make fund management screening and evaluation an even more important exercise in this case. Importance of Equity Flows and Capital Markets in Africa: Equity investment flows to Africa are directly relevant to the development community in at least three ways. First, there are strong links between the financial sector and economic growth. In the seminal papers on finance in developing countries, McKinnon (1973) and Shaw (1973) interpreted evidence from a number of emerging economies as strongly suggesting that Schumpeter was largely correct and that financial systems facilitated economic growth. More recent empirical research by King and Levine (1993) suggests a strong correlation between financial development and economic growth. Research by Levine and Zervos (1998) suggests that stock markets themselves are correlated with improved economic performance. Caprio and Demirguc-Kunt (1997) found that higher levels of long term finance were associated with higher productivity and growth. There are multiple ways in which capital markets might be expected to have such an impact on development: as a source of long-term capital for financing investment, broaden the menu of financial instruments available to savers (allowing risk diversification and encouraging resource
mobilization), for more efficient corporate control, Deep financial systems facilitate the trading of risk, allocate capital, monitor managers, mobilize savings, and ease the exchange of
goods, services, and financial contracts (Levine 1996). Institutional investors in particular (as opposed to individuals or smallholders) have an especially positive impact on corporate
governance. Motivation of the Study: Africa is the second largest continent by land area and population, behind only Asia. As Africa’s economies keep growing and its standards of living keep rising, high-growth public companies are emerging on the continent. The African continent is developing its own economic identity and infrastructure, similar to the European Union. The pan-African perspective identifies multi-national companies based in Africa that are well positioned to grow with cross-border commerce and rising consumer markets. Africa is a resource-rich continent with vast mineral reserves. Africa holds an estimated 30% of the world’s mineral reserves including 40% of the gold, 60% of the cobalt, and 90% of the platinum group reserves. According to the National Intelligence Council, 25% of U.S. oil imports will come from Africa by 2015. The largest economies in the world, including the U.S. and China, are looking to Africa for supplies of many valuable and strategic natural resources. We believe that exposure to the best public companies in Africa can enhance investors’ overall exposure to emerging markets. Yet Africa remains the least-researched sector in the emerging/frontier markets, and its stock market valuations are relatively attractive. Frontier African markets offer a select few attractive public companies that have remained relatively undiscovered. The economics of the African continent are dynamic, and opportunities are constantly emerging. We believe active portfolio management can add significant value by monitoring macro trends, identifying the most attractive companies, and avoiding volatile or high-risk areas. The investment community may also be in a better position to assess the risk-return profile of the investment companies. The study may be relevant to regulators with respect to market efficiency as it will shed some light on this and with respect to adequacy of disclosures in terms of risk and return. Many of these emerging markets are taking off and earning high rates of return but very often commensurate with high risk which is not adequately disclosed. We also hope that African investment companies may attract more of global investment flows; which is to the tune of billions of dollars; and at present they compare quite unfavourably with respect to other emerging markets in Asia. Mutual funds can also help investors to diversify their portfolio with a minimum investment. When investing in a single fund, an investor is actually investing in numerous securities. Mutual funds can assist in risk management and diversification; with positive impact on the cost of capital and the resultant implications for resource allocation and economic growth. Further diversification can be achieved by investing in multiple funds which invest in different sectors or categories. Mutual funds are managed and supervised by investment professionals. This eliminates the investor of the difficult task of trying to time the market. Furthermore, mutual funds can eliminate the cost an investor would incur when proper due diligence is given to researching securities. However; changing market conditions can create fluctuations in the value of a mutual fund investment. The value of a mutual fund investment, unlike a bank deposit, could fall and be worth less than the principal initially invested. There are fees and expenses associated with investing in mutual funds that do not usually occur when purchasing individual securities directly. Thus in case of mismanagement they can have important adverse wealth and destabilizing effects. Mutual funds may also create systemic risk in the financial system which may engender system-wide cost to society when they fail as a result of bad management and imprudent risk taking.

Proceedings of 4th
International Conference on Global Business Environment
(ICGBE-2014)
52
Objectives of the Study (i) The main objective of the study is to assess the performance of the investment companies in Mauritius. This will be done by comparing the returns on these funds with the domestic overall market return. The single parameter measures made up of the Sharpe ratio; the Treynor index and the Jensen’s alpha will be used. (ii) A comparison will also be made with the African Financial Services Index (AFSI) and the Emerging MSCI to gauge the performance of these investment companies. (iii)The market-timing ability and stock selection ability of the fund mangers will also be investigated. Can they time the market? Are there benefits from market timing? We use the Treynor and Mazuy model to investigate the latter. (iv)Persistence in performance is another issue of interest. Do the mutual funds show persistence in performance? Are winners followed by winners? African Stock Markets: An Overview: Africa currently has 18 stock exchanges with South Africa’s Johannesburg Stock Exchange (JSE) being the dominant market on the continent. At the end of 2009 the JSE was the 16th
largest exchange in the world and is considered a
sophisticated international market at par with the other leading emerging markets, such as Brazil or Malaysia. With a market capitalization of approximately $805 billion, the JSE account for around 94% of Sub-Saharan Africa’s total and is more than 14 times larger than all of the other markets combined. The Johannesburg Stock Exchange (JSE) is over 120 years old and by far the largest of the 18 African stock markets. Although South Africa’s equity exchange is one of the largest among emerging markets, the JSE represents a highly concentrated equity offering. The All Share Index has more than 20% of its weight in the largest two mining companies. The largest five companies together make up more than 40% of the index. The seven biggest companies out of the total 165 represent 50% of this index. By contrast, South African investors, who are restricted by exchange controls from unconstrained global diversification, have little reprieve from their concentrated investment universe. Currently the pension fund regulations in South Africa allow for a maximum foreign investment (across all asset classes) of 20%. South Africa’s equity market therefore provides a large (in terms of volume) but concentrated investment environment. In Mauritius, the mutual fund industry is relatively young and has a huge potential for growth. The Stock Exchange of Mauritius (SEM) set up in 1989 with 5 listed companies and a market capitalization of nearly USD 92 million has made considerable progress with presently 38 listed domestic companies on the Official Market, representing a market capitalisation of nearly US$ 3,294.52 million. Africa Regional Funds: There are 16 funds which are still active; around 6 are still at fund raising stage and 9 have closed down; with the biggest investments taking place in Pan-Africa and Sub-Saharan Africa. Many have closed owing to poor returns, lack of investor interest, or due to fraud and mismanagement. The first wave of Africa funds generally performed poorly and had difficulty attracting investors. Despite the generally disappointing track record of African regional equity funds, there are signs that interest in the region may be reviving, and that new regional equity funds may emerge. They thus hold potential for generating new inflows and for boosting trading volume in the frontier markets for the medium term. Hence the need to monitor performance as we cannot rely on financial regulators alone; which are often more concerned with compliance issues. 2. Literature Review Various performance measures have been suggested in the literature to evaluate the performance of mutual funds. In order to take into account underlying risk factors, mutual funds are classified as winners or losers using one of the following criteria: raw returns, the Treynor index (1965), the Sharpe (1966) ratio, Jensen’s (1968) alpha, Carhart’s (1997) alpha, and its augmented version to take into account bond returns. However, while many recent studies testing for performance persistence in the US fund industry use multi-factor measures à la Carhart, few studies employ such measures in an international setting and in the case of emerging markets. Empirically, most papers have concentrated on the issue whether managed funds are able to outperform some relevant benchmark portfolios. Typically, the conclusion of these papers has been that, on average, funds did not significantly earn more than the passive benchmark performance on a risk-adjusted basis after deduction of expenses and commissions. Some authors even found that risk-adjusted fund returns were significantly negative. However, some individual funds were found to outperform the benchmarks significantly. With the development of the capital asset pricing model it became clear that the CAPM could provide a benchmark for performance analysis. The first such study was Treynor’s (1965) article on the performance of mutual funds, closely followed by Sharpe’s (1966) rival article. Sharpe (1966) stated that both, active and passive investors have money in the market. Passive investors just buy the market portfolio and thus obtain the market return (ignoring costs) over any period of time. The active investors, on average, also obtain the market return. The most frequently cited article on fund managers’ performance is the detailed analysis of 115 mutual funds over the period 1955-64 undertaken by Jensen (1968). On a risk-adjusted basis, he found that any advantage that the portfolio managers might have was consumed by fees and expenses. Even if investment management fees and loads were added back to performance measures, and returns were measured gross of management expenses (assuming research and other expenses were obtained free), Jensen concluded that “on average the funds apparently were not quite successful enough in their trading activities to recoup even their brokerage expenses.” Droms and Walker (1994) examined the performance of four funds over 20 years (1971-1990), and 30 funds over a six-year period (1985-1990). The funds were compared to the Standard and Poor’s 500 Index, the Morgan Stanley Europe, Australia, and the Far East Index (EAFE) which proxied non-U.S. stock markets, and the World Index. Applying the Jensen, Sharpe, and Treynor indices of performance, they found that international funds had generally underperformed the U. S. market and the international market. Additionally, their results indicated that portfolio turnover, expense ratios, asset size, load status and fund size were unrelated to fund performance. Artikis (2003) evaluated the performance of ten domestic mutual funds operating in the Greek financial market over the period 1995 to 1998 employing the techniques of Treynor, Sharpe and Jensen. He found that the ten mutual funds achieved lower return than the General Index of the Athens Stock Exchange (ASE). However, the mutual funds achieved satisfactory return in relation to the total and systematic risk undertaken. Redman, Gullett and Manakyan (2000) examined the risk-adjusted returns using Sharpe’s Index, Treynor’s Index, and Jensen’s alpha for five portfolios of international mutual funds and for three time periods. The benchmarks for comparison were the U. S. market proxied by the Vanguard Index 500 mutual fund and a portfolio of funds that invested solely in U. S.

Proceedings of 4th
International Conference on Global Business Environment
(ICGBE-2014)
53
stocks. The results showed that there were potential diversification benefits to adding global funds to portfolios of domestic mutual funds. Mutual funds that invested solely in foreign securities or in combinations of U. S. stocks outperformed the U. S. market over the past ten years. Gruber (1996), using a four-factor model, found that the average mutual fund underperformed passive market indexes by about 65 basis points per year from 1985 to 1994. Since the average expense ratio in his sample was about 113 basis points per year, this implied that mutual funds earn positive risk-adjusted returns, but charge investors more than the value added. Carhart (1997), using a multi-factor performance attribution approach, found that net returns were negatively correlated with expense levels, which were generally much higher for actively managed funds. Furthermore, he found that the more actively a mutual fund manager traded, the lower the fund’s benchmark-adjusted net return to investors. Lai and Lau (2010) examine the performance of 311 mutual funds from January 1990 to December 2005 in Malaysia by using composite portfolio performance measures, the single market model, the Fama and French three-factor model, and the Carhart four-factor model across different investment horizons. Overall, they found evidence that mutual fund performances yield superior returns with relatively lower systematic risks. The results further indicate that the average equity funds in Malaysia hold smaller market capitalization stocks and value oriented stocks, as well as buying past-winning and selling past-losing stocks. Lin (2006) analyses the performance of three types of the Taiwan mutual funds over various investment horizons. This study is based on the premises that evaluating performance of mutual funds using data in fixed intervals such as weeks or month is not sensible because ‘funds of different objectives differ in risk attitudes, and hence also differ in their holding horizons’. The sample covers the period January 1995 to December 2002. The data contains 72 aggressive growth funds, 111 growth funds, and 5 growth and income funds. Aggressive funds appear to be more attractive for both short-term (less than one year) and long-term (greater than four years) investment. Growth and income funds and growth funds appear to be more attractive for medium term investment such as one to three years and three to four years respectively. Because investors differ in their risk attitudes and in holding horizons, it is unreasonable to evaluate fund performance based on one single investment horizon. Treynor and Mazuy (1966) developed the TM model - which incorporates a quadratic term to capture market timing. Holmes and Faff (2004) proposed a model (HF) with two quadratic terms that allows for the presence of asymmetric market timing. From this model, good (negative) timing implies that the slope for this relationship, the beta, increases (decreases) in up (down) markets. In the long term, this presumes a nonlinear fit between mutual fund and market returns. The early results from the TM model show evidence of the absence of timing, but the number of mutual funds with bad market timing is higher. This result does not differ from the evidence presented in the literature. When assessing mutual funds, there is evidence that portfolio managers’ market timing ability is relatively uneven. Treynor and Mazuy (1966), Grinblatt and Titman (1989), Coggin et al. (1993), Wenchi-Kao et al. (1998), Volkman (1999), Edelen (1999), Jiang (2003) and Holmes and Faff (2004) find no evidence of timing in general. In and Kim (2006) used a multi-scaling approach to evaluate the performance of US mutual funds, namely Institutional, Active and Index funds, adopting the Jensen’s alpha performance measure. Empirical results showed that none of the funds were dominant over all time-scales, while depending on the specific time scale, indicating that evaluating the performance of the mutual funds depended on the investment horizons. The empirical analysis of Matallin-Saez (2008) uses a sample of Spanish mutual funds from July 1998 to September 2004. The sample comprises all the equity mutual funds with a net value during this period. The conclusion adds nothing new to the literature: after deducting management costs, mutual funds do not beat the market. This is to say, after costs have been taken into account, active management in aggregate does not yield any added value when compared with passive management. Babalos et al. (2008) analysed performance persistence in domestic equity funds in the Greek market, during a period characterized by different market phases, a remarkable increase in the number of mutual funds and the integration of the market in the international financial system. A series of performance measures suggested in the literature have been used. Results of this study show that there is performance persistence in the first half of the sample chosen, while after 2001, no evidence has been found. This may be due to globalisation; the growing number of foreign institutional investors and the ‘dilution effect’ from direction of flows to past winners. The market has become more efficient with developments in regulation and a more competitive fund industry. The reliability of such a thesis and the consistency of performance is nevertheless questionable. Wessels and Krige (2005) in their study on the performance persistence of equity funds in the South African Unit Trust industry against the index benchmark found that amazing persistence (by over- performing or under-performing) is displayed by some funds. While current performance of a fund is seen to be replicated in the short term, less consistency is seen on year-to-year basis and on a three-year basis performance of a fund became mostly random in nature. Some funds displayed significant persistence in maintaining their performance in the top quartiles or beating the index regularly. However, some funds demonstrated persistence in underperforming in similar style and the remaining showed dispersed results. Cuthbertson et al. (2008) examine the ex-post performance of open-end mutual funds investing in UK equity (Unit Trusts and Open Ended Investment Companies) during the period April 1975 to December 2002. A data set of over 900 equity funds is examined. They use ‘alpha’ α and the t-statistic of alpha tα, as measures of risk adjusted performance. In contrast to earlier UK studies the bootstrap procedure indicates that there is strong evidence in support of stock picking ability but only for a relatively small number of ‘top ranked’ UK equity mutual funds. As they consider the centre of the performance distribution many funds have positive alphas but this can be attributed to luck rather than skill. Fama and French (2010) find that the aggregate portfolio of actively managed U.S. equity mutual funds is close to the market portfolio, but the high costs of active management show up intact as lower returns to investors. Bootstrap simulations suggest that few funds produce benchmark-adjusted expected returns sufficient to cover their costs. Mutual fund investors in aggregate realize net returns that underperform CAPM, three-factor, and four-factor benchmarks by about the costs in expense ratios. Barras et al. (2010) develop a simple technique that controls for “false discoveries,” or mutual funds that exhibit significant alphas by luck alone. The approach precisely separates funds into (1) unskilled, (2) zero- alpha, and (3) skilled funds. They find that 75% of funds exhibit zero alpha (net of expenses); a significant proportion of skilled (positive alpha) funds prior to 1996, but almost none by 2006. They use a technique to show that the proportion of skilled fund managers has diminished rapidly over the past 20 years, while the proportion of unskilled fund managers has increased substantially. The research also shows that the long-standing puzzle of actively managed mutual fund underperformance is due to the long-term survival of a minority of truly underperforming funds. Most actively managed funds provide either positive or zero net-of expense alphas, putting them at least at par with passive funds.

Proceedings of 4th
International Conference on Global Business Environment
(ICGBE-2014)
54
Aggarwal and Jorion (2009) also provide the first systematic analysis of performance patterns for emerging funds and managers in the hedge fund industry. Emerging funds and managers tend to add value in their early years. Thereafter, performance tends to deteriorate. Each additional year of fund age decreases fund performance by 42 basis points on average, although as we show below, this relation is better described as nonlinear. This result suggests that emerging funds, especially in the first two years of life, represent attractive investment opportunities. These studies overall do not provide a promising picture of active mutual fund management. Instead, most of the studies conclude that investors are better off, on average, buying a low-expense index fund. Yet, investors continue to pour money into actively managed funds in pursuit of performance. Barras et al. (2010) stress that it is puzzling why investors seem to increasingly tolerate the existence of a large minority of funds that produce negative alphas, when an increasing array of passively managed funds have become available. Similarly, Cuthbertson et al. (2008) argue that ‘bad skill’ should lead to large cash outflows and the return on funds who survive should, in equilibrium, equal that on a passive (index) fund. Yet the continued existence over long time periods of a large number of funds which have a truly ex-post inferior performance and which exhibit performance persistence for past loser-funds, indicates that many investors either cannot correctly evaluate fund performance or find it ‘costly’ to switch between funds or suffer from an element of irrationality. 3. Methodology Single Parameter Measures: The sample includes all the investment companies listed on the Stock Exchange of Mauritius. The period of analysis is from January 2000 to December 2008. The first part will present and discuss the single parameter measures of performance evaluation. The annual reports of the investment companies have also been obtained. Rates of return using monthly data were obtained by using the following formula: Rit = ln(Pit/Pit-3) (1) where: Rit is the quarterly rate of return of investment company i in period t; Pit is the closing price of investment company i in period t; and Pit-1 is the closing price of investment company i in period t-3 The same formula is used to determine the return on the SEMDEX; which is the market index. The 90-days Treasury bill rate is used as a proxy for the risk free rate of return with annualised rates being adjusted to give a quarterly return. The single parameter measures considered are the: 1. Sharpe Ratio 2. Treynor Index 3. Jensen’s Alpha Next we will also compare the performance of the funds with similar measures of returns being earned on the African Financial Services Index (AFSI) and the Emerging MSCI. We use the AFSI as it comes closest to an index tracking the performance of investment companies in Africa; besides the Emerging MSCI. Sharpe’s performance index : Sharpe (1966) developed a composite index; which use standard deviation to measure the portfolio risk. In other words, Sharpe used the total risk of the portfolio. (2) where, Si = Sharpe performance index Rp = Portfolio’s actual return during a specified time period Rf = Risk-free rate of return during the same period σp = Portfolio standard deviation σp is the measure of total risk of the portfolio. Sharpe index, therefore, evaluates funds’ performance based on both rate of return and diversification. The Treynor Index measures the ability of a portfolio to earn an excess return that has been adjusted for systematic risk. The Treynor index will be computed for all the mutual funds. (3) where, Ti = Treynor’s performance index Rp = Portfolio’s actual return during a specified time period Rf = Risk-free rate of return during the same period βp = Beta of the portfolio The betas are estimated using monthly data for the corresponding time period; for example; for the Treynor index over the time period January 2000 to December 2002; the beta is estimated using the monthly return data over that time period.
P
fR
PR
Ti
P
fR
PR
Si

Proceedings of 4th
International Conference on Global Business Environment
(ICGBE-2014)
55
Jensen’s alpha measures the ability of the mutual fund manager to add value over and above the return which would be justified by the systematic risk of his portfolio. Formally, this is given by the intercept (called Jensen α) of the regression of the fund’s excess returns on the market index excess returns: Rp − Rf = Jensen αp+ β (RM − Rf ) (4) where RM is the stock market return. The intercept of this single-factor model has also been used to infer the ‘stock picking’ ability or ‘selectivity’ of the manager. Jensen used the intercept, αp, as his performance measure. Market Timing and Stock Selection: The next section will then investigate whether fund managers have market timing and stock selection skills by using the unconditional model of Treynor and Mazuy (1966). In order to investigate the market timing ability of the mutual funds we use the Treynor and Mazuy unconditional model. The unconditional model is as follows: Rp - Rf = α + βp(Rm- Rf) + γ(Rm- Rf)2 + ep (5) where Rp = the portfolio return; Rf = the risk free rate; proxied by the Treasury Bill rate; Rm = the return on the market; α, βp, γ = are coefficients to be estimated by regression analysis. The third term of the Treynor and Mazuy (1966) model generalises the market timing measurement. Market timing is one of the elements of active management defined as the ability of managers to anticipate market movements and modify the risk position of the portfolio accordingly. Various measures can be applied to evaluate market timing ability. If the available information consists of returns, decisions on market timing must be incorporated into the return generating process. When the stock market is the most relevant factor, Treynor and Mazuy (1966) propose a model with a dynamic beta as the sum of a constant as a long term average beta and a slope γ; which measures the market timing ability, following a strategy which increases the beta when the excess market return is positive and decreases the beta when the excess market return is negative. When the dynamic beta is established in the classic model we obtain the Treynor and Mazuy quadratic regression. We can also add a fourth term in the model to capture another possible element of active management, that is; seasonality, defined as particular management in certain moments of time in order to achieve higher returns. Examining Persistence in Performance: The third section analyses whether there is persistence in performance. Following the methodology put forth by Goetzmann and Ibbotson (1994) the alpha estimates from the CAPM regressions may be used to test whether there was persistence or non-persistence in the performance of the companies. To obtain a measure of the extent, to which persistence in performance exists, the alpha values from all the mutual funds, for every two years41, will be regressed on the alpha values from the previous two years to obtain a new alpha and beta estimate, using the following equation: αt = γ + β(αt-2) (6) where: αt is the alpha value from the OLS regression in time t; αt-2 is the alpha value from the OLS regression in time t – 2; γ is the new intercept term; and, β is the new slope coefficient. The hypotheses tested were: Ho: β = 0 H1: β ≠ 0 The hypothesis is set up to determine whether or not there is a statistical relationship between the current two years' alpha values and the previous two years' alpha values. If such a relationship exists the performance of the previous period is reflected in the current period, indicating persistence in performance. The idea is to try to identify the ‘hot hands’ phenomenon, which represents persistent short-run superior performance. In other words; investors stand to gain from investing in the previous years’ winners. However, the counterpart of the ‘hot hands’ phenomenon is ‘icy hands’ representing short run inferior performance. According to the literature; there were more sustained poor performers than good performers. We will discover whether the mutual fund managers in Mauritius have 'hot hands' or 'icy hands'. 4. Results The results are presented and discussed. First we analyse the single parameter measures of Sharpe; Treynor’s index and Jensen's alpha for the investment companies listed on the Stock Exchange of Mauritius (SEM) over the sample period. With respect to the Jensen’s alpha a comparison is made when using (i) the African Financial Services index and (ii) the Emerging MSCI as benchmarks. This is then followed with an analysis of the results on persistence. Then finally, we analyse the market timing and stock selection ability of the managers of the mutual funds listed on the SEM. Analysis of Sharpe Ratios: When analyzing the rolling six monthly Sharpe ratios for the investment companies a mixed performance is observed and they compare on average relatively unfavourably with similar measures for the market index. The charts for the six monthly Sharpe ratios are reported in the appendix.This confirms a key issue discussed in the empirical literature by Lin (2006) warning
41 Ideally; it should be done on a year-to-year basis; but because of the small sample size the analysis will be conducted as explained above.

Proceedings of 4th
International Conference on Global Business Environment
(ICGBE-2014)
56
about the importance of the investment horizon when analysing the performance of mutual funds. The author explains that we have to analyse these ratios over different investment horizons and then select the ones which match the investment horizon being targeted by the investment company. Similarly, in another paper by In and Kim (2006), they cautioned about the importance of the investment horizon. This is in fact, what prompted us to use the rolling quarterly and six monthly Sharpe ratios. Other investment horizons which may be considered are yearly and three-yearly. (Results for quarterly have been computed but not reported due to space constraint). When we see the six monthly Sharpe ratios based on mean return (below); we observe the ratios are in the range of +2 to -2. This reinforces Lin’s (2006) point when using single parameter measures; it is important to consider the investment horizon. Analysis of Treynor Index: When analysing the rolling six-monthly Treynor index it is found that they vary in the range of 0.8 to -0.5; after excluding outliers and again they are on the low side. The betas are estimated using monthly data for the corresponding time period. We are here faced with a trade-off. If we apply a long time window to estimate the betas; they may not be so relevant. We therefore use a short time window (3 years using monthly data). What this shows? Risk is high yet excess return above risk free rate is not so high; thereby producing low Treynor values. This calls into question the portfolio evaluation abilities of investors. Do they suffer from myopia in terms of analysis of risk and return? Are investors irrational? Is it the case that so long the company’s return is above the risk free rate; investors feel complacent? When the company is doing very badly; then they realise but often it is then too late. Analysis of Jensen's Alpha using the local market index (SEMDEX) as Benchmark: The Jensen's alpha is estimated over three time periods: January 2000 to December 2002; January 2003 to December 2005 and January 2006 to December 2007; using monthly data. The results are reported in the table below. Only the results showing significant Jensen's alphas are reported. Over the time period January 2000 to December 2002; when the Jensen alpha is estimated for the mutual funds; it is observed that three mutual funds (BAI; GIDC and POL) show negative and statistically significant alphas; thus displaying under-performance compared to the market index. They are in the range of -0.71 percent to -2.65%.
*: significant at the 1% level. [Source: Author’s Computations] **: significant at 10% level or better. Over the period 2003 to 2005; four funds this time show abnormal performance which is statistically significant at the 1 % level; ranging from 1.05 to 1.95 percent. They are GIDC; MDIT; PAD and UDL. The remaining funds have positive or negative Jensen’s alphas which are not statistically significant. When considering the sample period 2006 to 2007; two funds BMH and NIT show positive Jensen’s alphas which are statistically significant at the 5 per cent level or better. Overall however; we see the evidence consistent with that in the empirical literature that on average the mutual funds underperform; they do not beat the market index. They do not show superior performance. Analysis of Jensen’s Alpha using African and Emerging Market Indices as Benchmark: The same analysis is performed but this time using the MSCI Emerging Market Index and the African Financial Services Index. The results are presented in the table below. The main observations are as follows: With respect to the EMSCI; over the period 2000 to 2002; five companies only display significant Jensen’s alpha at the 10 per cent level or better. However; they are all negative thereby showing underperformance. Over the period 2003 to 2005 only two companies show positive Jensen’s alpha which is significant at the five per cent level or better. Finally; over the period 2006 to 2007; none recorded abnormal performance.
Table 1 Jensen's Alpha
Investment Co. Jensen's Alpha t-ratio (p-value)
Year 2000-2002
POL -.026514* -2.4571[.018]
GIDC -.018510** -1.9115[.062]
BAI -.0071381* -2.2947[.026]
Year 2003-05
PAD .019542* 1.9986[.050]
MDIT .010525* 2.7724[.007]
UDL .018286** 1.9180[.059]
GIDC .01261* 2.78.51[.000]
Year 2006-07
BMH .0073537* 1.9884[.049]
NIT .022393* 2.3860[.023]

Proceedings of 4th
International Conference on Global Business Environment
(ICGBE-2014)
57
Table 2A Jensen’s Alpha using EMSCI as Benchmark Investment Company Jensen’s Alpha t-ratio (p-value) Year 2000-2002 POL -.018742 -2.0056[.053] BMH -.010777 -1.9978[.054] GIDC -.031147 -3.1565[.003] UTD -.0099724 -2.8589[.007] BAI -.014352 -3.7398[.001] Year 2003-2005 PAD .039868 3.5244[.001] UTD .038218 2.1514[.039] Year 2006-2007 None Table 2B Jensen’s Alpha using Africa Financial Services Index as Benchmark Investment Company Jensen’s Alpha t-ratio (p-value) Year 2000-2002 POL -.028571 -2.2103[.034] FIN .012054 1.8262[.077] NIT -.023898 -2.2671[.030] GIDC -.026496 -2.0038[.053] UTD -.011315 -2.4222[.021] BAI? -.010367 -2.0475[.048] Year 2003-2005 PAD .043148 3.3305[.002] Year 2006-2007 POL .40710 1.8807[.073]
Source: Author’s Computations With respect to the African Financial Services Index; more or less similar results were obtained. Over the period 2000 to 2002; five companies recorded negative Jensen’s alpha; statistically significant at the five per cent level. Only one company recorded a positive Jensen’s alpha which was significant only at the 10 per cent level. Over the periods 2003 to 2005 and 2006 to 2007; only one company displayed a positive Jensen’s alpha which was significant at the five per cent level and ten per cent level respectively. Overall; the big picture emerging is that except for some years and a few companies; the investments companies in the main underperform whether we use the local market index (the SEMDEX) or the African Financial Services index (AFSI) or the Emerging MSCI index as benchmark (EMSCI). Examining Persistence in Performance: Following the methodology put forth by Goetzmann and Ibbotson (1994) the alpha estimates from the CAPM regressions were used to test whether there was persistence or non-persistence in the performance of the companies. However; when we examine persistence in performance over successive two year periods; there was no evidence of persistence in performance. In fact; most of the coefficients of αt-2 were negative; tending to show that the fund managers have “icy” hands. But they were not statistically significant; meaning the coefficients were zero; hence no evidence of persistence. Market Timing and Stock Selection Ability: The market timing ability of the mutual funds is analysed using the unconditional Treynor and Mazuy (1966) model. The company’s monthly excess return is regressed on a constant term; on the market excess return and the market excess return squared. The coefficient of the market excess return gives us the share's beta; the coefficient of the market excess return squared gives us information on the market timing ability of the fund managers. Finally; the constant term provides information on the stock picking ability of the investors.
Table 3 Market Timing and Stock Selection Ability COMPANY Jensen’s α β Γ POL (t-ratio and p-value)
.0056286
.23139[.817] 1.9769* 3.0994[.002]
2.6494 .26519[.791]
FIN (t-ratio and p-value)
-.018984 -1.1045[.271]
0.52067 2.4186[.020]
.86088
.27888[.781] NIT (t-ratio and p-value)
-.0064011 -1.3181[.190]
.82029* 6.6683[.000]
1.8765 1.0759[.284]
BMH (t-ratio and p-value)
-.010574 -1.0735[.285]
.80258* 2.7390[.007]
3.3935 .82258[.412]
GIDC (t-ratio and p-value)
-.0080129 -1.0995[.273]
1.1923* 6.2529[.000]
-1.0925 -.40329[.687]
PAD -.0034952 1.0967* 3.4568**

Proceedings of 4th
International Conference on Global Business Environment
(ICGBE-2014)
58
(t-ratio and p-value) -.52552[.600] 7.3450[.000] 1.6773[.096] MDIT (t-ratio and p-value)
-.012111 -1.0316[.304]
1.0037* 3.8818[.000]
-1.1058 -.31086[.756]
UDL (t-ratio and p-value)
.0063564 1.0678[.287]
.54683* 4.1709[.000]
-6.7835* -3.7609[.000]
BAI (t-ratio and p-value)
-.012345** -1.7532[.082]
.72915* 4.2038[.000]
4.0379** 1.7041[.090]
*: significant at the 1% level. [Source: Author’s Computations] **: significant at 10% level. We observe only one fund (BAI) shows a significant (this is also at 10 per cent level) Jensen’s alpha (constant term) but it is negative. This shows that the fund managers do not have stock picking abilities. As it has been pointed out in the literature; that someone throwing darts at the stock market tables to pick stocks to form portfolios would on average do at least as well as the most brilliant fund manager. All the funds record betas which are statistically significant at the 1 per cent level or better and five funds have betas below one showing they have less systematic risk than the market index; two have betas greater than one and two have betas around one. Only two funds (BAI and PAD) display market timing ability which is statistically significant at the 10 per cent level or better. One fund (UDL) shows perverse timing which is statistically significant at the 10 per cent level. This is captured by the γ term. The remaining funds do not show any market timing ability. Summary & Main Findings: The main objective of this study was to assess the performance of the listed investment companies on the Stock Exchange of Mauritius. This was done by comparing the single parameter measures made up of the Sharpe ratio; the Treynor index and the Jensen’s alpha. With respect to the Jensen’s alpha; a comparison was also made when using the African Financial Services Index (AFSI) and the Emerging MSCI as benchmarks. Persistence in performance was another issue of interest. Do the mutual funds show persistence in performance? Are winners followed by winners? Last; the market-timing ability and stock selection ability of the fund mangers were investigated. Can they time the market? When analyzing Sharpe ratios we see they compare unfavourably with similar ratios for the local market index (the SEMDEX). Similarly; when analysing the rolling six-monthly Treynor index it is found that they vary in the range of 0.8 to -0.5; after excluding outliers; and they are on the low side. With respect to the measure of abnormal performance (the Jensen’s alpha); on average most of the funds underperform. The evidence thus far is very much consistent with the findings in the empirical literature that on average investment companies do not beat the market. A more or less similar pattern is observed when using the African Financial Services Index (AFSI) and the EMSCI as benchmarks. Using the methodology of Goetzmann and Ibbotson (1994); there was no evidence of persistence in performance. On balance; most funds do not show market timing or stock picking abilities. Given that these represent investment companies in an emerging stock market and given the possibility of moral hazard on the part of the fund managers; performance screening and regulation of their activities become quite crucial. Important characteristics of such markets are: -- Many Investors are not financially sophisticated --Investors may suffer from investment myopia; that is; they look at return only with no consideration for risk --the regulatory framework needed for investment companies may be different from that for other companies as their main activity is trading in securities. Indeed in the US they are considering different Performance Presentation Standards for investment companies. In the wake of the recent financial crisis we wonder whether these companies can report in the same format as other companies as their business activity is significantly different from other companies. Must they not also report explicitly on risk measures in their financial statements rather than just mentioning “share prices can go up or down”. References Aggarwal, R.K and P. Jorion (2009), The Performance of Emerging Hedge Funds and Managers; USC FBE Finance Seminar. Artikis, G. P., 2003, ‘Performance Evaluation: A Case Study of the Greek Mutual Funds’, Journal of Managerial Finance 29, 1-8. Babalos, V; G.M Caporale; A. Kostakis; and N. Philippas; (2008); Testing for persistence in mutual fund performance and the ex-post
verification problem: evidence from the Greek market; European Journal of Finance,Vol. 14, No. 8, 735–753. Barras,L; O. Scaillet, And R. Wermers (2010); False Discoveries in Mutual Fund Performance: Measuring Luck in Estimated Alphas;
Journal of Finance • Vol. Lxv, No. 1; 179-216. Caprio, G and A. Demirguc-Kunt (1997); The role of long term finance: Theory and evidence; World Bank, Policy Research Dept., Finance
and Private Sector Development Division (Washington, DC). Carhart, M. M., 1997, ‘On Persistence in Mutual Fund Performance,’ Journal of Finance 52, 57-82. Coggin, D., F. Fabozzi and S. Rahman (1993), ‘The Investment Performance of U.S. Equity Pension Fund Managers: An Empirical
Investigation’, Journal of Finance, Vol. 48, No. 3, pp. 1039–55. Cuthbertson, K; D.Nitzsche and N. O'Sullivan (2008). UK mutual fund performance: Skill or luck? Journal of Empirical Finance 15; 613–
634. Droms, W.G. and Walker, D.A., 1994, ‘Investment Performance of International Mutual Funds,’ Journal of Financial Research 17, 1-14. Edelen, R. (1999), ‘Investor Flows and the Assessed Performance of Open-end Mutual Funds’, Journal of Financial Economics, Vol. 53, No.
3, pp. 439–66. Fama , E and K. French (2010); Luck versus Skill in the Cross-Section of Mutual Fund Returns; Journal of Finance ; Vol. Lxv, No. 5; 1915-
47. Goetzmann, W.N. & Ibbotson, R.G. 1994. ‘Do winners repeat?’ Journal of Portfolio Management, 20(2):9-18. Grinblatt, M., and Titman, S., 1989, ‘Mutual Fund Performance: An Analysis of Quarterly Portfolio Holdings’, Journal of Business 62, 393-
416. Gruber, M., (1996), ‘Another puzzle: The growth in actively managed mutual funds’, Journal of Finance 51, 783-810.

Proceedings of 4th
International Conference on Global Business Environment
(ICGBE-2014)
59
Holmes, K. and R. Faff (2004), ‘Stability, Asymmetry and Seasonality of Fund Performance: An Analysis of Australian Multisector Managed Funds’, Journal of Business Finance & Accounting, Vol. 33, Nos. 3 & 4, pp. 539–78.
In, F., and Kim, S., (2006), ‘The New Assessment of US Mutual Fund Returns Through a Multiscaling Approach’, in Workshop for Funds Management Research: Emerging Issues, The Melbourne Centre for Financial Studies, Australia, 10 February 2006, 1-25.
Jensen, M. C., (1968), ‘The Performance of Mutual Funds in the Period 1945-1964’, Journal of Finance 23, 389-416. Jiang, W. (2003), ‘A Nonparametric Test of Market Timing’, Journal of Empirical Finance,Vol. 10, No. 4, pp. 399–425. King R. et Levine R. (1993); Finance, Entrepreneurship and growth: Theory and Evidence, Journal of Monetary Economics, Vol. 32, n°3,
pp 513-542. Lai, M and Lau, S. (2010); Evaluating mutual fund performance in an emerging Asian economy: The Malaysian experience; Journal of
Asian Economics; 378-390. Levine R. and Zervos S. (1998); Stock markets, Banks and Economic Growth, The American Economic Review, 537-558. Lin, M.C (2006), ‘An Examination of the Determinants of Mutual Fund Performance over Different Investment Horizons’; International
Journal of Management 23; 147-156. Matallin-Saez; J.C. (2008); The Dynamics of Mutual Funds and Market Timing Measurement; Studies in Nonlinear Dynamics &
Econometrics, Volume 12, Issue 4 Mac Kinnon RI. (1973); Money and capital in economic development , The Brookings Institution, Washington. Redman, A. L., Gullett, N.S., and Manakyan H., (2000), ‘The Performance of Global and International Mutual Funds’, Journal of Financial
and Strategic Decisions 13, 75-85. Shaw E.S. (1973); Financial Deepening in Economic Development, Oxford University Press, New York. Sharpe, W. F (1966), ‘Mutual Fund Performance’, Journal of Business 39, 119-138. Treynor, J. L (1965), ‘How to Rate Management of Investment Funds’, Harvard Business Review 43, 63-75. Treynor, J. L; and Mazuy, K; (1966), “Can Mutual Funds Outguess the Market?” Harvard Business Review 44, 131-136. Volkman, D. (1999), ‘Market Volatility and Perverse Timing Performance of Mutual Fund Managers’, Journal of Financial Research, Vol. 22,
No. 4, pp. 449–70. Wenchi-Kao, G., L. Cheng and K. Chan (1998), ‘International Mutual Fund Selectivity and Market Timing During Up and Down Market
Conditions’, Financial Review, Vol. 33, No. 2, pp. 127–44. Wessels, D.R and J.D. Krige (2005); The persistence of active fund management performance; South African Journal of Business
.Management, 36(2) 71-83.

Proceedings of 4th
International Conference on Global Business Environment
(ICGBE-2014)
60
Examining Perceived Value and Satisfaction of Penang Delicacies in Predicting Tourists’ Revisit Intention
A. Zainal, Y. Atikahambar, M. N. Mohd Hafiz, A.N. Zali, M.Z. Kutut
Universiti Teknologi MARA, Shah Alam, Malaysia [email protected]
Abstract: Penang commonly referred to as the Pearl of the Orient, is one of Asia’s famous islands and highlighted as the one of states for gastronomy routes to Malaysia. As a result, this has made Penang to be given the title of food capital of Malaysia. This present study focuses on examining perceived value(quality, monetary price and behavioral price) and satisfaction of Penang delicacies in predicting tourists’ revisit intention. The data were successfully gathered from a sample of three hundred twenty eight (328) respondents, yielding almost 82% response rate. The findings of this study revealed that tourists’ satisfaction has a positive relationship between perceived value, and revisit intention. It shows that 60 % of the effect of independent variable (IV) on the dependent variable (DV) goes through the mediating variable. Hence, it can be concluded that satisfaction is fully mediating the relationship between perceived value and revisit intention. It is therefore suffice to say that the findings of this study enable greater comprehension on examining perceived value and satisfaction of Penang delicacies in predicting tourists’ revisit intention and make a positive impact on the tourism industry in order for targeting international tourists’ arrival in Penang. Keywords: Perceived Value, Satisfaction and Revisit Intention
1. Introduction Malaysia is one of the most popular tourist destinations in the ASEAN region. ‘Malaysia: Truly Asia’ branding is recognized worldwide and the United Nations World Tourism Organization (UNWTO) in 2013 report, highlights Malaysia one of the world’s top ten tourist destinations in year 2012 (Bernama, 2013). Based on statistic from Tourism Malaysia (2013), it shows that total of tourist arrival in Malaysia from January to September 2013 has grown to 3.3 percent compared to year 2012, which has reached 25.03 million tourist arrivals and 60.6 billion receipts (RM). Meanwhile, Tourism and Culture Minister Datuk Seri Mohamed Nazri Abdul Aziz mentioned that Malaysia's tourism industry is the second largest foreign exchange earner for the country, and it would continue to flourish (Bernama, 2013). From global perspective, the tourism industry is becoming an essential component in economic development agenda and it continuously present a positive impact to the world wide economy (Goeldner & Ritchie, 2006). Tourism involves the activities of persons travelling to and staying in places outside their usual environment which do not take more than one consecutive year. The growth of tourist arrivals to Malaysia has made Malaysia promote the local destination regionally among the international tourists. Notably, Penang, which is located along the north western coast of Peninsular Malaysia, is one of thirteen states in Peninsular Malaysia most visited by foreign tourists. On 7 July 2007, Penang along with Malacca, another state in Peninsula Malaysia, was gazetted as World Heritage Sites by the United Nations Educational, Scientific and Cultural Organization (UNESCO) and this food heaven is recognized as having the Best Street Food in Asia by Time magazine in 2004 (Penang State Tourism and Development, 2010). Since Malaysian food is not one particular kind of food, but a unique culinary spectrum originating from Malaysia's multi-ethnic population that has a blend of different tastes, ingredients and cooking methods from each other, the gastronomic routes in the country could be promoted robustly. The authenticity of the delicacies of each state can be highlighted as “the state for gastronomy route” (Zainal, Zali and Kasim, 2010). This present study focuses on examining perceived value (quality, monetary price and behavioral price) and satisfaction of tourists on Penang delicacies in predicting tourists’ revisit intention. The hypothesis is formulated is: H1: Food tourists’ satisfaction mediates the relationship between perceived value and revisit intention.
2. Literature Review Previous researchers have studied the tourist’s behavior using significant factors such as perceived value, satisfaction, and purpose to revisit (Petrick, 2002; Petrick, 2004a; Petrick, 2004b; Yoon & Uysal, 2005). Consequently, many studies on perceived value and satisfaction revealed that there is a strong effect on future plan to revisit or repurchase products or services (Choi & Chu 2001; Tam, 2000; Yoon & Uysal, 2005). Explicitly tourists have to consume food and drink when they travel, and this sensory experience may be enjoyable and gratifying, if it is a new experience for them. Researchers noted that food tourism is fast becoming one of the most popular and interesting areas in the tourism industry today (Kim, Kim & Goh, 2011). Studies have also advocated that gastronomy plays a significant role in creating a quality visiting experience for tourists and, therefore, influences their revisit intentions (Kivela & Crotts, 2006). Perceived value: Perceived value is “the consumer’s overall assessment of the utility of the product based on perceptions of what is received and what is given” (Zeithaml, 1988). Kim et al., (2011) pointed out that perceived value is what consumers get for what they give; however, value is not an apparent concept that can be described or identified easily. Zeithaml (1998) identified four diverse meaning of value: 1. Value is low price. 2. Value is whatever consumer want in a product. 3. Value is the quality consumer gets for the price paid. 4. Value is what a consumer get for what they give. In other words, perceived service value is tradeoffs of visitors’ perceptions between what the visitors receive from the service providers. There are five dimensions of perceived value which are behavioral price, monetary price, emotional response, quality and reputation (Petrick, 2002; Petrick, 2004a; Petrick, 2004b). However, this study focuses on three dimensions of perceive value namely quality, monetary price and behavioral price.

Proceedings of 4th
International Conference on Global Business Environment
(ICGBE-2014)
61
Quality: As noted, quality and perceived value are cognitive responses to the service experience (Baker & Crompton, 2000). Cronin and Taylor (1992) pointed out that SERVQUAL is one of the most extensively used measures of service quality. Meanwhile, researchers highlighted that quality is referred to how well the product was made and the emotional response to how a product made the consumer feel (Sweeney, Soutar & Johnson, 1998). Kivela and Crotts (2006) acknowledged that gastronomy can add value to tourists’ experience and is associated with quality tourism for travelers in search of new products and experiences that yield a high level of satisfaction. It is highlighted that tourists request for a higher standard in quality services such as food quality. So, understanding tourists’ eating habits will help in enhancing tourist satisfaction while travelling (Quan & Wang, 2004). Monetary price: Monetary costs include both direct and indirect costs (O’Sullivan & Spangler, 1998). The definition utilized for monetary price is the price of service as encoded by the consumer (Jacoby & Olson, 1977). Behavioral price: Behavioral price is defined as the price (non- monetary) of obtaining service, which includes the time and effort, used to search for the service (Zeithaml, 1988). Non-monetary costs “consist of an opportunity and intrinsic prices paid for participating in an experience” (O’Sullivan & Spangler, 1998, p. 113). Tourists’ satisfaction: Satisfaction can be defined as an effective response to experiencing a service (Ziethaml, 1988; Oliver, 1997). Satisfaction is the consumer’s fulfillment response. It is a judgment that a product or service feature, or the product or service itself, provided (or is providing) a pleasurable level of consumption-related fulfillment, including levels of under- or over-fulfillment” (Oliver (1997). Satisfaction also refers to the perceived discrepancy between prior expectation and perceived performance after consumption (Oliver, 1980). Tourists are satisfied due to experiences compared to expectations results in feelings of gratification (Reisinger & Turner, 2003). While dissatisfied occur to tourists due to feelings of displeasure. The cultural differences between international tourists and the service providers may affect the social experience and finally effect the satisfaction of the tourists (Reisinger and Turner, 2003;2009). Revisit Intention: Revisit intention refers as whether a visitor to a program or facility will return or not (Baker & Crompton, 2000). As noted by Yoon and Uysal (2005), satisfaction leads to a higher level of repurchase intention and repeat attendance behavior. Thus, it is important to understanding why tourists revisit a vacation destination when developing effective tourism marketing and management strategies as well as building travel motivation and decision-making theories, (Petrick, 2004). Tourists are willing to spend if they perceive the service quality to be high, and are more likely to make a repeat visitation if their expectations are fulfilled. The high value that tourists place on their experience of a holiday destination also has the potential to influence their return to the destination (Capon, Farley & Hoenig, 1990). Notably, the repeat tourists were influenced most by regular visit to friends or family and the ease of travel (John, Frederick and Joseph, 2000). The study also pointed that first-time visitors will be more impressed by the destination’s culture and the man-made environment compared to repeat tourists. 3. Methodology Participants and procedures: A total of 328 (82%) out of 400 questionnaires were returned and met the screening requirement. The population of this study comprised of international tourists who visited or those their vacation trips in the Island of Penang. The instrument for the independent variable was adopted from Petrick (2002). There 4 items on quality , 6 items on monetary price and 5 items on behavioral price with scale measurement from “totally satisfied” (5) to “totally dissatisfied” (1). The mediating variable of satisfaction was adapted and modified from Oliver’s (1997) and the scale was further enhanced by Atikahambar et al., (2014). The items were rated on a 5-point Likert scale, ranging from “totally satisfied” (5) to “totally dissatisfied”(1). On the other hand, four (4) items adopted from Zeithaml, Berry and Parasuraman (1996) to measure revisit intention. The scale ranges from 5 (extremely sure to revisit) to 1 (will not revisit). 4. Results The descriptive statistic is used to analyze the respondents’ demographic profiles focusing on the tourists’ personal information including the purpose for visiting Penang Island. Respondents profile: 55.5% (182) of the respondents were male while the remaining 44.5 %(146) were females. Majority were in the age group between 18 to 27 years olds (41.5%). Approximately 35.4% of respondents indicated their occupation as professional and 42.7% of the respondents are degree holders. 51.2% of respondents were single. The nationality varies such as Australian, Americans, Asians and Europeans. Almost 41.5% respondents had visited Penang Island more than 7 times and 40.2% of the respondents visited Penang Island for the purpose of leisure. Table 1 provides the analysis that indicates the dimension behavioral price is a significant predictor. The findings reveal that the quality and monetary price are not supported. On the contrary, the dimension of behavioral price has a significant unique contribution on tourists’ satisfaction and revisit intention. The effect of multiple regression analysis reveals that satisfaction fully mediates the relationship between perceived value and revisit intention (60%). Table 1: Summary of the Mediation Test on Tourists’ Satisfaction Mediates the Relationship between Perceived Value on Revisit Intention
Independent Variables: Std. β Sig. Level
Perceive Value: 0.28** .000 Quality 0.04 .416 Monetary Price - 0.01 .726 Behavioral Price 0.41 .000 Mediating Variables: Tourists’ satisfaction 0.41 .000

Proceedings of 4th
International Conference on Global Business Environment
(ICGBE-2014)
62
R2 0.60 Adj. R2 0.36 R2 Change 0.36 F Change 69.48** Sig. F Change 0.000
Scale: p< 0.005*, p<0.01** Discussions: Based on the findings presented, it is found that perceived value is related to tourists’ satisfaction though quality and monetary price was found to be insignificant. Respondents felt that the quality of food in Penang Island is not consistent as the food being prepared in the local restaurants, food courts or stalls vary in taste though having the same name. Unlike in the hotels where standard recipes are required thus producing standard taste and appearance every time it is being consumed. On the same note, monetary price is not of concerned to many tourists because the food served on Island is affordable and considerably priced. As elaborated in the literature, past researches have confirmed that perceived value, which is a cognitive response lead to satisfaction (Cronin et al., 2000). In addition, Baker and Crompton (2000) acknowledged that higher quality of performance and levels of satisfaction are perceived to result in increased loyalty and future visitation, greater tolerance of price increases, and an enhanced reputation. The researchers indicated that the positive relationship between higher levels of customer satisfaction and the intention to revisit or recommend a destination to others has been evidenced in many studies(Baker & Crompton, 2000:Yoon & Uysal,2005). 5. Conclusion In order for Penang to sustain in the global industry as a food tourism destination preference it is important for tourism bodies, government and related sectors to understand the international tourists’ preferences and wants (Atikahambar et al., 2014). The findings of this study will give a clear view to local food providers how and what to improve in terms of quality and taste of Penang delicacies. It is recommended that tourism bodies, government and related sectors in Malaysia to cooperate and sustain each other and educate the service providers (food preparer and travel agencies) on the cleanliness of food area, quality and value of food in order to attract more tourists to consume Penang’s delicacies (Atikahambar et al., 2014). Thus, this will uphold Penang Island as an unforgettable food paradise and tourist destination. Furthermore with the gratification during the stay, tourists’ intention of revisits may further be augmented by including Penang cuisines in the tour or promotion package. Limitations & Recommendation: The empirical analyses were conducted based on data gauged at a particular time due to constrain in resources such as time and money. Another limitation that the present study faced was the lack of participation and cooperation from the respondents particularly the international tourists. In addition, other constraints included time limitation and language barrier among the tour guides and respondents. Findings of this study also contribute to more extensive understandings of theories that can be applied to hospitality and tourism industry. The changes of tourists’ tastes are the contributing factors due to the changes of tourists’ characters, attitudes and lifestyles in a tourism destination. This condition has changed due to the influenced of activity, product and space in tourism destination. Tourists should not be allowed to create a feeling of boredom about the destination and the mundane foods served during their vacations, thus; giving a negative perception. Consequently, these factors will affect the formation of tourist friendly and impressive destination concept, that allows for enjoyment and new knowledge and experience seeking. References Atikahambar, Y., Zainal, A., Zali, A. N., Nor’Aini, A., & Zain, M.K., (2014). Examining perceived value and tourists’ satisfaction on Penang
delicacies, Journal of Hospitality & Tourism, 229-232.London: Taylor and Francis Group, ISBN 978-1-138-00151-0 Baker, D. A., & Crompton, J. L. (2000). Quality, satisfaction and behavioral intentions. Annals of Tourism Research, 27(3),785-804. Bernama, (2013). The Malaysian Insider : Tourists spent more than RM18b on shopping alone last year, says Nazri. Retrieved November
23, 2013 from http://my.news.yahoo.com Capon, W., Farley, J. and Hoenig, S. (1990), ‘‘Determinants of financial performance: a meta analysis’’,Management Science, Vol. 36 No. 10,
pp. 1143-9 Choi, T. Y. & Chu, R. (2001). Determinants of hotel guests’ satisfaction and repeat patronage in the Hong Kong hotel industry,
International Journal of Hospitality Management, 20(3), 277-297. Cronin, J. J., Jr., & Taylor, S. A. (1992). Measuring service quality: a reexamination and extension. Journal of Marketing, 56(3), 55-68. Goeldner, C. R. and Ritchies, B. J. (2006). Tourism: principles, practices and philosophies (10th Ed.). New Jersey: John Wiley and Son, Inc. Jacoby, J., & Olson, J. C. (1977). Consumer response to price: an attitudinal, Information processing perspective, in Y. Wind and P.
Greenberg (Eds), Moving Ahead With Attitude Research, 73-86. Chicago: American Marketing Association. John, P. T., Frederick, A. D., & Joseph, A. W. (2000). Attributes of repeat visitors to small tourist- oriented communities. The Social Science
Journal, 37 (2), 299-308. Kim, Y. H., Kim, M., & Goh, B.K., (2011). An examination of food tourist’s behavior: Using the modified theory of reasoned action.
International Journal of Tourism Management, 32(2011), 1159-1165. Kivela, J., and Crotts, J., (2006). Tourism and gastronomy: gastronomy’s influence on how tourists experience a destination. Journal of
Hospitality and Tourism Research 30 (3), 354–377. Oliver, R. L. (1997). Effect of expectation and disconfirmation on post exposure evaluation: an alternative interpretation. Journal of
Applied Psychology, 62(August), 480-486. Oliver, R. (1980). A cognitive model of the antecedents and consequences of satisfaction decisions. Journal of Marketing Research, 17,
460–469. O’Sullivan, E. L., & Spangler, K. J. (1998). Experience marketing. State College: Venture Publishing, Inc. Penang State Tourism and Development, (2010). Practical Travel Guide Visit Penang 2010-2012.Retrieved March 14, 2012, from
http://www.visitpenang.gov.my

Proceedings of 4th
International Conference on Global Business Environment
(ICGBE-2014)
63
Petrick, J. F. (2002). Development of a multi-dimensional scale for measuring the perceived value of a service. Journal of Leisure Research, 34(2), 119-134.
Petrick, J. F. (2004a). First timers' and repeaters' perceived value. Journal of Travel Research, Vol. 43, August 2004, 29-38. Petrick, J. F. (2004b). The roles of quality, value, and satisfaction in predicting cruise passenger’ behavioral intention. Journal of Travel
Research, Vol. 42, May 2004, 397-407. Quan, S. & Wang, N. (2004). Towards a structural model of the tourist experience: an illustration from food experience in tourism.
Tourism Management, 25 (3), 297 – 305. Sweeney, J.C., Soutar, G. N., & Johnson, L. W.(1988). Consumer perceived value: Development of a multiple item scale. American
Marketing Association Conference Proceedings, 9,138. Tam, J. L. M. (2000). The effects of service quality, perceived value and customer satisfaction on behavioral intentions. Journal of
Hospitality and Leisure Marketing, 6(4), 31-43. Reisinger, Y., & Turner, L. W. (2003). Cross-cultural behaviour in tourism: Concepts and analysis.Oxford: Butterworth-Heinemann. Tourism Malaysia.(2013). Tourists Arrivals and Receipts to Malaysia. Retrieved November 23,2013. from
http://corporate.tourism.gov.my Yoon, Y., & Uysal, M. (2005). An examination of the effects of motivation and satisfaction on destination loyalty: a structural model.
Tourism Management, 26(1), 45-56. Zainal, A., Zali, A. N., & Kassim, M.N. (2010). Malaysian gastronomy routes as a tourist destination, Journal of Tourism, Hospitality &
Culinary Art,15-24. Zeithaml, (1998).Consumer perceptions of price, quality, and value: a means end model and synthesis of evidence. Journal of Marketing,
52 (1988), pp. 2-22. Zeithaml, V. A., Berry, L., and Parasuraman, A. (1996). The behavioral consequences of service quality. Journal of Marketing, 60, 31–46.
Proceedings of 4th
International Conference on Global Business Environment
(ICGBE-2014)
64
A Conceptual Framework of a Structural Equation Model of Green Supply Chain in Hotel Industry in Thailand
Pruksapakorn Pratyameteetham, Walailak Atthirawong
King Mongkut’s Institute of Technology Ladkrabang, Bangkok, Thailand [email protected]
Abstract: Under the current global trend of economic, social and environmental change, the service industry is one of the prominent industries which drivesworld economic forward. Hotel industry is part of the service industry that needs to adjust itself to respond to various drivers by taking into account the organization’s external and internal drivers in order to bring about adjusted practical guidelines. Specifically, it is extremely necessary for the hotel industry to adjust to the environmental friendly trend by takinginto consideration the whole supply chain in order to creategreen supply chain in hotel Industry. This study has, thus, developed and presented a research conceptual framework to study the importance of drivers such as environmental laws, rules and regulations as well asenvironmental management standard (ISO 14001) and raw material suppliers which will raise awareness of importance of the environment. This will lead to environmental friendly and green practices which include internal environmental management, green purchasing,customer environmental cooperation, green designand reverse logistics to bring about results of green supply chain inhotel industryaccording to the Six Service Performance Dimensions namely, financial performance, competitiveness performance, quality of service performance, flexibility performance,resource utilization performance and innovation performance.The findings from the study will enable all stakeholders in the supply chain to recognize the components and influence of green practices as drivers for green supply chain performance in hotel industry in Thailand and to be role model for hotel operators to apply in their green supply chain management. Keywords: Drivers, Environmental friendly practices, Performance, Green supply chain, Hotel industry
1. Introduction Hotel industry is one of the prominent service industry which drives world economy forward, and foreign investment in hotel industry in ASEAN countries tends to increasingly expand. Thailand is ranked the most interesting country to be invested in hotel industry, followed by Myanmar, Indonesia, Cambodia and Vietnam respectively. The ranking was voted by the meeting of 200 hotel operators from all over the Asia-Pacific region. Thailand is ranked the first because of its good infrastructures and well-prepared supports from the government. Moreover, tourists to Thailand were forecasted to reach 24 million in 2013(Thansettakit, 2013). The service industry, therefore, is an important element to drive economic sector to grow as witnessed by the steadily increasing trend of GDP since 2004 – 2011 in non-agricultural sector to which service industry of hotel and restaurant belongs, specifically in 2011, the revenue from service industry of hotel and restaurant in Thailand reached 338,644 million baht (Office of the National Economic and Social Development Board, 2013)
Hotel industry, being a bread earner in service industry, thus, is considered to have an important role in building good image for the industry and offering good experience to service users and to be an important revenue driver in tourism industry. According to the dialogue for liberalization of tourism sector of hotel business among allpartnes in FTA, namely ASEAN, China, South Korea, Japan, Australia and New Zealand, foreigners are allowed to have increased proportion in hotel shares in Thailand and financial, technological as well as service strength of foreign business chains, which have a complete range of service and various branches in many countries, are adopted to be implemented in Thailand (Department of Business Development, 2011). The adoption of foreign chains of hotel business management, due to their reputation and international standard as well as broad customer base, results in the ability of Thai hotel business to respond to service users’ need perfectly and their services, thus, are accepted and trusted. These chains include International Hotel Groups: IHG, under whose brand are Intercontinental and Holiday INN; Meridian chain, under whose brand are Sofitel, Grand Mercure and All Seasons (IBIS Style). As for Thai hotels, the ones whose services are recognized and used by foreign tourists continuously are ONYX Hospitality Group managed by Amari hotel for 45 years, Sentara chain and Dusit chain, for example (Prachachartturakij, 2012).
The steadily increasing trend of foreign tourists visiting Thailand and increasing number of Thai tourists every year force hotel industry to respond to such change. Moreover, shorter product life – cycle, technological cycle and competitiveness have driven rapid change in product design and services. Hotel industry in Spain is a clear example of the case where the influence of stakeholders in hotel industry acts as a driver for hotel industry to adjust itself toenvironmental laws and standards as well as environmental awareness of service users (Jose Cespedes-Lorente et al., 2003). Supply Chain (SC) is the network expected to enable service users to get products and services with correct specifications, at the right time and the right place. However, for supplies which are quite complex, supply chain network will control their own alliances, manage and improve the flow of materials, products, services and information from the origin to the destination (end-customers) in order to create customer’s satisfaction with minimum cost to all members of the supply chain (Lambert et al., 1998). A crucial difficulty in managing supply chains is environmental management. Green Supply Chain Management (GSCM) has become an organizational philosophy which will enable organizations and supply chain alliances to achieve organizational benefits and their objectives concerning market share by reducing environmental risk and impact while improving ecological effectiveness (Rao and Holt, 2005; Zhu et al., 2008) starting from attaching importance to the drive from community and consumers who care for environment to strict environmental laws and regulations. Laws and regulations have forced the producers to integrate environment into practices in organization management (Rao and Holt, 2005; Yang et al., 2008; Paulraj, 2009) and the organization needs to be aware of being environmental friendly organization in order to adopt environmental friendly practices of green design, green purchasing, and reverse logistics which will result in sustainable and environmental friendly performances of the organizations on a continual basis. This study, therefore, aims to study a research framework to test with hotel industry before implementing it in other industries in the future.

Proceedings of 4th
International Conference on Global Business Environment
(ICGBE-2014)
65
2. Literature Review According to literature review on supply chain of service industry which has unique characteristics and is different from manufacturing industry, especially in the way that hotel industry aims to respond to the demand of service users who are aware more of environment which results in the trend for green hotel and forces hotel industry to adjust themselves by adopting green supply chain management in order to create good image to service users who care for the environment. This study, therefore, proposes relevant principles and concepts to be further used as a research framework as follows: Service Industry Supply Chain: Due to the difference in supply chain management between manufacturing industry and service industry, in an attempt to try to develop a framework for service supply chain, Ellram et al. (2007) defined service supply chain management as the management of information, process, capacity, services and capital from the first supplier to the end customer. An important information in service supply chain management is the differentiation of activities. There are 7 theoretical processes of service supply chain (Baltacioglu et al., 2007) as follows: Table 1: Activities in Service Supply Chain Processes
Process Definition
Demand management
Capacity and resource
management
Customer relationship
management
Supplier relationship
Management (SRM)
Order process management
Service performance
management
Information and technology
management
Managing and balancing customer demand by keeping up-to-date demand information.
Managing capacity and resources of services, these resources are organized effectively
and operate efficiently at optimum capacity.
Maintaining and developing long-term customer relationships by developing customer
information continuously and trying to understand what customers want.
A process where customers and suppliers develop and maintain a close and long-term
relationship as partners. SRM composes of five key components, including coordination,
cooperation, commitment, information-sharing and feedback.
Organizing response for orders processed from customers. The scope of order process
management includes getting orders until delivering service to customers.
Managing services systems, all of which should be taken into account when managing,
measuring, modifying, and rewarding service performance to improve organizational
performance in order to achieve corporate strategic aims and promote its mission and
values.
Adoption of technologies to support and collaborate within supply chain to improve
service supply chain operations for achieving competitive advantage in their businesses.
Source: Adapted from Baltacioglu et al. (2007) In summary, service supply chain composes of the main activities in the process as mentioned above. To maximize the effectiveness of service supply chain, all activities need to be linked together to meet customers’ needs. Supply Chain in Hotel Industry: Hotel industry is an important industry within service industry. However, it is different from other service industries. Therefore, the service supply chain approach implemented in hotel industry,aiming for increasing the effectiveness in operation and decreasing cost, is different from such approach implemented in other industry in service industry as has been explained by Kothari, Hu, and Roehi (2005). There are 2 main services in hotel business, namely rooms and service processes of various departments such as dining-room, laundry, cleaning, reception, and catering. As can be seen, hotel’ services involve both internal and external relationships. The former refers to relationship among departments to coordinate in order to deliver impressive services to customers while the latter refers to the coordination with external suppliers and the response to the need of service users. Therefore, according to service supply chain approach, there are a lot of processes within the supply chain of hotel industry, namely demand

Proceedings of 4th
International Conference on Global Business Environment
(ICGBE-2014)
66
management, capacity and resource management, customer relationship management, supplier relationship management, order process management, service performance management, and information and technology management (Baltacioglu et al., 2007). Green Supply Chain Management in Hotel Industry: With rapid change in manufacturing industry, environmental and social issues become important in business organizations. Green Supply Chain Management (GSCM) has been developed through processes and products so as to respond to the demand of environmental laws (Hsu & Hu, 2008), the attention in greenhouse gas emissions and in pollution caused by business units. GSCM, thus, involves green purchasing, green manufacturing, green distribution, and reverse logistics. GSCM aims to eliminate or reduce wastes such as energy, pollution, hazardous waste, and garbage throughout the supply chain (Hervani, Helms, and Sarkis, 2005). The consumers’ awareness to comply with laws and regulations on environment in the US, European Union and Japan has raised the awareness of hotel operators to adjust their business strategies. GSCM has arisen from the realization of the importance of new innovation in helping organizations to develop “win-win” strategy to gain benefits and get more market share. It also can reduce environmental risk and impact which may occur in the future and create balance in ecological system ( Hock, 2000). Green hotels in hotel industry, therefore, have started to pay attention to impacts on environment caused by pollutions in every service process throughout supply chain from upstream which refers to suppliers to downstream which refers to service users or customers and use resources and energy with maximum effectiveness. Therefore, GSCM in hotel industry is a process taken into account criteria or elements concerning environmental protection in considering each activity to be launched in the hotel such as green design, green purchasing, and supplier relationship management in order to respond to the need of the service users who are aware of environment. Gibert (2001) suggested that GSCM could happen only if the organization has a policy which attaches importance to environment. Figture 1: Green Supply Chain of Hotel Industry Source: Adapted from Kothari et al. (2005) From figture 1, to consider GSCM in hotel industry from upstream to downstream is to study the relationship in every activity and process which has potential to have impact on environment starting from the coordination with suppliers involved to product demand of the hotel and the suppliers, which must be responding to the demand of the hotel as a customer. This is to supply environmental friendly products and services (product supply) because service users nowadays attach more importance to environmental issues and often choose environmental friendly hotels (service demand). The hotels, thus, have to adjust themselves and improve their products and services to be ready for delivering environmental friendly products and services (product & service delivery) as well (Kothari et al., 2005). Six Service Performance Dimension Measurement: In evaluating performance of hotel industry, Six Service Performance Dimension measurement approach has been applied in this research to measure hotel industry performance. Such approach comprises financial dimension, competitiveness dimension, service quality dimension, adaptation dimension, resource utilization dimension and innovation dimension (Fitzgerald et al., 1991). Relevant Researches: This study has reviewed researches concerning environmental friendly drivers and practices as has been summarized in Table 2 as follows: Table 2: Relevant Researches Elements Relevant researches
Drivers
Environmental laws and
regulations
Hitchcock (2012) Hsu et al. (2012) Large and Thomsen (2011)
Zhu et al. (2007)
Environmental collaboration with
suppliers
Hitchcock (2012) Large and Thomsen (2011) Diabata and
Govindan (2011) Wu et al. (2011) Zhu and Sarkis (2006)
Hotel Suppliers The Hotel Hotel Customers
Environmental Issues
Product Demand Service Demand
Product Supply Product & Service Delivery

Proceedings of 4th
International Conference on Global Business Environment
(ICGBE-2014)
67
Environmental collaboration with
customers
Hitchcock (2012) Hsu et al. (2012) Diabata and Govindan (2011)
Competitors Hsu et al. (2012)
Environmental friendly practices
Internal environmental
management
Lee et al. (2012) Azevedoet et al. (2011) Molina – Azorin et al. (2009) Rao and Holt (2005)
Environmental friendly design Lee et al. (2012) Hu and Hsu (2006) Zhu and Sarkis (2004)
Green purchaing Lee et al. (2012) Azevedoet et al. (2011) Routroy (2009)
Reverse logistics Kim and Min (2011) Routroy (2009)
Theories involved in Service Industry Supply Chain: According to the review of theories involving with the research, the followings are theories involving with green supply chain in hotel industry in Thailand (Sakis et al., 2011) 1) Ecological Modernization Theory: This theory has its underpinnings in sociological theory and has been further developed into policy and organizational theories. This theory is geared towards industrial development for environmental protection through innovation and technological development. Moreover, it has been widely adapted in manufacturing sector. EMT-based GSCM studies explain how an environmental policy can promote the adoption of GSCM and demonstrate that GSCM can bring both economic and environmental performances. Due to the theoretical foundation of ‘win-win’, governments urge companies to undertake environmental practices voluntarily. However, it is still a question of how this theory and GSCM can give rise to ‘win-win’ situation which is a key to urge suppliers and customers of the companies to have environmental friendly awareness. 2) Institutional Theory: This theory examines how external pressures influence a company to adopt an organizational practice. Within the theory, there are 3 forms of isomorphic drivers namely, coercive, normative, and mimetic. Coercive isomorphic drivers occur from influences exerted by those in power. The institutional theory can be used to study how a company addresses green issues due to external pressures. Therefore, the institutional theory has become a major research direction to explain environmental related practices. Normative isomorphic drivers cause enterprises to conform in order to be perceived as having legitimate organizational activities. Social normative pressures can explain environmental management practices among enterprises. Mimetic isomorphic drivers occur when enterprises imitate the actions of successful competitors in the industry, in an attempt to replicate the path of their success. 3) Resource Based – View: The resource-based model of competitive advantage suggests that competitive advantage may be sustained by harnessing resources that are valuable, rare, imperfectly imitable, and non-substitutable. Firms resources have been defined as all assets, capabilities, organizational processes, firm attributes, information, and knowledge controlled by an enterprise that enable the firm to conceive of and implement strategies with the goal to improve its efficiency and effectiveness (competitiveness). The extension of the resource based – view has included the integration of dynamic capabilities and natural resources. Building these operational through greening of supply chains further supports the value, rarity, inimitability, and non-substitutability aspects of the resource based-view. As for business value of GSCM, it is interesting that when considering the values associated with greening the supply chain, the competitive advantages are not necessarily in the upstream (supplier management) stages of the supply chain as they could even be larger in the downstream (customer) stages with green marketing capabilities and resources. Extension of the resource based – view to competitive advantages across the supply chain such as supply chain versus supply chain rather than organization versus organization, has also been a research direction within the greening of supply chains. 2.6.4 Resource Dependency Theory Resource dependency theory (RDT) suggests that, in the supply chain, member firms should be dependent and collaborate to seek higher performance gains in the long-run instead of pursuing short-term benefits at the expense of others. According to the RDT, firms are dependent on resources provided by others in order to sustain growth, as well as other organizations that may be dependent on them. One important assumption of the RDT is that firms cannot be fully self-sufficient with regards to strategically critical resources for survival. They need to depend on resources from outside parties to compete and carefully manage this dependency with other firms to strive for sustainable development. In GSCM, apart from green purchasing and customer collaboration, eco-design of products and materials recovery is exemplary organizational resources requiring supply chain partnership to effectuate performance benefits. 4) Stakeholder Theory: Stakeholder theory suggests that companies produce externalities that affect many parties (stakeholders) which are both internal and external to the firm. Externalities often cause stakeholders to increase pressures on companies. The stakeholder theory is usually introduced as an explanatory theory related to antecedents or contingencies for adoption of various GSCM practices. Specific stakeholder influences on green purchasing, life cycle analysis in the supply chain, environmentally oriented reverse logistics, for example.

Proceedings of 4th
International Conference on Global Business Environment
(ICGBE-2014)
68
Table 3: General Conceptualization and Theory Application Theory General conceptualization Current GSCM related study and theory application
Ecological
modernization
(EMT)
As a systematic eco-innovation theory, an EMT is
geared towards jointly achieving industrial
development and environmental protection through
innovation and technological development, or
‘modernity’. At least 2 dimensions of an EMT can
influence GSCM research and practice, new politics
of pollution and technological innovation.
1) To motivate GSCM related practice, proper
institutional arrangement and a legal framework by
government are needed.
2) The practice of GSCM is consistent with the concept
of environmental innovation from the EMT view.
3) Innovation typically occurs in the upper echelon of a
supply chain.
Institutional
theory
Institutional theory examines how external
pressures influence organizational actions. Within
institutional theory, three forms of isomorphic
drivers exist namely, coercive, normative, and
mimetic.
1) Coercive pressures mainly originated from
governments are key drivers for environmental
management practices.
2) Imitation plays a significant role for other hotels to
implement GSCM practices.
Resource based
– view (RBV)
The resource – based model of competitive
advantage suggests that competitive advantage may
be sustained by harnessing resources that are
valuable, rare, imperfectly imitable, and non-
substitutable.
1) Extension of RBV to the competitive advantages
across the supply chain can also be applied to greening
of supply chains.
2) Internal organizational resources mediate the
relationship to external forces (institutional forces) and
GSCM practices adoption.
Resource
dependence
theory (RDT)
RDT suggests that, in the supply chain, member
firms should depend and collaborate to seek higher
performance gains in the long-run instead of
pursuing short-term benefits at the expense of
others. One important assumption of the RDT is that
firms cannot be fully self-sufficient with regards to
strategically critical resources for survival.
1) In GSCM, eco-design of products and materials
recovery are exemplary organizational resources
requiring supply chain partnership to effectuate
performance benefits.
2) From the RDT perspective, customer and supplier
relationships are important linkages for firms to reduce
the uncertainty surrounding their operating
environment.
Stakeholder
theory
Stakeholder theory suggests that companies
produce externalities that affect many parties
(stakeholders), which are both internal and external
to the firm. Externalities often cause stakeholders to
increase pressures on companies to reduce negative
impacts and increase positive ones.
1) Specific stakeholder influences on green purchasing,
life cycle analysis, environmentally oriented reverse
logistics, ‘closing the loop’ for GSCM, and general GSCM
or green logistics practices.
2) Identifying and investigating roles of various
stakeholders within GSCM practices has also been
studied.
Source: Adapted from Sakis et al. (2011) 5) Perception Theory: Perception is a process occurred unconsciously or unintentionally and often influences by experience or social accumulation. Human beings cannot pay attention to all around us but choose to perceive only the parts one is interested in. Two persons may receive the same message with different perception. Such difference arises from the influences or filters such as motive, past experience, term of reference, environment and mood (Choeychanya, 2000). The following picture summarized perception as a process occurred between influence and stimulus response. Figture 2: Perception Influence Response Perception Source: Adpted from Choeychanya (2000)

Proceedings of 4th
International Conference on Global Business Environment
(ICGBE-2014)
69
Conceptual Framework: This research designs a conceptual framework concerning a structural equation model of green supply chain in hotel industry in Thailand by investigating drivers, environmental perception, and environmental friendly practices in order to measure GSCM performances in hotel industry. The conceptual framework is as follows: Figture 3: Conceptual framework From figture 3, external drivers such as environmental laws, environmental management standards, and competitors have influenced environmental recognition of hotel industry. In the figture, linkage from upstream namely suppliers to downstream namely customers in terms of environmental recognition throughout the supply chain has been considered. Such recognition results in the adaptation of their practices to be more environmental friendly, such as internal environmental management, green design, green purchasing, reverse logistics which will eventually lead to GSCM performances in hotel industry. 4. Conclusion Environmental and social issues have become important to business organizations. Green Supply Chain Management: GSCM has become organizational philosophy which enables organizations and their supply chain alliances to achieve their benefits and objectives concerning market share by reducing environmental risk and impact, while improving ecological effectiveness (Rao and Holt, 2005; Zhu et al., 2008), starting from attaching importance to the drive from community and consumers who care for environment to strict environmental laws and regulations. Laws and regulations have forced the producers to integrate environment into practices in organization management (Rao and Holt, 2005; Yang et al., 2008; Paulraj, 2009) and the organization needs to be aware of being environmental friendly organization in order to adopt environmental friendly practices of green design, green purchasing, and reverse logistics which will result in sustainable and environmental friendly performances of the organizations on a continual basis. This study has, thus, developed and presented a research conceptual framework to study the importance of drivers such as environmental laws, rules and regulations as well asenvironmental management standard (ISO 14001) and raw material suppliers which will raise awareness of importance of the environment. This will lead to environmental friendly and green practices which include internal environmental management, green purchasing,customer environmental cooperation, green designand reverse logistics to bring about results of green supply chain inhotel industryaccording to the Six Service Performance Dimensions namely, financial performance, competitiveness performance, quality of service performance, flexibility performance,resource utilization performance and innovation performance.The findings from the study will enable all stakeholders in the supply chain to recognize the components and influence of green practices as drivers for green supply chain performance in hotel industry in Thailand and to be role model for hotel operators to apply in their green supply chain management. Further Research: For further research, the study on relationship among variables in the structural equation according to the developed conceptual framework will be carried out in order to further investigate to see which variables have relationship with GSCM performances. Data collection will be done from 400 hotels which are research samples. Accordingly, research findings will be presented in the future. References Azevedo, S. G., Carvalho, H., &Mchado V.C. (2011). The influence of green Practices on supply chain performance: A case study approach.
Journal of Transportation Research Part E, 47 pp. 850-871. Baltacioglu, T., Ada, E., Kaplan, M. D.., Yurt, O., & Kaplan, Y. C. (2007). A new framework for service supply chain. The Service Industries
Journal, 27(2), pp. 105-124. Cespedes-Lorente, J., Burgos-Jimenez, J. & Alvarez-gil, M.J. (2003).Stakeholder’ environment influence. An empirical analysis in the
Spanish hotel industry. Scandinavian Journal of Management, 19, pp. 333-358. Department of Business Development.(2011). Annual Report B.E.2554, Bangkok.
Diabata, A.,&Govindah, K. (2011). An analysis of the drivers affecting the implementation of green supply chain management. Journal of Resources, Conservation and Recycling, 55 pp. 659-667.
Ellram, L.M., Tate, W.L., & Billing, C. (2007). Understanding and Managing the Services Supply Chain. Journal of Supply Chain Management, 40(4) pp. 17-32
Fitzgerald, L., Johnston, R., Brignall, T. J., Silvestro, R., & Voss, C. (1991).Performance measurement in service business. London: CIMA.
External
Drivers
Hotel
Perception
Service
Users
Green
Practices
GSCM
Performances
s
Suppliers

Proceedings of 4th
International Conference on Global Business Environment
(ICGBE-2014)
70
Gilbert, S. (2001). Greening supply chain : Integrated summary. In Asian Productivity Organization. Greening supply chain: Enhancing competitiveness through green productivity.Tokyo: APO, pp.1-6.
Hervani .A.A., Helms M.M., &Sarkis J. (2005). Performance measurement for green supply chain Management .Benchmarking : An International Journal , 12(4) pp. 330-353.
Hitchcock, T. (2012). Low carbon and green supply chains: the legal driver and Commercial pressures. Journal of Supply Chain Management, 17(1) pp. 98-101.
Hsu, C..& Hu, A. (2008).Green supply chain management in electronic industryJournal of Environmental Science and Technology, 5(2) pp. 205-216.
Hu, A. & Hsu, C. (2006). Empirical study in the critical factors of green supply chain management (GSCM) practice in the Taiwanese electrical and electronics industry. In: Management of innovation and Technology , 2006 IEEE International Conference on Management of Innovation and Technology, pp. 853-857.
Thansettakit newspaper. (2013). “Hotel Industry in ASEAN has a Bright Future”year 33(1) copy 2847(13) , 26-29 May 2013.
The Office of the National Economic and Social Development Board.(2013). Annual Report of GDP B.E. 2547 – 2555 ,Bangkok.
Kim, I. & Min, H. (2011).Measuring supply chain efficiency from a green perpective. Journal of Management Science Review, 34(11) pp. 1169-1189.
Kothari, T. , Hu, C. & Roehl, W.S. (2005). e – Procurement: an emerging tool for the hotel supply chain management. Journal of Hospitality Management, 24 pp. 369-389.
Lambert, D.M., Stock, J.R., Ellram, L.M. (1998).Fundamentals of Logistics International Edition. MaGraw-Hill Publishing Co. Large, R.O., & Thomsen, C. G. (2001). Driver of green supply management performance: Evidence from Germany. Journal of purchasing &
Supply Management, 17 pp. 176-184. Lee, S.M., Kim, S.T., & Choi, D. (2012). Green supply chain management and organizational performance. Journal of Industrial
Management & Data Systems, 112(8) pp. 1148-1180. Molina-Azorin J. F. ,Claver-Cortes, E. , Pereira-Moliner, J. &Tari, J. J. (2009).Environmental practices and firm performance: an empirical
analysis in the Spanish hotel industry. Journal of Cleaner Production, 17 pp. 516-524. Patchanee Choeychanya. (2000). Principles of Communication Arts. Bangkok: Kaofang publishing house.
Paulraj, A. (2009). Environment motivations : a classification scheme and its impact on environmental Strategies and practices. Business Strategy and the Environment, 18 (7) pp. 453-468.
PrachachartTurakijnewspapaer.(2012). “Hotel Industry in Thailand ” http://www.prachachat.net.Searched on 13 February 2013.
Rao, P., & Holt, D., (2005). Do green supply chains lead to conpetitiveness and economic performance, Journal of Operations & Production, 25(9) pp. 898-916.
Routroy, S. (2009). Evaluation of supply chain strategies : a case study. International Journal of Business Performance and Supply Chain Modelling, 1(4) pp.290-306.
Sarkis, J., Zhu, Q. & Lai, K. (2011).An organizational theoretic of green supply chain management literature. Journal of Production Economics, 130 pp. 1-15.
Yang, G., Wang, Z. & Li, X. (2008).The optimization of the closed-loop supply chain network. Transportation Research Part E: Logistics and Transportation Review, 45 (1) pp. 16-28.
Zhu, Q. &Sarkis, J. (2004).Relationships between operational practices and performance among early adopters of green supply chain management practices in Chinese manufacturing enterprises Journal of Operation Management, 22 pp.265-289.
Zhu, Q. &Sarkis, J. (2006).An inter-sectoral comparison of green supply chain Management in China: and practices. Journal of Cleaner Production, 14 pp. 472-486.
Zhu, Q., Sarkis, J.,& Lai, K. (2007). Green supply chain management: pressures and performance within the Chinese automobile industry, 15 pp. 1041-1052.
Zhu, Q., Sarkis, J.,& Lai, K. (2008). Confirmation of a measurement model for green supply chain management practices implementation. Journal of Production Economics., 111 pp. 261-273.
Proceedings of 4th
International Conference on Global Business Environment
(ICGBE-2014)
71
A Correlational Study on Childbirth based on Location and its Concentration of Hospitals in Chennai
*Ashwin Kumar Basu.S, Arulrajan Kuppuswamy
PSG Institute of Management Coimbatore Tamil Nadu, India *[email protected]
Executive Summary: This report in detail explains about the project titled “study on childbirth based on location and its concentration of hospitals”. A detailed analysis about hospitals located in Chennai and the consumer preference pattern among those who availed the facility. In addition to this preference of public for the type of facility and their travel pattern to the desired facility were analyzed. In depth study on these parameters of consumer behavior and insights are derived from the analysis. The Health care sector is one of the most challenging and fastest growing sectors in India. Revenues from the health care sector account for 5.2 per cent of the GDP, making it the third largest growth segment in India. The Indian Health sector consists of Medical care providers like physicians, specialist clinics, nursing homes, hospitals, Diagnostic service centers and pathology laboratories, Medical equipment manufacturers, Contract research organizations, pharmaceutical manufacturers. Overview on Health Care Sector Background: According to the World Health Organization norms, three beds per 1,000 people have to be maintained, whereas only 2 beds per 1,000 people in Tamil Nadu. Whereas India’s bed count for every thousand is less than 1, this does not fulfill World health Organization norms. In this table we will be looking into bed count to population ratio in different states. Table 1.1
STATE BED COUNT (every 1000 population)
Tamil Nadu 2
Delhi 1.4 Mumbai 0.8 Kolkata 0.8 Hyderabad 1.5 Bangalore 2.1
The private hospital sector in the city is expected to increase its bed strength by 25 percent in the near future. Apart from this collaboration from both government and private sector is under proposal, which will ensure good quality at nominal rate and make Tamil Nadu a global hub for healthcare facility. Overview on Type of Hospitals: The government-aided hospitals in the city include General Hospital, Government Kilpauk Hospital, Government Royapettah Hospital, Government Stanley Hospital, Adyar Cancer Institute, TB Sanatorium, and National Institute of Siddha. Not for profit hospitals in the city include the Hindu Mission Hospital, Voluntary Health Service. Few private hospitals in Chennai are Apollo Hospitals, Chettinad Health City, MIOT Hospital and Vasan Healthcare. Apollo Hospitals Group has five hospitals in the city, including a main hospital and a specialty oncology hospital, with a total bed count of 1,100. The city has about seven palliative care units. Poonamallee High Road, one of the arterial roads of the city, has more hospitals than any other roads in the city and is known as the city's Medical Street. The prime NABH-accredited hospitals include Chennai Apollo Specialty Hospital, Dr Mehta Hospitals, Frontier Lifeline Hospital, Global Hospitals & Health City, Sankara Nethralaya, and Vijaya Medical & Educational Trust. According to Chennai Corporation sources, there are about 250 registered laboratories in the city, although there are almost thrice as many unregistered ones. The city has six units of the state government's co-operative drug stores across the state known as Kamadhenu co-operative medical stores, where a wide range of 13,000 important medicines would be sold, including 6,000 medicines available on any given day. The government is planning to add 10 more stores in the city. Corporation of Chennai initiated an online direct health-reporting system under which all the hospitals in the city are required to provide details of the patients on a daily basis to the Corporation. Bird’s Eye View on top Private Hospitals in Chennai Apollo Hospitals Chennai was established in 1983. Today it is one of the most respected hospitals in the world, and is also amongst the most preferred destinations for both patients from several parts of India, as well as for medical tourism and medical value travel. Fortis Malar Hospital was established as one of the largest corporate hospitals in Chennai providing quality in super specialty and multi specialty healthcare services. Today it is one of the preferred hospitals in Chennai for patients in several parts of Tamil Nadu and other parts of the World. MIOT Hospital - Founded in 1999 by Padmashri winner Prof Dr PVA Mohandas, MIOT is a premier multi-specialty hospital which has incorporated the latest in medical technologies which results in minimally invasive treatments. SRM Hospital - provides a broad range of medical services in order to serve all our healthcare needs. Each service is highly specialized to meet your specific needs. Chennai Kaliappa Hospital is a well renowned hospital with best Ambulance Services in R.A. Puram. It also has a good customer service. Vijaya Hospital is one of the pioneer private health care institutions offering medical service to the people of Chennai. The trust was formed by Sri. B. Nagi Reddy, a recipient of Dada Saheb Phalke award and founder of Vijaya Vauhini Studios. C.S.I. Kalyani Multispeciality Hospital functions as a Charitable Institution and their aim is to provide subsidized medical care for the poor and downtrodden irrespective of caste, creed or religion.

Proceedings of 4th
International Conference on Global Business Environment
(ICGBE-2014)
72
St. Isabel's hospital is a 300 bedded hospital. St. Isabel's Hospital has 21 clinical departments and six paramedical departments. The hospital has specialist in all medical fields. The facilities include giving friendly medical services. The management of St. Isabel's Hospital also provides nursing education. The specialty of this hospital is dedicated Sisters, doctors and Staff. BILLROTH HOSPITALS was launched on 30th Nov.1990 by the late Dr.V.Jeganathan. BILLROTH HOSPITALS is on track to its fruition. Today, it provides services by nursing patients in assorted branches of Medical and Surgical treatments with a 600 bedded Super Specialty Hospital situated at Shenoy Nagar & R.A.Puram in Chennai, India. Their objective is to provide health care services of high quality at an affordable cost to the people and to achieve patient's satisfactions through effective service with trained manpower and continued medical education programs. List of Private Hospitals in Chennai: The following data sheet is explained in brief at the end of the report in ANNEXURE I. Bird’s Eye View on Government Hospitals: The city is preeminent in transplant surgery, with several city-based hospitals creating records in such surgeries. Chennai recorded the first ever liver transplant in the country in Government Stanley Medical College in the 1990s. In May 2011, the Madras Medical College opened the first-of-its-kind Orthopedic Cadaveric Skills Lab in Government College to train post graduate students in cadaveric dissection. In 2008, the state government established a cadaver transplant program at the Chennai Medical College. The program has a regular transplant-coordinator and a computerized network linking government and private hospitals. Apollo Hospitals and the Government General Hospital continue to be the two main sources of cadaveric organs in the city. With the organ donor rate in the state of Tamil Nadu standing at 1.2 per million populations, which is 15 times the national average, Chennai acts as a hub of deceased organ donation in India. In 2009, a group of doctors and specialists in Chennai and Coimbatore registered the successful treatment of thalassemia in a child using a sibling's umbilical cord blood. Government General Hospital: The hospital has a reputation of being one of the best in the state and ranks among the top ten in the subcontinent. While the hospital is managed by the medical superintendent, the dean is the head of the Madras Medical College (MMC) attached to the hospital. As of 2006, the hospital treats about 8,000 to 10,000 outpatients every day. The hospital also performs three open-heart surgeries free of cost daily. The hospital contributes to the second largest number of deceased organ donations in Tamil Nadu. In March 2012, the hospital performed its 1,000th kidney transplant, the highest in any government hospital in the country, of which about 90 were cadaver transplants. As of 2013, the hospital has a 22 percent share in organ transplants, the highest among hospitals in the city. In August 2011, the state government decided to convert the much controversial, half-constructed Assembly-Secretariat complex in the city, built at an estimated 10,920 million, into a multi-specialty hospital. Government Royapettah Hospital: In 2011, as part of its centenary celebration, the Central Government funded the hospital a sum of 43.5 million to construct two additional floors in its Accident and Trauma Block. There was also a proposal for setting up a "Zero Delay Ward". The state government funded 10 million on the new surgical block. The casualty ward is already under renovation. List of Government Hospitals: The following data sheet is explained in brief at the end of the report in ANNEXURE II. List of Government Health Posts: The following data sheet is explained zone wise in brief at the end of the report in ANNEXURE III. Chapter-2 About the Project-Birth Pattern Objective of the Study: The primary objective of the study was to provide an overview about the healthcare facilities available for child birth in Chennai. In addition to this preference of public for the type of facility and their travel pattern to the desired facility were analyzed. Secondary objective of the study was to analyse the distribution of hospitals in sub urban region and if there is scope of development for the hospitals. 1. Methodology To study about the public preference towards the healthcare facility, travel patterns were analyzed for the year 2007 and 2012 with a sample size of 800 data. The data was collected from birth certificates available on Chennai Corporation website. The data was collected across 12 months from year 2007 and 2012. 5 days are chosen at random using random selection software from each month. A sample size of 800 for both 2007 and 2012 was obtained. Table 3.1
Data Sample 2007 2012
per day sample chosen at random from a given month 14 14
5 days sample, for a given month (14*5) 70 70
data sample for 12 months (70*12) 840 840
unfit data for the project (approx) 40 40
Final sample size 800 800 Data Sample Collection: Information collected from the Birth Certificates: Zone where the birth took place.

Proceedings of 4th
International Conference on Global Business Environment
(ICGBE-2014)
73
Division inside which birth took place and had got registered. Gender Place of birth (Hospital name) Permanent address of the parents Address at the time of birth After data sample was collected, each data sample was given an unique code for identification. Few data entries contain area name instead of pin code, for which manually respective area pin code was entered. Later using the pin code distance between permanent address and hospital for 1600 data with the help of excel macros was obtained. With the help of annexure I, II, III out of the 800 final samples for year 2007 and 2012, frequency count of people visiting the destination hospital was grouped according to private or government hospital. From the entire 1600 data samples (i.e. 800 samples for 2007 & 800 samples for 2012), 218 different hospitals across Chennai were identified, from which the travel pattern and preferences towards healthcare facilities were interpreted. Then an analysis of how these patterns have changed from 2007 to 2012 is made and a conclusion is obtained. Apart from this, the distance each of them had travelled from their addresses to the hospital where they availed the facilities were calculated and were classified according to their preferences towards the healthcare facility (i.e. either Government or Private). The addresses of the sample data were categorized zone wise to find out if they have availed the facilities in their zone or travelled outside their zone for the facility. Chapter 3 Analysis and Report: In this chapter the report covers the findings from the exercise. This chapter is bifurcated into two parts, traveling pattern and choice of facilities. Travel Pattern Analysis: This graph explains the distance travelled (for availing medical facilities) in the year 2007 Vs 2012. Figure 3.1: Percentage of people traveling along with respective distance in 2007 and 2012
From this graph it is clearly shown that in 2012 people have availed a healthcare facility within 4 Km of their residence. We will be discussing in detail about their preference and the reasons for this shift in 2012 comparing with 2007 in this report. Figure 3.2: Increase/ decrease in percentage of people travelling overall in 2012 comparing with 2007.
34.75%
25.13%22.38%
10.00%
3.75% 4.00%
36.50%
20.13% 19.25%
15.63%
5.38%3.13%
0.00%
5.00%
10.00%
15.00%
20.00%
25.00%
30.00%
35.00%
40.00%
upto 4 km 4 to 8 9 to 13 14 to 19 20 to 25 26 & above
2007
2012
Base:2007 yr: 800 data2012 yr: 800 data
4.79%
-24.84%
-16.23%
36.00%30.23%
-28.00%-40.00%
-30.00%
-20.00%
-10.00%
0.00%
10.00%
20.00%
30.00%
40.00%
upto 4 km
4 to 8 9 to 13 14 to 19 20 to 25 26 & above
% change in 2012 comparing with 2007
% change between 2012 & 2007
BASE 2012: 800 (sample size)2007: 800 (sample size)

Proceedings of 4th
International Conference on Global Business Environment
(ICGBE-2014)
74
Figure 3.3: Increase/ decrease in percentage of people travelling to private hospitals in 2012 comparing with 2007.
It is understood from the graph that private hospital visitors have increased and irrespective to the distance people are ready to travel to the preferred private hospital. In the year 2012 comparing with 2007, there has been a great increase in the number of private hospitals within every 5 Kms of reach for the public in the chennai city. In addition people have their own preference towards the private hospitals for which they are ready to travel a longer distance. Figure 3.4: Increase/ decrease in percentage of people travelling to government hospitals in 2012 comparing with 2007.
There is a dip in the number of people travelling to government hospital and also people’s preference towards government facility as compared to 2007 has decreased. Comparison between private and government facility visited by the people, in the year 2007 and 2012 After distance is calculated for each and every data sample, mean median mode are calculated. The average distance travelled by the people (from the data sample) in both the years 2007 and 2012 combined together is 9 Km. Average distance travelled by people in 2007 and 2012 are 8.73 Km and 9.73 Km respectively. Table 3.1
Average km travelled to Private government
2007 8.61 8.81
2012 10.65 8.58
17.90%6.42%
35.63%
68.18% 71.43%
-50.00%
61.54%
-60.00%
-40.00%
-20.00%
0.00%
20.00%
40.00%
60.00%
80.00%
5 km 6 to 10 11 to 15 16 to 20 21 to 25 26 to 30 31 above
percentage increase/ decrease among those who availed private hospitals in 2012 comparing with 2007
Sample of those who traveled to private hospital
2007: 3222012: 440
-48.61% -50.00%-36.36%
-233.33%
-120.00%
-250.00%
-200.00%
-150.00%
-100.00%
-50.00%
0.00%
50.00%
5 km 6 to 10 11 to 15 16 to 20 21 to 25 26 to 30 31 above
percentage increase/ decrease among those who have availed government hospitals in 2012 comparing with 2007.
Sample of those who
traveled to
government hospital
2007: 478
2012: 360

Proceedings of 4th
International Conference on Global Business Environment
(ICGBE-2014)
75
From the table we are able to derive a conclusion that in the year 2007 people travelled longer distance to avail government healthcare facilities but in the year 2012 even though the average distance travelled to avail government facility is approximately the same, the average distance for private facility has extended by 2km in 2012 which indirectly speaks about the travel pattern and preference towards the type of facility people prefer in 2012 compared to 2007. Table 3.2: Number of people visited private and government facility in 2007 and 2012
Private Government
2007 322 478
2012 440 360 In 2007 number of people who visited a government hospital was 32.64% higher than those who visited a private hospital. Whereas in 2012 number of people who visited a private hospital had increased by 18.18% when compared to the number of people who visited a government hospital. From this we can infer that people preference from the year 2007 to 2012 has changed towards private healthcare facilities because of the quick and quality services available. Permanent Address Zone Wise Clustering: In this segment we will be discussing about the zone analysis. Innitialy segregated the zones according to the Chennai city area mapping. Eventually with the help of pin code and area name in permanent address, sample data of the year 2012 is grouped according to the respective zones. Chennai City Zone Grouping: The table explains how zones in Chennai city is segregated according to the area mapping.
zone 1
ZONE 6
ZONE 11
KATHIVAKKAM 600057 CHOOLAI 600112 VALASARAVAKKAM 600087
THIRUVOTRIYUR 600019 PULIANTHOPE 600012 RAMAPURAM 600089
THIRU VI KA NAGAR 600082 NERKUNDRAM 600107
ZONE 2
KOLATHUR 600099 MADURAVOYAL 600095
MANALI 600068
PORUR 600166
SADAYANKUPPAM 600103 ZONE 7
KARAMBAKKAM 600116
EDAYANCHAVADI 600103 AMBATTUR 600058 NOLAMBUR 600095
KADAPAKKAM 603304
THEEYAMPAKKAM 600114 ZONE 8
ZONE 12
MATHUR 600068 VILLIVAKKAM 600049 MEENAMBAKKAM 600027
ANNA NAGAR 600040 ALANDUR 600016
ZONE 3
KILPAUK 600010 NANDAMBAKKAM 600069
MADHAVARAM 600060 PURASAWALKAM 600007 ST.THOMAS MOUNT 600016
PUZHAL 600066 CHETPET 600031
0
2
4
6
8
10
12
2007 2012
8.61
10.65
8.81 8.58
private
government
in K
ms
Base:
2007yr: 800
2012yr: 800

Proceedings of 4th
International Conference on Global Business Environment
(ICGBE-2014)
76
KATHIRVEDU 600066 AMINJIKARAI 600029 ZONE 13
PUTHAGARAM 635651
VELACHERY 600042
SURAPPATTU 600066 ZONE 9
THIRUVANMIYUR 600041
NUNGAMBAKKAM 600034 ADYAR 600020
ZONE 4
THOUSAND LIGHTS 600006 RAJA ANNAMALAIPURAM 600028
TONDIARPET 600081 CHEPAUK 600005 DR.RADHAKRISHNAN
NAGAR 600090 THIRUVALLIKENI 600005 ZONE 14
VYSARPADI 600039 MYLAPORE 600004 ULLAGARAM PUZHUTHIVAKKAM 600091
PERAMBUR 600011 SANTHOME 600004 MADIPAKKAM 600091
KODUNGAIYUR 600118 ALWARPET 600018 PALLIKKARANAI 600100
TEYNAMPET 600018 JALLADAMPETTAI 600100
ZONE 5
ROYAPETTAH 600014 PERUNGUDI 600096
ROYAPURAM 600013
PALAVAKKAM 602028
OLD WASHERMENPET 600021 ZONE 10
MUTHIALPET 605003 THIYAGARAYA NAGAR 600017 ZONE 15
SOWCARPET 600079 MGR NAGAR 600078 SEMMANCHERY 603112
CHINTADRIPET 600002 ASHOK NAGAR 600083 UTHANDI 600119
PUDUPET 600002 SAIDAPET 600015 SOZHINGANALLUR 600119
EGMORE 600008 KODAMBAKKAM 600024 KARAPAKKAM 600097
VIRUGAMBAKKAM 600092 INJAMBAKKAM 600115
SALIGRAMAM 600093 NEELANKARAI 600041
VADAPALANI 600026
With the help of the above table 2012 data people’s permanent address is clustered and the below analysis is obtained. Table 3.4: Chennai City Zone Analysis
zone details
total data sample from zone inside zone Private government
outside zone private2 government2
zone1 22 4 2 2 18 7 11
zone2 6 2 2
4 2 2
zone3 18 4 2 2 14 9 5
zone4 108 56 26 30 52 28 24
zone5 96 73 34 39 23 9 14
zone6 54 42 15 27 12 7 5
zone7 30 7 4 3 23 16 7
zone8 55 41 20 21 14 9 5
zone9 50 44 21 23 6 1 5
zone10 78 46 27 19 32 18 14
zone11 52 22 15 7 30 20 10
zone12 18 3 3 0 15 9 6
zone13 49 29 15 14 20 13 7
zone14 36 6 5 1 30 22 8
zone15 10 2 0 2 8 4 4 In 2012 out of 800 data sample, 682 people are permanent resident or address in located in the city during child birth, whereas the rest 118 are people who have travelled from outskirts of Chennai or from the neighboring districts such as Kanchipuram, Arakonam, Thiruvallur, Thiruninravur, Gummudipundi, Thiruverkadu. The above table explains about the number of people who have travelled within and outside the zone for availing the health facility for child birth. In depth analysis about the number of people who have travelled outside the zone: Zone 1, 3, 7, 11, 12, 14, and 15: In these zones people have consulted outside their zone for birth facility than inside the same zone, which implies that there is no sufficient healthcare facility in these zones. Background of The Zones And Analysis Reporting: In this section we will be discussing about the zones, where people who visited health facility inside their zone is outnumbered by the people who travel outside their zones. The following zones madhavaram, puzhal, ambattur, st.thomas mount, pallikaranai, sholinganallur where suburban regions added to the Chennai City Corporation limit one after

Proceedings of 4th
International Conference on Global Business Environment
(ICGBE-2014)
77
the other and these regions are developing rapidly. There is no large sized government facility available in these zones compared to zones central, egmaore, anna nagar, T.nagar, nungambakkam, perambur, ashok nagar, guindy. People have to opt to travel long distance to avail government owned large sized facility or to get treated in a Private facility. Zone 1 consists of areas Kathivakkam, Thiruvotriyur which are considered to be industrial area, where population per square kilometer is comparatively less. In zone 3 madhavaram, puzhal, kathirvedu, redhills highway road to Andhra Pradesh is expanded from 60 feet to 100 feet road and bullet train from ennore to redhills is proposed by the state government. In zone 7 ambattur, ambattur estate is announced as SEZ, after which the surrounding areas have started to develop exponentially. OMR and ECR highways have brought in development across various zones such as pallikaranai, thuraipakkam, uthandi, pallavaram regions. Proposed express highway from heart of the city to maduravoyil has brought development in zone 11. Insights from the Project Analysis: There is a great scope of business development for new private hospitals and existing facilities to have a midsized facility in the developing zones which are included into the Chennai city corporation. This analysis report will help the hospital management to venture into midsized healthcare facility. On the other hand with the change in consumer behavior in and around Chennai, it helps the people in easy access to the healthcare facility. Reference Alan Wilson, Valarie A. Zeithaml, Mary Jo Bitner and Dwayne D. Gremler (2012) Services Marketing: Integrating Customer Focus across
the Firm (2nd Edition). Andy Pike, A Rodriguez Pose.(2006) Local and Regional Development. Cathrine V. Jansson-Boyd. (2010) Consumer Psychology. Dibb, Sally; Simkin, Lyndon; Pride, William M. and Ferrell, O. C. (2012) Marketing: Concepts and Strategies (6th Edition). Foxall, GR, Goldsmith, RE & Brown, S (2009).Consumer Psychology for Marketing, (2nd Edition). Hans Eibe Sorensen.(2012) Business Development: A Market-oriented Perspective. Martin M. Evans, Gordon Foxall, Ahmad Jamal (2009). Consumer Behaviour , (2nd Edition) Pradeep Salgaonkar (2008). Marketing of Healthcare Services: Patient Satisfaction and Loyalty. Annexure I (List of Private Hospitals in Chennai)
LIST OF PRIVATE HOSPITALS IN CHENNAI
A.K.N. Hospital
Amrit Hospital
Apollo Hospital
Aysha Hospital
B.R. Hospital
Balaji Hospital
Bharath Hospital
Billroth Hospital
Chennai Kaliappa Hospital
Communicable Diseases Hospital
CSI Rainy Hospital
Devaki Emergency Hospital
Dr. George Nursing Home
Dr. Mehta's Nursing Home
Dr. Rex's Hospital
First Med Hospital
H.M. Hospital
Hande Hospital
Hindu Mission Hospital
J.V. Hospital
K.J. Hospital
Kasthuri Hospital

Proceedings of 4th
International Conference on Global Business Environment
(ICGBE-2014)
78
Kumaran Hospital
Laxmi Nursing Home
M.R. Hospital
Madras Medical Mission
Madras Port Trust Hospital
Malar Hospital
MIOT Hospital
Mohan Hospital
Mohan Rao Memorial Hospital
Parvatien Trikamji Bhatt Gujarati Sahaykari Hospital
Philips Hospital
Public Health Cenre
R.M. Hospital
Ragas General Hospital
Raju Hospital
Ramiah Hospital
Rigid Hospital
Rotary Medical Centre
Sakthi Nursing Home and Scan Centre
Sampath Nursing Home
Santhosh Hospital
Sasthalaya Hospital
Sooriya Hospital
Sri Devi Hospital
Sri Ramachandra Hospital
Sri Ramana Surgical Clinic
St. Isabel Hospital
St.Thomas Hospital
Sugam Hospital
Trinity Hospital
Vijaya Hospital
Voluntary Health Services ANNEXURE II (LIST OF GOVERNMENT HOSPITALS IN CHENNAI)
Government Hospital Names
Aringnar Anna Govt.Hospital of Indian Medicine
Childs Trust Hospital
Communicable Disease Hospital
ESI Hospital (Ayanavaram)
ESI Hospital(KK Nagar)
ESI Hospital(Kilpauk)

Proceedings of 4th
International Conference on Global Business Environment
(ICGBE-2014)
79
Govt General Hospital
Govt.Children's Hospital
Govt.Hospital (Chrompet)
Govt.Hospital for Thoracic Medcine
Govt.Hospital for Women and Children
Govt.Kasturba gandhi hospital
Govt.Kilpauk Medical College Hospital
Govt.Mental Hospital
Govt.Opthalmic Hospital
Govt.Peripheral Hospitals (Anna Nagar)
Govt.Peripheral Hospitals (KK Nagar)
Govt.Peripheral Hospitals(Periyar Nagar)
Govt.Peripheral Hospitals (Tondiarpet)
Govt.Royapettah Hospital
Govt.RSRM Hospital
Govt.Stanely Hospital
Govt T.B.Sanatorium
Institute of Child Health Hospital
Institute of Thoracic Medical
Institute Of obstetrics & Gynecology ANNEXURE III (LIST OF PUBLIC HEALTH POST)
Zone Dn.No Name of the Health Post Address
I DR.R.K.NAGAR ZONE 1 KODUNGAIYUR-I 15.ANNA SALAI, KODUNGAIYUR, CHENNNAI-600 118.
3 R.K.NAGAR(N) NEHRU NAGAR MAIN ROAD, TONDIARPET, CHENNAI-600 021.
8 JEEVA NAGAR(S) OLD.AHO-I OFFICE, T.H.ROAD, OPP.TO ZONE-I OFFICE,CHENNAI-81
4 NEW WASHERMENPET CHERIAN NAGAR, 4TH STREET, NEW WASHERMENPET,CHENNAI-81.
7 JEEVA NAGAR(N) 1.CHELLIIAMMAN KOIL STREET, TONDIARPET, CHENNAI-81
12 DR.V.R.NAGAR 471.T.H.ROAD, OLD WASHERMENPET, CHENNAI-21
8 KORRUKKUPET OLD.AHO-I OFFICE, T.H.ROAD, OPP.TO ZONE-I OFFICE,CHENNAI-81
9 MOTTAIGARDEN 1.VENKATASAN STREET. 1ST LANE,ROYAPURAM, CHENNAI-600 013
11 DR.R.K.NAGAR (S) (Zone) 88.KATHIWAKKAM ROAD MEENAMBAL NAGAR, CHENNAI-88
35 KODUGAIYUR-II SHARMANAGAR DISPENSARY,ERUKKANCHERI HIGH ROAD,CHENNAI-39
II SANJEEVARAYANPET ZONE
15 SANJEEVARAYANPET (Zone) 194.SOLAIAPPAN STREET, OLD WASHERMENPET, CHENNAI-21
28 AMMAN KOIL(S) 8.APPUMAISTRY STREET, MANNADY, CHENNAI-1
29 SEVEN WELLS 62. AMMAN KOIL STREET, SEVEN WELLS, CHENNAI-600 001.
25 B.R.N.GARDEN 225.BROADWAY ROAD, CHENNAI-600 108
31 KONDITHOPE 60.BASIN BRIDGE ROAD, KONDITHOPE, CHENNAI-79
17 GRACE GARDEN 152.SURYANARAYANA CHETTY STREET, ROYAPURAM, CH-13
27 HARBOUR 1.IVTH LANE, BEACH ROAD, HARBOUR, CHENNAI-600 001

Proceedings of 4th
International Conference on Global Business Environment
(ICGBE-2014)
80
18 ROYAPURAM 1.VENKATASAN STREET. 1ST LANE,ROYAPURAM, CHENNAI-600 013
14 TONDIARPET 152.SURYANARAYANA CHETTTY STREET, CHENNAI-600 013.
III PULIANTHOPE ZONE
41 PULIANTHOPE (Zone) 40.THIRUVENGADAM STREET, PULIANTOPE, CHENNAI-600 012.
46 CHOOLAI 23.V.V.KOIL STREET, CHOOLAI, CHENNAI-600 112.
39 T.V.K.NAGAR DN. OFFICE, PERAMBUR HIGH RD.,NEAR JAMALIAYA, CH-11.
36 SATHYAVANIMUTHU NAGAR 18.DR.AMBEDKAR COLLEGE ROAD, VYASARPADI, CHENNAI-39
46 BESANT NAGAR 23.V.V.KOIL STREET, CHOOLAI, CHENNAI-600 112.
39 WADIA NAGAR 101.COOKS ROAD, CORPORATION HIGH SCHOOL,CHENNAI-12
36 ELANGO NAGAR 18.DR.AMBEDKAR COLLEGE ROAD, VYASARPADI, CHENNAI-39
33 VYASARPADI NORTH 156.A.14TH EAST CROSS ST,M.K.B.NAGAR, VYASARPADI,CH-39
37 PERAMBUR 4.VADIVELU IInd CROSS ST, PERAMBUR, CHENNAI-11
34 PERAMBUR(EAST) 20,IInd STREET, KAMARAJ NAGAR, VYASARPADI, CHENNAI-39
48 T.B.CENTRE 21.TRIVELYIN BASIN STREET, CHENNAI-600 079.
44 P.K.GARDEN 44.WALLTAX TROAD, CHENNAI-600 079.
36 NEHRU NAGAR 18.DR.AMBEDKAR COLLEGE ROAD, VYASARPADI, CHENNAI-39
I V AYANAVARAM ZONE
55 AYANAVARAM (Zone) 29.UNITED INDIA NAGAR, AYANAVARAM, CHENNAI-600 023
57 NAGAMMAIYAR NAGAR(S) 1.OFFICERS COLONY,(NEAR POST OFFICE)AYANAVARAM,CH-23
53 NAGAMMAIYAR NAGAR(N) VASANTHA GARDEN MAIN ST.AYANAVARAM, CHENNAI-23
59 MARAIMALAI ADIGAL NAGAR 46.SUBBURAYA 2ND STREET, CHENNAI-600 012
62 KOLATHUR SRINIVASA NAGAR, IIIrd MAIN ROAD, KOLATHUR, CHENNAI-99
51 AGARAM NORTH 238.PAPER MILLS ROAD, SEMBIUM, CHENNAI-600 082 54 AGARAM SOUTH 9.SOMAIAH RAJA STREET, AGARAM, CHENNAI-600 082.
51 SEMBIUM 238.PAPER MILLS ROAD, SEMBIUM, CHENNAI-600 011
52 SRIUVALLUR CORPN. SCHOOL COMPOUND, MADUMA NGR, KABILAR ST, CH-11.
63 VILLIWALKAM-I 99.SOUTH JEGANATHA I MAIN RD, IVth CROSS ST, VILLIWALKAM CH-49
58 PANNER SELVAM NAGAR ASPRIN GARDEN IST STREET, KILPAUK, CHENNAI-600 010 V SHENOY NAGAR ZONE
68 SHENOY NAGAR (Zone) 43.PULLA REDDT AVENUE, SHENOY NAGAR, CHENNAI-600 030 70 KILPAUK TEMPLE STREET, AVADI ROAD, DN.70 OFFICE, KILPAUK, CH-10
73 AMINJIKARAI EAST COLLECTORATE COLONY 6TH CROSS ST, AMINJIKARAI, CH-29 75 AMINJIKARAI WEST 445. PERIYAR E.V.R.ST, D.G.V.COLLEGE COMPOUND CH-106
76 PERIYAR NAGAR 17.SHERFUDEEN STREET, CHOOLAIMEDU, CHENNAI-600 094
75 M.M.D.A.COLONY 62A.PANDIAN STREET, D BLOCK M.M.D.A.COLONY CHENNAI-106 68 VILLIVAKKAM-II 43.PULLA REDDT AVENUE, SHENOY NAGAR, CHENNAI-600 030
65 VIRUGAMBAKKAM-I 44.NATESAN NAGAR 5TH MAIN ROAD, VIRUGAMBAKKAM, CHI-92 65 VIRUGAMBAKKAM-II 44.NATESAN NAGAR 5TH MAIN ROAD, VIRUGAMBAKKAM, CH-92 VI MIRSAHIBPET ZONE
93 MIRSAHIBPET (Zone) 11. BEGUM SAHIB VTH LANE, ROYAPETTAH, CHENNAI- 600 014 83 PUDUPAKKAM 51. CHELLA PILLAIYAR KOIL STREET, CHENNAI 600 014 89 TRIPLICANE 14.A.TULASINGA PERUMAL KOIL IIND LANE, TRIPLICANE, CH-5
87 ZAMBAZAR DEVARAJA MUDALI STREET, IST FLOOR, TRIPLICANE, CHENNAI-5
94 KRISHNAMPET 1. MECCA PURAM MAIN ROAD, CHENNAI- 600 005
82 PUDUPET 22.LONGS GARDEN ROAD, PUDUPET, CHENNAI-600 002
96 ROYAPETTAH 311.T.T.K.ROAD, ROYAPETTAH, CHENNAI-600 014
96 KALAYANI 311. T.T.K.ROAD, ROYAPETTAH, CHENNAI-600 014

Proceedings of 4th
International Conference on Global Business Environment
(ICGBE-2014)
81
VII PERUMALPET ZONE
102 PERUMALPET (Zone) 30.KARIAPPA STREET, PURASAIWALKAM, CHENNAI -600 007
71 GANGADEESWARAN KOIL 15.LOTONG ROAD, POLICE LANE, CHENNAI-600 007
104 CHETPET 1.JAGANNATHAPURAM 2ND STREET, CHETPET, CHENNAI-600 031
109 THOUSAND LIGHT 31.AZIZ MULK IIND STREET, THOUSAND LIGHTS, CHENNAI-600 006 107 PUSHPA NAGAR 1.PUSHPA NAGAR MAIN ROAD, NUNGAMBAKKAM,CH-34
60 AMBAL 74.A.K.SAMY NAGAR, KELLYS, CHENNAI 600 010.
98 CONRANSMITH NAGAR SATCHIDANANDAM STREET, KOSAPET, CHENNAI-600 012
61 PURASAIWALKAM 16.RATHNA SABAPATHY STREET, PURASAIWALKAM, CHENNAI-7 VIII VADAPALANI ZONE
120 VADAPALANI (Zone) 65.ARCOT ROAD, KODAMBAKKAM, CHENNAI-600 024
118 VADAPALANI (E) 3, 10TH CROSS STREET, TRUST PURAM, CHENNAI 600 024.
117 VADAPALANI WEST 1.RAJANGA MATHIYA VEETHI, SALIGRAMAM, CH-24
126 T.NAGAR (S) 4.SIVAGNANAM ROAD, T.NAGAR, CHENNAI 600 017
124 KAMARAJ NAGAR 1.BRINDHAVAN ST, WEST MAMBALAM, CHENNAI-600 033 123 M.G.R.NAGAR 5th AVENUE ROAD, PUDUR, ASHOK NAGAR, CHENNAI-600 083 122 NAVALAR NEDUNCHEZHIAN NAGAR SALIGRAMAM CORPORATION DISPENSARY, CHENNAI-78
122 ASHOK NAGAR 34. 35TH STREET, ASHOK NAGAR, CHENNAI-600 083
114 SATHYAMURTHY NAGAR 30.A.GIRIAPPPA ROAD, T.NAGAR, CHENNAI-600 017
115 TEYNAMPET 40.KAVINGAR BHARATHIDASAN ROAD, TEYN;AMPET, CHENNAI-18
129 C.P.W.D. 8TH STREET, DASARATHAPURAM, CHENNAI-600 093
IX SAIDAPET ZONE 139 SAIDAPET (Zone) 51.JEENIS ROAD, SAIDAPET, CHENNAI -600 015
132 SAIDPAET WEST RAGAVA REDDY COLONY II LINK ST, JAFFER KHANPET, CH-83 137 V.O.C.NAGAR 54.IVTH MAIN ROAD, C.I.T.NAGAR EAST, NANDANAM, CHENNAI-35
133 KUMARAN NAGAR NORTH 1.GOVINDAN ROAD, WEST MAMBALAM, CHENNAI-600 033 135 GUINDY WEST 69.VGP ROAD, SAIDAPET, CHENNAI-600 015
133 KANNAMMAPET 1.GOVINDAN ROAD, WEST MAMBALAM, CHENNAI-600 033 131 KODAMBAKKAM DN.131.OFFICE AYYAVU STREET, M.G.R.NAGAR, CHENNAI-600 078 138 KOTTURPURAM 12.DHANDAYUDHAPANI IIND STREET, KOTTURPURAM, CHENNAI-85 X SANTHOME ZONE
153 VELACHERY SEVA NAGAR, IST ST., GANDHI ROAD, VELACHERY, CHENNAI-42 151 ADYAR 1,BEACH ROAD, NEAR BESANT NGR. BUS STAND, CH.-20 155 THIRUVANMIYUR THIRUVEETHIAMMAN KOIL ST.,THIRUVANMIYUR, CHENNAIA-41 146 SANTHOME (Zone) 14.A.APPU MUDALI IIND LANE, MYLAPORE, CHENNAI-600 004 142 BEEMANNANPET 31. C.P.RAMASAMY ROAD, ALWARPET, CHENNAI-600 018
149 RAJA ANNAMALAIPURAM 17.R.K.NAGAR IInd MAIN ROAD, RAJA ANNAMALAIPURAM, CH-28

Proceedings of 4th
International Conference on Global Business Environment
(ICGBE-2014)
82
An E-learning System for New Employees: A Case Study of Chain Drug Stores
*Kuo-Hung Huang1, Li-Chen Chiu1, Yi-Chun Lin1, Ling-Yu Wei1, Pei-Lin Hsueh1, Ching-Ching Cheng2
1Department of E-learning Design and Management, National Chiayi University, Taiwan 2Institute of Education, Providence University, Taiwan
*[email protected] Abstract. In the wave of digitalization, many companies gradually adopt e-training. This article reports a case study of chain drug stores which expand the branches, recruit many new employees, and endeavor to cut the costs of training. Through implementing the e-learning for training novice employees, the research team cooperated with the human resource department to analyze and design a training system. In order to understand the effectiveness of this system, the researchers conducted an experiment by adopting questionnaires on learners’ attitudes and achievement tests on content comprehension. The results indicated that the employees showed positive attitude toward this e-learning system and performed better after using it. Keywords: human resource, e-learning, e-training, customer service, chain drug store
1. Introduction Over the last years, there has been an increased recognition of the importance of customer satisfaction. In a competitive market of retail sales, the salespeople’s behaviors will generate a great impact on the potential customers’ impression. To enhance customer’s satisfaction, training of the salesperson as a boundary agent is regarded critical. The objective of this research is to design, implement and evaluate a digital training system for the employees in the chain drug stores. As more stores expand all over the island in Taiwan, trainings of novice employees become slow and costly. Delivery of training through technology makes distance learning feasible while not increasing costs dramatically. This article reports a case study of applying e-learning in chain drug stores. 2. Literature Review Many companies decide to adopt computers for human resource development because e-learning presents knowledge in systematic way, as well as meets employees’ needs. For example, training department in Toyota emphasizes integration of curriculum (Goodridge, 2002). E-learning makes the curriculum more learner-centric and interactive by motivating users to learn in adaptive and challenging ways (Sausner, 2004; Rooney & Scott, 2003). To satisfy customers, retail store workers should demonstrate their efforts in the interaction with customers. A good customer service starts from understanding customers’ thinking. Through training, customer service staff develops correct skills (Mouawad & Kleiner, 1996; Grewal & Sharma, 1991; Fine & Gardial, 1990). E-learning provides situated trainings from case-based database. In addition, evaluation become a critical part of the e-learning development (Blanchard & Thacker, 1999). 3. Methodology This study focuses on the process of developing an e-learning system. In order to seek to understand a dynamic, continuously evolving process, the mixed research method design was chosen. Since the ADDIE model was adopted to develop the system (Lee & Owens, 2003), qualitative and quantitative data were collected and analyzed to report the results of this project. Subject matters tests: In order to evaluate how much employees comprehended the content delivered by the e-learning system, a pre-test and a post-test were used before and after using the e-learning. Questionnaires: After using the e-learning, the employees were asked to provide feedbacks regarding their perceptions on the system. The questions include the difficulty level, text size, usability, instruction strategy, and test items. Qualitative data: Being part of business activities, the study process continually evolves and unfolds in naturalistic way. Qualitative research is concerned with process, and understanding the process is more important than looking for an outcome (Mannaz, 1999). In addition, qualitative research is flexible. For business consideration, research schedule sometimes needs to be rearranged due to the unexpected events. To document the efficacy of the activities in the stores, the researchers collected data from questionnaires, interviews, and focus group. The experience of on-site observation also provided the researchers with information on business activities in stores. System Description Analysis: This company is expanding its chain stores and recruiting many new employees. Traditionally, these new employees will be trained in the main drug stores for three months. A senior pharmacist is responsible for the trainings. Paper-based materials are used for learning. These new pharmacists age from 25 to 30. Most of them are first-time workers. They speak Mandarin Chinese and own good computer skills. Each store is equipped with a networked computer. The new employees are able to access the e-learning system through web pages or CDs. Therefore, this e-learning system should be delivered through Internet. Design: The content of the training system is based on the existing training documents, as well as experiences compiled from senior employees. There are five units, namely ‘about company’, ‘organization structure’, ‘job description’, and ‘assessment’. The ‘about company’ unit contains company history, vision, and advantages. The ‘organization structure’ unit contains departments and personnel. The ‘job description’ unit contains regulations, SOPs, and best practices. The ‘assessment’ unit provides learners with questions to answer for comprehension purpose. Development: The materials are developed as many different scenarios on video or animations. Those videos and animations are produced as several files in Flash swf format. The reason for adopting the Flash technology is for the cross-platform consideration. In this

Proceedings of 4th
International Conference on Global Business Environment
(ICGBE-2014)
83
case, those curriculum resources are packaged as CD-ROMs and distributed for customer-service training. In the future, the digital materials can be easily transformed as a web-based training system. From a perspective of the situated learning model, a good way for novice employees to learn is to provide an opportunity of contextual learning. That is, creating an authentic learning environment to prepare the new comers for the involvement of the activities in workplace. For videos in e-learning system, all video clips were recorded at a chain drug store (see Fig.1). Also, animations were produced according the actual scenes in the stores. Fig.1: A screen shot of customer services, including blood pressure measurement and consultations
To present regulations, animations, instead of lists of statements, were created to describe the scenarios as in Fig 2.
Fig.2: A screen shot of animations about regulations in workplace
Procedures were simulated in animations and pictures. For example, cleaning up the doorway is the first task in the morning. As in Fig. 3, this procedure was display in animations. Fig.3: A screen shot of (a) simulation of the SOPs and (b) illustration of eye-catching display

Proceedings of 4th
International Conference on Global Business Environment
(ICGBE-2014)
84
Implementation and evaluation: The analysis of the questionnaires, observation and interviews revealed that this e-learning system changed the employees’ stereotype on training. To evaluate the effects of the e-learning system, 19 employees were asked to test use this system. They proceeded through the training lessons on their own pace. All the employees finish the training program within a week. As in Fig. 4, the results of the pre-test and post-test indicated this system improved employees’ understanding. Fig.4: The test scores before and after using the e-learning system indicated improvement
4. Conclusion The pharmacists in chain drug stores, rather than retails salespeople, provide professional customer services. Being unfamiliar with the company’s products and services, they gradually know how to engagement in daily tasks through this e-learning system. Providing services and health consultation in communities, pharmacists provide consumers with the aforementioned service and contribute to the customers’ positive shopping experience. In addition, their performances are often the variables making a significant impact on the store and the reputation of the chain brand. The training program offers the trainee a sense of being valued by the company and an opportunity of access to some experts who understand the company’s culture, personnel and ways of working. This e-learning system, evidenced by users’ feedback, provides a flexible, supportive, non-threatening source of support in developing skills in customer services. In this case, e-learning confirmedly increased the motivation and effectiveness without increasing costs. References Goodridge, E. (2002). E-learning struggles to make the grade. Information Week, 88, 64-65. Sausner, R. (2004). What happened to e-learning and why? University Business, 7(11), 60-63. Rooney, J. J., & Scott, W. (2003). E-learning: A primer. Association For quality & participation, 26(4), 4-7. Mouawad, M., & Kleiner, H. B. (1996). New developments in customer service training. Managing Service Quality, 6(2), 49-53. Grewal, D., & Sharma, A. (1991). The effect of salesforce behavior on customer satisfaction: An interactive framework, Journal of Personal
Selling and Sales Management, 9(3), 13-23. Fine, L. M., & Gardial, S. F. (1990). The Effects of Self-Monitoring and Similarity on Salesperson Inferential Processes. Journal of Personal
Selling and Sales Management, 10, 7-16. Blanchard, P. N., & Thacker, J. W. (1999). Effective training: Systems, strategies, and practices. Englewood Cliffs, NJ : Prentice Hall, Inc. Lee, W., & Owens, D.L.(2003). Multimedia-Based Instructional Design. New York: John Wiley & Son. Mannaz, M. (1999). An expert teacher’s thinking and teaching and instructional design models and principles: An Ethnographic study.
Educational Technology Research and Development, 46(2), 37-64.

Proceedings of 4th
International Conference on Global Business Environment
(ICGBE-2014)
85
An Empirical Study of Environmental Awareness in the Malaysian Restaurant Industry
*Zahariah Mohd Zain, Jamaliah Mhd Khalili, Muna Wadhiha Mohd Fauzi, Nur Hanifah Ngah Ramli
Universiti Teknologi MARA, Selangor, Malaysia * [email protected]
Abstract: The study seeks to examine the factors that affect environmental awareness in restaurant industries particularly in Malaysia. It will also investigate the interrelationship of these factors with environmental awareness in Malaysian restaurant industries. A motivation of this study comes from the prevalent attitude of unawareness of environmental issues among Malaysian restaurant industries. It has received little attention and the level of implementation of environmental-friendly practices is also quite low. A survey is conducted among 150 restaurant managers. Findings from the preliminary investigation is used to develop questionnaires. There are three key factors which are suppliers’ awareness, customers’ awareness and environmental education which contribute towards the environmental awareness. The results provide support for the hypotheses proposed that all the factors have significant relationship with environmental awareness in Malaysian restaurant industries. The key findings also indicate that supplier environmental awareness is the most influential factor and play a significant role in determining the environmental awareness in the Malaysian restaurant industries. Keywords: environmental awareness: suppliers’ awareness, customers’ awareness and environmental education: restaurant industry: Malaysia
1. Introduction Environmental awareness has long been a catch phrase for those concerned with protecting the air and water, other natural resources and Mother Earth. Today, major industries and businesses of all types and sizes are becoming better corporate citizens by implementing environmentally friendly or what are popularly known as Green Processes and Purchasing Programs. The restaurant and food service industry is no exception (Griffin, 2005). The potential of harming the lives of all biological beings on earth is relations to the widely acknowledged of the greenhouse effect pollution. The aim of this study is to find factors that are most important in explaining different levels of environmental awareness among restaurant industries in Malaysia. In reaction to bind the impact of economic activity on the natural ecology, the World Commission on Environment and Development in 1987 released a report entitled "Our Common Future" with the primary aim of advocating best practices among enterprises to achieve sustainability socioeconomics development (Puspavathy, Mahendran & Ravindra, 2010). Despite several NGOs like Yayasan Anak Warisan Alam (YAWA), World Wide Fund (WWF), Malaysian Nature Society (MNS) and Sahabat Alam Malaysia (SAM) hardly worked to raise Malaysian environmental awareness, environment still remain as 'second class' issues. The poll which was previously conducted by New Straits Times (base on Mac 10, 2007) about the most important issues that the Malaysian should deal with are showing that public safety is on the rank, followed by consumer price, illegal immigrant, employment and environment stays at the very end of the list. Tourism sector is the one of the largest economies sector that depends on and impact opposed the natural habitat. Since the long-term violability of the tourism sector depends on the preservation of these ecosystem, firms in the tourism sector and related industries have incorporated environmental considerations as part of their corporate strategy (Puspavathy et al, 2010). A key related industry to the tourism sector is restaurants industry. In order to achieve the sustainability if the restaurants industry, it is important to raise environmental awareness, promote the best practices and enable implementation of environmental programs. In order to accomplish these aims, restaurant's owners must be ready to act in an ecologically friendly manner which requires them to have sound knowledge and awareness of their company operating activities and its impact on the environment. 2. Literature Review Environmental awareness: Environmental awareness can be defined as the growth and development of awareness, understanding and consciousness toward the biophysical environment and its problems, including human interactions and effects (David, Jessica & Catherine, 2009). People must think "ecologically" or in terms of an ecological consciousness. The three of key elements of environmental awareness is the combinations of motivation, knowledge and skills. It has to be stressed that environmental awareness influences several spheres of an individual's life. The level of individual's choices in private life will affect by the public environmental awareness. Professional environmental awareness exerts an impact on the actions in working life, and political environmental awareness has an influence on voting and political behavior. Therefore, environmental information targeted the general public, professionals and politicians audiences. The general public, which is often passive as a recipient, professionals, who are often motivated to actively seek out the relevant environmental information needed for their work and the politicians, who need refined information as raw material for their proposals and as a basis for their decisions. Suppliers: Supplier relationship oriented behaviors (SROBs) of buying firms should be encouraged because SROBs lead to high performance of the buying firms through suppliers' improved input to the firm's product and service offerings (Robert, Steven, Robert & Steven, 2002). This show that supplier has related or affect to restaurant's performance. In addition, he stated that few studies have addressed how supplier performance in product and service quality (i.e., SURP) affects restaurant firms' performance in areas such as product and service quality (i.e., PRSQ) and FINP. Few companies use any structured analysis to evaluate suppliers along environmental dimensions (Robert et al., 2002). Increasingly, managers and policy makers are coming to realize that purchasing can significantly affect corporate performance along environmental dimensions. The products that firms acquire through the purchasing function can affect the level of waste and pollution generated. Buyers must purchase goods and services from those suppliers that are able to produce these products at the lowest costs, highest quality and within the shortest lead time, but that are also environmentally responsible in managing their associated processes. Customers: Customer relationships also have been widely advocated in the service industry because customers seek ongoing relationships with service providers not only to reduce their perceived risk in evaluating intangible services but also to pursue the

Proceedings of 4th
International Conference on Global Business Environment
(ICGBE-2014)
86
interpersonal focus of services. The drivers that influence innovative foodservice products are multifaceted and challenging, as consumer tastes and food trends change all the time (Chang, Lee & Tseng, 2008). Some of the most successful and largest restaurant chains are part of the quick-service restaurant (QSR) segment, such as McDonald's, Pizza Hut, Subway and KFC. Smoking is the bad habit that will affect the environment. Restaurant managers were asked what they thought their customers' opinions on smoking in restaurants might be. A comparison of their responses to the opinions expressed by patrons on the night of the survey show that restaurant managers underestimate the demand for restrictions on smoking. Half of the managers thought that more than 25% of their customers would want smoking to be allowed anywhere whereas only 3% of patrons actually said they would want this (Anida, Azilah & Mohd Salehuddin, 2010). Every customer has their own opinion toward this. In order to fulfill customer satisfaction, the restaurant manager must know the level of awareness of their customer. This will affect their business operation. People eat in particular places such as kitchens and dining rooms and employ specific object, for example chairs, utensils in the process of eating, and these components (places and objects) of the built environment shape food intake. As a result, built environment will influence the decisions about the types and amounts of food selected and eaten that determine energy intake and influence obesity (Abby, 2009). Important role in shaping customer evaluations of service recovery experiences and justice perceptions plans are widely accepted (Chang et al. , 2008). Environmental Education: Media is one of an important role to spread the information about an environment (Hale, 1995). The different media sources considered can be categorized, such as mass media, institutional media and traditional media. Examples of mass media are radio, television, newspaper and magazines. These tools are important because many Malaysia spend their time in watching television and listening radio. So, they can get the environmental information through these tools. In addition, institutional media such as school, government officials or village leaders and traditional media such as family members, other relatives, friends and NGO works also can give information about the important of environment awareness in our daily life. Changing is impossible without participation of employee. The participation is impossible without understanding. In the organizations, participation that will lead to better environment performance relies on utilization of knowledge (North & Daig, 1996). The National Round Table on the Environment and the Economy stated that in order to help employees and managers understand their role and responsibilities in implementing sustainable development in corporation, education and training must be vital (Hale, 1995). Sustainability education tool can be used to increase employee awareness of sustainability issues encountered by their organization while prompting them to consider their role and potential contribution. In order to communicate their employees' lasting knowledge of not only the organization's environmental management scheme and environmental policy but also of the organization' environmental impact, the organizations should implement an environmental awareness training program (Hale, 1995). The benefits of environmental awareness education and training in business are well known to include: a feeling of ownership among employees towards the success of the company, an improved ability to retain qualified employees, the ability to attract high achieving graduates and the improved status that comes from working for a company that shows care for the environment (Schneider & Bowen, 1985). As conclusion, it shows that suppliers' awareness, customers' awareness and environmental education affect the environmental awareness in restaurant industry in Malaysia. All the factors have positive relationship with environmental awareness in restaurant industry in Malaysia. 3. Methodology The type of investigation is based on quantitative study. The information of this study was mainly obtained by conducting a survey on restaurants managers. A total of 150 set of questionnaires will be distributed to restaurant managers in Malaysia. The locations of this research are Pahang, Johor and Selangor. The time frame of this survey is from early May to the end of June. Researcher focused on the primary and secondary data in order to gather information in completing the research. Primary data is obtained from questionnaire surveys that are distributed to respondents. Meanwhile, secondary data collected via online sources, websites, journals and articles. All primary data are processed and analyzed using Statistical Package for Social Science Version 18 (SPSS). The questionnaire for this study has three sections. Section A focuses on the demographic of the respondents (by using nominal scale). Meanwhile, Section B would primarily focuses on factors that affect the environmental awareness. The questionnaire is rating using Likert scale rating from 1 to 5 which valued 1 as equal to strongly disagree, 2 as equal to disagree, 3 as equal to neutral, 4 as equal to agree and 5 as equal to strongly agree. Section C would be captures the opinion and recommendation of restaurant managers as the respondents of this research. Type of question use is open-ended question. The manager had been asked on the appropriate way to raise the level of environmental awareness among restaurant managers. 4. Results and Discussion Demographic Profile: The total numbers of respondents are 150. Based on the findings, it shows that 58 percent of respondents are female while remaining 42 percent are male. 71 percent of respondents who participated in this research are between the 41 to 50 years that makes up the majority. 64 percent of respondents are qualified up to secondary school. The larger proportions of the respondents are Malays with a percentage of 78 percent. The rest are Chinese and Indians which are 13 percent and 9 percent respectively. Generally, it is expected that the good estimated regression equation will explain the variation of the dependent variable in the sample precisely. If it does, the estimated model fits the data well. The simple measure of fit that commonly used is coefficient of determination, R2 and adjusted R2. A value of R2 close to one shows an excellent overall fit, whereas a value near zero shows a failure of the estimated regression equation to explain the dependent variable. According to the Table 2, the R2 which is 0.470 can be considered as low as it lowers than 0.8. This shows that 47.0% of variation of the environmental awareness in restaurant industry in Malaysia can be explained by all the independent variables. The adjusted R2 is 0.459 and shows that 45.9% of the variation of the environmental awareness in restaurant industry in Malaysia can be explained by the all independent variables after taking into account the degree of freedom.

Proceedings of 4th
International Conference on Global Business Environment
(ICGBE-2014)
87
Table 1: Demographic Profile
Grouping Variables Percent
Gender
Male 42
Female 58
Age
31 to 40 13
41 to 50 71
51 to 60 10
61 and above 6
Educational Level
Never been to school 4
Up to primary school 17
Up to secondary school 64
Diploma/certificates 15
Race
Malay 78
Chinese 13
Indian 9
Total 100
Figure 1: Estimated Equations for Multiple Regression Overall Fit of Estimated Model Table 2: Overall Fit Of Estimated Model
Model R R Square Adjusted R Square 1 0.685 0.470 0.459
Reliability Test: Reliability analysis allows the researcher to test whether each of the independent and dependent variables are reliable or not for this study. One commonly used method is Cronbach's alpha, which is based on the average correlation of items within a test if the items are standardized.
EA = a + β1 SA + β2 CA + β3 EE EA = -0.396 + 0.559 SA + 0.093 CA + 0.167 EE
(0.297) (0.062) (0.047) (0.060) Observation : 150 R2 : 0.470 Adjusted R2 : 0.459 F-statistic : 43.075 Durbin-Watson Statistic : 2.119 Notes: 1. Significances at 5% Significance Level
2. SA = Sippliers Awareness CA= Customer Awareness EE= Environmental Awareness

Proceedings of 4th
International Conference on Global Business Environment
(ICGBE-2014)
88
Table 3: Cronbach's Alpha Coefficient Size
VARIABLE CRONBACH'S ALPHA
N OF ITEMS
Supplier's Environmental Awareness .792 3
Customer's Environmental Awareness .612 3
Environmental Education .758 3
Table 3 show the reliability of the independent variable which are supplier environmental awareness, customer environmental awareness and environmental education. The reliability is measure by measuring the size of Cronbach's Alpha. For supplier environmental awareness and environmental education, the reliability is good because the size of Cronbach's Alpha for tese independent variable is more than 0.7 and less than 0.8. Customer environmental awareness have moderate test pf reliabilty because it's Cronbach's Alpha is less than 0.7. Table 4: t-TEST
Coefficient t-test
Sig/p-value
Constant -1.332 0.185
Suppliers' Environmental Awareness 9.049 0.000
Customers Environmental Awareness 1.988 0.049
Environmental Education 2.792 0.006
Supplier Environmental Awareness H0: β1 ≤ 0, there is no significant relationship between suppliers' environmental awareness and environmental awareness in restaurant industry H1: β1 > 0, there is significant relationship between suppliers' environmental awareness and environmental awareness in restaurant industry. t- statistic = 9.049 The t-statistic = 9.049 is greater that critical value of t-statistic = 1.655, the null hypothesis is rejected. Thus it shows that the supplier environmental awareness is significant in determining the environmental awareness in restaurant industry at 5 percent confidence level. If using p-value approach. The significant relationship determine by if p-value less than significance level (⍺ = 0.05), reject H0. Since p-value = 0.000 is less than ⍺ = 0.05, so the null hypothesis is rejected. As the result, there is a significant relationship between suppliers' environmental awareness and environmental awareness in restaurant. Customer Environmental Awareness H0: β1 ≤ 0, there is no significant relationship between customers 'environmental awareness and environmental awareness in restaurant industry H1: β1 > 0, there is significant relationship between customers' environmental awareness and environmental awareness in restaurant industry t- statistic = 1.988 t-critical value (5%,146) = 1.655 The t-statistic = 1.988 is greater that critical value of t-statistic = 1.655, the null hypothesis is rejected. Thus it shows that the customer environmental awareness is significant in determining the environmental awareness in restaurant industry at 5 percent confidence level. If using p-value approach. The significant relationship determine by if p-value less than significance level (⍺ = 0.05), reject H0. Since p-value = 0.049 is less than ⍺ = 0.05, so the null hypothesis is rejected. As the result, there is significant relationship between customers' environmental awareness and environmental awareness in restaurant. Environmental Education H0: β1 ≤ 0, there is no significant relationship between environmental education awareness and environmental awareness in restaurant industry H1: β1 > 0, there is significant relationship between environmental education awareness and environmental awareness in restaurant industry t- statistic = 2.792 t-critical value (5%,146) = 1.655 The t-statistic = 2.792 is greater that critical value of t-statistic = 1.655, the null hypothesis is rejected. Thus it shows that the customer environmental awareness is significant in determining the environmental awareness in restaurant industry at 5 percent confidence level. If using p-value approach. The significant relationship determine by if p-value less than significance level (⍺ = 0.05), reject H0. Since p-value = 0.006 is less than ⍺ = 0.05, so the null hypothesis is rejected. As the result, there is significant relationship between environmental education and environmental awareness in restaurant.

Proceedings of 4th
International Conference on Global Business Environment
(ICGBE-2014)
89
Table 5: Coefficient of Correlation (r)
Environmental Awareness In Restaurant Industry
Suppliers' Environmental Awareness
Customers Environmental Awareness
Environmental Education
Environmental Awareness In Restaurant Industry
Pearson Correlation
1 .639 .306 .369
Sig. (1-tailed)
.000 .000 .000
N 150 150 150
**. Correlation is significant at the 0.05 level (1-tailed).
There is a significant relationship between the environmental awareness in restaurant industry in Malaysia and supplier environmental awareness (IVI) in which the value is 0.639. The value of 0.306 shows that there is a significant relationship between the environmental awareness in restaurant industry in Malaysia and customer environmental awareness (IV2).There is a significant relationship between the environmental awareness in restaurant industry in Malaysia and environmental education (IV3) in which the value is 0.369. As a conclusion, it indicates that the factor that has the most influence on the environmental awareness in restaurant industry in Malaysia is supplier environmental awareness. F-Test: The F-test is a formal hypotheses test that is designed to deal with a null hypothesis that contains multiple hypotheses or a single hypothesis about a group of coefficients.
H0 : β1 = β2 = β3 = 0 H1 : at least one of partial slope coefficient is non-zero F- statistic = 43.075 F-critical value (5%, 2,147)
The result shows that the F-statistic is greater than the F critical value, where F-statistic = 43.075 > F with the critical value = 3, and F-statistic value falls in the shaded area which is the rejection region. Therefore, the null hypothesis is rejected. Hence, all independent variables are significant in determining the environmental awareness in restaurant industry in Malaysia. Multicollinearity: The problem multicollinearity occurs when the explanatory variables are nearly or high correlated. The problem happened probably because the researcher put two variables that nearly similar meaning in explaining the dependent variable. Simple Correlation Coefficient and the Variance Inflation Factors (VIFs) are the methods that commonly used to detect the multicollinearity problem. One way to detect severe multicollinearity is to examine the simple correlation coefficient between the explanatory variables. If an r is high in absolute value, then these two particular independent variables are quite correlated and that multicollinearity is a potential problem.
Table 6: Variance Inflation Factors
Variance Inflation Factors
Independent Variables VIF
Suppliers' Environmental Awareness 1.154
Customers Environmental Awareness 1.083
Environmental Education 1.181
The Variance Inflation Factors (VIF) of all the independent variables which are suppliers' environmental awareness, customers' environmental awareness and environmental education is less than 5 which means that the multicollinearity does not exist. Autocorrelation: Autocorrelation frequently will be detected through a test called Durbin Watson test, in which the d-value lie between 0 to 4 and a good model will indicate the d-value around 1.5 to 2.5.
H0: p < 0 (no autocorrelation) H1: p > 0 (negative autocorrelation) Durbin-Watson = 2.119 DL = 1.69 DU = 1.77 (at 5%, n = 150, k = 3)
Since the d = 2.119 lies between DL and DU, where DL = 1.67 < d = 2.119 < DU = 1.77, so the null hypotheses is not rejected. The autocorrelation does not exist. 5. Conclusion and Recommendations In general, the objective of the study is to determine the relationship between the dependent variables, environmental awareness in restaurant industry in Malaysia and its independent variables which are suppliers’ environmental awareness, customers’ environmental awareness and environmental education. From the findings, it shows that 47.0% of variation of the environmental awareness in restaurant industry in Malaysia can be explained by all the independent variables. For supplier environmental awareness and environmental education, the reliability is good because the size of Cronbach’s Alpha for this independent variable is more than 0.7 and less than 0.8. Customer environmental awareness has moderate test of reliability because its Cronbach’s Alpha is less than 0.7.
Proceedings of 4th
International Conference on Global Business Environment
(ICGBE-2014)
90
Furthermore, there is a significant relationship between suppliers’ environmental awareness, customers’ environmental awareness and environmental education with environmental awareness in restaurant industries. It also indicates that the factor that has the most influence on environmental awareness in restaurant industry in Malaysia is supplier environmental awareness. In addition, all independent variables are significant in determining the environmental awareness in restaurant industry in Malaysia. For multiple regression problems, multicollinearity and autocorrelation does not exist. These can be shown by the Variance Inflation Factors (VIF) and Durbin Watsons respectively. All of these findings are consistent with most studies done by the previous researchers. It is recommended that one way to increase environmental awareness in restaurant industry is by giving rewards to restaurants that had fulfilled the environmental quality in their management. Government must reward the restaurant managers, for example they could give a cash incentive to the cleanest restaurant. Future study should consider using more robust statistical methods to assess the impact of various factors on environmental awareness and environmental management practice in Malaysian restaurant industries. To ensure that the Malaysian restaurant industry remains regionally and globally competitive, efforts to enhance environmental awareness should be intensified. References Abby, G. E. (2009). Enviromental Influences on Development of Type 2 Diabetes and Obesity: Challenges In Personalizing Prevention And
Management. 3(4): 727-734. Anida, Azilah & Mohd Salehuddin. (2010). Resposiveness of Restaurant Towards The Implementation of Environmental- Friendly
Practices. Vol 3, 2. Chang, H. S., Lee, J.C. & Tseng, C.M. (2008). The Influence of Service of Service Recovery on Perceived Justice Under Different Involvement Level. Journal of Management. Vol 4: 57-82. David, Jessica & Catherine. (2009). An Empirical Study Of Environmental Awareness And Practices In Smes. Journal of Business Ethics,
84, 45-63. Griffin, W. R. (2005). Greening Your Restaurant. President Cleaning Consultant Services.
http://www.cleaningconsultants.com/pages/articles/artgreerest0605.pdf Hale, M. (1995). Training for Environmental Technologies and Environmental Management. Journal of Cleaner Production. 19-23. New Straight Times (2007). Spread the Environmental Awareness to young Malaysia. http://misyakir.blogspot.com/2008/03/spreading-subtantial-environmental.html North, K. & Daig, S. (1996). Environmental Training in British and German Companies. 247 Puspavathy., Mahendran. & Ravindra. (2010). Evironmental Awareness In The Malaysia Hotel Industry. Economic Bulletin, 11, 51-69. Robert, H., Steven, V. W., Robert, S. & Steven, A. M. (2002). Applying Environmental Criteria To Supplier Assessment: A Study In The Application Of The Analytical Hierarchy Process. Journal of Operational Research. 141 (1), 70-87. Schneider. B. & Bowen. D. E. (1985). Employee and Customer Perceptions of Service In Banks. Journal Of Applied Psychology.
Proceedings of 4th
International Conference on Global Business Environment
(ICGBE-2014)
91
The effect of the incentive system on job performance for the employees of tourist hotel industry in Taiwan
*Su-Ming Huang1,2, Wen-Hsiang Lai1
1Feng Chia University, Taichung, Taiwan 2Instructor, Tatung Institute of Commerce and Technolog, Taiwan
*[email protected] Abstract: Tourism industry is regarded as the star in the 21st century, the reasons are not only creating the opportunities for employment , but also earning foreign exchange with significant benefits. Moreover, tourism industry plays an important role on the local economical society developement. According to Tourism Bureau with the statistical data, all the employees of the tourist hotels in Taipei city , the New Taipei city, Taichung city and Kaohsiung city excess nearly fifty percent of employees of the hospitality industry in Taiwan. Therefore, this study will focus on the employees in the tourist hotels (including international tourist hotels and general hotels in the four biggest cities in Taiwan. There are 200 questionnaires will be conducted. Amos will be an analytical tool. SEM explains the causal relationship among variables to verify the hypothesis. The purpose of this study is to propose and test an integrative model of job performance by conceptualizing that job performance is influenced by job satisfaction and incentive system. It explores the relationship among the incentive system, job satisfaction and job performance and proves that job satisfaction is the mediator role in the research framework. Keyword: tourism hotel industry、job performance、incentive system、job satisfaction
1. Introduction Background: Tourism industry is regarded as the star in the 21st century, the reasons are not only creating the opportunities for employment , but also earning foreign exchange with significant benefits. Moreover, tourism industry plays an important role on the local economical society development. To this end, the Executive Yuan ,Taiwan sets the fifth sub-projects of the "Challenge 2008 - National Development Plan" to be "Doubling Tourist Arrivals Plan". To this reason, the quality requirements of the hotels will be one of the key issues in the future tourism industry. Service quality is the successful key concept , it will depend on the ability to provide highly steady service quality and satisfying customers’ experience . Therefore, the behavior of employees can be regarded as the ultimate key for the job performance. According to the statistics of Tourism indicated Bureau on February 2012 (see Table 1), the number of tourist hotels are very significant growth trend in past 12 years under the tourism policy of the government and the global tourism and leisure tourism policy fueled by the tide, Furthermore, the existing applications for tourist hotels have seven; the preparing establishment hotels have 39, the amount of investment is expected to NT 73,788,540,082. Table 1: 2001-2012 the number of tourist hotels in Taiwan
YEAR 2001 2002 2003 2004 2005 2006 2007 2008 2009 2010 2011 2012 NUMBER 81 83 86 87 87 87 90 90 94 96 105 106
By the above official statistics, the future of Taiwan tourist hotel industry will create more job opportunities. Due to the hospitality industry is a high labor-intensive industry and flourishing in nowadays, these reasons make the demand for more staffs in doubled. In particular, tourist hotels provide the caterings, accommodations, recreational facilities and other multi-function, they create employment opportunities beyond imagination. But the operating characteristics of the hospitality industry are long working hours, many requirements and regulations, the mention above, they enable employees prone to burnout, and even lead to resignation, increased manpower shortages year by year. Therefore, it is a worth pondering issue that how to improve job performance by the employees' job satisfaction in the tourist hotels by effective incentive system. Research Objective: According to Public Agenda Forum (1995), conducted for the workforce study in the United States, shows that 75% of the employees admit that they work could be more efficient than they are at present, their performance is not satisfactory because they are not subject to "motivate”. This study will focus on the hotel industry employees to explore that incentive system is able to increase higher employee job satisfaction, thereby creating job performance improvement. Based on the above motivation, this study expected to achieve the following three objectives: 1) to explore the opinion of the tourist hotel industry employees on incentive system . 2) to explore the relationship among incentive systems, job satisfaction and job performance. 3) to prove if job satisfaction is the mediator role. 2. Literature Review Definition of tourist hotel: Tourist hotels definition: refers to "international tourist hotels" and "General tourist hotels."( 8 October 1999 the Ministry of Communications and the Ministry of Interior of Taiwan issue provisions). Incentive theory: Traditionally job satisfaction is relatively satisfied with the results of the work, there are only two results that are satisfaction and un-satisfaction. Herzberg (1959) proposed “Motivation-Hygiene Theory”, also known as “Two Factors Theory.” By the point of view, shaping satisfied employees has to make use of appropriate incentive mechanism .It will reach the efficient performance. Incentive system: Incentive system is able to stimulate employee motivation a way, from a business point of view, the company in order to achieve organizational goals or improve employee productivity by adopting various methods can be called the incentive system. In order to clearly define incentive system, the following refers to different view of the scholars:

Proceedings of 4th
International Conference on Global Business Environment
(ICGBE-2014)
92
a)Robbins (2001), incentive system was paid into the intrinsic rewards and extrinsic rewards. Intrinsic rewards including participation in decision-making, job autonomy, greater responsibility and personal growth. Extrinsic rewards can be divided into two :(1) the financial rewards (eg, bonus, bonus, etc.).(2) the non-financial rewards (such as: welfare, holidays, etc.). b) Urbanski (1986), incentive system was divided into four categories, namely, money-based incentive system, travel system, the system of four prizes and commendations system. c) Johnston, Boles & Hair (1987), for the most detailed classification of incentive systems, sales incentive system was divided into thirteen categories. namely: a recognition system, three individual performance bonus system, travel system, commission system, payroll system, promotion system, education and training system , goal management , specify the quota system , business people meeting, announced results system, department (or group) performance bonus system. d)Abrantt & Smythe (1989) ,the clerk of the incentive system was divided into two categories, one is a monetary remuneration (eg: commissions, bonuses, profit sharing and other cash compensation); the other is non-cash compensation (such as: prizes, travel awards and sales contests). e) Churchill (1990) ,reward system was divided into two categories: one is the "financial rewards"; the other is "non-financial rewards". f) Greenberg & Liebman (1997), by meeting the needs of different levels, the clerk of the incentive system will be divided into three categories:(1) the substance-based compensation(2) the social-Based compensation.(3) the activity- based compensation. In this study, the point of view of Robbins (2001) was adapted. as the basis for incentive system dimensions which are the intrinsic and extrinsic rewards. Job satisfaction: Hoppock (1935) first proposed the concept of job satisfaction , then an enthusiastic response by the majority of scholars , then job satisfaction refers to an individual 's emotional attitude on the job or orientation , subsequent researchers then this concept based on the development of different discourse , and can be divided into the following three categories: 1) the comprehensive definition: The concept of job satisfaction will make a general explanation , without involving job satisfaction -oriented , the causes and processes. If Kalleberg (1977) that the job satisfaction as a single concept , the worker can work in various configurations to meet the surface to be balanced and satisfied , form an overall satisfaction. 2) the reference architecture says: Job satisfaction is a personal reference architecture for the job based on their characteristics to explain the results obtained , therefore , whether a particular work situation affect job satisfaction, quality of work also involves a comparison , the comparison with others , personal ability and past experience many other factors. 3) the definition of expectation: The degree of job satisfaction as a personal work environment in the actual remuneration paid for and expected to be obtained depending on the pay gap , the gap is smaller, the higher the level of satisfaction ; Conversely, the lower the level of satisfaction . This research will adopt the viewpoint of Kalleberg (1977) that job satisfaction as a single concept , the worker will be able to work in different configurations to meet and do not meet face to be balanced , does not involve job satisfaction -oriented , with the reasons for the formation process of the formation of job satisfaction is the overall feeling satisfied . Job performance: In general, empirical studies , performance studies often because research object dimensions differ , mainly due to the industrial organizational goals , organizational structure is different, they adopt different performance objectives. Therefore, performance refers to the organization of a program of action to achieve their goals , and how far to reach a specific target level for a measure. George (1990)claimed that the performance evaluation of service enterprises in addition to concrete outcomes - service performance , but should also include assessment of the performance -related behavior . Newman & Maylor (2002) measure of job performance indicators will be divided into behavioral performance ( employee attendance and retention rates , work or service quality ) and service performance ( customer satisfaction and re- visit rate ) . Lings (2004) compilation of relevant literature , the job performance measurement indicators are divided into behavioral performance ( employee retention , employee motivation and morale , employee satisfaction, organizational commitment , work or service quality ) and service performance ( customer satisfaction , financial performance ) . Borman et al. (1993) proposed job performance is divided into two categories : task performance and contextual performance. The research will take the point of Borman et al. (1993),task performance and contextual performance are two variables as measurement indicators for job performance. Incentive system, job satisfaction and job performance related research Incentive system and the relationship between job satisfaction: Tzeng (2002), explore the incentive system and the relationship between job satisfaction, and the results are positively correlated. That is, the implementation of incentive systems, job satisfaction has a positive enhancement of the role. Therefore, formulating hypothese1. H1:「Incentive system」and「Job satisfaction」has a significant positive correlation. Job satisfaction and job performance related research: On job satisfaction and job performance studies, many scholars empirical results show positive effects on job satisfaction, job performance, scholars empirical results show positive impact on job satisfaction, job performance or job satisfaction and job performance interact each other. Babin & Boles (1996) for the U.S. restaurant staff survey found that a significant positive impact on job performance job satisfaction. Hochwarter et al. (1999) for the U.S. hotel industry staff survey found that job satisfaction and job performance significantly affect each other. Allred (2001) for U.S. banks and credit unit staff conducted a questionnaire survey and found a significant positive impact on job satisfaction, job performance. Newman & Maylor (2002) for the UK hospital nurse conducted a questionnaire survey and found a significant positive impact on job satisfaction, job performance. Ming-jie (2004) showed that job satisfaction and job performance was a significant positive correlation. In other words, employees’ job satisfaction is higher , then his " job performance is better .Therefore, formating hypothesis2 and. hypothesis3. H2:「Incentive system」 has directly impact on 「Job performance」.
H3:「Job satisfaction」has positive impact on「Job performance」.Job satisfaction is higher, then the job performance is better.

Proceedings of 4th
International Conference on Global Business Environment
(ICGBE-2014)
93
3. Methodology Sample: According to Tourism Bureau with the statistical data, all the employees of the tourist hotels in Taipei city , the New Taipei city, Taichung city and Kaohsiung city excess nearly fifty percent of employees of the hospitality industry in Taiwan. Therefore, this study will focus on the employees in the tourist hotels (including international tourist hotels and general hotels)in the four biggest city in Taiwan. There are 200 questionnaires will be conducted. Statistical Methods: AMOS will be an analytical tool. SEM analysis explains the causal relationship among variables to verify the hypothesis. That is to say, to explore the relationship among the reward system, the different personality traits, job satisfaction and job performance. Moreover, to prove whether the job satisfaction will be the mediator role in the research framework. Research framework Fig.1 The proposed model of the reseach Hypotheses: This study proposes the following assumptions: H1:「Incentive system」and「Job Satisfaction」has a significant positive correlation.
H2:「Incentive system」 has directly impact on 「Job performance」.
H3:「Job satisfaction」has positive impact on「Job performance」.Job satisfaction is higher, then the job performance is better. 4. Result Data collection: Two hundred questionnaires were initially distributed and 181 usable data were obtained. (Table 2) Table 2: Demographic characteristics and response of the sample n=181
Frequency %
Gender Male Female
60 121
33 70
Age
20~30 31~40 41~50 50above
104 47 28 2
57 27 15. 1
Education
High school graduate Bachelor’s degree Master’s degree (above)
66 110 5
36 61 3
Level of position basic mid high
113 62 6
63 34 3
Reliability &Construct validity: Instrument reliability was tested using Cronbach’s a technique and all values ranged from 0.59 to0.86 for the Incentive system Q items ,0.85–0.93 for Job Satisfaction and for job performance, providing internal consistency. Factor loadings for Incentive system and, Job Satisfaction and job performance were in the 0.62~1.00 range, 0.30~0.62 range and 0.55~0.80 ,respectively ,providing construct validity.
Overall structural model fit: The hypothesized model is tested employing structural equation modeling using AMOS. The over all fit of the model is acceptable(x2 = 30.39, df= 11(p-value = 0.0014),GFI = 0.93, AGFI = 0.83, NFI = 0.91, CFI=0.94, RMSEA = 0.056, RMR = 0.02). This mode intrinsic good fit, and the overall fit indicators have approached or reached the standard.On the whole, this study overall structural model fit is good. All the hypothesized paths are supported except one paths (i.e., incentive system-job performance). In this study, structural equation model path coefficients and statistical significance, as shown in Table3.
Job Satisfaction
Job performance
1. Task performance
2.Contextual Performance
Incentive system
1.Intrinsic rewards
2.Extrinsic rewards
H1 H3
H2

Proceedings of 4th
International Conference on Global Business Environment
(ICGBE-2014)
94
Table 3: Standardized parameter estimates of the hypothesized paths Hypothese path coefficient Result H1 H2 H3
Incentive system->Job Satisfaction
Incentive system->Job performance
Job Satisfaction->Job performance
0.67* -0.28
0.71*
Supported Rejected Supported
*p<0.05 Fig.2: Summary of results in the model
As shown in Table 3 and Fig. 2, incentive system has positive impact on job satisfaction, supporting H1. The effect of job-satisfaction is found to be significantly positive on job performance as wel,supporting H3. Incentive system did not have a significant effect on job performance, opposing the initial assumption,H2. The results indicate that incentive system have a positive direct relationship on job satisfaction. And incentive system has an impact on job performance through jobs satisfaction, because incentive system did not have a significant effect on job performance. Therefore, the study can prove job satisfaction is a mediator role. Theoretical and managerial implications: From a theoretical perspective, the contribution of this study is the integrative model of job performance development process by incorporating the incentive system, job satisfaction. From a managerial perspective, it is worth noting that job performance is based on both job satisfaction and incentive system. Job performance results from job satisfaction that is from incentive system. In other words, managers must understand the result of this study indicates that high job performance comes from high job satisfaction from incentive system. The employees in tourism industry still need motivation as the same as others. Limitations and suggestions for future studies: As funding for research and time constraints, could not comprehensive for all tourist hotels in Taiwan to do research. Thus, the sample may not be representative of a comprehensive analysis of information. We suggest future research that personality traits will be explored to prove whether it has the effect of interference between incentive system and job satisfaction. References Abrantt, R. and Smyth, M. A (1989)Survey of Sales Incentive Programs, Industrial Marketing Management, Vol.18, 209-214. Allred, A. T. (2001). Employee evaluations of service quality at banks and credit unions. The International Journal of Bank Marketing,
19(4/5), p179-185. Babin, B. J., & Boles, J. S. (1996). On the front lines: Stress, conflict, and the customer service provider. Journal of Business Research,
37(1), p41-50. Borman, W. C., & Motowidlo, S. J. (1993). Expanding the criterion behavior and contexual performance, In N. schmitt, W. C. Borman, &
Associates, Personnel Selection in Organization, San Francisco: Jossey-Bass, p.71-98. George, W. R. (1990). Internal marketing and organizational behavior: A partnership in developing customer-conscious employees at
every level. Journal of Business Research,20, 63-70. Hochwarter, W. A., Perrewe, P. L., & Ferris, G. R. (1999). Job satisfaction and performance: The moderating effects of value attainment and
affective position. Journal of Vocational Behavior, 54, 296-313. Johnstone M.,Boles J. & Hair J(1987)’’Motivation and Supervision of the Sales Force’’,Working Paper No.87-3, Department of
Marketing,Louisana State University,. Kalleberg, A. L. (1977), "Work Value and Job Rewards, A Theory of Job Satisfaction. "American Sociological Review. 42. Lings, I. N. (2004). Internal market orientation construct and consequences. Journal of Business Research, 57, 405-413. Newman, K., & Maylor, U. (2002).Empirical evidence for the nurse satisfaction, quality of care and patient satisfaction chain. International
Journal of Health Care Quality Assurance, 15(2), 80-88. Tzeng, H. M., Ketefian, S., & Redman, R. (2002). Relationship of staff nurses’ strength of organizational culture, job satisfaction, and
inpatient evalution with nursing care. International Journal of Nursing Studies, 39(1), 79-84. Urbanski A(1986). , Incentives Get Specific, Sales and Marketing Management, Apr,P98-P.102, Book Reference Campbell, J. P. (1990). Modeling the performance prediction problem in industrial and organizational psychology, In M. D. Dunnette & L.
M. Hough (Eds.). Handbook of industrial and organizational psychology. Churchill(1990), Sales force management 3rd ed). New York: McGraw-Hill. Greenberg,J. & Liebman, M.’(1997), Incentives’: The Missing in Strategic.
Incentive
system
Job satisfaction Job
performance
0.55 0.75
-0.28

Proceedings of 4th
International Conference on Global Business Environment
(ICGBE-2014)
95
Hoppock, R(1935). Job Satisfaction, N. Y. Harper & Brother. Herzberg(1959). The motivation to work. New York: John Wiley and Sons. Robbins(2001), S. P, Organizational Behavior, 9th, Prentice Hall.

Proceedings of 4th
International Conference on Global Business Environment
(ICGBE-2014)
96
The Mediating Effect of Supply Chain Integration on the Relationship between Information Technology, Trust and Firm Performance: A Conceptual Framework
*Mahdi Mohammad Bagheri, Abu Bakar Abdul Hamid, Abbas Mardani, Ali Af. Asgari, Azam Haghkhah
Universiti Teknologi Malaysia, Malaysia *[email protected]
Abstract: Supply chain Management has played a significant role in corporate efficiency and has attracted the attention of numerous academicians over the last few years. As the concept of becomes more widely accepted, supply chain integration (SCI) is gaining more attention among both practitioners and academics. The paper aims at understanding how SCI and its antecedents, impacts firm performance. For the literature review of the related academic articles for the previous studies has been taken by international journals in Logistics, Supply Chain Management and Operations Management. The study looked at some variables such as trust and information technology (IT) that might impact the SCI and finally improve firm performance. Therefore, it is crucial for managers to apply their firms IT and trust as lower-order organizational capabilities to improve SCI as a higher-order organizational capability. To aid the study, Resourced-Based View (RBV) theory has been developed as the framework for the present research. The paper also proposes the framework for future research in empirical investigation in manufacturing. This study bridges the gap by developing a framework for measuring SCI, which enables any organization to identify critical success factors for integrating their SC, measures the degree of integration qualitatively and quantitatively and suggest improvement measures. Keywords: Competitive Advantage, Firm Performance, Information Technology (IT), Supply Chain Integration (SCI), Trust
1. Introduction Supply chain management (SCM) has strategic relevance as a source of competitive advantage (Fine, 1998; Christopher, 2005; Alfalla-Luque et al., 2012). Managing SC effectively has become critical for the survival and growth of organizations (Alfalla-Luque and Medina-Lopez, 2009; Arana-Solares et al., 2010). Ideally, the entire SC processes need to be designed, managed and coordinated as a unit (Cooper et al., 1997; Bagchi et al., 2005b). Accordingly, the integration of the SC is a key element in the SCM strategy (Cigolini and Rossi, 2008). The SCI instrument encompasses three construct that involve; integration of a company with suppliers, integration of a company with customers and internal integration across the SC. Today’s manufacturers must not merely bring about their own organizations but similarly should be involved in the management of the network of downstream and upstream firms (Handfield and Nichols, 1999; HsuanMikkola and Skjøtt-Larsen, 2004; Zhang et al., 2010). Firms must know how to integrate both internally and externally; that is, with customers and suppliers. These integration efforts are crucial to lean initiatives where collaboration and coordination with both customers and suppliers is important and necessary (Shah et al., 2002; Womack and Jones, 2010). The theoretical lens of the firm’s RBV, on which the current research relies, propels the generation of research hypotheses and helps in developing theoretical model. Few SCM studies have taken into account the size of the organization (Çalıpınar, 2007). Little research, especially among SMEs, has been done to find the link between SCM and performance, as mentioned by Hsu et al. (2011) in their study. Evidence from previous researches endorses the idea that SMEs do not execute SCM in the right way; they do not use SCM strategies efficiently and do not choose SCM freely. As a matter of fact, there is a weak relationship between SCM and SMEs (Arend& Wisner, 2005; Gligor, 2013). Antecedents that improve SCI potentiality have been evaluated in this paper and also trust as an IT antecedent to improve SCI has also been used here, both of which have not been done in previous studies (DeGroote, 2011; Liu et al., 2013; Christopher, 2000, Christopher, 2010; Day, 1994; Tracey et al., 2005). To improve SCI, IT and other capabilities are required. IT alone is not enough. An example is trust in supply chain relationships being an important factor for IT (Chen et al., 2011; Chong et al., 2009; Petersen et al., 2005; Ramayah et al., 2008; Sheu et al., 2006). High level of trust among supply chain partners is the basis for successful supply chain performance (Kwon &Suh, 2004). Trust has been pointed out as one of the major factors which help to achieve strategic alliance success (Krishnan et al., 2006). Trust leads to greater honesty in SC (Chen et al., 2011; Morgan & Hunt, 1994). It decreases the perceived risks related to opportunistic (Krishnan et al., 2006; Moore, 1998). In supply chain partnerships trust facilitates information flow (Nyaga et al., 2010), stability (Handfield& Bechtel, 2002) and performance (Zaheer et al., 1998). The main reason for failed relationships between the partners is the absence of trust (Hsu et al., 2008). Because of trust supply chain team members can rely on each other (McAllister, 1995). Additionally, this study examines antecedent factors that can improve and enhance such capabilities that are lower-order capabilities (Liu et al., 2013). On this basis of capabilities’ hierarchy, which suggests that the capabilities of lower-order (IT and Trust) can assist an organization to formulate higher-order (SCI) one (Christopher, 2010; Rai et al., 2006; Grant, 1996; Liu et al., 2013). Hence, assuming the IT’s importance (Chen &Paulraj, 2004; DeGroote, 2011; Li et al., 2008; Wu et al., 2006) as a SCC antecedent and trust as IT’s antecedent (DeGroote, 2011) and SCI (Christopher, 2010, Rai et al., 2006; Khan &Pillania, 2008; Kwon &Suh, 2005). Hierarchy of capabilities and SCC perspective have been taken into consideration in this study, a conceptual model has been proposed that explains that how trust and IT (antecedents) as capabilities of lower-order affect capabilities of higher-order, namely SCI (Rai et al., 2006; Grant, 1996; Liu et al., 2013). Internal and external (Suppliers and Customers) of supply chain of a firm has been focused in this study. Literature, conceptual framework and propositions are the next sections that are described below. 2. Literature Review Small and Medium Sized Enterprises (SMEs): SMEs form the largest group of manufacturing firms in a number of developing countries, which basically provides specialty in support services and manufacturing to large firms (Huin et al., 2002; Ndubisi and Matanda, 2011). The segment of manufacturing SMEs keeps expanding, ultimately keep generating more jobs and rapid growth rates as oppose to big manufacturers (Hsu et al., 2011). There is a significant contribution of SMEs in an economy. A lot of SMEs are attempting to integrate their business processes and strategies with other firms in the supply chain, as a result of the growth in the Internet and related

Proceedings of 4th
International Conference on Global Business Environment
(ICGBE-2014)
97
communication technologies (Ehrlich, 2007). In the economies of most of the emerging nations, SMEs are playing a vital role from the perspective of economic growth and generating employment (Quayle, 2002; Bayraktar et al., 2009; Chan et al., 2012). SMEs are now, on the other hand, increasingly taking part in the worldwide business network by joining in several interlinked supply chains (Thakkar et al., 2008). SMEs are defined as ‘Enterprises which employ fewer than 250 persons and which have an annual turnover not exceeding 50 million Euro, and/or an annual balance sheet total not exceeding 43 million Euro’ (European Commission, 2005). SMEs as defined by USA includes small enterprises between 100-499 employees, very small enterprises with less than 20 employees, and medium enterprises between 20-99 employees (Thakkar et al., 2009). UK claims that there are no universal fixed definitions of SMEs. Australia defined SMEs in manufacturing and service as for a manufacturing concern less than 100 employees and service enterprises with less than 20 employees. China defined it as enterprises with less than 200 employees. French has a different definition of SMEs i.e. enterprises with employees between 10 to 400. Japan divided SMEs into three parts that consist of retail trade and services (asset capitalization less than 10 million yen or less than 50 employees), wholesale trade (asset capitalization less than 30 million yen or less than 50 employees), manufacturing (asset capitalization less than 100 million yen or less than 300 employees). Malaysia defined small industries as those establishments with a shareholders fund up to RM 500,000 or employing between 5 to 50 employees and medium industries with a shareholders fund between RM 500,000 to RM 205 million or employing between 50 to 75 employees 500,000 to RM 205 million (Thakkar et al., 2009). Based on the above literature review with respect to the definition of the SMEs in various countries of the world, this study suggest the SCM of SMEs in developing countries that companies need to be more integrate with partners to sense and respond to market changes. Developed Conceptual Framework and Propositions: Further research will test several propositions using this conceptual framework. The suggested conceptual framework consists of four variables such as trust, IT, SCA and firm performance. Table 2 shows variables and dimensions that suggest for further research. Therefore, we set the following propositions for future research. Relationship between Trust and Firm Performance: Over three decades ago, Argyris (1964) proposed that trust is important for organizational performance. In recent years, this acknowledgment of the significance of trust in organizational affiliations has developed quickly which is demonstrated by a great number of publications on the topic relevant to both practitioner and academic audiences. In spite of this interest, difficulties in defining and operationalizing trust have hampered the empirical study of its relationship with performance. Argyris' theorizing and the quote by Deming above are intuitively appealing. Although some research has investigated how trust affects group performance and the performance of inter-organizational relationships (Zaheer et al., 1998; Zaheer and Zaheer, 2006). According to Zaheer and Zaheer (2006), trust has emerged as a central theme in international strategy research from the middle of 1990s. Researchers from a variety of disciplines and numerous time periods appeared to be agreed that trust is extremely useful to the organizations’ operations (Dirks and Ferrin, 2001). In the past decades there has been a resurrection of interest in comprehending the consequences and sources of trust in economic exchanges. This attention has ensued in fresh exploration from a range of disciplinary perceptions which contain social psychology, organizational theory and strategy, business history and economics (Gulati and Sytch, 2008). According to many foreign studies, company’s performance is affected by inter-organizational trust, thus it is a very important area for research. The aim of present research is to verify the affiliation amid performance and trust. The benefits arising from harmonization among partners, according to Gattorna and Berger (2001) involve lower SC cost, improved delivery performance, superior prediction accuracy, inventory reduction, enhanced capacity, greater overall productivity and decrease in fulfillment cycle time.Wintrobe and Breton (1986) argued that an increase in trust throughout the organization does not necessarily predict a positive effect on performance, because in their article it is contended that the effect of trust on performance depends upon the distribution of the trust. This study, with a competitive advantage as the final objective, will remain unsatisfied if a relationship between final performance and trust is not verified. Therefore, the following proposition is formulated: Proposition 1: Trust has a positive influence on the Firm Performance Relationship between Trust and Supply Chain Integration: By means of process integration, shared information among SC partners is attained. ‘Process integration’ implicates cooperative functioning between suppliers and buyers, shared information and common systems, joint product development (Christopher, 2000a; Christopher, 2010). This comprehensive form of collaboration in the SC is turning out to be ever more dominant since companies emphasize on dealing their fundamental capabilities and outsource the remaining activities. More dependence on alliance partners and suppliers becomes unavoidable in this new world of integration; therefore, a different form of relationship is necessary. As it is often called, in the ‘extended enterprise’, a spirit of trust must prevail and there can be no limitations. The process integration brings and includes transparency of information, joint strategy determination, open-book accounting and even buyer–supplier teams (Agarwal et al., 2007). Based on trust among partners, effective supply chain is a vital component for effective SC implementation. In SC relationships, issues of trust can be considerably more essential since SC relationships usually include a greater amount of interdependency among enterprises (La Londe, 2002). This requirement i.e. sharing and releasing information is a daunting task, which entails a great deal of trust between and among the SC partners (Handfield, 2002). When information is available but cannot be pooled by the partners, it’s worth reduces exponentially. The trust, as claimed by Morgan and Hunt (1994) create results that encourage effectiveness, efficiency and productivity. It is stated that the lack of trust is the major tripping block to the achievement of strategic alliance creation, and consequently the trust is identified as a foundation of the strategic conglomerate. The achievement of service-to-profit AC model of Saturn is accredited to pooled information among SC partners (Dennis and Kambil, 2003). The research claimed that trust is a crucial achievement feature in succeeding SCI. Therefore, the following hypothesis is formulated: Proposition 2: Trust has a positive influence on the SC integration. Relationship between Trust and Information Technology: Significance of this study can be seen because of the following reasons: Focus on how trust affects IT; identification of effects on trust of technical and social conditions; how these factors relate and their effects; emphasis on the significance of contextual and temporal factors to increase trust. According to McAllister (1995) "the expressive qualities of behavior in organizations should be given more systematic treatment" (p.53). This study acknowledged that trust is very important for successful IT and hence investigated the effect of trust in a methodical manner. This study adds to the existing literature by applying factors which increase trust. Besides helping projects succeed, this research also helps socially by picking up those factors

Proceedings of 4th
International Conference on Global Business Environment
(ICGBE-2014)
98
which help to increase trust in IT. This socio technical view of systems development dwells on factors such as openness, identification, reliability, and competence that are critical to the team members’ attributes and behavior (Tawiah, 2012). Adopting IT can be riskier (Ulu& Smith, 2009). If the particulars of new technology are not clear, most of the times this will lead to people being insecure (Brashers, 2001). Individuals’ trust is dependent on their perception of the quality of a technology. Hence, technology implementation can be thought of as a trusting process. Not everyone has the same reaction. This is because of some trust new products more while others trust less. In societies where trust is high, individuals are more likely to search for new information and adopt new innovations (Hofstede, 2006). According to researchers, taking risk (high level of trust) is directly proportional to the acceptance of new product (Nakata &Sivakumar, 2001) because high level of trust in a society leads to increased flow of information which helps to spread information about a new technology. On the basis of the foregoing, we propose the following proposition and Figure 1 shows the conceptual framework for this study. Proposition 3: Trust has a positive influence on IT Relationship between Information Technology and Firm Performance: Firms gradually devoting additional resources in their IT and SCCS departments in order to grow the internal expertise essential to take full advantage of cutting-edge technologies (Philip and Booth, 2001). Though, a greater amount of IT investment does not certainly suggest healthier use of firm resources. Massive expenditures in communication and information technology most of the occasions do not essentially bring about expected benefits for a firm (Barney et al., 2001). However, by adopting advanced IT, it is possible that firms effectively improve productivity in their business processes and activities (Stank et al., 1999). In order for IT to turn into a firm-specific means and enhancing its appropriability as a result, the study claimed that it has to be implemented ahead of competitors or implanted within an organizational process (Barney et al., 2001). Implementing advanced IT before their competitors, raises the likelihood that the owning firms obtain some unique advantages. A high level of IT innovation once accumulated is expected to deliver added advantages that would not be accessible to late adopters. IT advancement, to be precise, is a mirror of strategic emphasize of a firm in accepting the most innovative technology so as to keep updated against competitors. IT becomes imperfectly mobile and unique across firms, in such a situation, and it can deliver the adopting firms with special aids via greater productivity against its rivals for as a minimum a certain time period (Philip and Booth, 2001; Wu et al., 2006). Hence, the following proposition is formulated: Proposition 4: Information technology has a positive effect on firm performance. Relationship between Information Technology and Supply Chain Integration: It is a well-established idea that IT is a foundation of competitive advantage. The risks and coordination costs related to inter-organizational affairs have been decreased via information technologies. Information technology permits sellers and buyers to communicate directly over easy-to-use, data-rich information networks that decrease coordination overheads (Lewis and Talalayevsky, 2000). IT is the backbone of the SC business organization which is engaged to share, acquire and process information amongst SC associates for important decision making (Sanders and Premus, 2002). In supply chains, the information technologies and systems signify one of the important features that “link” the SC organizations into a coordinated and unified system (Handfield and Nichols, 1999). The utilization and introduction of integrated information systems for organizing the SC would improve quality in addition to decreasing the delivery costs and times and, also increase the competitive position of the company (Narasimhan and Das, 2001). IT, nowadays, has infiltrated the SC at each point, converting exchange-related linkages and activities among those undertakings (Palmer and Griffith, 1998). IT has immense potential to enable coordination and integration among SC associates via the distribution of information on production schedules and demand forecasts that command activities of the SC (Karoway, 1997). The supply chain of a company splits it into a series of primary activities, together with support activities, which are: after sales service, marketing and sales, out- bound logistics, operations and inbound logistics. Some are external and some are internal to the organization, among these activities, and all with the main objective of generating value to the end-consumer (Handfield and Nichols, 1999). Through integration of activities, this objective is accomplished among connected organizations and owing to the removal of resource waste and operational duplication should result in reduced costs (Stank et al., 2001). It requires involving in integration that is both external and internal to the organization in order to attain this reduction. SCI needs to be attained through organization borders, customers, carrier partners and connecting external suppliers, as indicated by many researchers. Improved logistics-related communication describes higher levels of integration along with, the superior synchronization of logistics activities of the firm with those of its customers and suppliers and very unclear organizational divergence amid the logistics activities of the business and those of its customers and suppliers (Stock et al., 2000). Effective integration involves smooth stream of timely and accurate information across these SC companions. One of the essential weapons of leading edge organizations nowadays is the capability to bring about the information flow. IT holds the strength to organize the information stream and to offer associations that support collaboration and communication along with the SC (Brandyberry et al., 1999). IT’s implementation in SCM can coordinate and integrate the flow of finances, materials and information amongst end-consumers, retailers, wholesalers, manufacturers and suppliers. IT here functions as a crucial enabler of SCI via the sharing, capture and organization of key information concerning significant business processes, both outside and within the boundaries of an organization (Vickery et al., 2010; Kelle and Akbulut, 2005). This claim that IT enhances SCI is additionally reinforced by the transaction cost economics. Transaction cost economists possess that coordination and cooperation among firms is confined by the transaction cost of organizing the communication (Stroeken, 2000). Market transaction productivity decreases with the increase in transaction costs that might result in greater market rates. The factors of transaction costs are opportunistic behavior, bounded rationality, uncertainty, asset specificity and transaction frequency. As IT has the influence to deliver reliable, timely and accurate information, it offers managers with a low cost and convenient substitute to old-style head-on communication, the one which reduces the transaction frequency and information uncertainty. IT has similarly demonstrated as a critical mode of reducing both coordination costs, which involve transaction risk, i.e. the risk of being exploited in the affiliation and the direct cost of integrated judgments (Clemons et al.,1993). This study proposes the following proposition on the basis of the foregoing discussion and Table 1 shows the construct and sub-constructs. Proposition 5: Information technology has a positive effect on supply chain integration.
Proceedings of 4th
International Conference on Global Business Environment
(ICGBE-2014)
99
Table 1: Construct and Sub-constructs of Framework Variables Dimensions Trust Dependability/Reliability
Honesty Competence Friendliness/Benevolence
Information Technology (IT) Data Consistency Cross-Functional Application Integration
Supply Chain Integration (SCI) Information Flow Integration Physical Flow Integration Financial Flow Integration
Firm Performance Financial Performance Organizational Performance / non-financial
performance
Relationship between Supply Chain Integration and Firm Performance: Financial flow integration, according to Rai et al. (2006), is described as the degree to which altercation of economic resources amid a principal firm and its SC companions is determined by workflow measures. This comprises all actions necessary to enable the movement of funds across SC, involving internal transfers, invoicing customers and paying suppliers (Johnson and Mena, 2008). This indicates that the successful flow of funds across the SC enhances cash-to-cash cycle or cash conversion cycle via extended days-in-payables, shortened days-in-inventory and reduced days-in-receivables (Tsai, 2008). The financial flow optimization (Comelli et al., 2008) ultimately will make plausible the improvement in working on SC and shareholder satisfaction. Efficient and effective administration of financial flow integration as such is critical to enhance the performance of supply chain (Wong et al., 2009). Physical flow integration as described by Rai et al. (2006) is the degree to which a principal firm engages global enhancement with its SC associates to bring about the flow of finished goods and materials to the point of destination (final customer), from the point of beginning (ultimate supplier). Consequently, suppliers can be integrated with the core practices of their customers in an attempt to reduce costs and improve quality (Koufteros et al., 2005). By means of better supplier management, decrease in production cost and successful just-in-time inventory management, physical flow integration increases the throughput of manufacturing (principal firm) (Levy et al., 1995). This allows firms to gain improved customer services and order winning competencies in the long run (Quesada et al., 2008). Physical flow integration as such makes an important contribution to the firms' performance (Zailani and Rajagopal, 2005) and ultimately to the entire SC members (Zelbst et al., 2009). The degree to which information is pooled between SC partners and a focal firm is demarcated as information flow integration (Rai et al., 2006). Information sharing inside business units, according to Lee et al. (2007), across SC companions for example other strategic alliances and suppliers is necessary to achieve three key connections: customer linkage, supplier linkage and internal linkage. This integration in particular via efficient and effective information flow will ultimately take the firm and entire SC to improved performance (Pålsson and Johansson, 2009). Past studies (Gunasekaran and Ngai, 2004; Du, 2007) stated constructive associations between the level of information flow performance and integration. Enhancing the level of information and integration sharing (Trkman et al., 2007; Sezen, 2008) amongst the associates of a SC as such has turned into a requisite for refining the SC efficiency. Therefore, this study intends to investigate the following: Proposition 6: Supply chain integration of an organization has a positive influence on firm performance. 3. Methodology Following the methodology successfully used in previous papers (Gunasekaran and Ngai 2005, Van der Vaart and Van Donk 2008, Fabbe-Costes et al. 2009), this study reviews prior research publications. A critical review of the literature on SCI was undertaken in relevant Operations Management (OM) and Supply Chain/Logistics Management journals in order to identify previous studies and lack in the SCI. The number of literature on SCM is growing rapidly (Alfalla-Luque and Medina-Lopez 2009). Therefore, it is very important to focus on only the papers that deal with SCI. A systematic content analysis of papers was undertaken for identifying lacking in the SC and antecedents for SCA and developing the conceptual SCI framework. We suggest for future studies that use quantitative method research which would utilize the questionnaire to collect the data. Based on the conceptual framework of study the questionnaire should be design. Research Propositions: This study aimed at investigating the role of SCI, between trust, IT and firm performance. The literature review suggested that trust influence on firm performance directly and indirectly and also IT directly and indirectly effect on firm performance. This study highlighted the role of SCI as mediating variable between IT and firm performance (see Figure 1). Therefore, the following propositions suggested by this study for future research to investigate that were identified from the literature review. P1: Trust has a positive influence on the Firm Performance P2: Trust has a positive influence on the SC integration. P3: Trust has a positive influence on IT P4: Information technology has a positive effect on firm performance. P5: Information technology has a positive effect on supply chain integration. P6: Supply chain integration of an organization has a positive influence on firm performance. 4. Conclusion and Recommendation for Future Research The firm should evaluate its resources, organizational priorities, and current supply chain capabilities and constraints. It should then select the best strategy to integration with downstream and upstream. The paper also suggest the framework for future research to empirical investigate in manufacturing and also for more suggestion for future research can use another capabilities as an higher-order capabilities such as supply chain agility for improve firm performance with mediating role of supply chain agility between SCI and firm

Proceedings of 4th
International Conference on Global Business Environment
(ICGBE-2014)
100
performance. The proposed SCI framework has practical implications also. It offers managers to reveal the variables and the level of integrating to SC partners. Additionally, it helps measure effectiveness of SCI and means for improvement. Using the conceptual framework and taking into account their sector, companies could establish the current SCI level. Figure 1: The Conceptual Framework of the Study
References Agarwal, A., Shankar, R. &Tiwari, M. K. (2007).Modeling agility of supply chain.Industrial Marketing Management. 36(4), pp. 443-457. Alfalla-Luque, R. & Medina-Lopez, C. (2009). Supply chain management: unheard of in the 1970s, core to today's company. Business
History. 51(2), pp. 202-221. Alfalla-Luque, R., Medina-Lopez, C. &Dey, P. K. (2012). Supply chain integration framework using literature review. Production Planning
& Control. pp. 1-18. Arana-Solares, I., Machuca, J. &Alfalla-Luque, R. (2010).Proposed Framework for Research in the Triple A (Agility, Adaptability,
Alignment) in Supply Chains1.Managing global supply chain relationships.p. 306. Arend, R. J. & Wisner, J. D. (2005). Small business and supply chain management: is there a fit? Journal of Business Venturing. 20(3), pp.
403-436. Argyris, C. (1964). Integrating the Individual and the Organization.Transaction Publishers. Bagchi, P. K., Ha, B. C., Skjoett-Larsen, T. &Soerensen, L. B. (2005). Supply chain integration: a European survey. International Journal of
Logistics Management, The. 16(2), pp. 275-294. Barney, J., Wright, M. &Ketchen, D. J. (2001). The resource-based view of the firm: Ten years after 1991. Journal of Management. 27(6),
pp. 625-641. Bayraktar, E., Demirbag, M., Koh, S. C. L., Tatoglu, E. &Zaim, H. (2009). A causal analysis of the impact of information systems and supply
chain management practices on operational performance: Evidence from manufacturing SMEs in Turkey. International Journal of Production Economics. 122(1), pp. 133-149.
Brandyberry, A. A. (2003). Determinants of adoption for organisational innovations approaching saturation.European Journal of Innovation Management. 6(3), pp. 150-158.
Brashers, D. E. (2001).Communication and Uncertainty Management.Journal of Communication. 51(3), pp. 477-497. Çalıpınar, H. (2007). A Theoretical Model Proposal in Supply Chain Management for Turkish SMEs.Problems and Perspectives in
Management. 5(2), pp. 90-98. Chan, F. T., Yee-Loong Chong, A. & Zhou, L. (2012).An empirical investigation of factors affecting e-collaboration diffusion in
SMEs.International Journal of Production Economics. 138(2), pp. 329-344. Chen, I. J. &Paulraj, A. (2004). Towards a theory of supply chain management: the constructs and measurements. Journal of Operations
Management. 22(2), pp. 119-150. Chen, J. V., Yen, D. C., Rajkumar, T. M. &Tomochko, N. A. (2011). The antecedent factors on trust and commitment in supply chain
relationships. Computer Standards & Interfaces. 33(3), pp. 262-270. Chong, A. Y. L., Ooi, K. B. &Sohal, A. (2009). The relationship between supply chain factors and adoption of e-collaboration tools: An
empirical examination. International Journal of Production Economics. 122(1), pp. 150-160. Christopher, M. (2005). Logistics and Supply Chain Management: Creating Value-Added Networks. New York: Financial Times Prentice
Hall, Harlow, England. Christopher, M. (2010). Logistics and supply chain management. Financial Times/Prentice Hall. Christopher, M. &Towill, D. R. (2000). Supply chain migration from lean and functional to agile and customised. Supply Chain
Management: An International Journal. 5(4), pp. 206-213. Cigolini, R. & Rossi, T. (2008). Evaluating supply chain integration: a case study using fuzzy logic. Production Planning and Control. 19(3),
pp. 242-255.
P2
P3
P4 P5
P6
P1
Trust
IT Infrastructure
SC
Integration
Firm
Performance

Proceedings of 4th
International Conference on Global Business Environment
(ICGBE-2014)
101
Clemons, E. K., Reddi, S. P. & Row, M. C. (1993). The impact of information technology on the organization activity: The move to the middle hypothesis. Journal of management information systems. 10(2), pp. 9-35.
Comelli, M., Féniès, P. &Tchernev, N. (2008). A combined financial and physical flows evaluation for logistic process and tactical production planning: application in a company supply chain. International Journal of Production Economics. 112(1), pp. 77-95.
Commission, E. (2005). The New SME Definition: User Guide and Model Declaration (2005). Available from: http://europa. eu. int/comm/enterprise/enterprise_policy/sme_definition/sme_user_guide. pdf.
Cooper, M. C., Lambert, D. M. &Pagh, J. D. (1997). Supply chain management: more than a new name for logistics. International Journal of Logistics Management, The. 8(1), pp. 1-14.
Day, G. S. (1994). The capabilities of market-driven organizations.the Journal of Marketing. pp. 37-52. DeGroote, S. E. (2011). An Empirical Investigation of the Impact of Information Technology on Supply Chain Agility and Firm
Performance Among U.S. Manufacturers. Lawrence Technological University, College of Management. Dennis, M. J. &Kambil, A. (2003). Service Management: Building Profits After The Sale. Supply Chain Management Review. 7(3), pp. 42-48. Dirks, K. T. &Ferrin, D. L. (2001).The Role of Trust in Organizational Settings.Organization Science. 12(4), pp. 450–467. Du, L. (2007).Acquiring competitive advantage in industry through supply chain integration: a case study of Yue Yuen Industrial Holdings
Ltd. Journal of Enterprise Information Management. 20(5), pp. 527-543. Ehrlich, D. M. (2007). Adaptation of Business Processes in SMEs: An Interpretive Study. Nova Southeastern University. Fabbe-Costes, N., Jahre, M. &Roussat, C. (2009). Supply chain integration: the role of logistics service providers. International Journal of
Productivity and Performance Management. 58(1), pp. 71 - 91. Fine, C. H. (1998).Clockspeed: Winning industry control in the age of temporary advantage. Basic Books. Gattorna, J. & Berger, A. (2001).The eSynchronized Supply Chain. Supply Chain Management Review Global Supplement. pp. 22-26. Gligor, D. M. (2013). The Concept of Supply Chain Agility: Conceptualization, Antecedents, and the Impact on Firm Performance.
University of Tennessee, Knoxville, College of Business Administration. Grant, R. M. (1996). Prospering In Dynamically-Competitive Environments: Organizational Knowledge as Knowledge
Integration.Organization Science. 7(4), pp. 375-387. Gulati, R. &Sytch, M. (2008). Does familiarity breed trust? Revisiting the antecedents of trust.Managerial and Decision Economics.
29(2‐3), pp. 165-190. Gunasekaran, A. &Ngai, E. W. T. (2004). Information systems in supply chain integration and management. European Journal of
Operational Research. 159(2), pp. 269-295. Handfield, R. B. & Bechtel, C. (2002).The role of trust and relationship structure in improving supply chain responsiveness.Industrial
Marketing Management. 31(4), pp. 367-382. Handfield, R. B. & Nichols, E. L. (1999).Introduction to supply chain management.prentice Hall New-Jersey. Hofstede, G. (2006). What did GLOBE really measure? Researchers’ mind versus respondents’ minds. Journal of International Business
Studies. 37, pp. 882–896. Hsu, C.-C., Kannan, V. R., Tan, K.-C.& Leong, G. K. (2008). Information sharing, buyer-supplier relationships, and firm performance: a
multi-region analysis. International Journal of Physical Distribution & Logistics Management. 38(4), pp. 296-310. Hsu, C. C., Tan, K. C., Laosirihongthong, T. & Leong, G. K. (2011).Entrepreneurial SCM competence and performance of manufacturing
SMEs.International Journal of Production Research. 49(22), pp. 6629-6649. HsuanMikkola, J. &Skjøtt-Larsen, T. (2004). Supply-chain integration: implications for mass customization, modularization and
postponement strategies. Production Planning & Control. 15(4), pp. 352-361. Huin, S. F., Luong, L. H. S. &Abhary, K. (2002).Internal supply chain planning determinants in small and medium-sized
manufacturers.International Journal of Physical Distribution and Logistics Management. 32(9), pp. 771–782. Johnson, M. & Mena, C. (2008). Supply chain management for servitised products: a multi-industry case study. International Journal of
Production Economics. 114(1), pp. 27-39. Kelle, P. &Akbulut, A. (2005). The role of ERP tools in supply chain information sharing, cooperation, and cost optimization. International
Journal of Production Economics. 93, pp. 41-52. Khan, A. &Pillania, R. K. (2008). Strategic sourcing for supply chain agility and firms' performance: a study of Indian manufacturing
sector. Management Decision. 46(10), pp. 1508-1530. Koufteros, X., Vonderembse, M. &Jayaram, J. (2005). Internal and external integration for product development: the contingency effects of
uncertainty, equivocality, and platform strategy. Decision Sciences. 36(1), pp. 97-133. Krishnan, R., Martin, X. &Noorderhaven (2006). When does trust matter to alliance performance? Academy of Management Journal.49(5),
p. 894−917. Kwon, I.-W.G. &Suh, T. (2004).Factors Affecting the Level of Trust and Commitment in Supply Chain Relationships.Journal of Supply
Chain Management. 40(2), pp. 4-14. Kwon, I.-W.G. &Suh, T. (2005). Trust, commitment and relationships in supply chain management: a path analysis. Supply Chain
Management: An International Journal. 10(1), pp. 26-33. La Londe, B. (2002). Insights: Who Can You Trust These Days? Supply Chain Management Review. 6(3), pp. 9-12. Levy, P., Bessant, J., Sang, B. & Lamming, R. (1995). Developing integration through total quality supply chain management.Integrated
Manufacturing Systems. 6(3), pp. 4-12. Li, X., Chung, C., Goldsby, T. J. &Holsapple, C. W. (2008). A unified model of supply chain agility: the work-design perspective.
International Journal of Logistics Management, The. 19(3), pp. 408-435. Liu, H., Ke, W., Wei, K. K. &Hua, Z. (2013). The impact of IT capabilities on firm performance: The mediating roles of absorptive capacity
and supply chain agility. Decision Support Systems. 54(3), pp. 1452-1462. McAllister, D. J. (1995). Affect- and cognition-based trust as foundations for interpersonal co-operation in organisations. Academy of
Management Journal. 38 (1), pp. 24-59. Moore, K. R. (1998). Trust and relationship commitment in logistics alliances: a buyer perspective. Journal of Supply Chain Management.
34(1), pp. 24–37. Morgan, R. M. & Hunt, S. D. (1994). The commitment trust theory of relationship marketing. Journal of Marketing. 58, pp. 20-38.

Proceedings of 4th
International Conference on Global Business Environment
(ICGBE-2014)
102
Nakata, C. &Sivakumar, K. (2001).Instituting the Marketing Concept in a Multinational Setting: The Role of National Culture.Journal of the Academy of Marketing Science. 29(3), pp. 255-275.
Ndubisi, N. O. &Matanda, M. J. (2011).Industrial marketing strategy and B2B management by SMEs.Industrial Marketing Management. 40(3), pp. 334-335.
Nyaga, G., Whipple, J. & Lynch, D. (2010). Examining supply chain relationships: Do buyer and supplier perspectives on collaborative relationships differ? Journal of Operations Management. 28(2), pp. 101-114.
Pålsson, H. & Johansson, O. (2009). Supply chain integration obtained through uniquely labelled goods: A survey of Swedish manufacturing industries. International Journal of Physical Distribution & Logistics Management. 39(1), pp. 28-46.
Petersen, K. J., Handfield, R. B. &Ragatz, G. L. (2005). Supplier integration into new product development: coordinating product, process and supply chain design. Journal of Operations Management. 23(3), pp. 371-388.
Philip, G. & Booth, M. E. (2001).A new six ‘S’framework on the relationship between the role of information systems (IS) and competencies in ‘IS’management.Journal of Business Research. 51(3), pp. 233-247.
Quayle, M. (2002). E-commerce: the challenge for UK SMEs in the twenty-first century. International Journal of Operations & Production Management. 22(10), pp. 1148-1161.
Quesada, G., Rachamadugu, R., Gonzalez, M. & Martinez, J. L. (2008). Linking order winning and external supply chain integration strategies. Supply Chain Management: An International Journal. 13(4), pp. 296-303.
Rai, A., Patnayakuni, R. & Seth, N. (2006).Firm Performance Impacts of Digitally Enabled Supply Chain Integration Capabilities. MIS Quarterly. 30(2), pp. 225-246.
Ramayah, T., Tan Yen, S., Omar, R. &Dahlan, N. M. (2008). Impact of information technology (IT) tools, partner relationship and supply chain performance.Asian Academy of Management Journal. 13(2), pp. 33-55.
Sezen, B. (2008). Relative effects of design, integration and information sharing on supply chain performance. Supply Chain Management: An International Journal. 13(3), pp. 233-240.
Shah, R., Goldstein, S. M. & Ward, P. T. (2002). Aligning supply chain management characteristics and interorganizational information system types: an exploratory study. Engineering Management, IEEE Transactions on. 49(3), pp. 282-292.
Sheu, C., Yen, H. R. &Chae, B. (2006).Determinantsofsupplier–retailer collaboration: Evidenceformaninternationalstudy. International Journal of Operations and Production Management. 26(1), pp. 24–49.
Stank, T. P., Crum, M. R. &Arango, M. (1999). Benefits of interfirm coordination in food industry supply chains. Journal of Business Logistics.
Stock, G. N., Greis, N. P. &Kasarda, J. D. (2000). Enterprise logistics and supply chain structure: the role of fit. Journal of Operations Management. 18(5), pp. 531-547.
Stroeken, J. H. (2000). Information technology, innovation and supply chain structure. International Journal of Technology Management. 20(1), pp. 156-175.
Tawiah, T. N. (2012). Sociotechnical Perspectives of Enhancing Trust to Improve the Success of Information Technology Projects.Walden University, College of Management and Technology.
Thakkar, J., Kanda, A. &Deshmukh, S. (2008). Supply chain management in SMEs: development of constructs and propositions. Asia Pacific Journal of Marketing and Logistics. 20(1), pp. 97-131.
Thakkar, J., Kanda, A. &Deshmukh, S. G. (2009). Supply chain management for SMEs: a research introduction. Management Research News. 33(10), pp. 970 - 993.
Tracey, M., Lim, J. S. &Vonderembse, M. A. (2005).The impact of supply-chain management capabilities on business performance. Supply Chain Management: An International Journal. 10 (3), pp. 179 - 191.
Trkman, P., Štemberger, M. I., Jaklic, J. &Groznik, A. (2007).Process approach to supply chain integration. Supply Chain Management: An International Journal. 12(2), pp. 116-128.
Tsai, C.-Y. (2008). On supply chain cash flow risks. Decision Support Systems. 44(4), pp. 1031-1042. Ulu, C. & Smith, J. E. (2009).Uncertainty, Information Acquisition, and Technology Adoption.Operations Research. 57(3), pp. 740-752. Van der Vaart, T. & van Donk, D. P. (2008). A critical review of survey-based research in supply chain integration.International Journal of
Production Economics. 111(1), pp. 42-55. Vickery, S., Droge, C., Setia, P. &Sambamurthy, V. (2010). Supply chain information technologies and organisational initiatives:
complementary versus independent effects on agility and firm performance. International Journal of Production Research. 48(23), pp. 7025-7042.
Wintrobe, R. & Breton, A. (1986).Organizational structure and productivity.The American Economic Review. 76(3), pp. 530-538. Womack, J. P. & Jones, D. T. (2010). Lean Thinking: Banish Waste and Create Wealth in Your Corporation. SimonandSchuster.com. Wong, W.-K., Qi, J. & Leung, S. (2009). Coordinating supply chains with sales rebate contracts and vendor-managed inventory.
International Journal of Production Economics. 120(1), pp. 151-161. Wu, F., Yeniyurt, S., Kim, D. &Cavusgil, S. T. (2006). The impact of information technology on supply chain capabilities and firm
performance: a resource-based view. Industrial Marketing Management. 35(4), pp. 493-504. Zaheer, A., McEvily, B. &Perrone, V. (1998). Does Trust Matter? Exploring the Effects of Interorganizational and Interpersonal Trust on
Performance.Organization Science. 9(2), pp. 141–159. Zaheer, S. &Zaheer, A. (2006). Trust across Borders. Journal of International Business Studies. 37(1), pp. 21–29. Zailani, S. &Rajagopal, P. (2005). Supply chain integration and performance: US versus East Asian companies. Supply Chain Management:
An International Journal. 10(5), pp. 379-393. Zelbst, P. J., Green Jr, K. W., Sower, V. E. & Reyes, P. (2009). Impact of supply chain linkages on supply chain performance.Industrial
Management & Data Systems. 109(5), pp. 665-682. Zhang, X., Huang, G. Q., Humphreys, P. K. &Botta-Genoulaz, V. (2010). Simultaneous configuration of platform products and
manufacturing supply chains: comparative investigation into impacts of different supply chain coordination schemes. Production Planning & Control. 21(6), pp. 609-627.
Proceedings of 4th
International Conference on Global Business Environment
(ICGBE-2014)
103
Factors Influencing students’ to select B-School: a Study with reference to Coimbatore City, India
*Mahendran Sathish1, Rengasamy Natarajan Balamurugan1, Eason Yamalee2
1PSG Institute of Management, PSG College of Technology Coimbatore, India 2Bansomdejchaopraya Rajabhat University Dhonburi District, Bangkok
*[email protected] Abstract : MBA education is witnessing significant challenges from many dimensions. India is perhaps the world’s largest MBA market with 3850 B-Schools, including 283 PGDM institutes offering a whopping 3.85 lakhs seats. Today, there are various alternatives to traditional MBA degree. For instance, students can choose one year MBA, part time or online MBA programs instead of conventional 2 year program. There are short term specialized courses available in the market for working professionals to upgrade their skills in their domain. It’s obvious that selection of good business school plays an important role in shaping the career of students. This study uncovers the factors influenced by students. Engineering graduates are much concern about selection of B-School than other under graduates. Male gender gives importance for location, placement, peer advice, internship where as female gender gives importance for specialization, fees, value added courses, accreditation, and social works. The total sample size for the study is 402 respondents of which 201 from engineering graduates and 201 from arts & science graduates. Data was collected through questionnaire and tested using One-way Anova to identify the relationship between influencing factors with age and under graduation. Keywords: B-School, Age, gender, influencing factors
1. Introduction Higher education in India specifically management studies, there is a trend in increasing competition among business schools in attracting students both locally and internationally. Competitions are now stronger and every year number of business schools is entering the market with offers and trends. To survive in the competition each institution must have separate advantages than other institutions have. For that, management institutions must react to students, wants and their choice factor in selecting their B-School. The school of business provides opportunities for men and women at the undergraduate and graduate levels to prepare for meaningful and stimulating careers in modern business enterprises. A graduate student in the school must meet the requirements and standards of the school and the universities. Literature review emphasizes that the need of business schools is to identify their choice factor and various sources information used by students. These pressures have forced business schools to use most competitive marketing strategies to attract the students. Generally when we think about MBA degree and its preparation the thought that comes into our Mind quite often is b school . one of the most different tasks an MBA aspirant faces is the selection of institutions which he should apply to . The options are many and the tasks seem Herculean. What most students require is compact and reliable information about the plethora of institutions. Information which does not need an extraordinary amount of time and resources together. To help out my friends I have got together bits and pieces of information such as ranking of the factors that influencing the students in selecting business school which will help them to select B school on their requirement, ability and need. Organizations and individuals have been ranking business schools for years. Business school rankings can sometimes help applicants choose a business school. Other times, they leave applicants wondering just how important business school rankings really are. The ranking of the factors in selecting business school have had a major impact on business schools themselves.. Some experts claim that the effort to increase a school’s status in the business school rankings is a waste of time, money, and resources. However, there is no denying the effect business school rankings have on a school’s brand name and marketability. Importance of Business School: MBA colleges provide students with best managerial skills along with sound decisive capabilities. There are different choices in the Business Management studies, which aspirants can choose from. These can be Finance, Marketing, Sales, HR, Accountancy, Secretariats, among others. The students who pass out of reputed business schools never require looking back because their future is well settled, and hence MBA admissions are becoming more and more stringent with each passing financial year. Need of the Study : In the present environment, selection of a good business school plays a very important role in shaping the career of students .It is very important to understand the factors to which the students assign importance while selecting business school. Unlike olden days, now the choices of business school are available in plenty. Management study is no longer just a post graduate degree. It requires students to learn special skills which are heavily influenced by the reputation of the college, the quality of feeling and various other factors which have been analyzed in this research. Objectives of the Study
The broad objective of this study is to identify and examine the important choice factors considered by the students before they enroll in to B-school.
To find the attributes of the students of Arts and science and Engineering to choose the business school. To know the main factors that influence students to choose the best business school.
Scope and Limitations of the Study: Taken into consideration the wider scope of the subject following criteria has been adopted.
Out of the total Number of colleges in Coimbatore city ,top five engineering colleges and top five arts and science colleges were
selected for the study This study was restricted to Coimbatore city only. This study was confined with choice factors only.

Proceedings of 4th
International Conference on Global Business Environment
(ICGBE-2014)
104
This study was confined to MBA Course Out of 402 samples, 201 samples from engineering students and 201 samples from arts and science students.
2. Literature Review Over these years a large number of researches were made to know about the choice factors that influence the students in selection of business school .Some researches prefers a more economic based approach that is students choose the institutions based on costs , expected future earnings that suited for one’s taste and preferences. Sevier (1986) stated that location plays a important role factor in selection of institutions .Some prefer the institution should be close to their home town. Yusuf et al (2008) states that the availability of particular specializations also plays a major role in selection of institutions. Keiling (2007) stated that students value the reputation of the institution before selection. Absher and Crawford (1996) States that student will look for educational facilities such as classrooms, libraries, gym as important factors for selection of institutions. Yusof (2008) says that institutions which are helping the students in the case of availing financial aid also play a major role in selection of school. Many studies on college student decision-making use economic and sociologic Theoretical frameworks to examine factors of college choice (Hearn, 1984; Jackson, 1978; Tierney,1983; Somers, Haines, & Keene; 2006). These frameworks have been used to develop three theoretical, conceptual approaches to modeling college choice: (a) economic models, (b) status-attainment models, and (c) combined models. So students have to think about financial position before selecting the schools .The another major factor is employment opportunities .Students are looking for career opportunities and interested in outcomes from the college .Advertisements also have a small role in attracting the students .Hosseler et al (1990) says college marketing through medias has grown tremendously. First, the economic models focus on the econometric assumptions that prospective College students think rationally and make careful cost-benefit analyses when choosing a College (Hossler, Schmit, & Vesper, 1999). Second, the status-attainment models assume a utilitarian decision-making process that students go through in choosing a college, specifying a variety of social and individual factors leading to occupational and educational aspirations (Jackson, 1982). Third, the combined models incorporate the rational assumptions in the Economic models and components of the status attainment models. Most combined models divide the student decision-making process into three phases: aspirations development and alternative evaluation; options consideration; and evaluation of the remaining options and final decision (Jackson, 1982).
Zimmerman et al. (2000) has identified “push and pull” factors which operate along the students’ decision. Poutvaara (2005) have suggested that economic and cultural forces play a shaping the international students migration markets choice of higher education institution within countries (1999) found that field of study preferences scores, easy access to home and applicants’ choice of institution. more important for college students in England. Foskett et al. (2006) found that students consider more carefully economic factors in times of distress and financial difficulty. These factors include job opportunities to supplement their incomes, accommodation costs and family home proximity. Third, course of study decisions tend to be closely related to institutional choice decisions. Jame (2006) has identified a range of factors influencing course preference course among employers; graduate satisfaction from the course; graduate employment from the course; the quality of teaching in the course assessment from the course including opportunities for flexible study. Two different perspectives to understanding the complex college selection have emerged. One approach focuses on how inspiring students develop a college choice set. Geography also imposes constraints on college choices. That most students attend public, in state institutions implies that college options are circumscribed by state of residence (Niu & Tienda, 2008). The second approach a emphasizes institutional characteristics such as cost, size, Distance, quality of education and availability of financial aids. The factors mostly commonly associated with a comprehensive college choice model include student background characteristics (Jackson, 1982), aspirations (Chapman, 1984; Jackson 1982), educational achievement(Hanson & Litten 1982 ; Jackson, 1982), social environment (Hossler & Gallagher, 1987), financial variables (St. John, 1990; 1991), net cost(St.john& starkey, 1995) institutional climate (Chapman, 1984), and institutional characteristics (Hanson & Litten, 1982; Hossler et al., 1989). PROPOSED CONCEPTUAL FRAMEWORK
College effort to communicate
with students: Advertisement Representatives
Campus visits
College selection
Fixed College
Characteristics
Location
Academic Programmes
College reputation
Educational facilities
Cost
Availability of finance
Employment opportunities
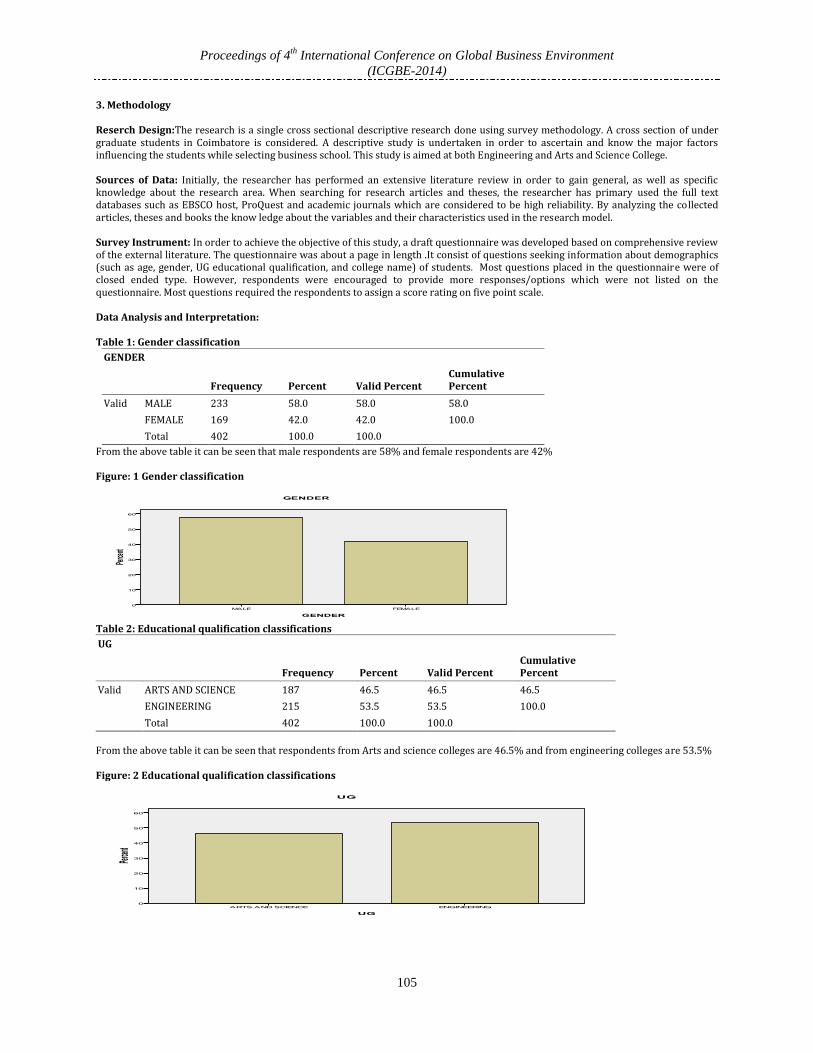
Proceedings of 4th
International Conference on Global Business Environment
(ICGBE-2014)
105
3. Methodology Reserch Design:The research is a single cross sectional descriptive research done using survey methodology. A cross section of under graduate students in Coimbatore is considered. A descriptive study is undertaken in order to ascertain and know the major factors influencing the students while selecting business school. This study is aimed at both Engineering and Arts and Science College. Sources of Data: Initially, the researcher has performed an extensive literature review in order to gain general, as well as specific knowledge about the research area. When searching for research articles and theses, the researcher has primary used the full text databases such as EBSCO host, ProQuest and academic journals which are considered to be high reliability. By analyzing the collected articles, theses and books the know ledge about the variables and their characteristics used in the research model. Survey Instrument: In order to achieve the objective of this study, a draft questionnaire was developed based on comprehensive review of the external literature. The questionnaire was about a page in length .It consist of questions seeking information about demographics (such as age, gender, UG educational qualification, and college name) of students. Most questions placed in the questionnaire were of closed ended type. However, respondents were encouraged to provide more responses/options which were not listed on the questionnaire. Most questions required the respondents to assign a score rating on five point scale. Data Analysis and Interpretation: Table 1: Gender classification
GENDER
Frequency Percent Valid Percent
Cumulative Percent
Valid MALE 233 58.0 58.0 58.0
FEMALE 169 42.0 42.0 100.0
Total 402 100.0 100.0
From the above table it can be seen that male respondents are 58% and female respondents are 42%
Figure: 1 Gender classification
Table 2: Educational qualification classifications
UG
Frequency Percent Valid Percent
Cumulative Percent
Valid ARTS AND SCIENCE 187 46.5 46.5 46.5
ENGINEERING 215 53.5 53.5 100.0
Total 402 100.0 100.0
From the above table it can be seen that respondents from Arts and science colleges are 46.5% and from engineering colleges are 53.5% Figure: 2 Educational qualification classifications

Proceedings of 4th
International Conference on Global Business Environment
(ICGBE-2014)
106
Table 3: Location classifications
LOCATION
Frequency Percent Valid Percent
Cumulative Percent
Valid STRONGLY AGREE 286 71.1 71.1 71.1
AGREE 94 23.4 23.4 94.5
NEUTRAL 14 3.5 3.5 98.0
DISAGREE 7 1.7 1.7 99.8
STRONGLY DISAGREE 1 .2 .2 100.0
Total 402 100.0 100.0
From the above table it can be seen that 71% of the students strongly agree location as an important factor.
Figure 3: Location classifications
Table 4: Placement factor
PLACEMENT
Frequency Percent Valid Percent
Cumulative Percent
Valid STRONGLY AGREE 199 49.5 49.5 49.5
AGREE 173 43.0 43.0 92.5
NEUTRAL 23 5.7 5.7 98.3
DISAGREE 5 1.2 1.2 99.5
STRONGLY DISAGREE 2 .5 .5 100.0
Total 402 100.0 100.0
From the above table it can be seen that 49.5% 0f the students strongly agree placement as an important factor.
Figure 4: Placement factor

Proceedings of 4th
International Conference on Global Business Environment
(ICGBE-2014)
107
Table 4: Reputation factor
REPUTATION
Frequency Percent Valid Percent
Cumulative Percent
Valid STRONGLY AGREE 125 31.1 31.1 31.1
AGREE 156 38.8 38.8 69.9
NEUTRAL 93 23.1 23.1 93.0
DISAGREE 25 6.2 6.2 99.3
STRONGLY DISAGREE 3 .7 .7 100.0
Total 402 100.0 100.0
Figure 4: Reputation factor
From the table it can be seen that 31.1% of the students strongly agree reputation as an important factor.
Table 5: Infrastructure factor
INFRASTRUCTURE
Frequency Percent Valid Percent
Cumulative Percent
Valid STRONGLY AGREE 132 32.8 32.8 32.8
AGREE 178 44.3 44.3 77.1
NEUTRAL 59 14.7 14.7 91.8
DISAGREE 27 6.7 6.7 98.5
STRONGLY DISAGREE 6 1.5 1.5 100.0
Total 402 100.0 100.0
From the above table it can be seen that 32.8% of the students strongly agree infrastructure as an important factor. Figure 5: Infrastructure factor

Proceedings of 4th
International Conference on Global Business Environment
(ICGBE-2014)
108
Table 6: Specialization factor
SPECIALIZATION
Frequency Percent Valid Percent
Cumulative Percent
Valid STRONGLY AGREE 141 35.1 35.1 35.1
AGREE 157 39.1 39.1 74.1
NEUTRAL 57 14.2 14.2 88.3
DISAGREE 22 5.5 5.5 93.8
STRONGLY DISAGREE 25 6.2 6.2 100.0
Total 402 100.0 100.0
From the above table it can be seen that 35.1% of the students strongly agree specialization as an important factor
Figure 6: Specialization factor
Table 7: Teaching Style factor
TEACHING
Frequency Percent Valid Percent
Cumulative Percent
Valid STRONGLY AGREE 118 29.4 29.4 29.4
AGREE 160 39.8 39.8 69.2
NEUTRAL 63 15.7 15.7 84.8
DISAGREE 35 8.7 8.7 93.5
STRONGLY DISAGREE 26 6.5 6.5 100.0
Total 402 100.0 100.0
From the above table it can see that 29.4% of the students strongly agree teaching as an important factor. Figure 7: Teaching Style factor

Proceedings of 4th
International Conference on Global Business Environment
(ICGBE-2014)
109
Table 8: Peer advice factor
PEER ADVICE
Frequency Percent Valid Percent
Cumulative Percent
Valid STRONGLY AGREE 89 22.1 22.1 22.1
AGREE 121 30.1 30.1 52.2
NEUTRAL 138 34.3 34.3 86.6
DISAGREE 32 8.0 8.0 94.5
STRONGLY DISAGREE 22 5.5 5.5 100.0
Total 402 100.0 100.0
From the above table it can be seen that 22.1% of the students strongly agree peer advice as an important factor. Figure 8: Peer advice factor
Table 9: Course Fee factor
FEES
Frequency Percent Valid Percent
Cumulative Percent
Valid STRONGLY AGREE 78 19.4 19.4 19.4
AGREE 176 43.8 43.8 63.2
NEUTRAL 104 25.9 25.9 89.1
DISAGREE 22 5.5 5.5 94.5
STRONGLY DISAGREE 22 5.5 5.5 100.0
Total 402 100.0 100.0
From the above table it can be seen 19.4 % of the students strongly agree fees as an important factor. Figure: 9. Course Fee factor
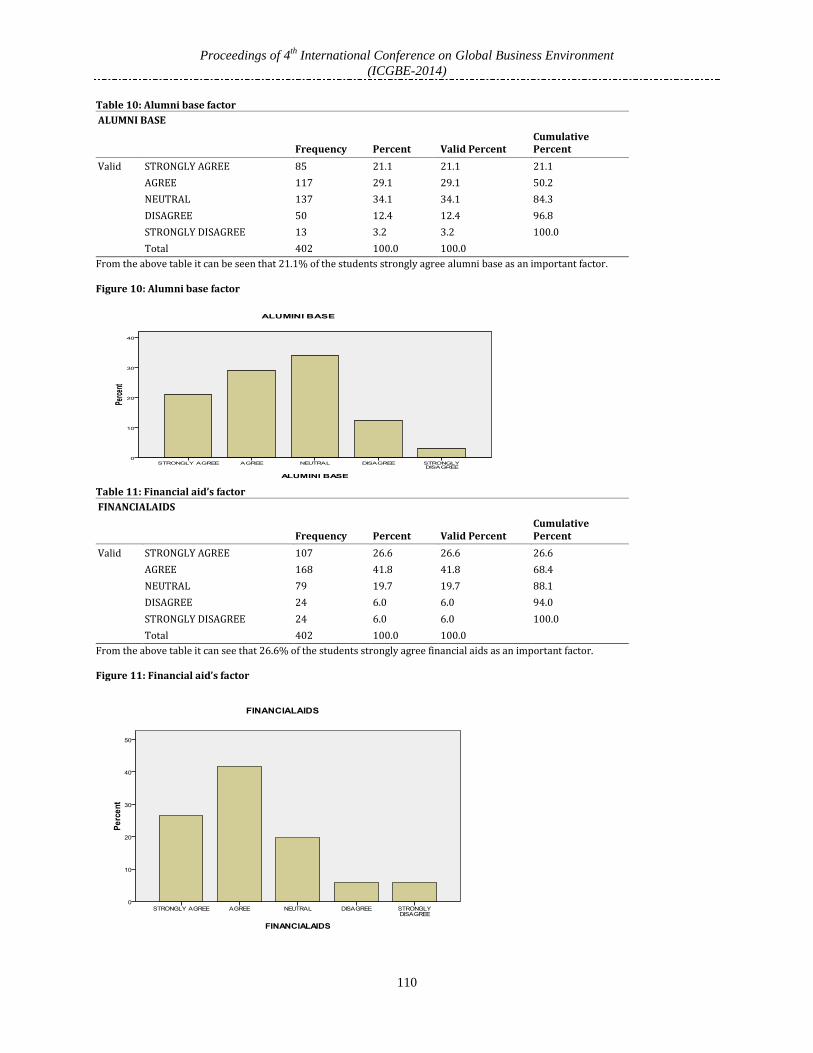
Proceedings of 4th
International Conference on Global Business Environment
(ICGBE-2014)
110
Table 10: Alumni base factor
ALUMNI BASE
Frequency Percent Valid Percent
Cumulative Percent
Valid STRONGLY AGREE 85 21.1 21.1 21.1
AGREE 117 29.1 29.1 50.2
NEUTRAL 137 34.1 34.1 84.3
DISAGREE 50 12.4 12.4 96.8
STRONGLY DISAGREE 13 3.2 3.2 100.0
Total 402 100.0 100.0
From the above table it can be seen that 21.1% of the students strongly agree alumni base as an important factor. Figure 10: Alumni base factor
Table 11: Financial aid’s factor
FINANCIALAIDS
Frequency Percent Valid Percent
Cumulative Percent
Valid STRONGLY AGREE 107 26.6 26.6 26.6
AGREE 168 41.8 41.8 68.4
NEUTRAL 79 19.7 19.7 88.1
DISAGREE 24 6.0 6.0 94.0
STRONGLY DISAGREE 24 6.0 6.0 100.0
Total 402 100.0 100.0
From the above table it can see that 26.6% of the students strongly agree financial aids as an important factor. Figure 11: Financial aid’s factor

Proceedings of 4th
International Conference on Global Business Environment
(ICGBE-2014)
111
Table 11: Value added course factor
VALUEADDEDCOURSES
Frequency Percent Valid Percent
Cumulative Percent
Valid STRONGLY AGREE 87 21.6 21.6 21.6
AGREE 163 40.5 40.5 62.2
NEUTRAL 100 24.9 24.9 87.1
DISAGREE 31 7.7 7.7 94.8
STRONGLY DISAGREE 21 5.2 5.2 100.0
Total 402 100.0 100.0
From the above table it can be seen that 21.6% of the students strongly agree value added courses as an important factor. Figure 11: Value added course factor
Table 12: Residential campus factor
RESICUMDAYCAMPUS
Frequency Percent Valid Percent
Cumulative Percent
Valid STRONGLY AGREE 114 28.4 28.4 28.4
AGREE 147 36.6 36.6 64.9
NEUTRAL 82 20.4 20.4 85.3
DISAGREE 31 7.7 7.7 93.0
STRONGLY DISAGREE 28 7.0 7.0 100.0
Total 402 100.0 100.0
From the above table it can be seen that 28% of the students strongly agree residence cum day campus as an important factor. Figure 12: Residential campus factor

Proceedings of 4th
International Conference on Global Business Environment
(ICGBE-2014)
112
Table 13: Accreditation factor
ACCREDIATION
Frequency Percent Valid Percent
Cumulative Percent
Valid STRONGLY AGREE 69 17.2 17.2 17.2
AGREE 135 33.6 33.6 50.7
NEUTRAL 138 34.3 34.3 85.1
DISAGREE 34 8.5 8.5 93.5
STRONGLY DISAGREE 26 6.5 6.5 100.0
Total 402 100.0 100.0
From the above table it can be seen that 17.2 % of the students strongly agree accreditation as an important factor. Figure 13: Accreditation factor
Table 13: Active Research factor
RESEARCH ACTIVATION
Frequency Percent Valid Percent
Cumulative Percent
Valid STRONGLY AGREE 80 19.9 19.9 19.9
AGREE 182 45.3 45.3 65.2
NEUTRAL 97 24.1 24.1 89.3
DISAGREE 20 5.0 5.0 94.3
STRONGLY DISAGREE 23 5.7 5.7 100.0
Total 402 100.0 100.0
From the above table it can be seen that 19.9 % of the students strongly agree research activation as an important factor.
Figure 13: Active Research factor

Proceedings of 4th
International Conference on Global Business Environment
(ICGBE-2014)
113
Table 14: Foreign university collaboration factor
COLLABORATION WITH ABROAD UNIVERSITIES
Frequency Percent Valid Percent Cumulative Percent
Valid STRONGLY AGREE 86 21.4 21.4 21.4
AGREE 128 31.8 31.8 53.2
NEUTRAL 141 35.1 35.1 88.3
DISAGREE 36 9.0 9.0 97.3
STRONGLY DISAGREE 11 2.7 2.7 100.0
Total 402 100.0 100.0
From the above table it can be seen that 21.4% of the students strongly agree collaboration with abroad universities as an important factor. Figure 14: Foreign university collaboration factor
Table 15: Library and Wi-Fi factor
LIBRARY AND WIFI
Frequency Percent Valid Percent Cumulative Percent
Valid STRONGLY AGREE 131 32.6 32.6 32.6
AGREE 146 36.3 36.3 68.9
NEUTRAL 81 20.1 20.1 89.1
DISAGREE 28 7.0 7.0 96.0
STRONGLY DISAGREE 16 4.0 4.0 100.0
Total 402 100.0 100.0
From the above table it can be seen that 32.6% of the students strongly agree and 36.3% of the students just agreed library and wifi as an important factor. Figure 15: Library and Wi-Fi factor

Proceedings of 4th
International Conference on Global Business Environment
(ICGBE-2014)
114
Table 16: Industrial Visit factor
INDUSTRIAL VISIT
Frequency Percent Valid Percent Cumulative Percent
Valid STRONGLY AGREE 100 24.9 24.9 24.9
AGREE 184 45.8 45.8 70.6
NEUTRAL 81 20.1 20.1 90.8
DISAGREE 16 4.0 4.0 94.8
STRONGLY DISAGREE 21 5.2 5.2 100.0
Total 402 100.0 100.0
From the above table it can be seen that 24.9% of the students strongly agree and 45.8% 0f the people just agree industrial visit as an important factor. Figure 16: Industrial Visit factor
Table 17: Internship factor
INTERNSHIP
Frequency Percent Valid Percent Cumulative Percent
Valid STRONGLY AGREE 73 18.2 18.2 18.2
AGREE 191 47.5 47.5 65.7
NEUTRAL 96 23.9 23.9 89.6
DISAGREE 22 5.5 5.5 95.0
STRONGLY DISAGREE 20 5.0 5.0 100.0
Total 402 100.0 100.0
From the above table it can be seen that 18.2% of the students strongly agree and 47.5% of the students just agree internship as an important factor. Figure 17: Internship factor

Proceedings of 4th
International Conference on Global Business Environment
(ICGBE-2014)
115
Table 18: Social Work factor
SOCIAL WORKS
Frequency Percent Valid Percent Cumulative Percent
Valid STRONGLY AGREE 55 13.7 13.7 13.7
AGREE 52 12.9 12.9 26.6
NEUTRAL 137 34.1 34.1 60.7
DISAGREE 93 23.1 23.1 83.8
STRONGLY DISAGREE 65 16.2 16.2 100.0
Total 402 100.0 100.0
From the above table it can be seen that majority of the students neutrally agree socialworks as an important factor. Table 18: Social Work factor
One Way Annova Comparison with Gender and Factors: H0: There is no significant association between gender and factors influencing the selection of business school H1: There is significant association between gender and factors influencing the selection of business school Table 19: Comparison with gender and factors
ANOVA
Sum of Squares df Mean Square F Sig.
LOCATION Between Groups
2.236 1 2.236 5.169 .024
Within Groups 173.011 400 .433
Total 175.246 401
PLACEMENT Between Groups
.611 1 .611 1.249 .264
Within Groups 195.707 400 .489
Total 196.318 401
REPUTATION Between Groups
.001 1 .001 .001 .969
Within Groups 343.185 400 .858
Total 343.187 401
INFRASTRUCTURE Between Groups
.318 1 .318 .360 .549
Within Groups 352.680 400 .882
Total 352.998 401
SPECIALISATION Between Groups
.285 1 .285 .225 .636
Within Groups 507.667 400 1.269
Total 507.953 401
TEACHING Between Groups
.098 1 .098 .073 .787
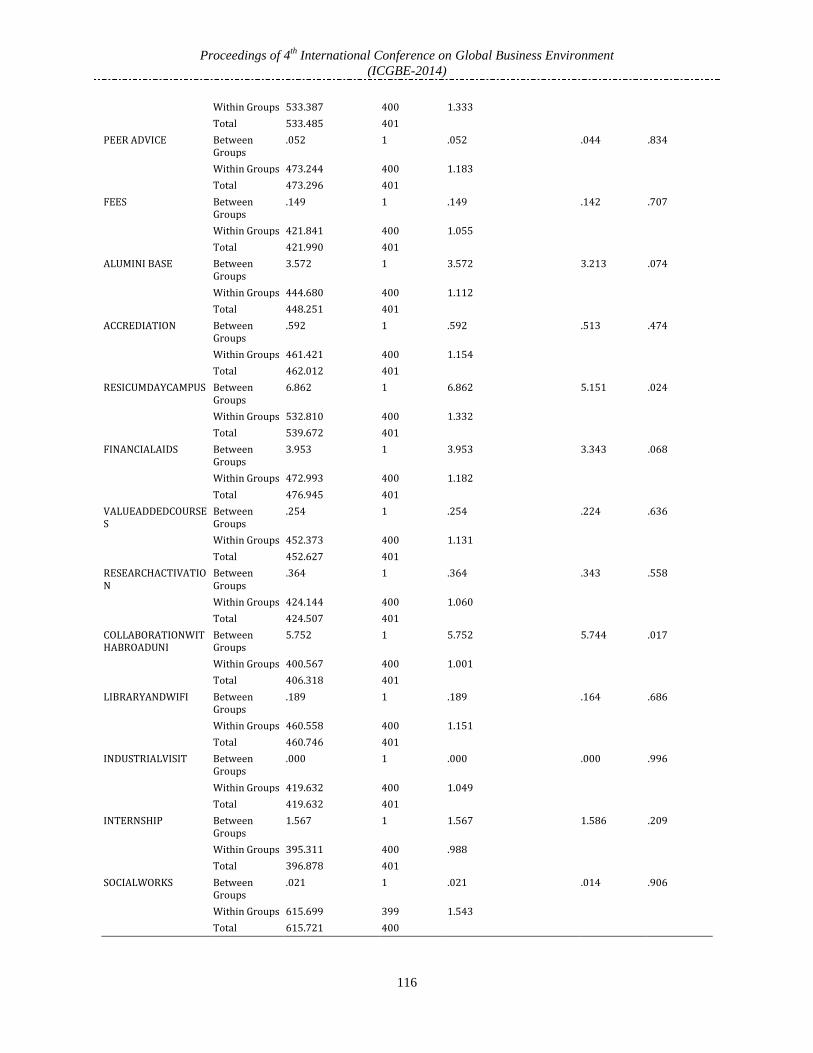
Proceedings of 4th
International Conference on Global Business Environment
(ICGBE-2014)
116
Within Groups 533.387 400 1.333
Total 533.485 401
PEER ADVICE Between Groups
.052 1 .052 .044 .834
Within Groups 473.244 400 1.183
Total 473.296 401
FEES Between Groups
.149 1 .149 .142 .707
Within Groups 421.841 400 1.055
Total 421.990 401
ALUMINI BASE Between Groups
3.572 1 3.572 3.213 .074
Within Groups 444.680 400 1.112
Total 448.251 401
ACCREDIATION Between Groups
.592 1 .592 .513 .474
Within Groups 461.421 400 1.154
Total 462.012 401
RESICUMDAYCAMPUS Between Groups
6.862 1 6.862 5.151 .024
Within Groups 532.810 400 1.332
Total 539.672 401
FINANCIALAIDS Between Groups
3.953 1 3.953 3.343 .068
Within Groups 472.993 400 1.182
Total 476.945 401
VALUEADDEDCOURSES
Between Groups
.254 1 .254 .224 .636
Within Groups 452.373 400 1.131
Total 452.627 401
RESEARCHACTIVATION
Between Groups
.364 1 .364 .343 .558
Within Groups 424.144 400 1.060
Total 424.507 401
COLLABORATIONWITHABROADUNI
Between Groups
5.752 1 5.752 5.744 .017
Within Groups 400.567 400 1.001
Total 406.318 401
LIBRARYANDWIFI Between Groups
.189 1 .189 .164 .686
Within Groups 460.558 400 1.151
Total 460.746 401
INDUSTRIALVISIT Between Groups
.000 1 .000 .000 .996
Within Groups 419.632 400 1.049
Total 419.632 401
INTERNSHIP Between Groups
1.567 1 1.567 1.586 .209
Within Groups 395.311 400 .988
Total 396.878 401
SOCIALWORKS Between Groups
.021 1 .021 .014 .906
Within Groups 615.699 399 1.543
Total 615.721 400

Proceedings of 4th
International Conference on Global Business Environment
(ICGBE-2014)
117
From the above table it is seen that the significant value is 0.024, which is less than 0.05, so the alternate hypothesis is accepted .Therefore there is significant association between location and gender. The significant value between collaboration with abroad universities and gender is 0.017, which is less than 0.05, so the alternate hypothesis is accepted. For others factors the significant value is more than 0.05. so hypothesis is rejected.
One Way Annova COMPARISSION BERWEEN UG QUALIFICATION AND THE FACTORS: H0: There is no significant association between undergraduate qualification and factors influencing the students in selection of business school. H1: There is significant association between undergraduate qualification and factors influencing the students in selection of business school. Table 20: Comparison with Under Graduation (Qualification) and factors
ANOVA
Sum of Squares df Mean Square F Sig.
LOCATION Between Groups .192 1 .192 .438 .508
Within Groups 175.054 400 .438
Total 175.246 401
PLACEMENT Between Groups 23.590 1 23.590 54.628 .000
Within Groups 172.729 400 .432
Total 196.318 401
REPUTATION Between Groups 31.986 1 31.986 41.113 .000
Within Groups 311.201 400 .778
Total 343.187 401
INFRASTRUCTURE Between Groups 17.249 1 17.249 20.550 .000
Within Groups 335.748 400 .839
Total 352.998 401
SPECIALISATION Between Groups 17.039 1 17.039 13.884 .000
Within Groups 490.914 400 1.227
Total 507.953 401
TEACHING Between Groups 29.439 1 29.439 23.362 .000
Within Groups 504.046 400 1.260
Total 533.485 401
PEER ADVICE Between Groups 13.886 1 13.886 12.090 .001
Within Groups 459.410 400 1.149
Total 473.296 401
FEES Between Groups 21.401 1 21.401 21.369 .000
Within Groups 400.589 400 1.001
Total 421.990 401
ALUMINI BASE Between Groups .342 1 .342 .305 .581
Within Groups 447.909 400 1.120
Total 448.251 401
ACCREDIATION Between Groups 16.008 1 16.008 14.357 .000
Within Groups 446.004 400 1.115
Total 462.012 401
RESICUMDAYCAMPUS Between Groups 33.670 1 33.670 26.617 .000
Within Groups 506.001 400 1.265
Total 539.672 401
FINANCIALAIDS Between Groups 15.835 1 15.835 13.737 .000
Within Groups 461.110 400 1.153
Total 476.945 401
VALUEADDEDCOURSES Between Groups 35.035 1 35.035 33.559 .000

Proceedings of 4th
International Conference on Global Business Environment
(ICGBE-2014)
118
Within Groups 417.592 400 1.044
Total 452.627 401
RESEARCHACTIVATION Between Groups 16.491 1 16.491 16.167 .000
Within Groups 408.016 400 1.020
Total 424.507 401
COLLABORATIONWITHABROADUNI
Between Groups 12.550 1 12.550 12.748 .000
Within Groups 393.769 400 .984
Total 406.318 401
LIBRARYANDWIFI Between Groups 50.573 1 50.573 49.319 .000
Within Groups 410.173 400 1.025
Total 460.746 401
INDUSTRIALVISIT Between Groups 11.123 1 11.123 10.891 .001
Within Groups 408.509 400 1.021
Total 419.632 401
INTERNSHIP Between Groups 30.331 1 30.331 33.099 .000
Within Groups 366.547 400 .916
Total 396.878 401
SOCIALWORKS Between Groups 15.483 1 15.483 10.292 .001
Within Groups 600.238 399 1.504
Total 615.721 400
The significant value between the factor Peer advice, social work, industrial visit and UG is 0.01 which is less than 0.05 (5% level of significance ),the alternate hypothesis is accepted. 4. Findings From the above study it is found that male gender people give more importance to location, placement, and peer advice, residence
cum day campus, financial aids, research activities, and internship. Female gender people give more importance to specialization, fees, alumni base, accreditation, value added courses, collaboration
with abroad universities, library and wifi, industrial visits and social works. And while comparing factors with undergraduate qualification, engineering students give more importance to all the above given
factors than arts and science students. Suggestions Colleges should concentrate in placement to get more students. Fees must be reduced to some extent. Students must concentrate on
social works which discipline to their career. Teaching should be made better versed to meet student’s expectations. Certain steps should be taken for reputation in their college,
so that placements will much more improve. Industrial visit should be arranged by the college which will be a way to increase their reputation.
Teaching should be provided to the students by foreign faculty such that they would have a broad mind to think out of the box. Steps should be taken to deal with collaborations with abroad universities.
5. Conclusion Through this study, the researcher has attempted to study different variables that influence students to choose their b-schools. However, there is scope to study variables which moderate students to choose b-school. The analysis is based on the data collected only from a particular city. It would be valuable to further test these variables across other cities. In this research, an attempt has been made only to study students’ influencing factors. There is a scope for researchers to study b-school’s attributes to attract the students’ community. Hence, the scope for future study is huge. References Ajzen, I., & Fishbein, M. (1980), “Understanding attitudes and predicting business school behaviour”, Journal of Experimental social
psychology, 22(5), Page No:543-474. Ariely.D (2009).”Predictabilty irrational, Revised and Expanded Edition:The hidden forces that shapes of decisions”, New York Times,
Page no: 77 Beggs, J., Bantham, J., & Taylor, S. (2008), “ Distinguishing the factors influencing college students’ choice of major”, College Student
Journal, 42(2), Page No: 381-394. Chung, Y. B., Loeb, J. W., & Gonzo, S. T. (1996), “Factors predicting the educational and career aspirations of black college aspirations”,
“Journal of Career Development”, 12(4), Page No:87-108. Crowley, M. (2011,). “The new generation gap” Times Magazine, November 14.

Proceedings of 4th
International Conference on Global Business Environment
(ICGBE-2014)
119
Cynthia.M., Farewell(2010) , “Factors influencing the university selection of international students”, Academic journal of educational leadership, 14(3), Page No:
Downey, J. P., McGaughey, R., & Roach, D. (2011). Attitudes and influences towards choosing a business major. Di Meglio, F. (2011, May 12). Dream jobs: College students make their picks. Kim, D., Markham, F. S., & Cangelosi, J. D. (2002). Why students pursue the business degree: Journal of education or business . Leppel, K. (2001). The impact of major on college persistence among freshmen. Pritchard, R. E., Potter, G. C., & Saccucci, M. S. (2004, January-February). The selection of a business major: Elements influencing student
choice and implications for outcomes assessment. Schwatrz, B. (2004). The tyranny of choice. Chronicle of higher education. Tang, M., Pan, W., & Newmeyer, M. D. (2008). Factors influencing high schools career aspirations. Zhang, (2007). Why IS: Understanding undergraduate students’ intentions to choose a business school.

Proceedings of 4th
International Conference on Global Business Environment
(ICGBE-2014)
120
The Impact of Service Quality, Student Satisfaction, and University Reputation on Student Loyalty: A Case Study of International Students in IIUM, Malaysia
*Djafri Fares1, Meguellati Achour2, Omar Kachkar1
1International Islamic University (IIUM), Malaysia 2University of Malaya, Malaysia
*[email protected] Abstract: The purpose of this paper is to examine the relationship between service quality, student satisfaction, university reputation, and student loyalty in the International Islamic University Malaysia (IIUM). This study aims to improve our understanding of student loyalty and to highlight the effect of student satisfaction, service quality, and brand image in building student loyalty towards IIUM. Data were randomly collected from 160 students studying in IIUM during the 2012/2013 academic session. Data analysis encompasses descriptive analysis, reliability analysis, exploratory factor analysis (EFA), correlation, and regression analysis. The data resulted in acceptably high reliability. The result indicates that all independent variables have significant impact on student loyalty. All three hypotheses were supported. This study is set to assist institutions of higher education to identify improvements in the service delivery process by identifying different aspects of service quality, brand image, and student satisfaction in IIUM. Keywords: Student Loyalty, Student Satisfaction, Service Quality, University Reputation
1. Introduction Student loyalty is widely accepted as a critical factor in the long-term success of an educational institution (Phadke, 2011). A critical issue for the continued success of an organization is its capability to retain its current customers and make them loyal to its brands (Dekimp et al., 1997). With the increasing significance of the service sector in the global economy beside the ever mounting competition between companies to attract new customers, educational institutions and universities are placing greater emphasis on meeting the expectation and needs of their customers “students” (Thomas, 2011). As a consequence, educational institutions are forced to commit themselves to certain quality criteria and adopt a market orientation strategy to differentiate themselves from their competitors by delivering superior quality services (Thomas, 2011). In line with this, Poole et al., (2000) noted that universities facing high competitive and commercial environment often turn to the strategy of addressing the quality of services delivered and related factors as a means of achieving a competitive advantage in this increasingly challenging environment (p.18). Student (customer) loyalty is supposed to be positively related to student (customer) satisfaction and the performance of an educational institution. Oliver (1997) mentioned that satisfaction with the entity, for example a product or a service, is based on experience. However, Ravald and Grönroos (1996) stated that customers’ appreciation is not only the focal product, but is the organization supplying the product or services. Accordingly, both the satisfaction experience and the reputation (image) of the supplier are important for customer loyalty (Zabala et al., 2005). The purpose of this paper is to examine the relationships between service quality, student satisfaction, university reputation (image), and student loyalty in the International Islamic University Malaysia (IIUM). Accordingly, the primary objectives of this research are: 1. To examine the relationship between service quality and student loyalty; 2. To determine the relationship between student satisfaction and student loyalty; 3. To determine the relationship between university reputation (image) and student loyalty. 2. Literature Review Service Quality and Student Loyalty: Service quality is a critical factor for developing and sustaining relationships with customers (Park et al., 2006). Since it has significant impact on customer satisfaction and customer loyalty to service firms, this construct is a major determinant of firm success or failure in a competitive environment (Lin et al., 2009). Service quality is the discrepancy between consumers’ perceptions of services offered by a particular firm and their expectations about the firms offering such services (Chou et al., 2011). Hernon and Nitecki (2001) noted that definitions of service quality are based on four main perspectives. The first perspective is ‘excellence’, which is often externally defined. Second view is ‘value’, which incorporates multiple attributes and is focused on benefit to the recipient. The third perspective is conformance to specifications’, which enables precise measurement, but customers may not know or care about internal specifications. Finally, meeting and/or exceeding expectations’, which is all-encompassing and applies to all service industries. Ramaiyah et al. (2007) classified service quality into four underlying classifications, namely expected service, which refers to the services that the customer expects from the service provider; desired service, which refers to the level of service that the customer wishes to obtain; adequate service, which refers to the minimum level of services that the customer expects from the service provider, and finally, predicted service, which is what the customer thinks the company will perform. Among the earliest to speak about service quality is Parasuraman et al. (1985).In his paper “A Conceptual Model of Service Quality and its Implications on future Research”, he identifies 10 determinants of service quality: Access, Communication, Competence, Courtesy, Credibility, Reliability, Responsiveness, Security, Tangibles, and Customer Knowledge. However, in a later paper he reduced the 10 determinants into 5 dimensions using factor analysis. These dimensions are Tangibles, Reliability, Responsiveness, Assurance, and Empathy. Interestingly, many studies have emphasized on the importance of service quality in educational institutions (Airey & Bennett, 2007; Shekarchizadeh et al., 2011; Annamdevula & Bellamkonda, 2012). Shekarchizadeh et al. (2011) analyses the educational service quality of selected Malaysian universities based on the modified service quality (SERVQUAL) instrument developed for international post-graduate students. More specifically, the objective of their research was to measure the service quality perceptions and expectations of international post-graduate students in selected Malaysian universities. The authors found that the modified SERVQUAL scale developed to measure postgraduate students’ perceptions of education service quality is statistically reliable. Moreover, this study found that international postgraduate students have negative perception of education service quality in the five selected universities. Besides that, students were dissatisfied with the service quality of education on all the five dimension quality factor. Annamdevula and Bellamkonda

Proceedings of 4th
International Conference on Global Business Environment
(ICGBE-2014)
121
(2012) developed a measuring instrument of service quality called HiEdQUAL. This new measuring instrument consists of 27 items divided into five dimensions, which they found to have significant positive influence on overall students’ perceived service quality. The five factors are: teaching and course content, administrative services, academic facilities, campus infrastructure, and support services of service quality within the higher education sector. In line with the above researches, the paper expects that Service Quality (SQ) will have a significant impact on Student Loyalty (SL). To this end, the following hypothesis is made: H1 Service Quality (SQ) has a significant direct impact on Student Loyalty (SL) Student Satisfaction and Student Loyalty: Satisfying customers is an important element in marketing theory as customer satisfaction affects future consumer purchase behaviour (Yoo & Park, 2007). According to Tse and Wilton (1988) customer satisfaction is the consumers’ response to evaluation of the perceived discrepancy between prior expectation and actual performance of the product as perceived after its consumption. The concept of students’ satisfaction has been defined by several researchers as “a short-term attitude resulting from an evaluation of student’s educational experience” (Elliott & Healy, 2001, p. 2), or as “a comparison between the experience obtained in the university and expectation to that experience” (Alves & Raposo, 2007). A number of studies found that student satisfaction is positively related to student loyalty (Marzo-Navarro et al., 2005; Schertzer & Schertzer, 2004). As such, the following hypothesis is made: H2 Student Satisfaction (SS) has a significant direct impact on Student Loyalty (SL). University Reputation (Image) and Student Loyalty: Brand image (reputation) has been recognized as one of the central tenets of marketing research, not only because of its role as a foundation for tactical marketing but also for its role in building long-term brand equity (Keller, 1993). Dick and Basu (1994) mentioned that image and reputation are important elements to develop and maintain a loyalty relationship with customers. Brand image is defined as the perception about a brand as reflected by the brand associations held in consumer memory. A brand’s image often influences a customer’s expectations and consequently his/her satisfaction with a product or service. Brand image pertains to the perception or the mental picture a customer holds of a brand and is formed through his/her response, whether reasoned or emotional; an organization’s image, on the other hand, is an important variable that positively influences marketing activities. Image is considered to have the ability to influence customers’ perceptions of the goods and the services offered (Zeithaml & Bitner, 1996). Thus, image will have an impact on the customers’ buying behaviour. Nguyen and Leblanc (2001) claim that corporate image is related to tangible elements, such as contact personnel and physical environment, and to the impression of quality communicated by each person interacting with the firm’s clients. Image building is looked upon as being essential for attracting and retaining students, that is, important drivers of student loyalty (Bush et al., 1998; Standifird, 2005). According to Airey and Bennett (2007) one of the main factors for international students when searching for the right institution to pursue their studies is the reputation (image) of the institution or the organization. Helgesen and Nesset (2007) noted that both the image of a university and the image of a study program of a university are assumed to have positive effects on student loyalty. Therefore, we expect that University Reputation (UR) will have a significant impact on Student Loyalty (SL) for which the following hypothesis is proposed: H3University Reputation (UR) has a significant direct impact on Student Loyalty (SL) To sum up, the following hypotheses are proposed for this study: H1 Service Quality (SQ) has a significant direct impact on Student Loyalty (SL) H2 Students satisfaction has a significant direct impact on Student Loyalty (SL) H3 University Reputation (UR) has a significant direct impact on Student Loyalty (SL)

Proceedings of 4th
International Conference on Global Business Environment
(ICGBE-2014)
122
3. Methodology Participants and Procedure: Data were randomly collected from 160 international students studying at the International Islamic University Malaysia during the 2012/2013 academic session. A total of 148 questionnaires were returned with a response rate of approximately 92 percent. The ages of respondents ranged from 18 to 45 years of age. Rapport was established by explaining the importance and the relevance of the study. Participants were assured that their responses would be kept confidential and utilized only for the research purpose. They were asked to complete the questionnaires by following the instructions written at the top of the questionnaire. The questionnaires were distributed at the International Islamic University where students would gather in the campus from various countries. Measures: Measures for independent and dependent variables used a seven-point Likert type response format, with “strongly disagree” and “strongly agree”. The respondents recorded their assessment of the items on seven-point Liker type scales (1= strongly disagree, 2= disagree, 3= somewhat disagree, 4= neither agree nor disagree, 5= somewhat agree, 6= agree, 7= strongly agree). A self-administrated questionnaire was pretested with 20 international students studying in IIUM. The purpose of the research was explained to the students in an effort to facilitate the respondents’ feedback, suggestions, and answering of the questions (Achour, 2011). The respondents suggested that some words in the questions were not clear or straightforward. Except for these comments, the results of the pre-test indicated that, on an overall level, the questions were realistic, clear, and easy to follow. Following the pre-test, the unclear words and sentences were revised (Achour, 2011). 4. Results Factor Analysis: The data is analysed using exploratory factor analysis (EFA), through principal components analysis (PCA) with the varimax rotation method. According to Costello and Osborne (2007), PCA is a data reduction method used to reduce the number of items in a survey questionnaire. To assess the reliability of the scale, Cronbach’s alpha coefficient was calculated for each variable and within each factor solution. All factors had coefficients greater than 0.70, indicating evidence of reliability. Hair et al., (2010), noted that one of the common measures for coefficient reliability is Cronbach’s alpha, which assesses the consistency of the entire scale (p.125). The minimum acceptable level is 0.70. However, Hair et al., (2010) admitted that in exploratory research 0.6 is acceptable. Table 1: Varimax-rotated factor loadings
No Items Factors F1 F2 F3 F4 12 The employees of IIUM are courteous. .510 13 The employees of IIUM are willing to help students .725 14 The employees of IIUM give international students
personal attention. .794
15 The employees of IIUM are able to answer students’ questions in a satisfactory way
.762
16 The employees of IIUM provide services promptly and timely
.775
17 The employees of IIUM gave you individual attention. .728 19 The employees of IIUM had knowledge to answer your
questions. .617
21 IIUM understood your specific needs. .655 22 IIUM showed honest interest solving your problem. .608 1 Overall, I am satisfied with the university. .663
2 I have always had a good impression of IIUM .632
5 Lecturers and students communicating with each other smoothly in teaching class.
.722
6 I am satisfied with the quality of teaching service that lecturers providing for students.
.705
7 The teaching services provided by lecturers is convenient.
.724
4 My experiences with IIUM exceed my expectations. .468
24 I believe that IIUM has a better image than other universities.
.618
27 I believe that IIUM provides more benefits than other universities.
.708
28 No other university in Malaysia performs services better than IIUM.
.708
29 I am willing to pay more to study in IIUM than in other universities.
.697
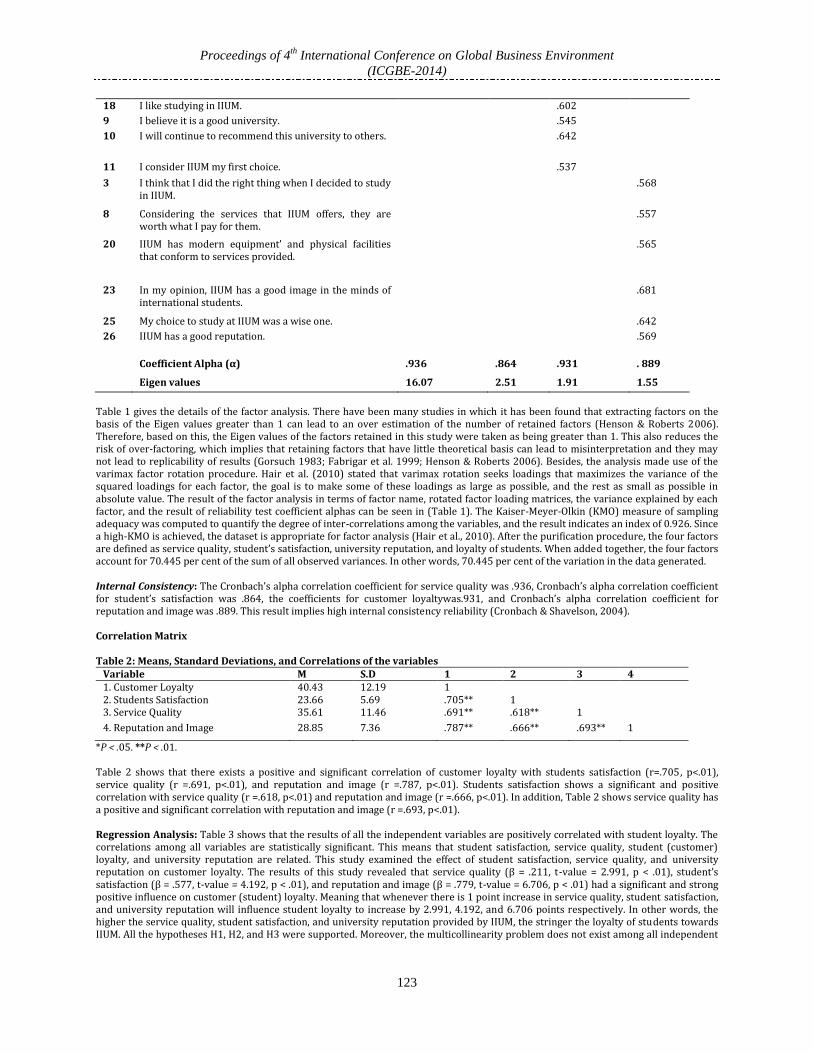
Proceedings of 4th
International Conference on Global Business Environment
(ICGBE-2014)
123
18 I like studying in IIUM. .602
9 I believe it is a good university. .545
10 I will continue to recommend this university to others. .642
11 I consider IIUM my first choice. .537
3 I think that I did the right thing when I decided to study in IIUM.
.568
8 Considering the services that IIUM offers, they are worth what I pay for them.
.557
20 IIUM has modern equipment’ and physical facilities that conform to services provided.
.565
23 In my opinion, IIUM has a good image in the minds of international students.
.681
25 My choice to study at IIUM was a wise one. .642
26 IIUM has a good reputation. .569
Coefficient Alpha (α)
.936
.864
.931
. 889
Eigen values 16.07 2.51 1.91 1.55
Table 1 gives the details of the factor analysis. There have been many studies in which it has been found that extracting factors on the basis of the Eigen values greater than 1 can lead to an over estimation of the number of retained factors (Henson & Roberts 2006). Therefore, based on this, the Eigen values of the factors retained in this study were taken as being greater than 1. This also reduces the risk of over-factoring, which implies that retaining factors that have little theoretical basis can lead to misinterpretation and they may not lead to replicability of results (Gorsuch 1983; Fabrigar et al. 1999; Henson & Roberts 2006). Besides, the analysis made use of the varimax factor rotation procedure. Hair et al. (2010) stated that varimax rotation seeks loadings that maximizes the variance of the squared loadings for each factor, the goal is to make some of these loadings as large as possible, and the rest as small as possible in absolute value. The result of the factor analysis in terms of factor name, rotated factor loading matrices, the variance explained by each factor, and the result of reliability test coefficient alphas can be seen in (Table 1). The Kaiser-Meyer-Olkin (KMO) measure of sampling adequacy was computed to quantify the degree of inter-correlations among the variables, and the result indicates an index of 0.926. Since a high-KMO is achieved, the dataset is appropriate for factor analysis (Hair et al., 2010). After the purification procedure, the four factors are defined as service quality, student’s satisfaction, university reputation, and loyalty of students. When added together, the four factors account for 70.445 per cent of the sum of all observed variances. In other words, 70.445 per cent of the variation in the data generated. Internal Consistency: The Cronbach’s alpha correlation coefficient for service quality was .936, Cronbach’s alpha correlation coefficient for student’s satisfaction was .864, the coefficients for customer loyaltywas.931, and Cronbach’s alpha correlation coefficient for reputation and image was .889. This result implies high internal consistency reliability (Cronbach & Shavelson, 2004). Correlation Matrix Table 2: Means, Standard Deviations, and Correlations of the variables
Variable M S.D 1 2 3 4 1. Customer Loyalty 40.43 12.19 1 2. Students Satisfaction 23.66 5.69 .705** 1 3. Service Quality 35.61 11.46 .691** .618** 1
4. Reputation and Image 28.85 7.36 .787** .666** .693** 1
*P < .05. **P < .01. Table 2 shows that there exists a positive and significant correlation of customer loyalty with students satisfaction (r=.705, p<.01), service quality (r =.691, p<.01), and reputation and image (r =.787, p<.01). Students satisfaction shows a significant and positive correlation with service quality (r =.618, p<.01) and reputation and image (r =.666, p<.01). In addition, Table 2 shows service quality has a positive and significant correlation with reputation and image (r =.693, p<.01). Regression Analysis: Table 3 shows that the results of all the independent variables are positively correlated with student loyalty. The correlations among all variables are statistically significant. This means that student satisfaction, service quality, student (customer) loyalty, and university reputation are related. This study examined the effect of student satisfaction, service quality, and university reputation on customer loyalty. The results of this study revealed that service quality (β = .211, t-value = 2.991, p < .01), student’s satisfaction (β = .577, t-value = 4.192, p < .01), and reputation and image (β = .779, t-value = 6.706, p < .01) had a significant and strong positive influence on customer (student) loyalty. Meaning that whenever there is 1 point increase in service quality, student satisfaction, and university reputation will influence student loyalty to increase by 2.991, 4.192, and 6.706 points respectively. In other words, the higher the service quality, student satisfaction, and university reputation provided by IIUM, the stringer the loyalty of students towards IIUM. All the hypotheses H1, H2, and H3 were supported. Moreover, the multicollinearity problem does not exist among all independent

Proceedings of 4th
International Conference on Global Business Environment
(ICGBE-2014)
124
variables because the tolerance values are more than .10 and VIF values are less than 10. Thus, the result suggests that the current study does not have any problem with multicollinearity. Table 3: Regression analysis
Variables
Β (t-value)
Sig
Collinearity Statistics
Tolerance (VIF)
Service Quality .211 (2.991)
.003 0.476 2.103
Students Satisfaction .577 (4.192)
.000 0.509 1.963
Reputation and Image .779 (6.706)
.000 0.428 2.337
R Square .697
Adjusted R Square .691 Sig. F Change .000
5. Conclusion This study sought to examine the impact of service quality, students’ satisfaction, and university reputation on student loyalty IIUM. For this purpose, we used EFA and multiple linear regression analysis. The findings of this study show that the regression model significantly explains the dependent variable as R2is 0.69 showing that the model is strong enough to explain the variability of student loyalty in IIUM. The results of this study also revealed that service quality, student satisfaction, and university reputation have positive effects on student loyalty. For the implications, the higher the service quality, student satisfaction, and image provided by IIUM, the higher the loyalty of students toward it. The study has limitations with respect to sampling and hence the findings of this study should be applied in the light of the fact that the study is conducted over a small sample size, which may limit the generalizability of the results and representativeness of the population area. Nevertheless, the findings from the study have great value for academic institutions elsewhere. References Achour, M., Md Said, N. P., & Boerhannoeddin, A. (2011). Customer loyalty: The case of mobile phone users in Universiti Utara
Malaysia. International Journal of Management Studies (IJMS), 18(2), 43-66. Airey, D., & Bennett, M. (2007). Service Quality in Higher Education: The Experience of Overseas Students. Journal of Hospitality, Leisure,
Sport & Tourism Education, 6 (2), 1473-8376. Alves, H., & Raposo, M. (2007). Conceptual model of student satisfaction in higher education. Total Quality Management, 18(5), 571-588. Annamdevula, S., & Bellamkonda, R. S. (2012). “Development of HiEdQUAL for Measuring Service Quality in Indian Higher Education
Sector” International Journal of Innovation, Management and Technology, 3(4), 2012. Bush, V., Ferrell, O. C., & Thomas, J. L. (1998). Marketing the business school: an exploratory investigation. Journal of Marketing
Education, 20(1), 16-23. Chou, C.-C., Liu, L.-J., Huang, S.-F., Yih, J.-M., & Han, T.-C. (2011). An evaluation of airline service quality using the fuzzy weighted
SERVQUAL method. Applied Soft Computing, 11(2), 2117-2128. doi: 10.1016/j.asoc.2010.07.010 Costello, A. B., & Osborne, J. W. (2007). Practical Assessment, Research & Evaluation. A peer-reviewed electronic journal, 10 (7), 1531-
7714. Cronbach, L.J. and Shavelson, R.J. (2004), “My current thoughts on coefficient alpha and successor procedure”, Educational and
Psychological Measurement, 64 (3), 391- 418. Dekimpe, M. G., Steenkamp, J. B. E., Mellens, M., & Vanden Abeele, P. (1997). Decline and variability in brand loyalty. International Journal
of Research in Marketing, 14(5), 405-420. Dick, A. S., & Basu, K. (1994). Customer loyalty: toward an integrated conceptual framework. Journal of the academy of marketing
science, 22(2), 99-113. Elliott, K. M., & Healy, M. A. (2001). Key factors influencing student satisfaction related to recruitment and retention. Journal of Marketing
for Higher Education, 10(4), 1-11. Fabrigar, L. R., Wegener, D. T., MacCallum, R. C., & Strahan, E. J. (1999). Evaluating the use of exploratory factor analysis in psychological
research. Psychological Methods, 4, 272-299. Gorsuch, R. L. (1983). Factor analysis (2nd ed.). Hillsdale, NJ: Lawrence Erlbaum. Hair, J. F., Black, W.C., Babin, B.J., & Anderson, R.E. (2010): Multivariate Data Analysis, 7th edn. Prentice Hall, Upper Saddle River, NJ,
07458 Helgesen, Ø., & Nesset, E. (2007). Images, satisfaction and antecedents: Drivers of student loyalty? A case study of a Norwegian university
college. Corporate Reputation Review, 10(1), 38-59. Henson, R. K., & Roberts, J. K. (2006). Use of exploratory factor analysis in published research. Educational and Psychological
Measurement, 66 (3), 393-416. Hernon, P. & Nitecki, D. (2001). Service Quality: A Concept not Fully Explored. Library Trends, 49, 687-708. Keller, K. (1993). Conceptualizing, measuring, and managing customer-based brand equity. Journal of Marketing, 57(1), 1-22. Lin, S. P., Chan, Y. H., & Tsai, M. C. (2009). A transformation function corresponding to IPA and gap analysis. Total Quality Management &
Business Excellence, 20 (8), 829–846.

Proceedings of 4th
International Conference on Global Business Environment
(ICGBE-2014)
125
Marzo-Navarro, M., Pedraja-Iglesias, M., & Rivera-Torres, M. P. (2005). Measuring customer satisfaction in summer courses. Quality Assurance in Education, 13(1), 53-65.
Nguyen, N., & LeBlanc, G. (2001). Image and reputation of higher education institutions in students’ retention decisions. International Journal of Educational Management, 15(6), 303-311.
Oliver, R. L. (1997). Satisfaction: A Behavioral Perspective on the Consumer, McGraw-Hill, New York, NY. Parasuraman, A., Zeithaml, V.A., & Berry, L. L. (1985) "A Conceptual Model of Service Quality and its Implications for Future Research",
Journal of Marketing, 49, pp. 41-50. Park, J.-W., Robertson, R., & Wu, C.-L. (2006). Modelling the Impact of Airline Service Quality and Marketing Variables on Passengers’
Future Behavioural Intentions. Transportation Planning and Technology, 29(5), 359-381. doi: 10.1080/03081060600917686 pp. 391-418.
Phadke, S. (2011). Modeling the Determinants of Student Loyalty in Indian Higher Education Setting. International Conference on Management, Behavioral Sciences and Economics Issues (ICMBSE 2011)
Poole, M., Harman, E., Snell, W., Deden, A., & Murray, S. (2000). ECU Service 2000: A client-centred transformation of corporate services, 00/16. Canberra: Evaluations and Investigations Programme. Higher Education Division, Department of Education, Training and Youth Affairs.
Ramaiyah, A., Zain, M., Nurulazam, A., & Ahmad, H. (n.d). Exploring the dimensions of service quality in higher education research. Retrieved from http://eprints.um.edu.my/16/1/arivalan.pdf 8 Nov 2013.
Ravald, A., & Grönroos, C. (1996). The value concept and relationship marketing. European journal of marketing, 30(2), 19-30. Schertzer, C. B., & Schertzer, S. M. (2004). Student satisfaction and retention: A conceptual model. Journal of Marketing for Higher
Education, 14(1), 79-91. Shekarchizadeh, A; Rasli, A; and Hon-Tat, H (2011). SERVQUAL in Malaysia Universities: perspectives of international students. Business
Process Management Journal, 17(1), 67-81. Standifird, S. S. (2005). Reputation among peer academic institutions: an investigation of the US News and World Report's
rankings. Corporate Reputation Review, 8(3), 233-244. Thomas, S. (2011). What Drives Student Loyalty in Universities: An Empirical Model from India. International Business Research, 4(2),
183-192. Tse, D. K., & Wilton, P. C. (1988). Models of consumer satisfaction formation: An extension. Journal of Marketing Research, 25(2), 204-212. Yoo, D. K., & Park, J. A. (2007). Perceived service quality - analyzing relationships among employees’ customers, and financial
performance. International Journal of Quality & Reliability Management, 24(9), 908-926. Zabala, I., Panadero, G., Gallardo, L.M., Amate, C.M., Sa ´nchez-Galindo, M., Tena, I., & Villalba, I. (2005). “Corporate reputation in
professional services firms: reputation managementbased on intellectual capital management”, Corporate Reputation Review, 8 (1), 59-71.
Zeithaml, V.A. & Bitner, M. J. (1996), Services Marketing, McGraw-Hill, New York, NY.

Proceedings of 4th
International Conference on Global Business Environment
(ICGBE-2014)
126
The Influence of Push and Pull Factors towards Tourists Consumption of Malay Food in Malaysia
A. Zainal, M. N. Mohd Hafiz, Y. Atikahambar, A.N. Zali & I. Shahariah
Universiti Teknologi MARA, Shah Alam, Malaysia [email protected]
Abstract: Motivational factors are the focal reasons as why majority of people nowadays are into travelling. Practically, they are pushed and pulled by either internal or external attributes before deciding where to visit and for what reasons to visit particular places of interest. Therefore, pull and push factors are the two variables that would assisting them during the decision making process. Meanwhile, in studying human attitudes, there are various unexpected behaviors and different reactions involved during decision session. Related to that, food is one of the medium in order to strengthen the reasons as to why people travel. This present study examines the motivational factors (push and pull factors) of tourists towards food while in Malaysia. A total of 200 tourists participated in this survey and the finding revealed that push and pull factors are positively significant related towards Malay food consumption by tourists (β=0. 45***, p<0.001; β=0. 30***, p<0.001). The results indicated that food was one of the contributors towards attracting tourists to visit Malaysia besides for visiting and shopping. It was found that although the Malay food is unfamiliar to tourists but they are willing to try a variety of Malay food. Keyword: Malay food, Motivational factor, push factor, pull factor, food consumption
1. Introduction Tourism industry is recognized as one of the major economic contributors in generating the national income and relatively synonym with the foreign money exchanged transaction (Jang and Wu, 2006; Fayissa, Nsiah and Tadesse, 2007). Excerpt by Secretary of United Nation World Tourism Organization at Dubai Travel Market Industry Forum 2012, he stated that currently tourism industry is one of the important contributors for country revenues. It has been proven in UNWTO 2013 report; the international tourism Worldwide receipts reachedUS$ 1,075 billion in 2012 compared US$ 1,042 billion in 2011 and almost 1035 million numbers of international tourists arrival Worldwide. As such, Asia and the Pacific have shown an increment of 7 per cent from tourism receipts (UNWTO, 2013). Due to the positive increment Hjalager and Richard (2002); Quan and Wang (2004) and Hjalager (2004) emphasized that, to be presented as a preferred destination, a vast of planning and ongoing investment need to be involved in order to sustain within this business. The Malaysian Government has formed a long-term planning programs called “Economic Transformation Programme” (ETP) as a base-line to achieve 36 million arrivals of international tourists and to earn a tourism receipts around RM 168 billion. (Tenth Malaysia Plan, 2010; BERNAMA, 2012 and Malaysia Country Report, 2013). As a result, in 2012 Malaysia succeed in increasing the tourist receipts by 3.9 per cent and generated RM 60.6 million as compared to RM 58.3 billion in 2011 (Malaysia Country Report, 2013). Malaysia is well known as a multiracial and multicultural country with many variations of authentic food. Each ethnic group has their own local creation in terms of culinary delights, and it is becoming a valuable resources to attract tourists to engage with the local culture (Zainal, Zali and Kasim, 2010). Thus, this is an opportunity for Malaysia to promote its local food creation focusing on Malay food which is unique in the usage of ingredients that is only familiar among the Malay Archipelago - Indonesia, Singapore and Brunei (Zainal et al., 2010). Notably, in the Malaysian context, food is highlighted as a minor aspect besides destination attractions (forest and beach), local handicraft, and fashion, as well as traditional and modern architectural (Tourism Malaysia, 2012). Thus, the primary aim of this research is to gain insight on tourists motivational factors in consuming Malay food. The research objectives are as follows: 1. To examine if push factor significantly influence tourists consumption of Malay food. 2. To examine if pull factor significantly influence tourists consumption of Malay food. 3. To identify the moderating effect of gender the consumption of Malay food. 2. Literature Review Motivational factors: Motivation is a process of getting to know why and how people act (Lien, 2010). In line with that, Solomon (2004) stated that a motivation could also be described as a driving force in doing things, and it leads people to act as they wish. Therefore, motivation is a process which starts from actual needs until the end of self-satisfaction. Nozawa (1992) further elucidated that nowadays people travel not for the sake of traveling but rather to travel for a specific purposes. Dan (1981); Chon (1989); Pearce (1993); and Uysal and Hagan (1993) postulated that motivation is a social needs and wants which includes internal and external forces. Those forces described how tourists are pushed by the various motivation reasons when making a decision to travel and how the destination attraction pulled or attract them during the selection process. Push factor: Generally, push factors refer to the specific forces that lead people to make a decision for vacation (Kim, Lee and Klenosky, 2003). In other words, it is a socio-psychological motive that is useful in explaining the desire to travel (Kim et al., 2003). Meanwhile, Jang and Wu (2006) enlightened that; push factor is known as personal internal force or intrinsic motivator to travel, and it is considered and categorized as a socio-psychological motivations that influence people to travel. Pull factor: Pull factor can be conceptualized as related to the destination features, attraction and destination attribute itself (Kim et al., 2003). Furthermore, pull factors engaged with several attributes of the places of attractions that magnetize people to go (Klenosky, 2002). Hence, it can be said that pulled factors are considered as one of the external forces to travel (Baloglu and Uysal, 1996), and it was proven that, in the tourists motivation theory, local attraction attributes for the tourists are the dominant pull factors (Riley and Van Doren ,1992).

Proceedings of 4th
International Conference on Global Business Environment
(ICGBE-2014)
127
Food Consumption: Undoubtedly, food industries are not excepted to act as a contributor in increment of the tourist receipts. Quan and Wang (2004) and Karim (2006) stated that food and tourism are the two elements closely related during a holiday period. As reported, tourists spend one-third of their expenditure of their holiday expenditure on food during vacation times through consuming an assorted of food choices that are being offered by local food provider (Telfer and wall, 2000 and Karim, 2006). Food consumption is about the understanding of food tourism, which has been an important aspect of the tourist experience (Shenoy, 2005). She further added that, tourist consumption does not involve sight and sound but relatively to the taste of the place. Meanwhile, food consumption can be divided into four perspectives. First, food is one of the destination attributes (tourism product), secondly tourist food consumption behavior, third dining experience with special interest in food selection and fourth is related to the activities in the destination (Hjalager and Richards, 2002). Malay food: Nummedal and Hall (2006) defined that the local food does not rely solely on the locally grown products but includes ingredients from outside of the area which contribute to the local and region identity. As such, the traditional Malay food has been influenced by traders from the neighboring countries such as Indonesia, India, the Middle-East, China and others (Zainal, Zali and Kassim., 2010). Due to this, all states in Malaysia strived to promote their own distinctive and unique identities by promoting their local cuisines including Kelantan; the state which is known as the Cradle of Malay Culture (Zainal et al, 2010, Syahida & Zainal, 2014) In line with the above notion, Rozin (,2006) has broken down Malay food into three components (i) the staple ingredients, (ii) the flavor principle (ginger, turmeric, chilies, lemon grass and dried shrimp paste and many others) and (iii) the way of preparing the dishes. Gender as Moderating Variables Affected the Relationship Between Motivational Factor Toward Tourist Consumption of food: Nordin, Broman and Nyroos (2004) showed that gender is one of the variables that can contribute to the different of food intake between male and female and have interrelations between variables. It was proven by Kim et al., (2009) that demographic factors of gender shows a significant impact towards the food choice, food selection and eating behavior. Flynn, Slovic, and Mertz (1994) asserted that, there are several different attitudes of food consumption between male and female where Male have higher tendency to taste of new food whereby female prefer to consume safety food as their primary food preference. In addition, Wadolowska, Babicz-Zielinska and Czarnocinska (2008) stressed that women are more concerned about health conscious and well being. The Relationship Between Motivational Factors Toward Tourists Consumption of Food: Pearce (1993) suggested that, in examining motivation factors, the variables (survey items) must be flexible in order to incorporate with individual changes across the life-span. Besides, most of the research in motivation are conducted in the broad tourist region and specific tourism destination (Fakeye and Crompton, 1991; Cha, McCleary and Uysal, 1995; Botha, Crompton and Kim, 1999). Majority of them acknowledged that push factor act as an escape from a routine, novelty, social interaction and prestige (Kim et al., 2003). It has shown that research on motivation are not only reasonable but also useful to examine and explored the relationship between push and pull factors items of motivation context (Sangpikul, 2008). 3. Methodology The purpose of this study is to gain insight understanding on tourists’ motivational (push and pull) factors toward local food consumption specifically on Malay food with emergence of gender factors moderates the strength of the relationship. Participants and procedures: The population of this study comprised of international tourists who are spending their vacation trip in Malaysia. The respondents were chosen based on the age range from 20 years old and above. 400 questionnaires were distributed with a total of 230 were returned and 200 out of it were usable, yielding to approximately 44.5% were analyzed. This study was carried out at the Kuala Lumpur International Airport (KLIA) and Low Cost Carrier Terminal (LCCT) they are the central public transportation in and out of the country. Measures: The instruments used were adapted from Sangpikul, (2008), based on the works of Cha, McCleary and Uysal (1995) with minor modification made. Six (6) push factors items, which are related to the desire to taste the Malay food, and five (5) items of pull factors (the Malay food attraction) were listed. Tourists’ consumption of the Malay food was measured using five (5) items, which were adapted from Sajna, 2005 and Kim et al., (2009) studies. In addition to that, gender was used as a moderating variable between push and pull factors toward tourists consumption of the Malay food in Malaysia. All the instruments were measured using a 5-point Likert scale. 4. Results 52% (N=104) of the respondents were male while the remaining 48% (N=96) were female. This study successfully engaged tourist from Asia continent (45%, N=90) followed by Europe (22%, N=44), Middle East (12.5%, N=25) and the rest were from Africa, America and others. 39% of them recorded visiting Malaysia for holiday and surprisingly, 14.3% (N=61) of the respondents visited Malaysia for gastronomy purposes. Cronbach’s alpha was used in measuring the reliability of the data, and the results show that the value of push factors, α = 0.76, pull factors α = 0.64 and tourists consumption of Malay food α = 0.89. Meanwhile, Table 1, depicts the two models that were created in order to see the relationship among the variables. Model 1 illustrates the relationship between push and pull factors without the presence of moderating variable. Meanwhile, Model 2 included gender as a moderating variable. Model 1 consists of 2 control variables explains the 46% (R2 = 0.46, F Change = 40.92, p<0.000) of the variance in tourists consumption while Model 2 consists of five controlled variables explaining 51% (R2 = 0.51, F Change = 43.28, p<0.000) of the increase in variance after gender variable moderates the relationship. It could be concluded that in this study and other control variable shown a positively significant relationship.

Proceedings of 4th
International Conference on Global Business Environment
(ICGBE-2014)
128
Table 1: Regression Analysis for Gender factors Moderates the Motivational (Push and Pull Factors) Factors on Tourists Consumption of Malay Food
Independent Variable Model 1 Model 2. (Control variables) β β
Motivational factors Push factors 0.21** 0.23* Pull factors 0.13* 0.13* Moderating Variable: Gender 0.45*** Push factors x Gender -0.31* Pull factors x Gender 0.42*** R2 0.46 0.51 Adj. R2 0.45 0.51 R2 Change 0.46 0.53 F Change 40.92*** 43.28*** Sig. F Change 0.000 0.000
Scale: p<0.05*, p<0.01**, p<0.001*** Implication: The motivational factors (push and pull) toward tourists’ consumption of Malay food are positively high. Majority of the respondents accepted the taste of Malay food and the uniqueness of eating food using hands. As such, by serving innovative and creative version (good in quality, hygienic and well presented) of Malay food it will be able to heighten the Malay cuisines popularity. Currently, many international tour companies and tour organizers in the world have included the gastronomic product as part in their tour itineraries (Kivela and Crotts’s research, 2006). Thus, this is the opportunity for local agencies and non-governmental organizations in Malaysia, to augment their current tour packages by implementing food based activities and food trails available in the country. In line with the above suggestions, the government authorities such as Ministry of Tourism could also gain benefits from this study by exploring and implementing more attractive gastronomy tourism activities (Malay food and Malay culture) as to gain competitive advantages in promoting Malaysia as one of the culinary destination. Limitations and Recommendation for Future Research: The analyses of this study highlighted a range of interesting, significant and meaningful findings. However, there are a few limitations such as this study was conducted based on data collected at a particular time due time and money constrained. Secondly, due to drug trafficking syndicate, the tourists are reluctant to participate as the researcher is seen as a stranger, approached them when they are in the airport. Thirdly, it could be noted that, the number of the respondents are unbalanced, the highest percentages are from Asian continent (45%), European (22%), Middle East (12.5%), African (5.5%), American (5%), Australia (4%) and 6% unstated. Fourthly, there is a language barrier between the tourists and the researcher and as such, the researcher had to provide some well-known Malay food pictures and personal explanation regarding the food before tourists could answer the questions. Thus, it is recommended that it is essential to expand this study by looking at broader scope and aspects especially to other traditional Malay food belonging to each state in Malaysia. 5. Conclusion It can be concluded that majority of the tourists that visited Malaysia are here for holidaying and shopping. While at the same time, they experience local food as one of the event. The findings indicate that, majority of the respondents accepted and admitted experiencing the Malay food which is very challenging as compared to the Chinese and Indian cuisines which may be familiar to them. Although, it is made up of a variety of aromatic ingredients, but the respondents do not hesitate to taste the Malay food such as satay and peanut sauce (kuah kacang), rendang and others. Consequently from now, tourism bodies and related government sectors have to collaborate and support each other in revealing the significant influences between motivational factors (push and pull) toward tourists’ consumption of the Malay food. With good involvement from all parties the gastronomy tourism activities could truly assist in portraying Malaysia as the gastronomy routes of Asia just like many European countries such as Italy, France and Japan has done to their food tourism. References Baloglu, A., and Uysal, M. (1996). Market segments of push and pull motivation: a canonical correlation approach. International Journal of
Contemporary Hospitality Management, 8(3), 32-38. BERNAMA (2012). Malaysia records 24.7 million tourists arrivals in 2011. Retrieved February 11, 2012, from
http://www.theborneopost.com Botha, C., Crompton, J. L. and Kim, S. (1999). Developing a revised competitive position for Sun/Lost City, South Africa. Journal of Travel
Research. 37, 341-352. Cha, S., McCleary, W, and Uysal, M. (1995). Travel motivations of Japanese overseas travellers: a factors cluster segmentation approach.
Journal of travel research, 34(1), 33-39. Chon, K. S.(1989). Understanding recreational traveler’s motivation, attitude and satisfaction. Tourist Review. 1, 3-6. Dan, G. M. (1981). Tourism motivations: An appraisal. Annual of Tourism Research, 4(4), 184-194. Fakeye, P. C., and Crompton, J. L. (1991). Image differences between prospective, first time and repeat visitors to the Lower Rio Grande
Valley. Journal of Travel Research. 30, 10-16. Fayissa, B., Nsiah, C., & Tadasse, B. (2007). The impact of tourism on economic growth and development in Africa. Department of
Economics and Finance working paper series. Middle Tennessee State University, Murfreesboro,USA. Retrived April 11, 2012, from Middle Tennessee State University Dig.
Flynn, J., Slovic, P., and Mertz, C. K. (1994). Gender, race and perception of environmental health risks. Risk Analysis. 14(6), 1101-1108. Hjalager, A. M., and Richard, G. (Eds.). (2002). Tourism and gastronomy. London: Routledge. Hjalager, A.M.(2004). What do tourist eat and why? Towards a sociology of gastronomy and tourism. Tourism, 52, 195-201.

Proceedings of 4th
International Conference on Global Business Environment
(ICGBE-2014)
129
Jang, S., and Wu, C. (2006). Seniors travel motivation and the influential factors: An examination of Taiwanese senior. Tourism Management, 27(2), 306–316.
Karim, S. A. (2006). Culinary tourism as a destination attraction: an empirical examination of the destination’s food image and information sources. PhD Thesis. Oklahoma State university. Retrieved Jun 15, 2011, from Mara University of Technology Digital Thesis.
Kim, S. S., Lee, C. K. and Klenosky, D. (2003). The influences of push and pull factors at Korean Nation Park. Tourism Management. 24(2), 169-180.
Kivela. J and Crotts, R. (2006). Tourism and gastronomy: gastronomy’s influence on how tourist experience a destination. Journal of Hospitality and Tourism, 3(30), 354-377.
Klenosky, D. (2002). The pull of tourism destinations: a means-end investigation. Journal of Travel Research, 40(4), 385–395. Lien, P. T. K. (2010). Tourists motivation and activities: A case study of Nha Trang, Vietnam.Master Thesis. The Norwegian College and
Aquaculture Management and Economics. Retrieved June 5, 2012, from The Norwegian College and Aquaculture Management and Economics Digital Thesis.
Malaysia Country Report, (2013). UNWTO 25TH CAP-CSA and UNWTO Conference on Sustainable Tourism Development 12-14 April 2013 Hyderabad India. Retrieved October 17, 2013, from http://www.media.unwto.org.
Mohd Hafiz, M. N., Zainal, A., Zali, A.N. & Shahariah, I. (2014). The influences of food neophilia and food neophobia towards tourists consumption of Malay food in Malaysia, Journal of Hospitality & Tourism, 223-227.London: Taylor and Francis Group, ISBN 978-1-138-00151-0
Nordin, S., Broman, D. A., and Nyroos, M. (2004). Gender differences in factors affecting rejection of food in healty young Swedish adults. Appetite. 43, 295-301.
Nozawa, H. (1992). A marketing analysis of Japanese outbound travel. Tourism Management. 13(2),226-234. Nummedal, M., and Hall, M. (2006). Local food and tourism: An investigation of the New Zealand South Island’s bed and breakfast
section’s use and perception of local food. Tourism Review International, 9, 365-378. Pearce, P. L. (1993). Fundamentals of tourists motivation. In D. G. Pearce and R. W. Butler (Eds). Tourism research: Critique and
Challengers. London: Routledge. 113-134. Quan, N., and Wang, N. (2004). Towards a structural model of the tourist experience: an illustration from food experiences in tourism.
Tourism Management, 297-305. Riley, R. W., and Van Doren, C. S. (1992). Movies as tourism promotion: A pull factors in a push location. Tourism Management
Research.267-274. Rozin, P. (2006). The integration of biological, social, cultural and psychological influences on food choice. The psychology of food choice.
Oxfordshire: CABI. Sajna, S. S. (2005). Food tourism and the culinary tourist. PhD Thesis. Clemson University. Retrieved April, 23, 2011, from Clemson
University Digital Th. Sangpikul, A. (2008). Travel motivations of Japanese senior travelers to Thailand. International Journal of Tourism Research, 10, 81-94. Shenoy, S. (2005). Food tourism and the culinary tourist. PhD Thesis. Graduate school of Clemson University. Solomon, M. R. (2004). Consumer Behaviour. (8th Ed.). New Jersey: Prentice Hall. Syahida, H.N and Zainal, A. (2014). The relationship between experiential marketing and tourists’ satisfaction on Kelantenese Food.
Journal of Hospitality & Tourism, 165-169.London: Taylor and Francis Group, ISBN 978-1-138-00151-0 Telfer, D,J., Wall, G., (2000). Strengthening backward economic linkages: local food purchasing by three Indonesian hotel. Tourism
Geographies, 2(4), 421- 447. Tenth Malaysia Plan recognized tourism industry. (2010, June 12). The Bernama News. Retrieved from
http://www.bernama.com/bernama. Tourism Malaysia. (2012). Tourists arrival to Malaysia for Januari - December. Retrieved on May 9, 2012, from
http://www.tourismmalaysia.com/facts&figures/02/.html. Uysal, M. and Hagan, L. (1993). Motivations of pleasure travel and tourism. In M. Khan, M. Oslen, and T. Var (Eds), Encyclopedia of
Hospitality and Tourism. New York: Van Nostrand Reinhold. 798-810. Wadolowska, L., Babicz-Zielinska, E., and Czarnocinska, J. (2008). Food choice models and their relation with food preferences and eating
frequency in the polish population. Food Policy. 33, 122-134. World Tourism Organization UNWTO (2012). International tourism receipts surpass US$ 1trillion in 2011 .Retrieved Mei 5, 2012, from
http://www.media.unwto.org. World Tourism Organization UNWTO (2013). UNWTO Tourism Highlight 2013 Edition.Retrieved September 12, 2013, from
http://www.mkt.unwto.org. Zainal, A., Zali, A. N., & Kassim, M.N. (2010). Malaysian gastronomy routes as a tourist destination, Journal of Tourism, Hospitality &
Culinary Art,15-24.

Proceedings of 4th
International Conference on Global Business Environment
(ICGBE-2014)
130
Integrating CLMV into the ASEAN Economic Community: Challenges and Opportunities
*Rakesh Singh, Rusha Das Durgadevi Saraf Institute of Management Studies, India
*[email protected] Abstract: The ASEAN Economic Community (AEC) is an integration effort that if realized will create a single borderless market ensuring free movement of goods and services, labor and capital encompassing nearly 600 million people. One of the bigger issues facing this effort of creating a borderless market is the integration of the newest members- CLMV economies into the ASEAN Economic Community. Several regional cooperation programs like the Greater Mekong Sub-region program by Asian Development Bank and Mekong-Japan cooperation were initiated to address the development gap. However, the weak institutional framework, rising inequality, uneven spatial development, rampant corruption, backward agriculture but a slowed steady progress are some of the major challenges ahead of their integration into the Southeast Asian Nations with which they not only need to collaborate but also compete. This puts forward an interesting argument that challenge for inclusive integration is broader than stimulating catch-up growth because CLMV has different economic and political history than pre-1995 ASEAN members. This paper evaluates this integration borrowing heavily from Economic Literature as well experience of other such regional integration. Keywords: ASEAN, CLMV, Economic Integration, transition economy, economic growth
1. Introduction The Mekong River is an important trade and economic corridor for the CLMV countries and Myanmar. The River also connects these countries with Yunnan, the southwestern province of China. This part of Asia is referred to as the Mekong Region. It is probably on such artery through which ASEAN can realize its ambition of inclusive integration and borderless trade across Asia. The CLMV economies became a part of the ASEAN in the second half of the 1990’s. Inspite of the region’s tremendous potential the main challenge that CLMV faces is its development gap with the older members of the ASEAN Community. During the second half of the 20th century political developments had a strong impact on these countries contributing to diverse developments of the region. Cambodia had a troubled period with French colonization, struggled relationship with larger neighbors’, troubles from Indochina conflict till 1975 and then ruled by murderous regime followed by Vietnamese Invasion. Lao PDR for much of 1970’s and early 1980’s remained extremely poor and isolated due to the outcome of years of Indochina conflict and strictly planned inward looking policies based around a central planning system. Myanmar faced 6 different intrastate conflicts and was believed to be the world’s most conflict prone country during 1946-2003.The military rule of Thailand continued in Myanmar as well. In the mid 1980’s Vietnam was an agricultural, less developed country that also had inward looking policies until 1986’s economic reform strategy known as the DOI MOI (RENOVATION) that boosted agricultural productivity and promoted inflows of overseas financial and managerial resources. Table 1: ASEAN Member countries, summary statistics, 2012
GDP (Million USD)
Ranking
Gross national income per capita 2012, (PPP 1$)
Ranking
HDI Value
Ranking
Population (thousands)
Brunei Darussalam
16954.00 112 NA NA 0.855 30 412
Cambodia
14062.00 119 2,360 169 0.543 138 14865
Indonesia
878193.00 16 4,810 146 0.629 121 246864
Lao People's Democratic Republic
9299.00 135 2,730 166 0.543
138
6646
Malaysia 303526.00 34 16,530 81 0.769 64 29240
Myanmar NA NA NA NA 0.498 149 52797
Philippines
250182.00 41 4,400 149 0.654 114 96707
Singapore
274701.00 35 61,100 8 0.895 9 5312
Thailand 365966.00 31 9,430 112 0.69 103 66785
Viet Nam 141669.00 57 3,440 160 0.617 127 88776
Source: World Bank World Development Indicators 2012 The development divide is clearly visible in the above table. The GDP’s of the CLMV economies are smaller than the ASEAN5 members (Singapore, Indonesia, Thailand, Malaysia, Philippines).However between the CLMV countries Vietnam holds a better ranking on any

Proceedings of 4th
International Conference on Global Business Environment
(ICGBE-2014)
131
measure. Cambodia and Lao has the smallest GDP in the ASEAN. Philippines has the smallest GDP amongst the ASEAN5, however it is 1.76 times that of Vietnam’s. The CLMV Countries: The idea of Mekong regional cooperation stems back from the post colonial period in Indo-China and the ensuing political developments. The United Nations Commission for Asia and the Far East initiated the creation of “Committee for Coordination on the Lower Mekong Basin” in 1957 later called as the Mekong Committee (MC). Later it became the Mekong River Commission in 1995. During 1990’s as peace and stability returned to the region several regional cooperation programs were initiated such as the Greater Mekong Sub-region program launched in 1992 by Asian Development Bank to physically link the countries of the Mekong region and accelerate economic growth. Cambodia: The economic development and policies of the country is heavily influenced by its history. Firstly the troubled period of Khmer Rouge rule, secondly the effects of Indochina war that resulted in excessive aerial bombardments and finally a neighborhood dominated by larger powers. It is a small country with GDP of $14 billion with neighbors’ like Thailand and Vietnam having GDP 26 times and 10 times larger than Cambodia. Ho Chi Minh City is the country’s most efficient port and civil aviation gateway. The agrarian economy is heavily supported by the Mekong River and sometimes the county is vulnerable to the arbitration actions of the upstream users. According to Human Development Report 2013 Cambodia has an HDI value of 0.543 - in the medium human development category—positioning the country at 138 out of 187 countries and territories. The rank is also shared with Lao People's Democratic Republic. Between 1995 and 2012, Cambodia’s HDI value increased from 0.411 to 0.543, an increase of 32 percent or average annual increase of about 1.7 percent. Table 2 reviews Cambodia’s progress in each of the HDI indicators. Between 1980 and 2012, Cambodia’s life expectancy at birth increased by 24.9 years, mean years of schooling increased by 0.8 years and expected years of schooling increased by 4.0 years. Cambodia’s GNI per capita increased by about 163 percent between 1995 and 2012. Table 2: Cambodia’s HDI trends based on consistent time series data
Life expectancy at birth
Expected years of schooling
Mean years of schooling
GNI per capita (2005 PPP$)
HDI value
1980 38.7 6.5 5
1985 52.6 6.5 5.2
1990 55.6 6.5 5.3
1995 56.2 6.5 5.5 0797 0.411
2000 57.6 7.5 5.7 1002 0.444
2005 60.1 10.1 5.7 1440 0.501
2010 62.7 10.5 5.8 1868 0.532
2011 63.1 10.5 5.8 1988 0.538
2012 63.6 10.5 5.8 2095 0.543
Source: United Nations Human Development Report 2013, Cambodia Table 3 shows Cambodia’s HDI indicators relative to selected countries and groups. Cambodia’s 2012 HDI of 0.543 is below the average of 0.64 for countries in the medium human development group and below the average of 0.683 for countries in East Asia and the Pacific. Table 3: Comparison of HDI and IHDI for 2012 relative to other countries HDI
value
HDI Ranking
Life expectancy at birth
Expected years of schooling
Mean years of schooling
GNI per capita (2005 PPP$)
IHDI value
Overall loss %
Loss due to inequality in life expectancy at birth %
Loss due to inequality in education %
Loss due to inequality in income %
Cambodia
0.543
138 63.6 10.5 5.8 2095 0.402
25.9 28.8 28.3 20.3
Lao PDR 0.543
138 67.8 10.1 4.6 2435 0.409
24.7 21.7 31.2 20.6
Myanmar
0.498
149 65.7 9.4 3.9 1817 ____ _____ _____ _____ ____
East Asia and Pacific
0.683
_____ 72.7 11.8 7.2 6874 0.537
21.3 14.2 21.9 27.2
Medium HDI
0.64 _____ 69.9 11.4 6.3 5428 0.485
24.2 19.3 30.2 22.7
Source: United Nations Human Development Report 2013, Cambodia Cambodia’s HDI for 2012 is 0.543. However, when the value is discounted for inequality, the HDI falls to 0.402, a loss of 25.9 percent due to inequality in the distribution of the dimension indices. Lao People's Democratic Republic shows losses due to inequality of 24.7

Proceedings of 4th
International Conference on Global Business Environment
(ICGBE-2014)
132
percent. The average loss due to inequality for medium HDI countries is 24.2 percent and for East Asia and the Pacific it is 21.3 percent. According to Human Development Report of 2013 on Cambodia 45.9 percent of the population lived in multidimensional poverty (the MPI ‘head count’) while an additional 21.4 percent were vulnerable to multiple deprivations. The intensity of deprivation – that is, the average percentage of deprivation experienced by people living in multidimensional poverty – in Cambodia was 46.1 percent. The country’s MPI value, which is the share of the population that is multi-dimensionally poor, adjusted by the intensity of the deprivations, was 0.212. Lao People's Democratic Republic had an MPI value of 0.267. Table 4 compares income poverty, measured by the percentage of the population living below PPP US$1.25 per day, and multidimensional deprivations in Cambodia. It shows that income poverty only tells part of the story. The multidimensional poverty headcount is 23.1 percentage points higher than income poverty. This implies that individuals living above the income poverty line may still suffer deprivations in education, health and other living conditions. Table 3 also shows the percentage of Cambodia’s population that live in severe poverty (deprivation score is 50 percent or more) and that are vulnerable to poverty (deprivation score between 20 and 30 percent). The contributions of deprivations in each dimension to overall poverty complete a comprehensive picture of people living in poverty in Cambodia. Figures for Lao People's Democratic Republic are also shown in the table for comparison. Table 4: MPI figures of Cambodia relative to Lao
Survey Year
MPI value
Headcount %
Intensity of Deprivation%
Population Contribution to overall poverty of deprivations in
Cambodia
2010 0.212 45.9 46.1 21.4 32.7
Lao PDR
2006 0.267 47.2 56.5 14.1 27.9
Source: UN Human Development Report 2013, Cambodia Since the Paris Peace Agreement of 1991 Cambodia has been heavily dependent on Foreign Aid. Official Development Assistance (ODA) was equivalent to more than 10% of its GDP. FDI also had been large overtaking ODA in 2007. The country has the world’s largest numbers of NGO’s per capita. The ODI flows are likely to continue in the future however it has some serious implications. It means that the government’ domestic tax effort is weak and there have been tendencies in some government circles to outsource key public sector responsibilities to NGOS’s and foreign donors. The donor presence has consequences of distribution for example the over concentration of development in the capital Phnom Penh is a result of the growing number of donors and their expenditure in the city. It also shaped the aspiration levels of young educated Cambodians who receive donor salaries that are atleast 5-6 times higher than those of the public sector. Figure 1: shows the flow of ODA and FDI from 1990-2012 clearly indicating the years where ODA exceeds the FDI
Source: Authors calculation using UNCTADStat database, ADB statistical database system, OECD database Being a highly open economy the value of the country’s merchandize trade relative to GDP IS 114% and inward FDI stock is estimated to be 53% of GDP. The average tariff rate is relatively high 12.4% signaling that the tax structure is still underdeveloped and the country is heavily supported by trade taxes. Its membership with WTO and ASEAN also resulted in continuous trade openness. Another reason for
0
0.0001
0.0002
0.0003
0.0004
0.0005
0.0006
0.0007
0.0008
0.0009
0.001
1990 1995 2000 2005 2010 2015
USD
in M
illio
ns
Years
ODA
FDI
Vulnera
ble to
poverty
%
In
severe
povert
y %
Below
Income
Poverty
Line %
Living
Standa
rds
Health Educati
on
17
28.1
22.8
33.9
22
33
45.1
39

Proceedings of 4th
International Conference on Global Business Environment
(ICGBE-2014)
133
an open economy is its gradual reduction in revenue generation through trade and related taxes, Cambodia now has only four tariff line at 0,7%,15% and 35%. As per the US accords it has elections at both national and local levels every 5 years. According to the World Bank World’s Governance Indicators (WGI) it ranks in the 25th bottom percentile against 5.7 of Laos, 0.9 of Myanmar and 8.5 of Vietnam in terms of voice and accountability. The Cambodian People’s Party (CPP) serves as the ruling party with Prime Minister Hun Sen. The country’s property rights are extremely poor and access to secure land title is an issue. Khmer’s decision to abolish private ownership coupled with 1970’s upheavals made land ownership an issue. The government allocates ownership rights on a 99 year lease basis which is often contestable. Nearly 60% of the cases in the Supreme Court are of land disputes. Volatile Economic Growth and Structural Change: The volatility in the economic growth is a consequence of political uncertainty, narrow economic base and external shocks. The collapse of the power sharing agreement between the political parties collapsed in July 1997 leading to a bitter civil war. The rural economy is heavily driven by rice production, garments being the major manufacturing activity while tourism, construction and other related service activities drives the urban population. The 1997-98 Asian financial crises has a lesser impact on the country owing to its domestic political crisis and isolation from the regional financial markets a key driver of the crisis. By contrast the 2008-09 global economic recessions hit the economy greatly during 2009 as the garments and tourism industry is heavily dependent on the Western Markets. Short term capital flows fell resulting in collapse of some construction projects in the capital Phnom Penh. However ODA where the major sources of capital inflow, surprisingly the banking sector remained robust Inspite of the slowdown of the construction industry to which banks are heavily exposed. This may be attributed to the National Bank’s cautious way of enforcing International banking management practices. However the volatile economic growth also resulted in structural change as seen in Table 5
1990 1995 2000 2005 2010 2012 In billion riel, current market prices GDP
598.6 8437.7 14089.3 25754.3 47048.0 56616.8
As a % of GDP Agriculture
55.6 47.7 35.9 30.7 33.8 33.5
Industry Mining Manufacturing Construction Electricity gas and water
11.2 0.5 5.2 0.4 5.0
14.3 0.2 9,1 0.4 4.5
21.8 0.2 16.0 0.4 5.2
25.0 0.4 17.8 0.5 6.3
21.6 0.6 14.9 0.5 5.5
22.8 0.7 15.12 0.5 6.4
Services Trade Transport and Communication Finance Public Administration Other Industries
31.7 9.4 3.8 6.8 4.7 7.0
34.2 14.6 5.2 6.6 2.8 4.9
37.1 14.4 6.6 7.3 2.7 6.1
39.1 13.5 7.4 7.7 1.8 8.6
38.5 13.8 7.5 1.5 1.8 14.0
37.6 13.6 7.5 7.2 1.5 7.8
Less: Imputed bank service charges
____ 0.9 1.1 1.0 1.2 1.1
Taxes less subsidies on production and imports
1.5 4.7 6.2 6.2 7.2 7.0
Total 100 100 100 100 100 100 Source: Authors calculations using ADB Statistical Database System Agriculture as a % of GDP has fallen from 55% to about 33% in less than 25 years. Manufacturing has grown at about 15% per annum but is heavily based on garments. Construction has grown rapidly during 2000-2005. Mining is small however shows a positive growth trend. It has a large service sector for the low income economy firstly because of a very large tourism sector and associated activities like hotels, restaurants, transport and personal services. Secondly large official Development Assistance and thirdly it comprises of a small tradable goods sector. Dollarization: Cambodia is a heavily dollarized country. Dollarization has both costs and benefits. The main cost is the loss of seigniorage and the limited ability of the monetary authority to implement discretionary monetary policy. Though Cambodia has a reverse relationship with dollarization and inflation yet being heavily dollarized means having a highly managed or fixed exchange rate. Furthermore in a dollarized country prices of significant portion of non traded goods may also set in dollars. The higher the share of these non traded goods priced in dollars the greater the rigidity of the real exchange rate to change to nominal rate (Menon 2008). However it should be noted that dollarization is more a effect than a problem, the cause of the problem is underdeveloped financial system. The Lao Economy: The economic progress in Lao PDR is based on economic reforms, with the introduction of more market oriented policies from 1987 onwards and successful development of exports based on natural resources. The exports include products of logging and mining, hydroelectric power for export to Thailand. Despite the real GDP growth of 8 % during 2012 the economic progress of Lao is

Proceedings of 4th
International Conference on Global Business Environment
(ICGBE-2014)
134
still one of Asia’s lowest. The human development index of Lao is 0.543 with a global ranking of 138 amongst 187 countries and is below the average of 0.64 for countries in the medium human development group. However when the value is discounted for inequality the HDI falls to 0.409, a loss of 24.7 % due to in equality in the distribution of the dimension indices. The country heavily capitalizes on natural resource exports. The effect of these revenues have on the people therefore depends on the way the government chooses to spend. Economic growth and structural change: Under the new economic mechanism the government began to decentralize control and introduce market oriented reforms in 1986.The reforms included removal of price controls, expansion of foreign and inter provincial trade, unified exchange rate and inclusion of private enterprise in agriculture and manufacturing. Economic growth contracted slightly in 1998 due to the Asian financial crisis. The economic had a growth rate of 7 % a year despite the outbreak of the global financial crisis in 2008. The growth also resulted in a gradual shift away from agriculture to industry and services. Agriculture steadily dropped from 60 % in 1990 to about 45 % by 2000 and further to 30 % / 2011. The growth of the industrial sector was heavily fueled by the growth in manufacturing, especially in textiles and garments. Resource based output increased to 5.5% of GDP in 1999 to above 27% in 2011 driven by minerals and electricity exports and investment in hydropower (Menon 2013). Table 6 shows the growth of output, annual change in percent
1995 2000 2005 2010 2012
GDP 7.1 6.3 6.8 8.1 7.9
Agriculture 3.1 4.2
0.7
3.2 3.3
Industry
13.3 9.3 10.6 17.5 11.4
Services 10.2 6.9 9.9 7.0 9.2
Source: ADB Statistical Database The Trade and Investment Regime: The Lao government allows 100% foreign ownership in almost all sectors under the Law on the promotion of Domestic and Foreign Investment. Only those sectors where investment may raise concerns for national security, protection of environment, health or national traditions are kept separate. Table 7 provides the Structure of tax Incentives for foreign investors
Tax Holiday1
Tax Holiday2
Concessionary Tax Rate 1
Concessionary Tax Rate 1
Zone 1 – No Economic Infrastructure
7 years ______ 10% ______
Zone 2- Basic Level of Economic Infrastructure
5 Years 3 years 5.5% 15%
Zone 3- Good Infrastructure 2 year No tax holiday
17 ½ % 35%
Mining and Energy Sectors Case by case basis
Source: ADB Working Paper Series, Menon (2013). The foreign investment applications are approved through a body called the Foreign Investment Management Committee that aims to approve the applications within a 60 day deadline. However the deadline may not always be observed. After the receipt of an investment license the foreign investor requires other licenses and permits to operate for which FIMC may only provide some form of assistance. The adoption of these unilateral policies have resulted in outward oriented trade and investment regime in Lao, however the limited capacity of the unilateral policies prompted the government to engage in economic cooperation agreements that would further accelerate trade openness. With this thought the earliest of the economic cooperation agreements was the Greater Mekong Sub-region (GMS) initiated by the Asian Development Bank in 1992. Physical connectivity between different parts of the region has been the agenda of GMS. Several hydropower projects, recently the Nam Theun 2 project, were developed in Lao PDR with the support of the private sector and for power export to Thailand. A detailed Cross Border Transport Agreement (CBTA) has been initiated to facilitate trade and investment. The CLMV Single Visa launched in July 2013 under the framework of Ayeyawady-Chao Phraya-Mekong Economic Cooperation is a successful initiative to attract Asean visitors by relaxing immigration procedures. Thailand has been Lao’s biggest trading partner. In 2012 the Thailand contributed 32.84% of total Lao’s export. The second biggest trading partner is PRC contributing to 20.7% of export in 2012.The changing pattern of demand from primary commodities to manufactured exports in 2000 mainly footwear and garments and back to primary commodities post 200 have transformed the structure of exports in the region. Protection Policy: The Lao PDR along with the other new ASEAN members operates on a two-tier tariff system with a different CEPT (Common Effective Preferential Tariff) and most favored nation (MFN) rate for each tariff line, resulting in a margin of preferences averaging about 8% in 2007.(Menon 2011). The Lao PDR as a consequence had to sign a multitude of FTA’s to join as a member of the ASEAN. Unless the multilateral FTA’s are employed this could really be a tough task to handle for the Lao economy. The multiple rate system is costly to administer, creates distortions and hence reduces welfare of an economy unlike the multilateralized single rate system. The multilateralization approach is not only to avoid trade diversion but it has become a necessity recognizing the domestic, administrative and bureaucratic capacity constraints (Menon 2013). The domestic absorption of the natural resource revenues

Proceedings of 4th
International Conference on Global Business Environment
(ICGBE-2014)
135
undermines the competitiveness of the traditionally traded goods industries-known as the DUTCH DISEASE. Have absorption of the natural resource revenues and other sources of capital inflow resulted in a Dutch Disease for Lao PDR? The level of Lao PDR’s foreign exchange reserves increased from 3% (GDP Share) in 1992 to 11% in 2003 and remained at that level till 2011. Clearly signaling that almost all the resources have been absorbed in the domestic economy resulting higher current account deficits than otherwise. The second question is if all the resource revenues are absorbed into the domestic country is this appropriate? The capacity of Lao PDR to implement efficient and productive use of new sources of revenue is limited. Therefore caution and restraint should implement in the short run like the administration of the Sovereign Wealth Fund by Norway. Lao should also focus on an expenditure policy where the natural resource based revenues are domestically absorbed in the areas of education, health- much of which has decreased as a share of GDP in the recent years. Table 8 shows the Direction of Trade from 1995-2012
Direction of Trade million US Dollars; calendar year
1995 2000 2005 2010 2012
Exports, total
1. Thailand
2. China, People's Rep. of
3. Viet Nam
4. United Kingdom
5. Germany
6. United States
7. Japan
8. Korea, Rep. of 9. India 10. France
311.2
83.3
8.8
87.7
0.9
12.7
5.3
5.3
–
–
11.1
391.3
68.9
5.8
96.1
7.2
20.8
8.8
10.9
0.5
27.1
726.6
204.4
23.2
88.6
38.5
31.6
4.1
7.3
1.9
0.1
41.9
2195.9
689.7
510.9
265.2
69.9
53.1
56.3
34.2
18.2
18.2
15.7
3444.0
1131.1
713.7
480.9
95.5
67.4
23.4
112.8
10.3
127.9
12.8
Source: ADB Statistical Database Figure 2 shows the amount of FDI by sector and the total FDI in the year 2013
Myanmar’s Macroeconomic Development: Myanmar’s economic development can be split into three different phases: 1. Early-Mid 1990- Moderate growth due to the Junta reforms (transfer from a socialist regime to a market based economy).Strong
growth of the agriculture sector due to the export of beans. FDI inflows in the real estate, mining, and construction sectors contributed to the growth. However FDI inflows widened trade deficits and made the economy vulnerable to external shocks.
2. Late 1990’s-2003- Damage due to AFC and recession caused by a bank run in 2003.The market exchange rate of Kyat depreciated to 31% per year between 1997-2003, the inflation rate was30-40%, the highest level in the 1990-2000s. However the robust domestic service sector and the garment industry still made the economy to grow until 2003. The garment industry amounted to 30% of the country’s total export and this reduced the trade deficit. In the early 2003 the informal financial institutions engaged in land speculation went bankrupt and triggered a bank run in private banking sector leading to an overall recession. The recession in 2003-04 can be seen as a consequence of incomplete reforms of the SOE privatization and fiscal and macroeconomic reforms by the military junta in the 1990’s (Fumiharu 2013).
Mid 2005- Recovery due to natural gas export post 2005. Owning to the export the current account turned to a surplus in 2002and the
shortage of foreign reserve disappeared, the economy attained a growth rate of 2-6% characterized by low inflation, kyat appreciation
and financial sector stability.
0100200300400500
Man
ufa
ctu
r-in
g Po
wer
Oil
and
Gas
Ho
tel a
nd
Tou
rism
Min
ing
Oth
ers
Agr
icu
ltu
re
Fish
erie
s
400.716 364.201309.200 300.000
15.334 14.766 9.650 5.600
Foreign Investment by Sector
2012-2013
US$ million

Proceedings of 4th
International Conference on Global Business Environment
(ICGBE-2014)
136
Source: Central Statistical Office (Myanmar), Selected Monthly Economic Indicators, various years. Figure 3 shows the export and import by government and private during 2012-13 clearly shows exports significantly improved during the second quarter of 2013 especially after July.
Source: Central Statistical Office (Myanmar), Selected Monthly Economic Indicators, various years. Corporate and Financial System: The money supply in the Figure 4 shows that the private banks are effective financial intermediaries in the national economy. However there is obviously room for further development.
Source: Central Statistical Office (Myanmar), Selected Monthly Economic Indicators, various years. Myanmar is still requires a well-designed legal system with well defined corporate and commercial laws. The government should focus on a structured financial system and work on policies towards land property rights, This will ensure less distorted prices and lighter taxation for the manufacturing sector. Though the FDI is the most stable component among the capital account components (, Ito 2007) still the structure of compensating outflow of foreign currency in the current account deficit by FDI inflows may make the economy vulnerable to external shocks (Fumiharu 2013). Thus a careful macroeconomic management is Myanmar’s requirement.
0100200300400500600700800
20
12
Oct
20
12
No
v
20
12
Dec
20
13
Jan
20
13
Feb
20
13
Mar
20
13
Ap
r
20
13
May
20
13
Ju
ne
20
13
Ju
ly
20
13
Au
g
20
13
Sep
t
13.369
331.242
51.243
348.620253.410
23.092
190.665226.047
393.820
21.819
731.414
53.459
Total Foreign Investment Foreign …US$
67
22
.62
55
63
.29
57
0.5
1
58
8.8
2
90
46
.19
66
94
.98
13
91
.61
95
9.5
9
87
54
.83
62
59
.22
14
41
.22
10
54
.39
0
2,000
4,000
6,000
8,000
10,000
Money Supply Currency in Circulation
Demand deposits State Owned Banks
Demand deposits Private Banks
Kyat Billion
2011-2012
2012-2013
2013-2014 (Apr - June)

Proceedings of 4th
International Conference on Global Business Environment
(ICGBE-2014)
137
Vietnamese Economy: The Vietnamese economy is characterized by macroeconomic turmoil and slow growth after 2007. The growth rate of GDP has been in an average of 6% per annum after 2007. All the macroeconomic indicators have highly deteriorated since 2007.The current account deficit had reached to a record level of 11.9% of GDP in 2008, fiscal deficit recorded as high as 7.2 in 2009 and trade deficit accounted for 15.85% of the GDP during 2008. The factors contributing to the downturn were mainly. 1. Vietnam’s membership in WTO in 2006- The membership stimulated large inflows of foreign capital. Due to the inefficient
monetary system this inflow resulted in the expansion of money supply and a high and volatile inflation rate. 2. State Owned Enterprise (SOEs) - were allowed to form groups. The conglomerate structure further resulted in the distortion of
resources allocation. They privileges to capital and land resources further accelerated after the formation of conglomerate in 2006.Many pro SOE policies that resulted in high investment rate and large debt were adopted during the Prime Minister ship of Nguyen Tan Dung, a strong supporter of SOE.
3. Rapid expansion of Vietnamese imports of manufactured products owing to strong impacts from China which brought about large trade deficits and contributed to macro economic instability.
Table 9 shows the major economic indicators of Vietnam from 2003-2011 2003 2004 2005 2006 2007 2008 2009 2010 2011 GDP growth % CPI Inflation Rate (end of yr) Investment/GDP % Saving/GDP % Trade balance/GDP % Current account balance/GDP % Fiscal deficit/GDP % Foreign debt (US$ Billions) (Government) (Government Guarantee) Gross International Reserve (US$ Billions) (Months of Imports) FDI Inflows (net, US$ Billions) Of which FDI inflows (US$ Billions) Exchange rate at the end of period(VND/US$)
7.4 3.0 35.44 30.56 -8.36 -4.9 -3,2 11.4 10.7 0.7 6.22 2.96 1.5 1.5 15,646
7.8 9.5 35.47 31.97 -7.55 -3.5 -0.2 13.5 12.5 1.0 7.04 2.64 1.6 1.6 15777
8.5 8.4 35.57 34.52 -4.18 -1.1 -1.3 14.2 13.3 0.9 9.05 2.95 1.9 2.0 15916
8.2 6.6 36.81 36.54 -4.56 -0.3 0.3 15.6 14.6 1.0 13.38 3.57 2.3 2.4 16054
8.5 12.6 43.13 33.30 -15.85 -9.8 -2.2 19.3 17.3 2.0 23.48 4.49 6.5 6.7 16114
6.3 19.9 39.71 27.77 -15.21 -11.9 -0.5 21.8 18.9 2.9 23.89 3.55 9.3 9.6 16977
5.3 6.5 38.13 31.56 -10.35 -6.6 -7.2 27.9 23.9 4.0 16.45 2.82 6.9 7.6 17941
6.8 11.8 38.88 34.85 -10.28 -4.0 -5.2 32.5 27.9 4.6 12.47 1.79 7.1 8.0 18932
5.9 18.1 32.62 32.79 -4.22 0.2 -2.7 NA NA NA 17.65 2.04 6.5 7.4 20490
Source: Vietnam’s General Statistic Office, Ministry of Industry and Trade, ADB, World Bank, IMF, State Bank of Vietnam. It is interesting to note that tough the current account deficit/GDP % rose sharply to 10% in 2007 from a zero balance in 2006. However the inflow of capital was twice as much as was required to fund the deficit Figure 5. After the membership of WTO foreign capital surged into Vietnam in the form of portfolio investment, FDI (Foreign Direct Investment), capitals invested in real estate. After the financing of the current deficit the rest of the capital was purchased by the state Bank of Vietnam, resulting in large increase in foreign reserve in one hand and expansion of the money supply on the other. This became a major factor for the spike of the inflation rate in 2007. The SBV had to buy the foreign capital due to the absence of liquid secondary government bond market. The higher inflation created devaluation of the VND, as evident in Table 9 where the currency depreciated six times from 2008-11. The weakening of the VND against the USD induced the local people to hedge their risk through gold as a result the price of the metal rose sharply. Figure 5 below shows the “net errors and omissions” are the payment for smuggled gold. (Tran Van Tho 2013).
Policies for Sustained Growth: The first phase of the Doi Moi (1986-2005, made the Vietnamese economy to grow to a low-middle income country with reforms primarily focused on agriculture and FDI and the existence of State Owned Enterprises (SOE) were not obstacles in the resource allocation. However in the current scenario the SOE’s have become state conglomerate that affect the direction of economic policies and allocation of resources. Therefore a new gradualist transition strategy should be implemented with special

Proceedings of 4th
International Conference on Global Business Environment
(ICGBE-2014)
138
attention to SOE’s. The basic feature of SOEs is a soft budget constraint where the state bails them out when they are in financial constraint. Thus the actions of SOEs are not subjected to market discipline. Therefore the SOEs should gradually be exposed to a hard budget constraint and exposed to market competition with private and other non SOE firms. Policies for promoting the industrial structure should be adopted as Vietnam’s export is heavily dependent on labour intensive manufactured products that have high import content. The problem may become worse since labour intensive products may receive competition from lower wage countries. Therefore it needs to strengthen the competitiveness of the products that are in high demand in international markets. It is still considered as the favourable investment destination by foreign countries owing to its geography, workforce, and population, social and political stability. Therefore efforts from the central and state government for a good labour market, policies to reduce the mismatch between demand and supply of semiskilled and unskilled labour in rural and urban markets is essential for stable activities of FDI and domestic companies. 3. Conclusion While the ASEAN5 went through a long process of development through import substitution to export oriented strategies and establishment of market oriented institutions, CLMV suffered from internal and external conflict followed by inward looking policies and came much later to market oriented development strategies. It is not about catch up with the older ASEAN+5 members but catch up with the moving target. The CLMV countries have stronger transition periods, for example to remove non tariff barriers to trade by 2015, but the real concern is whether targets would be implemented and enforced? Even more fundamental problem is the trade cost that if economical will only allow the CLMV economies to participate and benefit from the regional value chains. Out of three economies Vietnam is still robust in terms of institutions, logistics; however the remaining three have lesser prospects. References Asian Development Bank (ADB) (2008a). Emerging Asian Regionalism: A Partnership for Shared Prosperity. Manila: Asian Development
Bank. Asian Development Bank (ADB) (2008b). Corridor Chronicles: Profiles of Cross Border Activities in the Greater Mekong Subregion. Manila:
Asian Development Bank. World Bank (2011). Vietnam Development Report 2012: Market Economy for a Middle-Income Vietnam. Hanoi: World Bank. Hill H. & Menon J. (2013). Cambodia: Rapid growth with weak institutions. Asian Economic Policy Review, 8 (1), 46–65. Menon J. & Melendez A.C. (2011). Trade and investment in the greater Mekong subregion: Remaining challenges and the unfinished policy
agenda. ADB Working Paper Series on Regional Economic Integration No. 78. Asian Development Bank, Manilla. Menon J. & Warr P. (2008). Roads and poverty: A general equilibrium analysis for Lao PDR. In: Brooks D. & Menon J. (eds),Infrastructure
and Trade in Asia. Cheltenham: Edward Elgar, 115–142. Mieno F. (2013). Toward Mynamar’s new stage of development: Suggestions from the economic structure under twenty years of a military
regime.Asian Economic Policy Review, 8 (1), 94–117. Hill H. & Menon J. (2011). Reducing vulnerability in transition economies: Crises and adjustment in Cambodia. ASEAN Economic Bulletin,
28 (2), 134–159. Menon J. (1998). De-dollarising Cambodia.Cambodian Development Review, 2 (2), 6–9 World Bank (2009). Sustaining Rapid Growth in a Challenging Environment. Cambodia Country Economic Memorandum. Washington, DC:
World Bank. Asian Development Bank (ADB) (2012).ARIC Integration Indicators Database. Manila: ADB. Davading S., Phimmahasay K. & Boyreau G. (2012). Sustaining Robust Growth: Mitigating Risks and Deepening Reforms – Lao PDR
Economic Monitor (May 2012 update). Washington DC: The World Bank. Menon J. (2012). Narrowing the development divide in ASEAN: The role of policy. ADB Working Paper Series on Regional Economic
Integration No. 100, Asian Development Bank, Manila. Menon J., Athukorala P. & Bhandari S. (2006). Foreign Direct Investment in the Mekong Region. Manila: Asian Development Bank. United Nations Development Programme (UNDP) (2007). Assessment of development results. Evaluation of UNDP’s Contribution – Lao
PDR. Accessed 14 July 2012. Available from URL: http://web.undp.org/evaluation/documents/ADR/ADR_Reports/ADR_Laos.pdf.
Asian Development Bank (2012). Myanmar in Transition: Opportunities and Challengers. Manila: Asian Development Bank. Fujita K., Mieno F. & Okamoto I. (2009). Economic Transition in Myanmar after 1988: Market Economy versus State Control. Singapore:
NUS Press & CSEAS of Kyoto University. Fujita K. & Okamoto I. (2009). Overview of agricultural policies and the development in Myanmar. In: Fujita K., Mieno F. & Okamoto I. (eds),
Economic Transition in Myanmar after 1988: Market Economy versus State Control. Singapore: NUS Press & CSEAS of Kyoto University Press, 169–215.
Myint (2011). Reducing poverty in Myanmar: The way forward. Paper presented at Workshop on Rural Development and Poverty Alleviation, Nay Pyi Taw, Myanmar, 20–21 May 2001.
Myint (2012). Myanmar and FDI issue, Myanmar Development Resource Institute, mimeograph. Than M. & Thein M. (2000). Financial Resources for Development in Myanmar: Lessons from Asia. Singapore: Institute of Southeast Asian
Studies. Thanh V.T. & Duong N.A. (2011). Revisiting exports and foreign direct investment in Vietnam. Asian Economic Policy Review, 6 (1), 112–
131. Tran V.T. (2006). FDI and economic development: The case of Vietnam. In: Urata S., Chia S.Y. & Kimura F. (eds), Multinationals and Economic Growth in East Asia. London: Routledge, 393–422.

Proceedings of 4th
International Conference on Global Business Environment
(ICGBE-2014)
139
Effects of the triadic relationship among customers, service providers and the government on brand loyalty in mobile telecommunications industry
Thu Nguyen Quach, *Paramaporn Thaichon
Swinburne University of Technology, Victoria, Australia *[email protected]
Abstract: This research investigates the interactions of customers, service providers and government - three principle groups of forces in the market - in how customers’ loyalty can be influenced. The study was carried put in the context of mobile telephony services. Under the regulatory environment controlled by government through regulations and policies, companies provide service quality, promotions and create switching barriers; especially, switching barriers can be affected by the other two constructs, i.e. promotions (through switching costs) and service quality. On the other hand, customers’ habits influence social ties, and both of them are associated with switching cost in switching barriers. Customer satisfaction is an important antecedent of customer attitudinal and behavioural loyalty - the resultants of this study. Service quality directly impacts customer satisfaction and as a result, both types of loyalty. Switching barriers are directly related to attitudinal and behavioural loyalty. Customers’ habits are also associated with behavioural loyalty. Customer loyalty, therefore, is the end result from triadic interactions among subscribers, companies and government. This study can provide insights of customer behaviour in the telecommunications market and can help service operators to establish strategies to develop their loyal customer base. Keywords: Switching Barriers, Communication, Service Quality, Sales Promotions, Habits, Social Ties, Brand Loyalty
1. Introduction Research has revealed that, in the mobile telecommunications industry, the costs associated with acquiring new subscribers are approximately four to five times more than resources required to retain current customers (Chuang, 2011). The mobile telecommunications industry is characterised by enormous investment in equipment and facilities; thus it requires a significant number of customers to cover fixed costs (Chuang, 2011). Customer retention, as a result, is critical for mobile telephony service providers. However, it seems to be more challenging in telecommunications market due to the presence of government intervention. Background of the study: Customer switching has become a significant issue in mobile services industry (ROA Holdings, 2012). Every year, there is an average of 44 percent of subscribers switching providers in mobile telecommunications industry globally (Alcatel Lucent, 2012). This number varies drastically between pre-paid and post-paid subscribers, and between countries. For example, service providers in Canada typically experience annual churn rates from 15 to 20 percent whereas annual churn rates in South America range from 20 to 30 percent (Alcatel Lucent, 2012). Especially, some leading service providers in Vietnam report that their annual churn rates reach 100 percent (Alcatel Lucent, 2012). Despite being in top ten countries with the largest number of mobile telephony subscribers (CIA, 2011), Vietnam, together with Indonesia, is predicted to have the highest churn rate among Asian countries from 2012 to 2015 (ROA Holdings, 2012). Therefore, service providers need to take action to improve subscriber retention. Vietnam’s mobile services industry is still young and relatively different from other mature markets. In Vietnam it is common that one mobile user has two or three SIM cards (ROA Holdings, 2012). In addition, pre-paid service customers make up 90% of total Vietnamese mobile service subscribers. This is where the churn rate is found to be the most significant because prepaid customers are most likely motivated by promotions to purchase (Alcatel Lucent, 2012). Vietnamese government has imposed a regulation which restricts the monetary value of promotions in the telecommunications market. As a result, Vietnamese mobile service providers are facing more challenges in keeping their customers. This urges a need of creating a more loyal customer base. Therefore, understanding determinants of customer attitudinal and behavioural loyalty is very important for business survival and success in this market. Moreover, there is limited knowledge about the relationship among customers, service providers and government. In most of developing economies, the role of government is very important, especially in a communist country such as Vietnam. In 2009, Vietnamese government imposed a regulation on restricting the monetary promotions in the mobile telecommunications market in order to control unused numbers in prepaid services. In 2012, the regulation on subscribing procedures, especially for prepaid service, has caused some major changes in the market. For example, the number of new subscribers has decreased, as customers are able to purchase only a limited number of prepaid SIM cards. These regulations are definitely affecting customer loyalty since companies cannot rely on promotions to keep their customers anymore. It is worthwhile to examine customer loyalty under an unstable and reluctant market partly influenced by government. From the background stated above, it can be seen that the mobile telecommunication service providers are facing the risks of losing their customers, especially under unstable conditions of the market. Therefore, the main research problem is articulated as “How does the triadic relationship among the customers, service providers and the government influence the brand loyalty of mobile telecommunication consumers?” The objectives of this research study are: firstly, to investigate the antecedents of the brand loyalty in the mobile telecommunication market in Vietnam; secondly, to evaluate the role of the triadic relationship among customers, service providers and the government in determining brand loyalty; thirdly, to investigate how brand loyalty of mobile telecommunication consumers can be developed and improved in Vietnam. 2. Literature Review Customer loyalty: Customer loyalty is a topic which has received considerable attention in marketing literature (Bandyopadhyay & Martell, 2007). There are many approaches to customer loyalty and research attempts to define the “true nature” of loyalty. Several researchers purely explain loyalty from the behavioural point of view (Sharp, Sharp & Wright, 2002) while some of the others examine loyalty from an attitudinal perspective. This research embraces the integrated theory, which suggests that customer loyalty is a

Proceedings of 4th
International Conference on Global Business Environment
(ICGBE-2014)
140
combination of behavioural and attitudinal loyalty (Bandyopadhyay & Martell, 2007). Hence, behavioural loyalty is defined as repeat purchase, attitudinal loyalty refers to customer favorable attitudes and recommendations (Rauyruen & Miller, 2007). Customer affective evaluation: Numerous researchers have pointed out that both attitudinal and behavioral loyalty are influenced by satisfaction. A research by Kuo, Wu and Deng (2009) reveals the link between satisfaction and loyalty in Taiwanese telecommunications market. In fact, it is proved that there is a positive relationship between customer satisfaction and customer loyalty (Yang & Peterson, 2004). Consumers with a higher level of satisfaction are more likely to have a stronger intention of repeat purchase and recommendation (Su, Shao &Ye, 2011). Factors from service providers: Switching barriers and service quality are the two concepts that are closely related to service providers. Switching barriers, as an effort from the company to retain customer, are found to have an impact on loyalty (Tung, Kuo & Kuo, 2011). Patterson and Smith (2003) assert that switching barriers themselves are very powerful in predicting customer retention. Results from previous research also show that the two dimensions of customer loyalty, i.e. repurchase intention and attitudinal loyalty, are positively associated to switching barriers (Su, Shao & Ye, 2011). Jones, David and Sharon (2000) divide the switching barriers into three groups: interpersonal relationships, perceived switching costs, and attractiveness of alternative. While interpersonal relationships mean personal relationship between a customer and a service employee, perceived switching costs are defined as time, money, and effort that customers have to spend in order to change their service provider. The attractiveness of an alternative refers to how other options from competitors appeal to the customers. Moreover, there is evidence of how promotions can influence switching costs (Tung, Kuo & Kuo, 2011). Klemperer (1987) discovers that customers’ switching costs originate from the constraint of losing a chance to obtain prizes and discounts after numerous repurchases. Turnball and Wilson (1989) refer to switching costs as benefits which are offered by the current service provider and will be lost when the customers change to a new one. The more customers acquire from the incumbent providers, the more they give up when switching. Thus, it can be concluded that promotions can increase customers’ switching costs. Service quality is associated to switching barriers (Konuk & Konuk, 2012). Jones, Mothersbaugh and Beatty (2002) reveal a positive relationship between service quality and switching costs which are an important component of switching barriers. Jones, David and Sharon (2000) propose that switching costs can help businesses to manage short-term variations in service quality. Results from the study of Meng and Eliott (2009) also show a positive association between service quality and switching costs. Higher perceived service quality can result in higher perceived loss that customers experience when switching. It is found that service quality has a positive relationship with customer satisfaction. Recent evidence suggests that service quality determines customer satisfaction (Kuo, Wu & Deng, 2009). The higher service quality is, the more a customer feels satisfied about their service provider. Therefore, it is critical to ensure that service performance meets customer expectations, and customers are happy about their service providers, especially when satisfaction is also an important antecedent of loyalty (Su, Shao & Ye, 2011). Factors from customers: Customers are characterized by their habits and social ties. It is found that when habits begin to develop and increase their strength, planning is less important, and repeat purchase mainly happens based on automaticity and inertia (Chuang, 2011). Lin and Wang (2006), emphasised that habit have a direct effect on customer loyalty. Furthermore, Woisetschläger, Lentz and Evanschitzky (2011) assert that there is a significant positive impact of social ties on customer behavioural and attitudinal loyalty; and, economic switching barriers interact with social ties and habits significantly. In fact, previous research on switching barriers supports that habits affect economic switching barriers (Jones, Mothersbaugh & Beatty, 2002). The more habitual the behavior is, the more perceived effort (e.g., search and learning costs, time, psychological efforts) is needed to change that behavior (Woisetschläger, Lentz & Evanschitzky, 2011). Moreover, habits help to establish and retain social relationships (Woisetschläger, Lentz & Evanschitzky, 2011). Boorstin (1973) reports that consumers who share the same norms, values, and habits form groups of consumption - an idea which Wood, Witt and Tam (2005) adopt to illustrate that habits can be shared socially. In other words, habits are positively related to the establishment of social ties. Government power: In terms of government role, regulations influence the entire market including firm performance, and probably customer perceptions (Yu, Berg & Guo, 2004). For example, performance-based regulations can encourage cost control and service enhancements. Especially, service quality regulations can define awards and punishments related to service reliability or customer service standards, such as policy of installation postpones (Yu, Berg & Guo, 2004). In such a partially regulated market as telecommunications, the recurrent involvement by the government definitely means that a lot of uncertainties still occur in the upcoming industry development, especially in developing countries (Yu & Tan, 2005). A conceptual framework is proposed based on the previous literature review as depicted in Figure 1. Proposed conceptual framework: While service quality, switching barriers and promotions are controlled by providers, social ties and habits are factors on customers’ side; government plays their part through policies and regulations which can impact the whole industry. Although there has been limited study of government influence on an individual firm, it is believed that government policies can lift or remove switching barriers, and enhance service quality (Yu, Berg & Guo 2004), which can affect customers’ decision to stay with a service provider. Thus, this research aims to investigate the relationship between customers and service providers under a regulated environment by government, all of which are the three main components in the telecommunications market in Vietnam. The conceptual framework is presented in Figure 1. Under the regulatory environment controlled by government through regulations and policies, companies provide service quality, promotions and create switching barriers; especially, switching barriers can be affected by the other two constructs, i.e. promotions (through switching costs) and service quality. Promotions can make the alternatives less attractive and increase the benefits that customers might lose if they switch. Service quality is also found to have an impact on switching barriers, especially switching costs or economic costs (Jones, Mothersbaugh & Beatty 2002). On the other hand, customers’ habits influence social ties, and both of them are associated with switching cost in switching barriers. In many cases, customers fear a loss when they have to change their habit of purchasing or using a certain service/product. They also tend to choose and remain the service providers under peer pressure or social network influence. This is especially true in mobile telecommunication services because it is usually cheaper and convenient for subscribers under the same network to communicate with each other. Customer satisfaction is an important antecedent of customer attitudinal and behavioural loyalty - the resultants of this study. Service quality directly impacts customer satisfaction and as

Proceedings of 4th
International Conference on Global Business Environment
(ICGBE-2014)
141
a result, both types of loyalty. Switching barriers are directly related to attitudinal and behavioural loyalty. Customers’ habits are also associated with behavioural loyalty. Customer loyalty, therefore, is the end result from triadic interactions among subscribers, companies and government. Based on above discussion, we propose the following hypotheses: H1: Customer habits influence their social ties H2: Customer habits influence switching cost H3: Customers’ social ties influence switching cost H4: Company promotions influence switching cost H5: Service quality influence switching barriers H6: Service quality influence customer satisfaction H7: Switching barriers influence attitudinal loyalty H8: Switching barriers influence behavioural loyalty H9: Customer satisfaction influence attitudinal loyalty H10: Customer satisfaction influence behavioural loyalty H11: Government legislation mediates the customer perceptions on switching barriers and service quality Figure 1: Proposed conceptual model
3. Methodology In addition to the literature review which is purely secondary data, a qualitative approach, i.e. focus groups, will be used to gain more insights and to develop the full conceptual framework. Subsequently, meaningful hypotheses will be formed and ready to be assessed by quantitative research. Surveys will be used to obtain primary data. Validated scales are employed to design the questionnaire and again, focus groups will be conducted to improve and to test the survey instruments. Data will then be collected from a representative sample size, and will be analysed using advanced statistics analyses such as Structural Equation Modeling. Using 95% confidence level and a confidence interval of ±5, the acceptable sample size for mobile telephony market in Vietnam is determined to be a minimum of 384 people. However, provided available resources and the research’s ambition to produce more meaningful results, sample size for the survey could be approximately 1,000 mobile subscribers in Vietnam. The respondents will be randomly selected from a validated sample frame in Vietnam. Managerial implications: Telecommunications industry is well known for high switching rate. Although the number of mobile service subscribers is rocketing, service providers in this market are facing a considerably high churn rate every year (ROA Holdings 2012). This urges a need to study brand loyalty, and more specifically, customer retention in mobile telecommunications industry in order to help service providers to prepare themselves for an increasingly challenging and sophisticated market. This research aims to examine not only the individual antecedents of brand loyalty but also the relationships among three main forces in the market: service providers, customers, and government whose participation is crucial, especially in a developing economy where government plays an important role (Oyeniyi & Abiodun, 2010). This concept has not been adopted in any previous research and is promising to contribute a new body of knowledge to current literature. In addition, this research will be the very first study which will thoroughly investigate customer loyalty for mobile service providers in Vietnam. This study can explain customer behaviour in the telecommunications market and can help service operators to establish strategies to develop their loyal customer base. Customers are the center of business activities, and also the focus of this research. On the other hand, this is also a good opportunity to examine the literature in a new context. The triadic relationships of customers, service providers and government will be a foundation for the telecommunications operators and law enforcers to establish effective ways for industry development, especially in an unstable and young economy. By making customers central in relations to the other two forces, customers will be better supported by service providers and government, as they will be provided with more benefits, care and attention. Therefore, this research is meaningful not only with service providers, government, but also with customers, and other stakeholders. Furthermore, the results can be subsequently applied for other countries with similar background such as Laos and Cambodia.

Proceedings of 4th
International Conference on Global Business Environment
(ICGBE-2014)
142
References Alcatel Lucent (2012). Experience is everything: Customer experience strategy for the new mobile economy. Alcatel Lucent, Retrieved
14th February 2013. <http://webform.alcatellucent.com/res/alu/survey/alu2CustomForm.jsp?cw>. Bandyopadhyay, S. & Martell, M. (2007). Does attitudinal loyalty influence behavioral loyalty? A theoretical and empirical study. Journal
of Retailing and Consumer Services, 14 (1), 35-44. Boorstin, D. J. (1973). The Americans: the democratic experience. Random House. New York. Chuang, Y. F. (2011). Pull-and-suck effects in Taiwan mobile phone subscribers switching intentions. Telecommunications Policy, 35 (2),
128-140. CIA (2011). The world factbook. Central Intelligence Agency. Retrieved 22nd March 2013.
<https://www.cia.gov/library/publications/the worldfactbook/rankorder/2151rank.html>. Jahanzeb, S., Fatima, T. & Khan, B. K. (2011). An empirical analysis of customer loyalty in Pakistan’s telecommunication industry.
Database Marketing & Customer Strategy Management, 18 (1), 5–15. Jones, M. A., David, L. M. & Sharon, E. B. (2000). Switching barriers and repurchase intention in services. Journal of Retailing, 76 (2), 259-
274. Jones, M. A., Mothersbaugh, D. L. & Beatty, S. E. (2002). Why customers stay: measuring the underlying dimensions of service switching
costs and managing their differential strategic outcomes. Journal of Business Research, 55 (1), 44-50. Klemperer, P. (1987). Markets with consumer switching cost. The Quarterly Journal of Economics, 102 (2), 375-394. Konuk, F. A. & Konuk, F. (2012). The relationship between service quality, economic and switching costs in retail banking. Business
Systems Review, 2 (1), 1-16. Kuo, Y., Wu, C. & Deng, W. (2009). The relationships among service quality, perceived value, customer satisfaction, and post-purchase
intention in mobile value-added services. Computers in Human Behavior, 25 (4), 887-896. Lin, H. & Wang, Y. S. (2006). An examination of the determinants of customer loyalty in mobile commerce contexts. Information &
management, 43 (3), 271 - 282. Meng, J. & Elliott, K. M. (2009). Investigating structural relationships between service quality, switching costs, and customer satisfaction.
The Journal of Applied Business and Economics, 9 (2), 54-66. Oyeniyi, J. O. & Abiodun, J. A. (2010). Switching cost and customers loyalty in the mobile phone market: the Nigerian experience. Business
Intelligence Journal, 3 (1), 111-122. Patterson, P. G. & Smith, T. (2003). A cross-cultural study of switching barriers and propensity to stay with service providers. Journal of
Retailing, 79 (2), 107-120. Rauyruen, P. & Miller, K. E. (2007). Relationship quality as a predictor of B2B customer loyalty. Journal of Business Research, 60 (1), 21-
31. ROA Holdings (2012). Asian mobile market forecast 2012-2015. Research On Asia (ROA) Holdings. Retrieved 20th March 2013.
<global.roaholdings.com/download/download.html?&typereport&ei=ooyhUeGmLq>. Sharp, A., Sharp, B. & Wright, M. (2002). Questioning the value of the ‘‘True’’ brand loyalty distinction. International Journal of Research
in Marketing, 19 (1), 81-90. Su, Q., Shao, P. & Ye, Q. (2011). An integrated analysis framework for customer value, customer satisfactory, switching barriers,
repurchase intention and attitudinal loyalty: Evidences from China Mobile Data Services. Management Science and Engineering, 5 (3), 135-142.
Tung, G., Kuo, C. & Kuo, Y. (2011). Promotion, switching barriers, and loyalty. Australian Journal of Business and Management Research, 1 (2), 30-44.
Turnball, P. W. & Wilson, D. T. (1989). Developing and protecting profitable customer relationships. Industrial Marketing Management, 18 (3), 233-238
Woisetschläger, D. M., Lentz, P. & Evanschitzky, H. (2011). How habits, social ties, and economic switching barriers affect customer loyalty in contractual service settings. Journal of Business Research, 64 (8), 800-808.
Yang, Z. & Peterson, R. T. (2004). Customer perceived value, satisfaction, and loyalty: The role of switching costs. Psychology & Marketing, 21 (10), 799- 822.
Yu, J. & Tan, K. H. (2005). The evolution of China's mobile telecommunications industry: past, present and future. International Journal of Mobile Communications, 3 (2), 114-126.
Yu, L., Berg, S. & Guo, Q. (2004). Market performance of Chinese telecommunications: New regulatory policies. Telecommunications Policy, 28 (9), 715-732.

Proceedings of 4th
International Conference on Global Business Environment
(ICGBE-2014)
143
Could Integrated Marketing Communications be the answer to customer switching intention in mobile services?
*Paramaporn Thaichon, Thu Nguyen Quach
Swinburne University of Technology, Victoria, Australia *[email protected]
Abstract: This research investigates the path from Integrated Marketing Communications (IMCs) to switching intention of mobile service subscribers in Vietnam. In addition, this study looks into addressing direct antecedents of switching intention, namely switching cost, satisfaction, and continuance commitment of the mobile telecommunication customers. This research is based on extant literature that brand awareness, brand image and brand personality created by company IMCs influence consumer expectations. Exploratory research finds that, consumers will be satisfied with the brand if the brand can fulfil its promises and meet customer expectations towards its brand and services. Moreover, sales promotion has a direct relationship with switching costs. In return, switching costs affect the level of continuance commitment which can also be augmented by high consumer satisfaction. Customer satisfaction, continuance commitment and switching cost are direct antecedents of switching intention. Managerial implications and future research directions are also provided. Keywords: Marketing Communication, Sales Promotion, Switching Intention, Satisfaction, Mobile Service Providers
1. Introduction Being one of the fastest growing countries in mobile telephony subscribers, Vietnam was ranked 8th in top 10 countries in the world that have the highest number of cell phone subscribers in 2011 (CIA, 2011). Vietnam mobile telephony service has 127,318,000 subscribers, 1.5 times more than the total Vietnamese population (CIA, 2011). However, the mobile services market in Vietnam is still young and relatively different from other mature markets. For instance, it is common that one subscriber has two or three SIM cards in Vietnam (ROA Holdings, 2012). Also, pre-paid service customers make up 90% of total Vietnamese mobile service subscribers (U.S. Commercial Service, 2012). In addition, limited research has been done in Vietnam mobile telecommunication market. Therefore, it is essential to investigate this important and highly under researched service industry. Marketing communications have been widely used by companies to reach their target market. This research aims to investigate how two elements of integrated marketing communications, advertising and sales promotion, can influence switching intention of mobile telephony customers in Vietnam. This is especially critical when customer turnover has become a big issue in mobile services industry in many countries. In 2012, there was an average of 44% of the mobile telecommunications customers switching providers globally (Alcatel Lucent, 2012). Mobile telephony service providers in Canada, the United States of America and Sweden typically experience annual churn rates of 15% to 20% in 2012 (Alcatel Lucent, 2012). Some leading service providers in Vietnam also report that their annual churn rates reach 100% in 2012 (Alcatel Lucent, 2012). Vietnam is predicted to have the highest churn rate among Asian mobile telecommunication markets over the period from 2012 to 2015 (ROA Holdings, 2012). Particularly, churn rate is found to be the most significant in the prepaid services sector in which companies mainly compete on promotions to encourage purchase (Alcatel Lucent, 2012). Hence, service providers need to take action to manage subscribers’ switching intention. Past researched shows that Integrated Marketing Communications (IMC) have direct and indirect influence on different aspects of customer switching intention (Aaker, 1997). However, there have been various changes in the concept of Integrated Marketing Communications over the last few years. These changes are primarily concerned with new concepts in definitions, roles, and forms of IMC, and how marketing communication influence consumers in the Information Age of the 21st century. For this reason, this research aims to investigate two elements of IMC - advertising media and sales promotion, and their effects on customer behaviour, which eventually influences switching intention. Research has revealed that the costs associated with acquiring new subscribers are about four to five times more than what needs to be spent to retain current customers (Chuang, 2011). On the other hand, a study in Chinese mobile service industry shows that a 2% increase in the customer retention rate is equal to a 10% decrease in the cost of customer acquisition (Han, Lu & Leung, 2012). Mobile telecommunications industry is characterised by enormous investment in equipment and facilities; thus, it requires a significant number of customers to cover fixed costs (Chuang, 2011). Besides, the market is currently facing considerably high switching rate as mentioned earlier. For these reasons, customers switching intention becomes the main concern of many service providers (Flint, Blocker & Boutin, 2011). Service providers have been investing a large amount of money in their IMC to communicate with their customers (Chen & Green, 2009). This research provides an opportunity for mobile service providers in Vietnam to understand how marketing communications can influence antecedents of switching intention and thus, switching intention itself. The study attempts to help companies to use marketing communications more effectively and efficiently. The objectives of this research study are: firstly, to investigate the antecedents of switching intention of mobile telephony customers in Vietnam; secondly, to evaluate the indirect effects of advertising on switching intention of mobile telephony customers; thirdly, to investigate the indirect effects of sales promotion on switching intention of mobile telephony customers. This research will build a new body of knowledge with regards to the future potential of the IMC in mobile telecommunication services in Vietnam and in other similar developing countries, such as Malaysia, Thailand, Philippines and India. The proposed research aims to develop an in-depth understanding about effects of marketing communications on consumer behaviour in the mobile services market, and create an ideal model for customer switching intention. It suggests that, by working on their marketing communications, which are advertising and sales promotion in particular, service providers will be able to increase customers’ satisfaction, continuance commitment, and switching cost. As a result, customer turnover can be reduced in the mobile telecommunication market in Vietnam. Development of a Conceptual Model: Behavioral intention refers to both switching and repurchasing intention (Han, Back & Barrett, 2009). While repurchase intention implies positive consequences, switching intention is considered as negative results (Han, Back & Barrett, 2009). Switching intention is investigated as the final outcome in this research while the starting point for all of the examined

Proceedings of 4th
International Conference on Global Business Environment
(ICGBE-2014)
144
relationships is the integrated marketing communications. As a result of the literature review to date a conceptual model has been developed (see Figure 1). Figure 1: Proposed conceptual model
Integrated Marketing Communications: Companies are always trying to draw the attention of their market to their brand among plenty of other available brands. Their targets are not only to capture customer attention, but also to make the customers choose their brand and its services in the future purchase occasions. As mentioned earlier, this study aims to examine the two elements of IMC, which are advertising and sales promotion. Advertising is a part of marketing communications, which is often used to deliver messages from companies to its customers. Advertising can be in forms of traditional and online media, including radio, magazines, television, outdoor advertising, packaging, logo, and point of sale’s display (Grossmanova, Vojtkova & Kita, 2009). Companies can use media advertisements to create brand image and brand personality, as well as enhance brand awareness through higher brand exposure (Chen & Green, 2009). Supporting this view, Aaker (1997) suggest that advertising can, in fact, strengthen brand personality, brand image and brand awareness over time. Therefore, we hypothesise the following: H1: Advertising influences brand personality H2: Advertising influences brand image H3: Advertising influences brand awareness On the other hand, sales promotion such as discount and coupons are deemed to deteriorate brand equity despite the short-term benefits offered to the consumers (Buil, de Chernatony & Martínez, 2013). In fact, activities based on reducing prices can put brands at risk by stimulating uncertainty and volatility, which result in an image of volatile quality (Winer, 1986) or even low quality in customer point of view (Martinez, Montaner & Pina, 2011). As a result, brand image can be damaged by sales promotion (Martinez, Montaner & Pina, 2011). Moreover, there is evidence of how sales promotion can influence switching costs (Tung, Kuo & Kuo, 2011). The more sales promotion customers get from their current providers, the higher switching costs they perceive in changing to another company (Klemperer, 1987). Hence we propose the following hypotheses: H4: Sales promotion influences brand image H5: Sales promotion influences switching cost Brand management: Significant effort is put in shaping brand communications that deliver messages to generate specific brand awareness, personality, and image, which finally lead to customer expectations when customers are exposed to the brand (Rhee & Johnson, 2012). Brand awareness refers to customer knowledge about a brand’s existence or, the recall and recognition that consumers have towards a brand and its products or services (Huang & Sarigöllü, 2012). Brand awareness is considered as all information in a person’s memory that is interrelated to form an associative network and can be strengthened through marketing communications (Keller, 2008). In a study, Bertsch and Ostermann (2011) find that brand awareness can increase customer expectations for a brand’s services. Meanwhile, brand personality can take forms of human characteristics and emotions, such as honesty, fun, and creativeness, in order to display a brand (Aaker, 1997). These human traits provide customers with the ability to connect their own personal personalities with one particular brand, and afterwards wish to use the brand to express themselves (Rhee & Johnson, 2012). Therefore, brand personality can have a positive effect on attitudes and preferences towards a brand, which ultimately have an impact on customer expectations (Rhee & Johnson, 2012). On the other hand, brand image is a set of associations that consumers have in their mind of a brand and its products or services (Keller, 1993). Keller (2008) highlights that brand image is not something that a company has, but something that resides in the consumers’ mind, which lends to consumer expectations. Based on above discussion, we hypothesise the following: H6: Brand awareness influences customer expectations H7: Brand personality influences customer expectations

Proceedings of 4th
International Conference on Global Business Environment
(ICGBE-2014)
145
H8: Brand image influences customer expectations Cognitive and affective evaluations of customers: Consumer expectations can be in forms of assumptions on product performance, and judgments based on consumer’s experiences which can be influenced by brand information, such as brand awareness, brand image and brand personality (Varela et al., 2010). Researchers find that consumer expectations are related to consumer satisfaction (McDonald, Sutton & Milne, 1995). Consumers will be satisfied if the brand can fulfil its promises and meet their expectations (Keramati & Ardabili, 2011). Supporting this view, Tam (2012) states that consumer expectations affect consumer satisfaction, which in turn results in customers’ happiness, fulfilment and pleasure towards a brand and its services. Hence, we propose following hypothesis: H9: Customer expectation influences customer satisfaction It is proved that customer satisfaction has a significant and positive influence on continuance or calculative commitment (Davis-Sramek et al., 2009). Continuance commitment develops through a cognitive assessment of the gains and losses that would be generated if the transaction relationship were terminated (Hur, Park & Kim, 2010). Satisfaction can impact how customers perceive and react to these gain and losses (Davis-Sramek et al., 2009). In addition, continuance commitment is based on more rational motives related to the effort taken to split the relationship with the current service provider (Bugel, Buunk & Verhoef, 2010). This type of commitment sometimes makes customers feel trapped in a relationship (Johnson, Sivadas & Garbarino, 2008). For example, a 12 months contract of mobile telecommunication services often generates a feeling of being “locked in” with the particular service provider. Hur, Park and Kim (2010) report that financial considerations such as switching cost play a significant role in continuance commitment. Supporting this view, Cater and Zabkar (2009) assert that continuance commitment is formed by customer perceptions of switching costs. Based on above discussion, we hypothesise the following: H10: Customer satisfaction influences customer commitment Switching costs can be described as the costs and lost benefits associated with switching from one service provider to another (Deng et al., 2010; Wang & Wu, 2012). For instance, in the mobile telephony market, if a customer switches to another service provider, they might need to spend a lot of time and effort on informing other related parties such as friends, colleagues and business partners about their new contact number. In fact, high switching costs are found to discourage customers from switching to other competitive services (Wang & Wu, 2012). As a result, the following is hypothesised: H11: Switching cost influences customer commitment Resultant: Switching intention in this research refers to the possibility that customers will change their current service providers. Previous research shows that customer satisfaction is negatively associated with switching intention (Han, Kim & Hyun, 2011). When customers are satisfied with their service provider, they are less likely to switch to other companies. Furthermore, researchers prove that the continuance commitment, as the evaluation between gains from keeping the relationship and the losses generated from terminating the relationship, is the motivation for maintaining the relationship with the service provider (Hur, Park & Kim, 2010). Hence, continuance commitment can reduce customer switching intention. In addition, it is believed that the costs associated with switching to an alternative company prevent customers from changing their service providers (Abdolvand, Charkari & Mohammadi, 2006; Wang & Wu, 2012). In other words, switching costs can decrease customer switching intention. Hence we propose the following hypotheses: H12: Customer satisfaction influences switching intention H13: Customer commitment influences switching intention H14: Switching cost influences switching intention 3. Methodology This study uses an online questionnaire to obtain data on the ten constructs in the proposed conceptual model. It has been calculated that the representative sample of Vietnam’s population is a number exceeding 800 (using a confidence level of 95%). Hence, we plan to survey a total of 1500 mobile subscribers in Vietnam. The web link of the online survey, which will be made available via the university’s Opinio platform, will be forwarded to participants by email. The obtained data will be analysed by advanced statistics analysis such as exploratory factor analysis, confirmatory factor analysis, and structural equation modelling. It is a requirement that respondents should be over 18 years of age and currently subscribe to at least one mobile network in Vietnam. The survey consists of three sections. In the first section, there are 10 statements investigating customer experience with their current mobile phone services provider’s IMC. The second section includes 32 statements examining interactions and relationships between customers and their service provider. The third section aims to obtain some other general information (for instance, demographic information) about the respondents. The scales are used to operationalise the constructs were validated in previous research. The survey instrument originally in English and will be translated to Vietnamese by a bilingual researcher. Three focus groups, each consisting of ten participants who are familiar with the area of study, will be conducted to test the comprehensibility of survey instruments. The survey then will be translated back to English to verify the reliability of the translation. The translated versions will be crosschecked by four other bilingual researchers to ensure content validity. 4. Discussion and Conclusion This research reviews the key literature related to two elements of marketing communications, which are advertising and sales promotion, and how they can indirectly affect customer switching intention. By using marketing communications, companies can create brand awareness, brand personality and brand image, which influence customer expectations, and as a result, customer satisfaction. Moreover, apart from having an impact on brand image, sales promotion can increase switching cost. Both switching cost and customer satisfaction are related to continuance commitment; and these three constructs themselves are main antecedents of switching intention. This study has endeavoured to extend the literature in relation to the relationship between IMCs, brand management, and customer behaviour. The paper provides some managerial implications for the mobile service providers in Vietnam. Advertising and promotions are popular tools used to manipulate customer purchase intention. However little is known of how to prevent customers from switching

Proceedings of 4th
International Conference on Global Business Environment
(ICGBE-2014)
146
by employing these elements of IMCs. This study provides a foundation for service providers to efficiently and effectively manage their efforts. By using marketing communications wisely, companies can control the factors related to switching intention, and as a result, will be able to minimise the customer tendency to switch and maintain their customer base. This is critical as retaining customers have become a priority in this intensely competitive market, especially when customers’ needs and wants become more sophisticated. In term of limitations, the model in this study just includes two elements in marketing communications. Future research should also consider other elements of IMC such as public relations. Replications of this research in other contexts such as other countries (e.g. Thailand, Cambodia and Burma) and other services settings (e.g. banking) are also recommended to examine the generalisability of the findings and verify the model. References Aaker, J. (1997). Dimensions of brand personality. Journal of Marketing Research, 34, 347-356. Abdolvand, N., Charkari, M., & Mohammadi, R. (2006). Technical model for improving customer loyalty with m-commerce: mobile service
providers. International Journal on Computer Science and Information Systems, 1 (2), 50 - 62. Alcatel Lucent (2012). Experience is everything: Customer experience strategy for the new mobile economy. Alcatel Lucent, Retrieved
14th February 2013. from <http://webform.alcatellucent.com/res/alu/survey/alu2CustomForm.jsp?cw=alu2CorpDocDownload&LMSG_CABINET=TheStore&LMSG_CONTENT_FILE=164138&REFFER=alu.soln.detail%20%7C%20Motive%20Mobile%20Broadband%20Network%20Support>.
Bertsch, G., & Ostermann, G. (2011). The effect of wellness brand awareness on expected and perceived service quality. Tourismos: An International Multidisciplinary Journal of Tourism, 6 (2), 103-120.
Bügel, M., Buunk, A., & Verhoef, P. (2010). A comparison of customer commitment in five sectors using the psychological investment model. Journal of Relationship Marketing, 9 (1), 2-29.
Buil, I., de Chernatony, L., & Martínez, E. (2013). Examining the role of advertising and sales promotions in brand equity creation. Journal of Business Research, 66 (1), 115-122.
Cater, B., & Zabkar, V. (2009). Antecedents and consequences of commitment in marketing research services: the client’s perspective. Industrial Marketing Management, 38 (7), 785-797.
Chen, C., & Green, D. (2009). Marketing communications and Branding: Competitive Hypermarket Strategies. International Journal of Management and Marketing Research, 2 (1), 17 - 34.
Chuang, Y. (2011). Pull-and-suck effects in Taiwan mobile phone subscribers switching intentions. Telecommunications Policy, 35 (2), 128-140.
CIA (2011). The world factbook. Central Intelligence Agency. Retrieved 22 March 2013. from <https://www.cia.gov/library/publications/the worldfactbook/rankorder/2151rank.html>.
Davis-Sramek, B., Droge, C., Mentzer, J., & Myers, M. (2009). Creating commitment and loyalty behavior among retailers: what are the roles of service quality and satisfaction?. Journal of the Academy of Marketing Science, 37 (4), 440-454.
Deng, Z., Lu, Y., Wei, K., & Zhang, J. (2010). Understanding customer satisfaction and loyalty: An empirical study of mobile instant messages in China. International Journal of Information Management, 30 (1), 289 - 300.
Flint, J., Blocker, C., & Boutin, P. (2011). Customer value anticipation, customer satisfaction and loyalty: An empirical examination. Industrial Marketing Management, 40, 219-230.
Grossmanova, M., Vojtkova, M., & Kita, P. (2009). Role of Brand Loyalty in Purchase of Sports Shoes. Vezetestudomany, 6 (61), 60 - 67. Han, H., Back, K., & Barrett, B. (2009). Influencing factors on restaurant customers’ revisit intention: the roles of emotions and switching
barriers. International Journal of Hospitality Management, 28, 563-572. Han, H., Kim, W., & Hyun, S. (2011). Switching intention model development: Role of service performances, customer satisfaction, and
switching barriers in the hotel industry. International Journal of Hospitality Management, 30 (3), 619-629. Han, S., Lu, S., & Leung, S. (2012). Segmentation of telecom customers based on customer lifetime value by decision tree model. Expert
Systems with Application, 39, 3964 - 3973. Huang, R., & Sarigöllü, E. (2012). How brand awareness relates to market outcome, brand equity, and the marketing mix. Journal of
Business Research, 65 (1), 92-99. Hur, W., Park, J., & Kim, M. (2010). The role of commitment on the customer benefits-loyalty relationship in mobile service industry.
Service Industries Journal, 30 (14), 2293-309. Johnson, S., Sivadas, E., & Garbarino, E. (2008). Customer Satisfaction, Perceived Risk, and Attitudnal Loyalty: An Investigation of
Directions of Influence. Journal of Services Marketing, 22 (5), 353-362. Keller, K. (1993). Conceptualizing, measuring, and man- aging customer-based brand equity. Journal of Marketing, 57 (January), 1-22. Keller, K. (2008). Strategic brand management: Building, measuring and managing brand equity (3rd ed.). Upper Saddle River, NJ:
Prentice Hall. Keramati, A., & Ardabili, S. (2011). Churn analysis for an Iranian mobile operator. Telecommunications Policy, 35 (4), 344-356. Klemperer, P. (1987). Markets with consumer switching cost. The Quarterly Journal of Economics, 102 (2), 375-394. Martinez, E., Montaner, T., & Pina, J. (2011). Analysing The Impact of Price Promotions Versus No-Price Promotions on Brand Image.
Journal of Business & Economics Research, 4 (8), 31-40. McDonald, A., Sutton, A., & Milne, R. (1995). Teamqual: Measuring service quality in professional team sports. Sport Marketing Quarterly,
4 (1), 9 - 15. Rhee, J., & Johnson, K. (2012). Investigating relationships between adolescents' liking for an apparel brand and brand self congruency.
Young Consumers: Insight and Ideas for Responsible Marketers, 13 (1), 74-85. ROA Holdings (2012). Asian mobile market forecast 2012-2015. Research On Asia (ROA) Holdings, Retrieved 20 March 2013. From
<global.roaholdings.com/download /download.html?num=149&typereport&ei=ooyhUeGmLq>. Spiller, J., Vlasic, A., & Yetton, P. (2007). Post-adoption behavior of users of Internet Service Providers, Information & Management, 44
(1), 513 - 523.

Proceedings of 4th
International Conference on Global Business Environment
(ICGBE-2014)
147
Tam, J. (2012). Linking Perceived Service Quality to Relational Outcomes in a Chinese Context. Journal of International Consumer Marketing, 24 (1), 7 - 23.
Tung, G., Kuo, C., & Kuo, Y. (2011). Promotion, switching barriers, and loyalty. Australian Journal of Business and Management Research, 1 (2), 30 - 44.
U.S. Commercial Service (2012). Vietnam market for telecommunications equipment and services. The Commercial Service. Retrieved 7 January 2013. From <http://export. gov/vietnam/build/groups/public/@eg_vn/documents/webcontent/eg_vn_051751.pdf>.
Varela, P., Ares, G., Giménez, A., & Gámbaro, A. (2010). Influence of brand information on consumers’ expectations and liking of powdered drinks in central location tests. Food Quality and Preference, 21 (7), 873-880.
Wang, C., & Wu, L. (2012). Customer loyalty and the role of relationship length. Managing Service Quality, 22 (1), 58 - 74. Winer, R.S. (1986). A reference price model of brand choice for frequently purchased products. Journal of Consumer Research, 13, 250 -
256.

Proceedings of 4th
International Conference on Global Business Environment
(ICGBE-2014)
148
Incorporating Marketing Perspectives into Corporate Social Responsibility Programs (CSR)
Charles Jebarajakirthy, *Paramaporn Thaichon
Swinburne University of Technology, Victoria, Australia *[email protected]
Abstract: The purpose of this research is to develop a mechanism to effectively incorporate marketing perspectives into Corporate Social Responsibility (CSR) Programs. Customers have expectations that organisations need to carry out CSR activities and customers have various responses towards CSR activities. Hence marketing perspectives need to be incorporated into CSR decision making process. However, to date a mechanism of incorporating marketing perspectives into CSR programs lack in extant literature. This research provides a conceptual model to fill this gap. Based on the resource based theory of firms, we argue that CSR programs need to be viewed from marketing perspectives. Organisations’ CSR programs tend to differ as philanthropic and strategic in nature, and customers respond to both of these CSR types. Hence we propose that contribution of marketing is necessary to both kinds of CSR, which in turn would lead to customer satisfaction towards CSR programs. In the near future, we would empirically examine this conceptual model by collecting data from customers and marketing managers of the Sri Lankan financial sector. A mix method is proposed for this study. This research concludes with practical implications. Keywords: Corporate Social Responsibility (CSR), Marketing perspectives of CSR, Philanthropic CSR and Strategic CSR
1. Introduction The awareness level on social issues has increased among the public in the past few decades, and people have become increasingly socially conscious (Dawkins & Lewis, 2003; Macchiette & Roy, 1994). Hence, customers expect businesses to operate in a socially responsible way (Podnar & Golob, 2007). This is evidenced in a study conducted by Cone(2010)who found that 83% of American consumers expect organisations to behave in a socially responsible manner.Social needs could be defined as “customers’ sensitivity for societal issues” (Podnar & Golob, 2007, p. 328). Partly in response to customers’ increasing social expectations, organisations carry out various social activities (Jones, Comfort, & Hillier, 2005; Scholtens, 2009). These activities could be thought of as “Corporate Social Responsibility” (CSR) initiatives. Luo and Bhattacharya (2006) define “Corporate Social Responsibility” (CSR) as “a company’s activities and status related to its perceived societal or stakeholder obligations” (p. 2). CSR activities result in various customer responses (Bhattacharya & Sen, 2004; Luo & Bhattacharya, 2006). One such response is increased purchase intention of company’s products.Mohr, Webb and Harris (2001)argue that customers consider CSR as a factor when they decide to purchase products of a company, and they avoid purchasing products from organisations which are irresponsible towards society. Another customer response towards CSR is their attitudes towards organisations. Mohr et al. (2001)found that customers have positive attitudes towards firms that are involved in socially responsible activities. Additionally, CSR influences customer satisfaction. This issue was studied by Luo and Bhattacharya (2006) who investigated 500 companies, and found a link between CSR and customer satisfaction. Consumer behaviour is largely predicted on their prior expectations(Podnar & Golob, 2007). Thus, it could be argued that customers’ social expectations need to be properly understood and incorporated into CSR programs to improve their responses, and this would require marketers to be integrally involved in the development and implementation of CSR programs.Hence, a conceptual model to examine marketers’ role in CSR programs is discussed in thisresearch. In the near future, we intend to empirically validate this model by collecting data from the customers and marketing managers of the Sri Lankan financial sector. 2. Literature Review Underpinning Theory: Marketers’ role should not be restricted to the marketing department alone, because their contribution is necessary to strategic decision making too(Hooley et al., 1999; Hunt & Lambe, 2000).As highlightedby Harvey and Denton (1999), strategic decisions need to be made with a “customer focus” in order to produce “customer satisfaction”, which, in turn will contribute to company’s competitive position in the market place. The marketers’ role in corporate decision making is essential to ensure this outcome. The resource based theory of firms supports the argument that input of a marketer is necessary in strategic decision making. The resource based theory of firms advanced by Penrose (1959)postulates that the unique assets and capabilities of a firm are important factors that give rise to competitive position in the market place and superior performance for companies. Barney (1991)extended this theory, who argues that these resources need to be heterogeneous and imperfectly mobile to other companies, to achieve a competitive position and superior performance. Marketers generate knowledge of the market, customers and competitors,contributing to resources and capabilities of organisations. These marketing capabilities would ensure customer satisfaction, which is soundly linked with organisational profits and performance (Anderson, Fornell, & Rust, 1997), thus, marketing scholars apply the resource based theory of firms to justify the marketers’ role in strategic decision making (Hooley et al., 1999; Hunt & Lambe, 2000). CSR falls within the realm of corporate decision making, hence in line with the resource based theory of firms, marketersneed to contribute to CSR programs. Although some scholars made suggestions and recommendations in relation to marketers’ roles in CSR programs, to date, no prior conceptual framework or empirical study on the nature and contribution of marketers in CSR programs is available in the literature. The various roles that marketers could play in CSR programs are compiled below, with the support of suggestions given by scholars, and these roles would be useful to derive the conceptual framework for this study. Input Communication on Social Issues: Whilst making CSR decisions, a Marketer’s role is necessary to collect information on customers’ perceptions of social issues. In support of this idea, Macchiette and Roy (1994) stress that customers increasingly become socially consciouswho may give due consideration to social issues when forming purchase decisions. These customers are also likely to spread information about an organisation’s CSR activities to other customers and to the broader community. Hence , as suggested byMacchiette and Roy (1994), marketers’ involvement is necessary to collect information about customers’ attitudes and perceptions of social issues and expectations for CSR efforts, which information, in turn could enable management to understand and respond to the needs and concerns of these customers.Scholars suggest various measures to collect this information. A specific example is provided by

Proceedings of 4th
International Conference on Global Business Environment
(ICGBE-2014)
149
Macchiette and Roy (1994), who recommend that marketers may collect this information by forming a network with opinion leaders of socially conscious customer segments, participating in community affairsand arranging focus groups studies. However, Maignan, Ferrell and Ferrell (2005)propose that marketers could collect this information from sales representatives, customer service representatives, purchasing managersand public relations specialists. Although measures suggested by scholars are different, it seems clear that Marketers could well provide useful information to organisations when forming and implementing CSR initiatives. Dissemination of Knowledge about Customers: Subsequent to collecting information and identifying customers’ social expectations, marketers need to disseminate this knowledge to rest of the organisation(Maignan & Ferrell, 2004).It means thatmarketing managers need to convince the key CSR decision makers of the validity of customers’ expectations for company’s CSR programsto ensure that CSR initiatives meet customers’ interests.Maignan and Ferrell (2004) suggest that marketers may achieve this by sharing their views in inter-departmental meetings, circulating documents on social issues (e.g., reports and newsletters)and discussing findings of customer research on social issues. CSR Idea Generation: Marketers’contribution seems to be necessary in formulating CSR programs. Whilst firms develop CSR ideas, marketing managers need to determine whetherorganisations’ CSR ideas are in line with the interests of customers, andalso need to ensure such CSR programs will generate favourable customer responses, such as customer satisfaction and positive customer attitudes towards companies(McAlister & Ferrell, 2002). Furthermore,in the product development phase, marketers could assure that products are designed according to the social expectations of customers. As suggested by Macchiette and Roy (1994), marketers’ role would be indispensable in designing the ethical and socially desirable products especially to the vulnerable groups of customers, such as children, to confirm that these products are not exploiting vulnerable groups. CSR Communication: Marketers need to be involvedin communicating firms’ CSR programs to customers and society.Marketing managers have to provide information on CSR to various stakeholders,including their customers,particularly, the socially sensitive and vulnerable consumers, to create a positive perception among them about the organisationas a “Socially Responsible Business”(Macchiette & Roy, 1994; Maignan et al., 2005).Bhattacharya and Sen(2004) suggests that Marketers could use marketing promotion tools, such as advertising, publicity, and personal selling, to promote firms’ CSR activities among customers. The Literature Gap and Research Questions: Various scholars have highlighted that marketers need to have a role in CSR programs (Lantos, 2002; Macchiette & Roy, 1994;Podnar & Golob, 2007). Organisations make investments in CSR activities, and managers expect benefits in return, such as increased market share and profits, etc. (McDonald & Rundle-Thiele, 2008). However, as identified by Luo and Bhattacharya (2006), CSR programs would also determine customer satisfaction, which, in turn contribute to optimise market share, justifying the role of a marketer in CSR programs.Surprisingly, the marketers’ role in CSR programs has not been empirically investigated despite the call by Maignan and Ferrell (2004) who stated that past studies had rarely considered how marketing thinking and practices could contribute to CSR practices in organisations. Similarly, McAlister and Ferrell (2002)explain that marketing practices and marketing thoughts havenot been well integrated into CSR activities of organisations. Although institutions undertake CSR activities, marketers’ role in CSR programs has not yet been empirically investigated,advancing a knowledge gap, consequently, an absence of the Marketer’s role in CSR programs will affect management practices, such asinvestment activities, product design, etc.Hence from this literature gap, the following research questions are proposed: 1. What role do marketers play inthe development of CSR programs? 2. To what extent does a Marketers’ involvement in CSR programs enhance customer satisfaction towards the organisations’ CSR
programs? Development of a Conceptual Framework: Firms have different motives for designing CSR programs. Organisations design CSR programs with the motive of bringing benefits to society, and similarly firms develop another type of CSR initiatives to benefit both business and society. Hence based on motives, organisations carry out two types of CSR programs, and CSR development process differs between these types of CSR initiatives. These CSR programs discussed below. Philanthropic CSR Programs: Organisations are responsible to stakeholders who have interests in organisations, not just to the shareholders, and philanthropic CSR programs would be designed mainly to build the relationship between the organisation and society (Galbreath, 2006; Lantos, 2002; Yehya & Dutta, 2008). Lantos(2002) defines philanthropic CSR as “the fulfilment of an organisation’s altruistic responsibilities, going beyond preventing possible harm to helping alleviate public welfare deficiencies, regardless of whether or not this will benefit the business itself” (p206). Firms are engaged in various philanthropic activities, including financial support to NGOs and schools and natural disaster relief programs, and these initiatives would likely to serve to strengthen the relationship between companies and society. Lin-Hi (2010) reports that companies in the US spent 14.5 billion US dollars in charitable activities in 2008, indicating the popularity of philanthropic CSR activities among businesses. Proposed Conceptual Model Strategic CSR Programs: Organisations are essential social entities that createwealth in the economy, hence firms need to be productive and profitable to sustain their existence. Since resources are scarce, firms would prefer to select CSR initiatives that would create the “shared value”, implying that CSR would lead to a meaningful benefit to society and also to business. Porter and Kramer (2006)classify such CSR initiatives as strategic CSR, and define it as “the social initiatives that will bring significant social impacts and reap the greatest business benefits” (p. 85p. 85).For example, if a textile manufacturing company adopts an eco-friendly manufacturing process for its business, it would benefit society by preserving the environment; on the other hand, the adaptation of this process may contribute to profit, meaning that it saves the organisation’s money by doing so. The Intersection or Relationship between Philanthropic and Strategic CSR Activities: Firms may need to adopt a mix of strategic and philanthropic CSR activities to optimise its contributions. This issue is emphasised by Munilla and Miles (2005) who argue that firms
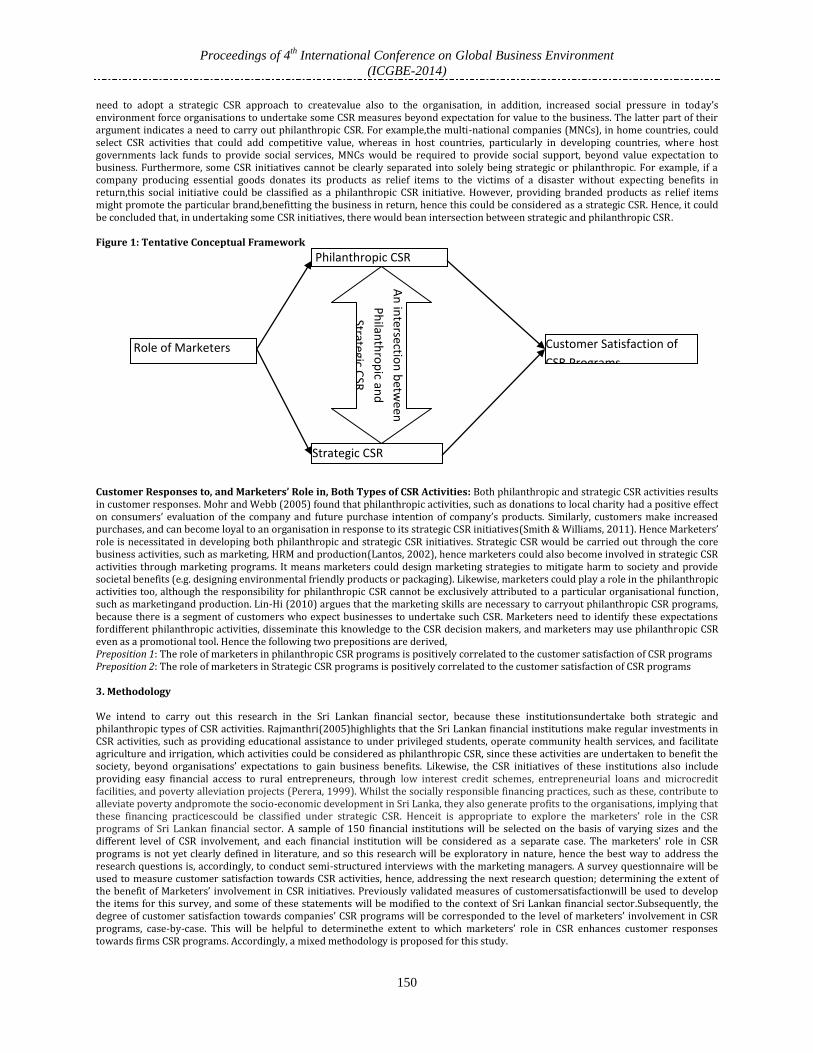
Proceedings of 4th
International Conference on Global Business Environment
(ICGBE-2014)
150
need to adopt a strategic CSR approach to createvalue also to the organisation, in addition, increased social pressure in today’s environment force organisations to undertake some CSR measures beyond expectation for value to the business. The latter part of their argument indicates a need to carry out philanthropic CSR. For example,the multi-national companies (MNCs), in home countries, could select CSR activities that could add competitive value, whereas in host countries, particularly in developing countries, where host governments lack funds to provide social services, MNCs would be required to provide social support, beyond value expectation to business. Furthermore, some CSR initiatives cannot be clearly separated into solely being strategic or philanthropic. For example, if a company producing essential goods donates its products as relief items to the victims of a disaster without expecting benefits in return,this social initiative could be classified as a philanthropic CSR initiative. However, providing branded products as relief items might promote the particular brand,benefitting the business in return, hence this could be considered as a strategic CSR. Hence, it could be concluded that, in undertaking some CSR initiatives, there would bean intersection between strategic and philanthropic CSR. Figure 1: Tentative Conceptual Framework Customer Responses to, and Marketers’ Role in, Both Types of CSR Activities: Both philanthropic and strategic CSR activities results in customer responses. Mohr and Webb (2005) found that philanthropic activities, such as donations to local charity had a positive effect on consumers’ evaluation of the company and future purchase intention of company’s products. Similarly, customers make increased purchases, and can become loyal to an organisation in response to its strategic CSR initiatives(Smith & Williams, 2011). Hence Marketers’ role is necessitated in developing both philanthropic and strategic CSR initiatives. Strategic CSR would be carried out through the core business activities, such as marketing, HRM and production(Lantos, 2002), hence marketers could also become involved in strategic CSR activities through marketing programs. It means marketers could design marketing strategies to mitigate harm to society and provide societal benefits (e.g. designing environmental friendly products or packaging). Likewise, marketers could play a role in the philanthropic activities too, although the responsibility for philanthropic CSR cannot be exclusively attributed to a particular organisational function, such as marketingand production. Lin-Hi (2010) argues that the marketing skills are necessary to carryout philanthropic CSR programs, because there is a segment of customers who expect businesses to undertake such CSR. Marketers need to identify these expectations fordifferent philanthropic activities, disseminate this knowledge to the CSR decision makers, and marketers may use philanthropic CSR even as a promotional tool. Hence the following two prepositions are derived, Preposition 1: The role of marketers in philanthropic CSR programs is positively correlated to the customer satisfaction of CSR programs Preposition 2: The role of marketers in Strategic CSR programs is positively correlated to the customer satisfaction of CSR programs 3. Methodology We intend to carry out this research in the Sri Lankan financial sector, because these institutionsundertake both strategic and philanthropic types of CSR activities. Rajmanthri(2005)highlights that the Sri Lankan financial institutions make regular investments in CSR activities, such as providing educational assistance to under privileged students, operate community health services, and facilitate agriculture and irrigation, which activities could be considered as philanthropic CSR, since these activities are undertaken to benefit the society, beyond organisations’ expectations to gain business benefits. Likewise, the CSR initiatives of these institutions also include providing easy financial access to rural entrepreneurs, through low interest credit schemes, entrepreneurial loans and microcredit facilities, and poverty alleviation projects (Perera, 1999). Whilst the socially responsible financing practices, such as these, contribute to alleviate poverty andpromote the socio-economic development in Sri Lanka, they also generate profits to the organisations, implying that these financing practicescould be classified under strategic CSR. Henceit is appropriate to explore the marketers’ role in the CSR programs of Sri Lankan financial sector. A sample of 150 financial institutions will be selected on the basis of varying sizes and the different level of CSR involvement, and each financial institution will be considered as a separate case. The marketers’ role in CSR programs is not yet clearly defined in literature, and so this research will be exploratory in nature, hence the best way to address the research questions is, accordingly, to conduct semi-structured interviews with the marketing managers. A survey questionnaire will be used to measure customer satisfaction towards CSR activities, hence, addressing the next research question; determining the extent of the benefit of Marketers’ involvement in CSR initiatives. Previously validated measures of customersatisfactionwill be used to develop the items for this survey, and some of these statements will be modified to the context of Sri Lankan financial sector.Subsequently, the degree of customer satisfaction towards companies’ CSR programs will be corresponded to the level of marketers’ involvement in CSR programs, case-by-case. This will be helpful to determinethe extent to which marketers’ role in CSR enhances customer responses towards firms CSR programs. Accordingly, a mixed methodology is proposed for this study.
An
intersectio
n b
etwe
en
Ph
ilanth
rop
ic and
Strategic CSR
Role of Marketers
Philanthropic CSR
Strategic CSR
Customer Satisfaction of
CSR Programs

Proceedings of 4th
International Conference on Global Business Environment
(ICGBE-2014)
151
4. Conclusion and Practical Implications This proposed research would be the pioneering study to investigate marketers’ role in CSR programs, thus, this study would contribute to the marketing and the CSR literature. In addition, this study would also give valuable insights into customerresponses, such as customer satisfaction of CSR programs of financial sector, indicating that the managers could design CSR programs responding to customers’ expectations. Understanding of customer behaviour towards CSR would be of use to managers in other countries too, which have similar customers’ demographic profile. Defining a marketer’s role in CSR would help managers increase Stakeholder satisfaction of CSR activities, since multiple stakeholders are considered as the “customers” for marketers. Consequently, Marketers’ role in CSR will enhance stakeholder support for CSR activities. References Anderson, E. W., Fornell, C., & Rust, R. T. (1997). Customer Satisfaction, Productivity, and Profitability: Differences Between Goods and
Services. Marketing Science, 16(2), 129-145. Barney, J. (1991). Firm resources and sustained competitive advantage. Journal of management, 17(1), 99. Bhattacharya, C. B., & Sen, S. (2004). Doing Better at Doing Good: When, why, and how consumers respond to corporate social initiatives.
California Management Review, 47(1), 9-24. Cone. (2010). 2010 Cone cause evaluation study. Boston. Dawkins, J., & Lewis, S. (2003). CSR in Stakeholder Expectations: And Their Implication for Company Strategy. Journal of Business Ethics,
44(2/3), 185-193. Galbreath, J. (2006). Corporate social responsibility strategy: strategic options, global considerations. Corporate Governance: The
International Journal of Business in Society, 6(2), 175-187. Harvey, C., & Denton, J. (1999). To come of age: the antecedents of organizational learning. Journal of Management Studies, 36(7), 897-
918. Hooley, G., Fahy, J., Cox, T., Beracs, J., Fonfara, K., & Snoj, B. (1999). Marketing capabilities and firm performance: a hierarchical model.
Journal of market-focused management, 4(3), 259-278. Hunt, S. D., & Lambe, C. J. (2000). Marketing’s contribution to business strategy: market orientation, relationship marketing and resource
advantage theory. International Journal of Management Reviews, 2(1), 17-43. Jones, P., Comfort, D., & Hillier, D. (2005). Corporate social responsibility and the UK's top ten retailers. International Journal of Retail &
Distribution Management, 33(12), 882-892. Lantos, G. P. (2002). The ethicality of altruistic corporate social responsibility. Journal of Consumer Marketing, 19(3), 205-232. Lin-Hi, N. (2010). The Problem With A Narrow-Minded Interpretation Of CSR: Why CSR Has Nothing To Do With Philanthropy. Ramon
Llull Journal of Applied Ethics(1), 79-95. Luo, X. M., & Bhattacharya, C. B. (2006). Corporate social responsibility, customer satisfaction, and market value. Journal of Marketing,
70(4), 1-18. Macchiette, B., & Roy, A. (1994). Sensitive Groups and Social Issues: Are You Marketing Correct? Journal of Consumer Marketing, 11(4),
55-64. Maignan, I., Ferrell, O., & Ferrell, L. (2005). A stakeholder model for implementing social responsibility in marketing. European Journal of
Marketing, 39(9/10), 956-977. Maignan, I., & Ferrell, O. C. (2004). Corporate Social Responsibility and Marketing: An Integrative Framework. Journal of the Academy of
Marketing Science, 32(1), 3-19. McAlister, D. T., & Ferrell, L. (2002). The role of strategic philanthropy in marketing strategy. European Journal of Marketing, 36(5-6),
689-705. McDonald, L. M., & Rundle-Thiele, S. (2008). Corporate social responsibility and bank customer satisfaction: A research agenda.
International Journal of Bank Marketing, 26(3), 170-182. Mohr, L. A., & Webb, D. J. (2005). The effects of corporate social responsibility and price on consumer responses. Journal of Consumer
Affairs, 39(1), 121-147. Mohr, L. A., Webb, D. J., & Harris, K. E. (2001). Do Consumers Expect Companies to be Socially Responsible? The Impact of Corporate
Social Responsibility on Buying Behavior. Journal of Consumer Affairs, 35(1), 45-72. Munilla, L. A., & Miles, M. P. (2005). The Corporate Social Responsibility Continuum As a Component of Stakeholder Theory. Business and
Society Review: Journal of the Center for Business Ethics at Bentley College, 110(4), 371-387. Penrose, E. (1959). The theory ofthe growth ofthe firm. JohnW iley& Sons, New York. Perera, T. (1999). The Study of Best Management Practices of Sri Lanka's High Performing Companies. Journal of Comparative
International Management, 2(1). Podnar, K., & Golob, U. (2007). CSR expectations: the focus of corporate marketing. Corporate Communications: An International Journal,
12(4), 326-340. Porter, M. E., & Kramer, M. R. (2006). Strategy & Society: The Link Between Competitive Advantage and Corporate Social Responsibility.
Harvard Business Review, 84(12), 78-92. Rajmanthri, S. (2005). Effects of Corporate Social Responsibility CSR on organizational sustainability A case study of the Sri Lankan
Corporate Sector. Social Responsibility Journal, 1(3-4), 149-152. Scholtens, B. (2009). Corporate Social Responsibility in the International Banking Industry. Journal of Business Ethics, 86(2), 159-175.
doi: 10.1007/s10551-008-9841-x Smith, N. C., & Williams, E. (2011). Responsible consumers and stakeholder marketing: building a virtuous circle of social responsibility.
Universia Business Review(30), 68-79. Yehya, N., & Dutta, M. (2008). Corporate Social Responsibility: Decision Support System. Conference Papers -International
Communication Association, 1-15.

Proceedings of 4th
International Conference on Global Business Environment
(ICGBE-2014)
152
Fragment Chain in Logistics: Empty Container Movement at the Off-Dock Depot
Rosmaizura Mohd Zain*, Mohd Nizam Ab Rahman, Zulkifli Mohd Nopiah
National University of Malaysia, Malaysia *[email protected]
Abstract: Today’s dynamic businesses use a container to transfer goods by sea. The container has become the most important node in physical flows between container depots, clients, ports, and vessels. However, growth in container demand may significantly affect key players in the container chain; such effects include bottleneck or traffic congestion at the container terminal or depot. To date, few studies have investigated why or how interruption occurs at the off-dock container depot located outside the Klang Port, Malaysia. This study aims to investigate the fragment chain of empty container movement by focusing on the bottleneck during day-to-day operations in the premise. A semi-structured interview was conducted among players in the container chain practices and site observations. Subsequently, the factors of bottlenecks that hinder the rapid movement of empty containers are discussed as well. The findings from this study will be highlighted to provide useful guidelines for future study to enhance the efficiency of the logistics chain in Malaysia. Keywords: empty container off-dock depot, logistics, key players of container chain, bottleneck, empty container movement
1. Introduction Maritime transport services have benefited from the economy of many regions around the world because ships transport more than 80% of world trade (Al-Eraqi et al. 2008). Container terminals play a substantial role in global cargo transportation by serving as an intermodal between the maritime and by a variety of carriers (Chen et al. 2003). According to Oram (1965), prior to the First World War, containers were used to ship a biscuit maker’s products from Dublin to London, and the port became a shore-based installation for the transfer of goods to and from ships. Therefore, containerization provides the mechanism that enabled companies to extend to international markets while improving reliability, flexibility, and costs of freight distribution. Through containerization, all competitors have the potential to gain the same level of access to the global cargo carriage system via port facilities (Notteboom & Rodrigue 2008). According to Song and Payanides (2007), seaports are very important to national economies by permitting higher levels of profitability, income, output, and employment in the logistics field. Maritime transport or the growth of containerization is important because it offers safety, comfort, and the possibility and ability to handle a high volume of goods at a relatively low cost (Islam et al. 2010 and Al-Eraqi et al. 2008). The steep rise of manufacturing sectors leads to the fast growth of container demands, thus enhancing the transportation activities in Malaysia (Shah 2003). Therefore, an efficient empty container management under logistics and shipping industry has become an important issue in this study. This aspect requires mutual independencies between the key players in the supply chain such as a system of containers, container ports/terminal facilities, and tracks or any transport modes that transfer cargos across the world. The basic activity under this system is to move physical items carried out by logistics providers, such as shipping lines, transporters, freight forwarders, and other companies that offer logistic services (Mol 2007; Vinstra et al. 2010 and Mhonyai et al. 2011). Related activities with higher collaboration between various parties are very crucial components that may influence the value chain for any successful business. This study aims to investigate the fragment chain of empty container movement at off-dock depots outside Klang Port, Malaysia. The main factors that hinder the movement of empty containers at the off-dock depot are identified. 2. Literature Review Up to now, empty container movements constitute approximately 20% of the world total international container port throughputs (Chew et al. 2011). In 2011, the twenty-foot equivalents (TEUs) handled by Malaysian ports stood at 19.8 million TEUs. However, positive growth in container handling was observed in 2012 or an increase of 676,908 TEUs, which reflects a recovery in both local and transshipment cargoes. Detailed comparisons are summarized in Table 1.
Table 1: Container throughput within Malaysian ports (2010-2012)
2010 2011 2012
1 Klang Port 8,870,296 9,435,408 9,933,634
2 PTP 6,298,734 7,302,461 7,493,806
3 Johor 876,268 830,340 801,058
4 Penang 1,067,173 1,202,179 1,165,733
5 Kuantan 142,080 132,796 246,715
6 Bintulu 251,243 215,451 430,186
7 Miri 29,773 31,839 54,048
8 Kuching 190,642 214,820 371,785
9 Rajang 80,333 88,700 149,240
10 Sabah 326,826 357,946 610,426 Source: Ministry of Transport Malaysia Table 1 shows the quantitative difference in container throughput between 2010 and 2012. In 2012, Port Klang handled up to 9.9 million TEUs in comparison to 9.4 million in 2011 and became the first largest container port in terms of the total throughput of the country in that period. The Port of Tanjung Pelepas (PTP) is the second largest container port, handling 7.49 million TEUs in 2012 compared with

Proceedings of 4th
International Conference on Global Business Environment
(ICGBE-2014)
153
7.3 million TEUs in 2011 and 6.2 million in 2010. Containerization International ranked Port Klang and PTP 13th and 17th among the top 20 container ports in the world, respectively, for 2009 to 2011 based on global performance. Therefore, yard operations play a vital role in port management and other parties involved in container chains to achieve high efficiency and maintain service level. This situation is crucial because although port terminals have limited space, container flows continue to increase. Accordingly, the rapidly growing container flows could bring some problems, such as terminals crowded with containers, bottlenecks that reduce the efficiency of port activities, and prolonged dwelling time for container operations (Roso et al. 2009). According to Park and Dragovic (2009), in the development of the container transport chain, container terminals have encountered disruptions, such as bottlenecks, for some time. According to Jula et al. (2006), the growth of container traffic may contribute to regional congestion. Fan et al. (2012) found that the congestion and flows of containers imported to US ports could negatively affect logistic functions. Problems or disruptions in this flow may affect one other; these problems may include different types of activities in transportation, shipping, and depot and lead to uncertainty in delivery to customer/shippers. Wang et al. (2003) reported that container transportation significantly affects the contemporary global economy. However, several challenges result in poor logistics in some cases, such as infrastructure (e.g., bad roads, inefficient railways, poor communication lines, and congestion in ports), taxation, inadequate information, information processing delays, shipment delays, and poor management decisions (Lambert et al. 1998). According to Christopher (2011), a bottleneck or congestion is the slowest activity in a chain, which may often be caused by a machine or part of the information flow such as order processing. In a bottleneck in a container supply chain, a fragment in the chain can have the lowest effective capacity compared with other operations (Vinstra et al. 2010). Therefore, the key players in the supply chain must be better coordinated.
Numerous studies deal with empty container management. Mhonyai et al. (2011) reviewed the problem of empty container management among the key players in the supply chain. Yur and Esmer (2011) and Braekers et al. (2013) discussed problems on empty container repositioning. Bin & Zhongchen (2007) reported on intermodal empty container repositioning of land carriage, while Diaz et al. (2011) studied forecasting volumes of empty containers at ports to minimize costs of repositioning empty containers. Steenken & Voss (2011) described the basic operation in a container terminal. Choong et al. (2002) and Chen et al. (2003) analyzed the problem related to tactical management of empty containers. Many studies that focus on port efficiency have also been carried out. Al-Eraqi et al. (2008) measured the efficiency of 22 seaports in the Middle East and East Africa by using data envelopment analysis. Steenken et al. (2004) described the categories of container operations based on a classic review and emphasized operation research technique at the terminal. Thai & Hwang (2005) studied the issues of port competitiveness by considering several factors of a port influenced by liners or shipping companies. This important factor also encouraged liners to fast-track the growth of container transportation, which is reflected in port throughput. Nevertheless, research on empty container movement at the off-dock depot in Malaysia is limited, particularly in the context of congestion or bottleneck. The focus of the present study is on the off-dock empty container depot, which is one of the essential components of container chain activities and part of the supply chain that influences the distribution of logistics in the country. The off-dock empty container depot is designated by the shipping line/carrier to hold empty containers, and it assists container users in collecting/returning the empty boxes to the depot (Rensburg et al. 2005). 3. Methodology
This study aims to investigate the fragment chain of empty container movement in the context of a bottleneck at the off-dock depot located outside the Klang Port. Several bottleneck factors will be identified and the key questions include: RQ1: What are the main issues or problems in empty container movement at the off-dock depot? RQ2: What are the key factors of the bottleneck that occurs at the container depot during physical movement of empty containers? RQ3: Among the key players of the container chain, which parties significantly contribute to the bottleneck problem? To answer these research questions, the study required a greater understanding of empty container practices at an off-dock depot. The first phase of this study was conducted qualitatively (how and why questions were asked) to obtain in-depth information (Coleman & Connor 2007). The qualitative method also enabled us to explore the richness of knowledge in empty container practices of 30 practitioners, including internal or local carriers, manufacturing firms, trucking companies, intermodal transport operators, freight forwarders, and marine container logistic specialists, involved in the issue. In this study, the semi-structured questionnaires were designed, and the face-to-face interviews were conducted in 2011 to 2012. The average duration of a session with each respondent was 40 minutes to 100 minutes. The interviews were recorded and professionally transcribed verbatim with coded themes and sub-themes through thematic analysis using Atlas.ti software. Selective coding was used to provide the overall theoretical picture. The objective of selective coding is to identify a key category or theme that can be used as the core of the study results (Coleman & Conner 2007). Some collected data were analyzed through the analytic hierarchy process (AHP) to determine the priority theme (factor) affecting the bottleneck or congestion. In this context, both approaches were considered suitable and reliable tools for identifying the real problems occurring at the depot in Klang Port. AHP evaluates the consistency of the pair wise comparisons as they are made through hierarchy (Tavana et al. 1997). 4. Results and discussion The coding scheme was used to answer the research questions (RQ1, RQ2 and RQ3). The Atlas.ti approach uses selective coding to achieve the objective of study. After analyzing and interpreting the transcripts from the participants, the following major themes emerged: (1) attitudes, (2) information, (3) operation handling, (4) monitoring, and (5) facilities. According to the frequency results in the interview transcripts of the 30 participants, 90% considered congestion or bottleneck to be a problem at the off-dock depot outside the Klang Port, and 10% mentioned that no critical problem was evident in this phenomenon because the movement of empty containers was efficient, with only minor problems. The results were categorized by different parties (Figure 1). The values in the chart indicate some attribute or problems occurring under these factors. The information factor under shipping lines is 20%, which is higher than that of other parties. The monitoring factor under shipping lines is 33%. The work attitude factor under haulier/driver is 38%, the operations factor under depot is 42%, and the facilities factor under depot is 25%. The operations factor under shippers/customer, which is linked

Proceedings of 4th
International Conference on Global Business Environment
(ICGBE-2014)
154
to depot problems, is 47%. Next section will provide the explanation of the factors and examples of problems based on the AHP prioritize factors. Figure 1: Percentage on the bottleneck issue on key players in the container chain According to the respondents, the shipper books the container with the shipping line or freight forwarder once the cargo is ready for export. Afterwards, the appointed hauliers pick up the empty container at the yard or assigned location and move it to the premises of the shipper for loading. Each factor is briefly explained as follows. Work Attitudes; An efficient coordination ensures the efficient and fast shipment process to customers (Vis & Koster 2003). The respondents acknowledged that too many container operators at each depot would lead to congestion or bottleneck, causing the queuing of trucks in front of the gate and in the container yard area. Currently, 28 to 32 empty container depots are assigned by shipping lines to manage their containers. The depot runs 24 hours a day, but the truck drivers tend to collect and deliver containers simultaneously between morning and lunch time. During peak hours, more than 30 trucks are at the depot area every hour, creating delay and congestion. Information; The ability to share information provides a powerful platform to link suppliers to customers and gives the potential to speed up day-to-day operations at terminals. In common practice, the depot will key in or report the information on container damage, grading, and inventory, which will be linked directly to the shipping lines. Late information may interrupt the container chain flow from the depot to the shipper, especially during inspection activities. Operations; The respondents revealed that 350 to 500 empty containers are moved in or out of each off-dock depot (per day). Movement at an inconsistent time by truckers and high-capacity containers at the limited storage depot can cause difficulty in managing the depot. This situation can become more critical if the containers are not segregated according to container owner (types of operators) and grades, increasing the possibility of a delay in the picking up of empty containers at the yard. However, other situations contribute to the congestion, particularly when the container is not yet repaired or if the conditions/structure of containers does not match with the customer specifications. Monitoring; The storing of empty containers is carried out by depot operators (appointed by shipping lines) to hold and manage their containers. According to a respondent, shipping lines must monitor the inventory, capacity, and operations of empty containers at the depot. This situation will become more critical if all parties are unable to support and maintain their responsibilities in container movement. Facilities; Information flow is a vital component among supply chain players and their partners that rely on electronic communication, such as electronic data interchange. According to the respondents, not all off-dock container depots implement this facility because of the high financial cost to invest in such systems. Analytic Hierarchy Process Implementation: Conducting thematic analysis with Atlas.ti aside from the AHP is effective because it enables the decision maker to represent the possible variables contributing to this study. AHP was used to obtain more confidence in decision problem results. The importance of every factor can be determined by AHP because it can influence decision-making (Chou 2010). AHP application can assist managers to effectively evaluate the overall performance of a firm in their long-term strategic planning even under complex economic and marketing conditions. AHP has become a widely used method for multiple-criteria decision making. This method is used extensively in evaluating and selecting in supply chain and logistics, manufacturing, and hospitalization (Saaty

Proceedings of 4th
International Conference on Global Business Environment
(ICGBE-2014)
155
2008). In this study, AHP was used to evaluate and select the optimal factor, and decide on an alternative to solve the bottleneck issue through following steps. This step has been highlighted in previous studies, such as Triantaphyllou and Mann (1995), Hashim et al. (2011), Rangone (1996), Chen et al. (2011), Ong & Chew (1996), and Kannan (2010). Several researchers have already applied AHP in the choice of problems as mentioned in the methodology. According to a respondent, the following four main parties are involved in this movement: shippers/customer, shipping line, haulier (driver), and depot. The customer also comes from a forwarding agent or consignee. Therefore, the alternative (Level 3) consists of four dimensions and five criteria (Level 2), which are initially important elements that contribute to the problem at the off-dock depot. These elements were derived using the selective coding approach of Atlas.ti software through a semi-structured interview with n=30 samples and supported by academic literature. By issuing a preliminary questionnaire to 30 logistic practices, five evaluation criteria were finally incorporated. This stage is known as the identification of factors. Figure 2 shows the decision hierarchy that consists of several layers. Each level consists of a set of decision elements. As shown in Figure 3, the hierarchy levels determine the objective of the decision, criteria, and alternatives. At Level 2, all criteria are represented as a group of factors (F): work attitudes (F1), information (F2), operations (F3), monitoring (F4), and facilities (F5). At Level 3, the four alternatives are represented by container chain players/parties (P): shipping lines (P1), haulier/driver (P2), depot (P3), and shippers/customer (P4), which were compared according to the criteria. The hierarchical structure of the five criteria with four decision choices is presented in Figure 2. Figure 2. Hierarchical structure of the decision After decomposing the decision-making problem into a hierarchy, the next stage is to quantify the relative priorities of the criteria through a square matrix. In this study, five criteria were involved so a 5x5 matrix was used (Table 2). Matrix A consists of the value of comparison, Cij. The weights were based on the responses of interviewees with different logistic backgrounds. All values of Cij were calculated from the absolute differences between the paired factors. Table 2 shows the matrix of the pairwise comparison of five criteria or factors that were compared with one another: A = (ij). The complete pairwise comparison matrix is as follows: Table 2: Pairwise comparison weights of factors (criteria)
Criteria (C) Work attitudes
Information Operations Monitoring Facilities
Work attitudes 1 (aij) 1 1 3 2 Information 1 1 0.5 2 1 Operations 1 2 1 4 1 Monitoring 0.33 0.50 0.25 1 1
Facilities 0.5 1 0.33 1 1
Consistency Ratio: 0.00 The criteria of 10 judgments are shown in the table and CR of 0.00 indicates that a pairwise comparison of judgments is consistent. As a rule of thumb, Saaty (1980) recommended a CR of ≤ 0.1 to be acceptable. Work attitudes were assumed to be moderately more important than the monitoring on the bottleneck issue. In Table 3, normalization was obtained by summing up all the values in that column (Table 2) and dividing each value in the matrix by the sum of all values in that column. After normalization, the values of factors were averaged across the results of rows with relative priority on each criterion. According to the relative priority in Table 3, operations (29.6%) are the most critical factors in bottlenecks, followed by work attitude (27.4%), information (19.1%), facilities (13.6%), and monitoring (10.3%). The ranking that indicates the amount of relative priority on each factor is shown in Table 4.
Level 1
Level 2
Level 3

Proceedings of 4th
International Conference on Global Business Environment
(ICGBE-2014)
156
Table 3: Normalized weights and relative priority of criteria A criteria Work
attitudes Information Operations Monitoring Facilities Relative
Priority
Work attitudes
0.26086957 0.181818182 0.324324324 0.272727273 0.333333333 0.2746145
Information 0.26086957 0.181818182 0.162162162 0.181818182 0.166666667 0.1906670 Operations 0.26086957 0.363636364 0.324324324 0.363636364 0.166666667 0.2958267 Monitoring 0.08695652 0.090909091 0.081081081 0.090909091 0.166666667 0.1033045 Facilities 0.13043478 0.181818182 0.108108108 0.090909091 0.166666667 0.1355874
Table 4: Ranking of factors
Criteria Relative Priority Ranking
Work attitudes 0.2746145 2
Information 0.190667 3
Operations 0.2958267 1
Monitoring 0.1033045 5
Facilities 0.1355874 4 Table 5 presents the weights of the container chain players derived from the pairwise comparison with regard to each factor. The resulting priorities of alternatives were computed after the normalization, as shown in Table 6. Table 5: Weights of alternatives with respect to the factors
Factor
Weights of factors, Wij
Weights of container chain players, Pij P1 P2 P3 P4
Work Attitudes 0.27461454 0.37878788 0.29292929 0.19191919 0.13636364
Information 0.19066695 0.39444444 0.19722222 0.23888889 0.16944444
Operations 0.29582666 0.42231211 0.35163448 0.1460192 0.08003421
Monitoring 0.10330449 0.5 0.16666667 0.16666667 0.16666667
Facilities 0.13558737 0.31904762 0.32857143 0.17619048 0.17619048
The consistency test of each matrix is satisfactory; all are ≦0.1, which indicates consistency. The overall priority vector of this study can be calculated by D = Pij x Wij. Therefore, the overall priorities of the key players of container chain or parties can be obtained by D = Pij x Wij. Based on the overall priority, P1 (shipping line) has the highest score with 39.9%, followed by P2 (haulier/driver) with 22.8%, P3 (depot) with 18.2%, and P4 (shippers) with 13.4%. Accordingly, Figure 3 also shows the overall ranking of alternatives. Table 6: Overall priority
Work attitudes (0.274614)
Information (0.190667)
Operations (0.295827)
Monitoring (0.103304)
Facilities (0.135587)
Overall Priority
P1 0.378788 0.394444 0.422312 0.5 0.319048 0.39907 P2 0.292929293 0.197222222 0.351634477 0.166666667 0.328571429 0.22838 P3 0.19191919 0.23888889 0.1460192 0.16666667 0.17619048 0.18256 P4 0.13636364 0.16944444 0.08003421 0.16666667 0.17619048 0.13454
Figure 3: Overall ranking of container chain players
0.399070.22838 0.18256 0.13454
P1 P2 P3 P4
Container chain players
Overall Priority

Proceedings of 4th
International Conference on Global Business Environment
(ICGBE-2014)
157
The weight of priorities by AHP reveals the influential factors of the bottleneck issue. The results show that the top four parties belong to P1 (shipping lines) and the top five factors belong to the handling problem of operations. Therefore, identifying the main causes or factors enables all parties to establish strategies to overcome the interruptions in the fragmented chain. Therefore, interrupting an off-dock depot may highly affect the bottleneck or congestion at the depot and automatically cause delay in logistic activities. This major problem may affect the driver, shipper, port, vessel, customers, and any other parties involved in these chains. For example, long waiting hours may cause the drivers to cancel their trip. Congestion creates delays that result in financial loss for the carriers and affects the environment, as more air pollutants are produced; congestion also generates interruption and noise in container handling of both trucks and depot terminal (Roso 2008). In this case, the hinterland depot requires some guidelines or a system to monitor the operation of empty containers. Therefore, we raised the following questions: To what extent the problem can be solved? How do we optimize the pick-up time to move the container in less than 45 minutes? How can the haulier, depot, shipper, and all stakeholders involved in this chain become more efficient? In other words, a possible solution must be created to implement good collaboration and coordination in the container supply chain and among logistic partners at the end of the research agenda.
5. Conclusion and recommendations The study attempts to examine the main factors of bottlenecks that occur at the off-dock depot located outside the Klang port. Finally the AHP approach is used to prioritize the factors that hindrance the rapid movement of empty containers out from off-dock depot. Therefore the study started with the interview session with 30 respondents; condense the transcript into code to obtain the variable or factors. Then, we use Atlas.ti to speed up the process of analysis through the coding process. This study has achieved its main objectives. As proposed by the previous study, there are numerous aspects to identify and measure port or container depot performance, for example; yard capacity, congestion, empty container allocation, empty container repositioning, coordination between importers and inland transport providers, and other aspects that create the problems, thus lead to the bottleneck or congestion (Adam 2009 & Breakers et al. 2011). Therefore, this study will concentrate on the operational factors. Future research will stress on the in-depth investigation on the operational problem that arise in depot, and determine suitable methods of modeling and simulation for analyzing bottleneck problem to reduce the total service time with the aspect of empty container movement (specifically during pick-up operations in this area). It is hoped that all stakeholders can obtain benefits, including time, cost, trip, and efficient operations. References Adam, S. (2009). Simulation and Analysis of Port Bottlenecks: The Case of Male’. Thesis: Master. Lincoln University. Al-Eraqi, A.S. Mustafa, A. Khader, A.T. & Barros, C.P. (2008). Efficiency of Middle Eastern and East African Seaports: Application of DEA
Using Window Analysis. European Journal of Scientific Research, 23(4), 597-612. Bin. W. & Zhongchen. W. (2007). Research on the optimization of intermodal empty container reposition of Land-Carriage. Journal of
transportation systems engineering and information technology, 7(3). 29-33. Braekers, K. Janssens, G.K. & Caris, A. (2011). Challenges in Managing Empty Container Movements at Multiple Planning Levels.
Transport Reviews, 31(6), 681–708. Chen, C. Hsu, W. J. & Huang, S.Y. (2003). Simulation And Optimization Of Container Yard Operations: A Survey. 2003. 2ND International
Conference On Port And Maritime R&D and Technology, 10 – 12 September 2003, Pan Pacific Hotel, Singapore. Chen, C.W. Chan, C.L. & Cheng, C.Y. (2011). Using AHP for determining priority in seamless Strategy: a case study of the click-and-mortar
Bookstore. International Journal of Electronic Business Management, 9(2), 95-106. Chew, E.P. Lee, L.H. & Tang, L.C. (2011). Advances in Maritime Logistics and Supply Chain Systems, Singapore: World Scientific
Publishing. Choong, S.T. Cole, M.H. & Kutanoglu, E. (2002). Empty container management for intermodal transportation networks. Transportation
Research Part E 38, 423–438. Chou, C.C, (2010). AHP model for the container port choice in the multiple-ports region. Journal of Marine Science and Technology, 18(2),
221-232. Christopher, M. (2011). Logistics & supply chain management. London: Pearson Education Limited. Coleman, G. & O'Connor, R.V. (2007). Using grounded theory to understand software process improvement: A study of Irish software
product companies. Journal of Information and Software Technology, 49(6), 654-667. Diaz, R. Talley, W. & Tulpule, M. (2011). Forecasting Empty Container Volumes. The Asian Journal of Shipping and Logistics, 27(2), 217-
236. Fan, L. Wilson, W.W. & Dahl, B. (2012). Congestion, port expansion and spatial competition for US container imports. Transportation
Research Part E 48, 1121–1136. Hashim, N.M. Ibrahim, Y. & Mohamad, S. (2011). Suitability analysis of education infrastructure using analitical hirarchy processes (AHP)
in Kuala Lumpur. Journal of Social Sciences and Humanities, 6(2), 336-348. Islam, S. Arthanari, T. & Olsen, T. (2010). Empty container-truck movement Problem: At Ports of Auckland. Proceedings of the 45th
Annual Conference of the ORSNZ, 239-248. J.J.V. Rensburg, J.J.V. He, Y. & and Kleywegt, A.J.(2005). A computer simulation model of container movement by sea. Proceedings of the
2005 Winter Simulation Conference, 1559-1566. Jula, H. Chassiakos, A. & Ioannou, P. (2006). Port dynmic empty container reuse. Transportation Research Part E 42, 43-60. Kannan, V. (2010). Benchmarking the service quality of ocean container carriers using AHP. Benchmarking: An international Journal,
17(5), 637-656. Lambert, D.M. Stock, J.R. & Ellram, L.M. (1998). Fundamentals of logistics management, Singapore: McGraw-Hills International Editions. Mhonyai, C. Suthikarnnarunai, N. Member, IAENG. & Rattanawong, W. (2011). Container Supply Chain Management: Facts, Problems,
Solution. Proceedings of the World Congress on Engineering and Computer Science 2011 Vol II WCECS 2011, October 19-21, San Francisco, USA.
Mol, F. (2007). Logistics of empty marine containers: A research on strategies for port planning, concerning the storage and flow of empty marine containers in the port of Rotterdam”, Master. Thesis, Technical University.
Proceedings of 4th
International Conference on Global Business Environment
(ICGBE-2014)
158
Notteboom, T. & Rodrigue, J.P. (2008). Containerisation, Box Logistics and Global Supply Chains: The Integration of Ports and Liner Shipping Networks. Maritime Economics & Logistics, 10, 152–174.
Ong, S.E. & Chew, T.1. (1996). Singapore residential market: An expert judgemental forecast incorporating the analytical hierarchy process. Journal of Property Valuation & Investment, 14(1), 50-66.
Oram R.B. (1965). Cargo Handling and the modern port.. London: Pergamon Press Ltd. Park, N.K. & Dragovic, B. (2009). A study of Container Terminal Planning. FME transactions 37, 203-209. Rangone, A. (1996). An analytical hierarchy process framework for comparing the overall performance of manufacturing departments”,
International Journal of Operations & Production Management 16(8), 104-119. Roso, V. Woxenius, J. &, Lumsden, K. (2009). The dry port concept: connecting the container seaports with the hinterland. Journal of
Transport Geography, 17, 338–345. Roso, V.(2008). Factor influency implementation of a dry port. International Journal of Physical Distribution & Logistics Management.
38(10), 782. Saaty, T.L. (1980). The analytic Hierarchy Process. New York: McGraw-Hill. Saaty, T.L. (2008). Decision making with the analytic hierarchy process. Int. J. Services Science, 1(1), 3-98. Shah, T.J.T.M. (2003). Liberalization of the container haulage industry in Malaysia. Transport and Communcation Bulletin for Asian and
the Pacific, 73. Song, D.W. & Payanides, P.M. (2007). Global supply chain and port/terminal: Integration and competitiveness. Maritime Policy and
Management. International Conference on Logistics, Shipping and Port Management, Taiwan. Steenken, D. Voss, S. & Stahlbock, R. (2004). Container terminal operation and operations research - a classification and literature
review. OR Spectrum, 26, 3-49. Tai, H.H. & Hwang, C.C. (2005). Analysis Of Hub Port Choice For Container Trunk Lines In East Asia. Journal of the Eastern Asia Society
for Transportation Studies, 6, 907 – 919. Tavana, M. Kennedy, D.T. Rappaport, J. & Ugras, Y.J. (1997). An AHP-Delphi Group Decision Support System Applied to Conflict resolution
in hiring decisions. Journal of Management Systems, 5(1), 49-74. Triantaphyllou, E. & Mann, S.H. (1995). Using The Analytic Hierarchy Process For Decision Making In Engineering Applications: Some
Challenges. International Journal of Industrial Engineering: Applications and Practice, 2(1), 35-44. Vinstra, A. Hinsta, J. & Zomer, G. (2010). Global Supply Chain Conpendium, Seventh framework programme, Theme 7. Vis, I.F.A. & Koster, R.D.(2003). Invited Review Transshipment of containers at a container terminal: An overview. European Journal of
Operational Research, 147, 1–16. Wang, T.F. Song, D.W. & Cullinane, K. (2003). Container port production efficiency: a Comparative Study of DEA and FDH Approaches.
Journal of the Eastern Asia Society for Transportation Studies, 5, 698-713. World Scientific Publishing. Yur, T. & Esmer, S. (2011). A review of the studies on empty container repositioning problem. European Conference on Shipping,
Intermodalism & Ports - ECONSHIP, Chios, Greece.

Proceedings of 4th
International Conference on Global Business Environment
(ICGBE-2014)
159
Reconnoitering and Fixing Variables through Qualitative Research: Precarious Working Conditions and Living Condition in Oil Palm Plantations
Dileep Kumar. M, Noor Azizi Ismail, Normala S Govindarajo
Othman Yeop Abdullah Graduate School of Business (OYA-GSB), Universiti Utara Malaysia, Malaysia Abstract: Oil palm plantations are the backbone of the Malaysian economy, since day immemorial. When you look into the past, the workers in the oil palm plantations were dominated by Indian and Chines communities. Later due to the sigma associate with oil palm plantations jobs viz., dirty, dangerous and distance, the Indians and Chinese workers moved away from the oil palm work and they were replaced by Indonesians and Philippines. These foreign workers whom having the legal and illegal status under enforcement in Malaysia, have been living in remotely located inhabitations engaging in ‘dirty, dangerous and distance’ wise Oil palm plantations. Though the larger oil palm plantation companies ensure minimum living and working conditions for the foreign workers, vastly located small holding plantations never follow such minimum and fair working environment. These conditions to be correlated with the term “precarious working conditions’ in small holding oil palm plantations. Due to lack of availability of the locals to engage in oil palm work, the plantations have to depend on foreign workers do all these ‘dirty, dangerous and distance’ workers in oil palm plantations. Except a few literature available from Amnesty international and local NGOs, there is less evidence to prove the existence of such exploitative working conditions in oil palm plantations. In order to explore precarious working conditions in oil palm plantations thus a qualitative research study is conducted in the Sabah region of the Eastern Part of Malaysia. The study followed, triangulation method through interviews with the migrated foreign workers, (legal and illegal), focus group discussions and Delphi technique with the identification of experts in the field to arrive at the factors and categories related to the theme ‘precarious working conditions’ in oil palm plantations. The outcome of the study fixes the variables that need to be concentrated for a higher level research through quantitative research. Keywords: Living conditions, Working condition, Plantation, Foreign workers
1. Introduction Malaysia is facing problem of labor shortage in oil palm plantations and the country is highly dependent on foreign workers coming from Indonesia and Philippines. Contextualizing the topic to the eastern part of Malaysia, the Sabah region of Malaysia, which is having 62.74% (268,992 people) foreign workers working in oil palm plantations, in comparison with the total Malaysia (450,396 people, in plantations). To improve the average annual plantation yield to 26.2 tons per hectare will require the harvesting of over 5 million hectares of mature trees by 2020; assuming harvester productivity of 1.5 tons per hectare, the industry will require 289,000 workers. There are currently 187,000 harvesters in the country and hence, the industry would have required a net addition of 102,000 harvesters to meet the targets if there was no replacement in mechanization or an increase in worker productivity. The locals in the regions are not willing to engage in the oil palm plantation since because they work in the plantations is labeled as distance, dangerous and dirty job. Moreover the working and living conditions of the oil palm plantations are very much pathetic and majority large and small holdings are filled with foreign workers. Even though an awareness of working conditions and foreign worker deployment in the oil palm plantations are available, very less literature that to support this issue providing evidence to the policy makers. In order to explore the factors related to the precarious working conditions prevalent in the oil palm plantations an exploratory study has been conducted in the Sabah region of the eastern part of Malaysia. This exploratory study made use of direct interviews, focus group discussions and Delphi technique to arrive at factors ad categories related to the working and living conditions of the foreign workers in oil palm plantations in Sabah region. Analysis based on the Delphi technique was made and appropriate factors related to working and living conditions of the foreign workers in oil palm plantations has been made. The study provides better insight into the precarious working conditions prevalent in oil palm plantations in Sabah region. Scenario of Plantations in Malaysia: Malaysia is currently the world’s largest producer and exporter of palm oil. The plantation sector dates back to 1896, with the start of the rubber industry. Oil palm cultivation began in 1917, but growth was initially very slow. It was only during the last 50 years that plantation development was accelerated through large-scale investments in the cultivation of the oil palm as one of the approved crops for diversifying the country’s agricultural development. Areas under oil palm increased from 54,000 hectares in 1960 to 4.05 million hectares in 2005, reflecting a compound annual growth of 10.06%. Production increased from 94,000 tonnes in 1960 to 15 million tonnes in 2005, or by almost 160 times within 45 years – this represents a compound annual growth of 11.93% per year (YusofBasiron, 2007). Today, Malaysia is the 2nd largest exporter of palm oil in the world. Of all palm oil produced in Malaysia, roughly 60% of it is exported to China, European countries, Pakistan and so forth. In 2008, Malaysia produced 17.7 million tons of palm oil from 4.5 million hectares of oil palm plantations. Much of the farmland used to grow rubber, cocoa, and coconut was turned into oil palm plantations and the growing area of oil palm continues to increase.In Malaysia, there are 153 estates and 67% of them are concentrated in the peninsula area. Of all the 580 thousand workers in the plantations, 350 thousand of them come from other countries. Allegedly, 90% of the labor force in Sabah state is Indonesian (Tirtrosudarmo, 2013). Oil Palm Plantations in Sabah: In Sabah, oil palm is cultivated in more than 700 thousand hectares and there are 58 palm oil mills. These plantations are spreading around both the Sandakan and Tawau division. Sabah produces the largest portion of palm oil in Malaysia, 25% of its total production. Sabah’s production accounts for 30% of palm oil export earnings of the whole of Malaysia. Javanese and Chinese made up the majority of foreign labor in Sabah before Malaysian independence while the number of Indonesian and Filipino workers has become dominant since its independence. Java comprises the majority of Indonesian workers in Sabah, followed by Bugis and Traja. This Indonesian labor inflow has continued, while local residents are facing hardship in finding good job opportunities. Even the impoverished local residents are unwilling to find jobs in plantations due to the poor working conditions. A monthly wage of 600 Ringgit is too low for the local residents. Poor living conditions and physically demanding jobs are the reasons why they are reluctant to find jobs in plantations (Tirtrosudarmo, 2013).

Proceedings of 4th
International Conference on Global Business Environment
(ICGBE-2014)
160
Why Foreign Workers? There have been frequent policy shifts to accommodate demands from employers to ease critical labor shortages, as well as to document and legalize the large number of undocumented migrant workers in the country. Several analyses on foreign policy have diagnosed these policy shifts as “stop-go”, inconsistent and lacking in clear policy directions to reduce the reliance on foreign workers (Azizah, 1995 and 1996; Pillai, 1992 and 1995; World Bank, 1995). They contend that the policy swings to “allow, restrict and ban” migrant workers contradict national objectives to foster quality growth based upon “high path” structural transformation to generate high-productivity high-skill employment. It has been speculated that the relatively easy access to the large pool of low-skilled workers tends to distort domestic factor prices and retard industrial upgrading and trap the economy in low-skill equilibrium. Yet, there has been little empirical analysis on whether foreign labor competes (displaces) or compliments (augments) local labor. Malaysia is currently experiencing a shortage of skilled and unskilled labor in plantations estimated at 20 percent of the total industry workforce. This is due in part to the demanding nature of the work in estates and the growing number of attractive alternative job opportunities in other industries. The lack of mechanization options in plantations creates an over reliance on manual labor for all key activities: land preparation, nurseries, planting, fertilizing, field upkeep and maintenance, harvesting, collection and transportation. As a result, Malaysian oil palm plantations are heavily dependent on foreign workers (currently estimated at 80 percent of total industry workforce) (ETP, Roadmap, 2010). The upstream activities of palm oil are very labor intensive and are thus largely dependent on the availability and productivity of workers. To improve the average annual plantation yield to 26.2 tonnes per hectare will require the harvesting of over 5 million hectares of mature trees by 2020; assuming harvester productivity of 1.5 tonnes per hectare, the industry will require 289,000 workers. There are currently 187,000 harvesters in the country and hence, the industry would have required a net addition of 102,000 harvesters to meet the targets if there was no replacement in mechanization or an increase in worker productivity (ETP, Roadmap, 2010). Migrant Worker Statistics: The foreign workers come from twelve countries in the region (ASEAN countries and neighboring countries) (CARAM, 2005) supplying a much needed workforce in Malaysia's agricultural, construction, manufacturing and services sectors. Of the 1,8 million persons registered in the statistics by the Ministry of Home Affairs, the largest number of migrants come from Indonesia (1,2 million) and works mainly in the plantation sector (381,582 of them) followed by Nepali (192,332 persons registered) mostly represented in the manufacturing industry (159,990). According to the figures, Indian workers (134946) are legally employed in the same sector (34685) but also in the services (61,273) and in the plantations (27,759). Other sending countries include Burma (88,573), Vietnam (81,194), Bangladesh (55,389), Philippines (21,694), Pakistan (13,296), Cambodia (5,832), Thailand (5,753), Sri Lanka (3,050) and China (1,295) (UNESCAP, 2006). The statistical data of 2005 tells us that Indonesians constitute the largest group of foreign labor in Malaysia. They occupy 68% (1.21 million) of all foreign workers and the number will rise to 2 million if we take into account undocumented, illegal workers. Among the Indonesian workers in Malaysia, plantation labor consists of the largest group with 26% followed by domestic workers (24%) and construction workers (18%) (Tirtrosudarmo, 2013). Economic disparity between Indonesia and Malaysia is the key factor in the continuing labor migration. Common problems the labor force is facing in every sector of work are: low wages, the confiscation of passports by employers and the poor living environment. The labor force in construction and manufacturing in many cases has to work in hazardous conditions. The turnover rate of construction workers is quite high, and those who quit often drift to plantation sites. The service industry, such as hotels and restaurants, also has many problems and in the worst case, it is connected with human trafficking (Tirtrosudarmo, 2013). Malaysia’s plantation industry relies heavily on Indonesian labor. Work in the plantations is known for its low wages, passport control by the employers, long hours of back-breaking work and exploitation by the brokers. In many cases, workers are placed in a harsh and isolated environment with minimal shelter so many of them quit and find work on construction sites. Indonesian workers earn 25-60 Ringgit a day in construction jobs while they make 25-40 Ringgit in plantation sites. The Malaysian government plans to reduce the number of foreign labor in Malaysia from 2.1 million in 2008 to 1.7 million by the year of 2015. Regarding the plantation industry, however, the government plans to raise the percentage of foreign workers from 16% in 2008 to 20% in 2015 (Tirtrosudarmo, 2013). Key Challenges of Plantations: Securing reliable labor is one of the key challenges for plantations, which are typically located in remote, rural communities far away from labor markets. Rural communities often lack the basic infrastructure that is required to support worker communities, such as housing, markets, schools, hospitals, commercial businesses, utilities, and security. It therefore often falls to plantations to create worker communities, providing the entire infrastructure (Abdullah, 2010). In both Indonesia and Malaysia, palm oil growers are compelled to recruit unskilled labor from distant markets to work and live on their estates. In Malaysia, working in the palm oil sector is not highly desirable to local populations, given that it is dangerous, difficult, and relatively low-paying in comparison to service-based work. Even in rural communities, there is often a little supply of local labor. Malaysian palm oil growers typically look to foreign labor markets to recruit workers. Roughly 70 percent of laborers on oil palm plantations are foreign migrants, most commonly from neighboring Indonesia, which has a large, low-income population and workforce (Robertson, 2008). Workers also commonly migrate from Bangladesh, India, Cambodia, and Thailand (Robertson, 2008). While this cross-border labor market has many positive economic functions for growers and migrant workers, it is also a source of significant concern and potential labor exploitation. The production and trade of palm oil are rapidly expanding, given the significant demand for vegetable oils in both developed and developing countries. Large corporate producers in Malaysia and Indonesia are continuing to expand their land holdings and their workforces. The palm oil industry is now one of the most significant employers in Malaysia and Indonesia, employing as many as 3.5 million workers (IFC, 2010, MPOB, 2012). Many of these workers are victims of serious labor exploitation: Workers are trafficked into bonded labor; forced to work and live under extreme conditions, with limited legal recourse; suffer from abuse or the threat of abuse; or are victims of child labor. These exploitations constitute modern forms of slavery (United States Department of State, 2012). The Malaysian palm oil industry is labor-intensive. Migrant workers from Indonesia, Thailand, and Bangladesh largely make up the plantation-based workforce as a way of achieving a higher income or more consistent work than in their home countries. These workers often migrate to provide for families and communities back home, which depend on remittances. Workers on palm plantations often find them work and live in remote areas within closed plantation complexes, or they are otherwise segregated from larger communities. Under these circumstances, workers are completely at the whim of plantation owners or managers, whose priority it is to maximize productivity, often at the expense of reasonable working and living conditions and the rights of plantation workers. When faced with these conditions, workers have little recourse other than to leave the plantations; however, workers are unable to do so due to the closed

Proceedings of 4th
International Conference on Global Business Environment
(ICGBE-2014)
161
nature of plantations (Amnesty International, 2010). Workers are often forced to submit work permits, visas, and passports to employers, which makes it impossible for them to legally depart plantations. This often does not prevent migrant workers from leaving the premises. However, if they leave, migrants are highly susceptible to extortion by local police, whose primary course of action is to return workers to the plantations where they are employed. Those migrants that successfully escape a plantation are unable to find legal employment in Malaysia. If they do find employment elsewhere, it is often at small, independent plantations that draw few visits from industry and government regulatory groups, making these migrants susceptible to further exploitative labor practices (Amnesty International, 2010). In Malaysia, children can be found working on palm oil plantations, where they assist their parents to collect loose fruit, help carry and load bunches of oil palm fruit, and weed the oil palm fields. One report estimates that 60 percent of the children working on palm oil plantations in Malaysia are 6 to 10 years old (Edge, 2012c) In order for workers on plantations to meet their daily quota of palm fruit harvested and collected, it has been identified that "assistance from the child worker is the savior (USDOL, 1995). As part of the terms of their immigration, migrant workers in Malaysia are not legally entitled to give birth to children. In practice, though, many migrants do. Children born of migrant parents in Malaysia are not granted citizenship in Malaysia or their parents’ home country and thus become stateless. The result is that the children are not awarded the rights of either their country of birth or their ancestral home, including the right to education. Without other opportunities, stateless children are often relegated to working on the plantations — mostly informally, to help family members in meeting the high quotas set by plantation management. In Malaysia, it is estimated that between 72,000 and 200,000 stateless children work on palm oil plantations. (Asia Foundation, 2010). Interviews with worker: In order to explore the issue the investigators have conducted several interviews. Comprehended form of the case interviews is incorporated as follows. Worker1: I’m working here almost 4 years now and we are staying in a group of 5 families in one “Kongsi” (long house). I’m originally from Makassar, Sulewasi, we are frombugis clan. I’m having 5 children belonged to the age group of 21,17,8, 4,2 years. I’m taking up harvesting work in the plantation and my wife is working as fertilizer and pesticide sprayer. My first and second son(that's 17 and 8 years old) currently helping me in the field. As I’m now 45 years old, it's really tough to work and easily get tired in the evening. I usually stop working and feel exhausted. My previous employer engaged me in more target work compared to here. Worker2: I’m 22 years,now. I started working in the plantation when I was 8 years old. Helping my father, collecting the lost fruit. I have beenin school for 2months only as itwas burdenedto my family to pay my monthly fees of RM10 a month at the school that was organized by the committee at the plantation when. I just played and do nothing, until one day father ask me to join him at the plantations. I start with the pay of RM3 a day for collecting the fruit, year by year increase RM5, RM7 and finally Rm15 per day as do hard work as fruit collector. Today I’m having 2 children.First son currently 10 years old and another 2 years old. I keep my elder son away from the plantation and giving him a good education at Semporna, the palcewhich is 4 hours away from here. I’m paying for his accommodation, food and daily care to school. Hoping one day he will not follow the hardship of life I was going through before. I want to change my next generation to a better one. With the income of RM900 as harvesting still can afford to save and giving a better life to my family compare to my father's generation which only having Rm600 to feed 7 of us last time. Worker 3: I’m Angka, 42 year old, living with 8 children and my wife in plantations. The plantation provides us with wooded housing that having 2 rooms. We are located deep inside the plantation. 4 of my children did not register their birth, I am scared because my wife came with social visit and was staying over here without a pass. My mentor assigned me and my family to a remote location and keeping us away from an enforcement officer. We have difficulty of getting basic amenities from town. My mandor will help me to purchase monthly provisions. We are using the system “masukbuku 555” in which we take thing first and pay after when we get wage. Mandor will automatically cut my wage for the item purchased. Beside that, the price tag is quite higher than normal. For example an instant noodle cost RM2 per pack, where outside it cost RM0.70. Worker4: I am Zaki, 40, working in the plantation for 4 years, but still not having my passport.But my mandor and manager have already taken my thumb print and told me they are in the process of doing the passport “Jaminan”. Myself and a few friends are in the same condition and are located at the same housing “Kongsi”, I am here without my family. My wife and children are in Indonesia. Every month Iusually send more than half of my wage to my family in Indonesia through my mandor, as the town is so far and I don’t have my document yet. It is very dangerous for us to go out of the plantation since the enforcement and rules and regulations are very stricthere. Every month I order only very basic food from the Mandor such as Salt, Rice, Salted fish, Assam, Cigarette, Instant noodles,Sugar and Coffee powder. With this order itself my monthly expenses will reach RM120, for one person. Besides that, vegetables we get it from the plantations, during our walk like “pokes” and “Daun obi”. Worker 5: I’m Ahmed staying with 3 children, my wife, and my children. The children belong to age from 3, 7 and 10 years old. Three of them have not any document so far and out of three two children yet to get their document. All three of my children are not going to school since the school is very far away from our house. There is Humana (an NOGO) in the other plantation, but I cannot afford to send them to that school as I only have one bicycle to go to work. Every morning me and my wife will go together by bicycle to assemble the fruits and it is very dark.During the journey of 30min cycle she will hold the torch light and sit at the back of my bicycle. My children will be at home andtaken care by our neighbor’s wife. I do pay her monthly RM20 for here service. My wife prepares food keeps in the kitchen. I do inform my elder son to look after the sister and brother. Me and my wife have to work hard to earn more money to live a better life since we long to go back to our own country. My wife earns RM15 by daily bases for her work in fertilizing section. I’m doing the loading work by following one of the tractors, with the earning range from RM600 to RM900, maximum depending on the seasons of the month too. I am working here almost 4 years now. During the peak time, I will bring my son (10 years old), to field to collect the lost fruit. At least he can get RM7 to RM10 at day depending how many sacks collected. Worker 6: Since the day I started working in plantations, I have never been to the nearby town. All my basic necessities will be purchased by the Mandor. I’m working with a contractor and not direct under the plantation.We are placed at a rundown housing “Kongsi yang banyakbocor” we are in the group. Every morning 5am we will assemble in front of the “Kongsi” and my Mandor will take us by Hilux to the block that need to harvest and loading fruit. We are monitoring closely for high productivity and sometimes, we do fall sick but we are forced to go to work as we have target to achieve. Our Mandor will just give us Panadol for relief from sickness . The Mandor will take us to outside Clinique’s only when only in case of high fever/suspected Malariahappens. Worker 7: I am Razak, working with a subcontractor. Our job ranges from planting, harvesting, loading, pesticide spraying, fertilizing, and pruning. We do change from one plantation to another plantation according to the contract we get. We work together with plantation

Proceedings of 4th
International Conference on Global Business Environment
(ICGBE-2014)
162
workers but we will get less benefit and our check roll will be monitored by Mandor. Bad words will be shouting at us if the target didn't meet up to their expectation. Mandors usually work as terror in plantations. They made us to work long hours starting from 5 am to 3 pm. Further we are living in poor condition. The housing provided is not equipped with safe drinking water. The workers have to highly depend on the rainwater that they would be saving. During summer season water supply will be from the adjacent river. Sometimes water smells chemical and as it is contaminated. Worker 8: I’m Azzal, 46 working in the plantation.My health is losing day by day. I cannot do harvesting job due to poor health. Now I am undertaking spraying job. It is almost 3 monthsI am engaged inthe pesticide spraying group. Everyone has to work as a group. Workers have to work on the stipulated working hours without having any consideration of pregnancy or illness. Many are fall in sick due to the chemical spraying and lack of good water facility in plantations. The washed away water causes danger to our skin. The chemical spray causes problems toour lungs as we smell the toxic substance. Every day I am having back pain. It may be due to my age. Walking with the ‘pom” spray tank of 15kg to a long pacing also give muscle pain. During night sleep muscle pull will always occur. My passport renewal is depending on the company and is uncertain. Worker 9: Myself and a group of people came to planatations from the same Indonesian province in Sulewasi (BugisEndrekan clan) and stay in same old long housing “Kongsi” made of wood. Our food style is depending on what ever available in the plantation since we cannot go out frequently for food provisions. We live with chicken goose and duck.We plant some vegetable near to our housing area that to for save of daily expenses and we also collect wild vegetable like “pakis”, “pucukubikayu” and tapioca. My wife currently pregnant for my first baby so I don’t allow her to work her till my kids grows. I earn only RM600 monthly as fertilizer. I am still waiting for a harvesting vacancy so that I can earn more. I did extra jobs like collecting lost fruit and pruning, during off season. Let me tell you, in my housing area many people are affected by Malaria recently due to poor hygiene. I am just worried about my wife'shealth; we do sleep inside mosquito netting “kelambu” to safeguard our health. Every month I will take debt “MasukBuku 555” from the shop nearby, around RM250 monthly. We never saved more than RM50 monthly. Allprovisions and amenities are really expensive. Problem Formulation: There have been frequent policy shifts to accommodate demands from employers to ease critical labor shortages, as well as to document and legalize the large number of undocumented migrant workers in the country. Several analyses on foreign policy have diagnosed these policy shifts as “stop-go”, inconsistent and lacking in clear policy directions to reduce the reliance on foreign workers (Azizah, 1995 and 1996; Pillai, 1992 and 1995; World Bank, 1995:79; Edwards, 1997). They contend that the policy swings to “allow, restrict and ban” migrant workers contradict national objectives to foster quality growth based upon “high path” structural transformation to generate high-productivity high-skill employment. It has been speculated that the relatively easy access to the large pool of low-skilled workers tends to distort domestic factor prices and retard industrial upgrading and trap the economy in low-skill equilibrium. Yet, there is little empirical analysis on whether foreign labor competes (displaces) or compliments (augments) local labor. Malaysia is currently experiencing a shortage of skilled and unskilled labor in plantations estimated at 20 percent of the total industry workforce. This is due in part to the demanding nature of the work in estates and the growing number of attractive alternative job opportunities in other industries. The lack of mechanization options in plantations creates an over reliance on manual labor for all key activities: land preparation, nurseries, planting, fertilizing, field upkeep and maintenance, harvesting, collection and transportation. As a result, Malaysian oil palm plantations are heavily dependent on foreign workers [currently estimated at 80 percent of the total industry workforce, (ETP, Roadmap, 2010)]. The upstream activities of palm oil are very labor intensive and are thus largely dependent on the availability and productivity of workers. To improve the average annual plantation yield to 26.2 tonnes per hectare will require the harvesting of over 5 million hectares of mature trees by 2020; assuming harvester productivity of 1.5 tonnes per hectare, the industry will require 289,000 workers. There are currently 187,000 harvesters in the country and hence, the industry would have required a net addition of 102,000 harvesters to meet the targets if there was no replacement in mechanization or an increase in worker productivity (ETP, Roadmap, 2010). Even though, the foreign workers' presence in plantations is well accounted into, and are more required in the coming days to sustain an oil palm economy, seldom any change in their poor living condition is envisaged. The government has given the moratorium to implement the minimum wage policy and better living condition, the note coming from NGOs and field sources, indicates that the foreign workers living condition are still pitiable as it is. Today, the social issues that beset the palm oil industry pertain more about the quality of life and working conditions of laborers in the plantations and mill factories. Sensitive to issues of wages, compensations and migrant workers (from Indonesia) are among the main problems and subjects of the debates and campaigns. It is rather difficult to obtain some concrete and unbiased information about these social issues in palm oil plantations but accounts of some reports (typically by journalists and NGOs) provide some insights about those sensitive issues. Although such accounts of journalists and NGOs may contain some biases, some interesting accounts are taken here to provide some perspectives to the issues. There is not much documents available to dig for these social issues or even if such documents exist, it is fairly difficult to judge the credibility and truthfulness of the claims about the plight of the workers in different palm oil plantations in Malaysia (and even Indonesia). Conducting actual plantation visits, interviews and observations could help this information dilemma, yet it is a limitation of this research. Nevertheless, based on the aforementioned accounts, it is hard to dismiss the claim that social problems exist in oil palm plantations. Hence contemporarily a study to be conducted with a mixed methodology that explore the right variables and quantify the factors related to precarious working conditions and related human and work issues. Problem Statement: The Malaysian palm oil industry is labor-intensive. Migrant workers from Indonesia, Filipino, Thailand, and Bangladesh largely make up the plantation-based workforce as a way of achieving a higher income or more consistent work than in their home countries. These workers often migrate to provide for families and communities back home, which depend on remittances. Workers on palm plantations often find them work and live in remote areas within closed plantation complexes, or they are otherwise segregated from larger communities. Under these circumstances, workers are completely at the whim of plantation owners or managers, whose priority it is to maximize productivity, often at the expense of reasonable working and living conditions and the rights of plantation workers. When faced with these conditions, workers have little recourse other than to leave the plantations; however, workers are unable to do so due to the closed nature of plantations (Amnesty International, 2010). Workers are often forced to submit work permits, visas, and passports to employers, which makes it impossible for them to legally depart plantations. This often does not

Proceedings of 4th
International Conference on Global Business Environment
(ICGBE-2014)
163
prevent migrant workers from leaving the premises. However, if they leave, migrants are highly susceptible to extortion by local police, whose primary course of action is to return workers to the plantations where they are employed. Those migrants that successfully escape a plantation are unable to find legal employment in Malaysia. If they do find employment elsewhere, it is often at small, independent plantations that draw few visits from industry and government regulatory groups, making these migrants susceptible to further exploitative labor practices (Amnesty International, 2010). In Malaysia, children can be found working on palm oil plantations, where they assist their parents to collect loose fruit, help carry and load bunches of oil palm fruit, and weed the oil palm fields. One report estimates that 60 percent of the children working on palm oil plantations in Malaysia are 6 to 10 years old (Edge, 2012c) In order for workers on plantations to meet their daily quota of palm fruit harvested and collected, it has been identified that "assistance from the child worker is the savior (USDOL, 1995). Several trafficking cases have been identified in the Malaysian (Verite, 2012) and Indonesian (Schaeffer, 2010) palm plantations. Men, women and children can be targeted by labor brokers who make false promises of good wages and working conditions (Schaeffer, 2010). Traffickers often confiscate passports and other official documents and charge workers high brokerage fees for finding them the jobs, which workers must then pay off as a debt (Verite, 2012). Once at the plantations, workers can face abusive conditions and are threatened with deportation or confiscation of wages (US Department of State, Trafficking in Persons Report, 2012). They may also be bonded to their employers through unrealistic debts from loans to cover their accommodation, food or other amenities. This can involve entire families, including children, being forced to work long hours in poor conditions to pay off extortionate debts. There have been reports of workers being forced into camps near plantations in Malaysia (The Jakarta Post, 2008), which are locked at night and guarded by security (Schaeffer, 2010). Workers are not free to leave and are forced to work long, tiring hours for little money. Security guards have also been reported to extort money from laborers. As part of the terms of their immigration, migrant workers in Malaysia are not legally entitled to give birth to children. In practice, though, many migrants do. Children born of migrant parents in Malaysia are not granted citizenship in Malaysia or their parents’ home country and thus become stateless. The result is that the children are not awarded the rights of either their country of birth or their ancestral home, including the right to education. Without other opportunities, stateless children are often relegated to working on the plantations — mostly informally, to help family members in meeting the high quotas set by plantation management. In Malaysia, it is estimated that between 72,000 and 200,000 stateless children work on palm oil plantations. (Asia Foundation, 2010). Various reports from the researchers thus indicate that the oil palm plantations in Malaysia, especially the small holdings are having precarious working conditions. However the literature provides seldom evidence to this condition considering the sensitivity of the topic. Though these foreign workers turned to be inevitable in running the oil plantation operations, little information is available to us regarding the precarious working conditions, that all are reported by various sources. These foreign workers are turning to be the backbone of the oil palm industry and further supporting the Malaysian economy directly or indirectly. The decision retains or detain these workers are up to the decision from the government. But ensuring their decent working condition that induces motivation and better employee engagement is a need of the hour to sustain the economy. Hence this particular study identifies the topic of this research as: Effect of Precarious Working Conditions on Ergonomics, Disengagement and Absconding Intention among Foreign Workers in Oil Palm Plantations Research Questions 1. How do you define precarious working condition? 2. What are the factors that closely related to precarious working conditions in oil palm plantations in general? 3. What are the factors that closely related to precarious working conditions in oil palm plantations in Malaysia? Research Questions Quantitative Research 1. How will you define precarious working conditions? 2. Which are the factors related to precarious working conditions in oil palm plantations? 3. Which are the factors related to precarious working conditions in oil palm plantations? 3. Methodology The methodology of research followed in this study was Delphi technique which provided exploratory insight into major factors of working conditions and living conditions. The Delphi technique, mainly developed by Dalkey and Helmer (1963) at the Rand Corporation in the 1950s, is a widely used and accepted method for achieving convergence of opinion concerning real-world knowledge solicited from experts within certain topic areas. Predicated on the rationale that, “two heads are better than one, or...n heads are better than one” (Dalkey, 1972), the Delphi technique is designed as a group communication process that aims at conducting detailed examinations and discussions of a specific issue for the purpose of goal setting, policy investigation, or predicting the occurrence of future events (Ulschak, 1983; Turoff&Hiltz, 1996; Ludwig, 1997). The Delphi method is especially useful for long-range forecasting (20-30 years), as expert opinions are the only source of information available. This research engaged semi-structured interviews. Based on the suitable time for the resource person interviews were arranged, during March 2013 to middle November 2013. Direct interview is conducted to gather information from the respondents. 20 experts from the Plantation Managers, Plantation Workers, Mandors of Plantations, Officers of Consulate Indonesia, Officers of Detention Centers, Officers of Immigration, Humana (NGO), Schools for Migrant Workers, Trade Union Leaders, Contractors of Housing, Faculty Members and Dean of Social Sciences Universiti Malaysia, Sabah (UMS), and Research Scholars were identified and approached by email or telephone and were invited to take part in the study. All the clarifications related to the objective of the study were made by the researcher. However, 30 respondents were being interacted and communicated, only 20 respondents shown their willingness to participate in the discussion. Finally, 20 participants were interviewed directly. The conversations taped recorded, and manually analyzed. The procedural steps in adopting the Delphi technique were as follows. Expert panel identification: The group of professional was made from specialists having high knowledge and expertise in plantation related. They are closely associated with plantation, as consultants, government body, Top level managers, NGO, Consulate, Professors, Researchers and Academicians. The specialized areas of these expert members include, 12 male members (60%) and 8 female members

Proceedings of 4th
International Conference on Global Business Environment
(ICGBE-2014)
164
(40%). These dynamic groups of panel of experts are knowledgeable and familiar to give relevant opinions and an admissible understanding of the business incubation centers. Rounds Round 1: In the first round, the Delphi process traditionally begins with an open-ended questionnaire. The open-ended questionnaire serves as the cornerstone of soliciting specific information about a content area from the Delphi subjects (Custer, Scarcella, & Stewart, 1999). The questions: 1. How do you define Precarious Working Conditions? 2. Which are the major factors, in general closely related to Precarious Working Conditions? 3. Which are the major factors, in general closely related to Precarious Working Conditions with specific with oil palm plantation
among foreign workers? 4. How do you define decent Living conditions? 5. Which are the factors related decent living conditions? How do you relate living conditions among foreign workers? 6. Contextualizing the topic to the Sabah scenario, which are the major factors, closely related to Precarious working conditions and
living conditions in Sabah? 7. How do you relate the Working conditions with living conditions in the plantation? 8. How define minimum living condition? 9. How you related the minimum living condition in the plantation? Round 2: In the second round, each Delphi member receives a second questionnaire and is asked to review the items summarized by the investigators based on the information provided in the first round. Accordingly, Delphi panelists may be required to rate or rank-order items to establish preliminary priorities among items. Because of round two, areas of disagreement and agreement are identified (Ludwig, 1994). In this round, consensus begins forming and the actual outcomes can be presented among the participants’ responses (Jacobs, 1996). Information regarding the precarious working conditions collected from the respondents. The process identifies 88 categories, which are having items with high and low proximity of working and living conditions identified. Rating process further identified in the categories and items identified. Round 3: In the third round, each Delphi panelist receives a questionnaire that includes the categories and items ratings, summarized by the investigators in the previous round and are asked to revise his/her judgments or “to specify the reasons for remaining outside the consensus” (Pfeiffer, 1968). This round gives Delphi panelists an opportunity to make further clarifications of both the information and their judgments about the relative importance of the categories and items. Second level screening of the 128 categories which were having a high and low influence on precarious working conditions identified with corresponding items. The process further identified 64 categories, which are having high and low proximity of the precarious working conditions identified. Classification of the items in 64 categories of 2 factors was being made with appropriate loaded items. Thematic presentation and the categorization of the items were done. Round 4: In the fourth and often final round, the list of remaining items, their ratings, minority opinions, and items achieving consensus are distributed to the panelists. This round provides a final opportunity for participants to revise their judgments. It should be remembered that the number of Delphi iterations depends largely on the degree of consensus sought by the investigators and can vary from three to five (Van de Ven, Gustafson, 1975; Ludwig, 1994). During fourth level, screening of the 30 categories which were having items with high and moderately high proximity of the precarious working conditions identified. Sought the expert opinion on the appropriateness of the core factors selected for the study.
BIP S/N
Factors Categories No. Items
No of Experts (N=20)
% of Experts
1 Working Conditions
Low wage Forced labour Discrimination No freedom at work Less safety Less security Hazardous Job Physical abuse Lack of supervisory support Rigid rules regulation Remote location Long working hours Work pacing Monotonous Job Lack of group cohesiveness
2 3 2 3 2 2 2 3 2 1 1 1 2 2 3
18 17 17 15 16 16 16 17 18 17 18 18 18 18 15
90% 85% 85% 75% 80% 80% 80% 85% 90% 85% 90% 90% 90% 90% 75%
2 Living Conditions
Remote location Poor hygiene No electric supply No clean water Big family Low quantity food Poor housing
1 2 3 2 2 3 3
18 17 17 18 18 18 18
90% 85% 85% 90% 90% 90% 90%

Proceedings of 4th
International Conference on Global Business Environment
(ICGBE-2014)
165
Frequent illness No education to children Isolated living Indebtedness Low social engagement Less recreations No transport facilities Stateless Conditions
3 1 1 3 1 1 2 3
17 18 18 18 17 16 17 18
85% 90% 90% 90% 85% 80% 85% 90%
The first factor considered for the study is the Precarious working Conditions which divide into two main conditions which are Working Conditions and Living Conditions in the plantation. The experts acknowledged 33 items for working conditions and 27 items for explaining the living conditions. The major factor working conditions consists of 16 categories. Low wage (90%),lack of supervisory support (90%), remote location (90%), long working hours (90%), work pacing (90%), monotonous job (90%) and stateless conditions (90%) are the major categories in precarious working condition, identified by the experts in relation to imparting appropriate working conditions in the plantations. Second categories like forced labor (85%), discrimination (85%), physical abuse (85%) and rigid rules regulations (85%). Third rank categories are less safety (80%), less security (80%), hazardous job (80%). The final rank categories in working condition are no freedom at work (75%) and lack of group cohesiveness (75%). The second factor considered for the study is the Living conditions which interrelated directly to precarious working conditions. Within the second factor the experts identified 27 items that are closely related to Precarious working conditions. The major factor of living conditions consists of 14 categories. The table showed that remote location (90%), no clean water (90%), big family (90%), low quality food (90%), poor housing (90%), no education to children (90%), isolated living (90%) and indebtedness (90%) as the prominent factor which closely knit with living conditions. Further the study pointed out the categories like poor hygiene (85%), no electric supply (85%), frequent illness (85%), low social engagement (85%) and no transportation facilities (85%). The final categories are less recreations (80%). Discussion: This particular study was conducted to explore the factors related to precarious working condition prevalent in oil palm plantation of Sabah state of Malaysia. An exploratory study, which follows Interview and Delphi technique was supported the research to understand the factors and categories that pertaining to the theme precarious working condition and living condition of foreign workers in oil palm plantation. The study segregates these factors as working conditions and living conditions and further discussions based on the expert opinion was made. Among the working condition, major factors identify by the expert include the low wage, lack of supervisory support, remote location of work, long working hours, too much of work pacing and stateless condition. The workers of the small holding plantation are getting only lesser wage compared to large oil palm plantations. The large plantation ensuresminimized and fair wage to the workers in addition to proper welfare facilities like housing, clean drinking water, hygiene, medical facilities, education of children and etc. On the contrary the workers in the small holding oil palm plantation are devoid of fair wage as well as facilities. It is reported further, during the interview with workers that, these foreign works are getting only RM500 to RM600 without any additional income or welfare facilities. These foreign workers are facing Major obstacles from supervisor. Being working in the remote locationswhich are almost 100 kms inside the plantation these workers is cut off from the external world and the workers have to totally depend on mandor and supervisors of oil palm plantation for their day to day sustenance. The workers do not have any freedom and they are closely monitored by the mandor on their work performance. Verbal abuse and physical abuse is very common among these plantations. The workers have to engage in long working hours and the activities include high mobility from one area to another inviting work pacing. The work is more of hazardous in nature in the area of harvesting, loading and unloading of heavy oil palm fruit, pest control which involve heavy use of chemical, pruning etc. The worksare more taxing which invite high physical labor without getting proper leisure, rest and in time food. They work in more monotonous in nature and is challenging and unhealthy foreign worker working in oil palm plantation. It is rightly reported by Amnesty International(2010) that workers on palm plantations often find they work and live in remote areas within closed plantation complexes, or they are otherwise segregated from larger communities. Under these circumstances, workers are completely at the whim of plantation owners or managers, whose priority it is to maximize productivity, often at the expense of reasonable working and living conditions and the rights of plantation workers. When faced with these conditions, workers have little recourse other than to leave the plantations; however, workers are unable to do so due to the closed nature of plantations. As expert identify, the workers are deprived of any welfare facilities in oil palm plantation. They feel less safety and security feel from the plantation jobs due to low wage, lack of welfare facilities and low security at work. The workers have the feel of high discrimination at work. They consider the work in oil palm plantation as a form of forced and bonded labor. Further in oil palm plantations, especially small holding, there is rigid rules and regulation which is strictly followed by the Mandor. In addition to that since there is the presence of different ethnic communities, lack of group cohesiveness among the group. The working environment turns to be uncongenial due to this ethnic group conflict and lack of group cohesiveness. Being isolated and devoid of all facilities which are supposed to get, these foreign workers do not have any happiness in their work or personal life. The expert also pointed out the precarious factor in relation to the living conditions of foreign workers in oil palm plantation. The ‘stateless’condition is very‘unique living conditions’ of the foreign workers living in remote locations of oil palm plantation. Majority foreign workers are from Indonesia and Philippines. They cross their countries to engage in plantation work long back years. Neither they do have the status of Malaysian citizenship nor do they have their own country passport. These foreign workers are living in small holding plantations keep a distance away from police and other enforcement agencies from Malaysia. Their living condition is unsafe, insecure and highly isolated. The expert further identified variablesrelated to living conditions like poor hygiene, no clean water to poor housing facilities, low level social engagement with less recreation facilities for foreign workers living in oil palm plantation. These foreign workers have to totally depend on the mandors and plantation manager’s support to sustain their life in remotely located oil palm plantation. They are more into bonded labor due to their indebtedness. It has been further opined by the expert that due to big family size and low wage structure these foreign workers are living with exploited living and working condition by the mandor and plantation management in oil palm plantations. They don’t have any voice since they have to work their day to day sustenance. All these factors identified in this exploratory research further would be providing a substantial base for an extensive researchrelating with appropriate dependent variables using quantitative research method.

Proceedings of 4th
International Conference on Global Business Environment
(ICGBE-2014)
166
Implication: This exploratory research on precarious working condition of foreign workers in oil palm plantation has four level implications. The first level implication is related to policy level. The expert identified many factors which are closely knit with working and living condition of foreign workers. These factors are an eye opener to the government to look on oil palm plantation workers that at least to ensure the fair wage and decent living condition. In the second level, the study points managerial implications. The plantation management should take into account these factors which would be providing more productive workforce in the plantation. Healthy and satisfied plantation foreign workers will be providing more productive labor which intent will contribute to oil palm plantation development. The study also paves methodological contributions. By following qualitative research methodology of Delphi, case studies and field observations, the study follows triangulation andleading the research for an extensive study in oil palm plantation with quantitative research method. Last but not least the study also ensures development of new theory on precarious working conditions in oil palm plantation. 4. Conclusion It is established through this exploratory research that precarious working conditions are prevalent in oil palm plantations especially in the Sabah region of Malaysia. The wide discrimination and injusticeof living and working conditions are more in small holding oil palm plantations compared to large plantations. In large plantations the workers are avail of minimum wages and all additional welfare facilities comparable to small holding plantation. The role of mandor, subcontractors and contractors, the statelessness nature of foreign workers, poor enforcement of the law of the land, acute shortages of labors among oil palm plantation etc. all contributed to precarious working and living condition of foreign workers in oil palm plantation. The study further supported to fix the variables that are correlated to precarious working and living condition of foreign workers oil palm plantation of the Sabah region of Malaysia. Reference Abdullah, R. (2010). Labor Requirements in the Malaysian Palm Oil Industry. Amnesty International, (2010).Trapped: The exploitation of migrant workers in Malaysia, Amnesty International, report. Asia Foundation, (December 8, 2010). Sabah’s Stateless Childre. Citation: available at http://asiafoundation.org/in-
asia/2010/12/08/sabahs-stateless-children/ (accessed on November 1, 2012) Azizah, K. (1995). From Neglect to Legalization: The Changing State Response to the Inflow of Illegal Labor into Malaysia Paper read at
the Conference on Globalization: Local Challenges and Responses, organized by the Malaysian Social Science Association at Universiti Sains Malaysia, Penang
Dalkey, N. C. &Helmer, O. (1963).An experimental application of the Delphi method to the use of experts.Management Science, 9(3), 458-467.
Dalkey, N. C. (1972). The Delphi method: An experimental study of group opinion. In N. C. Dalkey, D. L. Rourke, R. Lewis, & D. Snyder (Eds.).Studies on the quality of life: Delphi and decision-making (pp. 13-54). Lexington, MA: Lexington BooksEdge, Brian; Interview with Daniel Lo of CAMSA (Coalition to Abolish Modern-day Slavery in Asia) in Kuala Lumpur, Malaysia, on February 28, 2012.
Edge, Brian (2012). Interview with Dr. Irene Fernandes of Tenaganita in Kuala Lumpur, Malaysia, on April 13. Economic Transformation Programme (2010). A Roadmap For Malaysia Deepening Malaysia’s Palm Oil Advantage. Citation URL:
http://etp.pemandu.gov.my/upload/etp_handbook_ chapter_9_palm_oil.pdf(Retrieved on 29th September 2013). ILO (2004).International Programme on the Elimination of Child Labour, Safety and Health Fact Sheet.Hazardous Child Labour in
Agriculture. Online Doc. URL: https:// www.google.com /url?sa=t&rct=j&q =&esrc=s&source= web&cd=2&cad=rja&ved = 0CDAQFjAB&url=http%3A%2F%2Fwww.ilo.org%2Fipecinfo%2Fproduct%2Fdownload.do%3Ftype%3Ddocument%26id%3D5711&ei=9DufUuLYNY6IkgXT1oD4Bg&usg=AFQjCNEx-iI3pC5cHPBGO3-It24ZTJcyPA&sig2=jeMbKjwLrHTF8Mi3 pH8YaQ&bvm=bv.57155469,d.bmk(Retrieved on 21st October 2013).
IPEC, (2002). Hazardous Child Labour in Agriculture. Citation in International Programme on the Elimination of Child Labour, Safety and Health Fact Sheet.Online Doc. URL:https:// www.google. com/url?sa=t&rct =j&q=&esrc=s&source= web&cd=1&cad= rja&ved=0CCgQFjAA&url=http%3A%2F%2Fwww.ilo.org%2Fipecinfo%2Fproduct%2Fdownload.do%3Ftype%3Ddocument%26id%3D13334&ei=PTyfUrqkJcj_iAeWxYCwDQ&usg=AFQjCNF780x7Go0S8Su2jH7twbOT2VSqGA&sig2=DeIIiOBgRISRwpETA4RC3w&bvm=bv.57155469,d.bmk(Retrieved on 29th September 2013).
Ludwig, B. (1997). Predicting the future: Have you considered using the Delphi methodology? Journal of Extension, 35(5), 1-4. URL: from http://www.joe.org/joe/1997october/tt2.html (Retrieved November 6, 2005).
Pillai, (1992).People on the Move: An Overview of Recent Immigration and Emigration in Malaysia. Kuala Lumpur: ISIS. Pillai, (1995). Labor Migration in Asia: Malaysia,Asean Economic Bulletin, 12(2), 221-23. Schaeffer, (A 7/012/2010). Rainforest Action Network, ‘Slave Labour For Palm Oil Production’. Accessed on 28 June 2012. Available
from: http://understory.ran.org/2010/12/07/slavelabor-for-palm-oil-production/1 The Jakarta Post (09/17/2008). RI Workers, children ‘enslaved’ in Malaysia, commission says. Available from:
http://www.thejakartapost.com/news/2008/09/17/riworkers-children-039enslaved039-malaysia-commission-says.html (Accessed on 26 June 2012.).
Tirtrosudarmo,R. (2013). Indonesian migrant workers: with particular reference in the oil palm plantation industries in Sabah, Malaysia. Citation in: Kato, Y. (2010). Centre for South East Asian Studies Kyoto University, Japan URL: file:///C:/Users/user/Desktop/Plantation/%2%80%9CIndonesian%20migrant%20workers%20%20with%20particular%20reference%20in%20the%20oil%20palm%20plantation%20industries%20in%20Sabah,%20Malaysia%E2%80%9D%E3%80%80%5BDr.%20Riwanto%20Tirtrosudarmo%5D%20%20%20biomasssociety.org.htm (Retrieved, November 9, 2013)
Turoff, M. &Hiltz, S. R. (1996). Computer based Delphi process. In M. Adler, & E. Ziglio (Eds.).Gazing into the oracle: The Delphi method and its application to social policy and public health (pp. 56-88). London, UK: Jessica Kingsley Publishers.
Ulschak, F. L. (1983). Human resource development: The theory and practice of need assessment. Reston, VA: Reston Publishing Company, Inc.

Proceedings of 4th
International Conference on Global Business Environment
(ICGBE-2014)
167
UNESCAP Report (2006). See also statistics available at http://www.unescap.org/stat/meet/egm2006/ses.4_Malaysia.pdf (Retrieved December 10, 2013)
United States Department of State, (2012). Trafficking in Persons Report, 2012, http://www.state.gov/j/tip/rls/tiprpt/2012/index.htm (Accessed on 29June 2013)
US Department of State, Trafficking in Persons Report (2012). Available from: http://www.state.gov/documents/ organization/192596.pdf(Retrieved June 10, 2013)
UNESCAP Report (2006). See also statistics available at http://www.unescap.org/stat/meet/egm2006/ses.4_Malaysia.pdf (Retrieved June 12, 2013)
World Bank, (1995). Malaysia: Meeting Labor Needs: More Workers and Better Skills. Washington: World Bank.

Proceedings of 4th
International Conference on Global Business Environment
(ICGBE-2014)
168
Engage or Disengage? Exploring Factors Leading to Employee Disengagement in Oil Palm Plantations
Normala S Govindarajo, Dileep Kumar. M, Subrahmanium Sri Ramulu, Noor Azizi Ismail
Othman Yeop Abdullah Graduate School of Business (OYA-GSB), Universiti Utara Malaysia, Malaysia [email protected]
Abstract: Oil palm plantations are decisively situated in the various regions of Malaysia where the climatic conditions are appropriate for planting oil palm. One cannot compare the work environment of such plantations with normal office settings. The workers in those plantations are working in remote locations, totally cut off from the other part of the world. Majority workers are from Indonesia, Philippines like low income countries. The work environment is physically demanding and challenging to the workers due to many factors. An exploratory study has conducted on employee disengagement in the oil palm plantations in the Sabah region of Malaysia. The study has taken up employee disengagement factors due to the lack of interest among the local people to engage themselves in the oil palm plantations work and the plantation industry in Malaysia is facing an acute labor shortage to carry forwards the oil palm business. The study follows, field visits, interviews with the workers, focus group discussions and specifically Delphi. The findings supported to identify the 7 factors coming under the theme employee disengagement as Wage and Welfare, Work Environment, Lack of Safety and security, Poor Organizational Support, Rigid Rules and regulations, and Lack of individual motivation. The study paves better insight to lead this qualitative research in an organized quantitative research. Keywords: Employee engagement, disengagement, oil palm plantations, working condition
1. Introduction Much research has come out in the field of employee engagement in industrial settings. Several models have come out to explain the nature and significance of employee engagement and disengagement in organizational setting due to various organizations and individual factors. These models and theories can be the base to determine and fix the variables that areclosely related to any field research endeavor. While the issue here is that how far these models can be purely adopted considering the nature of field settings and organizational and individual factors. A study would be curious if those models and theories adaptability on the field settings like plantations. To explore the variables suitability to conduct a research on employee disengagement in oil palm plantations, where majority workers are working in a field setting in remote habitat an exploratory study was conducted. The study once again clarifies the variables suitability, by segregating each variable and further subjects them under the field setting for expert observation in order to ascertain which one are more relevant in the plantation environment and which one are irrelevant. The study has come up with a model which is suitable to analyze the factors contributing to employee disengagement in oil palm plantations in general and Sabah region of Malaysia in general. Employee disengagement: Kahn (1990) gave following definition for personal disengagement: “Personal disengagement… is the simultaneous withdrawal and defense of a person’s preferred self in behaviors that promote a lack of connections, physical, cognitive, and emotional absence, and passive, incomplete role performance.” Furthermore, Kahn discussed problems of personal disengagement, which lead to “the uncoupling of slaves from work roles” (Kahn (1990). Depending on the researcher, such unemployment of the self in one’s role can be called “robotic or apathetic” behavior, “burn out”, “apathetic or detached” behavior, or “effortless” (Kahn (1990). Employee engagement and Disengagement: The Gallup Organization in its survey (Gallup 2006) used the following characteristics of employees: Engaged workers, who involve their work with desire and eagerness and who are conscious of being highlyassociatedwith their
firm. They provide emotional and physical input to the organization’s performance and growth, and facilitate forward movement. Disengaged workers who are in fact “checked out”. These workers put their time into their job, but there is no vigor, desire or
eagerness from their side; it looks like “sleepwalking” during the workday. Keenly disengaged workers, who are unhappy at a job and who devote their working time actively acting out this feeling. The
undesirable influence of such workers continually influences other people and destroys attainments of engaging workmates. Consequences of disengagement: Wellins and Concelman, (2005) indicates that disengaged employees are not enthusiastic; they do not want to expend extra effort and support teamwork. They adopt a “wait-and-see attitude” and behave in a similar way requiring a push to join in. It is indicated that the employees with a low level of engagement are not interested and not inquisitive about their firm and their own role in it. Further, they frequently have deprivedaffairs with their supervisors and workmates. According to Branham (2005) disengaged workers can negatively influence morale and revenues of the organization; they often make trouble, complain, and have accidents. They can harm the organization in the manner in which they speak to customers; their negative behavior affects client satisfaction, and can lead to loss of them (Vajda and SpiritHeart, 2008). Disengaged employees are usually unhappy at work and actively express this feeling. The undesirable influence of such employeescontinuously affects other persons in the team and destroys accomplishments of engaged workmates (Gallup, 2006). Detachedworkers are disengaged from their jobs, tend to be suggestively less competent and less dedicated to their firms; they are less happy with their personal lives, experience more stress and uncertainty about their work than their co-workers (Gallup, 2001). Reasons why people disengage and quit: Having studied the findings of Kahn (1990), Branham (2005), and Pech and Slade (2006) it is possible to determine the potential sources or causes of employee disengagement and to divide them into several groups:External environment causes, which can become challenges for employees, for example, instability and insecurity arising from government, unions or shareholders, or possible opportunities, such as sudden wealth to buy independence, an unanticipated outside job offer, and so on. Psychological causes and sources, more specifically: lack of psychological meaningfulness and psychological safety at work, lack of

Proceedings of 4th
International Conference on Global Business Environment
(ICGBE-2014)
169
identification with an organization, lack of trust, a sense of being undervalued, perceived inequities in pay and performance, unrealized ambitions, stress and anxiety, disinterest, etc.; Organizational causes, such as restructuring of the company and connected to it, transformational changes, company’s culture with inadequate norms, traditions, policies and practices (unethical actions, sexual harassment, racial discrimination, unreasonable enforcement of authority, etc.), bad working conditions, poor management and leadership, overgrown bureaucracy, lack of resources, low standards and acceptance of poor performance, work complexity, etc.; Other sources, for example, employee’s substance abuse and unacceptable behaviour, illness, laziness, competency issues, poor interpersonal relationships leading to conflicts, etc. Findings of unpublished Saratoga Institute research showed that initiators of people’s disengagement at work were aligned with reasons of final decisions to quit the organization. The research results indicate that the employees leave the organization because of unsatisfactory leadership characteristics (35 %), firm environment (49 %), and job characteristics (11 %). Only five percent from the explanations of parting were inevitable and comprisedsuperannuation, birth of a child, household issues, and so on. (Branham, 2005) Negative comments about leadership included grievances about the lack of boss respect for employees, inattentiveness, absence of support, deprived leadership skills, partiality, inability, insensitivity, and discrepancy. Poor sides of organizational environment included inadequate career growth, inadequate compensation and benefits, excessive workloads, lack of recognition, bad working conditions, poor quality or lack of training, unethical behaviors inside the organization, and lack of collaboration. People were not satisfied with the job itself, if tasks were boring or not challenging. (Branham, 2005) Negative influence of disengagement: Organizations should pay attention to the employee disengagement phenomenon, because it has great impact on both the worker and employer, just as employee engagement. According to Bakker and Demerouti (2008) disengaged employees experience negative feelings and have health problems more often than engaged workers; they also can influence their colleagues by transferring negative emotions. Employees with a low level of engagement are more often likely to suffer from anxieties and depression (Robinson 2010); they are more likely to be emotionally exhausted, cynical (Maslach, et al. 2001), and unhappy in the workplace, as well as in their personal lives because of the inability to manage with work stresses (Gallup, 2006). Disengaged employees have misgivings about their company in terms of customer satisfaction, providing little personal investment in customer focus, so the productive output of not-engaged and disengaged employees is much less than the output of engaged workers (Towers Perrin, 2003). Employees with a low level of engagement have more accidents at work and more inventory shrinkage (Harter, Schmidt, Killham, and Asplund, 2006). Disengaged employees do not advocate their company as a place to work and less often recommend their company’s products or services (Baumruk, 2004). They are less innovative and creative, and do not tend to share new ideas with co-workers (Krueger and Killham, 2007). Disengaged employees often are not satisfied, not committed, and have an intention to leave their organization (Saks, 2006,). Prior notification of worker disengagement isemployee physical absence from work, slowness, or behavior that shows withdrawal or high negativity (Branham, 2005). According to Pech and Slade (2006), the symptoms of employee disengagement also can be represented by low morale, mistakes, lack of energy, and lack of attachment.By probing the effects of disengagement on both the worker and the company, it is possible to determine that this phenomenon can cause substantial harm to the business. The only way to get protection from the effects of employee disengagement is to halt it by pinpointing and removing its causes. The state of non-engagement: Non-engagement is the level of engagement when employees are not highly engaged or actively disengaged; this condition is some kind of “stuck in neutral position” (Sanford and Coffman, 2002). Not-engaged employees are not necessarily negatively disposed, but they do not have positive attitudes either. These employees spend their time and get their tasks done in accordance with organizational standards, but they do not have passion, enthusiasm, and the desire to put extra effort into their work. It happens because not-engaged employees do not feel a sense of achievement; in most cases, they are fixated on the process of doing the job instead of the results. They do the minimum they can in order only to accomplish the task. Not-engaged employees are stuck in a low-risk, low-commit mode being emotionally disconnected from their organization, their manager, or their workmates. They do not commit to work. As a result, not-engaged employees are likely to feel their contributions are being underestimated, and their potential is not being realized (Sanford and Coffman, 2002). According to Towers Perrin (2003), the large number of moderate or non-engaged employees is a challenge for the typical company right now. There is a risk for an employer that this group of people will slide towards the increasing disengagement with serious consequences on productivity and morale (Towers Perrin, 2003). If this happens, improvement of the employee engagement level will become a more complicated and time-consuming process. Kahn’s model of engagement: During two of Kahn’s qualitative studies (1990), he examined the psychological situations of individual engagement and disengagement at the task. Kahn interrogated employees of two different organizations about their moments of engagement and disengagement. The researcher stated that there are three psychological conditions that people experience at work, particularly, meaningfulness, safety, and availability. These psychological conditions are linked to personal engagement or disengagement. According to Kahn (1990), employees in each work situation unconsciously ask themselves three questions: 1. How meaningful is it for me to bring myself into this performance? 2. How safe is it to do so? and, 3. How available am I to do so? An empirical test of the model proposed by Kahn (May, et. al., 2004) indicates that meaningfulness, safety, and availability have significant influence on engagement. There were also identified several important links: Job enrichment, as an attempt to make the work different and interesting, and also fit between the employee and his or her work
role, isconstructiveforecasters of meaningfulness. Worthy relationships with work-mates and helpful supervisor relationships are constructiveforecasters of safety Strict observance of workmaterules (rules within the groups and firm) and self-consciousness isdestructiveforecasters of safety. Accessibility of physical, emotional and cognitive workers’ resources is a constructive forecaster of psychological availability. Contribution in external activities is a destructive forecaster of psychological availability (May, et. al., 2004). Model of task engagement - Job Demand-Resources: Bakker and Demerouti (2008) reviewed qualitative and quantitative studies on work engagement in order to identify its antecedents and consequences. Basing on the findings of previous studies they developed an overall model of work engagement that can be used in today’s workplace. The Job Demand-Resources (JD-R) model of work engagement.The authorsindicated that the main prognosticators of engagement are working resources (autonomy, performance
Proceedings of 4th
International Conference on Global Business Environment
(ICGBE-2014)
170
feedback, supervisory coaching, etc.) and individual resources (optimism, self-efficacy, self-esteem, etc.).Predictors of engagement can take effect independently or be combined with other factors. When job demands are high, these resources have a positive impact on work engagement, which, in turn, has a positive influence on job performance. Engaged employees provide better performance. Therefore, they are able to generate their own resources, which over time facilitate engagement development and create a positive gain spiral. (Bakker and Demerouti (2008). Saks model employee engagement: Saks (2006) did a research that meant to examine a model of the antecedents and consequences of job and firm engagements. Results of tests done by Saks (2006) showed that there is a differenceamong the constructs of job engagement and organization engagement. The support provided by an organization is a positive predictor of both work and firm engagement.The workfeatures considerably forecastwork engagement. Procedural fairness is an important predictor of organizational engagement. Work and firm engagement are importantprognosticators of work satisfaction, firm commitment, intentions to quit, and organizational citizenship behavior directed to organize. Saks (2006) asserted that employee engagement is a meaningful construct that should be studied more. Identification of other potential predictors of the phenomenon and possible effects of experimental interventions on employee engagement were offered by the researcher as issues for further studies. Wage: Unequal or inferiorpayedificescome under this group as well. While two or more workers perform almost alikework and have comparableaccountabilities, variation in pay rate can lead to lower paid employees to leave the organization. Further, if the organizationpays less than other employers for comparable work, workers are possible to jump ship for greater pay, if other aspects are comparatively equal. (Handelsman, 2009). Organizational Environment: In one his study Kahn (1990) specified that interpersonal relationships encourageemotional safety if the organizationprovides support, trust, openness, flexibility and lack of threat. The results of the study done by May et al. (2004) showed that the relationship with the supervisor is also an important factor affecting employee engagement. Schaufeli and Bakker (2004) and Saks (2006) confirmed that support from colleagues predicts engagement. Safety: Safety is the ability to be oneself at work without fear of negative consequences. It means that individual feels safe to take the risk of self-expression understanding the boundaries between allowed and disallowed behaviors. Employees feel safe in situations that are trustworthy, predictable, consistent, and secure (Kahn, 1990) Work-life balance: It is pointed out by Penna (2005) that work-life balance, is an appropriateordering between "work" (career and ambition) on one hand and "life" (outside activities and family) on the other, is an important predictor of employee engagement. Respondents to Penna’s (2005) research pointed out that being able to leave work on time and enjoy a work-life balance creates a positive experience at work. Ergonomics: Certain jobs or work conditions cause a greater rate worker grievance of unnecessary strain, localized exhaustion, uneasiness, or pain that does not move away after an overnight rest. These types of jobs are often those involving actions such as monotonous and vigorous exertions; recurrent, hefty, or overhead lifts; stroppy work positions; or usage of vibrating instruments (NIOSH, 2003). Welfare: Welfare services may be provided for matters concerning employees in terms of supplementing the income of the workers by providing services such as housing, medical assistance, canteens and recreation facilities (Manju and Mishra (2007). Priti (2009) argues that the role of welfare activities is to promote economic development by increasing efficiency and productivity with the underlying principle being made workers give their loyal services ungrudgingly in a genuine spirit of co-operation and the general well-being of the employee. Work Environment: Guaranteeingacceptableamenities are provided to workers is vital to producing greater employee commitment and productivity. Providinginsufficientinstruments, and adverse working conditions have been shown to influenceworkers' commitment and intention to stay with the organization (Weiss, 1999). Lack of Safety and security: Generally, health and safety at work are closely interrelated to ensure personal and material working conditions. Occupational hygiene refers to norms and procedures aimed at protecting workers’ physical and mental integrity, protecting them against health risks inherent to the type of tasks of the job and to the physical environment where these tasks are executed. Safety at work consist of the technical, educational, medical and psychological measures used to prevent accidents, either by eliminating unsafe conditions within the environment or instructing or convincing workers of the need to introduce preventive practices (Aço, 1998). Poor Organizational Support: As we aware the Social Exchanage Theory concentrates more on the stagesa firm should take to enhanceworkers' commitment (Blua, 1964). Adding to this point Gouldner, (1960) indicates that workers should feel cared and respect from the firm in order to be more dedicated to reducelabor turnover and job changing. Organizational support has a constructiveassociation with aworker’s sense of perceived self-obligation to care for the organization’s well-being in making sure that it reaches its goals (Eisenberger, et. al., 2001). Lack of individual motivation: It is argued by Kahn (1990) that emotionalvariances may affect on persons’ ability to attach or detach in their role enactment, just as they shape a person’s capability and readiness to be involved or committed at work. Consequently, individuals would engage in different manner given their experiences of psychological meaningfulness, safety and availability in specific situations (Kahn, 1990). It is pointed out that when peoplefeelcircumstances as unsafe, it is a concern of individual difference, what coping strategies they deploy, and the extent to which they engage or disengage (Portello, 1996). Workplace: Holbeche and Springett (2003) in their study indicate that person’s views of ‘meaning’ in relation to the workplace are evidentlyconnected to the levels of engagement and, eventually, their performance. The authors argue that workers enthusiastically seek meaning through their work and, unless the firm attempt to offer a sense of meaning, employees are likely to quit. Problem Formulation: Oil palm plantations are operating with foreign workers from Indonesia and Philippines in the eastern part of Malaysia, especially the Sabah region. Since local people gradually detach from oil palm plantation work, and trying to engage them in other occupations, more and more foreign workers are in need to fill up vacant positions and the oil palm operations to smoothly to be run. While it is observed that the rate of employee attrition is high in oil palm plantations, especially in small holding plantations. In general it is observed that large scale organizations are making provision of better working and living conditions of the workers compared to small holding plantations. It is observed that many workers are working plantations are with illegal status recruited by contractors and sub-contractors that to meet the oil palm plantation operations. An initial field visit in the plantations where these
Proceedings of 4th
International Conference on Global Business Environment
(ICGBE-2014)
171
foreign workers are more located was given a surface view about the working and living condition of the plantation employees. Since, Malaysian economy, to a certain extend depends on the oil palm operations, the workers’ productivity and performance is a factor to be serious to be looked into. It assumes that a fair and decent working and living conditions can ensure better engagement of the workers in the plantations. While the plantation workers are moving from one plantation to another due to several reasons associated with their working and living conditions. Hence, contemporarily, studies to be conducted to ascertain the factors that will lead to employee disengagement in the oil palm plantations. It is well evaluated that the foreign workers' movement would considerably affect the plantation operations, and it intern affect the economy as a whole. Since very less studies on foreign workers are conducted so far inthe oil palm context an exploratory study need to be conducted to explore the factors that correlated to employee disengagement at work. Problem statement: Hence, this particular study identifies its research topic as “Engage or Disengage? Exploring Factors Leading to Employee Disengagement in Oil Palm Plantations”. 3. Methodology The methodology of research followed in this study was Delphi technique which provided exploratory insight into major factors of working conditions and living conditions. The Delphi technique, mainly developed by Dalkey and Helmer (1963) at the Rand Corporation in the 1950s, is a extensively used and establishedtechnique for attainingmerging of opinion regarding real-world knowledge besought from experts within definitetheme areas. The Delphi technique is considered as a group communication process that targetsofleading detailed investigations and deliberations of a specific issue for the purpose of goal-setting, policy examination, or forecasting the occurrence of future events (Ulschak, 1983; Turoff & Hiltz, 1996; Ludwig, 1997). The research engaged semi-structured interviews. Based on the suitable time for the resource person interviews were arranged, during March 2013 to middle November 2013. Direct interview is conducted to gather information from the respondents. 20 experts from the Plantation Managers, Plantation Workers, Mandors of Plantations, Officers of Consulate Indonesia, Officers of Detention Centers, Officers of Immigration, Humana (NGO), Schools for Migrant Workers, Trade Union Leaders, Contractors of Housing, Faculty Members and Dean of Social Sciences Universiti Malaysia, Sabah (UMS), and Research Scholars were identified and approached by email or telephone and were invited to take part in the study. All the clarifications related to the objective of the study were made by the researcher. However, 30 respondents were being interacted and communicated, only 20 respondents shown their willingness to participate in the discussion. Finally, 20 participants were interviewed directly. The conversations taped recorded, and manually analyzed. The procedural steps in adopting the Delphi technique were as follows. Expert panel identification: The group of professional was made from specialists having high knowledge and expertise in plantation related. They are closely associated with plantation, as consultants, government body, Top level managers, NGO, Consulate, Professors, Researchers and Academicians. The specialized areas of these expert members include, 12 male members (60%) and 8 female members (40%). These dynamic groups of panel of experts are knowledgeable and familiar to give relevant opinions and an admissible understanding of the employee disengagement. Rounds Round 1: In the first round, the Delphi process usuallyinitiates with an open-ended questionnaire. The open-ended questionnaire attends as the keystone of soliciting precise information about a content area from the Delphi subjects (Custer, Scarcella, & Stewart, 1999). The questions:
1. How do you define employee engagement? 2. How do you define employee disengagement? 3. Which are the major factors, in general closely related to employee disengagement? 4. Which are the major factors, in general closely related to employee disengagement with specific with oil palm plantation among
foreign workers? Round 2: In the second round, each Delphi member obtains a second questionnaire and is requested to analyze the items abridged by the investigators based on the data provided in the first round. Accordingly, Delphi panelists may be needed to rate or rank-order items to instituteinitial priorities among items. Because of round two, areas of incongruity and agreement are identified (Ludwig, 1994). In this round, consensus begins forming and the actual outcomes can be presented among the participants’ responses (Jacobs, 1996). Information regarding the employee disengagement collected from the respondents. The process identifies 103 categories, which are having items with high and low proximity of employee disengagement identified. Rating process further identified in the categories and items identified. Round 3: In the third round, each Delphi panelist obtains a questionnaire that includes the categories and items ratings, abridged by the investigators in the previous round and are asked to revise his/her judgments or “to specify the reasons for remaining outside the consensus” (Pfeiffer, 1968). This round gives Delphi panelists an opportunity to make further clarifications of both the information and their judgments about the relative importance of the categories and items. Second level screening of the 103 categories which were having a high and low influence on employee disengagement identified with corresponding items. The process further identified 54 categories, which are having high and low proximity of the employee disengagement identified. Classification of the items in 64 categories of 2 factors was being made with appropriate loaded items. Thematic presentation and the categorization of the items were done. Round 4: In the fourth and often final round, the list of remaining items, their ratings, minority opinions, and items achieving consensus are distributed to the panelists. This round provides a final opportunity for members to review their decisions. It should be recalled that the number of Delphi iterations is contingent largely on the degree of agreement sought by the investigators and can vary from three to five (Van de Ven, Gustafson, 1975; Ludwig, 1994). During fourth level, screening of the 30 categories which were having items with high
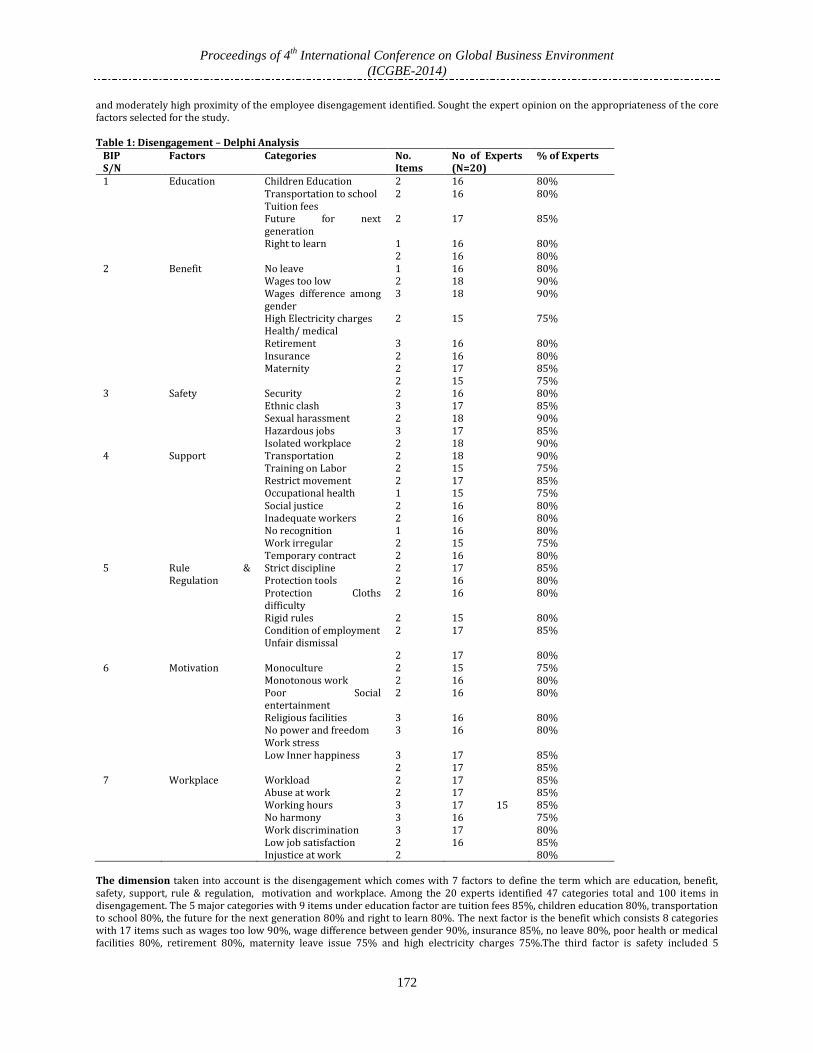
Proceedings of 4th
International Conference on Global Business Environment
(ICGBE-2014)
172
and moderately high proximity of the employee disengagement identified. Sought the expert opinion on the appropriateness of the core factors selected for the study. Table 1: Disengagement – Delphi Analysis
BIP S/N
Factors Categories No. Items
No of Experts (N=20)
% of Experts
1 Education Children Education Transportation to school Tuition fees Future for next generation Right to learn
2 2 2 1 2
16 16 17 16 16
80% 80% 85% 80% 80%
2 Benefit No leave Wages too low Wages difference among gender High Electricity charges Health/ medical Retirement Insurance Maternity
1 2 3 2 3 2 2 2
16 18 18 15 16 16 17 15
80% 90% 90% 75% 80% 80% 85% 75%
3 Safety Security Ethnic clash Sexual harassment Hazardous jobs Isolated workplace
2 3 2 3 2
16 17 18 17 18
80% 85% 90% 85% 90%
4 Support
Transportation Training on Labor Restrict movement Occupational health Social justice Inadequate workers No recognition Work irregular Temporary contract
2 2 2 1 2 2 1 2 2
18 15 17 15 16 16 16 15 16
90% 75% 85% 75% 80% 80% 80% 75% 80%
5 Rule & Regulation
Strict discipline Protection tools Protection Cloths difficulty Rigid rules Condition of employment Unfair dismissal
2 2 2 2 2 2
17 16 16 15 17 17
85% 80% 80% 80% 85% 80%
6 Motivation Monoculture Monotonous work Poor Social entertainment Religious facilities No power and freedom Work stress Low Inner happiness
2 2 2 3 3 3 2
15 16 16 16 16 17 17
75% 80% 80% 80% 80% 85% 85%
7 Workplace Workload Abuse at work Working hours No harmony Work discrimination Low job satisfaction Injustice at work
2 2 3 3 3 2 2
17 17 17 15 16 17 16
85% 85% 85% 75% 80% 85% 80%
The dimension taken into account is the disengagement which comes with 7 factors to define the term which are education, benefit, safety, support, rule & regulation, motivation and workplace. Among the 20 experts identified 47 categories total and 100 items in disengagement. The 5 major categories with 9 items under education factor are tuition fees 85%, children education 80%, transportation to school 80%, the future for the next generation 80% and right to learn 80%. The next factor is the benefit which consists 8 categories with 17 items such as wages too low 90%, wage difference between gender 90%, insurance 85%, no leave 80%, poor health or medical facilities 80%, retirement 80%, maternity leave issue 75% and high electricity charges 75%.The third factor is safety included 5

Proceedings of 4th
International Conference on Global Business Environment
(ICGBE-2014)
173
categories and 12 items to explain the factor which is sexual harassment 90% and isolated workplace 90% is the highest highlight by the experts and followed by hazardous jobs 85%, ethnic clash 85% and security 80%. The fourth factor identified by expert is supported with 9 categories and 16 items which cover transportation 90%, restrict movement 85%, temporary contract 80%, no recognition 80%, inadequate workers 80%, social justice 80%, work irregular 75%, occupational health 75% and training on labor 75%. The fifth factor identified by experts under the group of rule and regulation structure with 6 categories and 12 items are strict discipline 85%, condition of employment 85%, protection tools 80%, protection clothes difficulty during working 80%, rigid rules 80%, and unfair dismissal 80%. The sixth is a motivation factor as identified by experts which will lead to disengagement are sub categories into 7 and 17 items such as low inner happiness 85%, work stress 85%, no power and freedom 80%, religious facilities 80%, poor social entertainment 80%, monotonous work 80% and monoculture 75%. The final factor influence disengagement is the workplace which refers the plantation sector acknowledge by the experts during discussion. There are 7 categories with 17 items which are workload 85%, abuse at work 85%, working hours 85%, low job satisfaction 85%, work discrimination 80%, injustice at work 80% and no harmony among clan 75%. Discussion: The objective of the present research was to identify and fix variable related to employee disengagement in Malaysia oil palm plantations. In order to explore the factors and categories related to employee engagement the study followed case study analysis, field observation and primary Delphi technique of quality research. The results of the study clearly lead us to focus on 7 factors and 47 categories related to employee disengagement in Malaysia oil palm plantations. A detailed discussion on employee disengagement factors are incorporated below. The first factor identified by the experts in this particular research include the plantation workers dissatisfied towards the future of their children who are staying on the plantation devoid of proper education facilities. Many small holding plantations are not making provision of education to the children of plantation workers in and near to the plantation. Since the housing facilities arrange by the plantation to the plantation workers are very much deep inside the plantation the workers' children would not be able to travel to a nearby school, adding to that there is no transportation facilities arrange by the plantation management. In comparison with the wage, the workers are facing difficulty in paying regular monthly tuition fees for their child's education in school. In principle the children of oil plantation are devoid off right to learn and educated. Giving due weightage to the future of children and their education workers of oil palm plantation do not want to continue their present job and their attitude clearly persecuted in employee disengagement at work. One of the motivating factors which that influence employeestays back in any organization include the benefits that an organization extent to the employee. The benefits available from the organization develops attachment and detachment feeling among the workers at work. It is pointed out by the experts that wages, health facilities, medical facilities, insurance, maternity benefits, availability of leave and holidays, proper composition among male and female employees etc correlated to employees feeling of attachment and further engagement at work. Contextualization oil palm plantation an especially to small holding majority health and wealth fare facilities are totally lacking. The workers are devoid of proper compensation packages, safety and security, adequate health and medical facilities. Transportation facilities, leave and holidays, retirement benefits etc. it is almost a kind of unorganized form of labor policy with which the employees are reluctant to continue their in the small oil palm plantation. It is rightly pointed out by Saks(2006), that disengaged employee often are not satisfied, not committed and have an intention to leave their organization. All the above mention factors related to employee benefits, which are pointed out by the expert in this study does lead to understand the complexity employee disengagement in small holding oil palm plantation. The other factor pointed out by experts include lack of safety employees feel at work leading to employee disengagement oil palm plantation. It is pointed out by many researchers like Kotowski, Davis, water-hose, 2003 that oil palm harvester are exposed to multiple risk factors leading to musculoskeletal disorder MSD. The workers are provided with many equipment conventional and more prompt to work injuries and accidents. Hence, this hazardous nature of jobs associated with oil palm plantation work leading to employee feelings of detachment. In additional to that the experts also pointed out the categories closely knit with isolated working condition in remote locations. Categories leading to employee disengagement also include the physical harassment both male and female workers faced from the mandor and the plantation manager. A quite different category identified by the expert in this study include the ethnic clash between clan coming from different country. It has been pointed out that many cases are reported on lack of adjustment between the clans and their switching over from one plantation to another collectively. The worker does feel lack of safety and security at work and leading to employee disengagement. The next factor identified by the experts include the support facilities provided by plantation management leading to employee disengagement at work. It is expected plantation workers that they should get a proper employment contract before they get into the work. In many situations this contractual agreement does not observe because of the supply of labor done through the contractor and sub-contractor legally or illegally. The workers do not havea valid employment permit or the passport when they get into oil palm plantation for their work due to which there is nobody support these workers to get proper compensation and wealth fare facilities and majority workers faces atrocities discrimination and injustice at work. Since the workers are not part of regular employment, the government seldom would be able to ensure proper health, security compensation packages and other wealth fare facilities. It has been rightly identified by the experts that these workers of oil palm plantations are neglected by the plantation management and there is no freedom, no recognition, no contractual obligation and further subjected to poor management support leading towards employee disengagement at work. One of the major factors identified by the experts in relation to employee disengagement include rigid rule and regulation followed by the plantation management. As indicated elsewhere, the plantation workers are facing many challenges due to their lack of contractual employment and illegal status prevalent the host country. Many of the workers came to this plantation long years back. These workers, second and third generation are leaving in same plantation, with their extended families and without passport facing a unique condition of statelessness. This means that, these workers belong neither to their own motherland or belong to the host country. Due to which there are devoid of the protection from their own country as well as the host country. Unfair dismissal, lack of safety and security, rigid working condition, forces labor, strict discipline, discrimination, bonded labor etc. are quite common in oil palm plantation. All the above factors and the categories identified by the experts closely link to employee disengagement at work. Motivated workforce is a blessing to any organization while there are lots of factors which affect employee motivation at work. Contextualizing the topic to oil palm plantation the experts identified 7 categories which closely link to employees lack of motivation and leading to employee disengagement at work. As it is pointed out oil palm plantation is situated far interior from town and cities. The workers engaged in oil palm plantation totally cut off from common life. One cannot expect so much of the variation in costume, practices and culture followed in plantation

Proceedings of 4th
International Conference on Global Business Environment
(ICGBE-2014)
174
work. It is a form of monoculture and almost monotonous in nature. The nature of work circle around harvesting, pruning, fruit collection, loading and unloading of fruits like highly labor intensive task. The work stress which involves both physical and mental stress is very high and there is less entertainment, leisure and freedom at work. It can be inferred from this field observation, case studies and expert opinion the workers in the oil plantation devoid of inner happiness and comfort of life. All these factors thus lead to employee disengagement at work. The last factor pointed out by the experts include workplace environment which is unique to plantation. As indicated above issues related to education, issues related to wealth fare and composition, work discrimination, work injustice, long working hours, the role of contractors and sub-contractors, the harassment and abuse at work, excessive workload etc. are all leading to employees lack of motivation to work in oil palm plantation and leading to employee disengagement at work. Model development: The study has come out with a model which is having a direct relationship with the employee disengagement at work in oil palm plantations. It can be illustrated as; Figure 1: Model on Disengagement
Education
Benefits
Safety
Workplace
Support
Rules and
Regulations
Motivation
Employees
Disengagement
Employees
Intention
to Leave

Proceedings of 4th
International Conference on Global Business Environment
(ICGBE-2014)
175
Implication: This particular study concentrates on identifying and fixing variable on employee disengagement in oil palm plantation. The study has pointed out major 7 factors (education, benefit, safety, support, rule and regulation, motivation and workplace) and 47 categories. These factors incorporated with employee disengagement in oil palm plantation several implications like policy, managerial, theoretical and methodological. Sticking to the major objective of identification and categorization factors correlated to employee disengagement. The study strictly followed the triangulation method of qualitative research like case analysis, field observation, interview and especially Delphi techniques of qualitative research. This indicated that the observation make out of triangulation will provide appropriate methodological validity. This further support the researcher to apply factor analysis with appropriate factor loading and the instrument which is developed out of this research may subjectively to the extensive level of quantitative research, contextualizing the topic to oil palm plantation. This particular research further evaluate, integrated and adopt a certain employee engagement model which may be considered as theoretical of the study. Further the factors and categories identified by the expert have far reaching consequences in relation to employees disengagement it may lead to employee's intention to leave the plantation. Finally these factors giving better inside of the government of Malaysia to keenly look into the factors related to the employees productivity and performance which may affect contribution plantation to Malaysia economic development. Thus, these particular researches provide better understanding on issues related to employee disengagement in plantation thru qualitative research intervention. 4. Conclusion This particular study was conducted to explore the factors pertaining to employee disengagement of workers in oil palm plantations in the Sabah region of Malaysia. The study followed Delhi technique and allied qualitative research methods to arrive at the factors and categories that are closely knit with employee disengagement oil palm plantations. The study indicates two major factors which lead to possible employee disengagement viz., organizational factors, individual factors and Geographical factors. The organizational factors consist of categories like wage and welfare, safety, management, work environment,. The individual factors consist of health issues and motivation. While the geographical factors consist of many categories like, living in remote locations, issues of transportation, issues of hygiene, no access to better food drinking water, poor accommodation in remote areas, and wildlife issues. Thus the study identifies and fixes the variables which are closely linked to employee disengagement of workers in oil palm plantations, that support the future research with the support of quantitative research incorporating all these variables for validity and reliability. Reference Aço, S. (1998). Administration and management of human resources. Professional Training. Didactic material. Luanda: Emosist. Bakker, A.B., & Demerouti, E. (2008). Towards a model of work engagement. Career Development International, 13, 209–223. Baumruk, R. (2004). The missing link: the role of employee engagement in business success, Workspan, 47, 48-52. Blau, P. (1964). Exchange and Power in Social Life, Wiley, New York, NY. Branham, L. (2005). The 7 Hidden Reasons Employees Leave. New York, NY: American Management Association. Eisenberger, R., Armeli, S., Rexwinkel, B., Lynch, P.D. & Rhoades, L. (2001). Reciprocation of perceived organizational support. Journal of
Applied Psychology, 86(1), 42-51. Gallup Organization. (2001). Gallup Study indicates actively disengaged workers cost U.S. hundreds of billions each year. Gallup
Management Journal. http://gmj.gallup.com/content/466/gallup-study-indicates-actively-disengagedworkers-cost-us-hundreds.aspx (Accessed on 14 April 2010)
Gallup Organization. (2006). Feeling good matters in the workplace. Gallup Management Journal.http://gmj.gallup.com/content/20770/Gallup-Study-Feeling-Good-Matters-Workplace.aspx (Accessed on 5 April 2012)
Gouldner, A.W. (1960).The norm of reciprocity: a preliminary statement.American Sociological Review, 25(2), 165-78. Handelsman, J. (2009). Understanding and Remedying Employee Turnover. From Business Owner's Toolkit:
http://www.toolkit.com/news/newsDetail.aspx?nid=138 (Retrieved November 14, 2009) Harter, J.K., Schmidt, F.L., Killham, E.A., & Asplund, J.W. (2006). Q12 Meta-Analysis. Retrieved from
http://strengths.gallup.com/private/Resources/Q12Meta-Analysis_Flyer_GEN_08% 2008_BP. Pdf (Accessed on 5 June 2012) Holbeche, L. & Springett, N. (2003). In Search of Meaning in the Workplace. Horsham, Roffey Park. Kahn, W. A. (1990). Psychological conditions of personal engagement and disengagement at work. Academy of Management Journal,
33(4), 692-724. doi:10.2307/25628 Kumar D. M. (2013). Ways and Means of Research Method, Research India Publication. New Delhi, India. Krueger, J & Killham, E. (2007). The Innovation Equation. Gallup Management Journal. Towers Perrin, Global Work Force Study (2007-
2008). Manju, B. & Mishra, S. (2007). The Principles for Successful Implementation of Labour Welfare Activities. From Police Theory to
Functional Theory: Retrieved on October 26th 2011 from htt://www.tesioline.com/intl/indepth.jsp?id=575 May, D.R., Gilson, R.L., & Harter, L.M. (2004). The psychological conditions of meaningfulness, safety and availability and the engagement
of the human spirit at work. Journal of Occupational and Organizational Psychology, 77, 11–37. Pech, R. &Slade, B. (2006), Employee disengagement: is there evidence of a growing problem? Handbook of Business Strategy, 21–25. Penna Consulting PLC. (2005). Meaning at work. Research report. http://www.penna.com/research/?pageIndex=2 (Accessed on 23
November 2010). Portello, J. (1996). Dimensions of managerial and professional women’s stress: Interpersonal conflict and distress. Dissertation Abstracts
International: Section B: the Sciences and Engineering, US: University Microfilms International, 57(6-B). Priti, S. (2009). Employee Welfare. From http://www.citehr.com/176307-employee-welfare.html#ixzz1zTZ8HheC. (Retrieved on July 1,
2012). Robison, J. (2010). Disengagement can be really depressing. Gallup Management Journal.
http://gmj.gallup.com/content/127100/Disengagement-Really-Depressing.aspx (Accessed on 17 May 2010). Saks, A.M. (2006). Antecedents and consequences of employee engagement. Journal of Managerial Psychology, 21(7), 600–619.

Proceedings of 4th
International Conference on Global Business Environment
(ICGBE-2014)
176
Sanford, B. & Coffman, C. (2002). Start worrying about "not engaged" employees. http://gmj.gallup.com/content/142/Start-Worrying-About-Not-Engaged-Employees.aspx (Accessed on 25th June 2012).
Schaufeli, W.B. & Bakker, A.B. (2004). Job demands, job resources and their relationship with burnout and engagement: a multi-sample study. Journal of Organizational Behavior, 25(3), 293–315.
Vajda, P.G. & Spirit Heart. (2008). The thrill is gone - when employees disengage.http://www.spiritheart.net/media/the_thrill_is_gonewhen_employees_disengage.pdf (Accessed on 23 June 2013).
Weiss, E. M. (1999). Perceived Workplace Conditions and First-year Teachers Morale, Career Choice Commitment and Planned Retention: A Secondary Analysis. Teaching and Teacher Education, 15, 861-879.
Wellins, R., & Concelman, J. (2005). Creating a culture for engagement. Workforce Performance Solutions. www.ddiworld.com/pdf/wps_engagement_ ar.pdf (Accessed on 7 April 2010).

Proceedings of 4th
International Conference on Global Business Environment
(ICGBE-2014)
177
Identifying, Categorizing and Setting Variables on Ergonomics issues in Oil Palm Plantations
Normala S Govindarajo, Dileep Kumar. M, Subrahmanium Sri Ramulu, Noor Azizi Ismail
Othman Yeop Abdullah Graduate School of Business (OYA-GSB), Universiti Utara Malaysia, Malaysia [email protected]
Abstract: It is an eye opening scenario that Malaysia turned to be one of the major producer and exporter of palm oil. Malaysia has witnessed a dazzling growth of 10.06% of its production recently from 4.05 million hectares in 2005 in an area of 54,000 hectares. Further, the production has enlarged from 94,000 tons in 1960 to 15 million tons in 2005, or by almost 160 times within 45 years – this represents a compound annual growth of 11.93% per year. The oil palm industry is labor intensive, since there is less adoption of mechanization in the field operations. Production of agriculture is usually associated with high incidence of ergonomic injuries, mainly during rigorous manual labor and throughout harvesting. Although scientific explanations are available, very less research was conducted to identify and fix variables that are closely related to ergonomics issues of workers in oil palm plantations related to workers absconding and disengagement from work. Field visits were conducted in the present study, to get an insight into the causal factors of ergonomics in relation to workers intention to abscond and disengagement in oil palm plantations was further congregated into. Thus an exploratory study was conducted in the oil palm plantations following qualitative research methods like direct interviews, focus group discussions and Delphi technique arrive at factors and categories related to theergonomic issues of workers in oil palm plantations. The study provides better insight into theergonomic issues of workers in oil palm plantationsin the Sabah region of Malaysia. Keywords: Oil Palm Plantations, Ergonomics, Working Condition, Foreign Workers
1. Introduction In Malaysia, agriculture is being promoted as the third engine of growth and modernization for poverty reduction as stated in its latest ninth- 5-year development plan (Ninth Malaysian Plan, 2006). However, Malaysia is facing issues of worker shortage in oil palm plantations and the country is extremely reliant on foreign workers coming from Indonesia and Philippines. Contextualizing the topic to the eastern part of Malaysia, the Sabah region of Malaysia, which is having 62.74% (268,992 people) foreign workers working in oil palm plantations, in comparison with the total Malaysia (450,396 people, in plantations). The question raised in this context is what is the reason behind these shortages of workers in oil palm plantations? It is pointed out in some of the literature that the issues are related to working and living conditions prevalent in the oil palm plantation in the country. While the others pointed out the reasons being ergonomic issues related to the agrarian work, in remote locations. This particular explorative study was focused more on the issues related to ergonomics in oil palm plantations which may lead many workers either to abscond, disengage or leave back to their country of origin due to physical working conditions. As we all know, farming and agriculture tasks are highly physical demanding, arduous and require extremely large of energy in performing their tasks. Hence, this poses farm workers at potential risk of health problems caused by physical hazards, chemical hazards, biological hazards, psychosocial hazards and ergonomic hazards. Ergonomic hazards posea variety of musculoskeletal symptoms (MSS) encompasses the neck, low back pain, osteoarthritis of the hip and knee, upper limb complaints and hand-arm vibration syndrome (MTUC, 1989; Walker-bone et al., 2002). This study attempted to identify the ergonomic factors and its association with general working and living conditions of workers in oil palm plantations in Malaysia. 2. Literature Review The oil palm industry encompasses 4 major activities, the upstream oil palm plantation, midstream processing, downstream application and research and development (R&D). The upstream agricultural activities produce palm fruits that are rich sources of oil, while the midstream processing involves not only the extraction of crude and kernel oil but also biomass and animal feeds from the oil palm fruits and tree wastes. Thereafter, these intermediate products are then delivered to various industries for diversified downstream applications. In a special category by itself, R&D, especially of biotechnology, has a major role to play in deriving various applications not only for downstream uses but also for the benefit of the upstream oil palm plantation benefits such as genetic manipulation of seeds, soil, fertilizers and plantation management, mechanization, etc. (Ng, et., al., 2013). The cycle of oil palm plantation: Usually, germination of oil palm seeds and management of seedlings a nursery is carried out prior to, or concurrently with the establishment of a plantation. After the land has been cleared off, soil work such as terracing, conditioning, irrigation, weeding and cultivation of cover crops are commenced. Once the land is prepared, the ready young palm seedlings are transplanted to the plantation. Subsequently, the plantation is managed for 3−4 years, during which weeding, pesticides and herbicides spraying, fertilizer application and pruning are carried out until the oil palm fruits, fresh fruit bunches are ready for harvesting. In a typical oil palm plantation, harvesting tasks are performed by a team of 2 workers, afresh fruit bunch cutter and fresh fruit bunch collector, and as frequent as 3 cycles/visits per month are carried out for each tree. Harvested fruits are subsequently sent to an oil palm mill for oil extraction by truck, which is loaded separately by another category of workers known as loaders. Typically, an oil palm plantation has a lifespan of 25−30 years of production before fresh fruit bunch production finally declines to an unprofitable output level. Thereafter, the cycle of land clearing and preparation is repeated for replanting processes (Ng, et.al., 2013). The findings in various studies (Rainbird G, &O’Neill D, 1995;Fathallah, 2010) have shown that labor-intensive agricultural practices have been associated with high prevalence of musculoskeletal disorder (MSD). In a review article, Kirkhorn, Earle-Richardson, and Banks (2010) highlighted the association of ergonomics risk factors and MSDs with the agricultural commodities. It can be observed that MSDs were prevalent among traditional manual harvesting practices. Ergonomics issues: As the oil palm trees grow, the height at which the FFBs are located increases correspondingly. At 6−7 years old, the fruits of the palm tree are approximately 3 meters above the ground. At this time, the fresh fruit bunches cutter uses either a chisel or sickle, switching among the two depending on whichever is more convenient for performing the job tasks. For trees beyond 7 years old,

Proceedings of 4th
International Conference on Global Business Environment
(ICGBE-2014)
178
the fresh fruit bunches cutter will only use a sickle. At the height at this age, they naturally tilt their heads upward in order to locate ripe fruits (Ng, et. al., 2013). Ergonomic problems during harvesting: FFB cutter: It has been pointed out by Kotowski et.al., (2003) that that oil palm harvesters are exposed to manifold ergonomics risk factors that leading to musculoskeletal disorders. This is factual in the case of fresh fruit bunch cutters stooping, thatseems to be the most important posture at the initialphases of harvesting. Furthermore, for the period of cutting, the trunk and neck were also viewed to be somewhat rotated and being bent forward while the hand was vehemently pushing-pulling/swinging the chisel outside or across the body midline. The degree of the trunk flexion varies according to several factors, harvester’s height, the height of the fresh fruit bunches on the palm trees and the work environment. In terms of work situation, the branches of fresh oil palm trees branch out in a canopy arrangement. This indirectly promotes further bending as harvesters avoid the pointy and sharp leaves of the palms which may cause cut-type injuries to the skin (Ng,, et. al., 2013). In the early stage of harvesting, the fresh fruit bunch cutter suffers especially from postural stress due to awkward postures and stooping in addition to forceful exertion and a rapid work pace. The body areas potentially affected during this harvesting stage are the lower back, upper back, hands and arms due to the nature of the job or task requirement, the worker harvests the oil palm fruit typically at knee level in the early stage (Ng,, et. al., 2013). Ergonomic problems during harvesting—FFB collector: The ergonomics issues are widely neglected by the plantations prior to the 20th century. It has been pointed out by Rainbird, et.al., (2001) that musculoskeletal disorders and ergonomics in agricultural were an area deserted despite being the ones that warrant substantial attention. Further, Chapman L, & Meyers J. (2001) report that the common view of health care providers was normally to emphasis on signs of pesticide exposure with the notion that musculoskeletal disorders occur in combination with agricultural manual work activities.Earlier reports have shown that harvesting tasks have been related to the risk of developing musculoskeletal disorders. These illnesses are typically the consequence of recurrentacquaintance to strain that develops slowly over time (Davis & Kotowski 2007). Mainly, pain in the hand, arms, shoulders, neck, back and waist are the most commonly reported symptoms in association with production agriculture (Kirkhorn, et., al. 2002; Sesto M. 2012; Osborne, et. al., 2012). Several researchers have pointed out the risk factor associated with the oil palm work. Risk aspects such as rapid, repetitive motions, sustained static loading, awkward posture, externally applied compressive forces and vibration or any combination of them have also been reported to be stressful to one or more body regions (Kirkhorn, et., al. 2002; Sesto, M. 2012). It is observed from the oil palm plantations that the plantation work is more labor intensive. It is reported that in the initial stages of harvests, a fresh fruit bunch cutter can weigh an average of about 5 kg. Though, as the trees become older, the size and weights of fresh fruit bunches increase. This growth can be correlated with FFB of the oil palm tree at >15 years old weighing as much as 50 kg.It has been pointed out by (Ng, et. al., 2013) in their study that during the initial stage of harvesting, the fresh fruit bunches cutter suffers particularly from postural strain due to awkward postures and stooping further tovigorous exertion and a high work pace. It is indicated that the body portion which would be drastically affected during this harvesting phase are the lower back, upper back, hands and arms due to the nature of the task or task requirement. Further referring to the injuries or disorders of the locomotive apparatus, the muscles, nerves, tendons, joints and cartilage, of the upper and lower limbs, neck and lower back, musculoskeletal disorders or work-related musculoskeletal disorders (Bernard BP, et. al., 2001) have commonly been associated with agricultural practices corresponding to rigorous labor-intensive work tasks in terms of a multitude of ergonomic risk factors (Fathallah, et. al., 2012). Considering the related risk factors, the National Research Council and Institute of Medicine (2001) has proposed a conceptual model illustrating the complex interrelationship of workplace, organizational and social factors as well as individual factors that may contribute to the development of MSD. In addition, the harvesters may also concurrently be affected by different cultural, organizational, psychosocial and individual risk factors. Specifically, where foreign labor is involved, homesickness, health and socioeconomic well-being of the family as well as smoking habit and being overweight may increase the risk of developing an MSD. These risk factors have been shown in various studies to be significantly associated with MSD (Bernard, et.al., 1995; Sesto 2012). Rationale of the Study: Unfortunately, despite the intensive manual handling and labor activities involved in harvesting at an oil palm plantation (OPP), the agricultural ergonomics at the OPP have yet to be recognized, with only few articles related to ergonomics in OPP work activities published in local publications. Interviews with the Workers Worker 1: I am Latif working in oil palm plantations almost 20 years. I came to Malaysia from Indonesia, when I come to know that I will, get good wages and benefits from plantation job. I have obtained this information about the job from my friend working in the same plantations during these days. I started working on harvesting and then with all kinds of activities in the plantations. As such the plantation job is very much taxing to my body and mind. Physical stress is very high. Since I am sending majority of the income to my family in Indonesia, I used to keep my health ignored. I am finding only only one way to cope with this body pain is alcohol drinking habit. After having alcohol, I just sleep without realizing my body pain. Now I’m 38 my body can’t handle as much target as last time when at the younger age. I am not at all engaged in harvesting job. Due to poor health condition I am allocated to pesticide spraying in plantations. Worker 2: I have been workingon the plantation job for the past 13 years. I am engaged in harvesting job. It’s a tough job, as it neededhealthy physique to bring down 20kgs of fruit from a tree, which very much taller than us. Due to our carelessness and some time because of poor equipments that we use in the harvesting activities we are exposed to several physical injuries. For the first week when I start holding the long cutter “ tumbak” my hand was bleeding and skin torn off and in plantations the is little facilities to get the right aid in right time. Walking with the long “tumbak” and heavy tool we feel very much tired during the work.In order to reduce the high pacing, I have purchased a bicycle. But carrying heavy equipments and running the bicycle together is very much tedious task. Worker 3: I’m Amnah 23, working as pesticide sprayer in the plantation for the past 5 years. The plantation manager grouped us into 25 to 30 people in a block with all the female workers. One “gendongan” tank that we carry as a bag pack of pesticide tank, which is having 15 litters and it takes around 30 to 45 minutes to complete the whole tank. It depends on the person's energy to complete the expected roundsof spraying. One person can maximize spray up to 10 rounds, which is equal to 150 liters (±150 kg) per day. It gives me heavy

Proceedings of 4th
International Conference on Global Business Environment
(ICGBE-2014)
179
pain in my lower back. Morning hours I used to find difficult to wake up due to heavy pain in the body. No option, I have to force myself to wake up or else I will lose my daily wage. It can’t give enough rest over night to relief the pain. We do ask some “tukang urut” to massage with hot oil at least will give some relief to a good night's sleep. The plantation management never listens such stress and strain of employees. Worker 4: I am Yati. I am also working here in the oil palm plantation as pesticide spraying worker. Every morning, we will gather at the plantation office. The Mandor assigns the location/block for pesticide spraying for each worker. The assembly time will start at 5am as everyone has to move to the assign block by 5.30am. We will take a tractor to the block to undertake work in the assigned remote area. We will reach at the locationlater by 8am. One female leader will be joining us to control over the pesticide and indirectly she will monitor us. Sometimes we might see snake “ular sawa” or wild pig. Attach from the wild life animals are quest common and we fear to engage work in interior locations. Water is limited for us to wash off the chemical stain at our body. We just have to be careful during our food. We don’t have much choice. Due to our engagement with chemical substances, even when we clean our hands and body, there are higher chances to get our food contaminated. There is one time I hadallergy problemson skin because of the chemical reaction. I went to the clinic nearby for treatment, only they have given some white cream. Many days I couldn’t sleep very well due to itchiness and skin irritations. Worker 5: I just started working as fertilizing “membajak” in oil palm plantation. I am trying to learn the job from my “makcik” aunty. I’m coming from Sulawesi my name is Idawati and just 17 years old. We are assigned in 10 people per group. In a block both male and females are mixed up to engage in plantation activities. We usually get 30 sacks of fertilizer and each sack has 50kg. We have to work as a team to complete the work. Everyone will be given pail that can contain 3kg of fertilizer carry out the job. This activity involves high work pacing. Walking and carrying of the pail usually leads to pain at shoulders and hand area because of the movement of hand of throwing the fertilizer continuously. We have to wash our handssoon after the work, since the fertilizer act as the chemical, which is very strong can peel off our skin. I usually cause irritation in between the hand and leg fingers. Worker 6: My name is Ali, 28 with 5 children and my wife working on daily bases with nursery at the plantation. I am working under the section on loading the palm oil fruit to the tractor or lorry. It has been 6 years in the plantation. Wage is quite good compared with other task in the plantation, except harvesting. Monthly I can earn up to RM1300. I am engaged in loading and unloading activities of fresh fruit bunches. It creates heavy neck, shoulder and body pain, since the tractor that is taller than me. One bunch of oil palm fruit is from 10kg-20 kg it’s so difficult to carry to the tractor. This is some time leading to conditions of breathlessness. Muscle crunch and Muscle pull are quest common. Worker 7: I’m Hamza, 23 working on loading and unloading tasks in the plantation. I started working these plantations only about 3 months back. I don’t have much experience in oil palm plantations work. I was a paddy farmer in my home country. What difference I felt from oil palm plantation work is the heavy physical labor which can be less replaced by machines and equipments. It needs to be run through human energy and teamwork. Sometimes I feel like to quit the job, and go back to my home country, due to heavy physical stress. But due to better wage, as compared to paddy field working in my home country, that prompts me to stay back here. During these few months I met with many injuries due to my lack of skill with the work assigned especially during loading and loading the fresh fruit bunch jobs and lead to a high infection. Sometimes the fruit fall on my foot, and caused injuries. It’s really a tough job. My uncle told me to take “Jamu”(mix herbs by Indonesian) to regain the energy. Worker 8: I’m a tractor driver at the plantation since 2011. I got the job because I know how to drive. It’s quite fortunate for me to get a job, where I only need to drive the tractor to load and unload people, fertilizer and oil palm fruits. Although it sounds easy when people said it just driving. LatelyI faced with many issues due to like, cold and fever, allergies and skin disorders, due to due to the dusty road. The plantation management never gives any safety helmet or equipment to protect the health. Due to dust infection, several times my eyes get infected, swollen become red. Compare to another task we are the first and the last person on the plantation to finish the job. Early morning I need to send the workers to respective block and in the late evening I have to them taken back them to their houses. In between time, I need to load fertilizer from store to plantation side. Body ache and back pain arequite common to us. Worker 9: I’m Abbas Ali, 33 working in oil palm plantation almost 10 years. I have changed almost change 3 plantations. I’m working as a harvester for a contractor. I’m paid in “pajak” - piece rate as it depends on our hard work, and performance. I am putting my every effort to earn maximum from the plantation job, since I don’t have any intention to stay back a few more years. I am separated from my family. I have to go back to my home country. I was very much healthy, when I came here. But due to heavy work and my interested to earn more made me to diminish my health condition. Since, due to heavy change in the climatic condition of in plantations like rainfall, humidity, and sunny days, and I used to face illness. Ignoring those illnesses I have to work, or else, mandor terminates my work. Research Questions: The case analysis and the literature related to the ergonomic issues of the oil palm plantation s leading to several research questions or inquiries that need to be explored with proper research methods. In order to explore these concepts,the study posed three basic questions. They are: 1. How will you define ergonomics? 2. How will you define ergonomics issues? 3. Which are the factors related to ergonomics in oil palm plantations? Problem Formulation: It is well pointed out various studies that the oil palm plantation work is highly labor intensive agriculturalactivities which not only leading to high physical disorders but also developing psychosomatic disorders. Many studies that incorporated the issues related to labor intensive practices leading Musculoskeletal (MSD). These disorders are prevalent among traditional harvesting process which is devoid of modern mechanization practices. Many human body postures during fresh fruit bunch (FFB) cutting leading to the trunk and neck disorders and cut type injuries to the skin. If you look into fresh fruit bunch collector issues due to awkward postures and stooping in addition to forceful exertion and a rapid work pace during the harvesting lead to many disorders like lower back pain, upper back pain, hands and arm injuries in the early stages. National Research Council and Institute of Medicine has indicated many factors causing the ergonomics issue leading to Musculoskeletal (MSD) in oil palm plantation workers like workplace factors, organizational factors, social factors as well as individual factors. Although those factors having identified by the past researchers many factors leading to ergonomics issues among workers in oil palm plantation are less research into. Moreover, the factors identified which are more related to body postures and activities ignoring issues related environmental factors, labor intensive – high task orientated physical labor and poor adoption mechanize tools and techniques. This indicates that there is still theoretical and

Proceedings of 4th
International Conference on Global Business Environment
(ICGBE-2014)
180
methodological knowledge gap existing in studies related to ergonomics in oil palm plantation. Hence, contemporary a deep rooted study with the support of qualitative research is inevitable to identify the hidden factors related to ergonomics issues in oil palm plantations, leading to an extensive research incorporating the past variance and the hidden one which will be identified through this research. Problem statement: Hence, this particular study identifies its topic of research as identifying, categorizing and setting variables on ergonomics issues in oil palm plantations. 3. Methodology Delphi is one of the reliable qualitative research technique made by researchers with the expert opinion (Kumar, 2013). The methodology of research followed in this study was Delphi technique which provided exploratory insight into major factors of working conditions and living conditions. The Delphi technique, mainly developed by Dalkey and Helmer (1963) at the Rand Corporation in the 1950s, is a widely used and accepted method for achieving convergence of opinion concerning real-world knowledge solicited from experts within certain topic areas. Predicated on the rationale that, “two heads are better than one, or...n heads are better than one” (Dalkey, 1972), the Delphi technique is designed as a group communication process that aims at conducting detailed examinations and discussions of a specific issue for the purpose of goal setting, policy investigation, or predicting the occurrence of future events (Ulschak, 1983; Turoff & Hiltz, 1996; Ludwig, 1997). This research engaged semi-structured interviews. Based on the suitable time for the resource person interviews were arranged, during March 2013 to middle November 2013. Direct interview is conducted to gather information from the respondents. 20 experts from the Plantation Managers, Plantation Workers, Mandors of Plantations, Officers of Consulate Indonesia, Officers of Detention Centers, Officers of Immigration, Humana (NGO), Schools for Migrant Workers, Trade Union Leaders, Contractors of Housing, Faculty Members and Dean of Social Sciences Universiti Malaysia, Sabah (UMS), and Research Scholars were identified and approached by email or telephone and were invited to take part in the study. All the clarifications related to the objective of the study were made by the researcher. However, 30 respondents were being interacted and communicated, only 20 respondents shown their willingness to participate in the discussion. Finally, 20 participants were interviewed directly. The conversations taped recorded, and manually analyzed. The procedural steps in adopting the Delphi technique were as follows. Expert panel identification: The group of professional was made from specialists having high knowledge and expertise in plantation related. They are closely associated with plantation, as consultants, government body, Top level managers, NGO, Consulate, Professors, Researchers and Academicians. The specialized areas of these expert members include, 12 male members (60%) and 8 female members (40%). These dynamic groups of panel of experts are knowledgeable and familiar to give relevant opinions and an admissible understanding of the business incubation centers. Rounds Round 1: In the first round, the Delphi process traditionally begins with an open-ended questionnaire. The open-ended questionnaire serves as the cornerstone of soliciting specific information about a content area from the Delphi subjects (Custer, Scarcella, & Stewart, 1999). The questions: 1. How will you define ergonomics? 2. How will you define ergonomics issues? 3. Which are the factors related to ergonomics in oil palm plantations? Round 2: In the second round, each Delphi member receives a second questionnaire and is asked to review the items summarized by the investigators based on the information provided in the first round. Accordingly, Delphi panelists may be required to rate or rank-order items to establish preliminary priorities among items. Because of round two, areas of disagreement and agreement are identified (Ludwig, 1994). In this round, consensus begins forming and the actual outcomes can be presented among the participants’ responses (Jacobs, 1996). Information regarding the precarious working conditions collected from the respondents. The process identifies 128 categories, which are having items with high and low proximity of working and living conditions identified. Rating process further identified in the categories and items identified. Round 3: In the third round, each Delphi panelist receives a questionnaire that includes the categories and items ratings, summarized by the investigators in the previous round and are asked to revise his/her judgments or “to specify the reasons for remaining outside the consensus” (Pfeiffer, 1968). This round gives Delphi panelists an opportunity to make further clarifications of both the information and their judgments about the relative importance of the categories and items. Second level screening of the 128 categories which were having a high and low influence on precarious working conditions identified with corresponding items. The process further identified 64 categories, which are having high and low proximity of the precarious working conditions identified. Classification of the items in 64 categories of 2 factors was being made with appropriate loaded items. Thematic presentation and the categorization of the items were done. Round 4: In the fourth and often final round, the list of remaining items, their ratings, minority opinions, and items achieving consensus are distributed to the panelists. This round provides a final opportunity for participants to revise their judgments. It should be remembered that the number of Delphi iterations depends largely on the degree of consensus sought by the investigators and can vary from three to five (Van de Ven, Gustafson, 1975; Ludwig, 1994). During fourth level, screening of the 30 categories which were having items with high and moderately high proximity of the precarious working conditions identified. Sought the expert opinion on the appropriateness of the core factors selected for the study

Proceedings of 4th
International Conference on Global Business Environment
(ICGBE-2014)
181
Table: Ergonomicfactorcategories BIP S/N
Factors Categories No. Items
No of Experts (N=20)
% of Experts
1 Environment Frequent Climate variations High Humidity Heavy rain fall Dusty work atmosphere Danger from Wildlife
2 2 1 2 1
17 17 16 16 15
85% 85% 80% 80% 75%
2 Task Harvesting hazard Collecting heavy FFB Pruning related hazard Pesticide spraying Herbicides spraying Heavy use of fertilizing Planting work Too much walk-pacing Loading & unloading heavy FBB
1 2 3 2 3 2 2 2 2
18 18 18 18 18 17 16 18 18
90% 90% 90% 90% 90% 85% 80% 90% 90%
3 Tools Poorly maintain equipment Heavy equipment Sharp equipment Use of Long equipment
2 3 2 3
16 18 17 14
80% 90% 85% 70%
The first factor considered for the study is the ergonomics problem in a plantation which divided into three factors environment, Task and tools used in the plantation. The experts acknowledged 6 items for the environment, 19 items in the task and 10 items for explaining the tools nature that’s might affect the ergonomic of the workers. The major factor of environment consists of 5 categories. Frequent climate variations (85%) and high humidity (85%) the two major categories in an environment under ergonomic, identified by the experts in the related to plantation setting. Second categories like dusty work atmosphere (80%) and heavy rainfall (80%). And the final categories in environment related factor is the danger from wildlife (75%). The second factor considered for the study is the task related directly to ergonomics. Within the second factor the experts identified 17 items that are closely related to Ergonomics. The major factor of task consists of 9 common categories. The table showed that harvesting hazard (90%), collecting heavy FFB (90%), pruning related hazards (90%), pesticide spraying (90%), herbicides spraying (90%), loading and unloading heavy FFB (90%) and too much walk's pacing (90%) as the prominent factor which closely knit with ergonomics issue among workers. Further the study pointed out the categories like heavy use of fertilizing (85%) and planting work (80%) impact of ergonomic issues need to be highlighted. Besides that, tool use in the field indirectly imposed or contributed to ergonomics issues as identify by expert by 10 items and 4 categories which involved heavy equipment (90%), sharp equipment (85%), poorly maintain equipment (80%), and use of long equipment (70%). The final factor considered for the study is the tools related directly to ergonomics. The experts have identified 10 items and 4 categories closely related to ergonomics. The major issues highlighted by experts is a heavy equipment (90%), sharp equipment (85%), poorly maintain equipment (80%) and use of long equipment (70%). Discussion: The objective of this particular research is to identify, categories and setting variables on ergonomics issues of workers in oil palm plantation. The study followed case analysis, interview, field observation and Delphi technique to extract factors related to ergonomics in oil palm plantation. The study highly follows Delphi Technique where the experts’ opinion on causative factors and categories are relied upon. The experts identified three factors and 30 categories in relation to ergonomics issues. The factors identified include environmental factors, task related factors and tool related factors leading to ergonomics issues,worker disengagement and ultimately leading workers intention to leave. A detail discussion on these three factors incorporating 30 categories are pointed out as below. The first factor identified by the experts included the environmental factor leading to worker ergonomics issues. The oil palm plantation is usually located in those are which are clear from forest location and such geographical location isvulnerable to heavy rainfall, frequent climate variation and high humidity. Due to interior remote location, and frequent climate variation the workers working in oil palm plantation are highly vulnerable to varied illness and health disorders. Fever, running nose, headache, diarrhea, skin disease etc. are quite common in among plantation workers. In addition to that, the workers are exposed to forest environment where they have to face challenges from wildlife animals like monkeys, snakes, scorpions, elephants etc. they have strength their body to protect themselves from various environmental issues during their working environment. Further, due to lack of sophisticated road and routes inside the plantationthe workers are exposed to dusty work atmosphere leading to the respiratory issue, allergy and related physical disorders. Does the experts have identified the environmental factors as one of the major factors contributing to ergonomics. The second major factor identified by the experts is related to the task in which plantations workers engage in. Major activities in which the workers are exposed in oil palm plantation involves upstream oil palm plantation work, midstream process and downstream application. The cycle of oil palm plantation starts with seeds and management of seedlings follow by that clearing of soil work activities such as terracing, conditioning, irrigation, winding and containers of cover crops follow by that pesticide and herbicides spraying, fertilizer application and pruning are carried out until the oil palm fruit ready for averting followed by these activities harvested fruits have to be sent to the oil palm mill by truck. All these activities are routine base and there is no change so far in relation to the nature of the job. The experts observed that all these activities involves high levels of body stretching, leaning, bending, flection of trunk, muscle pull, due to forceful action and rapid work best. The body areaspotentially affected include lower back, upper back, hands and arms due to the nature of the job or task requirements. In addition to that, such task related activity is causing issue locomotors disordersof muscle, nervetenderness, joints, and cartilage, or the upper and lower limps, neck and lower back, MSD or work related. MSD leads to high multitude of ergonomics risk factors. Especially the people engaged in loading and unloading activities are exposed to continues problem related to pain in the hands, arms, shoulders, neck, back, and waist leading to high ergonomics related issues. Thus, all the work

Proceedings of 4th
International Conference on Global Business Environment
(ICGBE-2014)
182
activities in oil palm plantation are a susceptible ergonomic issuebetween workers in oil palm plantation. The last factor identified by the experts include the categories related to tools or equipment used by the plantation workers. It has been pointed out clearly by the experts that due to lack of mechanization and the usage of outdated or poorly maintain equipment used by the workers, this work force is continuously exposed to work related injuries and related ergonomics issues. Many activities like cutting, pruning, harvesting etc. required to appreciatethe tools to handle the task associated with especially as the oil palm tree growing up, the height at which the fresh fruit bunches (FFB) are located also increases correspondingly at this time the FFB cutter uses a chisel, or sickles to do the task. Quite naturally they have tilted their heads in order to locate the right fruit (Ng, Y.G, Bahri, M.T.S., Syah, M.Y.I., Mori, I, & Hashim, Z., 2013). Thus, the experts have identified clear variable related to tools and its implication on ergonomics issues. These three factors like environmental factor, task related factor and tools related factor is leading to ergonomics issues in oil palm plantation that intern having a high effect on productivity and performance in oil palm plantation. Figure1: Model development: The study has come out with a model which is having a direct relationship with the employee disengagement at work in oil palm plantations. It can be illustrated as; Implications: This particular study has far reaching implications for policy, managerial, methodological and theoretical level. Even though the effect of ergonomics issues like Musculoskeletal Disorders are well aware, the factors leading to such psychosomatic illnesses are less researched into. The literatures available from the plantations are no sufficient to arrive at appropriate inference about the issues related to ergonomics in oil palm plantations. Considering this factor, this particular research extent better theoretical framework to the existing literature through expert opinionregarding the issues relatedto ergonomics in oil palm plantation. Further the study pointed out important factors that can be considered by the plantation management to re-look into the work environment and technical support factor with which they can alleviate the somatic stress of employees working in the oil palm plantations. Accordingly, the study provides insight into the managerial implications of the outcomes. An adequate intervention to the said parameters may support employee attrition in oil palm plantations. This particular study follows triangulation method to arrive at the result. The study followed case analysis, field observations, interviews and Delphi technique and integrated the result from all, the methodologies. All the result, with the application of varied methodologies in the qualitative research, is used and the results are correlated. The study could observe seldom any variation among the result. Hence the result provide better validity of the outcome and the plantation management can try for better intervention strategies that alleviate the somatic stress of employees working in the oil palm plantations. Last but not least, the study further leading to the policy makers, especially the government to look into the results obtained from this research and force the plantation management to adopt mechanizations in oil plantation. Absence of proper mechanization and the use of outdated equipments are the major reason related to employee absconding or their intention to leave from the plantation jobs. The study also envisages appropriate steps from the government side to ensure proper monitoring in plantation sector that even attract the local employees to join in the work in the oil palm plantations. 4. Conclusion This particular research was conducted to identify and fix variables related to ergonomics issues in oil palm plantations. The study has observed major three factors that contributing to ergonomic issues in oil palm plantations. In order to arrive these factors the researchers followed the Delphi technique, short case analysis through interviews and field observation. The study identified 18 categories under 3 factors related to the theme, ergonomic issues. The study thus gives an insight into the antecedents of ergonomic issues of workers in oil palm plantations. These ergonomic issues are creating challenges to the workers to stay back in the organization or it leads to employee’s intention leave plantation jobs and take up alternative employment opportunities in small holding oil palm plantations. The issues are not much different in large scale plantations. The triangulation method'sapplicant in the research provides better validity to the construct. It is envisaged here in this context that wider research with the support of quantitative research to be conducted with the identified factors, categories and the items to ensure more reliability to the outcomes.
Environmental
Task
Tools
Ergonomic
Issues
Employees
Intention
to Leave

Proceedings of 4th
International Conference on Global Business Environment
(ICGBE-2014)
183
Reference Bernard, B.P., Putz-Anderson, V., & Burt, S.E. (1997). A critical review of epidemiologic evidence for work-related musculoskeletal disorders
of the neck, upper extremity, and low back. Cincinnati (OH): Centers for Disease Control and Prevention National Institute for Occupational Safety and Health Publication. P- 97−141.
Chapman, L., & Meyers, J. (2001). Ergonomics and musculoskeletal injuries in agriculture: recognizing and preventing the industry’s most widespread health and safety problem. Agricultural Safety and Health Conference Proceedings. March 2−3, Baltimore (MD).
Davis, K.G., & Kotowski, S.E. (2007). Understanding the ergonomic risk for musculoskeletal disorders in the United States agricultural sector. American Journal of Indigenous Medicine, 50, 501−11.
Fathallah, F.A. (2010). Musculoskeletal disorders in labor-intensive agriculture. Applied Ergonomics, 41, 738–43. General Association of Engineers in Romania, (AGIR) (2012). Musculoskeletal Disorders in Agriculture. [Online]. [cited 2012 Oct 15];
Available from: URL: http://www.agir.ro/buletine/1276.pdf Kirkhorn, S.R., Earle-Richardson, G., &, Banks., R.J. (2010). Ergonomic risksand musculoskeletal disorders in production agriculture:
recommendations for effective research to practice. Journal of Agromedicine, 15, 281−99. Kumar, D. M. (2013). Ways and Means of Research Method. Research India Publication. New Delhi, India. Malaysian Trade Union Congress (MTUC) and International Federation of Free Trade Union (ICFTU) (1989). Laporan Kajian
Occupational Health and Safety Issues in Malaysia. Meyers, J.M., Miles, J.A., & Tejeda, D.G., et. al. (2002). Priority risk factors for back injury in agricultural field work: vineyard ergonomics.
Journal of Agromedicine, 8, 39−54. National Research Council. (2001). The Institute of Medicine. Musculoskeletal disorders and the workplace: Low back and upper extremities.
Washington, DC: National Academy Press. Ng, Y.G., Bahri., M.T.S., Syah, M.Y.I., Mori, I. & Hashim, Z. (2013). Ergonomics Observation: Harvesting Tasks at Oil Palm Plantation.
Journal of Occupational Health, 55, 405–414. Osborne, A., Blake, C., & Fullen, B.M., et al. (2012). Prevalence of musculoskeletal disorders among farmers: a systematic review. American
Journal of Indigenous Medicine, 55, 143−58. Rainbird, G., & O’Neill, D. (1995). Occupational disorders affecting agricultural workers in tropical developing countries: results of a
literature review. Applied Ergonomics, 26, 187−93. Sesto M. (2000). Chronic Musculoskeletal Disorders in Agriculture for Partners in Agricultural Health. University of Wisconsin-Madison.
[Online]. Available from: URL: http://www.worh.org/files/AgHealth/musc.pdf[cited 2012 Oct 15th]; Solecki, L. (2001). Current state of ergonomics in agriculture--future needs. VIII International Symposium on Ergonomics, Work Safety and
Occupational Hygiene. 22−24 October 2001, Lublin. Annual Agricultural and Environmental Medicine, 8, 297. Walker-bone, K., & Palmer, K. T. (2002). Musculoskeletal disorders in farmers and farm workers. Journal of Occupational Medicine, 52(8),
441-450. http://dx.doi.org/10.1093/occmed/52.8.441

Proceedings of 4th
International Conference on Global Business Environment
(ICGBE-2014)
184
Categorizing and Fixing Variables on Entrepreneurial Intention through Qualitative Research
Muh. Amsal. Sahban, Dileep Kumar, Subramaniam Sri Ramalu
Othman Yeop Abdullah Graduate School of Business, Universiti Utara Malaysia, Malaysia [email protected]
Abstract: Many policies and regulations have been made by Indonesian Government to enhance the quality of graduates in higher education. Numerous programs have been launched to build the mentality and business awareness of university students such as National Science Fair (PIMNAS), Student Entrepreneur Program (PMW), Student Creativity Program (PKM), Business Incubator Program and many other programs that can enhance the propensity of the students to start up a business. However, there are only 17% of the graduates who are willing to become entrepreneurs each year. This indicates that students have a lack of intentions to become entrepreneurs. However, there is less research and literature to support the argument that the students do not have entrepreneurial intention. In order to explore the entrepreneurial intention among the Indonesian students graduating universities and business schools from a qualitative study was conducted. The methodology used to develop an appropriate variable for entrepreneurial intention is focused group discussion (FGD), case analysis, interviews and Delphi technique measures the student's entrepreneurial intention. There are 20 experts were willing to take part in this study and the study identified 4 factors that eventually suit the student desire to deal with entrepreneurship. This study gives a valuable contribution to the higher education institutions, to orient the students to become entrepreneurs through right grooming by ensuring better business incubation centers and curriculum. Keywords: Entrepreneurship, entrepreneurial intention, students, entrepreneurial incubation center
1. Introduction Entrepreneurial intentions lately began to receive attention for study because it is believed that a behavioral intention is proven to be a reflection of actual behavior (Krueger, 1993).Attitudes, behaviors, and interests of students towards entrepreneurship are influenced by consideration of the various aspects of the career choice as an entrepreneur. Consideration of the career options may vary depending on the preference of the risks that they will be responsible later. Students who have less courage to take risks (risk averter) tend to choose to be an employee of the private sector, civil servants, or employees of State Owned Enterprises (SOEs) as their career option, while for those students who are able to take risky action (risk takers) by leaving their comfort zone will tend to take up entrepreneurship as a career option (Lestari & Wijaya, 2012). However, Indonesia relies more on the entrepreneurs compared with the civil servants or employee because a large number of entrepreneurs can enhance the economic growth and development which are still considered very low in Indonesia.Meanwhile, only 17% of the graduates who are willing to become entrepreneurs each year, this indicates that students have less intention to become entrepreneurs (Amrullah, 2012; Fitriati, 2012; Rahmawati, Suwarto, & Endarwati, 2010). Other studies revealed that Indonesia only has 570.339 entrepreneurs or 0.24% this year (Arcom, 2013). This percentage still very low if we compare to Malaysia and Singapore and China. In order for a country to be considered as developed, the country must have at least 2% of entrepreneurs from its population (Mc Celland, cited in Rochmah, 2013). It is not few graduates recently wanting to be an employee, the result of many surveys and observations with the students revealed thatthere are around 75% want to apply for the job, in other words they want to be employees and only around 4% who answered that they would like to deal with entrepreneurship and the rest want to be employees(Brawijaya University, 2013). This result is in line with the study conducted in Spain. The study in Spain with the sample of 601 university students from Castilla district indicated that there is a high intention of the student to be an employee in both private or public companies, however, their intention to be entrepreneurs is low (León, Descals, & Domínguez, 2007). This study analyzes the low intention among students to be an entrepreneur because a stimulation of entrepreneurship activities provided by the universities is still low. Issues pertinent to entrepreneurial intention: There are several factors that lead a student does not like entrepreneurship, including the majority of students prefer the safer way rather than facing challenges to entrepreneurship.Students mostly prefer a safe way to obtain income rather than facing challenge to be an entrepreneur (Putra, 2012). They are generally not willing to take a risk, especially in term of funds. Zain (2013) stated that that the higher the someone’s education level, the lower the intention they have. From this study, it was revealed that only 6.14% of the graduates who want to take a part in entrepreneurship, while more than 20% of those who did not finish their study in elementary school are willing to be entrepreneurs. In addition to that, the data from the General Directorate of Youth and Education, National Education Departement stated that from 75.3% of youth, 6.6% are from university graduates, and 82% from the amount of youth are working as an employee at public and private institution, while only 18% become entrepreneurs. Further, the advisor of the Minister of Cooperatives and SMEs, Drs. Sutarto announced that student’s interest in entrepreneurship remains low.In 2011, over 10,000 students attended the studententrepreneurship programs, but it's only 5,000 students who make it happen and of the 4.8 million students, only 7.4 percent of students who are interested in entrepreneurship(Sutarto, 2012).Students are generally not willing to take risks, especially in terms of the use of funds. Basically, those who have the financial ability to spend their money prefer to spend their money in consumptive way. While they did not dare to spend money on activities which involve risks or entrepreneurial activity (Sulistyorini, 2013). This phenomenon indicate that the level of knowledge and awareness of university graduates about the importance of entrepreneurship is still very low that lead to a lower interest of entrepreneurship of the students(Astuti, 2013). Astuti(2013)also states that the students in senior high school located in Bandung, Indonesia are not even being embedded in a mindset of entrepreneurship, resulting they choose to become an employee instead of an entrepreneur. Referring to that, we can easily measure their mentality and business awareness and predict that they are likely to become job seekers once they pass out from universities. Lack of interest in entrepreneurship mostly because starting a business is too heavy compared to work in a company or other formal employment. In addition, the number of competitors in the business world also makes the graduates of vocational school feel less confident to open a

Proceedings of 4th
International Conference on Global Business Environment
(ICGBE-2014)
185
business. Lack of competence of the students also makes students less motivated, resulting they have no courage to take the risk to open a new business. This is because of there is a shadow of failure that will be faced in the future (Mustikawati & Bachtiar, 2008). Entrepreneurial world is basically a fairly rational choice in a situation and condition that are difficult to be relied upon, as well as the difficulty of finding a job. However, the entrepreneurial world until now has not become a demanded job field to young people. Even though there are many entrepreneurship programs have been launched to grow the entrepreneurial spirit and business awareness among Indonesian society, the people are unlikely interested in entrepreneurship. This statement is also supported by Ramadhan (2012), he found that the awareness of society and university students in Indonesia toward entrepreneurship spirit is still relatively low where their mindset is still embedded an employee spirit, particularly for the university graduates.Most of thegraduatesare not onlyexpectingto become a civil servant, but also are having lazy nature (do want to work), not yet ready for use, poor mental attitude, not confident, etc.Such characters are derived from a life that full of doubt, without having a firm orientation, the mentality is not good, no self confidence, no discipline, and a mentality that ignores the responsibility. It is due tothe difficulty to alter the perception of community that being an entrepreneur is a lucrative and noble job because it could open job vacancies for other people(Ifham & Helmi, 2002). On the other hand, the government does not totally encourage the emergence of new entrepreneurs; they are only shaping students to be employees. In other words, they only prepare the graduates to work in the company rather than being entrepreneurs who are able to reduce the number of unemployment, crime and are able to enhance the economy of a nation (Mulyana, 2013). 2. Literature Review There are quiet a lot definitions of entrepreneurship that are explained by previous researchers. For instance, Cole (1959) views the entrepreneurship as an activity that aims to initiate and establish trading that orientate to profit. While Kao(1995) declared the entrepreneurship as the process of creating something creatively and differently (innovation) which aims to acquire wealth for individuals and increase the value-added in society. Knight (1921)stated that entrepreneurship as an individual's ability to deal with risky activity anduncertainty in order to obtain a profit. As stated bySexton and Bowman-Upton(1991), entrepreneurship as a process of recognizing the opportunities with certainty that exist in the market, preparing resources to achieve the goals that ultimately the necessity of resources will be exploited in order to achieve personal gain in the long term.Meanwhile, according to Schumpeter (1934)argued that entrepreneurship aims to run new combinations such as creating a new product or service, obtaining new sources of raw materials, targetingnew markets, and new organizational formation. Entrepreneurship is considered very effective to reduce the problem of unemployment. Someone who has the entrepreneurial skills will be able to compete with others, including overseas labor strike in the midst of globalization. Entrepreneurship is one of the areas of work that could be an option for a person when he decided to enter the workforce. Entrepreneurship is a word often used to translate the word entrepreneurship as a process of creating something different with value devote the necessary time and effort, being willing to bear the financial risk, psychological, and social as well as generate financial rewards, personal satisfaction, and freedom(Hisrich & Peters, 1998). On the other hand, intention is an attribute that relatively stay on individual its impact is very big toward one’s activity because the individual will perform something that he is intended to, while, without the intention, the individual would not perform anything.As explained by Mustikawati and Bachtiar(2008)the interest is an intrinsic power to encourage, influence or cause the individual concerned or interested in something outside themselves consciously accompanied by pleasure. The ultimate purpose of intentions research is the prediction of behavior. Entrepreneurial intentions can be interpreted as the first step of the establishment process ofbusiness that is generally long term(Lee & Wong, 2004). As discoursed by Krueger(1993),entrepreneurialintention reflects the commitment of a person's to start a new business and is a central issue that need to consider in understanding the entrepreneurial process of new business establishment. Entrepreneurial intentions lately began to receive attention for study because it is believed that a behavioral intention is proven to be a reflection of the actual behavior. A person with the intention to start a business will have the readiness and better progress in the effort to run than someone without intense to start a business. As stated by Krueger (1993), the intention has been proven to be the best antecedent for one’s entrepreneurial behavior. Referring to that, we can simply use the intention as a predictor to understand who will definitely intent to be entrepreneurs (Choo & Wong, 2006). Lee and Wong(2004)affirmed that theentrepreneurial intention is the first step of the process of establishment of a business that is generally long term . Theory of Plan Behavior Model: One of the entrepreneurial interest models is a theory of Planned Behavior is (Ajzen, 1991) and has been heavily used in some research literature given its ability to reflect a person's behavior and interest in entrepreneurship. Based on the beliefs, attitudes, and person’s interests will certainly affect the behavior of the individual In the context of entrepreneurship, this means that the trust of an entrepreneur, and a person's attitude to entrepreneurship can be an entrepreneurs as well as building a business. Theory of Planned Behavior which is derived from the Theory of Reasoned Action (Fishbein & Ajzen, 1975), where the TRA states that a person's behavioral interests may be shaped by attitudes toward the behavior and subjective norms of the individual (for example, the attitude can be influenced by others such as parents, spouse, idol and so on) (Mcstay, 2008). Thus, either the attitude or the subjective norm is affected by the evaluation which means a motivation belief whichis formed through one's environment. For more details, Theory of Reasoned Action can be seen in Figure 1 below:
Figure 1: The Theory of Reasoned Action
Source : Fishbein and Ajzen (1975) cited in McStay (2008)

Proceedings of 4th
International Conference on Global Business Environment
(ICGBE-2014)
186
On the other hand, Theory of Planned Behavior assumes that human behavior is largely derived from the interest of the individual to display such behavior and their ability to decide or make a decision to do something (their own willing). This theory explains that a person's interest depends on three factors : (1) a person's attitude toward the behavior (do I want to do it ?) , (2) subjective norm (do other people want me to do it ?), And ( 3 ) perceived behavioral control ( do I perceive I am able to do it and have the resources to do it ?). Basically , the third factor is the additional factor of the original model - Theory of Reasoned Action . Person's attitude toward the behavior and subjective norms were also considering motivational factors that can affect behavior . In contrast , the three factors (perceived behavioral control) is assumed as the description of non-motivational factors that can influence behavior, in the case of entrepreneurship there are capital, skill , labor , location and so on. If these three factors combined, those would reflect the actual behavior of individuals and generally can be used to predict a person's interest or behavior (Ajzen , 1991, in McStay , 2008).
Figure 2: The Theory of Planned Behavior by Ajzen (1991) cited in McStay (2008) Source: Ajzen (1991) cited in McStay (2008) The figure above explains that attitude toward behavior, subjective norms, and perceived behavioral control can affect a person's intention while intention can affect a person's behavior. Despite the absence of attitude and subjective norm, but if it is supported by perceived behavioral control is good, then it will also be able to influence the behavior of a person to make choices and take decisions. While between the attitude, subjective norms, and perceived behavioral control can affect to each other. Then, Gurbuz and Aykol (2008) developed this model by taking several indicators to measure entrepreneurial intention which constitutessecurity and workload, avoid responsibility, economic opportunity and challenge, autonomy, authority, self-realization, participation, social environment and career, perceived behavioral control Shapero-Krueger Model: Today there have been several models of entrepreneurial interest developed by some experts such as Shapero and Sokol(1982)have developed a model of entrepreneurial interest is known as the "entrepreneurial event formation" which is considering a change in the flow of life and its effect on the individual's perception and desire for a new formation. This model assumes that the change of life will affect changes in a person's interest in entrepreneurship and subsequent behavior. The move will lead to two things whether negative or positive, negative for instance, there is a loss of a job and so on, while the positive things such as obtaining financial support. Propensity to become entrepreneurs and create a new venture highly rely on one's perception of desirabilitysuch as “do I want to execute it?” And feasibility such as ' do I have the resources to perform it? Guerrero, et al.,(2008) in Gurbuz and Aykol(2008) also stated the same thing where there are two related literatures have similarities about the factors that influence the behavior of a person to perform a certain activity. The approaches are: Shapero approach which is known as Model Shapero Entrepreneurial Event ( SEE ) and the Model Theory of Planned Behavior ( TPB ). As discoursed by Shapero there are two perceptions that influence a person's behavioral intention, namely; 1) perceived desirability that refers to the perception of someone for behavior that is attractive and desirable, 2) perceived feasibility that constitutes one's perception of her ability to perform the desired behavior. Krueger(2000)then inserts the three predictors as determination directly or indirectly toward the intensity of self-employed like propensity to act, which indicate a motivation in a person to behave. The intensity varies for each individual so that it is widely known asShapero-Krueger Model [See fig. 3](Krueger et al., 2000). Figure 3: Shapero-Krueger Model
Source: Krueger, N., Reilly, M. D., & Carsrud, A. L. (2000)
Intentions
Perceived Desirability
Propensity to Act
Perceived Feasibility
Specific Desirability
Perceived Self-Efficacy

Proceedings of 4th
International Conference on Global Business Environment
(ICGBE-2014)
187
To determine on how entrepreneurial goals are evident in ‘Entrepreneurial Event Formation’ Shapero and Sokol looked at life path changes and their influence on the individual’s perceptions of both desirability and availability leading to new business implementation. This framework considers that substantial life changes (displacement) precipitate a change in entrepreneurial desire and subsequent character. Displacement can happen in a negative form (e.g. Divorce, loss a job) or a positive form (financial support, good business partner). The desire to become an entrepreneur and make new business (an entrepreneurial happens), therefore, rely on one’s perceptions of both desirability and feasibility with regard to that activity (Mcstay, 2008). A good character is determined by the choice an individual makes for a given situation (in this situation to this decision maker) plus some “propensity to act” (Without which significant action may not be taken). “Credibility” requires a behavior be seen as both desirable and feasible. Entrepreneurial events thus require the potential to start a business (credibility and propensity to act) to exist before the displacement and a propensity to act afterwards (Shapero & Sokol, 1982). Perceptions of desirability of entrepreneurship: According to Shapero and Sokol, the entrepreneurial event is a product of an individual’s perception of desirability of entrepreneurship affected by their own personal attitudes, values and feelings, which are a result of their unique social environment (eg. Family, peer groups, educational and professional influences). In other words, an individual needs to see the act of self-employment as desirable before is likely self-employment intentions will be formed(Mcstay, 2008). Perceived desirability also reflected the personal attractiveness of starting a business and very closely relates to Ajzen’s attitude and subjective norm variables(Krueger et al., 2000).Bird(1988) cited in McStay(2008)considered desirability to be formed through ‘intuitive thinking’ in the intentions process. Giagtzi(2013) stated that the desirability can be influenced by the normative environment (social norms) and cultural factors. Perceived desirability of entrepreneurship is an affective attitudinal judgment (an emotive response) and entrepreneurs use such judgment to make decisions on whether or not to act(Mitchell et al., 2002). It is possible that university student possessing desirability for self-employment will consider self-employment as a viable career option following their graduation from university education. The desire of pursuing entrepreneurial action is a function of motivation and it is reasonable to assume that both participation in entrepreneurship education and previous entrepreneurial experience would be motivating factors for one to consider self-employment as a career option(McMullen & Shepherd, 2006). Perception of desirability refers to one’s entrepreneurial attitude who wants a better effort and always evaluates the cost and benefit of entrepreneurial activity results. Therefore, the higher the desirability and feasibility, the stronger the one’s intention to perform an entrepreneurial activity (Hisrich, 2008 in Astuti, 2009).On the desirability side, is generally accepted that the students, at this moment of their life, have more positive intrinsic motivations (to be independent from the economic point of viewto create something own or to create personal patrimony in the long term period) the necessities (to find a good job and monetary retributions to find a status in the society). Also, other influence is the normative environment (social norms) that exists in each region. It is noted that there are favorable attitudes towards entrepreneurship and specifically a positive perception of the entrepreneur as a profession(Guerrero, Rialp, & Urbano, 2006). Perceived desirability is defined as “the degree to which starting a new business is perceived as a desirable career option”. The three perceived desirability cognitive script element measures in the Krueger scale are: I would love doing it; I would not be tense at all; I would be very enthused(Dodd, Komselis, & Hassid, 2009). Perceived desirability reflected the personal attractiveness of starting a business and very closely relates to Ajzen’s attitude and subjective norm variables(Krueger et al., 2000). This is impacted by social background, which is comprised of broader cultural influences, as well as family, friends, and personal exposure to entrepreneurship. This history results in a pre-loaded perspective about this path or choice, positive or negative(Kuehn, 2008). Perceptions of feasibility of entrepreneurship: Based on Shapero’s Entrepreneurial Event(Shapero & Sokol, 1982), the perception of feasibility of entrepreneurship is based onone’s perception of available resources (e.g. Knowledge, financial support, and Colleagues). Krueger et al(2000) stated that perceived feasibility is the degree to which the individual feels personally capable of starting a business. Based on the Shapero-Krueger model, entrepreneurial self-efficacy is a suitable proxy for perceived feasibility. Moreover, McMullen and Shepherd(2006)asserted that belief in the ability to pursue entrepreneurial action (perceived feasibility) is a function of entrepreneurial understanding. McStay(2008) introduced Perceived entrepreneurial self-efficacy which is a specific form of self-efficacy. It means that an individual’s perceptions of their own entrepreneurial abilities. There are some item-scales addressed three different roles associated with entrepreneurial business ownership. The three tasks included opportunity recognition and innovation; business, financial and human resource management, and coping with risk and unexpected challenges. Efficacy for each task was assessed with five items. An example of statements from each task follow: opportunity recognition and innovation (“I believe I can create products or services that fulfill customers’ unmet needs” and “I believe I can think creatively in business”); Management Skills (“I believe I can establish and achieve goals and objectives related to a new business venture” and “I believe I can identify and build a management team to develop a business”); coping with risk and unexpected challenges (“I believe I can tolerate unexpected changes in business conditions”). Self-efficacy, which measures feasibility, also can be influenced by obstacles, personal capacities/skills, and confidence in their ability to perform entrepreneurial tasks, perceived availability needed to create a business and the regulatory environment(Gasse & Tremblay, 2011). In a similar train of thought, Drnovsek and Erikson (2005) in Giagtzi(2013) confirm that the individual’s control is dependent on the availability of opportunities, resources, as well as prior experiences. Bandura (1977) identified the four main sources of self efficacy beliefs: enactive mastery (prior experiences), vicarious experiences (observing others'performances), social persuasions (making people believe they are capable of being successful) and physiological stimulation. Perception feasibility reflects the level or degree or personal competence to start a business as felt by the person. This perception is viewed as related to Ajzen’s behavioral control variable in that both of these focus on a person’s assessment of his/her ability to manage the business start up process successfully. It is a measure of uncertainty, and uncertainty is the perception of controllability of a situation(Kuehn, 2008). Generally, relating to the idea of evaluating opportunity it is all about predicting the future, particularly with the integration of wealth resources (Haynie, Shepherd, & McMullen, 2009). Another explanation of the world opportunity has been introduced. Majorly comprises of three central components (Baron, 2006)such as potential economic value (ie. The capacity to generate profit), newness (ie.some product, serviceor technology that have not happened before), and perceived desirability (e’g moral and legal acceptability of the new product of service in society) . According to Gundry&Kickul (2007), in order to examine the opportunity, there are quiet a lot questions occurred such as :

Proceedings of 4th
International Conference on Global Business Environment
(ICGBE-2014)
188
1. The resources available to the entrepreneur and the management team, including the equity and debt sources of capital that are available and accessible, additional assistance from people with expertise needed by the firm, and the technology required to support the idea. What relationships can the entrepreneur or team relies on to acquire the necessary resources?
2. The knowledge and information demonstrated by the entrepreneur, including knowledge of the concept of new business, the industry, and market research. In addition, for the new venture to be a success, what sort of customer needs that should be identified? Facts relating to the competitors? Placing a priority for the costumer demand? How can this vital idea be attained?
3. The idea’s ability to generate revenue. How great the potential to sell something that is will generate actual revenues? One of the mistakes would be entrepreneurs make is to assume that everyone will love the idea and that people will be standing in line to buy it, once the business opens. To what degree can the entrepreneur manage and contain the costs while maximizing returns?
The Propensity to Act: Shapero’s idea on “propensity to act” is a personal disposition to act on one’s decisions, hence demonstrating one’s ability to do something (“I will do it”). It is hard to predict useful knowledge plan on intention if there is a lack of propensity to act. Actually, propensity to act on an opportunity relies on consistent check on one’s understanding an issue which is achieved by taking necessary action. Scientifically, we are required to obtain a measure that closely knit to start and to understandthe goal to channel human behavior depending on mishap. Relating to the influence of age on entrepreneurial propensity, they arise other great consequences. Firstly, the acquisition of human and financial capital will give rise thorough one’s life, that would likely commence with immediate effect. Secondly, an appreciable increase in private and job related commitment with a shorter lifespan will decrease to the propensity to venture depending on the risk and long-term oriented investment for a start up. Propensity means an inclination to do something, or an attitude of mind especially one that favors one alternative over others, or a disposition to behave in a certain way. Propensity to act reflects a person’s predisposition to act on a decision. Shapero and Sokol’s model presupposes an individual’s willingness to act on choices, but is explicitly developed by subsequent authors testing their model. This variable has been argued elsewhere to be similar to risk-taking propensity and tolerance of ambiguity, defined as a person’s willingness to take action when outcomes are not known (Shane, 2003 cited in Kuehn, 2008). As far as the measure of this variable, some have favored internal locus of control as an orientation to control life events, as has learned optimism(Krueger, et al., 2000). The possibility of venturing into thinking positive with the aim of getting an acknowledgement attach to be successful that is needed by an individual before he will give himself to the causes related to a failure, the alternative, the other means are getting little gains with little causes compared to the introduced condition(Hyrsky & Tuunanen, 1999). In addition, personal attitude predominantly affect entrepreneurial intention. Personal attitude represents an individual's belief about the value (value) which according to them is valuable and want to achieve in the future. Such value becomes one’s motive to pursue the profession of entrepreneurship. A number of motives are believed by researchers can be a driving factor to pursue one's profession such as freedom to act and make decisions, higher income, self-actualization, and self-reliance. Those motives will motivate students to pursue a profession as an entrepreneur in the future (Lestari & Wijaya, 2012).In addition to those 3 dimensions, there is another thing that we need to take into account which isthe self realization dimension. Self Realization-Participation: Self discovery is a way of appreciating one's potential by manifesting one’s true ability. The sun covered by thick cloud is a good way of comparing oneself with others of similar character which is not visible in oneself in the day to day activity. the separation of thinking too much about oneself, hidden traits with its psychosomatic character making a room for psyche's energy to affect one's world as it is, free of any assumptions.According to Alsos and Isaksen (2012) there are four statements were included in the self-realization dimension: (i) self-realization, (ii) realize one’s dreams, (iii) to have an interesting job, and (iv) to create something. Gurbuz and Aykol (2008) describe self-realization as participate in the whole process. Gurbuz and Aykol (2008) also used some attributes to measure self realization and participation of the individuals, they are: (1) to create something, (ii) to take advantage of your creative needs, (iii) to follow work tasks from a to z, (iv) participate in the whole process. Self realization also refers to the act of achieving the full development of your abilities and talents (http://www.learnersdictionary.com/definition/self-realization). Self realization described reasons involved with pursuing self-directed goals (Carter, Gartner, & Greene, 2002). Carter, et.al (2002) also used four items to represent the pursuit of self-realization that can motivate individuals to become entrepreneurs (i) fulfill a personal vision; (ii) to lead and motivate others; (iii) to have the power to greatly influence an organization; (iv) to challenge myself. 3. Methodology Delphi is one of the reliable qualitative research technique made by researchers with the expert opinion (Kumar, 2013). The research methodology undertaking by Delphi method reveals a deeper understanding into the main causes of setting up a business center. The Delphi approach was introduced by Dalkey and Helmer (1963) at the Rand Corporation in the 1950, is a broad way and generally use an approach of obtaining combined ideas relating to knowledge permitted by professional in a specific area of specialization, seeking on the expression "two heads are better than one, or ..n..heads are better that one" (Dalkey, 1972), the Delphi approach is adapted as a group communication process that focuses on getting comprehensive observation and making a particular point with the aim of setting goals, policy finding or making prediction for future activities (Ulschak, 1983; Turoff&Hiltz, 1996; Ludwig, 1997). This research engaged semi-structured interviews. Based on the suitable time for the resource person interviews were arranged, during 2012 July to 2012 December. Telephonic interview is conducted to gather information from the respondents. 40 experts from the industry and academia were identified and approached by email or telephone and were invited to take part in the study. All the clarifications related to the objective of the study were made by the researcher. However, 30 respondents were being interacted and communicated, only 20 respondents shown their willingness to participate in the discussion. Finally, 20 participants were interviewed by telephone and through email. The conversations taped recorded, and manually analyzed. The procedural steps in adopting the Delphi technique weredescribed as follows. Expert panel identification: The group of professional was made from specialists having high knowledge and expertise in entrepreneurial orientation. They are closely associated with industries, as consultants, Owners of industries, Top level managers, Entrepreneurs, Professors, Researchers and Academicians. The specialized areas of these expert members include, 15 male members (75%) and 5 female members (25%). These dynamic groups of panel of experts are knowledgeable and familiar to give relevant opinions and an admissible understanding of the concept of entrepreneurial orientation.

Proceedings of 4th
International Conference on Global Business Environment
(ICGBE-2014)
189
Rounds Round 1: In the first round, the Delphi process traditionally begins with an open-ended questionnaire. The open-ended questionnaire serves as the cornerstone of soliciting specific information about a content area from the Delphi subjects (Custer, Scarcella, & Stewart, 1999). The questions: 1. How do you define entrepreneurial intention? 2. How do you relate the entrepreneurial intention with entrepreneurial learning and development? 3. Which are the major factors, in general closely related to entrepreneurial intention? 4. Contextualizing the topic to the Indonesian scenario, which are the major factors, closely related to entrepreneurial intention in
Indonesia? Round 2: In the second round, each Delphi member receives a second questionnaire and is asked to review the items summarized by the investigators based on the information provided in the first round. Accordingly, Delphi panelists may be required to rate or rank-order items to establish preliminary priorities among items. Because of round two, areas of disagreement and agreement are identified (Ludwig, 1994). In this round, consensus begins forming and the actual outcomes can be presented among the participants’ responses (Jacobs, 1996). Information regarding the influential factors of entrepreneurial orientation collected from the respondents. The process identifies 191 categories, which are having items with high and low proximity of entrepreneurial orientation identified. Rating process further identified in the categories and items identified. Round 3: In the third round, each Delphi panelist receives a questionnaire that includes the categories and items ratings, summarized by the investigators in the previous round and are asked to revise his/her judgments or “to specify the reasons for remaining outside the consensus” (Pfeiffer, 1968). This round gives Delphi panelists an opportunity to make further clarifications of both the information and their judgments about the relative importance of the categories and items. Second level screening of the 191 categories which were having a high and low influence on business incubation centers identified with corresponding items. The process further identified 60 categories, which are having high and low proximity of the entrepreneurial orientation identified. Classification of the items in 60 categories of 4 factors was being made with appropriate loaded items. Thematic presentation and the categorization of the items were done. Round 4: In the fourth and often final round, the list of remaining items, their ratings, minority opinions, and items achieving consensus are distributed to the panelists. This round provides a final opportunity for participants to revise their judgments. It should be remembered that the number of Delphi iterations depends largely on the degree of consensus sought by the investigators and can vary from three to five (Van de Ven, Gustafson, 1975; Ludwig, 1994). During third level, screening of the 45 categories of 4 factors which were having items with high and moderately high proximity of entrepreneurial orientation identified. Sought the expert opinion on the appropriateness of the core factors selected for the study. 4. Results Table No 1: Delphi table on Entrepreneurial Intention
No Factors Categories No. of items
No. of Experts (N=20)
% of Experts
1 Perceived Desirability
Intention to be self employed. 1 17 85 Personal attractiveness of starting a business. 2 18 90 Intuitive thinking 2 15 75 Using attitudinal judgement 3 15 75 The desire for Entrepreneurial action. 2 17 85 Entrepreneurial attitude 2 17 85 Positive intrinsic motivation. 3 18 90 Positive perception 2 17 85 Perceived desirable career option. 2 18 90
2 Perceived Feasibility
Availability of knowledge and information 2 17 85 Availability of financial support 2 17 85 Availability of partners 2 16 80 Capable of starting a business 2 15 75 Having strong self-efficacy 2 17 85 Availability and accessibility of resources 2 17 85 Ability to pursue entrepreneurial action. 3 16 80 Ability to create products 4 16 80 Ability to cope with risk 2 15 75 Creative thinking 2 16 80 Envisioning the future 2 16 80 Confidence in performing entrepreneurial tasks 3 17 85 Prior experience 2 15 75 Observing other’s performance 3 15 75 Ability to convince others 3 16 80

Proceedings of 4th
International Conference on Global Business Environment
(ICGBE-2014)
190
Transforming the changes in technology 2 17 85 Personal competence 2 15 75 Self assessment to start up business 2 15 75 Legal acceptability of the new product 2 16 80 The idea’s ability to generate actual revenue 2 16 80
3
Self Realization-Participation
Participation in the whole process 3 18 90
Fulfill a personal vision 2 18 90 Lead and motivate others 3 17 85 The power to greatly influence an organization 2 17 85 Taking a self challenge 3 18 90 Creating something new 3 17 85 Taking advantage of one’s creative needs 3 17 85 Following work tasks from a to z 2 16 80 Reason with self-directed goals 2 15 75
4 Propensity to act
Disposition to behave in certain ways. 2 15 75 Person’s predisposition to act on a decision. 2 17 85 Desire to gain control by taking action. 2 16 80 Propensity to venture risky investment of a start up 3 18 90 The inclination to do something 2 17 85 Willingness to act on choices 2 15 75 Willingness to take action on certainty. 3 18 90
The first factor considered for the study was Perceived Desirability. The result indicates that the experts identified 19 items which come under 9 categories of perceived desirability. The table showed that personal attractiveness of starting a business (90%), perceive starting a new business is a desirable career option (90%) and having strong positive intrinsic motivation (90%) as the prominent factors which closely knit with an entrepreneurial intention towards young students. The experts also identified forming the intention to be self employed (85%), the desire of pursuing entrepreneurial action (85%), one’s entrepreneurial attitude who wants a better effort (85%) and positive perception on entrepreneur (85%) as the second most important factors that closely describe the entrepreneurial intention, followed with intuitive thinking in the intentions process and using attitudinal judgment to make a decision that constituted 75% of the experts’ consensus. The young wards need to have knowledge of these categories of entrepreneurial intention. The second factor considered for the study was the perceived feasibility in relation to entrepreneurial intention. The experts acknowledged 46 items. The factor perceived feasibility consists of 20 categories. Major factors identified by the researcher such as availability of knowledge and information (85%), availability of financial support (85%), having strong self-efficacy (85%), availability/accessibility of resources (85%) and confidence in their ability to perform entrepreneurial tasks (85%) and linking and transforming the changes in technology (85%) in relation to the theme of entrepreneurial intention. Other factors like availability of partners (80%), ability to pursue entrepreneurial action (80%), ability to create products that fulfill customers’ unmet (80%), having creative thinking in business (80%), envisioning the future (80%), ability to convince other (80%) and legal acceptability of the new product (80%) as well as the idea’s ability to generate actual revenue (80%) are the next key factors on entrepreneurial intention. The supplementary factors identified by the expert include the capability of starting a business (75%), ability to cope with risk and unexpected challenges (75%), having prior experience (75%), observing other’s performance (75%), the level of personal competence (75%) and the self achievement to start up business(75%). The third factor that correlated to business incubation centers was the Self Realization-Participation. The experts identified 23 items under 9 the categories of the major factor Self realization-participation in relation to student's intention to start up a business. The experts pointed out major influential categories like participation in the whole process (90%), fulfill a personal vision (90%) and challenging own self (90%) that are closely coupled to students' interest to involve in self employed. Further, the study also pointed out categories like to lead and motivate others (85%), to have the power to greatly influence an organization (85%), creating something new (85%), and taking advantage of one’s creative needs (85%), as categories in closely knit with entrepreneurial intention. In addition to the above factors, the experts also related the following work tasks from a to z (80%) of the students in their intention towards self employed. The experts have given minor scoring one category like Reason involved with pursuing self-directed goal (75%) also has close affinity with the entrepreneurial intention of university students. The last factor identified by the expert is Propensity to act. The experts identified 16 items under 7 categories that closely link to the young entrepreneur's regarding the propensity to act. Among this factor, major categories identified by the expert include a propensity to venture upon the risky investment of a startup (90%), and willingness to take action when outcomes are not known (90%). Further, the study considers categories like a predisposition to act on a decision (85%) and inclination to do something (85%) as second prominent factors in relation to the propensity to act. They further pointed out other categories such as desire to gain control (80%), disposition to behave (75%), and a willingness to act on choices (75%) as the categories that closely knit with the propensity to act. Younger students need to have orientation on these categories of entrepreneurial intention. Discussion: This particular study on entrepreneurial intention was to identify and fix variables through Delphi technique. As we aware a lot of models are available to study entrepreneurial intention among students, newcomers, new entrepreneurs, etc. While, with specific reference to Indonesian context how far these models and antecedents correlate with the entrepreneurial intention among students was yet to be as certain. Hence a study was made for categorizing fixing variables on entrepreneurial intention among Indonesian students. In these particular studies, two major models which are available in Entrepreneurial Intention context is well integrated and further

Proceedings of 4th
International Conference on Global Business Environment
(ICGBE-2014)
191
evaluated with expert opinion using the Delphi technique. The results of the Delphi technique indicate that the variables coming from these two models are well supported by the expert and further considered for understanding EI among students of Indonesia. The first factor expert identified in this particular research was perceived desirability, this dimension further elaborated as a student keen intention to become self-employed high attractiveness of starting a business, intuitive thinking in the intention process, high judgemental attitude in decision making, attitude to put better effort, very high positive intrinsic motivation, seeing entrepreneurship as a desirable career option and finally there is a positive outlook toward becoming an entrepreneur. Among these categories, the most important factors the expert identified was the strong positive intrinsic motivation and the student keen aspiration to become an entrepreneur. This indicates that these students need to have a perceived desirability of forming an intention to be self-employed. These attitude totally different from a person who wants to become a government employee or engage in casual employment without taking any risk in life. Intuitive thinking was the most important aspect with support a student desire to become self employed to see several ideas of the business, to understand how to make money and profit and select a career path with self confidence and risk taking and high tolerance. In order to get the desirability, the students should have basically a personal attraction to face the challenges and business and step by step walk toward success in any ventures he might take in the future. By measuring all these categories in relation to major factors perceived desirability support in measuring students' entrepreneurial intention. The second factor identified by the expert is perceived feasibility of a new ventures the students may take up soon after the completion of the course. In this context, the expert has categorized many aspects related to the feasibility of the project. In order to start the venture, a student need to have several information like starting a business, getting financial support, getting the right business partners, right entrepreneurial actions, level of personal competence, ability to convince the stakeholder, creative thinking, customer orientation, strong self efficacy, market analysis and prior experience. The feasibility of a business lies with several factors like market orientation, customer orientation, raw material availability, prior experience in handling business, availability of finance, availability workers, knowledge about logistics and supply chain, etc. Lack of knowledge related to all these prominent entrepreneurial factors may lead to business failures. So the experts have the opinion that the students need to perceive adequate feasibility on related categories which are identified elsewhere that determine their intention to become entrepreneurs. These categories need to be explored with adequate number of items in order to measure students' intention to become an entrepreneur. The third factors identified by the expert was self realization-participation. One of the most important aspect a student need to have in the learning and development process related to entrepreneurship is awareness about their self, abilities, vision of life and think differently from others. The students should not only ensure there on confidence in taking up the risk, facing the challenges, leading their personal vision with which they must lead them self and others all activities envision so far for the attainment of goal realization. The student need to have better participation in the whole process by leading and motivating others, challenging the present scenarios, following creative thinking, that support all activities from a to z reasoning and pursuing self directed goals. By assessing these categories, the researchers would be able to measure students' attitude toward entrepreneurial intentions. The last but not least factor identified by the expert include the students' propensity to act toward their goal to become an entrepreneur. In order to quantify their behavior, their disposition to act on entrepreneurial decision, they desire to gain control over the decision to become an entrepreneur, the propensity to venture upon risky investment, the strong inclination to do something by themselves rather than becoming a follower of the system, the decision to lead by choices than by chance and their strong inclination to choose a career as entrepreneur need to be measured. The measurement of all these categories would be able to assess whether the student will opt their career as an entrepreneur or their propensity to act as an entrepreneur. Hence forth, these four factors and the respective categories like to perceive desirability, perceived feasibility, self realization-participation and the propensity to act toward entrepreneurship need to be measured to examine student’s entrepreneurial intentions.
Implication: This particular study on entrepreneurial intention has the objective of identifying and fixing right variables to conduct and elaborate study on the student’s and their ability to convert their desire to intentionally further becoming an entrepreneur. The study identified 4 entrepreneurial intention factors like perceived desirability, perceived feasibility, self realization-participation and propensity to act which are closely related to entrepreneurial intention among Indonesian student. The study having far reaching implication when customizing the variables, connecting to various models in the Indonesian context. Before adopting a model in its application on varied geographical location and stakeholders, care should be taken that these variablesthat were developed in the west may or may not have its suitability to the east. So, fixing up variables on a theme like entrepreneurial intention among Indonesian students that need to integrate variables from different authors like Ajzen (1991)Shapero and Krueger(1982) as well as Gurbuz and Aykol(2008). This particular research thus leads us to point out theoretical and managerial implications closely connected to its adaptability in the Indonesian context, by identifying the need of integrating models and variables from different authors on the same phenomena.
5. Conclusion Several studies have been conducted tomeasure entrepreneurial intention among varied stakeholders. These studies have adopted single model and theoretical grounding to measure entrepreneurial intention among the stakeholders. Being different from the past studies, this particular study integrates 2 to 3 models available in entrepreneurial intention proposed by several research scholars to measure entrepreneurial intention among Indonesian student in universities and business schools. In order to integrate these models, this particular study employed delphi technique of qualitative research that runs through expert opinion in order to identify the factors, fix the categories belong to each factor and expose these categories and factor for extensive studies with the support of quantitative research. This study thus identifies 4 factors and 45 categories that support the researchers to have the extensive studies on Entrepreneurial Intention among Indonesian students.
References Ajzen, I. (1991). The Theory of Planned Behavior. Organizational Behavior and Human Decision Processes, 50(2), 179–211.

Proceedings of 4th
International Conference on Global Business Environment
(ICGBE-2014)
192
Alsos, G. A., & Isaksen, E. J. (2012). Closing the gender gap ? Entrepreneurial training and entrepreneurial intentions among male and female youth. In the 17th Nordic Conference on Small Business Research. Helsinski: Bodø Graduate School of Business at the University of Nordland.
Amrullah, A. (2012). Mayoritas Lulusan Perguruan Tinggi tak Tertarik Jadi Wirausahawan, Kok Bisa? Retrieved from http://www.republika.co.id/berita/nasional/umum/12/03/03/m0aira-mayoritas-lulusan-perguruan-tinggi-tak-tertarik-jadi-wirausahawan-kok-bisa
Arcom. (2013). Sekjen Kemenakertrans Muchtar Luthfi Membuka Forum Inkubator Bisnis Asia Pasific di Bandung. Retrieved from http://arcom.co.id/2013/06/11/sekjen-kemenakertrans-muchtar-luthfi-membuka-forum-inkubator-bisnis-asia-pasific-di-bandung/
Astuti, D. A. W. (2009). Pengaruh Konteks Keluarga, Kerja, Pendidikan, Hambatan Dalam Memulai Bisnis, Dukungan Sosial, Nilai – Nilai Individualisme dan Kolektivisme Pada Intensi Berwirausaha.
Astuti, P. F. (2013). Pengaruh Prestasi Belajar Mata Pelajaran Kewirausahaan Terhadapa Minat Berwirusaha Siswa. Bandura, A. (1977). Self Efficacy: Toward a Unifying theory of Behavioral Change. Psychologicall Review, 84(2), 191–215. Baron, R. A. (2006). Opportunity Recognition as Pattern Recognition: How Entrepreneurs “Connect the Dots” to Identify New Business
Opportunities. Academy of Management Perspectives, 20(1), 104–120. Brawijaya University. (2013). Mengapa Mahasiswa Harus Berwirausaha? Retrieved December 11, 2013, from
http://palupimanajemen.lecture.ub.ac.id/2013/02/mengapa-mahasiswa-harus-berwirausaha/ Carter, N. M., Gartner, W. B., & Greene, P. G. (2002). The Career Reasons Of Minority Nascent Entrepreneurs. Academy of Management
Proceedings, 2002(1), D1–D6. doi:10.5465/APBPP.2002.7516614 Choo, S., & Wong, M. (2006). Entrepreneurial Intention : Triggers and Barriers to New Venture Creations in Singapore. Singapore
Management Review, 28(2), 47–65. Cole, A. H. (1959). Business Enterprise in Its Social Setting. Cambridege, MA: Harvard University Press. Dodd, S. D., Komselis, A., & Hassid, J. (2009). The comparative perceived desirability and feasibility of entrepreneurship within. Spoudai,
59(1), 38–56. Fishbein, M., & Ajzen, I. (1975). Belief, Attitude, Intention, And Behavior : an Introduction to Theory And Research. Reading, Mass. : Addison-
Wesley Pub. Co. Fitriati, R. (2012). Entrepreneurship Education : Toward Models In Several Indonesia University. In Prosiding the 4th International
Conference on Indonesian Studies: Unity, Diversity and Future (pp. 681–698). Gasse, Y., & Tremblay, M. (2011). Entrepreneurial Beliefs and Intentions : A Cross-Cultural Study of University Students in Seven
Countries. International Journal of Business, 16(4), 304–314. Giagtzi, Z. (2013). How Perceived Feasibility and Desirability of Entrepreneurship Influence Entrepreneurial Intentions : A comparison
Between Southern and Northern European Countries . Erasmus Universiteit Rotterdam, Erasmus School of Economic. Guerrero, M., Rialp, J., & Urbano, D. (2006). The impact of desirability and feasibility on entrepreneurial intentions: A structural equation
model. International Entrepreneurship and Management Journal, 4(1), 35–50. doi:10.1007/s11365-006-0032-x Gundry, L. K., & Kickul, J. R. (2007). Entrepreneurship Strategy: Changing Patterns in New Venture Creation, Growth, and Reinvention (p.
424). New York: SAGE Publications, Inc. Gurbuz, G., & Aykol, S. (2008). Enterepreneurial Intention Of Young Educated Public In Turkey. Journal of Global Strategic Management, 4,
47–56. Haynie, J. M., Shepherd, D. a., & McMullen, J. S. (2009). An Opportunity for Me? The Role of Resources in Opportunity Evaluation
Decisions. Journal of Management Studies, 46(3), 337–361. doi:10.1111/j.1467-6486.2009.00824.x Hisrich, R. D., & Peters, M. P. (1998). Entrepreneurship (p. 681). McGraw-Hill. Hyrsky, K., & Tuunanen, M. (1999). Innovativeness and Risk-taking Propensity : A Cross-Cultural Study of Finnish and U . S .
Entrepreneurs and Small Business Owner. Retrieved December 23, 2013, from http://lta.hse.fi/1999/3/lta_1999_03_a2.pdf Ifham, A., & Helmi, A. F. (2002). Hubungan Kecerdasan Emosi Dengan Kewirausahaan Pada Mahasiswa. Kao, R. (1995). Entrepreneurship: A wealth Creation and Value-Adding Process. Singapore: Prentice-Hall. Knight, F. H. (1921). Risk, Uncertainty and Profit. New York: Harper and Row. Krueger, N. (1993). The Impact of Prior Entrepreneurial Exposure on Perceptions of New Venture Eeasibility and Desirability.
Entrepreneurship Theory and Practice, 18(1), 5–21. Krueger, N., Reilly, M. D., & Carsrud, A. L. (2000). Competing models of entrepreneurial intentions. Journal of Business Venturing, 15(5-6),
411–432. doi:10.1016/S0883-9026(98)00033-0 Kuehn, K. W. (2008). Entrepreneurial Intentions Research : Implications For Entrepreneurship Education. Journal of Entrepreneurship
Education, 11(1). Lee, S. H., & Wong, P. K. (2004). An exploratory study of technopreneurial intentions: a career anchor perspective. Journal of Business
Venturing, 19(1), 7–28. doi:10.1016/S0883-9026(02)00112-X León, J. A. M., Descals, F. J. P., & Domínguez, J. F. M. (2007). The Psychosocial Profile of The University Entrepreneur. Journal of Psychology
in Spain. Retrieved December 11, 2013, from http://www.academia.edu/229127/The_Psychosocial_Profile_Of_The_University_Entrepreneur
Lestari, R. B., & Wijaya, T. (2012). Pengaruh Pendidikan Kewirausahaan Terhadap Minat Berwirausaha Mahasiswa di STIE MDP, STMIK MDP, dan STIE MUSI. Jurnal Ilmiah STIE MDP, 1(2), 112–119. Retrieved from http://eprints.mdp.ac.id/672/1/6.Pengaruh Pendidikan Kewirausahaan Terhadap Minat Berwirausaha Mahasiswa di STIE MDP, STMIK MDP, dan STIE MUSI .pdf
McMullen, J. S., & Shepherd, D. a. (2006). Entrepreneurial Action and the Role of Uncertainty in the Theory of the Entrepreneur. Academy of Management Review, 31(1), 132–152. doi:10.5465/AMR.2006.19379628
Mcstay, D. (2008). An investigation of undergraduate student self-employment intention and the impact of entrepreneurship education and previous entrepreneurial experience Presented By. Bond University.
Mitchell, R. K., Busenitz, L. W., Lant, T., Mcdougall, P. P., Morse, E. A., & Smith, J. B. (2002). Toward a Theory of Entrepreneurial Cognition: Rethingking the People Side of Entrepreneurship Research. Entrepreneurship theory and Practice, 93–104.
Mulyana, R. A. (2013). Pengaruh Norma Subyektif, Persepsi Kontrol Perilaku, Dan Sikap Wirausaha Terhadap Minat Berwirausaha Siswa Smk. Universitas Pendidikan Indonesia.

Proceedings of 4th
International Conference on Global Business Environment
(ICGBE-2014)
193
Mustikawati, I., & Bachtiar, M. (2008). Hubungan Antara Dukungan Sosial ( Orang Tua ) Dengan Minat Berwirausaha Pada Siswa Sekolah Menengah Kejuruan Oleh : Fakultas Psikologi Dan Ilmu Sosial Budaya Universitas Islam Indonesia Yogyakarta. Yogyakarta.
Putra, R. A. (2012). Faktor-Faktor Penentu Minat Mahasiswa Manajemen Untuk Berwirausaha (Studi Mahasiswa Manajemen FE Universitas Negeri Padang). Jurnal Manajemen, 01(1). Retrieved from ejournal.unp.ac.id/students/index.php/mnj/article/download/45/33
Rahmawati, P., Suwarto, D. H., & Endarwati, M. L. (2010). Technopreneurship Course Development Program. Yogyakarta. Ramadhan, A. (2012). Politik Ekonomi Generasi Muda Implementasi kebijakan Gerakan Kewirausahaan Nasional di Jawa Timur. Jurnal
Politik Muda, 2(1), 1–8. Rochmah, S. (2013). Perpres 27 Tahun 2013: Mendukung UMKM Sambut Masyarakat Ekonomi ASEAN 2015. SEKRETARIAT KABINET
REPUBLIK INDONESIA. Retrieved from http://www.setkab.go.id/mobile/artikel-8679-perpres-27-tahun-2013-mendukung-umkm-sambut-masyarakat-ekonomi-asean-2015.html
Schumpeter, J. A. (1934). The Theory of Economic Development: An Inquiry Into Profits, Capital, Credit, Interest, and the Business Cycle. Cambridge MA: Harvard University Press.
Sexton, D. L., & Bowman-Upton, N. B. (1991). Entrepreneurship; Creative Ability in Business; Venture Capital. Macmillan (New York). Shapero, A., & Sokol, L. (1982). The Social Dimensions of Entrepreneurship. In Encyclopedia of Entrepreneurship. Retrieved from SSRN:
http://ssrn.com/abstract=1497759 Sulistyorini, U. T. (2013). Metode pembelajaran kewirausahaan dalam membangun perilaku kewirausahaan. Jurnal Administrasi dan
Bisnis, 4(1). Retrieved from http://admisibisnis.blogspot.com/2013/07/metode-pembelajaran-kewirausahaan-dalam.html Sutarto. (2012). Minat Wirausaha Mahasiswa Masih Rendah. Lensaindonesia. Retrieved December 12, 2013, from
http://www.lensaindonesia.com Zain, M. (2013). Makin Tinggi Tingkat Pendidikan, Semakin Rendah Minat Kewirausahaannya. Antaranews.com. Retrieved December 12,
2013, from http://www.antaranews.com/print/109998/

Proceedings of 4th
International Conference on Global Business Environment
(ICGBE-2014)
194
Variable Analysis and Model Confirmation Using Delphi Technique
Muh. Amsal. Sahban, Dileep Kumar, Subramaniam Sri Ramalu
Othman Yeop Abdullah Graduate School of Business, Universiti Utara Malaysia, Malaysia [email protected]
Abstract: Entrepreneurial world is trying their level best to attract university graduates across the world. Indonesian culture is still very colonial view that the status of employment is more respectable than being an entrepreneur. In addition, people often perceive that a university degree is much better and more important than a person's ability or skill. In fact, the skill is very much needed to support a person's life economically, instead of looking for a university degree first then searching the skill or capability. This is one of the reasons that many of them have a university degree but unemployed. In Indonesia, the number of scholars unemployed is getting higher statistically because most of them only rely on job vacancies, instead of becoming job creators. There is no motivation from various environments like family, friend, educational institution, etc. to build student’s mentally strong with business awareness to deal with entrepreneurial issues. Yet, when someone interested in pioneering new business, they are desperately in need of an endorsement. Entrepreneurial support usually comes from a family, partner,peers and educational institutions where they can discuss the idea of becoming an entrepreneur and entrepreneurial issues further seeking best of suggestions. A qualitative study was conducted among Indonesian universities and their social environment that identify the factors influencing social support among business graduate students to become an entrepreneur. The study follows focused group discussion, interviews, case analysis and Delphi technique to arrive at appropriate variables on social support factors among business graduates. The study observed 4 dimensions of social support which are closely knit with the attitude of business graduates to become an entrepreneur. These factors were identified by the expert group from various fields. This study provides an insight into the variables of social support among business graduates to become an entrepreneur in Indonesia. It is expected that the graduates later become the inspiration for others who are capable of creating jobs and giving a contribution to improve economic development in Indonesia. A business awareness and social supports are very much needed among university graduates by changing the mindset for those who in still motivation Keywords: Social support, Entrepreneurship, Motivation, Students
1. Introduction Decades ago, Schumpeter (1934)once said that "essentially, the entrepreneurs will drive the economy." This statement is really tragic if it is linked to Indonesian economy with a high rate of unemployment and lack of job opportunities. A good entrepreneurial climate, in fact, will be able to overcome this severe problem. However, starting a new business is not easy. Many people who are engaged in small business like street ventures, small shoppers, etc are perceived as almost equal to unemployed and are not considered as good ventures by the Indonesian community. While these small businesses are extending better turnover and good return on investment to the business starters. Here, the small ventures are associated with social stigma that these entrepreneurial Jobs are less prestigious as a government job. Whereas, it is obvious that when someone intends to pioneer new business, he desperately needs a support. Support for entrepreneurship usually comes from a family, partner and peers where they can discuss the idea and the problems encountered along with the ways to handle the problem(Mustikawati & Bachtiar, 2008). Substantiating these issues, one study also revealed that the existence of a social risk associated with starting a business, therefore the the fear of being demeaned and ridiculed when facing a failure in business and there is a negative perception toward the failure (Phikala and Vesatlenein cited in Astuti (2009). Meanwhile, most the parents of university students perceive that the risk of being an entrepreneur is too high (Hartanto, 2011). Such negative assumption sometimes becomes a constraint and discourage someone to start with entrepreneurship. In a study, Amalia (2012) further found that there is still a lack of confidence to the students in terms of entrepreneurship. They do not have the support of parents to become an entrepreneur. Parents tend to expect their children to work in a company instead of being an entrepreneur.A lot of parents often unconsciously forcing the will of their children and the parents are unable to distinguish between their desire and the children’s desire(Mustikawati & Bachtiar, 2008). 2. Literature Review It appears to be general agreement in the literature that social support is a complex and multidimensional construct, there is much less consensus on exactly how it is best conceptualized, defined and/or measured(e.g., Barrera, 1986; Thompson, 1995; Lakey & Cohen, 2000 cited in Lopez and Cooper 2011). Social support is a pleasant feeling, having attention, self-esteem or the aid received by people or group(Cobb, 1985). Further Cobb(1985) emphasizes social support on personal ownership toward the social communication networks and the need to cooperate with each other. Social support is generally defined as the presence of other people who can be trusted, people that make other’s loved for, pleasures that cannot be quantifiable. Sarason, et.al (1987)explains social support as a regular interaction with other people and immediate family members or relating to the provision of duties and attachments. Social support is the social way of communicating with others to manifest love and care for others. This kind of support serves as a building blocks of social, psychological and biological integrity. Both formal and informal support networks have been seen as a central component of an individual's social capital, a valuable resource that contributes to better health chances(Goodwin, Costa, & Adonu, 2004). Social support in reality can be understood as caring for one, providing for the needs of others, strengthening the social network of people globally. These resources that a given to others can be emotional, for example, in providing for the financial needs, providing adequate information for them and giving them a wonderful advice. Social support comprises of the characteristics of a good social relationship among people, readiness to give them assistance. It happened through a close relationship to others, for their right to keep an obligation and to maintain good will with others. Social support can be explained in a different way, depending on one’s understanding relating to it. It can be described as a resource giving to others, embracing care for others or giving out one’s resources to others. Different type of social support have been identified likethe instrumental support that can help to solve a problem on how people feel for others as well as reasonable support for like giving of goods and good advice but to mention a few (Schwarzer & Rieckmann, 2000). Social support refers to the potential entrepreneur’s beliefs and expectations about the support he or she will receive from groups to which he/she belongs

Proceedings of 4th
International Conference on Global Business Environment
(ICGBE-2014)
195
(parents, siblings, and spouse) and from other reference groups (friends, colleagues, and teachers) in the case of setting up a business or going self-employment(León, Descals, & Domínguez, 2007). Albrecht and Adelman defined social support as “verbal and nonverbal communication between recipients and providers that reduce uncertainty about the situation, the self, the other or the relationship, and functions to enhance the perception of personal control in one’s life experience. In this definition, the key features of social support are(Mattson’s Health as Communication Nexus, 2011): Communication Uncertainty reduction Enhanced control According to this definition, social support is a way of having a good relationship to other people with the aim of addressing their needs and affecting them positively to be a better person and to be incharge of any giving circumstances they find themselves in (Mattson’s Health as Communication Nexus, 2011). Social support that is giving for a short period of time needs the social interaction among people with their structure, strength and nature explaining the kind of social support that is on the ground. A social support may require giving encouragement for a given situation like reciprocity, accessibility and reliability, and one’s access to the social interaction. Hupcey(1998)describes social support is a multi-faceted ideology that is very complicated to understand to explain a measure. Despite this idea has been widely looked into, there is few acceptance among theoreticians and researchers as to its theoretical and applying its definition. Therefore, the understanding remains unclear and everything that relates to social relationship could be regarded as social support. Researchers of social support have constantly neglected the difficulty of the concept and the measurements relating to thechanges in its simplicity. He also suggested that social support with a good attitude to others helps to maintain a good relationship with others and gives a positive respond from the receiver (William, 2005). ISA (Institute for Student Achievement) explain social support refers to the sources of assistance (teachers, parents, peers, community) that bolster students’ effort to excel academically. Students in the study understood social support from teachers as being the frequency with which teachers “relate the subject to their personal interest, really listen to what they say, know them very well, and believe they can do well in the school. Social support relates to tangible outcomes such as the “actual and potential resources individuals obtain from knowing others, being part of a social network with them, or merely from being known to them and having a good reputation(Baron & Markman, 2000; Mair & Noboa, 2003). It was believed that the social support theory pays attention to three interrelated classes of variableslike Personality characteristics, interpersonal relationships and the factors that generate supportive efforts. These variables can be taken into account as context of social support because the influence of social support rely on the interaction of the three dimensions (Sarason et.al, 1992 cited in Rasheed,Sawal, Taj & Najam 2005). Social support is comprised of a multidimensional collection of material, emotional, or informational resources. These resources are provided through social ties with family, friends, groups, or professionals(Harris, 2006). Gottlieb (2000) cited in Mattson's Health as Communication Nexus (2011)defined social support more broadly as the process of interaction in relationships which improves coping, esteem, belonging, and competence through actual or perceived exchanges of physical or psychosocial resources”. In this definition the key features of social support are: Interaction Coping Esteem Belonging Competence Exchange Sarafino (1994) cited in Mustikawati dan Bachtiar(2008)classified a social support in 5 dimensions as follows: Emotional support: This support involves the expression of empathy and concern for individual, so the individual feel comfortable, feel loved and cared.Closed network of contacts around an entrepreneur, in which the contacts know each other, generate trust within the network. Trust between actors increase the likelihood that the entrepreneur may obtain sensitive information and emotional support(Klyver & Schøtt, 2011). Esteem Support: This refers to a positive assessment on the individual, encouragement and agreed statement on individual opinion. This support will help the valuable feeling for individuals who consider themselves to have different abilities with others, so it can generate a self-confidence and self-esteem to the individuals. Tangible or instrumental support: It refers to cash transfer such as money or other material. Informational support: A support that consists of the provision of advice, guidance, suggestions or feedback on how to solve the problem. Such support can help the individual to recognize and overcome a problem easily. Network support:This support causesa sense of belonging to the individual because the individual has become a member in a group. In this case, the individual can share interests and social activities, so that the individual feels himself to be accepted by the group. Emotional Supportinvolves the expression of empathy and concern for individual, so the individual feel comfortable, feel loved and cared. Closed network of contacts around an entrepreneur, in which the contacts know each other, generate trust within the network. Trust between actors increase the likelihood that the entrepreneur may obtain sensitive information and emotional support(Klyver & Schøtt, 2011).Emotional support is the most important social support, including sympathy, concern, love and trust. Especially, it can be realized by an operational definition such as offering self-respect, friendship, trust, concern, and hearing (Wei and Wang, 2009). Based on Wei and Wang(2009) questionnaire research adopted from House (1981) there are four items that can used to measure emotional support such as (i) concerning about the happiness and healthy in new venture creation, (ii) help individuals when he/she is in trouble in new venture creation and makes him/her feel better, (iii) make individuals relax when he/she feel exhausted in new venture creation, and (iv) make individuals feel comfort when he/she frustrated in new venture creation. Social relationships have the potential to provide supportive resources which include emotional resources. These may take the form of emotional expression which may sustain an individual in the short or long term; instrumental emotional support which may help an individual to master their emotional burdens; coherence support which may be overt or covert information, resulting in confidence in the individual’s preparation for a life event or transition; validation which may result in an individual feeling someone believes in them; an inclusion which may result in a sense a

Proceedings of 4th
International Conference on Global Business Environment
(ICGBE-2014)
196
belonging. Many aspects of the emotional resources offered by others can be considered either conditions of emotional provision, outcomes of emotional provision, or both; for example, feeling loved or cared for, feeling attached to or able to confide in another may be conditions or outcomes of effective emotional resource provision. Other outcomes may include the sustenance of self esteem, security and a reliable alliance with another. Family support, or lack of it, is of crucial importance in the decision-making process for the women entrepreneur and depending on the response from the family, the women entrepreneur can either be highly motivated in her new venture or completely demotivated. The discouragement from the home, coupled with opposition from society at large creates emotional and physical barriers(Bulsara & Pandurengan, 2007).Higher level of support include a positive evaluation on oneself, motivation and acceptance expression on one’s opinion. This support will assist to give meaningful feelings for others that sees themselves to possess different characteristic to other, therefore it can give birth to self confidence and self admiration for others (Sarafino,1994 cited in Mustikawati and Bachtiar,2008). High level of support is an aspect of social support that is given to others with the aim of promoting good feeling for others (Holmstrom & Burleson, 2011). Self-esteem shows individual an complete emotion of one’s value and self independence. Esteem support is described as the honour giving to others by oneself. Esteem support is manifested in self confidence or self motivation. Others providing esteem support can identify one strength that is neglected or making one have confidence in one’s ability. Esteem support is the evaluation giving to others, explaining the approval and disapproval of the attitude to others. Self esteem is the continuous process, resulting to a systematic development that is affected by new circumstances and happenings. Positive experience results to a giving amount of evaluations on one’s self esteem while a failure result to a gradual fall in one’s self esteem(Harris, 2006). Support from faculty/college is very important for the development of student entrepreneurship. Lack of supports from the faculty could be one of an obstacle to the development of student entrepreneurship. One study found that, from 51 students surveyed, a total of 26 students were declared to be sufficient support from the faculty, the support of the faculty may be providing seminars, training, and mentoring entrepreneurs for free. The free entrepreneurial mentoring can also be assistance from building a business during the start-up to maturity. Some programs have also been carried out such as assisting prospective entrepreneurs through business incubator programs(Amalia, 2012). In supporting people in entrepreneurship, the role of parents is not merely forming their personality tobecome a successful entrepreneur. The provision of capital is also one of the parents' role to improve their motivation for entrepreneurship. The role of parents to support can be financial capital (finance), a tool and a place for entrepreneurship and investment. In addition to encouraging children to entrepreneurship, parents can also help with the form of infrastructure or business space. Capital in the form of money or place of business should not be too much and enforced.Despite, providing a small capital can be a form of support for their children to become entrepreneurs(Sari, 2012). According to Susanti(2012) the instrumental support is a support in term of tangible assistance or actions provided by social familiarity. The direct social support such as the provision of equipment, jobs and finances. Social support is very much needed by the prospective entrepreneur. They need the support to start a business such as capital, loan,and so on.Information support is communication that provides useful or needed information. When facing any challenging situation, particularly in developing a business, usually information is needed in order to make decisions. Not knowing the details of what one is facing or about the different options available can be a source of upset and stress(Mattson’s Health as Communication Nexus, 2011). Informational support is the provision of advice, guidance, suggestions, or useful information to someone.An individual who wants to start a business usually needs more information relating to what kind of business could be generated nowadays and whether there are any competitors if he/she runs this business, etc. Network support relates to the relationship that exist with other people, confirming their individual possession of socializing with other through the availability of social network. In other words, network support is communication that reminds people that they are not alone in whatever situation they are facing. Members of the network may offer many types of support but the concept of network support emphasizes that a network is available for providing social support(Mattson’s Health as Communication Nexus, 2011). Peer group is the starting place of social interaction and individual takes decision to start a business due to influence of his or her peers. Peers who are already running their own business always try to provide him a comfortable environment in his or her business start up(Bönte, Falck, & Heblich, 2009). Peer pressure with regard to business leads toward other social influence like media, social networks and social organizations; therefore, it is easier for individuals to take initiative for business. One study found that having an entrepreneurial peer group has a positive effect on an individual’s entrepreneurial intentions(Falck, Heblich, & Luedemann, 2009). In Flack, Heblich and Luedemann’s model of occupational choice, this would mean that an individual’s intention to become an entrepreneur is influenced by her peers’ intentions to become entrepreneurs. In the second form of social interaction, youth behavior is influenced by exogenous characteristics of the youth’s reference group. In our model, this would mean that an individual’s intention to become an entrepreneur is influenced by her peers’ background characteristics (so-called exogenous or contextual effects). Such contextual effects might arise from student spending time at their peers’ homes and having contact with peers’ parents. In the presence of contextual effects, a student spending time at a peer’s home with entrepreneurial parents is going to be more exposed to entrepreneurship as a career option than a student who does not. Manski (1995) cited in Falck (2009) raises the possibility or spurious estimates of peer-group effects that may be erroneously interpreted as true endogenous or contextual effects: the so-called correlated effects. These can arise when youths in the same reference group express the same occupational intentions because they share a common set of unobserved characteristics. Family plays an important role in venture creation process and therefore their role deserves greater importance in the entrepreneurship. The kinship relationships provide the strongest ties in entrepreneurial networks. Family provides a range of resources in both professional and nonprofessional manner which is affective in nature. For the entrepreneur, network may be derived from membership of trade associations, business networks or indeed friendship with business people, which help the entrepreneur in providing the access to information(Leek, S., & Mason, k., (2003) cited in Zafar,2012). One study found that affective family-to-business enrichment (the transfer of positive affect, eg, positive mood or happiness, from the family domain to the work domain), instrumental family-to-business enrichment (the transfer of skills and behaviors acquired or nurtured in the family domain to the work domain) and family-to-business support (interpersonal support from family members) were positively related to entrepreneurial success and satisfaction for female business owners but not male business owners (Murphy, 2013). In addition, Murhpy stated that Family-to-business support was more positively related to women’s business performance, growth in employment, satisfaction with employee relationships, and satisfaction

Proceedings of 4th
International Conference on Global Business Environment
(ICGBE-2014)
197
with a status than for male entrepreneurs. Affective family-to-business enrichment was more positively related to women’s business performance, satisfaction with employee relationships, and satisfaction with a status than for male entrepreneurs. Instrumental family-to-business enrichment was more positively related to women’s satisfaction with a status than for male entrepreneurs. Therefore, female entrepreneurs may benefit more from family-to-business enrichment and support than men because of their relative lack of access to other resources like social and financial capital. In addition, women’s inclination to integrate work and family and to emphasize the interconnectedness and relationships may give them an advantage in capitalizing on sources of family-to-business enrichment and support. Problem Formulation: There are many researchers contributed to the field of social support support system's role in grooming a young graduate who was studying in universities ad business school to become entrepreneurs. However, these findings are topic specific not integrating varied models proposed by various authors in entepreneurship. Many aspects like family, peer group, educational institutions, etc. have keen role in acting as a factor of social support system. It has been pointed out by Susanti (2012) that someone who dare to choose entrepreneurship as a career is a person who feels being trusted by people, feel comfortable, able to deal with any risks. Such behavior can grow and thrive in the person who receive social support. The encouragement such as strong motivation to move from the family is the initial capital to become an entrepreneur. With the support of the families, they can have a stronger mentality and high motivation as the main driving factor (Kasmir, 2006). Widiastuti (2005) cited in Mindo & Retnanignsih (2008) also stated that the success of a person is supported by family atmosphere which includes the interaction of the person with his parents and brothers. In the family members, there is a process of interaction to each other to meet their individual goals and strive to meet the satisfaction of the social life in the family. It is obvious that someone who dare to choose entrepreneurship as a career is a person who feels being trusted by people, feel comfortable, able to deal with any risks. Such behavior can grow and thrive in the person who receive social support (Susanti, 2012). However, in Indonesia, there is a thought that many parents expect their children become civil servants then their life would be better than to be entrepreneurs (Mustikawati & Bachtiar, 2008). This assumption might be true that the attribute of an employee can raise the social status and the human personality to a certain extent, but the economic growth and development of Indonesia could not enhance or step higher if the number of entrepreneurs remains low. In addition to that, the interest in entrepreneurship will grow and thrive in a person who live and grow up in the environment of the entrepreneur's family. In fact, most of the family environment is not conducive to the formation of a person's interest in entrepreneurship. It is caused by many factors such as; lack of knowledge of parents, the family mindset of being civil servants or employees is safer than being an entrepreneur, there is no model as entrepreneur in the family, etc (Aprilianty, 2012). The achievement of students on their choosing career is not only the main support of the appearance for them, but the kind of education institution where they attended is more important. The duty of parents and the duty of professional school counselors most move side by side in the training of young adolescents. Schools lay down rules and regulation have and underlining regime to help students be equipped educationally and making decision for their career with the aim of supplying adequate resources and materials through a progressive and the comprehensive approach (Turner & Lapan, 2002). Entrepreneurship is not appreciated as like an important and prestigious profession. There have been many examples of successful entrepreneurs in Indonesia. However, awards and high attention to someone who is pioneering the entrepreneurship efforts would not so encouraging. In the family environment, for instance, there are not many parents who introduce, encourage, and provide entrepreneurship training to their young ones. There are still so many parents who boast of seeing their son become employees of the private or public sector rather than being an entrepreneur which has unpredictable income (Hartanto, 2011; Mulyana, 2013). People who have a strong family support will be ready to face the capabilities and resources needed in entrepreneurship (Gray cited in Astuti, 2009). They will be more stable if they pursue a career as an entrepreneur. The results of a study in Spain involving 601 college students stated that there is a significant positive relationship between family, work context, entrepreneurship education, social support and the intense entrepreneurial individualism. The study results also indicated that the lack of entrepreneurship students due to the stimulation of entrepreneurial activities to create new business given by the university is still very low. Respondents also stated that her relatives (parents, siblings, spouse) who has a background in entrepreneurship more generally encourage them to pursue careers as entrepreneurs. Their friends or their lecturer otherwise does not encourage them to entrepreneurship (Astuti, 2009). Furthermore, most of the students lack confidence to broaden their insight on the field of entrepreneurship (Amalia, 2012). All these researchers have pointed out the importance of social support system in grooming students to become young entrepreneurs. However, there are less number of studies have been conducted in Indonesian scenario to identify which are the variables that are closely knit with the social support theme in its contribution toward entrepreneurship among young graduates. Hence, contemporarily a student need to be conducted by examining various models, theories, and recent review of literature, contextualizing the topic into Indonesian business school. Problem Statement: Hence, this particular study identifies the topic of research as “ variable analysis and model confirmation using the Delphi technique. 3. Methodology Delphi is one of the reliable qualitative research technique made by researchers with the expert opinion (Kumar, 2013). The research methodology undertaking by Delphi method reveals a deeper understanding into the main causes of setting up a business center. The Delphi approach was introduced by Dalkey and Helmer (1963) at the Rand Corporation in the 1950s, is a broad way and generally use an approach of obtaining combined ideas relating to knowledge permitted by professional on a specific area of specialization. Based on the opinion that "two heads are better than one, or ..n..heads are better that one" (Dalkey, 1972), the Delphi approach is adapted as a group communication process that focuses on getting a comprehensive observation and making a particular point with the aim of setting goals, policy finding or making predictions for future activities (Ulschak, 1983; Turoff&Hiltz, 1996; Ludwig, 1997). This research engaged semi-structured interviews. Based on the suitable time for the resource person interviews were arranged, during 2012 July to 2012 December. Telephonic interview is conducted to gather information from the respondents. 40 experts from the industry and academia were identified and approached by email or telephone and were invited to take part in the study. All the clarifications related to the objective of the study were made by the researcher. However, 26 respondents were being interacted and communicated, only 20

Proceedings of 4th
International Conference on Global Business Environment
(ICGBE-2014)
198
respondents shown their willingness to participate in the discussion. Finally, the 20 participants were interviewed by telephone and through email. The conversations have been taped and recorded and manually analyzed. The procedural steps in adopting the Delphi technique were as follows. Expert panel identification: The group of professional was made from specialists having high knowledge and expertise in entrepreneurial orientation. They are closely associated with industries, as consultants, Owners of industries, Top level managers, Entrepreneurs, Professors, Researchers and Academicians. The specialized areas of these expert members include, 12 male members (60%) and 8 female members (40%). These dynamic groups of panel of experts are knowledgeable and familiar to give relevant opinions and an admissible understanding of the concept of entrepreneurial orientation. Rounds Round 1: In the first round, the Delphi process traditionally begins with an open-ended questionnaire. The open-ended questionnaire serves as the cornerstone of soliciting specific information about a content area from the Delphi subjects (Custer, Scarcella, & Stewart, 1999). The questions: 1. How do you define social support? 2. How do you relate the social support with entrepreneurial learning and development? 3. Which are the major factors, in general closely related to Social support? 4. Contextualizing the topic to the Indonesian scenario, which are the major factors, closely related to social support in Indonesia? Round 2: In the second round, each Delphi member receives a second questionnaire and is asked to review the items summarized by the investigators based on the information provided in the first round. Accordingly, Delphi panelists may be required to rate or rank-order items to establish preliminary priorities among items. Because of round two, areas of disagreement and agreement are identified (Ludwig, 1994). In this round, consensus begins forming and the actual outcomes can be presented among the participants’ responses (Jacobs, 1996). Information regarding the influential factors of entrepreneurial orientation collected from the respondents. The process identifies 82 categories, which are having items with high and low proximity of entrepreneurial orientation identified. Rating process further identified in the categories and items identified. Round 3: In the third round, each Delphi panelist receives a questionnaire that includes the categories and items ratings, summarized by the investigators in the previous round and are asked to revise his/her judgments or “to specify the reasons for remaining outside the consensus” (Pfeiffer, 1968). This round gives Delphi panelists an opportunity to make further clarifications of both the information and their judgments about the relative importance of the categories and items. Second level screening of the 82 categories which were having a high and low influence on business incubation centers identified with corresponding items. The process further identified 38 categories, which are having high and low proximity of the entrepreneurial orientation identified. Classification of the items in 38 categories of 2 factors was being made with appropriate loaded items. Thematic presentation and the categorization of the items were done. Round 4: In the fourth and often final round, the list of remaining items, their ratings, minority opinions, and items achieving consensus are distributed to the panelists. This round provides a final opportunity for participants to revise their judgments. It should be remembered that the number of Delphi iterations depends largely on the degree of consensus sought by the investigators and can vary from three to five (Van de Ven, Gustafson, 1975; Ludwig, 1994). During third level, screening of the 25 categories of 2 factors which were having items with high and moderately high proximity of entrepreneurial orientation identified. Sought the expert opinion on the appropriateness of the core factors selected for the study. Table 1: Delphi application
No Factors Categories No. of items
No. of Experts (N=20)
% of Experts
1. Family Support Support with useful information 4 17 85
Support with right advices 3 17 85 Support in decision making 4 16 80 Encouragement from family member 3 18 90 Sharing responsibility 3 17 85 Emotional Support 2 16 80 Providing self confidence 2 17 85 Providing financial assistance 3 18 90 Assisting start ups 3 18 90 Sharing problem 3 18 90 Support in networking 4 17 85 Identifying space and location 2 17 85 Coordinating activities 3 16 80
2 Peer Group support Motivation from friends 3 17 85 Making provision of adequate
information 3 17 85
Providing right suggestions 3 17 85

Proceedings of 4th
International Conference on Global Business Environment
(ICGBE-2014)
199
Facilitate better decision making 3 18 90 Sharing responsibility 3 17 85 Providing psychological support 2 16 80 Inducing self confidence 2 16 80 Sharing business problem 3 17 85 Supporting start up 3 17 85 Networking support 3 17 85 Identifying good location 2 16 80 Supporting coordination 3 16 80
The first factor that linked to Social support is the Family Support. The experts identified 39 items under 13 categories in relation to social support. The major categories identified by the experts are the Encouragement from family members (90%), Providing financial assistance (90%), Assisting start ups (90%) and sharing problems (90%). The expert further observed Support with useful information (85%), Support with right advices (85%), Sharing responsibility (85%), Providing self confidence (85%) Support in networking (85%) and Identifying space and location (85%). Though much difference in the scoring is further observed, the experts have given minor scoring three categories like Support in decision making (80%) and Emotional Support (80%) and Coordinating activities (80%)which are closely knit with social support. The last factor considered for the study is the Peer Group Support. The result indicates that the experts identified 33 items which come under 15 categories social support factor. The table showed that Facilitating better decision making (90%) as the prominent factor which closely knit with entrepreneurial training through business incubation centers. The experts also identified Motivation from friends (85%), Making provision of adequate information (85%), Providing right suggestion (85%), and Sharing responsibility (85%), Sharing business problem (85%), supporting start up (85%) and Networking support (85%) as the second prominent factors in relation to business incubation centers. Moreover the result also shows the importance of categories like Providingpsychological support (80%), Inducing self confidence (80%), Identifying good location (80%) and Supporting coordination (80%) that are knit with social support for the students. Discussion: This particular study on understanding familyseldom supports factor and fixing those variables for further studies has identified two major factors which include the family support and the peer support that would facilitate the students to become an entrepreneur. In the review of the literature and problem formulation part, it has been clearly cited that the Indonesian family seldom supports their youngsters to become entrepreneurs. Mustikawati and Bachtiar (2008) rightly point out in this context that in Indonesia there is a thought that many parents expect their children to becomea civil servant and their life would be better than to be entrepreneurs. With due consideration to this quotation, it is very important to assess various moderating factors that influence studententrepreneurial orientation and their intention to take up entrepreneurship as their profession. The first factor identified by the expert in this particular research was the family support. It is pointed out by Kashmir (2006) that with the support of families, the student can have a stronger mentality and high motivation as the main driving factor. Further, substantiating this argument, Widiastuti (2005) also stated that the success of a person who is supported by family atmosphere which includes the interaction with his parents and brothers that support them to become entrepreneurs. Under the family support, the expert were identified many factors like encouragement from family members, providing support with useful information, making provision of right advices, giving support in decision making, sharing the responsibility of new ventures, inducing emotional support, inducing self confidence, providing financial asssiatance, assisting start up, sharing entrepreneurial problem, providing support and networking, identifying appropriate space for starting the business and coordination of activities. In all these factors, family role is very important. It is expected that the family members should provide adequate psychological, financial, social, and allied support facilities for the youngsters to become entrepreneurs. Any form of discouragement the youngsters feel from the institution of family develop there by demotivation, lack of self confidence anddisappointment among youngsters. So, in this context the categories pointed out by the expert are very important in measuring young students' desire on intention to become an entrepreneur. The second factor identified by the experts in this research include, the support, the young studentsreceive from their peer groups. Just as, the support a student expect from the family members, they also expect appropriate support from their peer groups. The students should get appropriate motivation in taking the right decision, related to starting up a business with effective support and coordination. Under peer group support, the experts have identified many categories like motivation from friends, making provision of adequate information, providing right suggestion, getting support in right decision making, sharing all responsibilities related to new ventureship, providing adequate psychological support, inducing self confidence, sharing the new business problems, support in starting up new business, providing effective networking support, identifying the right location to start the business, and provide support in effective coordination and activities, are all very important in grooming students toward entrepreneurial motivation. The motivation and self confidence the students derived from the same age group people will sustain their vision to become an entrepreneur. Hence, the social support is a factor which may have a moderating effect of entrepreneurial orientation and the student's intention to become entrepreneurs. The social support is viewed as one of the basic blocks of social, psychological and biological integrity. These social supports act as formal and informal support factors which is considered as center components of individual social capital that contribute to their vision to become enterpereneur. It acts as a perception and actuality that one is totally taken care of by their family and their peer groups by extending appropriate assistance to realize their goal to become an entrepreneur. It has been rightly pointed out by Lion (2007) that social support act as potential entrepreneur belief and expectation about the support he or she will receive from the group to which he or she belongs which include the parent, siblings and spouse and from other reference group like the friends, the colleagues and the teachers in the case of setting up a business or going self-employment. Hence, the factors identified by the expert need to be further analyzedwith the support of extensive research. Implication: The objective of these particular research was to identify and fix variables related to the social support factors which influence a student decision to become an entrepreneur. This research identified two factors (family and peer support) and 25 Categories to explore the relationship between student entrepreneurial intention and social support system.In order to identify the social

Proceedings of 4th
International Conference on Global Business Environment
(ICGBE-2014)
200
support factors, this particular study followed many models like Sarafino (1994), House and Khan (1985), House (1981), Gottlieb (2000), Mattson (2011), etc. These models have segregated the social support factors into many sub factors like emotional support, esteem support, instrumental support, informational support, material support, etc. While the experts have the opinion that these factors can be clubbed together into two major factors like family support and peer support. These are the major institution which influences with their supporting facility to the youngster in making their goal towards entrepreneurship. These two institutions having far reaching influence and develop social collaborated psychological, economical, infrastructural and spiritual implications further to their decision to become a young entrepreneur or start up a new business venture. Hence, by incorporatingfactors like the family and peer group support withthe major theme social support, further study to be conducted with quantitative research to prove these variables acceptance as major factors moderating entrepreneurial orientation and intention. 4. Conclusion Several theories models and recent findings are available to understand the social support factors in relation to students' intention to become an entrepreneur. Contextualizing the topic to Indonesian student scenario, how far these theories and models that rooted from the west is adoptable that need to be further explored. Keeping in mind the objective of customizing the variables to the Indonesian context, all the theories and models of social support factors are thoroughly evaluated into and finally segregated into two major factors like family support and peer support. These segregation of factors further helps the researchers to identify the categories related to each factor and well envision that these factors to be further exposed to extensive research with the support of quantitative research. It is also directed by the researchers that these factors should be subjected to factor analysis to ascertain the validity and reliability on the factors loaded and the items incorporated. A mixed method of qualitative and quantitative method may thereby provide a better mediating effect of social support factors on entrepreneurial orientation and entrepreneurial intention among young graduates of Indonesia.
References Agustina, T. S. (2011). Pean Inkubator Bisnis Perguruan Tinggi Dalam Meminimalkan Resiko Kegagalan Bagi Wirausaha Baru Pada Tahap
Awal ( Start-Up ). Majalah Ekonomi, (1), 64–74. Retrieved from http://journal.lib.unair.ac.id/index.php/ME/article/view/834/829
Amalia. (2012). Kendala Berwirausaha Dikalangan Mahasiswa. Retrieved from http://manajemen.unnes.ac.id/wp-content/uploads/2013/01/Kendala-Berwirausaha-Dikalangan-Mahasiswa.pdf
Aprilianty, E. (2012). Pengaruh Kepribadian Wirausaha, Pengetahuan Kewirausahaan, dan Lingkungan Terhadap Minat Berwirausaha Siswa SMA. Jurnal Pendidikan Vokasi, 2(3), 311–324.
Astuti, D. A. W. (2009). Pengaruh Konteks Keluarga, Kerja, Pendidikan, Hambatan Dalam Memulai Bisnis, Dukungan Sosial, Nilai – Nilai Individualisme dan Kolektivisme Pada Intensi Berwirausaha.
Baron, R. A., & Markman, G. D. (2000). Beyond social capital: How social skills can enhance entrepreneurs’ success. Academy of Management Perspectives, 14(1), 106–116. doi:10.5465/AME.2000.2909843
Bönte, W., Falck, O., & Heblich, S. (2009). The Impact of Regional Age Structure on Entrepreneurship. Economic Geography, 85(3), 269–287. doi:10.1111/j.1944-8287.2009.01032.x
Brock, R. L., & Lawrence, E. (2009). Too much of a good thing: underprovision versus overprovision of partner support. Journal of family psychology : JFP : journal of the Division of Family Psychology of the American Psychological Association (Division 43), 23(2), 181–92. doi:10.1037/a0015402
Bulsara, H. P., & Pandurengan, V. (2007). Developing Women Entrepreneurship: A Challenge. In P. Jyothi (Ed.), Entrepreneurship: Issues and Challenges (pp. 387–406). India: Allied Publications Pvt. Ltd.
Cobb, S. (1985). Social Support as a Moderator of Life Stress. Psychosom. Brown University, Providence, RI. CC/Number. Custer, R. L., Scarcella, J. A., & Stewart, B. R. (1999). The modified Delphi technique: A rotational modification. Journal of Vocational and
Technical Education, 15 (2), 1-10 Dalkey, N. C. (1972). The Delphi method: An experimental study of group opinion. In N. C. Dalkey, D. L. Rourke, R. Lewis, & D. Snyder
(Eds.). Studies in the quality of life: Delphi and decision-making (pp. 13-54). Lexington, MA: Lexington Books.Ludwig, 1994). Dalkey, N.C. & Helmer, O. (1963). An Experimental Application of the Delphi Method to the Use of Experts. Management Science, 9, 458-
467. Falck, O., Heblich, S., & Luedemann, E. (2009, July 10). Identity and entrepreneurship: do school peers shape entrepreneurial intentions?
Small Business Economics. doi:10.1007/s11187-010-9292-5 Goodwin, R., Costa, P., & Adonu, J. (2004). Social support and its consequences: “positive” and “deficiency” values and their implications
for support and self-esteem. The British journal of social psychology / the British Psychological Society, 43, 465–74. doi:10.1348/0144666042038006
Hardiningtyas, D. (2011). Sharing Matching Dunia Kerja dan Lulusan Pendidikan Indonesia. University of Brawijaya. Retrieved November 12, 2013, from http://dewihardiningtyas.lecture.ub.ac.id/files/2012/04/Sharing-dunia-kerja-dan-motivasi-diri.pdf
Harris, J. G. (2006). Self-Esteem , Family Support , Peer Support , and Depressive Symptomatology : A Correlational Descriptive Study of Pregnant Adolescents. Georgia State University.
Hartanto, E. F. (2011). Kendala Berwirausaha di Indonesia. Retrieved December 11, 2013, from http://research.amikom.ac.id/index.php/KIM/article/view/3933/2272
Holmstrom, A. J., & Burleson, B. R. (2011). An Initial Test of a Cognitive-Emotional Theory of Esteem Support Messages. Communication Research, 38(3), 326–355. doi:10.1177/0093650210376191
Hupcey, J. E. (1998). Clarifying the social support theory-research linkage. Journal of Advanced Nursing, 27(6), 1231–1241. doi:10.1046/j.1365-2648.1998.01231.x
Kasmir. (2006). Kewirausahaan. Jakarta: Raja Grafindo Persada. Retrieved from http://library.um.ac.id Klyver, K., & Schøtt, T. (2011). How Social Network Structure Shapes Entrepreneurial Intentions? Journal of Global Entrepreneurship
Research, 1(1), 3–19. Kumar D. M. (2013). Ways and Means of Research Method, Research India Publication. New Delhi, India.

Proceedings of 4th
International Conference on Global Business Environment
(ICGBE-2014)
201
León, J. A. M., Descals, F. J. P., & Domínguez, J. F. M. (2007). The Psychosocial Profile of The University Entrepreneur. Journal of Psychology in Spain. Retrieved December 11, 2013, from http://www.academia.edu/229127/The_Psychosocial_Profile_of_The_University_Entrepreneur
Loo, V.de. E. (2006). Responsible Leadership at ABN AMRO Real. In: Maak, T. & Pless, N. M. (Eds.): Responsible Leadership. PriceWaterhouseCoopers. Oxon: Routledge, pp. 170–181.
Lopez, M. L., & Cooper, L. (2011). Social Support Measures Review. National Centre for Latino Child & Family Research. Retrieved from http://www.first5la.org/files/SSMS_LopezCooper_LiteratureReviewandTable_02212011.pdf
Ludwig, B. (1997). Predicting the future: Have you considered using the Delphi methodology? Journal of Extension, 35(5), 1-4. Retrieved on March 6th, 2012 from http://www.joe.org/joe/1997october/tt2.html
Mair, J., & Noboa, E. (2003). Social Entrepreneurship: How Intentions to Create a Social Enterprise Get Formed. IESE Business School: University of Navarra.
Mattson’s Health as Communication Nexus. (2011). Linking Health Communication With Social Support. In I. Junker, Shutterstock (Ed.), (pp. 181–218). Kendall Hunt Publishing Co.
Mead, S., Hilton, D., & Curtis, L. (2001, January). Peer support: a theoretical perspective. Psychiatric rehabilitation journal. Retrieved on Dcember 20th, 2013 from http://www.peerzone.info/sites/default/files/resource_materials/Peer Support A Theoretical Perspective Mead.pdf.
Mindo, R. R., & Retnaningsih. (2008). Relationship Between Social Support Parentsin Children With Learning Achievement Elementary School. Jakarta.
MIS. (2011). Information Systems : Definitions and Components. Retrieved December 31, 2013, from http://www.uotechnology.edu.iq/sweit/Lectures/SarmadFuad-MIS/MIS_Lecture_3.pdf
Mulyana, R. A. (2013). Pengaruh Norma Subjektif, Persepsi Kontrol Perilaku, Dan Sikap Wirausaha Terhadap Minat Berwirausaha Siswa SMK. Universitas Pendidikan Indonesia.
Murphy, C. (2013). Family Support Linked to Entrepreneurial Success Among Women. O&P Business News. Retrieved December 18, 2013, from http://www.healio.com/orthotics-prosthetics/human-resources/news/print/o-and-p-business-news/{2fd58362-e44d-4081-8624-d3d8c925314a}/family-support-linked-to-entrepreneurial-success-among-women
Mustikawati, I., & Bachtiar, M. (2008). Hubungan Antara Dukungan Sosial (Orangtua) Dengan Minat Berwirausaha Pada Siswa Sekolah Menengah Kejuruan Oleh : Fakultas Psikologi Dan Ilmu Sosial Budaya Universitas Islam Indonesia Yogyakarta. Yogyakarta.
Pfeiffer, J. (1968). New look at education. Poughkeepsie, NY: Odyssey Press Peplau, L. A. (1985). Social Support : Theory, Research and Applications. (Irwin G Sarason & B. R. Sarason, Eds.). Washington: Martinus
Nijhoff Publishers. Rasheed, S., Sawal, M., Taj, R., & Najam, N. (2005). Relationship between suicidal ideation, social support and coping skills in female
prisoners of a jail in Pakistan. Jouirnal of Pakistan Psychiatric Society (JPPS), 2(2). Retrieved from http://www.jpps.com.pk/display_articles.asp?d=106&p=art
Sarason, I. G., Sarason, B. R., Shearin, E. N., & Pierce, G. R. (1987). A Brief Measure of Social Support: Practical and Theoretical Implications. Journal of Social and Personal Relationships, 4(4), 497–510. doi:10.1177/0265407587044007
Sari, A. (2012). TheEntrepreneurial Readiness Of The Students Of The Food & Beverage Skill Competency In Public Vocational High Schools. Jurnal Pendidikan Vokasi, 2(2), 154–168.
Schumpeter, J. A. (1934). The Theory of Economic Development: An Inquiry Into Profits, Capital, Credit, Interest, and the Business Cycle. Cambridge MA: Harvard University Press.
Schwarzer, R., & Rieckmann, N. (2000). Social Support , Cardiovascular Disease , and Mortality. Berlin, Germany. Scott, E. (2012). Types of Social Support: How Do Different Types of Social Support Work? About.com. Retrieved December 31, 2013, from
http://stress.about.com/od/relationships/a/types-of-social-support.htm Susanti, N. (2012). Hubungan Antara Dukungan Sosial Dan Daya Juang Dengan Orientasi Wirausaha Pada Mahasiswa Program Profesi
Apoteker Universitas Ahmad Dahlan Yogyakarta. Retrieved from uad -journal.com/index.php/EMPATHY/article/download/1548/886
Turner, S., & Lapan, R. T. (2002). Career self-efficacy and perceptions of parent support in adolescent career development. National Career Development Association, 51(1). Retrieved from http://www.freepatentsonline.com/article/Career-Development-Quarterly/92036446.html
Turoff, M., & Hiltz, S. R. (1996). Computer based Delphi process. In M. Adler, & E. Ziglio (Eds.). Gazing into the oracle: The Delphi method and its application to social policy and public health (pp. 56-88). London, UK: Jessica Kingsley Publishers
Ulschak, F. L. (1983). Human resource development: The theory and practice of need assessment. Reston, VA: Reston Publishing Company, Inc.
Vadnjal, J., & Vadnjal, M. (2013). The role of husbands : Support or barrier to women ’ s entrepreneurial start-ups ?, 7(36), 3730–3738. doi:10.5897/AJBM11.3040
Wei, X., & Wang, C. (2009). Research on the Contents and Structure of Social Support for Private Entrepreneurs. Asian Social Science, 5(2), 11–14.
William, P. (2005). What is Social Support? A Grounded Theory of Social Interaction in the Context of the New Family. Retrieved on December 24, 1013, from digital.library.adelaide.edu.au/dspace/bitstream/2440/.../1/02whole.pdf
Zafar, M., Yasin, G., & Ijaz, M. (2012). Social Networking A Source For Developing Entrepreneurial Intentions Among Entrepreneurs: A Case Of Multan. Asian Economic and Financial Review, 2(8), 1072–1084. Retrieved from journal homepage: http://aessweb.com/journal-detail.php?id=5002

Proceedings of 4th
International Conference on Global Business Environment
(ICGBE-2014)
202
The Positives of Cross-cultural Interactions in Multinational Companies and Multicultural Groups
*Małgorzata Rozkwitalska1, Michał Chmielecki2, Sylwia Przytuła3, Łukasz Sułkowski2
1Gdansk School of Banking, Gdansk, Poland 2University of Social Sciences, Lodz, Poland
3Wroclaw University of Economics, Wroclaw, Poland *[email protected]
Abstract: The authors attempt to explore the positives of cross-cultural interactions in multicultural organizations such as multinational companies (MNCs) and multicultural teams (MTs). The prior research has generally accentuated problems in relationships among foreigners and less effort has been made so far to examine the benefits flowing from multiculturalism. Therefore, there is a need to fill in the gap identified above by providing evidence that professional contacts with representatives of different national cultural circles may be very fruitful for both multicultural organizations as well as individuals who are employed by them. The initial results of the authors’ study suggests that the following major positives can be obtained due to cultural diversity, namely 1) personal growth; 2) more creativity and innovation due to, among other factors, enhanced learning; 3) flexibility in working styles; 4) more effective communication; 5) individual benefits; and finally 6) confrontation with stereotypes. Keywords: cross-cultural interactions, cultural diversity, multicultural teams, multiculturalism, multinational companies, value-in-diversity hypothesis
1. Introduction Due to globalization, multicultural organizations such as multinational companies (MNCs) and multicultural teams (MTs) are an inherent element of the world economic landscape. They have appeared to be multicultural since they consist of members interacting both internally and externally, who represent various, frequently very distant national cultures. Those people face serious challenges caused by cultural diversity, thus, not surprisingly, problems typical of contacts with representatives of different cultures have attracted significant attention of numerous researchers (see e.g. Hernandez-Mogollon, Cepeda-Carrión, Cegarra-Navarro & Leal-Millán, 2010; Luo & Shenkar, 2006; McDermott & O’Dell, 2001; Rozkwitalska, 2012; Sano & Di Martino, 2003) and are now sufficiently well-documented. Yet, relationships with foreigners may be affluent in many positives that contribute to individual as well as group and organizational success. Therefore, recently some authors have endeavored to explore what benefits can be attained from multiculturalism in a workplace (see e.g. Rozkwitalska, in press; Stahl, 2006; Stahl, Maznevski, Voigt & Jonsen 2010; Stahl, Makela, Zanderd & Maznevski 2010a; Stevens, Plaut & Sanchez-Burks 2008). This paper follows the similar vein, i.e. it tries to examine the positive aspects of cross-cultural interactions in MNCs and MTs, which is the aim of the conducted analysis, further contributing to the literature that looks for benefits experienced in a multicultural setting and supports the value-in-diversity hypothesis (Cox & Blake, 1991; Jehn, Northcraft & Neale, 1999; Milliken & Martins, 1996). The paper begins with a brief literature review concerning the ‘bright side’ of cross-cultural interactions. Then the methods applied to the pilot study are depicted along with the sample characteristics and the empirical findings. Conclusions that close the analysis in the paper come with implications, contributions and limitations of the study, while the suggestions for future research are also discussed. 2. Literature Review Cross-cultural Interactions: Cross-cultural interactions could be perceived from different cognitive perspectives. The origins are rooted in symbolic interactionism formulated by Blumer (1969). However, contemporary interactions could be identified both as an interpretative and functionalist paradigm (Sułkowski, 2013). In this paper the main emphasis is on the functionalistic frame, showing mainly the benefits of the cross-cultural interactions perceived as a controllable psychological and sociological process. Cross-cultural interactions in this paper refer to mutual influences of individuals who represent different cultures (Rozkwitalska, in press). Such an interaction brings together individuals who have diverse patterns of behaviors and cognitive blueprints that help them to perceive and understand the environment (Webb & Wright, 1996). Considering the context of MNCs, cross-cultural interactions refer to contacts of individuals in every unit of MNCs’ system, including their foreign subsidiaries, clients, partners, suppliers, etc., embracing both internal and external interactions as well as direct and indirect ones. The examples of such a contact concern working in MTs, being a peer or subordinate of an expatriate, being involved in cross-cultural negotiations with external partners, maintaining working relationships with a MNC’s other units while carrying out duties, business trips to other states, transferring knowledge within a MNC, etc. (Rozkwitalska, in press). Regarding MTs, cross-cultural interactions are referred to working within a culturally diverse team, frequently a virtual one, which consists of teammates who are representatives of different national cultural circles. Culture can be defined as blueprints of all people’s activities that direct them, the lens enabling interpretation of the surroundings (Luna & Gupta, 2001), and the collective program affecting the mind and therefore cognition of interacting individuals (Hofstede, 1997). Hence, human beings whilst interacting in a multicultural setting, “interpret or define one another’s actions/behaviors through the lens of their cultures” (Rozkwitalska, in press). Identification of the Research Gap: First and foremost, it needs to be highlighted that the relevant state-of-the-art literature relatively widely portrays what the pros and cons of diversity within a team are (Stahl et al., 2010; Adler & Gundersen, 2008; Czerny, Steinkellner & Zehetner, 2011; O’Reilly, Williams & Barsade, 1998) without consistent argument which actually prevails. Cultural differences are one of the sources of diversity. Yet, diversity may be caused by observable attributes, so-called surface-level diversity, such as age, gender, creed or race, as well as invisible characteristics that are described as deep-level, task-related diversity and include e.g. educational background, learning styles, problem-solving ability, values, attitudes, etc. (Stahl et al., 2010; Hofstede, 1997; Yeager & Nafukho, 2012; Horwitz & Horwitz, 2007). Nevertheless, as far as cultural diversity is concerned, it may produce different outcomes from those generated by other sources of diversity, as reported by several authors. Those authors claim that cultural differences are rather subconsciously experienced
Proceedings of 4th
International Conference on Global Business Environment
(ICGBE-2014)
203
and although their effects are strong, they are not easily recognized by people (Stahl et al., 2010; Horwitz & Horwitz, 2007; Lane, Maznevski, DiStefano & Dietz, 2009). Thus, if the prior research on diversity does not allow for distinguishing the sources of diversity, its applicability to the analysis of the effects of cross-cultural interactions is rather limited and it suggests a significant gap in the previous studies. This paper is to fill in the gap by providing some empirical findings with regards to the issue of the positives of interactions among representatives of different cultures in MNCs and MTs. Specifically, with regards to MNCs, the topic appears to be less documented in the subject literature and research. Theoretical Background: The positives of cultural diversity can be inferred from the information-processing theory and the intergroup contact theory. Regarding to the former, diversity of workforce can provide access to individuals that have different backgrounds, personal networks, information, experiences, mental models, cognitive perspectives, expertise and skills, which prevent group-thinking and boost capacity for creative and innovative problem solving (Stahl et al., 2010a; Stevens et al, 2008; Mannix & Neale, 2006; Watson, Kumar & Michaelsen, 1993; Cox, 1994; Pettigrew & Tropp, 2008). Diverse individuals demonstrate more care to examine the problem at hand conscientiously, which creates chances for a deeper analysis and constructive conflicts. Different perspectives may further contribute to synergy and improve performance of a group (Mannix & Neale, 2006). It is worth mentioning that all mentioned above positive outcomes are associated with the deep-level sources of diversity (Stevens et al, 2008; Mannix & Neale, 2006). With regards to the intergroup contact theory, it affirms that frequent and extended contacts with representatives of different groups foster changes in attitudes towards people from an outgroup and consequently reduce prejudice. Nevertheless, it requires time for alteration in attitudes to develop (Yeager & Nafukho, 2012; Pettigrew & Tropp, 2008; Turner, Hewstone, Voci & Vonofakou, 2008). For instance, studies on expatriate management have also proved that success of overseas assignments depends, among other factors, on a manager’s ability to establish relationships with host country nationals (White, Absher & Huggins, 2011). Indirect references to cultural diversity’s plausible positive effects can be also deduced from the social capital theory. It indicates that if too much cohesiveness occurs in a group, it may cause rigidity, which impedes achievement of complex organizational tasks and hampers it to adapt to change (Stahl et al., 2010a). Basing on the results of empirical studies, the value-in-diversity hypothesis has been formulated. It specifically links diversity with creativity and the theory of information processing. The hypothesis states that heterogonous groups may produce more views on a task, are inclined to more scrupulous analysis of a problem and, as a result, make better decisions, which raise process gains (Stahl et al., 2010a; Cox & Blake, 1991; Czerny et al., 2011; Mannix & Neale, 2006; Pettigrew & Tropp; 2008). In particular, the value-in-diversity hypothesis reveals its strength when complex decision-making problems are considered (Mannix & Neale, 2006). Thereby, multicultural groups that differ in terms of their members’ skills, information and expertise may outperform as homogenous ones due to their potential for generating more alternatives that can lead to novel solutions (Mannix & Neale, 2006). Summarizing the above section, cultural diversity has a chance of enhancing effectiveness of a heterogonous workforce, which mainly results from an increased potential for creativity and innovation, fostering a better quality of decision making and achieving complex tasks. Furthermore, professional contacts with foreigners can support adaptability. Additionally, cross-cultural interactions may reduce prejudice towards members of different cultural groups. The ‘Bright side’ of Cross-cultural Interactions from the Prior Research: The research that has focused on the positive aspects of cultural diversity has indicated so far the following beneficial outcomes of contacts among representatives of different cultures, namely increased creativity, innovation and productivity as the consequences of learning opportunities, knowledge sharing, experiences broadening and adaptability (Stahl et al., 2010; Stevens et al., 2008; Mannix & Neale, 2006; Pettigrew & Tropp; 2008; Friday & Friday, 2003). With regards to the latter, a multicultural staff offers a better understanding of different needs and values of a client base from their cultural groups, which may dispose MNCs to be more adaptive and flexible (Czerny et al., 2011; Friday & Friday, 2003; Wentling, 2000). MNCs with a diverse workforce have also a chance of strengthening their competitive advantage as a result of cost improvements and access to the highest quality staff (Cox & Blake, 1991). Moreover, in the recent studies some authors have also reported that cultural diversity may contribute to a more effective communication and satisfaction (Stahl et al., 2010; Stahl et al., 2010a). Regarding communication, it has been revealed that if a multicultural staff takes into account the deep-level attributes of diversity, cross-cultural communication is likely to be more effective. In that case communication becomes a tool that fosters knowledge sharing and learning, generating more creativity as well. Then, interactions appear to be deeper, more effort is directed to careful explanations of ideas and thoughts, people put more energy into listening and providing feedback. Likewise, communication among diverse employees supports creation of social bonds, which in return increases efficiency of communication and consequently stimulates job satisfaction. Additionally, social bonds generate more trust in mutual relationships, which later improves communication (Stahl et al., 2010; Stahl et al., 2010a). The above findings may also indicate that among communication, creativity and satisfaction there is a feedback loop that furthers learning and contributes to the process gains as well as enhances team capability (Stahl et al., 2010a). Basing on the meta-analysis of the 112 previous studies, which have scrutinized the link between job satisfaction and cultural diversity, some authors disclosed that the relationship was positive (Stahl et al., 2010; Stahl et al., 2010a). The above observation may mean that working in a multicultural environment creates unique conditions for needs satisfaction that are not met when other types of diversity of workforce occur (Stahl et al., 2010a). The authors offered the following explanation, namely satisfaction arises because in cross-cultural contacts people have opportunities for learning and overcoming challenges. Hence, if an individual successfully manages barriers typical of operating in a multicultural setting, his/her satisfaction may appear. Furthermore, efforts to solve problems collectively increase trust in cross-cultural interactions, which in addition, affects them positively (Stahl et al., 2010a). Consequently, contacts among diverse staff enable to fulfill a man’s needs for a variety, personal growth and adventure, causing more job content (Rozkwitalska, in pres; Suutari & Makela, 2007). Encapsulating this part of the conducted analysis, it has to be emphasized that the research on the positives of cross-cultural interactions is rather scant. The prior studies have proved that cultural diversity may bring about more creativity and innovation due to the explained above enabling processes, which can also improve effectiveness of a multicultural workforce. Nevertheless, some other reported positives that derive from contacts with foreigners such as a better adaptability, an enhanced competitive advantage, improved communication or satisfaction have not been sufficiently documented in the previous research yet. Some authors speculate as well that cultural diversity may further vitality and a positive organizational change (Stevens et al., 2008), although there is a lack of evidence which would have supported this hypothesis so far.

Proceedings of 4th
International Conference on Global Business Environment
(ICGBE-2014)
204
3. Methodology and Results The Details of the Research Method and Sample: The empirical findings presented in this paper have an explorative nature. The qualitative study was carried out in four stages with two methods applied, i.e. a survey and a focus-group interview. The primary aim of the research was to gain insight into the positives of contacts with representatives of various cultural groups at work, involving external stakeholders too. The first stage of the research took place at the beginning of the year 2013. It was conducted in foreign subsidiaries of MNCs operating in Poland and was aimed at investigating the positives of cross-cultural interactions. The method that helped to collect the data was a survey (an e-mail survey and a questionnaire interview) via which the respondents were asked to share their remarks concerning some positive aspects of their cooperation with foreigners, including expatriates. The sample was obtained from the previous research in multinational subsidiaries that was carried out at the beginning of the year 2009 (for details see Rozkwitalska, 2011). However, it was also extended in 2013 and additional 22 managers in 13 subsidiaries were added (more details in Przytuła, 2013). The final sample was selected via non-probabilistic sampling methods, i.e. purposive and snowball techniques and was composed of 67 individuals. The majority of them represented middle level managers of Polish nationality (with two exceptions - from Italy and Turkey), men in their thirties. They had been working in various functional departments in their subsidiaries for at least 1.5 year (94% of the respondents had had a longer work experience in MNCs). The subsidiaries in the sample characterized a diverse capital origin and sector belongingness. The majority of the respondents gained an international experience by living abroad, previously working for a company with foreign capital, going on business trips to other countries or working outside Poland. During the second stage of the study a focus group interview was employed to obtain the data. It was carried out in May 2013 at Kaunas University of Technology in Lithuania. The group consisted of 12 master level full-time students of Faculty of Social Sciences, in a vast majority Lithuanian. These students successfully completed x-culture project (during the project students work on a business proposal in global virtual teams; for more details see http://www.x-culture.org/). The discussion during the class was held in English and moderated by the author. It referred to the positive and negative aspects of cross-cultural interactions within MTs in which the students were involved while working on their projects. Only a few participants of the focus group had had a prior experience in MTs. The third stage of the study was also carried out as a focus group interview in October 2013. The focus group consisted of 6 Polish women, who were attendees of a cross-cultural training. They worked for a multinational subsidiary as managers and specialists in various departments. They were 30-50 years old (with prevalence of those in their thirties) and they had had a previous working experience in Thailand. The discussion concerning the positives of contacts with foreigners was held at the beginning of the training and once again when the course was completed. Similarly to the first stage of the research, the fourth one was also conducted as an e-mail survey (occasionally complemented with additional short face-to-face or skype interviews) between October and December 2013. The respondents were selected via purposive and snowball sampling methods, i.e. personal contacts of the coach and the authors helped to gather the answers from additional 41 individuals, who experienced cross-cultural contacts at their work. They had worked for MNCs for many years, a lot of them abroad. Most of the respondents were Poles, although there were also five Germans, four Americans, three Dutchmen, two English people and an Italian. The men accounted for the majority of the sample, and the respondents’ age was over 30 (with a few individuals over the age of 50). They represented various levels of managerial hierarchy, departments and MNCs with a diverse capital origin and sector belongingness. It is worth emphasizing that since the majority of the respondents in the study had had an international experience, it could have affected their notion of cross-cultural contacts. In the subsequent section the empirical findings are reported from all the stages of the research depicted above. The Empirical Findings: First and foremost, it needs to be highlighted that although only the students were directly asked about both the positive and negative aspects of cross-cultural interactions, nearly 20% of the respondents (including Poles, Lithuanians, Italians and Germans) had a problem concerning indication what benefits could be associated with such a relationship. For instance, one respondent ascertained: “(…) we realize international projects, thus cooperation is a necessity and obviousness. I cannot observe any extraordinary advantage of such interactions, preferably it would be sometimes easier to reach an agreement with Poles.”, while another one observed: “Most managers that I work with accept that the employers benefit from a diverse workforce. And there is a strong tendency to diversify project teams in our company.” Nevertheless, the participant of the third stage of the research after the cross-cultural training which they received started declaring that they had became more aware of how professional contacts with representatives of different cultures could be fruitful to them. It may suggest that cultural awareness is an essential factor in building effective relationships with different nations. The foregoing observation is in congruence with the subject literature (see e.g. Hutchings, 2003; Mamman, 1995; Ang, Dyne, Koh, Ng, Templer, Tay & Chandrasekar, 2007). Notwithstanding some negative comments of the minority of the respondents, the other individuals presented a more balanced view on cross-cultural interactions, yet the “bright side” appears to dominate their remarks: Respondent A: “Whilst there are huge benefits of international collaboration and teamwork, working with people from different backgrounds isn’t always easy. It is definitely the source of those difficulties that make those experiences very valuable. The more diverse an organization, the better manager you become. More open, more creative and more flexible.” Respondent B: There is a lot of racial and ethnic discrimination in the UK. You have to prove very hard that you are good. At the beginning you have to earn respect by working three times as hard as the British. Nevertheless, it’s a great experience to be able to work together with people from several different countries, learn about their customs, traditions, religions. It is a way of growing, of developing oneself. All in all, this hard beginning is worth the experiences.” Respondent C: “Every single time you find yourself working with colleagues from a different culture you are likely to find pros and cons associated with the situation. What I love the most is the unique opportunity to expand my horizons, learn about new cultures, and create business relationships that span the globe.” Basing on the analysis and synthesis of the data obtained from the research, the following positives of cross-cultural interactions can be listed (in order of the respondents’ frequency of indicating, including at least three indications), namely: 1) personal growth along with the development of social skills and improvement of language; 2) learning opportunities, experience broadening and knowledge sharing; 3) flexibility in working style, process gains in a group work; 4) more perspectives, self-reflection; 5) communication effectiveness; 6) individual benefits; 7) confrontation with stereotypes. The first category mentioned above, i.e. personal growth, was directly selected by the respondents, yet the remaining categories (except the sixth and partially the third one) also reflect various aspects of an individual’s

Proceedings of 4th
International Conference on Global Business Environment
(ICGBE-2014)
205
improvements. Therefore, it may suggest that a development of human resources is the major positive output of cross-cultural interactions at work, as stated by one of the respondents: “From the company’s perspective I think that contacts with foreigners bring about many (…) benefits, including a growth in competences of human resources.” (Rozkwitalska, in press) It is worth highlighting that an individual growth as well as a human resource development as the positives of cross-cultural contacts have not been sufficiently explored or emphasized in the field literature and the prior research so far. The following quotations refer to the personal growth’s effect of relationships with foreigners: Respondent D: “Working with people is an unusually strong determinant of a personal growth. Working with foreigners helps to confront with the reality of our learned abilities.” Respondent E: “By dealing with people from different countries, because of cultural differences, you improve your negotiation and communication skills. You need to be more open and flexible (…) - this experience can be brought back into dealings in the country of origin.” Respondent F: “Mutual interactions foster self-development. (…) they are also an incentive in emotional intelligence building.” Respondent G: “The benefits of cooperation with foreigners include (…) overcoming your own limitations.” Respondent H: “I learnt much about different people and cultures, how to tolerate different attitudes, opinions, and so on.” Respondent I: “There are numerous benefits. One of them is self-development. Moving offshore for an assignment increases your confidence, enhances your cultural awareness, strongly improves your communication skills and changes you both as a person and as a business professional.” Respondent J: “By working for such a diverse organization you develop not only professionally but also as a person, you grow, you change. I’d never want to work for a monocultural organization anymore. It’s somehow like a waste of time.” Two of the categories in the respondents’ indications listed above, i.e. the second and the fourth ones, reflect an indirect positive impact of cross-cultural interactions in MNCs and MTs on creativity and innovation, as it is poised in the information processing theory and revealed in the previous research (see the literature review section). The selected citations from the authors’ study regarding the signaled issue are presented below: Respondent D: “Working with foreigners (…) broadens one’s perspectives and teaches to keep a healthy distance.” Respondent E: “You can learn from the experiences other people have in dealing with various situations. (…) Cross-cultural interactions at the business and personal levels enhance intellectual perspectives.” Respondent F: “We can utilize our reciprocal achievements.” Respondent L: “(…) my team members had a different educational background and had studied different disciplines before, which made me learn more other subjects and be able to work with a multidisciplinary environment.” Respondent M: “Cross-cultural interactions give people insight into other cultural experience, behaviors, intonation and communication of those from different countries or continents. You could compare your view of the world with different people’s views.” Respondent N: “Cooperation with foreigners allows for recognizing views different from yours, validating someone’s opinions, (…) it enriches your knowledge of the world and lets you adopt some solutions; additionally, it helps you to discover your implicit abilities.” Respondent O: “It really gives me the chance and possibility to explore things and ideas from a different angle, from a different perspective. My German colleagues think a little bit different and I like to confront my ideas with them.” Furthermore, with regards to creativity and innovation, one respondent noticed: “I think that contacts with foreign suppliers and partners increase the level of innovation and creativity in a company, help to transfer to our home environment the latest technology and consequently to raise the competitiveness level” (Rozkwitalska, in press), while another one added: “Diversity inside the an organization unlocks and powers innovation because it creates an environment where “outside the box” ideas are common.” Another positive outcome of the contacts with the members of alien cultural circles, flagged during the research, refers to increased flexibility in working style that may further better problem solving and enhance group performance (category 3), as reflected in the subsequent opinions of the respondents: Respondent P: “One of the key positives is the exposure to different ways of approaching the same issues, problems and challenges. By working with people from other cultures we learn how to be flexible in our approach and accept the fact there may be alternative ways to address the same issues and achieve the same outcomes.” Respondent H: “The benefits of cooperation with foreigners are: (…) demonstrating different working styles, coming up to solutions (…).” Respondent T: “I had problems with adapting to the German culture. There is no room and no need for improvisation. It was hard for me at the beginning. Now I understand that. Nevertheless, when something very unexpected happens, my German colleagues count on me very much. Previously they were stuck, they couldn’t move forward, now I can say they admire my possibility to improvise and to fight unexpected situations. So I must say as a group we produce better results.” Additionally, the process gains in MTs can result from more effective communication among diverse staff, as it was posited by Stahl et al. (2010; 2010a) and confirmed by several respondents: Respondent U: “Communication culture – there is a stronger mobilization. You must maintain standards. Carefulness for clarity of thoughts expression improves everything (logistics, negotiation, procedures, etc.). Courtesy is reflected in correspondence, you see attention to details. Cooperation and common work determine a need for reaching an agreement regardless of anything, including cultural differences. You simply look for a common ground/understanding.” Respondent W: “(…) working in an international team helps to improve your language skills. I mean both vocabulary and communication skills. You need to use simple phrases to make it understandable for everybody.” Respondent F: “While working on a strategy with a German person in Poland, communication effectiveness/ability to influence a German client will definitely grow.” Respondent G: “The benefits of cooperation with foreigners are: (…) skills improvements, e.g. language ones, such as nonverbal communication (…).” Respondent X: “It changes the way you communicate not only with other people, but with the world at large.” As far as the authors’ research is concerned, the respondents were able to notice the positive outcomes of their cross-cultural contacts for both them and MNCs/MTs, as commented in the citation from the study: “Positive familiarity with a cross-cultural work environment translates into your every-day reality (and vice versa).” Nonetheless, the individual benefits were usually associated with building social bonds as well as better career opportunities:

Proceedings of 4th
International Conference on Global Business Environment
(ICGBE-2014)
206
Respondent I: “I have more than 18 years of work experience in (…) MNCs. From the very nature such a job means contacts with foreigners (…) Parts of these relationships transformed into sustained private relations – for years my first boss - an Englishman – has been the best friend of mine and my family (…).” (Rozkwitalska, in press) Respondent G: “The benefits of cooperation with foreigners are: (…) forging relationships, winning friends forever.” Respondent Z: “Combining cultures often means understanding different value systems, providing a global advantage in your professional career.” Respondent O: “Cross-cultural training enhances our skills and therefore future employment opportunities”. Such individual benefits can be a source of satisfaction, yet this outcome was not openly addressed by the respondents.The last but not least, in conformity with the intergroup contact theory, cross-cultural contacts in MNCs and MTs may enable individuals to confront their stereotypes and as a result reduce their implicit or explicit prejudice: “(…) I guess that the most important positive aspect of contacts with foreigners is a chance of confronting stereotypes which are ingrained in our minds and concern particular nations and the actual representatives. Then we see that e.g. Russians or Germans are very likable and open people.” (Rozkwitalska, in press). In addition, the respondents indicated such positives of contacts among culturally heterogonous employees as optimism and self-efficacy of individuals, adaptability of MNCs and quality: Respondent D: “Working in a multicultural setting makes you aware that only the sky is the limit.” Respondent ZZ: “Cross-cultural communication promotes self-confidence in individuals because it empowers them with a sense of control over challenges in the workplace which were previously difficult.” Respondent YY: “We know that when at least one member of our team has traits in common with the end user of our products that comes from another culture, the entire team will better understand that user. Teams with a member who shares a client’s ethnicity are far more likely to understand that client than another team.” Respondent S: “Diversity translates into quality if a firm is capable of utilizing it.” (Rozkwitalska, in press) Due to the fact that a part of the research was specifically aimed at scrutinizing contacts among subsidiaries’ staff and expatriates, table 1 provides some quotations concerning perception of these individuals by the locals. Their observations suggest that expatriates may positively affect cross-cultural interactions since they possess certain qualities such as social skills, flexibility and international experience, which the local employees can derive from.
Table 1: Positive Cross-cultural Interactions among Expatriates and Managers The positives observed by the locals Quotations personal growth along with the development of social skills
“Expatriates are ambassadors of their corporations, they represent high presentation skills and personal culture that are over their weaknesses resulting from their personality traits”
learning opportunities, experience broadening and knowledge sharing
“They have experience in work in various countries – sometimes they are our instructors and trainers in managing diverse teams in our subsidiary”
“They showed us how to share experiences among the company’s subsidiaries in the whole world, how to build networking”
flexibility in working style “They facilitate global thinking and implementation of simple processes used all over the world”
“The expatriates present high adaptability to specific local circumstances, which follows from their previous experience”
communication effectiveness “They are focused on project and team management so their ability and will to build a positive communication platform is prevailing in their everyday work”
“They speak foreign languages (English, German, French) fluently and what is very positive - they are willing to learn the local language (e.g. Polish), even if their contract is for one year”
4. Conclusion The conducted analysis, by collecting evidence of the positives of cross-cultural interactions, may contribute to the stream in the intercultural management literature that looks for the ‘bright side’ of such a relationship in multicultural organizations and supports the value-in-diversity hypothesis. Moreover, the paper focuses on cultural diversity’s effects that seem to have been less examined so far and offers results that refer to the deep-level attributes of diversity. It especially adds to the literature on multiculturalism in MNCs since generally the previous studies regarding this issue have preferably been concerned with MTs. Moreover, some findings directly contribute to the stream regarding expatriates. The research have also exposed some findings that were not adequately explored in the prior studies, i.e. it accentuates such a fruitful outcome as personal growth, including the development of social skills, as well as sheds new light on the positives, while signaling self-reflection, optimism and self-efficacy as a result of contacts with culturally heterogonous stakeholders. Another contribution is that the authors examined the benefits of cross-cultural contacts in a broad sense, i.e. not limited to teammates but also extended to other groups of foreign stakeholders, involving the external ones, such as e.g. clients or suppliers. In general, the research confirmed most of the facts from the former studies of the other authors with one exception, namely it failed to directly prove that interactions with other countries’ nationals may be satisfactory. The empirical findings imply that cross-cultural interactions in MNCs and MTs may be translated into both a company’s and an individual’s asset, yet they still pose a risk of being a liability. Which of the effects prevails mainly depends, among other issues, on cultural awareness of those who function in a multicultural environment. The analysis in the paper is also limited primarily because of the drawbacks of the applied methods to select the sample and collect the data as well as its explorative character. Two sorts of informants were used to obtain the observation, i.e. MNCs’ staff and students. With regards to the latter, their opinion cannot be applied to the context of MNCs since their experience in a multicultural setting is relatively scant. Taking the foregoing into account, future research is recommended to deepen the conducted study. Also the very methodology is expected to be improved, e.g. in-depth interviews could provide more accurate observations and explain certain issues. For instance, further research should address the questions as follows: 1) Why cannot some people recognize any positive of cross-cultural interactions?; 2) Which actually preponderate in relationships among culturally heterogonous stakeholders - the positives or negatives?; 3) What determines their occurrence?; 4) What are other benefits of cross-cultural contacts?; 5) How does the context of MNCs affect external and internal

Proceedings of 4th
International Conference on Global Business Environment
(ICGBE-2014)
207
interactions of their multicultural employees? Finally, the next research may solely be concerned with MNCs and hence separate the positives of cultural diversity in MNCs from those achieved in MTs. Acknowledgment: The paper presents the empirical findings that have been conducted within the project financed by National Science Center in Poland, the research grant no. UMO-2013/09/B/HS4/00498. The authors thank Bożena Dancewicz, whose personal contacts in a multicultural environment of MNCs enabled the authors to collect a part of the data for this paper. References
Adler, N.J., Gundersen, A. (2008). International dimmensions of organizational behavior. (5th ed.). Mason, Ohio: Thomson-South Western,
135. Ang, S., Dyne, L.V., Koh, Ch., Ng, K. Y., Templer, K.J., Tay, Ch. & Chandrasekar, N. A. (2007). Cultural intelligence: its measurement and
effects on cultural judgment and decision making. cultural adaptation and task performance. Management and Organization Review, 3(3), 335-371.
Blumer, H. (1969). Symbolic interactionism: perspective and method. Berkeley: University of California Press. Cox, T.H. & Blake, S. (1991). Managing cultural diversity: Implications for organizational competitiveness. Academy of Management
Executive, 5 (3), 45-56. Cox, T.H. (1994). Cultural diversity in organizations: Theory, research, and practice. San Francisco: Benett-Koehler Publishers. Czerny, E.J., Steinkellner, P.F. & Zehetner, K. (2011).Team diversity as competitive advantage. Advances in Business-Related Scientific
Research Conference 2011 in Olbia (ABSRC 2011), September 7-9, Olbia, Italy. Retrieved from http://www.res.co.at/downloads/ABSRC2011_Team_Diversity.pdf
Friday, E. & Friday, S.S. (2003). Managing diversity using a strategic planned change approach. Journal of Management Development, 22, 863-880.
Hernandez-Mogollon, R., Cepeda-Carrión, G., Cegarra-Navarro, J.G. & Leal-Millán, A. (2010). The role of cultural barriers in the relationship between open-mindedness and organizational innovation. Journal of Organizational Change Management, 23(4), 360-376.
Hofstede, G. (1997). Cultures and organizations: Software of the Mind. New York: McGraw-Hill. Horwitz, S. K. & Horwitz, I.B. (2007). The effects of team diversity on team outcomes: A meta-analytic review of team demography.
Journal of Management, 33(6), 987–1015. Hutchings, K. (2003). Cross-cultural preparation of Australian expatriates in organisations in China: The need for greater attention to
training. Asia Pacific Joumal of Management, 20, 375-396. http://www.x-culture.org/ Jehn, K.A., Northcraft, G.B. & Neale, M.A. (1999). Why some differences make a difference: A field study of diversity, conflict, and
performance in workgroups. Administrative Science Quarterly, 44, 741–763. Lane, H.W., Maznevski, M.L., DiStefano, J.J. & Dietz, J. (2009). International management behavior: Leading with a global mindset (6th ed.).
Oxford: Blackwell Publishers. Luna, D. & Gupta, S.F. (2001). An integrative framework for cross-cultural consumer behaviour. International Marketing Review, 18(1),
45-69. Luo, Y. & Shenkar, O. (2006). The multinational corporation as a multilingual community: language and organization in a global context.
Journal of International Business Studies, 37, 321-339. McDermott, R. & O’Dell, C. (2001). Overcoming cultural barriers to sharing knowledge. Journal of Knowledge Management, 5(1),76-85. Mamman, A. (1995). Employee intercultural effectiveness in a multicultural workplace: theoretical propositions, strategies and direction
for future research. The International Journal of Human Resource Management, 6(3), 529-552. Mannix, E.A. & Neale, M.A. (2006). What differences make a difference? The promise and reality of diverse teams in organizations.
Psychological Science in the Public Interest, 6, 32-55. Milliken, F.J. & Martins, L.L. (1996). Searching for common threads: Understanding the multiple effects of diversity in organizational
groups. Academy of Management Review, 21, 402-433. O’Reilly, C.A., Williams, K.Y. & Barsade, W. (1998). Group demography and innovation: Does diversity help? In D. Gruenfeld (ed.),
Research on managing groups and teams (pp. 183-207). St. Louis, MO: Elsevier. Pettigrew, T. & Tropp, L. (2008). How does intergroup contact reduce prejudice? Meta-analytic tests of three mediators. European Journal
of Social Psychology, 38(6), 922-934. Przytuła, S. (2013). Expats in Poland – a strong or weak link in managing Polish subsidiary? Results of empirical fidings In M.
Rozkwitalska (ed.), Multiculturalizm, values and social responsibility. New challenges in managing organization, Academic Papers of Gdansk School of Banking (pp. 49-64). Gdańsk: CeDeWu; Przytuła, S., Ekspaci w Polsce - silnym czy słabym ogniwem w zarządzaniu polska filią? Wyniki badan empirycznych, w M. Rozkwitalska (red.), Wielokulturowość, ukierunkowanie na wartości i społeczna odpowiedzialność. Nowe wyzwania w zarządzaniu organizacją, Prace Naukowe Wyższej Szkoły Bankowej w Gdańsku (pp. 49-64). Gdańsk: CeDeWu.
Rozkwitalska, M. (2011). Barriers in intercultural management. Foreign subsidiaries of multinational corporations’ view. Warsaw: Wolter Kluwer; Rozkwitalska, M. (2011). Bariery w zarządzaniu międzykulturowym. Perspektywa filii zagranicznych korporacji transnarodowych. Warszawa: Wolters Kluwer.
Rozkwitalska, M. (2012). Human Resource Management strategies for overcoming the barriers in cross-border acquisitions of multinational companies: the case of multinational subsidiaries in Poland. Social Sciences, 77(3), 77-87.
Rozkwitalska, M. (in press). Negative and positive aspects of cross-cultural interactions: a case of multinational subsidiaries in Poland. Engineering Economics.
Sano, M. & Di Martino, L.A. (2003). Japanization of the employment relationship: three cases in Argentina. CEPAL Review, 80, 177-186. Stahl, G.K. (2006). Synergy springs from cultural revolution. Financial Times, October 6.
Proceedings of 4th
International Conference on Global Business Environment
(ICGBE-2014)
208
Stahl, G.K., Maznevski, M., Voigt, A. & Jonsen, K. (2010). Unrevealing the effects of cultural diversity in teams: A meta-analysis of research on multicultural work groups. Journal of International Business Studies, 41(4), 690-709.
Stahl, G.K., Makela, K., Zanderd, L. & Maznevski, M.L. (2010a). A look at the bright side of multicultural team diversity. Scandinavian Journal of Management, 26, 439-447.
Stevens, F.G., Plaut, C.V., Sanchez-Burks, J. (2008). Unlocking the benefits of diversity. All-inclusive multiculturalism and positive organizational change. The Journal of Applied Behavioral Science, 44(1), 116-133.
Sułkowski, Ł. (2013). Epistemology of management. Frankfurt-Oxford-New York-London: Peter Lang International, pp. 109-116. Suutari, V. & Makela, K. (2007). The career capital of managers with global careers. Journal of Managerial Psychology, 22(7), 628-648. Turner, R., Hewstone, M., Voci, A. & Vonofakou, C. (2008). A test of the extended intergroup contact hypothesis: the mediating role of
intergroup anxiety, perceived ingroup and outgroup norms, and inclusion of the outgroup in the self. Journal of Personality and Social Psychology, 95(4), 843-860.
Watson, W.E., Kumar, K. & Michaelsen, L.K. (1992). Cultural diversity’s impact on interaction process and performance: Comparing homogeneous and diverse task groups. Academy of Management Journal, 36, 590-602.
Webb, A. & Wright, P.C. (1996). The expatriate experience: implications for career success. Career Development International, 1(5), 38–44.
Wentling, R.M. (2000). Evaluation of diversity initiatives in multinational corporations. Human Resource Development International, 3, 435-450.
White, D.W., Absher, R.K. & Huggins, K.A. (2011). The effects of hardiness and cultural distance on sociocultural adaptation in an expatriate sales manager population. Journal of Personal Selling & Sales Management, 31(3), 325-337.
Yeager, K.L. & Nafukho, F.M. (2012). Developing diverse teams to improve performance in the organizational setting. European Journal of Training and Development, 36(4), 388-408.

Proceedings of 4th
International Conference on Global Business Environment
(ICGBE-2014)
209
Trans Inguri Trade Partnership
Vakhtang Charaia
Tbilisi State University [email protected]
Abstract: After the breakup of the USSR, Georgia was involved in two local conflicts on its own territory. The hardest was conflict on its breakaway region Abkhazia, conflict provoked by the Russian Federation. The conflict was waged mainly between Georgian government forces on one side and Abkhaz separatist forces supporting independence of Abkhazia from Georgia, Russian armed forces (unofficially, however they really won the battle for Abkhazian side) and North Caucasian hired fighters on the other side. Ethnic Georgians who lived in Abkhazia (239.9 thousand people) fought on the side of Georgian government forces, Ethnic Armenians (76.5 thousands) and Russians (74.9 thousands) within Abkhazia's population largely supported Abkhazians (Abkhazians – 93.3 thousand people) [1], and many fought on their side. The separatists were supported by thousands of the North Caucasus and Cossack militants and by the Russian Federation forces stationed in and near Abkhazia. Of course the conflict was managed and won by the Russian Federation [2]. More than 200 thousand ethnic Georgians become IDPs. On August 26, 2008, the Russian Federation officially recognized Abkhazia (together with the South Osetia – another breakaway region of Georgia) as independent states [3]. However, the key players in the international politics did not followed Russian initiative, even more, only those four countries - Nicaragua, Venezuela, Nauru and Tuvalu [4], most probably in change for some political and economic benefits from Russian Federation, supported this idea. On the other hand, the whole civilized world supported Georgian territorial integrity without any prepositions [5].
Keywords: Conflict Territories, Trade, Illegal Trade, Black Market
Map of Georgia together with its breakaway regions
Source: United Nations Cartographic Section Trade partnership: This report is mainly made based on the study – “trans Ingur/i economic relations, a case for regulation”, which analyzed economic relations across the Georgian-Abkhaz conflict divide, which evaluates the prospective of mutual economic interest as a starting point for conflict peaceful resolution. Despite the fact that economic issues could be a key point in the process of conflict regulation, it is not taken seriously by any of the sides and no one takes care to assist those businessmen who try to be active in this field. Even more, the official trade between these conflict territories is prohibited by law from the both sides. For the Georgian side, products crossing the boundary into Abkhazia are considered to be internal trade across an administrative border and commodities enter “occupied territory”; at the same time, Abkhazian side believes that this is a foreign trade. Security concerns of the Abkhaz side have led to the closure to any movement of commercial goods for many times (legal casus) to the both sides: inflow and outflow of products to and from Georgia. From a legal point of view, the decree of 2007 year, of so called “president of Abkhazia”, this movement of commercial goods to both directions is considered as contraband. On the other hand, Georgia side also considers this trade of goods not fully in line with the Georgian law. The Law on the Occupied Territories, which was adopted in the aftermath of the August 2008 war, declares that economic activity (including business) on the territory of Abkhazia is illegal [6]. However, the research shows that the trade issues exist! It makes a significant share of the Abkhazian Inflow (import) and Georgian outflow (export) of agricultural products. According to the research Georgian outflow to Abkhazia in some products, like meat and dairy (both through legal and illegal border crossing points, see the picture 1) is approximately equal to the total exports of these products from Georgia to other destinations [7]. Furniture makes up to 25 percent, of Georgia’s total official furniture exports [8]. What concerns the Abkhazian inflow of Georgian agricultural products to

Proceedings of 4th
International Conference on Global Business Environment
(ICGBE-2014)
210
Abkhazian market, it is different according to different products and makes up around 40 percent of total import of those products (Cucumber, tomatoes…)
Picture 1: Official (Rukhi-Chuburkhindzhi) and unofficial crossing points on the Inguri river
Source: Trans-Inguri economic relations: a case for regulation International Alert, May 2013. 80 percent of commodities brought into Abkhazia through the Inguri river are supposed for Sukhumi and Gagra markets. Only a small part of those products, 8–25 percent (depending on season) arrived from the Georgian side, remain in Gal/i. Potatoes, tomatoes, cucumbers, onions and apples constitute the largest group of vegetables brought to Abkhaz markets from across the Inguri, making up to 40 percent of entire number of vegetables inflow from Russia and Turkey. And at the same time those mentioned above trade products outflow to Abkhazian market from Georgia, equals to 10 times the total official Georgian exports of these particular products to all over the world. The outflow of meat and dairy products is almost identical to the whole Georgian exports of these products (other products please see on the Figure 2).
Figure 2: Inflow of Fruits and vegetables from Russia, Turkey and Georgia to Abkhazia (from left to the right)
Source: Trans-Inguri economic relations: a case for regulation International Alert, May 2013. Supply from across the Inguri constitutes a sizeable portion of goods in Gali markets, while in Sukhumi the share of goods from Georgia is small, because the inflow of products from Turkey and Russia to Abkhazia is relatively high, since the trade activities between this subjects are more or less better managed and so to say “legal”. Despite the fact that “war economy” typically consists from small groups of traders able to make brilliant income by violating embargoes and/or trading deadly products with the highest returns, conventional trade flows in the conflict environment, most notably between the conflicting parties, are contaminated by low penetration to the markets and extremely low purchasing power. Consequently the trade products are also not of the highest quality and mainly follow natural fundamental supply/demand and price gradient patterns. Prohibitive legal frameworks on both sides of the Inguri river prevents those, so important economic cooperation and as a result moves trans-Inguri trade relations to the black market. As a result Gali’s Georgian population is damaged the most, because products here are delivered mainly from Georgian side, since trade between Gali and

Proceedings of 4th
International Conference on Global Business Environment
(ICGBE-2014)
211
other part of Abkhazia is not properly managed. Nowadays, when economic factor is moving the world around, it is simply impossible, even during the conflict periods (another example is Georgia-Russian trade after the war of 2008 year, when trade did not disappeared even after the diplomatic break up and border closing between this two countries) not to have economic relations, especially trade relations and the most important here is that, with the proper management and assistant this trade could be increased dramatically and led to the economic prosperity of the involved sides, as well as to the food safety and trade diversification issues. Moreover, we see that this economic relation has a significant impact on the people’s living standards (economic, social and mental) in and around conflict territory, in other words supporting this cooperation should be one of the priorities in the way of conflict resolution. Therefore, it is necessary to create a special joint group of professionals (of different fields: lawyers, economists, businessmen…) from governmental, civil and business circles. However, before this step both sides should evaluate the possible benefits from this action clearly, to see the bigger picture, which can bring mutual benefits to the both sides. References Georgian genealogy. http://www.geogen.ge/index.php?id_menu=23&abc=0 E. Kizilbuga, “Russian involvement in the Abkhaz0Georgian Conflict”, Masters Paper at Middle East Technical University, April 2006.
http://etd.lib.metu.edu.tr/upload/12607208/index.pdf CLIFFORD J. LEVY, "RUSSIA BACKS INDEPENDENCE OF GEORGIAN ENCLAVES, THE NEW YORK TIMES, AUGUST 2008.
HTTP://WWW.NYTIMES.COM/2008/08/27/WORLD/EUROPE/27RUSSIA.HTML?PAGEWANTED=ALL&_R=0 BARRY, ELLEN “ABKHAZIA IS REGOCNIZED – BY NAURU”. NEW YORK TIMES, DECEMBER 2009. VOTING ON THE UN RESOLUTION FOR GEORGIA’S TERRITORIAL INTEGRITY. HTTP://WWW.PONARSEURASIA.ORG/ARTICLE/VOTING-UN-RESOLUTION-
GEORGIA%E2%80%99S-TERRITORIAL-INTEGRITY Government of Georgia State Strategy on Occupied Territories: Engagement Through Cooperation. http://www.civil.ge/files/files/SMR-
Strategy-en.pdf Trans-IngUr/I economic relaTIons: a case for regulation International Alert, 2013. http://www.international-
alert.org/sites/default/files/Caucasus_TransInguri_EconRelationsRegulation_EN_2013.pdf National Statistics office of Georgia. www.geostat.ge

Proceedings of 4th
International Conference on Global Business Environment
(ICGBE-2014)
212
Street Food Vending and Hygiene Practices and Implications for Consumers
R. Kok, R. Balkaran
[email protected] Abstract: Street food vending has and is becoming globally a convenient and in most cases an essential service. Lifestyle changes and socio economic factors creates very little space for consumers to look at other alternatives one of which would be to prepare one’s own meal. Street food therefore becomes an easy and economic means to acquire prepared food. Safe hygiene practices should become integral to the vendor as the product will be consumed by people of all ages and many may be vulnerable to poor quality food. The street food vendor in turn relies on this service as a means of employment and income generation. The competition between vendors is increased and the pressure to cut corners becomes a reality and one significant corner is appropriate hygiene practices. The practice of appropriate hygiene practices is also as a result of total ignorance of many vendors and the nature of the food that they prepare. The paper explores lessons from various countries in respect of dealing with ensuring good hygiene practices of street food vendors and its usefulness to the South African perspective. One such initiative is the programme launched by the India’s Food Safety and Standards Authority and the National Association of Street Vendors of India. South African street food industry is rapidly increasing in size and proportion. Several studies have been undertaken to look at this operation from various perspectives including hygiene practices and small business. Employment creation has become a national imperative of the country and small business development is seen as a significant component to employment creation. This paper sets out to establish the global practices in street food vending from a hygiene perspective and its relevance to the South African context. 1. Introduction Von Holy and Makhoane (2006) interpret street vended foods as foods and beverages prepared and/or sold by vendors in streets and other public places for immediate consumption or consumption at a later time without further processing or preparation. Globally, street food vending is an omnipresent activity in cities such as Bangkok and Mexico. Street foods can be found in clusters around places of work, schools, hospitals, universities, railway stations, bus terminals and taxi ranks in the urban areas. Very little is known about street food and fast food consumption patterns in South Africa despite this being a large sector of the national economy in terms of employment provision and food sales. Vending foods on the street is a common aspect of lifestyle in many countries. Street food vendors are a ubiquitous and conspicuous presence in most cities and they sell a variety of wares ranging from snacks and drinks to full meals. The street food trade has evolved into a large and complex food sector that provides both an important means of income to the vendors and affordable source of food to millions of people from all walks of life (Ohiokpehai, 2003). The street food industry plays an important role in the cities and towns of many countries in meeting the demands of the city dwellers. This food sector has been growing rapidly all over the world and South Africa is no exception. It is largely recognized that street foods play an important socio economic role in terms of employment potential, income for women, and in serving the food at prices affordable to the lower and middle-income groups and even to the high income groups all over the world (Muzaffar et al., 2009). The street-food trade has been reaching new dimensions in developing countries and is recognized as a phenomenon that has great economical and socio-cultural importance(Lucca et al., 2006). The street food trade is categorised under the informal sector which consists of those businesses that are not registered in any way. They are generally small in nature, and are seldom run from business premises. Instead, they are run from homes, street pavements or informal arrangements (Skinner, 2006). There is an assumption that by their nature, street food contamination is inevitable, yet millions of people depend on this source of nutrition and economic livelihood.The important contribution that small and micro-enterprises (SMEs) can make to employment and income generation is being recognized worldwide. (Martins, 2006) found that in South Africa the contribution of these SMEs is particularly significant in view of the fact that the non-agricultural formal sectors downsized by almost a million jobs between 1990 and 2000. As a last resort, many of these unemployed people started their own informal activities to survive. Most of them started with ‘easy-to-enter’ businesses where a relatively small capital layout is needed, such as in street food vending (Martins, 2006). Coupled with growing urbanization, these conditions (which are rife in Africa), have combined to give stimulus for the rapid expansion of the street food industry in Africa. “At the global level, a World Health Organization survey has shown that street foods constitute a significant part of the urban food supply of 74% of the African countries”. 2. Literature Review In South Africa the hot climate and the environmental conditions such as the dusty streets, in which street food vendors are working, favour bacterial growth. Food risk is influenced by food type, pH, and method of preparation, water availability, handling, exposure temperature, and holding time(Campbell, 2011). Arambulo et al., (1994) has identified various characteristics of street foods which influence the health risks involved. In general terms, these characteristics include the type of food product; the nonuse, use, or overuse of food additives; and the nature and extent of microbial or chemical contamination. Street food studies carried out in Africa have indicated that their tremendous unlimited and unregulated growth have placed a severe strain on city resources, such as water, sewage system and interferences with the city plan through congestion and littering adversely affecting daily life (Nicolas.B et al., 2007). The sale of food in public places is highly contentious from a health standpoint. This practice represents a serious threat to consumer health and is a matter of great importance for public health chiefly because of improper hygiene techniques (Lucca et al., 2006). Street food vending is therefore a source of a wide range of foods that may be nutritionally important for various groups of the population (Von Holy and Makhoane, 2006). The ways in which street foods are processed are also extremely variable and range from the preparation of foods "on the street" in relatively heterogeneous and unregulated conditions to the central processing of ready-to-eat foods, such as snacks (Draper, 1996). The types of street foods sold vary greatly between countries. However, most meals consist of the staple food served in various forms and in combination with side dishes such as stews, gravies and spices. In addition, snacks such as dried meat, fish and cereal based ready to eat foods are also prepared and served. Hygiene is the preservation of health and it involves all measures that ensure the safety and quality of food during its handling. These measures include correct storage of both raw and cooked foods as well as correct preparation and cooking methods. Unhygienic preparation of food provides plenty of opportunity for contamination, growth or survival of food borne pathogens. The hygiene sanitary aspect is the main factor that compromises food quality(Gordon-Davis, 1998). In most countries

Proceedings of 4th
International Conference on Global Business Environment
(ICGBE-2014)
213
street food stands are crude structures, and running water may not be readily available. Also toilets and adequate washing facilities are seldom available. The washing of hands, utensils and dishes are often done in bowls or pots of water. Disinfection is not usually carried out and insects and rodents may be attracted to sites where there is no organised sewage disposal. Finally food is not effectively refrigerated as electricity is not always accessible at these sites. Foods prepared on site pose health risks if hygiene principles are not applied properly(Gordon-Davis, 1998). According to WHO (1989), food handling personnel play an important role in ensuring food safety throughout the chain of food production and storage. Mishandling and disregard of hygienic measures on the part of the food vendors may enable pathogenic bacteria to come into contact with and in some cases survive and multiply in sufficient numbers to cause illness in the consumer (Abdalla et al., 2009). Failure to maintain equipment and utensils hygienically and in good repair may cause food poisoning. Gordon-Davis, (1998) has identified the most common food poisoning bacteria as salmonella, staphylococcus aureus, clostridium perfringens, bacillus cereus, Escherichia coli (E.coli) and clostridium botulinum, with salmonella being the most common. In food processing, foodborne microbes can be introduced from infected humans who handle the food, or by cross contamination from some other raw agricultural product and/or the in-plant environment. (Tambekar et al., 2011)explains that the hands are the most important vehicles for the transfer of organisms from faeces, nose, skin, or other sites to food vendors can be carriers of pathogens like E. coli, Salmonella, Shigella, Campylobacter and S. aureuswho eventually transfer these food borne hazards to consumers. For instance, a study done by Arambulo et al in 1994 in Santa Fe de Bogota, Colombia Street Food Vending found that over 30% of a group of food handlers examined were carriers of pathogenic microorganisms including Sulmonellatyphi, Staphylococcus aureus, salmonella enterifidis, and Shigella. Street foods are frequently associated with diarrhoeal diseases due to their improper handling and serving practices. Microbial contamination of ready-to-eat foods sold by street vendors and hawkers has become a major health problem (Tambekar et al., 2011).In 1994 a study conducted byAruambulo et al in the Dominican Republic demonstrated the presence of various bacteria in street foods-including Bacillus cereus, Clostridium perfringens, escherichia coli, and Staphylococcus aureus-as well as a tendency for the bacterial count of street foods to undergo a progressive increase during storage and vending. The serving utensils used at most vending sites are often contaminated with Staphylococcus sp. which may have originated from the vendors hands when they touch the food preparation areas, dish cloths and the water during dish washing and hand washing which indicates cross contamination between dish water, food preparation surfaces, and the food itself; consequently, perceive a major public health risk (Tambekar et al., 2011). Estrada-Garci et al., (2004) found that even though street-vendors in Mexico City provide ready-to-eat food to a high proportion of the inhabitants, their microbiological status, general hygienic and trading practices were not well known. During spring and summer 2000, five tianguis (open markets) were visited and 48 vendors in 48 stalls interviewed. A total of 103 taco dressings were sampled for E. coli and Salmonella spp.: (43%) contained E. coli and (5%) Salmonella. Both E. coli and salmonellas were isolated from three samples. Of Salmonella-positive stalls 80% (4/5) had three or more food-vendors and 80% of vendors were males, compared with 37·3% (16/43) and 46·4% (20/43) in the Salmonella-negative stalls respectively. Food-vendors kept water in buckets (reusing it all day), lacked toilet facilities, and prepared taco dressings the day before which remained at the tianguis without protection for 7 to 8 hours on average. From these statistics Estrada concluded that consumption of street-vended food by local and tourist populations posed a health risk. There is a lack of practical, applied knowledge of hygiene in South Africa, as very few people know about the principle and practices of health and hygiene, and even fewer are aware of the laws that relate to the handling, transport, and storage of food for public consumption (Gordon-Davis, 1998). Every year thousands of people in South Africa suffer from food borne illnesses, usually involving severe diarrhoea, vomiting and stomach cramps as a result of eating or drinking contaminated food (Gordon-Davis, 1998). It has also been found that in Latin America cholera epidemics have drawn increasing attention to street food’s potential for disease transmission and have created growing support for attempts to resolve these troubles (Arambulo et al., 1994). Survey of street food vendors in a Central Durban Transport Exchange: On 30TH October 2013, a survey of street food vendors was done at a vending site in the city of Durban South Africa. This survey was done in order to obtain a population count of street food vendors in this area for the purpose of a dissertation. Surveys are often used to analyse behavioural patterns and help to identifycustomer expectations, measure satisfaction levels, anddetermine specific areas for improvement(University, 2006). The site mentioned above is within the largest transport exchange in the city. Common foods for sale amongst the vendors included beef curry and rice, chicken curry, vetkoek, tripe, sugar beans, fried wors, fried beef and fried chicken amongst many other South African dishes. A total of 29 vendors were observed all of whom said they prepared all their meals on site and began preparation at 5am every day. Washing of utensils was carried out in bowls or pots which were also used for cooking and water was not being changed, as it was not easily accessible. This method of washing meant that water was becoming dirtier and dirtier with repeated use. The majority of the food handlers did not wear gloves, hairnets or aprons. Dirty pots and other dishes were left in heaps close to serving areas and already prepared foods. This caused a great number of flies in the area. Also garbage was left open. Prepared foods were displayed with no covers in very humid weather. Thus encouraging the proliferation of insects and rodents linked to enter disease. Many of these vendors had plastic chairs and tables’ setup with plastic flower arrangements and a variety of sauces for consumers to choose from. It was observed that even with clearly visible unhygienic conditions; consumers would still choose to have a meal at the vending site. This shows that vendors are more concerned with the convenience and availability of street foods than in its question of safety. In a study done byNicolas.B et al. in 2007 it was observed thatcookedand uncooked foodsat ambienttemperaturefor6hours orlongerwithoutanyappropriateholdingtemperature(reheatingincaseofcookedfood), constituteamajorcriticalcontrolpointofstreet-vending control (cook/hold) operations surveyed. In a d d i t i o n cooked foodswere subjected to cross-contamination and contaminationfromvarioussourcessuchasutensils, knivesrawfoodstuffs,fliesthatsporadicallylandonthefoods,byvendors’ bare hand serving and occasional foodhandlingbyconsumers.Streetfoodproducersandvendors neglect food safety practices, providing to the population unsafe foods. Public health risks associated with street foods in Durban South Africa: Ekanem, (1998) reports that African street foods appear to pose public health hazards because they are produced and delivered under unhygienic conditions. In 1998 Ekanem found that there was a very low level of awareness about food safety issues among street food vendors and consumers. Points-of-sale usually have a limited infrastructure, with restricted access to drinking water, toilets, refrigeration or ice, as well as to hand washing and waste disposal

Proceedings of 4th
International Conference on Global Business Environment
(ICGBE-2014)
214
facilities. Furthermore, the raw materials are generally of poor quality and improperly stored in temperatures that are not safe, for a long period of time(Lucca et al., 2006). Most handlers of street-vended foods in Africa, and the developing world at large, are largely ignorant of basic food safety issues. Consequently, street foods are commonly exposed to dangerous abuses, often at all stages of handling. Products (from the raw material to the finished stage) are often exposed to sources of contamination like soil, dust and sand (Ekanem, 1998). Street food vending is in profusion within the greater Durban area and plays a major role in meeting the food demand of the city dwellers, but because traders do not obey spatial conventions, they can show up anywhere in the city, leaving the impression that their numbers have become uncontrollable (Jeffrey Popke and Ballard, 2004). In Durban, street traders and their activities contravene the social and moral order, and are thus deemed to be defiling the city. This kind of equation is of course nothing new. Images of urban cleanliness and order have long been associated with the activities of its residents, and the sanitation of urban space equated with the ‘moral hygiene’ of its citizens (Jeffrey Popke and Ballard, 2004). Von Holy and Makhoane, (2006) have identified that some local authorities took the initiative to improve street food vending in their areas of jurisdiction. One such local authority is the Ethekwini Metropolitan Council (formerly called Durban Unicity), in the KwaZulu-Natal Province (Municipality, 2001 ). After some research into the impact of street food vending within Durban City, the Metro made the decision to integrate the informal economy into its long-term plan to promote its economic development. Some of the benefits of the informal economy that were identified were that the informal sector makes an important contribution to job creation; that it provides convenience to its customers; and that, due to its diverse nature, is able to meet the cultural and religious needs of the people in the Metro. The Durban Informal Economy Policy, which was developed as a result, provides a strategy that the Metro has aimed to follow in achieving its economic development goals. Today in the Ethekwini Metro street food vendors operate in allocated areas, thus minimizing the problem of public nuisance in Durban City and surrounding towns. The Metro ensures that prior to receiving the certificate of acceptability that allows them to operate; street food vendors receive essential food hygiene training, which enables them to comply with minimum hygiene regulations. Certification of vendors, in terms of national food hygiene regulations, allows for better control and coordination of the sector within the Metro(Municipality, 2001 ). In many cities, one of the common ways to regulate street food is for vendors to undergo medical tests. Some countries insist that food handlers undergo medical screening to test for infectious diseases such as typhoid fever, tuberculosis and cholera and other airborne diseases. Periodic screening is also a requirement by metropolitan, municipal and district environmental health officers and inspectors. The vendors are expected to carry out complete physical and medical examination and obtain health certificates issued by the authorized health centres. The health certificate is to be kept by the vendors, presented on inspection and renewed annually (Ackah et al., 2011). Steyn et al., (2011) found that microbial studies conducted on street foods in both Bloemfontein and Johannesburg in South Africa have found that the safety of street foods was better than expected in these two urban areas studied. Two critical points were identified as ensuring best safety of foods including cooking at temperatures over 65 degrees C and having short holding times. The practices studied in Johannesburg indicated that vendors bought food from retailers early every day; prepared the food in sufficient quantities for that day and gave away or took home the leftovers. This practice is thought to have contributed to the reasonably safe microbial content of the street foods examined but may have had ramifications for the families at home who most probably eat the left-overs. Food safety and standards authority of India chairperson, Mr K. Chandramouli stated that in India, unorganised food operators constitute for 90% of the total food business operators. Mr Chandramouli further stressed the idea of registration and training of street food vendors and said that the food safety department of every state should have a simple Standard Operating Procedure (SOP) manual and that trained food vendors should adhere to it(NASVI, 2013). Mr Chandramouli also mentioned that food and health are very much related to each other. ‘The taste of food prepared by the street vendors is unbeatable and if it is accompanied by hygienic practices then it has no match, even five star hotels cannot beat it” he added. 3. Conclusion and recommendations Street food vendors generally demonstrate the knowledge of food safety and hygiene. The knowledge of food safety and hygiene of these foods can however be improved if a sufficiently high proportion of vendors receive training in basic hygiene skills. Vendors need to be aware of hygienic, sanitary and technological aspects of street food vending and consumption. Training and education committees should be developed in order to assist vendors and to help street vendors assimilate into the urban food supply chain in the safest way possible.One such example is the India’s Food Safety and Standards Authority which was developed in order to provide training programmes for persons who are involved or intend to get involved in food businesses, contribute to the development of international technical standards for food, sanitary and phyto-sanitary standards as well as promote general awareness about food safety and food standards amongst other functions. Many sources have stressed the importance of a need for running water and toilets in areas where street vendors operate however, there does not appear to be national data on the food safety aspects of such operations. It is a suggestion that this aspect be given serious consideration in municipality planning since the extent of street food consumption in RSA certainly warrants this. Since the sale of street food is likely to increase, consideration should be given to ways and means that the practice can be done in a healthy and safe manner. Many studies done have indicated that street food vendors have adequate information regarding food safety principles and their attitudes to food safety can be regarded as attuned to the need to ensure safe practices in preparing street foods. The practices assessed in these studies also indicate that street food vendors can provide food safely although attention needs to be given to some practices and regulatory compliance. Training can thus be regarded as essential to ensure food safety. South African government should accept the need to regulate and institutionalize street food vending in a way that will structurally develop it and allow for application of measures dedicated to nurturing hygienic conditions and ensuring safe food for the consumer. Such reformation should be encouraged by initiatives already taken by certain countries-including Singapore and India. These regulations should create a favourable base from which to guide street food vending along a more beneficial and productive path. As mentioned earlier, street food vending plays an important role in the South African economy, hence, there is a profound need to apply new strategies that will permit currently illegal street food vending activities to be reorganized and to gain official recognition. This process should lead to adoption of measures designed to improve the hygienic conditions under which street food is sold, so as to ensure an adequate level of safety for the consumer. The new norms and regulations should emphasize the need for changes in consumer and street vendor attitudes based on equally necessary changes in their understanding of personal hygiene and food safety must be remembered that the basis for altering the present situation in the desired manner will be provided by training, education, and communication.

Proceedings of 4th
International Conference on Global Business Environment
(ICGBE-2014)
215
References
ABDALLA, M. A., SULIMAN, S. E. & BAKHIET, A. O. 2009. Food safety knowledge and practices of street food vendors in Atbara City (Naher Elneel State Sudan). African Journal of Biotechnology, 8, 6967-6971.
ACKAH, M., GYAMFI, E. T., ANIM, A. K., OSEIL, J., HANSEN, J. K. & AGYEMANG, O. 2011. Socioeconomic profile, knowledge of hygiene and food safety practices among street food vendors in some parts of Accra-Ghana. Internet journal of food safety, 13, 191-197.
ARAMBULO, P., ALMEIDA, C., CUBBLAR, S. & BELLOTTO, A. 1994. Street Food Vending in Latin America. BuLletin of PAHO 28. CAMPBELL, P. T. 2011. Assessing the knowledge, attitudes and practices of street food vendors in the city of Johannesburg regarding food
hygiene and safety. School of Public Health, University of the Western Cape. DRAPER, A. 1996. Street foods in developing counties :The potential for micronutrient fortification London School of Hygiene and Tropical
Medicine. EKANEM, E. O. 1998. The street food trade in Africa: safety and socio-environmental issues. Food Control, 9, 211-215. ESTRADA-GARCI, T., LOPEZ-SAUCEDO, C., ZAMARRIPA-AYALA, B., THOMPSON, M. R., ESCOBAR-GUTIERREZ, A., MANCERA-MARTINEZ, A.
& GUTIERREZ-COGCO, L. 2004. Prevalence of Escherichia coli and Salmonella spp. in street-vended food of open markets (tianguis) and general hygienic and trading practices in Mexico City. Epidemiology and Infection, . 132, 1181-1184.
GORDON-DAVIS, L. 1998. The Hospitality Industry Handbook on Hygiene and Safety for South African Students and Practioners South Africa, Juta & Company Ltd.
JEFFREY POPKE, E. & BALLARD, R. 2004. Dislocating modernity: Identity, space and representations of street trade in Durban, South Africa. Geoforum, 35, 99-110.
LUCCA, A., DA SILVA, T. & FERRAZ, E. A. 2006. Street-food: The hygiene conditions of hot-dogs sold in São Paulo, Brazil. Food Control, 17, 312-316.
MARTINS, J. H. 2006. Socioeconomic and hygiene features of street food vending in Gauteng. South african journal of clinical nutrition 19, 18-25.
MUNICIPALITY, E. U. 2001 Durban's Informal Economy Policy. MUZAFFAR, A. T., HUQ, I. & MALLIK, B. A. 2009. Entrepreneurs of the Streets: an Analytical Work on the Street Food Vendors of Dhaka
City. International Journal of Business and Management, 4, P80. NASVI. 2013. Sustaining food security from the streets Mass training of street food vendors on food safety and hygiene [Online]. India.
[Accessed 9 january 2014]. NICOLAS.B, RAZACK, B. A., YOLLANDE, I. & ALY, S. 2007. Street-Vended Foods Improvement: Contamination Mechanisms and Application
of Food Safety Objective Strategy : Critical Review. Pakistan Journal of Nutrition, 6, 1-10. OHIOKPEHAI, O. 2003. Nutritional aspects of street foods in Botswana. Pakistan Journal of Nutrition, 2, 76-81. SKINNER, C. 2006. Falling though the policy gaps? Evidence from the informal economy in Durban, South Africa. Urban Forum, 17, 125-
148. STEYN, D;LABADARIOS & J;NEL 2011. Factors which influence the consumption of street foods and fast foods in South Africa-a national
survey. Nutrition Journal, 10, 2-10. TAMBEKAR, D. H., KULNARI, R. V., SHIRSAT, S. D. & BHADANGE, D. G. 2011. Bacteriological quality of street vended food Panipuri: A case
study of Amravati city (MS) India. Bioscience Discovery, 2, 350-354. UNIVERSITY, P. S. 2006. Using Surveys for Data Collection in Continuous Improvement. Innovation insights, 14. VON HOLY, A. & MAKHOANE, F. M. 2006. Improving street food vending in South Africa: Achievements and lessons learned. International
journal of food microbiology, 111, 89-92.

Proceedings of 4th
International Conference on Global Business Environment
(ICGBE-2014)
216
A Comparative Analysis of the South African and Global Tourism Competitiveness Models with the aim of Enhancing a Sustainable Model for South Africa
S. Maharaj, R. Balkaran
Durban University of Technology, South Africa *[email protected]
Abstract: The quality of life of society as a whole is to a considerable extent determined by the role of government. South African society is characterised by the presence of a wide gap between the rich and the poor. This is exacerbated by the presence of poverty, HIV/AIDS, crime, corruption and exploitation. Governments attempt to address these contradictions are encapsulated in various policies that detail in accurate form, the needs of the majority of South Africans. Whilst policies depict the needs of the majority of South Africans, these needs remain undelivered. The void between the formulation of policy and service delivery has been most severely felt by the poor. Policy implementation is the responsibility of central, provincial and local government. The policy on tourism has been identified as one of the major players in resolving the impasse that is experienced by government. South Africa’s National Tourism Sector strategy seeks to increase tourism’s total direct and indirect contribution to the economy to R318, 16 billion by 2015 and R499 billion by 2020. The challenge however, remains in harnessing Tourism policy in a way that addresses the past and current contradictions. Legislative provisions, policies and plans have set the tone in terms of the direction that tourism should be heading. Public sector institutions at national, provincial and local levels have equipped themselves to develop and enhance the tourism industry in such a way that it resonates with the South African tourism imperatives. This places within context the role of public organisations and its capacity to deliver in terms of governments national imperative. The tourism industry is complex with a range of different stakeholders. There is an inextricable link between the tourism and hospitality industries. This paper attempts to improve on the South African tourism competitiveness with the expressed intention of enhancing growth and sustainability. Keywords: Tourism Competitiveness, destinations, sustainability, economy
1. Introduction The National Department of Tourism in South Africa envisage the country to be a top 20 global destination by the year 2020. The World Economic Forum with various tourism leaders and the travel and tourism industry conducted an in – depth analysis the of the travel and tourism industry on a global platform. The World Economic Forum for Travel and Tourism 2013 report is titled “Reducing Barriers to Economic Growth and Job Creation”. (WEFTT- 2013) states that the Travel and Tourism sector play an important role in job creation due to many countries suffering from high unemployment. The Travel and Tourism industry now accounts for one in eleven jobs on the planet and may rise to one in ten jobs by the year 2022 according to the World Travel and Tourism Council. The world is becoming increasingly complex and interconnected. Therefore the Travel and Tourism industry needs to contribute to job creation, quality work, poverty reduction, and global growth, economic growth and sustainability. Therefore South Africa needs to enhance its destination competitiveness, improve economic growth and ensure sustainability of its Travel and Tourism industry.Destinations have become more market orientated therefore the need for strategic marketing at destinations. The competitiveness of a destination must be measured long – term. Factors such as the attractiveness of South Africa must be considered. South Africa needs to consider it’s natural capital, infrastructure, economy and core attractors. Tourists first decide on destinations and then purchase a holiday. Tourists also have a variety of destinations to choose from therefore South Africa must be a first choice destination. 2. Literature Review According to the policy and practice for global tourism by UNWTO (2011- 94) suggests that destination competitiveness is one of the major themes associated with destination development as it affects the profitability and long-term sustainability of destinations. The destinations appeal and experiences offered are shaped by attractions, public and private amenities, accessibility, human resources, image and character and price. The policy and practice for global tourism by UNWTO (2011- 97) states that factors which shape destination competitiveness are investment, productivity, macro-economic policy, branding, image, price, market share, visitor satisfaction, safety, quality of experiences, innovation, strategy and training of human resources. South Africa needs to factor in the above areas and include benchmarking against other counties and tourism product development. According to the policy and practice for global tourism by UNWTO (2011- 38) states that sustainability is the biggest single issue facing the tourism sector globally. Sustainability affects all aspects of human activity and the planets resources which are expected to support a growing population. The increasing levels of travel and tourism consumptions are accompanied by the rise in the negative impacts of tourism. South Africa as a destination needs to ensure that tourism sustainability is the focal point for the interconnections between the visitor, the tourism sector and resources when developing policies and plans. The World Travel &Tourism Council’s (WTTC’s) report on the Travel and Tourism EconomicImpact 2013 for South Africaindicates that destinations need to be willing to invest in infrastructure suitable for new sources of demand. SA’s leisure travel spending generated 67.2% of the direct Travel and Tourism GDP in 2012. This is expected to grow by 2.0% in 2013 and by 4.6%pa in 2023. Business travel spending is expected to grow by 0.5% in 2013 and rise by 4.2% per annum in 2023.The WTTC’s research revealed that SA’s domestic travel spending generated 57.6% of the direct travel and tourism GDP 2012. This is expected to grow by 4.4% pa in 2023. Visitor exports are expected to grow by 2.3% in 2013 and by 4.6% per annum in 2023.Research conducted by the WTTC on the Comparative Economic Impact of Travel and Tourism, (Nov 2012:7).Countries with larger outbound business travel markets tend to enjoy higher exports and faster growth in business travel is linked to more rapid trade growth. Without the connectivity provided by the travel and tourism sector regions would find it difficult to attract foreign direct investment. Access to airport hubs is critical for increase foreign direct investment. Travel and Tourism demand stimulates infrastructure investments that benefit both local residents and tourists.

Proceedings of 4th
International Conference on Global Business Environment
(ICGBE-2014)
217
South Africa’s global competitiveness programme for the tourism industry has been benchmarked has been benchmarked against Australia, Brazil, Kenya and Thailand. The development of a sustainable destination competitiveness model is essential for South Africa UNWTO states that tourism is dynamic and it requires differentiation, innovation and renewal on a continuous basis. The key focus areas of this policy document are transformation, market access, air access, aviation pricing, public transport, safety and security, information, innovation, product development, investment, skills development and quality assurance and SMME development. SA’s Whitepaper document on tourism Part V, The Development and Promotion of Tourism in South Africa (May 1996) focuses on Igniting the engine of tourism growth in the country. The key areas of this section drives tourism competitiveness in terms of continually improving safety, security, investment opportunities environmental and cultural sustainability, product development, transportation, infrastructure, marketing and promotion, product quality and cooperation. The SA National Tourism Departments Strategic Plan – 2014/2015 focuses on the following aspects which Durban Tourism should also adopt in their competitiveness model. The main aspects are as follows: tourism growth, tourism research, sustainable tourism, service excellence, destination competitiveness and grading of accommodation in South Africa. The National Department of Tourism (July 2008) titled ‘Tourism Growth Strategy 2011-2016, Gearing up to be globally Competitive refers to the following areas. SA as a quality tourism destination that offers world class service with the correct marketing approach that fulfils the expectations of tourists. There are four vital aspects through which SA delivers world class visitor experience; SA’s potential to attract on going investments, the protection of SA’s environment and community involvement in tourism. This document also states that a strategic outcome is to improve competitiveness growth and sustainability of the tourism industry. According to the National Tourism Sector Strategy (2011) the main strategic objectives are tourism growth and the economy, Visitor experience and brand, sustainability and good governance. According to this research tourism stakeholders need to take into account the global exchange rate volatility, fuel costs, advancement in technology, policy response to climate change, green growth agenda, changing demographics and lifestyles and price conscious consumers. The National Department of Tourism’s Strategic Plan and Annual Performance Plan (2012/2013(4)) states that SA must be positioned as the world’s top 20 tourism destinations by the year 2020. In order for this to be achieved traditional markets need to be sustained, new markets identified, strengthening of regional integration, and identifying new niche markets. This document also states that SA is endowed with natural resources, which if properly used can benefit the country but needs to be preserved and sustained in the process. This plan also introduces the international and domestic tourism plans to grow the contribution of various tourism sectors. Section 6 of this plan (18) states that one of the Organisational Strategic goals is improved levels of competitiveness and sustainability in the tourism industry. The national tourism development plan stipulates that visitors to SA need to enjoy their stay and want to return to SA. These areas are growing tourist volumes, expanding tourist length of stay, reducing the pattern of seasonality to all year round visitors, increase in tourist spend; enhance provincial distribution, consumer driven and international destination competitiveness.The National Tourism Departments Medium – Term (2010 – 2015) objectives are sustainable tourism growth and development, to ensure competitiveness of the tourism sector and to address imbalanced geographic spread and seasonality of tourists and visitors. South African Tourism’s Marketing Tourism Growth Strategy for South Africa 2011-2013 focuses on retaining current purchasing patterns by existing travellers and segments. Stimulating current consumers to visit SA for a longer duration, stimulate current customers to visit for new experiences, offerings and purposes, convert consumers and segments from the competitor to SA, and convert low-frequency or non-travellers into frequent travellers, or short - haul visitor’s to long haul visitors. This document also discusses the growth of event and business travellers on a domestic and international level. The six key objectives are an increase in tourist volume, spend and length of stay. To improve geographic spread, seasonality and promote transformation. The key challenges regarding competitiveness is that SA needs to differentiate itself from it’s competitors in a dynamic world market.Re-balance the visitor portfolio markets, move from pushing what we like about SA to delivering to consumers what they want and in line with our tourism brand. Redefine and upgrade products and services to deliver against the marketing message. The South African Tourism Guide (2008-2010) which is a statistic guide refers to the growth strategy which started in 2001 and the Global Competitiveness Project which was done in two phases consecutively (2003 and 2004). This guide also includes the tourism marketing strategy for South Africa. According to the above mentioned brochure, South African Tourism’s main focus is on a sustainable GDP, sustainable job creation, redistribution and transformation through six key objectives: increase tourist volumes, improve geographic spread, increase tourist spend, improve seasonality patterns, increase length of stay and promote transformation. SA Tourism needs to adopt these six objectives when developing a long term strategy and competitiveness model.According to the South African Tourism (2008-2010:11) report, the key challenges for tourism at a national level are tourist volumes, value, transformation, distribution, seasonality, risk management, sustainability and tourism competitiveness. Internationally, the focus is on leisure and domestic travel, business tourism and events. South African tourism is currently working on a new competitiveness model strategy and branding strategy. According to the UNWTO 2012 annual report for 2012 international tourist arrivals will reach an estimated 1.4 billion in 2020 and 1.8 billion by 2030. By 2015 emerging economies will receive more international tourist arrivals than previous years and an approximate one billion arrivals by 2030. The UNWTO annual report states that improving tourism competitiveness is essential for all tourism companies. Tourism companies need to offer a competitive range of tourism products and adapt them to a constantly evolving market demands. Countries must constantly monitor their tourism flows and focus on sustainable tourism development. South Africa’s Tourism Competitiveness: Loubser, Martins and Van Wyk (2006:521) state that rapid changes characterize global business activities and global markets. According to Kruger and Welman (2001:2) research is the application of many techniques and methods in order to create scientifically obtained knowledge by using objective methods and procedures. The quantitative and qualitative data secondary data was used from the Global Tourism Competitiveness Report 2013 to determine methods of enhancing SA’s Tourism Competitiveness. Loubser, Martins and Van Wyk (2006:99) state that secondary data is defined which can be used in solving the problem under study. A mixed method research method was used in this research report. According to Bell and Bryman (2007:642) Mixed method research is research that integrates quantitative and qualitative research. The World Economic Forum engages key industry and thought leaders on a global platform to carry out and in depth analysis of the travel and tourism competitiveness economies across 140 different countries. The World Economic Forum Travel and Tourism 2013 report covers 140 countries. The purpose of this report is to provide strategic tool for measuring the factors and policies that make it feasible to develop Travel and Tourism in different countries. The results of this report of countries worldwide can enable stakeholders to work together to

Proceedings of 4th
International Conference on Global Business Environment
(ICGBE-2014)
218
improve the travel and tourism industry’s competitiveness in their national economies. The purpose of this document is to establish how South Africa can enhance its destination competitiveness using the research findings of this research report. The theme for “The Travel and Tourism Competitiveness Report 2013 is Reducing Barriers to Economic Growth and Job Creation”. This report is developed by the World Economic Forum to carry out an in-depth analysis of the travel and tourism economies around the world. It also provides a platform for multi-stakeholder dialogue.The tourism sector on a global level accounts for one in eleven jobs on the planet. South Africa ranks 64th /140 as per the 2013 reports and 66/139 as per the 2011 travel and tourism competitiveness report. “South Africa is ranked 3rd in the region of Northern Africa and the Middle East. South Africa comes in high at 17th place for its natural resources and 58th for its cultural resources, based on its many World Heritage sites, its rich fauna, its creative industries, and the many international fairs and exhibitions held in the country”. SA’s transport infrastructure ranked at 43rd position, road quality at 46th position, road quality at 42nd position. SA’s policy, rules and regulations ranked at 29th position with tourism continuing to be one of the five priority areas in the countries growth plan. The areas of great concern are SA’s safety and security which ranks at 117th position, health and hygiene which ranks at 87th position, this contributes to the concern about access to improves sanitation which also contributes to poor health of much of the workforce which ranks at 129th position, high rate of communicable diseases such as HIV ranking at 137th position. Increase in fuel prices which rank at 77th position and ticket taxes and airport charges ranking at 105th position. 3. Findings and Recommendations According to SA’s global competitiveness tourism study (June – 2004) the areas of focus are sustainability of natural and cultural assets, access, capacity, pricing, employment, product development, investment and transformation of the tourism industry. As per the 2013 competitiveness report SA’s rankings were as follows: T&T regulatory framework 81/140, business environment and infrastructure 59/140, T&T human, cultural and natural resources 57/140, policy and regulations 29/140, environmental sustainability 52/140, safety and security 117/140, prioritization of travel and tourism 62/140, health and hygiene 87/140, air transport infrastructure 43/140, ground transport infrastructure 43/140, tourism infrastructure, 54/140, ICT infrastructure 81/140, price competitiveness in the T&T industry 71/140, Human resources 132/140, affinity for travel and tourism 44/140, natural resources 17/140 and cultural resources 58/140. The SA rankings of the 2013 competitiveness report indicate that there is need for immediate government intervention to improve the rankings thus improving the competitiveness of SA. According to the Travel and Tourism Competitiveness Index 2013: Contributing to National Growth and Employment in research conducted by Blanke, J. Chiesa, Crotti, R. (WEF), the below elements of the diagram which describes a countries competitiveness elements. Subindex A: Travel and Tourism regulatory framework include, policy rules and regulations of a country have an important impact on the attractiveness of tourism. Singapore, Hong Kong and New Zealand occupy the top three ranks because their economies have conducive policies for the development the T&T industries, attracting foreign investment and minimum barriers to the development of businesses. The SA government can ensure that it has more conducive policies regarding T&T and focus on attracting outside investment. Environmental sustainability is crucial to ensuring that a county remains attractive, here a country’s environmental regulations are measured. In this pillar Sweden, Switzerland and Finland hold top three positions. These countries have stringent legislation on developing the tourism industry in a sustainable manner; there are low levels of pollution and environmental damage. Safety and security is a critical factor because tourists are deterred from travelling to dangerous countries. Finland, Switzerland, and Hong Kong occupy the top three positions because of the low crime levels and violence and safe roads by international standards with a few fatal road accidents.
Source: (Global Tourism Competitiveness Report, pg 8) Health and hygiene with access to drinking water and sanitation is vital because if tourists become ill then the county’s health care system must be able to provide the appropriate care required. Austria and Germany receive the best assessments with strengths in high levels of access to clean drinking water, sanitation and good health infrastructure. The manner in which government prioritizes this sector is important due to the impact it has on travel and tourism competitiveness of the county. Government need to ensure that there

Proceedings of 4th
International Conference on Global Business Environment
(ICGBE-2014)
219
are projects and budgets are in place with the aid of private sector investment. Seychelles takes first pale for the prioritization of the travel and tourism industry. Subindex B: Travel and Tourism business environment and infrastructure include a county’s air transport infrastructure which provides access to and from other countries. In this pillar a countries quantity of air transport is measured, the number of departures is operating airlines and the quality of international and national flights. Canada, United States and the United Arab Emirates rank in the top three positions, due to their airport hubs, several flights and a high number of operating flights and high quality service. The extensiveness and quality of a county’s ground infrastructure which takes into account the quality of roads, rail and ports, national transport networks which must offer efficient accessible transportation to key business centres and tourist attractions. Hong Kong, Singapore and Switzerland rank as top three with high quality roads, railroads and ports and ground transport networks. Tourism infrastructure also includes accommodation infrastructure such as the number of rooms, car rentals and financial infrastructure is available to tourists. Austria Italy and Greece rank in the top three positions because of their variety of hotels for visitors to choose room, excellent car rental facilities and support facilities for the tourist. A country’s ICT infrastructure is becoming more vital for the travel and tourism industry in planning of itineraries and purchasing travel and accommodation with the use of the internet, telephone lines, mobile phones and broadband. Korea, Hong Kong and Sweden rank as the top three destinations because of their high penetration r4ates of ICT’s such as use of internet. Price competitiveness of the travel and tourism industry is vital because the lower the costs the increased level of competitiveness. The price of a county’s goods and services in comparison to other counties. The prices of airfare ticket prices, airport charges, fuel prices, and tax and accommodation prices contribute to a county’s competitiveness. The top three ranks are occupied by Iran, Brunei Darussalam and Gambia which benefit from low fuel costs, low ticket prices, competitive hotel prices and airport charges. Subindex C: Travel and Tourism human cultural and natural resources. Quality human resources ensures that the tourism industry grows and develops. In this pillar a county’s training and education is measured and a countries educational system, a counties labour law and regulations, qualified labour force. The health of human resources and the effects of HIV on the labour force. Switzerland , Singapore and Iceland rank in the top three positions due to their strong educational systems, top-notch training facilities and a healthy workforce. The affinity for the Travel and Tourism industry is measured by customer satisfaction. A countries natural resources is vital to a the competitiveness of a county. The countries that rank in the top three positions are Lebanon, Barbados and Hong Kong due to their great openness of foreign travellers. Countries that offer travellers access to natural assets have a competitive advantage. In this pillar the number of world heritage sites, the richness of flora and fauna and different species of animal are measured. Brazil, Australia and the United States host several World Heritage Sites, rich fauna. These countries have inherent attractions to attract tourists interested in nature tourism. The cultural resources of a country add to a county’s competitiveness. In this pillar a county’s World Heritage sites, sports stadiums seat capacity, the number of national and international exhibitions. Spain, Sweden and the United Kingdom rank in the top three positions due to their world Cultural Heritage sites, movies, music, sport stadiums and ability to provide cultural and leisure business for tourists. With regards to the above research findings the National Department of Tourism and SA Tourism needs to incorporate or adopt best practice from other countries to enhance its own tourism competitiveness. The factors of each subindex are important as they are a vital contribution to the sustainability of tourism and the economy of SA. Pietsch, T. & Ringbeck, J. (2013: 43-47) state in their research on “How to Succeed as a Tourism Destination in a Volatile World” that cultural resources at each country’s disposal are another critical driver of travel and tourism competitiveness around the world. In this pillar we include the number of UNESCO cultural World Heritage sites, sports stadium seat capacity, and the number of international fairs and exhibitions in the country, as well as a measure of its creative industries exports, which provides an indication of cultural richness. SA needs to factor in the findings of this research into their policies. The below diagram focuses on macro and micro environmental changes on destination competitiveness. In order for SA as a destination to prevail under volatile market conditions and continue benefitting from a vibrant tourism sector, SA tourism policymakers should identify and focus on their country’s key competitive advantages over other countries and cities and differentiate the traveller’s experience in their country from the experience to be had elsewhere. The shifting trends in international customer origins and profiles. It is important to examine existing destination marketing and tourism development planning in the context of the challenges of a more volatile macroeconomic environment in SA. Developed destinations need to pool their efforts on innovations, multi-stakeholder cooperation, and flexibility if they are to respond successfully to demand from emerging regions. Developing destinations should consider effective short-term turnaround strategies to strengthen their travel and tourism sectors and re-establish their attraction for the international traveller by focusing on long-term sector development and making sustainability a core of destination development and marketing.
Source: (Global Tourism Competitiveness Report, pg 44)

Proceedings of 4th
International Conference on Global Business Environment
(ICGBE-2014)
220
Despite increasing instability induced by economic, political, and environmental challenges, tourism is expected to remain a significant driver of future economic growth. SA policymakers who concentrate on their countries’ most prominent assets and are able to leverage them most effectively are best positioned to turn volatility risks into opportunities for long-term stability. Price competitiveness will continue to influence travel behaviour, this may impact on areas in SA that focus on budget travellers. Tourism stakeholders in SA need to focus on price versus quality. Tourism policy makers in SA need to focus on investment and entrepreneurship, Tourism stakeholders in SA must also focus on unique travel experiences. Example Turkey is well known for its culture, history and natural scenery. Tourism policy makers in SA must also focus on sustainability of natural and cultural resources. The new tourists is now demanding green travel offerings instead of traditional sun and beach vacations. Policy makers need to undertake long term tourism master planning. Safety and security is clearly linked to inbound tourism. SA needs to focus on high crime areas and areas with political instability. Glaesser, D. and Kester, J. (2013:49-55) state in their article titled Visa Facilitation: stimulating Economic Growth and Development through Tourism that the link between visa facilitation and economic growth through tourism is increasingly recognized by national authorities. SA needs to focus a more seamless visa requirement system. The UNWTO will continue to promote for visa facilitation to support economic growth and development through tourism. The 94th session of the UNWTO Executive Council (held in October 2012) requested that the Organization make visa facilitation a priority area. The Executive Council further requested, in cooperation with the International Civil Aviation Organization and other partners, that it continues providing case studies as well as benchmarking information to support this process and better understands the progress already made. Perovic, J. (2013: 57 -61) indicates in her article titled “The Economic benefits of Aviation and Performance,”The aviation sector plays an important role in the global economy by providing connectivity through the only rapid worldwide transport network. The direct and wider impact on jobs and GDP globally is enormous contributing over 22 million jobs and US$1.4 trillion in GDP. The aviation sector makes contributions to other industries by facilitating their growth and supporting their operations. With a significant proportion of international tourists depending on air transport, the aviation industry supports 34.5million jobs within tourism globally, contributing around US$762 billion a year to world GDP. The benefits go beyond this economic footprint of aviation. The global connectivity that air transport facilitates has positive impacts that enhance overall productivity and economic growth in the long run. Making Travel & Tourism a government priority can enable the development of global connectivity through aviation, which in turn enhances the overall level of productivity and living standards in the long run. SA can enhance its tourism competitiveness increasing its aviation routs into and out of the country. Research by Turner, R. (2013: 63-69) focuses on Travel and Tourism as a Driver of Employment Growth in Africa is still expected to grow by 2.3 percent per year for the next 10 years and reach 2.9 percent of total employment by 2022, the industry faces a number of infrastructure and investment challenges in the region that are holding back its progress, and the transition to service economies on the continent is not as advanced as it is in other parts of the world. Still, with 8 million direct employees in Africa, Travel & Tourism is one of the leading employers in the region, surpassing the direct job creation of each of the chemicals manufacturing, auto manufacturing, communications, mining, and financial services industries. Sa need to make T&T a driver of employment contribution in the country. In research conducted by Delacy, T. Lipman, G. Whitelaw, P. (2013: 71-76) in a article titled Competitiveness, Jobs and Green Growth: A “Glocal” Model that The application of the above diagram will create a system through which destinations can identify optimum green growth development scenarios for Travel & Tourism in order to build wealth and create jobs in a sustainable manner. SA can adopt this research which reveals that travel and tourism need to play a key role in societal change by engaging in new transport platforms, networks, befouled, new climate-proofed hotel design construction, new green models for business meetings, new tactics for community engagement, new visions for education and training. The National Department of Tourism in SA can use the 2050 roadmap to respond to a rapidly moving marketplace in very uncertain times, engage travelism in a transformation to a low carbon, resource-efficient future, assess trends to improve competitiveness and the overall visitor economy, handle increasing number of visitors and their impacts more sustainably, and integrate travelism into overall community development with focus on livelihoods, engage local stakeholders and industry employees in transformation, access global education and training programs for capacity building in the sector, take into consideration new ways of investment and review progress on a regular basis.
Source: Travel and Tourism Competitiveness Report (2013: 74) Travelism is based the entire customer, company, community value chain which can play a much more significant role in this transformation. The result of the Green Growth 2050 Roadmap is a model for this type of approach. It has five distinct phases (Figure 1:

Proceedings of 4th
International Conference on Global Business Environment
(ICGBE-2014)
221
which focuses on) mapping and projecting forward the “visitor economy”, stakeholder engagement and analysis, development of the roadmap, implementation cluster and annual review and course correction. SA Tourism needs to focus on sustainability of its core attractions that makes it a competitive destination. The National Department of Tourism should adopt the process indicated in the green growth 2050 roadmap for Bali as it includes the benchmark principles of sustainable tourism, destination management and competitiveness.
Source: Travel and Tourism Competitiveness Report (2013: 74) 4. Conclusion Tourism competitiveness is also about providing better quality goods and services. SA needs to provide its overall attractiveness and quality experiences that are better than those of other destinations in order to achieve competitive advantage. SA can focus on improving its market position and share. SA as a destination must integrate value added products to sustain its resources.Ritchie, (2003:1) states that although the attractiveness of a destination may remain constant, the changing nature of competition need on going reassessment of the ability of a destination to compete. In order to develop a competitiveness model for SA as a destination, the cities macro and micro environmental factors need to be analysed and their competitiveness. SA needs to strive for superiority of a quality destination. The visitor experience is vital to this area. Comparative advantages should also be taken into consideration such as human resources, physical resources, knowledge resources, capital resources, infrastructure, historical and cultural resources. Poon, (1993:291) suggests that in order for a destination to be competitive they need to put the environment first, make tourism a lead sector, strengthen distribution channels in the market place and build a dynamic private sector. Durban tourism should also focus on the concept of new tourism rather than mass tourism. There should also be clearly defined market segments. Durban can ensure sustainability by identifying the best course of action and planning a long-term marketing strategy. Secondly maximizing community and industry support ensure the efficient use of resources and have a shared goal with local community. . Elements of SA’s competitiveness model should include the global microenvironment, the competitive micro environment, core resources and attractors, supporting factors and resources, destination policy, planning and development and destination management. Reference Brent, J.R. and Ritchie, J.R. 2003. The Competitive Destination: A sustainable tourism perspective. CAB International. Bell ,E. Bryman, A. 2007. Business Research Methods. Oxford University Press Kruger, S.J. and Welman, J.C. 2003. Research Methodology. Oxford University Press Southern Africa Martins, J.H. Loubser, M. Wyk, H. de. J.Van. 1996. Marketing Research a South African Approach. Unisa Press. Pretoria. Poon, A. (1993). Tourism Technology and Competitive Strategies. CAB International. Republic of South Africa. The National Department of Tourism, 2011-2016. Medium-Term Strategic Plan. Pretoria: Government Printer. Republic of South Africa. The National Department of Tourism, 2011. National Tourism Sector Strategy. Pretoria: Government Printer. Republic of South Africa. South African Tourism, 2011-2013. The Marketing Tourism Growth Strategy for South Africa. Pretoria:
Government Printer. Republic of South Africa. South African Tourism, 2008-2010. The Marketing Growth Strategy for South Africa. Pretoria: Government
Printer. Republic of South Africa. South African Tourism, 2004. Global Competitiveness Study- Integrated Presentation. Department of
Environmental Affairs and Tourism and the Department of Trade and Industry.

Proceedings of 4th
International Conference on Global Business Environment
(ICGBE-2014)
222
Republic of South Africa. National Department of Tourism, 2012-2013. Strategic Plan and Annual Performance Plan. Pretoria: Government Printer.
Republic of South Africa. Department of Environmental Affairs and Tourism, 1996. The White Paper on The Development and Promotion of Tourism in South Africa. Government Gazette May 1996.
Spain. 2011. The global tourism competitiveness report. Madrid: UNWTO Printer. Spain. 2013. The Travel and Tourism Competitiveness report. Madrid: UNWTO Printer. Spain. 2009. The global tourism competitiveness report. Madrid: UNWTO Printer. World Travel and Tourism Council. 2013. Travel and Tourism Economic Impact 2013 – South Africa. London. WTTC Printer. United Nations World Tourism Organisation. 2012. Annual Report. Madrid. UNWT Printer.

Proceedings of 4th
International Conference on Global Business Environment
(ICGBE-2014)
223
Health Care Management within the Health care System and its impact on Service delivery in South Africa: A comparative case study of two public hospitals in Gauteng and KwaZulu
Natal Provinces
A. Deen, Dr R. Balkaran
University of Johannesburg, South Africa Durban University of Technology, South Africa
1. Introduction Health care services is an essential component of the South African Government policy and this is regulated by the Health Act, Act 61 of 2003. This is geared to focus on the delivery of services and a large component of this focus has been hinged on addressing the serious health problems suffered by the majority, who are the poor. The fight against the HIV/AIDS pandemic and other serious conditions such as Tuberculosis, Malaria, Cholera has placed significant stress on the country’s resources which are needed to aid in the relief of services to the poor. Health Care management processes and service delivery share an intrinsic relationship in providing a sound basis for the effective use of very limited resources. Various government reports have indicated the lack of suitable skills at this level however its importance has been underestimated. It can be argued that effective management can provide a framework that creates less dependency on financial resources and more emphasis on effective and efficient management. Batho Pele principles which means "people first "are a set of principles that enshrine amongst others the need to deliver efficient and effective services to its people. The paper provides a systematic analysis and comparison of the management processes of two public hospitals, in South Africa and creates a theoretical platform on which current practices are critically scrutinized. The paper will also provide sound conclusions and recommendations for efficient and effective management of resources. Background: The public sector is under-resourced and over-used, whilst the growing private sector, run largely on commercial lines, caters to middle- and high-income earners who tend to be members of medical schemes, which are a small amount of the population, and to foreigners looking for top-quality surgical procedures at relatively affordable prices (South Africa. Info 2008). Kenneth (2002: 1078 cited in Otieno 2007: 1) found that over the past 20 years the delivery of public service in many countries have gone through radical changes and failure of health care needs has become more acute with diminishing resources to meet their demands. After South Africa's first democratic elections in 1994, the dismantling of the country's race-based health system began. During the apartheid era hospitals were assigned to particular racial groups and most were concentrated in white areas. Over the past few years the health sector has undergone rapid change to make it more equitable and accessible to the needy and since 1994, more than 1300 clinics have been built or upgraded (Health Care South Africa, 2009).Rondganger (2013: 1) headlines that public health is in a state of crisis with South Africa falling short of 14 351 doctors and 44 780 nurses respectively. Rondganger (2013: 1) further outlined that a South African survey by the Race Relations has revealed that Kwa Zulu Natal alone faced a chronic shortage of doctors with 49 percent of public health jobs being not filled. Otieno (2007: 1) emphasizes that the driving forces of changes within the country has often aimed at increasing productivity and getting more for less in keeping with tighter control over public expenditure and further identifies (2007: 2) that in many countries regardless of size or wealth, the health of the population and how health care is delivered is a major concern. A public hospital in Gauteng, South Africa: Why measure quality of healthcare? Camp and Tweet (1994: 120 cited in Otieno 2007: 6) observe that in order to improve every organization has to continuously measure its performance and this may be done by looking within an organization, internal bench marking or externally by comparing oneself with the best in the field, external bench marking or with nationally or internationally accepted best practises. Thereafter the continuous process of measuring products, services and practices against the companies toughest competitors or those companies renowned as industry leaders is benchmarking Camp and Tweet (1994: 120 cited in Otieno 2007: 6). According to Otieno (2007: 7) the need for health care quality information for decision makers and policy experts as well as for consumers and patients has recently been re-emphasized by the International Institute of Medicine (I.O.M, 2001: 30) report, ‘Crossing the quality chasm’. Otieno (2007: 7) highlights an argument that for a patient to be able to participate in their care, information needs to be available to them on quality of health care by various organizations, where this is a major challenge in the health care industry which quality monitoring is crucial as a counterforce to the demands of cost containment. Otieno (2007: 9) defines quality health care as illustrating the complexity of the concept and its evaluation and further adds that in assessment one ensures that the complex dynamics ofhealth care delivery, the varying levels at which care might be evaluated and the perspectives of the key stakeholders in the system are adequately represented.Mseleku (2007) states in the National Policy on Quality in Health Care, there are ways to improve the quality of care in both the public and private sectors. The policy sets out the main objectives of Government to assure the quality in health care and to continuously improve the care that is provided. The South African Government Information (2008) states that the provincial health departments are responsible for providing or rendering health services;formulating and implementing provincial health policy, standards and legislation;planning and managing a provincial health information system; researching health services to ensure efficiency and quality; controlling quality of health services and facilities; screening applications for licensing and inspecting private health facilities; coordinating the funding and financial management of district health authorities and consulting effectively on health matters at community levelensuring that delegating functions are performed. Reinersten (1998:835 cited in Otieno 2007: 9) argues that physicians still remain the major drivers of health care, although primary health care providers also play a major role, hence should therefore take the lead in change and improvements. Development in the legislations that steer the practice of health care is the current development of the National Health Insurance (NHI). According to van Eck (2011), the South African government is currently in the process of a major health sector to reform that is aimed at achieving universal access to good quality health care for all South Africans, whereby a National Health Insurance (NHI) has been proposed as the fundamental component of this reform process. However Kardas – Nelson (2013: 42) states that the NHI still have a long way to go before the training wheels come off and further argue if changes have been made during the 18 month pilot study.

Proceedings of 4th
International Conference on Global Business Environment
(ICGBE-2014)
224
Reviews of models used for quality of health care assessment: Castaneda-Mendez(1999 cited in Otieno 2007: 11) suggest the changing nature of today’s health care organizations, including pressure to reduce costs,improve the quality of care and meet stringent guidelines has forced health care professionals tore-examine how they evaluate their performance. However Castaneda-Mendez(1999 cited in Otieno 2007: 11) states the need to look beyond financial measures haslong been recognized, but the challenge remains as to what measures to select, how to collect itroutinely in an inexpensive manner and how to use the results of these measures. Otieno (2007: 12) indicates the demand for continuous quality improvement emphasized by the joint ‘Commission on Accreditation of Healthcare Organizations’ standards led to implementation of several ideas. The use of statistical tools and standardized problem solving procedures; data collection, including patient, physician and employee satisfaction surveys; process management using clinical algorithms and practice guidelines with training on pathway development, and planning using balance scorecards and performance measurementsOtieno (2007: 12). Oteino (2007: 12) suggests that organizations create interdependency among themselves, their customers and employees, and this interdependency weakens when one or more parties do not receive value or perceive the value as insufficient, therefore Otieno further suggests that health care organizations need to implement measures of business, patients and employee value. Furthermore the right to health care is an important and critical right, without which other fundamental rights cannot be exercised e.g the right to life in the Bill of Rights. One cannot live withoutthe accustomed need to be healthy. A provincial hospital in Kwa Zulu Natal, South Africa: KwaZulu Natal is seen as one of most densely populated out of South Africa’s nine provinces andtherefore the right to health care needs to be clarified and further defined in practice. Most complaints made within provincial hospitals are with regard to poor service and service delivery in the health care systems. Problems such as poor conditions of provincial hospitals, lack of trained health care workers, disregard for patients rights and poor hospital management (Ntuli, n.d). The Provincial Hospital is a District and Regional Hospital in line with the policy of the Provincial and National Departments of Health (Patient information booklet). It has 543 beds and located in Chatsworth, a suburb in the eThekwini health district Chetty (2009). It bears the name of the renowned Indian philanthropist and humanitarian who founded the hospital and the Dispensary Trust which donated 50% of the initial capital costs of building the core block of the hospital. The mission of the Provincial Hospital is to deliver a comprehensive mainly curative health service of a high standard to all people in their region, with compassion and empathy, in a cost effective manner (Patient Information Booklet). This mission is in endorsed by the KwaZulu-Natal Department of Health (2001) as their mission is to develop a sustainable, co-ordinated, integrated and comprehensive health system at all levels, based on the primary health care approach through the district health system. Mathuray (2005) conveys that Chatsworth is world renowned for its diversity in culture, religion and society. Consisting of a population of approximately 450 000, this suburb is considered to be the heart of the Indian community, and began some 40 years ago having been created by the Old Apartheid Regime of White dominance in South Africa Mathuray (2005). An unstructured interview with Chetty (2010) informed that patients arrive as early as 4am at the Provincial Hospital to wait patiently to receive treatment within the Outpatients department. The patients are allowed to enter the hospital from 5am. There is no designated parking facilities available to the public within the grounds of the Provincial Hospital, however there are two disabled bays available. Due to the existent poverty present in the community of the Chatsworth area, most patients depend on the public transport available to them; taxis, buses and trains. There is security at the entrance of the hospital assisting directing patients to their destination, information of visiting hours, screening the cars that enter and general safety and security. Chetty (2010) a patient should seek treatment at the preferred clinic in the area, and only once the patient receives a letter of referral then the next step should be a visit to the Provincial Hospital. The patient must be prepared to wait up to 8hours in the queue for treatment at theProvincial Hospital. The external environment is also emphasizedin the history of Chatsworth in terms of the political climate and struggle through the years and to date. Batho Pele Principles: Khoza& Du Toit (2011) describe from Batho Pele White Paper, number 1459 of 1997, The White Paper on Transforming Public Service Delivery provideda policy framework and implementation strategy for thetransformation of public service delivery, which includedthe delivery of health services. Van Rensburg (2004: 77 cited in Khoza 2009: 1) states that it was evident that predominantly white and wealthy people received privileged health are and black people were deprived of the same quality health care during the apartheid era. Khoza (2009: 2) reminds us that post 1994 and the first democratic election, the Constitution, Act 108 of 1996, introduced the Bill of Rights which forms the cornerstone of democracy in South Africa. Nezifo,Nobubha&Ithemba(2007) assert that the provincial department of health constitutes basic principles to citizen health care which constitutes principles that citizens are entitled to courtesy, consideration, transparency and value for money when they are provided with health care. The Batho Pele principles represent the people, and it emphasizes their right to how they should be treated when receiving health care, and these fundamental principles are in conjunction with the bill of rights within the constitution. According to Nzimakwe&Mpehle (2012) the aim introducing these principles was not only to transform the culture of public service delivery, but also to prescribe citizens’ service packages, set service standards that can be benchmarked against international standards, and to ensure that citizens are the central focus in service delivery, and therefore are put first. Comparative findings from the study of both Hospitals: The sample size of patients taken within the public hospital in Gauteng were 255 and targeted the emergency departments and were interviewed a day after admission to the wards (Otieno, 2007). The patient sample of the provincial hospital in Kwa Zulu Natal totaled to 306 and targeted the Out Patients department.

Proceedings of 4th
International Conference on Global Business Environment
(ICGBE-2014)
225
Table 1: Cross tabulation with the extent of satisfaction of the patient and the department they are unhappy with at the Provincial Hospital Kwa Zulu Natal
Table 1indicates the extent of satisfaction that the patient has with the Provincial Hospital and which department the patient was dissatisfied with. Table 1indicates that the OPD, the area for blue card and the dispensary are the leading departments (37.1%) of unhappiness of the respondents and only 3% of the respondents are happy with these departments respectively. Figure 2 Patient Identified Complaints at the Provincial Hospital in Kwa Zulu Natal
Figure 2indicates the actual complaints levelled from patients. The majority of the patients (84.3%) have indicated that they have never complained previously. The remaining 18.2% complained about matters that pertaining to poor patient care (4.6%), unhelpful service (6.2%), facilities (1.6%), lack of communication (3.6%) and lengthy waiting periods (1.3%). Figure 3 Patients’ views of staff attitude at the Provincial Hospital Kwa Zulu Natal
Figure 3describes the attitude of staff experienced by the patient when they visit the hospital. Multiple responses were possible for the options in the figure above. These multiple responses were group into 3 categories which reflected positive attitude of staff, negative

Proceedings of 4th
International Conference on Global Business Environment
(ICGBE-2014)
226
attitudes of staff and a category which depicted neutral comments. In respect of the positive attitudes 51.3% of the respondents agreed that staff were kind and gentle (15.4%), patient (11.4%) and concerned (24.5%). In respect of the negative attitudes 39.1% of the respondents believed that staff were aggressive and unconcerned (9.5%), unkind and rude (19.2%) and no privacy (0.3%). The remaining of the respondents (17%) chose to remain neutral. Table 2 Doctors attitudes at the Gauteng public hospital (Otieno, 2007)
Otieno (2007) found that 90.8% perceived doctors’ attitude to be good to excellent and only 9.3% perceiveddoctors’ attitude to be poor. Table 3 Nurses’ attitude at the Gauteng public hospital (Otieno, 2007)
Otieno (2007) found that 86.6% perceived the nurses’ attitude to be good to excellent and 13.4% perceived it aspoor. Table 4 Nurses’ responsiveness at the Gauteng public hospital (Otieno, 2007)
According to Otieno (2007) of those who waited for less than 30 minutes, 88.7% perceived responsiveness of nurses to be good to excellent and of those who waited for one hour, 64.7% perceived it to be good to excellent. Otieno (2007) further found that of those who perceived nurses’ responsiveness to be excellent, 66.2% waited for less than 30 minutes and 83.3% waited for more than one hour. Otieno (2007) makes a distinction that waiting time is significantly associated with perception of treatment with respect a P- Value of 0.0005.

Proceedings of 4th
International Conference on Global Business Environment
(ICGBE-2014)
227
Figure 4: Management representation of the application of Batho Pele Principles
Figure 4 highlights the managers’ representation of their application of the Batho Pele Principles. Majority of the respondents (84.6%) indicate that the Batho Pele Principles are applied whilst 15.4% of the respondents indicated that the Batho Pele Principles were not applied. Table 5 Treatment with respect to patients at the Gauteng public hospital (Otieno, 2007)
Otieno (2007) found that 84.5% of patients perceived that they were treated with respect whilst 15.5% did not. Research done byKhoza (2009) finds that none of the Batho Pele Principles were implemented effectively and that patients in general were not satisfied with treatment in public hospitals. 2. Conclusion Theory provides groundwork that the hospitals in both regions have been dramatically influenced by pre and post-apartheid As a result of post apartheid the Provincial Hospital in Kwa Zulu Natal shows direct influence which results the increasing
numbers of patients that the hospital treat There is evidence of similarities between the hospitals and their view of service delivery to their patients It is evident that waiting times are a crucial factor for service delivery issues in both hospitals respectively The public hospital in Gauteng shows evidence that the waiting times are associated with the perception of staff attitude whereas
the Provincial Hospital in KZN views complaints of attitude, unhelpful service, waiting times etc in isolation Both hospitals show similar results in the application of the Batho Pele Principles
Recommendations Management related strategies were recommended to alleviate the overwhelming significance of the waiting times of the patients
which may improve the perception of the quality of care given at the Gauteng Public Hospital Attitude change through staff training need to occur for both hospitals in aid of service delivery issues and unhelpful service The implementation of a mystery patient program at the Provincial Hospital KZN and the Gauteng Public Hospital.The mystery
patient program would be able to test on a regular basis the application of the Batho Pele Principles and furthermore sift out which departments are weaker in their application of the principles and find remedies to strengthen the Batho Pele thread across both hospitals.
References Chetty, K. 2009. RK Khan Hospital [online]. Available at: http://www.kznhealth.gov.za/rkkhanhospital.htm [Accessed at 28 November
2009]. Chetty, K 2010. Interviewed by A. Deen. RK Khan Hospital, Durban, 30 March

Proceedings of 4th
International Conference on Global Business Environment
(ICGBE-2014)
228
Khoza, V.L. and Du Toit, H.S. 2011. The Batho Pele Principles in the health services [online]. Prof Nurs Today, 15(3) 8-11. Available at: http://www.pntonline.co.za/index.php/PNT/article/viewFile/573/692 [Accessed 7 January 2014].
Kardas – Nelson, M. 2013. NHI still has a long way to go before the training wheels come off. Mail & Guardian. 6-12 December. Khoza, V.L. 2009. The implementation of the Batho Pele Principles from patients’ experiences. Gauteng: University of South Africa. Mathuray, R. 2005. Chatsworth – A community of success [online]. Available at:
http://www.chatsworthlive.co.za/articles.php?step=2&id=1 [Accessed 3 March 2010]. Media club South Afica.com. Healthcare in South Africa [online] 2009. Available at:
http://www.mediaclubsouthafrica.com/index.php?option=com_content&view=article&id=102:healthcare&catid=34:developmentbg[Accessed 15 September 2009].
Mseleku, T.D. 2007. A Policy on Quality in Health Care for South Africa [online] Available at: http://www.doh.gov.za/docs/policy/qhc.pdf [Accessed 24 June 2009].
Nezifo, S., Nobubha, S. and Ithemba, S. 2007. Batho Pele: People First [online]. Availabe at: http://www.kznhealth.gov.za/bathopele.htm [Accessed 20 March 2008].
Nzimakwe,T.I. and Mpehle, Z. 2012. Key factors in the successful implementation of Batho Pele Principles [online]. Journal of Public Administration, 47(1.1) 279 – 290. Available at: http://www.sabinet.co.za/abstracts/jpad/jpad/_v47_n1_sil_a6.html [Accessed 11 September 2012].
Ntuli, A.(n.d.). Provincial Findings in Preparation for The South African Human Rights Commission Public Enquiry into The Right to Have Access to Health Care Services [online]. Available at: www.sahrc.org.za/sahrc_cms/downloads/Provincial%20Synthesis%20Report.doc[Accessed 20 March 2008].
Otieno, F.A. 2007. Patient perception of Quality of Care and Service Delivery in Emergency Departments in Gauteng: A case study of One Public Hospital. Johannesburg:University of Johannesburg.
Rondganger, L. 2013. Public health skills crisis: South Africa short of 14 351 doctors, 44 780 nurses. Daily News, 22 January: 1. South Africa. 1996. The Constitution Act of 108 of 1996. Pretoria: Government Printer. South African Government Information: Health [online]. 2008. Available at: http://www.info.gov.za/aboutsa/health.htm[Accessed 10 May
2009]. van Eck, H. 2011. Mediclinic[online]. Available at: http://www.mediclinic.co.za/about/Pages/nhi.aspx [Accessed 20 October 2011].

Proceedings of 4th
International Conference on Global Business Environment
(ICGBE-2014)
229
The enhancement of Conference Tourism activities as a means to bolstering Business tourism in South Africa: A case study of Conferences within KwaZulu-Natal, South Africa
Wayne B. Tifflin, R. Balkaran
Durban University of Technology, South Africa [email protected]
1. Introduction Business Tourism is considered an important aspect of a Destination’s Competitiveness. However having a competitive advantage does not guarantee success (Ritchie and Crouch 2003). Destination success requires a well formulated competitiveness strategy which is effectively implemented (Seymour 2009:2). Business tourism and its elements (meeting, conference, and convention centres) need to be managed effectively to provide a destination with a competitive edge. Thus it is important to determine the effectiveness and suitability of conference centres and destinations from the perspective of the delegate. This paper examines the responses of delegate of 49 Conferences in relation to the facilities at the International Convention Centre in Durban, KwaZulu-Natal and the city of Durban as a conference destination. KwaZulu-Natal’s meetings and conferences are one of the more important attractions and activities of domestic and international tourists. This is clearly illustrated in the following tables: Table 1: Activities Undertaken in KZN - Domestic Visitors 2007:
Activity Tourists '000 %
Go to the beach 2 018 65.6
Go to a live show, theatre or concert 593 19.3
Watch a live sports event 567 18.4
Visit a museum, art gallery or historical building 523 17.0
Visit a nature or wildlife or game reserve 498 16.2
Take part in a sports event 449 14.6
Take part in any water sport 449 14.6
Visit an arts or craft outlet 401 13
Visit an African township or cultural village on a tour 330 10.7
Food and wine fair 294 9.6
Go hiking or mountain climbing 280 9.1
Bird watching 245 8
Art and crafts festival 209 6.8
Attend a conference, workshop or training session 196 6.4
Visit a health spa 163 5.3
See bushman paintings 150 4.9
Fly-fishing 133 4.3
Horse riding 121 3.9
Go backpack/hostel travelling 85 2.8
Mountain biking or other cycling 85 2.8
Tour of the battlefields 72 2.4
(TKZN, 2008) Table 2: Some Activities Undertaken in KZN - African Air Departure and Overseas Visitors 2007:
Air* % Land % Shopping 96 93
Nightlife 100 43 Theme parks 28 10 Trading 1 6 Visited a Casino 11 4 Sporting competed 2 1 Sporting attended 2 4 Business 23 6 Cultural, historical and heritage 59 15 Wildlife 70 14 Visiting natural attractions 85 19 Beach 73 46 Social 35 38 Medical 2 3 Health 1 0
*African Air Departure and Overseas Visitors Source: SAT 2008

Proceedings of 4th
International Conference on Global Business Environment
(ICGBE-2014)
230
2. Literature Review The UNWTO (2007:1) defines a destination as a physical space in which a tourist spends at least one night. It includes tourism products such as support services, attractions, and tourist resources within one day’s return journey. It has physical and administrative boundaries defining its management, and images and perceptions defining its market competitiveness. Destination competitiveness is linked to the ability of a destination to deliver goods and services that in comparison perform better than other destinations (Heath 2003:7). Competition among tourism destinations has also escalated in other growing travel and tourism sectors including business travel, gaming, resort areas, nature-based tourism, festivals and cultural tourism and major-events tourism. (Ritchie and Crouch 2000:2). To succeed in the international tourism marketplace any destination must ensure that its overall attractiveness, and the integrity of the experiences it delivers to visitors, must equal or surpass that of the many alternative destinations open to potential visitors (Dwyer and Kim 2003:1). The importance of tourists’ perceptions of a destination is such that Dwyer and Kim (2003: 3) agree with (Murphy, Pritchard and Smith 2000) that they warrant separate recognition in a model of destination competitiveness. Essentially they say, that Destination competitiveness is about the ability of a destination to deliver goods and services that perform better than other destinations on those aspects of the tourism experience considered to be important by tourists (2003:3). Dwyer and Kim (2003) measure the competitiveness of a destination by measuring the sustainable well-being of the residents. Manazec, WÖber and Zins (2007:87) quote a definition of destination competitiveness by Ritchie and Crouch (2003), which is: “[W]hat makes a tourism destination truly competitive is its ability to increase tourism expenditure, to increasingly attract visitors while providing them with satisfying, memorable experiences, and to do so in a profitable way, while enhancing the well-being of destination residents and preserving the natural capital of the destination for future generations”. They assert that this is more than a definition and that this is also an explanation. They contend that the satisfying and memorable experience is an antecedent to increasing tourism arrivals. This paper argues that the experiences of a conference/convention delegate also enhance the image and thus the competitiveness of the destination. Feng (2006:ii) states that studies indicated that tourists and their needs stand as the ultimate driving force which influences competition and competitiveness in the tourism destination. Today, destinations compete among other aspects, on the quality of tourism experience offered to visitors. These aspects include infrastructure, economic and political stability, and access. She claims that limited research has been undertaken to examine destination competitiveness from the tourists’ perspective (Feng 2006, ii). In her study Feng (2006:ii) found that tourists’ perception of destination competitiveness is positively influenced by the quality of tourism experience in terms of different phases (pre-trip planning, en-route experience, on-site instrumental experience, on-site expressive experience, and after-trip reflection). This study examines the perceptions of conference/convention delegates of the tourist destination of Durban. Fend (2006:35) states that for a tourism destination, comparative advantage would relate to inherited or endowed resources such as climate, scenery, flora, fauna, etc., while competitive advantage would relate to created items such as the tourism infrastructure (hotels, attractions, transport network, etc.), festivals and events, the quality of management, skills of employees, government policy and so on. It is perceived that comparative advantage involve the resource available to a destination, whereas competitive advantage relate to a destination’s ability to effectively utilize the resource. In order to strengthen the KwaZulu-Natal’s competitiveness the KZN Durban Convention Bureau (CVB) was established in 2010. The priority of the CVB is to increase the number of conventions/conferences held in the province. This is done through bidding for conventions/conferences and assisting federations, organisations, and PCO’s to provide a successful conference/convention. Thus far the CVB has brought in ??? conferences. 3. Methodology Tourism KwaZulu-Natal (TKZN) is a destination marketing organization (DMO) based in the KwaZulu-Natal of South Africa. It is responsible for the marketing and tourism development in the province. Research informs the basis of the marketing and development activities of TKZN. The research unit at TKZN, that is responsible for these surveys have implemented guidelines for the type of conferences that will be surveys. Each conference has to be an international one with a minimum of 500 delegates. Face to face surveys were conducted with delegates at each of the conferences. A probability sample design was used stratified by day. At each conference a minimum of 200 interviews was the target. Research at conferences is still ongoing. Discussion: At each conference both domestic and international visitors were interviewed. The total respondents thus are far 2 864 international (39%) and 4 460(61%) domestic respondents. These 49 conferences have had a combined total of ??? delegates. In order to attract conferences there needs to be a wide range of accommodation facilities available. Delegates need to have these various options available to them. The respondents stayed predominantly in 3-star (38.25%) hotel accommodation followed by 4-star (21.66%) and then 5-star (15.1%)) accommodation. Other types of accommodation were also used, such as Budget hotels (9.73%), Guest Houses (3.64%), B&B (3.46%), VFR (8.31%) and Other (2.51%). The mean length of stay was 5.1 nights. Respondents generally stayed 1.5 nights before, 3.6 nights during and 1.7 nights after a conference. In order to enhance the experience of the delegate at the destination, it is encouraged that visitors explore the destination prior to or after the conference. As indicated above respondents do not seem to spend much time in the destination prior to or after a conference. This is confirmed by the number of respondents who take tours in the destination. About 76% of the respondents do not take any tours, with 10% and 14% taking a pre-and post-tour respectively. In order to determine what attractions are popular with delegates, they are asked which attractions have they visited or intend visiting during their stay. It is clear that most respondents have visited the uShaka Marine Theme Park, followed by Durban’s Golden Mile. It is important to understand the respondents’ perception of the destination thus a number of questions are asked relating to the conferences facility and the destination. The respondents have been asked to rate the Durban as a convention destination. Most rated Durban a very good (38%), followed by excellent (31%), followed by good (26%), then bad (4%), very bad (3%) and extremely bad (1%). Respondents have also been asked to rate Durban as a holiday destination. Most of the delegates rated the destination as very good (39%), excellent (28%) and very good (27%). What is also important is the destination’s value for money. Most respondents rated Durban as good (45%), very good (35%) and excellent (14%). It is clear that the respondents rate the destination as a good convention and holiday destination but not as high as a value for money destination. In conjunction with these results respondents were also asked

Proceedings of 4th
International Conference on Global Business Environment
(ICGBE-2014)
231
how likely they were to visit Durban in the next five years. About 50% of the respondents indicated that they were extremely likely to visit Durban again, 36% possibly and 14% unlikely. It is however clear that that most of the respondents may be local residents. Figure 1: Attractions Visited Table 3:
Factor Average
Other 5
South Africa’s shopping 5
Travel time to Durban 10
Social events and other arrangements 7
South Africa’s adventure 8
Low registration costs 10
Durban & surrounds as a holiday destination 10
Sponsorship/ availability of funding 14
South Africa’s beaches 13
Speaker at/ organiser of convention 17
South Africa’s weather 16
South Africa as a holiday destination 18
South Africa’s wildlife scenery 18
South Africa’s culture/heritage 20
Membership of group holding convention 24
Invited to attend 40
Employer decision 42
Topics presented at convention 57
Opportunity to network with business colleagues 73
Respondents were asked what the motivating factor for attending the conference was. On average 73 respondents indicated that the ‘opportunity to network with business colleagues’ is the most important reason to attend. The ‘topics presented at the convention’ was the second highest rated by respondents. It seems as though the destination is not as important as the networking or topics of the conference. Do other factors, such as access, facilities, prices, in the destination in addition to these two factors increase the competitiveness of the destination? Other factors that were measured were satisfaction levels of convention issues and Durban and surrounds. The responses of the local and international respondents were examined. Several aspects were measured in trying to determine the respondents’ perception of the convention facility. Therese were accommodation quality and service, International Convention Centre (ICC) decors and fittings, Meetings rooms, food and beverage at the ICC, service at the ICC, technical equipment at the ICC, and the convention programme. A likert scale with 1 representing the lowest rating and 6 representing the highest was used. When taking all the responses into consideration the responses ranged from 4.3 to 5.0. Accommodation quality and services was rated the lowest at 4.3 while the decor and meeting rooms of the ICC was rated the highest at
25%
40%
7%13%
18%
9%13%
6%4% 5% 4% 4%
8%
1%
0%
5%
10%
15%
20%
25%
30%
35%
40%
45%

Proceedings of 4th
International Conference on Global Business Environment
(ICGBE-2014)
232
5.0. Of the last five conferences the international respondents rated their satisfaction of the convention issues as above. The lowest rating was 4.5 for accommodation quality and service. This was consistent with the overall rating. The ratings by the international delegates were relatively high. It is also important to rate the destination. The surveys asked the respondents to rate Durban and surrounds as a convention destination using specific variables using the likert scale with 1 presenting the lowest rating and 6 representing the highest rating. These were: Access into Durban and South Africa Reception in South Africa Safety Cleanliness Banking Public Transport Restaurants Price of Accommodation Figure 2: Satisfaction of convention issues Figure 3: Satisfaction of Convention Issues International delegates
Figure 4: Satisfaction of Durban and Surrounds
44.24.44.64.8
55.2
4.5
5.25.1
4.85 5
5.1
4.3
5.0 5.0
4.5
4.9 4.94.8
4.9
3.84.04.24.44.64.85.05.2
4.4
3.03.6 4.1
3.6 3.63.0
3.6 3.7
0.00.51.01.52.02.53.03.54.04.55.0

Proceedings of 4th
International Conference on Global Business Environment
(ICGBE-2014)
233
Durban and surrounds were rated as indicated in figure 4 above. The respondents rated their reception into South Africa and the public transport system the lowest. Theses aspects of Durban need to be improved or delegates to convention be made aware of the facilities that are available to them regarding particularly the public transport system. None of the variables were rated above 5 when compared to figure 2 above. Generally there seems to be some improvement necessary in these aspects of the destination. Figure 5: Satisfaction of Durban and Surrounds International respondents
It is clear that the international respondents also rated public transport low. However from a tourism perspective it is concerning that sight-seeing is rated the second lowest. It is important to allow convention delegates to visit the destinations attractions. This will improve their perception of the destination and thus the competitiveness. Banking was also rated low and in this context is was access to foreign exchange. 4. Conclusion It is clear that when respondents are asked to rate the destination in general, such as value for money as a holiday destination and as a convention destination, the ratings are above 4 and upto 5. However when asked to rate the destination according to specific variables the average ratings decline down to the lowest being 3 and the highest less than 5. Delegates overall perceive the destination to be good in terms of value for money, holiday and a convention destination, but there are some aspects of their experiences that need to be improved as indicated in figures 4 and 5. Recommendations 1. Provide delegates to conferences and conventions with easy access to discounts to various activities. The conference/convention organizers can also provide discounted access to the theatre that showcase local talent for conference delegates only. 2. The gala dinner of a conference can be held at a venue that provides delegates with an experience of one of the tourist offerings in the destination. 3. Conference organizers, hotels and the local government need to work together to provide transport for delegates who would want to explore the city after the conference hours. Refernces Brent Ritchie, J.R. & Crouch, G.I. (2003). The Competitive Destination A Sustainable Tourism Perspective Wallington Oxon, UK:
CABI International Crouch Geoffrey I. (2007). Modelling Tourism Destination Competitiveness: A Survey and Analysis of the Impact of Competiveness
Attributes (report) CRC for Sustainable Tourism Pty Ltd Dwyer, L. and Kim, C. (2003). Destination Competitiveness: Determinants and Indicators Current Issues in Tourism 6(5) 369-44 Heath, E. (2002). Towards a model to enhance Africa’s sustainable Tourism Competitiveness Journal of Public Administration (37) 3.1
327-353 http://137.215.9.22/bitstream/handle/2263/5439/Heath_Towards%282002%29.pdf?sequence=1 accessed on the 6th February 2012.)
Heath, E. (2003), Towards Model to enhance destination competitiveness: a Southern African perspective Feng, M. (2006). En Examination of Destination Competitiveness from a Tourists’ Perspective: The Relationship between Quality of
Tourism Experience and Perceived Destination Competitiveness. Unpublished PhD dissertation. Mazanex, Josef. A. WÖber, Karl & Zins, Andreas,H. (2007). Tourism Destination Competitiveness: From Defintion to Explanation Journal
of Travel Research, 46, August 2007, 86-95. Tourism KwaZulu-Natal (2013). Combined ICC Conference Delegate Survey. Top Line Summary. Power Point Presentation. unpiblished UNWTO (2007). Practical Guide to Tourism Destination Management
0
1
2
3
4
54.6 4.7
4.24.6
3.5 3.3 3
4.2 3.9
International

Proceedings of 4th
International Conference on Global Business Environment
(ICGBE-2014)
234
Religious Diversity and Political Change in Thailand
Petcharat Lovichakorntikul, John Walsh
Shinawatra University, Thailand [email protected]
Abstract: Thailand continues to undergo a process of political modernization, moving from a feudal to a fully-fledged and modernized capitalist society. This is a process that has involved numerous missteps and backward turns – most recently the 2006 military coup and the 2010 massacres – and the dissolution of previously existing cultural and social bonds. Marketization of all regions of the country has brought about changes in land ownership, social relations and gender relations but has not, as yet, brought about changes in religious beliefs or in the relationships between people of different belief systems. The majority Buddhist philosophy has been invigorated by emphasis placed on figures such as the goddess Guan Yin, who is eminently appropriate for the age of plenty, while animist hill tribes people incorporate new ways of life into a flexible and accommodating belief system. Only in the southern provinces bordering Malaysia, where the majority of people are ethnic Malay Muslims, is there a division between people based on religion. A faction of people in the border regions have been agitating for autonomous rule or, at least, an end to unfair and unpleasant treatment by high-handed representatives of the Thai state and their mandate to enforce the longstanding triumvirate of Thai language, Buddhist belief and respect for the monarchy as defining characteristics of citizens. Agitation has led to acts of terrorism and suppression including atrocities on both sides. These divisions are not reflected in any other part of the country, although plenty of other symptoms of division are. 1. Introduction The majority of Thai people, well in excess of 90%, profess Buddhism as their religion. Thai Buddhism is Theravadin in nature, which places an emphasis on doing good deeds (‘tam boon’) as a means of approaching enlightenment (‘nibbana’) and the early morning alms-giving to monks as a form of tam boon is a common sight throughout the country. The role of the monks as guardians and transmitters of valuable information is important in Thai society as it is throughout most of the Mekong Subregion. Most Thai men will be ordained as a monk for at least a temporary period during their lives. Women may become Bhikkunis (nuns) and live by the prescribed eight precepts but that status is not formally recognized. For more than a century, uniformity of belief has been stressed as an essential part of Thai citizenship as part of a triumvirate of institutions: central Thai dialect, Buddhism and respect for the monarchy. Opposition or even perceived opposition to this formula can be very problematic for the individual involved. Two factors within Buddhism itself have acted to promote regularity of belief. The first was Buddhist modernism, which began as a reaction against the colonization of neighbouring Burma (Myanmar), Malaya (Malaysia), Laos and Cambodia. Most important cultural, political, social and economic institutions were modernized along foreign, primarily western lives. However, embracing Christianity was a wholly unacceptable step too far and would have represented an admission of failure within Thai society which could not be made. Instead, it was determined that Buddhism, which had become adorned by a wide range of accretions, including beliefs in magical and supernatural powers quite unrelated to the dhamma of the Buddha. Efforts were made, therefore, to return to a purer form of belief that more closely related to the original, core Theravadin texts. To promote conformity with this approach, pamphlet production and distribution began to take place on a large-scale and some venerable monks have become well-known as authors of such tracts. The second movement within Buddhism has been the attempt to control the sangha – the organization of ordained monks. The great majority of the wats and the monks who reside in them belong to the Mahanikai sect, which has a tradition of decentralization and, hence, more likelihood for variations in belief. However, first under King Rama V Chulalongkorn (1853-1910) at the start of the twentieth century and then under the military dictatorship of Field Marshall Sarit (1958-63), the leadership of the sangha was given to the numerically much smaller monarchist Thammayut sect as a means of promoting the monarchy and making more explicit the link between temporal power and overt virtue. Nevertheless, Buddhism in Thailand remains very diverse in nature because of the importation of foreign elements and practices and because of the syncretic nature of Thai belief. Many if not all Thai people incorporate a variety of animist beliefs in their world view and those with Chinese ancestry may also incorporate Chinese religious elements and practices into their overall cosmology. One very notable example of this is the rise of the Guan Yin (Guan Im) goddess, whose likeness is found in a wide range of wats across the country but particularly in Bangkok. Guan Yin has become associated with aspirational middle class values such as family harmony at a time of transition, good health and regular income streams. Followers of the goddess tend to demonstrate their loyalty by giving up the consumption of beef and this has been taken up with such enthusiasm that the once-thriving beef noodles industry has collapsed and American fast food chains have been obliged to vary their product offerings or else to withdraw from the market. The state, too, has employed syncretic approaches to its use of religion as a means of promoting its own interests. This is particularly true in the case of Brahmanical rituals and ceremonies such as the annual buffalo-ploughing event that is used to foretell agricultural conditions prevalent in the Kingdom for the forthcoming year. Brahmanical rituals are known to be closely tied to the role and nature of kingship and also contain the sub-text of caste and hierarchies (Kuanpoonpol, 1990). Popular Superstition: Globalisation is translated in Thai as ‘lukanuwat’ – which refers to a process of becoming more engaged with the material world. This, globalization, is generally viewed with suspicion because worldliness is antithetical to the Buddhist aspiration to nibbana through the annihilation of the ego and is also contrary to the sermons and teachings of just about every monk in the public eye. Yet globalization is the process that has been embraced by the Thai state as part of the drive towards rapid economic development and modernization and this has led to one of a series of contradictions in Thai society. On the one hand, people as whole enjoy the benefits of globalisation and are involved in a capitalist system aimed at providing a greater accumulation of goods and capital; on the other hand, people are regularly reminded of their obligation that can b resolved in part through the creation of goof karma from tam boon; good karma can outweigh an accumulated stock of bad karma without eradicating it. Consequently, as people are forced to engage in the production of bad karma on a daily basis because of the involvement with lukanuwat, they can outweigh the involvement with the tawdry mundane world through the judicious creation of good karma. However, some people take a different approach and instead look to use their knowledge of magical and sacred knowledge to enlarge their stock of worldly goods. Perhaps through the mediation of helpful spirits, they hope to be able to unlock secret knowledge or foretell the future so as to win the lottery or obtain a better job or have

Proceedings of 4th
International Conference on Global Business Environment
(ICGBE-2014)
235
more success with personal relationships. There is also a reverse process by which things of the world (e.g. automobiles) may be brought into the realm of the sacred by having them blessed and marked with sacred symbols so that their own spirit will protect the people who use and rely on them. It is usually assumed that these kinds of activities are related to and indeed representative of the syncretic nature of Thai religious belief, in which disparate belief systems can be yoked together to make a coherent whole without cognitive dissonance. However, it has also been argued that a better way to understand Thai popular religion is as a process of hybridization, in which one belief system may have been imposed on a subject population through a process of colonization; hybridization then represents a degree of agency on the behalf of the colonised in reinventing their religious beliefs in formats which will not be suppressed (Kitiarsa, 2012: 11-6).This aspect of religion in Thailand is evident in recent political change, which has used some elements of popular religion in mass pro-democracy protests – to set against those divergent elements used by the authoritarian elite, such as the presence of Hindu-Brahmanist images used to demarcate certain sacred locations in the city centre, which were used in part as a pretext for the use of state violence on a large scale. Religious Diversity in the South of Thailand: Three provinces in the south of Thailand, Yala, Narathiwat and Pattani, have a population which are predominantly ethnically Malay Muslims and live in an area that was once an independent state known as Patani (Syukai, 1985). There are other groups of Muslims living in Thailand but these tend to live in smaller communities and as minorities which have been influenced by the prevailing Buddhist and Brahmanical practices (Scupin, 1998). By contrast, the Muslims of southern Thailand live as part of the majority, belong to a wider Malay-Indonesian cultural and religious ethos and speak a language of their own, Jawai, which combines classic Malay with Arabic script. The border between Thailand and what is now Malaysia has through most of history been porous in nature and this was brought into sharp focus during the long Emergency period (1948-60) – the Communist insurgency in Malaysia and potential uprising in Thailand. The ability of agents to cross the border very conveniently became evident. For decades, it has been the practice of the Thai bureaucracy to send officials out of favour to the south as a form of punishment and, as a result, they sometimes instituted unfair administrations in the region. This view, which is commonly propounded by foreign observers, is countered by the local Thai view that customarily sees the south as an area of outsiders wrongly trying to rebel against the rightful and righteous central rule (Aphornsuvan, 2008). The result, in any case has been a rather confused campaign of violence against centralised rule and for autonomy of some sort has been launched by different sets of people. There has been a series of attacks against representatives of the central state: security forces, schools and school teachers, Buddhist monks and civil servants. Since there is no central organization behind the insurgency, so it appears there has been no issuance of a coherent manifesto or list of demands and as the Thai state has refused to countenance any kind of discussion of the possibility of autonomy (Jitpirornsiri and McCargo, 2008), the thousands of death that have resulted seem set only to increase. Political Change: Politics in Thailand in the twenty-first century has witnessed a struggle by the masses of the people, organized by capitalist interests as part of an unprecedentedly wide coalition of interests aimed at wresting control of important institutions (parliament included) from the unaccountable authoritarian elites that have historically controlled them. The people have repeatedly demonstrated their ability to support political groupings able to win democratic elections with wide margins. In response, the elites have responded by military coup, convenient judicial dissolutions of victorious parties and banning of successful politicians as a means of maintaining the status quo. Numerous factions and groups have been involved in this process, although it is conventional and convenient to narrow them down to a Manichean duality. In this duality, the political struggle is matched by a cosmological struggle between the Brahmanical rituals and ceremonies of the Bangkok elite against the popular superstitions of the Thai people of the regions. One particularly striking example of this was the beginning of the mass pro-democracy demonstrations mounted against the AbhisitVejjajivaregime, which had been ushered in by a set of shabby accommodations brokered by the military after Abhisit’s party had again been defeated in free and fair elections. The demonstrators, who had for some years colonized the colour red, voluntarily donated their blood, which was amalgamated into a large tub and kept for some later use. That the demonstrations ended with a series of massacres by the military against the pro-democracy demonstrators only reinforced the realization that, in the minds of many of those involved, the struggle was taking place on more than just the mundane plane. 2. Conclusion Animist or popular religious beliefs are highly prevalent in contemporary Thailand and the celebration of the practices in so many representations of popular media – including the very popular ‘lakhon’ or soap operas –indicates their importance to people in navigating the trials and tribulations of daily life. They have a particular importance in helping to determine the future: in a pre-modern world in which individuals have little ability to control the overwhelming power of nature and the reach of monarchs and officials, magical or religious powers act as a means of empowering the individual against the world, particularly if it has the benefit of being sanctioned or even promoted by the local monks. In the modern world, the power of the forces of globalization represents a different but equally overwhelming series of powers that must be contended with and assistance is provided again by secret knowledge and practice. Such knowledge and practice is, theoretically at least, open to everyone and hence has implications for democratization. It would not be surprising if people concluded that, given the apparently uncontrollable forces seemingly arrayed against them, they feel constrained to call upon higher powers to try to give them the rights that they have been promised by various high-ranking interests. The sangha is one of the institutions that is divided into two or more factions with respect to the division of power and state resources, while the army is another. It is almost impossible for people from the outside to identify the relative importance of different factions without either detailed network connections or knowledge provided by some super-normal means. Religion has, at least according to some interpretations, throughout history provided an opportunity for people to understand the motives of super-normal people and institutions and to hope to be able to influence them. References Aphornsuvan, Thanet, “Origins of Malay Muslim ‘Separatism’ in Southern Thailand,” in Michael J. Montesano and Patrick Jory, eds., Thai
South and Malay North: Ethnic Interactions on a Plural Peninsula (Singapore: NUS Press, 2008), pp.91-123.

Proceedings of 4th
International Conference on Global Business Environment
(ICGBE-2014)
236
Jitpirornsiri, Srisompob and Duncan McCargo, “New Governance Proposals for Thailand’s Southern Region,” Contemporary Southeast Asia, Vol.30, No.3 (2008), pp.403-28.
Kitiarsa, Pattana, Mediums, Monks, and Amulets: Thai Popular Buddhism Today (Chiang Mai: Silkworm Books, 2012). Kuanpoonpol, Priyawat, “Court Brahmans of Thailand and the Celebration of the Brahmanic New Year,” Indo-Iranian Journal, Vol.33, No.1
(January, 1990), pp.31-51. Scupin, Raymond, “Muslim Accommodation in Thai Society,” Journal of Islamic Studies, Vol.9, No.2 (1998), pp.229-58. Syukai, Ibrahim, History of the Malay Kingdom of Patani (Athens, OH: Ohio University, 1985), translated by Conner Bailey and John N.
Miksic.

Proceedings of 4th
International Conference on Global Business Environment
(ICGBE-2014)
237
Significance of Hotel Facebook Page as Hotel Marketing Communication: The Facebook Users Perspective
Khanittha Prom-aksorn, PrateepWetprasit
Prince of Songkla University, Phuket Campus, Thailand [email protected]
Abstract: Facebook is the fastest growing social media and broad using by people around the world. Many business sectors had been using this communication channels and gain positive feedback in their business. This study therefore seeks to investigate the Facebook user’s perspective toward the significance of hotel Facebook. The study aims to determine the important of Hotel Facebook Page on hotel selection process of the Facebook users and also to identify what Facebook users’ needs in participated in Hotel Facebook Page. The instruments for this study are questionnaires survey and online questionnaires survey to reach as various demographic and geographic areas as possible. The study is not limited to any region or area of Facebook use as it aims to identify the common opinion of the Facebook user around the world toward the effectiveness of hoteliers in using Facebook Page as their marketing communication channel. The finding shown that more than 80% of the respondents agreed that it is necessary for the hotel to have their Facebook page where as the satisfaction toward hotel Facebook Page being display is quite low compare to their expectation. The finding can indicate that even though the Facebook users see that it is significance for the hotel to have their Facebook Page but the current effectiveness is not yet meet the Facebook user’s expectation. Keywords: Hotel Facebook Page, Facebook Users, Integrated Marketing Communication (IMC), Social Media
1. Introduction In the present day, it is rarely see the hotel website without their other social network site contact channel like twitter, YouTube, Skype and especially Facebook. These social network sites became one of a necessary tool for the hotel to have a close contacting point with their client. Social media marketing has become a new movement hoteliers are focusing on and an increasing number of hotels are using social media to promote their business. However, the marketing effectiveness of social media is still a big challenge in both academic and business world. Since social media marketing is totally different from traditional marketing approaches, traditional marketing theories and practices may not be applicable to social media. Besides, very few studies have examined the effectiveness of social media marketing in the academic world. Although the hotel business mostly agreed to the significant of Facebook as one of a social network marketing communication channel and put a lot of efforts to add Facebook channel to stay connected to their consumer. Nevertheless, from the Facebook user point of view, they still not see Facebook as a significant tool in data searching or decision making on their trip because the Facebook user still use the old channel like Google, website or travel agent to gather information and make decision on their trip. Facebook is the fastest growing and broad using by people around the world in the present. It has grown exponentially in a very short time and continues to do so. Facebook was originally used majority by college students to keep in touch with high school friends but the recent statistics prove that it has moved beyond its original use and has become an incredibly powerful business networking tool. One of the best things about Facebook is its unbeatable potential for publicity. If used regularly and cleverly, it will noticeably increase the company’s visibility. On the other hand, Facebook can also improve Google Rank as Facebook offers a Pages application, which allows the company to create a professional profile for their business, services, and products. Within these pages the company has the option to include a link to their website, or any other reference links or research they’ve done. Even though it is not the only thing the company need to do to improve Google rank, but it had been used broadly and believed by business section that it helps. One another greatest aspects of Facebook is that the business sector can build loyalty among their customers. As per record from Hospitality E-Business Strategies 2011 indicated that users share over 30 billion pieces of information and spend over 700 billion minutes on Facebook each month, which can conclude that it is the reason for business sectors need to make their presence and utilize their marketing via this channel. Whereas when it came to the statistic information, it has been accepted that Social networking developed into an E-Marketing tool that empowers the business firms to entry the market, learn about customer trends, and correspond to customers in a manner that could transform into market share and revenue [2]. Facebook developed as a leading social networking site with 350 million active users in July 2009 [25], which has grown to 500 million active users in 2010 and today’s active users increases to over 1,000 millions. This denotes an amazing 42.86 percent increase in users that constitutes 7.35 percent of the world’s 2010 population. The total number of Facebook users is bigger than the projected 310.2 million population of the United States in 2010. There are two associations for business firms. Facebook is a gathering place of a large pool of customers. This social networking site is also a source of consumer information and a means of distribution information to build market existence [15]. However, this is not to say that using Facebook ensures absolute marketing success. Similar to other online tools, implementation requires a strategic perspective to ensure the desired outcomes. Achieving results is a process involving preparation, resources, competencies, monitoring and evaluation [22][23]. It is important to keep realistic expectations about the marketing outcomes of using Facebook [25] because the results depend on how well business firms utilize the website as a marketing tool. 2. Methodology This study focuses on in identifying the significance and effectiveness of Hotel Facebook Pages from the Facebook user point of view. The target group for this study is the Facebook user who has been viewed or involved in hotel Facebook pages’ activities. The convenience sampling method had been designed and conducted on the sampling group. Online questionnaires distribute to Facebook users who had been participated in some activities provided by hotel Facebook pages and Facebook user who had been randomly selected at Phuket International Airport. The purposive sampling applied as the online questionnaires were posted to the hotel’s Facebook pages aiming to get responses from the Facebook user group who participating in hotel’s Facebook pages and also to gain benefit from a convenience sampling method.

Proceedings of 4th
International Conference on Global Business Environment
(ICGBE-2014)
238
Figure 1: Research model to test the Facebook user’s attitude towards significance and effectiveness of hotel Facebook page
Research Instrument: This research adopts the use of quantitative data collecting method. The Questionnaires and Online Questionnaires were utilized as research instruments for this study to collect data from the Facebook users. 3. Findings The quantitative findings are derived from the 364 completed questionnaires. The results are presented and illustrated through tables and figures. The collected data were analyzed by software package SPSS version 20. Data were analyzed by using descriptive statistics, Profile of Respondents:Group of respondents has 51.4 percent of female and 48.6 percent of male. Majority of the respondents are age 25-34 years follow by 35-44 years. The respondents were mostly having graduate or bachelor degree. The majority groups of respondents were Australian follow by Thai and German. The respondent mostly has internet using experience more than 6 years whereas their Facebook using experience is majority at 3-4 years Table 1: Profile of Respondents (N=364)
Demographic Factors Frequency Percent (%)
Gender Female Male
187 177
51.4 48.6
Age 18-24 years 25-34 years 35-44 years 45-54 years 55-64 years 65+ years
53 183 83 39 5 1
14.6 50.3 22.8 10.7 1.4 0.3
Education less than High school High school College Bachelor's degree Master degree Ph.D.
1 55 58 172 73 5
0.3 15.1 15.9 47.3 20.1 1.4
Nationality Asians Australians And Oceania European American Other (S.African, Egyptian, Saudi)
174 83 76 22 9
47.8 22.8 20.9 6 2.5
Task-Technology Fit
- Perceived
Usefulness
Perspective
toward
Hotel
Hotel
Facebook Page
Technology Model
- Functional Needs
- Social Needs
- Psychological
Needs
Hotel
Facebook Page
Usage
Perspective
toward
Hotel
Page
Communication Model
Compliance
Identification
- Cognitive
- Emotional
Internalizatio
Hotel
Page Usage
Perspective
toward
Social Psychology Model

Proceedings of 4th
International Conference on Global Business Environment
(ICGBE-2014)
239
Len
gth
o
f in
tern
et u
sin
g
Less than 1 year 1-2 years 3-4 years 5-6 years More than 6 years
2 3 14 46 299
0.5 0.8 3.8 12.6 82.1
Len
gth
o
f F
aceb
oo
k U
sin
g Less than 1 year 1-2 years 3-4 years 5-6 years More than 6 years
14 42 113 99 96
3.8 11.5 31.0 27.2 27.4
The overall purpose of this study is to provide empirical evidence of attitude and attention of how the users see the significance and feel about the hotel Facebook page they visited. Subjective responses on the important of various attitude and attention sources about their opinions on hotel Facebook page were given a five-point Likert scale ranging from one (Disagree) to Five (Agree). The 3 competitive models were test differently to measure the attitude and attention of the Facebook users toward to hotel Facebook page. The Technology Model to see easiness of using hotel Facebook page and information search via hotel Facebook page. The Communication model were to test the factor motivate Facebook users to join the hotel Facebook page they visited and engagement the Facebook users feel toward Hotel Facebook page. Social Psychological model to test the how the Facebook users feel if joining the hotel Facebook page they visited and self concept impacted by the hotel Facebook page. Finally the attitude and attention of the Facebook page as an overall opinions of how significance the hotel Facebook page toward hotel marketing communication. The t-test was in use to see possible associate between continuous outcome variables (mean score) and categorical determining variables, and chi-square statistic was used for investigation the statistical significant of attitude and attention in cross-tabulation. Up to 33.5% of the respondents agree that it is necessary for the hotel to have hotel Facebook page follow with 31.9% tend to agree that it is necessary for hotel to have hotel Facebook page where as only 5.5% disagree to the term, indicated a high level of Facebook users perspective toward hotel Facebook page as significance marketing tool to maintain. In table 2 Independent sample t-test was used for analysis. There are two statistically differences at p≤0.05 among genders in the overall attitude towards significance and effectiveness of hotel Facebook page. Table 2: Independent t-test for differences between genders in the overall attitude towards significance and effectiveness of hotel Facebook page
Variables Mean t-test
Female Male t-stat p-value Relationship with hotel
3.5054 3.5311 -.099 .338
Satisfaction 3.3978 3.6723 -2.529 .308 Comfortable 3.5753 3.7966 -2.128 .360 Significance 3.8065 3.8079 -.012 .951
In table 2, the independent sample t-test was used to analyze data in which p-value of Significance of hotel Facebook page is 0.00. Thus there were no significant differences at p≤0.05 among gender and attitude toward significance of hotel Facebook page. Analysis of Variance (ANOVA) was used to compare the means of different groups in which no statistically significant differences at p≤0.05 among the age groups in the overall attitude towards hotel Facebook page. Table 3: One-Way ANOVA tests for different age groups in the overall attitude towards significance and effectiveness of hotel Facebook page
Att
itu
de
Age groups
One-Way ANOVA
18-24
25-34
35-44
45-54
55-64
65+
F-Stat
p-value
A 4.0943 3.3880 3.4578 3.5897 2.8000 3.0000 .784 .562 B 3.5472 3.5027 3.6145 3.5897 2.8000 3.0000 .704 .620
C 3.8491 3.6885 3.5904 3.7436 2.8000 5.0000 1.616 .155
D 3.9623 3.8087 3.7229 3.8718 3.0000 5.0000 1.036 .396 A = Relationship with hotel, B = Satisfaction, C = Comfortable and D = Significance In table 4, Analysis of variance (ANOVA) was used to compare the means of different groups in which no statistically significant differences at p≤0.05 among education level in the overall attitude towards hotel Facebook page.

Proceedings of 4th
International Conference on Global Business Environment
(ICGBE-2014)
240
Table 4: One-Way ANOVA tests for different age groups in the overall attitude towards significance and effectiveness of hotel Facebook page
Att
itu
de
Education Level One-Way ANOVA
Le
ss
tha
n
Hig
h s
cho
ol
Hig
h s
cho
ol
Co
lle
ge
Ba
che
lor'
s D
eg
ree
Ma
ste
r D
eg
ree
Ph
.D.
F-Stat
p-value
A 1.0000 3.4000 3.5345 3.5291 3.5616 4.2000 .311 .906
B 1.0000 3.6545 3.6552 3.4070 3.6164 4.4000 2.863 .015
C 1.0000 3.7455 3.8448 3.6163 3.6712 4.4000 2.525 .029
D 1.0000 3.7636 4.1379 3.6570 3.9452 4.4000 3.40 .005
A = Relationship with hotel, B = Satisfaction, C = Comfortable and D = Significance A chi square test was conducted to test the significant different of the overall attitude towards significance and effectiveness of hotel Facebook page between females and males. There are no significant different between female and male to the overall attitude towards hotel Facebook page. Both groups were tending to agree that it is necessary for hotel to have hotel Facebook page. Table 5: Chi-Square, test for testing the overall attitude towards significance and effectiveness of hotel Facebook page between female and male
Female Male Chi-Square
Att
itu
de
tow
ard
n
eces
sary
fo
r h
ote
l to
h
ave
ho
tel
Fac
ebo
ok
pag
e
Disagree 6.5% 4.5% Pearson Chi-Square = 3.896a P = .866 d.f. = 8
Somewhat Disagree
5.4% 8.5%
Neither Agree nor Disagree
22.6% 22.0%
Somewhat Agree
32.3% 31.6%
Agree 33.3% 33.3% A chi square test was conducted to test the significant different of the overall attitude towards significance and effectiveness of hotel Facebook page between age groups. There are no significant different between age group to the overall attitude towards hotel Facebook page. Each group was tending to agree that it is necessary for hotel to have hotel Facebook page. Table 6 Chi-square test for testing the overall attitude towards significance and effectiveness of hotel Facebook page among age groups 18-24 25-34 35-44 45-54 55-64 65+ Chi-Square
1 1.9% 6.6% 7.2% 0.0% 20.0% 0.0% Pearson Chi-Square = 15.666a P = .737 d.f. = 20
2 3.8% 7.1% 8.4% 7.7% 0.0% 0.0% 3 26.4% 20.8% 21.7% 23.1% 40.0% 0.0% 4 32.1% 30.1% 30.1% 43.6% 40.0% 0.0%
5 35.8% 35.5% 32.5% 25.6% 0.0% 100.0% 1 = Disagree, 2 = Somewhat Disagree, 3 = Neither Agree nor Disagree, 4 = Somewhat Agree and 5 = Agree Sumery: This section is designed to conclude, discuss and provide recommendations base on the research finding of the survey. This study reveals the perspective of the Facebook users’ toward significance of hotel Facebook page as their marketing tool or another channel to promote their hotel. The majority group of respondents who had been view or participated in hotel Facebook were had been using Facebook for 3-4 years and among this group some are not familiar with hotel Facebook page. According to the model tested, the Technology model reveals significant information that hotel Facebook page are easy to use where as the information search result were low. Most of the Facebook users did not participate in hotel Facebook page to gather information. According to the information search, the Facebook users still use the internet search engine channel as priority choice. The Communication Model reveals the information that hotel Facebook page has low level of consent in term of communication to their prospective customer via hotel Facebook page such as useful information provided, motivation for the Facebook users to join the page, entertaining and affiliation with the users. The Social Psychology Model indicated the low level of consent toward the Facebook users’ perspective on feeling if joining the hotel Facebook page and self concept impact by hotel Facebook page. Anyway, when it came to the conclusion question, the overall attitude and attention toward the necessary for the hotel to have hotel Facebook page, the data indicated high level of consent. This information show that the Facebook users see it is important for the hotel to have hotel Facebook page. It can be concluding that the hotel Facebook page being use by hotel are low at effectiveness to motivate or get the Facebook users involve in. The hotel should pay more attention in term of information provide and attractiveness display of the page.

Proceedings of 4th
International Conference on Global Business Environment
(ICGBE-2014)
241
References Aakef, J. L. (1997). Dimensions of Brand Personality.Journal of Marketing Research Albee, A., (2010).eMarketing Strategies for the Complex Sale. Marketing Interactions, Inc., New York. Beard, F. (1996). Integrated marketing communications: New role expectations and performance issues in the client-ad agency
relationship. Journal of Business Research, 37(3), 207-215. Brown, K. (2011) What Is Social Networking? Retrieve from http://www.whatissocialnetworking.com Buttle, F. A. (1998). Word of mouth: understanding and managing referral marketing. Journal of strategic marketing, 6(3), 241-254. Caywood, C., Schultz, D.E., and Wang, P. (1991a) Integrated Marketing Communications: A Survey of National Goods Advertisers,
unpublished report. Medill School of Journalism, Northwestern University, Bloomington, IN, 1991. Caywood, C., Schultz, D.E., and Wang, P. (1991b) Integrated Marketing Communications, Northwestern University Medill School of
Journalism, Evanston, Illinois. Chan, N. L., &Guillet, B. D. (2011). Investigation of social media marketing: how does the hotel industry in Hong Kong perform in
marketing on social media websites?.Journal of Travel & Tourism Marketing, 28(4), 345-368. Dulworth, M. (2008). The connect effect. Building strong personal, professional and virtual networks. Berret Koehler, United States of
America. Duncan, T., & Moriarty, S. E. (1998).A communication-based marketing model for managing relationships.The Journal of marketing, 1-13. De Moya, M., & Jain, R. (2012). When tourists are your “friends”: Exploring the brand personality of Mexico and Brazil on Facebook. Public
Relations Review. Ellison, N. B., Steinfield, C., & Lampe, C. (2007). The benefits of Facebook “friends:” Social capital and college students’ use of online social
network sites.Journal of ComputerMediated Communication, 12(4), 1143-1168. Johnson, R. B., &Onwuegbuzie, A. J. (2004). Mixed methods research: A research paradigm whose time has come. Educational researcher,
33(7), 14-26. Goldenberg, J., Libai, B., & Muller, E. (2001). Talk of the network: A complex systems look at the underlying process of word-of-mouth.
Marketing letters, 12(3), 211. Hsu, Y. L. (2012). Facebook as international eMarketing strategy of Taiwan hotels.International Journal of Hospitality Management, 31(3),
972-980. Kaplan, A. M., &Haenlein, M. (2010). Users of the world, unite! The challenges and opportunities of Social Media.Business Horizons, 53, 59-
68. Kitchen, P. J., &Burgmann, I. (2004).Integrated marketing communication. John Wiley & Sons, Ltd. O Connor, P. (2011). An analysis of the use of Facebook by international hotel chains. Passow, T., Fehlmann, R., &Grahlow, H. (2005). Country reputation – from measurement to management: The case of Liechtenstein.
Corporate Reputation Review, 7(4), 309–326. Phelps, J., Nowak, G., & Ferrell, E. (2000). Privacy concerns and consumer willingness to provide personal information. Journal of Public
Policy & Marketing, 27-41. Schultz, D. E., & Kitchen, P. J. (1997). Integrated marketing communications in US advertising agencies: an exploratory study. Journal of
Advertising Research, 37(5), 7-18. Silk, J., 2006. What is Marketing? Harvard Business School Publishing, Boston, MA. Stokes, R., 2009. eMarketing: The Essential Guide to Online Marketing, second ed. Quirk eMarketing (Pty) Ltd., Johannesburg. Slattery, R. E., McHardy, R. R., &Bairathi, R. (2013).On the Topology of the Facebook Page Network.arXiv preprint arXiv:1307.2189. Treadaway, C., Smith, M., 2010. Facebook Marketing: An Hour a Day. Wiley Publishing, Inc., Indianapolis, IN. Xiang, Z., &Gretzel, U. (2010). Role of social media in online travel information search.Tourism management, 31(2), 179-188. Ye, Q., Law, R., &Gu, B. (2009). The impact of online user reviews on hotel room sales. International Journal of Hospitality Management,
28(1), 180-182.

Proceedings of 4th
International Conference on Global Business Environment
(ICGBE-2014)
242
Logistics Software from a Logistics Management and Management Information Systems (MIS) Perspective
Hermann Gruenwald
Burapha University International College, Thailand [email protected]
Abstract: The logistics profession has undergone severe changes over the last few decades, replacing muscle power with brain power. The virtual aspect of logistics has become equally important to the physical realm of transportation and warehousing. Supply Chain Management (SCM) deals with getting the right stuff to the right people at the right time in the right amount. To accomplish this task there are a number of more or less integrated logistics software application. Demand forecasting models based on historical data from data marts and data warehouses with built in seasonality and pricing models. Load planning software to appropriately palletize, containerize and load trucks and vessels. Route planning software with real time traffic and weather updates to reduce time and fuel costs. Electronic documents to accompany the shipment from purchase order, letter of credit to customs clearing and back-haul charges. Logistics software has many aspects and may be viewed differently from a software developer and user perspective. This study compares the perception of logistics software by management information systems (MIS) and logistics management students (Logistics) in Thailand. Some of the aspects include: user friendliness, ease of use, features and benefits, technical limitations. Keywords: Management Information Systems (MIS), Supply Chain Management (SCM) Software, Transportation & Warehouse Management, Logistics Management, Logistics Software
1. Introduction Logistics has changed over the years and moved from transportation and warehousing to integrated logistics solutions which cover the entire life cycle of the supply chain and start with demand forecast and close with reverse logistics and recycling of the good created on the farm or factory which were received by the personal or industrial end users. Logistics as a profession moved from load dock workers and teamsters to managers. Where once physical labor dominated today the key factor often more critical than the movement of the goods is the electronic information. Having said that it is clear that today’s logistics professional have to have a keen awareness of logistics information system can do and how to handle them. These information systems have to be created by someone. Many years ago the logistics software was created in house by some computer savvy logistics employees in the company who had a basic understanding of spreadsheets, databases and computer programming. The programming language of choice used to be basic and visual basic as it is a skill set that is readily available and often already taught at the high school level. This started with simple macros which were added to the spreadsheets or even word documents. Spreadsheets clearly were the preferred approach to collecting and storing information. Spreadsheets are single user but are difficult to manage when many users simultaneously input and update information. Databases were often created on the Microsoft platform using dbase, which is not a truly object oriented database. Multiple users could access and enter data simultaneously. The computers were initially connected through a sneaker network carrying floppy disks from desktop to desktop and later through local network cables that often ran on the office floor before finding their way in the suspended ceiling. The internet changed all that and local area networks both hard wired and wireless connected the office computers to each others and the rest of the world. This also allowed for web-enabled databases and applications which could be accessed from around the world on local servers. Wireless also allows the use of a smaller foot print in the form of hand-held applications as laptops, tablets, and smart phones. Logistics Software can be broadly divided into the following categories: Supply Chain Management (SCM) deals with getting the right stuff to the right people at the right time in the right quantity Enterprise Resource Planning (ERP) deals with integrating the enterprise as a whole this applies in particular to third party
logistics providers 3PL Supplier Relationship Management (SRM) this software tries to accurately forecast the demand thereby reducing transportation
and holding costs Transportation Management Systems (TMS) what equipment and staff to use to ship it the fastest way and most cost efficient,
selecting the right mode of transportation (land, water, air) loading the box, the crate, the container and the vessel the most efficient way as a subset it includes Global Positioning System (GPS)
Warehouse Management Systems (WMS) how to manage warehouses of various forms and shapes with various special functions such as climate controlled warehouses, automated warehouses, as well as container yards, distribution centers and cross docking facilities.
Electronic Data Interchange (EDI) introduced in the 1960s allows real-time data exchange and was the forerunner of the internet and is heavily used in logistics even so it is not an exclusive logistics application
Radio Frequency Identification (RFID) is replacing barcodes and allows the tracking of individual items, cartons, pallets, containers and movement vehicles
2. Literature Review In the literature review we looked at three main bodies of literature: management information system literature, logistics literature and logistics software literature. Logistics developed over centuries from the movement and warehousing to integrated logistics applications. The global supply chain requires an integrated logistics management solution, which is technology enabled (Arnold,2008). The scientific logistics software literature is relative limited. Even the trade magazines for computer software and logistics have limited information when it comes to logistics software. The resources could be found on the vendors’ websites, one has to be careful to distinguish between fact and hype of the software vendors. We also looked at the various categories of logistics software, Supply Chain Management (SCM), Enterprise Resource Planning (ERP), Supplier Relationship Management (SRM), Transportation Management Systems (TMS), Global Positioning System (GPS), Warehouse Management Systems (WMS), Electronic Data Interchange (EDI), Radio Frequency Identification

Proceedings of 4th
International Conference on Global Business Environment
(ICGBE-2014)
243
(RFID) for applied and theoretical research(Baumgartner, 2001). The literature related to ERP and supply chain software (Gammelgaard &Larson, 2001), was most fruitful both in terms of cases studies and limited theory basses (Anderson, 2003). There has been some finding that application software related to logistics applications lack the integration across the entire enterprise spectrum, the most integrated solution is provided by the German company SAP, but SAP for logistics applications is quite costly both from a licensing as well as implementation cost. The MIS literature deals with the issues of how individuals and corporations embrace technology and modify their business processes to best make use of the changing technology or adopt technology to fit their existing processes (Markus & Robey, 1988). Besides the technology roadmap, and technology integration a major issue in MIS the interaction of humans and technology (Alavi & Car1son 1992). The technical issues are addressed in depth by electrical engineering and computer science, the mayor problem is not technology but the human factor. Computer systems implementations following industry best practices are always a change management issues. Most people naturally resist change to one level or another. MIS deals less with the actual programming and the hardware issues and more with the difficulties at stake integrating the enterprise, departments and the individual stakeholders. A stakeholder analysis also contributes not only to establish user requirements but also to make the users a part of the development and implementation process. There have been numerous studies related to MIS and change management but there are limited studies related to the use and implementation of logistics software in the logistics industry. 3. Methodology This quantitative study surveyed undergraduate management information system (MIS) and logistics students in Thailand who studied in international programs. The survey was web-enabled and could be taken at the convenience of the students. The survey used the Moodle based e-learning system to administrate the survey. The survey used a five point likert scale. This research measured the perception of MIS and logistics students regarding logistics software and their first and limited impression of the software. Both student groups were introduced to logistics software in the respective course and received limited exposure to the software. Their impression comes mostly from the trade literature and the company websites. They also viewed the available demo videos and had a chance to test drive some of the software in the free software downloads through the vendor web sites. Screen shots of the software further contributed to the first impression in terms of user interface and user friendliness. The students were using the various software applications throughout the curriculum and were more and less familiar with the various types of applications. The percentage of male and female participants reflects the distribution in the MIS and logistics workforce. 35 female respondents and 22 male. The age distribution of the population was also representative of bachelor degree MIS and logistics students. Only 2% of the students were freshmen students age 18, 16% of the students were freshmen age 19, the majority of the students were second year students 32% 20 years old and 37% of the students being age 21. There were only 14% of the students who were 22 years old who may have entered college late or took this elective course out of sequence. For analysis purposes SPSS was used by the principal investigator (PI). 4. Results When asked what logistics software information the respondents were familiar with, the respondents found the following logistics software applications as most useful based on previous experiences. The MIS and logistics students pretty much agreed on the importance of the various applications only that the MIS students in general rate the logistics specific applications lower as the more well known applications like supply chain management, even so these differences are not significant. The more significant differences are in the areas such as EDI and RFID, which are more technical applications and probably more well know among MIS students than among logistics students. Supplier Relationship Management software was not recognized either by MIS nor logistics students, Maybe because it was not covered in depth in the various courses. Warehouse management surprisingly was the most popular application, And even among logistics students RFID was recognized, while transportation planning was really undervalued by the participants. Table 1: Most useful logistics software applications
Logistics Software Categories R. % MIS
R.% Logistics
Q. count % Correct Facility
SD Disc. Index
Disc. Coeff.
Warehouse Management Software (WMS)
(43%) (51%) 57 51 1 -0.25 0.066
Enterprise Resource Planning (ERP)
(4%) (7%)
Transportation Management System (TMS)
(3%) (5%) 57
Supply Chain Management (SCM) (15%) (16%) 57
Electronic Data Interchange (EDI) (15%) (2%) 57
Radio Frequency Identification (RFID)
(25%) (19%) 57
Supplier Relationship Management (SRM)
(0%) (0%) 57
If the users were asked if the like to use logistics software versus doing the work manually, the overwhelming number participants either very much liked (42%) or liked (35%) to use various forms of logistics software.

Proceedings of 4th
International Conference on Global Business Environment
(ICGBE-2014)
244
Table 2: Like to use logistics software Logistics Software Usage R. Counts R.% Q.
count % Correct Facility
SD Disc. Index
Disc. Coeff.
very much like it 24/57 (42%) 57 42 0 0.214 0.604
like it 20/57 (35%)
Ok 11/57 (19%)
don't like to use software 2/57 (4%)
hate to use software 0/57 (0%)
Similar the participants love to use internet for logistics business application, and are very fund of web-enabled on-line applications. Amazingly nobody dislikes the internet, or even hates going on-line. Table 3: Like to use internet
Internet R. Counts R.% Q. count
% Correct Facility
SD Disc. Index
Disc. Coeff.
very much like it 29/57 (51%) 57 51 1 0.071 0.503
like it 19/57 (33%)
Ok 8/57 (14%)
don't like to use software 0/57 (0%)
hate to use software 0/57 (0%)
E-mail is also very popular, nobody dislikes it but 35% of the participants are just ok with it, probably because they are aware how time consuming responding to e-mail correspondence in a business setting can be. Table 4: Like to use e-mail
e-mail R. Counts R.% Q. count
% Correct Facility
SD Disc. Index
Disc. Coeff.
very much like it 22/57 (39%) 57 39 0 0.143 0.569
like it 13/57 (23%)
Ok 20/57 (35%)
don't like to use software 0/57 (0%)
hate to use software 0/57 (0%)
Social media interestingly is not liked by 2% of the participants, they probably are aware of the risks associated with social media, in particular in a corporate setting, and how much effort is involved in maintaining a social media presence for the corporation including damage control. Almost half the respondents very much like social media, even in business setting. Social media as defined here included facebook as well as services like line and what’s up to stay in contact with customers and co-workers, to exchange multi-media messages real-time. Table 5: Like to use social media
Social Media R. Counts R.% Q. count % Correct Facility
SD Disc. Index
Disc. Coeff.
very much like it 24/57 (42%) 57 42 0 0.036 0.474
like it 20/57 (35%)
ok 12/57 (21%)
don't like to use software 1/57 (2%)
hate to use software 0/57 (0%)
The usage of smart phones including i-phones was even more welcomed 63% very much like to use smart phones and a combined 80% like them. This clearly shows the move from desk-top computer to mobile computing. Hand-held applications are very much embraced by logistics professionals and continue to grow in popularity. Table 6: Like to use smart phones
Smart Phone R. Counts R.% Q. count
% Correct Facility
SD Disc. Index
Disc. Coeff.
very much like it 36/57 (63%) 57 63 0 -0.071 0.392
like it 13/57 (23%)
ok 8/57 (14%)
don't like to use software 0/57 (0%)

Proceedings of 4th
International Conference on Global Business Environment
(ICGBE-2014)
245
hate to use software 0/57 (0%)
In terms of user friendliness only 8% of the participants find the logistics applications not user friendly, the majority considers them very user friendly and user friendly, a possible explaination is that most of the applications offer elaborate GUI (graphical user interfaces). Table 7: Ease of Use
User friendliness R. Counts
R.% Q. count % Correct Facility SD Disc. Index
Disc. Coeff.
very user friendly 23/61 (38%) 61 38 0 0.385 0.305
user friendly 18/61 (30%)
somewhat user friendly 14/61 (23%)
not user friendly 5/61 (8%)
not at all user friendly 0/61 (0%)
Not surprisingly the majority 72% of the participants prefer COTS commercial of the shelf software over in-house developed software. Table 8: COTS or in-house solution
COTS R. Counts
R.% Q. count % Correct Facility SD Disc. Index Disc. Coeff.
commercial of the shelf software (COTS)
44/61 (72%) 61 72 0 0.077 0.211
in-house software 17/61 (28%)
Discussion: The participants of this study found that the logistics software applications in the majority are very user friendly and offer easy to use interfaces. The participants also preferred web-enabled on-line applications. Also a smaller footprint in form of mobile applications is preffered over desk top applications. The way is paved to mobile commerce in the logistics business and the smaller the devices the more will they be used by logistics professionals. It appeared that the English user interfaces were not a handicap in terms of user friendliness and user acceptance. Supply chain management applications (Bozarth & Handfielf 2006) as in the literature appear to increase inpopularity and become more popular. Amazingly RFID and GPS are welknown household names among students and the applications are gaining in popularity. GPS as it is being used in private cares and RFID as it is getting more and more common place in retail applications. Warehouse management applications were very popular amoung the students, maybe because the inventory and demand part of logistics is the oldest software application reaching back to the days of accounting software. Students appear to be aware of the risks of social media especially when it comes to corporate setting 5. Conclusion In conclusion there is still a big gap between how information systems are used in the personal lives of Asian students and in business. While embracing i-pad, i-phones and smart phones in general using social applications like facebook, line and what’s up, students are less comfortable using these apps for business and return to using the phone or e-mail. The internet is great enabler in terms of information gathering and dissemination, but students have to learn how to make use of them in a business setting and in particular setting of logistics on a national and international level. One other conclusion based on the hypothesis is that the perception of the software changes with your role as developer or user. What the developer finds as easy to use software and self explanatory and user friendly is often perceived as less than user friendly software by the user. Hypothesis - Developer and end users have different perception of user friendly - Software applications are used in a personal but not in a professional setting - The development of logistics industry standards are still in its infancy - Logistics software is more international by its very nature - Both MIS and Logistics students have to gain a better understanding of the application and systems being used.

Proceedings of 4th
International Conference on Global Business Environment
(ICGBE-2014)
246
Figure 1: Logistics Software Classifications
Some applications or features are perceived as useful by the software designer and developer but as useless by the actual logistics user. What is technically feasible maybe to costly for the logistics professional from a time and money stand point. Recommendations: Logistics software has a long way to come, but made significant strives in the last few years. The development of international standards in terms of IT applications in logistics has made great progress both in hardware and software standards. Software applications in Asia often lack the interfaces and middleware to bridge various applications for in-house, government (customs) and customer usage ending up in re-entering the data in various formats. There is another issue which deals with the creation of the software and middleware and the available skill sets for a reasonable cost. Cost is also a major issue when it comes to the decision to automate a manual process. In Asia and in particular Thailand the labor costs are relatively low compared to the price of international software licenses. Therefore the integration of software applications is driven by the customer requirements, and the customer facing solutions are being computerized and integrated while the internal processes still rely on manual processes and copying and recopying original paperwork and entering into the system and cross checking the outputs from previous systems. The recommendation is to expand the research from logistics software to logistics information systems (LIS)
Logistics Software
Supply Chain Management
(SCM)
Enterprise Resource
Planning (ERP)
Supplier Relationship Management
(SRM)
Transportation Management Systems (TMS)
Warehouse Management
Systems (WMS
Electronic Data
Interchange (EDI)
Radio Frequency
Identification (RFID)
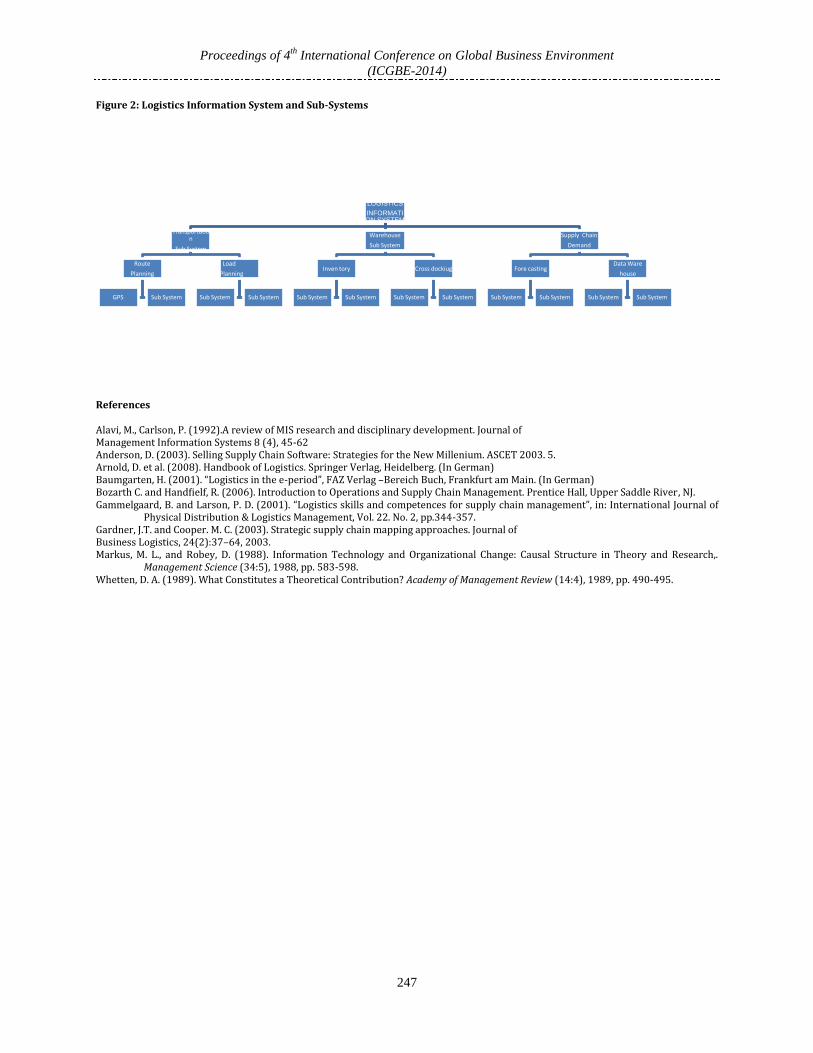
Proceedings of 4th
International Conference on Global Business Environment
(ICGBE-2014)
247
Figure 2: Logistics Information System and Sub-Systems
References Alavi, M., Carlson, P. (1992).A review of MIS research and disciplinary development. Journal of Management Information Systems 8 (4), 45-62 Anderson, D. (2003). Selling Supply Chain Software: Strategies for the New Millenium. ASCET 2003. 5. Arnold, D. et al. (2008). Handbook of Logistics. Springer Verlag, Heidelberg. (In German) Baumgarten, H. (2001). “Logistics in the e-period”, FAZ Verlag –Bereich Buch, Frankfurt am Main. (In German) Bozarth C. and Handfielf, R. (2006). Introduction to Operations and Supply Chain Management. Prentice Hall, Upper Saddle River, NJ. Gammelgaard, B. and Larson, P. D. (2001). “Logistics skills and competences for supply chain management”, in: International Journal of
Physical Distribution & Logistics Management, Vol. 22. No. 2, pp.344-357. Gardner, J.T. and Cooper. M. C. (2003). Strategic supply chain mapping approaches. Journal of Business Logistics, 24(2):37–64, 2003. Markus, M. L., and Robey, D. (1988). Information Technology and Organizational Change: Causal Structure in Theory and Research,.
Management Science (34:5), 1988, pp. 583-598. Whetten, D. A. (1989). What Constitutes a Theoretical Contribution? Academy of Management Review (14:4), 1989, pp. 490-495.
LOGISTICS
INFORMATION SYSTEM
Transportation
Sub System
Route
Planning
GPS Sub System
Load
Planning
Sub System Sub System
Warehouse
Sub System
Inven tory
Sub System Sub System
Cross dockiug
Sub System Sub System
Supply Chain
Demand
Fore casting
Sub System Sub System
Data Ware
house
Sub System Sub System
Copyright © 2022 FDOKUMEN