The political ontology of European integration
9
Adaptation of the Biological Simulation Model MAESTRA for Use in a Generic User Interface William L. Bauerle,* Dennis J. Timlin, Yakov A. Pachepsky, and Shruthi Anantharamu ABSTRACT Application of process-based models beyond the research commu- nity has been limited, in part because they do not operate in an in- tuitive graphical user-friendly environment. This article describes the procedure of adapting a spatially explicit biological-process model, MAESTRA (Multi-Array Evaporation Stand Tree Radiation A), to run in a standard graphical user interface (GUI). The methods used to adapt the MAESTRA model are generally applicable to other indi- vidual tree process-based models and, therefore, should simplify other coupling attempts. The three primary changes to MAESTRA were the placement of the MAESTRA code inside a Microsoft Windows API (application programming interface) function called WINMAIN, rear- rangement of the input file structure to fit the hierarchical file structure used by the Graphical User Interface for Crop Simulations (GUICS), and the addition of iteration counters to read array-based data read for each array within the MAESTRA input files. The procedure of adapt- ing MAESTRA’s input structure and interface design should allow other forest stand process-based models to work within GUICS. P HYSIOLOGICAL or process-based forest models de- scribe explicit biophysical and biochemical mecha- nisms with predictive algorithms. Within the last two decades, hundreds of ecological and agricultural simu- lation models have been developed in an attempt to pre- dict terrestrial ecosystem response to climate change (see reviews by Reynolds et al., 1996; Reddy et al., 1997; Goudriaan et al., 1999; Constable and Friend, 2000; Johnsen et al., 2001). Recently, substantial effort was made on developing mechanistic forest ecosystem models because trees are major components of the terrestrial eco- system C pool (Dixon et al., 1994). Mechanistic or process- based approaches are powerful tools that can be used to provide insights into forest dynamics. However, they often are complex and lack a user-friendly GUI inside a win- dowing environment. This prevents most models from being used by more than a handful of researchers, let alone beyond the research community. The input data for a mechanistic tree model usually includes tree-specific physiological and structural param- eters, weather data, and indirect soil water content (mois- ture status based on soil water-holding capacity and precipitation) as inputs to calculate primary productivity over the course of one or several growing seasons. Despite the common information input, the models vary con- siderably in framework and form, each representing the facets of the particular system considered crucial for modeling system behavior. The problem of data compi- lation is compounded by the fact that the complex nature and lack of a standardized Windows-based user interface currently precludes process-based models from being commonly used in the forest decision-making process. Before any model can become widely used, it must not have only clear documentation and a widely understood program language, but also possess a standardized input structure that can easily couple to a GUI. The use of GUICS as a generic user interface is the key next step in knowledge dissemination because it provides end users a simplified tool to operate complex forest ecophysio- logical models. As populations infringe on areas that were once des- ignated specifically for forest growth, it will become increasingly critical for forest managers to quantify pro- jected impact on existing and future stand management and other associated changes in climate. Forest manage- ment, therefore, will soon require using model predic- tions for critical decisions regarding protection, treatment, and utilization of forest resources (Ma ¨ kela ¨ et al., 2000). The potential application of process-based models, how- ever, is currently limited by operational implementation (Acock et al., 1999; Ma ¨ kela ¨ et al., 2000; Johnsen et al., 2001). Recently, Ditzer et al. (2000) exemplified the need to visualize forest process model output when they were successful in using geographic information systems to aid forest management decision-making. The mechanistic nature of process models linked to a GUI lends to this precise task because the process-based structure allows them to simulate responses that the system has never encountered and visually present the outcome. Moreover, from an educational and research perspective, process- based models provide insights into the underlying bio- logical response to ecosystem perturbations, a key tool for deciphering forest and ecosystem response. For the purpose of the application of process-based sustainable forest and tree nursery management analy- sis, we have developed a GUI that standardizes model/ interface coupling and simplifies end user operation. The original objective of this work was to couple a forest process-based model (MAESTRA) (Medlyn et al., 1999) to a generic GUI. In so doing, we encountered a num- ber of challenges. We describe the difficulties, as well as our solutions, to hopefully simplify other GUI/forest process-based model coupling attempts. W.L. Bauerle, Dep. of Hortic., and S. Anantharamu, Dep. of Electrical and Computer Eng., Clemson Univ., Clemson, SC 29634; D.J. Timlin, USDA-ARS, Crops Syst. and Global Change Lab., Beltsville, MD 20705; and Y.A. Pachepsky, USDA-ARS, Environ. Microbial Safety Lab., Beltsville, MD 20705. Received 12 Apr. 2005. *Corresponding author ([email protected]). Published in Agron. J. 98:220–228 (2006). Computers in Agriculture doi:10.2134/agronj2005.0109 ª American Society of Agronomy 677 S. Segoe Rd., Madison, WI 53711 USA Abbreviations: API, application programming interface; GUI, graphical user interface; GUICS, Graphical User Interface for Crop Simulations. Reproduced from Agronomy Journal. Published by American Society of Agronomy. All copyrights reserved. 220 Published online January 5, 2006
-
Upload
independent -
Category
Documents
-
view
0 -
download
0
Transcript of The political ontology of European integration
Adaptation of the Biological Simulation Model MAESTRA for Use in aGeneric User Interface
William L. Bauerle,* Dennis J. Timlin, Yakov A. Pachepsky, and Shruthi Anantharamu
ABSTRACTApplication of process-based models beyond the research commu-
nity has been limited, in part because they do not operate in an in-tuitive graphical user-friendly environment. This article describes theprocedure of adapting a spatially explicit biological-process model,MAESTRA (Multi-Array Evaporation Stand Tree Radiation A), torun in a standard graphical user interface (GUI). The methods usedto adapt the MAESTRA model are generally applicable to other indi-vidual tree process-based models and, therefore, should simplify othercoupling attempts. The three primary changes to MAESTRAwere theplacement of the MAESTRA code inside a Microsoft Windows API(application programming interface) function called WINMAIN, rear-rangement of the input file structure to fit the hierarchical file structureused by the Graphical User Interface for Crop Simulations (GUICS),and the addition of iteration counters to read array-based data read foreach array within the MAESTRA input files. The procedure of adapt-ing MAESTRA’s input structure and interface design should allowother forest stand process-based models to work within GUICS.
PHYSIOLOGICAL or process-based forest models de-scribe explicit biophysical and biochemical mecha-
nisms with predictive algorithms. Within the last twodecades, hundreds of ecological and agricultural simu-lation models have been developed in an attempt to pre-dict terrestrial ecosystem response to climate change(see reviews by Reynolds et al., 1996; Reddy et al., 1997;Goudriaan et al., 1999; Constable and Friend, 2000;Johnsen et al., 2001). Recently, substantial effort wasmade on developing mechanistic forest ecosystemmodelsbecause trees aremajor components of the terrestrial eco-systemCpool (Dixon et al., 1994).Mechanistic or process-based approaches are powerful tools that can be used toprovide insights into forest dynamics. However, they oftenare complex and lack a user-friendly GUI inside a win-dowing environment. This prevents most models frombeing usedbymore thana handful of researchers, let alonebeyond the research community.
The input data for a mechanistic tree model usuallyincludes tree-specific physiological and structural param-eters, weather data, and indirect soil water content (mois-ture status based on soil water-holding capacity andprecipitation) as inputs to calculate primary productivityover the course of one or several growing seasons.Despite
the common information input, the models vary con-siderably in framework and form, each representing thefacets of the particular system considered crucial formodeling system behavior. The problem of data compi-lation is compounded by the fact that the complex natureand lack of a standardized Windows-based user interfacecurrently precludes process-based models from beingcommonly used in the forest decision-making process.Before any model can become widely used, it must nothave only clear documentation and a widely understoodprogram language, but also possess a standardized inputstructure that can easily couple to a GUI. The use ofGUICS as a generic user interface is the key next stepin knowledge dissemination because it provides end usersa simplified tool to operate complex forest ecophysio-logical models.
As populations infringe on areas that were once des-ignated specifically for forest growth, it will becomeincreasingly critical for forest managers to quantify pro-jected impact on existing and future stand managementand other associated changes in climate. Forest manage-ment, therefore, will soon require using model predic-tions for critical decisions regarding protection, treatment,and utilization of forest resources (Makela et al., 2000).The potential application of process-based models, how-ever, is currently limited by operational implementation(Acock et al., 1999; Makela et al., 2000; Johnsen et al.,2001). Recently, Ditzer et al. (2000) exemplified the needto visualize forest process model output when they weresuccessful in using geographic information systems toaid forest management decision-making. The mechanisticnature of process models linked to a GUI lends to thisprecise task because the process-based structure allowsthem to simulate responses that the system has neverencountered and visually present the outcome.Moreover,from an educational and research perspective, process-based models provide insights into the underlying bio-logical response to ecosystemperturbations, a key tool fordeciphering forest and ecosystem response.
For the purpose of the application of process-basedsustainable forest and tree nursery management analy-sis, we have developed a GUI that standardizes model/interface coupling and simplifies end user operation.The original objective of this work was to couple a forestprocess-basedmodel (MAESTRA) (Medlyn et al., 1999)to a generic GUI. In so doing, we encountered a num-ber of challenges. We describe the difficulties, as wellas our solutions, to hopefully simplify other GUI/forestprocess-based model coupling attempts.
W.L. Bauerle, Dep. of Hortic., and S. Anantharamu, Dep. of Electricaland Computer Eng., Clemson Univ., Clemson, SC 29634; D.J. Timlin,USDA-ARS, Crops Syst. and Global Change Lab., Beltsville, MD20705; and Y.A. Pachepsky, USDA-ARS, Environ. Microbial SafetyLab., Beltsville, MD 20705. Received 12 Apr. 2005. *Correspondingauthor ([email protected]).
Published in Agron. J. 98:220–228 (2006).Computers in Agriculturedoi:10.2134/agronj2005.0109ª American Society of Agronomy677 S. Segoe Rd., Madison, WI 53711 USA
Abbreviations: API, application programming interface; GUI,graphical user interface; GUICS, Graphical User Interface for CropSimulations.
Reproducedfrom
AgronomyJournal.PublishedbyAmericanSociety
ofAgronomy.Allcopyrights
reserved.
220
Published online January 5, 2006

GUICS AND ITS ADAPTATIONThe GUICS Interface
A GUICS that is user friendly, capable of runningnumerous crop simulators, and available as freewarewas described in Acock et al. (1999). Briefly, GUICS is aWIMP (Windows, Icons, Menus, and Pointers) interface(Martin and Eastman, 1996), where the design is usercentered (Microsoft Press, 1995). To enhance usability,the design’s interface incorporates six features: consis-tency, directness, feedback, forgiveness, simplicity, anduser in control. Detailed descriptions of these featurescan be found in Acock et al. (1999).
Although other crop model interfaces have been de-veloped and are described in the literature (e.g., VanEvert and Campbell, 1994; Testezlaf et al., 1996;Bannayan and Crout, 1999), they are either crop spe-cific or built for a specific suite of crop simulators. TheGUICS is an attempt to standardize a GUI across var-ious crop simulators, each of which may be crop specificbut still present within an ecosystem (i.e., a single farm-ing operation; see Acock et al., 1999). The interface wasdesigned to minimize coding changes in the simulationmodel. Simulation models read data and output results;therefore, the connection with the user interface is viathese input/output files. GUICS acts as an intermediarybetween the user and model. The simulation model pro-vides data files to GUICS, and GUICS presents the datato users via a combo box or dialog box, a combination ofa text box and a list box where the user can type a valueor choose one from a list. Required changes to the modelsource code, therefore, are normally limited to file inputand output routines.
Users of crop or biological simulation models areoften interested in comparing the effects of competingmanagement decisions or contrasting environment onplant performance. For example, if the summer is wetand cool, how will it affect the harvest date as comparedwith a hot, warm summer? This requires that a user runa simulation a number of times with different input files.If the basic component of the model is a tree or croppedplant, i.e., corn (ZeamaysL.), soybean [Glycinemax (L.)Merr.], etc., each simulation represents a specific statein which the tree or plant would grow. Weather, soil,plant variety, management such as irrigation, initial con-ditions including row spacing, and planting date definethis state. GUICS is designed so that input files, rep-resenting the possibilities of different states, can be easilymanipulated and selected. Each arrangement of filesdefines a scenario that, after execution of the model,would provide a user with an estimate of how a cropwould respond to that particular state of the system.
GUICS allows a user to build variations on a scenario.The user selects two or more files of the same categoryof data (soil, weather, etc.) that represent the differentstates of the system where a comparison is desired. Tobuild scenarios efficiently, the input data files must begrouped into those that are specific to a particular sce-nario or simulation or those that are common to morethan one scenario. For example, an initialization file thatcontains row spacing and planting date would be specific
to a simulation for a particular field and crop (a sce-nario). A weather file, on the other hand, could be usedfor a range of scenarios for the same field and crop.Different variety files could be used for the sameweatherand initialization file to create several scenarios. If ini-tialization and variety data are mixed into one file, thenit would be difficult to simulate results for several vari-eties on one field without having to create multiple cop-ies of the same file, each with a slightly different value ofone or more variables.It may be necessary to recode a model to work with
GUICS so that its input files are allowed to have a vari-able file name and are arranged in nonoverlappingcategories. Many models, originally written for DOS op-erating systems that include MAESTRA, use the sameinput file names (the file names are hard-coded) and varythe folder or directory names for different simulations.Although this simplified the input in a DOS environment(via the use of master input files), this is a disadvantagein a user interface where the necessity to easily manipu-late files requires a structured file system. A convenientway tomanage files for a user interface is in a hierarchicalfile structure. With a hierarchical arrangement, commonfiles such as weather or physiology parameter files arestored in separate folders and canhavenames appropriateto the source or use of the data. The folders, in turn, willcorrespond to different categories of input data. The re-dundant data among the input files can be removed andthe related information encapsulated in the input files toincrease efficiency. A GUI, moreover, simplifies input offile names since a user can select a file from a list drawnfrom the same folder and having a common category andfile extension.A programmermust carry out several tasks tomake an
existing crop simulator capable of working with GUICS(Acock et al., 1998). The first task is to reorganize anddocument the input and output datasets (or datafiles).This places the structures of the files into a known for-mat and provides information to GUICS on how to readthe files. The documentation is available to GUICS asscript files, which provide information on titles for dia-log boxes and formats for reading and writing data. Thesimulator and GUICS also need to maintain some kindof synchronization to update simulation status to the in-terface and user and handle errors. This messaging isimplemented by adding standard code to the simulator tosend messages to GUICS concerning the model’s prog-ress (i.e., calendar date) during the course of the simu-lation and by notifying GUICS when the simulator ends.Script files are used by GUICS to describe the struc-
ture of the input datasets, specific to the simulator, anddescribe the variables present in the model’s input andoutput files. Each folder has an associated script file(named ,component-name..sct) to document the datacontained in the files in that folder. The script file con-tains three lines for every item of data read by the model(Table 1). These lines include an iteration number (tonumber the sequence of the variable and landmarkwhen editing), a title for the variable in the dialog box,and a format string to describe how GUICS should readthe variable and write it to a file if the user changes the
Reproducedfrom
AgronomyJournal.PublishedbyAmericanSociety
ofAgronomy.Allcopyrights
reserved.
221BAUERLE ET AL.: MAESTRA IN A GENERIC USER INTERFACE
input file (Table 1). The format strings allow for date,character, and numeric data; tabulation of data in row–column format; and presentation of data in combo ordrop-down boxes. A user can select from a number ofitems in a combo or drop-down box. Special script filesare also written to present output data in tabular andgraphic forms. Additional related files with the name,component-name..def are default data files that canbe used as templates by the end user to create new inputfiles in GUICS.
Adapting GUICSWhen GUICS was developed, the input files used in
over 20 other simulation models were evaluated (Acocket al., 1998). In spite of this, new formatting types werefound in both MAESTRA and other models such asSimpotato (Hodges et al., 1992). One of them was theuse of an “5” symbol to separate a parameter from adescription. A new script grammar had to be added toGUICS to handle this case.
The MAESTRA Model and Its AdaptationA detailed description of MAESTRA is beyond the
scope of this article; interested readers are referred toWang and Jarvis (1990a, 1990b), Bauerle et al. (2002,2004a), and Medlyn (2004). Briefly, MAESTRA, a spa-tially explicit biological-process model originally de-veloped for tree plantations-MAESTRO (Multi-ArrayEvaporation Stand Tree Radiation O; Wang and Jarvis,1990b), and recently updated and renamed MAESTRA(Medlyn et al., 1999), simulates gross and net photosyn-thesis, light absorption, stomatal conductance, transpi-ration, canopy temperature, and respiration in complexforest canopies using detailed information on leaf area,leaf distribution, physiological parameters, light inter-ception, and stand structural characteristics. Bauerle et al.(2002) recently demonstrated that the transpiration ofdeciduous trees could be estimated withMAESTRA. Forthe purposes of water and C management, MAESTRAis a valuable tool to assess intracrown and intracanopyresponse to interacting environmental variables such asCO2, water, and light (Bauerle et al., 2004a). VariousMAESTRO and MAESTRA versions exist; however,
our version was originally downloaded from the officialMAESTRA website (www.maestra.unsw.edu.au/; veri-fied 26 Oct. 2005) and has been modified by Bauerleet al. (unpublished data, 2005) to include leaf tempera-ture response functions (Bernacchi et al., 2001, 2002,2003), physical and hormonal drought response functions(Bauerle et al., 2002, 2004b), and deciduous tree lighttransfer (Bauerle et al., 2004a). Overall, MAESTRA is aforest ecosystem model recently applied in several stud-ies including Medlyn (1998), Livingston et al. (1998), Luoet al. (2001), and Binkley et al. (2002).
Adapting MAESTRA to GUICSMAESTRA is called from GUICS as an executable
(EXE) although it could be called as a dynamic linklibrary (DLL). This ensures the independence of thesimulator from GUICS in terms of coding. The EXE orDLL, when called from GUICS, needs to be directedto where GUICS resides in memory. This provides forthe exchange of messages between MAESTRA andGUICS since they have access to each other’s memoryspace. This is implemented by placing the MAESTRAcode inside a Microsoft Windows API function calledWINMAIN. The specific routine used, however, dependson the compiler (which does not have to be the same asthat used by GUICS). Since MAESTRA becomes aMicrosoft Windows function, the main program becomesa SUBROUTINE rather than a MAIN program and canbe added as a new model using a dialog box in GUICS.When this was implemented in MAESTRA, the codehad to be cleaned up to remove or recode all FORTRANSTOP and EXIT routines that would have allowed thesimulator to end and leave memory without notifyingGUICS. All subroutines were checked to make sure thatcontrol was always passed back to the calling routinewhen a subroutine was finished.
Some programs can write messages or other text tothe monitor or console to show simulation progress orerrors as the model runs. This is possible in GUICS, butall screen output must be handled by GUICS. For ex-ample, write (FORTRAN) statements to console mustbe deleted from the source code or redirected to a file.All console write statements in MAESTRA were de-leted, and error messages were directed to an error file.Progress through the simulation is updated by havingMAESTRA send the current day to GUICS, which thendisplays the date in its window. The MAESTRA codehad to be altered to calculate the current date of simu-lation rather than days past the simulation start date.When the simulation ends, a message is sent to GUICSby MAESTRA to allow GUICS to close the windowfor the simulator. This messaging is implemented usingWINDOWS API functions such as SENDMESSAGE.
The most significant change to MAESTRAwas in thestructure of the input files that had to be altered to fitthe hierarchical file structure of GUICS. The structuresof the five input files of this particular forest simulatorwere modified without affecting the data contained inthe files. Each input file corresponds to a GUICS “data-set.” The dataset consists of three files. The header file,
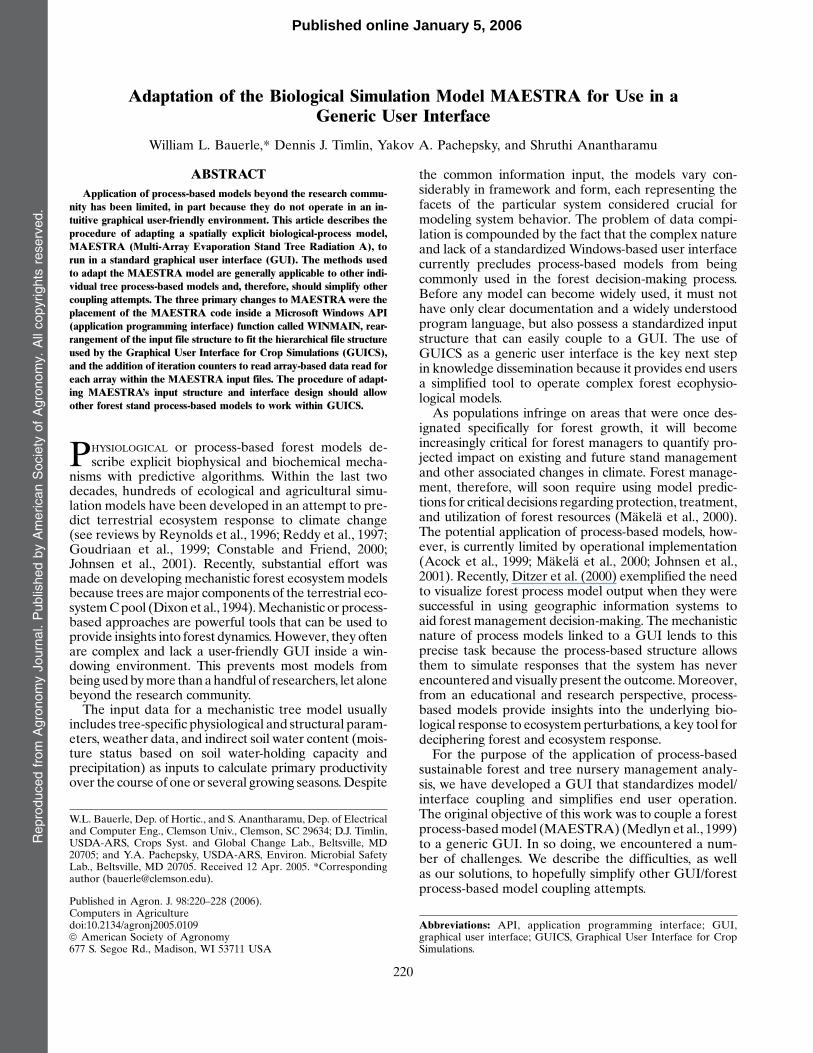
Table 1. Example of a script that describes to the Graphical UserInterface for Crop Simulators (GUICS) the format of weatherdata and how to read the weather data file.
Description Script file lines
Title or description of file A script for weather data file
First line starts with 0 @0Description for the data associated
with Line 0. This descriptionappears in the GUICS dialog box
table of the weather data
Format code—indicates tabular data(rows and columns)
table (, 9,&21)
Index number for next line @1Description day no.Format code—integer int(%4d)
Index number for next line @2Description date (MM/DD)Format descriptor—date format date(short)
Reproducedfrom
AgronomyJournal.PublishedbyAmericanSociety
ofAgronomy.Allcopyrights
reserved.
222 AGRONOMY JOURNAL, VOL. 98, JANUARY–FEBRUARY 2006
,dataset..hdr, contains the logical name of the dataset.The icon file,,dataset..ico, contains the datasets’ icon.The datasets’ data file,,dataset..xxx, contains the data-sets’ data. The extension (.xxx) is a function of the cate-gory of the data and varies with the types of datasets. Forexample, weather files have the extension ,.met..The method by which MAESTRA reads input data
was changed to fit the requirements of GUICS. The in-put file nameswere originally hard-coded inMAESTRAto minimize user intervention in a DOS environment.Projects were run in different directories to separatethem. MAESTRA was therefore modified to use vari-ables for the file names rather than hard-code them.Further modifications allowed MAESTRA to read theinput and output file names from the run.dat file andread from or write to them.
AnothermodificationtotheMAESTRAinputfileswasin the area of reading array-based data.Array-based dataare in rows, and the number of lines or rows readis controlled by a counter that is read first. For example,to read data from a soil file where there can be a vari-able number of depths, an iteration counter to define thenumber of soil depths will be read first, and then thenumber of rows of data to be read are defined by thatcounter. Because GUICS uses C-type pointers for iter-ation counter variables, only one iteration counter can beread for each array. MAESTRAwas originally designedto read an iteration counter and reuse it for later rowsof data.Therefore, additional iteration counters had tobeadded to theMAESTRA input files.
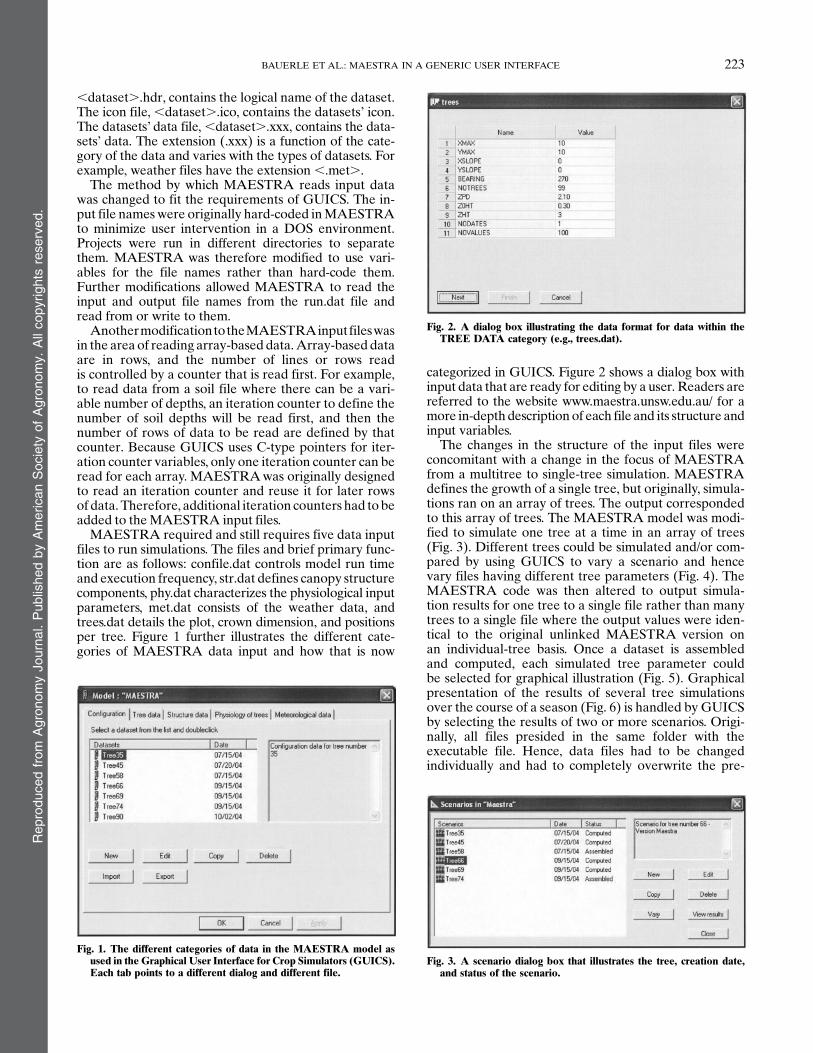
MAESTRA required and still requires five data inputfiles to run simulations. The files and brief primary func-tion are as follows: confile.dat controls model run timeand execution frequency, str.dat defines canopy structurecomponents, phy.dat characterizes the physiological inputparameters, met.dat consists of the weather data, andtrees.dat details the plot, crown dimension, and positionsper tree. Figure 1 further illustrates the different cate-gories of MAESTRA data input and how that is now
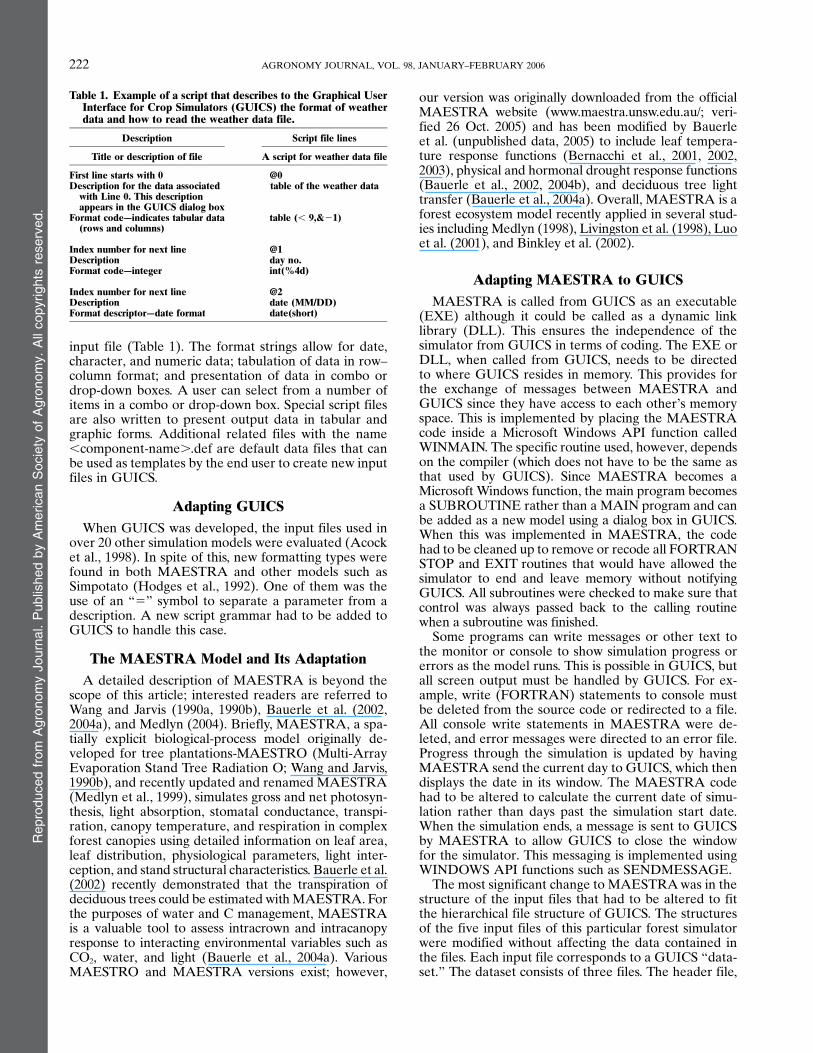
categorized in GUICS. Figure 2 shows a dialog box withinput data that are ready for editing by a user. Readers arereferred to the website www.maestra.unsw.edu.au/ for amore in-depth description of each file and its structure andinput variables.The changes in the structure of the input files were
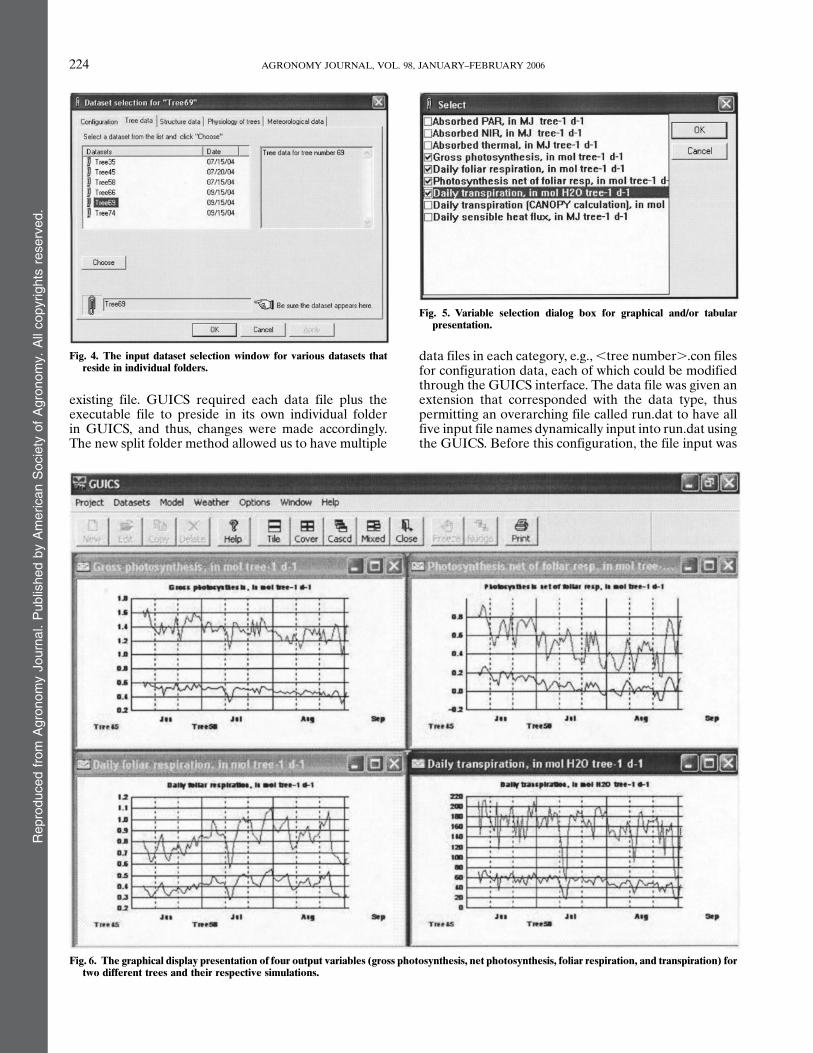
concomitant with a change in the focus of MAESTRAfrom a multitree to single-tree simulation. MAESTRAdefines the growth of a single tree, but originally, simula-tions ran on an array of trees. The output correspondedto this array of trees. The MAESTRA model was modi-fied to simulate one tree at a time in an array of trees(Fig. 3). Different trees could be simulated and/or com-pared by using GUICS to vary a scenario and hencevary files having different tree parameters (Fig. 4). TheMAESTRA code was then altered to output simula-tion results for one tree to a single file rather than manytrees to a single file where the output values were iden-tical to the original unlinked MAESTRA version onan individual-tree basis. Once a dataset is assembledand computed, each simulated tree parameter couldbe selected for graphical illustration (Fig. 5). Graphicalpresentation of the results of several tree simulationsover the course of a season (Fig. 6) is handled by GUICSby selecting the results of two or more scenarios. Origi-nally, all files presided in the same folder with theexecutable file. Hence, data files had to be changedindividually and had to completely overwrite the pre-
Fig. 1. The different categories of data in the MAESTRA model asused in the Graphical User Interface for Crop Simulators (GUICS).Each tab points to a different dialog and different file.
Fig. 2. A dialog box illustrating the data format for data within theTREE DATA category (e.g., trees.dat).
Fig. 3. A scenario dialog box that illustrates the tree, creation date,and status of the scenario.
Reproducedfrom
AgronomyJournal.PublishedbyAmericanSociety
ofAgronomy.Allcopyrights
reserved.
223BAUERLE ET AL.: MAESTRA IN A GENERIC USER INTERFACE
existing file. GUICS required each data file plus theexecutable file to preside in its own individual folderin GUICS, and thus, changes were made accordingly.The new split folder method allowed us to have multiple
data files in each category, e.g.,,tree number..con filesfor configuration data, each of which could be modifiedthrough the GUICS interface. The data file was given anextension that corresponded with the data type, thuspermitting an overarching file called run.dat to have allfive input file names dynamically input into run.dat usingthe GUICS. Before this configuration, the file input was
Fig. 4. The input dataset selection window for various datasets thatreside in individual folders.
Fig. 5. Variable selection dialog box for graphical and/or tabularpresentation.
Fig. 6. The graphical display presentation of four output variables (gross photosynthesis, net photosynthesis, foliar respiration, and transpiration) fortwo different trees and their respective simulations.
Reproducedfrom
AgronomyJournal.PublishedbyAmericanSociety
ofAgronomy.Allcopyrights
reserved.
224 AGRONOMY JOURNAL, VOL. 98, JANUARY–FEBRUARY 2006
static, and modification to any one of the five input filesrequired a complete file overwrite. Another change tothe overall MAESTRA structure required us to reducethe amount of concurrent tree simulations from severalto one. However, multiple runs of different trees resultedin the same per-tree output. Lastly, the total number oftrees present in the data had to be specified in trees.datfor data-accounting purposes, i.e., to edit tree data in tableformatwithin aGUICdatasetwindow (please seeRow 11in Fig. 2 for an illustration of the parameter addition).
The Process of Building and Executing aMAESTRA Scenario in GUICS
A scenario contains all the components of a simula-tion. Scenarios are organized into projects based on com-mon features of the scenarios. Auser creates a scenario bychoosing a name for the scenario, adding comments todocument the simulation, and selecting appropriate inputfiles—one from each category of data. GUICS writes theinput file names to a file with the scenario name and theextension “.run” and saves it to a subfolder in the projectsfolder. This subfolder has the same name as the scenarioname. Thus, all input and output related to a scenario areencapsulated into a single folder. The input only includesfile names; the original data still reside in the simulationmodel’s directory. The output files, however, are kept inthe projects’ folder. When the user chooses to run thesimulation,GUICScopies the,scenario..run file to a filecalled run.dat and then invokes the simulator. The sim-ulator reads the run.dat file, assigns the input file stringsto the appropriate variables, and opens the input files.The output files are also read from the run.dat file, as-signed to appropriate variables, and opened for output.GUICS provides for four kinds of output files, but not allhave to be created by a model. These include a graphicsfile, table file, summary file, and report file. These will bedescribed in greater detail with respect to integration withMAESTRA. Complete details of GUICS are provided inAcock et al. (1999), with directions to the accompanyingGUICS (Ver. 2.4) user manual (Acock et al., 1998) cur-rently available at www.ars.usda.gov/Services/docs.htm?docid56352 (verified 26Oct. 2005).
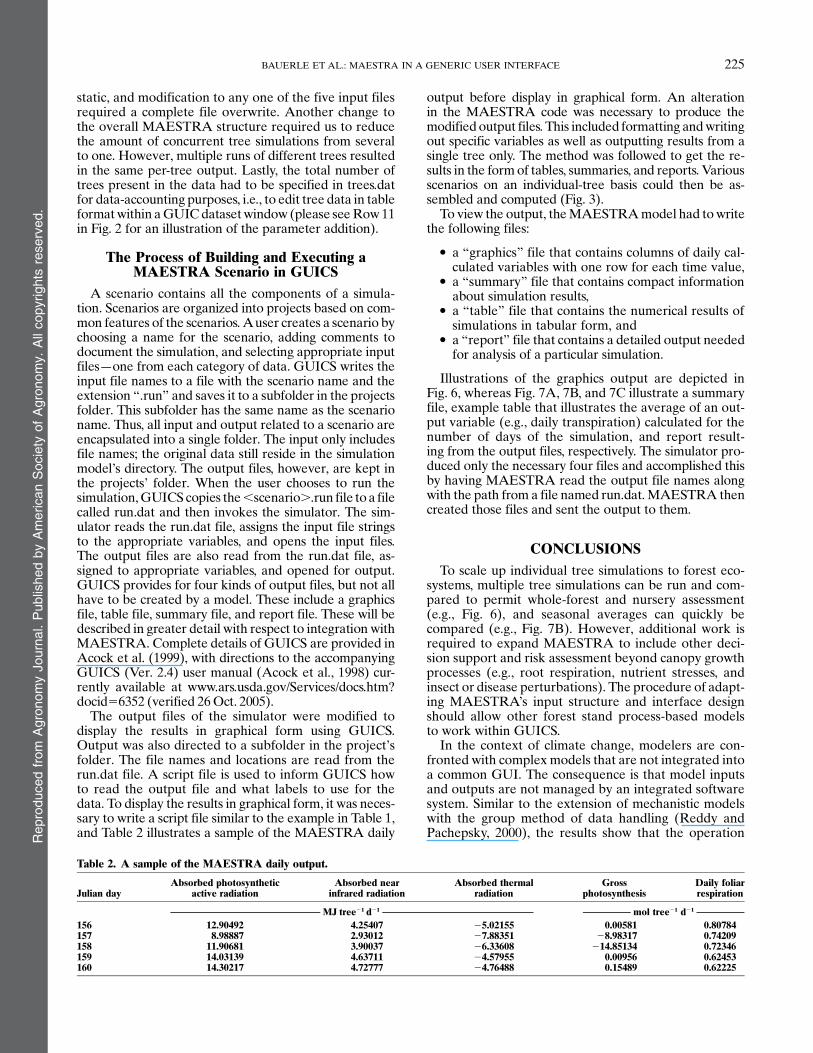
The output files of the simulator were modified todisplay the results in graphical form using GUICS.Output was also directed to a subfolder in the project’sfolder. The file names and locations are read from therun.dat file. A script file is used to inform GUICS howto read the output file and what labels to use for thedata. To display the results in graphical form, it was neces-sary to write a script file similar to the example in Table 1,and Table 2 illustrates a sample of the MAESTRA daily
output before display in graphical form. An alterationin the MAESTRA code was necessary to produce themodified output files. This included formatting andwritingout specific variables as well as outputting results from asingle tree only. The method was followed to get the re-sults in the formof tables, summaries, and reports. Variousscenarios on an individual-tree basis could then be as-sembled and computed (Fig. 3).To view the output, theMAESTRAmodel had towrite
the following files:
. a “graphics” file that contains columns of daily cal-culated variables with one row for each time value,
. a “summary” file that contains compact informationabout simulation results,
. a “table” file that contains the numerical results ofsimulations in tabular form, and
. a “report” file that contains a detailed output neededfor analysis of a particular simulation.
Illustrations of the graphics output are depicted inFig. 6, whereas Fig. 7A, 7B, and 7C illustrate a summaryfile, example table that illustrates the average of an out-put variable (e.g., daily transpiration) calculated for thenumber of days of the simulation, and report result-ing from the output files, respectively. The simulator pro-duced only the necessary four files and accomplished thisby having MAESTRA read the output file names alongwith the path from a file named run.dat.MAESTRA thencreated those files and sent the output to them.
CONCLUSIONSTo scale up individual tree simulations to forest eco-
systems, multiple tree simulations can be run and com-pared to permit whole-forest and nursery assessment(e.g., Fig. 6), and seasonal averages can quickly becompared (e.g., Fig. 7B). However, additional work isrequired to expand MAESTRA to include other deci-sion support and risk assessment beyond canopy growthprocesses (e.g., root respiration, nutrient stresses, andinsect or disease perturbations). The procedure of adapt-ing MAESTRA’s input structure and interface designshould allow other forest stand process-based modelsto work within GUICS.In the context of climate change, modelers are con-
fronted with complex models that are not integrated intoa common GUI. The consequence is that model inputsand outputs are not managed by an integrated softwaresystem. Similar to the extension of mechanistic modelswith the group method of data handling (Reddy andPachepsky, 2000), the results show that the operation
Table 2. A sample of the MAESTRA daily output.
Julian dayAbsorbed photosynthetic
active radiationAbsorbed near
infrared radiationAbsorbed thermal
radiationGross
photosynthesisDaily foliarrespiration
MJ tree21 d21 mol tree21 d21
156 12.90492 4.25407 25.02155 0.00581 0.80784157 8.98887 2.93012 27.88351 28.98317 0.74209158 11.90681 3.90037 26.33608 214.85134 0.72346159 14.03139 4.63711 24.57955 0.00956 0.62453160 14.30217 4.72777 24.76488 0.15489 0.62225
Reproducedfrom
AgronomyJournal.PublishedbyAmericanSociety
ofAgronomy.Allcopyrights
reserved.
225BAUERLE ET AL.: MAESTRA IN A GENERIC USER INTERFACE

Fig. 7. (A) A “summary” file that contains compact information about simulation results, (B) a “table” file that contains the numerical results ofsimulations, and (C) a “report” file that contains a detailed output needed for analysis of a particular simulation.
Reproducedfrom
AgronomyJournal.PublishedbyAmericanSociety
ofAgronomy.Allcopyrights
reserved.
226 AGRONOMY JOURNAL, VOL. 98, JANUARY–FEBRUARY 2006
of MAESTRA within GUICS can be used to extendthe usability and scope of computationally intensivemechanistic biological simulation models. Specific toMAESTRA, there are several advantages of couplingMAESTRAwith a GUI, including visual comparison oftree simulation results; less complicated input data,which makes it straightforward for the end user to usethe model; and shorter simulation time. This is impor-tant for climate-change studies and because process-based models project the impact of climate change andallow investigating the response of a system outside therange of historical data. In addition, it integrates theplant–soil–atmosphere–management interaction into auser-friendly Windows environment.
A flexible system that helps visual interpretation ofspatially explicit simulation data within a generic GUIis presented. This system will enable others to modifytheir particular model structure so that it can interfaceGUICS. The integration of a simulation model into auser interface is greatly simplified when the data for thesimulation model are arranged in a hierarchical manner(Cox, 1996). This arrangement facilitates the segrega-tion of data into groups having common characteristics.The objective is to provide a means to arrange the inputdata into variations of weather, physiological parameters,soil, or management to easily compare different simula-tions. The goal is also to provide an intuitive user interfaceto manipulate and organize the input data needed fora simulation model. The user-friendly environment forprocess-based models will be an effective way to increasetheir application beyond the research community. How-ever, the simulation quality, validity, and performance ofanymodel, whether it is run within aGUI or not, dependson the user.
ACKNOWLEDGMENTS
We acknowledge the assistance of Geetha Reddy in makingmodifications to GUICS. We also thank Dr. Basil Acock, Dr.James Ascough III, and Dr. Elaine Poulin for helpful com-ments on earlier drafts of themanuscript. This workwas fundedby the South Carolina Experiment Station.
REFERENCESAcock, B., E.V. Mironenko, Ya.A. Pachepsky, and V.R. Reddy. 1998.
GUICS: Graphical User Interface for Crop Simulators with Win-dows 1995. Version 1.7. User’s manual [Online]. Available at www.ars.usda.gov/Services/docs.htm?docid56352 (verified 26 Oct.2005). Version 2.4. USDA-ARS, Crops Syst. and Global ChangeLab., Beltsville, MD.
Acock, B., Ya.A. Pachepsky, E.V. Mironenko, F.D. Whisler, and V.R.Reddy. 1999. GUICS: A generic user interface for on-farm cropsimulators. Agron. J. 91:657–665.
Bannayan, M., and N.M.J. Crout. 1999. A stochastic modeling ap-proach for real-time forecasting of winter wheat yield. Field CropsRes. 62:85–95.
Bauerle, W.L., J.D. Bowden, M.F. McLeod, and J.E. Toler. 2004a.Modeling intra-crown and intra-canopy interactions in red maple:Assessment of light transfer on carbon dioxide and water vaporexchange. Tree Physiol. 24:589–597.
Bauerle, W.L., C.J. Post, M.F. McLeod, J.B. Dudley, and J.E. Toler. 2002.Measurement and modeling of the transpiration of a temperate redmaple container nursery. Agric. For. Meteorol. 114:45–57.
Bauerle, W.L., J.E. Toler, and G.G. Wang. 2004b. The stomatal con-ductance of Acer rubrum L. ecotypes under varying soil and atmo-
spheric water conditions: Predicting stomatal responses with anabscisic acid-based model. Tree Physiol. 24:805–811.
Bernacchi, C.J., C. Pimentel, and S.P. Long. 2003. In vivo temperatureresponse functions of parameters required to model RuBP-limitedphotosynthesis. Plant Cell Environ. 26:1419–1430.
Bernacchi, C.J., A.R. Portis, H. Nakano, S. von Caemmerer, and S.P.Long. 2002. Temperature response of mesophyll conductance; im-plications for the determination of Rubisco enzyme kinetics and forlimitations to photosynthesis in vivo. Plant Physiol. 130:1992–1998.
Bernacchi, C.J., E.L. Singsass, C. Pimentel, A.R. Portis, and S.P. Long.2001. Improved temperature response functions for models ofRubisco-limited photosynthesis. Plant Cell Environ. 24:253–259.
Binkley, D., J.L. Stape, M.G. Ryan, H.R. Barnard, and J. Fownes. 2002.Age-related decline in forest ecosystem growth: An individual-tree,stand-structure hypothesis. Ecosystems 5:58–67.
Constable, J.V.H., and A.L. Friend. 2000. Suitability of process-basedtree growth models for addressing tree response to climate change.Environ. Pollut. 110:47–59.
Cox, P.G. 1996. Some issues in the design of agricultural decisionsupport systems. Agric. Syst. 51:1–27.
Ditzer, T.R., M. Glauner, P. Forster, P. Kohler, and A. Huth. 2000. Theprocess-based stand growth model Formix 3-Q applied in a GISenvironment for growth and yield analysis in a tropical rain forest.Tree Physiol. 20:367–381.
Dixon, R.K., S. Brown, R.A. Houghton, A.M. Soloman, M.C. Trexler,and J. Wisniewski. 1994. Carbon pools and flux of global forestecosystems. Science (Washington, DC) 263:185–190.
Goudriaan, J., H.H. Shugart, H. Bugmann, W. Cramer, A. Bondeau,R.H. Gardner, L.A. Hunt, W.K. Lauenroth, J.J. Landsberg, S.Linder, I.R. Noble, W.J. Parton, L.F. Pitelka, M. Stafford Smith,R.W. Sutherst, C. Valentin, and F.I. Woodward. 1999. Use of modelsin global change studies. p. 106–140. In B.H. Walker et al. (ed.)Global change and the terrestrial biosphere: Implications for natu-ral and managed ecosystems. A synthesis of Gcte and related re-search. IGBP Book Ser. 4. Cambridge Univ., Cambridge, MA.
Hodges, T., S.L. Johnson, and B.S. Johnson. 1992. SIMPOTATO: Ahighly modular program structure for an IBSNAT style crop simu-lation. Agron. J. 84:911–915.
Johnsen, K., L. Samuelson, R. Teskey, S. McNulty, and T. Fox. 2001.Process models as tools in forestry research and management. For.Sci. 47:2–8.
Livingston, N.J., D. Whitehead, F.M. Kelliher, Y.P. Wang, J.C. Grace,A.S. Walcroft, J.N. Byers, T.M. McSeveny, and T.M. Millard. 1998.Nitrogen allocation and carbon isotope fractionation in relation tointercepted radiation and position in a young Pinus radiata D. Dontree. Plant Cell Environ. 21:795–803.
Luo, Y., B. Medlyn, D. Hui, D. Ellsworth, J. Reynolds, and G. Katul.2001. Gross primary productivity in Duke Forest: Modeling synthe-sis of CO2 experiment and eddy-flux data. Ecol. Appl. 11:239–252.
Makela, A., J. Landsberg, A.R. Ek, T.E. Burk, M. Ter-Mikaelian, G.I.Agren, C.D. Oliver, and P. Puttonen. 2000. Process-based modelsfor forest ecosystem management: Current state of the art and chal-lenges for practical implementation. Tree Physiol. 20:289–298.
Martin, A., and D. Eastman. 1996. The user interface design book forthe applications programmer. John Wiley & Sons, New York.
Medlyn, B.E. 1998. Physiological basis of the light use efficiencymodel. Tree Physiol. 18:167–176.
Medlyn, B.E. 2004. A MAESTRA retrospective. p. 105–122. In M.Mencuccini et al. (ed.) Forests at the land–atmosphere interface.CABI Publ., Cambridge, MA.
Medlyn, B.E., M. Broadmeadow, T. Randle, G. Matteucci, and E.Dufrene. 1999. Model comparison. p. 97–135. In P.G. Jarvis (ed.)Predicted impacts of rising carbon dioxide and temperature on forestsin Europe at stand scale. ECOCRAFT Rep. Univ. of Edinburgh,Edinburgh, UK.
Microsoft Press. 1995. TheWindows interface: Guidelines for softwaredesign. Microsoft Press, Redmond, WA.
Reddy, K.R., H.F. Hodges, and J.M. Mckinion. 1997. Crop modelingand applications: A cotton example. p. 225–290. InD.L. Sparks (ed.)Advances in agronomy. Vol. 59. Academic Press Inc., SanDiego, CA.
Reddy, V.R., and Ya.A. Pachepsky. 2000. Predicting crop yields underclimate change conditions from monthly GCMweather projections.Environ. Modell. Software 15:79–86.
Reynolds, J.F., P.R. Kemp, B. Acock, J.-L. Chen, and D.L. Moorehead.
Reproducedfrom
AgronomyJournal.PublishedbyAmericanSociety
ofAgronomy.Allcopyrights
reserved.
227BAUERLE ET AL.: MAESTRA IN A GENERIC USER INTERFACE

1996. Progress, limitations, and challenges in modeling the effectsof elevated CO2 on plants and ecosystems. p. 347–380. In G. Kochand H.A. Mooney (ed.) Carbon dioxide and terrestrial ecosystems.Academic Press, San Diego, CA.
Testezlaf, R., B.M. Jacobson, F.S. Zazueta, and T.H. Yeager. 1996. Agraphical user interface for real time irrigation control in green-houses. Proc. Soil Crop Sci. Soc. Fla. 55:59–62.
Van Evert, F.K., and G.S. Campbell. 1994. CropSyst: A collection of
object-oriented simulation models of agricultural systems. Agron.J. 86:325–331.
Wang, Y.P., and P.G. Jarvis. 1990a. Description and validation of anarray model-MAESTRO. Agric. For. Meteorol. 51:257–280.
Wang, Y.P., and P.G. Jarvis. 1990b. Influence of crown structural prop-erties on PAR absorption, photosynthesis, and transpiration inSitka spruce: Application of a model (MAESTRO). Tree Physiol. 7:297–316.
Reproducedfrom
AgronomyJournal.PublishedbyAmericanSociety
ofAgronomy.Allcopyrights
reserved.
228 AGRONOMY JOURNAL, VOL. 98, JANUARY–FEBRUARY 2006