THE PARADOX OF THE CONTENTED FEMALE WORKER IN A TRADITIONALLY FEMALE INDUSTRY
37
THE PARADOX OF THE CONTENTED FEMALE WORKER IN A TRADITIONALLY FEMALE INDUSTRY Tom Buchanan University of Tennessee at Chattanooga, Chattanooga, Tennessee, USA Women hold jobs in which they consistently experience less pay, fewer promotions, and less favorable working conditions than men. Despite these differences, studies show that women report comparable levels of job satisfaction. Crosby (1982) referred to this as the paradox of the contented female worker. Previous work has investigated the paradox in predominantly male settings. A random sample of 359 employees at a predominantly female organization is examined. Results confirm a gen- der paradox of job satisfaction. Surprisingly, pay is positively associated with job satisfaction for women, but not for men. Also contributing to the paradox is a weaker negative association of workload and satisfaction for women. Findings also suggest women referring to other women are more satisfied. Context is presented as a tool for assessing existing theoretical perspectives. Women hold jobs in which they consistently experience fewer rewards, poorer working conditions, less autonomy, and less auth- ority than men (Phelan 1994; Berch 1982; Featherman and Hauser 1976). Despite these differences in job characteristics, studies show This research was presented at the American Sociological Association 2003 meetings in Atlanta, Georgia. The author would like to thank David J. Maume and the Kunz Center for the Study of Work and Family at the University of Cincinnati, David Lundgren, Paula Dubeck, Sarah Beth Estes, P. Neal Ritchey, Benjamin Cornwell, Terri LeMoyne, the anonymous reviewers, and the editor of Sociological Spectrum for their constructive suggestions and assistance during different stages of this project. The authorwould also like to thank Moira Weir, Sandy Dulaney, Kathy Schellinger, and Denise Orchard of the Hamilton County Department of Job and Family Services. Address correspondence to Tom Buchanan, Department of Sociology, Anthropology, and Geography, University of Tennessee at Chattanooga, 615 McCallie Ave, Chattanooga, TN 37403, USA. E-mail: [email protected] Sociological Spectrum, 25: 677–713, 2005 Copyright # Taylor & Francis Inc. ISSN: 0273-2173 print/1521-0707 online DOI: 10.1080/02732170500256682
Transcript of THE PARADOX OF THE CONTENTED FEMALE WORKER IN A TRADITIONALLY FEMALE INDUSTRY

THE PARADOX OF THE CONTENTED FEMALE WORKERIN A TRADITIONALLY FEMALE INDUSTRY
Tom Buchanan
University of Tennessee at Chattanooga, Chattanooga, Tennessee, USA
Women hold jobs in which they consistently experience less pay, fewerpromotions, and less favorable working conditions than men. Despitethese differences, studies show that women report comparable levels ofjob satisfaction. Crosby (1982) referred to this as the paradox of thecontented female worker. Previous work has investigated the paradoxin predominantly male settings. A random sample of 359 employees ata predominantly female organization is examined. Results confirm a gen-der paradox of job satisfaction. Surprisingly, pay is positively associatedwith job satisfaction for women, but not for men. Also contributing to theparadox is a weaker negative association of workload and satisfaction forwomen. Findings also suggest women referring to other women are moresatisfied. Context is presented as a tool for assessing existing theoreticalperspectives.
Women hold jobs in which they consistently experience fewerrewards, poorer working conditions, less autonomy, and less auth-ority than men (Phelan 1994; Berch 1982; Featherman and Hauser1976). Despite these differences in job characteristics, studies show
This research was presented at the American Sociological Association 2003 meetings in
Atlanta, Georgia.
The author would like to thank David J. Maume and the Kunz Center for the Study of Work
and Family at the University of Cincinnati, David Lundgren, Paula Dubeck, Sarah Beth Estes,
P. Neal Ritchey, Benjamin Cornwell, Terri LeMoyne, the anonymous reviewers, and the editor
of Sociological Spectrum for their constructive suggestions and assistance during different
stages of this project. The author would also like to thank Moira Weir, Sandy Dulaney, Kathy
Schellinger, and Denise Orchard of the Hamilton County Department of Job and Family
Services.
Address correspondence to Tom Buchanan, Department of Sociology, Anthropology, and
Geography, University of Tennessee at Chattanooga, 615 McCallie Ave, Chattanooga, TN
37403, USA. E-mail: [email protected]
Sociological Spectrum, 25: 677–713, 2005
Copyright # Taylor & Francis Inc.
ISSN: 0273-2173 print/1521-0707 online
DOI: 10.1080/02732170500256682

that women are as satisfied with their jobs as men (Mueller andWallace 1996; Hodson 1989; Graham and Welbourne 1999; Crosby1982; Steel and Lovrich 1987; Keaveny and Inderrieden 2000;McDuff 2001). The disparity between objective job conditions andreported job satisfaction has been referred to as ‘‘the paradox of thecontented female worker’’ (Crosby 1982). The existence of the genderparadox has serious implications for equality in the workplace.Studies of workplace inequality and occupational sex-segregationare important for recognizing the sources of gender inequality inthe workplace (Baron and Bielby 1985; Tomskovic-Devey et al.1996). However, if women accept inequality at work, progressiontowards gender equality is not likely (Phelan 1994).
Explaining the gender paradox has proven a much greater under-taking than finding its existence. While several explanations for thisparadox have been suggested, a preponderance of evidence rests withno particular perspective. The five predominant explanations of thegender paradox reviewed and tested in this study are: differentialinputs, own gender referents, just rewards, subjective perceptions ofjob characteristics, and the differential job values perspective(McDuff 2001; Mueller and Wallace 1996; Phelan 1994).
In addition to inconsistent findings regarding the explanations ofthe paradox, research has generally focused on male-dominatedindustries and high-paying jobs. Women in male-dominated indus-tries, by definition, are minorities both numerically and in terms ofpower.
Studies of the gender paradox that focus on predominantly femaleindustries are needed to better understand the paradox for severalreasons. The difference in mere proportions of women in a work set-ting may affect the gender dynamics in a manner that alters the exist-ence and causes of the paradox. A work setting within a traditionallyfemale industry may be characterized by a different organizationalculture and different working experience for women and men. Theparadox may also be altered in a setting in which, hypothetically,relatively less objective inequality should exist.
THE IMPORTANCE OF EXAMINING THE GENDERPARADOX IN A FEMALE INDUSTRY
Whether focusing on the level of work group or division, organiza-tion, or industry, gender composition has become an important areaof research. Kanter (1977) argued that variations in the percentagesof women at work potentially confound studies of gender andorganizational behavior. In Men and Women of the Corporation,
678 T. Buchanan

she focused on the composition of women in top management at aparticular organization, but her theory was much more general.She argued that there are effects resulting from ‘‘particular numericaldistributions of categories of people’’ (1977, p. 208). In order to pro-vide a vocabulary, she developed a typology consisting of four distri-butions representing variations in proportional representation:uniform, skewed, tilted, and balanced. Uniform distributions consistof only one kind of person in terms of sex, race, or ethnicity. Skeweddistributions are those in which at least 85% of the work setting con-sists of members of a particular social category. Members of thenumerical minority in skewed settings are referred to as tokens.Tokens may experience unequal treatment by the majority consistingof greater performance pressure, stereotyping, and marginalization.Tilted groups exist when the numerical minority ranges from approxi-mately 16–35 percent. In tilted settings, minority members can beginto alter the organizational culture defined by the majority membersthrough the formation of coalitions and alliances. Finally, balanceddistributions exist when the dominant group ranges from 64 to 50percent. In balanced settings, one’s categorical label (gender, race,or ethnicity) is no longer driving the experience for individuals(Kanter 1977).
While Kanter’s theory has remained relevant, two implications ofher theory are complicated by recent research. First, Kanter’s workon tokenism suggests that being a minority member, as defined bycomposition, will be negative. Hypothetically, the experience oftokenism will hold whether the token is male, female, white, or black.Studies have demonstrated the negative effects of tokenism do notalways occur for males. For instance, tokenism results in more posi-tive outcomes for males in studies of male nurses (Williams 1995;Yoder 1994; Floge and Merrill 1986).
In addition to a focus on the supremacy of numbers, Kanter’s(1977) research suggests a relatively balanced proportional represen-tation is favorable for those in the numerical majority and minoritycategory. More recent research suggests balanced proportionalrepresentation may not have a positive affect on job satisfaction(Wharton and Baron 1987, 1991; Wharton et al. 2000). Using gendercomposition of both industries and occupations as indirect indicatorsof work settings, Wharton and Baron (1987) examined the relation-ship between gender composition and job satisfaction. For men, sat-isfaction seems to be lowest in gender-balanced work settings. Malesatisfaction is highest when they are either token males (15% maleor less) or are working in traditionally male settings (Wharton andBaron 1987). Females are also most content in work settings in which
The Paradox of the Contented Female Worker 679

they are tokens (at least 85% male work setting) or dominate numeri-cally (at least 85% female work setting). Female well-being is lowest,however, in female-tilted work settings, those in which males rep-resent a nontrivial minority (Wharton and Baron 1991).
Subsequent work focusing on the categorical compositions of worksettings has fallen under the label of organizational demography.This literature suggests individual attributes of the worker are impor-tant determinants of work outcomes and attitudes. However, individ-ual work attitudes also result from variations at the level of theworking environment itself (Pfeffer 1983). While work in this areahas addressed racial composition and tenure similarities of work set-tings, a primary focus has been gender composition (Wharton et al.2000; Ely 1995; Tsui et al. 1992). Level of analysis in this area varieswidely and ranges from occupation and industries to organizationsand smaller divisions and departments within them. Wharton et al.(2000) most recently examined the relationship of sex, race, and tenurecomposition across multiple levels of a university setting and foundthat job satisfaction was lower in more sex and race-heterogeneoussettings. Tsui et al.’s (1992) earlier work came to similar conclusionsfor psychological attachment to organizations.
In summary, the social and organizational context of an indivi-dual’s working environment plays a part in the formation of attitudesabout work. The gender paradox has been predominantly studied insettings that are typically male while work industries in which worksettings are female-tilted have been neglected. According to the find-ings of organizational demography, both women and men in bothtilted and balanced settings should be less satisfied with their jobs(Wharton et al. 2000; Tsui et al. 1992; Wharton and Baron 1987,1991). Examination of the existence and sources of the paradox ina female-tilted work industry will advance understanding of the gen-der paradox of the contented female worker.
COMPETING EXPLANATIONS OF THE GENDER PARADOX
The lack of difference between men and women in terms of job sat-isfaction is well-documented (Crosby 1982; Brush et al. 1987; Hodson1989; Phelan 1994; McDuff 2001). This finding is considered para-doxical because women hold jobs in which they experience fewer pro-motions, less pay, and less authority than their male counterparts.There are five explanations of the gender paradox proposed formallyby Jo Phelan (1994). Objective rewards such as pay and promotionsare not the primary focus for the subjective perceptions of jobcharacteristics and the differential job values perspectives. The
680 T. Buchanan

differential inputs, just rewards, and the own-gender referents per-spectives focus on the process by which objective rewards are evalu-ated as equitable.
Subjective Perceptions of Job Characteristics
The paradoxical nature of the phenomenon under consideration per-tains to women’s equal satisfaction despite unequal rewards comparedto men’s. This inequality generally is manifest in opportunity for pro-motions and salary. These types of rewards can have a great impact onjob satisfaction (Spector, 1997). However, the subjective perceptionsexplanation suggests that job satisfaction is predominantly affectedby perceptions of job characteristics such as autonomy and varietyrather than objective rewards. If satisfaction is affected by subjectiverather than objective criteria, similar satisfaction is a result of similarperceptions. (Phelan 1994; Phelan et al. 1993).
Arne Kalleberg (1977) found that perceptions of job characteristicscontributed independently to the job satisfaction of workers, evenwhen controlling for objective rewards. His study did not focus ongender differences, but he proclaims his findings should be examinedamong various social groups.
Phelan et al.’s (1993) study of male and female professionals repre-sents a critical contribution to this area. She measured workers’ per-ceptions of workload, role conflict, role ambiguity, peer cohesion,staff support, and importance rewards. Importance rewards consistedof subjective evaluations of prestige of one’s job, influence of one’sjob in the organization, overall importance of one’s job to organiza-tion. Comparing men and women in similar positions, she found thatwomen perceive their positions as more prestigious, influential, andimportant to organizations. Women also reported lower workloadsthan men in similar positions. In a later study, Phelan (1994) com-bined job satisfaction and organizational commitment into a singlemeasure she referred to as organizational satisfaction. Importancerewards were larger predictors of organizational satisfaction thaneither intrinsic rewards (perceptions of one’s views of how enjoyablethe job is, how personally valuable, and providing an opportunity touse skills) or salary. She concludes the perceptions of importancerewards are the sources of the paradox (Phelan 1994).
Subsequent evidence for the subjective perceptions argumentremains inconclusive. Yammarino and Dubinsky (1988) examinedrelationships between gender, type of sales position (insurance vs.retail), and perceived job characteristics (latitude, variety, autonomy,external control, and supervisory control). Gender was not related to
The Paradox of the Contented Female Worker 681

perceptions. Etzion (1988) examined a sample of fifty engineers insimilar positions. Out the seventeen perceptions, only one gender dif-ference was found. Men perceived greater opportunity for high earn-ings. While her study focused on race, Britton (1997) found that whitefemale correctional officers perceived better supervision than theirmale counterparts. In another study of correctional officers, Lovrichand Stohr (1993) found that women reported higher stress levels thanmales, but satisfaction levels were the same. Mueller and Wallace(1996) did not find support for this hypothesis. Female lawyersperceived their job conditions to be inferior and these perceptionsaffected both pay and job satisfaction. In conclusion, support forthe perceptions argument remains mixed.
Differential Job Values
According to the differential job values explanation, men valueextrinsic rewards such as pay and promotions more than women.Amidst unequal rewards, women continue to report similar levelsof satisfaction because they value promotion, authority, and salaryless than men. Instead, women value coworker support and work-place atmosphere (Kanter 1977; Rowe and Snizek 1995; Neil andSnizek 1988).
Specific tests have resulted in mixed support for the differentialjob values perspective. Hodson (1989) found that work complexityhad a positive effect on men’s satisfaction. However, he concludesthat satisfaction is determined by the same mechanisms for bothmen and women. Also, in both Phelan’s (1994) and Mueller andWallace’s studies (1996), job characteristics and rewards and theirinteractions with gender were examined for their effects on satisfac-tion. Neither study resulted in substantive support for the differen-tial values perspective. Most recently, McDuff (2001) found thatfemale ministers perceived lower levels of justice than males, andperceptions of justice had a stronger impact on their satisfaction.In addition, number of years in the ministry and negative affectivityhad a stronger impact on women’s satisfaction (McDuff 2001).Therefore, support for the differential values perspective variesacross studies and contexts.
Differential Job Inputs
The ‘‘differential job inputs’’ hypothesis proposes that women reportsimilar levels of job satisfaction compared to men because their lower
682 T. Buchanan

rewards are consistent with lower inputs. Therefore, in their evalua-tions of equity, outcomes for women match their investments. Inputsrefer to the workers’ contributions to the organization such as motiv-ation, education, and experience.
Recent empirical tests do not support this explanation of the gen-der paradox (Phelan 1994; Mueller and Wallace 1996). Phelanmatched male and female managers on tenure, job type, and yearsof education. Her results demonstrated that women take fewerbreaks, more frequently work through lunch, and work more fre-quently in the evenings. Also, women received lower returns for theseinputs than men. At the same time, women reported slightly higherlevels of organizational satisfaction than men (Phelan 1994). Muellerand Wallace (1996) found that women’s pay satisfaction increasedafter controlling for inputs.
Just Rewards
According to the ‘‘just rewards’’ perspective, women are socialized todevalue their inputs relative to men. Differential socialization experi-enced by men and women manifests itself at work in the form of dif-ferent expectations of rewards. As a result of lower expectations,women are just as satisfied with their jobs as men (Phelan 1994).
Experiments have demonstrated that females pay themselves lessfor comparable work and perform longer for a predeterminedamount of pay (Major et al. 1984). Research also shows that bothmales and females assign women lower starting salaries (Major1989; Keaveny and Inderrieden 2000). Evidence from survey researchindicates women, when assigning themselves starting positions, aremore likely to choose personnel while men choose higher levels suchas marketing or finance. Also, women expect to peak at a lower levelof pay than men (Major and Konar 1984). Desmarais and Curtis(1991) found that once women are working for an organization, theystill expect to receive lower levels of pay than males, even after con-trolling for personal and organizational characteristics. This evidencedemonstrates that women feel less entitled than men and this differ-ence affects their evaluations of fairness.
More recent examinations of this perspective have yielded littlesupport for entitlement differences. Jasso and Webster (1999) exam-ined perceptions of just earnings among males and females. Theirresults demonstrated that women rated themselves as deservinghigher rates of pay than males. When men and women were matchedon salary, Phelan (1994) found no evidence women reported theirjobs to be more rewarding. Mueller and Wallace (1996) found that
The Paradox of the Contented Female Worker 683

controlling for perceived justice evaluations partially explained theparadox in pay satisfaction but had no effect on job satisfaction. Wittand Nye (1992), in a meta-analysis of 30 studies, found no evidencethat men and women differed in perceptions of fairness.
In addition to mixed results, there has been a recent distinctionmade between distributive and procedural justice (Tremblay et al.2000). Distributive justice refers to the fairness of the actual rewardsreceived, whereas procedural justice pertains to the fairness of the dis-tribution process (Sweeney and McFarlin 1997; Tremblay et al.2000). Tremblay et al. (2000) found that distributive justice is a betterpredictor of job satisfaction while procedural justice better predictspay satisfaction. Sweeney and McFarlin (1997) argued that pro-cedural justice is a stronger determinant of women’s intent to leavewhile distributive justice is stronger for men.
Own-Gender Referents
Inherent in the study of equity and justice at work is the process ofcomparing one’s rewards to those of others. Reference theories gen-erally assume that it is one’s evaluation of fairness that determinesjustice and this evaluation is a product of the comparison process(Major and Testa 1989). Within the workplace, women are morelikely to work with other women earning a similar amount andthereby fail to notice inequities. Choosing other women as compari-sons when evaluating entitlement is not only convenient, but alsoprovides a way to avoid the discomfort of the objective genderinequity that generally exists in organizations (Bylsma and Major1992; Major 1989).
Support for the own-gender referent explanation of the paradox islimited. Crosby’s (1982) initial work demonstrated that most women,irrespective of gender composition of their work industries, choseother women as a referent. She found no evidence that their choiceof referent was related to job satisfaction. She later found that womenusing male referents did have lower satisfaction. The group usingmale referents had higher incomes and was more likely to be marriedwithout children (Zanna et al. 1987). Hodson (1989) found womenwith working mothers were less satisfied than those growing up withhomemakers. He suggests that women with working mothers havehigher expectations. Yet, Phelan (1994), Mueller and Wallace(1996), and McDuff (2001) found no support for the own genderreferent perspective. As with the other theoretical explanations ofthe paradox, existing studies reveal inconsistent findings renderingsubsequent analysis appropriate.
684 T. Buchanan

METHODS
Data
The human service industry represents a useful milieu for the paradoxfor several reasons. Most human service organizations within theindustry consist of large proportions of women. McNeely (1992) sug-gests that a minimum of 65% of all welfare workers are women and20% are members of a minority group. In addition, the human ser-vices industry is characterized by less gender inequality. Income differ-ences certainly exist in human services. White males earn the highestincomes while African-American females are at the bottom of theearnings hierarchy. However, the objective disparities in pay, promo-tions, and authority between the sexes are not as pronounced as otherindustries (McNeely 1992). In an earlier study, McNeely (1989) foundthat female human service workers earn about 80 percent of what menearn, compared to about 75 percent in the U.S. workforce overall(Hodson and Sullivan 2003). While women are now present in mostindustries, human services is a more typical industry for women.
The data come from a survey of human services workers at a large,county-level organization. Out of approximately 1,600 workers, asystematic random sample of 569 employees was selected. From thissample, 413 completed the survey, resulting in a 69% response rate.The final sample analyzed includes only those completing all sectionsof the survey (N ¼ 359). The organization is 80% female and typicalfor the human services industry in terms of gender proportions(McNeely 1992). Using Kanter’s (1977) typology, this organizationcan be described as female-tilted.
This study’s focus on a single organization represents both an assetand a limitation. The single organization offers the advantage ofeliminating variations in immeasurable organizational factors(Phelan 1994). This organization is representative of urban socialservice organizations. Emphasis is placed on centralization of auth-ority and standardization of procedures. On the other hand, theanalysis of one organization also runs the risk of not capturingvariations representative of the full spectrum of the human servicesindustry. For instance, differences in the sources of the paradoxmay exist in smaller or more rural work settings.
Measures
The purpose of this study is to test the competing explanations of thegender paradox using data collected in a unique context. With some
The Paradox of the Contented Female Worker 685

adjustments for organizational context, the measures chosen are simi-lar to those used by Mueller and Wallace (1996). Unless otherwisespecified, all scales involving Likert items have the following fourresponse categories: 1 ¼ strongly disagree, 2 ¼ disagree, 3 ¼ agree,and 4 ¼ strongly agree. Item responses are averaged giving final scalescores a range from 1–4.1 For a complete description of the measures,please refer to Appendix A. For correlation matrix of measures,please refer to Appendix B. Missing values on the independent vari-ables were minimal and, for most measures, were replaced. Completedescriptions of replacement techniques are described in Appendix A.2
During both the pilot testing and data collection phase of thestudy, respondents’ difficulty with the own-gender referent measurebecame apparent. Respondents frequently asked for clarification ofthis measure. Therefore, it was expected that there would be a sub-stantial number of missing cases on this measure. 53 cases out 413elected to skip the section, a loss of only 13%. Given the exploratorynature of this measure, the replacement of missing cases is not appro-priate. In order to test the competing perspectives across the samesample of respondents, analyses are restricted to the 359 respondentscompleting the referent section.3
1Scale scores were computed for all respondents answering at least one of the items for a
given scale. For instance, if a respondent completed two of the four job satisfaction items,
the scale score would be an average of the two completed items. In doing this, all scaled mea-
sures are converted to the original metric of the survey while retaining all respondents’ scores
answering at least one of the scale items. For instance, an overall score of one on job satisfac-
tion would mean that a respondent strongly disagreed with statements of job satisfaction, on
average.2Replacement of missing values for measures is described in detail in Table 1 of the Appen-
dix. Sample mean imputation was used for the following measures for respondents that did not
answer any items in a particular scale: education (one case), tenure (two cases), negative affec-
tivity (two cases), supervisor competence (three cases), promotional opportunity (two cases),
job impact (two cases), procedural justice (three cases), and distributive justice (two cases).
For the hourly wage measure, there were eight missing cases given the value of the average
wage of all the other respondents in the sample that reported the same job title. There were
two additional missing cases that did not report a job title. In these two cases, a regression
prediction equation using the following sample variables: tenure, hierarchical level, and female
was used to predict their values on hourly wage.3Logistic regression analysis revealed that the missing cases on the referent measures are
slightly less educated (14.0 years compared to 14.1), have been with the organization slightly
longer (13 to 10.3 years), and they reported significantly higher negative affectivity (2.2
compared to 2.0 on a four point scale). While statistically significant, these differences do
not represent substantive differences. Three and a half years of tenure would be important if
the lower average was six months. Also, both groups are below the midpoint for negative affec-
tivity. Again, given the number of variables, it is not surprising to find some differences.
686 T. Buchanan
Job Satisfaction: Dependent VariableGlobal satisfaction items attempt to measure satisfaction with theoverall job while facet items measure satisfaction with particularaspects of the job. Global satisfaction, as opposed to the facetapproach, was used for this study for a couple of reasons. First,given the large number of independent variables in relation torespondents, the global measure is desirable in relation to statisticalpower. Finally, following the logic of Brayfield and Rothe (1951),job satisfaction should measure the totality of satisfaction pro-duced by all facets of the work atmosphere. Job satisfaction wasmeasured by four Likert items adapted from Brayfield and Rothe’s(1951) 18-item scale of job satisfaction. These items measure thedegree to which the respondents enjoy, dislike, are enthusiasticabout, and are satisfied with their jobs. A four-item version of thisscale yielded a standardized alpha of (.84) and scale scores rangefrom 1 (lowest score for job satisfaction) to 4 (highest level ofjob satisfaction).
Control VariablesThere are several relevant factors that affect job satisfaction that arenot directly related to the gender paradox. Marital status is measuredas a dummy variable comparing those that are married or living witha significant other (coded 1) to everyone else. All of the male respon-dents and most of the female (94%) reported their racial and=or eth-nic category as exclusively African American or white. Therefore,race is coded as a dichotomous variable comparing white respondentsto all others.
Organization location was measured by the respondent’s pos-ition in both the organization’s hierarchy and particular division.The human services organization consists of three divisions: sharedservices (the business division of the organization housing infor-mation systems, fiscal, human resources, quality assurance, andmaintenance), children’s services (which handles child abuse andneglect investigations, foster care, adoptions, residential treatment,and on-going family case management), and client services (includ-ing cash assistance, foodstamps, daycare, and child support forexternal clients). Membership in each division is coded as dummyvariables with the shared services division as the reference cate-gory. Hierarchical position represents the major levels in the organi-zation ranging from the lowest to the highest level (1 ¼ supportivepositions, 2 ¼ direct service positions, 3 ¼ supervisors, and 4 ¼ topmanagement).
The Paradox of the Contented Female Worker 687

Input VariablesInputs refer to the workers’ contributions to the organization. Inputsinclude the number of overtime hours worked in a typical week,length of time with the organization, the respondent’s years ofeducation completed, level of work centrality, and level of negativeaffectivity. (Taylor 1953)
Subjective Perceptions of Job Characteristics VariablesThese measures pertain to the workers’ perceptions of various jobcharacteristics. Most of these measures are adapted from previouswork by Mueller (Mueller and Wallace 1996; Price and Mueller1981, 1986; see Appendix A). These include workload, autonomy,routinization, and promotional opportunity. Job impact andsupervisor competence were developed by the author and a rep-resentative of the organization. Job impact measures the worker’sperception of the extent to which their job contributes to thecommunity, clients, and achieves the organization’s mission.Supervisor competence measures the worker’s perception of hisor her supervisor’s competence, honesty, positive attitude, andtrustworthiness.
Just Rewards VariablesJust rewards measures include both distributive and proceduraljustice measures. Distributive justice includes the worker’s evalu-ation of the general fairness of his or her rewards and the specificfairness of pay. Procedural justice includes the worker’s evaluationof fairness in the organization’s system of pay and promotionaldistribution.
Differential Values VariablesIn order to determine if the certain aspects of work affect men andwomen differently, the interaction of all explanatory variables andfemale must be tested as predictors of job satisfaction. The purposeof the interaction variables is to analyze the differential impact ofthe explanatory variables on job satisfaction for males and females.However, only the worker’s hourly wage and the female by hourlywage interaction are tested in the initial analyses due to the smallsample size. In the trimmed stepwise analyses, job satisfaction isregressed on all interactions.
Referent VariablesSimilar to Crosby’s (1982) approach, respondents specified the firstname and gender of two people they compare themselves to when
688 T. Buchanan

evaluating their own job. Same sex referent measures the respon-dents’ self-reported reference group according to gender and is codedas a dummy variable for all referents being female. In order to ana-lyze the unique impact of women using only women as referents,the interaction of this variable with respondent’s gender is analyzed.
Analysis
Descriptive statistics are examined for gender differences. Next,multiple regression is used to determine the predictors of job sat-isfaction and their relationship to the gender paradox. Each stepof the multivariate analysis is determined by a different set of the-oretically relevant controls which test different perspectives on theparadox. Finally, a saturated model is also estimated in which allcontrols are included. Due to the small sample size and limitednumber of men in the sample, post hoc models provide corroborat-ing evidence for the major findings from the main multipleregression analysis.
If a paradox exists, women will not differ from males in their jobsatisfaction. Therefore, explaining the paradox consists of answeringthe following question: What is it, when accounted for, that decreasesthe job satisfaction of women? Merely determining significant predic-tors of job satisfaction is not the objective here. The objective is toevaluate how predictors of job satisfaction are related to the genderdifference.
RESULTS
Step One: Does the Paradox Exist?
The paradox of the contented female worker is defined by the absenceof a gender difference in job satisfaction in the presence of gender dif-ferences in rewards such as pay (Phelan 1994). If females do not differfrom males in job satisfaction, but do experience lower levels of otherrewards, then a paradox exists. In order to determine if the paradoxexists, it is necessary to examine gender differences among all thevariables in the sample. Table 1 represents the results of statisticalt-tests for gender differences on all variables. Significantly higher per-centages of men are white, married, in supervisory and managementpositions, and are more likely to be in shared services. Also, femalesuse others of the same sex (66.1) as referents significantly more thanmales (38.8).
The Paradox of the Contented Female Worker 689

Compared to males, females have been with the organizationabout a year longer than the average male and are slightly less
Table 1. Gender differences in satisfaction, controls, inputs, perceptions, just
rewards, values, and reference type (means and percentages)
Variables Female (N=292) Male (N=67)
Dependent
Job satisfaction 2.87 2.96
Controls
White (column%) 53.10%��� 76.10%
Black 40.80%�� 23.90%
Other 6.30% 0.00%
Dependents
Married or significant other (column %) 49.00%�� 66.00%
Organizational location
Hierarchy
Top management (column%) 1.00%� 6.00%
Supervisors 13.70% 19.00%
Direct service 67.80% 66.00%
Support services 17.50% 9.00%
Division
Shared services (column%) 24.00%�� 41.00%
Childrens’ services 31.60% 18.20%
Client services 43.80% 40.30%
Inputs
Overtime 3.50 3.52
Tenure (years) 10.60 9.25
Education 14.70� 15.34
Work centrality 2.11 2.18
Negative affectivity 2.00 1.95
Subjective perceptions
Workload 2.60 2.50
Decision making autonomy (z) �0.05 0.13
Supervisor relationship 2.80 3.00
Routinization 3.10� 2.80
Promotional opportunity 2.30 2.40
Making a contribution 3.20 3.30
Just rewards
Procedural justice 2.40 2.40
Distributive justice (z) �0.08�� 0.26
Rewards
Hourly wage 16.20��� 19.60
Own gender referent
Same sex referent 66.10%��� 38.80%
�p� .05, ��p� .01, ���p� .001.
Two-tailed t-tests for continuous variables, Chi-square test for categorical.
690 T. Buchanan

educated.4 Females report higher levels of routinization in their jobs.Also, women perceive their rewards as less fair compared to men.Women are also paid significantly less than men. Yet, despite thesedifferences, there is not a significant difference between males andfemales on job satisfaction.
The finding of the paradox in this organization is surprising giventhe less favorable conditions reported by women. Female employeesare paid less and perceive their rewards as less fair. They also perceivesignificantly higher levels of routinization in their jobs. These aspectstaken together should decrease job satisfaction.
EXPLAINING THE PARADOX
To test each of the competing perspectives on the paradox in femalejob satisfaction, job satisfaction is regressed on relevant explanatoryand control variables. The paradox is present when the femaleregression coefficient equals zero or higher. Statistically significantnegative values of the female coefficient represent lower levels ofjob satisfaction and are not paradoxical. Therefore, if the entry ofmeasures results in a negative gap in job satisfaction, the associatedexplanation of the paradox is supported.
Step Two: Do Women Bring Less to the Organization Than Men? DoesThis Input Difference Account for Their Equal Levels of Satisfaction?
First, following Mueller and Wallace (1996), work setting and familyvariables (organizational location, race, marital status, and depen-dents) are entered as controls. The first two models in the regressionanalysis in Table 2 display the female difference in job satisfactionbefore and after controls. After controls, there is not a significantdifference in job satisfaction.
In order to support the differential inputs perspective, twoconditions should be demonstrated. First, men and women shoulddiffer on inputs (education, tenure, work centrality, and negativeaffectivity). Also, those inputs should be significant predictors of
4Ideally, it would be necessary to first control for organizational level of position before
examining gender differences in organizational attitudes, inputs and perceptions. However,
sex differences after the former adjustment are not reported in the main body of the paper
for the sake of brevity. After adjusting for organizational level of position and comparing males
and females on inputs, perceptions, entitlement, and wages, the results were consistent with
those reported except for education. Males and females at similar hierarchical levels in the
organization are not significantly different on education.
The Paradox of the Contented Female Worker 691

Table
2.
Regressionequationsforjobsatisfaction
Models
Variables
12
34
56
78
Fem
alea
�0.061
�0.026
�0.012
0.022
0.003
�0.564��
��0.124b
�0.613��
�
(�.089)
(�.038)
(�.017)
(0.032)
(.004)
(�.815)
(�.179)
(�.885)
Controls
Level
inhierarchy
0.078
0.142�
0.031
�0.001
�0.042
0.092
0.029
Shareddivision
0.246��
�0.251��
�0.099�
0.131�
0.190��
0.261
0.083
Children’sdivision
0.144�
0.212��
�0.056
0.071
0.118�
0.138
0.066
White
�0.033
�0.019
�0.041
�0.041
�0.057
�0.020
�0.041
Marriedorcohabiting
0.087
0.086
0.004
0.049
0.064
0.099
0.024
Dep
enden
ts0.115�
0.090
0.063
0.108�
0.129�
0.112
0.075
Inputs
Hours
overtim
e�0.066
�0.028
Years
education
�0.129�
�0.090
Ten
ure
�0.042
0.020
Work
cen
trality
0.236��
�0.120��
Negative
affectivity
�0.195��
��0.114��
692

Subjective
percep
tions
Workload
�0.151��
��0.127��
Autonomy
0.254��
�0.163��
Supervisorrelationship
0.283��
�0.230��
�
Routinization
�0.070
�0.076
Promotionalopportunity
0.124��
0.054
Jobim
pact
0.167��
�0.142��
Just
rewards
Proced
uraljustice
0.214��
�0.089
Distributive
justice
0.323��
�0.132�
Differentialvalues
Hourlywage
�0.098
�0.231��
Fem
ale
�hourlywage
0.577��
�0.572��
�
Owngen
der
referent
Samesexreferent
�0.135
�0.080
Fem
ale
�samesexreferent
0.263c
0.232�
Twotailed
t-testsforsignificance:
� p�.05,��p�.01,��
� p�.001.
Standardized
Coefficients
presented.
aUnstandardized
Coefficientpresentedin
parentheses
forFem
ale
andrepresents
thegen
der
gapin
jobsatisfaction,bp¼
.78,cp¼
0.059.
693

satisfaction. Yet, only the latter is true. In terms of input variables,both work centrality and negative affectivity have significant effectson satisfaction. However, women do not contribute substantivelyless to the organization. The differential inputs perspective is notsupported.
Step Three: Do Women Perceive Job Characteristics as Men EvenThough Objective Rewards Are Different? Do These PerceptionsMediate Their Job Satisfaction?
According to this perspective, it is not objective rewards, but thesubjective perceptions of work and job characteristics that affectsatisfaction (Kalleberg, 1977). While women and men may receivedifferential objective rewards, they perceive similar conditions suchas levels of autonomy and workload. Because they do not differ onthese perceptions, their job satisfaction is similar.
Whereas the inputs perspective holds that women will be differenton inputs, the perceptions argument suggests women and men willhave similar perceptions of job characteristics. With the exceptionof routinization, the gender differences in perceptions are not statisti-cally significant at the p< .05 level as a two-tailed t-test. Yet, themean differences reveal a consistent a pattern in which women gener-ally perceive less favorable conditions than men (Table 1). Althoughnot statistically significant, female employees perceive less autonomy,fewer promotional opportunities, more repetitive work, and that theirjobs contribute less to the community.5 This is the opposite of whatthis perspective would predict. If perceptions are salient predictors ofjob satisfaction, removing the impact of less favorable perceptionsshould only inflate satisfaction for women.
Perceived work characteristics do have a great impact on satisfac-tion. All but the perception of routinization contribute significantlyto job satisfaction. However, the results of the regression demon-strate the unstandardized gender coefficient does, in fact, increasefrom�.038 in model 2 to .032 in model 4. This is expected giventhe less favorable perceptions of women. If perceived work andjob characteristics represented the source of the gender paradox,controlling for these perceptions should result in a significantlylower job satisfaction for women, or a negative female coefficient.
5Had this directional difference been hypothesized and the difference in means statistic
analyzed as a directional one-tailed t-test, all differences (except workload) are statistically sig-
nificant at the p < .10 level (one tailed probability of a Type I error: autonomy—p ¼ .047,
supervisor competence—p ¼ .062, promotional opportunity—.075, routinization—p ¼ .008).
694 T. Buchanan

While not statistically significant, the combined results of theincreased satisfaction and the small, but consistent differences inperceptions do not equate to support for the subjective perceptionsexplanation of the paradox.
Step Four: Do Women Feel They Are Entitled to Lower Rewards ThanMen? Does This Differential Standard of Just Rewards Impact TheirLevels of Job Satisfaction?
Due to socialization, women may feel that they are entitled to lessthan men in terms of rewards. Therefore, they may report similarlevels of satisfaction even though they receive fewer rewards, suchas less pay. If the perception of justice is the source of the genderparadox, the gender difference in satisfaction will be negative andstatistically significant after perceptions of procedural and distribu-tive justice are accounted for, or entered into the equation. Again,the results of the statistical t-tests in Table 1 suggest a lack of supportfor the differential entitlement standards perspective prior to theregression analysis. Women do not perceive their rewards as equallyjust compared to men.
Both procedural and distributive justice measures are tested asexplanations of the paradox in model 5. Justice does have a signifi-cant impact on job satisfaction, but the gender variable is notchanged, that is, women do not differ in satisfaction after controllingfor justice. Therefore, the just rewards perspective is not supported.
Step Five: Do Female Employees Value Pay Less Than Men? If So,Does This Impact Their Job Satisfaction?
If women value different aspects of work, then different characteris-tics will impact their job satisfaction. Specifically, it is argued thatwomen do not value extrinsic rewards as much as men (Phelan1994). The logic of the present analysis suggests that if extrinsicrewards are more important to men, then measures of those rewardswill have a greater impact on the job satisfaction of men. Pay is usedas a measure of extrinsic rewards. The impact of pay on job satisfac-tion, irrespective of worker sex, is estimated by the hourly wage vari-able. More importantly, job satisfaction is also regressed on thegender-by-hourly wage interaction variable to determine if pay affectsjob satisfaction differently for men and women. If the interactionterm is significant, then pay affects job satisfaction differentlyfor men and women. The degree of support for this perspective is
The Paradox of the Contented Female Worker 695

determined by the direction and statistical significance of the inter-action variables.6
Entering the interaction term results in a significant gender gap injob satisfaction (Table 3, model 6). At first glance it seems that thedifferential job values perspective has explained the paradox. Yet,observation of the differential effect of hourly wage for females
6In this sample, the number of respondents is small compared to the number of predictors.
Mueller and Wallace (1996) and McDuff (2001) both tested the interaction effects of gender
and all variables used as predictors of job satisfaction Mueller and Wallace (1996) did not find
support for the interactive model. McDuff (2001) found that negative affectivity, years in the
profession, and justice affected the satisfaction of male and female clergy differently. This pro-
cedure was not attempted in this study due to insufficient statistical power. Instead, job satis-
faction is regressed only on pay and the interaction term (female by hourly wage) at this stage.
Later, a stepwise regression of job satisfaction on all gender interactions is performed in a
trimmed analysis (Table 3).
Table 3. Trimmed regression of job satisfaction on previously significant
variables and stepwise regression on female interactions of those variables
Models
Variables 1 2 3 4
Femalea 0.026 �0.512��� �0.566��� �0.858���
(0.380) (�0.740) (�0.820) (�1.240)
Inputs
Work centrality 0.126�� 0.135��� 0.139��� 0.144���
Negative affectivity �0.096� �0.111�� �0.118�� �0.114��
Subjective perceptions
Workload �0.132��� �0.142�� �0.137�� �0.324��
Autonomy 0.212��� 0.2��� 0.202��� 0.201���
Supervisor relationship 0.262��� 0.257��� 0.264��� 0.264���
Job impact 0.151��� 0.16��� 0.147��� 0.151���
Just rewards
Distributive justice 0.23��� 0.216��� 0.223��� 0.229���
Differential values
Hourly wage 0.012 �0.235��� �0.208�� �0.217��
Own gender referent
Same sex referent 0.079 0.106�� �0.096 �0.080
Significant female interactions
Female� hourly wage 0.564��� 0.532��� 0.541���
Female� same sex 0.255� 0.238�
Female� workload 0.356�
Two tailed t-test for significance of predictors: �p� .05, ��p� .01, ���p� .001.
Standardized Coefficients presented.aUnstandardized Coefficient in parentheses for Female and represents gender gap in
satisfaction.
696 T. Buchanan

reveals that the relationship is not in the intended direction. Theinteraction term is significant and positive. Combining the maineffect of pay with the female interaction effect of pay suggests thatpay has a stronger positive impact on females. Accounting for the dif-ferential impact of pay on satisfaction for males and females results ina statistically significant and substantive difference between malesand females on job satisfaction (�0.815). This finding suggests thatpay affects satisfaction for females, but not for males. This findingruns counter to the differential values perspective which holds thatwomen value extrinsic rewards (pay) less than males. More attentionwill be given to this finding in the subsequent analyses.
Step Six: Do Women Refer to Other Women When Assessing TheirRewards? Does This Reference Account for an Elevated Sense ofSatisfaction?
Proponents of the own-gender referents perspective argue thatwomen do assess justice, but they use other women as a referencegroup. Because other women are also receiving rewards that are simi-lar to those making the evaluation, women do not perceive theirrewards to be inequitable. Those women using other men as part oftheir comparison will be able to assess inequity because they will thenrecognize their lesser rewards. The rationale of the analysis is thatwomen referring to other women will have inflated satisfaction. Inorder to test for this differential effect, it is necessary to include thesame sex by female interaction term in the regression with the mainreferent measure. It can then be determined if women comparingthemselves exclusively with other women have higher levels ofsatisfaction compared to men and women who use mixed genderreferents. If the effect of the gender coefficient decreases, this perspec-tive will be supported.
The same sex referent interaction variable demonstrates womenusing exclusively other women as referents are more satisfied withtheir jobs (Table 3, model 7). While not statistically significant atthe p < .05, both p values are small (for the female gap in satisfac-tion: p ¼ .078, for the female-same sex interaction: p ¼ .059). Thegap in satisfaction increases from model 2 and the satisfaction forwomen referring exclusively to other women increases. The own-gen-der referent perspective does contribute to the explanation of theparadox. Yet, how substantive is this contribution compared to thepay finding? In order to justify an argument for the gender referentperspective, it is important to note some methodological differencesin the measures. Most importantly, it must be mentioned that the
The Paradox of the Contented Female Worker 697

referent measure is an abstract measure and the pay measure is themost objective. The difficulty associated with the referent measurewas noted during the data collection. Respondents voiced their con-fusion over completion of the referent section. Taking this into con-sideration, a large effect was not expected. Therefore, support for theown gender referent perspective cannot be dismissed.
In order to reexamine all the perspectives at once, a saturatedmodel of job satisfaction is analyzed. The findings of the fullregression are displayed in model 8 of Table 2. As expected, the gen-der gap in satisfaction is statistically significant and larger than inprevious models. In the saturated model, the female by same sexreferent variable is statistically significant along with the female bypay interaction. Given the unexpected impact of pay on the genderdifference, further investigation is warranted.
Step Seven: Post Hoc Trimmed Analyses
Additional analyses are appropriate here in order to address severalissues. First, the surprising finding of pay affecting men andwomen’s satisfaction differently warrants further investigation ofadditional interaction effects. Secondly, given the small sample sizein relation to the number of measures, it is necessary to limitsubsequent analyses to significant predictors in former models(Table 2). Finally, the gender interaction effects of all variables werenot tested (see footnote 6). In order to test for interactions withoutoverspecifying the models, a sequential stepwise method of variableentry is used. In this method, the predictor with the largest semi-partial correlation with job satisfaction is entered into the modeland the predictor with the next largest semi-partial correlation withjob satisfaction is entered in the subsequent model. Models are gen-erated one predictor at a time until there is no longer a contributionto variation in job satisfaction. In the stepwise method, each predic-tor entered previously is reassessed in each subsequent model(Stevens 2002). The results of these analyses are reported in Table 3.(For additional corroboration of interpretations presented hereafter,refer to Appendix C.)
The first model displays the results of the regression of job satisfac-tion on variables that are significant in any of the models fromTable 2.As expected, the female difference in job satisfaction is not significant.Estimated separately by gender, the total effects of these predictors(used in model 1 of Table 3) are comparable for males and females(Adjusted R2 ¼ .54 for males and .49 for females). In the next threemodels (Table 3, Models 2–4) the significant female interactions are
698 T. Buchanan

included in descending order based on amount of variation explained,one variable at a time. The female by hourly wage interaction has thegreatest impact on job satisfaction (model 2). The significant interac-tion is represented by the standardized regression coefficient (0.564).In addition, the gender gap in satisfaction is also negative and signifi-cant. The two standardized coefficients are larger than any other pre-dictors in the model.
For women, this suggests that as pay increases, job satisfactionincreases. Surprisingly, there is not a relationship between pay andsatisfaction for men.7 Accounting for the differential relationshipresults in a negative gender gap in job satisfaction. (For additionalverification of interaction interpretations, refer to Appendix C.)Not surprisingly, the same sex referent interaction follows the payinteraction as the second stepwise variable (Table 3, model 3). Thegender gap in satisfaction increases and remains significant.
In addition to the expected significant interactions, workload isrevealed as the final contributing interaction to job satisfaction(Table 3, model 4). While workload is associated with decreasedjob satisfaction for both males and females, the association is stron-ger for men. These relationships are corroborated in Appendix C inwhich the models are estimated separately by gender. In the splitmodels, the standardized coefficient for workload is larger for males(�.322) than for females (�.246) and both are statistically significant.The differences in the impact of pay, sex of referent, and workloadcontribute to the explanation of the paradox.
DISCUSSION
The purpose of the current study is to comprehensively test the com-peting perspectives of the gender paradox in the context of a predomi-nantly female industry. Prior studies of the paradox focused on thework environments with predominantly male employees or in tra-ditionallymale industries. This study finds the existence of the paradoxof the contented female worker in a traditionally female industry. Theexistence of the paradox in human services is consistent with previousstudies of the paradox (Mueller and Wallace 1996; Hodson 1989;Graham and Welbourne 1999; Crosby 1982; Steel and Lovrich 1987;Keaveny and Inderrieden 2000; McDuff 2001). Women reported
7The interaction term demonstrates a gender difference in the impact of pay on satisfaction.
The term does not verify whether increases in pay decrease satisfaction for men and have no
effect on women or if there is no effect for men and a positive effect for women. Therefore,
the split models are estimated in Appendix C in order to provide this verification.
The Paradox of the Contented Female Worker 699

similar levels of job satisfaction compared to men, despite inequality inthe pay structure. While the purpose of the study was to explore theparadox in this context, this finding is not contrary to expectations.The human services industry generally employs more women thanmen. As a result, organizations and divisions tend to be predominantlyfemale. Women in these settings are more likely to advance to mana-gerial positions, but gender inequality is typically present.
In terms of locating the sources of the paradox, the results are bothperplexing and insightful. The first noteworthy finding is women’sperception of their rewards as less fair. These results differ greatlyfrom the work of Crosby (1982), who found that women generallyperceived discrimination of women overall but did not perceive per-sonal gender inequity. While the reports of lower distributive justicefor females may not be attributed to the perception of gender injusticeper se, maintaining that women feel entitled to less is difficult to rec-oncile. However, given the existence of the difference in the percep-tion of distributive justice amidst no gender differences in jobsatisfaction, the paradox is even more perplexing.
Surprisingly, pay is positively associated with job satisfaction forwomen, but not for men. This finding seems counter to the expecta-tions of the differential job values perspective which suggests that payis not as important to females. Also contributing to the paradox is thestronger negative association of workload and satisfaction for men.Finally, women using exclusively female referents are more satisfiedwith their jobs. Accounting for reference process contributes to theexplanation of the paradox.
How can these seemingly inconsistent findings be clarified? With-out the gender difference in distributive justice, it would appear logi-cal to attribute the paradox to women’s expectations of rewards, orthe just rewards perspective. Recall the research suggesting womenwork longer for similar amounts of pay, pay themselves less for simi-lar amounts of work, and assign themselves lower starting salaries(Major et al. 1984; Major 1989; Keaveny and Inderrieden 2000).Following the logic of the aforementioned findings, it makes sensethat women are more satisfied with increases in pay and less dissatis-fied by workloads, compared to men. However, the direct assessmentof the fairness of rewards for work is lower, not higher, for women.
The setting of a predominantly female organization within a pre-dominantly female industry represents a unique opportunity to con-textualize the findings of this study and to critically challenge existingexplanations of the paradox. First, while gender inequality exists inthis industry, women have greater access to promotion and pay rela-tive to other industries (McNeely 1992). Women in this organization
700 T. Buchanan

do hold positions across all departments and levels. Yet, because theindustry has historically belonged to females, gender inequality maybe perceived more easily due to the critical non-token distributionof males. Given the female-tilted rather than skewed setting, malesmay be more noticeable. This may result in an easier perception ofunfairness of rewards. Wharton and Baron (1991) found that womenworking in female-tilted settings, as in this study’s context, were theleast satisfied. Therefore, the gender make-up of the setting worksboth to prohibit and enhance the paradox of the contented femaleworker. In other words, women in traditionally female industriessuch as human services are stuck in contradictory locations in termsof assessing their situations.
Existing explanations of the paradox implicitly posit that womenare either incapable of perceiving gender inequity or are acquiescentto its existence. Attention should be moved away from the genderedsocialization instilled in women to a focus on women’s recognition ofgender inequities as real and salient aspects of working life. Crosby(1982) argued that a key component of felt deprivation is a person’sperception that he or she is likely to attain the object of which he orshe is deprived. Women may be well aware of the gendered inequalitythat takes place in most workplaces, but simply accept it as a culturalhindrance of equity at work. In traditionally female-typed industries,women may be more aware of this cultural reality than in typicallymale industries where women are breaking ground or in female indus-tries with a few token men. Research has shown that men enteringtypically female work settings are not penalized in terms of wagesor treatment as women are in male settings (Reskin 1993; Williams1995; Yoder 1994).
Women in female-tilted industries may be especially privy toinequity and therefore, may adjust by using other women as a com-parison before assessing job satisfaction. In other words, the owngender referent perspective may be flawed in terms of causal direc-tion. It is implied that women are duped into satisfaction and lowerstandards of entitlement by gender segregation (Phelan 1994; Zannaet al. 1987). In fact, it may be women’s actual recognition of genderinequity that results in the use of other women for comparison. It isone of the tenets of equity theory that individuals perceiving aninequitable relationship will attempt to restore equity psychologically(Walster et al. 1973). Choosing to refer to other women may operateas a mechanism by which equity is restored in assessing job satisfac-tion. Yet, a woman’s direct assessment of the gendered reward systemmay remain critical. Future studies should look at this process ofadjustment more directly.
The Paradox of the Contented Female Worker 701

As suggested by Mueller and Wallace (1996), future studies of theparadox should also include measures that move beyond the scope ofjob satisfaction. Kanter (1977) argues that job satisfaction may not bethe most valid indicator when examining gender inequality in organi-zations. Job satisfaction may be measuring an evaluation of one’s jobwithin the immediate task environment while measures such as joband organizational commitment may be more affected by organiza-tional fairness.
Next, attention needs to be given to explanations of male dissatis-faction as opposed to female satisfaction. Especially in organizationsin which men are performing jobs that were historically female-dominated, the effects of this anomalous experience on men needs to beexplored. By focusing the attention on the female worker, research tendsto concentrate on the deviation of women from normative standards.In these cases, normative standards are those set by male institutions.Yet, analyses of gender differences could be examined from the oppositeperspective. For research on gender differences in female industriesand work settings, this shift in focus would be particularly appropriate.
REFERENCES
Baron, James M. and William T. Bielby. 1985. ‘‘Organizational Barriers to Gender
Equality.’’ Pp. 233–251 in Gender and the Lifecourse, edited by Alice S. Rossi.
New York: Aldine.
Berch, Bettina. 1982. The Endless Day: The Political Economy of Women and Work.
New York: Harcourt Brace Jovanavich.
Brayfield, Authur H. and Harold F. Rothe. 1951. ‘‘An Index of Job Satisfaction.’’
Journal of Applied Psychology 35:307–331.
Britton, Dana M. 1997. ‘‘Perceptions of Work Environment Among Correctional
Officers: Do Race and Sex Matter?’’ Criminology 35:85–105.
Brush, Donald H., Michael K. Moch, and Abdullah Pooyan. 1987. ‘‘Individual
Demographic Differences in Job Satisfaction.’’ Journal of Occupational Behavior
8:139–156.
Bylsma, Wayne H. and Brenda Major. 1992. ‘‘Two Routes to Eliminating Gender
Differences in Personal Entitlement: Social Comparisons and Performance Eva-
luations.’’ Psychology of Women Quarterly 16:193–200.
Crosby, Faye J. 1982. Relative Deprivation and Working Women. New York: Oxford
University Press.
Desmarais, S. and J. Curtis. 1991. ‘‘Gender Differences in Perceived Income Enti-
tlements.’’ Paper presented at the International Conference on Social Justice
Research, Utrecht, The Netherlands.
Ely, Robin J. 1995. ‘‘The Power in Demography: Women’s Social Constructions of
Gender Identity at Work.’’ Academy of Management Journal 38:589–634.
702 T. Buchanan

Etzion, D. 1988. ‘‘The Experience of Burnout and Work=Non-Work Success in Male
an Female Engineers: A Matched Pairs Comparison.’’ Human Resource Manage-
ment 27:163–179.
Featherman, David L. and Robert M. Hauser. 1976. ‘‘Sexual Inequalities and Socio-
economic Status in the U.S., 1962–1973.’’ American Sociological Review 41:462–
483.
Floge, Liliane and Deborah M. Merrill. 1986. ‘‘Tokenism Reconsidered: Male
Nurses and Female Physicians in a Hospital Setting.’’ Social Forces 64:925–947.
Graham, Mary E. and Theresa M. Welbourne. 1999. ‘‘Gainsharing and Women’s
and Men’s Relative Pay Satisfaction.’’ Journal of Organizational Behavior
20:1027–1042.
Hodson, Randy. 1989. ‘‘Gender Differences in Job Satisfaction: Why Aren’t Women
More Satisfied?’’ The Sociological Quarterly 30:385–399.
Hodson, Randy and Teresa A. Sullivan. 2003. The Social Organization of Work.
3rd edition. Belmont, CA: Wadsworth Publishing.
Jasso, Guillermina and Murray Webster, Jr. 1999. ‘‘Assessing the Gender Gap in
Just Earnings and Its Underlying Mechanisms.’’ The Sociological Quarterly
62:367–380.
Kalleberg, Arne L. 1977. ‘‘Work Values and Job Rewards: A Theory of Job Satisfac-
tion.’’ American Sociological Review 42:124–143.
Kanter, Rosabeth Moss. 1977. Men and Women of the Corporation. New York: Basic
Books.
Kanungo, Rabrinda N. 1982. ‘‘Measurement of Job and Work Involvement.’’ Jour-
nal of Applied Psychology 67:341–349.
Keaveny, Timothy J. and Edward J. Inderrieden. 2000. ‘‘Gender Differences in Pay
Satisfaction and Pay Expectations.’’ Journal of Managerial Issues 12:363–379.
Lovrich, Nicholas P. and Mary K. Stohr. 1993. ‘‘Gender and Jail Work: Correctional
Policy Implications of Perceptual Diversity in the Work Force.’’ Policy Studies
Review 12:66–84.
Major, Brenda. 1989. ‘‘Gender Differences in Comparisons and Entitlement: Impli-
cations for Comparable Worth.’’ Journal of Social Issues 45:99–115.
Major, Brenda and Ellen Konar. 1984. ‘‘An Investigation of Sex Differences in Pay
Expectations and Their Possible Causes.’’ Academy of Management Journal
4:777–792.
Major, Brenda, Dean McFarlin, and Diana Gagnon. 1984. ‘‘Overworked and
Underpaid: On the Nature of Gender Differences in Personal Entitlement.’’ Jour-
nal of Personality and Social Psychology 47:1399–1412.
Major, Brenda and Maria Testa. 1989. ‘‘Social Comparison Processes and Judg-
ments of Entitlement and Satisfaction.’’ Journal of Experimental Social Psychology
25:101–120.
Marsden, Peter V., Arne L. Kalleberg, and Cynthia R. Cook. 1993. ‘‘Gender Differ-
ences in Organizational Commitment: Influence of Work Positions and Family
Roles.’’ Work and Occupations 20:368–390.
McDuff, Elaine M. 2001. ‘‘The Gender Paradox in Work Satisfaction and the Prot-
estant Clergy.’’ Sociology of Religion 62:1–21.
The Paradox of the Contented Female Worker 703

McNeely, R. L. 1992. ‘‘Job Satisfaction in the Public Social Services: Perspectives
on Structure, Situational Factors, Gender, and Ethnicity.’’ Pp. 224–256 in Human
Services as Complex Organizations, edited by Y. Hasenfeld. Newbury Park, CA:
Sage.
———.1989. ‘‘Gender, Job Satisfaction, Earnings, and Other Characteristics of
Human Service Workers During and After Midlife.’’ Administration in Social
Work 13:1989.
Mueller, Charles W. and Jean E. Wallace. 1996. ‘‘Justice and the Paradox of the
Contented Female Worker.’’ Social Psychology Quarterly 59:338–349.
Neil, Cecily C. and William E. Snizek. 1988. ‘‘Gender as a Moderator of Job Satis-
faction: A Multivariate Assessment.’’ Work and Occupations 15:201–219.
Pfeffer, Jeffrey. 1983. ‘‘Organizational Demography.’’ Research in Organizational
Behavior 3:299–357.
Phelan, Jo. 1994. ‘‘The Paradox of the Contented Female Worker: An Assessment of
Alternative Explanations.’’ Social Psychology Quarterly 57:95–107.
Phelan, Jo, Evelyn J. Bromet, Joseph E. Schwartz, Mary Amanda Dew, and
E. Carroll Curtis. 1993. ‘‘The Work Environments of Male and Female Profes-
sionals: Objective and Subjective Characteristics.’’ Work and Occupations
1993:68–89.
Price, James L. and Charles W. Mueller. 1981. Professional Turnover: The Case of
Nurses. New York: Spectrum.
———. 1986. Handbook of Organizational Measurement. White Plains, NY: Pitman
Publishing.
Reskin, Barbara. 1993. ‘‘Sex Segregation in the Workplace.’’ Annual Review of Soci-
ology 19:241–270.
Rowe, Reba, and William E. Snizek. 1995. ‘‘Gender Differences in Work Values:
Perpetuating the Myth.’’ Work and Occupations 22:215–229.
Spector, Paul E. 1997. Job Satisfaction: Application, Assessment, Cause and Conse-
quences. Thousand Oaks, CA: Sage.
Steel, B. S. and N. P. Lovrich. 1987. ‘‘Comparable Worth: The Problematic Politi-
cization of a Public Personnel Issue.’’ Public Personnel Management 16:23–36.
Stevens, James. 2002. Applied Multivariate Statistics for the Social Sciences. Hillsdale,
NJ: Lawrence Erlbaum Associates.
Sweeney, Paul D. and Dean B. McFarlin. 1997. ‘‘Process and Outcome: Gender
Differences in the Assessment of Justice.’’ Journal of Organizational Behavior
18:83–98.
Taylor, Janet A. 1953. ‘‘A Personality Scale of Manifest Anxiety.’’ The Journal of
Abnormal and Social Psychology 48:285–290.
Tomskovic-Devey, Donald, Arne L. Kalleberg, and Peter Marsden. 1996. ‘‘Organi-
zational Patterns of Gender Segregation.’’ Pp. 276–301 in Organizations in
America: Analyzing Their Structures and Human Resource Practice, edited by
A. Kalleberg, D. Knoke, P. Marsden, and J. Spaeth. Thousand Parks, CA: Sage
Publications.
Tremblay, Michel, Bruno Sire, and David B. Balkin. 2000. ‘‘The Role of Organiza-
tional Justice in Pay and Employee Benefit Satisfaction, and Its Effects on Work
Attitudes.’’ Group and Organizational Management 25:269–290.
704 T. Buchanan

Tsui, Anne S., Egan, Terri D., and O’ Reilly, Charles A. III. 1992. ‘‘Being Different:
Relational Demography and Organizational Attachment.’’ Administrative Science
Quarterly 37:549–580.
Walster, Elaine, Berscheid, Ellen, and G. William Walster. 1973. ‘‘New Directions in
Equity Research.’’ Journal of Personality and Social Psychology 25:151–176.
Wharton, Amy S. and James N. Baron. 1987. ‘‘So Happy Together? The Impact of
Gender Segregation on Men at Work.’’ American Sociological Review 52:574–587.
———. 1991. ‘‘Satisfaction? The Psychological Impact of Gender Segregation on
Women at Work.’’ The Sociological Quarterly 32:365–387.
Wharton, Amy S., Thomas Rotolo, and Sharon R. Bird. 2000. ‘‘Social Context at
Work: A Multilevel Analysis of Job Satisfaction.’’ Sociological Forum 15:65–90.
Williams, Christine. 1995. Still A Man’s World: Men Who Do Women’s Work. Berke-
ley and Los Angeles, CA: University of California Press.
Witt, L. Alan and Lendell G. Nye. 1992. ‘‘Gender and the Relationship Between
Perceived Fairness of Pay or Promotion and Job Satisfaction.’’ Journal of Applied
Psychology 77:910–917.
Yammarino, F. J. and A. J. Dubinsky. 1988. ‘‘Employee Responses: Gender or Job-
Related Differences?’’ Journal of Vocational Behavior 32:366–383.
Yoder, Janice D. 1994. ‘‘Looking Beyond Numbers: The Effects of Gender Status,
Job Prestige, and Occupational Gender-Typing on Tokenism Processes.’’ Social
Psychology Quarterly 57:150–159.
Zanna, Mark P., Faye Crosby, and George Lowenstein. 1987. ‘‘Male Reference
Groups and Discontent among Female Professionals.’’ Pp. 28–41 in Women’s
Career Development, edited by B. Gutek and L. Larwood. CA: Sage.
The Paradox of the Contented Female Worker 705

Appendix
A.
Measuresforeach
theoreticalperspective
Dependentvariable
Item
sorvariable
description
Rangeandcoding
Reliability
(Cronbach’salpha)
andreplacement
Jobsatisfaction
Iam
satisfiedwithmypresentjob.
1¼
strongly
disagree
Standardized
Alpha
¼.84
Brayfield
andRothe
(1951)
Iconsider
myjobvery
pleasant.
2¼
disagree
Most
daysIam
enthusiastic
aboutmyjob.
3¼
agree
Idefinitelydislikemyjob(reverse-coded
).4¼
strongly
disagree
Controls
Level
inhierarchy
Responden
tswereasked
fortheirjobtitles.
Withtheassistanceoforganizational
personnel,thesepositionswerecategorized
into
agen
eralhierarchywhichwas
consisten
tacross
divisions.
1¼
support
worker
2¼
directserviceworker
3¼
supervisor
4¼
topmanagem
ent
Organizational
division
Indicate
yourjobtitleanddivision.
Divisionsconsisted
ofChildren’sServices,
Clien
tServices,andSharedServices.
Threedummyvariableswerecreatedfor
each
division.
1¼
employmen
tin
division
0¼
allothers
2variablesare
included
inregression
analyses,
missingvariable
represents
the
referencecatego
ry.
White
Indicate
inthespaceyo
urRaceorEthnicity-
checkallthatapply.
1¼
white,
0¼
allothers,
seedescriptive
Table
1.
Marriedor
cohabiting
CheckifMarriedorLivingwithaSignificant
Other.
1¼
marriedorwithsignificantother,0¼
all
others.
Totaldep
enden
tsNumber
ofdep
enden
tch
ildrenandadults.
Inputs
Overtim
eIndicate
thenumber
ofhours
youtypically
work
inaweek.
Number
ofhours
beyondforty.
706

Education
How
much
schoolinghaveyo
ucompleted?
Highschoolgraduate
¼12
1missingvaluereplaced
withaverage(13.5)
educationforthose
withsamejobtitle.
Associate’sdegree¼
14
Somecollege¼
13
Bach
elor’sdegree¼
16
MSW
degreeorother
Master’sdegree
orhigher
¼18.5
Organizational
tenure
Indicate
beginningdate
ofem
ploymen
t.Totalmonthsattheorganization.
2missingvalues
replaced
withsample
mean.
Work
cen
trality
Kanungo
(1982)
Work
should
becen
tralto
one’slife.
Iconsider
work
tobecen
tralto
my
existence.
4catego
ryLikert(see
jobsatisfaction)
Standardized
Alpha¼
.61
Negative
affectivity
Taylor(1953)
Iam
noteasily
upset(reverse-coded
).
Inmywork,Idealwithem
otional
problemsvery
calm
ly(reverse-coded
).
4catego
ryLikert(see
jobsatisfaction)
Standardized
Alpha¼
.58
2missingvalues
replaced
withsample
mean.
SubjectivePercep
tions
Workload
Ihaveen
oughtimeto
accomplish
whatis
expectedofme(reverse-coded
).
Inever
haveen
oughtimeto
finishmy
work
tasks.
4catego
ryLikert(see
jobsatisfaction)
Standardized
Alpha¼
.75
Caplan,Cobb,
andFrench
(1975)
Autonomy
PriceandMueller
(1981)=
Marsden
,
Kalleb
erg,and
Cook(1993)
Please
indicate
how
much
sayyo
uactually
have
inmakingthefollowingdecisions:
(a)how
youdoyo
urjob,(b)ch
anginghow
youdoyo
urjob,(c)thesequen
ceofyo
ur
jobactivities.(d)Ihavealotofsayover
whathappen
sonthejob.
(e)Iam
allowed
totakepart
indecisions
thatpertain
tomywork.
(a–c)1¼
NoSayatAll,SomeSay,
2¼
Moderate
Say,
3¼
AGoodDealof
Say,
4¼
AVeryGreatDealofSay.
(d–e)
4category
Likert(see
job
satisfaction)
� scoresconverted
toz-scores
� factoranalysisproduced1factorfrom
allitem
s.
Standardized
Alpha¼
.85
(Continued)
707

Appendix
A.
(Continued
)
Dependentvariable
Item
sorvariable
description
Rangeandcoding
Reliability
(Cronbach’salpha)
andreplacement
Supervisor
relationship
� adaptedfrom
previoussurvey
atorganization.
Supervisory
relationship
isconstructive.
1¼
did
notach
ieve
Standardized
Alpha¼
.92
3missingvalues
replaced
withsample
mean.
Supervisory
relationship
fosterstrust.
2¼
partiallyach
ieved
Supervisoris
positive.
3¼
ach
ieved
Supervisoris
candid.
4¼
exceeded
Routinization
Priceand
Mueller
(1986)
(a)Howmuch
varietyistherein
theactivities
thatmakeupyo
urjob?
(a)1¼
very
greatvariety,
2¼
greatvariety,
3¼
moderate
variety,
4¼
Somevariety,
5¼
Littleornovariety;
(b)1¼
alm
ost
totallydifferenteveryday,
2¼
somew
hat
thesame,
3¼
moderately
thesame,
4¼
very
much
thesame,5¼
alm
osttotally
thesameeveryday;(c)1¼
little
ornone,
2¼
some,3¼
moderate
amount,4¼
great
deal,5¼
very
greatdeal.
Standardized
Alpha¼
.75
(b)Towhatextentdoyo
udothesamejobin
thesamewayeveryday?
(c)How
much
repetitivenessis
therein
the
activitiesthatmakeupyo
urjob?
Promotional
Opportunity
Price
andMueller,
(1981)
Promotionsare
regularfrom
myposition.
4category
Likert(see
jobsatisfaction)
Standardized
Alpha¼
.67
Thereis
opportunityforadvancem
entfrom
myposition.
Twomissingvalues
replaced
with
sample
mean.
Iam
inadead-endjob(reverse-coded
).
708

Jobim
pact
Created
forstudyby
Buch
ananand
Dulaney.
Myjobcontributesto
thewell-beingofthe
peo
ple
this
agen
cyserves.
4catego
ryLikert(see
jobsatisfaction)
Standardized
Alpha¼
.80
Twomissingvalues
replaced
with
sample
meanof.
Myjobcontributesvalueto
thecommunity.
Myjobhelpsthis
organizationach
ieve
its
mission.
Just
rewards
Proced
uraljustice
Muellerand
Wallace
(1996).
Ifeel
thatpromotionsandsalary
increases
are
basedonmyability.
4catego
ryLikert(see
jobsatisfaction)
Standardized
Alpha¼
.83
Threemissingvalues
replaced
with
sample
mean.
Salary
increasesandpromotionsare
based
primarily
onmyperform
ance.
Distributive
justice
PriceandMueller,
(1981)
Muellerand
Wallace
(1996)
� Neu
tralcatego
ry
(d3)added
to
originalmeasure
ofpayjustice
(a)Iam
rewarded
fairly
formyeffortsonthe
job.
(b)Iam
rewarded
fairly
forthe
responsibilitiesthatIhaveonmyjob.
(c)Iam
rewarded
fairly
fortheamountof
experienceIhave.
(d)Checkthestatemen
tthatbestdescribes
yourfeelingsaboutyo
urpay.
(a–c)4catego
ryLikert(see
jobsatisfaction).
(d)1¼
‘‘Ireceive
much
less
thanIdeserve.’’
2¼
‘‘Ireceive
alittle
less
thanIdeserve.’’
3¼
‘‘Ireceive
exactlywhatIdeserve.’’
4¼
‘‘Ireceive
alittle
more
thanIdeserve.’’
5¼
‘‘Ireceive
much
more
thanIdeserve.’’
� scoresconverted
toz-scores
� factoranalysisproduced1factorfrom
all
item
s.
Standardized
Alpha¼
.86
Twomissingvalues
replaced
with
sample
meanof0
Differentialvalues
Hourlywage
Fem
ale
byhourly
wageinteraction.
AnnualSalaries
converted
toHourlyWage
Wage¼
AnnualSalary=2000
Eightmissingvalues
replaced
withaverage
wageofresponden
ts
withthesamejobtitle.
Twocasespredicted
withtenure,hierarchical
level,andfemale.
(Continued)
709

Appendix
A.
(Continued
)
Dependentvariable
Item
sorvariable
description
Rangeandcoding
Reliability
(Cronbach’salpha)
andreplacement
Owngen
der
referent
Crosby(1982)with
adaptationof
wordingand
additionof
gen
der
response
byBuch
anan
andLundgren.
Samesexreferent
Fem
ale
bysame
sexreferent
interaction.
Intheprocessofevaluatinghow
goodone’s
jobis,peo
ple
compare
them
selves
with
other
peo
ple.Please
thinkofwhom
you
compare
yourselfwithwhen
thinkingof
how
goodyo
urjobis
interm
sofpay,
the
nature
ofwork
tasks,
andthevalues
and
relationsin
theworkplace.Then
,please
list
thefirstnames
oftw
opeo
ple
youcompare
yourselfwithin
thefollowingblanks
provided
.
Responden
tsfurther
instructedto
indicate
thegen
der
oftheirreferents.
1¼
female
0¼
male
1¼
allreferents
are
female.
0¼
referents
are
allmale
orare
both
male
andfemale.
710

Appendix
B.
Zero-order
correlations
jobsatisfaction
1
female
�0.06
1.00
overtim
e�0.01
0.00
1.00
education
�0.05
�0.13�
0.15��
1.00
tenure
0.00
0.06
0.09
�0.24��
1.00
work
invo
lvem
ent
0.25��
�0.05
0.02
�.094
0.13�
1.00
negative
affectivity
�0.19��
0.05
�0.04
0.03
0.04
0.02
1.00
externaljobopportunity
�0.04
0.14��
�0.04
0.05
�0.14�
�0.08
�0.04
1.00
work
load
�0.26��
0.02
0.21��
0.15��
0.05
0.01
�0.05
0.08
1.00
autonomy
0.51��
�0.09
0.06
0.04
�0.06
0.13�
�0.21��
�0.10
�0.23��
1.00
supervisorcompeten
ce
0.46��
�0.08
�0.09
0.00
�0.08
0.12�
�0.12�
�0.03
�0.08
0.32��
routinization
�0.28��
0.13�
�0.17��
�0.29��
0.05
�0.12�
0.08
0.00
�0.08
�0.38��
promotionalopportunity
0.37��
�0.08
�0.07
0.07
�0.31��
0.12�
�0.08
0.13�
�0.07
0.28��
jobim
pact
0.30��
�0.07
0.07
0.05
0.04
0.14��
�0.22��
0.07
�0.02
0.24��
proced
uraljustice
0.42��
�0.02
0.01
0.05
�0.12�
0.17��
�0.01
�0.03
�0.13�
0.35��
distributive
justice
0.49��
�0.16��
�0.08
0.07
�0.10
0.19�
0.02
�0.19��
�0.27��
0.47��
hourlywage
0.19��
�0.25��
0.22��
0.39��
0.23��
0.10
�0.02
�0.15��
�0.01
0.30��
samesexreferent
0.05
0.22��
0.04
�0.05
0.11�
0.02
0.07
�0.07
0.02
�0.02
female
�hourlywage
0.09
0.84��
0.14��
0.09
0.20��
�0.01
0.06
0.06
0.01
0.07
female
�samesexreferent
0.04
0.52��
0.05
0.04
0.12�
�0.02
0.09
0.02
0.01
�0.07
female
�workload
�0.18�
0.82��
0.13�
�0.02
0.05
�0.05
0.01
0.17��
0.54��
�0.20��
jsfem
ot
edten
wc
na
po
wl
auto
supervisorrelationship
1.00
routinization
�0.15��
1.00
promotionalopportunity
0.33��
�0.25��
1.00
jobim
pact
0.10
�0.16��
0.24��
1.00
proced
uraljustice
0.36��
�0.19��
0.48��
0.18��
1.00
distributive
justice
0.32��
�0.29��
0.46��
0.15��
0.59��
1.00
(Continued)
711
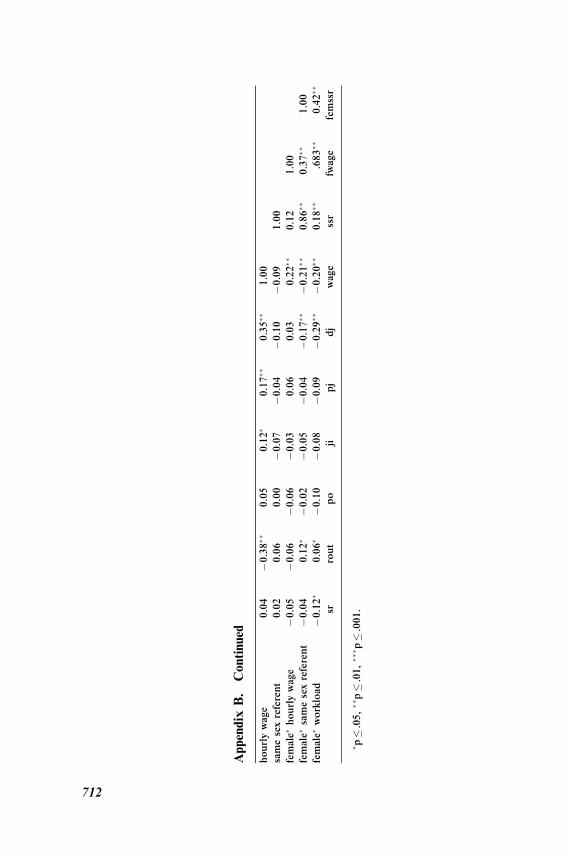
Appendix
B.
Continued
hourlywage
0.04
�0.38��
0.05
0.12�
0.17��
0.35��
1.00
samesexreferent
0.02
0.06
0.00
�0.07
�0.04
�0.10
�0.09
1.00
female
�hourlywage
�0.05
�0.06
�0.06
�0.03
0.06
0.03
0.22��
0.12
1.00
female
�samesexreferent
�0.04
0.12�
�0.02
�0.05
�0.04
�0.17��
�0.21��
0.86��
0.37��
1.00
female
�workload
�0.12�
0.06�
�0.10
�0.08
�0.09
�0.29��
�0.20��
0.18��
.683��
0.42��
srrout
po
jipj
dj
wage
ssr
fwage
femssr
� p�.05,��p�.01,��
� p�.001.
712

Appendix C. Regression of job satisfaction on hourly wage, same sex refer-
ent, and workload for male and female sub-samples
Females (N ¼ 292) Males (N ¼ 67)
Models Models
Variables 1 2 3 1 2 3
Hourly wage 0.281��� 0.297��� 0.296��� �0.11 �0.106 �0.124
Same sex referent 0.124� 0.124� �0.023 0.008
Workload �0.246��� �0.322��
�p� .05, ��p� .01, ���p� .001.
Values are standardized coefficients.
The Paradox of the Contented Female Worker 713