The neurobiology of groupthink: a qEEG approach to the study ...
298
Pepperdine University Pepperdine University Pepperdine Digital Commons Pepperdine Digital Commons Theses and Dissertations 2016 The neurobiology of groupthink: a qEEG approach to the study of The neurobiology of groupthink: a qEEG approach to the study of followership followership Angela A. Deulen Follow this and additional works at: https://digitalcommons.pepperdine.edu/etd Recommended Citation Recommended Citation Deulen, Angela A., "The neurobiology of groupthink: a qEEG approach to the study of followership" (2016). Theses and Dissertations. 628. https://digitalcommons.pepperdine.edu/etd/628 This Dissertation is brought to you for free and open access by Pepperdine Digital Commons. It has been accepted for inclusion in Theses and Dissertations by an authorized administrator of Pepperdine Digital Commons. For more information, please contact [email protected].
-
Upload
khangminh22 -
Category
Documents
-
view
2 -
download
0
Transcript of The neurobiology of groupthink: a qEEG approach to the study ...
Pepperdine University Pepperdine University
Pepperdine Digital Commons Pepperdine Digital Commons
Theses and Dissertations
2016
The neurobiology of groupthink: a qEEG approach to the study of The neurobiology of groupthink: a qEEG approach to the study of
followership followership
Angela A. Deulen
Follow this and additional works at: https://digitalcommons.pepperdine.edu/etd
Recommended Citation Recommended Citation Deulen, Angela A., "The neurobiology of groupthink: a qEEG approach to the study of followership" (2016). Theses and Dissertations. 628. https://digitalcommons.pepperdine.edu/etd/628
This Dissertation is brought to you for free and open access by Pepperdine Digital Commons. It has been accepted for inclusion in Theses and Dissertations by an authorized administrator of Pepperdine Digital Commons. For more information, please contact [email protected].
Pepperdine University
Graduate School of Education and Psychology
THE NEUROBIOLOGY OF GROUPTHINK:
A qEEG APPROACH TO THE STUDY OF FOLLOWERSHIP
A dissertation submitted in partial satisfaction
of the requirements for the degree of
Doctor of Education in Organizational Leadership
by
Angela A. Deulen
April, 2016
Kent Rhodes, Ed.D. – Dissertation Chairperson

This dissertation, written by
Angela A Deulen
under the guidance of a Faculty Committee and approved by its members, has been submitted to and accepted by the Graduate Faculty in partial fulfillment of the requirements for the degree of
DOCTOR OF EDUCATION
Doctoral Committee: Kent Rhodes, Ed.D., Chairperson John Tobin, J.D. Joseph Pelletier, Ph.D.

© Copyright by Angela A. Deulen (2016)
All Rights Reserved

TABLE OF CONTENTS
LIST OF TABLES ........................................................................................................................ vii
LIST OF FIGURES ..................................................................................................................... viii
DEDICATION ............................................................................................................................... ix
ACKNOWLEDGEMENTS ............................................................................................................ x
VITA .............................................................................................................................................. xi
ABSTRACT .................................................................................................................................. xv
Chapter One: Introduction .............................................................................................................. 1
Need for the Study .............................................................................................................. 2 Problem Statement .............................................................................................................. 5 Purpose of the Study ........................................................................................................... 5 Research Questions ............................................................................................................. 6 Limitations of the Study ...................................................................................................... 6 Definition of Terms ............................................................................................................. 8 Organization of the Study ................................................................................................. 13
Chapter Two: Literature Review .................................................................................................. 15
Background ....................................................................................................................... 15 Literature Search Strategies .............................................................................................. 17 Overview of the Organization of the Literature Review .................................................. 17 Literature Review .............................................................................................................. 18
Followership ......................................................................................................... 18 Conformity ............................................................................................................ 23 Conformity of Thought: Groupthink .................................................................... 32 Neuroscience ......................................................................................................... 41 Organizational Neuroscience: ............................................................................... 45
Summary ........................................................................................................................... 52
Chapter Three: Methodology ........................................................................................................ 55
Introduction ....................................................................................................................... 55 Research Questions ........................................................................................................... 56 Nature of study .................................................................................................................. 57 Characteristics Studied ...................................................................................................... 57

v
Definition of Characteristics ................................................................................. 58 Methodology ..................................................................................................................... 59
Population, Sample and Sampling Technique ...................................................... 60 Privacy, Confidentiality, and Data Protection ...................................................... 62 Use of Private Health Information ........................................................................ 62 Use of Deception ................................................................................................... 62 Debriefing ............................................................................................................. 63 Follow-up Procedures ........................................................................................... 63
Study 1 .............................................................................................................................. 64 Participants ............................................................................................................ 64 Procedure and Instrumentation ............................................................................. 64
Study 2 .............................................................................................................................. 65 Participants ............................................................................................................ 66 Procedure and Instrumentation ............................................................................. 66 Risk to Participants ............................................................................................... 71
Summary ........................................................................................................................... 74
Chapter Four: Results ................................................................................................................... 75
Introduction ....................................................................................................................... 75 Study One .......................................................................................................................... 75
Participants ............................................................................................................ 75 Analytical Techniques .......................................................................................... 76 Results ................................................................................................................... 76
Study Two ......................................................................................................................... 79 Participants ............................................................................................................ 80 Analytical Techniques .......................................................................................... 81 Results ................................................................................................................... 84
Summary ........................................................................................................................... 94
Chapter Five: Discussion .............................................................................................................. 96
Introduction ....................................................................................................................... 96 Study One .......................................................................................................................... 96
Problems with the Design and Sample ................................................................. 96 Study Two ......................................................................................................................... 97
Problems with the Design and Sample ................................................................. 98 Tying it Together ............................................................................................................ 100
Social Drivers ...................................................................................................... 101 Neurobiological Drivers ...................................................................................... 102 Implications for Organizations ........................................................................... 105 Implications for the Christian Church ................................................................. 106 Implications for Future Research ........................................................................ 108
Summary ......................................................................................................................... 109

vi
REFERRENCES ......................................................................................................................... 112
APPENDIX A: Request for Participation, Study One ................................................................ 130
APPENDIX B: Request for Participation, Study Two .............................................................. 131
APPENDIX C: Consent Form, Study One ................................................................................ 132
APPENDIX D: Consent Form, Study Two ................................................................................ 134
APPENDIX E: Participant Bill of Rights ................................................................................... 136
APPENDIX F: Email Debriefing Participants ............................................................................ 137
APPENDIX G: Participant Questionnaire .................................................................................. 138
APPENDIX H: Cognitive Flexibility Inventory (CFI) ............................................................... 140
APPENDIX I: Permission to use the CFI ................................................................................... 141
APPENDIX J: Vignette .............................................................................................................. 142
APPENDIX K: Exity Survey ...................................................................................................... 143
APPENDIX L: Data Collection Worksheet ................................................................................ 144
APPENDIX M: Decision-Making Guidelines ............................................................................ 145
APPENDIX N: Reliability Tables ............................................................................................. 146
APPENDIX O: Brain Mapping Comparison Tables ................................................................. 247
APPENDIX P: Posttest Comparison and LORETA Findings Table .......................................... 267
APPENDIX Q: Approval Letter from Pepperdine GPS IRB ..................................................... 278
APPENDIX R: Approval Letter from Secondary Institution's IRB ........................................... 280
APPENDIX S: Certificate in Human Subjects Training ............................................................ 281
APPENDIX T: Certificate of Completion in Quantitative Electroencephalography ................. 282

vii
LIST OF TABLES Table 1. Framework for Possible Interactions for Rigidity and Level of Commitment… 57
Table 2. Summary of Two-Phase Experiment…………………………………………... 76
Table 3. Study One: Ethnicity of Participants.……….………………………………….. 79
Table 4. Study Two: Ethnicity of Participants.……….……………...………………….. 84
Table 5. Summary of Associated Changes in Subcortical Structures …………………... 86
Table 6. Frontal Changes in Eyes Closed…...……….………………………………….. 90
Table 7. Frontal Changes in Eyes Open...…...……….………………………………….. 90
Table 8. Medial Frontal Gyrus Change in Eyes Closed..………………………………... 92
Table 9. Medial Frontal Gyrus Change in Eyes Open....………………………………... 92
Table 10. Activation of Anterior Cingulate in Eyes Closed…………………………….. 93
Table 11. Activation of Anterior Cingulate in Eyes Open...…………………………….. 93
Table 12. Activation of Precuneus/Cuneus in Eyes Closed…………………………….. 94
Table 13. Activation of Precuneus/Cuneus in Eyes Open……………………………….. 94
Table 14. Summary of Research Questions with Corresponding Results……………….. 95
viii
LIST OF FIGURES Figure 1. Treatment condition bar chart……………………………………………… 72
Figure 2. Level of political commitment……………………………………………… 80
Figure 3. Level of religious commitment.………………………….………………… 81
Figure 4. Level of ideological commitment…………………………………………… 82
Figure 5. Average commitment score….……………………………………………… 82
Figure 6. Brain map sample…………………………………………………………… 85
Figure 7. Statistical significance; Treatment condition and time to conform……….. 88
Figure 8. Side-by-side comparison of frontal cortex changes..……………………… 91

ix
DEDICATION
First, and foremost, for my Heavenly Father. Your love is extravagant and the favor with
which you have showered me is beyond my comprehension. It is amazing what You can do with
one broken life. Let there not be one tittle or iota that does not bring You glory, but in this, I pray
You be glorified.
For my husband. You have been a most excellent Samwise; there is no way I would have
made it without you. Your love and servant heart has been both a sword and a shield unto me
and I am forever grateful for the road that united us together.
For my three little non-conformists (all of a different sort). John, Chance and Devynn you
have sacrificed so much for this work to be done. I believe there is no compensation for what
you have gone without. However, I pray that this work will somehow edify and strengthen you
for the work He has called you to do.
Finally, to conformists for making the world safe and consistent and for defending our
traditions, and to non-conformists for ensuring that our own complacency does not devour our
sense of justice or mercy, or allow us to stagnate in self-righteous denial.

x
ACKNOWLEDGEMENTS
I want to first thank my committee (my three favorite southern gentlemen). I am grateful
to Dr. Kent Rhodes for hours of mentoring and encouragement in this journey and the grace with
which he himself lives as a non-conformist. I am grateful to the honorable Dr. John Tobin for his
attention to detail and the enthusiasm he brings with him everywhere. And, I am grateful to my
colleague and subject matter expert Dr. Joseph Pelletier for his patience with me as I continually
barge into his office for “just one more thing.”
I extend my deepest gratitude to Dr. Andrea Russell (as well as Leanne and Barney) at
Cornerstone Christian Counseling Service in Tucson, without whose instruction and mentoring
this work would not have been possible.
I wish to also thank John Anderson (Minnesota Neurofeedback Institute) for his patience
and guidance in this project as well as Steve Stern (Stens Corporation) for his flexibility with
regard to training and equipment.
I must thank all the faculty and staff in the School of Behavioral Sciences at California
Baptist University (as well as Lynette) for their tremendous support and encouragement,
accommodating my schedule, making space available for me, and keeping me grounded.
I wish to thank all of the volunteer confederates. I do not know what I would have done
without your generosity and enthusiasm… every last one of you.
Finally, I wish to thank two of my dearest friends. Maria Painter, my classmate, my
comic relief, and my companion. Thank you for the encouragement and for going on this
journey with me. Dr. Gary Collins, you have been both a mentor and a father. How I ever fell
into your good graces I will never know but I am so grateful every day that I did. Without your
investment in my life over the last 23 years, I would not be here today; of that I am certain.

xi
VITA
Education Ed.D. Organizational Leadership, Pepperdine University Doctoral Candidate; Anticipated final defense 09/2014 M.S. Counseling Psychology, California Baptist University B.A. Religious Studies, California Baptist University
ABD July, 1999 May, 1997
Pertinent Experience California Baptist University Assistant Professor, Director Counseling Psychology Program, Riverside, CA Instruct & conduct classes for the School of Behavioral Sciences including MFT Techniques, Family Therapy Theory and Techniques, MFT Practicum, Psychophysiology (Behavioral Neuroscience), Psychology Across the Life Span, & Tests & Measures (also Experimental Psychology, Methods of Research, & Statistics, etc.)
August 2010 – Present (Prev.: Lecturer November ’08 – August ’10; Adjunct faculty May 2000 – May ‘03; August ’08 – November ’08)
Doulos Community Services (Private Practice) Administrative Director, LMFT, Rancho Cucamonga, CA Oversee daily operations, supervisions of interns, adherence to policies and procedures and standards of practice, oversight to fiscal management. Therapy, treatment & evaluation for general & special populations (the aged, children & adolescents, developmentally disabled, the chronically mentally ill, dual diagnosis/chemically dependent). Perform therapy for individuals (adults & children), families & couples.
May 2007- Present
xii
Country Villa Riverside Healthcare Center Program Director Managed the Special Treatment Program for this 120 bed-inpatient psychiatric hospital.
Supervise the Program, Activities, & Vocational Rehabilitation Departments, & their staff.
Run and provide oversight to Interdisciplinary Team Meetings; ensure adherence to state and federal regulations
Annually updated the P&P manuals, organize Pro-Act (safety and restraint) training, oversee internal investigations and reviews
Provide support to Psychology team, crisis interventions, individual and group therapy services provided as needed
July 2006 – January 2008
Christian Family Counseling Service Executive Director, Riverside, CA Supervise staff of licensed MFTs & MFT Interns (provide staff evaluations, administrative & clinical supervision, prepare MFT Interns for state licensure) Oversee daily fiscal & administrative operations for agency. Develop & implement treatment programs, policies & procedures, & community outreach programs. LMFT Handle therapy treatment & evaluation for special populations (the aged, children & adolescents, developmentally disabled, the chronically mentally ill, dual diagnosis/chemically dependent). Perform therapy for individuals, families & couples. Lead, teach, & coordinate group therapy & psycho-education (Anger Management, Parenting, Communication, Self Worth, Drama & Art Therapy
March 2000 – January 2007

xiii
South Atlantic Medical Group (On behalf of State of CA Department of Mental Health) Level II PASRR Evaluator, Long Beach, CA Evaluate & perform complete assessments for patients diagnosed with a Mental Illness in SNFs & STPs under the Federal PASRR Requirements (Pre-Admission Screening & Resident Review).
Create multidimensional treatment plans. Order consults & make appropriate referrals as necessary.
October 2004 – October 2005
San Bernardino County Superintendent of Schools MFT Intern Perform therapy for children & adolescents in Alternative Education Placement Create & Implement Behavior Modification Programs in homes & in the classroom for children with Axis I & Axis II disorders Perform therapy for the families of children & adolescents in Alternative Education Placement Develop & lead group therapy (Drug & Alcohol Treatment, Anger Management, Parenting, Gang Diversion, Boundaries, Self Worth, etc.)
Develop procedures & instruments for documenting intervention & progress for the State of CA/Medi-Cal program. Train other Interns in documentation procedures.
August 1998 – July 2000
Post-Graduate Training Portland State University, Certificate Program in Interpersonal Neurobiology
January 2012 - Present
Training in Clinical qEEG September 2013
Licenses and Certification Licensed Marriage and Family Therapist, California BBS October 2003 to Present
Licensed Professional Clinical Counselor, California BBS August 2014 to Present
Certification in Neurotherapy (Clinical Track), BCIA In Process

xiv
Publications/Presentations Deulen, A (2013). Social constructivism and online learning environments: Toward a theological model for Christian educators. Christian Education Journal, 10(1). 90-98. Holloway-Deulen, A (2006). The bipolar bear family: When a parent has bipolar disorder. Wheaton, IL: Authorhouse. Previous Contributor to Suite101.com (online magazine) for their Psychology and Marriage and Family sections.
Research Experience School of Behavioral Sciences research Center, CBU: Committee Member
2011 - 2013
Began work on a project on Cranial Electrical Stimulation (using Alpha Wave Stimulation) for Depression and Insomnia
2014
Other Consulting and Teaching Experience Brandman University, Adjunct Professor July 2009 – June 2013
Seminario Internacional Teológico Baptista (International Baptist Theological Seminary) Buenos Aires: Consultancy, create multi-dimensional analysis and action plan to update library and university resources
June 2011 – January 2012
Provide consultancy services to churches and Christian Businesses
2003 to Present
Affiliations/Memberships California Association of Marriage and Family Therapists 1998 to Present
Christian Neuroscience Society 2012 to Present
National Council on Family Relations 2012 to Present
Inland Empire Chapter of the MFT Consortium of California 2011 to Present

xv
ABSTRACT
In recent decades, the study of leadership has focused on the qualities of leaders rather than on
those of followers. However, it has been argued that there can be no meaningful construct of
leadership without a coherent understanding of followership and group behavior. While the body
of literature is replete with information on the study of groupthink and conformity as it relates to
followership, the neurobiological drivers of such behavior remain under-investigated. The
purpose of this work was to investigate the neurobiological basis of groupthink (conformity of
thought) as a component of followership. Specifically, this work seeks to investigate six
research questions: How does cognitive rigidity and ideological commitment interact to
influence groupthink, does the presence or absence of decision-making protocol affect
groupthink outcomes, to what extent does the presence or absence of a leader, as well as leader
bias drive groupthink, and how does the brain respond in each of these conditions with regard to
groupthink and conformity. Two separate experiments were used. The first experiment served as
a pilot condition to test the efficacy of a hypothetical vignette. However, an opportunity was
seen to test an interactional matrix of cognitive rigidity and ideological commitment (the first
research question). In the second experiment, the research questions were tested in a similar
mock decision-making group using the same vignette. However, quantitative
electroencephalography (qEEG) baseline pretest data and posttest data were taken and compared
to assess for changes in the brain related to groupthink. Both studies utilized confederates to
form the groups to which the researcher measured conformity. While no statistically significant
relationships were found directly for any of the research questions, the research did show some
interesting patterns. The use of decision-making protocol did seem to slow down conformity
when taken into account with other variables, such as leader style. Additionally, consistent with

xvi
the pre-existing literature, patterns were seen in study two with regard to changes in the frontal
cortex, including the medial frontal gyrus, and anterior cingulate. Implications for organizations
and churches as well as suggestions for future studies are presented in the final chapter.
Keywords: neurobiology, conformity, groupthink, followership, medial frontal gyrus,
frontal cortex, anterior cingulate
1
Chapter One: Introduction
“It is easier to say what loyalty is not than what it is. It is not conformity. It is not
passive acquiescence to the status quo . . . It is the realization that America was born of revolt,
flourished on dissent, became great through experimentation.”
Henry Steele Commager (1947)
Emile Durkheim argued that a critical error occurs when one denies the social origins of
thought (Douglas, 1986). It is plausible that often when an individual asserts that they are an
independent thinker, they are in fact denying the social influences that have shaped their
thoughts. This kind of groupthink typically results from external pressures from within a group
to conform, deterring critical thinking processes (Robbins & Judge, 2010).
Agazarian (1997) developed a theory of living human systems, defining a hierarchy of
isomorphic organisms that operate interdependently to organize energy, function as a goal-
directed unit, and are system-correcting. As members of these living systems, people have a
need to belong (Baumeister & Leary, 1995). Not belonging has consequences, not the least of
which is a visceral anxiety that drives us to forge new relationships or mend available
relationships in order to restore a sense of well-being (Baumeister & Tice, 1990; Nesdale &
Pelyhe, 2009). Conformity, therefore, may be a survival mechanism that allows individuals to
belong by minimizing, or sometimes even negating, individual thought (M. L. Hoffman, 1957).
In the very least, it minimizes the anxiety associated with not being part of the in-group (Nesdale
& Pelyhe, 2009).
Though the word itself may have a negative connotation, conformity does have a place in
society (Baron, Branscomb, & Byrne, 2009). Imagine a world where no one followed traffic

2
laws, children held no innate sense directing them to follow familial rules or patterns, and no one
understood a need for governmentalized order. Conformity in the workplace is especially
important for efficiency, as well as brand development and maintenance (Shafritz, Ott, & Jang,
2001).
In recent decades, much of the conformity research has centered on what is referred to as
the groupthink phenomena, a term first coined by William Whyte in the 1950’s (Whyte, 1952)
but made popular by Irving Janis (Esser, 1998; Janis, 1971). Groupthink occurs when a group
makes faulty decisions because group pressures lead to a deterioration of “mental efficiency,
reality testing, and moral judgment” (Janis, 1972, p. 9). In short, groupthink, conformity of
thought, occurs when a group shares a common mindset about something in such a way that the
group’s process iteratively reinforces the same thinking, blocking new ideas, problem solving
strategies, and alternative viewpoints. The destructive nature of groupthink is well documented
in the literature (Esser, 1998). Some infamous episodes of groupthink disasters include policy
decisions made regarding the Bay of Pigs, the US involvement in both North Korea and Viet
Nam, and the failure to appropriately prepare for the attack on Pearl Harbor, all originally
studied by Janis and later supported by many other researchers in the years that followed (Esser,
1998; Janis, 1972; Janis, 1982) as well as the Space Shuttle Challenger disaster (Moorhead,
Ference, & Neck, 1991) and the Columbia tragedy (Ferraris & Carveth, 2003).
Need for the Study
Leadership, a continually evolving field of study, plays a central role in understanding
organizational behavior (Robbins & Judge, 2010). However, studies have focused more on the
qualities of leaders and on followers as they relate to those leaders, than on the qualities of
followers themselves (P. Hoffman, 2009). It could be said that it may not be possible to truly

3
understand leadership without developing a robust understanding of why people follow in the
first place. However, the study of “followership” remains an under-investigated domain
(Meindl, 1995).
The little that has been studied regarding followership is perhaps best represented in the
disciplines of anthropology, sociology, and social psychology. A review of the literature
provides a wealth of information regarding group dynamics that can logically be applied to an
operational understanding of followership. Concepts that translate well from these behavioral
sciences to a study of followership include phenomenon such as group dynamics, conformity,
and groupthink.
As stated earlier, conformity itself is not always a negative event. Conformity provides
several benefits (Baron et al., 2009). A tendency toward conformity can aid the decision making
process. This can be especially helpful in large groups or when consensus is needed within an
organization. Conformity also helps to uphold group standards and social mores. Further,
conformity helps to bring order to chaos (imagine a world where no one considered traffic laws).
However, while conformity certainly has its place in society (Baron et al., 2009),
unquestioned conformity can have a horrific outcome. Perhaps the most incredible example of
this from modern times is that of the Fübrerprinzip, “one leader, one Reich, one people”
(Chaleff, 2009, p. VII) in the era leading up to the rise of Hitler. Under this cultural norm,
unquestioned obedience to leadership was nothing short of noble (Chaleff, 2009). Those who
did not conform were not well received by their fellow countrymen, let alone the leaders loyal to
the Führer. Many “non-conformists” suffered the same fate as those they tried to defend. Other
destructive examples of conformity of thought, what Janis called groupthink, include those stated
earlier (the Bay of Pigs, US involvement in North Korea, the US failure to prevent the 1941

4
attack on Pearl Harbor, US involvement in Viet Nam, and both the space shuttle disasters) as
well as Watergate (Janis, 1982), the US decision to invade Iraq to find weapons of mass
destruction (Tavris & Aronson, 2007) and several corporate fiascos including the Enron scandal
(Prentice, 2007). There is also some evidence in the literature that while groupthink may not
always end with these sorts of terrible or consequences, groupthink in the very least blocks not
only organizational growth and development, but can completely thwart a leader’s attempt at
initiating any type of change process (Greyvenstein & Cilliers, 2012).
But why do people conform? Two reasons have been proposed to address this question:
The need to belong, and the need to be right (Baron et al., 2009; Deutsch & Gerard, 1955).
However, it has been noted that the need to be right can result in defensive routines that shut
down the learning process, blocking growth and forward movement (Argyris, 2008). Further,
studies on conformity reveal a strong groupthink phenomenon, which may be stronger in
organizations and situations with a moral component (Hornsey, Majkut, Terry, & McKimmie,
2003). This would seem to make certain organizations (for example faith based and cause-driven
institutions) especially vulnerable.
Some early researchers (e.g. Costell & Leiderman, 1968) suggested that conformity, at
least in part, is a result of an autonomic response in the central nervous system. Numerous others
(as outlined in Chapter Two) have begun to argue that the need to belong, as well as the need to
be right, is neurobiological in nature. However, while behavioral neuroscience is a growing field,
very little literature studying the neurological or psychophysiological dimensions of conformity
exists (Chen, Wu, Tong, Guan, & Zhou, 2012). One could assert the argument that it is not
possible to completely understand the function of conformity without understanding the neuro-
physiological drive behind the phenomenon.

5
In sum, while conformity certainly has a place in society, conformity left unchecked can
have disastrous consequences. However, too little literature exists with regard to followership
itself, let alone the neurobiological correlates of identified dimensions of followership such as
conformity and groupthink. Further, not only is an understanding of this phenomenon
imperative to creating healthy leadership strategies, but a new integrative model informed by an
understanding of followership and the neurobiology of groupthink conformity is needed to really
accomplish this end.
Problem Statement
A review of the literature reveals several problems. To begin, as stated earlier, leadership
has been the focus of research within the field for the last several years, while followership
remains understudied. Further, while the literature is replete with information on conformity,
such studies lack a focus on the neurobiological basis of such phenomenon. A more robust
understanding of followership is needed to create more effective learning organizations. Finally,
groupthink as a component of followership is certainly worthy of research attention as it has
powerful and sometimes even devastating consequences for individuals, their organizations, and
the people they serve or impact.
Purpose of the Study
The best approach to leadership is one that will consider followership as important, if not
more important, than leadership itself, and, in so doing, will foster a community that creates
courageous followers that can appropriately stand up to their leaders, dissent when needed,
question the status quo and offer alternative viewpoints (Chaleff, 2009). The purpose of this
study is to investigate the neurobiological basis of groupthink as a dimension of conformity, a

6
component of followership, in order to advance understanding of effective leadership strategies
and the development of healthy organizations.
Research Questions
This study will address the following research questions:
1.To what extent, if any, might groups higher in rigidity and commitment demonstrate high
levels of groupthink?
2.What difference, if any, does the implementation of decision-making protocols make in the
final outcome?
3.How does the presence of a leader impact the final decisional outcome with regard to
groupthink?
4.To what extent, if any, does the presence of a perceived leader moderate the
neurobiological dimensions of conformity?
5.To what extent, if any, does the partiality of the leader impact the final outcome?
6.To what extent, if any, does the partiality of a perceived leader moderate the
neurobiological dimensions of conformity?
Limitations of the Study
As is the case with all research studies, the present design has several limitations. To
begin, while empirical research is preferable for establishing relationships between variables, one
cannot hope to replicate group dynamics in a lab that normally develop over time. Secondly, as
Hewlin (2003) notes, this type of empirical research cannot capture the "facades" of conformity
(pretenses of compliance). Further, it cannot capture the phenomenon of what the literature
refers to as "tempered radicals," those that think differently than the group but choose to temper
their dissenting thought to maintain group norms (Zemke, 2010).

7
Another limitation is that of assessing brain function under this type of social-performance
situation. While qEEG (quantitative encephalography) measures, like those proposed in the
methods section of chapter three, provide some of the most temporally sensitive data, it is not an
in-depth measure. Further, there is no way in the present study to control for error variance in
qEEG recording related to pathology (e.g. histories of child abuse that have impacted brain
function, brain injuries, organic disease and pathology, the impact of prescribed medication,
etc.). Additionally, the age of the subjects (traditional undergraduate college students) presents
another limitation in that the brain of a young adult is still not completely mature and usually
undergoing rapid synaptogenesis (Carlson, 2010).
A clear limitation is the religious nature of the institution from which the participants will
be drawn; all the participants (and nearly all the confederates) will be drawn from a mid-sized
Southern Baptist University. As will be noted in chapter two, religiosity and spirituality play
important roles in conformity, as well as brain function (Newberg & Waldman, 2011). However,
in the current approach, there is no practical way to control for the influence of faith on
conformity.
An additional limitation revolves around the use of the cognitive flexibility inventory (CFI)
that will be used, as outlined in chapter three. This inventory, while practical for this approach
and demonstrated to yield test-retest reliability as well as construct and content validity (Dennis
& Vander Wal, 2010) has poor face validity. A savvy participant will be able to see through the
questions and answer according to their own bias.
The use of EEG and qEEG also produces its own limitations. One of the biggest
limitations in this study centers on the need to control for artifacting. In an EEG or qEEG, an
artifact is any part of the recording that is not part of the brain’s electrical potential, but rather an
8
unrelated event. Breathing, chewing, eye movements, muscle movements, and pulse are all
common examples of artifacts that frequently show up on EEG and qEEG recordings. These
artifacts can interfere with the interpretation of the data and should be reduced as much as
possible during EEG and qEEG recordings.
Finally, an important limitation in the proposed study to note is related to the amount of
time and cost involved in doing a brain study of any kind. For this reason, a smaller sample size
was used.
Definition of Terms
The following is a list of terms as they have been operationally defined for use in the
present study:
Anterior: For the purpose of this study, this will refer to the portion of the central nervous system
located near or toward the head.
Artifact: Any thing that shows up in the EEG that is not actually the result of electrical potential
in the cortex. Possible examples include movement, swallowing, eye movement and blinking,
heart rate or electro-cardio output, muscle tension, and signal interference from electrical
equipment such as computers and air conditioners.
Caudal/Caudate: Literally meaning “toward the tail;” for the purpose of this study, this will refer
to the portion of the central nervous system furthest away from the front of the face.
Cerebral Cortex: This is the outer layer of tissue in the brain referred to as grey matter. It
includes the four types of lobe structures (the temporal, occipital, parietal, and frontal lobes). It
is approximately 1.5 - 5 mm thick. It covers the cerebrum and the cerebellum.
Cingulate system: This is the most medial part of cortex and includes the cingulate gyrus. It is
part of the limbic system, and therefore involved in emotion formation, processing, learning, and

9
memory. Note: The rostral cingulate zone may play a role in a wide variety of autonomic
functions (e.g. blood pressure, heart rate) and rational cognitive functions, such as reward
anticipation, decision-making, empathy, impulse-control and emotion.
Cognitive Dissonance: Described as a part of dissonance theory, cognitive dissonance occurs
when a person holds two opposing behaviors or thoughts, resulting in a state of distress,
generally both psychological and physiological.
Compliance: A change in overt behavior generally produced by a specific request; it involves
getting other people to do what one wants them to do.
Conformity: Change induced by general rules concerning what behavior is appropriate or
required in a given situation. In essence, it is the degree to which one individual modifies the
behavior to match the behavior of another individual, a group, or to a social norm.
Dissonance Theory: This theory suggests that when individuals experience cognitive dissonance,
they will resort to compensatory mechanisms, including but not limited to self-justification, in
order to relieve the distress they experience associated with the dissonance.
Downregulation: This refers to a decrease in the quantity of cells, cellular connections, or a cell’s
receptors in the central nervous system.
Electroencephalography (EEG): This is a measure of electrical activity along the scalp that
results from the firing of neurons within the brain. An EEG recording generally captures these
data in the form of alpha, beta, delta, and theta waves.
Feigned Conformity: Referred to in the literature as facades of conformity, this refers to a
behavioral or outward conformity that is not necessarily congruent with thought. Specifically, it
refers to the accommodating behavior of an individual to match a norm or expectation, when the
accompanying belief is not actually held.

10
Frontal Lobe: This structure is the most anterior part of the brain. It is often referred to as the
“social brain” as it is what governs much of the social part of human behavior. It is also
involved with decision-making, problem solving, and planning. However, it is also associated
with some motor functions, planning, reasoning, judgment, impulse control, and memory.
Followership: An emerging field of study that focuses on the qualities of followers as well as
follower development, rather than on models of leadership.
Group mind: A neurobiological term developed by Siegel, and expanded by Gantt and
Agazarian, it refers to the interpersonal and relational aspects how information is shared and
regulated within an isomorphic group.
Groupthink: A term first coined by Whyte but made popular by Janis, it refers to the process by
which a group unquestioningly thinks together in one accord. In essence, it is conformity of
thought, which, may develop over time, or perhaps more quickly when high levels of group
cohesion and resonance exist. In this research, the terms conformity and groupthink are used
interchangeable, but in both cased refer to conformity of thought.
Gyrus: A gyrus (gyri in the plural form) is a ridge on the cerebral cortex. Gyri are found in all
four lobes of the brain.
In-group: A social psychology term used to refer to members belonging together to a group. It is
opposite of the out-group, composed of members that do not belong to the identified in-group.
Lateral: With regard to the central nervous system, this direction implies away from the middle.
Limbic System: This is sometimes referred to as the paleomammalian brain due to its prehistoric
nature; it is the oldest part of the brain. The limbic system is a set of structures that includes the
hippocampus, amygdala, hypothalamus, and thalamus. This complex system is involved in
emotion, behavior, motivation, and the formation of long-term memory.

11
Low Resolution Brain Electromagnetic Tomography (LORETA): This is brain imaging software
that allows for three-dimensional imaging based on EEG recordings, as well as for quantitative
analysis and comparison.
Medial: With regard to the central nervous system, this direction implies toward the middle,
away from the side.
Neuroscience: For the purpose of this study, this will refer to the discipline of research and study
of the human nervous system and its function.
Non-conformity: This refers to the act of choosing not to conform to a group whether passively,
or through more active dissent.
Nucleus Accumbens: This structure is a component of the ventral striatum, a part of the basal
ganglia. Its function is connected to pleasure as well as reward processing, and reinforcement
learning. It is also believed to play a role in addiction, fear, aggression, and impulsivity.
Obedience: Change induced by direct orders or commands from others is described as obedience.
Occipital Lobe: This structure is the most anterior part of the brain located within the skull and
controls vision.
Orbitofrontal Cortex: This term is synonymous with the ventromedial prefrontal cortex. It is part
of the prefrontal cortex responsible for decision-making.
Organizational Neuroscience: For the purpose of this study, this will refer to the incorporation of
neuroscience and organizational behavior.
Out-group: A social psychology term used to refer to those who do not belong to an identified
group. It is opposite of the in-group, composed of members that do belong to the identified in-
group.

12
Parietal Lobe: The parietal lobes (one in each hemisphere) are caudally located (toward the back
of the head) and sit between the occipital and frontal lobes. These structures are involved in the
reception and processing of sensory information, including pain and touch. However, they are
also associated with cognition, speech, and some visual perception.
Posterior: For the purpose of this study, this will refer to the portion of the central nervous
system away from the head, or “toward the tail.”
Posterior Medial Frontal Cortex: This structure is thought to be involved in the processing of
performance errors and to interact with other parts of the brain to create adaptations.
Prefrontal Cortex (PFC): The most evolved part of the human brain (compare to the limbic
system), it is the most anterior part of the brain’s frontal lobe. It includes the dorsolateral and
orbitofrontal cortexes. It is responsible for executive functioning, including planning, problem
solving, verbal reasoning, mental flexibility, and inhibition, attention, and working memory.
Promotional Leadership: The influence exercised by a leader toward his or her own bias. It is the
degree to which a leader directs the group toward this bias.
Quantitative Electroencephalography (qEEG): This is a technique that measures brain function in
such a way as to allow for quantitative analysis and comparison. It is generally thought of as the
analysis of a digital EEG and is sometimes referred to as brain mapping.
Rostral: Literally meaning “toward the beak;” for the purpose of this study, this will refer to the
portion of the central nervous system closest to the front of the face.
Striatum: Also known as the neostriatum or striate nucleus, is a part of the forebrain. This
structure receives input from the cerebral cortex and in turn, sends input to the basal ganglia
system. It is necessary for planning and execution of movement as well as cognition and working
memory.

13
Subcortical: Referring to structures or regions under or below the cerebral cortex.
Temporal Lobe: This structure, which sits below the parietal lobes on either side of the skull,
contains structures of the limbic system, including the amygdala and hippocampus. These lobes
are associated with memory, emotion, hearing, and language.
Upregulation: This refers to an increase in the quantity of cells, cellular connections, or a cell’s
receptors in the central nervous system.
Polyvagal Nerve Theory: This theory describes behavior in terms of the vagal nerve system.
Developed by George Porges, it asserts that different vagal nerves serve different purposes,
based on evolutionary needs and hierarchies. It is thought to mediate automatic behaviors
related to fear from both survival and social frameworks.
Ventral: Meaning “toward the belly;” for the purpose of this study, this will refer to the portion
of the central nervous system toward the bottom of the skull.
Organization of the Study
This study is organized into five chapters.
Chapter one: Introduction. This chapter discusses the background of the study, the
need for the study, a statement of the problem, as well as the purpose statement. This chapter
includes research questions, limitations, and definitions of terms. Chapter One concludes with
the organization of the study.
Chapter two: Literature review. Chapter Two provides an overview of the key
concepts incorporated in the development of this study. The literature review covers the
following domains: followership, conformity, groupthink, behavioral neuroscience,
organizational neuroscience, neuroscience of conformity and groupthink, and measurement
techniques.

14
Chapter three: Methodology. Chapter Three begins with an introduction to the
methodology to be used. The introduction is followed by a description of the nature of the study.
The hypotheses are then stated followed by a description of population, sample and sampling
technique. The characteristics under study are then described followed by definitions of those
characteristics. This chapter also outlines the data collection plan, and proposed analytical
techniques. The chapter concludes with a summary.
Chapter four: Results. Chapter Four outlines the results for both studies an provides
information regarding the analytical techniques used. This chapter also concludes with a
summary.
Chapter five: Discussion. Chapter Five discusses the results, the limitations discovered
during the course of both experiments, and provides suggestions for future research designs.
Further, this chapter explores organizational possibilities for limiting groupthink and promoting
organizational health. The chapter concludes with a summary.

15
Chapter Two: Literature Review
Background
It was a Sunday afternoon when the present author was watching a documentary on the
mass murder-suicide of the Peoples Temple Agricultural Project, more commonly known as the
massacre at Jonestown in 1978. It is still astonishing to consider how 900 people could
somehow agree that drinking cyanide laced Cool-Aid, and giving it to their young children, was
a good idea given their circumstances. This incident may serve as an extreme example of the
horrific outcomes that may follow poor collective thought, but recent history is littered with
dozens of examples of groupthink at all levels, and in all types of groups, from corporations
(Tavris & Aronson, 2007) to higher education (Hensley & Griffin, 1986) to the Federal
Government of the United States of America (Herek, Janis, & Huth, 1987; Janis, 1972;
McCauley, 1989). No one is immune from falling victim to the social influence of groupthink
within the organizations to which they belong (Janis, 1982).
That being said, the number of individuals directly impacted by groupthink roughly
estimates the population. As the consequences of groupthink in many circumstances can have
far reaching effects, for example in the case of public policy, groupthink disasters impact not
only the “thinkers” but anyone who can be touched by a decision’s ripple effects. Therefore, the
number of people impacted by groupthink in our society becomes almost immeasurable.
While the groupthink phenomenon was first studied in relation to organizational behavior
during the American Soldier Project of the 1950’s (Janis, 1971; Janis, 1982) several case studies
in the last four decades have provided support that many of the most consequential policy
decisions of the last half of the 20th century were incidents of groupthink including the failure to
anticipate or prevent the attack on Pearl Harbor, the Bay of Pigs, US involvement in North Korea
16
and Viet Nam, and Watergate (Esser, 1998). Further, groupthink has been determined to be the
underlying cause of at least two Space Shuttle fiascos: Challenger (Moorhead et al., 1991) and
Columbia (Ferraris & Carveth, 2003). More recently, the literature has referred to the decision
to invade Iraq in search of weapons of mass destruction as the result of pervasive groupthink
(Tavris & Aronson, 2007). While each of these incidents and the groupthink that fostered them
will be discussed in this chapter in light of the literature and empirical research supporting these
ideas, it is important to begin by noting the breadth and far reaching scope of the problem.
Groupthink is almost an insidious disease for which there is a cure, but without an understanding
of its drivers, we are ill equipped to treat or prevent.
It is well documented in the literature that there exists an important connection between
an organization’s ability to think well, creatively problem solve, and learn and overall
organizational health (Argyris, 2008; Bolman & Deal, 2008; Chaleff, 2009; Senge, 2006).
Further, while the literature will demonstrate that in most (if not all) cases where groupthink
prevails in a destructive form, the outcome was a direct result of a lack of checks and balances
such as decision making protocol, or accountability efforts that foster critical thinking
(Courtright, 1978; Neck & Moorhead, 1992) the cost of non-conformity can be very great for
some individuals. Included in this chapter is a brief discussion of examples of positive change
that have risen out of a refusal to conform to the normative group’s consensus (Quirk &
Richardson, 2010). These dissenters, as they are referred to in the literature, are credited with a
variety of feats such as working to change a mindset about slavery, for example (Quirk &
Richardson, 2010).
Also discussed in this chapter are the reasons why people conform. Conformity does in
fact have an important place in society. If people were not hard-wired in their neurobiology to

17
conform, society may very well disintegrate due to wide spread chaos; it would be a world
without rules, mores, structure, or normative expectations. One could argue that there would be
no waiting your turn at the stop light, no quiet libraries, and no children that attempted to
emulate positive or pro-social behaviors of the adults they admire. As the literature will discuss,
despite the fact that the neuroscience of conformity is still in its infancy, the drive to conform
seems to be neurobiological, as well as adaptive to our survival.
Literature Search Strategies
The literature review for this study was conducted in three basic phases:
Phase One: A literature search was done using Proquest, EBSCO Host, and Academic Search
Premier data bases for scholarly articles and dissertations in the areas of conformity and
neuroscience.
Phase Two: The present researcher accessed text books and dissertations on topics related to the
present design, analyzed their literature reviews, researched pertinent articles and findings,
pulling as many original sources as possible.
Phase Three: The present researcher examined the gaps in her literature review. Then, returning
to EBSCO Host, and Academic Search Premier, the present researcher commenced an additional
search for information that appeared to be lacking from the literature.
Overview of the Organization of the Literature Review
There are several theoretical considerations that makeup the context for the present
literature review. Each of those theoretical dimensions has been delineated into their perspective
sections, and will occupy the remainder of this chapter. The theoretical elements to be covered
in this literature review are:
18
A. Followership studies
B. Conformity
i. The Asch Paradigm
ii. Groupthink as a specific dimension of conformity
C. Behavioral neuroscience
i. Organizational Neuroscience as an Emerging Field
D. The Neuroscience of conformity and groupthink
Literature Review
Followership. It has been argued that to truly understand any model of leadership, one
must start with an understanding of followership (Bligh & Kohles, 2012). In point of fact,
Meindl (1995) argued that any approach to the study on leadership should first be follower-
centric. However, the literature has focused more on the qualities of leaders and on followers as
they relate to those leaders, than on the qualities of followers themselves (P. Hoffman, 2009).
Therefore, the study of “followership” remains an under-investigated domain. However, most of
us, in some capacity or another, are not just leaders; we are followers also (Chaleff, 2009).
Further, it can be argued, that one could spend a century studying the attributes of great leaders,
however, one cannot make complete sense of why people follow a particular leader without
studying those who follow him or her. In other words, without studying the follower, one cannot
completely formulate a leadership postulate.
It has been asserted that one of the reasons leadership theories fall short of completeness,
has to do with a lack of understanding of followers (Rosenau, 2004). This is because, even for
the most likeable leaders, his or her “charisma is embedded in the orientation and needs of his or
her followers” (Rosenau, 2004, p.16). While leaders may lead followers, followers also lead
19
leaders, so much so that it is often unclear “who is leading and who is following” (Rosenau,
2004, p.17). Further, studies demonstrate that within institutions of strong organizational
cultural identity, followers may reject leaders or leadership changes more vehemently (Nauta,
2007) choosing instead to reinforce the leadership of those who are more culturally homogenous
to the group’s identity.
Perhaps the freshest perspective on followership is the work of Ira Chaleff (2009) in his
book Courageous Followership: Standing up to and for our Leaders. In this pivotal book,
Chaleff discusses the need to address followership:
We need a dynamic model of followership that balances and supports dynamic
leadership. We need a model that helps us embrace rather than reject the identity of
follower because the model speaks to our courage, power, integrity, responsibility, and
sense of service. (p.1)
The work on followership within the context of conformity has powerful ramifications.
In many organizations, “expulsion for nonconformity is a very real threat” (Chaleff, 2009, p. 5).
This may be truer when nonconformity is deemed to be akin to sin (Zemke, 2010) as may be the
case in religious or faith-based organizations. Further still, some of the greatest changes within
this type of organization over the last several centuries have come not from the top down
(leadership) but from the bottom up (followership), from dissenting non-conformists like Martin
Luther (P. Hoffman, 2009).
An outstanding question in this arena is why do people follow or dissent? While a few
studies have been conducted on dissent (Packer, 2008), other researchers have found a number of
factors that drive conformed followership (Carsten, Uhl-Bien, West, Patera, & McGregor, 2010).
However, those drivers are difficult to define as follower behavior appears to be somewhat

20
contextually driven (Carsten et al., 2010). Other studies have validated this premise that
followership is contextual. For example, one study conducted with a large group of nurses found
that "followers do not necessarily fit into one category but may move between categories
depending on the situation” (Kean, Haycock-Stuart, Baggeley, & Carson, 2011). Those authors
note that little is known about followership and augment the argument that has been made that
leadership and followership need to be addressed as separate, but interdependent constructs
(Kean et al., 2011). Still, it is important to highlight what the literature does reveal about a
followership construct.
One of the primary problems that has resulted from a leadership model that emphasizes
business leadership rather than followership issues is that followers tend to feel disregarded or
unimportant as well as de-authorized to act in their own leader-like ways (Greyvenstein &
Cilliers, 2012). As a further result, followers may compensate by withholding their
“authorization” to participate in change or cooperate with leadership, perhaps even in a covert
manner. This results in difficulty to the leader with regard to managing change and
organizational development or transformation (Greyvenstein & Cilliers, 2012).
Just as the literature reveals that leadership paradigms are contextual, based on the needs
and climate of the organization, followership models should also be contextually defined (Cox,
Plagens, & Sylla, 2010). Further still is the need to differentiate between what it means to follow
(the actual act of submission, compliance, or obedience) and followership in a broader
framework (Cox et al., 2010). This broad approach to followership defines itself more in terms
of how the subordinate, or follower, actually relates to the nominal leader (Cox et al., 2010).
Therefore, while following is reactive, followership is driven by conscious choices regarding

21
behavior. This is especially important given the power that followers have to influence
organizational outcomes and success (Cox et al., 2010).
Focusing on the power that lies in the hands of followers then, it is appropriate to discuss
the relationship between followers and stated leaders. For example, we know that the more
agreement a follower perceives exists between a leader’s behavior and what the follower
determines are ideal leader values, the more satisfied followers are with their leaders,
independent of conditions (Quaquebeke, Kerschreiter, Buxton, & Dick, 2010). Further, it has
been demonstrated that the behavior of followers has a direct influence on a leader’s positive
affect (mood) as well as feelings of psychological empowerment (Lapierre, Bremner, &
McMullan, 2012). In turn, this dynamic reinforces a leader’s demonstration of their charismatic
capacities (Lapierre et al., 2012).
In an empirical study, two dimensions of followership were identified: independent
critical thinking, and active engagement (Blanchard, Welbourne, Gilmore, & Bullock, 2009).
These two dimensions do not always have positive outcomes for organizations however. For
example, while active engagement is positively correlated with job satisfaction, independent
critical thinking appears to be negatively correlated with both job satisfaction and organizational
commitment (Blanchard et al., 2009). In other words, when an organization includes followers
that are independent critical thinkers, those followers are less like to enjoy their jobs and less
likely to be committed to their organizations. These findings are consistent with other research
(Hoption, Christie, & Barling, 2012) that reveals that when an organization’s individuals are
labeled as “followers” those individuals report lower levels of positive affect and lower levels of
extra-role behavior (initiative).

22
In another empirical study, researchers gave 302 undergraduate participants a series of
vignettes describing a fictional organization (Thoroughgood, Hunter, & Sawyer, 2011).
Participants were instructed to envision themselves as a subordinate to the leader who was male
or female, aversive or not. The researchers found that leaders perceived as aversive elicited
greater whistle-blowing responses. Perhaps more interesting however, is the finding that female
aversive leaders were rated as more aversive than their aversive male counter-parts in the same
story, perhaps indicating a higher tolerance for aversive male leadership than aversive female
leadership (Thoroughgood et al., 2011).
Still, there remains no real theory of followership. Popper (2011) has attempted to
develop a theory based on three existing theoretical constructs: psychodynamic theories of
leadership in which the leader represents a parental figure, psycho-cognitive constructs where the
leader represents a simplified explanation for organizational complexity, and social-
psychological theory where the leader gives followership a meaningful narrative. This is a
complex model, however, that has yet to be empirically demonstrated.
In a simpler approach, researchers proposed five reasons why people follow, and 9 types
of leadership styles (Kim, Liss, Rao, Singer, & Compton, 2012). The following is a summary of
the five reasons provided for followership:
1. Fear of Retribution: “If I do not follow, I may lose my job!”
2. Blind Hope: “We must do something. I hope this works!”
3. Faith in Leader: “What a great person. If anyone knows the answer, they do!”
4. Intellectual Agreement: “What a good idea. That makes real sense”
5. Buying the Vision: “What a brilliant idea. I don’t care who thought of it”

23
The nine types of followers described, all animal archetypes, range from the very independent
but faithful (e.g. the eagle) to the interdependent and truly loyal (the lion) to the unquestioning
follower (sheep) to the utterly destructive or counter-productive type (hyena) (Kim et al., 2012).
While this is certainly a fun and creative approach to the development of a followership
construct, as a model it has not been tested, and the proponents are not at all clear on what basis
they have even derived their postulate. So, the construct of followership remains nebulous, at
best.
Conformity. Conformity studies emerged from the larger body of work now referred to
as Social Psychology, which emerged during the middle of the 1920’s (Baron et al., 2009). One
of the field’s pioneers, Floyd Allport, argued that social behavior arises out of many different
complex factors (Baron et al., 2009). Allport emphasized the value of experimentation in social
psychology and openly discussed his research on topics such as conformity (as well as task
performance, affective recognition, and scientific methodology (Allport, 1924).
Due in part to the work of Allport and others (in particular social psychology icons
Muzafer Sherif and Kurt Lewin to whom we owe the emergence of leadership studies), the next
two decades saw remarkable growth. These two decades were marked by a rapid increase in
scientific experimentation as well as new modalities for data collection (Baron et al., 2009).
Two of the most important milestones in the development of the field during this period,
which would contribute to our modern understanding of conformity, come from two of these
pioneers:
1. In 1935, Muzafer Sherif developed a theory of social norms, thus contributing to our
understanding of inter-personal pressures toward conformity (Baron et al., 2009).
24
2. Kurt Lewin and his colleagues carried out revealing research on the nature of leadership
and other group processes (Lewin, 1935).
While these studies served as an interesting foundation to the context of conformity and
social psychology, the aftermath of the Holocaust and Nazi behavior during World War II drove
behavioral scientists in an attempt to make sense of the atrocities resulting from blind
followership and conformity. As mentioned earlier, Nazi Germany operated under a collectivist
Fübrerprinzip (leadership principle) that valued unquestioned conformity (Chaleff, 2009). While
studies (Triandis, 1995; Triandis, 2001) have demonstrated that conformity does in fact occur
with greater frequency in collectivist cultures, other studies have found a multitude of factors
contributing to this phenomenon (Baron et al., 2009).
The Asch Paradigm. In 1955, a groundbreaking experiment took place that helped
researchers in the field of social psychology begin to understand the phenomenon for conformity
(Asch, 1955). The experiment (now commonly referred to as the Asch studies or Asch
paradigm) divided subjects into two groups: A control group, where participants were assessed
individually, and a treatment group where participants were placed into a room with one to eight
confederates (Asch, 1955; Asch, 1956). Subjects were told they were participating in a study on
visual perception. Subjects in both groups (n = 123 males) were shown a card with a black line
on it. Subjects were then shown a second card with three lines of differing lengths and asked to
identify which of the three was the same length as the first. Confederates unanimously gave
false answers, in an attempt to determine whether participants would conform to the group norm.
When subjects were assessed in the control group, only one participant out of 35
incorrectly identified the correct match. However, the results were different in the treatment
group. Results indicated that while one confederate had virtually no influence, the presence of a
25
second confederate resulted in slightly higher amounts of conformity. Further, the addition of
three or more confederates revealed significantly higher amounts of conformity (Asch, 1956).
Follow up studies on the Asch experiments have also explored the impact of shame
(Scheff, 1988), age (Walker & Andrade, 1996) as well as sexuality and gender (Tiegs, Perrin,
Kaly, & Heesacker, 2007). More than four decades after the original experiment, researchers
conducted a meta-analysis of all the replication studies that had been conducted using the Asch
paradigm (Bond & Smith, 1996). The results suggest that conformity has declined in the United
States since 1950 (at least for this type of line judgment task) and that conformity appears to be
higher in collectivist cultures than in individualistic cultures (Bond & Smith, 1996).
Walker & Andrade (1996) replicated Asch’s line judgment task experiment in order to
examine age as a variable in conformity. These researchers note that previous studies did not
find age a factor in conformity but state that those studies did not take into account whether the
task assignment was ambiguous or non-ambiguous (Walker & Andrade, 1996). Based on their
findings, they report that when ambiguity is controlled for, conformity decreases with age in
perceptually unambiguous tasks. This seems highly important to note; groupthink phenomenon,
such as that related to complex decision-making, typically follows along more ambiguous lines.
Related to how individuals conform in groups, researchers also using a replication
approach, tested their hypothesis that conformity would be higher among participants “forming a
group” in a face-to-face context rather than in an anonymous participation setting (Deutsch &
Gerard, 1955). This may correlate with findings that conformity in the Asch paradigm appears, at
least in part, to be related to constructions of shame (Scheff, 1988).
Factors affecting conformity. Although tremendously valuable, the Asch paradigm
composes only a fraction of the conformity phenomenon. To really understand conformity as it

26
relates to followership and groupthink, one must step back and look at the literature in a broader
context. The following summarizes factors identified in the literature affecting conformity.
Social influence. The literature reiterates that most people ignore or deny the social
influences that shape their cognition and behavior (Douglas, 1986; Robbins & Judge, 2010;
Cialdini, 2005). The literature notes three social influence factors impacting organizational
behavior: People Frequently ignore or underestimate the extent to which their behavioral actions
in a given situation are determined by others present, people ignore or underestimate the
persuasive nature others’ behavior can have on their own choices, and when one considers
themselves an expert on the topic, people ignore or underestimate the extent to which the input
of others can improve their decisions (Cialdini, 2005).
Psychological factors. According to social psychologists, there is two main reasons
people conform: The need to belong to the group and the need to be right (Baron et al., 2009;
Deutsch & Gerard, 1955).
The need to be right. While people tend to conform out of a need to be right, studies have
demonstrated that conformists employ compensatory mechanisms and cognitive processes that
allow them to fully justify the conformity (Buehler & Griffin, 1994). This dynamic is
exacerbated by the fact that the pressure to conform can create a dissonance. Dissonance Theory
explains that when a person encounters two opposing thoughts or behaviors (e.g. “I do not like
prejudice” and “I do not want to work with ‘a certain group of people’”) the individual
experiences a cognitive dissonance, most often experienced as an uncomfortable hyper arousal
(i.e. physiological tension) (Baron et al., 2009). To resolve the dissonance, individuals engage in
a self-justification regarding the conformity, choice, or behavior they decide to engage in order
to resolve that dissonance (Tavris & Aronson, 2007).

27
The need to belong. In The Art of Loving (Fromm, 2006) the famed social psychologist
and philosopher Erich Fromm argued that love is how humans experience belonging. He wrote
about love and belonging in the context of conformity and its implications for the individual and
society. Fromm argued that people insulate themselves from the frightening experience of being
alone by conforming to group norms, and thus gain some sort of sense of pseudo-unity (Fromm,
2006). In this instance, if one experienced a dissonance as a result of conforming to belong, it is
likely that one would use the same self-justification discussed by Tavris and Aronson (2007) to
preserve this pseudo-unity.
The Pain of not Conforming. Eisenberger (2008) notes that social pain, the pain
associated with not belonging to an in-group or with social exclusion, follows the same neural
circuitry as physical pain, so much so that researchers have found that the use of Acetaminophen
reduces social pain by both neural and behavioral evidence (DeWall et al., 2010). In a separate
study, researchers examined the specific neural correlates of social and physical pain finding that
the anterior cingulate cortex (ACC) was more active during exclusion than during inclusion and
correlated positively with self-reported distress (Eisenberger, Lieberman, & Williams, 2003).
The same study also found that the right ventral prefrontal cortex (RVPFC) was active during
exclusion but was negatively correlated with self-reported distress. The researchers surmise that
these ACC changes mediate the RVPFC-distress correlation, perhaps as a compensatory
mechanism allowing the RVPFC to regulate, or even minimize the distress of social exclusion by
disrupting ACC activity.
Morality or Moral Rigidity. Perhaps tied to the need to be right is the need to be right
with God, or in the least on matters of faith and religion. Research has demonstrated that
situations with a moral dimension tend to produce greater degrees of conformity (Hornsey et al.,
28
2003). Further research has empirically demonstrated that extrinsic religiosity (those who hold a
literal interpretation of the Bible) is positively correlated with higher levels of physical abuse (a
conformity to a literal interpretation of not sparing the rod) toward children as compared with
what researchers call intrinsic religiosity, a more internalized spirituality (Rodriguez &
Henderson, 2010). Perkins (1976) found a similar correlation between higher levels of
religiosity, defined as a level of belief in Christian dogma to measurements of bigotry. Perkins
also notes that when religiosity is reconceptualized to distinguish between measurements of
belief (which he refers to as orthodoxy) and an actual commitment to those beliefs (saliency) the
effect is mediated. However, it is important to note that the extraneous variable in both of these
studies is that of cognitive rigidity. Cognitive rigidity, a lack of flexibility of thought is tied to a
number of cognitive and affective problems (Siegel, 2006) and numerous psychiatric disorders
(Dennis & Vander Wal, 2010). It is reasonable to suggest that an interaction of morality and
cognitive rigidity may produce higher levels of conformity in certain circumstances.
Cohesiveness and Conformity. The degree to which members experience group
cohesiveness has been demonstrated to promote greater degrees of conformity (J. C. Turner,
1991). Further, the more one values being a part of the group, and the more one wants to be
accepted and liked by members of the group, the more one tends to conform (Baron et al., 2009).
Similarly, acting and looking like others (conformity) is often a means to win approval and
belonging (Baron et al., 2009).
Conformity and Group Size. Gerard, Wilhelmy, & Conolley (1968) as well as Asch
(1956) found that conformity increases with group size but only up to about three or four
members, and beyond that point, it appears to level off. However, later studies have
29
demonstrated greater variances, but none-the-less, strong correlations between group size and
conformity (Baron et al., 2009).
Situational Norms: Awareness of situational norms or expectations has been
demonstrated to play a large role in conformity (Cialdini & Trost, 1998). While some have
found that what is known about the environment plays a role in social behavior and conformity
(Aarts & Dijksterhuis, 2003) other findings suggest that such awareness is not necessary for
conformity to occur (Baars & Gage, 2010). Additional research has demonstrated that when
subjects are shown pictures of situations where behavioral norms are well know (e.g. the library)
the stimuli elicited autonomic responses to behave in kind (Aarts & Dijksterhuis, 2003). These
findings suggest that adherence to behavioral norms happens automatically, on the autonomic
level, when behavioral norms are well established (Aarts & Dijksterhuis, 2003).
Public verses private behavior. Another way in which a situation affects conformity is
along the private verses public dimension. Research has demonstrated that while many tend to
publicly follow social norms, they do not always change in their private views (Maass & Clark,
1984). Deutsch & Gerard (1955) were the first to find that social influence is greater when
participants belong to a group, and that there is less social influence when decisions are
"anonymous" rather than made face to face. To this end, Hewlin (2003) discusses these
"facades" of conformity, as well as the emotional and psychological consequences for this type
of conformist. That being said, it is important to differentiate between behavioral conformity that
only occurs on public and a cognitive conformity that transforms both the public and private life
of the individual. This latter type of conformity, groupthink as it is referred to in the literature, is
really true conformity. This assertion is consistent with research findings comparing the
conformity paradigm against the minority influence paradigm, concluding that people are more

30
likely to yield to the majority in public (conformity) while accepting the position of the minority
(dissent or minority influence) in private (Maass & Clark, 1984).
Gender Norms. Adherence to gender norms happens when individuals conform to the
roles generally associated by society for individuals of a given gender; this is a very specific type
of social norm has been linked to conformity (Baron et al., 2009). Studies have demonstrated
that the tendency to conform to gender norms can have far reaching consequences for
individuals, even interfere with sexual enjoyment among both women and men (Sanchez,
Crocker, & Boike, 2005; Sanchez, Kiefer, & Ybarra, 2006).
Conformity in the Workplace. Famed anthropologist Mary Douglas noted that as early
as the 1920’s, the social sciences emphatically believed that primitive cultures were more
conformist that developed cultures (Douglas, 1986). Douglas did assert however, that institutions
do in fact have their own (collective) mind. Further, the need for conformity in the workplace is
well documented (Robbins & Judge, 2010). Simon noted, conformity is necessary for unity of
command and is essential for administrative effectiveness (Shafritz et al., 2001). Further,
conformity has been positively correlated with higher levels of job satisfaction and more
effective output (Bolman & Deal, 2008).
In a series of three experiments, researchers studying the chameleon effect found that
participants report higher ratings of likability toward those who mimicked the participants’
posture, mannerisms, and facial expressions (Chartrand & Bargh, 1999). In a separate study,
researchers investigated the impact of followers flattery and opinion conformity toward leaders
(CEOs), finding that such conformity increased the CEOs overconfidence resulting in a biased
decision making process (S. H. Park, Westphal, & Stern, 2011). Similarly, Prentice (2007)
investigated corporate systems, including Enron, to assess the effect of both conformity bias and
31
groupthink (as well as obedience to authority & other dimensions) on ethical decision-making.
Prentice notes that each of these play a role in the final ethical outcome for many companies,
adding that corporate officers do not just wake up one day deciding to start a life of crime, but
over time, the influence of conformity pressures and groupthink result in an incremental ethical
change in decision making processes which have consequences for the organization and beyond.
Non-Conformity. Sometimes the voice of a minority can attract new comers overtime,
until those dissenters become either a loud enough minority, or even the majority. This was in
fact the case of the abolitionist movement (Quirk & Richardson, 2010). But why do people
dissent, or overtime, conform to a non-conforming entity?
Packer (2008) proposed what he calls a normative conflict model. This model
distinguishes between non-conformity due to dissent and non-conformity due to disengagement.
This is an important distinction in understanding conformity within organizations. Packer also
notes that, in general, the more one identifies with a group, they more they conform. However,
not all strong identifiers choose to conform and not all weak identifiers dissent to group norms.
However, sometimes one will demonstrate what Packer refers to as superconformity, an extreme
form of conformity whereby members dissent or violate a "norm" that will in turn get them
praised by the group (Packer, 2008).
The dark side of conformity. In 1973, Phillip Zimbardo created what would come to be
known as the Stanford Prison Experiment. He and his fellow researchers selected students and
assigned them either to the role of prisoner or guard in a mock prison in the basement of the
Stanford psychology building. However, participants conformed to their roles so well that the
guards began to take on authoritarian personalities, some even beginning ultimately to subject
some of the prisoners to torture. After only six days, the experiment had to be prematurely

32
terminated. This form of extreme conformity is sometime thought to be similar in some respects
to what Stanley Milgram found in his obedience experiments (Baron et al., 2009). While both
certainly had grim outcomes (not unlike the deaths at Jonestown), participants in the Stanford
experiment were conforming out of role expectation (i.e. a belief on how prison guards are
supposed to behave) whereas Milgram’s participants were conforming out of obedience (more
akin to what researchers have found in Nazi Germany) (Kenrick, Neuberg, & Cialdini, 2010).
Whether conforming to a role expectation, out of obedience, or for any of the other
reasons identified in the literature, behavioral conformity can have devastating outcomes. In the
very least, it can impact organizations in a negative way. However, because of the power of self-
justification, conformity of thought or groupthink can be even more dangerous (Tavris &
Aronson, 2007).
Conformity of Thought: Groupthink. When individuals or groups experience marked
conformity of thought, this is referred to as group think. Groupthink is a term first coined in
1952 (Whyte, 1952) but made popular by the work of Irving Janis (Esser, 1998). Janis began his
work in 1945 through the 1950’s in what was known as the American Soldier Project (Janis,
1982). Janis found that as stress increased, so did group cohesion, followed by groupthink.
Much of what Janis believed about groupthink can be summed up in what is known as
Parkinson’s Law:
The more amiability and esprit de corps there is among the members of a policy-making
ingroup, the greater the danger that independent critical thinking will be replaced by
groupthink, which is likely to result in irrational and dehumanizing actions directed
against outgroups. (Janis, 1971, p.43)

33
In the early 1970’s, Janis conducted in-depth case studies on six important events to
assess the degree to which groupthink was present. Those six cases included the Bay of Pigs,
North Korea, the attack on Pearl Harbor, Viet Nam, the Marshall Plan, and the Cuban Missile
Crisis. Janis concluded that four of those involved high levels of groupthink, while two (the
Marshall Plan and the missile crisis) were not (Janis, 1972). Janis later analyzed Watergate and
concluded that the individuals involved in that incident were also the victims of groupthink
(Janis, 1982).
Janis’ work produced new information about groupthink as a dimension of conformity.
To Janis’ surprise, groupthink happens to intelligent, educated people in the same way it does to
others, citing the individuals involved in the Bay of Pigs fiasco (Janis, 1982). Secondly, there
appears to be a lack of distinction between such groups & "ordinary citizens" with regard to
groupthink, and, finally, victims of groupthink tend to be “soft" toward one another (judgment)
but "hard-hearted" toward outgroups and perceived enemies (Janis 1982).
In his book titled Groupthink, Janis lists eight symptoms of groupthink. They are each
summarized below (all taken from Janis, 1982).
1. Illusion of invulnerability. Janis defines this as an excessive optimism that encourages
taking risks. Sometimes these risks may be extreme or unwarranted.
2. Collective rationalization. When this occurs, group members discount warnings about
their behavior or choices and do not reconsider the underlying assumptions for them.
3. Belief in inherent morality. Group members believe in the rightness of their cause and
therefore overlook the ethical or moral consequences of their decisions.
4. Stereotyped views of out-groups. Group members hold negative views of the “enemy.”
This in turn, makes an effective response to conflict seem unnecessary.

34
5. Direct pressure on dissenters. Group members fall under pressure not to express ideas
that are against any of the group’s views.
6. Self-censorship. Individual group members suppress doubts and deviations from the
perceived group consensus.
7. Illusion of unanimity. The majority view and judgments are assumed to be unanimous.
8. Self-appointed ‘mindguards.’ Members protect the group and the leader from information
that is problematic or contradictory to the group’s cohesiveness, their shared view and
group decisions.
Janis (1972; 1982) also determined that there are three antecedent conditions that tend to make a
group vulnerable to groupthink:
1.High group cohesiveness: Janis argued that when groups are highly cohesive, the result is
deindividuation and that the cohesiveness of the group becomes more important than
individual interests.
2.Faulty group structure: Groups that are structured poorly suffer from the insulation of the
group to outside experiences and ideas, partiality (or bias) of the leader, and a lack of
norms decision-making procedures.
3.Situational context: Janis determined that when stress levels are high due to perceived
external threats, when there have been recent failures of the group with regard to
performance, when decisions become difficult for the group to make, or when they face
moral dilemmas, groups are more likely to fall victim to groupthink behavior.
Janis (1982) also provided several suggestions on how to prevent groupthink based on his case
studies:
1. The leader should assign the role of critical evaluator to each member.

35
2. The leader should avoid stating preferences and expectations (bias).
3. Encourage each member to seek outside opinions and to discuss them in the group.
4. Invite outside experts to each meeting, even if they may be somewhat ideologically
different from the group.
5. Assign someone in the group to play the “Devil’s Advocate,” providing contrary or
alternative points of view to each issue.
6. The leader should ensure that a sizeable amount of group time is spent on examining
warning signals regarding decisions.
Other Work in the area of Groupthink. In the early years immediately following Janis’
first works in the area of groupthink, other researchers began to apply other forms of analysis to
the same events studied by Janis in order to rationally rule in, or rule out, groupthink as an
official diagnosis for those events. For example, Raven (1998) conducted a sociometric analysis
on each of the original six cases. He determined that two of the antecedent conditions
(cohesiveness and insulation) and six groupthink symptoms (all except rationalizations &
stereotypes) were present. With regard to the Watergate case, Raven noted that the Nixon group
did not possess the “esprit de corps” typically described in the context of cohesiveness, but found
that the group was cohesive through their loyalty to Nixon.
Another study used content analysis to explore the public statements made by key
decision makers in the following cases: the Bay of Pigs, North Korea, Viet Nam, the Cuban
Missile Crisis, and the Marshall Plan (Tetlock, 1979). Tetlock found that individuals associated
with these cases were more simplistic in their approach to policy issues (as compared to decision
makers in non-groupthink crises), and positive in evaluating their own groups, but that they were
not necessarily negative in their evaluation of their opponents. A similar approach examined 19
36
US policy decisions from 1947- 1973 to study the relationship between symptoms of poor
decision-making and decision outcomes (Herek et al., 1987). The researchers concluded that
when more symptoms of groupthink and poor decisional processes were present, adverse
outcomes were more likely.
McCauley (1989) analyzed the conditions originally hypothesized by Janis in each of the
original six cases examined by Janis. McCauley found that, contrary to some of Janis's
conclusions, the conditions themselves were conducive to compliance and internalization of
group ideals. He argues that compliance was an important part of poor decision making in at
least two of these cases. Further, McCauley argues that promotional leadership (leadership bias)
and group insulation were strong predictors of whether or not groupthink would occur.
McCauley did not find evidence to support cohesion as a predictor. Further, Esser (1998) has
provided a summary of all of the literature on groupthink over a 25-year period finding that
while there is an increase in the number of empirical designs validating many of the antecedents
and consequences of groupthink, cohesion as a factor continues to fail to demonstrate itself as a
factor in groupthink.
Smith (1985) examined the 1980 hostage rescue attempt in Iran (Operation Eagle Claw)
to determine whether or not groupthink was a factor in the poor planning and execution of the
attempt. He found that all eight symptoms of groupthink were present. However, in his study,
Smith did not consider any of the antecedents conditions or the decision making protocol of
those involved. In a similar approach that included an examination of symptoms, antecedents
and a review of decision making protocol, researchers examined the controversial decision of the
Kent State University Board of trustees to build a gymnasium annex on the site where students
were infamously shot and killed by the Ohio National Guard in 1970 (Hensley & Griffin, 1986).
37
It was determined that every antecedent, seven groupthink symptoms (all except unanimity), and
poor decision-making processes (incomplete survey of alternatives, failure to reconsider
alternatives, poor or inadequate attempts at information search, and selective bias in processing
information) were all present. This study added to the body of knowledge on groupthink as it
identified three new symptoms of poor decision-making process: a failure to maintain contact
with the opposition, a lack of cooperation with mediators, and a failure to extend deadlines when
appropriate. Perhaps the most important of these three is the need to stay in contact with the
opposition. This appears to have received little attention with regard to groupthink in the
literature. However, Sims (1992) in studying the influence groupthink has on organizations,
notes that these organizations suppress dissent by stating that the opposition "just doesn't get it."
Another study analyzed available information from the Iran Contra Affair to assess for
the presence of groupthink ('t Hart, 1990). It was determined that all eight symptoms of
groupthink and three antecedents (cohesiveness, insulation, and promotional leadership) were
present in the decision making process. It is noted that individuals involved in the Iran Contra
Affair as a group demonstrated poor decision-making processes, especially with regard to risk
analysis and consideration. Conversely, however, Neck & Moorhead (1992) examined the jury's
decision-making process during the United States’ entrapment case against John DeLorean. It
was determined that the jury avoided groupthink by exercising sound decision making processes.
At least two studies were conducted on the Space Shuttle Challenger disaster and
groupthink (Moorhead et al., 1991; Esser & Lindoerfer, 1989). The Moorhead study
approached the topic by conducting a textual analysis of all public documents related to the event
and found that groupthink was certainly a dominating factor in the decision to launch. Follow up
research came to the same conclusion regarding the Columbia disaster (Ferraris & Carveth,
38
2003). Another group of researcher examined groupthink through the use of a 100-item Q sort
method, assessing group dynamics related to organizational groupthink in several of the
previously described historical contexts (Tetlock, Peterson, McGuire, Chang, & Feld, 1992).
These researchers determined that there is substantial support for Janis’ previous classifications
on groupthink but that there was much less support for Janis’ causal model of groupthink.
Further, the researchers argue that, according to their findings, neither group cohesiveness nor
situational stress emerged as independent predictors of symptoms of groupthink. Conversely,
however, it was noted that deficits in organizational structure as well as procedural inadequacies
related to decision making did emerge as statistically significant predictors.
Another approach to the study of groupthink included the use of 64 ad hoc groups
(composed of 256 undergrad student, with a mean age 21 that was 89% white) to empirically test
Janis' entire model including all 24 variables (W. Park, 2000). This approach found mixed
support for Janis’ model, noting that there does appear to be a correlation between antecedent
conditions & decision making process, as well as decision making processes and final outcomes.
However, this researcher does not feel that is can be used as a predictive model in terms of
chronology. It should be noted that group dynamics may be to complicated to analyze in a linear
fashion such as most of these approaches.
Empirical studies. Flowers (1977) appears in the literature as the first researcher to
empirically test any of the components of Janis’ work on groupthink. In a pseudo-lab
experiment, Flowers tested the viability of a two-dimensional model examining levels of group
cohesion (high vs. low) against leadership style (directive vs. non-directive, what has also been
referred to as promotional/non-promotional leadership). The significant finding in this study was
a strong correlation between leadership style and decisional outcome. Specifically, more

39
solutions, and more facts were produced from groups with a non-directive (non-promotional)
leader. Leana (1985) also used this same two-dimensional model (high and low levels of
cohesion against directive and non-directive approaches to leadership). The later study
concluded that fewer facts were mentioned in non-cohesive groups and that groups with directive
leaders proposed and discussed fewer possible solutions. It was also noted that groups with
directive leaders were more likely to outwardly accept the leader’s solution but reported lower
levels of private agreement. Ahlfinger & Esser (2001) examined the influence of a promoting
leader’s direct influence on groupthink. The researchers found partial support for a positive
correlation between the two variables. However, they found no support for any correlation
between antecedent conditions (predispositions to groupthink) and actual groupthink behavior.
Still, that could simply be because groupthink is a phenomenon that typically develops overtime.
Courtright (1978) examined cohesiveness against the impact of decision-making
procedures (present or absent). The researcher determined that there was markedly less
disagreement in groups with higher levels of cohesiveness and limited decision-making
procedures, thus suggesting a tendency toward collective thinking. Callaway & Esser (1984)
also examined cohesiveness in conjunction with the presence or absence of decision-making
procedures. These researchers found that groups with medium levels of cohesion (rather than
high or low) made the highest quality decisions. This same study also suggests that groups with
the highest levels of cohesion were the most confident about their decisions and that the worst
decisions were made by groups that were high in cohesion where decision making procedures
were absent.
Another important factor in groupthink is that of perceived threat (as indicated in all of
the policy decisions previously discussed in this chapter). To this end, researchers have

40
conducted a series of experiments in which the researchers examined two independent variables:
level of threat (low or high) and levels of cohesion (M. E. Turner, Probasco, Pratkanis, & Leve,
1992). These researchers determined that higher levels of threat resulted in greater levels of
rationalization, or justification of group decisions. These researchers also determined that higher
levels of cohesions resulted in less self-censorship, and less risk assessment (as determined by
fewer conclusions that the solution may be risky). Further, the worst decisions were made on
high-threat/high-cohesion groups.
Several other studies have looked at the influence of decision-making procedures on
group outcomes. Foder & Smith (1982) found that in instances where fewer facts where
mentioned and where fewer proposals were considered, groups expressed a need for a leader
with a higher level of “power” (influence). In contrast to leader dominance, Callaway, Marriott,
& Esser (1985) conducted an experiment to examine the influence of member dominance and
decision-making procedures on group consensus. These researchers found that groups with more
dominant members tended to make better decisions and report lower levels of decisional anxiety.
Further, these groups took more time to make their decisions, as did groups that were provided
with decision-making protocols.
Venturing in bit of a different direction, Moorhead & Montanari (1986) used path
analysis to examine the causal impact of Janis’ three antecedents (cohesiveness, insulation, and
leadership) as well as four groupthink symptoms (invulnerability, morality, self-censorship, and
dissent) and two decision process symptoms (consideration of alternatives, and use of experts) on
a decision quality rating. The researchers concluded that higher levels of cohesiveness resulted
in lower levels of self-censorship, less dissent, and the discussion of more alternative approaches.
On the other hand, insulation tended to lead toward lower measures of “invulnerability,” as well
41
as an increase in the use of experts. However, groups with higher levels of insulation also
discussed fewer possible alternatives and tended to make quality decisions. Further, promotional
leadership led to greater feelings of morality, lower levels of dissent, and an increase in the
number of alternatives discussed.
In a less empirical approach, researchers utilized a questionnaire approach to assess the
impact that feelings of accountability, whether it is accountability to oneself, a group, or a non-
report of feelings of accountability, were related to consensus and decision-making (Kroon, 't
Hart, & van Kreveld, 1991). These researchers determined that feelings of individual
accountability tended to result in increased difficulty (or length of time) in coming to a group
consensus, more attempts to assert one’s own influence over the group, greater levels of shared
influence, and less risky decisions. In a follow up study, researchers examined these same
constructs of accountability against the co-variable of gender (Kroon, Van Kreveld, & Rabbie,
1992). In this study, researchers found no support for their hypothesis that individual
accountability (as opposed to collective accountability) resulted in lower levels of groupthink.
However, male groups appeared to be more impacted by differing accountability styles than
female groups. Further, while individually-accountable males shared influence more equally
than individually-accountable females, women with no particular accountabilities were the most
effective over all at sharing influence.
Neuroscience. Another emerging field holding importance for the disciplines of
behavioral science and leadership is that of neuroscience (Van Hecke, Callahan, Kolar, & Paller,
2010). Neuroscience, the study of the brain and nervous systems is currently an interdisciplinary
field that collaborates with other fields such as psychology, sociology, mathematics, chemistry,
and medicine (Baars & Gage, 2010). Further, there are several modalities by which
42
neuroscience and the brain are studied (Baars & Gage, 2010). Such techniques include positron
emission tomography (PET), single photon emission computed tomography (SPECT), functional
magnetic resonance imaging (fMRI), and electroencephalography (EEG). While some
techniques allow for detailed neural imaging (such as the fMRI) others allow for split-second
imaging that can keep pace with the rapid shifts associated with cognition (Baars & Gage, 2010).
Perhaps the best example of a temporally sensitive measure is the EEG.
History. Of course, the goal of all scientists is to explain the phenomena they study.
However, the study of behavioral neuroscience is very complex, involving both social
psychology and neurophysiology. Therefore, one might assert that a good behavioral
neuroscientist is, therefore, both a good behaviorist and a good physiologist.
The study of the physiology of behavior has its roots in antiquity (Carlson, 2010). Although
many ancient thinkers, including Hippocrates (460– 370 B. C.) believed the heart, not the brain,
was the seat of reason and emotion (Carlson, 2010). However, Aristotle asserted that the
function of the brain was to cool the passions of the heart (Carlson, 2010). Even Galen (130–
200 C.E.), who had the greatest respect for the work of Aristotle, thought the notion that the
heart was the seat of the mind was ridiculous (Carlson, 2010).
In later centuries, René Descartes, often referred to as the father of modern philosophy,
made forward speculations about the mind and the brain, even going so far as to name parts of
the brain and attempt to identify their function (Carlson, 2010). Descartes observed that many
functions of the body and brain are autonomic and involuntary in nature. Descartes called these
actions reflexes, from the Latin reflectere, “to bend back upon itself” (Carlson, 2010). While the
tern is still in use today we tend to think about reflexes a little differently. The autonomic nature
of such, however, is still the same.

43
During the 19th century, one of the most important figures in the development of
experimental physiology was Johannes Müller (Carlson, 2010). However, Müller was a staunch
advocate of the application of experimental techniques to physiology in a time when protective
laws for animals (or human subjects) did not exist. He argued that advances in physiology could
only be made through direct experimentation on animals (Carlson, 2010). Through his
experiments, Müller observed that although all nerves carry the same basic message, an electrical
impulse, we perceive the messages of different nerves in different ways (Carlson, 2010). He was
the first to assert that the brain was somehow functionally divided.
Building on the work of Müller, Pierre Flourens, French physiologist from the same era,
removed various parts of animals’ brains in order to observe their behavior (Carlson, 2010). He
created an experimental method known as ablation, which involved removal of various parts of
the brain. “By seeing what the animal could no longer do, he could infer the function of the
missing portion of the brain” (Carlson, 2010, p. 8). Soon after Flourens performed his
experiments, Paul Broca, a French surgeon, applied the principle of experimental ablation to the
human brain, using subjects whose brains were already damaged by stroke (Carlson, 2010). His
observations led him to the discovery of what became known as the Broca region, an area
thought to be involved in speech.
In 1870, German physiologists Gustav Fritsch and Eduard Hitzig used electrical
stimulation as a tool for understanding the brain (Carlson, 2010). Applying a weak electrical
stimulation to different portions of the brains of dogs, Fritsch and Hitzig discovered they could
elicit a muscular response on the opposite side of the body(Carlson, 2010). We now refer to this
part of the brain as the primary motor cortex.
44
Physiologist Hermann von Helmholtz was the first scientist to attempt to measure the
speed of conduction through nerves (Carlson, 2010). While scientists had previously believed
that such conduction was identical to the conduction that occurs in wires, such as telegraphs,
Helmholtz found that neural conduction is much slower, moving at only about 90 feet per second
(Carlson, 2010).
Modern Methods. Historically, many cases only allowed study to be conducted post-
mortem. However, recent advances in X- ray techniques and computers have led to the
development of several methods for studying the anatomy of the living brain (Carlson, 2010).
The following is an outline of the most commonly used methods.
Positron emission tomography (PET): PET measures emissions from a radioactive
substance that is injected into the bloodstream. This allows a computer interface to produce
either a two- or three-dimensional image of the brain. While this is a spatially in-depth
procedure, it is not at all temporally sensitive, capturing only still data and not split-second
responses to stimuli (Baars & Gage, 2010).
Single photon emission computed tomography (SPECT): This procedure is very similar
to PET and radioisotopes and a gamma camera to record dat. Just as the PET scan does, a
computer interface creates a two- or three-dimensional image of the active brain regions. Like a
PET it is not at all temporally sensitive, but it is effective with certain organic disorders such
epilepsy. A significant limitation of SPECT is its poor resolution compared to that of MRI
(Baars & Gage, 2010).
Magnetic resonance imaging (MRI): This technique uses magnetic fields and radio
waves to produce high quality two- or three-dimensional images of brain structures without the
use of radiation (X-rays) or radioactive chemical injections. During an MRI, the subject is put
45
through a large cylindrical machine that creates a magnetic field around the head of the patient.
The magnetic-radio frequency allows a signal transmission to create a brain image of the subject.
One of the great advantages of the MRI is that it is so vivid and precise that it allows detection of
changes in brain structures over time (Baars & Gage, 2010). While it is one of the most spatially
sensitive tests, like the others discussed so far, it is not at all temporally sensitive.
Functional magnetic resonance imaging (fMRI): This procedure uses paramagnetic
properties of hemoglobin to create images of changing blood flow in the brain associated with
neural activity (Baars & Gage, 2010). This allows images to be generated that reflect which
brain structures are activated during task performance as well as how they are activated. It is
more temporally sensitive than the others discussed so far.
Electroencephalography (EEG) is an imaging technique used to measure the electric fields
in the brain via electrodes placed on the scalp of a human. EEG offers a very direct measurement
of neural electrical activity with very high temporal resolution but relatively low spatial
resolution. Current quantitative EEG measures (qEEG) allow for detection of organic pathology,
as well as for diagnosis of psychiatric disturbances (Brietzke, 2007; Cloninger & Svrakic, 1997).
Organizational Neuroscience. The concept of organizational neuroscience as a field has
only been recently proposed (Becker, Cropanzano, & Sanfey, 2011). Becker and his colleagues
not only propose this discipline but also note that other related disciplines, such as economics
and marketing, have already integrated neuroscience into their prospective fields. These authors
further argue that, while the study of organizational behavior has been much slower to embrace
the neuroscience aspect, it has built into its own theoretical constructs cogent models for
understanding and including neuroscience, especially in the form of its models of organizational
emotions and ethical decision making postulates (Becker et al., 2011).

46
Neuroleadership. Similar to the proposal of an organizational neuroscience, the concept
of neuroleadership has been proposed but has caught on much more quickly (Ringleb & Rock,
2008). These authors attribute this shift to advances in technology, arguing that we now live and
work in an era where there is a demand that “hard science” support our theories. The work of
neuroleadership asserts that it shares work with at least four other organizational domains:
decision-making and problem solving, emotional regulations, collaborating with and influencing
others, and the facilitation of change (Ringleb & Rock, 2008).
Rock and Schwartz (2007) have made an impact in the emerging field of neuroleadership
by making a connection from the neurological dimension of physical pain and the discomfort of
organizational change. As these authors note, organizational change is difficult because it
produces sensations of actual physical discomfort. They further argue that this neurobiology
must be understood in any approach to organizational change, noting that the humanistic
approach is overrated, as empathy and persuasion is not enough to sufficiently engage the
organization in the change process, and that behaviorism does not work, as change efforts based
on incentive and threat (the carrot and the stick) lack any real efficacy in relationship to the
creation of change. Therefore, this new model is needed. Rock and Schwartz continue to make
this argument by highlighting the fact that the way in which people pay attention creates both
chemical and physical changes in the brain, shaping perception, personal realities, and identities.
Further, purposeful and focused attention in certain directions, as fostered individually or by a
leader, can lead to sustained personal (or organizational) actualization (Rock and Schwartz,
2007).
Neurobiological studies on conformity and groupthink. The first empirical approach to
the neurobiology of conformity appears to be the work of Costell & Leiderman (1968). In this
47
ground breaking study, researchers replicated the Asch paradigm examining skin responses for
subjects who were either part of a numeric minority or a numeric majority in the decision making
process. These researchers found that participants had increased arousal levels when behaving as
a dissenting minority.
Following the Costell and Leiderman study, years would pass before researchers resumed
an empirical approach to the intersection of neurobiology and groupthink, in part because
researchers needed to wait for technology to advance and become practical enough for such a use
in research. However, proponents of such an idea continued their contribution in the form of
theoretical development. For example, Agazarian (1997) proposed what she termed the theory
of living human systems (TLHS). In her work, she compares groups to living systems of
organism. This, however, is very similar to earlier work first proposed by Bronfenbrenner in his
ecology of systems approach (Bronfenbrenner, 1979). Still, Agazarian’s work has been utilized
by others to create an understanding of how isomorphic groups function collectively to form a
sort of unified mind. This unified mind has come to be called a “group mind” (Gantt &
Agazarian, 2010). This work is important to an emerging concept of a neurobiology of
groupthink in that isomorphic tendencies help explain the development of a group mind, or
uniformity in thought and behavior. These authors also make a compelling argument for the role
mirror neurons play in the development of a group mind. The mirror neuron system is highly
complex in humans. However, its basic function is to create a complete neural resonance
between individuals (Siegel, 2006). For example, watching someone perform a certain motor
activity causes the observer’s brain to fire in the same neural pattern, as if to prime the observer’s
brain to perform the same task. The same mirror neuron firing occurs when we watch someone
take a hard hit during the Friday night game, or when we watch someone mourn the loss of

48
something or someone beloved. It is therefore believed that this mirror neuron system plays a
vital role in empathy (Siegel, 2006) and in point of fact, persons with Autism appear to have
severe deficits in their mirror neuron development (Dapretto et al., 2005). However, it is
believed that the mirror neuron system also plays a vital role in the development of the group
mind, linking group members together through shared neural experiences (Gantt & Agazarian,
2010; Siegel, 2006). This linking is most likely reinforced by the neural plasticity in the brain
(Gantt & Agazarian, 2010). As the brain fires in certain patterns, frequently used neural
networks become strengthened and unused networks become pruned. Therefore, the mirror
neuron system interacts with the neural plasticity of the brain to reinforce the very patterns that
link members together in the group mind.
It seems important to note at this point the probable interplay between the group mind as
defined by both Siegel and Agazarian and the role the autonomic nervous system (ANS) plays in
social behavior as determined by polyvagal theory. Developed by Stephen Porges in the last
couple decades, polyvagal theory postulates the multiple branches of the vagal nervous system,
which comprises part of the autonomic nervous system, are largely responsible for several facets
of human interaction including the development of the social brain (Porges, 2001). Specifically,
the human brain is wired to ensure survival. As such, potentially life-threatening events, which
from an evolutionary perspective would include exclusion from a group, activate an alarm within
the sympathetic nervous system (also comprising the ANS, and inter-related to the vagal nerve)
that regulate the human to behave in such a way as to maintain their membership in the group
(Porges, 2001). Mirror neuron responses that signal threat would no doubt also trigger this vagal
response, and in turn the brain’s synaptic strengthening or pruning, the use it or loose it principle,
of information processing within the group, potentially reinforcing the group mind.
49
Other findings related to the neurobiology of a group mind. Other researchers have
contributed to a growing body of work that can be logically related to a construct of the
neurobiology of groupthink. For example, researchers have determined that the presence of
persons identified, or known to the group, as “experts” triggered responses in the caudate nucleus
involved in trustful behavior, reward processing, and learning (Klucharev, Smidts, & Fernández,
2008). Therefore, on a very neurobiological level, the presence of an expert triggers a brain
response that results in attitudinal influence (Klucharev et al., 2008). However, it is not just the
presence of experts that can impact how the brain responds to the environment. Researchers
have found that the brain responds with marked increased firing patterns to familiar faces, such
as grandmothers and certain well-liked celebrities, for example Jennifer Aniston, but not her
former spouse, Brad Pitt (Quiroga, Reddy, Kreiman, Koch, & Fried, 2005). It is important to
note that while we still do not completely understand this selective phenomenon, this neural
firing pattern may be related to ways on which other information is retained, stored, or processed
(Connor, 2005). This may, in time, help demonstrate the power of the celebrity spokesperson.
Another group of researchers used fMRI technology in conjunction with an assigned task
of mental rotation to investigate the neurobiology of conformity when participants were
subjected to peer pressure in contexts where they were given clearly wrong information (Berns et
al., 2005). Conformity behavior was associated with changes in the occipital-parietal network
(the part of the brain responsible for organizing visual information). However, non-conformist
behavior was associated with increased activity in the amygdala (the emotional brain) as well as
increased activity in the caudate nucleus, the part of the brain involved in learning and memory.
The authors suggest that this data may provide the first biological evidence for the role of both
perception and emotion related to conformity contexts (Berns et al., 2005).
50
Another group of researchers used fMRI technology to examine to role of social
influence on conformity similar to the previous study. However, the purpose of the latter
approach was to make a neurobiological distinction between true attitudinal conformity and a
public pretense of conformity (Zaki, Schirmer, & Mitchell, 2011). These researchers noted that
true social influence was associated with two particular brain regions: the nucleus accumbens,
part of the reward circuitry of the brain, and orbitofrontal cortex, the portion of the brain
involved in the cognitive aspect of decision-making (Zaki et al., 2011).
In a slightly different approach, researchers, again using fMRI, collected data on
participants while they learned about reviewer opinions on certain musical compositions,
examining the interaction effect of administered reward (tokens) and expert influence
(Campbell-Meiklejohn, Bach, Roepstorff, Dolan, & Frith, 2010). These researchers were
particularly interested in the ventral striatum. The ventral striatum, which contains the nucleus
accumbens involved in learning, is considered one of the brain’s important reward centers. Both
receipt of the valued tokens as well as agreement with two or more experts resulted in increased
activity in a particular region of the ventral striatum. The researchers determined that social
influence on the value of an object, in this case musical compositions, was correlated with the
brain’s learning circuitry and may therefore be a determinant for any rapid spread of values
throughout a population (Campbell-Meiklejohn et al., 2010).
While the current research certainly supports old-fashioned learning theory, an aspect of
learning theory, and conformity, that has received little attention in neurological research is that
of the “prediction-error” signal. When an individual finds that their opinion or thought is not in
agreement with the group, the individual experiences dissonance. As a result, it has been
postulated, that a message is unconsciously sent signaling that the individual’s own opinion or
51
thought is in error, thus urging the person to conform to the group (Garrett, 2011). This has
recently been tested in a study where participants we asked to make individual judgments of
facial attractiveness before being exposed to opinions of the group. Responses that were
divergent from the group resulted in increased activity in the rostral cingulate zone (believed to
anticipate the likelihood of negative outcomes in response to errors) and the ventral striatum.
This suggests that social group norms influence conformity through the learning and
reinforcement centers of the brain (Klucharev, Hytönen, Rijpkema, Smidts, & Fernández, 2009).
Others have conducted similar studies using electroencephalography (EEG) technology with
similar results, suggesting that the brain responds to social norm violations as “errors” (Kim et
al., 2012).
The neurobiology of reinforcement and learning circuitry may explain more than just
conformity; it appears to play a vital role in decision making itself. For example, using the
Ultimatum and Dictator games often used in business studies, researchers discovered marked
increases in the anterior cingulate cortex (a part of the brain associated with autonomic functions
as well as cognitive and emotional processes such as reward anticipation, decision making, and
empathy) when participants were confronted with unfair offers to which subjects had to make a
decision on how to respond (Hewig et al., 2011). This work highlights the emotional and social
influences on a neurobiological level that drive decision-making and why human often deviate
from what would seem to be rationale behavior (Hewig et al., 2011).
While others have continued to find links between the neural regions of the brain
underlying reinforcement learning and conformity based on social expectation and error
violation and correction (Harris & Fiske, 2010) as complex as the human brain is, no one area of
the brain can be tied to a construct of the neurobiology of conformity or groupthink. Researchers

52
continue to identify parts of the brain associated with conformity and groupthink. Through the
use of theta-burst transcranial magnetic stimulation to the posterior medial frontal cortex, (the
PMFC, also associated with error identification as well as behavioral adjustment based on social
norms) researchers determined that downregulation in the PMFC (a numeric decrease in the
number of cells or cellular connections) resulted in a marked decrease in conformity by
participants (Klucharev, Munneke, Smidts, & Fernández, 2011).
Summary
Leadership, a continually evolving field of study, plays a central role in understanding
organizational behavior (Robbins & Judge, 2010). However, studies have focused more on the
qualities of leaders and on followers as they relate to those leaders, than on the qualities of
followers themselves (P. Hoffman, 2009). Therefore, the study of “followership” remains an
under-investigated domain. It has been furthered argued that no model of leadership can be truly
understood without a well-developed construct of followership.
The little that has been studied regarding followership is perhaps best represented in the
disciplines of anthropology, sociology, and social psychology. The relationship between leaders
and followers is said to be so powerful that sometimes it is difficult to determine who is doing
the leading and who is doing the following. Further, some of the most important changes in
social history have come, not from the top down (the leadership approach) but from the bottom-
up (the followership approach). One such stated example is the Protestant Reformation. While
followers generally do not fit into any fixed category, five reasons for followership were
provided. Still, the relationship between followership and conformity also remains under
investigated.

53
Conformity can serve a useful function when people adhere to the social norms of a
group (Baron et al., 2009), such as standing in line to board a bus. However, conformity in
certain forms can have devastating effects on a group or society (Baron et al., 2009). In fact, in
the aftermath of the Holocaust, researchers like Solomon Asch and Phillip Zimbardo sought to
investigate the type of conformity that could lead a nation to commit such atrocities (Baron et al.,
2011). Janis took this information a step further in the development of his construct of
groupthink. Research on groupthink has made connections among several U.S. policy decisions
over the last three-quarters of a century, ranging from the failure to prevent the attack on Pearl
Harbor to the decision to invade Iraq in search of weapons of mass destruction.
Several subject variables have been linked to tendencies to conform including gender and
age. Persons from collectivists cultures are also slightly more inclined to conform to the group.
Other factors include the basic human need to belong to the group as well as the need to be right.
Researchers note that exclusion causes emotional pain to the individual and that emotional pain
follows the same neural circuitry as physical pain. Other factors include religiosity, cognitive
rigidity, group cohesiveness, group size, and awareness of group expectations or norms.
Janis provided eight symptoms of groupthink as well as three antecedent conditions.
Researchers have found mixed support for each of these. However, among the strongest
correlations are inherent morality and cohesiveness. Researchers also determined that the
presence or absence of decision-making protocol was extremely important in predicting whether
or not group members would engage in groupthink. The partiality of the leader (whether they
were objective or biased in a certain direction) was also influential.
While neuroscience is a continuing emerging field, the intersection of neurobiology and
groupthink or conformity remains relatively under-investigated. What is suggested by the
54
current literature is that the ANS plays a role in conformity as does certain other brain structures
(the occipital-parietal lobe responsible for organizing important information, the amygdala,
known as the seat of emotion, the caudate nucleus, responsible for learning and memory, and the
ventral striatum, part of the reward and reinforcement circuitry in the brain). While these data
have traditionally been captured through a wide range of technologies including fMRI, PET, and
SPECT, EEG and in this instance qEEG, provides a temporally sensitive approach to the current
elements under investigation.

55
Chapter Three: Methodology
Introduction
The purpose of this study is to investigate the neurobiological basis of groupthink as a
dimension of conformity, a component of followership, in order to advance understanding of
effective leadership strategies and the development of healthy organizations. Based on the
literature review, the researcher has several assumptions regarding the expansion of a groupthink
framework. Specifically, the researcher believes that the following social dynamics are integral
to the groupthink phenomenon: rigid thinking, level of commitment (moral, philosophical,
religious, political, ideological, etc.), leader bias and influence, and the presence or absence of
decision-making protocols. The researcher also asserts that the tendency to conform is also
neurobiological in nature; that as dissonance exists, or group pressures toward conformity
threaten expulsion from the in-group, individuals will often attempt to mediate this
neurophysiological distress by conforming.
In considering the interaction that rigid thinking may have on level of commitment, the
researcher has conceptualized a matrix describing a possible outcome. That matrix is presented
in Table 1. If rigid thinking and commitment levels interact with regard to conformity, one
would expect to see the highest levels of groupthink among groups whose members were more
cognitively rigid and reported higher levels of ideological commitment, and lower levels among
those whose thinking is more flexible and less committed. For the purpose of this project, low
levels of cognitive flexibility (high cognitive rigidity) were defined by scores in the bottom 50
percent of the distribution on a given inventory, whereas scores in the top 50 percent of the
distribution defined high cognitive flexibility (lower cognitive rigidity). Scores on a given

56
inventory of 5 or lower defined low levels of commitment or lower, and high levels were defined
by scores on the same inventory of 6 or higher.
Table 1.
Framework for Possible Interactions for Rigidity and Level of Commitment
Low Commitment High Commitment
Low Rigidity (Anticipate lowest
levels of groupthink)
High Rigidity (Anticipate highest levels
of groupthink)
Research Questions
The research questions presented in chapter one will be used in the hypothesis testing of
this design. Those questions are:
1.To what extent, if any, might groups higher in rigidity and commitment demonstrate high
levels of groupthink?
2.What difference, if any, does the implementation of decision-making protocols make in the
final outcome?
3.How does the presence of a leader impact the final decisional outcome with regard to
groupthink?
4.To what extent, if any, does the presence of a perceived leader moderate the
neurobiological dimensions of conformity?
5.To what extent, if any, does the partiality of the leader impact the final outcome?

57
6.To what extent, if any, does the partiality of a perceived leader moderate the
neurobiological dimensions of conformity?
Nature of study
This study has been conceptualized in two phases, as discussed below in the methodology
section of this chapter. The first phase was first conceived of as a pilot study to test the
worthiness of the vignette to be used in the later groupthink experiment. However, this “pilot”
condition appeared to be a perfect opportunity to test the researcher’s interactional matrix,
examining possible interactions between rigidity of thought and level of commitment with regard
to groupthink. This pilot condition has been renamed as study 1. The specific details associated
with study 1 are also outline in the methods section below.
The second phase is the actual experimental process. Although this phase, henceforth
referred to as study 2, is also outlined below, it is important to state at this point that the nature of
study 2 is a quasi-experimental design examining both socio-psychological factors (the influence
of leader bias and the influence of the presence or absence of decision-making protocol) as well
as neurobiological factors (as measured by qEEG and analyzed using LORETA software). A
summary of these two studies can be found in Table 2.
Characteristics Studied
The characteristics under investigation include neurological responses to social pressure
and conformity. However, this study was designed to include certain socio-psychological
variables. Those variables include rigid thinking, ideological commitment, leader influence
(present, not present, biased, or impartial) and the impact of decision-making protocol. Each of
these, as well as other key operational definitions, is defined in the following section.

58
Definition of characteristics. The following is a list of operational definitions for the
characteristics under investigation.
Conformity: The degree to which the participant acquiesces to the group. This is a basic
categorical definition (“yes” or “no”) as the participant could either conform or not conform.
Cortical changes: Differences in the brain’s cortex from a baseline, pretest condition, was
compared to data collected through qEEG in the posttest to ascertain possible changes related to
the conformity experiment during study 2. Any change not better accounted for by mental
activity was recorded.
Decision-making Protocol: In a broad sense, this refers to the procedures, whether fully
developed or not, or formal or informal, available to an individual to guide the decision making
process. However, specific to this design, a protocol patterned after Janis’ recommendation to
avoid group think (1972) was used in groups assigned as such. This is also a categorical, or
nominal, measurement in that either the protocol was made available to the group, or it was not.
Specific details of the protocol are discussed in the instrumentation section of study 2.
Groupthink: This refers to conformity of thought. In this research the terms groupthink and
conformity will be used interchangeably.
Level of Ideological Commitment: This is a self-report measure along three domains, measuring
commitment to political, religious, and general ideological viewpoints. For the purpose of this
study, the data were measured along a 10-point ordinal level scale. This measure is outlined in
specific detail in the instrumentation section of study 1.
Leader Influence: The degree to which the presence or absence, and biased or impartial nature of
the leader impacts the group’s ability to think or make decisions. This is also a bimodal,

59
categorical scale; the leader (an actor) will either attempt to persuade participants to a particular
outcome, or he will present unbiased without an attempt to persuade.
Quantitative Electroencephalography (qEEG): This is the instrumentation that was used to record
cortical behavior in both the pretest baseline and the posttest.
LORETA (Low Resolution Electromagnetic Topographic Assessment): This is a software
interface that allowed the researcher to identify the subcortical structures that were generating
the changes measured by the qEEG.
Rigid Thinking: This is demonstrated by a lack of ability to be flexible in thought, to consider
alternative views, and to tolerate opposing information. For the purpose of this study, rigid
thinking was measured using the Cognitive Flexibility Inventory (Dennis & Vander Wal, 2010).
This instrument measures cognitive flexibility verses rigidity using 20 items on a seven-point
semantic differential scale. Scores, therefore, could range from 20 to 140 with lower scores
representing increased cognitive rigidity. This instrument is discussed in more detail in the
instrumentation section of study 1.
Subcortical Source Generation: This refers to the subcortical structures of the brain that may be
generating the electrical signals that are observed in the brain’s cortex. Examples might include
the limbic system, the thalamus, and the insula.
Methodology
The author proposes a two-study design. The first is a pilot condition to test the efficacy
of a vignette, as well as the first research question. The second study was designed to test the
remaining research in a mock decision-making group session that will include confederates and
utilize the use of quantitative electroencephalography (qEEG) technology to examine the effects
of such group activities and conformity on the brain. Some general information, applicable to

60
both studies, will be given below. Sections for both study 1 and study 2 will then follow,
providing complete methodological details and participant data for each. Finally, information
regarding risk to participants, debriefing procedures, and follow-up are provided toward the end
of this chapter.
Population, sample and sampling technique. For the purpose of this study, participants
were recruited from a mid-sized private university in Southern California. Participants were
undergraduate level students participating in research as a part of a course requirement or as
extra credit for a course (the investigator does not teach at the undergraduate level at this time
and therefore, the students recruited were not her students for any classes). Further, while some
students may have been recruited from classes that require research participation and/or offer
extra credit for participation, those conditions were outside of the control or discretion of the
investigator. While this form of convenience sampling is less than ideal, this approach allowed
the researcher access to the number of participants needed to complete this research. Further,
this strategy facilitated ease of debriefing at the conclusion of the study. The specific process of
debriefing is outlined in the following paragraph under deception. Participants were not
compensated for their time.
Recruitment Procedure. Participants were recruited from undergraduate courses in the
School of Behavioral Sciences at California Baptist University using the information sheets
found in Appendix A and B. These documents were handed out in all undergraduate psychology
classes in the School of Behavioral Sciences by that course’s faculty (not the researcher). This
method is used routinely and students, apart from certain course requirements, know they are
free to choose, or not choose, to participate in such studies. Further, because this is done so
frequently within the School of Behavioral Sciences, students are provided several options in

61
which studies to participate; this is especially helpful for students in courses that require
participation in research as they have more freedom to choose studies with which they feel
comfortable. It also ensures that if they choose to withdraw from a study, there are still more
choices available. Instructors for the courses from which participants were drawn were only
informed about whether or not the subject participated in the research and not any other data or
results. Therefore, faculty members had no information on which to reward or penalize students.
Again, however, how the course is designed with regard to required research participation is
beyond the investigator’s control. Participants were told in their electronic consent (administered
on Survey Monkey) that their participation was strictly voluntary and that they could withdraw
from the study at any time. Further, the researcher, at the outset of the actual research, reminded
them of that verbally.
Informed Consent. In both studies of the design, consent to participate was obtained
from each participant before participation began. Further, participants were assured of their right
to withdraw from the study at any point and were given a copy of the participant bill of rights.
Copies of both the consent forms for both studies (Appendices C and D) and bill of rights
(Appendix E) are attached.
Consent Process. From the information sheets disseminated to recruit subjects,
participants were instructed to follow a Survey Monkey link that provided them the consent form
and participant bill of rights. Participants provided consent by either clicking “I do consent to
participate in the study” or “I do NOT consent to participate in the study.” Participants that
consented were directed to a page to sign up for a time to participate that best fit their schedule
using ONLY their student ID number. Those that did not consent were directed to a

62
“disqualification page” that read “Thank you for your participation.” This anonymous electronic
process allowed for data collection without attaching names to the data.
Privacy, confidentiality, and data protection. To ensure confidentiality, no names
were recorded on any of the data collected; only student ID numbers that were not easily
recognized were used. Because the consent forms and bill of rights were also provided
electronically, no names were recorded there either. Hard copies of data were (and will be)
stored in a locked filing cabinet only accessible to the researcher and any electronic copies have
been stored on a hard drive and have been password protected. Data will be stored for 5 years,
and then destroyed. To ensure the highest levels of confidentiality, participants provided student
ID numbers (rather than names) when they consented to the study; however, the researcher later
removed these numbers and reassigned a non-identifiable number (code) to all data collected. In
study two, the software being used to conduct the qEEG automatically generated those numbers.
The key and passwords for all data have been secured and is accessible only to the researcher.
This is in accordance with the Institutional Review Board policies of both institutions involved.
Use of private health information. This study did not include any private health
information (PHI) or fall under HIPPA as outlined under federal and APA guidelines. Data were
coded so that there would be no identifiable information. Further, the researcher does not meet
the criteria of a “covered entity” as outlined in federal regulations or APA guidelines, and this
study did not include a review of health/mental health information nor did it result in the addition
of new information to a medical record.
Use of deception. Because the participants were initially told they would be participating
in a study on decision-making (not conformity or groupthink) some use of deception, however

63
subtle, was involved. Therefore, debriefing was considered important for the ethical outcome of
the study. Debriefing procedures are discussed in the section that follows.
Debriefing. At the conclusion of study, the researcher visited every psychology class
from which students were drawn in order to provide an overview of the true nature of the study,
to discuss the use of deception, and to share the results. Students were provided with a time for
questions and reminded that they could withdraw their data should they choose. They were also
assured that if they needed or wanted to speak with the investigator they were welcome to do so;
contact information to that end was reiterated. Additionally, when all of the final data had been
completely analyzed, participants (all students enrolled in classes where recruitment took place)
were also debriefed by email. Those emails described the actual nature of the study with the
findings, and informed participants of their right to withdraw their data or participation in the
study. A sample email can be found in Appendix F.
Follow-up procedures. Participants were informed in advance that should they
experience any anxiety or psychological discomfort following the study, they were welcome to a
face-to-face debriefing with the PI, who is also a licensed clinical therapist. In the unlikely event
that the distress should continue beyond the face-to-face debrief, participants would be provided
with 3 referral sources for follow-up. Those referrals would be custom designed for the
particular participant but would likely include the CBU counseling center. To date, no participant
has come forward to state they experienced any anxiety or distress or stating a need or desire to
be debriefed personally by the investigator.
64
Study 1
Initially, the present researcher wanted to study the neurobiological correlates of
groupthink in a mock decision making activity using a vignette. However, the vignette would
first have to be piloted. It was at this time that the present researcher saw an opportunity; it was
determined to use the “pilot” condition as an opportunity to test the interactional matrix
described earlier in this chapter. Therefore, study 1 of this experiment functions to test the
worthiness of the vignette and make modifications as needed, and to test the matrix (research
question 1).
Participants. Thirty-five participants (five male, and 30 female) were recruited from
undergraduate classes at a midsized university using the procedures described earlier in this
chapter. Demographic information for these participants is provided in chapter four.
Procedure and instrumentation. Participants arrived to the institution’s research center
according to the day and time for which they had previously volunteered. The study’s
confederates were already seated as if they had arrived early as participants. Time was
streamlined as participants had already completed the online consent form process. Physical
copies of the participant bill of rights were made available. Participants were thanked for
coming and were again reminded that they could withdraw from the study at any time.
Participants were provided with a self-report instrument simply titled “Participant
Questionnaire,” found in Appendix G, as well as the Cognitive Flexibility Inventory (CFI) found
in Appendix H. Permission to use the CFI can be found in Appendix I. When all participants
had completed the form, they were given a vignette to read then discuss aloud (see Appendix J).
Participants (and confederates) were then given an “exit survey” to record privately their
response to the vignette. The exit survey can be found in Appendix K.
65
The experiment was conducted over a two-day period. Groups on day one were
designated as “no” groups, meaning the confederates would imply that they were going to vote
no as well as the reasons why they would vote this way. Groups on day two were designated as
“yes” groups, indicating that confederates would state they were going to vote yes, along with
the reasons why. Participants (unknowingly) self-assigned themselves to these groups based on
the day for which they signed up.
Participant Questionnaire. This instrument was designed as a self-report measure
intended to assess an individual’s reported level of commitment in three domains: political,
religious, and ideological. Created specifically for the purpose of this project by the present
researcher, this self-report measure (which includes the study’s demographic questions)
measures the three domains along a 10-point scale. This instrument can be found in Appendix G.
Cognitive Flexibility Inventory. To test the interactional matrix subjects were
administered the Cognitive Flexibility Scale (CFI) demonstrated to be both valid and reliable
(Dennis & Vander Wal, 2010). A copy of the CFI can be found in Appendix H. Permission to
use the CFI was granted by Springer New York, LLC through the Copyright Clearance Center
(see Appendix I).
Study 2
Study two is actually the original research design concept for this project, where it was
determined that the present researcher would examine the neurobiological correlates of
groupthink by taking pretest and posttest measures of electrical-cranial activity in the brain
before and after a group decision making activity. This is a non-medical study that used
digitalized electroencephalographic technology. However, the technology is FDA approved for
multiple medical uses and is considered safe and non-invasive. This research did not include any
66
review of a participant’s health history, nor did it result in new medical or mental health record
or data.
Participants. Twenty-two participants (two male, and 20 female) were recruited from
undergraduate classes at the same midsized university using the same procedures described
earlier in this chapter. Demographic information for these participants is also provided in
chapter four.
Procedure and Instrumentation. In this phase, subjects were assigned to one of six
experimental conditions: Biased leader with decision-making protocols, biased leader without
decision-making protocols, impartial leader with decision-making protocols, impartial leader
without decision-making protocols, no clear leader (confederates only) with decision-making
protocols, and no clear leader (confederates only) without decision-making protocols. The
“leader” of these groups acted as an implicit, rather than explicit leader; specifically, the leader
(confederate) knew he was assigned as the leader and was to take charge, but he was not
identified to participants as a leader, nor were there any other indications that he was in fact the
group leader.
Group assignment was made based on the day and time for which each participant signed
up. These assignments were made in advance, and because the sign-up process was electronic
and remote, the researcher had no influence on which days or times the participant selected.
Group assignments to the six groups are visually displayed in Figure 1.
Participants arrived at their self-assigned time. They were then seated in a comfortable
chair while the researcher asked for baseline information necessary to perform the qEEG. These
questions and the instrument used to collect that data can be found in Appendix L. It is
important to note, however, that the information collected on that form was for the sole purpose
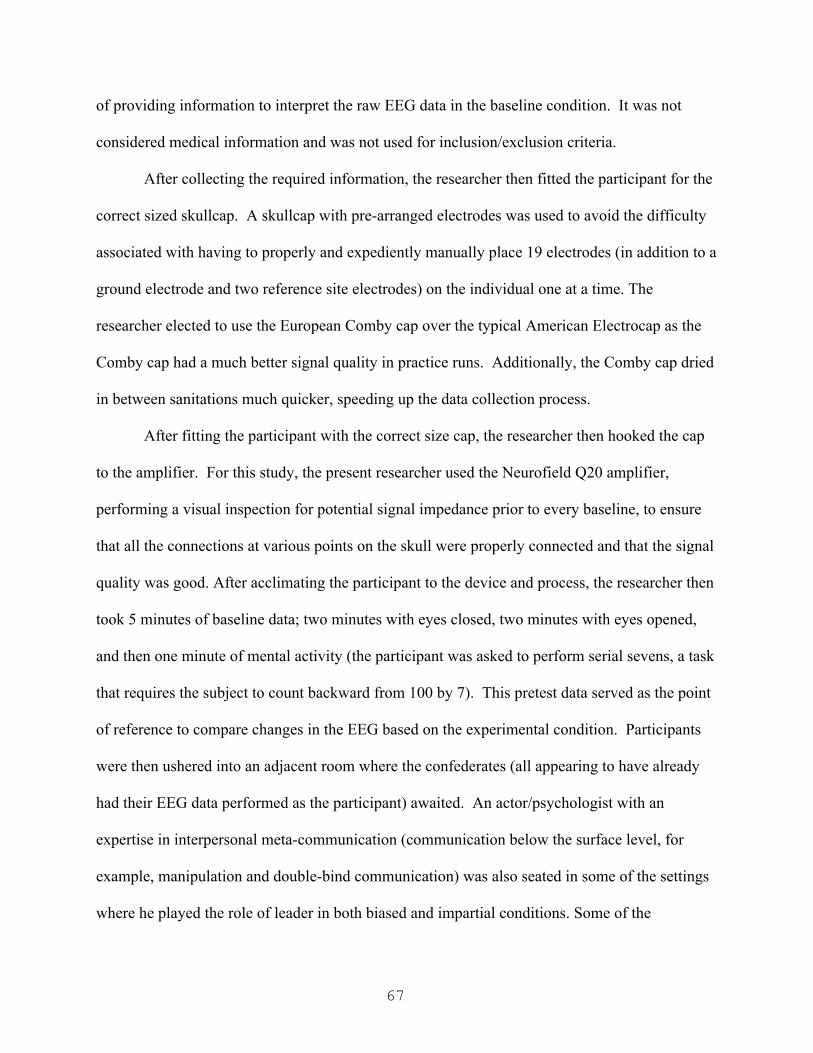
67
of providing information to interpret the raw EEG data in the baseline condition. It was not
considered medical information and was not used for inclusion/exclusion criteria.
After collecting the required information, the researcher then fitted the participant for the
correct sized skullcap. A skullcap with pre-arranged electrodes was used to avoid the difficulty
associated with having to properly and expediently manually place 19 electrodes (in addition to a
ground electrode and two reference site electrodes) on the individual one at a time. The
researcher elected to use the European Comby cap over the typical American Electrocap as the
Comby cap had a much better signal quality in practice runs. Additionally, the Comby cap dried
in between sanitations much quicker, speeding up the data collection process.
After fitting the participant with the correct size cap, the researcher then hooked the cap
to the amplifier. For this study, the present researcher used the Neurofield Q20 amplifier,
performing a visual inspection for potential signal impedance prior to every baseline, to ensure
that all the connections at various points on the skull were properly connected and that the signal
quality was good. After acclimating the participant to the device and process, the researcher then
took 5 minutes of baseline data; two minutes with eyes closed, two minutes with eyes opened,
and then one minute of mental activity (the participant was asked to perform serial sevens, a task
that requires the subject to count backward from 100 by 7). This pretest data served as the point
of reference to compare changes in the EEG based on the experimental condition. Participants
were then ushered into an adjacent room where the confederates (all appearing to have already
had their EEG data performed as the participant) awaited. An actor/psychologist with an
expertise in interpersonal meta-communication (communication below the surface level, for
example, manipulation and double-bind communication) was also seated in some of the settings
where he played the role of leader in both biased and impartial conditions. Some of the

68
conditions included decision-making guidelines. These decision-making protocols (Appendix
M) were influenced by the guidelines developed through Janis’ research on how to mediate
groupthink effects (Janis, 1982). Regardless of condition, all participants (and confederates)
were then orally given the instructions by the researcher to read the vignette silently, then to
discuss the vignette as a group. Participants were told when they were ready to decide what they
thought the protagonist (Chad) should do, they could record their response of their private exit
survey. Confederates generally covered their exit surveys up when writing their responses to add
to the illusion of anonymity. The amount of time it took for the participant to decide was then
recorded in minutes. These conditions, and the rest of the details about the design, are
summarized in Table 2.
Following the study, participants were then instructed that they would be re-measured
based on the order of the last one in the room. Therefore, the actual participant (not the
confederate) was the first to be escorted to the research room where the equipment was located.
The participant was then seated again in the comfortable chair and administered one last qEEG.
Another two minutes of data were collected (one minute eyes closed and one minute eyes
opened) while the participant was asked to recall their experience “working with the group to
make a decision.”
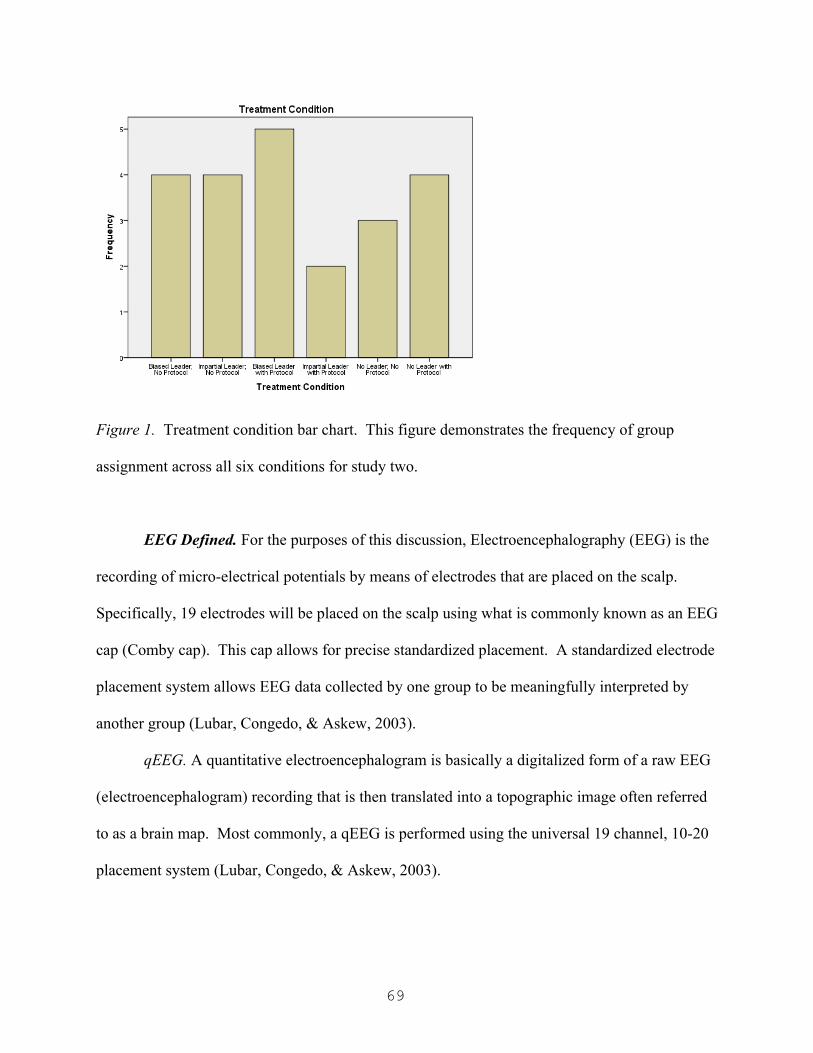
69
Figure 1. Treatment condition bar chart. This figure demonstrates the frequency of group
assignment across all six conditions for study two.
EEG Defined. For the purposes of this discussion, Electroencephalography (EEG) is the
recording of micro-electrical potentials by means of electrodes that are placed on the scalp.
Specifically, 19 electrodes will be placed on the scalp using what is commonly known as an EEG
cap (Comby cap). This cap allows for precise standardized placement. A standardized electrode
placement system allows EEG data collected by one group to be meaningfully interpreted by
another group (Lubar, Congedo, & Askew, 2003).
qEEG. A quantitative electroencephalogram is basically a digitalized form of a raw EEG
(electroencephalogram) recording that is then translated into a topographic image often referred
to as a brain map. Most commonly, a qEEG is performed using the universal 19 channel, 10-20
placement system (Lubar, Congedo, & Askew, 2003).
70
The 10-20 system of electrode placement is an international system that places electrodes
at sites that are all either 10% or 20% of the distance of the total amount of space from the nasion
to inion (front to back) or from one preauricular point to the other (side to side).
While imaging techniques such as MRI, PET and SPECT offer in-depth spatial resolution,
especially of the deeper brain structures such as the hippocampus and amygdala, they are not
temporally sensitive; that is to say they cannot provide information as to how the brain responds
to split second stimuli. However, high resolution, quantitative electroencephalography (qEEG),
also known as the digitalized EEG, does offer this ability. While there is considerable disparity
in the literature with regard to the few number of qEEG studies in comparison with measures
such as PET, MRI and fMRI, the qEEG is a relatively non-evasive practical approach to
neuroimaging (Brietzke, 2007). Although it is often used in research, it has also been
demonstrated effective in the detection of organicity (biologically driven pathology), as well as
for diagnosis of psychiatric disturbances (Brietzke, 2007; Cloninger & Svrakic, 1997).
Montaging and Analysis. Modern qEEG software allows for data to be recorded once
then montaged as many different ways as the researcher chooses or deems appropriate to the
data. A montage is an arrangement of electrode reference combinations. This allows a
researcher to reduce artifact and signal noise through identifying common modes in different
arrangements. For the purpose of this study, it was determined that all of the brain maps (5
recordings per participant) would be montaged using three standard montages. Those montages
included Average Reference, Linked Ears, and LaPlacian.
Raw EEG tracings were first inspected to remove artifact. Artifact refers to signal
interference that shows up in the EEG but is not part of the EEG record itself. Common
examples include eye blink or movement, swallowing, heartbeat, and muscle tension. Artifact

71
free data was then digitally analyzed to produce the appropriate brain maps in all three montages
using Neuroguide software, the standard in the industry (Gunkleman & Lubar, 2013).
Low Resolution Electromagnetic Tomography (LORETA). While both PET analysis
and fMRI studies provide good topographies of the brain, they are limited in their ability to
capture the rapid firing phenomenon in the brain (Pascual-Marqui, Esslen, Kochi, & Lehmann,
2002). A quantitative EEG does, however, capture these neuro-electrical firing processes.
Further, while the digital EEG allows for the creation of a brain map, interfacing that data with
low resolution electromagnetic tomographic software such as LORETA allows for topographic
analysis that is more temporally sensitive than PET or fMRI (Pascual-Marqui et al., 2002).
Additionally, LORETA offers a particular advantage in that it allows a researcher to identify the
subcortical source of the electromagnetic wave being generated (Gunkleman & Lubar, 2013).
After all of the data was digitally analyzed in the different montages, artifact free data in the
linked ears reference was selected and analyzed using the LORETA software. Specifically,
differences between baseline and posttest conditions were noted and LORETA was used to
identify the subcortical source generators for areas of interest.
Risk to Participants. The fact that EEG/qEEGs are safe and painless is well documented
in the literature and is even stated on the Mayo Clinic website. Deception sometimes entails
minor psychological risks. Should any participant report or present with any distress related to
the study’s deception, he or she would be assessed by a licensed clinician (the PI) and
immediately referred to an appropriate outlet (counseling center, etc.).

72
Table 2.
Summary of Two-Phase Experiment
Variables Tested Instruments Number of
Subjects
Procedure
Phase 1. Rigid v flexible
thinking X Level
of commitment
(2x2 matrix).
This is also a
“pilot” condition
to assess the
development of
the experimental
vignette.
Cognitive
Flexibility
Scale (CFI)
found in
Appendix I
and the self-
report
measure
found on the
instrument
provided in
Appendix H
10 groups
of 6-10
(with 1-3
con-
federates in
each
group)
Participants will be given
a vignette to read and then
discuss with the group.
Following the discussion,
participants will render a
written decision on an
“exit survey.” This
information will be
assessed against their
scores in the Cognitive
Flexibility Inventory and
the self-report measure of
commitment level in the
instrument found in
Appendix H.
(continued)

73
Variables Tested Instruments Number of
Subjects
Procedure
Phase 2. Socio-
psychological:
Leader influence
(bias verses
impartial) and the
impact of
decision-making
protocol
(Appendix L).
Neurobiological:
Changes in neuro-
electrical activity
related to a
conformity task,
as measured by
qEEG.
qEEG
equipment
including
software and
skull caps.
5 subjects
to each of
the six
conditions
(approx.
30)
Experimental (qEEG) Groups:
1. Biased Leader with
decision-making
protocol.
2. Biased leader without
decision-making
protocol.
3. Impartial leader with
decision-making
protocol.
4. Impartial leader without
decision-making
protocol.
5. No leader (confederates
only) with decision-
making protocol.
6. No leader (confederates
only) without
decision-making
protocol.
74
Summary
The present chapter outlines a two-phase approach to empirically testing a construct of
groupthink for six stated research questions. In the first phase, which also serves as a pilot study
to test the vignette, the interactional matrix was assessed in an attempt to determine if there was a
correlation between rigidity and ideological commitment in relationship to conformity.
Participants in this study self-selected one of two conditions (groups voting “no” or groups
voting “yes”) based on the day and time they selected to participate. They were administered a
demographic and ideological survey, as well as the CFI. They were then asked to participate in a
group decision-making activity where they read and discussed the vignette before recording their
responses on an exit survey.
In phase two, the neurobiological correlates and moderation effects were assessed in six
different treatment groups. The design for study two was similar to study one but in lieu of
paper instruments (the survey and CFI) pretest and posttest data was collected through the use of
qEEG, which was digitally analyzed in both Neuroguide (brain mapping software) and
LORETA. Because a modicum of deception was used, the methodological approach concluded
with a full debriefing to all participants.

75
Chapter Four: Results
Introduction
The purpose of chapter four is to provide a detailed description of the procedures for data
analysis and a complete overview of the research results. This chapter will first review the
participant characteristics, analytic process, and research findings for study one. Then, the
participant characteristics, analytic procedures and research results for study two will be
explained. Finally, this chapter will conclude with a summary.
Study One
The original purpose of study one was to pilot the vignette. However, an opportunity was
seen to use the pilot study to test out an interactional matrix to determine whether or not
cognitive rigidity or ideological commitment had any impact on conformity with regard to group
think. Research question one was developed specifically to explore this possibility. Research
question one asks the following: To what extent, if any, might groups higher in rigidity and
commitment demonstrate higher levels of groupthink? The outcome is described below.
Participants. The first study consisted of 35 participants, all recruited from
undergraduate courses at a mid-sized private university. Of the 35 participants, five were male
and 30 were female; three spoke English as a second language and were in the U.S. on student
visas from China. Age of participants ranged from 18 to 22, where the mode was 19, and the
mean age 19.67. Although the frequencies of ethnic backgrounds for the participants are
illustrated in Table 3, they are as follows: 54% Caucasian, 23% Hispanic, 11% Asian and 9%
African-American/Black.

76
Table 3.
Study One Ethnicity of Participant
Frequency Percent Valid Percent
Cumulative
Percent
Valid Asian 4 11.4 11.8 11.8
Black/African
American 3 8.6 8.8 20.6
White/Caucasian 19 54.3 55.9 76.5
Hispanic/Latino(a) 8 22.9 23.5 100.0
Total 34 97.1 100.0
Missing 99.00 1 2.9
Total 35 100.0
Analytical Techniques. Totals for the demographic and ideological survey as well as the
CFI were totaled and entered for data analysis. Data were analyzed using the Statistical Package
for the Social Sciences (SPSS).
Results. Of the 35 participants that participated in the study, only three did not conform
to the group position (two were in the same group, arrived together, and appeared to be friends).
The conformity rate for this study, therefore, was 91.4%. Because of the high level of
conformity, no significant statistical differences were found with regard to the interactional
matrix. The makeup of the participants with regard to religious, political, and ideological
commitment as reported on the ideological survey is interesting to note. Specifically, although
the sample was drawn from a Christian school, participants reported higher levels of political

77
commitment (Figure 1) than religious commitment (Figure 2). Levels of ideological
commitment can be seen in Figure 3. The overall level of commitment (the average of the three
types) demonstrates a fairly well shaped bell curve (Figure 4).
Overall, there was not enough information, likely due to small sample size and high
levels of conformity to truly address research question one.
Figure 2. Level of political commitment. This figure shows the level of political commitment as
reported by the participants in the sample. Note the distribution is negatively skewed (Mean =
8.34, S = 2.141, N = 35).
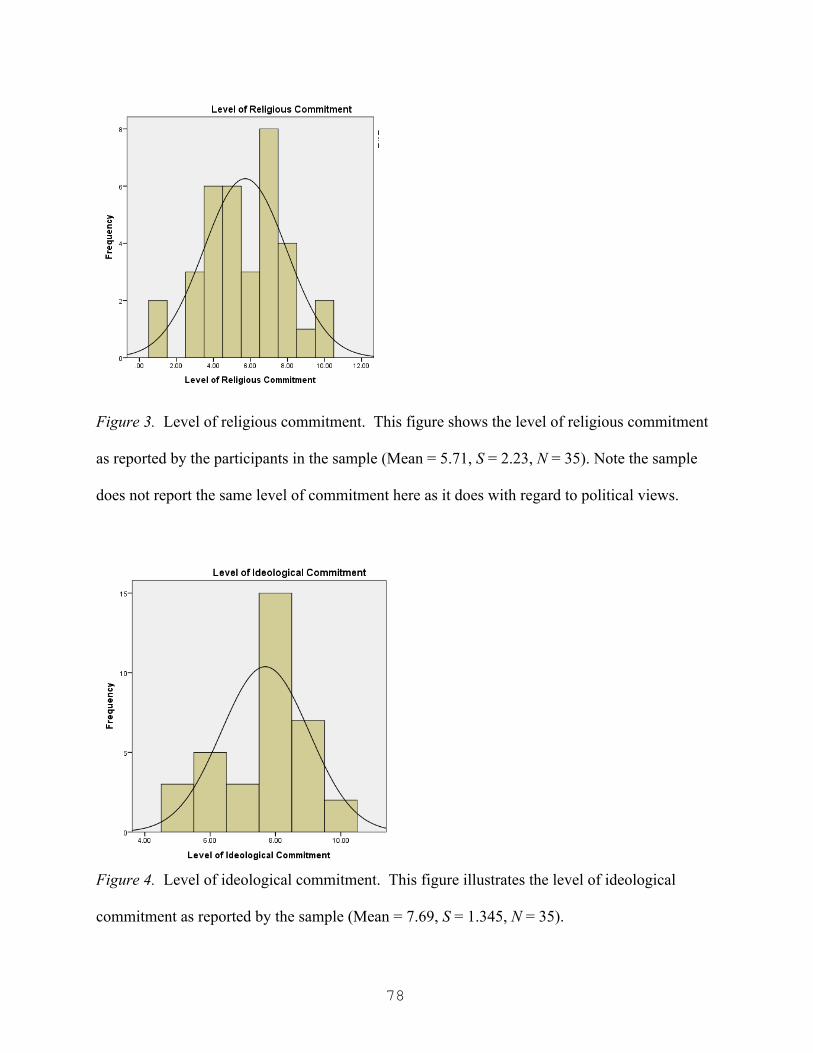
78
Figure 3. Level of religious commitment. This figure shows the level of religious commitment
as reported by the participants in the sample (Mean = 5.71, S = 2.23, N = 35). Note the sample
does not report the same level of commitment here as it does with regard to political views.
Figure 4. Level of ideological commitment. This figure illustrates the level of ideological
commitment as reported by the sample (Mean = 7.69, S = 1.345, N = 35).

79
Figure 5. Average commitment score. This figure provides a visual of the overall averaged
levels of commitment (the three dimensions averaged together) reported by the sample (Mean =
7.25, S = 1.387, N = 35).
Study Two
Study two was designed to explore the possible neurobiological correlates of conformity
in the form of groupthink. Out the outset, five research questions were designed:
• What difference, if any, does the implementation of decision-making protocols make
in the final outcome?
• How does the presence of a leader impact the final decisional outcome with regard to
groupthink?
• To what extent, if any, does the presence of a perceived leader moderate the
neurobiological dimensions of conformity?
• To what extent, if any, does the partiality of the leader impact the final outcome?
• To what extent, if any, does the partiality of a perceived leader moderate the
neurobiological dimensions of conformity?

80
Participants. Study two consisted of 22 participants; all recruited from the same
undergraduate courses at a mid-sized private university as in study one. Of the 22 participants,
two were male and 20 were female. Ages ranged from 18 to 24, with a mode of 18 and a mean
age of 19.32. A frequency table, identified below as Table 4, provides as overview of the ethnic
backgrounds of the 22 participants. However, a summary of the data is as follows: 54.5%
Caucasian, 32% Hispanic, 4.5% Asian, and 4.5% Other (self identified as Middle Eastern).
Table 4.
Study Two Ethnicity of Participant
Frequency Percent Valid Percent
Cumulative
Percent
Valid Asian 1 4.5 4.8 4.8
White/Caucasian 12 54.5 57.1 61.9
Hispanic/Latino(a) 7 31.8 33.3 95.2
Other 1 4.5 4.8 100.0
Total 21 95.5 100.0
Missing 99.00 1 4.5
Total 22 100.0

81
Analytical Techniques. As was the case in study one, data that was not neurobiological
in nature (e.g. group assignment, minutes to deliberate, whether or not the participant
conformed) was input and analyzed in SPSS. The data analysis for the neurobiological
information, however, was much more complex.
From each of the 22 participants, five qEEG recordings were taken (three as baseline
pretest measures, and two as posttests). All 110 recordings were visually inspected and analyzed
in Neuroguide and all artifact possible was removed. Data was selected for analysis from the
recording based on both test-retest reliability and split-half reliability. Data was not selected out
for further analysis until the test-retest reliability measures for the selected, artifact free data
were above 0.90 and the split-half reliability was above 0.95, consistent with the standard of
practice in qEEG analysis (Gunkleman & Lubar, 2013). Tables demonstrating all the test-retest
and split-half reliability for each recording, each montage, and each electrode site can be seen in
Appendix N.
Data were then analyzed in Neuroguide, using all three prescribed montages (linked ears,
average reference, and LaPlacian). Each montage was then mapped. The Neuroguide generates
brain maps based on a large normative database, providing a visual comparison of the subject
based on z scores. An example can be seen in Figure 6. The best data maps were then selected
for comparison. The eyes closed baseline was compared to the eyes closed posttest, and the eyes
open baseline was compared to the eyes open posttest. In both comparisons, the mental activity
baseline (where participants were asked to perform serial sevens) was used as a reference point
in an attempt to control for changes that were cognitively related, rather than as a result of the
experiment itself.

82
Figure 6. Brain map sample. An example of a Neuroguide generated set of brain maps for a
single recording based on a normative distribution and z scored.
A table was created with all 110 sets of brain maps in order to perform a side-by-side
comparison as described above and to notate important changes. That table can be seen in
Appendix O. From there, those changes were then transposed into an additional table that
provided space for the subcortical analysis. Specifically, the researcher imported the artifact free
posttest qEEG data for both eyes closed and eyes open from Neuroguide into the LORETA
software. This allowed the researcher to identify which brain structures might be associated with
the change. That table can be seen in Appendix P.
Once patterns (changes in associated brain structures) were identified, categories were
created in SPSS for further comparison across groups. A summary of those patterns and how
they were coded into SPSS is provided in Table 5.
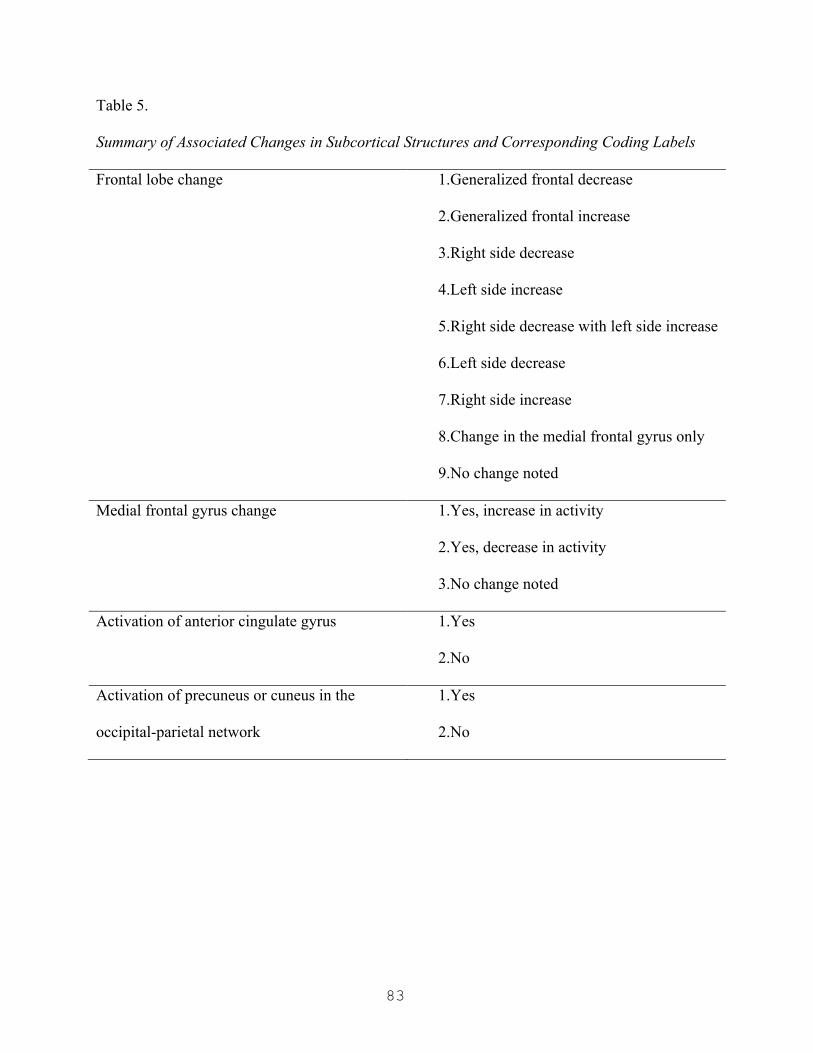
83
Table 5.
Summary of Associated Changes in Subcortical Structures and Corresponding Coding Labels
Frontal lobe change 1.Generalized frontal decrease
2.Generalized frontal increase
3.Right side decrease
4.Left side increase
5.Right side decrease with left side increase
6.Left side decrease
7.Right side increase
8.Change in the medial frontal gyrus only
9.No change noted
Medial frontal gyrus change 1.Yes, increase in activity
2.Yes, decrease in activity
3.No change noted
Activation of anterior cingulate gyrus 1.Yes
2.No
Activation of precuneus or cuneus in the
occipital-parietal network
1.Yes
2.No
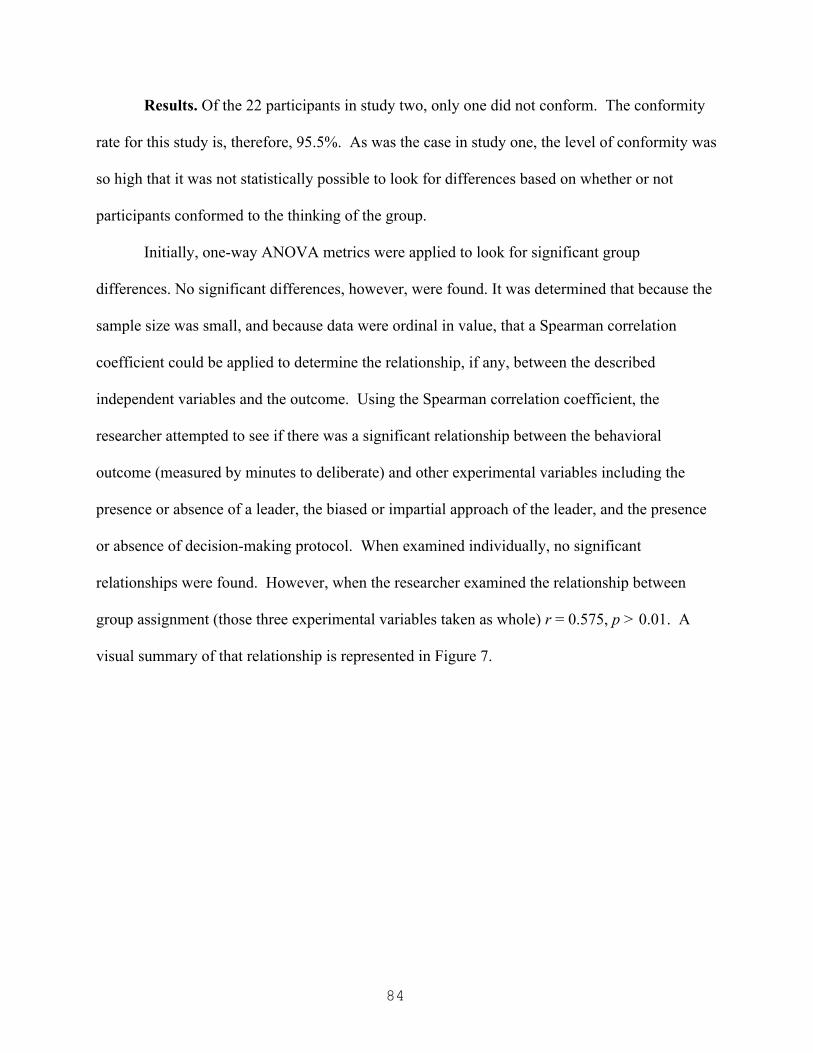
84
Results. Of the 22 participants in study two, only one did not conform. The conformity
rate for this study is, therefore, 95.5%. As was the case in study one, the level of conformity was
so high that it was not statistically possible to look for differences based on whether or not
participants conformed to the thinking of the group.
Initially, one-way ANOVA metrics were applied to look for significant group
differences. No significant differences, however, were found. It was determined that because the
sample size was small, and because data were ordinal in value, that a Spearman correlation
coefficient could be applied to determine the relationship, if any, between the described
independent variables and the outcome. Using the Spearman correlation coefficient, the
researcher attempted to see if there was a significant relationship between the behavioral
outcome (measured by minutes to deliberate) and other experimental variables including the
presence or absence of a leader, the biased or impartial approach of the leader, and the presence
or absence of decision-making protocol. When examined individually, no significant
relationships were found. However, when the researcher examined the relationship between
group assignment (those three experimental variables taken as whole) r = 0.575, p > 0.01. A
visual summary of that relationship is represented in Figure 7.
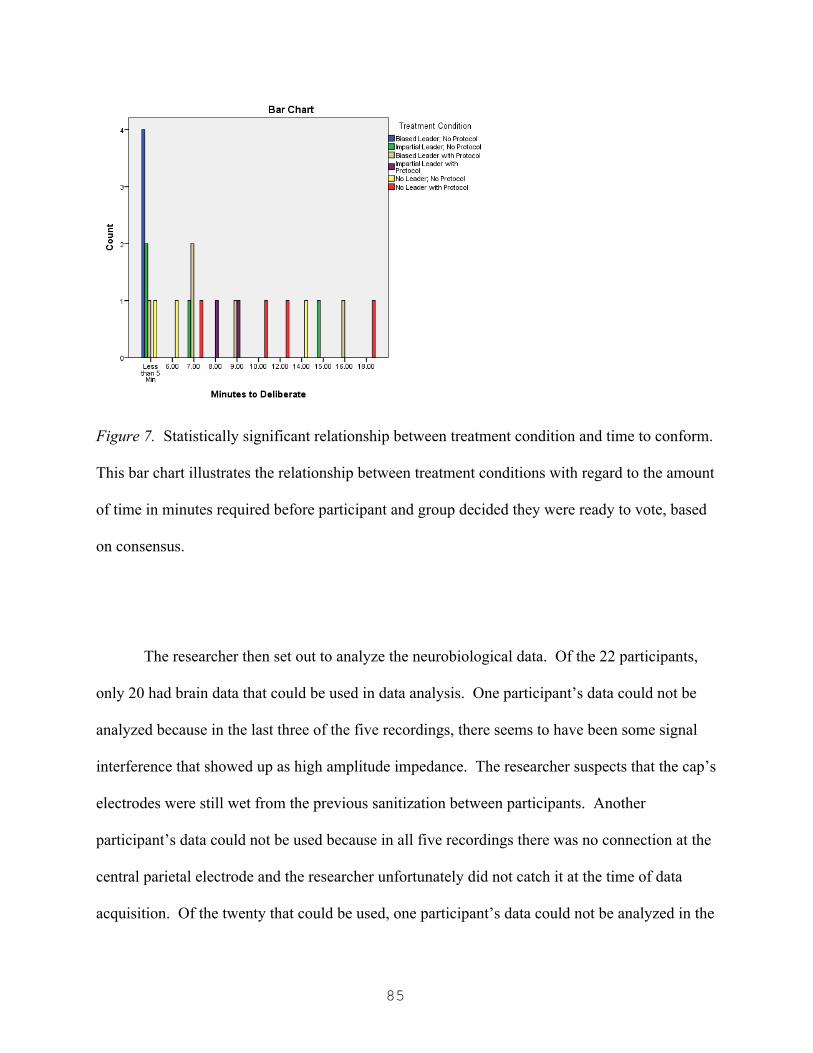
85
Figure 7. Statistically significant relationship between treatment condition and time to conform.
This bar chart illustrates the relationship between treatment conditions with regard to the amount
of time in minutes required before participant and group decided they were ready to vote, based
on consensus.
The researcher then set out to analyze the neurobiological data. Of the 22 participants,
only 20 had brain data that could be used in data analysis. One participant’s data could not be
analyzed because in the last three of the five recordings, there seems to have been some signal
interference that showed up as high amplitude impedance. The researcher suspects that the cap’s
electrodes were still wet from the previous sanitization between participants. Another
participant’s data could not be used because in all five recordings there was no connection at the
central parietal electrode and the researcher unfortunately did not catch it at the time of data
acquisition. Of the twenty that could be used, one participant’s data could not be analyzed in the
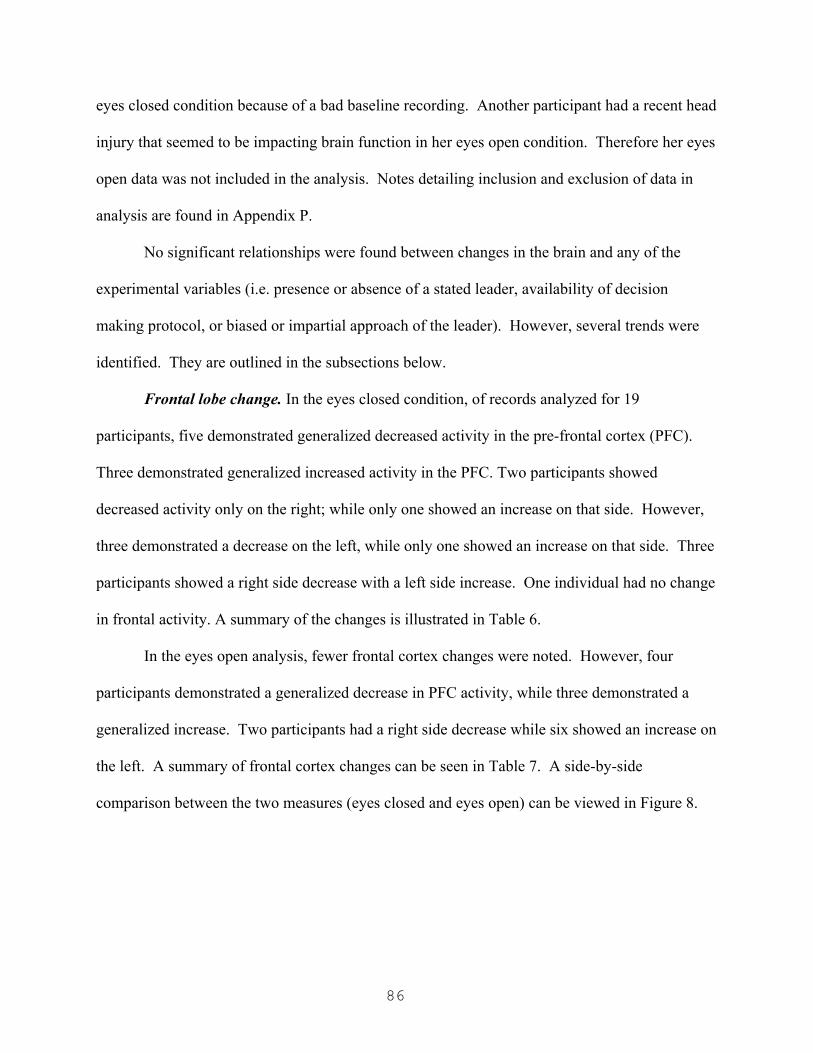
86
eyes closed condition because of a bad baseline recording. Another participant had a recent head
injury that seemed to be impacting brain function in her eyes open condition. Therefore her eyes
open data was not included in the analysis. Notes detailing inclusion and exclusion of data in
analysis are found in Appendix P.
No significant relationships were found between changes in the brain and any of the
experimental variables (i.e. presence or absence of a stated leader, availability of decision
making protocol, or biased or impartial approach of the leader). However, several trends were
identified. They are outlined in the subsections below.
Frontal lobe change. In the eyes closed condition, of records analyzed for 19
participants, five demonstrated generalized decreased activity in the pre-frontal cortex (PFC).
Three demonstrated generalized increased activity in the PFC. Two participants showed
decreased activity only on the right; while only one showed an increase on that side. However,
three demonstrated a decrease on the left, while only one showed an increase on that side. Three
participants showed a right side decrease with a left side increase. One individual had no change
in frontal activity. A summary of the changes is illustrated in Table 6.
In the eyes open analysis, fewer frontal cortex changes were noted. However, four
participants demonstrated a generalized decrease in PFC activity, while three demonstrated a
generalized increase. Two participants had a right side decrease while six showed an increase on
the left. A summary of frontal cortex changes can be seen in Table 7. A side-by-side
comparison between the two measures (eyes closed and eyes open) can be viewed in Figure 8.

87
Table 6
Frontal Change in Eyes Closed
Frequency Percent
Valid
Percent
Cumulative
Percent
Valid Generalized Decrease 5 22.7 26.3 26.3
Generalized Increase 3 13.6 15.8 42.1
Right Side Decrease 2 9.1 10.5 52.6
Left Side Increase 3 13.6 15.8 68.4
Right Side Decrease
with Left Side Increase 3 13.6 15.8 84.2
Left Side Decrease 1 4.5 5.3 89.5
Right Side Increase 1 4.5 5.3 94.7
No Change Noted 1 4.5 5.3 100.0
Total 19 86.4 100.0
Missing Missing 3 13.6
Total 22 100.0

88
Table 7
Frontal Change in Eyes Open
Frequency Percent
Valid
Percent
Cumulative
Percent
Valid Generalized Decrease 4 18.2 21.1 21.1
Generalized Increase 3 13.6 15.8 36.8
Right Side Decrease 2 9.1 10.5 47.4
Left Side Increase 6 27.3 31.6 78.9
Right Side Decrease with Left
Side Increase 1 4.5 5.3 84.2
Left Side Decrease 1 4.5 5.3 89.5
Right Side Increase 1 4.5 5.3 94.7
No Change Noted 1 4.5 5.3 100.0
Total 19 86.4 100.0
Missing Missing 3 13.6
Total 22 100.0

89
Figure 8. Side by side comparison of frontal cortex changes. This figures provides a comparison
of differences between eyes closed posttest measures and posttest data taken during eyes open.
Medial frontal gyrus change. In the eyes closed condition, the medial frontal gyrus in the
PFC showed a marked increase in activity in 11 of the 19 records analyzed. Of those 19, seven
participant records showed no significant change in the region. These data are summarized in
Table 8. However, in the eyes open measures, five participants showed an increase in the medial
frontal gyrus, one showed a decrease, and seven records demonstrated no significant change in
this region. These numbers are displayed in Table 9.
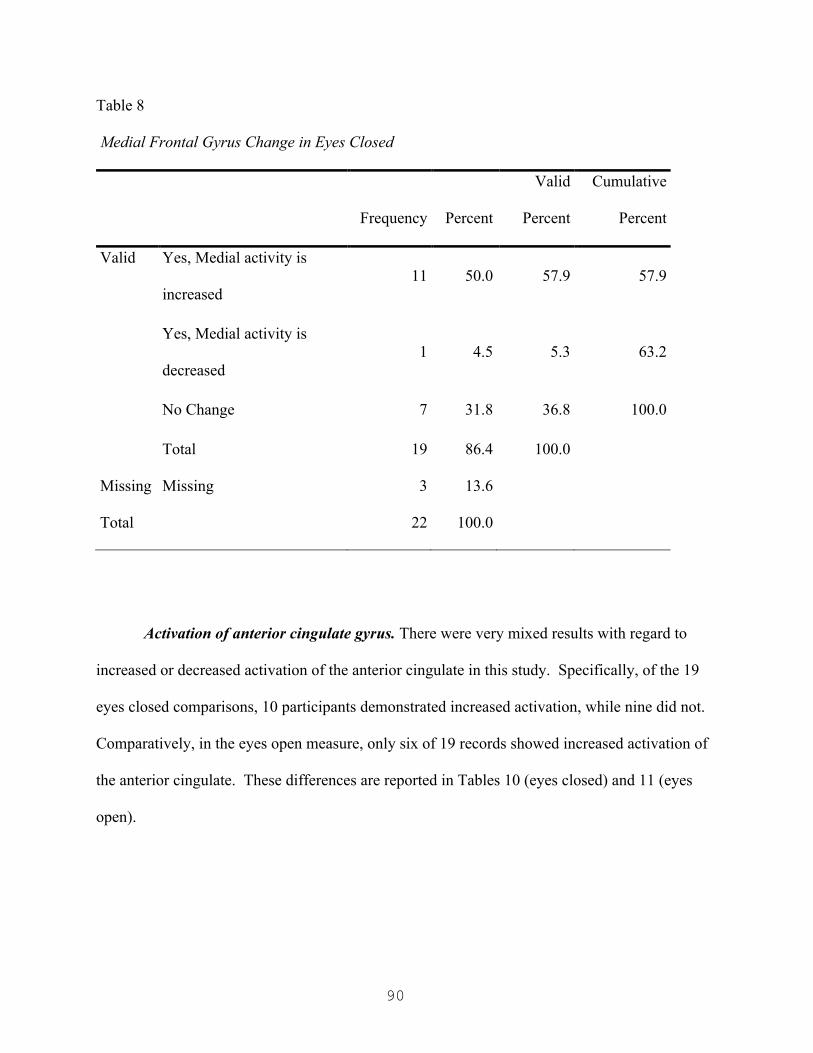
90
Table 8
Medial Frontal Gyrus Change in Eyes Closed
Frequency Percent
Valid
Percent
Cumulative
Percent
Valid Yes, Medial activity is
increased 11 50.0 57.9 57.9
Yes, Medial activity is
decreased 1 4.5 5.3 63.2
No Change 7 31.8 36.8 100.0
Total 19 86.4 100.0
Missing Missing 3 13.6
Total 22 100.0
Activation of anterior cingulate gyrus. There were very mixed results with regard to
increased or decreased activation of the anterior cingulate in this study. Specifically, of the 19
eyes closed comparisons, 10 participants demonstrated increased activation, while nine did not.
Comparatively, in the eyes open measure, only six of 19 records showed increased activation of
the anterior cingulate. These differences are reported in Tables 10 (eyes closed) and 11 (eyes
open).
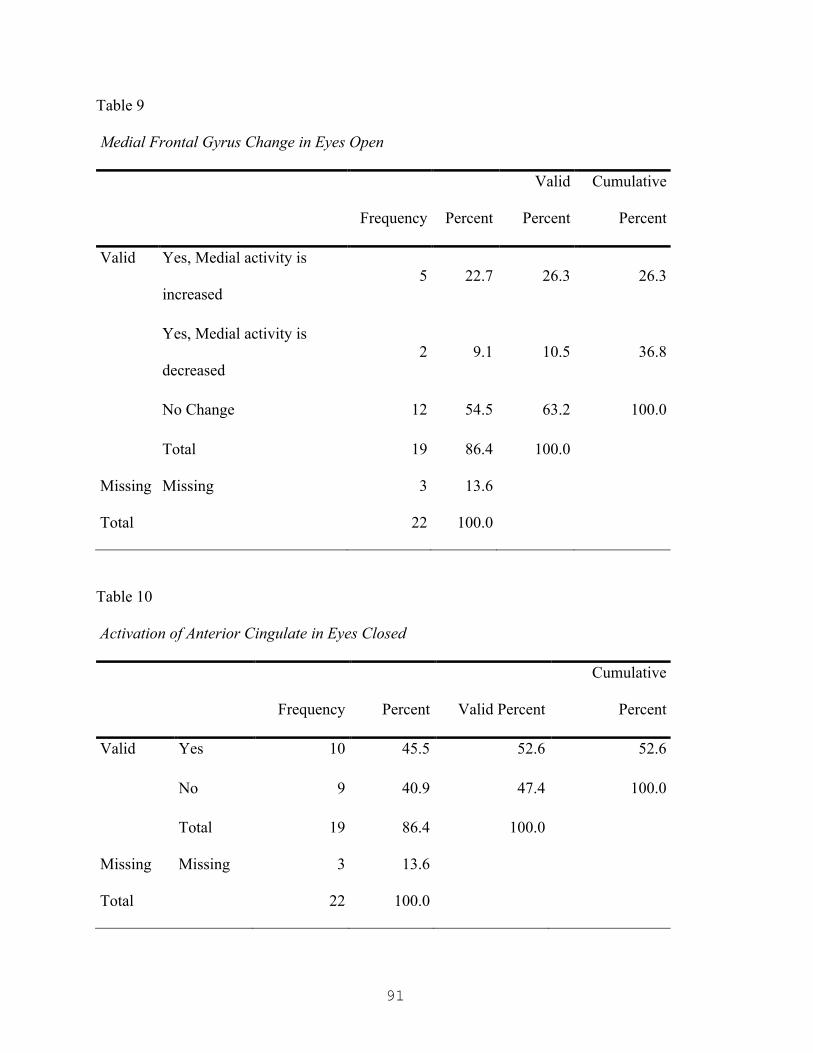
91
Table 9
Medial Frontal Gyrus Change in Eyes Open
Frequency Percent
Valid
Percent
Cumulative
Percent
Valid Yes, Medial activity is
increased 5 22.7 26.3 26.3
Yes, Medial activity is
decreased 2 9.1 10.5 36.8
No Change 12 54.5 63.2 100.0
Total 19 86.4 100.0
Missing Missing 3 13.6
Total 22 100.0
Table 10
Activation of Anterior Cingulate in Eyes Closed
Frequency Percent Valid Percent
Cumulative
Percent
Valid Yes 10 45.5 52.6 52.6
No 9 40.9 47.4 100.0
Total 19 86.4 100.0
Missing Missing 3 13.6
Total 22 100.0
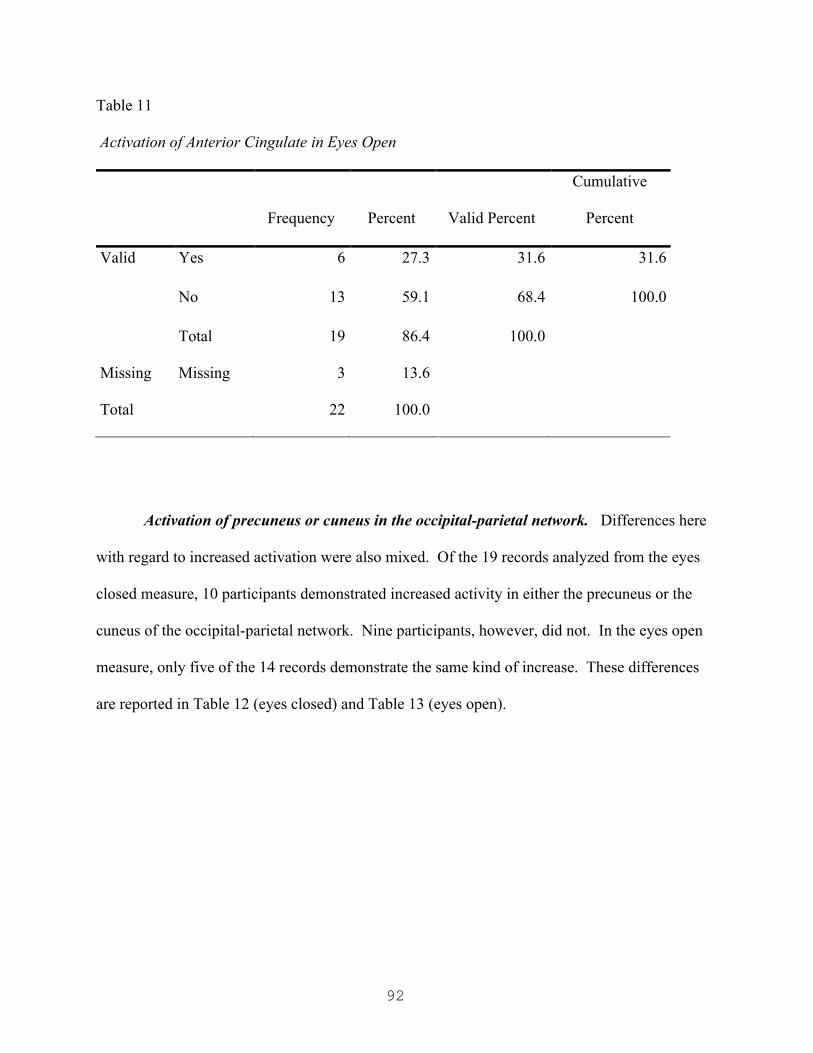
92
Table 11
Activation of Anterior Cingulate in Eyes Open
Frequency Percent Valid Percent
Cumulative
Percent
Valid Yes 6 27.3 31.6 31.6
No 13 59.1 68.4 100.0
Total 19 86.4 100.0
Missing Missing 3 13.6
Total 22 100.0
Activation of precuneus or cuneus in the occipital-parietal network. Differences here
with regard to increased activation were also mixed. Of the 19 records analyzed from the eyes
closed measure, 10 participants demonstrated increased activity in either the precuneus or the
cuneus of the occipital-parietal network. Nine participants, however, did not. In the eyes open
measure, only five of the 14 records demonstrate the same kind of increase. These differences
are reported in Table 12 (eyes closed) and Table 13 (eyes open).

93
Table 12
Activation of the Precuneus or Cuneus in Eyes Closed
Frequency Percent Valid Percent
Cumulative
Percent
Valid Yes 10 45.5 52.6 52.6
No 9 40.9 47.4 100.0
Total 19 86.4 100.0
Missing Missing 3 13.6
Total 22 100.0
Table 13
Activation of the Precuneus or Cuneus in Eyes Open
Frequency Percent Valid Percent
Cumulative
Percent
Valid Yes 5 22.7 26.3 26.3
No 14 63.6 73.7 100.0
Total 19 86.4 100.0
Missing Missing 3 13.6
Total 22 100.0

94
Summary
The present chapter presented the findings for both study one and study two. Very little
inferential data was gleaned as a result of small sample size coupled with extreme rates of
conformity. Overall, there were no real significant findings in study one. In study two,
statistically significant results were extremely limited. In point of fact, the only statistically
significant relationship was between treatment condition and the length of time for participants
to decide they were ready to vote as indicated by joining a consensus. This statistic is only
indirectly related to the research questions, specifically, research questions two, three, and five.
A summary of the research questions with a corresponding summary explanation of the results
can be found in Table 14.
That said, some interesting potential trends were identified in this study. In particular,
most of the participants experienced marked change (increase and/or decrease) in the prefrontal
cortex. Only one participant in the eyes closed measure, and one participant in the eyes open
measure did not. Further, almost 53% of the sample experienced increased activation of the
anterior cingulate in the limbic system during the eyes closed measure while, the same number of
participants experienced activation of the occipital-parietal network (specifically in the
precuneus and cuneus) also in the eyes closed measure. A discussion of these findings will be
provided in the following chapter.

95
Table 14
Summary of Research Questions with Corresponding Results
1. To what extent, if any, might groups higher
in rigidity and commitment demonstrate high
levels of groupthink?
No significant differences found. This may
be due to the extreme level of conformity
coupled with the small sample size.
2. What difference, if any, does the
implementation of decision-making protocols
make in the final outcome?
No significant relationship except when
taken into account with the presence of a
leader. In this instance, it seemed to have
slowed down the rate of consensus or
conformity in the form of groupthink.
3. How does the presence of a leader impact the
final decisional outcome with regard to
groupthink?
It did not seem to impact the final outcome,
in large part because, as is generally true
with regard to group dynamics, someone
almost always assumed a leadership role.
4. To what extent, if any, does the presence of a
perceived leader moderate the
neurobiological dimensions of conformity?
No significant relationships were found.
5. To what extent, if any, does the partiality of
the leader impact the final outcome?
The only significant relationship here was
found when this was taken into account
with the other experimental variables.
6. To what extent, if any, does the partiality of a
perceived leader moderate the
neurobiological dimensions of conformity?
No significant relationships were found.

96
Chapter Five: Discussion
Introduction
There is a saying in research circles: Data can be significant but not meaningful and data
can be meaningful but not significant. There was little statistically significant data in this study.
However, the present researcher believes that there is meaning to be found in the results. The
purpose of this chapter is to discuss the results of both studies, any meaning in those results, and
potential real world implications.
Study One
The purpose of study one was to pilot the vignette for use in study two and to test the
possible interaction of cognitive rigidity and ideological commitment on group think. Because
the conformity rate was so high, there was too little data to be used as a point of comparison.
However, study one did provide some helpful information for future research.
Problems with the design and sample. To begin, and perhaps most important to the
study at hand, the pilot study identified a typographical error on the exit survey that, in essence,
change the meaning of the question. Specifically, the original exit survey asked, “should Chad
accept the bribe?” However, the intended question was “should Chad pay the bribe?” This
identification allowed for the researcher to make the adjustment for the remaining groups in
study one as well as study two.
An additional problem that was encountered in study one was assuming that the average
college student would know what the researcher meant by the word “ideological.” Many
participants in study one, when completing the demographic and commitment survey, had to ask
what that word meant. When participants asked, a cursory definition was provided, but there is
no way to account for participants who did not truly know what the word meant and did not ask.

97
An unforeseen confounding variable in the study was the inclusion of international
students who speak English as a second language. Three students from China signed up to
participate in the research. The present writer is unclear how strong their command of the
English language was. However, at least one student appeared to have some confusion around
language nuance in English. This might have been less of a problem in an experiment that was
more task-oriented and less social in design. However, here it remains an unknown variable with
regard to how it may have impacted the overall outcome.
Study Two
The purpose of study two was to examine social drivers of conformity, such as the
presence or absence of a leader, the availability of decision-making protocol, and the relative
bias or impartiality of the leader, as well as possible neurobiological correlates of conformity.
Study two was clearly much more complex than study one, creating, therefore, much more
material for discussion.
To begin, it is clear that while the presence of decision-making protocol did not prevent
conformity, it does seem to have slowed it down, particularly in the biased leader group. This
may add some empirical validation to the notion that groups can protect themselves, at least in
part, from groupthink by adding such protocols to their decision-making procedures. This was
the only statistically significant finding in the study. However, there were also many unexpected
dynamics. For example, it is difficult to decide, apart from how the present researcher intended
the groups to function, which groups were truly leaderless. Specifically, in groups assigned as
“non-leader groups,” when no clear leader was established, someone typically assumed the role
of leader. In most cases it was a confederate but one participant, the sole non-conformist, took
that role upon herself at the outset of the experiment. This is likely consistent with how group
98
dynamics unfold in real day-to-day environments. There were some particular problems with the
sample and design however.
Problems with the design and sample. The present researcher tried to control for as
many possible variables in advance, especially for variables that could impact the actual EEG
recording. To that end, participants were given very specific instructions about not consuming
caffeine on the day of the study, how and when to eat, and about getting eight hours of sleep the
night before. However, in a sample of college students, it seems reasonable to predict that
participants might be over-caffeinated, sleep deprived, and not properly nourished. In point of
fact, several participants in the study consumed caffeine on that day. Some of the participants
had not read or remembered the instructions, while some participants seemed ignorant of what
beverages actually contain caffeine (e.g. black tea and Dr. Pepper). The researcher did her best
to try and control for caffeine effects in the analysis of the records, but that is difficult to do
when you do not have a non-caffeinated baseline to compare to, as caffeine affects different
brains in different ways.
As mentioned earlier, this was a sleep-deprived sample. Sleep deprivation has a
significant impact on both baseline data as well as posttest data as response rates in the brain
vary between individuals and across various sleep conditions, especially in instances of long-
term mild to moderate sleep deprivation (common in the college demographic). Further, these
participants seemed truly uneducated about appropriate sleep hygiene and its impact on the brain
and body. Specifically, while most participants reported a good night’s sleep, they consistently
reported six hours or less a night of sleep. This is at least 2 hours less per night of the amount of
sleep typically required for a brain at this age (Carlson, 2010).

99
A difficulty that was encountered relates to participant histories of head injuries. Three
participants reported significant histories of impact or trauma to the head. For each of those
participants, the visual analysis of their brain maps, particularly in LORETA corresponded with
the nature and narrative of their injuries as reported. However, one participant, who denied any
history of head trauma, presented, particularly with regard to findings in LORETA, consistent
with either a head injury or some form of serious neurological dysregulation that was
pronounced in the right hemisphere, in the frontal, parietal, and temporal lobes. Personal
histories of head injuries are commonly very underreported (Gunkleman & Lubar, 2013). As
reported in chapter four, that individual’s data was not used in analysis.
It is also important to note, at this point, that there were no real observable changes in
eyes open measures for any of the subjects who reported histories of head injuries. For one
participant reporting a head injury within approximately the last 12 months, there was marked
dysregulation on the right side, that was especially pronounced all along the frontal gyri and at
the frontal-temporal junction. This lack of response for participants with head injuries is likely
to have affected the overall findings.
A couple of problems arose in this study related to the equipment that was selected for
data acquisition. While a visual inspection of signal strength and impedance can be made, a
digital impedance check devise is preferred. However, this was not included due to additional
costs associated with adding an additional piece of equipment. While, overall, the data collected
was good data, an impedance check device could have negated a couple of problems related to
poor connectivity. Specifically, records for two separate participants could not be analyzed
because of poor signal quality that was not discovered until after data collection in the data
analysis stage. Additionally, there was some signal interference related to the type of cap used
100
to perform data acquisition. Specifically, the Comby caps use what is known as a mastoid
reference in place of an auricular reference. Both the mastoid (the bone behind the ear) and the
auricular points (i.e. the ear lobes) are thought to be neutral points, free of electrical potential.
However, because the mastoid reference is so close to the temporal electrode sites, they can, and
sometimes do, pick up extra noise (signal, muscle tension, etc.). Therefore, auricular references
are generally preferred in the industry (Gunkleman & Lubar, 2013). While most of the data
appeared to be fairly noise free, there are a couple of recordings where the researcher suspects
there may have been some interference from the mastoid references.
With regard to testing condition, it is important to note that participant expectation and
arousal related to both pretest and posttest dynamics may have influenced neurological responses
in both the baseline set of recordings and in the posttest recordings. Specifically, pretest
measures may have been influenced by any anxiety or arousal the participant might have been
experiencing due to the unknown or unfamiliar circumstances of sitting down with a faculty
researcher to have an EEG performed. Additionally, participants second-guessing their own
decisions, if this even happened, may have influenced some of the posttest data. More extensive
debriefing procedures would be important in studies going forward in an attempt to capture this
extraneous phenomenon.
Tying it Together
The purpose of this study was to investigate the neurobiological basis of groupthink as a
dimension of conformity, a component of followership, in order to advance the understanding of
effective leadership strategies and the development of healthy organizations. This section will
review the findings and where appropriate, make connections to the research. The sections that
follow will provide possible applications to organizations.

101
Social drivers. As mentioned earlier, there were not many significant findings with
regard to social drivers or influences (positive or negative) on conformity or groupthink in either
study. The one real interesting find was with regard to the presence of decision-making protocol,
which did not prevent groupthink, but it did seem to have slowed it down, particularly in the
biased leader group. Consistent with Janis’ suggestion and the collective work of many who
have researched groupthink, adding such a protocol may not completely insulate an organization
from groupthink but it may stave it off long enough for a different mind to prevail, when
necessary.
An interesting dynamic that emerged from this study is that, despite all the researcher’s
efforts to the contrary, there was never any truly “leaderless” group. Someone, usually a
confederate but on one occasion a participant, always stepped into that role. This may be
indicative of a human need to have a leader in a group; it may help mediate feelings of
uncertainty or feelings of chaos for example. This is also a likely reason no significant
difference with regard to social or neurobiological drivers, were found in groups with leaders by
design or self-appointed leaders. Further, when you look at this dynamic, the apparent need to
have a leader in the group, coupled with the fact that a leader’s position (biased or impartial)
seemed to have no influence on groupthink outcomes, the use of decision-making protocols
seems even more important. In other words, if we are attempting to protect our organizations
from groupthink, and if we know groups will self appoint leaders and that an impartial leader is
not likely to be any different in preventing groupthink than a biased leader, we need such
protocols as a first line of defense.
While this project has not discussed much about various types of non-conformists, or
what we might call potential challengers to groupthink, three different approaches to non-

102
conformist behavior were noted between the two studies. In study one, one participant who
decided to vote “yes” during a “no” condition, was very vocal and outspoken about her choice
and the reasons for it. So much so that the other group members (confederates and participants
alike) experienced her as abrasive. That did not seem to deter her however. It is likely, at least
in this researcher’s observation, that this individual is accustomed to not conforming, has an
abundance of interpersonal difficulty as a result, and probably experiences very little distress
over it. The other two non-conformists in study one were quite the opposite. They were very
quiet about their decisions, one giving no real indication how she would vote and the other
feigning that she would vote with the consensus but not actually doing so. They were likely
either the individual who feigns conformity (Hewlin, 2003) or the tempered radical who chooses
when they will openly dissent (Zemke, 2010). The fourth non-conformist came from study two.
Her approach was somewhere in the middle. She was respectful in her discourse but certain of
her position. During the debriefing part of this study, that participant confided in the researcher
that she too experiences a lot of interpersonal difficulty, which distresses her, over being such a
non-conformist. She stated that she often feels misunderstood by her peers as someone who
seeks conflict when in her mind she is simply being honest and transparent about her positions.
Her sincere approach to non-conformity is akin to what Chaleff refers to as courageous
followership (2009).
Neurobiological drivers. As stated earlier in this chapter and in chapter four, there were
no significant findings with regard to neurobiological correlates. However, patterns in posttest
data do seem to be consistent with the existing literature and may add meaning in further studies
on groupthink.
103
Medial frontal cortex. The medial frontal gyrus has been implicated in previous studies
as a region of interest in conformity studies (Klucharev, Munneke, Smidts, & Fernandez, 2011).
Specifically, it has been associated with the adjustment of one’s behavior based on social
expectations. Medial increases were seen in 50 % of all participants in the eyes closed measure
and 23% of participants in the eyes open measure. However, this does not account for any
upregulation in the medial frontal gyrus that may have been present in the pretest condition as a
result of a participant monitoring their own behavior, being seated and fitted with a funny
electrode equipped cap, in an unfamiliar faculty member’s office, and under some what uncertain
(or at least unfamiliar) circumstances. In other words, there may have been a bit of a
performance expectation causing participants to self monitor and adjust based on what they
perceived was being expected of them. This fact may also be augmented by the relatively young
age of the sample.
Prefrontal cortex. The right prefrontal cortex (PFC) has been associated with situations
where expulsion from the group is threatened. However, studies (e.g. Klucharev, Munneke,
Smidts, & Fernandez, 2011) show upregulation in the right PFC tends to mediate the distress
associated with an expulsion threat. The sole non-conformist in the group did not demonstrate
any medial frontal cortical change but did demonstrate a significant increase in activity in the
right PFC, suggesting possibly, that her brain was trying to help her negotiate the pain of
choosing to not conform.
Orbital-frontal cortex. The orbital-frontal cortex is the most ventral-medial region of the
frontal lobe. Previous researchers have identified the importance of the orbital-frontal cortex
function in distinguishing true conformity from feigned conformity (Klucharev, Munneke,
Smidts, & Fernandez, 2011). Specifically, upregulation in this region is associated with true
104
groupthink rather than a pretense of it. While LORETA analysis did not show this region of the
brain to be a significant source generator for electrical potential, it is important to note that this
area was active in about 50% of all posttest data.
Anterior cingulate. The anterior cingulate located in the limbic system is well
documented to play a role in conformity (Eisenberger, Lieberman, & Williams, 2003). The
present researcher did note a pattern of upregulation in the anterior cingulate in more than half
the cases during eyes closed measures and about a third of the cases during eyes opened. It is
difficult to say, but perhaps upregulation in the anterior cingulate would occur at higher
frequencies in instances where individuals were more personally or emotionally invested in the
group dynamics (for example, with peers or coworkers, or in a institution of worship such as a
church). Additionally, as has been mentioned throughout this chapter, it is difficult to determine
how much of the emotional brain (the limbic system in which the anterior cingulate is located)
was already activated or activating during the pretest baseline conditions, making posttest
comparisons more difficult.
Occipital-parietal network. Changes in the occipital-parietal network, seen in this
research in the relay between the precuneus and the cuneus, are also associated with research on
conformity (Berns, et al., 2003). There is a pattern in this present research to perhaps support
that, at least anecdotally. However, this network is responsible for visual processing. In the
posttest conditions, participants were asked to sit quietly and recall as much of the experiment as
they could to his or herself while the last two qEEG recordings were taken. It is possible that
any pattern or upregulation the present research observed was more a function of recalling visual
memory of the experiment, than a function of conformity itself.
105
Overall comparison to the literature. Of the four most notable key neurobiological
drivers identified in the literature review as potential factors in groupthink, patterns identified in
the present research suggest possible evidence for three of them. Specifically patterns related to
the prefrontal cortex in a broad sense, including upregulation of the medial frontal gyrus, and
activation of the anterior cingulate. Additionally, the orbital-frontal cortex may also play a role
but it is difficult to identify if what is being seen is related to conformity or visual processing.
No evidence was found to support the nucleus accumbens as playing a role in conformity in the
present study. However, this is a deep brain structure that is generally only measured through
the use of MRI or fMRI. Additionally the nucleus accumbens is associated with a pretense of
conformity, rather than true conformity itself.
Implications for Organizations. Part of the purpose in studying the neurobiological
drivers of conformity was to expand an understanding of followership that would in turn help to
identify possible strategies for creating healthy organizations as well as more effective leadership
practices. Suggestions for both are outlined below.
Developing healthy organizations. Conformity in the workplace has been positively
correlated with higher levels of workplace satisfaction (Boleman & Deal, 2008). Conversely,
non-conformists typically report greater levels of disengagement and/or disenchantment in the
workplace (Blanchard, Welbourne, Gilmore, & Bullock, 2009). That said it stands to reason that
if we want our organizations to be healthy and that if we want to help protect ourselves from the
type of groupthink that could lead to poor organizational health or decision-making down the
road, then we should work to identify talented non-conformists that have the potential of
strengthening our organizations. These non-conformists might be given a special role as “devil’s
advocate” for example (Janis, 1972). In valuing their non-conformists identity, organizations

106
may be able to help prevent burnout or disenchantment in the workplace for these individuals,
possibly keeping them engaged in the organization. In essence, organizations might consider
reaching out to such associates by valuing their non-conformity and giving them a space to do so
that is appropriate and healthy for the organization. Additionally, organizations might consider
creating incentives for employees and associates to “think outside the box” by creating solutions
or alternatives to the ways in which an organization typically thinks or functions.
Leadership strategies. Moving forward, organizations wishing to promote organizational
health, might consider developing and implementing trainings on groupthink. Specifically,
trainings might include the neurobiological aspects of groupthink, the pros and cons of such
conformity, and protocols for preventing pronounced groupthink within the organization.
Additionally, training should be considered to help leaders identify non-conformists, how to
utilize them in decision-making and planning, and how to value their strengths while effectively
managing them so that the non-conformist stays invested in the organization and wards off
burnout or disenchantment.
Implications for the Christian Church. While both studies were conducted at a private
Christian university, the application to religious, and specifically Christian settings is much more
intentional. Part of the author’s intent with this work is to understand, and possibly illuminate,
the neurobiological drivers of conformity in all organizations, and perhaps particularly in faith-
based organizations.
As Christians, we are called to not be conformed to this world (or to one another) but to
be transformed by the renewing of our mind in Christ Jesus (Romans 12:2, Philippians 2:5, New
King James Version). In his book The Pursuit of God, A.W. Tozer uses the example of 100
pianos all in tune with one another, not because they were tuned to one another but because they
107
were each tuned to a separate, higher standard (Tozer, 2013). The present researcher would add
that if they were in fact tuned to one another, rather than that higher standard, the result might
not be music, but noise.
The danger for institutions of faith in general, and the Christian church in particular, is
that our like-mindedness might be the result of group-mindedness rather than Christ-mindedness.
Conformity in the church left unchecked can, and will, have the same devastating effects as it has
had in other types of organizations. However, often, non-conformity in such institutions is akin
to “sin” or heresy (Zemke, 2010). Church leaders might consider following some of the same
suggestions provided above for organizations and their leaders in protecting the group from
insidious forms of groupthink. Further still, church leaders can edify their parishioners by
fostering a faith that is Christ-centric rather than church-centric. In doing so, leaders might
foster a like-mindedness that is the result of Christ-mindedness, like 100 pianos tuned to one
higher standard. This, in turn, is likely to have the widespread impact the gospel was intended to
have, for “Social religion is perfected when private religion is purified” (Tozer, 2013, p. 88).
Protecting the nonconformist. Mention has been made for organizations and churches to
identify non-conforming thinkers in their institutions and to consider leveraging those
individuals and their gifts for the greater corporate good. It is important for leaders to remember
that such employees and parishioners may feel vulnerable, or misunderstood. Like the sole non-
conformist in study two, he or she may feel they are seen as a source of conflict rather than as a
source of reason. In valuing their contributions, organizations may be able to retain talented
individuals that might otherwise become disengaged from the workplace, and churches can keep
insightful parishioners from falling out of fellowship with the congregation out of the pain of
108
being stigmatized as different. In both instances, such measures are likely to help prevent
pervasive and systemic groupthink in these institutions.
Implications for future research. One of the major drawbacks to any kind of brain
study is that they require a lot of time and money. For this reason, brain studies tend to use
smaller samples. However, as the present study shows, it is difficult to really gain any inferential
data using such small numbers of participants. Future studies might consider larger samples.
Additionally, the use of more than one researcher would allow for some sort of measure of inter-
rater reliability with regard to the visual analysis portion of such a study.
Another drawback to the present study relates to the limits set by the researcher on the
length of each qEEG recording. Initially it was determined that shorter recordings for this
sample would be better. The researcher wanted to avoid the participant getting drowsy during
recordings and thereby contaminating the EEG record with rhythms associated with fatigue.
However, the records really ended up being too short. In several records, there was so much
artifact that the researcher only ended up with 10 seconds or so of useable data. Future designs
should consider increasing the recording time as follows: five minutes baseline eyes closed, five
minutes baseline eyes open, two minutes (minimum) for mental activity such as serial sevens,
followed by five minutes eyes open and five minutes eyes closed posttest recordings.
It would be interesting to see if there is any empirical support for any of the suggestions
mentions earlier in this chapter for leaders and their organizations. For example, one might
propose a study on the mentoring of non-conformists in the workplace. If an organization
identifies these employees or associates, mentors them, gives them a space for their ideas and a
platform that is appropriate, does it change the way in which the employee or associate is
engaged in the organization? This might make a great pretest-posttest design.

109
A criticism of the literature review for this work was the exclusion of the Milgram
Studies. The now famous Milgram studies conducted by Stanley Milgram were designed to
explore the phenomenon of obedience to authority (Baars & Gage, 2010). For the present
author, conformity, in the form of groupthink, and obedience are two separate constructs.
However, future studies may wish to explore any possible correlation as well as any potential
impact obedience has on groupthink outcomes.
Finally, more research is needed on the types of non-conformists and how they respond
to the pain of not conforming. The present researcher is particularly interested in how certain
types of non-conformists, specifically those that are tenderhearted in nature (like the sole non-
conformist in study two), mediate the pain of not conforming. Martin Luther King Jr., Nelson
Mandela, and Mahatma Gandhi are all examples of tenderhearted non-conformists. Are there
neurobiological mechanisms that allow them to cope? Moreover, do they engage in coping
strategies that trigger neurobiological functions that allow them to mediate the pain of non-
conformity? Further study would not only enhance our understanding of followership, but our
constructs of effective leaders as well.
Summary
The purpose of this study was to investigate the neurobiological basis of groupthink as a
dimension of conformity, a component of followership, in order to advance the understanding of
effective leadership strategies and the development of healthy organizations. To that end, a
review of the existing literature was performed and two studies designed to capture such
phenomenon. Results were mixed.
Study one sought to answer the following research question: To what extent, if any,
might groups higher in rigidity and commitment demonstrate higher levels of groupthink?

110
However, no significant findings were found, in part because conformity rates in this study were
so high, there were no points of comparison. Study two conversely, sought to answer five
research questions. However, results yielded very little empirical evidence for any of them with
a single exception: When variables were taken as a whole (the relative presence or absence of a
leader, the leader’s biased or impartial position, and the presence or absence of decision making
protocols), the amount of time before participants conformed was slowed. This finding was most
pronounced in the biased leader conditions where protocols were available, suggesting that such
guidelines may help prevent, or at least stave off conformity for a time.
While there were no statistically significant findings with regards to neurobiological
correlates and conformity, some interesting patterns were noted. Specifically, changes in
posttest conditions from the groupthink experiment in study two reveal marked changes in the
pre-frontal cortex, including the medial frontal gyrus, as well as the anterior cingulate and the
occipital-parietal network. These changes are consistent with the existing body of scientific
literature. Interestingly, those correlates did not seem to be impacted by group assignment, in
part because there were no truly leaderless groups and the position of the leader did not seem to
impact the outcome.
Conformity seems to be a natural response for most people. As discussed it is a survival
mechanism that allows people to live and work well in groups. To some extent, groupthink may
help us preserve our traditions and values. However, as seen in certain US policy decisions and
corporate scandals, too much groupthink can be the beginning of the end, or at least a long road
that leads to consequences for not just the thinkers, but all that are impacted by those decisional
ripples. Perhaps by learning to both honor appropriate conformity and appropriate challengers

111
(non-conformists) to the status, we can create healthier organizations and more effective
leadership strategies.

112
References
Aarts, H., & Dijksterhuis, A. (2003). The silence of the library: Environment, situational norm,
and social behavior. Journal of Personality and Social Psychology, 84(1), 18.
doi:10.1037/0022-3514.84.1.18
Agazarian, Y. M. (1997). Systems-centered therapy for groups. London, UK: Karnac Books.
Ahlfinger, N. R., & Esser, J. K. (2001). Testing the groupthink model: Effects of promotional
leadership and conformity predisposition. Social Behavior & Personality: An International
Journal, 29(1), 31. doi:10.2224/sbp.2001.29.1.31
Allport, F. H. (1924). Social psychology. New York, NY: Houghton Mifflin.
Argyris, C. (2008). Teaching smart people how to learn (HBR classics). Boston, MA: Harvard
Business School Press Books.
Asch, S. E. (1955). Opinions and social pressure. Scientific American, 193(5), 31.
doi:10.1038/scientificamerican1155-31
Asch, S. E. (1956). Studies of independence and conformity: A minority of one against a
unanimous majority. Psychological Monographs, 70(9), 1-70. doi:10.1037/h0093718
Baars, B. J., & Gage, N. M. (2010). Cognition, brain, and consciousness: Introduction to
cognitive neuroscience (Second ed.). Boston, MA: Academic Press.
Baron, R. A., Branscomb, N. R., & Byrne, D. (2009). Social psychology (Twelfth ed.). Boston,
MA: Allyn and Bacon.
113
Baumeister, R. F., & Leary, M. R. (1995). The need to belong: Desire for interpersonal
attachments as a fundamental human motivation. Psychological Bulletin, 117(3), 497-529.
doi:10.1037/0033-2909.117.3.497
Baumeister, R. F., & Tice, D. M. (1990). Anxiety and social exclusion. Journal of Social and
Clinical Psychology, 9(2), 165-195. doi:10.1521/jscp.1990.9.2.165
Becker, W. J., Cropanzano, R., & Sanfey, A. G. (2011). Organizational neuroscience: Taking
organizational theory inside the neural black box. Journal of Management, 37(4), 933-961.
doi:10.1177/0149206311398955
Berns, G. S., Chappelow, J., Zink, C. F., Pagnoni, G., Martin-Skurski, M., & Richards, J. (2005).
Neurobiological correlates of social conformity and independence during mental rotation.
Biological Psychiatry, 58(3), 245-253. doi:10.1016/j.biopsych.2005.04.012
Blanchard, A. L., Welbourne, J., Gilmore, D., & Bullock, A. (2009). Followership styles and
employee attachment to the organization. The Psychologist-Manager Journal, 12(2), 111-
131. doi:10.1080/10887150902888718
Bligh, M. C., & Kohles, J. C. (2012). Approaching leadership with a follower focus. Zeitschrift
Für Psychologie/Journal of Psychology, 220(4), 201-204. doi:10.1027/2151-2604/a000114
Bolman, L. G., & Deal, T. E. (2008). Reframing organizations: Artistry, choice, and leadership.
San Francisco, CA: Jossey-Bass.
114
Bond, R., & Smith, P. B. (1996). Culture and conformity: A meta-analysis of studies using
Asch's (1952b, 1956) line judgment task. Psychological Bulletin, 119(1), 111-137.
doi:10.1037/0033-2909.119.1.111
Brietzke, C. A. (2007). Alpha electroencephalograph abnormalities in Vietnam-era combat
veterans diagnosed with posttraumatic stress disorder. (Doctoral dissertation, Chicago
School of Professional Psychology). Available from ProQuest Dissertations database. (UMI
No. 3420989)
Bronfenbrenner, U. (1979). The ecology of human development: Experiments by nature and
design. Boston, MA: Harvard University Press.
Buehler, R., & Griffin, D. (1994). Change-of-meaning effects in conformity and dissent:
Observing construal processes over time. Journal of Personality and Social Psychology,
67(6), 984. doi:10.1037/0022-3514.67.6.984
Callaway, M. R., & Esser, J. K. (1984). Groupthink: Effects of cohesiveness and problem-
solving procedures on group decision making. Social Behavior & Personality: An
International Journal, 12(2), 157-164. doi:10.2224/sbp.1984.12.2.157
Callaway, M. R., Marriott, R. G., & Esser, J. K. (1985). Effects of dominance on group decision
making: Toward a stress-reduction explanation of groupthink. Journal of Personality &
Social Psychology, 49(4), 949-952. doi:10.1037/0022-3514.49.4.949
115
Campbell-Meiklejohn, D., Bach, D. R., Roepstorff, A., Dolan, R. J., & Frith, C. D. (2010). How
the opinion of others affects our valuation of objects. Current Biology, 20(13), 1165-1170.
doi:10.1016/j.cub.2010.04.055
Carlson, N. R. (2010). Foundations in behavioral neuroscience (8th ed.). Boston, MA: Allyn and
Bacon.
Carsten, M. K., Uhl-Bien, M., West, B. J., Patera, J. L., & McGregor, R. (2010). Exploring social
constructions of followership: A qualitative study. The Leadership Quarterly, 21(3), 543-
562. doi:10.1016/j.leaqua.2010.03.015
Chaleff, I. (2009). The courageous follower: Standing up to and for our leaders. San Francisco,
CA: Berrett-Koehler Publishers.
Chartrand, T. L., & Bargh, J. A. (1999). The chameleon effect: The perception–behavior link and
social interaction. Journal of Personality and Social Psychology, 76(6), 893-910.
doi:10.1037/0022-3514.76.6.893
Chen, J., Wu, Y., Tong, G., Guan, X., & Zhou, X. (2012). ERP correlates of social conformity in
a line judgment task. BMC Neuroscience, 13(1), 43. doi:10.1186/1471-2202-13-43
Cialdini, R. B. (2005). Basic social influence is underestimated. Psychological Inquiry, 16(4),
158-161. doi:10.1207/s15327965pli1604_03
Cialdini, R. B., & Trost, M. R. (1998). Social influence: Social norms, conformity, and
compliance. In D. T. Gilbert, S. T. Fiske, & G. Lindzey (Eds.), The handbook of social
psychology (Vol 2, pp. 151–192). Boston, MA: McGraw-Hill.

116
Cloninger, C. R., & Svrakic, D. M. (1997). Integrative psychobiological approach to psychiatric
assessment and treatment. Psychiatry, 60(2), 120. Retrieved from
https://www.researchgate.net/profile/Robert_Cloninger/publication/13963548_Cloninger_C
R_Svrakic_DM._Integrative_psychobiological_approach_to_psychiatric_assessment_and_tr
eatment._Psychiatry_60_120-141/links/00463538f668e1af46000000.pdf
Connor, C. E. (2005). Neuroscience: Friends and grandmothers. Nature, 435(7045), 1036-1037.
doi:10.1038/4351036a
Costell, R. M., & Leiderman, P. H. (1968). Psychophysiological concomitants of social stress:
The effects of conformity pressure. Psychosomatic Medicine, 30, 298-310.
doi:10.1097/00006842-196805000-00004
Courtright, J. A. (1978). A laboratory investigation of groupthink. Communication Monographs,
45(3), 229-246. doi:10.1080/03637757809375968
Cox, I. R., Plagens, G. K., & Sylla, K. (2010). The leadership-followership dynamic: Making the
choice to follow. International Journal of Interdisciplinary Social Sciences, 5(8), 37-51.
Dapretto, M., Davies, M. S., Pfeifer, J. H., Scott, A. A., Sigman, M., Brookheimer, S. Y., &
Iacoboni, M. (2005). Understanding emotions in others: Mirror neuron dysfunction in
children with autism spectrum disorders. Nature Neuroscience, 9(1), 28-30.
doi:10.1038/nn1611

117
Dennis, J. P., & Vander Wal, J. S. (2010). The cognitive flexibility inventory: Instrument
development and estimates of reliability and validity. Cognitive Therapy and Research,
34(3), 241-253. doi:10.1007/s10608-009-9276-4
Deutsch, M., & Gerard, H. B. (1955). A study of normative and informational social influences
upon individual judgment. Journal of Abnormal and Social Psychology, 51(3), 629-636.
doi:10.1037/h0046408
DeWall, C. N., MacDonald, G., Webster, G. D., Masten, C. L., Baumeister, R. F., Powell, C., . . .
Eisenberger, N. I. (2010). Acetaminophen reduces social pain: Behavioral and neural
evidence. Psychological Science, 21(7), 931-937. doi:10.1177/0956797610374741
Douglas, M. (1986). How institutions think. Syracuse, NY: Syracuse University Press.
Eisenberger, N. I. (2008). Understanding the moderators of physical and emotional pain: A
neural systems-based approach. Psychological Inquiry, 19(3), 189-195.
doi:10.1080/10478400802608855
Eisenberger, N. I., Lieberman, M. D., & Williams, K. D. (2003). Does rejection hurt?: An fMRI
study of social exclusion. Science, 302(5643), 290-292. doi:10.1126/science.1089134
Esser, J. K. (1998). Alive and well after 25 years: A review of groupthink research.
Organizational Behavior & Human Decision Processes, 73(2), 116-141.
doi:10.1006/obhd.1998.2758

118
Esser, J. K., & Lindoerfer, J. S. (1989). Groupthink and the space shuttle Challenger accident:
Toward a quantitative case analysis. Journal of Behavioral Decision Making, 2(3), 167-177.
doi:10.1002/bdm.3960020304
Ferraris, C., & Carveth, R. (2003). NASA and the Columbia disaster: Decision-making by
groupthink?. In Proceedings of the 2003 Association for Business Communication Annual
Convention (p. 12). Retrieved from
http://bama.ua.edu/~sprentic/672%20Ferraris%20%26%20Carveth.pdf
Flowers, M. L. (1977). A laboratory test of some implications of Janis's groupthink hypothesis.
American Psychological Association. doi:10.1037/0022-3514.35.12.888
Fodor, E. M., & Smith, T. (1982). The power motive as an influence on group decision making.
Journal of Personality & Social Psychology, 42(1), 178-185.
doi:10.1037/0022-3514.42.1.178
Fromm, E. (2006). The art of loving. New York, NY: HarperCollins.
Gantt, S. P., & Agazarian, Y. M. (2010). Developing the group mind through functional
subgrouping: Linking systems-centered training (SCT) and interpersonal neurobiology.
International Journal of Group Psychotherapy, 60(4), 515-544.
doi:10.1521/ijgp.2010.60.4.515
Garrett, B. (2011). Brain and behavior: An introduction to biological psychology. Thousand
Oaks, CA: Sage.

119
Gerard, H. B., Wilhelmy, R. A., & Conolley, E. S. (1968). Conformity and group size. Journal of
Personality & Social Psychology, 8(1), 79-82. doi:10.1037/h0025325
Greyvenstein, H., & Cilliers, F. (2012). Followership's experiences of organisational leadership:
A systems psychodynamic perspective. SAJIP: South African Journal of Industrial
Psychology, 38(2), 1-10. doi:10.4102/sajip.v38i2.1001
Gunkleman, J., & Lubar, J. F. (2013). QEEG: From the basics to clinical application.
International Society for Neurofeedback and Research 21st Annual Conference, Dallas, TX.
Harris, L. T., & Fiske, S. T. (2010). Neural regions that underlie reinforcement learning are also
active for social expectancy violations. Social Neuroscience, 5(1), 76-91.
doi:10.1080/17470910903135825
Hensley, T. R., & Griffin, G. W. (1986). Victims of groupthink: The Kent State University board
of trustees and the 1977 gymnasium controversy. Journal of Conflict Resolution, 30, 497-
531. doi:10.1177/0022002786030003006
Herek, G. M., Janis, I. L., & Huth, P. K. (1987). Decision making during international crises: Is
quality of process related to outcome? Journal of Conflict Resolution, 31, 203-226.
doi:10.1177/0022002787031002001
Hewig, J., Kretschmer, N., Trippe, R. H., Hecht, H., Coles, M. G. H., Holroyd, C. B., & Miltner,
W. H. R. (2011). Why humans deviate from rational choice. Psychophysiology, 48(4), 507-
514. doi:10.1111/j.1469-8986.2010.01081.x
120
Hewlin, P. F. (2003). And the award for best actor goes to…: Facades of conformity in
organizational settings. Academy of Management Review, 28(4), 633-642. Retrieved from
https://drupalnode1.ncs.mcgill.ca/humanrights/files/humanrights/irndi-patricia_hewlin-
facade_conformity.pdf
Hoffman, P. (2009, January 5). An essay on followership. Retrieved from
http://ezinearticles.com/?An-Essay-on-Followership&id=1847870
Hoffman, M. L. (1957). Conformity as a defense mechanism and a form of resistance to genuine
group influence. Journal of Personality, 25(4), 412. doi:10.1111/1467-6494.ep8930988
Hoption, C., Christie, A., & Barling, J. (2012). Submitting to the follower label: Followership,
positive affect, and extra-role behaviors. Zeitschrift Für Psychologie/Journal of Psychology,
220(4), 221-230. doi:10.1027/2151-2604/a000116
Hornsey, M. J., Majkut, L., Terry, D. J., & McKimmie, B. M. (2003). On being loud and proud:
Non-conformity and counter-conformity to group norms. British Journal of Social
Psychology, 42(3), 319-335. doi:10.1348/014466603322438189
Janis, I. L. (1971, November). Groupthink. Psychology Today, 5, 43-46; 74-76. Retrieved from
http://apps.olin.wustl.edu/faculty/macdonald/GroupThink.pdf
Janis, I. L. (1972). Victims of groupthink: A psychological study of foreign policy decisions and
fiascoes. Boston, MA: Houghton Mifflin Company.
Janis, I. L. (1982). Groupthink: A psychological study of policy decisions and fiascoes. Boston,
MA: Wadsworth.

121
Kean, S., Haycock-Stuart, E., Baggeley, S., & Carson, M. (2011). Followers and the co-
construction of leadership. Journal of Nursing Management, 19(4), 507-516.
doi:10.1111/j.1365-2834.2011.01227.x
Kenrick, D. T., Neuberg, S. L., & Cialdini, R. B. (2010). Social psychology: Goals in
interaction. Boston, MA: Pearson.
Kim, B., Liss, A., Rao, M., Singer, Z., & Compton, R. (2012). Social deviance activates the
brain's error-monitoring system. Cognitive, Affective & Behavioral Neuroscience, 12(1), 65-
73. doi:10.3758/s13415-011-0067-5
Klucharev, V., Hytönen, K., Rijpkema, M., Smidts, A., & Fernández, G. (2009). Reinforcement
learning signal predicts social conformity. Neuron, 61(1), 140-151.
doi:10.1016/j.neuron.2008.11.027
Klucharev, V., Munneke, M. A. M., Smidts, A., & Fernández, G. (2011). Downregulation of the
posterior medial frontal cortex prevents social conformity. Journal of Neuroscience, 31(33),
11934-11940. doi:10.1523/JNEUROSCI.1869-11.2011
Klucharev, V., Smidts, A., & Fernández, G. (2008). Brain mechanisms of persuasion: How
‘expert power’ modulates memory and attitudes. Social Cognitive & Affective Neuroscience,
3(4), 353-366. doi:10.1093/scan/nsn022
Kroon, M. B., 't Hart, P., & van Kreveld, D. (1991). Managing group decision making processes:
Individual versus collective accountability and groupthink. International Journal of Conflict
Management, 2(2), 91-115. doi:10.1108/eb022695

122
Kroon, M. B., Van Kreveld, D., & Rabbie, J. M. (1992). Group versus individual decision
making: Effects of accountability and gender on groupthink. Small Group Research, 23(4),
427-458. doi:10.1177/1046496492234001
Lapierre, L. M., Bremner, N. L., & McMullan, A. D. (2012). Strength in numbers: How
employees’ acts of followership can influence their manager’s charismatic leadership
behavior. Zeitschrift Für Psychologie/Journal of Psychology, 220(4), 251-261.
doi:10.1027/2151-2604/a000119
Leana, C. R. (1985). A partial test of janis' groupthink model: Effects of group cohesiveness and
leader behavior on defective decision making. Journal of Management, 11(1), 5.
doi:10.1177/014920638501100102
Lewin, K. (1935). A dynamic theory of personality: Selected papers. New York, NY: McGraw
Hill.
Lubar, J. F., Congedo, M., & Askew, J. H. (2003). Low-resolution electromagnetic tomography
(LORETA) of cerebral activity in chronic depressive disorder. International Journal of
Psychophysiology, 49, 175-185. doi:10.1016/S0167-8760(03)00115-6
Maass, A., & Clark, R. D. (1984). Hidden impact of minorities: Fifteen years of minority
influence research. Psychological Bulletin, 95(3), 428-450.
doi:10.1037/0033-2909.95.3.428

123
McCauley, C. (1989). The nature of social influence in groupthink: Compliance and
internalization. Journal of Personality & Social Psychology, 57(2), 250-260.
doi:10.1037/0022-3514.57.2.250
Meindl, J. R. (1995). The romance of leadership as a follower-centric theory: A social
constructionist approach. The Leadership Quarterly, 6(3), 329-341.
doi:10.1016/1048-9843(95)90012-8
Moorhead, G., Ference, R., & Neck, C. P. (1991). Group decision fiascoes continue: Space
shuttle Challenger and a revised groupthink framework. Human Relations, 44(6), 539-550.
doi:10.1177/001872679104400601
Moorhead, G., & Montanari, J. R. (1986). An empirical investigation of the groupthink
phenomenon. Human Relations, 39, 399-410. doi:10.1177/001872678603900502
Nauta, R. (2007). People make the place: Religious leadership and the identity of the local
congregation. Pastoral Psychology, 56(1), 45-52. doi:10.1007/s11089-007-0098-6
Neck, C. P., & Moorhead, G. (1992). Jury deliberations in the trial of U.S. v. John DeLorean: A
case analysis of groupthink avoidance and an enhanced framework. Human Relations, 45,
1077-1091. doi:10.1177/001872679204501004
Nesdale, D., & Pelyhe, H. (2009). Effects of experimentally induced peer-group rejection and
out-group ethnicity on children's anxiety, self-esteem, and in-group and out-group attitudes.
European Journal of Developmental Psychology, 6(3), 294-317.
doi:10.1080/17405620601112436

124
Packer, D. J. (2008). On being both with us and against us: A normative conflict model of
dissent in social groups. Personality & Social Psychology Review, 12(1), 50-72.
doi:10.1177/1088868307309606
Park, S. H., Westphal, J. D., & Stern, I. (2011). Set up for a fall: The insidious effects of flattery
and opinion conformity toward corporate leaders. Administrative Science Quarterly, 56(2),
257-302. doi:10.1177/0001839211429102
Park, W. (2000). A comprehensive empirical investigation of the relationships among variables
of the groupthink model. Journal of Organizational Behavior, 21(8), 873-887.
doi:10.1002/1099-1379(200012)21:8<873::AID-JOB56>3.0.CO;2-8
Pascual-Marqui, R. D., Esslen, M., Kochi, K., & Lehmann, D. (2002). Functional imaging with
low resolution brain electromagnetic tomography (LORETA): Review, new comparisons,
and new validation. Japanese Journal of Clinical Neurophysiology, 30, 81-94. Retrieved
from http://www.uzh.ch/keyinst/NewLORETA/SomePapers/LorReview2.pdf
Perkins, R. B. (1976). The orthodox bigot: A sociological analysis. Journal of American
Scientific Affiliation, 28, 116-122. Retrieved from
http://www.asa3.org/ASA/PSCF/1976/JASA9-76Perkins.html
Popper, M. (2011). Toward a theory of followership. Review of General Psychology, 15(1), 29-
36. doi:10.1037/a0021989
125
Porges, S. W. (2001). The polyvagal theory: Phylogenetic substrates of a social nervous system.
International Journal of Psychophysiology, 42(2), 123-146.
doi:10.1016/S0167-8760(01)00162-3
Prentice, R. A. (2007). Ethical decision making: More needed than good intentions. Financial
Analysts Journal, 63(6), 17-30. doi:10.2469/faj.v63.n6.4923
Quaquebeke, N., Kerschreiter, R., Buxton, A., & Dick, R. (2010). Two lighthouses to navigate:
Effects of ideal and counter-ideal values on follower identification and satisfaction with
their leaders. Journal of Business Ethics, 93(2), 293-305. doi:10.1007/s10551-009-0222-x
Quirk, J., & Richardson, D. (2010). Religion, urbanisation and anti-slavery mobilisation in
Britain, 1787-1833. European Journal of English Studies, 14(3), 263-279.
doi:10.1080/13825577.2010.517298
Quiroga, R. Q., Reddy, L., Kreiman, G., Koch, C., & Fried, I. (2005). Invariant visual
representation by single neurons in the human brain. Nature, 435(7045), 1102-1107.
doi:10.1038/nature03687
Raven, B. H. (1998). Groupthink, Bay of Pigs, and Watergate reconsidered. Organizational
Behavior & Human Decision Processes, 73(2), 352-361. doi:10.1006/obhd.1998.2766
Ringleb, A. H., & Rock, D. (2008). The emerging field of neuroleadership. Neuroleadership
Journal, 1(1), 1-17. Retrieved from http://www.davidrock.net/files/IntroNLS.pdf
Robbins, S. P., & Judge, T. A. (2010). Essentials of organizational behavior (Tenth ed.). Upper
Saddle River, NJ: Pearson.
126
Rock, D., & Schwartz, J. (2007). The neuroscience of leadership. Reclaiming Children & Youth,
16(3), 10-17. Retrieved from
http://search.proquest.com/openview/d7459629a7028a491b11b09bf43632ec/1?pq-
origsite=gscholar
Rodriguez, C. M., & Henderson, R. C. (2010). Who spares the rod?: Religious orientation, social
conformity, and child abuse potential. Child Abuse & Neglect, 34(2), 84-94.
doi:10.1016/j.chiabu.2009.07.002
Rosenau, J. (2004). Followership and discretion. Harvard International Review, 26(3), 14-17.
Sanchez, D. T., Crocker, J., & Boike, K. R. (2005). Doing gender in the bedroom: Investing in
gender norms and the sexual experience. Personality and Social Psychology Bulletin,
31(10), 1445. doi:10.1177/0146167205277333
Sanchez, D. T., Kiefer, A. K., & Ybarra, O. (2006). Sexual submissiveness in women: Costs for
sexual autonomy and arousal. Personality and Social Psychology Bulletin, 32(4), 512.
doi:10.1177/0146167205282154
Scheff, T. J. (1988). Shame and conformity: The deference-emotion system. American
Sociological Review, 53(3), 395. doi:10.2307/2095647
Senge, P., M. (2006). The fifth discipline: The art and practice of the learning organization. New
York, NY: Doubleday.
Shafritz, J. M., Ott, J. S., & Jang, Y. S. (2001). Classics of organization theory. Boston, MA:
Cengage.

127
Siegel, D. J. (2006). An interpersonal neurobiology approach to psychotherapy: Awareness,
mirror neurons, and neural plasticity in the development of well-being. Psychiatric Annals,
36(4), 248-256. Retrieved from http://www.healio.com/journals/psycann/2006-4-36-
4/%7B231a1eb0-7230-4ff8-b173-c7f31c6b823f%7D/an-interpersonal-neurobiology-
approach-to-psychotherapy
Sims, R. R. (1992). The challenge of ethical behavior in organizations. Journal of Business
Ethics, 11(7), 505-513. doi:10.1007/BF00881442
Smith, S. (1985). Groupthink and the hostage rescue mission. British Journal of Political
Science, 15(1), 117-123. doi:10.1017/S0007123400004099
't Hart, P. (1990). Groupthink in government: A study of small groups and policy failure. Lisse,
Netherlands: Swets & Zeitlinger Publishers.
Tavris, C., & Aronson, E. (2007). Mistakes were made but not by me: Why we justify foolish
beliefs, bad decisions, and hurtful actions. Orlando, FL: Harcourt.
Tetlock, P. E. (1979). Identifying victims of groupthink from public statements of decision
makers. Journal of Personality and Social Psychology, 37(8), 1314-1324.
doi:10.1037/0022-3514.37.8.1314
Tetlock, P. E., Peterson, R. S., McGuire, C., Chang, S., & Feld, P. (1992). Assessing political
group dynamics: A test of the groupthink model. Journal of Personality and Social
Psychology, 63(3), 403-425. doi:10.1037/0022-3514.63.3.403

128
Thoroughgood, C. N., Hunter, S. T., & Sawyer, K. B. (2011). Bad apples, bad barrels, and
broken followers? An empirical examination of contextual influences on follower
perceptions and reactions to aversive leadership. Journal of Business Ethics, 100(4), 647-
672. doi:10.1007/s10551-010-0702-z
Tiegs, T. J., Perrin, P. B., Kaly, P. W., & Heesacker, M. (2007). My place or yours? Sex Roles,
56(7-8), 449. doi:10.1007/s11199-007-9185-5
Tozer, A. W. (2013). The pursuit of God. Ventura, CA: Regal Books.
Triandis, H. C. (1995). Individualism and collectivism. Boulder, CO: Westview Press.
Triandis, H. C. (2001). Individualism-collectivism and personality. Journal of Personality, 69(6),
907. doi:10.1111/1467-6494.696169
Turner, J. C. (1991). Social influence. Buckingham, UK: Open University Press.
Turner, M. E., Probasco, P., Pratkanis, A. R., & Leve, C. (1992). Threat, cohesion, and group
effectiveness: Testing a social identity maintenance perspective on groupthink. Journal of
Personality & Social Psychology, 63(5), 781-796. doi:10.1037/0022-3514.63.5.781
Van Hecke, M. L., Callahan, L. P., Kolar, B., & Paller, K. A. (2010). The brain advantage:
Become a more effective business leader using the latest brain research. Amherst, NY:
Prometheus.
Walker, M. B., & Andrade, M. G. (1996). Conformity in the Asch task as a function of age. The
Journal of Social Psychology, 136(3), 367. doi:10.1080/00224545.1996.9714014
129
Whyte, W. H. (1952, March). Groupthink. Fortune Magazine, 45, 114-117. Retrieved from
http://fortune.com/2012/07/22/groupthink-fortune-1952/
Zaki, J., Schirmer, J., & Mitchell, J. P. (2011). Social influence modulates the neural
computation of value. Psychological Science, 22(7), 894-900.
doi:10.1177/0956797611411057
Zemke, D. (2010). Now and not yet: The experience of tempered radicals in Christian
congregations. (Doctoral dissertation, Gonzaga University). Available from the ProQuest
Dissertation Database. (UMI No. 3425238)
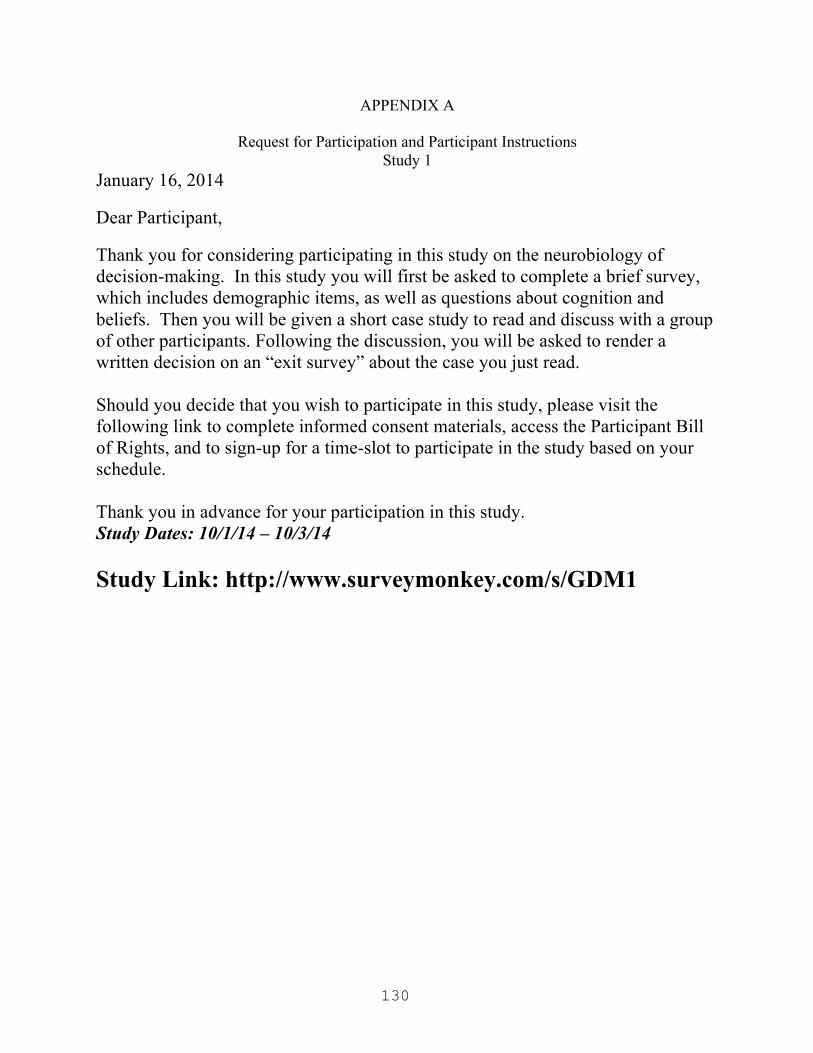
130
APPENDIX A
Request for Participation and Participant Instructions Study 1
January 16, 2014
Dear Participant,
Thank you for considering participating in this study on the neurobiology of decision-making. In this study you will first be asked to complete a brief survey, which includes demographic items, as well as questions about cognition and beliefs. Then you will be given a short case study to read and discuss with a group of other participants. Following the discussion, you will be asked to render a written decision on an “exit survey” about the case you just read. Should you decide that you wish to participate in this study, please visit the following link to complete informed consent materials, access the Participant Bill of Rights, and to sign-up for a time-slot to participate in the study based on your schedule. Thank you in advance for your participation in this study. Study Dates: 10/1/14 – 10/3/14 Study Link: http://www.surveymonkey.com/s/GDM1

131
APPENDIX B
Request for Participation and Participant Instructions Study 2
January 16, 2014
Dear Participant,
Thank you for considering participating in this study on the neurobiology of decision-making. In this study your brain will be measured using electroencephalography (EEG). This is a safe and painless procedure administered by a licensed clinician trained in EEG.
A special EEG cap to make the process quicker and easier will be used. The cap will be placed on your head to measure the electrical activity along your scalp. A baseline EEG will be taken, and then you will be asked to participate in a group decision-making activity. Following the activity, another EEG will be taken to look for any changes in the brain’s electrical activity. Your participation will take about 90 minutes.
Participant Requirements: The following is a description of the requirements to participate in this study.
• Not taking any prescription medication • No over the counter medication for 24 hours prior to the study • No caffeine on the day of the study • Please get a good night’s rest the night before the study • Eat a substantial (but not over-filling) meal 1 ½ to 2 hours before your appointment time • Wash your hair with a basic shampoo (please avoid a conditioning shampoo such as a 2-in-
1 formula) and do not condition your hair. Please also abstain from using hair products such as gel, hairspray, leave-in conditioner, wax, etc. as these will impede the electrical signals along the scalp. A free sample of clarifying shampoo is available to you by dropping by James 117.
Should you decide that you wish to participate in this study, please visit the following link to complete informed consent materials, access the Participant Bill of Rights, and to sign-up for a time-slot to participate in the study based on your schedule. Thank you in advance for your participation in this study. Study Dates: 10/8/14 – 10/17/14 Study Link: http://www.surveymonkey.com/s/GDM2

132
APPENDIX C
Consent Form (Study 1)
CONSENT TO ACT AS A HUMAN RESEARCH SUBJECT/PARTICIPANT (Study 1)
Date: January 16, 2014 Principal Investigator: Angela Deulen, M.S. Doctoral Candidate in the Graduate School of Education and Psychology at Pepperdine University under the supervision of Dr. Kent Rhodes, Dissertation chair. Research Project Title: The Neurobiology of Group Decision Making (Study 1)
1. By clicking “I do consent to participate at the bottom of this page, I agree to participate in the research study being conducted by Angela Deulen under the direction of Dr. Kent Rhodes.
2. Study Purpose: The purpose of this study is to examine the role cognition and belief play in a group decision-making activity.
3. Procedures: I understand that I will be asked to complete a brief survey then participate in a group activity where I will read a short case summary and then discuss it as a group. Afterward, I will make a decision about the case privately on a confidential form (exit survey).
4. My participation in the study will require approximately 30 minutes of my time. The study shall be conducted in Research Center in the School of Behavioral Sciences at California Baptist University.
5. Benefits: I understand that the possible benefits to participation in this study include the potential contribution to the body of literature by broadening our understanding of the role of cognition and belief in-group decision-making.
6. Compensation: No compensation for participation in this study will be offered. 7. Potential Risks: While I understand that there might be certain risks or discomforts
associated with this study, any risks associated with participation in this study are no greater in and of themselves than those ordinarily encountered in daily life or during the performance of routine physical or psychological examinations or tests. Any discomfort experienced would be consistent with the type encountered when working in groups of different people addressing fairly routine content. The risk of physical injury is very unlikely.
8. Because the risk is minimal, I understand that that no recovery period will likely be needed.
9. I understand that I may choose not to participate in this research.
10. I understand that my participation is voluntary and that I may refuse to participate and/or withdraw my consent and discontinue participation in the project or activity at any time without penalty or loss of benefits to which I am otherwise entitled.
133
11. I understand that the investigator(s) will take all reasonable measures to protect the confidentiality of my records and my identity will not be revealed in any publication that may result from this project. The confidentiality of my records will be maintained in accordance with applicable state and federal laws. Under California law, there are exceptions to confidentiality, including suspicion that a child, elder, or dependent adult is being abused, or if an individual discloses an intent to harm him/herself or others. I understand there is a possibility that my medical record, including identifying information, may be inspected and/or photocopied by officials of the Food and Drug Administration or other federal or state government agencies during the ordinary course of carrying out their functions. If I participate in a sponsored research project, a representative of the sponsor may inspect my research records.
12. I understand that the investigator is willing to answer any inquiries I may have concerning the research herein described. I understand that I may contact Dr. Kent Rhodes, Dissertation Chair, if I have other questions or concerns about this research. If I have questions about my rights as a research participant, I understand that I can contact Dr. Thema Bryant-Davis, Chairperson of the Graduate and Professional Schools IRB, Pepperdine University.
13. I will be informed of any significant new findings developed during the course of my participation in this research, which may have a bearing on my willingness to continue in the study.
14. I understand that in the event of physical injury resulting from the research procedures in which I am to participate, no form of compensation is available. Medical treatment may be provided at my own expense or at the expense of my health care insurer, which may or may not provide coverage. If I have questions, I should contact my insurer.
15. I also understand to my satisfaction the information regarding participation in the research project. All my questions have been answered to my satisfaction. I have received a copy of this informed consent form, which I have read and understand. I hereby consent to participate in the research described above.

134
APPENDIX D
Consent Form (Study 2)
CONSENT TO ACT AS A HUMAN RESEARCH SUBJECT/PARTICIPANT (Study 2)
Date: January 16, 2014 Principal Investigator: Angela Deulen, M.S. Doctoral Candidate in the Graduate School of Education and Psychology at Pepperdine University under the supervision of Dr. Kent Rhodes, Dissertation chair.
Research Project Title: The Neurobiology of Group Decision Making (Study 2) 1. By clicking “I do consent to participate at the bottom of this page, I agree to participate in
the research study being conducted by Angela Deulen under the direction of Dr. Kent Rhodes.
2. Study Purpose: The purpose of this study is to examine the neurobiological changes that take place in the brain during a group decision-making activity as measured by quantitative electroencephalography (EEG) also known as brain mapping.
3. Procedures: I understand I will be asked to complete a brief demographic survey, then 20 minutes of baseline data will be taken on the electrical activity of the brain’s cortex using quantitative EEG measures. I will then read a brief case study and participate in a group discussion on the reading. My cortical activity will then again be measured on the EEG.
Participant Requirements: The following is a description of the requirements to participate in this study.
• Not taking any prescription medication • No over the counter medication for 24 hours prior to the study • No caffeine on the day of the study • Please get a good night’s rest the night before the study • Eat a substantial (but not over-filling) meal 1 ½ to 2 hours before your
appointment time • Wash hair with a basic shampoo (please avoid a conditioning shampoo such
as a 2-in-1 formula) and do not condition hair. Please also abstain from using hair products such as gel, hairspray, leave-in conditioner, wax, etc. as these will impede the electrical signals along the scalp. A free sample of clarifying shampoo is available by dropping by James 117, if I choose.
4. My participation in the study will require approximately 90 minutes of my time. The study shall be conducted in Research Center in the School of Behavioral Sciences at California Baptist University.
5. Benefits: I understand that the possible benefits to participation in this study include the potential contribution to the body of literature by broadening our understanding of the role of cognition and belief in-group decision-making.

135
6. Compensation: No compensation for participation in this study will be offered. 7. Potential Risks: While I understand that there might be certain risks or discomforts
associated with this study, any risks associated with participation in this study are no more than one would encounter in everyday routine events. EEG is a non-invasive procedure routinely practiced and will be administered by a trained, licensed clinician. Risks associated with EEG recordings are minimal and are typically more of an inconvenience (e.g. slightly damp or messed-up hair following the procedure). The risk of physical injury is very unlikely.
8. Because the risk is minimal, I understand that that no recovery period will likely be needed. I may choose to wash my hair if it feels damp or sticky.
9. I understand that I may choose not to participate in this research. 10. I understand that my participation is voluntary and that I may refuse to participate and/or
withdraw my consent and discontinue participation in the project or activity at any time without penalty or loss of benefits to which I am otherwise entitled.
11. I understand that the investigator(s) will take all reasonable measures to protect the confidentiality of my records and my identity will not be revealed in any publication that may result from this project. The confidentiality of my records will be maintained in accordance with applicable state and federal laws. Under California law, there are exceptions to confidentiality, including suspicion that a child, elder, or dependent adult is being abused, or if an individual discloses an intent to harm him/herself or others. I understand there is a possibility that my medical record, including identifying information, may be inspected and/or photocopied by officials of the Food and Drug Administration or other federal or state government agencies during the ordinary course of carrying out their functions. If I participate in a sponsored research project, a representative of the sponsor may inspect my research records.
12. I understand that the investigator is willing to answer any inquiries I may have concerning the research herein described. I understand that I may contact Dr. Kent Rhodes, Dissertation Chair, if I have other questions or concerns about this research. If I have questions about my rights as a research participant, I understand that I can contact Dr. Thema Bryant-Davis, Chairperson of the Graduate and Professional Schools IRB, Pepperdine University.
13. I will be informed of any significant new findings developed during the course of my participation in this research, which may have a bearing on my willingness to continue in the study.
14. I understand that in the event of physical injury resulting from the research procedures in which I am to participate, no form of compensation is available. Medical treatment may be provided at my own expense or at the expense of my health care insurer, which may or may not provide coverage. If I have questions, I should contact my insurer.
15. I also understand to my satisfaction the information regarding participation in the research project. All my questions have been answered to my satisfaction. I have received a copy of this informed consent form, which I have read and understand. I hereby consent to participate in the research described above.

136
APPENDIX E
Participant Bill of Rights
BILL OF RIGHTS for RESEARCH PARTICIPANTS
All persons asked to participate as a subject in a research project, before deciding whether or not to participate, have the right to:
1. Be informed about the nature and purpose of the research. 2. Be given an explanation of the procedures used in the research and, if appropriate, any
drug or medical device utilized. 3. Be given a description of any attendant discomforts and risks reasonably expected from
or during the research. 4. Be given an explanation of any benefits to subjects potentially resulting from research, if
applicable. 5. Be given a disclosure of any appropriate alternative procedures, drugs, or devices that
might be advantageous to subjects, and the potential related risks and benefits. 6. Be informed about medical or psychological treatment, if any, available to the subject if
complications arise during or after the research. 7. Be given an opportunity to ask any questions concerning the research purposes and
procedures. 8. Be told that consent to participate in the research may be withdrawn at any time and
subjects may discontinue participation in the research without prejudice. 9. Be given a copy of any signed and dated written consent form related to the research. 10. Be given the opportunity to decide to consent or not consent to participate in the research
without the any element of force, fraud, deceit, duress, coercion or undue influence on the decision.
I carefully read this Bill of Rights and fully understand my rights as a potential subject in a research project involving people as subjects.

137
APPENDIX F
Email Debriefing Participants
Dear research participants,
I want to thank you again for your participation in both of my studies on group decision-making. I know you most likely heard me debrief participants on the results of both studies when I came to your class. However, I wanted to take the opportunity to provide you with the results in writing.
To begin, this study did use a modicum of deception. You were originally told that you were participating in a study on group decision-making, and that is true. However, the variable that was specifically being studied is that of conformity. I apologize for this use of deception; it was important to keep the true variable hidden so as to not compromise the study. If any of you feel distressed by this, please feel free to contact me personally. I would be more than happy to speak to you about it.
I would also like to share the results of the studies. They are outlined below:
Study 1: I was looking to see if there was any relationship between cognitive rigidity and ideological commitment with regard to conformity. The data were not significant. Thirty-five subjects (mean age of 19.67, and 86% female) participated in this study with a conformity rate of 91.4%.
Study 2: I was looking to see how the brain responded in different group dynamics (with a designated leader or without, with decision-making protocol or without, and with a biased leader or an impartial one). No significant differences in the brain were found with regard to the groups. However, some patterns and trends in general were identified, in particularly related to the brain’s frontal lobe and anterior cingulate found in the limbic system. Twenty-two participants took part in this study (average age of 19.32, and 91% female). The conformity rate was 95.5%.
I want to take this opportunity to remind participants that they have the right to ask for their data to be removed from the study. Further, again, if you would like to discuss any portion of the study with me, please feel free to contact me at any time.
Thank you again. This work would not have been possible without your contributions.
Kind regards, Angela Deulen, LPCC, LMFT Assistant Professor School of the Behavioral Sciences

138
APPENDIX G
Participant Questionnaire
Instructions: Please indicate your responses below by checking the appropriate boxes or filling in
the blanks.
Are you: ☐ Male ☐Female What is your age: ____________________
Please check your primary ethnicity:
☐Asian
☐Black/African American
☐White/Caucasian
☐Hispanic/Latino(a)
☐Native American
☐Other: Please Specify: _________
Ideological Commitment Scale
Rate your level of commitment in each of the three areas below on a scale of 1 (being the lowest) to 10 (being the highest). Circle the number in each category that best represents your rated level of commitment.
Commitm
ent to your current
Poli/
cal A
ffilia/o
n
• 10 • 9 • 8 • 7 • 6 • 5 • 4 • 3 • 2 • 1
Commitm
ent to your current
Religious Affilita/
on
• 10 • 9 • 8 • 7 • 6 • 5 • 4 • 3 • 2 • 1
Commitm
ent to your current
Idealogical Persuits
• 10 • 9 • 8 • 7 • 6 • 5 • 4 • 3 • 2 • 1
140
APPENDIX H
20-Item Cognitive Flexibility Inventory (CFI)
Please use the scale below to indicate the extent to which you agree or disagree with the following statements.
Strongly Disagree
Disagree Somewhat Disagree
Neutral Somewhat Agree
Agree Strongly Agree
1 2 3 4 5 6 7
1.I am good at ‘‘sizing up’’ situations. 2.I have a hard time making decisions when faced with difficult situations. 3.I consider multiple options before making a decision. 4.When I encounter difficult situations, I feel like I am losing control. 5.I like to look at difficult situations from many different angles. 6.I seek additional information not immediately available before attributing causes to
behavior. 7.When encountering difficult situations, I become so stressed that I cannot think of a way to
resolve the situation. 8.I try to think about things from another person’s point of view. 9.I find it troublesome that there are so many different ways to deal with difficult situations. 10. I am good at putting myself in others’ shoes. 11. When I encounter difficult situations, I just don’t know what to do. 12. It is important to look at difficult situations from many angles. 13. When in difficult situations, I consider multiple options before deciding how to behave. 14. I often look at a situation from different viewpoints. 15. I am capable of overcoming the difficulties in life that I face. 16. I consider all the available facts and information when attributing causes to behavior. 17. I feel I have no power to change things in difficult situations. 18. When I encounter difficult situations, I stop and try to think of several ways to resolve it. 19. I can think of more than one way to resolve a difficult situation I’m confronted with. 20. I consider multiple options before responding to difficult situations.
Cognitive therapy and research by SPRINGER NEW YORK LLC. Reproduced with permission of SPRINGER NEW YORK LLC in the format use in a thesis/dissertation via Copyright Clearance Center.

141
APPENDIX I
Permission to use CFI
Confirmation Number: 11112913 Order Date: 08/05/2013 Customer Information Customer: Angela Deulen Account Number: 3000683016 Organization: Angela Deulen Email: [email protected] Payment Method: Invoice
Order Details Cognitive therapy and research
Billing Status: N/A
Order detail ID: 63878860 Article Title: The Cognitive Flexibility Inventory: Instrument Development and Estimates of Reliability and Validity Author(s): Dennis, John P. ; Vander Wal, Jillon S. DOI: 10.1007/S10608-009-9276-4 Date: Jan 01, 2010 ISSN: 0147-5916 Publication Type: Journal Volume: 34 Issue: 3 Start page: 241 Publisher: SPRINGER NEW YORK LLC
Permission Status: Granted
Permission type: Republish or display content Type of use: use in a thesis/dissertation Order License Id: 3202690764379
Portion Excerpts Author of this Springer
article No
Title of your thesis / dissertation
THE NEUROBIOLOGY OF GROUPTHINK: A qEEG APPROACH TO THE STUDY OF FOLLOWERSHIP
Expected completion date May 2014 Estimated size(pages) 200
Note: This item was invoiced separately through our RightsLink service. More info
$ 0.00 Total order items: 1
The following terms & conditions apply to the specific publication under which they are listed Cognitive therapy and research Permission type: Republish or display content Type of use: use in a thesis/dissertation Citation Information Order Detail ID: 63878860 Cognitive therapy and research by SPRINGER NEW YORK LLC. Reproduced with permission of SPRINGER NEW YORK LLC in the format use in a thesis/dissertation via Copyright Clearance Center.

142
APPENDIX J
Vignette
Please use read the following vignette and then discuss with the other participants in your group.
Chad is an international corporate executive. Because his area of expertise is economic practices in the Chinese marketplace, his American company has decided to transfer him (as well as his wife, Ling, and their 2 children) to Beijing to oversee the development of a new enterprise in that region. Chad understands that financials exchanges, what Americans typically refer to as bribes, are deeply woven into the fabric of business practices in China, so much so that to him, it is a cultural and historical norm.
Once in China, at the outset of the project, these financial exchanges are small by American standards (under $10,000.00 per transaction). However, Chad hits a roadblock toward the end of building completion; the local permitting office has indirectly demanded $750,000.00 to grant his final permit. Chad can pay the “bribe” and still come in under budget, but he needs to make a decision quickly as he is close to the deadline set by international trade agreements. Because the budget is derived in part from American tax dollars, Chad is struggling with this final decision.
What do you think Chad should do?

143
APPENDIX K
Exit Survey
Please answer the following question by circling your response.
What is your conclusion about this case; should Chad pay the bribe?
Yes No
Comments (optional):

144
APPENDIX L
Study Two Data Collection Worksheet For Researcher Use: Have you had any caffeine today? Yes No Notes: When was your last meal/food eaten? Are you taking any medication? Yes No Notes: Have you ever had a seizure? Yes No Notes: Have you ever had a head injury or concussion? Yes No Notes: Measurement: Circumference of Head: ____________cm Length from Naison to Inion: _____________cm Preauriculars (ear to ear) ________________cm Cap size: SM MED LG Notes:

145
APPENDIX M
Decision Making Guidelines
Instructions: Please follow these steps in coming to a “verdict” on the case study you have been
assigned.
Step 1: As a group, assign someone to play the “devil’s advocate.” This person will present
opposing viewpoints to whatever idea has been presented for the purpose of generating broader
thinking on the topic. The devil’s advocate does not have to agree with his/her own statements,
just advocate for the opposite viewpoint.
Step 2: Discuss the case study as a group as well as possible outcomes.
Step 3: Start to identify emerging patterns/tendencies. For example, someone might say “it
sounds like many of us are leaning toward…”
Step 4: Identify those who disagree and give them an opportunity to discuss their reasons.
Step 5: Continue to discuss, assessing the support for each possible outcome. Repeat steps 2-4
as necessary.
Step 6: Finalize your decisions.
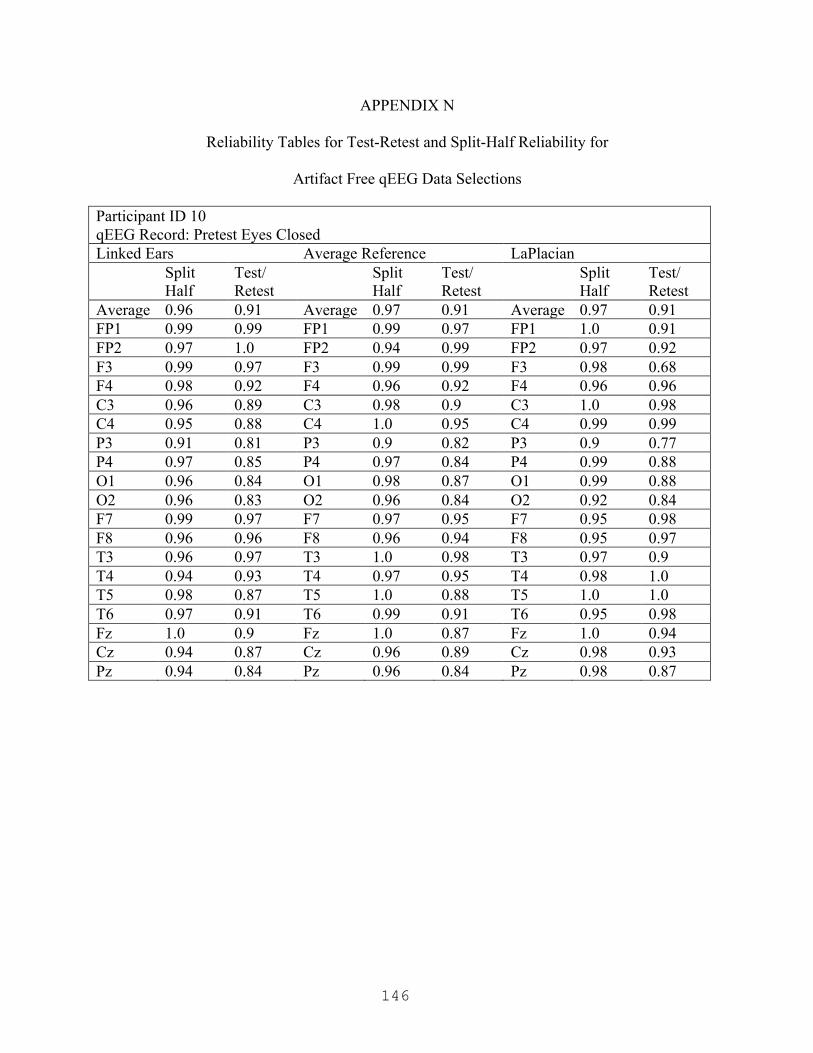
146
APPENDIX N
Reliability Tables for Test-Retest and Split-Half Reliability for
Artifact Free qEEG Data Selections
Participant ID 10 qEEG Record: Pretest Eyes Closed Linked Ears Average Reference LaPlacian Split
Half Test/ Retest
Split Half
Test/ Retest
Split Half
Test/ Retest
Average 0.96 0.91 Average 0.97 0.91 Average 0.97 0.91 FP1 0.99 0.99 FP1 0.99 0.97 FP1 1.0 0.91 FP2 0.97 1.0 FP2 0.94 0.99 FP2 0.97 0.92 F3 0.99 0.97 F3 0.99 0.99 F3 0.98 0.68 F4 0.98 0.92 F4 0.96 0.92 F4 0.96 0.96 C3 0.96 0.89 C3 0.98 0.9 C3 1.0 0.98 C4 0.95 0.88 C4 1.0 0.95 C4 0.99 0.99 P3 0.91 0.81 P3 0.9 0.82 P3 0.9 0.77 P4 0.97 0.85 P4 0.97 0.84 P4 0.99 0.88 O1 0.96 0.84 O1 0.98 0.87 O1 0.99 0.88 O2 0.96 0.83 O2 0.96 0.84 O2 0.92 0.84 F7 0.99 0.97 F7 0.97 0.95 F7 0.95 0.98 F8 0.96 0.96 F8 0.96 0.94 F8 0.95 0.97 T3 0.96 0.97 T3 1.0 0.98 T3 0.97 0.9 T4 0.94 0.93 T4 0.97 0.95 T4 0.98 1.0 T5 0.98 0.87 T5 1.0 0.88 T5 1.0 1.0 T6 0.97 0.91 T6 0.99 0.91 T6 0.95 0.98 Fz 1.0 0.9 Fz 1.0 0.87 Fz 1.0 0.94 Cz 0.94 0.87 Cz 0.96 0.89 Cz 0.98 0.93 Pz 0.94 0.84 Pz 0.96 0.84 Pz 0.98 0.87
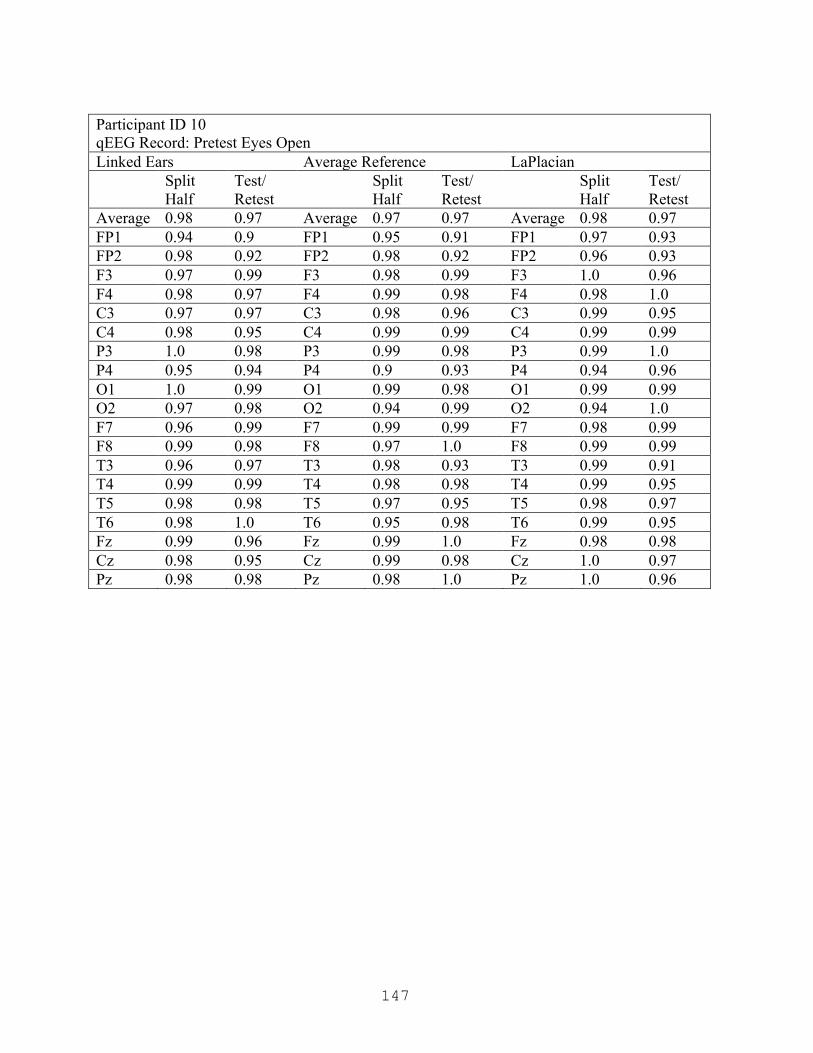
147
Participant ID 10 qEEG Record: Pretest Eyes Open Linked Ears Average Reference LaPlacian Split
Half Test/ Retest
Split Half
Test/ Retest
Split Half
Test/ Retest
Average 0.98 0.97 Average 0.97 0.97 Average 0.98 0.97 FP1 0.94 0.9 FP1 0.95 0.91 FP1 0.97 0.93 FP2 0.98 0.92 FP2 0.98 0.92 FP2 0.96 0.93 F3 0.97 0.99 F3 0.98 0.99 F3 1.0 0.96 F4 0.98 0.97 F4 0.99 0.98 F4 0.98 1.0 C3 0.97 0.97 C3 0.98 0.96 C3 0.99 0.95 C4 0.98 0.95 C4 0.99 0.99 C4 0.99 0.99 P3 1.0 0.98 P3 0.99 0.98 P3 0.99 1.0 P4 0.95 0.94 P4 0.9 0.93 P4 0.94 0.96 O1 1.0 0.99 O1 0.99 0.98 O1 0.99 0.99 O2 0.97 0.98 O2 0.94 0.99 O2 0.94 1.0 F7 0.96 0.99 F7 0.99 0.99 F7 0.98 0.99 F8 0.99 0.98 F8 0.97 1.0 F8 0.99 0.99 T3 0.96 0.97 T3 0.98 0.93 T3 0.99 0.91 T4 0.99 0.99 T4 0.98 0.98 T4 0.99 0.95 T5 0.98 0.98 T5 0.97 0.95 T5 0.98 0.97 T6 0.98 1.0 T6 0.95 0.98 T6 0.99 0.95 Fz 0.99 0.96 Fz 0.99 1.0 Fz 0.98 0.98 Cz 0.98 0.95 Cz 0.99 0.98 Cz 1.0 0.97 Pz 0.98 0.98 Pz 0.98 1.0 Pz 1.0 0.96

148
Participant ID 10 qEEG Record: Pretest Serial Sevens Linked Ears Average Reference LaPlacian Split
Half Test/ Retest
Split Half
Test/ Retest
Split Half
Test/ Retest
Average 0.97 0.96 Average 0.97 0.94 Average 0.98 0.94 FP1 0.95 0.92 FP1 0.93 0.96 FP1 0.95 0.98 FP2 0.97 0.94 FP2 0.99 0.89 FP2 0.95 0.84 F3 1.0 0.94 F3 1.0 0.99 F3 1.0 0.98 F4 0.99 0.99 F4 0.99 0.94 F4 0.99 0.91 C3 0.98 0.99 C3 0.98 0.88 C3 0.98 0.87 C4 0.98 0.96 C4 0.96 0.93 C4 1.0 0.94 P3 0.96 0.99 P3 0.93 0.99 P3 0.98 0.92 P4 0.97 0.93 P4 0.95 0.96 P4 0.95 0.96 O1 0.97 0.96 O1 0.96 0.97 O1 0.97 0.99 O2 0.97 0.96 O2 0.98 0.99 O2 0.97 0.98 F7 0.95 0.99 F7 1.0 0.88 F7 0.99 0.93 F8 0.97 0.93 F8 0.96 0.92 F8 0.99 0.86 T3 0.96 0.95 T3 0.96 0.93 T3 0.98 0.97 T4 1.0 0.95 T4 0.97 0.98 T4 0.99 0.97 T5 0.98 0.97 T5 1.0 0.98 T5 0.97 0.96 T6 0.98 0.92 T6 0.98 0.93 T6 0.95 0.99 Fz 0.99 0.95 Fz 0.98 0.96 Fz 0.96 0.96 Cz 0.96 0.97 Cz 0.95 0.91 Cz 0.99 0.91 Pz 0.97 0.95 Pz 0.99 0.94 Pz 0.99 0.95

149
Participant ID 10 qEEG Record: Posttest Eyes Open Linked Ears Average Reference LaPlacian Split
Half Test/ Retest
Split Half
Test/ Retest
Split Half
Test/ Retest
Average 0.98 0.95 Average 0.97 0.93 Average 0.96 0.96 FP1 0.96 0.84 FP1 0.99 0.76 FP1 0.98 0.85 FP2 0.96 0.97 FP2 1.0 0.92 FP2 0.99 0.98 F3 0.98 1.0 F3 0.99 0.95 F3 0.95 0.99 F4 0.91 0.87 F4 0.89 0.89 F4 0.85 0.9 C3 0.97 0.92 C3 0.95 0.91 C3 0.92 0.97 C4 0.99 0.92 C4 0.97 0.95 C4 0.92 0.99 P3 0.97 0.98 P3 0.96 0.98 P3 0.99 1.0 P4 0.99 0.99 P4 0.99 0.92 P4 0.97 0.98 O1 0.98 0.96 O1 0.99 1.0 O1 0.98 0.97 O2 0.95 1.0 O2 0.99 0.99 O2 1.0 0.97 F7 0.98 0.89 F7 0.94 0.88 F7 0.95 0.99 F8 0.99 0.98 F8 0.91 0.93 F8 0.91 0.99 T3 1.0 0.94 T3 0.95 0.94 T3 0.98 0.97 T4 0.95 0.95 T4 0.99 0.98 T4 0.98 0.93 T5 1.0 0.97 T5 0.96 0.93 T5 0.93 0.96 T6 0.99 0.95 T6 0.99 0.92 T6 1.0 0.96 Fz 0.99 0.94 Fz 0.99 0.98 Fz 1.0 0.98 Cz 1.0 0.92 Cz 1.0 0.99 Cz 0.99 0.93 Pz 0.99 0.98 Pz 1.0 0.94 Pz 0.94 0.98
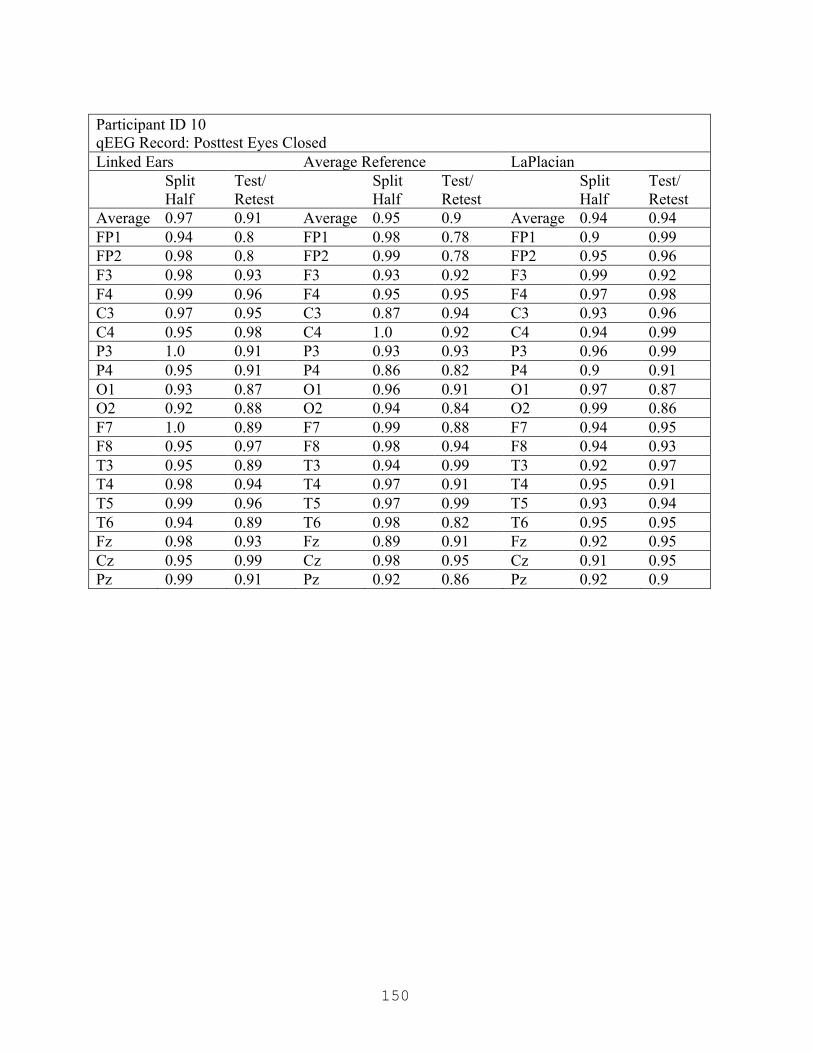
150
Participant ID 10 qEEG Record: Posttest Eyes Closed Linked Ears Average Reference LaPlacian Split
Half Test/ Retest
Split Half
Test/ Retest
Split Half
Test/ Retest
Average 0.97 0.91 Average 0.95 0.9 Average 0.94 0.94 FP1 0.94 0.8 FP1 0.98 0.78 FP1 0.9 0.99 FP2 0.98 0.8 FP2 0.99 0.78 FP2 0.95 0.96 F3 0.98 0.93 F3 0.93 0.92 F3 0.99 0.92 F4 0.99 0.96 F4 0.95 0.95 F4 0.97 0.98 C3 0.97 0.95 C3 0.87 0.94 C3 0.93 0.96 C4 0.95 0.98 C4 1.0 0.92 C4 0.94 0.99 P3 1.0 0.91 P3 0.93 0.93 P3 0.96 0.99 P4 0.95 0.91 P4 0.86 0.82 P4 0.9 0.91 O1 0.93 0.87 O1 0.96 0.91 O1 0.97 0.87 O2 0.92 0.88 O2 0.94 0.84 O2 0.99 0.86 F7 1.0 0.89 F7 0.99 0.88 F7 0.94 0.95 F8 0.95 0.97 F8 0.98 0.94 F8 0.94 0.93 T3 0.95 0.89 T3 0.94 0.99 T3 0.92 0.97 T4 0.98 0.94 T4 0.97 0.91 T4 0.95 0.91 T5 0.99 0.96 T5 0.97 0.99 T5 0.93 0.94 T6 0.94 0.89 T6 0.98 0.82 T6 0.95 0.95 Fz 0.98 0.93 Fz 0.89 0.91 Fz 0.92 0.95 Cz 0.95 0.99 Cz 0.98 0.95 Cz 0.91 0.95 Pz 0.99 0.91 Pz 0.92 0.86 Pz 0.92 0.9

151
Participant ID 11 qEEG Record: Pretest Eyes Closed Linked Ears Average Reference LaPlacian Split
Half Test/ Retest
Split Half
Test/ Retest
Split Half
Test/ Retest
Average 0.91 0.85 Average 0.87 0.82 Average 0.9 0.75 FP1 0.81 0.66 FP1 0.92 0.62 FP1 0.87 0.63 FP2 0.91 0.69 FP2 0.91 0.75 FP2 0.94 0.73 F3 0.96 0.98 F3 0.88 0.99 F3 0.97 0.92 F4 0.92 0.79 F4 0.89 0.76 F4 0.91 0.65 C3 0.9 0.55 C3 0.8 0.42 C3 0.8 0.38 C4 0.99 0.52 C4 0.9 0.46 C4 0.81 0.39 P3 0.9 0.92 P3 0.87 0.83 P3 0.91 0.84 P4 0.88 0.95 P4 0.86 0.92 P4 0.87 0.71 O1 0.98 0.96 O1 0.96 0.88 O1 0.98 0.84 O2 0.99 1.0 O2 0.96 0.91 O2 0.86 0.79 F7 0.96 1.0 F7 0.81 0.8 F7 0.82 0.97 F8 0.98 0.99 F8 0.86 0.82 F8 0.92 0.77 T3 0.93 0.86 T3 0.82 0.95 T3 0.94 0.83 T4 0.92 0.85 T4 0.94 0.97 T4 0.98 0.84 T5 0.82 0.95 T5 0.65 0.97 T5 0.77 0.81 T6 0.77 0.79 T6 0.86 0.95 T6 1.0 0.98 Fz 0.91 0.87 Fz 0.93 0.8 Fz 0.96 0.84 Cz 0.88 0.92 Cz 0.94 0.87 Cz 0.79 0.45 Pz 0.86 0.99 Pz 0.83 0.99 Pz 0.98 0.94
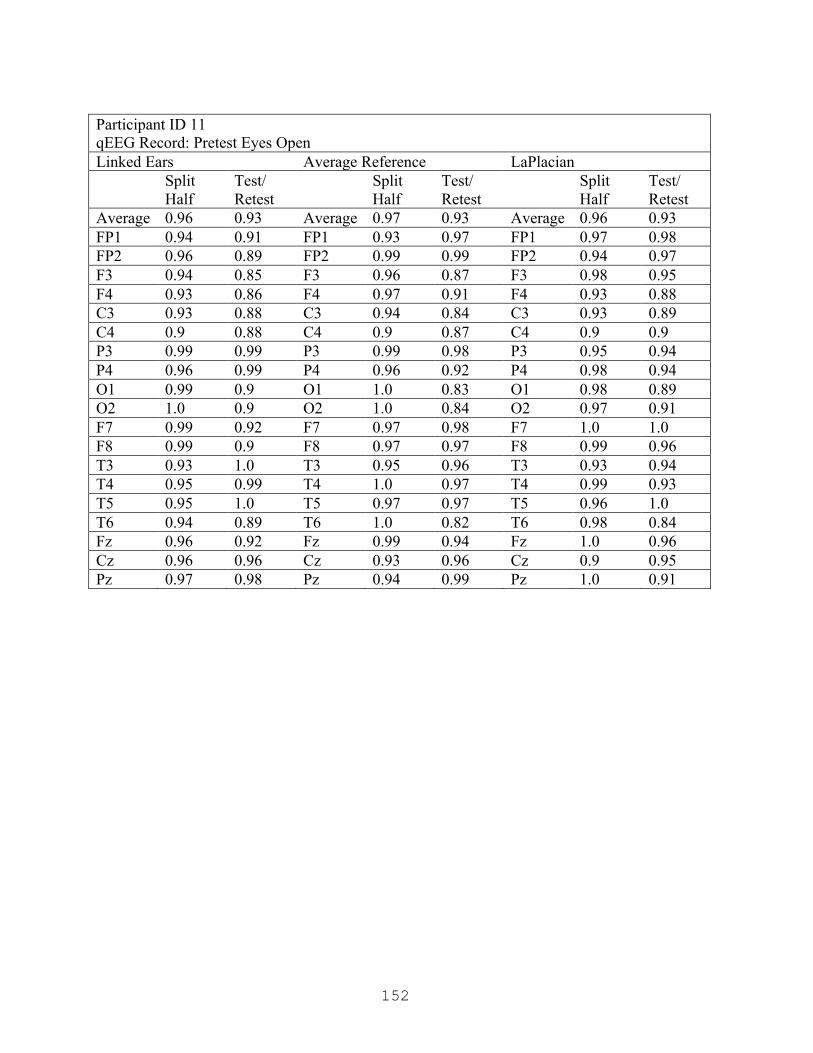
152
Participant ID 11 qEEG Record: Pretest Eyes Open Linked Ears Average Reference LaPlacian Split
Half Test/ Retest
Split Half
Test/ Retest
Split Half
Test/ Retest
Average 0.96 0.93 Average 0.97 0.93 Average 0.96 0.93 FP1 0.94 0.91 FP1 0.93 0.97 FP1 0.97 0.98 FP2 0.96 0.89 FP2 0.99 0.99 FP2 0.94 0.97 F3 0.94 0.85 F3 0.96 0.87 F3 0.98 0.95 F4 0.93 0.86 F4 0.97 0.91 F4 0.93 0.88 C3 0.93 0.88 C3 0.94 0.84 C3 0.93 0.89 C4 0.9 0.88 C4 0.9 0.87 C4 0.9 0.9 P3 0.99 0.99 P3 0.99 0.98 P3 0.95 0.94 P4 0.96 0.99 P4 0.96 0.92 P4 0.98 0.94 O1 0.99 0.9 O1 1.0 0.83 O1 0.98 0.89 O2 1.0 0.9 O2 1.0 0.84 O2 0.97 0.91 F7 0.99 0.92 F7 0.97 0.98 F7 1.0 1.0 F8 0.99 0.9 F8 0.97 0.97 F8 0.99 0.96 T3 0.93 1.0 T3 0.95 0.96 T3 0.93 0.94 T4 0.95 0.99 T4 1.0 0.97 T4 0.99 0.93 T5 0.95 1.0 T5 0.97 0.97 T5 0.96 1.0 T6 0.94 0.89 T6 1.0 0.82 T6 0.98 0.84 Fz 0.96 0.92 Fz 0.99 0.94 Fz 1.0 0.96 Cz 0.96 0.96 Cz 0.93 0.96 Cz 0.9 0.95 Pz 0.97 0.98 Pz 0.94 0.99 Pz 1.0 0.91

153
Participant ID 11 qEEG Record: Pretest Serial Sevens Linked Ears Average Reference LaPlacian Split
Half Test/ Retest
Split Half
Test/ Retest
Split Half
Test/ Retest
Average 0.92 0.94 Average 0.9 0.92 Average 0.88 0.92 FP1 1.0 0.93 FP1 0.93 0.9 FP1 0.94 0.95 FP2 0.94 0.94 FP2 0.89 0.9 FP2 0.93 0.99 F3 0.98 0.95 F3 0.97 0.86 F3 0.96 0.87 F4 0.92 0.96 F4 0.9 0.85 F4 0.88 0.92 C3 0.68 0.87 C3 0.64 0.84 C3 0.64 0.83 C4 0.62 0.88 C4 0.63 0.82 C4 0.62 0.82 P3 0.96 0.83 P3 0.99 0.86 P3 0.92 0.86 P4 0.95 0.95 P4 0.99 0.97 P4 0.85 0.99 O1 0.95 0.99 O1 0.92 0.95 O1 0.88 0.99 O2 0.98 0.96 O2 0.97 0.98 O2 0.93 0.95 F7 0.87 0.89 F7 0.96 1.0 F7 0.97 0.96 F8 0.94 0.92 F8 0.94 0.9 F8 0.95 0.89 T3 0.98 0.89 T3 0.92 0.95 T3 0.95 0.96 T4 0.99 0.94 T4 0.99 0.97 T4 0.97 0.94 T5 0.98 0.96 T5 0.93 0.93 T5 0.98 0.94 T6 0.88 1.0 T6 0.87 0.95 T6 0.92 0.89 Fz 0.97 1.0 Fz 0.95 0.9 Fz 0.94 0.92 Cz 0.95 0.97 Cz 0.92 0.96 Cz 0.71 0.78 Pz 0.89 0.95 Pz 0.87 0.98 Pz 0.87 0.99
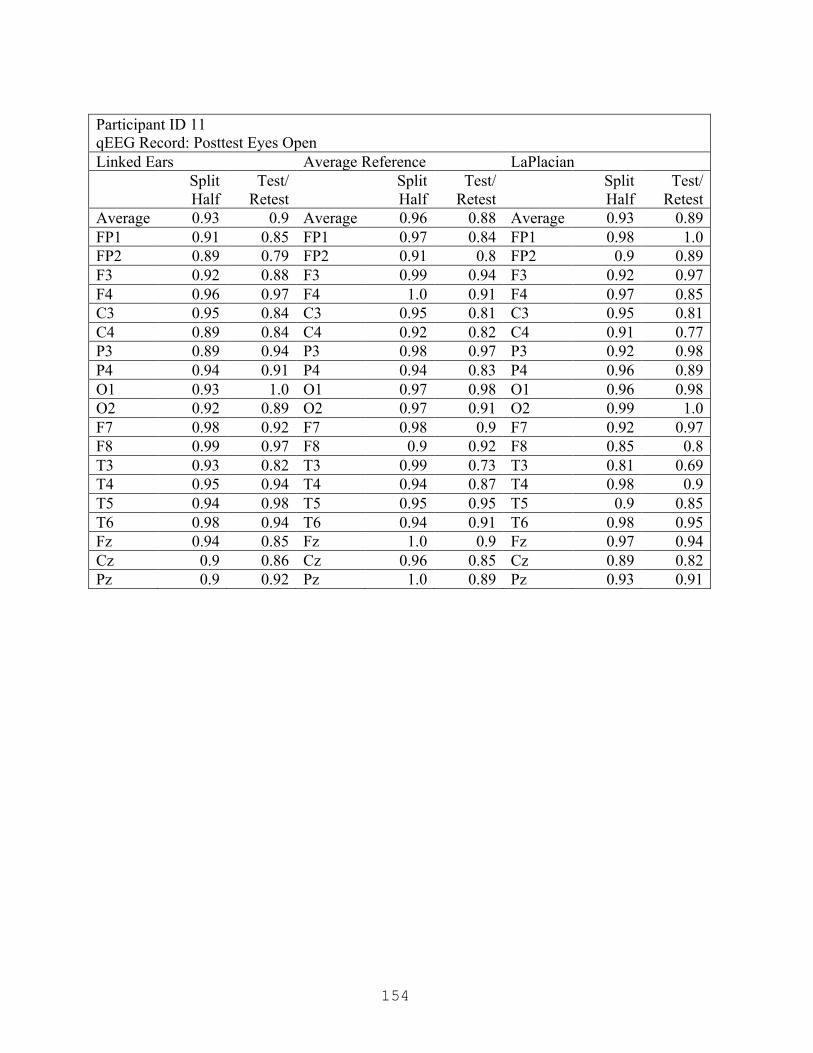
154
Participant ID 11 qEEG Record: Posttest Eyes Open Linked Ears Average Reference LaPlacian Split
Half Test/
Retest Split
Half Test/
Retest Split
Half Test/
Retest Average 0.93 0.9 Average 0.96 0.88 Average 0.93 0.89 FP1 0.91 0.85 FP1 0.97 0.84 FP1 0.98 1.0 FP2 0.89 0.79 FP2 0.91 0.8 FP2 0.9 0.89 F3 0.92 0.88 F3 0.99 0.94 F3 0.92 0.97 F4 0.96 0.97 F4 1.0 0.91 F4 0.97 0.85 C3 0.95 0.84 C3 0.95 0.81 C3 0.95 0.81 C4 0.89 0.84 C4 0.92 0.82 C4 0.91 0.77 P3 0.89 0.94 P3 0.98 0.97 P3 0.92 0.98 P4 0.94 0.91 P4 0.94 0.83 P4 0.96 0.89 O1 0.93 1.0 O1 0.97 0.98 O1 0.96 0.98 O2 0.92 0.89 O2 0.97 0.91 O2 0.99 1.0 F7 0.98 0.92 F7 0.98 0.9 F7 0.92 0.97 F8 0.99 0.97 F8 0.9 0.92 F8 0.85 0.8 T3 0.93 0.82 T3 0.99 0.73 T3 0.81 0.69 T4 0.95 0.94 T4 0.94 0.87 T4 0.98 0.9 T5 0.94 0.98 T5 0.95 0.95 T5 0.9 0.85 T6 0.98 0.94 T6 0.94 0.91 T6 0.98 0.95 Fz 0.94 0.85 Fz 1.0 0.9 Fz 0.97 0.94 Cz 0.9 0.86 Cz 0.96 0.85 Cz 0.89 0.82 Pz 0.9 0.92 Pz 1.0 0.89 Pz 0.93 0.91

155
Participant ID 11 qEEG Record: Posttest Eyes Closed Linked Ears Average Reference LaPlacian
Split Half
Test/ Retest
Split Half
Test/ Retest
Split Half
Test/ Retest
Average 0.93 0.9 Average 0.96 0.88 Average 0.93 0.89 FP1 0.91 0.85 FP1 0.97 0.84 FP1 0.98 1.0 FP2 0.89 0.79 FP2 0.91 0.8 FP2 0.9 0.89 F3 0.92 0.88 F3 0.99 0.94 F3 0.92 0.97 F4 0.96 0.97 F4 1.0 0.91 F4 0.97 0.85 C3 0.95 0.84 C3 0.95 0.81 C3 0.95 0.81 C4 0.89 0.84 C4 0.92 0.82 C4 0.91 0.77 P3 0.89 0.94 P3 0.98 0.97 P3 0.92 0.98 P4 0.94 0.91 P4 0.94 0.83 P4 0.96 0.89 O1 0.93 1.0 O1 0.97 0.98 O1 0.96 0.98 O2 0.92 0.89 O2 0.97 0.91 O2 0.99 1.0 F7 0.98 0.92 F7 0.98 0.9 F7 0.92 0.97 F8 0.99 0.97 F8 0.9 0.92 F8 0.85 0.8 T3 0.93 0.82 T3 0.99 0.73 T3 0.81 0.69 T4 0.95 0.94 T4 0.94 0.87 T4 0.98 0.9 T5 0.94 0.98 T5 0.95 0.95 T5 0.9 0.85 T6 0.98 0.94 T6 0.94 0.91 T6 0.98 0.95 Fz 0.94 0.85 Fz 1.0 0.9 Fz 0.97 0.94 Cz 0.9 0.86 Cz 0.96 0.85 Cz 0.89 0.82 Pz 0.9 0.92 Pz 1.0 0.89 Pz 0.93 0.91

156
Participant ID 13 qEEG Record: Pretest Eyes Closed Linked Ears Average Reference LaPlacian Split
Half Test/ Retest
Split Half
Test/ Retest
Split Half
Test/ Retest
Average 0.97 0.97 Average 0.97 0.96 Average 0.97 0.97 FP1 0.93 0.98 FP1 0.93 0.98 FP1 0.99 0.98 FP2 0.95 0.92 FP2 0.95 0.92 FP2 0.99 0.96 F3 0.99 0.94 F3 0.99 0.94 F3 0.93 0.97 F4 0.99 0.97 F4 0.99 0.97 F4 0.98 0.91 C3 0.96 0.96 C3 0.96 0.96 C3 0.97 1.0 C4 0.98 0.97 C4 0.98 0.97 C4 0.99 0.98 P3 0.98 0.98 P3 0.98 0.98 P3 0.96 0.97 P4 0.99 0.93 P4 0.99 0.93 P4 1.0 0.97 O1 0.97 0.98 O1 0.97 0.98 O1 0.99 0.97 O2 0.98 0.95 O2 0.98 0.95 O2 0.94 0.95 F7 0.93 0.97 F7 0.93 0.97 F7 0.96 0.99 F8 0.99 0.95 F8 0.99 0.95 F8 0.92 0.97 T3 0.96 1.0 T3 0.96 1.0 T3 0.99 0.95 T4 0.99 1.0 T4 0.99 1.0 T4 0.99 0.98 T5 0.99 0.99 T5 0.99 0.99 T5 0.97 0.97 T6 0.98 0.98 T6 0.98 0.98 T6 0.97 0.97 Fz 0.97 0.98 Fz 0.97 0.98 Fz 0.97 0.97 Cz 0.98 0.94 Cz 0.98 0.94 Cz 0.95 0.97 Pz 0.96 0.93 Pz 0.96 0.93 Pz 0.96 1.0

157
Participant ID 13 qEEG Record: Pretest Eyes Open Linked Ears Average Reference LaPlacian Split
Half Test/ Retest
Split Half
Test/ Retest
Split Half
Test/ Retest
Average 0.97 0.97 Average 0.97 0.96 Average 0.98 0.96 FP1 0.92 1.0 FP1 0.95 0.98 FP1 0.99 0.99 FP2 0.91 1.0 FP2 0.97 0.98 FP2 0.96 1.0 F3 0.98 0.94 F3 0.99 0.94 F3 0.9 0.94 F4 0.98 0.96 F4 0.98 0.91 F4 0.98 0.93 C3 1.0 0.98 C3 0.98 0.99 C3 0.98 0.97 C4 0.97 0.98 C4 0.97 0.99 C4 1.0 0.95 P3 0.99 0.98 P3 0.98 0.96 P3 0.99 0.99 P4 0.99 0.98 P4 1.0 0.99 P4 0.99 0.95 O1 0.99 0.97 O1 0.99 0.93 O1 1.0 0.96 O2 0.99 0.98 O2 0.99 0.98 O2 0.96 0.99 F7 0.95 1.0 F7 0.95 0.94 F7 0.99 0.96 F8 0.95 0.94 F8 0.98 0.97 F8 0.97 0.96 T3 0.99 0.99 T3 0.96 0.95 T3 0.99 0.98 T4 0.99 0.96 T4 0.93 0.95 T4 0.97 0.94 T5 0.99 0.97 T5 0.97 0.95 T5 0.98 0.96 T6 0.94 0.91 T6 0.99 0.97 T6 0.98 0.97 Fz 0.98 0.95 Fz 0.99 0.95 Fz 0.96 0.95 Cz 0.99 0.95 Cz 0.96 0.95 Cz 0.99 0.94 Pz 0.94 0.99 Pz 0.93 0.98 Pz 0.97 0.95

158
Participant ID 13 qEEG Record: Pretest Serial Sevens Linked Ears Average Reference LaPlacian Split
Half Test/ Retest
Split Half
Test/ Retest
Split Half
Test/ Retest
Average 0.98 0.96 Average 0.96 0.92 Average 0.96 0.93 FP1 0.99 0.99 FP1 0.97 0.98 FP1 0.97 0.9 FP2 0.96 1.0 FP2 1.0 0.87 FP2 0.96 0.91 F3 0.9 0.94 F3 0.94 0.83 F3 0.94 0.84 F4 0.98 0.93 F4 0.97 0.9 F4 0.89 1.0 C3 0.98 0.97 C3 0.99 0.92 C3 0.97 0.91 C4 1.0 0.95 C4 0.95 0.94 C4 0.97 0.99 P3 0.99 0.99 P3 0.96 0.96 P3 0.98 1.0 P4 0.99 0.95 P4 0.99 0.94 P4 1.0 0.98 O1 1.0 0.96 O1 0.95 0.91 O1 0.92 0.92 O2 0.96 0.99 O2 0.9 0.97 O2 0.9 0.98 F7 0.99 0.96 F7 0.88 0.99 F7 0.99 0.83 F8 0.97 0.96 F8 0.9 0.72 F8 0.89 0.91 T3 0.99 0.98 T3 0.97 0.94 T3 0.99 0.9 T4 0.97 0.94 T4 0.92 0.96 T4 0.99 0.88 T5 0.98 0.96 T5 0.97 0.95 T5 0.99 0.93 T6 0.98 0.97 T6 0.99 0.95 T6 0.96 0.87 Fz 0.96 0.95 Fz 0.99 0.93 Fz 0.99 0.95 Cz 0.99 0.94 Cz 0.94 0.96 Cz 0.98 0.96 Pz 0.97 0.95 Pz 0.98 0.91 Pz 1.0 0.99
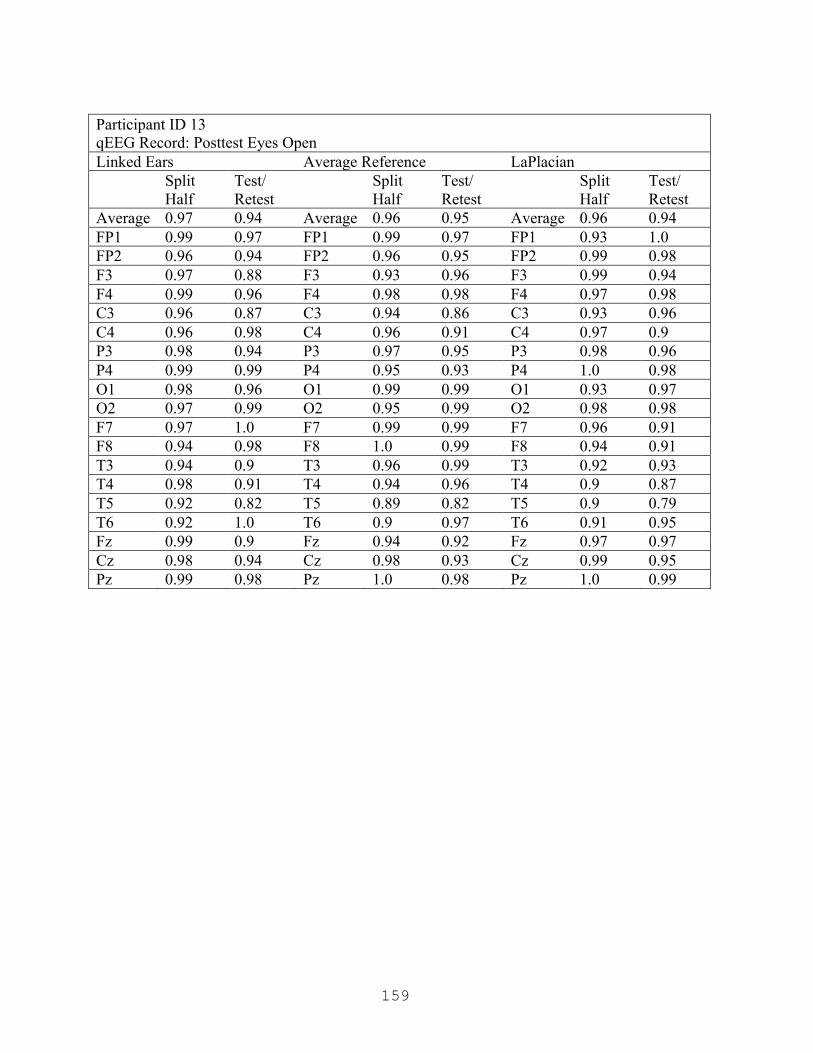
159
Participant ID 13 qEEG Record: Posttest Eyes Open Linked Ears Average Reference LaPlacian Split
Half Test/ Retest
Split Half
Test/ Retest
Split Half
Test/ Retest
Average 0.97 0.94 Average 0.96 0.95 Average 0.96 0.94 FP1 0.99 0.97 FP1 0.99 0.97 FP1 0.93 1.0 FP2 0.96 0.94 FP2 0.96 0.95 FP2 0.99 0.98 F3 0.97 0.88 F3 0.93 0.96 F3 0.99 0.94 F4 0.99 0.96 F4 0.98 0.98 F4 0.97 0.98 C3 0.96 0.87 C3 0.94 0.86 C3 0.93 0.96 C4 0.96 0.98 C4 0.96 0.91 C4 0.97 0.9 P3 0.98 0.94 P3 0.97 0.95 P3 0.98 0.96 P4 0.99 0.99 P4 0.95 0.93 P4 1.0 0.98 O1 0.98 0.96 O1 0.99 0.99 O1 0.93 0.97 O2 0.97 0.99 O2 0.95 0.99 O2 0.98 0.98 F7 0.97 1.0 F7 0.99 0.99 F7 0.96 0.91 F8 0.94 0.98 F8 1.0 0.99 F8 0.94 0.91 T3 0.94 0.9 T3 0.96 0.99 T3 0.92 0.93 T4 0.98 0.91 T4 0.94 0.96 T4 0.9 0.87 T5 0.92 0.82 T5 0.89 0.82 T5 0.9 0.79 T6 0.92 1.0 T6 0.9 0.97 T6 0.91 0.95 Fz 0.99 0.9 Fz 0.94 0.92 Fz 0.97 0.97 Cz 0.98 0.94 Cz 0.98 0.93 Cz 0.99 0.95 Pz 0.99 0.98 Pz 1.0 0.98 Pz 1.0 0.99

160
Participant ID 13 qEEG Record: Posttest Eyes Closed Linked Ears Average Reference LaPlacian Split
Half Test/ Retest
Split Half
Test/ Retest
Split Half
Test/ Retest
Average 0.97 0.92 Average 0.96 0.94 Average 0.96 0.91 FP1 0.98 0.95 FP1 1.0 0.99 FP1 0.91 1.0 FP2 0.99 0.83 FP2 0.95 0.84 FP2 0.96 0.82 F3 0.99 0.9 F3 0.99 0.95 F3 0.96 0.88 F4 0.94 0.91 F4 0.99 0.93 F4 0.99 0.86 C3 0.99 0.89 C3 0.94 0.92 C3 0.97 0.97 C4 0.96 0.88 C4 0.98 1.0 C4 0.99 0.9 P3 0.97 0.92 P3 0.94 0.99 P3 0.97 0.91 P4 0.97 0.92 P4 0.92 0.97 P4 0.97 0.93 O1 0.96 0.94 O1 0.96 0.92 O1 0.99 0.95 O2 0.99 0.82 O2 0.92 0.83 O2 0.99 0.84 F7 0.95 0.97 F7 0.99 0.94 F7 0.9 0.84 F8 0.98 0.97 F8 0.98 0.97 F8 0.95 0.91 T3 0.92 0.97 T3 0.97 0.98 T3 0.98 0.98 T4 0.95 0.92 T4 0.88 0.97 T4 0.79 0.9 T5 0.95 0.93 T5 0.99 0.99 T5 0.99 0.94 T6 0.99 0.88 T6 0.91 0.99 T6 0.99 0.91 Fz 0.99 0.91 Fz 0.97 0.99 Fz 0.94 0.96 Cz 0.98 0.9 Cz 0.98 0.93 Cz 0.97 0.9 Pz 0.98 1.0 Pz 0.98 0.86 Pz 0.93 0.94
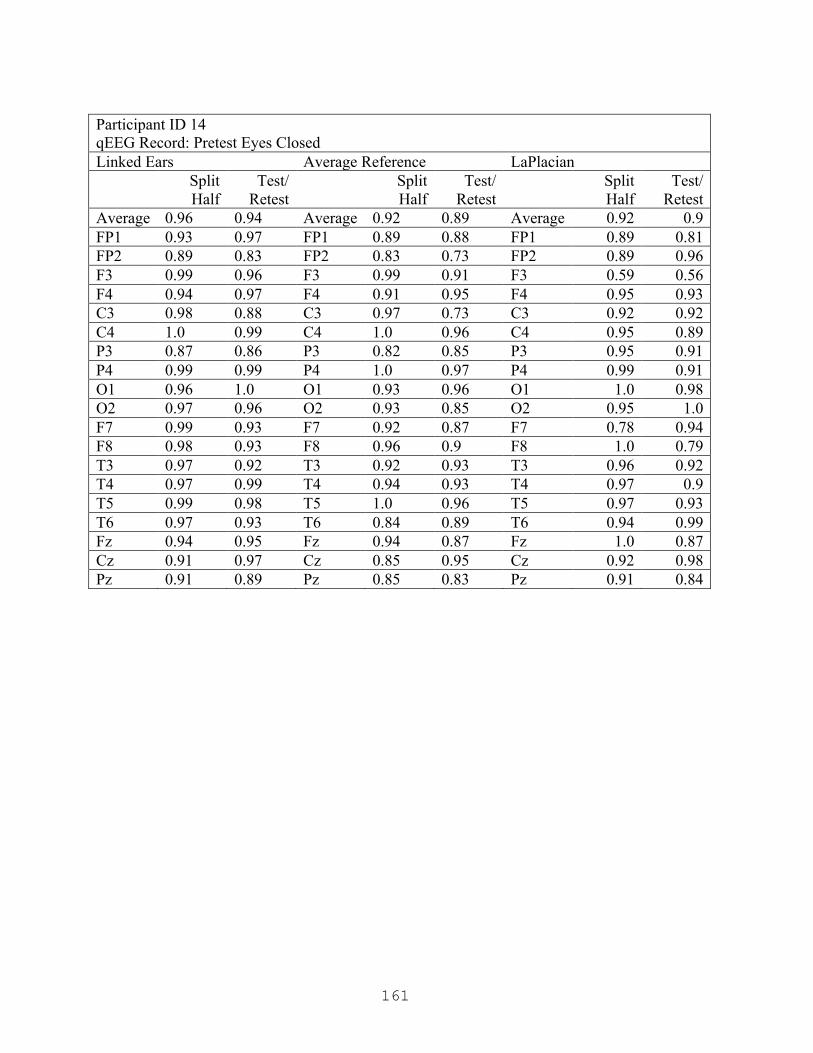
161
Participant ID 14 qEEG Record: Pretest Eyes Closed Linked Ears Average Reference LaPlacian
Split Half
Test/ Retest
Split Half
Test/ Retest
Split Half
Test/ Retest
Average 0.96 0.94 Average 0.92 0.89 Average 0.92 0.9 FP1 0.93 0.97 FP1 0.89 0.88 FP1 0.89 0.81 FP2 0.89 0.83 FP2 0.83 0.73 FP2 0.89 0.96 F3 0.99 0.96 F3 0.99 0.91 F3 0.59 0.56 F4 0.94 0.97 F4 0.91 0.95 F4 0.95 0.93 C3 0.98 0.88 C3 0.97 0.73 C3 0.92 0.92 C4 1.0 0.99 C4 1.0 0.96 C4 0.95 0.89 P3 0.87 0.86 P3 0.82 0.85 P3 0.95 0.91 P4 0.99 0.99 P4 1.0 0.97 P4 0.99 0.91 O1 0.96 1.0 O1 0.93 0.96 O1 1.0 0.98 O2 0.97 0.96 O2 0.93 0.85 O2 0.95 1.0 F7 0.99 0.93 F7 0.92 0.87 F7 0.78 0.94 F8 0.98 0.93 F8 0.96 0.9 F8 1.0 0.79 T3 0.97 0.92 T3 0.92 0.93 T3 0.96 0.92 T4 0.97 0.99 T4 0.94 0.93 T4 0.97 0.9 T5 0.99 0.98 T5 1.0 0.96 T5 0.97 0.93 T6 0.97 0.93 T6 0.84 0.89 T6 0.94 0.99 Fz 0.94 0.95 Fz 0.94 0.87 Fz 1.0 0.87 Cz 0.91 0.97 Cz 0.85 0.95 Cz 0.92 0.98 Pz 0.91 0.89 Pz 0.85 0.83 Pz 0.91 0.84

162
Participant ID 14 qEEG Record: Pretest Eyes Open Linked Ears Average Reference LaPlacian Split
Half Test/ Retest
Split Half
Test/ Retest
Split Half
Test/ Retest
Average 0.96 0.98 Average 0.95 0.95 Average 0.95 0.94 FP1 0.96 0.96 FP1 0.95 0.9 FP1 0.94 0.93 FP2 0.91 0.99 FP2 0.93 0.99 FP2 0.97 0.97 F3 1.0 0.96 F3 0.88 0.91 F3 0.89 0.88 F4 0.93 0.97 F4 0.94 0.95 F4 0.98 0.93 C3 0.96 0.99 C3 0.97 0.99 C3 0.98 0.99 C4 0.99 1.0 C4 0.9 0.97 C4 1.0 0.92 P3 0.96 1.0 P3 0.92 0.99 P3 1.0 0.95 P4 0.96 0.97 P4 0.96 0.93 P4 0.93 1.0 O1 0.99 0.96 O1 0.99 0.97 O1 0.94 0.94 O2 0.98 1.0 O2 0.94 0.93 O2 0.9 0.85 F7 0.97 0.97 F7 0.99 0.87 F7 0.98 0.85 F8 0.93 0.98 F8 0.96 0.97 F8 0.93 0.96 T3 0.96 1.0 T3 0.97 0.92 T3 0.98 0.89 T4 0.96 0.98 T4 1.0 0.95 T4 0.99 0.98 T5 0.99 0.99 T5 0.94 0.94 T5 0.95 0.96 T6 0.96 0.96 T6 1.0 0.96 T6 0.91 0.94 Fz 0.95 0.99 Fz 0.96 0.97 Fz 0.96 0.97 Cz 0.97 0.99 Cz 0.97 1.0 Cz 0.96 0.96 Pz 0.97 0.96 Pz 0.92 0.99 Pz 0.93 0.91

163
Participant ID 14 qEEG Record: Pretest Serial Sevens Linked Ears Average Reference LaPlacian Split
Half Test/ Retest
Split Half
Test/ Retest
Split Half
Test/ Retest
Average 0.96 0.97 Average 0.95 0.95 Average 0.96 0.93 FP1 0.89 0.97 FP1 0.94 0.99 FP1 1.0 0.97 FP2 0.91 0.98 FP2 0.92 0.94 FP2 0.98 0.92 F3 1.0 0.99 F3 0.99 0.9 F3 0.96 0.9 F4 1.0 0.94 F4 0.98 0.93 F4 0.99 0.99 C3 0.97 0.98 C3 0.91 0.95 C3 0.97 0.93 C4 0.96 0.98 C4 0.99 0.97 C4 0.94 0.99 P3 0.97 0.96 P3 1.0 0.87 P3 0.96 0.91 P4 1.0 0.99 P4 0.99 0.98 P4 0.98 0.92 O1 0.96 0.97 O1 0.91 0.83 O1 0.93 0.64 O2 0.97 0.94 O2 0.97 0.98 O2 0.97 0.95 F7 0.94 0.95 F7 0.91 0.99 F7 0.86 0.94 F8 0.94 0.95 F8 0.9 1.0 F8 0.95 0.94 T3 0.98 0.99 T3 0.99 1.0 T3 0.98 0.92 T4 0.96 0.99 T4 0.93 0.94 T4 0.99 0.98 T5 0.99 0.94 T5 0.98 0.91 T5 0.98 0.93 T6 0.95 0.98 T6 0.94 0.94 T6 0.92 0.98 Fz 0.98 0.95 Fz 0.99 0.95 Fz 0.99 0.92 Cz 0.97 0.98 Cz 0.95 0.99 Cz 0.95 1.0 Pz 0.95 0.98 Pz 0.94 0.99 Pz 0.87 0.95

164
Participant ID 14 qEEG Record: Posttest Eyes Open Linked Ears Average Reference LaPlacian Split
Half Test/ Retest
Split Half
Test/ Retest
Split Half
Test/ Retest
Average 0.96 0.91 Average 0.94 0.91 Average 0.96 0.91 FP1 0.92 0.9 FP1 0.92 0.93 FP1 0.99 0.95 FP2 0.95 0.93 FP2 0.98 0.95 FP2 0.99 0.85 F3 0.98 0.86 F3 0.95 0.82 F3 0.96 0.91 F4 0.99 0.93 F4 0.96 0.98 F4 0.97 0.99 C3 1.0 0.84 C3 0.97 0.73 C3 0.99 0.87 C4 0.93 0.9 C4 0.83 0.85 C4 0.92 0.84 P3 0.94 0.98 P3 0.95 0.96 P3 0.95 0.98 P4 0.89 0.99 P4 0.9 0.97 P4 1.0 0.96 O1 0.98 0.9 O1 0.94 0.95 O1 0.99 0.91 O2 0.94 0.86 O2 0.97 0.84 O2 0.98 0.84 F7 0.97 0.84 F7 0.99 0.96 F7 0.95 0.97 F8 1.0 0.92 F8 0.86 0.97 F8 0.92 0.94 T3 1.0 0.88 T3 0.92 1.0 T3 0.93 0.96 T4 0.98 0.88 T4 0.93 0.93 T4 0.93 0.82 T5 0.99 0.91 T5 1.0 0.83 T5 0.91 0.96 T6 0.92 0.93 T6 0.9 0.78 T6 0.93 0.76 Fz 0.98 0.9 Fz 0.99 0.93 Fz 0.98 0.95 Cz 0.98 0.92 Cz 0.87 0.98 Cz 0.88 0.93 Pz 0.97 0.99 Pz 0.97 0.91 Pz 0.97 0.92

165
Participant ID 14 qEEG Record: Posttest Eyes Closed Linked Ears Average Reference LaPlacian Split
Half Test/ Retest
Split Half
Test/ Retest
Split Half
Test/ Retest
Average 0.96 0.91 Average 0.93 0.85 Average 0.92 0.9 FP1 0.96 0.88 FP1 0.97 0.82 FP1 0.89 0.81 FP2 0.94 0.92 FP2 0.96 0.93 FP2 0.89 0.96 F3 0.88 0.82 F3 0.74 0.72 F3 0.59 0.56 F4 0.95 0.87 F4 0.99 0.8 F4 0.95 0.93 C3 0.98 0.82 C3 0.84 0.77 C3 0.92 0.92 C4 0.97 0.88 C4 0.97 0.84 C4 0.95 0.89 P3 0.95 0.87 P3 0.96 0.85 P3 0.95 0.91 P4 0.98 0.97 P4 0.89 0.89 P4 0.99 0.91 O1 0.98 0.96 O1 0.96 0.83 O1 1.0 0.98 O2 0.96 0.97 O2 0.94 0.8 O2 0.95 1.0 F7 0.96 0.94 F7 0.92 0.91 F7 0.78 0.94 F8 0.98 0.81 F8 0.92 0.68 F8 1.0 0.79 T3 0.98 0.89 T3 0.96 0.97 T3 0.96 0.92 T4 1.0 0.89 T4 0.92 0.81 T4 0.97 0.9 T5 0.96 0.95 T5 0.98 0.89 T5 0.97 0.93 T6 0.98 1.0 T6 0.91 0.86 T6 0.94 0.99 Fz 0.97 0.92 Fz 1.0 0.92 Fz 1.0 0.87 Cz 0.97 0.86 Cz 0.95 0.86 Cz 0.92 0.98 Pz 0.93 0.98 Pz 0.93 0.96 Pz 0.91 0.84
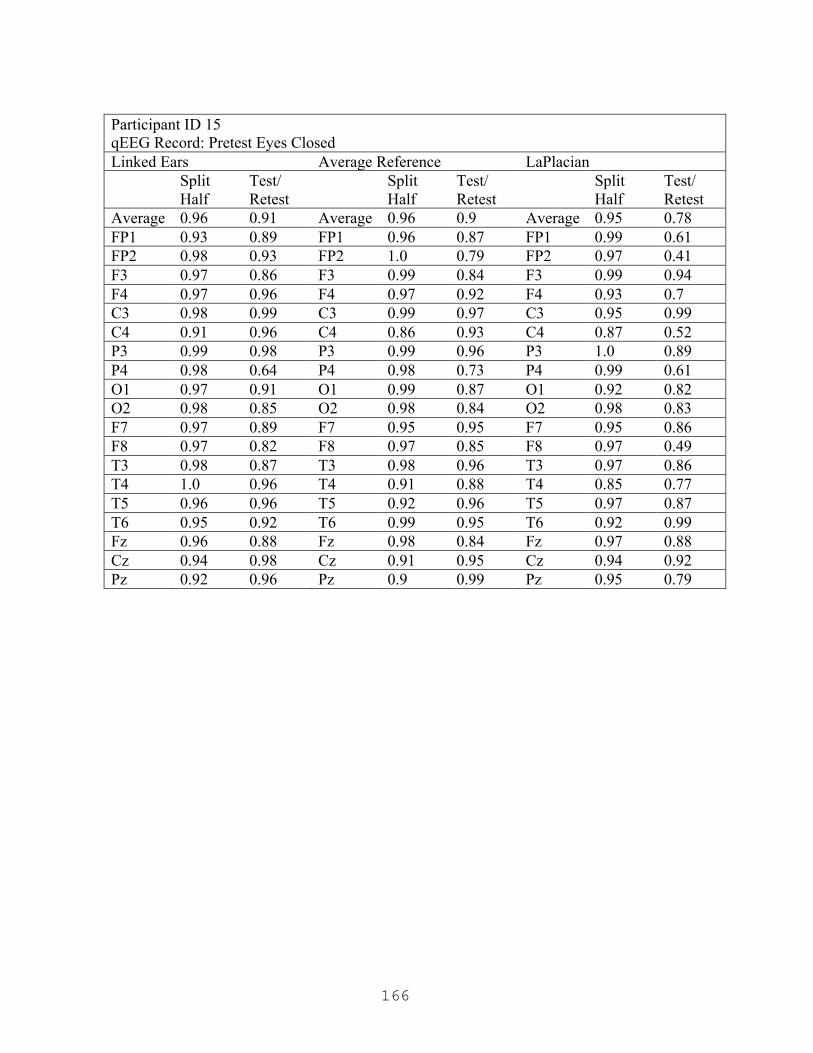
166
Participant ID 15 qEEG Record: Pretest Eyes Closed Linked Ears Average Reference LaPlacian Split
Half Test/ Retest
Split Half
Test/ Retest
Split Half
Test/ Retest
Average 0.96 0.91 Average 0.96 0.9 Average 0.95 0.78 FP1 0.93 0.89 FP1 0.96 0.87 FP1 0.99 0.61 FP2 0.98 0.93 FP2 1.0 0.79 FP2 0.97 0.41 F3 0.97 0.86 F3 0.99 0.84 F3 0.99 0.94 F4 0.97 0.96 F4 0.97 0.92 F4 0.93 0.7 C3 0.98 0.99 C3 0.99 0.97 C3 0.95 0.99 C4 0.91 0.96 C4 0.86 0.93 C4 0.87 0.52 P3 0.99 0.98 P3 0.99 0.96 P3 1.0 0.89 P4 0.98 0.64 P4 0.98 0.73 P4 0.99 0.61 O1 0.97 0.91 O1 0.99 0.87 O1 0.92 0.82 O2 0.98 0.85 O2 0.98 0.84 O2 0.98 0.83 F7 0.97 0.89 F7 0.95 0.95 F7 0.95 0.86 F8 0.97 0.82 F8 0.97 0.85 F8 0.97 0.49 T3 0.98 0.87 T3 0.98 0.96 T3 0.97 0.86 T4 1.0 0.96 T4 0.91 0.88 T4 0.85 0.77 T5 0.96 0.96 T5 0.92 0.96 T5 0.97 0.87 T6 0.95 0.92 T6 0.99 0.95 T6 0.92 0.99 Fz 0.96 0.88 Fz 0.98 0.84 Fz 0.97 0.88 Cz 0.94 0.98 Cz 0.91 0.95 Cz 0.94 0.92 Pz 0.92 0.96 Pz 0.9 0.99 Pz 0.95 0.79
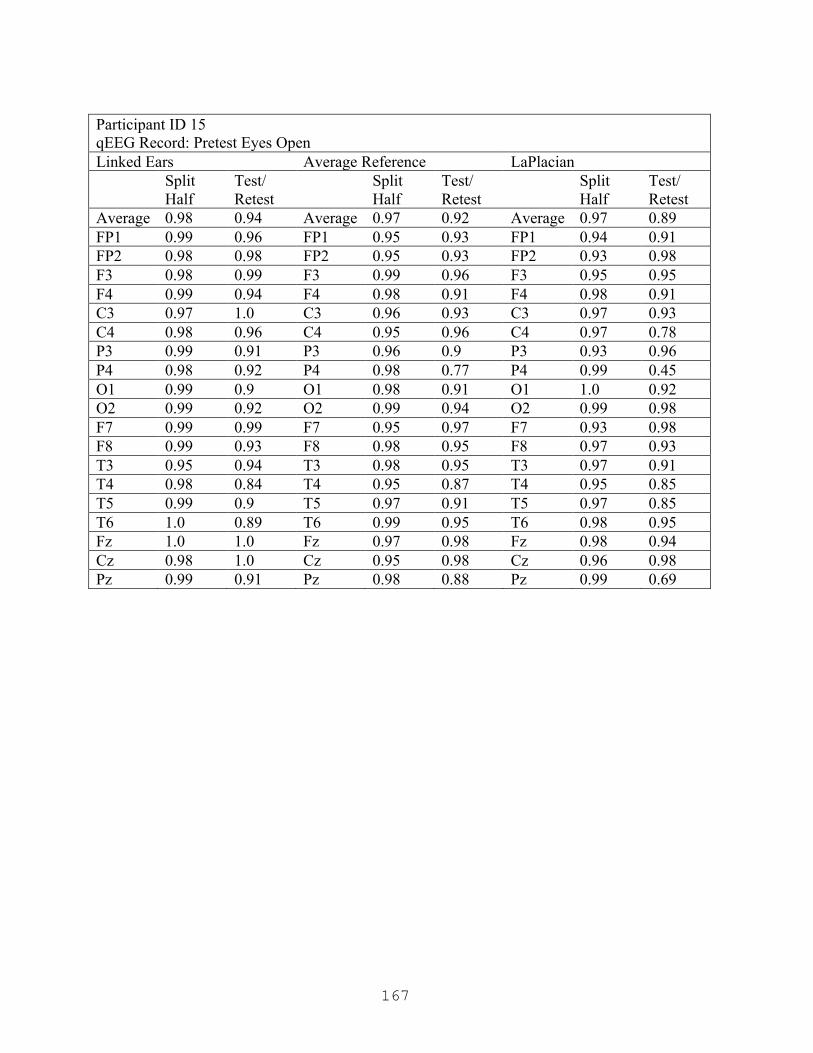
167
Participant ID 15 qEEG Record: Pretest Eyes Open Linked Ears Average Reference LaPlacian Split
Half Test/ Retest
Split Half
Test/ Retest
Split Half
Test/ Retest
Average 0.98 0.94 Average 0.97 0.92 Average 0.97 0.89 FP1 0.99 0.96 FP1 0.95 0.93 FP1 0.94 0.91 FP2 0.98 0.98 FP2 0.95 0.93 FP2 0.93 0.98 F3 0.98 0.99 F3 0.99 0.96 F3 0.95 0.95 F4 0.99 0.94 F4 0.98 0.91 F4 0.98 0.91 C3 0.97 1.0 C3 0.96 0.93 C3 0.97 0.93 C4 0.98 0.96 C4 0.95 0.96 C4 0.97 0.78 P3 0.99 0.91 P3 0.96 0.9 P3 0.93 0.96 P4 0.98 0.92 P4 0.98 0.77 P4 0.99 0.45 O1 0.99 0.9 O1 0.98 0.91 O1 1.0 0.92 O2 0.99 0.92 O2 0.99 0.94 O2 0.99 0.98 F7 0.99 0.99 F7 0.95 0.97 F7 0.93 0.98 F8 0.99 0.93 F8 0.98 0.95 F8 0.97 0.93 T3 0.95 0.94 T3 0.98 0.95 T3 0.97 0.91 T4 0.98 0.84 T4 0.95 0.87 T4 0.95 0.85 T5 0.99 0.9 T5 0.97 0.91 T5 0.97 0.85 T6 1.0 0.89 T6 0.99 0.95 T6 0.98 0.95 Fz 1.0 1.0 Fz 0.97 0.98 Fz 0.98 0.94 Cz 0.98 1.0 Cz 0.95 0.98 Cz 0.96 0.98 Pz 0.99 0.91 Pz 0.98 0.88 Pz 0.99 0.69

168
Participant ID 15 qEEG Record: Pretest Serial Sevens Linked Ears Average Reference LaPlacian Split
Half Test/ Retest
Split Half
Test/ Retest
Split Half
Test/ Retest
Average 0.95 0.91 Average 0.92 0.93 Average 0.92 0.92 FP1 0.93 0.97 FP1 0.92 0.98 FP1 0.88 0.95 FP2 0.99 0.97 FP2 0.94 0.99 FP2 0.94 0.9 F3 0.99 0.91 F3 0.99 0.97 F3 0.88 0.94 F4 1.0 0.96 F4 0.93 0.99 F4 0.98 0.9 C3 0.94 0.79 C3 0.98 0.9 C3 1.0 0.96 C4 0.93 0.89 C4 0.85 0.93 C4 0.88 0.94 P3 1.0 0.88 P3 0.97 0.88 P3 0.96 0.96 P4 0.92 0.96 P4 0.91 0.99 P4 0.95 0.93 O1 0.91 0.94 O1 0.89 0.84 O1 0.93 0.9 O2 0.95 0.95 O2 0.97 0.97 O2 0.87 0.98 F7 0.98 1.0 F7 0.85 0.94 F7 0.8 0.98 F8 0.98 0.69 F8 0.94 0.7 F8 0.99 0.79 T3 0.91 0.96 T3 0.84 0.99 T3 0.81 0.92 T4 0.93 0.88 T4 0.95 0.91 T4 0.94 0.88 T5 0.97 0.97 T5 0.94 0.9 T5 0.97 0.88 T6 0.77 0.8 T6 0.76 0.99 T6 0.89 0.97 Fz 0.98 0.9 Fz 0.95 0.97 Fz 1.0 0.97 Cz 0.99 0.85 Cz 0.98 0.87 Cz 0.97 0.88 Pz 0.93 0.95 Pz 0.92 0.97 Pz 0.92 0.9

169
Participant ID 15 qEEG Record: Posttest Eyes Open Linked Ears Average Reference LaPlacian Split
Half Test/ Retest
Split Half
Test/ Retest
Split Half
Test/ Retest
Average 0.95 0.92 Average 0.95 0.91 Average 0.95 0.92 FP1 0.98 0.77 FP1 1.0 0.8 FP1 0.98 0.86 FP2 0.89 0.8 FP2 0.94 0.93 FP2 0.94 0.89 F3 0.99 0.98 F3 0.93 0.91 F3 1.0 0.89 F4 0.9 0.99 F4 0.89 0.92 F4 0.95 1.0 C3 0.99 0.94 C3 0.98 0.98 C3 0.99 0.92 C4 0.99 0.98 C4 0.92 0.98 C4 0.89 0.88 P3 0.95 0.95 P3 0.94 0.87 P3 0.92 1.0 P4 0.94 0.99 P4 0.95 0.97 P4 0.97 0.9 O1 0.94 0.89 O1 0.96 0.89 O1 0.85 0.97 O2 0.96 0.99 O2 0.98 1.0 O2 0.86 0.92 F7 0.92 0.9 F7 0.92 0.93 F7 0.97 1.0 F8 0.87 0.83 F8 0.94 0.82 F8 0.99 0.95 T3 0.9 0.89 T3 0.95 0.95 T3 0.94 0.93 T4 1.0 0.93 T4 0.96 0.92 T4 0.99 0.98 T5 0.84 0.86 T5 0.86 0.75 T5 0.88 0.77 T6 1.0 0.89 T6 0.99 0.97 T6 1.0 0.9 Fz 0.97 1.0 Fz 0.99 0.89 Fz 0.92 0.99 Cz 0.96 0.9 Cz 0.95 0.89 Cz 0.99 0.95 Pz 0.99 0.98 Pz 0.98 0.92 Pz 0.95 0.81

170
Participant ID 15 qEEG Record: Posttest Eyes Closed Linked Ears Average Reference LaPlacian Split
Half Test/ Retest
Split Half
Test/ Retest
Split Half
Test/ Retest
Average 0.95 0.92 Average 0.93 0.9 Average 0.93 0.91 FP1 0.94 0.94 FP1 0.93 0.89 FP1 0.94 0.85 FP2 1.0 0.88 FP2 0.89 0.92 FP2 0.98 0.84 F3 0.92 0.89 F3 0.9 0.84 F3 0.98 0.98 F4 0.95 0.91 F4 0.97 0.93 F4 0.95 0.94 C3 0.91 0.97 C3 0.91 0.94 C3 0.98 0.81 C4 0.91 0.98 C4 0.86 0.97 C4 0.92 0.88 P3 0.93 0.99 P3 0.83 0.97 P3 0.97 0.98 P4 0.99 0.89 P4 0.98 0.88 P4 0.96 0.96 O1 0.92 0.91 O1 0.93 0.8 O1 0.92 0.88 O2 0.96 0.74 O2 0.93 0.71 O2 0.9 0.71 F7 0.88 0.92 F7 1.0 0.93 F7 0.85 0.96 F8 0.98 0.96 F8 1.0 0.97 F8 0.94 0.97 T3 0.99 0.97 T3 0.91 0.96 T3 0.99 0.95 T4 0.9 0.98 T4 0.97 0.95 T4 0.91 0.96 T5 0.97 0.76 T5 0.97 0.82 T5 0.9 0.99 T6 0.95 0.97 T6 0.95 0.99 T6 0.9 0.99 Fz 0.97 0.98 Fz 0.9 0.92 Fz 0.91 0.93 Cz 0.96 0.95 Cz 0.92 0.91 Cz 0.94 0.86 Pz 0.97 0.86 Pz 0.92 0.84 Pz 0.86 0.89

171
Participant ID 17 qEEG Record: Pretest Eyes Closed Linked Ears Average Reference LaPlacian Split
Half Test/ Retest
Split Half
Test/ Retest
Split Half
Test/ Retest
Average 0.98 0.9 Average 0.95 0.83 Average 0.97 0.87 FP1 0.99 0.9 FP1 0.94 0.78 FP1 0.98 0.94 FP2 0.99 0.95 FP2 0.95 0.84 FP2 1.0 0.74 F3 0.97 0.91 F3 0.94 0.82 F3 0.95 0.97 F4 0.99 0.91 F4 0.9 0.78 F4 0.99 0.88 C3 1.0 0.94 C3 1.0 0.87 C3 0.97 0.98 C4 0.96 0.9 C4 0.98 0.84 C4 0.97 0.7 P3 0.98 0.86 P3 0.92 0.81 P3 0.98 0.84 P4 0.97 0.93 P4 0.97 0.93 P4 0.94 0.81 O1 0.99 0.75 O1 0.98 0.72 O1 0.99 0.99 O2 0.98 0.95 O2 0.96 0.93 O2 0.96 0.85 F7 0.99 0.89 F7 0.97 0.8 F7 0.96 0.73 F8 0.99 0.9 F8 0.91 0.81 F8 0.96 0.87 T3 0.97 0.92 T3 0.99 0.88 T3 0.95 0.85 T4 1.0 0.85 T4 0.92 0.75 T4 0.95 0.9 T5 0.97 0.81 T5 0.98 0.76 T5 0.99 0.78 T6 0.96 0.91 T6 0.91 0.86 T6 0.95 0.87 Fz 0.97 0.91 Fz 0.95 0.79 Fz 0.96 0.95 Cz 0.99 0.91 Cz 0.99 0.84 Cz 0.95 0.93 Pz 0.94 0.91 Pz 0.96 0.92 Pz 0.95 0.9

172
Participant ID 17 qEEG Record: Pretest Eyes Open Linked Ears Average Reference LaPlacian Split
Half Test/ Retest
Split Half
Test/ Retest
Split Half
Test/ Retest
Average 0.95 0.93 Average 0.93 0.94 Average 0.95 0.88 FP1 0.85 0.84 FP1 0.8 0.84 FP1 0.89 0.71 FP2 0.85 0.69 FP2 0.84 0.62 FP2 0.94 0.48 F3 1.0 0.89 F3 0.87 0.98 F3 0.95 0.85 F4 0.96 0.92 F4 0.98 0.99 F4 0.98 0.82 C3 0.99 0.94 C3 0.97 0.96 C3 0.99 0.94 C4 0.95 0.93 C4 0.97 0.94 C4 0.89 0.86 P3 0.99 0.97 P3 0.93 0.94 P3 1.0 0.95 P4 0.98 0.96 P4 0.93 0.97 P4 0.99 0.96 O1 0.99 0.97 O1 1.0 0.97 O1 0.99 0.96 O2 0.95 0.98 O2 0.96 0.96 O2 0.94 1.0 F7 0.95 0.98 F7 0.96 0.91 F7 0.8 0.87 F8 0.95 0.98 F8 0.98 0.95 F8 0.92 0.68 T3 0.95 0.96 T3 0.96 0.97 T3 0.97 0.92 T4 0.94 0.97 T4 0.95 0.96 T4 1.0 0.95 T5 0.96 0.98 T5 0.98 0.97 T5 1.0 0.94 T6 0.91 0.94 T6 0.93 0.96 T6 0.93 0.94 Fz 0.97 0.9 Fz 0.87 0.97 Fz 0.96 0.99 Cz 0.95 0.92 Cz 0.95 0.98 Cz 0.93 0.98 Pz 1.0 0.94 Pz 0.95 0.98 Pz 0.97 0.98

173
Participant ID 18 qEEG Record: Pretest Eyes Closed Linked Ears Average Reference LaPlacian Split
Half Test/ Retest
Split Half
Test/ Retest
Split Half
Test/ Retest
Average 0.95 0.92 Average 0.95 0.93 Average 0.95 0.9 FP1 0.91 0.86 FP1 0.91 0.79 FP1 0.92 0.7 FP2 0.96 0.97 FP2 0.93 0.94 FP2 0.95 0.83 F3 0.91 0.85 F3 0.98 0.86 F3 0.96 0.88 F4 0.97 0.94 F4 0.93 0.99 F4 0.99 0.93 C3 0.99 0.85 C3 0.93 0.99 C3 0.95 0.92 C4 1.0 0.93 C4 0.99 0.94 C4 0.94 0.92 P3 0.94 0.92 P3 0.97 0.97 P3 0.98 0.95 P4 0.95 0.99 P4 0.97 0.97 P4 0.96 0.94 O1 0.94 0.98 O1 0.97 0.99 O1 0.99 0.95 O2 0.99 0.94 O2 0.95 0.91 O2 0.99 0.86 F7 0.94 0.91 F7 1.0 0.86 F7 0.96 0.79 F8 0.98 0.87 F8 0.91 0.83 F8 0.85 0.71 T3 0.97 0.91 T3 0.92 0.9 T3 0.96 0.98 T4 0.92 0.96 T4 0.92 0.99 T4 0.91 0.91 T5 0.96 0.98 T5 0.97 0.95 T5 0.99 1.0 T6 0.94 0.99 T6 0.92 0.95 T6 0.92 0.96 Fz 0.92 0.86 Fz 0.99 0.89 Fz 0.95 0.94 Cz 0.97 0.88 Cz 0.99 1.0 Cz 1.0 0.99 Pz 0.94 0.96 Pz 0.94 0.99 Pz 0.97 0.93

174
Participant ID 18 qEEG Record: Pretest Eyes Open Linked Ears Average Reference LaPlacian Split
Half Test/ Retest
Split Half
Test/ Retest
Split Half
Test/ Retest
Average 0.96 0.95 Average 0.96 0.95 Average 0.97 0.96 FP1 0.91 0.98 FP1 0.95 0.94 FP1 0.88 0.94 FP2 0.98 0.96 FP2 0.9 0.95 FP2 0.99 0.9 F3 0.94 0.99 F3 0.97 0.92 F3 0.99 0.96 F4 0.94 0.94 F4 0.98 0.98 F4 0.98 0.98 C3 0.98 0.92 C3 0.98 0.98 C3 0.99 0.99 C4 0.97 0.91 C4 0.97 0.96 C4 0.96 0.94 P3 0.96 1.0 P3 0.93 0.89 P3 0.97 0.93 P4 0.99 0.96 P4 0.97 0.94 P4 1.0 0.93 O1 0.96 0.95 O1 0.99 0.92 O1 0.99 0.99 O2 1.0 0.93 O2 0.97 0.97 O2 0.99 0.98 F7 0.91 0.92 F7 0.9 0.98 F7 0.86 0.96 F8 0.96 0.98 F8 0.98 0.99 F8 0.97 0.99 T3 0.99 0.95 T3 0.99 1.0 T3 0.97 0.98 T4 0.97 0.99 T4 0.97 0.94 T4 0.98 0.93 T5 0.97 0.95 T5 0.99 0.94 T5 0.98 1.0 T6 0.96 0.92 T6 0.99 0.97 T6 0.98 0.9 Fz 0.95 0.95 Fz 0.97 0.97 Fz 0.97 0.95 Cz 0.98 0.92 Cz 0.95 0.98 Cz 0.95 1.0 Pz 0.96 0.99 Pz 0.92 0.89 Pz 0.97 0.96

175
Participant ID 18 qEEG Record: Pretest Serial Sevens Linked Ears Average Reference LaPlacian Split
Half Test/ Retest
Split Half
Test/ Retest
Split Half
Test/ Retest
Average 0.95 0.91 Average 0.94 0.93 Average 0.96 0.94 FP1 0.92 0.8 FP1 0.9 0.86 FP1 0.92 0.88 FP2 0.93 0.8 FP2 0.95 0.96 FP2 0.98 0.95 F3 0.95 0.98 F3 0.94 1.0 F3 0.96 0.98 F4 0.96 0.98 F4 0.93 1.0 F4 0.99 0.9 C3 0.96 0.97 C3 0.96 0.89 C3 0.93 0.95 C4 0.97 0.95 C4 0.95 0.99 C4 0.95 1.0 P3 0.98 0.97 P3 0.89 0.95 P3 0.93 0.95 P4 0.96 0.81 P4 0.9 0.84 P4 0.96 0.92 O1 0.95 0.96 O1 0.99 0.98 O1 0.97 0.89 O2 0.95 0.87 O2 0.99 0.9 O2 0.97 1.0 F7 0.9 0.79 F7 0.81 0.87 F7 0.98 0.91 F8 0.9 0.88 F8 0.93 0.98 F8 0.88 0.89 T3 1.0 0.98 T3 0.98 0.89 T3 1.0 0.89 T4 0.98 0.99 T4 0.95 0.91 T4 0.94 0.98 T5 0.97 0.87 T5 0.96 1.0 T5 0.97 0.98 T6 0.96 0.9 T6 0.97 0.98 T6 0.94 0.87 Fz 0.91 0.97 Fz 0.91 0.94 Fz 0.95 0.97 Cz 0.94 0.94 Cz 0.99 0.88 Cz 0.97 0.93 Pz 0.95 0.89 Pz 0.9 0.9 Pz 0.99 0.97

176
Participant ID 18 qEEG Record: Posttest Eyes Open Linked Ears Average Reference LaPlacian Split
Half Test/ Retest
Split Half
Test/ Retest
Split Half
Test/ Retest
Average 0.97 0.92 Average 0.94 0.9 Average 0.95 0.92 FP1 0.95 0.99 FP1 0.95 0.97 FP1 0.84 0.95 FP2 0.91 0.93 FP2 0.86 0.92 FP2 0.84 0.92 F3 0.98 0.98 F3 1.0 0.98 F3 0.94 0.91 F4 0.97 0.94 F4 0.89 0.91 F4 0.95 0.84 C3 1.0 0.94 C3 0.96 0.84 C3 1.0 0.93 C4 0.99 0.94 C4 0.9 0.89 C4 0.99 0.97 P3 0.93 0.72 P3 0.86 0.68 P3 0.89 0.7 P4 0.96 0.9 P4 0.92 0.88 P4 0.91 0.95 O1 0.97 0.97 O1 0.96 0.98 O1 0.96 0.97 O2 0.98 0.94 O2 0.95 0.96 O2 0.94 0.98 F7 0.93 0.96 F7 0.94 0.99 F7 0.96 0.92 F8 0.96 0.94 F8 0.92 0.97 F8 0.98 0.92 T3 0.99 0.95 T3 0.99 0.93 T3 0.99 0.92 T4 0.94 0.96 T4 0.98 0.91 T4 0.99 0.95 T5 0.99 0.84 T5 0.97 0.85 T5 0.99 0.92 T6 0.98 0.93 T6 0.99 0.92 T6 0.99 0.95 Fz 0.97 0.93 Fz 0.92 0.88 Fz 0.95 0.99 Cz 0.99 0.95 Cz 0.97 0.87 Cz 0.97 0.9 Pz 1.0 0.84 Pz 0.98 0.8 Pz 0.92 0.89

177
Participant ID 18 qEEG Record: Posttest Eyes Closed Linked Ears Average Reference LaPlacian Split
Half Test/ Retest
Split Half
Test/ Retest
Split Half
Test/ Retest
Average 0.97 0.94 Average 0.97 0.93 Average 0.93 0.96 FP1 0.94 0.9 FP1 0.98 0.91 FP1 0.99 0.96 FP2 0.97 0.97 FP2 0.95 0.99 FP2 0.87 0.91 F3 0.98 0.87 F3 1.0 0.91 F3 0.88 0.97 F4 0.96 0.94 F4 0.95 0.91 F4 0.86 0.97 C3 0.97 0.91 C3 0.96 0.89 C3 0.96 0.95 C4 0.98 0.98 C4 0.99 0.94 C4 0.96 1.0 P3 0.95 0.96 P3 0.98 0.98 P3 0.99 0.97 P4 0.93 0.99 P4 0.97 0.9 P4 0.94 0.98 O1 0.97 0.9 O1 0.99 0.94 O1 0.93 0.98 O2 1.0 0.96 O2 1.0 0.85 O2 0.95 0.99 F7 0.94 0.92 F7 0.94 0.96 F7 0.94 0.95 F8 0.97 1.0 F8 0.94 0.99 F8 0.79 0.95 T3 0.98 0.96 T3 1.0 0.96 T3 0.97 1.0 T4 0.99 0.98 T4 0.96 0.93 T4 1.0 0.99 T5 0.97 0.88 T5 0.99 0.95 T5 0.98 0.99 T6 1.0 0.99 T6 0.96 0.87 T6 0.99 0.95 Fz 0.99 0.88 Fz 0.98 0.88 Fz 0.87 0.91 Cz 0.98 0.89 Cz 0.93 0.84 Cz 0.93 0.93 Pz 0.98 0.98 Pz 0.99 1.0 Pz 0.94 0.93
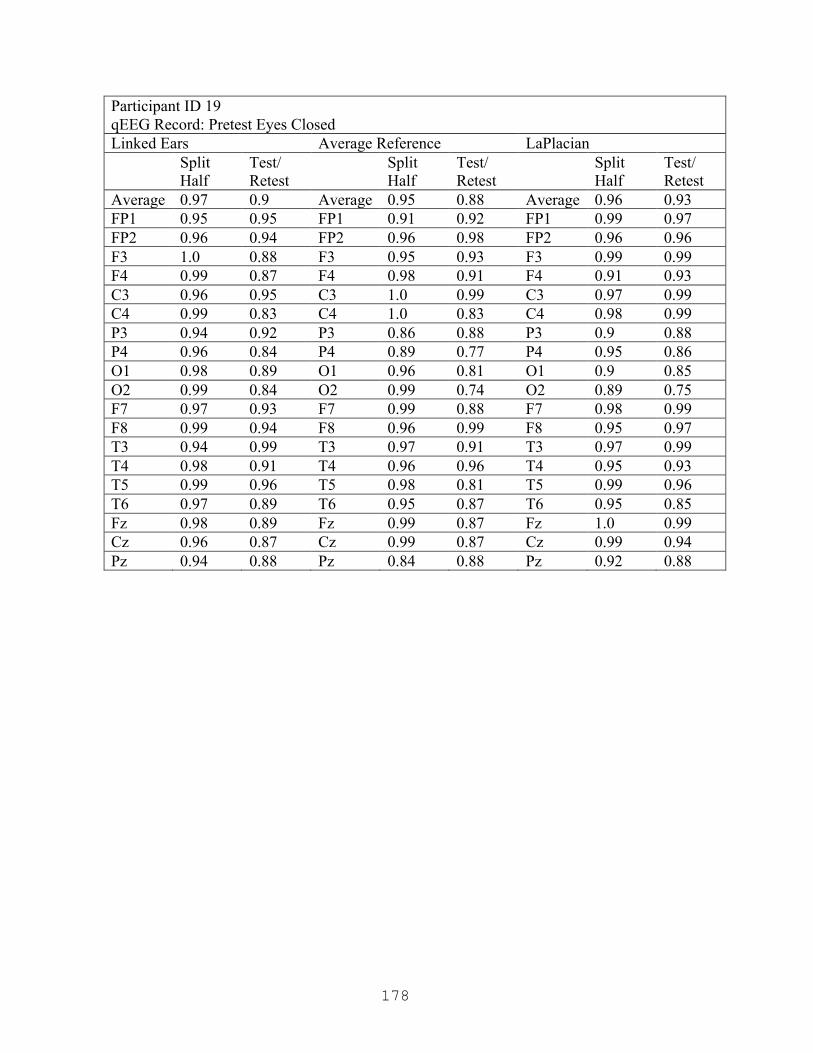
178
Participant ID 19 qEEG Record: Pretest Eyes Closed Linked Ears Average Reference LaPlacian Split
Half Test/ Retest
Split Half
Test/ Retest
Split Half
Test/ Retest
Average 0.97 0.9 Average 0.95 0.88 Average 0.96 0.93 FP1 0.95 0.95 FP1 0.91 0.92 FP1 0.99 0.97 FP2 0.96 0.94 FP2 0.96 0.98 FP2 0.96 0.96 F3 1.0 0.88 F3 0.95 0.93 F3 0.99 0.99 F4 0.99 0.87 F4 0.98 0.91 F4 0.91 0.93 C3 0.96 0.95 C3 1.0 0.99 C3 0.97 0.99 C4 0.99 0.83 C4 1.0 0.83 C4 0.98 0.99 P3 0.94 0.92 P3 0.86 0.88 P3 0.9 0.88 P4 0.96 0.84 P4 0.89 0.77 P4 0.95 0.86 O1 0.98 0.89 O1 0.96 0.81 O1 0.9 0.85 O2 0.99 0.84 O2 0.99 0.74 O2 0.89 0.75 F7 0.97 0.93 F7 0.99 0.88 F7 0.98 0.99 F8 0.99 0.94 F8 0.96 0.99 F8 0.95 0.97 T3 0.94 0.99 T3 0.97 0.91 T3 0.97 0.99 T4 0.98 0.91 T4 0.96 0.96 T4 0.95 0.93 T5 0.99 0.96 T5 0.98 0.81 T5 0.99 0.96 T6 0.97 0.89 T6 0.95 0.87 T6 0.95 0.85 Fz 0.98 0.89 Fz 0.99 0.87 Fz 1.0 0.99 Cz 0.96 0.87 Cz 0.99 0.87 Cz 0.99 0.94 Pz 0.94 0.88 Pz 0.84 0.88 Pz 0.92 0.88

179
Participant ID 19 qEEG Record: Pretest Eyes Open Linked Ears Average Reference LaPlacian Split
Half Test/ Retest
Split Half
Test/ Retest
Split Half
Test/ Retest
Average 0.98 0.94 Average 0.98 0.93 Average 0.97 0.9 FP1 0.99 0.98 FP1 0.98 0.95 FP1 0.93 0.91 FP2 0.98 0.9 FP2 0.98 0.94 FP2 0.96 0.91 F3 0.99 0.98 F3 0.94 0.92 F3 0.94 0.89 F4 0.97 0.99 F4 0.99 0.92 F4 0.98 0.88 C3 0.98 0.99 C3 0.97 0.91 C3 0.96 0.88 C4 0.99 0.95 C4 0.97 0.98 C4 1.0 0.99 P3 0.97 0.95 P3 0.98 0.96 P3 0.98 0.94 P4 0.99 0.98 P4 1.0 0.99 P4 0.99 0.95 O1 0.99 0.98 O1 1.0 0.97 O1 0.98 0.95 O2 1.0 0.99 O2 0.98 0.97 O2 0.96 0.88 F7 1.0 0.96 F7 0.99 0.92 F7 0.97 0.89 F8 0.99 0.71 F8 0.98 0.68 F8 1.0 0.67 T3 0.96 0.99 T3 0.97 0.97 T3 0.97 0.9 T4 0.98 0.93 T4 0.97 0.92 T4 0.99 0.94 T5 0.99 0.9 T5 0.99 0.87 T5 0.99 0.95 T6 0.97 0.83 T6 0.98 0.81 T6 0.94 0.8 Fz 0.95 0.91 Fz 0.98 0.98 Fz 1.0 0.88 Cz 0.95 0.92 Cz 0.98 0.94 Cz 0.99 0.99 Pz 0.98 0.95 Pz 0.96 0.96 Pz 0.97 0.98

180
Participant ID 19 qEEG Record: Pretest Serial Sevens Linked Ears Average Reference LaPlacian Split
Half Test/ Retest
Split Half
Test/ Retest
Split Half
Test/ Retest
Average 0.95 0.92 Average 0.94 0.93 Average 0.97 0.92 FP1 0.93 0.88 FP1 0.97 0.94 FP1 0.95 0.94 FP2 0.9 0.83 FP2 0.93 0.88 FP2 0.93 0.83 F3 0.95 0.94 F3 0.96 0.97 F3 0.99 0.94 F4 0.94 1.0 F4 0.95 0.98 F4 0.98 0.98 C3 0.93 0.91 C3 0.94 0.89 C3 0.98 0.86 C4 0.91 0.92 C4 0.91 0.98 C4 1.0 0.99 P3 0.97 0.95 P3 1.0 0.99 P3 0.95 0.99 P4 0.98 0.94 P4 0.95 0.92 P4 0.98 0.95 O1 0.94 0.99 O1 0.91 0.98 O1 0.93 0.86 O2 0.98 0.98 O2 0.96 0.96 O2 0.97 0.87 F7 0.96 0.9 F7 0.96 0.91 F7 0.98 0.88 F8 0.99 0.92 F8 0.88 0.94 F8 0.92 0.93 T3 0.94 0.87 T3 0.98 0.9 T3 1.0 0.92 T4 0.96 0.98 T4 1.0 0.99 T4 0.98 0.98 T5 0.99 0.95 T5 0.96 0.98 T5 0.97 0.96 T6 0.99 0.89 T6 0.92 0.85 T6 0.97 0.85 Fz 0.92 0.88 Fz 0.91 0.87 Fz 0.97 0.97 Cz 0.89 0.82 Cz 0.86 0.76 Cz 0.97 0.83 Pz 0.95 0.91 Pz 0.93 0.94 Pz 1.0 1.0

181
Participant ID 19 qEEG Record: Posttest Eyes Open Linked Ears Average Reference LaPlacian Split
Half Test/ Retest
Split Half
Test/ Retest
Split Half
Test/ Retest
Average 0.96 0.95 Average 0.94 0.92 Average 0.92 0.93 FP1 0.97 0.97 FP1 0.96 0.91 FP1 0.95 0.97 FP2 0.99 0.98 FP2 0.94 0.94 FP2 0.88 0.94 F3 0.98 0.98 F3 0.96 0.92 F3 0.98 0.99 F4 0.97 0.9 F4 0.99 0.94 F4 1.0 0.95 C3 0.97 0.94 C3 0.99 0.94 C3 0.93 0.86 C4 0.98 0.91 C4 0.98 0.9 C4 0.96 0.97 P3 0.96 0.95 P3 0.98 0.98 P3 0.96 0.97 P4 0.98 0.95 P4 0.94 0.94 P4 0.85 0.96 O1 0.97 0.94 O1 0.91 0.96 O1 0.92 0.94 O2 0.97 1.0 O2 0.94 0.89 O2 0.91 0.93 F7 0.97 1.0 F7 0.97 0.88 F7 0.96 0.98 F8 0.94 0.98 F8 0.99 0.99 F8 0.96 0.83 T3 0.98 0.97 T3 0.91 0.95 T3 0.87 0.95 T4 0.9 0.85 T4 0.84 0.72 T4 0.85 0.71 T5 0.96 0.92 T5 0.97 0.98 T5 0.88 0.93 T6 0.97 0.97 T6 0.89 0.91 T6 0.9 0.91 Fz 0.94 0.97 Fz 0.89 0.91 Fz 0.99 1.0 Cz 0.93 0.9 Cz 0.76 0.9 Cz 0.84 0.89 Pz 0.97 0.94 Pz 1.0 0.96 Pz 0.96 0.98

182
Participant ID 19 qEEG Record: Posttest Eyes Closed Linked Ears Average Reference LaPlacian Split
Half Test/ Retest
Split Half
Test/ Retest
Split Half
Test/ Retest
Average 0.96 0.96 Average 0.93 0.93 Average 0.94 0.92 FP1 0.95 0.97 FP1 0.89 0.9 FP1 0.98 0.93 FP2 0.93 0.92 FP2 0.91 0.91 FP2 0.88 0.92 F3 0.97 0.95 F3 0.87 0.93 F3 0.97 0.98 F4 0.99 0.99 F4 0.96 0.91 F4 0.98 0.94 C3 0.96 0.92 C3 1.0 1.0 C3 0.95 0.91 C4 1.0 0.98 C4 0.93 0.94 C4 0.95 0.89 P3 1.0 0.98 P3 0.91 0.95 P3 0.86 0.95 P4 0.98 0.91 P4 0.96 0.79 P4 0.95 0.86 O1 0.99 0.94 O1 0.93 0.9 O1 0.88 0.83 O2 0.92 0.97 O2 0.96 0.98 O2 0.96 0.96 F7 0.96 0.9 F7 0.95 0.99 F7 0.94 0.92 F8 0.99 0.98 F8 1.0 0.98 F8 0.94 0.99 T3 0.91 0.9 T3 0.9 0.9 T3 0.98 0.94 T4 0.97 0.98 T4 0.95 0.95 T4 0.91 0.86 T5 0.93 0.95 T5 0.94 0.97 T5 0.96 0.99 T6 0.94 0.98 T6 0.9 0.89 T6 0.94 0.81 Fz 0.95 1.0 Fz 0.95 0.94 Fz 1.0 0.9 Cz 0.95 0.97 Cz 0.92 0.96 Cz 0.92 0.93 Pz 0.97 0.95 Pz 0.9 0.83 Pz 0.87 0.99

183
Participant ID 21 qEEG Record: Pretest Eyes Closed Linked Ears Average Reference LaPlacian Split
Half Test/ Retest
Split Half
Test/ Retest
Split Half
Test/ Retest
Average 0.95 0.91 Average 0.94 0.89 Average 0.96 0.91 FP1 0.89 0.92 FP1 0.84 0.94 FP1 0.96 0.93 FP2 0.92 0.94 FP2 1.0 0.99 FP2 1.0 0.95 F3 0.93 0.96 F3 0.83 0.99 F3 0.9 0.99 F4 0.96 0.89 F4 0.99 0.9 F4 1.0 0.99 C3 0.96 0.93 C3 0.99 0.9 C3 0.87 0.82 C4 0.98 0.91 C4 0.97 0.98 C4 0.95 0.92 P3 0.92 0.9 P3 0.91 0.87 P3 0.93 0.85 P4 0.95 0.87 P4 0.99 0.77 P4 0.98 0.77 O1 0.92 0.94 O1 0.95 0.88 O1 1.0 0.99 O2 1.0 0.93 O2 0.91 0.94 O2 1.0 0.96 F7 0.98 0.91 F7 0.96 0.94 F7 0.99 0.98 F8 0.99 0.93 F8 0.84 0.84 F8 0.98 0.84 T3 0.97 0.89 T3 0.98 0.95 T3 0.99 0.95 T4 0.97 0.94 T4 0.93 0.83 T4 0.96 0.89 T5 0.96 0.92 T5 0.95 0.99 T5 0.9 0.94 T6 0.97 0.89 T6 0.98 0.78 T6 0.95 0.87 Fz 0.91 0.86 Fz 0.86 0.8 Fz 0.89 0.9 Cz 0.99 0.85 Cz 0.98 0.82 Cz 0.98 0.84 Pz 0.94 0.94 Pz 0.94 0.86 Pz 0.99 0.88

184
Participant ID 21 qEEG Record: Pretest Eyes Open Linked Ears Average Reference LaPlacian Split
Half Test/ Retest
Split Half
Test/ Retest
Split Half
Test/ Retest
Average 0.95 0.9 Average 0.94 0.9 Average 0.95 0.89 FP1 0.93 0.99 FP1 0.91 0.93 FP1 0.97 0.95 FP2 0.95 0.87 FP2 0.97 0.98 FP2 0.97 0.97 F3 0.93 0.85 F3 0.93 0.95 F3 0.95 0.91 F4 0.89 0.81 F4 0.89 0.88 F4 0.93 0.9 C3 0.96 1.0 C3 0.86 0.98 C3 0.92 0.9 C4 0.96 0.82 C4 0.94 0.82 C4 0.95 0.76 P3 1.0 0.97 P3 0.99 0.95 P3 0.94 0.89 P4 0.89 0.94 P4 0.87 0.96 P4 0.82 0.95 O1 1.0 0.98 O1 0.95 0.85 O1 0.89 0.9 O2 0.92 0.99 O2 0.98 0.9 O2 0.98 0.99 F7 0.98 0.89 F7 1.0 0.98 F7 0.97 0.89 F8 0.95 0.94 F8 0.94 0.96 F8 0.96 0.89 T3 0.99 0.92 T3 0.98 0.98 T3 1.0 0.8 T4 0.98 0.97 T4 0.95 0.97 T4 0.99 0.92 T5 0.99 0.93 T5 0.88 0.73 T5 0.93 0.87 T6 0.9 0.95 T6 0.96 0.98 T6 0.97 0.93 Fz 0.9 0.73 Fz 0.87 0.69 Fz 0.99 0.84 Cz 0.97 0.68 Cz 0.99 0.61 Cz 0.98 0.58 Pz 0.97 0.87 Pz 0.97 0.99 Pz 0.97 0.98

185
Participant ID 21 qEEG Record: Pretest Serial Sevens Linked Ears Average Reference LaPlacian Split
Half Test/ Retest
Split Half
Test/ Retest
Split Half
Test/ Retest
Average 0.95 0.91 Average 0.93 0.9 Average 0.94 0.92 FP1 0.99 0.97 FP1 0.92 0.88 FP1 0.94 0.99 FP2 0.97 0.86 FP2 0.91 0.88 FP2 0.89 0.76 F3 0.91 0.89 F3 0.99 0.94 F3 0.98 0.91 F4 0.99 0.87 F4 0.99 0.87 F4 0.93 0.9 C3 0.96 0.92 C3 0.88 0.92 C3 0.93 0.97 C4 0.94 0.9 C4 0.86 0.94 C4 0.97 0.98 P3 0.88 0.98 P3 0.92 0.9 P3 0.87 0.96 P4 0.99 0.95 P4 0.92 0.93 P4 0.95 0.91 O1 0.96 0.9 O1 0.89 0.91 O1 1.0 0.98 O2 0.99 0.87 O2 0.95 0.93 O2 0.95 0.96 F7 0.91 0.85 F7 0.98 0.77 F7 0.94 1.0 F8 0.98 0.87 F8 0.91 0.79 F8 0.96 0.98 T3 0.98 0.95 T3 0.99 0.94 T3 0.95 0.94 T4 0.91 0.9 T4 0.96 0.92 T4 0.98 0.89 T5 0.98 0.98 T5 0.97 1.0 T5 0.98 0.94 T6 0.94 0.92 T6 0.91 0.91 T6 0.95 0.79 Fz 0.93 0.85 Fz 0.96 0.85 Fz 0.98 0.86 Cz 0.87 0.89 Cz 0.79 0.93 Cz 0.82 1.0 Pz 0.89 0.98 Pz 0.89 0.88 Pz 0.99 0.82

186
Participant ID 21 qEEG Record: Posttest Eyes Open Linked Ears Average Reference LaPlacian Split
Half Test/ Retest
Split Half
Test/ Retest
Split Half
Test/ Retest
Average 0.95 0.93 Average 0.94 0.92 Average 0.94 0.94 FP1 0.98 0.93 FP1 0.98 1.0 FP1 0.99 0.93 FP2 1.0 0.99 FP2 0.98 0.96 FP2 0.96 0.95 F3 0.93 0.94 F3 0.9 0.98 F3 0.93 0.89 F4 0.96 0.97 F4 0.96 1.0 F4 0.96 0.96 C3 0.95 0.98 C3 0.94 0.98 C3 0.96 0.99 C4 0.98 0.8 C4 0.96 0.78 C4 0.96 0.94 P3 0.9 0.89 P3 0.85 0.92 P3 0.86 0.94 P4 0.93 0.98 P4 0.93 0.99 P4 0.95 0.94 O1 0.97 0.93 O1 0.95 0.88 O1 0.94 0.98 O2 0.98 1.0 O2 0.97 0.98 O2 0.99 0.95 F7 0.91 0.87 F7 0.98 0.94 F7 0.89 0.96 F8 0.96 0.9 F8 0.93 0.78 F8 0.92 0.97 T3 0.88 0.91 T3 0.91 0.92 T3 0.92 0.89 T4 0.96 0.92 T4 0.98 0.76 T4 0.96 0.82 T5 0.98 0.91 T5 0.98 0.97 T5 0.91 0.84 T6 0.95 0.98 T6 0.91 0.89 T6 0.98 0.98 Fz 0.99 0.98 Fz 1.0 0.97 Fz 1.0 0.96 Cz 0.98 0.91 Cz 0.95 0.86 Cz 0.9 0.89 Pz 0.88 0.94 Pz 0.86 0.95 Pz 0.92 1.0

187
Participant ID 21 qEEG Record: Posttest Eyes Closed Linked Ears Average Reference LaPlacian Split
Half Test/ Retest
Split Half
Test/ Retest
Split Half
Test/ Retest
Average 0.95 0.93 Average 0.95 0.93 Average 0.93 0.89 FP1 0.98 1.0 FP1 0.96 0.99 FP1 0.96 0.92 FP2 0.95 0.98 FP2 0.99 0.99 FP2 1.0 0.99 F3 0.93 0.94 F3 0.99 0.96 F3 0.91 0.99 F4 0.9 0.9 F4 0.92 0.95 F4 0.89 0.99 C3 0.97 0.99 C3 0.97 0.96 C3 0.9 0.76 C4 1.0 0.91 C4 0.99 0.98 C4 0.91 0.89 P3 0.97 0.87 P3 1.0 0.88 P3 0.98 0.74 P4 0.87 0.84 P4 0.84 0.96 P4 0.91 0.88 O1 0.98 1.0 O1 0.94 0.91 O1 0.93 1.0 O2 0.94 0.93 O2 0.96 0.95 O2 0.95 0.97 F7 0.99 1.0 F7 0.97 0.83 F7 0.98 0.92 F8 0.98 0.97 F8 0.99 0.98 F8 0.97 0.99 T3 1.0 0.99 T3 0.97 0.9 T3 0.88 0.93 T4 0.98 0.99 T4 0.89 0.99 T4 0.91 0.95 T5 0.98 0.95 T5 0.93 0.8 T5 0.94 0.81 T6 0.92 0.86 T6 0.98 0.97 T6 0.99 0.76 Fz 0.89 0.84 Fz 0.9 0.85 Fz 0.96 0.83 Cz 0.92 0.77 Cz 0.91 0.75 Cz 0.84 0.71 Pz 0.97 0.92 Pz 0.94 0.97 Pz 0.95 0.89
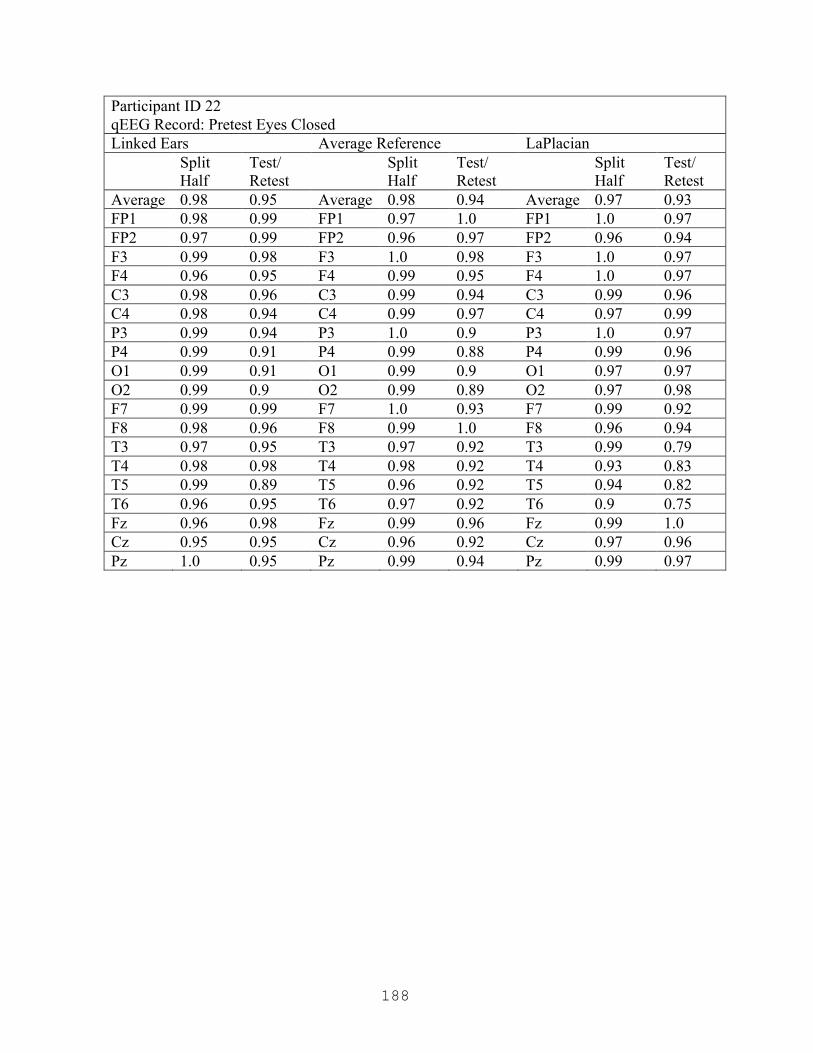
188
Participant ID 22 qEEG Record: Pretest Eyes Closed Linked Ears Average Reference LaPlacian Split
Half Test/ Retest
Split Half
Test/ Retest
Split Half
Test/ Retest
Average 0.98 0.95 Average 0.98 0.94 Average 0.97 0.93 FP1 0.98 0.99 FP1 0.97 1.0 FP1 1.0 0.97 FP2 0.97 0.99 FP2 0.96 0.97 FP2 0.96 0.94 F3 0.99 0.98 F3 1.0 0.98 F3 1.0 0.97 F4 0.96 0.95 F4 0.99 0.95 F4 1.0 0.97 C3 0.98 0.96 C3 0.99 0.94 C3 0.99 0.96 C4 0.98 0.94 C4 0.99 0.97 C4 0.97 0.99 P3 0.99 0.94 P3 1.0 0.9 P3 1.0 0.97 P4 0.99 0.91 P4 0.99 0.88 P4 0.99 0.96 O1 0.99 0.91 O1 0.99 0.9 O1 0.97 0.97 O2 0.99 0.9 O2 0.99 0.89 O2 0.97 0.98 F7 0.99 0.99 F7 1.0 0.93 F7 0.99 0.92 F8 0.98 0.96 F8 0.99 1.0 F8 0.96 0.94 T3 0.97 0.95 T3 0.97 0.92 T3 0.99 0.79 T4 0.98 0.98 T4 0.98 0.92 T4 0.93 0.83 T5 0.99 0.89 T5 0.96 0.92 T5 0.94 0.82 T6 0.96 0.95 T6 0.97 0.92 T6 0.9 0.75 Fz 0.96 0.98 Fz 0.99 0.96 Fz 0.99 1.0 Cz 0.95 0.95 Cz 0.96 0.92 Cz 0.97 0.96 Pz 1.0 0.95 Pz 0.99 0.94 Pz 0.99 0.97

189
Participant ID 22 qEEG Record: Pretest Eyes Open Linked Ears Average Reference LaPlacian Split
Half Test/ Retest
Split Half
Test/ Retest
Split Half
Test/ Retest
Average 0.95 0.92 Average 0.96 0.95 Average 0.97 0.95 FP1 0.94 1.0 FP1 0.94 0.96 FP1 0.97 0.96 FP2 0.95 0.91 FP2 0.94 0.86 FP2 1.0 0.88 F3 0.94 0.95 F3 0.96 0.97 F3 0.99 0.97 F4 0.99 0.97 F4 0.99 0.96 F4 1.0 0.9 C3 0.94 0.91 C3 0.96 0.99 C3 0.97 0.97 C4 1.0 0.98 C4 0.97 0.95 C4 0.99 0.96 P3 0.93 0.95 P3 0.95 0.98 P3 0.99 0.95 P4 0.94 0.89 P4 0.96 0.97 P4 0.94 1.0 O1 0.96 0.89 O1 1.0 0.94 O1 0.98 0.99 O2 0.93 0.84 O2 0.96 1.0 O2 0.99 0.99 F7 1.0 0.92 F7 0.99 0.99 F7 0.98 0.92 F8 0.88 0.89 F8 0.98 0.96 F8 0.93 0.98 T3 0.96 0.9 T3 0.97 0.95 T3 0.96 0.99 T4 0.99 0.87 T4 0.96 0.95 T4 0.92 0.92 T5 0.95 0.86 T5 0.95 0.94 T5 0.94 0.87 T6 0.93 0.8 T6 0.94 0.97 T6 0.96 0.93 Fz 0.98 0.93 Fz 0.94 0.88 Fz 0.96 0.95 Cz 0.96 0.99 Cz 0.94 0.92 Cz 0.92 0.99 Pz 0.99 0.98 Pz 1.0 0.96 Pz 0.96 0.98

190
Participant ID 22 qEEG Record: Pretest Serial Sevens Linked Ears Average Reference LaPlacian Split
Half Test/ Retest
Split Half
Test/ Retest
Split Half
Test/ Retest
Average 0.95 0.94 Average 0.94 0.92 Average 0.95 0.95 FP1 0.93 0.86 FP1 1..0 0.93 FP1 0.97 0.94 FP2 0.97 0.92 FP2 0.9 0.96 FP2 0.93 0.98 F3 0.83 0.9 F3 0.86 0.98 F3 0.93 0.98 F4 0.99 0.97 F4 0.93 0.96 F4 0.96 0.98 C3 0.9 0.95 C3 0.98 0.89 C3 0.95 0.96 C4 0.93 0.94 C4 0.91 0.91 C4 0.91 0.91 P3 0.98 0.95 P3 0.93 0.9 P3 0.94 1.0 P4 0.98 0.98 P4 0.94 0.92 P4 0.96 0.97 O1 0.97 0.96 O1 0.96 0.81 O1 1.0 0.89 O2 0.97 0.95 O2 0.99 0.88 O2 0.96 0.97 F7 0.98 0.98 F7 0.88 0.94 F7 0.96 0.98 F8 0.9 0.82 F8 0.87 0.89 F8 0.99 0.95 T3 0.99 1.0 T3 0.99 0.94 T3 0.95 0.94 T4 0.95 0.9 T4 0.98 0.9 T4 0.96 0.9 T5 0.97 0.99 T5 0.97 0.96 T5 0.96 0.91 T6 0.94 0.87 T6 0.98 0.95 T6 0.91 0.92 Fz 0.94 0.98 Fz 0.91 0.89 Fz 0.9 0.93 Cz 0.91 0.99 Cz 0.99 0.97 Cz 0.97 0.93 Pz 0.99 0.96 Pz 0.92 0.84 Pz 0.98 0.98

191
Participant ID 22 qEEG Record: Posttest Eyes Open Linked Ears Average Reference LaPlacian Split
Half Test/ Retest
Split Half
Test/ Retest
Split Half
Test/ Retest
Average 0.93 0.91 Average 0.92 0.89 Average 0.91 0.9 FP1 0.89 0.95 FP1 0.98 0.94 FP1 0.93 0.98 FP2 0.97 0.87 FP2 0.91 0.85 FP2 0.91 0.85 F3 0.8 0.99 F3 0.88 0.91 F3 0.99 0.97 F4 0.79 0.75 F4 0.85 0.79 F4 0.98 0.86 C3 0.95 0.84 C3 0.88 0.8 C3 0.88 0.88 C4 0.97 0.97 C4 0.93 0.99 C4 0.87 0.82 P3 0.96 0.93 P3 0.98 0.97 P3 0.79 0.88 P4 0.99 0.94 P4 0.85 0.92 P4 0.91 0.92 O1 0.94 1.0 O1 0.96 0.96 O1 0.86 0.92 O2 0.95 1.0 O2 0.95 0.96 O2 0.89 0.97 F7 0.94 0.88 F7 0.91 0.89 F7 0.99 0.89 F8 1.0 0.89 F8 0.94 0.81 F8 0.88 0.82 T3 0.88 0.95 T3 0.98 0.83 T3 0.95 0.84 T4 0.99 0.77 T4 0.93 0.73 T4 0.89 0.65 T5 0.83 0.9 T5 0.74 0.85 T5 0.9 1.0 T6 0.95 0.97 T6 0.95 0.93 T6 0.82 0.87 Fz 0.91 0.82 Fz 0.97 0.93 Fz 0.99 0.93 Cz 0.94 0.84 Cz 0.97 0.86 Cz 0.97 0.98 Pz 0.95 0.96 Pz 0.87 0.97 Pz 0.8 0.98

192
Participant ID 22 qEEG Record: Posttest Eyes Closed Linked Ears Average Reference LaPlacian Split
Half Test/
Retest Split
Half Test/
Retest Split
Half Test/
Retest Average 0.98 0.97 Average 0.97 0.94 Average 0.96 0.94 FP1 0.97 0.96 FP1 1.0 0.93 FP1 0.99 0.95 FP2 0.93 0.97 FP2 0.94 1.0 FP2 0.92 0.92 F3 0.99 0.96 F3 0.98 0.96 F3 0.97 0.95 F4 1.0 0.98 F4 0.96 0.99 F4 0.99 0.97 C3 1.0 0.98 C3 0.99 0.97 C3 0.97 0.98 C4 0.97 0.93 C4 0.92 0.91 C4 0.88 0.96 P3 1.0 0.99 P3 0.99 0.95 P3 0.98 0.93 P4 0.99 0.99 P4 0.98 0.96 P4 0.95 0.93 O1 0.94 0.94 O1 0.99 0.93 O1 0.98 0.93 O2 0.95 0.99 O2 0.98 0.87 O2 1.0 0.93 F7 0.98 0.99 F7 0.97 0.93 F7 0.97 0.9 F8 1.0 0.95 F8 0.97 0.98 F8 0.96 0.95 T3 0.98 0.98 T3 0.98 0.98 T3 0.97 0.97 T4 0.97 0.97 T4 0.99 0.92 T4 0.97 0.96 T5 0.99 0.95 T5 0.98 0.93 T5 1.0 0.91 T6 0.93 0.99 T6 0.92 0.91 T6 0.94 0.97 Fz 0.98 0.98 Fz 0.98 0.99 Fz 1.0 0.96 Cz 1.0 0.91 Cz 0.96 0.88 Cz 0.95 0.95 Pz 1.0 0.96 Pz 0.96 0.94 Pz 0.95 0.83

193
Participant ID 23 qEEG Record: Pretest Eyes Closed Linked Ears Average Reference LaPlacian Split
Half Test/
Retest Split
Half Test/
Retest Split
Half Test/
Retest Average 0.96 0.91 Average 0.95 0.87 Average 0.94 0.81 FP1 0.96 0.83 FP1 0.98 0.83 FP1 0.97 0.89 FP2 0.97 0.84 FP2 0.98 0.81 FP2 0.92 0.7 F3 0.97 0.88 F3 0.96 0.88 F3 0.98 0.93 F4 0.96 0.86 F4 0.94 0.81 F4 0.9 0.79 C3 0.97 0.9 C3 0.9 0.89 C3 0.98 0.92 C4 0.98 0.91 C4 0.99 0.91 C4 0.93 0.92 P3 0.92 0.96 P3 0.95 0.9 P3 0.93 0.91 P4 0.92 1.0 P4 0.99 0.93 P4 0.95 0.9 O1 0.97 0.76 O1 0.97 0.68 O1 0.98 0.45 O2 0.99 0.98 O2 0.89 0.89 O2 0.94 0.65 F7 0.99 0.9 F7 0.93 0.96 F7 0.98 0.9 F8 0.97 0.84 F8 0.99 0.74 F8 0.91 0.49 T3 0.98 0.94 T3 0.93 0.97 T3 0.93 0.97 T4 0.95 0.98 T4 0.93 1.0 T4 0.94 0.69 T5 0.94 0.89 T5 0.99 0.83 T5 0.93 0.7 T6 0.98 0.97 T6 0.88 0.89 T6 0.92 0.86 Fz 0.96 0.88 Fz 0.95 0.87 Fz 0.95 0.95 Cz 0.96 0.88 Cz 0.91 0.84 Cz 0.92 0.87 Pz 0.92 1.0 Pz 0.97 0.99 Pz 0.98 0.92
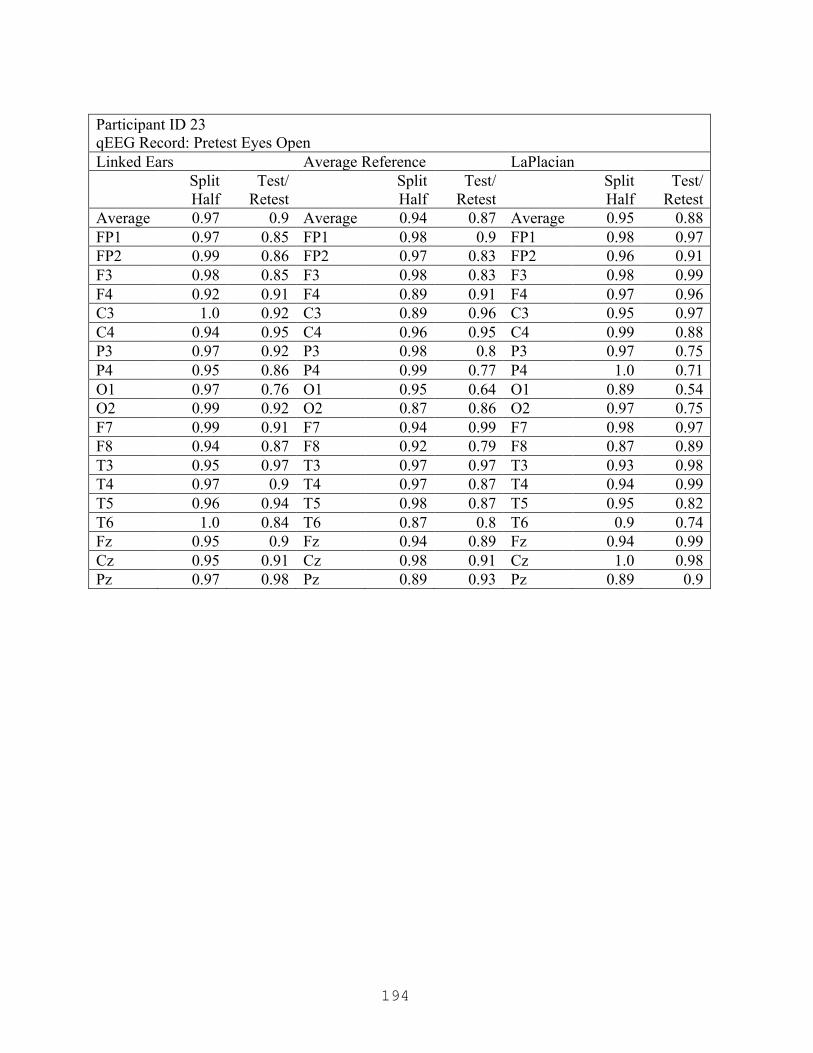
194
Participant ID 23 qEEG Record: Pretest Eyes Open Linked Ears Average Reference LaPlacian Split
Half Test/
Retest Split
Half Test/
Retest Split
Half Test/
Retest Average 0.97 0.9 Average 0.94 0.87 Average 0.95 0.88 FP1 0.97 0.85 FP1 0.98 0.9 FP1 0.98 0.97 FP2 0.99 0.86 FP2 0.97 0.83 FP2 0.96 0.91 F3 0.98 0.85 F3 0.98 0.83 F3 0.98 0.99 F4 0.92 0.91 F4 0.89 0.91 F4 0.97 0.96 C3 1.0 0.92 C3 0.89 0.96 C3 0.95 0.97 C4 0.94 0.95 C4 0.96 0.95 C4 0.99 0.88 P3 0.97 0.92 P3 0.98 0.8 P3 0.97 0.75 P4 0.95 0.86 P4 0.99 0.77 P4 1.0 0.71 O1 0.97 0.76 O1 0.95 0.64 O1 0.89 0.54 O2 0.99 0.92 O2 0.87 0.86 O2 0.97 0.75 F7 0.99 0.91 F7 0.94 0.99 F7 0.98 0.97 F8 0.94 0.87 F8 0.92 0.79 F8 0.87 0.89 T3 0.95 0.97 T3 0.97 0.97 T3 0.93 0.98 T4 0.97 0.9 T4 0.97 0.87 T4 0.94 0.99 T5 0.96 0.94 T5 0.98 0.87 T5 0.95 0.82 T6 1.0 0.84 T6 0.87 0.8 T6 0.9 0.74 Fz 0.95 0.9 Fz 0.94 0.89 Fz 0.94 0.99 Cz 0.95 0.91 Cz 0.98 0.91 Cz 1.0 0.98 Pz 0.97 0.98 Pz 0.89 0.93 Pz 0.89 0.9
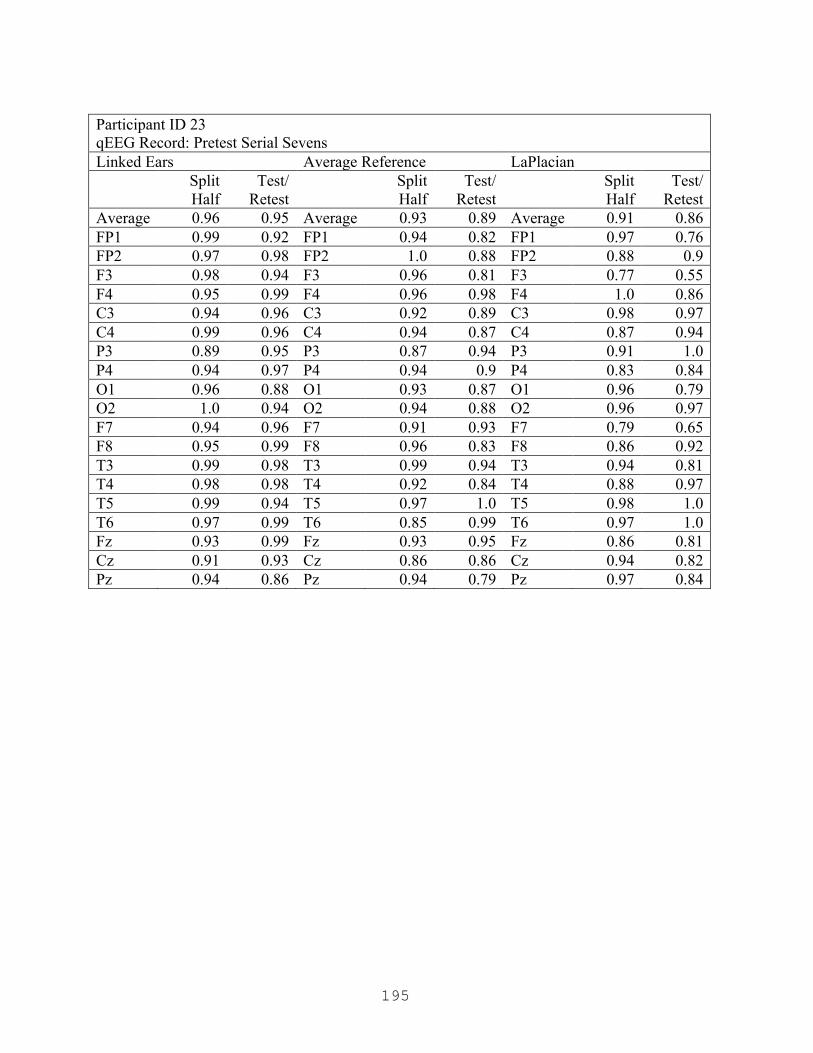
195
Participant ID 23 qEEG Record: Pretest Serial Sevens Linked Ears Average Reference LaPlacian Split
Half Test/
Retest Split
Half Test/
Retest Split
Half Test/
Retest Average 0.96 0.95 Average 0.93 0.89 Average 0.91 0.86 FP1 0.99 0.92 FP1 0.94 0.82 FP1 0.97 0.76 FP2 0.97 0.98 FP2 1.0 0.88 FP2 0.88 0.9 F3 0.98 0.94 F3 0.96 0.81 F3 0.77 0.55 F4 0.95 0.99 F4 0.96 0.98 F4 1.0 0.86 C3 0.94 0.96 C3 0.92 0.89 C3 0.98 0.97 C4 0.99 0.96 C4 0.94 0.87 C4 0.87 0.94 P3 0.89 0.95 P3 0.87 0.94 P3 0.91 1.0 P4 0.94 0.97 P4 0.94 0.9 P4 0.83 0.84 O1 0.96 0.88 O1 0.93 0.87 O1 0.96 0.79 O2 1.0 0.94 O2 0.94 0.88 O2 0.96 0.97 F7 0.94 0.96 F7 0.91 0.93 F7 0.79 0.65 F8 0.95 0.99 F8 0.96 0.83 F8 0.86 0.92 T3 0.99 0.98 T3 0.99 0.94 T3 0.94 0.81 T4 0.98 0.98 T4 0.92 0.84 T4 0.88 0.97 T5 0.99 0.94 T5 0.97 1.0 T5 0.98 1.0 T6 0.97 0.99 T6 0.85 0.99 T6 0.97 1.0 Fz 0.93 0.99 Fz 0.93 0.95 Fz 0.86 0.81 Cz 0.91 0.93 Cz 0.86 0.86 Cz 0.94 0.82 Pz 0.94 0.86 Pz 0.94 0.79 Pz 0.97 0.84

196
Participant ID 23 qEEG Record: Posttest Eyes Open Linked Ears Average Reference LaPlacian
Split Half
Test/ Retest
Split Half
Test/ Retest
Split Half
Test/ Retest
Average 0.95 0.94 Average 0.92 0.91 Average 0.92 0.88 FP1 0.89 0.93 FP1 0.95 0.9 FP1 0.83 0.94 FP2 0.95 0.95 FP2 0.91 0.89 FP2 0.97 0.93 F3 0.91 0.9 F3 0.94 0.83 F3 0.91 0.96 F4 0.99 0.98 F4 0.87 0.97 F4 0.99 0.96 C3 0.89 0.89 C3 0.98 0.79 C3 0.98 0.8 C4 0.98 1.0 C4 0.94 0.92 C4 0.87 0.95 P3 0.99 1.0 P3 0.88 0.96 P3 0.92 0.73 P4 0.94 0.99 P4 0.78 0.92 P4 0.88 0.8 O1 0.96 0.91 O1 0.9 0.93 O1 0.88 0.95 O2 0.99 0.98 O2 0.94 0.99 O2 0.99 0.92 F7 0.98 0.89 F7 0.89 0.94 F7 0.86 0.99 F8 0.93 0.89 F8 0.84 0.82 F8 0.99 0.9 T3 0.98 0.96 T3 0.88 0.99 T3 0.94 0.89 T4 1.0 0.94 T4 0.87 0.99 T4 0.95 0.81 T5 0.98 0.97 T5 0.96 0.92 T5 0.96 0.91 T6 0.96 0.92 T6 0.93 0.89 T6 0.79 0.92 Fz 0.94 0.96 Fz 0.98 0.95 Fz 0.98 0.87 Cz 0.92 0.97 Cz 0.99 0.9 Cz 0.96 0.99 Pz 0.92 0.8 Pz 0.95 0.7 Pz 0.84 0.48

197
Participant ID 23 qEEG Record: Posttest Eyes Closed Linked Ears Average Reference LaPlacian Split
Half Test/
Retest Split
Half Test/
Retest Split
Half Test/
Retest Average 0.95 0.97 Average 0.94 0.94 Average 0.95 0.93 FP1 1.0 0.99 FP1 0.92 0.99 FP1 0.95 0.93 FP2 0.99 1.0 FP2 0.94 1.0 FP2 0.99 0.97 F3 0.98 1.0 F3 0.97 0.99 F3 0.99 0.91 F4 1.0 0.99 F4 0.99 0.95 F4 0.92 0.92 C3 0.99 0.94 C3 0.95 0.86 C3 0.98 0.87 C4 0.96 0.93 C4 0.97 0.96 C4 0.99 0.96 P3 0.91 0.99 P3 0.97 0.96 P3 0.94 0.98 P4 0.88 1.0 P4 0.92 0.97 P4 0.93 0.94 O1 0.94 0.96 O1 0.95 0.93 O1 0.95 0.93 O2 0.92 0.98 O2 0.94 0.94 O2 0.96 0.83 F7 0.96 0.98 F7 0.92 0.87 F7 1.0 0.81 F8 0.95 0.97 F8 0.86 0.86 F8 0.88 0.92 T3 0.96 0.98 T3 0.96 0.86 T3 0.92 0.99 T4 0.97 0.97 T4 0.96 0.8 T4 0.97 0.9 T5 0.99 0.93 T5 0.93 0.94 T5 0.93 0.99 T6 0.9 1.0 T6 0.91 1.0 T6 0.93 0.91 Fz 0.97 1.0 Fz 1.0 0.99 Fz 0.87 0.97 Cz 1.0 0.98 Cz 0.97 0.96 Cz 0.96 0.92 Pz 0.88 0.91 Pz 0.9 0.95 Pz 0.99 0.96

198
Participant ID 24 qEEG Record: Pretest Eyes Closed Linked Ears Average Reference LaPlacian Split
Half Test/
Retest Split
Half Test/
Retest Split
Half Test/
Retest Average 0.97 0.98 Average 0.97 0.95 Average 0.97 0.81 FP1 0.96 0.99 FP1 0.98 0.95 FP1 0.97 0.88 FP2 0.98 0.98 FP2 1.0 0.99 FP2 0.94 0.91 F3 0.99 0.98 F3 0.99 0.93 F3 0.99 0.92 F4 0.97 0.98 F4 1.0 0.79 F4 0.99 0.41 C3 1.0 0.99 C3 1.0 0.97 C3 0.99 0.98 C4 0.99 1.0 C4 0.93 0.99 C4 0.91 0.82 P3 0.95 0.93 P3 0.95 0.97 P3 0.97 0.74 P4 0.98 0.93 P4 0.97 0.94 P4 0.98 0.59 O1 0.96 0.99 O1 0.96 0.98 O1 0.95 0.93 O2 0.97 0.96 O2 0.96 0.92 O2 0.97 0.88 F7 0.97 1.0 F7 0.97 0.97 F7 0.96 0.9 F8 0.96 1.0 F8 0.98 0.94 F8 1.0 0.88 T3 0.96 0.95 T3 0.93 0.91 T3 0.99 0.94 T4 0.92 1.0 T4 0.99 0.99 T4 0.99 0.89 T5 0.98 0.98 T5 0.93 0.98 T5 1.0 0.97 T6 0.92 0.95 T6 0.98 0.97 T6 0.99 0.93 Fz 0.98 0.99 Fz 1.0 0.97 Fz 0.94 0.67 Cz 0.99 0.96 Cz 0.99 0.98 Cz 0.95 0.65 Pz 0.99 1.0 Pz 0.99 0.87 Pz 0.95 0.41
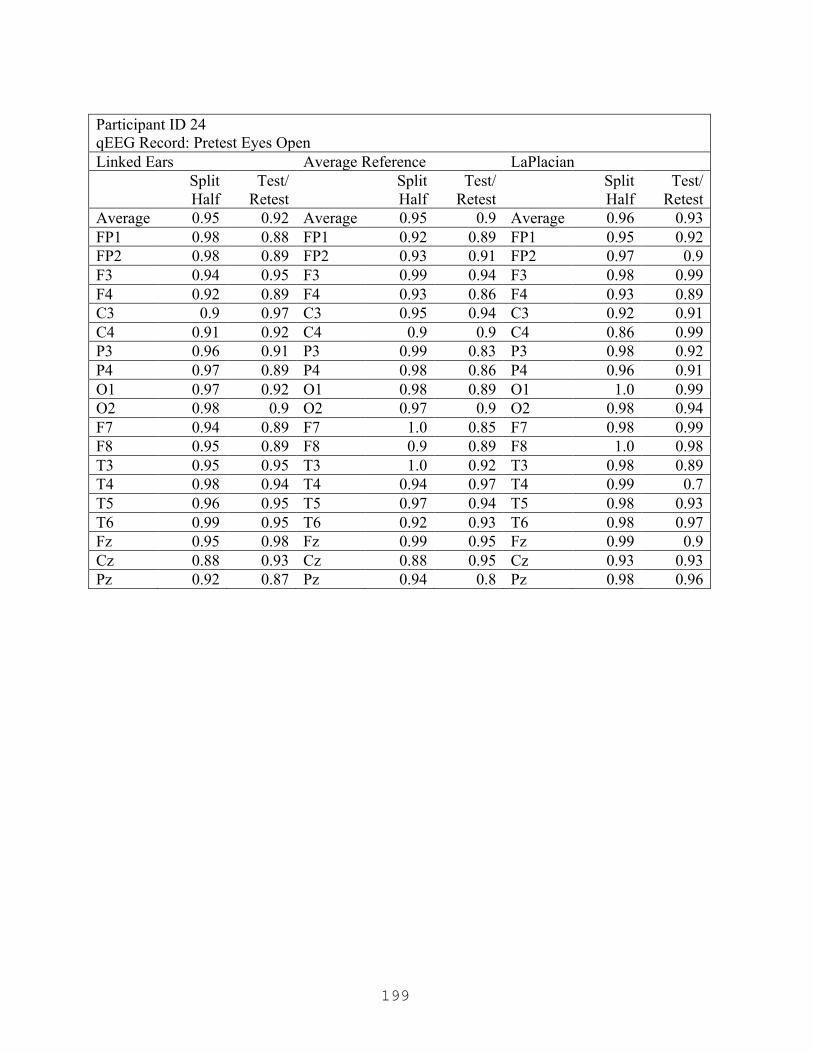
199
Participant ID 24 qEEG Record: Pretest Eyes Open Linked Ears Average Reference LaPlacian
Split Half
Test/ Retest
Split Half
Test/ Retest
Split Half
Test/ Retest
Average 0.95 0.92 Average 0.95 0.9 Average 0.96 0.93 FP1 0.98 0.88 FP1 0.92 0.89 FP1 0.95 0.92 FP2 0.98 0.89 FP2 0.93 0.91 FP2 0.97 0.9 F3 0.94 0.95 F3 0.99 0.94 F3 0.98 0.99 F4 0.92 0.89 F4 0.93 0.86 F4 0.93 0.89 C3 0.9 0.97 C3 0.95 0.94 C3 0.92 0.91 C4 0.91 0.92 C4 0.9 0.9 C4 0.86 0.99 P3 0.96 0.91 P3 0.99 0.83 P3 0.98 0.92 P4 0.97 0.89 P4 0.98 0.86 P4 0.96 0.91 O1 0.97 0.92 O1 0.98 0.89 O1 1.0 0.99 O2 0.98 0.9 O2 0.97 0.9 O2 0.98 0.94 F7 0.94 0.89 F7 1.0 0.85 F7 0.98 0.99 F8 0.95 0.89 F8 0.9 0.89 F8 1.0 0.98 T3 0.95 0.95 T3 1.0 0.92 T3 0.98 0.89 T4 0.98 0.94 T4 0.94 0.97 T4 0.99 0.7 T5 0.96 0.95 T5 0.97 0.94 T5 0.98 0.93 T6 0.99 0.95 T6 0.92 0.93 T6 0.98 0.97 Fz 0.95 0.98 Fz 0.99 0.95 Fz 0.99 0.9 Cz 0.88 0.93 Cz 0.88 0.95 Cz 0.93 0.93 Pz 0.92 0.87 Pz 0.94 0.8 Pz 0.98 0.96

200
Participant ID 24 qEEG Record: Pretest Serial Sevens Linked Ears Average Reference LaPlacian
Split Half
Test/ Retest
Split Half
Test/ Retest
Split Half
Test/ Retest
Average 0.95 0.9 Average 0.91 0.9 Average 0.92 0.9 FP1 0.95 0.85 FP1 0.95 0.8 FP1 0.93 0.94 FP2 0.88 0.97 FP2 0.79 0.93 FP2 0.93 0.83 F3 0.96 0.88 F3 0.97 0.83 F3 0.98 0.8 F4 0.98 0.87 F4 0.81 0.83 F4 0.97 0.9 C3 0.98 0.98 C3 0.82 0.89 C3 0.9 0.95 C4 0.99 0.8 C4 0.84 0.79 C4 0.81 0.77 P3 0.99 0.99 P3 0.88 0.96 P3 0.96 0.92 P4 0.91 0.95 P4 0.97 0.98 P4 0.96 0.92 O1 0.96 0.9 O1 0.96 0.94 O1 0.98 0.94 O2 0.96 0.83 O2 0.96 0.96 O2 0.94 0.89 F7 0.98 0.96 F7 0.99 0.99 F7 0.7 0.86 F8 1.0 0.85 F8 0.89 0.96 F8 0.89 0.78 T3 0.89 0.92 T3 0.84 0.82 T3 0.99 0.96 T4 0.91 0.88 T4 0.99 0.96 T4 0.95 0.98 T5 0.89 0.8 T5 0.88 0.76 T5 0.99 0.85 T6 0.91 0.78 T6 0.95 0.98 T6 0.92 0.98 Fz 0.94 0.99 Fz 0.83 0.96 Fz 0.83 0.93 Cz 0.98 0.95 Cz 0.96 0.96 Cz 0.96 0.96 Pz 0.93 0.98 Pz 1.0 0.87 Pz 0.98 0.99
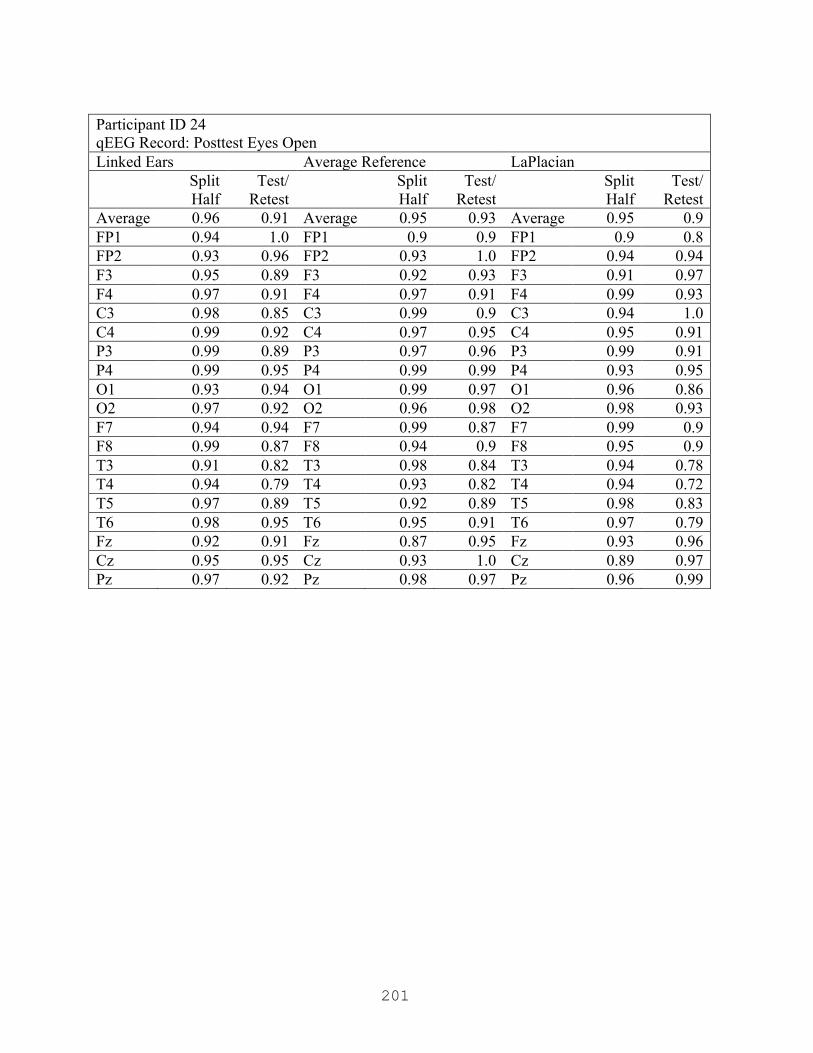
201
Participant ID 24 qEEG Record: Posttest Eyes Open Linked Ears Average Reference LaPlacian Split
Half Test/
Retest Split
Half Test/
Retest Split
Half Test/
Retest Average 0.96 0.91 Average 0.95 0.93 Average 0.95 0.9 FP1 0.94 1.0 FP1 0.9 0.9 FP1 0.9 0.8 FP2 0.93 0.96 FP2 0.93 1.0 FP2 0.94 0.94 F3 0.95 0.89 F3 0.92 0.93 F3 0.91 0.97 F4 0.97 0.91 F4 0.97 0.91 F4 0.99 0.93 C3 0.98 0.85 C3 0.99 0.9 C3 0.94 1.0 C4 0.99 0.92 C4 0.97 0.95 C4 0.95 0.91 P3 0.99 0.89 P3 0.97 0.96 P3 0.99 0.91 P4 0.99 0.95 P4 0.99 0.99 P4 0.93 0.95 O1 0.93 0.94 O1 0.99 0.97 O1 0.96 0.86 O2 0.97 0.92 O2 0.96 0.98 O2 0.98 0.93 F7 0.94 0.94 F7 0.99 0.87 F7 0.99 0.9 F8 0.99 0.87 F8 0.94 0.9 F8 0.95 0.9 T3 0.91 0.82 T3 0.98 0.84 T3 0.94 0.78 T4 0.94 0.79 T4 0.93 0.82 T4 0.94 0.72 T5 0.97 0.89 T5 0.92 0.89 T5 0.98 0.83 T6 0.98 0.95 T6 0.95 0.91 T6 0.97 0.79 Fz 0.92 0.91 Fz 0.87 0.95 Fz 0.93 0.96 Cz 0.95 0.95 Cz 0.93 1.0 Cz 0.89 0.97 Pz 0.97 0.92 Pz 0.98 0.97 Pz 0.96 0.99

202
Participant ID 24 qEEG Record: Posttest Eyes Closed Linked Ears Average Reference LaPlacian Split
Half Test/
Retest Split
Half Test/
Retest Split
Half Test/
Retest Average 0.96 0.94 Average 0.96 0.92 Average 0.95 0.93 FP1 0.99 0.98 FP1 0.98 0.97 FP1 0.92 0.97 FP2 0.99 0.97 FP2 0.99 0.92 FP2 0.95 0.98 F3 0.96 0.97 F3 0.97 0.96 F3 0.87 0.98 F4 0.96 0.98 F4 0.94 0.93 F4 0.98 0.99 C3 0.98 0.97 C3 0.97 0.87 C3 0.93 0.98 C4 0.92 0.84 C4 0.96 0.74 C4 0.97 0.88 P3 0.94 0.89 P3 0.91 0.88 P3 0.99 0.92 P4 1.0 0.93 P4 0.94 0.94 P4 0.92 0.93 O1 0.98 0.95 O1 0.99 0.96 O1 1.0 0.99 O2 0.98 0.89 O2 0.99 0.93 O2 0.95 0.91 F7 0.9 0.97 F7 0.99 1.0 F7 0.95 0.9 F8 0.97 0.96 F8 0.94 0.95 F8 0.98 0.91 T3 0.98 0.87 T3 0.92 0.88 T3 0.97 0.77 T4 0.99 1.0 T4 0.98 0.89 T4 0.96 0.84 T5 0.98 0.89 T5 0.92 0.93 T5 0.95 0.95 T6 0.95 0.9 T6 0.98 0.93 T6 0.97 0.92 Fz 0.95 0.93 Fz 0.97 0.87 Fz 0.9 0.98 Cz 0.93 0.95 Cz 0.94 0.93 Cz 0.97 0.91 Pz 0.97 0.96 Pz 1.0 0.99 Pz 0.96 0.96
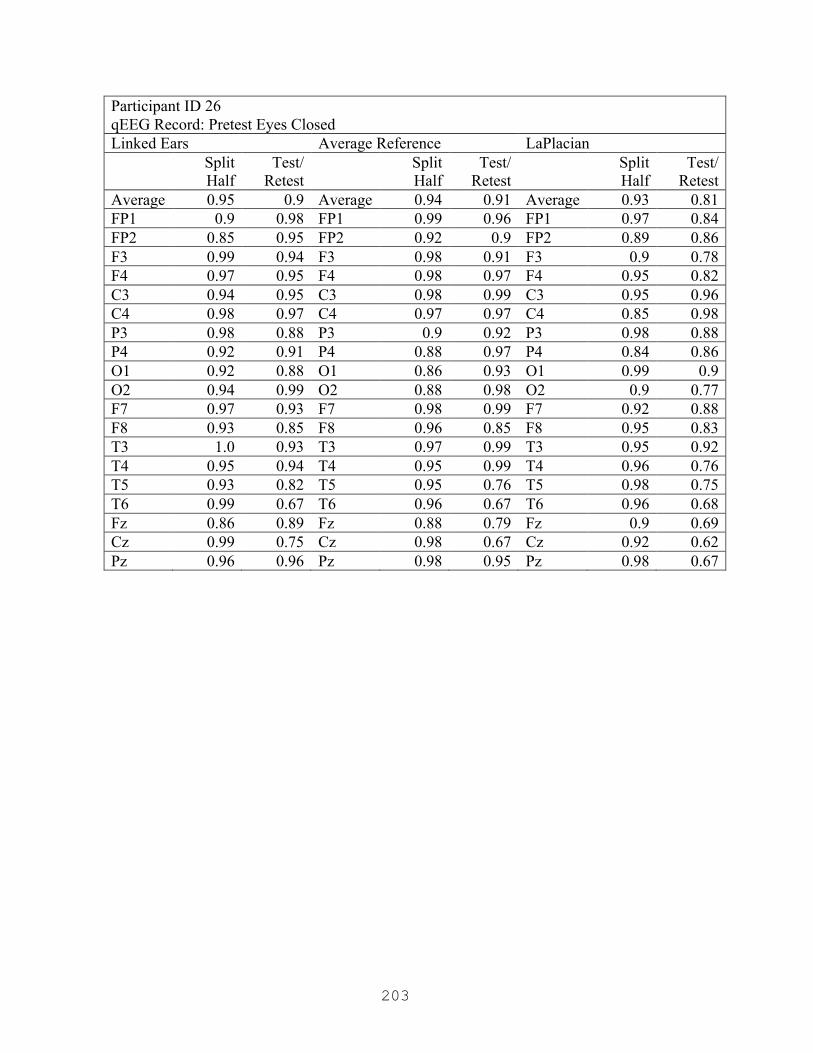
203
Participant ID 26 qEEG Record: Pretest Eyes Closed Linked Ears Average Reference LaPlacian
Split Half
Test/ Retest
Split Half
Test/ Retest
Split Half
Test/ Retest
Average 0.95 0.9 Average 0.94 0.91 Average 0.93 0.81 FP1 0.9 0.98 FP1 0.99 0.96 FP1 0.97 0.84 FP2 0.85 0.95 FP2 0.92 0.9 FP2 0.89 0.86 F3 0.99 0.94 F3 0.98 0.91 F3 0.9 0.78 F4 0.97 0.95 F4 0.98 0.97 F4 0.95 0.82 C3 0.94 0.95 C3 0.98 0.99 C3 0.95 0.96 C4 0.98 0.97 C4 0.97 0.97 C4 0.85 0.98 P3 0.98 0.88 P3 0.9 0.92 P3 0.98 0.88 P4 0.92 0.91 P4 0.88 0.97 P4 0.84 0.86 O1 0.92 0.88 O1 0.86 0.93 O1 0.99 0.9 O2 0.94 0.99 O2 0.88 0.98 O2 0.9 0.77 F7 0.97 0.93 F7 0.98 0.99 F7 0.92 0.88 F8 0.93 0.85 F8 0.96 0.85 F8 0.95 0.83 T3 1.0 0.93 T3 0.97 0.99 T3 0.95 0.92 T4 0.95 0.94 T4 0.95 0.99 T4 0.96 0.76 T5 0.93 0.82 T5 0.95 0.76 T5 0.98 0.75 T6 0.99 0.67 T6 0.96 0.67 T6 0.96 0.68 Fz 0.86 0.89 Fz 0.88 0.79 Fz 0.9 0.69 Cz 0.99 0.75 Cz 0.98 0.67 Cz 0.92 0.62 Pz 0.96 0.96 Pz 0.98 0.95 Pz 0.98 0.67
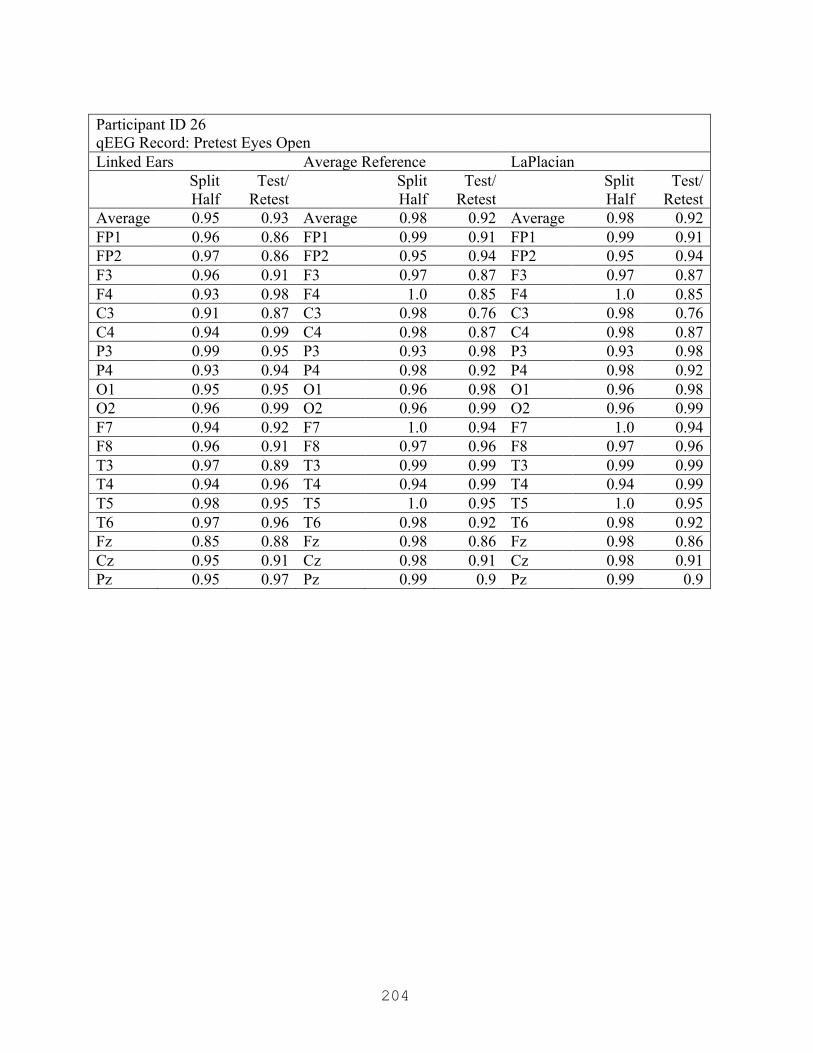
204
Participant ID 26 qEEG Record: Pretest Eyes Open Linked Ears Average Reference LaPlacian Split
Half Test/
Retest Split
Half Test/
Retest Split
Half Test/
Retest Average 0.95 0.93 Average 0.98 0.92 Average 0.98 0.92 FP1 0.96 0.86 FP1 0.99 0.91 FP1 0.99 0.91 FP2 0.97 0.86 FP2 0.95 0.94 FP2 0.95 0.94 F3 0.96 0.91 F3 0.97 0.87 F3 0.97 0.87 F4 0.93 0.98 F4 1.0 0.85 F4 1.0 0.85 C3 0.91 0.87 C3 0.98 0.76 C3 0.98 0.76 C4 0.94 0.99 C4 0.98 0.87 C4 0.98 0.87 P3 0.99 0.95 P3 0.93 0.98 P3 0.93 0.98 P4 0.93 0.94 P4 0.98 0.92 P4 0.98 0.92 O1 0.95 0.95 O1 0.96 0.98 O1 0.96 0.98 O2 0.96 0.99 O2 0.96 0.99 O2 0.96 0.99 F7 0.94 0.92 F7 1.0 0.94 F7 1.0 0.94 F8 0.96 0.91 F8 0.97 0.96 F8 0.97 0.96 T3 0.97 0.89 T3 0.99 0.99 T3 0.99 0.99 T4 0.94 0.96 T4 0.94 0.99 T4 0.94 0.99 T5 0.98 0.95 T5 1.0 0.95 T5 1.0 0.95 T6 0.97 0.96 T6 0.98 0.92 T6 0.98 0.92 Fz 0.85 0.88 Fz 0.98 0.86 Fz 0.98 0.86 Cz 0.95 0.91 Cz 0.98 0.91 Cz 0.98 0.91 Pz 0.95 0.97 Pz 0.99 0.9 Pz 0.99 0.9

205
Participant ID 26 qEEG Record: Pretest Serial Sevens Linked Ears Average Reference LaPlacian
Split Half
Test/ Retest
Split Half
Test/ Retest
Split Half
Test/ Retest
Average 0.96 0.9 Average 0.94 0.92 Average 0.91 0.93 FP1 0.99 0.87 FP1 0.92 0.96 FP1 0.87 0.88 FP2 0.98 0.91 FP2 0.95 0.97 FP2 0.97 0.95 F3 0.99 0.88 F3 0.94 0.97 F3 0.98 0.98 F4 0.97 0.88 F4 0.99 0.97 F4 0.78 0.92 C3 0.92 0.72 C3 0.89 0.75 C3 0.92 0.79 C4 0.97 0.81 C4 0.97 0.89 C4 0.92 0.95 P3 0.99 0.99 P3 0.93 0.93 P3 0.98 0.92 P4 0.95 0.89 P4 0.95 0.94 P4 0.95 0.94 O1 1.0 0.93 O1 0.98 0.95 O1 0.92 0.98 O2 0.97 0.94 O2 0.99 0.89 O2 0.95 0.99 F7 0.95 0.87 F7 0.99 0.81 F7 0.89 0.97 F8 0.98 0.89 F8 0.99 0.96 F8 0.94 0.89 T3 0.99 0.92 T3 1.0 0.95 T3 0.97 0.98 T4 1.0 0.93 T4 0.89 0.98 T4 0.91 0.92 T5 0.96 0.94 T5 0.91 0.83 T5 0.96 0.85 T6 0.94 0.91 T6 0.99 0.93 T6 0.97 1.0 Fz 0.96 0.96 Fz 0.83 0.98 Fz 0.73 0.95 Cz 0.86 0.9 Cz 0.82 0.97 Cz 0.99 0.86 Pz 0.98 0.9 Pz 0.91 0.85 Pz 0.78 0.87

206
Participant ID 26 qEEG Record: Posttest Eyes Open Linked Ears Average Reference LaPlacian
Split Half
Test/ Retest
Split Half
Test/ Retest
Split Half
Test/ Retest
Average 0.95 0.94 Average 0.94 0.94 Average 0.93 0.91 FP1 0.92 0.86 FP1 0.98 0.79 FP1 0.94 0.85 FP2 0.91 0.97 FP2 0.96 0.98 FP2 0.96 0.93 F3 0.93 1.0 F3 0.91 1.0 F3 0.99 0.94 F4 0.99 0.96 F4 0.97 0.98 F4 0.93 0.97 C3 0.99 0.94 C3 0.98 0.99 C3 0.99 0.91 C4 0.98 0.93 C4 0.96 0.97 C4 0.9 0.92 P3 0.96 0.93 P3 0.93 0.91 P3 0.94 0.92 P4 0.97 0.91 P4 0.98 0.93 P4 1.0 0.87 O1 0.75 0.82 O1 0.8 0.76 O1 0.66 0.69 O2 0.99 0.88 O2 0.96 0.87 O2 0.83 0.72 F7 0.96 0.96 F7 0.95 1.0 F7 0.96 0.98 F8 0.99 0.91 F8 0.94 0.88 F8 0.98 0.92 T3 0.98 0.99 T3 0.98 0.99 T3 0.98 0.96 T4 0.92 0.96 T4 0.92 0.95 T4 0.93 0.87 T5 0.95 0.97 T5 0.96 0.98 T5 0.97 0.94 T6 0.96 0.95 T6 0.91 0.95 T6 0.96 0.99 Fz 0.9 0.99 Fz 0.83 0.99 Fz 0.82 0.96 Cz 0.96 0.93 Cz 0.87 0.96 Cz 0.93 0.94 Pz 0.99 0.96 Pz 0.99 0.97 Pz 0.92 0.93

207
Participant ID 26 qEEG Record: Posttest Eyes Closed Linked Ears Average Reference LaPlacian
Split Half
Test/ Retest
Split Half
Test/ Retest
Split Half
Test/ Retest
Average 0.95 0.92 Average 0.93 0.91 Average 0.92 0.89 FP1 0.92 0.86 FP1 0.91 0.7 FP1 0.86 0.93 FP2 1.0 0.99 FP2 0.94 0.95 FP2 0.98 0.81 F3 0.92 0.86 F3 0.98 0.87 F3 0.91 0.79 F4 1.0 0.92 F4 0.96 0.91 F4 0.96 0.83 C3 0.99 0.98 C3 0.94 0.96 C3 0.94 0.89 C4 0.97 0.96 C4 0.85 0.93 C4 0.98 0.96 P3 0.88 0.98 P3 0.98 0.81 P3 0.98 0.96 P4 1.0 0.93 P4 0.92 0.9 P4 0.9 0.92 O1 0.75 0.83 O1 0.94 0.99 O1 0.97 0.92 O2 0.99 0.84 O2 0.94 0.96 O2 0.82 0.86 F7 0.81 0.89 F7 0.78 0.99 F7 0.93 0.78 F8 0.99 0.98 F8 0.87 0.98 F8 0.95 0.96 T3 0.99 0.98 T3 0.91 0.88 T3 0.96 0.9 T4 0.97 1.0 T4 0.96 0.88 T4 0.84 0.88 T5 0.98 0.96 T5 0.93 0.99 T5 0.93 0.95 T6 0.99 0.87 T6 0.99 0.95 T6 0.86 0.95 Fz 0.96 0.81 Fz 0.94 0.82 Fz 0.93 0.83 Cz 1.0 0.85 Cz 0.98 0.86 Cz 0.9 0.87 Pz 0.95 0.98 Pz 0.98 0.96 Pz 0.97 0.94

208
Participant ID 27 qEEG Record: Pretest Eyes Open Linked Ears Average Reference LaPlacian
Split Half
Test/ Retest
Split Half
Test/ Retest
Split Half
Test/ Retest
Average 0.98 0.93 Average 0.97 0.93 Average 0.97 0.95 FP1 0.95 0.91 FP1 0.98 0.91 FP1 0.94 0.96 FP2 1.0 0.87 FP2 0.97 0.84 FP2 0.98 0.82 F3 0.98 0.95 F3 0.97 0.99 F3 0.98 0.89 F4 1.0 0.94 F4 1.0 0.95 F4 0.98 0.98 C3 0.99 0.92 C3 1.0 0.95 C3 0.97 0.97 C4 1.0 0.94 C4 0.98 0.97 C4 0.99 0.89 P3 1.0 0.92 P3 0.96 0.93 P3 0.95 0.97 P4 0.94 0.94 P4 0.98 0.92 P4 0.95 1.0 O1 0.99 0.92 O1 0.96 0.89 O1 0.99 0.91 O2 1.0 0.94 O2 0.96 0.92 O2 0.94 0.99 F7 0.98 0.87 F7 0.96 0.84 F7 0.92 0.92 F8 0.99 0.98 F8 0.96 0.98 F8 0.99 0.98 T3 0.96 0.97 T3 0.96 0.97 T3 0.95 1.0 T4 0.97 0.95 T4 1.0 0.88 T4 0.98 0.93 T5 0.96 0.98 T5 0.96 0.98 T5 0.99 0.98 T6 0.99 1.0 T6 0.99 0.98 T6 0.99 0.99 Fz 0.98 0.95 Fz 0.95 0.98 Fz 0.99 0.97 Cz 0.96 0.92 Cz 0.96 0.96 Cz 0.94 0.96 Pz 0.96 0.91 Pz 0.98 0.87 Pz 0.97 1.0

209
Participant ID 27 qEEG Record: Pretest Serial Sevens Linked Ears Average Reference LaPlacian
Split Half
Test/ Retest
Split Half
Test/ Retest
Split Half
Test/ Retest
Average 0.95 0.91 Average 0.94 0.94 Average 0.94 0.95 FP1 0.96 0.86 FP1 0.96 0.94 FP1 0.92 0.9 FP2 0.84 0.84 FP2 0.77 0.99 FP2 0.91 0.99 F3 0.98 0.92 F3 0.94 0.93 F3 0.9 0.98 F4 0.94 0.88 F4 0.97 0.94 F4 0.91 0.98 C3 0.9 0.98 C3 0.89 0.94 C3 0.99 0.92 C4 0.96 0.84 C4 1.0 0.98 C4 0.96 1.0 P3 0.94 0.84 P3 0.96 0.9 P3 0.89 0.92 P4 0.99 0.85 P4 0.93 0.97 P4 0.96 0.97 O1 0.97 0.9 O1 0.94 0.96 O1 0.94 0.99 O2 0.97 0.84 O2 0.94 0.98 O2 0.91 0.92 F7 0.97 0.99 F7 0.85 0.9 F7 0.91 0.85 F8 0.95 0.91 F8 0.96 0.88 F8 0.94 0.99 T3 0.97 0.91 T3 0.95 0.94 T3 0.94 0.85 T4 0.97 0.99 T4 0.98 0.96 T4 1.0 0.96 T5 0.96 0.97 T5 0.93 0.95 T5 0.98 0.91 T6 0.93 0.97 T6 0.98 0.89 T6 0.98 0.98 Fz 0.98 0.96 Fz 0.99 0.93 Fz 0.97 0.89 Cz 0.95 0.96 Cz 0.99 0.95 Cz 0.89 0.97 Pz 0.91 0.84 Pz 0.91 0.92 Pz 0.94 0.99
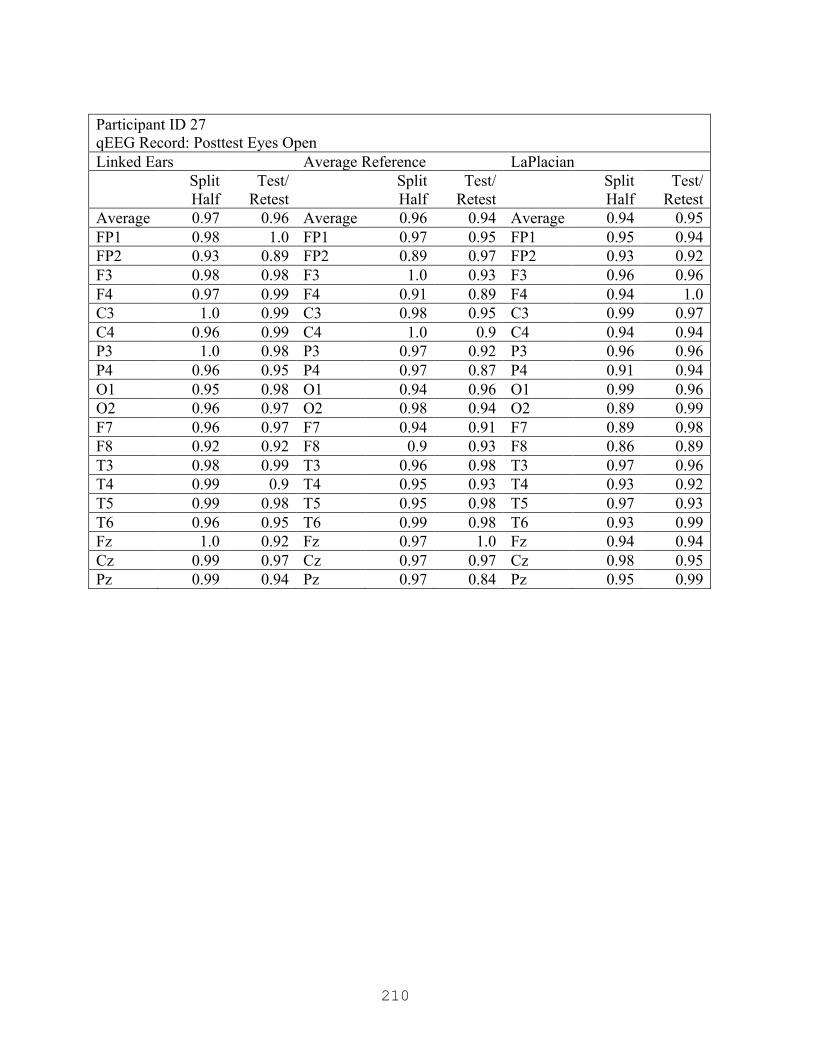
210
Participant ID 27 qEEG Record: Posttest Eyes Open Linked Ears Average Reference LaPlacian
Split Half
Test/ Retest
Split Half
Test/ Retest
Split Half
Test/ Retest
Average 0.97 0.96 Average 0.96 0.94 Average 0.94 0.95 FP1 0.98 1.0 FP1 0.97 0.95 FP1 0.95 0.94 FP2 0.93 0.89 FP2 0.89 0.97 FP2 0.93 0.92 F3 0.98 0.98 F3 1.0 0.93 F3 0.96 0.96 F4 0.97 0.99 F4 0.91 0.89 F4 0.94 1.0 C3 1.0 0.99 C3 0.98 0.95 C3 0.99 0.97 C4 0.96 0.99 C4 1.0 0.9 C4 0.94 0.94 P3 1.0 0.98 P3 0.97 0.92 P3 0.96 0.96 P4 0.96 0.95 P4 0.97 0.87 P4 0.91 0.94 O1 0.95 0.98 O1 0.94 0.96 O1 0.99 0.96 O2 0.96 0.97 O2 0.98 0.94 O2 0.89 0.99 F7 0.96 0.97 F7 0.94 0.91 F7 0.89 0.98 F8 0.92 0.92 F8 0.9 0.93 F8 0.86 0.89 T3 0.98 0.99 T3 0.96 0.98 T3 0.97 0.96 T4 0.99 0.9 T4 0.95 0.93 T4 0.93 0.92 T5 0.99 0.98 T5 0.95 0.98 T5 0.97 0.93 T6 0.96 0.95 T6 0.99 0.98 T6 0.93 0.99 Fz 1.0 0.92 Fz 0.97 1.0 Fz 0.94 0.94 Cz 0.99 0.97 Cz 0.97 0.97 Cz 0.98 0.95 Pz 0.99 0.94 Pz 0.97 0.84 Pz 0.95 0.99
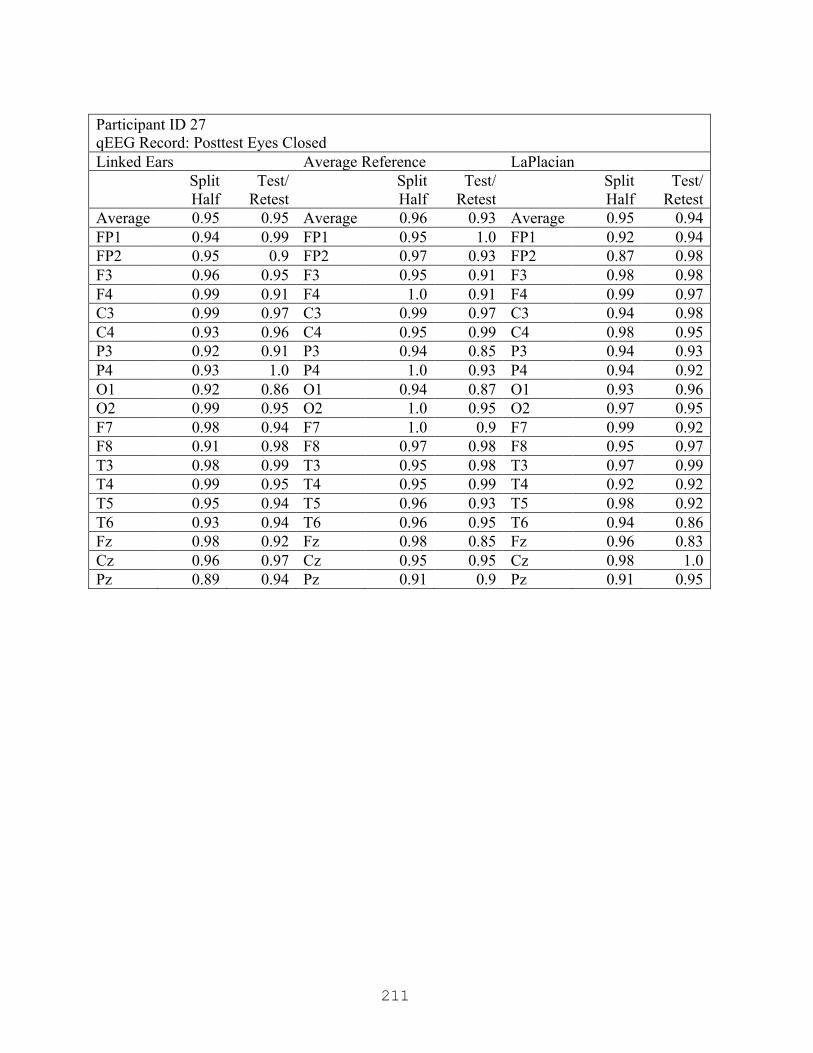
211
Participant ID 27 qEEG Record: Posttest Eyes Closed Linked Ears Average Reference LaPlacian
Split Half
Test/ Retest
Split Half
Test/ Retest
Split Half
Test/ Retest
Average 0.95 0.95 Average 0.96 0.93 Average 0.95 0.94 FP1 0.94 0.99 FP1 0.95 1.0 FP1 0.92 0.94 FP2 0.95 0.9 FP2 0.97 0.93 FP2 0.87 0.98 F3 0.96 0.95 F3 0.95 0.91 F3 0.98 0.98 F4 0.99 0.91 F4 1.0 0.91 F4 0.99 0.97 C3 0.99 0.97 C3 0.99 0.97 C3 0.94 0.98 C4 0.93 0.96 C4 0.95 0.99 C4 0.98 0.95 P3 0.92 0.91 P3 0.94 0.85 P3 0.94 0.93 P4 0.93 1.0 P4 1.0 0.93 P4 0.94 0.92 O1 0.92 0.86 O1 0.94 0.87 O1 0.93 0.96 O2 0.99 0.95 O2 1.0 0.95 O2 0.97 0.95 F7 0.98 0.94 F7 1.0 0.9 F7 0.99 0.92 F8 0.91 0.98 F8 0.97 0.98 F8 0.95 0.97 T3 0.98 0.99 T3 0.95 0.98 T3 0.97 0.99 T4 0.99 0.95 T4 0.95 0.99 T4 0.92 0.92 T5 0.95 0.94 T5 0.96 0.93 T5 0.98 0.92 T6 0.93 0.94 T6 0.96 0.95 T6 0.94 0.86 Fz 0.98 0.92 Fz 0.98 0.85 Fz 0.96 0.83 Cz 0.96 0.97 Cz 0.95 0.95 Cz 0.98 1.0 Pz 0.89 0.94 Pz 0.91 0.9 Pz 0.91 0.95
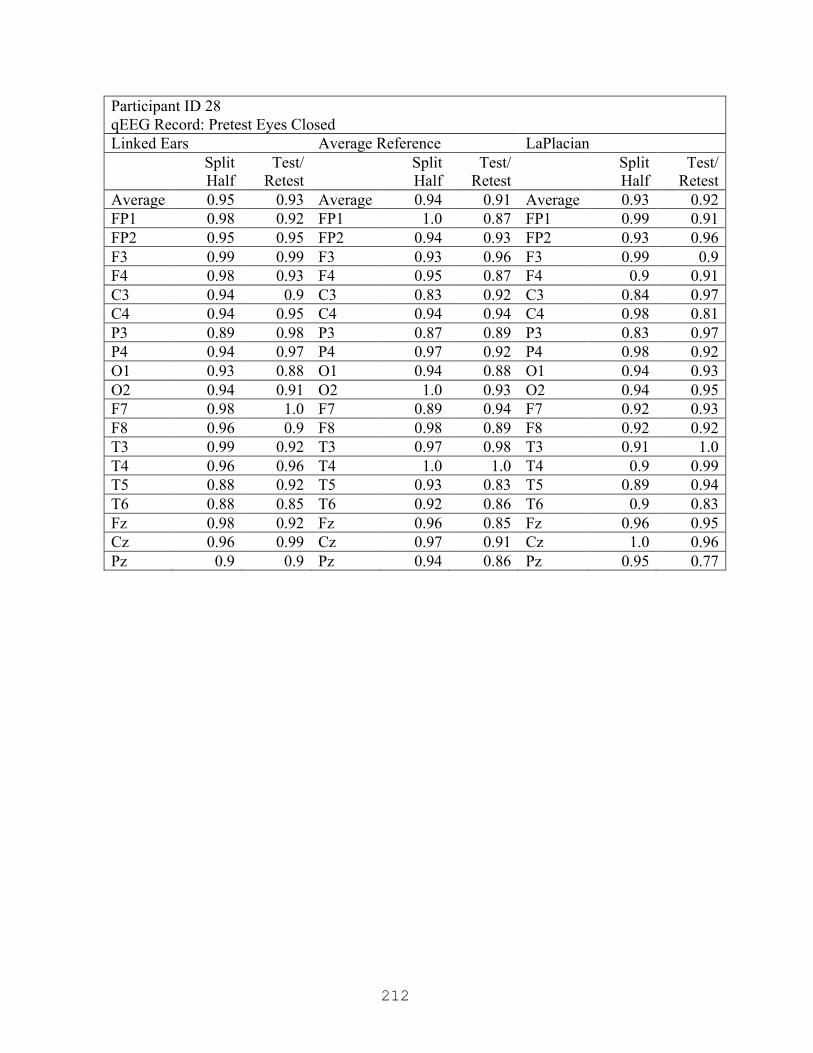
212
Participant ID 28 qEEG Record: Pretest Eyes Closed Linked Ears Average Reference LaPlacian
Split Half
Test/ Retest
Split Half
Test/ Retest
Split Half
Test/ Retest
Average 0.95 0.93 Average 0.94 0.91 Average 0.93 0.92 FP1 0.98 0.92 FP1 1.0 0.87 FP1 0.99 0.91 FP2 0.95 0.95 FP2 0.94 0.93 FP2 0.93 0.96 F3 0.99 0.99 F3 0.93 0.96 F3 0.99 0.9 F4 0.98 0.93 F4 0.95 0.87 F4 0.9 0.91 C3 0.94 0.9 C3 0.83 0.92 C3 0.84 0.97 C4 0.94 0.95 C4 0.94 0.94 C4 0.98 0.81 P3 0.89 0.98 P3 0.87 0.89 P3 0.83 0.97 P4 0.94 0.97 P4 0.97 0.92 P4 0.98 0.92 O1 0.93 0.88 O1 0.94 0.88 O1 0.94 0.93 O2 0.94 0.91 O2 1.0 0.93 O2 0.94 0.95 F7 0.98 1.0 F7 0.89 0.94 F7 0.92 0.93 F8 0.96 0.9 F8 0.98 0.89 F8 0.92 0.92 T3 0.99 0.92 T3 0.97 0.98 T3 0.91 1.0 T4 0.96 0.96 T4 1.0 1.0 T4 0.9 0.99 T5 0.88 0.92 T5 0.93 0.83 T5 0.89 0.94 T6 0.88 0.85 T6 0.92 0.86 T6 0.9 0.83 Fz 0.98 0.92 Fz 0.96 0.85 Fz 0.96 0.95 Cz 0.96 0.99 Cz 0.97 0.91 Cz 1.0 0.96 Pz 0.9 0.9 Pz 0.94 0.86 Pz 0.95 0.77

213
Participant ID 28 qEEG Record: Pretest Eyes Open Linked Ears Average Reference LaPlacian
Split Half
Test/ Retest
Split Half
Test/ Retest
Split Half
Test/ Retest
Average 0.96 0.93 Average 0.96 0.94 Average 0.96 0.95 FP1 0.98 1.0 FP1 0.97 0.96 FP1 0.98 0.94 FP2 0.95 1.0 FP2 0.9 0.97 FP2 0.98 0.95 F3 0.98 0.9 F3 0.96 0.94 F3 0.99 0.9 F4 0.93 0.91 F4 0.93 0.95 F4 0.97 0.96 C3 0.98 0.89 C3 0.99 0.97 C3 0.97 0.96 C4 0.95 0.93 C4 0.98 0.99 C4 0.96 0.95 P3 0.94 0.87 P3 0.89 0.83 P3 0.89 0.85 P4 0.97 0.91 P4 0.98 0.96 P4 0.93 0.92 O1 0.91 0.9 O1 0.89 0.87 O1 0.94 0.96 O2 0.98 0.96 O2 0.99 0.94 O2 0.96 0.97 F7 0.96 0.94 F7 0.98 0.97 F7 1.0 0.97 F8 0.96 0.99 F8 0.98 0.97 F8 0.95 0.95 T3 0.99 0.91 T3 1.0 1.0 T3 0.97 0.96 T4 0.99 0.98 T4 0.92 0.95 T4 0.96 0.98 T5 0.93 0.88 T5 0.9 0.85 T5 0.95 0.93 T6 0.99 0.97 T6 1.0 0.99 T6 0.95 0.96 Fz 0.96 0.89 Fz 0.99 0.92 Fz 0.99 0.97 Cz 0.96 0.88 Cz 0.98 0.95 Cz 0.98 1.0 Pz 0.97 0.9 Pz 0.95 0.94 Pz 0.93 0.93
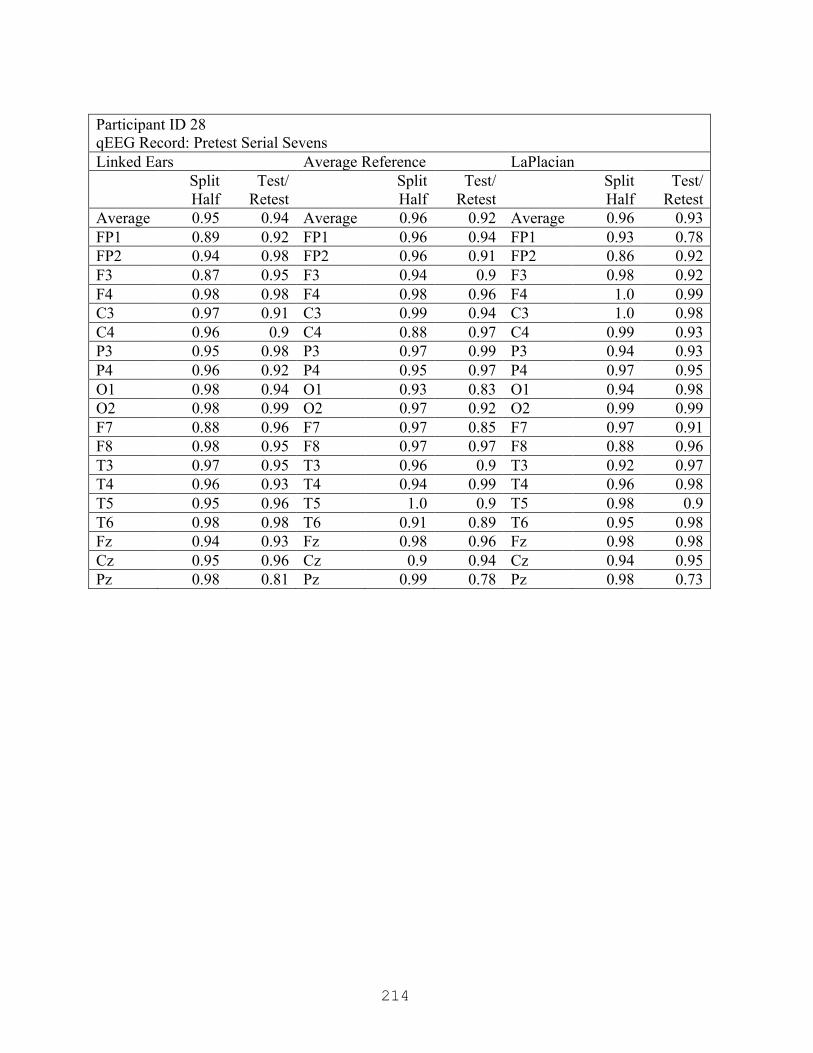
214
Participant ID 28 qEEG Record: Pretest Serial Sevens Linked Ears Average Reference LaPlacian
Split Half
Test/ Retest
Split Half
Test/ Retest
Split Half
Test/ Retest
Average 0.95 0.94 Average 0.96 0.92 Average 0.96 0.93 FP1 0.89 0.92 FP1 0.96 0.94 FP1 0.93 0.78 FP2 0.94 0.98 FP2 0.96 0.91 FP2 0.86 0.92 F3 0.87 0.95 F3 0.94 0.9 F3 0.98 0.92 F4 0.98 0.98 F4 0.98 0.96 F4 1.0 0.99 C3 0.97 0.91 C3 0.99 0.94 C3 1.0 0.98 C4 0.96 0.9 C4 0.88 0.97 C4 0.99 0.93 P3 0.95 0.98 P3 0.97 0.99 P3 0.94 0.93 P4 0.96 0.92 P4 0.95 0.97 P4 0.97 0.95 O1 0.98 0.94 O1 0.93 0.83 O1 0.94 0.98 O2 0.98 0.99 O2 0.97 0.92 O2 0.99 0.99 F7 0.88 0.96 F7 0.97 0.85 F7 0.97 0.91 F8 0.98 0.95 F8 0.97 0.97 F8 0.88 0.96 T3 0.97 0.95 T3 0.96 0.9 T3 0.92 0.97 T4 0.96 0.93 T4 0.94 0.99 T4 0.96 0.98 T5 0.95 0.96 T5 1.0 0.9 T5 0.98 0.9 T6 0.98 0.98 T6 0.91 0.89 T6 0.95 0.98 Fz 0.94 0.93 Fz 0.98 0.96 Fz 0.98 0.98 Cz 0.95 0.96 Cz 0.9 0.94 Cz 0.94 0.95 Pz 0.98 0.81 Pz 0.99 0.78 Pz 0.98 0.73

215
Participant ID 28 qEEG Record: Posttest Eyes Open Linked Ears Average Reference LaPlacian
Split Half
Test/ Retest
Split Half
Test/ Retest
Split Half
Test/ Retest
Average 0.96 0.93 Average 0.94 0.9 Average 0.95 0.91 FP1 0.93 0.78 FP1 0.94 0.88 FP1 0.85 0.91 FP2 0.86 0.92 FP2 0.89 0.76 FP2 0.99 0.74 F3 0.98 0.92 F3 0.91 0.96 F3 0.92 0.93 F4 1.0 0.99 F4 0.96 0.92 F4 0.98 0.99 C3 1.0 0.98 C3 0.92 0.84 C3 0.91 0.96 C4 0.99 0.93 C4 0.99 0.85 C4 0.99 0.94 P3 0.94 0.93 P3 0.93 0.94 P3 0.91 0.95 P4 0.97 0.95 P4 0.87 0.89 P4 0.93 0.9 O1 0.94 0.98 O1 0.98 0.8 O1 0.96 0.82 O2 0.99 0.99 O2 0.98 0.91 O2 0.99 0.92 F7 0.97 0.91 F7 1.0 0.91 F7 0.98 0.9 F8 0.88 0.96 F8 0.96 0.93 F8 0.91 0.85 T3 0.92 0.97 T3 0.94 0.88 T3 0.98 0.97 T4 0.96 0.98 T4 0.95 0.92 T4 0.97 1.0 T5 0.98 0.9 T5 0.99 0.94 T5 0.97 0.91 T6 0.95 0.98 T6 0.97 0.98 T6 0.94 0.91 Fz 0.98 0.98 Fz 0.93 0.9 Fz 0.99 0.93 Cz 0.94 0.95 Cz 0.89 0.91 Cz 0.93 0.98 Pz 0.98 0.73 Pz 0.86 0.88 Pz 0.87 0.87

216
Participant ID 28 qEEG Record: Posttest Eyes Closed Linked Ears Average Reference LaPlacian
Split Half
Test/ Retest
Split Half
Test/ Retest
Split Half
Test/ Retest
Average 0.96 0.92 Average 0.94 0.9 Average 0.93 0.89 FP1 0.99 0.85 FP1 0.98 0.84 FP1 0.95 0.94 FP2 0.99 0.76 FP2 1.0 0.75 FP2 0.92 0.68 F3 0.96 0.98 F3 0.99 0.99 F3 0.98 0.92 F4 0.96 0.96 F4 0.95 0.9 F4 0.96 0.85 C3 0.9 1.0 C3 0.95 1.0 C3 0.88 0.98 C4 0.95 0.9 C4 0.92 0.84 C4 0.88 0.91 P3 0.99 0.85 P3 0.99 0.82 P3 1.0 0.91 P4 0.98 0.94 P4 0.95 0.99 P4 0.93 0.95 O1 0.95 0.87 O1 0.96 0.88 O1 0.93 0.96 O2 0.97 0.99 O2 0.93 0.93 O2 0.94 0.98 F7 0.93 0.97 F7 0.95 0.91 F7 0.94 0.84 F8 0.98 0.9 F8 0.96 0.86 F8 0.84 0.71 T3 0.9 0.96 T3 0.91 0.93 T3 0.98 0.92 T4 0.96 0.84 T4 0.91 0.88 T4 0.94 0.92 T5 1.0 0.93 T5 0.94 0.89 T5 1.0 0.98 T6 0.97 0.98 T6 0.85 0.88 T6 0.89 0.9 Fz 0.94 1.0 Fz 0.95 0.96 Fz 0.89 0.89 Cz 0.89 0.98 Cz 0.87 0.98 Cz 0.97 0.85 Pz 0.93 0.84 Pz 0.94 0.78 Pz 0.93 0.81

217
Participant ID 29 qEEG Record: Pretest Eyes Closed Linked Ears Average Reference LaPlacian
Split Half
Test/ Retest
Split Half
Test/ Retest
Split Half
Test/ Retest
Average 0.97 0.96 Average 0.96 0.94 Average 0.97 0.95 FP1 0.99 0.97 FP1 0.98 0.97 FP1 0.97 0.92 FP2 0.94 0.97 FP2 0.91 0.95 FP2 0.96 0.91 F3 0.96 0.97 F3 0.98 0.98 F3 0.96 0.96 F4 0.99 1.0 F4 0.97 0.99 F4 0.93 0.98 C3 0.96 0.97 C3 0.99 0.97 C3 0.97 0.92 C4 0.97 0.93 C4 0.91 0.88 C4 0.98 0.98 P3 0.98 0.94 P3 0.98 0.91 P3 1.0 0.99 P4 0.94 0.88 P4 0.9 0.88 P4 0.95 0.89 O1 0.97 1.0 O1 0.94 0.96 O1 0.96 0.99 O2 0.99 0.87 O2 0.98 0.89 O2 0.96 0.97 F7 0.97 0.99 F7 0.96 0.94 F7 0.97 0.96 F8 0.92 0.92 F8 0.9 0.86 F8 0.95 0.97 T3 0.98 0.98 T3 0.95 0.88 T3 0.98 0.87 T4 0.94 1.0 T4 0.97 0.96 T4 0.97 0.89 T5 0.99 0.93 T5 0.99 1.0 T5 0.99 0.97 T6 0.94 0.99 T6 1.0 0.96 T6 0.99 1.0 Fz 0.98 1.0 Fz 0.97 0.99 Fz 0.98 0.97 Cz 0.99 0.96 Cz 0.99 0.95 Cz 1.0 0.95 Pz 0.99 1.0 Pz 0.95 0.97 Pz 0.96 0.97

218
Participant ID 29 qEEG Record: Pretest Eyes Open Linked Ears Average Reference LaPlacian
Split Half
Test/ Retest
Split Half
Test/ Retest
Split Half
Test/ Retest
Average 0.97 0.95 Average 0.97 0.96 Average 0.97 0.93 FP1 0.95 0.99 FP1 0.96 0.98 FP1 0.99 1.0 FP2 0.95 0.95 FP2 0.96 0.97 FP2 0.99 0.89 F3 0.98 0.99 F3 0.91 0.88 F3 0.83 0.8 F4 0.99 0.97 F4 0.99 0.99 F4 0.97 0.99 C3 0.98 0.94 C3 0.99 0.97 C3 0.94 0.9 C4 1.0 0.92 C4 0.98 0.96 C4 0.99 1.0 P3 0.96 0.94 P3 0.95 0.99 P3 0.98 0.94 P4 1.0 0.95 P4 0.98 0.97 P4 0.97 0.99 O1 0.96 0.94 O1 0.98 0.98 O1 0.98 0.93 O2 0.98 0.97 O2 0.95 0.97 O2 0.99 0.96 F7 0.97 0.98 F7 0.98 0.97 F7 0.97 0.92 F8 0.99 0.91 F8 0.98 0.9 F8 0.98 0.92 T3 0.97 0.94 T3 0.99 0.86 T3 0.97 0.78 T4 0.97 0.99 T4 0.98 0.92 T4 1.0 0.87 T5 0.96 0.97 T5 0.98 0.97 T5 1.0 0.97 T6 0.99 0.95 T6 0.96 0.96 T6 0.97 0.99 Fz 0.96 0.96 Fz 0.96 0.98 Fz 0.94 0.96 Cz 0.97 0.95 Cz 0.96 1.0 Cz 0.99 0.95 Pz 0.98 0.94 Pz 0.96 0.99 Pz 1.0 0.99
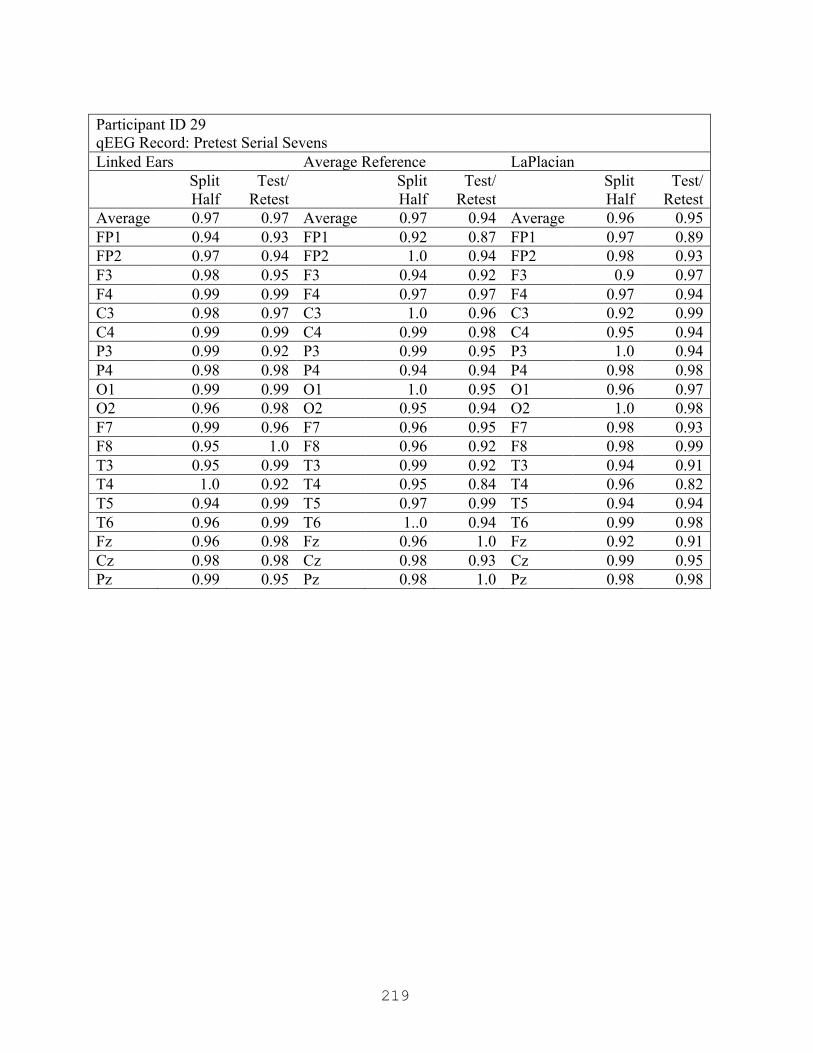
219
Participant ID 29 qEEG Record: Pretest Serial Sevens Linked Ears Average Reference LaPlacian
Split Half
Test/ Retest
Split Half
Test/ Retest
Split Half
Test/ Retest
Average 0.97 0.97 Average 0.97 0.94 Average 0.96 0.95 FP1 0.94 0.93 FP1 0.92 0.87 FP1 0.97 0.89 FP2 0.97 0.94 FP2 1.0 0.94 FP2 0.98 0.93 F3 0.98 0.95 F3 0.94 0.92 F3 0.9 0.97 F4 0.99 0.99 F4 0.97 0.97 F4 0.97 0.94 C3 0.98 0.97 C3 1.0 0.96 C3 0.92 0.99 C4 0.99 0.99 C4 0.99 0.98 C4 0.95 0.94 P3 0.99 0.92 P3 0.99 0.95 P3 1.0 0.94 P4 0.98 0.98 P4 0.94 0.94 P4 0.98 0.98 O1 0.99 0.99 O1 1.0 0.95 O1 0.96 0.97 O2 0.96 0.98 O2 0.95 0.94 O2 1.0 0.98 F7 0.99 0.96 F7 0.96 0.95 F7 0.98 0.93 F8 0.95 1.0 F8 0.96 0.92 F8 0.98 0.99 T3 0.95 0.99 T3 0.99 0.92 T3 0.94 0.91 T4 1.0 0.92 T4 0.95 0.84 T4 0.96 0.82 T5 0.94 0.99 T5 0.97 0.99 T5 0.94 0.94 T6 0.96 0.99 T6 1..0 0.94 T6 0.99 0.98 Fz 0.96 0.98 Fz 0.96 1.0 Fz 0.92 0.91 Cz 0.98 0.98 Cz 0.98 0.93 Cz 0.99 0.95 Pz 0.99 0.95 Pz 0.98 1.0 Pz 0.98 0.98

220
Participant ID 29 qEEG Record: Posttest Eyes Open Linked Ears Average Reference LaPlacian
Split Half
Test/ Retest
Split Half
Test/ Retest
Split Half
Test/ Retest
Average 0.96 0.96 Average 0.95 0.92 Average 0.95 0.92 FP1 0.93 0.94 FP1 0.94 0.92 FP1 0.99 0.94 FP2 0.98 0.93 FP2 0.97 0.9 FP2 1.0 0.94 F3 0.99 0.93 F3 0.97 0.83 F3 0.99 0.77 F4 0.97 0.98 F4 0.92 0.94 F4 0.91 0.9 C3 0.97 0.96 C3 0.92 0.91 C3 0.98 0.98 C4 0.97 0.96 C4 0.95 0.97 C4 0.97 0.99 P3 0.97 0.99 P3 0.97 0.96 P3 0.98 0.93 P4 0.88 0.91 P4 0.79 0.8 P4 0.71 0.66 O1 0.96 0.94 O1 0.96 0.95 O1 0.99 1.0 O2 0.98 0.97 O2 0.99 0.93 O2 0.99 0.98 F7 0.99 0.97 F7 0.96 0.92 F7 0.95 0.92 F8 0.9 0.91 F8 0.95 0.83 F8 0.88 0.87 T3 0.98 0.97 T3 0.99 0.89 T3 0.99 0.89 T4 0.9 0.99 T4 0.92 1.0 T4 0.87 0.97 T5 0.97 0.93 T5 0.96 0.97 T5 0.97 0.97 T6 0.92 0.99 T6 0.95 0.96 T6 0.9 0.94 Fz 1.0 0.98 Fz 0.99 1.0 Fz 0.98 0.94 Cz 0.99 0.96 Cz 0.98 0.93 Cz 0.98 0.97 Pz 0.97 0.99 Pz 0.96 0.94 Pz 1.0 0.92
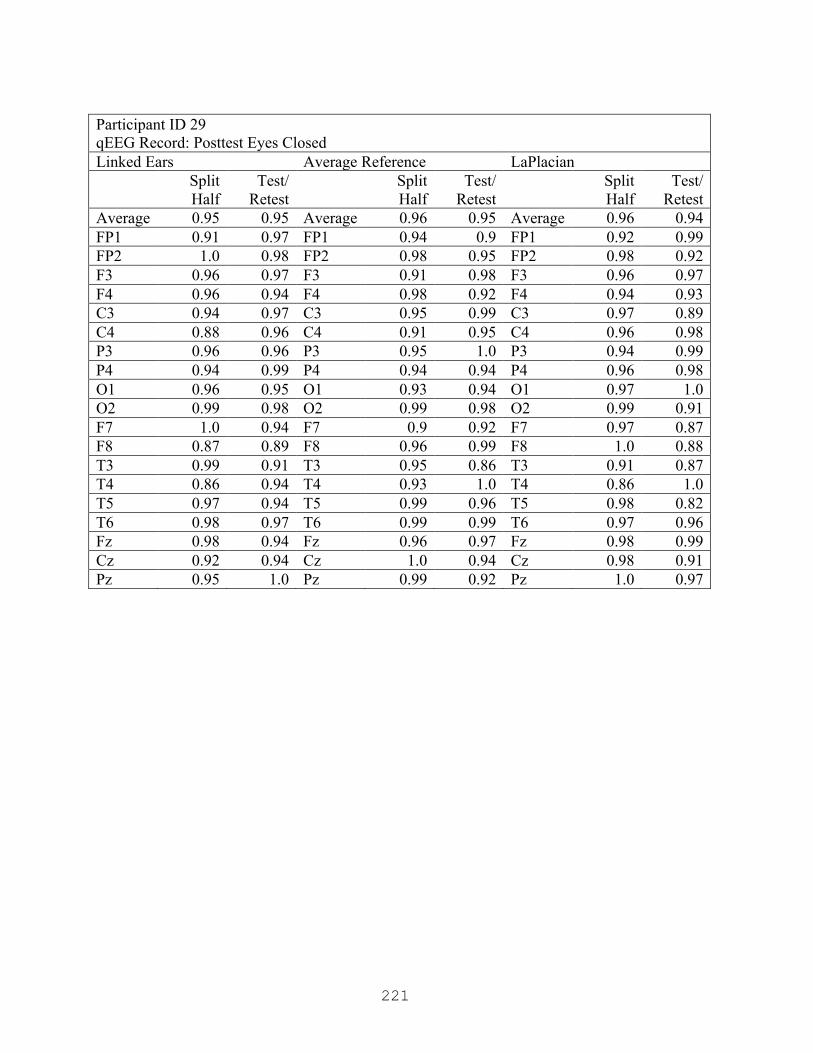
221
Participant ID 29 qEEG Record: Posttest Eyes Closed Linked Ears Average Reference LaPlacian
Split Half
Test/ Retest
Split Half
Test/ Retest
Split Half
Test/ Retest
Average 0.95 0.95 Average 0.96 0.95 Average 0.96 0.94 FP1 0.91 0.97 FP1 0.94 0.9 FP1 0.92 0.99 FP2 1.0 0.98 FP2 0.98 0.95 FP2 0.98 0.92 F3 0.96 0.97 F3 0.91 0.98 F3 0.96 0.97 F4 0.96 0.94 F4 0.98 0.92 F4 0.94 0.93 C3 0.94 0.97 C3 0.95 0.99 C3 0.97 0.89 C4 0.88 0.96 C4 0.91 0.95 C4 0.96 0.98 P3 0.96 0.96 P3 0.95 1.0 P3 0.94 0.99 P4 0.94 0.99 P4 0.94 0.94 P4 0.96 0.98 O1 0.96 0.95 O1 0.93 0.94 O1 0.97 1.0 O2 0.99 0.98 O2 0.99 0.98 O2 0.99 0.91 F7 1.0 0.94 F7 0.9 0.92 F7 0.97 0.87 F8 0.87 0.89 F8 0.96 0.99 F8 1.0 0.88 T3 0.99 0.91 T3 0.95 0.86 T3 0.91 0.87 T4 0.86 0.94 T4 0.93 1.0 T4 0.86 1.0 T5 0.97 0.94 T5 0.99 0.96 T5 0.98 0.82 T6 0.98 0.97 T6 0.99 0.99 T6 0.97 0.96 Fz 0.98 0.94 Fz 0.96 0.97 Fz 0.98 0.99 Cz 0.92 0.94 Cz 1.0 0.94 Cz 0.98 0.91 Pz 0.95 1.0 Pz 0.99 0.92 Pz 1.0 0.97
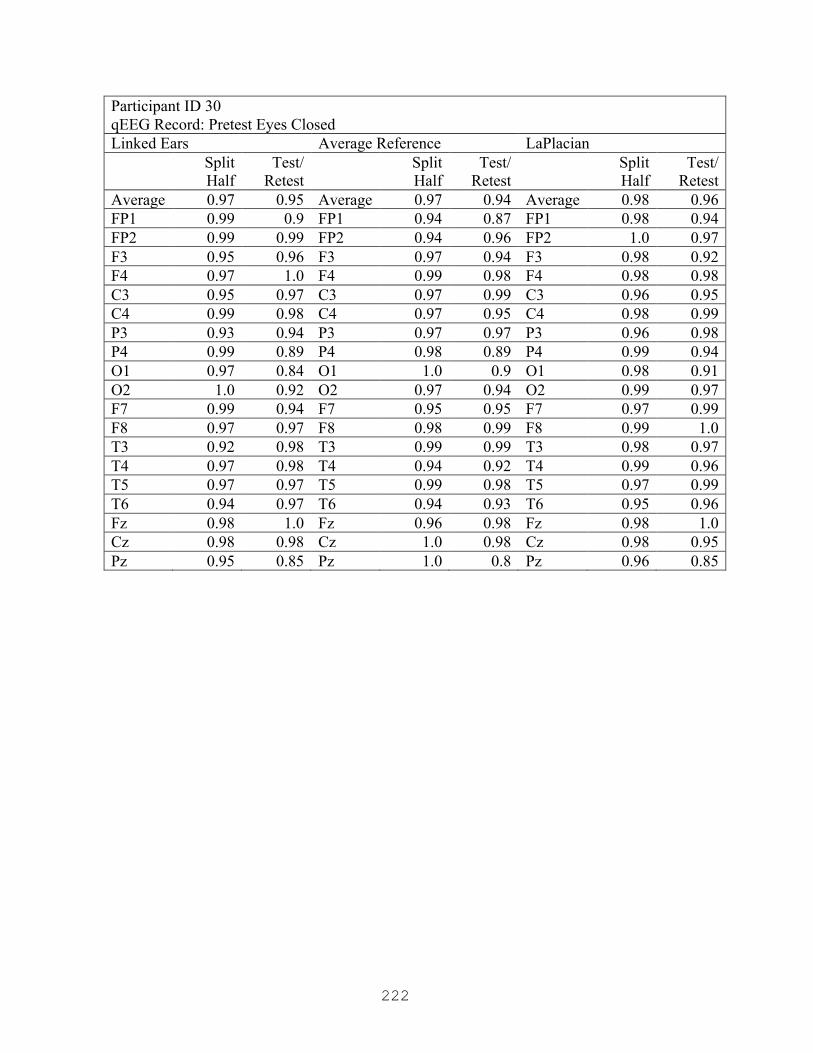
222
Participant ID 30 qEEG Record: Pretest Eyes Closed Linked Ears Average Reference LaPlacian
Split Half
Test/ Retest
Split Half
Test/ Retest
Split Half
Test/ Retest
Average 0.97 0.95 Average 0.97 0.94 Average 0.98 0.96 FP1 0.99 0.9 FP1 0.94 0.87 FP1 0.98 0.94 FP2 0.99 0.99 FP2 0.94 0.96 FP2 1.0 0.97 F3 0.95 0.96 F3 0.97 0.94 F3 0.98 0.92 F4 0.97 1.0 F4 0.99 0.98 F4 0.98 0.98 C3 0.95 0.97 C3 0.97 0.99 C3 0.96 0.95 C4 0.99 0.98 C4 0.97 0.95 C4 0.98 0.99 P3 0.93 0.94 P3 0.97 0.97 P3 0.96 0.98 P4 0.99 0.89 P4 0.98 0.89 P4 0.99 0.94 O1 0.97 0.84 O1 1.0 0.9 O1 0.98 0.91 O2 1.0 0.92 O2 0.97 0.94 O2 0.99 0.97 F7 0.99 0.94 F7 0.95 0.95 F7 0.97 0.99 F8 0.97 0.97 F8 0.98 0.99 F8 0.99 1.0 T3 0.92 0.98 T3 0.99 0.99 T3 0.98 0.97 T4 0.97 0.98 T4 0.94 0.92 T4 0.99 0.96 T5 0.97 0.97 T5 0.99 0.98 T5 0.97 0.99 T6 0.94 0.97 T6 0.94 0.93 T6 0.95 0.96 Fz 0.98 1.0 Fz 0.96 0.98 Fz 0.98 1.0 Cz 0.98 0.98 Cz 1.0 0.98 Cz 0.98 0.95 Pz 0.95 0.85 Pz 1.0 0.8 Pz 0.96 0.85

223
Participant ID 30 qEEG Record: Pretest Eyes Open Linked Ears Average Reference LaPlacian
Split Half
Test/ Retest
Split Half
Test/ Retest
Split Half
Test/ Retest
Average 0.97 0.94 Average 0.96 0.94 Average 0.96 0.93 FP1 0.91 0.93 FP1 0.88 0.96 FP1 0.97 0.91 FP2 0.89 0.97 FP2 0.86 0.96 FP2 0.88 0.95 F3 0.95 0.87 F3 0.92 0.92 F3 0.95 0.97 F4 0.97 0.96 F4 0.95 0.99 F4 0.97 0.96 C3 0.94 0.95 C3 0.97 0.99 C3 0.99 0.98 C4 1.0 0.95 C4 0.98 0.97 C4 0.97 0.94 P3 0.94 0.91 P3 0.92 1.0 P3 0.89 0.91 P4 0.98 0.98 P4 0.97 0.95 P4 0.99 0.97 O1 1.0 0.75 O1 0.99 0.82 O1 0.97 0.86 O2 0.99 0.91 O2 0.97 0.97 O2 0.97 0.93 F7 0.94 0.92 F7 0.99 0.94 F7 0.94 0.9 F8 0.96 0.96 F8 0.98 0.94 F8 0.95 0.85 T3 0.99 0.94 T3 0.97 0.87 T3 0.97 0.87 T4 0.96 0.98 T4 0.97 0.96 T4 0.97 0.92 T5 0.96 0.99 T5 0.99 0.94 T5 1.0 0.93 T6 0.99 0.98 T6 0.98 0.99 T6 0.97 0.99 Fz 1.0 0.88 Fz 0.99 0.86 Fz 0.96 0.94 Cz 0.99 1.0 Cz 0.95 0.92 Cz 0.88 0.83 Pz 1.0 1.0 Pz 0.97 0.95 Pz 0.97 0.96
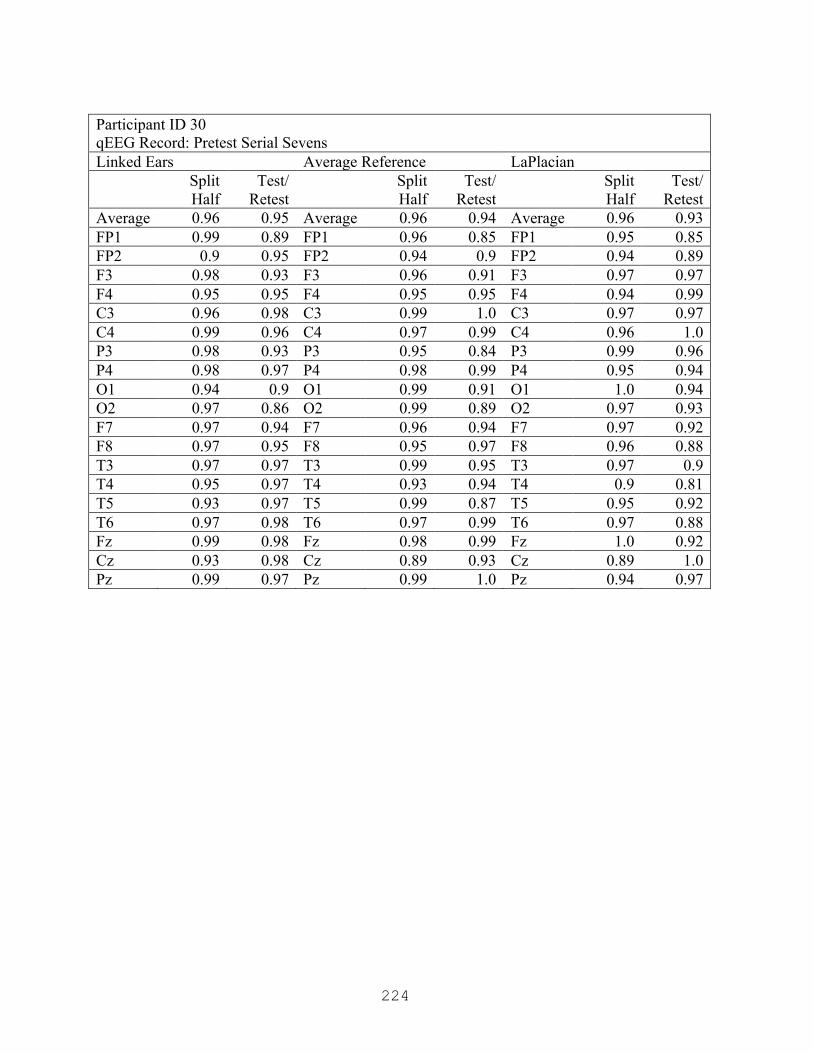
224
Participant ID 30 qEEG Record: Pretest Serial Sevens Linked Ears Average Reference LaPlacian
Split Half
Test/ Retest
Split Half
Test/ Retest
Split Half
Test/ Retest
Average 0.96 0.95 Average 0.96 0.94 Average 0.96 0.93 FP1 0.99 0.89 FP1 0.96 0.85 FP1 0.95 0.85 FP2 0.9 0.95 FP2 0.94 0.9 FP2 0.94 0.89 F3 0.98 0.93 F3 0.96 0.91 F3 0.97 0.97 F4 0.95 0.95 F4 0.95 0.95 F4 0.94 0.99 C3 0.96 0.98 C3 0.99 1.0 C3 0.97 0.97 C4 0.99 0.96 C4 0.97 0.99 C4 0.96 1.0 P3 0.98 0.93 P3 0.95 0.84 P3 0.99 0.96 P4 0.98 0.97 P4 0.98 0.99 P4 0.95 0.94 O1 0.94 0.9 O1 0.99 0.91 O1 1.0 0.94 O2 0.97 0.86 O2 0.99 0.89 O2 0.97 0.93 F7 0.97 0.94 F7 0.96 0.94 F7 0.97 0.92 F8 0.97 0.95 F8 0.95 0.97 F8 0.96 0.88 T3 0.97 0.97 T3 0.99 0.95 T3 0.97 0.9 T4 0.95 0.97 T4 0.93 0.94 T4 0.9 0.81 T5 0.93 0.97 T5 0.99 0.87 T5 0.95 0.92 T6 0.97 0.98 T6 0.97 0.99 T6 0.97 0.88 Fz 0.99 0.98 Fz 0.98 0.99 Fz 1.0 0.92 Cz 0.93 0.98 Cz 0.89 0.93 Cz 0.89 1.0 Pz 0.99 0.97 Pz 0.99 1.0 Pz 0.94 0.97

225
Participant ID 30 qEEG Record: Posttest Eyes Open Linked Ears Average Reference LaPlacian
Split Half
Test/ Retest
Split Half
Test/ Retest
Split Half
Test/ Retest
Average 0.96 0.95 Average 0.95 0.93 Average 0.93 0.94 FP1 0.86 0.94 FP1 0.84 0.97 FP1 0.96 0.9 FP2 0.92 0.98 FP2 0.91 0.99 FP2 0.9 0.99 F3 0.92 0.93 F3 0.99 0.95 F3 0.99 0.98 F4 0.96 0.95 F4 0.96 0.97 F4 0.94 1.0 C3 0.97 0.98 C3 0.99 0.99 C3 0.92 0.99 C4 1.0 0.93 C4 0.95 0.94 C4 0.96 0.89 P3 0.96 0.91 P3 0.99 0.81 P3 0.97 0.94 P4 0.97 0.91 P4 0.91 0.97 P4 0.92 0.98 O1 0.99 0.86 O1 0.96 0.81 O1 0.95 0.84 O2 0.98 0.91 O2 0.99 0.86 O2 0.93 0.97 F7 0.95 0.96 F7 0.92 0.99 F7 0.89 0.93 F8 0.94 0.97 F8 0.99 0.96 F8 0.93 0.87 T3 0.99 0.99 T3 0.99 0.86 T3 0.98 0.96 T4 1.0 0.98 T4 0.94 0.87 T4 0.86 0.9 T5 0.97 0.94 T5 0.96 0.98 T5 0.94 1.0 T6 0.91 0.98 T6 0.9 0.79 T6 0.78 0.74 Fz 0.93 0.99 Fz 0.99 0.95 Fz 0.9 0.95 Cz 0.95 0.97 Cz 0.96 0.98 Cz 0.98 0.94 Pz 0.98 0.96 Pz 0.93 0.97 Pz 0.98 0.99

226
Participant ID 30 qEEG Record: Posttest Eyes Closed Linked Ears Average Reference LaPlacian
Split Half
Test/ Retest
Split Half
Test/ Retest
Split Half
Test/ Retest
Average 0.96 0.92 Average 0.93 0.93 Average 0.96 0.94 FP1 0.86 0.88 FP1 0.93 0.96 FP1 0.98 1.0 FP2 0.94 0.98 FP2 0.86 0.88 FP2 0.87 0.83 F3 0.89 0.86 F3 0.91 0.96 F3 0.91 0.99 F4 0.98 0.89 F4 0.92 1.0 F4 0.96 0.97 C3 0.95 0.87 C3 0.93 0.89 C3 1.0 0.91 C4 0.97 0.88 C4 0.93 0.99 C4 1.0 0.99 P3 0.97 0.92 P3 0.88 0.86 P3 0.92 0.82 P4 0.99 0.99 P4 0.97 0.98 P4 0.98 0.99 O1 0.96 0.97 O1 0.96 0.99 O1 0.92 0.95 O2 0.98 0.92 O2 0.99 0.93 O2 0.99 0.9 F7 0.97 0.91 F7 0.93 0.86 F7 0.96 1.0 F8 0.92 0.94 F8 0.88 0.97 F8 0.95 0.99 T3 0.98 0.95 T3 0.93 0.9 T3 0.98 0.85 T4 0.96 0.95 T4 0.92 0.89 T4 0.99 0.99 T5 0.99 0.98 T5 0.97 0.93 T5 0.97 1.0 T6 0.98 0.97 T6 0.98 0.85 T6 0.97 0.88 Fz 1.0 0.86 Fz 0.97 0.99 Fz 0.96 0.93 Cz 0.98 0.86 Cz 0.96 0.94 Cz 0.89 0.97 Pz 0.96 0.97 Pz 0.93 1.0 Pz 0.94 0.97

227
Participant ID 31 qEEG Record: Pretest Eyes Closed Linked Ears Average Reference LaPlacian
Split Half
Test/ Retest
Split Half
Test/ Retest
Split Half
Test/ Retest
Average 0.97 0.9 Average 0.96 0.89 Average 0.94 0.81 FP1 0.95 0.98 FP1 0.94 0.9 FP1 0.98 0.94 FP2 0.99 0.98 FP2 0.99 0.9 FP2 0.97 0.84 F3 0.97 0.98 F3 0.92 0.98 F3 0.96 0.73 F4 1.0 0.96 F4 0.98 0.99 F4 0.98 0.78 C3 0.98 0.91 C3 0.97 0.98 C3 1.0 0.94 C4 0.94 0.79 C4 0.93 0.63 C4 0.88 0.56 P3 0.98 0.8 P3 0.96 0.87 P3 0.9 0.85 P4 0.99 0.87 P4 0.98 0.83 P4 0.9 0.89 O1 0.95 0.88 O1 0.97 0.85 O1 0.93 0.74 O2 0.99 0.87 O2 0.99 0.86 O2 0.92 0.88 F7 0.91 0.9 F7 0.86 0.89 F7 0.87 0.92 F8 0.95 0.88 F8 0.98 0.81 F8 0.91 0.74 T3 0.96 0.9 T3 0.98 0.99 T3 0.96 0.93 T4 0.99 0.75 T4 0.97 0.62 T4 0.89 0.56 T5 0.96 0.88 T5 0.99 0.97 T5 1.0 0.97 T6 0.99 0.89 T6 0.98 0.98 T6 0.93 0.78 Fz 0.97 0.98 Fz 0.96 0.98 Fz 0.97 0.83 Cz 0.99 0.96 Cz 0.98 0.98 Cz 0.96 0.78 Pz 0.97 0.9 Pz 0.97 0.91 Pz 0.93 0.76

228
Participant ID 31 qEEG Record: Pretest Eyes Open Linked Ears Average Reference LaPlacian
Split Half
Test/ Retest
Split Half
Test/ Retest
Split Half
Test/ Retest
Average 0.98 0.95 Average 0.97 0.95 Average 0.95 0.94 FP1 0.99 0.97 FP1 0.98 0.99 FP1 0.99 0.92 FP2 0.99 0.98 FP2 1.0 0.92 FP2 0.96 0.94 F3 0.96 0.93 F3 0.99 0.94 F3 0.99 0.93 F4 0.98 1.0 F4 0.99 0.96 F4 0.98 0.99 C3 0.98 0.97 C3 0.96 0.94 C3 0.93 0.97 C4 0.97 0.93 C4 0.9 0.93 C4 0.91 0.9 P3 0.97 0.92 P3 0.95 0.94 P3 0.99 1.0 P4 0.99 0.96 P4 0.97 0.97 P4 0.99 0.94 O1 0.97 0.96 O1 0.99 0.96 O1 0.97 0.99 O2 0.99 0.96 O2 0.99 0.99 O2 0.94 0.98 F7 0.99 0.89 F7 0.98 0.9 F7 1.0 0.88 F8 0.98 0.98 F8 0.96 0.99 F8 0.98 0.97 T3 0.99 0.93 T3 0.97 0.96 T3 0.94 0.9 T4 1.0 0.9 T4 0.95 0.95 T4 0.92 0.89 T5 0.95 0.94 T5 0.98 0.92 T5 0.94 0.98 T6 0.99 0.93 T6 0.95 0.96 T6 0.88 0.82 Fz 1.0 0.95 Fz 0.98 0.92 Fz 1.0 0.91 Cz 0.97 0.95 Cz 0.9 0.97 Cz 0.9 0.98 Pz 1.0 0.94 Pz 0.98 0.99 Pz 0.92 0.98

229
Participant ID 31 qEEG Record: Pretest Serial Sevens Linked Ears Average Reference LaPlacian
Split Half
Test/ Retest
Split Half
Test/ Retest
Split Half
Test/ Retest
Average 0.95 0.93 Average 0.95 0.93 Average 0.92 0.93 FP1 0.91 0.99 FP1 0.9 0.95 FP1 0.8 1.0 FP2 0.94 0.98 FP2 0.98 0.95 FP2 0.91 0.89 F3 0.98 0.94 F3 1.0 0.98 F3 0.79 0.88 F4 0.98 0.99 F4 0.99 0.96 F4 0.95 0.98 C3 1.0 0.89 C3 0.96 0.97 C3 0.93 0.85 C4 0.98 0.98 C4 0.98 0.85 C4 1.0 0.84 P3 0.92 0.93 P3 0.9 0.92 P3 0.89 0.92 P4 0.97 0.95 P4 0.98 0.98 P4 0.96 0.98 O1 0.93 0.93 O1 0.98 0.99 O1 0.97 0.93 O2 0.99 0.97 O2 0.87 0.97 O2 0.94 0.99 F7 0.99 0.76 F7 0.92 0.75 F7 0.88 0.82 F8 0.87 0.96 F8 0.97 0.98 F8 0.93 0.96 T3 0.97 0.87 T3 0.95 0.96 T3 0.93 0.97 T4 0.85 0.91 T4 0.86 0.87 T4 0.87 0.91 T5 0.98 0.91 T5 0.94 0.98 T5 0.99 0.98 T6 0.88 1.0 T6 0.93 0.92 T6 0.8 0.96 Fz 0.99 0.96 Fz 0.91 0.86 Fz 0.99 1.0 Cz 0.98 0.91 Cz 0.96 0.93 Cz 0.92 0.94 Pz 0.98 0.94 Pz 0.98 0.98 Pz 0.97 0.92

230
Participant ID 31 qEEG Record: Posttest Eyes Open Linked Ears Average Reference LaPlacian
Split Half
Test/ Retest
Split Half
Test/ Retest
Split Half
Test/ Retest
Average 0.95 0.9 Average 0.91 0.88 Average 0.93 0.93 FP1 0.9 0.88 FP1 0.85 0.91 FP1 0.85 0.95 FP2 0.97 0.91 FP2 0.84 0.93 FP2 1.0 0.98 F3 0.98 0.82 F3 0.98 0.8 F3 0.97 0.97 F4 0.96 0.85 F4 0.92 0.81 F4 0.95 0.98 C3 0.99 0.78 C3 0.88 0.7 C3 0.81 0.74 C4 1.0 0.95 C4 0.9 1.0 C4 0.82 0.93 P3 0.96 0.95 P3 0.95 0.9 P3 0.98 0.97 P4 0.94 0.92 P4 0.96 0.79 P4 0.94 0.95 O1 0.89 1.0 O1 0.92 0.91 O1 0.97 0.95 O2 0.99 0.92 O2 0.91 0.82 O2 0.98 0.92 F7 1.0 0.85 F7 0.87 0.92 F7 0.77 0.98 F8 0.95 0.87 F8 0.85 1.0 F8 0.93 0.87 T3 0.92 0.93 T3 0.93 0.97 T3 0.98 0.85 T4 0.97 0.97 T4 0.93 0.85 T4 0.85 0.97 T5 0.96 0.97 T5 0.9 0.96 T5 0.97 0.96 T6 0.86 0.97 T6 0.9 0.81 T6 0.94 0.87 Fz 0.96 0.76 Fz 0.93 0.74 Fz 0.94 0.99 Cz 0.89 0.79 Cz 0.92 0.88 Cz 0.99 0.87 Pz 0.98 0.96 Pz 0.94 0.95 Pz 0.96 0.94

231
Participant ID 31 qEEG Record: Posttest Eyes Closed Linked Ears Average Reference LaPlacian
Split Half
Test/ Retest
Split Half
Test/ Retest
Split Half
Test/ Retest
Average 0.95 0.95 Average 0.91 0.93 Average 0.93 0.96 FP1 0.97 0.98 FP1 0.86 0.89 FP1 0.94 0.95 FP2 0.94 0.96 FP2 0.85 0.9 FP2 0.97 0.95 F3 0.99 0.98 F3 0.85 1.0 F3 0.87 0.99 F4 0.9 1.0 F4 0.84 0.95 F4 0.83 0.98 C3 0.98 0.93 C3 0.89 0.86 C3 0.83 0.96 C4 0.94 0.95 C4 0.76 0.99 C4 0.85 0.92 P3 0.97 0.91 P3 0.9 0.98 P3 0.99 1.0 P4 0.97 0.91 P4 0.98 0.96 P4 0.95 1.0 O1 0.99 0.98 O1 0.97 0.9 O1 0.93 1.0 O2 0.95 0.97 O2 0.98 0.89 O2 0.98 0.96 F7 0.93 0.89 F7 0.91 0.94 F7 1.0 0.87 F8 0.9 0.95 F8 0.99 0.91 F8 1.0 0.94 T3 0.98 0.96 T3 0.92 0.95 T3 0.99 0.99 T4 0.91 0.97 T4 0.96 0.91 T4 0.96 0.98 T5 0.96 0.97 T5 0.98 0.95 T5 0.91 0.99 T6 1.0 0.99 T6 0.93 0.82 T6 0.96 0.92 Fz 0.99 0.99 Fz 0.88 1.0 Fz 0.91 0.97 Cz 0.98 0.98 Cz 0.97 0.99 Cz 0.95 0.98 Pz 0.85 0.83 Pz 0.77 0.83 Pz 0.8 0.97

232
Participant ID 32 qEEG Record: Pretest Eyes Closed Linked Ears Average Reference LaPlacian
Split Half
Test/ Retest
Split Half
Test/ Retest
Split Half
Test/ Retest
Average 0.97 0.94 Average 0.96 0.93 Average 0.97 0.95 FP1 0.93 0.89 FP1 0.93 0.86 FP1 0.98 0.92 FP2 0.9 0.89 FP2 0.89 0.88 FP2 0.89 0.97 F3 0.98 0.98 F3 0.94 0.97 F3 0.98 0.91 F4 0.97 0.95 F4 0.96 1.0 F4 0.91 0.98 C3 0.97 1.0 C3 1.0 0.98 C3 0.99 0.97 C4 1.0 0.95 C4 0.94 0.89 C4 0.99 0.88 P3 0.98 0.91 P3 0.98 0.93 P3 0.97 0.99 P4 0.96 0.92 P4 0.98 0.91 P4 1.0 0.93 O1 0.99 0.86 O1 1.0 0.89 O1 0.98 0.99 O2 0.99 0.89 O2 0.95 0.94 O2 0.98 0.98 F7 0.98 0.98 F7 0.96 0.91 F7 0.9 0.96 F8 0.96 0.93 F8 0.97 0.92 F8 0.99 0.96 T3 1.0 0.97 T3 1.0 0.97 T3 0.97 1.0 T4 0.98 0.95 T4 0.96 0.93 T4 0.93 0.94 T5 0.95 0.95 T5 1.0 0.96 T5 0.98 0.98 T6 0.99 0.92 T6 0.95 0.92 T6 0.99 0.97 Fz 0.99 0.96 Fz 0.99 0.93 Fz 0.99 0.95 Cz 0.98 0.97 Cz 0.98 1.0 Cz 0.98 0.93 Pz 0.92 0.93 Pz 0.92 0.92 Pz 0.97 0.92
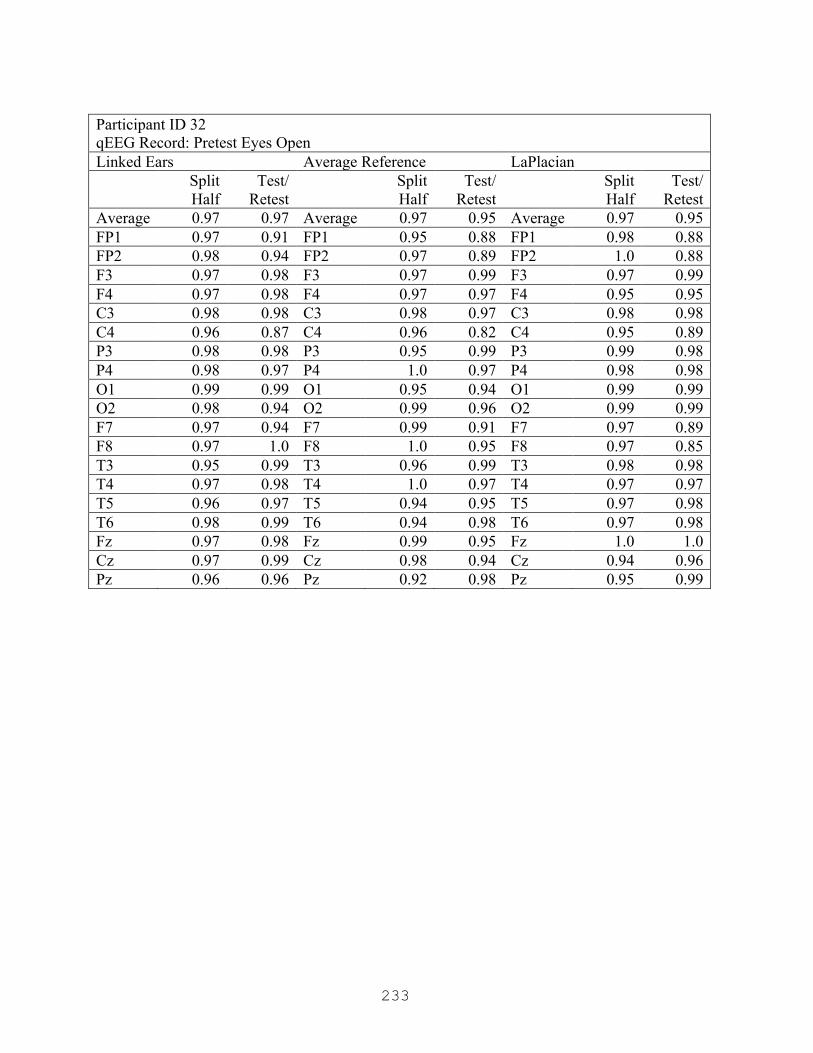
233
Participant ID 32 qEEG Record: Pretest Eyes Open Linked Ears Average Reference LaPlacian
Split Half
Test/ Retest
Split Half
Test/ Retest
Split Half
Test/ Retest
Average 0.97 0.97 Average 0.97 0.95 Average 0.97 0.95 FP1 0.97 0.91 FP1 0.95 0.88 FP1 0.98 0.88 FP2 0.98 0.94 FP2 0.97 0.89 FP2 1.0 0.88 F3 0.97 0.98 F3 0.97 0.99 F3 0.97 0.99 F4 0.97 0.98 F4 0.97 0.97 F4 0.95 0.95 C3 0.98 0.98 C3 0.98 0.97 C3 0.98 0.98 C4 0.96 0.87 C4 0.96 0.82 C4 0.95 0.89 P3 0.98 0.98 P3 0.95 0.99 P3 0.99 0.98 P4 0.98 0.97 P4 1.0 0.97 P4 0.98 0.98 O1 0.99 0.99 O1 0.95 0.94 O1 0.99 0.99 O2 0.98 0.94 O2 0.99 0.96 O2 0.99 0.99 F7 0.97 0.94 F7 0.99 0.91 F7 0.97 0.89 F8 0.97 1.0 F8 1.0 0.95 F8 0.97 0.85 T3 0.95 0.99 T3 0.96 0.99 T3 0.98 0.98 T4 0.97 0.98 T4 1.0 0.97 T4 0.97 0.97 T5 0.96 0.97 T5 0.94 0.95 T5 0.97 0.98 T6 0.98 0.99 T6 0.94 0.98 T6 0.97 0.98 Fz 0.97 0.98 Fz 0.99 0.95 Fz 1.0 1.0 Cz 0.97 0.99 Cz 0.98 0.94 Cz 0.94 0.96 Pz 0.96 0.96 Pz 0.92 0.98 Pz 0.95 0.99

234
Participant ID 32 qEEG Record: Pretest Serial Sevens Linked Ears Average Reference LaPlacian
Split Half
Test/ Retest
Split Half
Test/ Retest
Split Half
Test/ Retest
Average 0.97 0.96 Average 0.96 0.95 Average 0.96 0.96 FP1 0.98 0.98 FP1 0.97 0.9 FP1 0.98 0.95 FP2 0.99 0.98 FP2 0.97 0.88 FP2 0.98 0.92 F3 0.97 0.98 F3 0.98 0.94 F3 0.99 0.96 F4 0.96 0.92 F4 0.97 0.98 F4 0.95 0.99 C3 0.96 0.97 C3 0.95 0.96 C3 0.96 0.95 C4 0.99 0.94 C4 0.97 0.93 C4 0.94 0.97 P3 0.95 0.95 P3 0.97 0.98 P3 0.95 0.97 P4 0.97 0.91 P4 0.98 0.99 P4 1.0 0.99 O1 0.95 1.0 O1 0.97 0.99 O1 0.99 0.97 O2 0.99 1.0 O2 0.94 0.92 O2 1.0 0.95 F7 0.9 0.94 F7 0.99 0.94 F7 0.99 0.89 F8 0.98 0.97 F8 1.0 0.87 F8 0.97 0.94 T3 0.97 1.0 T3 0.94 0.96 T3 0.96 0.94 T4 0.97 0.99 T4 0.96 0.89 T4 0.97 0.94 T5 1.0 0.94 T5 0.9 0.96 T5 0.93 0.93 T6 0.96 0.95 T6 0.98 0.96 T6 0.93 0.94 Fz 0.98 0.93 Fz 0.94 1.0 Fz 0.92 1.0 Cz 0.98 0.9 Cz 0.92 0.98 Cz 0.92 1.0 Pz 0.92 0.95 Pz 0.93 0.96 Pz 0.97 0.98

235
Participant ID 32 qEEG Record: Posttest Eyes Open Linked Ears Average Reference LaPlacian
Split Half
Test/ Retest
Split Half
Test/ Retest
Split Half
Test/ Retest
Average 0.96 0.96 Average 0.94 0.94 Average 0.96 0.96 FP1 0.98 0.9 FP1 0.96 0.94 FP1 0.97 0.96 FP2 0.98 0.96 FP2 0.97 0.91 FP2 0.91 0.99 F3 0.96 0.95 F3 0.92 0.97 F3 0.94 0.94 F4 0.99 0.97 F4 0.96 0.92 F4 0.99 0.95 C3 0.92 0.91 C3 0.91 0.99 C3 0.95 0.98 C4 0.95 0.99 C4 0.94 0.96 C4 0.99 0.95 P3 1.0 1.0 P3 0.98 0.96 P3 0.99 0.97 P4 0.93 0.97 P4 0.93 0.99 P4 0.97 0.99 O1 0.94 0.99 O1 0.99 0.98 O1 0.97 0.98 O2 0.9 0.98 O2 0.93 0.97 O2 0.98 1.0 F7 0.93 0.94 F7 0.9 0.9 F7 0.93 0.99 F8 0.98 0.96 F8 0.89 0.9 F8 0.98 0.98 T3 0.97 0.99 T3 0.96 0.87 T3 0.98 1.0 T4 0.98 0.98 T4 0.9 0.89 T4 0.91 0.88 T5 0.95 0.97 T5 0.95 0.96 T5 0.89 0.95 T6 0.95 0.98 T6 0.91 0.94 T6 0.89 1.0 Fz 0.95 0.96 Fz 0.87 0.96 Fz 0.98 0.96 Cz 0.98 0.99 Cz 0.97 0.99 Cz 0.96 0.93 Pz 0.98 0.91 Pz 0.97 0.83 Pz 1.0 0.87

236
Participant ID 32 qEEG Record: Posttest Eyes Closed Linked Ears Average Reference LaPlacian
Split Half
Test/ Retest
Split Half
Test/ Retest
Split Half
Test/ Retest
Average 0.96 0.9 Average 0.92 0.92 Average 0.96 0.91 FP1 0.93 0.77 FP1 0.9 0.75 FP1 0.91 0.81 FP2 0.91 0.9 FP2 0.83 0.84 FP2 0.92 0.85 F3 0.98 0.97 F3 0.94 0.96 F3 0.95 0.95 F4 0.99 0.88 F4 0.93 0.95 F4 0.96 0.83 C3 1.0 0.94 C3 0.95 0.97 C3 0.95 0.94 C4 0.98 0.8 C4 0.95 0.86 C4 1.0 0.89 P3 0.95 0.96 P3 0.94 0.94 P3 1.0 0.98 P4 0.89 0.84 P4 0.85 0.97 P4 0.95 0.95 O1 0.93 0.98 O1 0.92 0.97 O1 0.88 0.98 O2 0.93 0.93 O2 0.93 0.98 O2 0.98 0.99 F7 1.0 0.97 F7 1.0 0.89 F7 0.95 0.8 F8 1.0 0.81 F8 0.97 0.85 F8 0.99 0.83 T3 0.98 0.97 T3 0.92 0.87 T3 1.0 0.96 T4 0.92 0.84 T4 0.91 0.89 T4 1.0 0.96 T5 0.99 0.98 T5 0.96 0.99 T5 0.92 0.91 T6 0.99 0.87 T6 0.92 0.99 T6 0.96 0.98 Fz 0.96 0.96 Fz 0.91 0.94 Fz 0.95 0.89 Cz 1.0 0.97 Cz 0.97 0.91 Cz 1.0 0.93 Pz 0.87 0.84 Pz 0.81 0.94 Pz 0.9 0.94
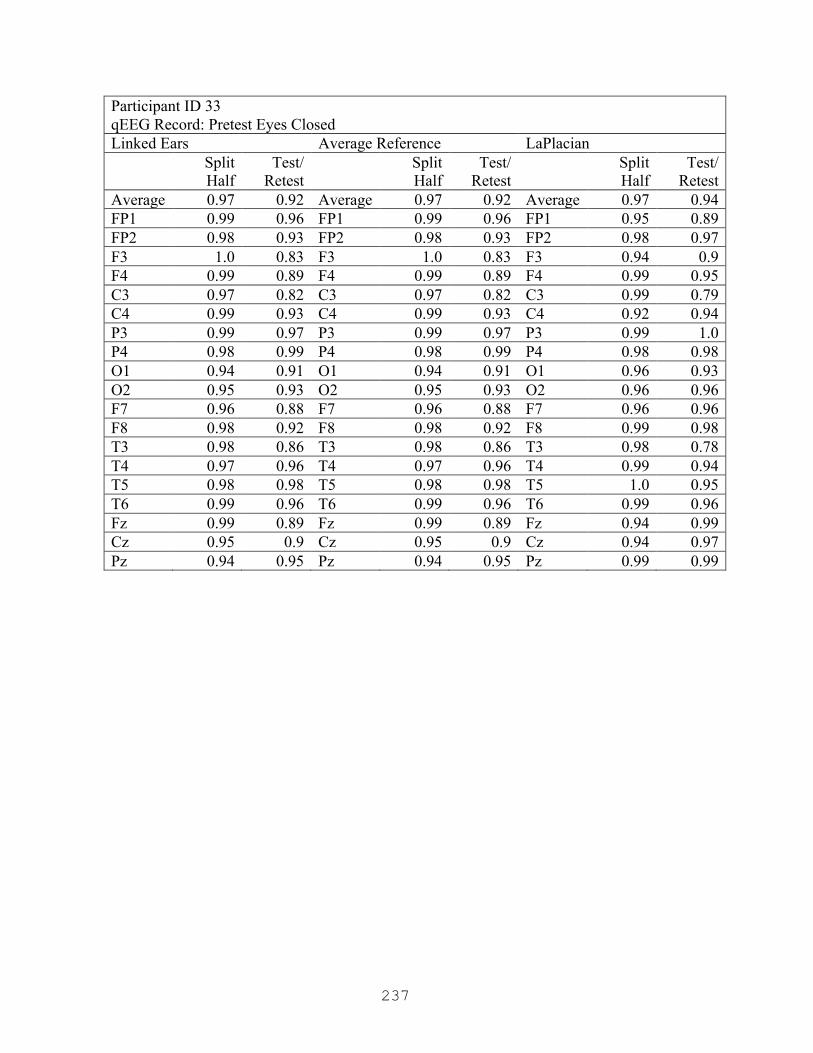
237
Participant ID 33 qEEG Record: Pretest Eyes Closed Linked Ears Average Reference LaPlacian
Split Half
Test/ Retest
Split Half
Test/ Retest
Split Half
Test/ Retest
Average 0.97 0.92 Average 0.97 0.92 Average 0.97 0.94 FP1 0.99 0.96 FP1 0.99 0.96 FP1 0.95 0.89 FP2 0.98 0.93 FP2 0.98 0.93 FP2 0.98 0.97 F3 1.0 0.83 F3 1.0 0.83 F3 0.94 0.9 F4 0.99 0.89 F4 0.99 0.89 F4 0.99 0.95 C3 0.97 0.82 C3 0.97 0.82 C3 0.99 0.79 C4 0.99 0.93 C4 0.99 0.93 C4 0.92 0.94 P3 0.99 0.97 P3 0.99 0.97 P3 0.99 1.0 P4 0.98 0.99 P4 0.98 0.99 P4 0.98 0.98 O1 0.94 0.91 O1 0.94 0.91 O1 0.96 0.93 O2 0.95 0.93 O2 0.95 0.93 O2 0.96 0.96 F7 0.96 0.88 F7 0.96 0.88 F7 0.96 0.96 F8 0.98 0.92 F8 0.98 0.92 F8 0.99 0.98 T3 0.98 0.86 T3 0.98 0.86 T3 0.98 0.78 T4 0.97 0.96 T4 0.97 0.96 T4 0.99 0.94 T5 0.98 0.98 T5 0.98 0.98 T5 1.0 0.95 T6 0.99 0.96 T6 0.99 0.96 T6 0.99 0.96 Fz 0.99 0.89 Fz 0.99 0.89 Fz 0.94 0.99 Cz 0.95 0.9 Cz 0.95 0.9 Cz 0.94 0.97 Pz 0.94 0.95 Pz 0.94 0.95 Pz 0.99 0.99

238
Participant ID 33 qEEG Record: Pretest Eyes Open Linked Ears Average Reference LaPlacian
Split Half
Test/ Retest
Split Half
Test/ Retest
Split Half
Test/ Retest
Average 0.97 0.96 Average 0.96 0.96 Average 0.97 0.96 FP1 0.93 0.92 FP1 0.93 0.95 FP1 0.97 0.99 FP2 0.96 0.94 FP2 0.94 0.98 FP2 0.97 0.94 F3 0.98 0.99 F3 0.98 0.94 F3 0.92 0.98 F4 0.98 0.97 F4 0.99 0.98 F4 0.99 0.98 C3 0.99 0.97 C3 0.97 0.92 C3 0.95 0.98 C4 0.96 0.99 C4 0.97 0.98 C4 0.96 0.99 P3 0.99 0.97 P3 0.97 0.94 P3 1.0 0.97 P4 0.97 1.0 P4 0.97 0.99 P4 0.97 0.96 O1 0.97 0.92 O1 0.95 0.92 O1 0.93 0.9 O2 1.0 0.94 O2 0.99 0.93 O2 0.98 0.87 F7 0.98 0.99 F7 1.0 0.97 F7 0.96 0.97 F8 0.97 0.93 F8 0.92 0.99 F8 1.0 1.0 T3 0.93 0.96 T3 0.93 0.91 T3 0.98 0.96 T4 0.97 0.96 T4 0.99 1.0 T4 0.96 1.0 T5 0.92 0.94 T5 0.93 0.94 T5 0.97 0.94 T6 0.94 0.91 T6 0.96 0.94 T6 0.94 0.87 Fz 1.0 0.96 Fz 0.99 0.98 Fz 0.97 0.96 Cz 0.96 0.93 Cz 0.97 0.91 Cz 0.99 0.96 Pz 0.95 1.0 Pz 0.97 0.99 Pz 0.99 0.98

239
Participant ID 33 qEEG Record: Pretest Serial Sevens Linked Ears Average Reference LaPlacian
Split Half
Test/ Retest
Split Half
Test/ Retest
Split Half
Test/ Retest
Average 0.95 0.93 Average 0.93 0.9 Average 0.92 0.95 FP1 0.95 1.0 FP1 0.91 0.95 FP1 0.95 0.87 FP2 0.93 0.91 FP2 0.92 0.89 FP2 0.9 0.98 F3 0.98 0.91 F3 0.93 0.93 F3 1.0 1.0 F4 0.91 0.95 F4 0.99 0.96 F4 0.93 0.96 C3 0.91 0.93 C3 0.81 0.88 C3 0.95 0.95 C4 0.97 0.96 C4 0.92 0.93 C4 0.82 0.88 P3 0.99 0.99 P3 0.97 0.87 P3 0.91 0.99 P4 0.9 0.95 P4 0.76 0.86 P4 0.7 0.79 O1 0.92 0.89 O1 0.95 0.83 O1 0.93 0.98 O2 1.0 0.84 O2 0.95 0.89 O2 0.99 0.98 F7 1.0 0.93 F7 0.92 0.98 F7 0.96 0.98 F8 0.89 0.82 F8 0.92 0.77 F8 0.89 1.0 T3 0.98 0.9 T3 0.99 0.83 T3 0.96 0.89 T4 0.97 0.96 T4 0.99 0.95 T4 0.93 0.98 T5 0.89 0.91 T5 0.92 0.84 T5 0.89 0.98 T6 0.98 0.91 T6 0.96 0.96 T6 0.97 0.95 Fz 0.94 0.89 Fz 0.98 0.94 Fz 0.88 0.95 Cz 0.94 0.97 Cz 0.94 0.92 Cz 0.96 0.95 Pz 0.95 0.97 Pz 0.95 0.9 Pz 0.96 0.93

240
Participant ID 33 qEEG Record: Posttest Eyes Open Linked Ears Average Reference LaPlacian
Split Half
Test/ Retest
Split Half
Test/ Retest
Split Half
Test/ Retest
Average 0.95 0.94 Average 0.9 0.92 Average 0.94 0.94 FP1 0.96 0.99 FP1 0.93 0.99 FP1 0.87 0.96 FP2 0.99 0.99 FP2 0.94 1.0 FP2 0.94 0.93 F3 0.95 1.0 F3 0.91 0.94 F3 0.94 0.98 F4 0.93 0.96 F4 0.91 0.99 F4 0.86 0.84 C3 0.94 0.91 C3 0.88 0.72 C3 0.9 0.88 C4 0.97 0.91 C4 0.94 0.96 C4 0.98 0.86 P3 0.99 0.88 P3 0.9 0.84 P3 0.99 0.92 P4 0.92 0.84 P4 0.89 0.81 P4 0.98 0.9 O1 0.96 0.92 O1 0.83 0.95 O1 0.95 1.0 O2 0.97 0.89 O2 0.99 0.88 O2 0.93 0.96 F7 1.0 0.94 F7 0.95 0.88 F7 0.98 0.9 F8 0.96 0.97 F8 0.9 0.83 F8 0.95 0.96 T3 0.98 0.96 T3 0.91 0.98 T3 0.99 1.0 T4 0.94 0.95 T4 0.84 0.93 T4 0.9 0.99 T5 0.9 0.93 T5 0.85 0.95 T5 0.95 0.88 T6 0.91 0.93 T6 0.85 0.98 T6 0.86 0.99 Fz 0.85 0.99 Fz 0.75 0.99 Fz 0.98 0.98 Cz 0.98 0.96 Cz 0.97 0.97 Cz 0.91 0.98 Pz 0.97 0.94 Pz 0.88 0.92 Pz 0.96 0.92

241
Participant ID 33 qEEG Record: Posttest Eyes Closed Linked Ears Average Reference LaPlacian
Split Half
Test/ Retest
Split Half
Test/ Retest
Split Half
Test/ Retest
Average 0.96 0.92 Average 0.95 0.94 Average 0.96 0.92 FP1 0.96 0.95 FP1 0.99 1.0 FP1 0.97 0.93 FP2 0.96 0.94 FP2 0.99 1.0 FP2 0.95 0.91 F3 1.0 0.86 F3 0.95 0.91 F3 0.99 0.97 F4 0.99 0.87 F4 0.98 0.95 F4 0.98 0.98 C3 0.97 0.85 C3 0.98 0.85 C3 0.93 0.85 C4 0.94 0.96 C4 0.91 0.9 C4 0.97 0.94 P3 0.99 0.89 P3 1.0 0.94 P3 0.96 0.79 P4 0.91 0.98 P4 0.88 0.96 P4 0.93 0.98 O1 0.98 0.91 O1 0.94 0.89 O1 0.98 0.91 O2 0.93 0.93 O2 0.94 0.85 O2 0.98 0.96 F7 0.93 0.89 F7 0.87 0.93 F7 0.93 0.89 F8 0.98 0.91 F8 1.0 0.99 F8 0.97 0.97 T3 0.89 0.91 T3 0.79 0.96 T3 0.93 0.82 T4 0.99 0.95 T4 1.0 0.99 T4 0.96 0.97 T5 0.96 0.95 T5 0.9 0.92 T5 0.97 0.87 T6 0.97 0.98 T6 0.99 0.91 T6 1.0 0.99 Fz 0.99 0.88 Fz 0.98 0.97 Fz 0.97 0.89 Cz 0.96 0.9 Cz 0.96 0.92 Cz 0.9 0.92 Pz 0.96 0.94 Pz 0.94 0.96 Pz 0.97 0.89
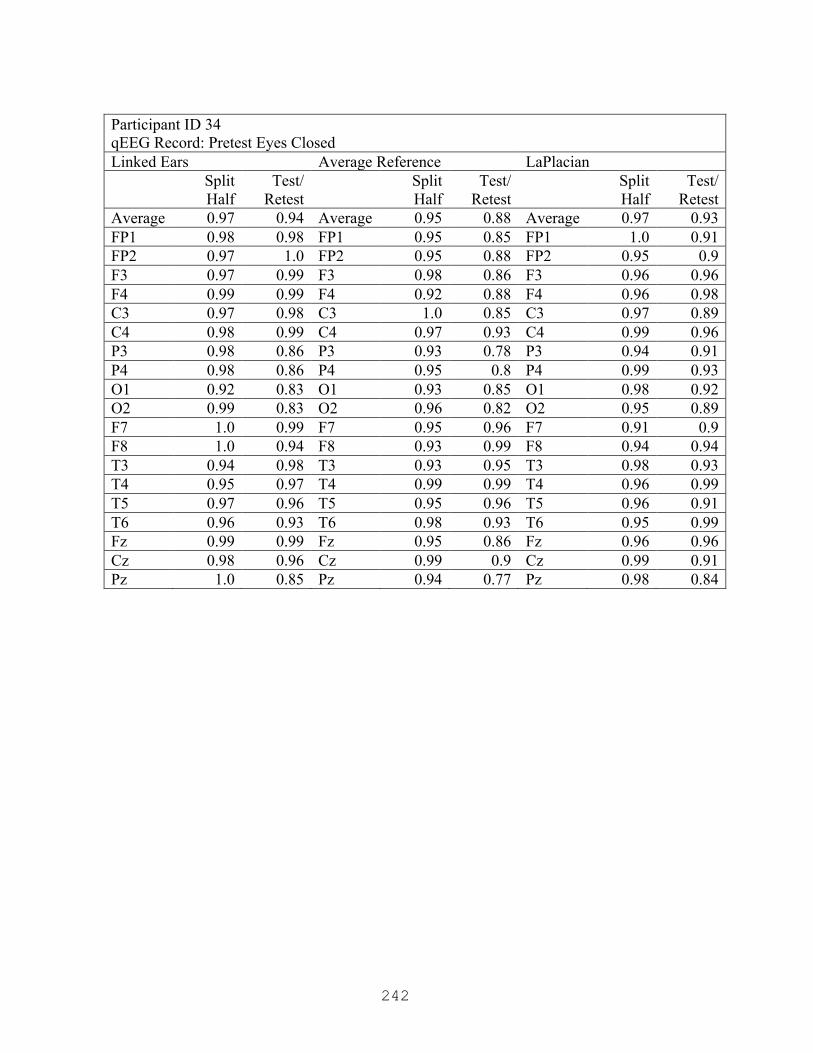
242
Participant ID 34 qEEG Record: Pretest Eyes Closed Linked Ears Average Reference LaPlacian
Split Half
Test/ Retest
Split Half
Test/ Retest
Split Half
Test/ Retest
Average 0.97 0.94 Average 0.95 0.88 Average 0.97 0.93 FP1 0.98 0.98 FP1 0.95 0.85 FP1 1.0 0.91 FP2 0.97 1.0 FP2 0.95 0.88 FP2 0.95 0.9 F3 0.97 0.99 F3 0.98 0.86 F3 0.96 0.96 F4 0.99 0.99 F4 0.92 0.88 F4 0.96 0.98 C3 0.97 0.98 C3 1.0 0.85 C3 0.97 0.89 C4 0.98 0.99 C4 0.97 0.93 C4 0.99 0.96 P3 0.98 0.86 P3 0.93 0.78 P3 0.94 0.91 P4 0.98 0.86 P4 0.95 0.8 P4 0.99 0.93 O1 0.92 0.83 O1 0.93 0.85 O1 0.98 0.92 O2 0.99 0.83 O2 0.96 0.82 O2 0.95 0.89 F7 1.0 0.99 F7 0.95 0.96 F7 0.91 0.9 F8 1.0 0.94 F8 0.93 0.99 F8 0.94 0.94 T3 0.94 0.98 T3 0.93 0.95 T3 0.98 0.93 T4 0.95 0.97 T4 0.99 0.99 T4 0.96 0.99 T5 0.97 0.96 T5 0.95 0.96 T5 0.96 0.91 T6 0.96 0.93 T6 0.98 0.93 T6 0.95 0.99 Fz 0.99 0.99 Fz 0.95 0.86 Fz 0.96 0.96 Cz 0.98 0.96 Cz 0.99 0.9 Cz 0.99 0.91 Pz 1.0 0.85 Pz 0.94 0.77 Pz 0.98 0.84

243
Participant ID 34 qEEG Record: Pretest Eyes Open Linked Ears Average Reference LaPlacian
Split Half
Test/ Retest
Split Half
Test/ Retest
Split Half
Test/ Retest
Average 0.96 0.97 Average 0.97 0.95 Average 0.97 0.95 FP1 0.98 1.0 FP1 0.98 0.97 FP1 0.93 0.95 FP2 1.0 0.98 FP2 0.96 0.97 FP2 0.98 0.97 F3 0.96 0.98 F3 0.99 0.99 F3 1.0 0.99 F4 0.98 0.98 F4 0.99 0.99 F4 0.97 0.97 C3 0.93 1.0 C3 0.99 0.98 C3 0.97 0.96 C4 0.97 0.95 C4 0.98 0.86 C4 0.99 0.85 P3 0.93 0.96 P3 0.95 0.96 P3 1.0 0.96 P4 0.92 0.94 P4 0.95 0.92 P4 0.98 0.95 O1 0.93 0.94 O1 0.96 0.93 O1 0.96 0.92 O2 0.9 0.94 O2 0.98 0.94 O2 0.94 0.95 F7 0.95 0.99 F7 0.99 0.96 F7 0.99 0.95 F8 0.95 0.95 F8 0.96 0.97 F8 0.96 0.94 T3 0.93 0.99 T3 0.92 0.97 T3 0.92 0.97 T4 0.99 0.95 T4 0.96 0.94 T4 1.0 0.93 T5 0.94 0.98 T5 1.0 0.99 T5 0.97 0.94 T6 0.95 0.94 T6 0.95 0.96 T6 0.98 0.96 Fz 0.98 1.0 Fz 1.0 0.95 Fz 1.0 0.95 Cz 0.97 0.97 Cz 0.99 0.94 Cz 0.98 0.93 Pz 0.96 0.96 Pz 0.99 0.95 Pz 1.0 0.98

244
Participant ID 34 qEEG Record: Pretest Serial Sevens Linked Ears Average Reference LaPlacian
Split Half
Test/ Retest
Split Half
Test/ Retest
Split Half
Test/ Retest
Average 0.96 0.94 Average 0.93 0.9 Average 0.94 0.93 FP1 0.98 0.93 FP1 0.89 0.83 FP1 0.9 0.99 FP2 0.94 0.98 FP2 0.94 0.92 FP2 0.98 1.0 F3 0.99 0.96 F3 0.97 0.95 F3 0.94 0.94 F4 0.93 0.94 F4 0.93 0.93 F4 0.99 0.97 C3 0.97 0.93 C3 0.97 0.88 C3 1.0 0.97 C4 0.98 0.95 C4 0.89 0.99 C4 0.9 0.98 P3 0.96 0.93 P3 0.93 0.87 P3 0.98 0.86 P4 0.97 0.94 P4 1.0 0.96 P4 0.99 0.88 O1 0.96 0.96 O1 0.99 0.83 O1 0.92 0.85 O2 1.0 0.95 O2 0.97 0.96 O2 0.99 0.97 F7 0.95 0.9 F7 0.92 0.93 F7 0.94 0.93 F8 0.87 0.84 F8 0.77 0.76 F8 0.78 0.82 T3 0.98 0.98 T3 0.88 0.94 T3 0.95 0.97 T4 0.99 0.87 T4 0.93 0.82 T4 0.92 0.93 T5 0.99 0.97 T5 1.0 0.92 T5 0.95 1.0 T6 0.98 0.95 T6 0.93 0.83 T6 0.96 0.97 Fz 0.93 0.98 Fz 1.0 0.98 Fz 0.95 0.92 Cz 0.95 0.95 Cz 0.93 0.9 Cz 0.94 0.89 Pz 0.96 0.9 Pz 0.89 0.81 Pz 0.94 0.86

245
Participant ID 34 qEEG Record: Posttest Eyes Open Linked Ears Average Reference LaPlacian
Split Half
Test/ Retest
Split Half
Test/ Retest
Split Half
Test/ Retest
Average 0.95 0.9 Average 0.92 0.89 Average 0.92 0.89 FP1 1.0 0.83 FP1 0.97 0.83 FP1 0.82 0.82 FP2 0.98 0.96 FP2 0.97 0.99 FP2 0.91 0.96 F3 1.0 0.89 F3 0.94 0.86 F3 0.87 0.83 F4 0.96 0.99 F4 0.99 0.99 F4 0.99 0.94 C3 0.96 0.86 C3 0.9 0.84 C3 0.93 0.93 C4 1.0 0.88 C4 0.97 0.85 C4 0.93 0.84 P3 0.96 0.84 P3 0.94 0.91 P3 1.0 0.91 P4 0.99 0.93 P4 0.96 0.96 P4 0.99 0.99 O1 0.94 0.97 O1 0.97 0.93 O1 0.96 0.87 O2 0.96 0.91 O2 0.93 0.98 O2 0.93 0.98 F7 0.83 0.77 F7 0.7 0.65 F7 0.67 0.65 F8 0.93 0.88 F8 0.84 0.9 F8 0.95 0.91 T3 0.96 0.9 T3 0.96 0.8 T3 1.0 0.75 T4 0.86 0.94 T4 0.84 0.89 T4 0.96 1.0 T5 0.94 0.92 T5 0.93 0.9 T5 0.94 0.74 T6 0.92 0.99 T6 0.87 0.92 T6 0.87 0.96 Fz 0.94 0.91 Fz 0.88 0.96 Fz 0.93 0.89 Cz 0.97 0.9 Cz 0.93 0.91 Cz 0.9 0.98 Pz 0.99 0.87 Pz 0.97 0.91 Pz 0.98 1.0

246
Participant ID 34 qEEG Record: Posttest Eyes Closed Linked Ears Average Reference LaPlacian
Split Half
Test/ Retest
Split Half
Test/ Retest
Split Half
Test/ Retest
Average 0.96 0.92 Average 0.96 0.87 Average 0.95 0.92 FP1 0.98 0.95 FP1 0.98 0.89 FP1 0.99 0.98 FP2 0.99 0.95 FP2 0.98 0.86 FP2 0.94 0.93 F3 0.96 0.95 F3 0.94 0.87 F3 0.92 0.94 F4 0.98 0.93 F4 1.0 0.86 F4 0.97 0.86 C3 0.98 0.93 C3 0.9 0.85 C3 0.87 0.94 C4 0.98 0.9 C4 0.96 0.79 C4 0.95 0.79 P3 0.97 0.92 P3 0.99 0.86 P3 0.98 0.98 P4 0.94 0.83 P4 0.89 0.76 P4 0.94 0.9 O1 0.99 0.95 O1 0.98 0.93 O1 0.99 0.99 O2 0.88 0.8 O2 0.89 0.84 O2 0.88 0.84 F7 0.97 0.92 F7 0.99 0.93 F7 0.97 0.99 F8 0.97 0.96 F8 0.93 0.91 F8 0.96 0.84 T3 0.98 0.94 T3 0.95 0.95 T3 0.99 0.86 T4 0.88 0.87 T4 0.98 0.88 T4 0.97 0.97 T5 0.94 0.98 T5 0.99 0.97 T5 0.98 0.87 T6 0.99 0.85 T6 0.98 0.89 T6 0.96 0.97 Fz 0.97 0.93 Fz 0.95 0.87 Fz 0.98 0.96 Cz 0.96 0.93 Cz 0.92 0.87 Cz 0.95 0.94 Pz 0.97 0.9 Pz 0.96 0.83 Pz 0.88 0.93

247
APPENDIX O
Brain Map Comparison Tables (Personal Notes)
Participant ID 10 Pretest Eyes Closed
Decrease in all bands, especially right frontal, except up at P3 in theta and beta
Posttest Eyes Closed
Pretest Eyes Open
Marked increase in high beta at PZ (verses C4 in S7)
Posttest Eyes Open
Eyes Open Serial Sevens (Mental Activity)
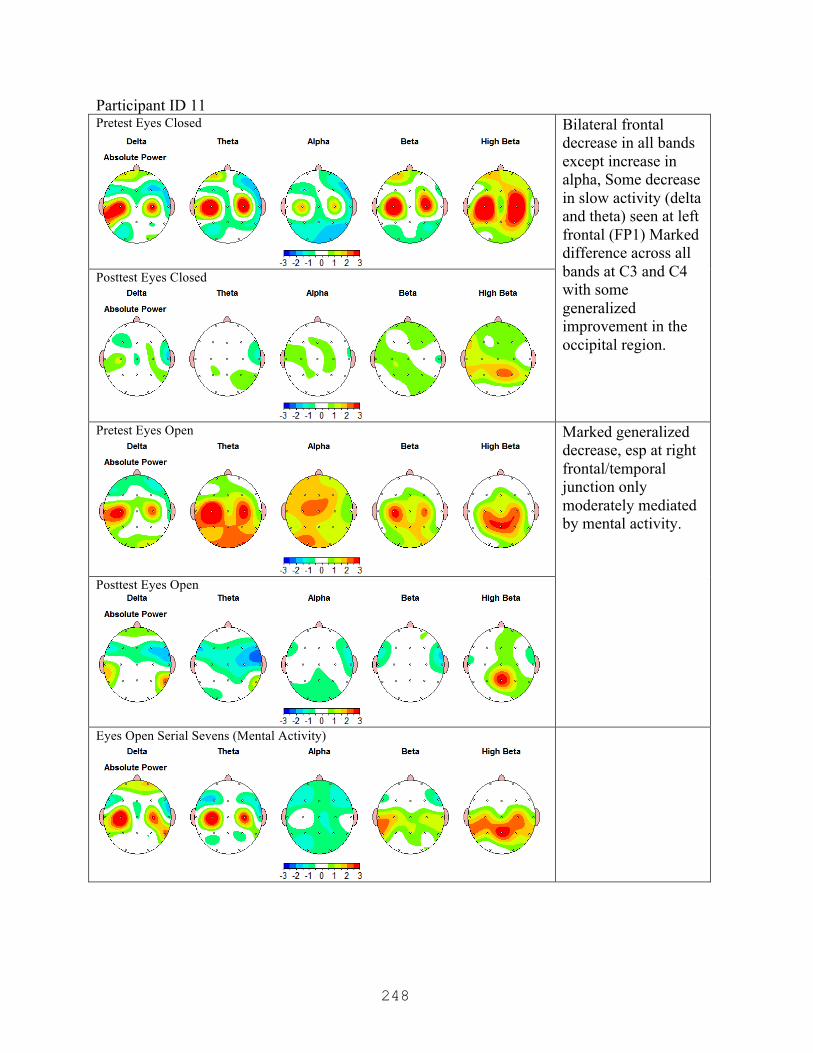
248
Participant ID 11 Pretest Eyes Closed
Bilateral frontal decrease in all bands except increase in alpha, Some decrease in slow activity (delta and theta) seen at left frontal (FP1) Marked difference across all bands at C3 and C4 with some generalized improvement in the occipital region.
Posttest Eyes Closed
Pretest Eyes Open
Marked generalized decrease, esp at right frontal/temporal junction only moderately mediated by mental activity.
Posttest Eyes Open
Eyes Open Serial Sevens (Mental Activity)
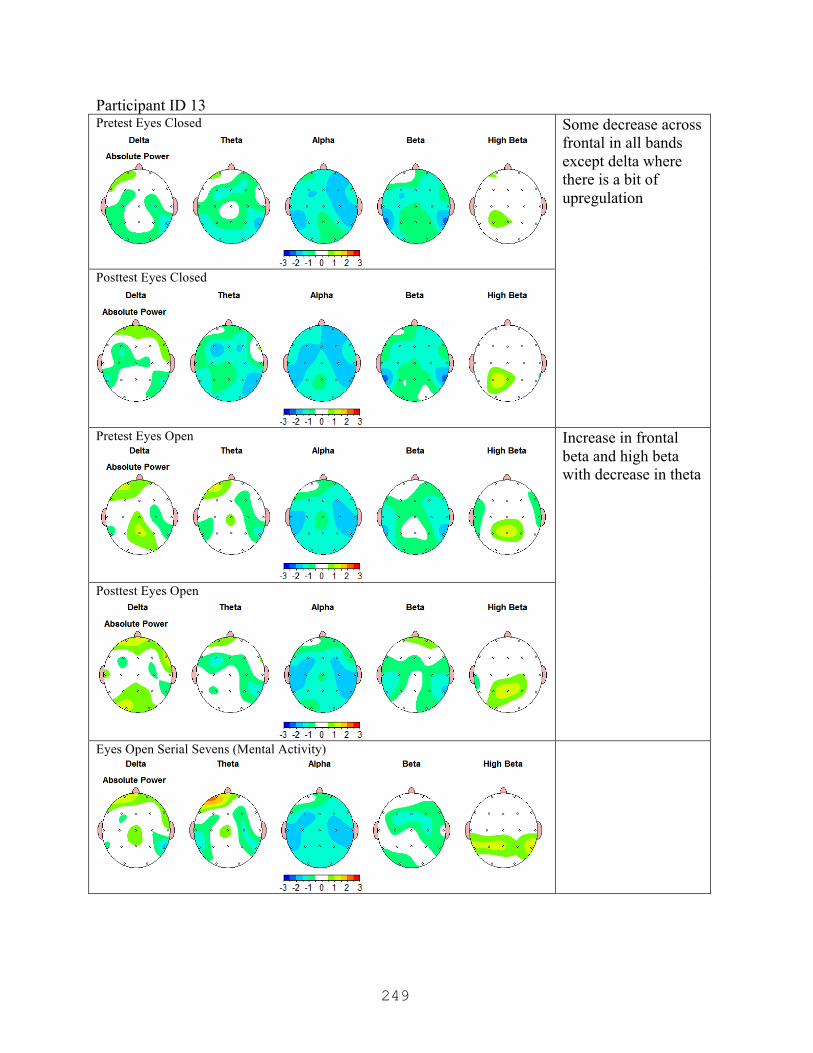
249
Participant ID 13 Pretest Eyes Closed
Some decrease across frontal in all bands except delta where there is a bit of upregulation
Posttest Eyes Closed
Pretest Eyes Open
Increase in frontal beta and high beta with decrease in theta
Posttest Eyes Open
Eyes Open Serial Sevens (Mental Activity)

250
Participant ID 14 Pretest Eyes Closed
Frontal upregulation in delta and theta; marked decrease in R frontal with marked increase in L frontal fast activity (F3) (some activity at F3 accounted for in S7 condition) Increase in beta and high beta at P3
Posttest Eyes Closed
Pretest Eyes Open
Marked decrease in fast activity except at F3 accompanied by increase in slow rhythms frontally;
Posttest Eyes Open
Eyes Open Serial Sevens (Mental Activity)
Participant is caffeinated by report
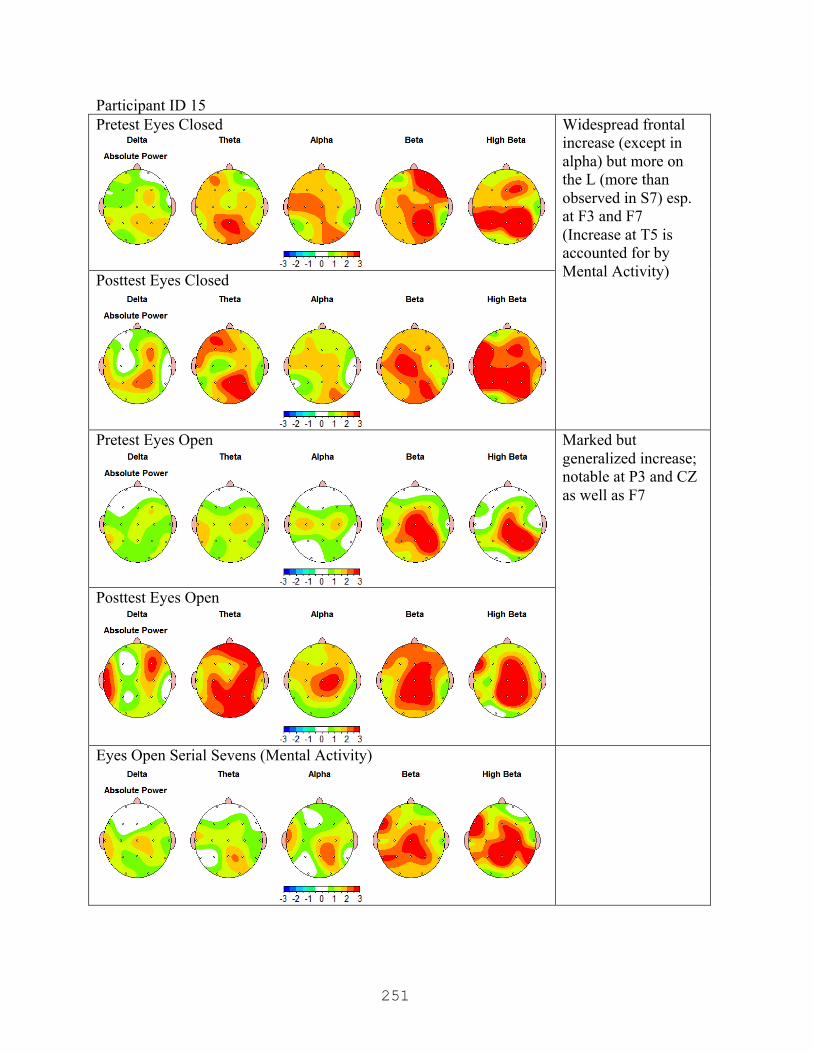
251
Participant ID 15 Pretest Eyes Closed
Widespread frontal increase (except in alpha) but more on the L (more than observed in S7) esp. at F3 and F7 (Increase at T5 is accounted for by Mental Activity) Posttest Eyes Closed
Pretest Eyes Open
Marked but generalized increase; notable at P3 and CZ as well as F7
Posttest Eyes Open
Eyes Open Serial Sevens (Mental Activity)

252
Participant ID 18 Pretest Eyes Closed
Some generalized decrease frontally (except beta), not accounted for in S7; upregulation at P3 and PZ greater than accounted for in S7
Posttest Eyes Closed
Pretest Eyes Open
Marked increase in frontal, esp alpha; increase across all bands at P3, more than S7
Posttest Eyes Open
Eyes Open Serial Sevens (Mental Activity)
Participant is caffeinated by report
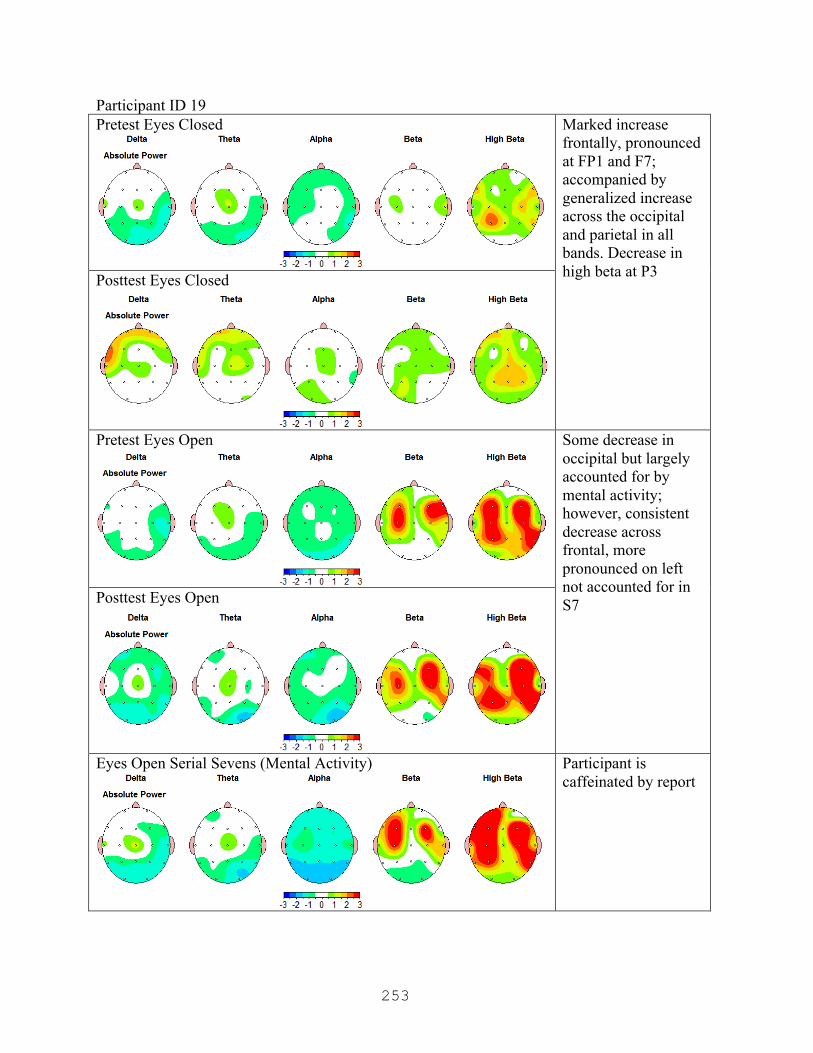
253
Participant ID 19 Pretest Eyes Closed
Marked increase frontally, pronounced at FP1 and F7; accompanied by generalized increase across the occipital and parietal in all bands. Decrease in high beta at P3 Posttest Eyes Closed
Pretest Eyes Open
Some decrease in occipital but largely accounted for by mental activity; however, consistent decrease across frontal, more pronounced on left not accounted for in S7 Posttest Eyes Open
Eyes Open Serial Sevens (Mental Activity)
Participant is caffeinated by report
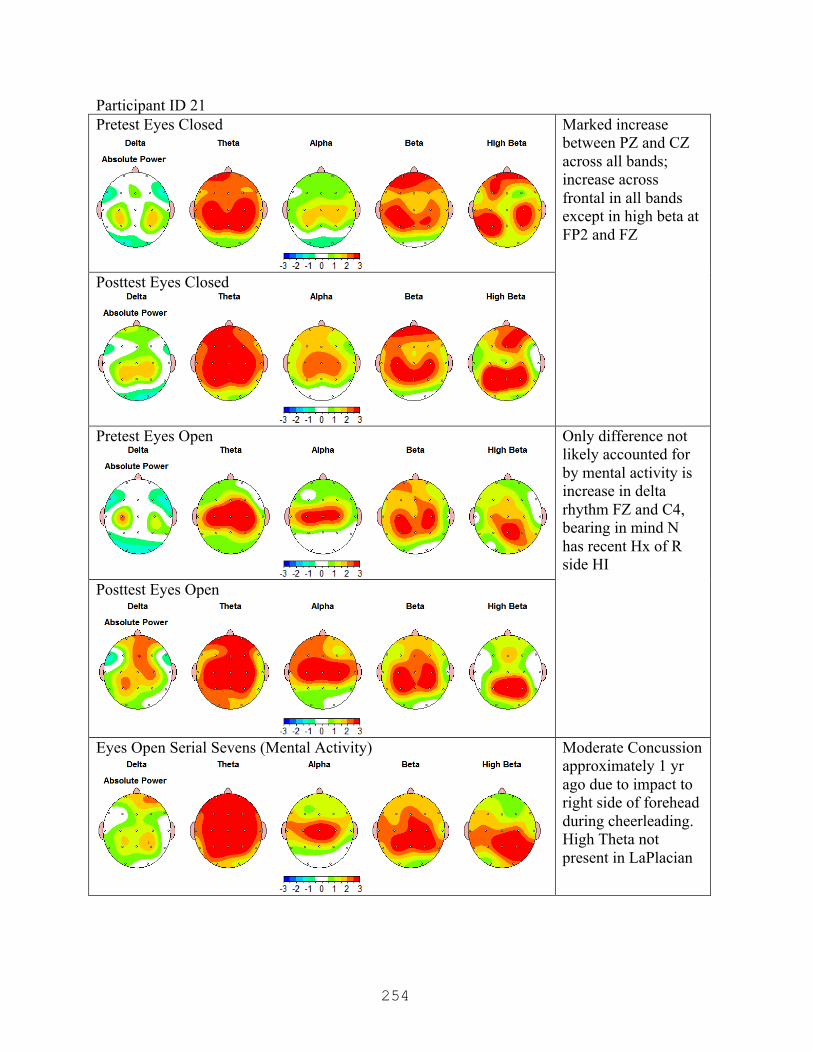
254
Participant ID 21 Pretest Eyes Closed
Marked increase between PZ and CZ across all bands; increase across frontal in all bands except in high beta at FP2 and FZ
Posttest Eyes Closed
Pretest Eyes Open
Only difference not likely accounted for by mental activity is increase in delta rhythm FZ and C4, bearing in mind N has recent Hx of R side HI
Posttest Eyes Open
Eyes Open Serial Sevens (Mental Activity)
Moderate Concussion approximately 1 yr ago due to impact to right side of forehead during cheerleading. High Theta not present in LaPlacian

255
Participant ID 22 Pretest Eyes Closed
Generalized frontal increase, which is normal for this n when compared to S7; however, what is remarkable is that baseline data demonstrates that increase to be associated with right frontal activity, where here it is somewhat pronounced on the left.
Posttest Eyes Closed
Pretest Eyes Open
Frontal increase, more pronounced on left, esp. when taking into account S7 condition
Posttest Eyes Open
Eyes Open Serial Sevens (Mental Activity)
Possible caffeinated

256
Participant ID 23 Pretest Eyes Closed
Generalized frontal decrease more than can be accounted for by mental activity
Posttest Eyes Closed
Pretest Eyes Open
Widespread bilateral frontal decrease across bands except in delta where there is a small increase on the left between FP1 and F3;
Posttest Eyes Open
Eyes Open Serial Sevens (Mental Activity)
Left handed Both theta and delta are markedly lower in the LaPlacian montage; however, the beta and high beta are higher and appear consistent with eye movement
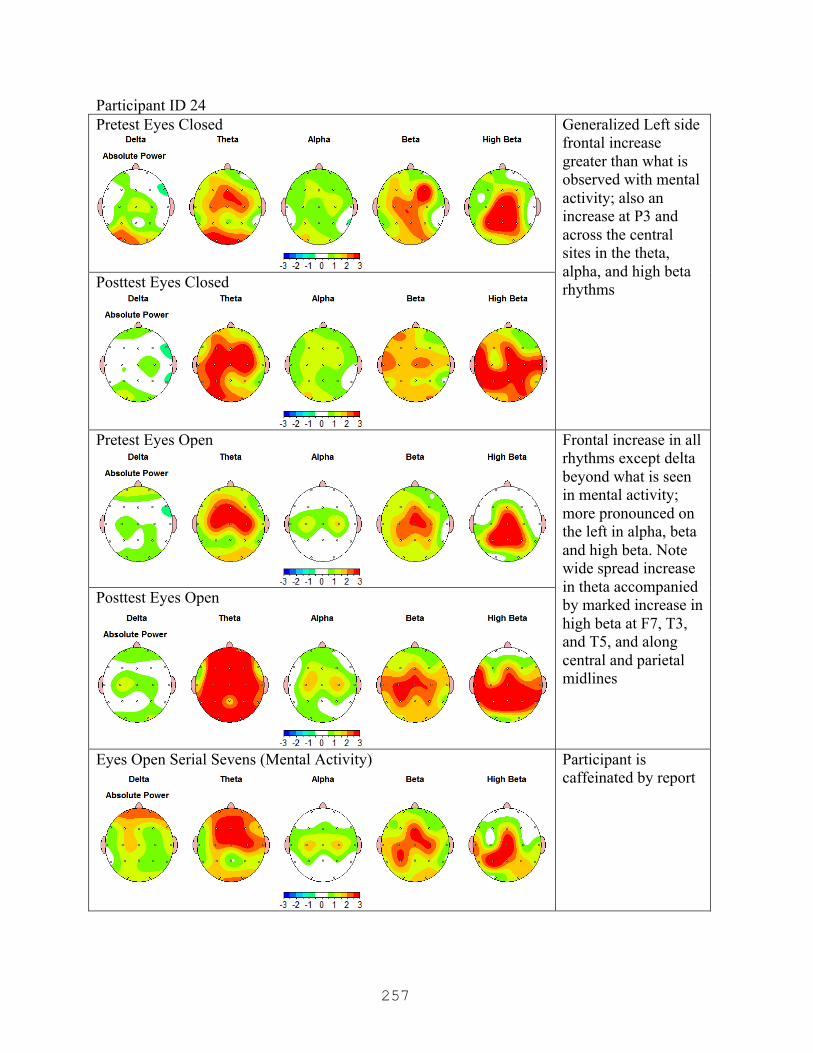
257
Participant ID 24 Pretest Eyes Closed
Generalized Left side frontal increase greater than what is observed with mental activity; also an increase at P3 and across the central sites in the theta, alpha, and high beta rhythms Posttest Eyes Closed
Pretest Eyes Open
Frontal increase in all rhythms except delta beyond what is seen in mental activity; more pronounced on the left in alpha, beta and high beta. Note wide spread increase in theta accompanied by marked increase in high beta at F7, T3, and T5, and along central and parietal midlines
Posttest Eyes Open
Eyes Open Serial Sevens (Mental Activity)
Participant is caffeinated by report
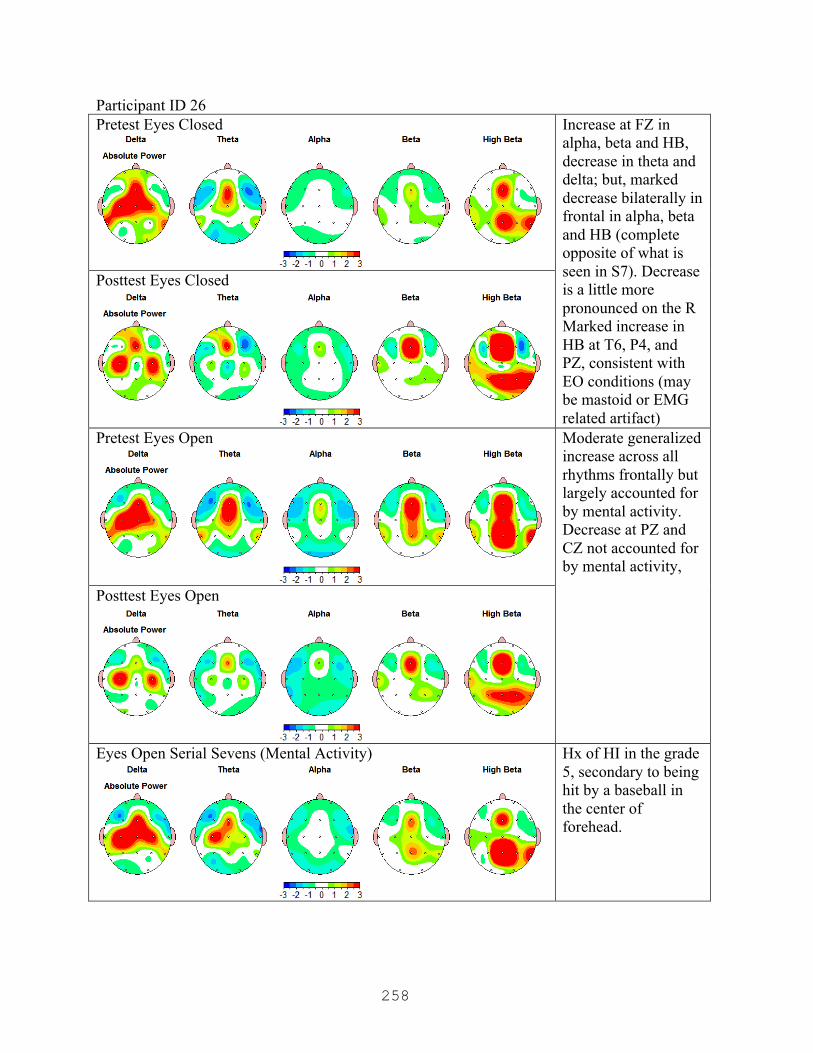
258
Participant ID 26 Pretest Eyes Closed
Increase at FZ in alpha, beta and HB, decrease in theta and delta; but, marked decrease bilaterally in frontal in alpha, beta and HB (complete opposite of what is seen in S7). Decrease is a little more pronounced on the R Marked increase in HB at T6, P4, and PZ, consistent with EO conditions (may be mastoid or EMG related artifact)
Posttest Eyes Closed
Pretest Eyes Open
Moderate generalized increase across all rhythms frontally but largely accounted for by mental activity. Decrease at PZ and CZ not accounted for by mental activity,
Posttest Eyes Open
Eyes Open Serial Sevens (Mental Activity)
Hx of HI in the grade 5, secondary to being hit by a baseball in the center of forehead.
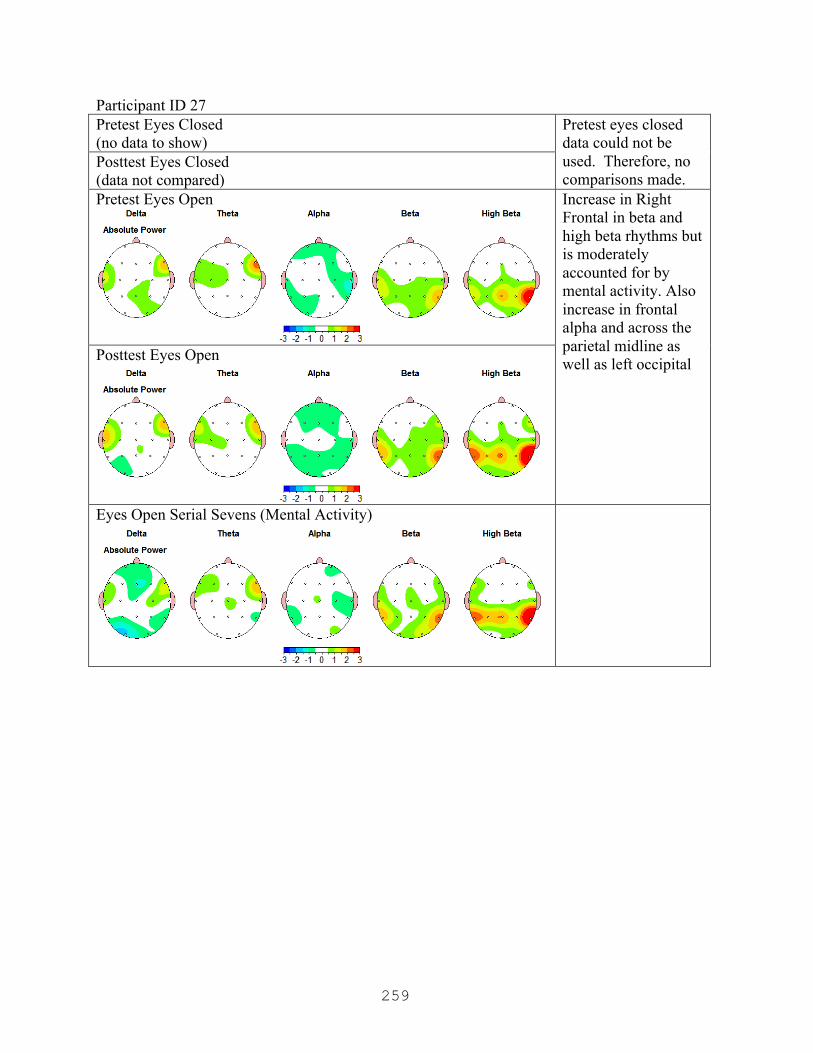
259
Participant ID 27 Pretest Eyes Closed (no data to show)
Pretest eyes closed data could not be used. Therefore, no comparisons made.
Posttest Eyes Closed (data not compared) Pretest Eyes Open
Increase in Right Frontal in beta and high beta rhythms but is moderately accounted for by mental activity. Also increase in frontal alpha and across the parietal midline as well as left occipital Posttest Eyes Open
Eyes Open Serial Sevens (Mental Activity)

260
Participant ID 28 Pretest Eyes Closed
Right side hot spot associated with OD Bx present in baseline but disappears in posttest. Increase in frontal in theta, alps and beta rhythms; in delta the increase is on the right. Bilateral increase along the parietal midline appears consistent with mental activity.
Posttest Eyes Closed
Pretest Eyes Open
Generalized frontal increase more than what is seen in S7; note especially increase in delta and theta at FP2. Note decrease in high beta at T4 P3 increase appears only in the delta rhythm.
Posttest Eyes Open
Eyes Open Serial Sevens (Mental Activity)
Sole non-conformist Hx of Head Injury E/M

261
Participant ID 29 Pretest Eyes Closed
Generalized downregulation in several regions; frontally it is more pronounced on the right, especially at F8.
Posttest Eyes Closed
Pretest Eyes Open
Some frontal down regulation, more pronounced on left; Some decrease in PZ not seen in S7
Posttest Eyes Open
Eyes Open Serial Sevens (Mental Activity)
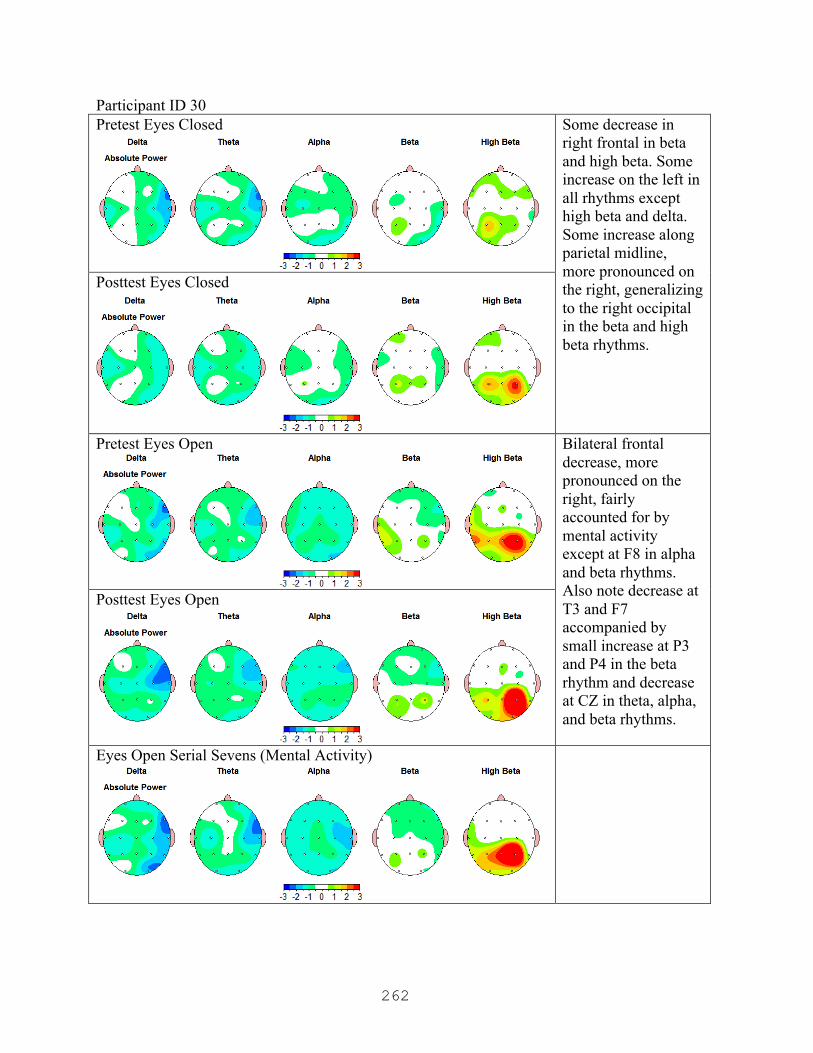
262
Participant ID 30 Pretest Eyes Closed
Some decrease in right frontal in beta and high beta. Some increase on the left in all rhythms except high beta and delta. Some increase along parietal midline, more pronounced on the right, generalizing to the right occipital in the beta and high beta rhythms.
Posttest Eyes Closed
Pretest Eyes Open
Bilateral frontal decrease, more pronounced on the right, fairly accounted for by mental activity except at F8 in alpha and beta rhythms. Also note decrease at T3 and F7 accompanied by small increase at P3 and P4 in the beta rhythm and decrease at CZ in theta, alpha, and beta rhythms.
Posttest Eyes Open
Eyes Open Serial Sevens (Mental Activity)
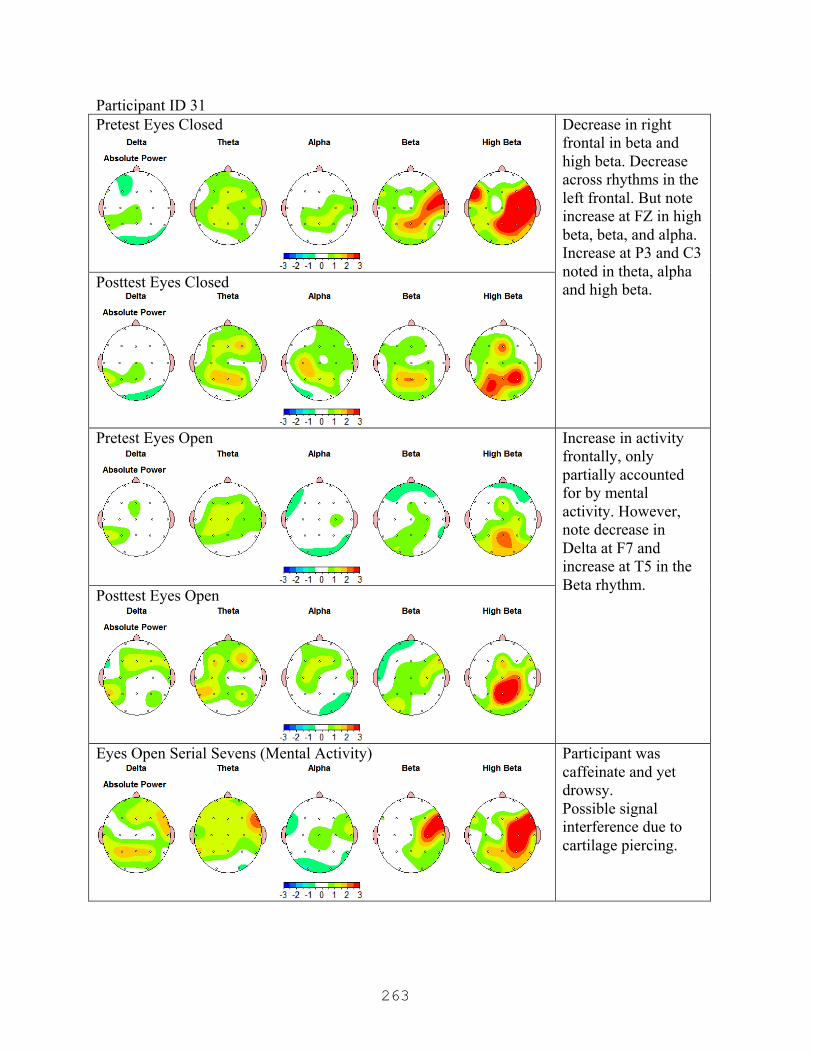
263
Participant ID 31 Pretest Eyes Closed
Decrease in right frontal in beta and high beta. Decrease across rhythms in the left frontal. But note increase at FZ in high beta, beta, and alpha. Increase at P3 and C3 noted in theta, alpha and high beta. Posttest Eyes Closed
Pretest Eyes Open
Increase in activity frontally, only partially accounted for by mental activity. However, note decrease in Delta at F7 and increase at T5 in the Beta rhythm.
Posttest Eyes Open
Eyes Open Serial Sevens (Mental Activity)
Participant was caffeinate and yet drowsy. Possible signal interference due to cartilage piercing.
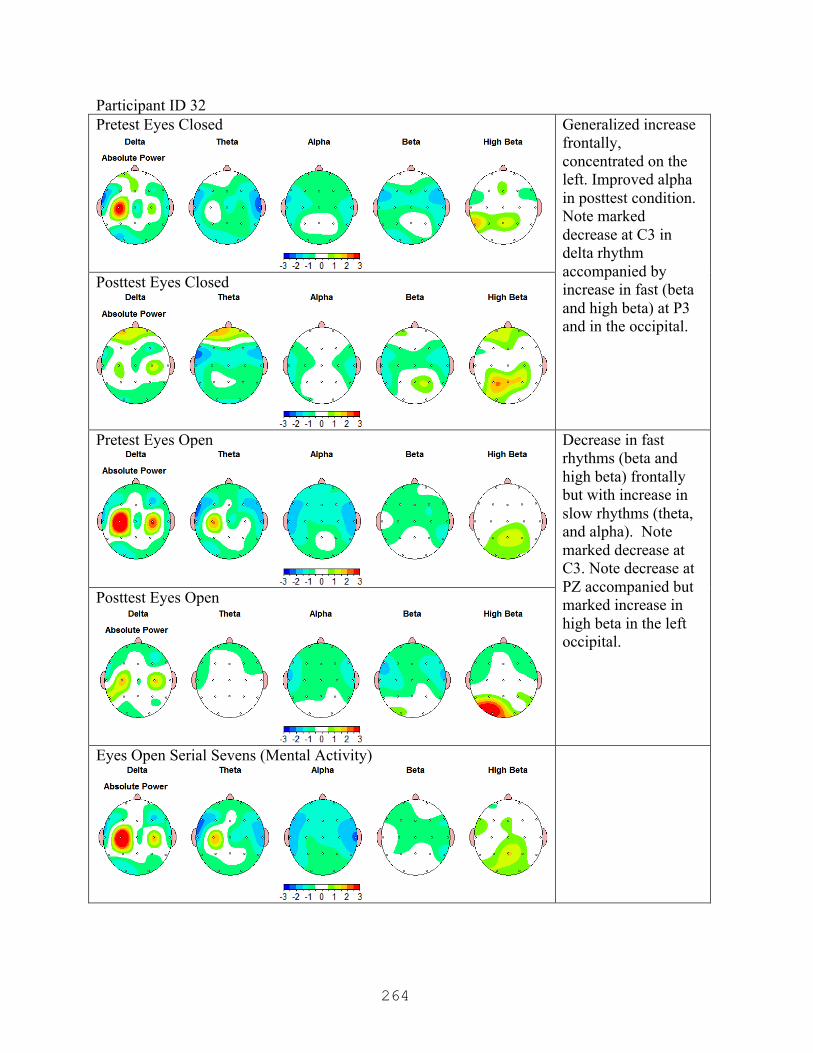
264
Participant ID 32 Pretest Eyes Closed
Generalized increase frontally, concentrated on the left. Improved alpha in posttest condition. Note marked decrease at C3 in delta rhythm accompanied by increase in fast (beta and high beta) at P3 and in the occipital.
Posttest Eyes Closed
Pretest Eyes Open
Decrease in fast rhythms (beta and high beta) frontally but with increase in slow rhythms (theta, and alpha). Note marked decrease at C3. Note decrease at PZ accompanied but marked increase in high beta in the left occipital.
Posttest Eyes Open
Eyes Open Serial Sevens (Mental Activity)
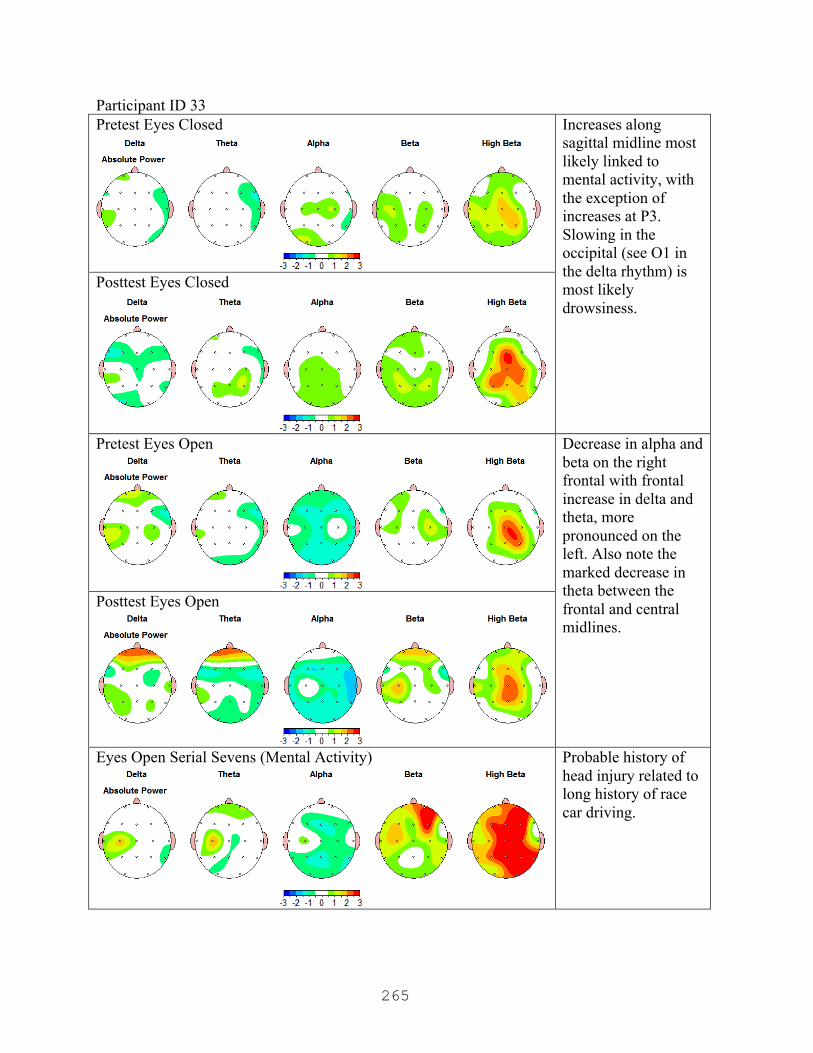
265
Participant ID 33 Pretest Eyes Closed
Increases along sagittal midline most likely linked to mental activity, with the exception of increases at P3. Slowing in the occipital (see O1 in the delta rhythm) is most likely drowsiness.
Posttest Eyes Closed
Pretest Eyes Open
Decrease in alpha and beta on the right frontal with frontal increase in delta and theta, more pronounced on the left. Also note the marked decrease in theta between the frontal and central midlines.
Posttest Eyes Open
Eyes Open Serial Sevens (Mental Activity)
Probable history of head injury related to long history of race car driving.

266
Participant ID 34 Pretest Eyes Closed
Frontal increase across in beta and high beta but with marked decrease at F8, increase at P3 in beta and high beta.
Posttest Eyes Closed
Pretest Eyes Open
Increase in frontal, more pronounced on the right, but note marked increase at F7.
Posttest Eyes Open
Eyes Open Serial Sevens (Mental Activity)

267
APPENDIX P
Posttest Comparison and LORETA Findings Tables (Personal Notes)
N ID
Eyes Closed Finding
LORETA Source Generation
Eyes Open Findings
LORETA Source Generation
Notes
10 Widespread decrease esp. in the right
Decreased activity in the frontal lobe (specifically in the middle and subcallosal gyrus of the frontal lobe)
Increase (HB) at PZ
Appears to be generated from the cuneus
Increase at P3 (theta, beta)
Anterior cingulate in the limbic system, with some activity in the cuneus/precuneus of the occipital lobe
11 Slowing due to bilateral frontal decrease in beta & HB; increase in alpha, theta and delta on the right.
Increase at Medial frontal gyrus
Large decrease R frontal/temporal, esp. between F8 and T4
Marked downregulation of the Insula as well as the precentral and medial frontal gyri of the frontal lobe
Some decrease (delta and theta) seen at (FP1)
Decrease in Superior frontal gyrus,
Marked diff at C3 and C4 & in the occipital
C3 and C4 accounted for by Upregulation at Medial Frontal Gyrus; Cuneus is source for changes at O1, O2

268
13 Slowing due to decrease in fast activity across frontal except for increase in delta
Appears to be marked upregulation in the anterior cingulate of the limbic system, possibly extending into the medial frontal gyrus3
Increase in frontal fast rhythms with decrease in theta
Medial frontal gyrus is upregulated
14 Slowing due to frontal increase delta and theta;
Appears to be marked upregulation in the anterior cingulate of the limbic system, possibly extending into the medial frontal gyrus
Increase in frontal fast rhythms with decrease in theta
Upregulation in Medial Frontal gyrus, with marked upregulation in Left middle frontal gyrus accounting for increased activity at F3. Right side continues to appear downregulated in frontal lobe.
marked decrease in R frontal
Downregulation in Middle frontal Gyrus of Frontal Lobe
with marked increase in L frontal (F3)
Marked Upregulation in Middle Frontal Gyrus of Frontal Lobe
15 Widespread frontal increase, more pronounced on left
Appears to be secondary to fluctuations in both the anterior cingulate as well as the medial frontal gyrus
Widespread, generalized increase (also accounts for increase at P3 and CZ)
Marked upregulation along the entire medial frontal gyrus extending back to the paracentral lobule of the frontal lobe, as well as the cingulate in the limbic system
Greatest at F7 Left Middle frontal gyrus

269
18 Some decrease frontally,
Down regulation in superior and middle frontal gyri of the frontal lobe
Increase in frontal alpha and beta
Limbically generated from the anterior cingulate
increase at P3 and PZ
Up regulation in the precuneus of the parietal lobe
Increase at P3 Appears to be generated in the cuneus of the occipital lobe but can also be seen generating into the posterior cingulate of the limbic system as well as the precuneus in the occipital region.
19 Marked increase frontally, pronounced at FP1 and F7;
Some upregulation in Medial Frontal Gyrus of frontal lobe
Frontal decrease, more pronounced on the left
Marked decrease in superior and middle frontal gyri in the left frontal lobe
Increase across the occipital and parietal in all bands except high beta.
Marked upregulation in the precuneus of the parietal
Decrease in high beta at P3
Possibly generated by marked upregulation in inferior parietal lobule on the left side
270
21 Marked increase between PZ and CZ;
Appears secondary to upregulation in the medial frontal gyrus that is generating back through the paracentral lobule in the parietal to the precuneus in the parietal lobe.
Slowing due to increase in delta at FZ and C4
LORETA Time Domain Capture Reveals marked dysfunction along entire Right side in both the middle and superior gyri of frontal lobe; when compared to TDC for EC, insula may also be affected
Head Injury
increase across frontal except in high beta which increases at FP2 and FZ
Fluctuations both up and down in right superior frontal gyrus (region is consistent with head injury location); upregulation in medial frontal gyrus also present
22 Generalized frontal increase, pronounced on the left.
Upregulation along Medial Frontal Gyrus and in Anterior Cingulate. Upregulation on left likely due to upregulation in middle frontal gyrus on that side.
Generalized frontal increase, pronounced on the left.
Same upregulation along Medial Frontal Gyrus and in Anterior Cingulate. Upregulation in middle frontal gyrus on left side still present.

271
23 Generalized frontal decrease
Widespread downregulation across frontal lobe in all substructures. (However, his precuneus in the parietal is still working.)
Slowing due to bilateral frontal increase except in delta
Seems to be generated by upregulation in both the precuneus in the parietal and the cingulate in the limbic system
Left handed; the pronunciation in the left temporal for almost all subjects is seen in this record on the right (demonstrating differences in part of the brain used to process language and perhaps some social cognition)
Note increase between FP1 and F3
Some intermittent upregulation in middle and superior frontal gyri
24 Generalized Left side frontal increase;
Increase in anterior cingulate at limbic system juncture. Left side increase may sourcing from here or from temporal fluctuations
Generalized frontal increase, pronounced on the left.
Both temporal lobes in flux, but increase appears attributed to increase in anterior cingulate, as well as some increase noted in superior, inferior, and middle frontal gyri. It is also noted that the precuneus in the parietal is upregulated
increase at P3 and across the central sites
Bilateral fluctuations in temporal lobes
272
26 Increase at FZ in alpha, beta and HB, decrease in theta and delta;
Most likely coming from Upregulation in the anterior cingulate and cingulate structures in the limbic system
Decrease at PZ and CZ
May be related to the downregulation in cingulate gyrus in limbic system
ROTC Head Injury
Slowing due to marked decrease bilaterally in frontally in alpha, beta and HB, more pronounced on the right
Upregulation in the anterior cingulate and cingulate structures in the limbic system and in the medial frontal gyrus. There is differentiation between R and L middle frontal gyri (left is upregulated; right is down)
Marked increase in HB at T6, P4, and PZ
May be related to increase in cingulate
273
27 Not analyzed due to poor recording.
Increase in right frontal fast
Increase sourcing from insula. Other increases seen in right middle frontal gyrus, superior frontal gyrus, and anterior cingulate from the limbic system.
Increase in frontal alpha that generalizes back along parietal midline to occipital region
Upregulation in both the anterior cingulate and the precuneus and cuneus in the parietal and occipital lobes
28 (Right side hot spot present in baseline but disappears in posttest) Increase frontally in theta, alpha and beta rhythms; in delta the increase is on the right.
Slowing due to frontal increase esp. in delta and theta at FP2
Some down regulation in frontal lobe accompanied by some activity in medial frontal gyrus. Note: “Hot spot” seems to have moved to R temporal.
Increase in HB at T4
Marked increase in R temporal
Some slowing due to increase in Delta at P3
Fluctuations in regulation in left parietal gyri
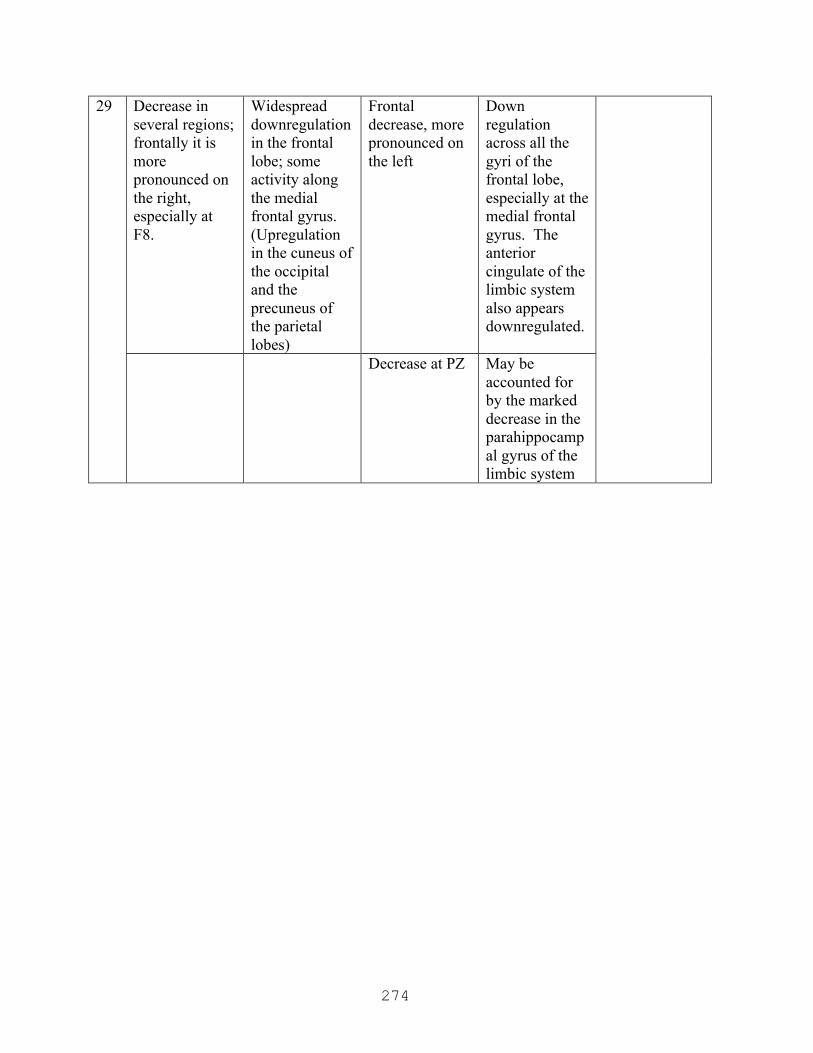
274
29 Decrease in several regions; frontally it is more pronounced on the right, especially at F8.
Widespread downregulation in the frontal lobe; some activity along the medial frontal gyrus. (Upregulation in the cuneus of the occipital and the precuneus of the parietal lobes)
Frontal decrease, more pronounced on the left
Down regulation across all the gyri of the frontal lobe, especially at the medial frontal gyrus. The anterior cingulate of the limbic system also appears downregulated.
Decrease at PZ May be accounted for by the marked decrease in the parahippocampal gyrus of the limbic system

275
30 Some slowing due to slight decrease in right frontal in beta and high beta with some increase on the left in except high beta and delta.
Right side slowing may be consistent with the observed decrease in right side activity; left side increase most likely correlated with increase, especially in the left middle frontal gyrus. There is also marked activity in the anterior cingulate in the limbic system.
Frontal increase with decrease in delta at F7
Increase in left middle frontal gyrus
Increase in beta at T5
Increase is consistent with language processing or semantic memory
Some increase along parietal medial line, more pronounced on the right, generalizing to the right occipital in the beta and high beta rhythms.
Source generation indicated the precuneus in both the parietal and occipital lobes.

276
31 Slowing due to decrease in right frontal in beta and high beta. Decrease in left frontal.
Widespread down regulation in the frontal lobe
Frontal increase with decrease in delta at F7
Increase from the anterior cingulate in the limbic system
But note increase at FZ in high beta, beta, and alpha.
Dysregulation along medial frontal gyrus
Increase in HB at T5
Increase is consistent with language processing or semantic memory
Increase at P3 and C3 noted in theta, alpha and high beta.
Marked increase in precuneus of the parietal and occipital lobes
32 Generalized increase frontally, concentrated on the left. Improved alpha in posttest condition.
Marked increase in the anterior cingulate generalizing into the medial frontal gyrus
Frontal slowing (decrease in fast with increase in slower rhythms)
Widespread downregulation across frontal region.
increase in fast (beta and high beta) at P3 and at O1, O2
Increase in posterior cingulate in the limbic system as well as the cuneus of the occipital
Increase in HB at O1
Marked increase in the posterior cingulate and occipital cuneus
33 Increases at P3. Most likely the posterior cingulate in the limbic system
Slowing due to decrease in alpha and beta in right frontal, with increase in delta and theta on the left with decreased theta between frontal and central midlines
Widespread frontal downregulation except for activity generated from anterior cingulate in the limbic system
Head Injury
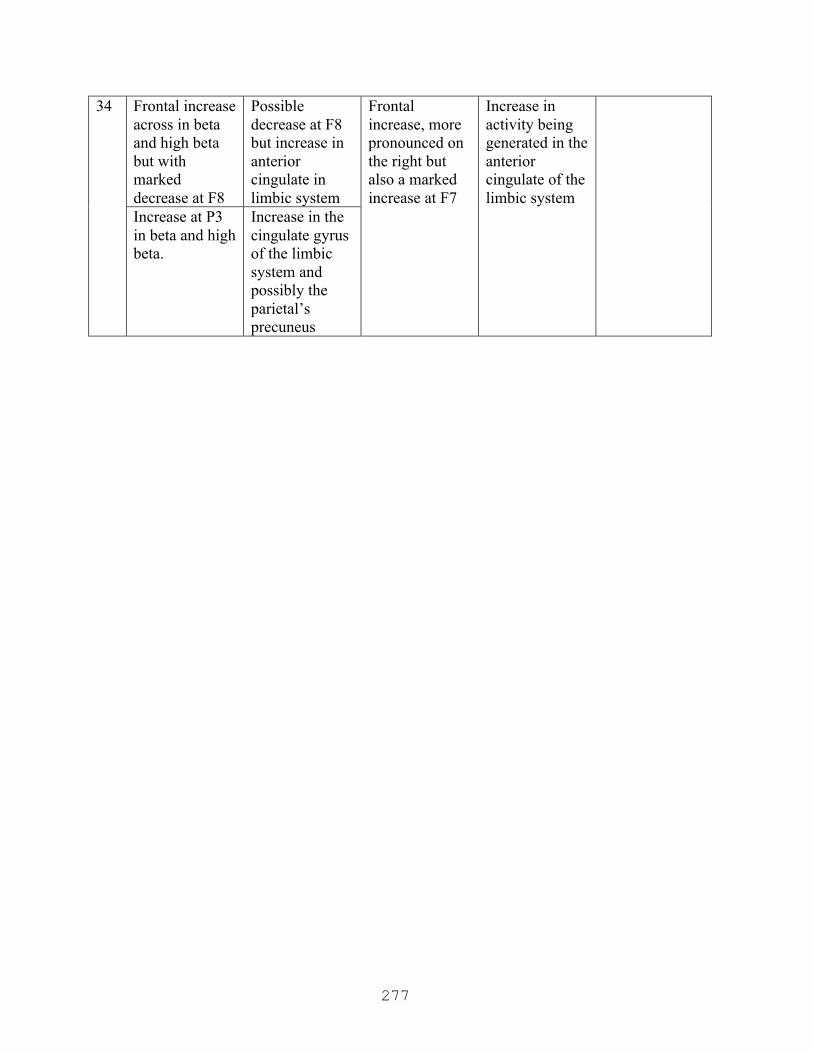
277
34 Frontal increase across in beta and high beta but with marked decrease at F8
Possible decrease at F8 but increase in anterior cingulate in limbic system
Frontal increase, more pronounced on the right but also a marked increase at F7
Increase in activity being generated in the anterior cingulate of the limbic system
Increase at P3 in beta and high beta.
Increase in the cingulate gyrus of the limbic system and possibly the parietal’s precuneus
278
APPENDIX Q
Approval Letter from Pepperdine GPS IRB
Graduate & Professional Schools Institutional Review Board
May 22, 2014
Angela Deulen
Protocol #: E0214D02 Project Title: The Neurobiology of Group Decision-Making
Dear Ms. Deulen:
Thank you for submitting your application, The Neurobiology of Group Decision-Making, for expedited review to Pepperdine University’s Graduate and Professional Schools Institutional Review Board (GPS IRB). The IRB appreciates the work you and your advisor, Dr. Rhodes completed on the proposal. The IRB has reviewed your submitted IRB application and all ancillary materials. As the nature of the research met the requirements for expedited review under provision Title 45 CFR 46.110 (Research Category 7) of the federal Protection of Human Subjects Act, the IRB conducted a formal, but expedited, review of your application materials.
I am pleased to inform you that your application for your study was granted Full Approval. The IRB approval begins today, May 22, 2014, and terminates on May 22, 2015.
Your final consent form has been stamped by the IRB to indicate the expiration date of study approval. One copy of the consent form is enclosed with this letter and one copy will be retained for our records. You can only use copies of the consent that have been stamped with the GPS IRB expiration date to obtain consent from your participants.
Please note that your research must be conducted according to the proposal that was submitted to the GPS IRB. If changes to the approved protocol occur, a revised protocol must be reviewed and approved by the IRB before implementation. For any proposed changes in your research protocol, please submit a Request for Modification form to the GPS IRB. Please be aware that changes to your protocol may prevent the research from qualifying for expedited review and require submission of a new IRB application or other materials to the GPS IRB. If contact with subjects will extend beyond May 22, 2015, a Continuation or Completion of Review Form must be submitted at least one month prior to the expiration date of study approval to avoid a lapse in approval.

279
A goal of the IRB is to prevent negative occurrences during any research study. However, despite our best intent, unforeseen circumstances or events may arise during the research. If an unexpected situation or adverse event happens during your investigation, please notify the GPS IRB as soon as possible. We will ask for a complete explanation of the event and your response. Other actions also may be required depending on the nature of the event. Details regarding the timeframe in which adverse events must be reported to the GPS IRB and the appropriate form to be used to report this information can be found in the Pepperdine University Protection of Human Participants in Research: Policies and Procedures Manual (see link to “policy material” at http://www.pepperdine.edu/irb/graduate/).
Please refer to the protocol number denoted above in all further communication or correspondence related to this approval. Should you have additional questions, please contact me. On behalf of the GPS IRB, I wish you success in this scholarly pursuit.
Sincerely,
Thema Bryant-Davis, Ph.D. Chair, Graduate and Professional Schools IRB Pepperdine University
cc: Dr. Lee Kats, Vice Provost for Research and Strategic Initiatives Mr. Brett Leach, Compliance Attorney Dr. Kent Rhodes, Faculty Advisor

280
APPENDIX R
Approval Letter from Secondary Institution’s IRB
RE: IRB Review IRB No.: 14-‐EF-‐002 Project: The Neurobiology of Group Decision-‐Making Date Received: 1/30/2014 Principle Investigator: Angela Deulen (Faculty member completing doctoral studies at Pepperdine University, CA) Faculty Advisor: Kent Rhodes (non-‐CBU faculty associated with Pepperdine University) Department/Program: School of Behavioral Sciences IRB Determination: Expedited Status Approved (filed for Full Review, which is not warranted; expedited criteria utilized) – Pilot and subsequent study (two Studys) conducted using laboratory-‐based research with human subjects/participants who are not members of a protected class; contrived situation using voluntary subjects; safe EEG/qEEG caps used, minimal risk to subjects; some data collected via online surveys; deception utilized as part of the independent variable, but in keeping with accepted practices for such research; may begin data collection. NOTE: PI may not recruit students in her courses; CBU student subjects may not be coerced or required to participate in this research. IRB renewal is for one (1) year from the date shown below. PI must notify the IRB within ten (10) working days after completing or discontinuing the research. Date: 2/4/2014
Neal F. McBride Certified IRB Professional (CIP) Chair, IRB
Neal F. McBride, Ed.D., Ph.D., CIP Associate Provost and Professor of Psychology Office of Institutional Research, Planning, and Assessment (OIRPA) CALIFORNIA BAPTIST UNIVERSITY 8432 Magnolia Ave Riverside, CA 92504 951.343.4925 [email protected]

281
APPENDIX S
Certificate of Human Subjects Training
CITI Collaborative Institutional Training Initiative (CITI) Social and Behavioral Responsible Conduct of Research Curriculum Completion Report Printed on 12/6/2011 Learner: Angela Deulen (username: [email protected]) Institution: Pepperdine University Contact Information Department: GSEP Email: [email protected] Social and Behavioral Responsible Conduct of Research: This course is for investigators, staff and students with an interest or focus in Social and Behavioral research. This course contains text, embedded case studies AND quizzes. Stage 1. Basic Course Passed on 12/06/11 (Ref # 7119652) Elective Modules Date Completed Score Introduction to the Responsible Conduct of Research 12/06/11 no quiz Research Misconduct 2-1495 12/06/11 4/5 (80%) Data Acquisition, Management, Sharing and Ownership 2-1523
12/06/11 4/5 (80%)
Publication Practices and Responsible Authorship 2-1518
12/06/11 5/5 (100%)
Peer Review 2-1521 12/06/11 4/5 (80%) Mentor and Trainee Responsibilities 01234 1250 12/06/11 5/6 (83%) Using Animal Subjects in Research 13301 12/06/11 6/8 (75%) Conflicts of Interest and Commitment 2-1462 12/06/11 6/6 (100%) Collaborative Research 2-1484 12/06/11 4/6 (67%) Human Subjects 13566 12/06/11 9/11 (82%) The CITI RCR Course Completion Page 12/06/11 no quiz
For this Completion Report to be valid, the learner listed above must be affiliated with a CITI participating institution. Falsified information and unauthorized use of the CITI course site is unethical, and may be considered scientific misconduct by your institution. Paul Braunschweiger Ph.D. Professor, University of Miami Director Office of Research Education CITI Course Coordinator

282
APPENDIX T
Certificate of Completion in qEEG