The National Forest System
199
U.S. GOVERNMENT PUBLISHING OFFICE WASHINGTON : 38–016 PDF 2020 THE NATIONAL FOREST SYSTEM: RESTORING OUR FOREST INFRASTRUCTURE HEARING BEFORE THE SUBCOMMITTEE ON CONSERVATION AND FORESTRY OF THE COMMITTEE ON AGRICULTURE HOUSE OF REPRESENTATIVES ONE HUNDRED SIXTEENTH CONGRESS FIRST SESSION SEPTEMBER 26, 2019 Serial No. 116–19 ( Printed for the use of the Committee on Agriculture agriculture.house.gov VerDate Aug 31 2005 16:26 Dec 16, 2020 Jkt 000000 PO 00000 Frm 00001 Fmt 5011 Sfmt 5011 P:\DOCS\116-19\38016.TXT BRIAN
-
Upload
khangminh22 -
Category
Documents
-
view
0 -
download
0
Transcript of The National Forest System
U.S. GOVERNMENT PUBLISHING OFFICE
WASHINGTON : 38–016 PDF 2020
THE NATIONAL FOREST SYSTEM: RESTORING OUR FOREST INFRASTRUCTURE
HEARING BEFORE THE
SUBCOMMITTEE ON CONSERVATION AND FORESTRY OF THE
COMMITTEE ON AGRICULTURE
HOUSE OF REPRESENTATIVES
ONE HUNDRED SIXTEENTH CONGRESS
FIRST SESSION
SEPTEMBER 26, 2019
Serial No. 116–19
(
Printed for the use of the Committee on Agriculture agriculture.house.gov
VerDate Aug 31 2005 16:26 Dec 16, 2020 Jkt 000000 PO 00000 Frm 00001 Fmt 5011 Sfmt 5011 P:\DOCS\116-19\38016.TXT BRIAN
COMMITTEE ON AGRICULTURE
COLLIN C. PETERSON, Minnesota, Chairman DAVID SCOTT, Georgia JIM COSTA, California MARCIA L. FUDGE, Ohio JAMES P. MCGOVERN, Massachusetts FILEMON VELA, Texas STACEY E. PLASKETT, Virgin Islands ALMA S. ADAMS, North Carolina
Vice Chair ABIGAIL DAVIS SPANBERGER, Virginia JAHANA HAYES, Connecticut ANTONIO DELGADO, New York TJ COX, California ANGIE CRAIG, Minnesota ANTHONY BRINDISI, New York JEFFERSON VAN DREW, New Jersey JOSH HARDER, California KIM SCHRIER, Washington CHELLIE PINGREE, Maine CHERI BUSTOS, Illinois SEAN PATRICK MALONEY, New York SALUD O. CARBAJAL, California AL LAWSON, JR., Florida TOM O’HALLERAN, Arizona JIMMY PANETTA, California ANN KIRKPATRICK, Arizona CYNTHIA AXNE, Iowa
K. MICHAEL CONAWAY, Texas, Ranking Minority Member
GLENN THOMPSON, Pennsylvania AUSTIN SCOTT, Georgia ERIC A. ‘‘RICK’’ CRAWFORD, Arkansas SCOTT DESJARLAIS, Tennessee VICKY HARTZLER, Missouri DOUG LAMALFA, California RODNEY DAVIS, Illinois TED S. YOHO, Florida RICK W. ALLEN, Georgia MIKE BOST, Illinois DAVID ROUZER, North Carolina RALPH LEE ABRAHAM, Louisiana TRENT KELLY, Mississippi JAMES COMER, Kentucky ROGER W. MARSHALL, Kansas DON BACON, Nebraska NEAL P. DUNN, Florida DUSTY JOHNSON, South Dakota JAMES R. BAIRD, Indiana JIM HAGEDORN, Minnesota
ANNE SIMMONS, Staff Director MATTHEW S. SCHERTZ, Minority Staff Director
SUBCOMMITTEE ON CONSERVATION AND FORESTRY
ABIGAIL DAVIS SPANBERGER, Virginia, Chair MARCIA L. FUDGE, Ohio TOM O’HALLERAN, Arizona CHELLIE PINGREE, Maine CYNTHIA AXNE, Iowa
DOUG LAMALFA, California, Ranking Minority Member
RICK W. ALLEN, Georgia RALPH LEE ABRAHAM, Louisiana TRENT KELLY, Mississippi
FELIX MUNIZ, JR., Subcommittee Staff Director
(II)
VerDate Aug 31 2005 16:26 Dec 16, 2020 Jkt 000000 PO 00000 Frm 00002 Fmt 0486 Sfmt 0486 P:\DOCS\116-19\38016.TXT BRIAN
(III)
C O N T E N T S
Page LaMalfa, Hon. Doug, a Representative in Congress from California, opening
statement .............................................................................................................. 8 Pingree, Hon. Chellie, a Representative in Congress from Maine, submitted
article .................................................................................................................... 68 Schrier, Hon. Kim, a Representative in Congress from Washington, submitted
letter ...................................................................................................................... 72 Spanberger, Hon. Abigail Davis, a Representative in Congress from Virginia,
opening statement ................................................................................................ 1 Prepared statement .......................................................................................... 2 Submitted news release ................................................................................... 29
WITNESS
Lago, Lenise, Associate Chief, U.S. Forest Service, U.S. Department of Agri-culture, Washington, D.C. ................................................................................... 3
Prepared statement .......................................................................................... 5 Submitted questions ......................................................................................... 73
VerDate Aug 31 2005 16:26 Dec 16, 2020 Jkt 000000 PO 00000 Frm 00003 Fmt 5904 Sfmt 5904 P:\DOCS\116-19\38016.TXT BRIAN

VerDate Aug 31 2005 16:26 Dec 16, 2020 Jkt 000000 PO 00000 Frm 00004 Fmt 5904 Sfmt 5904 P:\DOCS\116-19\38016.TXT BRIAN
(1)
THE NATIONAL FOREST SYSTEM: RESTORING OUR FOREST INFRASTRUCTURE
THURSDAY, SEPTEMBER 26, 2019
HOUSE OF REPRESENTATIVES, SUBCOMMITTEE ON CONSERVATION AND FORESTRY,
COMMITTEE ON AGRICULTURE, Washington, D.C.
The Subcommittee met, pursuant to call, at 10:05 a.m., in Room 1300 of the Longworth House Office Building, Hon. Abigail Davis Spanberger [Chair of the Subcommittee] presiding.
Members present: Representatives Spanberger, Fudge, O’Halleran, Pingree, Axne, Schrier, Panetta, Peterson (ex officio), LaMalfa, Allen, Kelly, Johnson, and Thompson.
Staff present: Melinda Cep, Prescott Martin III, Felix Muniz, Jr., Alison Titus, Ricki Schroeder, Patricia Straughn, Josh Maxwell, Dana Sandman, and Jennifer Yezak.
OPENING STATEMENT OF HON. ABIGAIL DAVIS SPANBERGER, A REPRESENTATIVE IN CONGRESS FROM VIRGINIA
The CHAIR. This hearing of the Subcommittee on Conservation and Forestry entitled, The National Forest System: Restoring our Forest Infrastructure, will come to order.
Good morning. I would like to welcome everyone to this hearing of the Conservation and Forestry Subcommittee on the National Forest System: restoring our forest infrastructure, a critically im-portant topic. I would also like to thank Ranking Member LaMalfa, who will be arriving shortly, for his engagement on this issue, as well as each Subcommittee Member for taking part in this hearing today.
The roads, trails, bridges, dams, and other facilities that make up our National Forest infrastructure help ensure safe and reliable access to natural resources and serve as an essential backbone for our economic activity.
More than 140 million Americans visit National Forest lands every year to camp, hike, fish, hunt, ski, and more. Recreation on and around Forest Service land contributes more than $10 billion to the U.S. economy every year and supports more than 143,000 full-time and part-time American jobs.
In addition to recreation, 66 million Americans in over 3,000 communities depend on Forest Service infrastructure for drinking water and wastewater services and many communities rely on For-est Service roads to drive their children to school; shop in neighbor-hood stores; and visit their doctors.
VerDate Aug 31 2005 16:26 Dec 16, 2020 Jkt 000000 PO 00000 Frm 00005 Fmt 6633 Sfmt 6633 P:\DOCS\116-19\38016.TXT BRIAN
2
However, as a consequence of deferring maintenance across the agency’s infrastructure portfolio, our forest infrastructure is in dis-repair, and no longer meets the needs of forest users, local commu-nities, and emergency responders. As is the case with all Federal land management agencies, appropriated funds have so far been in-sufficient.
With the deferred maintenance backlog of $5.2 billion, the ability of the American public to safely access and benefit from National Forests is greatly diminished. As many of our Subcommittee Mem-bers know all too well, one contributing factor to this acute backlog has been soaring fire suppression costs. The increasing frequency and intensity of wildfires has forced the agency to make some tough decisions, often pulling funds from non-fire accounts to ad-dress wildfires, and leaving fewer and fewer resources to support other aspects of the agency’s work, like deferred maintenance. We hope that the fire fix that goes into effect in Fiscal Year 2020 helps address this part of the deferred maintenance challenge.
Despite the challenges of aging infrastructure, the dedicated pub-lic servants at the Forest Service have continually worked to do more with less, and to deliver upon their mission: to sustain the health, diversity, and productivity of the nation’s forests and grass-lands to meet the needs of present and future generations.
Proper maintenance of our National Forests is a matter of safety and economic well-being. I hope this hearing will help us better un-derstand the severity of the deferred maintenance backlog, its im-pact on regional economies, and the agency’s future plans for cap-ital improvement.
[The prepared statement of Ms. Spanberger follows:]
PREPARED STATEMENT OF HON. ABIGAIL DAVIS SPANBERGER, A REPRESENTATIVE IN CONGRESS FROM VIRGINIA
Good morning, I would like to welcome everyone to this hearing of the Conserva-tion and Forestry Subcommittee on The National Forest System: Restoring Our For-est Infrastructure, a critically important topic. I would also like to thank Ranking Member LaMalfa for his engagement on this issue, as well as each Subcommittee Member for taking part in this hearing today.
National Forest infrastructure is the physical link to the outdoors. Its network of roads, trails, bridges, dams, and facilities helps ensure access to natural resources and secure the economic well-being of neighboring communities.
Over 140 million Americans visit National Forest lands year-round to camp, hike, fish, hunt, ski and snowboard, and take part in a wide range of other recreation. Recreation on and around Forest Service land contributes more than $10 billion to the U.S. economy every year and supports more than 143,000 full and part-time jobs.
66 million Americans in over 3,000 communities depend on Forest Service infra-structure for drinking water and wastewater services. Similarly, many communities rely on Forest Service roads to drive their children to school; shop in neighborhood stores; or visit their doctor, among other routine travel needs. Over the last 2 dec-ades alone, community development along the Wildland-Urban Interface has ex-panded by more than 46 million acres, an area larger than the State of Washington.
However, as a consequence of deferring maintenance in the agency’s infrastruc-ture portfolio, the state of our forest infrastructure has fallen far behind what is necessary to meet the needs of forest users, local communities, and emergency re-sponders. As is the case with all Federal land management agencies, appropriated funds have been insufficient to adequately maintain roads, trails, bridges, dams, and other important structures.
Over the last few decades, fire suppression costs have increased as the frequency and intensity of wildfires have also increased. These escalating costs have forced the agency to make some tough decisions, often pulling funds from non-fire accounts to address wildfires and leaving fewer and fewer resources to support other aspects of
VerDate Aug 31 2005 16:26 Dec 16, 2020 Jkt 000000 PO 00000 Frm 00006 Fmt 6633 Sfmt 6621 P:\DOCS\116-19\38016.TXT BRIAN
3
the agency’s work, like deferred maintenance. We hope that the fire budget fix that goes into effect in FY20 solves that component of this issue. With a deferred mainte-nance backlog of $5.2 billion, the ability of the American public to safely access and benefit from National Forests is greatly diminished.
Despite the challenges of aging infrastructure, the Forest Service has continually worked to do more with less and has charged itself to develop a long-term plan to deliver upon its mission to ‘‘sustain the health, diversity, and productivity of the na-tion’s forests and grasslands to meet the needs of present and future generations.’’
Proper maintenance of our National Forests is a matter of safety and economic well-being. I hope this hearing will help us better understand the severity of the deferred maintenance backlog, its impact on regional economies, and the agency’s future plans for capital improvement.
This is the important subject of our hearing today, to better understand the level of deferred maintenance; its impact on economic opportunity and public use; and to examine agency plans for capital improvement.
The CHAIR. With that, I will recognize the Ranking Member once he has arrived. But in consultation with the Ranking Member and pursuant to Rule XI(e), I want to make Members of the Sub-committee aware that other Members of the full Committee may join us today.
The chair would request that other Members submit their open-ing statements for the record so the witness may begin her testi-mony, and to ensure there is ample time for questions today.
I would like to welcome our witness, Ms. Lenise Lago, Associate Chief for the U.S. Forest Service. In coordination with the Chief, Ms. Lago helps lead a workforce of more than 28,000 year-round employees, and an additional 12,000 seasonal employees, and is a steward to 193 million acres of National Forests and Grasslands.
Ms. Lago worked briefly in the forest products industry before joining the Forest Service in 1989. She has worked in a variety of planning, budget, and resource management jobs, splitting time be-tween Washington, D.C., and the western United States, including Montana, Washington, and Oregon.
Associate Chief Lago is a native of Athens, Georgia, and a grad-uate of the University of Georgia’s Warnell School of Forest Re-sources.
Ms. Lago, you will have 5 minutes to present your testimony. The light will turn yellow, signaling when you have 1 minute left to complete your testimony. Please begin when you are ready.
STATEMENT OF LENISE LAGO, ASSOCIATE CHIEF, U.S. FOREST SERVICE, U.S. DEPARTMENT OF AGRICULTURE, WASHINGTON, D.C.
Ms. LAGO. Thank you, Madam Chair, Ranking Member LaMalfa, and Members of the Committee. Thank you for inviting me to share the Administration’s views on infrastructure within USDA’s Forest Service. I want to thank and acknowledge how important this opportunity is to testify on this important topic. I would also like to thank you for the support you have given us to carry out our programs.
Infrastructure is the physical link between Americans and their public lands, and Forest Service infrastructure is vital to rural and urban communities alike. It includes roads, trails, bridges, visitor centers used by the public, as well as offices, air tanker bases, em-ployee housing, water and wastewater systems which we use to manage and protect all of the other resources. People depend on a safe Forest Service road network to get to schools, to hospitals,
VerDate Aug 31 2005 16:26 Dec 16, 2020 Jkt 000000 PO 00000 Frm 00007 Fmt 6633 Sfmt 6601 P:\DOCS\116-19\38016.TXT BRIAN
4
homes, stores. The road system is also critical to carrying out ac-tive management to improve forest conditions.
Infrastructure drives the economic benefits communities derive from National Forests. The Forest Service provides the most di-verse recreation opportunities in the nation, across world-class landscapes that attract, as you mentioned, Madam Chair, over 140 million visitors annually, contributes $10 billion to the U.S. econ-omy each year, and supports over 140,000 jobs, mostly in gateway and rural communities. Outdoor recreation and tourism are the single greatest source of jobs for local economies in the National Forest System.
Perhaps most critically, forest infrastructure provides fire protec-tion for communities. Firefighters and emergency responders use forest infrastructure to access forest lands for firefighting oper-ations, to protect communities, to evacuate families from areas at risk, and to rescue individuals from danger.
Of specific interest here today is deferred maintenance, and my written testimony includes tables listing various assets the Forest Service owns and maintains, and the deferred maintenance by asset category. I am not going to cite all that here, but just to roughly identify the portfolio that we are talking about, the Forest Service maintains over 370,000 miles of roads. That includes over 6,000 bridges. We have 158,000 miles of trail, including over 7,000 trail bridges. We have almost 40,000 buildings of all types, includ-ing administrative buildings, research buildings, employee housing, and recreation sites.
I think you know; deferred maintenance is scheduled mainte-nance that doesn’t get done. It has a dollar value, and the dollar value accumulates over time. As a result of deferred maintenance, the state of the Forest Service infrastructure has fallen far behind what is necessary to meet the needs of our forests and our forest users.
Today, the Forest Service has a deferred maintenance backlog of more than $5.2 billion. Our capital improvement budget has not kept up with needed maintenance. The President’s budget request for Fiscal Year 2020 includes a public land infrastructure fund, which allocates monies for deferred maintenance in the National Forest System.
Another funding source for Forest Service infrastructure comes from the Federal Highway Administration Federal Lands Trans-portation Program. Interestingly, while the Forest Service has more miles of publicly accessible road and many times more bridges than other Federal land management agencies, the Forest Service receives only about five percent of the funding from this program.
In addition to funding, the agency is doing its part to reduce de-ferred maintenance. We are taking bold steps to streamline our en-vironmental review process and speed up important work that could protect communities, livelihoods, and resources. We are using tools provided by Congress as well. We have continued to use con-veyance authority, which allows us to sell facilities that are no longer needed, and keep the proceeds to address other infrastruc-ture needs. We just proposed a rulemaking for the Powerline Util-ity Corridor Authority from the 2018 appropriations bill, and the
VerDate Aug 31 2005 16:26 Dec 16, 2020 Jkt 000000 PO 00000 Frm 00008 Fmt 6633 Sfmt 6601 P:\DOCS\116-19\38016.TXT BRIAN
5
1 ‘‘Deferred maintenance’’ is the continual delay of maintenance of Forest Service infrastruc-ture assets. Deferred maintenance prevents buildings, roads, bridges, and other assets from reaching their expected useful lifespans. The total dollar value of deferred maintenance is deter-mined by totaling all of the work items of components and systems that need to be repaired or replaced. It does not include unforeseen failures such as a boiler leak, or a wash out of a road or bridge by a storm, etc.
Communication Sites Authority from the 2018 Farm Bill, in addi-tion to the Leasing Authority, which was included in the 2018 Farm Bill.
FLREA, the Federal Lands Recreation Enhancement Act, has en-abled us to keep up with needed maintenance at heavily-used de-veloped recreation sites across the country.
So, with funding, innovation, efficiency, and partnerships, those are the keys to taking care of these important assets. Managing a healthy infrastructure is an important part of our job, and it sup-ports our ability to carry out our mission.
Again, I am deeply grateful to the Committee for this oppor-tunity to talk about our infrastructure, to share ideas about how to improve our backlog of deferred maintenance, and we appreciate your support. I am happy to answer any questions.
Thank you. [The prepared statement of Ms. Lago follows:]
PREPARED STATEMENT OF LENISE LAGO, ASSOCIATE CHIEF, U.S. FOREST SERVICE, U.S. DEPARTMENT OF AGRICULTURE, WASHINGTON, D.C.
Regarding Infrastructure on National Forest System Lands Madam Chair and Members of the Subcommittee, thank you for inviting me to
share the Administration’s position on deferred maintenance within the U.S. De-partment of Agriculture’s Forest Service.
On the National Forest System, infrastructure is the physical link between Ameri-cans and their public lands. It strengthens communities by giving them safe access to the many ecological, economic, and social amenities these lands provide. For in-stance, people use infrastructure on the National Forest System for ranching, farm-ing, logging, outdoor recreation, tourism, and municipal water services, all of which support thriving small businesses, particularly in local communities. People depend on the Forest Service road network to get to schools, stores, hospitals, and homes. Perhaps most critically, forest infrastructure provides fire protection for commu-nities. Firefighters and emergency responders use forest infrastructure to access for-est lands for firefighting operations to protect communities, evacuate families from areas at risk, and rescue individuals from danger.
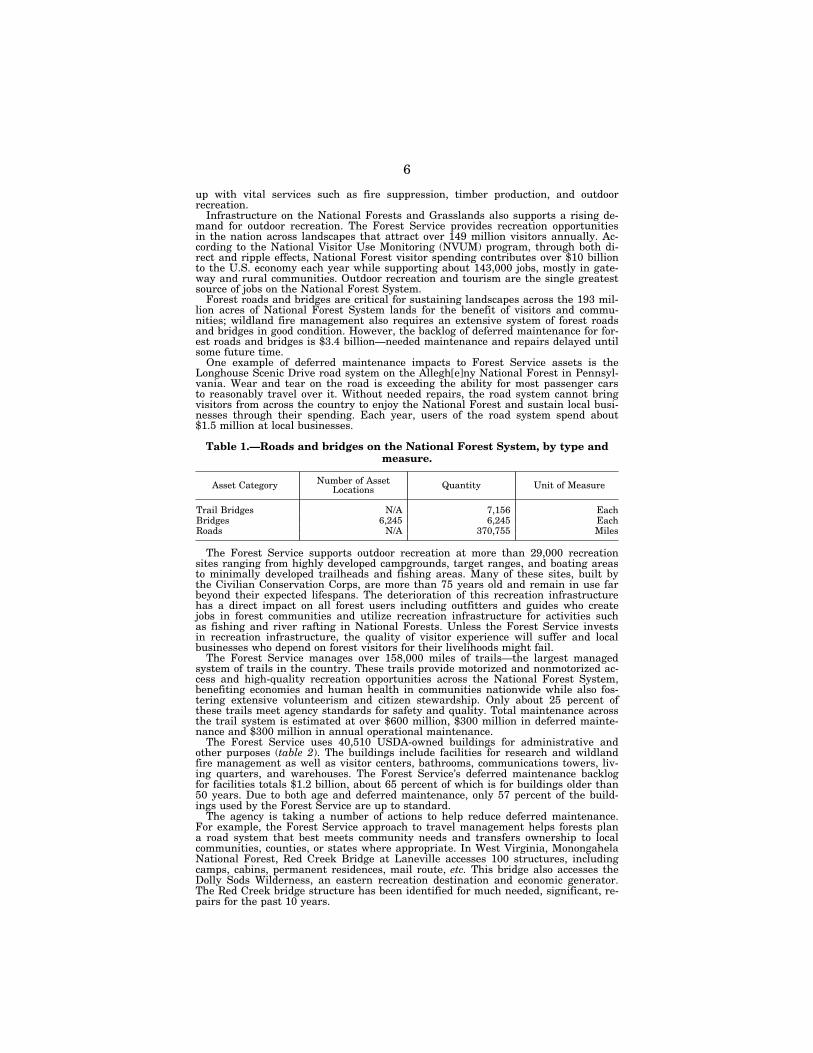
The infrastructure on the National Forest System includes over 370,000 miles of road, 13,400 bridges and trail bridges (see table 1), 158,000 miles of trail, nearly 500 Forest Service owned dams, over 1,100 privately owned dams overseen by the Forest Service, and facilities for both administration and wildland fire management. The roads, bridges, facilities, and other infrastructure affect every aspect of the For-est Service mission and are critical to the effective management of National Forests and Grasslands on behalf of the American public.
However, as a consequence of deferring maintenance in our extensive infrastruc-ture portfolio, the state of the Forest Service’s infrastructure has fallen far behind what is necessary to meet the needs of our forests and forest users. Today, the For-est Service has a deferred maintenance 1 backlog of more than $5.2 billion (table 3— Deferred Maintenance Backlog; data is also available by state).
The President’s Budget for Fiscal Year 2020 includes a Public Lands Infrastruc-ture Fund allocating monies for deferred maintenance on the National Forest Sys-tem. USDA welcomes the opportunity for further discussion with the Subcommittee regarding the proposed fund to meet the Forest Service’s deferred maintenance needs.
Our infrastructure needs are pressing, and neglecting to meet them only makes the problem worse. Neglecting routine maintenance turns minor repairs into major- overhaul work. Ultimately, if left unchecked, it can turn critical infrastructure unus-able to the point of requiring full replacement. Every delay expands deferred main-tenance beyond the Forest Service’s ability to maintain our infrastructure and keep
VerDate Aug 31 2005 16:26 Dec 16, 2020 Jkt 000000 PO 00000 Frm 00009 Fmt 6633 Sfmt 6621 P:\DOCS\116-19\38016.TXT BRIAN
6
up with vital services such as fire suppression, timber production, and outdoor recreation.
Infrastructure on the National Forests and Grasslands also supports a rising de-mand for outdoor recreation. The Forest Service provides recreation opportunities in the nation across landscapes that attract over 149 million visitors annually. Ac-cording to the National Visitor Use Monitoring (NVUM) program, through both di-rect and ripple effects, National Forest visitor spending contributes over $10 billion to the U.S. economy each year while supporting about 143,000 jobs, mostly in gate-way and rural communities. Outdoor recreation and tourism are the single greatest source of jobs on the National Forest System.
Forest roads and bridges are critical for sustaining landscapes across the 193 mil-lion acres of National Forest System lands for the benefit of visitors and commu-nities; wildland fire management also requires an extensive system of forest roads and bridges in good condition. However, the backlog of deferred maintenance for for-est roads and bridges is $3.4 billion—needed maintenance and repairs delayed until some future time.
One example of deferred maintenance impacts to Forest Service assets is the Longhouse Scenic Drive road system on the Allegh[e]ny National Forest in Pennsyl-vania. Wear and tear on the road is exceeding the ability for most passenger cars to reasonably travel over it. Without needed repairs, the road system cannot bring visitors from across the country to enjoy the National Forest and sustain local busi-nesses through their spending. Each year, users of the road system spend about $1.5 million at local businesses.
Table 1.—Roads and bridges on the National Forest System, by type and measure.
Asset Category Number of Asset Locations Quantity Unit of Measure
Trail Bridges N/A 7,156 Each Bridges 6,245 6,245 Each Roads N/A 370,755 Miles
The Forest Service supports outdoor recreation at more than 29,000 recreation sites ranging from highly developed campgrounds, target ranges, and boating areas to minimally developed trailheads and fishing areas. Many of these sites, built by the Civilian Conservation Corps, are more than 75 years old and remain in use far beyond their expected lifespans. The deterioration of this recreation infrastructure has a direct impact on all forest users including outfitters and guides who create jobs in forest communities and utilize recreation infrastructure for activities such as fishing and river rafting in National Forests. Unless the Forest Service invests in recreation infrastructure, the quality of visitor experience will suffer and local businesses who depend on forest visitors for their livelihoods might fail.
The Forest Service manages over 158,000 miles of trails—the largest managed system of trails in the country. These trails provide motorized and nonmotorized ac-cess and high-quality recreation opportunities across the National Forest System, benefiting economies and human health in communities nationwide while also fos-tering extensive volunteerism and citizen stewardship. Only about 25 percent of these trails meet agency standards for safety and quality. Total maintenance across the trail system is estimated at over $600 million, $300 million in deferred mainte-nance and $300 million in annual operational maintenance.
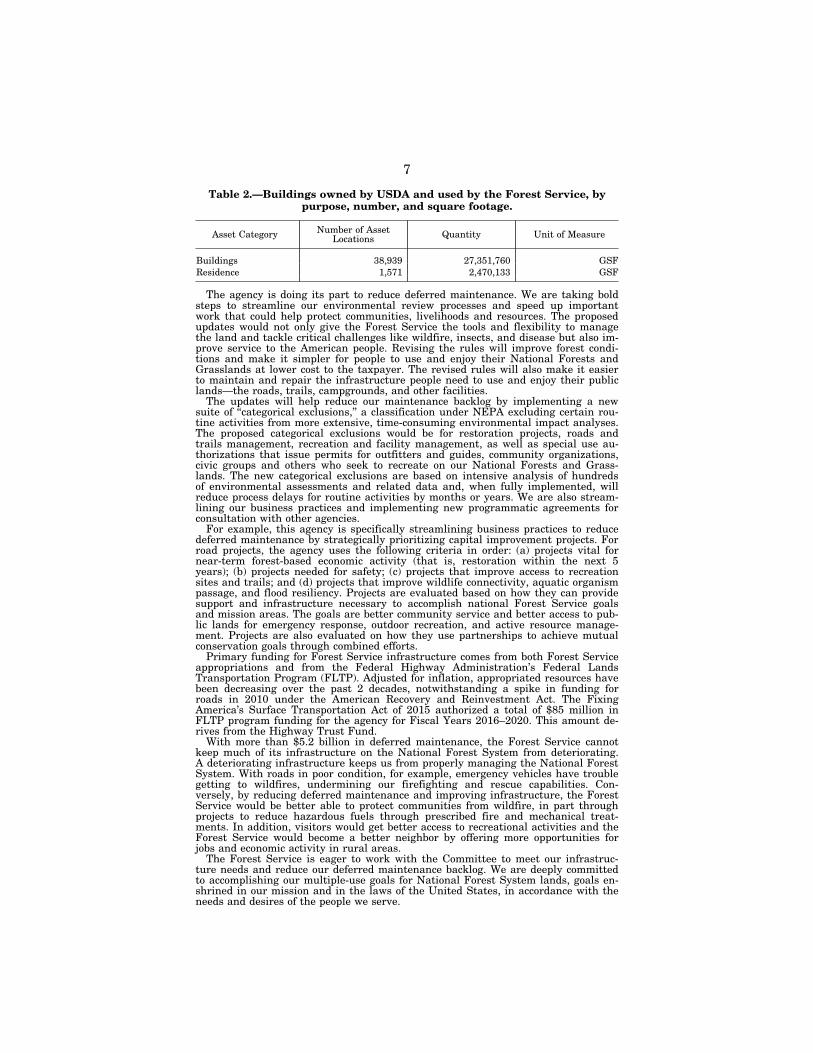
The Forest Service uses 40,510 USDA-owned buildings for administrative and other purposes (table 2). The buildings include facilities for research and wildland fire management as well as visitor centers, bathrooms, communications towers, liv-ing quarters, and warehouses. The Forest Service’s deferred maintenance backlog for facilities totals $1.2 billion, about 65 percent of which is for buildings older than 50 years. Due to both age and deferred maintenance, only 57 percent of the build-ings used by the Forest Service are up to standard.
The agency is taking a number of actions to help reduce deferred maintenance. For example, the Forest Service approach to travel management helps forests plan a road system that best meets community needs and transfers ownership to local communities, counties, or states where appropriate. In West Virginia, Monongahela National Forest, Red Creek Bridge at Laneville accesses 100 structures, including camps, cabins, permanent residences, mail route, etc. This bridge also accesses the Dolly Sods Wilderness, an eastern recreation destination and economic generator. The Red Creek bridge structure has been identified for much needed, significant, re-pairs for the past 10 years.
VerDate Aug 31 2005 16:26 Dec 16, 2020 Jkt 000000 PO 00000 Frm 00010 Fmt 6633 Sfmt 6621 P:\DOCS\116-19\38016.TXT BRIAN
7
Table 2.—Buildings owned by USDA and used by the Forest Service, by purpose, number, and square footage.
Asset Category Number of Asset Locations Quantity Unit of Measure
Buildings 38,939 27,351,760 GSF Residence 1,571 2,470,133 GSF
The agency is doing its part to reduce deferred maintenance. We are taking bold steps to streamline our environmental review processes and speed up important work that could help protect communities, livelihoods and resources. The proposed updates would not only give the Forest Service the tools and flexibility to manage the land and tackle critical challenges like wildfire, insects, and disease but also im-prove service to the American people. Revising the rules will improve forest condi-tions and make it simpler for people to use and enjoy their National Forests and Grasslands at lower cost to the taxpayer. The revised rules will also make it easier to maintain and repair the infrastructure people need to use and enjoy their public lands—the roads, trails, campgrounds, and other facilities.
The updates will help reduce our maintenance backlog by implementing a new suite of ‘‘categorical exclusions,’’ a classification under NEPA excluding certain rou-tine activities from more extensive, time-consuming environmental impact analyses. The proposed categorical exclusions would be for restoration projects, roads and trails management, recreation and facility management, as well as special use au-thorizations that issue permits for outfitters and guides, community organizations, civic groups and others who seek to recreate on our National Forests and Grass-lands. The new categorical exclusions are based on intensive analysis of hundreds of environmental assessments and related data and, when fully implemented, will reduce process delays for routine activities by months or years. We are also stream-lining our business practices and implementing new programmatic agreements for consultation with other agencies.
For example, this agency is specifically streamlining business practices to reduce deferred maintenance by strategically prioritizing capital improvement projects. For road projects, the agency uses the following criteria in order: (a) projects vital for near-term forest-based economic activity (that is, restoration within the next 5 years); (b) projects needed for safety; (c) projects that improve access to recreation sites and trails; and (d) projects that improve wildlife connectivity, aquatic organism passage, and flood resiliency. Projects are evaluated based on how they can provide support and infrastructure necessary to accomplish national Forest Service goals and mission areas. The goals are better community service and better access to pub-lic lands for emergency response, outdoor recreation, and active resource manage-ment. Projects are also evaluated on how they use partnerships to achieve mutual conservation goals through combined efforts.
Primary funding for Forest Service infrastructure comes from both Forest Service appropriations and from the Federal Highway Administration’s Federal Lands Transportation Program (FLTP). Adjusted for inflation, appropriated resources have been decreasing over the past 2 decades, notwithstanding a spike in funding for roads in 2010 under the American Recovery and Reinvestment Act. The Fixing America’s Surface Transportation Act of 2015 authorized a total of $85 million in FLTP program funding for the agency for Fiscal Years 2016–2020. This amount de-rives from the Highway Trust Fund.
With more than $5.2 billion in deferred maintenance, the Forest Service cannot keep much of its infrastructure on the National Forest System from deteriorating. A deteriorating infrastructure keeps us from properly managing the National Forest System. With roads in poor condition, for example, emergency vehicles have trouble getting to wildfires, undermining our firefighting and rescue capabilities. Con-versely, by reducing deferred maintenance and improving infrastructure, the Forest Service would be better able to protect communities from wildfire, in part through projects to reduce hazardous fuels through prescribed fire and mechanical treat-ments. In addition, visitors would get better access to recreational activities and the Forest Service would become a better neighbor by offering more opportunities for jobs and economic activity in rural areas.
The Forest Service is eager to work with the Committee to meet our infrastruc-ture needs and reduce our deferred maintenance backlog. We are deeply committed to accomplishing our multiple-use goals for National Forest System lands, goals en-shrined in our mission and in the laws of the United States, in accordance with the needs and desires of the people we serve.
VerDate Aug 31 2005 16:26 Dec 16, 2020 Jkt 000000 PO 00000 Frm 00011 Fmt 6633 Sfmt 6621 P:\DOCS\116-19\38016.TXT BRIAN
8
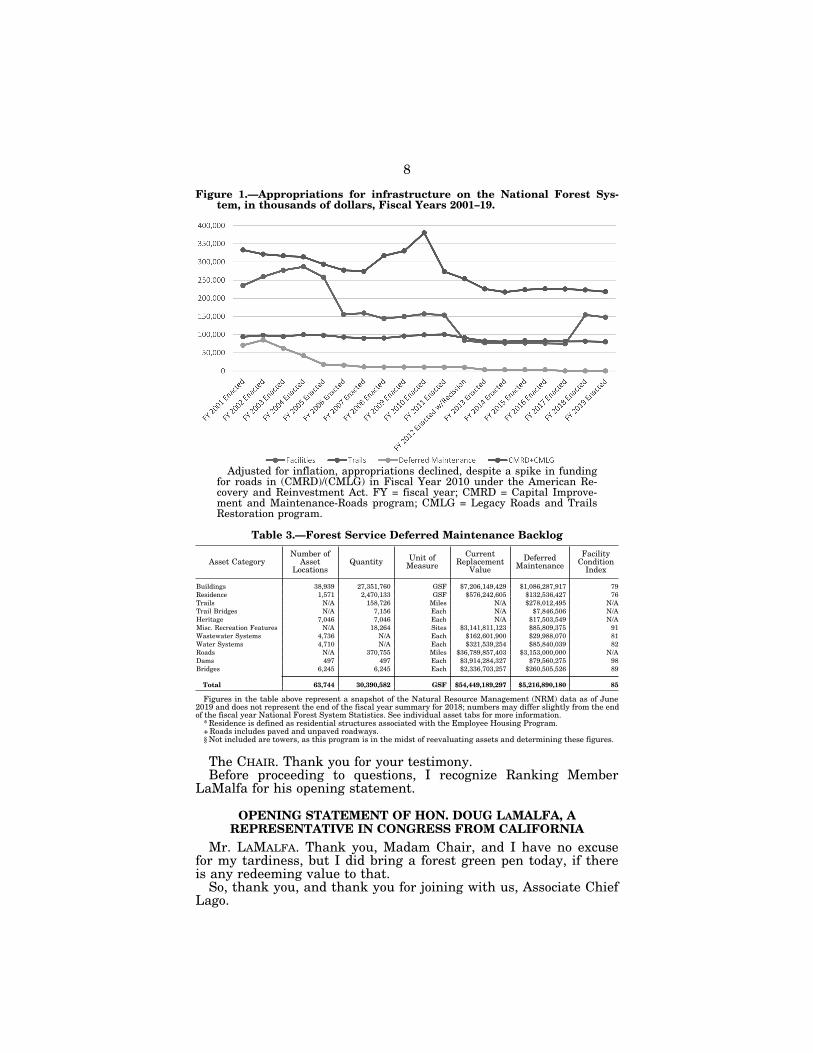
Figure 1.—Appropriations for infrastructure on the National Forest Sys-tem, in thousands of dollars, Fiscal Years 2001–19.
Adjusted for inflation, appropriations declined, despite a spike in funding for roads in (CMRD)/(CMLG) in Fiscal Year 2010 under the American Re-covery and Reinvestment Act. FY = fiscal year; CMRD = Capital Improve-ment and Maintenance-Roads program; CMLG = Legacy Roads and Trails Restoration program.
Table 3.—Forest Service Deferred Maintenance Backlog
Asset Category Number of
Asset Locations
Quantity Unit of Measure
Current Replacement
Value Deferred
Maintenance Facility
Condition Index
Buildings 38,939 27,351,760 GSF $7,206,149,429 $1,086,287,917 79 Residence 1,571 2,470,133 GSF $576,242,605 $132,536,427 76 Trails N/A 158,726 Miles N/A $278,012,495 N/A Trail Bridges N/A 7,156 Each N/A $7,846,506 N/A Heritage 7,046 7,046 Each N/A $17,503,549 N/A Misc. Recreation Features N/A 18,264 Sites $3,141,811,123 $85,809,375 91 Wastewater Systems 4,736 N/A Each $162,601,900 $29,988,070 81 Water Systems 4,710 N/A Each $321,539,254 $85,840,039 82 Roads N/A 370,755 Miles $36,789,857,403 $3,153,000,000 N/A Dams 497 497 Each $3,914,284,327 $79,560,275 98 Bridges 6,245 6,245 Each $2,336,703,257 $260,505,526 89
Total 63,744 30,390,582 GSF $54,449,189,297 $5,216,890,180 85
Figures in the table above represent a snapshot of the Natural Resource Management (NRM) data as of June 2019 and does not represent the end of the fiscal year summary for 2018; numbers may differ slightly from the end of the fiscal year National Forest System Statistics. See individual asset tabs for more information.
* Residence is defined as residential structures associated with the Employee Housing Program. + Roads includes paved and unpaved roadways. § Not included are towers, as this program is in the midst of reevaluating assets and determining these figures.
The CHAIR. Thank you for your testimony. Before proceeding to questions, I recognize Ranking Member
LaMalfa for his opening statement.
OPENING STATEMENT OF HON. DOUG LAMALFA, A REPRESENTATIVE IN CONGRESS FROM CALIFORNIA
Mr. LAMALFA. Thank you, Madam Chair, and I have no excuse for my tardiness, but I did bring a forest green pen today, if there is any redeeming value to that.
So, thank you, and thank you for joining with us, Associate Chief Lago.
VerDate Aug 31 2005 16:26 Dec 16, 2020 Jkt 000000 PO 00000 Frm 00012 Fmt 6633 Sfmt 6601 P:\DOCS\116-19\38016.TXT BRIAN 1161
9001
.eps
9
As we know, the National Forest System created more than 100 years ago, designed—and this is an important key point—for mul-tiple uses for the surrounding communities. And so, it is a vast net-work, 193 million acres of public land, and much of the infrastruc-ture, like we hear with our National Park System, is aging and re-quires regular upkeep, which hasn’t been quite regular. We have budget challenges, such as fire borrowing, loss of revenue due to declining timber harvests, all contributing to the backlog we are talking about.
A significant portion of the backlog, nearly 75 percent, is mainte-nance of the 370,000 mile road system within our forests, a lot of that in California, my home state. Of course, the maintenance of these forest roads cannot be understated, and they provide access to the public for access to their lands, recreation, resources. They connect our communities and are very important for our fire-fighters, of which we suffer a lot of fire in the West lately.
Congress has worked to provide several solutions to address the deferred maintenance, such as providing the fire funding fix in the Consolidated Appropriations Act of 2018 to prevent fire borrowing, something we are all happy about, from other accounts, including those accounts used for National Forest roads. The 2018 Farm Bill provided more tools for the Forest Service, with management of for-est lands, and allows more partners to assist them in these activi-ties. The House-passed version of the farm bill also contained sev-eral provisions that would have strengthened these goals, including several categorical exclusions that would have addressed bureau-cratic red tape that has hindered the Forest Service from address-ing many of the maintenance issues we will be talking about today.
Unfortunately, that version did not make it through the Senate last year. Earlier this year, though, the Forest Service announced they were working on streamlining environmental analyses. I be-lieve it is common sense that current facilities should be able to be improved without wasting significant time and money due to un-necessary hurdles.
The Forest Service has recently completed a comprehensive cap-ital improvement plan also that we hope can be a strategy to help address this maintenance backlog, and get back to a healthy and sustainable functioning forest system.
Again, Associate Chief Lago, we appreciate your being here today, and look forward to the dialogue and Q&A.
So, thank you, and I appreciate it, Madam Chair. I yield back. The CHAIR. Members will be recognized for questioning in order
of seniority for Members who were here at the start of the hearing. After that, Members will be recognized in the order of their arrival.
I first recognize myself for 5 minutes. Associate Chief Lago, in your written testimony, you mention the
Forest Service currently has a deferred maintenance backlog of more than $5.2 billion. Can you speak to the backlog’s impact on local economies, including recreational outfitters and other small businesses that serve locals and visitors alike? Additionally, please discuss the impact on local small businesses that would complete some of the infrastructure work on projects such as building and maintaining roads?
Ms. LAGO. Certainly. Thank you, Madam Chair.
VerDate Aug 31 2005 16:26 Dec 16, 2020 Jkt 000000 PO 00000 Frm 00013 Fmt 6633 Sfmt 6601 P:\DOCS\116-19\38016.TXT BRIAN
10
The condition of deteriorated infrastructure means we can’t pro-vide a full season of use to many users of National Forest lands. You mentioned outfitter guides, campground operators. Just to bring it down to the operator level, an outfitter and guide needs road access, typically some parking lots, uses campgrounds some-times, boat launches. When we can’t keep those open or when we have to restrict the season of use, that means that outfitter and guide has to reduce their season days. It has a direct economic ef-fect on that outfitter and guide.
It is the same with a campground. A campground operator is charging a fee, and we can’t maintain the water system so we have to shut the water off to that campground. They can still have campers, but they have to provide their own water. It degrades the experience for campers, and they are less likely to go to that camp-ground. Again, a direct economic hit to a service provider.
How increasing our maintenance affects local economies is for the most part, that deferred maintenance is carried out by contrac-tors, partners, service providers in those local communities.
The CHAIR. Thank you, and I do have a second question with a little bit of a personal bit to it.
I have been a Girl Scout leader for the past 5 years, and I have seen the importance of scouting and the role that the outdoors play in the lives of young women and in boys who participate in Boy Scouts. And events like the upcoming Hike-a-palooza in George Washington National Forest not only provides young women with the opportunity to explore the outdoors, but also promotes environ-mental stewardship and provides exposure to careers in conserva-tion.
The Forest Service’s ability to maintain its infrastructure is cen-tral to ensuring that the future generations are invested in con-servation and have the opportunity to enjoy our country’s stunning public lands.
On the topic of environmental stewardship, I understand the Forest Service relies on partnerships and volunteers, in addition to Federal funding. Can you tell us about some of these cooperative agreements, and how they help maintain safe, accessible trails in places like the George Washington National Forest?
Ms. LAGO. Sure. Thank you for that. Just generally speaking, the total value of our partnerships and
agreements is over $1 billion annually, and more than half of that is contributed by the partner.
Within the volunteer service hours that we rack up, trails work represents the majority of that work. We have people volunteering to do trail maintenance that is more than 1.5 billion hours annu-ally. That is more than 800 full-time equivalents, and they help us maintain over 30,000 miles of trail a year.
And in your local forest, the G.W. Jeff, we have more than 50 co-operators on trails projects. I think last year they helped us main-tain almost 5,000 miles of trail. We have partnerships with student conservation organizations, back country horsemen, lots of partner-ships interested in helping us maintain that infrastructure.
The CHAIR. Thank you very much. I appreciate your answering my questions, and I would now recognize Ranking Member LaMalfa for his questions.
VerDate Aug 31 2005 16:26 Dec 16, 2020 Jkt 000000 PO 00000 Frm 00014 Fmt 6633 Sfmt 6601 P:\DOCS\116-19\38016.TXT BRIAN
11
Mr. LAMALFA. Thank you again, Assistant Chief. We are talking about—and you mentioned in your comments a
$5.2 billion maintenance backlog, and that has been a number that seems to be frozen for quite a few years, going back as far as 2012. Which if you look at inflation costs alone, but then obviously we have had some big events there in many of our forests with large fires, runoff, record levels of snow pack, and flooding, et cetera. And we know, we hear about it from our forest people out there about considerable damage to the roads, trails, et cetera, culverts.
But the dollar figure has stayed the same since 2012, so it makes me wonder, is there really some type of system as to how the For-est Service is monitoring, cataloging the damage to the various pieces of infrastructure in the forests to see that we are actually keeping up with the real number on the maintenance backlog that we are talking about.
Again, we know that there is a huge number for our National Parks, and I am wondering is there a system in place that we could be improving or one that you are working on to get what probably needs to be a more accurate number?
Ms. LAGO. Yes, sir. So it is, first of all, a big number, and as I described, our totality of infrastructure is big, diverse, spread out, and inaccessible.
The way we arrive at that number is we do sampling on an an-nual basis. We sample a portion of the roads, and then calculate an estimate. We sample buildings and dams on a 5 year cycle, dams on a 2 year cycle.
But in addition, events like fires and floods can take out bridges. Sometimes we don’t replace them, so that removes the asset and it removes the deferred maintenance along with it.
We are doing lands transactions every year, and we may convey an asset with a deferred maintenance, and thus reduce it.
Mr. LAMALFA. So, with the loss of a bridge in a situation like that, you can take it off the books because it doesn’t exist anymore.
Now on my farm, if one of my tractors catches fire, I don’t get just to write of the asset. I still need that amount of tractor power to be able to get over the acres I do in a year.
How is this going to be serving the people in the area, whether it is for firefighters, access, logging, whatever it is? How can we just write that asset off?
Ms. LAGO. It depends on the local area, and a lot of these assets are legacies from many, many years ago. It might be in a portion of the forest where access has been terminated or is seasonally closed, and we may decide not to replace that bridge in-kind, but do some sort of lower scale, more like a trail bridge or something like that.
Mr. LAMALFA. Is it done in conjunction with local needs, with local—whether it is safety officials or logging or access, or is that decision made in D.C.? Is it made by the local forester? I mean, that is kind of disturbing to me that we can just write this off and maybe not have the input. How is that done?
Ms. LAGO. Yes, sir. It is a local decision. It is done with public input, environmental analysis, and disclosure.
Mr. LAMALFA. Okay. So timber receipts have been down. Back years ago, we are looking at 1991, we could see that there is $680
VerDate Aug 31 2005 16:26 Dec 16, 2020 Jkt 000000 PO 00000 Frm 00015 Fmt 6633 Sfmt 6601 P:\DOCS\116-19\38016.TXT BRIAN
12
million in timber receipts, of which ten percent goes directly to-wards forest roads, and it is also very important, those receipts, for local schools and roads under what is the Secure Rural Schools Fund. And so, now you want $680 million in receipts, and more re-cently, it is down to $21 million. It would seem to me we could be going farther if we had the timber receipts for the road mainte-nance for that ten percent.
Would you comment upon that? Ms. LAGO. Yes, sir. In recent years, we have been increasing our
timber sales. Those receipts are increasing as a result of that, and so——
Mr. LAMALFA. Do you know that number now compared to the $680 million not-inflation-adjusted 1991 number?
Ms. LAGO. I don’t know the total revenue, but I believe our tim-ber receipts—I will have to get back to you. No, I don’t.
Mr. LAMALFA. Okay, please do. With them down significantly, and since recreation is a primary
driver of road use; how much is being done to boost what is coming in on recreation fees, not by just raising the fees, but actually hav-ing more access in order to keep from losing more roads to deterio-ration?
Ms. LAGO. Our annual recreation fee collection is about $100 mil-lion. Eighty-five percent of that goes back to the site where it was generated, and the decision about fees for recreation use is on a site-by-site basis.
Mr. LAMALFA. I mean, as far as boosting the amount of recre-ation happening, is that a part of the strategy?
Ms. LAGO. On an individual site basis, the local management can and does suggest a fee increase, or to add an additional site into the fee revenue program.
Mr. LAMALFA. Yes. I am not angling for fee increases, but just more access where it is possible.
So, I am over time. I will yield back, Madam Chair. The CHAIR. I now recognize the gentlewoman from Ohio, for 5
minutes. Ms. FUDGE. Thank you, Madam Chair, and thank you, Chief
Lago, for being here this morning. I want to change the subject a bit to Job Corps, if we could just
talk about that for a bit. The Job Corps Civilian Conservation Cen-ters in particular.
We know that last year almost 2,000 Job Corps students from under-served communities contributed more than 100,000 hours to infrastructure improvements and to maintenance projects. Tell me what you see as the opportunity to grow that program?
Ms. LAGO. Yes, ma’am. Thank you. Just this week, Secretary of Agriculture Perdue traveled to Den-
ver, national Job Corps headquarters, and met with our Job Corps leadership, several center directors, and laid out a plan for a more formal program between National Forests and the Job Corps cen-ters where they reside to have more students doing restoration and maintenance work on Forest Service facilities, more conservation- related trades at Job Corps centers, and ultimately, more hiring of Job Corps graduates into Forest Service jobs.
VerDate Aug 31 2005 16:26 Dec 16, 2020 Jkt 000000 PO 00000 Frm 00016 Fmt 6633 Sfmt 6601 P:\DOCS\116-19\38016.TXT BRIAN
13
Ms. FUDGE. If I understand you correctly then, USDA is sup-portive of the program, wants to keep the program, and is going to try to broaden the program?
Ms. LAGO. Yes, ma’am. Ms. FUDGE. Good. Let me also ask, do the students who participate in this program
have any path toward becoming employed with the Forest Service or some other land management agency?
Ms. LAGO. Yes, ma’am. We currently have an authority called Public Land Corps Authority, which Job Corps students qualify for by doing certain number of hours of restoration work on public land. They are still required to compete for jobs in an open merit application.
What we would like to do is work with OPM on a direct hire au-thority for Job Corps graduates.
Ms. FUDGE. Can you tell me just for maybe some of my col-leagues’ benefit who are not familiar with the program, how has this program helped the agency?
Ms. LAGO. Well, you said it yourself. More than 2,000 students and 100,000 hours on projects doing restoration work in National Forests.
In addition to those numbers, we have upwards of 300,000 stu-dents annually supporting firefighting, either doing things like mo-bile cooking camps, or actually being on the fire line. About, ten of our 24 centers have conservation trades. You know, the typical trade at Job Corps is carpentry, masonry, plumbing, painting, auto mechanics. We have ten centers where we have forestry-related trades, and we would like to expand the conservation trades to all of our centers.
Ms. FUDGE. Well, I just appreciate the fact that the program is going to continue. It is an outstanding program. It gets young peo-ple involved at a level that we could never do in any other way.
I thank you, Assistant Chief, and I yield back, Madam Chair. The CHAIR. Thank you. I now recognize the gentleman from Mis-
sissippi, for 5 minutes. Mr. KELLY. Thank you, Madam Chair. I guess, what is the primary purpose of the National Forests? Ms. LAGO. To have enduring natural resources for the nation. Mr. KELLY. And specifically for recreation or for people—I know
there is some money-making, but sometimes we forget the main thing has got to be the main thing, and it is to provide opportuni-ties for people who may not have forests of their own to go enjoy that, the recreation, and also, there is some financial benefits to the United States as a whole. But it is to provide those opportuni-ties, recreational and hunting and other things, for our people.
I just ask that you remember, the main thing has always got to be the main thing. And so, I ask that we do all that we can to keep that open and accessible to all those hunters and recreationers and campers and bikers and cross-country runners and trail hikers, that we do everything we can. Because that is the purpose of these National Forests, what it was originally, is to keep that open.
That being said, the House farm bill last time contained several categorical exclusions that would have streamlined NEPA for re-constructing or rehabilitating National Forest infrastructure, from
VerDate Aug 31 2005 16:26 Dec 16, 2020 Jkt 000000 PO 00000 Frm 00017 Fmt 6633 Sfmt 6601 P:\DOCS\116-19\38016.TXT BRIAN
14
roads to dams and bridges, even bathroom and shower facilities at recreational sites. How would these CEs have been helpful to sav-ing time and money, while addressing the backlog of deferred maintenance programs?
Ms. LAGO. Yes, sir. Thank you, Congressman. The CEs that did not get included in the farm bill are very simi-
lar to the CEs we have just proposed in our rulemaking for NEPA for infrastructure for roads, bridges, and facilities. And we have ex-isting CEs for routine maintenance. But, most of our facilities need something beyond routine maintenance, major reconstruction, de-commissioning, and so, these CEs in the footprint of an existing structure allow us to be consistent with state law, Federal law, doc-umenting a decision, do that work without going through a longer environmental analysis.
Mr. KELLY. And I just want you to understand, this has major impacts. I received several calls last year when we closed some Na-tional Forest roads, trails—that cars could go on—to my squirrel hunters and folks who use those National Forests to do that. There are significant impacts that maybe you guys don’t always see, but I can assure you, when you start getting calls at the Congressional office because my squirrel hunters can’t get to where they want to go.
What have we done to do public-private partnerships? Are you forbidden to do that? You know, because a lot of these folks would go on and improve those trails, which would also make them acces-sible to fight fires. Or are we co-oping with 70 percent of the engi-neers in the entire United States Army or in the Guard and Re-serves? Camp Shelby is a National Forest which you have engi-neers, and they just did a new running trail down there in the old rail bed system. What opportunities do we use to use those to help us with the maintenance under the supervision of the Forest Serv-ice?
Ms. LAGO. Yes, sir. Thank you. In a minute and 47 seconds, I won’t be able to tell you all the
partnerships that we have, but for example, we have partnerships with user groups—and I mentioned before Student Conservation Association, Ducks Unlimited. We also have partnerships with counties in particular that help us maintain roads. The Army Na-tional Guard has an authority—because they are largely engi-neers—they can do major construction, reconstruction, demolition work on our sites and our facilities.
The pathway to those things is the instrument that documents the agreement and what each side needs to do. We can be bureau-cratic about that. We need to instill all of our workforce with the curiosity and the innovation to use those partnerships.
Mr. KELLY. What can we in Congress and on this Committee do to make that process easier?
Ms. LAGO. Sir, the attention in this hearing is a tremendous, tre-mendous value. I will confer with my staff about what is limiting in those partnerships and be happy to visit with your staff.
Mr. KELLY. Please let me know. As an Army engineer who still serves, I am interested in whatever we can do to make this easier for you all so that we can serve the main thing, the public that we are trying to give opportunities, offer recreation to.
VerDate Aug 31 2005 16:26 Dec 16, 2020 Jkt 000000 PO 00000 Frm 00018 Fmt 6633 Sfmt 6601 P:\DOCS\116-19\38016.TXT BRIAN
15
And with that, I yield back, Madam Chair. The CHAIR. Thank you. I now recognize the gentlewoman from
Maine, for 5 minutes. Ms. PINGREE. Thank you very much, Madam Chair, and thank
you to the Chair and Ranking Member for holding this hearing, and to Associate Chief Lago, thank you very much for being here today and for your long career and service in the Forest Service. That is so important to all of us.
I am also on the House Appropriations Committee, the Interior Subcommittee, so we had a very interesting and instructive hear-ing earlier this year with Chief Christiansen. We appreciated that very much, and also have spent a lot of time trying to understand the funding of the Forest Service and the unique challenges you have been dealing with because of the wildfires and the challenges out West.
I am going to take a little bit different tact because I am a Rep-resentative from Maine, and in Maine, we know the importance of our forests. Eighty-six percent of Maine is forested land. Only six percent of that is public, so very different from the issues we deal with in the West. I think that is the highest percentage of any state in the nation. We have almost 17 million acres of forests, 16 million of which are privately-owned, and that supports about 30,000 good paying jobs.
One imminent concern that we feel our forests can help us with is the issue of climate change, but it also presents a challenge. For-ests are facing rising temperatures, increased and prolonged drought, extreme weather events, invasive species, all contributing in many ways to widespread declines in the forest health.
But on the other hand, forests can be a positive force for change in the climate debate because of their role as carbon sinks. Just last week, there was an article in the Portland Press Herald in Maine that highlights the carbon store capacity of our Maine for-ests, and without objection, Madam Chair, I would like to submit that for the record.
The CHAIR. Without objection. [The article referred to is located on p. 68.] Ms. PINGREE. Thank you. By promoting the value of working forests in the United States
and recognizing the continual cycle of growth, harvesting, and re-planting, our working forests provide a carbon solution.
Can you tell me a little bit about some of the efforts by the For-est Service that promote healthy working forests, and the carbon benefits associated with growing trees and the wood products they produce?
Ms. LAGO. Yes, Congresswoman, thank you. We have a branch of the Forest Service called State and Private
Forestry. We have authorities under State and Private Forestry that enable us—and first of all, recognizes there is 800 million acres of forest and land in this country owned by states and private entities, and it is just as important for conservation on those lands as on Federal lands. Our State and Private Forestry authorities allow us to work with State Foresters, private land owners, indus-trial corporations on conservation efforts.
VerDate Aug 31 2005 16:26 Dec 16, 2020 Jkt 000000 PO 00000 Frm 00019 Fmt 6633 Sfmt 6601 P:\DOCS\116-19\38016.TXT BRIAN
16
Just this morning, talking about innovation and partnerships, one of my colleagues sent me an announcement from the National Forest Foundation, U.S. Endowment for Forests and Communities, and the Forest Service Partnership Office, announcing grants for public-private partnerships for forest stewardship and forest con-servation. There is a lot of growing interest in the importance and the benefits to all of us from a health standpoint, from a climate change standpoint of keeping forests healthy.
Finally, in the Southeast and in the Northeast, we have pro-grams called Keeping Forests Forests. They are big partnerships between us, state forests, and industrial land owners.
Ms. PINGREE. Just to tack on one of the earlier questions, I know the Forest Service is trying to streamline the NEPA review to make it easier for people to manage forests without significant en-vironmental review. But what will you do if those management practices aren’t actually storing carbon? Are they considering car-bon sequestration in their efforts to streamline NEPA reviews, or is that not part of the consideration?
Ms. LAGO. No, ma’am, I don’t see carbon sequestration as a cal-culus in those environmental reviews.
Ms. PINGREE. Okay. Well, I will follow up on that later. One other quick thing. I am very familiar with the USDA’s re-
gional climate hubs and have asked other USDA agencies about their hubs in previous hearings. Based on budget documents that I have received from USDA, I understand the Forest Service spent $3.3 million on the climate hubs in 2016, which I think is great, but the 2019 estimate is $400,000. Given the challenges that we are dealing with, why is there such a big drop, and do you see those as a valuable part of what you are doing?
Ms. LAGO. Yes. Our investment and our continued commitment to climate hubs is significant. I don’t have the dollar values at hand. I can research that with staff and get back to you or submit it for the record.
Ms. PINGREE. Great. Well, I do have great concerns about that number going down, and I appreciate your talking about the value of them.
And I am basically out of time, so again, thank you very much for your answers to the questions.
Ms. LAGO. Thank you. The CHAIR. I want to recognize the Chair of the full Committee
has joined us. Thank you for being here, Chairman Peterson, and I now recognize the gentleman from Georgia, for 5 minutes.
Mr. ALLEN. Thank you, Madam Chair, and thank you for being with us today.
In your written testimony, you mentioned that perhaps most critically, forest infrastructure provides fire protection for commu-nities, especially by providing access to forest lands and roads for firefighters and emergency responders during rescue operations.
Due to the deferred maintenance backlog, how many miles of Forest Service system roads have been decommissioned over the past 10 years?
Ms. LAGO. I don’t have 10 year figures. On an average basis, I think we decommission somewhere between 300 and 400 miles of road a year. It is not strictly related to deferred maintenance.
VerDate Aug 31 2005 16:26 Dec 16, 2020 Jkt 000000 PO 00000 Frm 00020 Fmt 6633 Sfmt 6601 P:\DOCS\116-19\38016.TXT BRIAN
17
There might be restoration management objective tied, but in any event, I will get you 10 year figures.
Mr. ALLEN. Okay. All right, and during wildfire suppression, what percentage of decommissioned roads from within the fire pe-rimeter are reopened and used for suppression activities? Do you have any idea?
Ms. LAGO. I don’t know on a percentage basis. Mr. ALLEN. Okay. Ms. LAGO. I know we do do that. The fire line officer has the call
on it. Mr. ALLEN. Right, okay. And then to that, can you further elaborate on the potential
threat the deferred maintenance poses on being able to respond to wildfires, and as a result, additional damage to forest infrastruc-ture?
Ms. LAGO. I can’t quantitatively summarize it, but the deferred maintenance accumulates not just on roads, but also our fire guard stations, our air tanker bases, our bunkhouses where our fire-fighters are housed over the summer. So, the accumulated effect of that is our capacity is diminished where it wouldn’t otherwise be.
Mr. ALLEN. And why is your capacity diminished? I mean, why would you do that?
Ms. LAGO. Well, we are not able to house people in bunkhouses because of the deteriorating condition.
Mr. ALLEN. I got you. Well, then that gets to my next question. The U.S. Forest Service
recently completed its comprehensive Capital Improvement Plan. Can you further detail how you plan to implement this strategy, going forward, as far as dealing with these issues?
Ms. LAGO. Yes, sir. Thank you. Our plan has been released in the last couple of weeks. What it
primarily does is identifies criteria for submitting projects for the national prioritization, and those criteria include access to active forest management, access to recreation facilities, access for fire op-erations, research and development, and revenue generating des-tinations. Those criteria are applied to the submitted project. It runs through a model. The model prioritizes projects, and so we have funding set aside and cut off the funding at the level that——
Mr. ALLEN. Outside of that, what is your biggest challenge? Ms. LAGO. The level of funding. Mr. ALLEN. The level of funding? Ms. LAGO. Yes, sir. Mr. ALLEN. You are looking at Members of this Committee who
are Members of the United States Congress, and you need more funding?
Ms. LAGO. That is correct. Mr. ALLEN. Okay. All right. Thank you, and I yield back. The CHAIR. Thank you. I now recognize the gentleman from Ari-
zona. Mr. O’HALLERAN. Thank you, Madam Chair. My district contains all or parts of six National Forests, and the
Grand Canyon, and 22 other National Parks and monuments. I fully understand the conditions that you are under, because I live in Forest Service country. I also—my house is located—I take For-
VerDate Aug 31 2005 16:26 Dec 16, 2020 Jkt 000000 PO 00000 Frm 00021 Fmt 6633 Sfmt 6601 P:\DOCS\116-19\38016.TXT BRIAN
18
est Service roads back to the house. That road hasn’t been touched by a blade in about 20 years, and we even offered at one time to pay for part of it—well, half of it, and they still didn’t—because they only have one grader for the entire Coconino National Forest. And that grader has to be borrowed by the Kaibab sometimes in order to get some roads done over there. And so, this whole concept of—how many personnel has the Forest Service lost or percentage in the last decade because of funding?
Ms. LAGO. I have heard the figure 1⁄3, 33 percent in non-fire pro-fessions. I would have to double check is that the last 10 years or some other time period, but that is the figure that I am familiar with.
Mr. O’HALLERAN. And how much more personnel are you going to be able to hire now that you have been able to get the fire fund-ing off your books?
Ms. LAGO. That is a good question. It is not easy to answer. In my own career, we have changed significantly from using For-
est Service employees and equipment doing projects, road projects, for example, to funding partners or counties or contract workers. So, the increase in funding may not necessarily turn around more, let’s say, road crews. What we do need is senior experienced engi-neers and specialists who can plan and design the work, and then do contract oversight.
Mr. O’HALLERAN. Well, let’s put it another way. The fire funding has been taken out. How much has been restored to your budget in order to meet your other obligations and needs?
Ms. LAGO. Okay, I can do that one. It goes into effect in 2020, and if we had to request the 10 year
average for fire suppression, it would—which we don’t, because the fire funding fix froze it at 2015 level, we would have to increase the request for fire suppression by $270 million.
What that means is we get to add $270 million back to programs, as long as our cap stays the same.
Mr. O’HALLERAN. Now, it is also, at least out in the West and in my district, a lot of the forests were put in place because of wa-tershed protection. What impact has the lack of funding had on the ability of us to protect our watersheds, our wildlife that the hunt-ers love, and our fish that they—and the streams that impact the quality of our tourists and our recreational activities in the forest?
Ms. LAGO. Yes, sir. The two most important things that affect water quality and water coming off National Forests is healthy for-est condition and maintaining the road system.
A former long-time Member of the House, Norm Dicks, used to say, ‘‘You don’t fix the roads, you’re going to drink the roads.’’ Our inability to maintain the road system contributes to degraded water. Overcrowded, over-dense forests that stagnate, lead to insect infestation, wildfire, that contributes to poor water quality. We need to take care of those two things.
Mr. O’HALLERAN. Well, I want to thank the Forest Service for helping start the 4FRI projects in Arizona. It has been very impor-tant. We are on another step now, and hopefully we will move for-ward again.
But the management process that you just talked about is crit-ical to watershed protection and wildlife and the whole ecosystem
VerDate Aug 31 2005 16:26 Dec 16, 2020 Jkt 000000 PO 00000 Frm 00022 Fmt 6633 Sfmt 6601 P:\DOCS\116-19\38016.TXT BRIAN
19
that is there. And I just look at Arizona as an example. We have millions and millions of acres that are not managed or haven’t been able to be managed, I should say, that are just going up in fire all the time, and that is throughout the West. I would kind of like to know the plan of attack, other than a 4FRI for the other National Forests.
Ms. LAGO. Yes, sir. You might recall, we announced an initiative earlier this year
that we called Shared Stewardship, and we have ten states now under an agreement where we are partnering with states to agree on the areas of highest priority treatment, and then we are work-ing on those areas together. And I think that is a commitment that is going to build both support for the work that we need to do, and additional capacity for doing it.
Mr. O’HALLERAN. Thank you, and I yield back. The CHAIR. Thank you. Before moving to recognize Members of
the full Committee, I am going to recognize, for 5 minutes, the gen-tlewoman from Iowa, who stepped out. Excuse me. I apologize. I will now recognize, for 5 minutes, the gentleman from South Da-kota, Mr. Johnson.
Mr. JOHNSON. Thank you very much, Madam Chair. I know in your line of work you get a fair amount of criticism,
but I just want to start by saying thank you on a personal basis, ma’am. The Black Hills National Forest is a ways, we have a very large Congressional district. I suppose I am probably 4 hours from the National Forest, but I can’t tell you how many hundreds of memories my family has made in that great national asset that you, throughout your career, and your people have helped to main-tain.
And it is wonderful. I mean, some of the most beautiful, quiet moments in our lives have been nestled among those Black Hills ponderosa pine. Some of our most active moments of our life have been in that forest. And so, thank you for what you are doing.
Of course, it is not just the Johnson family that enjoys that re-source. Every year, there are millions of South Dakotans and folks from all over the world who recreate there. I get the sense that our deferred maintenance backlog is perhaps smaller there than in many of the forests we have discussed. Perhaps, because it is such an actively managed, well-maintained forest. We have some of the highest timber sales of National Forests in the country. And so, if you are willing to, ma’am, could you elaborate on the connection, if any, that exists between a well-maintained, actively managed forest and the impact that that can have on lower deferred mainte-nance?
Ms. LAGO. Yes, sir. Thank you for the opportunity, and thank you very much for the compliment. The Black Hills is a very spe-cial place, I agree.
All our forests are similar in the way that people love them and rely on them. And that said, they are still unique in their own way. And where a forest is well-maintained, able to reduce deferred maintenance, my guess is that is a forest with a lot of thriving partnerships. We don’t have the same ability to partner every-where. It depends on opportunity and economic capacity. But it also depends on commitment to partnering.
VerDate Aug 31 2005 16:26 Dec 16, 2020 Jkt 000000 PO 00000 Frm 00023 Fmt 6633 Sfmt 6601 P:\DOCS\116-19\38016.TXT BRIAN
20
And so, I would put my finger on partnerships where the Black Hills are concerned.
Mr. JOHNSON. Well, I think that is exquisitely well said, and I do think thriving partnerships are a key part of that story of a lower deferred maintenance backlog, and higher use of the forest. Thank you for calling out the importance of having a USDA com-mitment to that, and to the extent that that commitment can even grow in the Black Hills National Forest and elsewhere, I would cer-tainly love to see more efforts in that regard.
I hate to bring up such a terrible subject of the mountain pine beetle, because I know that little fellow has done a lot of damage in a lot of places. In the Black Hills, we had less damage from the pine beetle than was feared at the onset of this round of the epi-demic, and frankly, less damage than many National Forests.
I have attributed that to a more actively managed forest. I want to give you an opportunity to correct my misconception, if I have one, and offer any other thoughts you have.
Ms. LAGO. Yes, sir. Definitely, well-maintained forests are in a more vigorous condi-
tion, and a more vigorous condition allows forests to repel bark bee-tle attacks. It is a native pest. They have been around a long time. What has changed is the vitality of forests and their ability to just naturally withstand them.
I think definitely better maintained forests, active management such as what we have in the Black Hills, is key to preventing fur-ther spread by that insect.
Mr. JOHNSON. Well, Madam Chair, I would just close by trying to highlight some of these great phrases. This conversation has pulled out the importance of active management, being well-main-tained, and having thriving partnerships. Those are wonderful phrases, Associate Chief. Thanks for the work you do, and thanks for your presence here today.
Ms. LAGO. Thank you, sir. Mr. JOHNSON. And I yield back. The CHAIR. I now recognize Mr. Thompson from Pennsylvania,
for 5 minutes. Mr. THOMPSON. Thank you, Madam Chair. Thanks for hosting
this, and Ranking Member, for this hearing. Assistant Chief, good to see you. Thank you for your service and
your record of service to the nation through the Forest Service, I greatly appreciate it. Also, special thanks when you were testifying on the other side of the Capitol in the Senate Energy and Natural Resources Committee. You used Longhouse Drive in the Allegheny National Forest as an example of the threat of lack of maintenance and roadways deteriorating. And as you really nicely point out in your testimony, the users of that road contribute about $1.5 million a year to the local businesses, local economy. That just speaks to the importance—the economic importance of this.
You have talked a lot about partnership. I am going to start out by really—I think one of our best partners—and we have many great partners, obviously, with the Forest Service—but one of the best partners are those from the forest products industry, the tim-ber industry, that bid on contracts, help us so that we can main-tain a healthy forest. We make it so that they are the largest car-
VerDate Aug 31 2005 16:26 Dec 16, 2020 Jkt 000000 PO 00000 Frm 00024 Fmt 6633 Sfmt 6601 P:\DOCS\116-19\38016.TXT BRIAN
21
bon sinks in the world. Also, as my friend across the aisle talked about making sure that those healthy forests are—making sure that we have a great filtration system for those watersheds that start in our National Forests.
And so, I am concerned right now. The first thing I have for you is not really looking for a response on, just a request to take back. And I am going to follow up in writing; but, the situation with the tariffs, and specifically the hardwoods industry, we have a lot of folks, good people that bid and obtain contracts. Specifically, I am going to speak about hardwoods, because I have the Allegheny Na-tional Forest. Unfortunately, with the trade wars that are going on, the bottom just completely dropped out of the price. They bid at a certain price. They are mandated contracted to pursue that, but they have lost their market for the time being.
I will say talking with them, they are all behind the President and they are supportive, and you know, they want to see fair and free trade, which is what the President wants.
But in the meantime, just two things that we could look at that and will be sent along in a written request. You know, any type of trade relief for hardwoods. They were not included in that pack-age. And I get it. It is different for—it might be because a part of this is administered—that part of trade is administered through commerce. I don’t know why. Trees are a crop. It is agriculture. But they need—we are hoping, actually, just to get resolution to trade agreements. But if this goes on for any amount of time, those hardwood folks need this. Because if we lose those industries, then we will not have that valuable partner to keep our forests healthy. And in the long run, that would be a deterioration of tremendous proportions of our National Forests.
The other thing is a request to take back is we need extension on current contracts, and I would say up to a period of 2 years at this point, because there is not a business plan given what the con-tracts are at and where the pricing has fallen. That may be a little more difficult, I understand, but those are just—not really looking for a response on that. If you could take that back and I will be following back up with certainly the Secretary and the President on those.
The most pressing maintenance issue that we currently have in the Allegheny National Forest is the Mayburg Bridge located in Forest County. There are 128 permanent and seasonal dwellings in Mayburg and the bridge, which is owned by the Forest Service, and it is the only really practical year-round route in and out of that village. Thankfully, we don’t have any kids right now living in that area, so there are no school buses, because that bridge would not handle a school bus. And I would be concerned if there is a fire, because an emergency vehicle is not going to be handled as well.
Unfortunately, that bridge has fallen into disrepair and is in need of critical repairs. The Forest Service has indicated that the funding will be coming for the bridge, but there is still a lot of un-certainty about the future.
Now, currently maintenance for infrastructure like this must be a priority, yet it is not being completed. So, it is a simple question. How is the Forest Service prioritizing this kind of maintenance, es-
VerDate Aug 31 2005 16:26 Dec 16, 2020 Jkt 000000 PO 00000 Frm 00025 Fmt 6633 Sfmt 6601 P:\DOCS\116-19\38016.TXT BRIAN
22
pecially when it comes down to access for local residents and public safety?
Ms. LAGO. Thank you, Congressman. I thought we had the funding for that bridge and completed the
environmental analysis, and I thought it was moving forward. I will double check on that.
Funding for maintenance is part of regional allocations, and the priorities for maintenance is decided at the local level. When it ex-ceeds routine maintenance and becomes a capital investment, then it is going to be subject to that capital investment strategy and those criteria for prioritization that I mentioned.
Mr. THOMPSON. I appreciate it. I also appreciate your engage-ment with the community, because it was apparent in the begin-ning—I am not sure the Forest Service or whoever was involved even locally recognized that there was a permanent village, basi-cally. People live there year-round, and quite frankly, it was the only way in and out. But, because of how you all did conduct your-selves, engaging in the community, that all came to light, and I really appreciate it. And I appreciate the support with the Mayburg bridge.
Ms. LAGO. Thank you. The CHAIR. I now recognize the gentlewoman from Washington,
for 5 minutes. Ms. SCHRIER. Thank you, Madam Chair, and Ms. Lago, thank
you for coming today and joining us. It is great to have a witness with experience in Washington forests, and I would love to host you back at home, along with the Forest Service Chief, in the district— which by the way, includes Mount Rainier, the Mount Baker- Snoqualmie National Forest——
Ms. LAGO. Beautiful area. Ms. SCHRIER. To raise some of these various issues on deferred
maintenance, and in addition to the deferred maintenance projects the Forest Service Legacy Roads and Trails Remediation Program is a critical program that leverages dollars outside of the Forest Service to address water quality issues, and I have an appropria-tions letter for the record that I would like to submit, outlining the importance of that program, and the need for it to have a dedicated line item.
The CHAIR. So noted. [The letter referred to is located on p. 72.] Ms. SCHRIER. The program was created in 2008, because the gen-
eral Forest Service road maintenance budget was unable to address the sheer volume of blocked culverts, landslides, and washouts, which were impacting water quality and access for threatened and endangered species. And in Washington State and other parts of the country, the program is critical to address water quality issues and habitat, particularly for Chinook salmon, bull trout, and steelhead. These fish are an important part of the Northwest cul-ture, heritage, ecosystem, and they have suffered heavily, as you know. A recent New York Times report stated that the Chinook salmon may be extinct in 20 years. I will also add that Chinook salmon are the key food source for the endangered southern resi-dent Orcas, and old weather-damaged roads and broken culverts are key culprits in this demise.
VerDate Aug 31 2005 16:26 Dec 16, 2020 Jkt 000000 PO 00000 Frm 00026 Fmt 6633 Sfmt 6601 P:\DOCS\116-19\38016.TXT BRIAN
23
Washington State has invested millions, multiple millions of dol-lars to address downstream barriers and culverts, including dams and whatnot, while the Chinook salmon spawning grounds are lo-cated upstream in the National Forest headwaters.
And on page 4 of your testimony, you outline the criteria for road projects, listing priorities. And unfortunately, the projects that im-prove wildlife and aquatic passage are last. And so, I was just won-dering if you could expand on this and help me understand how projects affecting water quality can be addressed in a timely man-ner when the Forest Service is facing a $5+ billion backlog?
Ms. LAGO. Yes, thank you, Congresswoman. When I was still in the Pacific Northwest, we hosted a chiefs re-
view, and the theme of the entire review was Save our Salmon. I really understand the integral role of salmon in the economy and lifestyle, and that ecosystem.
In addition to the criteria, which includes benefits—the ability to be an economic driver in water and recreation, there is an intan-gible benefit criteria. You know, salmon is a lot more—and water quality is a lot more than an intangible benefit certainly, and local managers—also there is a layer where they put a personal priority on their projects, based on their knowledge of local issues and what is important to the local economy, people, community.
So, there is more than just the criteria that I named in my testi-mony. It is fair to really think about how we are valuing water, the economic value of water, as well as the fact that we all rely on it. I will go back and discuss that.
Ms. SCHRIER. Thank you, and the way I interpreted economic was really related to timber; but, if you think about the rec-reational economy and salmon and habitat and our Tribes, that those do weave in economics.
Yes. I appreciate your going back. I think that is it, and I would just like to reiterate my invitation, and thank you for paying atten-tion to this issue.
I yield back the rest of my time. The CHAIR. Thank you. I now recognize the gentleman from Cali-
fornia, for 5 minutes, Mr. Panetta. Mr. PANETTA. Thank you, Madam Chair. I appreciate you allow-
ing me to sit in on this very important hearing, especially when it comes to my district on the Central Coast.
Ranking Member LaMalfa, good morning, and good morning, Chief. Thank you for being here. I appreciate your testimony and appreciate your service.
I represent the Central Coast of California, Big Sur Los Padres National Forest, and in 2016, I am sure you know well, we had a pretty extensive fire there called the Soberanes fire, which encom-passed about 2062 miles being burned, and the cost at the time was the most expensive in our nation’s history at the time, until re-cently, a cost of about $260 million.
The reason that fire started was because of an illegal campfire, unfortunately, and we are seeing a lot of that, especially in Los Pa-dres Forest, in the sense that you have a number of people out there, despite the numerous signs everywhere, saying don’t do something as stupid as that. But people continue to conduct them-selves in that manner, unfortunately. Obviously, it would be nice
VerDate Aug 31 2005 16:26 Dec 16, 2020 Jkt 000000 PO 00000 Frm 00027 Fmt 6633 Sfmt 6601 P:\DOCS\116-19\38016.TXT BRIAN
24
to have staff there, Forest Service officers there, who actually are on the grounds and enforcing those types of laws. But unfortu-nately, we had to resort to certain volunteers. I say unfortunately because that shouldn’t be their job. They are not armed. They don’t have the right law and the legal background to enforce those types of laws. But that is what we have had to resort to in order to en-sure that people are out there, making sure that people don’t do these acts that could threaten—the forest could threaten people.
Obviously staffing is a big issue, and you know that. And so, I was wondering if you could elaborate on any sort of plans that you have to address the chronic staffing issues, obviously not just in Los Padres National Forest, but in other National Forests across our country?
Ms. LAGO. Yes, sir. Thank you. As I mentioned, and I am not sure if you were in the room at
the time. Mr. PANETTA. And I apologize if I was not. I just came in late.
Thank you. Ms. LAGO. No problem. The result of the fire funding fix is we
have room, if our cap stays the same, to request funding for other programs that would have had to go to the 10 year average for fire suppression. And so, we are deeply aware of the shortages in many programs. Law enforcement and fire prevention are two of the areas forest protection officers—which is a designation for people in all kinds of resources—but in addition to their resource job, they patrol. So, having more people on the ground is something that we are acutely aware of.
We did get direct hire authority recently for firefighting jobs, which allows us to more efficiently hire people to be on the ground. It will last for 1 year while OPM sees how we use it. There is not unlimited money. We all know that. Being more efficient with the money that we have and prioritizing these on-the-ground activities is how we can address those issues.
Mr. PANETTA. Got you. Thank you. Thank you. I appreciate that. Now, obviously, and I know you have talked about deferred
maintenance, and in Los Padres, our deferred maintenance exceeds $24 million.
First of all, my question is where does that lie relative to other National Forests and deferred maintenance?
Ms. LAGO. I believe I submitted for the record a deferred mainte-nance breakdown by state. I don’t have one by forest, but I am sure it exists and I would be happy to supply it.
Mr. PANETTA. Understood. Obviously, as we approach the start of the new fiscal year, as the
wildfire fix funding becomes available, can you give me a little bit of light on the priorities, little bit of light on your priorities, specifi-cally whether you will be prioritizing deferred maintenance back-log? I would like to hear about Los Padres, but I would be more than willing to hear about California.
Ms. LAGO. Okay, thank you. A lot of people will eventually weigh in on what the priorities
are. Mr. PANETTA. Sure.
VerDate Aug 31 2005 16:26 Dec 16, 2020 Jkt 000000 PO 00000 Frm 00028 Fmt 6633 Sfmt 6601 P:\DOCS\116-19\38016.TXT BRIAN
25
Ms. LAGO. We have had a continuing emphasis on active man-agement and reducing fuels. I don’t see that changing. This hearing helps us highlight the issue of maintenance and deferred mainte-nance for our facilities. It is felt throughout the Forest Service and throughout the communities that we serve. I am happy to work with you and your staff and this Committee’s staff on how to prioritize, going forward.
Mr. PANETTA. Outstanding. I look forward to that. I yield back my time. Thank you, Madam Chair. The CHAIR. Thank you. With the first round of questions com-
pleted and without objection, we will begin a second round of ques-tions. Members will be recognized for 3 minutes in order of senior-ity.
All right. I will begin by recognizing myself for 3 minutes. Associate Chief Lago, thank you for all of your answers today,
and I would also offer for the hearing record a copy of the Depart-ment of Commerce’s news release on outdoor recreation economy.
[The news release referred to is located on p. 29.] The CHAIR. The report released just last week shows that the
outdoor recreation economy accounted for 2.2 percent of GDP and supported 5.2 million jobs in 2017. This not only includes conven-tional activities like camping, hiking, boating, but also value-added activities such as construction and travel. For the first time, the re-port included information on the recreation industry’s contributions by state.
Is data from reports like this considered as the Forest Service prioritizes maintenance, and does the Forest Service use data like this to leverage assistance from states and other partners?
Ms. LAGO. Yes, thank you, Madam Chair. First of all with regard to that report, it is interesting that the
statistic of 2.2 percent might sound small, but it is interesting to note that it is growing almost 50 percent faster than general GDP. And I can tell you from the communities that I have lived in, the ones that I hear from that depend on a recreation economy, it is far more impactful to their economies than 2.2 percent.
We recognize that 15 states across the country now have recre-ation officers, so showing that states recognize the importance of this recreation economy. It is not right for every state, but defi-nitely the recognition of the Commerce Department, our own with-in USDA, not just our agency, but Rural Development has an ex-panding recreation economy interest. So, it helps us bring partners to the table. It helps us bring investors to the table.
So, to answer your question in a word, yes. The CHAIR. Thank you so much, and coming from the Common-
wealth of Virginia where we have seen recreation continue to be a strong use of our natural resources and a major economic driver here, I thank you for your comments.
I now recognize Mr. LaMalfa, for 3 minutes. Mr. LAMALFA. Thank you again. I appreciate, again, Assistant
Chief Lago, for your being here. I wanted to delve a little bit more into, again with the road
maintenance and the issues there where access has been more dif-ficult over the years. We have wrestled in northern California with what is being put in travel management plans, and it seems like
VerDate Aug 31 2005 16:26 Dec 16, 2020 Jkt 000000 PO 00000 Frm 00029 Fmt 6633 Sfmt 6601 P:\DOCS\116-19\38016.TXT BRIAN
26
it just means less and less access. We are finding more and more closed gates and less ability for people during the snow season for snowmobiling or off-road activity, hunting, anybody to take vehicles in, or without vehicles. We are finding more and more closed gates.
Does this tie in partly towards a changing view of the multi-pur-pose, multi-use forest policy, or is it more about the backlog we have of maintenance? You are talking about bridges being removed and no longer counting them as an asset, but you know, a great amount of frustration by my constituents, and neighboring districts as well, is that whether you call it the travel management plan or the maintenance backlog, it is just meaning less access.
The travel management plan efforts, are they moving in that di-rection because of the lack of maintenance, or is it some other phil-osophical shift?
Ms. LAGO. Thank you, Ranking Member. We are not walking away from the multiple-use sustained yield
mandate from Congress. It is more the observation that we want people to have access to their public lands. They don’t need public lands if they don’t have access to them. But we need to maintain the resource in a healthy condition, but we also need to maintain those roads in a safe condition for people to use them, roads and trails.
Our effort at travel management is aimed at looking at the re-source from the standpoint of what can we safely provide?
Mr. LAMALFA. Okay. Well, even as Mr. Panetta mentioned here, he had a six-digit fire in number of acres in his district. We have multiple six-digit fires in the more northern part and other western states, and an important component of being able to do the pre-fire work is this access, and as well when it does come to fire suppres-sion time, having these roads available and intact bridges and all that, and not closed gates and all that.
Can you please comment on the fire aspect of that and how im-portant it is we step back up on this?
Ms. LAGO. Well, yes, sir. Roads are an essential way that we stop fires before they get large, get people out of harm’s way when there are fires, and we absolutely need a safe, accessible road system to be able to fulfill that part of our mission.
Mr. LAMALFA. The multi-use? Okay, thank you. I yield back. The CHAIR. I now recognize Mr. Thompson, for 3 minutes. Mr. THOMPSON. Madam Chair, thank you. Chief, I just want to check in. I know in the Forest Service we
use a concessionaire style approach, and concessionaires play a very important role, obviously. They help us where we need, it helps supplement the staffing and in keeping areas open and ac-cess. My understanding, it’s the Granger-Thye Act which basically defines a landlord-tenant relationship where the Forest Service is the landlord responsible for all behind-the-wall fixes, including the maintenance, capital improvements. And the tenant, the conces-sionaire, just keeps everything clean and operating.
My question for you is would you like to have the authority actu-ally that has been granted to the Department of Defense and to the Army Corps of Engineers which allows, basically, where 30 year leases are an option—not mandated, but an option, and in that 30 years, that longevity, what would be that the concessionaires are
VerDate Aug 31 2005 16:26 Dec 16, 2020 Jkt 000000 PO 00000 Frm 00030 Fmt 6633 Sfmt 6601 P:\DOCS\116-19\38016.TXT BRIAN
27
able to take on the responsibility for some of the capital improve-ments.
Today, that doesn’t occur in the Forest Service with a conces-sionaire system. I don’t know the timeline on when the Department of Defense and the Army Corps made that transition. Just a simple question. Was that something Forest Service would want to con-sider getting the authority to do? Obviously, we would have to pro-vide that through the bill or whatever.
Ms. LAGO. Yes, sir. I am not sure what the Army Corps of Engi-neers authority is, but in fact, the Forest Service did get leasing authority in the 2018 Farm Bill. We are developing rules and direc-tives, but it would enable us to do those kind of long-term leases. I am not sure of the time period, but also to enable the leaseholder to do improvements.
I think the Park Service has some kind of authority like that, too. I can check on that and get back to you.
Mr. THOMPSON. I appreciate that. It just seems like it is working well with the Army Corps. I have seen some of the projects, obvi-ously, in my Congressional district from time to time with what these folks do, and so, it would be great to be able—I am glad to hear that we provided at least part of that authority.
Ms. LAGO. Yes, sir. Mr. THOMPSON. If we haven’t done enough, please let us know.
We want you to have the authority to be successful. Ms. LAGO. Thank you. Mr. THOMPSON. Thank you, Madam Chair. I yield back. The CHAIR. And I now recognize Ranking Member LaMalfa for
one more 3 minute question. Mr. LAMALFA. Just one more. Thank you so much. Again, when we were talking about the backlog, when we are
seeing the Forest Service absorbing more lands through donations from maybe NGOs or other instances, or the LWCF has also intro-duced more land back into Forest Service control. How is that con-tributing to the backlog and your ability to keep up, and as well as updating this $5.2 billion backlog figure?
Ms. LAGO. Well, that is a great question. I am not sure what the value or the assets that a lot of the lands
that we acquire through Land and Water Conservation Fund. I am familiar with areas that we prioritize because they have important wildlife habitat value, water quality value, that kind of thing, which leads me to think they don’t have a lot of infrastructure on them. But you know, I don’t know that conclusively and I would have to do some checking.
Mr. LAMALFA. I would be really interested in that, how much that is adding to the burden of an already difficult situation.
So, with that, I appreciate it, Madam Chair, and for your appear-ance today, Ms. Lago, and I will yield back.
The CHAIR. Thank you. I would like to thank Associate Chief Lago for her comments and for her time here today.
What we have heard today underscores the importance of the Forest Service’s work, and the challenges it faces. I hope we all leave here with an appreciation for the role that well-maintained forest infrastructure can have significant impacts on people’s lives, their work, and their play in and around National Forests, as well
VerDate Aug 31 2005 16:26 Dec 16, 2020 Jkt 000000 PO 00000 Frm 00031 Fmt 6633 Sfmt 6601 P:\DOCS\116-19\38016.TXT BRIAN
28
as the communities and economies surrounding our National For-ests.
We have also heard loud and clear that dozens of infrastructure projects are ready for implementation, but require the necessary funding, and carrying out these much-needed maintenance projects will support jobs in rural communities, as soon as the Forest Serv-ice receives the funding to complete them.
I hope that we all leave here with a better sense of what we can do in the Subcommittee to help the Forest Service carry out its mission, and again, I thank you, Ms. Lago, for your time today.
Before we adjourn, I invite the Ranking Member to make any closing remarks that he may have.
Without any, under the Rules of the Committee, the record of to-day’s hearing will remain open for 10 calendar days to receive addi-tional material and supplemental written responses from the wit-ness to any question posed by a Member.
This hearing of the Subcommittee on Conservation and Forestry is adjourned.
[Whereupon, at 11:23 a.m., the Subcommittee was adjourned.] [Material submitted for inclusion in the record follows:]
VerDate Aug 31 2005 16:26 Dec 16, 2020 Jkt 000000 PO 00000 Frm 00032 Fmt 6633 Sfmt 6601 P:\DOCS\116-19\38016.TXT BRIAN
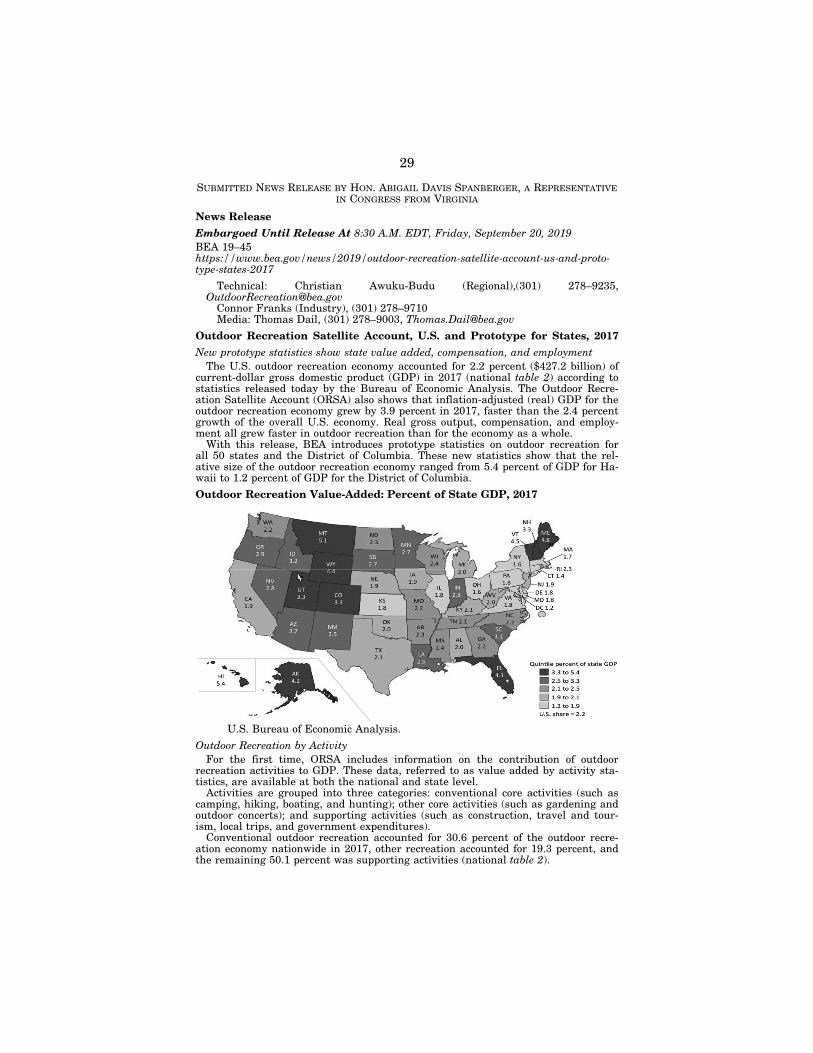
29
SUBMITTED NEWS RELEASE BY HON. ABIGAIL DAVIS SPANBERGER, A REPRESENTATIVE IN CONGRESS FROM VIRGINIA
News Release
Embargoed Until Release At 8:30 A.M. EDT, Friday, September 20, 2019 BEA 19–45 https://www.bea.gov/news/2019/outdoor-recreation-satellite-account-us-and-proto-type-states-2017
Technical: Christian Awuku-Budu (Regional),(301) 278–9235, [email protected]
Connor Franks (Industry), (301) 278–9710 Media: Thomas Dail, (301) 278–9003, [email protected]
Outdoor Recreation Satellite Account, U.S. and Prototype for States, 2017
New prototype statistics show state value added, compensation, and employment The U.S. outdoor recreation economy accounted for 2.2 percent ($427.2 billion) of
current-dollar gross domestic product (GDP) in 2017 (national table 2) according to statistics released today by the Bureau of Economic Analysis. The Outdoor Recre-ation Satellite Account (ORSA) also shows that inflation-adjusted (real) GDP for the outdoor recreation economy grew by 3.9 percent in 2017, faster than the 2.4 percent growth of the overall U.S. economy. Real gross output, compensation, and employ-ment all grew faster in outdoor recreation than for the economy as a whole.
With this release, BEA introduces prototype statistics on outdoor recreation for all 50 states and the District of Columbia. These new statistics show that the rel-ative size of the outdoor recreation economy ranged from 5.4 percent of GDP for Ha-waii to 1.2 percent of GDP for the District of Columbia.
Outdoor Recreation Value-Added: Percent of State GDP, 2017
U.S. Bureau of Economic Analysis.
Outdoor Recreation by Activity For the first time, ORSA includes information on the contribution of outdoor
recreation activities to GDP. These data, referred to as value added by activity sta-tistics, are available at both the national and state level.
Activities are grouped into three categories: conventional core activities (such as camping, hiking, boating, and hunting); other core activities (such as gardening and outdoor concerts); and supporting activities (such as construction, travel and tour-ism, local trips, and government expenditures).
Conventional outdoor recreation accounted for 30.6 percent of the outdoor recre-ation economy nationwide in 2017, other recreation accounted for 19.3 percent, and the remaining 50.1 percent was supporting activities (national table 2).
VerDate Aug 31 2005 16:26 Dec 16, 2020 Jkt 000000 PO 00000 Frm 00033 Fmt 6621 Sfmt 6621 P:\DOCS\116-19\38016.TXT BRIAN 1161
9002
.eps
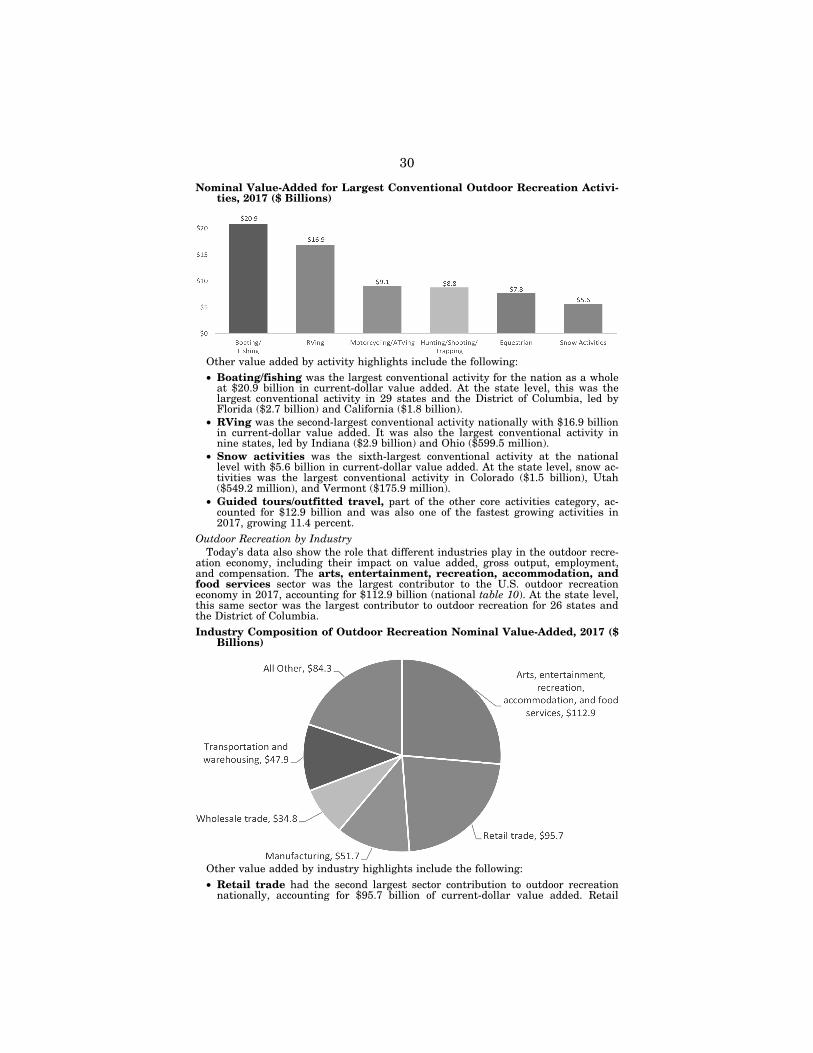
30
Nominal Value-Added for Largest Conventional Outdoor Recreation Activi-ties, 2017 ($ Billions)
Other value added by activity highlights include the following: • Boating/fishing was the largest conventional activity for the nation as a whole
at $20.9 billion in current-dollar value added. At the state level, this was the largest conventional activity in 29 states and the District of Columbia, led by Florida ($2.7 billion) and California ($1.8 billion).
• RVing was the second-largest conventional activity nationally with $16.9 billion in current-dollar value added. It was also the largest conventional activity in nine states, led by Indiana ($2.9 billion) and Ohio ($599.5 million).
• Snow activities was the sixth-largest conventional activity at the national level with $5.6 billion in current-dollar value added. At the state level, snow ac-tivities was the largest conventional activity in Colorado ($1.5 billion), Utah ($549.2 million), and Vermont ($175.9 million).
• Guided tours/outfitted travel, part of the other core activities category, ac-counted for $12.9 billion and was also one of the fastest growing activities in 2017, growing 11.4 percent.
Outdoor Recreation by Industry Today’s data also show the role that different industries play in the outdoor recre-
ation economy, including their impact on value added, gross output, employment, and compensation. The arts, entertainment, recreation, accommodation, and food services sector was the largest contributor to the U.S. outdoor recreation economy in 2017, accounting for $112.9 billion (national table 10). At the state level, this same sector was the largest contributor to outdoor recreation for 26 states and the District of Columbia. Industry Composition of Outdoor Recreation Nominal Value-Added, 2017 ($
Billions)
Other value added by industry highlights include the following: • Retail trade had the second largest sector contribution to outdoor recreation
nationally, accounting for $95.7 billion of current-dollar value added. Retail
VerDate Aug 31 2005 16:26 Dec 16, 2020 Jkt 000000 PO 00000 Frm 00034 Fmt 6621 Sfmt 6621 P:\DOCS\116-19\38016.TXT BRIAN 1161
9003
.eps
1161
9004
.eps
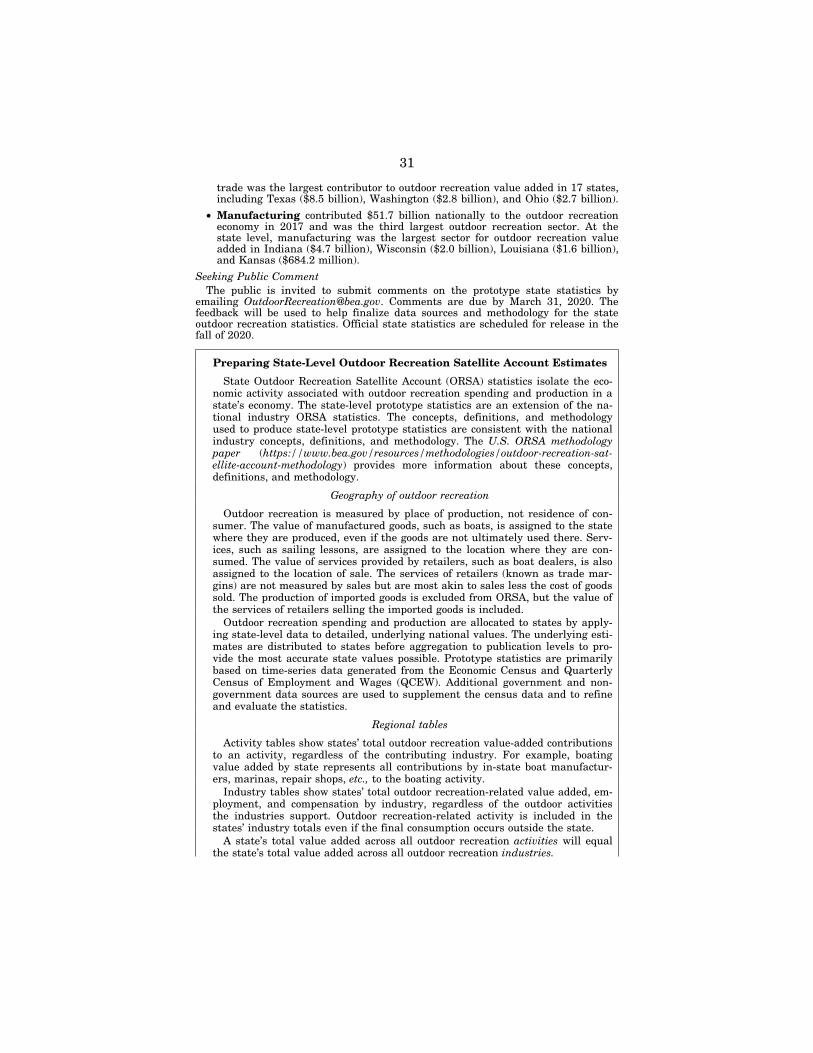
31
trade was the largest contributor to outdoor recreation value added in 17 states, including Texas ($8.5 billion), Washington ($2.8 billion), and Ohio ($2.7 billion).
• Manufacturing contributed $51.7 billion nationally to the outdoor recreation economy in 2017 and was the third largest outdoor recreation sector. At the state level, manufacturing was the largest sector for outdoor recreation value added in Indiana ($4.7 billion), Wisconsin ($2.0 billion), Louisiana ($1.6 billion), and Kansas ($684.2 million).
Seeking Public Comment The public is invited to submit comments on the prototype state statistics by
emailing [email protected]. Comments are due by March 31, 2020. The feedback will be used to help finalize data sources and methodology for the state outdoor recreation statistics. Official state statistics are scheduled for release in the fall of 2020.
Preparing State-Level Outdoor Recreation Satellite Account Estimates
State Outdoor Recreation Satellite Account (ORSA) statistics isolate the eco-nomic activity associated with outdoor recreation spending and production in a state’s economy. The state-level prototype statistics are an extension of the na-tional industry ORSA statistics. The concepts, definitions, and methodology used to produce state-level prototype statistics are consistent with the national industry concepts, definitions, and methodology. The U.S. ORSA methodology paper (https://www.bea.gov/resources/methodologies/outdoor-recreation-sat-ellite-account-methodology) provides more information about these concepts, definitions, and methodology.
Geography of outdoor recreation
Outdoor recreation is measured by place of production, not residence of con-sumer. The value of manufactured goods, such as boats, is assigned to the state where they are produced, even if the goods are not ultimately used there. Serv-ices, such as sailing lessons, are assigned to the location where they are con-sumed. The value of services provided by retailers, such as boat dealers, is also assigned to the location of sale. The services of retailers (known as trade mar-gins) are not measured by sales but are most akin to sales less the cost of goods sold. The production of imported goods is excluded from ORSA, but the value of the services of retailers selling the imported goods is included.
Outdoor recreation spending and production are allocated to states by apply-ing state-level data to detailed, underlying national values. The underlying esti-mates are distributed to states before aggregation to publication levels to pro-vide the most accurate state values possible. Prototype statistics are primarily based on time-series data generated from the Economic Census and Quarterly Census of Employment and Wages (QCEW). Additional government and non-government data sources are used to supplement the census data and to refine and evaluate the statistics.
Regional tables
Activity tables show states’ total outdoor recreation value-added contributions to an activity, regardless of the contributing industry. For example, boating value added by state represents all contributions by in-state boat manufactur-ers, marinas, repair shops, etc., to the boating activity.
Industry tables show states’ total outdoor recreation-related value added, em-ployment, and compensation by industry, regardless of the outdoor activities the industries support. Outdoor recreation-related activity is included in the states’ industry totals even if the final consumption occurs outside the state.
A state’s total value added across all outdoor recreation activities will equal the state’s total value added across all outdoor recreation industries.
VerDate Aug 31 2005 16:26 Dec 16, 2020 Jkt 000000 PO 00000 Frm 00035 Fmt 6621 Sfmt 6621 P:\DOCS\116-19\38016.TXT BRIAN
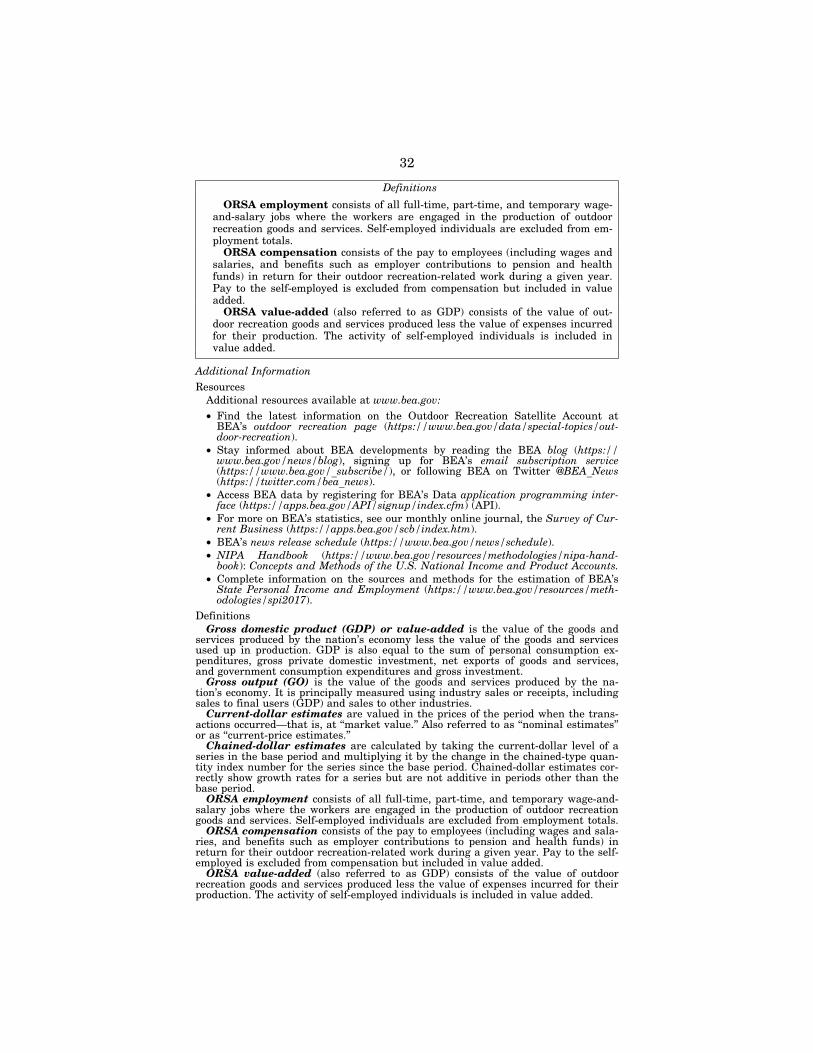
32
Definitions
ORSA employment consists of all full-time, part-time, and temporary wage- and-salary jobs where the workers are engaged in the production of outdoor recreation goods and services. Self-employed individuals are excluded from em-ployment totals.
ORSA compensation consists of the pay to employees (including wages and salaries, and benefits such as employer contributions to pension and health funds) in return for their outdoor recreation-related work during a given year. Pay to the self-employed is excluded from compensation but included in value added.
ORSA value-added (also referred to as GDP) consists of the value of out-door recreation goods and services produced less the value of expenses incurred for their production. The activity of self-employed individuals is included in value added.
Additional Information Resources
Additional resources available at www.bea.gov: • Find the latest information on the Outdoor Recreation Satellite Account at
BEA’s outdoor recreation page (https://www.bea.gov/data/special-topics/out-door-recreation).
• Stay informed about BEA developments by reading the BEA blog (https:// www.bea.gov/news/blog), signing up for BEA’s email subscription service (https://www.bea.gov/_subscribe/), or following BEA on Twitter @BEA_News (https://twitter.com/bea_news).
• Access BEA data by registering for BEA’s Data application programming inter-face (https://apps.bea.gov/API/signup/index.cfm) (API).
• For more on BEA’s statistics, see our monthly online journal, the Survey of Cur-rent Business (https://apps.bea.gov/scb/index.htm).
• BEA’s news release schedule (https://www.bea.gov/news/schedule). • NIPA Handbook (https://www.bea.gov/resources/methodologies/nipa-hand-
book): Concepts and Methods of the U.S. National Income and Product Accounts. • Complete information on the sources and methods for the estimation of BEA’s
State Personal Income and Employment (https://www.bea.gov/resources/meth-odologies/spi2017).
Definitions Gross domestic product (GDP) or value-added is the value of the goods and
services produced by the nation’s economy less the value of the goods and services used up in production. GDP is also equal to the sum of personal consumption ex-penditures, gross private domestic investment, net exports of goods and services, and government consumption expenditures and gross investment.
Gross output (GO) is the value of the goods and services produced by the na-tion’s economy. It is principally measured using industry sales or receipts, including sales to final users (GDP) and sales to other industries.
Current-dollar estimates are valued in the prices of the period when the trans-actions occurred—that is, at ‘‘market value.’’ Also referred to as ‘‘nominal estimates’’ or as ‘‘current-price estimates.’’
Chained-dollar estimates are calculated by taking the current-dollar level of a series in the base period and multiplying it by the change in the chained-type quan-tity index number for the series since the base period. Chained-dollar estimates cor-rectly show growth rates for a series but are not additive in periods other than the base period.
ORSA employment consists of all full-time, part-time, and temporary wage-and- salary jobs where the workers are engaged in the production of outdoor recreation goods and services. Self-employed individuals are excluded from employment totals.
ORSA compensation consists of the pay to employees (including wages and sala-ries, and benefits such as employer contributions to pension and health funds) in return for their outdoor recreation-related work during a given year. Pay to the self- employed is excluded from compensation but included in value added.
ORSA value-added (also referred to as GDP) consists of the value of outdoor recreation goods and services produced less the value of expenses incurred for their production. The activity of self-employed individuals is included in value added.
VerDate Aug 31 2005 16:26 Dec 16, 2020 Jkt 000000 PO 00000 Frm 00036 Fmt 6621 Sfmt 6621 P:\DOCS\116-19\38016.TXT BRIAN

33
Statistical Conventions Quarter-to-quarter percent changes are calculated from unrounded data and are
annualized. Annualized growth rates show the rate of change that would have oc-curred had the pattern been repeated over four quarters (1 year). Annualized rates of change can be calculated as follows: (((level of later quarter/level of earlier quar-ter)^4)¥1)*100. Quarterly estimates are expressed at seasonally adjusted annual rates, unless otherwise specified. Quarter-to-quarter dollar changes are differences between published estimates. List of National Level News Release Tables
Table 1. Real Outdoor Recreation Value-Added by Activity Table 2. Outdoor Recreation Value-Added by Activity Table 3. Outdoor Recreation Value-Added by Activity as a Percentage of Gross Do-
mestic Product Table 4. Outdoor Recreation Value-Added by Activity as a Percentage of Total Out-
door Recreation Value-Added Table 5. Chain-type Quantity Indexes for Outdoor Recreation Value-Added by Ac-
tivity Table 6. Percent Changes in Chain-Type Quantity Indexes for Outdoor Recreation
Value-Added by Activity Table 7. Chain-Type Price Indexes for Outdoor Recreation Value-Added by Activity Table 8. Percent Changes in Chain-Type Price Indexes for Outdoor Recreation
Value-Added by Activity Table 9. Real Outdoor Recreation Value-Added by Industry Table 10. Outdoor Recreation Value-Added by Industry Table 11. Outdoor Recreation Value-Added by Industry as a Percentage of Gross
Domestic Product Table 12. Outdoor Recreation Value-Added by Industry as a Percentage of Total
Outdoor Recreation Value-Added Table 13. Chain-type Quantity Indexes for Outdoor Recreation Value-Added by In-
dustry Table 14. Percent Changes in Chain-Type Quantity Indexes for Outdoor Recreation
Value-Added by Industry Table 15. Chain-Type Price Indexes for Outdoor Recreation Value-Added by Indus-
try Table 16. Percent Changes in Chain-Type Price Indexes for Outdoor Recreation
Value-Added by Industry Table 17. Real Outdoor Recreation Gross Output by Activity Table 18. Outdoor Recreation Gross Output by Activity Table 19. Chain-type Quantity Indexes for Outdoor Recreation Gross Output by Ac-
tivity Table 20. Percent Changes in Chain-Type Quantity Indexes for Outdoor Recreation
Gross Output by Activity Table 21. Chain-Type Price Indexes for Outdoor Recreation Gross Output by Activ-
ity Table 22. Percent Changes in Chain-Type Price Indexes for Outdoor Recreation
Gross Output by Activity Table 23. Real Outdoor Recreation Gross Output by Industry Table 24. Outdoor Recreation Gross Output by Industry Table 25. Chain-type Quantity Indexes for Outdoor Recreation Gross Output by In-
dustry Table 26. Percent Changes in Chain-Type Quantity Indexes for Outdoor Recreation
Gross Output by Industry Table 27. Chain-Type Price Indexes for Outdoor Recreation Gross Output by Indus-
try Table 28. Percent Changes in Chain-Type Price Indexes for Outdoor Recreation
Gross Output by Industry Table 29. Outdoor Recreation Compensation by Industry Table 30. Outdoor Recreation Employment by Industry
List of State Level News Release Tables Table 1. Outdoor Recreation Value-Added, Employment, and Compensation as a
percent of Total, 2017 Table 2. Value-Added Outdoor Recreation by State, Selected Activities, 2017 Table 3. Value-Added Outdoor Recreation by State, Selected Industries, 2017 Table 4. Employment, Outdoor Recreation by State, Selected Industries, 2017 Table 5. Compensation, Outdoor Recreation by State, Selected Industries, 2017
VerDate Aug 31 2005 16:26 Dec 16, 2020 Jkt 000000 PO 00000 Frm 00037 Fmt 6621 Sfmt 6621 P:\DOCS\116-19\38016.TXT BRIAN
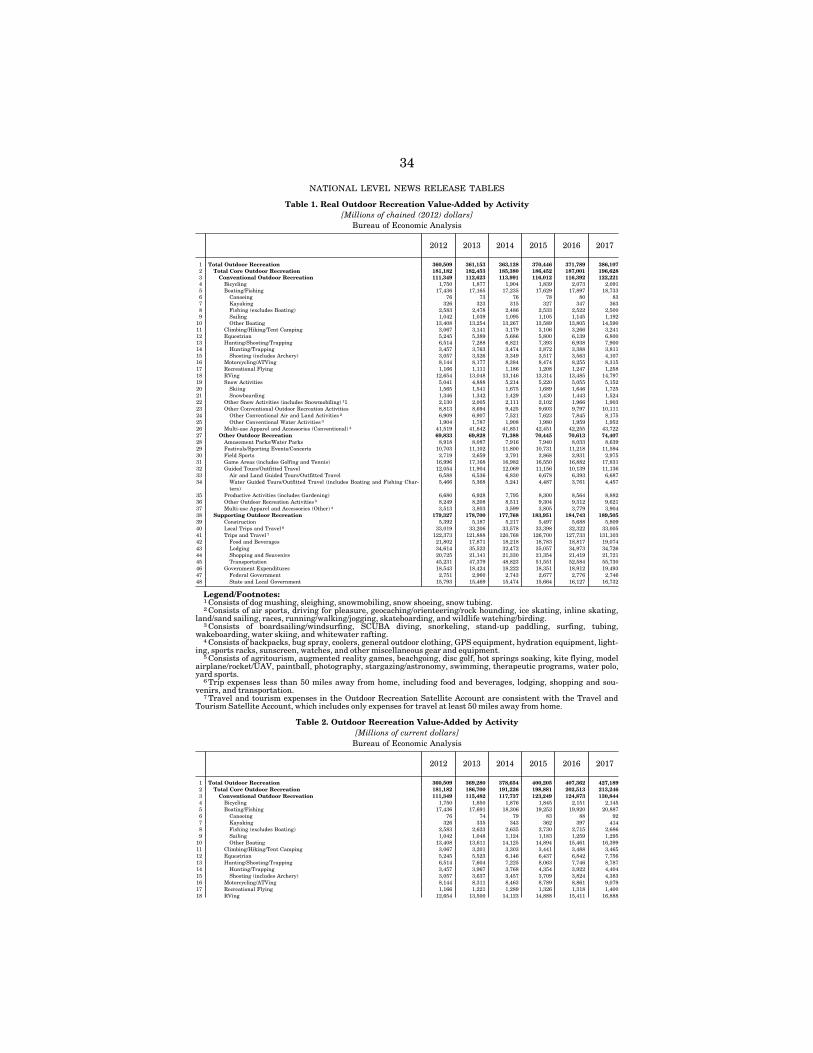
34
NATIONAL LEVEL NEWS RELEASE TABLES Table 1. Real Outdoor Recreation Value-Added by Activity
[Millions of chained (2012) dollars] Bureau of Economic Analysis
2012 2013 2014 2015 2016 2017
1 Total Outdoor Recreation 360,509 361,153 363,128 370,446 371,789 386,107 2 Total Core Outdoor Recreation 181,182 182,453 185,380 186,452 187,001 196,628 3 Conventional Outdoor Recreation 111,349 112,623 113,991 116,012 116,392 122,221 4 Bicycling 1,750 1,877 1,904 1,839 2,073 2,091 5 Boating/Fishing 17,436 17,165 17,235 17,629 17,897 18,733 6 Canoeing 76 73 76 78 80 83 7 Kayaking 326 323 315 327 347 363 8 Fishing (excludes Boating) 2,583 2,478 2,486 2,533 2,522 2,500 9 Sailing 1,042 1,039 1,095 1,105 1,145 1,192
10 Other Boating 13,408 13,254 13,267 13,589 13,805 14,590 11 Climbing/Hiking/Tent Camping 3,067 3,141 3,179 3,106 3,266 3,241 12 Equestrian 5,245 5,389 5,686 5,800 6,139 6,800 13 Hunting/Shooting/Trapping 6,514 7,288 6,821 7,393 6,938 7,900 14 Hunting/Trapping 3,457 3,763 3,474 3,872 3,388 3,811 15 Shooting (includes Archery) 3,057 3,526 3,349 3,517 3,563 4,107 16 Motorcycling/ATVing 8,144 8,177 8,384 8,474 8,255 8,315 17 Recreational Flying 1,166 1,111 1,186 1,208 1,247 1,258 18 RVing 12,654 13,048 13,146 13,314 13,485 14,797 19 Snow Activities 5,041 4,888 5,214 5,220 5,055 5,152 20 Skiing 1,565 1,541 1,675 1,689 1,646 1,725 21 Snowboarding 1,346 1,342 1,429 1,430 1,443 1,524 22 Other Snow Activities (includes Snowmobiling) 11 2,130 2,005 2,111 2,102 1,966 1,903 23 Other Conventional Outdoor Recreation Activities 8,813 8,694 9,425 9,603 9,797 10,111 24 Other Conventional Air and Land Activities 2 6,909 6,907 7,521 7,623 7,845 8,175 25 Other Conventional Water Activities 3 1,904 1,787 1,908 1,980 1,959 1,952 26 Multi-use Apparel and Accessories (Conventional) 4 41,519 41,842 41,851 42,451 42,255 43,722 27 Other Outdoor Recreation 69,833 69,828 71,388 70,445 70,613 74,407 28 Amusement Parks/Water Parks 8,918 8,087 7,916 7,940 8,033 8,639 29 Festivals/Sporting Events/Concerts 10,703 11,102 11,800 10,731 11,218 11,594 30 Field Sports 2,719 2,659 2,791 2,868 2,931 2,975 31 Game Areas (includes Golfing and Tennis) 16,996 17,168 16,982 16,550 16,882 17,831 32 Guided Tours/Outfitted Travel 12,054 11,904 12,069 11,156 10,139 11,136 33 Air and Land Guided Tours/Outfitted Travel 6,588 6,536 6,830 6,678 6,393 6,687 34 Water Guided Tours/Outfitted Travel (includes Boating and Fishing Char-
ters) 5,466 5,368 5,241 4,487 3,761 4,457
35 Productive Activities (includes Gardening) 6,680 6,928 7,795 8,300 8,564 8,882 36 Other Outdoor Recreation Activities 5 8,249 8,208 8,511 9,304 9,312 9,621 37 Multi-use Apparel and Accessories (Other) 4 3,513 3,803 3,599 3,805 3,779 3,904 38 Supporting Outdoor Recreation 179,327 178,700 177,768 183,951 184,743 189,505 39 Construction 5,392 5,187 5,217 5,497 5,688 5,809 40 Local Trips and Travel 6 33,019 33,206 33,578 33,398 32,322 33,005 41 Trips and Travel 7 122,373 121,888 120,768 126,700 127,733 131,103 42 Food and Beverages 21,802 17,871 18,218 18,783 18,817 19,074 43 Lodging 34,614 35,523 32,472 35,057 34,973 34,726 44 Shopping and Souvenirs 20,725 21,141 21,330 21,354 21,419 21,721 45 Transportation 45,231 47,379 48,823 51,551 52,584 55,730 46 Government Expenditures 18,543 18,424 18,222 18,351 18,912 19,493 47 Federal Government 2,751 2,960 2,743 2,677 2,776 2,746 48 State and Local Government 15,793 15,469 15,474 15,664 16,127 16,732
Legend/Footnotes: 1 Consists of dog mushing, sleighing, snowmobiling, snow shoeing, snow tubing. 2 Consists of air sports, driving for pleasure, geocaching/orienteering/rock hounding, ice skating, inline skating,
land/sand sailing, races, running/walking/jogging, skateboarding, and wildlife watching/birding. 3 Consists of boardsailing/windsurfing, SCUBA diving, snorkeling, stand-up paddling, surfing, tubing,
wakeboarding, water skiing, and whitewater rafting. 4 Consists of backpacks, bug spray, coolers, general outdoor clothing, GPS equipment, hydration equipment, light-
ing, sports racks, sunscreen, watches, and other miscellaneous gear and equipment. 5 Consists of agritourism, augmented reality games, beachgoing, disc golf, hot springs soaking, kite flying, model
airplane/rocket/UAV, paintball, photography, stargazing/astronomy, swimming, therapeutic programs, water polo, yard sports.
6 Trip expenses less than 50 miles away from home, including food and beverages, lodging, shopping and sou-venirs, and transportation.
7 Travel and tourism expenses in the Outdoor Recreation Satellite Account are consistent with the Travel and Tourism Satellite Account, which includes only expenses for travel at least 50 miles away from home.
Table 2. Outdoor Recreation Value-Added by Activity [Millions of current dollars]
Bureau of Economic Analysis
2012 2013 2014 2015 2016 2017
1 Total Outdoor Recreation 360,509 369,280 378,654 400,205 407,362 427,189 2 Total Core Outdoor Recreation 181,182 186,700 191,226 198,881 202,513 213,246 3 Conventional Outdoor Recreation 111,349 115,482 117,737 123,249 124,873 130,844 4 Bicycling 1,750 1,850 1,876 1,845 2,151 2,145 5 Boating/Fishing 17,436 17,691 18,306 19,253 19,920 20,887 6 Canoeing 76 74 79 83 88 92 7 Kayaking 326 335 343 362 397 414 8 Fishing (excludes Boating) 2,583 2,623 2,635 2,730 2,715 2,686 9 Sailing 1,042 1,048 1,124 1,183 1,259 1,295
10 Other Boating 13,408 13,611 14,125 14,894 15,461 16,399 11 Climbing/Hiking/Tent Camping 3,067 3,201 3,303 3,441 3,488 3,465 12 Equestrian 5,245 5,523 6,146 6,437 6,842 7,756 13 Hunting/Shooting/Trapping 6,514 7,604 7,225 8,063 7,746 8,787 14 Hunting/Trapping 3,457 3,967 3,768 4,354 3,922 4,404 15 Shooting (includes Archery) 3,057 3,637 3,457 3,709 3,824 4,383 16 Motorcycling/ATVing 8,144 8,311 8,463 8,789 8,861 9,079 17 Recreational Flying 1,166 1,221 1,289 1,326 1,318 1,400 18 RVing 12,654 13,500 14,123 14,888 15,411 16,888
VerDate Aug 31 2005 16:26 Dec 16, 2020 Jkt 000000 PO 00000 Frm 00038 Fmt 6621 Sfmt 6621 P:\DOCS\116-19\38016.TXT BRIAN
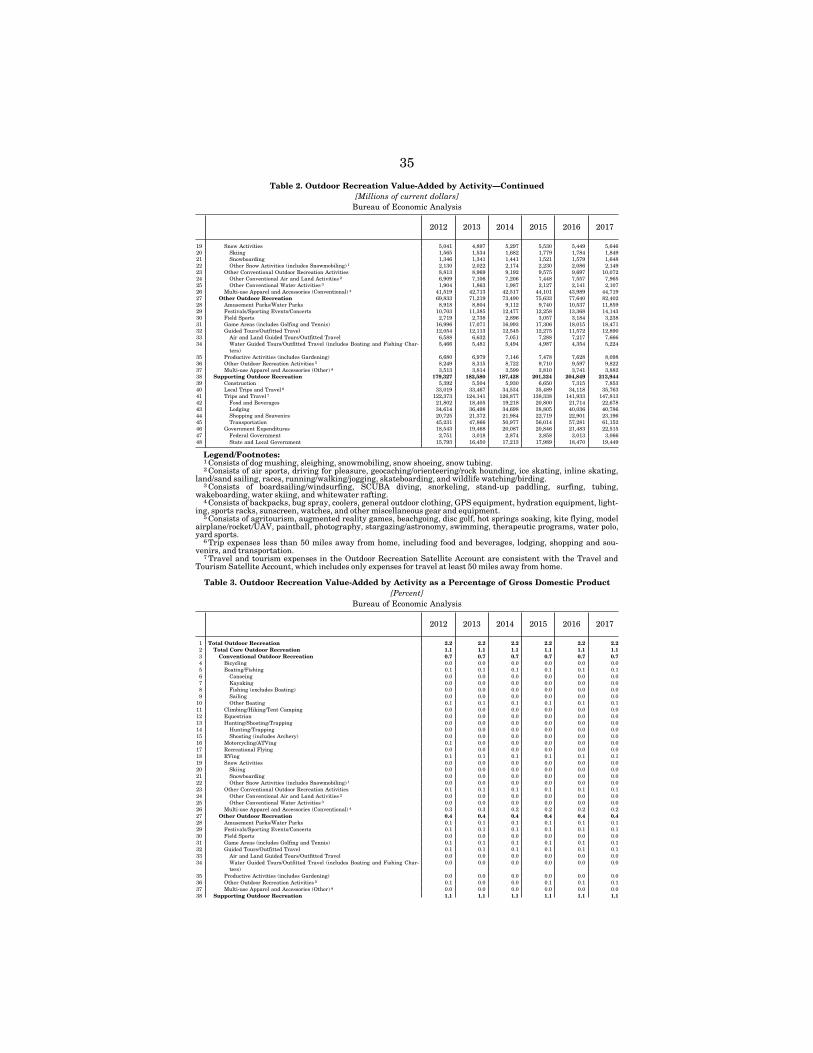
35
Table 2. Outdoor Recreation Value-Added by Activity—Continued [Millions of current dollars]
Bureau of Economic Analysis
2012 2013 2014 2015 2016 2017
19 Snow Activities 5,041 4,897 5,297 5,530 5,449 5,646 20 Skiing 1,565 1,534 1,682 1,779 1,784 1,849 21 Snowboarding 1,346 1,341 1,441 1,521 1,579 1,648 22 Other Snow Activities (includes Snowmobiling) 1 2,130 2,022 2,174 2,230 2,086 2,149 23 Other Conventional Outdoor Recreation Activities 8,813 8,969 9,192 9,575 9,697 10,072 24 Other Conventional Air and Land Activities 2 6,909 7,106 7,206 7,448 7,557 7,965 25 Other Conventional Water Activities 3 1,904 1,863 1,987 2,127 2,141 2,107 26 Multi-use Apparel and Accessories (Conventional) 4 41,519 42,713 42,517 44,101 43,989 44,719 27 Other Outdoor Recreation 69,833 71,219 73,490 75,633 77,640 82,402 28 Amusement Parks/Water Parks 8,918 8,804 9,112 9,740 10,537 11,859 29 Festivals/Sporting Events/Concerts 10,703 11,385 12,477 12,258 13,368 14,143 30 Field Sports 2,719 2,738 2,896 3,057 3,184 3,238 31 Game Areas (includes Golfing and Tennis) 16,996 17,071 16,993 17,306 18,015 18,471 32 Guided Tours/Outfitted Travel 12,054 12,113 12,545 12,275 11,572 12,890 33 Air and Land Guided Tours/Outfitted Travel 6,588 6,632 7,051 7,288 7,217 7,666 34 Water Guided Tours/Outfitted Travel (includes Boating and Fishing Char-
ters) 5,466 5,481 5,494 4,987 4,354 5,224
35 Productive Activities (includes Gardening) 6,680 6,979 7,146 7,478 7,628 8,098 36 Other Outdoor Recreation Activities 5 8,249 8,315 8,722 9,710 9,597 9,822 37 Multi-use Apparel and Accessories (Other) 4 3,513 3,814 3,599 3,810 3,741 3,882 38 Supporting Outdoor Recreation 179,327 182,580 187,428 201,324 204,849 213,944 39 Construction 5,392 5,504 5,930 6,650 7,315 7,853 40 Local Trips and Travel 6 33,019 33,467 34,534 35,489 34,118 35,763 41 Trips and Travel 7 122,373 124,141 126,877 138,338 141,933 147,813 42 Food and Beverages 21,802 18,405 19,218 20,800 21,714 22,678 43 Lodging 34,614 36,498 34,698 38,805 40,036 40,786 44 Shopping and Souvenirs 20,725 21,372 21,984 22,719 22,901 23,196 45 Transportation 45,231 47,866 50,977 56,014 57,281 61,152 46 Government Expenditures 18,543 19,468 20,087 20,846 21,483 22,515 47 Federal Government 2,751 3,018 2,874 2,858 3,013 3,066 48 State and Local Government 15,793 16,450 17,213 17,989 18,470 19,449
Legend/Footnotes: 1 Consists of dog mushing, sleighing, snowmobiling, snow shoeing, snow tubing. 2 Consists of air sports, driving for pleasure, geocaching/orienteering/rock hounding, ice skating, inline skating,
land/sand sailing, races, running/walking/jogging, skateboarding, and wildlife watching/birding. 3 Consists of boardsailing/windsurfing, SCUBA diving, snorkeling, stand-up paddling, surfing, tubing,
wakeboarding, water skiing, and whitewater rafting. 4 Consists of backpacks, bug spray, coolers, general outdoor clothing, GPS equipment, hydration equipment, light-
ing, sports racks, sunscreen, watches, and other miscellaneous gear and equipment. 5 Consists of agritourism, augmented reality games, beachgoing, disc golf, hot springs soaking, kite flying, model
airplane/rocket/UAV, paintball, photography, stargazing/astronomy, swimming, therapeutic programs, water polo, yard sports.
6 Trip expenses less than 50 miles away from home, including food and beverages, lodging, shopping and sou-venirs, and transportation.
7 Travel and tourism expenses in the Outdoor Recreation Satellite Account are consistent with the Travel and Tourism Satellite Account, which includes only expenses for travel at least 50 miles away from home.
Table 3. Outdoor Recreation Value-Added by Activity as a Percentage of Gross Domestic Product [Percent]
Bureau of Economic Analysis
2012 2013 2014 2015 2016 2017
1 Total Outdoor Recreation 2.2 2.2 2.2 2.2 2.2 2.2 2 Total Core Outdoor Recreation 1.1 1.1 1.1 1.1 1.1 1.1 3 Conventional Outdoor Recreation 0.7 0.7 0.7 0.7 0.7 0.7 4 Bicycling 0.0 0.0 0.0 0.0 0.0 0.0 5 Boating/Fishing 0.1 0.1 0.1 0.1 0.1 0.1 6 Canoeing 0.0 0.0 0.0 0.0 0.0 0.0 7 Kayaking 0.0 0.0 0.0 0.0 0.0 0.0 8 Fishing (excludes Boating) 0.0 0.0 0.0 0.0 0.0 0.0 9 Sailing 0.0 0.0 0.0 0.0 0.0 0.0
10 Other Boating 0.1 0.1 0.1 0.1 0.1 0.1 11 Climbing/Hiking/Tent Camping 0.0 0.0 0.0 0.0 0.0 0.0 12 Equestrian 0.0 0.0 0.0 0.0 0.0 0.0 13 Hunting/Shooting/Trapping 0.0 0.0 0.0 0.0 0.0 0.0 14 Hunting/Trapping 0.0 0.0 0.0 0.0 0.0 0.0 15 Shooting (includes Archery) 0.0 0.0 0.0 0.0 0.0 0.0 16 Motorcycling/ATVing 0.1 0.0 0.0 0.0 0.0 0.0 17 Recreational Flying 0.0 0.0 0.0 0.0 0.0 0.0 18 RVing 0.1 0.1 0.1 0.1 0.1 0.1 19 Snow Activities 0.0 0.0 0.0 0.0 0.0 0.0 20 Skiing 0.0 0.0 0.0 0.0 0.0 0.0 21 Snowboarding 0.0 0.0 0.0 0.0 0.0 0.0 22 Other Snow Activities (includes Snowmobiling) 1 0.0 0.0 0.0 0.0 0.0 0.0 23 Other Conventional Outdoor Recreation Activities 0.1 0.1 0.1 0.1 0.1 0.1 24 Other Conventional Air and Land Activities 2 0.0 0.0 0.0 0.0 0.0 0.0 25 Other Conventional Water Activities 3 0.0 0.0 0.0 0.0 0.0 0.0 26 Multi-use Apparel and Accessories (Conventional) 4 0.3 0.3 0.2 0.2 0.2 0.2 27 Other Outdoor Recreation 0.4 0.4 0.4 0.4 0.4 0.4 28 Amusement Parks/Water Parks 0.1 0.1 0.1 0.1 0.1 0.1 29 Festivals/Sporting Events/Concerts 0.1 0.1 0.1 0.1 0.1 0.1 30 Field Sports 0.0 0.0 0.0 0.0 0.0 0.0 31 Game Areas (includes Golfing and Tennis) 0.1 0.1 0.1 0.1 0.1 0.1 32 Guided Tours/Outfitted Travel 0.1 0.1 0.1 0.1 0.1 0.1 33 Air and Land Guided Tours/Outfitted Travel 0.0 0.0 0.0 0.0 0.0 0.0 34 Water Guided Tours/Outfitted Travel (includes Boating and Fishing Char-
ters) 0.0 0.0 0.0 0.0 0.0 0.0
35 Productive Activities (includes Gardening) 0.0 0.0 0.0 0.0 0.0 0.0 36 Other Outdoor Recreation Activities 5 0.1 0.0 0.0 0.1 0.1 0.1 37 Multi-use Apparel and Accessories (Other) 4 0.0 0.0 0.0 0.0 0.0 0.0 38 Supporting Outdoor Recreation 1.1 1.1 1.1 1.1 1.1 1.1
VerDate Aug 31 2005 16:26 Dec 16, 2020 Jkt 000000 PO 00000 Frm 00039 Fmt 6621 Sfmt 6621 P:\DOCS\116-19\38016.TXT BRIAN
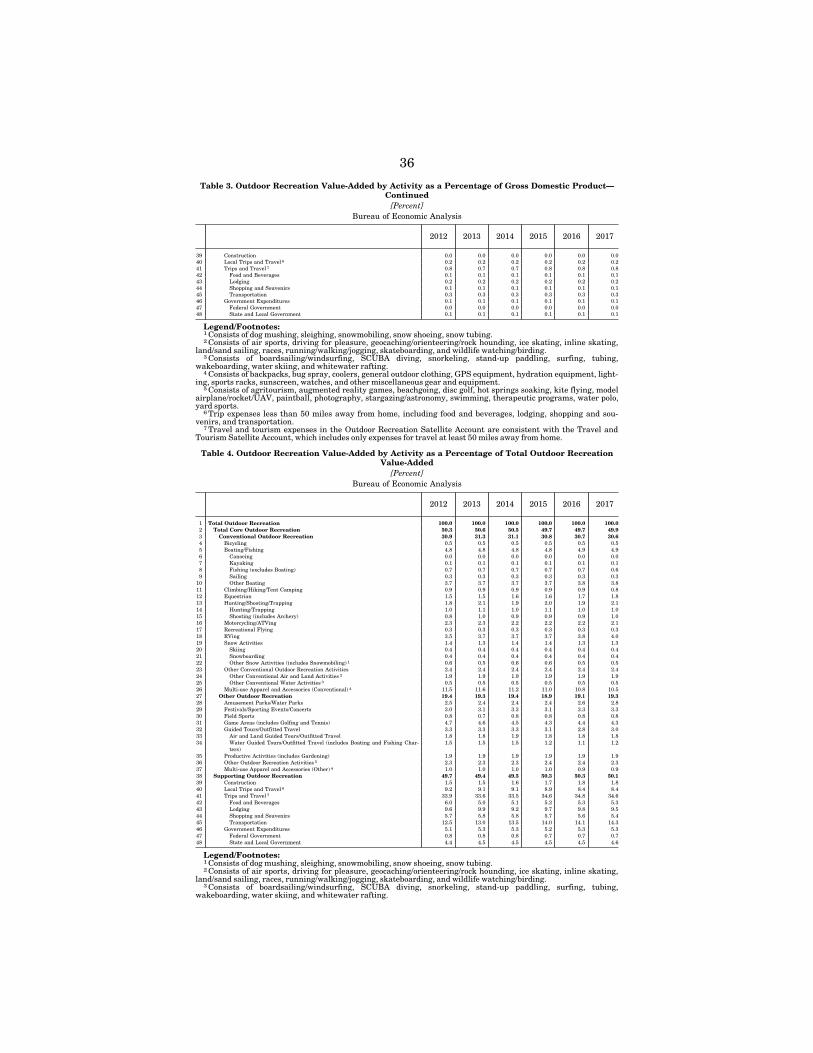
36
Table 3. Outdoor Recreation Value-Added by Activity as a Percentage of Gross Domestic Product— Continued
[Percent] Bureau of Economic Analysis
2012 2013 2014 2015 2016 2017
39 Construction 0.0 0.0 0.0 0.0 0.0 0.0 40 Local Trips and Travel 6 0.2 0.2 0.2 0.2 0.2 0.2 41 Trips and Travel 7 0.8 0.7 0.7 0.8 0.8 0.8 42 Food and Beverages 0.1 0.1 0.1 0.1 0.1 0.1 43 Lodging 0.2 0.2 0.2 0.2 0.2 0.2 44 Shopping and Souvenirs 0.1 0.1 0.1 0.1 0.1 0.1 45 Transportation 0.3 0.3 0.3 0.3 0.3 0.3 46 Government Expenditures 0.1 0.1 0.1 0.1 0.1 0.1 47 Federal Government 0.0 0.0 0.0 0.0 0.0 0.0 48 State and Local Government 0.1 0.1 0.1 0.1 0.1 0.1
Legend/Footnotes: 1 Consists of dog mushing, sleighing, snowmobiling, snow shoeing, snow tubing. 2 Consists of air sports, driving for pleasure, geocaching/orienteering/rock hounding, ice skating, inline skating,
land/sand sailing, races, running/walking/jogging, skateboarding, and wildlife watching/birding. 3 Consists of boardsailing/windsurfing, SCUBA diving, snorkeling, stand-up paddling, surfing, tubing,
wakeboarding, water skiing, and whitewater rafting. 4 Consists of backpacks, bug spray, coolers, general outdoor clothing, GPS equipment, hydration equipment, light-
ing, sports racks, sunscreen, watches, and other miscellaneous gear and equipment. 5 Consists of agritourism, augmented reality games, beachgoing, disc golf, hot springs soaking, kite flying, model
airplane/rocket/UAV, paintball, photography, stargazing/astronomy, swimming, therapeutic programs, water polo, yard sports.
6 Trip expenses less than 50 miles away from home, including food and beverages, lodging, shopping and sou-venirs, and transportation.
7 Travel and tourism expenses in the Outdoor Recreation Satellite Account are consistent with the Travel and Tourism Satellite Account, which includes only expenses for travel at least 50 miles away from home.
Table 4. Outdoor Recreation Value-Added by Activity as a Percentage of Total Outdoor Recreation Value-Added
[Percent] Bureau of Economic Analysis
2012 2013 2014 2015 2016 2017
1 Total Outdoor Recreation 100.0 100.0 100.0 100.0 100.0 100.0 2 Total Core Outdoor Recreation 50.3 50.6 50.5 49.7 49.7 49.9 3 Conventional Outdoor Recreation 30.9 31.3 31.1 30.8 30.7 30.6 4 Bicycling 0.5 0.5 0.5 0.5 0.5 0.5 5 Boating/Fishing 4.8 4.8 4.8 4.8 4.9 4.9 6 Canoeing 0.0 0.0 0.0 0.0 0.0 0.0 7 Kayaking 0.1 0.1 0.1 0.1 0.1 0.1 8 Fishing (excludes Boating) 0.7 0.7 0.7 0.7 0.7 0.6 9 Sailing 0.3 0.3 0.3 0.3 0.3 0.3
10 Other Boating 3.7 3.7 3.7 3.7 3.8 3.8 11 Climbing/Hiking/Tent Camping 0.9 0.9 0.9 0.9 0.9 0.8 12 Equestrian 1.5 1.5 1.6 1.6 1.7 1.8 13 Hunting/Shooting/Trapping 1.8 2.1 1.9 2.0 1.9 2.1 14 Hunting/Trapping 1.0 1.1 1.0 1.1 1.0 1.0 15 Shooting (includes Archery) 0.8 1.0 0.9 0.9 0.9 1.0 16 Motorcycling/ATVing 2.3 2.3 2.2 2.2 2.2 2.1 17 Recreational Flying 0.3 0.3 0.3 0.3 0.3 0.3 18 RVing 3.5 3.7 3.7 3.7 3.8 4.0 19 Snow Activities 1.4 1.3 1.4 1.4 1.3 1.3 20 Skiing 0.4 0.4 0.4 0.4 0.4 0.4 21 Snowboarding 0.4 0.4 0.4 0.4 0.4 0.4 22 Other Snow Activities (includes Snowmobiling) 1 0.6 0.5 0.6 0.6 0.5 0.5 23 Other Conventional Outdoor Recreation Activities 2.4 2.4 2.4 2.4 2.4 2.4 24 Other Conventional Air and Land Activities 2 1.9 1.9 1.9 1.9 1.9 1.9 25 Other Conventional Water Activities 3 0.5 0.5 0.5 0.5 0.5 0.5 26 Multi-use Apparel and Accessories (Conventional) 4 11.5 11.6 11.2 11.0 10.8 10.5 27 Other Outdoor Recreation 19.4 19.3 19.4 18.9 19.1 19.3 28 Amusement Parks/Water Parks 2.5 2.4 2.4 2.4 2.6 2.8 29 Festivals/Sporting Events/Concerts 3.0 3.1 3.3 3.1 3.3 3.3 30 Field Sports 0.8 0.7 0.8 0.8 0.8 0.8 31 Game Areas (includes Golfing and Tennis) 4.7 4.6 4.5 4.3 4.4 4.3 32 Guided Tours/Outfitted Travel 3.3 3.3 3.3 3.1 2.8 3.0 33 Air and Land Guided Tours/Outfitted Travel 1.8 1.8 1.9 1.8 1.8 1.8 34 Water Guided Tours/Outfitted Travel (includes Boating and Fishing Char-
ters) 1.5 1.5 1.5 1.2 1.1 1.2
35 Productive Activities (includes Gardening) 1.9 1.9 1.9 1.9 1.9 1.9 36 Other Outdoor Recreation Activities 5 2.3 2.3 2.3 2.4 2.4 2.3 37 Multi-use Apparel and Accessories (Other) 4 1.0 1.0 1.0 1.0 0.9 0.9 38 Supporting Outdoor Recreation 49.7 49.4 49.5 50.3 50.3 50.1 39 Construction 1.5 1.5 1.6 1.7 1.8 1.8 40 Local Trips and Travel 6 9.2 9.1 9.1 8.9 8.4 8.4 41 Trips and Travel 7 33.9 33.6 33.5 34.6 34.8 34.6 42 Food and Beverages 6.0 5.0 5.1 5.2 5.3 5.3 43 Lodging 9.6 9.9 9.2 9.7 9.8 9.5 44 Shopping and Souvenirs 5.7 5.8 5.8 5.7 5.6 5.4 45 Transportation 12.5 13.0 13.5 14.0 14.1 14.3 46 Government Expenditures 5.1 5.3 5.3 5.2 5.3 5.3 47 Federal Government 0.8 0.8 0.8 0.7 0.7 0.7 48 State and Local Government 4.4 4.5 4.5 4.5 4.5 4.6
Legend/Footnotes: 1 Consists of dog mushing, sleighing, snowmobiling, snow shoeing, snow tubing. 2 Consists of air sports, driving for pleasure, geocaching/orienteering/rock hounding, ice skating, inline skating,
land/sand sailing, races, running/walking/jogging, skateboarding, and wildlife watching/birding. 3 Consists of boardsailing/windsurfing, SCUBA diving, snorkeling, stand-up paddling, surfing, tubing,
wakeboarding, water skiing, and whitewater rafting.
VerDate Aug 31 2005 16:26 Dec 16, 2020 Jkt 000000 PO 00000 Frm 00040 Fmt 6621 Sfmt 6621 P:\DOCS\116-19\38016.TXT BRIAN
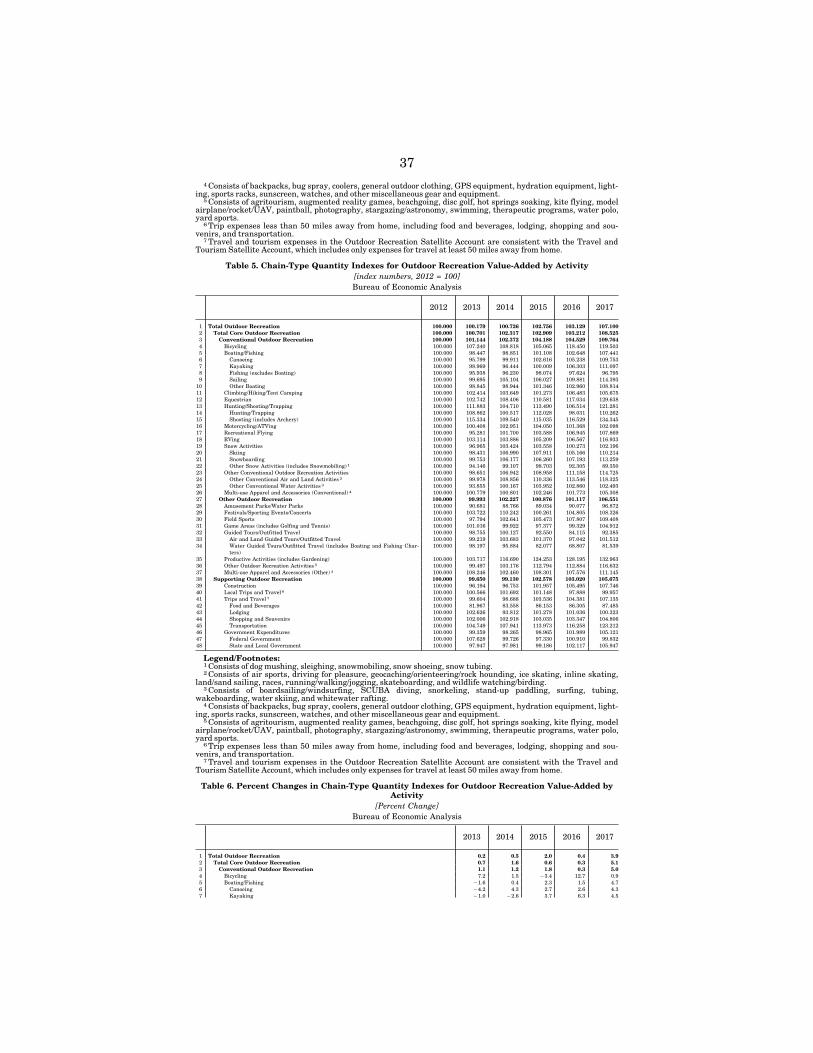
37 4 Consists of backpacks, bug spray, coolers, general outdoor clothing, GPS equipment, hydration equipment, light-
ing, sports racks, sunscreen, watches, and other miscellaneous gear and equipment. 5 Consists of agritourism, augmented reality games, beachgoing, disc golf, hot springs soaking, kite flying, model
airplane/rocket/UAV, paintball, photography, stargazing/astronomy, swimming, therapeutic programs, water polo, yard sports.
6 Trip expenses less than 50 miles away from home, including food and beverages, lodging, shopping and sou-venirs, and transportation.
7 Travel and tourism expenses in the Outdoor Recreation Satellite Account are consistent with the Travel and Tourism Satellite Account, which includes only expenses for travel at least 50 miles away from home.
Table 5. Chain-Type Quantity Indexes for Outdoor Recreation Value-Added by Activity [index numbers, 2012 = 100] Bureau of Economic Analysis
2012 2013 2014 2015 2016 2017
1 Total Outdoor Recreation 100.000 100.179 100.726 102.756 103.129 107.100 2 Total Core Outdoor Recreation 100.000 100.701 102.317 102.909 103.212 108.525 3 Conventional Outdoor Recreation 100.000 101.144 102.372 104.188 104.529 109.764 4 Bicycling 100.000 107.240 108.818 105.065 118.450 119.503 5 Boating/Fishing 100.000 98.447 98.851 101.108 102.648 107.441 6 Canoeing 100.000 95.799 99.911 102.616 105.238 109.753 7 Kayaking 100.000 98.969 96.444 100.009 106.303 111.097 8 Fishing (excludes Boating) 100.000 95.938 96.230 98.074 97.624 96.795 9 Sailing 100.000 99.695 105.104 106.027 109.881 114.393
10 Other Boating 100.000 98.845 98.944 101.346 102.960 108.814 11 Climbing/Hiking/Tent Camping 100.000 102.414 103.649 101.273 106.483 105.675 12 Equestrian 100.000 102.742 108.406 110.581 117.034 129.638 13 Hunting/Shooting/Trapping 100.000 111.883 104.710 113.490 106.514 121.281 14 Hunting/Trapping 100.000 108.862 100.517 112.028 98.031 110.262 15 Shooting (includes Archery) 100.000 115.334 109.540 115.035 116.529 134.345 16 Motorcycling/ATVing 100.000 100.408 102.951 104.050 101.368 102.098 17 Recreational Flying 100.000 95.281 101.700 103.588 106.945 107.869 18 RVing 100.000 103.114 103.886 105.209 106.567 116.933 19 Snow Activities 100.000 96.965 103.424 103.558 100.273 102.196 20 Skiing 100.000 98.431 106.990 107.911 105.166 110.214 21 Snowboarding 100.000 99.753 106.177 106.260 107.193 113.259 22 Other Snow Activities (includes Snowmobiling) 1 100.000 94.146 99.107 98.703 92.305 89.350 23 Other Conventional Outdoor Recreation Activities 100.000 98.651 106.942 108.958 111.158 114.725 24 Other Conventional Air and Land Activities 2 100.000 99.978 108.856 110.336 113.546 118.325 25 Other Conventional Water Activities 3 100.000 93.855 100.167 103.952 102.860 102.493 26 Multi-use Apparel and Accessories (Conventional) 4 100.000 100.779 100.801 102.246 101.773 105.308 27 Other Outdoor Recreation 100.000 99.993 102.227 100.876 101.117 106.551 28 Amusement Parks/Water Parks 100.000 90.681 88.766 89.034 90.077 96.872 29 Festivals/Sporting Events/Concerts 100.000 103.722 110.242 100.261 104.805 108.326 30 Field Sports 100.000 97.794 102.641 105.473 107.807 109.408 31 Game Areas (includes Golfing and Tennis) 100.000 101.016 99.922 97.377 99.329 104.912 32 Guided Tours/Outfitted Travel 100.000 98.755 100.127 92.550 84.115 92.385 33 Air and Land Guided Tours/Outfitted Travel 100.000 99.219 103.683 101.370 97.042 101.512 34 Water Guided Tours/Outfitted Travel (includes Boating and Fishing Char-
ters) 100.000 98.197 95.884 82.077 68.807 81.539
35 Productive Activities (includes Gardening) 100.000 103.717 116.690 124.253 128.195 132.963 36 Other Outdoor Recreation Activities 5 100.000 99.497 103.176 112.794 112.884 116.632 37 Multi-use Apparel and Accessories (Other) 4 100.000 108.246 102.460 108.301 107.576 111.145 38 Supporting Outdoor Recreation 100.000 99.650 99.130 102.578 103.020 105.675 39 Construction 100.000 96.194 96.753 101.957 105.495 107.746 40 Local Trips and Travel 6 100.000 100.566 101.692 101.148 97.888 99.957 41 Trips and Travel 7 100.000 99.604 98.688 103.536 104.381 107.135 42 Food and Beverages 100.000 81.967 83.558 86.153 86.305 87.485 43 Lodging 100.000 102.626 93.812 101.278 101.036 100.323 44 Shopping and Souvenirs 100.000 102.006 102.918 103.035 103.347 104.806 45 Transportation 100.000 104.749 107.941 113.973 116.258 123.212 46 Government Expenditures 100.000 99.359 98.265 98.965 101.989 105.121 47 Federal Government 100.000 107.628 99.726 97.330 100.910 99.832 48 State and Local Government 100.000 97.947 97.981 99.186 102.117 105.947
Legend/Footnotes: 1 Consists of dog mushing, sleighing, snowmobiling, snow shoeing, snow tubing. 2 Consists of air sports, driving for pleasure, geocaching/orienteering/rock hounding, ice skating, inline skating,
land/sand sailing, races, running/walking/jogging, skateboarding, and wildlife watching/birding. 3 Consists of boardsailing/windsurfing, SCUBA diving, snorkeling, stand-up paddling, surfing, tubing,
wakeboarding, water skiing, and whitewater rafting. 4 Consists of backpacks, bug spray, coolers, general outdoor clothing, GPS equipment, hydration equipment, light-
ing, sports racks, sunscreen, watches, and other miscellaneous gear and equipment. 5 Consists of agritourism, augmented reality games, beachgoing, disc golf, hot springs soaking, kite flying, model
airplane/rocket/UAV, paintball, photography, stargazing/astronomy, swimming, therapeutic programs, water polo, yard sports.
6 Trip expenses less than 50 miles away from home, including food and beverages, lodging, shopping and sou-venirs, and transportation.
7 Travel and tourism expenses in the Outdoor Recreation Satellite Account are consistent with the Travel and Tourism Satellite Account, which includes only expenses for travel at least 50 miles away from home.
Table 6. Percent Changes in Chain-Type Quantity Indexes for Outdoor Recreation Value-Added by Activity
[Percent Change] Bureau of Economic Analysis
2013 2014 2015 2016 2017
1 Total Outdoor Recreation 0.2 0.5 2.0 0.4 3.9 2 Total Core Outdoor Recreation 0.7 1.6 0.6 0.3 5.1 3 Conventional Outdoor Recreation 1.1 1.2 1.8 0.3 5.0 4 Bicycling 7.2 1.5 ¥3.4 12.7 0.9 5 Boating/Fishing ¥1.6 0.4 2.3 1.5 4.7 6 Canoeing ¥4.2 4.3 2.7 2.6 4.3 7 Kayaking ¥1.0 ¥2.6 3.7 6.3 4.5
VerDate Aug 31 2005 16:26 Dec 16, 2020 Jkt 000000 PO 00000 Frm 00041 Fmt 6621 Sfmt 6621 P:\DOCS\116-19\38016.TXT BRIAN
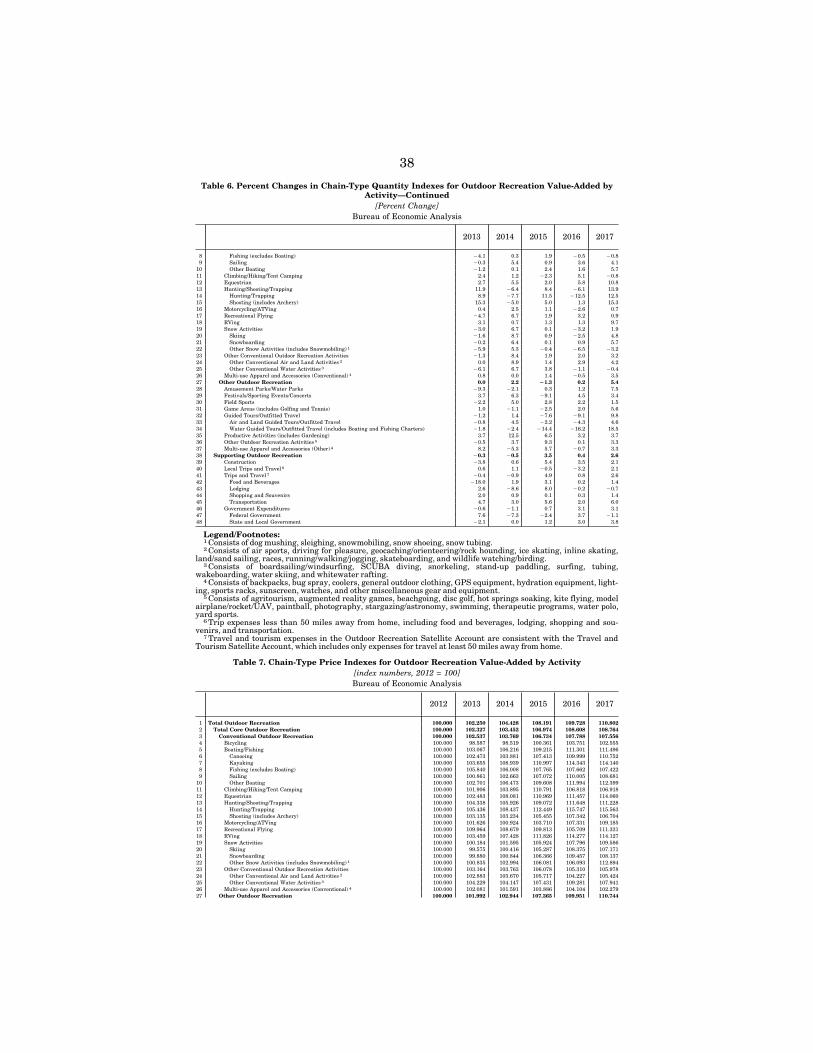
38
Table 6. Percent Changes in Chain-Type Quantity Indexes for Outdoor Recreation Value-Added by Activity—Continued
[Percent Change] Bureau of Economic Analysis
2013 2014 2015 2016 2017
8 Fishing (excludes Boating) ¥4.1 0.3 1.9 ¥0.5 ¥0.8 9 Sailing ¥0.3 5.4 0.9 3.6 4.1
10 Other Boating ¥1.2 0.1 2.4 1.6 5.7 11 Climbing/Hiking/Tent Camping 2.4 1.2 ¥2.3 5.1 ¥0.8 12 Equestrian 2.7 5.5 2.0 5.8 10.8 13 Hunting/Shooting/Trapping 11.9 ¥6.4 8.4 ¥6.1 13.9 14 Hunting/Trapping 8.9 ¥7.7 11.5 ¥12.5 12.5 15 Shooting (includes Archery) 15.3 ¥5.0 5.0 1.3 15.3 16 Motorcycling/ATVing 0.4 2.5 1.1 ¥2.6 0.7 17 Recreational Flying ¥4.7 6.7 1.9 3.2 0.9 18 RVing 3.1 0.7 1.3 1.3 9.7 19 Snow Activities ¥3.0 6.7 0.1 ¥3.2 1.9 20 Skiing ¥1.6 8.7 0.9 ¥2.5 4.8 21 Snowboarding ¥0.2 6.4 0.1 0.9 5.7 22 Other Snow Activities (includes Snowmobiling) 1 ¥5.9 5.3 ¥0.4 ¥6.5 ¥3.2 23 Other Conventional Outdoor Recreation Activities ¥1.3 8.4 1.9 2.0 3.2 24 Other Conventional Air and Land Activities 2 0.0 8.9 1.4 2.9 4.2 25 Other Conventional Water Activities 3 ¥6.1 6.7 3.8 ¥1.1 ¥0.4 26 Multi-use Apparel and Accessories (Conventional) 4 0.8 0.0 1.4 ¥0.5 3.5 27 Other Outdoor Recreation 0.0 2.2 Ø1.3 0.2 5.4 28 Amusement Parks/Water Parks ¥9.3 ¥2.1 0.3 1.2 7.5 29 Festivals/Sporting Events/Concerts 3.7 6.3 ¥9.1 4.5 3.4 30 Field Sports ¥2.2 5.0 2.8 2.2 1.5 31 Game Areas (includes Golfing and Tennis) 1.0 ¥1.1 ¥2.5 2.0 5.6 32 Guided Tours/Outfitted Travel ¥1.2 1.4 ¥7.6 ¥9.1 9.8 33 Air and Land Guided Tours/Outfitted Travel ¥0.8 4.5 ¥2.2 ¥4.3 4.6 34 Water Guided Tours/Outfitted Travel (includes Boating and Fishing Charters) ¥1.8 ¥2.4 ¥14.4 ¥16.2 18.5 35 Productive Activities (includes Gardening) 3.7 12.5 6.5 3.2 3.7 36 Other Outdoor Recreation Activities 5 ¥0.5 3.7 9.3 0.1 3.3 37 Multi-use Apparel and Accessories (Other) 4 8.2 ¥5.3 5.7 ¥0.7 3.3 38 Supporting Outdoor Recreation ¥0.3 ¥0.5 3.5 0.4 2.6 39 Construction ¥3.8 0.6 5.4 3.5 2.1 40 Local Trips and Travel 6 0.6 1.1 ¥0.5 ¥3.2 2.1 41 Trips and Travel 7 ¥0.4 ¥0.9 4.9 0.8 2.6 42 Food and Beverages ¥18.0 1.9 3.1 0.2 1.4 43 Lodging 2.6 ¥8.6 8.0 ¥0.2 ¥0.7 44 Shopping and Souvenirs 2.0 0.9 0.1 0.3 1.4 45 Transportation 4.7 3.0 5.6 2.0 6.0 46 Government Expenditures ¥0.6 ¥1.1 0.7 3.1 3.1 47 Federal Government 7.6 ¥7.3 ¥2.4 3.7 ¥1.1 48 State and Local Government ¥2.1 0.0 1.2 3.0 3.8
Legend/Footnotes: 1 Consists of dog mushing, sleighing, snowmobiling, snow shoeing, snow tubing. 2 Consists of air sports, driving for pleasure, geocaching/orienteering/rock hounding, ice skating, inline skating,
land/sand sailing, races, running/walking/jogging, skateboarding, and wildlife watching/birding. 3 Consists of boardsailing/windsurfing, SCUBA diving, snorkeling, stand-up paddling, surfing, tubing,
wakeboarding, water skiing, and whitewater rafting. 4 Consists of backpacks, bug spray, coolers, general outdoor clothing, GPS equipment, hydration equipment, light-
ing, sports racks, sunscreen, watches, and other miscellaneous gear and equipment. 5 Consists of agritourism, augmented reality games, beachgoing, disc golf, hot springs soaking, kite flying, model
airplane/rocket/UAV, paintball, photography, stargazing/astronomy, swimming, therapeutic programs, water polo, yard sports.
6 Trip expenses less than 50 miles away from home, including food and beverages, lodging, shopping and sou-venirs, and transportation.
7 Travel and tourism expenses in the Outdoor Recreation Satellite Account are consistent with the Travel and Tourism Satellite Account, which includes only expenses for travel at least 50 miles away from home.
Table 7. Chain-Type Price Indexes for Outdoor Recreation Value-Added by Activity [index numbers, 2012 = 100] Bureau of Economic Analysis
2012 2013 2014 2015 2016 2017
1 Total Outdoor Recreation 100.000 102.250 104.428 108.191 109.728 110.802 2 Total Core Outdoor Recreation 100.000 102.327 103.452 106.974 108.608 108.764 3 Conventional Outdoor Recreation 100.000 102.537 103.769 106.734 107.788 107.556 4 Bicycling 100.000 98.587 98.519 100.361 103.751 102.555 5 Boating/Fishing 100.000 103.067 106.216 109.215 111.301 111.496 6 Canoeing 100.000 102.473 103.881 107.413 109.999 110.752 7 Kayaking 100.000 103.655 108.939 110.997 114.343 114.140 8 Fishing (excludes Boating) 100.000 105.840 106.008 107.765 107.662 107.422 9 Sailing 100.000 100.861 102.663 107.072 110.005 108.681
10 Other Boating 100.000 102.701 106.473 109.608 111.994 112.399 11 Climbing/Hiking/Tent Camping 100.000 101.906 103.895 110.791 106.818 106.918 12 Equestrian 100.000 102.483 108.081 110.969 111.457 114.060 13 Hunting/Shooting/Trapping 100.000 104.338 105.926 109.072 111.648 111.228 14 Hunting/Trapping 100.000 105.436 108.437 112.449 115.747 115.563 15 Shooting (includes Archery) 100.000 103.135 103.234 105.455 107.342 106.704 16 Motorcycling/ATVing 100.000 101.626 100.924 103.710 107.331 109.185 17 Recreational Flying 100.000 109.964 108.679 109.813 105.709 111.321 18 RVing 100.000 103.459 107.428 111.826 114.277 114.127 19 Snow Activities 100.000 100.184 101.595 105.924 107.796 109.586 20 Skiing 100.000 99.575 100.416 105.287 108.375 107.171 21 Snowboarding 100.000 99.880 100.844 106.366 109.457 108.137 22 Other Snow Activities (includes Snowmobiling) 1 100.000 100.835 102.994 106.081 106.093 112.894 23 Other Conventional Outdoor Recreation Activities 100.000 103.164 103.763 106.078 105.310 105.978 24 Other Conventional Air and Land Activities 2 100.000 102.883 103.670 105.717 104.227 105.424 25 Other Conventional Water Activities 3 100.000 104.229 104.147 107.431 109.281 107.941 26 Multi-use Apparel and Accessories (Conventional) 4 100.000 102.081 101.591 103.886 104.104 102.279 27 Other Outdoor Recreation 100.000 101.992 102.944 107.365 109.951 110.744
VerDate Aug 31 2005 16:26 Dec 16, 2020 Jkt 000000 PO 00000 Frm 00042 Fmt 6621 Sfmt 6621 P:\DOCS\116-19\38016.TXT BRIAN
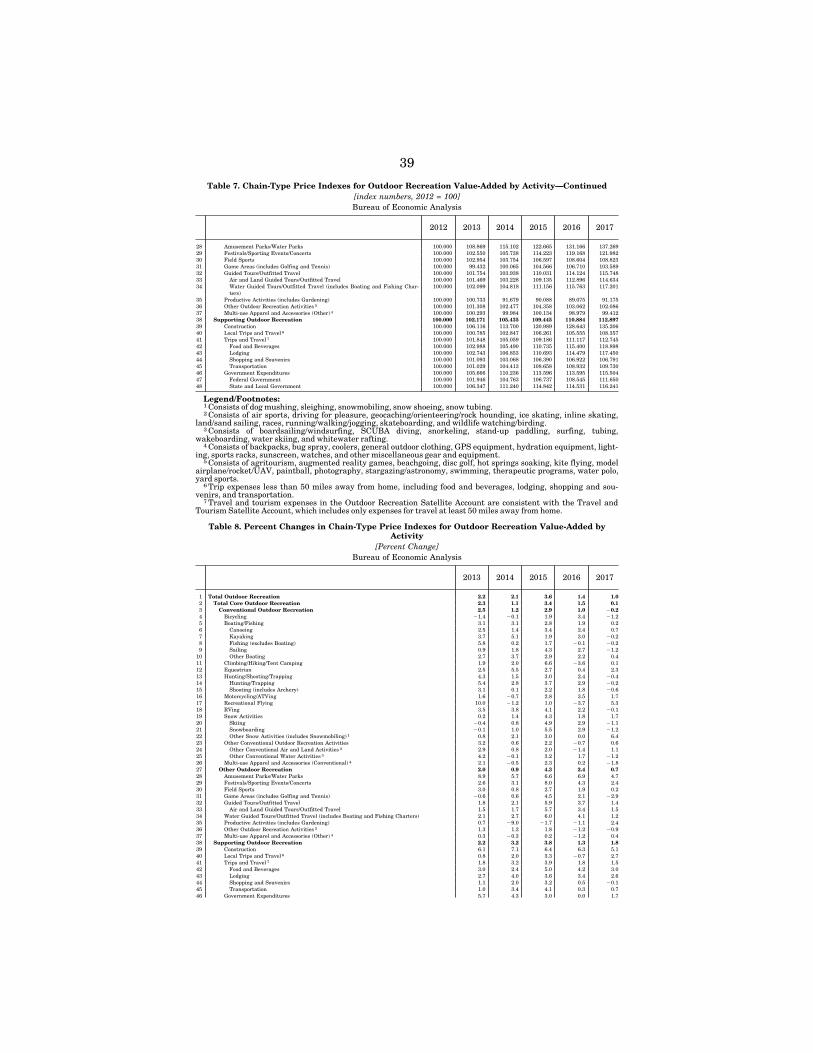
39
Table 7. Chain-Type Price Indexes for Outdoor Recreation Value-Added by Activity—Continued [index numbers, 2012 = 100] Bureau of Economic Analysis
2012 2013 2014 2015 2016 2017
28 Amusement Parks/Water Parks 100.000 108.869 115.102 122.665 131.166 137.269 29 Festivals/Sporting Events/Concerts 100.000 102.550 105.738 114.223 119.168 121.982 30 Field Sports 100.000 102.954 103.754 106.597 108.604 108.823 31 Game Areas (includes Golfing and Tennis) 100.000 99.432 100.065 104.566 106.710 103.589 32 Guided Tours/Outfitted Travel 100.000 101.754 103.938 110.031 114.124 115.748 33 Air and Land Guided Tours/Outfitted Travel 100.000 101.469 103.228 109.135 112.896 114.634 34 Water Guided Tours/Outfitted Travel (includes Boating and Fishing Char-
ters) 100.000 102.099 104.818 111.156 115.763 117.201
35 Productive Activities (includes Gardening) 100.000 100.733 91.679 90.088 89.075 91.175 36 Other Outdoor Recreation Activities 5 100.000 101.308 102.477 104.358 103.062 102.086 37 Multi-use Apparel and Accessories (Other) 4 100.000 100.293 99.984 100.134 98.979 99.412 38 Supporting Outdoor Recreation 100.000 102.171 105.435 109.445 110.884 112.897 39 Construction 100.000 106.116 113.700 120.989 128.643 135.206 40 Local Trips and Travel 6 100.000 100.785 102.847 106.261 105.555 108.357 41 Trips and Travel 7 100.000 101.848 105.059 109.186 111.117 112.745 42 Food and Beverages 100.000 102.988 105.490 110.735 115.400 118.898 43 Lodging 100.000 102.743 106.853 110.693 114.479 117.450 44 Shopping and Souvenirs 100.000 101.093 103.068 106.390 106.922 106.791 45 Transportation 100.000 101.029 104.413 108.658 108.932 109.730 46 Government Expenditures 100.000 105.666 110.236 113.596 113.595 115.504 47 Federal Government 100.000 101.946 104.763 106.737 108.545 111.650 48 State and Local Government 100.000 106.347 111.240 114.842 114.531 116.241
Legend/Footnotes: 1 Consists of dog mushing, sleighing, snowmobiling, snow shoeing, snow tubing. 2 Consists of air sports, driving for pleasure, geocaching/orienteering/rock hounding, ice skating, inline skating,
land/sand sailing, races, running/walking/jogging, skateboarding, and wildlife watching/birding. 3 Consists of boardsailing/windsurfing, SCUBA diving, snorkeling, stand-up paddling, surfing, tubing,
wakeboarding, water skiing, and whitewater rafting. 4 Consists of backpacks, bug spray, coolers, general outdoor clothing, GPS equipment, hydration equipment, light-
ing, sports racks, sunscreen, watches, and other miscellaneous gear and equipment. 5 Consists of agritourism, augmented reality games, beachgoing, disc golf, hot springs soaking, kite flying, model
airplane/rocket/UAV, paintball, photography, stargazing/astronomy, swimming, therapeutic programs, water polo, yard sports.
6 Trip expenses less than 50 miles away from home, including food and beverages, lodging, shopping and sou-venirs, and transportation.
7 Travel and tourism expenses in the Outdoor Recreation Satellite Account are consistent with the Travel and Tourism Satellite Account, which includes only expenses for travel at least 50 miles away from home.
Table 8. Percent Changes in Chain-Type Price Indexes for Outdoor Recreation Value-Added by Activity
[Percent Change] Bureau of Economic Analysis
2013 2014 2015 2016 2017
1 Total Outdoor Recreation 2.2 2.1 3.6 1.4 1.0 2 Total Core Outdoor Recreation 2.3 1.1 3.4 1.5 0.1 3 Conventional Outdoor Recreation 2.5 1.2 2.9 1.0 ¥0.2 4 Bicycling ¥1.4 ¥0.1 1.9 3.4 ¥1.2 5 Boating/Fishing 3.1 3.1 2.8 1.9 0.2 6 Canoeing 2.5 1.4 3.4 2.4 0.7 7 Kayaking 3.7 5.1 1.9 3.0 ¥0.2 8 Fishing (excludes Boating) 5.8 0.2 1.7 ¥0.1 ¥0.2 9 Sailing 0.9 1.8 4.3 2.7 ¥1.2
10 Other Boating 2.7 3.7 2.9 2.2 0.4 11 Climbing/Hiking/Tent Camping 1.9 2.0 6.6 ¥3.6 0.1 12 Equestrian 2.5 5.5 2.7 0.4 2.3 13 Hunting/Shooting/Trapping 4.3 1.5 3.0 2.4 ¥0.4 14 Hunting/Trapping 5.4 2.8 3.7 2.9 ¥0.2 15 Shooting (includes Archery) 3.1 0.1 2.2 1.8 ¥0.6 16 Motorcycling/ATVing 1.6 ¥0.7 2.8 3.5 1.7 17 Recreational Flying 10.0 ¥1.2 1.0 ¥3.7 5.3 18 RVing 3.5 3.8 4.1 2.2 ¥0.1 19 Snow Activities 0.2 1.4 4.3 1.8 1.7 20 Skiing ¥0.4 0.8 4.9 2.9 ¥1.1 21 Snowboarding ¥0.1 1.0 5.5 2.9 ¥1.2 22 Other Snow Activities (includes Snowmobiling) 1 0.8 2.1 3.0 0.0 6.4 23 Other Conventional Outdoor Recreation Activities 3.2 0.6 2.2 ¥0.7 0.6 24 Other Conventional Air and Land Activities 2 2.9 0.8 2.0 ¥1.4 1.1 25 Other Conventional Water Activities 3 4.2 ¥0.1 3.2 1.7 ¥1.2 26 Multi-use Apparel and Accessories (Conventional) 4 2.1 ¥0.5 2.3 0.2 ¥1.8 27 Other Outdoor Recreation 2.0 0.9 4.3 2.4 0.7 28 Amusement Parks/Water Parks 8.9 5.7 6.6 6.9 4.7 29 Festivals/Sporting Events/Concerts 2.6 3.1 8.0 4.3 2.4 30 Field Sports 3.0 0.8 2.7 1.9 0.2 31 Game Areas (includes Golfing and Tennis) ¥0.6 0.6 4.5 2.1 ¥2.9 32 Guided Tours/Outfitted Travel 1.8 2.1 5.9 3.7 1.4 33 Air and Land Guided Tours/Outfitted Travel 1.5 1.7 5.7 3.4 1.5 34 Water Guided Tours/Outfitted Travel (includes Boating and Fishing Charters) 2.1 2.7 6.0 4.1 1.2 35 Productive Activities (includes Gardening) 0.7 ¥9.0 ¥1.7 ¥1.1 2.4 36 Other Outdoor Recreation Activities 5 1.3 1.2 1.8 ¥1.2 ¥0.9 37 Multi-use Apparel and Accessories (Other) 4 0.3 ¥0.3 0.2 ¥1.2 0.4 38 Supporting Outdoor Recreation 2.2 3.2 3.8 1.3 1.8 39 Construction 6.1 7.1 6.4 6.3 5.1 40 Local Trips and Travel 6 0.8 2.0 3.3 ¥0.7 2.7 41 Trips and Travel 7 1.8 3.2 3.9 1.8 1.5 42 Food and Beverages 3.0 2.4 5.0 4.2 3.0 43 Lodging 2.7 4.0 3.6 3.4 2.6 44 Shopping and Souvenirs 1.1 2.0 3.2 0.5 ¥0.1 45 Transportation 1.0 3.4 4.1 0.3 0.7 46 Government Expenditures 5.7 4.3 3.0 0.0 1.7
VerDate Aug 31 2005 16:26 Dec 16, 2020 Jkt 000000 PO 00000 Frm 00043 Fmt 6621 Sfmt 6621 P:\DOCS\116-19\38016.TXT BRIAN
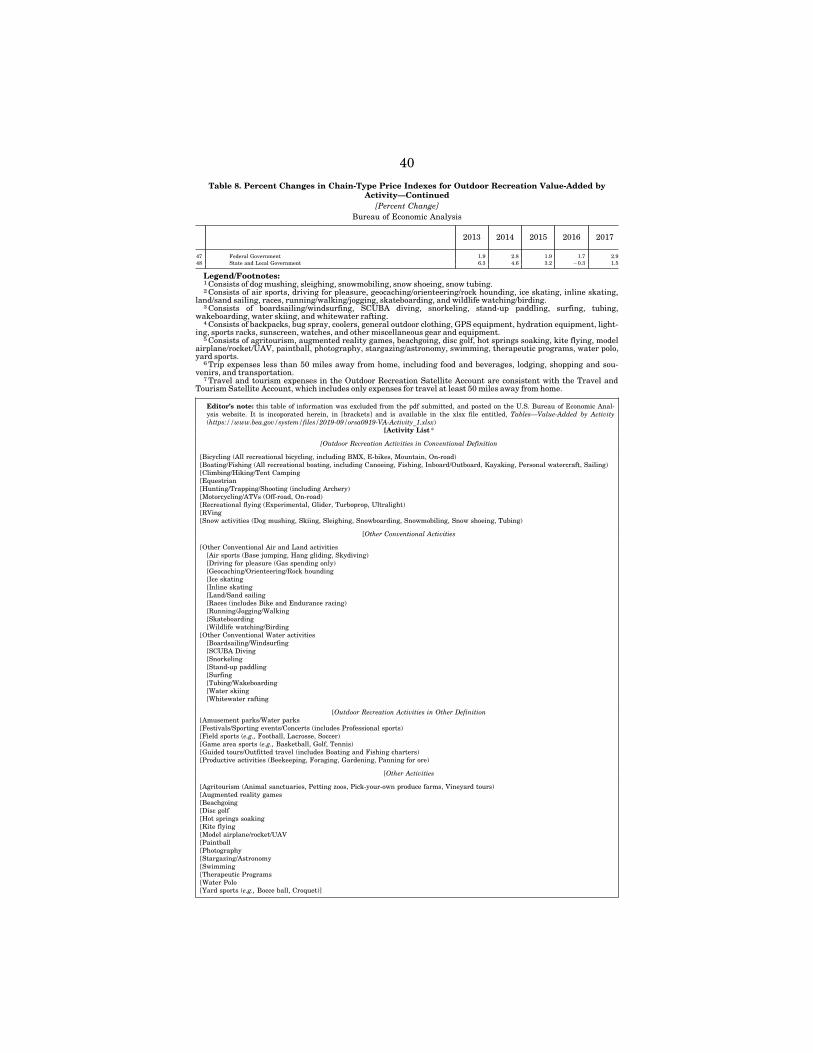
40
Table 8. Percent Changes in Chain-Type Price Indexes for Outdoor Recreation Value-Added by Activity—Continued
[Percent Change] Bureau of Economic Analysis
2013 2014 2015 2016 2017
47 Federal Government 1.9 2.8 1.9 1.7 2.9 48 State and Local Government 6.3 4.6 3.2 ¥0.3 1.5
Legend/Footnotes: 1 Consists of dog mushing, sleighing, snowmobiling, snow shoeing, snow tubing. 2 Consists of air sports, driving for pleasure, geocaching/orienteering/rock hounding, ice skating, inline skating,
land/sand sailing, races, running/walking/jogging, skateboarding, and wildlife watching/birding. 3 Consists of boardsailing/windsurfing, SCUBA diving, snorkeling, stand-up paddling, surfing, tubing,
wakeboarding, water skiing, and whitewater rafting. 4 Consists of backpacks, bug spray, coolers, general outdoor clothing, GPS equipment, hydration equipment, light-
ing, sports racks, sunscreen, watches, and other miscellaneous gear and equipment. 5 Consists of agritourism, augmented reality games, beachgoing, disc golf, hot springs soaking, kite flying, model
airplane/rocket/UAV, paintball, photography, stargazing/astronomy, swimming, therapeutic programs, water polo, yard sports.
6 Trip expenses less than 50 miles away from home, including food and beverages, lodging, shopping and sou-venirs, and transportation.
7 Travel and tourism expenses in the Outdoor Recreation Satellite Account are consistent with the Travel and Tourism Satellite Account, which includes only expenses for travel at least 50 miles away from home.
Editor’s note: this table of information was excluded from the pdf submitted, and posted on the U.S. Bureau of Economic Anal-ysis website. It is incoporated herein, in [brackets] and is available in the xlsx file entitled, Tables—Value-Added by Activity (https://www.bea.gov/system/files/2019-09/orsa0919-VA-Activity_1.xlsx)
[Activity List *
[Outdoor Recreation Activities in Conventional Definition
[Bicycling (All recreational bicycling, including BMX, E-bikes, Mountain, On-road) [Boating/Fishing (All recreational boating, including Canoeing, Fishing, Inboard/Outboard, Kayaking, Personal watercraft, Sailing) [Climbing/Hiking/Tent Camping [Equestrian [Hunting/Trapping/Shooting (including Archery) [Motorcycling/ATVs (Off-road, On-road) [Recreational flying (Experimental, Glider, Turboprop, Ultralight) [RVing [Snow activities (Dog mushing, Skiing, Sleighing, Snowboarding, Snowmobiling, Snow shoeing, Tubing)
[Other Conventional Activities
[Other Conventional Air and Land activities [Air sports (Base jumping, Hang gliding, Skydiving) [Driving for pleasure (Gas spending only) [Geocaching/Orienteering/Rock hounding [Ice skating [Inline skating [Land/Sand sailing [Races (includes Bike and Endurance racing) [Running/Jogging/Walking [Skateboarding [Wildlife watching/Birding
[Other Conventional Water activities [Boardsailing/Windsurfing [SCUBA Diving [Snorkeling [Stand-up paddling [Surfing [Tubing/Wakeboarding [Water skiing [Whitewater rafting
[Outdoor Recreation Activities in Other Definition [Amusement parks/Water parks [Festivals/Sporting events/Concerts (includes Professional sports) [Field sports (e.g., Football, Lacrosse, Soccer) [Game area sports (e.g., Basketball, Golf, Tennis) [Guided tours/Outfitted travel (includes Boating and Fishing charters) [Productive activities (Beekeeping, Foraging, Gardening, Panning for ore)
[Other Activities
[Agritourism (Animal sanctuaries, Petting zoos, Pick-your-own produce farms, Vineyard tours) [Augmented reality games [Beachgoing [Disc golf [Hot springs soaking [Kite flying [Model airplane/rocket/UAV [Paintball [Photography [Stargazing/Astronomy [Swimming [Therapeutic Programs [Water Polo [Yard sports (e.g., Bocce ball, Croquet)]
VerDate Aug 31 2005 16:26 Dec 16, 2020 Jkt 000000 PO 00000 Frm 00044 Fmt 6621 Sfmt 6621 P:\DOCS\116-19\38016.TXT BRIAN
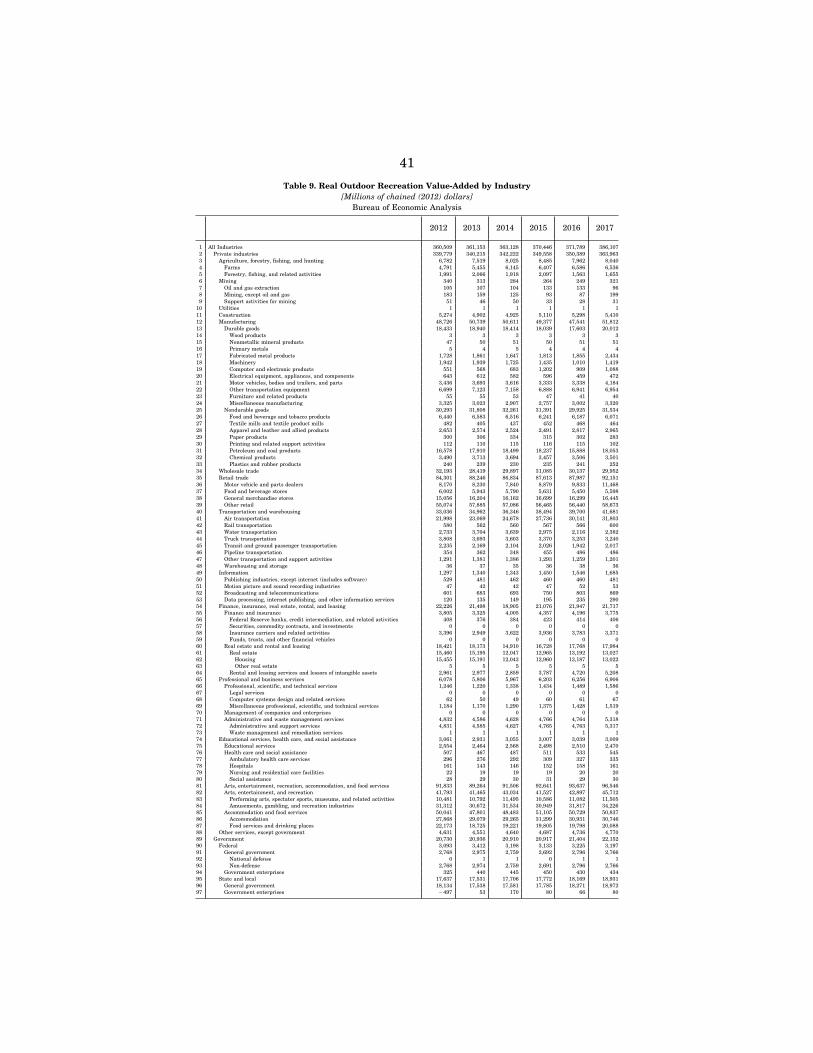
41
Table 9. Real Outdoor Recreation Value-Added by Industry [Millions of chained (2012) dollars]
Bureau of Economic Analysis
2012 2013 2014 2015 2016 2017
1 All Industries 360,509 361,153 363,128 370,446 371,789 386,107 2 Private industries 339,779 340,215 342,222 349,558 350,389 363,963 3 Agriculture, forestry, fishing, and hunting 6,782 7,519 8,025 8,485 7,962 8,040 4 Farms 4,791 5,455 6,145 6,407 6,586 6,536 5 Forestry, fishing, and related activities 1,991 2,066 1,918 2,097 1,563 1,655 6 Mining 340 313 284 264 249 321 7 Oil and gas extraction 105 107 104 133 133 96 8 Mining, except oil and gas 183 159 125 93 87 199 9 Support activities for mining 51 46 50 33 28 31
10 Utilities 1 1 1 1 1 1 11 Construction 5,274 4,902 4,925 5,110 5,298 5,410 12 Manufacturing 48,726 50,739 50,611 49,377 47,541 51,812 13 Durable goods 18,433 18,940 18,414 18,039 17,603 20,012 14 Wood products 3 3 3 3 3 3 15 Nonmetallic mineral products 47 50 51 50 51 51 16 Primary metals 5 4 5 4 4 4 17 Fabricated metal products 1,728 1,861 1,647 1,813 1,855 2,434 18 Machinery 1,942 1,939 1,725 1,435 1,010 1,419 19 Computer and electronic products 551 568 683 1,202 909 1,088 20 Electrical equipment, appliances, and components 643 612 582 596 459 472 21 Motor vehicles, bodies and trailers, and parts 3,436 3,693 3,616 3,333 3,338 4,184 22 Other transportation equipment 6,699 7,123 7,158 6,888 6,941 6,954 23 Furniture and related products 55 55 53 47 41 40 24 Miscellaneous manufacturing 3,325 3,023 2,907 2,757 3,002 3,320 25 Nondurable goods 30,293 31,808 32,261 31,391 29,925 31,534 26 Food and beverage and tobacco products 6,440 6,583 6,516 6,241 6,187 6,071 27 Textile mills and textile product mills 482 405 437 452 468 464 28 Apparel and leather and allied products 2,653 2,574 2,524 2,491 2,817 2,965 29 Paper products 300 306 334 315 302 283 30 Printing and related support activities 112 110 115 116 115 102 31 Petroleum and coal products 16,578 17,910 18,499 18,237 15,888 18,053 32 Chemical products 3,490 3,713 3,694 3,457 3,506 3,501 33 Plastics and rubber products 240 239 230 235 241 252 34 Wholesale trade 32,193 28,419 29,897 31,085 30,137 29,952 35 Retail trade 84,301 88,246 86,834 87,613 87,987 92,151 36 Motor vehicle and parts dealers 8,170 8,230 7,840 8,879 9,833 11,468 37 Food and beverage stores 6,002 5,943 5,790 5,631 5,450 5,598 38 General merchandise stores 15,056 16,204 16,162 16,699 16,299 16,445 39 Other retail 55,074 57,885 57,086 56,465 56,440 58,673 40 Transportation and warehousing 33,036 34,962 36,346 38,494 39,700 41,681 41 Air transportation 21,998 23,069 24,678 27,736 30,141 31,803 42 Rail transportation 580 562 560 567 566 600 43 Water transportation 2,733 3,704 3,639 2,975 2,116 2,382 44 Truck transportation 3,808 3,693 3,603 3,370 3,253 3,240 45 Transit and ground passenger transportation 2,235 2,169 2,104 2,026 1,942 2,017 46 Pipeline transportation 354 362 348 455 486 486 47 Other transportation and support activities 1,291 1,381 1,386 1,293 1,259 1,201 48 Warehousing and storage 36 37 35 36 38 36 49 Information 1,297 1,340 1,343 1,450 1,546 1,685 50 Publishing industries, except internet (includes software) 529 481 462 460 460 481 51 Motion picture and sound recording industries 47 42 42 47 52 53 52 Broadcasting and telecommunications 601 683 693 750 803 869 53 Data processing, internet publishing, and other information services 120 135 149 195 235 290 54 Finance, insurance, real estate, rental, and leasing 22,226 21,498 18,905 21,076 21,947 21,717 55 Finance and insurance 3,805 3,325 4,005 4,357 4,196 3,775 56 Federal Reserve banks, credit intermediation, and related activities 408 376 384 423 414 406 57 Securities, commodity contracts, and investments 0 0 0 0 0 0 58 Insurance carriers and related activities 3,396 2,949 3,622 3,936 3,783 3,371 59 Funds, trusts, and other financial vehicles 0 0 0 0 0 0 60 Real estate and rental and leasing 18,421 18,173 14,910 16,728 17,768 17,984 61 Real estate 15,460 15,195 12,047 12,965 13,192 13,027 62 Housing 15,455 15,191 12,043 12,960 13,187 13,022 63 Other real estate 5 5 5 5 5 5 64 Rental and leasing services and lessors of intangible assets 2,961 2,977 2,859 3,787 4,720 5,208 65 Professional and business services 6,078 5,806 5,967 6,203 6,256 6,906 66 Professional, scientific, and technical services 1,246 1,220 1,338 1,434 1,489 1,586 67 Legal services 0 0 0 0 0 0 68 Computer systems design and related services 62 50 49 60 61 67 69 Miscellaneous professional, scientific, and technical services 1,184 1,170 1,290 1,375 1,428 1,519 70 Management of companies and enterprises 0 0 0 0 0 0 71 Administrative and waste management services 4,832 4,586 4,628 4,766 4,764 5,318 72 Administrative and support services 4,831 4,585 4,627 4,765 4,763 5,317 73 Waste management and remediation services 1 1 1 1 1 1 74 Educational services, health care, and social assistance 3,061 2,931 3,055 3,007 3,039 3,009 75 Educational services 2,554 2,464 2,568 2,498 2,510 2,470 76 Health care and social assistance 507 467 487 511 533 545 77 Ambulatory health care services 296 276 292 309 327 335 78 Hospitals 161 143 146 152 158 161 79 Nursing and residential care facilities 22 19 19 19 20 20 80 Social assistance 28 29 30 31 29 30 81 Arts, entertainment, recreation, accommodation, and food services 91,833 89,264 91,506 92,641 93,637 96,546 82 Arts, entertainment, and recreation 41,793 41,465 43,034 41,527 42,897 45,712 83 Performing arts, spectator sports, museums, and related activities 10,481 10,792 11,495 10,586 11,082 11,505 84 Amusements, gambling, and recreation industries 31,312 30,672 31,534 30,949 31,817 34,226 85 Accommodation and food services 50,041 47,801 48,483 51,105 50,729 50,837 86 Accommodation 27,868 29,079 29,265 31,299 30,931 30,746 87 Food services and drinking places 22,173 18,725 19,221 19,805 19,798 20,088 88 Other services, except government 4,631 4,551 4,640 4,687 4,736 4,770 89 Government 20,730 20,936 20,910 20,917 21,404 22,152 90 Federal 3,093 3,412 3,198 3,133 3,225 3,197 91 General government 2,768 2,975 2,759 2,692 2,796 2,766 92 National defense 0 1 1 0 1 1 93 Non-defense 2,768 2,974 2,759 2,691 2,796 2,766 94 Government enterprises 325 440 445 450 430 434 95 State and local 17,637 17,531 17,706 17,772 18,169 18,931 96 General government 18,134 17,538 17,581 17,785 18,271 18,972 97 Government enterprises ¥497 53 170 80 66 80
VerDate Aug 31 2005 16:26 Dec 16, 2020 Jkt 000000 PO 00000 Frm 00045 Fmt 6621 Sfmt 6621 P:\DOCS\116-19\38016.TXT BRIAN

42
Table 10. Outdoor Recreation Value-Added by Industry [Millions of current dollars]
Bureau of Economic Analysis
2012 2013 2014 2015 2016 2017
1 All Industries 360,509 369,280 378,654 400,205 407,362 427,189 2 Private industries 339,779 347,211 355,672 376,142 382,564 401,264 3 Agriculture, forestry, fishing, and hunting 6,782 7,718 7,621 7,851 7,181 7,428 4 Farms 4,791 5,528 5,487 5,422 5,286 5,414 5 Forestry, fishing, and related activities 1,991 2,189 2,133 2,429 1,895 2,014 6 Mining 340 312 284 205 182 271 7 Oil and gas extraction 105 117 128 92 81 91 8 Mining, except oil and gas 183 143 102 73 65 139 9 Support activities for mining 51 52 54 41 36 40
10 Utilities 1 1 1 1 1 1 11 Construction 5,274 5,192 5,593 6,193 6,838 7,338 12 Manufacturing 48,726 50,409 50,590 50,494 46,638 51,667 13 Durable goods 18,433 19,866 19,734 20,438 20,478 23,064 14 Wood products 3 3 3 3 3 4 15 Nonmetallic mineral products 47 50 51 53 55 56 16 Primary metals 5 4 5 5 5 4 17 Fabricated metal products 1,728 2,118 1,896 2,137 2,186 2,860 18 Machinery 1,942 2,002 1,861 1,629 1,120 1,554 19 Computer and electronic products 551 551 663 1,094 732 864 20 Electrical equipment, appliances, and components 643 622 598 633 493 496 21 Motor vehicles, bodies and trailers, and parts 3,436 3,975 4,088 4,176 4,517 5,853 22 Other transportation equipment 6,699 7,381 7,501 7,659 8,084 8,119 23 Furniture and related products 55 59 58 57 54 51 24 Miscellaneous manufacturing 3,325 3,101 3,010 2,993 3,228 3,204 25 Nondurable goods 30,293 30,543 30,856 30,056 26,160 28,604 26 Food and beverage and tobacco products 6,440 6,720 7,057 7,511 7,645 7,339 27 Textile mills and textile product mills 482 439 484 512 541 532 28 Apparel and leather and allied products 2,653 2,674 2,605 2,616 3,022 3,267 29 Paper products 300 300 317 307 304 272 30 Printing and related support activities 112 110 117 124 125 112 31 Petroleum and coal products 16,578 16,258 16,130 14,760 10,089 12,640 32 Chemical products 3,490 3,803 3,915 3,973 4,168 4,171 33 Plastics and rubber products 240 239 231 253 267 270 34 Wholesale trade 32,193 31,794 33,303 35,298 34,612 34,774 35 Retail trade 84,301 87,648 87,539 91,022 92,373 95,661 36 Motor vehicle and parts dealers 8,170 8,453 8,483 9,441 10,260 11,309 37 Food and beverage stores 6,002 6,092 6,197 6,486 6,591 6,800 38 General merchandise stores 15,056 15,640 15,159 15,452 15,337 15,543 39 Other retail 55,074 57,464 57,700 59,644 60,186 62,008 40 Transportation and warehousing 33,036 35,587 38,432 42,981 45,538 47,932 41 Air transportation 21,998 23,448 26,385 30,828 33,607 35,680 42 Rail transportation 580 590 603 639 641 688 43 Water transportation 2,733 3,670 3,524 3,412 3,142 3,336 44 Truck transportation 3,808 3,809 3,864 3,830 3,741 3,766 45 Transit and ground passenger transportation 2,235 2,246 2,182 2,215 2,225 2,314 46 Pipeline transportation 354 383 401 563 620 622 47 Other transportation and support activities 1,291 1,404 1,438 1,459 1,524 1,490 48 Warehousing and storage 36 37 36 36 38 36 49 Information 1,297 1,368 1,382 1,493 1,580 1,711 50 Publishing industries, except internet (includes software) 529 493 481 486 496 527 51 Motion picture and sound recording industries 47 50 53 59 60 66 52 Broadcasting and telecommunications 601 687 697 751 789 826 53 Data processing, internet publishing, and other information services 120 137 151 198 236 291 54 Finance, insurance, real estate, rental, and leasing 22,226 22,085 20,070 22,647 24,002 24,600 55 Finance and insurance 3,805 3,415 4,184 4,662 4,757 4,595 56 Federal Reserve banks, credit intermediation, and related activities 408 394 410 459 467 468 57 Securities, commodity contracts, and investments 0 0 0 0 0 0 58 Insurance carriers and related activities 3,396 3,020 3,774 4,202 4,289 4,127 59 Funds, trusts, and other financial vehicles 0 0 0 0 0 0 60 Real estate and rental and leasing 18,421 18,670 15,886 17,985 19,245 20,005 61 Real estate 15,460 15,625 12,785 14,263 15,066 15,453 62 Housing 15,455 15,620 12,780 14,258 15,061 15,447 63 Other real estate 5 5 5 5 5 5 64 Rental and leasing services and lessors of intangible assets 2,961 3,045 3,101 3,722 4,179 4,552 65 Professional and business services 6,078 5,898 6,133 6,595 6,859 7,786 66 Professional, scientific, and technical services 1,246 1,249 1,396 1,547 1,658 1,805 67 Legal services 0 0 0 0 0 0 68 Computer systems design and related services 62 53 54 65 63 71 69 Miscellaneous professional, scientific, and technical services 1,184 1,195 1,342 1,482 1,594 1,733 70 Management of companies and enterprises 0 0 0 0 0 0 71 Administrative and waste management services 4,832 4,649 4,737 5,048 5,201 5,981 72 Administrative and support services 4,831 4,648 4,736 5,047 5,200 5,980 73 Waste management and remediation services 1 1 1 1 1 1 74 Educational services, health care, and social assistance 3,061 3,058 3,267 3,328 3,482 3,610 75 Educational services 2,554 2,583 2,772 2,806 2,936 3,047 76 Health care and social assistance 507 475 495 522 546 562 77 Ambulatory health care services 296 282 296 309 323 329 78 Hospitals 161 146 152 163 172 180 79 Nursing and residential care facilities 22 20 20 21 22 22 80 Social assistance 28 27 28 29 29 30 81 Arts, entertainment, recreation, accommodation, and food services 91,833 91,434 96,529 102,891 107,934 112,870 82 Arts, entertainment, and recreation 41,793 42,291 44,954 46,169 49,500 52,880 83 Performing arts, spectator sports, museums, and related activities 10,481 11,062 12,145 12,070 13,181 14,006 84 Amusements, gambling, and recreation industries 31,312 31,229 32,809 34,099 36,319 38,874 85 Accommodation and food services 50,041 49,143 51,575 56,722 58,434 59,990 86 Accommodation 27,868 29,865 31,308 34,779 35,538 36,072 87 Food services and drinking places 22,173 19,278 20,268 21,943 22,896 23,918 88 Other services, except government 4,631 4,708 4,927 5,142 5,344 5,615 89 Government 20,730 22,069 22,982 24,063 24,799 25,926 90 Federal 3,093 3,456 3,293 3,248 3,400 3,471 91 General government 2,768 3,033 2,891 2,872 3,034 3,087 92 National defense 0 1 1 0 1 1 93 Non-defense 2,768 3,032 2,890 2,872 3,034 3,087 94 Government enterprises 325 423 402 376 366 383 95 State and local 17,637 18,613 19,689 20,815 21,398 22,455 96 General government 18,134 18,569 19,448 20,359 20,890 21,948 97 Government enterprises ¥497 44 241 456 508 508
VerDate Aug 31 2005 16:26 Dec 16, 2020 Jkt 000000 PO 00000 Frm 00046 Fmt 6621 Sfmt 6621 P:\DOCS\116-19\38016.TXT BRIAN
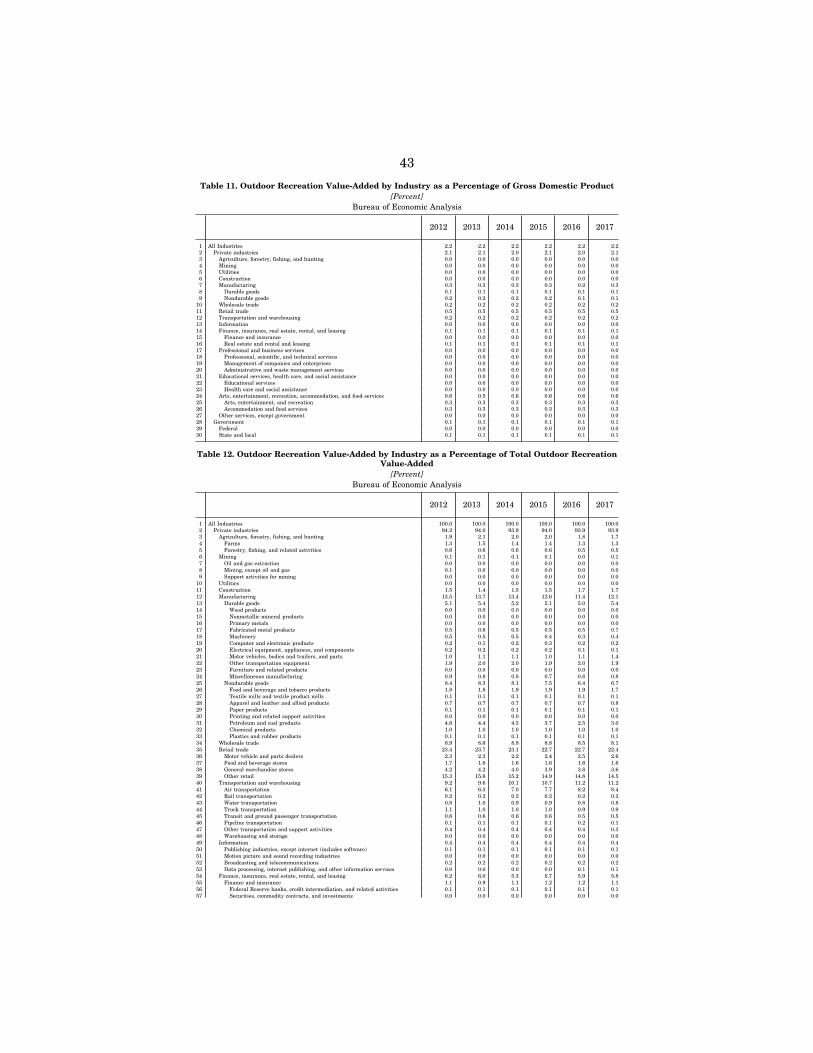
43
Table 11. Outdoor Recreation Value-Added by Industry as a Percentage of Gross Domestic Product [Percent]
Bureau of Economic Analysis
2012 2013 2014 2015 2016 2017
1 All Industries 2.2 2.2 2.2 2.2 2.2 2.2 2 Private industries 2.1 2.1 2.0 2.1 2.0 2.1 3 Agriculture, forestry, fishing, and hunting 0.0 0.0 0.0 0.0 0.0 0.0 4 Mining 0.0 0.0 0.0 0.0 0.0 0.0 5 Utilities 0.0 0.0 0.0 0.0 0.0 0.0 6 Construction 0.0 0.0 0.0 0.0 0.0 0.0 7 Manufacturing 0.3 0.3 0.3 0.3 0.2 0.3 8 Durable goods 0.1 0.1 0.1 0.1 0.1 0.1 9 Nondurable goods 0.2 0.2 0.2 0.2 0.1 0.1
10 Wholesale trade 0.2 0.2 0.2 0.2 0.2 0.2 11 Retail trade 0.5 0.5 0.5 0.5 0.5 0.5 12 Transportation and warehousing 0.2 0.2 0.2 0.2 0.2 0.2 13 Information 0.0 0.0 0.0 0.0 0.0 0.0 14 Finance, insurance, real estate, rental, and leasing 0.1 0.1 0.1 0.1 0.1 0.1 15 Finance and insurance 0.0 0.0 0.0 0.0 0.0 0.0 16 Real estate and rental and leasing 0.1 0.1 0.1 0.1 0.1 0.1 17 Professional and business services 0.0 0.0 0.0 0.0 0.0 0.0 18 Professional, scientific, and technical services 0.0 0.0 0.0 0.0 0.0 0.0 19 Management of companies and enterprises 0.0 0.0 0.0 0.0 0.0 0.0 20 Administrative and waste management services 0.0 0.0 0.0 0.0 0.0 0.0 21 Educational services, health care, and social assistance 0.0 0.0 0.0 0.0 0.0 0.0 22 Educational services 0.0 0.0 0.0 0.0 0.0 0.0 23 Health care and social assistance 0.0 0.0 0.0 0.0 0.0 0.0 24 Arts, entertainment, recreation, accommodation, and food services 0.6 0.5 0.6 0.6 0.6 0.6 25 Arts, entertainment, and recreation 0.3 0.3 0.3 0.3 0.3 0.3 26 Accommodation and food services 0.3 0.3 0.3 0.3 0.3 0.3 27 Other services, except government 0.0 0.0 0.0 0.0 0.0 0.0 28 Government 0.1 0.1 0.1 0.1 0.1 0.1 29 Federal 0.0 0.0 0.0 0.0 0.0 0.0 30 State and local 0.1 0.1 0.1 0.1 0.1 0.1
Table 12. Outdoor Recreation Value-Added by Industry as a Percentage of Total Outdoor Recreation Value-Added
[Percent] Bureau of Economic Analysis
2012 2013 2014 2015 2016 2017
1 All Industries 100.0 100.0 100.0 100.0 100.0 100.0 2 Private industries 94.2 94.0 93.9 94.0 93.9 93.9 3 Agriculture, forestry, fishing, and hunting 1.9 2.1 2.0 2.0 1.8 1.7 4 Farms 1.3 1.5 1.4 1.4 1.3 1.3 5 Forestry, fishing, and related activities 0.6 0.6 0.6 0.6 0.5 0.5 6 Mining 0.1 0.1 0.1 0.1 0.0 0.1 7 Oil and gas extraction 0.0 0.0 0.0 0.0 0.0 0.0 8 Mining, except oil and gas 0.1 0.0 0.0 0.0 0.0 0.0 9 Support activities for mining 0.0 0.0 0.0 0.0 0.0 0.0
10 Utilities 0.0 0.0 0.0 0.0 0.0 0.0 11 Construction 1.5 1.4 1.5 1.5 1.7 1.7 12 Manufacturing 13.5 13.7 13.4 12.6 11.4 12.1 13 Durable goods 5.1 5.4 5.2 5.1 5.0 5.4 14 Wood products 0.0 0.0 0.0 0.0 0.0 0.0 15 Nonmetallic mineral products 0.0 0.0 0.0 0.0 0.0 0.0 16 Primary metals 0.0 0.0 0.0 0.0 0.0 0.0 17 Fabricated metal products 0.5 0.6 0.5 0.5 0.5 0.7 18 Machinery 0.5 0.5 0.5 0.4 0.3 0.4 19 Computer and electronic products 0.2 0.1 0.2 0.3 0.2 0.2 20 Electrical equipment, appliances, and components 0.2 0.2 0.2 0.2 0.1 0.1 21 Motor vehicles, bodies and trailers, and parts 1.0 1.1 1.1 1.0 1.1 1.4 22 Other transportation equipment 1.9 2.0 2.0 1.9 2.0 1.9 23 Furniture and related products 0.0 0.0 0.0 0.0 0.0 0.0 24 Miscellaneous manufacturing 0.9 0.8 0.8 0.7 0.8 0.8 25 Nondurable goods 8.4 8.3 8.1 7.5 6.4 6.7 26 Food and beverage and tobacco products 1.8 1.8 1.9 1.9 1.9 1.7 27 Textile mills and textile product mills 0.1 0.1 0.1 0.1 0.1 0.1 28 Apparel and leather and allied products 0.7 0.7 0.7 0.7 0.7 0.8 29 Paper products 0.1 0.1 0.1 0.1 0.1 0.1 30 Printing and related support activities 0.0 0.0 0.0 0.0 0.0 0.0 31 Petroleum and coal products 4.6 4.4 4.3 3.7 2.5 3.0 32 Chemical products 1.0 1.0 1.0 1.0 1.0 1.0 33 Plastics and rubber products 0.1 0.1 0.1 0.1 0.1 0.1 34 Wholesale trade 8.9 8.6 8.8 8.8 8.5 8.1 35 Retail trade 23.4 23.7 23.1 22.7 22.7 22.4 36 Motor vehicle and parts dealers 2.3 2.3 2.2 2.4 2.5 2.6 37 Food and beverage stores 1.7 1.6 1.6 1.6 1.6 1.6 38 General merchandise stores 4.2 4.2 4.0 3.9 3.8 3.6 39 Other retail 15.3 15.6 15.2 14.9 14.8 14.5 40 Transportation and warehousing 9.2 9.6 10.1 10.7 11.2 11.2 41 Air transportation 6.1 6.3 7.0 7.7 8.2 8.4 42 Rail transportation 0.2 0.2 0.2 0.2 0.2 0.2 43 Water transportation 0.8 1.0 0.9 0.9 0.8 0.8 44 Truck transportation 1.1 1.0 1.0 1.0 0.9 0.9 45 Transit and ground passenger transportation 0.6 0.6 0.6 0.6 0.5 0.5 46 Pipeline transportation 0.1 0.1 0.1 0.1 0.2 0.1 47 Other transportation and support activities 0.4 0.4 0.4 0.4 0.4 0.3 48 Warehousing and storage 0.0 0.0 0.0 0.0 0.0 0.0 49 Information 0.4 0.4 0.4 0.4 0.4 0.4 50 Publishing industries, except internet (includes software) 0.1 0.1 0.1 0.1 0.1 0.1 51 Motion picture and sound recording industries 0.0 0.0 0.0 0.0 0.0 0.0 52 Broadcasting and telecommunications 0.2 0.2 0.2 0.2 0.2 0.2 53 Data processing, internet publishing, and other information services 0.0 0.0 0.0 0.0 0.1 0.1 54 Finance, insurance, real estate, rental, and leasing 6.2 6.0 5.3 5.7 5.9 5.8 55 Finance and insurance 1.1 0.9 1.1 1.2 1.2 1.1 56 Federal Reserve banks, credit intermediation, and related activities 0.1 0.1 0.1 0.1 0.1 0.1 57 Securities, commodity contracts, and investments 0.0 0.0 0.0 0.0 0.0 0.0
VerDate Aug 31 2005 16:26 Dec 16, 2020 Jkt 000000 PO 00000 Frm 00047 Fmt 6621 Sfmt 6621 P:\DOCS\116-19\38016.TXT BRIAN
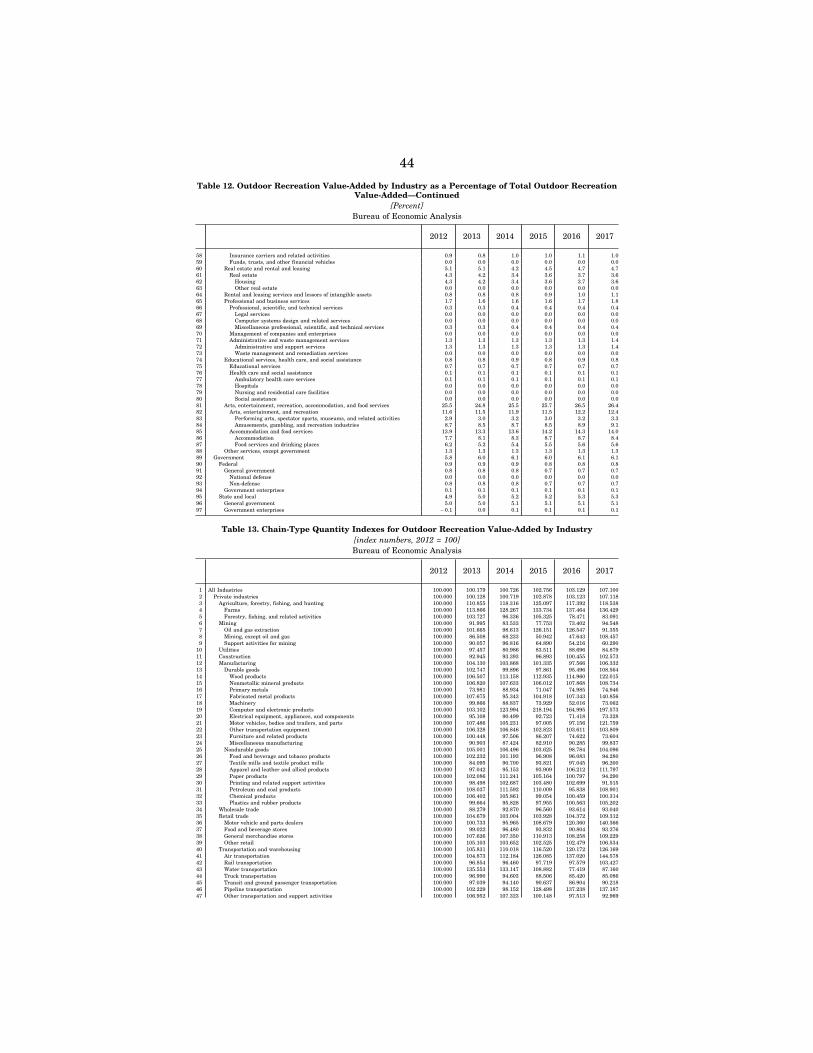
44
Table 12. Outdoor Recreation Value-Added by Industry as a Percentage of Total Outdoor Recreation Value-Added—Continued
[Percent] Bureau of Economic Analysis
2012 2013 2014 2015 2016 2017
58 Insurance carriers and related activities 0.9 0.8 1.0 1.0 1.1 1.0 59 Funds, trusts, and other financial vehicles 0.0 0.0 0.0 0.0 0.0 0.0 60 Real estate and rental and leasing 5.1 5.1 4.2 4.5 4.7 4.7 61 Real estate 4.3 4.2 3.4 3.6 3.7 3.6 62 Housing 4.3 4.2 3.4 3.6 3.7 3.6 63 Other real estate 0.0 0.0 0.0 0.0 0.0 0.0 64 Rental and leasing services and lessors of intangible assets 0.8 0.8 0.8 0.9 1.0 1.1 65 Professional and business services 1.7 1.6 1.6 1.6 1.7 1.8 66 Professional, scientific, and technical services 0.3 0.3 0.4 0.4 0.4 0.4 67 Legal services 0.0 0.0 0.0 0.0 0.0 0.0 68 Computer systems design and related services 0.0 0.0 0.0 0.0 0.0 0.0 69 Miscellaneous professional, scientific, and technical services 0.3 0.3 0.4 0.4 0.4 0.4 70 Management of companies and enterprises 0.0 0.0 0.0 0.0 0.0 0.0 71 Administrative and waste management services 1.3 1.3 1.3 1.3 1.3 1.4 72 Administrative and support services 1.3 1.3 1.3 1.3 1.3 1.4 73 Waste management and remediation services 0.0 0.0 0.0 0.0 0.0 0.0 74 Educational services, health care, and social assistance 0.8 0.8 0.9 0.8 0.9 0.8 75 Educational services 0.7 0.7 0.7 0.7 0.7 0.7 76 Health care and social assistance 0.1 0.1 0.1 0.1 0.1 0.1 77 Ambulatory health care services 0.1 0.1 0.1 0.1 0.1 0.1 78 Hospitals 0.0 0.0 0.0 0.0 0.0 0.0 79 Nursing and residential care facilities 0.0 0.0 0.0 0.0 0.0 0.0 80 Social assistance 0.0 0.0 0.0 0.0 0.0 0.0 81 Arts, entertainment, recreation, accommodation, and food services 25.5 24.8 25.5 25.7 26.5 26.4 82 Arts, entertainment, and recreation 11.6 11.5 11.9 11.5 12.2 12.4 83 Performing arts, spectator sports, museums, and related activities 2.9 3.0 3.2 3.0 3.2 3.3 84 Amusements, gambling, and recreation industries 8.7 8.5 8.7 8.5 8.9 9.1 85 Accommodation and food services 13.9 13.3 13.6 14.2 14.3 14.0 86 Accommodation 7.7 8.1 8.3 8.7 8.7 8.4 87 Food services and drinking places 6.2 5.2 5.4 5.5 5.6 5.6 88 Other services, except government 1.3 1.3 1.3 1.3 1.3 1.3 89 Government 5.8 6.0 6.1 6.0 6.1 6.1 90 Federal 0.9 0.9 0.9 0.8 0.8 0.8 91 General government 0.8 0.8 0.8 0.7 0.7 0.7 92 National defense 0.0 0.0 0.0 0.0 0.0 0.0 93 Non-defense 0.8 0.8 0.8 0.7 0.7 0.7 94 Government enterprises 0.1 0.1 0.1 0.1 0.1 0.1 95 State and local 4.9 5.0 5.2 5.2 5.3 5.3 96 General government 5.0 5.0 5.1 5.1 5.1 5.1 97 Government enterprises ¥0.1 0.0 0.1 0.1 0.1 0.1
Table 13. Chain-Type Quantity Indexes for Outdoor Recreation Value-Added by Industry [index numbers, 2012 = 100] Bureau of Economic Analysis
2012 2013 2014 2015 2016 2017
1 All Industries 100.000 100.179 100.726 102.756 103.129 107.100 2 Private industries 100.000 100.128 100.719 102.878 103.123 107.118 3 Agriculture, forestry, fishing, and hunting 100.000 110.855 118.316 125.097 117.392 118.538 4 Farms 100.000 113.866 128.267 133.734 137.464 136.429 5 Forestry, fishing, and related activities 100.000 103.727 96.336 105.325 78.471 83.091 6 Mining 100.000 91.995 83.533 77.753 73.402 94.548 7 Oil and gas extraction 100.000 101.665 98.613 126.151 126.547 91.355 8 Mining, except oil and gas 100.000 86.508 68.233 50.942 47.643 108.457 9 Support activities for mining 100.000 90.057 96.816 64.890 54.216 60.290
10 Utilities 100.000 97.457 80.986 83.511 88.696 84.879 11 Construction 100.000 92.945 93.393 96.893 100.455 102.573 12 Manufacturing 100.000 104.130 103.868 101.335 97.566 106.332 13 Durable goods 100.000 102.747 99.896 97.861 95.496 108.564 14 Wood products 100.000 106.507 113.158 112.935 114.960 122.015 15 Nonmetallic mineral products 100.000 106.820 107.633 106.012 107.868 108.734 16 Primary metals 100.000 73.981 88.934 71.047 74.985 74.946 17 Fabricated metal products 100.000 107.675 95.343 104.918 107.343 140.856 18 Machinery 100.000 99.866 88.837 73.929 52.016 73.062 19 Computer and electronic products 100.000 103.102 123.994 218.194 164.995 197.573 20 Electrical equipment, appliances, and components 100.000 95.108 90.499 92.723 71.418 73.328 21 Motor vehicles, bodies and trailers, and parts 100.000 107.486 105.231 97.005 97.156 121.759 22 Other transportation equipment 100.000 106.328 106.846 102.823 103.611 103.809 23 Furniture and related products 100.000 100.448 97.506 86.207 74.622 73.604 24 Miscellaneous manufacturing 100.000 90.903 87.424 82.910 90.285 99.837 25 Nondurable goods 100.000 105.001 106.496 103.625 98.784 104.096 26 Food and beverage and tobacco products 100.000 102.232 101.193 96.908 96.083 94.280 27 Textile mills and textile product mills 100.000 84.095 90.700 93.821 97.045 96.200 28 Apparel and leather and allied products 100.000 97.042 95.153 93.909 106.212 111.797 29 Paper products 100.000 102.086 111.241 105.164 100.797 94.290 30 Printing and related support activities 100.000 98.498 102.687 103.480 102.699 91.515 31 Petroleum and coal products 100.000 108.037 111.592 110.009 95.838 108.901 32 Chemical products 100.000 106.402 105.861 99.054 100.459 100.314 33 Plastics and rubber products 100.000 99.664 95.828 97.955 100.563 105.202 34 Wholesale trade 100.000 88.279 92.870 96.560 93.614 93.040 35 Retail trade 100.000 104.679 103.004 103.928 104.372 109.312 36 Motor vehicle and parts dealers 100.000 100.733 95.965 108.679 120.360 140.366 37 Food and beverage stores 100.000 99.022 96.480 93.832 90.804 93.276 38 General merchandise stores 100.000 107.626 107.350 110.913 108.258 109.229 39 Other retail 100.000 105.103 103.652 102.525 102.479 106.534 40 Transportation and warehousing 100.000 105.831 110.018 116.520 120.172 126.169 41 Air transportation 100.000 104.873 112.184 126.085 137.020 144.578 42 Rail transportation 100.000 96.854 96.460 97.719 97.579 103.427 43 Water transportation 100.000 135.553 133.147 108.882 77.419 87.160 44 Truck transportation 100.000 96.990 94.603 88.506 85.420 85.086 45 Transit and ground passenger transportation 100.000 97.039 94.140 90.637 86.904 90.218 46 Pipeline transportation 100.000 102.229 98.152 128.498 137.238 137.187 47 Other transportation and support activities 100.000 106.952 107.323 100.148 97.513 92.969
VerDate Aug 31 2005 16:26 Dec 16, 2020 Jkt 000000 PO 00000 Frm 00048 Fmt 6621 Sfmt 6621 P:\DOCS\116-19\38016.TXT BRIAN
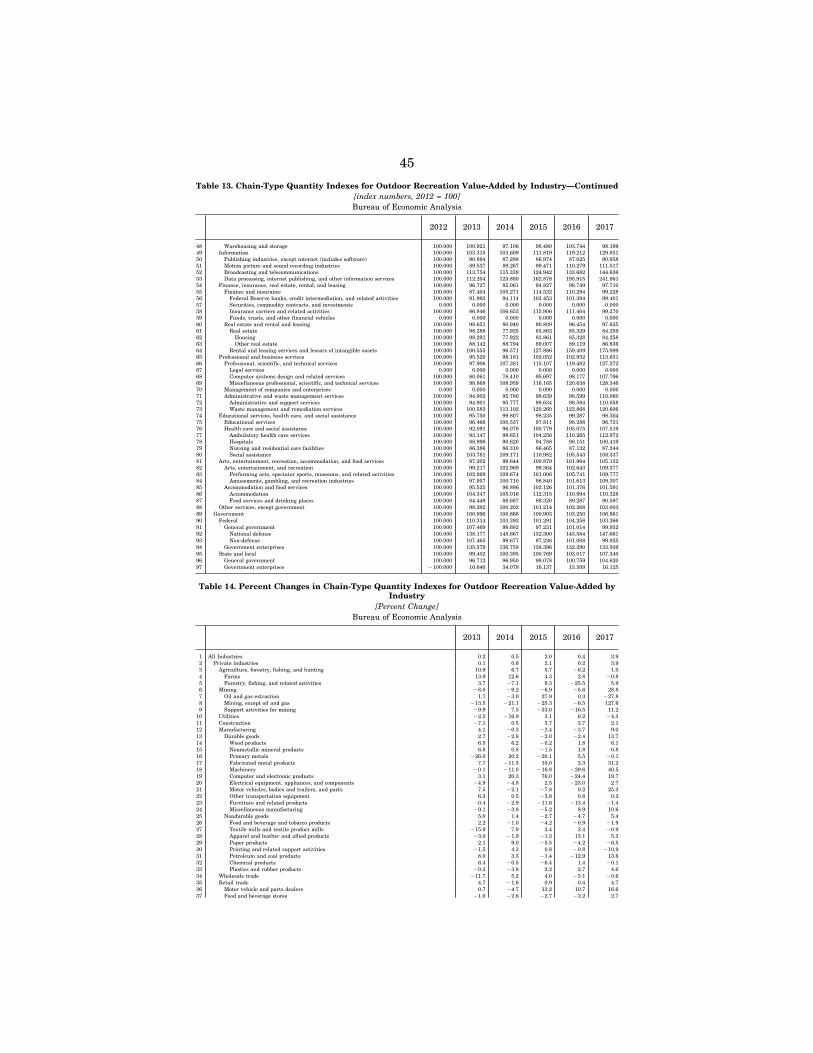
45
Table 13. Chain-Type Quantity Indexes for Outdoor Recreation Value-Added by Industry—Continued [index numbers, 2012 = 100] Bureau of Economic Analysis
2012 2013 2014 2015 2016 2017
48 Warehousing and storage 100.000 100.921 97.106 98.480 103.744 98.199 49 Information 100.000 103.315 103.609 111.819 119.212 129.931 50 Publishing industries, except internet (includes software) 100.000 90.894 87.288 86.974 87.025 90.858 51 Motion picture and sound recording industries 100.000 89.537 89.267 99.471 110.279 111.517 52 Broadcasting and telecommunications 100.000 113.754 115.339 124.942 133.682 144.636 53 Data processing, internet publishing, and other information services 100.000 112.204 123.880 162.878 195.915 241.861 54 Finance, insurance, real estate, rental, and leasing 100.000 96.727 85.061 94.827 98.749 97.710 55 Finance and insurance 100.000 87.404 105.271 114.532 110.294 99.228 56 Federal Reserve banks, credit intermediation, and related activities 100.000 91.993 94.114 103.453 101.384 99.401 57 Securities, commodity contracts, and investments 0.000 0.000 0.000 0.000 0.000 0.000 58 Insurance carriers and related activities 100.000 86.846 106.653 115.906 111.404 99.270 59 Funds, trusts, and other financial vehicles 0.000 0.000 0.000 0.000 0.000 0.000 60 Real estate and rental and leasing 100.000 98.651 80.940 90.809 96.454 97.625 61 Real estate 100.000 98.288 77.925 83.863 85.329 84.259 62 Housing 100.000 98.291 77.922 83.861 85.328 84.258 63 Other real estate 100.000 88.142 88.794 89.007 89.119 86.836 64 Rental and leasing services and lessors of intangible assets 100.000 100.555 96.571 127.886 159.409 175.899 65 Professional and business services 100.000 95.520 98.181 102.052 102.932 113.631 66 Professional, scientific, and technical services 100.000 97.906 107.381 115.107 119.482 127.272 67 Legal services 0.000 0.000 0.000 0.000 0.000 0.000 68 Computer systems design and related services 100.000 80.061 78.410 95.697 98.177 107.796 69 Miscellaneous professional, scientific, and technical services 100.000 98.868 108.959 116.165 120.638 128.346 70 Management of companies and enterprises 0.000 0.000 0.000 0.000 0.000 0.000 71 Administrative and waste management services 100.000 94.902 95.780 98.639 98.599 110.060 72 Administrative and support services 100.000 94.901 95.777 98.634 98.594 110.058 73 Waste management and remediation services 100.000 100.583 113.102 120.260 123.868 120.606 74 Educational services, health care, and social assistance 100.000 95.750 99.807 98.235 99.287 98.304 75 Educational services 100.000 96.466 100.537 97.811 98.288 96.721 76 Health care and social assistance 100.000 92.091 96.079 100.779 105.075 107.519 77 Ambulatory health care services 100.000 93.147 98.651 104.256 110.265 112.972 78 Hospitals 100.000 88.998 90.620 94.788 98.151 100.419 79 Nursing and residential care facilities 100.000 86.386 86.310 86.465 87.132 87.244 80 Social assistance 100.000 103.781 109.171 110.982 105.543 108.337 81 Arts, entertainment, recreation, accommodation, and food services 100.000 97.202 99.644 100.879 101.964 105.132 82 Arts, entertainment, and recreation 100.000 99.217 102.969 99.364 102.643 109.377 83 Performing arts, spectator sports, museums, and related activities 100.000 102.969 109.674 101.006 105.741 109.777 84 Amusements, gambling, and recreation industries 100.000 97.957 100.710 98.840 101.613 109.307 85 Accommodation and food services 100.000 95.525 96.886 102.126 101.376 101.591 86 Accommodation 100.000 104.347 105.016 112.315 110.994 110.328 87 Food services and drinking places 100.000 84.449 86.687 89.320 89.287 90.597 88 Other services, except government 100.000 98.292 100.202 101.214 102.268 103.003 89 Government 100.000 100.996 100.868 100.903 103.250 106.861 90 Federal 100.000 110.314 103.393 101.291 104.258 103.366 91 General government 100.000 107.469 99.683 97.231 101.014 99.932 92 National defense 100.000 138.177 145.667 132.300 143.584 147.661 93 Non-defense 100.000 107.465 99.677 97.226 101.008 99.925 94 Government enterprises 100.000 135.379 136.758 138.396 132.290 133.509 95 State and local 100.000 99.402 100.395 100.769 103.017 107.340 96 General government 100.000 96.712 96.950 98.078 100.759 104.620 97 Government enterprises ¥100.000 10.640 34.078 16.137 13.309 16.125
Table 14. Percent Changes in Chain-Type Quantity Indexes for Outdoor Recreation Value-Added by Industry
[Percent Change] Bureau of Economic Analysis
2013 2014 2015 2016 2017
1 All Industries 0.2 0.5 2.0 0.4 3.9 2 Private industries 0.1 0.6 2.1 0.2 3.9 3 Agriculture, forestry, fishing, and hunting 10.9 6.7 5.7 ¥6.2 1.0 4 Farms 13.9 12.6 4.3 2.8 ¥0.8 5 Forestry, fishing, and related activities 3.7 ¥7.1 9.3 ¥25.5 5.9 6 Mining ¥8.0 ¥9.2 ¥6.9 ¥5.6 28.8 7 Oil and gas extraction 1.7 ¥3.0 27.9 0.3 ¥27.8 8 Mining, except oil and gas ¥13.5 ¥21.1 ¥25.3 ¥6.5 127.6 9 Support activities for mining ¥9.9 7.5 ¥33.0 ¥16.5 11.2
10 Utilities ¥2.5 ¥16.9 3.1 6.2 ¥4.3 11 Construction ¥7.1 0.5 3.7 3.7 2.1 12 Manufacturing 4.1 ¥0.3 ¥2.4 ¥3.7 9.0 13 Durable goods 2.7 ¥2.8 ¥2.0 ¥2.4 13.7 14 Wood products 6.5 6.2 ¥0.2 1.8 6.1 15 Nonmetallic mineral products 6.8 0.8 ¥1.5 1.8 0.8 16 Primary metals ¥26.0 20.2 ¥20.1 5.5 ¥0.1 17 Fabricated metal products 7.7 ¥11.5 10.0 2.3 31.2 18 Machinery ¥0.1 ¥11.0 ¥16.8 ¥29.6 40.5 19 Computer and electronic products 3.1 20.3 76.0 ¥24.4 19.7 20 Electrical equipment, appliances, and components ¥4.9 ¥4.8 2.5 ¥23.0 2.7 21 Motor vehicles, bodies and trailers, and parts 7.5 ¥2.1 ¥7.8 0.2 25.3 22 Other transportation equipment 6.3 0.5 ¥3.8 0.8 0.2 23 Furniture and related products 0.4 ¥2.9 ¥11.6 ¥13.4 ¥1.4 24 Miscellaneous manufacturing ¥9.1 ¥3.8 ¥5.2 8.9 10.6 25 Nondurable goods 5.0 1.4 ¥2.7 ¥4.7 5.4 26 Food and beverage and tobacco products 2.2 ¥1.0 ¥4.2 ¥0.9 ¥1.9 27 Textile mills and textile product mills ¥15.9 7.9 3.4 3.4 ¥0.9 28 Apparel and leather and allied products ¥3.0 ¥1.9 ¥1.3 13.1 5.3 29 Paper products 2.1 9.0 ¥5.5 ¥4.2 ¥6.5 30 Printing and related support activities ¥1.5 4.3 0.8 ¥0.8 ¥10.9 31 Petroleum and coal products 8.0 3.3 ¥1.4 ¥12.9 13.6 32 Chemical products 6.4 ¥0.5 ¥6.4 1.4 ¥0.1 33 Plastics and rubber products ¥0.3 ¥3.8 2.2 2.7 4.6 34 Wholesale trade ¥11.7 5.2 4.0 ¥3.1 ¥0.6 35 Retail trade 4.7 ¥1.6 0.9 0.4 4.7 36 Motor vehicle and parts dealers 0.7 ¥4.7 13.2 10.7 16.6 37 Food and beverage stores ¥1.0 ¥2.6 ¥2.7 ¥3.2 2.7
VerDate Aug 31 2005 16:26 Dec 16, 2020 Jkt 000000 PO 00000 Frm 00049 Fmt 6621 Sfmt 6621 P:\DOCS\116-19\38016.TXT BRIAN
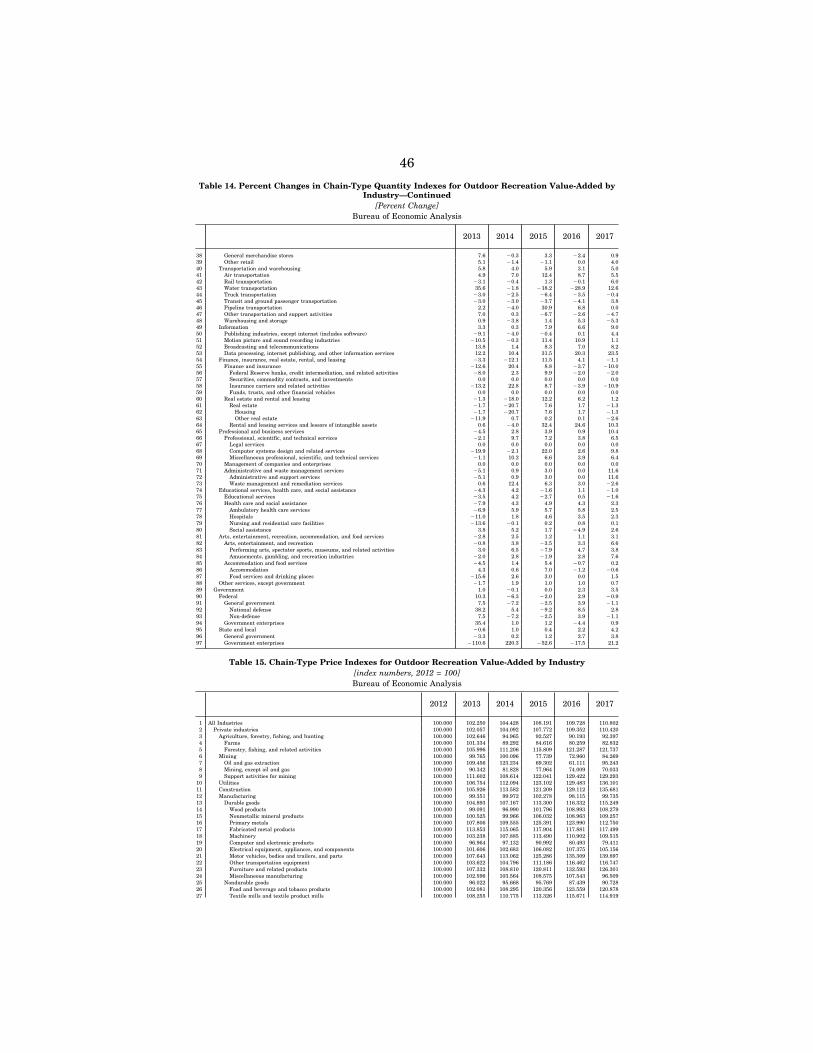
46
Table 14. Percent Changes in Chain-Type Quantity Indexes for Outdoor Recreation Value-Added by Industry—Continued
[Percent Change] Bureau of Economic Analysis
2013 2014 2015 2016 2017
38 General merchandise stores 7.6 ¥0.3 3.3 ¥2.4 0.9 39 Other retail 5.1 ¥1.4 ¥1.1 0.0 4.0 40 Transportation and warehousing 5.8 4.0 5.9 3.1 5.0 41 Air transportation 4.9 7.0 12.4 8.7 5.5 42 Rail transportation ¥3.1 ¥0.4 1.3 ¥0.1 6.0 43 Water transportation 35.6 ¥1.8 ¥18.2 ¥28.9 12.6 44 Truck transportation ¥3.0 ¥2.5 ¥6.4 ¥3.5 ¥0.4 45 Transit and ground passenger transportation ¥3.0 ¥3.0 ¥3.7 ¥4.1 3.8 46 Pipeline transportation 2.2 ¥4.0 30.9 6.8 0.0 47 Other transportation and support activities 7.0 0.3 ¥6.7 ¥2.6 ¥4.7 48 Warehousing and storage 0.9 ¥3.8 1.4 5.3 ¥5.3 49 Information 3.3 0.3 7.9 6.6 9.0 50 Publishing industries, except internet (includes software) ¥9.1 ¥4.0 ¥0.4 0.1 4.4 51 Motion picture and sound recording industries ¥10.5 ¥0.3 11.4 10.9 1.1 52 Broadcasting and telecommunications 13.8 1.4 8.3 7.0 8.2 53 Data processing, internet publishing, and other information services 12.2 10.4 31.5 20.3 23.5 54 Finance, insurance, real estate, rental, and leasing ¥3.3 ¥12.1 11.5 4.1 ¥1.1 55 Finance and insurance ¥12.6 20.4 8.8 ¥3.7 ¥10.0 56 Federal Reserve banks, credit intermediation, and related activities ¥8.0 2.3 9.9 ¥2.0 ¥2.0 57 Securities, commodity contracts, and investments 0.0 0.0 0.0 0.0 0.0 58 Insurance carriers and related activities ¥13.2 22.8 8.7 ¥3.9 ¥10.9 59 Funds, trusts, and other financial vehicles 0.0 0.0 0.0 0.0 0.0 60 Real estate and rental and leasing ¥1.3 ¥18.0 12.2 6.2 1.2 61 Real estate ¥1.7 ¥20.7 7.6 1.7 ¥1.3 62 Housing ¥1.7 ¥20.7 7.6 1.7 ¥1.3 63 Other real estate ¥11.9 0.7 0.2 0.1 ¥2.6 64 Rental and leasing services and lessors of intangible assets 0.6 ¥4.0 32.4 24.6 10.3 65 Professional and business services ¥4.5 2.8 3.9 0.9 10.4 66 Professional, scientific, and technical services ¥2.1 9.7 7.2 3.8 6.5 67 Legal services 0.0 0.0 0.0 0.0 0.0 68 Computer systems design and related services ¥19.9 ¥2.1 22.0 2.6 9.8 69 Miscellaneous professional, scientific, and technical services ¥1.1 10.2 6.6 3.9 6.4 70 Management of companies and enterprises 0.0 0.0 0.0 0.0 0.0 71 Administrative and waste management services ¥5.1 0.9 3.0 0.0 11.6 72 Administrative and support services ¥5.1 0.9 3.0 0.0 11.6 73 Waste management and remediation services 0.6 12.4 6.3 3.0 ¥2.6 74 Educational services, health care, and social assistance ¥4.3 4.2 ¥1.6 1.1 ¥1.0 75 Educational services ¥3.5 4.2 ¥2.7 0.5 ¥1.6 76 Health care and social assistance ¥7.9 4.3 4.9 4.3 2.3 77 Ambulatory health care services ¥6.9 5.9 5.7 5.8 2.5 78 Hospitals ¥11.0 1.8 4.6 3.5 2.3 79 Nursing and residential care facilities ¥13.6 ¥0.1 0.2 0.8 0.1 80 Social assistance 3.8 5.2 1.7 ¥4.9 2.6 81 Arts, entertainment, recreation, accommodation, and food services ¥2.8 2.5 1.2 1.1 3.1 82 Arts, entertainment, and recreation ¥0.8 3.8 ¥3.5 3.3 6.6 83 Performing arts, spectator sports, museums, and related activities 3.0 6.5 ¥7.9 4.7 3.8 84 Amusements, gambling, and recreation industries ¥2.0 2.8 ¥1.9 2.8 7.6 85 Accommodation and food services ¥4.5 1.4 5.4 ¥0.7 0.2 86 Accommodation 4.3 0.6 7.0 ¥1.2 ¥0.6 87 Food services and drinking places ¥15.6 2.6 3.0 0.0 1.5 88 Other services, except government ¥1.7 1.9 1.0 1.0 0.7 89 Government 1.0 ¥0.1 0.0 2.3 3.5 90 Federal 10.3 ¥6.3 ¥2.0 2.9 ¥0.9 91 General government 7.5 ¥7.2 ¥2.5 3.9 ¥1.1 92 National defense 38.2 5.4 ¥9.2 8.5 2.8 93 Non-defense 7.5 ¥7.2 ¥2.5 3.9 ¥1.1 94 Government enterprises 35.4 1.0 1.2 ¥4.4 0.9 95 State and local ¥0.6 1.0 0.4 2.2 4.2 96 General government ¥3.3 0.2 1.2 2.7 3.8 97 Government enterprises ¥110.6 220.3 ¥52.6 ¥17.5 21.2
Table 15. Chain-Type Price Indexes for Outdoor Recreation Value-Added by Industry [index numbers, 2012 = 100] Bureau of Economic Analysis
2012 2013 2014 2015 2016 2017
1 All Industries 100.000 102.250 104.428 108.191 109.728 110.802 2 Private industries 100.000 102.057 104.092 107.772 109.352 110.420 3 Agriculture, forestry, fishing, and hunting 100.000 102.646 94.965 92.527 90.193 92.397 4 Farms 100.000 101.334 89.292 84.616 80.259 82.832 5 Forestry, fishing, and related activities 100.000 105.996 111.206 115.809 121.287 121.737 6 Mining 100.000 99.765 100.096 77.739 72.960 84.269 7 Oil and gas extraction 100.000 109.456 123.234 69.302 61.111 95.243 8 Mining, except oil and gas 100.000 90.342 81.828 77.964 74.009 70.033 9 Support activities for mining 100.000 111.602 108.614 122.041 129.422 129.293
10 Utilities 100.000 106.754 112.094 123.102 129.483 136.101 11 Construction 100.000 105.926 113.582 121.209 129.112 135.681 12 Manufacturing 100.000 99.351 99.972 102.278 98.115 99.735 13 Durable goods 100.000 104.893 107.167 113.300 116.332 115.249 14 Wood products 100.000 99.091 96.990 101.796 108.993 108.279 15 Nonmetallic mineral products 100.000 100.525 99.966 106.032 108.963 109.257 16 Primary metals 100.000 107.806 109.555 125.391 123.990 112.750 17 Fabricated metal products 100.000 113.853 115.065 117.904 117.881 117.499 18 Machinery 100.000 103.238 107.885 113.490 110.902 109.515 19 Computer and electronic products 100.000 96.964 97.132 90.992 80.493 79.411 20 Electrical equipment, appliances, and components 100.000 101.606 102.683 106.082 107.375 105.156 21 Motor vehicles, bodies and trailers, and parts 100.000 107.643 113.062 125.286 135.309 139.897 22 Other transportation equipment 100.000 103.622 104.796 111.186 116.462 116.747 23 Furniture and related products 100.000 107.332 108.810 120.811 132.593 126.301 24 Miscellaneous manufacturing 100.000 102.596 103.564 108.575 107.543 96.509 25 Nondurable goods 100.000 96.022 95.668 95.769 87.439 90.728 26 Food and beverage and tobacco products 100.000 102.081 108.295 120.356 123.559 120.878 27 Textile mills and textile product mills 100.000 108.255 110.775 113.326 115.671 114.919
VerDate Aug 31 2005 16:26 Dec 16, 2020 Jkt 000000 PO 00000 Frm 00050 Fmt 6621 Sfmt 6621 P:\DOCS\116-19\38016.TXT BRIAN
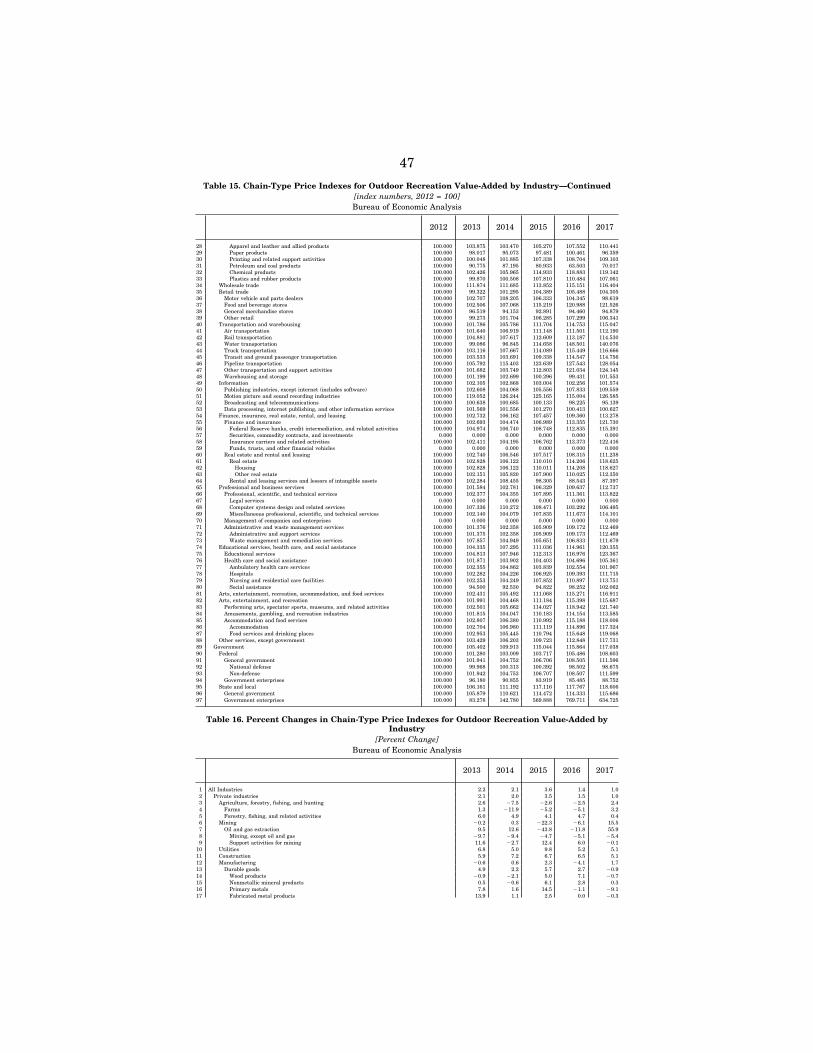
47
Table 15. Chain-Type Price Indexes for Outdoor Recreation Value-Added by Industry—Continued [index numbers, 2012 = 100] Bureau of Economic Analysis
2012 2013 2014 2015 2016 2017
28 Apparel and leather and allied products 100.000 103.875 103.470 105.270 107.552 110.441 29 Paper products 100.000 98.017 95.073 97.481 100.461 96.359 30 Printing and related support activities 100.000 100.048 101.885 107.338 108.704 109.103 31 Petroleum and coal products 100.000 90.775 87.195 80.933 63.503 70.017 32 Chemical products 100.000 102.426 105.965 114.933 118.883 119.142 33 Plastics and rubber products 100.000 99.870 100.508 107.810 110.484 107.061 34 Wholesale trade 100.000 111.874 111.685 113.852 115.151 116.404 35 Retail trade 100.000 99.322 101.295 104.389 105.488 104.305 36 Motor vehicle and parts dealers 100.000 102.707 108.205 106.333 104.345 98.619 37 Food and beverage stores 100.000 102.506 107.068 115.219 120.988 121.526 38 General merchandise stores 100.000 96.519 94.153 92.891 94.460 94.879 39 Other retail 100.000 99.273 101.704 106.285 107.299 106.341 40 Transportation and warehousing 100.000 101.786 105.786 111.704 114.753 115.047 41 Air transportation 100.000 101.640 106.919 111.148 111.501 112.190 42 Rail transportation 100.000 104.881 107.617 112.609 113.187 114.530 43 Water transportation 100.000 99.086 96.845 114.658 148.501 140.076 44 Truck transportation 100.000 103.116 107.667 114.089 115.449 116.666 45 Transit and ground passenger transportation 100.000 103.533 103.691 109.338 114.547 114.756 46 Pipeline transportation 100.000 105.792 115.403 123.639 127.543 128.054 47 Other transportation and support activities 100.000 101.682 103.749 112.803 121.034 124.145 48 Warehousing and storage 100.000 101.199 102.699 100.296 99.431 101.553 49 Information 100.000 102.105 102.868 103.004 102.256 101.574 50 Publishing industries, except internet (includes software) 100.000 102.608 104.068 105.556 107.833 109.559 51 Motion picture and sound recording industries 100.000 119.052 126.244 125.165 115.004 126.585 52 Broadcasting and telecommunications 100.000 100.638 100.685 100.133 98.225 95.139 53 Data processing, internet publishing, and other information services 100.000 101.569 101.556 101.270 100.413 100.627 54 Finance, insurance, real estate, rental, and leasing 100.000 102.732 106.162 107.457 109.360 113.278 55 Finance and insurance 100.000 102.693 104.474 106.989 113.355 121.730 56 Federal Reserve banks, credit intermediation, and related activities 100.000 104.974 106.740 108.748 112.835 115.391 57 Securities, commodity contracts, and investments 0.000 0.000 0.000 0.000 0.000 0.000 58 Insurance carriers and related activities 100.000 102.411 104.195 106.762 113.373 122.416 59 Funds, trusts, and other financial vehicles 0.000 0.000 0.000 0.000 0.000 0.000 60 Real estate and rental and leasing 100.000 102.740 106.546 107.517 108.315 111.238 61 Real estate 100.000 102.828 106.122 110.010 114.206 118.625 62 Housing 100.000 102.828 106.122 110.011 114.208 118.627 63 Other real estate 100.000 102.151 105.820 107.900 110.025 112.350 64 Rental and leasing services and lessors of intangible assets 100.000 102.284 108.455 98.305 88.543 87.397 65 Professional and business services 100.000 101.584 102.781 106.329 109.637 112.737 66 Professional, scientific, and technical services 100.000 102.377 104.355 107.895 111.361 113.822 67 Legal services 0.000 0.000 0.000 0.000 0.000 0.000 68 Computer systems design and related services 100.000 107.336 110.272 108.471 103.292 106.495 69 Miscellaneous professional, scientific, and technical services 100.000 102.140 104.079 107.835 111.673 114.101 70 Management of companies and enterprises 0.000 0.000 0.000 0.000 0.000 0.000 71 Administrative and waste management services 100.000 101.376 102.358 105.909 109.172 112.469 72 Administrative and support services 100.000 101.375 102.358 105.909 109.173 112.469 73 Waste management and remediation services 100.000 107.857 104.949 105.651 106.833 111.679 74 Educational services, health care, and social assistance 100.000 104.335 107.295 111.036 114.961 120.355 75 Educational services 100.000 104.813 107.946 112.313 116.976 123.367 76 Health care and social assistance 100.000 101.871 103.902 104.403 104.696 105.361 77 Ambulatory health care services 100.000 102.355 104.862 103.839 102.554 101.967 78 Hospitals 100.000 102.282 104.226 106.925 109.393 111.715 79 Nursing and residential care facilities 100.000 102.253 104.249 107.852 110.897 113.751 80 Social assistance 100.000 94.500 92.530 94.822 98.252 102.062 81 Arts, entertainment, recreation, accommodation, and food services 100.000 102.431 105.492 111.068 115.271 116.911 82 Arts, entertainment, and recreation 100.000 101.991 104.468 111.184 115.398 115.687 83 Performing arts, spectator sports, museums, and related activities 100.000 102.501 105.662 114.027 118.942 121.740 84 Amusements, gambling, and recreation industries 100.000 101.815 104.047 110.183 114.154 113.585 85 Accommodation and food services 100.000 102.807 106.380 110.992 115.188 118.006 86 Accommodation 100.000 102.704 106.980 111.119 114.896 117.324 87 Food services and drinking places 100.000 102.953 105.445 110.794 115.648 119.068 88 Other services, except government 100.000 103.429 106.203 109.723 112.848 117.731 89 Government 100.000 105.402 109.913 115.044 115.864 117.038 90 Federal 100.000 101.280 103.009 103.717 105.486 108.603 91 General government 100.000 101.941 104.752 106.706 108.505 111.596 92 National defense 100.000 99.968 100.313 100.392 98.502 98.675 93 Non-defense 100.000 101.942 104.753 106.707 108.507 111.599 94 Government enterprises 100.000 96.180 90.855 83.919 85.485 88.752 95 State and local 100.000 106.161 111.192 117.116 117.767 118.606 96 General government 100.000 105.879 110.621 114.472 114.333 115.686 97 Government enterprises 100.000 83.278 142.780 569.888 769.711 634.725
Table 16. Percent Changes in Chain-Type Price Indexes for Outdoor Recreation Value-Added by Industry
[Percent Change] Bureau of Economic Analysis
2013 2014 2015 2016 2017
1 All Industries 2.2 2.1 3.6 1.4 1.0 2 Private industries 2.1 2.0 3.5 1.5 1.0 3 Agriculture, forestry, fishing, and hunting 2.6 ¥7.5 ¥2.6 ¥2.5 2.4 4 Farms 1.3 ¥11.9 ¥5.2 ¥5.1 3.2 5 Forestry, fishing, and related activities 6.0 4.9 4.1 4.7 0.4 6 Mining ¥0.2 0.3 ¥22.3 ¥6.1 15.5 7 Oil and gas extraction 9.5 12.6 ¥43.8 ¥11.8 55.9 8 Mining, except oil and gas ¥9.7 ¥9.4 ¥4.7 ¥5.1 ¥5.4 9 Support activities for mining 11.6 ¥2.7 12.4 6.0 ¥0.1
10 Utilities 6.8 5.0 9.8 5.2 5.1 11 Construction 5.9 7.2 6.7 6.5 5.1 12 Manufacturing ¥0.6 0.6 2.3 ¥4.1 1.7 13 Durable goods 4.9 2.2 5.7 2.7 ¥0.9 14 Wood products ¥0.9 ¥2.1 5.0 7.1 ¥0.7 15 Nonmetallic mineral products 0.5 ¥0.6 6.1 2.8 0.3 16 Primary metals 7.8 1.6 14.5 ¥1.1 ¥9.1 17 Fabricated metal products 13.9 1.1 2.5 0.0 ¥0.3
VerDate Aug 31 2005 16:26 Dec 16, 2020 Jkt 000000 PO 00000 Frm 00051 Fmt 6621 Sfmt 6621 P:\DOCS\116-19\38016.TXT BRIAN
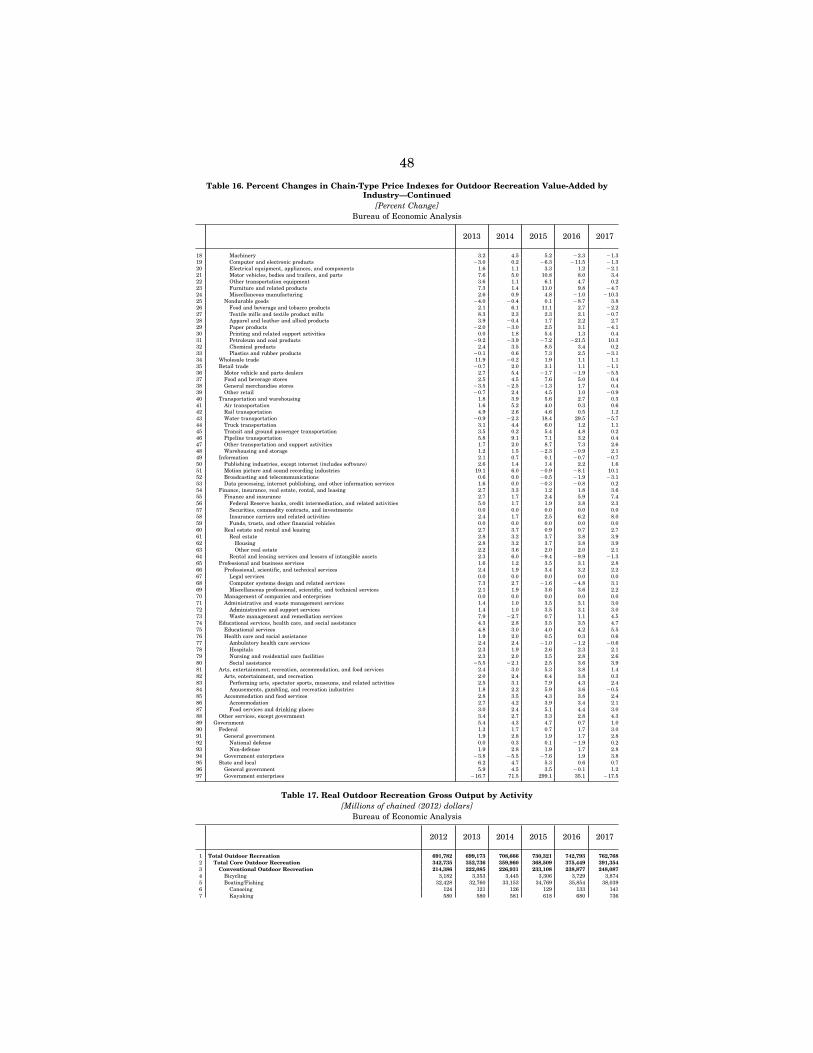
48
Table 16. Percent Changes in Chain-Type Price Indexes for Outdoor Recreation Value-Added by Industry—Continued
[Percent Change] Bureau of Economic Analysis
2013 2014 2015 2016 2017
18 Machinery 3.2 4.5 5.2 ¥2.3 ¥1.3 19 Computer and electronic products ¥3.0 0.2 ¥6.3 ¥11.5 ¥1.3 20 Electrical equipment, appliances, and components 1.6 1.1 3.3 1.2 ¥2.1 21 Motor vehicles, bodies and trailers, and parts 7.6 5.0 10.8 8.0 3.4 22 Other transportation equipment 3.6 1.1 6.1 4.7 0.2 23 Furniture and related products 7.3 1.4 11.0 9.8 ¥4.7 24 Miscellaneous manufacturing 2.6 0.9 4.8 ¥1.0 ¥10.3 25 Nondurable goods ¥4.0 ¥0.4 0.1 ¥8.7 3.8 26 Food and beverage and tobacco products 2.1 6.1 11.1 2.7 ¥2.2 27 Textile mills and textile product mills 8.3 2.3 2.3 2.1 ¥0.7 28 Apparel and leather and allied products 3.9 ¥0.4 1.7 2.2 2.7 29 Paper products ¥2.0 ¥3.0 2.5 3.1 ¥4.1 30 Printing and related support activities 0.0 1.8 5.4 1.3 0.4 31 Petroleum and coal products ¥9.2 ¥3.9 ¥7.2 ¥21.5 10.3 32 Chemical products 2.4 3.5 8.5 3.4 0.2 33 Plastics and rubber products ¥0.1 0.6 7.3 2.5 ¥3.1 34 Wholesale trade 11.9 ¥0.2 1.9 1.1 1.1 35 Retail trade ¥0.7 2.0 3.1 1.1 ¥1.1 36 Motor vehicle and parts dealers 2.7 5.4 ¥1.7 ¥1.9 ¥5.5 37 Food and beverage stores 2.5 4.5 7.6 5.0 0.4 38 General merchandise stores ¥3.5 ¥2.5 ¥1.3 1.7 0.4 39 Other retail ¥0.7 2.4 4.5 1.0 ¥0.9 40 Transportation and warehousing 1.8 3.9 5.6 2.7 0.3 41 Air transportation 1.6 5.2 4.0 0.3 0.6 42 Rail transportation 4.9 2.6 4.6 0.5 1.2 43 Water transportation ¥0.9 ¥2.3 18.4 29.5 ¥5.7 44 Truck transportation 3.1 4.4 6.0 1.2 1.1 45 Transit and ground passenger transportation 3.5 0.2 5.4 4.8 0.2 46 Pipeline transportation 5.8 9.1 7.1 3.2 0.4 47 Other transportation and support activities 1.7 2.0 8.7 7.3 2.6 48 Warehousing and storage 1.2 1.5 ¥2.3 ¥0.9 2.1 49 Information 2.1 0.7 0.1 ¥0.7 ¥0.7 50 Publishing industries, except internet (includes software) 2.6 1.4 1.4 2.2 1.6 51 Motion picture and sound recording industries 19.1 6.0 ¥0.9 ¥8.1 10.1 52 Broadcasting and telecommunications 0.6 0.0 ¥0.5 ¥1.9 ¥3.1 53 Data processing, internet publishing, and other information services 1.6 0.0 ¥0.3 ¥0.8 0.2 54 Finance, insurance, real estate, rental, and leasing 2.7 3.3 1.2 1.8 3.6 55 Finance and insurance 2.7 1.7 2.4 5.9 7.4 56 Federal Reserve banks, credit intermediation, and related activities 5.0 1.7 1.9 3.8 2.3 57 Securities, commodity contracts, and investments 0.0 0.0 0.0 0.0 0.0 58 Insurance carriers and related activities 2.4 1.7 2.5 6.2 8.0 59 Funds, trusts, and other financial vehicles 0.0 0.0 0.0 0.0 0.0 60 Real estate and rental and leasing 2.7 3.7 0.9 0.7 2.7 61 Real estate 2.8 3.2 3.7 3.8 3.9 62 Housing 2.8 3.2 3.7 3.8 3.9 63 Other real estate 2.2 3.6 2.0 2.0 2.1 64 Rental and leasing services and lessors of intangible assets 2.3 6.0 ¥9.4 ¥9.9 ¥1.3 65 Professional and business services 1.6 1.2 3.5 3.1 2.8 66 Professional, scientific, and technical services 2.4 1.9 3.4 3.2 2.2 67 Legal services 0.0 0.0 0.0 0.0 0.0 68 Computer systems design and related services 7.3 2.7 ¥1.6 ¥4.8 3.1 69 Miscellaneous professional, scientific, and technical services 2.1 1.9 3.6 3.6 2.2 70 Management of companies and enterprises 0.0 0.0 0.0 0.0 0.0 71 Administrative and waste management services 1.4 1.0 3.5 3.1 3.0 72 Administrative and support services 1.4 1.0 3.5 3.1 3.0 73 Waste management and remediation services 7.9 ¥2.7 0.7 1.1 4.5 74 Educational services, health care, and social assistance 4.3 2.8 3.5 3.5 4.7 75 Educational services 4.8 3.0 4.0 4.2 5.5 76 Health care and social assistance 1.9 2.0 0.5 0.3 0.6 77 Ambulatory health care services 2.4 2.4 ¥1.0 ¥1.2 ¥0.6 78 Hospitals 2.3 1.9 2.6 2.3 2.1 79 Nursing and residential care facilities 2.3 2.0 3.5 2.8 2.6 80 Social assistance ¥5.5 ¥2.1 2.5 3.6 3.9 81 Arts, entertainment, recreation, accommodation, and food services 2.4 3.0 5.3 3.8 1.4 82 Arts, entertainment, and recreation 2.0 2.4 6.4 3.8 0.3 83 Performing arts, spectator sports, museums, and related activities 2.5 3.1 7.9 4.3 2.4 84 Amusements, gambling, and recreation industries 1.8 2.2 5.9 3.6 ¥0.5 85 Accommodation and food services 2.8 3.5 4.3 3.8 2.4 86 Accommodation 2.7 4.2 3.9 3.4 2.1 87 Food services and drinking places 3.0 2.4 5.1 4.4 3.0 88 Other services, except government 3.4 2.7 3.3 2.8 4.3 89 Government 5.4 4.3 4.7 0.7 1.0 90 Federal 1.3 1.7 0.7 1.7 3.0 91 General government 1.9 2.8 1.9 1.7 2.8 92 National defense 0.0 0.3 0.1 ¥1.9 0.2 93 Non-defense 1.9 2.8 1.9 1.7 2.8 94 Government enterprises ¥3.8 ¥5.5 ¥7.6 1.9 3.8 95 State and local 6.2 4.7 5.3 0.6 0.7 96 General government 5.9 4.5 3.5 ¥0.1 1.2 97 Government enterprises ¥16.7 71.5 299.1 35.1 ¥17.5
Table 17. Real Outdoor Recreation Gross Output by Activity [Millions of chained (2012) dollars]
Bureau of Economic Analysis
2012 2013 2014 2015 2016 2017
1 Total Outdoor Recreation 691,782 699,173 708,666 730,321 742,793 762,768 2 Total Core Outdoor Recreation 342,735 352,736 359,960 368,509 375,449 391,354 3 Conventional Outdoor Recreation 214,386 222,085 226,931 233,108 238,877 248,087 4 Bicycling 3,182 3,353 3,445 3,306 3,729 3,874 5 Boating/Fishing 32,428 32,760 33,153 34,769 35,854 38,039 6 Canoeing 124 121 126 129 133 141 7 Kayaking 580 580 581 618 680 736
VerDate Aug 31 2005 16:26 Dec 16, 2020 Jkt 000000 PO 00000 Frm 00052 Fmt 6621 Sfmt 6621 P:\DOCS\116-19\38016.TXT BRIAN
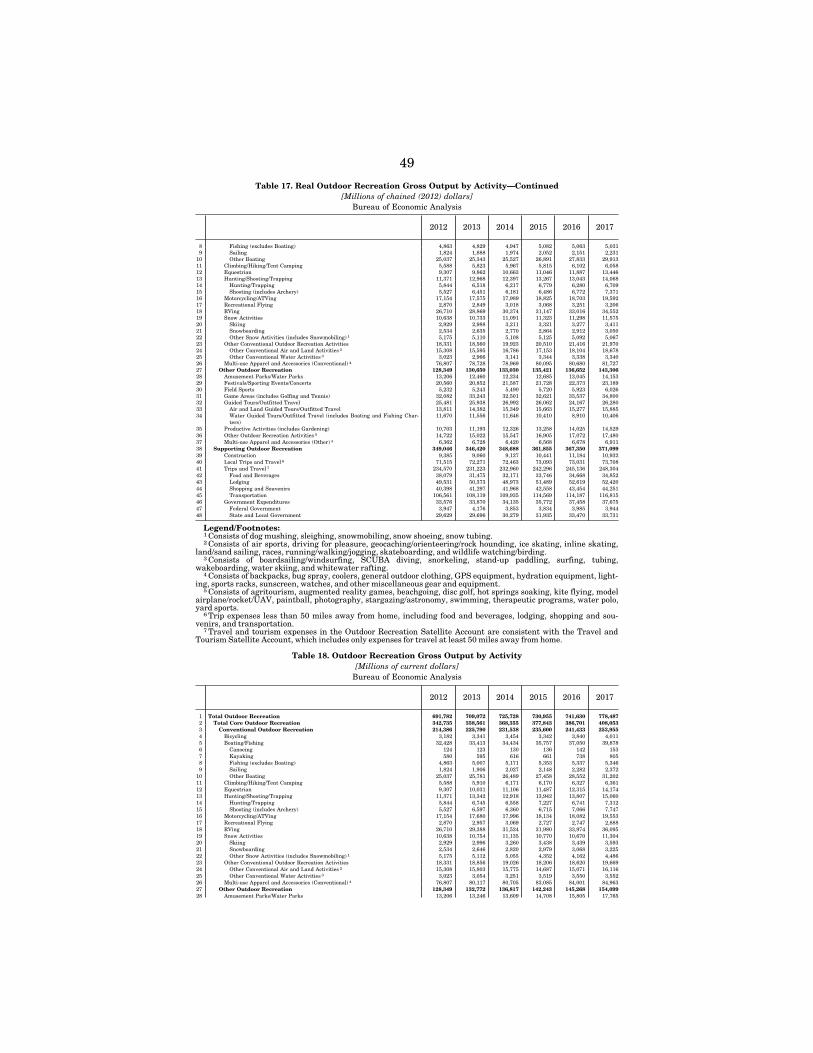
49
Table 17. Real Outdoor Recreation Gross Output by Activity—Continued [Millions of chained (2012) dollars]
Bureau of Economic Analysis
2012 2013 2014 2015 2016 2017
8 Fishing (excludes Boating) 4,863 4,829 4,947 5,082 5,063 5,031 9 Sailing 1,824 1,888 1,974 2,052 2,151 2,231
10 Other Boating 25,037 25,343 25,527 26,891 27,833 29,913 11 Climbing/Hiking/Tent Camping 5,588 5,823 5,967 5,815 6,102 6,058 12 Equestrian 9,307 9,862 10,663 11,046 11,887 13,446 13 Hunting/Shooting/Trapping 11,371 12,968 12,397 13,267 13,043 14,068 14 Hunting/Trapping 5,844 6,518 6,217 6,779 6,280 6,709 15 Shooting (includes Archery) 5,527 6,451 6,181 6,486 6,772 7,371 16 Motorcycling/ATVing 17,154 17,575 17,989 18,825 18,703 19,592 17 Recreational Flying 2,870 2,849 3,018 3,068 3,251 3,206 18 RVing 26,710 28,869 30,374 31,147 33,016 34,552 19 Snow Activities 10,638 10,733 11,091 11,323 11,298 11,575 20 Skiing 2,929 2,988 3,211 3,321 3,277 3,411 21 Snowboarding 2,534 2,635 2,770 2,864 2,912 3,050 22 Other Snow Activities (includes Snowmobiling) 1 5,175 5,110 5,108 5,125 5,092 5,067 23 Other Conventional Outdoor Recreation Activities 18,331 18,560 19,923 20,510 21,416 21,970 24 Other Conventional Air and Land Activities 2 15,308 15,595 16,786 17,153 18,104 18,678 25 Other Conventional Water Activities 3 3,023 2,966 3,141 3,344 3,338 3,340 26 Multi-use Apparel and Accessories (Conventional) 4 76,807 78,728 78,969 80,095 80,680 81,727 27 Other Outdoor Recreation 128,349 130,650 133,030 135,421 136,652 143,306 28 Amusement Parks/Water Parks 13,206 12,460 12,234 12,685 13,045 14,153 29 Festivals/Sporting Events/Concerts 20,560 20,852 21,587 21,728 22,373 23,189 30 Field Sports 5,232 5,243 5,490 5,720 5,923 6,026 31 Game Areas (includes Golfing and Tennis) 32,082 33,243 32,501 32,621 33,537 34,800 32 Guided Tours/Outfitted Travel 25,481 25,938 26,992 26,062 24,167 26,280 33 Air and Land Guided Tours/Outfitted Travel 13,811 14,382 15,349 15,663 15,277 15,885 34 Water Guided Tours/Outfitted Travel (includes Boating and Fishing Char-
ters) 11,670 11,556 11,646 10,410 8,910 10,406
35 Productive Activities (includes Gardening) 10,703 11,193 12,326 13,258 14,025 14,529 36 Other Outdoor Recreation Activities 5 14,722 15,022 15,547 16,905 17,072 17,480 37 Multi-use Apparel and Accessories (Other) 4 6,362 6,728 6,420 6,568 6,678 6,911 38 Supporting Outdoor Recreation 349,046 346,420 348,688 361,855 367,350 371,099 39 Construction 9,385 9,060 9,127 10,441 11,184 10,932 40 Local Trips and Travel 6 71,515 72,271 72,463 73,093 73,031 73,708 41 Trips and Travel 7 234,570 231,223 232,960 242,296 245,136 248,304 42 Food and Beverages 38,079 31,475 32,171 33,746 34,668 34,852 43 Lodging 49,531 50,373 48,973 51,489 52,619 52,420 44 Shopping and Souvenirs 40,398 41,297 41,968 42,558 43,454 44,251 45 Transportation 106,561 108,119 109,935 114,569 114,187 116,815 46 Government Expenditures 33,576 33,870 34,135 35,772 37,458 37,675 47 Federal Government 3,947 4,176 3,853 3,834 3,985 3,944 48 State and Local Government 29,629 29,696 30,279 31,935 33,470 33,731
Legend/Footnotes: 1 Consists of dog mushing, sleighing, snowmobiling, snow shoeing, snow tubing. 2 Consists of air sports, driving for pleasure, geocaching/orienteering/rock hounding, ice skating, inline skating,
land/sand sailing, races, running/walking/jogging, skateboarding, and wildlife watching/birding. 3 Consists of boardsailing/windsurfing, SCUBA diving, snorkeling, stand-up paddling, surfing, tubing,
wakeboarding, water skiing, and whitewater rafting. 4 Consists of backpacks, bug spray, coolers, general outdoor clothing, GPS equipment, hydration equipment, light-
ing, sports racks, sunscreen, watches, and other miscellaneous gear and equipment. 5 Consists of agritourism, augmented reality games, beachgoing, disc golf, hot springs soaking, kite flying, model
airplane/rocket/UAV, paintball, photography, stargazing/astronomy, swimming, therapeutic programs, water polo, yard sports.
6 Trip expenses less than 50 miles away from home, including food and beverages, lodging, shopping and sou-venirs, and transportation.
7 Travel and tourism expenses in the Outdoor Recreation Satellite Account are consistent with the Travel and Tourism Satellite Account, which includes only expenses for travel at least 50 miles away from home.
Table 18. Outdoor Recreation Gross Output by Activity [Millions of current dollars]
Bureau of Economic Analysis
2012 2013 2014 2015 2016 2017
1 Total Outdoor Recreation 691,782 709,072 725,728 730,955 741,630 778,487 2 Total Core Outdoor Recreation 342,735 358,561 368,355 377,843 386,701 408,053 3 Conventional Outdoor Recreation 214,386 225,790 231,538 235,600 241,433 253,955 4 Bicycling 3,182 3,341 3,454 3,342 3,840 4,011 5 Boating/Fishing 32,428 33,413 34,434 35,757 37,050 39,878 6 Canoeing 124 123 130 136 142 153 7 Kayaking 580 595 616 661 738 805 8 Fishing (excludes Boating) 4,863 5,007 5,171 5,353 5,337 5,346 9 Sailing 1,824 1,906 2,027 2,148 2,282 2,372
10 Other Boating 25,037 25,781 26,489 27,458 28,552 31,202 11 Climbing/Hiking/Tent Camping 5,588 5,910 6,171 6,170 6,327 6,361 12 Equestrian 9,307 10,031 11,106 11,487 12,315 14,174 13 Hunting/Shooting/Trapping 11,371 13,342 12,918 13,942 13,807 15,060 14 Hunting/Trapping 5,844 6,745 6,558 7,227 6,741 7,312 15 Shooting (includes Archery) 5,527 6,597 6,360 6,715 7,066 7,747 16 Motorcycling/ATVing 17,154 17,680 17,996 18,134 18,082 19,553 17 Recreational Flying 2,870 2,957 3,069 2,727 2,747 2,888 18 RVing 26,710 29,388 31,524 31,980 33,974 36,095 19 Snow Activities 10,638 10,754 11,135 10,770 10,670 11,304 20 Skiing 2,929 2,996 3,260 3,438 3,439 3,593 21 Snowboarding 2,534 2,646 2,820 2,979 3,068 3,225 22 Other Snow Activities (includes Snowmobiling) 1 5,175 5,112 5,055 4,352 4,162 4,486 23 Other Conventional Outdoor Recreation Activities 18,331 18,856 19,026 18,206 18,620 19,669 24 Other Conventional Air and Land Activities 2 15,308 15,803 15,775 14,687 15,071 16,116 25 Other Conventional Water Activities 3 3,023 3,054 3,251 3,519 3,550 3,552 26 Multi-use Apparel and Accessories (Conventional) 4 76,807 80,117 80,705 83,085 84,001 84,963 27 Other Outdoor Recreation 128,349 132,772 136,817 142,243 145,268 154,099 28 Amusement Parks/Water Parks 13,206 13,246 13,609 14,708 15,805 17,765
VerDate Aug 31 2005 16:26 Dec 16, 2020 Jkt 000000 PO 00000 Frm 00053 Fmt 6621 Sfmt 6621 P:\DOCS\116-19\38016.TXT BRIAN
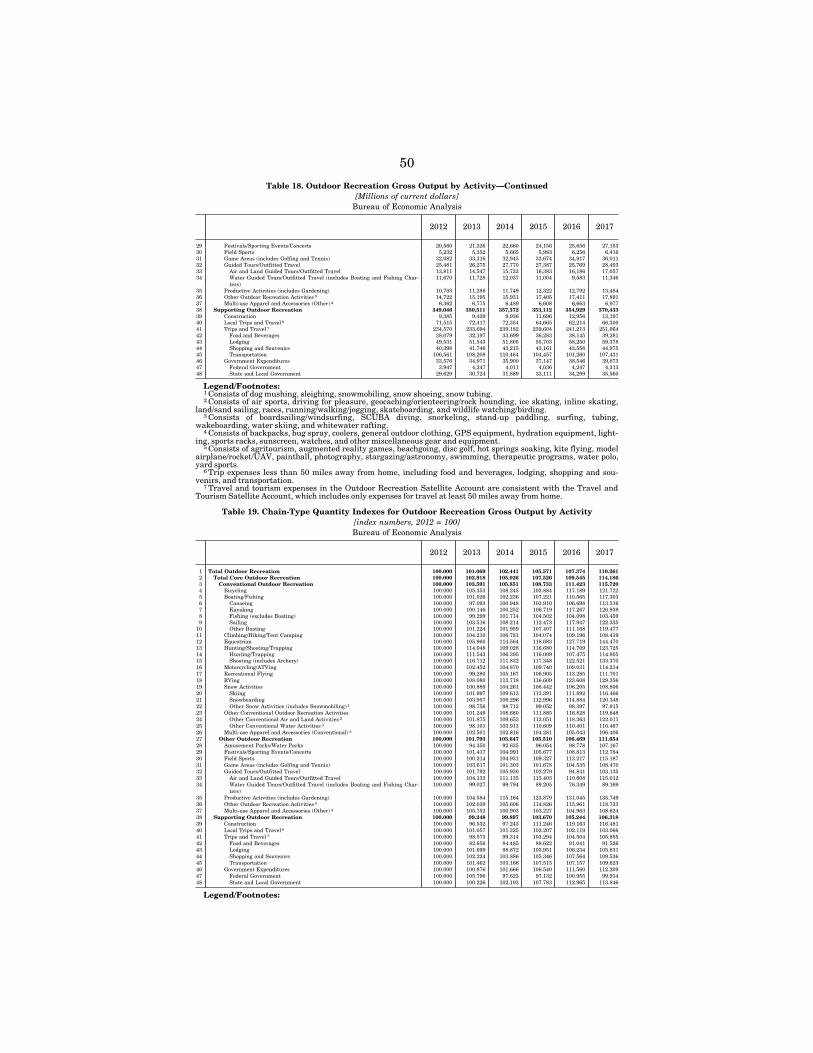
50
Table 18. Outdoor Recreation Gross Output by Activity—Continued [Millions of current dollars]
Bureau of Economic Analysis
2012 2013 2014 2015 2016 2017
29 Festivals/Sporting Events/Concerts 20,560 21,326 22,660 24,156 25,656 27,153 30 Field Sports 5,232 5,352 5,665 5,983 6,256 6,416 31 Game Areas (includes Golfing and Tennis) 32,082 33,316 32,945 33,674 34,917 36,011 32 Guided Tours/Outfitted Travel 25,481 26,275 27,770 27,387 25,769 28,403 33 Air and Land Guided Tours/Outfitted Travel 13,811 14,547 15,733 16,383 16,186 17,057 34 Water Guided Tours/Outfitted Travel (includes Boating and Fishing Char-
ters) 11,670 11,728 12,037 11,004 9,583 11,346
35 Productive Activities (includes Gardening) 10,703 11,288 11,749 12,322 12,792 13,484 36 Other Outdoor Recreation Activities 5 14,722 15,195 15,931 17,405 17,411 17,891 37 Multi-use Apparel and Accessories (Other) 4 6,362 6,775 6,489 6,608 6,663 6,977 38 Supporting Outdoor Recreation 349,046 350,511 357,372 353,112 354,929 370,433 39 Construction 9,385 9,429 9,936 11,696 12,956 13,197 40 Local Trips and Travel 6 71,515 72,417 72,354 64,665 62,214 66,300 41 Trips and Travel 7 234,570 233,694 239,182 239,604 241,213 251,064 42 Food and Beverages 38,079 32,197 33,699 36,283 38,145 39,281 43 Lodging 49,531 51,543 51,805 55,703 58,250 59,378 44 Shopping and Souvenirs 40,398 41,746 43,215 43,161 43,558 44,975 45 Transportation 106,561 108,208 110,464 104,457 101,260 107,431 46 Government Expenditures 33,576 34,971 35,900 37,147 38,546 39,873 47 Federal Government 3,947 4,247 4,011 4,036 4,247 4,313 48 State and Local Government 29,629 30,724 31,889 33,111 34,299 35,560
Legend/Footnotes: 1 Consists of dog mushing, sleighing, snowmobiling, snow shoeing, snow tubing. 2 Consists of air sports, driving for pleasure, geocaching/orienteering/rock hounding, ice skating, inline skating,
land/sand sailing, races, running/walking/jogging, skateboarding, and wildlife watching/birding. 3 Consists of boardsailing/windsurfing, SCUBA diving, snorkeling, stand-up paddling, surfing, tubing,
wakeboarding, water skiing, and whitewater rafting. 4 Consists of backpacks, bug spray, coolers, general outdoor clothing, GPS equipment, hydration equipment, light-
ing, sports racks, sunscreen, watches, and other miscellaneous gear and equipment. 5 Consists of agritourism, augmented reality games, beachgoing, disc golf, hot springs soaking, kite flying, model
airplane/rocket/UAV, paintball, photography, stargazing/astronomy, swimming, therapeutic programs, water polo, yard sports.
6 Trip expenses less than 50 miles away from home, including food and beverages, lodging, shopping and sou-venirs, and transportation.
7 Travel and tourism expenses in the Outdoor Recreation Satellite Account are consistent with the Travel and Tourism Satellite Account, which includes only expenses for travel at least 50 miles away from home.
Table 19. Chain-Type Quantity Indexes for Outdoor Recreation Gross Output by Activity [index numbers, 2012 = 100] Bureau of Economic Analysis
2012 2013 2014 2015 2016 2017
1 Total Outdoor Recreation 100.000 101.069 102.441 105.571 107.374 110.261 2 Total Core Outdoor Recreation 100.000 102.918 105.026 107.520 109.545 114.186 3 Conventional Outdoor Recreation 100.000 103.591 105.851 108.733 111.423 115.720 4 Bicycling 100.000 105.353 108.245 103.884 117.189 121.722 5 Boating/Fishing 100.000 101.026 102.236 107.221 110.565 117.303 6 Canoeing 100.000 97.093 100.948 103.910 106.698 113.516 7 Kayaking 100.000 100.146 100.252 106.719 117.267 126.939 8 Fishing (excludes Boating) 100.000 99.299 101.714 104.502 104.098 103.459 9 Sailing 100.000 103.516 108.214 112.473 117.947 122.335
10 Other Boating 100.000 101.224 101.959 107.407 111.168 119.477 11 Climbing/Hiking/Tent Camping 100.000 104.210 106.781 104.074 109.196 108.419 12 Equestrian 100.000 105.960 114.564 118.683 127.719 144.470 13 Hunting/Shooting/Trapping 100.000 114.048 109.028 116.680 114.709 123.725 14 Hunting/Trapping 100.000 111.543 106.395 116.009 107.475 114.805 15 Shooting (includes Archery) 100.000 116.712 111.832 117.348 122.521 133.370 16 Motorcycling/ATVing 100.000 102.452 104.870 109.740 109.031 114.214 17 Recreational Flying 100.000 99.280 105.167 106.905 113.285 111.701 18 RVing 100.000 108.080 113.718 116.609 123.608 129.356 19 Snow Activities 100.000 100.889 104.261 106.442 106.205 108.806 20 Skiing 100.000 101.997 109.613 113.391 111.892 116.466 21 Snowboarding 100.000 103.957 109.296 112.996 114.884 120.348 22 Other Snow Activities (includes Snowmobiling) 1 100.000 98.756 98.713 99.052 98.397 97.915 23 Other Conventional Outdoor Recreation Activities 100.000 101.249 108.680 111.885 116.828 119.848 24 Other Conventional Air and Land Activities 2 100.000 101.875 109.653 112.051 118.263 122.011 25 Other Conventional Water Activities 3 100.000 98.101 103.913 110.609 110.401 110.467 26 Multi-use Apparel and Accessories (Conventional) 4 100.000 102.501 102.816 104.281 105.043 106.406 27 Other Outdoor Recreation 100.000 101.793 103.647 105.510 106.469 111.654 28 Amusement Parks/Water Parks 100.000 94.350 92.635 96.054 98.778 107.167 29 Festivals/Sporting Events/Concerts 100.000 101.417 104.991 105.677 108.813 112.784 30 Field Sports 100.000 100.214 104.931 109.327 113.217 115.187 31 Game Areas (includes Golfing and Tennis) 100.000 103.617 101.303 101.678 104.535 108.470 32 Guided Tours/Outfitted Travel 100.000 101.792 105.930 102.279 94.841 103.135 33 Air and Land Guided Tours/Outfitted Travel 100.000 104.133 111.135 113.403 110.608 115.012 34 Water Guided Tours/Outfitted Travel (includes Boating and Fishing Char-
ters) 100.000 99.027 99.794 89.205 76.349 89.169
35 Productive Activities (includes Gardening) 100.000 104.584 115.164 123.879 131.045 135.749 36 Other Outdoor Recreation Activities 5 100.000 102.039 105.606 114.826 115.961 118.733 37 Multi-use Apparel and Accessories (Other) 4 100.000 105.752 100.903 103.227 104.963 108.624 38 Supporting Outdoor Recreation 100.000 99.248 99.897 103.670 105.244 106.318 39 Construction 100.000 96.532 97.243 111.246 119.163 116.481 40 Local Trips and Travel 6 100.000 101.057 101.325 102.207 102.119 103.066 41 Trips and Travel 7 100.000 98.573 99.314 103.294 104.504 105.855 42 Food and Beverages 100.000 82.656 84.485 88.622 91.041 91.526 43 Lodging 100.000 101.699 98.872 103.951 106.234 105.831 44 Shopping and Souvenirs 100.000 102.224 103.886 105.346 107.564 109.536 45 Transportation 100.000 101.462 103.166 107.515 107.157 109.623 46 Government Expenditures 100.000 100.876 101.666 106.540 111.560 112.209 47 Federal Government 100.000 105.796 97.623 97.132 100.955 99.914 48 State and Local Government 100.000 100.226 102.193 107.783 112.965 113.846
Legend/Footnotes:
VerDate Aug 31 2005 16:26 Dec 16, 2020 Jkt 000000 PO 00000 Frm 00054 Fmt 6621 Sfmt 6621 P:\DOCS\116-19\38016.TXT BRIAN
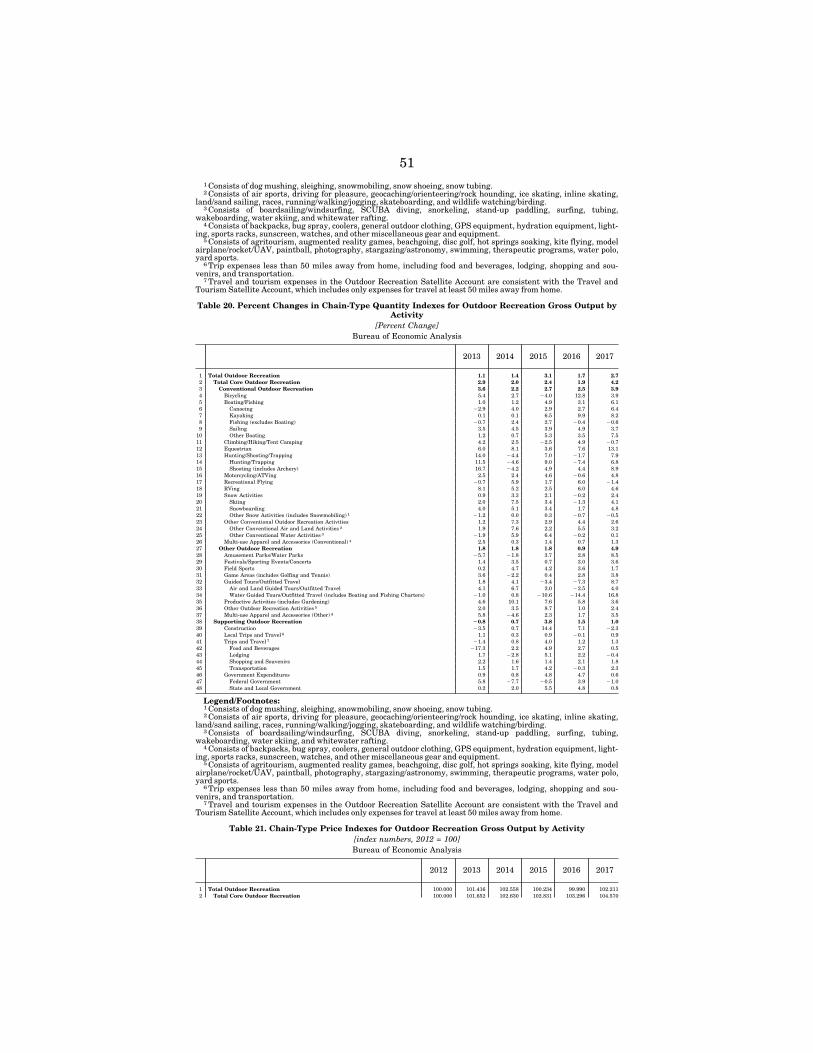
51 1 Consists of dog mushing, sleighing, snowmobiling, snow shoeing, snow tubing. 2 Consists of air sports, driving for pleasure, geocaching/orienteering/rock hounding, ice skating, inline skating,
land/sand sailing, races, running/walking/jogging, skateboarding, and wildlife watching/birding. 3 Consists of boardsailing/windsurfing, SCUBA diving, snorkeling, stand-up paddling, surfing, tubing,
wakeboarding, water skiing, and whitewater rafting. 4 Consists of backpacks, bug spray, coolers, general outdoor clothing, GPS equipment, hydration equipment, light-
ing, sports racks, sunscreen, watches, and other miscellaneous gear and equipment. 5 Consists of agritourism, augmented reality games, beachgoing, disc golf, hot springs soaking, kite flying, model
airplane/rocket/UAV, paintball, photography, stargazing/astronomy, swimming, therapeutic programs, water polo, yard sports.
6 Trip expenses less than 50 miles away from home, including food and beverages, lodging, shopping and sou-venirs, and transportation.
7 Travel and tourism expenses in the Outdoor Recreation Satellite Account are consistent with the Travel and Tourism Satellite Account, which includes only expenses for travel at least 50 miles away from home.
Table 20. Percent Changes in Chain-Type Quantity Indexes for Outdoor Recreation Gross Output by Activity
[Percent Change] Bureau of Economic Analysis
2013 2014 2015 2016 2017
1 Total Outdoor Recreation 1.1 1.4 3.1 1.7 2.7 2 Total Core Outdoor Recreation 2.9 2.0 2.4 1.9 4.2 3 Conventional Outdoor Recreation 3.6 2.2 2.7 2.5 3.9 4 Bicycling 5.4 2.7 ¥4.0 12.8 3.9 5 Boating/Fishing 1.0 1.2 4.9 3.1 6.1 6 Canoeing ¥2.9 4.0 2.9 2.7 6.4 7 Kayaking 0.1 0.1 6.5 9.9 8.2 8 Fishing (excludes Boating) ¥0.7 2.4 2.7 ¥0.4 ¥0.6 9 Sailing 3.5 4.5 3.9 4.9 3.7
10 Other Boating 1.2 0.7 5.3 3.5 7.5 11 Climbing/Hiking/Tent Camping 4.2 2.5 ¥2.5 4.9 ¥0.7 12 Equestrian 6.0 8.1 3.6 7.6 13.1 13 Hunting/Shooting/Trapping 14.0 ¥4.4 7.0 ¥1.7 7.9 14 Hunting/Trapping 11.5 ¥4.6 9.0 ¥7.4 6.8 15 Shooting (includes Archery) 16.7 ¥4.2 4.9 4.4 8.9 16 Motorcycling/ATVing 2.5 2.4 4.6 ¥0.6 4.8 17 Recreational Flying ¥0.7 5.9 1.7 6.0 ¥1.4 18 RVing 8.1 5.2 2.5 6.0 4.6 19 Snow Activities 0.9 3.3 2.1 ¥0.2 2.4 20 Skiing 2.0 7.5 3.4 ¥1.3 4.1 21 Snowboarding 4.0 5.1 3.4 1.7 4.8 22 Other Snow Activities (includes Snowmobiling) 1 ¥1.2 0.0 0.3 ¥0.7 ¥0.5 23 Other Conventional Outdoor Recreation Activities 1.2 7.3 2.9 4.4 2.6 24 Other Conventional Air and Land Activities 2 1.9 7.6 2.2 5.5 3.2 25 Other Conventional Water Activities 3 ¥1.9 5.9 6.4 ¥0.2 0.1 26 Multi-use Apparel and Accessories (Conventional) 4 2.5 0.3 1.4 0.7 1.3 27 Other Outdoor Recreation 1.8 1.8 1.8 0.9 4.9 28 Amusement Parks/Water Parks ¥5.7 ¥1.8 3.7 2.8 8.5 29 Festivals/Sporting Events/Concerts 1.4 3.5 0.7 3.0 3.6 30 Field Sports 0.2 4.7 4.2 3.6 1.7 31 Game Areas (includes Golfing and Tennis) 3.6 ¥2.2 0.4 2.8 3.8 32 Guided Tours/Outfitted Travel 1.8 4.1 ¥3.4 ¥7.3 8.7 33 Air and Land Guided Tours/Outfitted Travel 4.1 6.7 2.0 ¥2.5 4.0 34 Water Guided Tours/Outfitted Travel (includes Boating and Fishing Charters) ¥1.0 0.8 ¥10.6 ¥14.4 16.8 35 Productive Activities (includes Gardening) 4.6 10.1 7.6 5.8 3.6 36 Other Outdoor Recreation Activities 5 2.0 3.5 8.7 1.0 2.4 37 Multi-use Apparel and Accessories (Other) 4 5.8 ¥4.6 2.3 1.7 3.5 38 Supporting Outdoor Recreation Ø0.8 0.7 3.8 1.5 1.0 39 Construction ¥3.5 0.7 14.4 7.1 ¥2.3 40 Local Trips and Travel 6 1.1 0.3 0.9 ¥0.1 0.9 41 Trips and Travel 7 ¥1.4 0.8 4.0 1.2 1.3 42 Food and Beverages ¥17.3 2.2 4.9 2.7 0.5 43 Lodging 1.7 ¥2.8 5.1 2.2 ¥0.4 44 Shopping and Souvenirs 2.2 1.6 1.4 2.1 1.8 45 Transportation 1.5 1.7 4.2 ¥0.3 2.3 46 Government Expenditures 0.9 0.8 4.8 4.7 0.6 47 Federal Government 5.8 ¥7.7 ¥0.5 3.9 ¥1.0 48 State and Local Government 0.2 2.0 5.5 4.8 0.8
Legend/Footnotes: 1 Consists of dog mushing, sleighing, snowmobiling, snow shoeing, snow tubing. 2 Consists of air sports, driving for pleasure, geocaching/orienteering/rock hounding, ice skating, inline skating,
land/sand sailing, races, running/walking/jogging, skateboarding, and wildlife watching/birding. 3 Consists of boardsailing/windsurfing, SCUBA diving, snorkeling, stand-up paddling, surfing, tubing,
wakeboarding, water skiing, and whitewater rafting. 4 Consists of backpacks, bug spray, coolers, general outdoor clothing, GPS equipment, hydration equipment, light-
ing, sports racks, sunscreen, watches, and other miscellaneous gear and equipment. 5 Consists of agritourism, augmented reality games, beachgoing, disc golf, hot springs soaking, kite flying, model
airplane/rocket/UAV, paintball, photography, stargazing/astronomy, swimming, therapeutic programs, water polo, yard sports.
6 Trip expenses less than 50 miles away from home, including food and beverages, lodging, shopping and sou-venirs, and transportation.
7 Travel and tourism expenses in the Outdoor Recreation Satellite Account are consistent with the Travel and Tourism Satellite Account, which includes only expenses for travel at least 50 miles away from home.
Table 21. Chain-Type Price Indexes for Outdoor Recreation Gross Output by Activity [index numbers, 2012 = 100] Bureau of Economic Analysis
2012 2013 2014 2015 2016 2017
1 Total Outdoor Recreation 100.000 101.416 102.558 100.234 99.990 102.211 2 Total Core Outdoor Recreation 100.000 101.652 102.630 102.831 103.296 104.570
VerDate Aug 31 2005 16:26 Dec 16, 2020 Jkt 000000 PO 00000 Frm 00055 Fmt 6621 Sfmt 6621 P:\DOCS\116-19\38016.TXT BRIAN
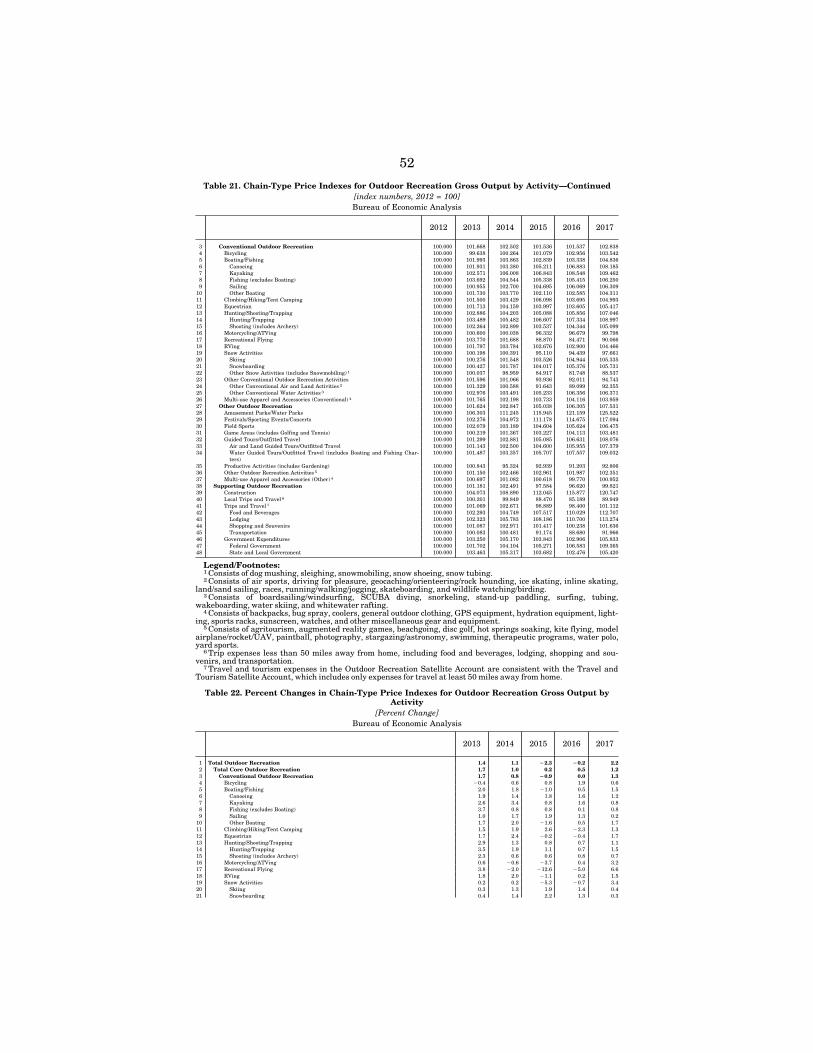
52
Table 21. Chain-Type Price Indexes for Outdoor Recreation Gross Output by Activity—Continued [index numbers, 2012 = 100] Bureau of Economic Analysis
2012 2013 2014 2015 2016 2017
3 Conventional Outdoor Recreation 100.000 101.668 102.502 101.536 101.537 102.838 4 Bicycling 100.000 99.638 100.264 101.079 102.956 103.542 5 Boating/Fishing 100.000 101.993 103.863 102.839 103.338 104.836 6 Canoeing 100.000 101.931 103.380 105.211 106.883 108.185 7 Kayaking 100.000 102.571 106.008 106.843 108.548 109.462 8 Fishing (excludes Boating) 100.000 103.692 104.544 105.338 105.415 106.250 9 Sailing 100.000 100.955 102.700 104.695 106.069 106.309
10 Other Boating 100.000 101.730 103.770 102.110 102.585 104.311 11 Climbing/Hiking/Tent Camping 100.000 101.500 103.429 106.098 103.695 104.993 12 Equestrian 100.000 101.713 104.159 103.997 103.605 105.417 13 Hunting/Shooting/Trapping 100.000 102.886 104.203 105.088 105.856 107.046 14 Hunting/Trapping 100.000 103.489 105.482 106.607 107.334 108.997 15 Shooting (includes Archery) 100.000 102.264 102.899 103.537 104.344 105.099 16 Motorcycling/ATVing 100.000 100.600 100.038 96.332 96.679 99.798 17 Recreational Flying 100.000 103.770 101.688 88.870 84.471 90.066 18 RVing 100.000 101.797 103.784 102.676 102.900 104.466 19 Snow Activities 100.000 100.198 100.391 95.110 94.439 97.661 20 Skiing 100.000 100.276 101.548 103.526 104.944 105.335 21 Snowboarding 100.000 100.427 101.787 104.017 105.376 105.731 22 Other Snow Activities (includes Snowmobiling) 1 100.000 100.037 98.959 84.917 81.748 88.537 23 Other Conventional Outdoor Recreation Activities 100.000 101.596 101.066 93.936 92.011 94.743 24 Other Conventional Air and Land Activities 2 100.000 101.329 100.588 91.643 89.099 92.355 25 Other Conventional Water Activities 3 100.000 102.976 103.491 105.233 106.356 106.371 26 Multi-use Apparel and Accessories (Conventional) 4 100.000 101.765 102.198 103.733 104.116 103.959 27 Other Outdoor Recreation 100.000 101.624 102.847 105.038 106.305 107.531 28 Amusement Parks/Water Parks 100.000 106.303 111.245 115.945 121.159 125.522 29 Festivals/Sporting Events/Concerts 100.000 102.276 104.972 111.178 114.675 117.094 30 Field Sports 100.000 102.079 103.189 104.604 105.624 106.475 31 Game Areas (includes Golfing and Tennis) 100.000 100.219 101.367 103.227 104.113 103.481 32 Guided Tours/Outfitted Travel 100.000 101.299 102.881 105.085 106.631 108.076 33 Air and Land Guided Tours/Outfitted Travel 100.000 101.143 102.500 104.600 105.955 107.379 34 Water Guided Tours/Outfitted Travel (includes Boating and Fishing Char-
ters) 100.000 101.487 103.357 105.707 107.557 109.032
35 Productive Activities (includes Gardening) 100.000 100.843 95.324 92.939 91.203 92.806 36 Other Outdoor Recreation Activities 5 100.000 101.150 102.466 102.961 101.987 102.351 37 Multi-use Apparel and Accessories (Other) 4 100.000 100.697 101.082 100.618 99.770 100.952 38 Supporting Outdoor Recreation 100.000 101.181 102.491 97.584 96.620 99.821 39 Construction 100.000 104.073 108.890 112.045 115.877 120.747 40 Local Trips and Travel 6 100.000 100.201 99.849 88.470 85.189 89.949 41 Trips and Travel 7 100.000 101.069 102.671 98.889 98.400 101.112 42 Food and Beverages 100.000 102.293 104.749 107.517 110.029 112.707 43 Lodging 100.000 102.323 105.783 108.186 110.700 113.274 44 Shopping and Souvenirs 100.000 101.087 102.971 101.417 100.238 101.636 45 Transportation 100.000 100.083 100.481 91.174 88.680 91.966 46 Government Expenditures 100.000 103.250 105.170 103.843 102.906 105.833 47 Federal Government 100.000 101.702 104.104 105.271 106.583 109.365 48 State and Local Government 100.000 103.463 105.317 103.682 102.476 105.420
Legend/Footnotes: 1 Consists of dog mushing, sleighing, snowmobiling, snow shoeing, snow tubing. 2 Consists of air sports, driving for pleasure, geocaching/orienteering/rock hounding, ice skating, inline skating,
land/sand sailing, races, running/walking/jogging, skateboarding, and wildlife watching/birding. 3 Consists of boardsailing/windsurfing, SCUBA diving, snorkeling, stand-up paddling, surfing, tubing,
wakeboarding, water skiing, and whitewater rafting. 4 Consists of backpacks, bug spray, coolers, general outdoor clothing, GPS equipment, hydration equipment, light-
ing, sports racks, sunscreen, watches, and other miscellaneous gear and equipment. 5 Consists of agritourism, augmented reality games, beachgoing, disc golf, hot springs soaking, kite flying, model
airplane/rocket/UAV, paintball, photography, stargazing/astronomy, swimming, therapeutic programs, water polo, yard sports.
6 Trip expenses less than 50 miles away from home, including food and beverages, lodging, shopping and sou-venirs, and transportation.
7 Travel and tourism expenses in the Outdoor Recreation Satellite Account are consistent with the Travel and Tourism Satellite Account, which includes only expenses for travel at least 50 miles away from home.
Table 22. Percent Changes in Chain-Type Price Indexes for Outdoor Recreation Gross Output by Activity
[Percent Change] Bureau of Economic Analysis
2013 2014 2015 2016 2017
1 Total Outdoor Recreation 1.4 1.1 Ø2.3 Ø0.2 2.2 2 Total Core Outdoor Recreation 1.7 1.0 0.2 0.5 1.2 3 Conventional Outdoor Recreation 1.7 0.8 Ø0.9 0.0 1.3 4 Bicycling ¥0.4 0.6 0.8 1.9 0.6 5 Boating/Fishing 2.0 1.8 ¥1.0 0.5 1.5 6 Canoeing 1.9 1.4 1.8 1.6 1.2 7 Kayaking 2.6 3.4 0.8 1.6 0.8 8 Fishing (excludes Boating) 3.7 0.8 0.8 0.1 0.8 9 Sailing 1.0 1.7 1.9 1.3 0.2
10 Other Boating 1.7 2.0 ¥1.6 0.5 1.7 11 Climbing/Hiking/Tent Camping 1.5 1.9 2.6 ¥2.3 1.3 12 Equestrian 1.7 2.4 ¥0.2 ¥0.4 1.7 13 Hunting/Shooting/Trapping 2.9 1.3 0.8 0.7 1.1 14 Hunting/Trapping 3.5 1.9 1.1 0.7 1.5 15 Shooting (includes Archery) 2.3 0.6 0.6 0.8 0.7 16 Motorcycling/ATVing 0.6 ¥0.6 ¥3.7 0.4 3.2 17 Recreational Flying 3.8 ¥2.0 ¥12.6 ¥5.0 6.6 18 RVing 1.8 2.0 ¥1.1 0.2 1.5 19 Snow Activities 0.2 0.2 ¥5.3 ¥0.7 3.4 20 Skiing 0.3 1.3 1.9 1.4 0.4 21 Snowboarding 0.4 1.4 2.2 1.3 0.3
VerDate Aug 31 2005 16:26 Dec 16, 2020 Jkt 000000 PO 00000 Frm 00056 Fmt 6621 Sfmt 6621 P:\DOCS\116-19\38016.TXT BRIAN
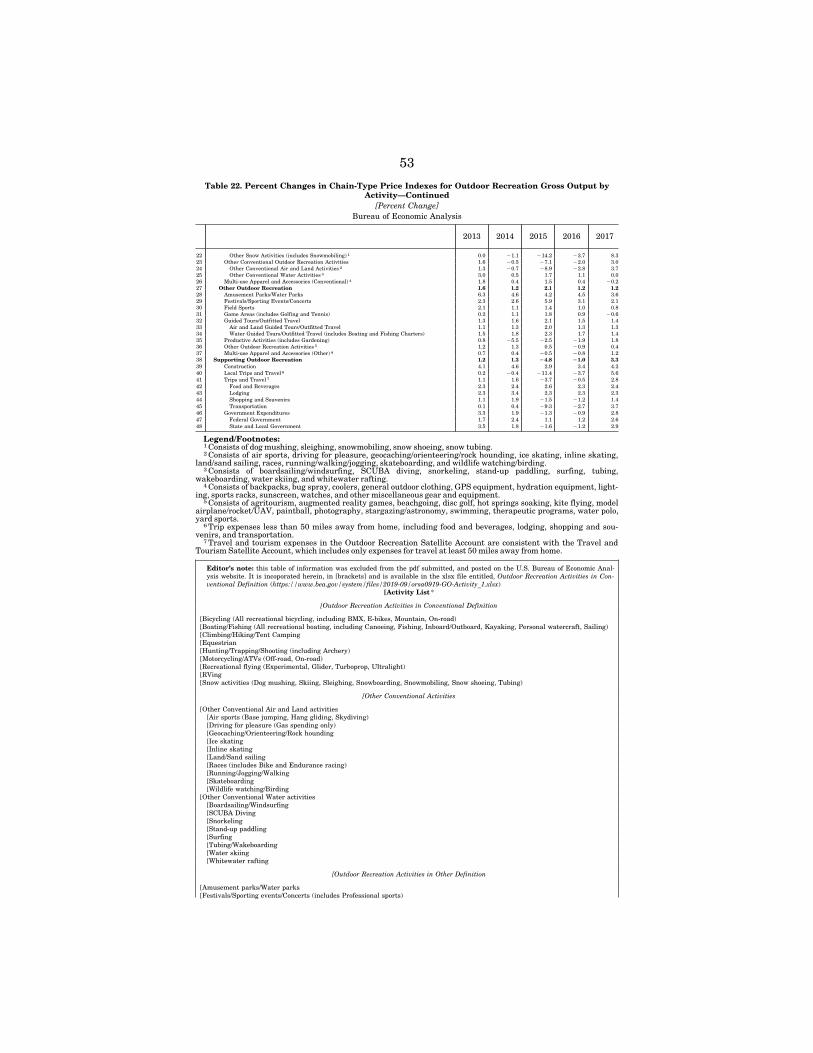
53
Table 22. Percent Changes in Chain-Type Price Indexes for Outdoor Recreation Gross Output by Activity—Continued
[Percent Change] Bureau of Economic Analysis
2013 2014 2015 2016 2017
22 Other Snow Activities (includes Snowmobiling) 1 0.0 ¥1.1 ¥14.2 ¥3.7 8.3 23 Other Conventional Outdoor Recreation Activities 1.6 ¥0.5 ¥7.1 ¥2.0 3.0 24 Other Conventional Air and Land Activities 2 1.3 ¥0.7 ¥8.9 ¥2.8 3.7 25 Other Conventional Water Activities 3 3.0 0.5 1.7 1.1 0.0 26 Multi-use Apparel and Accessories (Conventional) 4 1.8 0.4 1.5 0.4 ¥0.2 27 Other Outdoor Recreation 1.6 1.2 2.1 1.2 1.2 28 Amusement Parks/Water Parks 6.3 4.6 4.2 4.5 3.6 29 Festivals/Sporting Events/Concerts 2.3 2.6 5.9 3.1 2.1 30 Field Sports 2.1 1.1 1.4 1.0 0.8 31 Game Areas (includes Golfing and Tennis) 0.2 1.1 1.8 0.9 ¥0.6 32 Guided Tours/Outfitted Travel 1.3 1.6 2.1 1.5 1.4 33 Air and Land Guided Tours/Outfitted Travel 1.1 1.3 2.0 1.3 1.3 34 Water Guided Tours/Outfitted Travel (includes Boating and Fishing Charters) 1.5 1.8 2.3 1.7 1.4 35 Productive Activities (includes Gardening) 0.8 ¥5.5 ¥2.5 ¥1.9 1.8 36 Other Outdoor Recreation Activities 5 1.2 1.3 0.5 ¥0.9 0.4 37 Multi-use Apparel and Accessories (Other) 4 0.7 0.4 ¥0.5 ¥0.8 1.2 38 Supporting Outdoor Recreation 1.2 1.3 Ø4.8 Ø1.0 3.3 39 Construction 4.1 4.6 2.9 3.4 4.2 40 Local Trips and Travel 6 0.2 ¥0.4 ¥11.4 ¥3.7 5.6 41 Trips and Travel 7 1.1 1.6 ¥3.7 ¥0.5 2.8 42 Food and Beverages 2.3 2.4 2.6 2.3 2.4 43 Lodging 2.3 3.4 2.3 2.3 2.3 44 Shopping and Souvenirs 1.1 1.9 ¥1.5 ¥1.2 1.4 45 Transportation 0.1 0.4 ¥9.3 ¥2.7 3.7 46 Government Expenditures 3.3 1.9 ¥1.3 ¥0.9 2.8 47 Federal Government 1.7 2.4 1.1 1.2 2.6 48 State and Local Government 3.5 1.8 ¥1.6 ¥1.2 2.9
Legend/Footnotes: 1 Consists of dog mushing, sleighing, snowmobiling, snow shoeing, snow tubing. 2 Consists of air sports, driving for pleasure, geocaching/orienteering/rock hounding, ice skating, inline skating,
land/sand sailing, races, running/walking/jogging, skateboarding, and wildlife watching/birding. 3 Consists of boardsailing/windsurfing, SCUBA diving, snorkeling, stand-up paddling, surfing, tubing,
wakeboarding, water skiing, and whitewater rafting. 4 Consists of backpacks, bug spray, coolers, general outdoor clothing, GPS equipment, hydration equipment, light-
ing, sports racks, sunscreen, watches, and other miscellaneous gear and equipment. 5 Consists of agritourism, augmented reality games, beachgoing, disc golf, hot springs soaking, kite flying, model
airplane/rocket/UAV, paintball, photography, stargazing/astronomy, swimming, therapeutic programs, water polo, yard sports.
6 Trip expenses less than 50 miles away from home, including food and beverages, lodging, shopping and sou-venirs, and transportation.
7 Travel and tourism expenses in the Outdoor Recreation Satellite Account are consistent with the Travel and Tourism Satellite Account, which includes only expenses for travel at least 50 miles away from home.
Editor’s note: this table of information was excluded from the pdf submitted, and posted on the U.S. Bureau of Economic Anal-ysis website. It is incoporated herein, in [brackets] and is available in the xlsx file entitled, Outdoor Recreation Activities in Con-ventional Definition (https://www.bea.gov/system/files/2019-09/orsa0919-GO-Activity_1.xlsx)
[Activity List *
[Outdoor Recreation Activities in Conventional Definition
[Bicycling (All recreational bicycling, including BMX, E-bikes, Mountain, On-road) [Boating/Fishing (All recreational boating, including Canoeing, Fishing, Inboard/Outboard, Kayaking, Personal watercraft, Sailing) [Climbing/Hiking/Tent Camping [Equestrian [Hunting/Trapping/Shooting (including Archery) [Motorcycling/ATVs (Off-road, On-road) [Recreational flying (Experimental, Glider, Turboprop, Ultralight) [RVing [Snow activities (Dog mushing, Skiing, Sleighing, Snowboarding, Snowmobiling, Snow shoeing, Tubing)
[Other Conventional Activities
[Other Conventional Air and Land activities [Air sports (Base jumping, Hang gliding, Skydiving) [Driving for pleasure (Gas spending only) [Geocaching/Orienteering/Rock hounding [Ice skating [Inline skating [Land/Sand sailing [Races (includes Bike and Endurance racing) [Running/Jogging/Walking [Skateboarding [Wildlife watching/Birding
[Other Conventional Water activities [Boardsailing/Windsurfing [SCUBA Diving [Snorkeling [Stand-up paddling [Surfing [Tubing/Wakeboarding [Water skiing [Whitewater rafting
[Outdoor Recreation Activities in Other Definition
[Amusement parks/Water parks [Festivals/Sporting events/Concerts (includes Professional sports)
VerDate Aug 31 2005 16:26 Dec 16, 2020 Jkt 000000 PO 00000 Frm 00057 Fmt 6621 Sfmt 6621 P:\DOCS\116-19\38016.TXT BRIAN
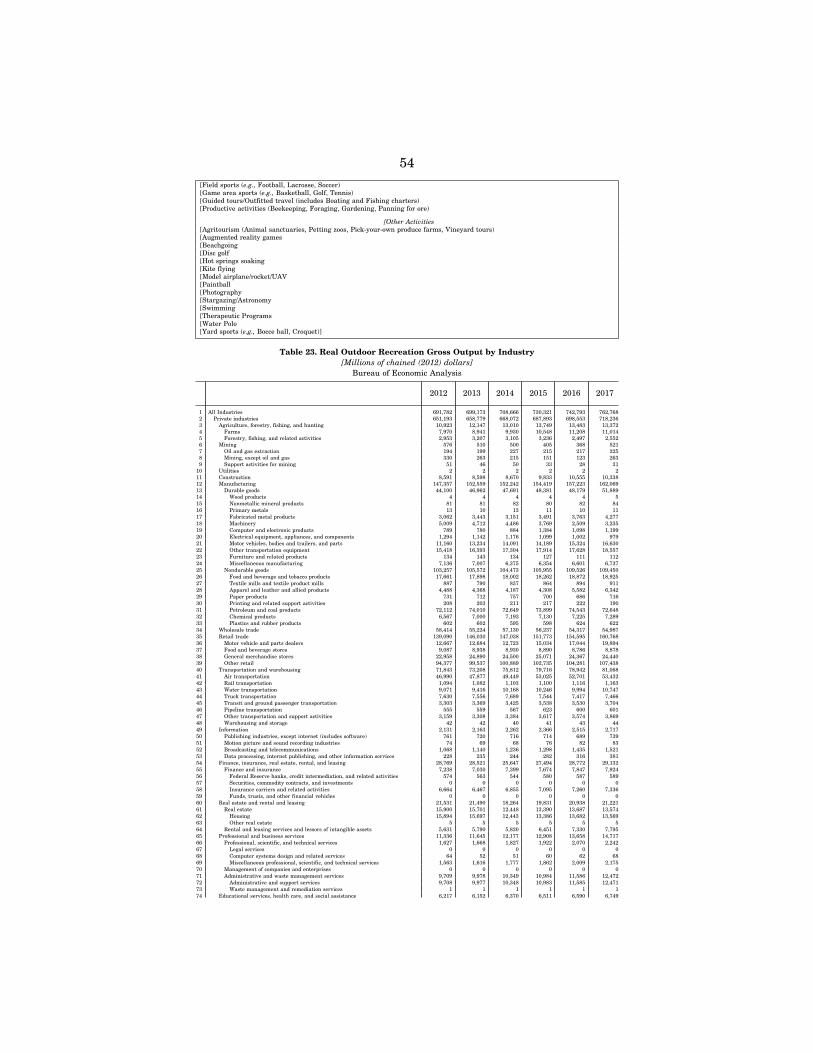
54 [Field sports (e.g., Football, Lacrosse, Soccer) [Game area sports (e.g., Basketball, Golf, Tennis) [Guided tours/Outfitted travel (includes Boating and Fishing charters) [Productive activities (Beekeeping, Foraging, Gardening, Panning for ore)
[Other Activities [Agritourism (Animal sanctuaries, Petting zoos, Pick-your-own produce farms, Vineyard tours) [Augmented reality games [Beachgoing [Disc golf [Hot springs soaking [Kite flying [Model airplane/rocket/UAV [Paintball [Photography [Stargazing/Astronomy [Swimming [Therapeutic Programs [Water Polo [Yard sports (e.g., Bocce ball, Croquet)]
Table 23. Real Outdoor Recreation Gross Output by Industry [Millions of chained (2012) dollars]
Bureau of Economic Analysis
2012 2013 2014 2015 2016 2017
1 All Industries 691,782 699,173 708,666 730,321 742,793 762,768 2 Private industries 651,193 658,779 668,072 687,893 698,553 718,236 3 Agriculture, forestry, fishing, and hunting 10,923 12,147 13,010 13,749 13,483 13,372 4 Farms 7,970 8,941 9,930 10,548 11,208 11,014 5 Forestry, fishing, and related activities 2,953 3,207 3,105 3,236 2,497 2,552 6 Mining 576 510 500 405 368 521 7 Oil and gas extraction 194 199 227 215 217 225 8 Mining, except oil and gas 330 263 215 151 123 263 9 Support activities for mining 51 46 50 33 28 31
10 Utilities 2 2 2 2 2 2 11 Construction 8,591 8,598 8,670 9,833 10,555 10,338 12 Manufacturing 147,357 152,559 152,242 154,419 157,223 162,069 13 Durable goods 44,100 46,962 47,691 48,381 48,179 51,889 14 Wood products 4 4 4 4 4 5 15 Nonmetallic mineral products 81 81 82 80 82 84 16 Primary metals 13 10 13 11 10 11 17 Fabricated metal products 3,062 3,443 3,151 3,491 3,763 4,277 18 Machinery 5,009 4,712 4,486 3,769 2,509 3,235 19 Computer and electronic products 789 780 884 1,384 1,098 1,199 20 Electrical equipment, appliances, and components 1,294 1,142 1,176 1,099 1,002 979 21 Motor vehicles, bodies and trailers, and parts 11,160 13,234 14,091 14,189 15,324 16,630 22 Other transportation equipment 15,418 16,393 17,304 17,914 17,628 18,557 23 Furniture and related products 134 143 134 127 111 112 24 Miscellaneous manufacturing 7,136 7,007 6,375 6,354 6,601 6,737 25 Nondurable goods 103,257 105,572 104,473 105,955 109,526 109,450 26 Food and beverage and tobacco products 17,661 17,898 18,002 18,262 18,872 18,925 27 Textile mills and textile product mills 887 790 837 864 894 911 28 Apparel and leather and allied products 4,488 4,368 4,187 4,308 5,582 6,342 29 Paper products 731 712 757 700 686 716 30 Printing and related support activities 208 203 211 217 222 190 31 Petroleum and coal products 72,112 74,010 72,649 73,899 74,543 72,648 32 Chemical products 6,567 7,000 7,193 7,130 7,225 7,289 33 Plastics and rubber products 602 602 595 598 624 622 34 Wholesale trade 58,414 55,224 57,130 56,237 54,317 54,987 35 Retail trade 139,090 146,030 147,038 151,773 154,595 160,768 36 Motor vehicle and parts dealers 12,667 12,684 12,723 15,034 17,044 19,894 37 Food and beverage stores 9,087 8,938 8,930 8,890 8,786 8,878 38 General merchandise stores 22,958 24,890 24,500 25,071 24,367 24,440 39 Other retail 94,377 99,537 100,889 102,735 104,281 107,438 40 Transportation and warehousing 71,843 73,208 75,812 79,716 78,942 81,068 41 Air transportation 46,990 47,877 49,449 53,025 52,701 53,432 42 Rail transportation 1,094 1,082 1,103 1,100 1,116 1,163 43 Water transportation 9,071 9,416 10,168 10,246 9,994 10,747 44 Truck transportation 7,630 7,556 7,689 7,544 7,417 7,466 45 Transit and ground passenger transportation 3,303 3,369 3,425 3,538 3,530 3,704 46 Pipeline transportation 555 559 567 623 600 601 47 Other transportation and support activities 3,159 3,308 3,384 3,617 3,574 3,869 48 Warehousing and storage 42 42 40 41 43 44 49 Information 2,131 2,163 2,262 2,366 2,515 2,717 50 Publishing industries, except internet (includes software) 761 720 716 714 689 739 51 Motion picture and sound recording industries 74 69 68 76 82 83 52 Broadcasting and telecommunications 1,068 1,140 1,236 1,298 1,435 1,521 53 Data processing, internet publishing, and other information services 228 235 244 282 316 381 54 Finance, insurance, real estate, rental, and leasing 28,769 28,521 25,647 27,494 28,772 29,132 55 Finance and insurance 7,238 7,030 7,399 7,674 7,847 7,924 56 Federal Reserve banks, credit intermediation, and related activities 574 563 544 580 587 589 57 Securities, commodity contracts, and investments 0 0 0 0 0 0 58 Insurance carriers and related activities 6,664 6,467 6,855 7,095 7,260 7,336 59 Funds, trusts, and other financial vehicles 0 0 0 0 0 0 60 Real estate and rental and leasing 21,531 21,490 18,264 19,831 20,938 21,221 61 Real estate 15,900 15,701 12,448 13,390 13,687 13,574 62 Housing 15,894 15,697 12,443 13,386 13,682 13,569 63 Other real estate 5 5 5 5 5 5 64 Rental and leasing services and lessors of intangible assets 5,631 5,790 5,820 6,451 7,330 7,795 65 Professional and business services 11,336 11,645 12,177 12,908 13,658 14,717 66 Professional, scientific, and technical services 1,627 1,668 1,827 1,922 2,070 2,242 67 Legal services 0 0 0 0 0 0 68 Computer systems design and related services 64 52 51 60 62 68 69 Miscellaneous professional, scientific, and technical services 1,563 1,616 1,777 1,862 2,009 2,175 70 Management of companies and enterprises 0 0 0 0 0 0 71 Administrative and waste management services 9,709 9,978 10,349 10,984 11,586 12,472 72 Administrative and support services 9,708 9,977 10,348 10,983 11,585 12,471 73 Waste management and remediation services 1 1 1 1 1 1 74 Educational services, health care, and social assistance 6,217 6,152 6,370 6,511 6,590 6,749
VerDate Aug 31 2005 16:26 Dec 16, 2020 Jkt 000000 PO 00000 Frm 00058 Fmt 6621 Sfmt 6621 P:\DOCS\116-19\38016.TXT BRIAN
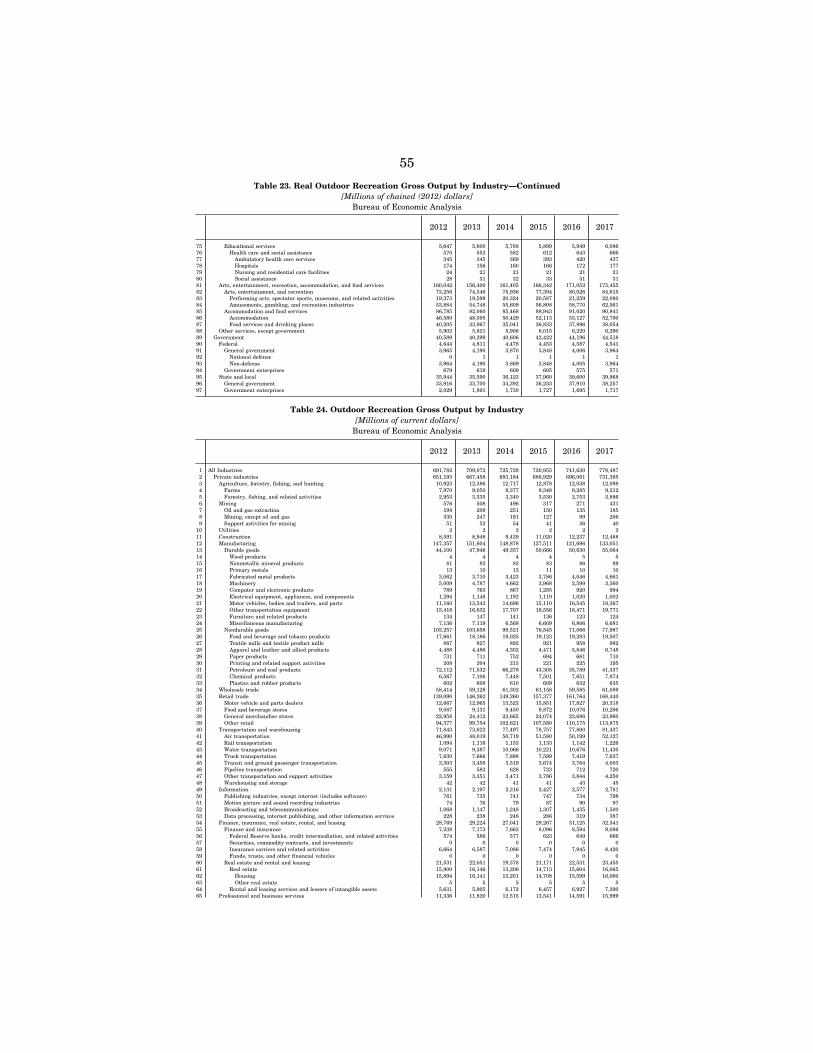
55
Table 23. Real Outdoor Recreation Gross Output by Industry—Continued [Millions of chained (2012) dollars]
Bureau of Economic Analysis
2012 2013 2014 2015 2016 2017
75 Educational services 5,647 5,600 5,788 5,899 5,949 6,086 76 Health care and social assistance 570 553 582 612 643 666 77 Ambulatory health care services 345 345 369 393 420 437 78 Hospitals 174 156 160 166 172 177 79 Nursing and residential care facilities 24 21 21 21 21 21 80 Social assistance 28 31 32 33 31 31 81 Arts, entertainment, recreation, accommodation, and food services 160,042 156,400 161,405 166,342 171,052 175,455 82 Arts, entertainment, and recreation 73,256 74,346 75,936 77,394 80,026 84,615 83 Performing arts, spectator sports, museums, and related activities 19,373 19,599 20,324 20,587 21,259 22,080 84 Amusements, gambling, and recreation industries 53,884 54,748 55,609 56,808 58,770 62,561 85 Accommodation and food services 86,785 82,060 85,468 88,943 91,020 90,841 86 Accommodation 46,580 48,095 50,429 52,113 53,127 52,790 87 Food services and drinking places 40,205 33,967 35,041 36,833 37,896 38,054 88 Other services, except government 5,902 5,821 5,906 6,015 6,220 6,290 89 Government 40,589 40,399 40,606 42,422 44,196 44,518 90 Federal 4,644 4,811 4,478 4,453 4,587 4,541 91 General government 3,965 4,190 3,870 3,848 4,006 3,964 92 National defense 0 1 1 1 1 1 93 Non-defense 3,964 4,190 3,869 3,848 4,005 3,964 94 Government enterprises 679 619 609 605 575 571 95 State and local 35,944 35,590 36,123 37,960 39,600 39,968 96 General government 33,916 33,700 34,392 36,233 37,910 38,257 97 Government enterprises 2,029 1,891 1,730 1,727 1,695 1,717
Table 24. Outdoor Recreation Gross Output by Industry [Millions of current dollars]
Bureau of Economic Analysis
2012 2013 2014 2015 2016 2017
1 All Industries 691,782 709,072 725,728 730,955 741,630 778,487 2 Private industries 651,193 667,458 683,184 686,929 696,061 731,385 3 Agriculture, forestry, fishing, and hunting 10,923 12,386 12,717 12,878 12,038 12,098 4 Farms 7,970 9,050 9,377 9,348 9,285 9,212 5 Forestry, fishing, and related activities 2,953 3,335 3,340 3,530 2,753 2,886 6 Mining 576 508 496 317 271 431 7 Oil and gas extraction 194 209 251 150 135 185 8 Mining, except oil and gas 330 247 191 127 99 206 9 Support activities for mining 51 52 54 41 36 40
10 Utilities 2 2 2 2 2 2 11 Construction 8,591 8,948 9,439 11,020 12,237 12,488 12 Manufacturing 147,357 151,604 148,878 127,511 121,696 133,051 13 Durable goods 44,100 47,946 49,357 50,666 50,630 55,064 14 Wood products 4 4 4 4 5 5 15 Nonmetallic mineral products 81 82 83 83 86 89 16 Primary metals 13 10 13 11 10 10 17 Fabricated metal products 3,062 3,710 3,423 3,786 4,046 4,661 18 Machinery 5,009 4,787 4,662 3,968 2,599 3,360 19 Computer and electronic products 789 763 867 1,285 920 994 20 Electrical equipment, appliances, and components 1,294 1,148 1,192 1,119 1,020 1,002 21 Motor vehicles, bodies and trailers, and parts 11,160 13,543 14,696 15,110 16,545 18,367 22 Other transportation equipment 15,418 16,632 17,707 18,556 18,471 19,771 23 Furniture and related products 134 147 141 136 123 124 24 Miscellaneous manufacturing 7,136 7,119 6,568 6,609 6,806 6,681 25 Nondurable goods 103,257 103,658 99,521 76,845 71,066 77,987 26 Food and beverage and tobacco products 17,661 18,186 19,025 19,123 19,283 19,507 27 Textile mills and textile product mills 887 827 892 921 958 982 28 Apparel and leather and allied products 4,488 4,486 4,302 4,471 5,846 6,748 29 Paper products 731 711 752 694 681 710 30 Printing and related support activities 208 204 213 221 225 195 31 Petroleum and coal products 72,112 71,532 66,278 43,305 35,789 41,337 32 Chemical products 6,567 7,106 7,448 7,501 7,651 7,874 33 Plastics and rubber products 602 608 610 609 632 635 34 Wholesale trade 58,414 59,128 61,302 61,158 59,585 61,089 35 Retail trade 139,090 146,262 149,260 157,377 161,764 168,440 36 Motor vehicle and parts dealers 12,667 12,965 13,523 15,851 17,827 20,318 37 Food and beverage stores 9,087 9,131 9,450 9,872 10,076 10,286 38 General merchandise stores 22,958 24,412 23,665 24,074 23,686 23,960 39 Other retail 94,377 99,754 102,621 107,580 110,175 113,875 40 Transportation and warehousing 71,843 73,622 77,497 78,757 77,800 81,437 41 Air transportation 46,990 48,019 50,719 51,580 50,199 52,127 42 Rail transportation 1,094 1,116 1,153 1,133 1,142 1,226 43 Water transportation 9,071 9,387 10,066 10,221 10,676 11,430 44 Truck transportation 7,630 7,666 7,898 7,599 7,419 7,637 45 Transit and ground passenger transportation 3,303 3,458 3,519 3,674 3,764 4,003 46 Pipeline transportation 555 583 628 723 712 720 47 Other transportation and support activities 3,159 3,351 3,471 3,786 3,844 4,250 48 Warehousing and storage 42 42 41 41 43 45 49 Information 2,131 2,197 2,316 2,427 2,577 2,781 50 Publishing industries, except internet (includes software) 761 735 741 747 734 798 51 Motion picture and sound recording industries 74 76 79 87 90 97 52 Broadcasting and telecommunications 1,068 1,147 1,248 1,307 1,435 1,500 53 Data processing, internet publishing, and other information services 228 238 248 286 319 387 54 Finance, insurance, real estate, rental, and leasing 28,769 29,224 27,041 29,267 31,125 32,541 55 Finance and insurance 7,238 7,173 7,663 8,096 8,594 9,086 56 Federal Reserve banks, credit intermediation, and related activities 574 586 577 623 649 666 57 Securities, commodity contracts, and investments 0 0 0 0 0 0 58 Insurance carriers and related activities 6,664 6,587 7,086 7,474 7,945 8,420 59 Funds, trusts, and other financial vehicles 0 0 0 0 0 0 60 Real estate and rental and leasing 21,531 22,051 19,378 21,171 22,531 23,455 61 Real estate 15,900 16,146 13,206 14,713 15,604 16,065 62 Housing 15,894 16,141 13,201 14,708 15,599 16,060 63 Other real estate 5 5 5 5 5 5 64 Rental and leasing services and lessors of intangible assets 5,631 5,905 6,172 6,457 6,927 7,390 65 Professional and business services 11,336 11,820 12,515 13,541 14,591 15,999
VerDate Aug 31 2005 16:26 Dec 16, 2020 Jkt 000000 PO 00000 Frm 00059 Fmt 6621 Sfmt 6621 P:\DOCS\116-19\38016.TXT BRIAN
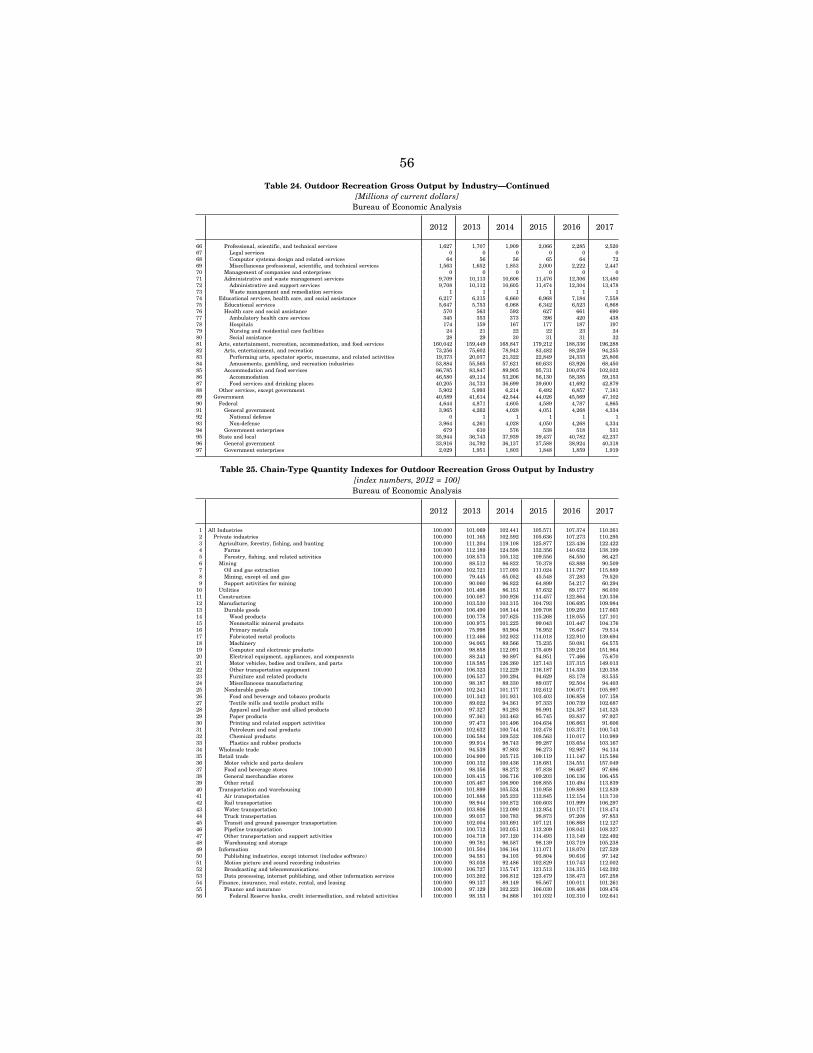
56
Table 24. Outdoor Recreation Gross Output by Industry—Continued [Millions of current dollars]
Bureau of Economic Analysis
2012 2013 2014 2015 2016 2017
66 Professional, scientific, and technical services 1,627 1,707 1,909 2,066 2,285 2,520 67 Legal services 0 0 0 0 0 0 68 Computer systems design and related services 64 56 56 65 64 72 69 Miscellaneous professional, scientific, and technical services 1,563 1,652 1,853 2,000 2,222 2,447 70 Management of companies and enterprises 0 0 0 0 0 0 71 Administrative and waste management services 9,709 10,113 10,606 11,476 12,306 13,480 72 Administrative and support services 9,708 10,112 10,605 11,474 12,304 13,478 73 Waste management and remediation services 1 1 1 1 1 1 74 Educational services, health care, and social assistance 6,217 6,315 6,660 6,968 7,184 7,558 75 Educational services 5,647 5,753 6,068 6,342 6,523 6,868 76 Health care and social assistance 570 563 592 627 661 690 77 Ambulatory health care services 345 353 373 396 420 438 78 Hospitals 174 159 167 177 187 197 79 Nursing and residential care facilities 24 21 22 22 23 24 80 Social assistance 28 29 30 31 31 32 81 Arts, entertainment, recreation, accommodation, and food services 160,042 159,449 168,847 179,212 188,336 196,288 82 Arts, entertainment, and recreation 73,256 75,602 78,943 83,482 88,259 94,255 83 Performing arts, spectator sports, museums, and related activities 19,373 20,037 21,322 22,849 24,333 25,806 84 Amusements, gambling, and recreation industries 53,884 55,565 57,621 60,633 63,926 68,450 85 Accommodation and food services 86,785 83,847 89,905 95,731 100,076 102,032 86 Accommodation 46,580 49,114 53,206 56,130 58,385 59,153 87 Food services and drinking places 40,205 34,733 36,699 39,600 41,692 42,879 88 Other services, except government 5,902 5,993 6,214 6,492 6,857 7,181 89 Government 40,589 41,614 42,544 44,026 45,569 47,102 90 Federal 4,644 4,871 4,605 4,589 4,787 4,865 91 General government 3,965 4,262 4,028 4,051 4,268 4,334 92 National defense 0 1 1 1 1 1 93 Non-defense 3,964 4,261 4,028 4,050 4,268 4,334 94 Government enterprises 679 610 576 538 518 531 95 State and local 35,944 36,743 37,939 39,437 40,782 42,237 96 General government 33,916 34,792 36,137 37,588 38,924 40,318 97 Government enterprises 2,029 1,951 1,803 1,848 1,859 1,919
Table 25. Chain-Type Quantity Indexes for Outdoor Recreation Gross Output by Industry [index numbers, 2012 = 100] Bureau of Economic Analysis
2012 2013 2014 2015 2016 2017
1 All Industries 100.000 101.069 102.441 105.571 107.374 110.261 2 Private industries 100.000 101.165 102.592 105.636 107.273 110.295 3 Agriculture, forestry, fishing, and hunting 100.000 111.204 119.108 125.877 123.436 122.422 4 Farms 100.000 112.189 124.598 132.356 140.632 138.199 5 Forestry, fishing, and related activities 100.000 108.573 105.132 109.556 84.550 86.427 6 Mining 100.000 88.512 86.822 70.378 63.888 90.509 7 Oil and gas extraction 100.000 102.721 117.093 111.024 111.797 115.889 8 Mining, except oil and gas 100.000 79.445 65.052 45.548 37.283 79.520 9 Support activities for mining 100.000 90.060 96.822 64.899 54.217 60.294
10 Utilities 100.000 101.498 86.151 87.632 89.177 86.030 11 Construction 100.000 100.087 100.926 114.457 122.864 120.336 12 Manufacturing 100.000 103.530 103.315 104.793 106.695 109.984 13 Durable goods 100.000 106.490 108.144 109.708 109.250 117.663 14 Wood products 100.000 100.778 107.625 115.268 118.055 127.101 15 Nonmetallic mineral products 100.000 100.975 101.225 99.043 101.447 104.176 16 Primary metals 100.000 75.998 93.904 78.952 76.647 79.514 17 Fabricated metal products 100.000 112.466 102.932 114.018 122.910 139.694 18 Machinery 100.000 94.065 89.566 75.235 50.081 64.575 19 Computer and electronic products 100.000 98.858 112.091 175.409 139.216 151.964 20 Electrical equipment, appliances, and components 100.000 88.243 90.897 84.951 77.466 75.670 21 Motor vehicles, bodies and trailers, and parts 100.000 118.585 126.260 127.143 137.315 149.013 22 Other transportation equipment 100.000 106.323 112.229 116.187 114.330 120.358 23 Furniture and related products 100.000 106.537 100.294 94.629 83.178 83.535 24 Miscellaneous manufacturing 100.000 98.187 89.330 89.037 92.504 94.403 25 Nondurable goods 100.000 102.241 101.177 102.612 106.071 105.997 26 Food and beverage and tobacco products 100.000 101.342 101.931 103.403 106.858 107.158 27 Textile mills and textile product mills 100.000 89.022 94.361 97.333 100.739 102.687 28 Apparel and leather and allied products 100.000 97.327 93.293 95.991 124.387 141.325 29 Paper products 100.000 97.361 103.463 95.745 93.837 97.927 30 Printing and related support activities 100.000 97.473 101.496 104.634 106.663 91.606 31 Petroleum and coal products 100.000 102.632 100.744 102.478 103.371 100.743 32 Chemical products 100.000 106.584 109.532 108.563 110.017 110.989 33 Plastics and rubber products 100.000 99.914 98.743 99.287 103.654 103.167 34 Wholesale trade 100.000 94.539 97.803 96.273 92.987 94.134 35 Retail trade 100.000 104.990 105.715 109.119 111.147 115.586 36 Motor vehicle and parts dealers 100.000 100.132 100.436 118.681 134.551 157.049 37 Food and beverage stores 100.000 98.356 98.272 97.838 96.687 97.696 38 General merchandise stores 100.000 108.415 106.716 109.203 106.136 106.455 39 Other retail 100.000 105.467 106.900 108.855 110.494 113.839 40 Transportation and warehousing 100.000 101.899 105.524 110.958 109.880 112.839 41 Air transportation 100.000 101.888 105.233 112.845 112.154 113.710 42 Rail transportation 100.000 98.944 100.872 100.603 101.999 106.297 43 Water transportation 100.000 103.806 112.090 112.954 110.171 118.474 44 Truck transportation 100.000 99.037 100.783 98.873 97.208 97.853 45 Transit and ground passenger transportation 100.000 102.004 103.691 107.121 106.868 112.127 46 Pipeline transportation 100.000 100.712 102.051 112.209 108.041 108.227 47 Other transportation and support activities 100.000 104.718 107.120 114.493 113.149 122.492 48 Warehousing and storage 100.000 99.781 96.587 98.139 103.719 105.238 49 Information 100.000 101.504 106.164 111.071 118.070 127.529 50 Publishing industries, except internet (includes software) 100.000 94.581 94.103 93.804 90.616 97.142 51 Motion picture and sound recording industries 100.000 93.038 92.486 102.829 110.743 112.002 52 Broadcasting and telecommunications 100.000 106.727 115.747 121.513 134.315 142.392 53 Data processing, internet publishing, and other information services 100.000 103.202 106.812 123.479 138.473 167.258 54 Finance, insurance, real estate, rental, and leasing 100.000 99.137 89.149 95.567 100.011 101.261 55 Finance and insurance 100.000 97.129 102.223 106.030 108.408 109.476 56 Federal Reserve banks, credit intermediation, and related activities 100.000 98.153 94.868 101.032 102.310 102.641
VerDate Aug 31 2005 16:26 Dec 16, 2020 Jkt 000000 PO 00000 Frm 00060 Fmt 6621 Sfmt 6621 P:\DOCS\116-19\38016.TXT BRIAN
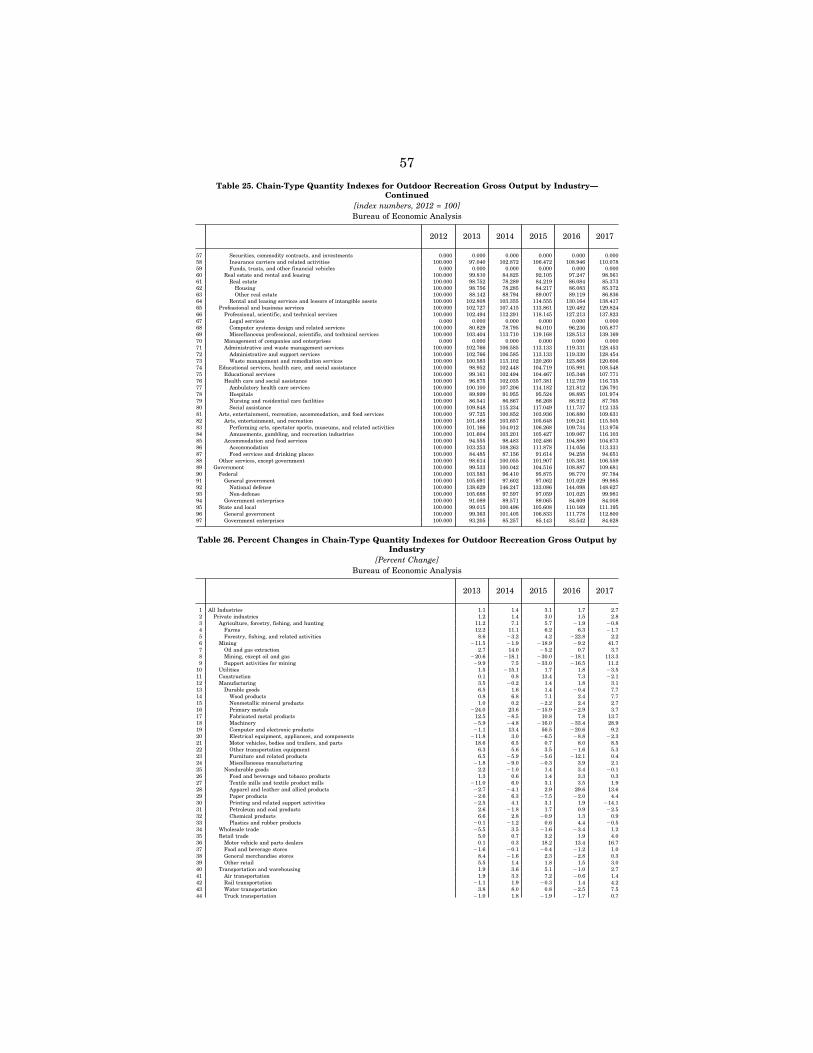
57
Table 25. Chain-Type Quantity Indexes for Outdoor Recreation Gross Output by Industry— Continued
[index numbers, 2012 = 100] Bureau of Economic Analysis
2012 2013 2014 2015 2016 2017
57 Securities, commodity contracts, and investments 0.000 0.000 0.000 0.000 0.000 0.000 58 Insurance carriers and related activities 100.000 97.040 102.872 106.472 108.946 110.078 59 Funds, trusts, and other financial vehicles 0.000 0.000 0.000 0.000 0.000 0.000 60 Real estate and rental and leasing 100.000 99.810 84.825 92.105 97.247 98.561 61 Real estate 100.000 98.752 78.289 84.219 86.084 85.373 62 Housing 100.000 98.756 78.285 84.217 86.083 85.372 63 Other real estate 100.000 88.142 88.794 89.007 89.119 86.836 64 Rental and leasing services and lessors of intangible assets 100.000 102.808 103.355 114.555 130.164 138.417 65 Professional and business services 100.000 102.727 107.415 113.861 120.482 129.824 66 Professional, scientific, and technical services 100.000 102.494 112.291 118.145 127.213 137.823 67 Legal services 0.000 0.000 0.000 0.000 0.000 0.000 68 Computer systems design and related services 100.000 80.829 78.795 94.010 96.236 105.877 69 Miscellaneous professional, scientific, and technical services 100.000 103.404 113.710 119.168 128.513 139.169 70 Management of companies and enterprises 0.000 0.000 0.000 0.000 0.000 0.000 71 Administrative and waste management services 100.000 102.766 106.585 113.133 119.331 128.453 72 Administrative and support services 100.000 102.766 106.585 113.133 119.330 128.454 73 Waste management and remediation services 100.000 100.583 113.102 120.260 123.868 120.606 74 Educational services, health care, and social assistance 100.000 98.952 102.448 104.719 105.991 108.548 75 Educational services 100.000 99.161 102.494 104.467 105.348 107.771 76 Health care and social assistance 100.000 96.875 102.035 107.381 112.759 116.735 77 Ambulatory health care services 100.000 100.100 107.206 114.182 121.812 126.791 78 Hospitals 100.000 89.899 91.955 95.524 98.895 101.974 79 Nursing and residential care facilities 100.000 86.541 86.867 86.268 86.912 87.765 80 Social assistance 100.000 109.848 115.234 117.049 111.737 112.135 81 Arts, entertainment, recreation, accommodation, and food services 100.000 97.725 100.852 103.936 106.880 109.631 82 Arts, entertainment, and recreation 100.000 101.488 103.657 105.648 109.241 115.505 83 Performing arts, spectator sports, museums, and related activities 100.000 101.166 104.912 106.268 109.734 113.976 84 Amusements, gambling, and recreation industries 100.000 101.604 103.201 105.427 109.067 116.103 85 Accommodation and food services 100.000 94.555 98.483 102.486 104.880 104.673 86 Accommodation 100.000 103.253 108.263 111.878 114.056 113.331 87 Food services and drinking places 100.000 84.485 87.156 91.614 94.258 94.651 88 Other services, except government 100.000 98.614 100.055 101.907 105.381 106.559 89 Government 100.000 99.533 100.042 104.516 108.887 109.681 90 Federal 100.000 103.583 96.410 95.875 98.770 97.784 91 General government 100.000 105.691 97.602 97.062 101.029 99.985 92 National defense 100.000 138.629 146.247 133.086 144.098 148.627 93 Non-defense 100.000 105.688 97.597 97.059 101.025 99.981 94 Government enterprises 100.000 91.089 89.571 89.065 84.609 84.008 95 State and local 100.000 99.015 100.496 105.608 110.169 111.195 96 General government 100.000 99.363 101.405 106.833 111.778 112.800 97 Government enterprises 100.000 93.205 85.257 85.143 83.542 84.628
Table 26. Percent Changes in Chain-Type Quantity Indexes for Outdoor Recreation Gross Output by Industry
[Percent Change] Bureau of Economic Analysis
2013 2014 2015 2016 2017
1 All Industries 1.1 1.4 3.1 1.7 2.7 2 Private industries 1.2 1.4 3.0 1.5 2.8 3 Agriculture, forestry, fishing, and hunting 11.2 7.1 5.7 ¥1.9 ¥0.8 4 Farms 12.2 11.1 6.2 6.3 ¥1.7 5 Forestry, fishing, and related activities 8.6 ¥3.2 4.2 ¥22.8 2.2 6 Mining ¥11.5 ¥1.9 ¥18.9 ¥9.2 41.7 7 Oil and gas extraction 2.7 14.0 ¥5.2 0.7 3.7 8 Mining, except oil and gas ¥20.6 ¥18.1 ¥30.0 ¥18.1 113.3 9 Support activities for mining ¥9.9 7.5 ¥33.0 ¥16.5 11.2
10 Utilities 1.5 ¥15.1 1.7 1.8 ¥3.5 11 Construction 0.1 0.8 13.4 7.3 ¥2.1 12 Manufacturing 3.5 ¥0.2 1.4 1.8 3.1 13 Durable goods 6.5 1.6 1.4 ¥0.4 7.7 14 Wood products 0.8 6.8 7.1 2.4 7.7 15 Nonmetallic mineral products 1.0 0.2 ¥2.2 2.4 2.7 16 Primary metals ¥24.0 23.6 ¥15.9 ¥2.9 3.7 17 Fabricated metal products 12.5 ¥8.5 10.8 7.8 13.7 18 Machinery ¥5.9 ¥4.8 ¥16.0 ¥33.4 28.9 19 Computer and electronic products ¥1.1 13.4 56.5 ¥20.6 9.2 20 Electrical equipment, appliances, and components ¥11.8 3.0 ¥6.5 ¥8.8 ¥2.3 21 Motor vehicles, bodies and trailers, and parts 18.6 6.5 0.7 8.0 8.5 22 Other transportation equipment 6.3 5.6 3.5 ¥1.6 5.3 23 Furniture and related products 6.5 ¥5.9 ¥5.6 ¥12.1 0.4 24 Miscellaneous manufacturing ¥1.8 ¥9.0 ¥0.3 3.9 2.1 25 Nondurable goods 2.2 ¥1.0 1.4 3.4 ¥0.1 26 Food and beverage and tobacco products 1.3 0.6 1.4 3.3 0.3 27 Textile mills and textile product mills ¥11.0 6.0 3.1 3.5 1.9 28 Apparel and leather and allied products ¥2.7 ¥4.1 2.9 29.6 13.6 29 Paper products ¥2.6 6.3 ¥7.5 ¥2.0 4.4 30 Printing and related support activities ¥2.5 4.1 3.1 1.9 ¥14.1 31 Petroleum and coal products 2.6 ¥1.8 1.7 0.9 ¥2.5 32 Chemical products 6.6 2.8 ¥0.9 1.3 0.9 33 Plastics and rubber products ¥0.1 ¥1.2 0.6 4.4 ¥0.5 34 Wholesale trade ¥5.5 3.5 ¥1.6 ¥3.4 1.2 35 Retail trade 5.0 0.7 3.2 1.9 4.0 36 Motor vehicle and parts dealers 0.1 0.3 18.2 13.4 16.7 37 Food and beverage stores ¥1.6 ¥0.1 ¥0.4 ¥1.2 1.0 38 General merchandise stores 8.4 ¥1.6 2.3 ¥2.8 0.3 39 Other retail 5.5 1.4 1.8 1.5 3.0 40 Transportation and warehousing 1.9 3.6 5.1 ¥1.0 2.7 41 Air transportation 1.9 3.3 7.2 ¥0.6 1.4 42 Rail transportation ¥1.1 1.9 ¥0.3 1.4 4.2 43 Water transportation 3.8 8.0 0.8 ¥2.5 7.5 44 Truck transportation ¥1.0 1.8 ¥1.9 ¥1.7 0.7
VerDate Aug 31 2005 16:26 Dec 16, 2020 Jkt 000000 PO 00000 Frm 00061 Fmt 6621 Sfmt 6621 P:\DOCS\116-19\38016.TXT BRIAN
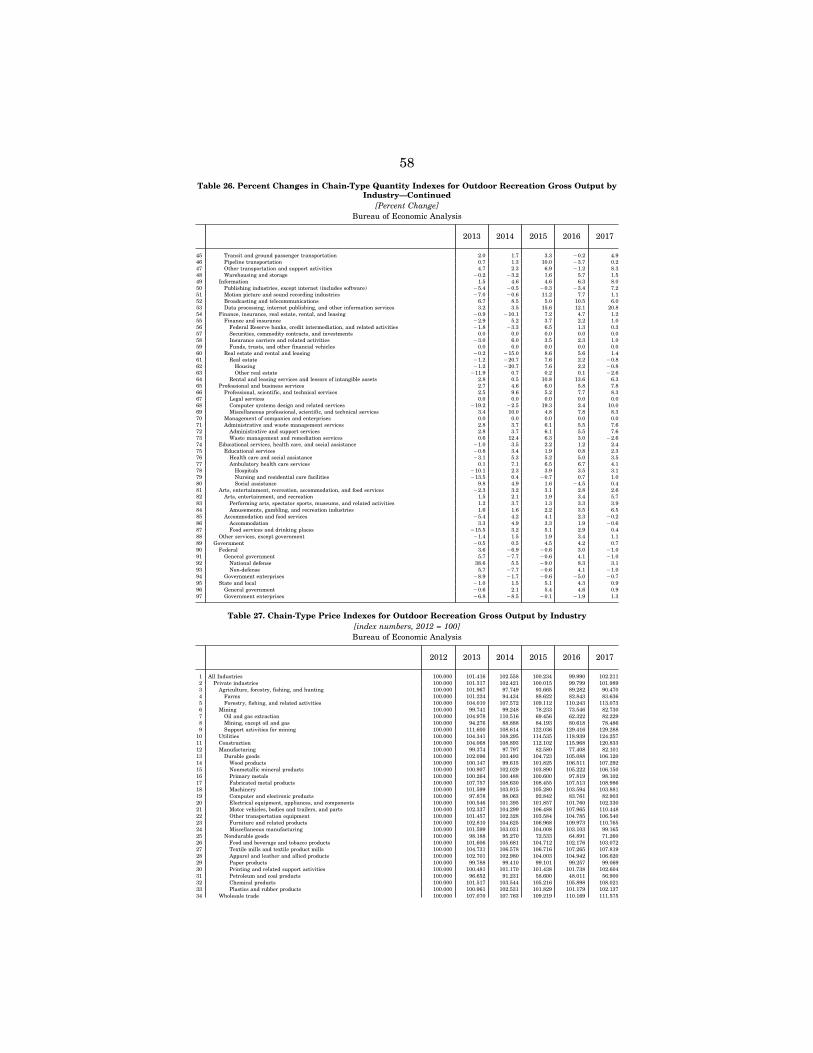
58
Table 26. Percent Changes in Chain-Type Quantity Indexes for Outdoor Recreation Gross Output by Industry—Continued
[Percent Change] Bureau of Economic Analysis
2013 2014 2015 2016 2017
45 Transit and ground passenger transportation 2.0 1.7 3.3 ¥0.2 4.9 46 Pipeline transportation 0.7 1.3 10.0 ¥3.7 0.2 47 Other transportation and support activities 4.7 2.3 6.9 ¥1.2 8.3 48 Warehousing and storage ¥0.2 ¥3.2 1.6 5.7 1.5 49 Information 1.5 4.6 4.6 6.3 8.0 50 Publishing industries, except internet (includes software) ¥5.4 ¥0.5 ¥0.3 ¥3.4 7.2 51 Motion picture and sound recording industries ¥7.0 ¥0.6 11.2 7.7 1.1 52 Broadcasting and telecommunications 6.7 8.5 5.0 10.5 6.0 53 Data processing, internet publishing, and other information services 3.2 3.5 15.6 12.1 20.8 54 Finance, insurance, real estate, rental, and leasing ¥0.9 ¥10.1 7.2 4.7 1.2 55 Finance and insurance ¥2.9 5.2 3.7 2.2 1.0 56 Federal Reserve banks, credit intermediation, and related activities ¥1.8 ¥3.3 6.5 1.3 0.3 57 Securities, commodity contracts, and investments 0.0 0.0 0.0 0.0 0.0 58 Insurance carriers and related activities ¥3.0 6.0 3.5 2.3 1.0 59 Funds, trusts, and other financial vehicles 0.0 0.0 0.0 0.0 0.0 60 Real estate and rental and leasing ¥0.2 ¥15.0 8.6 5.6 1.4 61 Real estate ¥1.2 ¥20.7 7.6 2.2 ¥0.8 62 Housing ¥1.2 ¥20.7 7.6 2.2 ¥0.8 63 Other real estate ¥11.9 0.7 0.2 0.1 ¥2.6 64 Rental and leasing services and lessors of intangible assets 2.8 0.5 10.8 13.6 6.3 65 Professional and business services 2.7 4.6 6.0 5.8 7.8 66 Professional, scientific, and technical services 2.5 9.6 5.2 7.7 8.3 67 Legal services 0.0 0.0 0.0 0.0 0.0 68 Computer systems design and related services ¥19.2 ¥2.5 19.3 2.4 10.0 69 Miscellaneous professional, scientific, and technical services 3.4 10.0 4.8 7.8 8.3 70 Management of companies and enterprises 0.0 0.0 0.0 0.0 0.0 71 Administrative and waste management services 2.8 3.7 6.1 5.5 7.6 72 Administrative and support services 2.8 3.7 6.1 5.5 7.6 73 Waste management and remediation services 0.6 12.4 6.3 3.0 ¥2.6 74 Educational services, health care, and social assistance ¥1.0 3.5 2.2 1.2 2.4 75 Educational services ¥0.8 3.4 1.9 0.8 2.3 76 Health care and social assistance ¥3.1 5.3 5.2 5.0 3.5 77 Ambulatory health care services 0.1 7.1 6.5 6.7 4.1 78 Hospitals ¥10.1 2.3 3.9 3.5 3.1 79 Nursing and residential care facilities ¥13.5 0.4 ¥0.7 0.7 1.0 80 Social assistance 9.8 4.9 1.6 ¥4.5 0.4 81 Arts, entertainment, recreation, accommodation, and food services ¥2.3 3.2 3.1 2.8 2.6 82 Arts, entertainment, and recreation 1.5 2.1 1.9 3.4 5.7 83 Performing arts, spectator sports, museums, and related activities 1.2 3.7 1.3 3.3 3.9 84 Amusements, gambling, and recreation industries 1.6 1.6 2.2 3.5 6.5 85 Accommodation and food services ¥5.4 4.2 4.1 2.3 ¥0.2 86 Accommodation 3.3 4.9 3.3 1.9 ¥0.6 87 Food services and drinking places ¥15.5 3.2 5.1 2.9 0.4 88 Other services, except government ¥1.4 1.5 1.9 3.4 1.1 89 Government ¥0.5 0.5 4.5 4.2 0.7 90 Federal 3.6 ¥6.9 ¥0.6 3.0 ¥1.0 91 General government 5.7 ¥7.7 ¥0.6 4.1 ¥1.0 92 National defense 38.6 5.5 ¥9.0 8.3 3.1 93 Non-defense 5.7 ¥7.7 ¥0.6 4.1 ¥1.0 94 Government enterprises ¥8.9 ¥1.7 ¥0.6 ¥5.0 ¥0.7 95 State and local ¥1.0 1.5 5.1 4.3 0.9 96 General government ¥0.6 2.1 5.4 4.6 0.9 97 Government enterprises ¥6.8 ¥8.5 ¥0.1 ¥1.9 1.3
Table 27. Chain-Type Price Indexes for Outdoor Recreation Gross Output by Industry [index numbers, 2012 = 100] Bureau of Economic Analysis
2012 2013 2014 2015 2016 2017
1 All Industries 100.000 101.416 102.558 100.234 99.990 102.211 2 Private industries 100.000 101.317 102.421 100.015 99.799 101.989 3 Agriculture, forestry, fishing, and hunting 100.000 101.967 97.749 93.665 89.282 90.470 4 Farms 100.000 101.224 94.434 88.622 82.843 83.636 5 Forestry, fishing, and related activities 100.000 104.010 107.572 109.112 110.243 113.073 6 Mining 100.000 99.741 99.248 78.233 73.546 82.730 7 Oil and gas extraction 100.000 104.978 110.516 69.456 62.322 82.229 8 Mining, except oil and gas 100.000 94.276 88.888 84.193 80.618 78.486 9 Support activities for mining 100.000 111.600 108.614 122.036 129.416 129.288
10 Utilities 100.000 104.341 108.295 114.535 118.939 124.257 11 Construction 100.000 104.068 108.893 112.102 115.968 120.833 12 Manufacturing 100.000 99.374 97.797 82.580 77.408 82.101 13 Durable goods 100.000 102.096 103.493 104.723 105.088 106.120 14 Wood products 100.000 100.147 99.615 101.825 106.511 107.292 15 Nonmetallic mineral products 100.000 100.907 102.029 103.890 105.222 106.150 16 Primary metals 100.000 100.264 100.488 100.600 97.819 98.102 17 Fabricated metal products 100.000 107.757 108.630 108.455 107.513 108.986 18 Machinery 100.000 101.599 103.915 105.280 103.594 103.881 19 Computer and electronic products 100.000 97.878 98.063 92.842 83.761 82.903 20 Electrical equipment, appliances, and components 100.000 100.546 101.395 101.857 101.760 102.330 21 Motor vehicles, bodies and trailers, and parts 100.000 102.337 104.299 106.488 107.965 110.448 22 Other transportation equipment 100.000 101.457 102.328 103.584 104.785 106.540 23 Furniture and related products 100.000 102.810 104.625 106.968 109.973 110.765 24 Miscellaneous manufacturing 100.000 101.599 103.031 104.008 103.103 99.165 25 Nondurable goods 100.000 98.188 95.270 72.533 64.891 71.260 26 Food and beverage and tobacco products 100.000 101.606 105.681 104.712 102.176 103.072 27 Textile mills and textile product mills 100.000 104.731 106.578 106.716 107.265 107.819 28 Apparel and leather and allied products 100.000 102.701 102.980 104.003 104.942 106.620 29 Paper products 100.000 99.788 99.410 99.101 99.257 99.069 30 Printing and related support activities 100.000 100.481 101.170 101.438 101.738 102.604 31 Petroleum and coal products 100.000 96.652 91.231 58.600 48.011 56.900 32 Chemical products 100.000 101.517 103.544 105.216 105.898 108.021 33 Plastics and rubber products 100.000 100.961 102.531 101.829 101.179 102.137 34 Wholesale trade 100.000 107.070 107.763 109.219 110.169 111.575
VerDate Aug 31 2005 16:26 Dec 16, 2020 Jkt 000000 PO 00000 Frm 00062 Fmt 6621 Sfmt 6621 P:\DOCS\116-19\38016.TXT BRIAN
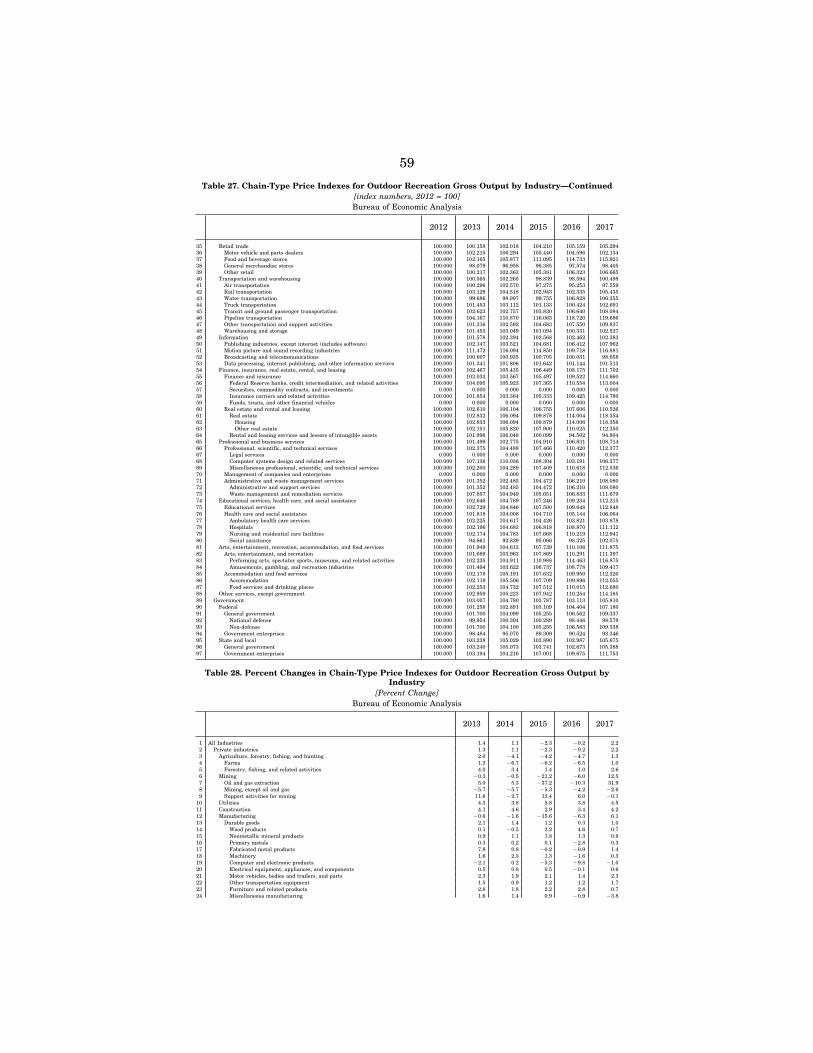
59
Table 27. Chain-Type Price Indexes for Outdoor Recreation Gross Output by Industry—Continued [index numbers, 2012 = 100] Bureau of Economic Analysis
2012 2013 2014 2015 2016 2017
35 Retail trade 100.000 100.158 102.018 104.210 105.159 105.294 36 Motor vehicle and parts dealers 100.000 102.215 106.294 105.440 104.596 102.134 37 Food and beverage stores 100.000 102.165 105.877 111.095 114.733 115.921 38 General merchandise stores 100.000 98.079 96.958 96.385 97.574 98.405 39 Other retail 100.000 100.217 102.363 105.381 106.323 106.665 40 Transportation and warehousing 100.000 100.565 102.265 98.839 98.594 100.498 41 Air transportation 100.000 100.296 102.570 97.275 95.253 97.559 42 Rail transportation 100.000 103.129 104.518 102.943 102.335 105.435 43 Water transportation 100.000 99.686 98.997 99.755 106.828 106.355 44 Truck transportation 100.000 101.453 103.112 101.133 100.424 102.691 45 Transit and ground passenger transportation 100.000 102.623 102.757 103.830 106.640 108.084 46 Pipeline transportation 100.000 104.167 110.870 116.063 118.720 119.686 47 Other transportation and support activities 100.000 101.316 102.592 104.683 107.550 109.837 48 Warehousing and storage 100.000 101.453 103.049 101.094 100.331 102.527 49 Information 100.000 101.578 102.394 102.568 102.462 102.383 50 Publishing industries, except internet (includes software) 100.000 102.147 103.521 104.681 106.412 107.962 51 Motion picture and sound recording industries 100.000 111.472 116.094 114.850 109.718 116.881 52 Broadcasting and telecommunications 100.000 100.607 100.935 100.705 100.031 98.658 53 Data processing, internet publishing, and other information services 100.000 101.341 101.806 101.642 101.144 101.513 54 Finance, insurance, real estate, rental, and leasing 100.000 102.467 105.435 106.449 108.175 111.702 55 Finance and insurance 100.000 102.033 103.567 105.497 109.522 114.660 56 Federal Reserve banks, credit intermediation, and related activities 100.000 104.095 105.923 107.365 110.554 113.004 57 Securities, commodity contracts, and investments 0.000 0.000 0.000 0.000 0.000 0.000 58 Insurance carriers and related activities 100.000 101.854 103.364 105.333 109.425 114.780 59 Funds, trusts, and other financial vehicles 0.000 0.000 0.000 0.000 0.000 0.000 60 Real estate and rental and leasing 100.000 102.610 106.104 106.755 107.606 110.526 61 Real estate 100.000 102.832 106.094 109.878 114.004 118.354 62 Housing 100.000 102.833 106.094 109.879 114.006 118.356 63 Other real estate 100.000 102.151 105.820 107.900 110.025 112.350 64 Rental and leasing services and lessors of intangible assets 100.000 101.996 106.048 100.099 94.502 94.804 65 Professional and business services 100.000 101.499 102.775 104.910 106.831 108.714 66 Professional, scientific, and technical services 100.000 102.375 104.488 107.466 110.420 112.377 67 Legal services 0.000 0.000 0.000 0.000 0.000 0.000 68 Computer systems design and related services 100.000 107.136 110.036 108.304 103.191 106.377 69 Miscellaneous professional, scientific, and technical services 100.000 102.200 104.289 107.409 110.618 112.536 70 Management of companies and enterprises 0.000 0.000 0.000 0.000 0.000 0.000 71 Administrative and waste management services 100.000 101.352 102.485 104.472 106.210 108.080 72 Administrative and support services 100.000 101.352 102.485 104.472 106.210 108.080 73 Waste management and remediation services 100.000 107.857 104.949 105.651 106.833 111.679 74 Educational services, health care, and social assistance 100.000 102.646 104.769 107.246 109.234 112.215 75 Educational services 100.000 102.729 104.846 107.500 109.648 112.848 76 Health care and social assistance 100.000 101.818 104.008 104.710 105.144 106.064 77 Ambulatory health care services 100.000 102.225 104.617 104.426 103.821 103.878 78 Hospitals 100.000 102.196 104.683 106.818 108.870 111.112 79 Nursing and residential care facilities 100.000 102.174 104.783 107.668 110.219 112.941 80 Social assistance 100.000 94.661 92.829 95.066 98.325 102.075 81 Arts, entertainment, recreation, accommodation, and food services 100.000 101.949 104.613 107.739 110.106 111.875 82 Arts, entertainment, and recreation 100.000 101.689 103.963 107.869 110.291 111.397 83 Performing arts, spectator sports, museums, and related activities 100.000 102.235 104.911 110.988 114.463 116.875 84 Amusements, gambling, and recreation industries 100.000 101.494 103.622 106.737 108.778 109.417 85 Accommodation and food services 100.000 102.178 105.191 107.632 109.950 112.320 86 Accommodation 100.000 102.119 105.506 107.709 109.896 112.055 87 Food services and drinking places 100.000 102.253 104.732 107.512 110.015 112.680 88 Other services, except government 100.000 102.959 105.223 107.942 110.254 114.185 89 Government 100.000 103.007 104.780 103.787 103.113 105.810 90 Federal 100.000 101.258 102.891 103.109 104.404 107.180 91 General government 100.000 101.700 104.099 105.255 106.562 109.337 92 National defense 100.000 99.954 100.304 100.289 98.446 98.579 93 Non-defense 100.000 101.700 104.100 105.255 106.563 109.338 94 Government enterprises 100.000 98.484 95.070 89.309 90.524 93.346 95 State and local 100.000 103.238 105.029 103.890 102.987 105.675 96 General government 100.000 103.240 105.073 103.741 102.673 105.388 97 Government enterprises 100.000 103.194 104.216 107.001 109.675 111.753
Table 28. Percent Changes in Chain-Type Price Indexes for Outdoor Recreation Gross Output by Industry
[Percent Change] Bureau of Economic Analysis
2013 2014 2015 2016 2017
1 All Industries 1.4 1.1 ¥2.3 ¥0.2 2.2 2 Private industries 1.3 1.1 ¥2.3 ¥0.2 2.2 3 Agriculture, forestry, fishing, and hunting 2.0 ¥4.1 ¥4.2 ¥4.7 1.3 4 Farms 1.2 ¥6.7 ¥6.2 ¥6.5 1.0 5 Forestry, fishing, and related activities 4.0 3.4 1.4 1.0 2.6 6 Mining ¥0.3 ¥0.5 ¥21.2 ¥6.0 12.5 7 Oil and gas extraction 5.0 5.3 ¥37.2 ¥10.3 31.9 8 Mining, except oil and gas ¥5.7 ¥5.7 ¥5.3 ¥4.2 ¥2.6 9 Support activities for mining 11.6 ¥2.7 12.4 6.0 ¥0.1
10 Utilities 4.3 3.8 5.8 3.8 4.5 11 Construction 4.1 4.6 2.9 3.4 4.2 12 Manufacturing ¥0.6 ¥1.6 ¥15.6 ¥6.3 6.1 13 Durable goods 2.1 1.4 1.2 0.3 1.0 14 Wood products 0.1 ¥0.5 2.2 4.6 0.7 15 Nonmetallic mineral products 0.9 1.1 1.8 1.3 0.9 16 Primary metals 0.3 0.2 0.1 ¥2.8 0.3 17 Fabricated metal products 7.8 0.8 ¥0.2 ¥0.9 1.4 18 Machinery 1.6 2.3 1.3 ¥1.6 0.3 19 Computer and electronic products ¥2.1 0.2 ¥5.3 ¥9.8 ¥1.0 20 Electrical equipment, appliances, and components 0.5 0.8 0.5 ¥0.1 0.6 21 Motor vehicles, bodies and trailers, and parts 2.3 1.9 2.1 1.4 2.3 22 Other transportation equipment 1.5 0.9 1.2 1.2 1.7 23 Furniture and related products 2.8 1.8 2.2 2.8 0.7 24 Miscellaneous manufacturing 1.6 1.4 0.9 ¥0.9 ¥3.8
VerDate Aug 31 2005 16:26 Dec 16, 2020 Jkt 000000 PO 00000 Frm 00063 Fmt 6621 Sfmt 6621 P:\DOCS\116-19\38016.TXT BRIAN
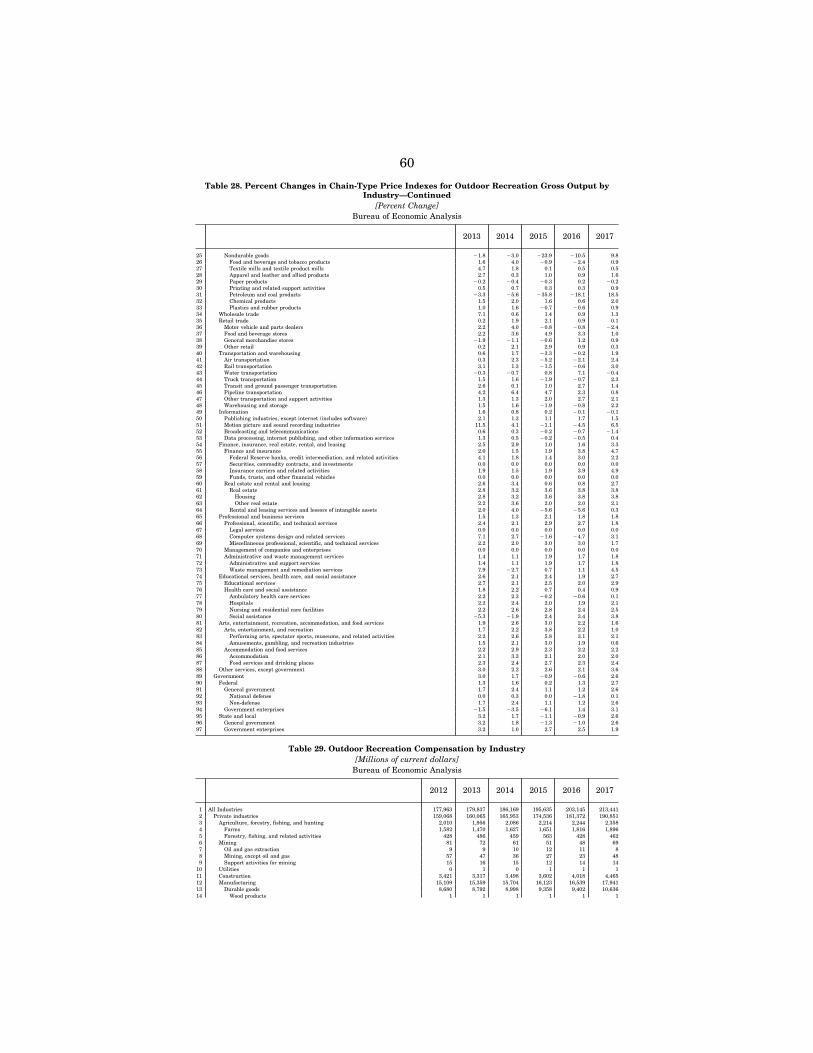
60
Table 28. Percent Changes in Chain-Type Price Indexes for Outdoor Recreation Gross Output by Industry—Continued
[Percent Change] Bureau of Economic Analysis
2013 2014 2015 2016 2017
25 Nondurable goods ¥1.8 ¥3.0 ¥23.9 ¥10.5 9.8 26 Food and beverage and tobacco products 1.6 4.0 ¥0.9 ¥2.4 0.9 27 Textile mills and textile product mills 4.7 1.8 0.1 0.5 0.5 28 Apparel and leather and allied products 2.7 0.3 1.0 0.9 1.6 29 Paper products ¥0.2 ¥0.4 ¥0.3 0.2 ¥0.2 30 Printing and related support activities 0.5 0.7 0.3 0.3 0.9 31 Petroleum and coal products ¥3.3 ¥5.6 ¥35.8 ¥18.1 18.5 32 Chemical products 1.5 2.0 1.6 0.6 2.0 33 Plastics and rubber products 1.0 1.6 ¥0.7 ¥0.6 0.9 34 Wholesale trade 7.1 0.6 1.4 0.9 1.3 35 Retail trade 0.2 1.9 2.1 0.9 0.1 36 Motor vehicle and parts dealers 2.2 4.0 ¥0.8 ¥0.8 ¥2.4 37 Food and beverage stores 2.2 3.6 4.9 3.3 1.0 38 General merchandise stores ¥1.9 ¥1.1 ¥0.6 1.2 0.9 39 Other retail 0.2 2.1 2.9 0.9 0.3 40 Transportation and warehousing 0.6 1.7 ¥3.3 ¥0.2 1.9 41 Air transportation 0.3 2.3 ¥5.2 ¥2.1 2.4 42 Rail transportation 3.1 1.3 ¥1.5 ¥0.6 3.0 43 Water transportation ¥0.3 ¥0.7 0.8 7.1 ¥0.4 44 Truck transportation 1.5 1.6 ¥1.9 ¥0.7 2.3 45 Transit and ground passenger transportation 2.6 0.1 1.0 2.7 1.4 46 Pipeline transportation 4.2 6.4 4.7 2.3 0.8 47 Other transportation and support activities 1.3 1.3 2.0 2.7 2.1 48 Warehousing and storage 1.5 1.6 ¥1.9 ¥0.8 2.2 49 Information 1.6 0.8 0.2 ¥0.1 ¥0.1 50 Publishing industries, except internet (includes software) 2.1 1.3 1.1 1.7 1.5 51 Motion picture and sound recording industries 11.5 4.1 ¥1.1 ¥4.5 6.5 52 Broadcasting and telecommunications 0.6 0.3 ¥0.2 ¥0.7 ¥1.4 53 Data processing, internet publishing, and other information services 1.3 0.5 ¥0.2 ¥0.5 0.4 54 Finance, insurance, real estate, rental, and leasing 2.5 2.9 1.0 1.6 3.3 55 Finance and insurance 2.0 1.5 1.9 3.8 4.7 56 Federal Reserve banks, credit intermediation, and related activities 4.1 1.8 1.4 3.0 2.2 57 Securities, commodity contracts, and investments 0.0 0.0 0.0 0.0 0.0 58 Insurance carriers and related activities 1.9 1.5 1.9 3.9 4.9 59 Funds, trusts, and other financial vehicles 0.0 0.0 0.0 0.0 0.0 60 Real estate and rental and leasing 2.6 3.4 0.6 0.8 2.7 61 Real estate 2.8 3.2 3.6 3.8 3.8 62 Housing 2.8 3.2 3.6 3.8 3.8 63 Other real estate 2.2 3.6 2.0 2.0 2.1 64 Rental and leasing services and lessors of intangible assets 2.0 4.0 ¥5.6 ¥5.6 0.3 65 Professional and business services 1.5 1.3 2.1 1.8 1.8 66 Professional, scientific, and technical services 2.4 2.1 2.9 2.7 1.8 67 Legal services 0.0 0.0 0.0 0.0 0.0 68 Computer systems design and related services 7.1 2.7 ¥1.6 ¥4.7 3.1 69 Miscellaneous professional, scientific, and technical services 2.2 2.0 3.0 3.0 1.7 70 Management of companies and enterprises 0.0 0.0 0.0 0.0 0.0 71 Administrative and waste management services 1.4 1.1 1.9 1.7 1.8 72 Administrative and support services 1.4 1.1 1.9 1.7 1.8 73 Waste management and remediation services 7.9 ¥2.7 0.7 1.1 4.5 74 Educational services, health care, and social assistance 2.6 2.1 2.4 1.9 2.7 75 Educational services 2.7 2.1 2.5 2.0 2.9 76 Health care and social assistance 1.8 2.2 0.7 0.4 0.9 77 Ambulatory health care services 2.2 2.3 ¥0.2 ¥0.6 0.1 78 Hospitals 2.2 2.4 2.0 1.9 2.1 79 Nursing and residential care facilities 2.2 2.6 2.8 2.4 2.5 80 Social assistance ¥5.3 ¥1.9 2.4 3.4 3.8 81 Arts, entertainment, recreation, accommodation, and food services 1.9 2.6 3.0 2.2 1.6 82 Arts, entertainment, and recreation 1.7 2.2 3.8 2.2 1.0 83 Performing arts, spectator sports, museums, and related activities 2.2 2.6 5.8 3.1 2.1 84 Amusements, gambling, and recreation industries 1.5 2.1 3.0 1.9 0.6 85 Accommodation and food services 2.2 2.9 2.3 2.2 2.2 86 Accommodation 2.1 3.3 2.1 2.0 2.0 87 Food services and drinking places 2.3 2.4 2.7 2.3 2.4 88 Other services, except government 3.0 2.2 2.6 2.1 3.6 89 Government 3.0 1.7 ¥0.9 ¥0.6 2.6 90 Federal 1.3 1.6 0.2 1.3 2.7 91 General government 1.7 2.4 1.1 1.2 2.6 92 National defense 0.0 0.3 0.0 ¥1.8 0.1 93 Non-defense 1.7 2.4 1.1 1.2 2.6 94 Government enterprises ¥1.5 ¥3.5 ¥6.1 1.4 3.1 95 State and local 3.2 1.7 ¥1.1 ¥0.9 2.6 96 General government 3.2 1.8 ¥1.3 ¥1.0 2.6 97 Government enterprises 3.2 1.0 2.7 2.5 1.9
Table 29. Outdoor Recreation Compensation by Industry [Millions of current dollars]
Bureau of Economic Analysis
2012 2013 2014 2015 2016 2017
1 All Industries 177,963 179,837 186,169 195,635 203,145 213,441 2 Private industries 159,068 160,065 165,953 174,536 181,372 190,851 3 Agriculture, forestry, fishing, and hunting 2,010 1,956 2,086 2,214 2,244 2,358 4 Farms 1,582 1,470 1,627 1,651 1,816 1,896 5 Forestry, fishing, and related activities 428 486 459 563 428 462 6 Mining 81 72 61 51 48 69 7 Oil and gas extraction 9 9 10 12 11 8 8 Mining, except oil and gas 57 47 36 27 23 48 9 Support activities for mining 15 16 15 12 14 14
10 Utilities 0 1 0 1 1 1 11 Construction 3,421 3,317 3,498 3,602 4,018 4,465 12 Manufacturing 15,109 15,359 15,704 16,123 16,539 17,941 13 Durable goods 8,680 8,792 8,998 9,358 9,402 10,636 14 Wood products 1 1 1 1 1 1
VerDate Aug 31 2005 16:26 Dec 16, 2020 Jkt 000000 PO 00000 Frm 00064 Fmt 6621 Sfmt 6621 P:\DOCS\116-19\38016.TXT BRIAN
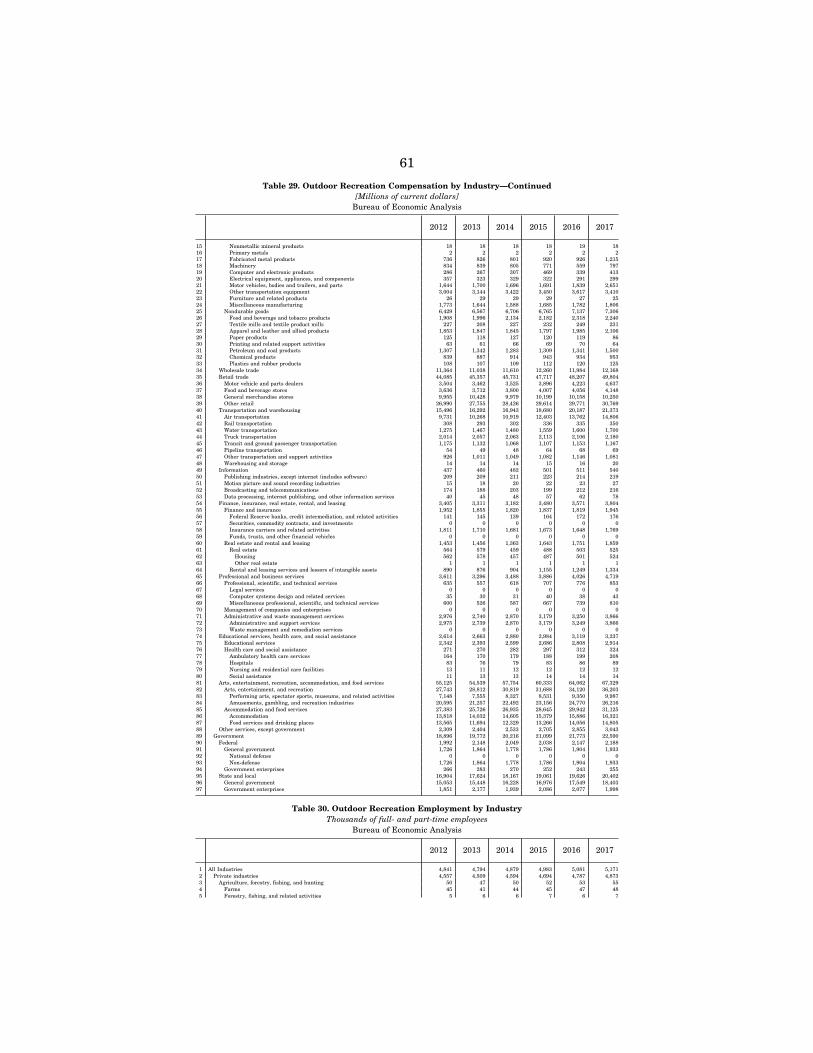
61
Table 29. Outdoor Recreation Compensation by Industry—Continued [Millions of current dollars]
Bureau of Economic Analysis
2012 2013 2014 2015 2016 2017
15 Nonmetallic mineral products 18 18 18 18 19 18 16 Primary metals 2 2 2 2 2 2 17 Fabricated metal products 736 826 801 920 926 1,215 18 Machinery 834 839 805 771 559 797 19 Computer and electronic products 286 267 307 469 339 413 20 Electrical equipment, appliances, and components 357 323 329 322 291 299 21 Motor vehicles, bodies and trailers, and parts 1,644 1,700 1,696 1,691 1,839 2,651 22 Other transportation equipment 3,004 3,144 3,422 3,450 3,617 3,410 23 Furniture and related products 26 29 29 29 27 25 24 Miscellaneous manufacturing 1,773 1,644 1,588 1,685 1,782 1,806 25 Nondurable goods 6,429 6,567 6,706 6,765 7,137 7,306 26 Food and beverage and tobacco products 1,908 1,996 2,134 2,182 2,318 2,240 27 Textile mills and textile product mills 227 208 227 232 249 231 28 Apparel and leather and allied products 1,853 1,847 1,845 1,797 1,985 2,106 29 Paper products 125 118 127 120 119 86 30 Printing and related support activities 63 61 66 69 70 64 31 Petroleum and coal products 1,307 1,342 1,283 1,309 1,341 1,500 32 Chemical products 839 887 914 943 934 953 33 Plastics and rubber products 108 107 109 112 120 125 34 Wholesale trade 11,364 11,038 11,610 12,260 11,984 12,168 35 Retail trade 44,085 45,357 45,731 47,717 48,207 49,804 36 Motor vehicle and parts dealers 3,504 3,462 3,525 3,896 4,223 4,637 37 Food and beverage stores 3,636 3,712 3,800 4,007 4,056 4,148 38 General merchandise stores 9,955 10,428 9,979 10,199 10,158 10,250 39 Other retail 26,990 27,755 28,426 29,614 29,771 30,769 40 Transportation and warehousing 15,496 16,292 16,943 18,680 20,187 21,373 41 Air transportation 9,731 10,268 10,919 12,403 13,762 14,806 42 Rail transportation 308 293 302 336 335 350 43 Water transportation 1,275 1,467 1,480 1,559 1,600 1,700 44 Truck transportation 2,014 2,057 2,063 2,113 2,106 2,180 45 Transit and ground passenger transportation 1,175 1,132 1,068 1,107 1,153 1,167 46 Pipeline transportation 54 49 48 64 68 69 47 Other transportation and support activities 926 1,011 1,049 1,082 1,146 1,081 48 Warehousing and storage 14 14 14 15 16 20 49 Information 437 460 482 501 511 540 50 Publishing industries, except internet (includes software) 209 209 211 223 214 219 51 Motion picture and sound recording industries 15 18 20 22 23 27 52 Broadcasting and telecommunications 174 188 203 199 212 216 53 Data processing, internet publishing, and other information services 40 45 48 57 62 78 54 Finance, insurance, real estate, rental, and leasing 3,405 3,311 3,182 3,480 3,571 3,804 55 Finance and insurance 1,952 1,855 1,820 1,837 1,819 1,945 56 Federal Reserve banks, credit intermediation, and related activities 141 145 139 164 172 176 57 Securities, commodity contracts, and investments 0 0 0 0 0 0 58 Insurance carriers and related activities 1,811 1,710 1,681 1,673 1,648 1,769 59 Funds, trusts, and other financial vehicles 0 0 0 0 0 0 60 Real estate and rental and leasing 1,453 1,456 1,363 1,643 1,751 1,859 61 Real estate 564 579 459 488 503 525 62 Housing 562 578 457 487 501 524 63 Other real estate 1 1 1 1 1 1 64 Rental and leasing services and lessors of intangible assets 890 876 904 1,155 1,249 1,334 65 Professional and business services 3,611 3,296 3,488 3,886 4,026 4,719 66 Professional, scientific, and technical services 635 557 618 707 776 853 67 Legal services 0 0 0 0 0 0 68 Computer systems design and related services 35 30 31 40 38 43 69 Miscellaneous professional, scientific, and technical services 600 526 587 667 739 810 70 Management of companies and enterprises 0 0 0 0 0 0 71 Administrative and waste management services 2,976 2,740 2,870 3,179 3,250 3,866 72 Administrative and support services 2,975 2,739 2,870 3,179 3,249 3,866 73 Waste management and remediation services 0 0 0 0 0 0 74 Educational services, health care, and social assistance 2,614 2,663 2,880 2,984 3,119 3,237 75 Educational services 2,342 2,393 2,599 2,686 2,808 2,914 76 Health care and social assistance 271 270 282 297 312 324 77 Ambulatory health care services 164 170 179 188 199 208 78 Hospitals 83 76 79 83 86 89 79 Nursing and residential care facilities 13 11 12 12 12 12 80 Social assistance 11 13 13 14 14 14 81 Arts, entertainment, recreation, accommodation, and food services 55,125 54,539 57,754 60,333 64,062 67,329 82 Arts, entertainment, and recreation 27,743 28,812 30,819 31,688 34,120 36,203 83 Performing arts, spectator sports, museums, and related activities 7,148 7,555 8,327 8,531 9,350 9,987 84 Amusements, gambling, and recreation industries 20,595 21,257 22,492 23,156 24,770 26,216 85 Accommodation and food services 27,383 25,726 26,935 28,645 29,942 31,125 86 Accommodation 13,818 14,032 14,605 15,379 15,886 16,321 87 Food services and drinking places 13,565 11,694 12,329 13,266 14,056 14,805 88 Other services, except government 2,309 2,404 2,533 2,705 2,855 3,043 89 Government 18,896 19,772 20,216 21,099 21,773 22,590 90 Federal 1,992 2,148 2,049 2,038 2,147 2,188 91 General government 1,726 1,864 1,778 1,786 1,904 1,933 92 National defense 0 0 0 0 0 0 93 Non-defense 1,726 1,864 1,778 1,786 1,904 1,933 94 Government enterprises 266 283 270 252 243 255 95 State and local 16,904 17,624 18,167 19,061 19,626 20,402 96 General government 15,053 15,448 16,228 16,976 17,549 18,403 97 Government enterprises 1,851 2,177 1,939 2,086 2,077 1,998
Table 30. Outdoor Recreation Employment by Industry Thousands of full- and part-time employees
Bureau of Economic Analysis
2012 2013 2014 2015 2016 2017
1 All Industries 4,841 4,794 4,879 4,983 5,081 5,171 2 Private industries 4,557 4,509 4,594 4,694 4,787 4,873 3 Agriculture, forestry, fishing, and hunting 50 47 50 52 53 55 4 Farms 45 41 44 45 47 48 5 Forestry, fishing, and related activities 5 6 6 7 6 7
VerDate Aug 31 2005 16:26 Dec 16, 2020 Jkt 000000 PO 00000 Frm 00065 Fmt 6621 Sfmt 6621 P:\DOCS\116-19\38016.TXT BRIAN
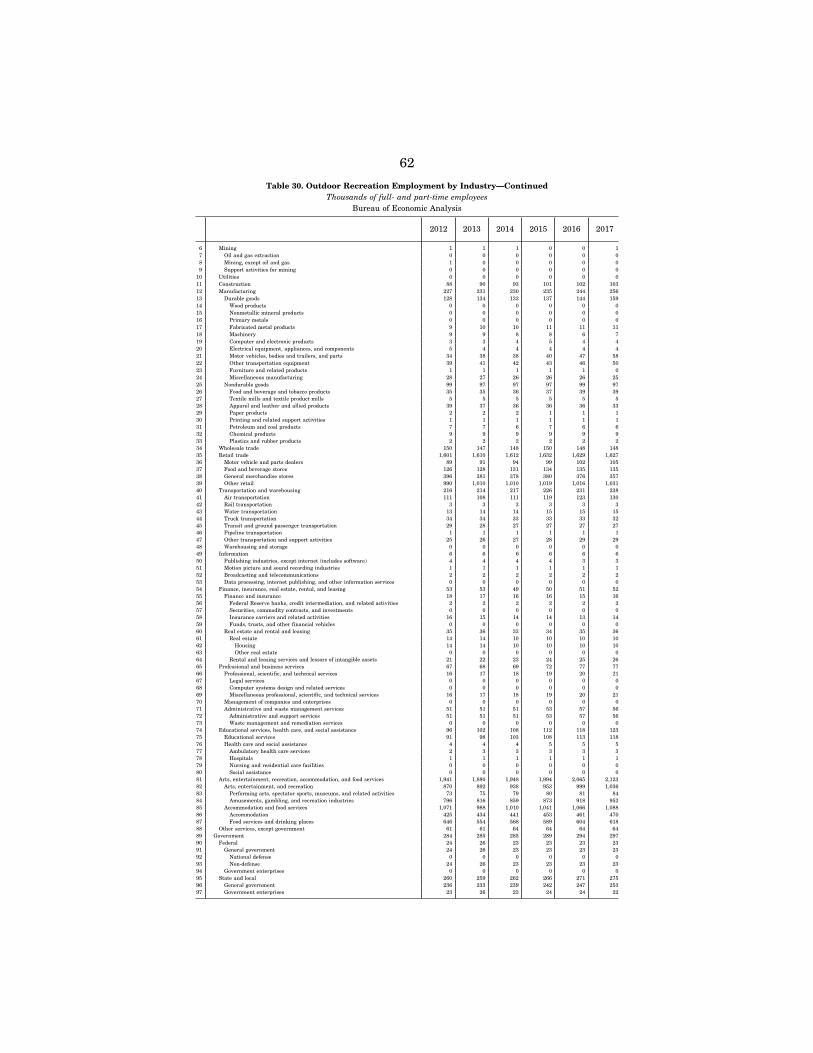
62
Table 30. Outdoor Recreation Employment by Industry—Continued Thousands of full- and part-time employees
Bureau of Economic Analysis
2012 2013 2014 2015 2016 2017
6 Mining 1 1 1 0 0 1 7 Oil and gas extraction 0 0 0 0 0 0 8 Mining, except oil and gas 1 0 0 0 0 0 9 Support activities for mining 0 0 0 0 0 0
10 Utilities 0 0 0 0 0 0 11 Construction 88 90 93 101 102 103 12 Manufacturing 227 231 230 235 244 256 13 Durable goods 128 134 133 137 144 159 14 Wood products 0 0 0 0 0 0 15 Nonmetallic mineral products 0 0 0 0 0 0 16 Primary metals 0 0 0 0 0 0 17 Fabricated metal products 9 10 10 11 11 11 18 Machinery 9 9 8 8 6 7 19 Computer and electronic products 3 3 4 5 4 4 20 Electrical equipment, appliances, and components 5 4 4 4 4 4 21 Motor vehicles, bodies and trailers, and parts 34 38 38 40 47 58 22 Other transportation equipment 39 41 42 43 46 50 23 Furniture and related products 1 1 1 1 1 0 24 Miscellaneous manufacturing 28 27 26 26 26 25 25 Nondurable goods 99 97 97 97 99 97 26 Food and beverage and tobacco products 35 35 36 37 39 39 27 Textile mills and textile product mills 5 5 5 5 5 5 28 Apparel and leather and allied products 39 37 36 36 36 33 29 Paper products 2 2 2 1 1 1 30 Printing and related support activities 1 1 1 1 1 1 31 Petroleum and coal products 7 7 6 7 6 6 32 Chemical products 9 9 9 9 9 9 33 Plastics and rubber products 2 2 2 2 2 2 34 Wholesale trade 150 147 148 150 148 148 35 Retail trade 1,601 1,610 1,612 1,632 1,629 1,627 36 Motor vehicle and parts dealers 89 91 94 99 102 105 37 Food and beverage stores 126 128 131 134 135 135 38 General merchandise stores 396 381 378 380 376 357 39 Other retail 990 1,010 1,010 1,019 1,016 1,031 40 Transportation and warehousing 216 214 217 226 231 238 41 Air transportation 111 108 111 119 123 130 42 Rail transportation 3 3 3 3 3 3 43 Water transportation 13 14 14 15 15 15 44 Truck transportation 34 34 33 33 33 32 45 Transit and ground passenger transportation 29 28 27 27 27 27 46 Pipeline transportation 1 1 1 1 1 1 47 Other transportation and support activities 25 26 27 28 29 29 48 Warehousing and storage 0 0 0 0 0 0 49 Information 6 6 6 6 6 6 50 Publishing industries, except internet (includes software) 4 4 4 4 3 3 51 Motion picture and sound recording industries 1 1 1 1 1 1 52 Broadcasting and telecommunications 2 2 2 2 2 2 53 Data processing, internet publishing, and other information services 0 0 0 0 0 0 54 Finance, insurance, real estate, rental, and leasing 53 53 49 50 51 52 55 Finance and insurance 18 17 16 16 15 16 56 Federal Reserve banks, credit intermediation, and related activities 2 2 2 2 2 2 57 Securities, commodity contracts, and investments 0 0 0 0 0 0 58 Insurance carriers and related activities 16 15 14 14 13 14 59 Funds, trusts, and other financial vehicles 0 0 0 0 0 0 60 Real estate and rental and leasing 35 36 33 34 35 36 61 Real estate 14 14 10 10 10 10 62 Housing 14 14 10 10 10 10 63 Other real estate 0 0 0 0 0 0 64 Rental and leasing services and lessors of intangible assets 21 22 23 24 25 26 65 Professional and business services 67 68 69 72 77 77 66 Professional, scientific, and technical services 16 17 18 19 20 21 67 Legal services 0 0 0 0 0 0 68 Computer systems design and related services 0 0 0 0 0 0 69 Miscellaneous professional, scientific, and technical services 16 17 18 19 20 21 70 Management of companies and enterprises 0 0 0 0 0 0 71 Administrative and waste management services 51 51 51 53 57 56 72 Administrative and support services 51 51 51 53 57 56 73 Waste management and remediation services 0 0 0 0 0 0 74 Educational services, health care, and social assistance 96 102 108 112 118 123 75 Educational services 91 98 103 108 113 118 76 Health care and social assistance 4 4 4 5 5 5 77 Ambulatory health care services 2 3 3 3 3 3 78 Hospitals 1 1 1 1 1 1 79 Nursing and residential care facilities 0 0 0 0 0 0 80 Social assistance 0 0 0 0 0 0 81 Arts, entertainment, recreation, accommodation, and food services 1,941 1,880 1,948 1,994 2,065 2,123 82 Arts, entertainment, and recreation 870 892 938 953 999 1,036 83 Performing arts, spectator sports, museums, and related activities 73 75 79 80 81 84 84 Amusements, gambling, and recreation industries 796 816 859 873 918 952 85 Accommodation and food services 1,071 988 1,010 1,041 1,066 1,088 86 Accommodation 425 434 441 453 461 470 87 Food services and drinking places 646 554 568 589 604 618 88 Other services, except government 61 61 64 64 64 64 89 Government 284 285 285 289 294 297 90 Federal 24 26 23 23 23 23 91 General government 24 26 23 23 23 23 92 National defense 0 0 0 0 0 0 93 Non-defense 24 26 23 23 23 23 94 Government enterprises 0 0 0 0 0 0 95 State and local 260 259 262 266 271 275 96 General government 236 233 239 242 247 253 97 Government enterprises 23 26 23 24 24 22
VerDate Aug 31 2005 16:26 Dec 16, 2020 Jkt 000000 PO 00000 Frm 00066 Fmt 6621 Sfmt 6621 P:\DOCS\116-19\38016.TXT BRIAN
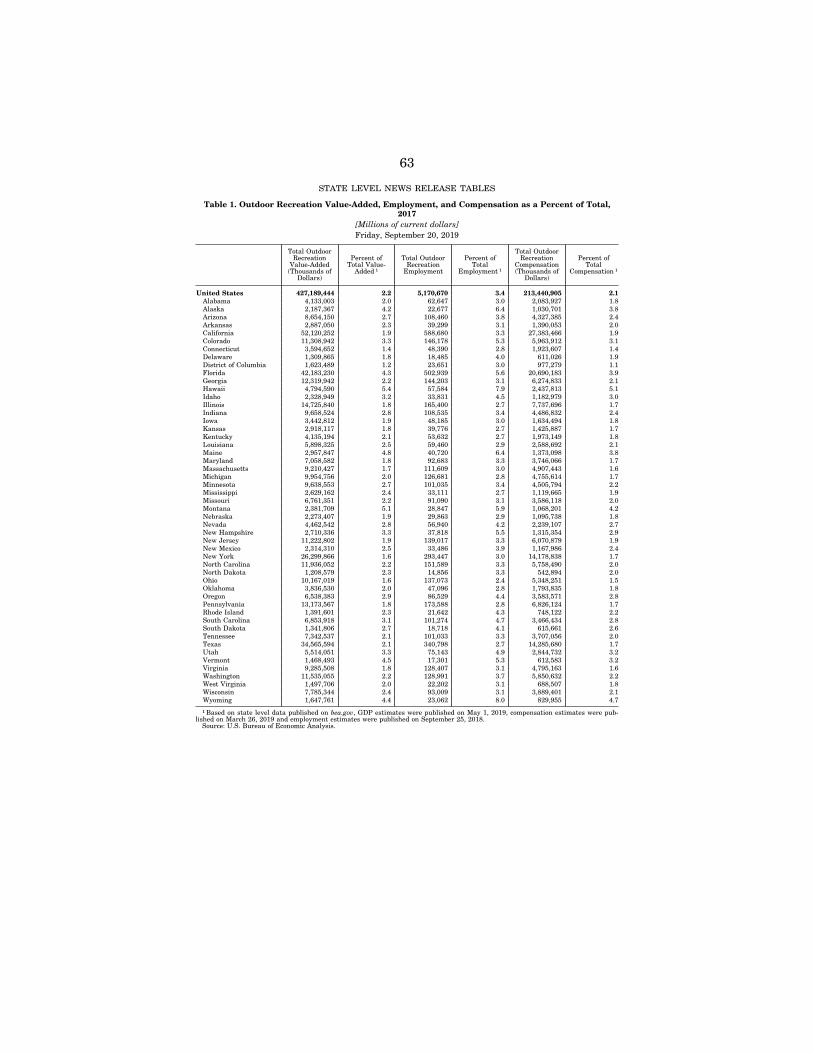
63
STATE LEVEL NEWS RELEASE TABLES Table 1. Outdoor Recreation Value-Added, Employment, and Compensation as a Percent of Total,
2017 [Millions of current dollars] Friday, September 20, 2019
Total Outdoor Recreation
Value-Added (Thousands of
Dollars)
Percent of Total Value-
Added 1
Total Outdoor Recreation
Employment
Percent of Total
Employment 1
Total Outdoor Recreation
Compensation (Thousands of
Dollars)
Percent of Total
Compensation 1
United States 427,189,444 2.2 5,170,670 3.4 213,440,905 2.1 Alabama 4,133,003 2.0 62,647 3.0 2,083,927 1.8 Alaska 2,187,367 4.2 22,677 6.4 1,030,701 3.8 Arizona 8,654,150 2.7 108,460 3.8 4,327,385 2.4 Arkansas 2,887,050 2.3 39,299 3.1 1,390,053 2.0 California 52,120,252 1.9 588,680 3.3 27,383,466 1.9 Colorado 11,308,942 3.3 146,178 5.3 5,963,912 3.1 Connecticut 3,594,652 1.4 48,390 2.8 1,923,607 1.4 Delaware 1,309,865 1.8 18,485 4.0 611,026 1.9 District of Columbia 1,623,489 1.2 23,651 3.0 977,279 1.1 Florida 42,183,230 4.3 502,939 5.6 20,690,183 3.9 Georgia 12,319,942 2.2 144,203 3.1 6,274,833 2.1 Hawaii 4,794,590 5.4 57,584 7.9 2,437,813 5.1 Idaho 2,328,949 3.2 33,831 4.5 1,182,979 3.0 Illinois 14,725,840 1.8 165,400 2.7 7,737,696 1.7 Indiana 9,658,524 2.8 108,535 3.4 4,486,832 2.4 Iowa 3,442,812 1.9 48,185 3.0 1,634,494 1.8 Kansas 2,918,117 1.8 39,776 2.7 1,425,887 1.7 Kentucky 4,135,194 2.1 53,632 2.7 1,973,149 1.8 Louisiana 5,898,325 2.5 59,460 2.9 2,588,692 2.1 Maine 2,957,847 4.8 40,720 6.4 1,373,098 3.8 Maryland 7,058,582 1.8 92,683 3.3 3,746,066 1.7 Massachusetts 9,210,427 1.7 111,609 3.0 4,907,443 1.6 Michigan 9,954,756 2.0 126,681 2.8 4,755,614 1.7 Minnesota 9,638,553 2.7 101,035 3.4 4,505,794 2.2 Mississippi 2,629,162 2.4 33,111 2.7 1,119,665 1.9 Missouri 6,761,351 2.2 91,090 3.1 3,586,118 2.0 Montana 2,381,709 5.1 28,847 5.9 1,068,201 4.2 Nebraska 2,273,407 1.9 29,863 2.9 1,095,738 1.8 Nevada 4,462,542 2.8 56,940 4.2 2,239,107 2.7 New Hampshire 2,710,336 3.3 37,818 5.5 1,315,354 2.9 New Jersey 11,222,802 1.9 139,017 3.3 6,070,879 1.9 New Mexico 2,314,310 2.5 33,486 3.9 1,167,986 2.4 New York 26,299,866 1.6 293,447 3.0 14,178,838 1.7 North Carolina 11,936,052 2.2 151,589 3.3 5,758,490 2.0 North Dakota 1,208,579 2.3 14,856 3.3 542,894 2.0 Ohio 10,167,019 1.6 137,073 2.4 5,348,251 1.5 Oklahoma 3,836,530 2.0 47,096 2.8 1,793,835 1.8 Oregon 6,538,383 2.9 86,529 4.4 3,583,571 2.8 Pennsylvania 13,173,567 1.8 173,588 2.8 6,826,124 1.7 Rhode Island 1,391,601 2.3 21,642 4.3 748,122 2.2 South Carolina 6,853,918 3.1 101,274 4.7 3,466,434 2.8 South Dakota 1,341,806 2.7 18,718 4.1 615,661 2.6 Tennessee 7,342,537 2.1 101,033 3.3 3,707,056 2.0 Texas 34,565,594 2.1 340,798 2.7 14,285,680 1.7 Utah 5,514,051 3.3 75,143 4.9 2,844,732 3.2 Vermont 1,468,493 4.5 17,301 5.3 612,583 3.2 Virginia 9,285,508 1.8 128,407 3.1 4,795,163 1.6 Washington 11,535,055 2.2 128,991 3.7 5,850,632 2.2 West Virginia 1,497,706 2.0 22,202 3.1 688,507 1.8 Wisconsin 7,785,344 2.4 93,009 3.1 3,889,401 2.1 Wyoming 1,647,761 4.4 23,062 8.0 829,955 4.7
1 Based on state level data published on bea.gov, GDP estimates were published on May 1, 2019, compensation estimates were pub-lished on March 26, 2019 and employment estimates were published on September 25, 2018.
Source: U.S. Bureau of Economic Analysis.
VerDate Aug 31 2005 16:26 Dec 16, 2020 Jkt 000000 PO 00000 Frm 00067 Fmt 6621 Sfmt 6621 P:\DOCS\116-19\38016.TXT BRIAN
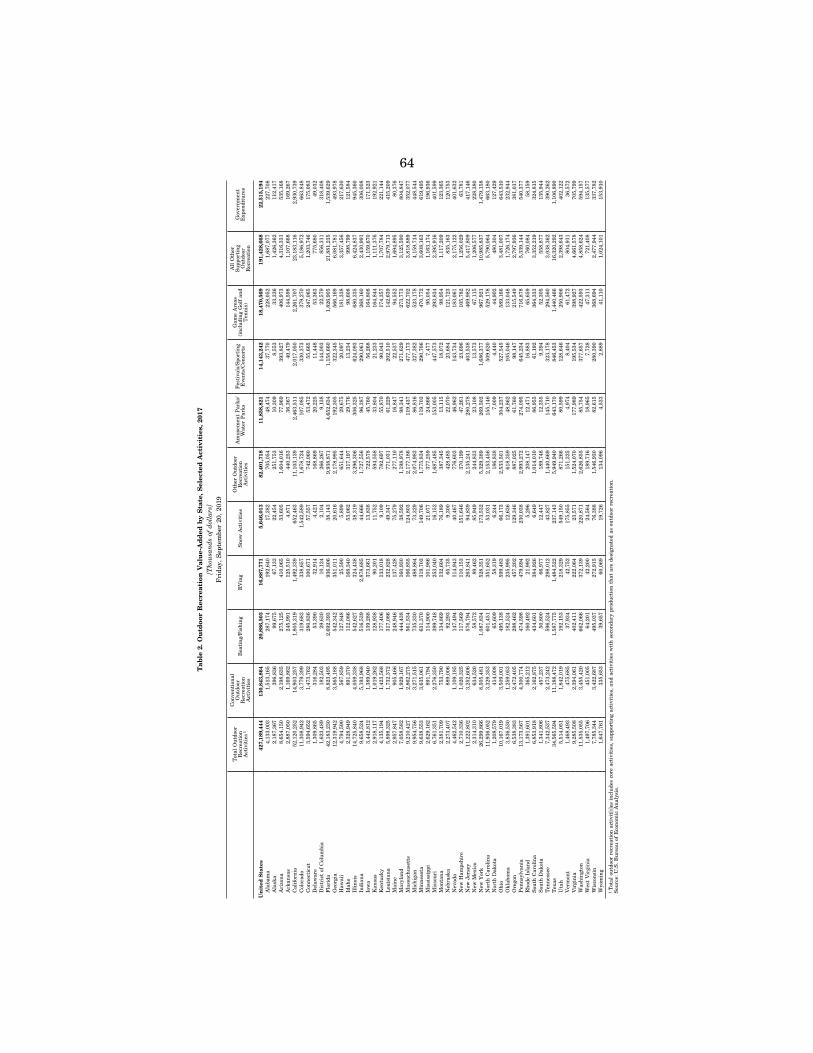
64
Tab
le 2
. Ou
tdoo
r R
ecre
atio
n V
alu
e-A
dd
ed b
y S
tate
, Sel
ecte
d A
ctiv
itie
s, 2
017
[Th
ousa
nd
s of
dol
lars
] F
rida
y, S
epte
mbe
r 20
, 20
19
Tot
al O
utd
oor
Rec
reat
ion
A
ctiv
itie
s1
Con
ven
tion
al
Ou
tdoo
r R
ecre
atio
n
Act
ivit
ies
Boa
tin
g/F
ish
ing
RV
ing
Sn
ow A
ctiv
itie
s O
ther
Ou
tdoo
r R
ecre
atio
n
Act
ivit
ies
Am
use
men
t P
arks
/ W
ater
Par
ks
Fes
tiva
ls/S
port
ing
Eve
nts
/Con
cert
s G
ame
Are
as
(in
clu
din
g G
olf
and
Ten
nis
)
All
Oth
er
Su
ppor
tin
g O
utd
oor
Rec
reat
ion
Gov
ern
men
t E
xpen
ditu
res
Un
ited
Sta
tes
427,
189,
444
130,
843,
864
20,8
86,5
03
16,8
87,7
71
5,64
6,01
3 82
,401
,718
11
,858
,821
14
,143
,242
18
,470
,569
19
1,42
8,66
8 22
,515
,194
A
laba
ma
4,13
3,00
3 1,
513,
165
287,
174
192,
640
17,3
82
705,
054
48,4
74
37,7
70
228,
052
1,68
7,07
7 22
7,70
8 A
lask
a 2,
187,
367
396,
836
99,6
75
67,1
33
22,4
54
251,
753
10,3
09
8,55
3 33
,336
1,
426,
362
112,
417
Ari
zon
a 8,
654,
150
2,19
8,63
5 27
5,12
5 41
0,06
5 33
,605
1,
604,
016
77,9
69
393,
827
406,
973
4,31
6,33
1 53
5,16
8 A
rkan
sas
2,88
7,05
0 1,
169,
862
245,
991
125,
510
4,87
1 44
0,25
3 36
,367
40
,479
14
4,59
8 1,
107,
668
169,
267
Cal
ifor
nia
52
,120
,252
14
,903
,257
1,
805,
319
1,49
2,33
9 65
2,46
3 11
,103
,139
2,
463,
511
2,01
7,05
0 2,
261,
707
23,1
83,1
16
2,93
0,73
9 C
olor
ado
11,3
08,9
42
3,77
9,39
9 31
9,68
3 33
8,65
7 1,
542,
589
1,67
8,72
4 10
7,08
5 33
0,37
3 37
9,27
0 5,
186,
972
663,
848
Con
nec
ticu
t 3,
594,
652
1,47
3,76
2 28
0,83
6 10
0,67
1 57
,557
74
2,06
0 53
,472
55
,665
24
7,06
5 1,
203,
746
175,
083
Del
awar
e 1,
309,
865
316,
284
53,3
90
32,9
14
4,42
1 16
8,86
9 20
,225
11
,448
53
,363
77
5,68
0 49
,032
D
istr
ict
of C
olu
mbi
a 1,
623,
489
182,
503
29,6
30
10,1
24
2,10
4 26
6,26
7 9,
138
144,
003
22,5
79
856,
311
318,
408
Flo
rida
42
,183
,230
8,
823,
495
2,69
2,39
3 93
6,80
6 38
,143
9,
938,
871
4,65
2,63
4 1,
158,
660
1,82
6,90
5 21
,881
,235
1,
539,
629
Geo
rgia
12
,319
,942
3,
565,
188
542,
342
351,
011
20,6
16
2,17
8,99
5 19
2,30
5 32
2,34
5 56
6,16
9 6,
081,
781
493,
978
Haw
aii
4,79
4,59
0 56
7,85
9 12
7,84
8 25
,590
5,
899
651,
644
29,6
75
20,0
97
181,
338
3,35
7,45
6 21
7,63
0 Id
aho
2,32
8,94
9 89
1,37
0 11
2,08
6 16
8,34
0 53
,062
31
7,19
7 29
,776
13
,234
98
,608
99
8,79
9 12
1,58
4 Il
lin
ois
14,7
25,8
40
4,05
9,33
8 54
2,62
7 32
4,43
8 38
,319
3,
296,
306
306,
325
624,
093
680,
335
6,42
4,83
7 94
5,36
0 In
dian
a 9,
658,
524
5,19
3,96
8 51
6,53
9 2,
878,
685
44,6
66
1,72
7,55
6 96
,387
29
0,06
1 26
8,16
0 2,
430,
991
306,
008
Iow
a 3,
442,
812
1,38
9,04
0 13
9,28
8 37
3,66
1 13
,838
72
2,57
8 45
,760
56
,268
16
4,80
8 1,
159,
670
171,
523
Kan
sas
2,91
8,11
7 1,
019,
262
128,
938
90,2
01
11,7
52
594,
558
33,8
04
21,2
33
164,
844
1,11
1,37
6 19
2,92
1 K
entu
cky
4,13
5,19
4 1,
423,
568
177,
406
133,
018
9,10
9 78
2,69
7 55
,870
90
,043
17
4,35
7 1,
707,
784
221,
144
Lou
isia
na
5,89
8,32
5 1,
732,
372
317,
086
232,
828
49,3
47
771,
031
61,2
29
202,
510
142,
639
2,97
9,71
3 41
5,20
9 M
ain
e 2,
957,
847
905,
466
248,
946
137,
428
75,2
79
277,
110
16,8
47
22,5
37
94,5
52
1,69
4,89
5 80
,376
M
aryl
and
7,05
8,58
2 1,
929,
167
444,
438
160,
930
38,5
92
1,19
8,97
8 98
,341
27
1,62
9 27
3,77
3 3,
125,
590
804,
847
Mas
sach
use
tts
9,21
0,42
7 2,
862,
275
561,
534
166,
855
124,
803
2,17
7,18
6 11
9,43
7 47
7,17
3 62
2,70
2 3,
818,
889
352,
077
Mic
hig
an
9,95
4,75
6 3,
271,
515
735,
330
488,
864
73,3
29
2,07
4,98
3 86
,816
32
7,38
2 52
3,17
8 4,
159,
714
448,
544
Min
nes
ota
9,63
8,55
3 3,
635,
061
631,
370
319,
703
149,
706
1,77
5,83
4 11
9,70
3 29
0,70
6 47
0,77
2 3,
608,
163
619,
495
Mis
siss
ippi
2,
629,
162
891,
794
114,
900
101,
986
21,0
77
377,
259
24,8
66
7,47
7 95
,054
1,
163,
174
196,
936
Mis
sou
ri
6,76
1,35
1 2,
276,
350
399,
748
253,
040
16,1
52
1,68
7,48
5 15
3,00
5 44
7,57
3 29
3,83
4 2,
395,
916
401,
599
Mon
tan
a 2,
381,
709
753,
790
134,
869
132,
604
76,1
89
387,
345
13,1
15
18,0
72
98,9
54
1,11
7,20
9 12
3,36
5 N
ebra
ska
2,27
3,40
7 88
9,00
6 92
,293
65
,735
9,
300
428,
485
22,0
70
23,6
84
121,
723
835,
163
120,
753
Nev
ada
4,46
2,54
2 1,
109,
185
147,
494
114,
943
40,4
67
776,
603
46,9
62
143,
734
183,
061
2,17
5,12
2 40
1,63
2 N
ew H
amps
hir
e 2,
710,
336
1,02
0,32
5 11
7,56
9 11
0,15
3 15
1,64
6 37
0,19
9 47
,261
23
,696
10
5,78
2 1,
256,
029
63,7
81
New
Jer
sey
11,2
22,8
02
3,25
2,60
6 57
6,79
4 26
3,84
1 94
,839
2,
135,
241
280,
278
403,
538
469,
982
5,41
7,80
9 41
7,14
6 N
ew M
exic
o 2,
314,
310
634,
520
58,5
72
89,4
62
85,9
49
244,
833
23,1
08
13,5
73
67,1
15
1,20
6,57
7 22
8,38
0 N
ew Y
ork
26,2
99,8
66
8,50
5,48
1 1,
087,
834
528,
351
173,
532
5,32
9,38
9 26
9,50
2 1,
686,
377
967,
921
10,9
85,8
37
1,47
9,15
8 N
orth
Car
olin
a 11
,936
,052
3,
329,
353
601,
451
351,
652
53,0
31
2,15
3,45
6 15
5,14
6 50
9,62
0 52
9,17
8 5,
790,
064
663,
180
Nor
th D
akot
a 1,
208,
579
414,
008
65,6
09
58,3
19
6,24
4 18
6,83
8 7,
009
4,44
0 44
,902
48
0,30
4 12
7,42
9 O
hio
10
,167
,019
3,
509,
001
495,
138
599,
483
66,1
73
2,53
3,50
1 30
4,23
7 52
7,54
5 58
9,16
6 3,
481,
007
643,
510
Okl
ahom
a 3,
836,
530
1,25
9,05
3 18
2,52
4 23
5,99
5 12
,636
61
8,35
9 48
,862
10
5,04
6 13
3,04
8 1,
726,
174
232,
944
Ore
gon
6,
538,
383
2,47
2,40
5 29
8,46
2 45
7,20
2 12
9,34
6 88
7,02
5 61
,760
98
,147
21
5,54
9 2,
797,
936
381,
017
Pen
nsy
lvan
ia
13,1
73,5
67
4,30
0,77
4 47
4,59
8 47
9,69
4 23
0,03
8 2,
993,
272
274,
095
645,
234
716,
878
5,33
9,14
4 54
0,37
7 R
hod
e Is
lan
d 1,
391,
601
365,
212
160,
492
21,9
92
5,29
6 20
8,14
7 12
,471
16
,883
65
,659
76
0,08
4 58
,159
S
outh
Car
olin
a 6,
853,
918
2,16
2,87
5 43
4,60
1 38
4,92
6 6,
649
1,01
4,01
0 86
,955
61
,192
36
4,33
3 3,
352,
219
324,
815
Sou
th D
akot
a 1,
341,
806
457,
237
50,8
00
66,9
77
12,4
47
189,
748
12,3
55
9,39
4 52
,305
55
8,87
7 13
5,94
4 T
enn
esse
e 7,
342,
537
2,47
3,24
2 59
6,52
4 29
8,01
2 43
,827
1,
440,
669
145,
710
323,
178
294,
560
3,03
8,36
2 39
0,26
2 T
exas
34
,565
,594
11
,188
,472
1,
587,
775
1,48
4,52
2 23
7,14
3 5,
949,
940
643,
170
846,
453
1,44
0,46
6 16
,320
,292
1,
106,
890
Uta
h
5,51
4,05
1 1,
842,
019
192,
153
218,
329
549,
150
871,
266
80,5
99
128,
646
250,
906
2,39
8,64
3 40
2,12
2 V
erm
ont
1,46
8,49
3 47
5,68
5 37
,934
42
,752
17
5,85
5 15
1,32
5 4,
974
8,40
4 61
,472
80
4,91
1 36
,572
V
irgi
nia
9,
285,
508
2,39
4,06
1 40
2,41
1 22
2,06
4 23
,571
1,
524,
070
177,
989
195,
534
398,
927
4,66
1,57
8 70
5,79
9 W
ash
ingt
on
11,5
35,0
55
3,45
5,42
0 66
2,06
6 37
2,13
9 22
0,87
1 2,
626,
855
85,7
54
377,
657
422,
593
4,85
8,62
4 59
4,15
7 W
est
Vir
gin
ia
1,49
7,70
6 45
1,00
5 64
,201
42
,200
24
,564
18
9,71
6 18
,965
7,
728
47,3
11
721,
408
135,
577
Wis
con
sin
7,
785,
344
3,42
2,68
7 49
5,03
7 27
2,91
5 76
,388
1,
546,
930
82,6
15
280,
390
368,
694
2,47
7,94
4 33
7,78
2 W
yom
ing
1,64
7,76
1 33
5,65
3 39
,657
60
,069
19
,726
13
4,09
6 4,
533
2,88
9 41
,110
1,
024,
101
153,
910
1T
otal
ou
tdoo
r re
crea
tion
act
ivit
[i]e
s in
clu
des
core
act
ivit
ies,
su
ppor
tin
g ac
tivi
ties
, an
d ac
tivi
ties
wit
h s
econ
dary
pro
duct
ion
th
at a
re d
esig
nat
ed a
s ou
tdoo
r re
crea
tion
. S
ourc
e: U
.S.
Bu
reau
of
Eco
nom
ic A
nal
ysis
.
VerDate Aug 31 2005 16:26 Dec 16, 2020 Jkt 000000 PO 00000 Frm 00068 Fmt 6621 Sfmt 6621 P:\DOCS\116-19\38016.TXT BRIAN
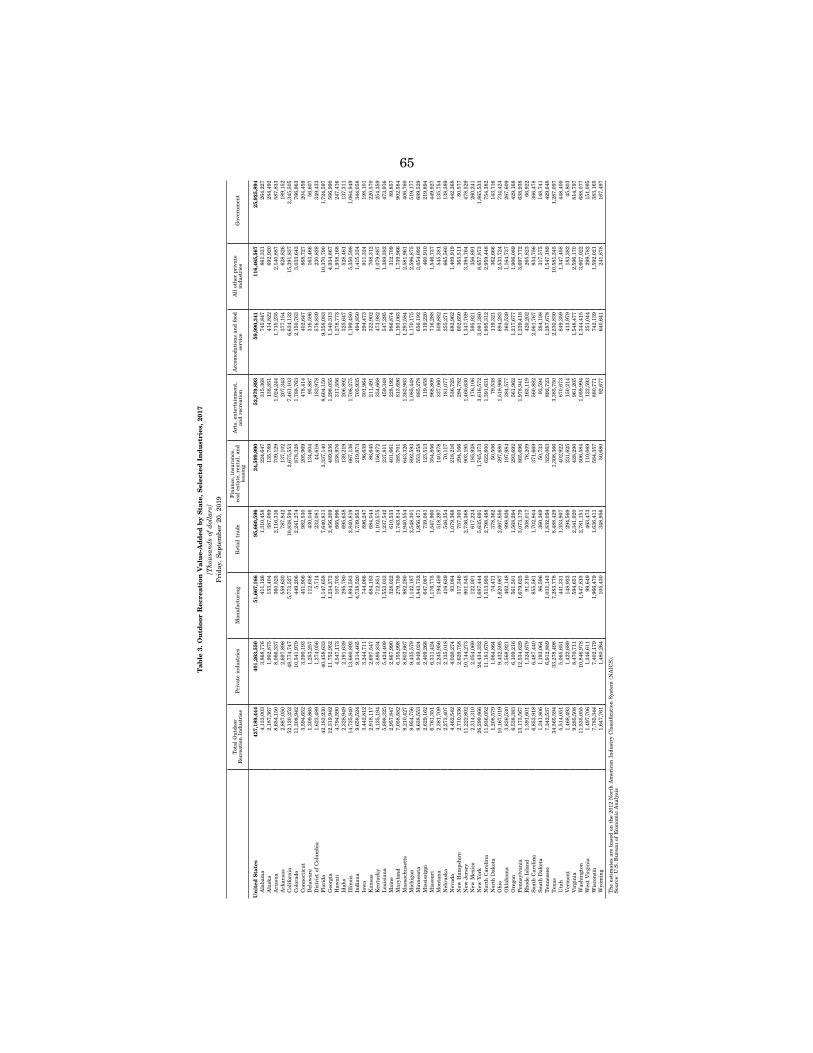
65
Tab
le 3
. Ou
tdoo
r R
ecre
atio
n V
alu
e-A
dd
ed b
y S
tate
, Sel
ecte
d I
nd
ust
ries
, 201
7 [T
hou
san
ds
of d
olla
rs]
Fri
day,
Sep
tem
ber
20,
2019
Tot
al O
utd
oor
Rec
reat
ion
In
dust
ries
P
riva
te i
ndu
stri
es
Man
ufa
ctu
rin
g R
etai
l tr
ade
Fin
ance
, in
sura
nce
, re
al e
stat
e, r
enta
l, an
d le
asin
g A
rts,
en
tert
ain
men
t,
and
recr
eati
on
Acc
omod
atio
ns
and
food
se
rvic
e A
ll o
ther
pri
vate
in
dust
ries
G
over
nm
ent
Un
ited
Sta
tes
427,
189,
444
401,
263,
550
51,6
67,1
66
95,6
60,5
96
24,5
99,9
90
52,8
79,8
93
59,9
90,3
41
116,
465,
567
25,9
25,8
94
Ala
bam
a 4,
133,
003
3,86
8,77
6 41
1,12
6 1,
310,
458
224,
647
315,
368
745,
847
861,
331
264,
227
Ala
ska
2,18
7,36
7 1,
902,
875
133,
404
387,
089
135,
789
138,
851
414,
822
692,
920
284,
492
Ari
zon
a 8,
654,
150
8,06
6,33
7 36
0,52
5 2,
116,
316
709,
129
1,02
4,24
4 1,
715,
235
2,14
0,88
7 58
7,81
3 A
rkan
sas
2,88
7,05
0 2,
697,
898
559,
630
787,
842
137,
102
207,
343
377,
154
628,
826
189,
152
Cal
ifor
nia
52
,120
,252
48
,774
,747
5,
773,
527
10,8
38,5
94
2,67
5,55
3 7,
461,
103
6,63
4,13
2 15
,391
,837
3,
345,
505
Col
orad
o 11
,308
,942
10
,541
,979
44
9,20
6 2,
241,
274
878,
328
1,78
8,76
3 2,
150,
763
3,03
3,64
3 76
6,96
3 C
onn
ecti
cut
3,59
4,65
2 3,
390,
193
451,
906
982,
530
205,
969
478,
414
402,
647
868,
727
204,
459
Del
awar
e 1,
309,
865
1,25
3,25
7 11
2,65
8 43
0,04
6 13
4,60
4 95
,887
31
6,59
6 16
3,46
6 56
,607
D
istr
ict
of C
olu
mbi
a 1,
623,
489
1,27
4,05
6 5,
714
232,
081
44,6
16
183,
978
576,
839
230,
828
349,
433
Flo
rida
42
,183
,230
40
,458
,633
1,
147,
658
7,64
0,81
1 3,
337,
140
8,60
4,15
0 9,
358,
083
10,3
70,7
90
1,72
4,59
7 G
eorg
ia
12,3
19,9
42
11,7
52,9
52
1,23
4,27
2 2,
456,
209
489,
236
1,29
8,05
5 1,
340,
313
4,93
4,86
7 56
6,99
0 H
awai
i 4,
794,
590
4,54
7,17
3 10
7,70
5 66
5,99
6 23
8,97
6 31
7,55
6 1,
278,
773
1,93
8,16
8 24
7,41
6 Id
aho
2,32
8,94
9 2,
191,
639
295,
780
695,
638
139,
219
206,
892
325,
647
528,
461
137,
311
Illi
noi
s 14
,725
,840
13
,660
,892
1,
894,
583
2,84
0,81
9 66
7,13
6 1,
708,
275
1,19
9,48
0 5,
350,
598
1,06
4,94
9 In
dian
a 9,
658,
524
9,31
4,46
5 4,
738,
520
1,73
9,95
3 21
9,87
3 70
5,93
5 49
4,85
0 1,
415,
334
344,
058
Iow
a 3,
442,
812
3,24
4,71
1 74
4,06
6 89
6,24
7 96
,639
30
1,96
4 29
4,47
3 91
1,32
4 19
8,10
1 K
ansa
s 2,
918,
117
2,69
7,54
7 68
4,15
3 68
4,04
4 86
,645
21
1,49
1 32
2,90
2 70
8,31
2 22
0,57
0 K
entu
cky
4,13
5,19
4 3,
880,
834
712,
851
1,10
2,57
5 15
6,87
2 35
4,66
8 47
3,98
2 1,
079,
887
254,
359
Lou
isia
na
5,89
8,32
5 5,
424,
409
1,55
3,03
3 1,
237,
542
237,
811
459,
348
547,
295
1,38
9,38
2 47
3,91
6 M
ain
e 2,
957,
847
2,86
7,99
0 32
8,02
2 61
0,53
3 40
1,66
1 22
8,19
2 98
6,87
4 31
2,70
9 89
,857
M
aryl
and
7,05
8,58
2 6,
155,
998
279,
759
1,74
3,81
4 38
5,70
1 81
3,69
6 1,
193,
063
1,73
9,96
6 90
2,58
4 M
assa
chu
sett
s 9,
210,
427
8,80
3,66
7 98
2,28
0 1,
940,
554
643,
326
1,36
3,96
3 1,
291,
584
2,58
1,96
1 40
6,76
0 M
ich
igan
9,
954,
756
9,43
5,57
9 1,
142,
187
2,54
8,30
1 89
2,59
3 1,
085,
448
1,17
0,17
5 2,
596,
875
519,
177
Min
nes
ota
9,63
8,55
3 8,
949,
024
1,84
3,73
2 1,
956,
471
553,
258
885,
278
656,
192
3,05
4,09
2 68
9,52
9 M
issi
ssip
pi
2,62
9,16
2 2,
409,
268
647,
087
739,
081
123,
513
119,
458
319,
220
460,
910
219,
894
Mis
sou
ri
6,76
1,35
1 6,
311,
424
1,17
6,77
5 1,
547,
960
354,
856
968,
809
716,
288
1,54
6,73
7 44
9,92
7 M
onta
na
2,38
1,70
9 2,
245,
956
194,
459
518,
297
140,
878
337,
060
509,
882
545,
381
135,
754
Neb
rask
a 2,
273,
407
2,13
5,01
8 41
6,63
9 54
6,35
4 70
,117
18
1,07
7 25
5,27
1 66
5,56
0 13
8,38
9 N
evad
a 4,
462,
542
4,02
0,27
4 93
,084
1,
079,
368
218,
216
536,
725
682,
962
1,40
9,91
9 44
2,26
8 N
ew H
amps
hir
e 2,
710,
336
2,62
9,75
8 31
7,34
6 75
7,30
3 29
4,16
6 29
4,78
2 60
2,65
0 36
3,51
1 80
,577
N
ew J
erse
y 11
,222
,802
10
,744
,273
90
1,54
5 2,
736,
368
903,
195
1,46
0,63
0 1,
347,
769
3,39
4,76
4 47
8,52
9 N
ew M
exic
o 2,
314,
310
2,05
4,06
9 12
2,00
1 61
7,22
4 18
5,92
8 17
6,10
6 59
5,92
1 35
6,89
1 26
0,24
1 N
ew Y
ork
26,2
99,8
66
24,4
34,3
32
1,68
7,44
4 5,
635,
691
1,74
5,37
3 3,
616,
572
3,09
1,38
0 8,
657,
873
1,86
5,53
3 N
orth
Car
olin
a 11
,936
,052
11
,181
,670
1,
513,
993
2,79
8,48
8 62
2,80
0 1,
391,
631
1,89
5,31
2 2,
959,
448
754,
382
Nor
th D
akot
a 1,
208,
579
1,06
4,86
4 74
,471
37
8,36
2 50
,506
79
,538
11
9,32
1 36
2,66
6 14
3,71
6 O
hio
10
,167
,019
9,
432,
595
1,62
0,08
7 2,
667,
856
397,
680
1,51
8,96
6 69
4,28
3 2,
533,
724
734,
424
Okl
ahom
a 3,
836,
530
3,56
8,92
1 46
2,14
8 99
8,93
6 19
7,98
4 38
4,57
7 36
0,53
9 1,
164,
737
267,
609
Ore
gon
6,
538,
383
6,10
9,21
6 56
1,50
1 1,
568,
294
293,
692
561,
962
1,21
7,67
7 1,
906,
089
429,
168
Pen
nsy
lvan
ia
13,1
73,5
67
12,5
34,6
29
1,67
9,62
5 3,
073,
179
865,
696
1,97
8,94
1 1,
239,
418
3,69
7,77
2 63
8,93
8 R
hod
e Is
lan
d 1,
391,
601
1,32
4,67
9 91
,310
30
8,01
7 76
,209
16
3,11
9 42
0,20
2 26
5,82
3 66
,922
S
outh
Car
olin
a 6,
853,
918
6,48
7,44
0 85
5,56
1 1,
702,
804
371,
669
560,
882
2,06
1,76
7 93
4,75
6 36
6,47
8 S
outh
Dak
ota
1,34
1,80
6 1,
193,
064
86,5
96
360,
369
50,7
33
93,5
94
284,
198
317,
575
148,
741
Ten
nes
see
7,34
2,53
7 6,
912,
889
1,03
1,14
3 1,
832,
094
322,
063
892,
723
1,28
7,67
8 1,
547,
189
429,
648
Tex
as
34,5
65,5
94
33,2
78,4
98
7,28
3,77
8 8,
488,
429
1,30
8,36
6 3,
385,
750
2,23
0,83
0 10
,581
,345
1,
287,
097
Uta
h
5,51
4,05
1 5,
065,
651
441,
331
1,35
3,90
7 40
2,92
2 67
0,67
3 84
9,35
9 1,
347,
458
448,
400
Ver
mon
t 1,
468,
493
1,42
2,68
9 14
8,92
3 29
4,56
9 23
1,62
5 15
0,21
4 41
3,97
9 18
3,38
2 45
,803
V
irgi
nia
9,
285,
508
8,47
0,71
1 59
4,65
1 2,
341,
920
428,
290
961,
205
1,54
8,47
7 2,
596,
170
814,
797
Was
hin
gton
11
,535
,055
10
,846
,978
1,
547,
813
2,78
1,15
1 50
6,58
4 1,
059,
994
1,34
4,41
5 3,
607,
022
688,
077
Wes
t V
irgi
nia
1,
497,
706
1,34
6,61
1 99
,649
46
3,47
3 11
0,06
9 12
2,59
3 25
1,04
4 29
9,78
2 15
1,09
5 W
isco
nsi
n
7,78
5,34
4 7,
402,
179
1,96
6,47
9 1,
636,
411
584,
357
880,
771
742,
139
1,59
2,02
1 38
3,16
5 W
yom
ing
1,64
7,76
1 1,
480,
264
105,
430
348,
956
50,6
80
92,6
77
640,
641
241,
878
167,
497
Th
e es
tim
ates
are
bas
ed o
n t
he
2012
Nor
th A
mer
ican
In
dust
ry C
lass
ific
atio
n S
yste
m (
NA
ICS
).
Sou
rce:
U.S
. B
ure
au o
f E
con
omic
An
alys
is
VerDate Aug 31 2005 16:26 Dec 16, 2020 Jkt 000000 PO 00000 Frm 00069 Fmt 6621 Sfmt 6621 P:\DOCS\116-19\38016.TXT BRIAN
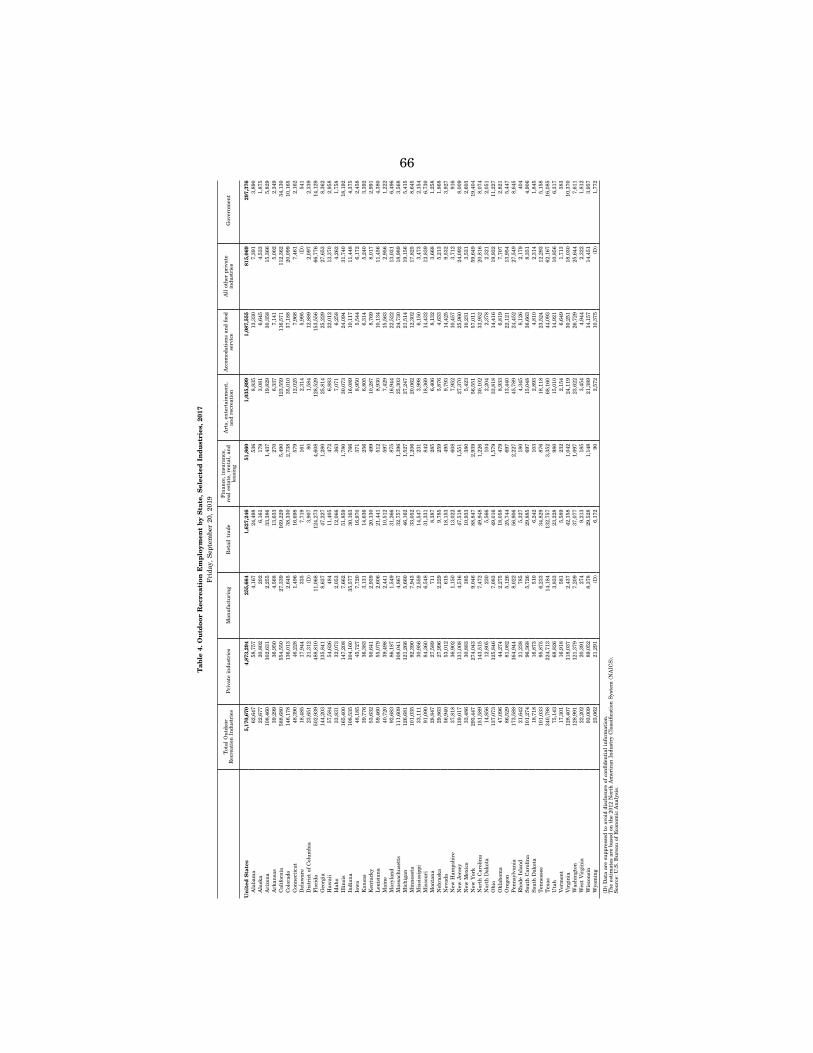
66
Tab
le 4
. Ou
tdoo
r R
ecre
atio
n E
mp
loym
ent
by
Sta
te, S
elec
ted
In
du
stri
es, 2
017
Fri
day,
Sep
tem
ber
20,
2019
Tot
al O
utd
oor
Rec
reat
ion
In
dust
ries
P
riva
te i
ndu
stri
es
Man
ufa
ctu
rin
g R
etai
l tr
ade
Fin
ance
, in
sura
nce
, re
al e
stat
e, r
enta
l, an
d le
asin
g A
rts,
en
tert
ain
men
t,
and
recr
eati
on
Acc
omod
atio
ns
and
food
se
rvic
e A
ll o
ther
pri
vate
in
dust
ries
G
over
nm
ent
Un
ited
Sta
tes
5,17
0,67
0 4,
873,
294
255,
664
1,62
7,24
6 51
,860
1,
035,
899
1,08
7,55
5 81
5,06
9 29
7,37
6 A
laba
ma
62,6
47
58,7
57
4,16
7 24
,498
53
6 8,
835
13,3
30
7,39
1 3,
890
Ala
ska
22,6
77
20,8
02
202
6,16
1 17
9 3,
081
6,64
5 4,
533
1,87
5 A
rizo
na
108,
460
102,
631
2,25
5 33
,386
1,
437
19,8
29
30,3
58
15,3
66
5,82
9 A
rkan
sas
39,2
99
36,9
50
4,56
8 13
,633
27
0 6,
337
7,14
1 5,
002
2,34
9 C
alif
orn
ia
588,
680
554,
550
27,3
39
169,
229
5,49
0 12
3,55
9 11
6,57
1 11
2,36
2 34
,130
C
olor
ado
146,
178
136,
013
2,64
5 38
,330
2,
738
35,0
10
37,1
88
20,0
99
10,1
65
Con
nec
ticu
t 48
,390
46
,228
1,
496
16,6
98
579
12,0
25
7,96
8 7,
461
2,16
2 D
elaw
are
18,4
85
17,9
44
335
7,71
9 16
1 2,
314
5,99
5 (D
) 54
1 D
istr
ict
of C
olu
mbi
a 23
,651
21
,312
(D
) 3,
907
80
1,58
4 12
,889
2,
097
2,33
9 F
lori
da
502,
939
488,
810
11,0
68
124,
273
4,60
8 12
8,52
9 15
3,55
6 66
,776
14
,129
G
eorg
ia
144,
203
135,
841
8,63
7 47
,227
1,
280
25,8
14
25,2
29
27,6
53
8,36
2 H
awai
i 57
,584
54
,626
48
4 11
,405
47
2 6,
883
22,0
12
13,3
70
2,95
8 Id
aho
33,8
31
32,0
73
2,05
3 12
,066
36
3 7,
071
6,25
8 4,
262
1,75
8 Il
lin
ois
165,
400
147,
208
7,66
2 51
,859
1,
780
30,0
73
24,0
94
31,7
40
18,1
92
Indi
ana
108,
535
104,
160
35,5
77
30,1
63
766
16,0
89
10,1
17
11,4
48
4,37
5 Io
wa
48,1
85
45,7
27
7,72
0 16
,970
37
1 8,
950
5,54
4 6,
172
2,45
8 K
ansa
s 39
,776
36
,383
3,
131
14,6
36
256
6,80
5 6,
314
5,24
0 3,
392
Ken
tuck
y 53
,632
50
,641
2,
939
20,1
30
499
10,2
87
8,76
9 8,
017
2,99
1 L
ouis
ian
a 59
,460
55
,079
2,
606
21,4
41
512
8,93
0 10
,134
11
,456
4,
380
Mai
ne
40,7
20
39,4
98
2,44
1 10
,512
59
7 7,
429
15,5
63
2,95
6 1,
222
Mar
ylan
d 92
,683
86
,187
1,
549
31,2
66
875
16,9
44
22,5
22
13,0
31
6,49
6 M
assa
chu
sett
s 11
1,60
9 10
8,04
1 4,
867
32,7
57
1,39
6 25
,303
24
,730
18
,989
3,
568
Mic
hig
an
126,
681
121,
266
5,66
0 46
,162
1,
527
27,2
47
21,5
14
19,1
56
5,41
5 M
inn
esot
a 10
1,03
5 92
,390
7,
943
33,0
52
1,20
6 20
,062
12
,302
17
,825
8,
645
Mis
siss
ippi
33
,111
30
,956
2,
559
14,5
47
231
3,99
8 6,
150
3,47
3 2,
154
Mis
sou
ri
91,0
90
84,3
60
6,54
8 31
,331
84
2 18
,369
14
,432
12
,839
6,
730
Mon
tan
a 28
,847
27
,589
71
1 8,
387
285
6,40
6 8,
132
3,66
8 1,
258
Neb
rask
a 29
,863
27
,996
2,
229
9,78
5 25
9 5,
876
4,63
3 5,
213
1,86
8 N
evad
a 56
,940
53
,012
61
5 18
,153
49
5 9,
793
14,4
25
9,53
2 3,
927
New
Ham
psh
ire
37,8
18
36,9
02
1,15
0 13
,022
60
8 7,
952
10,4
57
3,71
2 91
6 N
ew J
erse
y 13
9,01
7 13
1,00
8 4,
516
47,5
18
1,55
1 27
,370
25
,960
24
,092
8,
009
New
Mex
ico
33,4
86
30,8
83
385
10,9
33
380
5,42
3 10
,231
3,
531
2,60
3 N
ew Y
ork
293,
447
274,
043
9,04
6 88
,847
2,
939
56,5
51
57,0
11
59,6
49
19,4
04
Nor
th C
arol
ina
151,
589
143,
515
7,47
2 49
,948
1,
226
30,1
02
33,9
52
20,8
16
8,07
4 N
orth
Dak
ota
14,8
56
12,8
05
230
5,56
6 10
4 2,
204
2,37
8 2,
321
2,05
1 O
hio
13
7,07
3 12
5,84
6 7,
083
49,0
16
1,57
9 33
,818
14
,416
19
,932
11
,227
O
klah
oma
47,0
96
44,2
74
2,27
5 18
,058
47
9 8,
933
6,81
9 7,
707
2,82
1 O
rego
n
86,5
29
81,0
82
5,12
6 25
,744
69
7 13
,440
22
,121
13
,954
5,
447
Pen
nsy
lvan
ia
173,
588
164,
944
8,02
2 56
,906
2,
227
45,7
89
24,4
52
27,5
49
8,64
5 R
hod
e Is
lan
d 21
,642
21
,238
78
5 5,
327
180
4,34
5 8,
126
2,17
9 40
4 S
outh
Car
olin
a 10
1,27
4 96
,368
5,
726
29,8
85
697
15,0
48
36,6
63
8,35
1 4,
906
Sou
th D
akot
a 18
,718
16
,873
51
0 6,
242
103
2,89
3 4,
810
2,31
4 1,
845
Ten
nes
see
101,
033
95,8
75
6,23
3 34
,829
87
6 18
,118
23
,524
12
,293
5,
158
Tex
as
340,
798
324,
713
14,1
84
132,
757
3,35
2 68
,160
44
,093
62
,167
16
,085
U
tah
75
,143
68
,826
3,
833
23,2
28
980
15,0
10
14,9
21
10,8
56
6,31
7 V
erm
ont
17,3
01
16,9
18
581
5,58
9 23
2 2,
154
6,64
9 1,
713
383
Vir
gin
ia
128,
407
118,
037
2,43
7 42
,158
1,
042
24,1
19
30,2
51
18,0
30
10,3
70
Was
hin
gton
12
8,99
1 12
1,37
9 7,
209
37,0
77
1,09
7 23
,622
26
,729
25
,644
7,
611
Wes
t V
irgi
nia
22
,202
20
,391
27
4 9,
213
185
3,45
4 4,
944
2,32
2 1,
812
Wis
con
sin
93
,009
89
,052
8,
378
29,5
28
1,14
8 21
,389
14
,157
14
,451
3,
957
Wyo
min
g 23
,062
21
,291
(D
) 6,
172
90
2,57
2 10
,375
(D
) 1,
772
(D)
Dat
a ar
e su
ppre
ssed
to
avoi
d di
sclo
sure
of
con
fide
nti
al i
nfo
rmat
ion
. T
he
esti
mat
es a
re b
ased
on
th
e 20
12 N
orth
Am
eric
an I
ndu
stry
Cla
ssif
icat
ion
Sys
tem
(N
AIC
S).
S
ourc
e: U
.S.
Bu
reau
of
Eco
nom
ic A
nal
ysis
.
VerDate Aug 31 2005 16:26 Dec 16, 2020 Jkt 000000 PO 00000 Frm 00070 Fmt 6621 Sfmt 6621 P:\DOCS\116-19\38016.TXT BRIAN
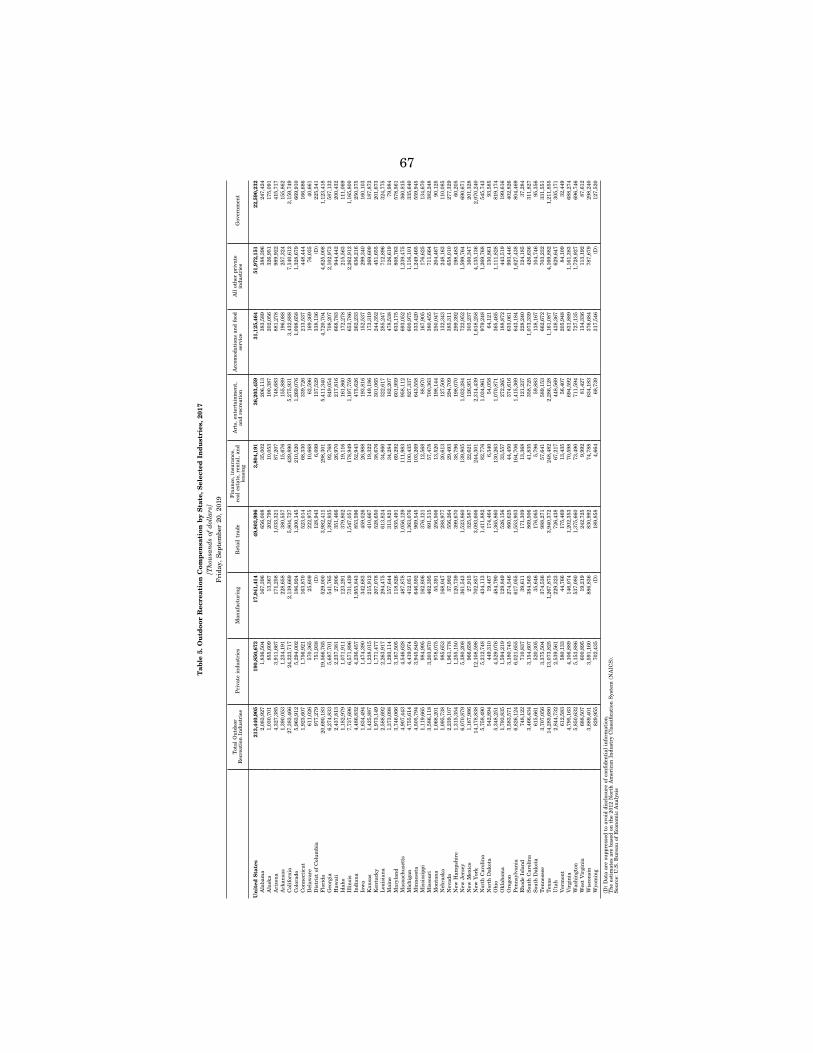
67
Tab
le 5
. Ou
tdoo
r R
ecre
atio
n C
omp
ensa
tion
by
Sta
te, S
elec
ted
In
du
stri
es, 2
017
[Th
ousa
nd
s of
dol
lars
] F
rida
y, S
epte
mbe
r 20
, 20
19
Tot
al O
utd
oor
Rec
reat
ion
In
dust
ries
P
riva
te i
ndu
stri
es
Man
ufa
ctu
rin
g R
etai
l tr
ade
Fin
ance
, in
sura
nce
, re
al e
stat
e, r
enta
l, an
d le
asin
g A
rts,
en
tert
ain
men
t,
and
recr
eati
on
Acc
omod
atio
ns
and
food
se
rvic
e A
ll o
ther
pri
vate
in
dust
ries
G
over
nm
ent
Un
ited
Sta
tes
213,
440,
905
190,
850,
673
17,9
41,4
14
49,8
03,9
96
3,80
4,19
1 36
,203
,459
31
,125
,464
51
,972
,151
22
,590
,232
A
laba
ma
2,08
3,92
7 1,
836,
504
167,
396
656,
008
35,0
02
206,
113
383,
589
388,
396
247,
424
Ala
ska
1,03
0,70
1 85
5,60
9 13
,367
20
2,79
8 10
,053
10
0,38
7 20
2,05
6 32
6,95
1 17
5,09
1 A
rizo
na
4,32
7,38
5 3,
911,
667
171,
258
1,03
3,32
1 87
,207
74
8,68
3 88
1,27
8 98
9,92
2 41
5,71
7 A
rkan
sas
1,39
0,05
3 1,
234,
191
228,
658
380,
557
15,6
76
155,
889
196,
088
257,
324
155,
862
Cal
ifor
nia
27
,383
,466
24
,223
,717
2,
139,
669
5,80
4,72
7 42
9,89
0 5,
275,
931
3,43
2,88
8 7,
140,
612
3,15
9,74
9 C
olor
ado
5,96
3,91
2 5,
294,
002
186,
924
1,20
0,14
5 21
0,52
0 1,
269,
076
1,09
8,65
8 1,
328,
679
669,
910
Con
nec
ticu
t 1,
923,
607
1,75
6,92
1 16
3,87
0 52
3,01
4 68
,330
33
9,72
6 21
3,53
7 44
8,44
4 16
6,68
6 D
elaw
are
611,
026
570,
365
25,6
09
222,
975
10,6
68
62,5
96
169,
369
76,0
35
40,6
61
Dis
tric
t of
Col
um
bia
977,
279
751,
938
(D)
128,
943
6,09
9 13
7,52
9 33
8,13
6 (D
) 22
5,34
1 F
lori
da
20,6
90,1
83
19,5
66,7
65
529,
000
3,98
2,41
1 29
8,30
1 5,
411,
340
4,72
0,70
4 4,
625,
008
1,12
3,41
8 G
eorg
ia
6,27
4,83
3 5,
687,
701
541,
765
1,39
2,93
5 92
,768
84
9,05
4 70
8,20
7 2,
102,
973
587,
132
Haw
aii
2,43
7,81
3 2,
237,
381
27,9
06
351,
466
26,9
70
217,
816
668,
783
944,
442
200,
432
Idah
o 1,
182,
979
1,07
1,91
1 12
3,29
1 37
9,80
2 19
,116
16
1,86
0 17
2,27
8 21
5,56
3 11
1,06
9 Il
lin
ois
7,73
7,69
6 6,
571,
896
731,
439
1,54
7,05
1 17
8,94
9 1,
197,
759
653,
786
2,26
2,91
2 1,
165,
800
Indi
ana
4,48
6,83
2 4,
236,
457
1,95
5,84
3 85
3,59
6 52
,943
47
5,62
6 26
2,23
3 63
6,21
6 25
0,37
5 Io
wa
1,63
4,49
4 1,
474,
390
342,
683
459,
026
26,9
88
193,
816
152,
537
299,
340
160,
103
Kan
sas
1,42
5,88
7 1,
238,
015
215,
912
410,
667
19,3
22
149,
186
173,
319
269,
609
187,
872
Ken
tuck
y 1,
973,
149
1,77
1,47
7 20
7,07
8 52
8,65
0 38
,676
30
1,06
5 24
4,35
2 45
1,65
5 20
1,67
3 L
ouis
ian
a 2,
588,
692
2,26
3,91
7 29
4,47
5 61
3,82
4 34
,860
32
2,61
7 28
5,24
7 71
2,89
6 32
4,77
5 M
ain
e 1,
373,
098
1,29
3,11
4 15
7,64
4 31
3,82
1 34
,284
18
2,20
7 47
8,53
8 12
6,61
9 79
,984
M
aryl
and
3,74
6,06
6 3,
167,
505
118,
826
935,
491
69,2
92
601,
959
633,
175
808,
763
578,
561
Mas
sach
use
tts
4,90
7,44
3 4,
546,
628
487,
878
1,05
6,12
9 11
1,98
3 95
8,11
2 69
3,05
2 1,
239,
475
360,
815
Mic
hig
an
4,75
5,61
4 4,
419,
974
412,
051
1,36
3,07
6 10
0,43
5 82
7,33
7 60
0,97
5 1,
116,
101
335,
640
Min
nes
ota
4,50
5,79
4 3,
945,
849
646,
592
969,
545
103,
269
643,
558
333,
420
1,24
9,46
5 55
9,94
5 M
issi
ssip
pi
1,11
9,66
5 98
4,99
5 16
2,80
6 37
6,12
1 12
,568
88
,970
16
7,90
5 17
6,62
5 13
4,67
0 M
isso
uri
3,
586,
118
3,20
3,87
0 46
2,39
5 89
1,51
5 57
,478
70
0,36
3 38
0,45
5 71
1,66
4 38
2,24
8 M
onta
na
1,06
8,20
1 97
8,07
5 55
,391
25
6,50
6 13
,520
19
8,14
4 25
0,04
7 20
4,46
7 90
,125
N
ebra
ska
1,09
5,73
8 98
5,65
3 16
8,04
7 28
8,97
7 20
,613
12
7,50
9 13
2,34
3 24
8,16
3 11
0,08
5 N
evad
a 2,
239,
107
1,96
1,77
8 37
,992
55
6,26
4 29
,493
29
4,70
9 38
5,31
1 65
8,01
0 27
7,32
9 N
ew H
amps
hir
e 1,
315,
354
1,25
5,15
0 12
0,73
9 39
9,67
0 38
,796
19
8,07
0 29
9,39
2 19
8,48
3 60
,205
N
ew J
erse
y 6,
070,
879
5,38
0,20
8 36
1,54
3 1,
523,
860
139,
805
1,03
2,28
4 72
2,95
2 1,
599,
764
690,
671
New
Mex
ico
1,16
7,98
6 96
6,65
8 27
,915
32
5,58
7 22
,621
12
6,95
1 30
3,23
7 16
0,34
7 20
1,32
8 N
ew Y
ork
14,1
78,8
38
12,1
08,5
98
702,
857
3,09
3,60
6 24
4,30
1 2,
314,
439
1,61
8,25
8 4,
135,
136
2,07
0,24
0 N
orth
Car
olin
a 5,
758,
490
5,21
2,74
8 43
4,11
3 1,
411,
882
82,7
76
1,03
4,96
1 97
9,24
8 1,
269,
768
545,
743
Nor
th D
akot
a 54
2,89
4 44
9,31
0 19
,467
17
4,46
4 6,
340
54,0
58
64,1
21
130,
861
93,5
85
Oh
io
5,34
8,25
1 4,
529,
076
484,
790
1,36
5,86
0 13
0,26
3 1,
070,
871
365,
465
1,11
1,82
8 81
9,17
4 O
klah
oma
1,79
3,83
5 1,
594,
219
129,
849
526,
156
33,5
57
272,
265
188,
872
443,
519
199,
616
Ore
gon
3,
583,
571
3,18
0,74
5 27
4,54
6 86
0,62
5 44
,450
37
4,61
6 63
3,06
1 99
3,44
6 40
2,82
6 P
enn
sylv
ania
6,
826,
124
6,02
1,65
5 61
7,05
5 1,
553,
903
164,
706
1,41
5,36
9 64
3,18
4 1,
627,
438
804,
469
Rh
ode
Isla
nd
748,
122
710,
837
39,6
11
171,
309
13,3
68
121,
237
228,
240
124,
185
37,2
84
Sou
th C
arol
ina
3,46
6,43
4 3,
154,
607
384,
565
869,
506
41,8
35
358,
725
1,07
3,33
9 42
6,63
6 31
1,82
7 S
outh
Dak
ota
615,
661
520,
305
35,6
46
176,
065
5,79
6 59
,883
13
8,16
7 10
4,74
6 95
,356
T
enn
esse
e 3,
707,
056
3,37
5,50
4 37
4,53
6 98
8,27
1 57
,641
58
9,15
3 66
2,67
2 70
3,23
2 33
1,55
1 T
exas
14
,285
,680
13
,073
,825
1,
267,
875
3,94
0,37
2 24
8,48
2 2,
286,
128
1,16
1,08
7 4,
169,
882
1,21
1,85
5 U
tah
2,
844,
732
2,53
9,56
1 22
9,32
3 72
6,43
8 67
,217
44
8,56
9 43
8,36
7 62
9,64
7 30
5,17
1 V
erm
ont
612,
583
580,
133
44,7
66
175,
469
13,4
35
56,4
07
205,
948
84,1
09
32,4
49
Vir
gin
ia
4,79
5,16
3 4,
106,
889
146,
074
1,20
2,35
3 70
,598
69
4,59
2 83
1,88
9 1,
161,
383
688,
274
Was
hin
gton
5,
850,
632
5,15
3,88
6 53
7,08
0 1,
375,
660
73,4
90
711,
594
727,
135
1,72
8,92
7 69
6,74
6 W
est
Vir
gin
ia
688,
507
600,
895
19,2
19
242,
725
9,99
2 81
,427
13
4,33
6 11
3,19
2 87
,612
W
isco
nsi
n
3,88
9,40
1 3,
591,
160
886,
836
830,
992
74,7
88
634,
183
376,
684
787,
679
298,
240
Wyo
min
g 82
9,95
5 70
2,43
5 (D
) 18
9,85
8 4,
664
68,7
39
317,
546
(D)
127,
520
(D)
Dat
a ar
e su
ppre
ssed
to
avoi
d di
sclo
sure
of
con
fide
nti
al i
nfo
rmat
ion
. T
he
esti
mat
es a
re b
ased
on
th
e 20
12 N
orth
Am
eric
an I
ndu
stry
Cla
ssif
icat
ion
Sys
tem
(N
AIC
S).
S
ourc
e: U
.S.
Bu
reau
of
Eco
nom
ic A
nal
ysis
VerDate Aug 31 2005 16:26 Dec 16, 2020 Jkt 000000 PO 00000 Frm 00071 Fmt 6621 Sfmt 6621 P:\DOCS\116-19\38016.TXT BRIAN
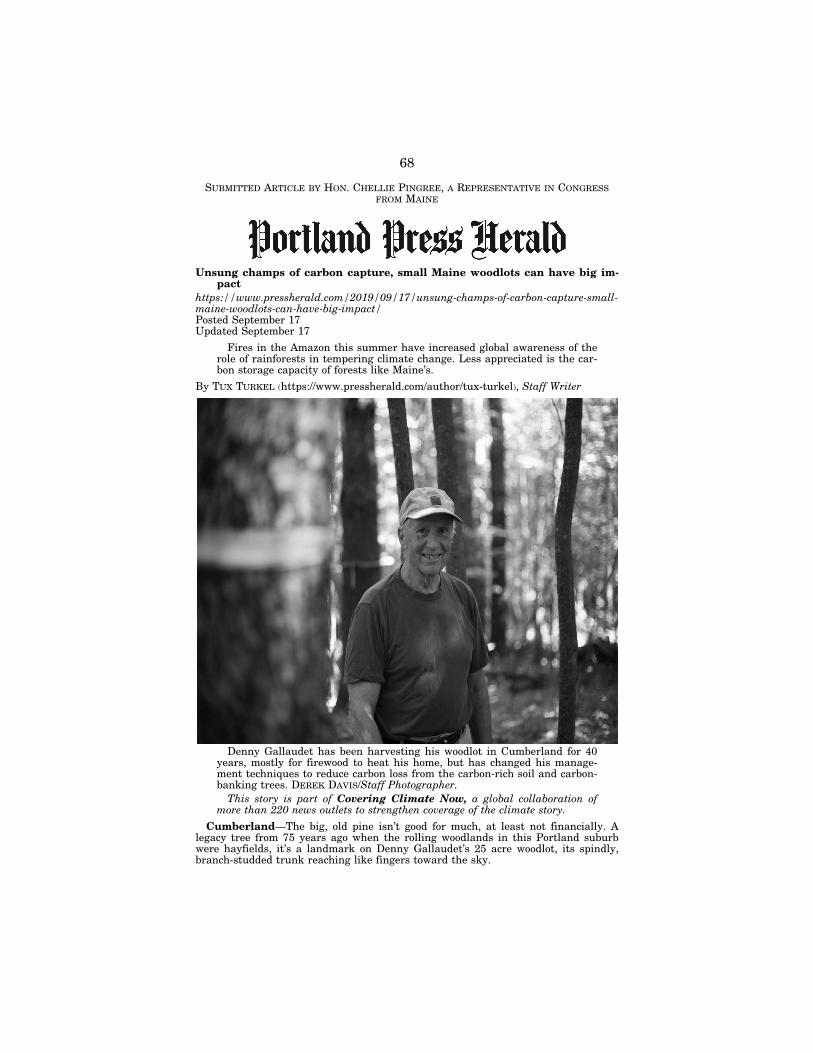
68
SUBMITTED ARTICLE BY HON. CHELLIE PINGREE, A REPRESENTATIVE IN CONGRESS FROM MAINE
Unsung champs of carbon capture, small Maine woodlots can have big im-pact
https://www.pressherald.com/2019/09/17/unsung-champs-of-carbon-capture-small- maine-woodlots-can-have-big-impact/ Posted September 17 Updated September 17
Fires in the Amazon this summer have increased global awareness of the role of rainforests in tempering climate change. Less appreciated is the car-bon storage capacity of forests like Maine’s.
By TUX TURKEL (https://www.pressherald.com/author/tux-turkel), Staff Writer
Denny Gallaudet has been harvesting his woodlot in Cumberland for 40 years, mostly for firewood to heat his home, but has changed his manage-ment techniques to reduce carbon loss from the carbon-rich soil and carbon- banking trees. DEREK DAVIS/Staff Photographer.
This story is part of Covering Climate Now, a global collaboration of more than 220 news outlets to strengthen coverage of the climate story.
Cumberland—The big, old pine isn’t good for much, at least not financially. A legacy tree from 75 years ago when the rolling woodlands in this Portland suburb were hayfields, it’s a landmark on Denny Gallaudet’s 25 acre woodlot, its spindly, branch-studded trunk reaching like fingers toward the sky.
VerDate Aug 31 2005 16:26 Dec 16, 2020 Jkt 000000 PO 00000 Frm 00072 Fmt 6621 Sfmt 6621 P:\DOCS\116-19\38016.TXT BRIAN 1161
9010
.eps
1161
9005
.eps
69
A logging contractor might suggest felling it for softwood chips. But to Gallaudet, the misshapen pine has a higher value. By his calculations, it’s storing roughly 6 metric tons of carbon as it grows, keeping heat-trapping carbon dioxide out of Earth’s warming atmosphere.
Fires in the Amazon this summer have increased awareness of the role of rain forests in blunting climate change. Less appreciated is the carbon storage capacity of northern temperate forests, like the one covering most of Maine.
Now Gallaudet, who’s leading a team at Sierra Club Maine, is trying to figure out how the state’s small woodlot owners can be encouraged to manage their land not only for income, wildlife and recreation, but to maximize carbon sequestration. To-gether, these local forests have the potential to become a world-class carbon sink, Gallaudet and other activists say.
America’s northern forest covers roughly 176 million acres and its growth has been increasing, according to the most recent USDA survey, in part because of re-duced timber harvesting for the region’s contracted paper industry. By some meas-ures, today’s forest is soaking up 1 to 2 tons of carbon per acre every year.
As the state with the highest percentage of forest land in the nation, Maine is a critical vault in this carbon bank, removing and storing 1.4 pounds of carbon (https://www.mdf.org/wp-content/uploads/2019/04/MOG-FullReport2019- FNL.pdf) for every pound emitted by burning fossil fuels. Put another way, 5.5 acres of forest (https://www.epa.gov/energy/greenhouse-gas-equivalencies-calculator) can capture the annual emissions from one passenger car, according to the Environ-mental Protection Agency.
But Gallaudet believes the small landowners who control 40 percent of Maine’s 17.6 million acres are in a unique position to do more. Collectively, they could sub-stantially offset the CO2 emitted each year in Maine from cars, factories and energy production. Transformational Tactics
To get there, many small owners would need to change the way they manage their land and embrace the practices of low-impact forestry.
They’ll have to leave more big, carbon-banking trees standing, like Gallaudet’s old pine, as well as more dead trees. After a harvest, they’ll need to leave more limbs and branches on the forest floor. Both will emit carbon, of course, but slowly, as they decay over time.
Landowners also will need to employ logging methods that have less impact on the soil, where a surprising 50 percent carbon is stored. And in some instances, for some trees, they just shouldn’t do any cutting.
In the long run, this transformation will require changes in government policies and perhaps modifications to the nascent markets that offer financial rewards for storing carbon, so small owners can see value from carbon storage, just as they do from pulp, chips or saw logs.
Right now, those financial incentives are largely absent for small woodlots, which in Maine tend to be less than 500 acres.
‘‘We’ve struggled to find a way for small owners to participate in the carbon mar-ket,’’ said Tom Doak, executive director of Maine Woodland Owners, whose members own a total of 500,000 acres. ‘‘We’ve looked at this for years and so far can’t make the numbers work.’’
But simply increasing awareness of how forests store carbon, Doak said, can lead owners to make changes.
‘‘There is an educational role,’’ he said. Earning Credit for Carbon
One example is an upcoming presentation (http://www.mofga.org/The-Fair/ Schedule) on carbon-capture forestry techniques, Sept. 21 at the Common Ground
VerDate Aug 31 2005 16:26 Dec 16, 2020 Jkt 000000 PO 00000 Frm 00073 Fmt 6621 Sfmt 6621 P:\DOCS\116-19\38016.TXT BRIAN 1161
9006
.eps
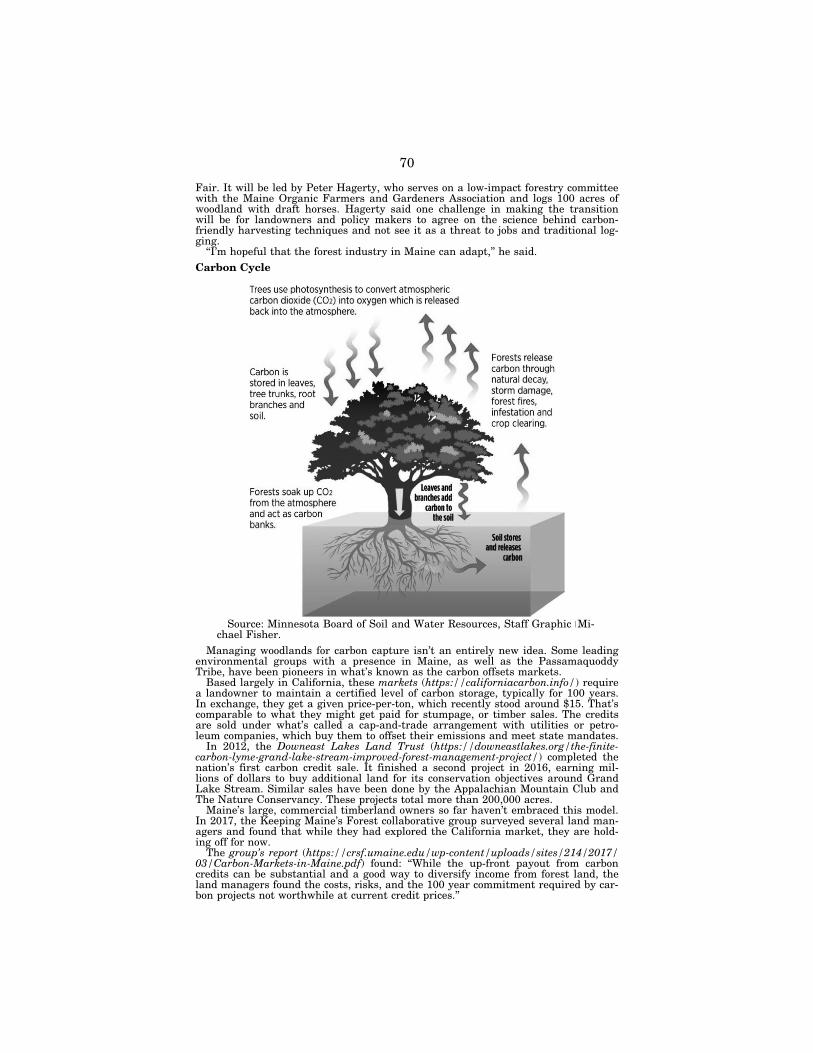
70
Fair. It will be led by Peter Hagerty, who serves on a low-impact forestry committee with the Maine Organic Farmers and Gardeners Association and logs 100 acres of woodland with draft horses. Hagerty said one challenge in making the transition will be for landowners and policy makers to agree on the science behind carbon- friendly harvesting techniques and not see it as a threat to jobs and traditional log-ging.
‘‘I’m hopeful that the forest industry in Maine can adapt,’’ he said. Carbon Cycle
Source: Minnesota Board of Soil and Water Resources, Staff Graphic ≥ Mi-chael Fisher.
Managing woodlands for carbon capture isn’t an entirely new idea. Some leading environmental groups with a presence in Maine, as well as the Passamaquoddy Tribe, have been pioneers in what’s known as the carbon offsets markets.
Based largely in California, these markets (https://californiacarbon.info/) require a landowner to maintain a certified level of carbon storage, typically for 100 years. In exchange, they get a given price-per-ton, which recently stood around $15. That’s comparable to what they might get paid for stumpage, or timber sales. The credits are sold under what’s called a cap-and-trade arrangement with utilities or petro-leum companies, which buy them to offset their emissions and meet state mandates.
In 2012, the Downeast Lakes Land Trust (https://downeastlakes.org/the-finite- carbon-lyme-grand-lake-stream-improved-forest-management-project/) completed the nation’s first carbon credit sale. It finished a second project in 2016, earning mil-lions of dollars to buy additional land for its conservation objectives around Grand Lake Stream. Similar sales have been done by the Appalachian Mountain Club and The Nature Conservancy. These projects total more than 200,000 acres.
Maine’s large, commercial timberland owners so far haven’t embraced this model. In 2017, the Keeping Maine’s Forest collaborative group surveyed several land man-agers and found that while they had explored the California market, they are hold-ing off for now.
The group’s report (https://crsf.umaine.edu/wp-content/uploads/sites/214/2017/ 03/Carbon-Markets-in-Maine.pdf) found: ‘‘While the up-front payout from carbon credits can be substantial and a good way to diversify income from forest land, the land managers found the costs, risks, and the 100 year commitment required by car-bon projects not worthwhile at current credit prices.’’
VerDate Aug 31 2005 16:26 Dec 16, 2020 Jkt 000000 PO 00000 Frm 00074 Fmt 6621 Sfmt 6621 P:\DOCS\116-19\38016.TXT BRIAN 1161
9007
.eps
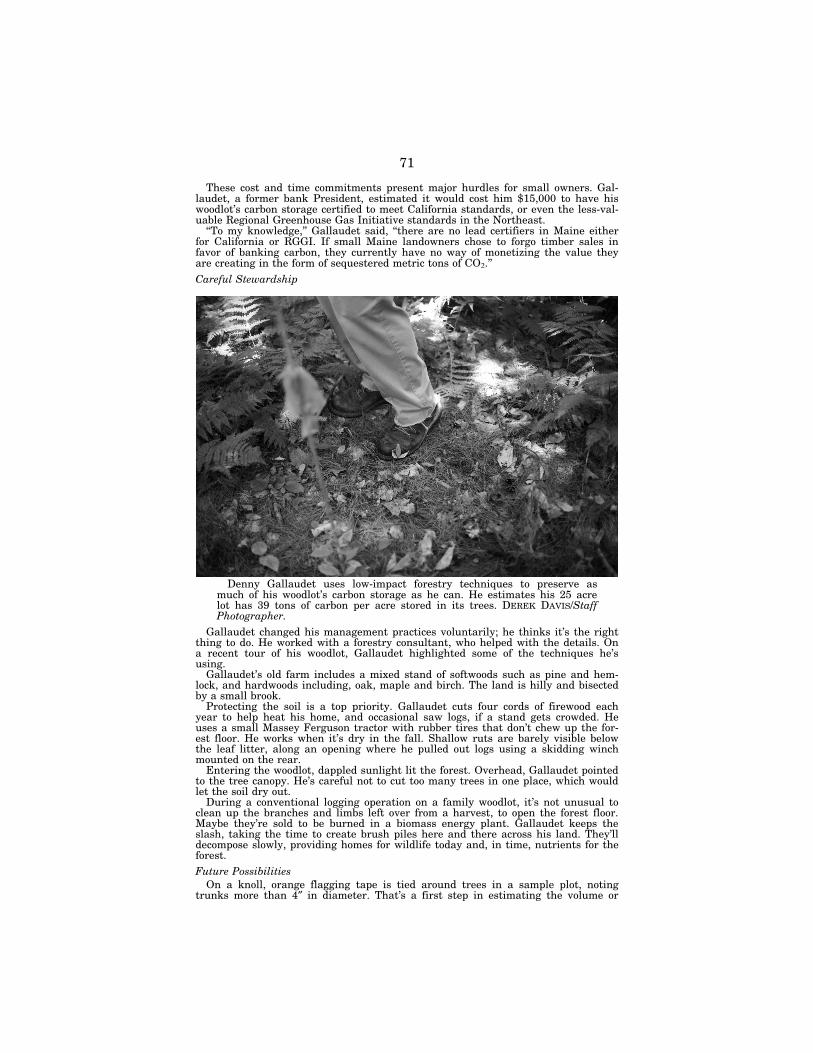
71
These cost and time commitments present major hurdles for small owners. Gal-laudet, a former bank President, estimated it would cost him $15,000 to have his woodlot’s carbon storage certified to meet California standards, or even the less-val-uable Regional Greenhouse Gas Initiative standards in the Northeast.
‘‘To my knowledge,’’ Gallaudet said, ‘‘there are no lead certifiers in Maine either for California or RGGI. If small Maine landowners chose to forgo timber sales in favor of banking carbon, they currently have no way of monetizing the value they are creating in the form of sequestered metric tons of CO2.’’ Careful Stewardship
Denny Gallaudet uses low-impact forestry techniques to preserve as much of his woodlot’s carbon storage as he can. He estimates his 25 acre lot has 39 tons of carbon per acre stored in its trees. DEREK DAVIS/Staff Photographer.
Gallaudet changed his management practices voluntarily; he thinks it’s the right thing to do. He worked with a forestry consultant, who helped with the details. On a recent tour of his woodlot, Gallaudet highlighted some of the techniques he’s using.
Gallaudet’s old farm includes a mixed stand of softwoods such as pine and hem-lock, and hardwoods including, oak, maple and birch. The land is hilly and bisected by a small brook.
Protecting the soil is a top priority. Gallaudet cuts four cords of firewood each year to help heat his home, and occasional saw logs, if a stand gets crowded. He uses a small Massey Ferguson tractor with rubber tires that don’t chew up the for-est floor. He works when it’s dry in the fall. Shallow ruts are barely visible below the leaf litter, along an opening where he pulled out logs using a skidding winch mounted on the rear.
Entering the woodlot, dappled sunlight lit the forest. Overhead, Gallaudet pointed to the tree canopy. He’s careful not to cut too many trees in one place, which would let the soil dry out.
During a conventional logging operation on a family woodlot, it’s not unusual to clean up the branches and limbs left over from a harvest, to open the forest floor. Maybe they’re sold to be burned in a biomass energy plant. Gallaudet keeps the slash, taking the time to create brush piles here and there across his land. They’ll decompose slowly, providing homes for wildlife today and, in time, nutrients for the forest. Future Possibilities
On a knoll, orange flagging tape is tied around trees in a sample plot, noting trunks more than 4″ in diameter. That’s a first step in estimating the volume or
VerDate Aug 31 2005 16:26 Dec 16, 2020 Jkt 000000 PO 00000 Frm 00075 Fmt 6621 Sfmt 6621 P:\DOCS\116-19\38016.TXT BRIAN 1161
9008
.eps
72
weight of a tree and how much carbon a forest can store, based on its species and other factors. Carbon calculators, (https://fsht.org/forestcarbonproject/ forestcarbonproject-calculator/) such as one linked on the website of the Francis Small Heritage Trust in Limerick, make the task easier.
Big hardwoods are denser and store the most carbon. Older stands capture more than new growth. Gallaudet’s calculations show that his woodlot holds roughly 39 tons of carbon per acre, nearly eight times the carbon footprint of his home and small farm.
Maine small landowners could join forces to maximize carbon storage and combine their acreage to take advantage of the offset markets, at least in theory. But the existing markets don’t recognize so-called aggregation, so Sierra Club Maine and other advocates will be looking at other options in the months ahead.
One idea could be to expand Maine’s Tree Growth Tax, the 47 year old law that reduces property taxes for owners who keep at least 10 acres in commercial timberland. But there are high financial penalties for removing land from the pro-gram, and Doak said the rules are constantly under assault by interest groups try-ing to modify them. He wonders if the Farm and Open Space Tax law, which values land at less than fair market value if certain requirements are met, might be a bet-ter vehicle.
Another model could be the credits that some major corporations use to offset their power consumption, by getting a percentage of their energy from wind power, for instance. Hagerty foresees the possibility of Maine companies partnering with small woodlot owners, buying local credits to offset their carbon footprint.
‘‘In a state where people know each other well, that could be possible,’’ he said.
SUBMITTED LETTER BY HON. KIM SCHRIER, A REPRESENTATIVE IN CONGRESS FROM WASHINGTON
April 1, 2019 Hon. BETTY MCCOLLUM, Chairwoman, House Appropriations Subcommittee on Interior, Environment, and Related Agen-cies, Washington, D.C.; Hon. DAVID JOYCE, Ranking Minority Member, House Appropriations Subcommittee on Interior, Environment, and Related Agen-cies, Washington, D.C. Dear Chairwoman McCollum and Ranking Member Joyce: I am writing requesting your support for watershed restoration and addressing
backlogs of road and trail maintenance on our National Forests by appropriating $50 million in funding for the Forest Service Legacy Roads and Trails Remediation Program (CMLG).
Since its authorization in FY 2008, the Legacy Roads and Trails program has sig-nificantly enhanced the Forest Service’s ability to address key problems associated with its aging and poorly maintained road system. This includes repairing roads and trails needed for public access, replacing failed or undersized culverts to improve aquatic passage and retire unneeded roads to prevent sediment pollution from en-tering waterways important for salmon, trout, and other aquatic species. The pro-gram delivers funds to address road problems in real time, which enables the Forest Service to efficiently plan, design, and implement restoration treatments. It is a crit-ical tool for leveraging non-Federal funds resulting in stronger projects and en-hanced community engagement. And because funds primarily go to actual work on the ground, Legacy Roads and Trails creates high wage jobs for contractors, includ-ing those who specialize in stream restoration, environmental design, and heavy equipment operation.
From 2008–2018, this unique bipartisan program has invested over $430 million to the following tangible and accountable results on our National Forest watersheds:
• Maintained and/or storm-proofed 18,057 miles of needed roads, helping Americans get where they wish to go on Forest Service lands;
• Reclaimed 7,053 miles of unneeded roads, preventing sediment from enter-ing streams, many of which supply drinking water to rural and urban towns and cities;
VerDate Aug 31 2005 16:26 Dec 16, 2020 Jkt 000000 PO 00000 Frm 00076 Fmt 6621 Sfmt 6621 P:\DOCS\116-19\38016.TXT BRIAN
73
• Replaced 1,030 culverts restoring fish passage to 1,671 miles of habitat, aiding the recovery of fish species important to restoration goals, Tribal commu-nities and sportfishing enthusiasts;
• Improved 5,020 miles of trails, keeping the $535 million National Forest recreation industry going strong;
• Created or maintained 697–1,115 jobs annually across the nation, bring-ing dollars and jobs into rural communities;
• Saved America’s taxpayers $3.5 million per year in road maintenance costs, promoting a more sustainable Forest Service road system in the future.
In Washington, D.C. we’ve seen an interest in rebuilding America’s infrastructure. During these conversations we ask that you encourage your colleagues to consider the proven track record of success from the Legacy Roads and Trails program as a model. The program helps adapt the road system to a more manageable size over time, reducing fiscal and environmental burdens and enabling the Forest Service to ensure better and more reliable access. It focuses on the key areas where projects improve up and downstream connections for salmon, improve water quality and en-sure road/trail resilience in a changing climate. It’s a simple solution to a formidable problem. But it needs funding to succeed.
FY19 was the first year that the Legacy Roads and Trail program was not specifi-cally funded despite making a difference for Forest Service watersheds, fish habitat, recreational infrastructure and local jobs for a decade.
We ask for your support of the program by reinstating Legacy Roads and Trails as a separate line item in the Fiscal Year (FY) 2020 Interior-Environ-ment Appropriations Bill with a $50M allocation. This is a small down pay-ment on the growing problem impacting how people access and experience public lands.
Sincerely,
Hon. KIM SCHRIER.
SUBMITTED QUESTIONS
Response from Lenise Lago, Associate Chief, U.S. Forest Service, U.S. De-partment of Agriculture
Questions Submitted by Hon. Abigail Davis Spanberger, a Representative in Con-gress from Virginia
Question 1. Associate Chief Lago, how does the Forest Service calculate and clas-sify deferred maintenance?
Answer. The Forest Service determines deferred maintenance for each asset based on condition assessments conducted at different intervals depending on the asset. During these assessments, staff collects information on maintenance and repair needs. Condition surveys for most assets are performed on a 5 year revolving sched-ule, except for road bridges. Road bridges are required to be inspected every 2 years in accordance with the National Bridge Inspection Standards. Deferred maintenance for National Forest System (NFS) roads for passenger cars is determined bi-annu-ally from a random sample. Deferred maintenance for high clearance/closed roads is not reported at this time.
Question 2. The Forest Service periodically assesses the condition of its assets in order to estimate deferred maintenance. Please provide detail on how the agency conducts these assessments, including whether they differ for the various asset classes (e.g., roads versus facilities) and the frequency of the assessments.
Answer. The procedures to conduct condition assessments varies between assets. The assessments occur as follows:
• Facilities—Assessments are generally done every 5 years. Assessments are con-ducted following the enclosed guidance (see Facilities Condition Assessment Field Training Guide [see Attachment 1]);
• Roads—A random sample of road segments is surveyed every 2 years using the Deferred Maintenance Protocols for Roads (enclosed [see Attachment 2]); and
• Road Bridges—Inspection reports are done every 2 years as required by the Na-tional Bridge Inspection Standards. Detailed procedures on how to conduct these inspections can be found in the Bridge Inspection Guide (BIG).
VerDate Aug 31 2005 16:26 Dec 16, 2020 Jkt 000000 PO 00000 Frm 00077 Fmt 6621 Sfmt 6621 P:\DOCS\116-19\38016.TXT BRIAN 1161
9009
.eps
74
• Trails—A random sample of 1% of Forest Service trails that are Trail Class 1– 4 are assessed each year via the Trail Assessment and Condition Surveys. All Class 5 trails, those that are most highly developed, are surveyed every 5 years.
Question 3. The Forest Service receives funding to address deferred maintenance from several sources. They include discretionary accounts (e.g., Capital Improve-ment and Maintenance), mandatory appropriations (e.g., recreation fees), and other agencies (e.g., the Federal Highway Administration). Please identify all sources of funding that are used for deferred maintenance, and the total from all funding sources used in FY 2018.
Answer. The Forest Service uses different sources of funding to address deferred maintenance including direct appropriations to the Capital Improvement and Main-tenance account, and external allocations from the Federal Highway Administra-tion’s Federal Lands Transportation Program and Federal Lands Access Program. The Agency also uses partnerships to accomplish some of the deferred maintenance work including cost-share agreements with counties and states, volunteer work on trail improvement, and via the Good Neighbor Authority. Total spending from all sources was approximately $230 million in 2018 to address deferred maintenance directly.
Question 4. Associate Chief Lago, can you speak to the role individual forests, re-gional foresters, and headquarters will play in prioritizing maintenance projects moving forward?
Answer. Prioritization of routine maintenance, including annual maintenance, and small non-recurring maintenance projects will continue to be identified, prioritized and managed at the forest level with the Regional Forester providing guidance and allocating funding based on the Agency’s priorities. The role of the Washington Of-fice is to communicate agency priorities and develop national policies and standards to help determine where appropriated dollars should be allocated for deferred main-tenance projects that target larger agency goals.
Question 5. In the past, Forest Service has needed to transfer funds from other accounts to help cover the costs of wildfire suppression. The wildfire funding fix, however, is intended to eliminate some of the need for fire transfer and is set to take effect in FY 2020. Has fire transfer affected the Forest Service’s ability to ad-dress maintenance needs? If so, in what ways might the wildfire funding fix allevi-ate those concerns?
Answer. In the past, funds for maintenance were transferred to firefighting efforts usually during the summer season, which is also the time that most of the Agency’s maintenance activities are scheduled to occur, when there are an increased number of seasonal staff for oversight of activities and favorable weather conditions. When fire transfers from capital maintenance accounts occurred, planned maintenance ac-tivities were deferred to the following year continuing the never-ending cycle of de-ferring maintenance. The wildland fire suppression funding fix should allow mainte-nance projects to proceed as planned, allowing for less deferred maintenance to ac-cumulate.
Question 6. How can the Forest Service enhance public-private partnerships to ad-dress deferred maintenance projects? What is the staffing level assigned to work on public-private partnerships, how has that changed in recent years, and is the cur-rent staffing level sufficient to foster and manage additional partnerships?
Answer. With a $5.2 billion deferred maintenance backlog, the Forest Service rec-ognizes new approaches are needed to address deferred maintenance and infrastruc-ture priorities on NFS lands. The Agency is placing a major emphasis on building capacity for public-private partnerships, with partnership coordinators assigned to every Forest Service region, and an increasing number of National Forests desig-nating specific partnership positions. While we do face staffing capacity challenges due to a workforce that has migrated into wildland fire related work, partnerships are increasingly important to accomplish our mission.
Trails maintenance is already highly leveraged within the Forest Service to maxi-mize maintenance and infrastructure funds. Furthermore, the Forest Service en-gages a robust volunteer community that annually contributes 4.7 million hours of work valued at $120,000,000 with the help of 110,000 individuals.
Limited capacity to meet competing priorities continues to challenge the Forest Service to find new ways to meet the needs of an aging infrastructure. Conservation finance, through Pay for Success and other funding models, has proven promising in recent pilot projects, as a way of bringing private sector funding to local recre-ation projects. Growing our skills and staffs in partnership collaboration will allow us to foster new and innovative ways to accomplish work. For example, a collabo-rative of local governments in Athens County, Ohio, industry partners, nonprofits, Quantified Ventures and the Wayne National Forest are funding sustainable recre-
VerDate Aug 31 2005 16:26 Dec 16, 2020 Jkt 000000 PO 00000 Frm 00078 Fmt 6621 Sfmt 6621 P:\DOCS\116-19\38016.TXT BRIAN
75
ation infrastructure by introducing the first-ever Outdoor Recreation Environmental Impact Bond. Together, the partners are developing the 88 mile Baileys Trail Sys-tem on the Wayne National Forest to revitalize the rural economy of southeast Ohio. The Baileys Trail System will utilize a mix of new and existing trail infra-structure on and adjacent to the National Forest to provide new access to public lands and create new jobs within the Athens County tourism industry. The Forest Service has partnered with the U.S. Endowment for Forestry and Communities to implement a grant fund that hopes to replicate the Baileys Trail System model, among other types of conservation finance projects, in additional communities that rely on the National Forest System. Questions Submitted by Hon. Marcia L. Fudge, a Representative in Congress from
Ohio Question 1. Ms. Lago, what are the existing pathways for hiring Job Corps stu-
dents into the Forest Service? Answer. The Forest Service is committed to connecting our Job Corps Civilian
Conservation Centers directly to our mission and continuously improving the per-formance of our centers and our student outcomes. The current pathways for hiring our Job Corps students include:
• Public Lands Corps Act. The Public Land Corps (PLC) allows any student completing 640 hours of special conservation project work under a Natural Re-source Agency to apply for a merit vacancy announcement (open to current Fed-eral employees and others with competitive eligibility) for up to 2 years upon program completion. Eligible candidates can be selected for permanent positions and are provided career-conditional appointments.
• Pathways Program. Students attending any of our five accredited Job Corps Centers may qualify for the Pathways special hiring authority if their specific trades align with an applicable Forest Service position. A student selected under the Pathways Intern Program must complete 640 paid work hours and additional training upon Job Corps graduation to be eligible for conversion into a permanent or Term Forest Service position. The 640 hours must be performed on a unit-school program hours do not count toward eligibility. In addition, stu-dents who have completed an accredited trades program within the last 2 years or are within 9 months of graduation may be selected under the Pathways Re-cent Graduate Program for a Forest Service position. Those who have not yet graduated will be appointed upon graduation.
• Schedule A or Veterans Recruitment Action (VRA). Students who qualify for Schedule A (disability hiring) or VRA may be hired non-competitively, by ap-plying to a vacancy announcement or other recruitment avenues, such as non- competitive direct appointment.
• Direct Hire Authority for Firefighters. On August 8, 2019, the Office of Personnel Management authorized the Forest Service to use a direct hire au-thority to assist in meeting critical hiring needs in support of the FY 2020 wildland firefighting season. This authority enables the Forest Service to streamline the hiring process for permanent and temporary firefighting posi-tions. Every civilian conservation center supports a wildland fire program, training students to serve as firefighters. Eligible, qualifying students can be hired directly upon graduation into Federal firefighter positions.
Question 1a. What does that process look like for a Job Corps student? Answer. Every center has a student advisor who assists students in creating their
resumes and applying for positions under the PLC authority or any other authority they qualify for when applying for a Forest Service job. To date, the PLC program has resulted in over 200 students completing internships that led to receiving a non- competitive hiring authority preference. Of those students, approximately 20 have been placed into permanent, full-time positions with the Forest Service.
Question 1b. Are students made aware of opportunities within the Forest Service? Answer. Yes. Students who are interested in Forest Service careers learn about
those opportunities through the Job Corps Program. Students compete for intern-ship opportunities with the Forest Service, and if they are successful, they complete a 4 month work experience and receive non-competitive application preference sta-tus. This status gives students a competitive advantage for permanent Forest Serv-ice positions.
Question 2. You mentioned that the Forest Service is interested in working with OPM to create a direct hiring authority for Job Corps students. What is the status of this effort currently?
VerDate Aug 31 2005 16:26 Dec 16, 2020 Jkt 000000 PO 00000 Frm 00079 Fmt 6621 Sfmt 6621 P:\DOCS\116-19\38016.TXT BRIAN
76
Answer. The Forest Service Job Corps National Office is working to assemble and approve the appropriate materials through USDA and OPM that will provide:
• Direct hiring authority for Job Corps graduates under the Public Land Corps Authority that is similar to the direct hiring authority available for Resource Assistants.
• Special hiring authority for Job Corps graduates that is similar to the special hiring authority for AmeriCorps and Peace Corps.
Question 3. What activities are Civilian Conservation Corps students trained to assist with? How does that help to reduce the deferred maintenance backlog?
Answer. Student trades include a variety of construction, information technology, and natural resource trades. Construction trades include carpentry, facilities main-tenance, masonry, bricklaying, painting, welding, operation of heavy equipment, and floor-covering. Center students perform work on their local unit. In the last 2 years, this work has contributed a total of almost $3 million in deferred maintenance projects.
Question 4. You mentioned that the Forest Service is interested in expanding the conservation trades to all of the Job Corps centers. When do you expect to make that expansion? What impact could that have on the deferred maintenance backlog?
Answer. Currently ten trades directly align with Forest Service conservation work, including forestry, fire suppression, and dispatch. The Forest Service is working to increase the alignment through an expansion of conservation-related training cur-ricula. Centers will also work directly with their local National Forests to fully inte-grate their curricula into the Forest’s annual program of work. In addition, each Center will be represented on their local National Forest’s leadership team and will participate in the planning of work for the districts in their forest. Students will take part in work-based learning on National Forests and in communities, including facilities maintenance. The value of these projects could eventually add up to mil-lions of dollars but will still be far less than what would be needed to appreciably slow the growth of deferred maintenance across the agency.
We welcome the opportunity to update the Committee on our efforts to strengthen Job Corps. Question Submitted by Hon. Tom O’Halleran, a Representative in Congress from Ari-
zona Question. In Arizona, road and trail repair needs account for nearly 50% of the
deferred maintenance backlog on Federal lands. Lack of road and trail access to Federal public lands reduces visitation and limits opportunities for recreation, im-pacting the economy of gateway communities. Understanding this, our local govern-ments have stepped up to play their part in maintaining roads and other access points. 70% of the 2,100 vehicles using Lake Mary road each day are due to rec-reational traffic. For nearly a century, Coconino county has maintained this road through a combination of funds, including local taxes. Has the Forest Service ex-plored similar partnerships with local governments and does the forest service see this or other existing partnerships as potential models for tackling deferred mainte-nance?
Answer. The cooperative road maintenance agreement as described above is wide-ly used on Forest Service transportation systems across the country. This mecha-nism is actively used and promoted to allow other public entities to participate in maintenance of routes critical to local communities. Other methods of public-public partnerships are also employed and encouraged by the Forest Service. One example of these partnerships is the agreement between the Tennessee Valley Authority (TVA) and the Forest Service under which TVA performs inspections of Forest Serv-ice road bridges to meet the requirement under the National Bridge Inspection Standards for a quality assurance check of Forest Service road bridges by an exter-nal agency. Questions Submitted by Hon. Chellie Pingree, a Representative in Congress from
Maine Question 1. The Forest Service has an FY 2020 list of 25 Land and Water Con-
servation Fund priority projects for acquisition, and 22 for Forest Legacy. These projects would likely be funded under anticipated appropriations for next year, but the agency has unmet needs beyond the current list of projects. Based on need alone, how many acquisition and Forest Legacy projects would the agency need to pursue? Can your agency quantify the backlog, and say how many projects beyond the list could improve management and reduce costs, if LWCF was more fully fund-ed?
VerDate Aug 31 2005 16:26 Dec 16, 2020 Jkt 000000 PO 00000 Frm 00080 Fmt 6621 Sfmt 6621 P:\DOCS\116-19\38016.TXT BRIAN
77
Answer. Each year, Forest Legacy Program (FLP) projects are selected through a two-stage competitive process. The first stage is state-level identification and ap-proval. After a project is selected at the state level, the second stage is a national level project review conducted by a panel of representatives from states partici-pating in the FLP and the Forest Service. This two-stage process results in high- quality projects that are supported both locally and nationally.
For FY 2020, 36 projects, with a total request of $123 million, were submitted for consideration through the FLP. Some of these projects received funding when FY 2019 appropriations were enacted, while some of the proposed projects were no longer viable.
Maine has been an active participant in the FLP at 741,000 acres. In terms of funds, Maine has received $76,061,534, which is second only to Montana, which has received $77,405,533.
For land acquisition, the Forest Service works with a variety of non-governmental organizations and willing sellers from the general public. In Fiscal Year 2020, Con-gress appropriated $57,639,000 for purchase of lands from willing sellers in 18 states. The acquisition projects are prioritized based on: (1) the significance of the acquisition; (2) the urgency of the acquisition; (3) management efficiencies; (4) man-agement cost savings; (5) geographic distribution; (6) threats to the integrity of the land; and (7) the recreational value of the land. The Forest Service’s nine regions hold competitions to cull the projects from units within the region’s National Forests and Grasslands, then submit top projects to the Washington Office (WO) for a na-tional competition. The WO competition results in a smaller list of projects that is submitted to Congress, which determines the amount of appropriations for the projects.
Question 2. Based on budget documents that I have received from USDA, I under-stand the Forest Service spent $3.3 million on the climate hubs in 2016, which I think is great, but the 2019 estimate is $400,000. Given the challenges that we are dealing with, why is there such a big drop, and do you see those as a valuable part of what you are doing?
Answer. In FY 2016, the Forest Service allocated $3.3 million for Climate Hubs. The Forest Service allocated $1.85 million per year for both FY 2017 and FY 2018. In FY 2019, Climate Hub allocation was $1.665 million and has been budgeted to remain at this level for FY 2020. The funding drop is reflective of prioritization of urgent forest restoration program and project work. However, the agency continues to support many important initiatives through our multiple Research and Develop-ment programs. Questions Submitted by Hon. Cynthia Axne, a Representative in Congress from Iowa
Question 1. The Forest Service supplies water for agriculture and communities and is a major economic driver for many forest dependent communities. In fact, Na-tional Forest System lands are the nation’s largest source of municipal drinking water supply, serving more than 66 million people. Ms. Lago, please speak to the importance of these systems to the environment, public health, and safety. Can you speak to the current condition of Forest Service water systems?
Answer. The Forest Service continues to foster conditions for clean, abundant water to help ensure the productive and sustainable use of National Forest System lands. The Agency emphasizes reforestation and revegetation efforts. Restoring eco-systems ensures that vital amenities, such as clean water, are available to society. In FY 2018, the Agency targeted investments in the National Best Management Practices Program to improve tools to meet agency requirements under the Clean Water Act and other statutes to protect clean water. The program made advance-ments to increase the speed and accuracy of use and sharing of data with state water quality agencies, the Environmental Protection Agency, and other partners.
The Forest Service owns and operates over 4,700 drinking water systems, of which over 30% are in poor or fair condition. Thirty-six percent of all drinking water systems are more than 50 years old with escalating repair costs every year. With a current water system deferred maintenance backlog of $93 million, the impact of not addressing this will affect the ability for the public and employees to access recreation facilities, fire, administration and other facilities.
Question 2. We recognize that restoration and maintenance of our National For-ests can be a source of long-term, sustainable jobs in rural communities. Studies have indicated that for every $1 million spent on forest watershed restoration, 14.5 jobs can be generated. Can you provide references to studies documenting the im-pact of infrastructure improvements on jobs?
Answer. Federal agencies examined job contributions of infrastructure improve-ments with the American Recovery and Reinvestment Act of 2009 (ARRA) consistent with goals of the act, specifically, to preserve and create jobs and stimulate economic
VerDate Aug 31 2005 16:26 Dec 16, 2020 Jkt 000000 PO 00000 Frm 00081 Fmt 6621 Sfmt 6621 P:\DOCS\116-19\38016.TXT BRIAN
78
recovery. Further, USDA agencies used a common general framework for estimating the potential effects of the ARRA using concepts and techniques embodied in a tool called IMPLAN. Infrastructure investments by USDA Rural Development in com-munity facilities, water and waste, rural business support, single family housing support, broadband and Rural Development Salary resulted in 16 jobs per $1 mil-lion invested (USDA NRCS, 2010). Infrastructure investments by USDA Farm Serv-ice Agency in information technology resulted in 22 jobs per $1 million invested (USDA NRCS, 2010). A 2010 study partially funded by the Forest Service indicated that forest and watershed restoration activities have the potential to create an aver-age of 14 jobs per $1 million invested (M. Nielsen-Pincus and C. Moseley, 2010). A more recent study published by the Public Library of Science, cites up to 33 jobs per $1 million invested from environmental restoration, restoration-related con-servation, and mitigation actions (BenDor, et al., 2015). Infrastructure investments by USDA Natural Resource Conservation Service in floodplain, dam and other projects resulted in 220 jobs per $1 million invested (USDA NRCS 2010). Recent ex-amination of Forest Service investment in over $3 billion in infrastructure indicates that 35,000 to 38,000 jobs annually could be sustained across the nation, or 11 to 12 jobs per $1 million invested (USDA Forest Service, 2017). In addition, a 2017 analysis of Forest Service resource management investments ($5.9 billion) in pro-gram areas such as infrastructure construction and maintenance, firefighting, eco-system restoration, research and development, fuels treatments, Job Corps, salaries, etc. contributed 120,620 jobs across the nation; or 20 jobs per $1 million invested (USDA Forest Service, 2019). References
BenDor, T. et al. ‘‘Estimating the size and impact of the ecological restoration economy,’’ PLoS ONE, 10 (6) (2015): e0128339.
M. Nielsen-Pincus and C. Moseley. Economic and Employment Impacts of Forest and Watershed Restoration in Oregon, 2010. Available from Oregon State University at https://scholarsbank.uoregon.edu/xmlui/bitstream/handle/1794/10776/ WP24.pdf?sequence=1.
USDA NRCS 2010. Job Creation Estimates for Rural Development, FSA, and NRCS Items in the American Recovery and Reinvestment Act. Available from NRCS at https://www.nrcs.usda.gov/wps/portal/nrcs/detail/national/technical/econ/ tools/?cid=nrcs143_009732.
USDA Forest Service 2017. Briefing Paper on Forest Service Infrastructure Im-provement Opportunities.
USDA Forest Service 2019. Briefing Paper on Forest Service Jobs and GDP Eco-nomic Contribution. Supporting the FY2020 Budget Justification.
Questions Submitted by Hon. Kim Schrier, a Representative in Congress from Wash-ington
Capital Improvement Plan Projects Question 1. What considerations are made to narrow down the list of projects sub-
mitted that meet the national priorities outlined? Answer. The primary considerations for selecting and ranking capital improve-
ment projects are how the projects support our current priorities including the fol-lowing benefit areas: active management, access to recreation, economic benefits, fire operations, environment and sustainability, and research and technology. In ad-dition, project criticality and readiness are also considered when scheduling imple-mentation.
Question 2. Are Regions allocated a percentage of the CIP budget based on need, miles of road, acres of Forest Service land? Or are simply the top number of projects funded?
Answer. Regions are allocated funds for operations and maintenance based on a distribution formula that includes miles of roads, visitation, timber volume targets and others. Since 2017, the Forest Service has set aside a small portion of the Cap-ital Improvement and Maintenance (CI&M) account for Roads and Facilities to fund competitive Capital Improvement Plan (CIP) and Decommissioning projects.
Question 3. Given that the states with the highest concentration of deferred re-pairs are: California, Montana, Idaho, Oregon, Colorado, and Washington, respec-tively, will these states be allocated larger proportion of the CIP budget due to their needs?
Answer. In general, these states get a large portion of CI&M funding for oper-ations and maintenance. However, the national CIP project competition focuses on project specific cost-benefit ratio rather than accumulated deferred maintenance.
VerDate Aug 31 2005 16:26 Dec 16, 2020 Jkt 000000 PO 00000 Frm 00082 Fmt 6621 Sfmt 6621 P:\DOCS\116-19\38016.TXT BRIAN
79
The reduction of deferred maintenance as result of implementing a project is a de-sired outcome.
Question 4. How are Regional priorities considered? For example, in Region 6, if improving Chinook salmon habitat and removing fish passage barriers is of utmost priority, what weight will that be given in the national priorities?
Answer. The CIP model used to rank and prioritize project uses quantitative metrics and criticality scoring. Although the regional ranking of projects is not used in the calculation of the final score, it would be taken into consideration. Before fi-nalizing the CIP list of projects for each fiscal year the Asset Management Review Board (AMRB) would make necessary adjustments to ensure that regional and na-tional priorities are in alignment. Legacy Roads and Trails Program
Question 5. What direction are you providing to Regional Offices to Legacy Roads and Trails program projects are implemented and tracked?
Answer. While the Legacy Roads and Trails Program was retired from our budget line items starting in FY 2018, the Forest Service continues to plan, implement and track projects which meet the goals of this formerly dedicated funding mechanism.
Question 6. Is the USFS continuing to track and report annual accomplishments under the program?
Answer. The Forest Service continues to track accomplishments from transpor-tation projects that improve watershed conditions, including bettering streams for water quality and aquatic organisms.
Question 7. Across National Forest lands in OR/WA, 6,000 stream miles are des-ignated as critical habitat for federally listed fish, and 5,550 stream miles have been listed as water quality impaired under the Federal Clean Water Act of 1972. What management improvements does the USFS need to make to ensure waters are re-moved from the listings?
Answer. The Forest Service established a Watershed Condition Framework to pro-vide a consistent, comparable, and credible process for improving the health of wa-tersheds on National Forests and Grasslands in 2011. The Pacific Northwest Region continues to focus on the priority watersheds and choose projects to fund that im-prove watershed conditions, including bettering streams for water quality and aquatic organisms.
Question 8. How will the USFS meet its obligations to protect water quality and salmon in my state?
Answer. The Pacific Northwest Region continues to leverage existing and new partnerships to invest in watershed improvement projects that address water qual-ity and aquatic organism passage. Questions Submitted by Hon. Jimmy Panetta, a Representative in Congress from
California Question 1. The Nacimiento-Fergusson Road is a 24 mile long Forest Service road
in the Los Padres National Forest. When Big Sur residents face inclement weather like mudslides and wildfires that cause road failures on Highway 1, the Nacimiento- Fergusson road is the only way they can get out of the Big Sur region. After storms in 2017 that shut down Highway 1, there were hundreds of people who had no way to get out of Big Sur. At the same time, the Nacimiento-Fergusson road has suffered as a result of the Forest Service’s maintenance backlog. Associate Chief Lago, once the Wildfire Funding Fix is implemented in Fiscal Year 2020, would you be willing to continue this dialogue and work with me to ensure the Big Sur community can access much-needed funding to for deferred maintenance on their roads?
Answer. Yes, the implementation of the Wildfire Funding Fix is going to allow the agency to be more efficient in addressing infrastructure needs and to better plan long term solutions to address the deferred maintenance backlog.
Question 2. In Los Padres National Forest, our deferred maintenance exceeds $24 million. My question is where does that lie relative to other National Forests?
Answer. Los Padres National Forest deferred maintenance is consistent with other National Forests. We have enclosed a file with more detailed information on the de-ferred maintenance for all units of the National Forest System [see Attachment 3].
Question 3. The State of California prides itself on technological innovation. I am consistently impressed when I see the innovation in our agricultural fields, from robotic harvesters to agricultural drones that monitor crop growth. Can you speak to any Forest Service investments in technology, including drones, satellites, and fire surveillance cameras?
Answer. The Forest Service is actively involved in leveraging leading edge tech-nology to support decision-making at all levels of the Forest Service from the field,
VerDate Aug 31 2005 16:26 Dec 16, 2020 Jkt 000000 PO 00000 Frm 00083 Fmt 6621 Sfmt 6621 P:\DOCS\116-19\38016.TXT BRIAN
80
to the regional offices, and to the Washington Office. The FY 2021 Forest Service budget proposes $5 million to be used to implement the Wildfire Technology Mod-ernization section of the Dingell Conservation and Management Act (2019). Imple-mentation includes the development of a common, single display of all fire resources and will significantly increase accountability for how the agency uses assets. This will allow the agency to monitor, analyze, and evaluate how tactical decisions and resource utilization influences incident outcomes. This information will create a feedback loop, allowing the agency to learn where, when, and how resources are most effective. When combined with the Risk Management Assistance framework, technology modernization for fire resources will enable improvement in the efficient use of agency resources through early, risk-based decision-making with State and local partners and through transparent deployment of assets. The Forest Service is accelerating adoption of new technologies to modernize the wildland fire system, consistent with direction provided in the Dingell Act. Technology is key not only for real-time incident management, but also to be able to learn where and when re-sources are most effective. That learning will be key for improved deployment in the future that will reduce risk to responders and be more cost-effective. Investments in technology include (among others):
• UAS (drones). The Forest Service began evaluating UAS in 2003, and we now have an established Forest Service—UAS Program Office to manage, support and expand the use of this revolutionary capability. We are actively leveraging UAS technologies to support a number of business needs including fire/disaster support, engineering fieldwork (infrastructure inspection and assessment), invasive species mapping, and environmental cleanup. The Forest Service has also started testing the use of drones to perform bridge inspection. The use of UAS provides new data streams, saves time, and improves personnel safety in the field.
• Satellite Imagery. The Forest Service heavily leverages the use of imagery from Federal-civil and commercial satellites to support traditional mapping (paper and digital maps) and fire/disaster support. The remote sensing commu-nity continues to evaluate and incorporate new sensor data streams as they come online. The Forest Service is a significant user of commercial high-resolu-tion satellite imagery, which is provided at no cost to Federal-civil agencies by the National Geospatial-Intelligence Agency.
• Fire Surveillance Cameras. Federal, state and local fire managers are in-creasingly relying on both airborne and ground (fixed) fire surveillance cameras. The Forest Service is actively pursuing automated smoke detection in the networked ground surveillance cameras, as well as the use of UAS, new thermal infrared cameras and the use of national systems to support improved fire de-tection (and reporting) and active fire management.
Questions Submitted by Hon. Doug LaMalfa, a Representative in Congress from California
Question 1. Timber receipts have been down. Back years ago, we are looking at 1991, we could see that there is $680 million in timber receipts, of which ten per-cent goes directly towards forest roads, and it is also very important, those receipts, for local schools and roads under what is the Secure Rural Schools Fund. And so, now you want $680 million in receipts, and more recently, it is down to $21 million. So, it would seem to me we could be going farther if we had the timber receipts for the road maintenance for that ten percent.
Would you comment upon that? Question 1a. Do you know that number now compared to the $680 million not-
inflation-adjusted 1991 number? Answer 1–1a. The 2014–2018 5 year average of timber receipts was $32.8 million
(see Table [1] below), as compared to the $686.6 million sold, $845.7 million in re-ceipts, and $84.57 million in ‘‘Purchaser Road Credits’’ in 1991. This 5 year average is roughly 4% of the 1991 timber receipts. In 1991, the Forest Service changed from collecting ‘‘Purchaser Road Credits’’ to the ‘‘Specified Road Costs’’ approach to main-taining Forest Service Roads above the standards necessary for timber harvest. As in the past, where the road maintenance credits were 10% of the receipts, we are very close to that same rate today, as we calculate the road costs to be 9% of total receipts.
VerDate Aug 31 2005 16:26 Dec 16, 2020 Jkt 000000 PO 00000 Frm 00084 Fmt 6621 Sfmt 6621 P:\DOCS\116-19\38016.TXT BRIAN
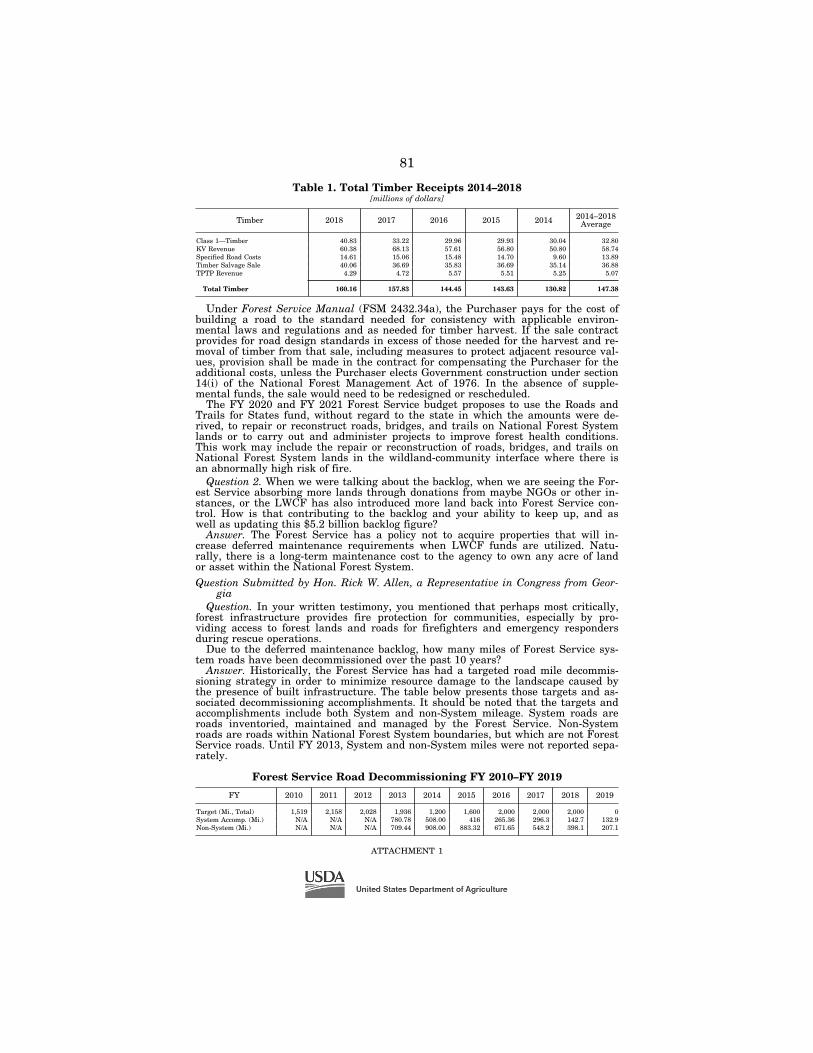
81
Table 1. Total Timber Receipts 2014–2018 [millions of dollars]
Timber 2018 2017 2016 2015 2014 2014–2018 Average
Class 1—Timber 40.83 33.22 29.96 29.93 30.04 32.80 KV Revenue 60.38 68.13 57.61 56.80 50.80 58.74 Specified Road Costs 14.61 15.06 15.48 14.70 9.60 13.89 Timber Salvage Sale 40.06 36.69 35.83 36.69 35.14 36.88 TPTP Revenue 4.29 4.72 5.57 5.51 5.25 5.07
Total Timber 160.16 157.83 144.45 143.63 130.82 147.38
Under Forest Service Manual (FSM 2432.34a), the Purchaser pays for the cost of building a road to the standard needed for consistency with applicable environ-mental laws and regulations and as needed for timber harvest. If the sale contract provides for road design standards in excess of those needed for the harvest and re-moval of timber from that sale, including measures to protect adjacent resource val-ues, provision shall be made in the contract for compensating the Purchaser for the additional costs, unless the Purchaser elects Government construction under section 14(i) of the National Forest Management Act of 1976. In the absence of supple-mental funds, the sale would need to be redesigned or rescheduled.
The FY 2020 and FY 2021 Forest Service budget proposes to use the Roads and Trails for States fund, without regard to the state in which the amounts were de-rived, to repair or reconstruct roads, bridges, and trails on National Forest System lands or to carry out and administer projects to improve forest health conditions. This work may include the repair or reconstruction of roads, bridges, and trails on National Forest System lands in the wildland-community interface where there is an abnormally high risk of fire.
Question 2. When we were talking about the backlog, when we are seeing the For-est Service absorbing more lands through donations from maybe NGOs or other in-stances, or the LWCF has also introduced more land back into Forest Service con-trol. How is that contributing to the backlog and your ability to keep up, and as well as updating this $5.2 billion backlog figure?
Answer. The Forest Service has a policy not to acquire properties that will in-crease deferred maintenance requirements when LWCF funds are utilized. Natu-rally, there is a long-term maintenance cost to the agency to own any acre of land or asset within the National Forest System. Question Submitted by Hon. Rick W. Allen, a Representative in Congress from Geor-
gia Question. In your written testimony, you mentioned that perhaps most critically,
forest infrastructure provides fire protection for communities, especially by pro-viding access to forest lands and roads for firefighters and emergency responders during rescue operations.
Due to the deferred maintenance backlog, how many miles of Forest Service sys-tem roads have been decommissioned over the past 10 years?
Answer. Historically, the Forest Service has had a targeted road mile decommis-sioning strategy in order to minimize resource damage to the landscape caused by the presence of built infrastructure. The table below presents those targets and as-sociated decommissioning accomplishments. It should be noted that the targets and accomplishments include both System and non-System mileage. System roads are roads inventoried, maintained and managed by the Forest Service. Non-System roads are roads within National Forest System boundaries, but which are not Forest Service roads. Until FY 2013, System and non-System miles were not reported sepa-rately.
Forest Service Road Decommissioning FY 2010–FY 2019
FY 2010 2011 2012 2013 2014 2015 2016 2017 2018 2019
Target (Mi., Total) 1,519 2,158 2,028 1,936 1,200 1,600 2,000 2,000 2,000 0 System Accomp. (Mi.) N/A N/A N/A 780.78 508.00 416 265.36 296.3 142.7 132.9 Non-System (Mi.) N/A N/A N/A 709.44 908.00 883.32 671.65 548.2 398.1 207.1
ATTACHMENT 1
VerDate Aug 31 2005 16:26 Dec 16, 2020 Jkt 000000 PO 00000 Frm 00085 Fmt 6621 Sfmt 6621 P:\DOCS\116-19\38016.TXT BRIAN 1161
9012
.eps
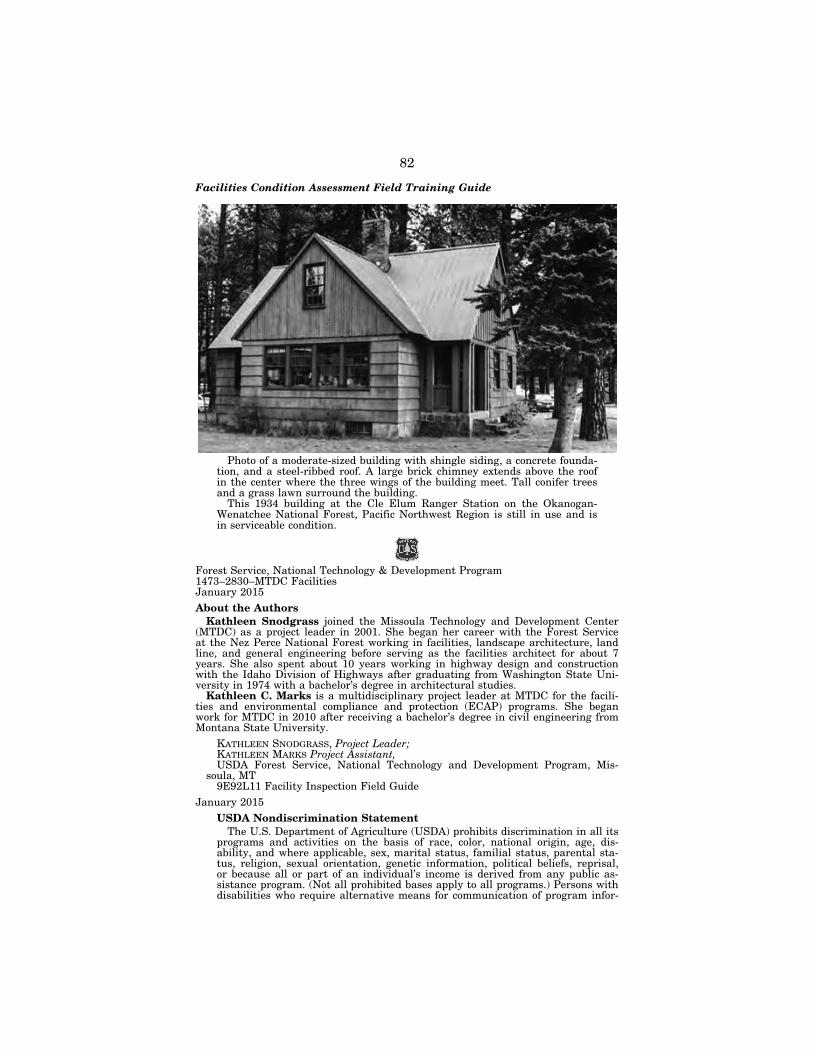
82
Facilities Condition Assessment Field Training Guide
Photo of a moderate-sized building with shingle siding, a concrete founda-tion, and a steel-ribbed roof. A large brick chimney extends above the roof in the center where the three wings of the building meet. Tall conifer trees and a grass lawn surround the building.
This 1934 building at the Cle Elum Ranger Station on the Okanogan- Wenatchee National Forest, Pacific Northwest Region is still in use and is in serviceable condition.
Forest Service, National Technology & Development Program 1473–2830–MTDC Facilities January 2015 About the Authors
Kathleen Snodgrass joined the Missoula Technology and Development Center (MTDC) as a project leader in 2001. She began her career with the Forest Service at the Nez Perce National Forest working in facilities, landscape architecture, land line, and general engineering before serving as the facilities architect for about 7 years. She also spent about 10 years working in highway design and construction with the Idaho Division of Highways after graduating from Washington State Uni-versity in 1974 with a bachelor’s degree in architectural studies.
Kathleen C. Marks is a multidisciplinary project leader at MTDC for the facili-ties and environmental compliance and protection (ECAP) programs. She began work for MTDC in 2010 after receiving a bachelor’s degree in civil engineering from Montana State University.
KATHLEEN SNODGRASS, Project Leader; KATHLEEN MARKS Project Assistant, USDA Forest Service, National Technology and Development Program, Mis-
soula, MT 9E92L11 Facility Inspection Field Guide
January 2015 USDA Nondiscrimination Statement
The U.S. Department of Agriculture (USDA) prohibits discrimination in all its programs and activities on the basis of race, color, national origin, age, dis-ability, and where applicable, sex, marital status, familial status, parental sta-tus, religion, sexual orientation, genetic information, political beliefs, reprisal, or because all or part of an individual’s income is derived from any public as-sistance program. (Not all prohibited bases apply to all programs.) Persons with disabilities who require alternative means for communication of program infor-
VerDate Aug 31 2005 16:26 Dec 16, 2020 Jkt 000000 PO 00000 Frm 00086 Fmt 6621 Sfmt 6621 P:\DOCS\116-19\38016.TXT BRIAN 1161
9011
.eps
1161
9113
.eps
83
mation (Braille, large print, audiotape, etc.) should contact USDA’s TARGET Center at (202) 720–2600 (voice and TDD). To file a complaint of discrimination, write USDA, Director, Office of Civil Rights, 1400 Independence Avenue, S.W., Washington, D.C. 20250–9410, or call (800) 795–3272 (voice) or (202) 720–6832 (TDD). USDA is an equal opportunity provider and employer.
Forest Service The Forest Service, an agency of the U.S. Department of Agriculture (USDA),
has developed this information for the guidance of its employees, its contractors, and its cooperating Federal and State agencies. The Forest Service assumes no responsibility for the interpretation or use of this information by anyone except its own employees. The use of trade, firm, or corporation names is for the infor-mation and convenience of the reader. Such use does not constitute an official endorsement or approval of any product or service to the exclusion of others that may be suitable.
Acknowledgments The authors deeply appreciate the contributions of Steve Oravetz, Bruce Crockett,
Randy Warbington, and Mark McDonough, who were the lead developers of the For-est Service Condition Assessment system and provided advice about and informa-tion for this publication. The authors also thank the many Forest Service employees who provided great photos of facilities, especially those who responded to specific item requests. The authors thank the editors and visual information specialists for turning the rough draft into a polished field guide.
The Facility Condition Assessment Form This training guide is a memory-jogger that you can take with you as you perform
facility condition assessments. It contains the same items in the same order as the complex facility condition assessment form that is used to record work items for entry into the Natural Resources Manager (NRM) Infra database. Use this guide to perform condition assessments in a manner consistent with those performed by other inspectors throughout the Forest Service.
Keep in mind that facility condition assessments are only intended to record major facility maintenance needs. Performing operations work and minor mainte-nance work on a regular basis is important, but such work is not recorded through the facility condition assessment process. The National Technology and Develop-ment Program (T&D) report ‘‘So That’s Why It’s Always Cold in Here: A Guide for Conducting Facilities Condition Assessment Surveys’’ (0473–2839–MTDC), provides detailed guidance for inspecting buildings and associated assets to determine their condition and what work is needed to correct deficiencies, including operations and minor maintenance. The report is available in printed form from the Missoula Tech-nology and Development Center (MTDC) or electronically at http:// fsweb.mtdc.wo.fs.fed.us/php/library_card.php?p_num=0473 2839.
This guide does not explain how to properly conduct condition assessments on Forest Service buildings. You will need to take the 7100—Basic Building Condition Assessment and Work Items or 7300—Complex Building Condition Survey Training course in person or through AgLearn before using this guide in the field.
This guide does not explain how to use the NRM Infra database. Please see your supervisor and forest NRM specialist if you need more information about NRM or role assignments to access and modify data in the NRM Infra database.
Before using this guide in the field, print the condition assessment form for each building using the NRM Infra report BLDSRV01JRL: Facility Condition Assessment Form (figure 1). NRM Infra automatically populates the header information for the printed form, except for the inspector signature, inspection date, and inspector name. Check to ensure that you’ve printed the appropriate form (complex versus basic building) and that the header information is accurate.
VerDate Aug 31 2005 16:26 Dec 16, 2020 Jkt 000000 PO 00000 Frm 00087 Fmt 6621 Sfmt 6621 P:\DOCS\116-19\38016.TXT BRIAN
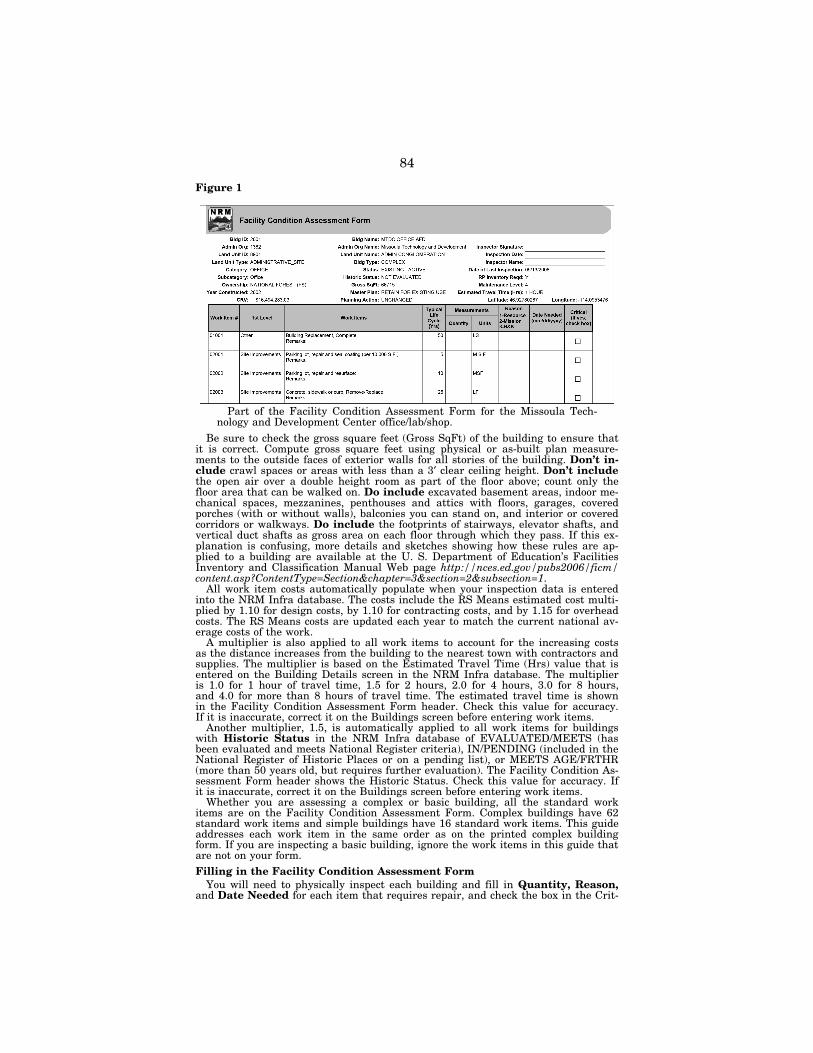
84
Figure 1
Part of the Facility Condition Assessment Form for the Missoula Tech-nology and Development Center office/lab/shop.
Be sure to check the gross square feet (Gross SqFt) of the building to ensure that it is correct. Compute gross square feet using physical or as-built plan measure-ments to the outside faces of exterior walls for all stories of the building. Don’t in-clude crawl spaces or areas with less than a 3′ clear ceiling height. Don’t include the open air over a double height room as part of the floor above; count only the floor area that can be walked on. Do include excavated basement areas, indoor me-chanical spaces, mezzanines, penthouses and attics with floors, garages, covered porches (with or without walls), balconies you can stand on, and interior or covered corridors or walkways. Do include the footprints of stairways, elevator shafts, and vertical duct shafts as gross area on each floor through which they pass. If this ex-planation is confusing, more details and sketches showing how these rules are ap-plied to a building are available at the U. S. Department of Education’s Facilities Inventory and Classification Manual Web page http://nces.ed.gov/pubs2006/ficm/ content.asp?ContentType=Section&chapter=3§ion=2&subsection=1.
All work item costs automatically populate when your inspection data is entered into the NRM Infra database. The costs include the RS Means estimated cost multi-plied by 1.10 for design costs, by 1.10 for contracting costs, and by 1.15 for overhead costs. The RS Means costs are updated each year to match the current national av-erage costs of the work.
A multiplier is also applied to all work items to account for the increasing costs as the distance increases from the building to the nearest town with contractors and supplies. The multiplier is based on the Estimated Travel Time (Hrs) value that is entered on the Building Details screen in the NRM Infra database. The multiplier is 1.0 for 1 hour of travel time, 1.5 for 2 hours, 2.0 for 4 hours, 3.0 for 8 hours, and 4.0 for more than 8 hours of travel time. The estimated travel time is shown in the Facility Condition Assessment Form header. Check this value for accuracy. If it is inaccurate, correct it on the Buildings screen before entering work items.
Another multiplier, 1.5, is automatically applied to all work items for buildings with Historic Status in the NRM Infra database of EVALUATED/MEETS (has been evaluated and meets National Register criteria), IN/PENDING (included in the National Register of Historic Places or on a pending list), or MEETS AGE/FRTHR (more than 50 years old, but requires further evaluation). The Facility Condition As-sessment Form header shows the Historic Status. Check this value for accuracy. If it is inaccurate, correct it on the Buildings screen before entering work items.
Whether you are assessing a complex or basic building, all the standard work items are on the Facility Condition Assessment Form. Complex buildings have 62 standard work items and simple buildings have 16 standard work items. This guide addresses each work item in the same order as on the printed complex building form. If you are inspecting a basic building, ignore the work items in this guide that are not on your form. Filling in the Facility Condition Assessment Form
You will need to physically inspect each building and fill in Quantity, Reason, and Date Needed for each item that requires repair, and check the box in the Crit-
VerDate Aug 31 2005 16:26 Dec 16, 2020 Jkt 000000 PO 00000 Frm 00088 Fmt 6621 Sfmt 6621 P:\DOCS\116-19\38016.TXT BRIAN 1161
9014
.eps
85
ical column, if necessary. The cost for each item self-populates from an interface with the current edition of RS Means Building Construction Cost Data when the information from the printed form is entered electronically into the NRM Infra data-base.
Quantity of work must be measured, calculated, or counted, unless the preprinted unit is LS (lump sum). If the unit is LS, the quantity is always ‘‘1’’ if the work is needed and ‘‘0’’ if no work is needed.
Other units of measure are: CSF: 100 square feet EA: each LF: linear feet MSF: 1,000 square feet M.S.F.: 10,000 square feet SF: square feet SQ: 100 square feet STEP, EA: stair riser SYSTEM: each complete system
To calculate square feet, measure the length and width (or length and height for vertical surfaces) in feet, then multiply length by width (or length by height). CSF, MSF, SQ, and M.S.F. are variants of SF, and are explained further under items using these units of measure. Do not confuse M.S.F. with MSF. Available fonts pre-vented use of the Roman numeral for 10,000 on the form. Designating 10,000 square feet as M.S.F. was the workaround.
The Reason column identifies the reason for performing the work. It contains only three choices:
1. Resource protection work items must be performed to avoid damage, obstruc-tion, or negative impact to a natural or cultural resource.
2. Mission work items must be completed to ensure the ability of employees to carry out the Forest Service mission. Needs are related to administration and providing services (transportation, recreation, grazing, etc.) that do not fall into the H&S or Resource categories.
3. Health and safety (H&S) work items are necessary to address immediate threats to human health and safety.
In the Date Needed column, you normally should write in the last day of the fiscal year in which the work needs to be performed.
Check the box in the Critical column only if completion of the work item is nec-essary to correct a serious and immediate threat to health or safety, a natural or cultural resource, or the ability of the Forest Service to carry out its mission. Other work items necessary to address potential risks to public or employee safety or health; compliance with codes, standards, regulations, etc.; or needs that address po-tential adverse consequences to natural resources or mission accomplishment are considered non-critical. For example:
• Complying with Notices of Violation (Occupational Safety and Health Adminis-tration [OSHA], Environmental Protection Agency [EPA], etc.) is a critical health and safety need.
• Preventing irreversible damage to or loss of a historic structure is a critical re-source protection need.
• Providing accessibility for people with disabilities is a non-critical health and safety need.
• Complying with Federal, State, and local building codes is a non-critical health and safety need.
• Making modifications to accommodate increased visitation is a non-critical mis-sion need.
• Energy efficiency or renewable energy retrofits are a non-critical mission need. Please DO check your data to ensure that everything is entered correctly, includ-
ing the unit of measure. Inspection Tips
Experienced inspectors provided the following tips to help you perform a quicker, more effective inspection.
• Use two people to survey large labs or office buildings. One person can measure while the other records.
• Use a set of as-built plans (if available) to count light fixtures, windows, etc.
VerDate Aug 31 2005 16:26 Dec 16, 2020 Jkt 000000 PO 00000 Frm 00089 Fmt 6621 Sfmt 6621 P:\DOCS\116-19\38016.TXT BRIAN
86
• If you don’t have as-built plans, sketch a simple floor plan as you inspect to show doors, windows, flooring types, and dimensions. Keep the sketch in the building file for future reference.
• Builders often use rules of thumb to estimate quantities. You can, too, where it seems prudent. For instance:
➢ Multiply the gross square feet of the finished area of a house by 4.5 for a good approximation of the total square feet of gypsum board that would be needed to completely replace the gypsum board inside the house. If the garage is a full-finish structure, multiply its square footage by 2.25 and then add the result to the house total. A reasonable multiplier for small office buildings is 3.2.
◊ These estimating multipliers also work for repainting the entire interior.
➢ Each region has a cooling ratio that is either implied or dictated by the local building officials. The ratio states how many square feet can be conditioned per ton of cooling. If you know this ratio, you can easily estimate the tons of cooling capacity needed for the building.
◊ Use the adjustment factors shown in table 1 to figure the roof area on the slope, if you know the roof pitch and the horizontal area covered by the roof (including overhangs). Multiply the covered area by the adjustment factor.
Table 1
Roof Slope Adjustment Factor
3 in 12 1.031 4 in 12 1.054 6 in 12 1.118 8 in 12 1.202 12 in 12 1.414
• After entering the work items into the NRM Infra database, check your entered data to ensure that you entered everything correctly and that you used the unit of measure the work item requires.
➢ Enter roofing and siding quantities in 100 square feet units (CSF), not square feet units (SF).
➢ Enter parking lot seal coat in 10,000 square feet units (M.S.F.), and parking lot resurfacing in 1,000 square feet units (MSF).
• A work item is deferred maintenance if the material has been in place longer than the typical life cycle listed on the page for each work item. A carpet that was installed in 2000 and inspected in 2012 was 12 years old when inspected. Because the life cycle for carpeting is 8 years, replacing the carpet would be considered deferred maintenance using the Forest Service standard, even if the carpet was still in good condition. Whether you agree with this logic or not, please conform to the standard so our practices remain uniform and defensible.
• A list of survey tools a facility inspector may wish to take along to increase effi-ciency when performing condition assessment inspections is available at http:// fsweb.wo.fs.fed.us/eng/programs/facilities/documents/ToolList.doc.
Work Items The remainder of this guide consists of information about the standard work
items. Each work item has its own page that includes a photo or two depicting the item as well as information to help you decide whether the item applies to the build-ing you’re inspecting, how often this work normally is needed, and how to measure and record the quantity of work. This guide includes much of the information in-cluded in the ‘‘Building Work Items Data Dictionary’’ http://fsweb.wo.fs.fed.us/eng/ programs/facilities/documents/BldgsWIDDictionary.pdf.
In the interest of minimizing the number of work items, similar work is some-times grouped together under a single work item. The actual replacement costs for these similar items aren’t identical, so a representative cost is used. The work item title may not reflect the range of work covered by the item. Check the consider-ations bullets for more information about the work included in the item.
VerDate Aug 31 2005 16:26 Dec 16, 2020 Jkt 000000 PO 00000 Frm 00090 Fmt 6621 Sfmt 6621 P:\DOCS\116-19\38016.TXT BRIAN
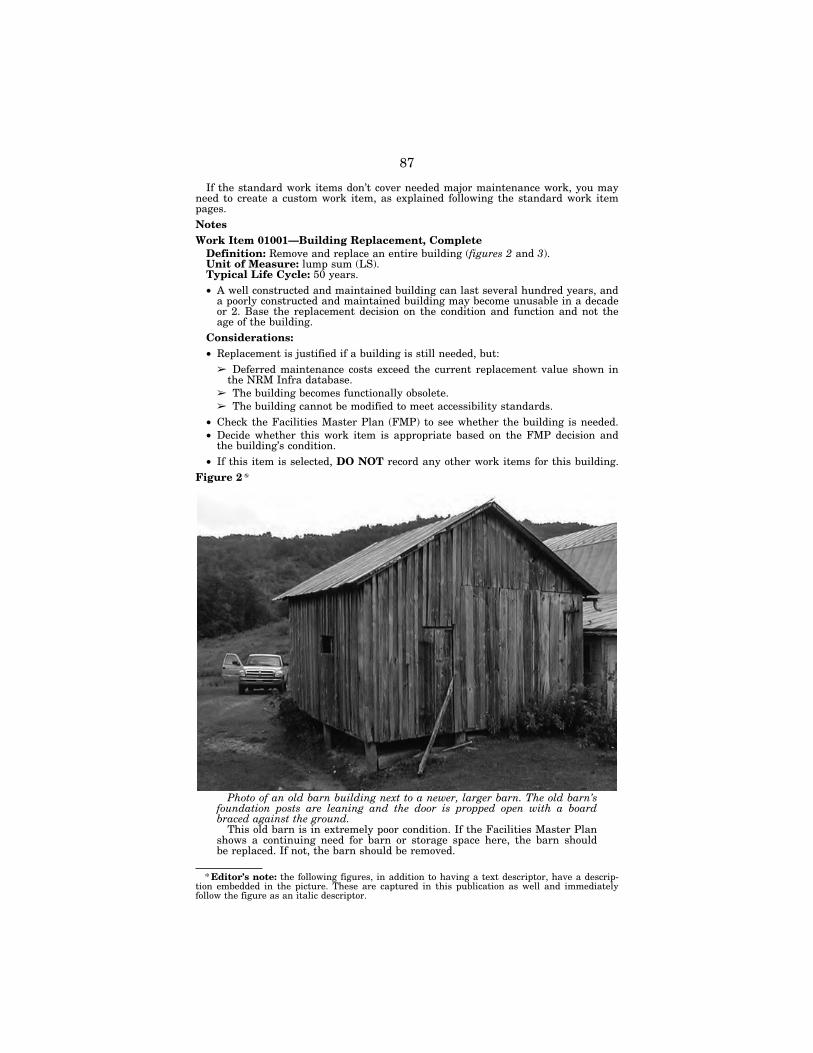
87
* Editor’s note: the following figures, in addition to having a text descriptor, have a descrip-tion embedded in the picture. These are captured in this publication as well and immediately follow the figure as an italic descriptor.
If the standard work items don’t cover needed major maintenance work, you may need to create a custom work item, as explained following the standard work item pages. Notes Work Item 01001—Building Replacement, Complete
Definition: Remove and replace an entire building (figures 2 and 3). Unit of Measure: lump sum (LS). Typical Life Cycle: 50 years. • A well constructed and maintained building can last several hundred years, and
a poorly constructed and maintained building may become unusable in a decade or 2. Base the replacement decision on the condition and function and not the age of the building.
Considerations: • Replacement is justified if a building is still needed, but:
➢ Deferred maintenance costs exceed the current replacement value shown in the NRM Infra database.
➢ The building becomes functionally obsolete. ➢ The building cannot be modified to meet accessibility standards.
• Check the Facilities Master Plan (FMP) to see whether the building is needed. • Decide whether this work item is appropriate based on the FMP decision and
the building’s condition. • If this item is selected, DO NOT record any other work items for this building.
Figure 2 *
Photo of an old barn building next to a newer, larger barn. The old barn’s foundation posts are leaning and the door is propped open with a board braced against the ground.
This old barn is in extremely poor condition. If the Facilities Master Plan shows a continuing need for barn or storage space here, the barn should be replaced. If not, the barn should be removed.
VerDate Aug 31 2005 16:26 Dec 16, 2020 Jkt 000000 PO 00000 Frm 00091 Fmt 6621 Sfmt 6621 P:\DOCS\116-19\38016.TXT BRIAN 1161
9015
.eps
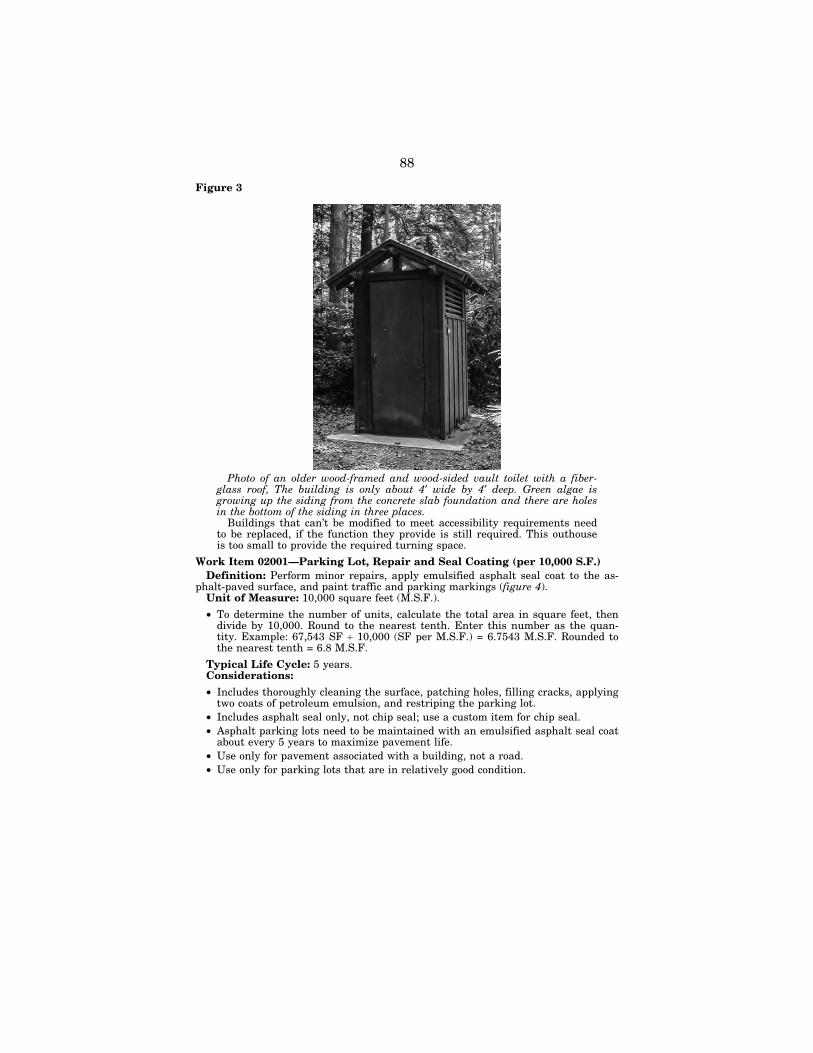
88
Figure 3
Photo of an older wood-framed and wood-sided vault toilet with a fiber-glass roof, The building is only about 4′ wide by 4′ deep. Green algae is growing up the siding from the concrete slab foundation and there are holes in the bottom of the siding in three places.
Buildings that can’t be modified to meet accessibility requirements need to be replaced, if the function they provide is still required. This outhouse is too small to provide the required turning space.
Work Item 02001—Parking Lot, Repair and Seal Coating (per 10,000 S.F.) Definition: Perform minor repairs, apply emulsified asphalt seal coat to the as-
phalt-paved surface, and paint traffic and parking markings (figure 4). Unit of Measure: 10,000 square feet (M.S.F.).
• To determine the number of units, calculate the total area in square feet, then divide by 10,000. Round to the nearest tenth. Enter this number as the quan-tity. Example: 67,543 SF ÷ 10,000 (SF per M.S.F.) = 6.7543 M.S.F. Rounded to the nearest tenth = 6.8 M.S.F.
Typical Life Cycle: 5 years. Considerations:
• Includes thoroughly cleaning the surface, patching holes, filling cracks, applying two coats of petroleum emulsion, and restriping the parking lot.
• Includes asphalt seal only, not chip seal; use a custom item for chip seal. • Asphalt parking lots need to be maintained with an emulsified asphalt seal coat
about every 5 years to maximize pavement life. • Use only for pavement associated with a building, not a road. • Use only for parking lots that are in relatively good condition.
VerDate Aug 31 2005 16:26 Dec 16, 2020 Jkt 000000 PO 00000 Frm 00092 Fmt 6621 Sfmt 6621 P:\DOCS\116-19\38016.TXT BRIAN 1161
9016
.eps
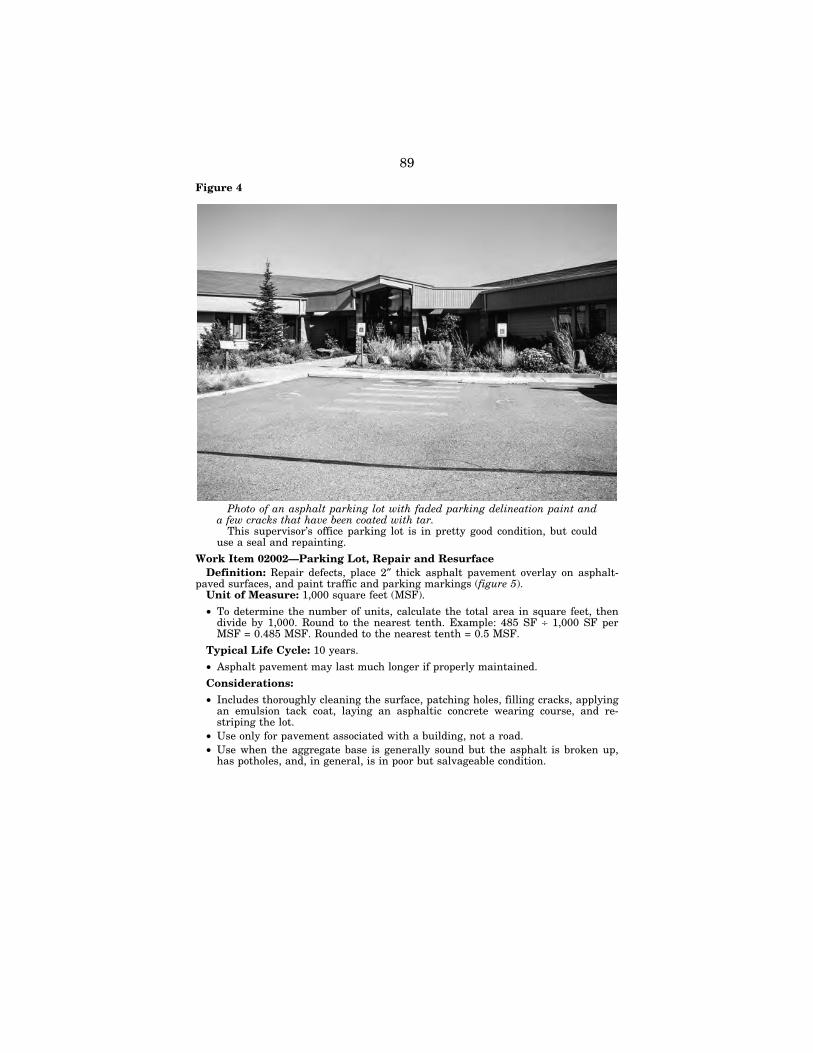
89
Figure 4
Photo of an asphalt parking lot with faded parking delineation paint and a few cracks that have been coated with tar.
This supervisor’s office parking lot is in pretty good condition, but could use a seal and repainting.
Work Item 02002—Parking Lot, Repair and Resurface Definition: Repair defects, place 2″ thick asphalt pavement overlay on asphalt-
paved surfaces, and paint traffic and parking markings (figure 5). Unit of Measure: 1,000 square feet (MSF).
• To determine the number of units, calculate the total area in square feet, then divide by 1,000. Round to the nearest tenth. Example: 485 SF ÷ 1,000 SF per MSF = 0.485 MSF. Rounded to the nearest tenth = 0.5 MSF.
Typical Life Cycle: 10 years.
• Asphalt pavement may last much longer if properly maintained.
Considerations:
• Includes thoroughly cleaning the surface, patching holes, filling cracks, applying an emulsion tack coat, laying an asphaltic concrete wearing course, and re-striping the lot.
• Use only for pavement associated with a building, not a road. • Use when the aggregate base is generally sound but the asphalt is broken up,
has potholes, and, in general, is in poor but salvageable condition.
VerDate Aug 31 2005 16:26 Dec 16, 2020 Jkt 000000 PO 00000 Frm 00093 Fmt 6621 Sfmt 6621 P:\DOCS\116-19\38016.TXT BRIAN 1161
9017
.eps
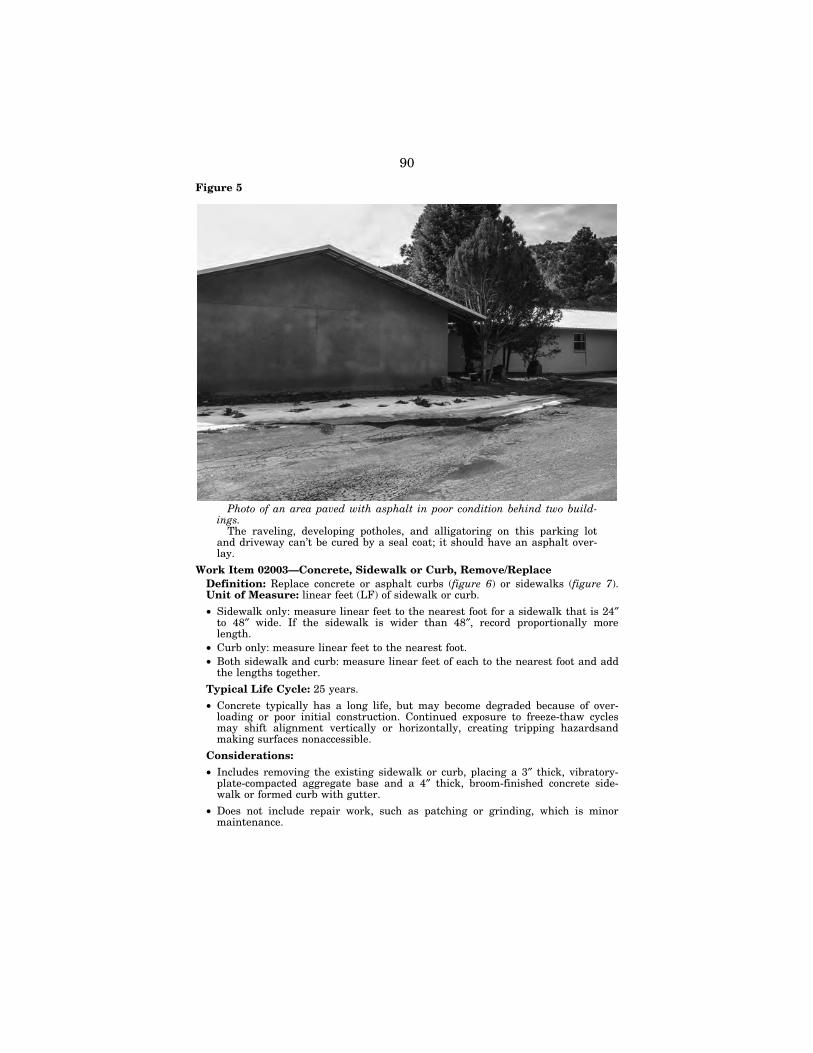
90
Figure 5
Photo of an area paved with asphalt in poor condition behind two build-ings.
The raveling, developing potholes, and alligatoring on this parking lot and driveway can’t be cured by a seal coat; it should have an asphalt over-lay.
Work Item 02003—Concrete, Sidewalk or Curb, Remove/Replace Definition: Replace concrete or asphalt curbs (figure 6) or sidewalks (figure 7). Unit of Measure: linear feet (LF) of sidewalk or curb.
• Sidewalk only: measure linear feet to the nearest foot for a sidewalk that is 24″ to 48″ wide. If the sidewalk is wider than 48″, record proportionally more length.
• Curb only: measure linear feet to the nearest foot. • Both sidewalk and curb: measure linear feet of each to the nearest foot and add
the lengths together.
Typical Life Cycle: 25 years.
• Concrete typically has a long life, but may become degraded because of over-loading or poor initial construction. Continued exposure to freeze-thaw cycles may shift alignment vertically or horizontally, creating tripping hazardsand making surfaces nonaccessible.
Considerations:
• Includes removing the existing sidewalk or curb, placing a 3″ thick, vibratory- plate-compacted aggregate base and a 4″ thick, broom-finished concrete side-walk or formed curb with gutter.
• Does not include repair work, such as patching or grinding, which is minor maintenance.
VerDate Aug 31 2005 16:26 Dec 16, 2020 Jkt 000000 PO 00000 Frm 00094 Fmt 6621 Sfmt 6621 P:\DOCS\116-19\38016.TXT BRIAN 1161
9018
.eps
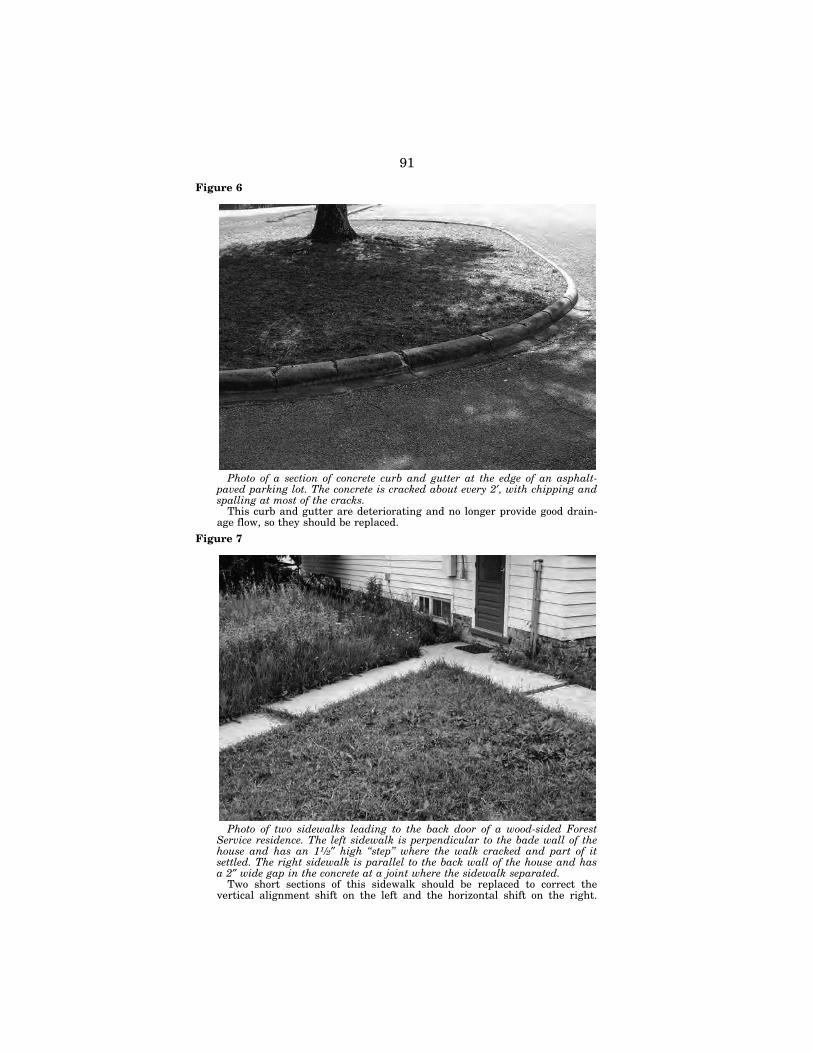
91
Figure 6
Photo of a section of concrete curb and gutter at the edge of an asphalt- paved parking lot. The concrete is cracked about every 2′, with chipping and spalling at most of the cracks.
This curb and gutter are deteriorating and no longer provide good drain-age flow, so they should be replaced.
Figure 7
Photo of two sidewalks leading to the back door of a wood-sided Forest Service residence. The left sidewalk is perpendicular to the bade wall of the house and has an 11⁄2″ high ‘‘step’’ where the walk cracked and part of it settled. The right sidewalk is parallel to the back wall of the house and has a 2″ wide gap in the concrete at a joint where the sidewalk separated.
Two short sections of this sidewalk should be replaced to correct the vertical alignment shift on the left and the horizontal shift on the right.
VerDate Aug 31 2005 16:26 Dec 16, 2020 Jkt 000000 PO 00000 Frm 00095 Fmt 6621 Sfmt 6621 P:\DOCS\116-19\38016.TXT BRIAN 1161
9019
.eps
1161
9020
.eps
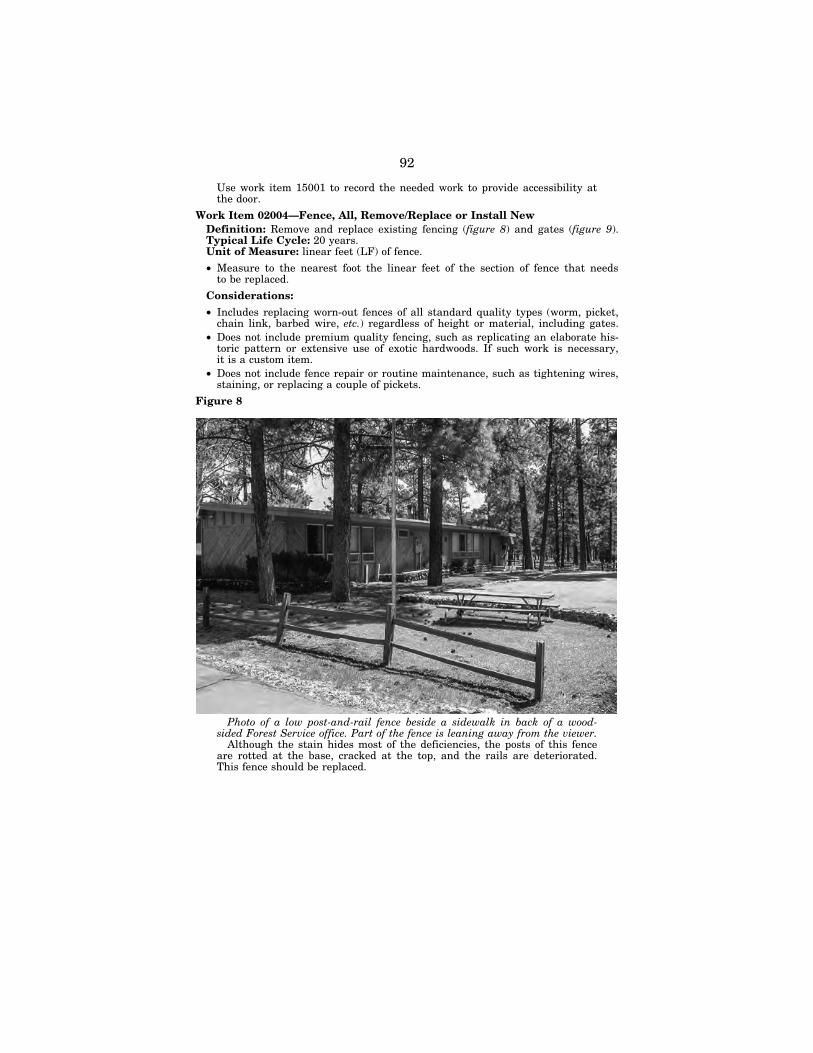
92
Use work item 15001 to record the needed work to provide accessibility at the door.
Work Item 02004—Fence, All, Remove/Replace or Install New Definition: Remove and replace existing fencing (figure 8) and gates (figure 9). Typical Life Cycle: 20 years. Unit of Measure: linear feet (LF) of fence.
• Measure to the nearest foot the linear feet of the section of fence that needs to be replaced.
Considerations:
• Includes replacing worn-out fences of all standard quality types (worm, picket, chain link, barbed wire, etc.) regardless of height or material, including gates.
• Does not include premium quality fencing, such as replicating an elaborate his-toric pattern or extensive use of exotic hardwoods. If such work is necessary, it is a custom item.
• Does not include fence repair or routine maintenance, such as tightening wires, staining, or replacing a couple of pickets.
Figure 8
Photo of a low post-and-rail fence beside a sidewalk in back of a wood- sided Forest Service office. Part of the fence is leaning away from the viewer.
Although the stain hides most of the deficiencies, the posts of this fence are rotted at the base, cracked at the top, and the rails are deteriorated. This fence should be replaced.
VerDate Aug 31 2005 16:26 Dec 16, 2020 Jkt 000000 PO 00000 Frm 00096 Fmt 6621 Sfmt 6621 P:\DOCS\116-19\38016.TXT BRIAN 1161
9021
.eps
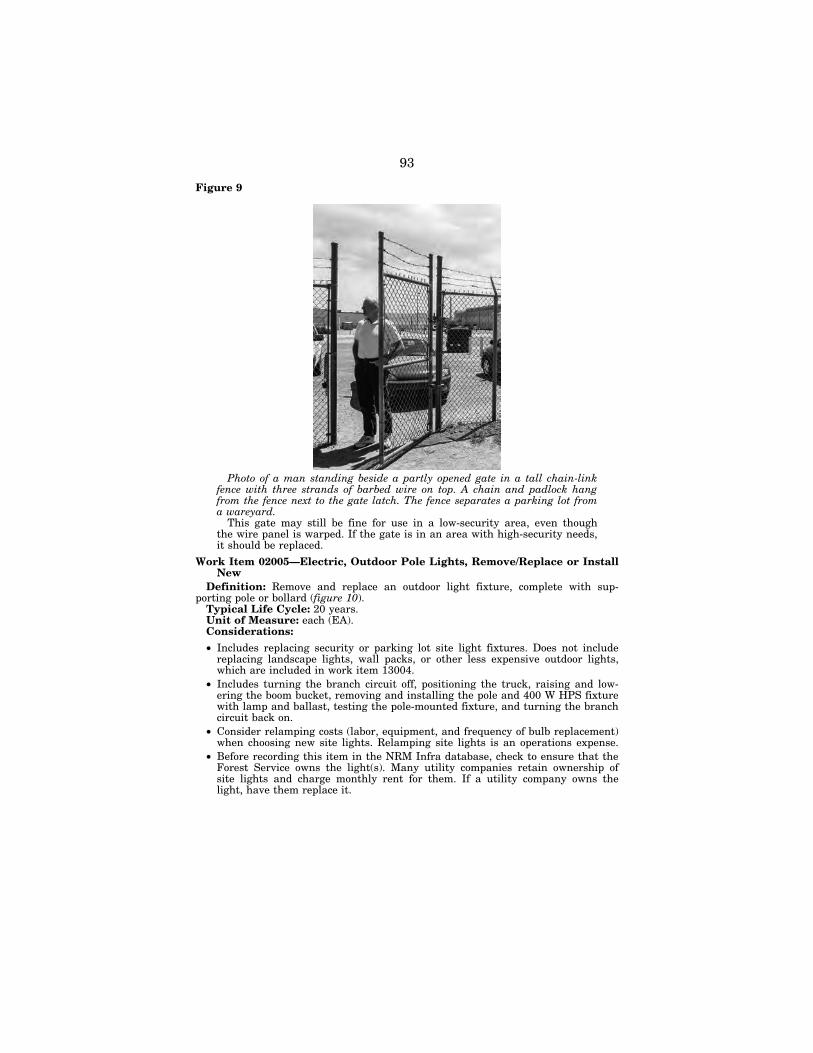
93
Figure 9
Photo of a man standing beside a partly opened gate in a tall chain-link fence with three strands of barbed wire on top. A chain and padlock hang from the fence next to the gate latch. The fence separates a parking lot from a wareyard.
This gate may still be fine for use in a low-security area, even though the wire panel is warped. If the gate is in an area with high-security needs, it should be replaced.
Work Item 02005—Electric, Outdoor Pole Lights, Remove/Replace or Install New
Definition: Remove and replace an outdoor light fixture, complete with sup-porting pole or bollard (figure 10).
Typical Life Cycle: 20 years. Unit of Measure: each (EA). Considerations:
• Includes replacing security or parking lot site light fixtures. Does not include replacing landscape lights, wall packs, or other less expensive outdoor lights, which are included in work item 13004.
• Includes turning the branch circuit off, positioning the truck, raising and low-ering the boom bucket, removing and installing the pole and 400 W HPS fixture with lamp and ballast, testing the pole-mounted fixture, and turning the branch circuit back on.
• Consider relamping costs (labor, equipment, and frequency of bulb replacement) when choosing new site lights. Relamping site lights is an operations expense.
• Before recording this item in the NRM Infra database, check to ensure that the Forest Service owns the light(s). Many utility companies retain ownership of site lights and charge monthly rent for them. If a utility company owns the light, have them replace it.
VerDate Aug 31 2005 16:26 Dec 16, 2020 Jkt 000000 PO 00000 Frm 00097 Fmt 6621 Sfmt 6621 P:\DOCS\116-19\38016.TXT BRIAN 1161
9022
.eps
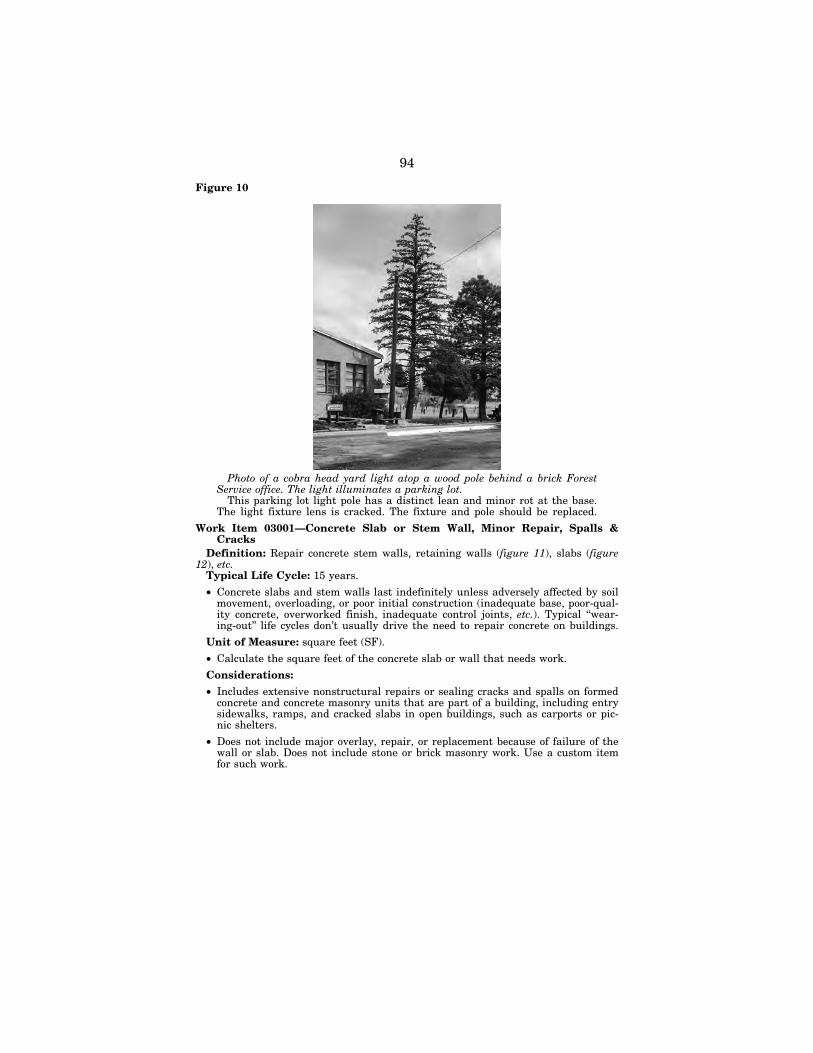
94
Figure 10
Photo of a cobra head yard light atop a wood pole behind a brick Forest Service office. The light illuminates a parking lot.
This parking lot light pole has a distinct lean and minor rot at the base. The light fixture lens is cracked. The fixture and pole should be replaced.
Work Item 03001—Concrete Slab or Stem Wall, Minor Repair, Spalls & Cracks
Definition: Repair concrete stem walls, retaining walls (figure 11), slabs (figure 12), etc.
Typical Life Cycle: 15 years.
• Concrete slabs and stem walls last indefinitely unless adversely affected by soil movement, overloading, or poor initial construction (inadequate base, poor-qual-ity concrete, overworked finish, inadequate control joints, etc.). Typical ‘‘wear-ing-out’’ life cycles don’t usually drive the need to repair concrete on buildings.
Unit of Measure: square feet (SF).
• Calculate the square feet of the concrete slab or wall that needs work.
Considerations:
• Includes extensive nonstructural repairs or sealing cracks and spalls on formed concrete and concrete masonry units that are part of a building, including entry sidewalks, ramps, and cracked slabs in open buildings, such as carports or pic-nic shelters.
• Does not include major overlay, repair, or replacement because of failure of the wall or slab. Does not include stone or brick masonry work. Use a custom item for such work.
VerDate Aug 31 2005 16:26 Dec 16, 2020 Jkt 000000 PO 00000 Frm 00098 Fmt 6621 Sfmt 6621 P:\DOCS\116-19\38016.TXT BRIAN 1161
9023
.eps
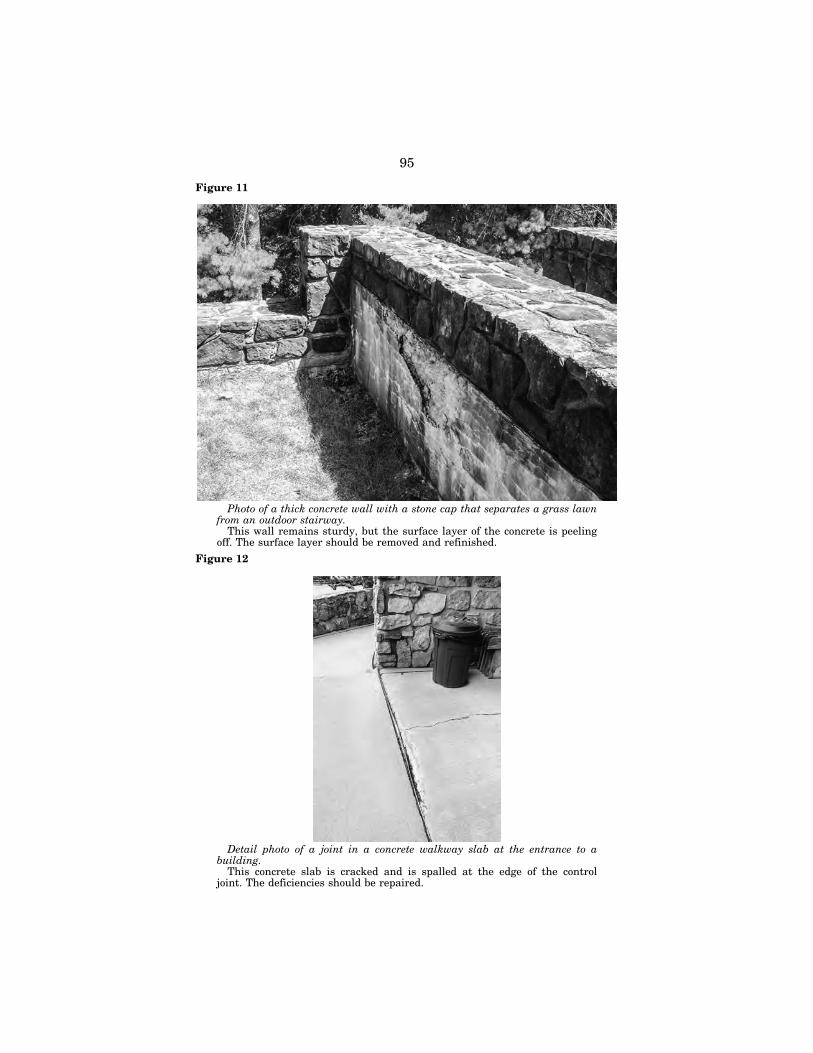
95
Figure 11
Photo of a thick concrete wall with a stone cap that separates a grass lawn from an outdoor stairway.
This wall remains sturdy, but the surface layer of the concrete is peeling off. The surface layer should be removed and refinished.
Figure 12
Detail photo of a joint in a concrete walkway slab at the entrance to a building.
This concrete slab is cracked and is spalled at the edge of the control joint. The deficiencies should be repaired.
VerDate Aug 31 2005 16:26 Dec 16, 2020 Jkt 000000 PO 00000 Frm 00099 Fmt 6621 Sfmt 6621 P:\DOCS\116-19\38016.TXT BRIAN 1161
9024
.eps
1161
9025
.eps
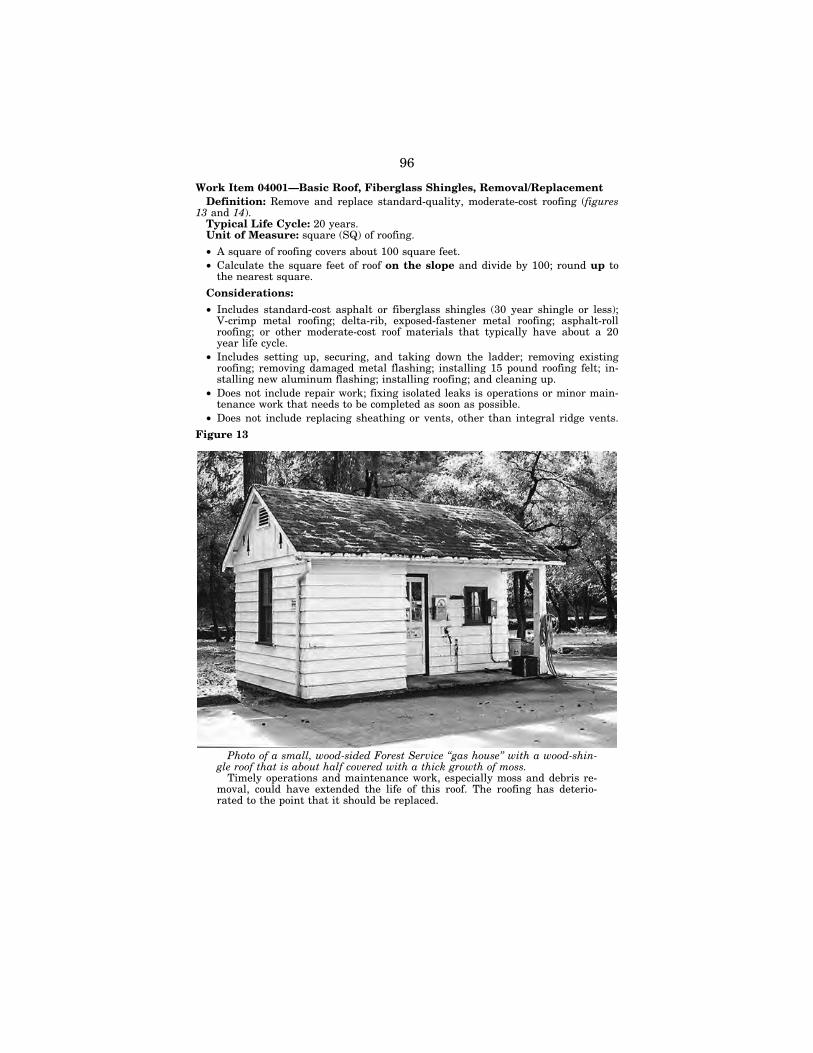
96
Work Item 04001—Basic Roof, Fiberglass Shingles, Removal/Replacement Definition: Remove and replace standard-quality, moderate-cost roofing (figures
13 and 14). Typical Life Cycle: 20 years. Unit of Measure: square (SQ) of roofing.
• A square of roofing covers about 100 square feet. • Calculate the square feet of roof on the slope and divide by 100; round up to
the nearest square.
Considerations:
• Includes standard-cost asphalt or fiberglass shingles (30 year shingle or less); V-crimp metal roofing; delta-rib, exposed-fastener metal roofing; asphalt-roll roofing; or other moderate-cost roof materials that typically have about a 20 year life cycle.
• Includes setting up, securing, and taking down the ladder; removing existing roofing; removing damaged metal flashing; installing 15 pound roofing felt; in-stalling new aluminum flashing; installing roofing; and cleaning up.
• Does not include repair work; fixing isolated leaks is operations or minor main-tenance work that needs to be completed as soon as possible.
• Does not include replacing sheathing or vents, other than integral ridge vents.
Figure 13
Photo of a small, wood-sided Forest Service ‘‘gas house’’ with a wood-shin-gle roof that is about half covered with a thick growth of moss.
Timely operations and maintenance work, especially moss and debris re-moval, could have extended the life of this roof. The roofing has deterio-rated to the point that it should be replaced.
VerDate Aug 31 2005 16:26 Dec 16, 2020 Jkt 000000 PO 00000 Frm 00100 Fmt 6621 Sfmt 6621 P:\DOCS\116-19\38016.TXT BRIAN 1161
9026
.eps
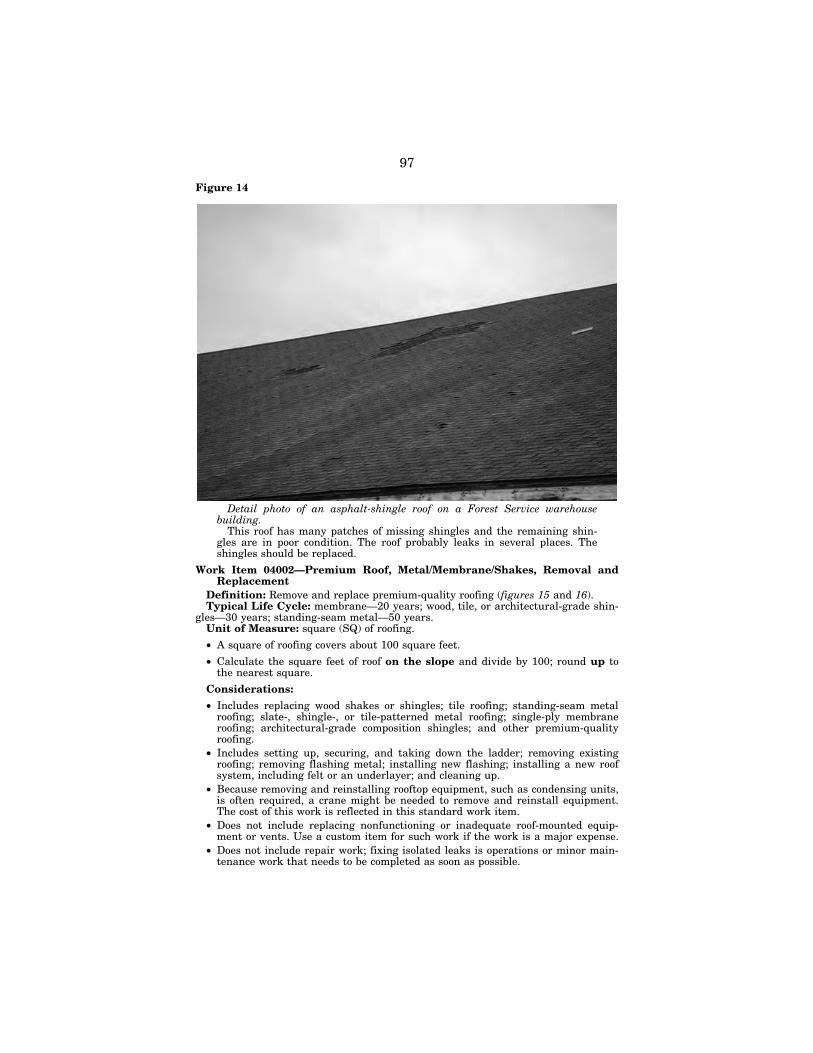
97
Figure 14
Detail photo of an asphalt-shingle roof on a Forest Service warehouse building.
This roof has many patches of missing shingles and the remaining shin-gles are in poor condition. The roof probably leaks in several places. The shingles should be replaced.
Work Item 04002—Premium Roof, Metal/Membrane/Shakes, Removal and Replacement
Definition: Remove and replace premium-quality roofing (figures 15 and 16). Typical Life Cycle: membrane—20 years; wood, tile, or architectural-grade shin-
gles—30 years; standing-seam metal—50 years. Unit of Measure: square (SQ) of roofing.
• A square of roofing covers about 100 square feet.
• Calculate the square feet of roof on the slope and divide by 100; round up to the nearest square.
Considerations:
• Includes replacing wood shakes or shingles; tile roofing; standing-seam metal roofing; slate-, shingle-, or tile-patterned metal roofing; single-ply membrane roofing; architectural-grade composition shingles; and other premium-quality roofing.
• Includes setting up, securing, and taking down the ladder; removing existing roofing; removing flashing metal; installing new flashing; installing a new roof system, including felt or an underlayer; and cleaning up.
• Because removing and reinstalling rooftop equipment, such as condensing units, is often required, a crane might be needed to remove and reinstall equipment. The cost of this work is reflected in this standard work item.
• Does not include replacing nonfunctioning or inadequate roof-mounted equip-ment or vents. Use a custom item for such work if the work is a major expense.
• Does not include repair work; fixing isolated leaks is operations or minor main-tenance work that needs to be completed as soon as possible.
VerDate Aug 31 2005 16:26 Dec 16, 2020 Jkt 000000 PO 00000 Frm 00101 Fmt 6621 Sfmt 6621 P:\DOCS\116-19\38016.TXT BRIAN 1161
9027
.eps
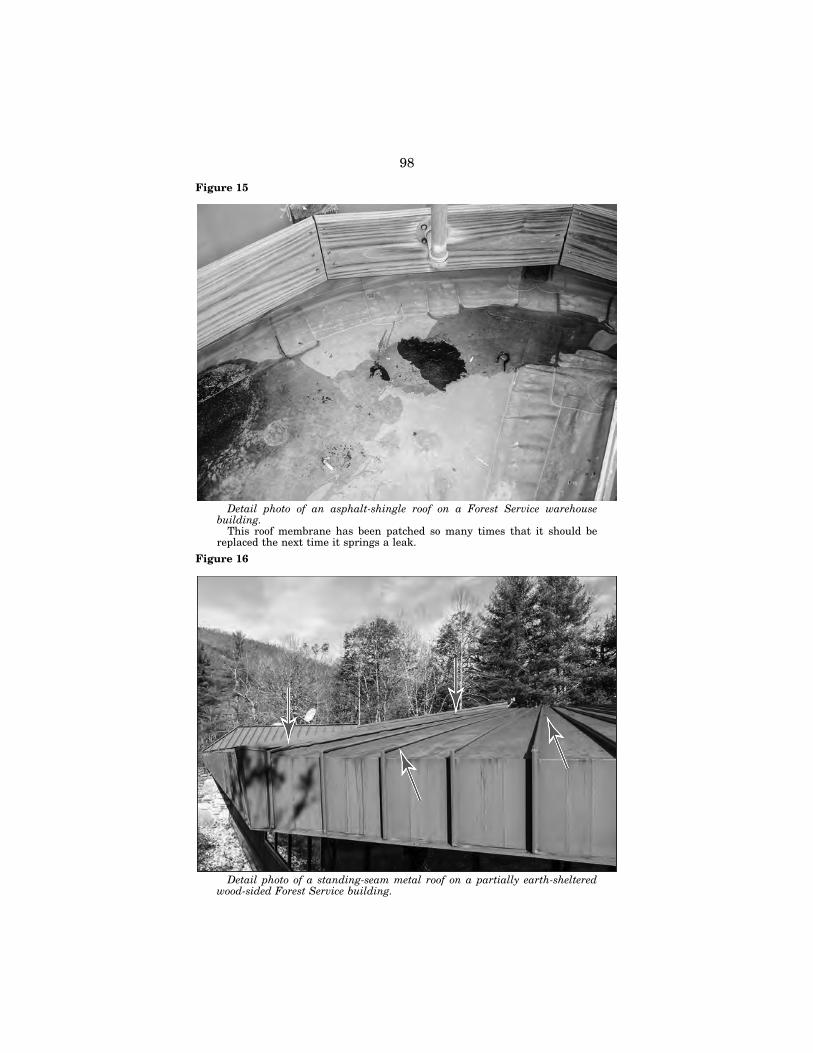
98
Figure 15
Detail photo of an asphalt-shingle roof on a Forest Service warehouse building.
This roof membrane has been patched so many times that it should be replaced the next time it springs a leak.
Figure 16
Detail photo of a standing-seam metal roof on a partially earth-sheltered wood-sided Forest Service building.
VerDate Aug 31 2005 16:26 Dec 16, 2020 Jkt 000000 PO 00000 Frm 00102 Fmt 6621 Sfmt 6621 P:\DOCS\116-19\38016.TXT BRIAN 1161
9028
.eps
1161
9029
.eps
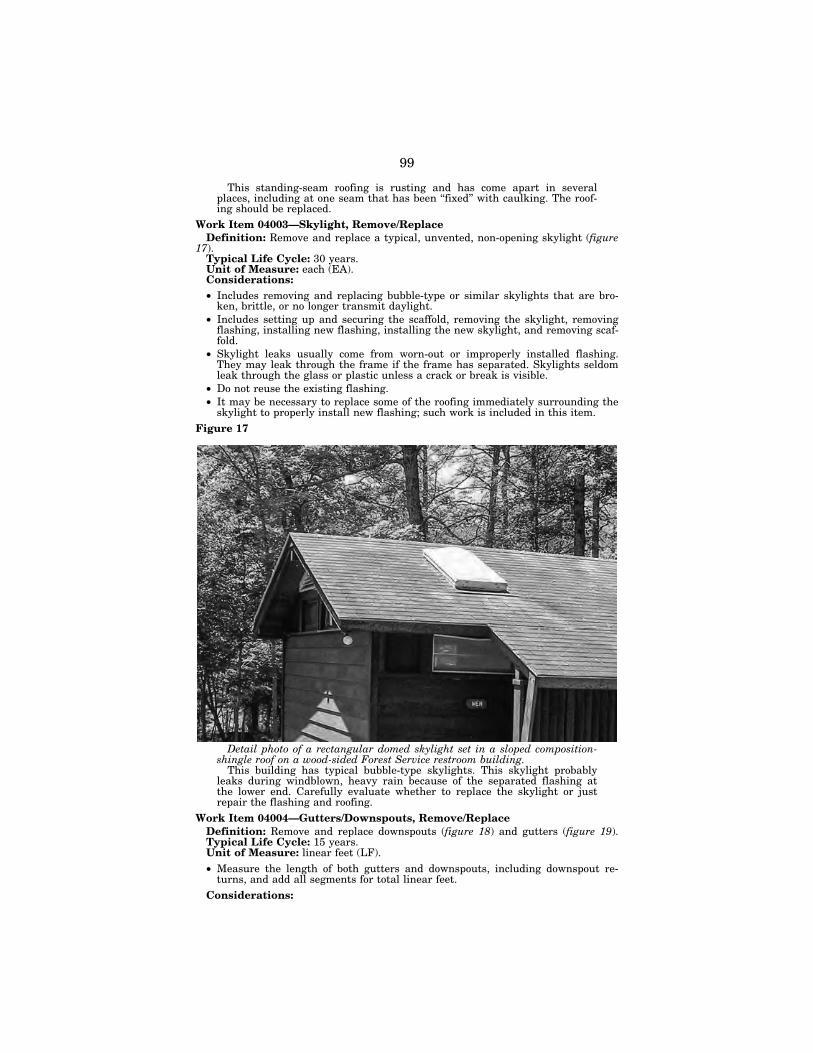
99
This standing-seam roofing is rusting and has come apart in several places, including at one seam that has been ‘‘fixed’’ with caulking. The roof-ing should be replaced.
Work Item 04003—Skylight, Remove/Replace Definition: Remove and replace a typical, unvented, non-opening skylight (figure
17). Typical Life Cycle: 30 years. Unit of Measure: each (EA). Considerations: • Includes removing and replacing bubble-type or similar skylights that are bro-
ken, brittle, or no longer transmit daylight. • Includes setting up and securing the scaffold, removing the skylight, removing
flashing, installing new flashing, installing the new skylight, and removing scaf-fold.
• Skylight leaks usually come from worn-out or improperly installed flashing. They may leak through the frame if the frame has separated. Skylights seldom leak through the glass or plastic unless a crack or break is visible.
• Do not reuse the existing flashing. • It may be necessary to replace some of the roofing immediately surrounding the
skylight to properly install new flashing; such work is included in this item. Figure 17
Detail photo of a rectangular domed skylight set in a sloped composition- shingle roof on a wood-sided Forest Service restroom building.
This building has typical bubble-type skylights. This skylight probably leaks during windblown, heavy rain because of the separated flashing at the lower end. Carefully evaluate whether to replace the skylight or just repair the flashing and roofing.
Work Item 04004—Gutters/Downspouts, Remove/Replace Definition: Remove and replace downspouts (figure 18) and gutters (figure 19). Typical Life Cycle: 15 years. Unit of Measure: linear feet (LF). • Measure the length of both gutters and downspouts, including downspout re-
turns, and add all segments for total linear feet. Considerations:
VerDate Aug 31 2005 16:26 Dec 16, 2020 Jkt 000000 PO 00000 Frm 00103 Fmt 6621 Sfmt 6621 P:\DOCS\116-19\38016.TXT BRIAN 1161
9030
.eps
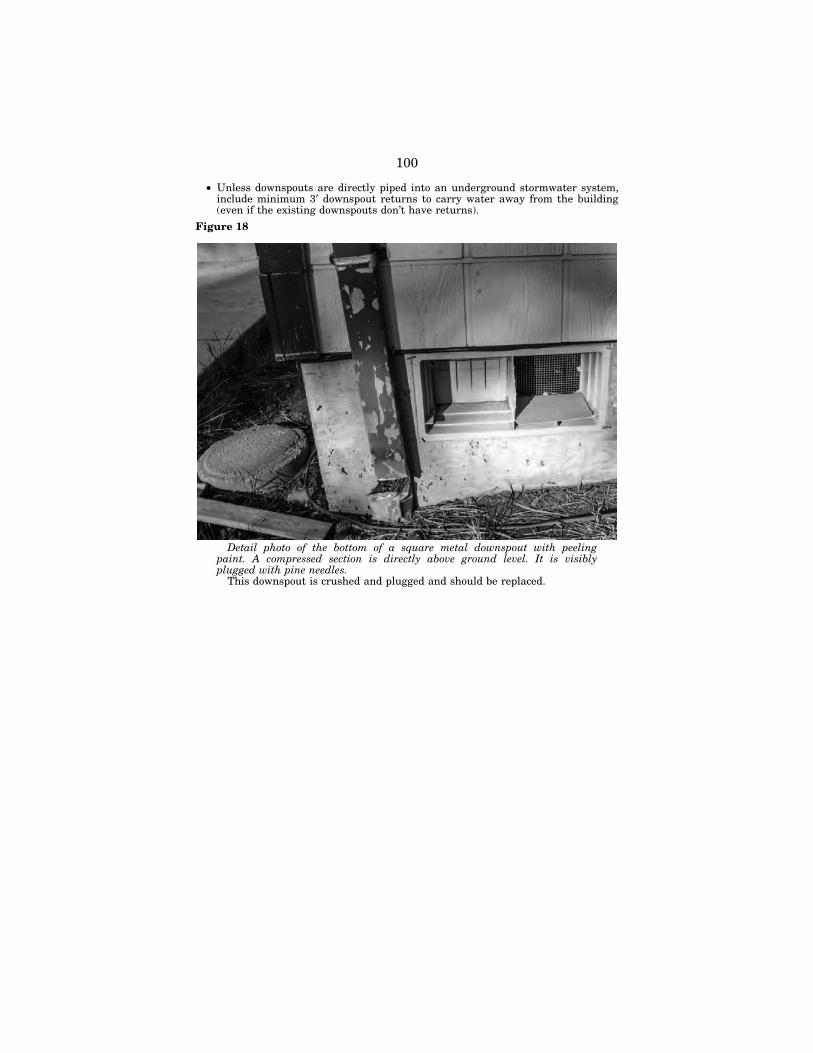
100
• Unless downspouts are directly piped into an underground stormwater system, include minimum 3′ downspout returns to carry water away from the building (even if the existing downspouts don’t have returns).
Figure 18
Detail photo of the bottom of a square metal downspout with peeling paint. A compressed section is directly above ground level. It is visibly plugged with pine needles.
This downspout is crushed and plugged and should be replaced.
VerDate Aug 31 2005 16:26 Dec 16, 2020 Jkt 000000 PO 00000 Frm 00104 Fmt 6621 Sfmt 6621 P:\DOCS\116-19\38016.TXT BRIAN 1161
9031
.eps
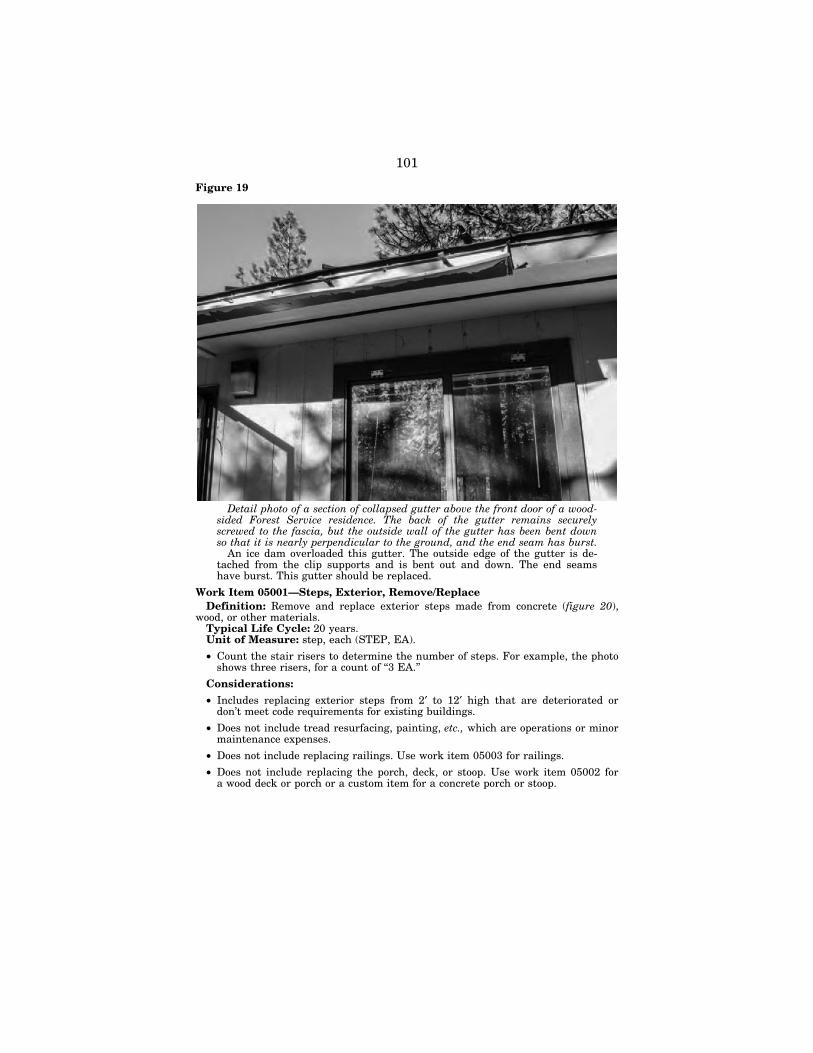
101
Figure 19
Detail photo of a section of collapsed gutter above the front door of a wood- sided Forest Service residence. The back of the gutter remains securely screwed to the fascia, but the outside wall of the gutter has been bent down so that it is nearly perpendicular to the ground, and the end seam has burst.
An ice dam overloaded this gutter. The outside edge of the gutter is de-tached from the clip supports and is bent out and down. The end seams have burst. This gutter should be replaced.
Work Item 05001—Steps, Exterior, Remove/Replace Definition: Remove and replace exterior steps made from concrete (figure 20),
wood, or other materials. Typical Life Cycle: 20 years. Unit of Measure: step, each (STEP, EA).
• Count the stair risers to determine the number of steps. For example, the photo shows three risers, for a count of ‘‘3 EA.’’
Considerations:
• Includes replacing exterior steps from 2′ to 12′ high that are deteriorated or don’t meet code requirements for existing buildings.
• Does not include tread resurfacing, painting, etc., which are operations or minor maintenance expenses.
• Does not include replacing railings. Use work item 05003 for railings.
• Does not include replacing the porch, deck, or stoop. Use work item 05002 for a wood deck or porch or a custom item for a concrete porch or stoop.
VerDate Aug 31 2005 16:26 Dec 16, 2020 Jkt 000000 PO 00000 Frm 00105 Fmt 6621 Sfmt 6621 P:\DOCS\116-19\38016.TXT BRIAN 1161
9032
.eps
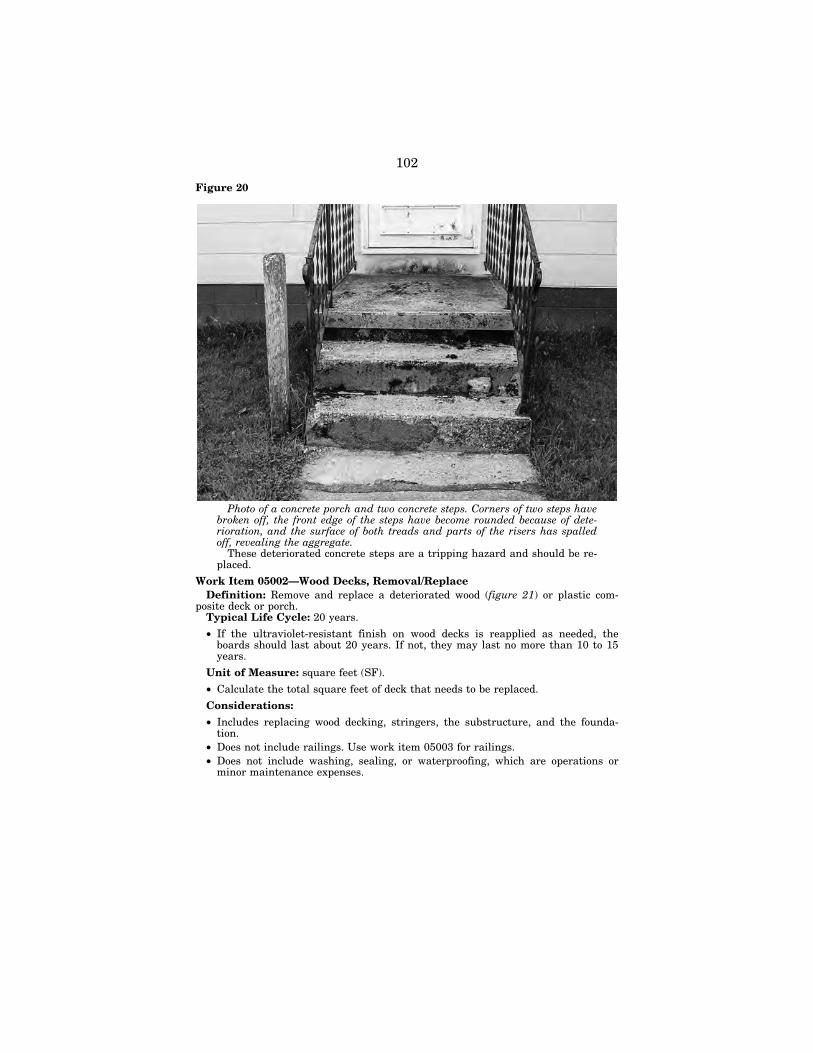
102
Figure 20
Photo of a concrete porch and two concrete steps. Corners of two steps have broken off, the front edge of the steps have become rounded because of dete-rioration, and the surface of both treads and parts of the risers has spalled off, revealing the aggregate.
These deteriorated concrete steps are a tripping hazard and should be re-placed.
Work Item 05002—Wood Decks, Removal/Replace Definition: Remove and replace a deteriorated wood (figure 21) or plastic com-
posite deck or porch. Typical Life Cycle: 20 years.
• If the ultraviolet-resistant finish on wood decks is reapplied as needed, the boards should last about 20 years. If not, they may last no more than 10 to 15 years.
Unit of Measure: square feet (SF).
• Calculate the total square feet of deck that needs to be replaced.
Considerations:
• Includes replacing wood decking, stringers, the substructure, and the founda-tion.
• Does not include railings. Use work item 05003 for railings. • Does not include washing, sealing, or waterproofing, which are operations or
minor maintenance expenses.
VerDate Aug 31 2005 16:26 Dec 16, 2020 Jkt 000000 PO 00000 Frm 00106 Fmt 6621 Sfmt 6621 P:\DOCS\116-19\38016.TXT BRIAN 1161
9033
.eps
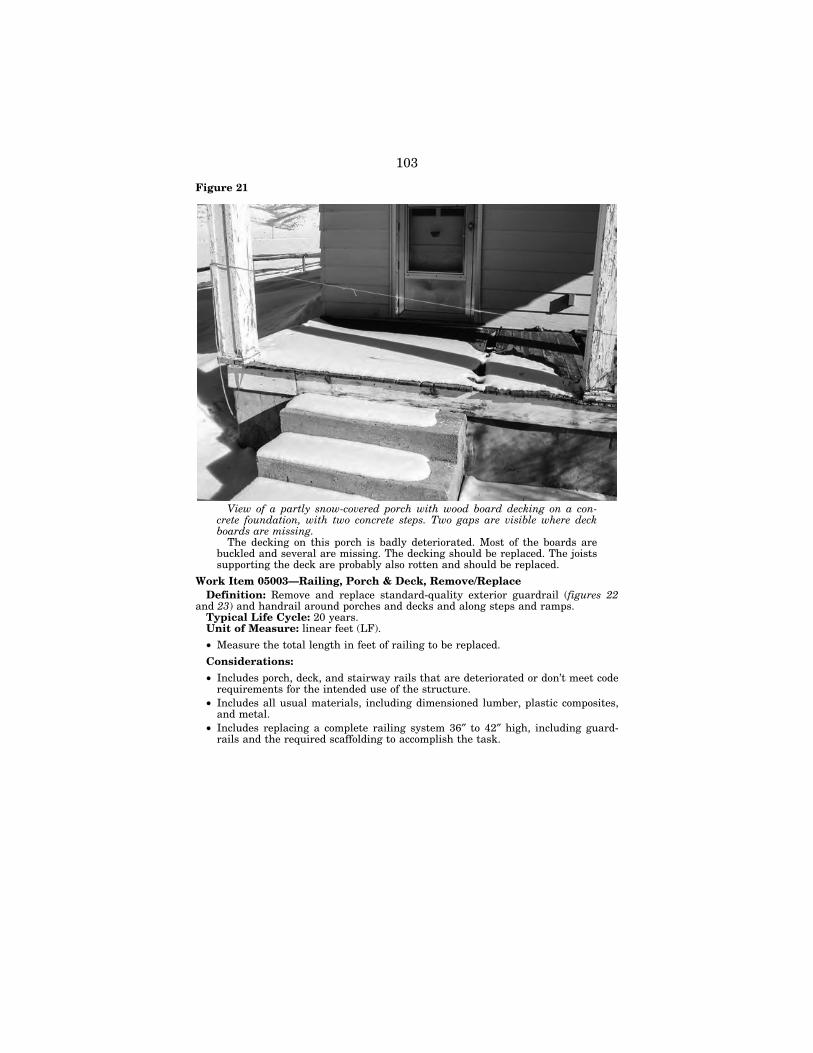
103
Figure 21
View of a partly snow-covered porch with wood board decking on a con-crete foundation, with two concrete steps. Two gaps are visible where deck boards are missing.
The decking on this porch is badly deteriorated. Most of the boards are buckled and several are missing. The decking should be replaced. The joists supporting the deck are probably also rotten and should be replaced.
Work Item 05003—Railing, Porch & Deck, Remove/Replace Definition: Remove and replace standard-quality exterior guardrail (figures 22
and 23) and handrail around porches and decks and along steps and ramps. Typical Life Cycle: 20 years. Unit of Measure: linear feet (LF).
• Measure the total length in feet of railing to be replaced.
Considerations:
• Includes porch, deck, and stairway rails that are deteriorated or don’t meet code requirements for the intended use of the structure.
• Includes all usual materials, including dimensioned lumber, plastic composites, and metal.
• Includes replacing a complete railing system 36″ to 42″ high, including guard-rails and the required scaffolding to accomplish the task.
VerDate Aug 31 2005 16:26 Dec 16, 2020 Jkt 000000 PO 00000 Frm 00107 Fmt 6621 Sfmt 6621 P:\DOCS\116-19\38016.TXT BRIAN 1161
9034
.eps
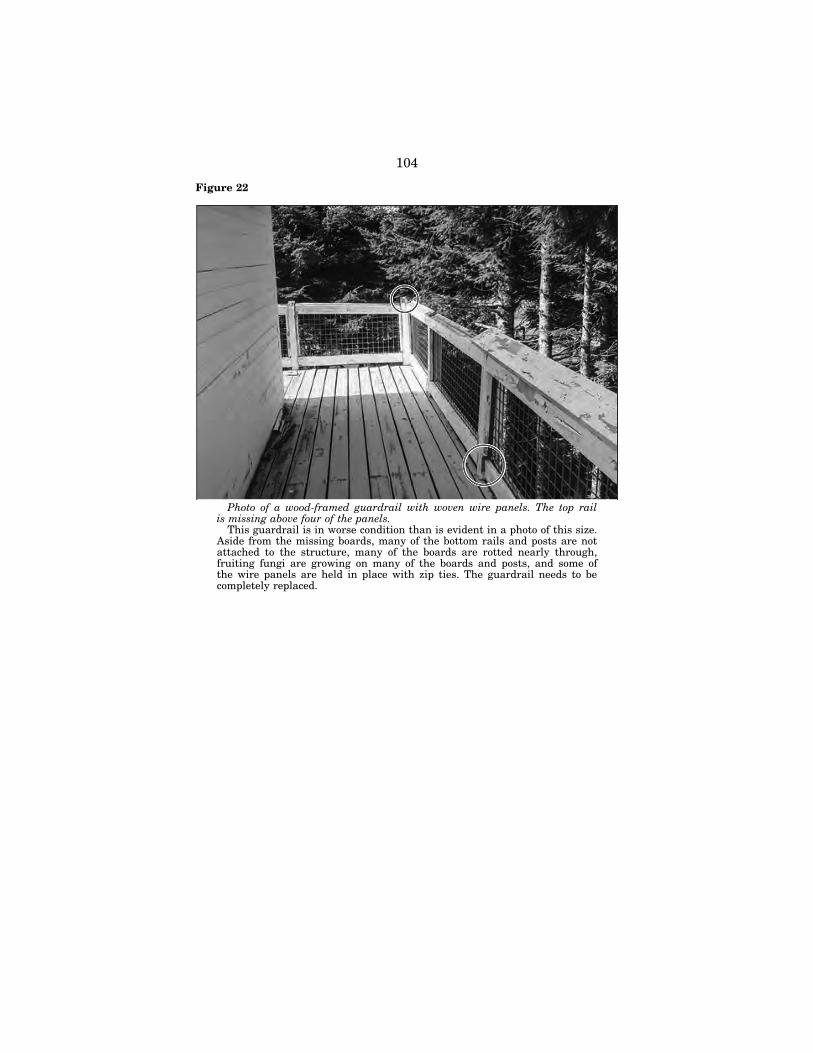
104
Figure 22
Photo of a wood-framed guardrail with woven wire panels. The top rail is missing above four of the panels.
This guardrail is in worse condition than is evident in a photo of this size. Aside from the missing boards, many of the bottom rails and posts are not attached to the structure, many of the boards are rotted nearly through, fruiting fungi are growing on many of the boards and posts, and some of the wire panels are held in place with zip ties. The guardrail needs to be completely replaced.
VerDate Aug 31 2005 16:26 Dec 16, 2020 Jkt 000000 PO 00000 Frm 00108 Fmt 6621 Sfmt 6621 P:\DOCS\116-19\38016.TXT BRIAN 1161
9035
.eps
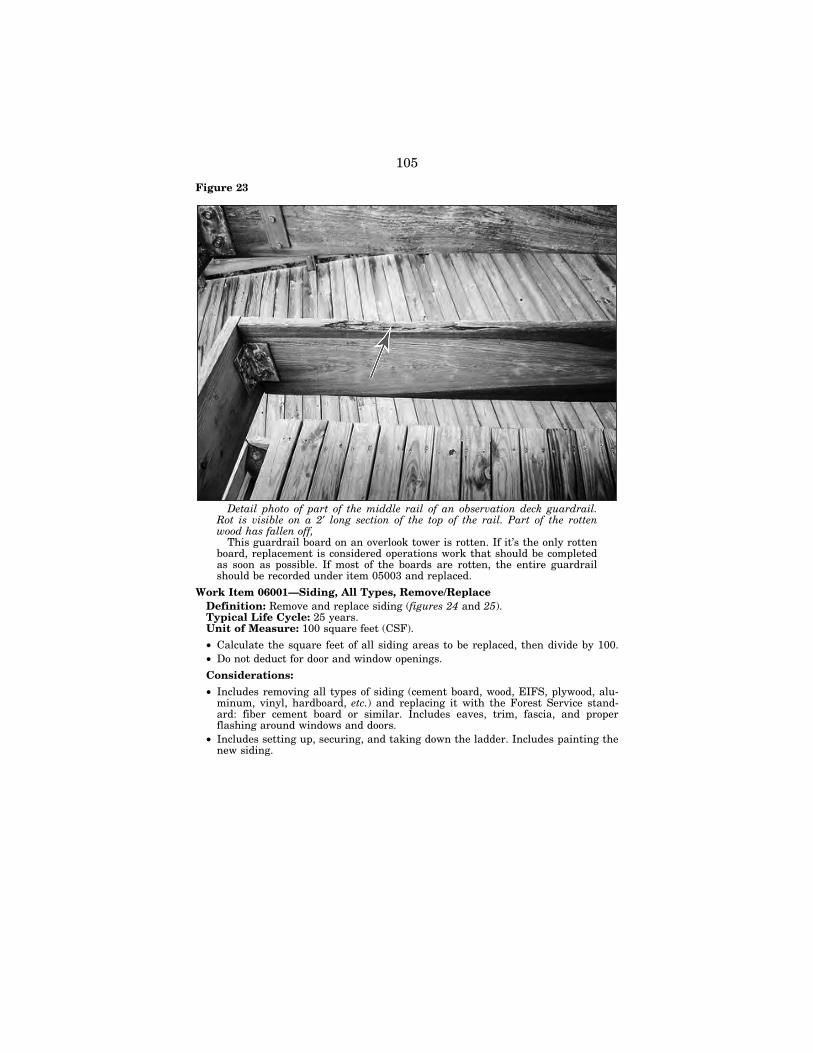
105
Figure 23
Detail photo of part of the middle rail of an observation deck guardrail. Rot is visible on a 2′ long section of the top of the rail. Part of the rotten wood has fallen off,
This guardrail board on an overlook tower is rotten. If it’s the only rotten board, replacement is considered operations work that should be completed as soon as possible. If most of the boards are rotten, the entire guardrail should be recorded under item 05003 and replaced.
Work Item 06001—Siding, All Types, Remove/Replace Definition: Remove and replace siding (figures 24 and 25). Typical Life Cycle: 25 years. Unit of Measure: 100 square feet (CSF).
• Calculate the square feet of all siding areas to be replaced, then divide by 100. • Do not deduct for door and window openings.
Considerations:
• Includes removing all types of siding (cement board, wood, EIFS, plywood, alu-minum, vinyl, hardboard, etc.) and replacing it with the Forest Service stand-ard: fiber cement board or similar. Includes eaves, trim, fascia, and proper flashing around windows and doors.
• Includes setting up, securing, and taking down the ladder. Includes painting the new siding.
VerDate Aug 31 2005 16:26 Dec 16, 2020 Jkt 000000 PO 00000 Frm 00109 Fmt 6621 Sfmt 6621 P:\DOCS\116-19\38016.TXT BRIAN 1161
9036
.eps
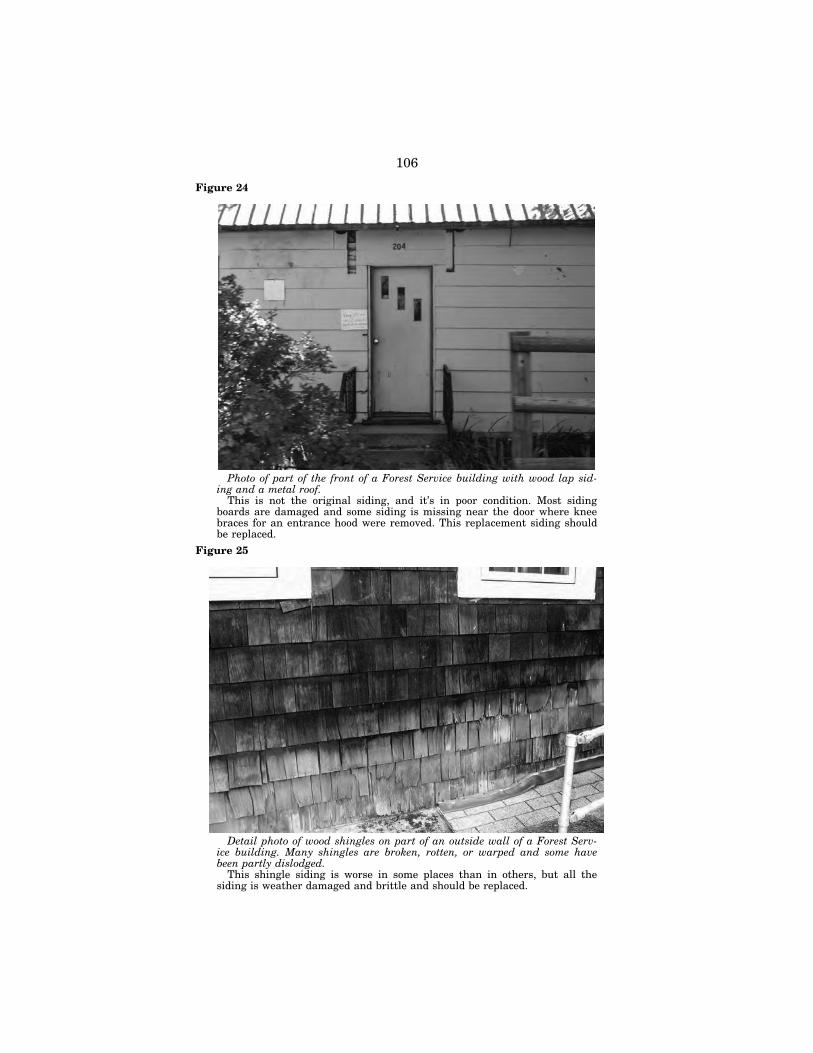
106
Figure 24
Photo of part of the front of a Forest Service building with wood lap sid-ing and a metal roof.
This is not the original siding, and it’s in poor condition. Most siding boards are damaged and some siding is missing near the door where knee braces for an entrance hood were removed. This replacement siding should be replaced.
Figure 25
Detail photo of wood shingles on part of an outside wall of a Forest Serv-ice building. Many shingles are broken, rotten, or warped and some have been partly dislodged.
This shingle siding is worse in some places than in others, but all the siding is weather damaged and brittle and should be replaced.
VerDate Aug 31 2005 16:26 Dec 16, 2020 Jkt 000000 PO 00000 Frm 00110 Fmt 6621 Sfmt 6621 P:\DOCS\116-19\38016.TXT BRIAN 1161
9037
.eps
1161
9038
.eps
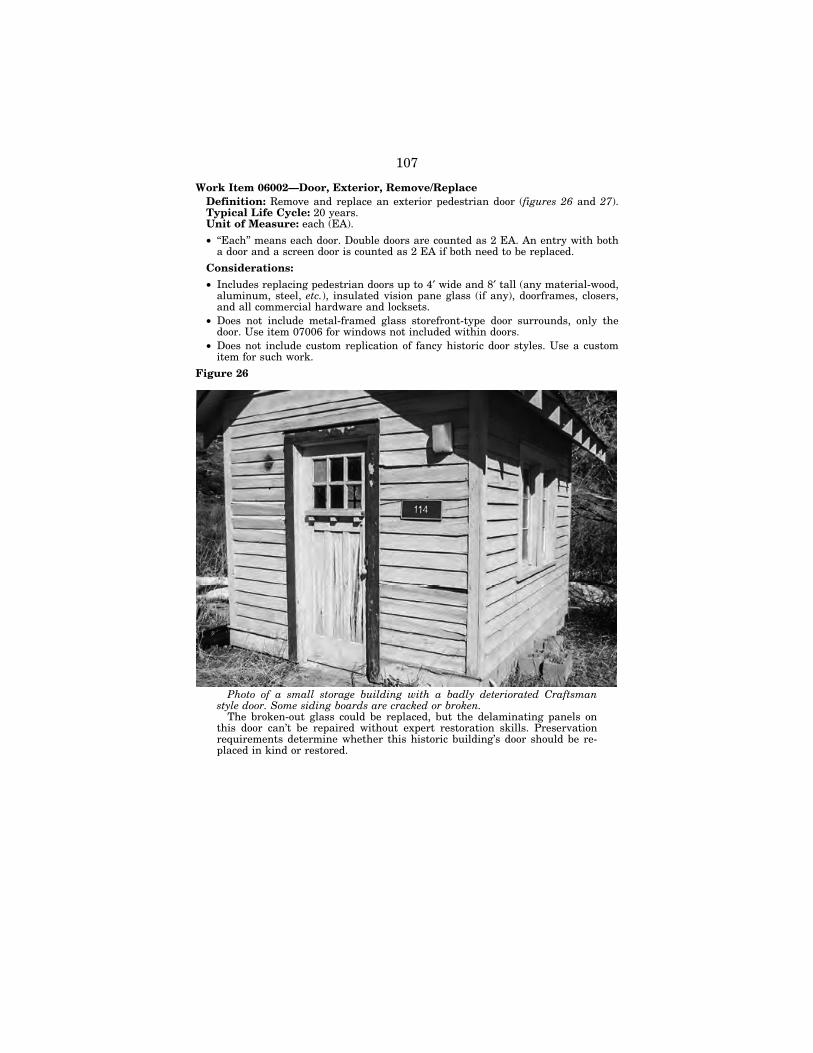
107
Work Item 06002—Door, Exterior, Remove/Replace Definition: Remove and replace an exterior pedestrian door (figures 26 and 27). Typical Life Cycle: 20 years. Unit of Measure: each (EA).
• ‘‘Each’’ means each door. Double doors are counted as 2 EA. An entry with both a door and a screen door is counted as 2 EA if both need to be replaced.
Considerations:
• Includes replacing pedestrian doors up to 4′ wide and 8′ tall (any material-wood, aluminum, steel, etc.), insulated vision pane glass (if any), doorframes, closers, and all commercial hardware and locksets.
• Does not include metal-framed glass storefront-type door surrounds, only the door. Use item 07006 for windows not included within doors.
• Does not include custom replication of fancy historic door styles. Use a custom item for such work.
Figure 26
Photo of a small storage building with a badly deteriorated Craftsman style door. Some siding boards are cracked or broken.
The broken-out glass could be replaced, but the delaminating panels on this door can’t be repaired without expert restoration skills. Preservation requirements determine whether this historic building’s door should be re-placed in kind or restored.
VerDate Aug 31 2005 16:26 Dec 16, 2020 Jkt 000000 PO 00000 Frm 00111 Fmt 6621 Sfmt 6621 P:\DOCS\116-19\38016.TXT BRIAN 1161
9039
.eps
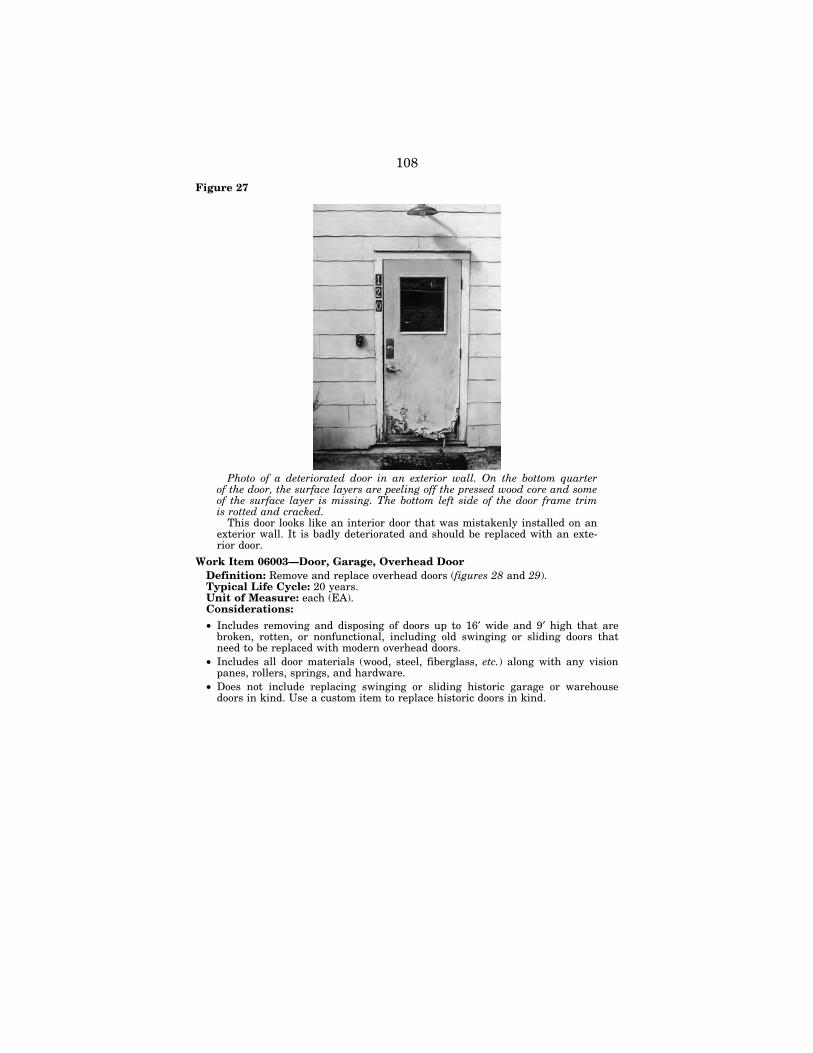
108
Figure 27
Photo of a deteriorated door in an exterior wall. On the bottom quarter of the door, the surface layers are peeling off the pressed wood core and some of the surface layer is missing. The bottom left side of the door frame trim is rotted and cracked.
This door looks like an interior door that was mistakenly installed on an exterior wall. It is badly deteriorated and should be replaced with an exte-rior door.
Work Item 06003—Door, Garage, Overhead Door Definition: Remove and replace overhead doors (figures 28 and 29). Typical Life Cycle: 20 years. Unit of Measure: each (EA). Considerations:
• Includes removing and disposing of doors up to 16′ wide and 9′ high that are broken, rotten, or nonfunctional, including old swinging or sliding doors that need to be replaced with modern overhead doors.
• Includes all door materials (wood, steel, fiberglass, etc.) along with any vision panes, rollers, springs, and hardware.
• Does not include replacing swinging or sliding historic garage or warehouse doors in kind. Use a custom item to replace historic doors in kind.
VerDate Aug 31 2005 16:26 Dec 16, 2020 Jkt 000000 PO 00000 Frm 00112 Fmt 6621 Sfmt 6621 P:\DOCS\116-19\38016.TXT BRIAN 1161
9040
.eps
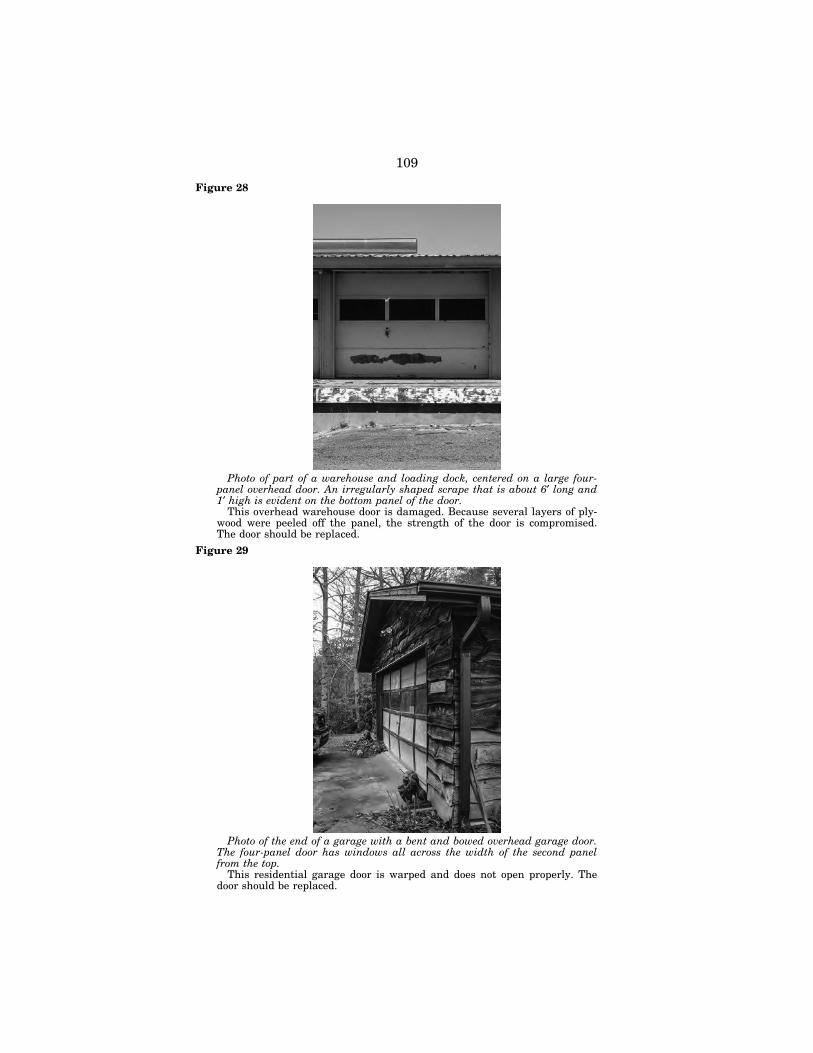
109
Figure 28
Photo of part of a warehouse and loading dock, centered on a large four- panel overhead door. An irregularly shaped scrape that is about 6′ long and 1′ high is evident on the bottom panel of the door.
This overhead warehouse door is damaged. Because several layers of ply-wood were peeled off the panel, the strength of the door is compromised. The door should be replaced.
Figure 29
Photo of the end of a garage with a bent and bowed overhead garage door. The four-panel door has windows all across the width of the second panel from the top.
This residential garage door is warped and does not open properly. The door should be replaced.
VerDate Aug 31 2005 16:26 Dec 16, 2020 Jkt 000000 PO 00000 Frm 00113 Fmt 6621 Sfmt 6621 P:\DOCS\116-19\38016.TXT BRIAN 1161
9041
.eps
1161
9042
.eps
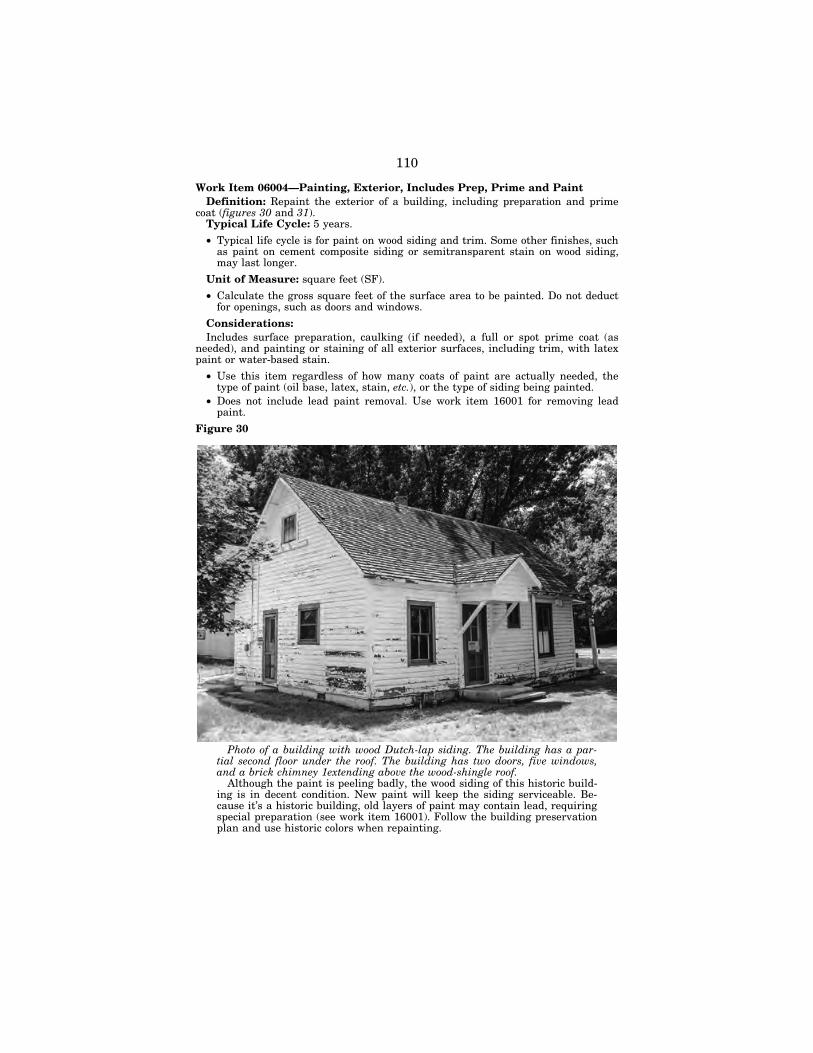
110
Work Item 06004—Painting, Exterior, Includes Prep, Prime and Paint Definition: Repaint the exterior of a building, including preparation and prime
coat (figures 30 and 31). Typical Life Cycle: 5 years.
• Typical life cycle is for paint on wood siding and trim. Some other finishes, such as paint on cement composite siding or semitransparent stain on wood siding, may last longer.
Unit of Measure: square feet (SF).
• Calculate the gross square feet of the surface area to be painted. Do not deduct for openings, such as doors and windows.
Considerations: Includes surface preparation, caulking (if needed), a full or spot prime coat (as
needed), and painting or staining of all exterior surfaces, including trim, with latex paint or water-based stain.
• Use this item regardless of how many coats of paint are actually needed, the type of paint (oil base, latex, stain, etc.), or the type of siding being painted.
• Does not include lead paint removal. Use work item 16001 for removing lead paint.
Figure 30
Photo of a building with wood Dutch-lap siding. The building has a par-tial second floor under the roof. The building has two doors, five windows, and a brick chimney 1extending above the wood-shingle roof.
Although the paint is peeling badly, the wood siding of this historic build-ing is in decent condition. New paint will keep the siding serviceable. Be-cause it’s a historic building, old layers of paint may contain lead, requiring special preparation (see work item 16001). Follow the building preservation plan and use historic colors when repainting.
VerDate Aug 31 2005 16:26 Dec 16, 2020 Jkt 000000 PO 00000 Frm 00114 Fmt 6621 Sfmt 6621 P:\DOCS\116-19\38016.TXT BRIAN 1161
9043
.eps
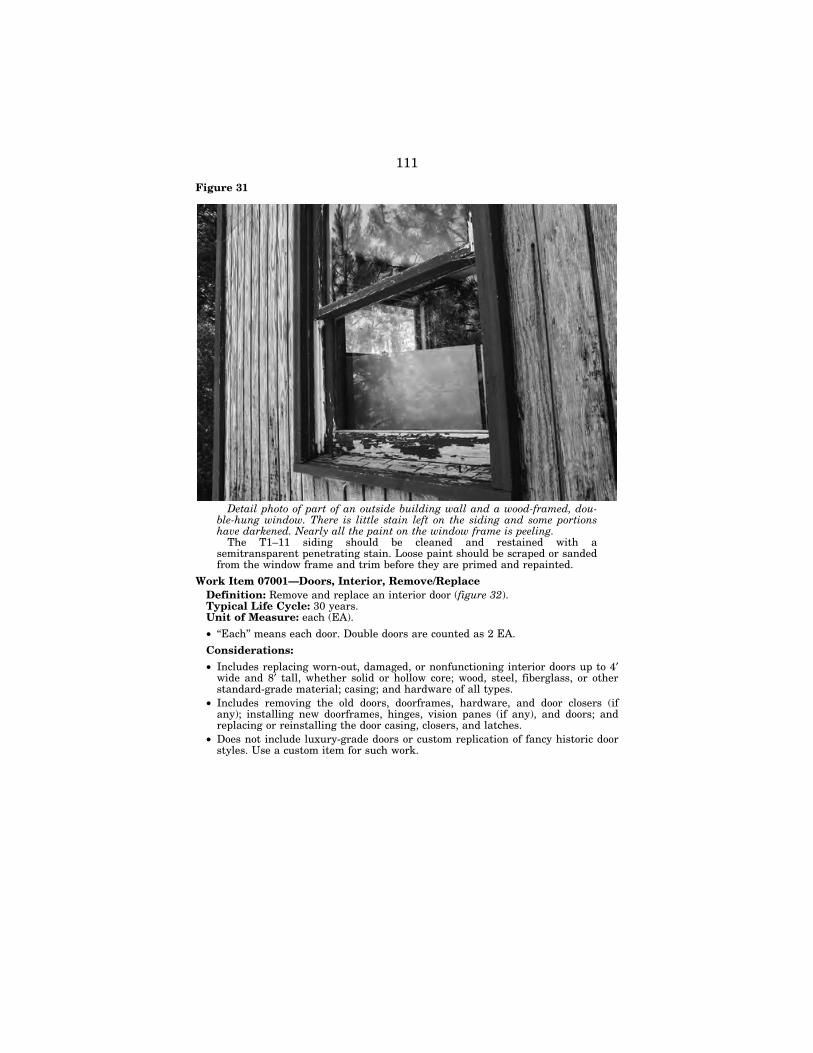
111
Figure 31
Detail photo of part of an outside building wall and a wood-framed, dou-ble-hung window. There is little stain left on the siding and some portions have darkened. Nearly all the paint on the window frame is peeling.
The T1–11 siding should be cleaned and restained with a semitransparent penetrating stain. Loose paint should be scraped or sanded from the window frame and trim before they are primed and repainted.
Work Item 07001—Doors, Interior, Remove/Replace Definition: Remove and replace an interior door (figure 32). Typical Life Cycle: 30 years. Unit of Measure: each (EA).
• ‘‘Each’’ means each door. Double doors are counted as 2 EA.
Considerations:
• Includes replacing worn-out, damaged, or nonfunctioning interior doors up to 4′ wide and 8′ tall, whether solid or hollow core; wood, steel, fiberglass, or other standard-grade material; casing; and hardware of all types.
• Includes removing the old doors, doorframes, hardware, and door closers (if any); installing new doorframes, hinges, vision panes (if any), and doors; and replacing or reinstalling the door casing, closers, and latches.
• Does not include luxury-grade doors or custom replication of fancy historic door styles. Use a custom item for such work.
VerDate Aug 31 2005 16:26 Dec 16, 2020 Jkt 000000 PO 00000 Frm 00115 Fmt 6621 Sfmt 6621 P:\DOCS\116-19\38016.TXT BRIAN 1161
9044
.eps
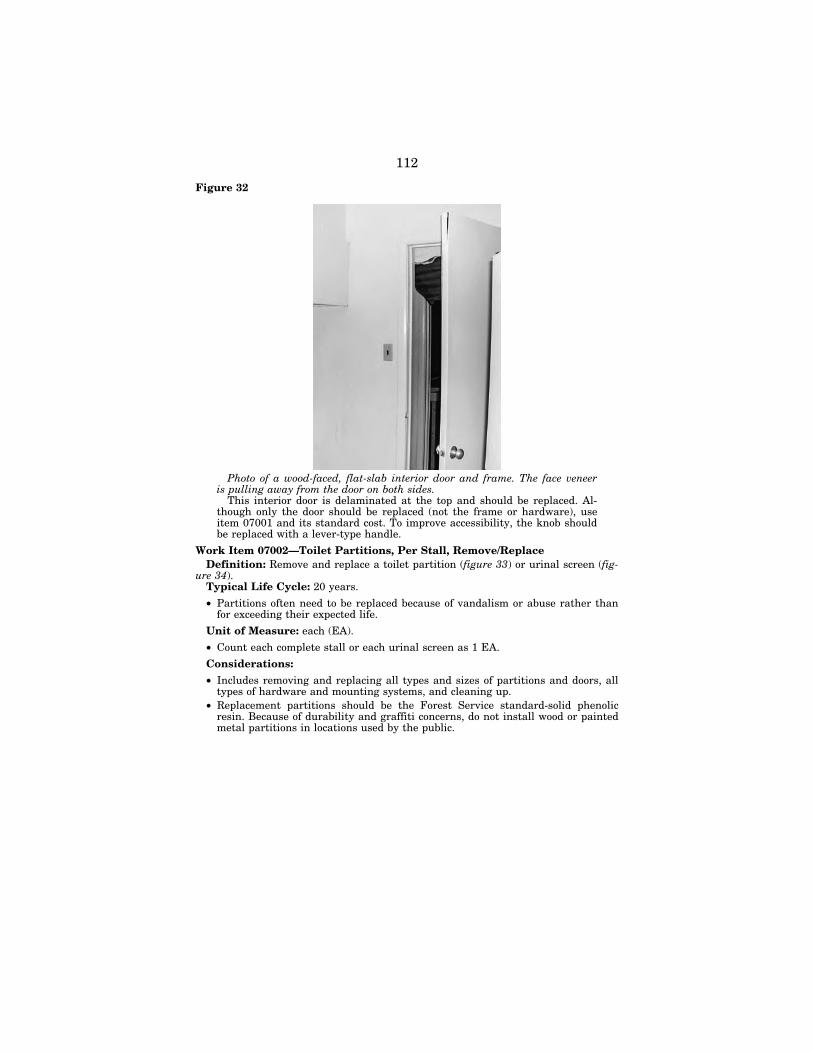
112
Figure 32
Photo of a wood-faced, flat-slab interior door and frame. The face veneer is pulling away from the door on both sides.
This interior door is delaminated at the top and should be replaced. Al-though only the door should be replaced (not the frame or hardware), use item 07001 and its standard cost. To improve accessibility, the knob should be replaced with a lever-type handle.
Work Item 07002—Toilet Partitions, Per Stall, Remove/Replace Definition: Remove and replace a toilet partition (figure 33) or urinal screen (fig-
ure 34). Typical Life Cycle: 20 years.
• Partitions often need to be replaced because of vandalism or abuse rather than for exceeding their expected life.
Unit of Measure: each (EA).
• Count each complete stall or each urinal screen as 1 EA.
Considerations:
• Includes removing and replacing all types and sizes of partitions and doors, all types of hardware and mounting systems, and cleaning up.
• Replacement partitions should be the Forest Service standard-solid phenolic resin. Because of durability and graffiti concerns, do not install wood or painted metal partitions in locations used by the public.
VerDate Aug 31 2005 16:26 Dec 16, 2020 Jkt 000000 PO 00000 Frm 00116 Fmt 6621 Sfmt 6621 P:\DOCS\116-19\38016.TXT BRIAN 1161
9045
.eps
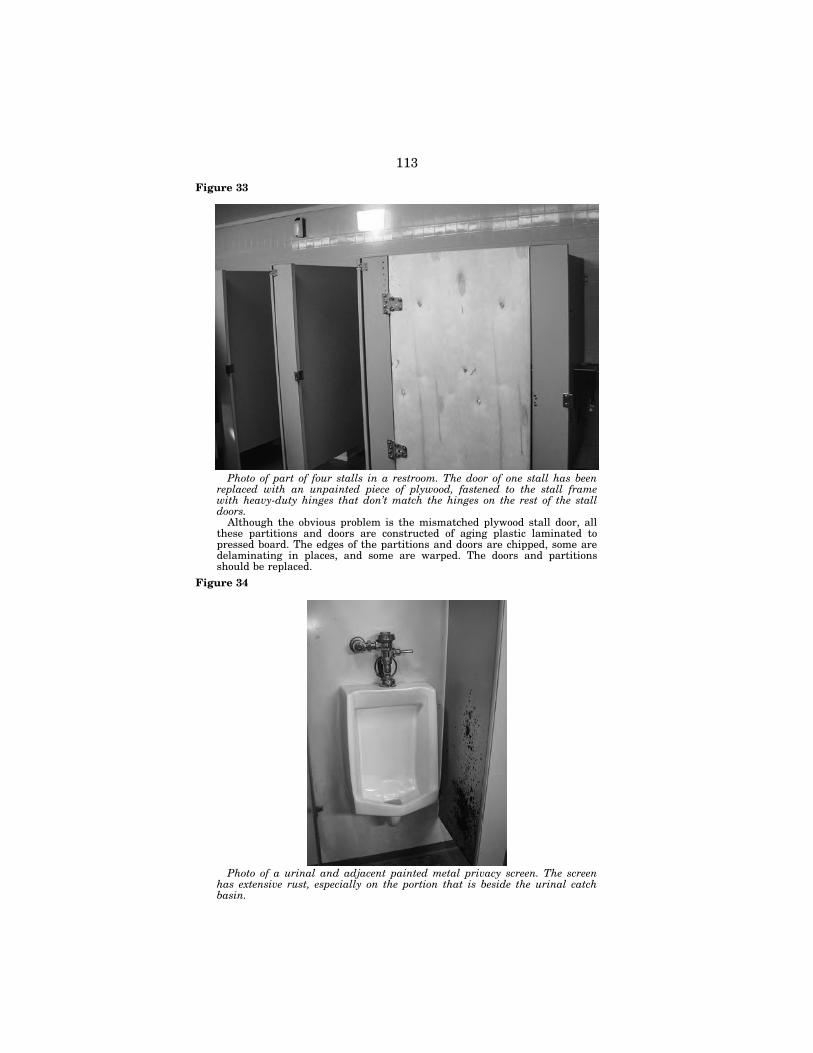
113
Figure 33
Photo of part of four stalls in a restroom. The door of one stall has been replaced with an unpainted piece of plywood, fastened to the stall frame with heavy-duty hinges that don’t match the hinges on the rest of the stall doors.
Although the obvious problem is the mismatched plywood stall door, all these partitions and doors are constructed of aging plastic laminated to pressed board. The edges of the partitions and doors are chipped, some are delaminating in places, and some are warped. The doors and partitions should be replaced.
Figure 34
Photo of a urinal and adjacent painted metal privacy screen. The screen has extensive rust, especially on the portion that is beside the urinal catch basin.
VerDate Aug 31 2005 16:26 Dec 16, 2020 Jkt 000000 PO 00000 Frm 00117 Fmt 6621 Sfmt 6621 P:\DOCS\116-19\38016.TXT BRIAN 1161
9046
.eps
1161
9047
.eps
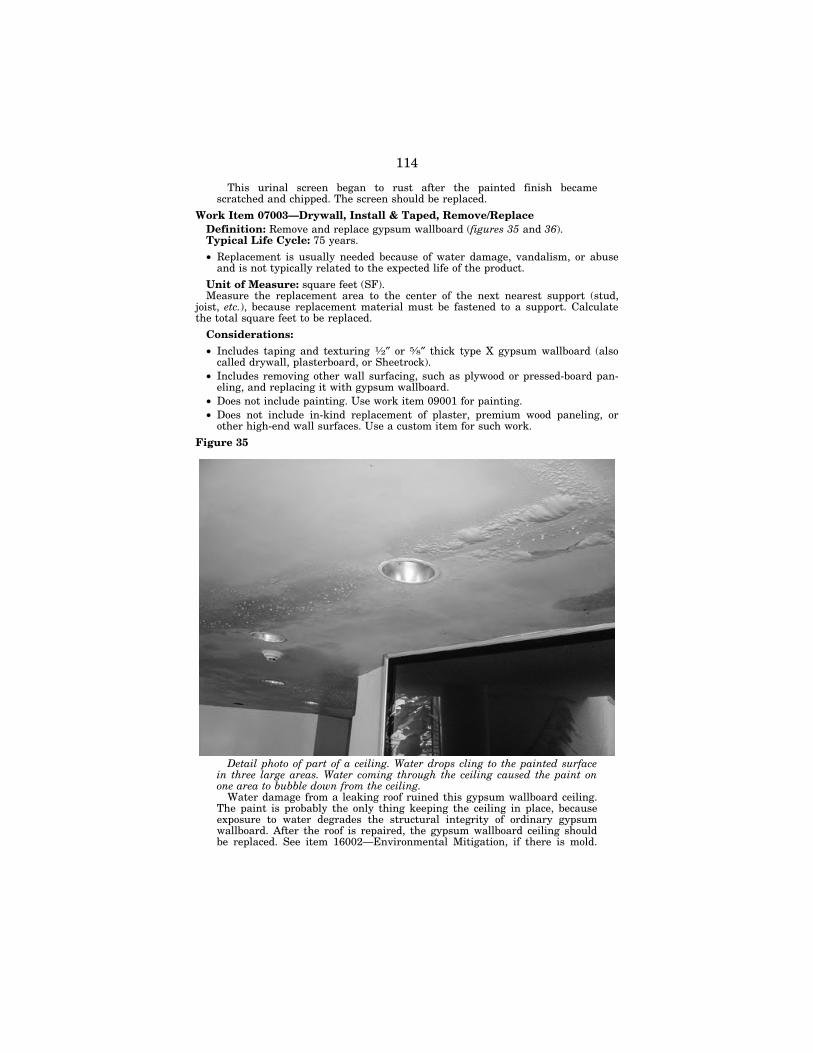
114
This urinal screen began to rust after the painted finish became scratched and chipped. The screen should be replaced.
Work Item 07003—Drywall, Install & Taped, Remove/Replace Definition: Remove and replace gypsum wallboard (figures 35 and 36). Typical Life Cycle: 75 years.
• Replacement is usually needed because of water damage, vandalism, or abuse and is not typically related to the expected life of the product.
Unit of Measure: square feet (SF). Measure the replacement area to the center of the next nearest support (stud,
joist, etc.), because replacement material must be fastened to a support. Calculate the total square feet to be replaced.
Considerations:
• Includes taping and texturing 1⁄2″ or 5⁄8″ thick type X gypsum wallboard (also called drywall, plasterboard, or Sheetrock).
• Includes removing other wall surfacing, such as plywood or pressed-board pan-eling, and replacing it with gypsum wallboard.
• Does not include painting. Use work item 09001 for painting. • Does not include in-kind replacement of plaster, premium wood paneling, or
other high-end wall surfaces. Use a custom item for such work.
Figure 35
Detail photo of part of a ceiling. Water drops cling to the painted surface in three large areas. Water coming through the ceiling caused the paint on one area to bubble down from the ceiling.
Water damage from a leaking roof ruined this gypsum wallboard ceiling. The paint is probably the only thing keeping the ceiling in place, because exposure to water degrades the structural integrity of ordinary gypsum wallboard. After the roof is repaired, the gypsum wallboard ceiling should be replaced. See item 16002—Environmental Mitigation, if there is mold.
VerDate Aug 31 2005 16:26 Dec 16, 2020 Jkt 000000 PO 00000 Frm 00118 Fmt 6621 Sfmt 6621 P:\DOCS\116-19\38016.TXT BRIAN 1161
9048
.eps
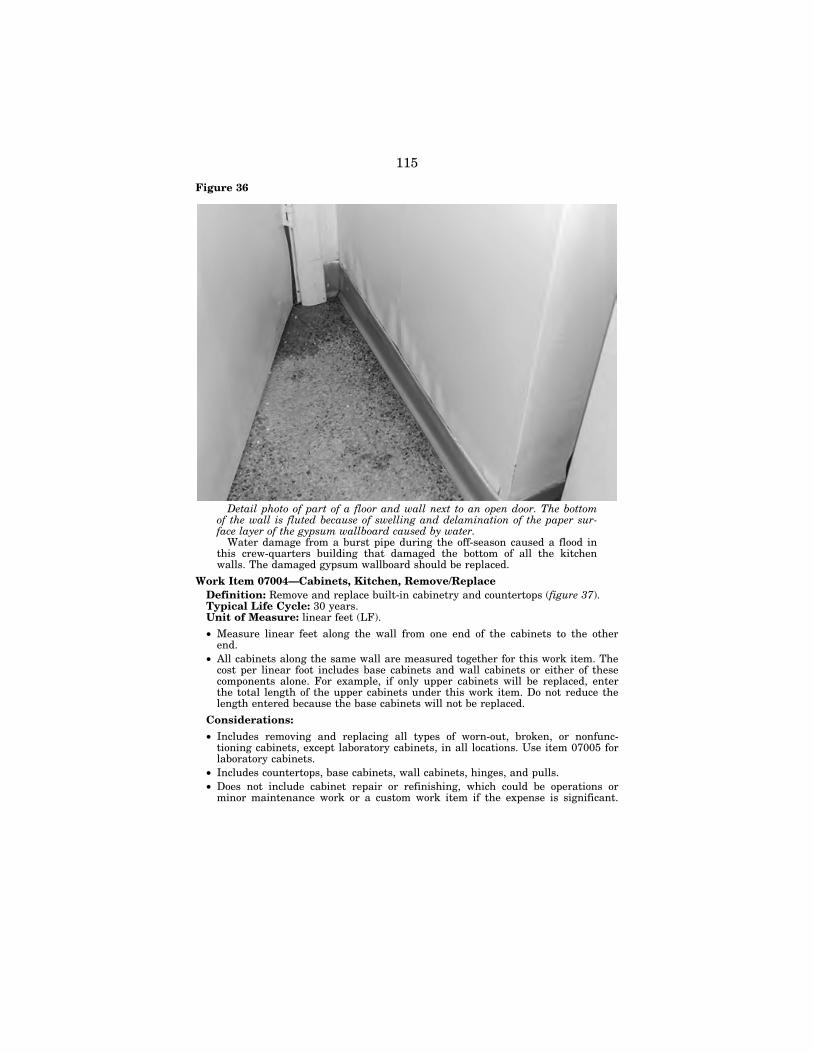
115
Figure 36
Detail photo of part of a floor and wall next to an open door. The bottom of the wall is fluted because of swelling and delamination of the paper sur-face layer of the gypsum wallboard caused by water.
Water damage from a burst pipe during the off-season caused a flood in this crew-quarters building that damaged the bottom of all the kitchen walls. The damaged gypsum wallboard should be replaced.
Work Item 07004—Cabinets, Kitchen, Remove/Replace Definition: Remove and replace built-in cabinetry and countertops (figure 37). Typical Life Cycle: 30 years. Unit of Measure: linear feet (LF).
• Measure linear feet along the wall from one end of the cabinets to the other end.
• All cabinets along the same wall are measured together for this work item. The cost per linear foot includes base cabinets and wall cabinets or either of these components alone. For example, if only upper cabinets will be replaced, enter the total length of the upper cabinets under this work item. Do not reduce the length entered because the base cabinets will not be replaced.
Considerations:
• Includes removing and replacing all types of worn-out, broken, or nonfunc-tioning cabinets, except laboratory cabinets, in all locations. Use item 07005 for laboratory cabinets.
• Includes countertops, base cabinets, wall cabinets, hinges, and pulls. • Does not include cabinet repair or refinishing, which could be operations or
minor maintenance work or a custom work item if the expense is significant.
VerDate Aug 31 2005 16:26 Dec 16, 2020 Jkt 000000 PO 00000 Frm 00119 Fmt 6621 Sfmt 6621 P:\DOCS\116-19\38016.TXT BRIAN 1161
9049
.eps
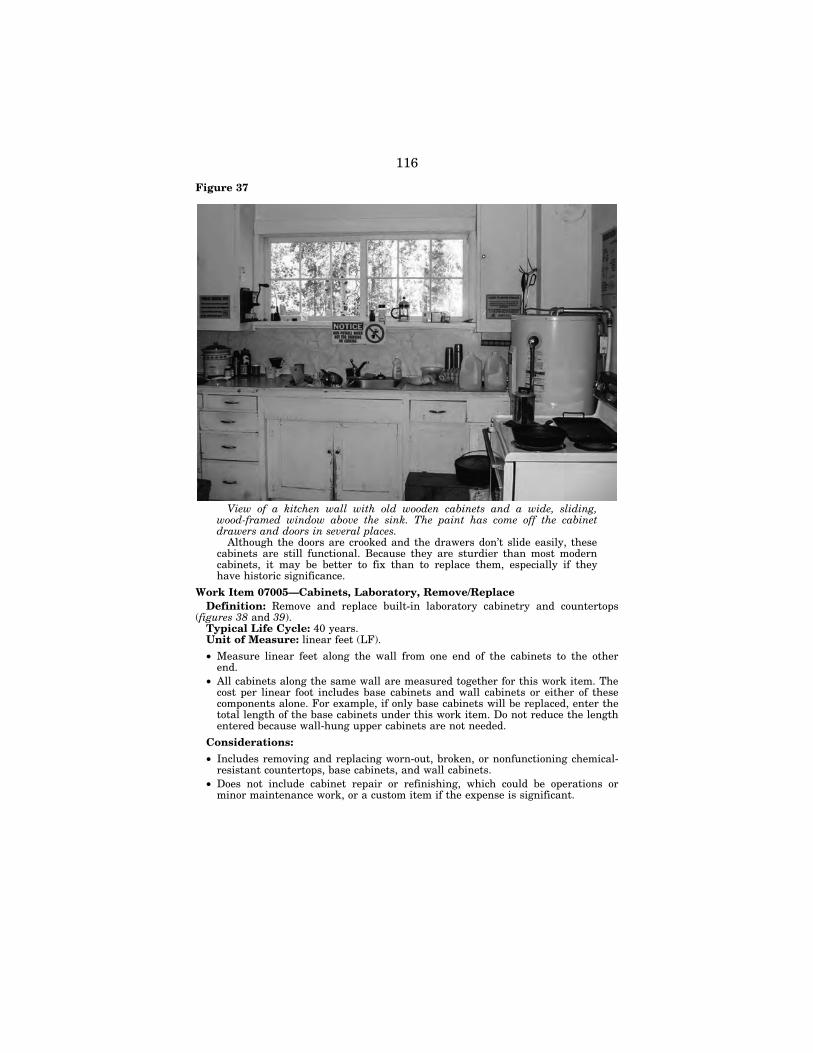
116
Figure 37
View of a kitchen wall with old wooden cabinets and a wide, sliding, wood-framed window above the sink. The paint has come off the cabinet drawers and doors in several places.
Although the doors are crooked and the drawers don’t slide easily, these cabinets are still functional. Because they are sturdier than most modern cabinets, it may be better to fix than to replace them, especially if they have historic significance.
Work Item 07005—Cabinets, Laboratory, Remove/Replace Definition: Remove and replace built-in laboratory cabinetry and countertops
(figures 38 and 39). Typical Life Cycle: 40 years. Unit of Measure: linear feet (LF).
• Measure linear feet along the wall from one end of the cabinets to the other end.
• All cabinets along the same wall are measured together for this work item. The cost per linear foot includes base cabinets and wall cabinets or either of these components alone. For example, if only base cabinets will be replaced, enter the total length of the base cabinets under this work item. Do not reduce the length entered because wall-hung upper cabinets are not needed.
Considerations:
• Includes removing and replacing worn-out, broken, or nonfunctioning chemical- resistant countertops, base cabinets, and wall cabinets.
• Does not include cabinet repair or refinishing, which could be operations or minor maintenance work, or a custom item if the expense is significant.
VerDate Aug 31 2005 16:26 Dec 16, 2020 Jkt 000000 PO 00000 Frm 00120 Fmt 6621 Sfmt 6621 P:\DOCS\116-19\38016.TXT BRIAN 1161
9050
.eps
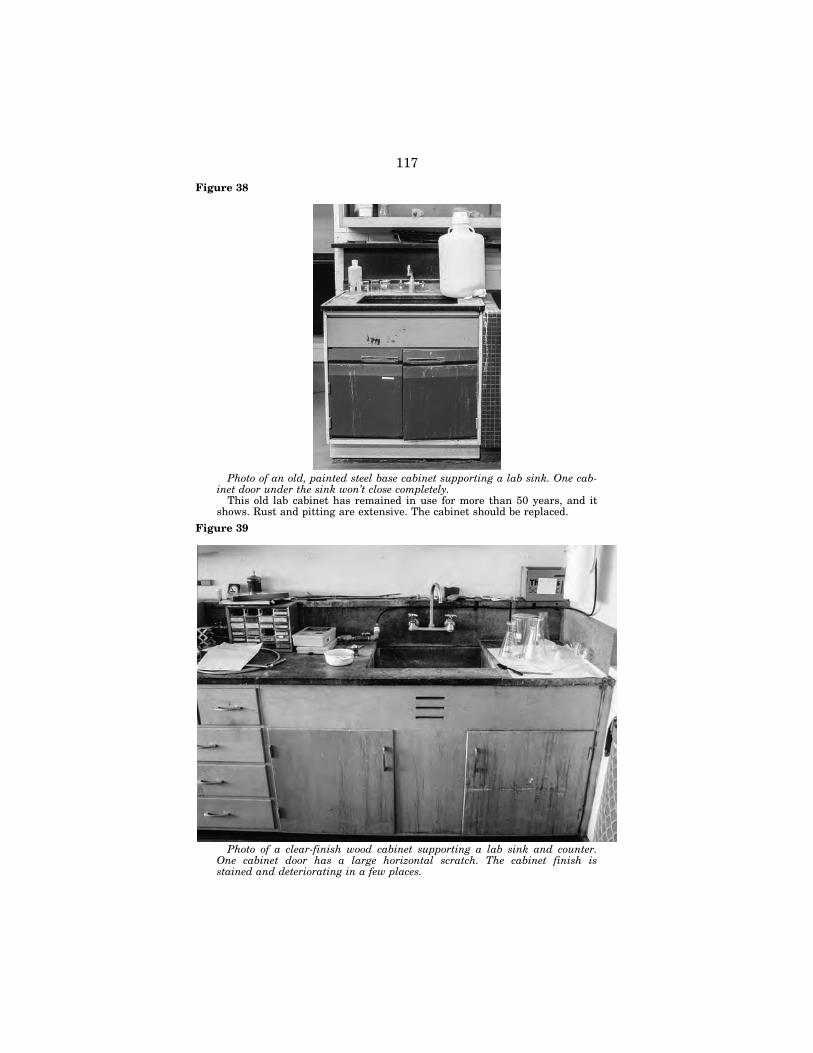
117
Figure 38
Photo of an old, painted steel base cabinet supporting a lab sink. One cab-inet door under the sink won’t close completely.
This old lab cabinet has remained in use for more than 50 years, and it shows. Rust and pitting are extensive. The cabinet should be replaced.
Figure 39
Photo of a clear-finish wood cabinet supporting a lab sink and counter. One cabinet door has a large horizontal scratch. The cabinet finish is stained and deteriorating in a few places.
VerDate Aug 31 2005 16:26 Dec 16, 2020 Jkt 000000 PO 00000 Frm 00121 Fmt 6621 Sfmt 6621 P:\DOCS\116-19\38016.TXT BRIAN 1161
9051
.eps
1161
9052
.eps
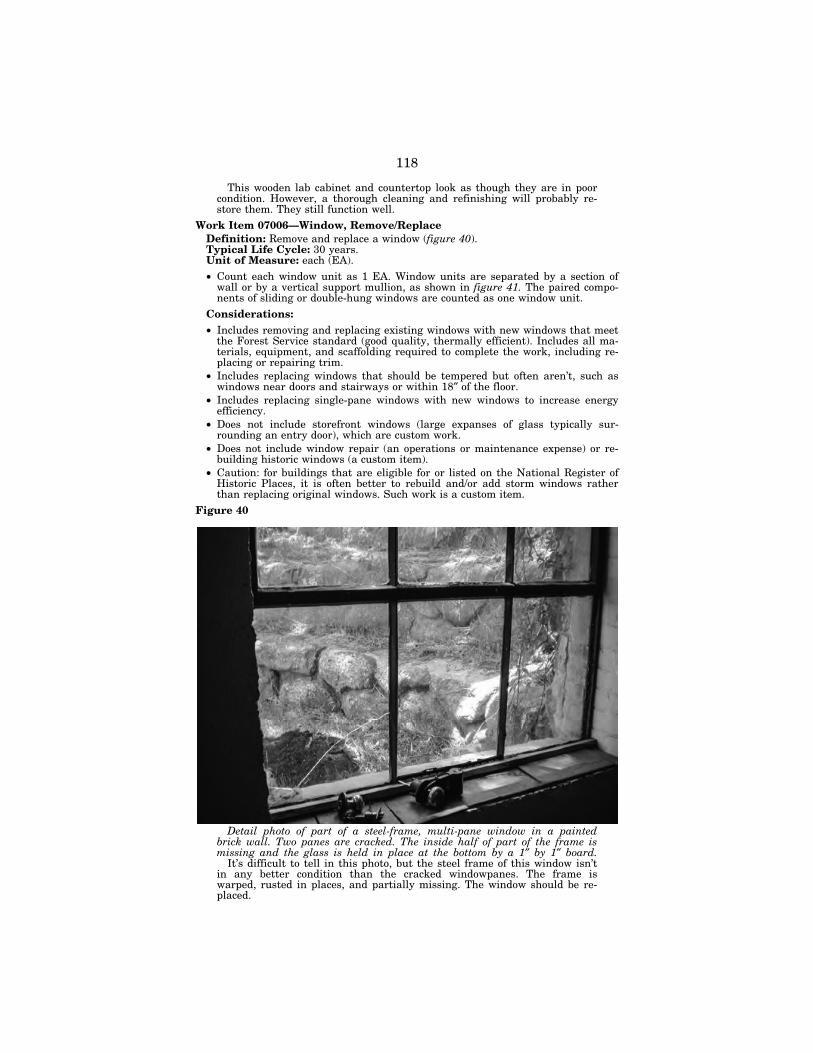
118
This wooden lab cabinet and countertop look as though they are in poor condition. However, a thorough cleaning and refinishing will probably re-store them. They still function well.
Work Item 07006—Window, Remove/Replace Definition: Remove and replace a window (figure 40). Typical Life Cycle: 30 years. Unit of Measure: each (EA). • Count each window unit as 1 EA. Window units are separated by a section of
wall or by a vertical support mullion, as shown in figure 41. The paired compo-nents of sliding or double-hung windows are counted as one window unit.
Considerations: • Includes removing and replacing existing windows with new windows that meet
the Forest Service standard (good quality, thermally efficient). Includes all ma-terials, equipment, and scaffolding required to complete the work, including re-placing or repairing trim.
• Includes replacing windows that should be tempered but often aren’t, such as windows near doors and stairways or within 18″ of the floor.
• Includes replacing single-pane windows with new windows to increase energy efficiency.
• Does not include storefront windows (large expanses of glass typically sur-rounding an entry door), which are custom work.
• Does not include window repair (an operations or maintenance expense) or re-building historic windows (a custom item).
• Caution: for buildings that are eligible for or listed on the National Register of Historic Places, it is often better to rebuild and/or add storm windows rather than replacing original windows. Such work is a custom item.
Figure 40
Detail photo of part of a steel-frame, multi-pane window in a painted brick wall. Two panes are cracked. The inside half of part of the frame is missing and the glass is held in place at the bottom by a 1″ by 1″ board.
It’s difficult to tell in this photo, but the steel frame of this window isn’t in any better condition than the cracked windowpanes. The frame is warped, rusted in places, and partially missing. The window should be re-placed.
VerDate Aug 31 2005 16:26 Dec 16, 2020 Jkt 000000 PO 00000 Frm 00122 Fmt 6621 Sfmt 6621 P:\DOCS\116-19\38016.TXT BRIAN 1161
9053
.eps
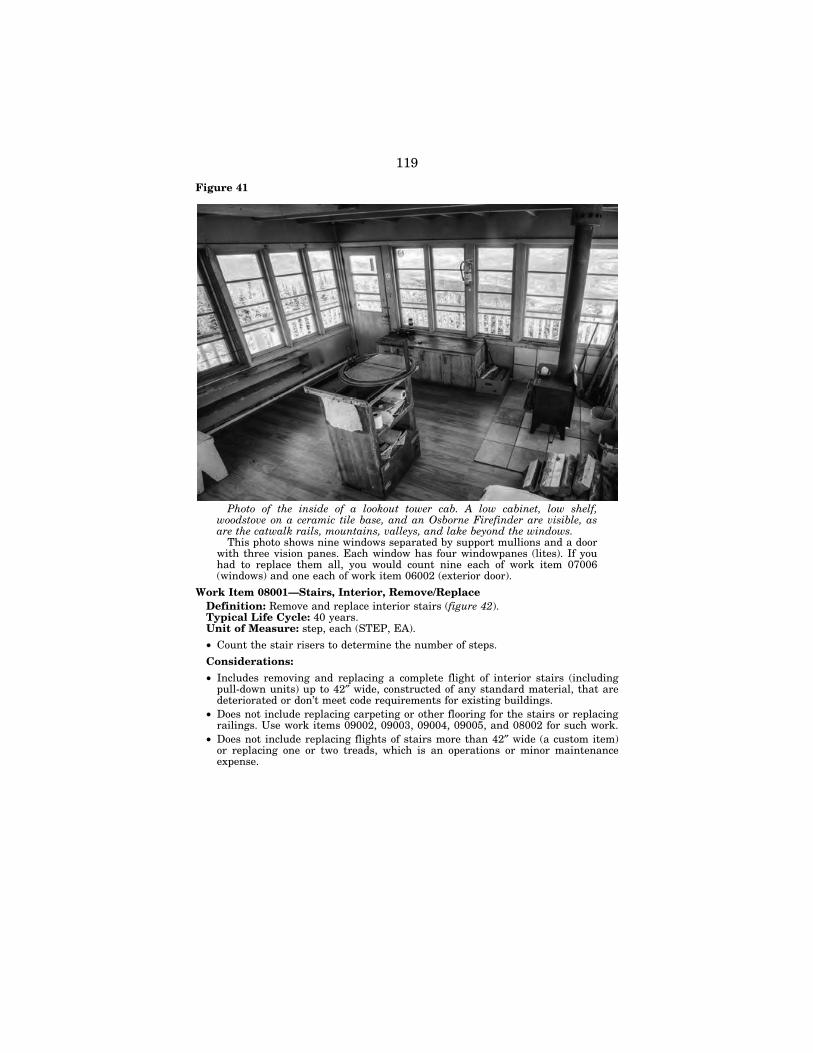
119
Figure 41
Photo of the inside of a lookout tower cab. A low cabinet, low shelf, woodstove on a ceramic tile base, and an Osborne Firefinder are visible, as are the catwalk rails, mountains, valleys, and lake beyond the windows.
This photo shows nine windows separated by support mullions and a door with three vision panes. Each window has four windowpanes (lites). If you had to replace them all, you would count nine each of work item 07006 (windows) and one each of work item 06002 (exterior door).
Work Item 08001—Stairs, Interior, Remove/Replace Definition: Remove and replace interior stairs (figure 42). Typical Life Cycle: 40 years. Unit of Measure: step, each (STEP, EA).
• Count the stair risers to determine the number of steps.
Considerations:
• Includes removing and replacing a complete flight of interior stairs (including pull-down units) up to 42″ wide, constructed of any standard material, that are deteriorated or don’t meet code requirements for existing buildings.
• Does not include replacing carpeting or other flooring for the stairs or replacing railings. Use work items 09002, 09003, 09004, 09005, and 08002 for such work.
• Does not include replacing flights of stairs more than 42″ wide (a custom item) or replacing one or two treads, which is an operations or minor maintenance expense.
VerDate Aug 31 2005 16:26 Dec 16, 2020 Jkt 000000 PO 00000 Frm 00123 Fmt 6621 Sfmt 6621 P:\DOCS\116-19\38016.TXT BRIAN 1161
9054
.eps
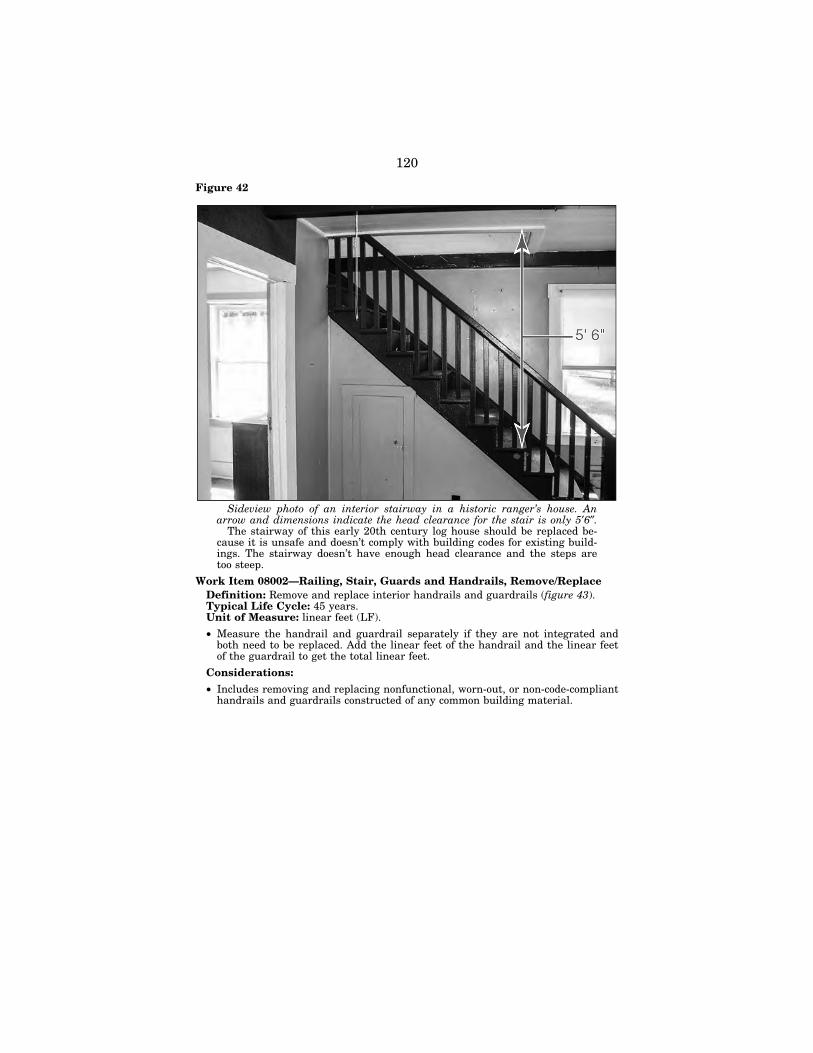
120
Figure 42
Sideview photo of an interior stairway in a historic ranger’s house. An arrow and dimensions indicate the head clearance for the stair is only 5′6″.
The stairway of this early 20th century log house should be replaced be-cause it is unsafe and doesn’t comply with building codes for existing build-ings. The stairway doesn’t have enough head clearance and the steps are too steep.
Work Item 08002—Railing, Stair, Guards and Handrails, Remove/Replace Definition: Remove and replace interior handrails and guardrails (figure 43). Typical Life Cycle: 45 years. Unit of Measure: linear feet (LF).
• Measure the handrail and guardrail separately if they are not integrated and both need to be replaced. Add the linear feet of the handrail and the linear feet of the guardrail to get the total linear feet.
Considerations:
• Includes removing and replacing nonfunctional, worn-out, or non-code-compliant handrails and guardrails constructed of any common building material.
VerDate Aug 31 2005 16:26 Dec 16, 2020 Jkt 000000 PO 00000 Frm 00124 Fmt 6621 Sfmt 6621 P:\DOCS\116-19\38016.TXT BRIAN 1161
9055
.eps
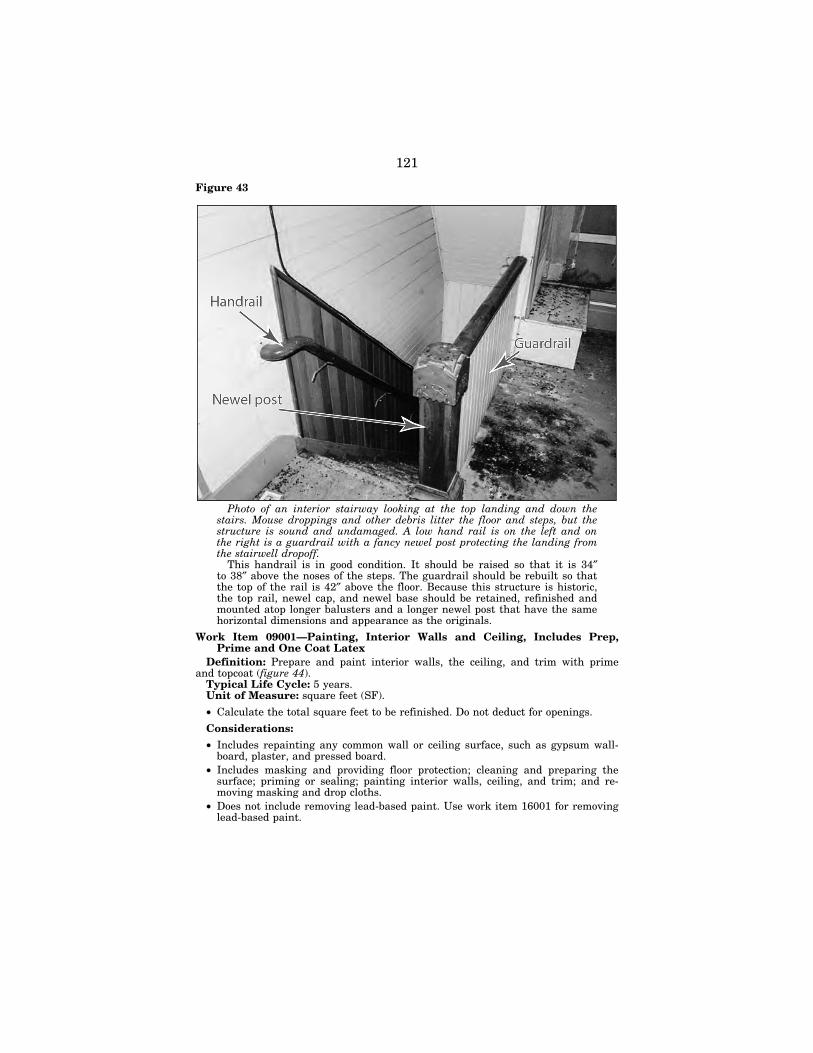
121
Figure 43
Photo of an interior stairway looking at the top landing and down the stairs. Mouse droppings and other debris litter the floor and steps, but the structure is sound and undamaged. A low hand rail is on the left and on the right is a guardrail with a fancy newel post protecting the landing from the stairwell dropoff.
This handrail is in good condition. It should be raised so that it is 34″ to 38″ above the noses of the steps. The guardrail should be rebuilt so that the top of the rail is 42″ above the floor. Because this structure is historic, the top rail, newel cap, and newel base should be retained, refinished and mounted atop longer balusters and a longer newel post that have the same horizontal dimensions and appearance as the originals.
Work Item 09001—Painting, Interior Walls and Ceiling, Includes Prep, Prime and One Coat Latex
Definition: Prepare and paint interior walls, the ceiling, and trim with prime and topcoat (figure 44).
Typical Life Cycle: 5 years. Unit of Measure: square feet (SF).
• Calculate the total square feet to be refinished. Do not deduct for openings.
Considerations:
• Includes repainting any common wall or ceiling surface, such as gypsum wall-board, plaster, and pressed board.
• Includes masking and providing floor protection; cleaning and preparing the surface; priming or sealing; painting interior walls, ceiling, and trim; and re-moving masking and drop cloths.
• Does not include removing lead-based paint. Use work item 16001 for removing lead-based paint.
VerDate Aug 31 2005 16:26 Dec 16, 2020 Jkt 000000 PO 00000 Frm 00125 Fmt 6621 Sfmt 6621 P:\DOCS\116-19\38016.TXT BRIAN 1161
9056
.eps
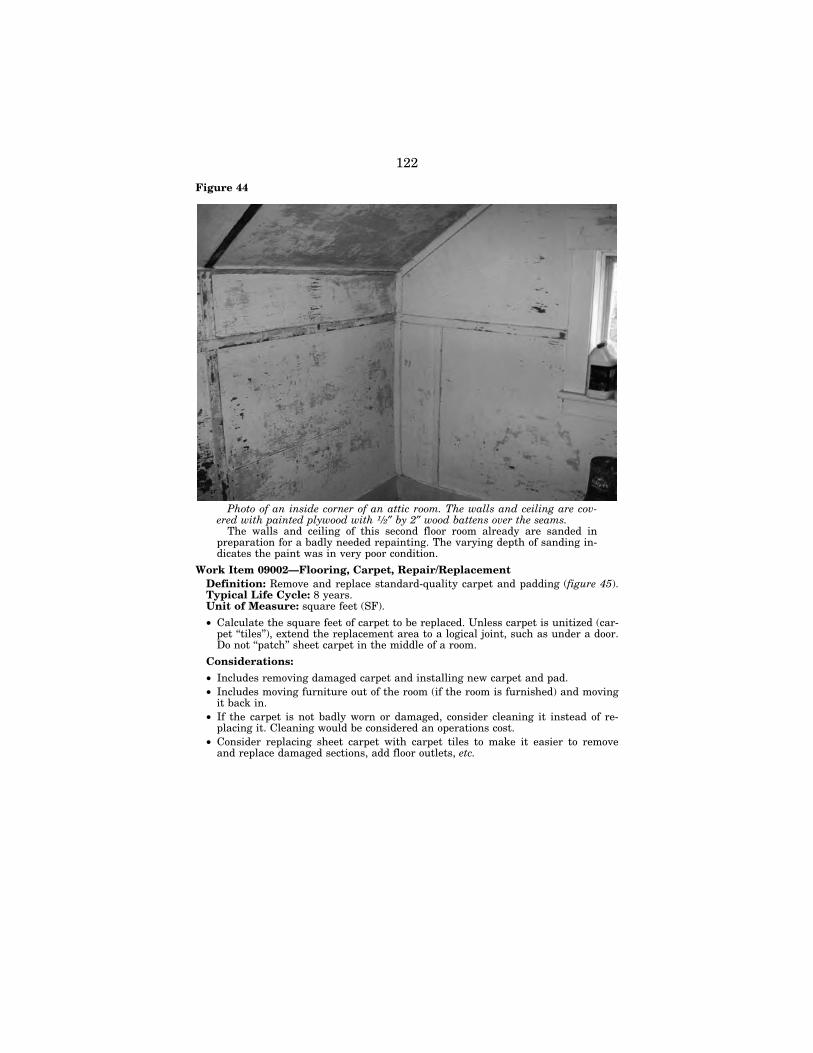
122
Figure 44
Photo of an inside corner of an attic room. The walls and ceiling are cov-ered with painted plywood with 1⁄2″ by 2″ wood battens over the seams.
The walls and ceiling of this second floor room already are sanded in preparation for a badly needed repainting. The varying depth of sanding in-dicates the paint was in very poor condition.
Work Item 09002—Flooring, Carpet, Repair/Replacement Definition: Remove and replace standard-quality carpet and padding (figure 45). Typical Life Cycle: 8 years. Unit of Measure: square feet (SF).
• Calculate the square feet of carpet to be replaced. Unless carpet is unitized (car-pet ‘‘tiles’’), extend the replacement area to a logical joint, such as under a door. Do not ‘‘patch’’ sheet carpet in the middle of a room.
Considerations:
• Includes removing damaged carpet and installing new carpet and pad. • Includes moving furniture out of the room (if the room is furnished) and moving
it back in. • If the carpet is not badly worn or damaged, consider cleaning it instead of re-
placing it. Cleaning would be considered an operations cost. • Consider replacing sheet carpet with carpet tiles to make it easier to remove
and replace damaged sections, add floor outlets, etc.
VerDate Aug 31 2005 16:26 Dec 16, 2020 Jkt 000000 PO 00000 Frm 00126 Fmt 6621 Sfmt 6621 P:\DOCS\116-19\38016.TXT BRIAN 1161
9057
.eps
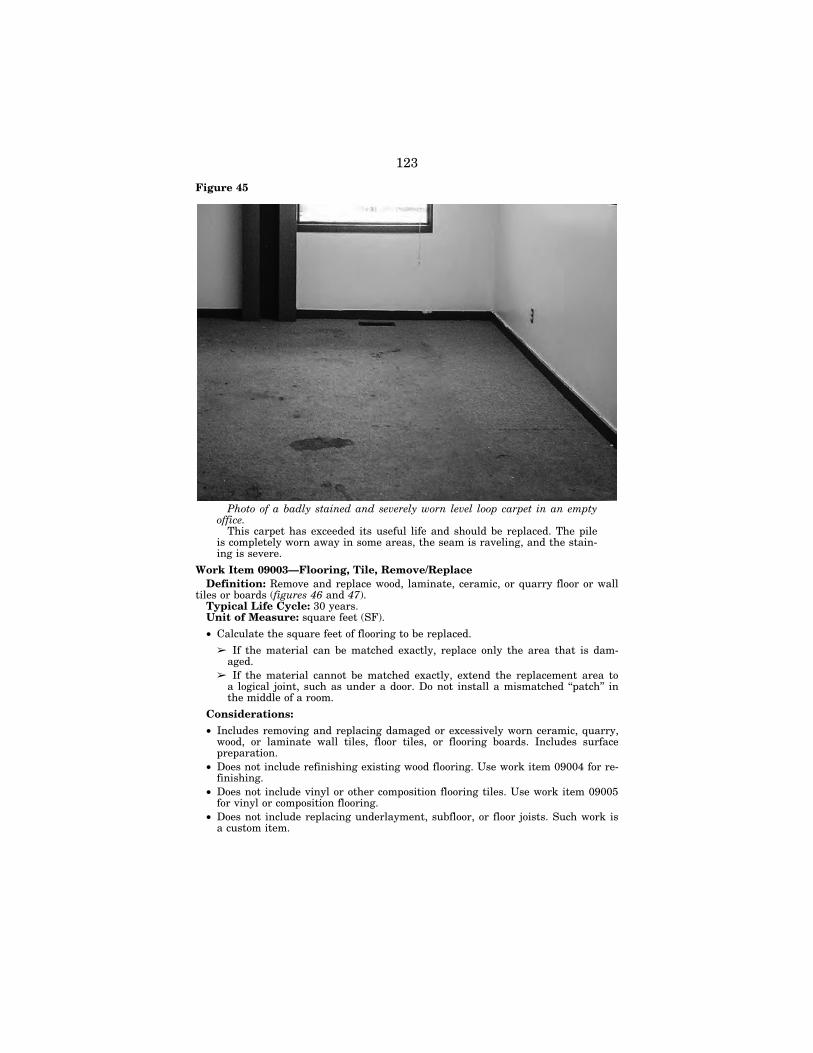
123
Figure 45
Photo of a badly stained and severely worn level loop carpet in an empty office.
This carpet has exceeded its useful life and should be replaced. The pile is completely worn away in some areas, the seam is raveling, and the stain-ing is severe.
Work Item 09003—Flooring, Tile, Remove/Replace Definition: Remove and replace wood, laminate, ceramic, or quarry floor or wall
tiles or boards (figures 46 and 47). Typical Life Cycle: 30 years. Unit of Measure: square feet (SF).
• Calculate the square feet of flooring to be replaced.
➢ If the material can be matched exactly, replace only the area that is dam-aged.
➢ If the material cannot be matched exactly, extend the replacement area to a logical joint, such as under a door. Do not install a mismatched ‘‘patch’’ in the middle of a room.
Considerations:
• Includes removing and replacing damaged or excessively worn ceramic, quarry, wood, or laminate wall tiles, floor tiles, or flooring boards. Includes surface preparation.
• Does not include refinishing existing wood flooring. Use work item 09004 for re-finishing.
• Does not include vinyl or other composition flooring tiles. Use work item 09005 for vinyl or composition flooring.
• Does not include replacing underlayment, subfloor, or floor joists. Such work is a custom item.
VerDate Aug 31 2005 16:26 Dec 16, 2020 Jkt 000000 PO 00000 Frm 00127 Fmt 6621 Sfmt 6621 P:\DOCS\116-19\38016.TXT BRIAN 1161
9058
.eps
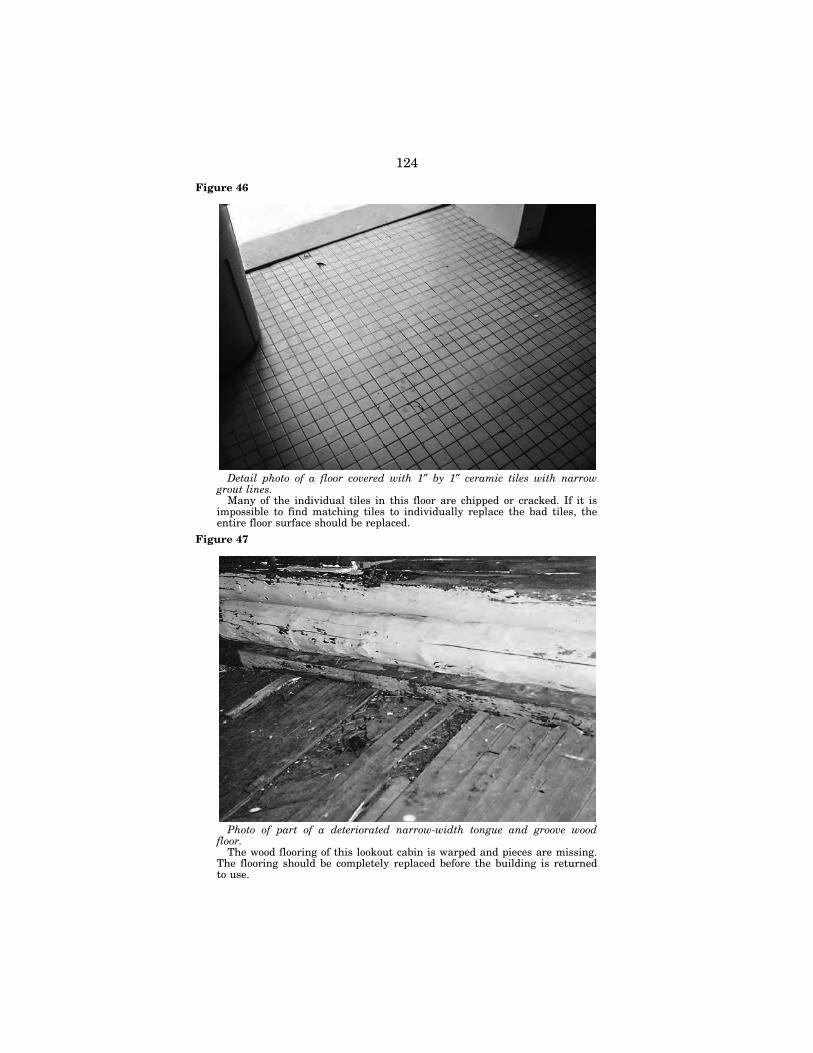
124
Figure 46
Detail photo of a floor covered with 1″ by 1″ ceramic tiles with narrow grout lines.
Many of the individual tiles in this floor are chipped or cracked. If it is impossible to find matching tiles to individually replace the bad tiles, the entire floor surface should be replaced.
Figure 47
Photo of part of a deteriorated narrow-width tongue and groove wood floor.
The wood flooring of this lookout cabin is warped and pieces are missing. The flooring should be completely replaced before the building is returned to use.
VerDate Aug 31 2005 16:26 Dec 16, 2020 Jkt 000000 PO 00000 Frm 00128 Fmt 6621 Sfmt 6621 P:\DOCS\116-19\38016.TXT BRIAN 1161
9059
.eps
1161
9060
.eps
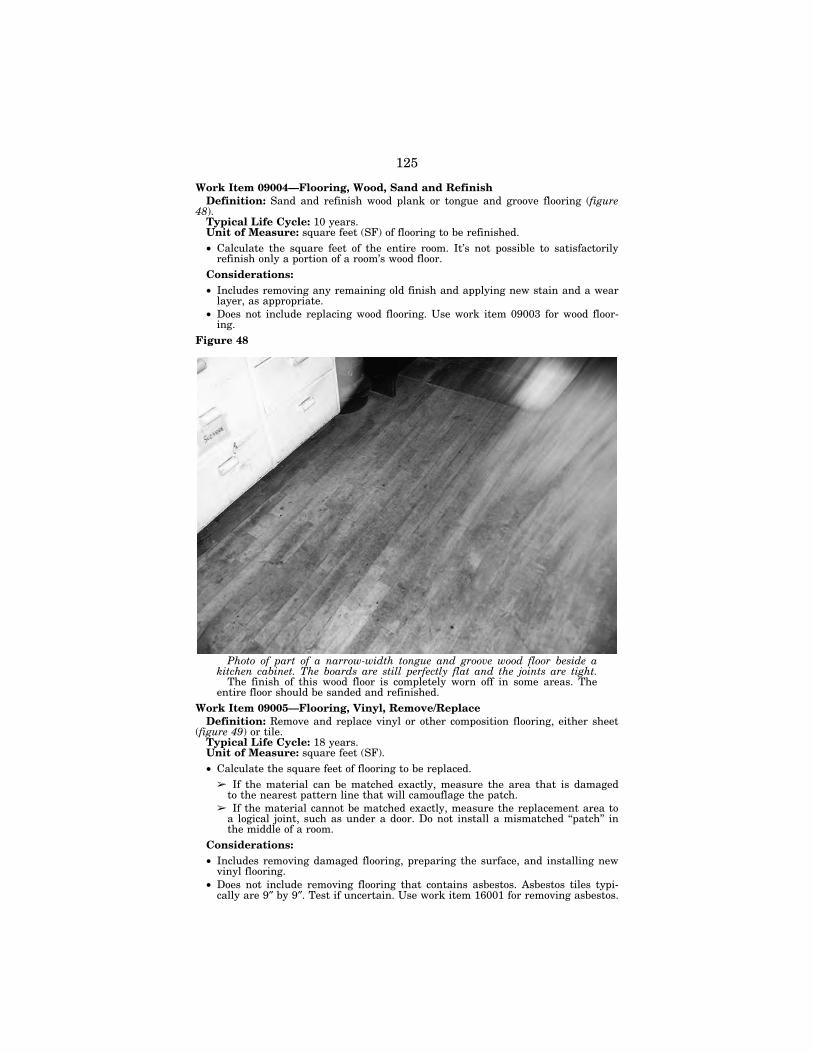
125
Work Item 09004—Flooring, Wood, Sand and Refinish Definition: Sand and refinish wood plank or tongue and groove flooring (figure
48). Typical Life Cycle: 10 years. Unit of Measure: square feet (SF) of flooring to be refinished. • Calculate the square feet of the entire room. It’s not possible to satisfactorily
refinish only a portion of a room’s wood floor. Considerations: • Includes removing any remaining old finish and applying new stain and a wear
layer, as appropriate. • Does not include replacing wood flooring. Use work item 09003 for wood floor-
ing. Figure 48
Photo of part of a narrow-width tongue and groove wood floor beside a kitchen cabinet. The boards are still perfectly flat and the joints are tight.
The finish of this wood floor is completely worn off in some areas. The entire floor should be sanded and refinished.
Work Item 09005—Flooring, Vinyl, Remove/Replace Definition: Remove and replace vinyl or other composition flooring, either sheet
(figure 49) or tile. Typical Life Cycle: 18 years. Unit of Measure: square feet (SF). • Calculate the square feet of flooring to be replaced.
➢ If the material can be matched exactly, measure the area that is damaged to the nearest pattern line that will camouflage the patch.
➢ If the material cannot be matched exactly, measure the replacement area to a logical joint, such as under a door. Do not install a mismatched ‘‘patch’’ in the middle of a room.
Considerations: • Includes removing damaged flooring, preparing the surface, and installing new
vinyl flooring. • Does not include removing flooring that contains asbestos. Asbestos tiles typi-
cally are 9″ by 9″. Test if uncertain. Use work item 16001 for removing asbestos.
VerDate Aug 31 2005 16:26 Dec 16, 2020 Jkt 000000 PO 00000 Frm 00129 Fmt 6621 Sfmt 6621 P:\DOCS\116-19\38016.TXT BRIAN 1161
9061
.eps
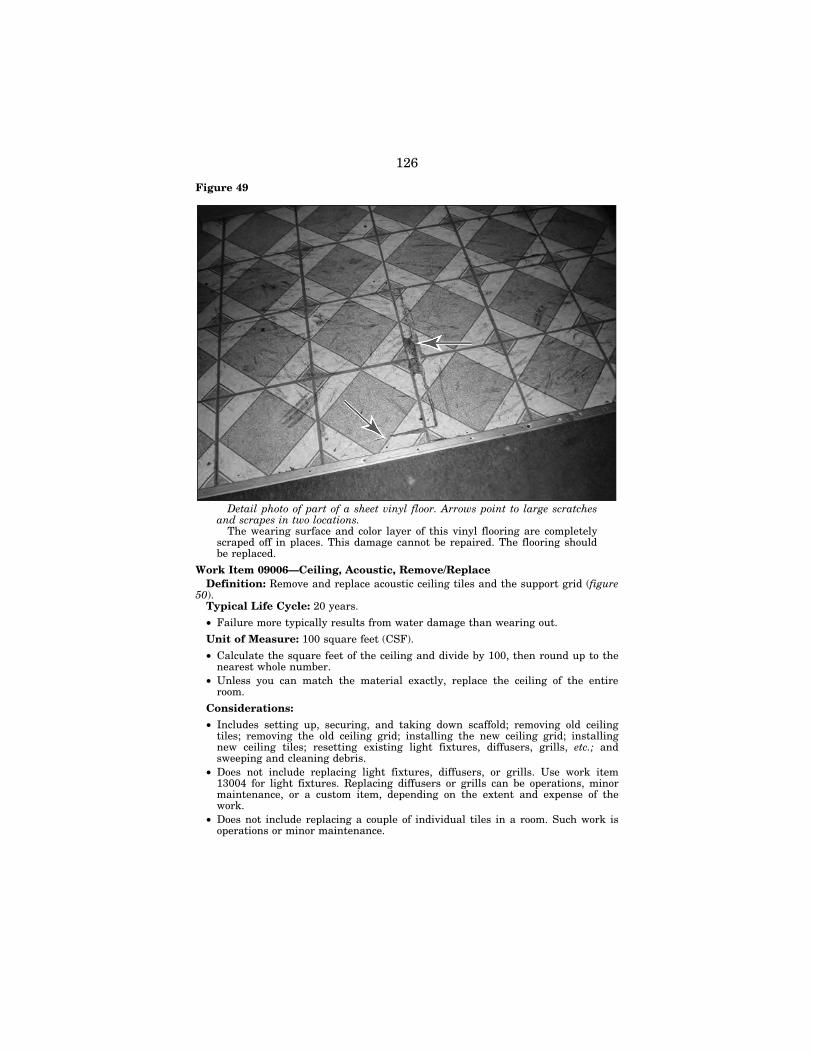
126
Figure 49
Detail photo of part of a sheet vinyl floor. Arrows point to large scratches and scrapes in two locations.
The wearing surface and color layer of this vinyl flooring are completely scraped off in places. This damage cannot be repaired. The flooring should be replaced.
Work Item 09006—Ceiling, Acoustic, Remove/Replace Definition: Remove and replace acoustic ceiling tiles and the support grid (figure
50). Typical Life Cycle: 20 years.
• Failure more typically results from water damage than wearing out.
Unit of Measure: 100 square feet (CSF).
• Calculate the square feet of the ceiling and divide by 100, then round up to the nearest whole number.
• Unless you can match the material exactly, replace the ceiling of the entire room.
Considerations:
• Includes setting up, securing, and taking down scaffold; removing old ceiling tiles; removing the old ceiling grid; installing the new ceiling grid; installing new ceiling tiles; resetting existing light fixtures, diffusers, grills, etc.; and sweeping and cleaning debris.
• Does not include replacing light fixtures, diffusers, or grills. Use work item 13004 for light fixtures. Replacing diffusers or grills can be operations, minor maintenance, or a custom item, depending on the extent and expense of the work.
• Does not include replacing a couple of individual tiles in a room. Such work is operations or minor maintenance.
VerDate Aug 31 2005 16:26 Dec 16, 2020 Jkt 000000 PO 00000 Frm 00130 Fmt 6621 Sfmt 6621 P:\DOCS\116-19\38016.TXT BRIAN 1161
9062
.eps
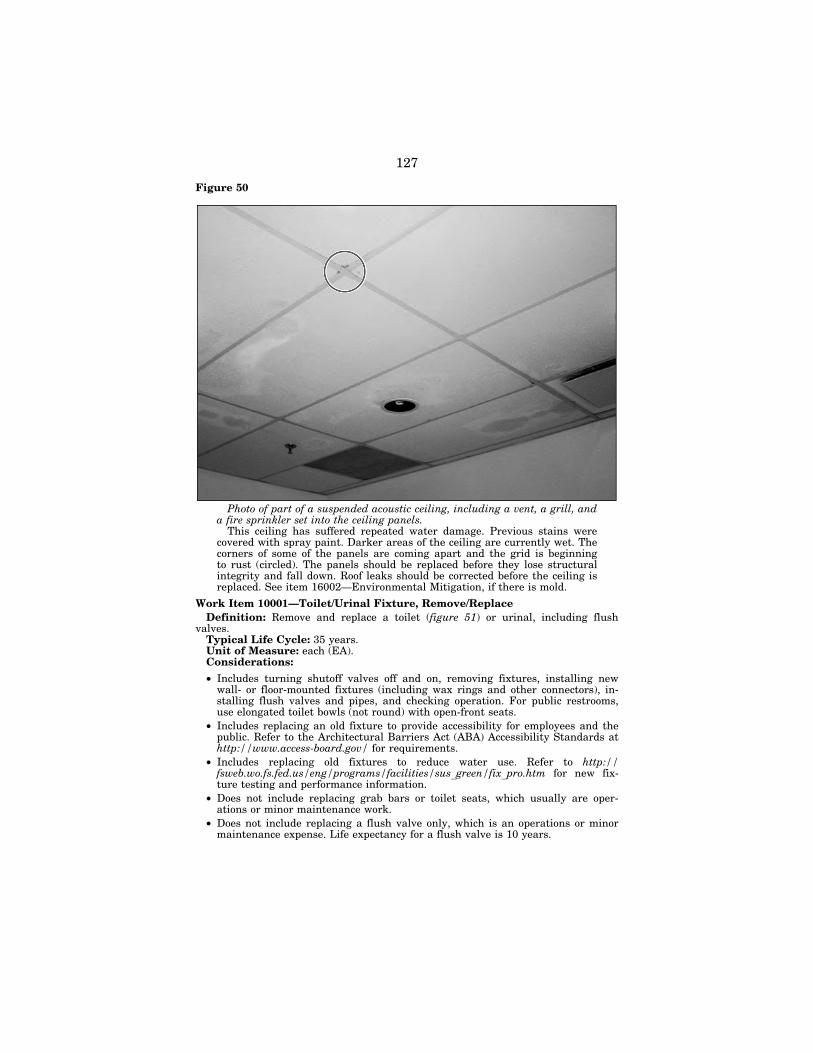
127
Figure 50
Photo of part of a suspended acoustic ceiling, including a vent, a grill, and a fire sprinkler set into the ceiling panels.
This ceiling has suffered repeated water damage. Previous stains were covered with spray paint. Darker areas of the ceiling are currently wet. The corners of some of the panels are coming apart and the grid is beginning to rust (circled). The panels should be replaced before they lose structural integrity and fall down. Roof leaks should be corrected before the ceiling is replaced. See item 16002—Environmental Mitigation, if there is mold.
Work Item 10001—Toilet/Urinal Fixture, Remove/Replace Definition: Remove and replace a toilet (figure 51) or urinal, including flush
valves. Typical Life Cycle: 35 years. Unit of Measure: each (EA). Considerations:
• Includes turning shutoff valves off and on, removing fixtures, installing new wall- or floor-mounted fixtures (including wax rings and other connectors), in-stalling flush valves and pipes, and checking operation. For public restrooms, use elongated toilet bowls (not round) with open-front seats.
• Includes replacing an old fixture to provide accessibility for employees and the public. Refer to the Architectural Barriers Act (ABA) Accessibility Standards at http://www.access-board.gov/ for requirements.
• Includes replacing old fixtures to reduce water use. Refer to http:// fsweb.wo.fs.fed.us/eng/programs/facilities/sus_green/fix_pro.htm for new fix-ture testing and performance information.
• Does not include replacing grab bars or toilet seats, which usually are oper-ations or minor maintenance work.
• Does not include replacing a flush valve only, which is an operations or minor maintenance expense. Life expectancy for a flush valve is 10 years.
VerDate Aug 31 2005 16:26 Dec 16, 2020 Jkt 000000 PO 00000 Frm 00131 Fmt 6621 Sfmt 6621 P:\DOCS\116-19\38016.TXT BRIAN 1161
9063
.eps
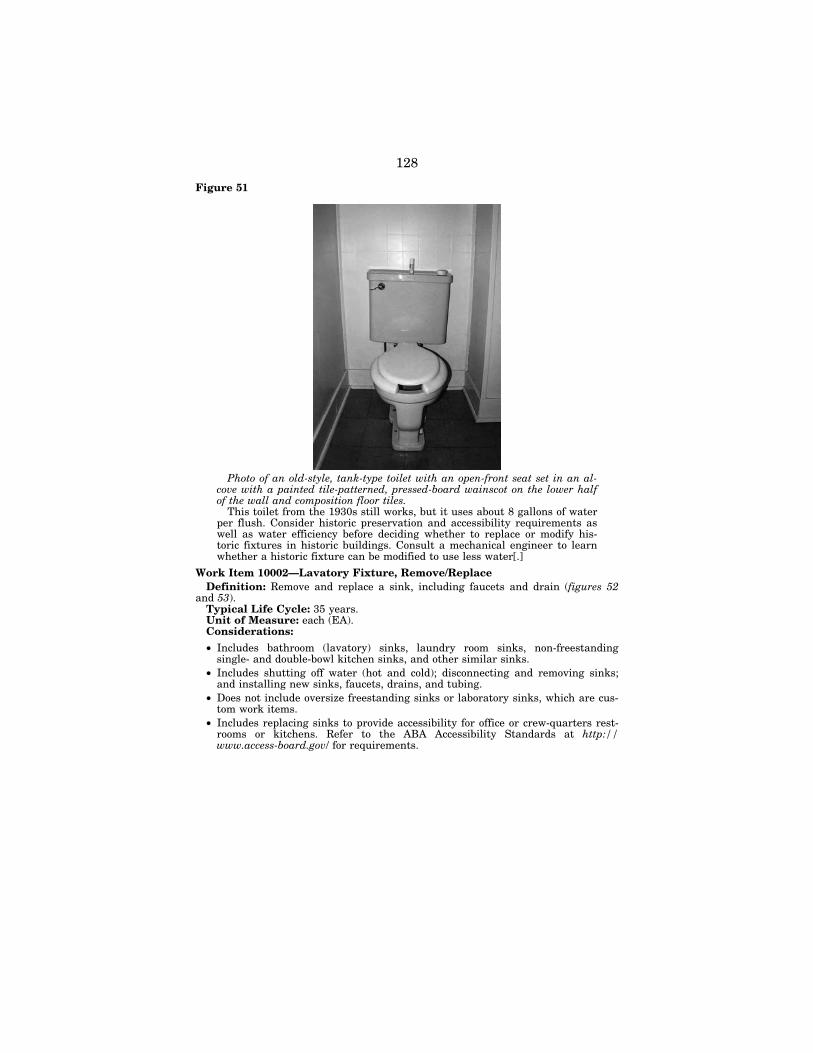
128
Figure 51
Photo of an old-style, tank-type toilet with an open-front seat set in an al-cove with a painted tile-patterned, pressed-board wainscot on the lower half of the wall and composition floor tiles.
This toilet from the 1930s still works, but it uses about 8 gallons of water per flush. Consider historic preservation and accessibility requirements as well as water efficiency before deciding whether to replace or modify his-toric fixtures in historic buildings. Consult a mechanical engineer to learn whether a historic fixture can be modified to use less water[.]
Work Item 10002—Lavatory Fixture, Remove/Replace Definition: Remove and replace a sink, including faucets and drain (figures 52
and 53). Typical Life Cycle: 35 years. Unit of Measure: each (EA). Considerations:
• Includes bathroom (lavatory) sinks, laundry room sinks, non-freestanding single- and double-bowl kitchen sinks, and other similar sinks.
• Includes shutting off water (hot and cold); disconnecting and removing sinks; and installing new sinks, faucets, drains, and tubing.
• Does not include oversize freestanding sinks or laboratory sinks, which are cus-tom work items.
• Includes replacing sinks to provide accessibility for office or crew-quarters rest-rooms or kitchens. Refer to the ABA Accessibility Standards at http:// www.access-board.gov/ for requirements.
VerDate Aug 31 2005 16:26 Dec 16, 2020 Jkt 000000 PO 00000 Frm 00132 Fmt 6621 Sfmt 6621 P:\DOCS\116-19\38016.TXT BRIAN 1161
9064
.eps
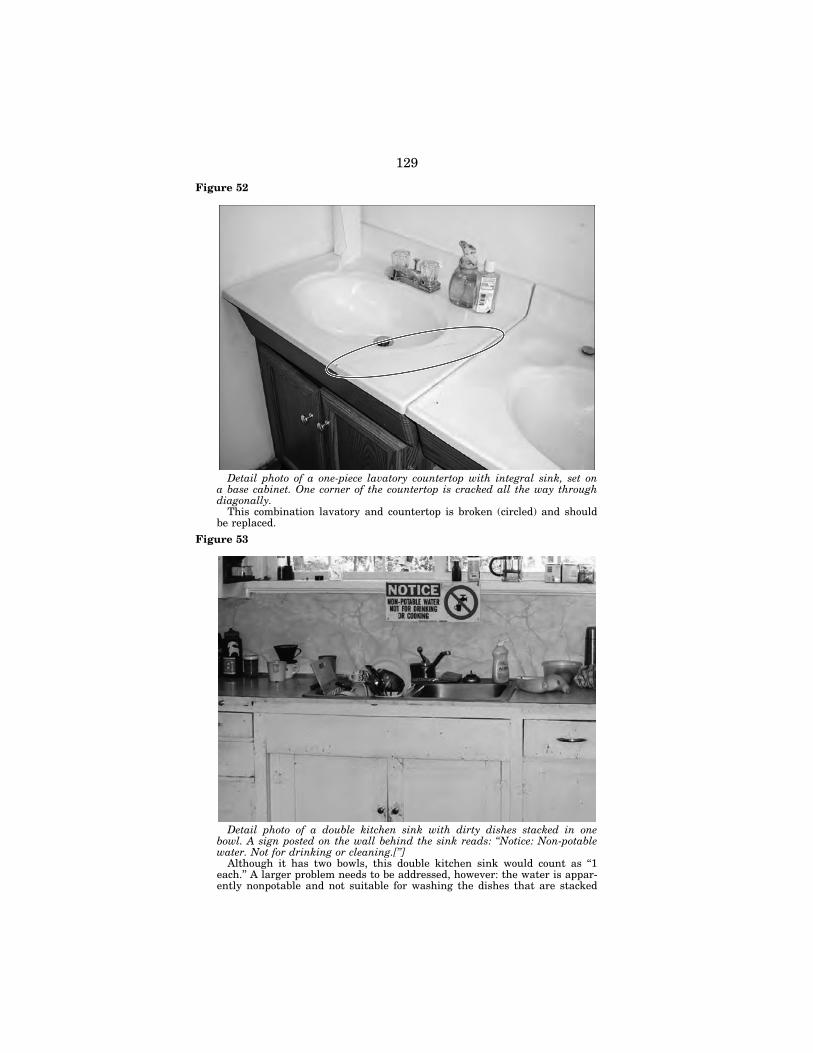
129
Figure 52
Detail photo of a one-piece lavatory countertop with integral sink, set on a base cabinet. One corner of the countertop is cracked all the way through diagonally.
This combination lavatory and countertop is broken (circled) and should be replaced.
Figure 53
Detail photo of a double kitchen sink with dirty dishes stacked in one bowl. A sign posted on the wall behind the sink reads: ‘‘Notice: Non-potable water. Not for drinking or cleaning.[’’]
Although it has two bowls, this double kitchen sink would count as ‘‘1 each.’’ A larger problem needs to be addressed, however: the water is appar-ently nonpotable and not suitable for washing the dishes that are stacked
VerDate Aug 31 2005 16:26 Dec 16, 2020 Jkt 000000 PO 00000 Frm 00133 Fmt 6621 Sfmt 6621 P:\DOCS\116-19\38016.TXT BRIAN 1161
9065
.eps
1161
9066
.eps
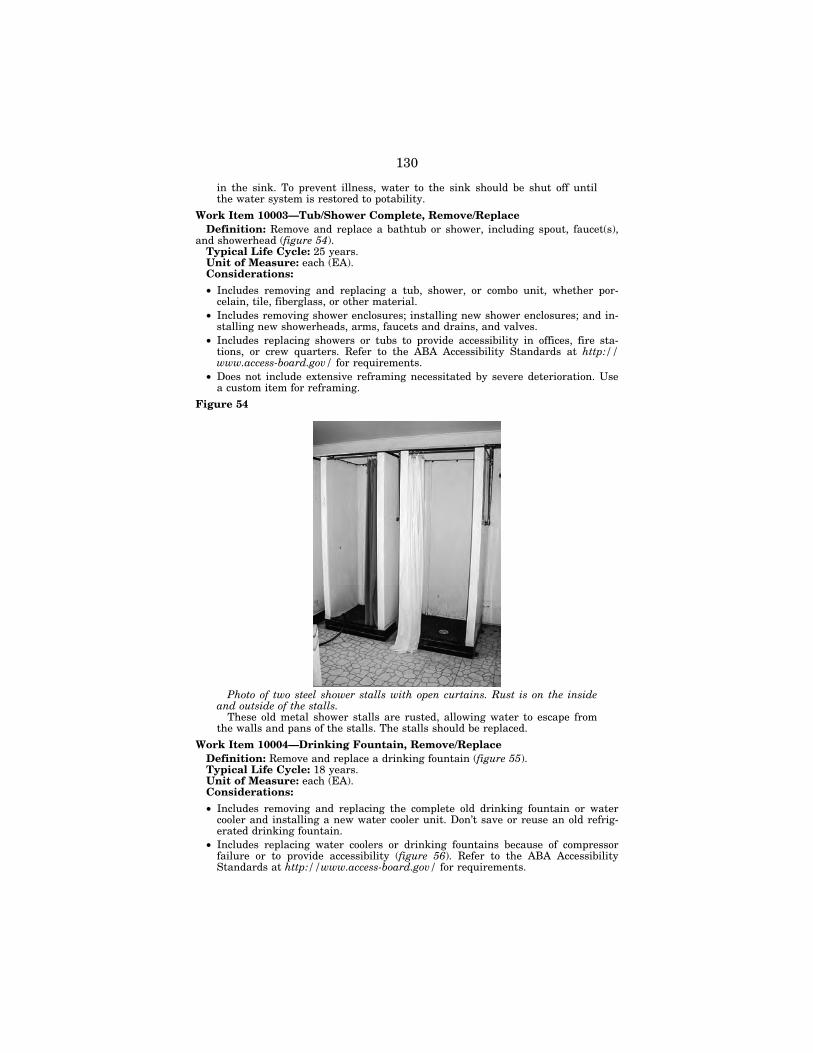
130
in the sink. To prevent illness, water to the sink should be shut off until the water system is restored to potability.
Work Item 10003—Tub/Shower Complete, Remove/Replace Definition: Remove and replace a bathtub or shower, including spout, faucet(s),
and showerhead (figure 54). Typical Life Cycle: 25 years. Unit of Measure: each (EA). Considerations:
• Includes removing and replacing a tub, shower, or combo unit, whether por-celain, tile, fiberglass, or other material.
• Includes removing shower enclosures; installing new shower enclosures; and in-stalling new showerheads, arms, faucets and drains, and valves.
• Includes replacing showers or tubs to provide accessibility in offices, fire sta-tions, or crew quarters. Refer to the ABA Accessibility Standards at http:// www.access-board.gov/ for requirements.
• Does not include extensive reframing necessitated by severe deterioration. Use a custom item for reframing.
Figure 54
Photo of two steel shower stalls with open curtains. Rust is on the inside and outside of the stalls.
These old metal shower stalls are rusted, allowing water to escape from the walls and pans of the stalls. The stalls should be replaced.
Work Item 10004—Drinking Fountain, Remove/Replace Definition: Remove and replace a drinking fountain (figure 55). Typical Life Cycle: 18 years. Unit of Measure: each (EA). Considerations:
• Includes removing and replacing the complete old drinking fountain or water cooler and installing a new water cooler unit. Don’t save or reuse an old refrig-erated drinking fountain.
• Includes replacing water coolers or drinking fountains because of compressor failure or to provide accessibility (figure 56). Refer to the ABA Accessibility Standards at http://www.access-board.gov/ for requirements.
VerDate Aug 31 2005 16:26 Dec 16, 2020 Jkt 000000 PO 00000 Frm 00134 Fmt 6621 Sfmt 6621 P:\DOCS\116-19\38016.TXT BRIAN 1161
9067
.eps
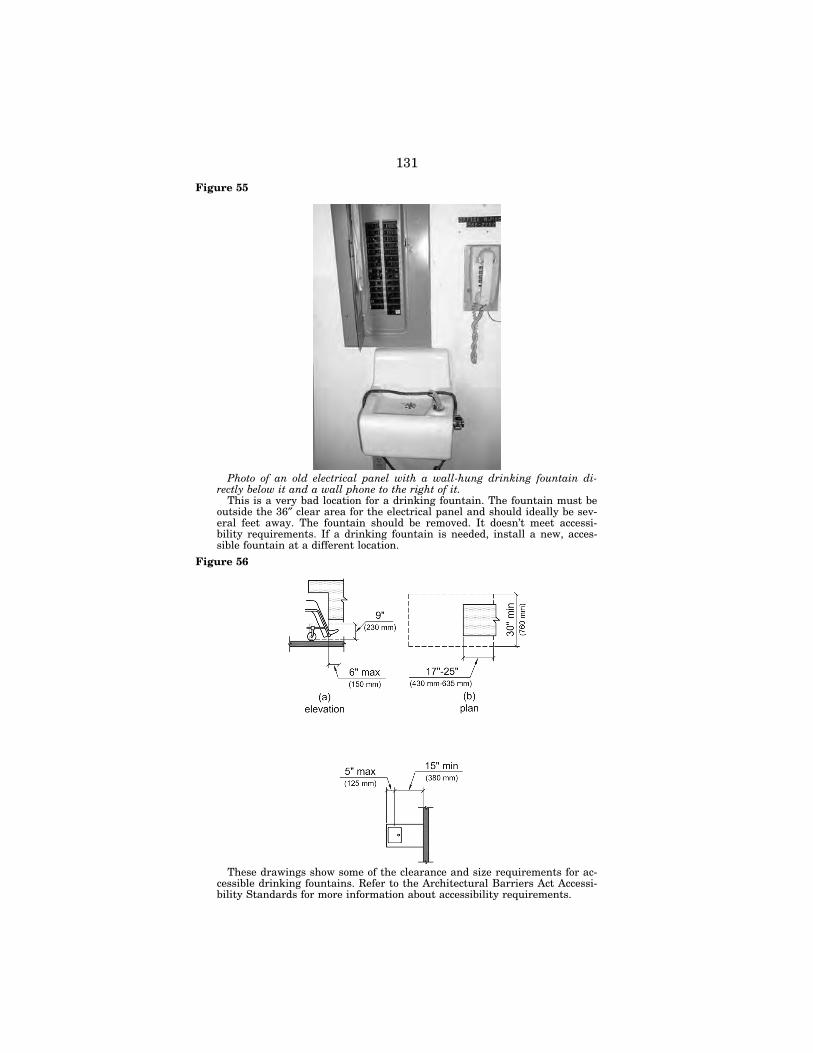
131
Figure 55
Photo of an old electrical panel with a wall-hung drinking fountain di-rectly below it and a wall phone to the right of it.
This is a very bad location for a drinking fountain. The fountain must be outside the 36″ clear area for the electrical panel and should ideally be sev-eral feet away. The fountain should be removed. It doesn’t meet accessi-bility requirements. If a drinking fountain is needed, install a new, acces-sible fountain at a different location.
Figure 56
These drawings show some of the clearance and size requirements for ac-cessible drinking fountains. Refer to the Architectural Barriers Act Accessi-bility Standards for more information about accessibility requirements.
VerDate Aug 31 2005 16:26 Dec 16, 2020 Jkt 000000 PO 00000 Frm 00135 Fmt 6621 Sfmt 6621 P:\DOCS\116-19\38016.TXT BRIAN 1161
9068
.eps
1161
9069
.eps
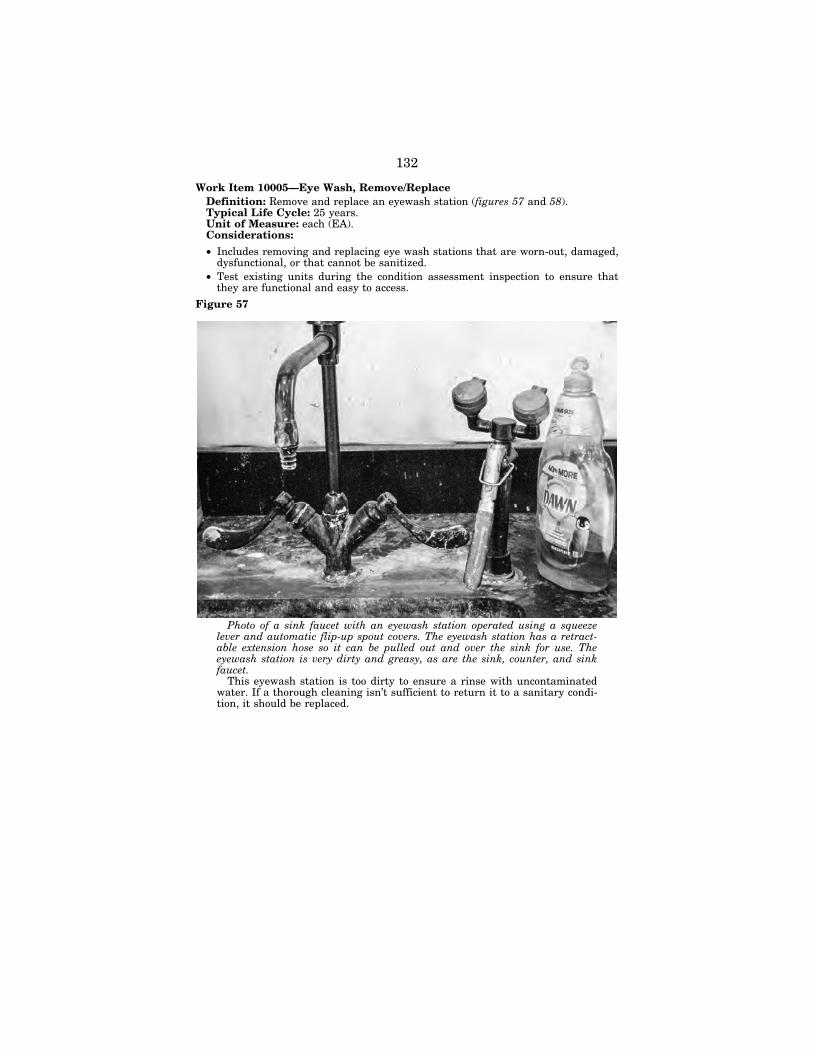
132
Work Item 10005—Eye Wash, Remove/Replace Definition: Remove and replace an eyewash station (figures 57 and 58). Typical Life Cycle: 25 years. Unit of Measure: each (EA). Considerations:
• Includes removing and replacing eye wash stations that are worn-out, damaged, dysfunctional, or that cannot be sanitized.
• Test existing units during the condition assessment inspection to ensure that they are functional and easy to access.
Figure 57
Photo of a sink faucet with an eyewash station operated using a squeeze lever and automatic flip-up spout covers. The eyewash station has a retract-able extension hose so it can be pulled out and over the sink for use. The eyewash station is very dirty and greasy, as are the sink, counter, and sink faucet.
This eyewash station is too dirty to ensure a rinse with uncontaminated water. If a thorough cleaning isn’t sufficient to return it to a sanitary condi-tion, it should be replaced.
VerDate Aug 31 2005 16:26 Dec 16, 2020 Jkt 000000 PO 00000 Frm 00136 Fmt 6621 Sfmt 6621 P:\DOCS\116-19\38016.TXT BRIAN 1161
9070
.eps
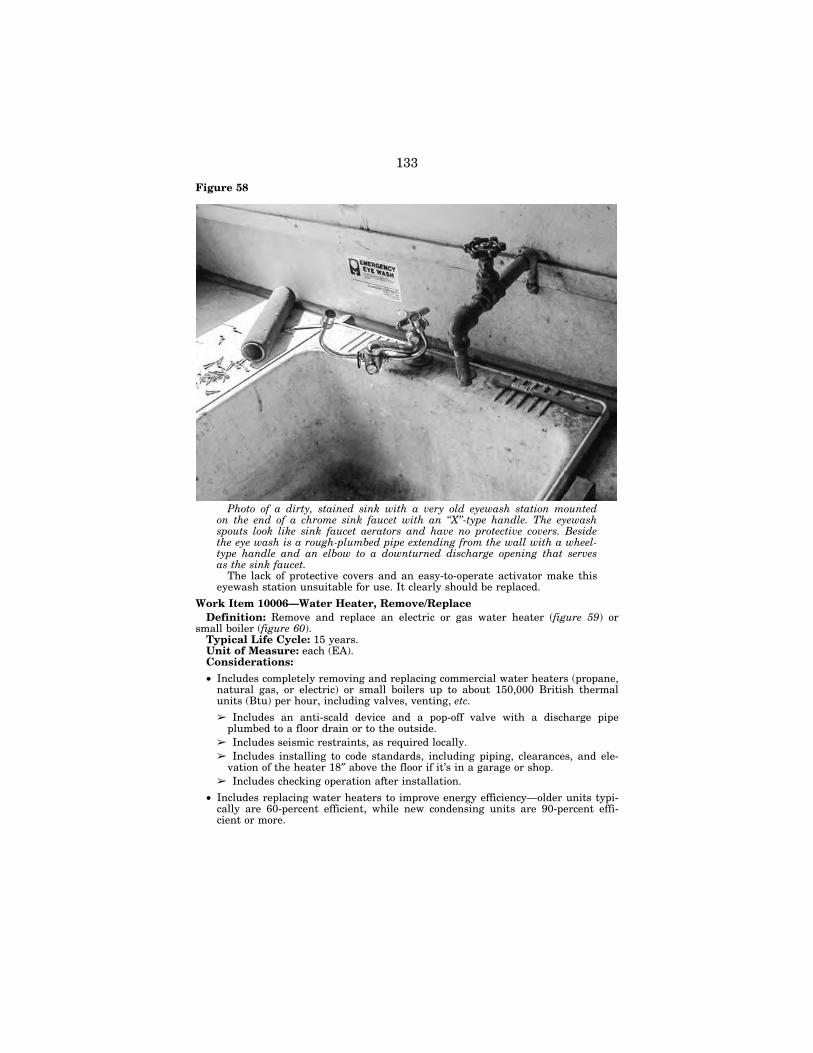
133
Figure 58
Photo of a dirty, stained sink with a very old eyewash station mounted on the end of a chrome sink faucet with an ‘‘X’’-type handle. The eyewash spouts look like sink faucet aerators and have no protective covers. Beside the eye wash is a rough-plumbed pipe extending from the wall with a wheel- type handle and an elbow to a downturned discharge opening that serves as the sink faucet.
The lack of protective covers and an easy-to-operate activator make this eyewash station unsuitable for use. It clearly should be replaced.
Work Item 10006—Water Heater, Remove/Replace Definition: Remove and replace an electric or gas water heater (figure 59) or
small boiler (figure 60). Typical Life Cycle: 15 years. Unit of Measure: each (EA). Considerations:
• Includes completely removing and replacing commercial water heaters (propane, natural gas, or electric) or small boilers up to about 150,000 British thermal units (Btu) per hour, including valves, venting, etc.
➢ Includes an anti-scald device and a pop-off valve with a discharge pipe plumbed to a floor drain or to the outside.
➢ Includes seismic restraints, as required locally. ➢ Includes installing to code standards, including piping, clearances, and ele-
vation of the heater 18″ above the floor if it’s in a garage or shop. ➢ Includes checking operation after installation.
• Includes replacing water heaters to improve energy efficiency—older units typi-cally are 60-percent efficient, while new condensing units are 90-percent effi-cient or more.
VerDate Aug 31 2005 16:26 Dec 16, 2020 Jkt 000000 PO 00000 Frm 00137 Fmt 6621 Sfmt 6621 P:\DOCS\116-19\38016.TXT BRIAN 1161
9071
.eps
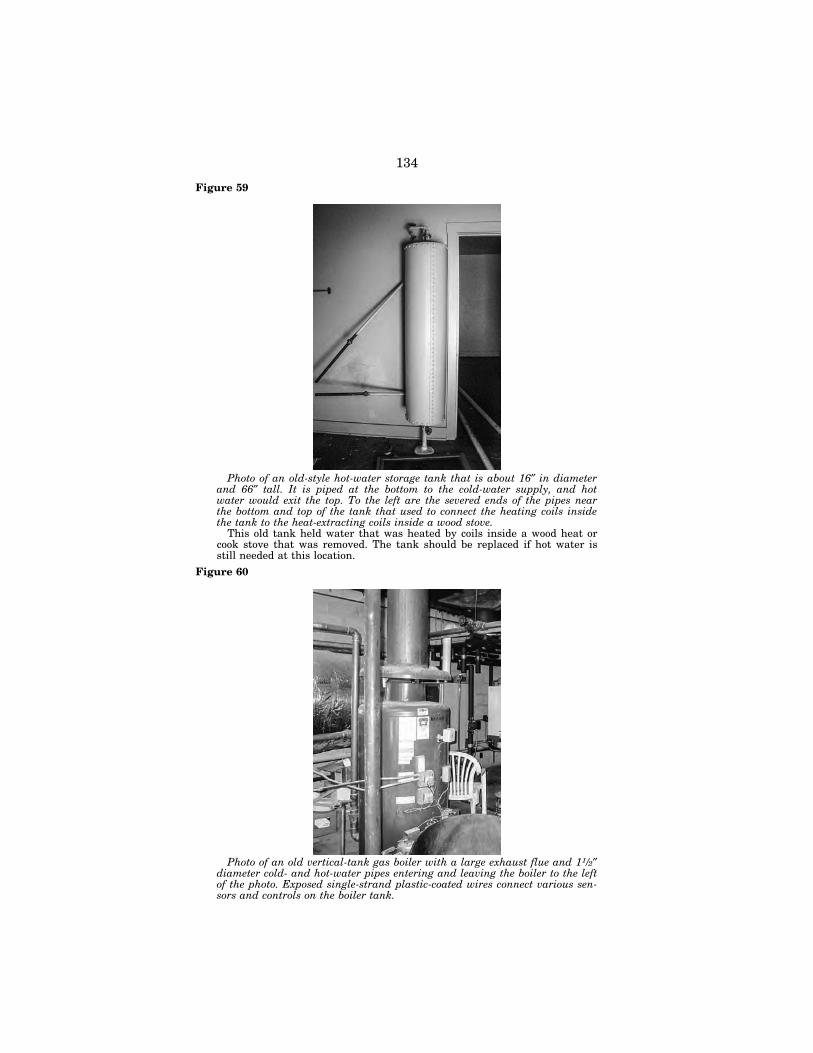
134
Figure 59
Photo of an old-style hot-water storage tank that is about 16″ in diameter and 66″ tall. It is piped at the bottom to the cold-water supply, and hot water would exit the top. To the left are the severed ends of the pipes near the bottom and top of the tank that used to connect the heating coils inside the tank to the heat-extracting coils inside a wood stove.
This old tank held water that was heated by coils inside a wood heat or cook stove that was removed. The tank should be replaced if hot water is still needed at this location.
Figure 60
Photo of an old vertical-tank gas boiler with a large exhaust flue and 11⁄2″ diameter cold- and hot-water pipes entering and leaving the boiler to the left of the photo. Exposed single-strand plastic-coated wires connect various sen-sors and controls on the boiler tank.
VerDate Aug 31 2005 16:26 Dec 16, 2020 Jkt 000000 PO 00000 Frm 00138 Fmt 6621 Sfmt 6621 P:\DOCS\116-19\38016.TXT BRIAN 1161
9072
.eps
1161
9073
.eps
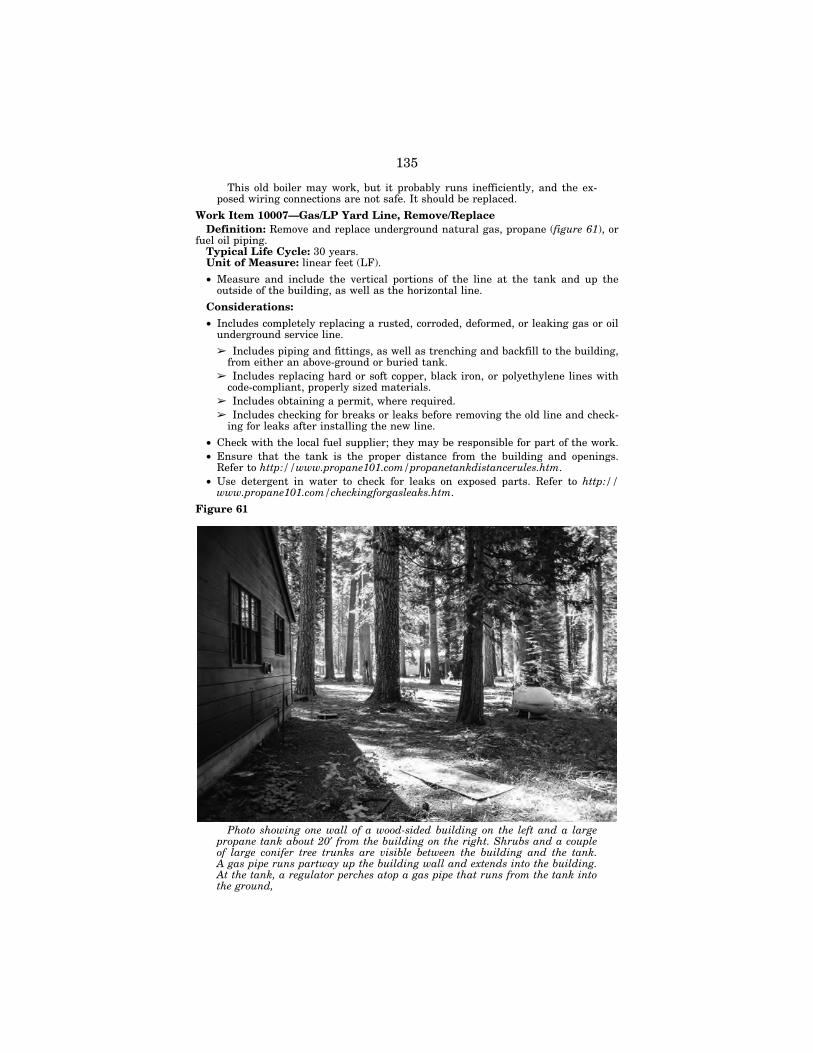
135
This old boiler may work, but it probably runs inefficiently, and the ex-posed wiring connections are not safe. It should be replaced.
Work Item 10007—Gas/LP Yard Line, Remove/Replace Definition: Remove and replace underground natural gas, propane (figure 61), or
fuel oil piping. Typical Life Cycle: 30 years. Unit of Measure: linear feet (LF).
• Measure and include the vertical portions of the line at the tank and up the outside of the building, as well as the horizontal line.
Considerations:
• Includes completely replacing a rusted, corroded, deformed, or leaking gas or oil underground service line.
➢ Includes piping and fittings, as well as trenching and backfill to the building, from either an above-ground or buried tank.
➢ Includes replacing hard or soft copper, black iron, or polyethylene lines with code-compliant, properly sized materials.
➢ Includes obtaining a permit, where required. ➢ Includes checking for breaks or leaks before removing the old line and check-
ing for leaks after installing the new line.
• Check with the local fuel supplier; they may be responsible for part of the work. • Ensure that the tank is the proper distance from the building and openings.
Refer to http://www.propane101.com/propanetankdistancerules.htm. • Use detergent in water to check for leaks on exposed parts. Refer to http://
www.propane101.com/checkingforgasleaks.htm.
Figure 61
Photo showing one wall of a wood-sided building on the left and a large propane tank about 20′ from the building on the right. Shrubs and a couple of large conifer tree trunks are visible between the building and the tank. A gas pipe runs partway up the building wall and extends into the building. At the tank, a regulator perches atop a gas pipe that runs from the tank into the ground,
VerDate Aug 31 2005 16:26 Dec 16, 2020 Jkt 000000 PO 00000 Frm 00139 Fmt 6621 Sfmt 6621 P:\DOCS\116-19\38016.TXT BRIAN 1161
9074
.eps
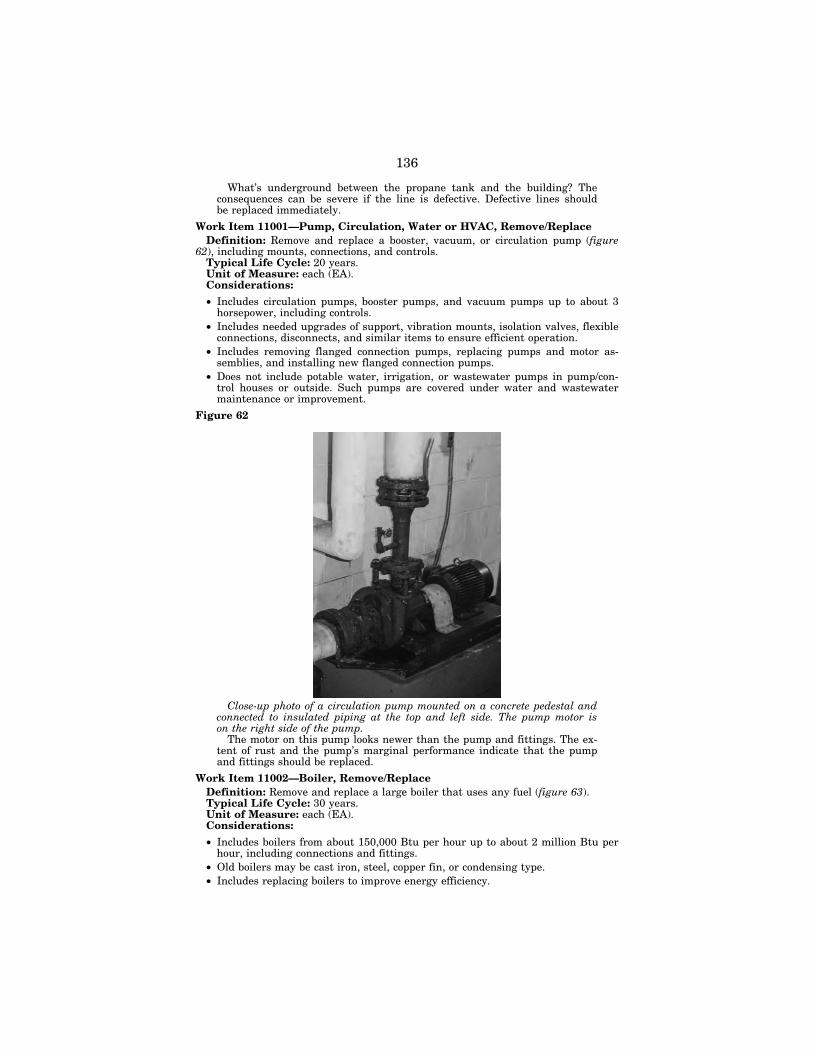
136
What’s underground between the propane tank and the building? The consequences can be severe if the line is defective. Defective lines should be replaced immediately.
Work Item 11001—Pump, Circulation, Water or HVAC, Remove/Replace Definition: Remove and replace a booster, vacuum, or circulation pump (figure
62), including mounts, connections, and controls. Typical Life Cycle: 20 years. Unit of Measure: each (EA). Considerations:
• Includes circulation pumps, booster pumps, and vacuum pumps up to about 3 horsepower, including controls.
• Includes needed upgrades of support, vibration mounts, isolation valves, flexible connections, disconnects, and similar items to ensure efficient operation.
• Includes removing flanged connection pumps, replacing pumps and motor as-semblies, and installing new flanged connection pumps.
• Does not include potable water, irrigation, or wastewater pumps in pump/con-trol houses or outside. Such pumps are covered under water and wastewater maintenance or improvement.
Figure 62
Close-up photo of a circulation pump mounted on a concrete pedestal and connected to insulated piping at the top and left side. The pump motor is on the right side of the pump.
The motor on this pump looks newer than the pump and fittings. The ex-tent of rust and the pump’s marginal performance indicate that the pump and fittings should be replaced.
Work Item 11002—Boiler, Remove/Replace Definition: Remove and replace a large boiler that uses any fuel (figure 63). Typical Life Cycle: 30 years. Unit of Measure: each (EA). Considerations:
• Includes boilers from about 150,000 Btu per hour up to about 2 million Btu per hour, including connections and fittings.
• Old boilers may be cast iron, steel, copper fin, or condensing type. • Includes replacing boilers to improve energy efficiency.
VerDate Aug 31 2005 16:26 Dec 16, 2020 Jkt 000000 PO 00000 Frm 00140 Fmt 6621 Sfmt 6621 P:\DOCS\116-19\38016.TXT BRIAN 1161
9075
.eps
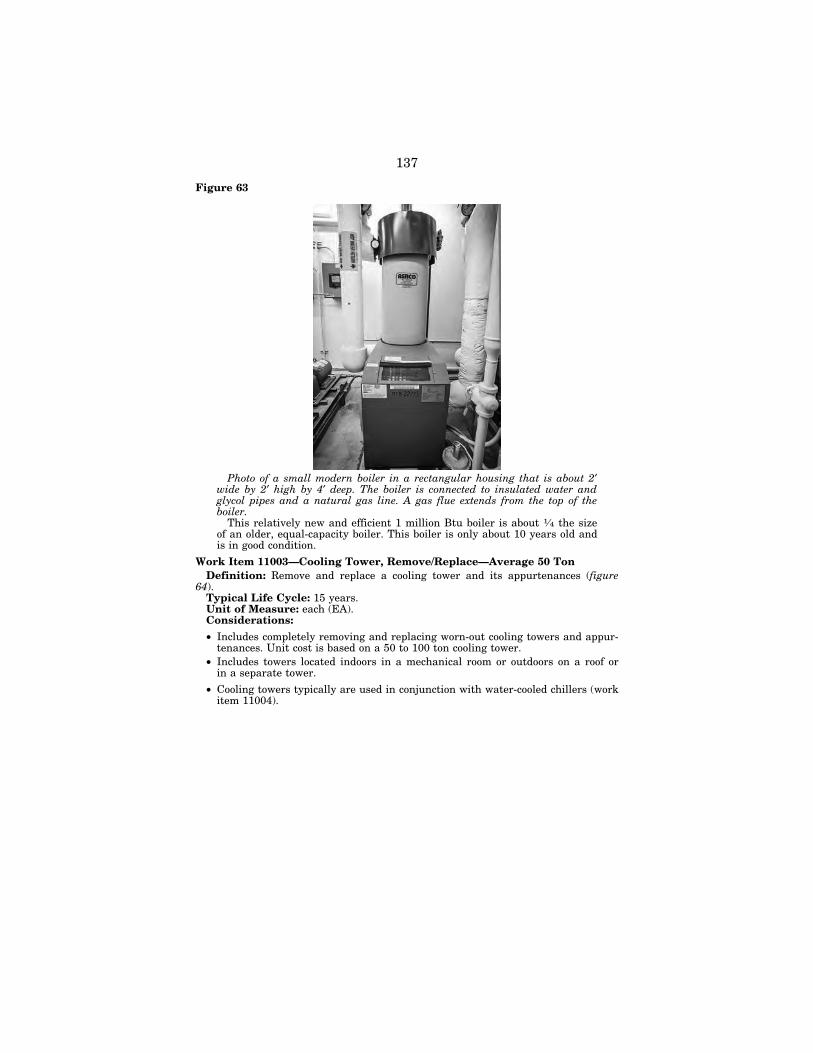
137
Figure 63
Photo of a small modern boiler in a rectangular housing that is about 2′ wide by 2′ high by 4′ deep. The boiler is connected to insulated water and glycol pipes and a natural gas line. A gas flue extends from the top of the boiler.
This relatively new and efficient 1 million Btu boiler is about 1⁄4 the size of an older, equal-capacity boiler. This boiler is only about 10 years old and is in good condition.
Work Item 11003—Cooling Tower, Remove/Replace—Average 50 Ton Definition: Remove and replace a cooling tower and its appurtenances (figure
64). Typical Life Cycle: 15 years. Unit of Measure: each (EA). Considerations:
• Includes completely removing and replacing worn-out cooling towers and appur-tenances. Unit cost is based on a 50 to 100 ton cooling tower.
• Includes towers located indoors in a mechanical room or outdoors on a roof or in a separate tower.
• Cooling towers typically are used in conjunction with water-cooled chillers (work item 11004).
VerDate Aug 31 2005 16:26 Dec 16, 2020 Jkt 000000 PO 00000 Frm 00141 Fmt 6621 Sfmt 6621 P:\DOCS\116-19\38016.TXT BRIAN 1161
9076
.eps
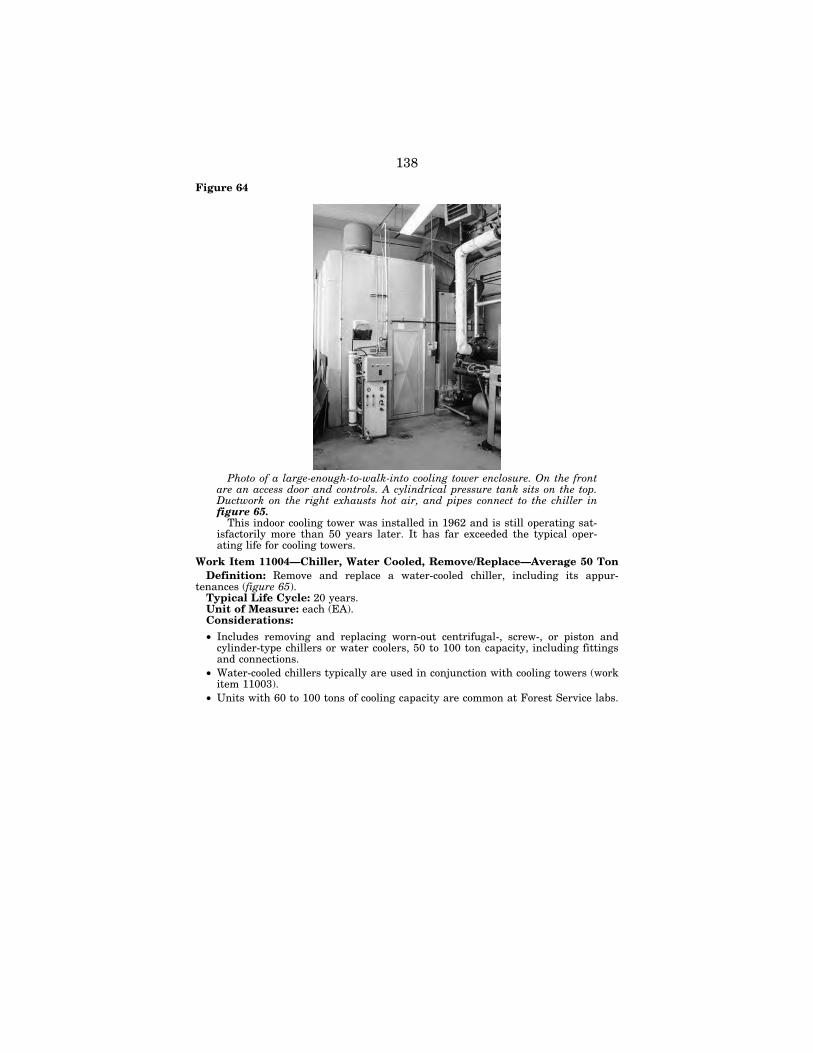
138
Figure 64
Photo of a large-enough-to-walk-into cooling tower enclosure. On the front are an access door and controls. A cylindrical pressure tank sits on the top. Ductwork on the right exhausts hot air, and pipes connect to the chiller in figure 65.
This indoor cooling tower was installed in 1962 and is still operating sat-isfactorily more than 50 years later. It has far exceeded the typical oper-ating life for cooling towers.
Work Item 11004—Chiller, Water Cooled, Remove/Replace—Average 50 Ton Definition: Remove and replace a water-cooled chiller, including its appur-
tenances (figure 65). Typical Life Cycle: 20 years. Unit of Measure: each (EA). Considerations:
• Includes removing and replacing worn-out centrifugal-, screw-, or piston and cylinder-type chillers or water coolers, 50 to 100 ton capacity, including fittings and connections.
• Water-cooled chillers typically are used in conjunction with cooling towers (work item 11003).
• Units with 60 to 100 tons of cooling capacity are common at Forest Service labs.
VerDate Aug 31 2005 16:26 Dec 16, 2020 Jkt 000000 PO 00000 Frm 00142 Fmt 6621 Sfmt 6621 P:\DOCS\116-19\38016.TXT BRIAN 1161
9077
.eps
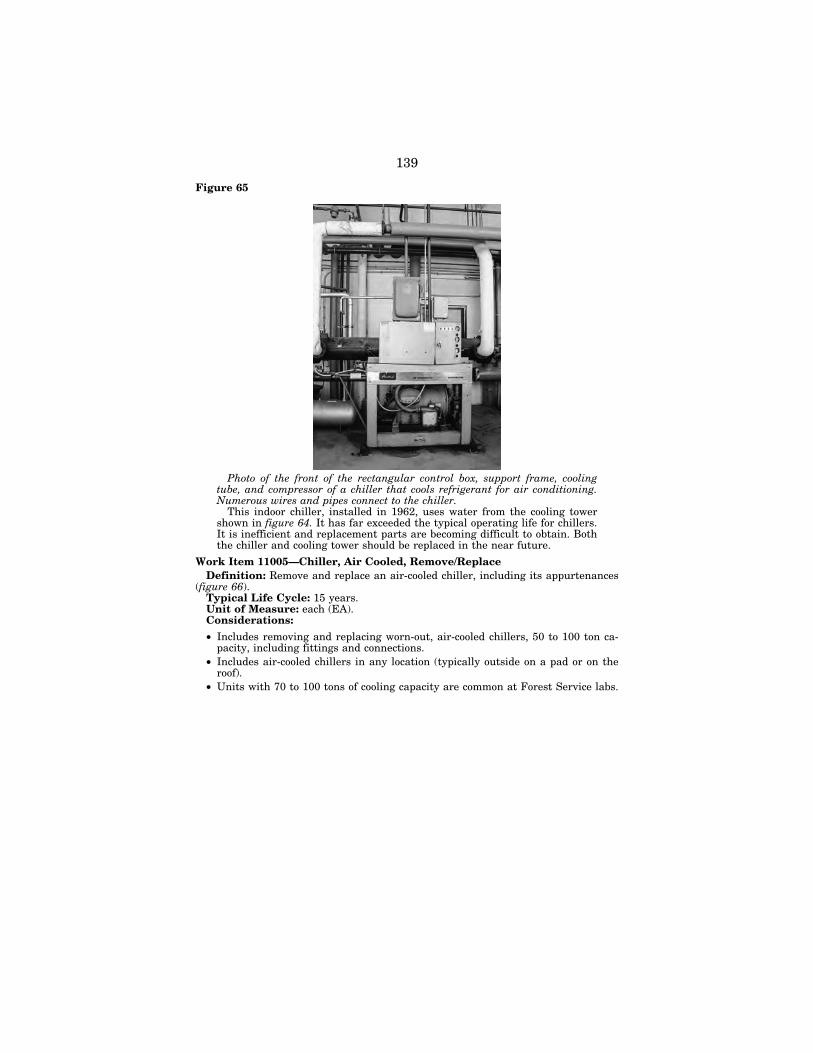
139
Figure 65
Photo of the front of the rectangular control box, support frame, cooling tube, and compressor of a chiller that cools refrigerant for air conditioning. Numerous wires and pipes connect to the chiller.
This indoor chiller, installed in 1962, uses water from the cooling tower shown in figure 64. It has far exceeded the typical operating life for chillers. It is inefficient and replacement parts are becoming difficult to obtain. Both the chiller and cooling tower should be replaced in the near future.
Work Item 11005—Chiller, Air Cooled, Remove/Replace Definition: Remove and replace an air-cooled chiller, including its appurtenances
(figure 66). Typical Life Cycle: 15 years. Unit of Measure: each (EA). Considerations:
• Includes removing and replacing worn-out, air-cooled chillers, 50 to 100 ton ca-pacity, including fittings and connections.
• Includes air-cooled chillers in any location (typically outside on a pad or on the roof).
• Units with 70 to 100 tons of cooling capacity are common at Forest Service labs.
VerDate Aug 31 2005 16:26 Dec 16, 2020 Jkt 000000 PO 00000 Frm 00143 Fmt 6621 Sfmt 6621 P:\DOCS\116-19\38016.TXT BRIAN 1161
9078
.eps
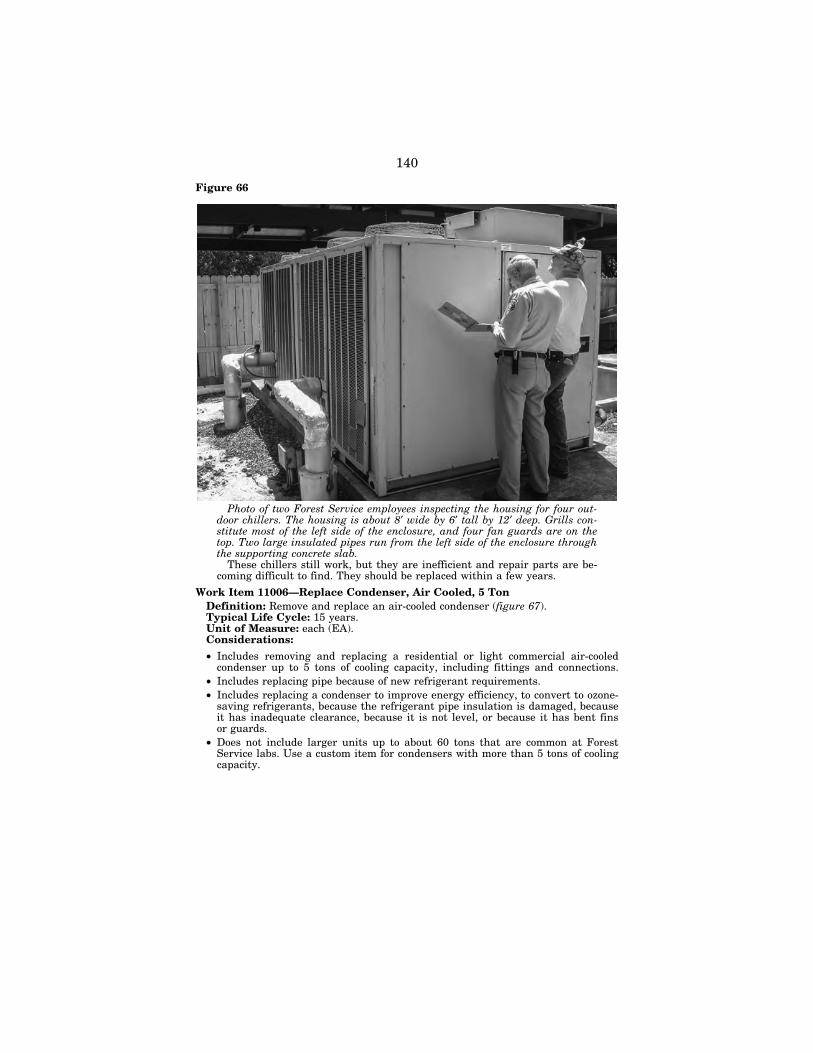
140
Figure 66
Photo of two Forest Service employees inspecting the housing for four out-door chillers. The housing is about 8′ wide by 6′ tall by 12′ deep. Grills con-stitute most of the left side of the enclosure, and four fan guards are on the top. Two large insulated pipes run from the left side of the enclosure through the supporting concrete slab.
These chillers still work, but they are inefficient and repair parts are be-coming difficult to find. They should be replaced within a few years.
Work Item 11006—Replace Condenser, Air Cooled, 5 Ton Definition: Remove and replace an air-cooled condenser (figure 67). Typical Life Cycle: 15 years. Unit of Measure: each (EA). Considerations:
• Includes removing and replacing a residential or light commercial air-cooled condenser up to 5 tons of cooling capacity, including fittings and connections.
• Includes replacing pipe because of new refrigerant requirements. • Includes replacing a condenser to improve energy efficiency, to convert to ozone-
saving refrigerants, because the refrigerant pipe insulation is damaged, because it has inadequate clearance, because it is not level, or because it has bent fins or guards.
• Does not include larger units up to about 60 tons that are common at Forest Service labs. Use a custom item for condensers with more than 5 tons of cooling capacity.
VerDate Aug 31 2005 16:26 Dec 16, 2020 Jkt 000000 PO 00000 Frm 00144 Fmt 6621 Sfmt 6621 P:\DOCS\116-19\38016.TXT BRIAN 1161
9079
.eps
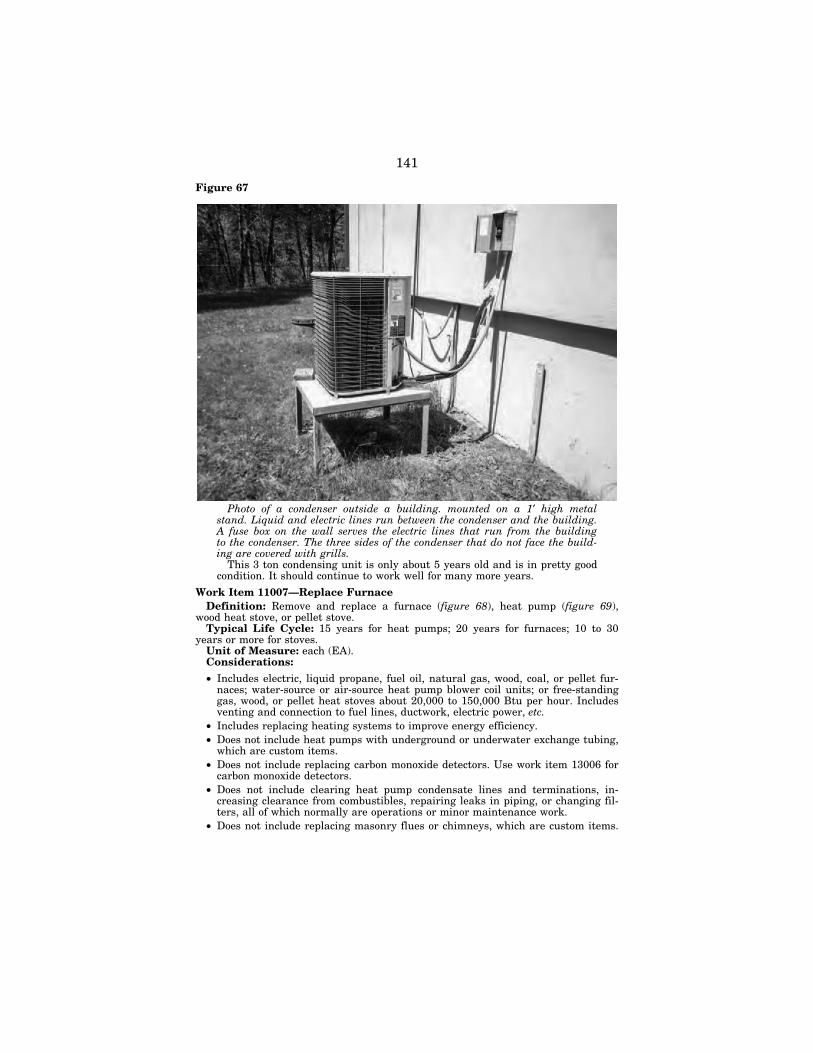
141
Figure 67
Photo of a condenser outside a building. mounted on a 1′ high metal stand. Liquid and electric lines run between the condenser and the building. A fuse box on the wall serves the electric lines that run from the building to the condenser. The three sides of the condenser that do not face the build-ing are covered with grills.
This 3 ton condensing unit is only about 5 years old and is in pretty good condition. It should continue to work well for many more years.
Work Item 11007—Replace Furnace Definition: Remove and replace a furnace (figure 68), heat pump (figure 69),
wood heat stove, or pellet stove. Typical Life Cycle: 15 years for heat pumps; 20 years for furnaces; 10 to 30
years or more for stoves. Unit of Measure: each (EA). Considerations:
• Includes electric, liquid propane, fuel oil, natural gas, wood, coal, or pellet fur-naces; water-source or air-source heat pump blower coil units; or free-standing gas, wood, or pellet heat stoves about 20,000 to 150,000 Btu per hour. Includes venting and connection to fuel lines, ductwork, electric power, etc.
• Includes replacing heating systems to improve energy efficiency. • Does not include heat pumps with underground or underwater exchange tubing,
which are custom items. • Does not include replacing carbon monoxide detectors. Use work item 13006 for
carbon monoxide detectors. • Does not include clearing heat pump condensate lines and terminations, in-
creasing clearance from combustibles, repairing leaks in piping, or changing fil-ters, all of which normally are operations or minor maintenance work.
• Does not include replacing masonry flues or chimneys, which are custom items.
VerDate Aug 31 2005 16:26 Dec 16, 2020 Jkt 000000 PO 00000 Frm 00145 Fmt 6621 Sfmt 6621 P:\DOCS\116-19\38016.TXT BRIAN 1161
9080
.eps
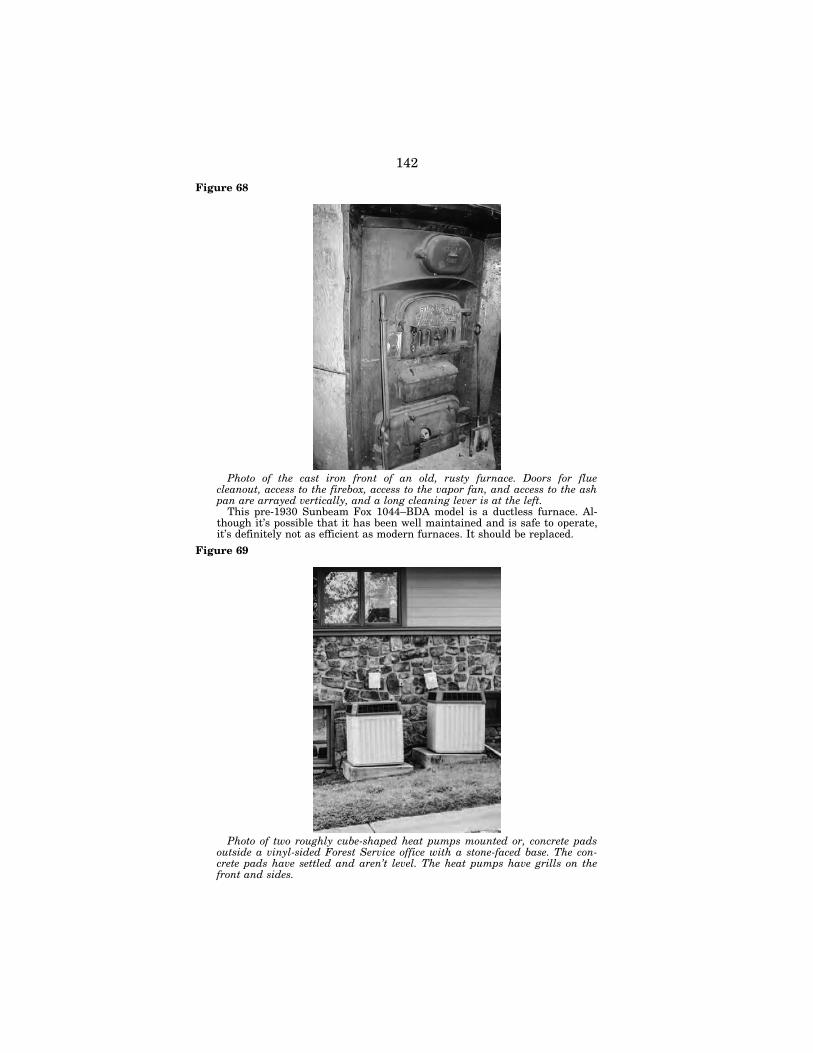
142
Figure 68
Photo of the cast iron front of an old, rusty furnace. Doors for flue cleanout, access to the firebox, access to the vapor fan, and access to the ash pan are arrayed vertically, and a long cleaning lever is at the left.
This pre-1930 Sunbeam Fox 1044–BDA model is a ductless furnace. Al-though it’s possible that it has been well maintained and is safe to operate, it’s definitely not as efficient as modern furnaces. It should be replaced.
Figure 69
Photo of two roughly cube-shaped heat pumps mounted or, concrete pads outside a vinyl-sided Forest Service office with a stone-faced base. The con-crete pads have settled and aren’t level. The heat pumps have grills on the front and sides.
VerDate Aug 31 2005 16:26 Dec 16, 2020 Jkt 000000 PO 00000 Frm 00146 Fmt 6621 Sfmt 6621 P:\DOCS\116-19\38016.TXT BRIAN 1161
9081
.eps
1161
9082
.eps
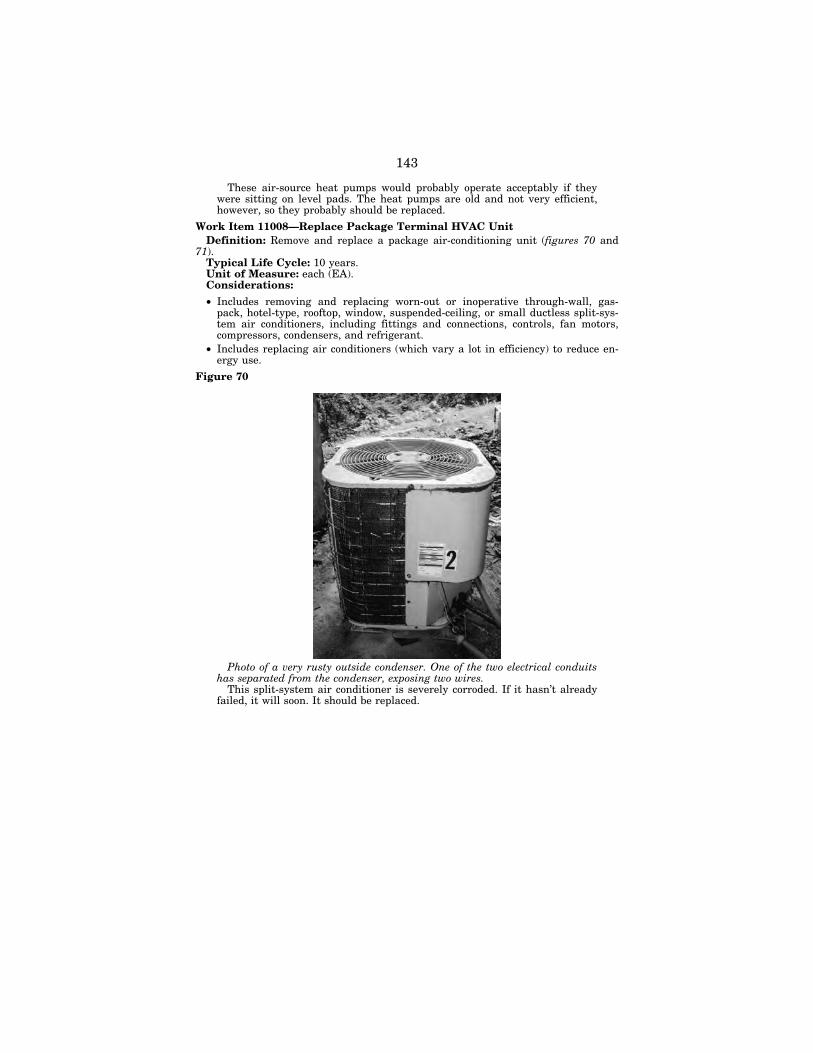
143
These air-source heat pumps would probably operate acceptably if they were sitting on level pads. The heat pumps are old and not very efficient, however, so they probably should be replaced.
Work Item 11008—Replace Package Terminal HVAC Unit Definition: Remove and replace a package air-conditioning unit (figures 70 and
71). Typical Life Cycle: 10 years. Unit of Measure: each (EA). Considerations:
• Includes removing and replacing worn-out or inoperative through-wall, gas- pack, hotel-type, rooftop, window, suspended-ceiling, or small ductless split-sys-tem air conditioners, including fittings and connections, controls, fan motors, compressors, condensers, and refrigerant.
• Includes replacing air conditioners (which vary a lot in efficiency) to reduce en-ergy use.
Figure 70
Photo of a very rusty outside condenser. One of the two electrical conduits has separated from the condenser, exposing two wires.
This split-system air conditioner is severely corroded. If it hasn’t already failed, it will soon. It should be replaced.
VerDate Aug 31 2005 16:26 Dec 16, 2020 Jkt 000000 PO 00000 Frm 00147 Fmt 6621 Sfmt 6621 P:\DOCS\116-19\38016.TXT BRIAN 1161
9083
.eps
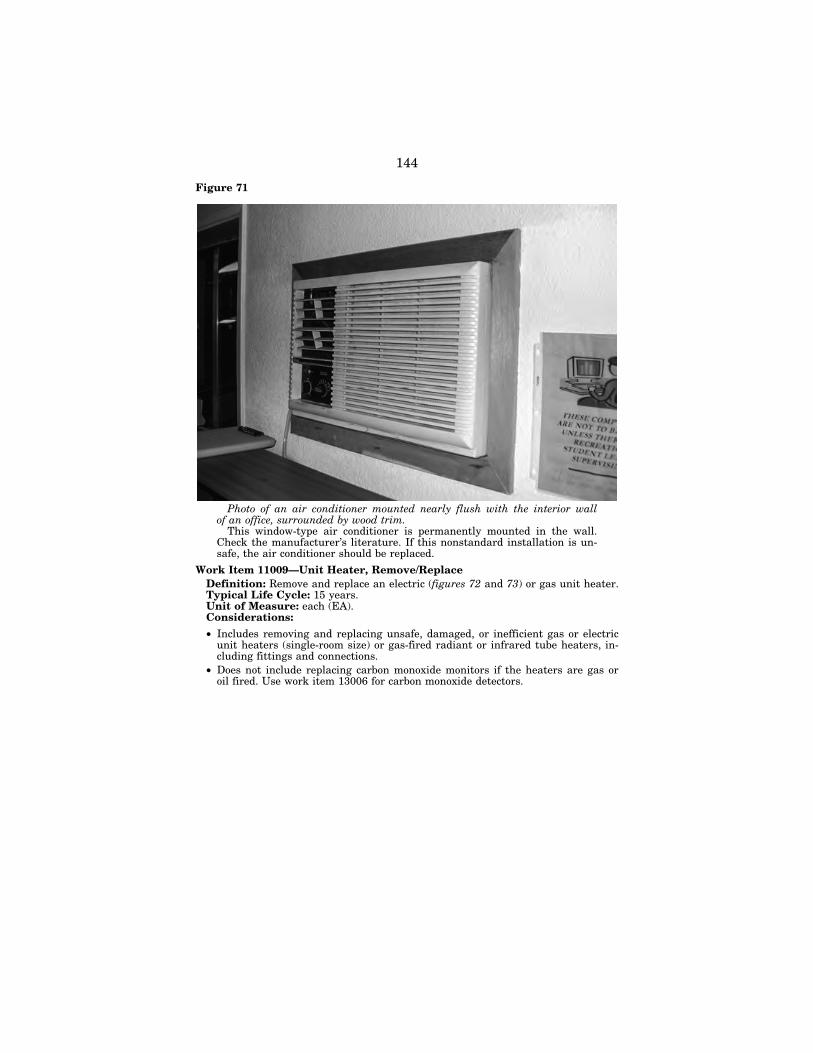
144
Figure 71
Photo of an air conditioner mounted nearly flush with the interior wall of an office, surrounded by wood trim.
This window-type air conditioner is permanently mounted in the wall. Check the manufacturer’s literature. If this nonstandard installation is un-safe, the air conditioner should be replaced.
Work Item 11009—Unit Heater, Remove/Replace Definition: Remove and replace an electric (figures 72 and 73) or gas unit heater. Typical Life Cycle: 15 years. Unit of Measure: each (EA). Considerations:
• Includes removing and replacing unsafe, damaged, or inefficient gas or electric unit heaters (single-room size) or gas-fired radiant or infrared tube heaters, in-cluding fittings and connections.
• Does not include replacing carbon monoxide monitors if the heaters are gas or oil fired. Use work item 13006 for carbon monoxide detectors.
VerDate Aug 31 2005 16:26 Dec 16, 2020 Jkt 000000 PO 00000 Frm 00148 Fmt 6621 Sfmt 6621 P:\DOCS\116-19\38016.TXT BRIAN 1161
9084
.eps
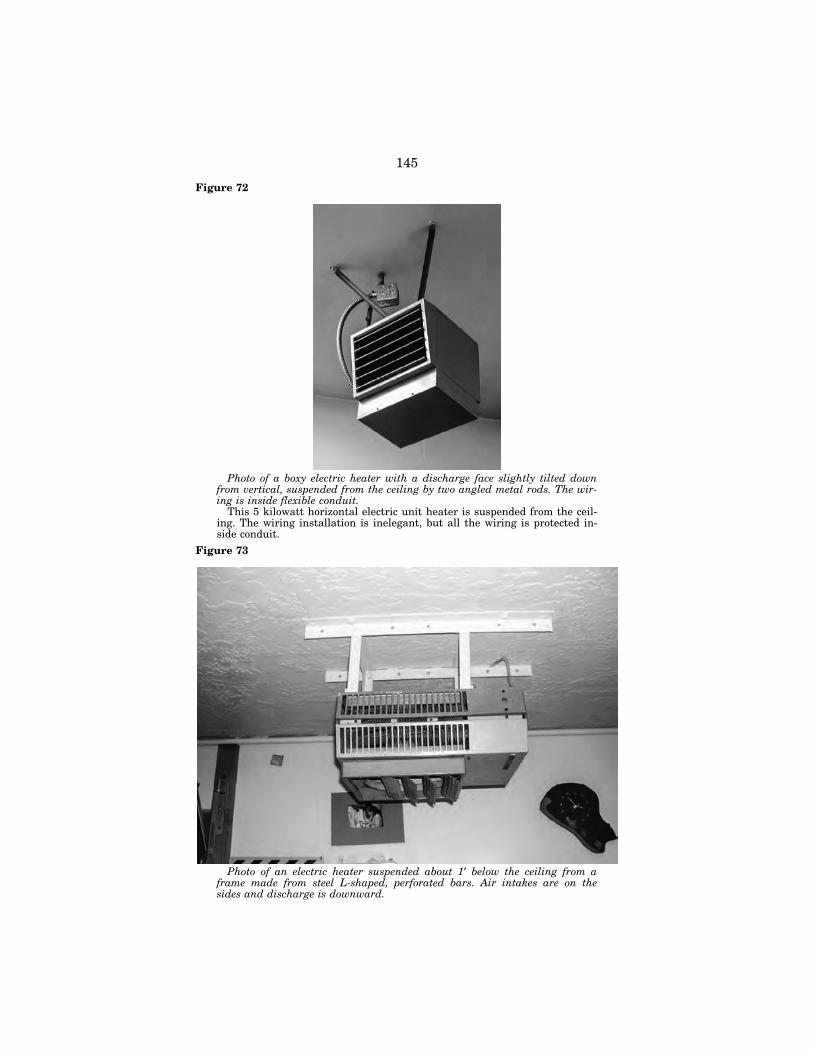
145
Figure 72
Photo of a boxy electric heater with a discharge face slightly tilted down from vertical, suspended from the ceiling by two angled metal rods. The wir-ing is inside flexible conduit.
This 5 kilowatt horizontal electric unit heater is suspended from the ceil-ing. The wiring installation is inelegant, but all the wiring is protected in-side conduit.
Figure 73
Photo of an electric heater suspended about 1′ below the ceiling from a frame made from steel L-shaped, perforated bars. Air intakes are on the sides and discharge is downward.
VerDate Aug 31 2005 16:26 Dec 16, 2020 Jkt 000000 PO 00000 Frm 00149 Fmt 6621 Sfmt 6621 P:\DOCS\116-19\38016.TXT BRIAN 1161
9085
.eps
1161
9086
.eps
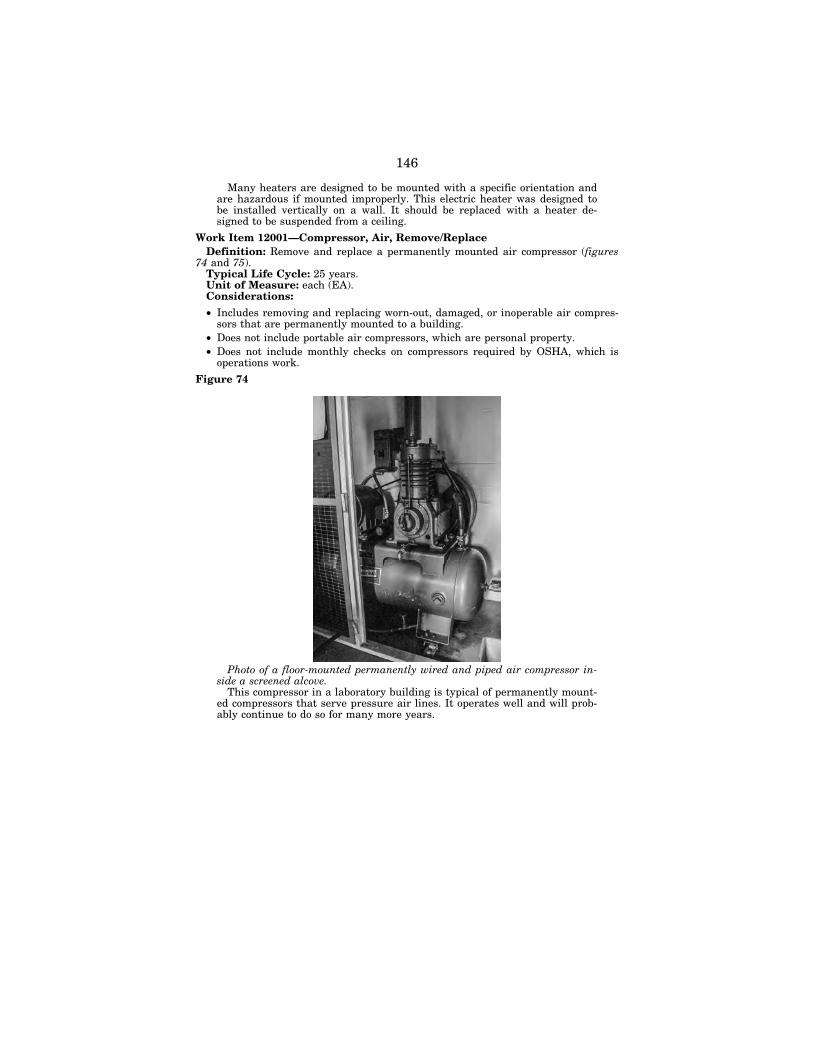
146
Many heaters are designed to be mounted with a specific orientation and are hazardous if mounted improperly. This electric heater was designed to be installed vertically on a wall. It should be replaced with a heater de-signed to be suspended from a ceiling.
Work Item 12001—Compressor, Air, Remove/Replace Definition: Remove and replace a permanently mounted air compressor (figures
74 and 75). Typical Life Cycle: 25 years. Unit of Measure: each (EA). Considerations:
• Includes removing and replacing worn-out, damaged, or inoperable air compres-sors that are permanently mounted to a building.
• Does not include portable air compressors, which are personal property. • Does not include monthly checks on compressors required by OSHA, which is
operations work.
Figure 74
Photo of a floor-mounted permanently wired and piped air compressor in-side a screened alcove.
This compressor in a laboratory building is typical of permanently mount-ed compressors that serve pressure air lines. It operates well and will prob-ably continue to do so for many more years.
VerDate Aug 31 2005 16:26 Dec 16, 2020 Jkt 000000 PO 00000 Frm 00150 Fmt 6621 Sfmt 6621 P:\DOCS\116-19\38016.TXT BRIAN 1161
9087
.eps
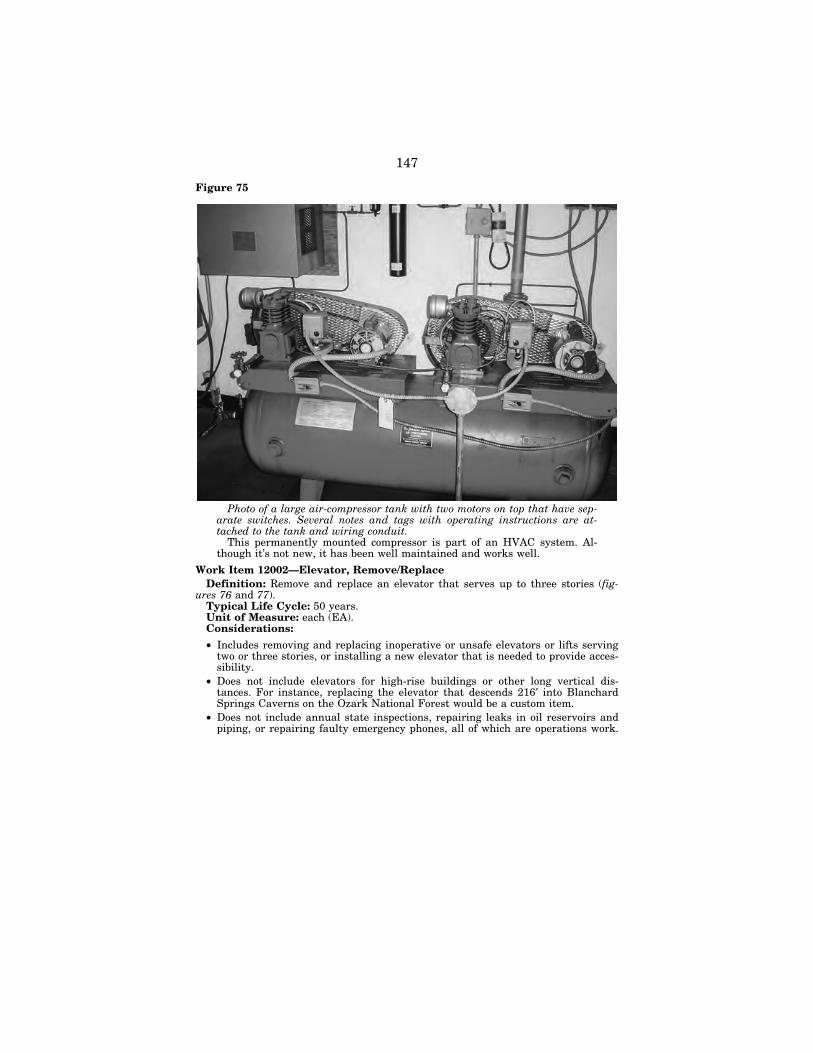
147
Figure 75
Photo of a large air-compressor tank with two motors on top that have sep-arate switches. Several notes and tags with operating instructions are at-tached to the tank and wiring conduit.
This permanently mounted compressor is part of an HVAC system. Al-though it’s not new, it has been well maintained and works well.
Work Item 12002—Elevator, Remove/Replace Definition: Remove and replace an elevator that serves up to three stories (fig-
ures 76 and 77). Typical Life Cycle: 50 years. Unit of Measure: each (EA). Considerations:
• Includes removing and replacing inoperative or unsafe elevators or lifts serving two or three stories, or installing a new elevator that is needed to provide acces-sibility.
• Does not include elevators for high-rise buildings or other long vertical dis-tances. For instance, replacing the elevator that descends 216′ into Blanchard Springs Caverns on the Ozark National Forest would be a custom item.
• Does not include annual state inspections, repairing leaks in oil reservoirs and piping, or repairing faulty emergency phones, all of which are operations work.
VerDate Aug 31 2005 16:26 Dec 16, 2020 Jkt 000000 PO 00000 Frm 00151 Fmt 6621 Sfmt 6621 P:\DOCS\116-19\38016.TXT BRIAN 1161
9088
.eps
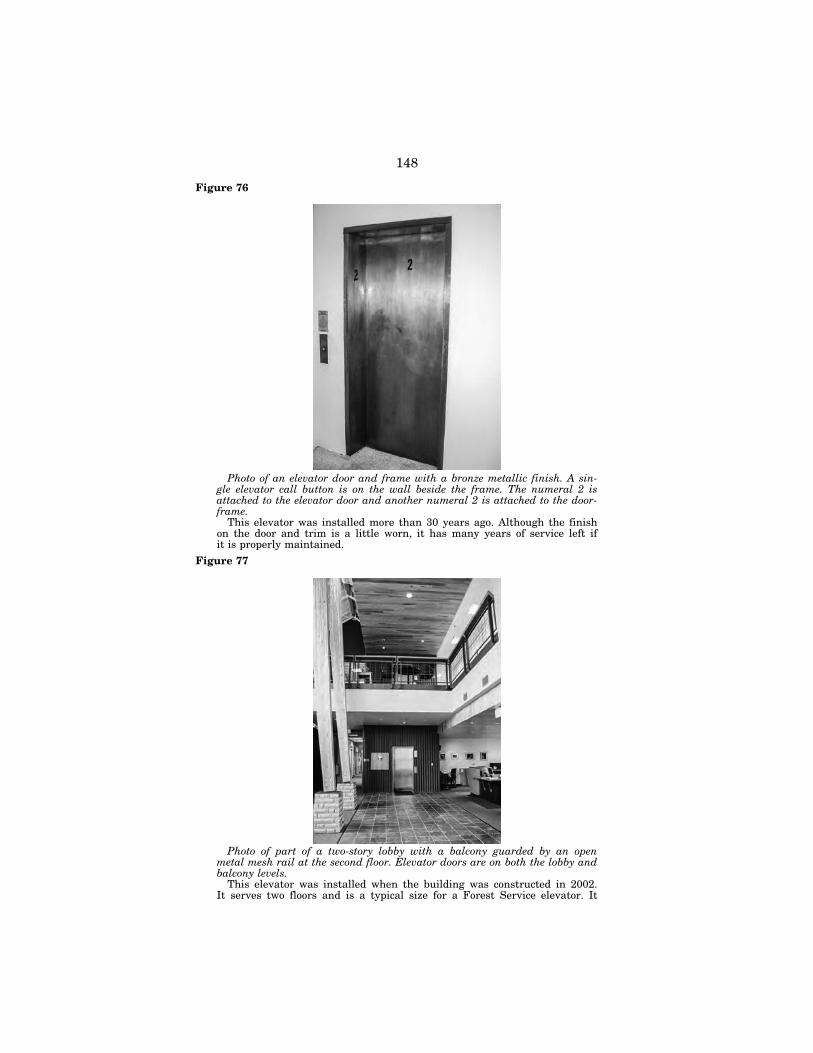
148
Figure 76
Photo of an elevator door and frame with a bronze metallic finish. A sin-gle elevator call button is on the wall beside the frame. The numeral 2 is attached to the elevator door and another numeral 2 is attached to the door-frame.
This elevator was installed more than 30 years ago. Although the finish on the door and trim is a little worn, it has many years of service left if it is properly maintained.
Figure 77
Photo of part of a two-story lobby with a balcony guarded by an open metal mesh rail at the second floor. Elevator doors are on both the lobby and balcony levels.
This elevator was installed when the building was constructed in 2002. It serves two floors and is a typical size for a Forest Service elevator. It
VerDate Aug 31 2005 16:26 Dec 16, 2020 Jkt 000000 PO 00000 Frm 00152 Fmt 6621 Sfmt 6621 P:\DOCS\116-19\38016.TXT BRIAN 1161
9089
.eps
1161
9090
.eps
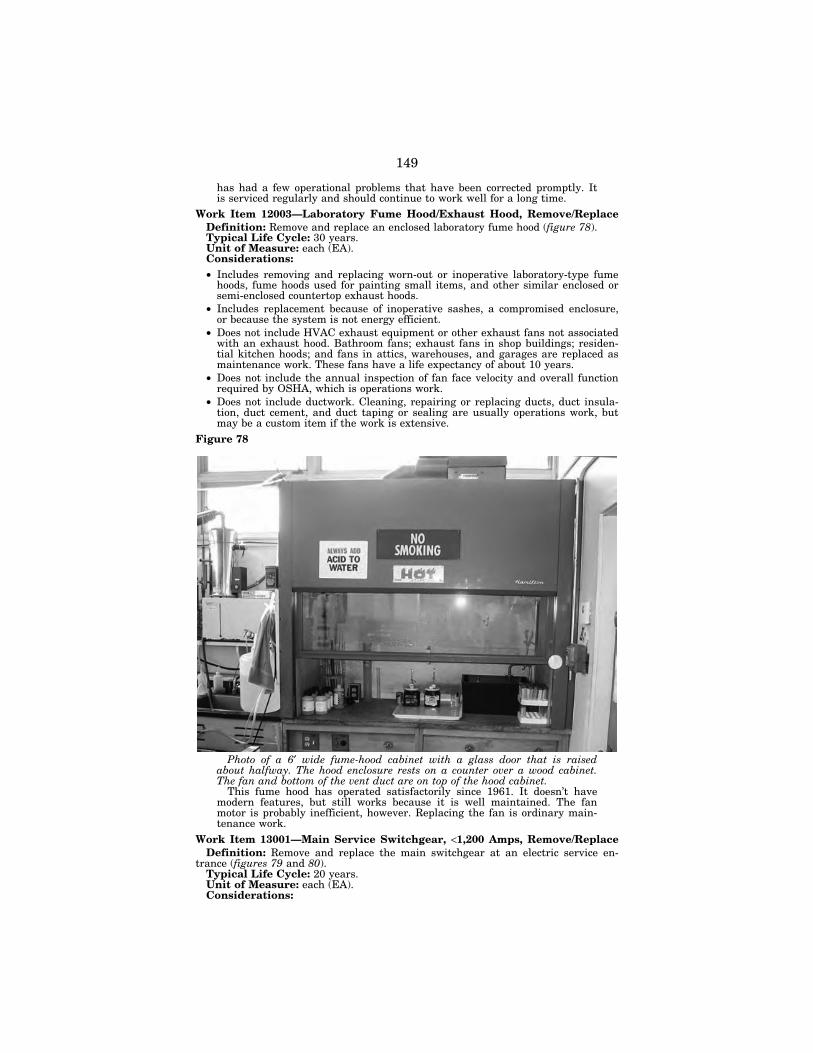
149
has had a few operational problems that have been corrected promptly. It is serviced regularly and should continue to work well for a long time.
Work Item 12003—Laboratory Fume Hood/Exhaust Hood, Remove/Replace Definition: Remove and replace an enclosed laboratory fume hood (figure 78). Typical Life Cycle: 30 years. Unit of Measure: each (EA). Considerations: • Includes removing and replacing worn-out or inoperative laboratory-type fume
hoods, fume hoods used for painting small items, and other similar enclosed or semi-enclosed countertop exhaust hoods.
• Includes replacement because of inoperative sashes, a compromised enclosure, or because the system is not energy efficient.
• Does not include HVAC exhaust equipment or other exhaust fans not associated with an exhaust hood. Bathroom fans; exhaust fans in shop buildings; residen-tial kitchen hoods; and fans in attics, warehouses, and garages are replaced as maintenance work. These fans have a life expectancy of about 10 years.
• Does not include the annual inspection of fan face velocity and overall function required by OSHA, which is operations work.
• Does not include ductwork. Cleaning, repairing or replacing ducts, duct insula-tion, duct cement, and duct taping or sealing are usually operations work, but may be a custom item if the work is extensive.
Figure 78
Photo of a 6′ wide fume-hood cabinet with a glass door that is raised about halfway. The hood enclosure rests on a counter over a wood cabinet. The fan and bottom of the vent duct are on top of the hood cabinet.
This fume hood has operated satisfactorily since 1961. It doesn’t have modern features, but still works because it is well maintained. The fan motor is probably inefficient, however. Replacing the fan is ordinary main-tenance work.
Work Item 13001—Main Service Switchgear, <1,200 Amps, Remove/Replace Definition: Remove and replace the main switchgear at an electric service en-
trance (figures 79 and 80). Typical Life Cycle: 20 years. Unit of Measure: each (EA). Considerations:
VerDate Aug 31 2005 16:26 Dec 16, 2020 Jkt 000000 PO 00000 Frm 00153 Fmt 6621 Sfmt 6621 P:\DOCS\116-19\38016.TXT BRIAN 1161
9091
.eps
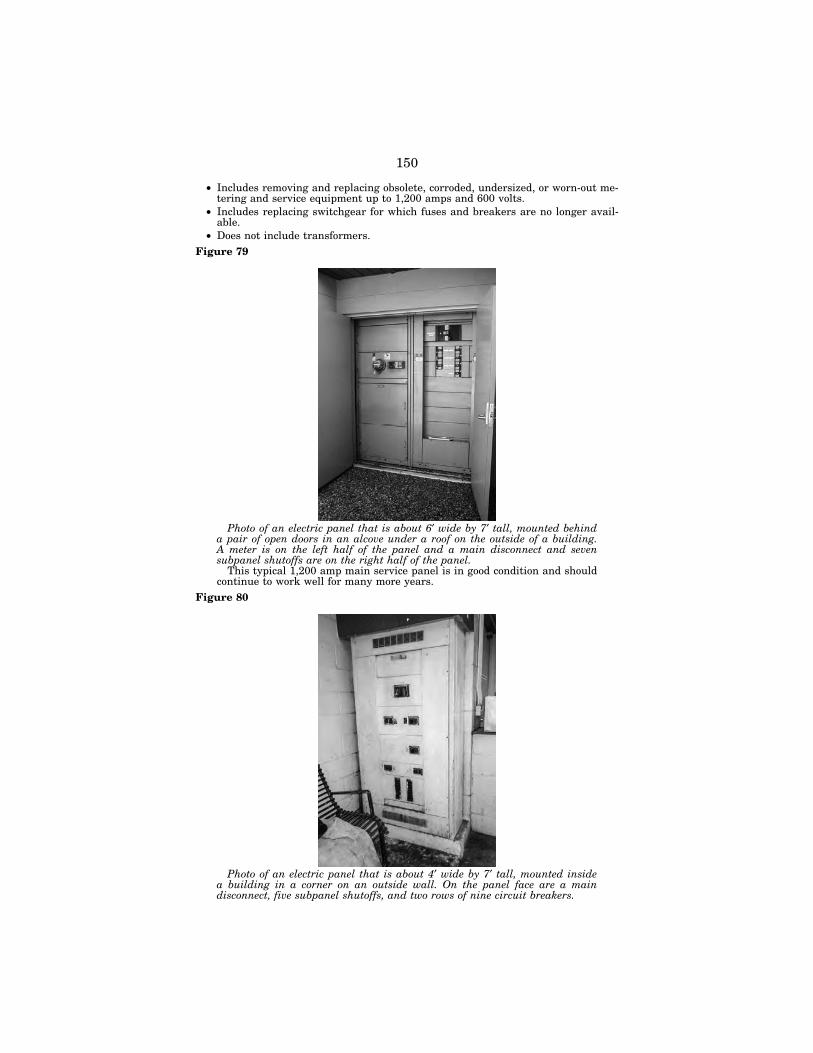
150
• Includes removing and replacing obsolete, corroded, undersized, or worn-out me-tering and service equipment up to 1,200 amps and 600 volts.
• Includes replacing switchgear for which fuses and breakers are no longer avail-able.
• Does not include transformers. Figure 79
Photo of an electric panel that is about 6′ wide by 7′ tall, mounted behind a pair of open doors in an alcove under a roof on the outside of a building. A meter is on the left half of the panel and a main disconnect and seven subpanel shutoffs are on the right half of the panel.
This typical 1,200 amp main service panel is in good condition and should continue to work well for many more years.
Figure 80
Photo of an electric panel that is about 4′ wide by 7′ tall, mounted inside a building in a corner on an outside wall. On the panel face are a main disconnect, five subpanel shutoffs, and two rows of nine circuit breakers.
VerDate Aug 31 2005 16:26 Dec 16, 2020 Jkt 000000 PO 00000 Frm 00154 Fmt 6621 Sfmt 6621 P:\DOCS\116-19\38016.TXT BRIAN 1161
9092
.eps
1161
9093
.eps
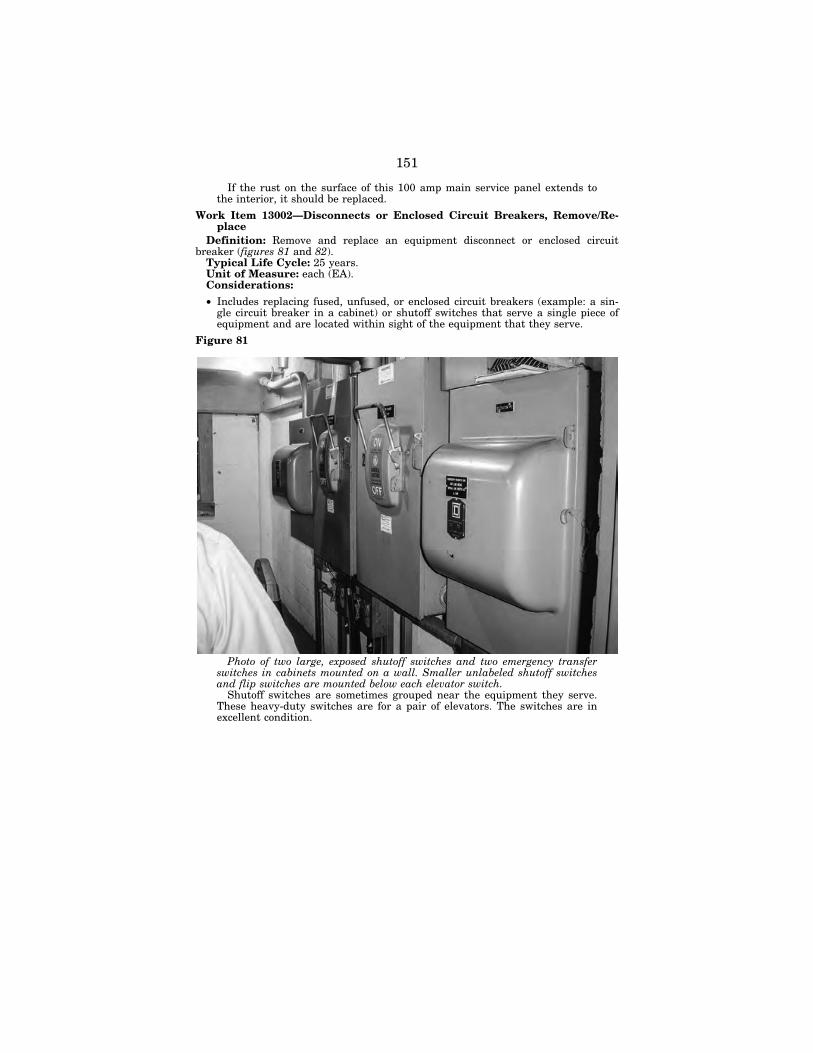
151
If the rust on the surface of this 100 amp main service panel extends to the interior, it should be replaced.
Work Item 13002—Disconnects or Enclosed Circuit Breakers, Remove/Re-place
Definition: Remove and replace an equipment disconnect or enclosed circuit breaker (figures 81 and 82).
Typical Life Cycle: 25 years. Unit of Measure: each (EA). Considerations:
• Includes replacing fused, unfused, or enclosed circuit breakers (example: a sin-gle circuit breaker in a cabinet) or shutoff switches that serve a single piece of equipment and are located within sight of the equipment that they serve.
Figure 81
Photo of two large, exposed shutoff switches and two emergency transfer switches in cabinets mounted on a wall. Smaller unlabeled shutoff switches and flip switches are mounted below each elevator switch.
Shutoff switches are sometimes grouped near the equipment they serve. These heavy-duty switches are for a pair of elevators. The switches are in excellent condition.
VerDate Aug 31 2005 16:26 Dec 16, 2020 Jkt 000000 PO 00000 Frm 00155 Fmt 6621 Sfmt 6621 P:\DOCS\116-19\38016.TXT BRIAN 1161
9094
.eps
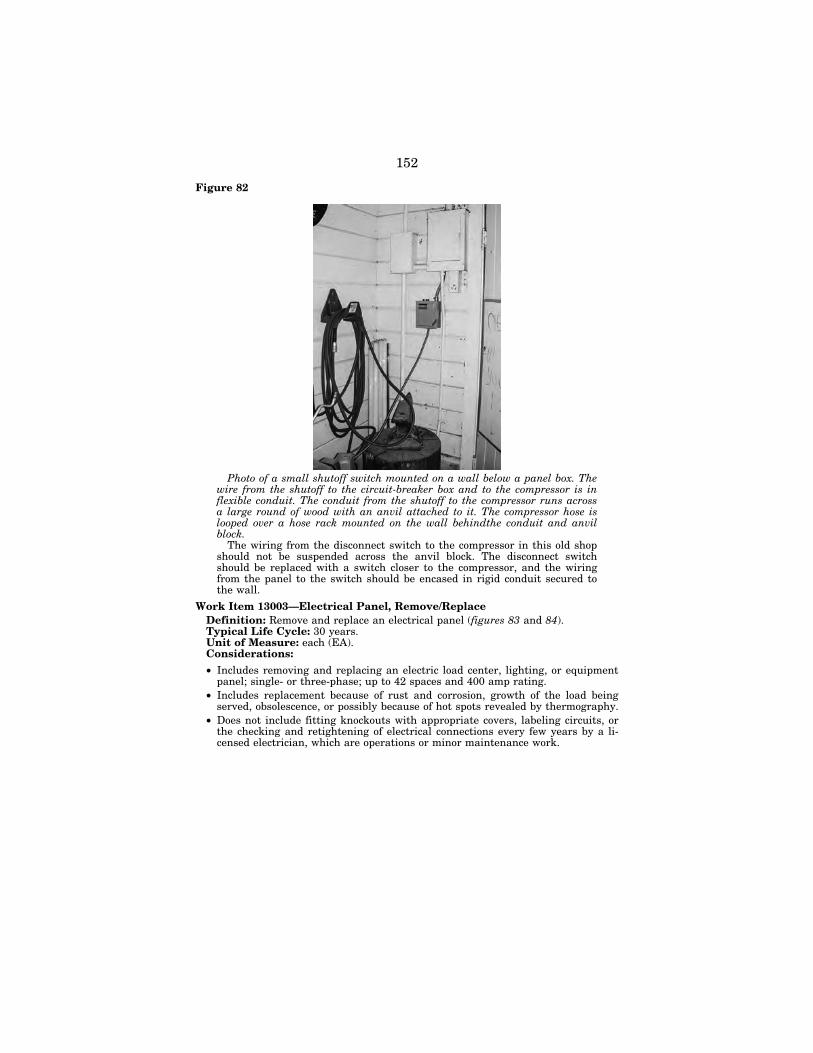
152
Figure 82
Photo of a small shutoff switch mounted on a wall below a panel box. The wire from the shutoff to the circuit-breaker box and to the compressor is in flexible conduit. The conduit from the shutoff to the compressor runs across a large round of wood with an anvil attached to it. The compressor hose is looped over a hose rack mounted on the wall behindthe conduit and anvil block.
The wiring from the disconnect switch to the compressor in this old shop should not be suspended across the anvil block. The disconnect switch should be replaced with a switch closer to the compressor, and the wiring from the panel to the switch should be encased in rigid conduit secured to the wall.
Work Item 13003—Electrical Panel, Remove/Replace Definition: Remove and replace an electrical panel (figures 83 and 84). Typical Life Cycle: 30 years. Unit of Measure: each (EA). Considerations:
• Includes removing and replacing an electric load center, lighting, or equipment panel; single- or three-phase; up to 42 spaces and 400 amp rating.
• Includes replacement because of rust and corrosion, growth of the load being served, obsolescence, or possibly because of hot spots revealed by thermography.
• Does not include fitting knockouts with appropriate covers, labeling circuits, or the checking and retightening of electrical connections every few years by a li-censed electrician, which are operations or minor maintenance work.
VerDate Aug 31 2005 16:26 Dec 16, 2020 Jkt 000000 PO 00000 Frm 00156 Fmt 6621 Sfmt 6621 P:\DOCS\116-19\38016.TXT BRIAN 1161
9095
.eps
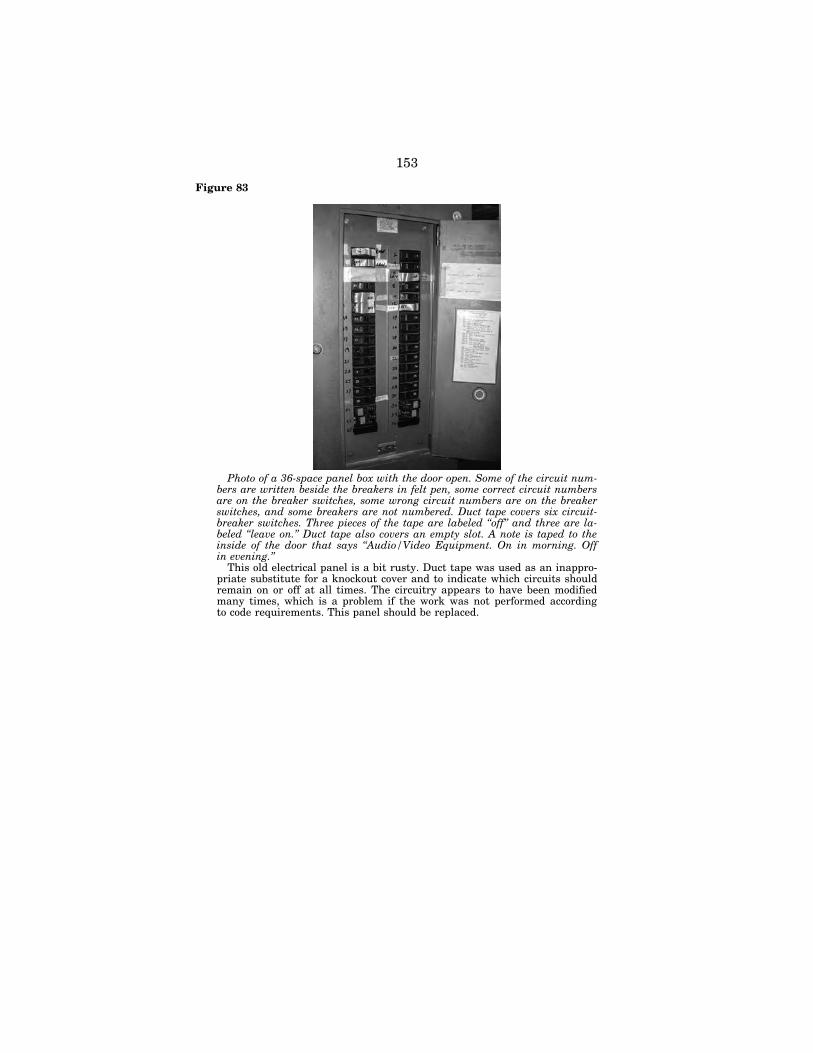
153
Figure 83
Photo of a 36-space panel box with the door open. Some of the circuit num-bers are written beside the breakers in felt pen, some correct circuit numbers are on the breaker switches, some wrong circuit numbers are on the breaker switches, and some breakers are not numbered. Duct tape covers six circuit- breaker switches. Three pieces of the tape are labeled ‘‘off’’ and three are la-beled ‘‘leave on.’’ Duct tape also covers an empty slot. A note is taped to the inside of the door that says ‘‘Audio/Video Equipment. On in morning. Off in evening.’’
This old electrical panel is a bit rusty. Duct tape was used as an inappro-priate substitute for a knockout cover and to indicate which circuits should remain on or off at all times. The circuitry appears to have been modified many times, which is a problem if the work was not performed according to code requirements. This panel should be replaced.
VerDate Aug 31 2005 16:26 Dec 16, 2020 Jkt 000000 PO 00000 Frm 00157 Fmt 6621 Sfmt 6621 P:\DOCS\116-19\38016.TXT BRIAN 1161
9096
.eps
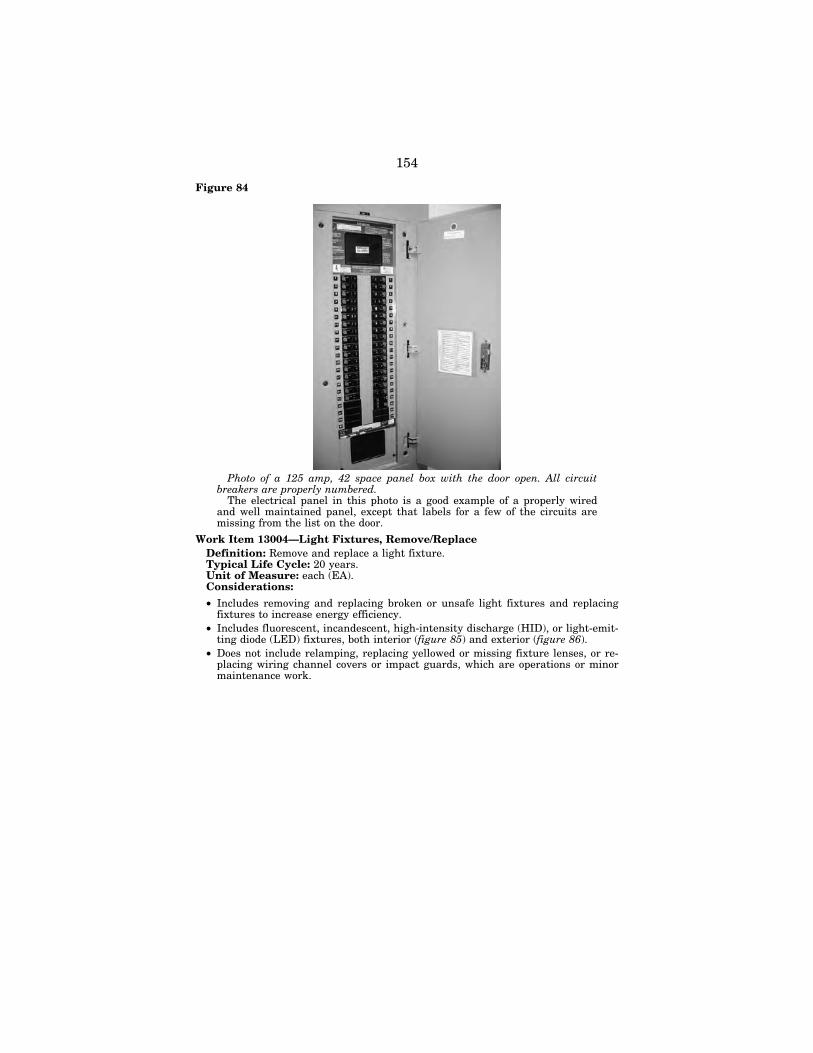
154
Figure 84
Photo of a 125 amp, 42 space panel box with the door open. All circuit breakers are properly numbered.
The electrical panel in this photo is a good example of a properly wired and well maintained panel, except that labels for a few of the circuits are missing from the list on the door.
Work Item 13004—Light Fixtures, Remove/Replace Definition: Remove and replace a light fixture. Typical Life Cycle: 20 years. Unit of Measure: each (EA). Considerations:
• Includes removing and replacing broken or unsafe light fixtures and replacing fixtures to increase energy efficiency.
• Includes fluorescent, incandescent, high-intensity discharge (HID), or light-emit-ting diode (LED) fixtures, both interior (figure 85) and exterior (figure 86).
• Does not include relamping, replacing yellowed or missing fixture lenses, or re-placing wiring channel covers or impact guards, which are operations or minor maintenance work.
VerDate Aug 31 2005 16:26 Dec 16, 2020 Jkt 000000 PO 00000 Frm 00158 Fmt 6621 Sfmt 6621 P:\DOCS\116-19\38016.TXT BRIAN 1161
9097
.eps
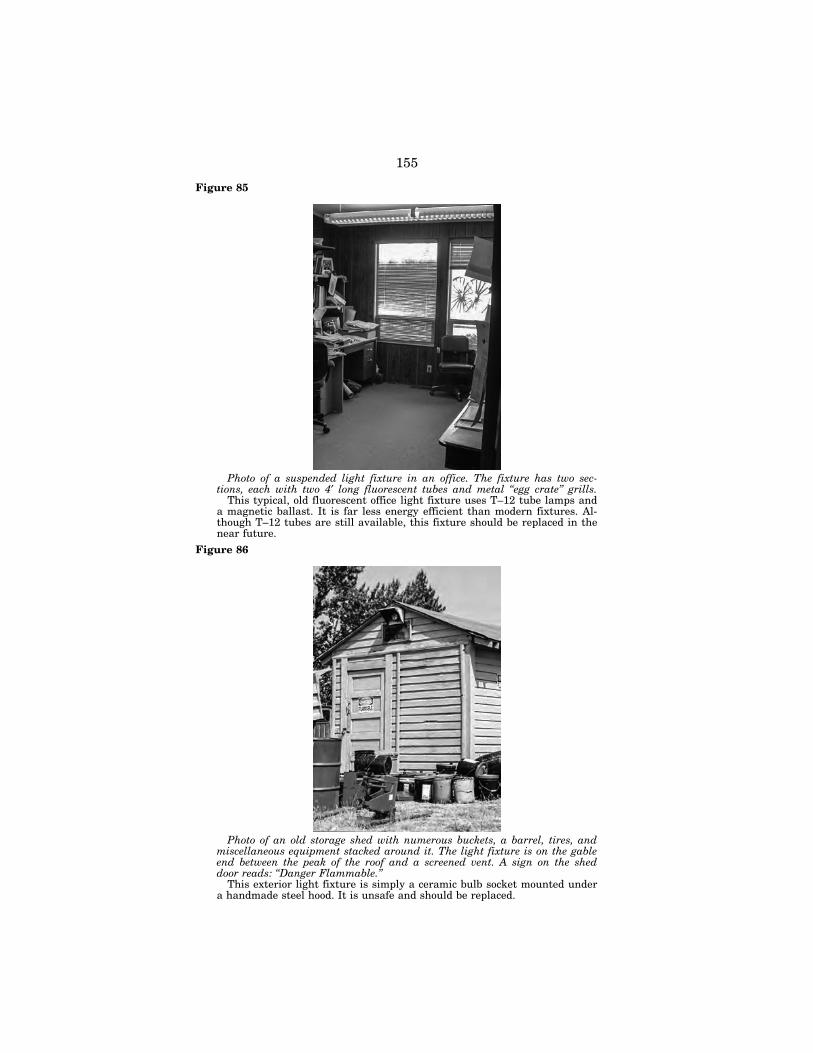
155
Figure 85
Photo of a suspended light fixture in an office. The fixture has two sec-tions, each with two 4′ long fluorescent tubes and metal ‘‘egg crate’’ grills.
This typical, old fluorescent office light fixture uses T–12 tube lamps and a magnetic ballast. It is far less energy efficient than modern fixtures. Al-though T–12 tubes are still available, this fixture should be replaced in the near future.
Figure 86
Photo of an old storage shed with numerous buckets, a barrel, tires, and miscellaneous equipment stacked around it. The light fixture is on the gable end between the peak of the roof and a screened vent. A sign on the shed door reads: ‘‘Danger Flammable.’’
This exterior light fixture is simply a ceramic bulb socket mounted under a handmade steel hood. It is unsafe and should be replaced.
VerDate Aug 31 2005 16:26 Dec 16, 2020 Jkt 000000 PO 00000 Frm 00159 Fmt 6621 Sfmt 6621 P:\DOCS\116-19\38016.TXT BRIAN 1161
9098
.eps
1161
9099
.eps
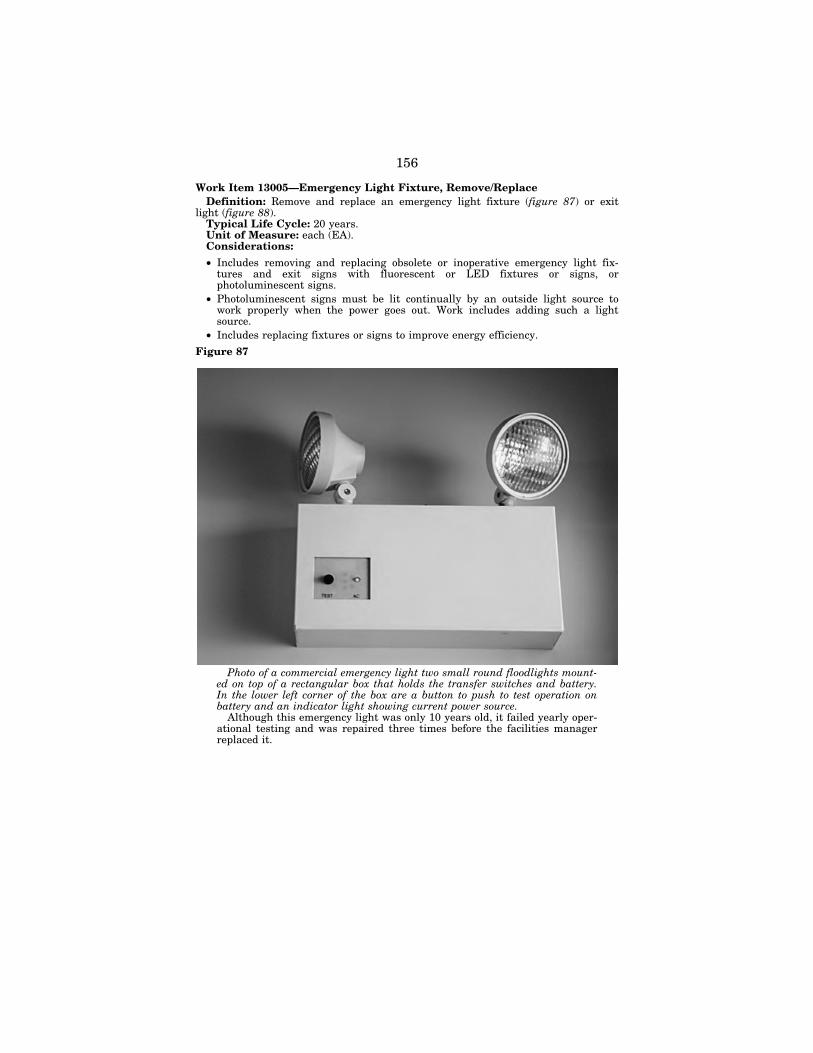
156
Work Item 13005—Emergency Light Fixture, Remove/Replace Definition: Remove and replace an emergency light fixture (figure 87) or exit
light (figure 88). Typical Life Cycle: 20 years. Unit of Measure: each (EA). Considerations:
• Includes removing and replacing obsolete or inoperative emergency light fix-tures and exit signs with fluorescent or LED fixtures or signs, or photoluminescent signs.
• Photoluminescent signs must be lit continually by an outside light source to work properly when the power goes out. Work includes adding such a light source.
• Includes replacing fixtures or signs to improve energy efficiency.
Figure 87
Photo of a commercial emergency light two small round floodlights mount-ed on top of a rectangular box that holds the transfer switches and battery. In the lower left corner of the box are a button to push to test operation on battery and an indicator light showing current power source.
Although this emergency light was only 10 years old, it failed yearly oper-ational testing and was repaired three times before the facilities manager replaced it.
VerDate Aug 31 2005 16:26 Dec 16, 2020 Jkt 000000 PO 00000 Frm 00160 Fmt 6621 Sfmt 6621 P:\DOCS\116-19\38016.TXT BRIAN 1161
9100
.eps
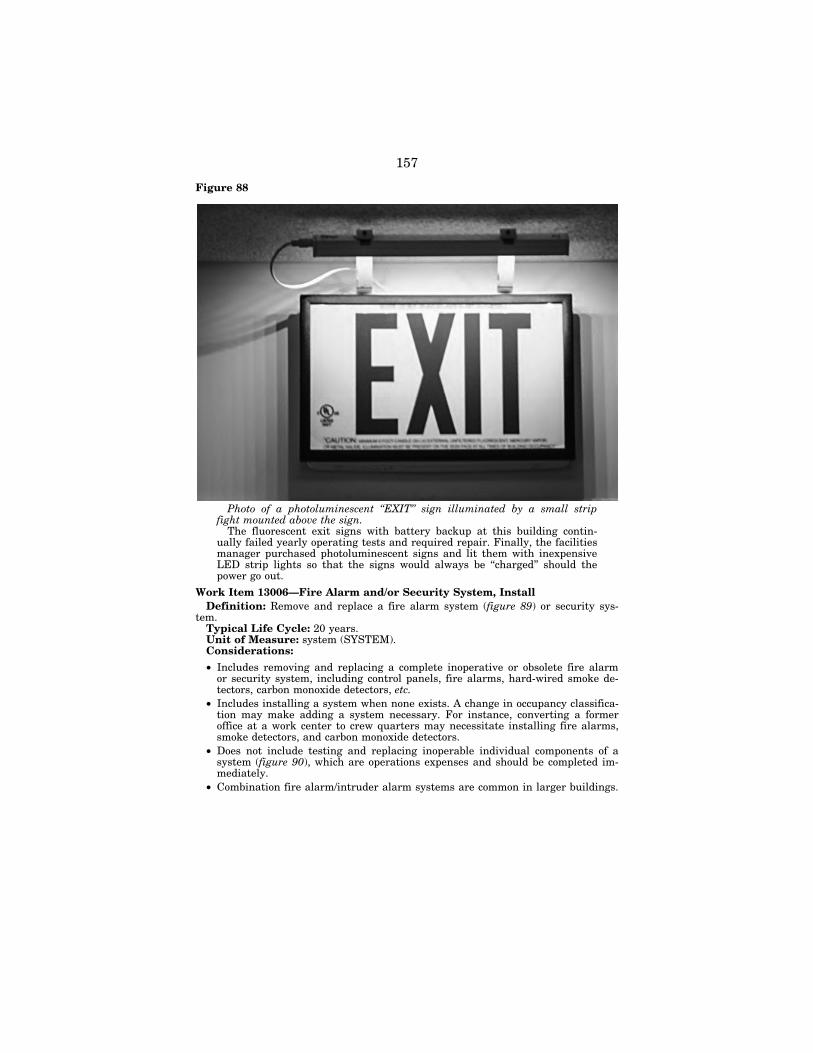
157
Figure 88
Photo of a photoluminescent ‘‘EXIT’’ sign illuminated by a small strip fight mounted above the sign.
The fluorescent exit signs with battery backup at this building contin-ually failed yearly operating tests and required repair. Finally, the facilities manager purchased photoluminescent signs and lit them with inexpensive LED strip lights so that the signs would always be ‘‘charged’’ should the power go out.
Work Item 13006—Fire Alarm and/or Security System, Install Definition: Remove and replace a fire alarm system (figure 89) or security sys-
tem. Typical Life Cycle: 20 years. Unit of Measure: system (SYSTEM). Considerations:
• Includes removing and replacing a complete inoperative or obsolete fire alarm or security system, including control panels, fire alarms, hard-wired smoke de-tectors, carbon monoxide detectors, etc.
• Includes installing a system when none exists. A change in occupancy classifica-tion may make adding a system necessary. For instance, converting a former office at a work center to crew quarters may necessitate installing fire alarms, smoke detectors, and carbon monoxide detectors.
• Does not include testing and replacing inoperable individual components of a system (figure 90), which are operations expenses and should be completed im-mediately.
• Combination fire alarm/intruder alarm systems are common in larger buildings.
VerDate Aug 31 2005 16:26 Dec 16, 2020 Jkt 000000 PO 00000 Frm 00161 Fmt 6621 Sfmt 6621 P:\DOCS\116-19\38016.TXT BRIAN 1161
9101
.eps
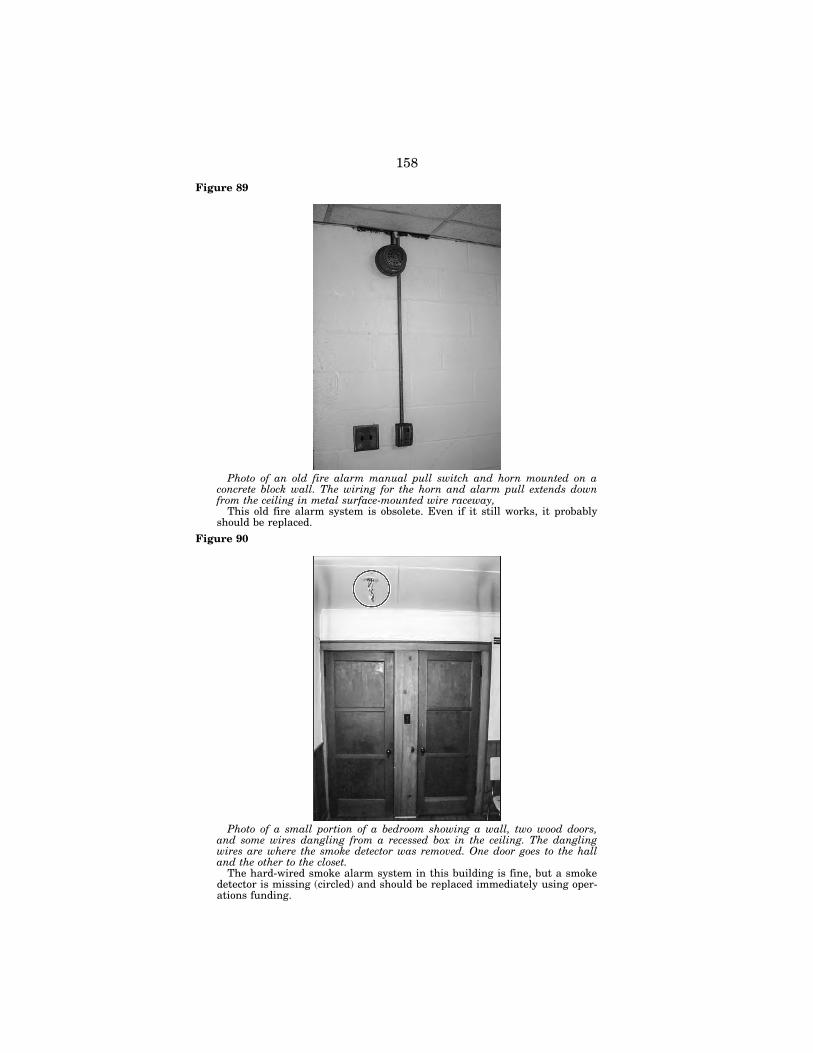
158
Figure 89
Photo of an old fire alarm manual pull switch and horn mounted on a concrete block wall. The wiring for the horn and alarm pull extends down from the ceiling in metal surface-mounted wire raceway,
This old fire alarm system is obsolete. Even if it still works, it probably should be replaced.
Figure 90
Photo of a small portion of a bedroom showing a wall, two wood doors, and some wires dangling from a recessed box in the ceiling. The dangling wires are where the smoke detector was removed. One door goes to the hall and the other to the closet.
The hard-wired smoke alarm system in this building is fine, but a smoke detector is missing (circled) and should be replaced immediately using oper-ations funding.
VerDate Aug 31 2005 16:26 Dec 16, 2020 Jkt 000000 PO 00000 Frm 00162 Fmt 6621 Sfmt 6621 P:\DOCS\116-19\38016.TXT BRIAN 1161
9102
.eps
1161
9103
.eps
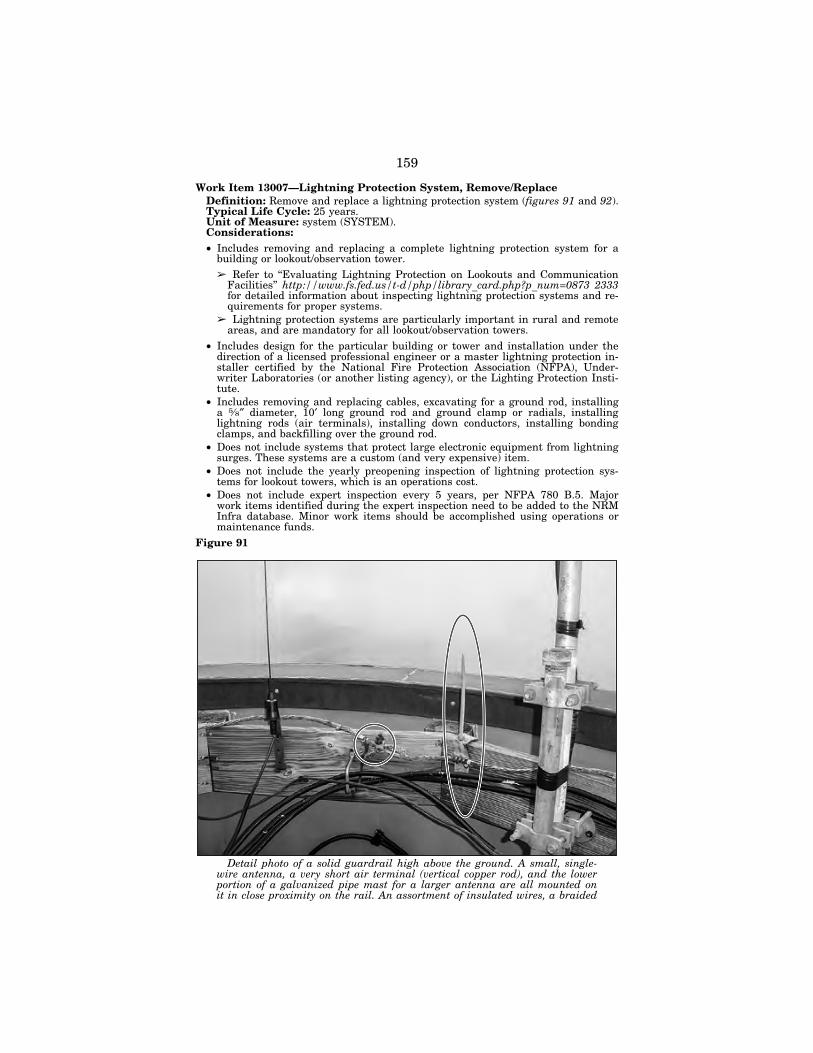
159
Work Item 13007—Lightning Protection System, Remove/Replace Definition: Remove and replace a lightning protection system (figures 91 and 92). Typical Life Cycle: 25 years. Unit of Measure: system (SYSTEM). Considerations: • Includes removing and replacing a complete lightning protection system for a
building or lookout/observation tower. ➢ Refer to ‘‘Evaluating Lightning Protection on Lookouts and Communication
Facilities’’ http://www.fs.fed.us/t-d/php/library_card.php?p_num=0873 2333 for detailed information about inspecting lightning protection systems and re-quirements for proper systems.
➢ Lightning protection systems are particularly important in rural and remote areas, and are mandatory for all lookout/observation towers.
• Includes design for the particular building or tower and installation under the direction of a licensed professional engineer or a master lightning protection in-staller certified by the National Fire Protection Association (NFPA), Under-writer Laboratories (or another listing agency), or the Lighting Protection Insti-tute.
• Includes removing and replacing cables, excavating for a ground rod, installing a 5⁄8″ diameter, 10′ long ground rod and ground clamp or radials, installing lightning rods (air terminals), installing down conductors, installing bonding clamps, and backfilling over the ground rod.
• Does not include systems that protect large electronic equipment from lightning surges. These systems are a custom (and very expensive) item.
• Does not include the yearly preopening inspection of lightning protection sys-tems for lookout towers, which is an operations cost.
• Does not include expert inspection every 5 years, per NFPA 780 B.5. Major work items identified during the expert inspection need to be added to the NRM Infra database. Minor work items should be accomplished using operations or maintenance funds.
Figure 91
Detail photo of a solid guardrail high above the ground. A small, single- wire antenna, a very short air terminal (vertical copper rod), and the lower portion of a galvanized pipe mast for a larger antenna are all mounted on it in close proximity on the rail. An assortment of insulated wires, a braided
VerDate Aug 31 2005 16:26 Dec 16, 2020 Jkt 000000 PO 00000 Frm 00163 Fmt 6621 Sfmt 6621 P:\DOCS\116-19\38016.TXT BRIAN 1161
9104
.eps
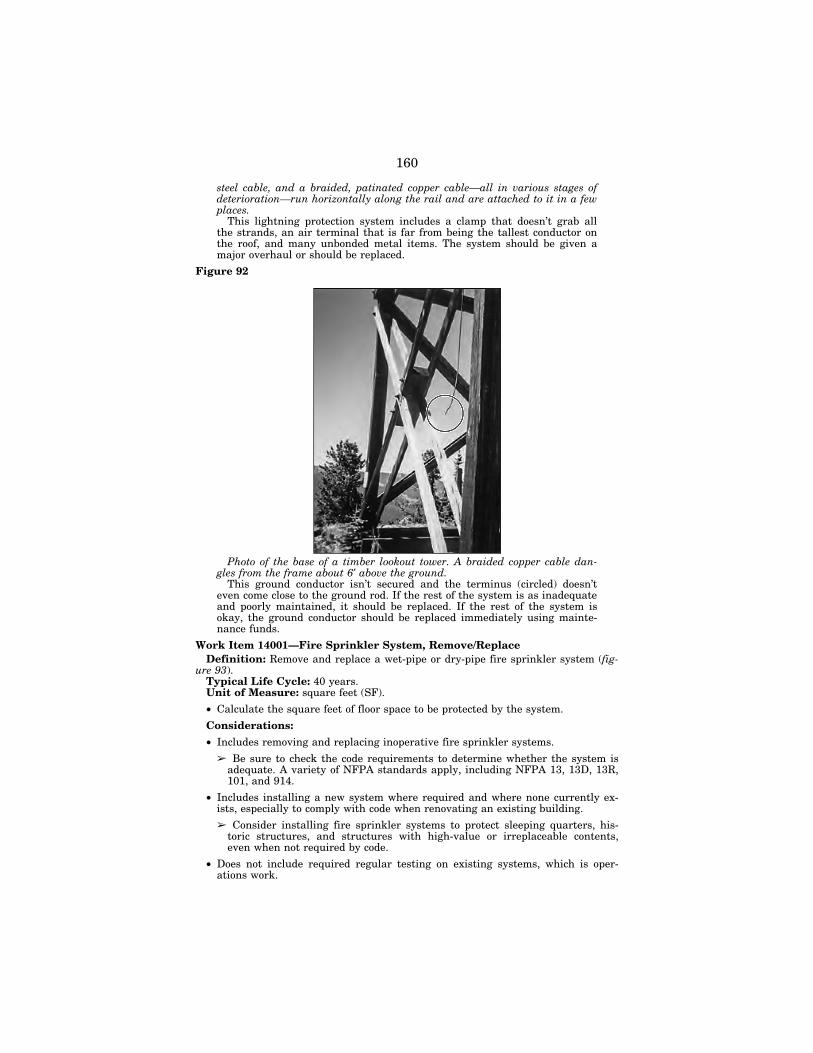
160
steel cable, and a braided, patinated copper cable—all in various stages of deterioration—run horizontally along the rail and are attached to it in a few places.
This lightning protection system includes a clamp that doesn’t grab all the strands, an air terminal that is far from being the tallest conductor on the roof, and many unbonded metal items. The system should be given a major overhaul or should be replaced.
Figure 92
Photo of the base of a timber lookout tower. A braided copper cable dan-gles from the frame about 6′ above the ground.
This ground conductor isn’t secured and the terminus (circled) doesn’t even come close to the ground rod. If the rest of the system is as inadequate and poorly maintained, it should be replaced. If the rest of the system is okay, the ground conductor should be replaced immediately using mainte-nance funds.
Work Item 14001—Fire Sprinkler System, Remove/Replace Definition: Remove and replace a wet-pipe or dry-pipe fire sprinkler system (fig-
ure 93). Typical Life Cycle: 40 years. Unit of Measure: square feet (SF).
• Calculate the square feet of floor space to be protected by the system.
Considerations:
• Includes removing and replacing inoperative fire sprinkler systems.
➢ Be sure to check the code requirements to determine whether the system is adequate. A variety of NFPA standards apply, including NFPA 13, 13D, 13R, 101, and 914.
• Includes installing a new system where required and where none currently ex-ists, especially to comply with code when renovating an existing building.
➢ Consider installing fire sprinkler systems to protect sleeping quarters, his-toric structures, and structures with high-value or irreplaceable contents, even when not required by code.
• Does not include required regular testing on existing systems, which is oper-ations work.
VerDate Aug 31 2005 16:26 Dec 16, 2020 Jkt 000000 PO 00000 Frm 00164 Fmt 6621 Sfmt 6621 P:\DOCS\116-19\38016.TXT BRIAN 1161
9105
.eps
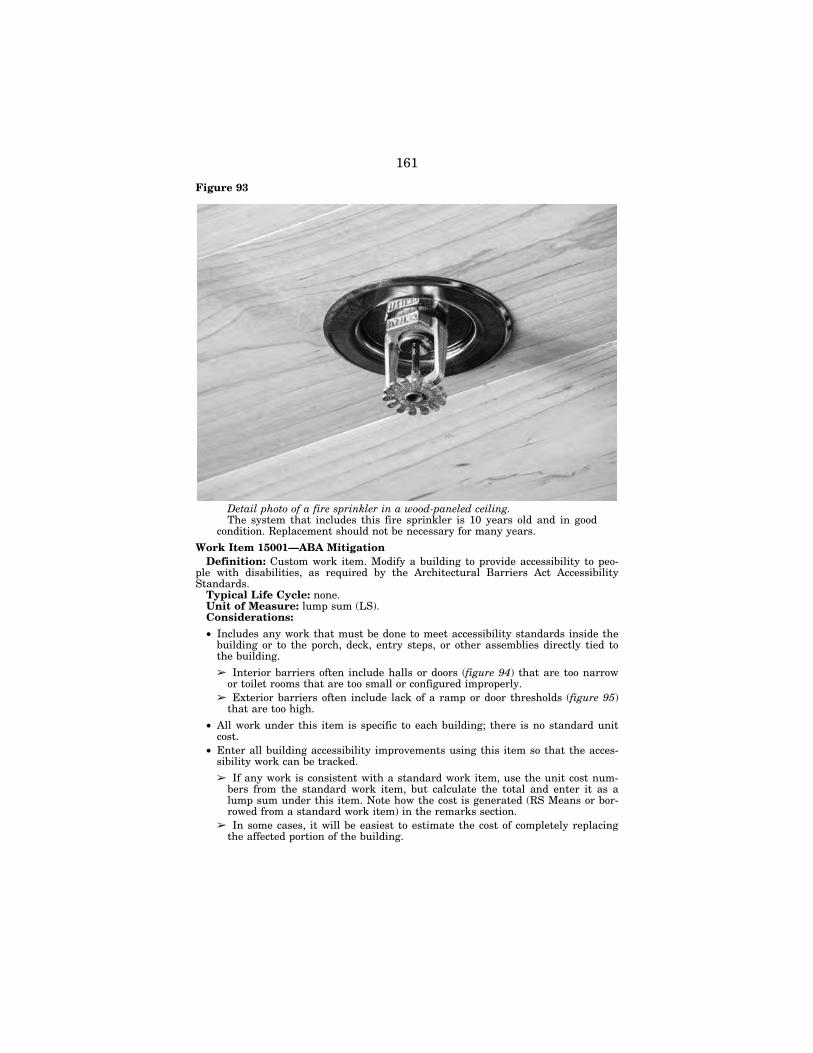
161
Figure 93
Detail photo of a fire sprinkler in a wood-paneled ceiling. The system that includes this fire sprinkler is 10 years old and in good
condition. Replacement should not be necessary for many years.
Work Item 15001—ABA Mitigation Definition: Custom work item. Modify a building to provide accessibility to peo-
ple with disabilities, as required by the Architectural Barriers Act Accessibility Standards.
Typical Life Cycle: none. Unit of Measure: lump sum (LS). Considerations:
• Includes any work that must be done to meet accessibility standards inside the building or to the porch, deck, entry steps, or other assemblies directly tied to the building.
➢ Interior barriers often include halls or doors (figure 94) that are too narrow or toilet rooms that are too small or configured improperly.
➢ Exterior barriers often include lack of a ramp or door thresholds (figure 95) that are too high.
• All work under this item is specific to each building; there is no standard unit cost.
• Enter all building accessibility improvements using this item so that the acces-sibility work can be tracked.
➢ If any work is consistent with a standard work item, use the unit cost num-bers from the standard work item, but calculate the total and enter it as a lump sum under this item. Note how the cost is generated (RS Means or bor-rowed from a standard work item) in the remarks section.
➢ In some cases, it will be easiest to estimate the cost of completely replacing the affected portion of the building.
VerDate Aug 31 2005 16:26 Dec 16, 2020 Jkt 000000 PO 00000 Frm 00165 Fmt 6621 Sfmt 6621 P:\DOCS\116-19\38016.TXT BRIAN 1161
9106
.eps
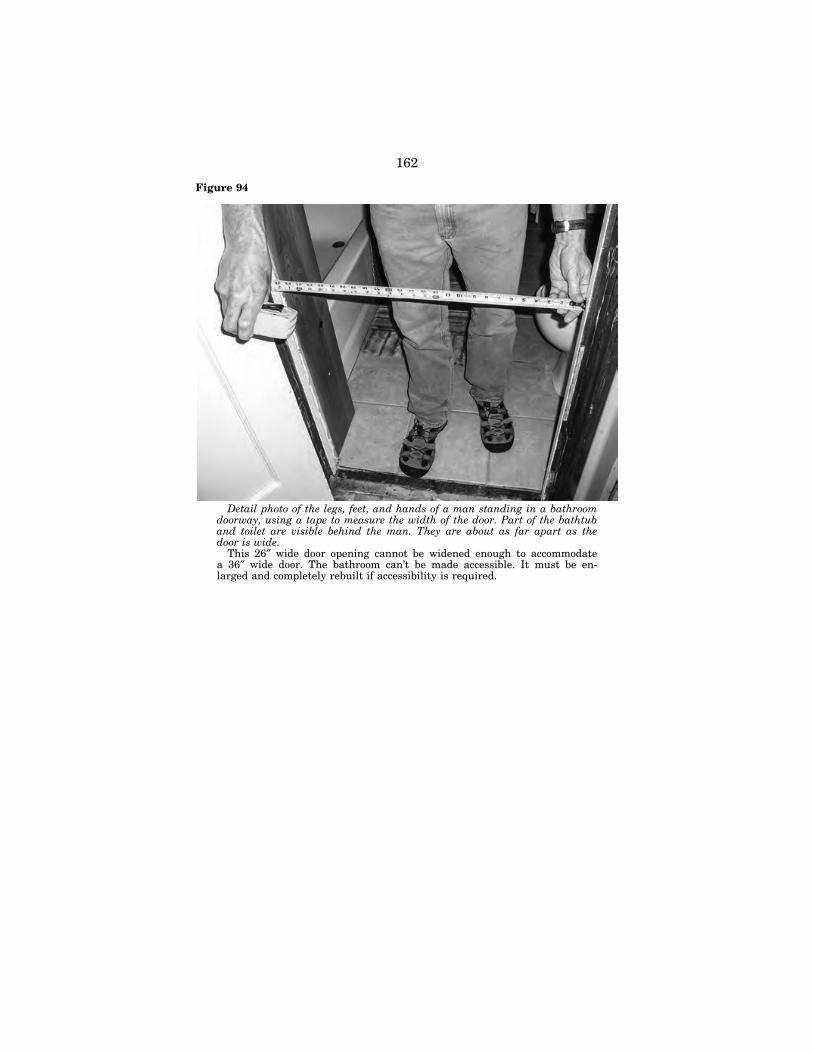
162
Figure 94
Detail photo of the legs, feet, and hands of a man standing in a bathroom doorway, using a tape to measure the width of the door. Part of the bathtub and toilet are visible behind the man. They are about as far apart as the door is wide.
This 26″ wide door opening cannot be widened enough to accommodate a 36″ wide door. The bathroom can’t be made accessible. It must be en-larged and completely rebuilt if accessibility is required.
VerDate Aug 31 2005 16:26 Dec 16, 2020 Jkt 000000 PO 00000 Frm 00166 Fmt 6621 Sfmt 6621 P:\DOCS\116-19\38016.TXT BRIAN 1161
9107
.eps
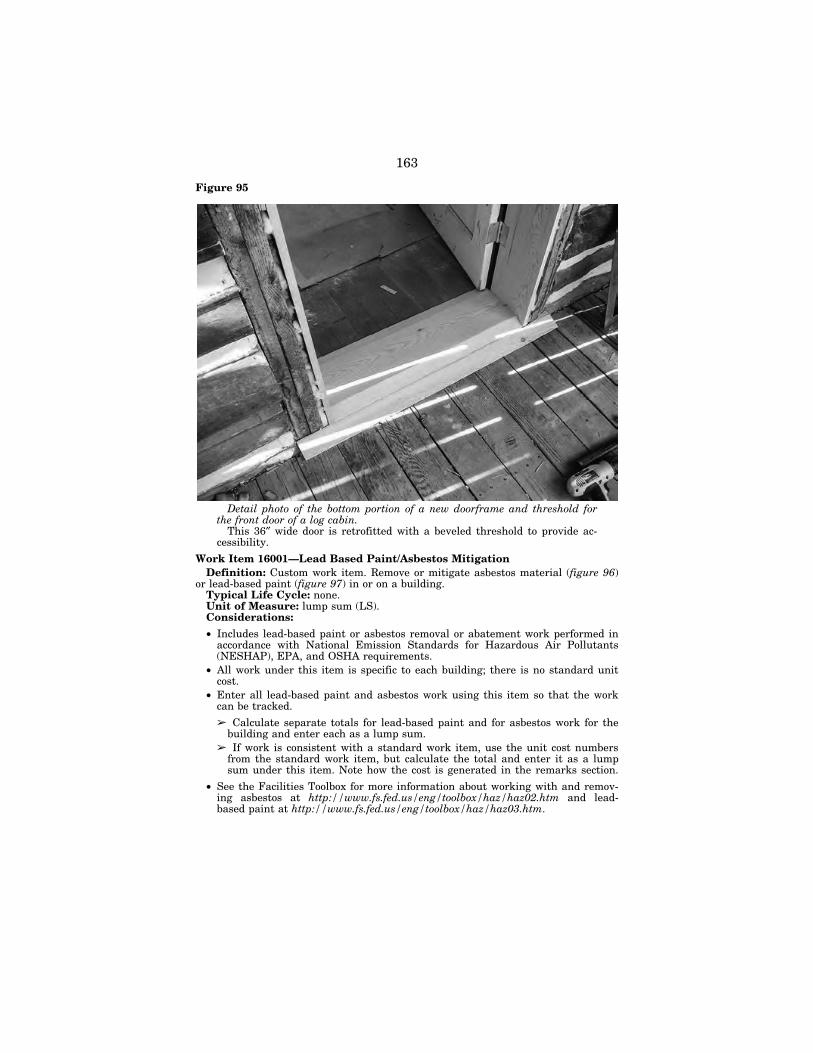
163
Figure 95
Detail photo of the bottom portion of a new doorframe and threshold for the front door of a log cabin.
This 36″ wide door is retrofitted with a beveled threshold to provide ac-cessibility.
Work Item 16001—Lead Based Paint/Asbestos Mitigation Definition: Custom work item. Remove or mitigate asbestos material (figure 96)
or lead-based paint (figure 97) in or on a building. Typical Life Cycle: none. Unit of Measure: lump sum (LS). Considerations:
• Includes lead-based paint or asbestos removal or abatement work performed in accordance with National Emission Standards for Hazardous Air Pollutants (NESHAP), EPA, and OSHA requirements.
• All work under this item is specific to each building; there is no standard unit cost.
• Enter all lead-based paint and asbestos work using this item so that the work can be tracked.
➢ Calculate separate totals for lead-based paint and for asbestos work for the building and enter each as a lump sum.
➢ If work is consistent with a standard work item, use the unit cost numbers from the standard work item, but calculate the total and enter it as a lump sum under this item. Note how the cost is generated in the remarks section.
• See the Facilities Toolbox for more information about working with and remov-ing asbestos at http://www.fs.fed.us/eng/toolbox/haz/haz02.htm and lead- based paint at http://www.fs.fed.us/eng/toolbox/haz/haz03.htm.
VerDate Aug 31 2005 16:26 Dec 16, 2020 Jkt 000000 PO 00000 Frm 00167 Fmt 6621 Sfmt 6621 P:\DOCS\116-19\38016.TXT BRIAN 1161
9108
.eps
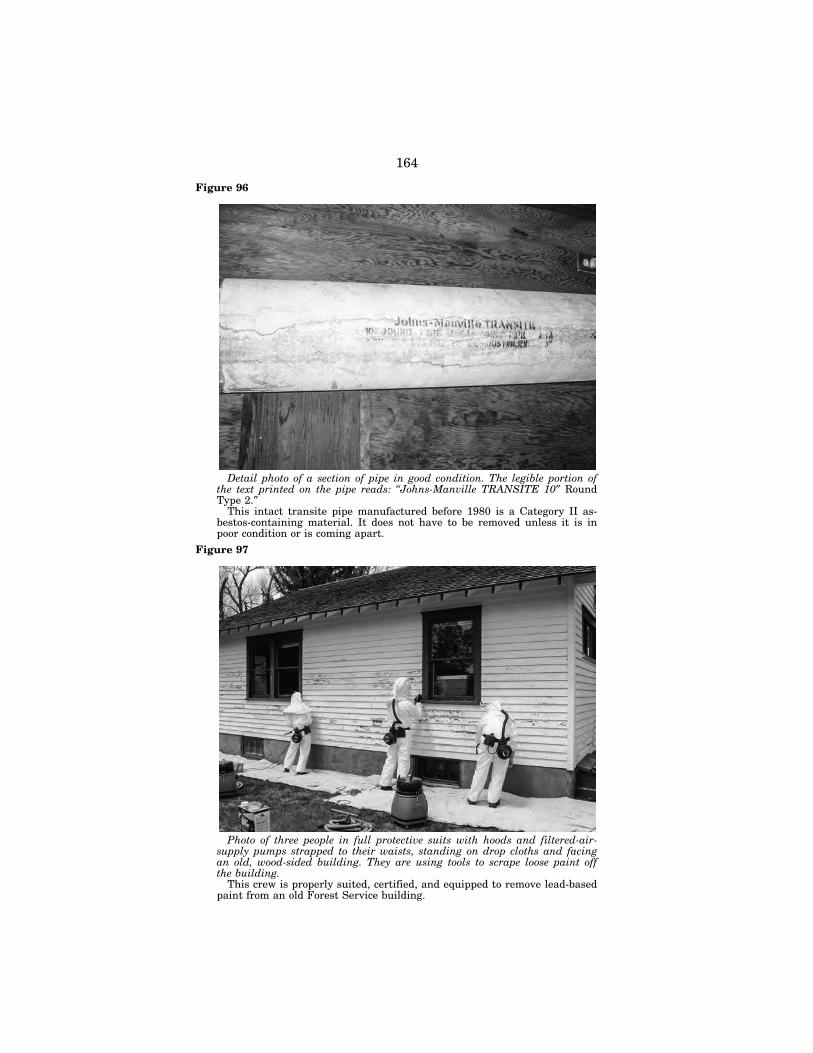
164
Figure 96
Detail photo of a section of pipe in good condition. The legible portion of the text printed on the pipe reads: ‘‘Johns-Manville TRANSITE 10″ Round Type 2.″
This intact transite pipe manufactured before 1980 is a Category II as-bestos-containing material. It does not have to be removed unless it is in poor condition or is coming apart.
Figure 97
Photo of three people in full protective suits with hoods and filtered-air- supply pumps strapped to their waists, standing on drop cloths and facing an old, wood-sided building. They are using tools to scrape loose paint off the building.
This crew is properly suited, certified, and equipped to remove lead-based paint from an old Forest Service building.
VerDate Aug 31 2005 16:26 Dec 16, 2020 Jkt 000000 PO 00000 Frm 00168 Fmt 6621 Sfmt 6621 P:\DOCS\116-19\38016.TXT BRIAN 1161
9109
.eps
1161
9110
.eps
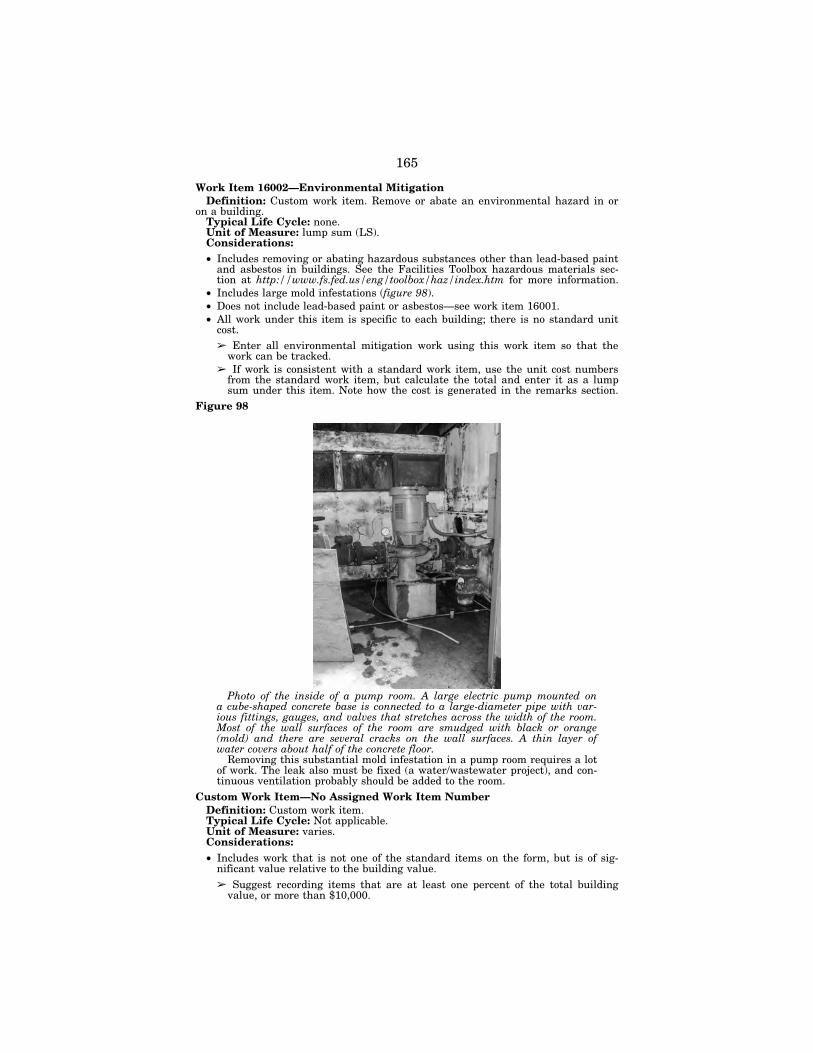
165
Work Item 16002—Environmental Mitigation Definition: Custom work item. Remove or abate an environmental hazard in or
on a building. Typical Life Cycle: none. Unit of Measure: lump sum (LS). Considerations: • Includes removing or abating hazardous substances other than lead-based paint
and asbestos in buildings. See the Facilities Toolbox hazardous materials sec-tion at http://www.fs.fed.us/eng/toolbox/haz/index.htm for more information.
• Includes large mold infestations (figure 98). • Does not include lead-based paint or asbestos—see work item 16001. • All work under this item is specific to each building; there is no standard unit
cost. ➢ Enter all environmental mitigation work using this work item so that the
work can be tracked. ➢ If work is consistent with a standard work item, use the unit cost numbers
from the standard work item, but calculate the total and enter it as a lump sum under this item. Note how the cost is generated in the remarks section.
Figure 98
Photo of the inside of a pump room. A large electric pump mounted on a cube-shaped concrete base is connected to a large-diameter pipe with var-ious fittings, gauges, and valves that stretches across the width of the room. Most of the wall surfaces of the room are smudged with black or orange (mold) and there are several cracks on the wall surfaces. A thin layer of water covers about half of the concrete floor.
Removing this substantial mold infestation in a pump room requires a lot of work. The leak also must be fixed (a water/wastewater project), and con-tinuous ventilation probably should be added to the room.
Custom Work Item—No Assigned Work Item Number Definition: Custom work item. Typical Life Cycle: Not applicable. Unit of Measure: varies. Considerations: • Includes work that is not one of the standard items on the form, but is of sig-
nificant value relative to the building value. ➢ Suggest recording items that are at least one percent of the total building
value, or more than $10,000.
VerDate Aug 31 2005 16:26 Dec 16, 2020 Jkt 000000 PO 00000 Frm 00169 Fmt 6621 Sfmt 6621 P:\DOCS\116-19\38016.TXT BRIAN 1161
9111
.eps
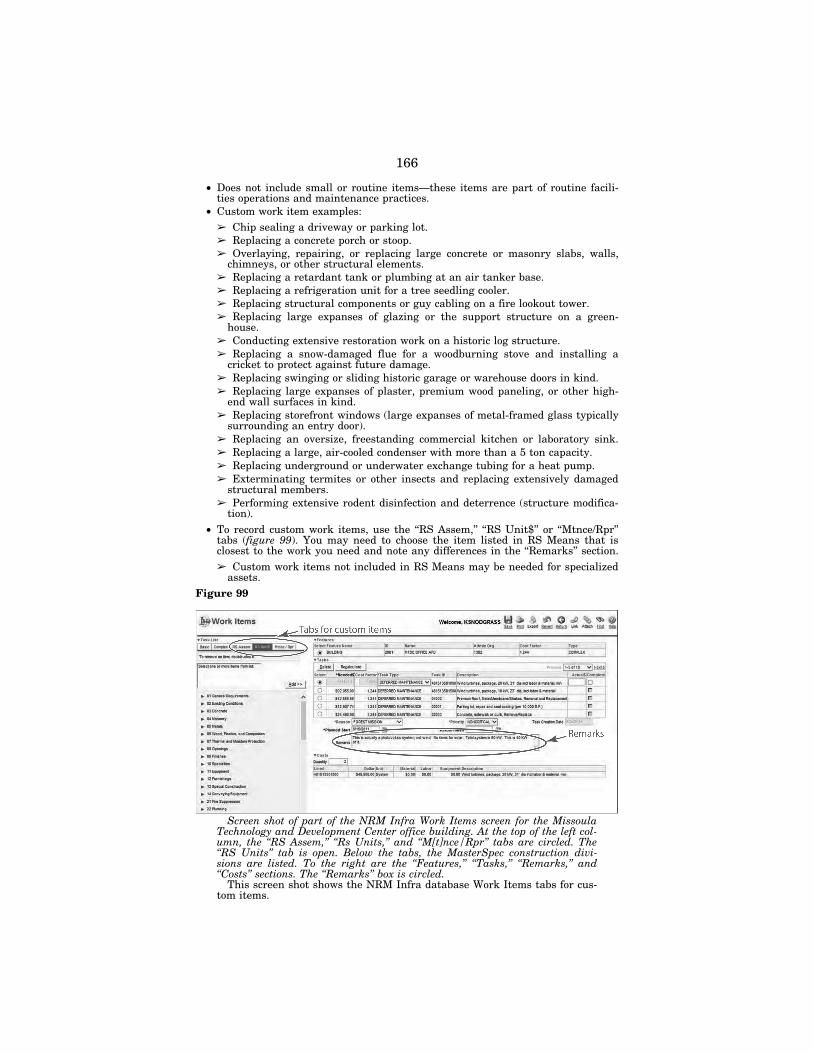
166
• Does not include small or routine items—these items are part of routine facili-ties operations and maintenance practices.
• Custom work item examples: ➢ Chip sealing a driveway or parking lot. ➢ Replacing a concrete porch or stoop. ➢ Overlaying, repairing, or replacing large concrete or masonry slabs, walls,
chimneys, or other structural elements. ➢ Replacing a retardant tank or plumbing at an air tanker base. ➢ Replacing a refrigeration unit for a tree seedling cooler. ➢ Replacing structural components or guy cabling on a fire lookout tower. ➢ Replacing large expanses of glazing or the support structure on a green-
house. ➢ Conducting extensive restoration work on a historic log structure. ➢ Replacing a snow-damaged flue for a woodburning stove and installing a
cricket to protect against future damage. ➢ Replacing swinging or sliding historic garage or warehouse doors in kind. ➢ Replacing large expanses of plaster, premium wood paneling, or other high-
end wall surfaces in kind. ➢ Replacing storefront windows (large expanses of metal-framed glass typically
surrounding an entry door). ➢ Replacing an oversize, freestanding commercial kitchen or laboratory sink. ➢ Replacing a large, air-cooled condenser with more than a 5 ton capacity. ➢ Replacing underground or underwater exchange tubing for a heat pump. ➢ Exterminating termites or other insects and replacing extensively damaged
structural members. ➢ Performing extensive rodent disinfection and deterrence (structure modifica-
tion). • To record custom work items, use the ‘‘RS Assem,’’ ‘‘RS Unit$’’ or ‘‘Mtnce/Rpr’’
tabs (figure 99). You may need to choose the item listed in RS Means that is closest to the work you need and note any differences in the ‘‘Remarks’’ section. ➢ Custom work items not included in RS Means may be needed for specialized
assets. Figure 99
Screen shot of part of the NRM Infra Work Items screen for the Missoula Technology and Development Center office building. At the top of the left col-umn, the ‘‘RS Assem,’’ ‘‘Rs Units,’’ and ‘‘M[t]nce/Rpr’’ tabs are circled. The ‘‘RS Units’’ tab is open. Below the tabs, the MasterSpec construction divi-sions are listed. To the right are the ‘‘Features,’’ ‘‘Tasks,’’ ‘‘Remarks,’’ and ‘‘Costs’’ sections. The ‘‘Remarks’’ box is circled.
This screen shot shows the NRM Infra database Work Items tabs for cus-tom items.
VerDate Aug 31 2005 16:26 Dec 16, 2020 Jkt 000000 PO 00000 Frm 00170 Fmt 6621 Sfmt 6621 P:\DOCS\116-19\38016.TXT BRIAN 1161
9112
.eps
167
That’s it. Congratulations! You have completed the facilities condition as-sessment for the building. Library Card
Snodgrass, K.; Marks, K. 2014. Facilities condition assessment field training guide. 1473–2830–MTDC. Missoula, MT: U.S. Department of Agriculture, Forest Service, Missoula Technology and Development Center. 142 p.
This booklet is a training guide and a memory-jogger for Forest Service employees who are trained to do facilities condition assessments. The format enables inspectors to easily reference necessary information onsite and to easily conduct assessments in a manner that is consistent throughout the Forest Service. Each work item has its own page that includes photos, guidance on whether the item applies to the building being inspected, the normal useful life of the item, and how to measure and record the quantity of necessary work.
Keywords: assessment, basic, building, complex, condition, construction, data-base, deficiencies, energy, facility, facility engineers, facilities, Infra, inspect, inspec-tions, Iweb, maintenance, measure, natural resources manager, NRM, operations, quantity, record, survey, work item[.]
Additional single copies of this document may be ordered from: USDA Forest Service, Missoula Technology and Development Center, 5785 Hwy. 10 West, Missoula, MT 59808–9361 Phone: 406–329–3978 Fax: 406–329–3719 Email: [email protected]
For additional technical information, contact MTDC: Phone: 406–329–3900 Fax: 406–329–3719
Electronic copies of National Technology and Development documents are available on the Internet at: http://www.fs.fed.us/eng/pubs
Forest Service and Bureau of Land Management employees can search National Technology and Development documents, CDs, DVDs, and videos on their internal computer networks at: http://fsweb.mtdc.wo.fs.fed.us/ search/; http://fsweb.sdtdc.wo.fs.fed.us/. Produced by the National Technology & Development Program Missoula, MT 1473–2830–MTDC
ATTACHMENT 2
FY 2020—Deferred Maintenance Protocols for Roads Contents
1. Requirements for Reporting Deferred Maintenance, Annual Maintenance, and Capital Improvement Needs for Roads
2. National Random Sample for Roads 3. Business Rules for Field Surveys 4. Year-End Schedule and Summarization Processes 5. Required Data Fields from FSH 7709.55, Zero Code 6. Frequently Asked Questions
Purpose of National Random Sample The national random sample for roads is generated solely for: 1. External reporting of:
a. Critical and non-critical deferred maintenance needs for passenger car roads in FS financial statement
b. Deferred Maintenance backlog to Congress, and c. Condition class of transportation system (Performance Measures—not yet
implemented) The following guidelines are applicable only for collecting and reporting
the agency’s national deferred maintenance needs. Thank you to Catherine Taylor and Christina Foreman of the Volpe
Center for their work on our Deferred Maintenance Method in accordance with the OIG Audit recommendations and contributing information incorporated into
VerDate Aug 31 2005 16:26 Dec 16, 2020 Jkt 000000 PO 00000 Frm 00171 Fmt 6621 Sfmt 6621 P:\DOCS\116-19\38016.TXT BRIAN
168
this document on the revised sample methodology goals and objectives and their Tables 1–3.
1. Requirements for Reporting Deferred Maintenance, Annual Mainte-nance, and Capital Improvement Needs for Roads
Deferred Maintenance The agency has moved to a national random sample to report deferred mainte-
nance for passenger car roads (operational maintenance level 3–5). See item 2 below. There are no requirements to report deferred maintenance needs at the Re-gional or Forest level. Annual Maintenance
There are no national requirements to report annual maintenance needs. Collec-tion of annual maintenance needs, costs, and accomplishments for the random sam-ple is not required for agency reporting purposes.
Reporting annual maintenance accomplishments on all system roads, regardless of the random sample is required. The Road Maintenance Planning tool is now available in NRM to support annual maintenance planning, cost estimating, and ac-complishment reporting. The tool can be useful in prioritizing annual maintenance needs within a given budget to produce annual maintenance plans. For more infor-mation on the Road Maintenance Planning tool, see the Travel Routes Road User Board webpage (https://usdagcc.sharepoint.com/sites/fs-wo-eng/SitePages/ RUB.aspx)[.] Capital Improvements
There are no requirements to report capital improvement needs at any level. 2. National Random Sample for Roads
Note: Conclusions and extrapolations determined from national random sample condition survey data for roads are ONLY VALID AT THE NA-TIONAL LEVEL. Limitations of National Random Sample
1. Deferred maintenance needs determined from the national random sample are only valid for required reporting at the Forest Service national level.
2. Only deferred maintenance needs must be collected for the random sample. Collection of annual maintenance needs data for the national random sample is optional. Such data will not be used at the national level but may be useful at the forest level for planning purposes
3. All deferred maintenance summaries or extrapolations resulting from the data collected on the random sample are only valid in the context of nationally averaged unit costs.
4. The data gathered through this effort has been analyzed and determine to be statistically invalid for use below the national level reporting.
Business Process for Running the National Random Sample There are four key considerations to address within the Random Sample process: 1. The total sample size (i.e., the total number of ML3–ML5 road fragments to
pull from the national database); and 2. All the fragments in the new subset database have an equal probability of
being selected regardless of whether a segment is on the same road has al-ready been selected, and
3. Roads sampled in prior years are available for inclusion in the current sam-ple, and
4. The method for ensuring randomness. Each of the four steps is summarized in the following sections.
Goals and Objectives Because the goal is to estimate deferred maintenance cost per mile, the statistic
of interest is a ratio. The sample size calculation for a ratio estimator is more intri-cate than the basic estimator because its calculation takes into account variations in both the deferred maintenance costs and segment lengths.
The original sampling method relied on the ROADCORE II database which con-tains road segments of varying lengths that are defined by natural breakpoints in the road such as county boundaries, bridges, change in surface types like gravel, pavement, etc. As the result the length of the segments in the database varied sig-
VerDate Aug 31 2005 16:26 Dec 16, 2020 Jkt 000000 PO 00000 Frm 00172 Fmt 6621 Sfmt 6621 P:\DOCS\116-19\38016.TXT BRIAN
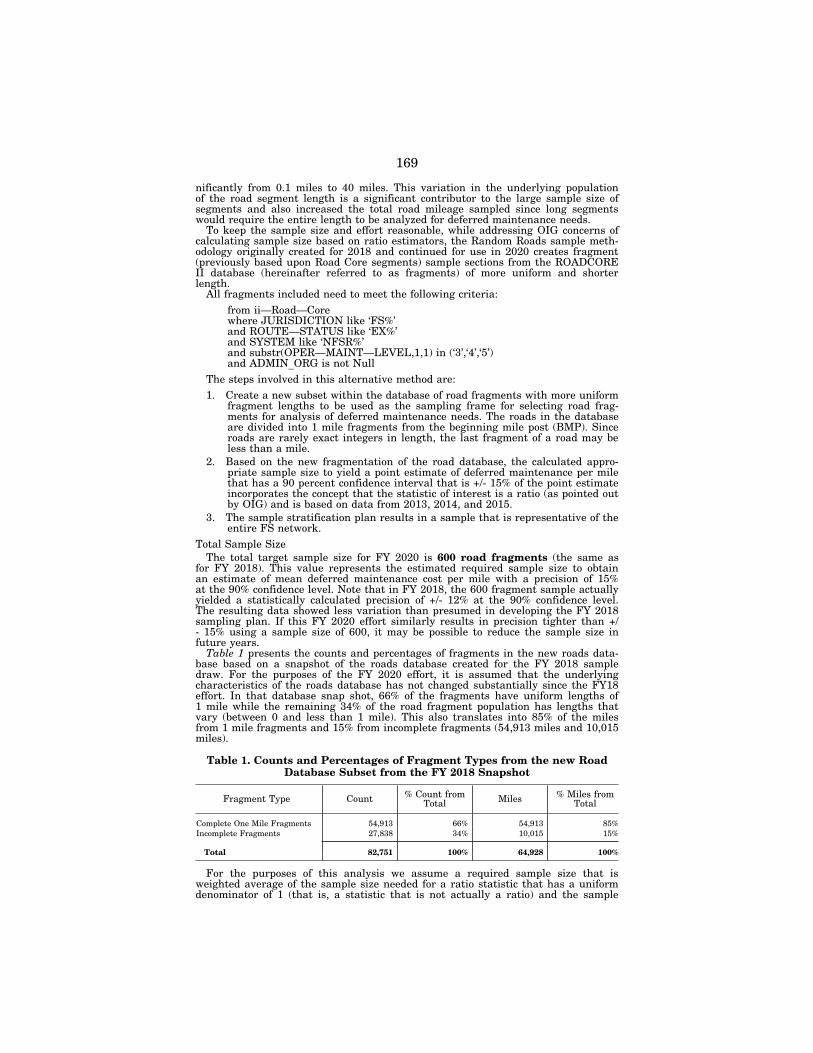
169
nificantly from 0.1 miles to 40 miles. This variation in the underlying population of the road segment length is a significant contributor to the large sample size of segments and also increased the total road mileage sampled since long segments would require the entire length to be analyzed for deferred maintenance needs.
To keep the sample size and effort reasonable, while addressing OIG concerns of calculating sample size based on ratio estimators, the Random Roads sample meth-odology originally created for 2018 and continued for use in 2020 creates fragment (previously based upon Road Core segments) sample sections from the ROADCORE II database (hereinafter referred to as fragments) of more uniform and shorter length.
All fragments included need to meet the following criteria: from ii—Road—Core where JURISDICTION like ‘FS%’ and ROUTE—STATUS like ‘EX%’ and SYSTEM like ‘NFSR%’ and substr(OPER—MAINT—LEVEL,1,1) in (‘3’,‘4’,‘5’) and ADMIN_ORG is not Null
The steps involved in this alternative method are: 1. Create a new subset within the database of road fragments with more uniform
fragment lengths to be used as the sampling frame for selecting road frag-ments for analysis of deferred maintenance needs. The roads in the database are divided into 1 mile fragments from the beginning mile post (BMP). Since roads are rarely exact integers in length, the last fragment of a road may be less than a mile.
2. Based on the new fragmentation of the road database, the calculated appro-priate sample size to yield a point estimate of deferred maintenance per mile that has a 90 percent confidence interval that is +/- 15% of the point estimate incorporates the concept that the statistic of interest is a ratio (as pointed out by OIG) and is based on data from 2013, 2014, and 2015.
3. The sample stratification plan results in a sample that is representative of the entire FS network.
Total Sample Size The total target sample size for FY 2020 is 600 road fragments (the same as
for FY 2018). This value represents the estimated required sample size to obtain an estimate of mean deferred maintenance cost per mile with a precision of 15% at the 90% confidence level. Note that in FY 2018, the 600 fragment sample actually yielded a statistically calculated precision of +/- 12% at the 90% confidence level. The resulting data showed less variation than presumed in developing the FY 2018 sampling plan. If this FY 2020 effort similarly results in precision tighter than +/ - 15% using a sample size of 600, it may be possible to reduce the sample size in future years.
Table 1 presents the counts and percentages of fragments in the new roads data-base based on a snapshot of the roads database created for the FY 2018 sample draw. For the purposes of the FY 2020 effort, it is assumed that the underlying characteristics of the roads database has not changed substantially since the FY18 effort. In that database snap shot, 66% of the fragments have uniform lengths of 1 mile while the remaining 34% of the road fragment population has lengths that vary (between 0 and less than 1 mile). This also translates into 85% of the miles from 1 mile fragments and 15% from incomplete fragments (54,913 miles and 10,015 miles).
Table 1. Counts and Percentages of Fragment Types from the new Road Database Subset from the FY 2018 Snapshot
Fragment Type Count % Count from Total Miles % Miles from
Total
Complete One Mile Fragments 54,913 66% 54,913 85% Incomplete Fragments 27,838 34% 10,015 15%
Total 82,751 100% 64,928 100%
For the purposes of this analysis we assume a required sample size that is weighted average of the sample size needed for a ratio statistic that has a uniform denominator of 1 (that is, a statistic that is not actually a ratio) and the sample
VerDate Aug 31 2005 16:26 Dec 16, 2020 Jkt 000000 PO 00000 Frm 00173 Fmt 6621 Sfmt 6621 P:\DOCS\116-19\38016.TXT BRIAN
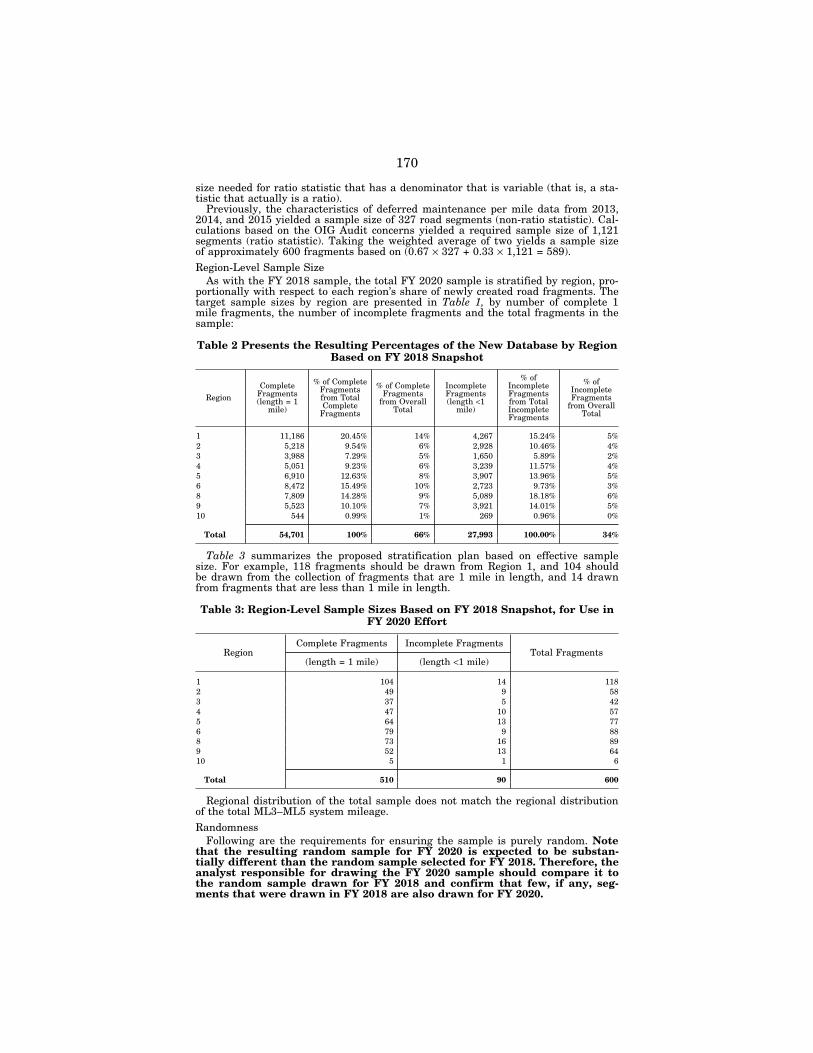
170
size needed for ratio statistic that has a denominator that is variable (that is, a sta-tistic that actually is a ratio).
Previously, the characteristics of deferred maintenance per mile data from 2013, 2014, and 2015 yielded a sample size of 327 road segments (non-ratio statistic). Cal-culations based on the OIG Audit concerns yielded a required sample size of 1,121 segments (ratio statistic). Taking the weighted average of two yields a sample size of approximately 600 fragments based on (0.67 × 327 + 0.33 × 1,121 = 589). Region-Level Sample Size
As with the FY 2018 sample, the total FY 2020 sample is stratified by region, pro-portionally with respect to each region’s share of newly created road fragments. The target sample sizes by region are presented in Table 1, by number of complete 1 mile fragments, the number of incomplete fragments and the total fragments in the sample:
Table 2 Presents the Resulting Percentages of the New Database by Region Based on FY 2018 Snapshot
Region Complete
Fragments (length = 1
mile)
% of Complete Fragments from Total Complete
Fragments
% of Complete Fragments
from Overall Total
Incomplete Fragments (length <1
mile)
% of Incomplete Fragments from Total Incomplete Fragments
% of Incomplete Fragments
from Overall Total
1 11,186 20.45% 14% 4,267 15.24% 5% 2 5,218 9.54% 6% 2,928 10.46% 4% 3 3,988 7.29% 5% 1,650 5.89% 2% 4 5,051 9.23% 6% 3,239 11.57% 4% 5 6,910 12.63% 8% 3,907 13.96% 5% 6 8,472 15.49% 10% 2,723 9.73% 3% 8 7,809 14.28% 9% 5,089 18.18% 6% 9 5,523 10.10% 7% 3,921 14.01% 5% 10 544 0.99% 1% 269 0.96% 0%
Total 54,701 100% 66% 27,993 100.00% 34%
Table 3 summarizes the proposed stratification plan based on effective sample size. For example, 118 fragments should be drawn from Region 1, and 104 should be drawn from the collection of fragments that are 1 mile in length, and 14 drawn from fragments that are less than 1 mile in length.
Table 3: Region-Level Sample Sizes Based on FY 2018 Snapshot, for Use in FY 2020 Effort
Region Complete Fragments Incomplete Fragments
Total Fragments (length = 1 mile) (length <1 mile)
1 104 14 118 2 49 9 58 3 37 5 42 4 47 10 57 5 64 13 77 6 79 9 88 8 73 16 89 9 52 13 64 10 5 1 6
Total 510 90 600
Regional distribution of the total sample does not match the regional distribution of the total ML3–ML5 system mileage. Randomness
Following are the requirements for ensuring the sample is purely random. Note that the resulting random sample for FY 2020 is expected to be substan-tially different than the random sample selected for FY 2018. Therefore, the analyst responsible for drawing the FY 2020 sample should compare it to the random sample drawn for FY 2018 and confirm that few, if any, seg-ments that were drawn in FY 2018 are also drawn for FY 2020.
VerDate Aug 31 2005 16:26 Dec 16, 2020 Jkt 000000 PO 00000 Frm 00174 Fmt 6621 Sfmt 6621 P:\DOCS\116-19\38016.TXT BRIAN
171
1. Each road fragment has an equal probability of being selected within a region and road (It is possible to have multiple fragments in one road.)
2. The target region-level sample sizes in Table 3 are achieved. 3. An entire road fragment is selected unless the ML changes or the route ends.
FY 2018 Random Sample The National Random Sample of 600 fragments, generated with the above criteria
is available from within NRM by running the roads report RD—DM01L. These roads must receive a deferred maintenance condition survey in FY 2020. The data collected from the condition surveys will be used to determine the Forest Service’s agency-wide road deferred maintenance needs for ML 3–5 roads. The accuracy of the data contained in the sixteen required fields listed in the Travel Planning Handbook (FSH 7709.55, Zero Code) must be validated, and corrections made when errors are discovered.
Users will be able to query live NRM data by security ID to monitor condition survey accomplishments and check data entry. A Random Sample List and Accom-plishment Report are available for managers on the Corporate Data Warehouse (CDW), under Deferred Maintenance/Roads, using a snapshot of data that will be refreshed regularly.
3. Business Rules for Field Surveys
1. Only Deferred Maintenance needs are required to be collected for the random sample. Collection of Annual Maintenance needs is optional.
2. Deferred maintenance needs should be collected by Priority (Critical/Non-Crit-ical) and Reason (Health & Safety/Resource Protection/Forest Mission), ac-cording to Deferred Maintenance Protocols already established.
3. All condition surveys should be based on operational maintenance level needs. This change occurred in FY 2007, and was done to place condition surveys in the context of annual maintenance planning.
4. All deferred maintenance needs will be computed using the National Unit Costs accessed through the Task Tab in NRM or ERL.
5. If ERL is not used to conduct the condition survey, a Condition Survey record must be entered in the Record of Events.
6. Field surveys for random sample roads shall validate all existing deferred maintenance work items and/or create new deferred maintenance work items that reflect current conditions. If a previous year’s work item is no longer valid, it should be deleted.
7. Field surveys shall validate and reconcile the data contained in the sixteen required fields listed in the Travel Planning Handbook (FSH 7709.55, Zero Code). Make corrections in the database when errors are found.
8. Deferred Maintenance data for the random sample will be loaded into NRM, and quality checked, by the date specified in the Year-End Schedule.
9. The Regional Engineer shall assure the quality and completeness of the data collected for the Random Sample at the end of each fiscal year. The Forest Staff Officer for Engineering is responsible for the estimate of Deferred Main-tenance needs and will select individuals to complete condition surveys based on knowledge, education, and experience.
10. At a minimum, survey and enter work items for the road fragment that is included in the random sample list. Surveying and entering work items for any other portion of the road is optional. Data on fragments not in the ran-dom sample will not be used at the national level but may be useful at the forest level for planning purposes.
4. Year-End Schedule and Summarization Processes Schedule
October 31, 2019–September 29, 2020: Forests and regions enter deferred mainte-nance needs and validate data for the random sample in NRM. Forests and regions use NRM accomplishment and summarization reports to check NRM data and make appropriate edits before agency summaries are generated.
September 30: NRM is closed to editing. The following dates are approximate: October 2–6: Data Summarization Process is executed by NRM Programmers. WO
Roads Program Manager validates and approves data. (See Summarization descrip-
VerDate Aug 31 2005 16:26 Dec 16, 2020 Jkt 000000 PO 00000 Frm 00175 Fmt 6621 Sfmt 6621 P:\DOCS\116-19\38016.TXT BRIAN
172
tion below.) Once approved, NRM programmers will finalize agency summaries and formats for formal submittal.
October 6: NRM is open for editing. Records cannot be deleted until replication with CPAIS resumes. This can take up to 6 weeks. Summarization Process
The data summarization process occurs after Forests and Regions have validated their data in NRM and involves calculating total deferred maintenance needs by Priority (Critical/Non-Critical) and Reason (Health & Safety/Resource Protection/ Forest Mission) for the Random Sample. The WO Road Program Manager will use the random sample subtotals, prior year needs reports, and other information to validate the data for the Random Sample. Once validated, the random sample data will be used to determine a national average unit cost per mile extrapolated over the total Operational Maintenance Level 3–5 system to determine the agency’s de-ferred maintenance needs by priority and reason. 5. Required Data Fields from FSH 7709.55, Zero Code
1. Route number. 2. Beginning mile post. 3. Ending mile post. 4. System. 5. Jurisdiction. 6. Development status. 7. State. 8. County. 9. Congressional district. 10. Administrative Unit (region, forest, and ranger district). 11. Functional class. 12. Number of lanes. 13. Surface type. 14. Primary maintainer. 15. Operational maintenance level. 16. Objective maintenance level.
6. Frequently Asked Questions: Field Surveys
Q1. What do I do if the selected road does not physically exist? • Do not survey a replacement road. • Document road numbers and explain why they exist in the inventory. • Forward documentation to the RO User Board Representative. • Correct data in NRM. For example, update the route status for decommissioned
roads. Q2. What do I do if the selected road does not have any fragments with FS juris-
diction? • Do not survey a replacement road. • Document road numbers and explain why Jurisdiction is incorrect in the inven-
tory. • Forward documentation to the RO User Board Representative. • Correct data in NRM. For example, update the road fragments with incorrect
Jurisdiction values equal to FS. Q3. What do I do if the road selected is not a ML 3–5? The random sample business process and NRM scripts are designed to only select
ML 3–5 roads. However, there may be situations where data discrepancies or data edits that occurred after the random sample was generated resulted on ML 1–2 roads being selected for the random sample. In such cases:
• Do not survey a replacement road. • Document road numbers and explain the maintenance level is incorrect in the
inventory. • Forward documentation to the RO User Board Representative.
VerDate Aug 31 2005 16:26 Dec 16, 2020 Jkt 000000 PO 00000 Frm 00176 Fmt 6621 Sfmt 6621 P:\DOCS\116-19\38016.TXT BRIAN
173
• Correct data in NRM. For example, update the operational maintenance level.
Q4. How are these condition surveys related to Real Property Roads Inventory? The purpose of the condition surveys is to allow the Forest Service to estimate
its Deferred Maintenance needs on its passenger car road system. As part of those surveys, units are required to validate the 16 required data fields, and update as needed. The Real Property Roads Inventory is done to verify the existence of all roads in our inventory, and to verify some of the data elements. These two efforts are not related.
Q5. What do I do if the selected road has been changed from ML3 to ML2?
• Do not survey a replacement road. • Document road numbers and explain why they exist in the inventory. • Forward documentation to the RO User Board Representative. • Correct data in NRM.
Data Q1. What date fields are populated in NRM from ERL? A ‘‘Record of Event’’ entry is made for a Condition Survey type Inspection with
the date (Inspection Date) and survey party (to Remarks) from ERL. For existing tasks:
• The YEAR field is left unchanged • the DAY_ID field is updated with the date of the current field survey • The CREATED_DATE is left unchanged • The MODIFIED_DATE is updated with the date of the upload.
For new tasks:
• The YEAR field is populated with the current FY • The DAY_ID field is populated with the date of the current field survey • The CREATED_DATE is populated with the date of the upload • The MODIFIED_DATE is populated with the date of the upload.
An ‘‘Event’’ entry is made in NRM. An Inspection Event Subtype = CS—Condition Survey is made with the date of the condition survey recorded in ERL.
Q2. Where is the Deferred Maintenance data collected prior to FY 2006?
• Prior to FY06, all tasks (AM, DM, CI) regardless of completion were archived. Beginning in FY06 and forward, only completed tasks were archived. This change occurred due to file size concerns, and accomplishment reporting re-quirements.
• In addition, a snapshot of all tasks that existed at the end of FY05 is included with the completed tasks on the Archived Tasks screen.
• To date, the Archived Tasks screen (filtered view of the ii tasks table) contains a mix of completed tasks (AM, DM, CI) when the YEAR is >= 2006, and all tasks (completed and uncompleted) when the YEAR equals 2005.
• To access road tasks older than 2005, utilize the Archived Tasks for Roads (II_TASKS_ARCHIVR_ROAD_V) user view or submit a helpdesk ticket. These tasks are stored in a separate table in the database.
• For condition surveys performed using ERL, the Survey Date (DAY_ID) field will retain the original survey date, until the work item is revisited on a subse-quent condition survey; at which time it will be overwritten with the latest sur-vey date. The work item date history, which records when the work item was originally identified on a condition survey, is no longer available. This elimi-nates the ability to determine how long some of the maintenance needs have been languishing.
NRM’s business rules for how date fields are handled has changed several times. This has resulted in inconsistencies in date related data for work tasks. It is dif-ficult to establish any pattern for how these dates have been handled since condition survey data was collected in 1999. It is nearly impossible, without a major under-taking, to utilize archived data older than FY 2006 for any kind of accomplishment reporting or trend analysis.
VerDate Aug 31 2005 16:26 Dec 16, 2020 Jkt 000000 PO 00000 Frm 00177 Fmt 6621 Sfmt 6621 P:\DOCS\116-19\38016.TXT BRIAN
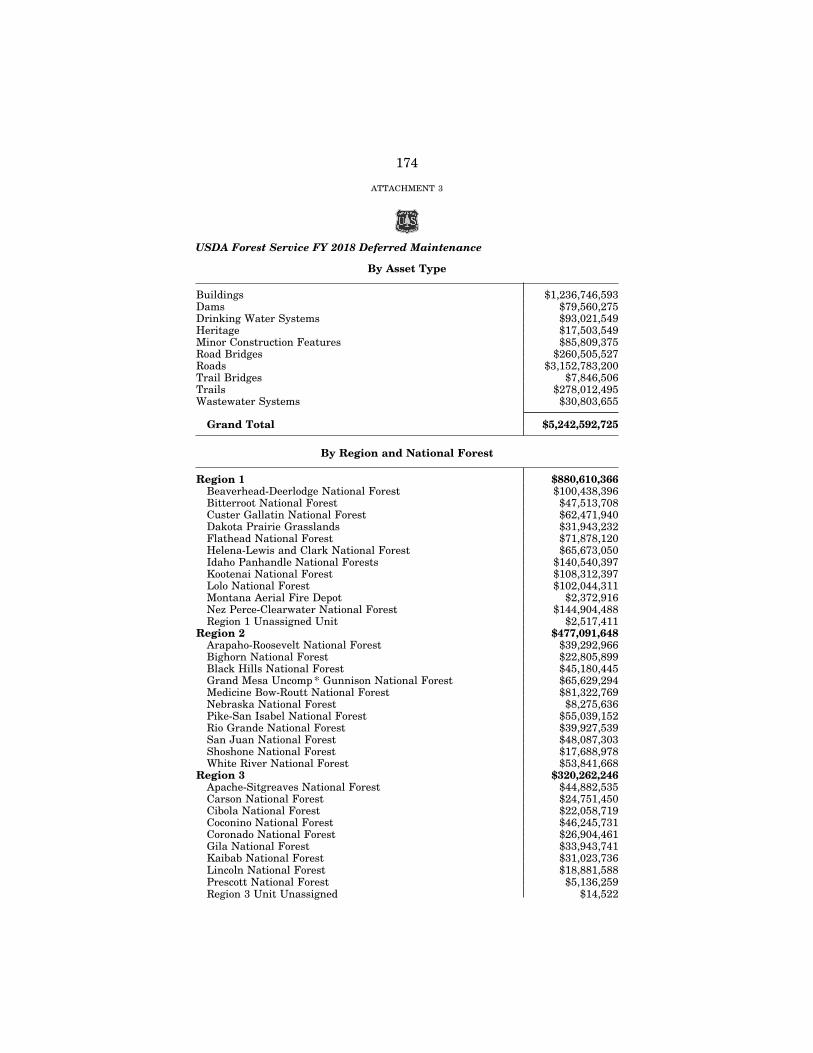
174
ATTACHMENT 3
USDA Forest Service FY 2018 Deferred Maintenance
By Asset Type
Buildings $1,236,746,593 Dams $79,560,275 Drinking Water Systems $93,021,549 Heritage $17,503,549 Minor Construction Features $85,809,375 Road Bridges $260,505,527 Roads $3,152,783,200 Trail Bridges $7,846,506 Trails $278,012,495 Wastewater Systems $30,803,655
Grand Total $5,242,592,725
By Region and National Forest
Region 1 $880,610,366 Beaverhead-Deerlodge National Forest $100,438,396 Bitterroot National Forest $47,513,708 Custer Gallatin National Forest $62,471,940 Dakota Prairie Grasslands $31,943,232 Flathead National Forest $71,878,120 Helena-Lewis and Clark National Forest $65,673,050 Idaho Panhandle National Forests $140,540,397 Kootenai National Forest $108,312,397 Lolo National Forest $102,044,311 Montana Aerial Fire Depot $2,372,916 Nez Perce-Clearwater National Forest $144,904,488 Region 1 Unassigned Unit $2,517,411
Region 2 $477,091,648 Arapaho-Roosevelt National Forest $39,292,966 Bighorn National Forest $22,805,899 Black Hills National Forest $45,180,445 Grand Mesa Uncomp * Gunnison National Forest $65,629,294 Medicine Bow-Routt National Forest $81,322,769 Nebraska National Forest $8,275,636 Pike-San Isabel National Forest $55,039,152 Rio Grande National Forest $39,927,539 San Juan National Forest $48,087,303 Shoshone National Forest $17,688,978 White River National Forest $53,841,668
Region 3 $320,262,246 Apache-Sitgreaves National Forest $44,882,535 Carson National Forest $24,751,450 Cibola National Forest $22,058,719 Coconino National Forest $46,245,731 Coronado National Forest $26,904,461 Gila National Forest $33,943,741 Kaibab National Forest $31,023,736 Lincoln National Forest $18,881,588 Prescott National Forest $5,136,259 Region 3 Unit Unassigned $14,522
VerDate Aug 31 2005 16:26 Dec 16, 2020 Jkt 000000 PO 00000 Frm 00178 Fmt 6621 Sfmt 6621 P:\DOCS\116-19\38016.TXT BRIAN 1161
9113
.eps
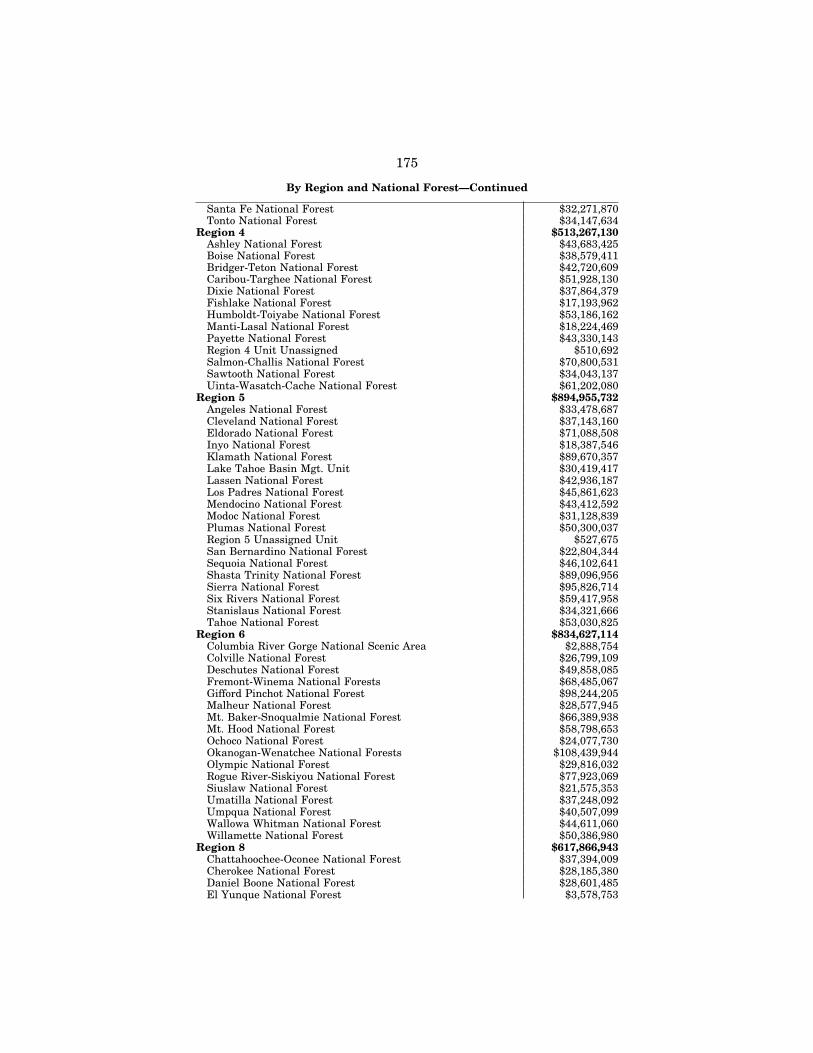
175
By Region and National Forest—Continued
Santa Fe National Forest $32,271,870 Tonto National Forest $34,147,634
Region 4 $513,267,130 Ashley National Forest $43,683,425 Boise National Forest $38,579,411 Bridger-Teton National Forest $42,720,609 Caribou-Targhee National Forest $51,928,130 Dixie National Forest $37,864,379 Fishlake National Forest $17,193,962 Humboldt-Toiyabe National Forest $53,186,162 Manti-Lasal National Forest $18,224,469 Payette National Forest $43,330,143 Region 4 Unit Unassigned $510,692 Salmon-Challis National Forest $70,800,531 Sawtooth National Forest $34,043,137 Uinta-Wasatch-Cache National Forest $61,202,080
Region 5 $894,955,732 Angeles National Forest $33,478,687 Cleveland National Forest $37,143,160 Eldorado National Forest $71,088,508 Inyo National Forest $18,387,546 Klamath National Forest $89,670,357 Lake Tahoe Basin Mgt. Unit $30,419,417 Lassen National Forest $42,936,187 Los Padres National Forest $45,861,623 Mendocino National Forest $43,412,592 Modoc National Forest $31,128,839 Plumas National Forest $50,300,037 Region 5 Unassigned Unit $527,675 San Bernardino National Forest $22,804,344 Sequoia National Forest $46,102,641 Shasta Trinity National Forest $89,096,956 Sierra National Forest $95,826,714 Six Rivers National Forest $59,417,958 Stanislaus National Forest $34,321,666 Tahoe National Forest $53,030,825
Region 6 $834,627,114 Columbia River Gorge National Scenic Area $2,888,754 Colville National Forest $26,799,109 Deschutes National Forest $49,858,085 Fremont-Winema National Forests $68,485,067 Gifford Pinchot National Forest $98,244,205 Malheur National Forest $28,577,945 Mt. Baker-Snoqualmie National Forest $66,389,938 Mt. Hood National Forest $58,798,653 Ochoco National Forest $24,077,730 Okanogan-Wenatchee National Forests $108,439,944 Olympic National Forest $29,816,032 Rogue River-Siskiyou National Forest $77,923,069 Siuslaw National Forest $21,575,353 Umatilla National Forest $37,248,092 Umpqua National Forest $40,507,099 Wallowa Whitman National Forest $44,611,060 Willamette National Forest $50,386,980
Region 8 $617,866,943 Chattahoochee-Oconee National Forest $37,394,009 Cherokee National Forest $28,185,380 Daniel Boone National Forest $28,601,485 El Yunque National Forest $3,578,753
VerDate Aug 31 2005 16:26 Dec 16, 2020 Jkt 000000 PO 00000 Frm 00179 Fmt 6621 Sfmt 6621 P:\DOCS\116-19\38016.TXT BRIAN
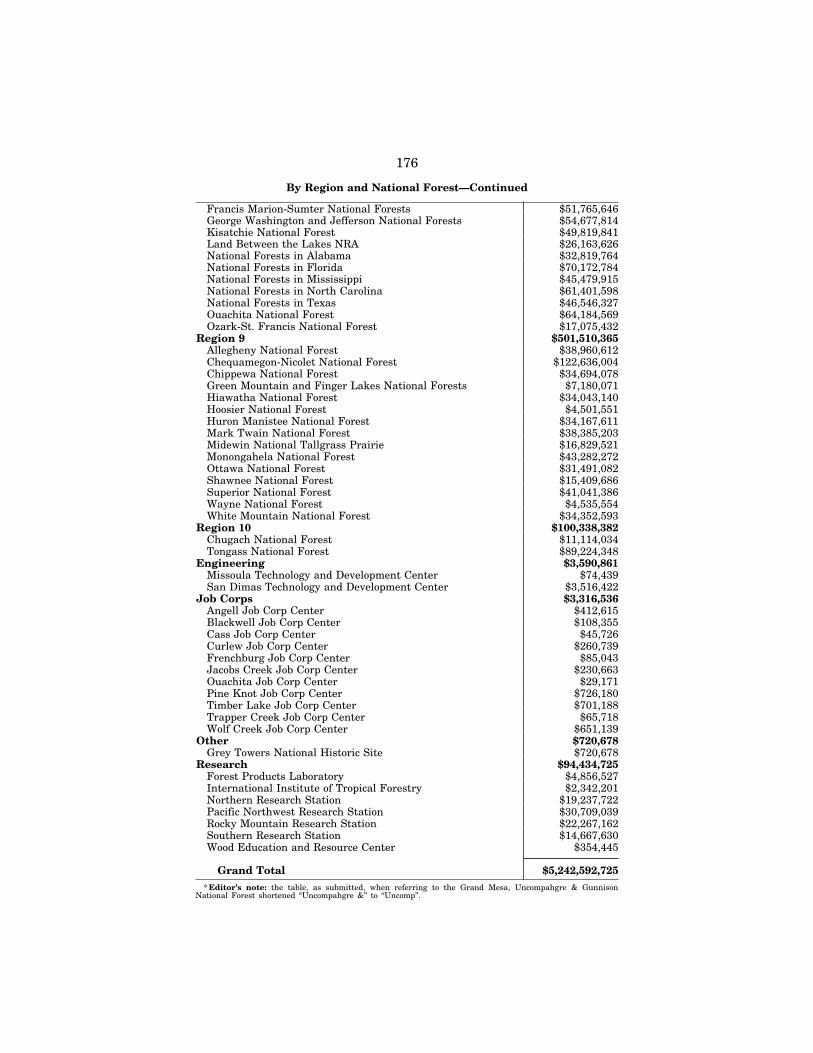
176
By Region and National Forest—Continued
Francis Marion-Sumter National Forests $51,765,646 George Washington and Jefferson National Forests $54,677,814 Kisatchie National Forest $49,819,841 Land Between the Lakes NRA $26,163,626 National Forests in Alabama $32,819,764 National Forests in Florida $70,172,784 National Forests in Mississippi $45,479,915 National Forests in North Carolina $61,401,598 National Forests in Texas $46,546,327 Ouachita National Forest $64,184,569 Ozark-St. Francis National Forest $17,075,432
Region 9 $501,510,365 Allegheny National Forest $38,960,612 Chequamegon-Nicolet National Forest $122,636,004 Chippewa National Forest $34,694,078 Green Mountain and Finger Lakes National Forests $7,180,071 Hiawatha National Forest $34,043,140 Hoosier National Forest $4,501,551 Huron Manistee National Forest $34,167,611 Mark Twain National Forest $38,385,203 Midewin National Tallgrass Prairie $16,829,521 Monongahela National Forest $43,282,272 Ottawa National Forest $31,491,082 Shawnee National Forest $15,409,686 Superior National Forest $41,041,386 Wayne National Forest $4,535,554 White Mountain National Forest $34,352,593
Region 10 $100,338,382 Chugach National Forest $11,114,034 Tongass National Forest $89,224,348
Engineering $3,590,861 Missoula Technology and Development Center $74,439 San Dimas Technology and Development Center $3,516,422
Job Corps $3,316,536 Angell Job Corp Center $412,615 Blackwell Job Corp Center $108,355 Cass Job Corp Center $45,726 Curlew Job Corp Center $260,739 Frenchburg Job Corp Center $85,043 Jacobs Creek Job Corp Center $230,663 Ouachita Job Corp Center $29,171 Pine Knot Job Corp Center $726,180 Timber Lake Job Corp Center $701,188 Trapper Creek Job Corp Center $65,718 Wolf Creek Job Corp Center $651,139
Other $720,678 Grey Towers National Historic Site $720,678
Research $94,434,725 Forest Products Laboratory $4,856,527 International Institute of Tropical Forestry $2,342,201 Northern Research Station $19,237,722 Pacific Northwest Research Station $30,709,039 Rocky Mountain Research Station $22,267,162 Southern Research Station $14,667,630 Wood Education and Resource Center $354,445
Grand Total $5,242,592,725 * Editor’s note: the table, as submitted, when referring to the Grand Mesa, Uncompahgre & Gunnison
National Forest shortened ‘‘Uncompahgre &’’ to ‘‘Uncomp’’.
VerDate Aug 31 2005 16:26 Dec 16, 2020 Jkt 000000 PO 00000 Frm 00180 Fmt 6621 Sfmt 6621 P:\DOCS\116-19\38016.TXT BRIAN
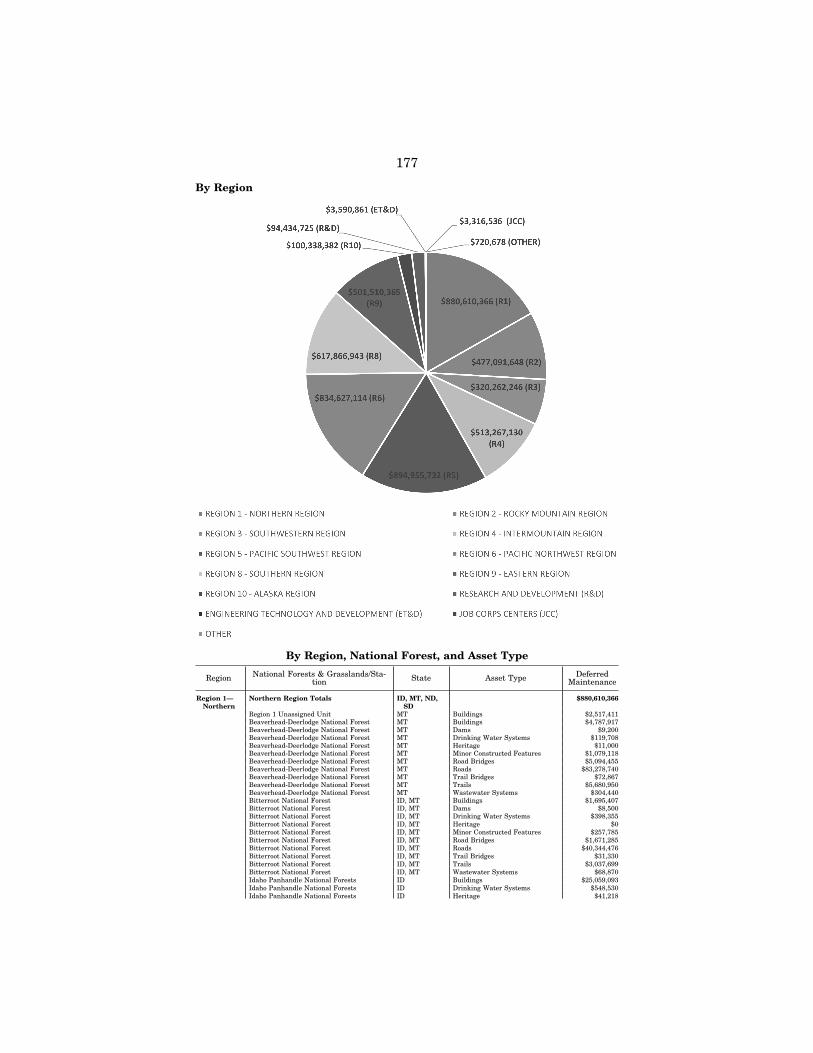
177
By Region
By Region, National Forest, and Asset Type
Region National Forests & Grasslands/Sta-tion State Asset Type Deferred
Maintenance
Region 1— Northern
Northern Region Totals ID, MT, ND, SD
$880,610,366
Region 1 Unassigned Unit MT Buildings $2,517,411 Beaverhead-Deerlodge National Forest MT Buildings $4,787,917 Beaverhead-Deerlodge National Forest MT Dams $9,200 Beaverhead-Deerlodge National Forest MT Drinking Water Systems $119,708 Beaverhead-Deerlodge National Forest MT Heritage $11,000 Beaverhead-Deerlodge National Forest MT Minor Constructed Features $1,079,118 Beaverhead-Deerlodge National Forest MT Road Bridges $5,094,455 Beaverhead-Deerlodge National Forest MT Roads $83,278,740 Beaverhead-Deerlodge National Forest MT Trail Bridges $72,867 Beaverhead-Deerlodge National Forest MT Trails $5,680,950 Beaverhead-Deerlodge National Forest MT Wastewater Systems $304,440 Bitterroot National Forest ID, MT Buildings $1,695,407 Bitterroot National Forest ID, MT Dams $8,500 Bitterroot National Forest ID, MT Drinking Water Systems $398,355 Bitterroot National Forest ID, MT Heritage $0 Bitterroot National Forest ID, MT Minor Constructed Features $257,785 Bitterroot National Forest ID, MT Road Bridges $1,671,285 Bitterroot National Forest ID, MT Roads $40,344,476 Bitterroot National Forest ID, MT Trail Bridges $31,330 Bitterroot National Forest ID, MT Trails $3,037,699 Bitterroot National Forest ID, MT Wastewater Systems $68,870 Idaho Panhandle National Forests ID Buildings $25,059,093 Idaho Panhandle National Forests ID Drinking Water Systems $548,530 Idaho Panhandle National Forests ID Heritage $41,218
VerDate Aug 31 2005 16:26 Dec 16, 2020 Jkt 000000 PO 00000 Frm 00181 Fmt 6621 Sfmt 6621 P:\DOCS\116-19\38016.TXT BRIAN 1161
9114
.eps
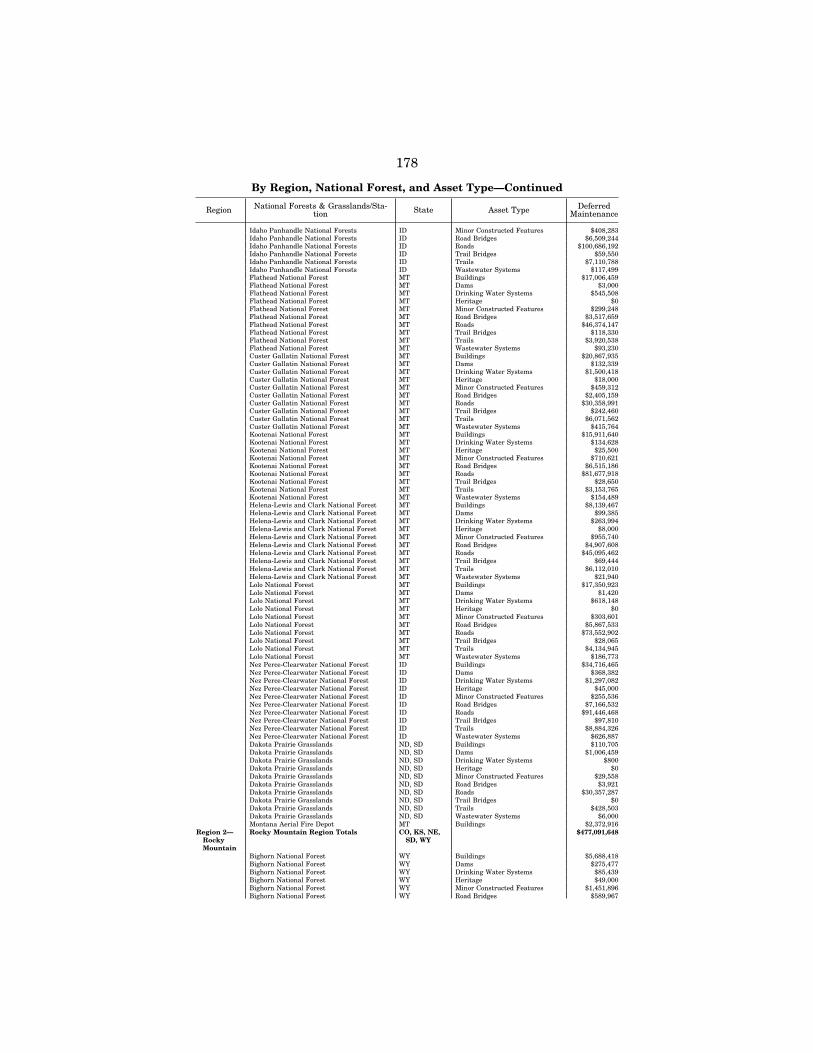
178
By Region, National Forest, and Asset Type—Continued
Region National Forests & Grasslands/Sta-tion State Asset Type Deferred
Maintenance
Idaho Panhandle National Forests ID Minor Constructed Features $408,283 Idaho Panhandle National Forests ID Road Bridges $6,509,244 Idaho Panhandle National Forests ID Roads $100,686,192 Idaho Panhandle National Forests ID Trail Bridges $59,550 Idaho Panhandle National Forests ID Trails $7,110,788 Idaho Panhandle National Forests ID Wastewater Systems $117,499 Flathead National Forest MT Buildings $17,006,459 Flathead National Forest MT Dams $3,000 Flathead National Forest MT Drinking Water Systems $545,508 Flathead National Forest MT Heritage $0 Flathead National Forest MT Minor Constructed Features $299,248 Flathead National Forest MT Road Bridges $3,517,659 Flathead National Forest MT Roads $46,374,147 Flathead National Forest MT Trail Bridges $118,330 Flathead National Forest MT Trails $3,920,538 Flathead National Forest MT Wastewater Systems $93,230 Custer Gallatin National Forest MT Buildings $20,867,935 Custer Gallatin National Forest MT Dams $132,339 Custer Gallatin National Forest MT Drinking Water Systems $1,500,418 Custer Gallatin National Forest MT Heritage $18,000 Custer Gallatin National Forest MT Minor Constructed Features $459,312 Custer Gallatin National Forest MT Road Bridges $2,405,159 Custer Gallatin National Forest MT Roads $30,358,991 Custer Gallatin National Forest MT Trail Bridges $242,460 Custer Gallatin National Forest MT Trails $6,071,562 Custer Gallatin National Forest MT Wastewater Systems $415,764 Kootenai National Forest MT Buildings $15,911,640 Kootenai National Forest MT Drinking Water Systems $134,628 Kootenai National Forest MT Heritage $25,500 Kootenai National Forest MT Minor Constructed Features $710,621 Kootenai National Forest MT Road Bridges $6,515,186 Kootenai National Forest MT Roads $81,677,918 Kootenai National Forest MT Trail Bridges $28,650 Kootenai National Forest MT Trails $3,153,765 Kootenai National Forest MT Wastewater Systems $154,489 Helena-Lewis and Clark National Forest MT Buildings $8,139,467 Helena-Lewis and Clark National Forest MT Dams $99,385 Helena-Lewis and Clark National Forest MT Drinking Water Systems $263,994 Helena-Lewis and Clark National Forest MT Heritage $8,000 Helena-Lewis and Clark National Forest MT Minor Constructed Features $955,740 Helena-Lewis and Clark National Forest MT Road Bridges $4,907,608 Helena-Lewis and Clark National Forest MT Roads $45,095,462 Helena-Lewis and Clark National Forest MT Trail Bridges $69,444 Helena-Lewis and Clark National Forest MT Trails $6,112,010 Helena-Lewis and Clark National Forest MT Wastewater Systems $21,940 Lolo National Forest MT Buildings $17,350,923 Lolo National Forest MT Dams $1,420 Lolo National Forest MT Drinking Water Systems $618,148 Lolo National Forest MT Heritage $0 Lolo National Forest MT Minor Constructed Features $303,601 Lolo National Forest MT Road Bridges $5,867,533 Lolo National Forest MT Roads $73,552,902 Lolo National Forest MT Trail Bridges $28,065 Lolo National Forest MT Trails $4,134,945 Lolo National Forest MT Wastewater Systems $186,773 Nez Perce-Clearwater National Forest ID Buildings $34,716,465 Nez Perce-Clearwater National Forest ID Dams $368,382 Nez Perce-Clearwater National Forest ID Drinking Water Systems $1,297,082 Nez Perce-Clearwater National Forest ID Heritage $45,000 Nez Perce-Clearwater National Forest ID Minor Constructed Features $255,536 Nez Perce-Clearwater National Forest ID Road Bridges $7,166,532 Nez Perce-Clearwater National Forest ID Roads $91,446,468 Nez Perce-Clearwater National Forest ID Trail Bridges $97,810 Nez Perce-Clearwater National Forest ID Trails $8,884,326 Nez Perce-Clearwater National Forest ID Wastewater Systems $626,887 Dakota Prairie Grasslands ND, SD Buildings $110,705 Dakota Prairie Grasslands ND, SD Dams $1,006,459 Dakota Prairie Grasslands ND, SD Drinking Water Systems $800 Dakota Prairie Grasslands ND, SD Heritage $0 Dakota Prairie Grasslands ND, SD Minor Constructed Features $29,558 Dakota Prairie Grasslands ND, SD Road Bridges $3,921 Dakota Prairie Grasslands ND, SD Roads $30,357,287 Dakota Prairie Grasslands ND, SD Trail Bridges $0 Dakota Prairie Grasslands ND, SD Trails $428,503 Dakota Prairie Grasslands ND, SD Wastewater Systems $6,000 Montana Aerial Fire Depot MT Buildings $2,372,916
Region 2— Rocky Mountain
Rocky Mountain Region Totals CO, KS, NE, SD, WY
$477,091,648
Bighorn National Forest WY Buildings $5,688,418 Bighorn National Forest WY Dams $275,477 Bighorn National Forest WY Drinking Water Systems $85,439 Bighorn National Forest WY Heritage $49,000 Bighorn National Forest WY Minor Constructed Features $1,451,896 Bighorn National Forest WY Road Bridges $589,967
VerDate Aug 31 2005 16:26 Dec 16, 2020 Jkt 000000 PO 00000 Frm 00182 Fmt 6621 Sfmt 6621 P:\DOCS\116-19\38016.TXT BRIAN
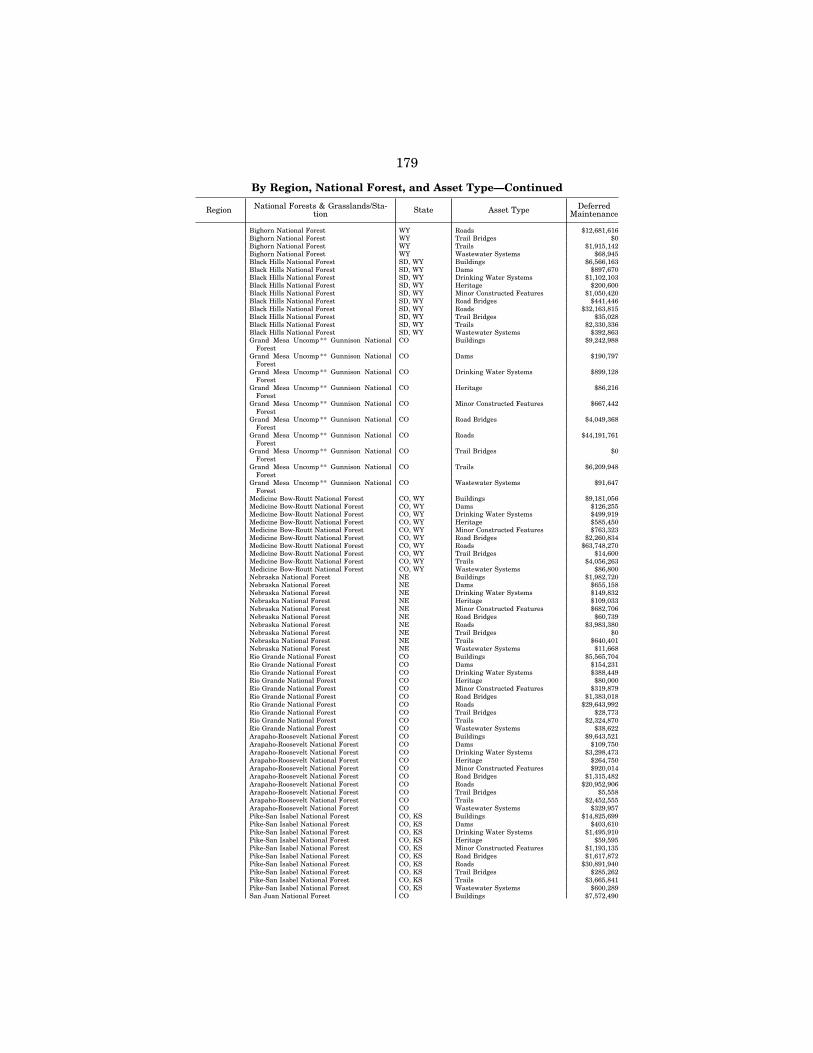
179
By Region, National Forest, and Asset Type—Continued
Region National Forests & Grasslands/Sta-tion State Asset Type Deferred
Maintenance
Bighorn National Forest WY Roads $12,681,616 Bighorn National Forest WY Trail Bridges $0 Bighorn National Forest WY Trails $1,915,142 Bighorn National Forest WY Wastewater Systems $68,945 Black Hills National Forest SD, WY Buildings $6,566,163 Black Hills National Forest SD, WY Dams $897,670 Black Hills National Forest SD, WY Drinking Water Systems $1,102,103 Black Hills National Forest SD, WY Heritage $200,600 Black Hills National Forest SD, WY Minor Constructed Features $1,050,420 Black Hills National Forest SD, WY Road Bridges $441,446 Black Hills National Forest SD, WY Roads $32,163,815 Black Hills National Forest SD, WY Trail Bridges $35,028 Black Hills National Forest SD, WY Trails $2,330,336 Black Hills National Forest SD, WY Wastewater Systems $392,863 Grand Mesa Uncomp ** Gunnison National
Forest CO Buildings $9,242,988
Grand Mesa Uncomp ** Gunnison National Forest
CO Dams $190,797
Grand Mesa Uncomp ** Gunnison National Forest
CO Drinking Water Systems $899,128
Grand Mesa Uncomp ** Gunnison National Forest
CO Heritage $86,216
Grand Mesa Uncomp ** Gunnison National Forest
CO Minor Constructed Features $667,442
Grand Mesa Uncomp ** Gunnison National Forest
CO Road Bridges $4,049,368
Grand Mesa Uncomp ** Gunnison National Forest
CO Roads $44,191,761
Grand Mesa Uncomp ** Gunnison National Forest
CO Trail Bridges $0
Grand Mesa Uncomp ** Gunnison National Forest
CO Trails $6,209,948
Grand Mesa Uncomp ** Gunnison National Forest
CO Wastewater Systems $91,647
Medicine Bow-Routt National Forest CO, WY Buildings $9,181,056 Medicine Bow-Routt National Forest CO, WY Dams $126,255 Medicine Bow-Routt National Forest CO, WY Drinking Water Systems $499,919 Medicine Bow-Routt National Forest CO, WY Heritage $585,450 Medicine Bow-Routt National Forest CO, WY Minor Constructed Features $763,323 Medicine Bow-Routt National Forest CO, WY Road Bridges $2,260,834 Medicine Bow-Routt National Forest CO, WY Roads $63,748,270 Medicine Bow-Routt National Forest CO, WY Trail Bridges $14,600 Medicine Bow-Routt National Forest CO, WY Trails $4,056,263 Medicine Bow-Routt National Forest CO, WY Wastewater Systems $86,800 Nebraska National Forest NE Buildings $1,982,720 Nebraska National Forest NE Dams $655,158 Nebraska National Forest NE Drinking Water Systems $149,832 Nebraska National Forest NE Heritage $109,033 Nebraska National Forest NE Minor Constructed Features $682,706 Nebraska National Forest NE Road Bridges $60,739 Nebraska National Forest NE Roads $3,983,380 Nebraska National Forest NE Trail Bridges $0 Nebraska National Forest NE Trails $640,401 Nebraska National Forest NE Wastewater Systems $11,668 Rio Grande National Forest CO Buildings $5,565,704 Rio Grande National Forest CO Dams $154,231 Rio Grande National Forest CO Drinking Water Systems $388,449 Rio Grande National Forest CO Heritage $80,000 Rio Grande National Forest CO Minor Constructed Features $319,879 Rio Grande National Forest CO Road Bridges $1,383,018 Rio Grande National Forest CO Roads $29,643,992 Rio Grande National Forest CO Trail Bridges $28,773 Rio Grande National Forest CO Trails $2,324,870 Rio Grande National Forest CO Wastewater Systems $38,622 Arapaho-Roosevelt National Forest CO Buildings $9,643,521 Arapaho-Roosevelt National Forest CO Dams $109,750 Arapaho-Roosevelt National Forest CO Drinking Water Systems $3,298,473 Arapaho-Roosevelt National Forest CO Heritage $264,750 Arapaho-Roosevelt National Forest CO Minor Constructed Features $920,014 Arapaho-Roosevelt National Forest CO Road Bridges $1,315,482 Arapaho-Roosevelt National Forest CO Roads $20,952,906 Arapaho-Roosevelt National Forest CO Trail Bridges $5,558 Arapaho-Roosevelt National Forest CO Trails $2,452,555 Arapaho-Roosevelt National Forest CO Wastewater Systems $329,957 Pike-San Isabel National Forest CO, KS Buildings $14,825,699 Pike-San Isabel National Forest CO, KS Dams $403,610 Pike-San Isabel National Forest CO, KS Drinking Water Systems $1,495,910 Pike-San Isabel National Forest CO, KS Heritage $59,595 Pike-San Isabel National Forest CO, KS Minor Constructed Features $1,193,135 Pike-San Isabel National Forest CO, KS Road Bridges $1,617,872 Pike-San Isabel National Forest CO, KS Roads $30,891,940 Pike-San Isabel National Forest CO, KS Trail Bridges $285,262 Pike-San Isabel National Forest CO, KS Trails $3,665,841 Pike-San Isabel National Forest CO, KS Wastewater Systems $600,289 San Juan National Forest CO Buildings $7,572,490
VerDate Aug 31 2005 16:26 Dec 16, 2020 Jkt 000000 PO 00000 Frm 00183 Fmt 6621 Sfmt 6621 P:\DOCS\116-19\38016.TXT BRIAN
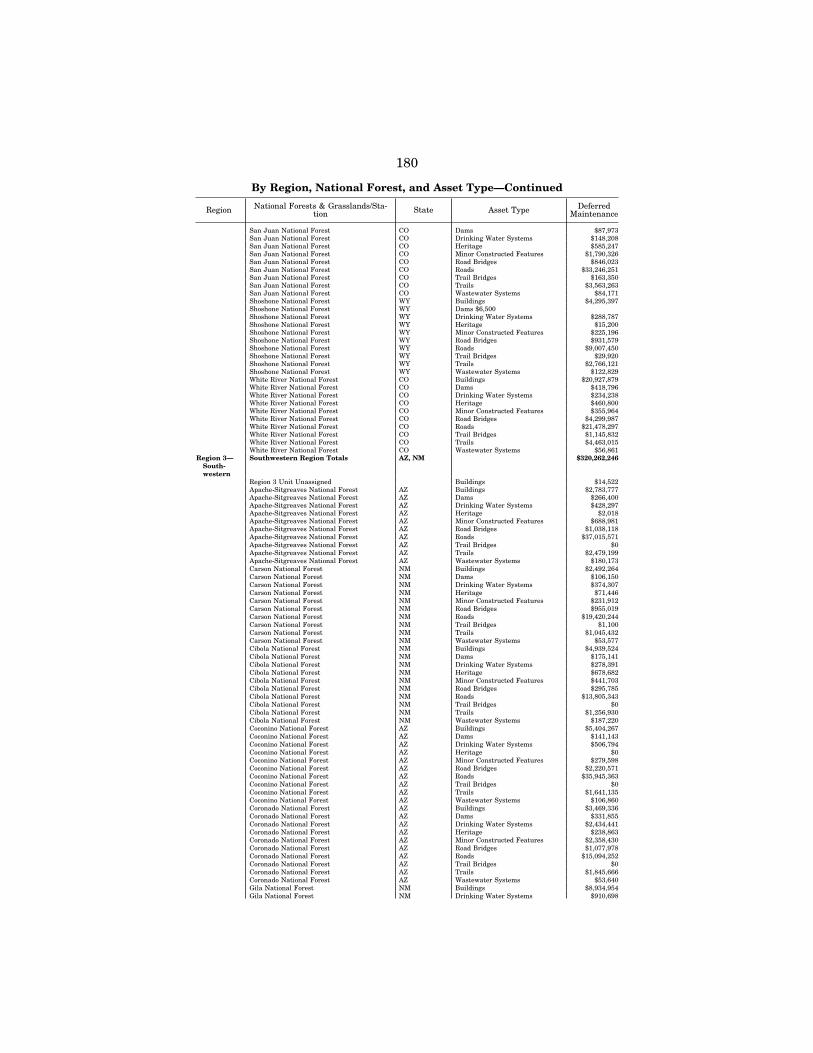
180
By Region, National Forest, and Asset Type—Continued
Region National Forests & Grasslands/Sta-tion State Asset Type Deferred
Maintenance
San Juan National Forest CO Dams $87,973 San Juan National Forest CO Drinking Water Systems $148,208 San Juan National Forest CO Heritage $585,247 San Juan National Forest CO Minor Constructed Features $1,790,326 San Juan National Forest CO Road Bridges $846,023 San Juan National Forest CO Roads $33,246,251 San Juan National Forest CO Trail Bridges $163,350 San Juan National Forest CO Trails $3,563,263 San Juan National Forest CO Wastewater Systems $84,171 Shoshone National Forest WY Buildings $4,295,397 Shoshone National Forest WY Dams $6,500 Shoshone National Forest WY Drinking Water Systems $288,787 Shoshone National Forest WY Heritage $15,200 Shoshone National Forest WY Minor Constructed Features $225,196 Shoshone National Forest WY Road Bridges $931,579 Shoshone National Forest WY Roads $9,007,450 Shoshone National Forest WY Trail Bridges $29,920 Shoshone National Forest WY Trails $2,766,121 Shoshone National Forest WY Wastewater Systems $122,829 White River National Forest CO Buildings $20,927,879 White River National Forest CO Dams $418,796 White River National Forest CO Drinking Water Systems $234,238 White River National Forest CO Heritage $460,800 White River National Forest CO Minor Constructed Features $355,964 White River National Forest CO Road Bridges $4,299,987 White River National Forest CO Roads $21,478,297 White River National Forest CO Trail Bridges $1,145,832 White River National Forest CO Trails $4,463,015 White River National Forest CO Wastewater Systems $56,861
Region 3— South-western
Southwestern Region Totals AZ, NM $320,262,246
Region 3 Unit Unassigned Buildings $14,522 Apache-Sitgreaves National Forest AZ Buildings $2,783,777 Apache-Sitgreaves National Forest AZ Dams $266,400 Apache-Sitgreaves National Forest AZ Drinking Water Systems $428,297 Apache-Sitgreaves National Forest AZ Heritage $2,018 Apache-Sitgreaves National Forest AZ Minor Constructed Features $688,981 Apache-Sitgreaves National Forest AZ Road Bridges $1,038,118 Apache-Sitgreaves National Forest AZ Roads $37,015,571 Apache-Sitgreaves National Forest AZ Trail Bridges $0 Apache-Sitgreaves National Forest AZ Trails $2,479,199 Apache-Sitgreaves National Forest AZ Wastewater Systems $180,173 Carson National Forest NM Buildings $2,492,264 Carson National Forest NM Dams $106,150 Carson National Forest NM Drinking Water Systems $374,307 Carson National Forest NM Heritage $71,446 Carson National Forest NM Minor Constructed Features $231,912 Carson National Forest NM Road Bridges $955,019 Carson National Forest NM Roads $19,420,244 Carson National Forest NM Trail Bridges $1,100 Carson National Forest NM Trails $1,045,432 Carson National Forest NM Wastewater Systems $53,577 Cibola National Forest NM Buildings $4,939,524 Cibola National Forest NM Dams $175,141 Cibola National Forest NM Drinking Water Systems $278,391 Cibola National Forest NM Heritage $678,682 Cibola National Forest NM Minor Constructed Features $441,703 Cibola National Forest NM Road Bridges $295,785 Cibola National Forest NM Roads $13,805,343 Cibola National Forest NM Trail Bridges $0 Cibola National Forest NM Trails $1,256,930 Cibola National Forest NM Wastewater Systems $187,220 Coconino National Forest AZ Buildings $5,404,267 Coconino National Forest AZ Dams $141,143 Coconino National Forest AZ Drinking Water Systems $506,794 Coconino National Forest AZ Heritage $0 Coconino National Forest AZ Minor Constructed Features $279,598 Coconino National Forest AZ Road Bridges $2,220,571 Coconino National Forest AZ Roads $35,945,363 Coconino National Forest AZ Trail Bridges $0 Coconino National Forest AZ Trails $1,641,135 Coconino National Forest AZ Wastewater Systems $106,860 Coronado National Forest AZ Buildings $3,469,336 Coronado National Forest AZ Dams $331,855 Coronado National Forest AZ Drinking Water Systems $2,434,441 Coronado National Forest AZ Heritage $238,863 Coronado National Forest AZ Minor Constructed Features $2,358,430 Coronado National Forest AZ Road Bridges $1,077,978 Coronado National Forest AZ Roads $15,094,252 Coronado National Forest AZ Trail Bridges $0 Coronado National Forest AZ Trails $1,845,666 Coronado National Forest AZ Wastewater Systems $53,640 Gila National Forest NM Buildings $8,934,954 Gila National Forest NM Drinking Water Systems $910,698
VerDate Aug 31 2005 16:26 Dec 16, 2020 Jkt 000000 PO 00000 Frm 00184 Fmt 6621 Sfmt 6621 P:\DOCS\116-19\38016.TXT BRIAN
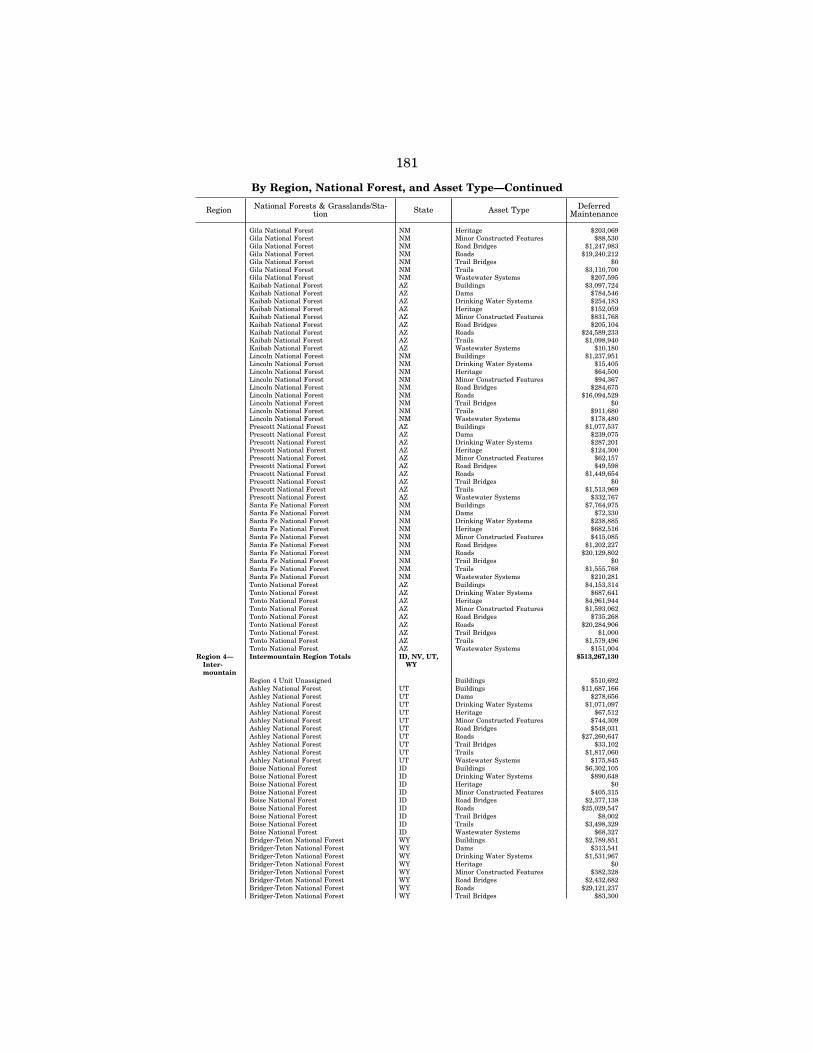
181
By Region, National Forest, and Asset Type—Continued
Region National Forests & Grasslands/Sta-tion State Asset Type Deferred
Maintenance
Gila National Forest NM Heritage $203,069 Gila National Forest NM Minor Constructed Features $88,530 Gila National Forest NM Road Bridges $1,247,983 Gila National Forest NM Roads $19,240,212 Gila National Forest NM Trail Bridges $0 Gila National Forest NM Trails $3,110,700 Gila National Forest NM Wastewater Systems $207,595 Kaibab National Forest AZ Buildings $3,097,724 Kaibab National Forest AZ Dams $784,546 Kaibab National Forest AZ Drinking Water Systems $254,183 Kaibab National Forest AZ Heritage $152,059 Kaibab National Forest AZ Minor Constructed Features $831,768 Kaibab National Forest AZ Road Bridges $205,104 Kaibab National Forest AZ Roads $24,589,233 Kaibab National Forest AZ Trails $1,098,940 Kaibab National Forest AZ Wastewater Systems $10,180 Lincoln National Forest NM Buildings $1,237,951 Lincoln National Forest NM Drinking Water Systems $15,405 Lincoln National Forest NM Heritage $64,500 Lincoln National Forest NM Minor Constructed Features $94,367 Lincoln National Forest NM Road Bridges $284,675 Lincoln National Forest NM Roads $16,094,529 Lincoln National Forest NM Trail Bridges $0 Lincoln National Forest NM Trails $911,680 Lincoln National Forest NM Wastewater Systems $178,480 Prescott National Forest AZ Buildings $1,077,537 Prescott National Forest AZ Dams $239,075 Prescott National Forest AZ Drinking Water Systems $287,201 Prescott National Forest AZ Heritage $124,300 Prescott National Forest AZ Minor Constructed Features $62,157 Prescott National Forest AZ Road Bridges $49,598 Prescott National Forest AZ Roads $1,449,654 Prescott National Forest AZ Trail Bridges $0 Prescott National Forest AZ Trails $1,513,969 Prescott National Forest AZ Wastewater Systems $332,767 Santa Fe National Forest NM Buildings $7,764,975 Santa Fe National Forest NM Dams $72,330 Santa Fe National Forest NM Drinking Water Systems $238,885 Santa Fe National Forest NM Heritage $682,516 Santa Fe National Forest NM Minor Constructed Features $415,085 Santa Fe National Forest NM Road Bridges $1,202,227 Santa Fe National Forest NM Roads $20,129,802 Santa Fe National Forest NM Trail Bridges $0 Santa Fe National Forest NM Trails $1,555,768 Santa Fe National Forest NM Wastewater Systems $210,281 Tonto National Forest AZ Buildings $4,153,314 Tonto National Forest AZ Drinking Water Systems $687,641 Tonto National Forest AZ Heritage $4,961,944 Tonto National Forest AZ Minor Constructed Features $1,593,062 Tonto National Forest AZ Road Bridges $735,268 Tonto National Forest AZ Roads $20,284,906 Tonto National Forest AZ Trail Bridges $1,000 Tonto National Forest AZ Trails $1,579,496 Tonto National Forest AZ Wastewater Systems $151,004
Region 4— Inter-mountain
Intermountain Region Totals ID, NV, UT, WY
$513,267,130
Region 4 Unit Unassigned Buildings $510,692 Ashley National Forest UT Buildings $11,687,166 Ashley National Forest UT Dams $278,656 Ashley National Forest UT Drinking Water Systems $1,071,097 Ashley National Forest UT Heritage $67,512 Ashley National Forest UT Minor Constructed Features $744,309 Ashley National Forest UT Road Bridges $548,031 Ashley National Forest UT Roads $27,260,647 Ashley National Forest UT Trail Bridges $33,102 Ashley National Forest UT Trails $1,817,060 Ashley National Forest UT Wastewater Systems $175,845 Boise National Forest ID Buildings $6,302,105 Boise National Forest ID Drinking Water Systems $890,648 Boise National Forest ID Heritage $0 Boise National Forest ID Minor Constructed Features $405,315 Boise National Forest ID Road Bridges $2,377,138 Boise National Forest ID Roads $25,029,547 Boise National Forest ID Trail Bridges $8,002 Boise National Forest ID Trails $3,498,329 Boise National Forest ID Wastewater Systems $68,327 Bridger-Teton National Forest WY Buildings $2,789,851 Bridger-Teton National Forest WY Dams $313,541 Bridger-Teton National Forest WY Drinking Water Systems $1,531,967 Bridger-Teton National Forest WY Heritage $0 Bridger-Teton National Forest WY Minor Constructed Features $382,328 Bridger-Teton National Forest WY Road Bridges $2,432,682 Bridger-Teton National Forest WY Roads $29,121,237 Bridger-Teton National Forest WY Trail Bridges $83,300
VerDate Aug 31 2005 16:26 Dec 16, 2020 Jkt 000000 PO 00000 Frm 00185 Fmt 6621 Sfmt 6621 P:\DOCS\116-19\38016.TXT BRIAN
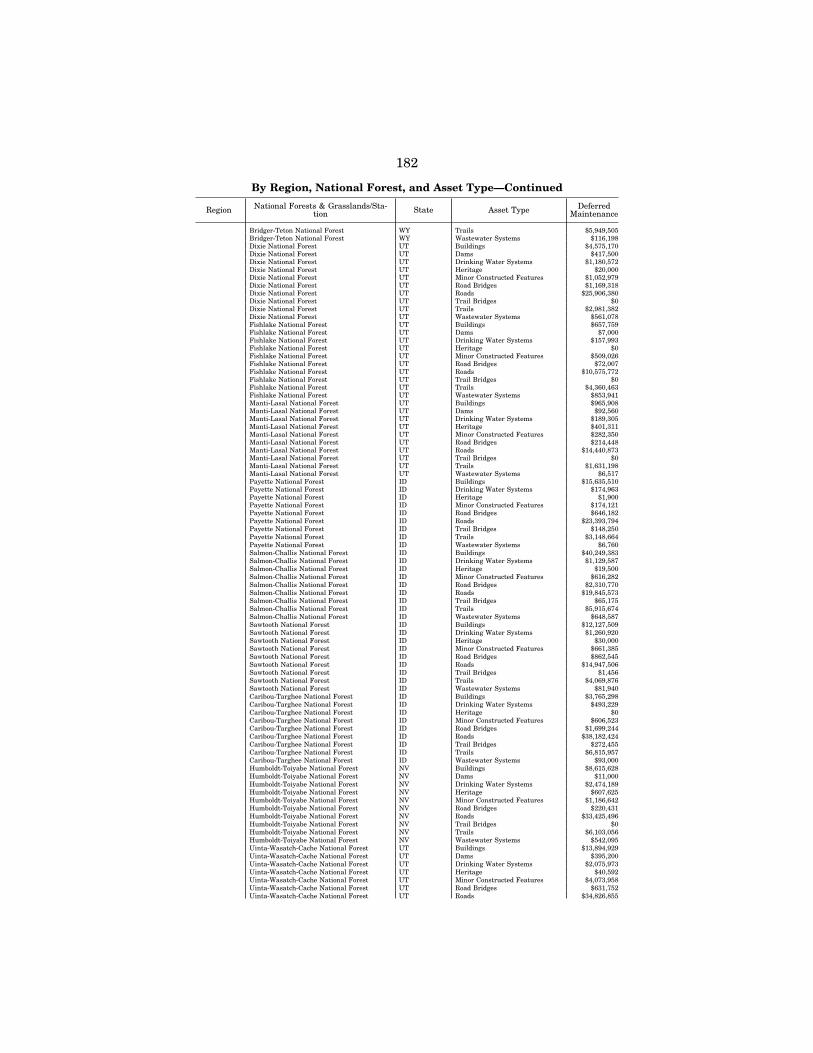
182
By Region, National Forest, and Asset Type—Continued
Region National Forests & Grasslands/Sta-tion State Asset Type Deferred
Maintenance
Bridger-Teton National Forest WY Trails $5,949,505 Bridger-Teton National Forest WY Wastewater Systems $116,198 Dixie National Forest UT Buildings $4,575,170 Dixie National Forest UT Dams $417,500 Dixie National Forest UT Drinking Water Systems $1,180,572 Dixie National Forest UT Heritage $20,000 Dixie National Forest UT Minor Constructed Features $1,052,979 Dixie National Forest UT Road Bridges $1,169,318 Dixie National Forest UT Roads $25,906,380 Dixie National Forest UT Trail Bridges $0 Dixie National Forest UT Trails $2,981,382 Dixie National Forest UT Wastewater Systems $561,078 Fishlake National Forest UT Buildings $657,759 Fishlake National Forest UT Dams $7,000 Fishlake National Forest UT Drinking Water Systems $157,993 Fishlake National Forest UT Heritage $0 Fishlake National Forest UT Minor Constructed Features $509,026 Fishlake National Forest UT Road Bridges $72,007 Fishlake National Forest UT Roads $10,575,772 Fishlake National Forest UT Trail Bridges $0 Fishlake National Forest UT Trails $4,360,463 Fishlake National Forest UT Wastewater Systems $853,941 Manti-Lasal National Forest UT Buildings $965,908 Manti-Lasal National Forest UT Dams $92,560 Manti-Lasal National Forest UT Drinking Water Systems $189,305 Manti-Lasal National Forest UT Heritage $401,311 Manti-Lasal National Forest UT Minor Constructed Features $282,350 Manti-Lasal National Forest UT Road Bridges $214,448 Manti-Lasal National Forest UT Roads $14,440,873 Manti-Lasal National Forest UT Trail Bridges $0 Manti-Lasal National Forest UT Trails $1,631,198 Manti-Lasal National Forest UT Wastewater Systems $6,517 Payette National Forest ID Buildings $15,635,510 Payette National Forest ID Drinking Water Systems $174,963 Payette National Forest ID Heritage $1,900 Payette National Forest ID Minor Constructed Features $174,121 Payette National Forest ID Road Bridges $646,182 Payette National Forest ID Roads $23,393,794 Payette National Forest ID Trail Bridges $148,250 Payette National Forest ID Trails $3,148,664 Payette National Forest ID Wastewater Systems $6,760 Salmon-Challis National Forest ID Buildings $40,249,383 Salmon-Challis National Forest ID Drinking Water Systems $1,129,587 Salmon-Challis National Forest ID Heritage $19,500 Salmon-Challis National Forest ID Minor Constructed Features $616,282 Salmon-Challis National Forest ID Road Bridges $2,310,770 Salmon-Challis National Forest ID Roads $19,845,573 Salmon-Challis National Forest ID Trail Bridges $65,175 Salmon-Challis National Forest ID Trails $5,915,674 Salmon-Challis National Forest ID Wastewater Systems $648,587 Sawtooth National Forest ID Buildings $12,127,509 Sawtooth National Forest ID Drinking Water Systems $1,260,920 Sawtooth National Forest ID Heritage $30,000 Sawtooth National Forest ID Minor Constructed Features $661,385 Sawtooth National Forest ID Road Bridges $862,545 Sawtooth National Forest ID Roads $14,947,506 Sawtooth National Forest ID Trail Bridges $1,456 Sawtooth National Forest ID Trails $4,069,876 Sawtooth National Forest ID Wastewater Systems $81,940 Caribou-Targhee National Forest ID Buildings $3,765,298 Caribou-Targhee National Forest ID Drinking Water Systems $493,229 Caribou-Targhee National Forest ID Heritage $0 Caribou-Targhee National Forest ID Minor Constructed Features $606,523 Caribou-Targhee National Forest ID Road Bridges $1,699,244 Caribou-Targhee National Forest ID Roads $38,182,424 Caribou-Targhee National Forest ID Trail Bridges $272,455 Caribou-Targhee National Forest ID Trails $6,815,957 Caribou-Targhee National Forest ID Wastewater Systems $93,000 Humboldt-Toiyabe National Forest NV Buildings $8,615,628 Humboldt-Toiyabe National Forest NV Dams $11,000 Humboldt-Toiyabe National Forest NV Drinking Water Systems $2,474,189 Humboldt-Toiyabe National Forest NV Heritage $607,625 Humboldt-Toiyabe National Forest NV Minor Constructed Features $1,186,642 Humboldt-Toiyabe National Forest NV Road Bridges $220,431 Humboldt-Toiyabe National Forest NV Roads $33,425,496 Humboldt-Toiyabe National Forest NV Trail Bridges $0 Humboldt-Toiyabe National Forest NV Trails $6,103,056 Humboldt-Toiyabe National Forest NV Wastewater Systems $542,095 Uinta-Wasatch-Cache National Forest UT Buildings $13,894,929 Uinta-Wasatch-Cache National Forest UT Dams $395,200 Uinta-Wasatch-Cache National Forest UT Drinking Water Systems $2,075,973 Uinta-Wasatch-Cache National Forest UT Heritage $40,592 Uinta-Wasatch-Cache National Forest UT Minor Constructed Features $4,073,958 Uinta-Wasatch-Cache National Forest UT Road Bridges $631,752 Uinta-Wasatch-Cache National Forest UT Roads $34,826,855
VerDate Aug 31 2005 16:26 Dec 16, 2020 Jkt 000000 PO 00000 Frm 00186 Fmt 6621 Sfmt 6621 P:\DOCS\116-19\38016.TXT BRIAN

183
By Region, National Forest, and Asset Type—Continued
Region National Forests & Grasslands/Sta-tion State Asset Type Deferred
Maintenance
Uinta-Wasatch-Cache National Forest UT Trail Bridges $38,915 Uinta-Wasatch-Cache National Forest UT Trails $4,324,598 Uinta-Wasatch-Cache National Forest UT Wastewater Systems $899,308
Region 5— Pacific Southwest
Pacific Southwest Region Totals CA $894,955,732
Region 5 Unassigned Unit CA Buildings $527,675 Angeles National Forest CA Buildings $15,211,848 Angeles National Forest CA Drinking Water Systems $2,638,377 Angeles National Forest CA Heritage $132,100 Angeles National Forest CA Minor Constructed Features $1,717,297 Angeles National Forest CA Road Bridges $29,569 Angeles National Forest CA Roads $9,802,608 Angeles National Forest CA Trail Bridges $174,816 Angeles National Forest CA Trails $1,300,705 Angeles National Forest CA Wastewater Systems $2,471,367 Cleveland National Forest CA Buildings $24,951,619 Cleveland National Forest CA Dams $17,600 Cleveland National Forest CA Drinking Water Systems $5,974,053 Cleveland National Forest CA Heritage $100,000 Cleveland National Forest CA Minor Constructed Features $996,639 Cleveland National Forest CA Road Bridges $4,723 Cleveland National Forest CA Roads $4,300,701 Cleveland National Forest CA Trail Bridges $0 Cleveland National Forest CA Trails $564,442 Cleveland National Forest CA Wastewater Systems $233,383 Eldorado National Forest CA Buildings $42,036,548 Eldorado National Forest CA Drinking Water Systems $1,000,106 Eldorado National Forest CA Heritage $9,500 Eldorado National Forest CA Minor Constructed Features $297,304 Eldorado National Forest CA Road Bridges $40,112 Eldorado National Forest CA Roads $26,159,328 Eldorado National Forest CA Trail Bridges $38,132 Eldorado National Forest CA Trails $1,461,611 Eldorado National Forest CA Wastewater Systems $45,867 Inyo National Forest CA Buildings $4,070,414 Inyo National Forest CA Drinking Water Systems $918,831 Inyo National Forest CA Heritage $0 Inyo National Forest CA Minor Constructed Features $3,195,462 Inyo National Forest CA Road Bridges $69,075 Inyo National Forest CA Roads $6,066,996 Inyo National Forest CA Trail Bridges $217,249 Inyo National Forest CA Trails $2,773,722 Inyo National Forest CA Wastewater Systems $1,075,796 Klamath National Forest CA Buildings $37,971,575 Klamath National Forest CA Dams $7,400 Klamath National Forest CA Drinking Water Systems $466,679 Klamath National Forest CA Heritage $0 Klamath National Forest CA Minor Constructed Features $247,550 Klamath National Forest CA Road Bridges $6,631,125 Klamath National Forest CA Roads $42,490,969 Klamath National Forest CA Trail Bridges $145,073 Klamath National Forest CA Trails $1,580,694 Klamath National Forest CA Wastewater Systems $129,292 Lassen National Forest CA Buildings $6,727,998 Lassen National Forest CA Dams $34,039 Lassen National Forest CA Drinking Water Systems $569,941 Lassen National Forest CA Heritage $150,800 Lassen National Forest CA Minor Constructed Features $965,884 Lassen National Forest CA Road Bridges $93,301 Lassen National Forest CA Roads $33,534,718 Lassen National Forest CA Trail Bridges $395 Lassen National Forest CA Trails $775,612 Lassen National Forest CA Wastewater Systems $83,500 Los Padres National Forest CA Buildings $22,772,624 Los Padres National Forest CA Dams $7,900 Los Padres National Forest CA Drinking Water Systems $2,003,834 Los Padres National Forest CA Heritage $35,445 Los Padres National Forest CA Minor Constructed Features $915,972 Los Padres National Forest CA Road Bridges $394,242 Los Padres National Forest CA Roads $16,877,867 Los Padres National Forest CA Trail Bridges $3,500 Los Padres National Forest CA Trails $2,458,809 Los Padres National Forest CA Wastewater Systems $391,430 Mendocino National Forest CA Buildings $26,832,563 Mendocino National Forest CA Dams $12,648 Mendocino National Forest CA Drinking Water Systems $267,528 Mendocino National Forest CA Heritage $205,650 Mendocino National Forest CA Minor Constructed Features $359,266 Mendocino National Forest CA Road Bridges $1,709 Mendocino National Forest CA Roads $14,781,295 Mendocino National Forest CA Trail Bridges $0 Mendocino National Forest CA Trails $942,305 Mendocino National Forest CA Wastewater Systems $9,627 Modoc National Forest CA Buildings $3,695,401
VerDate Aug 31 2005 16:26 Dec 16, 2020 Jkt 000000 PO 00000 Frm 00187 Fmt 6621 Sfmt 6621 P:\DOCS\116-19\38016.TXT BRIAN
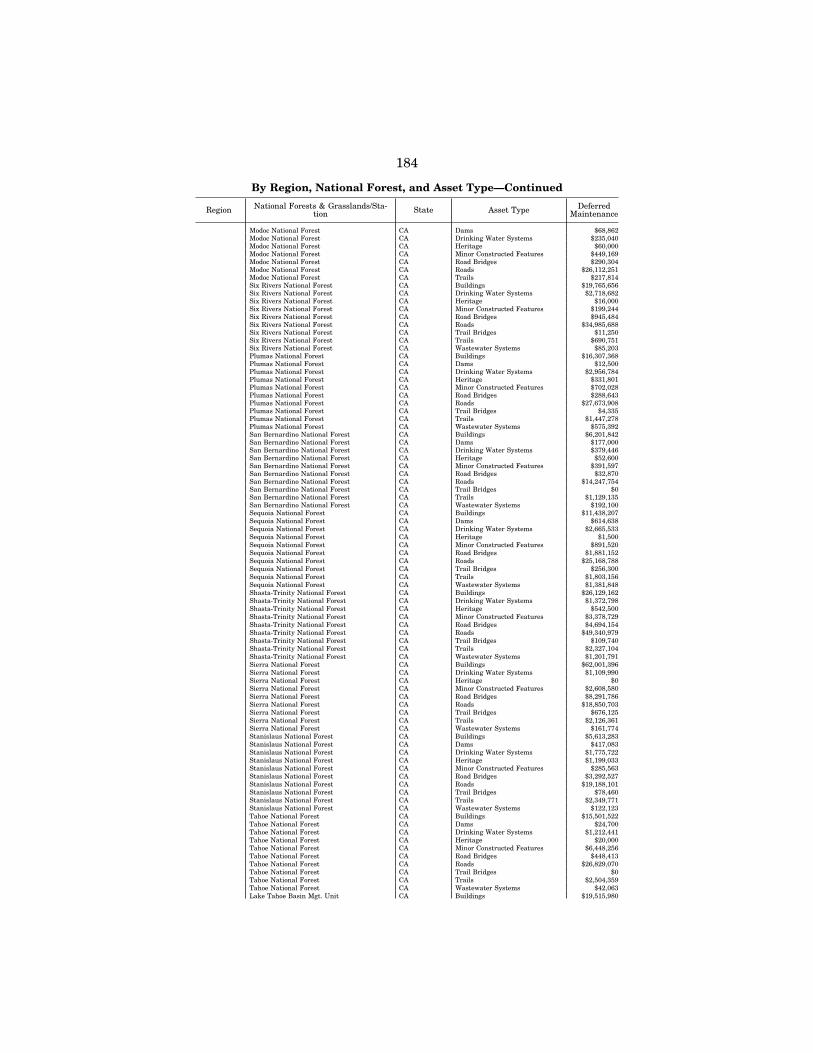
184
By Region, National Forest, and Asset Type—Continued
Region National Forests & Grasslands/Sta-tion State Asset Type Deferred
Maintenance
Modoc National Forest CA Dams $68,862 Modoc National Forest CA Drinking Water Systems $235,040 Modoc National Forest CA Heritage $60,000 Modoc National Forest CA Minor Constructed Features $449,169 Modoc National Forest CA Road Bridges $290,304 Modoc National Forest CA Roads $26,112,251 Modoc National Forest CA Trails $217,814 Six Rivers National Forest CA Buildings $19,765,656 Six Rivers National Forest CA Drinking Water Systems $2,718,682 Six Rivers National Forest CA Heritage $16,000 Six Rivers National Forest CA Minor Constructed Features $199,244 Six Rivers National Forest CA Road Bridges $945,484 Six Rivers National Forest CA Roads $34,985,688 Six Rivers National Forest CA Trail Bridges $11,250 Six Rivers National Forest CA Trails $690,751 Six Rivers National Forest CA Wastewater Systems $85,203 Plumas National Forest CA Buildings $16,307,368 Plumas National Forest CA Dams $12,500 Plumas National Forest CA Drinking Water Systems $2,956,784 Plumas National Forest CA Heritage $331,801 Plumas National Forest CA Minor Constructed Features $702,028 Plumas National Forest CA Road Bridges $288,643 Plumas National Forest CA Roads $27,673,908 Plumas National Forest CA Trail Bridges $4,335 Plumas National Forest CA Trails $1,447,278 Plumas National Forest CA Wastewater Systems $575,392 San Bernardino National Forest CA Buildings $6,201,842 San Bernardino National Forest CA Dams $177,000 San Bernardino National Forest CA Drinking Water Systems $379,446 San Bernardino National Forest CA Heritage $52,600 San Bernardino National Forest CA Minor Constructed Features $391,597 San Bernardino National Forest CA Road Bridges $32,870 San Bernardino National Forest CA Roads $14,247,754 San Bernardino National Forest CA Trail Bridges $0 San Bernardino National Forest CA Trails $1,129,135 San Bernardino National Forest CA Wastewater Systems $192,100 Sequoia National Forest CA Buildings $11,438,207 Sequoia National Forest CA Dams $614,638 Sequoia National Forest CA Drinking Water Systems $2,665,533 Sequoia National Forest CA Heritage $1,500 Sequoia National Forest CA Minor Constructed Features $891,520 Sequoia National Forest CA Road Bridges $1,881,152 Sequoia National Forest CA Roads $25,168,788 Sequoia National Forest CA Trail Bridges $256,300 Sequoia National Forest CA Trails $1,803,156 Sequoia National Forest CA Wastewater Systems $1,381,848 Shasta-Trinity National Forest CA Buildings $26,129,162 Shasta-Trinity National Forest CA Drinking Water Systems $1,372,798 Shasta-Trinity National Forest CA Heritage $542,500 Shasta-Trinity National Forest CA Minor Constructed Features $3,378,729 Shasta-Trinity National Forest CA Road Bridges $4,694,154 Shasta-Trinity National Forest CA Roads $49,340,979 Shasta-Trinity National Forest CA Trail Bridges $109,740 Shasta-Trinity National Forest CA Trails $2,327,104 Shasta-Trinity National Forest CA Wastewater Systems $1,201,791 Sierra National Forest CA Buildings $62,001,396 Sierra National Forest CA Drinking Water Systems $1,109,990 Sierra National Forest CA Heritage $0 Sierra National Forest CA Minor Constructed Features $2,608,580 Sierra National Forest CA Road Bridges $8,291,786 Sierra National Forest CA Roads $18,850,703 Sierra National Forest CA Trail Bridges $676,125 Sierra National Forest CA Trails $2,126,361 Sierra National Forest CA Wastewater Systems $161,774 Stanislaus National Forest CA Buildings $5,613,283 Stanislaus National Forest CA Dams $417,083 Stanislaus National Forest CA Drinking Water Systems $1,775,722 Stanislaus National Forest CA Heritage $1,199,033 Stanislaus National Forest CA Minor Constructed Features $285,563 Stanislaus National Forest CA Road Bridges $3,292,527 Stanislaus National Forest CA Roads $19,188,101 Stanislaus National Forest CA Trail Bridges $78,460 Stanislaus National Forest CA Trails $2,349,771 Stanislaus National Forest CA Wastewater Systems $122,123 Tahoe National Forest CA Buildings $15,501,522 Tahoe National Forest CA Dams $24,700 Tahoe National Forest CA Drinking Water Systems $1,212,441 Tahoe National Forest CA Heritage $20,000 Tahoe National Forest CA Minor Constructed Features $6,448,256 Tahoe National Forest CA Road Bridges $448,413 Tahoe National Forest CA Roads $26,829,070 Tahoe National Forest CA Trail Bridges $0 Tahoe National Forest CA Trails $2,504,359 Tahoe National Forest CA Wastewater Systems $42,063 Lake Tahoe Basin Mgt. Unit CA Buildings $19,515,980
VerDate Aug 31 2005 16:26 Dec 16, 2020 Jkt 000000 PO 00000 Frm 00188 Fmt 6621 Sfmt 6621 P:\DOCS\116-19\38016.TXT BRIAN
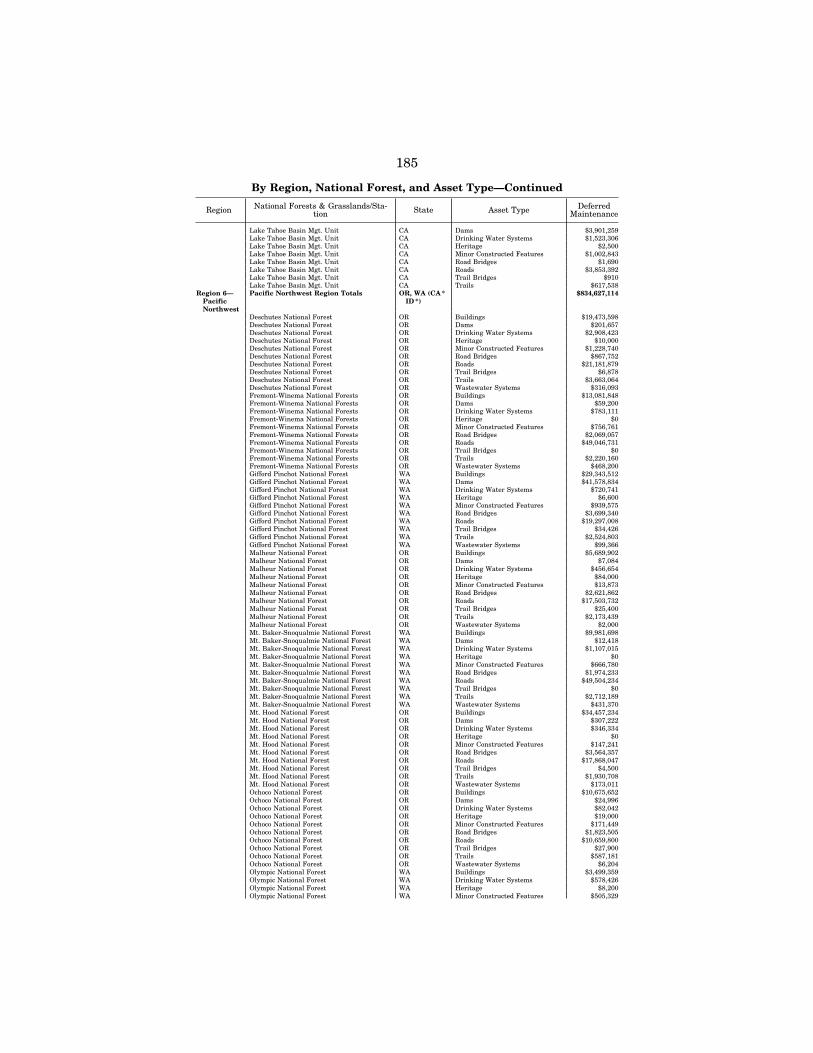
185
By Region, National Forest, and Asset Type—Continued
Region National Forests & Grasslands/Sta-tion State Asset Type Deferred
Maintenance
Lake Tahoe Basin Mgt. Unit CA Dams $3,901,259 Lake Tahoe Basin Mgt. Unit CA Drinking Water Systems $1,523,306 Lake Tahoe Basin Mgt. Unit CA Heritage $2,500 Lake Tahoe Basin Mgt. Unit CA Minor Constructed Features $1,002,843 Lake Tahoe Basin Mgt. Unit CA Road Bridges $1,690 Lake Tahoe Basin Mgt. Unit CA Roads $3,853,392 Lake Tahoe Basin Mgt. Unit CA Trail Bridges $910 Lake Tahoe Basin Mgt. Unit CA Trails $617,538
Region 6— Pacific Northwest
Pacific Northwest Region Totals OR, WA (CA * ID *)
$834,627,114
Deschutes National Forest OR Buildings $19,473,598 Deschutes National Forest OR Dams $201,657 Deschutes National Forest OR Drinking Water Systems $2,908,423 Deschutes National Forest OR Heritage $10,000 Deschutes National Forest OR Minor Constructed Features $1,228,740 Deschutes National Forest OR Road Bridges $867,752 Deschutes National Forest OR Roads $21,181,879 Deschutes National Forest OR Trail Bridges $6,878 Deschutes National Forest OR Trails $3,663,064 Deschutes National Forest OR Wastewater Systems $316,093 Fremont-Winema National Forests OR Buildings $13,081,848 Fremont-Winema National Forests OR Dams $59,200 Fremont-Winema National Forests OR Drinking Water Systems $783,111 Fremont-Winema National Forests OR Heritage $0 Fremont-Winema National Forests OR Minor Constructed Features $756,761 Fremont-Winema National Forests OR Road Bridges $2,069,057 Fremont-Winema National Forests OR Roads $49,046,731 Fremont-Winema National Forests OR Trail Bridges $0 Fremont-Winema National Forests OR Trails $2,220,160 Fremont-Winema National Forests OR Wastewater Systems $468,200 Gifford Pinchot National Forest WA Buildings $29,343,512 Gifford Pinchot National Forest WA Dams $41,578,834 Gifford Pinchot National Forest WA Drinking Water Systems $720,741 Gifford Pinchot National Forest WA Heritage $6,600 Gifford Pinchot National Forest WA Minor Constructed Features $939,575 Gifford Pinchot National Forest WA Road Bridges $3,699,340 Gifford Pinchot National Forest WA Roads $19,297,008 Gifford Pinchot National Forest WA Trail Bridges $34,426 Gifford Pinchot National Forest WA Trails $2,524,803 Gifford Pinchot National Forest WA Wastewater Systems $99,366 Malheur National Forest OR Buildings $5,689,902 Malheur National Forest OR Dams $7,084 Malheur National Forest OR Drinking Water Systems $456,654 Malheur National Forest OR Heritage $84,000 Malheur National Forest OR Minor Constructed Features $13,873 Malheur National Forest OR Road Bridges $2,621,862 Malheur National Forest OR Roads $17,503,732 Malheur National Forest OR Trail Bridges $25,400 Malheur National Forest OR Trails $2,173,439 Malheur National Forest OR Wastewater Systems $2,000 Mt. Baker-Snoqualmie National Forest WA Buildings $9,981,698 Mt. Baker-Snoqualmie National Forest WA Dams $12,418 Mt. Baker-Snoqualmie National Forest WA Drinking Water Systems $1,107,015 Mt. Baker-Snoqualmie National Forest WA Heritage $0 Mt. Baker-Snoqualmie National Forest WA Minor Constructed Features $666,780 Mt. Baker-Snoqualmie National Forest WA Road Bridges $1,974,233 Mt. Baker-Snoqualmie National Forest WA Roads $49,504,234 Mt. Baker-Snoqualmie National Forest WA Trail Bridges $0 Mt. Baker-Snoqualmie National Forest WA Trails $2,712,189 Mt. Baker-Snoqualmie National Forest WA Wastewater Systems $431,370 Mt. Hood National Forest OR Buildings $34,457,234 Mt. Hood National Forest OR Dams $307,222 Mt. Hood National Forest OR Drinking Water Systems $346,334 Mt. Hood National Forest OR Heritage $0 Mt. Hood National Forest OR Minor Constructed Features $147,241 Mt. Hood National Forest OR Road Bridges $3,564,357 Mt. Hood National Forest OR Roads $17,868,047 Mt. Hood National Forest OR Trail Bridges $4,500 Mt. Hood National Forest OR Trails $1,930,708 Mt. Hood National Forest OR Wastewater Systems $173,011 Ochoco National Forest OR Buildings $10,675,652 Ochoco National Forest OR Dams $24,996 Ochoco National Forest OR Drinking Water Systems $82,042 Ochoco National Forest OR Heritage $19,000 Ochoco National Forest OR Minor Constructed Features $171,449 Ochoco National Forest OR Road Bridges $1,823,505 Ochoco National Forest OR Roads $10,659,800 Ochoco National Forest OR Trail Bridges $27,900 Ochoco National Forest OR Trails $587,181 Ochoco National Forest OR Wastewater Systems $6,204 Olympic National Forest WA Buildings $3,499,359 Olympic National Forest WA Drinking Water Systems $578,426 Olympic National Forest WA Heritage $8,200 Olympic National Forest WA Minor Constructed Features $505,329
VerDate Aug 31 2005 16:26 Dec 16, 2020 Jkt 000000 PO 00000 Frm 00189 Fmt 6621 Sfmt 6621 P:\DOCS\116-19\38016.TXT BRIAN
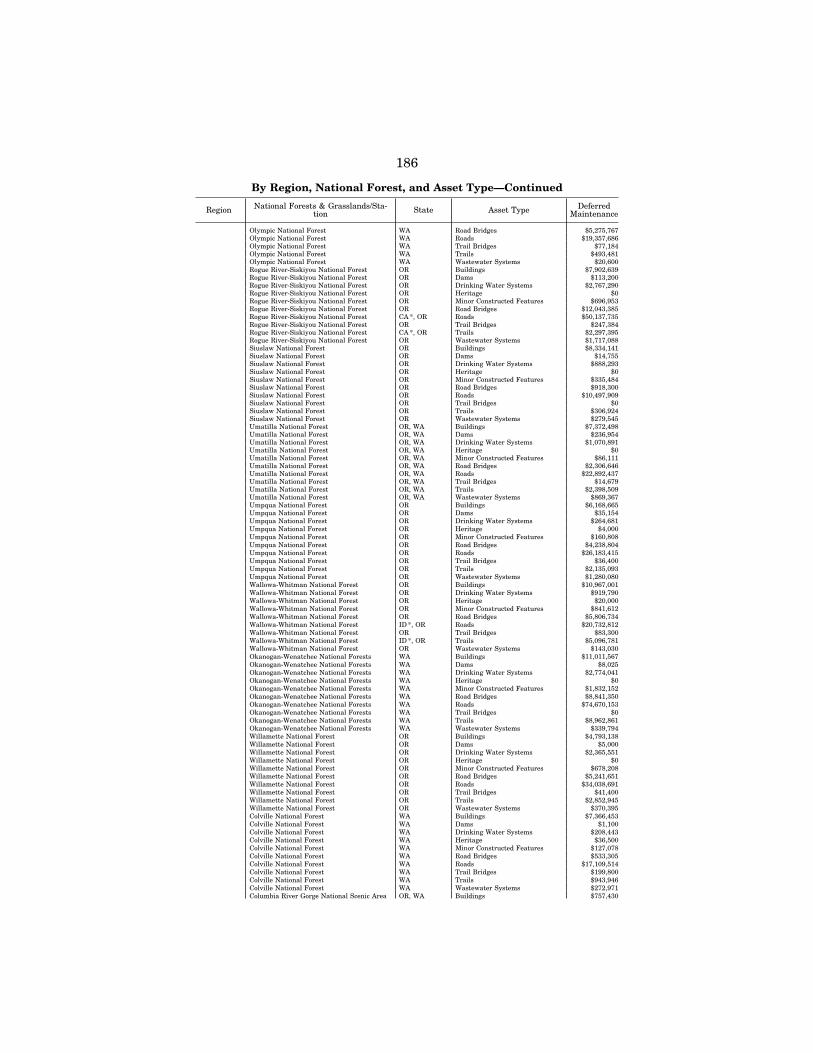
186
By Region, National Forest, and Asset Type—Continued
Region National Forests & Grasslands/Sta-tion State Asset Type Deferred
Maintenance
Olympic National Forest WA Road Bridges $5,275,767 Olympic National Forest WA Roads $19,357,686 Olympic National Forest WA Trail Bridges $77,184 Olympic National Forest WA Trails $493,481 Olympic National Forest WA Wastewater Systems $20,600 Rogue River-Siskiyou National Forest OR Buildings $7,902,639 Rogue River-Siskiyou National Forest OR Dams $113,200 Rogue River-Siskiyou National Forest OR Drinking Water Systems $2,767,290 Rogue River-Siskiyou National Forest OR Heritage $0 Rogue River-Siskiyou National Forest OR Minor Constructed Features $696,953 Rogue River-Siskiyou National Forest OR Road Bridges $12,043,385 Rogue River-Siskiyou National Forest CA *, OR Roads $50,137,735 Rogue River-Siskiyou National Forest OR Trail Bridges $247,384 Rogue River-Siskiyou National Forest CA *, OR Trails $2,297,395 Rogue River-Siskiyou National Forest OR Wastewater Systems $1,717,088 Siuslaw National Forest OR Buildings $8,334,141 Siuslaw National Forest OR Dams $14,755 Siuslaw National Forest OR Drinking Water Systems $888,293 Siuslaw National Forest OR Heritage $0 Siuslaw National Forest OR Minor Constructed Features $335,484 Siuslaw National Forest OR Road Bridges $918,300 Siuslaw National Forest OR Roads $10,497,909 Siuslaw National Forest OR Trail Bridges $0 Siuslaw National Forest OR Trails $306,924 Siuslaw National Forest OR Wastewater Systems $279,545 Umatilla National Forest OR, WA Buildings $7,372,498 Umatilla National Forest OR, WA Dams $236,954 Umatilla National Forest OR, WA Drinking Water Systems $1,070,891 Umatilla National Forest OR, WA Heritage $0 Umatilla National Forest OR, WA Minor Constructed Features $86,111 Umatilla National Forest OR, WA Road Bridges $2,306,646 Umatilla National Forest OR, WA Roads $22,892,437 Umatilla National Forest OR, WA Trail Bridges $14,679 Umatilla National Forest OR, WA Trails $2,398,509 Umatilla National Forest OR, WA Wastewater Systems $869,367 Umpqua National Forest OR Buildings $6,168,665 Umpqua National Forest OR Dams $35,154 Umpqua National Forest OR Drinking Water Systems $264,681 Umpqua National Forest OR Heritage $4,000 Umpqua National Forest OR Minor Constructed Features $160,808 Umpqua National Forest OR Road Bridges $4,238,804 Umpqua National Forest OR Roads $26,183,415 Umpqua National Forest OR Trail Bridges $36,400 Umpqua National Forest OR Trails $2,135,093 Umpqua National Forest OR Wastewater Systems $1,280,080 Wallowa-Whitman National Forest OR Buildings $10,967,001 Wallowa-Whitman National Forest OR Drinking Water Systems $919,790 Wallowa-Whitman National Forest OR Heritage $20,000 Wallowa-Whitman National Forest OR Minor Constructed Features $841,612 Wallowa-Whitman National Forest OR Road Bridges $5,806,734 Wallowa-Whitman National Forest ID *, OR Roads $20,732,812 Wallowa-Whitman National Forest OR Trail Bridges $83,300 Wallowa-Whitman National Forest ID *, OR Trails $5,096,781 Wallowa-Whitman National Forest OR Wastewater Systems $143,030 Okanogan-Wenatchee National Forests WA Buildings $11,011,567 Okanogan-Wenatchee National Forests WA Dams $8,025 Okanogan-Wenatchee National Forests WA Drinking Water Systems $2,774,041 Okanogan-Wenatchee National Forests WA Heritage $0 Okanogan-Wenatchee National Forests WA Minor Constructed Features $1,832,152 Okanogan-Wenatchee National Forests WA Road Bridges $8,841,350 Okanogan-Wenatchee National Forests WA Roads $74,670,153 Okanogan-Wenatchee National Forests WA Trail Bridges $0 Okanogan-Wenatchee National Forests WA Trails $8,962,861 Okanogan-Wenatchee National Forests WA Wastewater Systems $339,794 Willamette National Forest OR Buildings $4,793,138 Willamette National Forest OR Dams $5,000 Willamette National Forest OR Drinking Water Systems $2,365,551 Willamette National Forest OR Heritage $0 Willamette National Forest OR Minor Constructed Features $678,208 Willamette National Forest OR Road Bridges $5,241,651 Willamette National Forest OR Roads $34,038,691 Willamette National Forest OR Trail Bridges $41,400 Willamette National Forest OR Trails $2,852,945 Willamette National Forest OR Wastewater Systems $370,395 Colville National Forest WA Buildings $7,366,453 Colville National Forest WA Dams $1,100 Colville National Forest WA Drinking Water Systems $208,443 Colville National Forest WA Heritage $36,500 Colville National Forest WA Minor Constructed Features $127,078 Colville National Forest WA Road Bridges $533,305 Colville National Forest WA Roads $17,109,514 Colville National Forest WA Trail Bridges $199,800 Colville National Forest WA Trails $943,946 Colville National Forest WA Wastewater Systems $272,971 Columbia River Gorge National Scenic Area OR, WA Buildings $757,430
VerDate Aug 31 2005 16:26 Dec 16, 2020 Jkt 000000 PO 00000 Frm 00190 Fmt 6621 Sfmt 6621 P:\DOCS\116-19\38016.TXT BRIAN
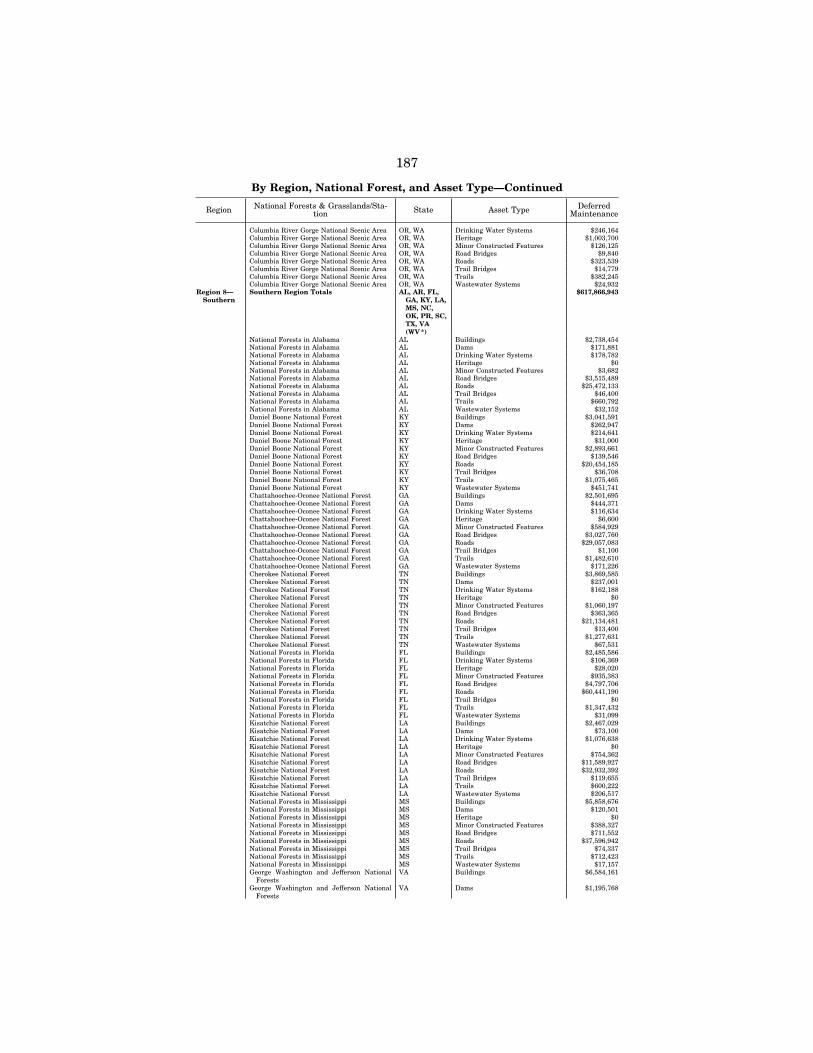
187
By Region, National Forest, and Asset Type—Continued
Region National Forests & Grasslands/Sta-tion State Asset Type Deferred
Maintenance
Columbia River Gorge National Scenic Area OR, WA Drinking Water Systems $246,164 Columbia River Gorge National Scenic Area OR, WA Heritage $1,003,700 Columbia River Gorge National Scenic Area OR, WA Minor Constructed Features $126,125 Columbia River Gorge National Scenic Area OR, WA Road Bridges $9,840 Columbia River Gorge National Scenic Area OR, WA Roads $323,539 Columbia River Gorge National Scenic Area OR, WA Trail Bridges $14,779 Columbia River Gorge National Scenic Area OR, WA Trails $382,245 Columbia River Gorge National Scenic Area OR, WA Wastewater Systems $24,932
Region 8— Southern
Southern Region Totals AL, AR, FL, GA, KY, LA, MS, NC, OK, PR, SC, TX, VA (WV *)
$617,866,943
National Forests in Alabama AL Buildings $2,738,454 National Forests in Alabama AL Dams $171,881 National Forests in Alabama AL Drinking Water Systems $178,782 National Forests in Alabama AL Heritage $0 National Forests in Alabama AL Minor Constructed Features $3,682 National Forests in Alabama AL Road Bridges $3,515,489 National Forests in Alabama AL Roads $25,472,133 National Forests in Alabama AL Trail Bridges $46,400 National Forests in Alabama AL Trails $660,792 National Forests in Alabama AL Wastewater Systems $32,152 Daniel Boone National Forest KY Buildings $3,041,591 Daniel Boone National Forest KY Dams $262,947 Daniel Boone National Forest KY Drinking Water Systems $214,641 Daniel Boone National Forest KY Heritage $31,000 Daniel Boone National Forest KY Minor Constructed Features $2,893,661 Daniel Boone National Forest KY Road Bridges $139,546 Daniel Boone National Forest KY Roads $20,454,185 Daniel Boone National Forest KY Trail Bridges $36,708 Daniel Boone National Forest KY Trails $1,075,465 Daniel Boone National Forest KY Wastewater Systems $451,741 Chattahoochee-Oconee National Forest GA Buildings $2,501,695 Chattahoochee-Oconee National Forest GA Dams $444,371 Chattahoochee-Oconee National Forest GA Drinking Water Systems $116,634 Chattahoochee-Oconee National Forest GA Heritage $6,600 Chattahoochee-Oconee National Forest GA Minor Constructed Features $584,929 Chattahoochee-Oconee National Forest GA Road Bridges $3,027,760 Chattahoochee-Oconee National Forest GA Roads $29,057,083 Chattahoochee-Oconee National Forest GA Trail Bridges $1,100 Chattahoochee-Oconee National Forest GA Trails $1,482,610 Chattahoochee-Oconee National Forest GA Wastewater Systems $171,226 Cherokee National Forest TN Buildings $3,869,585 Cherokee National Forest TN Dams $237,001 Cherokee National Forest TN Drinking Water Systems $162,188 Cherokee National Forest TN Heritage $0 Cherokee National Forest TN Minor Constructed Features $1,060,197 Cherokee National Forest TN Road Bridges $363,365 Cherokee National Forest TN Roads $21,134,481 Cherokee National Forest TN Trail Bridges $13,400 Cherokee National Forest TN Trails $1,277,631 Cherokee National Forest TN Wastewater Systems $67,531 National Forests in Florida FL Buildings $2,485,586 National Forests in Florida FL Drinking Water Systems $106,369 National Forests in Florida FL Heritage $28,020 National Forests in Florida FL Minor Constructed Features $935,383 National Forests in Florida FL Road Bridges $4,797,706 National Forests in Florida FL Roads $60,441,190 National Forests in Florida FL Trail Bridges $0 National Forests in Florida FL Trails $1,347,432 National Forests in Florida FL Wastewater Systems $31,099 Kisatchie National Forest LA Buildings $2,467,029 Kisatchie National Forest LA Dams $73,100 Kisatchie National Forest LA Drinking Water Systems $1,076,638 Kisatchie National Forest LA Heritage $0 Kisatchie National Forest LA Minor Constructed Features $754,362 Kisatchie National Forest LA Road Bridges $11,589,927 Kisatchie National Forest LA Roads $32,932,392 Kisatchie National Forest LA Trail Bridges $119,655 Kisatchie National Forest LA Trails $600,222 Kisatchie National Forest LA Wastewater Systems $206,517 National Forests in Mississippi MS Buildings $5,858,676 National Forests in Mississippi MS Dams $120,501 National Forests in Mississippi MS Heritage $0 National Forests in Mississippi MS Minor Constructed Features $388,327 National Forests in Mississippi MS Road Bridges $711,552 National Forests in Mississippi MS Roads $37,596,942 National Forests in Mississippi MS Trail Bridges $74,337 National Forests in Mississippi MS Trails $712,423 National Forests in Mississippi MS Wastewater Systems $17,157 George Washington and Jefferson National
Forests VA Buildings $6,584,161
George Washington and Jefferson National Forests
VA Dams $1,195,768
VerDate Aug 31 2005 16:26 Dec 16, 2020 Jkt 000000 PO 00000 Frm 00191 Fmt 6621 Sfmt 6621 P:\DOCS\116-19\38016.TXT BRIAN
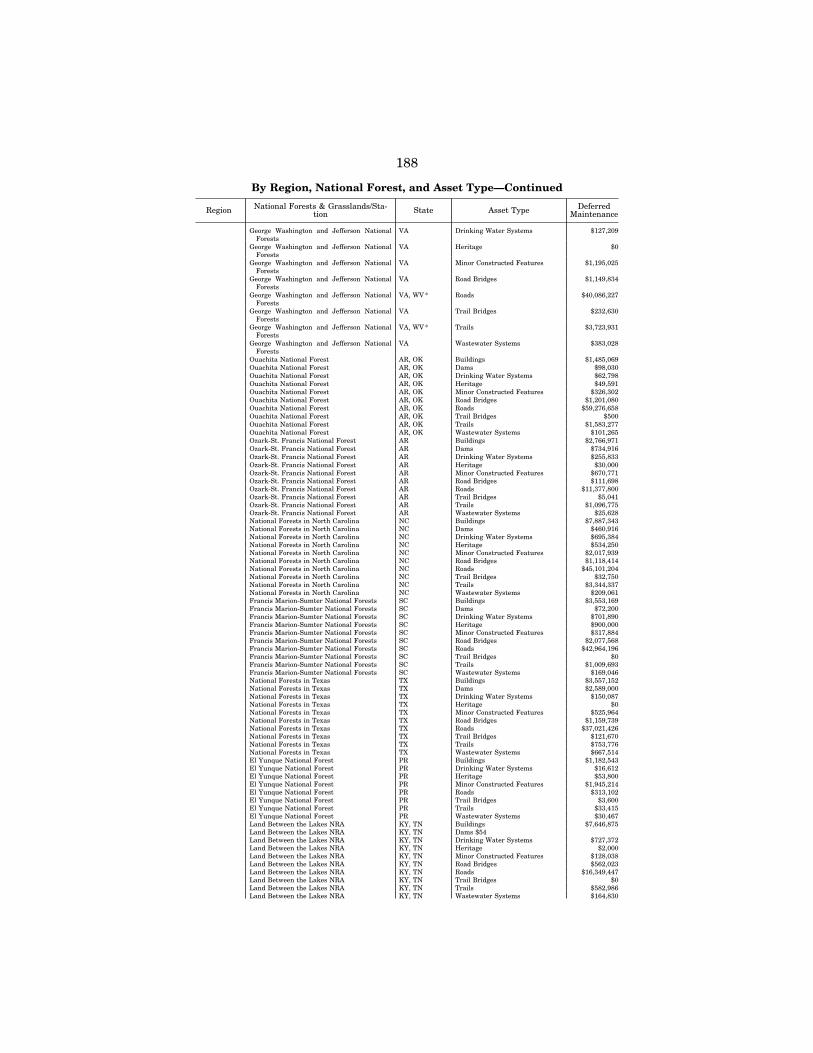
188
By Region, National Forest, and Asset Type—Continued
Region National Forests & Grasslands/Sta-tion State Asset Type Deferred
Maintenance
George Washington and Jefferson National Forests
VA Drinking Water Systems $127,209
George Washington and Jefferson National Forests
VA Heritage $0
George Washington and Jefferson National Forests
VA Minor Constructed Features $1,195,025
George Washington and Jefferson National Forests
VA Road Bridges $1,149,834
George Washington and Jefferson National Forests
VA, WV * Roads $40,086,227
George Washington and Jefferson National Forests
VA Trail Bridges $232,630
George Washington and Jefferson National Forests
VA, WV * Trails $3,723,931
George Washington and Jefferson National Forests
VA Wastewater Systems $383,028
Ouachita National Forest AR, OK Buildings $1,485,069 Ouachita National Forest AR, OK Dams $98,030 Ouachita National Forest AR, OK Drinking Water Systems $62,798 Ouachita National Forest AR, OK Heritage $49,591 Ouachita National Forest AR, OK Minor Constructed Features $326,302 Ouachita National Forest AR, OK Road Bridges $1,201,080 Ouachita National Forest AR, OK Roads $59,276,658 Ouachita National Forest AR, OK Trail Bridges $500 Ouachita National Forest AR, OK Trails $1,583,277 Ouachita National Forest AR, OK Wastewater Systems $101,265 Ozark-St. Francis National Forest AR Buildings $2,766,971 Ozark-St. Francis National Forest AR Dams $734,916 Ozark-St. Francis National Forest AR Drinking Water Systems $255,833 Ozark-St. Francis National Forest AR Heritage $30,000 Ozark-St. Francis National Forest AR Minor Constructed Features $670,771 Ozark-St. Francis National Forest AR Road Bridges $111,698 Ozark-St. Francis National Forest AR Roads $11,377,800 Ozark-St. Francis National Forest AR Trail Bridges $5,041 Ozark-St. Francis National Forest AR Trails $1,096,775 Ozark-St. Francis National Forest AR Wastewater Systems $25,628 National Forests in North Carolina NC Buildings $7,887,343 National Forests in North Carolina NC Dams $460,916 National Forests in North Carolina NC Drinking Water Systems $695,384 National Forests in North Carolina NC Heritage $534,250 National Forests in North Carolina NC Minor Constructed Features $2,017,939 National Forests in North Carolina NC Road Bridges $1,118,414 National Forests in North Carolina NC Roads $45,101,204 National Forests in North Carolina NC Trail Bridges $32,750 National Forests in North Carolina NC Trails $3,344,337 National Forests in North Carolina NC Wastewater Systems $209,061 Francis Marion-Sumter National Forests SC Buildings $3,553,169 Francis Marion-Sumter National Forests SC Dams $72,200 Francis Marion-Sumter National Forests SC Drinking Water Systems $701,890 Francis Marion-Sumter National Forests SC Heritage $900,000 Francis Marion-Sumter National Forests SC Minor Constructed Features $317,884 Francis Marion-Sumter National Forests SC Road Bridges $2,077,568 Francis Marion-Sumter National Forests SC Roads $42,964,196 Francis Marion-Sumter National Forests SC Trail Bridges $0 Francis Marion-Sumter National Forests SC Trails $1,009,693 Francis Marion-Sumter National Forests SC Wastewater Systems $169,046 National Forests in Texas TX Buildings $3,557,152 National Forests in Texas TX Dams $2,589,000 National Forests in Texas TX Drinking Water Systems $150,087 National Forests in Texas TX Heritage $0 National Forests in Texas TX Minor Constructed Features $525,964 National Forests in Texas TX Road Bridges $1,159,739 National Forests in Texas TX Roads $37,021,426 National Forests in Texas TX Trail Bridges $121,670 National Forests in Texas TX Trails $753,776 National Forests in Texas TX Wastewater Systems $667,514 El Yunque National Forest PR Buildings $1,182,543 El Yunque National Forest PR Drinking Water Systems $16,612 El Yunque National Forest PR Heritage $53,800 El Yunque National Forest PR Minor Constructed Features $1,945,214 El Yunque National Forest PR Roads $313,102 El Yunque National Forest PR Trail Bridges $3,600 El Yunque National Forest PR Trails $33,415 El Yunque National Forest PR Wastewater Systems $30,467 Land Between the Lakes NRA KY, TN Buildings $7,646,875 Land Between the Lakes NRA KY, TN Dams $54 Land Between the Lakes NRA KY, TN Drinking Water Systems $727,372 Land Between the Lakes NRA KY, TN Heritage $2,000 Land Between the Lakes NRA KY, TN Minor Constructed Features $128,038 Land Between the Lakes NRA KY, TN Road Bridges $562,023 Land Between the Lakes NRA KY, TN Roads $16,349,447 Land Between the Lakes NRA KY, TN Trail Bridges $0 Land Between the Lakes NRA KY, TN Trails $582,986 Land Between the Lakes NRA KY, TN Wastewater Systems $164,830
VerDate Aug 31 2005 16:26 Dec 16, 2020 Jkt 000000 PO 00000 Frm 00192 Fmt 6621 Sfmt 6621 P:\DOCS\116-19\38016.TXT BRIAN
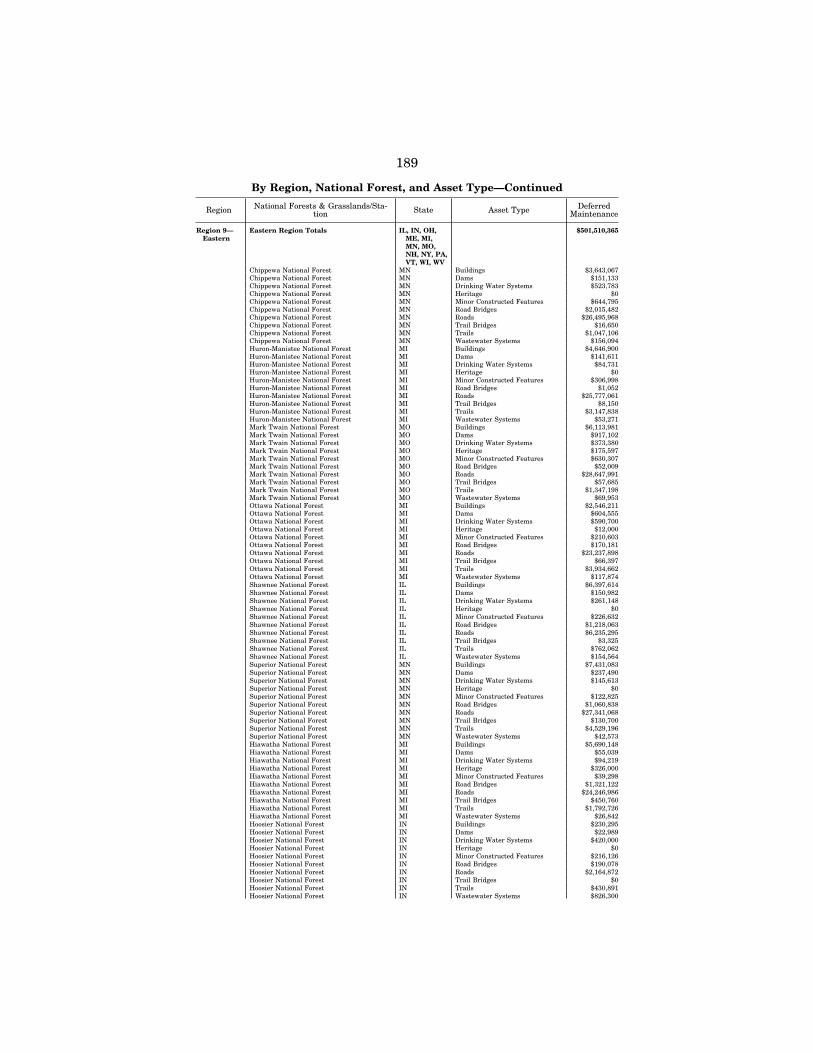
189
By Region, National Forest, and Asset Type—Continued
Region National Forests & Grasslands/Sta-tion State Asset Type Deferred
Maintenance
Region 9— Eastern
Eastern Region Totals IL, IN, OH, ME, MI, MN, MO, NH, NY, PA, VT, WI, WV
$501,510,365
Chippewa National Forest MN Buildings $3,643,067 Chippewa National Forest MN Dams $151,133 Chippewa National Forest MN Drinking Water Systems $523,783 Chippewa National Forest MN Heritage $0 Chippewa National Forest MN Minor Constructed Features $644,795 Chippewa National Forest MN Road Bridges $2,015,482 Chippewa National Forest MN Roads $26,495,968 Chippewa National Forest MN Trail Bridges $16,650 Chippewa National Forest MN Trails $1,047,106 Chippewa National Forest MN Wastewater Systems $156,094 Huron-Manistee National Forest MI Buildings $4,646,900 Huron-Manistee National Forest MI Dams $141,611 Huron-Manistee National Forest MI Drinking Water Systems $84,731 Huron-Manistee National Forest MI Heritage $0 Huron-Manistee National Forest MI Minor Constructed Features $306,998 Huron-Manistee National Forest MI Road Bridges $1,052 Huron-Manistee National Forest MI Roads $25,777,061 Huron-Manistee National Forest MI Trail Bridges $8,150 Huron-Manistee National Forest MI Trails $3,147,838 Huron-Manistee National Forest MI Wastewater Systems $53,271 Mark Twain National Forest MO Buildings $6,113,981 Mark Twain National Forest MO Dams $917,102 Mark Twain National Forest MO Drinking Water Systems $373,380 Mark Twain National Forest MO Heritage $175,597 Mark Twain National Forest MO Minor Constructed Features $630,307 Mark Twain National Forest MO Road Bridges $52,009 Mark Twain National Forest MO Roads $28,647,991 Mark Twain National Forest MO Trail Bridges $57,685 Mark Twain National Forest MO Trails $1,347,198 Mark Twain National Forest MO Wastewater Systems $69,953 Ottawa National Forest MI Buildings $2,546,211 Ottawa National Forest MI Dams $604,555 Ottawa National Forest MI Drinking Water Systems $590,700 Ottawa National Forest MI Heritage $12,000 Ottawa National Forest MI Minor Constructed Features $210,603 Ottawa National Forest MI Road Bridges $170,181 Ottawa National Forest MI Roads $23,237,898 Ottawa National Forest MI Trail Bridges $66,397 Ottawa National Forest MI Trails $3,934,662 Ottawa National Forest MI Wastewater Systems $117,874 Shawnee National Forest IL Buildings $6,397,614 Shawnee National Forest IL Dams $150,982 Shawnee National Forest IL Drinking Water Systems $261,148 Shawnee National Forest IL Heritage $0 Shawnee National Forest IL Minor Constructed Features $226,632 Shawnee National Forest IL Road Bridges $1,218,063 Shawnee National Forest IL Roads $6,235,295 Shawnee National Forest IL Trail Bridges $3,325 Shawnee National Forest IL Trails $762,062 Shawnee National Forest IL Wastewater Systems $154,564 Superior National Forest MN Buildings $7,431,083 Superior National Forest MN Dams $237,490 Superior National Forest MN Drinking Water Systems $145,613 Superior National Forest MN Heritage $0 Superior National Forest MN Minor Constructed Features $122,825 Superior National Forest MN Road Bridges $1,060,838 Superior National Forest MN Roads $27,341,068 Superior National Forest MN Trail Bridges $130,700 Superior National Forest MN Trails $4,529,196 Superior National Forest MN Wastewater Systems $42,573 Hiawatha National Forest MI Buildings $5,690,148 Hiawatha National Forest MI Dams $55,039 Hiawatha National Forest MI Drinking Water Systems $94,219 Hiawatha National Forest MI Heritage $326,000 Hiawatha National Forest MI Minor Constructed Features $39,298 Hiawatha National Forest MI Road Bridges $1,321,122 Hiawatha National Forest MI Roads $24,246,986 Hiawatha National Forest MI Trail Bridges $450,760 Hiawatha National Forest MI Trails $1,792,726 Hiawatha National Forest MI Wastewater Systems $26,842 Hoosier National Forest IN Buildings $230,295 Hoosier National Forest IN Dams $22,989 Hoosier National Forest IN Drinking Water Systems $420,000 Hoosier National Forest IN Heritage $0 Hoosier National Forest IN Minor Constructed Features $216,126 Hoosier National Forest IN Road Bridges $190,078 Hoosier National Forest IN Roads $2,164,872 Hoosier National Forest IN Trail Bridges $0 Hoosier National Forest IN Trails $430,891 Hoosier National Forest IN Wastewater Systems $826,300
VerDate Aug 31 2005 16:26 Dec 16, 2020 Jkt 000000 PO 00000 Frm 00193 Fmt 6621 Sfmt 6621 P:\DOCS\116-19\38016.TXT BRIAN
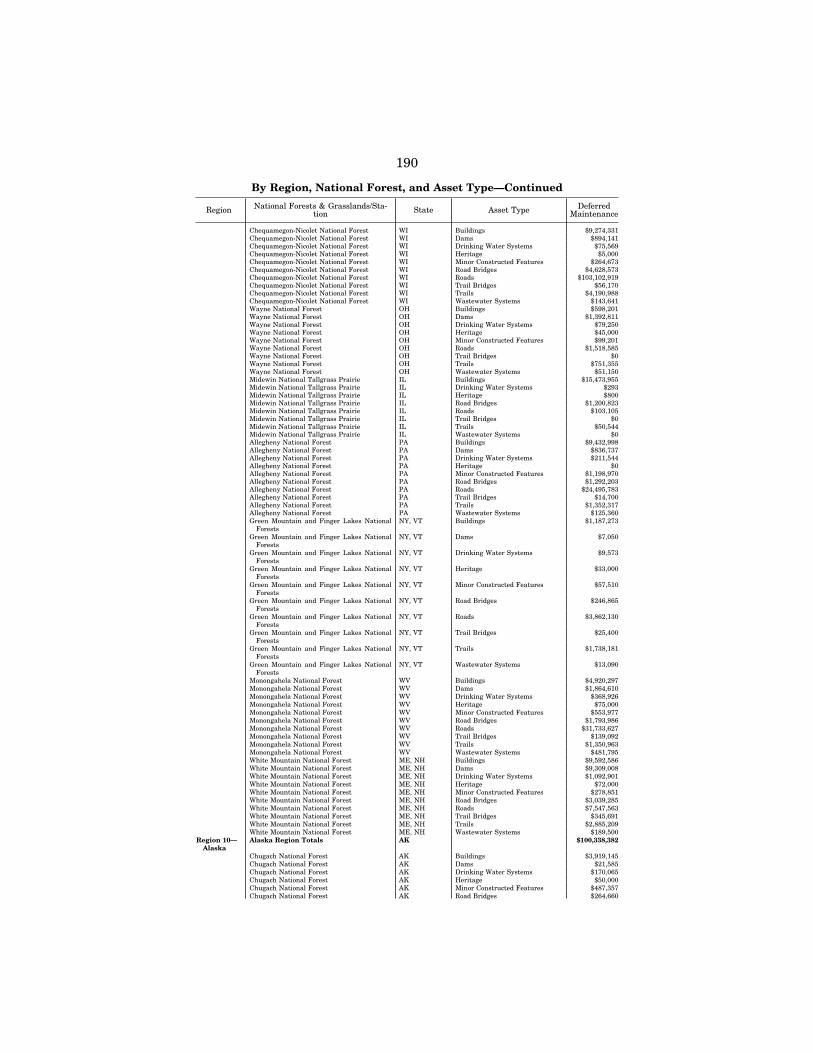
190
By Region, National Forest, and Asset Type—Continued
Region National Forests & Grasslands/Sta-tion State Asset Type Deferred
Maintenance
Chequamegon-Nicolet National Forest WI Buildings $9,274,331 Chequamegon-Nicolet National Forest WI Dams $894,141 Chequamegon-Nicolet National Forest WI Drinking Water Systems $75,569 Chequamegon-Nicolet National Forest WI Heritage $5,000 Chequamegon-Nicolet National Forest WI Minor Constructed Features $264,673 Chequamegon-Nicolet National Forest WI Road Bridges $4,628,573 Chequamegon-Nicolet National Forest WI Roads $103,102,919 Chequamegon-Nicolet National Forest WI Trail Bridges $56,170 Chequamegon-Nicolet National Forest WI Trails $4,190,988 Chequamegon-Nicolet National Forest WI Wastewater Systems $143,641 Wayne National Forest OH Buildings $598,201 Wayne National Forest OH Dams $1,392,811 Wayne National Forest OH Drinking Water Systems $79,250 Wayne National Forest OH Heritage $45,000 Wayne National Forest OH Minor Constructed Features $99,201 Wayne National Forest OH Roads $1,518,585 Wayne National Forest OH Trail Bridges $0 Wayne National Forest OH Trails $751,355 Wayne National Forest OH Wastewater Systems $51,150 Midewin National Tallgrass Prairie IL Buildings $15,473,955 Midewin National Tallgrass Prairie IL Drinking Water Systems $293 Midewin National Tallgrass Prairie IL Heritage $800 Midewin National Tallgrass Prairie IL Road Bridges $1,200,823 Midewin National Tallgrass Prairie IL Roads $103,105 Midewin National Tallgrass Prairie IL Trail Bridges $0 Midewin National Tallgrass Prairie IL Trails $50,544 Midewin National Tallgrass Prairie IL Wastewater Systems $0 Allegheny National Forest PA Buildings $9,432,998 Allegheny National Forest PA Dams $836,737 Allegheny National Forest PA Drinking Water Systems $211,544 Allegheny National Forest PA Heritage $0 Allegheny National Forest PA Minor Constructed Features $1,198,970 Allegheny National Forest PA Road Bridges $1,292,203 Allegheny National Forest PA Roads $24,495,783 Allegheny National Forest PA Trail Bridges $14,700 Allegheny National Forest PA Trails $1,352,317 Allegheny National Forest PA Wastewater Systems $125,360 Green Mountain and Finger Lakes National
Forests NY, VT Buildings $1,187,273
Green Mountain and Finger Lakes National Forests
NY, VT Dams $7,050
Green Mountain and Finger Lakes National Forests
NY, VT Drinking Water Systems $9,573
Green Mountain and Finger Lakes National Forests
NY, VT Heritage $33,000
Green Mountain and Finger Lakes National Forests
NY, VT Minor Constructed Features $57,510
Green Mountain and Finger Lakes National Forests
NY, VT Road Bridges $246,865
Green Mountain and Finger Lakes National Forests
NY, VT Roads $3,862,130
Green Mountain and Finger Lakes National Forests
NY, VT Trail Bridges $25,400
Green Mountain and Finger Lakes National Forests
NY, VT Trails $1,738,181
Green Mountain and Finger Lakes National Forests
NY, VT Wastewater Systems $13,090
Monongahela National Forest WV Buildings $4,920,297 Monongahela National Forest WV Dams $1,864,610 Monongahela National Forest WV Drinking Water Systems $368,926 Monongahela National Forest WV Heritage $75,000 Monongahela National Forest WV Minor Constructed Features $553,977 Monongahela National Forest WV Road Bridges $1,793,986 Monongahela National Forest WV Roads $31,733,627 Monongahela National Forest WV Trail Bridges $139,092 Monongahela National Forest WV Trails $1,350,963 Monongahela National Forest WV Wastewater Systems $481,795 White Mountain National Forest ME, NH Buildings $9,592,586 White Mountain National Forest ME, NH Dams $9,309,008 White Mountain National Forest ME, NH Drinking Water Systems $1,092,901 White Mountain National Forest ME, NH Heritage $72,000 White Mountain National Forest ME, NH Minor Constructed Features $278,851 White Mountain National Forest ME, NH Road Bridges $3,039,285 White Mountain National Forest ME, NH Roads $7,547,563 White Mountain National Forest ME, NH Trail Bridges $345,691 White Mountain National Forest ME, NH Trails $2,885,209 White Mountain National Forest ME, NH Wastewater Systems $189,500
Region 10— Alaska
Alaska Region Totals AK $100,338,382
Chugach National Forest AK Buildings $3,919,145 Chugach National Forest AK Dams $21,585 Chugach National Forest AK Drinking Water Systems $170,065 Chugach National Forest AK Heritage $50,000 Chugach National Forest AK Minor Constructed Features $487,357 Chugach National Forest AK Road Bridges $264,660
VerDate Aug 31 2005 16:26 Dec 16, 2020 Jkt 000000 PO 00000 Frm 00194 Fmt 6621 Sfmt 6621 P:\DOCS\116-19\38016.TXT BRIAN
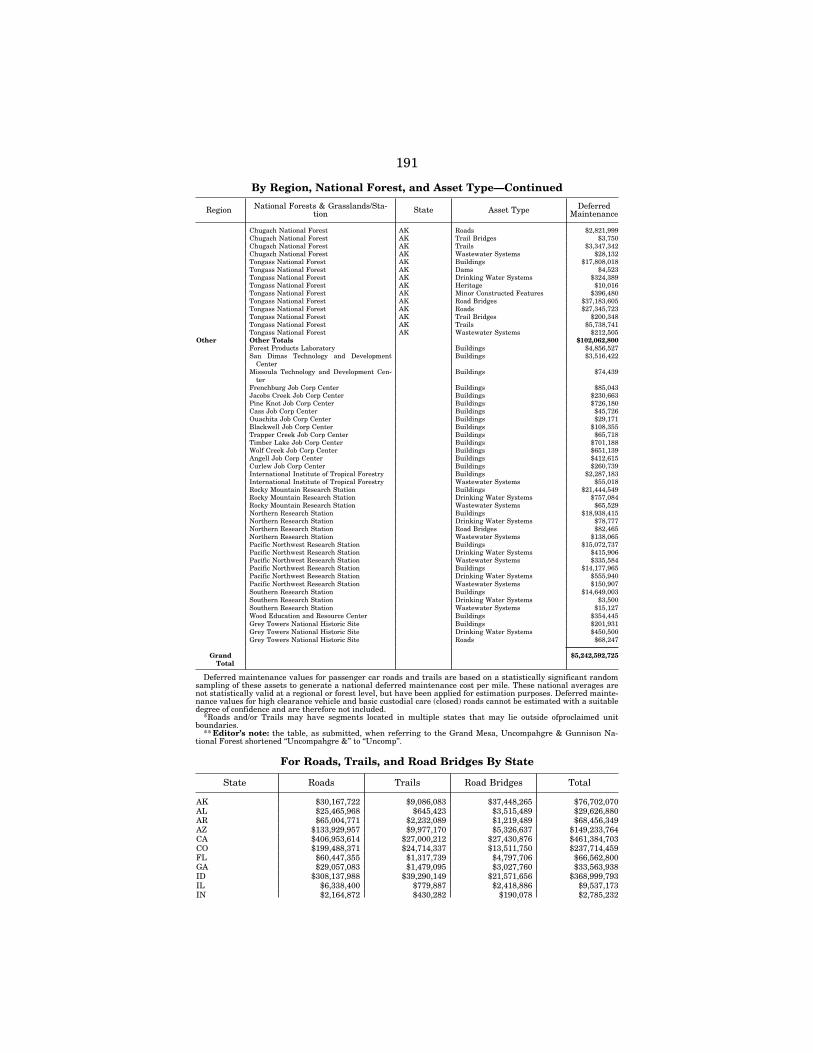
191
By Region, National Forest, and Asset Type—Continued
Region National Forests & Grasslands/Sta-tion State Asset Type Deferred
Maintenance
Chugach National Forest AK Roads $2,821,999 Chugach National Forest AK Trail Bridges $3,750 Chugach National Forest AK Trails $3,347,342 Chugach National Forest AK Wastewater Systems $28,132 Tongass National Forest AK Buildings $17,808,018 Tongass National Forest AK Dams $4,523 Tongass National Forest AK Drinking Water Systems $324,389 Tongass National Forest AK Heritage $10,016 Tongass National Forest AK Minor Constructed Features $396,480 Tongass National Forest AK Road Bridges $37,183,605 Tongass National Forest AK Roads $27,345,723 Tongass National Forest AK Trail Bridges $200,348 Tongass National Forest AK Trails $5,738,741 Tongass National Forest AK Wastewater Systems $212,505
Other Other Totals $102,062,800 Forest Products Laboratory Buildings $4,856,527 San Dimas Technology and Development
Center Buildings $3,516,422
Missoula Technology and Development Cen-ter
Buildings $74,439
Frenchburg Job Corp Center Buildings $85,043 Jacobs Creek Job Corp Center Buildings $230,663 Pine Knot Job Corp Center Buildings $726,180 Cass Job Corp Center Buildings $45,726 Ouachita Job Corp Center Buildings $29,171 Blackwell Job Corp Center Buildings $108,355 Trapper Creek Job Corp Center Buildings $65,718 Timber Lake Job Corp Center Buildings $701,188 Wolf Creek Job Corp Center Buildings $651,139 Angell Job Corp Center Buildings $412,615 Curlew Job Corp Center Buildings $260,739 International Institute of Tropical Forestry Buildings $2,287,183 International Institute of Tropical Forestry Wastewater Systems $55,018 Rocky Mountain Research Station Buildings $21,444,549 Rocky Mountain Research Station Drinking Water Systems $757,084 Rocky Mountain Research Station Wastewater Systems $65,529 Northern Research Station Buildings $18,938,415 Northern Research Station Drinking Water Systems $78,777 Northern Research Station Road Bridges $82,465 Northern Research Station Wastewater Systems $138,065 Pacific Northwest Research Station Buildings $15,072,737 Pacific Northwest Research Station Drinking Water Systems $415,906 Pacific Northwest Research Station Wastewater Systems $335,584 Pacific Northwest Research Station Buildings $14,177,965 Pacific Northwest Research Station Drinking Water Systems $555,940 Pacific Northwest Research Station Wastewater Systems $150,907 Southern Research Station Buildings $14,649,003 Southern Research Station Drinking Water Systems $3,500 Southern Research Station Wastewater Systems $15,127 Wood Education and Resource Center Buildings $354,445 Grey Towers National Historic Site Buildings $201,931 Grey Towers National Historic Site Drinking Water Systems $450,500 Grey Towers National Historic Site Roads $68,247
Grand Total
$5,242,592,725
Deferred maintenance values for passenger car roads and trails are based on a statistically significant random sampling of these assets to generate a national deferred maintenance cost per mile. These national averages are not statistically valid at a regional or forest level, but have been applied for estimation purposes. Deferred mainte-nance values for high clearance vehicle and basic custodial care (closed) roads cannot be estimated with a suitable degree of confidence and are therefore not included.
*Roads and/or Trails may have segments located in multiple states that may lie outside ofproclaimed unit boundaries.
** Editor’s note: the table, as submitted, when referring to the Grand Mesa, Uncompahgre & Gunnison Na-tional Forest shortened ‘‘Uncompahgre &’’ to ‘‘Uncomp’’.
For Roads, Trails, and Road Bridges By State
State Roads Trails Road Bridges Total
AK $30,167,722 $9,086,083 $37,448,265 $76,702,070 AL $25,465,968 $645,423 $3,515,489 $29,626,880 AR $65,004,771 $2,232,089 $1,219,489 $68,456,349 AZ $133,929,957 $9,977,170 $5,326,637 $149,233,764 CA $406,953,614 $27,000,212 $27,430,876 $461,384,703 CO $199,488,371 $24,714,337 $13,511,750 $237,714,459 FL $60,447,355 $1,317,739 $4,797,706 $66,562,800 GA $29,057,083 $1,479,095 $3,027,760 $33,563,938 ID $308,137,988 $39,290,149 $21,571,656 $368,999,793 IL $6,338,400 $779,887 $2,418,886 $9,537,173 IN $2,164,872 $430,282 $190,078 $2,785,232
VerDate Aug 31 2005 16:26 Dec 16, 2020 Jkt 000000 PO 00000 Frm 00195 Fmt 6621 Sfmt 6621 P:\DOCS\116-19\38016.TXT BRIAN
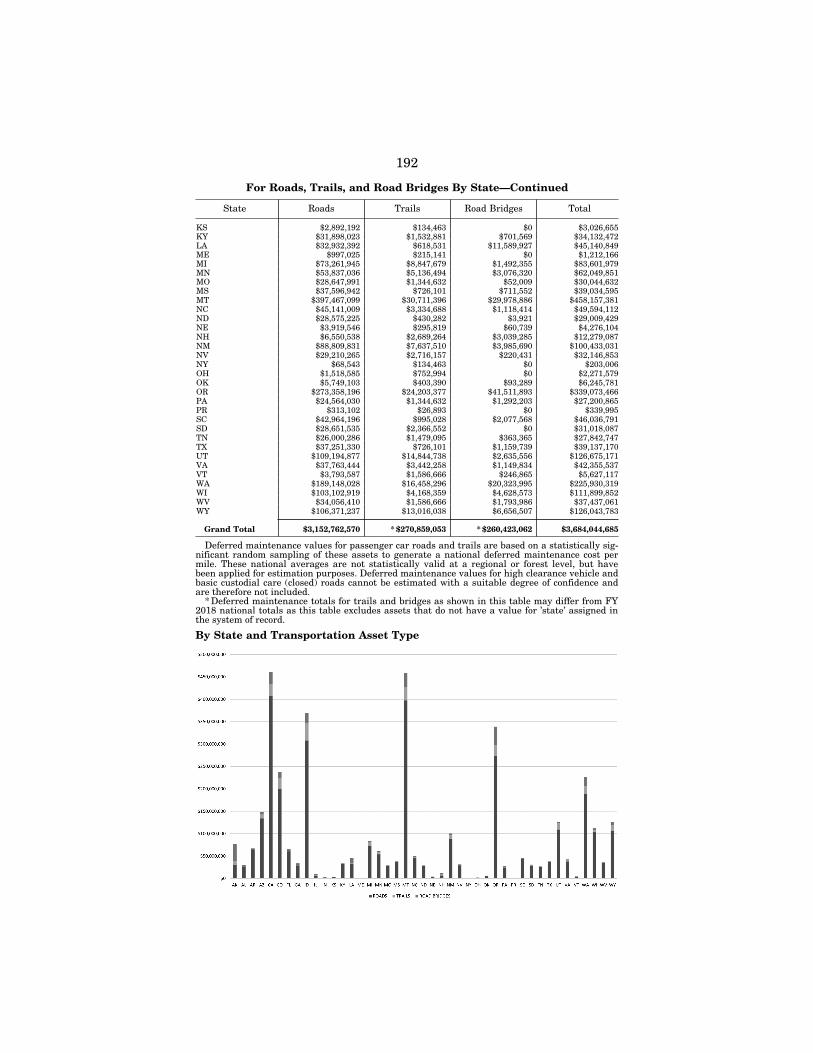
192
For Roads, Trails, and Road Bridges By State—Continued
State Roads Trails Road Bridges Total
KS $2,892,192 $134,463 $0 $3,026,655 KY $31,898,023 $1,532,881 $701,569 $34,132,472 LA $32,932,392 $618,531 $11,589,927 $45,140,849 ME $997,025 $215,141 $0 $1,212,166 MI $73,261,945 $8,847,679 $1,492,355 $83,601,979 MN $53,837,036 $5,136,494 $3,076,320 $62,049,851 MO $28,647,991 $1,344,632 $52,009 $30,044,632 MS $37,596,942 $726,101 $711,552 $39,034,595 MT $397,467,099 $30,711,396 $29,978,886 $458,157,381 NC $45,141,009 $3,334,688 $1,118,414 $49,594,112 ND $28,575,225 $430,282 $3,921 $29,009,429 NE $3,919,546 $295,819 $60,739 $4,276,104 NH $6,550,538 $2,689,264 $3,039,285 $12,279,087 NM $88,809,831 $7,637,510 $3,985,690 $100,433,031 NV $29,210,265 $2,716,157 $220,431 $32,146,853 NY $68,543 $134,463 $0 $203,006 OH $1,518,585 $752,994 $0 $2,271,579 OK $5,749,103 $403,390 $93,289 $6,245,781 OR $273,358,196 $24,203,377 $41,511,893 $339,073,466 PA $24,564,030 $1,344,632 $1,292,203 $27,200,865 PR $313,102 $26,893 $0 $339,995 SC $42,964,196 $995,028 $2,077,568 $46,036,791 SD $28,651,535 $2,366,552 $0 $31,018,087 TN $26,000,286 $1,479,095 $363,365 $27,842,747 TX $37,251,330 $726,101 $1,159,739 $39,137,170 UT $109,194,877 $14,844,738 $2,635,556 $126,675,171 VA $37,763,444 $3,442,258 $1,149,834 $42,355,537 VT $3,793,587 $1,586,666 $246,865 $5,627,117 WA $189,148,028 $16,458,296 $20,323,995 $225,930,319 WI $103,102,919 $4,168,359 $4,628,573 $111,899,852 WV $34,056,410 $1,586,666 $1,793,986 $37,437,061 WY $106,371,237 $13,016,038 $6,656,507 $126,043,783
Grand Total $3,152,762,570 * $270,859,053 * $260,423,062 $3,684,044,685
Deferred maintenance values for passenger car roads and trails are based on a statistically sig-nificant random sampling of these assets to generate a national deferred maintenance cost per mile. These national averages are not statistically valid at a regional or forest level, but have been applied for estimation purposes. Deferred maintenance values for high clearance vehicle and basic custodial care (closed) roads cannot be estimated with a suitable degree of confidence and are therefore not included.
* Deferred maintenance totals for trails and bridges as shown in this table may differ from FY 2018 national totals as this table excludes assets that do not have a value for ’state’ assigned in the system of record.
By State and Transportation Asset Type
VerDate Aug 31 2005 16:26 Dec 16, 2020 Jkt 000000 PO 00000 Frm 00196 Fmt 6621 Sfmt 6621 P:\DOCS\116-19\38016.TXT BRIAN 1161
9115
.eps
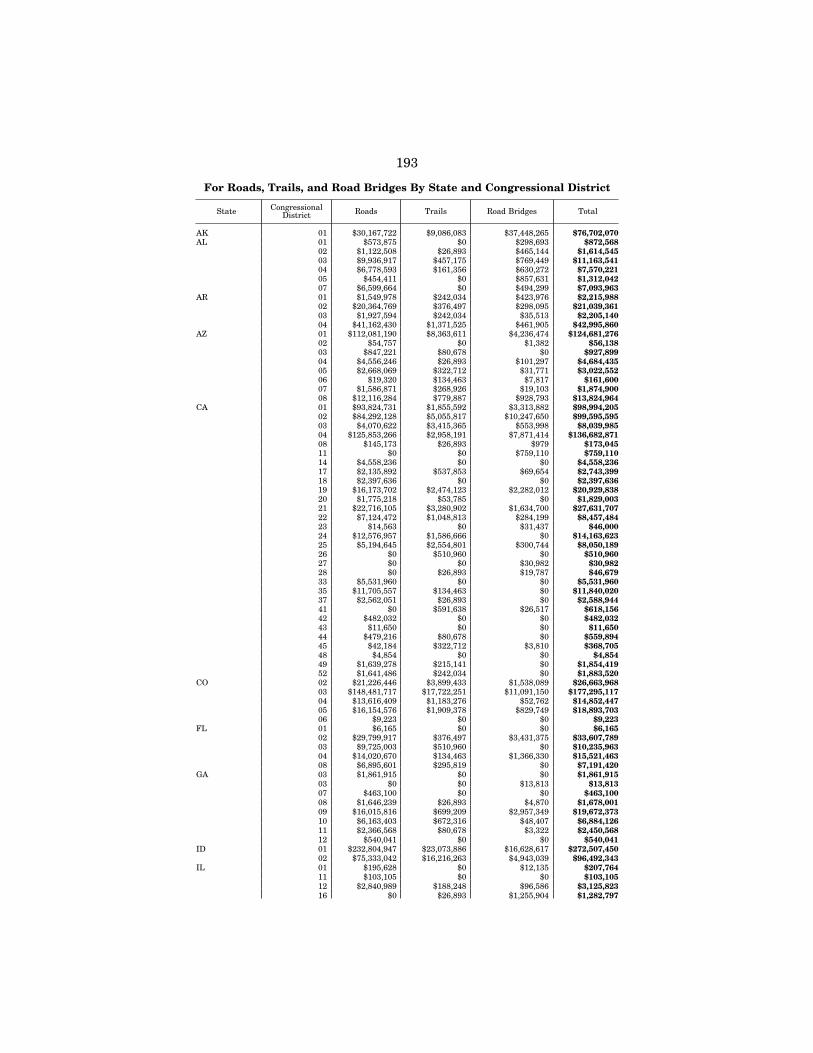
193
For Roads, Trails, and Road Bridges By State and Congressional District
State Congressional District Roads Trails Road Bridges Total
AK 01 $30,167,722 $9,086,083 $37,448,265 $76,702,070 AL 01 $573,875 $0 $298,693 $872,568
02 $1,122,508 $26,893 $465,144 $1,614,545 03 $9,936,917 $457,175 $769,449 $11,163,541 04 $6,778,593 $161,356 $630,272 $7,570,221 05 $454,411 $0 $857,631 $1,312,042 07 $6,599,664 $0 $494,299 $7,093,963
AR 01 $1,549,978 $242,034 $423,976 $2,215,988 02 $20,364,769 $376,497 $298,095 $21,039,361 03 $1,927,594 $242,034 $35,513 $2,205,140 04 $41,162,430 $1,371,525 $461,905 $42,995,860
AZ 01 $112,081,190 $8,363,611 $4,236,474 $124,681,276 02 $54,757 $0 $1,382 $56,138 03 $847,221 $80,678 $0 $927,899 04 $4,556,246 $26,893 $101,297 $4,684,435 05 $2,668,069 $322,712 $31,771 $3,022,552 06 $19,320 $134,463 $7,817 $161,600 07 $1,586,871 $268,926 $19,103 $1,874,900 08 $12,116,284 $779,887 $928,793 $13,824,964
CA 01 $93,824,731 $1,855,592 $3,313,882 $98,994,205 02 $84,292,128 $5,055,817 $10,247,650 $99,595,595 03 $4,070,622 $3,415,365 $553,998 $8,039,985 04 $125,853,266 $2,958,191 $7,871,414 $136,682,871 08 $145,173 $26,893 $979 $173,045 11 $0 $0 $759,110 $759,110 14 $4,558,236 $0 $0 $4,558,236 17 $2,135,892 $537,853 $69,654 $2,743,399 18 $2,397,636 $0 $0 $2,397,636 19 $16,173,702 $2,474,123 $2,282,012 $20,929,838 20 $1,775,218 $53,785 $0 $1,829,003 21 $22,716,105 $3,280,902 $1,634,700 $27,631,707 22 $7,124,472 $1,048,813 $284,199 $8,457,484 23 $14,563 $0 $31,437 $46,000 24 $12,576,957 $1,586,666 $0 $14,163,623 25 $5,194,645 $2,554,801 $300,744 $8,050,189 26 $0 $510,960 $0 $510,960 27 $0 $0 $30,982 $30,982 28 $0 $26,893 $19,787 $46,679 33 $5,531,960 $0 $0 $5,531,960 35 $11,705,557 $134,463 $0 $11,840,020 37 $2,562,051 $26,893 $0 $2,588,944 41 $0 $591,638 $26,517 $618,156 42 $482,032 $0 $0 $482,032 43 $11,650 $0 $0 $11,650 44 $479,216 $80,678 $0 $559,894 45 $42,184 $322,712 $3,810 $368,705 48 $4,854 $0 $0 $4,854 49 $1,639,278 $215,141 $0 $1,854,419 52 $1,641,486 $242,034 $0 $1,883,520
CO 02 $21,226,446 $3,899,433 $1,538,089 $26,663,968 03 $148,481,717 $17,722,251 $11,091,150 $177,295,117 04 $13,616,409 $1,183,276 $52,762 $14,852,447 05 $16,154,576 $1,909,378 $829,749 $18,893,703 06 $9,223 $0 $0 $9,223
FL 01 $6,165 $0 $0 $6,165 02 $29,799,917 $376,497 $3,431,375 $33,607,789 03 $9,725,003 $510,960 $0 $10,235,963 04 $14,020,670 $134,463 $1,366,330 $15,521,463 08 $6,895,601 $295,819 $0 $7,191,420
GA 03 $1,861,915 $0 $0 $1,861,915 03 $0 $0 $13,813 $13,813 07 $463,100 $0 $0 $463,100 08 $1,646,239 $26,893 $4,870 $1,678,001 09 $16,015,816 $699,209 $2,957,349 $19,672,373 10 $6,163,403 $672,316 $48,407 $6,884,126 11 $2,366,568 $80,678 $3,322 $2,450,568 12 $540,041 $0 $0 $540,041
ID 01 $232,804,947 $23,073,886 $16,628,617 $272,507,450 02 $75,333,042 $16,216,263 $4,943,039 $96,492,343
IL 01 $195,628 $0 $12,135 $207,764 11 $103,105 $0 $0 $103,105 12 $2,840,989 $188,248 $96,586 $3,125,823 16 $0 $26,893 $1,255,904 $1,282,797
VerDate Aug 31 2005 16:26 Dec 16, 2020 Jkt 000000 PO 00000 Frm 00197 Fmt 6621 Sfmt 6621 P:\DOCS\116-19\38016.TXT BRIAN
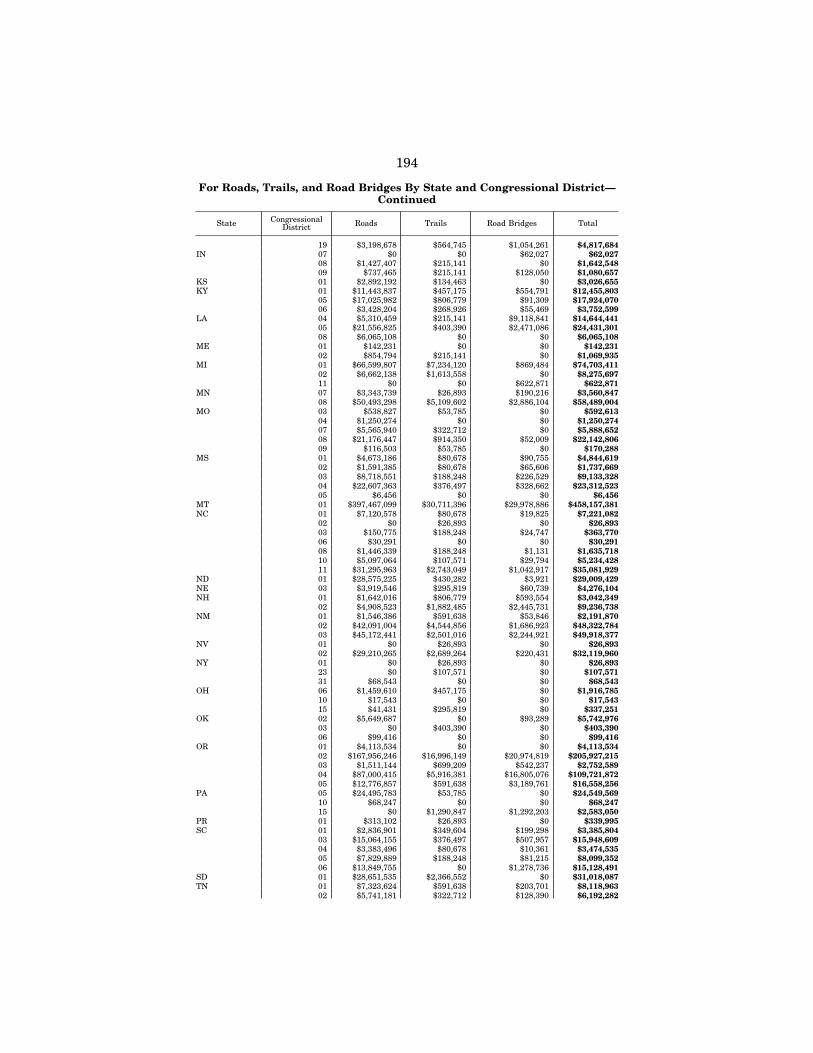
194
For Roads, Trails, and Road Bridges By State and Congressional District— Continued
State Congressional District Roads Trails Road Bridges Total
19 $3,198,678 $564,745 $1,054,261 $4,817,684 IN 07 $0 $0 $62,027 $62,027
08 $1,427,407 $215,141 $0 $1,642,548 09 $737,465 $215,141 $128,050 $1,080,657
KS 01 $2,892,192 $134,463 $0 $3,026,655 KY 01 $11,443,837 $457,175 $554,791 $12,455,803
05 $17,025,982 $806,779 $91,309 $17,924,070 06 $3,428,204 $268,926 $55,469 $3,752,599
LA 04 $5,310,459 $215,141 $9,118,841 $14,644,441 05 $21,556,825 $403,390 $2,471,086 $24,431,301 08 $6,065,108 $0 $0 $6,065,108
ME 01 $142,231 $0 $0 $142,231 02 $854,794 $215,141 $0 $1,069,935
MI 01 $66,599,807 $7,234,120 $869,484 $74,703,411 02 $6,662,138 $1,613,558 $0 $8,275,697 11 $0 $0 $622,871 $622,871
MN 07 $3,343,739 $26,893 $190,216 $3,560,847 08 $50,493,298 $5,109,602 $2,886,104 $58,489,004
MO 03 $538,827 $53,785 $0 $592,613 04 $1,250,274 $0 $0 $1,250,274 07 $5,565,940 $322,712 $0 $5,888,652 08 $21,176,447 $914,350 $52,009 $22,142,806 09 $116,503 $53,785 $0 $170,288
MS 01 $4,673,186 $80,678 $90,755 $4,844,619 02 $1,591,385 $80,678 $65,606 $1,737,669 03 $8,718,551 $188,248 $226,529 $9,133,328 04 $22,607,363 $376,497 $328,662 $23,312,523 05 $6,456 $0 $0 $6,456
MT 01 $397,467,099 $30,711,396 $29,978,886 $458,157,381 NC 01 $7,120,578 $80,678 $19,825 $7,221,082
02 $0 $26,893 $0 $26,893 03 $150,775 $188,248 $24,747 $363,770 06 $30,291 $0 $0 $30,291 08 $1,446,339 $188,248 $1,131 $1,635,718 10 $5,097,064 $107,571 $29,794 $5,234,428 11 $31,295,963 $2,743,049 $1,042,917 $35,081,929
ND 01 $28,575,225 $430,282 $3,921 $29,009,429 NE 03 $3,919,546 $295,819 $60,739 $4,276,104 NH 01 $1,642,016 $806,779 $593,554 $3,042,349
02 $4,908,523 $1,882,485 $2,445,731 $9,236,738 NM 01 $1,546,386 $591,638 $53,846 $2,191,870
02 $42,091,004 $4,544,856 $1,686,923 $48,322,784 03 $45,172,441 $2,501,016 $2,244,921 $49,918,377
NV 01 $0 $26,893 $0 $26,893 02 $29,210,265 $2,689,264 $220,431 $32,119,960
NY 01 $0 $26,893 $0 $26,893 23 $0 $107,571 $0 $107,571 31 $68,543 $0 $0 $68,543
OH 06 $1,459,610 $457,175 $0 $1,916,785 10 $17,543 $0 $0 $17,543 15 $41,431 $295,819 $0 $337,251
OK 02 $5,649,687 $0 $93,289 $5,742,976 03 $0 $403,390 $0 $403,390 06 $99,416 $0 $0 $99,416
OR 01 $4,113,534 $0 $0 $4,113,534 02 $167,956,246 $16,996,149 $20,974,819 $205,927,215 03 $1,511,144 $699,209 $542,237 $2,752,589 04 $87,000,415 $5,916,381 $16,805,076 $109,721,872 05 $12,776,857 $591,638 $3,189,761 $16,558,256
PA 05 $24,495,783 $53,785 $0 $24,549,569 10 $68,247 $0 $0 $68,247 15 $0 $1,290,847 $1,292,203 $2,583,050
PR 01 $313,102 $26,893 $0 $339,995 SC 01 $2,836,901 $349,604 $199,298 $3,385,804
03 $15,064,155 $376,497 $507,957 $15,948,609 04 $3,383,496 $80,678 $10,361 $3,474,535 05 $7,829,889 $188,248 $81,215 $8,099,352 06 $13,849,755 $0 $1,278,736 $15,128,491
SD 01 $28,651,535 $2,366,552 $0 $31,018,087 TN 01 $7,323,624 $591,638 $203,701 $8,118,963
02 $5,741,181 $322,712 $128,390 $6,192,282
VerDate Aug 31 2005 16:26 Dec 16, 2020 Jkt 000000 PO 00000 Frm 00198 Fmt 6621 Sfmt 6621 P:\DOCS\116-19\38016.TXT BRIAN
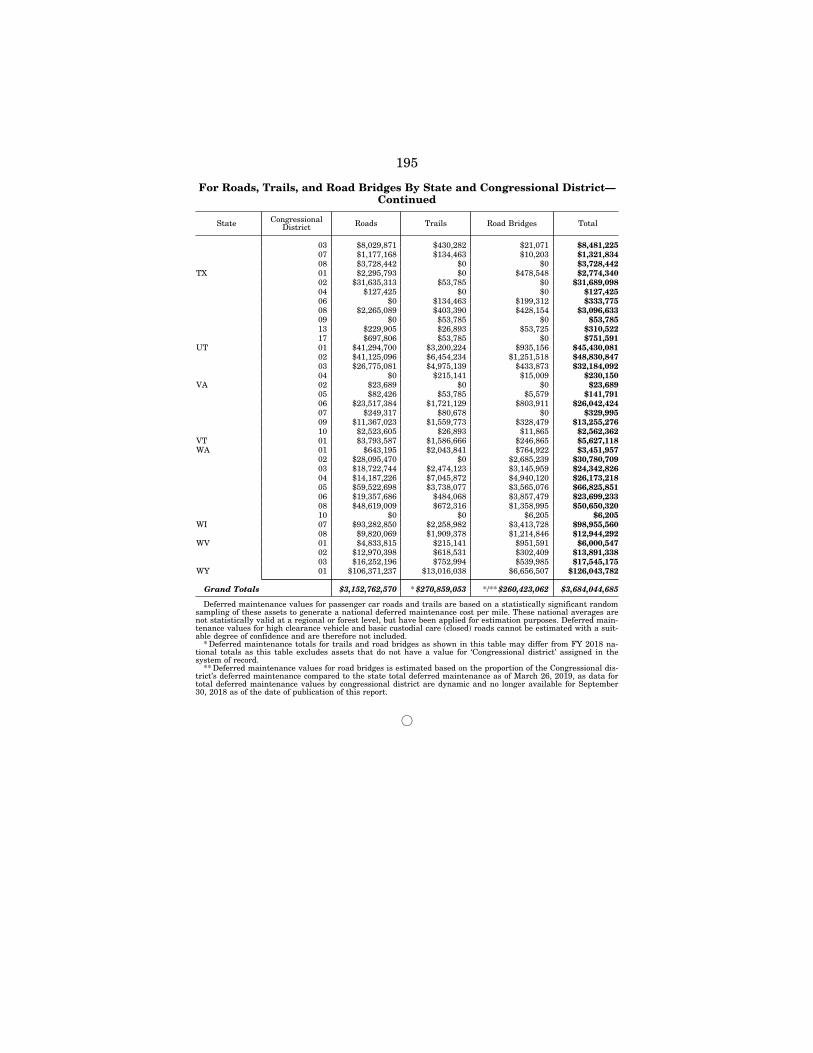
195
For Roads, Trails, and Road Bridges By State and Congressional District— Continued
State Congressional District Roads Trails Road Bridges Total
03 $8,029,871 $430,282 $21,071 $8,481,225 07 $1,177,168 $134,463 $10,203 $1,321,834 08 $3,728,442 $0 $0 $3,728,442
TX 01 $2,295,793 $0 $478,548 $2,774,340 02 $31,635,313 $53,785 $0 $31,689,098 04 $127,425 $0 $0 $127,425 06 $0 $134,463 $199,312 $333,775 08 $2,265,089 $403,390 $428,154 $3,096,633 09 $0 $53,785 $0 $53,785 13 $229,905 $26,893 $53,725 $310,522 17 $697,806 $53,785 $0 $751,591
UT 01 $41,294,700 $3,200,224 $935,156 $45,430,081 02 $41,125,096 $6,454,234 $1,251,518 $48,830,847 03 $26,775,081 $4,975,139 $433,873 $32,184,092 04 $0 $215,141 $15,009 $230,150
VA 02 $23,689 $0 $0 $23,689 05 $82,426 $53,785 $5,579 $141,791 06 $23,517,384 $1,721,129 $803,911 $26,042,424 07 $249,317 $80,678 $0 $329,995 09 $11,367,023 $1,559,773 $328,479 $13,255,276 10 $2,523,605 $26,893 $11,865 $2,562,362
VT 01 $3,793,587 $1,586,666 $246,865 $5,627,118 WA 01 $643,195 $2,043,841 $764,922 $3,451,957
02 $28,095,470 $0 $2,685,239 $30,780,709 03 $18,722,744 $2,474,123 $3,145,959 $24,342,826 04 $14,187,226 $7,045,872 $4,940,120 $26,173,218 05 $59,522,698 $3,738,077 $3,565,076 $66,825,851 06 $19,357,686 $484,068 $3,857,479 $23,699,233 08 $48,619,009 $672,316 $1,358,995 $50,650,320 10 $0 $0 $6,205 $6,205
WI 07 $93,282,850 $2,258,982 $3,413,728 $98,955,560 08 $9,820,069 $1,909,378 $1,214,846 $12,944,292
WV 01 $4,833,815 $215,141 $951,591 $6,000,547 02 $12,970,398 $618,531 $302,409 $13,891,338 03 $16,252,196 $752,994 $539,985 $17,545,175
WY 01 $106,371,237 $13,016,038 $6,656,507 $126,043,782
Grand Totals $3,152,762,570 * $270,859,053 */** $260,423,062 $3,684,044,685
Deferred maintenance values for passenger car roads and trails are based on a statistically significant random sampling of these assets to generate a national deferred maintenance cost per mile. These national averages are not statistically valid at a regional or forest level, but have been applied for estimation purposes. Deferred main-tenance values for high clearance vehicle and basic custodial care (closed) roads cannot be estimated with a suit-able degree of confidence and are therefore not included.
* Deferred maintenance totals for trails and road bridges as shown in this table may differ from FY 2018 na-tional totals as this table excludes assets that do not have a value for ‘Congressional district’ assigned in the system of record.
** Deferred maintenance values for road bridges is estimated based on the proportion of the Congressional dis-trict’s deferred maintenance compared to the state total deferred maintenance as of March 26, 2019, as data for total deferred maintenance values by congressional district are dynamic and no longer available for September 30, 2018 as of the date of publication of this report.
Æ
VerDate Aug 31 2005 16:26 Dec 16, 2020 Jkt 000000 PO 00000 Frm 00199 Fmt 6621 Sfmt 6611 P:\DOCS\116-19\38016.TXT BRIAN