
The Molecular Emission of the Irradiated Star-Forming Core Ahead of HH 80N
27
arXiv:0901.4034v1 [astro-ph.SR] 26 Jan 2009 The molecular emission of the irradiated star forming core ahead of HH 80N Josep M. Masqu´ e 1 , Josep M. Girart 2 , Maria T. Beltr´an 1 , Robert Estalella 1 and Serena Viti 3 ABSTRACT We present a Berkeley-Illinois-Maryland Association (BIMA) Array molec- ular survey of the star forming core ahead of HH 80N, the optically obscured northern counterpart of the Herbig-Haro objects HH 80/81. Continuum emis- sion at 1.4 mm and 8 μm is detected at the center of the core, which confirms the presence of an embedded very young stellar object in the core. All detected molecular species arise in a ring-like structure, which is most clearly traced by CS (2–1) emission. This molecular ring suggests that strong molecular deple- tion occurs in the inner part of the core (at a radius of ≃ 0.1 pc and densities higher than ∼ 5 × 10 4 cm −3 ). Despite of the overall morphology and kinematic similarity between the different species, there is significant molecular differenti- ation along the ring-like structure. The analysis of the chemistry along the core shows that part of this differentiation may be caused by the UV irradiation of the nearby HH 80N object, that illuminates the part of the core facing HH 80N, which results in an abundance enhancement of some of the detected species. Subject headings: ISM: individual (HH 80N) — ISM: molecules — radio lines: ISM — stars: formation — ISM: abundances — 1. Introduction IRAS 18162−2048 is a high mass protostar, with a luminosity of ∼ 2 × 10 4 L ⊙ , powering the most luminous and largest Herbig-Haro (HH) system, HH 80/81/80N, associated with a 1 Departament d’Astronomia i Meteorologia, Universitat de Barcelona, Mart´ ı i Franqu` es 1, 08028 Barcelona, Catalunya, Spain 2 Institut de Ci` encies de l’Espai, (CSIC-IEEC), Campus UAB, Facultat de Ci` encies, Torre C5 - parell 2, 08193 Bellaterra, Catalunya, Spain 3 Department of Physics and Astronomy, University College London, London, WC1E 6BT, UK
Transcript of The Molecular Emission of the Irradiated Star-Forming Core Ahead of HH 80N

arX
iv:0
901.
4034
v1 [
astr
o-ph
.SR
] 2
6 Ja
n 20
09
The molecular emission of the irradiated star forming core ahead
of HH 80N
Josep M. Masque1, Josep M. Girart2, Maria T. Beltran1, Robert Estalella1
and
Serena Viti3
ABSTRACT
We present a Berkeley-Illinois-Maryland Association (BIMA) Array molec-
ular survey of the star forming core ahead of HH 80N, the optically obscured
northern counterpart of the Herbig-Haro objects HH 80/81. Continuum emis-
sion at 1.4 mm and 8 µm is detected at the center of the core, which confirms
the presence of an embedded very young stellar object in the core. All detected
molecular species arise in a ring-like structure, which is most clearly traced by
CS (2–1) emission. This molecular ring suggests that strong molecular deple-
tion occurs in the inner part of the core (at a radius of ≃ 0.1 pc and densities
higher than ∼ 5 × 104 cm−3). Despite of the overall morphology and kinematic
similarity between the different species, there is significant molecular differenti-
ation along the ring-like structure. The analysis of the chemistry along the core
shows that part of this differentiation may be caused by the UV irradiation of
the nearby HH 80N object, that illuminates the part of the core facing HH 80N,
which results in an abundance enhancement of some of the detected species.
Subject headings: ISM: individual (HH 80N) — ISM: molecules — radio lines:
ISM — stars: formation — ISM: abundances —
1. Introduction
IRAS 18162−2048 is a high mass protostar, with a luminosity of ∼ 2 × 10⁴ L⊙, powering
the most luminous and largest Herbig-Haro (HH) system, HH 80/81/80N, associated with a
1Departament d’Astronomia i Meteorologia, Universitat de Barcelona, Martı i Franques 1, 08028
Barcelona, Catalunya, Spain
2Institut de Ciencies de l’Espai, (CSIC-IEEC), Campus UAB, Facultat de Ciencies, Torre C5 - parell 2,
08193 Bellaterra, Catalunya, Spain
3Department of Physics and Astronomy, University College London, London, WC1E 6BT, UK

– 2 –
very highly collimated radio jet (Rodrıguez et al. 1980; Reipurth & Graham 1988; Martı et
al. 1993). This source is located in the GGD 27 region, at a distance of 1.7 kpc in Sagittarius
(Rodrıguez et al. 1980). A far-IR spectroscopic study of the HH 80/81/80N system shows
that the FUV field radiated by the ionized material in the shock recombination region is able
to induce the formation of a photodissociation region (PDR) in the surrounding medium of
the HH objects and the jet flow (Molinari et al. 2001). The HH 80N object has not been
detected in the optical neither at near infrared wavelengths, which is likely a consequence of
the extinction due to a molecular cloud in the foreground (Martı et al. 1993).
A dense clump of 20 M⊙ was found ahead of HH 80N, firstly detected in ammonia (Girart
et al. 1994) and afterward detected in other species, such as CS and HCO+ (Girart et al.
1998). BIMA array observations (with 10′′ of angular resolution) carried out by Girart et al.
(2001) (hereafter GEVWH) showed that the CS (2–1) emission traces a ring-like structure,
with a radius of 0.24 pc, seen edge on. This observed morphology is most likely the result
of a strong CS depletion in the inner region of the core (GEVWH). The analysis of the CS
kinematics suggests that this structure is contracting with an infall velocity of 0.6 km s−1.
Assuming a gas temperature of 17 K, equivalent to the ammonia rotational temperature
(Girart et al. 1994) the sound speed is ∼ 0.3 km s−1, implying supersonic collapse. In
addition, the CO (1–0) emission reveals a bipolar outflow that implies the presence of an
embedded protostellar object within the HH 80N core (GEVWH).
In recent years, observations have found that a number of HH objects have associated
molecular condensations. Typically, these clumps are cool (∼ 10–20 K), dense (& 3 ×
104 cm−3), small (sizes of . 0.1 pc and masses of . 1 M⊙), starless and show little or no
evidence of dynamical interaction with the stellar jet (e.g. HH 1/2: Torrelles et al. 1994; Viti
et al. 2006; HH 34: Anglada et al. 1995). They are possibly of the same type as the transient
small clumps found by Morata et al. (2005) in L673. The high molecular abundances of
some species (e.g., CH3OH, NH3, HCO+) found in these clumps (Girart et al. 2005; Viti et
al. 2006) suggest a chemical alteration induced by the UV radiation incoming from the HH
object (Taylor & Williams 1996; Viti & Williams 1999; Viti et al. 2003). However, BIMA
observations towards the HH 2 region reveal that despite the generally quiescent nature
of the molecular condensations ahead of the HH objects, complex dynamical and radiative
interactions occur in this region (Girart et al. 2005). The dense core ahead of HH 80N seems
to be one of these examples of irradiated cores (Girart et al. 1994, 1998), but it has two
peculiarities that make this region an interesting target to study. First, the HH 80N core is
significantly larger and more massive than those described above, and shows star formation
signatures (GEVWH). This suggests a more complex scenario involving a variety of physical
processes. Second, the core shows supersonic infall velocity, which differs from what standard
contracting core models predict (e.g. Shu et al. 1987; Basu & Mouschovias 1994; Ciolek &

– 3 –
Mouschovias 1995) or what is observed in other contracting cores (Williams et al. 1999;
Belloche et al. 2002; Furuya et al. 2006; Swift et al. 2006). This raises the question whether
the outflow has triggered or at least sped up the collapse of the core (GEVWH).
In this work we present the study of the emission of different molecular species observed
in the HH 80N core with the BIMA interferometer. Our aim is to characterize the proper-
ties of the emission for different molecular tracers and to establish their deviations from the
CS (2–1) emission analyzed in GEVWH. We also attempt to provide some possible explana-
tions for the origin of these observed differences by means of a qualitative comparison with
other regions, but with special attention to the HH 80N influence. A subsequent analysis of
the physical properties as well as a modeling of the chemistry of the core ahead of HH 80N
will be reported in a forthcoming paper. In § 2 we present our observations. Their analysis
is shown in § 3. In § 4 we discuss the results. Finally, in § 5, we summarize our conclusions.
2. Observations
The 10-antenna BIMA array observations were carried out between November 1999 and
May 2001. The phase calibrator used was the QSO J1733−130 and the flux calibrators were
Mars, Uranus or Neptune depending on the epoch. A total of 12 frequency setups were used,
one at 218.2 GHz and the rest covering frequencies between 85.1 and 109.8 GHz. All the
frequency setups were observed in the C configuration apart from the 93.1 GHz frequency
setup which was observed in the D configuration. The C configuration had baselines between
6.3 to 100 m, providing an angular resolution of ∼ 5′′ and ∼ 9′′ at 1 mm and 3 mm,
respectively. The D configuration had baselines between 6.3 and 30 m, providing an angular
resolution of ∼ 25′′ at 3 mm. Each frequency setup has upper and lower frequency bands.
The digital correlator was configured to sample part of the 800 MHz wide IF passband in
several windows. The typical window for the line observation was configured with a 25 MHz
bandwidth and 256 channels, giving a spectral resolution typically of ∼ 100 kHz, which
corresponds to a velocity resolution of ∼ 0.15 km s−1 and ∼ 0.3 km s−1 observing at 1 mm
and 3 mm, respectively. For the continuum maps, typical windows of 0.1 GHz divided in 32
channels were used.
The phase tracking center of the observations was set at α(J2000) = 18h19m18.s618 and
δ(J2000) = −20◦40′55.′′00. The data were calibrated using the MIRIAD package. Maps
were made with the visibility data weighted by the associated system temperature and using
natural weighting. Different taper functions were used to improve the signal-to-noise ratio
depending on the transition. Table 1 lists characteristic parameters of channel as well as
continuum emission maps. The table gives the frequency of the transition, the resulting

– 4 –
synthesized beam, the channel resolution and the rms noise of the maps at the channel
resolution.
3. Results and analysis
Table 1 lists the transitions (excluding hyperfine components) of all detected molecules:
C18O, HCO+, H13CO+, HCN, CS, SO, N2H+, C3H2 and CH3OH. The Table also lists the
transitions of several molecules that were undetected, among them SiO and H2CO. The
1.4 mm continuum emission was detected marginally with a flux density of 61 ± 16 mJy,
peaking at α(J2000) = 18h19m17.s81 and δ(J2000) = −20◦40′42.′′70, while no continuum
emission was detected at 3.1 mm with an upper limit of ∼ 12 mJy beam−1 (at the 3–σ
level). Very Large Array 2 cm continuum observations with the D configuration (beamsize
8.1′′ ×4.9′′) do not show emission towards the 1.4 mm continuum peak up to 0.27 mJy beam−1
(at the 3–σ level) (Martı et al. 1993). The combination of 2 cm and 1.4 mm flux density
yields α ≥ 2.0 where α is defined as Sν ∝ να, being Sν the flux density at frequency ν. This
lower limit value obtained for the spectral index is clearly compatible with having thermal
dust emission. Figure 1 shows the integrated emission of the detected lines superimposed on
the 8 µm Spitzer image retrieved from the Spitzer archive. For reference, we define the bright
central source seen in the 8 µm Spitzer image as the core center (α(J2000) = 18h19m17.s81
and δ(J2000) = −20◦40′47.′′74).
As seen in Fig. 1, all the detected molecules (except for N2H+) present an elongated
structure with a position angle of ∼ 120◦ (i.e. the direction of the major axis) following
approximately the same morphology revealed by the dark lane seen in the 8 µm Spitzer image.
Clearly, CS is the most extended molecular tracer showing half-power angular dimensions
of 60′′ × 25′′. SO, HCN and HCO+ behave similarly to CS showing approximately the
same angular size, while CH3OH, C18O, H13CO+ and C3H2, present smaller sizes, typically
50′′ × 15′′.
Figure 2 shows the channel maps for the different species over the ∼ 10.5 to ∼ 13.1 km s−1
velocity range, where most of the emission is detected. The 1.4 mm continuum emission is
included in the bottom right panel of this figure. The emission of most of the species
has a clumpy morphology with different substructures along the core. As mentioned above,
GEVWH analyzed the CS (2–1) emission and found that the flattened structure is consistent
with a ring-like structure seen edge on. Thus, on basis of this result and for clarity, we divided
the core in the different parts of the ring analyzed by GEVWH, plus some other structures.
The features indicated in the first row of Fig. 2 belonging to the ring are: (1) the

– 5 –
eastern side of the ring that appears as a clump seen at 11.0–11.5 km s−1 (hereafter we will
call this component East Ring); (2) the western side of the ring, that consists of a clump
visible at the same velocities as the East Ring (hereafter, West Ring); (3) the red-shifted
side of the ring that is seen at 12 km s−1 as a clump spatially coincident with the core
center (hereafter, CR-Ring); (4) in addition, we define the blue-shifted side of the ring at
the center of the core as the CB-Ring, seen in 10.52 km s−1 channel. The other features
that do not seem to belong to the ring are: (5) the eastern elongated structure found at red-
shifted velocities, 12.6–13.1 km s−1, eastwards of the East Ring structure (hereafter, RSE,
following the nomenclature used in GEVWH); (6) the northern blue-shifted clump seen only
at 11 km s−1 (hereafter, NB). This nomenclature will be followed in the forthcoming analysis.
The inspection of channel maps of Fig. 2 reveals an interesting differentiation between
molecular tracers. In addition, the kinematic complexity becomes evident along the major
axis of the core. The molecules can be grouped according to the morphology of their emission:
(a) CS, SO and CH3OH. CS and SO are characterized by having the brightest emission
in the East Ring. They also trace other structures such as the West Ring, the NB and the
RSE. CH3OH shows a similar morphology to CS and SO even though its emission is more
compact and it is weaker. In particular, the emission of CH3OH in the RSE and CB-Ring is
very marginal.
(b) HCO+ and HCN. The strongest emission of these species, especially HCO+, arises
in the CR-Ring where it shows a prominent clump. In addition, these two species trace the
RSE structure. However, the peculiarity of this group of species is that they show little
or no emission in the East Ring, unlike the rest of species. The emission of H13CO+, the
optically thin isotopologue of HCO+, appears more compact being only significant in the
11.0 to 12.0 km s−1 velocity channels. The H13CO+ emission is consistent with the HCO+
and HCN emission. However, the East Ring shown faintly by HCO+ and missed by HCN
is clearly traced by H13CO+. As the two species of this group have a large dipole moment,
the lack of emission in the most abundant HCO+ isotopologue probably means that there
is a foreground cold and low density layer efficiently absorbing their emission (Girart et al.
2000).
The rest of the species exhibit peculiar features and can not be included in any group:
the emission of C3H2 is quite similar to that of H13CO+ and traces all the structures except
RSE and NB. On the other hand, C18O only traces the East Ring and the RSE structures.
Finally, the N2H+ emission is more compact than the other species not only due to the
poor angular resolution, but to the poor signal-to-noise ratio of the observations that would
prevent us from detecting any extended emission.

– 6 –
3.1. Analysis of the morphology and kinematics
To better study the kinematic signatures as well as the morphological differences between
the detected species, we performed a set of position-velocity (PV) plots along the major
(P.A. = 122◦) and minor (P.A. = 32◦) axis of the core. Subsequently, we analyzed the
properties of the emission for the different species by modeling the emission as an optically
thin and uniform contracting ring-like structure. This model has been found to fit well the
CS emission (GEVWH). The model consists, basically, in a spatially thin disk seen edge-on.
A similar model was first used by Ohashi et al. (1997) to study the emission of the contracting
core associated with IRAS 04368 + 2557 in L1527. The parameters of our model are the
inner and outer radii of the ring, Rin and Rout, respectively, the infall velocity, Vinf , and the
intrinsic line width ∆V. Our model does not account for rotation because GEVWH found
it to be negligible (≤ 0.2 km s−1), neither for dynamical infalling, for simplicity. For clarity,
we show in Fig. 3 a 3D view of the model geometry. This figure indicates the components
of the ring defined in § 3, as well as the directions of minor and major axis. Our strategy is
to obtain synthetic PV plots in the minor and major axis of the edge-on ring-like structure,
and to compare them with the PV plots taken from the data. Although the ring model is
assumed to be spatially thin, we convolved the spatial axis of all the PV plots taken from the
model with the angular resolution of our observations. A similar procedure was performed
in GEVWH in their attempt to study the CS emission. The authors obtained an inner and
outer radii of Rin= 23′′ and Rout= 35′′ (∼ 4×10⁴ AU and ∼ 6×10⁴ AU, respectively), an
infall velocity of ∼ 0.6 km s−1, and a line width of 0.8 km s−1. In our analysis, we adopted
the same model parameters as GEVWH but leaving the inner and outer radii of the ring
as free parameters. For consistency, we first analyzed the CS (2–1) data. Once the CS
emission is modeled, it becomes a reference for the rest of species. We found a Rout of 35′′
(∼ 6×10⁴ AU) and a Rin of 15′′ (∼ 2.5×10⁴ AU) being the latter value somewhat smaller
than that obtained by GEVWH. For other species, the use of different values of Rin and/or
Rout does not improve significantly the appearance of the residual PV plots. Thus, in those
cases we adopted the same Rin and Rout as for the CS.
Figure 4 shows the PV plots along the major and minor axis of the emission, as well
as the residual PV plots after subtracting the best-fit model from the data. As found by
GEVWH, the model fits the CS emission reasonably well. However, the PV plots for the
other species reveal that they trace the contracting ring–like structure in a non-uniform
fashion. The residual PV plots show some of the structures defined above as important
features of emission and absorption for most species:
- RSE. This eastern elongated structure, which is visible in CS, SO, HCO+, C18O and
marginally in HCN, is clearly independent from the contracting ring as pointed out by

– 7 –
GEVWH. The RSE exhibits a clear linear velocity gradient with increasing velocity
toward the east, i.e., as it gets closer to HH 80N.
- NB. It is clearly seen in the PV plots along the minor axis of CS, SO and CH3OH
(and marginally C18O). Due to its position (20′′ east from the emission expected from
the ring in the minor axis PV plot) this clump is probably independent from the ring
structure.
- East Ring. It appears as a spot seen in the residual PV plots along the major axis
of CS, SO and C18O (and marginally CH3OH) located at 11 km s−1 at the eastern
part of the ring. Although its position indicates that the East Ring seems to belong
to the ring structure, the residual PV plots show that its emission clearly exceeds the
emission generated by the uniform ring model.
- West Ring. Contrary to the other structures, the West Ring does not show significant
emission in the residual PV plots for almost all the species. Only CS, SO and C18O seem
to show marginal emission in the western part of the ring structure. This implies that
for the majority of the species the molecular emission is consistent with the emission
expected for the ring model in this part of the ring.
- CR–Ring. The CR-Ring seems to be physically part (at least partially) of the ring
structure but it exhibits stronger emission than that expected from the ring model for
HCN and, especially HCO+, as clearly seen in the residual PV plots.
- CB–Ring. This structure is visible as negative contours in the residual PV plots for
the major and minor axis for most of the species. The CB-Ring component is best
traced by CS, but presents an important lack of emission for the rest of species, being
most evident for HCO+.
3.2. Relative abundances
Table 2 lists the positions that we consider most representative of the structures defined
previously. Figure 5 shows the spectra of the detected transitions taken at the five selected
positions shown in Table 2. Note that some of the spectra taken at the center of the core
present two velocity components, separated by ∼ 1 km s−1. This result, especially evident
for CS, is perfectly compatible with the contracting ring-like morphology found previously
for the core and, in fact, these two velocity components appear to coincide with the CB–
Ring and CR–Ring components. Another general feature is that the spectra show narrow
linewidths, with a FWHM ranging from 0.6 to 1.4 km s−1, which indicates that the gas in

– 8 –
the cores is not shocked (typical linewidths found in shocked regions are 6-7 km s−1, e.g.
Bachiller et al. 1995).
From the spectra of Fig. 5 we derived the column densities in all the components. To
do so, we used RADEX, a non-LTE excitation and radiative transfer code that can provide
us constraints on the gas density, kinetic temperature and/or the column density (van der
Tak et al. 2007). RADEX was used adopting the temperature of 17 K, which is close
to the rotational temperature obtained from ammonia (Girart et al. 1994). We used the
HCO+ (3–2) and H13CO+ (3–2) lines observed by Girart et al. (1998) in combination with
the H13CO+ (1–0) (smoothed to the CSO angular resolution) of our dataset to constrain
the range of possible values for the average gas density. We calculated line intensity ratios
of these lines assuming a comparable beam dilution. Then, we ran the code to explore
the densities that yield brightness temperatures ratios compatible with our measured values
(within a 20 per cent range due to uncertainties).
We found a possible range of 5 × 10⁴ – 1.3 × 105 cm−3 for the average gas density in
the core. Once the density range is constrained and the kinetic temperature fixed, using
RADEX again we were able to search for the column density range that yields the line
intensities measured in the spectra of Fig. 5. For HCO+, the column density was derived
using the optically thin isotopologue H13CO+ and adopting a carbon isotope abundance
ratio, C12/C13, of 63 (Langer & Penzias 1990; 1993). The results are presented in Table 3.
In order to clarify the scenario that leads to the chemical properties observed in each
structure we computed the relative abundances with respect to CS. The reason for adopting
such a scale is that CS appears to be the most fiducial molecule since its chemistry seems
to be directly related to dense gas. In fact, it is the molecule that more regularly traces the
contracting edge-on ring. In addition, as the lines involved in this analysis were taken with
the same configuration and beam sizes, then the missing flux effects are probably canceled
out. Another advantage of using the molecular abundances relative to CS is that most of the
observed transitions have a high critical density similar to CS (2–1) and, hence, they trace
approximately the same gas (with the possible exception of C18O). The resulting ranges of
fractional abundances with respect to CS corresponding to the density range derived above
are shown in Table 4.
We also calculated the logarithmic median and the standard deviation of the relative
abundances for the same molecules detected in the HH 80N clump over a sample for three
types of environments related with dense gas found in the bibliography: molecular clumps
associated with HH objects, low-mass star-forming cores and dark molecular clouds. Figure 6
shows the comparison of the fractional abundances of these three types of environments with
the values of Table 4 (see figure caption for information on the sources of these samples).

– 9 –
The description of the chemical properties seen in Fig. 6 led us to classify the observed
molecules depending on the variability of their relative abundances between the different
components of the core:
(a) C18O is the molecule that presents the major variability between components. It
exhibits a high relative abundance with respect to CS towards RSE (between a factor of 2
to 5 with respect to the rest of components) although it is undetected or has low relative
abundances in the rest of the components.
(b) SO, CH3OH and HCO+ have abundances higher than CS but presents a moderate
variability. The comparison between their relative abundances with respect to CS in the
different components of the core for the different species in this group never exceeds a factor
of 3. There is, however, a difference between the molecules in this group: while SO and
CH3OH relative abundances are maximum at the East Ring position, HCO+ presents the
highest abundances towards CR-Ring and West Ring.
(c) C3H2 and HCN exhibit a moderate variability and each molecule shows a distinct
behavior. Clearly, C3H2 is poorly detected along the core. On the other hand, as seen
in § 3, HCN has a similar morphology as HCO+. Since both molecules have comparable
dipole moments, the HCN emission may be considerably self-absorbed, similarly as HCO+.
Therefore, HCN relative abundances are likely underestimated in most components of the
core.
4. Discussion
4.1. Star formation activity within the core
This work presents the results of a molecular survey carried out with BIMA towards the
star forming core ahead of HH 80N, for which the CS and CO data were already reported
in GEVWH. From the CS data, GEVWH detected an elongated dense core with 0.24 pc
of radius seen edge on. The properties of the CS emission suggested that it was tracing a
ring structure contracting with a striking supersonic infall velocity (0.6 km s−1). The central
’hole’ of the ring is presumably the result of molecular depletion due to the high central
density that might be reached in this core. From the CO data, GEVWH found a bipolar
outflow that is a signpost of an ongoing star forming process in the core. The Spitzer 8 µm
and the BIMA 1.4 mm dust images show a bright source located at the center of the bipolar
CO outflow. This strongly suggests the presence of an embedded protostellar object within
the core, which powers the bipolar outflow.

– 10 –
The CS emission was used in GEVWH to derive the mass of the ring structure. Their
obtained value, which is 12 M⊙ assuming X(CS) = 2×10⁻⁹ (10 M⊙ belonging to the main
core, and 2 M⊙ to RSE), is somewhat lower than the value obtained from NH3 (20 M⊙,
Girart et al. 1994). The 1.4 mm continuum emission is barely resolved, which implies that
it arises from a region with a size of ∼ 104 AU in diameter. The mass of the dust can be
estimated using the formula
Md =S1.4D
2c2
2kTdν2k1.4
(1)
where S1.4 is the continuum flux measured at 1.4 mm, D is the distance to the source, Td is
the dust temperature, and k1.4 is the mass opacity coefficient at 1.4 mm. In our calculations
we assume a k1.4 of 0.83 cm2 gr−1 obtained from k1.3 for a density of nH2≃ 106 cm−3 (Col. 2
in Table 2 of Ossenkopf & Henning 1994) and assuming a dust opacity index of 2, and
a temperature range of 20–40 K (Jennings et al. 1987), which is among the temperatures
expected from classical theoretical models of protostellar envelopes (e.g. Adams & Shu
1985). Note that this expression uses the Rayleigh-Jeans approximation, valid at millimeter
wavelengths. For our values the mass of the dust is 0.019-0.036 M⊙. Adopting a gas-to-dust
ratio of 100, the total mass of the envelope traced by the dust emission is 1.9-3.6 M⊙
Bontemps et al. (1996) found a relationship between the outflow momentum flux, the
envelope mass and the bolometric luminosity. GEVWH found that the envelope mass was
almost an order of magnitude higher than the values predicted by Bontemps et al., for the
measured CO momentum flux. However, Bontemps et al. derived the mass of the envelope
for the sources in their sample by integrating the 1.3 mm emission over a region corresponding
to ∼ 0.05 pc (104 AU), whereas GEVWH used the mass derived from the CS emission, which
traces a region with a radius of 0.24 pc. The derived mass from the 1.4 mm dust corresponds
to a region of size approximately similar to that used in Bontemps et al. Thus, if we use the
total mass of the envelope derived from the 1.4 mm flux, then the relationship between the
envelope mass and the CO outflow momentum flux fits very well.
The study of the circumstellar mass surrounding the YSOs at several radii is a useful
tool to track their evolution (Andre & Montmerle 1994). Class 0 YSOs are best interpreted
as very young protostars whose dense circumstellar envelope still contains an important
reservoir of mass to be accreted. Therefore the fact that the bulk of the mass of the HH 80N
core is found at large radii from its central embedded YSO suggests that this object should
be at the beginning of the main accretion phase and, hence, it is another signpost of being
an extremely young YSO found probably in the Class 0 stage (e.g. Girart et al. 2009).

– 11 –
4.2. Chemical properties
The analysis of the other species of the molecular survey confirms that their morphol-
ogy roughly follows the ring-like morphology seen in CS, contracting with a supersonic infall
velocity (∼ 0.6 km s−1), though this is a first-order result: a more accurate analysis re-
veals that most of the molecular species, although tracing approximately the same region as
CS, show important local differences. This deviation reflects a possible combination effect
of excitation, optical depth and molecular abundance, being the latter the most plausible
candidate to explain most of the observed differences.
In this section, we attempt a simple discussion on the possible origin of the observed
differentiation by means of a qualitative comparison with the chemistry observed in several
environments associated with the dense gas. We investigate whether the chemistry observed
in the HH 80N core is the result of a strong central depletion and of photochemical effects
caused by the UV radiation coming from the HH 80N object, as pointed out by GEVWH.
4.2.1. The ring-like morphology and the central depletion
As suggested by GEVWH, the ring-like structure is likely due to the freeze–out of the
molecules onto the dust grains at the inner regions of the core, where high densities are
expected. In addition, there is a young protostellar object embedded in the core. Thus, the
conditions of the central part of the core should resemble those found in protostellar cores.
In this section we analyze the inner structure of the core by comparing it qualitatively with
other similar regions.
When modeling the radial variation of molecular abundances in a circumstellar envelope
one has to take into account the effects of the central embedded YSO, heating the inner part
of the core, which causes partial sublimation of the icy dust mantles (e.g. IRAS 16293-2422:
Ceccarelli et al. 2000; Schoier et al 2002; NGC1333: Maret et al. 2002, 2004; Jørgensen et
al. 2005; Bottinelli et al. 2007). However, we do not see any signpost of a warm component
(temperatures of several tens of K) in the HH 80N core, which could be due to either the low
luminosity or the youth of the YSO, as well as the distance of the region (in other words,
the expected warm region is likely highly beam diluted).
Outside the undetected warm inner region, the HH 80N core exhibits a large region
where molecules seem to be strongly frozen in the icy mantles, except possibly for NH3
(Girart et al. 1994) and N2H+, molecules that seem to exhibit a more compact emission.
Unfortunately, from the analysis of the PV plots we are not able to determine whether other
species deplete at different radii from the center of the core than that of CS. In any case,

– 12 –
the depletion radius of the HH 80N core (∼ 2.5×10⁴ AU) is significantly larger (by 3–4
times) than those obtained for prestellar cores by Tafalla et al. (2006). Because the densest
gas traced by molecular species is expected to be found at the inner radius of the ring, the
lower value of the possible range of average densities for the HH 80N core found in § 3.2
(5 × 104 cm−3) can be taken as a lower limit for the density at the depletion radius (i.e.
depletion density). As the Class 0 object forming inside the HH 80N core is very young, the
core probably still retains the initial conditions for star formation. Hence, there might be
some physical connection with the prestellar cores, specially with those that are found on the
verge of dynamical collapse. The CS is depleted at densities of the order of a few 104 cm−3
in prestellar cores (Tafalla et al. 2002; Pagani et al. 2005), slightly below the lower limit for
the depletion density in the HH 80N core. The large depletion radius and densities found
for the HH 80N core suggests high central densities. This could be due to a more evolved
stage of the HH 80N core with respect to prestellar cores, favored by its rapid collapse.
Surrounding the ‘frozen’ region, the HH 80N core has a molecular shell or ring-like
structure. Since a minimum gas density is required to observe a given molecular transition,
the detection of some specific transitions of our dataset can provide an estimation of the lower
possible densities of this shell (i.e. at outer radius 6 × 10⁴ AU). In particular, the detection
of HCO+ (1–0) line implies densities higher than 2.4 × 103 cm−3 (for which this transition
is easily detectable, Evans et al. 1999). In summary, we conclude that the densities traced
by the molecular emission associated with the ring-like structure are above ∼ 2× 103 cm−3,
reaching values likely higher than 5 × 104 cm−3 at the inner radius.
4.2.2. The components of the ring-like structure
In Figure 3 we present the most likely scenario as seen by an hypothetical observer. In
the following we analyze the enhancement of some species on the basis of this scenario and in
the frame of the UV irradiation. Our main consideration is the effect of the distance of each
component with HH 80N. The fact that HH 80N may not lie in the same plane of sky as the
core does not affect qualitatively our analysis. This picture implies higher photochemical
activity in the East Ring and moderate or low photochemical effects for the CR-Ring, West
Ring and CB-Ring. In particular, Table 3 shows that the column densities of CS, CH3OH,
C18O and SO follow fairy well this trend: most of them are higher in the East Ring than in
the West Ring.
One of the most evident results of Fig. 6 is that the enhancement of SO in the East Ring
component (the closest in projection to HH 80N) resembles that obtained for the clump ahead
of the HH 2 jet (Girart et al. 2005) and determined to be due to chemical effects induced

– 13 –
by an enhanced radiation field. This trend is also observed for CH3OH and C18O. Figure 7
also shows that SO and CH3OH are higher than the typical range of values of low mass star
forming cores. The caveat to this scenario is HCO+, which presents similar column densities
in all the components of the ring (with the exception of CB-Ring) instead of being greater in
the East Ring and CR-Ring, as one would expect if the radiation field impinging on the ring
were higher than the interstellar radiation field. This result indicates that other parameters,
apart from the effect of the distance to HH 80N, also play a role on the chemistry of the core.
Clearly, a detailed modeling, which is however beyond the scope of this paper, is required in
order to characterize the chemistry of the core ahead of HH 80N.
Molinari et al. (2001), using a simple model, derived a value of 670 G0 for the FUV field
emanating from the recombination region in HH 80N. From this value, only the fraction of
photons that impinges to the HH 80N core over the total has to be taken in account. Taking
0.2 pc as the distance between the core and the HH object, and assuming that the core is
seen edge on from HH 80N, we obtain a dilution factor of 1/16, which yields ∼ 40 G0 for the
side of the core facing HH 80N (the East Ring). Interestingly, this value is within the range
of possible values for the radiation field expected to impinge the clump ahead of HH 2 (Viti
et al. 2003). However, note that the dilution factor derived above is based on a projected
distance. Therefore, its value as well as the estimated FUV are upper limits.
On the other hand, based on the range of average density values estimated in § 3.2,
the derived column density through the ring seen from the edge of the core is N(H2) =
2.5 − 6.5 × 1022 cm−2. Then, the derived the visual extinction, Av, from the relationship
N(H2) ≃ 1021Av (Spitzer 1978) is between 25–65 mag, much greater than the values where
the photochemical effects are attenuated (e.g. Viti & Williams 1999). Although HH 80N does
not lie exactly on the same plane of the ring, these high extinction values are only approx-
imate and indicate that the UV photons hardly penetrate deep inside the core. Therefore,
any photochemical effects that may affect the East Ring are likely to happen on the ”surface”
of the ring.
The decrease of photochemical activity in the parts of the ring further away than the
East Ring is possibly a combined effect of geometrical dilution and the presence of a low
density cloud component. In fact, the distance from HH 80N to the western parts of the
ring is a factor of 2–3 greater than that to the illuminated side (∼ 0.2 pc), and much larger
than the typical distances between other HH objects and their respective associated clumps
(∼ 0.05 pc, Viti et al. 2006).

– 14 –
4.2.3. Other molecular clumps in the region
The RSE and NB structures were poorly detected in the species of our survey. Both
structures appear to be spatially independent from the ring structure in addition of being
smaller. Therefore, these components may present different chemistry simply because their
basic physical structure might be different from the physical structure of the ring. There is,
however, an important difference between RSE and NB: while C18O exhibits a high relative
abundance with respect to CS in RSE reaching values typical of those found in the HH 2
region (I4 position), it is undetected in NB. In addition, HCO+ is not enhanced with respect
standard molecular cloud values in NB, implying that the UV radiation does not play a
significant role in the chemistry of this structure.
5. Conclusions
We have carried out an observational study with the BIMA array of the star forming
dense core ahead of HH 80N in order to characterize its morphological and chemical prop-
erties. We present maps of the different molecular species detected with BIMA (CS, HCO+,
H13CO+, HCN, CH3OH, SO, C18O, and C3H2) as well as 1.4 mm continuum dust emission.
These maps reveal a complex morphology and kinematics for this core. In an attempt to un-
derstand this complexity, we obtained PV plots for all the species along the major and minor
axis of the core and modeled them in a similar procedure as in GEVWH. Subsequently, we
derived the column density and the relative abundances with respect to CS in some selected
positions along the core. Our main conclusions can be summarized as follows:
1. The 1.4 mm dust emission was detected marginally in a position close to the Spitzer
8 µm source. This source is located at the center of the CO bipolar outflow found by
GEVWH and, therefore, it is likely its powering source. The 1.4 mm dust emission
traces the inner and denser region (. 104 AU) of the dense core around the protostar.
The mass of the dense core (1.9–3.6 M⊙) at scales up to ≃ 104 AU and the momentum
flux of the CO bipolar outflow correlate well with what is expected for very young
Class 0 sources (Bontemps et al. 1996).
2. The integrated emission for most of the molecular tracers reveals a clumpy and elon-
gated morphology with a size of ∼ 60′′× 25′′ (0.5 pc × 0.2 pc) and a position angle of
∼ 120◦. Three main structures can be distinguished: the central core around the proto-
star and two smaller clumps (RSE and NB). As previously observed in CS by GEVWH,
the molecular emission associated with the central core arises from the outer shell of
the dense core. This molecular shell has a ring-like morphology seen edge-on, which is
– 15 –
well-traced by CS and partially traced by the other molecular species. The inner and
outer radii of the ring are ∼ 2.5 × 10⁴ AU and ∼ 6.0 × 10⁴ AU, respectively, and the
estimated averaged density ranges between 5×104 cm−3 and 1.3×105 cm−3. The ring
structure has been divided in four regions, following the CS clumpy morphology: the
East Ring, Central Red-shifted Ring (CR–ring), the Central Blue-shifted Ring (CB–
ring) and the West Ring. The kinematics traced by the different molecules are similar
to that found for CS by GEVWH, which is indicative of contraction with a supersonic
infall velocity of 0.6 km s−1.
3. The relative abundances with respect to CS derived in different positions were com-
pared with those obtained for a sample of dark clouds, low-mass star-forming cores
and other molecular clumps ahead of HH objects. This comparison suggests that the
relative abundances of SO, C18O and, to a lesser extent CH3OH, are partially com-
patible with the high level of UV irradiation generated by HH 80N. In particular, the
section of the molecular ring facing HH 80N (East Ring), as well as RSE, seem to
be the regions more exposed to the UV radiation, whereas in the other sections of
the ring and NB the photochemical effects seem to be less important. The molecular
ring has a visual extinction, Av, between 25 and 65 mag seen from the edge. These
values are much higher than the maximum extinction at which the UV radiation can
effectively penetrate the ring and release the molecular species from the dust mantles
triggering the photochemistry (Viti et al. 2003). Inside the molecular ring, at scales of
. 2.5 × 10⁴ AU, where extremely high densities are found, the dense core exhibits a
“frozen” region, where the observed molecules are significantly depleted onto icy dust
mantles.
We thank the anonymous referee for his valuable comments, which helped to improve
the paper. JMG, RE, MBT and JMM are supported by MEC grant AYA2005-05823-C03
(co-funded with FEDER funds). JMG and JMM are partially supported by AGAUR grant
2005 SGR 00489. SV acknowledges financial support from an individual STFC (ex-PPARC)
Advanced Fellowship.
REFERENCES
Adams, F. C., & Shu, F. H. 1985, ApJ, 296, 655
Andre, P., & Montmerle, T. 1994, ApJ, 420, 837

– 16 –
Anglada, G., Estalella, R., Mauersberger, R., Torrelles, J. M., Rodrıguez, L. F., Canto, J,
Ho, P. T. P., & D’Alessio, P. 1995, ApJ, 443, 682
Bachiller, R., Liechti, S., Walmsley, C. M., & Colomer, F. 1995, A&A, 295, L51
Basu, S., & Mouschovias, T.C. 1994, ApJ, 432, 720
Belloche, A., Andre, P., Despois, D., & Blinder, S. 2002, A&A, 393, 927
Blake, G. A., Sandell, G., van Dishoeck, E. F., Groesbeck, T. D., Mundy, & L. G., Aspin,
C. 1995, ApJ, 441, 689
Bontemps, S., Andre, P., Terebey, S., & Cabrit, S. 1996, A&A, 1996, 311, 858
Bottinelli, S, Ceccarelli, C., Williams, J. P., & Lefloch, B. 2007, A&A, 463, 601
Ceccarelli, C., Castets, A., Caux, E., Hollenback, D., Loinard, L., Molinari, S., & Tielens,
A. G. G. M. 2000, A&A, 355, 1129
Ciolek, G. E., & Mouschovias, T. C. 1995, ApJ, 454, 194
di Francesco, J., Hogerheide, M. R., Welch, W. J., & Bergin, E. A. 2002, AJ, 124, 2749
Evans, N. 1999, ARA&A, 37, 311
Furuya, R. S., Kitamura, Y., & Shinnaga, H. 2006, ApJ, 653, 1369
Girart, J.M., et al. 1994, ApJ, 435, L145
Girart, J. M., Estalella, R., & Ho, P. T. P. 1998, ApJ, 495, L59
Girart, J. M., Estalella, R., Ho, P. T. P., & Rudolph, A. L. 2000, ApJ, 539, 763
Girart, J. M., Estalella, R., Viti, S., Williams, D. A., & Ho, P. T. P. 2001, ApJ, 562, L91
Girart, J. M., Viti, S., Estalella, & Williams, D. A. 2005, A&A, 439, 601
Girart, J. M., Rao, R., & Estalella, R. 2009, ApJ, in press (arXiv:1108.3415)
Jennings, R. E., Cameron, D. H. M., Cudlip, W., & Hirst, C. J. 1987, MNRAS, 226, 461
Jørgensen, J. K., Schoier, F. L., & van Dishoeck, E. F. 2004, A&A, 416, 603
Jørgensen, J. K., Bourke, T. L., Myers, P., Schoier, F. L., van Dishoeck, E. F., & Wilner,
D. J. 2005, ApJ, 632, 973
Langer, W. D., & Penzias, A. A. 1990, ApJ, 357, 477
Langer, W. D., & Penzias, A. A. 1993, ApJ, 408, 539
Maret, S., Ceccarelli, C., Tielens, A. G. G. M., Caux, E., & Castets, A. 2002, A&A, 395,
573
Maret, S., et al. 2004, A&A, 416, 577

– 17 –
Maret, S., Ceccarelli, C., Tielens, A. G. G. M., Caux, E., Lefloch, B., Faure, A., Castets, A.,
& Flower, D. R. 2005, A&A, 442, 527
Martı, J., Rodrıguez, L. F., & Reipurth, B. 1993, ApJ, 416, 208
Molinari, S., Noriega-Crespo, A., & Spinoglio, L. 2001, ApJ, 547, 292
Morata, O., Girart J. M., & Estalella, R., 2005 A&A, 435, 113
McMullin, J. P., Mundy, L. G., & Blacke, G. A. 1994, ApJ, 437, 305
McMullin, J. P., Mundy, L. G., Blacke, G. A., Wilking, B. A. Mangum, J. G., & Latter, W.
B. 2000, ApJ, 536, 845
Ohashi, N., Hayashi, M., Ho, P. T. P., & Momose, M. 1997, ApJ, 475, 211
Ossenkopf, V., & Henning, T. 1994, A&A, 291, 943
Pagani, L., Pardo, J. -R., Apponi, A. J., Bacmann, A., & Cabrit, S. 2005, A&A, 429, 181
Pratap, P., Dickens, J. E., Snell, R. L., Miralles, M. P. Bergin, E. A. Irvine, W. M., &
Schloerb, F. P. 1997, ApJ, 486, 862
Reipurt, B., & Graham, J. A. 1988, A&A, 202, 219
Rodrıguez, L. F., Moran, J. M., Gottlieb, E. W., & Ho, P. T. P. 1980, ApJ, 235, 845
Schoier, F. L., Jørgensen, J. K., van Dishoek, E. F., & Blacke, G. A. 2002, A&A, 390, 1001
Shu, F. H., Adams, F. C., & Lizano, S. 1987, ARA&A, 25, 23
Spitzer, L. 1978, Physical Processes in the Interestellar Medium (New York: Wiley)
Swift, J., Welch, W. J., di Francesco, J. D., & Stojimirovic, I. 2006, ApJ, 637, 392
Tafalla, M., Myers, P. C., Caselli, P., Walsmley, C. M., & Comito, C. 2002, ApJ, 569, 815
Tafalla, M., Santiago-Garcia, J., Myers, P. C., Caselli, P., Walmsley, C. M., & Crapsi, A.
2006, A&A, 455, 577
Taylor, S.D., & Williams, D.A. 1996, MNRAS, 282, 1343
Torrelles, J. M., Gomez, J. F., Ho, P. T. P., Rodrıguez, L. F., Anglada, G., & Canto, J.
1994, ApJ, 435, 290
Ungerechts, H., Bergin, E. A., Goldsmith, P. F., Irvine, W. M., Schloerb, F. P., & Snell, R.
L. 1997, ApJ, 482, 245
van der Tak, F. F. S., Black, J. H., Schoier, F. L., Jansen, D. J., & van Dishoeck, E. F. 2007,
A&A, 468, 627
van Dishoeck, E. F., Blake, G. A., Geoffrey, A., Jansen, D. J., & Groesbeck, T. D. 1995,
ApJ, 447, 760
– 18 –
Viti, S., & Williams, D. A. 1999, MNRAS, 310, 517
Viti, S., Girart, J. M., Garrod, R., Williams, D. A., &, Estalella, R. 2003, A&A, 399, 187
Viti, S., Girart, J. M., & Williams, D. A. 2006, A&A, 449, 1089
Williams, J. P., Myers, P. C., Wilner, D. J., & di Francesco, J. 1999, ApJ, 513, L61
This preprint was prepared with the AAS LATEX macros v5.2.

– 19 –
Table 1: Characteristic values of BIMA channel maps.Transition ν Beama PA rms ∆vch Peak emission b
GHz Configuration arcsec×arcsec degrees (Jy beam−1) (km s−1) (Jy beam−1)
HCO+ (1–0) 89.1885 C 14.1 × 6.9 1.2 0.13 0.33 3.65
HCN (1–0) 88.6319 C 14.2 × 6.7 1.7 0.13 0.33 1.55
C3H2 (21,2–10,1) 85.3389 C 14.7 × 7.0 1.8 0.13 0.34 0.87
CS (2–1) 97.9810 C 15.6 × 7.1 3.0 0.18 0.30 2.36
C18O (1–0) 109.7822 C 13.9 × 6.5 −2.9 0.29 0.27 2.77
SO (23–12) 109.2522 C 14.2 × 6.6 −2.0 0.24 0.40 ≤0.72
SO (21–11) 86.7543 C 18.1 × 7.8 0.6 0.15 0.58 ≤0.45
SO (32–21) 99.2999 C 15.6 × 7.2 0.7 0.21 0.29 3.05
SO (55–44) 215.2207 C 7.8 × 3.8 −2.4 0.93 0.41 ≤2.79
CH3OH (2n–1n) 96.7414c C 16.9 × 7.5 −6.0 0.18 0.30 1.33
N2H+ (1–0) 93.1738d D 32.1 × 18.8 10.0 0.73 0.16 6.01
H13CO+ (1–0) 86.7543 C 16.2 × 7.6 2.0 0.16 0.34 0.99
C2S (67–56) 86.1841 C 17.2 × 7.9 1.1 0.12 0.58 ≤0.36
SiO (2–1) 86.8461 C 18.1 × 7.9 −0.8 0.12 0.32 ≤0.36
HCOOH (40,4–30,3) 89.5792 C 17.6 × 7.8 −0.9 0.16 0.55 ≤0.48
H2CS (30,3–20,2) 103.0404 C 14.5 × 6.2 2.0 0.15 0.57 ≤0.45
H2CO (30,3–20,2) 218.2222 C 7.7 × 3.7 −9.5 0.94 0.40 ≤2.82
Continuum (1.4 mm) 217.0 C 7.3 × 3.0 −4.5 0.016 — 0.061
Continuum (3.1 mm) 99.5 C 15.5 × 6.8 −6.7 0.004 — ≤0.012
aA taper function of 4′′ was used in all the channel maps except for C18O(1–0) (2.0′′), SO(55–44) (2.5′′),
SiO(2–1) (2.0′′), H2CS(303–202) (2.0′′), H2CO(303–202) (2.5′′) and continuum (1.4 mm) (1.0′′) maps.b Upper limits are 3 times the rms.c Frequency for the 20–10–A line. The 2−1–1−1–E line was also detected.d Frequency for the F1 F=23–12 hyperfine line. All the hyperfine 1–0 components were detected.

– 20 –
Table 2: Representative positions.
Position
Structure α (J2000) δ (J2000) Map counterparta
RSE 18h19m21.s10 −20◦41′15.′′0 CS (2–1) > 12 km s−1 eastern elongation
NB 18h19m18.s10 −20◦40′26.′′9 CS (2–1) 11 km s−1 northern peak
East Ring 18h19m19.s03 −20◦40′53.′′0 SO (32–21) 11 km s−1 eastern peak
CB-Ring & CR-Ring 18h19m17.s81 −20◦40′47.′′7 HCO+ (1–0) 12 km s−1 center peak
West Ring 18h19m16.s57 −20◦40′31.′′5 CS (2–1) 11 km s−1 western peak
aMolecule used to better highlight the structure.
Table 3: Column densitiesa (in units of 1013 cm−2)Molecule CS SO CH3OHb HCN HCO+d C3H2 C18O
Nm NM Nm NM Nm NM Nm NM Nm NM Nm NM Nm NM
RSE 0.9 0.5 1.2 0.7 ≤ 1.8c ≤ 2.1c 0.6 0.3 ≤ 2.5c ≤ 1.8c ≤ 0.2c ≤ 0.1c 171 180
NB 2.2 1.0 2.1 1.1 ≤ 3.0c ≤ 3.4c ≤ 1.0c ≤ 0.5c ≤ 2.2c ≤ 1.6c ≤ 0.5c ≤ 0.2c ≤ 154c ≤ 162c
East Ring 4.6 2.4 13.6 6.4 10.0 11.4 1.8 0.7 7.2 5.1 0.8 0.4 280 293
CB-Ring 1.2 0.7 2.1 1.2 ≤ 2.6c ≤ 2.9c ≤ 1.2c ≤ 0.5c ≤ 4.8c ≤ 3.4c ≤ 0.5c ≤ 0.3c ≤ 123c ≤ 130c
CR-Ring 2.8 1.5 3.1 1.7 2.7 3.1 6.6 2.2 6.9 4.7 0.5 0.2 ≤ 123c ≤ 130c
West Ring 4.1 2.1 8.7 4.0 5.1 5.8 6.2 2.2 9.1 6.0 1.0 0.5 166 175
aNm and NM are the column densities derived for the lower (5 × 104 cm−3) and upper (1.3 × 105 cm−3)
values of the density range derived from the RADEX analysis (see § 3.2)b Including CH3OH-A and CH3OH-E.c Upper limits are 3 times the rms noise.d Derived from H13CO+.
Table 4: Relative abundances with respect to CSa
Molecule SO CH3OHb HCN HCO+ C3H2 C18O
Xm XM Xm XM Xm XM Xm XM Xm XM Xm XM
RSE 1.3 1.3 ≤ 2.0c ≤ 4.0c 0.7 0.5 ≤ 2.7c ≤ 3.4c ≤ 0.2c ≤ 0.2c 190 346
NB 1.0 1.1 ≤ 1.4c ≤ 3.3c ≤ 0.5c ≤ 0.4c ≤ 1.0c ≤ 1.6c ≤ 0.2c ≤ 0.2c ≤ 72c ≤ 157c
East Ring 3.0 2.7 2.2 4.8 0.4 0.3 1.6 2.2 0.2 0.2 61 125
CB-Ring 1.7 1.7 ≤ 2.1c ≤ 4.1c ≤ 1.0c ≤ 0.7c ≤ 4.0c ≤ 4.8c ≤ 0.5c ≤ 0.4c ≤ 103c ≤ 183c
CR-Ring 1.1 1.2 1.0 2.1 2.4 1.5 2.5 3.2 0.2 0.2 ≤ 45c ≤ 89c
West Ring 2.1 1.9 1.3 2.7 1.5 1.0 2.2 2.8 0.3 0.2 40 83
aXm and XM are the abundance values derived for the lower (5 × 104 cm−3) and upper (1.3×105 cm−3)
limits of the density range derived from the RADEX analysis (see § 3.2).b Including CH3OH-A and CH3OH-E.c 3–sigma upper limits.

– 21 –
Fig. 1.— Superposition of the Spitzer image (8 µm; color scale) and the zero-order moment
(integrated emission; white contours) over the 9.5–14.09 km s−1 velocity range, of the species
detected with BIMA in the HH 80N core. The Spitzer image shows the HH 80N core in
absorption against the background emission. The contour levels are 2, 4, 7, 10, 14, 18, 23,
and 30 times the rms of each map: 0.14 (CS and SO), 0.11 (HCN, CH3OH and HCO+), 0.1
(H13CO+ and C3H2), 0.17 (C18O) and 0.40 (N2H+) Jy beam−1 km s−1. The beam is shown
in the bottom right corner of each panel. The large and small crosses mark the HH 80N
object and the continuum peak at 1 mm, respectively. The tilted cross marks the NH3 peak
(Girart et al. 1994). The solid lines represent the minor (P.A. = 32◦) and the major (P.A. =
122◦) axes of the core. The dashed line gives approximately the orientation and extension of
the outflow detected by GEVWH (P.A. ∼ 80◦). The central bright source is likely associated
with the source powering the molecular outflow.

– 22 –
Fig. 2.— Channel velocity maps of the species shown in Fig. 1 over the 10.5 km s−1 to
13.0 km s−1 velocity range, with a velocity resolution of ∼ 0.5 km s−1. The level contours
are -3, 3, 5, 7, 9, 11, 13, 15, 18, and 21 times the rms noise level for each species. For
H13CO+ and C3H2 the contours -2 and 2 times rms the noise are also shown. The labels
shown in the first row indicate the parts of the ring-like morphology (see § 3), as well as
other structures. The thick solid contour shown in the bottom right panel represents 2 times
the rms of the 1.4 mm continuum emission. The beam for each species (filled ellipse) is
shown in the bottom right corner of the panels of the first column. The beam of the 1.4 mm
continuum emission (open ellipse) is shown in the bottom right corner of the bottom right
panel. The symbols are the same as in Fig. 1.

– 23 –
Fig. 3.— Sketch of the of the model geometry used in the analysis of the PV plots, including
a schematic representation of the HH 80N scenario that we propose in order to account for
the observed chemistry in the ring components discussed in § 4.2.2. Note that this figure is
not plotted to scale.

– 24 –
Fig. 4.— Sets of PV plots for (from left to right and from top to bottom): model, CS (2–1),
HCN (1–0), SO (32–21), CH3OH (20–10–A+), HCO+ (1–0), C18O (1–0), H13CO+ (1–0) and
C3H2 (21,2–10,1). For each set, the PV plots of the BIMA data are shown at the top and
the residual PV plots resulting from subtracting the data and the model are shown at the
bottom. The panels on the left represent the PV plots along the major axis while the panels
on the right represent the PV plots along the minor axis of the core. For the set of PV plots
obtained from the model, the two panels at the top show the best fit model (see text) for
the major (left) and minor (right) axis of the ring-like structure seen edge-on. The positive
offsets of the PV plots corresponds to South-East and to North-East directions for the major
and minor axis, respectively. The contour levels are -10, -8, -6, -4, -3, 3, 4, 6, 8, 10, 12, 14,
16, and 20 times the rms noise for each species. For H13CO+ and C3H2 the contours -2 and
2 times the rms noise are also shown. The dashed ellipse, drawn to highlight the best fit
model for the major axis, corresponds to a ring with a radius of 30′′.

– 25 –
Fig. 5.— Spectra of (from top to bottom) CS (2–1), SO (32–21), CH3OH (20–10)-A+, C18O (1–
0), HCN (1–0, F(2–1)), HCO+ (1–0), H13CO+ (1–0), C3H2 (21,2–10,1), and N2H+ (1–0, F1(0–
1)) towards (from left to right) RSE, NB, East Ring, CB and CR-Ring, and West Ring
components given in Table 2. For RSE, the spectra were obtained for a box of ∼ 15′′× 25′′.
– 26 –
.
SO0.1
1
Dark cloudsLow mass SFRHH objects
HH 2 (I4)
.
CH3OH
1
10
Independent from the ring
Belongs to the ring
.
HCO+
1
10
N[m
olec
ule]
/ N
[CS]
.
HCN
1
10
.
C3H
2
0.1
1
.
C18
O10
100
RSE
NB
East Ring
CR-Ring
West Ring
CB-Ring
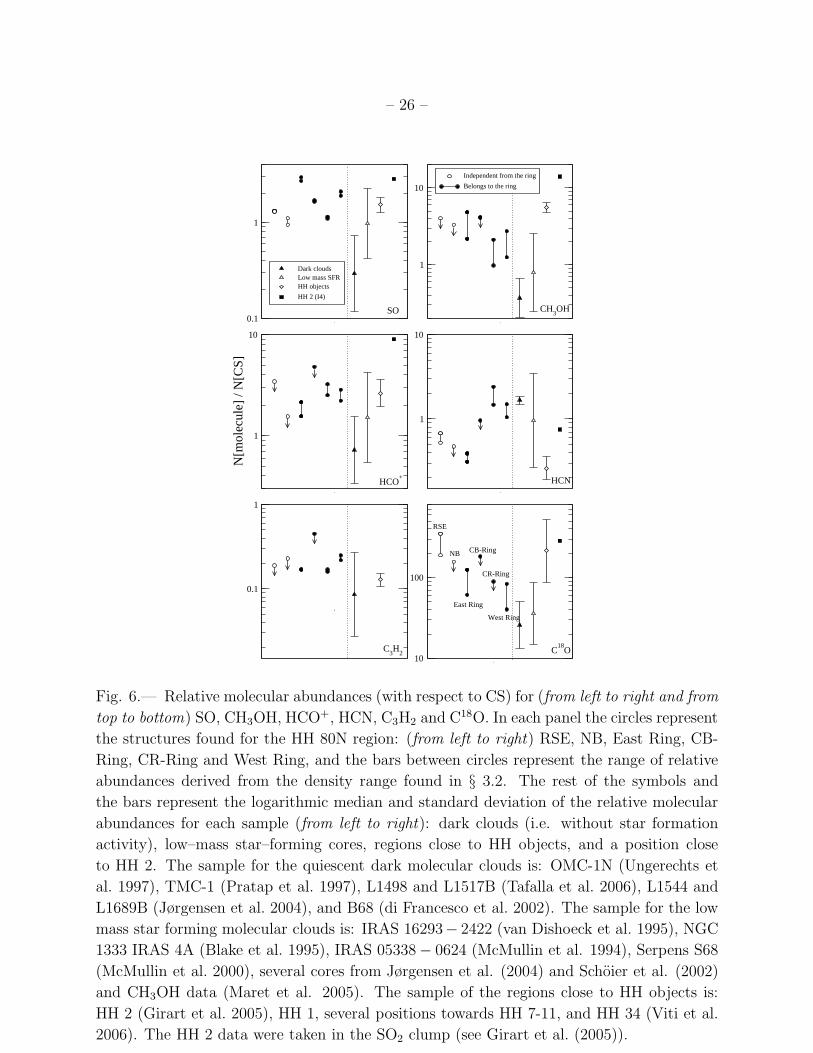
Fig. 6.— Relative molecular abundances (with respect to CS) for (from left to right and from
top to bottom) SO, CH3OH, HCO+, HCN, C3H2 and C18O. In each panel the circles represent
the structures found for the HH 80N region: (from left to right) RSE, NB, East Ring, CB-
Ring, CR-Ring and West Ring, and the bars between circles represent the range of relative
abundances derived from the density range found in § 3.2. The rest of the symbols and
the bars represent the logarithmic median and standard deviation of the relative molecular
abundances for each sample (from left to right): dark clouds (i.e. without star formation
activity), low–mass star–forming cores, regions close to HH objects, and a position close
to HH 2. The sample for the quiescent dark molecular clouds is: OMC-1N (Ungerechts et
al. 1997), TMC-1 (Pratap et al. 1997), L1498 and L1517B (Tafalla et al. 2006), L1544 and
L1689B (Jørgensen et al. 2004), and B68 (di Francesco et al. 2002). The sample for the low
mass star forming molecular clouds is: IRAS 16293− 2422 (van Dishoeck et al. 1995), NGC
1333 IRAS 4A (Blake et al. 1995), IRAS 05338− 0624 (McMullin et al. 1994), Serpens S68
(McMullin et al. 2000), several cores from Jørgensen et al. (2004) and Schoier et al. (2002)
and CH3OH data (Maret et al. 2005). The sample of the regions close to HH objects is:
HH 2 (Girart et al. 2005), HH 1, several positions towards HH 7-11, and HH 34 (Viti et al.
2006). The HH 2 data were taken in the SO2 clump (see Girart et al. (2005)).

– 27 –
0,1 1N(SO)/N(CS)
1
10
N(C
H3O
H)/
N(C
S)
East Ring
West Ring
CR-Ring
NBRSE CB-Ring
Fig. 7.— CH3OH vs. SO relative molecular abundances (with respect to CS). The circles
represent the structures found for the HH 80N region and the bars associated with the circles
represent the range of relative abundances for the density range found in § 3.2. The rest of
the symbols and bars are the same as in Fig. 6.