PALNNING AHEAD: - United Nations Development Programme
163
MINISTRY OF LABOUR, INVALIDS AND SOCIAL AFFAIRS EVALUATION OF THE NATIONAL TARGETED PROGRAMME ON HUNGER ERADICATION AND POVERTY REDUCTION AND PROGRAMME 135 UNITED NATIONS DEVELOPMENT PROGRAMME Ha Noi - Viet Nam November 2004 TAKING STOCK, PALNNING AHEAD:
-
Upload
khangminh22 -
Category
Documents
-
view
3 -
download
0
Transcript of PALNNING AHEAD: - United Nations Development Programme
MINISTRY OF LABOUR, INVALIDSAND SOCIAL AFFAIRS
EVALUATION OF THE NATIONAL TARGETEDPROGRAMME ON HUNGER ERADICATION
AND POVERTY REDUCTION AND PROGRAMME 135
UNITED NATIONSDEVELOPMENT PROGRAMME
Ha Noi - Viet NamNovember 2004
TAKING STOCK,PALNNING AHEAD:


FOREWORD
Although Viet Nam is still a poor country, it has made impressive progress on poverty reduction. Povertyincidence has more than halved since 1990 and the well-being of people has increased. People in poorcommunes nowadays have smiling faces and Viet Nam has achieved considerable progress in fulfillingthe MDGs on poverty reduction for 2015. These significant outcomes have resulted from the strongcommitments from various levels of government, mass organisations, international organisations,enterprises and the poor themselves.
Nevertheless, despite the achievements, further poverty reduction faces fresh challenges. Theseinclude: (i) the gap in income and well-being among rural and urban areas, among geographical regionsand among specific population groups; (ii) resources not being focused on the most difficult areas likemountainous areas, ethnic minority populated areas, etc., (iii) dependency behaviour and thinking is stillpopular; (iv) recent poverty reduction gains are not sustainable; and (v) a large number of householdslive barely above the poverty line.
In this context, the National Targeted Programmes (NTPs) which are an integral part of theComprehensive Poverty Reduction and Growth Strategy (CPRGS) and the 5-year socio-economic plans,have an important role in delivering resources to poor areas. These programmes guarantee high ratesof growth and contribute to sustainable HEPR.
This evaluation report of the NTP for HEPR and Programme 135 acknowledges the achievements ofboth programmes. But, in order to improve the programmes in the future, the report also highlights someissues, which need to be addressed during the next phase, from 2006-2010 to have greater impact onthe well-being of Viet Nam’s poor.
In particular, the report recommends improved targeting of poor households to increase the efficiencyof the programmes and incentives for poor households to escape poverty. It also recommendsstrengthening staff capacity at various levels, especially at the commune level and of local leaders ofmass organizations; developing an efficient and effective programme monitoring and evaluation system;and better efforts to implement Grassroots Democracy.
The report, another example of the close cooperation among the Government of Viet Nam, UNDP andother donors, helps build an effective HEPR programme, ensuring both the achievement of programmetargets on poverty reduction and VDGs for the next phase.
NGUYEN THI HANGMinister
Ministry of Labour, Invalids and Social Affairs
JORDAN D. RYANResident Representative
United Nations Development Programme


ACKNOWLEDGEMENTSThis evaluation report was produced under the guidance of Dr. Dam Huu Dac (Vice Minister, MOLISA)and Dr. Nguyen Hai Huu (Director, Social Protection Division, MOLISA), who are also director anddeputy director respectively, of the UNDP-supported project VIE/02/001 responsible for this evaluation.
The report is the result of the combined efforts of numerous individuals and institutions. Earlier drafts ofthis report were shared at an internal workshop at Ha Long City on 13-14 July 2004, and at agovernment-donor workshop at Do Son on 17-18 August 2004. Suggestions and comments byworkshop participants have helped improve the report.
Overall management - Dang Kim Chung (Deputy Director) and Le Viet Hoa (Manager) of ProjectVIE/02/001
Support from institutions – CEM, HEPR office, GSO, MARD, MOF, MPI, DOLISAs and various otheroffices in the selected provinces, districts and communes
National consultants – Vu Tuan Anh, Nguyen Van Bay, Nguyen Tuan Doanh, Nguyen Cao Duc, VuXuan Dao, Nguyen Thien Duc, Le Hoang Dung, Le Tien Dung, Nguyen Viet Hai, Nguyen Thi Hang, TranThi Hanh, Vu Duc Hoi, Hoang Thanh Huong, Nguyen Thi Lan Huong, Truong Quoc Khanh, Than Phuc,Dao Tran Phuong, Doan Hong Quang, Nguyen Kien Quyet, Dao Tien Thang, Nguyen Thang, NguyenChien Thang, Thai Phuc Thanh, Le Dai Tri, Ngo Truong Thi, Vu Van Toan, Le Dang Trung, Nguyen HuuTu, Phung Duc Tung, Truong Vinh Tung
International consultants – Peter Brooke (Bannock), Alain Jacquemin (Project VIE/02/001), MarkMinford (Bannock), Koos Neefjes (Freelance consultant), Paul Shaffer - IDEA International), Mike Winter(Freelance consultant)
Ideas and information contributors - Bob Baulch (IDS), Doan Mau Diep (ICD, MOLISA), Tong Thi Dua(GSO), Koos Neefjes (Freelance consultant), Rab Nawaz (STA, Project VIE/01/023), Nguyen TienPhong (UNDP), Edwin Shanks (Freelance consultant), Rob Swinkels (World Bank), Carrie Turk (WorldBank), Nguyen Quang Vinh (CEM)
Peer reviewers – Vu Tuan Anh (Institute of Economics), Alwyn Chilver (DFID), Robin Mearns (WorldBank), Koos Neefjes (Freelance consultant), Martin Rama (World Bank), Paul Shaffer (IDEAInternational), Jonathan Pincus (UNDP), Dang Kim Son (MARD)
UNDP – Do Thanh Lam, Divya Nair (Intern), Subinay Nandy, Nguyen Tien Phong, Nguyen Thuc Quyen,Kanni Wignaraja
Secretarial support – Pham Thi Duyen, Nguyen Thi Van Huong
Translation - Hoang Anh (ILSSA), Dang Hai Ha (MOLISA), Pham Hong Phuong (Project VIE/02/001),Le Van Son (Freelancer)
Coordinator and Principal Author - Saurabh Sinha (STA, Project VIE/02/001)
Copy Editing, Graphics and Layout – Dang Huu Cu (UNDP), Russell Goldman (FreelanceConsultant), Nguyen Ba Ngoc (Labour and Social Affairs Publishing House)

CONTENTS
Executive Summary.................................................................................................................................................................1A. Background of the Evaluation...............................................................................................................................10
I. Overall Objectives ..........................................................................................................................................................10II. Evaluation Framework..................................................................................................................................................11III. Scope of the Evaluation...............................................................................................................................................11IV. Structure of the Report.................................................................................................................................................16
B. Programme Context....................................................................................................................................................19
I. Evolution of HEPR as a NTP....................................................................................................................................19II. NTP on HEPR ................................................................................................................................................................21III. Programme 135 .............................................................................................................................................................25
C. Programme Evaluation..............................................................................................................................................29
I. Relevance of Programme Objectives, Targets and Components..................................................................291. Identification of Poor Households and Poor Communes..........................................................................292. Resource Allocation................................................................................................................................................55
II. Implementation Systems and Capacities...............................................................................................................68
1. Administrative Decentralization..........................................................................................................................682. Institutional Capacities ..........................................................................................................................................713. Financial Management System..........................................................................................................................794. Monitoring Programme Performance.................................................................................................................87
III. Impact of NTP on HEPR and P135 on house hold well-being...................................................................101
D. Conclusions .................................................................................................................................................................115
E. Implications for Design of NTP on HEPR for 2006-2010........................................................................120References..............................................................................................................................................................................128Annexes....................................................................................................................................................................................130

TABLES
1. Methods and Data Sources for the Evaluation ............................................................................................ 132. Trend in resource allocation for HEPR components ................................................................................. 233. Trend in resource allocation for P135 components ..................................................................................... 274. MOLISA threshold for identifying poor households ..................................................................................... 305. MOLISA threshold for identifying hungry households ................................................................................ 306. Awareness of how the list of poor households is prepared ..................................................................... 327. Distribution of households classified as poor by quintile .......................................................................... 358. Regional distribution of households classified as poor .............................................................................. 379. Increasing coverage of P135 ............................................................................................................................... 40
10. Regional distribution of population in poor communes .............................................................................. 4111. Distribution of population in poor communes by quintile ........................................................................... 4212. Distribution of access to HEPR sub-programmes by quintile .................................................................. 4313. Regional distribution of access to HEPR sub-programmes ..................................................................... 4414. Targeting Effectiveness of HEPR Programme Components .................................................................... 4515. Distribution of forms for supporting the poor in health care in provinces............................................. 4816. Number of health insurance cards for the poor 1998-2002 ..................................................................... 4817. Scale of support for implementation of education policy .......................................................................... 5218. Adjusted Plans for Programme 135 in Soc Trang ....................................................................................... 5819. Central Allocations for HEPR (2001-2003) ..................................................................................................... 5920. Central Allocations and non-central contributions - HEPR ....................................................................... 6021. Central Allocations and non-central contributions - P135 ......................................................................... 6022. Central Allocations per poor household for HEPR (2001-2003) ............................................................ 6423. Central Allocations and actual spending per poor household - HEPR ................................................ 6524. Average Central allocations and actual spending - HEPR (2001-2003) ............................................. 6625. Distribution of central allocation by sector (2001-2003) ............................................................................ 6626. Allocations and Actual Spending of P135 Central Funds, 2001-2003 ..................................................8027. Allocations and Spending of P135 funds, district and commune levels, 2003................................... 8028. Central Allocations and actual spending of HEPR funds, 2001-2003 .................................................. 8129. Questions addressed in the Integrated impact assessment...................................................................10330. Annual health care expenditure of households without health insurance (by region and
quintile).........................................................................................................................................................................10631. Share of expenditure on health care in total consumption expenditure (by region and
quintile).........................................................................................................................................................................10632. Average annual school fee per student by by category and as % of total household
expenditure.................................................................................................................................................................10833. Types of other educational expenses per annum (from Ninh Thuan provine – South East)......10834. Sgare of expenditure on education in total household consumption expenditure
(by region and quintile)...........................................................................................................................................10935. Share of Tuition Fee in total educational expenditure of households without fee exemptions
(by region and quintile)...........................................................................................................................................109

FIGURES
Study Locations............................................................................................................................................................181. Organizational Structure of the NTP on HEPR ...............................................................................................252. How many households on the list of poor households are considered poor? .....................................353. Percentage of household members always received health care exemption .....................................504. Reasons that eligible household members did not receive health care exemption............................515. Reasons that eligible households did not receive tuition fee reduction..................................................536. Non-central contribution as % of total - HEPR ................................................................................................617. Central allocations and non-central contributions - P135 ............................................................................628. Breakdown of non-central contributions by province-P135 .......................................................................629. Breakdown of non-central contributions by province – HEPR ...................................................................63
10. Self-reported importance of money saved from the health fee exemption across regions.......... 10511. Would health care have been sought even without health fee exemption?....................................... 10512. School enrollment without school maintenance or fee exemption/reduction..................................... 107
BOXES
1. Criteria for the selection of a programme as a NTP ................................................................................... 202. Support Policies ........................................................................................................................................................ 223. HEPR-JC Projects .................................................................................................................................................... 224. Steps in preparing the list of poor households .............................................................................................. 315. Villagers’ criteria for assessing household well-being status .................................................................. 336. Constraints in application of poverty thresholds ........................................................................................... 337. Delays and errors in Poor Household Cards ................................................................................................. 368. Criteria for the selection of communes under Programme 135 .............................................................. 389. Criteria for the selection of communes under Programme 133/143 ..................................................... 39
10. Increase in poor communes in spite of decline in poverty ........................................................................ 4011. Entitlements of households classified as poor .............................................................................................. 4212. Factors constraining access to poor households ......................................................................................... 4613. Decentralisation of Programme 135 in Tuyen Quang ................................................................................ 7214. Elements of a Programme Monitoring System............................................................................................... 8815. Functioning of Project Supervision Boards and people’s Inspection Boards .................................... 9516. Effects of improved grassroots democracy on mobilisation and distribution of resources
for poverty reduction................................................................................................................................................. 9617. Requirements for tracking poverty...................................................................................................................... 99
ABBREVIATIONS
ADB Asian Development BankCEM Committee for Ethnic MinoritiesCPC Commune Peoples’ CommitteeCPRGS Comprehensive Growth and Poverty Reduction StrategyCRP Centre for Rural ProductionDARD Department of Agriculture and Rural DevelopmentDFID Department for International Development (UK)DOET Department of Education and TrainingDOH Department of HealthDOLISA Department of Labour, War Invalids and Social AffairsDPC District Peoples’ CommitteeDPI Department of Planning and InvestmentEA Executing AgencyGOVN Government of Viet NamGSO General Statistical OfficeHEPR Hunger Eradication and Poverty Reduction (Programme 133)HEPR-JC Hunger Eradication Poverty Reduction and Job Creation (Programme 143)ICD International Cooperation DepartmentIDS Institute of Development Studies (Sussex, UK)ILSSA Institute of Labour and Social Science AffairsM&E Monitoring and EvaluationMARD Ministry of Agriculture and Rural DevelopmentMDGs Millennium Development GoalsMRDP Viet Nam-Sweden Mountainous Rural Development Programme MOET Ministry of Education and TrainingMOF Ministry of FinanceMOLISA Ministry of Labour, Invalids and Social AffairsMOH Ministry of HealthMPI Ministry of Planning and InvestmentNTP National Targeted ProgrammeP135 Programme 135PDCED Programme for Socio-economic Development in Communes faced with Extreme
Difficulties (also known as Programme 135)

PER Public Expenditure ReviewPPA Participatory Poverty AssessmentPPC Provincial Peoples’ CommitteePRA Participatory Rural AppraisalPRSP Poverty Reduction Strategy PaperQHS Qualitative Household SurveySBV State Bank of Viet NamSPB Social Policy BankSFDP Small Farmers Development ProgrammeSRV Socialist Republic of Viet NamUNDP United Nations Development ProgrammeVBARD Viet Nam Bank for Agriculture and Rural DevelopmentVCP Viet Nam Communist PartyVDGs Viet Nam Development GoalsVFF Viet Nam Fatherland FrontVHLSS Viet Nam Household Living Standards Survey

EXECUTIVE SUMMARY
BACKGROUND
Viet Nam is unusual in many respects. Few countries in the world combine a strong commitment towardspoverty reduction, an elaborate hunger eradication and poverty reduction programme and strongachievements in poverty reduction.
The scope of the hunger eradication and poverty reduction programme (HEPR) is indeed impressive.Formally launched in 1998 as Programme 133 and targeted at poor households across the country, it isbudgeted for a total sum of approximately VND19,000 billion that comes from state and local budgets.
The HEPR programme consists of six policies offering free healthcare, school tuition waivers, support toethnic minorities, support to vulnerable people, and funding for housing and production tools.Additionally, the programme comprises eight projects on credit, extension, infrastructure, productionassistance, training of cadres, settlement of migrants into new economic zones, sedentarisation and settlement in poor communes and developing models for replication. The current programme was combined with Programme 120 in 2001 and extended up to 2005 as Programme 143.
From 1996-2002, a sum of VND14,695 billion was provided as concessional loans to 2.75 million households across the country. Up to 1.5 million health insurance cards had been distributed to poorhouseholds by 2002, and more than VND120 billion has been set aside for education programmes forthe poor.
Programme 135 (P135), or the Programme for socio-economic Development in Communes faced withExtreme Difficulties was also approved in July 1998. P135 was initially conceived as part of the NationalTarget Programme (NTP) but was split from the HEPR programme due to institutional imperatives.Initially, covering 1,715 communes, of which 1,568 were mountainous and 147 were in lowland areas,P135 including around 1.1 million households and over 6 million people. It has recently been expandedto cover 2,362 poor and remote communes. With a total investment of more than VND6,000 billion, from1998-2003, P135 has focused primarily on developing village and communal infrastructure as well asinter-communal infrastructure.
While the scale of investment and breadth of outreach is clear, what is less certain is the impact of thesetwo programmes on reducing poverty.
EVALUATION
Recognising the need to systematically assess the impact on poverty of the NTP on HEPR, the government (GOVN) requested UNDP assist the Ministry of Labour, Invalids and Social Affairs (MOLISA)in conducting an overall evaluation of the programme. Though separate, the evaluation of P135 was
MOLISA-UNDP: TAKING STOCK, PLANNING AHEAD 1

undertaken at the same time, because the two programmes were designed as one and have considerable overlaps. The two executing agencies, MOLISA and the Committee for Ethnic Minorities(CEM), proposed a joint evaluation to reduce costs and facilitate cross-programme learning that will helpin planning the next phase.
The purposes of the evaluation are to: (i) assess the overall effectiveness of the National TargetProgramme on Hunger Eradication and Poverty Reduction (NTP on HEPR) and Programme 135 inreducing poverty in Viet Nam, and (ii) draw lessons for designing the NTP on HEPR for the period 2006-2010.
The evaluation addresses both thematic and sectoral questions:
Are the programmes doing the right things? That is, are the programme objectives feasible and thetargeting approaches appropriate? How effectively do the programmes target poor households andpoor communes, and are public resources allocated for achieving sustainable poverty reduction sufficient?
Are the programmes doing things right? That is, are optimal institutional arrangements in place forefficient implementation of the programmes? To address this question issues such as the organizational structure, decentralisation, financial management and M&E systems, as well as institutional capacity to satisfactorily implement the two programmes are analysed.
What is the impact of the programmes on household well-being? And to what extent can well-beingbe attributed to specific results of the two programmes?
KEY FINDINGS
Targeting households and communes
It is easy to apply income-based criteria to determine which households should be the recipients of programme benefits. However, income levels are set arbitrarily and are difficult to compare across communes. Poor people acknowledge that the official list of poor households is prepared in a consultative way. However, there is often a discrepancy between the number of households officiallyclassified as poor and the number of households considered poor by village residents.
Commune officials classify a total of 11.4% of the population as poor. Even though “many” or “all” households on the list of poor households are considered poor by their neighbours, many poor households do not figure on the list because authorities do not have sufficient resources to include them.
Few “poor household” certificates have been issued to non-poor households. This extent of mis-targeting is not high by international standards.
In terms of access to programme benefits, less than 16% of all households in the country have accessto subsidized credit. Of these, 75% are poor. Similarly, less than 10% of households receive free healthinsurance; of these, more than 70% are poor. Of the 20% of households that receive tuition waivers, 70%are considered poor.
EXECUTIVE summary
2 MOLISA-UNDP: TAKING STOCK, PLANNING AHEAD

Though each of the sub-programmes in the NTP on HEPR, namely credit, health insurance and tuitionexemptions are reasonably well-targeted, reaching more than 70% of poor households in each case, thesub-programmes have very limited coverage among the total poor households in the country.
Nearly a quarter of all communes in the country benefit from Programme 135, covering about 15% of thetotal population. As more than half of them are below the poverty line, with 66% in the bottom two quintiles, P135 is fairly well targeted.
Resource Allocation
A fixed sum of VND500 million per poor commune under P135 is an apparently equitable distribution oflimited resources and has the benefit of clarity and transparency. But it is a relatively blunt instrument inrelieving poverty since communes with larger populations and/or communes with relatively more poorpeople (and hence greater infrastructure needs e.g. water supply, housing etc.) receive similar amountsof funding.
Although the GOVN has a formula for allocating state budget resources across provinces for the HEPRprogramme, it is not always clear how it is applied, and whether it is always followed.
There is a large variation in allocation of HEPR resources across provinces (both in absolute terms aswell as on a per household basis). Large allocations to less poor provinces, suggests that equally poorhouseholds in different provinces receive different amounts of government benfits.
This discrepancy is often further increased by provinces contributing their own funds to those allocatedfrom the state. Richer provinces are more likely to generate additional funds, whereas poorer provincesare heavily dependent upon central funding.
This strengthens the argument for the continuation of the NTP framework, but also highlights the needto develop a resource allocation mechanism that does not increase inter-provincial inequality.
In spite of provinces contributing additional funds, the total actual spending on a poor household remainslow. It varies from less than VND750,000 to about VND4.2 million per household per year. Even for well-resourced provinces (such as Tuyen Quang) this amounts to about VND11,000 per household perday, or less than USD1 a day. This amount of spending is unlikely to lead to large poverty reduction onits own – other policies are therefore necessary.
In the four provinces from which data on resource allocation were analysed, 50-85% of the centralresources during 2001-2003 were allocated for providing subsidized credit to the poor. If at all, the allocation for training HEPR staff was less than 1%.
Decentralisation and Participation
The NTP on HEPR is managed and implemented in a decentralised manner, and provincial authorities,particularly local Party organizations and Provincial People’s Committees (PPCs), have considerable discretion in allocating funds.
However, decentralisation below the provincial level is uneven. Most funds allocated to HEPR projectsare still controlled at the provincial and district levels (by sector departments), even though the responsibility for implementing the programmes lies with the communes.
EXECUTIVE summary
MOLISA-UNDP: TAKING STOCK, PLANNING AHEAD 3

In spite of intentions to decentralise P135, most districts still manage the planning, implementing andmonitoring of the programme’s different activities. By 2003, only 385 out of 2,362 (or only 16%) of the“poorest and most difficult communes” in 20 out of 49 provinces under P135 were “investment holders.”
Even where the management is devolved to the commune, spending plans still need approval at the district and provincial levels and may change in the approval process.
There has been some improvement in local level participation in decisions regarding implementation ofsome components of the two programmes. But this is largely attributable to the Grassroots DemocracyDecree (GRDD) and not to the HEPR programme. Even so, GRDD has had little impact in the remotestcommunes on capacity issues such as financial transparency which are central to the programme’s success.
Capacity Constraints
The limited capacities of staff and village leaders, especially in remote and mountainous communes, isoften used as an argument against decentralisation. But no effort has been made to reverse the trend asless than 1% of the programme budget is allocated to training cadres.
Village leaders play a crucial role in increasing consultion with locals and supplying them with information, especially in upland villages. However, their capacities are often limited, and in many casestraining efforts under the NTPs have focused on commune and higher-level People’s Committee cadres,instead of village leaders, heads of social organizations, and members of People’s Councils.
Mass organizations play an active role in the HEPR programme’s implementation at the grassroots level.But their effectiveness is hampered by weak technical capacities, limited influence on decision-makingat higher levels, insufficient integration with HEPR bodies and limited access to funds.
At the central level, the HEPR Office plays a critical role in coordination and monitoring the programme.However, it is limited by its stature and capacity, hampering its ability to perform effectively.
Adequate training needs to be combined concurrently with a system of incentives to improve the performance of the programme staff.
Financial Management System
The allocation of funds for Programme 135 is clear and transparent, and funds pass directly to communes or projects. In contrast to HEPR, poor communes are more aware of the amount of fundingavailable and are thereby more equipped to supervise the implementation of projects. However, meaningful financial information, particularly regarding the signing of contracts, is infrequently supplied.
This lack of transparency arises from the limited consultation that takes place during the planning stage.Although the financing system is relatively strong, the large number of separate sub-programmes withinHEPR prevents clear central oversight and control over programme funds. Moreover, the variety of funding sources makes the HEPR programme insufficiently transparent and accountable.
EXECUTIVE summary
4 MOLISA-UNDP: TAKING STOCK, PLANNING AHEAD

The flow of funds through the Treasury system from the central, province and district levels involves theuse of separate accounts which should make accounting for the use of funds relatively straightforward.But, adequate accounting, audit and review mechanisms are not in place, and the system relies heavilyon paper-based controls, such as formal annual reports, and one-off audit type checks by the StateInspectorate. As a result, it is difficult to accurately assess the use of funds or check whether those fundsare used or transferred for other purposes.
There is insufficient evidence to estimate how much of HEPR funds are “leaked,” or do not actually makeit to where they were allocated, because it is difficult to track allocations (even at the provincial level).Financial reports tend to lack actual spending details and recurrent spending cannot be tracked separately.
For recurrent expenditures e.g. staff training, salary/allowances, O&M costs etc., funding is delegated toorganizations such as DOLISA, CEM, and the Extension Centres, and funds are allocated along with thecurrent budgets of these organizations. Thus, the Treasury cannot distinguish between recurrent expenditure by the bodies concerned and current spending on the relevant elements of NTPs. This,again, limits transparency.
Overall, the potential for leakage exists in the HEPR programme, and is probably several times higherthan that of Programme 135. One of the most likely areas for leakage is in the procurement process forpublic capital works. Infrastructure and housing capital works are implemented through appointing contractors, often from the local area.
The main potential for leakage is likely to be at the commune level and efforts to tighten the systemshould be focused at this level. Where communes only passively receive benefits or households largelyreceive support in kind, there is a higher potential for leakage of funds due to limited involvement andaccountability of local people.
Financial documentation and recording at the commune level is a weak link in the system. Many localprogramme activities are not reflected in the accounts (e.g. providing housing to the poor, contribution bylabour, or materials) and commune finance staff often do not have adequate accounting skills.
Monitoring Programme Performance
Even though information on a variety of indicators for both programmes is regularly collected, this doesnot constitute a programme monitoring system. Input, output and final impact indicators are indiscriminately listed. Without analyzing the pathways of impact, it is impossible to tell how specific policies or projects lead to poverty reduction.
An absence of baseline data has made the present evaluation an extremely challenging exercise. Thereis little objective data to compare and assess changes in household well-being.
The success of the two programmes is judged solely by frequent estimations of the poverty rate. Butthere is considerable variation in the way in which poverty rates are calculated in communes. This variation arises from: (i) use of different sampling techniques (census or sample), (ii) the method of datacollection (self-reporting and/or village-level discussion or interviews), and (iii) the calculation of household income on the basis of this data (prices and conversion rates). Often these variations are dueto flexible interpretations of the definition of poverty lines.
EXECUTIVE summary
MOLISA-UNDP: TAKING STOCK, PLANNING AHEAD 5

Much of the tracking of poverty rates is driven by the pressure to meet poverty reduction targets set atthe central and provincial levels. Annually, exact numbers of households, are assigned to each village astargets based on a certain percentage. These targets are often at variance with what is achievable onthe ground.
While there is a strong case for the use of proxy indicators to better identify poor households, thereshould be clear guidelines on how to use the additional information to assess household well-being.
The central Executing Agencies (EAs) are unable to satisfactorily monitor the use of funds for HEPRactivities. Funds are allocated by the PPCs to the provincial departments, and central EAs are oftenunaware of how much funding is received by provincial departments for sub-programme activities.Additionally, there is no separate budget allocation for monitoring NTPs. Funds for programme monitoring are taken out of the normal annual budget of the EAs. Most agencies, however, are disinclined to spend resources for programme monitoring.
People’s Councils, People’s Inspection Boards and Project Supervision Boards have been strengthenedto some extent, and new legislation is likely to help strengthen them further. But progress reporting onthe NTPs takes place from the commune level upwards. There is currently a focus on outputs and outcomes, with no clear, formal mechanism for inputs from the Inspection and Supervision Boards.Furthermore, they monitor only those activities managed by the commune PC and not those managedby higher levels.
The HEPR Office and the EAs have very limited monitoring capacity. There is no full time monitoring staffin most EAs and provincial departments and there are few incentives for good monitoring.
Impact on household well-being of selected components
In the absence of a baseline survey or periodic tracking of outcomes, a mix of techniques were used toassess the impact of selected HEPR and P135 components on household well-being. The results of theQualitative Household Survey were combined with the results from the PPAs and the VHLSS 2002 to geta better idea of the programmes’ impact.
Credit
About half the respondents claimed to have benefited from access to credit. The small size and shortduration of the loans as well as a lack of support services were the dominant reasons for lack of a significantly positive impact.
Health
While free healthcare does not increase access to health facilities, the money saved is important for poorhouseholds. However, almost 25% of respondents were denied access to health care when they needed it because of complicated procedures or late arrival of health insurance cards.
Tuition Waiver
Waiving tuition increases school attendance of children from poor households. Twelve percent of poorhouseholds would not have enrolled their children without tuition waivers. But 20% of households reported difficulties because of complicated procedures or lack of knowledge about the programme.
EXECUTIVE summary
6 MOLISA-UNDP: TAKING STOCK, PLANNING AHEAD

Extension
Even though many respondents claimed a positive impact of extension programmes on production, otherevidence does not corroborate this. Respondents face problems that arise from limited training, insufficient staff, inappropriate technology, and lack of attention to marketing.
Sedentarisation
Nearly 75% of respondents reported no significant impact of sedentarisation on their well-being. Themain reasons include: lack of quality infrastructure, poor soil quality and lack of consultation in programme design.
Most respondents rated the impact of the infrastructure projects highly positive. The problems mentionedrelated to the poor quality and maintenance of local infrastructure.
IMPLICATIONS FOR DESIGN OF NTP ON HEPR FOR 2006-2010
Ten themes emerge from the overall evaluation. Addressing these issues will greatly enhance the programme’s effectiveness in the next phase. These are presented as proposals and grouped under fourmain categories:
1. Resource allocation and budgets
Provide programme funds as block grants to provinces to increase local-level autonomy
The next phase of the HEPR programme should move towards a system whereby provinces are formally and legally allocated annual block grants for funding poverty reduction activities. Provincesshould have considerable and official discretionary spending powers
Grants should consider (i) discretion over HEPR budgetary allocations that provinces already appear toenjoy, (ii) the new State Budget Law, which devolves further budgeting responsibilities to the provincialand local levels, and (iii) the location-specific nature of poverty which requires local - rather than national - planning.
Establish a transparent and easy-to-administer system of allocating budgetary resources toprovinces
A simple and transparent mechanism should be established for allocating annual funds to provinces. Itis important that the formula is simple, easy to administer, and widely disseminated so that a large number of people can understand the basis on which provincial allocations are made. In addition, theinformation used to calculate provincial allocations should be unambiguous and not subject to manipulation.
Build incentives by linking resource allocation to performance
The current HEPR funding mechanism provides no incentives (or sanctions) for improved (or deteriorating) performance at the provincial level. This issue could be addressed by setting-up a systemof (i) minimum conditions (MCs) for provincial access to annual block grants, and (ii) performance criteria (PCs) for assessing provincial performance.
EXECUTIVE summary
MOLISA-UNDP: TAKING STOCK, PLANNING AHEAD 7

2. Targeting poor households
Strengthen targeting mechanisms to increase the coverage of poor beneficiaries
The present system of identification of poor households uses arbitrarily-set poverty thresholds to assessthe household’s well-being against an absolute poverty standard. These are often at variance with localperceptions where relative poverty criteria are used to identify the poorest households. In addition, identification of poor households is driven by the pressure to meet poverty reduction targets, set at theCentral level.
Setting poverty reduction targets realistically, for example, to be determined over a two-year period ratherthan over one year, can help increase the coverage of poor beneficiaries.
3. Organization & Management
Develop mechanisms to promote transparency and accountability of financial management
Mechanisms to promote transparency and accountability, consistent with the spirit of the GrassrootsDemocracy Decree, could include expanding and deepening “commune development fund” mechanisms. Clear incentives and sanctions for the publication of programme budgets and plans, and astronger role for community-based monitoring are also essential.
Improve participation at local levels by operationalising the Grassroots Democracy Decree
Consistent with the Government’s Socio-economic Development Strategy for 2001-10, the primary aimof the NTP on HEPR for the next phase should be “empowerment of poor people,” to ensure their participation in decision making at all stages of the project cycle. At the same time, the programmes muststrengthen horizontal links with other projects and policies, especially in regards to administrative reformand the decentralisation processes.
Develop an effective M&E system with a focus on reporting and tracking intermediate indicators
The monitoring system presently used needs to be strengthened in four essential ways: (i) develop a setof intermediate indicators that help track outcomes, (ii) conduct a baseline study prior to the start of thenext phase, (iii) build-in plans for a mid-term review in 2008 and an evaluation in 2010-11, and (iv)streamline the reporting system to reduce the number of narrative reports.
Make the programme more manageable by reducing the number of programme components
Some components e.g. health cards, tuition waivers and extension do not need to be under the NTPframework and can be mainstreamed within their respective ministries. Consolidating and reducing thenumber of components of the HEPR programme, whilst maintaining the use of existing programme management boards, will make funding allocations more transparent. It will furthermore improve thefinancial accounting system and make funding choices easier.
All infrastructure-related components may be put together under a single programme such asProgramme 135, and all employment-related components could be moved to a separate programme tomake the HEPR programme leaner and more efficient.
EXECUTIVE summary
8 MOLISA-UNDP: TAKING STOCK, PLANNING AHEAD

4. Capacity Building
Build capacity at all levels, especially at the commune level including local cells and leaders ofmass organizations
Additional investment in capacity building is necessary for the successful implementation of the NTP onHEPR 2006-10. The total budget for training should be increased, and closer collaboration should besought with other capacity building efforts such as those under internationally-funded projects.
The next phase of the NTP on HEPR should also encourage capacity building of local people throughmass organizations, and other local groups (including informal groups and newly emerging local associations) to enhance the basic technical supervisory skills for local level monitoring.
Strengthen the stature and capacity of the HEPR Office for better programme management
The capacity of the HEPR Office in communication, organization, coordination, reporting and policyanalysis is critical for the successful implementation of the programme. However, the Office does notseem to enjoy the same level of administrative authority as other departments of MOLISA. This handicapsits ability to coordinate with other HEPR stakeholders.
The HEPR office should have a stronger mandate for monitoring and evaluating the performance ofprovinces and act as a central location for exchanging information and advising the government on thestrategic direction of the programme.
EXECUTIVE summary
MOLISA-UNDP: TAKING STOCK, PLANNING AHEAD 9

A. BACKGROUND OF THE EVALUATION
Formally launched in July 1998 as Programme 133, the Government of Viet Nam’s National TargetedProgramme on Hunger Eradication and Poverty Reduction (NTP on HEPR) has now been operationalfor nearly six years. It was renewed in 2001 for the period 2001-05 and combined with the EmploymentCreation Programme (Programme 120) to become Programme 143, or the National Target Programmeon Hunger Eradication, Poverty Reduction and Job Creation (NTP on HEPR-JC).
Programme 135, or the Programme for socio-economic Development in Communes faced with ExtremeDifficulties (PDCED) was approved by GOVN Decision No. 135 on 31 July 1998. Initially, it covered 1,715communes including 1,568 mountainous communes and 147 lowland communes with around 1.1 millionhouseholds and over 6 million people. The Programme has now expanded to 2,362 communes. To anextent it is part of the NTP but was split from the HEPR due to institutional imperatives.
The government undertakes periodic reviews and monitors the programmes. In particular, a mid-termreview of the NTP on HEPR was conducted by the Executing Agencies in October 2003, and of the P135by CEM in April 2004. However, there has not yet been an independent evaluation of the two programmes. External assessments conducted by donor agencies in the past were limited to certainaspects and components of the programme. A study on HEPR institutional capacity was commissionedby UNDP in 1999.
1During 2000-01, three components (credit, forestry and sedentarisation) were
assessed by consultants commissioned by the ADB.2
The latter was limited to only focus group discussions at central and local levels, and some qualitative case studies in Quang Tri, Quang Binh, HaGiang, Dak Lak and Lai Chau provinces. Other than these few reports, the cupboard of independent andcomprehensive assessments of the two programmes is rather bare.
I. OVERALL OBJECTIVES
Recognising the need to systematically assess the impact of the NTP on HEPR, the Government of VietNam requested UNDP to assist MOLISA in conducting an overall evaluation of the programme. An evaluation of P135 was also undertaken at the same time since even though separate, the two programmes were designed as one and have considerable overlaps.
The evaluation aims to:
(i) assess the overall effectiveness of the NTP on HEPR and Programme 135 in reducing povertyin Viet Nam
(ii) draw lessons for designing the NTP on HEPR for the period 2006-2010.
10 MOLISA-UNDP: TAKING STOCK, PLANNING AHEAD
1 UNDP (1999).2 ADB (2001).

II. EVALUATION FRAMEWORK
In order to assess the overall effectiveness of the two programmes in reaching their objectives, threeissues are central to the evaluation:
(i) Are the programmes doing the right things? That is, are the programme objectives feasible, the targeting approaches appropriate, and the programme components relevant? Are the two programmestargeting the right people (i.e. poor households and poor communes), and are sufficient public resourcesallocated for achieving sustainable poverty reduction?
(ii) Are the programmes doing things right? That is, are optimal institutional arrangements in place forefficient implementation of the programmes? This requires an analysis of decentralisation, financial management and M&E systems as well as a review of whether there is sufficient capacity to satisfactorily implement the programmes.
(iii) What is the impact of the programmes on household well-being? That is, given the targetingapproaches and the implementation systems, what is the impact of the programmes on the socio-economic status of poor households? To what extent can these households’ current well-being beattributed to the two programmes?
To address these questions, the evaluation was split into a number of components as discussed in Annex2. In a way, the components correspond to the different stages of the impact chain. Therefore, while theanalysis of targeting approaches and selection of programme components relate to the provision ofinputs, analysis of implementation systems (such as financial management and M&E) helps assess theprocess. Finally, to assess the programmes’ impact, the report looks at the effects of project outputs andwhether a causal relationship can be established between project outputs and changes in householdwell-being.
The extent of household participation in the two programmes was a key theme through all evaluationcomponents.
III. SCOPE AND METHODOLOGY
The NTP on HEPR and P135 consist of a number of sub-programmes or sectors, also called supportpolicies and projects.
This evaluation does not review the performance of each policy and project separately. Instead, it hasboth a thematic and sectoral focus, analysing thematic areas central to both programmes, such as targeting, resource allocation, financial management and M&E systems. This provides valuable insightsinto the actual functioning of the two programmes, contributes to an improved assessment of their overall effectiveness, and allows the analyses to effectively contribute to implementing the next phase.
However, for assessing impact, the evaluation focuses on specific sectos, or sub-programmes, examiningchanges in household well-being and the extent to which these could be attributed to the sub-programmes.But given the large number of sub-programmes, it was decided to focus on a few of them comprehensivelyrather than many poorly.
background of the evaluation
MOLISA-UNDP: TAKING STOCK, PLANNING AHEAD 11

The report focuses on the impact of the following sub-programmes:3
NTP on HEPR Programme 135
Credit for the Poor Commune infrastructure (roads, irrigation, schools, electricity)Health cardExemption of tuition fees Extension services Sedentarisation
1. Time period of the evaluation
The two programmes have been operational since July 1998. Initially, the evaluation focused on the period 1998-2001. But it was not always possible to confine the various elements of the evaluation to thistime period. The expenditure tracking study, for instance, relates to the period 2001-03 because dataprior to 2001 is not readily accessible.
4Similarly, impact of different sub-programmes was assessed for
two groups of households: (i) those that were on the list of poor households anytime during 1999 and2002, and (ii) those that are currently classified as poor.
Work on different components of the evaluation was undertaken during May 2003–May 2004.
2. Use of multiple methods and data sources
The overall evaluation consists of a number of components that require a range of methods and equally diverse range of data sources (Table 1).
The methodology used in the impact assessment differs from “standard” impact studies. An attempt wasmade to integrate three different approaches relying heavily on a new instrument, the “Qualitative”Survey (QS). The QS put the types of questions that often figure in PRA-type impact studies within anational sampling frame. The implementation of the QS, and in particular the open-ended semi-structured questions, was a learning experience. As such, it familiarised national partners with anew type of data collection instrument and served as a sort of pilot which may be adapted in any number of ways in future. Further details of the different approaches are provided in Section C. III.
background of the evaluation
12 MOLISA-UNDP: TAKING STOCK, PLANNING AHEAD
3 The sub-programmes for impact assessment were selected on the basis of the following criteria: (i) size of resource allocation,(ii) data availability (for components analysed using VHLSS data), (iii) policy relevance, and (iv) ability to establish a clear linkbetween the output of the sub-programme and well-being outcomes at the household level.
4 This is not likely to affect the overall result since the studied processes do not change quickly.

Table 1: Methods and Data Sources for the Evaluation
Evaluation Component Method Data Sources
Primary Secondary
Synthesis of Targeting Desk review - Approaches
Budget Allocation Field Study, Interviews, Documentation review
Expenditure Tracking Field Study, Interviews, Documentation review
Monitoring System Review Field Study, Interviews, Documentation review
Impact Assessment Qualitative Survey, Data Analysis, VHLSS 2002 Data Analysis
Participation/Empowerment Desk Review -
Institutional Capacity Desk Review, Interviews -
The evaluation aims to get a well-rounded and objective assessment of the achievement of NTP onHEPR and P135. For this it is necessary to bring together the extraordinarily rich data on different elements of the two programs from different sources to see whether they “fit” together to tell a crediblestory.
Thus, the overall analysis is not limited to the primary data collected specifically for the different evaluation components as shown in Table 1. Secondary data from the following sources were also consulted extensively:
Progress reviews/reports prepared by different line ministries
Official statistics
Data from VHLSS 20025
PPAs conducted during 2003, and
Reports from other Technical Assistance (TA) projects relating to the sub-programmes.
background of the evaluation
MOLISA-UNDP: TAKING STOCK, PLANNING AHEAD 13
5 Data from VHLSS 2002 is used only as a reference since the poverty threshold used by MOLISA is lower than the poverty lineset by GSO and so the two “lines” are not entirely comparable.

3. Limitations
Given the magnitude and complexity of the task, and the diversified nature of the two programs, somelimitations of the overall evaluation should be made explicit. These have been grouped under genericlimitations – those that are common to the different components, and specific limitations - those that arespecific to a particular component.
3.1. Generic limitations
Lack of a baseline
Problems of attribution
Problems in availability of reliable and consistent data
Limitations arising from memory recall of survey respondents
3.2. Specific limitations
3.2.1. Expenditure Tracking Study
This study has a number of limitations. First, it is not a full-length expenditure tracking study trackingfinancial flows to all provinces and lower tiers. Such a study requires sampling all (or the vast majority)of decentralized units and hence is time and resource-intensive. Due mainly to time constraints, such afull study was not done.
Second, the study was only able to undertake a limited field study rather than review project spending.An expenditure tracking study should ideally consist of two components:
(i) Qualitative Field Survey component involves asking all responsible financial authorities aboutthe release and receipts of funds from source to destination and expenditures undertaken. This entailsadministering the survey to authorities at central, provincial, district and commune level.
(ii) Project Expenditure Review component involves convening a meeting with local level authoritiesand villagers to publicly review the financial statements regarding projects with a view to determine if allocated funds were actually received by beneficiaries and projects undertaken as envisaged.
Project reviews were not conducted separately. However, the household questionnaires in the QualitativeSurvey specifically asked about awareness of funds allocation at the local level.
Third, the survey was undertaken in a small sample of four provinces in the country. In each province,two districts were selected and in each district, two communes were selected to administer the survey to
background of the evaluation
14 MOLISA-UNDP: TAKING STOCK, PLANNING AHEAD

government officials resposible for financial matters. Thus, in the time available the study covered fourprovinces, eight districts and sixteen communes and could only look in detail at the records of only a sub-setof district in the province (two in each province) and a sample of communes in each district (four communes in each province). Due to the limited selection of districts and communes within the fourprovinces, the complete funding flow from the province level to all districts and from districts to all communes could not be traced. To assess the full flow of funds would have required visiting all districtsin a province and sampling a high number of communes (and preferably all communes) in those districts.Instead, it was possible to only trace the funding that was supposed to be allocated by the province toadistrict, and then the funding that was allocated by the district to a particular commune by looking at stateTreasury records. If the sums recorded as being spent at district or commune level were less or morethan sums allocated, there was no way of checking that these sums were indeed being spent or takenaway from other districts/communes.
The main implication of these limitations for the overall findings is that the extent of leakage from the twoprogramme studied could not be determined with great precision, due to limited geographical coverageand inability to scrutinize projects. The latter meant that the extent to which spending corresponded tolocal needs and was necessary could not be assessed.
But the data collected represent an accurate overall picture of funding flows and expenditure in theprovinces, districts and communes surveyed. Given the cross-checking of data at different levels andwith different sources (MPI, MoF, MOLISA etc.), the broad nature of the findings and recommendationsare likely to be valid. However, a wider geographic review and deeper study at commune level (preferably conducted by local consultants and officials) would be necessary to determine the extent ofleakage and precision of targeting on poor households with confidence.
The study has, despite the limitations of time and coverage, provided an insight into the allocation, distribution and expenditure at a decentralized level for the two programmes, which will inform theirdesign for the period 2006-10.
3.2.2. Impact Assessment
Measurement error is likely to be an issue for the QS. While all surveys are affected by measurementerror, the “newness” of the approach and the fact that enumerators had limited experience in semi-structuredinterviewing suggests that it may have played a role in this study. It is likely that the semi-structuredinterview questions on “magnitude of impact” are the most affected by measurement error and otherquestions less so. Some of the results to these questions should be treated with caution.
The QS relied heavily on self-reports to gauge the magnitude of impact. There are clearly limitationsassociated with this approach to impact assessment as well as a number of potential biases. The choiceof methodology took full account of these issues as well as others related to existing data, time andresource constraints and the inherent complexity of HEPR which contains a vast number of sub-projectswhich are only loosely related. But all approaches to impact assessment have limitations.
background of the evaluation
MOLISA-UNDP: TAKING STOCK, PLANNING AHEAD 15

The impact assessment has attempted to provide a sense of the magnitude of impact and underlyingreasons for six major program components, some of which contained multiple sub-components. In principle, each one of these should be the subject of a much more detailed evaluation, which would beable to provide much finer information relevant to project design. Clearly, this is not possible in the present context given the broader scope of the study (in addition to time and resource constraints). Soresults should be interpreted with caution.
4. Research Locations
To ensure nation-wide representation and geographical spread, primary data collection for different evaluation components was spread across a number of provinces.
The Qualitative Survey (QS) was the most widespread. It sampled a total of 3,700 households over twenty provinces and one city in all eight regions. The field sites for the other components were selected to ensure an overlap, to the extent possible, with the sites for the QS.
Field-level interviews were conducted and data for the study of Budget Allocation processes was collected in Tuyen Quang, Lao Cai and Quang Nam provinces in selected districts and communes.
The Expenditure Tracking Study was limited to sixteen communes and eight districts in the four provincesof Tuyen Quang, Son La, Quang Ngai and Soc Trang.
A review of the monitoring system was conducted at the provincial, district and commune levels in TuyenQuang, Quang Ngai, Phu Yen and Ho Chi Minh City. The research locations are shown in the map onpage 18.
5. Partnerships
While largely independent, different components of the evaluation were undertaken in partnership withdifferent government agencies and research institutes. A team of supervisors and enumerators from theGeneral Statistical Office (GSO) implemented the QS. This required designing, pre-testing, revising andadministering the questionnaire and later entering the data from the completed questionnaires. TheInstitute of Economics was the core national research team involved in the Impact Assessment study andwas responsible for developing the QS sampling strategy, analysing QS data, and conducting sensitivity analysis on the propensity score matching exercise.
Work on the Expenditure Tracking Study was undertaken in close cooperation with the Ministry ofFinance and with the active participation and support of the staff of the four provinces. The review of theMonitoring System was undertaken with the help of the HEPR office and DOLISA in the four provinces.
IV. STRUCTURE OF THE REPORT
Section A provides the Background of the Evaluation – its objectives, framework, scope, methodologyand limitations. The rest of the report consists of three sections.
background of the evaluation
16 MOLISA-UNDP: TAKING STOCK, PLANNING AHEAD

Section B sets the Programme Context by describing the details of the two programmes.
Section C is the essence of this report. It is divided into three parts. In Section C.I it analyses whetherthe NTP on HEPR and P135 are doing the right thing. This is done by asking to what extent are theobjectives, targeting approaches and components relevant to the reality on the ground. It also examineswhether the budgetary resources are allocated to where the poor are, and whether the programme components reflect peoples’ priorities.
Section C.II analyses whether the two programmes are implemented the right way. This is done by examining the organisational structure and the extent of decentralisation, and implementation mechanisms such as the financial management and monitoring and evaluation systems. Capacity issuesare reviewed to assess the strength of the supportive mechanisms for successful programme implementation.
Section C.III examines the impacts of the two programmes on household well-being using the qualitativehousehold survey and other surveys such as the VHLSS 2002, and the Participatory PovertyAssessments (PPAs). Section D draws conclusions from the research.
Finally, Section E, looks to the future. It uses the results of the evaluation to draw lessons for the designof the next phase of NTP on HEPR for 2006-2010.
background of the evaluation
MOLISA-UNDP: TAKING STOCK, PLANNING AHEAD 17

background of the evaluation
18 MOLISA-UNDP: TAKING STOCK, PLANNING AHEAD
STUDY LOCATIONS

B. PROGRAMME CONTEXT
I. EVOLUTION OF HEPR AS A NTP6
Hunger and poverty in mountainous and remote regions of Viet Nam was first recognised as a persistent problem at the 7th VCP Congress in 1991. The Congress also noted a lack of sufficient emphasis by the government on providing support services, commune infrastructure, health care andeducation to the poor and ethnic minorities in these areas.
Ho Chi Minh City, which was well ahead of other cities and provinces in the economic reform (doi moi)process, initiated the first HEPR effort at the provincial level in 1992. The initiative aimed to eradicatehunger through increased public expenditure that improved access for the poorest people and communes to preferential credit, housing, food subsidies, basic social services and commune infrastructure. Following the lead of HCMC, 44 provinces set up HEPR funds as a way of coordinating(local and central) activities, resource mobilisation and spending. Most of the funds’ activities centeredon granting loans with preferential interest rates to help individuals set up businesses.
These efforts received official approval from the central government through MOLISA’s participation inguidance and monitoring. The first national poverty lines were also drawn by MOLISA in 1993.7 TheGovernment launched a number of nationwide HEPR-related initiatives in 1993 such as VBARD’s non-collateral credit for the poor, and programmes 3278 and 120.9 The latter were pilot-tests of the government’s attempts to address socio-economic priorities through targeted programmes.
Prior to 1996, different ministries and agencies implemented many national programmes to meet socio-economic development targets. However, there were no clear regulations on the performance ofthese national programmes. HEPR emerged as an important component of national policy after theVCP’s 8th Congress in 1996, which outlined the objectives of HEPR and associated policy measures. Theimpetus for the national HEPR programme arose out of the growing recognition of limitations in the country’s existing approach to poverty alleviation, including: (i) the lack of integration between existingprogrammes leading to a lack of coordination between policies and a diffusion of resources, (ii) the heavyemphasis on credit and a relative neglect of education, training, health care and infrastructure development, (iii) the lack of national poverty standards, and (iv) the lack of effective mobilisation of thecommunity behind poverty reduction.
In 1996 the government proposed10 a national hunger elimination and poverty reduction (HEPR) programme to coordinate existing and new efforts, as well as to channel resources for combatingpoverty.
MOLISA-UNDP: TAKING STOCK, PLANNING AHEAD 19
6 This section is based on UNDP (1999).7 The poverty lines were subsequently revised in 1995 and every two years thereafter. 8 'Reclamation of barren hills, wasted land and sedentarization of nomadic ethnic minorities' 9 'Employment promotion'.10 By Prime Minister's Decision No. 531/TTg dated 8/8/1996.

In November 1997 the VCP’s Central Executive Committee reviewed local HEPR experiences and created a detailed outline for a future national HEPR11 programme whereby planning and managementare defined by the programme while the actual investment is done by the different component-projects.
HEPR was formally set up as a national targeted programme (NTP) in 1998 consolidating a large number of national programmes into fewer but more focused projects. The criteria for selection as anational targeted programme are provided in Box 1.
In April 1999 the development of the national HEPR framework led to the enactment of a number of inter-ministerial instructions to guide the implementation of the NTP and related programmes (such asplanning, integration, finance, infrastructure development, health care and staffing).
Thus, the NTP for HEPR did not appear suddenly. Rather, it was the result of a long process of interactions between local initiatives and central responses to emerging challenges by providing policyguidance.
.
programme context
20 MOLISA-UNDP: TAKING STOCK, PLANNING AHEAD
11 VCP's Central Executive Committee Instruction No. 23-CT/TW on leading and working of HEPR issued on 29 November 1997.
Box 1: Criteria for the selection of a programme as a NTP
Urgent, regional and/or ministerial issues of national social and economic importance that require concen-tration of government guidance and resources
Clear and quantifiable programme objectives or those under the national development strategy
Definite medium-term, usually 5 years
Source: Decision No. 531/QD-TTg dated 8/8/96 quoted in Vu Tuan Anh (2003)

II. NATIONAL TARGETED PROGRAMME ON HUNGER ERADICATION AND POVERTY REDUC-TION (NTP ON HEPR)
1. Objectives
The objective of Programme 133 was to eliminate chronic hunger and reduce the percentage of poorhouseholds in the country to 10% by 2000.
Another objective, not explicitly stated but often emphasized by the 8th VCP Congress, political leadersand the public was “to narrow the gap among population groups and geographical areas by acceleratingthe socio-economic development of the disadvantaged.”12
These objectives were expanded for the period 2001-05. Thus, Programme 143 aims to:
Reduce the proportion of poor households to below 10%, using MOLISA’s new poverty line – i.e.an average decrease of 1.5-2.0% per year and eliminate chronic hunger.
Ensure that poor communes have basic infrastructure works such as small-scale irrigation,schools, health care, roads, water electricity, markets, etc.
Provide jobs for 1.4-1.5 million labourers every year.
Reduce the unemployment rate in urban areas to less than 6% and promote the labour time usein rural areas to 80% by 2005.
2. Target Groups
The programme benefits are directed at poor households, as defined by the MOLISA poverty line. Themechanism for the identification of poor households is discussed in Section C.I.1.
Despite merging programmes 133 and 120 to make Programme 143, they are still known by their separate names and their activities implemented separately at the central and local levels. This may bebecause the target groups of the two components are different - while the HEPR components target poorhouseholds and poor communes, the job creation activities do not focus only on the poor.
3. Programme Components and Resources
Programme 143, like the earlier Programme 133 on HEPR, is not really a programme, but rather a coordination mechanism for a number of policies and projects implemented by different Ministries. It consists of six “support policies” and twelve “projects”:13
Support policies (Box 2) are budgeted for a total non-refundable capital of VND1,600 billion (aboutUSD100 million) all of which is expected to come from local budgets.
Projects (Box 3) are budgeted for a total of VND4,640 billion (almost USD300 million), most of which isexpected to come from the central budget but is channeled through province, district and commune
programme context
MOLISA-UNDP: TAKING STOCK, PLANNING AHEAD 21
12 UNDP (1999).13 SRV (2001b).
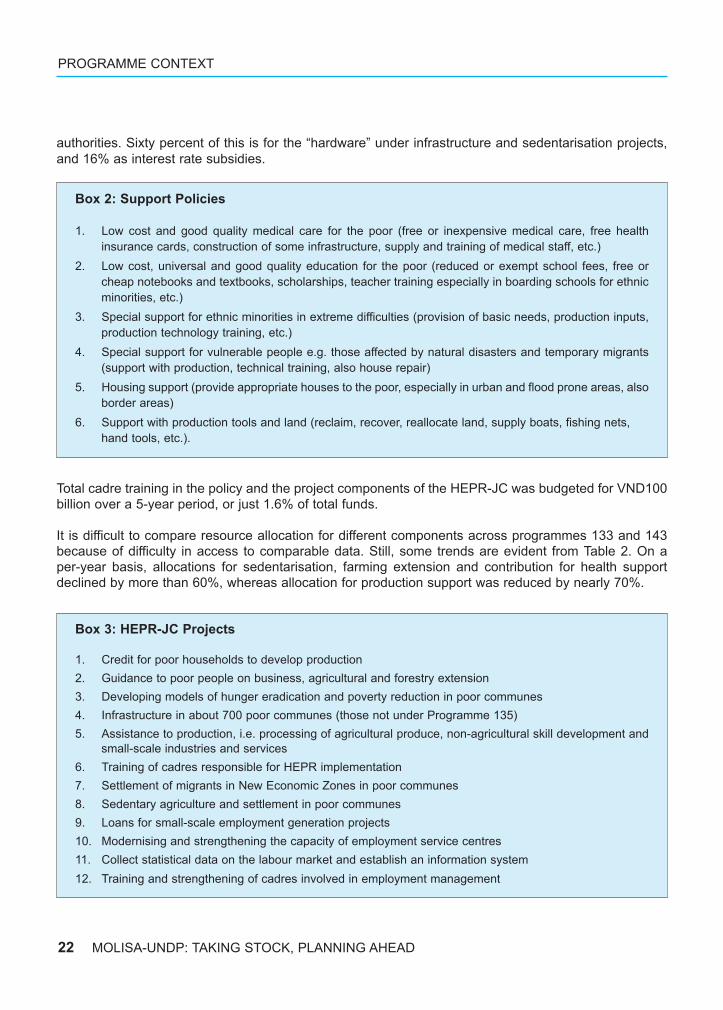
authorities. Sixty percent of this is for the “hardware” under infrastructure and sedentarisation projects,and 16% as interest rate subsidies.
Total cadre training in the policy and the project components of the HEPR-JC was budgeted for VND100billion over a 5-year period, or just 1.6% of total funds.
It is difficult to compare resource allocation for different components across programmes 133 and 143because of difficulty in access to comparable data. Still, some trends are evident from Table 2. On a per-year basis, allocations for sedentarisation, farming extension and contribution for health supportdeclined by more than 60%, whereas allocation for production support was reduced by nearly 70%.
programme context
22 MOLISA-UNDP: TAKING STOCK, PLANNING AHEAD
Box 2: Support Policies
1. Low cost and good quality medical care for the poor (free or inexpensive medical care, free health insurance cards, construction of some infrastructure, supply and training of medical staff, etc.)
2. Low cost, universal and good quality education for the poor (reduced or exempt school fees, free orcheap notebooks and textbooks, scholarships, teacher training especially in boarding schools for ethnic minorities, etc.)
3. Special support for ethnic minorities in extreme difficulties (provision of basic needs, production inputs, production technology training, etc.)
4. Special support for vulnerable people e.g. those affected by natural disasters and temporary migrants (support with production, technical training, also house repair)
5. Housing support (provide appropriate houses to the poor, especially in urban and flood prone areas, alsoborder areas)
6. Support with production tools and land (reclaim, recover, reallocate land, supply boats, fishing nets,hand tools, etc.).
Box 3: HEPR-JC Projects
1. Credit for poor households to develop production 2. Guidance to poor people on business, agricultural and forestry extension 3. Developing models of hunger eradication and poverty reduction in poor communes4. Infrastructure in about 700 poor communes (those not under Programme 135) 5. Assistance to production, i.e. processing of agricultural produce, non-agricultural skill development and
small-scale industries and services 6. Training of cadres responsible for HEPR implementation 7. Settlement of migrants in New Economic Zones in poor communes 8. Sedentary agriculture and settlement in poor communes 9. Loans for small-scale employment generation projects 10. Modernising and strengthening the capacity of employment service centres 11. Collect statistical data on the labour market and establish an information system12. Training and strengthening of cadres involved in employment management

Table 2: Trend in resource allocation for HEPR sub-programmes
(VND bn)
Component 1998-2001 2001-2005 Executing Agency
Policies
Health support 800 500 MOH
Education 834 n.a. MOET
Support with production tools and land n.a. n.a.
Assistance to ethnic minorities 262 150
Housing support - 250
Special support to vulnerable people - 700 MOLISA
HEPR Projects
Credit 6000* 750# SBV
Farming extension 200 100 MARD
Models of hunger eradication - 100 MOLISA
HEPR Projects for non-P135 communes
Infrastructure 3825** 1400 MARD
Production support 200 90 MARD
Training 100 100 MOLISA
Settlement of new economic zones - 1400 MARD
Sedentarisation 1200 700 MARD
TOTAL 6240
JC Projects (included from 2001)
Loans for small-scale employment generation - ~ 3000* MOLISA
Modernising employment service centres - 210 MOLISA
Strengthen labor market information system - 30 MOLISA
Training of cadres for employment management - 30 MOLISA
Source: MOLISA documents, various.Notes:* Credit capital** Includes allocation for Programme 135# Interest rate subsidy- No allocation made under NTP modalityn.a. Data not available
programme context
MOLISA-UNDP: TAKING STOCK, PLANNING AHEAD 23

4. Implementation Arrangement
The organizational structure of the programme management for NTP on HEPR is depicted in Figure 1.The organizations and their responsibilities are summarised in Annex 3.
The programme’s management structure is operational at four levels, namely the central, provincial, district and commune. At the central level, MOLISA (assigned as the Programme Managing Agency),MPI, MOF MARD, CEM, MOET, MOH and SBV are responsible for the programme’s overall guidance.Together with representatives from mass organizations (namely, VFF, VWU and VFA) they are represented at the National HEPR Steering Board, headed by the Deputy Prime Minister in charge of therural sector, to assist the government in the programme’s overall supervision, coordination and evaluation.
At local levels, PPCs are in charge of organizing and managing the programme, and accounting for theuse of all resources within their territory. The implementation authority is delegated to commune PCs ortemporarily to district PCs wherever the former have capacity constraints. HEPR Boards have beenestablished in all provinces and most districts and poor communes. Some PPCs and DPCs have anHEPR section or group of experts to help them and the HEPR Board in daily management and coordination of HEPR efforts.
Among central agencies MOLISA, MPI and MOF play key roles in HEPR planning, funding, and coordination. MPI and MOF are responsible for balancing demand and available resources for HEPRand allocating the total amount of funds to the NTP. Moreover, MPI and its local branches (e.g. DPI andSPI) have been designated as the government’s focal points for the planning, managing and coordinating of national programmes at their respective levels. MOF is in charge of budgeting, and thetransfer and use of funds.
MOLISA is in charge of synthesizing and submitting to MPI and MOF the proposed allocation of the NTPresources among provinces and participating programmes after being cleared by the National HEPRSteering Board.
The Programme Steering Board is designed as a mechanism for coordination, supervision and evaluation and its collective decisions are to be formalized by instructions from concerned members (e.g.the Deputy PM or vice ministers). The Board’s coordinating role also overlaps with the coordinatingresponsibility of MPI and MOLISA.
The key players in HEPR are not central agencies but provincial authorities, particularly the VCP andPPC which are solely responsible for setting targets, organizing, guiding, and coordinating the implementation of HEPR and its resources in the province. The role of commune authorities and massorganizations is essential since they are in charge of the bottom-up planning and implementation of theprogramme. The districts play a significant role in delivery since most specialized service providers (i.e.VBP, VBARD, extension service centers, education and health care providers) are based at the districtlevel.
programme context
24 MOLISA-UNDP: TAKING STOCK, PLANNING AHEAD

Figure 1: Organizational structure of the NTP for HEPR
III. PROGRAMME 135
The Programme for Socio-economic Development in Communes faced with Extreme Difficulties(PDCED also known as Programme 135) was approved by the Prime Minister by Decision 135/1998/QD-TTg issued on 31 July 1998, to enhance poverty reduction in especially disadvantaged communes in 52provinces in the country. On 29 November 2000, Decision 138/2000/QD-TTg integrated the earlier NTPon HEPR components on sedentarisation, support to especially disadvantaged minorities, and inter-commune center development in mountainous communes into Programme 135. In addition, thecomponent “support for disadvantaged ethnic minority households” was changed into “support for
programme context
MOLISA-UNDP: TAKING STOCK, PLANNING AHEAD 25
GOVERNMENT/PMHEPR PROGRAMME
MANAGEMENT BOARD
PROVINCIALPEOPLE’S COMMITTEE PROVINCIAL
HEPR BOARD
COMMUNEPEOLE’S COMMITTEE COMMUNE
HEPR BOARD
DISTRICTPEOPLE’S COMMITTEE DISTRICT
HEPR BOARD
VILLAGE/HAMLET CHIEF VILLAGEHAMLET HEPR
GROUPS
.
.
.
.
.
...
. ... .
.
.
CEMMA OTHER LINEMINISTRIES MPI MOFMOLISA
..
MARD
HEPRPROGRAMME
OFFICE

disadvantaged ethnic minority policies” and shifted from the NTP on HEPR to Programme 135 in 2001.Following these shifts, P135 now consists of five sub-programmes: infrastructure development, inter-commune center infrastructure development, relocation planning, agricultural and forestry extension (linked to processing industries), and training for commune/village staff in remote and mountainous areas.
Technically not a NTP because it does not cover all the provinces, Programme 135 is still considered afocus programme14 as it is spread over 49 provinces.15 In terms of budget allocation it is larger than theHEPR projects of Programme 143.
Although formally combined, the two are now independently managed programmes, but there is still noclear division between them. Most local authorities treat Programme 135 as a special channel for thecentral government’s priority investment into commune infrastructure in the pre-selected communes andthe NTP on HEPR as a channel for the remaining supports. Funds for Programme 135 in 1998-2000 andthe central government’s contribution in 1999 were planned as a part of the total funding for the NTP onHEPR.
Programme 135 may be considered a special vehicle to focus HEPR resources and activities on particular geographical areas. In fact, the government has simplified investment procedures for infrastructure projects under the programme. The NTP on HEPR and the PDCED overlap geographically, and the coordination and integration of the two programmes are done through the annual planning at local levels, especially at the provincial level.
1. Programme Objectives and Target Groups
To an extent, Programme 135 presents a more comprehensive approach to HEPR, aiming at the promotion of a market economy in disadvantaged areas and setting up a wide range of policies to be further developed. In addition to the HEPR primary target, Programme 135 also contains a number ofsecondary targets, which are not included in this report and do not completely fit into the NTP for HEPR(e.g. “to integrate ethnic minorities into the national development …[and] to promote national security”).
Specifically, Programme 135 aims to:
reduce the proportion of poor households in severe-difficulty communes to less than 25% in 2005, and
provide adequate clean water, increase the proportion of school-age children attending school to morethan 70%, further train poor people in production, control dangerous and social diseases, constructroads to inter-commune centers, and develop rural markets.
programme context
26 MOLISA-UNDP: TAKING STOCK, PLANNING AHEAD
14 Vu Tuan Anh (2003).15 However, State Budget funds are only provided to 43 of the 49 provinces included in the P135 - in the remaining 6, funds are
allocated from provincial budgets.

A major difference between the two programmes is their targeting methods. This is discussed in furtherdetail in Section C.I.1. Initially focused on 1,000 of the 1,715 communes faced with extreme difficulties,the PDCED uses the geographical method of targeting and includes a wide range of criteria other thanpoverty and lack of infrastructure for the selection of target communes.
2. Programme Components and Resources
Programme 135 was first implemented in the country’s 1,000 poorest communes and was graduallyexpanded to the 2,362 poorest communes. It funds
a construction of infrastructure at the village and commune level (roads, health centres, schools, irri-gation systems, water supply systems, markets, etc.)
b construction of infrastructure at commune-cluster level (inter-commune roads, clinics, markets,etc.)
c settlement and sedentarisation of ethnic minorities d agricultural and forestry extensione training of commune level cadres (especially for management and monitoring of works)
Funding for 2,233 of the poorest communes is allocated from the State budget and the other 129 fromprovincial funds. Total investment during 1999-2004 was VND6,795 billion or nearly USD430 million. Ofthis about 3.5% went to components (c) and (d), and less than 1% for training of commune-level cadres.Almost all funds are allocated for construction of commune- and inter-commune infrastructure (Table 3).
Table 3: Trend in resource allocation across P135 components (VND bn.)
Component 1999-2001 2002-2004
Village and commune infrastructure 2064.4 3129.7
Inter-commune infrastructure 434.0 865.0
Settlement and sedentarisation of ethnic minorities 0 35.0
Agricultural extension 50.0 164.0
Training of commune-level cadre 21.6 32.0
TOTAL 2570.0 4225.7
Source: CEM
programme context
MOLISA-UNDP: TAKING STOCK, PLANNING AHEAD 27

3. Implementation Arrangement
At the central level, CEM is the Programme Managing Agency for the implementation of Programme 135.
The National Steering Committee for Programme 135 was established, and operates in accordance withthe Regulation on the 135 National Steering Committee operations, as per Decision 01/TTg of 4 January1999 and Decision No-13/1998/QD-TTg of 23 January 1999 issued by the Prime Minister. TheCommittee consists of representatives from various ministries and agencies such as CEM, MOLISA,MPI, MOF, MARD, VFA, and the Minorities Committee of the National Assembly. CEM is the StandingAgency in the committee.
There are clear guidelines for project implementation procedures. For individual sub-programmes, theCEM as the standing body and the EAs have issued inter-ministerial circulars on programme management and implementation.
16MARD, as the other EA for P135, has also issued various guidelines
on implementation of related components.17
Further details of the organisational structure are summarised in Annex 4.
programme context
28 MOLISA-UNDP: TAKING STOCK, PLANNING AHEAD
16 For example, the inter-ministerial Circular 666/2001/TTLT-BKH-UBDTMN-TC-XD, Guidelines on P135 infrastructure projects'investment and construction management, Circular 12/2000/TT-BXD of 25 October 2000, Guidelines on cost units for P135infrastructure projects, Circular 867/2001/TT-UBDTMN of 5 November 2001, Guidelines on implementation of P135 "inter-commune center development projects", inter-ministerial Circular No- 912/2001/TTLT/UBDTMN-BTC-BKHÐT, issued on16 November 2001 by CEM, MPI and MOF, and Guidelines on implementation of especially disadvantaged minorities supportpolicies.
17 For example, Document No-976/BNN-DCDC of 29 April 2003, Guidelines on implementation of "agricultural and forestry production promotion" sub-programme, Document No-3301/BNN-HTX of 9 October 2003, and Guidelines on implementationof relocation planning projects.

C. PROGRAMME EVALUATION
I. RELEVANCE OF PROGRAMME OBJECTIVES, TARGETS AND COMPONENTS
As laid out in the evaluation framework (Section A.II), this section analyses whether the two programmesare doing the right things. That is, whether and to what extent are the two programmes targeting the rightpeople (i.e. poor households and poor communes) and allocating adequate resources to achieve sustainable poverty reduction?
1. Identification of poor households and poor communes
The issue of targeting, i.e. directing, benefits to poor and disadvantaged households and regions is notone of whether, but of how and first requires proper identification of poor households and communes.This section will review the criteria and process by which poor households and poor communes are identified. It will then assess the extent to which the two programmes accurately identify the “true” poor.The ability of beneficiaries to access benefits from the various policies and projects will also be analysed.
In addressing these issues, the extent of people’s awareness of the criteria, their participation in theselection process, and their perceptions of the outcomes are also analysed as cross-cutting themes.
1.1. Identification of poor households
MOLISA devised the first poverty threshold for Viet Nam in 1993 to support the Government’s HEPR-related initiatives driven by the need to identify poor households (and poor communes) eligible fordirect assistance.
The MOLISA threshold serves purely as a reference income level to which state transfers are linked.Those with incomes below this threshold are entitled to support from the HEPR and other governmentprogrammes.
The MOLISA “line”, however, carries with it fiscal implications. The minimum income at which it is set isnot determined so much by a notion of need but, instead by the availability of budgetary resources.
The main criticism of the MOLISA threshold is that it is set too low. Financial resource limitations may beone reason. This is also the perception of 42% of the respondents of the Qualitative Household Surveywhen asked why some poor households do not figure on the list of poor households.
Traditionally, poverty in Viet Nam has been associated with insufficient food and poverty reduction is synonymous with staving off hunger. It is likely that in identifying poor households, the original MOLISAthreshold focused only on meeting the food needs of the poor.
MOLISA-UNDP: TAKING STOCK, PLANNING AHEAD 29

The threshold has been adjusted periodically to stay in step with the average growth of the economy andthe improvement of the overall living conditions (Tables 4 and 5). In 1997, it was re-adjusted to apply tothe 1996-2000 period, and two main changes were introduced: (i) rural locations were sub-divided intomountain areas and plains, and (ii) minimum rice-equivalent per capita monthly income was expressedin monetary terms. In 2001, rice equivalence was dropped altogether and the poverty threshold for eachlocation is now expressed as the minimum income necessary to meet the food needs for each personper month.
Table 4: MOLISA threshold for poor households (in rice equivalence and VND)(per person per month)
Location 1993 1995 1997 2001
Rural 15 kg 20 kg
Urban 20 kg 25 kg
Rural Mountainous and Island < 15 kg (= VND55,000) VND80,000
Rural Plains and Midland < 20 kg (= VND70,000) VND100,000
Urban < 25 kg (= VND90,000) VND150,000
Source: MOLISA documents, various years
Table 5: MOLISA threshold for “hungry” households (in rice equivalence and VND)(per person per month)
Location 1993 1995 1997 2001
Rural 8 kg 13 kg
Urban 13 kg 13 kg
Rural Mountainous and Island
Rural Plains and Midland < 13 kg (= VND45,000) VND50,000
Urban
Source: MOLISA documents, various years
The poverty threshold used by MOLISA to identify poor households for the period 2001-05 comprisesthree levels of income (Table 5) for:18
urban (VND150,000or USD9.6 per person per month),
programme evaluation
30 MOLISA-UNDP: TAKING STOCK, PLANNING AHEAD
18 The current poverty standard was adjusted by Decision 1143/2000/QD-LDTBXH.

rural lowlands (VND100,000 or USD6.4 per person per month), and
mountainous areas (VND80,000, or USD5.1 per person per month).19
The income thresholds for identifying poor households are presently under review and new thresholdsare being devised for the period 2006-10. They are likely to be set at VND230,000 per capita per monthfor urban and VND200,000 per capita per month for rural areas.
MOLISA’s method of identifying poor households for targeting is a combination of simple means testtargeting and community-based targeting. Different targeting methods are discussed in Annex 5. Afterthe formal start of the NTP on HEPR in 1998, the first assessment was initiated in December 1999 andconsisted of four steps (Box 4).
Updating the list of poor households is based on a relatively simple annual census that collects information on sources of income and other household characteristics (see Annex 6 for a copy of the survey format). The household income as obtained from the respondent is divided by the household size.This information is needed for making the list of each commune’s poor and very poor households basedon the income thresholds. The use of income-based and location-specific thresholds, which allow for differences in costs of living across different areas, has a number of advantages:
inadequate income as a cause of poverty is easily understood at the local level, and
it is easy to administer a two page questionnaire to collect basic demographic, income and assetdata.
programme evaluation
MOLISA-UNDP: TAKING STOCK, PLANNING AHEAD 31
Box 4: Steps in preparing the list of poor households
Step 1 Members of the Commune People’s Committee including the village head, cadres of village massorganizations, village police and heads of self-governing groups made a preliminary list of poorhouseholds and submitted it to the Commune HEPR Committee.
Step 2 The commune HEPR Committee assigned staff to verify the situation of the listed households. Stafffrom the district HEPR committee assisted in this phase to develop the proposed list of poor households.
Step 3 The Commune People’s Committee conducted a village meeting, including the better-off householdsin order to seek their opinions on the proposed list. The proposed list was then revised and submitted to the district HEPR Committee.
Step 4 Head of village conducted a meeting that included poor households only to inform the certified poorhouseholds in the village.
19 MOLISA (2003a).

The main disadvantages are that the thresholds
are set arbitrarily and are strictly not comparable,
the testing is not uniformly undertaken in all communes,
it does not cover the entire population, and
factors other than inadequate income may determine the priorities to identify poor households.
Many households are unaware of the income thresholds for poverty assessment, though nearly 76% ofthe respondents of the QHS are aware of how the list of poor households is prepared. More than 98%of them confirm that the list is prepared after a consultative process (Table 6).
Table 6: Awareness of how the list of poor households is prepared( in percent)
Region The list is prepared by the village head:
Without After meeting with After meeting with Others (includingconsultation local orgnanisations many persons Don’t Know)
Red River Delta 0.33 36.39 62.62 0.66
North East 0.00 3.08 97.17 0.00
North West 0.26 4.21 95.26 0.26
North Central Coast 0.28 14.45 84.42 0.85
South Central Coast 2.17 32.25 64.13 1.45
Central Highlands 3.38 18.80 77.44 0.75
South East 1.24 12.03 86.72 0.00
Ho Chi Minh City 5.56 63.89 28.47 1.39
Mekong River Delta 1.00 11.78 87.43 0.20
Total 1.19 17.83 80.56 0.53
Source: Qualitative Household Survey, 2004Note: Ho Chi Minh City is recorded separately so as not to bias the results from the region.
However, there is usually a discrepancy between the number of households officially classified as poorand those considered poor at the village and commune levels. Much of this has to do with popular perceptions of what constitutes poverty. Local criteria for assessment of well-being usually include anumber of factors, of which income is only one (Box 5).
programme evaluation
32 MOLISA-UNDP: TAKING STOCK, PLANNING AHEAD

The difference between households identified as poor and those that appear on the list of poor households also arises because of pre-determined numbers of poor households “allocated” for each village. In some cases villagers select poor households based on allocated numbers and their subjectiveevaluations. The list drawn from village meetings is then submitted to the commune for approval beforethe households are informed.
Other than the constraints imposed by pre-set numbers, both local authorities and people feel that thecurrent average income criteria are too low. Many commune officials do not agree with the prescribedincome criteria, yet are afraid of listing a higher number of households as poor for fear of damaging theirpoverty reduction performance (Box 6).
Commune and village staff also find it difficult to categorise households on the basis of average incomessince (i) villagers often have several income sources, and (ii) most poor households do not have stable
programme evaluation
MOLISA-UNDP: TAKING STOCK, PLANNING AHEAD 33
Box 5: Villagers’ criteria for assessing household well-being status
Housing conditions and furniture
Land: quality and area, location (proximity to a water resource)
Food availability
Quantity of livestock (buffalo, cow, goat)
Inherited assets
Capacity in doing business, intellectual level
Labour sources
Source: Ha Giang PPA, (2003)
Box 6: Constraints in application of poverty thresholds
Officials and local people in Ninh Phuoc and Ninh Son Districts in Ninh Thuan Province said that the per person per month poverty thresholds of VND100,000 for Ninh Phuoc (a Mekong Delta district) andVND80,000 for Ninh Son (a mountainous district) do not reflect actual costs of living. In group discussions inTuan Tu Village, An Hai Commune and in Hoa Thuy Village, Phuoc Hai Commune, people felt that thesethresholds do not incorporate expenditures on necessary items such as education, healthcare, or income-generating investments. The general opinion is that the minimum income threshold must beVND150,000 (per person per month).
compiled from Ninh Thuan PPA, 2003
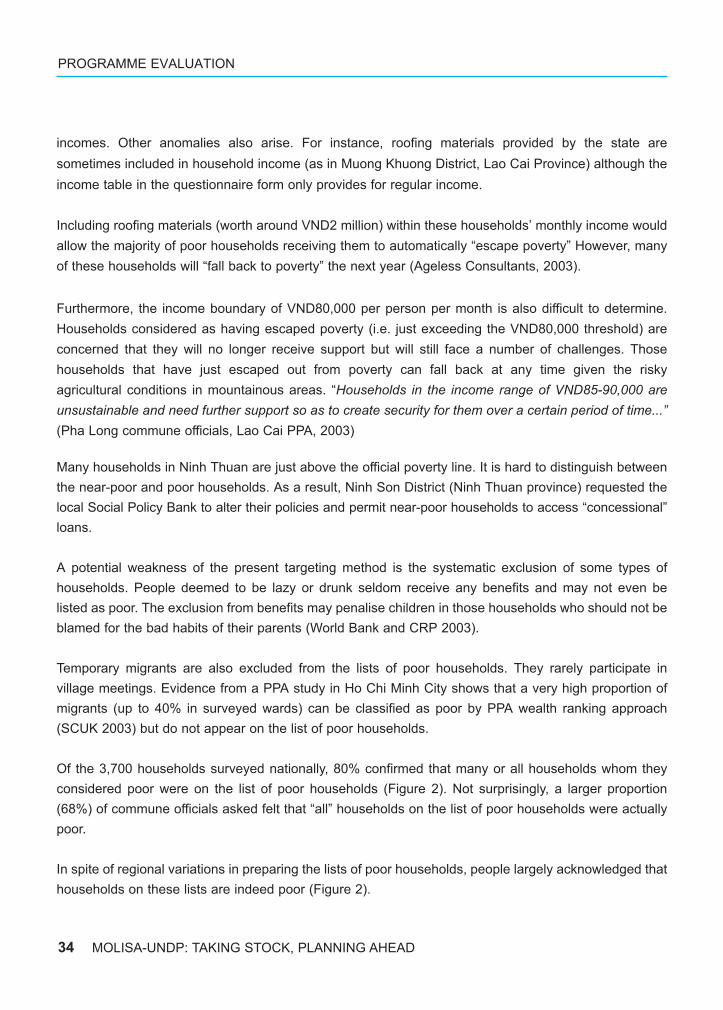
incomes. Other anomalies also arise. For instance, roofing materials provided by the state are sometimes included in household income (as in Muong Khuong District, Lao Cai Province) although theincome table in the questionnaire form only provides for regular income.
Including roofing materials (worth around VND2 million) within these households’ monthly income wouldallow the majority of poor households receiving them to automatically “escape poverty” However, manyof these households will “fall back to poverty” the next year (Ageless Consultants, 2003).
Furthermore, the income boundary of VND80,000 per person per month is also difficult to determine.Households considered as having escaped poverty (i.e. just exceeding the VND80,000 threshold) areconcerned that they will no longer receive support but will still face a number of challenges. Those households that have just escaped out from poverty can fall back at any time given the risky agricultural conditions in mountainous areas. “Households in the income range of VND85-90,000 areunsustainable and need further support so as to create security for them over a certain period of time...”(Pha Long commune officials, Lao Cai PPA, 2003)
Many households in Ninh Thuan are just above the official poverty line. It is hard to distinguish betweenthe near-poor and poor households. As a result, Ninh Son District (Ninh Thuan province) requested thelocal Social Policy Bank to alter their policies and permit near-poor households to access “concessional”loans.
A potential weakness of the present targeting method is the systematic exclusion of some types ofhouseholds. People deemed to be lazy or drunk seldom receive any benefits and may not even be listed as poor. The exclusion from benefits may penalise children in those households who should not beblamed for the bad habits of their parents (World Bank and CRP 2003).
Temporary migrants are also excluded from the lists of poor households. They rarely participate in village meetings. Evidence from a PPA study in Ho Chi Minh City shows that a very high proportion ofmigrants (up to 40% in surveyed wards) can be classified as poor by PPA wealth ranking approach(SCUK 2003) but do not appear on the list of poor households.
Of the 3,700 households surveyed nationally, 80% confirmed that many or all households whom theyconsidered poor were on the list of poor households (Figure 2). Not surprisingly, a larger proportion(68%) of commune officials asked felt that “all” households on the list of poor households were actuallypoor.
In spite of regional variations in preparing the lists of poor households, people largely acknowledged thathouseholds on these lists are indeed poor (Figure 2).
programme evaluation
34 MOLISA-UNDP: TAKING STOCK, PLANNING AHEAD

Figure 2: How many poor housholds on list of poor households are considered poor?
Source: Qualitative Household Survey, 2003
Note: Subsequent figures are all based on data from the QHS, 2003, unless otherwise stated.
Table 7: Distribution of households classified as poor by quintile
Percentage of households
Classified as poor* With poor household card/certificate
Total 11.4 3.8
Non-Poor (1) 29.0 27.4
Poor (1) 71.0 72.6
Quintile 1 (Poorest) 58.2 58.5
Quintile 2 22.1 24.7
Quintile 3 11.3 9.1
Quintile 4 5.2 6.5
Quintile 5 (Richest) 3.2 1.1
Source: Compiled from VHLSS 2002
Notes: * By commune officials using the MOLISA thresholds
(1) As per the expenditure-based poverty line
programme evaluation
MOLISA-UNDP: TAKING STOCK, PLANNING AHEAD 35
100
80
60
40
20
0None Few Many All Don’t know
0.05
%
7.57
46.31
33.29
12.78

A point of concern is that though 11.4% of the households are classified as poor, only 3.8% were granted poor household certificates by 2002 (Table 7).20 This number may have gone up since then, butit suggests a time lag between preparation of the list of poor households at the commune level andreceipt of poor certificates/cards by the designated poor households. Very often the time lag of 4-6months severely limits the use of the card normally valid for a few months to one year. This concern wasvoiced repeatedly in the PPAs conducted last year (Box 7).
Spatial distribution of poor households and poor household cards – The North Central Coast and theMekong River Delta together make up 41% of the poor households in the country but receive 57% of allpoor household cards (Table 8). On the other hand, only half and one-third of poor households in theNorth West and the South Central Coast respectively have access to poor household cards.
Although the North Western region this region has the highest poverty rate by any measurement methodonly 5.4% of households are classified as poor. This suggests a low population density and may be areason for neglecting the region.
No method for identification of poor households is perfect. The overall picture that emerges is that theidentification of poor households is progressive, and a fairly large number of poor households have beenidentified to receive benefits under the NTP on HEPR. The extent to which they do will be examined inSection 1.4.
programme evaluation
36 MOLISA-UNDP: TAKING STOCK, PLANNING AHEAD
Box 7: Delays and Errors in Poor Household Cards
The issuance of the poverty certificates is slow and subject to a high margin of error. Villagers in Tra Giangreceived their poverty certificates in July even though these certificates were dated 1st January 2003. Thesepoor households therefore could only use the certificate for a maximum of 4 months. Furthermore, five outof 15 cards had the wrong date of birth entered for the recipient.
CRP (2003)
20 This may be because some localities do not provide "poor household books", rather have the names of poor households inthe list of poor households.

Table 8: Regional distribution of households classified as poor
Percentage of households Poverty Rate (%)
Classified as poor* With poor GSO (2002) MOLISA (2002)household card
Total 11.4 3.8 28.9 11.4
Urban 12.1 9.7 6.6 6.2
Rural 87.9 90.3 35.6 15.1
North East 13.0 10.0 38.8 13.9
North West 5.4 2.8 68.1 21.9
Red River Delta 12.1 8.0 22.7 8.4
North Central Coast 19.2 25.6 43.6 17.8
South Central Coast 6.9 2.2 25.6 13.0
Central Highlands 9.4 8.8 51.4 17.4
South East 12.1 11.3 9.9 6.3
Mekong River Delta 21.9 31.3 23.0 11.3
Total 100.0 100.0
Source: Compiled from VHLSS 2002. Data on MOLISA poverty rate from MOLISA-GTZ (2004)
Note: * By commune officials using the MOLISA thresholds
1.2. Identification of poor communes
CEM uses the MOLISA poverty rate information as one criterion amongst five to classify communes inespecially difficult circumstances (Box 8).
Based on these five criteria, a commune is placed in one of three Areas or Groups:
Area (or Group) I: Communities that are starting to develop
Area (or Group) II: Communities with mainly stabilised development
Area (or Group) III: The poorest and most vulnerable communities: those that meet 4 of the 5 criteria
programme evaluation
MOLISA-UNDP: TAKING STOCK, PLANNING AHEAD 37

Using these criteria, CEM in 1995-96 identified the 1,715 communes facing especially difficult circumstances - this included 1,568 mountainous communes and 147 communes in the Mekong Deltadistributed amongst 267 Districts in 46 provinces and municipal areas.21
It is difficult to get a clear sense of exactly how the criteria were applied in practice, and whether the districts had a role in identifying the communes for inclusion in the list. Review of past reports and discussions with officials reveal that based on the selection criteria issued by CEM in 1995-96, the PPCsrequested the districts prepare a list of communes which qualified for inclusion. CEM then sent specialists to work with the provinces, districts and communes to verify this list.
On other occasions, it was claimed that while communes provided information on request, the DistrictProgramme 135 Implementation Board prepared the proposals and they were sent to the province andonward to Hanoi. In Hanoi, the P135 Central Consideration and Approval Committee consisting of representatives of CEM, MPI, MOLISA, MARD, the Government Committee for Organizations andPersonnel, and the General Department for Land Administration decided which communes wereselected.
After the 1,715 Communes were selected, a sub-set of 1,000 were selected to receive targeted funds inthe first phase (1999-2000) of Programme 135. In practice, it seems that informal criteria guided theselection of the 1,000 priority communes and that this selection was largely delegated to provinces. By2002 the list had expanded from 1,715 to 1,870 communes. In the second phase, the total number ofcommunes increased to 2,362.
programme evaluation
38 MOLISA-UNDP: TAKING STOCK, PLANNING AHEAD
21 MOLISA et al 1999: 37, SRV 1998: 6-7.
Box 8: Criteria for the selection of communes under P135
A Location: remote border or island; more than 20km from a developing centre.
B Available infrastructure: is absent or temporary; significant transport problems prevail; no access by carto the commune; little or no electricity supply, irrigation, clean water, schools or health centres.
C Social issues: illiteracy is more than 60%; significant health problems; backward custom.
D Production conditions: generally unfavourable and inadequate to meet the population’s requirements;collection of forest products accounts for a significant proportion of household incomes; forest land isused for agricultural cultivation; shifting cultivation is practiced.
E Living conditions: more than 60% of households are poor by MOLISA income threshold.
Source: SRV, 1998: 4-6.

In addition to communes chosen based on poverty criteria, a further round of communes were selectedby CEM purely for being located on an international border. In the Northern Mountains the inclusion ofthese communes has not dramatically affected the total numbers, given that in these provinces themajority of communes, including those on the border with China and Laos, were already selected on thebasis of the poverty criteria. The exact definition of these communes varies across districts. Someinclude them in the list of Area III Communes; other do not, making a clear distinction between Area III(chosen on the basis of poverty/lack of infrastructure) and those chosen by CEM. All, however, qualifyfor and receive P135 funds.
Apart from the P135 communes, NTP on HEPR also identifies poor communes for directing infrastructure investments under P143 (Box 9).
The total number of poor communes has increased steadily since 1998 and at present 2,362 communesare classified under P135 (Table 9). This appears to be an anomaly since poverty has continued todecline from 1998-2002. Part of the increase in poor communes may be because of administrativerestructuring. But as presented in Box 10, it could also have been a late realization by commune and district officials of the possible benefits of increased participation in the programme.
The explanation in Box 10 seems plausible except that it suggests that (i) a similar approach must beadopted by government officials in general to under-state poverty so as not to appear inefficient, and (ii)there is considerable “latent poverty” in Viet Nam which surfaces as soon as more resources becomeavailable. Official data, therefore, has to be interpreted with caution.
programme evaluation
MOLISA-UNDP: TAKING STOCK, PLANNING AHEAD 39
Box 9: Criteria for selection of poor communes under P133/143
1. Poverty rate over 25%
2. Infrastructure: have less than 3 of the 6 basic infrastructure items listed below:
Access to safe water: less than 30% of the total number of households within the commune
Access to electricity for household consumption: less than 50% of total number of households
Transportation: no road to the commune centre, or inaccessible at certain periods of the year
School facilities: the number of classrooms (following MOET criteria) cannot accommodate more than70% of the school population, or classrooms are temporary and built from simple raw materials
No communal health care centre or rudimentary centre
No market or rudimentary market

Table 9: Increasing coverage of P135
1999 2000 2001 2002 2003 2004*
Extremely disadvantaged communes 1,012 1,490 1,884 1,907 1,907 1,919
Border communes 188 388 388 388 388 388
Communes of Safety areas during the war 0 0 53 67 67 67
Total 1200 1,878 2,325 2,362 2,362 2,374
Of which: Funded from the state budget 1200 1,753 2,200 2,233 2,233 2,245
Funded from the local budget 0 125 125 129 129 129
Note : Border communes include communes in Zones II and III.* Planned
Source: CEM (2004)
Slightly more than 50% of all poor communes under P135 are located in the two northern regions. Theseare also the regions with high poverty rates - 38% and 68% respectively for the northeastern and northwestern regions by VHLSS 2002. However, only about 12% of the total population living in P135communes nationally, are located in these two regions (Table 10).
In terms of targeting poor households, nearly two-thirds (66%) of the total population in P135 communeslie in the bottom two quintiles (Table 11). But at the same time, 45% of the households in the P135 communes are not poor. The government has a number of area-specific programmes, data for two ofwhich are presented alongside that of P135. In the poor communes under P143 there are an almostequal number of poor and non-poor households. The non-poor households are likely to benefit disproportionately from the large investments in public goods such as commune infrastructure and otherbenefits.
programme evaluation
40 MOLISA-UNDP: TAKING STOCK, PLANNING AHEAD
Box 10: Increase in poor communes in spite of decline in poverty
Discussions with CEM and provincial officials in Ha Tinh and Phu Tho provinces revealed that when selectmountainous communes with special difficulties were ranked in 1996, most provinces across the countrywere unaware about the real purpose of the exercise. Wanting to present a good record of their provinces,officials did not disclose that they still had poor communes with special difficulties. However, when the gov-ernment started implementing Programme 135 by providing block grants for investment to the “difficult” communes, many districts asked to have more communes included on the list of poor communes.
- from DFID (2000a, 2000b)

The proportion of non-poor households receiving P135 benefits has important implications for the designof future targeting mechanisms.
Table 10: Regional distribution of population in poor communes
Percentage of population in: Poverty Rate (%)
P135 Remote Poor GSO MOLISAAreas Communes (2002) (2002)
under P143
[1] [2] [3]
Total 14.8 15.9 19.2 28.9 1.4
Urban 3.9 4.0 5.8 6.6 6.2
Rural 96.1 96.0 94.2 35.6 15.1
North East 10.4 9.1 13.0 38.8 13.9
North West 1.7 2.4 5.4 68.1 21.9
Red River Delta 22.7 19.8 12.1 22.7 8.4
North Central Coast 20.1 17.5 19.2 43.6 17.8
South Central Coast 8.9 7.3 6.9 25.6 13.0
Central Highlands 4.0 10.9 9.4 51.4 17.4
South East 11.7 12.5 12.1 9.9 6.3
Mekong River Delta 20.6 20.6 21.9 23.0 11.3
Total 100.0 100.0 100.0
Notes: [1] Population located in communes with the Programme 135
[2] Population located in communes classified as remote areas by the Government
[3] Population located in communes classified as a poor commune by the PPC
Source: Compiled from VHLSS 2002
programme evaluation
MOLISA-UNDP: TAKING STOCK, PLANNING AHEAD 41

Table 11: Distribution of population in poor communes by quintile
Percentage of population in:
P135 communes Remote Areas Poor Communes under P143
[1] [2] [3]
Total 14.8 15.9 19.2
Non-Poor (1) 44.8 47.1 49.3
Poor (1) 55.2 52.9 50.7
Quintile 1 (Poorest) 43.5 41.1 39.4
Quintile 2 22.6 22.8 22.3
Quintile 3 15.1 17.9 18.0
Quintile 4 13.6 13.0 13.8
Quintile 5 (Richest) 5.3 5.2 6.5
Total 100 100 100
Notes: (1) As per the expenditure-based poverty lineSource: Compiled from VHLSS 2002
1.3. Access to benefits
This section deals with access of poor households’ access to benefits from various policies and projectsfrom NTP on HEPR. Being classified as a poor household entitles the household to the following benefits (Box 11):
programme evaluation
42 MOLISA-UNDP: TAKING STOCK, PLANNING AHEAD
Box 11: Entitlements of households classified as poor
- Reduction or exemption of tuition fees and other school fees- Free healthcare cards and vouchers - Availability of loans at low interest rates- Exemption from compulsory public work- Exemption from agriculture tax- Exemption from various contributions (national security and defense, education promotion, natural dis-
aster prevention, village events, association fees, etc.)- Food provision between harvest seasons- New Year gifts
Source: CRP (2003)

Of these only credit, tuition waivers and free health care are provided as part of the NTP on HEPR forwhich the households classified as poor need to have poor cards or certificates. But many householdsdo not know how to use the certificates and what kind of services they are entitled to with the certificates.Some certificates have no date of issue and arrive only 4-6 months before they expire. In addition, notenough information is supplied on the certificate to guide the households on how to access programmeservices (Mekong PPA, 2003).
Analysis of data from the PPAs suggests that certificates are necessary but not sufficient to access programme services. For example, to get education fees waived/reduced, schools require additionalstamped papers from CPC or from DOLISA. Consequently, the key questions addressed in this sectionare: what proportion of the identified poor households actually access programme benefits and whatproblems do they face in accessing these benefits?
Table 12: Distribution of access to HEPR sub-programmes by quintile
Percentage of households with access to:
Credit for the Free Health Education Policy Education for thePoor Insurance Household Poor
Total 2.2 4.0 11.7 5.5
Non-Poor (1) 25.1 28.6 41.1 30.2
Poor (1) 74.9 71.4 58.9 69.8
Quintile 1 (Poorest) 60.2 57.8 46.0 53.6
Quintile 2 20.4 20.8 23.9 24.1
Quintile 3 13.7 13.6 15.4 13.4
Quintile 4 4.4 4.6 10.7 6.4
Quintile 5 (Richest) 1.3 3.3 4.0 2.5
Total 100 100 100 100
Source: Compiled from VHLSS 2002.Note: (1) As per the expenditure-based poverty line
1.3.1. Subsidised credit
According to government data, a total of VND14,695 billion was provided as concessional loans by theBank for Social Policies22 during the period 1996-2002 to 2.75 million households across the country.
programme evaluation
MOLISA-UNDP: TAKING STOCK, PLANNING AHEAD 43
22 Earlier known as the Viet Nam Bank for the Poor (VBP).

However, data from VHLSS 2002 indicates that only a small percentage of households across the country have access to subsidized credit (Table 12). Of these about a quarter (25.1%) are non-poorhouseholds.
Analysing by quintile, more than 80% of households with access to subsidized credit are in the bottomtwo quintiles and only about 6% of households lie in the top two quintiles. Also, nearly 26% of all households with access to subsidized credit are located in the northern uplands (Table 13) which is aregion with a high poverty rate and a large proportion of ethnic minority people.
But there is no data to assess the proportion of total lending by quintile. The average amount of a loanis VND2.5 million (approx. USD170). However, poor households borrow in small amounts and eventhough 80% of the borrowers are from the bottom two quintiles, the amount of capital reaching these categories is likely to be disproportionately low.
Banks and local organizations still fear that the poor will fail to pay back loans when lending money tothem.
Table 13: Regional distribution of access to HEPR sub-programmes
Percentage of households with access to:
Credit for the Free Health Education forPoor Insurance the Poor
Total 2.2 4.0 5.5
Urban 10.6 15.6 13.2
Rural 89.4 84.4 86.8
North East 21.7 10.4 8.8
North West 4.1 7.6 2.8
Red River Delta 9.2 14.4 8.2
North Central Coast 30.6 17.2 13.5
South Central Coast 4.7 11.3 7.2
Central Highlands 5.8 7.7 23.3
South East 9.7 15.4 10.5
Mekong River Delta 14.1 16.0 25.8
Total 100 100 100
Source: Compiled from VHLSS 2002
programme evaluation
44 MOLISA-UNDP: TAKING STOCK, PLANNING AHEAD

Both VBARD and BSP require CPC endorsement for loans thereby making CPC a guarantor. People’sCommittees are reluctant to endorse really poor households who don’t have any assets. In many casesbank staff authorized CPC chairmen to select the borrowers with the condition that the CPC would alsoassume responsibility for the timely recovery of the loan. Furthermore, CPCs often require the villagehead or village head of mass organizations to endorse a request before they recommend it to the bank.Local Women’s Unions often endorse applications only for members’ households. But most poor households, especially in ethnic minority areas, are not members of mass organizations, and so are sidelined at the first stage.
Data from the VHLSS 2002 is used to assess the targeting efficacy of the various sub-programmes. Atargeting efficacy study was also undertaken as part of the evaluation (Shaffer and Thang, 2004). Apartfrom some variation in the education component, both studies estimated the coverage and mis-targetingor “leakage” rates of the sub-programmes to a similar order of magnitude. The results are presented inTable 14.
The results need to be interpreted carefully. Programme coverage rates suggest that, for example, 20%of the all poor households23 have access to tuition waivers, and nearly 10% of all poor households haveaccess to health insurance. Programme mis-targeting rates on the other hand, reflect the extent of mis-targeting of programme benefits to the non-poor. So, 25% of non-poor households have access tosubsidized credit, or 30% of non-poor households have access to tuition waivers.
Table 14: Targeting Effectiveness of HEPR programme components
Sub-programme Programme Coverage (C) (%) Programme Leakage (L) (%)
(1) (2) (1) (2)
Credit for the Poor 5.8 5.7 25.1 33.1
Health Care Certificate 2.6 - 27.3 -
Health Insurance 9.9 9.8 28.6 38.1
Education for the Poor 20.0 12.1 30.2 37.7
Sources: (1) Compiled from VHLSS 2002
(2) Prepared by Shaffer and Thang (2004) also using data from VHLSS 2002
programme evaluation
MOLISA-UNDP: TAKING STOCK, PLANNING AHEAD 45
“The Bank for the Poor drew up a list of poor households but offered (funds) to rich householdsand poor households were granted small loans or nothing. (Thai ethnic woman, aged 30, mixedgroup discussion in Tam Dinh Commune, Nghe An Province, 2003).
“The policy was worked out, yet poor houses could borrow only little money while big loans wentto the rich.” (a woman, aged 68, in Tam Dinh Commune, Nghe An Province, 2003).
23 Here poor households are defined using the GSO poverty line.

Despite the many achievements of the programme in recent years, which this evaluation recognises,accessibility to credit by the poor remains a problem. There is considerable qualitative evidence to corroborate the low coverage rate of the subsidized credit sub-programme. Reviewing past research,Huong and Thang (2003) summarise the factors that constrain poor household’s access to subsidizedcredit (Box 12).
programme evaluation
46 MOLISA-UNDP: TAKING STOCK, PLANNING AHEAD
Programme Coverage (C) measures the number of poor households which are programme participants asa proportion of the total number of poor households. That is, C = Np,i/Np, where Np,i is the number of poorhouseholds in the programme and Np is the total number of poor households.
Programme Leakage (L) measures the number of non-poor households who are programme participants asa proportion of the total households in the programme. That is, L = Nnp,i/Ni, where Nnp,i is the number ofnon-poor households in the programme and Ni is the total number of households in the programme.
Box 12: Factors constraining credit access to poor households
Not all poor households in need of capital, especially in very poor communes, can get access to credit. Inmountainous provinces, e.g. Son La and Lai Chau, bank officials are unable to reach the communes frequently. In some cases it takes 3-4 days to get to necessary places which costs the officials more thantheir transport allowance of about VND300,000 (Hoang Son, 2001).
The targeting-related problems are documented as follows:
Often the poor borrowers are screened out because of a low repayment capacity. Instead, householdsnot poor according to the MOLISA’s poverty thresholds but with a higher credit demand and repaymentcapacity get loans.
Insufficient information on financial services in rural Viet Nam is also a problem. The poor are often notaware of the eligibility conditions, interest rates, and other loan terms. Information about credit is mainly conveyed via credit officers and is usually inconsistent (The Viet Nam-Canada Rural FinanceOutreach Project, 1999 cited in Dufhues et al, 2002).
Evidence from the village survey by Dufhues et al. (2003) show that in some cases “hungry” householdsare officially excluded as they are assessed as too poor. In contrast to the national policy of providingcollateral-free loans, some credit officers insist on collateral in the form of a “Red Book” for a VBP loan.This is in contrast to the national policy of providing collateral-free loans. Some farmers switched fromVBARD to VBP because of its lower interest rate, despite having collateral and not belonging to the eligible target group of the VBP.
In some cases poor households find it difficult to access the loans due to an absence of regular loan provision. The VBP provides loans to the selected poor households in a commune at one time a yearbut it is once in 2 or 3 years for each village. Then, a poor household that did not gain access to VBPloan at the first time has to wait for 2 or 3 years to next credit cycle to borrow (Nguyen Xuan Nguyen,2001).

1.3.2. Health Support
The exemption or reduction in health costs is one component of HEPR’s Health Care Support policy. Itentails providing poor households or communes free or subsidised health care through:
the distribution of health insurance cards or poor household certificates which entitle the holders tofree or subsided care, and
the direct provision of free services in healthcare facilities or through mobile health units.
The Government’s Decision 139 allows for free-of-charge medical examinations and treatment for thepoor. Targeted groups include:
poor households under Programme 143
all households living in communes under Programme 135, and
ethnic minority households in the Central Highlands.24
In 2002, a total of 43 provinces/cities implemented a policy of providing health insurance cards to thepoor, and 18 provinces were supporting the poor in other forms (such as issuing free healthcare books,waivers at hospital, etc.). No province however, applied the reimbursement scheme for HIPC (Table 15).
By end of 2002, about 1.5 million insurance cards had been issued nationwide (Table16).
programme evaluation
MOLISA-UNDP: TAKING STOCK, PLANNING AHEAD 47
The poorest households generally do not access VBP loans partly due to self-exclusion (for fear of indebtedness), and also because of restricted outreach and limited range of credit products (Dao VanHung, 2001).
Focusing on ethnic groups, Huynh Thu Ba et al. (2002) found that in many credit and saving projects,some ethnic groups with no special needs might become beneficiaries of these projects. The provincialgovernment aims at subsidizing the preferential loan interest rate to the poorest communities, which cannot afford the rate set by the Viet Nam Bank for the Poor. Nonetheless, there is no restriction on whocan borrow this kind of credit. Many ethnic minorities refuse to borrow money because they do not feel the need to borrow and some of them are even afraid of not being able to pay back the debt. In addition,the Women’s Union, which manages the fund, uses some loan criteria that cannot be met by ethnicminorities. Instead, 60-70% of borrowers are Kinh, who are not in the groups that are in need of low-interest loans most.
Source: Huong and Thang (2003)
24 By Decision 168 of the Prime Minister.

Table 15: Distribution of forms for supporting the poor in healthcare in provinces (up to June 2002)
Number of provinces
Form 1995 1998 1999 2000 2002
Provision of HI cards to the poor, and settlement is 1 11 32 39 43done following normal health insurance procedures
Provision of HI cards to the poor following 7 1 2 6 -reimbursement scheme
Other forms such as provision of Poor Household 45 49 27 16 18card, Free Health Card, direct exemption at hospital...
Total 53 61 61 61 61
Source: Dang Boi Huong (2003)
Table 16: Number of health insurance cards for the poor 1998-2002
Type of card 1998 1999 2000 2002*
HI card for the poor following normal settlement 134,000 550,789 1,169,072 1,542,744procedure
HI card for the poor following reimbursement 40,000 52,262 198,451 -scheme
Total 174,000 606,051 1,367,523 1,542,744
Source: Dang Boi Huong (2003)
Note: * Until June.
Analysing the distribution of access to free or subsidised healthcare to poor households (Tables 12 and13) reveals that:
4% of the total population has received either a health care certificate or has access to free healthinsurance,
of these, non-poor households make up 29% of total beneficiaries,
78% of all beneficiaries are located in the bottom two quintiles,
programme evaluation
48 MOLISA-UNDP: TAKING STOCK, PLANNING AHEAD

one-third of all free health care certificate recipients are in the North Central Coast and the MekongRiver Delta, and
users of free health insurance are evenly spread across the regions except in the North West and theCentral Highlands.
As shown in Table 14, examining the effectiveness of health support policies, free health insurance covers close to 10% of poor households, though the mis-targeting is around 28%.
These estimates seem plausible as the government’s mid-term performance review of NTP on HEPR for2001-05 acknowledges that “even though health facilities at the grassroots level… have been prioritizedfor investment, demands of the poor have not been met”. The report states that only about 32% of thepoor in the two mountainous regions had access to health insurance cards.
Focusing on households with access to the government’s healthcare support, the QHS asked eligiblerespondents if they always received the fee reductions or exemptions when they were sought medicalcare and if not, the reasons why. By eligibility, it was meant either eligible to receive: (i) the health insurance card or poor household certificate or (ii) the actual fee exemption or reduction when seekingmedical care. The question is concerned with access to the card or certificate as well as access to theactual services that are supposed to be provided to card holders.
In total, around 75% of respondents maintained that they always received the health fee exemption orreduction when seeking medical care (Figure 3). But there is considerable regional variation. Northernprovinces appear to have fared the worst, with only around two-thirds of respondents claiming to alwaysreceive the exemption/reduction. In the northeastern region, less than 60% always received healthcare.The provinces in the South recorded the highest percentage of affirmative responses.25 There is also significant variation within and between the three regions as evidenced by the table entries. There areno statistically significant differences in the responses of the subgroups within ethnic or gender categories.
programme evaluation
MOLISA-UNDP: TAKING STOCK, PLANNING AHEAD 49
25 A similar question was administered to commune officials in the commune questionnaire concerning the frequency with whicheligible households in the commune received the exemption/reduction. The response categories included "always", "frequently", "sometimes" and "never". As above, the South recorded the highest percentage of responses in the "always" category (45%).

Figure 4 presents some of the reasons why the exemption/reduction was not always received accordingto the 25 per cent of respondents who didn’t always receive it. The two main reasons were that:
the health card arrived too late and the procedures were too complicated to get the card.26
This pattern holds across all geographic regions with two exceptions: in the Centre, “complicated procedures” were not identified as a major reason; in the South, a major reason involved the refusal ofhealth facilities to accept the Poor Household Certificate. This evidence is corroborated by a survey conducted in ten provinces by the Viet Nam Health Insurance Agency and Hanoi Medical University(VHIA, 2002) which states that about 12.5% of patients, who showed introduction papers that they hadobtained from their commune authorities were rejected by hospitals which doubted their veracity. Mostpeople with PHB or HIPC are actually poor, while many people who are exempted directly by hospitalsare not. The survey highlighted this as one weakness of the direct exemption scheme.
Another difficulty in selection and provision of PHB and HIPC is the ambiguity of Circular 0527, which doesnot regulate whether health insurance (HI) cards should be provided to households or to individuals. Thishas caused confusion for both DOLISA (in charge of approving the list of beneficiaries) and the HI
programme evaluation
50 MOLISA-UNDP: TAKING STOCK, PLANNING AHEAD
26 A significant number of responses fell into the 'other' category which could not be coded and included in the present analysis.
27 Circular No. 05/1999/TTLT-BLDTBXH-BYT-BTC on Health Insurance and Free Health Care for the Poor.
100
80
60
40
20
0Red
RiverNorthEast
NorthWest
NorthCentralCoast
SouthCentralCoast
CentralHighland
SouthEast
MekongRiverDelta
%
Yes No
Figure 3: Percentage of Eligible Household Members always received healthcare exemption

Agency (in charge of issuing cards). If the provision is for sick, poor individuals, the HI agency is unableto balance the insurance fund, and is not consistent with the risk sharing principle (Dang Boi Huong,2003).
Additionally, the difficulty in uniform application of the poverty standard to identify beneficiaries of healthinsurance cards among different localities has forced some provinces to allocate the number of poor people evenly throughout districts and then communes. Therefore, a poorer district/commune is notguaranteed to have more beneficiaries than a non-poor district/commune. This has partly distorted thespirit of the policy.
1.3.3. Tuition Waiver
The government’s achievements in implementing the education support policy are remarkable (Table17). During 2001-02, the last two years for which comparable data is available, a sum of more thanVND120 billion (USD8 million) was set aside for supporting the implementation of the educationalpolicy.
Tables 12 and 13 analyse the distribution of access poor households have to the various types of support provided by the government. A total of 5.5% of households receive partial or full tuition
programme evaluation
MOLISA-UNDP: TAKING STOCK, PLANNING AHEAD 51
Figure 4: Reasons that Eligible Household Members did not always receive Health CareExemption when Seeking Medical Care
0
20
40
60
80
100
Red RiverDelta
North East North West NorthCentralCoast
SouthCentralCoast
CentralHighland
South East MekongRiver Delta
%
Facility did not accept health insurance cardFacility did not accept Poor Household CertificateDidn't want to be known as a poor householdProcedures were too complecated to get the health insurance cardHealth insurance card arrived too lateOthers

exemptions, another 11.7% are education policy households. The Education for the Poor scheme is better targeted than the other sub-programmes as nearly 70% of the households with access are poorand nearly 80% belong to the bottom two quintiles. Nearly 60% of the households receiving tuitionwaivers are in the Central Highlands, the Southeast and the Mekong River Delta regions. The programme also has the best outreach as it covers 20% of all poor households (Table 14).
Table 17: Scale of support for implementation of Education Policy(‘000 students, billion VND)
1998 1999 1999-2000 2001 2002
Provinces —-> 25 31 38 50 39
Students exempted from tuition fees 683 764 2660 2004* 851
Budget for tuition fee exemption N.A. 39 95 39 42
Students granted free text books 352 200 1640 1650** 720
Budget for book grant N.A. 8.3 37.8 6.7 3.1
Students exempted from maintenance fees 1980 600 342
Budget for maintenance fee exemption 47.5 20 8.3
Students granted scholarships 20 12.5
Budget for scholarships 5 3.1
Source: “Educational Support within the framework of the NTP on HEPR for the 1998-2000 and 2001-2005 periods”, presentationby MOET, 2004
Notes: * including 730,000 poor children who were also exempted
** including 1.35 million poor children who were also granted free books
In total, around 80% of eligible respondents of the Qualitative Survey maintained that they alwaysreceived the tuition and school maintenance fee exemption or reduction (Figure 5). While there is someregional variation, there are no statistically significant differences between individual regions and thenational average (minus that region). In addition, there are no statistically significant differences in theresponses of the subgroups within the ethnic or gender categories based on ethnicity or gender.
The two main reasons why the fee exemption/reduction was not always received were:
(i) respondents didn’t know they were entitled to exemptions and
(ii) the procedures were too complicated to get the card.28
programme evaluation
52 MOLISA-UNDP: TAKING STOCK, PLANNING AHEAD
28 A significant number of responses fell into the 'other' category which could not be coded and included in the present analysis.

This pattern holds in all three geographic regions with the exception of the South-East where the majorproblem cited was the refusal to accept the Poor Household Certificate. As discussed in the previoussection, refusal to accept these certificates seems to arise because the process of identification of identifying poor households is prone to extraneous influence at the local levels.
Even though the classification as a poor household and the subsequent possession of a poor householdcard entitles the household to a number of benefits, a poor household does not always receive all thosebenefits. Because of limited availability, commune officials often distribute access to these benefitsamong a larger number of poor (and maybe some non-poor) households to increase coverage.
Precisely because poor households don’t always have access to the entire panoply of benefits, there isa weak correlation between programme pairs. That is, if a poor household has access to free health care,it may not also have a subsidised loan (r=0.079).29 Or, if the poor household has access to a tuition feewaiver, it will most likely not have free health care (r=0.129).
programme evaluation
MOLISA-UNDP: TAKING STOCK, PLANNING AHEAD 53
Figure 5: Reasons why Eligible Households did not Always Receive the Tuition and SchoolMaintenance Care
29 Correlation coefficients (depicted by 'r') range from 0 (no correlation) to 1 (perfect correlation).
0
20
40
60
80
100
Red RiverDelta
North East NorthWest
NorthCentralCoast
SouthCentralCoast
CentralHighland
South East MekongRiver Delta
%
Didn't know about the exemptions at that time Procedures too complicatedPoor Household Certificate not accepted Others

That is, poor households most often have access to a fewer number of benefits than they are entitled.Poverty is multidimensional and very often two or more factors work together to perpetuate poverty. Thisequalizing, or benefit-rationing, approach may adversely affect the prospects of achieving sustainableimprovement in household welfare and getting out of poverty.
As confirmed elsewhere, the seemingly “high” mis-targeting rates are not high by international standards(Coady, et al, 2002). Increasing coverage rates, however, require a shift in approach. At present only asmall percentage of total households in the country have access to different benefits (Table 14). Poorhouseholds make up 60-75% of the households that do have access. In that sense the targeting is satisfactory. But because these households make up only a small percentage of the total poor households in the country, coverage rates are low (Table 14). Merely increasing the targeting percentage,therefore, is unlikely to increase the coverage rate. It is more a question of scaling-up which may requirea different approach.
1.4. Key Conclusions
The income-based criteria for identifying poor households for targeting programme benefits is easyto understand, though the income levels are set arbitrarily and difficult to compare across communes.
Households acknowledge that the list of poor households is prepared in a consultative way, but thereis usually a discrepancy between the number of households classified as poor and those consideredas poor at the village level.
Nearly a quarter of all communes in the country are targeted by Programme 135, covering about 15%of the total population. More than half of them are below the poverty line, with 66% in the bottom twoquintiles. Thus, P135 seems to be fairly well targeted.
Of the total households that have access to subsidised credit under NTP on HEPR, 75% are poor.Yet numerous factors still limit poor peoples’ access to subsidised credit.
A total of about 1.5 million health insurance cards had been distributed by 2002, of which nearly 70%went to poor households. Two-thirds of all health care certificate recipients are in the North CentralCoast and the Mekong River Delta regions, though users of free health insurance are more evenlyspread across the regions except in the North West and the Central Highlands.
About 25% of respondents of the Qualitative Survey did not always receive the healthcare feeexemptions because theirs health cards arrived too late and the procedures were often too complicated to get the card.
programme evaluation
54 MOLISA-UNDP: TAKING STOCK, PLANNING AHEAD
“At present, all poor households in the commune have been issued poor households’ books with restrictionas allocated from the higher levels. The commune was allocated 350 poor households, but the numberselected by the people is higher than that. The solution is poor households must take turns to receive poorhouseholds books.”
Source: Chairman of Tam Dinh Commune’s Fatherland Front, quoted in Nghe An PPA, 2003

Nearly 70% of the households accessing the Education for the Poor scheme are below the poverty line.The programme also has the best outreach as it covers 20% of all poor households.
In total, around 80% of eligible respondents to the Qualitative Survey maintained that they alwaysreceived the tuition and school maintenance fee exemption or reduction.
The two main reasons why the fee exemption/reduction was not always received were that the respondents did not know they were entitled to exemptions and the procedures were too complicated toget the card.
However, even though classification as a poor household and the subsequent possession of a poorhousehold card entitles the household to a number of benefits, a poor household does not alwaysreceive all those benefits. Because of limited availability, commune officials very often distribute accessto these benefits among a larger number of poor (and maybe some non-poor) households to increasecoverage.
This equalizing, or benefit-rationing, approach may adversely affect the prospects of achieving sustainable improvement in household welfare and getting out of poverty.
Key recommendations
The system of identifying poor households at the commune level needs to be strengthened by possiblyincluding proxy indicators of welfare. However, that should be accompanied by clear set of guidelines onimplementation so as to reduce arbitrariness.
To ensure transparency and fairness, norms should be developed on how many poor households willhave access to how many benefits. Given that much of poverty in Viet Nam is extreme, a certain number of poor households per commune should be ensure access to multiple inputs to maximiseimpact and maximise the prospects of escaping from poverty.
There needs to be widespread recognition that well-being indicators do not change in the short run, andeven when they do, it takes some time before income levels stabilise at a higher level. This requires special efforts to also target near-poor households to ensure that they don’t lapse into poverty soon aftercrossing the threshold.
Efforts should be made to increase the coverage rates of different sub-programmes.
2. Resource Allocation30
Proper identification of poor households and communes needs to be accompanied by, among otherthings, allocation of adequate resources to significantly reduce poverty. This section examines theprocess and basis for, and regional variation in, allocation of state budget resources to the provinces
programme evaluation
MOLISA-UNDP: TAKING STOCK, PLANNING AHEAD 55
30 This section is based on Vu Tuan Anh (2003), Winter and Tuan Anh (2003) and Minford and Tu (2004).

and lower levels within the two programmes. The objective is to assess the process of resource allocation and the possible implications of regional and annual variation in resource availability.
The discussion in this section relies upon primary data collected during the expenditure tracking studyfrom selected communes and districts in four provinces – Tuyen Quang, Son La, Quang Ngai and SocTrang. While the results are interpreted with caution and sweeping generalizations may be hazardous,the results do provide an insight into the allocation and distribution of resources at the decentralisedlevel. This can greatly contribute towards the design of the 2006-10 programme.
2.1. Resource allocation to provinces and lower levels
For making provincial allocations for the NTP on HEPR, the following criteria are used31
:
Poverty rate of the province – so that poorer provinces get more
Difficulties faced because of natural calamities – so that provinces vulnerable to natural disasters getmore funds
Other sources of funds – provinces with other sources of funds get less from the central pool
Results of the previous year’s level of spending and objectives set for the next year.
However, it is unclear how these criteria are applied in practice and whether they are appropriate fordirecting resources equitably (on a per poor household basis) across provinces. This is because theprocess of State Budget formulation proceeds in a series of steps “similar to the way a Chinese medicalprescription is made” (Vu Tuan Anh, 2003):
MoF and MPI send guidelines for budget estimates (for the following year) to central agencies andto the provinces in June;
Provinces and line ministries draw up their plans and budgets, the finalised versions of which mustbe sent to the central level (MoF and MPI) by August;
MoF and MPI then assess the plans and make adjustments as a function of national revenue estimates – known as “balancing”. In the event that there are adjustments, provinces and line ministries reconsider their plans and budgets. At the latest, finalised budgets should be ready byOctober, for submission to the Government;
Once the Government has adopted the State Budget proposal, it is sent to the National Assembly forapproval. By law, the National Assembly should approve the State Budget by the end of November;
State Budget implementation begins at the end of December. Much of the responsibility for implementation lies at the local levels.
programme evaluation
56 MOLISA-UNDP: TAKING STOCK, PLANNING AHEAD
31 Vu Tuan Anh (2003)

A fixed sum is allocated to each poor commune under P135. This system of allocation is easy to administer and is apparently equitable (in terms of an equal amount of money allocated to each poorcommune). Recent changes in rules have given provinces some flexibility in distributing resources(above and below the VND500 million norm) across communes. Yet, this allocation mechanism is a relatively blunt instrument in relieving poverty. Communes with larger populations and/or communes withrelatively more poor people (and hence greater infrastructure needs e.g. water supply, housing etc.), orvery remote communes with huge cost implications, all receive similar amounts of central funds.
Resource allocation from the centre to provinces – The allocation of HEPR resources to the provinces ismore negotiated than those for P135. A review of spending for 2001-03 suggests considerable lack oftransparency in the budget allocation process for the HEPR programme. Although the process has botha bottom up and a top down component, funds allocated from the centre do not bear a clear relationshipto plans made and funds requested at the province and lower levels. For example, allocations for job creation and training do not always correspond to local needs.
Until recently, funds were allocated in a lump sum for all NTPs, and the provinces did not know the exactamount of funds for each programme, except the funds for P135 which are allocated separately. Thismade it difficult to target funds precisely. This system has changed in 2004, whereby separate sums areallocated to provinces for each NTP. This change is expected to make the attribution of funds to their targeted purposes easier to assess.
Resource allocation from the province to districts and communes – The PPCs and People’s Councilsdetermine the allocation of funds within each province, based on the province’s own socio-economic“master” plan. Provincial–level Programme Management Boards oversee the disbursement of funds andmanage the programme. Central budget funds are allocated in addition to those from the local level.
The provinces distribute central and local funding to districts based on the latter’s own plans and funding priorities. In practice, this degree of variation sometimes leads to inequity between communeswith similar degrees of need and/or poverty, and is an arbitrary way to allocate funds.
Funds for P135 are transferred to each district based on the number of qualifying communes within thedistrict. The district allocates funds to communes according to the norm. These funds go to projects within the commune, approved by the PPC.
In theory funding for each commune should equal the norm. In practice districts do not always allocatethe specified sum to each commune. Usually, at the end of the third quarter, provincial authorities reviewactual expenditures and contrasting plans. They estimate their capacity to implement projects in the lastquarter, determine where funds are unlikely to be spent, and review which projects have been implemented over budget. Funds are transferred from areas where implementation has been relativelyweak to areas of better performance. Fairness is maintained since districts ensure that, over a five-yearperiod, funds available to qualifying communes, on average, equal the norm. This is illustrated by thechanging allocations in Long Phu district in Soc Trang province (Table 18).
programme evaluation
MOLISA-UNDP: TAKING STOCK, PLANNING AHEAD 57

Table 18: Adjusted plans for Programme 135 in Soc Trang(VND mn.)
Previous allocation New adjustment(decision in March 2003) (decision in Dec. 2003)
Internal road in Liey Tu commune 100 0
Ngan Ro – market in Dai An commune 214 0
Road – Keng Nga – Long Phu commune 376 473
Road – Soc Dong – Tan Hung commune 300 415
Internal bridge – Tan Hung commune 0 111
Road – Trung Binh commune 306 402
Bridge – Trung Binh commune 80 0
Total 1376 1401
Source: Decision No. 2003/2003/QDUBNDT dated 29 Dec 2003 in Long Phu district on Adjusting Budget Allocation Plan of P135
In the HEPR programme, the province is often responsible for planning and allocation while districts andcommunes have only a limited role in this process. The PPC allocates funds to line ministry departments(DARD, DOLISA, DOH etc.) for implementation. Line departments then transmit information to the districts about their budget allocation. Capital funds are allocated on the basis of projects approved bythe PPC to be implemented in a particular commune. Recurrent funds are allocated on the basis ofstaffing and other costs incurred by each department.
Most of the responsibility for the management and implementation lies with the districts while provincesretain responsibility for staff training and healthcare. Some provinces (e.g. Tuyen Quang and Soc Trang)retain responsibility at provincial level for extension services.
Using the data from four provinces, the next section estimates the total amount of resources available tothe provinces and analyses the variation in resource availability for HEPR programme componentsacross provinces.
2.2. Variation in resource allocation
There are wide variations in the amount of central allocations across provinces annually under HEPR.Though allocations are not entirely insensitive to provincial poverty rates, it is difficult to understand howthe provincial poverty rate is used for making allocations (Table 19).
It is not immediately clear why Son La and Tuyen Quang received approximately the same amount ofcentral funds in 2001, when Son La’s poverty rate was more than twice that of Tuyen Quang. With a similar poverty rate to that of Son La, Quang Ngai received roughly 30% more in 2001.
The next year (2002), Son La and Quang Ngai with similar poverty rates received roughly the sameamount of central money, though nearly one-third less than Tuyen Quang which had a poverty rate ofonly around 8%. The allocation for Soc Trang tripled over the previous year, possibly in recognition of itsalarmingly high poverty rate.
programme evaluation
58 MOLISA-UNDP: TAKING STOCK, PLANNING AHEAD

Table 19: Central Allocations for HEPR (2001-2003)
2001 2002 2003
Province Poverty Allocation Poverty Allocation Poverty Allocationrate (%)1 (VND mn.) rate (%)2 (VND mn.) rate (%)3 (VND mn.)
Tuyen Quang 12.41 38805 8.19 34259 6.54 14471
Son La 27.06 37433 22.79 24247 18.26 38750
Quang Ngai 24.62 49988 22.01 27072 18.30 27414
Soc Trang 34.35 16870 30.21 52594 26.92 98116
Viet Nam 17.18 14.42 11.61
Sources: Poverty data from MOLISA; Budget Allocations from MOF and DPIs, DOLISAs in different provinces
Notes:1 At the beginning of 2001 (with the new poverty line)2 As on 31 December 20013 As on 31 December 2002
In 2003 there was a sharp decline in state budget allocation to Tuyen Quang, which may be explainedby its low poverty rate. However, it is difficult to understand the stagnation in Quang Ngai’s allocation,since Son La with a similar poverty rate, received 50% more money over the previous year. The six-foldincrease in allocation to Soc Trang over 2001-03 contrasts an only marginal decline in poverty during thisperiod.
Correlation is not causality and the data requires more rigorous analysis, but it does seem that centralbudget allocations have only a very weak impact on poverty reduction, except maybe in Tuyen Quang.
In Son La, for instance, a 35% decline in resource allocation in 2001-2002 over the previous year, and a50% increase in the next year seem to have little impact as poverty continued to decline steadily during2001-2003. This is brought out more sharply in Quang Ngai where the rate of poverty reduction was maintained in spite of a 50% decline in resources in 2001-2002 and no further increase in allocation during 2002-2003.
Poverty performance in Soc Trang is a cause for concern and requires a closer look. Despite a massivesix-fold increase in central budget allocation during 2001-03, the poverty rate has not reduced appreciably.
2.2.1. Provincial and non-central budget contributions
Topping-up of centrally allocated funds with provincial resources and contributions from mass organizations, state corporations, households and donors is critical for implementation of HEPR
programme evaluation
MOLISA-UNDP: TAKING STOCK, PLANNING AHEAD 59

components. Tables 20 (for HEPR) and 21 (for P135) show that (i) the provincial and non-central contributions vary considerably across provinces, and (ii) topping up can be substantial in provincessuch as Tuyen Quang.
Table 20: Central allocations and non-central contributions - HEPR(VND mn.)
2001 2002 2003
Province Central Non-central Central Non-central Central Non-centralAllocation contribution Allocation contribution Allocation contribution
Tuyen Quang 38805 24617 34259 28840 14471 25613
Son La 37433 3268 24247 5949 38750 6579
Quang Ngai 49988 7256 27072 7293 27414 2316
Soc Trang 16870 0 52594 5712 98116 14091
Sources: MOFI and DPIs and DOLISAs in different provinces
In some provinces such as Tuyen Quang in 2003, non-central contributions for HEPR programme components constituted more than half the total funds available (Figure 6). In both Son La and QuangNgai, non-central contributions (as a percentage of the total) increased in 2002, and then declined in2003. Non-central contributions did not contribute anything to actual spending in Soc Trang in 2001,though the province has begun to generate some local resources since 2002.
The contribution of non-central sources to the total allocation is much more varied across provinces inP135 (Figure 7). Except in 2003, Quang Ngai consistently has larger non-central contributions comparedto the other three provinces.
Table 21: Central allocations and non-central contributions – P135(VND mn.)
2001 2002 2003
Province Central Non-central Central Non-central Central Non-centralAllocation contribution Allocation contribution Allocation contribution
Tuyen Quang 28200 3002 29400 4108 36190 4018
Son La 41000 0 43300 0 54950 31831
Quang Ngai 28800 6200.5 29000 8800 38140 15500
Soc Trang 23600 489 24800 195 32000 1037
Sources: MOFI and DPIs and DOLISAs in different provinces
programme evaluation
60 MOLISA-UNDP: TAKING STOCK, PLANNING AHEAD

Differences in non-central resources emerge where provincial authorities have:
actively considered finding additional resources;
organized and delegated responsibility to organizations and agencies in considering and helping poor communes/people;
taken advantage of foreign donations and encouraged household contributions.
Breaking down the non-central contributions, for HEPR programme components (Figure 9), the provincial budget was the only source of additional funds in Son La and Quang Ngai. In Tuyen Quang,the provincial budget contributed only about 16%– the rest came from donor funds. Soc Trang has amore diversified funding base.
Figure 8 presents a similar picture for P135. The key point is that fund mobilisation by mass organizations plays an important role in both Son La and Quang Ngai, but especially in Quang Ngaiwhere it provides more than 90% of non-central budget contributions.
programme evaluation
MOLISA-UNDP: TAKING STOCK, PLANNING AHEAD 61
Figure 6: Non-central contribution as % of total - HEPR
0
20
40
60
80
100
Tuyen Quang Son La Quang Ngai Soc Trang
%
2001 2002 2003

programme evaluation
62 MOLISA-UNDP: TAKING STOCK, PLANNING AHEAD
Figure 7: Central allocations and non-central contributions - P135
0
20
40
60
80
100
Tuyen Quang Son La Quang Ngai Soc Trang
%
2001 2002 2003
Figure 8: Breakdown of non-central contributions by province - P135
Tuyen Quang Son La Quang Ngai Soc Trang
Provincial budget contributions State enterprise contributionsContributions from mass organizations Household contributionsOther contributions
0
20
40
60
80
100
120
%

By their nature, external donor projects are disbursed and monitored outside the usual Treasury system,with different donors often insisting on their own procedures. Due to the size and complexity of donorprojects, these are often undertaken over many years and can be very large in relation to the annual flowof central and local funding for infrastructure and other poverty reduction programmes.
Household contributions - It is difficult to get a sense of household contributions towards HEPR and P135since these are usually applied directly to projects and not recorded at the provincial level. Householdcontributions vary significantly both by province and within province, by commune. These variationsemerge because (a) the enthusiasm with which this policy is implemented varies in each province; and(b) the method of seeking household contributions is also different.
All household contributions are made in the form of direct project contributions, either in cash, labour orin kind. Contributions in the form of free labour dominate, with in-kind contributions being next mostimportant. Cash contributions are negligible.
Household contributions are used in projects such as infrastructure, housing support and extension support. Many communes have no household level contributions.
Accounting for household contributions is variable and some communes do not account for householdcontributions when reporting their total project budgets. For example, household contributions of communes in Tuyen Quang are included in the budget account, whereas in Soc Trang and Quang Ngai,these contributions are not recorded in their commune-level accounts.
programme evaluation
MOLISA-UNDP: TAKING STOCK, PLANNING AHEAD 63
Figure 9: Breakdown of non-central contributions by province - HEPR
Tuyen Quang Son La Quang Ngai Soc Trang
Provincial budget contributions State enterprise contributionsContributions from mass organizations Household contributionsOther contributions
0
20
40
60
80
100
%

Use of HEPR Non-Central Funds – Contributions from provincial budgets are usually earmarked for elements of the programme designed to be funded from local budgets, such as infrastructure of poorcommunes outside P135, housing support to the poor (such as the cost of fibro-cement roofing sheets)and extension.
Contributions from enterprises and foreign donors are usually spent directly on projects and are notreflected in district and commune account books. Officials are often unaware of the exact contributionsfrom state enterprises or foreign donors to particular projects and instead act simply as receivers andbeneficiaries.
2.2.2. Resource allocation per poor household
Examining central allocations per poor household in each province presents an interesting picture (Table22). Poor households in Tuyen Quang continue to receive more money than in other provinces, thoughthis seems to have been rectified; per poor household allocation declined in 2003 to half the level of theprevious year. On the face of it, it is inexplicable that the per poor household allocation in Tuyen Quangincreased in 2002, even as the poverty rate declined to a single digit. But consistent infusion of sizeablefunds may be one factor responsible for poverty reduction in Tuyen Quang. A definite answer, however,requires more research.
Table 22: Central Allocations per poor household for HEPR (2001-2003)
2001 2002 2003
Province No. of poor Allocation No. of poor Allocation No. of poor Allocationhouseholds1 (VND mn.) households 2 (VND mn.) households 3 (VND mn.)
Tuyen Quang 18000 2.16 12000 2.85 9790 1.48
Son La 46000 0.81 39200 0.62 32085 1.21
Quang Ngai 64000 0.78 58000 0.47 49062 0.56
Soc Trang 79000 0.21 71000 0.74 65000 1.51
Viet Nam 2800200 2368200 1941300
Sources: Poverty data from MOLISA; Budget Allocations from MOFI and DPIs, DOLISAs in different provinces
Notes:
1 At the beginning of 2001 (with the new poverty line)
2 As on 31 December 2001
3 As on 31 December 2002
programme evaluation
64 MOLISA-UNDP: TAKING STOCK, PLANNING AHEAD

The trend in per poor household allocation in Son La and Quang Ngai are difficult to interpret. Startingfrom similar levels of per poor household allocation in 2001 (and similar poverty rates – see Table 19),both provinces saw a sharp decline in their allocations in 2002. Allocations for both provinces climbed in2003, though only marginally for Quang Ngai. For Son La, with nearly 35% fewer poor households thanQuang Ngai, the allocation in 2003 was double that of 2002.
While Quang Ngai has many more poor households than Son La (and Tuyen Quang), its per person
allocations are lower. This is a clear indication that funds are not distributed solely according to the number of poor households in a province.
The per poor household allocation for Soc Trang in 2001 was roughly one-fourth that of Son La andQuang Ngai, and one-tenth that of Tuyen Quang. This anomaly seems to have been recognised and allocations have risen sharply in Soc Trang for the last two years. In 2003 Soc Trang allocations werehigher than those in Tuyen Quang. This shift in funding may begin to yield results, if the level of fundingis maintained over the next few years.
Actual spending per poor household – Examining the data for actual spending32
on a per poor householdbasis reveals that non-central sources definitely increase the amount of spending on poor householdsthough the level varies across provinces (Table 23).
However, the total amount is still quite low ranging from about VND710,000 (USD45) in Quang Ngai toabout VND4.2 million (USD270) in Tuyen Quang per poor household per year during the period 2001-2003 (Table 24).
Table 23: Central allocation and actual spending per poor household - HEPR(VND mn.)
2001 2002 2003
Province Central Actual Central Actual Central Actual Allocation Spending Allocation Spending Allocation Spending
Tuyen Quang 2.16 3.44 2.85 5.18 1.48 4.08
Son La 0.81 0.95 0.62 0.93 1.21 1.30
Quang Ngai 0.78 0.94 0.47 0.69 0.56 0.77
Soc Trang 0.21 0.21 0.74 0.50 1.51 1.37
Sources: MOF and DPIs and DOLISAs in different provinces
programme evaluation
MOLISA-UNDP: TAKING STOCK, PLANNING AHEAD 65
32 Actual spending is the amount of money actually spent in a particular year and is usually the sum of central allocation, non-central contributions and previous year's unspent balance.

Table 24: Average central allocation and actual spending – HEPR (2001-2003)(per poor household per year)
Average VND mn. Average USD
Central Allocation Actual Spending Central Allocation Actual Spending
Tuyen Quang 2.20 4.19 141.93 270.14
Son La 0.86 0.99 55.24 63.93
Quang Ngai 0.61 0.71 39.40 45.76
Soc Trang 0.78 0.87 50.29 56.23
Sources: MOF and DPIs and DOLISAs in different provinces
Richer provinces are therefore more likely to be able to generate additional funds to spend. The poorestprovinces are heavily dependent upon central funding. This disparity is also a reason to continue targeted programmes in Viet Nam.
What is the money spent on? – Analysing the spending pattern (Table 25) reveals that during the period2001-03 a substantial proportion of total central allocation – close to 85% in Tuyen Quang and QuangNgai, and around 50% in Son La and Soc Trang – was for providing credit to the poor.
Of the four, Soc Trang was the only province where there was central allocation for infrastructure.Strangely the allocation for training in all four provinces was minimal – none in Tuyen Quang and lessthan 1% elsewhere. This aspect is discussed in detail in Section C.II.2.
Table 25: Distribution of central allocation by sector (2001-2003)(%)
Sector Tuyen Quang Son La Quang Ngai Soc Trang
Infrastructure 0 0 0 11.8
Housing 0.4 2.0 0 14.9
Settlement 13.3 17.0 10.4 4.6
Extension 0.3 3.7 1.7 0.7
Health 1.8 24.9 2.3 18.5
Training 0 0.9 0.7 0.2
Credit 84.2 50.6 84.9 49.2
Total 100 100 100 100
Source: Compiled from data collected from provincial levels during fieldwork for Expenditure Tracking Study, 2004
programme evaluation
66 MOLISA-UNDP: TAKING STOCK, PLANNING AHEAD

2.3. Key Conclusions
Key conclusions emerging from the preceding discussion are:
A fixed sum per poor commune under P135 has the benefit of clarity and transparency. It is also anapparently equitable distribution of scarce resources. But communes with larger populations and/orcommunes with relatively more poor people receive similar amounts of central funds.
Although the government has criteria for allocating state budget resources across provinces for theHEPR programme, it is not always clear how they are applied or if they are always followed.
Thus, there is a large variation in allocation of HEPR resources across provinces (both in absoluteterms as well as on a per poor household basis).
There is an equally large year-to-year variation in funds available across provinces.
Though not entirely insensitive to poverty rates, large allocations to less poor provinces (for HEPR)suggests that equally poor households receive different amounts of government resources and benefits depending upon their location.
Because of limited resources, topping up of central allocation by provincial resources and other contributions is critical for the implementation of HEPR components. Often, the addition of non-central sources accentuates the differences in resource availability across provinces.
Richer provinces are more likely to generate additional funds whereas poorer provinces are heavilydependent upon central funding.
In spite of topping up, the total amount of actual spending on a poor household is limited. It variesfrom less than USD50 to about USD270 per poor household per year - i.e. even for well-resourcedprovinces (such as Tuyen Quang) this amounts to less than USD1 a day.
A substantial proportion of the central allocation during 2001-03 was for providing subsidized creditto the poor. There was almost no allocation for training.
Key recommendations
There should be greater equity by making central HEPR funding allocations clearer and more transparently linked to poverty levels at the commune and district level. Recent work on poverty map-ping will help in this regard.
There needs to be greater stability and more certainty about when funds will be allocated to theprovinces, possibly through a 3 year planning framework (with pre-announced central allocations).
The central government should set an achievable target (if possible separately negotiated with eachprovince) for funds to be raised locally and this target should be monitored on an annual basis.
Guidelines should be issued to districts and communes to help ensure that household contributionsare raised fairly, and that poorer households are not unusually burdened.
programme evaluation
MOLISA-UNDP: TAKING STOCK, PLANNING AHEAD 67

II. IMPLEMENTATION SYSTEMS AND CAPACITIES
This section will review the organizational structure for implementing the NTP on HEPR and P135.Provincial authorities are the key players in implementing the HEPR programme. They are responsiblefor target setting, organizing, guiding, and coordinating the implementation of HEPR in each province.
The section focuses on whether provincial, district and commune-level agencies have sufficient andappropriate capacity to:
(i) plan for community development, (ii) design and implement projects,(iii) monitor and coordinate projects and(iv) mobilize resources
The section will first review the responsibilities of the different key stakeholders in the programme-management structure and the extent of administrative decentralisation. This will then beused as a backdrop to assess whether those agencies, particularly at the sub-national level, have thenecessary capacity to successfully manage the HEPR programme.
1. Administrative Decentralization33
The NTP on HEPR is managed and implemented in a decentralized manner (Figure 1). At the nationallevel, the National HEPR Steering Board and ministries are responsible for the allocation of centralresources, the programme’s overall guidance, supervision, coordination, evaluation and policy development.
Provincial People’s Committees (PPCs) are responsible for organizing and managing programme implementation and accounting for resources within their territory. Commune PCs (or district PCs, wherever the former have capacity constraints) are in charge of planning and implementing commune-based activities.
Under the NTP, provincial authorities, particularly VCP and PPC, are the key players. Provinces coordinate HEPR efforts by making and implementing annual plans. This degree of authority is borne outby the wide level of discretion enjoyed by the provinces in allocating funds.
At the local level, the implementation and management of the HEPR programme is the responsibility oflocal Party organs and People’s Committees. All have set up local Steering Committees, headed by achairman or vice chairman of the PC to facilitate coordination and supervision. As at the national level,the actual organization, management and implementation of HEPR activities are carried out by functional departments.
programme evaluation
68 MOLISA-UNDP: TAKING STOCK, PLANNING AHEAD
33 This section has been written with help from UNDP (1999) and Neefjes (2004).

To assist local steering committees, the DOLISA is usually designated to host the HEPR office. The localSteering Committees help the PPCs and local technical departments to identify and appraise projectsand distribute funds. SCs also monitor and supervise project implementation.
Mass organizations play an active role in HEPR programme implementation at the grassroots level. Aspart of the political system, they act as a link between the Government and Party, encouraging local people to engage in social movements. They are strongly committed to helping the less fortunate andare experienced working with the target groups. These organizations have extensive networks from thecentral to village level that enable them to target assistance directly to beneficiaries.
In many cases, they facilitate the delivery of credit services to the poor by forming credit groups, mediating between banks and target groups or guaranteeing loans for their members. The Women’sUnion and Farmers’ Union are involved to varying degrees, from selecting borrowers to actually managing capital in the “credit for the poor” component of HEPR. The Viet Nam’ Fatherland Front is thekey local agency for convening Peoples’ Inspection Boards at the commune level.
The leaders of local cells of the mass organizations such as the Women’s Union and the Farmers’ Unionare often members of the People’s Councils. The implementation of the Grassroots Democracy Decreehas improved the way local cells of mass organizations channel citizen’s feedback to the PC, and hashelped strengthen local informal groups
34.
Different line departments participate in the programme to different degrees. Those departments whosesuperior line ministry receive HEPR programme funds have a greater opportunity to be involved in programme implementation (e.g. agriculture, health, education, and planning). Others which receive nodirect programme funds but whose functions concern HEPR programme implementation at the grassroots levels often try to profit from providing specific services. For example, the constructiondepartment will provide inspection services, and the land cadastral office will survey and allocate landand issue land use certificates.
Most funds under HEPR projects are still controlled at district and province levels by sector departments,even though much of the implementation responsibility lies at the commune level
35with commune PCs,
school principals, heads of health centres, etc. In the four provinces surveyed for the ExpenditureTracking Study,
36staff training, health care, extension schemes and new economic zones are mainly
managed at the provincial level.37
Management of some components, such as commune cluster development, healthcare, housing support and the provision of credit, are delegated to the districtalthough in Tuyen Quang provision of inter-commune centres is managed at the provincial level.
programme evaluation
MOLISA-UNDP: TAKING STOCK, PLANNING AHEAD 69
34 NCSSH-IoE/Oxfam GB (2003)35 See e.g. UNDP (1999), p.31.36 Provinces surveyed for the expenditure tracking study include Tuyen Quang, Son La, Quang Ngai and Soc Trang.37 Except in Son La where these elements, except training, were managed at the district level.

The decentralisation of decision-making and budgeting responsibilities, for most sector projects, to thecommune level does not appear to be a priority.
38Some communes (for example, in Quang Ngai and Soc
Trang) reported that the process of local level consultation only works during the preparation of the 5-10year plan and when the plan is reviewed. In regular years, commune officials decide which projects willbe implemented from the strategic plan, and these plans are then submitted to the higher authorities forapproval.
Districts and communes have little room for re-interpretation of provincial and national guidelines on, forexample, allocating money to build schools and classrooms, waiving school fees, supplying free textbooks or providing health insurance cards. The sedentarisation and settlement projects under MARDseem to be managed sectorally at the province and district levels. Most sector programmes under theHEPR programme were decided at the national level, and concern handouts, subsidies and/or exemptions from payments for poor people.
Under Programme 135 the DPCs were initially to be the “project owners” and commune PCs were to beresponsible for overall planning, cadre training, supervision of small projects, and mobilisation ofresources (notably local labour). Since 1998, planning was expected to include the “full democratic participation of locals,
39but plans had to be approved by district and province PCs. The intention of
gradual decentralisation to the commune level was reinforced by various implementation guidelines, andthe same process is followed for deciding the content of the programmes:
Communes prepare a 5-10 year strategic plan based on the demands of each village with some participation of households. It is then submitted to the district and province and forms part of theprovincial P135 “master” plan.
Every year, based on this approved “master” plan, each village chooses projects to invest in.Households in the village rank the projects to be implemented that year.
The Commune People’s Committee submits the projects to the Commune People’s Council to decide.The list of projects is then submitted to the district and province People’s committees for approval.
However, of the provinces surveyed, only Tuyen Quang had decentralized implementation and financialmanagement of infrastructure works to the commune level. The other provinces - Son La, Soc Trang andQuang Ngai – had decentralized programme implementation only to the district level. Each of theseprovinces had implemented a few pilot projects in some communes where they felt there was sufficientmanagement capacity. Hence, contrary to the aim of the programme, the role of the commune in managing projects is often very limited.
programme evaluation
70 MOLISA-UNDP: TAKING STOCK, PLANNING AHEAD
38 This can be inferred from MOLISA (2003a), and, for example, the presentation Education support to the poor households andpoor communes by Dang Huynh Mai (vice Minister of Education & Training), and Renewed health care mechanism of healthcare services for the poor by Le Ngoc Trong (Vice-Minister of Health), to the HEPR-JC Programme review conference inOctober 2003.
39 CEM (1998), part III

By 2003, after five years of implementing P135, only 385 communes out of the 2,362 “poorest and mostdifficult communes” in 20 of the 49 provinces had become “investment holders.”
40In the other cases the
districts still managed the programmes, despite intentions to decentralise to the commune level.
This lack of decentralisation reduces the role citizens in planning, implementing and monitoring the different activities under P135. Furthermore, even where the management is decentralised to the commune, plans for spending still need to be approved by district and province authorities, and maychange in the process.
Programme management boards at province and district levels delegate various organizations to manage the different components of the HEPR programme. For example, in general, the training for thepoor component is delegated to DOLISA, resettlement works are delegated to the ProvincialResettlement Department, and agricultural extension is delegated to Department of Agriculture and RuralDevelopment (DARD).
Those districts, provinces, and sector departments which are reluctant to decentralise management ofinfrastructure projects should be made aware of the success of decentralisation in P135 and the lessonsof the NTP on HEPR and various internationally-funded projects.
Indeed, decentralisation should be accelerated. But, it should also be accompanied by improving thecapacity of higher-level authorities to provide guidance and monitoring.
2. Institutional Capacities
This section assesses whether key stakeholders have the requisite capacity to successful manage theHEPR programme. It will analyse the role of the HEPR Office and examine capacity at the local level.
The often-made argument against decentralisation hinges on the “weak capacities” of commune authorities and village leaders, especially in remote, poor, and mountainous Programme 135 communes.However it is unclear whether the slow pace of decentralisation has more to do with the provinces’ desireto retain control of scarce resources or the actual capacity of commune-level officials.
There are some successful cases of decentralisation and capacity building in provinces underProgramme 135 (Box 13). Though some internationally funded projects have been successful in building project planning and management capacity at commune and village levels,41 there have beenonly modest efforts to build capacity under the NTPs. This is borne out by the almost zero resource allocation for training in the four provinces during 2001-03 (Table 25).
2.1. Capacities of the HEPR Office42
The HEPR Programme Office (PO) was established within MOLISA in 1998 to help the NSC manageand coordinate the implementation of the NTP on HEPR. The office has been assigned the followingfunctions:
programme evaluation
MOLISA-UNDP: TAKING STOCK, PLANNING AHEAD 71
40 CEM (2003), p.12. 41 Shanks et al. (2003) summarise some of this. See also SFDP (2003) and MARD & MRDP (2002)42 This section draws heavily on UNDP (1999).

To assist the National Steering Committee (NSC) Chairperson in synthesizing the programme’s plans,including programme budgets
To help the NSC monitor and coordinate programme activities by other institutions, ministries andprovinces on a daily basis
To prepare programme progress reports and to arrange meetings for the NSC. In particular, the POprepares the programme progress report in the first week of each month to submit to the HEPRChairperson and his/her two deputies before their monthly meeting.
The capacity of the HEPR Office in communication, organization, coordination, monitoring, reporting andpolicy analysis of the HEPR implementation is clearly important to the NTP’s success.
However, the programme office has been able to carry out only some operational functions such as synthesizing annual plans for MOLSA and Steering Committee approval, preparing work plans, writingregular reports, arranging meetings and preparing training materials.
programme evaluation
72 MOLISA-UNDP: TAKING STOCK, PLANNING AHEAD
Box 13: Decentralization of Programme 135 in Tuyen Quang
Project management under Programme 135 has been decentralised to all 58 “Area III” communes inTuyen Quang Province. This success in decentralisation of the NTP may be attributed to the following.
Early decentralisation (from the outset of P135) combined with strong province leadership, clarity in regulation/guidelines for implementation, strict administrative controls/close supervision by higher levels, and limited corruption.
Close links with the GRDD reflected in implementation guidelines for P135.
A “learning-by-doing” approach meaning management took risks to decentralise, but through managingthe projects the capacity of commune officials improved.
Training programmes that were considerably stronger than in some other provinces. (Capacities of localleaders were reasonable to begin with and somewhat better than in some of the poorest and most mountainous provinces.)
Strengthened communes (and commune staff) meant that “demands” (needs) for technical support fromthe districts were articulated better, which in turn strengthened commune capacities.
Use of innovative ways to increase accountability to local people, e.g. through village meetings in whichsimple works are allocated to local artisans, cooperatives, etc., early on in the planning cycle.
Experience from internationally funded projects that started with participatory planning in the early-1990sat village and commune levels. The province legitimised the Village Management Boards and WaterUsers Associations that were introduced under IFAD and SIDA funded projects.
Source: Shanks et al. (2003), p.63-65

The programme office is designed as a semi-independent office within MOLISA but it is directly controlledby MOLISA. The programme office does not enjoy the same level of administrative authority as otherdepartments of MOLISA. This has affected its ability to coordinate with other HEPR stakeholders withinand outside MOLISA.
The office is responsible for assisting the Chairperson of the Steering Committee in preparing programme plans. However, it generally collects plan proposals from other ministries and PPCs and submits them unedited to the members, rather than prepare its own comprehensive and improved plans.
The monthly programme progress report assigned to the office is not regularly submitted to the HEPRSC directors before their monthly meeting. The office staff need a better idea of what these reportsshould include and what resources should be utilized to write them. The PO needs to ensure that thedata and information received from lower levels is properly analysed.
The HEPR office’s weaknesses in monitoring and coordinating programme implementation of other institutions, ministries and provinces stems from its minimal role in allocation and management of financial resources. HEPR funds are allocated by MPI and MOF, and the HEPR office has no role.Therefore stakeholders often only report to these line ministries.
Playing the role of HEPR programme coordinator, the HEPR office is responsible for information collection, analysis, assessment and dissemination. However, it has access to only limited information.Information on local and international experience, progress of components at different levels and otherinformation that is needed for management is often unavailable to the office staff. Not all HEPR EAsreport back regularly to the PO even though the office is expected to provide detailed information onprogress that can only be collected from lower administrative levels.
The HEPR office has little experience in preparing comprehensive poverty alleviation policy. Most staffmembers provide only technical inputs rather than coordinate a programme. The skills needed to accessand disseminate information should be included in training plans for HEPR staff at central and provinciallevels. Providing training facilities is important for improving the capacity of the office.
Without improved capacity and greater empowerment, the HEPR programme office’s mandate is unlikely to be met. To ensure success of the HEPR programme, information management should be onefocus of the office.
The HEPR office publishes a magazine every two months and also has a website. Still the capacity ofthe HEPR office needs to be strengthened in terms of:
Clarifying types of information needed for programme management (financial, personnel, HEPR activities, experiences, HEPR plans);
Identifying the sources of information needed from HEPR agencies at ministerial and local (province,district) levels;
Disseminating HEPR information through mass media; and
Designing a system to collect information from HEPR entities.
programme evaluation
MOLISA-UNDP: TAKING STOCK, PLANNING AHEAD 73

For this, the Programme Office should improve its capacity to:
Consolidate local experiences into key principles and HEPR guidelines, particularly in the areas of targeting, management and reporting.
Monitor the quality of targeting, implementation and programme impacts.
Propose HEPR-related social and economic policy analysis and use the results for policy formulationand programme management to ensure better linkages between HEPR and macro policies.
Coordinate HEPR activities through information sharing and joint planning.
Facilitate communication and raise awareness among both government officials and target groups.
2.2. Local level Capacities43
This section discusses the capacities at the local levels for implementing the two NTPs.
In spite of their numerous advantages, mass organizations are still weak in remote, poor and uplandcommunes and villages, and sometimes altogether “dormant”.
44This is explained by the limited
capacities of leaders of the local cells, and also by language barriers, and transport and communicationdifficulties. The organizations are often biased against non-members and many poor people are oftenneglected in credit and other training programmes because they are not members.
A number of specific constraints reduce the effectiveness of mass organizations:
Often the cadres of mass organizations are not technically equipped to handle many tasks. Their rolein programme coordination and implementation is often insignificant as they have limited capacity todesign and manage the HEPR projects to meet their members’ needs.
The role of mass organizations in HEPR decision-making at higher levels is limited. They may beinvited to meetings, but their opinions often do not differ from the mainstream or tend to be neglected when they do.
There is insufficient collaboration between mass organizations and administrative bodies in HEPR.The mass organizations often apply top-down mobilization approaches with programmes designedcentrally without room for local initiative.
They also have no financial resources to cover their own expenses, let alone implement projectsthemselves.
programme evaluation
74 MOLISA-UNDP: TAKING STOCK, PLANNING AHEAD
43 Based on Neefjes (2004).44 DFID (2003), p. 26; see also several other PPAs of 2003.

Thus, to improve their role in HEPR planning and implementation, they need improved skills in community facilitation, monitoring, as well as awareness of social relations and ways to address socialinequality. Technical skills to improve monitoring of infrastructure projects also need strengthening.
The following plans to improve capacity can be considered:
Continued training on participatory approaches as in participatory rural appraisal (PRA) should beimplemented at all levels particularly with mass organizations other than the Women’s Union.
More cadres, particularly in the Women’s Union, should be trained in financial management andaccounting who will then be better equipped to support non-political activities.
2.3. Building institutional capacities45
The NTPs have small training budgets. The focus of training has shifted since the formal start of the programmes in 1998, and now includes various social aspects
46. Initially the training for commune and
district level cadres focused on administrative procedures, Decrees, guidelines, etc.47
Under Programme135 the curriculum also includes some technical training.
However, overall the training under Programme 135 was judged to be “limited and unfocused on essential tasks”.
48Training often happens in conjunction with other meetings, instead of in relation to
needs and planning cycles. The critical role of village heads for communication, facilitation and monitoring was not reflected; they were only occasionally included in training.
On the positive side, the Tuyen Quang experience with decentralised implementation of P135 (Box 13)has:
strengthened capacities at the local level through training and “learning-by-doing”,
increased the confidence of higher level authorities in the capacities of the commune and village levels, and
legitimised local bodies such as the Village Management Boards and Water Users’ Association.49
This is documented by internationally-funded projects which have experimented with management ofvarious funds at the commune and village levels. In all cases, their success is strongly attributed toextensive, long-term capacity building efforts in project management skills (including basic financialaccounting), some technical skills, skills that relate to community consultation (including PAR), and
programme evaluation
MOLISA-UNDP: TAKING STOCK, PLANNING AHEAD 75
45 Based on Neefjes (2004).46 See CEM (2004b) and MOLISA (2003b,c)47 See e.g. Truong Van Am (2000)48 Shanks et al. (2003), p.6249 Shanks et al. (2003), p.65

communication/awareness raising skills.50
However, it is also suggested that some of the structures andimprovements in capacities were lost when projects ended.
51
Under the Public Administration Reform Programme (PAR) capacities of district and commune officialsfor general administration, service provision, and implementation of various projects have been strengthened over the past years. By placing, usually young, cadres the People’s Committees in theremotest and weakest communes are being reinforced. ThePPAs recognise young cadres are veryimportant for these communes and therefore their training should be continued according to recentPPAs. Though not directly related, these efforts are important for the success of the two NTPs.
Though administrative decentralization of the two NTPs has happened to some degree it has been slow.The Tuyen Quang experience with decentralization of managing P135 may be replicated widely, but thatrequires reinforcement of training programmes, for cadres, village leaders, leaders of mass organizationsand local people.
The village heads are particularly important for improved consultation, monitoring, and empowerment.Some of the successes with decentralization suggests the advantage of encouraging other villagers, toform various village management structures (even though the village is not an official administrative unitin Viet Nam)
52.
Recently updated training materials for commune, district and province HEPR-JC staff include varioussections on consultative, participatory approaches including PRA elements. Other concepts have alsoentered these manuals, including a discussion on gender relations.
53This happened only in the third
edition of the manual, published in 2003, and can therefore not yet have had an impact beyond someimproved consultation of citizens. Nevertheless, it shows a structural change and depending onresources allocated for training, thousands of local cadres will be exposed to this over the coming years.
One component of Programme 135 is capacity building of commune PC staff and local leaders, including members of Project Supervision Boards, which are created for the duration of an infrastructureproject’s implementation. The recently updated training materials for grassroots cadres involved inProgramme 135 make a direct link between implementing the GRDD and popular consultation, information supply and direct popular involvement in decision-making regarding Programme 135.
54The
importance of upgrading technical skills of leaders and some citizens for monitoring of infrastructure projects are also addressed, and there is need for more of that.
Thus a potential for stronger capacity building in the next phase of the NTP already exists. This needsto be delivered by (provincial, district) training institutes, whose own capacity, for the most part, alsoneeds improving.
programme evaluation
76 MOLISA-UNDP: TAKING STOCK, PLANNING AHEAD
50 See SFDP (2003) for extensive experience in Son la province; MARD & MRDP (2002) for experience in various provinces inthe Northern Mountains, and also Shanks et al. (2003) who use several sources for case studies.
51 This is the case in, for example, some of the researched communities in the Lao Cai PPA - see DFID (2003)52 The important role of village heads is highlighted in several PPAs - see World Bank Viet Nam (2003), and for example DFID
(2003), p.29-30, which suggests that deputy heads are widely needed, also in small villages in the uplands. 53 See MOLISA (2003 b & c). These manuals were developed and produced with German Technical Assistance. 54 CEM (2004b)

In addition, there is considerable training experience in various projects and local private organizations.This experience is generated from the documented experience of a range of successful projects thatoften include training of local officers in behavioural skills, facilitation skills, and general “communitydevelopment”. A strong capacity building approach can lead to the institutionalization of participation.
Several official donor and NGO funded community development projects have increased staff capacitiesat the district and commune levels. There are several examples where this capacity building benefits theimplementation of the NTPs. However, not all projects cover all or most communes in a certain provinceor district, as the NTPs do.
Two large-scale World Bank funded programmes are currently operating in a total of 19 provinces, andwith activities closely related to the two NTPs.
55These have substantial capacity building components,
and in both cases some of the funds are directly managed by commune authorities. Most investment inlarger infrastructure, however, is managed by the districts. They make substantial efforts at training community facilitators and others, through local training institutes. Other large and medium scale projects with World Bank or ADB loans or bilateral grants also have grassroots-level capacity buildingcomponents.
56
While there has been some improvement in local administration and leadership, more capacity buildingis needed, especially in terms of acquiring the skills necessary to plan and monitor a range of projects.There is room to learn from the experiences of internationally funded projects in rural and urban areas.This is despite the fact that all these projects are implemented at the local level by PCs, mass organizations, and sometimes other local organizations. In some cases the individuals involved in thoseprojects also have roles in implementing the NTPs.
2.4. Key Conclusions and Recommendations
The NTP on HEPR is to be managed and implemented in a decentralised manner, and the provincialauthorities, particularly VCP and PPC, are the key players. They have considerable discretion in allocating funds.
However, decentralisation below the provincial level is patchy. Most funds under the HEPR projectsare still controlled at province and district levels (by sector departments), even though much of theimplementation responsibility lies at the commune level.
In spite of the intention to decentralise P135, most districts still manage the planning, implementingand monitoring different activities. Even where the management is decentralised to the commune,spending plans still need approval at district and province levels, and may be changed in the approvalprocess.
programme evaluation
MOLISA-UNDP: TAKING STOCK, PLANNING AHEAD 77
55 The Community Based Rural Infrastructure Project in 13 Central provinces, and the Northern Mountains Poverty ReductionProject in 6 provinces. Each are based on a soft loan through the World Bank of about USD100 million and in addition theyhave some grant funded capacity building components.
56 See e.g. Shanks et al. (2003), p.19

Thus, by 2003, only 385 communes out of 2,362 “poorest and most difficult communes” in 20 out of49 provinces under P135 were “investment holders”.
There has been some improvement in local level participation in decisions regarding implementationof some components of the two programmes. But this is largely attributable to the GRDD.
Even so GRDD has so far had least effects in remotest communes on e.g. financial transparency,which is central to successful implementation of the two programmes.
At the central level, the HEPR Programme Office has a critical role in coordination and monitoringof the HEPR Programme. However, it has serious limitations of stature and capacity because ofwhich it is unable to carry out its functions effectively.
‘Weak capacities’ of commune staff and village leaders, especially in the remote, poor, and oftenmountainous P135 communes is often used as an argument for non-decentralisation. But less than1% of the programme budget was allocated for training of cadres.
Village leaders have a crucial role in increasing popular consultation and information supply to vil-lagers, especially in upland villages. However, their capacities are often limited, and in many casestraining efforts under the NTPs have focused on commune and higher level PC cadre, instead of vil-lage leaders, heads of social organisations, and members of People’s Councils.
Mass organisations play an active role in the HEPR programme implementation at the grassrootslevel. Women’s Union and Farmers’ Union are involved in implementing the credit for the poor com-ponent. Viet Nam Fatherland Front is the key local agency for convening Peoples’ Inspection Boardsat the commune level.
However, the effectiveness of mass organisations is hampered by weak technical capacities, limit-ed influence in decision-making at higher levels, insufficient integration with HEPR bodies, and lim-ited access to funds.
Key recommendations
Consistent with the Government’s Socio-economic Development Strategy for 2001-2010 and theCPRGS, the NTP on HEPR for 2006-2010 should have ‘empowerment of poor people’ as a primaryaim.
The principle of popular consultation and participation in decision making should be applied through-out the (sub-) project cycles (i.e. during the preparation, implementation, and evaluation stages).
The programs must strengthen horizontal links with other projects and policies, especially with thegrassroots democratisation and administrative reform and decentralisation processes.
The HEPR Program Office’s stature and capacity should be strengthened to enable it to play a moresignificant role in the implementation of the NTP on HEPR.
programme evaluation
78 MOLISA-UNDP: TAKING STOCK, PLANNING AHEAD

Technical supervision capacities of local people and of mass organisations should be increased forlocal monitoring and accountability.
3. Financial Management System
This section analyses the tracking of expenditures across various levels to get a sense of how the financing system operates.
The section addresses three issues:
(i) whether funds released for activities within HEPR and Programme 135 actually arrive at theirdestination,
(ii) the extent, or potential, of “leakage” of funds in financial resource flows, and
(iii) whether service providers have the correct incentives for providing services to the targeted beneficiaries.
3.1. Tracking Expenditures
Funding for both programmes is managed and disbursed through the Treasury system and is based onrecorded progress in project implementation. Signed certificates are required to prove projects havebeen completed. However, in some circumstances, projects received acquittals from the Treasury basedon estimates and not on actual funding requirements based on implementation.
Where there are specific norms for investment, such as for Programme 135 and for the “Housing Supportfor the Poor” component of the HEPR programme, the process and flow of funds is transparent andbased on a clear delegation of management authority. Each level of government is informed about funding and monitoring expenditure.
Under P135, a fixed total for capital infrastructure spending per commune makes it easy to track expenditures in the field. In general, funds are, by and large, accurately passed down to district and commune levels and spending is properly recorded.
Budgets are usually almost completely spent within the year (Tables 26 and 27). The largest discrepancy was a failure to spend a little over 16% in Quang Ngai in 2001.
An under-spend can occur when there is a significant increase in budget allocations from one year to thenext (e.g. in Quang Ngai from 2002 to 2003), as disbursements generally lag behind allocations. This isnot surprising and reflects a common difficulty by expenditure managers under most systems (includingthose in developed countries) in matching activities with sudden increases in resource availability.
Allocations from the district to the commune level are clear-cut (Table 27). Funds allocated by the districtin all provinces could be matched with commune level expenditures in the four provinces sampled for thestudy.
programme evaluation
MOLISA-UNDP: TAKING STOCK, PLANNING AHEAD 79

Table 26: Allocations and Actual Spending of P135 Central Funds, 2001-2003(VND mn.)
Sources: MOF/MPI and various DOLISAs, 2004.Note: Provincial re-allocation adds the previous year’s unspent amount to the central allocation. Actual spending, as the name suggests, is the actual amount spent in a particular year and is the sum of the central and non-central funds.
Table 27: Allocations & Spending of P135 funds, District & Commune levels, 2003
(VND mn.)
Note: Data could only be collected on district allocations and commune spending for 2003 in one commune in Tuyen Quangand Son La, two communes in Soc Trang and three communes in Quang Ngai. Where data was collected, it showed(except in one commune in Soc Trang) very small discrepancies between allocations and spending.
programme evaluation
80 MOLISA-UNDP: TAKING STOCK, PLANNING AHEAD
2001 2002 2003
Province Centralallocation
Provincial re-allocation
Actualspending
Centralallocation
Provincial re-allocation
Actualspending
Centralallocation
Provincialre-allocation
Actualspending
Tuyen Quang 28,200 31,521 30,420 29,400 31,140 29,540 36,190 37,690 35,240
Quang Ngai 28,800 36,343 30,419 29,000 29,390 29,366 38,140 39,638 36,757
Soc Trang 23,600 24,900 24,900 24,800 25,000 24,834 32,000 33,266 33,265
Son La 41,000 49,300 43,186 43,300 51,650 49,101 54,950 56,950 57,742
Province Total allocation from Additional (commune) Total programme(Commune-District) the district contributions spending
Tuyen Quang
Tan Trao - Son Duong 500 4 504
Son La
Nam Ty 585 0 585
Quang Ngai
Binh An - Binh Son 500 0 477
Son Thuong - Son Ha 530 0 500
Son Thanh - Son Ha 500 0 480
Soc Trang
Chau Hung 893 0 893
Lieu Tu 500 0 312

The main weakness in accounting for expenditure seems to be at the commune level where, due to limited skills and frequently changing accountants, accounting and reporting of expenditure was notalways accurate or thorough. Funds from non-central or provincial sources, as well as monitoring returnson income and expenditure were not always integrated in reports (such as in An Tong commune, YenSon district, Tuyen Quang).
While capital investment is managed and tracked clearly and transparently at all levels by the stateTreasury system, the costs of recurrent expenditure for HEPR sub-programmes cannot be separatedfrom “non-productive” costs for sectoral agencies. This is the result of HEPR funds being merged withmainstream spending (“recurrent costs”) by the relevant agencies.
Allocations and spending were verifiable under HEPR and allocations were largely equal to the spending recorded (Table 28).
Table 28: Central Allocations and Actual Spending of HEPR Funds, 2001-2003(VND mn.)
2001 2002 2003
Province Programme Actual Programme Actual Programme Actual allocation spending allocation spending allocation spending
Tuyen Quang 38,805 61,974 34,259 62,169 14,471 39,954
Quang Ngai 49,988 60,156 27,072 40,170 27,414 37,748
Soc Trang 16,870 16,259 52,594 35,773 98,116 88,818
Son La 37,433 43,866 24,247 36.353 38,750 41,869
There is consistent overspending by Tuyen Quang, Quang Ngai and Son La (partly due to credit fundspending exceeding allocations). There is significant underspending in Soc Trang (again largely drivenby credit spending) and decreases in allocations in recent years in Tuyen Quang and Quang Ngai.Allocations, especially from 2002 to 2003, increased in Soc Trang.
Where spending is not equal to allocations (as in Son La), this may be due to:
non-implementation of some sub-programmes because of limitations in planning, and changes in conditions;
non-disbursement of funding for credit to the poor, for example in Soc Trang for about VND8 billion;
problems in commune level accounts including the variable practice in recording non-central contributions, meaning expenditure probably took account of funds that were not recorded as incomeat the local level; and
programme evaluation
MOLISA-UNDP: TAKING STOCK, PLANNING AHEAD 81

lags in recording expenditure, which occur when allocations exceed disbursements, for example inhealth funds in Soc Trang and Son La where allocations exceeded disbursements by more thanVND10 billion.
Funds that are unspent by the end of the year can be transferred to the next fiscal year as long as payments are made by the following January. Funds unspent by the end of January must be remitted tothe centre. Although the additional time window granted is fairly small, it limits the practice (often seenwhere end-year flexibility (EYF) is not available) of committing resources to unnecessary projects inorder to avoid returning funds to the centre.
3.2. “Leakage” of Programme Funds
“Leakage” of funds is said to occur either when spending of funds on the programme have not beenrecorded in provincial, district or commune accounts, or expenditure exceeds allocation for no documented reason.
The State Treasury at the provincial and the district levels is responsible for recording the use of statefunds and contributions made according to the State Budget Law. Spending under the two programmesis covered by this provision.
Central and provincial allocations are recorded and controlled by the Treasury and so leakage of fundsis limited by the control exerted by the Treasury over disbursement and acquittals. However, other contributions e.g. by state enterprises, individual households and donor agencies are not always, or routinely, recorded through this system. For example, household contributions (whether in cash or inkind) are not usually recorded at district or provincial levels. This means that there is no full accountingfor the funds flowing into the programmes at different levels.
Use of different distribution mechanisms for capital and recurrent expenditure has consequences for thetransparency of spending. In the case of programme capital expenditure, such as on infrastructure, inter-commune centres, resettlement projects or new economic zones, Treasury records are kept separate. This is therefore a relatively transparent process.
However, for recurrent expenditure e.g. staff training, salaries/allowances, O&M costs etc., funding is delegated to organizations such as DOLISA, CEM, Extension Centres, and others. Funds are allocatedalong with the current budgets of these departments/organizations. But the Treasury cannot distinguishbetween recurrent expenditure by these organizations and current spending on the relevant elements ofNTPs. This limits the transparency of such expenditure.
It is difficult to assess the precise share of recurrent spending for the above reasons, but much of P135spending is on capital works, so the share of recurrent spending of P135 funds are likely to be small.The share is estimated at under 10 per cent and perhaps as low as 2-5 per cent.
The share of recurrent expenditure in HEPR funding is higher. This, however, is likely to be a relativelysmall proportion of the total funds made available to provinces. The majority of HEPR funds are creditfunds, although Soc Trang and Son La to some extent, have large capital and health care expenditurecomponents as well.
programme evaluation
82 MOLISA-UNDP: TAKING STOCK, PLANNING AHEAD

In the case of recurrent spending there is not a presumption of leakage per se (as opposed to a lack oftransparency), but the accounting framework makes it very difficult to accurately assess the use of HEPRfunds or check whether those funds are used or transferred for other purposes.
The 2003 State Inspectorate report on Programme 135 expenditure in 23 provinces reported errors/mis-spending for around five percent of programme funds. That is to say, USD750,000 out of atotal capital investment of USD15 million was mis-spent. The review of financial systems and data onallocations and spending would suggest that leakage was not much higher than this. For example, officials in the Treasury of Long Phu District, Soc Trang Province and the Treasury in Son Ha District,Quang Ngai, were mis-spending 0.3-0.6% of committed funds.
Examining acquittals and disbursements from district and provincial Treasury records for Programme135 suggests that disbursement of funds is managed according to the provisions for regulating construction investment. Acquittal data showed that typically all funds for Programme 135 were used. Insome cases in Soc Trang, funds were not fully spent. In those (relatively rare) cases, unspent communefunds were transferred to other communes. It is believed that these transferred funds are refunded overthe next few years to ensure that the average spending in each commune equals the central norm.
Where there is leakage, it is likely to be in construction projects, since the Supervision Boards of mostcommunes and many districts do not have the requisite skills to manage and control the constructionprocess, and there are no standard procedures for obtaining bids from contractors, drawing up a shortlist, or assessing the value-for-money (VFM) of proposals and monitoring outturns.
Recent state inspection reports have commented that leakage of funds may occur through deficienciesin the quality of project implementation, such as in materials being the wrong quality, incorrect or insufficient materials being used, costs being over-stated by contractors etc. A reported error rate of 5% iswell within international standards for leakage/errors in capital programmes and, while the managementand value-for-money of the programme could be improved further, relatively strong treasury systems andprocedures are in place.
The main potential for leakage is likely to be at the commune level and efforts to tighten the systemshould be focused at this level. In situations where communes only have the role of passively receivingbenefits or households are largely receiving support in kind, there is higher potential for leakage of fundsdue to limited involvement and accountability of local people.
This is brought out by the analysis of transparency in Programme 135 which suggests that the supply ofinformation - in particular, the meaningful and timely disclosure of financial information to the public - isstill limited. Related information, such as the signing of contracts is also rarely provided, or is late. Thislack of transparency is related to the (still) limited consultation at the planning stage. If good consultations were held, detailed information on budgets and draft designs would be provided. Leakagehas also been linked to non-public decision-making about budgets and contractors.
57
programme evaluation
MOLISA-UNDP: TAKING STOCK, PLANNING AHEAD 83
57 Shanks et al. (2003), Pham Hai (2002) and Do Xuan Hoa (2002)

Instituting a “community development fund” may be an effective way to ensure poor households and village leaders are involved in management and supervision of funding. The fund might also ensure thatfunding is commensurate with real demands in the area.
There is insufficient evidence to estimate leakage from the HEPR programme. There is also little corroborative evidence available. Overall, the potential for leakage exists in the HEPR programme, andis probably several times higher than that of Programme 135, since:
it is difficult to track allocations to expenditure (even at the province level),
financial reporting to the centre is limited in details of actual project spending because of capacity limitations at lower levels and
recurrent spending cannot be tracked separately.
Under HEPR, one of the most likely areas for leakage is in the procurement process for public capitalworks. Infrastructure and housing works are implemented through contractors, often from the local area.The advantage of retaining funds in the local area through the use of local firms/individuals gives socialand economic dividends to poor localities, uses local labour and stimulates the local economy. Anotheradvantage of this approach is the quick selection and mobilization of a contractor. But these are outweighed by disadvantages. Selection is often arbitrary and determined by a contractor’s links with officials. Bid prices are often inflated, and a well-connected contractor does not worry about accountability and quality.
Given the scope for manipulation of prices/quality (especially where locals are not involved in supervision/implementation), the same contractors should not receive work year after year in the samelocalities.
In recent years, provision of health services to the poor have led to wasted funds and leakage, especially in the provision of free medicines. In Tuyen Quang, the province did not distribute free healthinsurance cards. In Soc Trang cards were only distributed in October 2003, and in Son La there wereproblems with bureaucracy e.g. households had to travel to claim entitlement and faulty planning meantthat demand did not materialise as anticipated and the drugs were wasted. From 2003 (by decision ofthe Prime Minister) the basis for funding the programme was changed from one of supplying medicinesdirectly to reimbursing households through a Fund for Health Care for the Poor. This is likely to reducewasted funds.
Leakage may also occur in extension services. The supply of materials (such as breeding animals,plants, medicinal drugs etc) to beneficiaries has many advantages. However, with the current delegationof management for extension activities to Extension Service Centres (ESCs)58, this can result in difficulties in accounting at the commune/district level and therefore the possibility for leakage to occur.For example, individuals typically only sign for receiving materials while the agencies (e.g. ESCs) willacquit with the Treasury to the value of the materials supplied.
programme evaluation
84 MOLISA-UNDP: TAKING STOCK, PLANNING AHEAD
58 Extension Service Centres seek contractors to provide the breeding animals, plants etc to households with prices of contactcontrolled by DOF. However, in some communes, households when receiving the breeding plants, animals did not knowwhether the qualities of materials and prices of materials corresponded to what was ordered.

Corroborative evidence for this comes from the PPA in Quang Ngai (and several others) which highlightthe fact that top-down planning is still the norm and that extension services, for example, are still not fullyresponsive to people’s needs. Consultation on extension needs and transparency in decision-makingabout extension service implementation need to be improved.
3.3. Programme Incentives
It is unclear whether incentives currently available for project managers are best designed to ensure thatresources are allocated optimally, and that people receive the highest quality services within given economic constraints.
While provincial and district administrations are, in theory, encouraged to allocate funds according tolocal conditions, there is considerable variation in practice. These variations are dependent on the capacity of local staff and the extent to which funding meets more than very basic needs.
The incentives for improved targeting and management within the two programmes are further limited bythe management mechanisms. The centre does not provide significant economic incentives regardingimplementation or for the effective use of programme monies. Those that do exist operate poorly andoften with significant delays. The sanctions that do exist – sudden inspections and withdrawal of fundingfor lack of capacity - are mainly punitive.
The following incentives exist:
Awards (in the form of certificates) to the best performing province or communes, after several yearsof implementation.
Communes which showed progress towards programme objectives could be advanced funds for project implementation. These resources are generally transferred from funds of other communes,which have problems in implementation or have low capacity for implementation. These advancedfunds are paid back in future years.
Unspent funds in one financial year could be transferred to the next (until the end of January) without penalty (the ‘end year flexibility’). However, this negative incentive is of limited benefit. Lowlevels of funding and the non-use of credit funds, result in few funds being leftover in any given year.
It is often difficult to strike the right balance between rewarding good provinces and penalising bad/inefficient behaviour. Allocating additional funds to well-performing provinces, districts or communeswill lead to greater inequalities between provinces and disparities in growth and employment. There issome evidence that this is already happening. The relatively well-performing province of Tuyen Quangis allocated extra funds by the centre and also receives additional donor funds.
The central government should consider introducing some positive incentive mechanisms such as:
Providing bonuses to provinces/districts for ensuring that allocations are correctly spent, althoughcare will need to be taken that the regional distribution of rewards or donor funds does not exacerbate tendencies within the funding system to reward dynamic provinces.
programme evaluation
MOLISA-UNDP: TAKING STOCK, PLANNING AHEAD 85

Poor performance as assessed in annual reviews triggers additional funds (say, for capacity building)to help the province/district address the causes of poor performance. This would help balance thecurrent sanctions-based regime with some positive incentives to help create an environment for desirable outcomes.
3.4. Key Conclusions
The flow of funds through the Treasury (DoF) system from the central, province and down to the district level involves the use of separate accounts which means funds are easy to control and monitor as well as prevent leakage.
Partly due to the relatively rigorous financial system, adequate accounting, audit and review mechanisms are not in place. The system relies heavily on paper-based controls (formal annualreports) and one-off audit type checks (by State Inspectorate etc.)
The allocation of funds for Programme 135 is clear and transparent, and funds pass directly to communes or projects. Poor communes are more aware than under HEPR of the amount of fundingavailable to them and this enables them to properly supervise project implementation.
Although the financing system is relatively strong, the large number of separate sub-programmeswithin HEPR prevents clear central oversight and control over programme funds. Combined with avariety of funding sources, this makes the HEPR programme insufficiently transparent and accountable.
Financial documentation and recording at the commune level is a weak link in the system. Many localprogramme activities are not reflected in the accounts (e.g. providing housing to the poor and labouror material contributions). Commune finance staff often do not have the necessary knowledge andtraining in accounting and financing.
Adequate training needs to be combined with a system of incentives to improve performance of programme staff.
Key recommendations
Central spending norms should be streamlined and brought up to date using the latest price levelsand best practices in procurement.
Provinces and districts should audit commune level practices and systematically improve the wayfunds are monitored at the commune level, with help provided through training etc.
Inspection arrangements should be improved at all levels to consolidate, control and reduce inappropriate practices at local levels.
Adequate training of programme staff needs to be combined with a system of incentives to improveperformance.
programme evaluation
86 MOLISA-UNDP: TAKING STOCK, PLANNING AHEAD

4. Monitoring Programme Performance59
This section explains the monitoring system and reviews the way is which the two programmes are monitored compared to the attributes of a sound monitoring system found in Box 14. The review of themonitoring system includes:
the selection of indicators: the system of data collection at different levels and use of the data for decision-making,
the reporting system,
capacity for data collection and analysis, and
performance of local level monitoring structures.
Since much of the focus on monitoring tracks the achievements in reducing the number of poor households, the last section will examine the process of assessing impact.
The results of the monitoring system review undertaken in four provinces – Tuyen Quang, Quang Ngai,Phu Yen and HCMC – are combined with additional data from other provinces.
4.1. Institutional Structure
At the central level, the HEPR Programme Office under MOLISA and the Policy Department under CEMare responsible for monitoring the NTP on HEPR and Programme 135 respectively. The mandate of theHEPR office is to assist the programme’s National Steering Board in developing HEPR annual and 5-year plans. These “master” plans are based on sectoral and provincial plans and monitoring programme implementation. They provide guidelines to the central EAs and the provincial programmeSC standing bodies on programme management, monitoring and implementation.
The EAs that implement the NTP on HEPR and P135 are also responsible for monitoring and reportingon subprogramme activities and outcomes, as per Decision 42.
60Information on programme performance
and outcomes are channeled both horizontally and vertically, at the central and local levels. Horizontally,such information is shared at different levels, among the sub-programme EAs, the programmes’Standing Bodies in the Steering Boards/Committees and other stakeholders in theseBoards/Committees. The Standing Bodies at various levels co-ordinate the monitoring of and reportingon programme performance and impact.
Vertically, such guidelines and data are channeled from the Prime Minister’s Office, through the HEPRJC/135 Steering Boards, to the programme EAs at the central level, down to the HEPRJC/135Steering Committees at the provincial level, and similar Steering Committees at the district and commune level.
programme evaluation
MOLISA-UNDP: TAKING STOCK, PLANNING AHEAD 87
59 This section draws upon Hanh, Toan and Doanh (2004) with contributions from Alain Jacquemin.60 Regulation on management of National Target Programmes, issued by the Prime Minister as part of Decision
42/2002/QD-TTg of 19 March 2002, includes sections on reporting requirements (what reports are to be prepared, by whom,to whom, and how frequently).

However, there is no legal document which defines what areas the programme standing agency, EAsand relevant agencies are responsible for monitoring. Nor is there any formal information-sharing mechanism between provincial and central EAs on the one hand, and provincial EAs and provincialstanding agencies on the other.
programme evaluation
88 MOLISA-UNDP: TAKING STOCK, PLANNING AHEAD
Box 14: Elements of a Programme Monitoring System
Programme monitoring involves:
Tracking changes in outcomes over time and across groups and areas,
Collecting information to study the determinants of such outcomes, and
Providing feedback on the effectiveness of the programme intervention.
Specifically, a Programme Monitoring system consists of the following activities:
Data collection,
Data collation,
Data analysis, and
Dissemination of results.
Data collection and collation constitute one group of integrated activities, whereas data analysis and thensubsequent dissemination and feedback comprise another set of activities.
An important step in the design of a poverty monitoring system is the selection of indicators and their levelof disaggregation.
A Programme Monitoring System should collect data to monitor the following indicators:
Outcomes – These can assess progress in reducing poverty, improving health, raising educationalachievement and enhancing the voice and participation of the poor using information from household sur-veys. Changes in access to, usage of and satisfaction with the supply of services such school dropoutand repetition rates; distance to facilities; and satisfaction with the services can also be tracked.
Output – These are indicators of goods and services generated and assess whether programme activities are implemented in accordance with the plans. Examples include number of beneficiaries ofemployment programmes for the poor; number of new schools built; number of primary school teachers;number of doctors per 100,000 inhabitants, etc.
Input – These are essentially public expenditure reviews to assess whether the financial and physicalresources are being allocated to the appropriate programmes in accordance with the plans. Examplesinclude expenditure on primary education as a share of total expenditure on education and expenditureon primary health care as a share of total expenditure on health, etc.

There is no separate budget allocation for monitoring of NTPs. Funds for programme monitoring aretaken from the normal annual budget of the EAs. Therefore, most EAs are rarely keen on spendingresources for programme monitoring.
For monitoring of P135 sub-programmes, the inter-ministerial Circular 666/2001/TTLT-BKH-UBDTMN-TC-XD stipulates:
(i) reporting procedures and frequency (quarterly, semi-annual and annual),
(ii) content of the report (assignments, mobilised funds, delays, number of works completed, problemsencountered, and recommendations),
(iii) and responsible reporting authorities: PMU reports to project owner, project owner to provincial P135 standing agency, provincial programme steering committee to National SteeringCommittee, NSC to the Prime Minister.
Additionallly, CEM issued Circular 894/2001/TT-UBDTMN of 13 November 2001, includes guidelines ondata collection for reporting on the development of infrastructure and inter-commune centers, with clearguidance on reporting and presenting data.
4.2. Selection of monitoring indicators
The HEPR office, after consultations with relevant ministries and the DOLISAs, developed a set of indicators to monitor implementation of the two programmes. All central EAs identified a set of relevantindicators to assess their own sub-programme. The HEPR office compiled these sets and added a number of indicators, for example on household poverty status. The combined set of indicators was sentto the provincial Standing Bodies (usually the DOLISA) in a number of provinces for feedback.
The HEPR office included the feedback into the final set of indicators and sent it to all EAs. The latterthen selected the indicators that they considered relevant for their own work and sent the set of guidelines and indicators to their provincial departments. In some provinces the EA departments adjusted the final list of indicators (added a few locally relevant ones). Thus, the final full DOLISA list ofindicators varies slightly across provinces. In P135 provinces, the lists of indicators again differ.
61
These indicators have been organised into standard formats to facilitate monitoring by provinces anddistricts as part of their semi-annual and annual poverty reports. The indicators are categorized into threegroups (see Annex 7):
Group 1 - indicators on households,
Group 2 - indicators on commune poverty status and
Group 3 - performance indicators for investment project/policies.
Group 1 indicators collect data on the number of poor households in the district/province, broken downby location (rural/urban), targeting status, and ethnicity. Data is also collected on the number of
programme evaluation
MOLISA-UNDP: TAKING STOCK, PLANNING AHEAD 89
61 For example, the Programme 135 has some small health component, and a few indicators for that component may be addedto the final indicator list.

households that have crossed the poverty line or fallen back again in the reporting period. As shown inthe table, most of the data in this group is reported every six months.
Group 2 Indicators collect information on the infrastructure status of communes and the information isupdated every six months.
Group 3 indicators collect information on the implementation of the policies and sub-programmes thatcomprise the HEPR programme. All except two health-related indicators track either inputs or outputs.
Annex 7 demonstrates that there is an indiscriminate listing of input, output and final outcome indicatorswith no real analysis. Indicators were not selected after a careful analysis of the processes of impact, sothere is no real monitoring system – only a collection of indicators. This is also borne out by the following:
For all three groups, it is not clear why data on some indicators are collected every six months, andothers annually. It seems that input indicators are tracked annually, whereas output indicators aretracked biannually. However, this is not always the case - the “amount of funds” for infrastructuredevelopment (an input indicator) is tracked every six months.
Of this list, only four indicators track outcomes – the rest are input or output indicators. There is a lackof analysis as to why these indicators are the most appropriate, how the data collected will track programme performance, or the impact on poverty. Collecting data on the number of poor householdsin the district/province, and their movement on and off the poor households list assumes that this isentirely due to the implementation of the HEPR activities.
This assumption is difficult to believe in the absence of any analysis of the channels or processes ofimpact, particularly when the total central and non-central resources allocated to poor households is, onaverage, less than US$ 1 per day (see Table 24 and discussion in Section C.I.2).
Even if there was a direct link between HEPR programme implementation and poverty reduction, asevere limitation of the monitoring system is the undue emphasis on tracking the poverty status ofhouseholds without tracking outcomes of the programme components that are assumed to contributeto the overall objective of the programme.
Changes in household well-being come about more slowly than in the six month period required forreporting.
CEM also issued guidelines on P135 monitoring and formats for statistical reporting to the PMUs and therelevant provincial PCs. The indicators in the reports include input indicators such as the amount of fundsdisbursed as total and broken down by source at the provincial and district level, and output indicatorssuch as the number of infrastructure works completed. Again, no outcome indicators are included.
Thus, the overall emphasis is on getting data on final impacts but without tracking intermediate (i.e. outcome) indicators. This makes it difficult to attribute impacts to specific policies or projects.
Baselines - Prior to the start of the programme, the HEPR programme office did not carry out a separatenational baseline survey to assess the nation’s poverty status. It tried to develop baseline data based onsurveys done by GSO and MARD as well as poverty data from the provinces. In addition, it organised
programme evaluation
90 MOLISA-UNDP: TAKING STOCK, PLANNING AHEAD

some sample surveys to get additional information on household living standards and income. No otherministries and agencies, including CEM, carried out any baseline surveys before the start of the programme.
Absence of a baseline has made the present evaluation of the two programmes a hazardous exercise.There is little data to make comparisons with, in order to assess changes in household well-being as aresult of the two programmes. It is hoped that this shortcoming will be rectified prior to the start of thenext phase of the HEPR programme in 2006.
4.3. Reporting System and Guidelines
As per the Prime Minister’s decision, the HEPR Office and CEM are responsible for monitoring programme performance and preparing semi-annual and annual programme reviews and poverty statusreports based on the subprogramme EAs and the provincial SC standing bodies. These are submittedto the Prime Minister, MPI and MOF every six months.
But the HEPR office and CEM face considerable difficulties in getting timely and reliable data. Most sub-programme EAs and provinces send only narrative reports by post. Not all information needed isincluded in these reports. Furthermore, not all EAs and provinces send regular reports as required. In2003, only 54 of 61 provinces/cities sent annual reports to the HEPR office.
Often the provinces and EAs send only annual reviews, not biannual reports as required. Consequently,the HEPR office and CEM have to collect information about programme implementation by telephoneand fax. Data collected this way are not reliable. Data is not often collected through field visits becauseof limited resources.
The sub-programme EAs for the HEPR, MARD, MOET, MOH, and SPB are to collect data from provincesbased on their regular reports. However, most provinces do not send biannual programme portfolioreview reports even as a part of the sector performance review reports to these EAs. This is because thefunds are allocated by the PPCs to the provincial departments, and central EAs often do not know theamount of funds received by their provincial departments for subprogramme activities. So the centralEAs are unable to compare the actual funds used for the HEPR activities and planned funds.
In order to compare the percentage of poor households at the reporting moment to the previous year,they have to get the data from the previous year reports. This is difficult to do because of constraints ofdata storage and access. Therefore, most EAs provide descriptive and narrative reports, with little analysis.
Last year MOH received the annual reports on the programme performance initially only from 22provinces. Substantial follow up was required to get the reports from the other provinces.
CEM issued the guidelines on Programme 135 monitoring62
with the formats for statistical reports toPMUs and to the relevant provincial PCs. The indicators in the reports include only input indicators (such
programme evaluation
MOLISA-UNDP: TAKING STOCK, PLANNING AHEAD 91
62 Circular No- 894/2001/TT-UBDTMN, issued in November 13th 2001, on the 'Infrastructure development and commune clus-ters development' components implementation data collection and reporting.

as the amount of funds disbursed as total and broken down by sources in the province/district) and output indicators (such as the number of works done). No outcome indicator is included.
MARD developed different guidelines but mostly for the implementation and not the monitoring of somecomponents, including Promotion of farming and off-farm production, employment for the Poor, andSedentarization in poor communes. Other EAs such as MPI, MOF, MOH and MOET have not issued separate guidelines on HEPR and P135 monitoring, except those guidelines on preparing the socio-economic development plan performance review. This is because the HEPR and P135 monitoringis put in the same basket with the sectoral socio-economic development plan performance monitoring.Specific indicators on programme performance are included in the overall sector reports. MOET andMOH take the needed information on HEPR policies implementation from the overall sector reports andsend the reports on the HEPR policies implementation to HEPRJC office when requested or once a year.
Use of data - The sector-related data are used by concerned ministries and agencies, primarily for meeting the reporting requirements. For the ministries as the sub-programme EAs, the data are alsoused for making decisions on sub-programme management, e.g. the decisions on the sub-programmebudget proposals preparation and sub-programme scope review and adjustment. For MPI and MOF, thedata are used for budgeting, mainstreaming the HEPR activities into the socio-economic developmentplanning and policy analysis (to a limited extent). For MOLISA and CEMMA as the Standing Bodies ofthe HEPR and P135, the data are used for making decisions on sub-programme management and policy analysis (to a limited extent).
Some EAs such as the Social Policy Bank strictly follow reporting requirements, but data collected fromtheir reports has only a very limited use for policy analysis in the absence of data on outcome indicators.
In the absence of any data on outcomes, it is difficult to get a sense of the overall direction of the programmes and undertake mid-course corrections if necessary. Thus, the data collected is not used forsteering the programmes. The most common use of the data is for reporting on financial inputs (such asthe amount of funds used) and physical outputs (such as the number of infrastructure projects completed).
4.4. Monitoring capacity
The HEPR programme office and all HEPR-JC departments under MOLISA have been equipped withcomputers, fax machines and telephones. However, these computers are connected neither to the network of the local ministries, nor to provinces. The same situation is true for the MOF, MPI, MARD,MOH and CEM. For PB the data on the HEPR programme performance are collected together with thedata on normal lending activities. The SPB uses a special software for monitoring lending performance.
There are seven full-time professional staff in the HEPR Office with graduate and postgraduate qualifications. Most of them have experience in project management and monitoring. Some of them haveparticipated in in-country or overseas short training courses on data processing tools, such as STATA orpoverty mapping. In the Policy department of CEM only one staff member has been assigned to monitor programme 135.
programme evaluation
92 MOLISA-UNDP: TAKING STOCK, PLANNING AHEAD

The Department of Social Security under MOLISA is responsible managing and monitoring the two sub-programmes and two full-time staff members have been assigned. Funds for these sub-programmescome from the state budget to MOLISA. Therefore, it is less difficult for MOLISA to collect the data onthe sub-programme performance from selected provinces and state general corporations. MOLISAsends quarterly, semi-annual and annual reports directly to the National Steering Board.
For the remaining EAs only one, usually part-time, staff member has been assigned to monitor the sub-programme. There are few incentives for the person to perform well. Moreover, they have little powerin receiving reports from the provinces on time, to complete the reporting requirements. Few ministriessend reports as required (quarterly, biannually and annually). Most EAs send annual portfolio reviewreports only because data for most indicators are available by the end of the year. There is no incentivefor good monitoring and no full time monitoring staff in provincial departments. Therefore, provincialdepartments do not send the separate HEPR review reports, but send data on HEPR sub-programmeperformance as part of their annual plan performance review report.
The HEPR office has prepared two sets of training manuals, one for commune HEPR staff with 11 topics and one for provincial and district HEPR staff with 13 topics.
Four topics (“Introduction of the NTP on HEPR-JC,” “Gender issues in poverty reduction,” “Participatoryapproach in poverty reduction,” and “The Policy Bank and Credit for poor households”) are included inboth manuals the same way. The first three topics are useful, but the presentation does not seem appropriate to commune HEPR staff. They are too long and academic. The topic “the Policy Bank andCredit for poor households” should be more specific and shorter so that commune HEPR staff can better understand how to monitor credit disbursements.
Among the 11 topics for commune HEPR staff, two topics relate to monitoring: “Household survey andhow to prepare poor households’ monitoring records” and “Poverty reduction performance monitoring,assessment and reporting”. All formats of the survey have been included to help commune HEPR staffconduct household surveys. The guidance given is specific enough. However, the topic “Poverty reduction performance monitoring, assessment and reporting” is too short. Commune HE PR staff shouldbe better trained on how to undertake “Poor household movement analysis”, and review “HEPR programme performance”.
For district and provincial staff there are two topics relating to monitoring: “Monitoring and evaluation indicators system” and “Methodology and Experience in poverty data collection.” The list of indicators isintroduced with some information on the requirements for poverty assessment and how to identify theindicators to be monitored. Under the topic “Methodology and Experience in poverty data collection” thepoor household and commune eligibility criteria and the methodologies of surveys and preparation ofpoor household lists have been introduced for carrying out household surveys. The information includedin this topic is specific enough to be useful for district and provincial HEPR staff.
Most of the other topics, in both sets, are about individual projects, such as Guidelines on communeinfrastructure development project management, HEPR modality development, etc. However, theGuideline on “Commune infrastructure development project management”, for example, is short and notvery specific for project management.
programme evaluation
MOLISA-UNDP: TAKING STOCK, PLANNING AHEAD 93
4.5. Performance of local level monitoring structures63
The Grassroots Democracy Decree provides a framework and methodology for supervising projects withpopular participation through a group of elected representatives.
64It provides for the creation of Project
Supervision Boards, which are to work independently towards community benefits through supervisionof construction projects in the communes. Each board has three to five elected members, who are generally respected men and women. These boards are expected to be dissolved upon project completion. They are supervised by the local Fatherland Front and the commune People’s Council.
All communes in Viet Nam also have People’s Inspection Boards65
which predate the SupervisionBoards. They have a broad mandate and are part of a national structure of supervision, focusing onfinancial matters. They are overseen by the State, province and district level inspectorates. The People’sInspection Board and selection of its members is led by the commune Fatherland Front, which reportsto the People’s Council. Members of the People’s Inspection Board officially cannot hold posts in thecommune People’s Committee.
People’s Inspection Boards (PIBs) and Project Supervision Boards are a means of democratic supervision in addition to the elected members of the People’s Council and village leaders. They are localmonitoring mechanisms that exist widely. The creation of Project Supervision Boards was stimulated byincreased investments in localities, partly under the two NTPs, and are primarily relevant to infrastructure investments under Programme 135. Their mandate overlaps that of the People’sInspection Boards which are generally seen as still too weak, largely because of limited technical skillsof local people.
Both boards were generally considered weak in the early years of the two NTPs, especially in remoteand mountainous communes as a result of low cadre capacities and limited education of the general population. However, their effectiveness has gradually improved since 1998, and there are suggestionsthat the PIBs may in some cases have been strengthened as a result of the Decree 29 and the popularisation of the mandate of Project Supervision Boards.66 At the same time, however, there are several reports that indicate they are not as effective and independent as they should be, often becausethey are strongly influenced by the PCs.67 They are also not part of the formal reporting process for thetwo NTPs as confirmed by recent evidence (Box 15).
Nevertheless, at the same time many project management and monitoring teams, boards and committees exist in a majority of communes, for all kinds of purposes. Estimates put the number of suchboards in any one commune at between ten and 15.
68For various projects, government funded or
funded by international agencies, district and commune authorities usually form “Project ManagementBoards” with members from different departments and mass organizations.
programme evaluation
94 MOLISA-UNDP: TAKING STOCK, PLANNING AHEAD
63 This section uses material in Neefjes (2004).64 This Decree was promulgated in 1998 and renewed/improved in 2003.65 Set up under Decree 241-HDBT of the Council of Ministers (1991) - see NCSSH-IoE/Oxfam GB (2003) 66 NCSSH-IoE/Oxfam GB (2003), p.2167 See e.g. AAV/ADB (2003), p.2668 Shanks et al. (2003), p.31

Analysis of the overall implementation systems and field observations in several provinces led to the conclusion in 2000 that local level “monitoring and evaluation systems are extremely weak” in the twoNTPs, so it was difficult to absorb lessons and adjust the programme direction and implementation practices.
69
Thus, strengthening basic technical skills of local people for local-level monitoring is a priority for capacity building.
70
programme evaluation
MOLISA-UNDP: TAKING STOCK, PLANNING AHEAD 95
Box 15: Functioning of Project Supervision Boards and People’s Inspection Boards
Assessment of M&E systems and practices in several provinces reveals the following:
Consultation and participation
There is some but very limited consultation of beneficiaries of the projects, and also limited consultationof village heads and village and commune leaders of mass organizations with regards to progress, completion and quality of the various projects under the two NTPs.
In HCM City, for example, certain “self management savings groups” supply minutes of their meetings totheir commune / ward level HEPR unit. In Tuyen Quang the provincial DOLISA adjusted guidelines andindicators for reporting based on “participatory consultation.” In that province DOLISA has also donesome participatory analyses of poverty status. However, current M&E practice under the two NTPs cancertainly not be labeled “participatory.”
Reporting progress
The systems of upwards reporting starts with the commune PC (Chairman) and also school principals,heads of health centres and others. This focuses on output and outcome indicators.
The Project Supervision Boards (for infrastructure) and People’s Inspection Boards (with a wider remit)do not appear to have a role in the reporting system.
It is common that People’s Council Chairmen or commune Party Secretaries head these two types ofBoards and relationships with the PC are generally very close, if not too close for effective supervision.This would suggest that the findings of these Boards should be well known at the PC, but there is noguarantee that they will be reported to district and province HEPR Boards.
Reporting impact
Reports on trends in poverty incidence by the national poverty criteria are also supplied upwards, starting with reports from village heads.
Reduction in poverty is arguably the main aim and therefore the main impact of all the projects underHEPR-JC and 135 put together. However, analysis of the comparative contribution of some or all thecomponents under these NTPs to poverty reduction is generally absent.
69 Fritzen (2000), p.1470 See e.g. Shanks et al. (2003), p.62

This is not to suggest that there has been no change as a result of the promulgation of GRDD and theimplementation of NTPs. There has been improvement in direct monitoring by citizens and monitoring byrepresentatives, although not uniformly and in many cases only in modest ways. There are, however,many examples where improvements were significant, and where the knock-on effects were clearly felt.Improvements in transparency, and participation in monitoring have helped achieve practical goals suchas improved construction quality, and stimulated the generation of local resources, i.e. people’s own contributions. This may happen despite poverty and strong limitations in time and financial capability.
Box 16 provides a summary of knock-on effects of improved grass roots democracy – these effects arenot primarily attributed to the NTPs, but rather to the success of the GRDD in several localities. It illustrates what could happen if the NTPs and their sub-projects were better linked to the GRDD. It alsoillustrates the idea that empowerment (participation as an end in itself) and functional participation (as ameans to an end) can become two mutually reinforcing aspects of a virtual cycle.
4.6. Tracking the poverty rate
Indicators on the number of poor households and the proportion moving in and out of poverty are veryclosely monitored. In a sense, progress towards the achievement of the overall objectives of the NTP onHEPR and Programme 135 are judged solely by regular estimations of the poverty rate.
Without going into the merits of this approach, this section analyses the process of estimating the poverty rate. Does the process build confidence in the poverty numbers?
programme evaluation
96 MOLISA-UNDP: TAKING STOCK, PLANNING AHEAD
Box 16: Effects of improved grassroots democracy on mobilisation and distribution ofresources for poverty reduction
In many communities local people now often discuss issues related to mobilization and distribution of localresources for poverty reduction. The GRDD has helped mobilise more local resources for poverty reductionprogrammes through local contributions to Government investment programmes and local voluntary supportto the poor. Community organizations participate actively in the management and distribution of suchresources.
Women, the poor, elderly, single people, ethnic minorities, and generally those with the least formal education still have little voice in the discussions about poverty reduction, due to their limited capabilities.Nevertheless, distribution of resources for poverty reduction has become fairer and more effective. This is atleast partly because of the GRDD.
Inadequate decentralization leaves the provinces and districts as “investment-owners” of many projects.Because commune officers have little responsibility for these projects there is little consultation with the localpopulation, and they cannot explain to citizens about budgets, implementation schedules and arrangements.Therefore local officers and citizens cannot be expected to mobilise local resources for such projects, or helpstrengthen their poverty focus.
Source: NCSSH-IoE/Oxfam GB (2003), p.28

There is considerable variation in the way in which poverty rates are calculated in communes arisingfrom:
the use of different sampling techniques (census or sample), the different methods of data collection (self-reporting and/or village-level discussion or interviews),and the calculation of household income on the basis of this data (prices and conversion ratios).
Sometimes, however, the variability is due to the flexible interpretation of the definition of the povertylines.
All communes have undertaken at least one “comprehensive survey” (around 1998-99) to identify poorand hungry households and reasons for their poverty. This baseline information was collected using atwo-page form (Annex 6). Reports have been supplemented with field-level interviews to confirm the considerable variation across communes in the way these forms were completed.
While monitoring poverty, it is this baseline information (“list of poor households”) that is updated every6 or 12 months.
The post-baseline estimates involve revisiting the households on the original list of poor and hungry, andseeing if their status has changed (i.e. if they have escaped from poverty or hunger). It was assumedthat this list was taken only as a base, and that when reporting the annual poverty rate commune officials would add to the list those households which have fallen into poverty (or even hunger) since thefirst survey. There is evidence from the Bac Kan and Cao Bang provinces (EU 2001), that this was explicitly not the case in some communes, and unclear in others. Most often, for the purposes of monitoring progress using the official data, the poverty rate can only ever remain stable or decline.Increases are rare.
Variation across communes and provinces in monitoring poverty emerge from the use of differentprocesses. The following are the types of methods in use:
Commune staff and village heads distribute forms to households, asking them to complete the formand return it to the village chief. Those who are illiterate are helped to complete the form by the village chief.
In some communes, the monitoring of poverty reduction is less formal. Households identified aspoor or hungry in the baseline survey were divided among members of the Commune PovertyReduction Board: each member is responsible for a small number of households, which he or sheis expected to know very well. Poverty monitoring surveys (i.e. evaluations of whether householdson the baseline list have escaped from poverty or hunger) are completed by these officers on thebasis of their knowledge of these households.
In some places, poverty-monitoring surveys are based upon the findings of interviews. However,the household income/poverty status form is not completed during the interview, but back at the commune office, on the basis of notes and recollection from the interview.
The household income/poverty status forms are completed on the basis of information collected earlier in the year (mainly harvest information) and consultations with the village chiefs.
programme evaluation
MOLISA-UNDP: TAKING STOCK, PLANNING AHEAD 97

At the same time, and as evident from the form, there is considerable potential for the flexible interpretation of the data collected during the re-survey. It is unclear how the data on assets is used toassess the poverty status of the household. Quality of house and the value of durable consumptiongoods are the most common indicators. However, there are no specific quantitative criteria for these indicators. As a result, there is a likelihood that these indicators may be used arbitrarily.
While there is a strong case for the use of proxy indicators to better identify poor households, thereshould be clear guidelines on how to use this additional information in assessing household well-being.
Much of the tracking of poverty rates is driven by the pressure to meet poverty reduction targets, set atthe central level. They are in turn, set in a way so as to meet the specific objectives of the programmes(see Section B.II.1). Presently, the targets are about 2% per year, that is, the proportion of poor households in the commune has to decline by that rate. Exact numbers of households are assigned toeach village as a target for each year.
These targets are often at variance with what is achievable on the ground. For example, in Tan LapVillage (Ninh Thuan Province), twenty-five poor households were identified using MoLISA criteria but thecommune approved only fifteen. The village leaders then had to choose the programme beneficiariesfrom the twenty-five.
It is not clear how the final selection of households is done, but in the absence of any guidelines, thereis considerable flexibility in assessing the final number. This has two implications: (i) the numbers of poorhouseholds cannot be compared across villages or communes, and (ii) it is difficult to assume that thefinal number of poor households arrived at by this process constitutes the total number of poor households.
While a large number of people are aware of how the list of poor households is made (Table 6), themajority of poor people are not aware of the criteria used to identify hosueholds that have escaped poverty. ”The village considered us to be better so they collect the certificates back for other poor households”. - Poor households in Dong Thap (Ninh Thuan province, PPA, 2003).
Most of so called “poverty-escaped households” were not informed that they had already escaped frompoverty. Their certificates were taken back without any explanation. When they realised that they werenot on the list of poor households any more they guessed that it must be because they are no longerconsidered poor (CRP, 2003).
The households that really escape poverty are usually those with specific conditions such as havingsmall land, abundant labour, certain skills/experience in agriculture production or having family memberswho get regular jobs in other provinces. These pople have better chances to succeed in their businnesses when they borrow subsidized loans for the poor and get other support at the same time.
programme evaluation
98 MOLISA-UNDP: TAKING STOCK, PLANNING AHEAD

Further research to identify characteristics of such households and factors responsible for their “escapefrom poverty”, will greatly assist the design of appropriate mechanisms for the next phase.
In light of the requirements for tracking poverty (Box 17), the present system of collecting reliable information on poverty rates at the commune level can be improved considerably.
4.7. Key Conclusions and Recommendations
Indicators
There is no effective monitoring system - only an indiscriminate list of input, output and final impactindicators. The overall emphasis is on getting data on final impacts but without tracking intermediate(i.e. outcome) indicators.
programme evaluation
MOLISA-UNDP: TAKING STOCK, PLANNING AHEAD 99
Box 17: Requirements for tracking poverty
To effectively monitor change in poverty, the data should possess the following attributes:
The poverty line should be set at an appropriate level.
The poverty line should be uniform across all administrative areas.
The methodology used to measure household income/consumption and to calculate the poverty rateshould be technically sound.
The methodology used to calculate the poverty rate should be uniformly applied across administrativeareas and be consistent over time.
Aspects of methodology that must be standardised include:
Sampling: Are the annual poverty statistics derived from a census of all households in the administrative unit,or from a sample of selected households?
Method of data collection: Is the data recorded by commune officials through interview with households;reported by households; or discussed and agreed in village-level meetings? If a form is used to recordincome and food production, is it the same form in all districts and communes? Is this form filled in duringthe interview, or back in the Commune office, based on notes from the interview, or from what is alreadyknown of the household?
Methods of calculation and conversion: When converting income into rice consumption terms, or consumption of own-produced non-rice crops into rice consumption, are the same prices and ratios usedthroughout?
Timing: do surveys occur in different places simultaneously or at different times?
The data on poverty rates should be available at regular, preferably annual intervals, and reasonablyaccessible to project staff (i.e. available for individual communes at the district and province level as wellas at the commune itself) within a reasonable period after the data was collected.

The indicators have not been selected after a careful analysis of the pathways of impact and so itis not clear how implementation of specific policies or projects leads to poverty reduction.
In the absence of any data on outcomes, it is difficult to get a sense of the overall direction of the programmes and undertake mid-course corrections if necessary. The data collected is not used forsteering the programmes, but only for reporting on financial inputs (such as the amount of fundsused) and physical outputs (such as number of infrastructure projects completed).
Lack of baseline data
Absence of baseline data has made the present evaluation of the two programmes an extremely challenging exercise. There is little objective data to compare with changes found in household well-being in the two programmes. This shortcoming should be rectified prior to the start of the nextphase of HEPR programme in 2006.
Reporting
The central EAs are unable to monitor the use of funds for the HEPR activities. Funds are allocat-ed by the PPCs to the provincial departments, and central EAs are often unaware of the amountof funds received by their provincial departments for sub-programme activities.
There is no separate budget allocation for monitoring of NTPs. Funds for programme monitoringare taken from the normal annual budget of the EAs. Therefore, most EAs are disinclined to spendresources for programme monitoring.
The HEPR Programme Office and the EAs have limited monitoring capacity. There is no incentivefor good monitoring and no full time monitoring staff in most of the EAs and provincial departments.
Local level monitoring
Local monitoring mechanisms such as the People’s Inspection and Supervisory Boards exist wide-ly. Basic technical supervisory skills of local people should be strengthened for enhanced local levelmonitoring of projects.
People’s Councils, People’s Inspection Boards and Project Supervision Boards have been strengthened to some extent, in most of the country, and new legislation is likely to help strength-en them further.
Progress reporting on the NTPs happens from the commune level upwards (PC Chairman, schoolprincipal, head of health post). This focuses on outputs and outcomes, and provides very little analysis of the causes of poverty reduction.
There is no clear, formal mechanism for the People’s Inspection Boards and Project SupervisionBoards to input their findings into reports. Furthermore, they only have formal monitoring roles foractivities managed by the commune PC, not those managed by higher levels.
programme evaluation
100 MOLISA-UNDP: TAKING STOCK, PLANNING AHEAD
Even though there are few mechanisms for popular feedback on the quality of the services provid-ed (e.g. health, education and extension services), general complaints and feedback channelshave improved somewhat as a result of the GRDD.
Poverty Monitoring
There is considerable variation in the way in which poverty rates are calculated in communes. Alot of it is due to the flexible interpretation of the data collected during the re-survey.
While there is a strong case for the use of proxy indicators to better identify poor households, thereshould be clear guidelines on how to use the additional information to assess household material well-being.
Much of the tracking of poverty rates is driven by the pressure to meet poverty reduction targets,set at the central level. Exact numbers of households are assigned to each village as a target foreach year. These targets are often at variance with what is achievable on the ground.
While a large number of people are aware of how the list of poor households is made, a majorityof poor people are unaware of the criteria used to identify hosueholds that have escaped poverty.
Key recommendations
An effective monitoring and evaluation system needs to be put in place with clear links betweeninputs, outputs and outcomes.
The selection of indicators should be preceded by an analysis of the channels of impact, and thereshould be greater emphasis on developing proxy indicators to better identify poor households.
The next phase of the HEPR programme should be preceded by a nationally representative base-line survey to enable mid-term steering of the programme and clearly assess the programme’simpact in 2010.
The monitoring capacities of local bodies should be strengthened to enable them to play a greaterrole in community-based monitoring of the HEPR sub-components.
Stabilising the incomes of households that have recently escaped poverty needs greater attention.
III. IMPACT OF NTP ON HEPR AND P135 ON HOUSEHOLD WELL-BEING71
Impact assessment requires making a causal link between programmes and outcome variables toessentially answer the question: what difference does the project make? In the absence of a baselinesurvey, assessing the impact of HEPR and Programme 135 requires multiple approaches.
programme evaluation
MOLISA-UNDP: TAKING STOCK, PLANNING AHEAD 101
71 This section is based on Shaffer (2004)

The methodology for the impact assessment combined three approaches - a Literature Review, aQualitative Survey, and a Propensity Score Matching Exercise - within an integrated research design.These are briefly discussed below.
Component 1 - Literature Review (Process Tracing)
The primary objective of this component was to provide a detailed understanding of the processes ortransmission mechanisms linking outputs to outcomes. It specifically focused on the reasons whyproject components have succeeded or failed to generate an impact on well-being. Information was compiled and synthesised from a range of sources including PRAs, project evaluations, research studies, etc. This information guided questionnaire design for the ““Qualitative” Survey.
There are three key limitations of the data contained in the literature reviews. First, it is unclear how representative the findings are. Second, the quality of the different studies varies. And third, these datagenerally, do not provide an assessment of the magnitude of impact.
Component 2 - “Qualitative” Survey (Process Tracing + Self-Reports)
Component 2 aimed to present a representative account of: (i) people’s perceptions of the project components’ impact and (ii) the factors contributing to and limiting that impact.
In the QHS, respondents were asked to rank the well-being impact of project components over time,based on open-ended questions regarding the processes or transmission mechanisms generatingimpact. Respondents were then asked for their opinions about why some components impacted themnegatively, insignificantly or not at all, using pre-coded reasons drawn, inter alia, from the results of theliterature review. The QHS combines process tracing exercises and self-reports.
Component 3 - Propensity Score Matching (Quasi-Experiment)
The primary objective of Component 3 was to conduct sensitivity analysis on the results of a PropensityScore Matching (PSM) exercise conducted by the World Bank in 2003. The PSM is an example of aquasi-experimental approach which uses statistical techniques, to create a control group (non-projectparticipants) who are then compared to the treatment group (project participants).
The PSM analysis provides an estimate of the magnitude of impact of select HEPR project componentscontained in the VHLSS relative to what would have happened in the absence of the project.
The three project components assessed using this technique were: tuition and school maintenance feeexemption or reduction, health fee exemption or reduction and credit from the Viet Nam Bank for thePoor. The sensitivity tests were designed to determine if changes in the way the analysis was conducted wouldaffect the results. Specifically, different weights were used to calculate average outcome indicator valuesamong non-participants, and tests were conducted to check for selection bias.
Propensity score matching has the following limitations. First, there is no analysis of the transmissionmechanisms generating impact, or the reasons why impact was or was not generated. This informationis particularly important for programme redesign. Second, quasi-experiments are always potentially
programme evaluation
102 MOLISA-UNDP: TAKING STOCK, PLANNING AHEAD

vulnerable to the problem of selection bias. It is extremely difficult to take into account all the factors jointly affecting project participation and impact when creating comparison groups.
Table 29 provides a summary of the key questions that the different components of the integrated impactassessment attempted to address.
Table 29: Questions Addressed in the Integrated Impact Assessment
To get a rounded picture of impact, these results were supplemented with data from the VHLSS 2002.
1. Credit
Around 50% of the respondents ranked the impact of credit on household income to be significantly positive, whereas around one-third of the respondents maintained it was insignificant.
72Much smaller
proportions felt impact was significantly negative or non-existent. It is striking that the core finding is uniform across the eight geographic regions, though there is some intra-regional variation. There are statistically significant differences between minorities and the Kinh/Hoa ethnic group, with the formerranking project performance less positively. No statistically significant gender differences are apparent.
These findings present a very different assessment of programme impact than the results of the PSMexercise which suggested the programme has not had a statistically significant impact on householdexpenditure per capita. There are a number of potential reasons to explain these differences. First, thetime frame for the PSM was a one-year period prior to the VHLSS, whereas the present time period wasbetween 1999 and 2002. Second, “impact over time due to credit” is not the same thing as “impact relative to the situation of the comparison group”. For example, a good credit programme with significantimpact upon income over time may show no or little impact in a PSM if a suitably matched comparisongroup also gets access to credit from other sources (formal or informal).
73Both approaches legitimately
measure “impact”, but relative to different scenarios. Third, it is possible that the open-ended questionswere not sufficiently probed, leading to a positive response bias.
programme evaluation
MOLISA-UNDP: TAKING STOCK, PLANNING AHEAD 103
Component
LiteratureReview
QualitativeSurvey
PropensityScore
1. Why and how have project components succeed or failedto have an impact?
2. How much impact have project components had over timeaccording to people’s perceptions?
3. How much impact have project components had relativeto what would have happened in the absence of the project?
72 The results of the commune questionnaire show an implausibly high figure of 97% of commune officials who considered thatcredit had a significantly positive impact upon the income of a majority of commune households.
73 The assumption is that the treatment group could also have received credit in the absence of the project.

Small loan size and a short duration are the two main reasons for the credit sub-programme’s lack of asignificantly positive result at the national level.
There is variation between and within regions. In the South, lack of support services figured prominent-ly as they did in the North West (Son La) and the Central Highlands. Lack of knowledge about investmentopportunities was a major response only in the South East and did not appear to disproportionately affectethnic populations. In general, the data do not reveal large difference in responses across ethnic or gender categories.
2. Health
A vast majority of respondents considered the money saved a result of access to free healthcare to beeither very important or important (Figure 10). There is a high degree of uniformity to this result acrossregions, ethnic groups and gender categories. This finding contrasts with one of the explanationsadvanced in the VDR2004 for the limited impact of the programme.
Overwhelmingly, respondents maintained that they would still have sought medical care when they wereill even if they had not benefited from the health fee exemption or reduction (Figure 11). Taking intoaccount sampling error, and omitting the “don’t knows”, up to 95% of respondents said they would havesought medical care. Once again, there is a high degree of uniformity across regions, as well as ethnicand gender categories.
These results are consistent with, and provide an explanation for, those of the PSM, which suggestedthat the programme has had very little or no impact on the utilisation of healthcare. The insignificantimpact of this programme on healthcare utilisation rates, relative to non-participants, may be due to thefact that people would simply pay for health services in the absence of the programme. No, or little,impact would be discernable if focusing on utilisation rates. A different conclusion would emerge if focusing on the perceived importance of the money saved.
It is instructive to understand how much money the beneficiaries can save as a result of improved accessto free healthcare by analysing the data from the VHLSS 2002. The average annual household expenditureon health is VND630,000 (Table 30). While this varies across regions and quintiles, on average it constitutes nearly 5% of total consumption expenditure (Table 31).
As expected richer households have a higher expenditure on health than the poor. This is because richer households have a propensity to seek private, more expensive medical attention for problems thatmight be ignored by the poorer households – either because medical attention is not available, or expensive,or they don’t perceive it to be a problem requiring attention.
Given that around 80% of households with access to free health care or insurance are in the bottom twoquintiles (Table 12), the health policy component of NTP on HEPR has a sizable progressive impact. Theonly problem seems to be limited outreach – only 1-4% households have access.
Results from the household questionnaire do not suggest systematic poor treatment of HEPR recipientsby healthcare providers. In fact, similar percentages of HEPR beneficiaries felt their treatment was asgood or bad as paying patients. This finding holds across all major regional, ethnic and gender groupings.
programme evaluation
104 MOLISA-UNDP: TAKING STOCK, PLANNING AHEAD

programme evaluation
MOLISA-UNDP: TAKING STOCK, PLANNING AHEAD 105
0
20
40
60
80
100
Red RiverDelta
North East North West NorthCentralCoast
SouthCentralCoast
CentralHighland
South East MekongRiver Delta
%
Very important Important Not important
Figure 11: Would health care have been sought even without health fee exemption?
0
20
40
60
80
100
Red RiverDelta
North East North West NorthCentralCoast
SouthCentralCoast
CentralHighland
South East MekongRiver Delta
%
Yes No

Table 30: Annual health care expenditure of households without health insurance (by regionand quintile)
(‘000VND)
Region Quintiles
1 2 3 4 5 Total
North East 188 408 831 1735 1102 328North West 259 325 4028 160 N.A. 344Red River Delta 371 739 1339 3241 2588 909North Central Coast 313 863 885 2946 8505 627South Central Coast 133 667 745 2006 421 434Central Highlands 413 823 649 2733 5169 574South East 338 570 852 877 1917 819Mekong River Delta 365 713 847 1146 4531 657
Total 313 690 930 1707 2705 620
Source: Compiled from VHLSS 2002Notes: Quintile 1 – poorest; Quintile 5 – richest N.A. Not Available
Table 31: Share of expenditure on health care in total consumption expenditure (by region andquintile)
(%)
Region Quintiles
1 2 3 4 5 Total
North East 2.5 3.2 4.6 4.0 5.0 3.6North West 3.7 5.4 4.8 4.1 5.2 4.2Red River Delta 4.9 5.0 5.2 5.4 5.4 5.2North Central Coast 4.3 4.5 4.6 5.8 7.5 4.9South Central Coast 3.5 4.6 4.9 5.4 6.0 4.9Central Highlands 4.5 5.8 6.3 6.6 6.1 5.4South East 3.9 5.0 4.6 4.3 4.1 4.3Mekong River Delta 4.2 4.9 5.7 5.7 6.3 5.4
Total 3.7 4.6 5.1 5.3 5.4 4.8
Source: Compiled from VHLSS 2002Notes: Quintile 1 – poorest; Quintile 5 – richest
programme evaluation
106 MOLISA-UNDP: TAKING STOCK, PLANNING AHEAD

3. Tuition Waiver
A vast majority of respondents of the Qualitative Survey considered the money saved because of tuitionwaivers to be either very important or important. There is a high degree of uniformity to this result acrossregions, ethnic groups and gender categories. There are statistically significant differences betweenpopulation proportions of Kinh/Hoa and ethnic minorities in the “not important” category, though the levels are still very low.
On average around 12% of respondents claimed that they would not have enrolled their children inschool in the absence of the programme (Figure 12). This figure is within the range of programme impactfound in the propensity score matching exercise which examined actual differences in attendancebetween programme participants and non-participants. There is some regional variation in this findingbut no statistically significant differences between individual regions and the national average (minus thatregion). In addition, there are no statistically significant differences between ethnic or gender categories.
Annual school fees per student vary by category and region (Table 32). Thus, while the annual fee forprimary school education is less than VND75,000 in the North West, it can exceed VND1,000,000 at theupper secondary level.
programme evaluation
MOLISA-UNDP: TAKING STOCK, PLANNING AHEAD 107
Figure 12: School enrollment without school maintenance or fee exemption/reduction
0
20
40
60
80
100
Red RiverDelta
North East North West NorthCentralCoast
SouthCentralCoast
CentralHighland
South East MekongRiver Delta
%
Yes No Don't know

Table 32: Average annual school fee per student by category and as % of total householdexpenditure
Primary School Lower Secondary Upper Secondary
Annual Fee as %of Annual Fee as % of Annual Fee as % of(‘000 VND) total HH (‘000 VND) total HH (‘000 VND) total HH
exp. exp. exp.
North East 97.7 0.8 223 1.6 752.8 3.4North West 72.9 0.7 217 1.6 565.6 3.1Red River Delta 148.1 1.1 329 2.1 1092.3 4.9North Central Coast 134.4 1.2 299 2.4 748.6 4.1South Central Coast 117.9 0.8 252 1.6 1064.5 4.8Central Highlands 164.2 1.1 306.6 1.7 1065.5 3.8South East 250.7 0.9 407.3 1.3 1506.2 3.8Mekong River Delta 80.5 0.5 252.4 1.2 1107.2 4.1
Total 137.4 0.9 299.7 1.8 1066.6 4.3
Source: Compiled from VHLSS 2002
But tuition is only one of many expenditure categories on school education.
Current government assistance to poor households includes exemptions and reductions from variousschool fees. In addition to the official fees, there are other fees including purchasing the family liaisonbook, school reports, class funds, and electricity if the school uses fans. Pupil health insurance is in principle voluntary, but some schools require pupils to purchase health insurance making it mandatory.Parents rarely know the breakdown of school fees and usually have to pay a lump sum at the beginningof the year. Table 33 provides an example of the different types of expenditures at primary and secondarylevels in Ninh Thuan Province. Even though the poor households are exempted from 50% of costs, theystill have to pay around VND 225,000-450,000.
Table 33: Types of other educational expenses per annum (from Ninh Thuan province – SouthEast)
(‘000 VND)
Expenses Primary level Secondary level
Non poor Poor Non poor Poor
Tuition 0 0 60 30Construction fees 50 25 70 35Parent Association Fund 40 20 50 25Textbooks 60 60 80 80Supplies: notebook, pen and book bag 60 60 80 80Uniforms 60 60 100 100Insurance 40 0* 40 0*Facilities: Bicycle parking/ water and toilets 0 0 100 100
Total 310 225 580 450Source: Ninh Thuan PPA, 2003
* Insurance usually not purchased
programme evaluation
108 MOLISA-UNDP: TAKING STOCK, PLANNING AHEAD

Table 34: Share of expenditure on education in total household consumption expenditure (byregion and quintile)
(%)
Region Quintiles
1 2 3 4 5 Total
North East 1.9 3.5 4.0 5.6 6.2 4.2North West 1.9 2.6 3.3 4.7 5.7 2.8Red River Delta 3.4 4.1 5.1 7.8 7.5 6.0North Central Coast 3.4 5.2 6.6 7.0 7.3 5.8South Central Coast 2.4 3.7 5.7 6.5 6.4 5.3Central Highlands 1.6 3.8 3.1 8.1 8.1 4.7South East 1.9 2.9 4.8 4.9 5.7 5.1Mekong River Delta 2.1 1.8 2.4 3.4 5.6 3.2
Total 2.5 3.5 4.4 5.7 6.3 4.8
Source: Compiled from VHLSS 2002
Table 35: Share of Tuition Fee in total educational expenditure of households without feeexemptions (by region and quintile)
(%)
Region Quintiles
1 2 3 4 5 Total
North East 25.7 25.6 24.1 29.6 33.0 27.8North West 18.1 15.1 21.9 19.8 22.2 19.0Red River Delta 30.8 31.9 28.7 30.1 37.5 32.3North Central Coast 23.6 22.6 26.4 27.6 25.4 25.2South Central Coast 22.7 23.9 27.1 27.2 29.2 26.9Central Highlands 16.0 17.4 24.9 24.7 31.3 23.9South East 20.5 23.5 24.1 18.3 30.8 27.0Mekong River Delta 12.8 17.2 17.9 18.4 22.5 18.6
Total 22.3 24.5 24.5 24.5 30.8 26.3
Source: Compiled from VHLSS 2002
On average expenditure on school education makes up about 5% of total household consumption expenditure (Table 34), tuition exemptions comprise 25% of the total household expenditure on educationacross all except the top quintile (Table 35). Thus, tuition waivers can positively impact household well-being especially for poor households with two or more school-going children. While education for thepoor reaches about 5-6% of the total population across the country (see Tables 12 and 13), it covers onlyabout 20% of poor households (see Table 14).
programme evaluation
MOLISA-UNDP: TAKING STOCK, PLANNING AHEAD 109

The household and commune questionnaires of the Qualitative Survey asked questions concerning perceptions of service quality by teachers. The questions attempted to gauge the “attitude” or “behavior”of teachers towards recipients of the HEPR exemption/reduction, but not the “quality” of education perse. Some studies had reported discrimination against HEPR beneficiaries and worse treatment from teachers.
These data do not suggest systematic worse treatment of HEPR recipients by teachers. In fact, a higherpercentage of HEPR beneficiaries felt that their treatment was better than non-HEPR students. This finding holds across all major regional, ethnic and gender groupings. In addition, over 95% of respondents in the commune questionnaire felt that the treatment of HEPR and non-HEPR students wasthe same.
4. Extension
Around 60% of respondents ranked the impact of extension on productive activities to be significantlypositive. Only around one-third of respondents maintained it was insignificant.
74Much smaller proportions
felt impact was significantly negative or non-existent. As with credit, it is striking that the core finding isquite uniform across the three geographic regions, though in the South, there is substitution between the“no impact” and “insignificant impact” categories. Not surprisingly, the highest percentage of respondentswho maintained that extension had no impact, insignificant or a significantly negative impact were inHCMC (around three quarters.) No statistically significant differences between ethnic or gender categoriesare apparent.
A limited number staff, insufficient training and inappropriate technology were the main reasons for thelack of a significantly positive result.
There is significant regional variation. Inappropriate technology appears to be more of a problem in theSouth and Centre than in the North. In the South, lack of attention to marketing also figures prominently.In general, the data do not reveal large differences in responses across ethnic or gender categoriesthough ethnic minorities appear to place more emphasis on “too few trainings and not enough staff” thanthe Kinh/Hoa group.
5. Sedentarisation
Nationally, around 75% of respondents felt that resettlement had insignificant impact upon their lives.There are striking regional differences. Almost all respondents in the North felt that project impact wasinsignificant while around half of respondents in the Centre felt the project had no or insignificant impact.While relatively high standard errors are a concern, especially in the Centre, the results suggest that alarge proportion of the population did not rate this project component favourably. In fact, it received thelowest rating of all the project components assessed.
programme evaluation
110 MOLISA-UNDP: TAKING STOCK, PLANNING AHEAD
74 The results of the commune questionnaire show an implausibly high figure of 97% of commune officials who considered thatcredit had a significantly positive impact upon the income of a majority of commune households.

The results are heavily weighted toward the situation in the North. The three main reasons cited were:
lack of quality infrastructure poor quality soil lack of consultation in programme design.
No gender or ethnic differences are apparent as all respondents were ethnic minorities and male.
Infrastructure
Unlike the self-report-based data presented hitherto in the report, some of these data reveal extremelyhigh positive ratings for some of the infrastructure projects. Schools and irrigation works were rated particularly well, though healthcare centres and roads received more modest responses. The positivevalues may be the result of small sample size (n=17 for schools), or more likely, measurement error, i.e.the failure to sufficiently probe the open-ended questions. In these cases, there is no meaningful information on “reasons for lack of a significantly positive impact” because very few respondents were inthis category. Responses in the Health Center module present a more balanced assessment of impactbut small sample size precludes a more detailed understanding of the reasons for the lack of a positiveimpact. The Roads module provides more useful information and is discussed below.
Roads
Across the Centre and North, around 60% of respondents maintained that roads had a significantly positive impact upon their lives. The assessment of the road’s impact is slightly more favourable in theCentre. While relatively high standard errors are a concern, especially in the Centre, the results suggestthat a significant proportion of the poor population, around 40%, did not rate this project componentfavourably.
The three reasons identified for a significantly negative impact were
the poor condition of the roads, a lack of consultation and a lack of employment opportunities during road construction.75
Small sample size and high standard errors urge caution when interpreting this result.
Some of these data reveal extremely high positive ratings (schools and electricity). The range varies fromalmost 100% of “significantly positive” responses for electricity and schools to around 75% for irrigation.It is likely that these high values are due to measurement error, in particular the failure to adequately
programme evaluation
MOLISA-UNDP: TAKING STOCK, PLANNING AHEAD 111
75 The largest number of responses fell into the "'other" category which could not be coded and included in the present analysis.

probe the open-ended question on the pathways of impact. While it is possible that impact of electrificationon living conditions may rate very high, the extremely high rating of schools is less likely given that the physical location and condition of schools is only one among many factors affecting enrolment/attendance. In general, the self-reports appear to work less well with the infrastructure projects than with the other project components included in the evaluation.
6. Programme 135
6.1 People’s Participation
Nationally, the results on People’s participation in P135 are quite mixed. For irrigation and electrificationprojects, consultations appear to have been more widespread with around half of respondents statingthat they had been consulted. For roads and schools, only around one third of respondents claim to havebeen consulted. There is significant regional variation with higher levels of consultation in the Centre thanin the other two regions. Ethnic differences are pronounced as well though no clear pattern emerges.Consultation of minorities is apparently lower in the cases of roads and schools but higher for electrificationprojects.
The data reveal agreement rates of near 100% for all projects. While this result has been found elsewhere where similar questions were posed, it does raise questions concerning a positive responsebias. Nevertheless, the data are consistent with the very positive assessment of impact and do not suggest widespread disagreement with project decisions regardless of the extent of consultation.
6.2 Roads
At the national level, around 85% maintained that roads had a significantly positive impact upon theirlives. The assessment of the roads’ impact is highest in the Centre, though still very high in the Northand South. There are no statistically significant differences between gender or ethnic categories in thepopulation proportions within the significantly positive category.
The number one reason 15% of respondents did not rank impact as significantly positive, was the poorquality of roads.
76Quality was the top reason cited in all three geographic regions (after taking into
account sampling error).
6.3 Irrigation
At the national level, around 75% maintained that irrigation had a significantly positive impact upon theiragricultural production. Those who disagreed were almost all from the Center, in particular the CentralHighlands. There are no statistically significant differences between gender or ethnic categories. Themain for the lack of a significantly positive impact among the other 25% of respondents, was the poorquality of the irrigation system.
77The small sample size, however, urges caution when interpreting this
finding.
programme evaluation
112 MOLISA-UNDP: TAKING STOCK, PLANNING AHEAD
76 The largest number of responses fell into the "'other" category which could not be coded and included in the present analysis.
77 The largest number of responses fell into the "'other" category which could not be coded and included in the present analysis.

7. Key Conclusions and Recommendations
In the absence of a baseline survey or periodic tracking of outcomes, a mix of techniques wereused to assess the impact of selected HEPR and P135 components on household well-being. Theresults of the Qualitative Household Survey were combined with the results from the PPAs and theVHLSS 2002 to get a better idea of impact.
Credit
About half the respondents claimed to have benefited from access to credit though small loan sizeand short loan duration seem to be the dominant reasons for lack of a significantly positive impact.Lack of support services was an important reason for low impact in the South, North West andCentral Highlands.
Health
While health fee exemptions do not increase access to health facilities, the money saved is veryimportant to poor households.
Almost 25% of respondents were denied access to health care when they needed it because ofcomplicated procedures or late arrival of the health insurance card.
Tuition Waiver
Tuition waivers increased school attendance of children from poor households. 12% of poor households would not have enrolled their children without tuition exemptions.
But 20% of households report difficulties because of complicated procedures or lack of knowledgeabout the programme.
Extension
Nearly 60% respondents claim a positive impact of extension on production. But this figure seemsfar too high.
Respondents also face problems that arise because of limited training and insufficient staff (acrossall regions), inappropriate technology (in the South and Central regions), and lack of attention tomarketing (in the South).
Sedentarisation
Nearly 75% respondents report no significant impact of sedentarisation on their well-being. Mainreasons include: lack of quality infrastructure, poor soil quality and lack of consultation in programme design.
Most respondents rated the impact of the four infrastructure types highly positive. Problems mentioned refer to poor quality of construction and maintenance of infrastructure.
programme evaluation
MOLISA-UNDP: TAKING STOCK, PLANNING AHEAD 113

Key recommendations
Health Fee Exemption/Reduction
Priority should be given to ensuring the timely issuance of health cards and simplifying procedures.
School Tuition Exemption/Reduction
Priority should be given to raising awareness about the programme and simplifying procedures foraccessing the exemption or reduction.
Credit
Increase the proportion of loans of medium or long-term duration for productive investments withlonger-term returns.
Analyse the feasibility, and implications for coverage, of increasing loan size.
Provide more systematic support services for credit recipients in the form of extension, marketing,veterinary services or financial management.
Extension
Increase the number of extension cadres and frequency of training.
Reassess the “standard models” of extension technology proposed in close consultation with localpeople, with a view to better match technical solutions and local needs.
Broaden extension training to provide information on marketing processes and channels.
Sedentarisation
With respect to resettlement: i) Improve the quality of infrastructure in new settlements and ii) Involvelocal people more closely in programme design and implementation.
With respect to road construction: i) direct more attention to the quality of road construction and its maintenance and ii) provide increased employment opportunities during road construction.
Programme 135
With respect to both roads and irrigation, greater emphasis on the quality of construction and maintenanceis needed.
Local poor people should be given priority for all wage labour opportunities in the scheme. Using poorworker should be a standard clause in the contract awarded for scheme construction.
programme evaluation
114 MOLISA-UNDP: TAKING STOCK, PLANNING AHEAD

D. CONCLUSION
The evaluation framework (Section A.II) outlined a way to assess the effectiveness of the two programmes in reaching their objectives. The report examined whether the programmes were doing theright things, doing things right, and their impact on household well-being.
This section will not reiterate the conclusions made at the end of each of the earlier sections. Rather, thissection will critically review the evidence presented, in order to address some key elements of eachissue. Later, Section E will prioritise and review the key findings and recommendations to suggest howthey might contribute to the design of an improved NTP on HEPR for 2006-2010.
1. Are the programmes doing the right things?
The NTP on HEPR and P135 do three essential things:
(i) By directing additional benefits to poor communes and poor households the programmes aimto increase the rate of poverty reduction. This is considered necessary because while growthmight eventually lead to poverty reduction, the process may not be pro-poor in the short-term,that is, poorer groups may be left out of mainstream socio-economic development, leading to anincrease in inequality.
(ii) By directing public resources to poor provinces, communes and households, the programmesaim to keep inequality in check. Government funding for targeted programmes often makes upto 80% of a poor commune’s annual budget. Thus, targeted programs may well serve as inter-provincial fiscal transfer mechanisms to poorer provinces/communes.
(iii) By providing resources directly to provinces, the NTPs provide autonomy to sub-national levelsfor allocating, spending and managing funds. Programme funds can, therefore, be used moreflexibly to finance local solutions and meet local needs.
The major significance of the NTP is that in addition to raising awareness, it promotes mainstreaminghunger eradication and poverty reduction concerns into the government’s regular planning process. It utilizes government annual plans - the tool that the government uses for management of the country’ssocio-economic development - for the purpose of poverty reduction. The NTP for HEPR’s targets, activities and resources are planned and implemented as a part of the government’s development plansat all levels.
In terms of financial management, the NTP is a fast disbursing resource allocation mechanism.Government funds are transferred directly to poor households, communes, districts or institutionsaccording to approved plans and volume of work done.
MOLISA-UNDP: TAKING STOCK, PLANNING AHEAD 115

The funds are transferred, in the form of benefits such as subsidized credit, health insurance cards, etc.to poor households identified as lying below the poverty threshold. The key questions focus on whethertargeting approaches are appropriate and whether the programmes are targeting the benefits to the right(i.e. poor) people and communes.
There is evidence that:
(i) even though the lists of poor households are prepared in consultation with the villagers, and
(ii) most households on these lists are indeed poor,
(iii) the number of households considered poor at the village level usually exceeds the number officially classified as poor. That is, many poor households do not make it to the list of poorhouseholds. Thus,
(iv) relying largely on these lists, the different programme components have not reached all intended target poor households.
Increasing the number of poor households with access to programme benefits is a major challenge.
Correctly identifying poor households is important to reduce mis-targeting and improve targeting efficiency. Improved measurement and targeting methods will be necessary as the economy becomesmore market-oriented and public spending decisions are delegated to provinces.
Protecting public spending for the poor will require budget transfers from rich to poor provinces and thus,a reliable estimate of measuring poverty at the provincial level. An effective mechanism to identify thepoorest households within each commune is necessary for the allocation of specific benefits, such astuition waivers and free health insurance cards.
However, proper identification of poor households is only part of the story. It does not necessarily ensureaccess to benefits by poor households. For example, subsidised credit still does not reach a large proportion of “correctly-identified” poor households. Suitable targeting mechanisms need to be devisedto ensure that programme benefits indeed reach the poor. In January 2005 the government is expectedto approve the new poverty line for 2006-2010, as the living standard of the majority of Vietnamese people has improved. The poverty line for urban residents will be set at VND 233,000/person/month(USD15) and for rural residents at VND200,000 (USD13)/person/month. With this new standard, VietNam’s poverty rate at the end of 2005 will be around 26%, more than twice the proportion of people currently classified as poor by MOLISA. This will put an additional burden on the administrative systemto maintain the current, albeit low, rate of coverage.
Already there are complaints of complicated procedures, late arrival of cards, and bureaucratic rationing.In this context, it seems highly unlikely that the next phase of the programme will be able to increase coverage of poor households using the present administrative targeting methods. Thus, even while theprogrammes are doing the right thing by transferring fiscal resources to poor households and poor communes, there is an urgent need to increase efficiency of targeting for increased impact.
Conclusion
116 MOLISA-UNDP: TAKING STOCK, PLANNING AHEAD

2. Are the programmes doing the things right?
Administrative decentralisation is one of the key vehicles for implementing the two programmes. P135shows that decentralisation does work, even though only 16% of all P135 communes are “investmentholders” so far.
Instituting a “community development fund” can be an effective way to ensure that poor households andvillage leaders are involved in management and supervision of funding as well as ensure funding is commensurate with real demand in the area.
There is a concern that these community development funds may end up becoming “village elite funds,“controlled by the village elites for the benefit of a small number of people, who are not necessarily poor.
But even at present, in most cases, these funds are controlled by the provinces and districts, and thecommunes have little say in how the funds are spent. Decentralisation through “community developmentfunds” should therefore be accompanied by increased grassroots participation, transparency, accountability and local capacity for supervision of projects.
A key element of doing things right is knowing that the process is on track. In the absence of any dataon outcomes, it is difficult to get a sense of the overall direction of the programmes in order to make mid-course corrections if necessary. Currently, data collected is not used for steering the programmes,but only for reporting on financial inputs (such as the amount of funds used) and physical outputs (suchas the number of infrastructure projects completed).
At the same time there is an excessive emphasis on tracking the movement of poor households out ofpoverty every six months to one year. This is because the success of the two programmes is judged byfrequent estimations of the poverty rate and number of completed infrastructure projects. But there isconsiderable variation in the way in which poverty rates are calculated across communes that arisesfrom: (i) use of different sampling techniques (census or sample), (ii) the method of data collection (self-reporting and/or village-level discussion or interviews), and (iii) the calculation of household incomeon the basis of this data. Often the variability is due to the flexible interpretation of the definition of thepoverty lines.
Much of the tracking of poverty rates is driven by pressure to meet poverty reduction targets, set at thecentral level. Exact numbers of households to escape poverty are assigned to each village as a targetfor each year. These targets are often at variance with what is achievable on the ground. These factorstend to distort the assessment of the overall impact of the programme.
Additionally, changes in household well-being are not always apparent in the short interval of a singleyear. Sustainable poverty reduction requires a combination of policy interventions and project inputs andoccurs over a longer period of time. Thus, there is a strong case for enhancing programme monitoring(with an emphasis on intermediate or outcome indicators), and move away from annual or semiannualmonitoring.
3. Impact on household well-being
In the absence of a baseline survey a variety of techniques were used to assess impact on householdwell-being, as discussed in Section C.III. The Qualitative Survey relied heavily on self-reports to gauge
Conclusion
MOLISA-UNDP: TAKING STOCK, PLANNING AHEAD 117

the magnitude of impact. There are clearly limitations associated with this approach to assessing impactincluding a number of potential biases.
It is in the nature of self-assessments that few respondents are likely to reply that a particular componenthas had a negative impact. This is because whatever impact the component would have had is betterthan nothing.78 It is clear that the NTP on HEPR has had some positive impact, but it is not clear whetherthe programme provides value-for-money, or how it compares with other alternatives. The results of theimpact assessment, therefore, have to be interpreted with caution.
The impact assessment attempted to provide a sense of the magnitude of impact for the major programme components, some of which contained multiple sub-components. In principle, each one ofthese should be the subject of a much more detailed evaluation, which would be able to provide detailedinformation on impact and be relevant for future project design.
The absence of periodic monitoring of outcome indicators has made it difficult to assess the contributionof the NTPs to poverty reduction across the nation. As per various official documents, the GOVN claimsthat poverty reduced at the rate of 2% per annum from 1998-2001. The implication being that povertyreduction is the result of the whole process of socio-economic development, in which the NTP on HEPRand P135 play an important role.
Given the generally limited access of poor households, especially those in remote and mountainousareas, to basic social services, subsidised credit, and other social assistance, the additional benefits provided by the NTP on HEPR and P135 are considered very valuable by poor households. These havealso had some important impact on their well-being, and have been rated as such in the QHS.
It is difficult to claim, on this basis, that poverty reduction in Viet Nam during the last five to six years hascome about almost entirely from the targeted programmes. To do so, is to ignore the contributions ofmacroeconomic policies, fiscal management, commodity prices, international trade and other factors.
At the same time, it needs to be recognised that (i) the impact of the NTP on HEPR and P135 could havebeen increased through better targeting, increased participation, more transparent and accountablefinancial management systems, and better capacity and incentives to implement the programmes, and(ii) there may be more effective and efficient ways to achieve similar results that should be explored.
However, the evaluation highlights the need for a longer-term impact assessment of various componentsduring the next phase. This can begin by designing a proper baseline survey, and developing an M&Esystem to track progress periodically. As mentioned earlier, the evaluation analysed the impact of selected programme components on household well-being. A review of the results may help determinethe composition of the NTP on Poverty Reduction in 2006-2010.
Barriers for poor households when accessing subsidised credit, the limited impact of subsidized creditdue to the small loan sizes and short-term durations, and problems facing sedentarisation and settlement demonstrate the urgent need to reconsider each component in the future.
Conclusion
118 MOLISA-UNDP: TAKING STOCK, PLANNING AHEAD
78 Mot mieng khi doi bang mot goi khi no - a small bite of bread when you are hungry equals a big loaf.

Conclusion
MOLISA-UNDP: TAKING STOCK, PLANNING AHEAD 119
Poor households consider health support and tuition waivers considerably more important to improvingtheir well-being than other sub-programmes. However, delays in the issuance of health cards, complicated procedures and a lack of awareness about accessing benefits need to be addressed.
Infrastructure projects also were highly rated by respondents of the QHS but the impact of farming extension received mixed reviews.
The overall picture that emerges is that there seems to be little rationale for continuing with sedentarisation, settlement of new economic zones, and farming extension as HEPR components.Farming extension while useful, does not always have a pro-poor focus and may be mainstreamed within its respective ministry.
Credit is essential for poor households and attempts should be made to increase their access.International evidence suggests that poor households are willing to pay market rates for accessing credit, without affecting repayment rates, provided they have reliable and easy access.
There may also be a strong case for separating the social sectors (health care cards and school tuitionexemptions) from the livelihood related components such as subsidised credit, farming extension, andinfrastructure. In any case, these different component categories should not be in a single managementstructure as they require different management/targeting approaches.
Based on this discussion, Section E will make recommendations for the design of the NTP on HEPR forthe next phase.

E. IMPLICATIONS FOR DESIGN OF NTP ON HEPR 2006-2010
The second of the two objectives of the overall evaluation was to draw lessons for designing the NTP onHEPR for the next phase. This section prioritises and analyses the key findings and recommendationsin order to contribute ideas to the design of an improved poverty reduction programme for 2006-2010.
Ten themes emerge from the overall evaluation. Addressing these themes can greatly enhance the programme’s effectiveness in the next phase. These are presented as proposals grouped under fourmain programme facets:
Resource allocation and budgets.
Targeting mechanism (province, commune & beneficiaries)
Organization & Management, including M&E etc.
Capacity Building.
This allows discussion and analysis of linked issues in one block at the same time and in a more comprehensive manner e.g. M&E is closely linked with overall organization and management. Blockgrants, budget allocations, transparency and accountability of financial management are also closelylinked.
These are discussed below.
Resource allocation and budgets
1. Provide programme funds as block grants to provinces to increase local-level autonomy
The next phase of NTP on HEPR can achieve more by doing less by providing the provinces with blockgrant. This will simplify the planning, budgeting, monitoring and coordination of HEPR activities at theprovincial level, involving interactions between both line agencies and local governments.
This is in line with the (i) considerable discretion over HEPR budgetary allocations that provinces alreadyappear to enjoy, (ii) new State Budget Law, which devolves further budgeting responsibilities to theprovincial and local levels, and (iii) location-specific nature of poverty issues which require local level –rather than national – planning.
The HEPR programme should move towards a system whereby provinces are formally and legally allocated annual block grants for funding poverty reduction activities. Provinces would be given considerable and official discretionary spending powers.
Block grants will need to be accompanied by a set of unified guidelines (or “norms”) governing their use,specifying:
120 MOLISA-UNDP: TAKING STOCK, PLANNING AHEAD

the broad intention of the HEPR programme is to address poverty and the priority areas/sectorsfor provincial investments, in line with the SEDP 2006-2010;
an eligible “investment menu “, detailing the kinds of activities that provinces will be able to fundusing their HEPR block grant;
a list of “exclusions”, or items that cannot be financed out of the HEPR block grant (e.g. vehicles,office buildings);
the range of spending applicable to certain kinds of activities (e.g. a maximum of 30% to be spenton infrastructure, a minimum of 25% to be spent on capacity-building for district and commune levelstaff, a minimum of 20% to be spent on extension services, etc.);
the basic mechanisms for the administration of provincial poverty reduction block grants (reportingrequirements, devolution of responsibilities to districts and communes, performance criteria, etc.).
At the same time, (i) given the relative lack of emphasis on “software” activities (extension, capacity-building, etc.), the government may want to build incentives for provinces to use their HEPRblock grants for such purposes and (ii) encourage the provinces to devolve poverty reduction responsibilities and activities to districts and communes in line with the Grassroots Democracy Decree.
The ultimate aim should be to enable the communes to become “investment holders”. But that will needto be preceded by first successfully decentralising management to the provincial level, and strengthening capacity at the grassroots level. There should also be greater programme managementand coordination at provincial levels as currently exists for donor-funded projects.
2. Set-up a transparent and easy-to-administer system of allocating budgetary resources toprovinces
A simple and transparent mechanism should be established for dividing up the total annual allocationearmarked for provinces. Two options
79are:
Allocate block grants to provinces on the basis of the absolute number of poor households in eachprovince. This option would rely on the new poverty thresholds currently being developed.
Combine the population size of each province with an additional weighting for the province’sHuman Development Index (HDI). Thus, a large province with a low HDI would be allocated a larger block grant than a large province with a high HDI – the logic being that the former has greaterneeds and probably fewer resources. The advantage of using HDI is that it provides a broader definitionof development, and is not based solely on income.
80
MOLISA-UNDP: TAKING STOCK, PLANNING AHEAD 121
implications for design of ntp on hepr 2006 - 2010
79 Winter and Tuan Anh (2003).80 However, this has to be devised carefully, since "wealthier" provinces may contain "poor" communes. For example, 32 com-
munes of Thua Thien Hue province are included under P135 - even though, according to the HDR 2001, Thua Thien Huehas a high HDI based on a high average per capita income. It would be inequitable to reduce per capita allocations to the 32communes simply because they are situated within a province with a high HDI.

Other options may be developed using the results of current on-going research on poverty mapping. Itis important that the formula is simple, is easy to administer, and widely disseminated so that a largenumber of people can understand the basis upon which provincial allocations are made. In addition, theinformation used to calculate provincial allocations should be unambiguous and not subject to easymanipulation.
It was observed in Section C.I.2.1 that the current fixed-sum allocations of VND500 million to each P135commune is a relatively blunt instrument for reducing poverty. P135 should develop a more equitable formula for allocating block grants to communes. The formula
81could be structured as follows:
An equal share component would enable all communes to meet a basic minimum of investmentrequirements. This takes into account the large variations in the demographic size of communes,which (in one Lao Cai district alone) ranges from less than 2,000 to over 14,000 people. The totalvalue of equal share components (for all the communes in a given province) should not exceed15% of the total allocation made to communes (so as to keep per capita variations to tolerable levels).
A population-based component, proportional to the population of the commune, reflects the assumption that development needs generally grow with the size of the constituency. Up-to-datedemographic data is readily available in the communes.
The allocation formula could be limited to these two criteria alone if P135 communes in individualprovinces are homogeneous in terms of poverty and remoteness. However, if there are significant differences in the relative poverty and isolation of P135 communes in a province, the allocation formulacould include one and/or two other components:
Communes that are more remote would have access to proportionately more funds than lessremote communes, on the assumption that increasing remoteness raises the costs of development investment.
The formula could include a poverty weighting, so poorer communes receive higher per capita allocations than less poor communes.
3. Build incentives by linking resource allocation to performance
The current HEPR funding mechanism provides no incentives (or sanctions) for improved (or deteriorating) performance at the provincial level. This could be addressed by the government in the nextprogramme phase by putting in place a system of
minimum conditions (MCs) for provincial access to annual block grants,
performance criteria (PCs) for assessing provincial performance.
122 MOLISA-UNDP: TAKING STOCK, PLANNING AHEAD
implications for design of ntp on hepr 2006 - 2010
81 Suggested by Winter and Tuan Anh (2003).

implications for design of ntp on hepr 2006 - 2010
Complying with MCs would be an essential basis for accessing annual HEPR block grants. Unless aprovince demonstrates full compliance with HEPR MCs, it will not be allocated its annual block grant. Forexample, MCs could be designed to encourage timely reporting by provinces on the use of their blockgrants.
At the very least, the MCs will provide incentives for provinces to report on their HEPR activities and onHEPR budget implementation. They will also enable the HEPR office to track HEPR implementation ona more timely and consistent basis.
PCs refer to the pre-determined criteria used to assess provincial performance – with assessments having budgetary consequences. Provinces that plan and implement their HEPR activities are compensated through increases in their annual block grant allocation. Provinces that demonstrate inadequate performance, on the other hand, will be sanctioned through reductions in their annual blockgrants.
As there is a danger of increasing inequality among provinces, with better performing provinces progressively getting more, this system needs to be devised carefully. Winter and Tuan Anh (2003) propose some criteria to do this. However, care should be taken to ensure that the poor in one provincedo not suffer because of the incompetence of the provincial leadership. Poor performance should firsthave negative fallout for the provincial leadership, and only later for programme allocation.
Targeting poor households
4. Strengthen targeting mechanisms to increase the number of poor beneficiaries
The present system to identify poor households relies upon a combination of methods. The arbitrarypoverty thresholds aim to assess the households’ well-being against an absolute poverty standard.These are often at variance with the decisions of the villagers’ who, using relative poverty criteria, identify the poorest households. So only one of two equally poor households in neighbouring villagesmay benefit from the sub-programmes.
In addition, identification of poor households is driven by the pressure to meet poverty reduction targets,set at the Central level. Currently, the targets are about 2% per year, that is, the proportion of poor households in the commune has to decline by that rate. Exact numbers of households are assigned toeach village as a target for each year.
Setting poverty reduction targets realistically may help increase the number of poor beneficiaries.
Organization and Management
5. Develop mechanisms to promote transparency and accountability of financial management
The highly negotiated nature of HEPR in particular and the variability of local contributions makes transparency an issue. A key implication is the transparency within the resource allocation system i.e.
MOLISA-UNDP: TAKING STOCK, PLANNING AHEAD 123

implications for design of ntp on hepr 2006 - 2010
the predictability of how resources introduced into the system will be deployed and the objectivity of thecriteria used. The new 2004 Budget Law may help in this respect.
Mechanisms that promote transparency and accountability, consistent with the spirit of the GrassrootsDemocracy Decree, will play an important role in the new programme. These could include expandingand deepening “commune development fund” mechanisms, clear incentives and sanctions for the publication of programme budgets and plans, or a stronger role for community-based monitoring in theNTP on HEPR.
6. Improve participation at local levels by operationalising the Grassroots Democracy Decree
Successful implementation of decentralised development approaches will require the formal revision ofa number of regulations and procedures by provincial governments. The required regulatory frameworkshould be established prior to the start of the next phase in 2006. This could be, as earlier recommended, part of the minimum conditions for accessing HEPR funds.
The overall aims of the NTPs for the period 2006-2010 should express “empowerment of poor people”as a primary aim. Popular consultation and participation in decision making will be applied throughoutthe (sub-) project cycles (i.e. during the preparation, implementation, and evaluation stages). This is consistent with the Government’s Socio-economic Development Strategy for 2001-2010 and theCPRGS.
The programmes must strengthen horizontal links with other projects and policies, especially with thegrassroots democracy, administrative reform and decentralisation processes. This is imperative for tworeasons:
Synergies from working with and learning from other policy processes and projects will increasethe effectiveness of the NTPs, i.e. they will achieve their immediate objectives of poverty reductionbetter if PAR and improved grassroots democracy are successful. Additionally, NTPs will absorblessons from other projects, especially on capacity building and decentralisation.
All national projects should contribute to the wider objectives of the government. That is, the NTPsshould also contribute to achieving the aims of, for example, grassroots democracy legislation andpolicies on improving gender equality (the status of women in the household and community) andthe participation of ethnic minorities in public life.
The patchy achievement in participation and empowerment reinforces the imperative for the NTPs toseek synergy and aim more clearly to support the implementation of the GRDD.
7. Develop an effective M&E system with a focus on tracking intermediate indicators and ratio-nalising reporting
A good M&E system also promotes transparency and accountability. To assess efficiency and effectiveness, a combination of quantitative and qualitative methods involving a range of stakeholders atdifferent levels needs to be considered while developing the M&E system for the programme.
124 MOLISA-UNDP: TAKING STOCK, PLANNING AHEAD

implications for design of ntp on hepr 2006 - 2010
The monitoring system presently used needs to be enhanced in four essential ways:
(i) develop a set of intermediate indicators that help track outcomes,
(ii) conduct a baseline study in 2005 prior to the start of the next phase in 2006
(iii) build-in plans for a mid-term review in 2008 and an evaluation in 2010-2011 into the design of theM&E system for the next phase,
(iv) streamline the reporting system to reduce the number of narrative reports, but increase the use ofthe information for effectively steering the programme.
The new NTP on HEPR should have a clearer and more transparent link between funding provided atthe centre or localities and outputs achieved/reported. At the moment, it is difficult to tell which GOVNprogramme (whether mainstream or NTP) is responsible for reductions in poverty. Further developmentof the planning process in order to create clearer connections between resource allocation at the top andthe results for which managers in the field are accountable, would assist agencies in demonstrating theimpact of funding.
8. Make the programme more manageable by reducing the number of programme components
Consolidating and reducing the number of components of the HEPR programme, whilst maintaining theuse of existing programme management boards, will make funding allocations more transparent andfunding choices easier. For instance, all infrastructure-related components may be put together under asingle programme such as Programme 135, and all employment-related components could be moved toa separate programme to make the HEPR programme lean and focused.
At the same time, some components do not need to be under the NTP framework any more and can bemainstreamed within their respective ministries. Some parts e.g. health cards and tuition fee waiver canbe placed under sector plans of ministries rather than under NTP. Fewer components will also help inimproving the financial accounting system.
Capacity Building
9. Build capacities at all levels, especially at the commune level and including local cells/leaders of mass organizations
Capacity building of grassroots cadres must be embedded in wider learning mechanisms. For instance,HEPR Boards in provinces and the central level HEPR Steering Committee should create centres or regular forums where lessons from implementing the programme are discussed. Participatory Poverty(reduction) Assessments (PPAs) may be conducted regularly to evaluate impacts and inform the learning process.82
MOLISA-UNDP: TAKING STOCK, PLANNING AHEAD 125
82 Most of the proposals in this section are from Neefjes (2004).

implications for design of ntp on hepr 2006 - 2010
The NTP on HEPR in 2006-2010 should encourage capacity building of local men and women throughsocial organizations such as the Women’s Union, Youth Union, Farmers’ Union, and other local groups(including informal groups and newly emerging local associations). In some cases additional clubs andspecial classes may be initiated, for example on monitoring and maintenance of infrastructure, management of Water Users’ Groups, savings and credit, gender equality and literacy classes (especially for ethnic minority women).
The percentage of the total budget under HEPR for training should be increased. Closer collaborationshould be sought with other capacity building efforts, including internationally funded and national andprovincial cadre training institutes.Additional investment in capacity building is necessary for the successful implementation of the NTP onHEPR 2006-2010. But this will have to be aligned with the priorities of the programme for the next phase.The following skills can greatly improve popular consultation and participation in decision making, andenhance the likelihood of empowerment and effective poverty reduction:
Facilitation skills, for ensuring popular participation in public meetings, consultations and decision-making.
PRA tools and processes, and similar inclusive methodologies for shared analysis in planning, implementation and monitoring of projects and services.
Communication skills, for improving transparency, and awareness raising.
Social analysis, including gender analysis, ways to help develop the potential of women and ethnicminorities, and ways to enhance their status and active participation in public life.
Technical skills, of local officers, village leaders and/or (selected) local people who are or can beinvolved in technical monitoring of infrastructure projects.
Budget and project management skills.
Cadre training must be delivered in structurally improved ways, by regional and provincial trainingcentres/cadre schools. That means that trainer/teacher capacity needs be boosted, with specific focuson the above skills.
10. Strengthen the stature and capacity of the HEPR Office for better programme managementand monitoring
The capacity of the HEPR Office in communication, organization, coordination, reporting and policyanalysis of the HEPR implementation is important to the NTP’s success.
However, the programme office does not seem to enjoy the same level of administrative authority asother departments of MOLISA. This handicaps its ability to coordinate with other HEPR stakeholders.
126 MOLISA-UNDP: TAKING STOCK, PLANNING AHEAD

implications for design of ntp on hepr 2006 - 2010
MOLISA-UNDP: TAKING STOCK, PLANNING AHEAD 127
To ensure success of the HEPR programme, the programme office should have improved capacity in:
Consolidating local experiences into key principles of success and HEPR guidelines, particularly inthe area of targeting, management and reporting,
Monitoring programme impacts,
Proposing HEPR-related social and economic policy analysis and using the results for policy formulation and programme management to ensure better links between HEPR and macro policies,
Coordinating HEPR activities through information sharing and joint planning, and
Communicating and informing both government officials and target groups.
Apart from capacity constraints, the HEPR office’s weaknesses in monitoring and coordinating programme implementation of other ministries and provinces stems from its minimal role in allocationand management of financial resources. HEPR funds are allocated by MPI and MOF, and the HEPRoffice has no role. The stakeholders often only report to these line ministries.
The central HEPR office should have a stronger mandate for monitoring and evaluating the performances of provinces and act as a central lesson-sharing and information dissemination clearing-house. The office should provide advice to the government on the strategic direction of the programme.

REFERENCES
AAV/ADB (2003) Nguyen Tat Canh, Ta Van Tuan, Ngo Minh Huong, Nguyen Quang Minh and Pham VanNgoc, Dak Lak – A Participatory Poverty and Governance Assessment, Action Aid Viet Nam and AsianDevelopment Bank, 2003
ADB (2001) Rural poverty Reduction: Lessons learnt from credit forestry and sedenterisation programme(TA 3464 VIE), 2001
CEM (1998), Implementing the major tasks of the socio-economic development program for mountainous, remote and deep communes - report of the Minister, Chairman of the Committee for EthnicMinorities and Mountainous Areas, Hoang Duc Nghi, to the National Conference of the 135 ProgrammeImplementation 6-7 January 1999, December 1998
CEM (2004a) Report on 5 year (1999-2003) implementation of Programme 135 and directions and tasksfor 2004-2005, Committee for Ethnic Minorities, Steering Committee Programme 135, 2004
CEM (2004b) Training Materials: Training and development of grassroots staff responsible forProgramme 135, Volume 1 and 3, HCM City 2003
CRP (2003) Participatory Poverty Assessment (PPA) Ninh Thuan Province funded by WB
Dang Boi Huong (2003) Review of Free Health Cards and Other Financing Initiatives to Support the Poor,Ministry of Health/ Asian Development Bank, Ha Noi, 2003
DFID (2000a) Truong Van Am, Case Study of Programme 135 in Huong Khe District, Ha Tinh Province,Ha Noi, September 2000
DFID (2000b) Pham Quang Sang, The Implementation of Programme 135 in Kiet Son and Tam ThanhCommunes, Thanh Son District, Phu Tho Province, Ha Noi, September 2000
DFID (2003) Koos, Neefjes and Hoang Xuan Thanh, Poverty Reduction in the Northern Mountains – asynthesis of participatory poverty assessments in Lao Cai and Ha Giang province and regional VHLSSdata
Do Xuan Hoa (2002) “The 135 Programme and implementation experience on democratic managementand utilization of funds at the commune level,” in MARD & MRDP 2002
Fritzen, Scott (2000), Institutionalising Participation: Lessons Learnt and Implications for StrengtheningViet Nam’s National Programmes, UNDP-UNCDF-CIDA, Ha Noi, 2000
Hanh Toan and Doanh (2004) Review of Monitoring Systems of HEPRJC and 135 Programme, ProjectVIE/02/001 UNDP- MOLISA, Ha Noi, June 2004
Hoang Thanh Huong and Nguyen Chien Thang, Impact Assessment of the HEPR and Programme 135Literature Review, Ha Noi, August-September 2003
128 MOLISA-UNDP: TAKING STOCK, PLANNING AHEAD

references
IDEA (2004) IDEA International, Impact Assessment of the Hunger Eradication and Poverty ReductionProgramme (HEPR) and Programme 135, VIE/02/002- Support to the National HEPR, July 2004
Koos Neefjes, Participation and Empowerment in the HEPR Programme: Report of a Desk Study,Project VIE/02/001 Support to the Improvement and Implementation of the National HEPR TargetedProgramme, UNDP and Ministry of Labour, Invalids and Social Affairs, Ha Noi, May 2004
MARD and MRDP (2002) Proceedings of the National Workshop on Commune and Village ManagedFunds for Poverty Alleviations in Disadvantaged Areas, Ministry of Agriculture and Rural Developmentand the Viet Nam-Sweden Mountain Rural development Programme, Ha Noi, May 2002
MOLISA (2003b) Training manual for poverty alleviation staff at a commune level (third edition, with addi-tions and corrections)
UNDP (1999) Nguyen The Dzung, Capacity Assessment for Viet Nam’s National Target Program forHunger Eradication and Poverty Reduction: Part 1 Programme Assessment, Ha Noi May 1999
NCSSH-IoE/Oxfam GB (2003) Le Anh Vu et al, Strengthening Grassroots Democracy for HungerEradication & Poverty Reduction and Rural Development in Rural Viet Nam – Action Research onImpacts of the Grassroots Democracy Decree, Report for Oxfam GB by the National Centre for SocialSciences & Humanities – Institute of Economics, 2003
Pham Hai (2002) “Poverty alleviation and community policy and mechanism,” in MARD & MRDP 2002
SFDP (2003) Workshop on implementation of grassroots democracy and decentralized budget planning,Son La, 25-26 November 2003, organized by the Son La PC and DPI, with support from (GTZ) GermanGovernment and Song Da SFDP (Social Forestry Development Project)
Shanks et al (2003) Community Driven Development in Viet Nam: A review and discussion platform, TheWorld Bank and the Ministry of Planning and Investment, 2003
SRV (1998) The 1715 Poorest Mountainous and Remote Communes, Ha Noi, 1998
SRV (2001b) National Target Programme on HEPR and Employment for the Period 2001-2005, SocialistRepublic of Viet Nam, Ministry of Labour, Invalids and Social Affairs, Ha Noi, September 2001.
Vu Tuan Anh, Budget Allocation in National Targeted Program of Humger Eradication Poverty Reductionand Job Creation Programme, Individual Report, 2003
MOLISA-UNDP: TAKING STOCK, PLANNING AHEAD 129

Annex 1
List of Participants at the Ha Long Workshop (13-14 July 2004)
CEM
NguyÔn Quang Vinh, Officer, Dept of Ethnic Policy
CIEM
NguyÔn Th¾ng
Lª M¹nh Hïng
Consultant
Ng« Huy Liªm
DOLISAs
TrÇn NhiÖm, Director, S¬n La
NguyÔn V¨n Nam, Director, H¶i D¬ng
TrÇn Xu©n Giíi, Deputy Director, H¶i Phßng
TrÇn ThÕ C¶o, H¶i Phßng
Vò M¹nh Hïng, H¶i Phßng
Cao Hång Linh, H¶i Phßng
NguyÔn Minh An, Deputy Director, Qu¶ng Ninh
NguyÔn C«ng Hµn, Director of Insurance and Social Protection Section, Qu¶ng Ninh
Economics Institute
NguyÔn Th¾ng
Farmers’ Union
Lª Anh Dòng, Deputy Director
§oµn ThÞ Ninh, Officer
130 MOLISA-UNDP: TAKING STOCK, PLANNING AHEAD

annex 1
GSO
Phïng §øc Tïng, Officer
MARD
§Æng Kim S¬n, Director
§ç V¨n Hßa, Director
TrÇn V¨n M«n, Deputy Head
NguyÔn V¨n Ch©u, Officer
MOF
Hoµng Kim Hµ, Officer
Ministry of Fishery
NguyÔn V¨n DiÖp, Deputy Director
NguyÔn Minh Toµn, Officer
MOLISA
§µm H÷u §¾c, Vice Minister
NguyÔn H¶i H÷u, Director, Social Protection Dept
§ç Träng Hïng, Director
NguyÔn M¹nh Cuong, Deputy Director
§µo Quang Vinh, Deputy Director
NguyÔn ThÞ Lan Hu¬ng, Deputy Director, ILSSA
TrÇn H÷u Trung, Director, Office of NTP ON HEPR & Job Creation
Ng« Trêng Thi, Deputy Director, Office of NTP ON HEPR & Job Creation
Bïi Xu©n Dù, Officer, Ministry Office
Lª TuyÕt Nhung, Officer, Social Protection Dept
NguyÔn Ngäc To¶n, Officer, Social Protection Dept
Ph¹m Ngäc TiÕn, Deputy Director, Social Protection Dept
NguyÔn V¨n ChØnh
Do·n MËu DiÖp, Deputy Director
§Æng H¶i Hµ, Officer, Dept of International Cooperation
Hµ Thanh QuÕ, Officer, Dept of International Cooperation
Lª Hoµng Dòng, Officer, ILSSA
MOLISA-UNDP: TAKING STOCK, PLANNING AHEAD 131

annex 1
MPI
Vò Xu©n Th¹nh, Deputy Director, Cultural, Social & Labour Dept
NguyÔn ThÕ Ba, Officer, Social & Labour Dept
Chu V¨n Hoµng, Deputy Director
NguyÔn Xu©n Minh, Officer
Nutrition Institute
Phan V¨n Hu©n, Director of Planning
Project VIE 02/001
§Æng Kim Chung, Deputy NPD
Lª ViÖt Hoa, PM
NguyÔn V©n H¬ng, AA
Ph¹m ThÞ Duyªn, Accountant
Ph¹m Hång Ph¬ng, Interpreter
Saurabh Sinha, STA
Alain Jacquemin, International Consultant
Koos Neefjes, International Consultant
Social Policy Bank
Ph¹m Kim NhuÇn, Deputy Head
Ph¹m Anh §øc
State Bank of Viet Nam
Cao V©n Anh, Head of IMF Section, Dept of Foreign Relations
UNDP Viet Nam
§ç Thanh L©m, Programme Officer
Youth Union
Lª Ngäc Kh¸nh, Officer
132 MOLISA-UNDP: TAKING STOCK, PLANNING AHEAD

annex 1
List of Participants at the Do Son Workshop (13-14 July 2004)
NguyÔn Minh ThuËn
§ç ThÞ V©n
CEM
NguyÔn Quang Vinh, Officer, Dept of Ethnic Policy
Central Communist Party Office
NguyÔn H÷u Tõ, Director
CIEM
Vâ ChÝ Thµnh, Section Head
DOLISAs
Do·n MËu DiÖp, Director, B¾c K¹n
Hå TÊt Th¾ng, Director, Nghe An
NguyÔn §¨ng D¬ng, Head of Wages and Labour Section, NghÖ An
Lª V¨n Thóy, NghÖ An
Phan Duy N¨m, NghÖ An
Lª Nhung, Director, Hµ TÜnh
NguyÔn V¨n Duyªn, Head of Wages and Labour Section, Hµ TÜnh
TrÇn Thanh NghÞ, Deputy Director, §iÖn Biªn
Ph¹m V¨n Thµnh, §iÖn Biªn
Lª Hång S¬n, Director, Thanh Hãa
NguyÔn V¨n, Thanh Hãa
SÌn ChØn Ly, Director, Hµ Giang
NguyÔn Ngäc L©m, Deputy Director, Hµ Giang
Vò Nh Chung, Hµ Giang
NguyÔn V¨n ChiÕn, Hµ Giang
NguyÔn M¹nh TuÊn, Cao B»ng
L¬ng Anh Dòng, Deputy Head of Social Protection Section, Cao B»ng
§inh Duy S¬n, Director, Hoµ B×nh
MOLISA-UNDP: TAKING STOCK, PLANNING AHEAD 133

annex 1
Lª B¹ch Hång, Director, Yªn B¸i
NguyÔn Trung Thoa, Yªn B¸i
Lª ThÞ Dung, Director, Tuyªn Quang
TrÇn TiÕn Khang, Deputy Director, Phó Thä
Phó Thä, KhuÊt Duy T©m
Lª Thi §µi, Deputy Director, H¶i Phßng
TrÇn ThÕ C¶o, H¶i Phßng
NguyÔn Chung, H¶i Phßng
Cao Hång Linh, H¶i Phßng
Economics Institute
Vò TuÊn Anh, Expert
NguyÔn ChiÕn Th¾ng
Farmer’s Union
Lª Anh Dòng, Deputy Head
§oµn ThÞ Ninh, Officer
GSO
NguyÔn Phong, Director
MARD
TrÇn V¨n M«n, Deputy Head
NguyÔn V¨n Bæng
MOLISA
NguyÔn ThÞ H»ng, Minister
§µm H÷u §¾c, Vice Minister
NguyÔn H¶i H÷u, Director, Social Protection Dept
Hoµng Kim Ngäc, Deputy Ministry and Office Director
§ç Träng Hïng, Director
TrÇn Phi Tíc, Director
NguyÔn H÷u Dòng, Institute Director
NguyÔn ThÞ Lan Hu¬ng, Deputy Institute Director
TrÇn H÷u Trung, Director, Office of NTP on HEPR & Job Creation
Ng« Trêng Thi, Deputy Director, Office of NTP on HEPR & Job Creation
134 MOLISA-UNDP: TAKING STOCK, PLANNING AHEAD

annex 1
Bïi Xu©n Dù, Officer, Ministry Office
NguyÔn Ngäc Khiªm, Officer, ILSSA
Th¸i Phóc Thµnh, Officer, Office of NTP on HEPR & Job Creation
Lª TuyÕt Nhung, Officer, Social Protection Dept
NguyÔn Ngäc To¶n, Officer, Social Protection Dept
Bïi Ngäc Quúnh, Officer, Social Protection Dept
Ph¹m V¨n Söu, Officer, Social Protection Dept
NguyÔn ThÞ Yen, Officer, Social Protection Dept
Phan Tù Kiªn, Officer, Labour and Social Journal
Bïi §øc Tïng, Officer, Labour and Social Journal
NguyÔn Thanh H¶i, Officer, Dept of International Cooperation
§Æng H¶i Hµ, Officer, Dept of International Cooperation
Hµ Thanh QuÕ, Officer, Dept of International Cooperation
Ng« B¸ Trêng Giang, Officer, Dept of International Cooperation
Phïng §¾c Quang, Officer, Dept of International Cooperation
H»ng, Officer, Dept of International Cooperation
Lª Hoµng Dòng, Officer, ILSSA
Chö Hµ, Labour and Social Paper
Ministry of Fishery
NguyÔn Minh Toµn, Officer
MOET
Vò V¨n Long, Officer
MOF
Vò V¨n Thao, Dept of Administration
Vò ThÞ H¶i YÕn, Officer, Dept of Administration
NguyÔn H÷u Thanh
MOH
NguyÔn Thµnh Th¸i, Officer
MPI
Lª §¨ng Doanh, Minister Advisor
Vò Xu©n Th¹nh, Deputy Director
MOLISA-UNDP: TAKING STOCK, PLANNING AHEAD 135

annex 1
NguyÔn ThÕ Ba, Officer
D¬ng Ngäc Kh¸nh, Officer
National Assembly
NguyÔn Thóy Anh, Committee for Social Affairs
Bïi Quang TrÝ
Nutrition Institute
Phan V¨n Hu©n
Project VIE 02/001
§Æng Kim Chung, Deputy NPD
Lª ViÖt Hoa, PM
NguyÔn V©n H¬ng, AA
Ph¹m ThÞ Duyªn, Accountant
Ph¹m Hång Ph¬ng, Interpreter
Saurabh Sinha, STA
Alain Jacquemin, International Consultant
Koos Neefjes, International Consultant
Section of Social-Politics, People Paper
TrÇn Hång Thanh
Social Policy Bank
Ph¹m Kim NhuÇn, Deputy Head
Sociology Institute
NguyÔn H÷u Minh, Deputy Director
NguyÔn XÝch ViÖt
Bïi ThÕ Cêng, Deputy Director
VTV
5 people, News Section
Youth Union
Hµ V¨n Chung, Director
136 MOLISA-UNDP: TAKING STOCK, PLANNING AHEAD

annex 1
List of International participants at Do Son Workshop, 17-18 August 2004
Action Aid
Ramesh Jung Khadka, Country Director
Phan V¨n Ngoc, Policy Research and Advocacy Manager
ADB
Vâ Trùc DiÖn, Programme Officer
CARE International in Viet Nam
NguyÔn Thanh Tïng, CASI Programme Adviser
Counterpart International
Mai Ph¬ng, Assistant of Programme Officer
DED
Tran Thi Thu Lan, Programme Officer
Nguyen Cam Van, Programme Officer
DFID
Bella Bird, Head of Office
Th©n Thiªn H¬ng, Senior Programme Officer
Vâ Thanh S¬n, Senior Programme Officer
Alwyn Chilver, Senior Programme Officer
Cindy Berman, Senior Programme Officer
Harwal Gitta, Senior Programme Officer
Donald Brown, Senior Programme Officer
Hoµng ThÞ Ph¬ng, Programme Officer
Embassy of Australia
Andrew Rowell, Development Cooperation Counselor
NguyÔn Quèc ViÖt, Senior Advisor
MOLISA-UNDP: TAKING STOCK, PLANNING AHEAD 137

annex 1
Embassy of Finland
Pekka Seppälä, Development Cooperation Counselor
Embassy of Luxemburg
§Æng ThÞ Minh Th¾ng, Counselor Assistant
GTZ
Hans Gsanger, International Consultant
Vâ NguyÔn Khanh Nh·, Programme Officer
IFAD
Atsuko Toda, Country Programme Director
ILO
Rose Marie Greve, Director
Tr¬ng §øc Tïng, Programme Officer
JBIC
Satoko Hirakawa, Representative
JICA
Naganawa Shingo, Senior Project Formulation Adviser
TrÇn ThÞ H¶i Dzung, Assistant Programme Officer
MPI
Edwin Shanks, International Consultant, PAC – Coordinator
Oxfam GB
Ph¹m Quang Nam, Programme Officer for Tra Vinh
NguyÔn Lª Hoa, Programme Coordinator
Lª ThÞ S©m, Local Programme Officer for Lao Cai
Oxfam Hong Kong
NguyÔn ThÞ Oanh, Programme Officer
138 MOLISA-UNDP: TAKING STOCK, PLANNING AHEAD

annex 1
Save the Children
Britta Ostrom, Director
SCUK
Ph¹m ThÞ Lan, Project Manager
SDC
NguyÔn ThÞ BÝch Liªn, Programme Officer
UNDP
Jordan Ryan, UNDP Resident Representative/ UN Resident Coordinator
Junichi Imai, Programme Officer
NguyÔn Tiªn Phong, Head of Poverty & Social Development Cluster
§ç Thanh L©m, Programme Officer
Johnathan Pincus, Country Economist
UNICEF
Daniel Seymour, Planning Officer
VNAH
Caillin Wyndham, Programme Officer
Voluntary Service Overseas
Tim Boyes-Watson, Director
WB
Carrie Turk, Poverty Specialist
Martin Rama, Lead Economist
§oµn Hång Quang, Economist
NguyÔn ThÕ Dzung, Economist
NguyÔn ThÞ Kim Ph¬ng,
WHO
Nguyen Thi Kim Phuong, Public Health Officer
MOLISA-UNDP: TAKING STOCK, PLANNING AHEAD 139

Annex 2List of Study Teams and Background Papers
1. Budget Allocation Study - Mike Winter and Vu Tuan Anh
Vu Tuan Anh, Budget Allocation in National Targeted Programme of Humger Eradication PovertyReduction and Job Creation Programme, Individual Report, 2003
Winter, Mike and Vu Tuan Anh, 2003, Budget Allocations for the HEPR-JC and 135 Programmes
2. Targeting - Doan Hong Quang, Paul Shaffer and Nguyen Thang
Doan Hong Quang, 2004, “A Synthesis of Poverty Targeting Methods in Viet Nam”Shaffer, Paul and Nguyen Thang, 2004, “Targeting Efficacy Study”
3. Monitoring Systems Review - Tran Thi Hanh, Vu Van Toan and Nguyen Toan Doanh
Hanh, Toan and Doanh (2004) Review of Monitoring Systems of HEPRJC and 135 Programme,Project VIE/02/001 UNDP- MOLISA, Ha Noi, June 2004
4. Public Expenditure Tracking - Mike Minford, Doan Hong Quang and Nguyen Huu Tu
Minford, Mark with Doan Quang and Nguyen Huu Tu, 2004, “An Expenditure Tracking Study of theHunger Eradication and Poverty Reduction Programme and Programme 135”
5. Literature Review - Hoang Thanh Huong and Nguyen Chien Thang
Hoang Thanh Huong and Nguyen Chien Thang, 2003, Impact Assessment of the HEPR andProgramme 135 Literature Review, Ha Noi, August-September 2003
6. Impact Assessment - IDEA International (Paul Shaffer and Nguyen Thang)
IDEA International, 2004, Impact Assessment of the Hunger Eradication and Poverty ReductionProgramme (HEPR) and Programme 135, VIE/02/002- Support to the National HEPR, July 2004
7. Participation and Empowerment - Koos Neefjes
Koos Neefjes, 2004, Participation and Empowerment in the HEPR Programme: Report of a DeskStudy.
140 MOLISA-UNDP: TAKING STOCK, PLANNING AHEAD

Annex 3Responsibilities for HEPR programme management
MOLISA-UNDP: TAKING STOCK, PLANNING AHEAD 141
RESPONSIBILITIES
Programme National Steering Board General guidance and overall supervision and coordination of programme implementation
StandingBody MOLISA
Assist the government and the HEPR Steering Board in programmeimplementation coordination, monitoring and supervision. Developpoverty lines and provide general HEPR instructions, training and information
ExecutingAgencies
MOLISA, MARD, CEM,
MOH, MOET, SBV
Supervise the implementation of programme components delegated tothem, develop sectoral policies and provide technical guidance andsupports according to their mandate. CEM is the focal point for theP135.
Others
MOF
(i) Prepare budget for the programme’s recurrent expenditures, (ii)Allocate funds from the State Budget for the programme, (iii) Provideguidance to local authorities on financial management and (iv) M&E offunds utilization.
MPI
Budget the programme’s capital investment part, (ii) Prepare budgetsfor the programme’s recurrent expenditures in cooperation with MOF,(iii) Mainstream the NTP on HEPR and P135 in the national socio-economic development plans, (iv) Provide guidance to localauthorities on integrating other poverty reduction related programmesand projects into their development plans, (v) Evaluate programme performance, and (vi) Mobilize and coordinate ODA for poverty reduction.
MassOrgansiations
VFA, VFF, VWU, VYU
Involved in various activities according to their functions and mandates,such as helping organizing credit savings teams, identifying the trainingneeds of farmers for agricultural extension. In addition, these organizations have been allocated some funds from the state budgetwithin the HEPRJC framework to provide credit to their members.
At theProvincelevel
PPC
Fully responsible for HEPR in the province - planning and integratingHEPR activities, approving HEPR plans and projects of the sub-provincial levels, funding mobilization and management, coordinating and supervising the implementation of HEPR efforts in theprovince with assistance from DOLISA (in charge of monitoring, andthe general HEPR general implementation coordination), DPI (incharge of integration and funds allocation) and Ethnic Minorities Board(in charge of the implementation of the P135). Often also adapt poverty lines, list of priority communes & HEPR policies to local conditions, identify commune infrastructures to be developed based onconsultation with sub-provincial levels and approve infrastructuredevelopment projects.

annex 3
142 MOLISA-UNDP: TAKING STOCK, PLANNING AHEAD
Source: Compiled from materials in UNDP (1999)
RESPONSIBILITIES
At theDistrict level DPC
Approve HEPR plans and projects of the commune (except infrastructure projects above VND2 bn.), implement commune-basedHEPR projects if the commune level lacks necessary capacity; otherwise, provide support role (e.g. assist the PPC in monitoring andsupervising the commune-based HEPR activities and support commune PCs in undertaking technical supervision of their implementation). Also provide technical services (including projectdesign and construction works) to communes without approval authority for commune infrastructure projects.
At theCommunelevel
CPC
Focal point for implementation of commune-based HEPR plan/projects.Mobilizing people’s participation at the grassroots level, and organizingand managing the implementation of the plan/projects. It is accountableto the Commune People’s Council, DPC & PPC. Specifically, the PCregularly reports to the commune people’s council & community, organizing the preparation of the commune’s HEPR plan and its implementation, when approved; mobilizing commune resources anddisbursing HEPR funds. Also conduct poverty mapping & maintainupdated list of poor households.

Annex 4
Responsibilities for Programme 135 management
MOLISA-UNDP: TAKING STOCK, PLANNING AHEAD 143
Agency RESPONSIBILITIES
Standing Body CEM Coordinating with relevant ministries/agencies and provinces in programme implementation,
Providing guidelines on programme implementation, managementand monitoring
Executing Agencies CEM Coordinating sub-programme implementation
MARD Coordinating sub-programme implementation
Providing guidelines to provinces on land planning and relocation,and agricultural and forestry production promotion linked to processing industries
Others MPI In cooperation with MOF and other agencies, prepare programmebudgets
MOF Providing guidance and supervise disbursement and utilisation offunds from state budget, and report to Government on fund usefrom local budget
VFA, NCMA andMOLISA Participate in programme evaluation

Annex 5
Targeting Methods
Targeting methods can be broadly classified into two groups: administrative targeting and self-selection(Coady et al, 2002). Each has advantages and disadvantages. Targeting methods are, however, notmutually exclusive and as in Viet Nam, governments often use two or more methods together.
Administrative targeting relies on limited eligibility and consists of individual/household assessment andcategorical targeting. In this methodology, applicants are directly assessed by officials as to whether theyare eligible for the program. The most common methods of individual/household assessment are the verified means test and the simple means test in which eligibility criteria like income is independentlyusing verified using documented evidence or qualitatively with visits to households by program workers.Community-based targeting is another popular assessment method that selects program participantsbased on the decision of community members or a community leader.
Categorical targeting, also referred to as statistical or group targeting, views all individuals in a specifiedcategory as being eligible to participate in the program. In categorical targeting, it is common to use easily observable characteristics of individuals as eligibility criteria. For example, age and geographiclocation are two categories commonly used in targeted programs in developing countries.
Targeting by self-selection is associated with universal eligibility, that is, the programme is open to all individuals. However, the program is designed in a way that encourages the poorest to while discouraging the participation of the non-poor. The incentive to participate depends on the private participation costs, which differ between poor and non-poor households. By generating appropriate low-level benefits, the non-poor with higher private costs will not take part in the program as long as thebenefits they obtain are lower than the costs.
The choice of the targeting method depends critically on the concept of poverty. Poverty is multi-dimensional, encompassing both material and psychological deprivations, and can be viewed interms of not having enough money, not being able to work, being ill, lacking education, lacking land andother physical capital, and/or being excluded from social, economic or political processes. There is nounique definition of poverty and, therefore, no perfect indicator to measure it.
All the same, income and/or expenditure are commonly used to classify poor households as thesemoney-metric indicators are correlated to other dimensions of poverty, and are easy to measure andcompare across regions and time.
The effectiveness of targeting depends, among other things, on how well the targeting units are classified. A useful tool for classifying targeting units is a poverty line or threshold, which separates thepopulation into poor and non-poor categories. These categories are based on commonly accepted welfare indicators such as income or expenditure.
144 MOLISA-UNDP: TAKING STOCK, PLANNING AHEAD

Annex 6
Declaration form of poor households
PART I – GENERAL INFORMATION ON HOUSEHOLDS
Full name of household head………………................................…………………………. Sex: Male, FemaleNumber of capita:………………..............................………….. Number of labours:…....……… Ethnic……......…...
Address: Village (hamlet)………………….....................….. Commune………......................…… District…………...
LIST OF CAPITA IN HOUSEHOLD
* Note for column 8: 1. Never been to school 2. Being in school 3. Drop out, complete school1. Household having deserved people. Regional code:2. Social policy household. 1. Urban3. Female household head. 2. Rural.4. Household having social addicts. 3. Mountainous.
MOLISA-UNDP: TAKING STOCK, PLANNING AHEAD 145
No. Full name Year ofbirth Sex
Relation tohousehold
head
Educational level(grade/system)
Status of schooling ofpeople from 5 years
above (follow notes atthe end of the form)
1 2 3 4 5 6 7 8
1
2
3
4
5
6
7
8
9
10
.....................................
.....................................
.....................................
.....................................
.....................................
.....................................
.....................................
.....................................
.....................................
.....................................
................
................
................
................
................
................
................
................
................
................
..........
..........
..........
..........
..........
..........
..........
..........
..........
..........
...........
...........
...........
...........
...........
...........
...........
...........
...........
...........
......................
....................
......................
....................
......................
....................
......................
....................
......................
....................
...........................
...........................
...........................
...........................
...........................
...........................
...........................
...........................
...........................
...........................
....................................
....................................
....................................
....................................
....................................
....................................
....................................
....................................
....................................
....................................

annex 6
PART II – HOUSEHOLD INCOME
PART III – HOUSEHOLD ASSETS VALUE
146 MOLISA-UNDP: TAKING STOCK, PLANNING AHEAD
No. Income source
SELF-DECLARATION OF HOUSEHOLD ADJUSTMENT
Totalincome(1000 d)
Expenses andhiring costs
(1000 d)
Netincome(1000 d)
Totalincome(1000 d)
Expenses andhiring costs
(1000 d)
Netincome
(1000 d)
1 2 3 4 5 6 7 8
IIIIII
IVAB
C
From cultivationFrom animal husbandryTrading, services, othercareersSalary, allowancesTotalAverage income per capita er annumAverage income per capitaper month
….…..…......…….....…....…….....…....
…….....…....…....….…....
…….....…....
…….........…
….…..........…......…….............…....……............…....
…….............…....…....…..........…....
……..............…....
……..................…
….…..….....…….....…...…….....…...
…….....…...…....….…...
…….....…...
……...........
….…..….....…….....…...…….....…...
…….....…...…....….…...
…….....…...
…….........
….…...........…......……..............…....……..............…....
……...............…....…..............….…....
……................…....
……...................…
….…..….....…….....…...…….....…...
…….....…...…....….…...
…….....…...
…….........
ASSETS TYPEASSETS VALUE (million dong)
Self-declared by household Adjustment
Housing
Bathrooms
Cages/breeding facilities
Household tools (radio, bicycle, case, …)
Production tools
Materials (cement, bricks, wood, roof …)
Not harvested products value
Other
Total value of assets
Average value of assets per capita

annex 6
Types of household (Circle the selected figure)1. Solid houses (built houses, flat roof houses)2. Semi-solid houses (tiling roof houses)3. Leaking and dilapidated houses (bamboo& grass houses, bamboo wall, temporary houses)4. No houses rented or borrowed houses.
Main reasons influencing income and poverty situation of household(Circle the selected figure)
1. Lack of experience in doing business. 6. Having lazy/social addicts2. Lack of labor 7. Accidents, risks3. Many dependents 8. Having sickness, disable, 4. Lack of funds elderly without working ability5. Lack of production land
Classification by village, hamlet:
Rank household income (Circle the selected figure)1. Under 55.000 d 4. Under 90.000 d2. Under 70.000 d 5. Under 100.000 d3. Under 80.000 d 6. Under 150.000 d
Classify poor household by new poverty line (Circle the selected figure)1. Poor 2. Non-poor
Day….…month……..year 200…
VILLAGE HEAD DECLARED PERSON(write down full name and sign) (write down full name and sign)
MOLISA-UNDP: TAKING STOCK, PLANNING AHEAD 147

annex 6
Annex 7: Poverty Indicators system for the provincial and district reports
148 MOLISA-UNDP: TAKING STOCK, PLANNING AHEAD
Indicator Unit Plan Frequency
6-month Annual
I. Household data
11.11.2
Total Number of households- Urban- Rural
x
22.12.22.32.42.52.6
Total Number of poor households- Urban- Rural- Privilege- Of social targeting policy- Vietnamese- Minority
x
3 Percentage of poor households x
4 Number of poor households going out from thepoor household list
x
5 Number of poor households falling in again thepoor household list
x
II. Commune data
66.16.2
Total number of communes:- of specially disadvantaged, border - of poor communes
77.1
7.27.37.47.5
Percentage of poor communes:- Number of communes with the poor householdpercentage of more than 40%- 25 - 40%- 20 - 25%- 10 - 20% - lower than 10%
x

MOLISA-UNDP: TAKING STOCK, PLANNING AHEAD 149
annex 6
Indicator Unit Plan Frequency
6-month Annual
88.1
8.2
8.3
8.4
8.5
8.6
8.7
Total number of communes without infrastructure:- Number of communes without roads for all seasons- Number of communes having classrooms meeting less than 50% of the needs- Number of communes without commune healthcare centers- Number of communes having small irrigationmeeting < 50% of the irrigation needs- Number of communes with < 30% of householdsaccessing to clean drinking water- Number of communes with < 50% of householdshaving electricity grid connected- Number of communes without commune/commune cluster market
x
III. Policy and investment support performance
1. Policies
9 9.19.29.39.4
9.5
9.6
9.7
a/ Health policy- Number of the poor receiving health cards- Amount of funds used for health cards - Number of hospital visits of the poor- Number of the poor receiving health service feesexemption certificates- Number of poor receiving free of charge healthservices- Amount of funds used for free of charge healthservices - Number of the poor receiving health service fromcharity centers
x
x
1010.1
10.2
10.3
b/ Education support - Number of the poor students exempted fromeducation fees- Amount of funds used for education fees exemption- Number of the poor students exempted fromschool repairing and other expenses
x
x

150 MOLISA-UNDP: TAKING STOCK, PLANNING AHEAD
annex 6
Indicator Unit Plan Frequency
6-month Annual
10.4
10.5
10.6
10.7
10.8
10.910.10
- Amount of funds used for school repairing andother expenses contribution exemption- Number of the poor students receiving free ofcharge text books and note books - Amount of funds used for text books and notebooks - Number of the poor students receiving socialsupport and scholarship- Amount of funds used for social support andscholarship- Number of boarding schools for minorities- Number of minorities staying in boarding schools
1111.1
11.2
12
123
c/ Housing supportTotal number of poor households receiving housing support:- for new construction- for repairingTotal amount of funds used for housing support:- from the state budget- community contribution- international donors
x
2. Investment support
1212.1
12
2.1 Poverty reduction subprogrammea/ CreditTotal households receiving concessional loans:- number of poor households- number of poor households just gone out fromthe poor household list
x
12.212.3
12
Percentage to the total number of householdsTotal amount of funds used for concessionalloans:- from BP- from other sources
xx

MOLISA-UNDP: TAKING STOCK, PLANNING AHEAD 151
annex 6
Indicator Unit Plan Frequency
6-month Annual
1313.113.213.3
13.413.5
13.613.713.8
123
b/ Agr. Extension subprogramme- Number of demonstration models- Number of poor beneficiaries- Number of poor attending training courses onbusiness- Number of poor households trainees - Number of communes having agricultural extension (AE) workers- Number of commune AE workers- Amount of allowance given to AE workersTotal amount of funds used for AE:- from the state budget- community contribution- other sources
x
x
1414.114.2
14.3
123
c/ PR modality developmentNumber of PR modalities developedNumber of households benefitted from the modalities developedTotal amount of funds used for PR modality development:- from the state budget- local budget- other sources
x
1515.115.2
2.2 PR subprogramme not under the 135 programmea/ Infrastructure developmentNumber of poor communes receiving investmentTotal amount of funds used for infrastructure development:
xx
15.3
123
- from the state and local budget- community contribution- other sourcesAmount of funds received by villagers for participatinginto the work implementation
xx

152 MOLISA-UNDP: TAKING STOCK, PLANNING AHEAD
annex 6
Indicator Unit Plan Frequency
6-month Annual
15.4
15.5
12345678
Total number of infrastructure projects:- roads- schools (classrooms)- health centers- water supply- small irrigation schemes- electricity- market- othersNumber of projects completed and delivered intooperation
1616.1
1234
b/ Non- farming industries support subprogrammeTotal number of households supported:- by giving land- seeds and fertilizers- training- others
x
x
16.2
1234
Total amount of funds used for jobs creation support:- from the state- local budget- community contribution- other sources
17
17.1
17.2
12
c/ Settlement and new economic zones developmentNumber of households voluntarily migrated receiving supportTotal amount of funds used for resettlement andnew economic zones development:- from the state- from local budget
x
x
1818.1
d/ Sedentarization in poor communesNumber of households supported for stable settlement
x

MOLISA-UNDP: TAKING STOCK, PLANNING AHEAD 153
annex 6
Indicator Unit Plan Frequency
6-month Annual
18.212
Total amount of funds used for sedentarization:- from the state- from local budget
1919.119.219.3
19.4
19.5
19.6
12
12
123
e/ Training for HEPR staffNumber of communes having fixed HEPR staffNumber of communes giving allowance to HEPRstaffAllowance level given to HEPR staffTotal number of training courses:- at commune level- at district/provincial levelTotal number of trainees:- from communes- from districts/ provinceTotal amount of funds used for HEPR staff:- from the state budget- from local budget- other sources
x
x