THE MOBILIZATION OF HUMAN RESOURCES AS AN EFFECT OF THE DEPLETION OF ENVIRONMENTAL AND SOCIAL ASSETS
21
Stefano Bartolini° and Luigi Bonatti°° THE MOBILIZATION OF HUMAN RESOURCES AS AN EFFECT OF THE DEPLETION OF ENVIRONMENTAL AND SOCIAL ASSETS ABSTRACT: In this paper, the growth process is not fed by the accumulation of productive assets (physical and/or human capital, knowledge…), but by the depletion of environmental or social resources, which induces individuals to increase their labor supply in order to consume more of the market goods that substitute for the depleted resources. Hence, production is expanded, thus eroding the resources’ ability to regenerate, which decreases with aggregate production. Within this context, the ‘green’ net national product is derived and it is shown how a regulatory authority should manage the resources for achieving Pareto-optimality. KEY WORDS: Renewable resources, Negative externalities, Market failures, Net national product. JEL CLASSIFICATION NUMBERS: J22, O41, Q28. Corresponding author: Luigi Bonatti – via Moscova 58 – 20121 MILANO (Italy); phone: 39+02+6599863; e-mail: [email protected] ° Dipartimento di Economia Politica - Università di Siena °° Dipartimento di Scienze Economiche “Hyman P. Minsky” - Università di Bergamo
-
Upload
independent -
Category
Documents
-
view
0 -
download
0
Transcript of THE MOBILIZATION OF HUMAN RESOURCES AS AN EFFECT OF THE DEPLETION OF ENVIRONMENTAL AND SOCIAL ASSETS
Stefano Bartolini° and Luigi Bonatti°°
THE MOBILIZATION OF HUMAN RESOURCES AS AN EFFECT OF
THE DEPLETION OF ENVIRONMENTAL AND SOCIAL ASSETS
ABSTRACT: In this paper, the growth process is not fed by the accumulation of productive assets
(physical and/or human capital, knowledge…), but by the depletion of environmental or social
resources, which induces individuals to increase their labor supply in order to consume more of the
market goods that substitute for the depleted resources. Hence, production is expanded, thus eroding the
resources’ ability to regenerate, which decreases with aggregate production. Within this context, the
‘green’ net national product is derived and it is shown how a regulatory authority should manage the
resources for achieving Pareto-optimality.
KEY WORDS: Renewable resources, Negative externalities, Market failures, Net national product.
JEL CLASSIFICATION NUMBERS: J22, O41, Q28.
Corresponding author: Luigi Bonatti – via Moscova 58 – 20121 MILANO (Italy); phone:
39+02+6599863; e-mail: [email protected]
° Dipartimento di Economia Politica - Università di Siena °° Dipartimento di Scienze Economiche “Hyman P. Minsky” - Università di Bergamo
1
1. INTRODUCTION*
There is an increasing awareness among economists that a better understanding of how time and
“effort” devoted to market activities are determined is crucial for explaining growth and development
processes. This paper intends to contribute to this understanding by presenting a neoclassical model in
which the growth process is not fed by the accumulation of productive assets (physical and/or human
capital, knowledge…), but by the decumulation (depletion) of a commonly owned resource (an
environmental or social asset) that each household can use at no cost. Given that this renewable resource
affects positively individual utility, households react to its depletion by increasing their labor supply in
order to buy more market goods as substitutes for its declining services. By so doing, each of them
stimulates production and contributes to a further deterioration of the resource, since its ability to
regenerate is a negative function of aggregate production. This ignites a cumulative process. However,
this process cannot go on forever: in the absence of capital accumulation or technological progress,
growth in per capita output can be fed only by the increase in the proportion of the households’ time that
is sold on the market in order to raise their purchasing power and to buy increasing amount of
substitutes for the diminishing resource.1 Hence, the economy converges to a steady state, but under
laissez faire this steady state is characterized by an inefficiently low endowment of the commonly
owned resource and by an inefficiently high level of labor effort, market production and consumption of
market goods.
* A special thank to E. Bonatti, A. Leijonhufvud and L. Punzo, who encouraged and discussed these ideas since their
beginning. Thanks for useful comments also to G. Becattini, L. Bosco, E. Cresta, M. Dardi, V. Ferrante, A. Gay, D.
Heymann , F. Luna, L. Marengo, G. Mondello, U. Pagano, R. Palma, M. Pugno, P. L. Sacco, A. Vercelli, G. Wagner.
The usual disclaimer applies.
1 It is straightforward that perpetual growth in per capita output can be generated--as in Solow (1956)--by adding an
exogenous source of technological progress. It should be clear that the objective of the paper is not to propose a self-
sufficient growth theory but rather to model a mechanism that may contribute to explain important aspects of the
growth process, in the awareness that the mobilization of human resources has to be supplemented by other sources of
growth in order to generate perpetual growth.
2
The process described above is open to more than one interpretation. If the resource is
interpreted as an environmental asset, one can think of its deterioration as due to the pollution or over-
exploitation brought about by some market activity, which induces defensive consumption on the part of
the households, thus resulting in a further expansion of private consumption and production.2 According
to a sociological interpretation of the process, the institutional and immaterial bases of communitarian
organizations of life are undermined by the expansion of market activities, thus forcing the individuals
to satisfy their needs by buying and selling goods and services on the marketplace. In other words, the
2 Along these lines, we follow Fred Hirsch, who emphasizes that to a large extent growth in advanced economies is due
to an increase in defensive consumption. Hirsch interprets the notion of defensive consumption in a broad sense,
consistently with the idea that reactions to a situation of general decay may be very general and that individuals can
compensate for deterioration in everything that is public with the wealth and concern for everything that is private.
Among the examples contained in the literature on defensive consumption, one has: medical expenses to treat illnesses
due to environmental deterioration or tranquilizers and sleeping pills, the consumption of which is closely correlated
with noise pollution, soundproofing (double glazing, etc.), anti-pollution expenses, land reclamation, defense against
crime. The demand for package holidays may also be considered sensible to deterioration of the local environment, or
swimming pools can be considered substitutes for water quality deterioration. Typically, agents are able to escape the
deterioration of the environment by deciding, for example, to buy a weekend cottage in pleasant surroundings or more
simply by moving to a more comfortable city house. In any event, the limits of the concept of substitute are largely
contiguous on those of psychological inquiry. What the reactions to psychological malaise and stress may be in terms
of consumption is an open question. The econometric literature on defensive consumption displays a number of
conceptual difficulties--evidenced, for example, by the variety of definitions of defensive expenditure--which derive in
part from a failure to understand that the concept of defensive expenditure is a sub-case of the concept of substituted
good (which is clearly codified). In the set of substitutes it is the sub-set of substitutes for environmental goods (i.e. for
the free goods subject to negative externalities). In the opinion of these authors, however, it is difficult to give plausible
statistical substance to the concept, due to the difficulty of identifying spending for defensive reasons among the items
in the GNP, constructed on other criteria. The strategy followed is generally highly restrictive, in that only classified as
defensive is spending which is certainly and wholly such: spending on environmental purification, on land reclamation,
on pollution-related diseases. The estimates obtained are not negligible, but on the admission of the authors themselves
they are enormously under-estimated.

3
weakening of these institutions enlarges the sphere of market relations; in its turn, this enlargement
causes further erosion of these institutions. As different aspects of this general tendency in advanced
societies, one may include heterogeneous phenomena like the progressive privatization of certain
resources (land, water…) or services (health, transportation… ) that were predominantly provided by
public agencies, the “commodification” of leisure, or the diminishing role of the family as provider of
services (children and elderly care, meals preparation…).
Other implications of our model for an economy under laissez faire are the following:
1) Exogenous technological progress3 making labor more productive increases steady-state labor supply
and production, thus causing a negative impact on the environmental asset. Therefore, technological
advances boosting productivity but with no effect on the incidence of productive activities on the
environmental asset may even lead in the long run to a worsening of the households’ lifetime welfare.
2) In contrast, the use of technologies with a less detrimental impact on the environmental asset leads in
the long run to a lower level of production and consumption of market goods, since the commonly
owned resource will be less depleted and households will be less dependent on market goods in order to
satisfy their needs. As a result, exogenous technological progress reducing the negative incidence of
productive activities on the environmental asset raises the steady-state welfare of the households.
3) Exogenous technological advances improving the ability of produced goods to substitute for the
environmental asset lead in the long run to more production and consumption of market goods. Hence,
the introduction of better substitutes for natural or social assets may worsen the welfare of future
generations. This is at odds with the literature on sustainable development, which implicitly assumes
that a high degree of substitutability between 'man-made' goods and natural resources is welfare
improving for future generations.4 In contrast, our model shows that improving the possibility of
3 In the model, technological progress takes the form of a shift in a parameter entering the production function.
4 In this literature, the degree of substitutability between ‘man-made’ capital and natural capital is considered crucial
for sustainability if the condition for sustainability is that the aggregate stock of capital ('man-made' plus natural)
should not decline ('weak' sustainability) (see, for instance, Hartwick, 1977). In contrast, the degree of substitutability
does not matter if the condition for sustainability is that there should be no net damage to environmental assets ('strong'
sustainability) (see, for instance, Pearce et al., 1990; Daly, 1991).
4
substituting man-made goods for environmental assets can accentuate that self-reinforcing process of
resources’ depletion which may lead to a long-term worsening of individual well-being.
4) An increase in population tends to raise per-capita output. Indeed, everything that exerts greater
pressure on natural (or social) assets and that accelerates their decline induces individuals to react by
relying more on market goods in order to satisfy their needs, thus raising the steady-state level of
economic activity. Hence, the associated steady-state level of households’ welfare will be lower.
Therefore, an implication of the model is that the long-run equilibrium level of per-capita output is
higher as the population and/or the negative impact of production on commonly owned resources
become larger.5 In contrast, policies that reduce population growth and the impact of market activities
on environmental and social assets restrain the steady-state level of per capita output.
The paper is organized as it follows. Sections 2 presents the model; section 3 compares the path
of the economy obtained under laissez faire to the path consistent with the Pareto-optimal plan; section 4
presents a Cobb-Douglas example in order to discuss the steady-state effects of parametric changes;
section 5 concludes.
2. THE MODEL
5 The prediction that an increase in population will raise the steady-state level of per-capita output is consistent with the
predictions made by models of technological change concerning the impact of population increase on the steady-state
rate of growth of the economy. According to Kuznets (1960), higher population density can explain the
disproportionally larger number of innovations in cities, since it boosts technological progress by favoring intellectual
contacts among people and labor specialization. In endogenous growth models (see Grossman and Helpman, 1991;
Aghion and Howitt, 1992; Kremer, 1993), an increase in population spurs technological change and economic growth
by increasing the size of the market, because the cost of inventing a new technology is independent of the number of
people who use it. However, our model has normative implications regarding the desirability of population increases
which are at odds with those stressed by models of endogenous technological change, since our prediction depends on
the increase in negative externalities due to congestion (increased pressure on environmental and social assets), rather
than on positive externalities due to scale effects.
5
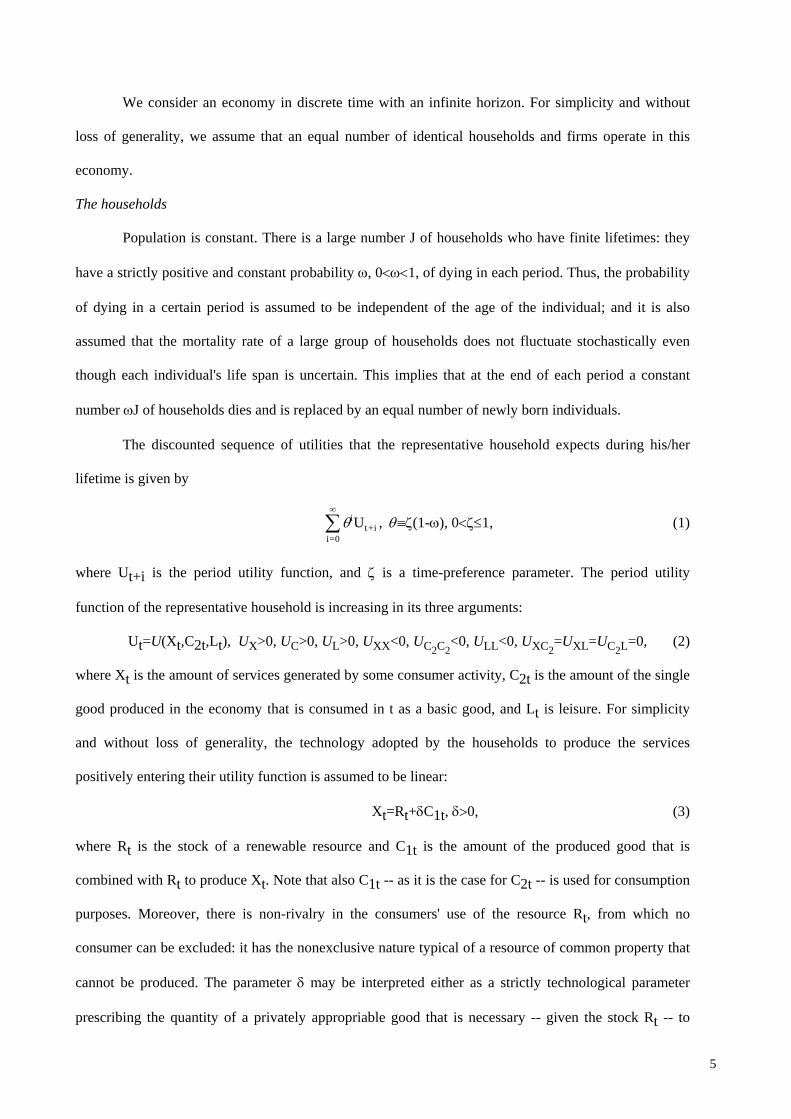
We consider an economy in discrete time with an infinite horizon. For simplicity and without
loss of generality, we assume that an equal number of identical households and firms operate in this
economy.
The households
Population is constant. There is a large number J of households who have finite lifetimes: they
have a strictly positive and constant probability , 01, of dying in each period. Thus, the probability
of dying in a certain period is assumed to be independent of the age of the individual; and it is also
assumed that the mortality rate of a large group of households does not fluctuate stochastically even
though each individual's life span is uncertain. This implies that at the end of each period a constant
number J of households dies and is replaced by an equal number of newly born individuals.
The discounted sequence of utilities that the representative household expects during his/her
lifetime is given by
it+i
i=
U ,0
(1-), 01, (1)
where Ut+i is the period utility function, and is a time-preference parameter. The period utility
function of the representative household is increasing in its three arguments:
Ut=U(Xt,C2t,Lt), UX>0, UC>0, UL>0, UXX<0, UC2C2<0, ULL<0, UXC2
=UXL=UC2L=0, (2)
where Xt is the amount of services generated by some consumer activity, C2t is the amount of the single
good produced in the economy that is consumed in t as a basic good, and Lt is leisure. For simplicity
and without loss of generality, the technology adopted by the households to produce the services
positively entering their utility function is assumed to be linear:
Xt=Rt+C1t, 0, (3)
where Rt is the stock of a renewable resource and C1t is the amount of the produced good that is
combined with Rt to produce Xt. Note that also C1t -- as it is the case for C2t -- is used for consumption
purposes. Moreover, there is non-rivalry in the consumers' use of the resource Rt, from which no
consumer can be excluded: it has the nonexclusive nature typical of a resource of common property that
cannot be produced. The parameter may be interpreted either as a strictly technological parameter
prescribing the quantity of a privately appropriable good that is necessary -- given the stock Rt -- to
6
produce the amount of Xt desired by the consumers, or as a measure of the efficiency of C1t as a
substitute in consumption for the resource of common property.
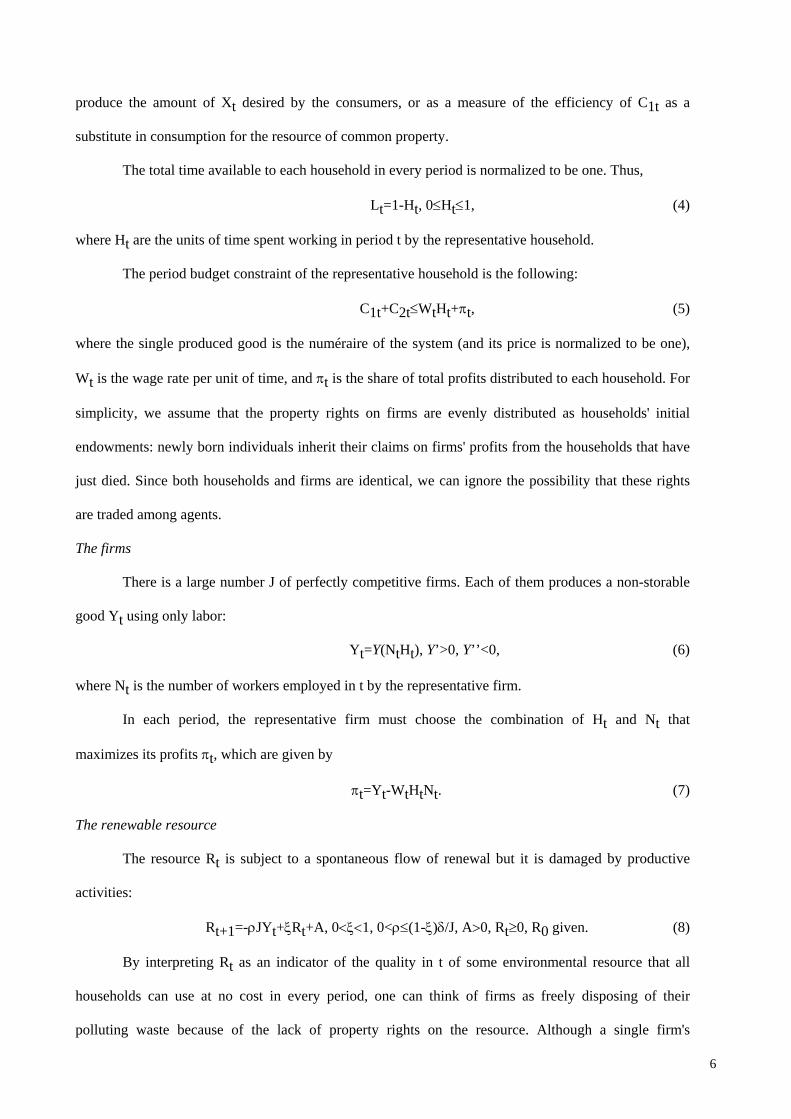
The total time available to each household in every period is normalized to be one. Thus,
Lt=1-Ht, 0Ht1, (4)
where Ht are the units of time spent working in period t by the representative household.
The period budget constraint of the representative household is the following:
C1t+C2tWtHt+t, (5)
where the single produced good is the numéraire of the system (and its price is normalized to be one),
Wt is the wage rate per unit of time, and t is the share of total profits distributed to each household. For
simplicity, we assume that the property rights on firms are evenly distributed as households' initial
endowments: newly born individuals inherit their claims on firms' profits from the households that have
just died. Since both households and firms are identical, we can ignore the possibility that these rights
are traded among agents.
The firms
There is a large number J of perfectly competitive firms. Each of them produces a non-storable
good Yt using only labor:
Yt=Y(NtHt), Y’>0, Y’’<0, (6)
where Nt is the number of workers employed in t by the representative firm.
In each period, the representative firm must choose the combination of Ht and Nt that
maximizes its profits t, which are given by
t=Yt-WtHtNt. (7)
The renewable resource
The resource Rt is subject to a spontaneous flow of renewal but it is damaged by productive
activities:
Rt+1=-JYt+Rt+A, 01, 0<(1-)/J, A0, Rt0, R0 given. (8)
By interpreting Rt as an indicator of the quality in t of some environmental resource that all
households can use at no cost in every period, one can think of firms as freely disposing of their
polluting waste because of the lack of property rights on the resource. Although a single firm's
7
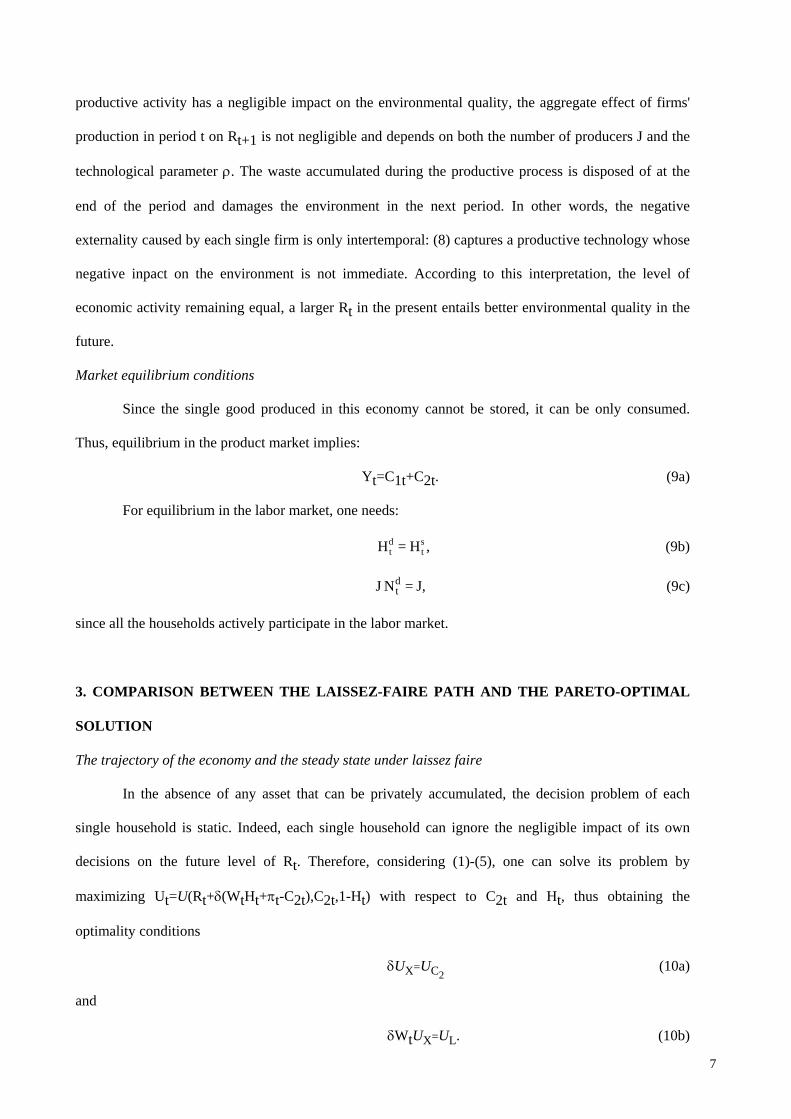
productive activity has a negligible impact on the environmental quality, the aggregate effect of firms'
production in period t on Rt+1 is not negligible and depends on both the number of producers J and the
technological parameter . The waste accumulated during the productive process is disposed of at the
end of the period and damages the environment in the next period. In other words, the negative
externality caused by each single firm is only intertemporal: (8) captures a productive technology whose
negative inpact on the environment is not immediate. According to this interpretation, the level of
economic activity remaining equal, a larger Rt in the present entails better environmental quality in the
future.
Market equilibrium conditions
Since the single good produced in this economy cannot be stored, it can be only consumed.
Thus, equilibrium in the product market implies:
Yt=C1t+C2t. (9a)
For equilibrium in the labor market, one needs:
H = H ,td
ts (9b)
J N = J,td (9c)
since all the households actively participate in the labor market.
3. COMPARISON BETWEEN THE LAISSEZ-FAIRE PATH AND THE PARETO-OPTIMAL
SOLUTION
The trajectory of the economy and the steady state under laissez faire
In the absence of any asset that can be privately accumulated, the decision problem of each
single household is static. Indeed, each single household can ignore the negligible impact of its own
decisions on the future level of Rt. Therefore, considering (1)-(5), one can solve its problem by
maximizing Ut=U(Rt+(WtHt+t-C2t),C2t,1-Ht) with respect to C2t and Ht, thus obtaining the
optimality conditions
UX=UC2 (10a)
and
WtUX=UL. (10b)
8
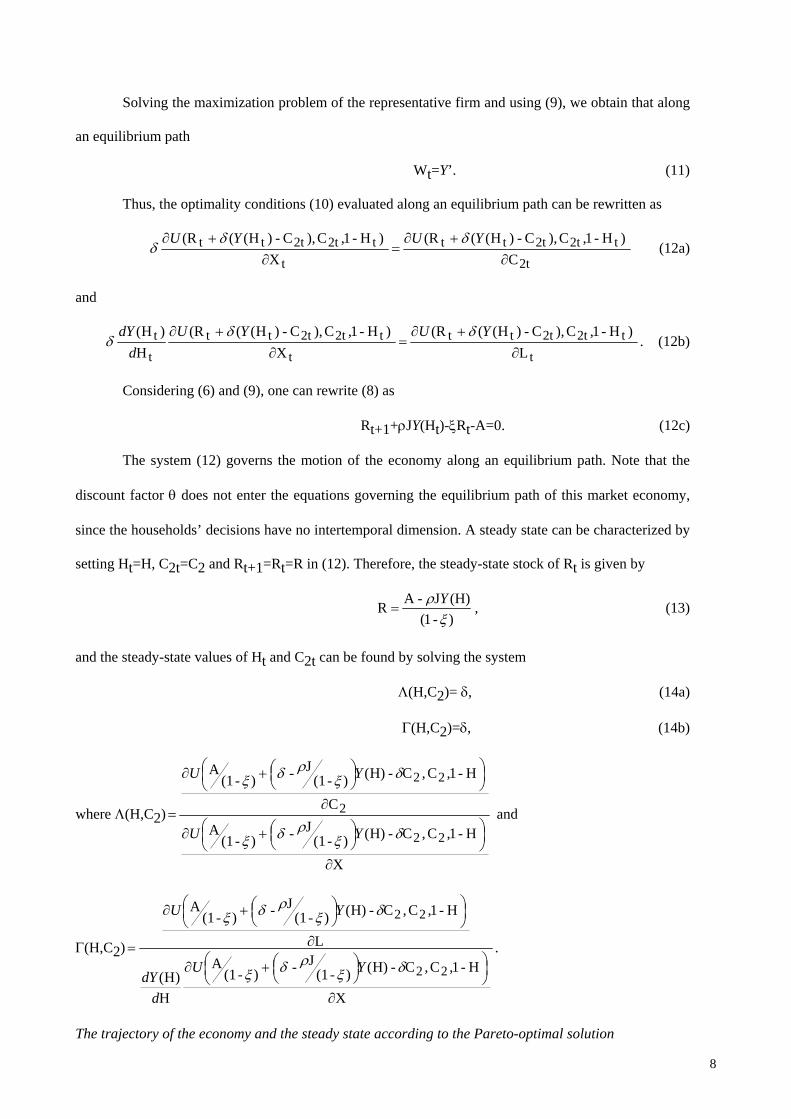
Solving the maximization problem of the representative firm and using (9), we obtain that along
an equilibrium path
Wt=Y’. (11)
Thus, the optimality conditions (10) evaluated along an equilibrium path can be rewritten as
2t
t2t2ttt
t
t2t2tttC
)H-1,C),C-)H(((R
X
)H-1,C),C-)H(((R
YUYU (12a)
and
t
t2t2ttt
t
t2t2ttt
t
tL
)H-1,C),C-)H(((R
X
)H-1,C),C-)H(((R
H
)H(
YUYU
d
dY . (12b)
Considering (6) and (9), one can rewrite (8) as
Rt+1+JY(Ht)-Rt-A=0. (12c)
The system (12) governs the motion of the economy along an equilibrium path. Note that the
discount factor does not enter the equations governing the equilibrium path of this market economy,
since the households’ decisions have no intertemporal dimension. A steady state can be characterized by
setting Ht=H, C2t=C2 and Rt+1=Rt=R in (12). Therefore, the steady-state stock of Rt is given by
)-1(
(H)J-AR
Y
, (13)
and the steady-state values of Ht and C2t can be found by solving the system
(H,C2)= , (14a)
(H,C2)=, (14b)
where (H,C2)
X
H-1,C,C-H)()-(1J-)-(1
A
C
H-1,C,C-H)()-(1J-)-(1
A
22
2
22
YU
YU
and
(H,C2)
X
H-1,C,C-H)()-(1J-)-(1
A
H
)H(
L
H-1,C,C-H)()-(1J-)-(1
A
22
22
YU
d
dY
YU
.
The trajectory of the economy and the steady state according to the Pareto-optimal solution
9
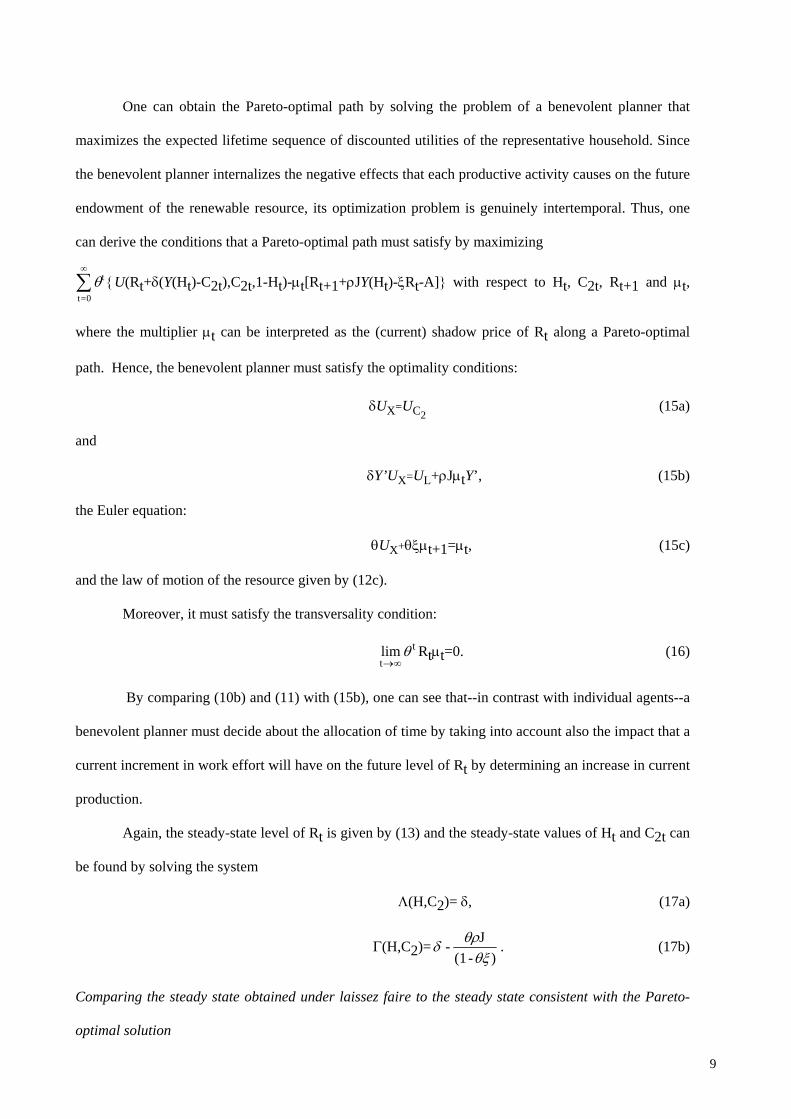
One can obtain the Pareto-optimal path by solving the problem of a benevolent planner that
maximizes the expected lifetime sequence of discounted utilities of the representative household. Since
the benevolent planner internalizes the negative effects that each productive activity causes on the future
endowment of the renewable resource, its optimization problem is genuinely intertemporal. Thus, one
can derive the conditions that a Pareto-optimal path must satisfy by maximizing
t
t=0
U(Rt+(Y(Ht)-C2t),C2t,1-Ht)-t[Rt+1+JY(Ht)-Rt-A] with respect to Ht, C2t, Rt+1 and t,
where the multiplier t can be interpreted as the (current) shadow price of Rt along a Pareto-optimal
path. Hence, the benevolent planner must satisfy the optimality conditions:
UX=UC2 (15a)
and
Y’UX=UL+JtY’, (15b)
the Euler equation:
UX+t+1=t, (15c)
and the law of motion of the resource given by (12c).
Moreover, it must satisfy the transversality condition:
limt
t
Rtt=0. (16)
By comparing (10b) and (11) with (15b), one can see that--in contrast with individual agents--a
benevolent planner must decide about the allocation of time by taking into account also the impact that a
current increment in work effort will have on the future level of Rt by determining an increase in current
production.
Again, the steady-state level of Rt is given by (13) and the steady-state values of Ht and C2t can
be found by solving the system
(H,C2)= , (17a)
(H,C2)=)-(1
J-
. (17b)
Comparing the steady state obtained under laissez faire to the steady state consistent with the Pareto-
optimal solution
10
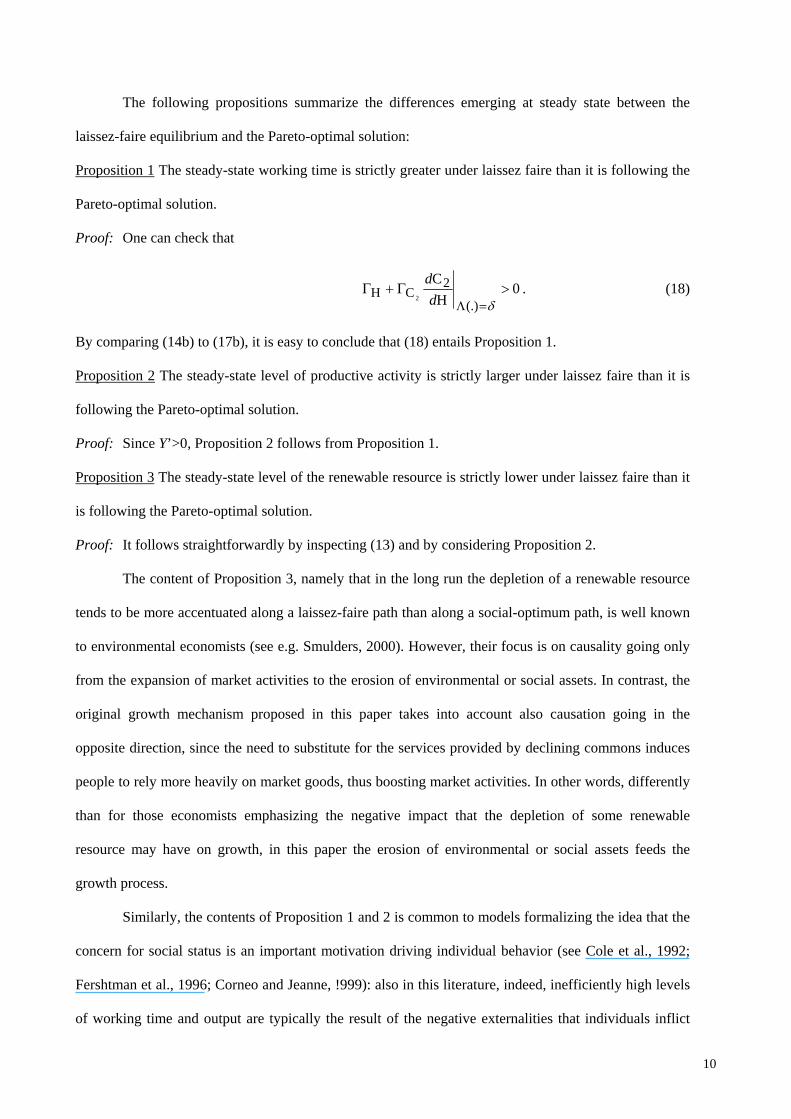
The following propositions summarize the differences emerging at steady state between the
laissez-faire equilibrium and the Pareto-optimal solution:
Proposition 1 The steady-state working time is strictly greater under laissez faire than it is following the
Pareto-optimal solution.
Proof: One can check that
0H
C
(.)
2CH 2
d
d. (18)
By comparing (14b) to (17b), it is easy to conclude that (18) entails Proposition 1.
Proposition 2 The steady-state level of productive activity is strictly larger under laissez faire than it is
following the Pareto-optimal solution.
Proof: Since Y’>0, Proposition 2 follows from Proposition 1.
Proposition 3 The steady-state level of the renewable resource is strictly lower under laissez faire than it
is following the Pareto-optimal solution.
Proof: It follows straightforwardly by inspecting (13) and by considering Proposition 2.
The content of Proposition 3, namely that in the long run the depletion of a renewable resource
tends to be more accentuated along a laissez-faire path than along a social-optimum path, is well known
to environmental economists (see e.g. Smulders, 2000). However, their focus is on causality going only
from the expansion of market activities to the erosion of environmental or social assets. In contrast, the
original growth mechanism proposed in this paper takes into account also causation going in the
opposite direction, since the need to substitute for the services provided by declining commons induces
people to rely more heavily on market goods, thus boosting market activities. In other words, differently
than for those economists emphasizing the negative impact that the depletion of some renewable
resource may have on growth, in this paper the erosion of environmental or social assets feeds the
growth process.
Similarly, the contents of Proposition 1 and 2 is common to models formalizing the idea that the
concern for social status is an important motivation driving individual behavior (see Cole et al., 1992;
Fershtman et al., 1996; Corneo and Jeanne, !999): also in this literature, indeed, inefficiently high levels
of working time and output are typically the result of the negative externalities that individuals inflict
11
upon others. However, the policy implications of these models are quite different than the agenda
suggested by our model. If the quest for social status is a pulse that “nature imposes upon us”, as Adam
Smith (1982) claimed in The theory of moral sentiments, there is little that collective action can do for
avoiding the sub-optimal outcome due to the fact that total social reward within a group is fixed and
aggregate satiation is impossible. In contrast, if the externalities are generated by productive activities
that have a negative impact on some environmental or social asset, there is more room for corrective
actions. An example of these corrective actions is proposed in the next paragraph.
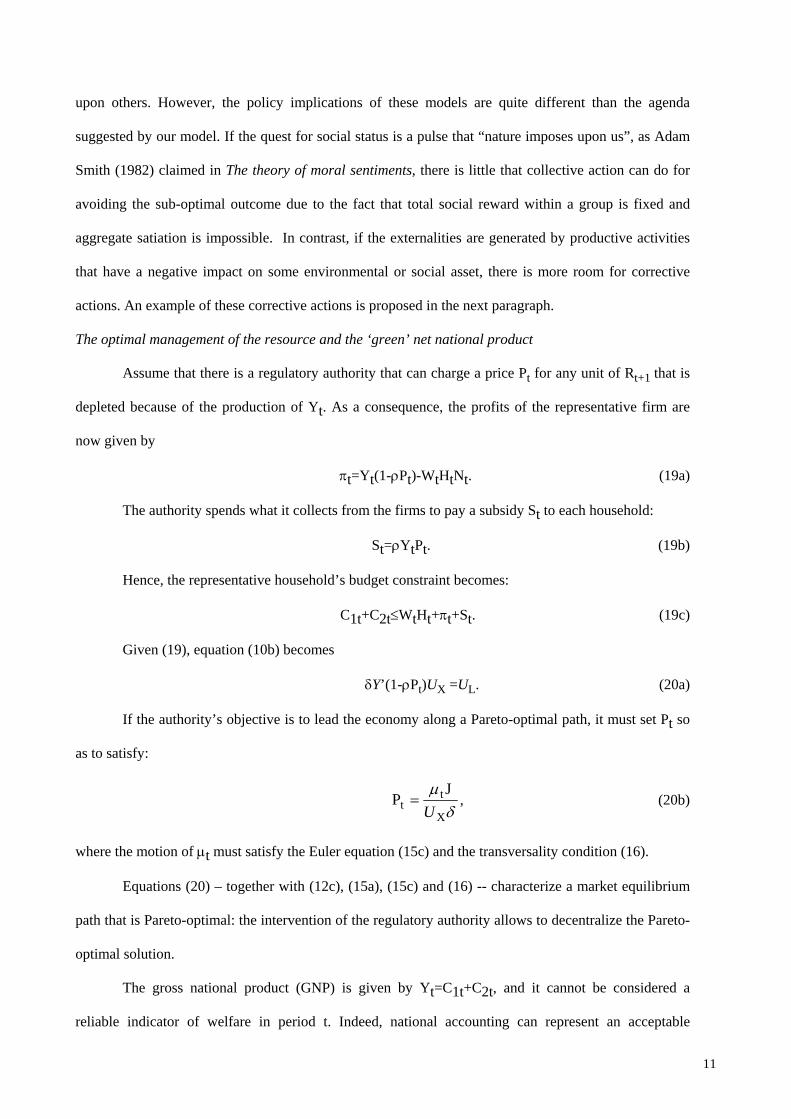
The optimal management of the resource and the ‘green’ net national product
Assume that there is a regulatory authority that can charge a price Pt for any unit of Rt+1 that is
depleted because of the production of Yt. As a consequence, the profits of the representative firm are
now given by
t=Yt(1-Pt)-WtHtNt. (19a)
The authority spends what it collects from the firms to pay a subsidy St to each household:
St=YtPt. (19b)
Hence, the representative household’s budget constraint becomes:
C1t+C2tWtHt+t+St. (19c)
Given (19), equation (10b) becomes
Y’(1-Pt)UX =UL. (20a)
If the authority’s objective is to lead the economy along a Pareto-optimal path, it must set Pt so
as to satisfy:
X
tt
JP
U , (20b)
where the motion of t must satisfy the Euler equation (15c) and the transversality condition (16).
Equations (20) – together with (12c), (15a), (15c) and (16) -- characterize a market equilibrium
path that is Pareto-optimal: the intervention of the regulatory authority allows to decentralize the Pareto-
optimal solution.
The gross national product (GNP) is given by Yt=C1t+C2t, and it cannot be considered a
reliable indicator of welfare in period t. Indeed, national accounting can represent an acceptable

12
approximation of the true human well-being at a given point in time only if it takes into account the
value of the net investment in environmental or social asset and the value of all components entering the
individual utility function (inclusive of leisure time and of non-market commodities such as those
services rendered by environmental and social assets). Such an amended indicator is the ‘green’ net
national product in period t, gtNNP . In this regulated economy, such indicator is given by
gtNNP = PtRt+C1t+ C2t+Wt(1-Ht)+Pt[ tt R)-(1-JY-A ], (21)
where in our framework human well-being depends on the ‘consumer commodities’ entering the
households’ utility function, namely Xt=Rt+C1t, C2t and Lt=1-Ht, and the net investment in
environmental or social asset is given by ttt1+t R)-(1-JY-AR-R . Note in (21) that Pt is given
by (20b) and that Wt= (1-Pt)Y’ represents the opportunity cost of time.
4. A COBB-DOUGLAS EXAMPLE: STEADY-STATE EFFECTS OF PARAMETRIC
CHANGES
Let us assume that (2) is specified by
U(Xt,C2t,Lt)=ln(Xt)+ln(C2t)+(1--)ln(Lt), 0, 0, +1, (22a)
and that (6) is specified by
Y(NtHt)=(NtHt), 0<<A/J, 01, (22b)
where is a parameter measuring the state of technology.
The trajectory of the economy and the steady state under laissez faire
Given (22), equations (12) can be rewritten as
,C)CH(+R 2t2ttt
(23a)
t2ttt
1-t
H1
)--1(
)CH(+R
H
(23b)
and
ARHJR tt1+t , (23c)
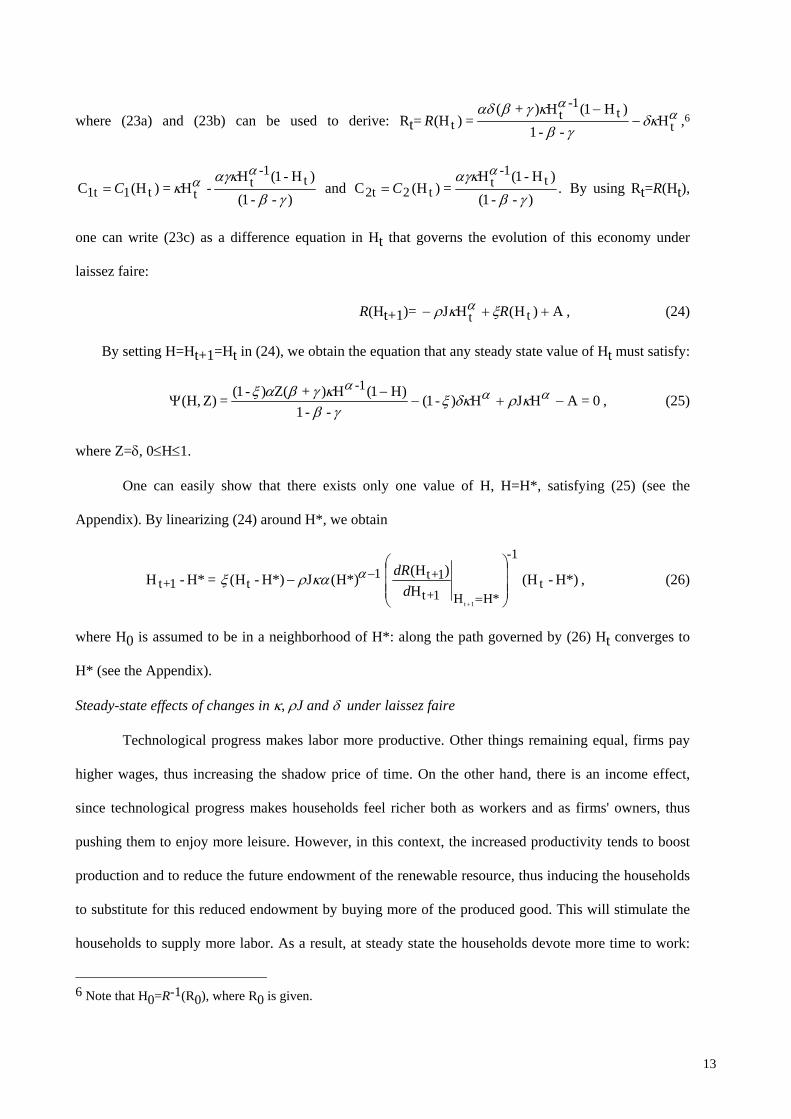
13
where (23a) and (23b) can be used to derive: Rt=
tt
1-t
t H--1
)H1(H)+(=)(H
R ,6
)--1(
)H-1(H-H=)(HC
t1-
ttt11t
C and .
)--1(
)H-1(H=)(HC
t1-
tt22t
C By using Rt=R(Ht),
one can write (23c) as a difference equation in Ht that governs the evolution of this economy under
laissez faire:
R(Ht+1)= A)H(HJ tt R , (24)
By setting H=Ht+1=Ht in (24), we obtain the equation that any steady state value of Ht must satisfy:
0=AHJH)-1(--1
)H1(H)+Z()-1(=Z)(H,
1-
, (25)
where Z=, 0H1.
One can easily show that there exists only one value of H, H=H*, satisfying (25) (see the
Appendix). By linearizing (24) around H*, we obtain
=H*-H 1+t1
t H*)(JH*)-H(
-1
*HH1+t
1+t
1t
H
)(H
d
dRH*)-(H t , (26)
where H0 is assumed to be in a neighborhood of H*: along the path governed by (26) Ht converges to
H* (see the Appendix).
Steady-state effects of changes in , J and under laissez faire
Technological progress makes labor more productive. Other things remaining equal, firms pay
higher wages, thus increasing the shadow price of time. On the other hand, there is an income effect,
since technological progress makes households feel richer both as workers and as firms' owners, thus
pushing them to enjoy more leisure. However, in this context, the increased productivity tends to boost
production and to reduce the future endowment of the renewable resource, thus inducing the households
to substitute for this reduced endowment by buying more of the produced good. This will stimulate the
households to supply more labor. As a result, at steady state the households devote more time to work:
6 Note that H0=R-1(R0), where R0 is given.

14
H *
07 entailing Y *
0. Given the negative externalities caused by production, an improved state of
technology can even lower the steady-state well-being of the representative household, especially when
the detrimental impact of a higher level of economic activity on the renewable resource is relatively
strong with respect to the efficiency of the produced good as a substitute for the renewable resource:
-1
J is a sufficient condition for having
U *
08. Note that it is more likely that this condition is
fulfilled when the number of firms and households operating in the economy is larger: the presence of a
larger number of private agents exacerbates the aggregate effect on the renewable resource due to
increases in individual market production.
It is worth to emphasize that an increase either in the parameter measuring the incidence of each
firm's level of activity on the renewable resource or in the number of firms and households raises the
steady-state level of per-capita output: H *
J09 entailing
Y *
J0. In other words, technologies that
have a larger impact on Rt generate a higher steady-state level of per-capita output by inducing the
households to work more, so as to finance their increased use of the produced good as a substitute for
the renewable resource that is depleted more intensively. The same effect is caused by an increase in
total population. Therefore, the prediction that a larger population of firms and households gives a
positive contribution to the growth of per-capita output is obtained by the model, but without relying on
7.0
*)()-(1J-)--(1*)()((H*))+)(-1(
*)()-(1J-)--(1H*)-1(*)H()(
*H
1-1-22-
1-
HH
H
8
H*)()-(1J-)-(1
A
H*)()-(1J-)+(
*H
*U*H*U
, where*H-1
)--(1-
H*)()-(1J-)-(1
A
H*)()-(1J-)+(
*H
*U1-
,
which – by taking into account (23b) -- can be written as .0H*)()-(1
J-)-(1A
H*)()-(1J
*H
*U1-
9
H *
J
(1- - ) (1 - )
- )( + ) (H*) (1 - - ) - J(1 - )
-2 -1 -
(
( ( ) ( (.
H*)
H*) H*)10
2 1
15
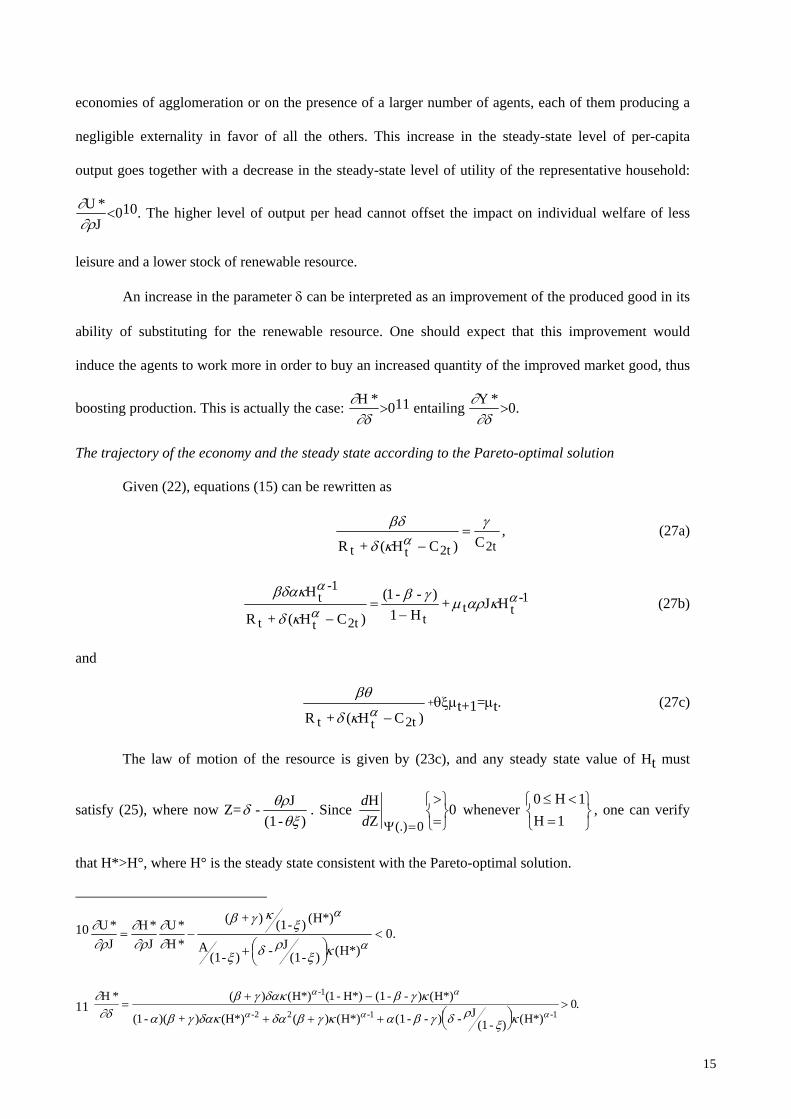
economies of agglomeration or on the presence of a larger number of agents, each of them producing a
negligible externality in favor of all the others. This increase in the steady-state level of per-capita
output goes together with a decrease in the steady-state level of utility of the representative household:
U *
J010. The higher level of output per head cannot offset the impact on individual welfare of less
leisure and a lower stock of renewable resource.
An increase in the parameter can be interpreted as an improvement of the produced good in its
ability of substituting for the renewable resource. One should expect that this improvement would
induce the agents to work more in order to buy an increased quantity of the improved market good, thus
boosting production. This is actually the case: H *
011 entailing Y *
0.
The trajectory of the economy and the steady state according to the Pareto-optimal solution
Given (22), equations (15) can be rewritten as
,C)CH(+R 2t2ttt
(27a)
t2ttt
1-t
H1
)--1(
)CH(+R
H
+ 1-
tt HJ (27b)
and
)CH(+R 2ttt
+t+1=t. (27c)
The law of motion of the resource is given by (23c), and any steady state value of Ht must
satisfy (25), where now Z=)-(1
J-
. Since
1H
1H0 whenever0
Z
H
0(.)d
d, one can verify
that H*>H°, where H° is the steady state consistent with the Pareto-optimal solution.
10 .0H*)()-(1
J-)-(1A
H*)()-(1)+(
*H
*U
J
*H
J
*U
11
H * H*) - H*) (1- - )
- )( + ) (H*) (1- - ) - J(1 - )
-1
-2 -1 -
( ) ( ( (
( ( ) ( (.
1
10
2 1
H*)
H*) H*)
16
5. CONCLUDING REMARKS
Human resources mobilization has been largely ignored by neoclassical growth modeling. The
reason is that this literature concentrates on other determinants of growth, such as capital accumulation
and technical progress. Symmetrically, the model presented in this paper ignores capital accumulation
and endogenous technical progress in order to focus on human resources mobilization, which has long
been a central concern of development theory (Lewis, 1954). Moreover, in our model, causality does not
go only from the expansion of market activities to the erosion of environmental (or social) assets but
also in the opposite direction, since the need to substitute for the services provided by declining
commons induces people to rely more heavily on market goods. Within this context, growth tends to go
‘too far’. Under laissez faire, indeed, the long-run equilibrium of the economy is characterized by: i) an
inefficiently high level of production, ii) an excessive portion of households’ time devoted to market
activities, and iii) an excessive depletion of the environmental (or social) asset. In addition, the model
shows that in an economy under laissez faire: iv) technological advances making labor more productive
increases the steady-state level of production, but they may lead to worsening the steady-state well-
being of the representative household; v) technological advances reducing the negative impact of
productive activities on the environmental (or social) asset decrease the steady-state level of production,
but they raise the steady-state well-being of the representative household; vi) technological advances
improving the ability of produced good to substitute for the environmental (or social) asset increase the
steady-state level of production, but they may worsen the steady-state well-being of the representative
household; vii) increases in population raise the steady-state level of per-capita, but they worsen the
steady-state well-being of the representative household.
Furthermore, the model studies the possible role that a regulatory authority can play in this
context. In principle, indeed, a regulatory authority can set a price for the use of the environmental (or
social) asset by the productive units so that the market economy can follow the Pareto-optimal path. In
this regulated economy, we have computed the ‘green’ net national product, that is an acceptable
approximation of the true human well-being at a given point in time, since it takes into account the value
of all components entering the individual utility function (inclusive of leisure time and of non-market
17
commodities such as those services rendered by environmental and social assets) and the value of the net
investment in environmental (or social) assets (see Asheim, 2000; Dasgupta and Mäler, 2000;
Weitzman, 2000). It is worth to emphasize that an important effect of this ‘green’ policy is to lead in the
long run to a reduction (relatively to the laissez-faire scenario) of the time devoted to market activities.
The model’s prediction according to which technological advances making labor more
productive in the market sector of the economy lead in the long run to an increase in labor supply and in
the level of market production may shed light on the reasons why technological progress does not bring
about marked reductions in labor time. As a matter of fact, even superficial examination of the evidence
breeds the suspicion that the long-run tendency for per-capita labor input to decline in response to
spectacular advances in labor productivity (GDP per hour worked) is relatively weak, displaying striking
reversals of tendency, and for long periods. For instance, the average weekly hours of market work per
person in the U.S. has been roughly constant since the 1950s.12 The explanation suggested by our model
of the tendency of labor supply to remain high in the presence of long-period productivity increases
relies on the fact that technological progress can accelerate the degradation of environmental and social
assets, by making more convenient to undertake market activities that erode these assets. This
explanation can be considered complementary to those explanations based on the concepts of
“preference for status”13 (see Cole et al., 1992; Fershtman et al., 1996; Corneo and Jeanne, 1999) and
12 According to the figures presented by Schor (1992), in 1987 Americans worked around one month per year more
than they did in 1969 (+163 hours). Obviously, satisfactory assessment of the extent to which total working time reacts
to productivity improvements also requires analysis of how productivity changes affect homework. This is especially
true in the light of the historical trend toward increased female labor-market participation distinctive of the advanced
countries during the twentieth century. However, the fact that the production of certain services is no longer confined to
the family is part of the general and progressive weakening of communitarian modes of life that has accompanied
modern economic growth.
13 “Preference for status” amounts to a concern for social status that may induce people to work and to save more than
they would have done if they did not care about their relative position in society with respect to income or wealth.
18
“conspicuous consumption”14 (see Veblen, 1967; Duesenberry, 1949), or on the idea that preferences are
manipulated by advertising through the media (see Benhabib and Bisin, 2002). It is apparent, however,
that these explanations have very different implications for social theory and economic policy.
APPENDIX Existence, uniqueness and local stability of H* Note the following three facts:
(i) H
Z)(H,
0;
(ii)
Z)(H,lim0H
;
(iii) 0A)-1(J=Z)(H,lim 1H
.
These three facts together ensures the existence of a unique steady-state value of H, H=H*. By inspecting (26), one can verify that tas *HH t if and only if
(iv) 1-H*)(J
-1
*HH1+t
1+t
1t
H
)(H
d
dR 1.
One can check that (iv) holds if and only if
(v) *HHH
Z)(H,
0,
which follows straightforwardly from (i).
REFERENCES Aghion P. and Howitt P. (1992) "A model of growth through creative destruction", Econometrica 60, 323-
352.
Asheim G. B. (2000) “Green national accounting: why and how?”, Environmental and Development
Economics 5, parts 1&2 (Special issue: advances in green accounting), 25-48.
Benhabib J. and Bisin A. (2002) Advertising, mass consumption and capitalism, New York University,
mimeo.
14 “Conspicuous consumption” is that consumer activity which is primarily motivated by the quest for social
distinction.
19
Cole H., Mailath G. and Postlewaite A. (1992) “Social norms, savings behavior, and growth”, Journal of
Political Economy 100, 1126-1152.
Corneo G. and Jeanne O. (1999) “Pecuniary emulation, inequality and growth”, European Economic Review
43, 1665-1678.
Daly H. E. (1991) Steady state economics: second edition with new essays, Washington: Island Press.
Dasgupta P. and Mäler K.-G. (2000) “Net national product, wealth, and social well-being”, Environmental
and Development Economics 5, parts 1&2 (Special issue: advances in green accounting), 69-93.
Duesenberry J.S. (1949) Income, saving and the theory of consumer behavior, Cambridge Mass.: Harvard
University Press.
Fershtman C., Murphy K. and Weiss Y. (1996) “Social status, education and growth”, Journal of Political
Economy 104, 108-132.
Grossman G.M. and Helpman E. (1991) Innovation and growth in the global economy, Cambridge Mass.:
The MIT Press.
Hartwick J. M. (1977) “Intergenerational equity and the investing of rents from exhaustible resources”,
American Economic Review 67, 972-974.
Kremer M. (1993) "Population growth and technological change: one million B. C. to 1990", Quarterly
Journal of Economics 108, 681-716.
Kuznets S. (1960) Demographic and economic change in developed countries, Princeton: Princeton
University Press.
Lewis W.A. (1954) “Development with unlimited supplies of labour”, Manchester School of Economic and
Social Studies 20, 139-192.
Pearce D.W., Markandya A. and Barbier E. (1990) Sustainable development: economy and environment in
the Third World, London: Earthscan Publications.
Schor J.B. (1992) The overworked American: the unexpected decline of leisure in America, New York: Basic
Books.
Smith A. (1982) The theory of moral sentiments, Indianapolis: Liberty Fund.
Smulders S. (2000) “Economic growth and environmental quality”, in H. Folmer and H.L. Gabel
(eds.), Principles of environmental and resource economics, Cheltenham: Edward Elgar.
20
Solow R. (1956) “A contribution to the theory of economic growth”, Quarterly Journal of
Economics 70, 65-94.
Veblen T. (1967) The theory of leisure class, New York: Penguin (original edition, 1899).
Weitzman M. L. (2000) “The linearized Hamiltonian as comprehensive NDP”, Environmental and
Development Economics 5, parts 1&2 (Special issue: advances in green accounting), 55-68.