The Mobilization of Core Supporters: Campaigns, Turnout, and Electoral Composition in United States...
16
http://www.jstor.org The Mobilization of Core Supporters: Campaigns, Turnout, and Electoral Composition in United States Presidential Elections Author(s): Thomas M. Holbrook and Scott D. McClurg Source: American Journal of Political Science, Vol. 49, No. 4, (Oct., 2005), pp. 689-703 Published by: Midwest Political Science Association Stable URL: http://www.jstor.org/stable/3647691 Accessed: 11/08/2008 13:57 Your use of the JSTOR archive indicates your acceptance of JSTOR's Terms and Conditions of Use, available at http://www.jstor.org/page/info/about/policies/terms.jsp. JSTOR's Terms and Conditions of Use provides, in part, that unless you have obtained prior permission, you may not download an entire issue of a journal or multiple copies of articles, and you may use content in the JSTOR archive only for your personal, non-commercial use. Please contact the publisher regarding any further use of this work. Publisher contact information may be obtained at http://www.jstor.org/action/showPublisher?publisherCode=mpsa. Each copy of any part of a JSTOR transmission must contain the same copyright notice that appears on the screen or printed page of such transmission. JSTOR is a not-for-profit organization founded in 1995 to build trusted digital archives for scholarship. We work with the scholarly community to preserve their work and the materials they rely upon, and to build a common research platform that promotes the discovery and use of these resources. For more information about JSTOR, please contact [email protected].
Transcript of The Mobilization of Core Supporters: Campaigns, Turnout, and Electoral Composition in United States...
http://www.jstor.org
The Mobilization of Core Supporters: Campaigns, Turnout, and Electoral Composition inUnited States Presidential ElectionsAuthor(s): Thomas M. Holbrook and Scott D. McClurgSource: American Journal of Political Science, Vol. 49, No. 4, (Oct., 2005), pp. 689-703Published by: Midwest Political Science AssociationStable URL: http://www.jstor.org/stable/3647691Accessed: 11/08/2008 13:57
Your use of the JSTOR archive indicates your acceptance of JSTOR's Terms and Conditions of Use, available at
http://www.jstor.org/page/info/about/policies/terms.jsp. JSTOR's Terms and Conditions of Use provides, in part, that unless
you have obtained prior permission, you may not download an entire issue of a journal or multiple copies of articles, and you
may use content in the JSTOR archive only for your personal, non-commercial use.
Please contact the publisher regarding any further use of this work. Publisher contact information may be obtained at
http://www.jstor.org/action/showPublisher?publisherCode=mpsa.
Each copy of any part of a JSTOR transmission must contain the same copyright notice that appears on the screen or printed
page of such transmission.
JSTOR is a not-for-profit organization founded in 1995 to build trusted digital archives for scholarship. We work with the
scholarly community to preserve their work and the materials they rely upon, and to build a common research platform that
promotes the discovery and use of these resources. For more information about JSTOR, please contact [email protected].

The Mobilization of Core Supporters: Campaigns,
Turnout, and Electoral Composition in United States
Presidential Elections
Thomas M. Holbrook University of Wisconsin, Milwaukee Scott D. McClurg Southern Illinois University
Our objective is to investigate the relationship between presidential campaign activities and political mobilization in the states, with specificfocus on the mobilization of core constituents. Using data on presidential campaign visits, presidential campaign media purchases, and party transfers to the states, we highlight some interesting mobilization patterns. First, voter turnout is positively influenced by presidential campaigns, though not by all campaign activities. Second, there is some
evidence that campaigns have direct effects on the participation of core partisan groups. Finally, the ability of parties to
mobilize their core groups has a strong effect on state electoral success that exists over and above the direct effect of campaign activity on electoral outcomes. All in all, we see the results as strong evidence that political mobilization in general and
party transfers to the states in particular are an important componentfor understanding campaign effects in presidential elections.
~t ... he impact of presidential campaigns has received
| renewed attention since the early 1990s. Beginning . L roughly with the work of Finkel (1993), Bartels
(1993), and Gelman and King (1993), a number of schol- ars have reexamined the "minimal effects" hypothesis in the context of today's high cost, media-driven campaigns (also see Campbell 2000; Herr 2002; Holbrook 1994,1996; Jones 1998; Shaw 1999a, 1999b; Shaw and Roberts 2000). While these studies exhibit rekindled interest in the ex- istence of campaign effects, less attention has been de- voted to investigating the mechanisms by which modern
campaigns achieve those effects. Specifically, these stud- ies generally do not distinguish between the persuasive and mobilizing effects of campaigns in their analysis. This
strongly contrasts earlier campaign research that priori- tized this distinction and found that campaigns primarily serve to activate partisanship and mobilize core support- ers (Lazarsfeld, Berelson, and Gaudet 1944; Finkel 1993; Kramer 1973).
We focus explicitly on the mobilizing effects of
modern-day presidential campaigns. The crux of our ar-
gument is that core party voters are more likely to re-
ceive and respond to campaign information, implying that successful campaigns are those that mobilize their
supporters enough to translate their natural predisposi- tions into actual votes. As a consequence, we expect par- tisan mobilization to be tied closely to campaign activi- ties. Along these lines we examine hypotheses about the extent to which (a) campaign activities mobilize the elec- torate and influence turnout, (b) campaign activities de-
termine the partisan composition of the electorate, and (c) how this type of campaign mobilization influences elec-
tion outcomes. Our findings add to the aforementioned literature on modern presidential campaigns by explic-
itly highlighting the role of mobilization in linking con-
temporary campaign activity to election outcomes. Our
study also expands the scope of mobilization by using a
more comprehensive list of factors to measure contempo-
Thomas M. Holbrook is professor of political science, University of Wisconsin, Milwaukee, PO Box 413, 3210 N. Maryland Avenue, Milwaukee, WI 53201 ([email protected]). Scott D. McClurg is assistant professor of political science, Southern Illinois University, Mailcode 4501, Carbondale, IL 62901-4501 ([email protected]).
The authors are grateful to Daron Shaw for sharing his data and participants from Southern Illinois University's Political Science Work-
in-Progress Seminar for their helpful comments. This article was prepared for presentation at the 2003 Annual Meeting of the Midwest Political Science Association. All errors remain our responsibility.
American Journal of Political Science, Vol. 49, No. 4, October 2005, Pp. 689-703
?2005 by the Midwest Political Science Association ISSN 0092-5853
689

THOMAS M. HOLBROOK AND SCOTT D. McCLURG
rary presidential campaign activity. Especially important on this score is that we provide the first examination of
party monetary transfers to the states, which include oft- debated soft money funds, as an electoral force.
Studies of Political Mobilization
Considerable attention has been devoted to the study of
political mobilization over the years. One group of stud- ies shows that partisan contacting increases the likeli- hood that individuals participate in elections (Abramson and Claggett 2001; Gerber and Green 2000a, 2000b; Goldstein and Ridout 2002; Huckfeldt and Sprague 1992; Kramer 1973; McClurg 2004; Rosenstone and Hansen 1993; Wielhouwer 1999, 2003; Wielhouwer and Locker- bie 1994). A second set examines how contextual indi- cators of mobilization, such as the impact of candidate
spending and competition in House, Senate, and gu- bernatorial elections, contribute to voter turnout (Cox and Munger 1989; Jackson 1997, 2002; Patterson and Caldeira 1983). A third group has arisen around a lively debate about the consequences of negative advertising (Ansolabehere and Iyengar 1995; Ansolabehere, Iyengar, Simon 1999; Ansolabehere, Iyengar, Simon, and Valentino 1994; Djupe and Peterson 2002; Finkel and Geer 1998; Freedman and Goldstein 1999; Kahn and Kenny 1999; Lau et al. 1999; Sigelman and Kugler 2003; Wattenberg and Brians 1999). Still another group of studies examine the potential for campaigns to demobilize voters by acti-
vating cross-pressures or increasing feelings of alienation
(e.g., Berelson, Lazarsfeld, and McPhee 1954; Converse 1962; Zipp 1985). For the most part this research sup- ports the notion that campaign activity increases partic- ipation, with the general consensus being that this effect is achieved by reducing information costs and creating interest in the campaign.
Nevertheless, most recent studies of presidential cam-
paign effects have evolved separately from research on mobilization, with only a couple studies directly address-
ing the relationship between presidential campaigns and voter mobilization. Unfortunately, these studies have pro- duced mixed results (Herr 2002; Jones 1998) and leave a number of questions about the relationship of campaigns to election outcomes unanswered. One issue pertains to the conditions under which campaigns can mobilize
people and, concomitantly, who is mobilized. This is
important because a key message of the party canvass-
ing literature is that most efforts are directed at partisans (whose votes are relatively certain) rather than undecided voters (whose votes are less certain). A second issue is that mobilization studies fail to measure modern campaign activity consistently or comprehensively. Of particular in-
terest is the failure to examine the potential impact of tele- vision advertising and national party transfers to the state and local committees (about two-thirds of which is soft
money) as mobilizing forces.1 This shortcoming is im-
portant because there is a tendency to focus on forms of
campaigning that are vestiges of the old party system, such as campaign appearances (Cohen, Krassa, and Hamman 1991; Herr 2002; Jones 1998), while the newer research on
campaigns is motivated by an interest in the broader array of activities relevant in today's political environment.
A couple of studies acknowledge the possibility that
campaigns may have effects that stem from both mobiliza- tion and persuasion, though they only indirectly exam- ine this distinction. For instance, using National Election
Study data, Finkel (1993) identifies three types of voters in the 1980 presidential election: those who were converted
(change in preference), those whose predispositions were activated (undecided and misplaced partisans returning to the fold), and those who were unmoved by the cam-
paign. Although Finkel concludes that most people were unmoved, he shows that a substantial number were ac- tivated by the campaign, a finding that strongly suggests the presence of important mobilization effects.
Shaw's (1999a) analysis of campaign activities in the states during the 1988, 1992, and 1996 presidential cam-
paigns, also provides an innovative-though indirect- assessment of the mobilizing and persuasive effects of
campaigns. His analysis shows that the impact of cam-
paign activities is (among other things) conditioned on the size of the normal vote, implying that campaign ef- fects can be larger in states with a sizeable number of
partisans. However even Shaw points out that, "persua- sive effects can also be captured by this variable, [so] it
provides a suggestive but imperfect test of mobilization's
singular effect" (1999a, 350). Finally, Campbell's (2000) analysis of turnout among
partisan groups points to important mobilization effects.
Using aggregated National Election Study data from 1952 to 1996, Campbell finds that the relative turnout of parti- san groups played a key role in shaping presidential elec- tions at the national level, although this impact was clearly secondary to that of partisan loyalty (2000, 8485). As in-
teresting and suggestive as this finding is, Campbell did not plumb the impact of specific campaign activities on relative turnout among partisan groups.
In sum, existing research on presidential campaigns does not adequately explore the impact of presidential campaign activity on the mobilization of different groups. And the one study that examines both persuasion and mobilization effects in earnest-Kramer's research on
'For the elections under study here, soft money was still an impor- tant part of the political environment.
690o
MOBILIZATION OF CORE SUPPORTERS
the 1952-64 elections-occurred before the substantial changes in presidential campaign affected by the advent of widespread television advertising and campaign finance reform. Overlooking the distinction between the two ef- fects means that what are often interpreted as persuasive effects may in fact be the product of mobilization (see Shaw 1999a for discussion of this point). Understanding which type of effect exists is central to our substantive under- standing of the electoral process. We help fill this void in existing research by offering a model of political mobiliza- tion and investigating the mobilization of core supporters in the states during the 1992, 1996, and 2000 presidential elections.
A Model of Campaign Mobilization
Presidential campaign strategy revolves around the com- munication of information to voters (Bartels 1993; Gelman and King 1993; Holbrook 1996; Popkin 1991). Broadly speaking, campaigns use information to shape everything from the electorate's perceptions of candidate character to the importance of issues to the relevance of the election to levels of emotional engagement. While this characterization is the basis for research on how cam- paigns influence vote choice (e.g., Carsey 2000), our focus is on the mobilization of voters. For this task, we outline a model that conceptually links campaigns to mobilization by emphasizing which voters are most likely to receive and use campaign information prior to deciding whether to participate. We specifically argue that reception and use of campaign information is a function of three fea- tures: (1) the partisan biases of voters, (2) the expenditure of campaign resources, and (3) the preferences of other voters.
Who You Are. We begin with the assumption that there are two types of voters in the electorate-partisans and nonpartisans. The standard view of partisans is that they begin campaigns with natural affinities for one candidate and automatic disdain for the other. But they are also better informed (Delli Carpini and Keeter 1996), better able to discount dissonant information surrounding cam- paign communications (Fischle 2000; Zaller 1992), and are consequently more likely to vote than people who are independents (Campbell et al. 1960; Miller and Shanks 1996; Rosenstone and Hansen 1993). Though partisans do not always cast ballots for candidates from their party, their predispositions make them less open to persuasion than independents. At the same time these predisposi- tions must be activated or reactivated by the campaign so that their predispositions turn into actual support at
the polls (Berelson, Lazarsfeld, and McPhee 1954; Lazars- feld, Berelson, and Gaudet 1944).2 Simplifying this task for campaigns is the fact that partisans are more likely to encounter and process political messages (Zaller 1992).
Independents present different challenges to cam-
paigns. Because they do not possess strong partisan biases, they are less likely to filter campaign communications in a consistent manner. Mobilization of independents is therefore both more difficult (i.e., costlier in resources) and riskier for campaigns. That is, independents need to be persuaded and mobilized, while partisans mainly need to be mobilized. Therefore, campaigns have strate-
gic incentives to target their mobilization efforts on par- tisans out of fear that the core will stay home without the mobilization effort and that a broader canvass would
bring the wrong voters to the polls (Goldstein and Ridout 2002).
Consider, for example, an electorate that is evenly divided between Party A, Party B, and independents. Fur- ther assume that both parties have a loyalty rate of 90%, and that independents, perhaps by virtue of ideology or other considerations, lean toward Party A with 60% sup- port. Now, suppose that Party A wants to mobilize sup- porters in order to ensure victory. If Party A increases turnout among its core supporters by 5 percentage points, it will gain 4.5 percentage points at the polls (.90 * 5). But if it increases turnout among independents by 5 percent- age points, its yield will only be 3 percentage points at the polls (.60 * 5). To achieve the same "payoff," Party A would have to increase turnout among independents 1.5 times more than among its own partisans. And more to the point, if Party B were to mobilize independent vot- ers through its campaign activities, it would actually lose votes! Granted, these are hypothetical rates and loyalty among peripheral voters may be much lower than among active partisans (DeNardo 1980), but the argument we're trying to make is clearly plausible: parties run a consid- erable risk by trying to mobilize independents and could realize much more predictable benefits by focusing efforts on their core supporters. Where You Are. Although partisans are more likely to be exposed and respond to campaign information, not all partisans are equally exposed to such information. As Shaw's (2003) analysis of presidential campaigns il- lustrates, resources are not equally distributed through- out the states. Instead, they are dispersed among states
2The term activation refers to undecided partisans ultimately de- ciding to vote for their party's candidate, and reactivation is the process of misplaced partisans, those who intended to vote for the other party, changing their intention and voting for their party's candidate (Berelson et al. 1954; Lazarsfeld, Berelson, and Gaudet
691
1944).

THOMAS M. HOLBROOKAND SCOTT D. McCLURG
based upon strategic considerations such as the number of Electoral College votes and the competitiveness of the race in the state (Shaw 1999b). This implies that the mo- bilization of core voters is a function of the unequal distri- bution of campaign resources: states that receive greater attention from presidential campaigns should therefore have larger numbers of partisans casting ballots.
Additionally not all campaign activities are equally targeted at partisan audiences nor do they provide equiva- lent information. Consider the role of two particular cam-
paign activities highlighted in earlier research-candidate visits and television ad buys. Although campaign appear- ances generate considerable media attention, one of their
primary effects is to place the candidate in front of sym- pathetic, partisan audiences. Not only does this produce the kind of good visuals campaign professionals strive for, but it allows candidates to convey information di-
rectly to core groups at rallies, fundraisers, and similar events. By contrast, advertisements purchased by pres- idential campaigns typically run in front of politically broader audiences on television and increasingly empha- size issues and character over explicit partisan cues (West 2001). Relative to each other, visits should influence parti- san participation more than advertisements because they are targeted more directly at partisans and include more
explicitly partisan cues. Another important activity in recent presidential
campaigns is party transfers to the states, which include the oft-criticized soft money. In part, this campaign re- source differs from candidate visits and ad buys in that the
campaigns do not directly control its use. So even though party transfers are spent in support of presidential can- didates, they are also used to support statewide partisan efforts down the ballot. Relative to other campaign re- sources, we should then expect that the information pro- duced by the expenditure of these funds is targeted at and successful in mobilizing partisans.
Who Is With You. Finally, it would be unreasonable to assume that campaign information that reaches the ears of partisan voters always finds an attentive audience. This is because campaign information is only one part of a broader environment in which voters decide. Among the environmental factors that might affect core voter's re-
sponsiveness to a campaign is the level of competition between the parties. Partisans living in a state where their candidate has little to no chance of winning the election- for instance, a Democrat in Utah-will not be persuaded otherwise by any amount of campaign information. Per-
haps more important, presidential campaigns can only make credible requests that the participation of core sup- porters is crucial when the outcome of the race is in doubt.
Presidential Campaigns in the States
To examine hypotheses based on this model of mobi-
lization, we pursue an analytic strategy that focuses on
presidential campaign activities at the state level and how those activities influence measures of turnout and elec- toral composition in the states. The bulk of our analyses draw on information from the 1992, 1996, and 2000 cam-
paigns.3 We focus on two categories of campaign activities in this analysis, one that is candidate based and one that is party based. Candidate-based campaign activities are those that fall under the direct control of the candidates'
campaign organizations, including the total number can- didate appearances and voter ad exposure in the states.4 Candidate appearances are measured as the number of times the presidential candidate visited a state from Au-
gust to November. Ad exposure is estimated with a strat-
egy developed by Shaw (1999a) that measures audience saturation using gross rating points (GRPs). In Shaw's
method, state GRPs are estimated by determining how
many GRPs are bought for each media market in a state,
multiplying that by the percentage of a state's voters in that
market, and then summing across all of the state's mar- kets.5 Our measure of party campaign effort is the amount of national party transfers to state and local party com- mittees in the year of the election.6 These funds, which include soft money expenditures, are controlled by state
3Since we are combining our analysis of all three elections, we often include a lagged value of our dependent variables in the statistical models provided below. As a result, we also occasionally draw on information from the 1988 campaign. Unfortunately, we do not have lagged (1984) values of the dependent variables for 1988. The end result is a dataset with roughly 200 observations overall, 150 of which are used in the analysis.
4Candidate appearances and campaign advertising data for 1988, 1992, and 1996 come from Shaw (1999a). The 2000 appearance data were generously supplied by Daron Shaw. More information on and analysis of the 2000 data can be found in Shaw (2003).
5GRPs can be interpreted as follows: "one hundred GRPs rep- resent 100% of voters in a market seeing an advertisement once" (Shaw 1999a, 349). GRP data for 1988, 1992, and 1996 come directly from Shaw's (1999a) article. The 2000 GRPs were estimated by the authors based on media market costs per 100 GRPs and campaign expenditures per market supplied by Daron Shaw. Voting age population in each media mar- ket was culled from the Federal Election Commission's webpage (http://www.fec.gov/pages/2000turnout/reg&toOO.htm), while the adult population in each media market was taken from the SRDS TV & Cable Source.
6We use the per capita (voting age population) Republican National Committee (RNC) and Democratic National Committee (DNC) transfers to state and local party committees, in constant (1982- 86 = 100) dollars. The party transfer data represent the amount of money transferred during the calendar year. Given that parties rarely get involved in primary election campaigns, it is our expec- tation that the money was spent primarily in the fall campaign period.
692

MOBILIZATION OF CORE SUPPORTERS
and local party organizations and are typically spent on
get-out-the-vote drives, issue advertisements, and other activities intended to help the respective parties on elec- tion day (Ansolabehere and Snyder 2002; Herrnson 2000). Surprisingly, there is no academic work on the connection between party transfers and election outcomes.
Several data sources were used for other indepen- dent and dependent variables. Data for turnout, elec- tion outcomes, and national party transfers to the states are taken from the Federal Election Commission
(http://www.fec.gov). Data on the partisan composition of the electorate are taken from the Voter News Service exit polls, aggregated at the state level.7 Our measures of
group composition are based on the marginal percentages for demographic and political groups in the exit polls.
The Impact of Presidential Campaigns on Voter Turnout
Our model suggests a number of hypotheses about state-
by-state election patterns. First, as campaigns become more active in the states, voters (core voters in partic- ular) become better informed, more enthused, and more motivated, subsequently leading them to go to the polls on election day. We therefore expect turnout to increase as a function of campaign activity. Second, we expect party transfers and candidate appearances to exert the strongest effect on turnout, since these activities are specifically tar-
geted to partisan groups. Presidential advertising buys, on the other hand, are expected to reach much broader au- diences including nonaligned voters as well as partisans. Finally, we expect the effect of campaign activities to be
stronger in the most competitive states. Table 1 presents the results first for a basic model
of campaign effects and then for a conditional model that includes several interaction terms. The dependent variable in both models is the change in statewide voter turnout from one presidential election to the next (turnoutt - turnoutt_ ). The models include measures of overall campaign activities (total candidate appearances,
7Data for 1992 and 1996 exit polls are taken from http:// www.cnn.com/ELECTION/1998, and data for the 2000 race were taken from http://www.abcnews.go.com/sections/politics/ 2000vote/general/exitpoll hub.html. Although exit polls received a lot of bad press following the 2000 election, in particular for their performance in Florida, it is worth noting that the Florida exit polls actually show a virtual tie, and, nationally, the 2000 exit polls showed Gore eking out a slim popular vote victory. In addition, our understanding is that the problem in Florida was not so much the exit poll data as it was how those data were used in conjunction with other pieces of information to make a projection (Frankovic 2001).
television expenditures, and party transfers), a poll-based measure of pre-election of competition,8 lagged turnout
(to capture regression to the mean effects), third-party vote (included to account for the influx of sporadic vot- ers typically associated with third-party efforts), a control for the potentially mobilizing impact of having a Senate race on the ballot, and controls for specific election years to capture global features of the contests. The manner in which we've specified the models provides a rigorous test for the mobilization hypothesis. By expressing the depen- dent variable as change in turnout, and by including a
lagged measure of turnout, we are able to hold constant a whole host of long-term determinants of voter turnout. This poses a stringent statistical test and allows us to fo- cus much more explicitly on those short-term forces that influence turnout in presidential elections.
Consistent with our expectations, party transfers have a statistically significant and positive effect on voter turnout.9 According to our estimate, turnout can be ex-
pected to increase approximately.69 percentage points for
every dollar per capita transferred to the state and local committees. Given that the average per capita transfer was
$0.44, this effect appears to be rather meager-a change of approximately one-third a percentage point in turnout.
However, at its maximum (2.48) the effect of party trans- fers can be quite significant-it produces an increase of 1.7 percentage points in turnout. This positive relation-
ship makes a great deal of sense to us, given that one of the explicit purposes of party money is to turn out the
party base. In doing so, parties are also contributing to the overall level of turnout in the states.
8The measure of competition used here is based on the average of all state-level presidential trial-heat polls taken at least thirty days prior to the election (in most cases, this means late August through early October). We settled on a dichotomous measure that identifies those contests that were in the most competitive one- third of all contests. This worked out to be those states in which the pre-election polls showed the leading candidate winning by a
margin of four percentage points or less. Our reason for doing so is that the difference between "not at all" competitive and "sort of"
competitive is not likely to be important to voters, at least in terms of making them feel that their vote could be more important. On the other hand, being in a very competitive state is likely to affect how voters view the importance of their vote. Running the same models with a continuous measure of competition did not alter the results in any meaningful way. The poll-based competition data have been used in studies of state-level presidential polls (DeSart and Holbrook 2003; Holbrook and DeSart 1999) and were taken from "Poll Track" at NationalJournal.com and the now defunct PoliticsNow.com.
9We use one-tailed tests in establishing statistical significance be- cause we have directional hypotheses. The only exception is when a finding meets conventional levels of statistical significance and runs counter to our expectations. In these cases, we report two- tailed tests in the interest of full disclosure and to not exaggerate our findings.
693

THOMAS M. HOLBROOKAND SCOTT D. McCLURG
TABLE 1 Change in Voter Turnout as a Function of Campaign Activities and Other Factorsa
Variables
Total Presidential Campaign Visits
Total Presidential Ad Buys (Thous. of GRPs)
National Party Contributions
High Competition State
Lagged Voter Turnout
Senate Race on Ballot
Third Party Vote
1996 Election (1 if 1996, 0 otherwise)
2000 Election (1 if 2000, 0 otherwise)
Base Model
0.02
(0.57)b
0.006
(0.17) 0.69**
(1.92) 0.24
(0.56) -0.15**
(-1.86) 0.50
(0.65) 0.26**
(2.40) -9.70**
(-76.70) -0.11
(-0.07) Visits * Competition
Ads * Competition
Party Contributions * Competition
Constant
N
7.83**
(2.65)
150
0.82
273,556** Wald X2
Interaction Effects
-0.01 (-0.28)
0.02 (0.38) 0.81**
(2.46) 0.19
(0.26) -0.15**
(-2.03) 0.45
(0.57) 0.27**
(2.63) -9.52**
(-6.92) 0.07
(0.04) 0.10
(1.11) -0.01
(-0.56) -0.22
(-0.34) 7.99**
(2.68)
150
0.83 15,611.78**
**p < .05, one-tailed test. aRegression estimates with heteroskedastic panel corrected standard errors. bValues in parentheses are z-values.
Contrary to our hypotheses, campaign visits and ad-
vertising purchases exhibit no effect on overall turnout in the baseline model. And the findings from the interaction model offer no additional evidence of important effects from these variables.10 Instead, it appears that the most
important campaign-based influence on turnout comes from national party transfers to the states.
The findings from Table 1 suggest a modest but in-
teresting role for presidential campaigns in determining patterns of voter turnout across the states. The results
imply that party-based politics embedded in the states
(represented here by party transfers) are important to
general levels of participation. However, the absence of
strong and consistent findings for the other campaign variables suggests that overall turnout is more sensitive
to the broader political context of the election and long- term trends in the states than it is to short-term campaign effects. For example, strong third-party efforts appear to
generate increases in turnout, and the national political environment also has an impact on turnout as revealed
by a statistically significant difference between the highly contentious 1992 race and the low key 1996 race.
The Impact of Presidential Campaigns on the Composition
of the Electorate
Though the influence of the campaign on turnout ap- pears substantively small, a limited focus on voter turnout
694
MOBILIZATION OF CORE SUPPORTERS
may mask their most important effects, which is to shape who turns out to the polls. According to our theoret- ical model, presidential campaigns are most influential in shaping the partisan composition of the electorate rather than its overall size. Although the size of the elec- torate is not strongly responsive to campaign activities, aggregate stability may mask significant dynamics that exist below the surface (e.g., Huckfeldt and Sprague 1995, Chapter 4).
Patterns of Change. We begin with a simple question- does the political composition of state electorates change from election to election? At first glance, the answer is that they change very little. The average number of self- identified Democrats across states exhibits little change from election to election, with roughly 38% of voters con- sidering themselves to be Democrats in 1992, 38% again in 1996, and 37% in 2000. Similarly, the average number of Republicans in each state is roughly 35% in all three elections. The percentage of Independents is just 22% in 1992 and then rises to about 27% in 1996 and 2000.
Despite this apparent stability, further analysis shows that substantial dynamics exist in how the electorate changes from state to state. Figure 1 plots the percentage of core voters-self-identified Democrats and Republi- cans in exit polls-in each state against the percentage of that group in the preceding presidential election. We look for dynamics in two ways. First, each graph contains a solid line representing equality (meaning no change from one election to the next) and a regression line summariz- ing the statistically efficient relationship. If these lines have the same slope and intercept, it implies the absence of sys- tematic change in the state electoral composition between elections. If they are different, then it indicates that the composition of state electorates changes from one election to the next. Second, we can examine the variance around the regression line as an indicator of electoral dynam- ics. The larger the spread of cases around the regression
1?One potential explanation for these null results is that ad buys and candidate visits are collinear with statewide competition, thus masking their relationship with turnout. Consistent with Shaw's (2003) original analyses of these data, we do find significant corre- lations between competition, the total number of candidate visits (r = .24), and ad buys (r = .52) in the three campaigns for which we have full information. For sake of comparison, party expen- ditures are also correlated with competition (r = .40). In general terms, then, competitive states see more campaign activity than noncompetitive states. We do find that every state received some party money but that a fair number of states were exposed to no ads or candidate visits (see Shaw [2003] for the specifics). But since the interitem correlations are not very strong, and our results do not change significantly when the control for competition is removed from our models, we do not see collinearity as a plausible expla- nation for our modest findings regarding presidential campaign activity other than party expenditures.
line-and the farther they fall from the line of equality- the larger the change in electoral composition."1
In both Democratic plots the regression slope is lower and the intercept is higher than the line of equality. This means that states with high numbers of Democrats in one year had fewer in the next year, while states that had few Democrats participating in one election on average had more in the next election. The two lines are similar in the Republican graphs, showing very little change in the underlying structure of the Republican vote. However, despite this similarity, the mean-squared errors for the two Republican regression lines are 3.03 and 3.25, both of which are higher than the corresponding Democratic numbers (2.62 and 2.94, respectively). All in all, this graph illustrates that the partisan nature of the voting electorate shifts from election-to-election. The next step is to in- vestigate whether these changes are related to presidential campaigns.
Mobilization of Partisans. Recognizing the presence of dynamic change in electoral composition, we postulate that campaign activities mobilize the voters who con- stitute a party's core to participate but that they have weak effects on political independents. To investigate partisan mobilization, we examine change in net parti- san composition of the electorate from one presidential election to the next where net partisan composition is measured as the difference between self-identified Re- publicans and self-identified Democrats.12 We model underlying shifts in the partisan composition of state
"The VNS partisanship question is as follows: "No matter how you voted today, do you think of yourself as a Democrat, Repub- lican, independent, or something else?" Since this question does not "branch" independents who "lean" toward a particular party into partisan categories, we are probably underestimating the size of each party's core electorate in the states. On the one hand, we are capturing that part of the party core that most people would agree are true partisans (Miller 1991), but we are excluding independent leaners, who are just as partisan in their behavior as many "true" partisans (Keith et al. 1992). One implication of the underestima- tion of the parties' core electorate is that our models may understate the electoral consequences of partisan mobilization. It also means that we may find that campaign activities aimed at partisans may influence any measure of the nonpartisan portion of the electorate as well since it will include some who could rightly be considered partisans.
'2The technical representation of this measure is as follows: [Re- publicans, - Democratst] - [Republicanst_l - Democratst_l]. By using this measure, we are assuming that year-to-year changes in the states represent activation and reactivation of underlying pref- erences rather than fundamental shifts in underlying party identi- fications. There is some evidence that aggregate partisan shifts are responses to economic and political conditions (MacKuen, Erick- son, and Stimson 1989), providing indirect support for the second interpretation. However, we go forward with our interpretation for two reasons. First, it seems likely that on balance the individu- als who drive the aggregate change are more likely to be partisans
695

THOMAS M. HOLBROOKAND SCOTT D. McCLURG
FIGURE 1 Scatterplots of the Partisan Composition of State Electorate, 1992-2000
Democrats Democrats
LDCO
Lr)
C:,
Lr)
25 30 35 40 45 50 55
1996
Republicans
o
0 0 O
o 0 o
i , !
I
30 40 50
1992
Republicans
O A 00 O
o 0
''~00
.0 .
I I I
m o co
.,- CO
20 30 40 50 20 25 30 35 40 45 50
1996 1992
These graphs depict the state-by-state relationship in the proportion of Democrats and Repub- licans from one election to the next.
electorates as a function of net party differences (Re- publican - Democrat) in campaign effort (each party's candidate visits, campaign advertising, party transfers),13 the third-party vote (to account for peripheral, probably nonpartisan voters attracted by strong third-party bids), the existence of a Senate race on the ballot, a dichoto- mous variable for highly competitive races, a lagged mea- sure of the dependent variable, and dummy variables to control for year-specific influences on partisan compo- sition. As in Table 1, we analyze the composition of the electorate first in a baseline model and then with inter- actions of the competition variable with the campaign measures.
in everything but name only than they are to be individuals who radically reshape their political preferences. This would still con- stitute activation by the definition offered earlier and is consistent with our argument. Second, national shifts in aggregate partisan- ship are controlled for with other variables in the model, such as our dichotomous variables for election year. This minimizes the possibility that we are picking up global shifts in partisanship.
"3We are grateful to an anonymous reviewer for suggesting this approach.
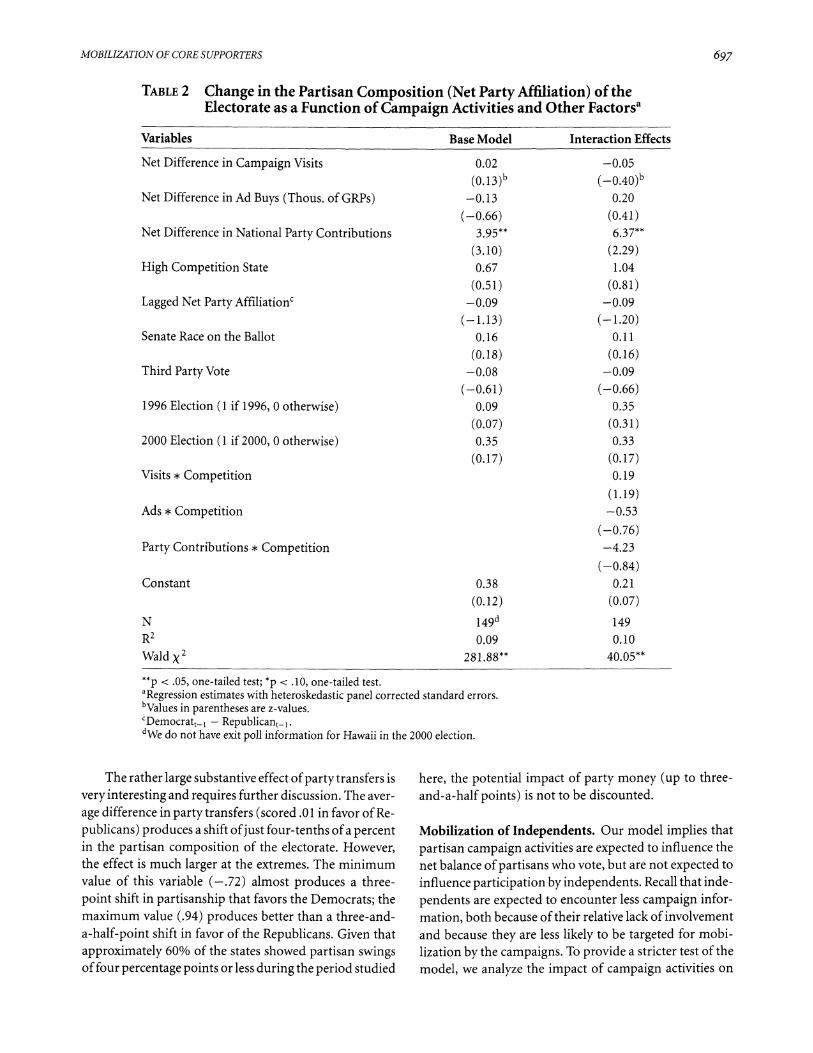
The results presented in Table 2 are similar to what we found in our analysis of voter turnout.14 As before, vari- ables measuring campaign visits and presidential cam-
paign advertising purchases are not statistically significant predictors of the partisan composition of the electorate in the baseline model. As implied by our theoretical model, national party transfers do have strong and sta- ble effects on partisan composition, despite the model
specification.
14One way in which this model is different from the turnout model is found in the relatively low level of explained variance (R2 = .10). We attribute this to the impact of differencing, which had varying effects in the two models. One consequence of using a "change" model is that the impact of one of the most important predictors of current values of the dependent variable-lagged values-is ab- sorbed in the differencing. Because the correlation between lagged and current net partisanship is appreciably stronger than the cor- relation between lagged and current turnout (r = .90 vs. r = .66), differencing has a greater (negative) effect on explained variance in Table 2 than in Table 1. Fortunately, this has no effect on the slopes and significance levels of the independent variables (except, of course, for lagged net partisanship): when the dependent vari- able is changed to current net partisanship, the only findings that change are the slope and z-score for lagged net partisanship and the explained variance, all of which increased in size dramatically.
,/ " /0 o
o
0
0 o <0
0
696
Ln -
CD
*
c:14'C3 co c -
o 0
C4 -
CD (:l c-
*n
CD
CN
o or-
CN c1-..
MOBILIZATION OF CORE SUPPORTERS
TABLE 2 Change in the Partisan Composition (Net Party Affiliation) of the Electorate as a Function of Campaign Activities and Other Factorsa
Variables Base Model
Net Difference in Campaign Visits
Net Difference in Ad Buys (Thous. of GRPs)
Net Difference in National Party Contributions
High Competition State
Lagged Net Party Affiliationc
Senate Race on the Ballot
Third Party Vote
1996 Election (1 if 1996, 0 otherwise)
2000 Election (1 if 2000, 0 otherwise)
Visits * Competition
Ads * Competition
Party Contributions * Competition
Constant
N
Wald X2
0.02
(0.13)b -0.13
(-0.66) 3.95**
(3.10) 0.67
(0.51) -0.09
(-1.13) 0.16
(0.18) -0.08
(-0.61) 0.09
(0.07) 0.35
(0.17)
0.38
(0.12)
149d
0.09 281.88**
Interaction Effects
-0.05
(-0.40)b
0.20
(0.41) 6.37**
(2.29) 1.04
(0.81) -0.09
(-1.20) 0.11
(0.16) -0.09
(-0.66) 0.35
(0.31) 0.33
(0.17) 0.19
(1.19) -0.53
(-0.76) -4.23
(-0.84) 0.21
(0.07)
149 0.10
40.05**
**p < .05, one-tailed test; *p < .10, one-tailed test. aRegression estimates with heteroskedastic panel corrected standard errors. bValues in parentheses are z-values. CDemocratt_l - Republicant_l. dWe do not have exit poll information for Hawaii in the 2000 election.
The rather large substantive effect of party transfers is
very interesting and requires further discussion. The aver-
age difference in party transfers (scored .01 in favor of Re-
publicans) produces a shift ofjust four-tenths of a percent in the partisan composition of the electorate. However, the effect is much larger at the extremes. The minimum value of this variable (-.72) almost produces a three-
point shift in partisanship that favors the Democrats; the maximum value (.94) produces better than a three-and-
a-half-point shift in favor of the Republicans. Given that
approximately 60% of the states showed partisan swings of four percentage points or less during the period studied
here, the potential impact of party money (up to three- and-a-half points) is not to be discounted.
Mobilization of Independents. Our model implies that
partisan campaign activities are expected to influence the net balance of partisans who vote, but are not expected to influence participation by independents. Recall that inde-
pendents are expected to encounter less campaign infor- mation, both because of their relative lack of involvement and because they are less likely to be targeted for mobi- lization by the campaigns. To provide a stricter test of the model, we analyze the impact of campaign activities on
697

THOMAS M. HOLBROOKAND SCOTT D. McCLURG
TABLE 3 Change in Independent Composition of the Electorate as a Function of Campaign Activities and Other Factorsa
Variables
Total Presidential Campaign Visits
Total Presidential Ad Buys (Thous. of GRPs)
National Party Contributions
High Competition State
Lagged Independents
Senate Race on Ballot
Third Party Vote
1996 Election (1 if 1996, 0 otherwise)
2000 Election (1 if 2000, 0 otherwise)
Base Model
-0.05
(-1.27)b 0.08**
(2.88) 0.47
(0.83) -0.25
(-0.75) -0.14**
(-2.64) 0.79**
(4.65) 0.18**
(2.53) -2.38**
(-2.54) -0.55
(-0.40) Visits * Competition
Ads * Competition
Party Contributions * Competition
Constant
N
3.29**
(2.42)
149
0.46
21,796.34** Wald X2
Interaction Models
-0.03
(-1.09) 0.09*
(1.31) 0.99
(0.74) 0.22
(0.22) -0.14**
(-2.57) 0.75**
(3.85) 0.17**
(2.24) -2.51**
(-2.67) -0.47
(-0.28) -0.04
(-0.50) 0.02
(0.16) -0.85
(-0.64) 3.07*
(1.61)
149
0.46
722.51**
**p < .05, one-tailed test; *p < .10, one-tailed test. aRegression estimates with heteroskedastic panel corrected standard errors. bValues in parentheses are z-values.
the independent composition of the electorate in Table 3, where the dependent variable is the change in the percent of the electorate who call themselves independents from one election to the next. The independent variables are the same as in the previous analysis, with the important excep- tions that the lagged variable is now the percent who were
independent in the previous election and campaign ac-
tivity is measured in terms of total activity rather than net
partisan differences. What we find here is rather striking: the primary engine of mobilization found in Tables 1 and
2-party money-has no discernable impact on changes in the share of the electorate that are independents.
However, there is some evidence that presidential ad-
vertising buys, measured in thousands of GRPs, have a
slight positive effect on the size of the nonpartisan portion of the electorate. According to the coefficient in the base- line model, the independent share of the electorate should increase by eight-tenths of 1 percent for every additional 1000 GRPs bought by the campaigns. The mean value of the TV advertising variable is 6,178, which translates into a modest increase in independents of approximately .49 percentage points. But at its maximum (26,218 GRPs), TV advertising translates into an increase in independents of 2.1 percentage points. And while this contradicts our
698

MOBILIZATION OF CORE SUPPORTERS
specific hypothesis, it is understandable in our theoreti- cal terms since these advertisements reach a much broader
population than do the other measures of campaign activ-
ity and are increasingly unlikely to employ partisan cues
(West 2001). At the same time, we don't want to make too much of this finding, as it represents a tenuous rela-
tionship, one that becomes marginally significant in the
presence of the interaction terms (second column of find-
ings in Table 3). In contrast to partisans then, independents seem
more affected by the presence of external stimuli such as a third-party candidate, the presence of a Senate race, and the national context of the election, none of which had an impact on changes in the net party composition of the electorate. These differences in findings illustrate the importance of making a core-nonpartisan distinction in studies of mobilization and campaign dynamics. In- stead of the asking "do campaigns mobilize?" we should be asking "whom do campaigns mobilize?"
Composition of the Electorate and Electoral Outcomes
Kramer's (1973) early party mobilization study postulated that the real impact of campaigns on election outcomes was to increase a party's proportion of sympathetic voters in the electorate. While the previous two sections show that the campaign is related to both voter turnout and the
proportion of core voters in the electorate, the final piece of the puzzle is to show that these have a meaningful effect on electoral success.
We therefore investigate the impact of demographic group participation, political composition, and campaign activity on the Democratic margin of victory in each state. The dependent variable in this analysis is the change in the Democratic margin of victory from the previous election, and the independent variable of primary interest is the change in net partisanship from the previous elec- tion. This variable is central to our argument that the mo-
bilizing effects of campaign activities have important con-
sequences for state-level presidential election outcomes.
Having demonstrated that party transfers influence the relative turnout of partisan groups, it is now necessary to demonstrate that changes in the partisan composition of the electorate have an impact on election outcome. We are not testing whether Democrats (Republicans) do bet- ter in states with more Democrats (Republicans). Instead, we are testing whether a short-term change in the relative numbers of Democrats (Republicans) has an impact on
The model also includes a host of demographic vari-
ables that are used to ensure that our estimates of the im-
pact of core voters on electoral outcomes are not subject to omitted variable bias. Among the demographic groups we examine are African Americans, low-income voters,
high-income voters, and women, each of which is esti- mated from exit poll data.15 We also include controls for
southern and northeastern states to account for other un- measured demographic and political factors.16 These vari-
ables should adequately capture the main group-based cleavages in American politics.
The first column of results in Table 4 illustrates the
impact of changes in partisanship on changes in votes. Here we see a pronounced positive and significant in-
fluence from changes in partisan composition. The co-
efficient for change in net partisanship suggests that for
every one-point increase in their net partisan advantage over Democrats, the Republicans can expect to increase the vote for their presidential candidate by .56 percentage points. At the mean level of change in partisan compo- sition (.02) this coefficient does not produce much of
an effect, but if you consider the range of impact from
one standard deviation below the mean (-5.13) to one
standard deviation above the mean (5.17), the change in
Democratic margin of victory ranges from a 2.9 point vote gain to a 2.9 point loss for Democrats. Given that
many states saw changes in partisan composition of the
electorate outside this one-standard deviation range, the
potential impact on vote is quite substantial. This finding lends support to the argument that cam-
paign activities-party transfers in particular-have im-
portant consequences for election outcomes. To the extent
that these activities influence the partisan composition of
the electorate through mobilization, they clearly have an
important effect on votes through changes in net parti- sanship. But it is also possible that their effect extends
'5For low-income and high-income voters, we used the percent whose income was less than $30,000 or greater than $75,000, re-
spectively. One problem with this operationalization, however, is that it becomes hopelessly intertwined with cost of living, which ends up correlating relatively strongly with party strength in the states. To ameliorate this problem we divided the percent in the
high- and low-income categories by the average percent in those
categories in each state across the three elections. This effectively expresses high- and low-income electorate relative to each state's
average percent of high- and low-income respondents.
"6Chief among these is political ideology, which tends to diverge from partisanship in the southern states. We are unable to include the exit poll marginals for ideology in our model because the ideol-
ogy question was only included in a handful of states in 1992. The states we code as south are Alabama, Florida, Georgia, Louisiana, Mississippi, North Carolina, South Carolina, Texas, and Virginia. States coded as North East are Connecticut, Delaware, Maine, Mas- sachusetts, New Hampshire, New Jersey, New York, Pennsylvania,
short-term changes in election outcomes.
699
Rhode Island, and Vermont.
THOMAS M. HOLBROOK AND SCOTT D. McCLURG
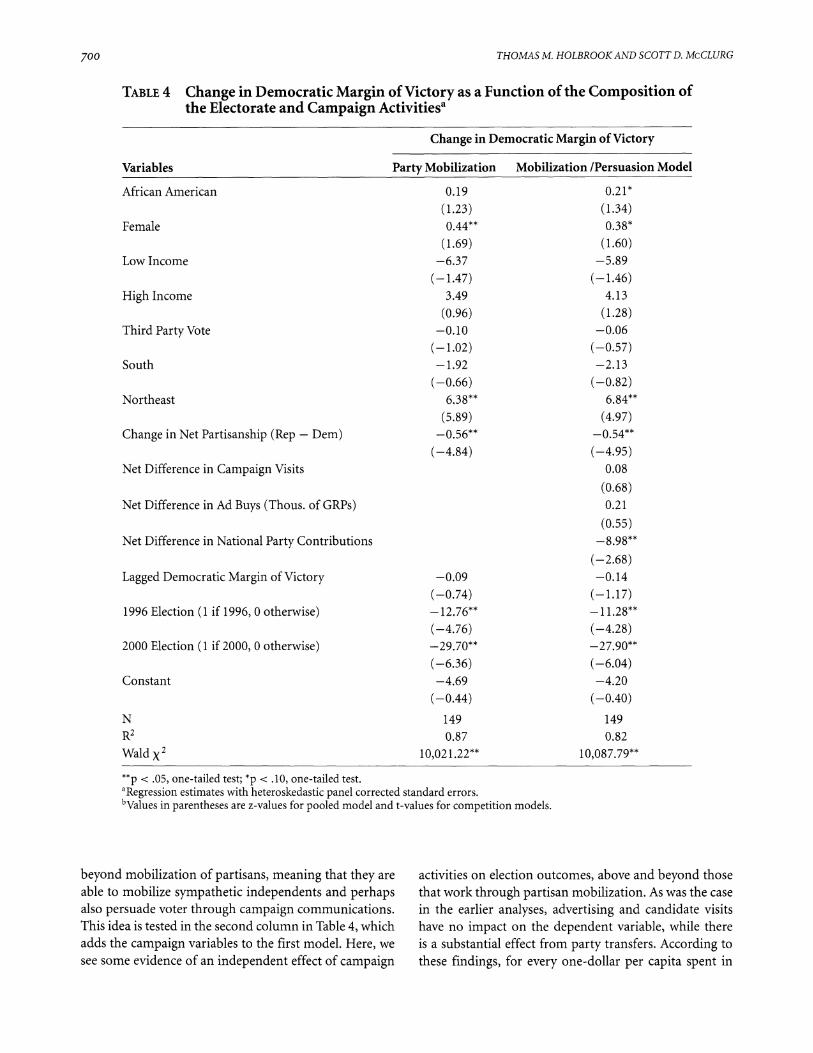
TABLE 4 Change in Democratic Margin of Victory as a Function of the Composition of the Electorate and Campaign Activitiesa
Change in Democratic Margin of Victory
Variables
African American
Female
Low Income
High Income
Third Party Vote
South
Northeast
Change in Net Partisanship (Rep - Dem)
Net Difference in Campaign Visits
Net Difference in Ad Buys (Thous. of GRPs)
Net Difference in National Party Contributions
Lagged Democratic Margin of Victory
1996 Election (1 if 1996, 0 otherwise)
2000 Election (1 if 2000, 0 otherwise)
Constant
N R2 Wald X
2
Party Mobilization
0.19
(1.23) 0.44**
(1.69) -6.37
(-1.47) 3.49
(0.96) -0.10
(-1.02) -1.92
(-0.66) 6.38**
(5.89) -0.56**
(-4.84)
-0.09 (-0.74) -12.76**
(-4.76) -29.70** (-6.36) -4.69
(-0.44) 149 0.87
10,021.22**
Mobilization /Persuasion Model
0.21*
(1.34) 0.38*
(1.60) -5.89
(-1.46) 4.13
(1.28) -0.06
(-0.57) -2.13
(-0.82) 6.84**
(4.97) -0.54**
(-4.95) 0.08
(0.68) 0.21
(0.55) -8.98**
(-2.68) -0.14
(-1.17) -11.28** (-4.28) -27.90**
(-6.04) -4.20
(-0.40) 149 0.82
10,087.79**
**p < .05, one-tailed test; *p < .10, one-tailed test. aRegression estimates with heteroskedastic panel corrected standard errors. bValues in parentheses are z-values for pooled model and t-values for competition models.
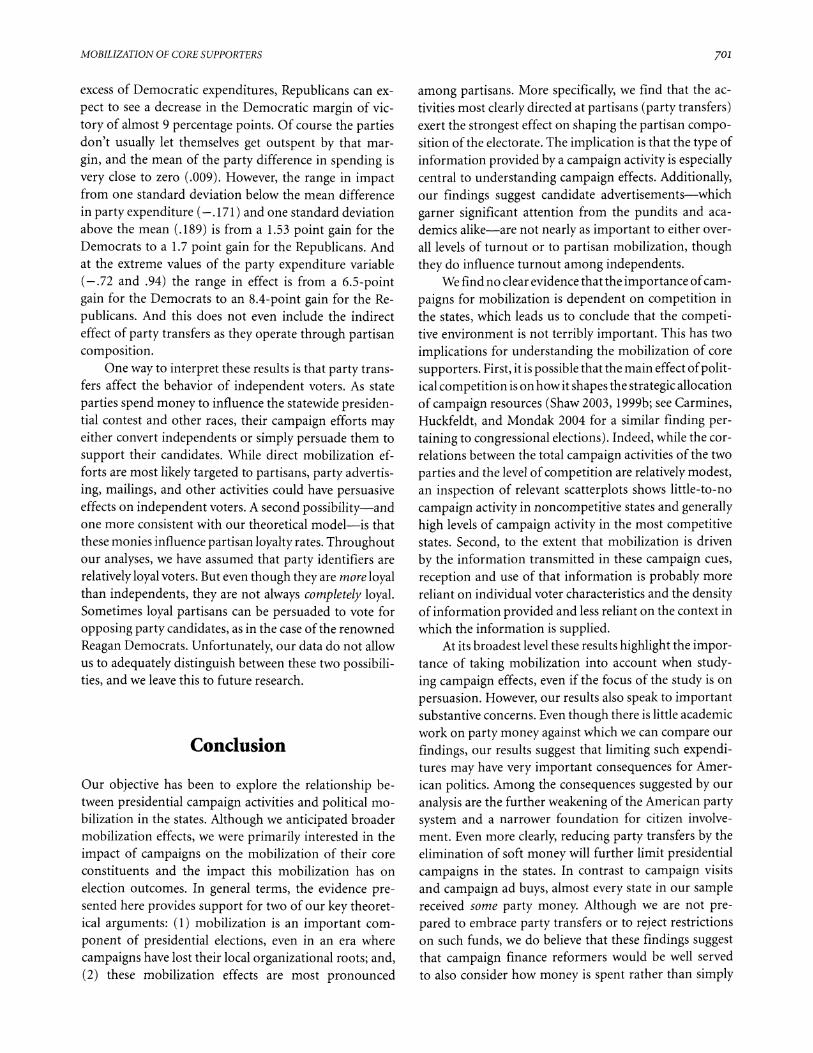
beyond mobilization of partisans, meaning that they are able to mobilize sympathetic independents and perhaps also persuade voter through campaign communications. This idea is tested in the second column in Table 4, which adds the campaign variables to the first model. Here, we see some evidence of an independent effect of campaign
activities on election outcomes, above and beyond those that work through partisan mobilization. As was the case in the earlier analyses, advertising and candidate visits have no impact on the dependent variable, while there is a substantial effect from party transfers. According to these findings, for every one-dollar per capita spent in
7oo
MOBILIZATION OF CORE SUPPORTERS
excess of Democratic expenditures, Republicans can ex-
pect to see a decrease in the Democratic margin of vic-
tory of almost 9 percentage points. Of course the parties don't usually let themselves get outspent by that mar-
gin, and the mean of the party difference in spending is
very close to zero (.009). However, the range in impact from one standard deviation below the mean difference in party expenditure (-.171) and one standard deviation above the mean (.189) is from a 1.53 point gain for the Democrats to a 1.7 point gain for the Republicans. And at the extreme values of the party expenditure variable (-.72 and .94) the range in effect is from a 6.5-point gain for the Democrats to an 8.4-point gain for the Re-
publicans. And this does not even include the indirect effect of party transfers as they operate through partisan composition.
One way to interpret these results is that party trans- fers affect the behavior of independent voters. As state
parties spend money to influence the statewide presiden- tial contest and other races, their campaign efforts may either convert independents or simply persuade them to
support their candidates. While direct mobilization ef- forts are most likely targeted to partisans, party advertis-
ing, mailings, and other activities could have persuasive effects on independent voters. A second possibility-and one more consistent with our theoretical model-is that these monies influence partisan loyalty rates. Throughout our analyses, we have assumed that party identifiers are
relatively loyal voters. But even though they are more loyal than independents, they are not always completely loyal. Sometimes loyal partisans can be persuaded to vote for
opposing party candidates, as in the case of the renowned
Reagan Democrats. Unfortunately, our data do not allow us to adequately distinguish between these two possibili- ties, and we leave this to future research.
Conclusion
Our objective has been to explore the relationship be- tween presidential campaign activities and political mo- bilization in the states. Although we anticipated broader mobilization effects, we were primarily interested in the
impact of campaigns on the mobilization of their core constituents and the impact this mobilization has on election outcomes. In general terms, the evidence pre- sented here provides support for two of our key theoret- ical arguments: (1) mobilization is an important com-
ponent of presidential elections, even in an era where
campaigns have lost their local organizational roots; and,
among partisans. More specifically, we find that the ac- tivities most clearly directed at partisans (party transfers) exert the strongest effect on shaping the partisan compo- sition of the electorate. The implication is that the type of information provided by a campaign activity is especially central to understanding campaign effects. Additionally, our findings suggest candidate advertisements-which
garner significant attention from the pundits and aca- demics alike-are not nearly as important to either over- all levels of turnout or to partisan mobilization, though they do influence turnout among independents.
We find no clear evidence that the importance of cam-
paigns for mobilization is dependent on competition in the states, which leads us to conclude that the competi- tive environment is not terribly important. This has two
implications for understanding the mobilization of core
supporters. First, it is possible that the main effect of polit- ical competition is on how it shapes the strategic allocation of campaign resources (Shaw 2003, 1999b; see Carmines, Huckfeldt, and Mondak 2004 for a similar finding per- taining to congressional elections). Indeed, while the cor- relations between the total campaign activities of the two
parties and the level of competition are relatively modest, an inspection of relevant scatterplots shows little-to-no
campaign activity in noncompetitive states and generally high levels of campaign activity in the most competitive states. Second, to the extent that mobilization is driven
by the information transmitted in these campaign cues,
reception and use of that information is probably more reliant on individual voter characteristics and the density of information provided and less reliant on the context in which the information is supplied.
At its broadest level these results highlight the impor- tance of taking mobilization into account when study- ing campaign effects, even if the focus of the study is on
persuasion. However, our results also speak to important substantive concerns. Even though there is little academic work on party money against which we can compare our
findings, our results suggest that limiting such expendi- tures may have very important consequences for Amer- ican politics. Among the consequences suggested by our
analysis are the further weakening of the American party system and a narrower foundation for citizen involve- ment. Even more clearly, reducing party transfers by the elimination of soft money will further limit presidential campaigns in the states. In contrast to campaign visits and campaign ad buys, almost every state in our sample received some party money. Although we are not pre- pared to embrace party transfers or to reject restrictions on such funds, we do believe that these findings suggest that campaign finance reformers would be well served to also consider how money is spent rather than simply
701
(2) these mobilization effects are most pronounced
THOMAS M. HOLBROOK AND SCOTT D. McCLURG
regulating how much can be raised. In any case, we believe more analysis of this issue is required.
The assumptions of our mobilization model suggest other pathways for future research. First, we assume- rather than demonstrate-that the link between cam-
paign activity and the mobilization of core voters is based on the information transmitted by campaigns. Second, we also assume that the relationship between campaign activity and electoral composition is related to the ac- tivation of latent support. Both assumptions are them- selves worthy of empirical exploration. Our results also show that party transfers influence election outcomes above their effect on electoral composition, which, as we
suggested earlier, may be an indication that campaigns are important in how they influence rates of partisan loyalty.
Altogether we see that mobilization plays an impor- tant role in presidential elections. Campaign effects occur not only through winning the hearts and minds of some voters, but also by getting the right people-their likely supporters-to turnout to vote. The ability of parties to
change the balance of partisans in the electorate through campaign activities could pay big dividends, especially in
relatively close contests.
References
Abramson, Paul R., and William Claggett. 2001. "Recruit- ment and Political Participation." Political Research Quar- terly 54(4):905-16.
Ansolabehere, Stephen, and Shanto Iyengar. 1995. Going Nega- tive: How Political Advertising Shrinks and Polarizes the Elec- torate. New York: Free Press.
Ansolabehere, Stephen, and James M. Snyder, Jr. 2000. "Soft Money, Hard Money, Strong Parties." Columbia Law Review 100:598-619.
Ansolabehere, Stephen, Shanto Iyengar, Adam Simon. 1999. "Replicating experiments using aggregate and survey data: The case of negative advertising and turnout." American Po- litical Science Review 93(4):901-09.
Ansolabehere, Stephen, Shanto Iyengar, Adam Simon, and Nicholas Valentino. 1994. "Does Attack Advertising De- mobilize the Electorate?" American Political Science Review 88:829-38.
Bartels, Larry M. 1993. "Messages Received: The Political Im- pact of Media Exposure." American Political Science Review 87:267-85.
Berelson, Bernard R., Paul F. Lazarsfeld, and William N. McPhee. 1954. Voting: A Study of Opinion Formation in a Presidential Campaign. Chicago: University of Chicago Press.
Campbell, Angus, Phillip E. Converse, Warren E. Miller, and Donald E. Stokes. 1960. The American Voter. New York: John Wiley & Sons.
Campbell, James E. 2000. The American Campaign: U.S. Pres- idential Campaigns and the National Vote. College Station: Texas A&M University Press.
Carsey, Thomas M. 2000. Campaign Dynamics: The Race for Governor. Ann Arbor: University of Michigan Press.
Carmines, Edward G., and Robert Huckfeldt, and Jeffrey J. Mon- dak. 2004. "Information, Activation, and Electoral Compe- tition in the 2002 Congressional Election." Prepared for pre- sentation at the Annual Meetings of the Southern Political Science Association, New Orleans.
Cohen, Jeffery E., Michael A. Krassa, and John A. Hamman. 1991. "The Impact of Presidential Campaigning on Midterm U.S. Senate Elections." American Political Science Review 85:165-78.
Converse, Phillip. 1962. "Information Flow and the Stability of Partisan Attitudes." Public Opinion Quarterly 26(4):578- 99.
Cox, Gary, and Michael Munger. 1989. "Closeness, Expendi- tures, and Turnout in the1982 U.S. House Elections." Amer- ican Political Science Review 83:217-31.
Delli Carpini, Michael X., and Scott Keeter. 1996. What Amer- icans Know about Politics and Why It Matters. New Haven: Yale University Press.
DeNardo, James. 1980. "Turnout and the Vote: The Jokes on the Democrats." American Political Science Review 93(4):901-09.
Djupe, Paul A., and David A.M. Peterson. 2002. "The Impact of Negative Campaigning: Evidence from the 1998 Sen- atorial Primaries." Political Research Quarterly 55(4):845- 60.
Desart, Jay, and Thomas M. Holbrook. 2003 "State-wide Trial- Heat Polls and the 2000 Presidential Election: A Forecast Model." Social Science Quarterly 84:561-73.
Finkel, Steven. 1993. "Reexamining the 'Minimal Effects' model in Recent Presidential Elections." Journal of Politics 55:1- 21.
Finkel, Steven E., and John G. Geer. 1998. "A Spot Check: Cast- ing Doubt on the Demobilizing Effect of Attack Advertising." American Journal of Political Science 42:573-95.
Fischle, Mark. 2000. "Mass Response to the Lewinsky Scandal: Motivated Reasoning or Bayesian Updating?" Political Psy- chology 21:135-59.
Frankovic, Kathleen. 2001. "Fixing the U.S. Election Polling Problems Means Fixing Election Problems." WAPOR Newsletter First Quarter: 1-5.
Freedman, Paul, and Ken Goldstein. 1999. "Measuring Media Exposure and the Effects of Negative Campaign Ads." Amer- ican Journal of Political Science 43:1189-208.
Gelman, Andrew, and Gary King. 1993. "Why Are American Presidential Election Polls so Variable When Votes Are so Predictable?" British Journal of Political Science 23:409- 519.
Gerber, A.S., and D.P. Green. 2000a. "The Effect of a Nonpartisan Get-Out-the-Vote Drive: An Experimen- tal Study of Leafleting." Journal of Politics 62(3):846- 57.
Gerber, Allan S., and Donald P. Green. 2000b. "The Effects of Canvassing, Telephone Calls, and Direct Mail on Voter Turnout: A Field Experiment." American Political Science Re- view 94(3):656-64.
702

MOBILIZATION OF CORE SUPPORTERS
Goldstein, Kenneth, and Travis Ridout. 2002. "The Politics of Participation: Mobilization and Turnout over Time." Politi- cal Behavior 24:3-29.
Herr, J. Paul. 2002. "The Impact of Campaign Appearances in the 1996 Election." Journal of Politics 64(3):904-13.
Herrnson, Paul S. 2000. Congressional Elections: Campaigning at Home and in Washington, 3rd ed. Washington: Congressional Quarterly Press.
Holbrook, Thomas. 1994. "Campaigns, National Conditions, and U.S. Presidential Elections." American Journal of Political Science 38(4):973-98.
Holbrook, Thomas. 1996. Do Campaigns Matter? Thousand Oaks: Sage Publications.
Holbrook, Thomas, and Jay DeSart. 1999. "Using State Polls to Forecast Presidential Elections in the American States." International Journal of Forecasting 15(2):137-42.
Huckfeldt, Robert, and John Sprague. 1992. "Political Parties and Electoral Mobilization: Political Structure, Social Struc- ture, and the Party Canvass." American Political Science Re- view 86(1):405-23.
Huckfeldt, Robert, and John Sprague. 1995. Citizens, Politics, and Social Communication: Information and Influence in an Election Campaign. Cambridge: Cambridge University Press.
Jackson, Robert A. 1997. "The Mobilization of US State Elec- torates in the 1988 and 1990 Elections." Journal of Politics 59(2):520-37.
Jackson, Robert A. 2002. "Gubernatorial and Senatorial Cam- paign Mobilization of Voters." Political Research Quarterly 55(4):825-44.
Jones, Jeffery M. 1998. "Does Bringing Out the Candidate Bring Out the Votes? The effects of Nominee Campaigning in Pres- idential Elections." American Politics Quarterly 26(4):395- 419.
Kahn, Kim, and Patrick Kenney. 1999. "Do Negative Campaigns Mobilize or Suppress Turnout? Clarifying the Relationship between Negativity and Participation." American Political Science Review 93(4):877-89.
Keith, Bruce E., David B. Magelby, Candice J. Nelson, Elizabeth Orr, Mark C. Westlye, and Raymond E. Wolfinger. 1992. The Myth of the Independent Voter. Berkeley: University of California Press.
Kramer, Gerald. 1973. "The Effects of Precinct -Level Canvass- ing on Voter Behavior." Public Opinion Quarterly 34(4):560- 72.
Lau, Richard R., Lee Sigelman, Caroline Heldman, and Paul Babbitt. 1999. "The Effects of Negative Political Advertise- ments: A Meta-Analytic Assessment." American Political Sci- ence Review 93(4):851-75.
Lazarsfeld, Paul F, Bernard Berelson, and Hazel Gaudet. 1944. The People's Choice: How the Voter Makes Up His Mind in a Presidential Campaign. New York: Duell, Sloan and Pearce.
MacKuen, Michael B., Robert S. Erikson, and James A. Stim- son. 1989. "Macropartisanship." American Political Science Review 83(4):1125-42.
McClurg, Scott D. 2004. "Indirect Mobilization: The Social
Consequences of Party Contacts in an Election Campaign." American Politics Research 32(4):403-46.
Miller, Warren E. 1991. "Party Identification, Realignment, and
Party Voting: Back to Basics." American Political Science Re- view 85(2):557-68.
Miller, Warren E., and J. Merrill Shanks. 1996. The New Ameri- can Voter. Cambridge: Harvard University Press.
Patterson, Samuel, and Gregory A. Caldeira. 1983. "Getting out the Vote: Participation in Gubernatorial Elections." Ameri- can Political Science Review 77(3):675-89.
Popkin, Samuel. 1991. The Reasoning Voter. Chicago: University of Chicago Press.
Rosenstone, Steven, and John Mark Hansen. 1993. Mobiliza- tion, Participation and Democracy in America. New York: MacMillan.
Shaw, Daron R. 1999a. "The Effect of TV Ads and Candidate Appearances on Statewide Presidential Votes, 1988-1996." American Political Science Review 93(2):345- 61.
Shaw, Daron R. 1999b. "The Methods Behind the Madness: Presidential Electoral College Strategies, 1988-1996." Jour- nal of Politics 61(4):893-913.
Shaw, Daron R. 2003. "A Simple Game: Uncovering Cam-
paign Effects in the 2000 Presidential Election." Unpublished manuscript. University of Texas at Austin.
Shaw, Daron, and Brian Roberts. 2000. "Campaign Events and the Prospects of Victory: The 1992 and 1996 U.S. Presiden- tial Elections." British Journal of Political Science 30(2):259- 89.
Sigelman, Lee, and Mark Kugler. 2003. "Why Is Research on the Effects of Negative Campaigning So Inconclusive? Un-
derstanding Citizens' Perceptions of Negativity." Journal of Politics 65(1): 142-60.
Wattenberg, Martin, and Craig Brians. 1999. "Negative Cam-
paign Advertising: Demobilizer or Mobilizer?" American Po- litical Science Review 93(4):891-99.
West, Darrell. 2001. Air Wars: Television Advertising in Election
Campaigns, 1952-2000. Washington: Congressional Quar-
terly Press.
Wielhouwer, Peter W. 1999. "The Mobilization of Campaign Activists by the Party Canvas." American Politics Quarterly 27:177-200.
Wielhouwer, Peter W. 2003. "In Search of Lincoln's Perfect List - Targeting in grassroots campaigns." American Politics Re- search 31(6):632-69.
Wielhouwer, Peter W., and Brad Lockerbie. 1994. "Party Con-
tacting and Political Participation, 1952-1990." American
Journal of Political Science 38(1):211-29.
Zaller, John. 1992. The nature and origins of mass opinion. Cam-
bridge: Cambridge University Press.
Zipp, John F 1985. "Perceived Representativeness and Voting: The Impact of 'Choices' versus 'Echoes'." American Political Science Review 79(1):50-61.
703