The method of N-grams in large-scale clustering of DNA texts
11
ARTICLE IN PRESS Pattern Recognition ( ) – www.elsevier.com/locate/patcog The method of N -grams in large-scale clustering of DNA texts Z. Volkovich a , ∗ , V. Kirzhner b , A. Bolshoy b , E. Nevo b , A. Korol b a Department of Software Engineering, ORT Braude College, P.O. Box 78, Karmiel, 20101, Israel b Institute of Evolution, University of Haifa, Mount Carmel, Haifa 31905, Israel Received 30 July 2004; received in revised form 2 May 2005; accepted 2 May 2005 Abstract This paper is devoted to the techniques of clustering of texts based on the comparison of vocabularies of N-grams. In contrast to the regular N-grams approach, the proposed N-grams method is based on calculation of imperfect occurrences of N-grams in a text up to a number of mismatched strings. We demonstrated that such an approach essentially improves the resolving capacity of the N-grams method for DNA texts. Additionally, we discuss a mutual usage scheme of different clustering technique types to verify the partition quality. 2005 Pattern Recognition Society. Published by Elsevier Ltd. All rights reserved. Keywords: N -grams; Strings mismatching; Clustering; Genome comparisons; Compositional spectra 1. Introduction Clustering problems arise in various areas of text mining and information retrieval. Typically, given a language each document is reduced to representation by a vector of fre- quencies of terms selected in an appropriate way. The next step relates to finding a suitable distance between the vec- tors, such as Euclidian, Manhattan, Covariance distances, etc. (e.g. Refs. [1,2]), which could provide a reasonable di- vision. Finally, a clustering based on the chosen distance is performed by means of one of the partitioning methods, e.g. resembling the k-means method [3] or k-medoids pro- cedures [4]. 1.1. N -grams technique Probably, Shannon [5] in 1948 was the first to employ N-grams for characterizing texts (he also proposed the ∗ Corresponding author. Tel.: +972 4 990 1862; fax: +972 4 990 1852. E-mail address: [email protected] (Z. Volkovich). 0031-3203/$30.00 2005 Pattern Recognition Society. Published by Elsevier Ltd. All rights reserved. doi:10.1016/j.patcog.2005.05.002 term N-gram). He was speaking about a “discrete source as generating the message, symbol by symbol” [5]. By Shan- non, this could be a message written in a natural language, continuous information sources that have been rendered dis- crete (for example, speech) and, more generally, an abstract stochastic process which generates a sequence of symbols. In particular, Shannon’s N-grams were defined as formal words (i.e. not related to their real values). Informally speak- ing, if an object can be represented by a sequence over the taken alphabet A, then one way of performing a feature ex- traction is to describe it in terms of its subsequences. An N- gram is a subsequence of length N. Despite its initial narrow usage in the theory of communication, N-grams were later applied more widely including such fields as classification of different “texts” like messages in natural and artificial languages, music, images, etc. Depending on the application field, this approach may use N-grams of different length—for example, from 2 to 100 letters. The effect of N-grams lengths is discussed in detail in the literature. For instance, the Stores system [6] suggests the value of N = 3 because it yields the best selectivity in the search access rate. Other systems have used trigrams in order to conserve memory or disk accesses [7]. Cavnar [8]
-
Upload
independent -
Category
Documents
-
view
1 -
download
0
Transcript of The method of N-grams in large-scale clustering of DNA texts
ARTICLE IN PRESS
Pattern Recognition ( ) –www.elsevier.com/locate/patcog
The method ofN -grams in large-scale clustering of DNA texts
Z. Volkovicha,∗, V. Kirzhnerb, A. Bolshoyb, E. Nevob, A. KorolbaDepartment of Software Engineering, ORT Braude College, P.O. Box 78, Karmiel, 20101, Israel
bInstitute of Evolution, University of Haifa, Mount Carmel, Haifa 31905, Israel
Received 30 July 2004; received in revised form 2 May 2005; accepted 2 May 2005
Abstract
This paper is devoted to the techniques of clustering of texts based on the comparison of vocabularies ofN-grams. Incontrast to the regularN-grams approach, the proposedN-grams method is based on calculation of imperfect occurrencesof N-grams in a text up to a number of mismatched strings. We demonstrated that such an approach essentially improvesthe resolving capacity of theN-grams method for DNA texts. Additionally, we discuss a mutual usage scheme of differentclustering technique types to verify the partition quality.� 2005 Pattern Recognition Society. Published by Elsevier Ltd. All rights reserved.
Keywords:N -grams; Strings mismatching; Clustering; Genome comparisons; Compositional spectra
1. Introduction
Clustering problems arise in various areas of text miningand information retrieval. Typically, given a language eachdocument is reduced to representation by a vector of fre-quencies of terms selected in an appropriate way. The nextstep relates to finding a suitable distance between the vec-tors, such as Euclidian, Manhattan, Covariance distances,etc. (e.g. Refs.[1,2]), which could provide a reasonable di-vision. Finally, a clustering based on the chosen distanceis performed by means of one of the partitioning methods,e.g. resembling thek-means method[3] or k-medoids pro-cedures[4].
1.1. N -grams technique
Probably, Shannon[5] in 1948 was the first to employN-grams for characterizing texts (he also proposed the
∗ Corresponding author. Tel.: +972 4 990 1862;fax: +972 4 990 1852.
E-mail address:[email protected](Z. Volkovich).
0031-3203/$30.00� 2005 Pattern Recognition Society. Published by Elsevier Ltd. All rights reserved.doi:10.1016/j.patcog.2005.05.002
termN-gram). He was speaking about a “discrete source asgenerating the message, symbol by symbol”[5]. By Shan-non, this could be a message written in a natural language,continuous information sources that have been rendered dis-crete (for example, speech) and, more generally, an abstractstochastic process which generates a sequence of symbols.In particular, Shannon’sN-grams were defined as formalwords (i.e. not related to their real values). Informally speak-ing, if an object can be represented by a sequence over thetaken alphabet A, then one way of performing a feature ex-traction is to describe it in terms of its subsequences. AnN-gram is a subsequence of lengthN. Despite its initial narrowusage in the theory of communication,N-grams were laterapplied more widely including such fields as classificationof different “texts” like messages in natural and artificiallanguages, music, images, etc.
Depending on the application field, this approach mayuseN-grams of different length—for example, from 2 to 100letters. The effect ofN-grams lengths is discussed in detailin the literature. For instance, the Stores system[6] suggeststhe value ofN = 3 because it yields the best selectivity inthe search access rate. Other systems have used trigrams inorder to conserve memory or disk accesses[7]. Cavnar[8]
2 Z. Volkovich et al. / Pattern Recognition ( ) –
ARTICLE IN PRESS
employed bigrams and trigrams together in the same sys-tem assuming that bigrams provide better matching for in-dividual words while trigrams provide the connections be-tween words to improve phrase matching, thus complement-ing each other. Cohen[9] and Damashek[10] used 5-grams,while Robertson and Willett[11] used bigrams and trigrams,with no reasons provided for these choices. It is also possi-ble to use initiallyk-grams and then move to(k − 1)-gramsto improve the results. Thus, Huffman and Damashek[12]and Huffman[13] reached about 20% improvement of gar-bled text. For Korean text retrieval, bigrams applied in com-bination withN-grams provided the best 11-point averageprecision[14].
In general, a comparison of linear symbolic sequencesbased on theN-grams technique proved to be effective re-gardless of the origin of the sequence processed includingimaging, voice processing, and music. Any such “text” is re-duced to a vocabulary of the frequencies ofN-grams alongthe whole sequence or its pieces. Proximity between suchvocabularies can then be used for text comparisons.
In this paper, we apply theN-grams technique for classi-fying DNA sequences considered as text over the four-letteralphabetU={A, C, G, T}. One can consider formal wordsof varying lengthsL: word means a string of lengthL overthe alphabetU. Clearly, these words are exactly Shannon’sN-grams. However, in order to retain the standard terminol-ogy evolved in the field of bioinformatics, we continue touse the term “word” for discussing concrete biological sit-uations andN-grams in general contexts.
1.2. Clustering technique
Generally speaking, most of the existing clustering meth-ods can be categorized into three groups: partitioning, hier-archical, and density-based approaches. We apply here parti-tioning and hierarchical methods only. Partitioning methodshave the advantage of being able to incorporate knowledgeabout the size of the clusters by using certain templates andthe elements’ dissimilarity in the objective function. Such analgorithm is guaranteed to produce clustering for any dataalthough there is currently no generally accepted way to testthe null hypothesis of no clustering (e.g. that the data aredistributed uniformly).
In addition, the known hierarchical clustering proce-dures yield a nested sequence of partitions and, as a rule,avoid specifying how many clusters are appropriate. This isachieved by providing a partition from cutting the tree (den-drogram) at some level. Inner statistical tests (see generaloverview in Ref.[15]) could hardly serve a guide on whereto cut the dendrogram. On the other hand, partitioning meth-ods may produce a tighter cluster structure than hierarchicalones and are computationally faster with a larger numberof variables in the case of a small number of clusters. Suchmethods do not usually do well with non-globular clusters,and the difference between various partitioning methodslies in the strategies of making a compromise to find
suboptimal solutions. In fact, different methods could yielddiverse results. Even with a specific method, the solutionsare usually sensitive to initial conditions. Both clusteringtypes may also be used together[16].
1.3. Methods of comparison of DNA texts based onN -grams
It is important to realize that the four chemical bases ofDNA are exactly the same in all living organisms. EachDNA fragment may be sequenced and its sequence will au-thentically and adequately represent it. We apply the ap-proach based on theN-grams technique to cluster DNA se-quences representing complete genomes. The genome is thetotal genetic constitution of an organism. Excluding thoseof viruses, genomes consist of one or more double-strandedmolecules of DNA. Certainly DNA fragments, short or long,are molecules (biopolymers) but from an information pointof view these molecules may be fully characterized by theirsequences and DNA sequences are linear texts over the fourletter alphabet: {A, T, G, C}. A complete genome of a rel-atively simple organism is a pretty long text, hundreds ofthousands for the smallest; usually millions of letters. Hered-itary fragments of a genome are called genes. The vast ma-jority of genes code for messenger RNAs (mRNAs) that aretranslated into proteins, with the collection of all protein-coding genes within a genome referred to as the proteome.Some methods of genome classification are based on reduc-tion of a whole genome to its proteome exclusively. Thegenome also contains a small set of genes coding for struc-tural RNAs. In both prokaryotes and eukaryotes, such RNAsplay critical roles in many functions. Collectively, all theprotein-coding and structural RNA-coding genes constitutethe genic DNA of a genome. For prokaryotes, this is the bulkof the entire genome. In eukaryotes, genic DNA comprisesonly a fraction (and in some cases a very small fraction) ofthe total genome.There are methods of genome taxonomybased on comparison of chosen genic elements, protein cod-ing or RNA-coding. However, there are also methods of se-quence comparisons unrelated to genomic functional struc-ture. Frequently such methods are called linguistic becausethey use variousN-grams-based techniques.
In one of the recent reviews[17], a few methods ofDNA sequence analysis based on counting textualN-gramswere presented. As we mentioned above, the most acceptedapproach to genome comparison is to calculate similar-ity among one or more pairs of homologous genes of thegenomes. This is the strategy of choice in molecular evo-lution studies. The methods based on counting word occur-rences cannot replace the methods based on investigationof homologies. Nevertheless, they serve as a supporting ap-proach in comparative genomics and molecular evolution.One form of statistical summarization is based on analyzingfrequencies of oligonucleotides (DNAN-grams). For exam-ple, consideringN equal to four, there are 256 different 4-grams (256 tetranucleotides over the DNA alphabet). One
ARTICLE IN PRESSZ. Volkovich et al. / Pattern Recognition ( ) – 3
can treat the set of tetranucleotide frequencies as a statisti-cal summary of the given DNA sequence. By using the fre-quency distributions of tetranucleotides, one can carry out acomparison between a pair of DNA sequences. It was shownmany times that this method could reveal certain biologi-cally significant features in a DNA sequence (see, for exam-ple, Refs.[18–20]). This methodology assumes thatN (thefixed given size of theN-words) is relatively small allow-ing for computationally reasonable and statistically justifiedsequence comparisons.
There are biologically motivated improvements of sucha methodology. One direction of development lies in a se-rious increase of word length. Kirzhner et al.[21,22] pro-posed a novel natural approach to characterize genomic se-quences. According to this approach, a genomic sequenceis reduced to a histogram of imperfect occurrences ofN-grams. High flexibility characterizes this approach due toan allowance for imperfect matching, so that relatively longwords comprising the compositional spectra can be consid-ered. The similarity of spectra obtained on different stretchesof the same genome, and, simultaneously, a broad range ofdissimilarities between spectral representations of differentgenomes, justify the usefulness of compositional spectra asan informative genome characteristic.
We analyzed different values ofN and possible dimen-sions ofN-grams vectors. It appeared that in the case ofa DNA text, a set of 200N-grams withN = 10 may besufficient to successful clustering of DNA sequences. As itwas mentioned above the issue of the number ofN-grams(i.e. dimension of a corresponding vector) appears to bevery widespread. Usually, the suggestion is to include allN-grams. Their potential number grows exponentially, yetthe real number, evidently, is confined by the length of aspecific text. It is also important to mention that in contrastto usualN-gram techniques, we have determined the occur-rence of a givenN-gram in a text with certain inaccuracy[21]. Indeed, small local “mismatching” in a genetic text isusually considered routine in biological systems, as opposedto linguistic texts, when the number of such mistakes shouldbe very limited. In addition, by the allowance of a certainlevel of mismatching, we obtain better frequency statistics:instead of tens of occurrences of eachN-gram we can gethundreds and thousands.
In this paper, we analyze possible distances in the space ofN-gram frequencies from the viewpoint of clustering DNAtexts. Two clustering approaches are employed. The firstone, WPGMA, is agglomerative whereas the second one,Partition Around Medoids (PAM or thek-medoids), is a par-tition algorithm. The obtained results are compared keepingin mind biological interpretations.
The article is arranged in the following way. In Section2 we describe, based on our previous work[21,22], theN-grams method as applied to DNA texts. In Section 3, wecompare characteristics of several distances from the view-point of clustering genomes (DNA sequences). In Section4, we describe clustering methods and results, which are
discussed in Section 5 on the basis of formal and biologi-cally meaningful criteria. The list of species and the clus-tering results are given inTable 3in the appendix.
2. Dictionary of N -grams for DNA text
2.1. Calculating compositional spectrum (CS)
In accordance with our previous definitions[21] as a per-fect occurrence in a target sequenceS meansx is a substringof string S. Word y is an imperfect occurrence ofx in S
meansy is a substring ofS, and distance (in a given met-ric space) betweenx andy is less than a threshold (in thegiven metrics). Wordx is an imperfect occurrence ofwi inS if Hamming distance between wordwi and wordx lessthan givenr. This approximate matching can be denoted as“r-mismatching”.
Let us consider a setW (dictionary) ofn different words(oligonucleotides in biochemical terminology)wi of lengthL, n>4L, where 4L are the total number of maximally pos-sible different words of lengthL. The quantityn is assumedrelatively small. Bymi we denote the number of imperfectoccurrences of wordwi of the setW in a target sequenceS : mi = occ(wi |S). Now let M = �mi . The vector of fre-quency distributionF(W, S) of fi =mi/M will be referredto as a compositional spectrum of the sequence S relative tothe setW .
2.2. N -grams selection and dictionary composition
The pre-selected setW ofN-grams effectively distinguish-ing the texts may (a) not be attached to the texts beforehand,(b) not be unique, and (c) be relatively small. In particular,
(a) For any given parametersL and n we consider a setW as a random sample from the set of all possibleN-grams with a sampling procedure that can be representedas a stochastic procedure of word generation. Let thewords be produced by sequentially adding new letters(out of the four-letter alphabet) with equal probability ofappearance of each letter at the new currently generatedposition. We call such stochastic procedure uniformlyrandom and any resulted random set W of words willalso be referred to as a uniformly random set. Thus, weselect a setW independently of the current base of thetexts.
(b) Every uniformly random set defined in (a) may be usedas anN-gram dictionary. Theoretically, different dictio-naries may result in a different correlation between textdistances. However, the remarkable fact is that this isnot the case for DNA texts[21]. In particular, a veryhigh correlation is characteristic for sequences taken ran-domly from the same genomes.
(c) Concerning the size of the dictionaryW and a fixedlength of a word in the dictionary, the following
4 Z. Volkovich et al. / Pattern Recognition ( ) –
ARTICLE IN PRESS
considerations based on our previous massive compar-isons may be helpful[21]. Remarkably, selection of ap-propriate dictionary parameters depends on a text size.As a first step of reduction, we randomly chose a contin-uous genome fragment of the size|S|=500, 000 bp. Ex-cept a few small parasites, all organisms have genomeslarger than 1 Mbp, so a random extraction of such afragment is possible leaving the rest of a genome for theverification of results. A next step is to choose a sizeN
for a N-gram dictionary. There are a few different con-siderations in a choice of this parameter. From the bio-logical point of view, the length should be in the rangeof 8–20 bases, typical for protein binding sites. A nextparameter, a number of mismatches should correspondto about 20–30% of a site length. Alternatively, it ispossible to get a theoretical estimate of a character wordlength. For this purpose we would use the theory usedin DNA sequencing and technology, which was namedsequencing by hybridization (SBH). According to thisapproach the whole sequence of the lengthN is recon-structed from a complete set of its subsequences of thepredefined length (N-grams). This theory also considersa possibly ambiguous reconstruction resulting in a fewvariants of a whole sequence, so the theory provides “theprobability of unique reconstruction”. Theoretical esti-mations for the chosen length of the text (500,000 bp)give the following values: sizeL from 10 (words aspatterns with gaps of un-sampled positions—imperfectmatching with a number of mismatches close to 20% oftheL value), up to 20 letters (perfect matching)[23–25].
It is obvious, that a problem of reconstruction, especiallypartial, is similar to a problem of classification. Thus, bas-ing both on empirical and theoretical considerations we tooksets of words of a fixed length from 10 up to 20. In a text of500,000 letters a word of the length 10 has in average about10 perfect occurrences. Allowing two mismatches numbersof imperfect occurrences of words of length 10 vary in sig-nificant range—from hundreds up to thousand. It createsstretched enough scale. At significant increase in length ofa word, sayL = 15, allows the number of mismatchesr togrow from 7 to 8 if we consider the same number of words(for e.g. 8) in sequences of the same length, i.e. the numberof identical letters remains constant—about 8. Therefore wechose parametersL = 10, r = 2 though, it seems that, somevariation of these parameters is insignificant for the furtherconsiderations.
The sizen of the dictionary was established empiricallyminding a problem of further clustering. For this procedurewe took a set of approximately 50 genomes. In one cycleof the procedure for the fixed dictionary of the sizen, allpairwise distances between any pair of those genomes werecalculated. Repeating this step for 100 dictionaries of thelengthn we obtained an average dispersion as a function ofn. The saturation happened aroundn = 200. Thus, in thisstudy we deal withCS for parametersL=10, n=200, r=2.
Testing of various dictionaries with such parametersshowed, thatCS various parts of genomes of the size of500,00 bp appeared to be practically identical.
2.3. Material
The described approach was applied to the analysis ofcluster structures in a set of genomes including DNA se-quences of 37 species of Eukaryota, Eubacteria, and Archaea(see Appendix,Table 3, column A).
3. Distances in the compositional spectra space
By definition, a compositional spectrum of the sequenceS relative to the setW is a vector of frequenciesF(W, S).There are various methods to measure dissimilarity be-tween two distribution-vectorst = (t1, t2, . . . , tn) andu = (u1,u2, . . . ,un). In this paper we compare severalpossible distances.
It is associated with one of the famous problems of theCluster Analysis concerning the identification of the opti-mum number of clusters. As the synthesis process contin-ues, increasingly dissimilar clusters must be fused, i.e. theclassification becomes increasingly artificial. Usage of thehistogram of distances appears to be the most appropriateway to handle this problem (see Refs.[26,27]). Namely, lo-cal minima of the histogram of all pairwise distances makea cluster structure of the data such that the masses of all lo-cal peaks indicate the density of the clusters’ concentration.(A number of local minima could provide a lower bound forthe number of possible clusters.) Note that this methodol-ogy makes it possible to assess the discriminating capabil-ities of a distance measure without running any clusteringprocedure. For example, detection of two essential local his-togram minimum points leads to an assumption that thereare at least three clusters.
We examined the next distances:1. The Euclidian distance that is defined for two distribu-
tionst = (t1, t2, . . . , tn) andu= (u1,u2, . . . ,un) by the con-
ventional way as
d1(t,u) =n∑
i=1
(ti − ui )2.
2. The Manhattan distance
d2(t,u) =n∑
i=1
abs(ti − ui ).
3. The Max-distance
d3(t,u) = maxi
abs(ti − ui ).
ARTICLE IN PRESSZ. Volkovich et al. / Pattern Recognition ( ) – 5
4. KS-like distance, in the case when the coordinates ofthe vectorst andu can be interpreted as frequencies
d4(t,u) = maxi
|Fi − Ui |,
where
Fi =∑i
j=1tj∑nj=1tj
, Ui =∑i
j=1uj∑nj=1uj
are the relative cumulative distributions. This distance is as-sociated with the well-known Kolmogorov–Smirnov statis-tics.
5. The correlation dissimilarity
d5(t,u) = (1 − R(t,u))/2,
whereR(t,u) is the Pearson correlation coefficient.6. The Spearman dissimilarity
d6(t,u) = (1 − �(t,u))/2,
where�(t,u) is the Spearman rank correlation coefficient.7. The Kendall dissimilarity
d7(t,u) = (1 − �(t,u))/2,
where�(t,u) is the Kendall rank correlation coefficient.We investigated all distances according to their potential
ability to produce a “meaningful” partition using the sameset of 37 chosen species (Appendix). We have also takentwo sequences 300–400 kb long from each genome, exclud-ing the Human genome (where 11 sequences were taken).Thus, the initial set (database) included 85 sequences. Sucha structure of the database (more than one sequence fromevery genome) will allow a natural control of the groupingquality in data. Then, the compositional spectrum (N-gramvector) had been calculated for every sequence as describedin Section 2.
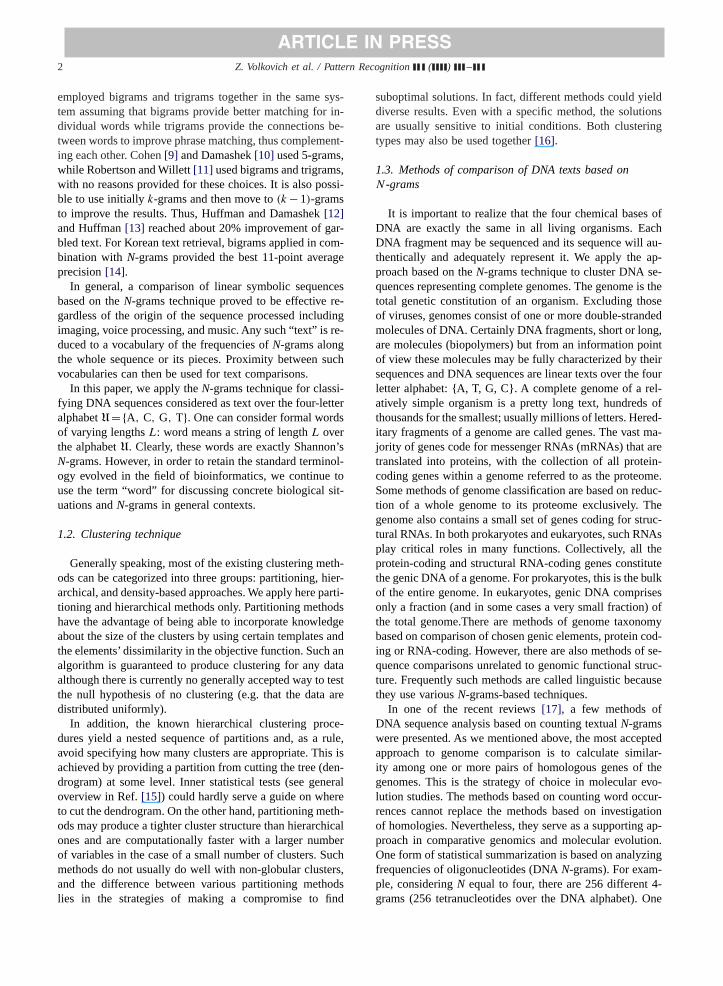
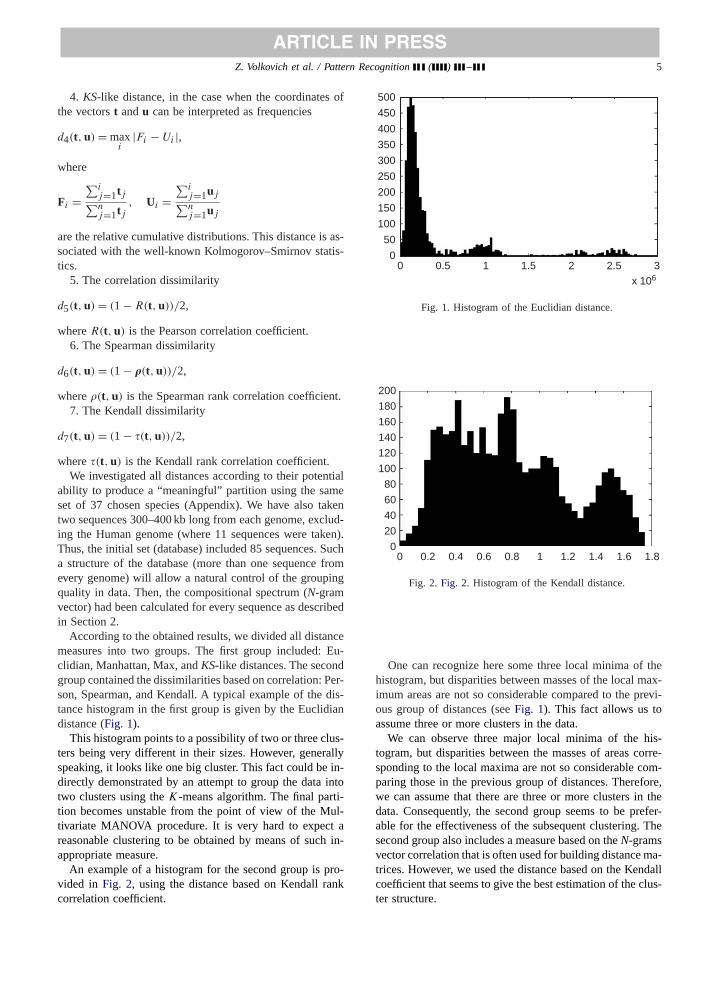
According to the obtained results, we divided all distancemeasures into two groups. The first group included: Eu-clidian, Manhattan, Max, andKS-like distances. The secondgroup contained the dissimilarities based on correlation: Per-son, Spearman, and Kendall. A typical example of the dis-tance histogram in the first group is given by the Euclidiandistance (Fig. 1).
This histogram points to a possibility of two or three clus-ters being very different in their sizes. However, generallyspeaking, it looks like one big cluster. This fact could be in-directly demonstrated by an attempt to group the data intotwo clusters using theK-means algorithm. The final parti-tion becomes unstable from the point of view of the Mul-tivariate MANOVA procedure. It is very hard to expect areasonable clustering to be obtained by means of such in-appropriate measure.
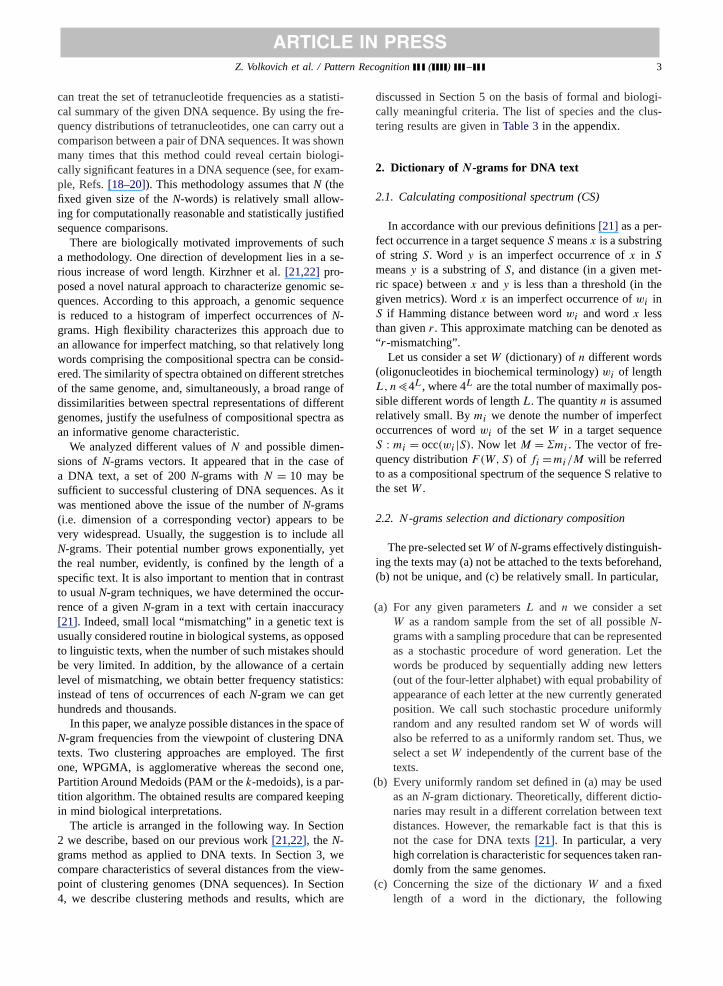
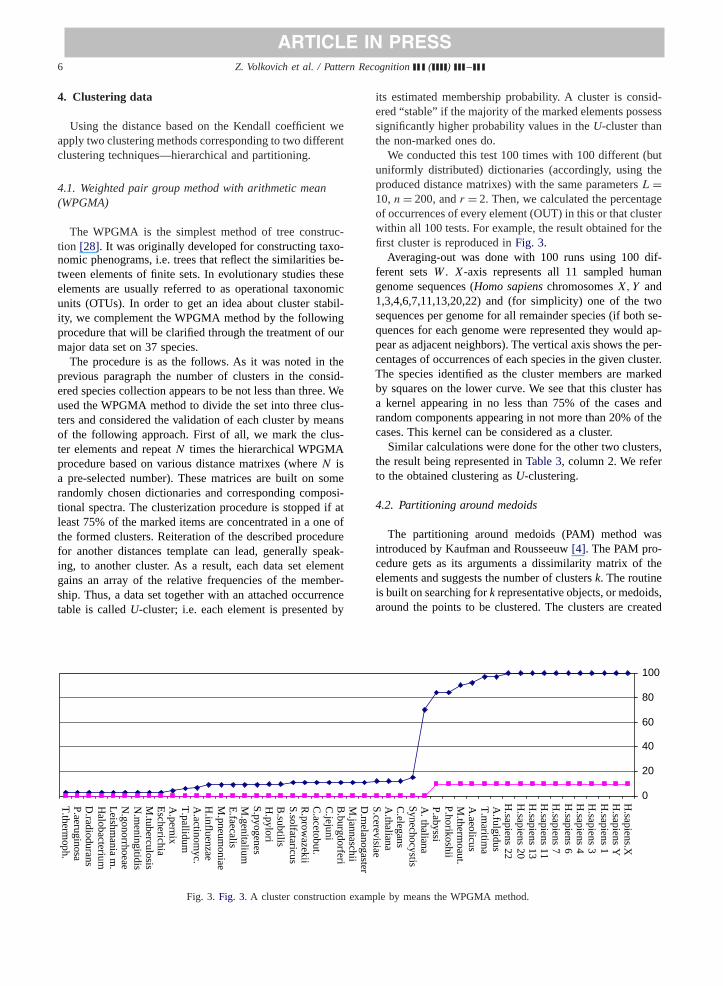
An example of a histogram for the second group is pro-vided in Fig. 2, using the distance based on Kendall rankcorrelation coefficient.
500
450
400
350
300
250
200
150
100
50
00 0.5 1 1.5 2 2.5 3
x 106
Fig. 1. Histogram of the Euclidian distance.
200
180
160
140
120
100
80
60
40
20
00 0.2 0.4 0.6 0.8 1 1.2 1.4 1.6 1.8
Fig. 2. Fig. 2. Histogram of the Kendall distance.
One can recognize here some three local minima of thehistogram, but disparities between masses of the local max-imum areas are not so considerable compared to the previ-ous group of distances (seeFig. 1). This fact allows us toassume three or more clusters in the data.
We can observe three major local minima of the his-togram, but disparities between the masses of areas corre-sponding to the local maxima are not so considerable com-paring those in the previous group of distances. Therefore,we can assume that there are three or more clusters in thedata. Consequently, the second group seems to be prefer-able for the effectiveness of the subsequent clustering. Thesecond group also includes a measure based on theN-gramsvector correlation that is often used for building distance ma-trices. However, we used the distance based on the Kendallcoefficient that seems to give the best estimation of the clus-ter structure.
6 Z. Volkovich et al. / Pattern Recognition ( ) –
ARTICLE IN PRESS
4. Clustering data
Using the distance based on the Kendall coefficient weapply two clustering methods corresponding to two differentclustering techniques—hierarchical and partitioning.
4.1. Weighted pair group method with arithmetic mean(WPGMA)
The WPGMA is the simplest method of tree construc-tion [28]. It was originally developed for constructing taxo-nomic phenograms, i.e. trees that reflect the similarities be-tween elements of finite sets. In evolutionary studies theseelements are usually referred to as operational taxonomicunits (OTUs). In order to get an idea about cluster stabil-ity, we complement the WPGMA method by the followingprocedure that will be clarified through the treatment of ourmajor data set on 37 species.
The procedure is as the follows. As it was noted in theprevious paragraph the number of clusters in the consid-ered species collection appears to be not less than three. Weused the WPGMA method to divide the set into three clus-ters and considered the validation of each cluster by meansof the following approach. First of all, we mark the clus-ter elements and repeatN times the hierarchical WPGMAprocedure based on various distance matrixes (whereN isa pre-selected number). These matrices are built on somerandomly chosen dictionaries and corresponding composi-tional spectra. The clusterization procedure is stopped if atleast 75% of the marked items are concentrated in a one ofthe formed clusters. Reiteration of the described procedurefor another distances template can lead, generally speak-ing, to another cluster. As a result, each data set elementgains an array of the relative frequencies of the member-ship. Thus, a data set together with an attached occurrencetable is calledU-cluster; i.e. each element is presented by
0
20
40
60
80
100
H.sapiens.X
H.sapiens Y
H.sapiens 1
H.sapiens 3
H.sapiens 4
H.sapiens 6
H.sapiens 7
H.sapiens 11
H.sapiens 13
H.sapiens 20
H.sapiens 22
A.fulgidus
T.m
aritima
A.aeolicus
M.therm
oaut. P
.horikoshii P
.abyssi A
. thaliana S
ynechocystis C
.elegans A
.thaliana S
.cerevisiae D
.melanogaste r
M.jannaschii
B.burgdorferi
C.jejuni
C.acetobut.
R.prow
azekii S
.solfataricus B
.subtilis H
.pylori S
.pyogenes M
.genitalium E
.faecalis M
.pneumoniae
H.influenzae
A.actinom
yc. T
.pallidum A
.pernix E
scherichia M
.tuberculosis N
.meningitidis
N.gonorrhoeae
Leishmania m
. H
alobacterium D
.radiodurans P
.aeruginosa T
.thermoph.
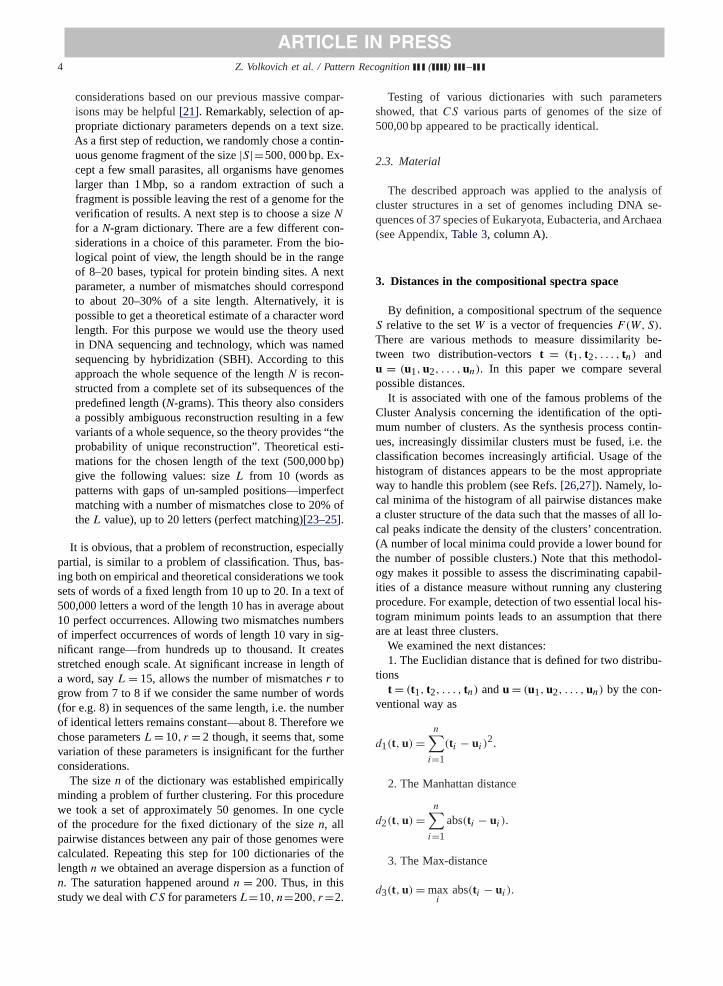
Fig. 3. Fig. 3. A cluster construction example by means the WPGMA method.
its estimated membership probability. A cluster is consid-ered “stable” if the majority of the marked elements possesssignificantly higher probability values in theU-cluster thanthe non-marked ones do.
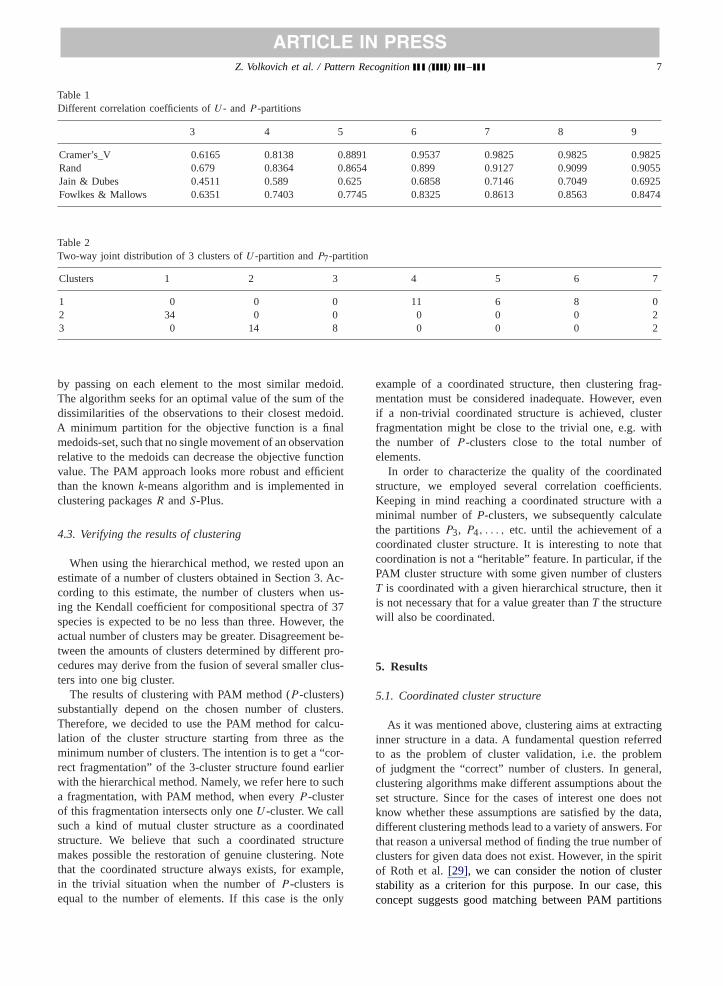
We conducted this test 100 times with 100 different (butuniformly distributed) dictionaries (accordingly, using theproduced distance matrixes) with the same parametersL =10, n = 200, andr = 2. Then, we calculated the percentageof occurrences of every element (OUT) in this or that clusterwithin all 100 tests. For example, the result obtained for thefirst cluster is reproduced inFig. 3.
Averaging-out was done with 100 runs using 100 dif-ferent setsW . X-axis represents all 11 sampled humangenome sequences (Homo sapienschromosomesX, Y and1,3,4,6,7,11,13,20,22) and (for simplicity) one of the twosequences per genome for all remainder species (if both se-quences for each genome were represented they would ap-pear as adjacent neighbors). The vertical axis shows the per-centages of occurrences of each species in the given cluster.The species identified as the cluster members are markedby squares on the lower curve. We see that this cluster hasa kernel appearing in no less than 75% of the cases andrandom components appearing in not more than 20% of thecases. This kernel can be considered as a cluster.
Similar calculations were done for the other two clusters,the result being represented inTable 3, column 2. We referto the obtained clustering asU-clustering.
4.2. Partitioning around medoids
The partitioning around medoids (PAM) method wasintroduced by Kaufman and Rousseeuw[4]. The PAM pro-cedure gets as its arguments a dissimilarity matrix of theelements and suggests the number of clustersk. The routineis built on searching fork representative objects, or medoids,around the points to be clustered. The clusters are created
ARTICLE IN PRESSZ. Volkovich et al. / Pattern Recognition ( ) – 7
Table 1Different correlation coefficients ofU - andP -partitions
3 4 5 6 7 8 9
Cramer’s_V 0.6165 0.8138 0.8891 0.9537 0.9825 0.9825 0.9825Rand 0.679 0.8364 0.8654 0.899 0.9127 0.9099 0.9055Jain & Dubes 0.4511 0.589 0.625 0.6858 0.7146 0.7049 0.6925Fowlkes & Mallows 0.6351 0.7403 0.7745 0.8325 0.8613 0.8563 0.8474
Table 2Two-way joint distribution of 3 clusters ofU -partition andP7-partition
Clusters 1 2 3 4 5 6 7
1 0 0 0 11 6 8 02 34 0 0 0 0 0 23 0 14 8 0 0 0 2
by passing on each element to the most similar medoid.The algorithm seeks for an optimal value of the sum of thedissimilarities of the observations to their closest medoid.A minimum partition for the objective function is a finalmedoids-set, such that no single movement of an observationrelative to the medoids can decrease the objective functionvalue. The PAM approach looks more robust and efficientthan the knownk-means algorithm and is implemented inclustering packagesR andS-Plus.
4.3. Verifying the results of clustering
When using the hierarchical method, we rested upon anestimate of a number of clusters obtained in Section 3. Ac-cording to this estimate, the number of clusters when us-ing the Kendall coefficient for compositional spectra of 37species is expected to be no less than three. However, theactual number of clusters may be greater. Disagreement be-tween the amounts of clusters determined by different pro-cedures may derive from the fusion of several smaller clus-ters into one big cluster.
The results of clustering with PAM method (P -clusters)substantially depend on the chosen number of clusters.Therefore, we decided to use the PAM method for calcu-lation of the cluster structure starting from three as theminimum number of clusters. The intention is to get a “cor-rect fragmentation” of the 3-cluster structure found earlierwith the hierarchical method. Namely, we refer here to sucha fragmentation, with PAM method, when everyP -clusterof this fragmentation intersects only oneU -cluster. We callsuch a kind of mutual cluster structure as a coordinatedstructure. We believe that such a coordinated structuremakes possible the restoration of genuine clustering. Notethat the coordinated structure always exists, for example,in the trivial situation when the number ofP -clusters isequal to the number of elements. If this case is the only
example of a coordinated structure, then clustering frag-mentation must be considered inadequate. However, evenif a non-trivial coordinated structure is achieved, clusterfragmentation might be close to the trivial one, e.g. withthe number ofP -clusters close to the total number ofelements.
In order to characterize the quality of the coordinatedstructure, we employed several correlation coefficients.Keeping in mind reaching a coordinated structure with aminimal number ofP-clusters, we subsequently calculatethe partitionsP3, P4, . . . , etc. until the achievement of acoordinated cluster structure. It is interesting to note thatcoordination is not a “heritable” feature. In particular, if thePAM cluster structure with some given number of clustersT is coordinated with a given hierarchical structure, then itis not necessary that for a value greater thanT the structurewill also be coordinated.
5. Results
5.1. Coordinated cluster structure
As it was mentioned above, clustering aims at extractinginner structure in a data. A fundamental question referredto as the problem of cluster validation, i.e. the problemof judgment the “correct” number of clusters. In general,clustering algorithms make different assumptions about theset structure. Since for the cases of interest one does notknow whether these assumptions are satisfied by the data,different clustering methods lead to a variety of answers. Forthat reason a universal method of finding the true number ofclusters for given data does not exist. However, in the spiritof Roth et al.[29], we can consider the notion of clusterstability as a criterion for this purpose. In our case, thisconcept suggests good matching between PAM partitions
8 Z. Volkovich et al. / Pattern Recognition ( ) –
ARTICLE IN PRESS
Table 3Summary table of the used species and theirU - andP -partitions
A B 3 4 5 6 7 8 9
Operational taxonomic units U -structure PAM PAM PAM PAM PAM PAM PAM
Homo sapienschr. X 1 0 3 3 3 3 3 3Homo sapienschr. Y 1 0 3 3 3 3 3 3Homo sapienschr. 1 1 0 3 3 3 3 3 3Homo sapienschr. 3 1 0 3 3 3 3 3 3Homo sapienschr. 4 1 0 3 3 3 3 3 3Homo sapienschr. 6 1 0 3 3 3 3 3 3Homo sapienschr. 7 1 0 3 3 3 3 3 3Homo sapienschr. 11 1 0 3 3 3 3 3 3Homo sapienschr. 13 1 0 3 3 3 3 3 3Homo sapienschr. 20 1 0 3 3 3 3 3 3Homo sapienschr. 22 1 0 3 3 3 3 3 3Pyrococcus hor 1 0 0 0 5 5 5 5Pyroccocus hor 1 0 0 0 5 5 5 5Methanobacterium thermoautotroph 1 0 3 4 4 4 4 8Methanobacterium thermoautotroph 1 1 3 4 4 4 4 8Archaeoglobus fungulus 1 0 3 4 4 4 4 4Archaeoglobus fungulus 1 2 2 4 4 4 4 4Aquifex aeolicus 1 0 0 4 5 5 5 5Aquifex aeolicus 1 0 0 4 5 5 5 5A. thalianamitochondrial genome 1 0 3 3 5 5 5 5A. thalianamitochondrial genome 1 0 3 3 5 5 5 5Thermotoga maritima 1 0 0 4 4 4 4 4Thermotoga maritima 1 0 0 4 4 4 4 4Pyrococcus abyssi 1 0 0 0 5 5 5 5Pyrococcus abyssi 1 0 0 0 5 5 5 5Caenorhabditis elegans 2 0 0 0 0 0 0 0Caenorhabditis elegans 2 0 0 0 0 0 0 0Synechocystissp. 2 2 2 2 2 6 6 6Synechocystissp. 2 2 2 2 2 6 6 6Saccharomyces cerevisiae 2 0 0 0 0 0 0 0Saccharomyces cerevisiae 2 0 0 0 0 0 0 0Arabidopsis thaliana 2 0 0 0 0 0 0 0Arabidopsis thaliana 2 0 0 0 0 0 0 0Drosophila melanogaster 2 0 0 0 0 0 0 0Drosophila melanogaster 2 0 0 0 0 0 0 0Methanococcus jan 2 0 0 0 0 0 0 0Methanococcus jan 2 0 0 0 0 0 0 0Streptococcus pyogenes 2 0 0 0 0 0 0 0Streptococcus pyogenes 2 0 0 0 0 0 0 0Borrelia burgdorferi 2 0 0 0 0 0 0 0Borrelia burgdorferi 2 0 0 0 0 0 0 0Bacillus subtilis 2 0 0 0 0 0 0 0Bacillus subtilis 2 0 0 0 0 0 0 0Helicobacter pylori 2 0 0 0 0 0 0 0Helicobacter pylori 2 0 0 0 0 0 0 0Mycoplasma genitalium 2 0 0 0 0 0 0 0Mycoplasma genitalium 2 0 0 0 0 0 0 0Enterococcus faecalis 2 0 0 0 0 0 0 0Enterococcus faecalis 2 0 0 0 0 0 0 0Mycoplasma pneumoniae 2 0 0 0 0 0 0 0Mycoplasma pneumoniae 2 0 0 0 0 0 0 0Campylobacter jejuni 2 0 0 0 0 0 0 0Campylobacter jejuni 2 0 0 0 0 0 0 0Haemophilus influenzae 2 0 0 0 0 0 0 0Haemophilus influenzae 2 0 0 0 0 0 0 0
ARTICLE IN PRESSZ. Volkovich et al. / Pattern Recognition ( ) – 9
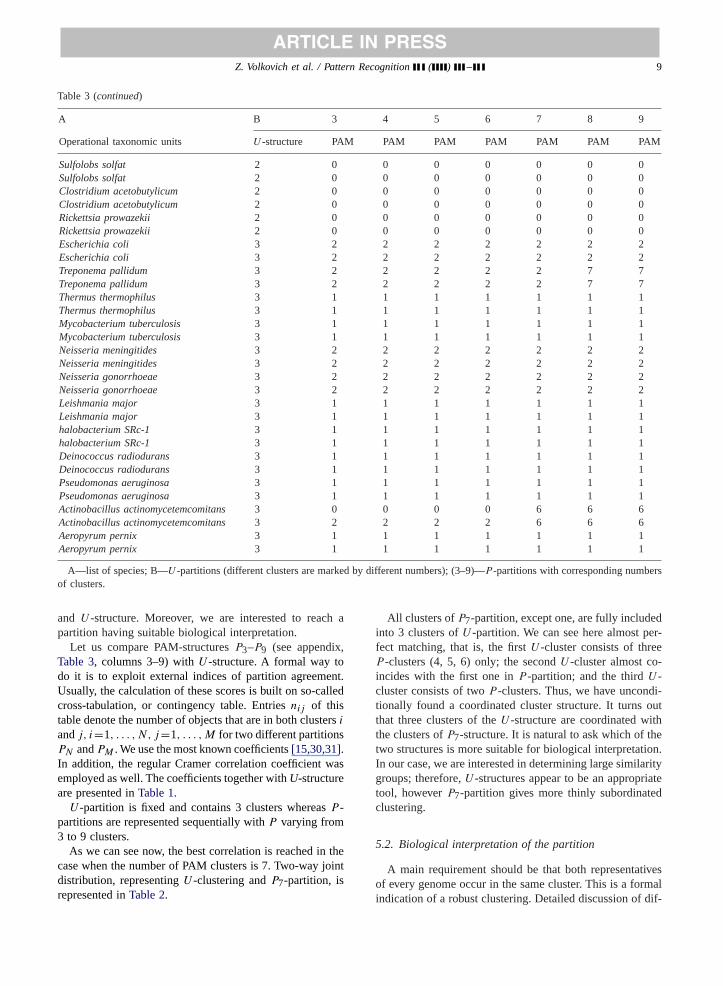
Table 3 (continued)
A B 3 4 5 6 7 8 9
Operational taxonomic units U -structure PAM PAM PAM PAM PAM PAM PAM
Sulfolobs solfat 2 0 0 0 0 0 0 0Sulfolobs solfat 2 0 0 0 0 0 0 0Clostridium acetobutylicum 2 0 0 0 0 0 0 0Clostridium acetobutylicum 2 0 0 0 0 0 0 0Rickettsia prowazekii 2 0 0 0 0 0 0 0Rickettsia prowazekii 2 0 0 0 0 0 0 0Escherichia coli 3 2 2 2 2 2 2 2Escherichia coli 3 2 2 2 2 2 2 2Treponema pallidum 3 2 2 2 2 2 7 7Treponema pallidum 3 2 2 2 2 2 7 7Thermus thermophilus 3 1 1 1 1 1 1 1Thermus thermophilus 3 1 1 1 1 1 1 1Mycobacterium tuberculosis 3 1 1 1 1 1 1 1Mycobacterium tuberculosis 3 1 1 1 1 1 1 1Neisseria meningitides 3 2 2 2 2 2 2 2Neisseria meningitides 3 2 2 2 2 2 2 2Neisseria gonorrhoeae 3 2 2 2 2 2 2 2Neisseria gonorrhoeae 3 2 2 2 2 2 2 2Leishmania major 3 1 1 1 1 1 1 1Leishmania major 3 1 1 1 1 1 1 1halobacterium SRc-1 3 1 1 1 1 1 1 1halobacterium SRc-1 3 1 1 1 1 1 1 1Deinococcus radiodurans 3 1 1 1 1 1 1 1Deinococcus radiodurans 3 1 1 1 1 1 1 1Pseudomonas aeruginosa 3 1 1 1 1 1 1 1Pseudomonas aeruginosa 3 1 1 1 1 1 1 1Actinobacillus actinomycetemcomitans 3 0 0 0 0 6 6 6Actinobacillus actinomycetemcomitans 3 2 2 2 2 6 6 6Aeropyrum pernix 3 1 1 1 1 1 1 1Aeropyrum pernix 3 1 1 1 1 1 1 1
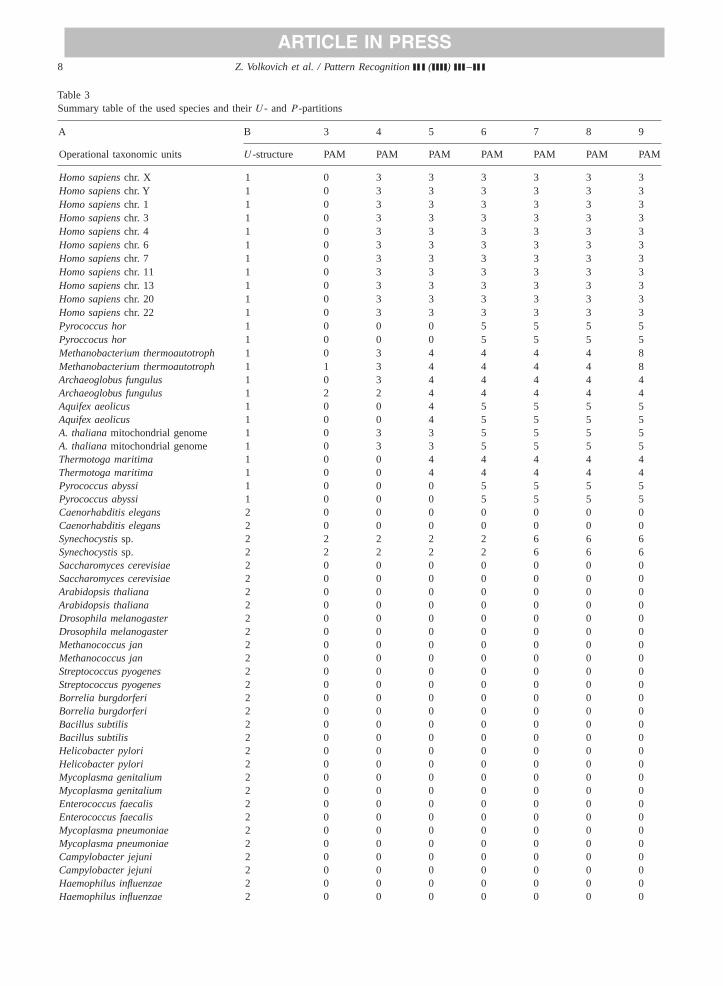
A—list of species; B—U -partitions (different clusters are marked by different numbers); (3–9)—P -partitions with corresponding numbersof clusters.
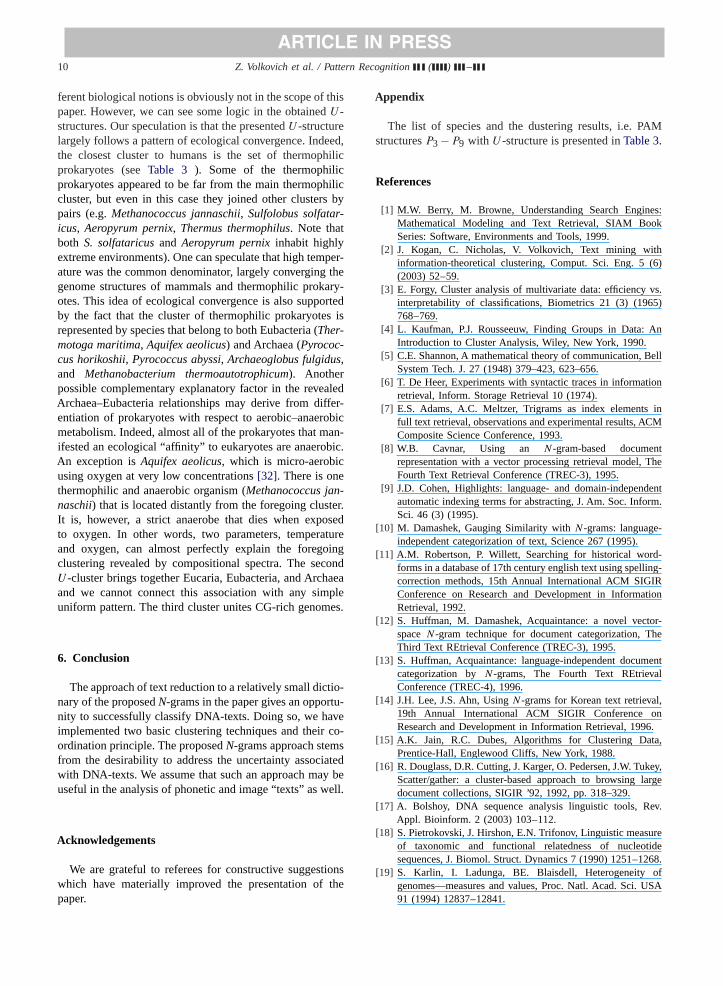
and U -structure. Moreover, we are interested to reach apartition having suitable biological interpretation.
Let us compare PAM-structuresP3–P9 (see appendix,Table 3, columns 3–9) withU -structure. A formal way todo it is to exploit external indices of partition agreement.Usually, the calculation of these scores is built on so-calledcross-tabulation, or contingency table. Entriesnij of thistable denote the number of objects that are in both clustersi
andj, i=1, . . . , N, j=1, . . . , M for two different partitionsPN andPM . We use the most known coefficients[15,30,31].In addition, the regular Cramer correlation coefficient wasemployed as well. The coefficients together withU-structureare presented inTable 1.
U -partition is fixed and contains 3 clusters whereasP -partitions are represented sequentially withP varying from3 to 9 clusters.
As we can see now, the best correlation is reached in thecase when the number of PAM clusters is 7. Two-way jointdistribution, representingU -clustering andP7-partition, isrepresented inTable 2.
All clusters ofP7-partition, except one, are fully includedinto 3 clusters ofU -partition. We can see here almost per-fect matching, that is, the firstU -cluster consists of threeP -clusters (4, 5, 6) only; the secondU -cluster almost co-incides with the first one inP -partition; and the thirdU -cluster consists of twoP -clusters. Thus, we have uncondi-tionally found a coordinated cluster structure. It turns outthat three clusters of theU -structure are coordinated withthe clusters ofP7-structure. It is natural to ask which of thetwo structures is more suitable for biological interpretation.In our case, we are interested in determining large similaritygroups; therefore,U -structures appear to be an appropriatetool, howeverP7-partition gives more thinly subordinatedclustering.
5.2. Biological interpretation of the partition
A main requirement should be that both representativesof every genome occur in the same cluster. This is a formalindication of a robust clustering. Detailed discussion of dif-
10 Z. Volkovich et al. / Pattern Recognition ( ) –
ARTICLE IN PRESS
ferent biological notions is obviously not in the scope of thispaper. However, we can see some logic in the obtainedU -structures. Our speculation is that the presentedU -structurelargely follows a pattern of ecological convergence. Indeed,the closest cluster to humans is the set of thermophilicprokaryotes (seeTable 3 ). Some of the thermophilicprokaryotes appeared to be far from the main thermophiliccluster, but even in this case they joined other clusters bypairs (e.g.Methanococcus jannaschii, Sulfolobus solfatar-icus, Aeropyrum pernix, Thermus thermophilus. Note thatboth S. solfataricusandAeropyrum pernixinhabit highlyextreme environments). One can speculate that high temper-ature was the common denominator, largely converging thegenome structures of mammals and thermophilic prokary-otes. This idea of ecological convergence is also supportedby the fact that the cluster of thermophilic prokaryotes isrepresented by species that belong to both Eubacteria (Ther-motoga maritima, Aquifex aeolicus) and Archaea (Pyrococ-cus horikoshii, Pyrococcus abyssi, Archaeoglobus fulgidus,and Methanobacterium thermoautotrophicum). Anotherpossible complementary explanatory factor in the revealedArchaea–Eubacteria relationships may derive from differ-entiation of prokaryotes with respect to aerobic–anaerobicmetabolism. Indeed, almost all of the prokaryotes that man-ifested an ecological “affinity” to eukaryotes are anaerobic.An exception isAquifex aeolicus, which is micro-aerobicusing oxygen at very low concentrations[32]. There is onethermophilic and anaerobic organism (Methanococcus jan-naschii) that is located distantly from the foregoing cluster.It is, however, a strict anaerobe that dies when exposedto oxygen. In other words, two parameters, temperatureand oxygen, can almost perfectly explain the foregoingclustering revealed by compositional spectra. The secondU -cluster brings together Eucaria, Eubacteria, and Archaeaand we cannot connect this association with any simpleuniform pattern. The third cluster unites CG-rich genomes.
6. Conclusion
The approach of text reduction to a relatively small dictio-nary of the proposedN-grams in the paper gives an opportu-nity to successfully classify DNA-texts. Doing so, we haveimplemented two basic clustering techniques and their co-ordination principle. The proposedN-grams approach stemsfrom the desirability to address the uncertainty associatedwith DNA-texts. We assume that such an approach may beuseful in the analysis of phonetic and image “texts” as well.
Acknowledgements
We are grateful to referees for constructive suggestionswhich have materially improved the presentation of thepaper.
Appendix
The list of species and the dustering results, i.e. PAMstructuresP3 −P9 with U -structure is presented inTable 3.
References
[1] M.W. Berry, M. Browne, Understanding Search Engines:Mathematical Modeling and Text Retrieval, SIAM BookSeries: Software, Environments and Tools, 1999.
[2] J. Kogan, C. Nicholas, V. Volkovich, Text mining withinformation-theoretical clustering, Comput. Sci. Eng. 5 (6)(2003) 52–59.
[3] E. Forgy, Cluster analysis of multivariate data: efficiency vs.interpretability of classifications, Biometrics 21 (3) (1965)768–769.
[4] L. Kaufman, P.J. Rousseeuw, Finding Groups in Data: AnIntroduction to Cluster Analysis, Wiley, New York, 1990.
[5] C.E. Shannon, A mathematical theory of communication, BellSystem Tech. J. 27 (1948) 379–423, 623–656.
[6] T. De Heer, Experiments with syntactic traces in informationretrieval, Inform. Storage Retrieval 10 (1974).
[7] E.S. Adams, A.C. Meltzer, Trigrams as index elements infull text retrieval, observations and experimental results, ACMComposite Science Conference, 1993.
[8] W.B. Cavnar, Using an N -gram-based documentrepresentation with a vector processing retrieval model, TheFourth Text Retrieval Conference (TREC-3), 1995.
[9] J.D. Cohen, Highlights: language- and domain-independentautomatic indexing terms for abstracting, J. Am. Soc. Inform.Sci. 46 (3) (1995).
[10] M. Damashek, Gauging Similarity withN -grams: language-independent categorization of text, Science 267 (1995).
[11] A.M. Robertson, P. Willett, Searching for historical word-forms in a database of 17th century english text using spelling-correction methods, 15th Annual International ACM SIGIRConference on Research and Development in InformationRetrieval, 1992.
[12] S. Huffman, M. Damashek, Acquaintance: a novel vector-spaceN -gram technique for document categorization, TheThird Text REtrieval Conference (TREC-3), 1995.
[13] S. Huffman, Acquaintance: language-independent documentcategorization by N -grams, The Fourth Text REtrievalConference (TREC-4), 1996.
[14] J.H. Lee, J.S. Ahn, UsingN -grams for Korean text retrieval,19th Annual International ACM SIGIR Conference onResearch and Development in Information Retrieval, 1996.
[15] A.K. Jain, R.C. Dubes, Algorithms for Clustering Data,Prentice-Hall, Englewood Cliffs, New York, 1988.
[16] R. Douglass, D.R. Cutting, J. Karger, O. Pedersen, J.W. Tukey,Scatter/gather: a cluster-based approach to browsing largedocument collections, SIGIR ’92, 1992, pp. 318–329.
[17] A. Bolshoy, DNA sequence analysis linguistic tools, Rev.Appl. Bioinform. 2 (2003) 103–112.
[18] S. Pietrokovski, J. Hirshon, E.N. Trifonov, Linguistic measureof taxonomic and functional relatedness of nucleotidesequences, J. Biomol. Struct. Dynamics 7 (1990) 1251–1268.
[19] S. Karlin, I. Ladunga, BE. Blaisdell, Heterogeneity ofgenomes—measures and values, Proc. Natl. Acad. Sci. USA91 (1994) 12837–12841.
ARTICLE IN PRESSZ. Volkovich et al. / Pattern Recognition ( ) – 11
[20] S. Karlin, C. Burge, Dinucleotide relative abundance extremes:a genomic signature, Trends Genet. 11 (1995) 283–290.
[21] V. Kirzhner, A. Korol, A. Bolshoy, E. Nevo, Compositionalspectrum—revealing patterns for genomic sequencecharacterization and comparison, Physics A 312 (2002) 447–457.
[22] V. Kirzhner, E. Nevo, A. Korol, A. Bolshoy, One promisingapproach to a large-scale comparison of genomic sequences,Acta Biotheor. 51 (2) (2003) 73–89.
[23] S.A. Heath, F.P. Preparata, J. Young, Sequencing byhybridization using direct and reverse cooperating spectra,Proceedings of the Sixth Annual International Conference onComputational Biology, 2002, pp. 186–193.
[24] F. Preparata, A. Frieze, E. Upfal, Optimal reconstruction of asequence from its probes, J. Comput. Biol. 6 (1999) 361–368.
[25] F.P. Preparata, Sequencing-by-hybridization revisited: theanalog-spectrum proposal, Comput. Biol. Bioinform. 1 (2004)47–52.
[26] N.N. Aprausheva, A new approach for the cluster detection,Computer Center of the Russian Academy of Science,Moscow, 1993 (in Russian).
[27] L.J. Latecki, R. Venugopal, M. Sobel, S. Horvath, Tree-structured partitioning based on splitting histograms ofdistances, IEEE International Conference on Data Mining(ICDM’03), Melbourne, FL, USA, 2003.
[28] R.R. Sokal, C.D. Michener, A statistical method for evaluatingsystematic relationships, Univ. Kansas Sci. Bull. 38 (1958)1409–1438.
[29] V. Roth, V. Lange, M. Braun, J. Buhmann, A resamplingapproach to cluster validation, COMPSTAT 2002, available athttp://www.cs.unibonn.De/∼braunm.
[30] W.M. Rand, Objective criteria for the evaluation of clusteringmethods, J. Am. Stat. Assoc. 66 (1971) 846–850.
[31] E.B. Fowlkes, C.L. Mallows, A method for comparingtwo hierarchical clustering, J. Am. Stat. Assoc. 78 (1983)553–584.
[32] G. Deckert, P.V. Warren, T. Gaasterland, W.G. Young, A.L.Lenox, D.E. Graham, R. Overbeek, M.A. Snead, M. Keller,M. Aujay, R. Huber, R.A. Feldman, J.M. Short, G.J. Olsen,R.V. Swanson, The complete genome of the hyperthermo-philic bacterium Aquifex aeolicus, Nature 392 (1998)353–358.
About the Author—ZEEV (VLADIMIR) VOLKOVICH is an Associate Professor in the Department of Software Engineering at CollegeORT Braude Karmiel, Israel. He received a Ph.D. in Probability Theory and Mathematical Statistics in 1982. Dr. Volkovich is doing researchin statistical pattern recognition, feature selection, text mining, stochastic models, and generalized convolutions. His recent research includesclassification with unsupervized learning and clustering initialization.
About the Author—VALERY KIRZHNER is a Professor in the Faculty of Science, University of Haifa. He holds a Ph.D. in Mathematicsfrom Leningrad Department of Steklov Institute of Mathematics (Academy of Science former USSR). He is an author more then 100 papersin fields of mathematics, mathematical and computer modeling in biology, population dynamics and bioinformatics.
About the Author—ALEXANDER BOLSHOY is an Associate Professor of Computational Biology in the Institute of Evolution at HaifaUniversity. Dr. Bolshoy’s research is aimed to reveal the biological role of certain evolutionary preserved genomic patterns using statisticaltechniques and different methods of sequence and structure comparison. He graduated from the faculty of mathematics at the MoscowState University, USSR and received his Ph.D. in Structural Biology at the Weizmann Institute of Science. Since then he has worked at theInstitute for Biological Sciences, NRC of Canada; at the Center for Biological Sequence Analysis at the Technical University of Denmark;at NCBI/NLM/NIH and in the School of Informatics at Indiana University.
About the Author—Professor EVIATAR NEVO is a world-leading scientist in evolutionary biology. Nevo contributed to biodiversityevolution in nature involving genes, genomes, phenomes, populations, species, and ecosystems of bacteria, fungi, plants, animals, andhumans focusing on adaptation and speciation. Nevo founded the Institute of Evolution at the University of Haifa in 1976 and has been theDirector since its inception. The Institute has become a world center of excellence conducting active integrative research in biodiversity,molecular biology, genomic, and organismal evolutions linkingfield, laboratory, and theoretical research programs across life. Nevo is aforeign member of the National Academy of Science, USA, the Linnean Society of London, and the Ukraine Academy of Sciences. He wasawarded numerous prizes. He is also the author and/or co-author of 19 books and hundreds papers in diverse fields of evolutionary biology.
About the Author—ABRAHAM KOROL is a Professor of Genetics at Faculty of Science, University of Haifa. He holds a Ph.D. inBiology from the Institute of General Genetics (Moscow, Academy of Science former USSR), Doctor of Science in Biology from LeningradUniversity, and M.Sc. in Computer Science from Leningrad Technical University. He is an author of four books and about 200 papers infields of genetics, evolutionary and population biology, mathematical and computer modeling in biology and bioinformatics. He is head oflaboratory of mathematical and population genetics and laboratory ofDrosophilagenetics.