The Matrix of Drivers: 2022 Update - Our Land & Water
169
1 The Matrix of Drivers: 2022 Update Timothy Driver Simon Duff Tiffany McIntyre Professor Caroline Saunders Report for Our Land and Water National Science Challenge Agribusiness & Economics Research Unit (AERU), Lincoln University
-
Upload
khangminh22 -
Category
Documents
-
view
3 -
download
0
Transcript of The Matrix of Drivers: 2022 Update - Our Land & Water

1
The Matrix of Drivers: 2022 Update
Timothy Driver
Simon Duff
Tiffany McIntyre
Professor
Caroline Saunders
Report for Our Land and Water National Science Challenge Agribusiness & Economics Research Unit (AERU), Lincoln University

2
Table of Contents
1. Introduction .................................................................................................................. 9
1.1 Project background ..................................................................................................... 9
2. New Zealand Primary Industry Stakeholder Survey ....................................................... 12
2.1 Survey methodology ................................................................................................. 12
2.2 Survey results ............................................................................................................ 13
2.2.1 Critical International Issues ............................................................................ 19
2.2.2 Critical Domestic Issues .................................................................................. 21
2.2.3 Impact of international drivers/issues on New Zealand land use
change/practice .............................................................................................................. 23
2.2.4 Impact of domestic drivers/issues on New Zealand land use change/practice
......................................................................................................................... 24
2.2.5 Moving from volume to value ........................................................................ 25
2.2.6 Agribusiness scheme participation ................................................................ 26
2.2.7 Discussion ........................................................................................................ 28
3. Future trends and challenges and their impact on New Zealand land use change/practice
33
3.1 Climate Change ......................................................................................................... 33
3.1.1 Extreme Weather Events ................................................................................ 33
3.1.2 Response to Climate Change .......................................................................... 34
3.1.3 New Zealand Domestic Policy/Agricultural Emissions .................................. 36
3.1.4 International Climate Change Policy/Legislation .......................................... 37
3.1.5 Climate Investment Funds/ESG Investing/Sustainable Finance ................... 38
3.2 New Zealand’s Environmental Policy ........................................................................ 38
3.2.1 Significant Natural Areas (SNAs) .................................................................... 38
3.2.2 Freshwater Management Policy .................................................................... 39
3.3 COVID-19 .................................................................................................................. 40
3.4 Global Trends and Challenges ................................................................................... 43
3.4.1 Food Waste ..................................................................................................... 43
3.4.2 Sustainable Development Goals (SGDs) ........................................................ 44
3.4.3 Commodity Prices ........................................................................................... 44
3.4.4 Global Economic Growth, Inflationary Pressures and Dietary Changes ....... 45
3.5 Emerging Technologies ............................................................................................. 47
3.5.1 Alternative Energy .......................................................................................... 47

3
3.5.2 Blockchain Technology ................................................................................... 47
3.5.3 Robotics and Autonomous Systems ............................................................... 48
3.5.4 Climate Change Mitigation Technology ......................................................... 49
3.5.5 Precision Agriculture ....................................................................................... 49
3.5.6 Genetics ........................................................................................................... 50
3.5.7 Regenerative Agriculture ................................................................................ 51
3.6 Innovative Products/New Food Technology ............................................................. 52
3.6.1 Alternative Protein Sources ............................................................................ 52
3.6.2 Cellular Agriculture ......................................................................................... 54
3.7 International Trading Environment ........................................................................... 55
3.7.1 Brexit ............................................................................................................... 55
3.7.2 Free Trade Agreements (FTAs) ....................................................................... 56
3.7.3 Geopolitical Relationships .............................................................................. 58
3.8 Consumer Trends ...................................................................................................... 59
3.8.1 Demand for Social and Environmental Attributes ......................................... 59
3.8.2 Consumer Diets/Trends .................................................................................. 62
3.8.3 Urban Agriculture ........................................................................................... 64
3.8.4 Impact of COVID-19 on Consumers ................................................................ 64
3.8.5 Organic Foods ................................................................................................. 65
3.8.6 Indigenous/First Nations/Māori Enterprise - Cultural Attributes ................. 66
4. Conclusion ................................................................................................................... 68
References .......................................................................................................................... 70
Appendix A: Review of international consumer preferences studies – choice experience (CE)
and willingness-to-pay (WTP) case studies ........................................................................... 83
A1.1 Meat and seafood products ...................................................................................... 84
General studies ............................................................................................................... 84
European studies ............................................................................................................ 85
North American studies .................................................................................................. 98
Asian studies ................................................................................................................. 103
Other regions ................................................................................................................ 110
Cross-regional studies ................................................................................................... 114
A1.2 Dairy products ..................................................................................................... 115
European studies .......................................................................................................... 115
North American studies ................................................................................................ 118

4
Asian studies ................................................................................................................. 121
A1.3 Fruit & vegetable products ................................................................................. 123
European studies .......................................................................................................... 123
North American studies ................................................................................................ 125
Asian studies ................................................................................................................. 126
Other regions ................................................................................................................ 128
A1.4 Wine products .................................................................................................... 130
General studies ............................................................................................................. 130
European studies .......................................................................................................... 130
Asian studies ................................................................................................................. 133
Other regions ................................................................................................................ 133
Cross-regional studies ................................................................................................... 136
A1.5 Other product categories .................................................................................... 137
European studies .......................................................................................................... 137
North American studies ................................................................................................ 143
A1.6 Products adopting new technology .................................................................... 145
European studies .......................................................................................................... 145
North American studies ................................................................................................ 146
A1.7 Summary ............................................................................................................. 148
Appendix A: References ...................................................................................................... 149
Appendix B: Survey Instrument .......................................................................................... 156

5
List of Figures
Figure 2-1: Survey participants’ alignment with sectors (%) (n=247) ..................................... 13
Figure 2-2: Participant’s level of knowledge regarding markets/regions ............................... 14
Figure 2-3: Participants’ level of experience in industry fields ............................................... 14
Figure 2-4: Critical international issues (ranked scores) (unprompted).................................. 20
Figure 2-5: Critical domestic issues (ranked scores) (unprompted) ........................................ 22
Figure 2-6: Impact of international drivers/issues on New Zealand land use change/practice
................................................................................................................................................. 23
Figure 2-7: Impact of domestic drivers/issues on New Zealand land use change/practice .... 24
Figure 2-8: Importance of product attributes in achieving higher product value from lower
volume ..................................................................................................................................... 25
Figure 2-9: Number of agribusinesses schemes participated in (n=20) .................................. 26
Figure 2-10: Number of dimensions accounted for in agribusinesses scheme(s) ................... 26
Figure 2-11: Number of criteria for each dimension accounted for in agribusinesses
scheme(s) (average n) ............................................................................................................. 27
Figure 2-12: Audit frequency by dimension for agribusiness scheme(s) ................................ 27
Figure 2-13: Impact of agribusiness scheme participation on prices received (n=36) ............ 27
Figure 2-14: Relative importance of pre-defined international drivers of New Zealand land-
use change – Climate Change .................................................................................................. 28
Figure 2-15: Relative importance of pre-defined international drivers of New Zealand land-
use change – Consumer Preferences ...................................................................................... 29
Figure 2-16: Relative importance of pre-defined international drivers of New Zealand land-
use change – Water ................................................................................................................. 29
Figure 2-17: Relative importance of pre-defined domestic drivers of New Zealand land-use
change – Climate Change ........................................................................................................ 30
Figure 2-18: Relative importance of pre-defined domestic drivers of New Zealand land-use
change – Cultural and Māori values ........................................................................................ 31
Figure 2-19: Relative importance of pre-defined domestic drivers of New Zealand land-use
change – Soil and Water .......................................................................................................... 31
Figure 2-20: Relative importance of pre-defined domestic drivers of New Zealand land-use
change – Consumer Preferences and Product Quality............................................................ 32
Figure 3-1: Contributions of Common Agricultural Policy to Climate Change according to the
European Commission, 2014-2020. ........................................................................................ 37
Figure 3-2: ANZ Commodity Price Index ................................................................................. 41
Figure 3-3: Food and Agriculture Organisation (FAO) Food Price Index (FFPI) (2018-2021) .. 45
Figure 3-4: Food and Agriculture Organisation (FAO) Food Commodity Price Indices (2020-
2021) ........................................................................................................................................ 45
Figure 3-5: Annual percentage change in core inflation across global economies (2019-2021)
................................................................................................................................................. 46
Figure 3-6: Shanghai consumer willingness-to-pay (WTP) for selected attributes of kiwifruit
................................................................................................................................................. 60
Figure 3-7: Japanese consumer willingness-to-pay (WTP) for selected attributes of kiwifruit
................................................................................................................................................. 61

6
Figure 3-8: Chinese consumer willingness-to-pay (WTP) for selected attributes of ultra-high-
processing (UHT) milk .............................................................................................................. 62
Figure 3-9: Continuum of different consumer diets................................................................ 63
Figure 3-10: Demand side greenhouse gas emissions (GHG) mitigation potential of different
diets ......................................................................................................................................... 64
Figure 3-11: Food, beverage and other shopping conducted online by consumers in China,
Japan and the United Kingdom between 2015-2019 (average %) .......................................... 65
Figure 3-12: Worldwide sales of organic food, 1999 to 2018 (USD billions) ........................... 66

7
List of Tables
Table 1-1: Current list of international and domestic drivers likely to impact on land use
practice and/or change (as of February 2022) ........................................................................ 10
Table 2-1: Level of knowledge (China) by sectoral alignment, % of sector participants ........ 15
Table 2-2: Level of knowledge (European Union) by sectoral alignment, % of sector
participants .............................................................................................................................. 15
Table 2-3: Level of knowledge (Japan) by sectoral alignment, % of sector participants ........ 16
Table 2-4: Level of knowledge (North America) by sectoral alignment, % of sector
participants .............................................................................................................................. 16
Table 2-5: Level of knowledge (Other European countries) by sectoral alignment, % of sector
participants .............................................................................................................................. 17
Table 2-6: Level of knowledge (Southeast Asia) by sectoral alignment, % of sector
participants .............................................................................................................................. 17
Table 2-7: Level of knowledge (South Korea) by sectoral alignment, % of sector participants
................................................................................................................................................. 18
Table 2-8: Level of knowledge (United Kingdom) by sectoral alignment, % of sector
participants .............................................................................................................................. 18
Table 3-1: Summary of implementation timeline for freshwater National Environmental
Standards ................................................................................................................................. 40
Table 3-2: New Zealand GDP reduction under COVID-19 Alert Levels.................................... 41
Table 3-3: New Zealand-based companies producing alternative protein products .............. 54

8
The Matrix of Drivers: 2022 Update
Research team: Timothy Driver, Simon Duff, Dr Tiffany McIntyre, Professor Caroline
Saunders
Agribusiness and Economics Research Unit (AERU), Lincoln University
Enhancing primary sector production and productivity while maintaining and improving our
land and water quality for future generations is a key outcome of the National Science
Challenge for Our Land and Water. It is therefore important to identify the hierarchy of
international and national issues in order to provide an evidence base to guide investment
and inform the Challenge Research Strategy. To this end, it was proposed that a small project
be conducted, and regularly updated.
This project aims to deliver an overview of international and domestic drivers, as well as issues
that are of particular relevance to the New Zealand primary sector and land use. This overview
is based on a literature search of the most important issues, followed by a survey of key
stakeholders as to their opinion of the most important issues affecting New Zealand land use
and land use practice from overseas and domestically. In addition, a review of the level of
interest and concern of international consumers on various issues is produced relevant to the
primary sector.
This is the fourth report in this series and provides an updated understanding of the
international and national drivers and issues of land use change/practice, and their
importance to the primary sector. These drivers will help prioritise where investments in
primary sector research based on their relationship to economic growth, social, cultural and
environmental interactions. Updates of this research will allow us to understand how drivers
and issues change, which will help to assess the impact the Challenge has had as well as future
research investment needs. This work also provides a contribution to the Challenge Strategy.
This report is structured as follows: Chapter 1 provides an introduction to this report and its
wider context; Chapter 2 presents the results of a survey of primary sector stakeholders
regarding their views of the importance of key international and domestic drivers of land use
change/practice; Chapter 3 examines future trends and challenges related to land use
change/practice (particularly within a New Zealand context); and Chapter 4 concludes the
report and provides a summary of its findings.

9
1. Introduction
1.1 Project background
This report is the fourth in a series providing updated overviews of international and domestic
drivers that have the potential to affect land use change and/or practice. This work has been
undertaken in order to inform the strategic direction of the Our Land and Water (OLW)
component of the National Science Challenge. The OLW challenge mission is to “enhance primary sector production and productivity while maintaining and improving our land and
water quality for future generations.” As different international and domestic drivers are likely
to impact on New Zealand land use change and/or practice in a variety of ways, it is important
to quantify to what extent this is likely to occur in order to prioritise key areas of focus for the
Challenge.
To meet this requirement, this report presents an academic literature review of the latest
research relevant to the international and domestic drivers of land use change and/or
practice. The initial literature review undertaken in the first Drivers Project identified a
preliminary list of 30 drivers (Saunders et al., 2016b). This was updated in 2017 and 2019 to
include new arising issues or drivers relevant to land use change/practice (Saunders et al.,
2018; Driver et al., 2019). The current list of international and domestic drivers is presented
in Table 1-1 below. This report has expanded upon previous literature reviews, with an
examination of the latest reports produced by key organisations such as the United Nations
(including the FAO and IPCC), as well as key academic literature. A summary of each driver
and its impact on land use change and/or practice (where possible) has been compiled, and
can be accessed digitally by clicking on the links in Table 1-1 below. The updated evidence
base used to inform these summaries is also available here.

10
Table 1-1: Current list of international and domestic drivers likely to impact on land use
practice and/or change (as of February 2022)
Agricultural and
Trade Policy Air Quality
Animal Health and
Welfare
Authenticity and
Traceability
Biodiversity Biosecurity Brand Chemical Residues
Climate Change Country-of-Origin Cultural Values Demographics
Digital
Communication
Systems
Emissions Trading
Schemes
Environmental
Condition
Extreme Weather
Events
Family and
Community Food Safety Functional Food Gene Technology
Greenhouse Gas
(GHG) Emissions Innovative Products
Local Food/Food
Miles Organic Production
Pasture-Based
Production Precision Agriculture Product Quality Public Health
Religion Social Responsibility
and Fair Trade Soil Quality Sustainable Supply
Waste and Recycling Water Footprinting
and Use Water Quality
The literature review identified the key domestic and international drivers that have the
potential to affect land use change and/or practice in New Zealand. The review also identified
literature that demonstrated how these drivers may change over time drawing on trade
modelling, consumer attitudes and behaviour research.
The domestic drivers were originally informed by key strategic documents from government
agencies such as The Ministry for Primary Industries (MPI), The Ministry for the Environment
(MfE) and The Ministry of Foreign Affairs and Trade (MFAT). The strategic documents of
regional and local agencies were also reviewed. Where publicly available, key information
from sector groups and farmer associations such as Beef+Lamb New Zealand and Fonterra
were also considered. Relevant academic literature was assessed. Important legislative and
regulatory documents were also considered. This review included voluntary standards such as
AsureQuality Organic standards and Sustainable Winegrowing New Zealand standards.
International trade agreements, government legislation and reports, retailer requirements,
strategic documents, and academic literature helped identify the international drivers. The
literature review also looked at future trends that could influence these drivers.
The initial Drivers Project included a broad literature review of studies involving the use of
methods such as choice experiments (CE) – an economic valuation method used to assess

11
willingness-to-pay (WTP) for different attributes of goods and/or services. Purchasing
behaviour in markets is often influenced by product attributes such as price, quality and
appearance, but also the credence attributes of a product. These are qualities that are not
immediately seen or experienced during purchase or consumption, such as food safety,
animal welfare, environmental protection, country-of-origin, and sustainability credentials.
The CE method requires participants to make trade-offs between attributes by selecting one
option from a series of products with multiple attributes, typically with an associated price
attribute. This literature review has been updated to include recent CE and other WTP studies
relevant to the drivers, covering academic literature published up to 2022. These can be found
in Appendix A of this report.

12
2. New Zealand Primary Industry Stakeholder Survey
The overall aim of this project is to review and cross-reference domestic and international
drivers in order to identify and prioritise areas of importance to the National Science
Challenge, to assess the relative importance of the drivers by international regions and in New
Zealand, and a survey addressing issues relating to the drivers administered to stakeholders
involved in New Zealand’s primary industries. In this report, the survey has been updated, as
presented below.
2.1 Survey methodology
As stated above, the three earlier Drivers reports included a survey of stakeholders (Saunders
et al., 2016; Driver et al., 2018; 2019). This was repeated for this report with an updated
survey, administered in October/November 2021. The overall aim of this survey was to assess
the relative importance of the drivers from New Zealand and international regions, with a
particular focus on drivers’ impact on land use practice/change in New Zealand. The survey
was distributed on October 27th 2021 using Qualtrics™, a web-based survey system. Two
rounds of survey participation invitations were distributed – the first were specific invitations
to a list of participants selected in consultation with the Science Challenge Directorate based
on their experience and expertise in relation to New Zealand’s primary industries. The second was to a list of participants from a database held by the Our Land and Water National Science
Challenge. Additional reminder emails were sent following the initial distribution. The survey
was distributed to 2,818 people in total, receiving 622 responses, including 251 completed
surveys, thereby achieving an approximate 40 per cent completion rate.
The survey first asked participants to indicate (unprompted) the three most critical
international and domestic issues that they believed could influence New Zealand land use
practice/change in a ranked order (e.g. 1 = most critical, in descending order of importance).
These responses were then weighted (e.g. 1 (Most Critical) was given a weighting of 3; 3 (Least
Critical) was given a weighting of 1) to provide scores of the overall importance of these
international and domestic issues.
Participants were then asked to identify from a predetermined list of issues/drivers which of
these were likely to have a ‘high’, ‘medium’ or ‘low’ impact on New Zealand land use
change/practice. These predetermined drivers were chosen from previous Drivers reports, the
literature, and in consultation with the Challenge Directorate.
Participants were also asked to identify their field of expertise and geographical region that
they were most familiar with in relation to their work in New Zealand’s primary industries. A copy of the survey instrument is in Appendix B of this report. Completed responses were then
analysed and are given below.
The survey was expanded to include questions regarding participants’ engagement with agribusiness schemes, including the number of schemes and criteria therein, across four sets
of considerations – environmental, social, economic and cultural. This also included questions
relating to the extent to which participants believed that these schemes improved returns for
their products. In addition, a question regarding participant’s view on the importance of a

13
range of product attributes in achieving higher product value from lower volume was also
included in this survey.
Participants were also asked to identify their field of expertise and geographical region that
they were most familiar with in relation to their work in New Zealand’s primary industries. A copy of the survey instrument is in Appendix B of this report. Completed responses were then
analysed and are given below.
2.2 Survey results
Survey participants were asked to identify the sector that they were most closely aligned with.
As shown in Figure 2-1, 34 per cent of participants identified with the Science/Research sector,
followed by Government and Other sectors (17.4 per cent and 13.4 per cent respectively). The
most represented primary sector was dairy (8.9 per cent), followed by horticulture (6.1 per
cent) and meat (4.5 per cent). Sectors stated within the ‘other’ category included arable, local
government, NGOs, farm consultancy, inputs, advocacy, organic dairy, education,
communications, irrigation, supply chains, finance, landscape design, and conservation, as
well as work across multiple sectors.
Figure 2-1: Survey participants’ alignment with sectors (%) (n=247)
Participants were also asked to indicate their levels of knowledge regarding particular markets
and regions. As shown in Figure 2-2 below, 21 per cent of participants indicated they were
‘very knowledgeable’ or ‘knowledgeable’ regarding the European Union, followed by the
United Kingdom (20 per cent ‘very knowledgeable’ or ‘knowledgeable’) and North America (18
per cent ‘very knowledgeable’ or ‘knowledgeable’). Other markets/regions that participants
identified as being familiar with included Australia, Pacific, Middle East, India, Ireland, South
America, Brazil, Canada, and United Arab Emirates.
0.4%
0.4%
1.2%
1.6%
2.4%
3.6%
4.5%
6.1%
6.1%
8.9%
13.4%
17.4%
34.0%
0% 5% 10% 15% 20% 25% 30% 35% 40%
Wool (n=>5)
Aquaculture (n=>5)
Viticulture/Wine (n=>5)
Smart Agriculture (n=>5)
Māori Enterprise (n=6)
Forestry (n=9)
Meat (n=11)
Horticulture (n=15)
Extension Work (n=15)
Dairy (n=22)
Other (n=33)
Government (n=43)
Science/Research (n=84)

14
Figure 2-2: Participant’s level of knowledge regarding markets/regions
As shown in Figure 2-3 below, participants were also asked to indicate their level of experience
in Environmental Policy, International Markets, R&D and Innovation, Trade Policy and Other
Domestic. Forty-two per cent of participants had either ‘extensive’ or ‘moderate’ experience
in environmental policy, followed by R&D/Innovation (36 per cent ‘extensive’ or ‘moderate’ experience’) and other domestic (23 per cent ‘extensive’ or ‘moderate’ experience).
Figure 2-3: Participants’ level of experience in industry fields
Further analysis revealed participants’ level of knowledge regarding particular markets and regions by sectoral alignment. As shown in Tables 2.1 to 2.8 below, results show that the level
of knowledge of specific areas/markets shown by participants differs based on their sectoral
alignment. For example, government participants indicated a higher relative level of
knowledge of areas/markets such as North America (Table 2.4) and United Kingdom (Table
2.8), while primary sector participants indicated a higher relative level of knowledge of Asian
markets such as China (Table 2.1).
3%
3%
3%
6%
5%
6%
6%
4%
7%
6%
10%
10%
13%
14%
15%
17%
22%
25%
22%
38%
39%
42%
36%
47%
46%
45%
41%
34%
31%
25%
32%
28%
23%
21%
24%
13%
13%
13%
12%
South Korea
Other European countries
Japan
South-East Asia (Vietnam, Thailand, Cambodia,
Indonesia, Malaysia, Myanmar)
China
North America (Canada, USA, Mexico)
United Kingdom
European Union
Very knowledgeable Knowledgeable Some knowledge Little knowledge No knowledge
2%
5%
5%
16%
17%
6%
7%
18%
20%
25%
18%
16%
27%
26%
27%
24%
27%
28%
24%
22%
50%
46%
22%
14%
8%
Trade policy
International markets
Other domestic
R&D/Innovation
Environmental policy
Extensive High Moderate Some None

15
Table 2-1: Level of knowledge (China) by sectoral alignment, % of sector participants
LEVEL OF KNOWLEDGE
SECTOR Industry Very
knowledgeable Knowledgeable
Some
knowledge
Little
knowledge
No
knowledge
Primary
Sector 13% 16% 39% 23% 9%
Meat 10% 20% 40% 20% 10%
Dairy 10% 14% 38% 19% 19%
Horticulture 17% 17% 33% 33% 0%
Forestry 13% 25% 38% 25% 0%
Other
Primary
Sector
20% 0% 60% 20% 0%
Science/
Research 0% 10% 48% 35% 6%
Government 5% 5% 31% 36% 23%
Māori
Enterprise 5% 13% 33% 40% 10%
Extension
Work 0% 20% 0% 80% 0%
Smart
Agriculture 0% 0% 67% 33% 0%
Other Sector 0% 0% 50% 50% 0%
Table 2-2: Level of knowledge (European Union) by sectoral alignment, % of sector
participants
LEVEL OF KNOWLEDGE
SECTOR Industry Very
knowledgeable Knowledgeable
Some
knowledge
Little
knowledge
No
knowledge
Primary
Sector 13% 20% 35% 20% 13%
Meat 10% 40% 20% 20% 10%
Dairy 5% 25% 35% 20% 15%
Horticulture 33% 0% 8% 42% 17%
Forestry 0% 13% 75% 0% 13%
Other
Primary
Sector
20% 20% 60% 0% 0%
Science/
Research 3% 10% 39% 42% 6%
Government 4% 13% 33% 34% 16%
Māori
Enterprise 3% 18% 38% 33% 10%
Extension
Work 0% 20% 20% 40% 20%
Smart
Agriculture 7% 0% 47% 40% 7%
Other Sector 0% 0% 75% 25% 0%

16
Table 2-3: Level of knowledge (Japan) by sectoral alignment, % of sector participants
LEVEL OF KNOWLEDGE
SECTOR Industry Very
knowledgeable Knowledgeable
Some
knowledge
Little
knowledge
No
knowledge
Primary
Sector 7% 13% 24% 40% 16%
Meat 0% 10% 40% 30% 20%
Dairy 5% 10% 20% 50% 15%
Horticulture 17% 17% 8% 42% 17%
Forestry 0% 13% 38% 38% 13%
Other
Primary
Sector
20% 20% 20% 20% 20%
Science/
Research 6% 3% 13% 68% 10%
Government 0% 5% 29% 34% 33%
Māori
Enterprise 3% 0% 25% 55% 18%
Extension
Work 0% 20% 0% 80% 0%
Smart
Agriculture 7% 0% 27% 53% 13%
Other Sector 0% 0% 75% 25% 0%
Table 2-4: Level of knowledge (North America) by sectoral alignment, % of sector
participants
LEVEL OF KNOWLEDGE
SECTOR Industry Very
knowledgeable Knowledgeable
Some
knowledge
Little
knowledge
No
knowledge
Primary
Sector 7% 16% 44% 24% 9%
Meat 10% 10% 70% 0% 10%
Dairy 0% 20% 45% 20% 15%
Horticulture 17% 8% 25% 50% 0%
Forestry 0% 25% 38% 25% 13%
Other
Primary
Sector
20% 20% 40% 20% 0%
Science/
Research 3% 13% 42% 35% 6%
Government 2% 11% 33% 35% 19%
Māori
Enterprise 8% 8% 40% 30% 15%
Extension
Work 0% 40% 20% 20% 20%
Smart
Agriculture 0% 13% 40% 40% 7%
Other Sector 25% 0% 50% 25% 0%

17
Table 2-5: Level of knowledge (Other European countries) by sectoral alignment, % of sector
participants
LEVEL OF KNOWLEDGE
SECTOR Industry Very
knowledgeable Knowledgeable
Some
knowledge
Little
knowledge
No
knowledge
Primary
Sector 4% 11% 26% 43% 17%
Meat 0% 30% 20% 40% 10%
Dairy 0% 0% 40% 40% 20%
Horticulture 8% 17% 17% 42% 17%
Forestry 0% 13% 0% 63% 25%
Other
Primary
Sector
20% 0% 40% 20% 0%
Science/
Research 0% 0% 26% 65% 10%
Government 1% 4% 23% 37% 35%
Māori
Enterprise 0% 13% 15% 53% 20%
Extension
Work 0% 20% 0% 40% 40%
Smart
Agriculture 0% 7% 20% 53% 20%
Other Sector 0% 0% 25% 75% 0%
Table 2-6: Level of knowledge (Southeast Asia) by sectoral alignment, % of sector
participants
LEVEL OF KNOWLEDGE
SECTOR Industry Very
knowledgeable Knowledgeable
Some
knowledge
Little
knowledge
No
knowledge
Primary
Sector 7% 18% 23% 32% 20%
Meat 0% 10% 20% 50% 20%
Dairy 10% 14% 24% 29% 24%
Horticulture 8% 33% 25% 25% 8%
Forestry 0% 25% 13% 38% 25%
Other
Primary
Sector
20% 0% 40% 20% 20%
Science/
Research 0% 6% 16% 68% 10%
Government 1% 8% 18% 38% 36%
Māori
Enterprise 3% 5% 28% 43% 23%
Extension
Work 0% 0% 20% 40% 40%
Smart
Agriculture 0% 7% 33% 47% 13%
Other Sector 0% 25% 25% 25% 25%

18
Table 2-7: Level of knowledge (South Korea) by sectoral alignment, % of sector participants
LEVEL OF KNOWLEDGE
SECTOR Industry Very
knowledgeable Knowledgeable
Some
knowledge
Little
knowledge
No
knowledge
Primary
Sector 7% 13% 18% 40% 22%
Meat 0% 10% 30% 30% 30%
Dairy 5% 10% 19% 48% 19%
Horticulture 17% 8% 8% 42% 25%
Forestry 0% 25% 13% 50% 13%
Other
Primary
Sector
25% 25% 25% 0% 25%
Science/
Research 3% 3% 13% 63% 17%
Government 0% 3% 16% 41% 40%
Māori
Enterprise 3% 0% 20% 50% 28%
Extension
Work 0% 0% 20% 40% 40%
Smart
Agriculture 7% 0% 20% 53% 20%
Other Sector 0% 0% 0% 100% 0%
Table 2-8: Level of knowledge (United Kingdom) by sectoral alignment, % of sector
participants
LEVEL OF KNOWLEDGE
SECTOR Industry Very
knowledgeable Knowledgeable
Some
knowledge
Little
knowledge
No
knowledge
Primary
Sector 9% 23% 38% 20% 11%
Meat 10% 40% 20% 20% 10%
Dairy 0% 29% 48% 10% 14%
Horticulture 17% 17% 17% 42% 8%
Forestry 0% 13% 63% 13% 13%
Other
Primary
Sector
40% 0% 40% 20% 0%
Science/
Research 0% 13% 56% 28% 3%
Government 4% 10% 41% 27% 19%
Māori
Enterprise 5% 18% 40% 25% 13%
Extension
Work 0% 20% 40% 0% 40%
Smart
Agriculture 7% 0% 53% 33% 7%
Other Sector 0% 25% 50% 25% 0%

19
2.2.1 Critical International Issues
Participants were then presented with an open-ended question that asked them to identify
the three most critical domestic issues that would have the potential to influence land use
change/practice in New Zealand. This was done to allow participants to identify important
domestic issues without being prompted. As shown in Figure 2-4 below, climate change was
indicated to be significantly more important to participants than any other international issue.
These results are consistent with previous surveys in which participants identified climate
change as the most highly critical international issue, with the relative importance of climate
change as an international issue increasing between the previous and current surveys (Driver
et al., 2018, 2019; Saunders et al., 2017). Other critical issues identified included consumer
preferences, international agreements, biodiversity, trade/market access, water
quality/availability, trade relations, changing dietary preferences, market demands/dynamics,
and climate policy. The results were consistent with previous survey results (Driver et al.,
2018, 2019; Saunders et al., 2017).

20
Figure 2-4: Critical international issues (ranked scores) (unprompted)
Note: Issues with scores of less than 10 are omitted from this figure.
10
10
10
13
13
14
14
15
18
20
20
21
25
26
33
33
35
35
36
37
38
39
41
42
62
392
0 50 100 150 200 250 300 350 400
Agrichemical use
Economic fragility/collapse
Food safety/traceability
Food and commodity prices
Food availability
Distribution/Supply chain
Environmental stewardship
COVID-19
Social license to operate
Alternative proteins
Population growth
Food security
Animal welfare
Sustainability
Geopolitics
GHG emissions
Climate policy
Market demands/dynamics
Changing dietary preferences
Trade relations
Water quality/availability
Trade/market access
Biodiversity
International agreements
Consumer preferences
Climate change

21
2.2.2 Critical Domestic Issues
The survey also asked participants to identify the three most critical international issues that
could influence New Zealand land use change/practice. Like the previous question, this was
done to allow participants to identify important international issues without being prompted.
As shown in Figure 2-5 below, climate change was indicated to be important to more
participants (followed closely by water quality) than any other domestic issues. Other critical
issues identified included government policy, water policy, social license to operate, climate
policy, and environmental policy. These results are consistent with previous surveys in which
participants identified water-related issues as highly critical domestic issues, with the
exception of the increase in the importance of climate change at a domestic level (Driver et
al., 2018, 2019; Saunders et al., 2017). The importance of climate change at a domestic level
overtook water quality in the current study for the first time, potentially indicating the
increasing focus on climate change in relation to primary production in New Zealand. In
addition, issues regarding government policy, particularly related to agricultural, trade and
environmental policy, were shown to be of high importance as domestic drivers of New
Zealand land-use change. This could be attributed to the increasing prevalence of public
discussion and policy development regarding primary production’s impact on the natural environment in recent years.

22
Figure 2-5: Critical domestic issues (ranked scores) (unprompted)
Note: Issues with scores of less than 10 are omitted from this figure.
10
11
11
11
11
11
12
12
13
14
15
15
16
16
17
18
18
20
28
33
34
42
49
53
70
76
158
218
0 50 100 150 200 250
National politics
Afforestation
Agricultural intensification
Carbon farming
Carbon price
Political favourability
Animal welfare
Housing development
Nitrates
Māori rights and interests
Economics
Labour availability
COVID-19
Environmental stewardship
Consumer preferences
Soil quality
Water availability
Emissions trading
Urbanisation
Biodiversity
GHG emissions
Environmental policy
Climate policy
Social license to operate
Water policy
Government policy
Water quality
Climate change

23
2.2.3 Impact of international drivers/issues on New Zealand land use
change/practice
Participants were then presented with a list of 39 international drivers (as identified by
previous surveys and extensive literature review) and asked to indicate whether these would
have a low, medium, or high impact on New Zealand land use change/practise over the coming
decade. Echoing prior unprompted statements, Figure 2-6 below shows that 89 per cent of
respondents identified climate change as having a potentially high impact on New Zealand
land use change/practice. This was followed by greenhouse gas emissions (77 per cent high,
19 per cent medium), condition of the environment (72 per cent high, 25 per cent medium)
and water quality (70 per cent high, 24 per cent medium).
Figure 2-6: Impact of international drivers/issues on New Zealand land use change/practice
0%
9%
10%
12%
14%
14%
15%
15%
16%
18%
21%
21%
23%
24%
26%
26%
29%
30%
33%
34%
35%
36%
38%
39%
40%
47%
47%
48%
48%
51%
53%
55%
56%
58%
58%
70%
72%
77%
89%
12%
36%
44%
50%
50%
38%
42%
48%
43%
45%
56%
49%
53%
42%
52%
43%
47%
48%
46%
47%
42%
44%
48%
43%
46%
40%
44%
39%
42%
37%
33%
34%
35%
33%
35%
24%
25%
19%
8%
88%
55%
46%
38%
36%
48%
43%
36%
41%
37%
24%
31%
24%
34%
23%
31%
24%
21%
22%
20%
23%
20%
14%
19%
14%
13%
9%
13%
9%
12%
13%
12%
9%
8%
7%
6%
3%
4%
3%
Religion
Air quality
Family and community values
Functional foods
Fair trade
Organic production
Demographics
GM and nanotechnology
Digital communications system
Health and safety
Innovative products and services
Cultural values
Local foods/Food miles
Māori valuesSocial responsibiliy
Waste and recycling
Country of origin
Pasture-based production
Brand
Chemical residues
Public health
Soil quality
Animal health and welfare
Biodiversity
Authentication and traceability
Food safety
Emissions trading
Product quality
Sustainable supply
Water footprinting and use
Extreme weather events
Biosecurity
Trade policy
Agricultural policy
Trade agreements
Water quality
Condition of the environment
Greenhouse gas emissions
Climate change
High Medium Low

24
2.2.4 Impact of domestic drivers/issues on New Zealand land use change/practice
Participants were then presented with a list of 39 domestic drivers (as identified by previous
surveys and extensive literature review) and asked to identify whether these would have a
high, medium or low impact on New Zealand land use change/practice.
As shown in Figure 2-7 below, 99 per cent of respondents indicated that water quality was
either of high or medium importance in relation to New Zealand land use change/practice,
followed by climate change (84 per cent high, 13 per cent medium) and condition of the
environment (83 per cent high, 15 per cent medium).
Figure 2-7: Impact of domestic drivers/issues on New Zealand land use change/practice
9%
13%
14%
15%
16%
16%
16%
17%
18%
19%
24%
25%
30%
31%
33%
37%
37%
37%
37%
37%
39%
44%
47%
49%
55%
61%
62%
64%
73%
78%
83%
84%
89%
6%
46%
29%
36%
47%
36%
42%
41%
40%
55%
40%
46%
43%
48%
45%
51%
41%
46%
39%
41%
45%
42%
44%
41%
41%
34%
31%
29%
27%
24%
18%
15%
13%
10%
94%
45%
58%
50%
38%
48%
42%
43%
44%
26%
40%
30%
33%
22%
24%
16%
22%
17%
24%
21%
18%
19%
11%
12%
10%
11%
8%
8%
9%
3%
4%
2%
3%
1%
0% 10% 20% 30% 40% 50% 60% 70% 80% 90% 100%
Religion
Functional food
Air quality
GM and nanotechnology
Family and community values
Organic production
Digital communication systems
Demographics
Local foods/Food miles
Innovative products and services
Brand
Health and safety
Authentication and traceability
Social responsibility
Chemical residues
Cultural values
Food safety
Animal health and welfare
Public health
Waste and recycling
Product quality
Māori valuesSustainable supply
Soil quality
Biodiversity
Emissions trading
Water footprinting and use
Extreme weather events
Biosecurity
Greenhouse gas emissions
Agricultural policy
Condition of the environment
Climate change
Water quality
High Medium Low

25
2.2.5 Moving from volume to value
Participants were then asked to indicate the relative importance of a range of primary product
attributes in achieving higher product value from lower volume – these results are presented
in Figure 2-8 below. This shows that participants rated high quality (66 per cent very
important, 32 per cent important) as the most important product attribute in achieving higher
product value from lower volume, followed closely by lower environmental impact of
production (66 per cent very important, 30 per cent important).
Figure 2-8: Importance of product attributes in achieving higher product value from lower
volume
9%
6%
11%
13%
15%
23%
25%
22%
20%
23%
22%
29%
27%
27%
33%
28%
27%
36%
36%
39%
32%
42%
40%
41%
41%
60%
41%
48%
48%
61%
53%
66%
66%
24%
28%
27%
30%
29%
28%
31%
35%
40%
39%
41%
35%
41%
44%
42%
47%
50%
42%
43%
40%
49%
40%
44%
44%
47%
29%
50%
44%
44%
31%
42%
30%
32%
36%
43%
41%
40%
34%
29%
31%
35%
32%
25%
31%
26%
26%
25%
21%
22%
20%
17%
17%
15%
16%
16%
13%
12%
11%
10%
8%
7%
8%
7%
5%
4%
2%
22%
19%
15%
12%
17%
13%
12%
7%
6%
9%
6%
7%
5%
3%
2%
3%
2%
5%
4%
4%
2%
2%
3%
2%
2%
8%
4%
6%
5%
5%
7%
2%
2%
2%
3%
3%
Produced by kind, generous people
Produced by a family enterprise
Produced by a Māori enterpriseOrganic production
Low price
GM-free
Glyphosate-free
Care for traditional cultures
Low level of processing
Brand
Seasonal availability
Regenerative farming practices
100% grass fed
Personal health-enhancing
Free range
No additives
Care for workers
Reduced energy use
Reduced water use
Pasture-raised rather than housed indoors
Traceability to farm
Made in New Zealand
Reduced chemical residues
Socially responsible production
Good reputation of producer/grower
Low carbon footprint
Nutritional content
Animal welfare credentials
Freshness
Food safety
Taste
Lower environmental impact of production
High quality
Very important Important Neutral Unimportant Very unimportant

26
2.2.6 Agribusiness scheme participation
Participants were then asked to indicate their level of participation in agribusiness schemes.
In this survey, agribusiness schemes were defined as schemes through which agribusinesses
could improve quality assurance, marketing, certification, and other purposes. Examples used
in the survey instrument (see Appendix) included the New Zealand Farm Assurance
Programme (NZFAP) and GlobalGAP. In total, 41 participants (17 per cent) indicated that they
participated in agribusiness schemes, while 205 participants (83 per cent) indicated that they
do not currently participate in agribusiness schemes. Participants were also asked to indicate
how many agribusinesses schemes they participated in – as shown in Figure 2-9 below, the
largest proportion of participants participated in two agribusiness schemes. The responses
indicate that people tend to participate in multiple schemes: only 25 per cent participated in
only one scheme, while 75% participated in more than one.
Figure 2-9: Number of agribusinesses schemes participated in (n=20)
Participants were then asked to indicate whether, and the extent to which, the agribusiness
scheme(s) that they participated in accounted for environmental, social, economic and
cultural dimensions. As shown in Figure 2-10 below, 83 per cent of participants indicated that
their scheme(s) included an environmental dimension, followed by social, economic and
cultural dimensions.
Figure 2-10: Number of dimensions accounted for in agribusinesses scheme(s)
Following this, participants were asked to indicate the number of criteria considered for each
dimension included within their agribusiness scheme(s) - Figure 2-11 below presents the average number of criteria indicated for each dimension. This shows that participants
indicated the highest number of considered criteria within the environmental dimension (31
criteria on average), followed by social (8 criteria on average), economic (4 criteria on average)
and cultural dimensions (3 criteria on average). The total range of criteria ranged for each
dimension – environmental, between 3 and 300 criteria; social, between 1 and 60 criteria;
economic, between 1 and 6 criteria; and social, between 1 and 6 criteria.
25%
45%
15%
30%
15%
5%
1
2
3
4
5
6
7
8
9
10
34%
39%
66%
83%
Cultural
Economic
Social
Environmental

27
Figure 2-11: Number of criteria for each dimension accounted for in agribusinesses
scheme(s) (average n)
Following this, participants were asked to indicate the frequency at which they are audited for
their compliance with the agribusiness scheme(s) they participate in across the above dimensions
– these results are presented in Figure 2-12 below. This shows the most common audit frequency
across all dimensions considered to be annually, followed by less than annually.
Figure 2-12: Audit frequency by dimension for agribusiness scheme(s)
Finally, participants were asked to indicate how their participation in agribusiness schemes affects
the prices that they receive for what they sell – results are shown in Figure 2-13 below. This shows
that no participants indicated a decrease in prices received for their goods as a result of
participation in agribusiness schemes, with half of participants indicating neither an increase or
decrease in prices received.
Figure 2-13: Impact of agribusiness scheme participation on prices received (n=36)
3
4
8
31
Cultural
Economic
Social
Environmental
14%
11%
4%
3%
8%
3%
71%
78%
73%
72%
14%
11%
15%
22%
0% 10% 20% 30% 40% 50% 60% 70% 80% 90% 100%
Cultural
Economic
Social
Environmental
Monthly Quarterly Annually Less than annually
50%
19%
25%
6%
0% 10% 20% 30% 40% 50% 60%
Large decrease in prices received
Moderate decrease in prices received
Small decrease in prices received
No increase or decrease in prices
Small increase in prices received
Moderate increase in prices received
Large increase in prices received

28
2.2.7 Discussion
A side-by-side analysis of results from previous expert surveys provides an indication of
changes in the importance of international and domestic drivers of land-use change over time.
In both the current and previous surveys (2017, 2019 and 2021) participants were asked to
indicate the relative importance (High, Medium, Low) of a range of pre-defined international
drivers of New Zealand land-use change (see Figure 2-6 above). The following analysis shows
key results of changes over time across the three surveys, suggesting changing trends in the
perceived importance of particular international drivers of New Zealand land-use change.
Observed across the three survey years was a shift in the importance of a range of
international drivers related to climate change and associated issues – results are shown in
Figure 2-14 below. This shows a relatively high importance attributed to climate change at an
international level, with greatly increasing importance of related drivers, such as agricultural
policy, emissions trading, extreme weather events, and greenhouse gas emissions. The
increasing importance of these drivers may be related to increasing awareness of the impacts
of greenhouse gas emissions from New Zealand agriculture, including the potential
international reputational risk associated with greenhouse gas emissions, and New Zealand
domestic policy intended to slow and sequester emissions, such as the New Zealand Emissions
Trading Scheme.
Figure 2-14: Relative importance of pre-defined international drivers of New Zealand land-
use change – Climate Change
Similarly, change in the relative importance international drivers of land-use change in relation
to potential consumer reputational risk over time are shown in Figure 2-15 below –
specifically, animal health and welfare, biodiversity, and condition of the environment. This
shows a step-wise decrease in the perceived importance of animal health and welfare as an
international driver of New Zealand land-use change, and a relative increase in the importance
77%
70%
45%
53%
46%
24%
47%
40%
37%
89%
83%
58%
46%
37%
19%
25%
45%
33%
42%
66%
44%
44%
47%
8%
14%
33%
42%
45%
4%
5%
11%
13%
12%
11%
9%
16%
16%
3%
3%
8%
13%
16%
2021
2019
2017
2021
2019
2017
2021
2019
2017
2021
2019
2017
2021
2019
2017
Gre
en
ho
use
gas
em
issi
on
s
Exr
rem
e
we
ath
er
eve
nts
Em
issi
on
s
trad
ing
Clim
ate
chan
ge
Agr
icu
ltu
ral
po
licy
High Medium Low

29
of biodiversity and condition of the environment as international drivers of New Zealand land-
use change.
Figure 2-15: Relative importance of pre-defined international drivers of New Zealand land-
use change – Consumer Preferences
The relative importance of international drivers of New Zealand land-use change relating to
water over the three survey years is shown in Figure 2-16 below. This shows that participants
rated water issues consistently highly over the three survey years, with the importance of
water footprinting/use as an international driver of New Zealand land-use change increasing
over time.
Figure 2-16: Relative importance of pre-defined international drivers of New Zealand land-
use change – Water
In both the current and previous surveys (2017, 2019 and 2021) participants were also asked
to indicate the relative importance (High, Medium Low) of a range of pre-defined domestic -
drivers of New Zealand land-use change (see Figure 2-7 above). The following analysis shows
key results of changes over time across the three surveys, suggesting changing trends in the
perceived importance of particular domestic drivers of New Zealand land-use change.
Observed across the three survey years was a shift in the importance of a range of domestic
drivers related to climate change and associated issues – results are shown in Figure 2-17
72%
68%
58%
39%
33%
21%
38%
46%
61%
25%
28%
37%
43%
49%
50%
48%
42%
32%
3%
4%
5%
19%
18%
29%
14%
11%
8%
2021
2019
2017
2021
2019
2017
2021
2019
2017
Co
nd
itio
n o
f
the
en
viro
nm
en
tB
iod
ive
rsit
y
An
imal
he
alth
and
we
lfar
e
High Medium Low
70%
69%
68%
51%
43%
42%
24%
26%
24%
37%
42%
45%
6%
5%
8%
12%
14%
13%
2021
2019
2017
2021
2019
2017
Wat
er
qu
alit
y
Wat
er
foo
tpri
nti
ng/
us
e
High Medium Low

30
below. This shows similarly large increases in the importance of greenhouse gas emissions and
agricultural policy as domestic drivers of New Zealand land-use change across the survey
years. This could be attributed to increased prevalence of public discussion regarding policy
approaches to curbing greenhouse gas emissions from the primary section. However, while
the importance of emissions trading has increased over the same period, this has not kept
pace with the increasing importance of agricultural policy and greenhouse gas emissions.
Similarly, the overall importance of climate change has increased (see also Figures 2-4 and 2-
5), as have extreme weather events, as domestic drivers of New Zealand land-use change.
Figure 2-17: Relative importance of pre-defined domestic drivers of New Zealand land-use
change – Climate Change
Also observed across the three survey years was a shift in the importance of cultural, and
specifically Māori, values as domestic drivers of New Zealand land-use change – results are
shown in Figure 2-18 below. This shows a gradual increase in the importance of both general
cultural values and Māori values over time, with larger increases in the importance general
cultural values relative to Māori values.
73%
73%
41%
62%
52%
24%
55%
52%
35%
84%
76%
78%
77%
38%
24%
24%
43%
29%
38%
59%
34%
40%
46%
13%
20%
18%
18%
49%
3%
3%
16%
8%
11%
16%
11%
8%
14%
3%
4%
4%
4%
11%
2021
2019
2017
2021
2019
2017
2021
2019
2017
2021
2019
2017
2021
2019
2017
Gre
en
ho
use
gas
em
issi
on
s
Ext
rem
e
we
ath
er
eve
nts
Em
issi
on
s
trad
ing
Clim
ate
chan
ge
Agr
icu
ltu
ral
po
licy
High Medium Low

31
Figure 2-18: Relative importance of pre-defined domestic drivers of New Zealand land-use
change – Cultural and Māori values
The relative importance of domestic drivers of New Zealand land-use change relating to soil
and water quality/use were also examined. As shown in Figure 2-19 below, the importance of
water quality as a domestic driver of New Zealand land-use change remained consistently high
over the three survey years, with the relative importance of both soil quality and water
footprinting/use increasing over time.
Figure 2-19: Relative importance of pre-defined domestic drivers of New Zealand land-use
change – Soil and Water
Finally, domestic drivers of New Zealand land-use change relating to consumer preferences
and product quality were examined – results are shown in Figure 2-20 below. This shows a
relative decrease in the importance of a range of drivers, including animal health and welfare,
authentication/traceability, innovative goods and services, and product quality over time. This
could be caused by a perceived shift in consumer preferences away from traditional ethical
and product quality-related attributes to more environmentally-focussed concerns, such as
climate change. In addition, the relative importance of biodiversity remained high over the
three survey years, with a relative uptick in importance shown between 2019 and 2021. This
could be partially attributed to the development and implementation of New Zealand
biodiversity policy, including Te Mana o te Taiao, and the proposed National Policy Statement
of Indigenous Biodiversity.
39%
28%
14%
33%
22%
5%
42%
52%
64%
51%
52%
59%
19%
20%
22%
16%
26%
32%
2021
2019
2017
2021
2019
2017
Māo
ri va
lues
Cu
ltu
ral v
alu
es
High Medium Low
89%
91%
76%
61%
54%
38%
47%
42%
22%
10%
8%
19%
31%
33%
41%
41%
38%
57%
1%
1%
5%
8%
12%
19%
12%
20%
22%
2021
2019
2017
2021
2019
2017
2021
2019
2017
Wat
er
qu
alit
y
Wat
er
foo
tpri
nti
ng/
use
Soil
qu
alit
y
High Medium Low

32
Figure 2-20: Relative importance of pre-defined domestic drivers of New Zealand land-use
change – Consumer Preferences and Product Quality
37%
48%
57%
18%
28%
38%
49%
37%
43%
25%
26%
32%
37%
41%
46%
45%
39%
38%
55%
49%
49%
41%
48%
38%
43%
48%
46%
46%
47%
43%
18%
14%
5%
26%
22%
14%
10%
15%
19%
33%
26%
22%
17%
11%
11%
2021
2019
2017
2021
2019
2017
2021
2019
2017
2021
2019
2017
2021
2019
2017
Pro
du
ct q
ual
ity
Inn
ova
tive
pro
du
cts
and
serv
ice
sB
iod
ive
rsit
y
Au
the
nti
cati
on
/Tra
ceab
ility
An
imal
he
alth
and
we
lfar
eHigh Medium Low

33
3. Future trends and challenges and their impact on New Zealand
land use change/practice
The primary sector represents a large proportion of domestic land use and contributes heavily
to the New Zealand economy. The primary sector contributes around 8 per cent of gross
domestic product (GDP), which rises to nearly 20 per cent if downstream and processing
industries are included. It is a significant proportion of New Zealand’s exports at nearly 80 per
cent in 2018/19. The Ministry for Primary Industries (MPI) outlined the value of primary
exports for the year ending June 2021, fell 1.1 per cent to NZ$47.5 billion (MPI, 2021d). It has
forecast for the year ending June 2022, export revenue will rebound and reach a record
NZ$49.1 billion as demand slowly recovers for the main export market products and market
destinations; while revenue is estimated to reach NZ$53.1 billion by 2025 (MPI, 2021d). New
Zealand’s primary sector aims to continue achieving strong export returns while simultaneously addressing local and global trends and challenges. This chapter will examine
the key future trends and challenges that have the potential to impact primary land use
change/practice in New Zealand.
3.1 Climate Change
3.1.1 Extreme Weather Events
Climate change is likely to increase the frequency and intensity of extreme weather events
such as heatwaves, fires, droughts, dust storms, precipitation, and flooding (IPCC, 2021).
These have the potential to negatively affect food security and significantly impact land use
change/practice. Extreme weather events are likely to cause reductions in total yield for many
staple crops, thereby negatively affecting food security (IPCC, 2021). Lesk et al. (2016)
estimated that extreme weather events were responsible for approximately 9-10 per cent
reductions in cereal production losses internationally between 1964 and 2007 and believed
the frequency and intensity of these events would likely increase under climate change. Lesk
and Anderson (2021) outlined that extreme heat and drought often reduce important food
crop yields around the world, putting additional stress on regional and global food security.
The study suggests that the global climate is transitioning from one in which concurrent heat
and drought occur rarely to one in which they occur over an important area of croplands every
year (Lesk & Anderson, 2021). The Intergovernmental Panel on Climate Change (IPCC) also
concluded in their latest report (2021) that anthropogenic influences have increased the
chance of compound extreme events since the 1950s. The report stated that: “human-induced
climate change is already affecting many weather and climate extremes in every region across
the globe. Evidence of observed changes in extremes such as heatwaves, heavy precipitation,
droughts, and tropical cyclones, and, in particular, their attribution to human influence, has
strengthened, [since the previous report]” (IPCC, 2021, p. 10).
There have been several well-documented extreme weather events around the globe in
recent times. Bushfires in Australia and California attracted considerable attention due to the
unprecedented scale of damage and the underlying links to anthropogenic climate change.
The 2019-2020 Australian bushfire season resulted in over 17 million hectares burnt across
New South Wales, Victoria, Queensland, Western and Southern Australia, and Capital
territories. These events claimed 28 human lives, over 1.25 billion animals, damaged over
3,000 homes, and caused a total economic loss of over AU$110 billion (Deb et al., 2020).
Sanderson and Fisher (2020, p. 176) outlined that higher temperatures will likely result in

34
more fire-prone conditions, stating that: “Mean warming levels are now sufficiently large that many high-temperature extreme events would be impossible without anthropogenic influence,
and they can be reliably projected to become more intense in the future”. California also
experienced significant bushfires during 2021.The Californian State Department of Forestry
and Fire Protection (CAL FIRE) estimated that 4.25 million acres of land was burned (more
than 4 per cent of the state’s total land area), making 2020 the largest fire season in the state’s modern history (Department of Forestry and Fire Protection, 2021). Europe has also
experienced several extreme weather events in recent years. In July 2021, flash flooding
caused extensive damage for some countries on the continent. In Germany, over 100 people
were reported to have died, while reconstruction costs were estimated at around EU €6
billion. Climate change will likely mean more flooding in Europe. According to the European
Commission’s Joint Research Centre, it is estimated that flood damages could cost as much as
EU €48 billion each year by 2100, up from the current cost of EU €7.8 billion (Cornwell, 2021).
Agricultural systems are sensitive to changes, due to their dependence on stable, long-term
climatic conditions in which current land-use practises were developed, and through impacts
on production, yield, and quality (Cradock-Henry et al., 2020). Anthropogenic climate change
will increase the frequency and intensity of extreme weather events, which will likely have a
negative impact on agricultural systems and cause disruptions to existing supply chains (IPCC,
2021). For example, Beillouin et al. (2020) expressed concern that extreme weather would
increase the risk of large-scale crop failures.
New Zealand’s primary sector is already confronting extreme weather events/patterns. Recent flooding events in Canterbury had a significant impact on farming communities,
causing extensive damage to infrastructure and livestock. It was estimated that NZ$8-10
million would be required to remove shingle on farming land brought up by the floods (Porter
& McDonald, 2021). These types of extreme weather events will continue to impact future
land use change/practise across New Zealand’s primary industries including meat, diary,
horticulture, viticulture, wool, and forestry.
3.1.2 Response to Climate Change
In August 2021, the Intergovernmental Panel on Climate Change (IPCC) released their latest
report titled Climate Change 2021: the Physical Science Basis. This was the first instalment of
the IPCC’s Sixth Assessment Report (AR6), which is scheduled for completion in 2022. The
report outlined that many of the climatic changes observed are unprecedented, and some of
the changes set in motion are irreversible over hundreds or even thousands of years (IPCC,
2021). The authors of the report stated: “It is unequivocal that human influence has warmed the atmosphere, ocean and land. Widespread and rapid changes in the atmosphere, ocean,
cryosphere and biosphere have occurred” (IPCC, 2021, p. 5).
The report noted that strong and sustained reduction in carbon dioxide (CO2) emissions could
help to limit climate change. The associated benefits for improved air quality would likely
arrive quickly; however, it could take 20-30 years to see global temperatures stabilise. The
report also noted that unless there are immediate, rapid, and large-scale reductions in
greenhouse gas (GHG) emissions, limiting warming to 1.5 degrees or even 2 degrees will be
unattainable (IPCC, 2021). The report projected that in the coming decades climate change
will intensify in all regions. For 1.5 degrees of global warming, there will be increasing heat
waves, longer warm seasons, and shorter cold seasons. At 2 degrees of global warming, heat
extremes would be more often reach critical tolerance thresholds for agriculture. The impact
35
of climate change will likely vary between regions. Climate change will also intensify the water
cycle, bringing more intense rainfall and droughts. Rainfall patterns will be affected, and in
the higher latitudes precipitation is likely to increase, while it is projected to decline in parts
of the subtropics.
In 2021, the United Kingdom hosted the 26th United Nations Climate Change Conference of
the Parties (COP26) in Glasgow. The parties are the signatories of the United Nations
Framework Convention on Climate Change (UNFCCC). COP26 set out several objectives
including to:
1) Secure global net zero by mid-century and keep 1.5 degrees within reach by
accelerating out of the use of coal, curtailing deforestation, speeding up the transition
to electric vehicles, and encouraging investment in renewables;
2) Employ adaption measures to protect communities and natural habitats;
3) Ensure that at least US$100 billion is mobilised to combat climate change in
developing countries;
4) Collaborate to finalise the Paris Rulebook and accelerate action to tackle climate crisis
(UKCOP26, 2021).
The COP26 summit had several notable outcomes that included a commitment from India to
reach net-zero emissions by 2070, a pledge from 141 countries to halt/reverse forest loss and
land degradation, and 109 counties signed to the ‘Global Methane Pledge’, which aims to
reduce methane emissions by 30 per cent (World Research Institute, 2021). Minister of
Climagte Change James Shaw announed that New Zealand had signed on to reduce its
methane emissions, stating that “New Zealand is placed to be part of a global initiaitve […]. New Zealand aims to cut biogenic methane emissions by 10 per cent on 2017 levels by 2030
and by between 24 to 47 per cent lower by 2050” (Shaw, 2021). At present, methane
contributes 43.5 per cent of New Zealand’s overall GHG footprint, with agriculture responsible
for 85.5 per cent of these emissions (Statistics New Zealand, 2020). The government has
introduced a partnership called He Waka Eke Noa that will create a system to measure and
price on-farm biogenic emissions.
In 2015, the Paris Climate Agreement was adopted by 195 countries, a legally binding
international climate agreement, which entered into force on November 4th 2016. It was
signed with the intention of participating countries to hit net zero emissions by 2050. A raft of
measures were agreed upon, including attempting to limit global temperature increase to 1.5
degrees (European Commission, 2021b). To date, 190 countries and the European Union have
joined the Paris Agreement. At time of writing, Turkey, Iraq, Iran, Yemen, Eritrea, and Libya
are still yet to ratify the agreement. In 2017, the US President Donald Trump notified the UN
of the intention of the US to withdraw from the Paris Climate Agreement, claiming that
participation disadvantaged the US to the exclusive benefit of other countries (Bowen et al.,
2020). On November 4th 2019, the US Government initiated the withdrawal from the
Agreement, which was completed on 4th November 2020. On January 20th 2021, this was
reversed as newly elected President Joe Biden re-joined the agreement and announced
renewed support for measures to combat climate change (White House, 2021b).
A recent report conducted by the independent group Climate Action Tracker observed that
almost every country is falling short of their commitments under the Paris Climate Agreement
(Climate Action Tracker, 2021b). New Zealand has committed to reducing its GHG emissions
to 30 per cent below 2005 levels by 2030 (MfE, 2021d). As of September 2021, the Climate

36
Action Tracker views New Zealand’s efforts towards cutting GHG emissions as ‘highly insufficient’ (Climate Action Tracker, 2021c). This means that New Zealand’s climate policies and current rate of emissions are likely to track towards the 3oC of global warming. As
deadlines approach and expectations of action rise, there has been pressure on New Zealand
from other countries to cut GHG emissions within New Zealand’s GHG emissions profile
(Newshub, 2021).
3.1.3 New Zealand Domestic Policy/Agricultural Emissions
The legislation guiding New Zealand’s efforts to combat climate change is the Climate Change
Response Act (2002), which was developed to meet obligations under the United Nations
Framework Convention on Climate Change and the Kyoto Protocol. In 2019, this was amended
to the Climate Change Response (Zero Carbon) Amendment Act. These amendments set
targets for reducing all GHG emissions (excluding biogenic methane emissions) to net zero by
2050, with targets for reducing biogenic methane emissions to 10 per cent below 2017 levels
by the year 2030 (MfE, 2019). In 2020, the Climate Change Response (Emissions Trading
Reform) Amendment Act was passed to support New Zealand’s efforts to move to a low-
emissions, climate-resilient economy (New Zealand Parliament, 2020). This introduced a new
penalty regime and set out new provisions for forestry. It also included decisions to address
New Zealand’s agricultural emissions, committing the primary sector to have a system for
farm-level accounting and reporting of agricultural GHG emissions for all farms by 2025. This
framework is being developed by He Waka Eke Noa, a primary sector climate action
partnership between the New Zealand Government, the primary sector, and iwi (MPI, 2021a).
The partnership seeks to equip and empower farmers and growers to measure, manage and
reduce agricultural GHG emissions, including biogenic methane (CH4), nitrous oxide (N2O), and
carbon dioxide (CO2). In 2022, a report will be provided to the New Zealand Government
detailing a framework for an appropriate emissions pricing system. A broad nationwide
engagement will be conducted with farmers and growers, seeking feedback on the options of
a ‘farm-level levy’ and ‘processor-level hybrid levy’. The first option (farm-level levy) would
involve farmers calculating emissions using on-farm data and require farms to pay a price for
their net emissions. This approach would reward eligible on-farm sequestration, while any
additional revenue would be invested to help further reduce emissions in the agricultural
sector. The second option (processor-level hybrid levy) would calculate emissions at the
processor level and would pass on costs based on the quantities of product supplied to
processors or fertiliser brought by farms (RNZ, 2021c). The New Zealand Government has
legislated that agricultural emissions will enter the New Zealand Emissions Trading Scheme if
an effective and workable alternative is not put forward by the partnership (He Waka Eke Noa,
2021). The legislation of emissions reduction targets will likely impact land use in New Zealand
(particularly primary production) by requiring land-users to adapt practices to meet legal
requirements.
The incumbent Labour Government has made changes to legislation concerning the
environment and climate change. In 2020, Prime Minister Jacinda Arden declared a climate
emergency and committed that by 2025 the New Zealand Government and public sector
would be carbon neutral, backed by a NZ$200 million State Sector Decarbonisation Fund. In
Feburary 2021, the New Zealand Government announced its decision to repeal the Resource
Mangement Act 1991 (RMA) and enact new legislation based on recommendations made by
a Resource Manangement Review Panel (MfE, 2021c). There were three proposed acts
including the Natural and Built Environments Act (NBA), Strategic Planning Act (SPA), and the
Climate Adaptation Act (CAA). The CAA will support New Zealand’s response to the effects of

37
climate change, addressing the complex legal and technical issues associated with managed
retreat and funding/financing adaption to climate change (MfE, 2021c). The SPA will provide
a long-term approach to the management of land and coastal marine areas, and will identify
areas vulnerable to the effects of climate change.
3.1.4 International Climate Change Policy/Legislation
Climate policies are being steadily implemented internationally. The United States under
President Joe Biden recently re-entered the Paris Climate Agreement. As part of re-entering,
Biden established new emissions reduction targets through the National Climate Task Force.
Accordingly, the US seeks to achieve a 50-52 per cent reduction from 2005 levels in economy-
wide net GHG emissions by 2030 (White House, 2021a). The European Union (EU) recently
engaged in talks that discussed reforms to the Common Agricultural Policy (CAP). Since 2013,
climate change mitigation and emissions reduction has been a primary objective of the CAP.
In 2021, a special report released by the European Court of Auditors outlined that over EU
€100 billion of CAP funds provided for climate change efforts during 2014-2020 had little
impact on agricultural emissions since 2010 (see Figure 3-1 below) (European Court of
Auditors, 2021). This was attributed to a primary focus on financing measures with low
potential to mitigate climate change. The report recommended that the European
Commission do the following:
1) take action to ensure that the CAP reduces agricultural emissions;
2) take measures to reduce emissions from cultivated drained organic soils; and
3) regularly report on the CAP’s contributions to climate mitigation (European Court of Auditors, 2021).
In 2021, negotiations focused on reforms that would support agriculture making stronger
contributions to the climate goals of the European Union’s Green Deal (MFAT, 2021b). The
scheme is supported financially by EU €387 billion allocated between 2021 and 2027, of which
40 per cent is required to be ‘climate relevant’ (European Commission, 2021a). Incoming CAP rules that seek to reduce total EU agricultural emissions by 10 per cent will apply from 2023
(Melander, 2021).
Figure 3-1: Contributions of Common Agricultural Policy to Climate Change according to the
European Commission, 2014-2020.
Source: European Court of Auditors, 2021.

38
In 2020, the Canadian government announced a ten-year CA$3.16 billion fund to combat
climate change (Department of Finance Canada, 2020). The fund will be used to support the
planting of two billion trees by 2030, with aid already provided during the COVID-19 pandemic
that allowed for approximately 600 million trees to be planted in 2020 (Government of
Canada, 2021). In 2020, China announced its intention to become carbon neutral before 2060,
proposing new climate targets (Climate Action Tracker, 2021a). China also published its 14th
Five Year Plan (FYP), which included energy- and carbon-intensity reduction targets for 2025.
President Xi Jinping later announced that China would be strictly controlling its coal
generation until 2025, from which point it will start to slowly phase out its use. This is the first
time that China has signalled a strong intent to decouple economic growth from coal, as well
as the first time it has suggested a specific year for peak coal consumption (Climate Action
Tracker, 2021a).
3.1.5 Climate Investment Funds/ESG Investing/Sustainable Finance
There has been a strong movement within the banking and investment sector towards
sustainable finance and investing using ethical, social and governance (ESG) criteria. Investors
are currently seeking to make investments that generate returns while also having positive
social, economic, and/or environmental impacts. Bank of New Zealand (BNZ) chief executive
Angela Mentis outlined that their bank “will increasingly seek to use environmental, social, and governance (ESG) linked lending with New Zealand farmers, agribusinesses, and other
sectors to help meet New Zealand’s climate change obligations” (BNZ, 2021). The Aotearoa
Circle group has established a sustainable agriculture finance initiative (SAFI) - a programme
that seeks to develop a definition and classification system for sustainable agriculture that can
be used by the financial sector when considering lending and investment options (The
Aotearoa Circle, 2021). SAFI will also align with emerging international frameworks and
sustainability standards used by New Zealand farmers and growers. New Zealand’s primary sector and land users may have to adapt existing, or adopt new, land use practises to gain
investment or access to lending/credit from banks in the future.
International institutions are also seeking to enable and direct finance/capital towards
initiatives and investments that will likely influence land use change and/or practise. For
example, the European Union (EU) has issued a sustainable finance strategy and framework.
This will help guide the flow of private finance towards sustainable economic activities and
will enable the transition towards a carbon neutral economy by 2050. The EU Platform on
Sustainable Finance is an expert group established to advise the European Commission on the
development of a sustainable finance market. In 2021, the group released a report on
transition finance that detailed how the Commission can enable financing from companies
and other economic actors working to improve their environmental footprint (European
Commission, 2021c). The United Nations has also launched the Land Use Finance Programme
(UNLUFP) to proactively unlock and upscale private finance from banks, investors, and
agribusinesses directed towards sustainable land use. It has established partnerships with
banks, including BNP Paribas and Rabobank, which have contributed significant funds to
preventing deforestation and promoting inclusive commodity production (UNEP, 2021a).
3.2 New Zealand’s Environmental Policy
3.2.1 Significant Natural Areas (SNAs)
Significant natural areas (SNAs) are areas that contain significant indigenous flora and/or
fauna, and are required to be protected under the Resource Management Act (RMA) 1991,
Section 6 (RNZ, 2021f). SNAs have been under increased scrutiny across New Zealand. There
39
have been concerns in some sectors that SNAs on private land could affect land use practises,
causing issues for current landowners. Māori have also voiced strong concerns over SNAs,
citing land appropriations by previous New Zealand governments. The Far North District
Council halted the establishment of SNAs after a large hīkoi protested proposed changes. In 2020, former Conservation Minister Eugenie Sage ruled out direct government compensation
for landholders with large SNAs; however, pointed out that landholders could potentially use
the Native Heritage Fund to facilitate the purchase of land (RNZ, 2021f). It has also been
suggested that SNAs may impact land use practise/change; however, it has been suggested
that existing practises (e.g. bee keeping or tourism) could potentially continue if these do not
negatively affect the land. Minister for the Environment James Shaw estimated that around
60 per cent of local councils had identified potential SNAs. The draft National Policy Statement
for Indigenous Biodiversity (NPSIB) is seeking to provide clarity on the identification of SNAs.
Councils with existing SNAs will have three years to comply, while those that do not have SNAs
will have five years to comply. SNAs will likely continue to be a pressing issue that could affect
land use over the coming years as local/regional council bodies seek to implement these new
policies.
3.2.2 Freshwater Management Policy
In 2020, the Labour government introduced new legislation under the banner of Essential
Freshwater: Action for Healthy Waterways (New Zealand Government, 2020). This legislation
package seeks to stop further degradation of freshwater resources and improve water quality
within a five-year period. It also looks to reverse past damages and bring waterways and
ecosystems back to a healthy state within one generation (MfE, 2021a). New rules and
regulations include:
1) a National Policy Statement for Freshwater Management (NPSFM) (2020); 2) National Environment Standards;
3) stock exclusion regulations;
4) regulations for the measurement and reporting of water takes (MfE, 2021a).
The NPSFM introduces new regulations that will guide government efforts to restore
waterways. These requirements include managing freshwater in a way that gives effect to Te
Mana o Te Wai. This will be achieved through the involvement of tāngata whenua, prioritising
the health and wellbeing of waterbodies, and working alongside tāngata whenua and
communities to set out long-term visions within Regional Policy Statements (MfE, 2021b). The
NPSFM expands the national objectives framework through the inclusion of two additional
values – threatened species and mahinga kai. These join ecosystem health and human health
for recreation as values that are compulsory to uphold (MfE, 2021b). New regulations also
place tougher bottom lines for ammonia and nitrate toxicity attributes to protect 95 per cent
of species (up from 80 per cent) from toxic effects.
The new National Environmental Standards regulate primary land use activities that pose risks
to freshwater and ecosystem health (see Table 3-1 below). The standards set out minimum
levels for feedlots and other stockholding areas, improve practises for intensive winter grazing
of forage crop, and restrict further agricultural intensification (until the end of 2024). It also
places limits on the discharge of synthetic nitrogen fertiliser on land and requires the reporting
of fertiliser use. Regulations have also been introduced that aim to reduce damages caused
by stock in waterways. These new rules apply to the owners of beef cattle, dairy cattle, deer,
and pigs, and require stock to be excluded from wetlands, lakes, and rivers that are more than
1 metre wide. Stock must also be excluded from the beds of lakes, rivers, and wetlands, and

40
cannot be on land closer than 3 metres to these waterbodies. In addition, stock (excluding
deer) can only cross waterways using dedicated bridges or culverts, unless crossing no more
than twice a month (MfE, 2021a). There are also new water measurement and reporting
regulations - these apply to holders of water permits that allow freshwater to be taken at a
rate of 5 litres/second or more. A new staged timeline requires these holders to:
1) measure their water use every 15 minutes;
2) store their records;
3) electronically submit their records to their council every day (MfE, 2021a).
The new freshwater regulations will likely have a significant impact on primary land use
practise in New Zealand as land users adopt these new requirements.
Table 3-1: Summary of implementation timeline for freshwater National Environmental
Standards
Action Period of
Implementation
Interim controls on intensification 2020-20241
Wetland protection (earthworks, drainage, vegetation clearance, etc) 2020-20232
Winter grazing standards met (area, slope, pugging, resowing, buffers) through Intensive Winter Grazing farm plan module or resource
consent
2020-20212
Nitrogen fertiliser cap (190 kg N/ha/year) 2021-20222
Stock holding area standards (feed, winter, standoff, loafing pads) 2020-20212
Farm plans (starting with priority catchments) 2022-20262
Real-time water use reporting (>20 L/sec) 2022-20242
Real-time water use reporting (>10-20 L/sec) 2024-20262
Real-time water use reporting (>5 L/sec) 20262
1 Ends at set date. 2Policy will continue into future.
Source: Adapted from Federated Farmers, 2021a.
3.3 COVID-19
The COVID-19 pandemic has been a significant issue confronting the global community since
late 2019. New Zealand initially adopted an elimination strategy hallmarked by a “go hard and
go early” approach (Baker et al., 2020; Gray, 2020). The first case of COVID-19 was detected
in New Zealand in February 2020, and several Level 4 lockdowns have occurred over the past
18 months. The ongoing COVID-19 pandemic has presented significant challenges for New
Zealand’s economy due to the emergence of new virus variants, deteriorating global economic
outlooks, supply chain disruptions, and extended border closures (MBIE, 2021). The Reserve
Bank of New Zealand (RBNZ) estimated that containing COVID-19 has had a considerable
impact on GDP (refer to Table 3-2 below) (RBNZ, 2020). At Alert Level 4, it was estimated that
GDP was approximately 37 per cent lower than it would have been without any restrictions.
Over a four and half week period, this equated to NZ$10 billion of lost production, reducing
New Zealand’s annual GDP by 3.2 per cent (RBNZ, 2020).

41
Table 3-2: New Zealand GDP reduction under COVID-19 Alert Levels
Alert Level GDP reduction (%)
1 3.8
2 8.8
3 19.0
4 37.0 Source: RBNZ, 2020
The COVID-19 pandemic has presented significant challenges for New Zealand’s primary sector; however, the sector has also shown considerable resilience and strength compared to
other sectors of the New Zealand economy. In addition, there have significant commodity
price increases for primary products, including dairy, meat, and fibre products, which reflected
strong underlying demand (see Figure 3-2 below) (ANZ, 2021). Border closures have restricted
the inflow of seasonal and skilled workers causing labour shortages that have affected
industries including dairy, wine, kiwifruit, apples, and cherries (MPI, 2021d). A survey carried
out in 2021 by Federated Farmers and DairyNZ showed that 49 per cent of surveyed farmers
were short-staffed, while 87 per cent had made changes to attract local employees (DairyNZ,
2021). Dairy farmers found recruiting staff the most challenging of all industries, with an 18.5
per cent increase in those finding it harder to obtain workers compared to six months ago
(Federated Farmers, 2021b). Shortages in labour availability are expected to be resolved over
time as more workers are able to gradually enter the country (MPI, 2021d).
Figure 3-2: ANZ Commodity Price Index
Source: ANZ, 2021.
Ongoing supply chain disruptions around the world are influencing the movement of goods
across border for both air and sea freight. Port congestion and shipping delays due to reduced
freight capacity and a critical shortage of containers continue to be issues, domestically and
abroad. COVID-19 outbreaks have also shut ports and led to slower freight processing due to
necessary safety precautions (e.g. social distancing). For New Zealand, this had led to an
increased risk of perishable products spoiling before they reach customers, or reduced shelf
life for some of New Zealand products. Given the strong demand for shipping containers and
limited shipping capacity, major trans-shipment ports are experiencing delays.

42
In New Zealand, the ports of Auckland have been heavily congested since December 2020,
and shipping companies have been deploying additional vessels to move empty containers to
other regions (MPI, 2021d). Problems with the port’s automation systems have also
contributed to the delays and congestion (RNZ, 2021a). Increasing shipping costs, shipping
delays, and a container shortage are all putting upward pressure on import prices for key
primary sector inputs, such as machinery, fertilisers, and feed - as a result, farmers, growers,
and processors are facing higher production costs. Companies within the primary sector have
been significantly impact by the pandemic. For example, Zespri Kiwifruit exports to China were
temporally halted after products tested positive for COVID-19. Although this was resolved
quickly, it highlighted some of the risks associated with the pandemic for New Zealand’s primary sector (RNZ, 2021e). MPI estimated that food and fibre sector export revenue could
fall 1.1 per cent in 2021 to NZ$47.5 billion (MPI, 2021d). For the year ending June 2022, MPI
has forecast that export revenue will rebound to around NZ$49.1 billion as demand recovers
for the country’s main export products and destination markets (MPI, 2021d).
MPI has supported the primary sector during the pandemic with initiatives such as the
‘Opportunity Grows Here’ campaign. This sought to encourage New Zealanders into jobs in the food and fibre sector, and includes jobs such as citrus picking, kiwifruit packing, seafood
processing, planning trees, and pruning vines (MPI, 2021d). In 2020, MPI launched the ‘Fit for a Better World – Accelerating out Economic Potential’ roadmap last year to boost productivity, sustainability, and jobs. MPI brought forward almost NZ$96 million to kick-start
the delivery of the roadmap, including $84 million to upscale Sustainable Food & Fibre Futures
(SFF Futures) to further boost innovation efforts, on top of the NZ$40 million already available
each year (MPI, 2021d). The New Zealand Government also set aside NZ$600 million for an
aviation relief package as part of the NZ$12.1 billion support package in March 2020. This
resulted in NZ$372 million allocated to the air freight connectivity scheme. The Government
has extended support to the aviation sector through to the end of 2021 to help keep New
Zealand connected with trade partners and maintain international passenger services. The
Reserve Bank of New Zealand (RBNZ) has also provided support lowering the official cash rate
to 0.25 per cent, and potential facilitate the purchase of up to NZ$100 billion of New Zealand
Government Bonds, Local Government Funding Agency Bonds, and New Zealand Government
Inflation-Indexed Bonds in the secondary market. At the end of May 2021, RBNZ had
purchased around NZ$56 billion in bonds (RNZ, 2021b). This support has helped the primary
sector cope with the pandemic and positioned it to continue as an important driver of
economic recovery in New Zealand.
COVID-19 has disrupted the global agricultural industry and placed existing supply chains
under considerable stress, revealing their vulnerabilities to external shocks. The pandemic has
resulted in changes to consumption patterns/demands due to businesses not being open.
Lockdowns have affected demand for food services and products, such as venison and
crayfish. In addition, there has been growth in home cooking and online shopping. It remains
unclear if these changes in consumption patterns/demands will continue post-pandemic, but
some will likely persist. Global supply chains will also overcome disruptions - however, this
will likely take some time to come to fruition.

43
3.4 Global Trends and Challenges
3.4.1 Food Waste
Across global food systems, food loss and waste (FLW) is a major issue that presents a
significant challenge for waste management systems, food security, and environmental
sustainability (World Bank, 2021). The United Nations Food and Agriculture Organisation
(FAO) estimates that approximately one third of all global food production is wasted (Barrera
& Hertel, 2021). Meeting future global food demand will require action and initiatives that
reduce waste and loss. Reducing FLW will be critical for achieving a zero-hunger world and
developing sustainable production and consumption patterns (FAO, 2013). The 2030 Agenda
for Sustainable Development reflects growing awareness of the issue concerning FLW. Target
12.3 of the Sustainable Development Goals (SDGs) seeks to make improvements in global
FLW, and calls for reductions in waste at the retail and consumer level, and reductions in food
waste and loss along production and supply chain (FAO, 2013). Food wastage can occur at all
stages of global supply chains, while the scope and nature of food waste can differ
considerably between regions and states (Roodhuyzen et al., 2017; Xue & Liu, 2019). Food
waste per capita is far higher in Europe and North America than in Sub-Saharan Africa and
South/Southeast Asia, with food waste often generated at the consumption stage of the
supply chain in developed countries, whereas in developing countries it is at the harvest and
post-harvest storage stage.
A key barrier to reducing FLW is a lack of data at the national and international level (Barrera
& Hertel, 2021). The FAO is currently developing two indices - the Food Loss Index (FLI) and
the Food Waste Index (FWI). The FLI will provide estimates on food loss from post-harvest up
to the retail stage. Initial estimates suggest that approximately 14 per cent of the global food
supply is lost annually from post-harvest up to the retail stage. The FWI will provide global
estimates on food waste at the retail and consumption level. The United Nations Environment
Programme (UNEP) recently released their Food Waste Index Report 2021, which estimated
that households, retailers, and the food service industry generate approximately 931 million
tonnes of food waste each year, while households generate approximately 570 million tonnes
each year. The report also identified that the global average for food waste was 74kg per
capita (UNEP, 2021b). In 2013, the United Nations FAO estimated around 1.6 billion tonnes of
food was wasted and the direct economic cost of this wastage at around US$750 billion (FAO,
2013).
The extent of New Zealand’s FLW is unclear due to a lack of data. Estimates for total food to
landfill have been varied. Reynolds et al. (2016) estimated that approximately 327,000 tonnes
of food was wasted annually in New Zealand. In 2014, the National Food Waste Prevention
Project estimated that New Zealand households sent 229,002 tonnes of food waste to landfill.
The total waste that could have been avoided was estimated at 122,547 tonnes - this would
generate total savings of around NZ$872 million, or NZ$563 per household (New Zealand
Parliamentary Committee, 2020). In 2016, the Ministry for the Environment estimated that
New Zealand’s food waste was around 571,000 tonnes per year (New Zealand Parliamentary
Committee, 2020). In 2018, an Environment Select Committee was appointed to explore the
quantity, impact, prevention strategies and redistribution methods of food waste in New
Zealand (Goodman-Smith et al., 2020). A subsequent report prepared by Associate Professor
Miranda Mirosa was released, detailing recommendations for government, and setting out a
three-step approach for reducing food waste: target, measure, and act (New Zealand
Parliamentary Committee, 2020). The report suggested that the primary sector likely wasted

44
a significant amount of food at the production end of the supply chain. It was pointed out that
Zespri alone had a self-reported wastage of 2.5 million trays of kiwifruit (New Zealand
Parliamentary Committee, 2020). In 2021, the New Zealand Government announced funding
to support five projects that aim to help address the issue of FLW.
3.4.2 Sustainable Development Goals (SGDs)
In 2015, the United Nations signed the 2030 Agenda for Sustainable Development and
adopted a set of 17 Sustainable Development Goals (SDGs) (UNDESA, 2021). The SDG
framework consists of 17 goals, 169 targets and 247 indicators designed to reconcile the dual
need of environmental protection and socio-economic development (Zeng et al., 2020).
COVID-19 has disrupted globalisation and economic growth, both of which will play an
important role in achieving the SDGs. The 2021 United Nations SDG report outlined that
COVID-19 has contributed to the first rise in extreme poverty in a generation, and severely set
back gains made in education, while the impact of climate change has continued relatively
unabated (United Nations, 2021). The pandemic has exposed the fragility of the goals adopted
by the United Nations, and it is expected that most goals will not be met by 2030 (Naidoo &
Fisher, 2020). Moyer and Hedden (2020) argued that the world was not currently on-track to
achieve the 9 human-development related SDGs. This is compounded by the fact that
populations of the most vulnerable countries (MVCs) are estimated to grow from 751 million
people in 2015 to 1,721 million people by 2050. Despite the lack of progress, governments are
developing and integrating policy that will help address the SDGs. In 2021, the Aotearoa
Sustainable Development Goals Summit was held, setting out New Zealand’s current and future efforts towards meeting the SDGs. Foreign Affairs Minister Nanaia Mahuta outlined
government contributions to this, including the formation of the Public Sector Act 2020,
adoption of the Living Standards Framework (LSF), wellbeing-focused budgets, reforms of
freshwater and climate change policy, international aid for pacific partners, and support for
multilateralism (Mahuta, 2021).
3.4.3 Commodity Prices
The COVID-19 pandemic has affected commodity prices since the initial outbreak (Boone et
al., 2020). In early 2020, there was a major drop in commodity prices as governments moved
swiftly to contain the virus – these have since recovered strongly (Ezeaku et al., 2021). The
International Monetary Fund’s (IMF) Global Price Index of all Commodities has increased from 83.97 in April 2020 to 177.55 in September 2021 (IMF, 2021a). The United Nations Food and
Agriculture Organisation (FAO) projected record global cereal production in 2021, but
believed that this would be outpaced by forecasted consumption. The FAO’s Food Price Index tracks international prices for globally traded food commodities – this averaged 130 points in
September 2021, the highest reading since 2011 (see Figure 3-3 below) (FAO, 2021). The price
of food commodities has risen steadily since 2020, with vegetable oils, cereals, dairy, sugar,
and meat prices increasing (see Figure 3-4 below). Climate change will also likely contribute
to food price volatility in the future, as primary land users are confronted with increased
extreme weather patterns that affect underlying production and yield.
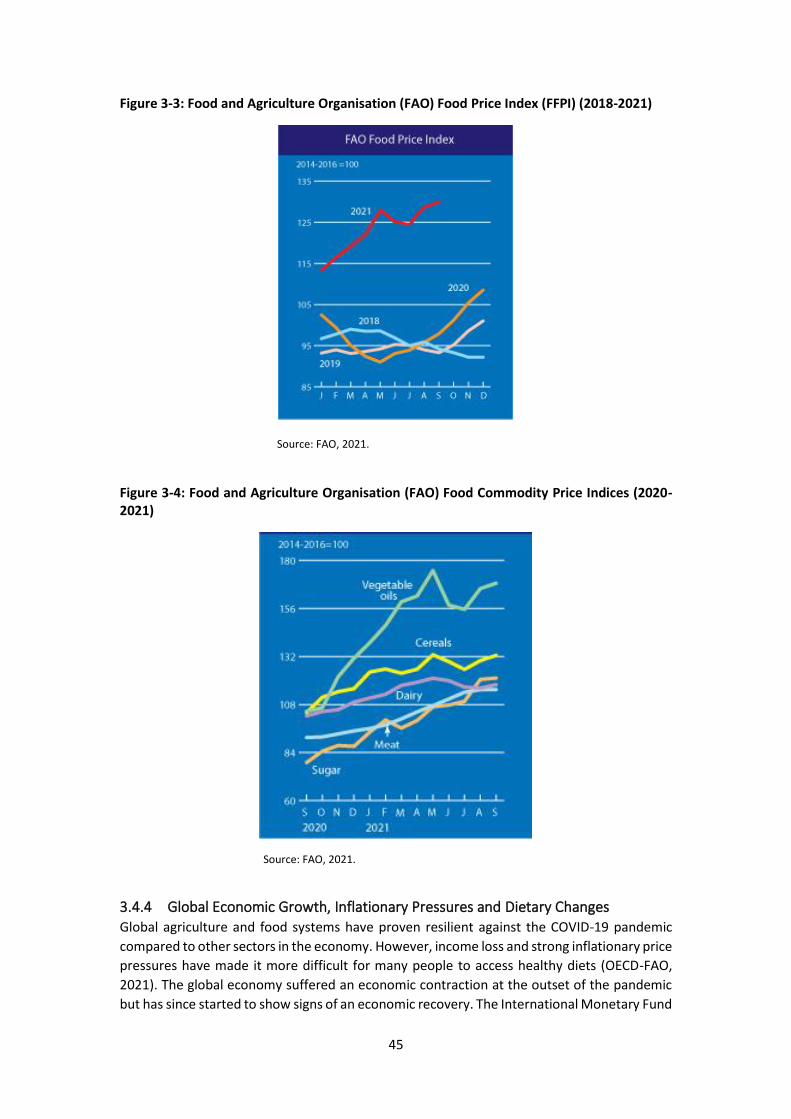
45
Figure 3-3: Food and Agriculture Organisation (FAO) Food Price Index (FFPI) (2018-2021)
Source: FAO, 2021.
Figure 3-4: Food and Agriculture Organisation (FAO) Food Commodity Price Indices (2020-
2021)
Source: FAO, 2021.
3.4.4 Global Economic Growth, Inflationary Pressures and Dietary Changes
Global agriculture and food systems have proven resilient against the COVID-19 pandemic
compared to other sectors in the economy. However, income loss and strong inflationary price
pressures have made it more difficult for many people to access healthy diets (OECD-FAO,
2021). The global economy suffered an economic contraction at the outset of the pandemic
but has since started to show signs of an economic recovery. The International Monetary Fund

46
(IMF) projected that the global economy will grow six per cent in 2021 and 4.9 per cent in
2022 (IMF, 2021b). The current price pressures reflect unusual pandemic-related issues,
significant fiscal support stemming from monetary policy, supply chain disruptions, and
supply-demand mismatches (see Figure 3-5 below) (IMF, 2021b). Inflation has risen, but is
expected to return to pre-pandemic levels for most countries in 2022/23 once disruptions are
worked through - though uncertainty does remain high, particularly if pressures remain
persistent (IMF, 2021b). The annual rate of inflation in the United States from October 2020
to October 2021 as measured by the consumer price index (CPI) was 6.2 per cent (Edelberg,
2021). CPI inflation in New Zealand hit a 10-year-high annual rate of 4.9 per cent for the
September Quarter 2021 (RNZ, 2021d). The global economic recovery could also be influenced
by social unrest, geopolitical tensions, cyberattacks on critical infrastructure, and extreme
weather events (which have increased in frequency and intensity due to anthropogenic
climate change) (IMF, 2021b).
Figure 3-5: Annual percentage change in core inflation across global economies (2019-2021)
Note: AEs = advanced economies; EMs = emerging market economies.
Source: IMF, 2021b
The OECD-FAO Agricultural Outlook 2021-2030 report outlined that global demand for
agricultural commodities (includes non-food uses) is projected to grow at 1.2 per cent per
annum over the coming decade, well below the growth experienced over the past decade (2.2
per cent per annum) (OECD-FAO, 2021). This is mainly due to an expected slowdown in
demand growth in China (0.8 per cent per annum compared to 2.7 per cent per annum over
the last decade) and other emerging economies, and lower global demand for biofuels (OECD-
FAO, 2021). It is expected that population growth will be the major driver of overall demand
growth for commodities over the coming decade. Global food demand is estimated to
increase 1.3 per cent per annum over the coming decade, driven primarily by rising
populations and per capita income. Global food availability per person is projected to increase
by four per cent over the next ten years, reaching just over 3025 kcal/day in 2030 (OECD-FAO,
2021). This, however, masks differences across regions, with consumers in middle income
countries expected to increase their food intake more significantly, while food consumption

47
patterns in low-income nations are projected to remain largely unchanged. For high-income
countries, per capita consumption of animal protein is projected to plateau. This levelling off
is attributed to health and environmental concerns, and will likely be replaced by poultry and
dairy products. Middle-income nations’ preferences for animal protein will remain strong, and
is projected to increase by around 11 per cent over this period.
3.5 Emerging Technologies
3.5.1 Alternative Energy
To produce the food supply, the agricultural sector undertakes various practices across the
agri-food chain (e.g. soil ploughing, sowing, spraying and weeding, storage, and packaging),
and to do this a secure energy source is required (Gorjian et al., 2021). Machinery, including
tractors, combines, loaders, trucks, all-terrain vehicles (ATVs), and motorbikes, perform
important roles and help carry out these land use activities for the primary sector (Gorjian et
al., 2021; Malik & Kohli, 2020). Fossil fuels generally power this machinery, which further
contributes to GHG emissions and the carbon footprint of primary industries globally. The
Consultative Group on International Agricultural Research (CGIAR) outlined that agri-food
chains consume around 30 per cent of total global energy and release around a third of annual
GHG emissions (Gorjian et al., 2021). Therefore, decreasing dependency on traditional fuel
sources will be an important step reducing GHG emissions (Li et al., 2018).
EVs for farming represents a move towards a more sustainable agricultural future (Lombardi
& Berni, 2021). They offer high torque, low maintenance, low operational costs and zero
emissions - however, there are high initial costs, lack of charging infrastructure and low
awareness of the technology (Malik & Kohli, 2020). The use of electricity in agriculture has
increased from three per cent in 1970 to nine per cent in 2018, with a projection of 22 per
cent in the near future (Harchaoui & Chatzimpiros, 2018). There are several companies that
have developed operational electric tractor machinery. German manufacturer Fendt has
launched the e100 Vario, an all-electric tractor that can operate for up to five hours under
working conditions. US manufacturer John Deere has unveiled an electric tractor called
SESAM, while Swiss manufacturer Rigitrac has introduced the Rigitrac SKE 50. Indian
manufacturer Escorts has also launched Farmtrac 26E for use around vineyards and
horticultural production operations.
Photovoltaic technology (PV) also offers a promising renewable energy source for sustainable
agriculture practises. Barriers preventing solar powered tractors are the cost of PV modules
and battery units, along with limitations associated with storage capacity and battery charging
times (Gorjian et al., 2021). Solar power must also account for environmental parameters
including solar radiation intensity, ambient temperature, dust accumulation, air humidity, bird
fouling, and shading (Gorjian et al., 2021; Mustafa et al., 2020). Improvements in technology
and reduced costs could generate an uptake in the use of solar powered farm vehicles. The
automotive industry and companies including Tesla, Lucid, Rivian, and Ford have shown the
transition to alternative energy is not only possible, but rapidly occurring around the world.
3.5.2 Blockchain Technology
The use of data and information is being increasingly used by the primary sector to improve
productivity and sustainability. Existing technologies have already considerably increased the
effectiveness and efficiency of collecting, storing, analysing, and using data in agriculture
(Walter et al., 2017; Xiong et al., 2020). Blockchain technology allows for a secure and reliable
ledger of accounts and transactions to be written and stored by all participants. Iansiti and

48
Lakhani (2017, p. 4) described blockchain technology as an “open, distributed ledger that can record transactions between two parties efficiently and in a verifiable and permanent way”.
Blockchain technology can offer a secure and reliable source of information on the state of
farms, inventory supply and contracts in agriculture. It can track the provenance of food and
help create trustworthy supply chains. It offers smart contracts that settle payments between
different stakeholders and can detect issues in real-time (Xiong et al., 2020).
Blockchain technology has several potential applications and use-cases for agriculture and
food sectors. Conventional farm/crop insurance systems are complicated and not often
economically feasible, and farmers can be reluctant to get insurance for their farm/crops due
to a lack of trust in insurance firms and a fear of delayed or non-payment for their claims (Jha
et al., 2021). A blockchain-based insurance system could help detect fraud and enable quick
processing and settlement of claims using smart contracts. Smart contract can integrate
external data using smart oracles such as Chainlink. This technology could be particularly
useful as extreme weather events will likely threaten agricultural production and food security
(Xiong et al., 2020). The first blockchain-based insurance prototypes are being prepared, or
have already launched. For example, Etherisc, a Swiss company, provides crop insurance using
blockchain technology and weather data to provide payments using Decentralised Insurance
Protocol tokens (DIP) (Xiong et al., 2020). Another key issue confronting smart agriculture is
the development of a comprehensive security system that enables the use and management
of key data (Xiong et al., 2020). Traditional methods are centralised and can include inaccurate
or distorted data, and may be prone to cyber-attacks. Blockchain technology can store data
and information for all stakeholders across the supply chain. It can ensure all recorded data is
transparent and immutable for all stakeholders involved (Xiong et al., 2020). Agricultural and
food supply chains are often long and complex, and face issues including food traceability,
food safety and quality, food trust, and supply chain inefficiency. The blockchain
characteristics of transparency, security, and decentralisation make it possible to track food
quality across the entire supply chain (Xiong et al., 2020; Xu et al., 2020). This can help prevent
fraud in food transactions and reduce supply chain costs. Several companies are utilising this
technology to enhance the food security and safety of their supply chains, with companies
currently developing these systems including Walmart, Carrefour, Nestle, Tyson Foods,
Kelloggs, and Raw Seafood Inc (Xu et al., 2020). In 2016, Walmart established the Walmart
Food Safety Centre in Beijing, investing US$25 million to develop a blockchain solution for
food safety. As the provision of transparency and traceability is associated with a market
premium, the implementation of blockchain systems may provide higher returns for New
Zealand primary producers. An increased need for both transparency and direct
communication between producers and consumers is also emphasised in the strategic
documents of New Zealand primary sector bodies.
3.5.3 Robotics and Autonomous Systems
The agricultural sector has been active in digital innovation for decades, and continues to
exhibit growth in the use and application of robotics and autonomous systems (Lezoche et al.,
2020). Artificial intelligence, and robotics and autonomous systems (RAS) are expected to
have a significant impact on global industries, including the agricultural sector. These
technologies have the potential to improve agricultural land use practises and increase crop
yields (Roshanianfard et al., 2020). Autonomous vehicles use a range of technologies,
including global positioning systems (GPS), light detecting and ranging (LIDAR) systems, neural
networks, and machine learning. Over the past decade, there has been considerable progress
made in autonomous technology. Tesla has launched full self-driving beta and recently

49
updated its software to version 10.5. The advanced driver-assistance system (ADAS) offers
Level 2 vehicle automation with features including lane centring, traffic-aware cruise control,
automatic lane changes, semi-autonomous navigation, self-parking, auto-park, smart
summon, traffic, and stop sign control (Tesla, 2021). This underlying technology will likely
make its way into the agricultural sector over time. Autonomous systems are currently being
used in farm equipment such as tractors, combine harvesters, utility vehicles, and
transplanters. At the 2021 Consumer Technology Association (CTA) conference, John Deere
unveiled autonomous vehicles for the agricultural sector. As autonomous vehicle technology
improves and prices drop, New Zealand could see a greater uptake in the technology, thereby
influencing land use change/practice.
3.5.4 Climate Change Mitigation Technology
There are technologies emerging that seek to mitigate the impacts of agricultural GHG
emissions, with considerable research and investment carried out regarding these
technologies. The New Zealand Agricultural Greenhouse Gas Research Centre (NZAGRC) is
leading a research programme that is seeking to reduce methane emissions. The programme
has identified genetic markers in low methane emitting sheep and is incorporating these into
breeding indices (NZAGRC, 2021). New Zealand breeders can now measure and rank sheep
according to their methane emissions. Work is also currently underway to identify low-
emitting dairy cattle and develop a national breeding programme. Research has also shown
that some supplementary feeds can produce different fermentation effects in an animal’s rumen and produce less methane per unit of feed consumed. Research and development on
methane inhibitors and vaccines is also currently underway in New Zealand. Methane
inhibitors are chemical compounds that be given to livestock to reduce methane production,
while a methane vaccine introduces antibodies into a cow’s saliva, which is then passed on to
the animal’s rumen/stomach, binding with the methanogens that convert hydrogen into
methane (NZAGRC, 2021). Fonterra has partnered with a Dutch-based company DSM that
developed a methane inhibitor product called Bovaer (also known as 3-NOP), which has been
shown to reduce methane emissions across a range of ruminant breeds (DSM, 2019). These
technologies, if successful, could be crucial in helping New Zealand meet its ambitious 2030
and 2050 methane reduction targets, and may influence primary land-use practise and
decisions in New Zealand.
3.5.5 Precision Agriculture
Precision agriculture is a management strategy that gathers, processes and analyses temporal,
spatial, and individual data, and combines it with other information to support management
decisions according to estimated variability for improved resource use efficiency, productivity,
quality, profitability, and sustainability of agricultural production. The satellite and space
sector are contributing to the expansion of internet connectivity in rural areas, with
companies SpaceX and their subsidiary Starlink making significant contributions to the
industry. The Starlink internet constellation currently contains over 1,600 satellites, and
paperwork has been filed for another 42,000. The company is seeking to provide global
internet coverage, and this will likely greatly benefit rural regions. As of September 2021, the
beta service is available in 17 countries, including New Zealand. New Zealand still has some
areas that do not have access to wireless broadband or fibre optic connections. Southland
District councillor Margie Ruddenklau operates a beef and cattle farm in Hokonui, and found
that the Starlink service considerably improved their access to high-speed internet, enabling
them to be online when weighing calves (Jackson, 2021). The technology will continue to help

50
connect farms and bring high-speed connectivity to areas without internet access. In 2020,
the United States Federal Communications Commission announced a US$9 billion federal
support fund to develop rural 5G networks and precision agriculture (FCC, 2020). The fund
was later put on hold until mapping had been conducted to identify the areas most in need.
John Deere is also seeking to incorporate 5G technology into their tractors. Improvements in
connectivity, low latency and additional bandwidth will enable farmers to eventually have
fully autonomous tractors, and gather real-time data without being physically present in their
tractor (Marek, 2021). This technology will likely influence primary land users’ decision-
making and land use practises as they incorporate additional data derived from enhanced
connectivity.
3.5.6 Genetics
Humans have been altering the genomic make-up of plants and animals for years using
traditional breeding techniques (Phillips, 2008). Artificial selection, for example, has resulted
in a variety of different organisms, but has been limited to natural occurring traits (Phillips,
2008). In recent times, however, advances in genetic engineering have been made that allow
for precise control over genetic changes introduced/made to an organism/species (Phillips,
2008). Genetically modified crops cover approximately 190 million hectares, which is
equivalent to the size of Mexico (Turnbull et al., 2021). These crops contain genetic
modifications that have often boosted yield and/or improved resistance to disease/pests
(Redden, 2021). Soybeans (50 per cent), maize (30 per cent), cotton (13 per cent), and canola
(5 per cent) make up the four primary crops that are cultivated using GM technology (Turnbull
et al., 2021). There are currently five tools employed for gene editing purposes:
1) Oligonucleotide Directed Mutagenesis (ODM);
2) Zinc-Finger Nucleases (ZFNs);
3) Meganucleases;
4) Transcription Activator-Like Effectors Nucleases (TALENs); and
5) Clustered Regularly Interspaced Short Palindromic Repeats (CRISPR) systems
(Turnbull et al., 2021).
In 2021, the first genome-edited product was launched in Japan by Sanatech Seed - the Sicilian
Rouge High GABA tomato - using CRISPR/Cas9 technology (ISAAA, 2021). The tomato contains
up to five times the amount of gamma-aminobutyric acid (GABA) compared with a regular
tomato. GABA is an amino acid that is believed to help relaxation and lower blood pressure.
Extensive research is being carried out globally using genome editing techniques. In 2021, the
United Kingdom’s Rothamsted Research was granted permission by DEFRA to run a series of
field trial of genome-edited wheat (UKRI, 2021). These are the first field trials of regularly
interspaced short palindromic repeats (CRISPR) edited wheat in the UK/Europe. The wheat
variant has been modified to reduce levels of the naturally occurring amino acid asparagine,
which is converted to acrylamide (carcinogen) when baked or toasted. The edited plants have
shown reduced levels of asparagine, with one line showing a 90 per cent reduction (UKRI,
2021). In 2020, the United States, regulations were introduced that eased restrictions on
genetic engineering of food crops. The USDA Animal and Plant Health Inspection Service
(APHIS) will now focus on gene traits rather than the technology used to create them
(Stokstad, 2020). These regulations will likely ease the path for GMO products to enter the
market.

51
New Zealand does not currently cultivate GM crops and takes a strong line against
crops/animals developing using gene editing techniques (Turnbull et al., 2021). Such
regulations are contained in the Hazardous Substances and New Organisms Act 1996 (HNSO)
and are administered by the Environmental Protection Agency (EPA) (Parliamentary Counsel
Office, 2021). Genetically modified organisations (GMOs) are defined as any organism in
which any of the genes or genetic material have been modified in vitro techniques, or are
inherited or derived from any other genes or genetic material that has been modified by in
vitro techniques (MPI, 2021b). There are strict minimum standards set for any GMO approval.
In the assessment, the EPA must consider whether the benefits outweigh the risks, and
particular focus is given to the impact the novel organism may have on Māori culture, values, and traditions (Hudson et al., 2019). In 2016, the Royal Society of New Zealand convened a
multidisciplinary panel of experts to examine the implications of using gene-editing
technologies in New Zealand, which reported that gene-editing was emerging in global
primary production and influencing land use change/practice (RSNZ, 2016). In 2019, the Royal
Society released a report titled Gene Editing Legal and Regulatory Implications, which outlined
that there was a need to overhaul existing gene-editing regulations, arguing that New Zealand
had an ethical obligation to contribute to global knowledge on gene editing technology,
adding this could not be left to other countries (RSNZ, 2019). At present, no genetically
modified plants can be grown outside of the laboratory, with any experiment requiring
approval from the EPA (MPI, 2021b).
Researchers are currently assessing the use of gene-editing techniques on New Zealand
primary production. AgResearch employs genomic-based research tools to improve growth
rates, health, meat and milk production, and fecundity, and to reduce use of chemicals in
livestock (Pantoja, 2021). The organisation has identified that gene-edited ryegrass could
grow up to 50 per cent faster, require less water, and reduce cattle methane emissions by 23
per cent (Hogan, 2019). Plant and Food’s Chief Scientist Richard Newcomb suggested that
gene-editing technology could help to create crop varieties that are more resilient to extreme
weather events, enable native trees to be better protected, and help New Zealand to reach
its 2050 carbon neutral and predator-free targets (Nicol-Williams, 2019). If regulations
change, the use of gene editing could have a significant impact on land use change/practice
in New Zealand.
3.5.7 Regenerative Agriculture
Regenerative agriculture is an approach to producing food that advocates claim may have
lower – or even net positive – environmental and/or social impacts (Newton et al., 2020). It is
viewed as a potential solution to address climate change, biodiversity loss, poor water quality
and health of freshwater ecosystems, wellbeing crises in rural and farming communities, and
food system dysfunctions (Grelet et al., 2021; Gosnell et al., 2019). Paustian et al. (2020)
argued that regenerative agriculture could contribute significantly to emission reductions and
CO2 removal, as well as improve soil health. The authors pointed out evidence that supports
claims that regenerative agricultural practises will help minimise soil degradation and improve
the yield stability (Paustian et al., 2020). Regenerative organic agriculture techniques can
sequester CO2, thereby helping combat global warming (White, 2020). Field trials have shown
significant reductions in CO2 emissions from farms practising regenerative agriculture (Rodale
Institute, 2013). LaCanne and Lundgren (2018) argued that promoting soil biology and
biodiversity on farms means regenerative farmers also required less costly inputs (e.g.
pesticides and insecticides) and can more effectively manage their pest populations, while
organic soil matter is seen the key driver of farm profitability rather than yield.

52
There is growing support for regenerative agricultural practises on a domestic and
international level. Danone and Nestlé have committed around US$1.4 billion to support
regenerative agriculture across their supply chains over the next five years (Yu, 2020). These
funds will support farmers and suppliers to transition to more sustainable land use practises.
In 2020, Beef and Lamb New Zealand (B+LNZ) and New Zealand Wine (NZW) commissioned
Alpha Food Labs using financial support from the MPI Sustainable Food and Fibres Futures
fund to improve understanding on the current state and future market potential of
regenerative agriculture in wine and food across three of New Zealand’s international markets, including the United States, Germany and the United Kingdom (Beef+Lamb, 2021b).
Their report noted that there was no clear or consistent definition of regenerative agriculture
in New Zealand; however, outlined that the regenerative agriculture movement was gathering
momentum internationally and will likely become a significant trend across the international
food and fibre sector (Beef+Lamb, 2021b). The report pointed out that regenerative
agriculture is a significant opportunity for the primary sector, which is well positioned to take
advantage of this emerging global trend. This will require defining the term regenerative in a
New Zealand context, ensuring that regenerative attributes are embedded in a New Zealand
story, develop and implement standards that are verifiable/relevant and linked with
international supply chains, and ensure that all claims are underpinned by science
(Beef+Lamb, 2021b). Research has shown that consumers are willing to pay for regeneratively
produced food, especially if their social and environmental benefits can be verified by science.
Growing awareness and adoption of regenerative agricultural practises will likely contribute
to shifts in land use change/practise in New Zealand.
3.6 Innovative Products/New Food Technology
3.6.1 Alternative Protein Sources
Alternative protein sources have emerged as a significant alternative to traditional sources of
protein such as meat or fish, this has been driven by changing consumer preferences and the
climate impacts of traditional livestock production systems (Akhtar & Isman, 2018; Driver et
al., 2020a). These alternative sources of protein can generally be placed into three categories:
edible insects, plant-based proteins, and cellular/cultured proteins (Sexton et al., 2019).
The consumption of insects as food is currently practised by around 2 billion people across
Africa, Asia, Central and South Africa, and Australia (Akhtar & Isman, 2018; Baiano, 2020).
Baiano (2020) outlined that the tropics provide the most insect biodiversity, while insect
eating declines at higher latitudes. The research estimated that humans consume
approximately 2,300 different types of insect species, with entomophagy (eating insects)
practised by approximately 3,000 ethnic groups in over 100 countries (Baiano, 2020). There is
some evidence to suggests that awareness of insect protein is growing in Western regions that
have traditionally obtained protein from livestock - however, cultural attitudes regarding the
palatability of insects may be a barrier to widespread consumption. Dagevos (2021, p. 258)
conducted a broad literature review of consumer research on edible insects and concluded
that “many Westerners remain hesitant to include insect eating in their daily diet, and
consequently, the evidence suggests that the eating of insects is anything but widespread and
common but rather surrounded by unfamiliarity and reluctance”. Nevertheless, insects can
offer a healthy source of protein, energy, fat, and fibre (Sogari et al., 2019). Payne and Ryan
(2019) assessed New Zealand consumers’ perceptions of and preferences for insect-based
food products, finding that approximately 67 per cent of consumers indicated a willingness to
consume insects as food if they were processed into a powder that could be added to existing

53
foods. The researchers suggested this indicates that an insect product with clearly detailed
health and environmental benefits could be successful in New Zealand (Payne & Ryan, 2019).
The global food sector is increasingly turning towards addressing sustainability issues.
Aschemann-Witzel et al. (2020) identified several key issues and trade-offs connected to
protein production and consumption. Firstly, there is an increasing demand for protein.
Secondly, there is an uneven distribution of protein consumption globally with
overconsumption occurring in many developed countries, while poorer regions often have
insufficient protein intake. Thirdly, animal-based protein, particularly meat, has a high
environmental impact (Aschemann-Witzel et al., 2020; Faber et al., 2020; Westhoek et al.,
2014). Plant-based protein products are seeking to address these challenges, and a wide range
of products have entered the marketplace. Companies with an established presence for plant-
based alternative protein products include Beyond Meat, Garden Protein International Inc,
Danone SA, and Impossible Foods.
New Zealand is involved in the development of a variety of alternative proteins sources. The
Ministry for Primary Industries (MPI) contributed more than NZ$95,000 through the
Sustainable Food and Fibres Futures Fund to help boost Kabocha Milk Co’s work to formulate, manufacture, and market kabocha milk (made from squash) to consumers across Asia. In
2020, under the New Zealand-Singapore Enhanced Partnership, the Ministry of Business,
Innovation & Employment (MBIE) and Singapore’s National Research Foundation (NRF) and Agency for Science, Technology and Research (ASTAR), partnered on a future foods research
programme. New Zealand has contributed NZ$11.8 million to alternative protein research
being undertaken by AgResearch Limited, Massey University, The Cawthorn Institute and
Auckland University (MFAT, 2020). In 2021, a report titled Emerging Proteins in Aotearoa New
Zealand: What will it take for the sector to thrive? was released, detailing the current
landscape of alternative proteins in New Zealand. The report recommended adopting a New
Zealand whole-of-value-chain approach, formalising and funding a national network to
coordinate initiatives and bring cohesion to the discussion, establishing a cross-government
working group that includes all relevant parties, and developing and implementing a New
Zealand strategy for emerging proteins (Emerging Proteins NZ, 2021).
There is growing demand for alternative protein products in New Zealand. Research
conducted by Colmar Brunton for Food Frontier found that 1 in 3 people were actively
reducing their meat intake, while New Zealanders defined as flexitarian grew by 18 per cent
(Food Frontier, 2019). Retailer Countdown observed that demand for plant-based vegan and
vegetarian meals increased 36 per cent between 2018 and 2019 (RNZ, 2019). There has also
been growth in the number of New Zealand companies producing alternative protein products
(see Table 3-3 below). Sunfed Meats manufactures plant-based products including Chicken-
Free Chicken, Bull Free Beef, and Boar Free Bacon, which are sold to a global market. Plant &
Food Research observed that new consumer trends regarding plant-based foods, plant
proteins and flexitarian lifestyles are emerging in New Zealand, and suggested that the
production of ingredients for these products should be incorporated into existing primary
production systems. It is estimated that New Zealand currently has approximately 1.74 million
hectares of land suitable for growing plant protein crops (Sutton et al., 2018). The growth of
alternative proteins is likely to influence primary land use in New Zealand as global consumers
increasingly demand environmentally sustainable products.

54
Table 3-3: New Zealand-based companies producing alternative protein products
Company Products
Otago Locusts Insect products
The Green Brothers Hemp food products
Plant Culture Hemp seed products
Angel Food Dairy-free cheese
Otis Milk Oat milk
The Alternative Dairy Co Dairy free milks and cheese
The Alternative Meat Co Plant-based meat
Olive and Ash – Vince Plant based meat
Sunfed Meat Plant-based meat
The Craft Meat Co Plant-based meat Note: This is not an exhaustive review of existing companies in New Zealand, but instead seeks to highlight some
of the organisations participating in the alternative protein market.
Source: Adapted from Downie-Melrose, 2020.
The Agribusiness and Economics Research Unit (AERU) estimated values for selected credence
attributes of alternative protein products by UK and US (Californian) consumers, with a focus
on identifying preferences for attributes considered distinctively New Zealand (Driver et al.,
2020b). Nearly half of the participants in the UK and US were shown to have reduced their
overall meat consumption (46 per cent and 44 per cent respectively), with these reductions
strongly motivated by health concerns. It was found that 40 per cent of UK participants
consumed plant-based protein products at least monthly, with 11 per cent consuming edible
insect products. By comparison, Californian participants’ consumption of edible insects was
slightly higher, and plant-based meat consumption slightly lower. The survey identified that
the top four factors motivating participants to increase their consumption of alternative
products are taste, animal welfare, personal health, and price. The perceived poor taste of
alternative protein products was the factor most likely to impede the consumption of
alternative protein sources (Driver et al., 2020b).
3.6.2 Cellular Agriculture
Cellular agriculture is an alternative farming approach for products such as meat and eggs,
and differentiates itself from conventional practises due to its use of isolated cells rather than
animals to produce food (Ogilvie, 2021a). There are currently two classes of cellular
agriculture, both of which involve culturing cells under conditions that are controlled. The first
is acellular agriculture, in which goods do not contain cells within the final consumer product,
but instead uses proteins or compounds that have been isolated from the cultured cells. The
second is cell-based products, which contain cultured animal cells. Proponents of cellular
agriculture argue that it can address the ethical and sustainability issues of traditional animal
agriculture while meeting increasing demand for animal protein (Helliwell & Burton, 2021).
Cellular agriculture may also offer significant environmental benefits over traditional meat
and milk production (Lynch & Pierrehumbert, 2019; Stephens & Ellis, 2020). Tuomisto and
Teixeira de Mattos (2011) produced a highly influential anticipatory life-cycle assessment that
supported positive environmental claims. The study modelled cellular agriculture and
observed that it was considerably more efficient than conventional European livestock
agriculture, and had 7–45 per cent lower energy use, 78–96 per cent lower GHG emissions, 99
per cent lower land use, and 82–96 per cent lower water use (Tuomisto & Teixeira de Mattos,
2011).

55
Cellular agriculture is growing quickly, but much of the technology remains in the earlier
stages of development (Ogilvie, 2021a). In 2013, the first cell-cultured meat patty was
produced at Maastricht University, reportedly costing €250,000 to produce (Burton, 2019). There are currently no products available in New Zealand, but there are several commercial
products sold overseas. One such product is an ice cream that contains milk products
produced using acellular agriculture. Perfect Day Foods and Brave Foods manufacture the ice
cream product, which is currently only available in the US or online (Ogilvie, 2021a). Another
product is a chicken nugget product that contains plant protein and chicken cells, and is
currently only available in Singapore (Ogilvie, 2021a). Currently, there are approximately 80
start-ups commercialising cellular agriculture technology, most of which are based in North
America (Ogilvie, 2021b). These organisations face considerable technical, market, regulatory
and societal challenges before reaching full commercialisation of products. Current estimates
for the arrival of lab-grown meats on supermarket shelves range between 1-20 years, with
preliminary studies showing that consumers are willing to try such products, and if satisfied
with their experience, incorporate them into their regular diet (Heffernan, 2017). However, a
synthesis of consumer research into lab-grown meat also suggests that consumers in the US
and China are concerned about the safety of such products, which could influence their
willingness to purchase (Antedote, 2018).
In 2020, the Ministry of Business, Innovation & Employment (MBIE) and Singapore’s National Research Foundation (NRF) and Agency for Science, Technology and Research (ASTAR), jointly
funded the New Zealand-Singapore Bilateral Research Programme on Future Foods. Research
being conducted by the University of Auckland is seeking to understand the interactions
between plant-based proteins and cellular agriculture (MFAT, 2020). The New Zealand
Treasury has stated that it will be monitoring the global synthetic protein market, concluding
that while these products do not currently have the potential to significantly disrupt
traditional meat markets, they could pose risks in the future (New Zealand Treasury, 2018).
Similarly, New Zealand meat industry bodies have previously stated that they do not consider
synthetic meat products to be a risk to the industry. However, if a feasible international
market for synthetic protein products were to emerge, this could influence land use
change/practice in New Zealand.
3.7 International Trading Environment
3.7.1 Brexit
In 2016, the British public voted to leave the European Union (EU). The UK government then
officially notified the EU, triggering Article 50 of the EU Treaty. The Article specified that the
UK was required to leave the EU within two years. On January 31st 2020, the United Kingdom
left the EU, and is no longer a Member State. A transition period was installed which kept
most pre-departure arrangements in place, ending on December 31st 2020. A deal on post-
Brexit trade and future EU-UK relations has since been formally ratified. This allows tariff-free,
quota-free bilateral trade access for goods – but not services – and covers future competition,
fishing rights, and cooperation on matters such as security. The UK’s departure from the EU’s Single Market and Customs Union has disrupted trade and UK exports to the EU. London and
Brussels have expressed disagreement regarding fishing rights, diplomatic representation,
coronavirus vaccine exports, and Northern Ireland.
New Zealand spent several years negotiating a free trade agreement (FTA) with the United
Kingdom. New Zealand was one of four countries that the United Kingdom identified as being
a priority partner for new trade agreements post-Brexit. There were six rounds of negotiations

56
between the two countries, with the most recent being held virtually between 19th and 30th
July 2021. New Zealand negotiators sought market access for exporters through the removal
of tariffs and the reduction of trade barriers. The United Kingdom was New Zealand’s seventh-
largest trading partner pre-COVID-19, with trade valued at around NZ$6 billion to March 2020.
New Zealand’s main exports to the UK are meat, wine, fruit, eggs, honey, and wool. Recent
modelling has suggested the impact of Brexit on New Zealand will be minimal (Saunders et al.,
2019). These negotiations have since concluded with a new FTA deal announced in late 2021.
3.7.2 Free Trade Agreements (FTAs)
3.7.2.1 Bilateral Free Trade Agreements
New Zealand relies on market access for the trade of agricultural products and the success of
its primary industries. It seeks preferential trade agreements with other nations to lower tariff
and non-tariff barriers, the most common of which are bilateral free trade agreement (FTAs).
In addition to multilateral FTAs, New Zealand currently has bilateral FTAs in force with the
United Kingdom, China, Australia, Malaysia, Thailand, Singapore, and South Korea, with an
FTA under negotiation with the EU. FTAs are signed not only to reduce tariff barriers for
bilateral trade, but also to create market opportunities, streamline processes, reduce
overhead costs, and generate more certainty and security for businesses conducting work
overseas (MFAT, 2021a). FTAs can also improve market access for local businesses and enable
them to be more competitive in overseas markets (MFAT, 2021a).
As new agreements come into force, the primary sector may need to adapt production
processes and land use practices to comply with new standards, quotas, or policies. The
potential for future agreements could greatly affect the trading profile and primary
production/land use in New Zealand. Verevis and Üngör (2021) estimated that without the
FTA with China, New Zealand would experience 22 per cent less total commodity exports, and
185 per cent less for the food and animal sectors. FTAs will continue to play an important role
in market connectivity within the international trading environment, especially for the
agricultural sector.
New Zealand has several existing bilateral agreements including the following:
• Australia: Closer Economic Relations (1983)
• China: New Zealand-China Free Trade Agreement (2008)
• Hong Kong: New Zealand-Hong Kong, China Closer Economic Partnership (2011)
• Malaysia: Malaysia-New Zealand Free Trade Agreement (2009)
• Singapore: New Zealand and Singapore Closer Economic Partnership (2001)
• South Korea: NZ-Korea Free Trade Agreement (2015)
• Taiwan: Agreement between New Zealand and the Separate Customs Territory of
Taiwan, Penghu, Kinmen, and Matsu on Economic Cooperation (2013)
• Thailand: New Zealand and Thailand Closer Economic Partnership (2005)
• United Kingdom: New Zealand and United Kingdom Free Trade Agreement (2021)
There have been changes to existing bilateral FTAs in recent years. In January 2021, New
Zealand and China announced they had signed an upgrade of their existing agreement. This
built on current commitments and improved technical barriers to trade, customs procedures,
and cooperation, which will benefit the primary sector. Trade facilitation provisions will
simplify export procedures, remove a level of administration, paperwork, and reduce
compliance costs for red meat exporters. The New Zealand-China FTA, which came into force
in 2008, has played a major part in growing the Chinese market, with tariffs on sheepmeat,

57
beef and associated products going to zero on 1 January 2017 (excluding wool). China is the
largest market for New Zealand’s agricultural exports. In 2020, agricultural exports cost
NZ$3.4 billion while the sector saved over NZ$475 million on tariffs (Beef+Lamb, 2021a).
In October 2021, the New Zealand Government announced that it had secured an FTA with
the UK, and the deal will provide significant benefits for the primary sector. The UK was New
Zealand’s seventh largest trading partner pre-COVID-19, with trade between the countries
worth NZ$6 billion in year-ended March 2020 (MFAT, 2021g). Modelling has shown that once
fully implemented (in Year 15), exports to the UK will increase by up to 40 per cent, GDP will
increase by NZ$970 million, and exporters will save an estimated NZ$37.8 million on tariffs
each year based on current volumes (MFAT, 2021g). The FTA will eventually eliminate all
tariffs on New Zealand’s exports to the UK, with 97 per cent eliminated from Day 1. Tariffs will
be eliminated immediately on wine (export value NZ$463.1 million), honey (export value
NZ$74.9 million) and onions (export value NZ$8 million). Tariffs on apples will be eliminated
after three years, while tariff-free access has been granted for off-season exports for the first
three years of the FTA. The fisheries sector will see tariffs on hoki (export value NZ$2.2 million)
removed from Day 1, while after three years tariffs on mussels will be removed (export value
NZ$6.4 million).
The NZ-UK FTA opens an important market for New Zealand’s dairy exporters that have been
historically constrained by high tariffs. Tariffs will be removed on butter after five years
(export value NZ$1.6 million) and cheese (export value NZ$500,0000), while other dairy
products will also become tariff-free (MFAT, 2021g). Transitional duty-free quotas will be
established, starting at 7,000 tonnes for butter and 24,000 tonnes for cheese, and increasing
to 15,000 tonnes for butter and 48,000 tonnes for cheese (MFAT, 2021e). Tariffs on meat
exports will be removed after 15 years for sheep (export value NZ$336.1 million) and beef
(export value NZ$4.0 million). Transitional tariff-free quotas have been agreed upon, which
will see sheepmeat quotas increase over time up to between 149,205 and 164,205 tonnes
annually, while beef will increase over time up to between 12,000 and 60,000 tonnes annually
(MFAT, 2021e). The NZ-UK FTA also includes far-reaching trade and environmental
commitments. There are provisions that address trade distortion and environmentally
damaging subsidies. The FTA also includes commitments to prohibit subsidies that exacerbate
overfishing and addresses the consumption/production of fossil fuels (MFAT, 2021g). Over
260 environmentally friendly products been selected for tariff elimination - the largest list ever
complied for an FTA. Overall, the agreement represents a significant trade milestone for New
Zealand’s primary sector and will influence demand for agricultural products and services.
3.7.2.2 Multilateral Free Trade Agreements
The failure of the World Trade Organisation (WTO) to complete the Doha Development
negotiations in 2015 was a setback to the development of global/multilateral FTAs (MFAT,
2021f). New Zealand was actively involved in discussions and sought the elimination of
agricultural export subsidies and other trade-distorting practises that affected agriculture. The
failure of the negotiations placed New Zealand at risk of being excluded from trade
negotiations, which could have resulted in lost market share in foreign markets. Fortunately,
New Zealand is a signatory on several multilateral FTAs including:
• Trans-Pacific Strategic Economic Partnership - Brunei (2005)
• Trans-Pacific Strategic Economic Partnership - Chile (2005)
• Trans-Pacific Strategic Economic Partnership (2005) Singapore - Auxiliary to the
bilateral New Zealand and Singapore Closer Economic Partnership
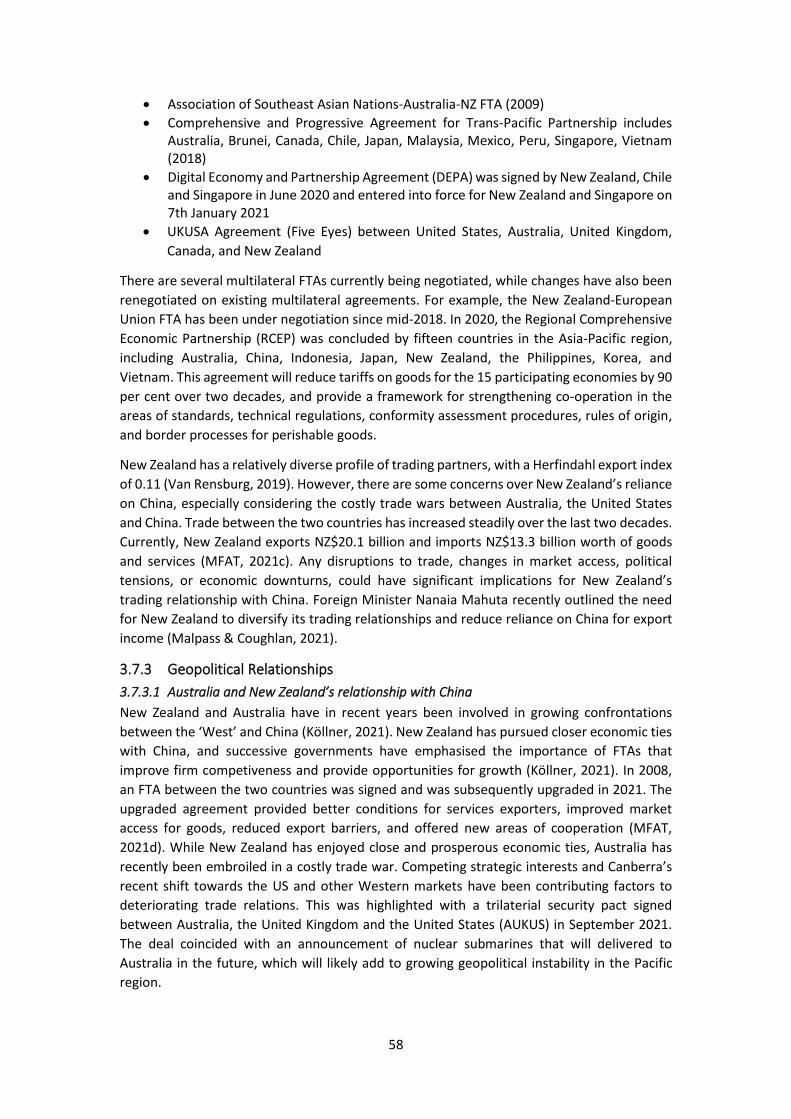
58
• Association of Southeast Asian Nations-Australia-NZ FTA (2009)
• Comprehensive and Progressive Agreement for Trans-Pacific Partnership includes Australia, Brunei, Canada, Chile, Japan, Malaysia, Mexico, Peru, Singapore, Vietnam
(2018)
• Digital Economy and Partnership Agreement (DEPA) was signed by New Zealand, Chile
and Singapore in June 2020 and entered into force for New Zealand and Singapore on
7th January 2021
• UKUSA Agreement (Five Eyes) between United States, Australia, United Kingdom,
Canada, and New Zealand
There are several multilateral FTAs currently being negotiated, while changes have also been
renegotiated on existing multilateral agreements. For example, the New Zealand-European
Union FTA has been under negotiation since mid-2018. In 2020, the Regional Comprehensive
Economic Partnership (RCEP) was concluded by fifteen countries in the Asia-Pacific region,
including Australia, China, Indonesia, Japan, New Zealand, the Philippines, Korea, and
Vietnam. This agreement will reduce tariffs on goods for the 15 participating economies by 90
per cent over two decades, and provide a framework for strengthening co-operation in the
areas of standards, technical regulations, conformity assessment procedures, rules of origin,
and border processes for perishable goods.
New Zealand has a relatively diverse profile of trading partners, with a Herfindahl export index
of 0.11 (Van Rensburg, 2019). However, there are some concerns over New Zealand’s reliance on China, especially considering the costly trade wars between Australia, the United States
and China. Trade between the two countries has increased steadily over the last two decades.
Currently, New Zealand exports NZ$20.1 billion and imports NZ$13.3 billion worth of goods
and services (MFAT, 2021c). Any disruptions to trade, changes in market access, political
tensions, or economic downturns, could have significant implications for New Zealand’s trading relationship with China. Foreign Minister Nanaia Mahuta recently outlined the need
for New Zealand to diversify its trading relationships and reduce reliance on China for export
income (Malpass & Coughlan, 2021).
3.7.3 Geopolitical Relationships
3.7.3.1 Australia and New Zealand’s relationship with China
New Zealand and Australia have in recent years been involved in growing confrontations
between the ‘West’ and China (Köllner, 2021). New Zealand has pursued closer economic ties with China, and successive governments have emphasised the importance of FTAs that
improve firm competiveness and provide opportunities for growth (Köllner, 2021). In 2008,
an FTA between the two countries was signed and was subsequently upgraded in 2021. The
upgraded agreement provided better conditions for services exporters, improved market
access for goods, reduced export barriers, and offered new areas of cooperation (MFAT,
2021d). While New Zealand has enjoyed close and prosperous economic ties, Australia has
recently been embroiled in a costly trade war. Competing strategic interests and Canberra’s recent shift towards the US and other Western markets have been contributing factors to
deteriorating trade relations. This was highlighted with a trilaterial security pact signed
between Australia, the United Kingdom and the United States (AUKUS) in September 2021.
The deal coincided with an announcement of nuclear submarines that will delivered to
Australia in the future, which will likely add to growing geopolitical instability in the Pacific
region.

59
China is Australia’s largest trading partner for both the import and export of goods. Between
2019 and 2020, 39 per cent of exported goods went to China, while 27 per cent of all goods
imported were from China (Australian Bureau of Statistics, 2020). The value of exports
doubled from AU$75 billion in 2014-2015 to AU$150 billion in 2019-2020, with imports
increasing 42 per cent over the same period (Australian Bureau of Statistics, 2020). Until
recently, China accounted for 96 per cent of Australian southern rock lobster exports, worth
approximately half a billion USD - however, China imposed a ban on these imports due to
samples containing high amounts of heavy metals (Dobson, 2021). The trade dispute between
the two countries has also affected agricultural exports, including barley, wine, and beef.
China introduced tariffs of 80 per cent on barley imports and over 200 per cent on Australian
wine imports. This breakdown in trade has cost Australia an estimated AU$2.3 billion (Dobson,
2021).
There has since been more retaliatory actions between the two nations, with Beijing
suspending China-Australia Strategic Economic dialogue indefinitely, while Canberra
suspended a Chinese infrastructure deal that was part of the Belt and Road Initiative. Growing
tensions in the Pacific and South China Seas will likely continue into the future. New Zealand
may be confronted with difficult decisions, particularly due to our reliance on the Chinese
markets for our agricultural exports. As seen in Australia, there can be significant costs
associated with geopolitical instability and positioning, which could potentially impact New
Zealand primary sector.
3.7.3.2 United States and China
The relationship between the US and China has deteriorated in recent years, culminating in a
costly trade war. In 2018, former President Donald Trump cited unfair Chinese trade practises
and intellectual property rights (IPR) violations. Over the coming months, a series of tariffs
were put in place by both sides on a variety of goods and services. This trade war had a
considerable impact on the US agricultural sector. US exports of agricultural products to China
declined by 63 per cent between 2017 and 2018, from US$15.8 billion to US$5.9 billion (Chinn
& Plumley, 2020). In 2019, a deal titled Phase One was signed, in which China pledged to
increase US exports and improve IPR rules (BBC, 2020). Since arriving in office, President Joe
Biden has yet to remove US tariffs on US$380 billion worth of Chinese goods entering the US,
citing that Beijing has failed to meet aspects of the Phase One deal. Therefore, it remains
unclear how trade will proceed between the two countries. Despite uncertainty, the US
agricultural sector has avoided further impacts. The USDA has forecasted that a record
US$39.0 billion worth of agricultural products will be shipped to China in 2022 (USDA, 2021).
The implications of further trade wars between China and the United States could influence
demand for New Zealand products from the primary sector.
3.8 Consumer Trends
3.8.1 Demand for Social and Environmental Attributes
New Zealand has a biological economy, and a large proportion of economic activity is related
to the land. Marketing social, cultural and environmental characteristics to consumers in
export markets can help achieve greater value for New Zealand producers and their land-
based export products. The Agribusiness and Economics Research Unit (AERU) has conducted
a number of surveys and choice experiments across different countries and commodities to
value consumers’ willingness-to-pay (WTP) for certain product credence attributes (refer to
Appendix A). These choice experiments reveal that country-of-origin plays an important role
in kiwifruit consumers’ choices. Relative to the average price of a kilogram of kiwifruit, on

60
average, respondents were willing to pay a 123 per cent premium for kiwifruit from NZ
(¥108/kg) (see Figure 3-6 below). The most preferred production attributes were organic,
followed by social responsibility and water use and pollution minimisation equally (Tait et al.,
2020).
Figure 3-6: Shanghai consumer willingness-to-pay (WTP) for selected attributes of kiwifruit
Note: Willingness to pay (WTP) is the percentage of average product price as used in choice experiments.
Source: Saunders et al., 2021
A survey was also carried out with Japanese kiwifruit consumers. The consumer sample was
segmented (using latent class modelling) into three groups with different characteristics and
preferences (see Figure 3-7 below). The first group of consumers was shown to have the
strongest preferences for environmental and health attributes. This group were more likely to
believe that carbon neutral production is important when purchasing kiwifruit, believe that
improving personal health is important, and were conscious of minimising harm to the
environment. The second group exhibited the broadest preferences, but their choices were
largely driven by taste. These consumers were likely to be older, pay higher prices, and
purchase Zespri kiwifruit at least weekly. The third group of consumers valued enhanced food
safety standards and exhibited the highest WTP for organic production.

61
Figure 3-7: Japanese consumer willingness-to-pay (WTP) for selected attributes of kiwifruit
Note: Willingness to pay (WTP) is the percentage of average product price as used in choice experiments.
Source: Saunders et al., 2021
Consumer surveys have been carried out across a variety of other commodities. In 2019 and
2020, two surveys were conducted to estimate WTP values for selected credence attributes
of lamb leg products by United Kingdom consumers, with a focus on identifying preferences
for attributes considered distinctively New Zealand. Comparison of the results showed only
small differences in consumption and preferences before and during the COVID-19 pandemic.
Nevertheless, there was increase in the premiums that consumers were willing to pay for lamb
from New Zealand, and for lamb from Māori farms (Saunders et al., 2021).
Surveys were also conducted to estimate Chinese consumers’ WTP (located in Shanghai and
Beijing) for attributes of ultra-high processing (UHT) milk (see Figure 3-8 below). The qualities
associated with New Zealand-sourced UHT milk were high food safety, quality, nutritional
value, organic, and environmental standards. Consumers in Group Three expressed a high
WTP for pasture-raised, animal welfare and organic production credence attributes (Saunders
et al., 2021).

62
Figure 3-8: Chinese consumer willingness-to-pay (WTP) for selected attributes of ultra-high-
processing (UHT) milk
Note: Willingness to pay (WTP) is the percentage of average product price as used in choice experiments.
Source: Saunders et al., 2021
A survey of USA (California) consumers of Sauvignon Blanc showed that millennials had higher
WTP across a range of social and environmental wine product attributes, including social
responsibility, by-product management, made with organic grapes, and 100 per cent organic,
compared to Gen-X and baby Boomer consumers (Saunders et al., 2021).
3.8.2 Consumer Diets/Trends
There is a broad spectrum of consumer diets practised around the world that can range from
least-strict diets (omnivorous) to the most-strict diets (vegan) (see Figure 3-9 below).
Vegetarian and vegan diets are well-recognised diets that are gaining more attention and
adherents. People choose vegetarian or vegan diets for a variety of reasons, including respect
for animal life, health benefits, and environmental and sustainability concerns (Ploll et al.,
2020). The number of Americans (US) that follow a vegan diet has increased by 500 per cent
from around 4 million in 2014 to 19.6 million in 2017 (Alcorta et al., 2021). A national study
conducted in the US found that two-thirds of respondents had reduced their meat
consumption within the previous three years (Alcorta et al., 2021). In the UK, 21 per cent of
the population identify as flexitarian, while one in eight identify as vegetarian or vegan. In
Germany, the number of vegetarians grew from 1 per cent of the population in 2005 to 7 per
cent in 2018, while in Italy, those not consuming meat increased by 94.4 per cent (Alcorta et
al., 2021). In 2019, a global survey observed that 40 per cent of consumers were actively trying
to reduce their meat consumption, while 10 per cent were avoiding red meat completely
(Alcorta et al., 2021). The global growth in vegetarian and vegan diets will likely continue into
the future. This is also evidenced by substantial growth in the consumption of plant-based
proteins and alternative milk products in recent years. Consumers are increasingly demanding
products that are sustainable, palatable, safe, nutritious, and affordable. A recent report
conducted by Research and Markets estimated the size of the vegan food market could reach
US$31.4 billion by 2026 (PR Newswire, 2020).

63
Figure 3-9: Continuum of different consumer diets
Note: Not all dietary trends are included within the continuum.
Source: Adapted from Salehi et al., 2020.
Internationally, more consumers are reducing their overall meat consumption, sometimes
referred to as flexitarian or meat reducing diets. Adherents to this type of diet still eat meat
and fish products, but make a conscious effort to reduce the amount of these products that
they regularly consume. The AERU conducted research examining alternative protein
consumption in the UK and US (California). It was observed that 46 per cent of participants
were actively reducing their meat intake, particularly beef, with reductions strongly motivated
by health concerns (Driver et al., 2020b). Research conducted by Colmar Brunton found that
one in three New Zealanders were consciously reducing their meat consumption (Food
Frontier, 2019). It was also found that those that defined themselves as flexitarian grew by 18
per cent between 2018 and 2019, while 24 per cent of meat eaters had reduced their meat
consumption (Food Frontier, 2019). Globally, agriculture and food production account for a
substantial portion of the world’s emissions (Drew et al., 2020; Tilman & Clark, 2015). It has been estimated that CO2 emissions from agriculture and food production were around 18
billion tonnes in 2015, representing around 34 per cent of total global emissions (Crippa et al.,
2021). The largest contributions came from agriculture and related land use/land-use change
activities (71 per cent), with the remaining from supply chain activities including retail,
transport, consumption, waste management, industrial processing, and packaging (Crippa et
al., 2021).
Research has suggested that adherence to diets with lower consumption of animal-based
proteins will reduce GHG emissions. As such, changing diets on a global scale will be a major
contributing factor in combating climate change (Plackett, 2020). In the UK, it has been
estimated that the elimination of meat from diets could reduce GHG emissions by 35 per cent
(Hoolohan et al., 2013). In 2019, a report published by the IPCC outlined that if the global
population followed a balanced diet, containing more plant-based and sustainable animal-
sourced food, up to eight billion tonnes of CO2 could be avoided each year (see Figure 3-10
below). In addition, low carbon diets on average tend to be healthier and have a smaller land
footprint (IPCC, 2019). Drew et al. (2020) examined the transition towards a healthier more
climate friendly food system in New Zealand. The research found whole plant foods (e.g.
vegetables, fruits, legumes, and whole grains) were considerably less polluting that animal-
based proteins (e.g. red meat). It was estimated that population dietary shifts could confer
emission savings of between 4 and 42 per cent, depending on the scale of dietary change and
food waste reduction achieved (Drew et al., 2020). It was also estimated that dietary changes
could confer substantial health benefits and savings for the health care system of between
NZ$14-20 billion.

64
Figure 3-10: Demand side greenhouse gas emissions (GHG) mitigation potential of different
diets
Source: IPCC, 219.
3.8.3 Urban Agriculture
Dietary change towards a balanced vegetable-rich diet is being increasingly recognised as
critical to achieving climate goals (Poore & Nemecek, 2018; Wang et al., 2021). It has been
suggested that urban agriculture will play an important role in changing behaviours and
transitioning consumers to more climate friendly diets (Puigdueta et al., 2021). Wang et al
(2021) suggested that consumer demands are changing, and more attention is being given to
the safety and freshness of food consumed daily. Puigdueta et al. (2021) outlined that urban
gardens could be used as social catalysts for pro-environmental behaviour and GHG mitigation
in urban areas. The study observed that participation in urban gardens had an impact on food
consumption decisions and could help reduce individuals’ carbon footprint by approximately
205kg CO2 per year per capita. The largest contributing factor related to dietary changes was
specifically the reduced consumption of animal-based proteins (Puigdueta et al., 2021).
3.8.4 Impact of COVID-19 on Consumers
COVID-19 has influenced consumers’ food consumption and diets (Janssen et al., 2021).
Ogundijo et al. (2021) outlined that consumer eating habits have changed significantly for a
variety of reasons, including heightened boredom and anxiety, change in work patterns,
controlled/restricted food shopping, and inability to interact physically with friends and
family. These changes in consumption often differ between groups of people. Janssen et al.
(2021) found that the pandemic had different impacts on people’s lifestyles and food consumption patterns in Denmark, Germany, and Slovenia. The authors observed a decline in
the consumption of fresh food, except for households with children, while women were more
likely than men to increase fresh fruit and vegetable intake. Attwood and Hajat (2020)
suggested that the pandemic shifted public awareness of illnesses linked to animals, which
resulted in short-term changes to meat consumption. It was also suggested that the pandemic
could act as a catalyst towards lower meat diets that are already being seen in some high-
income nations.
The COVID-19 pandemic also influenced how consumers purchased food and brought their
fruit and vegetables (Chenarides et al., 2021). The move to online grocery shopping has been
particularly noticeable amongst retirees and households that do not traditionally purchase

65
these goods from home (Charlesbois, 2020). This has important implications, as there is
evidence to suggest that consumers are more likely to make healthier purchases when
ordering online (Chenarides et al., 2021). Driver et al. (2021) explored consumer preferences
and use of digital media and smart technology for food and beverage (F&B) information in
China, Japan and the UK (see Figure 3-11 below). The study observed an increase in online
F&B shopping, with the percentage of UK consumers increasing from 27.4 per cent in 2015 to
42.3 per cent in 2021, while the percentage of Chinese consumers increased from 41.5 per
cent in 2015 to 54.7 per cent in 2021. COVID-19 and subsequent safety precautions are likely
to have contributed to more consumers using online services rather than brick-and-mortar
stores.
Figure 3-11: Food, beverage and other shopping conducted online by consumers in China,
Japan and the United Kingdom between 2015-2019 (average %)
Source: Driver et al., 2021.
COVID-19 has severely disrupted supply chains and the flow of goods, which has influenced
demand for local products (Moreno & Malone, 2021). According to the GlobalData COVID-19
Recovery Consumer Survey, 52 per cent of consumers claimed locally sourced ingredients
were more important because of the pandemic (Just Food, 2020). This localism trend has been
particularly noticeable in the food sector. Locally sourced foods are often associated with
superior quality, safety and flavour compared to imported products (Just Food, 2020).
GlobalData (2020) conducted another survey, which found that 35 per cent of consumers
believed that supporting local businesses was more important than it was pre-COVID-19
(GlobalData, 2020). Mintel (2021) identified hyper-localism, as consumers’ concept of local has shrunk. In the Asia-Pacific region, 66 per cent of consumers felt that because of COVID-19
they were willing to buy more from local businesses (Nambiar, 2021). The pandemic has
significantly affected consumers over the last two years - however, it remains unclear if the
changes in consumer diets and consumption patterns are long lasting.
3.8.5 Organic Foods
Consumer demand for organic products (with no fertilisers, chemicals, antibiotics, or
hormones) has grown rapidly in recent decades (Wojciechowska-Solis & Barska, 2021). As
shown in Figure 3-12 below, the global organic food market has increased steadily from
US$15.2 billion in 1999 to US$97 billion in 2017 (Rout & Reid, 2020). This demand has likely

66
been driven by consumer perceptions of food quality, safety, and sustainability (Dangi et al.,
2020).
Figure 3-12: Worldwide sales of organic food, 1999 to 2018 (USD billions)
Source: Adapted from Rout & Reid, 2020.
New Zealand’s organic sector is growing steadily and is estimated to be a NZ$720 million
industry. To support continued growth, MPI announced in February 2021 that it was providing
NZ$212,500 from the Sustainable Food and Fibre Futures Fund to help develop a three-year
organic sector strategy (MPI, 2021c). The industry produces NZ$620 million in export and
domestic revenue, with a further NZ$100 million of imported product entering New Zealand
to meet consumer demand. There has been strong demand for New Zealand’s organic dairy, wine, and kiwifruit products. The US, China, Europe, Australia, and Japan are the largest export
markets for New Zealand’s organic products. The US currently accounts for NZ$86.8 million or
20.6 per cent of all organic exports, although this is just a small portion of their organic market,
which totals over US$55.1 billion, and is growing at 4.6 per cent per annum (OANZ, 2021).
According to Organics Aotearoa New Zealand (2021), over the past three years, the New
Zealand organic sector has experienced an average annual growth rate of 6.4 per cent (OANZ,
2021). Even during the global COVID-19 pandemic the New Zealand organic sector has
continued to grow. There is currently 86,000 hectares of land under organic certification, with
the average earnings approximately NZ$7,250 dollars per hectare (OANZ, 2021). The growing
demand for organic products has been met with increased production. Since 2017, the
number of certified organic operators has increased by 105, while the number of organic
operations has increased by 198 (OANZ, 2021). In addition, a further 6,000 hectares is
currently being converted for organic dairy, wine, and horticultural production. This data
suggests the growth in domestic and global demand for organic products will likely continue
to influence land use practise/change in New Zealand.
3.8.6 Indigenous/First Nations/Māori Enterprise - Cultural Attributes
Western consumers are increasingly demanding to understand the provenance of their food
(Reid & Rout, 2016). New Zealand agri-food producers are aware that they can earn
significantly more export revenue by improving the communication of underlying cultural
qualities of their products to consumers (Rout & Reid, 2020). This is an integral part of a
broader argument that suggests that New Zealand’s primary sector needs to focus on adding value rather than volume (Rout & Reid, 2019). Culture can be understood as the collective set
of rules, understandings, and practises that help a group of people live as a society, though
15.2 18.0 20.9 23.1 25.5 28.733.2
38.646.1
50.9 54.159.1 62.9
70.8 68.5
80.0 81.690.0
97.0
0
20
40
60
80
100
120
1999 2000 2001 2002 2003 2004 2005 2006 2007 2008 2009 2010 2011 2012 2013 2014 2015 2016 2017
Sale
s in
bill
ion
s (U
SD)

67
even within a society culture can vary (Rout & Reid, 2019). Therefore, the cultural attributes
of food can be understood as a society’s particular beliefs, values and behaviours regarding the production, preparation, and consumption of food. Consumers have been increasingly
distanced from their food, both physically and psychologically. Yet consumers may want a
genuine connection to their food, one that not only reassures them of its safety and
environmental sustainability etc., but also one that has an intangible legitimacy and meaning
(Rout & Reid, 2020).
Māori agribusinesses are emerging as leaders amongst producers and processors in New Zealand, implementing production practises/protocols that embrace indigenous values
emphasising environmental, social, and economic sustainability (Rout & Reid, 2020). Māori enterprises are doing this authentically and this reflects their own understanding of place and
expresses their own indigenous perspective (Reid & Rout, 2016). It is recognised that
transitioning to alternate food production, processing, and supply-chain arrangements can
provide premiums for agribusinesses. The food produced by Māori agribusinesses has unique
value propositions, i.e. the indigenous principles underlying production sets it apart from
other food. Māori agribusinesses and their products have attributes that are substantively different from traditional Western approaches, and these are well-positioned and resonate
with many cultural traditions and food movements around the world (Rout & Reid, 2020).
AERU research has shown an increased consumer WTP for cultural attributes, e.g., produced
on a Māori farm, across multiple international markets for New Zealand commodities such as
lamb (Saunders et al., 2021; Tait et al., 2020). Embracing cultural attributes will be a crucial
part of New Zealand’s journey towards adding value to its primary exports and will likely influence future primary land use practises.

68
4. Conclusion
Enhancing primary sector production and productivity while maintaining and improving our
land and water quality for future generations is a key outcome of the Our Land and Water
National Science Challenge. It is therefore important to identify the hierarchy of international
and national issues to provide an evidence base to inform the Challenge Research Strategy.
This report presents an overview of the international and domestic drivers that have the
potential to influence land use change/practice In New Zealand. This report also looks to
inform the strategic direction of the Our Land and Water National Science Challenge by
identifying the likely impact of these drivers in the future.
The current report has been informed by three previous iterations, in which workshops,
stakeholder surveys and extensive literature review produced a series of 32 key drivers of land
use change/practice. This was later expanded to 35 key drivers. Links to updated summaries
of the key drivers are provided, along with an evidence base comprising 1,500 unique sources
(1,152 international and 348 domestic sources) across the four iterations of this project, are
included in this report.
The current report modified and extended a survey of New Zealand primary sector
stakeholders, designed to identify which drivers they believed to be the most important for
land use change/practice domestically and internationally. The survey was distributed to
2,818 individuals in total, receiving 251 completed surveys.
The survey asked participants (unprompted) to identify important domestic and international
issues that could influence New Zealand land use change/practice. Climate change was viewed
as the most critical international issue, while other critical issues included consumer
preferences, international agreements, biodiversity, trade/market access, water
quality/availability, trade relations, changing dietary preferences, market demands/dynamics,
and climate policy. These findings were consistent with findings from the prior surveys.
Climate change was also viewed as the most critical domestic issue, while water quality was
also regarded as a significant issue. Other critical issues included government policy, water
policy, social licence to operate, climate policy, and environmental policy. These findings were
also consistent with results from the prior surveys.
Survey participants provided their perspectives on the impact that key international
drivers/issues would have on land use change/practise in New Zealand. Most individuals
viewed climate change as likely having a high impact on land use change/practise. Greenhouse
gas emissions, condition of the environment, and water quality were also viewed by a large
proportion of participants as having a high impact. Survey participants also provided their
perspectives on the impact key domestic drivers/issues would have on land use
change/practise in New Zealand. Most individuals viewed water quality as likely having a high
impact land use change/practise. Climate change, condition of the environment, agricultural
policy, and greenhouse gas emissions was also viewed by a large proportion of individuals as
having a high impact.
The survey prompted participants to consider the importance of primary product attributes
in achieving higher product value from lower volume. Most participants viewed the attributes
of high quality, lower environmental impact of production, food safety, and low carbon
footprint as very important. The survey followed on by asking individuals to provide an
indication of their participation in agribusiness schemes. The findings showed that 17 per cent
of the sample group were involved in a scheme. These schemes often had an environmental
69
and social dimension, and in some cases did increase the prices received for their
goods/services.
This report also addressed some of the future trends and challenges that would likely impact
land use change/practice in New Zealand. These were grouped under eight broad headings:
climate change, COVID-19, global trends and challenges, New Zealand environmental policy,
emerging technologies, innovative products, international trading environment, and
consumer trends. Climate change is likely to have a significant impact on future land use
change/practice in New Zealand. It will likely produce more frequent and intense extreme
weather events and influence domestic and international policy. Climate change is pushing
the banking and investment sector towards sustainable finance and investing using ethical,
social and governance (ESG) criteria. International institutions are also seeking to enable and
direct finance/capital towards initiatives and investments likely to influence land use
change/practise. COVID-19 has disrupted the global agricultural industry and placed existing
supply chains under considerable stress, revealing their vulnerabilities to external shocks. The
pandemic has resulted in changes to consumption patterns/demands due to businesses not
being open. Although the pandemic has presented significant challenges for New Zealand’s primary sector, it has shown considerable resilience compared to other sectors. Emerging
technologies are likely to enhance access to data and improve practices, both on-farm and in-
market. Many consumers in developed countries are consciously reducing their meat
consumption, and are turning to vegetarian, vegan, flexitarian diets, and consuming
alternative protein products. The international trading environment will continue to be crucial
for New Zealand’s primary product exports. The recent UK-NZ FTA and updated FTA with
China provide important market access. However, growing tensions between the United
States, China and Australia could affect New Zealand’s trading relationships.
The mission statement of the Our Land and Water Challenge is to “enhance primary sector production and productivity while maintaining and improving our land and water quality for
future generations” (OLW, 2022). This report has examined the impact of domestic and
international drivers on New Zealand land use change/practice, and has utilised the
knowledge and expertise of those involved in the primary sector to help inform these. The
likely impact of future trends and challenges on land use change/practice in New Zealand was
also examined. The future of sustainable and productive primary land use will likely require
identifying and adapting to the issues, trends and drivers outlined in this report.

70
References Akhtar, Y., & Isman, M. (2018). Insects as an alternative protein source. In R. Yada (Ed.). Proteins in Food
Processing (2nd Ed., pp. 263-288). United Kingdom. Woodhead Publishing. https://doi.org/10.1016/B978-
0-08-100722-8.00011-5
Alcorta, A., Porta, A., Tárrega, A., Alvarez, M. D., & Vaquero, M. P. (2021). Foods for plant-based diets:
Challenges and innovations. Foods, 10(2), 293. https://doi.org/10.3390/foods10020293
Antedote. (2018). Future of Meat: How should New Zealand’s red meat sector respond to alternative protein advancements? Summary Report. Beef+Lamb. Retrieved 21/10/2021 from
https://beeflambnz.com/sites/default/files/levies/files/Alternative%20Proteins%20summary%20report.pdf
ANZ. (2021). ANZ Commodity Price Index. Australia and New Zealand Banking Group Limited. Retrieved
23/10/2021 from https://www.anz.co.nz/about-us/economic-markets-research/commodity-price-index/
Aschemann-Witzel, J., Gantriis, R. F., Fraga, P., & Perez-Cueto, F. J. (2020). Plant-based food and protein
trend from a business perspective: markets, consumers, and the challenges and opportunities in the future.
Critical Reviews in Food Science and Nutrition, 61(18), 3119-3128.
https://doi.org/10.1080/10408398.2020.1793730
Attwood, S., & Hajat, C. (2020). How will the COVID-19 pandemic shape the future of meat consumption?
Public health nutrition, 23(17), 3116-3120. http://doi.org/10.1017/S136898002000316X
Australian Bureau of Statistics. (2020). Australia's trade in goods with China in 2020. Australian Bureau of
Statistics,. Retrieved 13/09/2021 from https://www.abs.gov.au/articles/australias-trade-goods-china-2020
Baiano, A. (2020). Edible insects: An overview on nutritional characteristics, safety, farming, production
technologies, regulatory framework, and socio-economic and ethical implications. Trends in Food Science &
Technology, 100, 35-50. https://doi.org/10.1016/j.tifs.2020.03.040
Baker, M. G., Kvalsvig, A., Verrall, A. J., & Wellington, N. (2020). New Zealand’s COVID-19 elimination
strategy. Med J Aust, 213(5), 198-200.
Barrera, E. L., & Hertel, T. (2021). Global food waste across the income spectrum: Implications for food
prices, production and resource use. Food Policy, 98, 101874.
https://doi.org/10.1016/j.foodpol.2020.101874
BBC. (2020). A quick guide to the US-China trade war. British Broadcasting Corporation. Retrieved
16/09/2021 from https://www.bbc.com/news/business-45899310
Beef+Lamb. (2021a). New Zealand Sheep and Beef Sector - Barriers to International Trade. Beef + Lamb
New Zealand. Retrieved 13/10/2021 from https://www.mia.co.nz/assets/Uploads/Barriers-to-Trade-2020-
low.pdf
Beef+Lamb. (2021b). Regenerative Agriculture: Market Scan - Understanding the current state and future
potential of regenerative agriculture in the United States, United Kingdom, and Germany. Retrieved
14/10/2021 from https://beeflambnz.com/sites/default/files/data/files/Regenerative%20Agriculture%20-
%20MARKET%20SCAN%20-%20FINAL%20v4.pdf
Beillouin, D., Schauberger, B., Bastos, A., Ciais, P., & Makowski, D. (2020). Impact of extreme weather
conditions on European crop production in 2018. Philosophical Transactions of the Royal Society B,
375(1810), 20190510. https://doi.org/10.1098/rstb.2019.0510
BNZ. (2021). NZ’s first farm sustainability linked loan to deliver water and biodiversity benefits. Bank of New Zealand. Retrieved 12/10/2021 from https://blog.bnz.co.nz/2021/03/nzs-first-farm-sustainability-
linked-loan-to-deliver-water-and-biodiversity-benefits
Boone, L. (2020). Tackling the fallout from COVID-19. In R. Balwin & B. Weder di Mauro (Ed.). Economics in
the Time of COVID-19 (1st Ed., pp 37-44). London: CEPR Press.

71
Bowen, A., Marshall Burke, C., Donovan, K. G., Moore, F. C., Stavins, R., Wagner, G., & Ward, B. (2020).
Policy brief The economic case for the United States to remain in the Paris Agreement on climate change.
The London School of Economics and Political Science. Retrieved 10/10/2021 from
https://scholar.harvard.edu/files/stavins/files/us_paris_agreement_policy_brief.pdf
Burton, R. J. (2019). The potential impact of synthetic animal protein on livestock production: the new “war against agriculture”? Journal of Rural Studies, 68, 33-45.
https://doi.org/https://doi.org/10.1016/j.jrurstud.2019.03.002
Charlesbois, S. (2020). Why COVID-19 Will Change Canadian Grocery Industry Forever: Expert. Retail
Insider. Retrieved 23/09/2021 from https://retail-insider.com/retail-insider/2020/03/why-covid-19-will-
change-the-food-industry-forever/
Chenarides, L., Richards, T. J., & Rickard, B. (2021). COVID‐19 impact on fruit and vegetable markets: One year later. Canadian Journal of Agricultural Economics/Revue canadienne d'agroeconomie, 69(2), 203-214. https://doi.org/10.1111/cjag.12272
Chinn, M., & Plumley, B. (2020). What is the toll of trade wars on U.S. agriculture? Public Broadcasting
Service (PBS). Retrieved 15/09/2021 from https://www.pbs.org/newshour/economy/making-sense/what-
is-the-toll-of-trade-wars-on-u-s-agriculture
Climate Action Tracker. (2021a). China. Climate Action Tracker. Retrieved 14/10/2021 from
https://climateactiontracker.org/countries/china/
Climate Action Tracker. (2021b). Climate target updates slow as science ramps up need for action. Climate
Action Tracker. Retrieved 28/09/2021 from https://climateactiontracker.org/documents/871/CAT_2021-
09_Briefing_GlobalUpdate.pdf
Climate Action Tracker. (2021c). New Zealand. Climate Action Tracker. Retrieved 28/09/2021 from
https://climateactiontracker.org/countries/new-zealand/
Cornwell, W. (2021). Europe's deadly floods leave scientists stunned. Science. Retrieved 28/00/2021 from
https://www.science.org/content/article/europe-s-deadly-floods-leave-scientists-stunned
Cradock-Henry, N. A., Blackett, P., Hall, M., Johnstone, P., Teixeira, E., & Wreford, A. (2020). Climate
adaptation pathways for agriculture: insights from a participatory process. Environmental Science & Policy,
107, 66-79. https://doi.org/10.1016/j.envsci.2020.02.020
Crippa, M., Solazzo, E., Guizzardi, D., Monforti-Ferrario, F., Tubiello, F., & Leip, A. (2021). Food systems are
responsible for a third of global anthropogenic GHG emissions. Nature Food, 2(3), 198-209.
https://doi.org/10.1038/s43016-021-00225-9
Dagevos, H. (2021). A literature review of consumer research on edible insects: Recent evidence and new
vistas from 2019 studies. Journal of Insects as Food and Feed, 7(3), 249-259.
https://doi.org/10.3920/JIFF2020.0052
DairyNZ. (2021). Dairy farmers hung out to dry as season peak hits. DiaryNZ.
https://www.dairynz.co.nz/news/dairy-farmers-hung-out-to-dry-as-season-peak-hits/
Dangi, N., Gupta, S. K., & Narula, S. A. (2020). Consumer buying behaviour and purchase intention of
organic food: a conceptual framework. Management of Environmental Quality: An International Journal,
31(6), 1515-1530. https://doi.org/https://doi.org/10.1108/MEQ-01-2020-0014
Deb, P., Moradkhani, H., Abbaszadeh, P., Kiem, A. S., Engström, J., Keellings, D., & Sharma, A. (2020).
Causes of the widespread 2019–2020 Australian bushfire season. Earth's Future, 8(11) 1-17.
https://doi.org/10.1029/2020EF001671
Department of Finance Canada. (2020). Supporting Canadians and Fighting Covid-19: Fall Economic
Statement 2020. Department of Finance Canada. Retrieved 14/10/2021 from
https://www.budget.gc.ca/fes-eea/2020/report-rapport/FES-EEA-eng.pdf

72
Department of Forestry and Fire Protection. (2021). 2020 Fire Season. California Department of Forestry
and Fire Protection. Retrieved 10/9/2021 from https://www.fire.ca.gov/incidents/2020/
Dobson, M. (2021). Australia embraces U.S. and pays price with China as trade war hits bottom line.
National Broadcasting Company (NBC). Retrieved 20/09/2021 from
https://www.nbcnews.com/news/world/australia-embraces-u-s-pays-price-china-trade-war-hits-n1270458
Downie-Melrose, K. (2020). The Protein Debate – understanding the movement to plant-based eating.
Kellogg Rural Leadership Programme. Retrieved 1/10/2021 from https://ruralleaders.co.nz/wp-
content/uploads/2020/12/Downie-Melrose-Kate_Kellogg-report-final.pdf
Drew, J., Cleghorn, C., Macmillan, A., & Mizdrak, A. (2020). Healthy and climate-friendly eating patterns in
the New Zealand context. Environmental health perspectives, 128(1), 017007 1-13.
Driver, T., Guenther, M., Saunders, C. M., Dalziel, P. C., Rutherford, P., & Tait, P. R. (2021). Changing
consumer use of digital media and smart technology in relation to New Zealand's food product exports in
key international markets. 2021 European Union Studies Association Asia Pacific (EUSAAP) Conference,
Melbourne.
Driver, T., Saunders, C. M., Dalziel, P. C., Tait, P. R., Rutherford, P., & Guenther, M. (2020a). UK and USA
alternative proteins consumer consumption behaviours and product preferences. AERU. Lincoln University.
Driver, T., Saunders, C. M., Dalziel, P. C., Tait, P. R., Rutherford, P., & Guenther, M. (2020b). UK and USA
alternative proteins consumer consumption behaviours and product preferences (1877519987). AERU.
Lincoln University. http://dspace.lincoln.ac.nz/handle/10182/14123
DSM. (2019). Taking action on climate change, together: Summary of scientific research how 3-NOP
effectively reduces enteric methane emissions from cows. DSM. Retrieved 12/10/2021 from
https://www.dsm.com/content/dam/dsm/corporate/en_US/documents/summary-scientific-papers-3nop-
booklet.pdf
Edelberg, W. (2021). What does current inflation tell us about the future? Brookings Institute. Retrieved
15/10/2021 from https://www.brookings.edu/blog/up-front/2021/11/16/what-does-current-inflation-tell-
us-about-the-future/
Emerging Proteins NZ. (2021). Emerging Proteins NZ. Retrieved 25/09/2021 from
https://www.emergingproteins.co.nz/wp-content/uploads/2021/06/Emerging-Proteins-in-Aotearoa-Jun16-
2021-LR.pdf
European Commission. (2021a). The new common agricultural policy: 2023-27. European Commission.
Retrieved 12/10/2021 from https://ec.europa.eu/info/food-farming-fisheries/key-policies/common-
agricultural-policy/new-cap-2023-27_en
European Commission. (2021b). Paris Agreement. European Commission Retrieved 12/10/2021 from
https://ec.europa.eu/clima/eu-action/international-action-climate-change/climate-negotiations/paris-
agreement_en
European Commission. (2021c). Platform on Sustainable Finance: Transition finance report (March 2021).
European Commission. Retrieved 12/10/2021 from
https://ec.europa.eu/info/sites/default/files/business_economy_euro/banking_and_finance/documents/2
10319-eu-platform-transition-finance-report_en.pdf
European Court of Auditors. (2021). Common Agricultural Policy and Climate - Half of EU climate spending
but farm emissions are not decreasing. Retrieved 12/10/2021 from
https://www.eca.europa.eu/Lists/ECADocuments/SR21_16/SR_CAP-and-Climate_EN.pdf
Ezeaku, H. C., Asongu, S. A., & Nnanna, J. (2021). Volatility of international commodity prices in times of
COVID-19: Effects of oil supply and global demand shocks. The Extractive Industries and Society, 8(1), 257-
270. https://doi.org/10.1016/j.exis.2020.12.013

73
Faber, I., Castellanos-Feijoó, N. A., Van de Sompel, L., Davydova, A., & Perez-Cueto, F. J. (2020). Attitudes
and knowledge towards plant-based diets of young adults across four European countries. Exploratory
survey. Appetite, 145, 104498. https://doi.org/10.1016/j.appet.2019.104498
FAO. (2013). Food Loss and Food Waste. Food and Agriculture Organisation of the United Nations.
Retrieved 12/10/2021 from https://www.fao.org/food-loss-and-food-waste/flw-data
FAO. (2021). World Food Situation. Food and Agriculture Organisation of the United Nations Retrieved
18/10/2021 from https://www.fao.org/worldfoodsituation/foodpricesindex/en/
FCC. (2020). 5G Fund. Federal Communications Commission. Retrieved 7/10/2021 from
https://www.fcc.gov/5g-fund
Federated Farmers. (2021a). New ‘Action for Healthy Waterways’ regulations Federated Farmers. Retrieved 21/12/2021 from https://www.fedfarm.org.nz/FFPublic/Policy2/National/2019/Essential_Freshwater_-
_Action_for_healthy_waterways.aspx
Federated Farmers. (2021b). New Season Farm Confidence Survey - Research Report July 2021. Research
First, New Zealand.
Food Frontier. (2019). Hungry for Plant-Based: New Zealand Consumer Insights. Food Frontier. Retrieved
13/10/2021 from https://www.foodfrontier.org/wp-content/uploads/2019/10/Hungry-For-Plant-Based-
New-Zealand-Consumer-Insights-Oct-2019.pdf
GlobalData. (2020). UK customers expected to continue supporting local stores post-COVID-19 as 35% of
consumers say it is more important than before, says GlobalData. GlobalData. Retrieved 12/10/2021 from
https://www.globaldata.com/uk-customers-expected-to-continue-supporting-local-stores-post-covid-19-
as-35-of-consumers-say-it-is-more-important-than-before-says-globaldata/
Goodman-Smith, F., Mirosa, M., & Skeaff, S. (2020). A mixed-methods study of retail food waste in New
Zealand. Food Policy, 92, 101845. https://doi.org/10.1016/j.foodpol.2020.101845
Gorjian, S., Ebadi, H., Trommsdorff, M., Sharon, H., Demant, M., & Schindele, S. (2021). The advent of
modern solar-powered electric agricultural machinery: A solution for sustainable farm operations. Journal
of Cleaner Production, 126030. https://doi.org/10.1016/j.jclepro.2021.126030
Gosnell, H., Gill, N., & Voyer, M. (2019). Transformational adaptation on the farm: processes of change and
persistence in transitions to ‘climate-smart’ regenerative agriculture. Global Environmental Change, 59,
101965. https://doi.org/10.1016/j.gloenvcha.2019.101965
Government of Canada. (2021). The Government of Canada Provides an Update on Planting Two Billion
Trees. Government of Canada. https://www.canada.ca/en/natural-resources-canada/news/2021/06/the-
government-of-canada-provides-an-update-on-planting-two-billion-trees.html
Gray, B. (2020). COVID-19 from Wellington New Zealand. Journal of Bioethical Inquiry, 17(4), 633-638.
Grelet, G., Garland, C., Phillips, C., Rissman, C., Anderson, C., Stronge, D., Matthews, J. (2021). Regenerative
agriculture in Aotearoa New Zealand–research pathways to build science-based evidence and national
narratives [White Paper]. Our Land and Water National Science Challenge.
Harchaoui, S., & Chatzimpiros, P. (2018). Can agriculture balance its energy consumption and continue to
produce food? A framework for assessing energy neutrality applied to French agriculture. Sustainability,
10(12), 4624.
He Waka Eke Noa. (2021). Pricing options: What are we discussing in February? He Waka Eke Noa.
Retrieved 20/11/2021 from https://hewakaekenoa.nz/pricing-options-february/
Heffernan, O. (2017). Sustainability: A meaty issue. Nature, 544(7651), S18-S20.
74
Helliwell, R., & Burton, R. J. (2021). The promised land? Exploring the future visions and narrative silences
of cellular agriculture in news and industry media. Journal of Rural Studies, 84, 180-191.
https://doi.org/10.1016/j.jrurstud.2021.04.002
Hogan, F. (2019). NZ embracing gene-editing is a ‘no-brainer’ – Geoff Simmons. Newshub. Retrieved
20/10/2021 from https://www.newshub.co.nz/home/shows/2019/05/nz-embracing-gene-editing-is-a-no-
brainer-geoff-simmons.html.
Hoolohan, C., Berners-Lee, M., McKinstry-West, J., & Hewitt, C. (2013). Mitigating the greenhouse gas
emissions embodied in food through realistic consumer choices. Energy Policy, 63, 1065-1074.
https://doi.org/10.1016/j.enpol.2013.09.046
Hudson, M., Mead, A. T. P., Chagné, D., Roskruge, N., Morrison, S., Wilcox, P. L., & Allan, A. C. (2019).
Indigenous perspectives and gene editing in Aotearoa New Zealand. Frontiers in Bioengineering and
Biotechnology, 7, 70. https://doi.org/10.3389/fbioe.2019.00070
Iansiti, M., & Lakhani, K. R. (2017). The Truth About Blockchain. Harvard Business Review. Retrieved
12/10/2021 from https://hbr.org/2017/01/the-truth-about-blockchain
IMF. (2021a). Global Price Index of All Commodities. International Monetary Fund. Retrieved 18/10/2021
from https://fred.stlouisfed.org/series/PALLFNFINDEXM
IMF. (2021b). World Economic Outlook Update, July 2021: Fault Lines Widen in the Global Recovery.
International Monetary Fund Retrieved 21/10/2021 from
https://www.imf.org/en/Publications/WEO/Issues/2021/07/27/world-economic-outlook-update-july-2021
IPCC. (2019). Special Report on Climate Change and Land: Food Security. International Panel on Climate
Change. Retrieved 10/10/2021 from https://www.ipcc.ch/srccl/chapter/chapter-5/
IPCC. (2021). AR6 Climate Change 2021: The Physical Science Basis: Contribution of Working Group I to the
Sixth Assessment Report of the Intergovernmental Panel on Climate Change. Cambridge University Press.
ISAAA. (2021). World’s First Genome-Edited Tomato’ Steps up To the Plate. International Service for the Acquistion of Agri-biotech Applications. Retrieved 13/10/2021 from
https://www.isaaa.org/kc/cropbiotechupdate/article/default.asp?ID=18668
Jackson, B. (2021). Southlanders embrace satellite broadband from Elon Musk's Starlink. Stuff. Retrieved
12/20/2021 from https://www.stuff.co.nz/technology/digital-living/126246920/southlanders-embrace-
satellite-broadband-from-elon-musks-starlink
Janssen, M., Chang, B. P., Hristov, H., Pravst, I., Profeta, A., & Millard, J. (2021). Changes in food
consumption during the COVID-19 pandemic: analysis of consumer survey data from the first lockdown
period in Denmark, Germany, and Slovenia. Frontiers in Nutrition, 8, 60.
https://doi.org/10.3389/fnut.2021.635859
Jha, N., Prashar, D., Khalaf, O. I., Alotaibi, Y., Alsufyani, A., & Alghamdi, S. (2021). Blockchain Based Crop
Insurance: A Decentralized Insurance System for Modernization of Indian Farmers. Sustainability, 13(16),
8921. https://doi.org/10.3390/su13168921
Just Food. (2020). Demand for local food to last beyond Covid-19. Just Food Media. Retrieved 13/10/2021
from https://www.just-food.com/comment/demand-for-local-food-to-last-beyond-covid-19/
Köllner, P. (2021). Australia and New Zealand recalibrate their China policies: convergence and divergence.
The Pacific Review, 34(3), 405-436. https://doi.org/10.1080/09512748.2019.1683598
LaCanne, C. E., & Lundgren, J. G. (2018). Regenerative agriculture: merging farming and natural resource
conservation profitably. PeerJ, 6, e4428. https://doi.org/https://doi.org/10.7717/peerj.4428
Lesk, C., & Anderson, W. (2021). Decadal variability modulates trends in concurrent heat and drought over
global croplands. Environmental Research Letters, 16(5), 055024.

75
Lesk, C., Rowhani, P., & Ramankutty, N. (2016). Influence of extreme weather disasters on global crop
production. Nature, 529(7584), 84-87. https://doi.org/10.1038/nature16467
Lezoche, M., Hernandez, J. E., Díaz, M. d. M. E. A., Panetto, H., & Kacprzyk, J. (2020). Agri-food 4.0: A survey
of the supply chains and technologies for the future agriculture. Computers in Industry, 117, 103187.
https://doi.org/10.1016/j.compind.2020.103187
Li, N., Jiang, Y., Mu, H., & Yu, Z. (2018). Efficiency evaluation and improvement potential for the Chinese
agricultural sector at the provincial level based on data envelopment analysis (DEA). Energy, 164, 1145-
1160. https://doi.org/10.1016/j.energy.2018.08.150
Lombardi, G. V., & Berni, R. (2021). Renewable energy in agriculture: farmers Willingness-to-Pay for a
photovoltaic electric farm tractor. Journal of Cleaner Production, 127520.
https://doi.org/10.1016/j.jclepro.2021.127520
Lynch, J., & Pierrehumbert, R. (2019). Climate impacts of cultured meat and beef cattle. Frontiers in
Sustainable Food Systems, 3, 5. https://doi.org/ https://doi.org/10.3389/fsufs.2019.00005
Mahuta, N. (2021). Aotearoa New Zealand Sustainable Development Goals Summit 2021. New Zealand
Parliament. Retrieved 18/10/2021 from https://www.beehive.govt.nz/speech/aotearoa-new-zealand-
sustainable-development-goals-summit-2021
Malik, A., & Kohli, S. (2020). Electric tractors: Survey of challenges and opportunities in India. Materials
today: Proceedings, 28, 2318-2324. https://doi.org/10.1016/j.matpr.2020.04.585
Malpass, L., & Coughlan, T. (2021). The taniwha and the dragon: Foreign Minister Nanaia Mahuta talks
China in major speech. Stuff. Retrieved 11/10/2021 from
https://www.stuff.co.nz/national/politics/300280386/the-taniwha-and-the-dragon-foreign-minister-
nanaia-mahuta-talks-china-in-major-speech
Marek, S. (2021). John Deere wants to help feed the world using 5G, cloud computing. Lightreading.
Retrieved 14/11/2021 from https://www.lightreading.com/aiautomation/john-deere-wants-to-help-feed-
world-using-5g-cloud-computing/d/d-id/766884
MBIE. (2021). Estimating Labour Market Activity post COIVD-19. Ministry of Business, Innovation and
Employment. Retrieved 12/10/2021 from https://www.mbie.govt.nz/dmsdocument/13964-estimating-
labour-market-activity-post-covid-19-april-2021
Melander, I. (2021). European Parliament gives green light to huge farm subsidies deal. Reuters. Retrieved
17/12/2021 from https://www.reuters.com/markets/commodities/european-parliament-set-vote-huge-
farm-subsidies-deal-2021-11-23/
MFAT. (2020). Singapore: Alternative Proteins - 9 December 2020. Ministry of Foreign Affairs and Trade.
Retrieved 13/10/2021 from https://www.mfat.govt.nz/en/trade/mfat-market-reports/market-reports-
asia/singapore-alternative-proteins-9-december-2020/
MFAT. (2021a). About free trade agreements. Ministry of Foreign Affairs and Trade. Retrieved 13/10/201
from https://www.mfat.govt.nz/en/trade/free-trade-agreements/about-free-trade-agreements/
MFAT. (2021b). EU Common Agricultural Policy aims to be “fairer, greener, more animal friendly and
flexible”. Ministry of Foreign Affairs and Trade. Retrieved 12/12/2021 from
https://www.mfat.govt.nz/en/trade/mfat-market-reports/market-reports-europe/eu-common-
agricultural-policy-aims-to-be-fairer-greener-more-animal-friendly-and-flexible/
MFAT. (2021c). Key facts on New Zealand-China Trade. Ministry of Foreign Affairs and Trade. Retrieved
13/10/2021 from https://www.mfat.govt.nz/br/trade/free-trade-agreements/free-trade-agreements-in-
force/nz-china-free-trade-agreement/key-facts-on-new-zealand-china-trade/
MFAT. (2021d). Key outcomes to the NZ-China free trade agreement upgrade. Ministry of Foreign Affairs
and Trade. Retrieved 2/10/2021 from https://www.mfat.govt.nz/br/trade/free-trade-agreements/free-

76
trade-agreements-concluded-but-not-in-force/nz-china-free-trade-agreement-upgrade/key-outcomes-to-
the-nz-china-free-trade-agreement-upgrade/
MFAT. (2021e). NZ-UK FTA. Ministry of Foreign Affairs and Trade. Retrieved 06/12/2021 from
https://www.mfat.govt.nz/assets/Trade-agreements/UK-NZ-FTA/Tariffs.pdf
MFAT. (2021f). Our work with the WTO. Ministry of Foreign Affairs and Trade. Retrieved 13/09/2021 from
https://www.mfat.govt.nz/br/trade/our-work-with-the-wto/
MFAT. (2021g). NZ-UK FTA key statistics. Ministry of Foreign Affairs and Trade. Retrieved 10/10/2021 from
https://www.mfat.govt.nz/assets/Trade-agreements/UK-NZ-FTA/NZ-UK-FTA-National-Interest-Analysis.pdf
MfE. (2019). Climate Change Response (Zero Carbon) Amendment Bill: Summary. Ministry for the
Environment. Retrieved 19/09/2021 from
https://www.mfe.govt.nz/sites/default/files/media/Climate%20Change/climate-change-response-zero-
carbon-amendment-bill-summary.pdf
MfE. (2021a). Essential freshwater new rules and regulations. Ministry for the Environment. Retrieved
21/12/21 from https://environment.govt.nz/what-government-is-doing/areas-of-
work/freshwater/e/freshwater-reform/#the-action-we-are-taking
MfE. (2021b). National policy statement for freshwater management. Ministry for the Environment.
Retrieved 20/12/2021 from https://environment.govt.nz/acts-and-regulations/national-policy-
statements/national-policy-statement-freshwater-management/
MfE. (2021c). Overview of the resource management reforms. Ministry for the Environment. Retrieved
12/10/2021 from https://environment.govt.nz/what-government-is-doing/key-initiatives/resource-
management-system-reform/overview/
MfE. (2021d). Paris Agreement. Ministry for the Environment. Retrieved 1/10/2021 from
https://environment.govt.nz/what-government-is-doing/international-action/about-the-paris-agreement/
Moreno, F., & Malone, T. (2021). The role of collective food identity in local food demand. Agricultural and
Resource Economics Review, 50(1), 22-42. https://doi.org/10.1017/age.2020.9
Moyer, J. D., & Hedden, S. (2020). Are we on the right path to achieve the sustainable development goals?
World Development, 127, 104749. https://doi.org/10.1016/j.worlddev.2019.104749
MPI. (2021a). Climate Change and the Primary Industries. Ministry for Primary Industries. Retrieved
08/10/2021 from https://www.mpi.govt.nz/funding-rural-support/environment-and-natural-
resources/climate-change-primary-industries/
MPI. (2021b). Genetically modified seeds and nursery stock. Ministry for Primary Industries. Retrieved
13/10/2021 from https://www.mpi.govt.nz/import/plants-flowers-seeds-plant-growing-products/seeds-
for-sowing/genetically-modified-seeds-and-nursery-stock/
MPI. (2021c). SFF Futures Projects: Horticulture. Ministry for Primary Industries. Retrieved 5/09/2021 from
https://www.mpi.govt.nz/funding-rural-support/sustainable-food-fibre-futures/current-sff-futures-
projects/sff-futures-projects-horticulture/
MPI. (2021d). Situation and Outlook for Primary Industries - June 2021. Ministry for Primary Industries.
Retrieved 08/10/2021 from https://www.mpi.govt.nz/dmsdocument/45451-Situation-and-Outlook-for-
Primary-Industries-SOPI-June-2021
Mustafa, R. J., Gomaa, M. R., Al-Dhaifallah, M., & Rezk, H. (2020). Environmental impacts on the
performance of solar photovoltaic systems. Sustainability, 12(2), 608.
https://doi.org/10.3390/su12020608
Naidoo, R., & Fisher, B. (2020). Reset Sustainable Development Goals for a pandemic world. Nature.
Retrieved 18/10/2021 from https://www.nature.com/articles/d41586-020-01999-x

77
Nambiar, M. (2021). Consumer trends to watch in 2021 and beyond - APAC Edition. Mintel. Retrieved
11/10/2021 from https://www.mintel.com/blog/consumer-market-news/consumer-trends-to-watch-in-
2021-and-beyond-apac-edition
New Zealand Government. (2020). New rules in place to restore healthy rivers. New Zealand Government.
Retrieved 21/12/2021 from https://www.beehive.govt.nz/release/new-rules-place-restore-healthy-rivers
New Zealand Parliament. (2020). Climate Change Response (Emissions Trading Reform) Amendment Bill.
New Zealand Parliament. Retrieved 01/10/2021 from https://www.parliament.nz/en/pb/bills-and-
laws/bills-proposed-laws/document/BILL_92847/climate-change-response-emissions-trading-reform-
amendment
New Zealand Parliamentary Committee. (2020). Briefing to investigate food waste in New Zealand.
Environment Committee. Retrieved 10/10/2021 from https://www.parliament.nz/resource/en-
NZ/SCR_96164/cebeaf7cf20b40245fdf5c60601d83a2ac5b105f
New Zealand Treasury. (2018). MEI Special Topic: Alternative proteins, artificial meats and the implications
for New Zealand's agricultural sector. New Zealand Treasury. Retrieved 21/10/2021 from
https://www.treasury.govt.nz/publications/research-and-commentary/rangitaki-blog/mei-special-topic-
alternative-proteins-artificial-meats-and-implications-new-zealands-agricultural-sector
Newshub. (2021). New Zealand among major methane emitters targeted by new US, EU climate change
push. Newshub. Retrieved 12/10/2021 from https://www.newshub.co.nz/home/new-
zealand/2021/09/new-zealand-among-major-methane-emitters-targeted-by-new-us-eu-climate-change-
push.html
Newton, P., Civita, N., Frankel-Goldwater, L., Bartel, K., & Johns, C. (2020). What is regenerative
agriculture? A review of scholar and practitioner definitions based on processes and outcomes. Frontiers in
Sustainable Food Systems, 4, 194. https://doi.org/10.3389/fsufs.2020.577723
Nicol-Williams, K. (2019). NZ will fall behind unless archaic gene editing law is updated, scientists say. TVNZ.
Retrieved 12/20/201 from https://www.tvnz.co.nz/one-news/new-zealand/nz-fall-behind-unless-archaic-
gene-editing-law-updated-scientists-say.
NZAGRC. (2021). Methane research programme. New Zealand Agricultural Greenhouse Gas Research
Centre. Retrieved 12/10/2021 from https://www.nzagrc.org.nz/domestic/methane-research-programme/
OANZ. (2021). New Zealand Organic Market Report 2020/21. Retrieved 01/12/2021 from
https://www.oanz.org/market-reports
OECD-FAO. (2021). The OECD-FAO Agricultural Outlook 2021-2030. Organisation for Economic Co-
operation and Development and Food and Agriculture Organisation of the United Nations. Retrieved
01/12/2021 from https://www.oecd-ilibrary.org/sites/19428846-
en/index.html?itemId=/content/publication/19428846-en
Ogilvie, O. (2021a). Cellular Agriculture. Office of the Prime Minister's Chief Science Advisor. Retrieved
21/10/2021 from https://www.pmcsa.ac.nz/topics/cellular-agriculture/
Ogilvie, O. (2021b). Hot Topic: Cellular Agriculture. Matū. Retrieved 21/10/2021 from https://matu.co.nz/2021/03/hot-topic-cellular-agriculture/
Ogundijo, D. A., Tas, A. A., & Onarinde, B. A. (2021). Exploring the impact of Covid-19 pandemic on eating
and purchasing behaviours of people living in England. Nutrients, 13(5), 1499.
https://doi.org/10.3390/nu13051499
Our Land and Water National Science Challenge (OLW) (2022). About Us [website]. Accessed 28/01/2022
from https://ourlandandwater.nz/about-us/.
Pantoja, Y. (2021). Vested Interests and Business Diplomacy: biotechnology companies and gene editing in
New Zealand. Policy Quarterly, 17(2). https://doi.org/10.26686/pq.v17i2.6824

78
Parliamentary Counsel Office. (2021). Hazardous Substances and New Organisms Act. New Zealand
Government - Parliamentary Counsel Office. Retrieved 12/10/2021 from
https://www.legislation.govt.nz/act/public/1996/0030/latest/DLM381222.html
Paustian, K., Chenu, C., Conant, R., Cotrufo, F., Lal, R., Smith, P., & Soussana, J-F. (2020). Climate mitigation
potential of regenerative agriculture is significant. Princeton University. Retrieved 26/10/2021 from
https://static1.squarespace.com/static/5f90d6a90795c927511f7f1e/t/60349f967f294f10542841aa/161406
1462284/Climate+Mitigation+Potential+of+Regenerative+Ag+is+Significant+-+Response+to+WRI.pdf
Payne, P., & Ryan, A. (2019). Insects as mini-livestock? A study of New Zealand attitudes toward insect
consumption. AgResearch. Retrieved 4/12/2021 from https://www.agresearch.co.nz/assets/agresearch-
report-insects-as-mini-livestock-june-2019.pdf
Phillips, T. (2008). Genetically modified organisms (GMOs): Transgenic crops and recombinant DNA
technology. Nature Education, 1(1), 213.
Plackett, B. (2020). Changing diets at scale. Nature, 588(7837), S70-S72.
Ploll, U., Petritz, H., & Stern, T. (2020). A social innovation perspective on dietary transitions: Diffusion of
vegetarianism and veganism in Austria. Environmental Innovation and Societal Transitions, 36, 164-176.
https://doi.org/10.1016/j.eist.2020.07.001
Poore, J., & Nemecek, T. (2018). Reducing food’s environmental impacts through producers and consumers. Science, 360(6392), 987-992. DOI: 10.1126/science.aaq0216
Porter, N., & McDonald, L. (2021). Flood-affected Ashburton farmers slam $4 million support package. Stuff
Publishing. Retrieved 20/12/2021 from https://www.stuff.co.nz/national/125543755/floodaffected-
ashburton-farmers-slam-4-million-support-package
PR Newswire. (2020). The Future of the Vegan Food Market to 2026: Global Industry Overview, Value Chain
Analysis, Lucrative Segments, Key Player Profiles, Winning Strategies. PR Newswire. Retrieved 21/09/2021
from https://www.prnewswire.com/news-releases/the-future-of-the-vegan-food-market-to-2026-global-
industry-overview-value-chain-analysis-lucrative-segments-key-player-profiles-winning-strategies-
301009214.html
Puigdueta, I., Aguilera, E., Cruz, J. L., Iglesias, A., & Sanz-Cobena, A. (2021). Urban agriculture may change
food consumption towards low carbon diets. Global Food Security, 28, 100507.
https://doi.org/10.1016/j.gfs.2021.100507
RBNZ. (2020). Economic impacts of Covid-19 containment measures. Reserve Bank of New Zealand.
Retrieved 12/10/2021 from https://www.rbnz.govt.nz/-
/media/reservebank/files/publications/analytical%20notes/2020/an2020-04.pdf
Redden, R. (2021). Genetic Modification for Agriculture—Proposed Revision of GMO Regulation in
Australia. Plants, 10(4), 747. https://doi.org/10.3390/plants10040747
Reid, J., & Rout, M. (2016). Getting to know your food: The insights of indigenous thinking in food
provenance. Agriculture and Human Values, 33(2), 427-438. https://doi.org/10/1007/s10460-015-9617-8
Reynolds, C. J., Mirosa, M., & Clothier, B. (2016). New Zealand’s food waste: estimating the tonnes, value, calories and resources wasted. Agriculture, 6(1), 9. https://doi.org/10.3390/agriculture6010009
RNZ. (2019). Supermarket shoppers hunt down plant-based proteins. Radio New Zealand. Retrieved
13/10/2021 from https://www.stuff.co.nz/business/farming/116565410/supermarket-shoppers-hunt-
down-plantbased-proteins
RNZ. (2021a). Auckland port's controversial automation system paused after another crash. Radio New
Zealand. Retrieved 13/10/2021 from
https://www.rnz.co.nz/national/programmes/checkpoint/audio/2018800391/auckland-port-s-
controversial-automation-system-paused-after-another-crash

79
RNZ. (2021b). Cash rate kept at 0.25 percent, but Reserve Bank changes tack. Radio New Zealand.
Retrieved 15/11/2021 from https://www.rnz.co.nz/news/business/446885/cash-rate-kept-at-0-point-25-
percent-but-reserve-bank-changes-tack
RNZ. (2021c). He Waka Eke Noa releases discussion document on farm emissions levies. Radio New
Zealand. Retrieved 18/11/2021 from https://www.rnz.co.nz/news/country/456374/he-waka-eke-noa-
releases-discussion-document-on-farm-emissions-levies
RNZ. (2021d). Inflation expected to average at 3.7 percent over next year. Radio New Zealand. Retrieved
13/12/2021 from https://www.rnz.co.nz/news/business/456027/inflation-expected-to-average-at-3-point-
7-percent-over-next-year
RNZ. (2021e). Praise for Zespri response to Covid-positive result on kiwifruit in China. Radio New Zealand.
Retrieved 12/10/2021 from https://www.rnz.co.nz/news/country/452402/praise-for-zespri-response-to-
covid-positive-result-on-kiwifruit-in-china
RNZ. (2021f). Significant Natural Areas (SNAs): What you need to know. Radio New Zealand Retrieved
14/10/2021 from https://www.rnz.co.nz/news/national/444466/significant-natural-areas-snas-what-you-
need-to-know
Rodale Institute. (2013). Regenerative Organic Agriculture and Climate Change: A Down-to-Earth Solution
to Global Warming. Rodale Institute. Retrieved 26/10/2021 from https://rodaleinstitute.org/wp-
content/uploads/rodale-white-paper.pdf.
Roodhuyzen, D. M., Luning, P. A., Fogliano, V., & Steenbekkers, L. (2017). Putting together the puzzle of
consumer food waste: Towards an integral perspective. Trends in Food Science & Technology, 68, 37-50.
https://doi.org/10.1016/j.tifs.2017.07.009
Roshanianfard, A., Noguchi, N., Okamoto, H., & Ishii, K. (2020). A review of autonomous agricultural
vehicles (The experience of Hokkaido University). Journal of Terramechanics, 91, 155-183.
https://doi.org/10.1016/j.jterra.2020.06.006
Rout, M., & Reid, J. (2019). Unlocking export prosperity: The distinctive cultural attributes of food
(1877519642). AERU. Lincoln University.
https://researcharchive.lincoln.ac.nz/bitstream/handle/10182/11971/RR%20350%20Cultural%20Attributes
%20report_FINAL.pdf?sequence=1&isAllowed=y
Rout, M., & Reid, J. (2020). Cultural Attributes of Ngāi Tahu Food and the International Consumer Cultures that Will Recognise Them. AERU. Lincoln University.
https://static1.squarespace.com/static/5a9f5444cef372803fb33678/t/5f7e68971e018875042abe9d/16021
19853584/RR+358.pdf
RSNZ. (2016). Gene editing technologies. Royal Society of New Zealand. Retrieved 6/10/2021 from
https://www.royalsociety.org.nz/what-we-do/our-expert-advice/all-expert-advice-papers/gene-editing-
technologies/
RSNZ. (2019). Gene editing: legal and regulatory implications. Royal Society of New Zealand. Retrieved
13/10/2021 from https://www.royalsociety.org.nz/assets/Uploads/Gene-Editing-Legal-and-regulatory-
implications-DIGITAL.pdf
Salehi, G., Díaz, E., & Redondo, R. (2020). Consumers’ switching to vegan, vegetarian, and plant-based
(vegan) diets: A systematic review of literature. 19th International Conference on Public and Non-profit
Marketing (AIMPN).
Sanderson, B. M., & Fisher, R. A. (2020). A fiery wake-up call for climate science. Nature Climate Change,
10(3), 175-177. https://doi.org/10.1038/s41558-020-0707-2
Saunders, C., Paul Dalziel, Peter Tait, Tim Driver, Meike Guenther, Paul Rutherford, & John Saunders.
(2021). A Global Perspective on New Zealand's Agriculture and Horticultural Brand. Sustainable and
Profitable Farming – What is our Brand?. AERU. Lincoln University.

80
Saunders, J., Guenther, M., & Saunders, C. M. (2019). The impacts of changes in agricultural policies in the
United Kingdom on trade and agriculture especially in New Zealand–the WTO Option. AERU. Lincoln
University.
Sexton, A. E., Garnett, T., & Lorimer, J. (2019). Framing the future of food: The contested promises of
alternative proteins. Environment and Planning E: Nature and Space, 2(1), 47-72.
https://doi.org/10.1177/2514848619827009
Shaw, J. (2021). NZ joins global initiative to tackle methane. New Zealand Government. Retrieved
14/11/2021 from https://www.beehive.govt.nz/release/nz-joins-global-initiative-tackle-methane
Sogari, G., Liu, A., & Li, J. (2019). Understanding edible insects as food in western and eastern societies. In
Bogueva, D., Marinova, D., Raphaely, T., Schmindinger, K. (Ed.). Environmental, health, and business
opportunities in the new meat alternatives market (pp. 166-181). United States. IGI Global.
Statistics New Zealand. (2020). New Zealand's greenhouse gas emissions. Statistics New Zealand.
https://www.stats.govt.nz/indicators/new-zealands-greenhouse-gas-emissions
Stephens, N., & Ellis, M. (2020). Cellular agriculture in the UK: a review. Wellcome Open Research, 5(12),
23. https://doi.org/10.12688/wellcomeopenres.15685.2
Stokstad, E. (2020). United States relaxes rules for biotech crops. Science. Retrieved 13/10/2021 from
https://www.science.org/content/article/united-states-relaxes-rules-biotech-crops
Sutton, K., Larsen, N., Moggre, G., Huffman, L., Clothier, B., Eason, J., & Bourne, R. (2018). Opportunities in
plant-based foods: Protein. Plant & Food Research report prepared for Ministry of Primary Industries and
Plant & Food Research. SPTS(15748).
Tait, P. R., Driver, T., & Saunders, C. M. (2020). Consumer willingness to pay for environmental attributes –
results from AERU research. AERU. Lincoln University.
https://researcharchive.lincoln.ac.nz/bitstream/handle/10182/14440/Consumer%20willingness%20to%20
pay%20for%20environmental%20attributes-Results%20from%20AERU.pdf?sequence=1&isAllowed=y
Tesla. (2021). Autopilot and Full Self-Driving Capability. Tesla. Retrieved 12/10/2021 from
https://www.tesla.com/en_NZ/support/autopilot
The Aotearoa Circle. (2021). Sustainable Finance. The Aotearoa Circle. Retrieved 9/10/2021 from
https://www.theaotearoacircle.nz/sustainablefinance
Tilman, D., & Clark, M. (2015). Food, agriculture & the environment: Can we feed the world & save the
earth? Daedalus, 144(4), 8-23. https://doi.org/10.1162/DAED_a_00350
Tuomisto, H. L., & Teixeira de Mattos, M. J. (2011). Environmental impacts of cultured meat production.
Environmental Science & Technology, 45(14), 6117-6123. https://doi.org/10.1021/es200130u
Turnbull, C., Lillemo, M., & Hvoslef-Eide, T. A. (2021). Global regulation of genetically modified crops amid
the gene edited crop boom–a review. Frontiers in Plant Science, 12, 258.
https://doi.org/10.3389/fpls.2021.630396
UKCOP26. (2021). COP26 Goals. United Nations. Retrieved 12/12/2021 from https://ukcop26.org/cop26-
goals/
UKRI. (2021). Government gives green light to genome-edited wheat trial. United Kingdom Research
Institute. Retrieved 13/10/2021 from https://www.ukri.org/news/government-gives-green-light-to-
genome-edited-wheat-trial/
UNDESA. (2021). The 17 Goals United Nations Department of Economic and Social Affairs. Retrieved
18/10/2021 from https://sdgs.un.org/goals
UNEP. (2021a). Financing sustainable land use for people and planet: Leveragin and unlocking private
finance for sustainable commodity production improves rural livelihoods, protects forests and restores

81
degraded land. United Nations Environment Programme. Retrieved 8/10/2021 from
https://wedocs.unep.org/bitstream/handle/20.500.11822/31216/FSLU.pdf?sequence=1&isAllowed=y
UNEP. (2021b). UNEP Food Waste Index Report 2021. United Nations Environment Programme. Retrieved
12/10/2021 from https://www.unep.org/resources/report/unep-food-waste-index-report-2021
United Nations. (2021). The Sustainable Development Goals Report 2021. United Nations. Retrieved
19/10/2021 from https://unstats.un.org/sdgs/report/2021/The-Sustainable-Development-Goals-Report-
2021.pdf
USDA. (2021). Outlook for U.S. Agricultural Trade. United States Department of Agriculture. Retrieved
19/09/2021 from https://www.ers.usda.gov/topics/international-markets-us-trade/u-s-agricultural-
trade/outlook-for-us-agricultural-trade/
Van Rensburg, M. (2019). MEI Special Topic: New Zealand's Increasing Export Concentration. New Zealand
Treasury. Retrieved 11/10/2021 from https://www.treasury.govt.nz/publications/research-and-
commentary/rangitaki-blog/mei-special-topic-new-zealands-increasing-export-concentration
Verevis, S., & Üngör, M. (2021). What has New Zealand gained from The FTA with China?: Two
counterfactual analyses. Scottish Journal of Political Economy, 68(1), 20-50.
https://doi.org/10.1111/sjpe.12260
Walter, A., Finger, R., Huber, R., & Buchmann, N. (2017). Opinion: Smart farming is key to developing
sustainable agriculture. Proceedings of the national academy of sciences, 114(24), 6148-6150.
https://doi.org/10.1073/pnas.1707462114
Wang, N., Zhu, L., Bing, Y., Chen, L., & Fei, S. (2021). Assessment of urban agriculture for evidence-based
food planning: A case study in Chengdu, China. Sustainability, 13(6), 3234.
https://doi.org/10.3390/su13063234
Westhoek, H., Lesschen, J. P., Rood, T., Wagner, S., De Marco, A., Murphy-Bokern, D., Oenema, O. (2014).
Food choices, health and environment: Effects of cutting Europe's meat and dairy intake. Global
Environmental Change, 26, 196-205. https://doi.org/10.1016/j.gloenvcha.2014.02.004
White, C. (2020). Why Regenerative Agriculture? American Journal of Economics and Sociology, 79(3), 799-
812. https://doi.org/10.1111/ajes.12334
White House. (2021a). FACT SHEET: President Biden Sets 2030 Greenhouse Gas Pollution Reduction Target
Aimed at Creating Good-Paying Union Jobs and Securing U.S. Leadership on Clean Energy Technologies.
White House. Retrieved 12/10/2021 from https://www.whitehouse.gov/briefing-room/statements-
releases/2021/04/22/fact-sheet-president-biden-sets-2030-greenhouse-gas-pollution-reduction-target-
aimed-at-creating-good-paying-union-jobs-and-securing-u-s-leadership-on-clean-energy-technologies/
White House. (2021b). Paris Climate Agreement. The White House. Retrieved 3/10/2021 from
https://www.whitehouse.gov/briefing-room/statements-releases/2021/01/20/paris-climate-agreement/
Wojciechowska-Solis, J., & Barska, A. (2021). Exploring the preferences of consumers’ organic products in aspects of sustainable consumption: The case of the polish consumer. Agriculture, 11(2), 138.
https://doi.org/10.3390/agriculture11020138
World Bank. (2021). Global food loss and waste. World Bank. Retrieved 10/10/2021 from
https://datatopics.worldbank.org/what-a-waste/global_food_loss_and_waste.html
World Research Institute. (2021). COP26: Key Outcomes From the UN Climate Talks in Glasgow World
Research Institute. Retrieved 08/11/2022 from https://www.wri.org/insights/cop26-key-outcomes-un-
climate-talks-glasgow
Xiong, H., Dalhaus, T., Wang, P., & Huang, J. (2020). Blockchain technology for agriculture: applications and
rationale. Frontiers in Blockchain, 3, 7. https://doi.org/10.3389/fbloc.2020.00007

82
Xu, J., Guo, S., Xie, D., & Yan, Y. (2020). Blockchain: A new safeguard for agri-foods. Artificial Intelligence in
Agriculture, 4, 153-161. https://doi.org/10.1016/j.aiia.2020.08.002
Xue, L., & Liu, G. (2019). Introduction to global food losses and food waste. In C, Galanakis (Ed.). Saving
Food (pp. 1-31). London: Elsevier Publishing. https://doi.org/10.1016/B978-0-12-815357-4.00001-8
Yu, D. (2020). Consumer Companies Are Accelerating Investments in Regenerative Agriculture to Combat
Climate Change. Forbes. Retrieved 26/10/2021 from
https://www.forbes.com/sites/douglasyu/2020/12/22/consumer-companies-accelerating-investments-in-
regenerative-agriculture-to-combat-climate-change/?sh=70c368305d86
Zeng, Y., Maxwell, S., Runting, R. K., Venter, O., Watson, J. E., & Carrasco, L. R. (2020). Environmental
destruction not avoided with the Sustainable Development Goals. Nature Sustainability, 3(10), 795-798.
https://doi.org/10.1038/s41893-020-0555-0

83
Appendix A: Review of international consumer preferences studies –
choice experience (CE) and willingness-to-pay (WTP) case studies
It is important to value the range of premiums that international consumers are willing to pay
for the inclusion of attributes in products. One method to assess this is the use of choice
experiments. A choice experiment (CE) is an economic valuation method used to assess
willingness-to-pay (WTP) for different attributes of goods or services that can (but does not
have to be) traded in markets. This belongs to the category of stated preference non-market
valuation methods (Hanley et al., 2013; Hensher et al., 2015). CE can be used to explore
consumer preferences for attributes that do not currently exist in-market (Teratanavat and
Hooker, 2006) for application in product development or market access, and to simulate real
markets and the product choices involving trade-offs (Carlsson et al., 2005; Mueller Loose and
Remaud, 2013; Poelmans and Rousseau, 2016).
This chapter updates a literature review of consumer WTP for a series of basic and credence
attributes relating to the international and domestic drivers included in this report. This
review complements previous large-scale literature reviews produced as part of the
Maximising Export Returns (MER) research programme by Agribusiness and Economics
Research Unit (Miller et al., 2014), as well as Stage 1 and 2 of the Drivers Project for the Our
Land and Water component of the National Science Challenge (Saunders et al., 2016b; 2018),
and covers mainly academic CE literature published between 2003 and 2021. Previous reviews
identified food safety as a key credence attribute across all markets, including positive WTP
with high associated premiums in some cases (e.g. food safety credentials on food products
in China). This is understandable due to widespread public concerns regarding previous food
safety incidents around the world.
Previous reviews also identified product quality (and associated indicators) as another
credence attribute. Examples of this include the freshness of milk products or tenderness of
steak products. Product quality can also extent to aspects of a product’s origin, whereby a common finding is that people prefer domestically-produced over imported food products.
There is also a range of case studies considering production methods, typically comparing
organic, genetically modified (GM) and conventional production practices. Regarding GM
production, evidence is mixed, while WTP for organic production (for dairy, fruit and
vegetable, wine, oil and flour products) was found to be consistently positive. It has also been
shown that consumers can associate organic foods with a range of benefits, such as increased
healthiness and limited use of pesticides.
Similarly, functional foods (i.e. food products that offer health benefits beyond basic nutrition)
have also shown some positive WTP. In China and Singapore, for example, there is growing
interest in these types of products, such as those intended to enhance the immune system,
supplement basic nutrition or assist with aspects of beauty, among other effects.
Finally, the previous review found some evidence that consumers are concerned with
environmental or animal welfare issues, particularly in relation to the ethical dimensions of
production. For example, studies indicate that consumers in the UK, China and India are willing
to pay for reduced water pollution, reduced greenhouse gas (GHG) emissions and improved
biodiversity in agricultural production (Saunders et al., 2013). Likewise, research has indicated
that many consumers are concerned about the health and welfare of animals, potentially
influencing their purchase decisions. The CE studies have included general animal welfare or
free range attributes alongside other types of attributes related to animal health and welfare.

84
A1.1 Meat and seafood products
The current review includes 38 CE and other WTP studies examining the attributes of meat
and seafood products in Europe, North America, Asia and other regions. The most commonly
examined markets across these studies include Germany, the United Kingdom (UK), the
United States (US) and China. Attributes examined in these studies include animal health
and/or welfare, organic, different production methods, traceability, local food, country-of-
origin, nutritional content, functional foods, social responsibility, environmental condition,
certification, carbon/GHG emissions associated with production, water use and genetic
modification (GM), as well as generic attributes such product quality, appearance and taste.
General studies
Yang and Renwick (2019) conducted a meta-analysis of credence attributes for livestock
products. To do this, the authors conducted a systematic literature review and applied a meta-
regression analysis in an effort to introduce some generality to WTP studies. 566 WTP
estimates from 94 studies were initially identified. However, 11 of these were negative and
excluded from the meta-analysis, but controlled for using a dummy variable in the meta-
regression. Table A1 shows the frequency of estimates across a number of variables.
Table A1: Frequency of study characteristics (papers N=94) (estimates N=555)
Category Variable Frequencya
Product Beef 283
Lamb 44
Dairy 206
Other products 22
Labelling &
perception
Labelled 399
Perceived 156
Data collection
time
Before 2000 22
2000-2004 116
2005-2009 239
After 2010 178
Estimation method Choice experiment 276
Contingent valuation 39
Conjoint analysis 63
Hedonic 26
Others 151
Valuation method Hypothetical 405
Non-hypothetical 150
Credence attribute Environment-friendly 42
Animal welfare 108
Organic 62
Hormone/antibiotic free 38
Grass-based 49
Food safety 43
PDOs/PGIs 27
ROOs/COOs 102
Traceabilityb 18
Mixed attributes 66
Region
North America 152
Europe 280

85
Asia 72
Australasia 6
Other regions 45 Notes: (a) Frequency refers to the number of observations in each category. (b) Traceability is sometimes
relevant to geographical information, but it is different from GIs. This attribute can also be called ‘identity preservation’, and is defined as the ability of a system to maintain a credible custody of identification for animals or animal products through various steps, from the farm to the retailer.
The authors (Yang and Renwick, 2019) created two subsamples within the data to separate
red meat from dairy. The applied regression model highlighted that in the red meat sample
there is a higher WTP for beef products than for lamb, with organic production associated
with the highest price premium, and environmentally friendly attributes values the least by
consumers. In terms of dairy products, food safety was associated with the highest price
premium, and environmentally friendly the lowest. In addition, WTP estimates were
modelled based on the meta-regression results with the study year was set after 2010 to
capture recent market demand for livestock products. A2 shows the results WTP results for
the whole model, red meat, and dairy estimates, with a 95 per cent confidence interval.
Table A2: WTP estimates of a price premium for livestock products (%)
Model credence attributes Whole sample
model Red meat model Dairy model
Environment-friendly 24.1 [6.1, 42.1] 18.9 [3.7, 34.2] 25 [11.2, 38.9]
Animal welfare 31.9 [5.6, 58.2] 19.3 [3, 35.6] 31 [0.5, 61.5]
Organic 35.8 [8.1, 63.5] 31.37 [8.1, 54.5] 28.5 [ 9.2, 47.9]
Hormone/ antibiotic free 32.2 [4.5, 60] 24 [1.5, 46.6] 34.3 [3.8, 64.8]
Grass-based 24.9 [-3.8, 53.6] 22.3 [0.5, 44.1] 25.1 [4.5, 45.7]
Food safety 29.9 [5.3, 54.6] 23 [2.4, 43.6] 39.2 [18.8, 59.6]
PDOs/PGIs 24.7 [7.3, 42] 22.4 [6.1, 38.7] 25.7 [4.3, 47]
COOs/ROOs 29.8 [9.4, 50.3] 22.5 [7.8, 37.2] 29.9 [11.3, 48.4]
Traceability 20.1 [-2.5, 42.7] 17.7 [-3.3, 38.7] 26.1 [-1.8, 50.3]
Mixed attributes 25.68 [1.7, 49.7] 19.2 [1.8, 36.6] 25.8 [2.2, 48.8]
European studies
The current review includes 18 CE and other WTP studies examining the attributes of meat
and seafood products in Europe, including studies conducted in Germany, Denmark, Portugal,
Spain, France, UK, Sweden, Italy, Netherlands and Belgium. Attributes examined in these
studies include animal health and/or welfare, organic, different production methods,
traceability, local food, country-of-origin, nutritional content, functional foods, social
responsibility, environmental condition, certification, carbon/GHG emissions associated with
production, water use and genetic modification (GM), as well as generic attributes such
product quality, appearance and taste.
Clark et al. (2017) conducted a review of international WTP literature regarding farm animal
welfare for pigs, chickens, cattle and fish. The authors estimated a weighted mean WTP (in
Euros) for the provision of higher standards of farm animal welfare across a range of studies,
measures and differences in WTP by type of production animal. As shown in Table A3, the
authors found higher mean WTP for beef cows and fish compared to pigs and broiler chickens.
This indicates that consumers prefer the provision of farm animal welfare depending on the
type of animal involved in production.

86
Table A3: Willingness-to-pay for farm animal welfare, international literature review
Animal Type No. of Measures No. of Studies Weighted Mean WTP (€) Pig 90 13 0.54
Layer Hen 47 10 0.09
Broiler Chicken 26 8 1.24
Dairy Cow 27 7 0.50
Beef Cow 24 7 5.00
More than one type 6 2 11.20
Fish 6 3 3.53 Source: Clark et al., 2017.
Denver et al. (2017) conducted a WTP study to value Danish consumers’ WTP for the provision of relative levels of animal welfare for pigs in pork production. The study was designed to
assess consumers’ WTP for trade-offs between standard, medium and high levels of animal
welfare in production. Table A4 shows that there is a small difference between WTP for
medium and high levels, with many consumers not willing to pay additional premiums to move
beyond the medium level of animal welfare.
Table A4: Willingness-to-pay for animal welfare in relation to pork, Denmark (N=396)
Attribute Level Market price
premiums
Stated WTP for welfare pork
Respondents usually
buying standard or
medium level welfare
pork
Respondents usually
buying high level welfare
pork
Standard 0% Base (WTP not estimated)
Medium (relative to
standard) 17-75% higher 80% higher 170% higher
High (relative to
medium) 14% higher 0% higher 15% higher
Source: Denver et al., 2017.
Risius and Hamm (2017) examined the effects of exposure to communication materials on
German consumers’ WTP for organic and animal husbandry attributes in relation to beef products. The authors tested consumer preferences and WTP for beef products before and
after being shown communication materials regarding different animal husbandry and
production methods. Prior to being shown material, participants indicated a preference for
enhanced husbandry practices and organic production. Participants were then shown either
an image film, a documentary film or a leaflet giving further information regarding each type
of production method or husbandry practice (including organic production, extensive suckler
cow husbandry and pasture-based husbandry). As shown in Table A5, following the
presentation of this information, consumer preferences and WTP for each system changed
based on the type of information presented.

87
Table A5: Willingness-to-pay (€) for organic and animal husbandry attributes following presentation of communication materials (image film, documentary film and leaflet),
Germany (N=676)
Communication
material
Attributes
Organic Extensive suckler cow
husbandry
Pasture-based
husbandry
Image film 2.98 3.79 0.98
Documentary film 2.67 5.93 0.27
Leaflet 4.22 4.68 -0.31 Source: Risius and Hamm, 2017.
Kallas et al. (2019) used a discrete choice experiment to determine Spanish consumers’ WTP for health-enhancing properties in pork patty products before and after a hedonic taste test
of product types. Specifically, this involved innovative pork patty products with enhanced
health claims through the addition of Porcini (added dietary fibre) and blueberries (added
antioxidants). Initially, the researchers determined the “food neophobia” (degree of aversion
to innovative food products) of the participants, subsequently segmenting participants into
three groups – low, average and high food neophobic (LN, AN and HN respectively). WTP
values were calculated prior to and following taste testings of each of the products, deriving
a range of premiums associated with each product – these are shown in Table A6 below. This
showed a generally higher WTP for both traditional and innovative pork products by
consumers with lower food neophobia, as well as a perceived higher WTP prior to tasting for
those innovative products including blueberries over Porcini (Kallas et al., 2019).
Table A6: Willingness-to-pay (€) for traditional and innovative pork products before and
after tasting, Spanish consumers (2018) (N = 121)
Segment Product Type
WTP (€) Expected
Before Tasting
WTP (€) Experienced
After Tasting
Low Food Neophobia
(LN) (n = 24)
Traditional Pork Product 3.87 4.31
Innovative Pork Product 1 – Porcini 3.60 2.70
Innovative Pork Product 2 – Blueberries 4.60 2.34
Average Food
Neophobia (AN)
(n = 41)
Traditional Pork Product 3.71 3.38
Innovative Pork Product 1 – Porcini 3.50 2.79
Innovative Pork Product 2 – Blueberries 3.71 1.86
High Food Neophobia
(HN) (n = 55)
Traditional Pork Product 2.88 3.43
Innovative Pork Product 1 – Porcini 2.88 2.41
Innovative Pork Product 2 – Blueberries 3.34 1.89 Source: Kallas et al., 2019.
Calvo Dopico et al. (2016) examined European fish consumers’ (Portugal, Spain, France, UK
and Germany) preferences and WTP for the provision of traceability information with fish
products. Table A7 shows that while around half of participants stated that they would not be
willing to pay a premium for this (particularly Portuguese and Spanish participants).

88
Table A7: Willingness-to-pay for traceability programme, European countries
Country Sample WTP: No WTP: Yes WTP for traceability programme
Premium % participants
Spain 410 262 (63.9%) 148 (36.1%)
€0–0.25 10.2
€0.26–0.50 8.8
€0.51–0.75 6.3
€0.76–1 5.9
€ > 1 4.9
UK 302 147 (48.68%) 155 (51.32%)
€0–0.25 9.93
€0.26–0.50 18.87
€0.51–0.75 9.27
€0.76–1 7.28
€ > 1 5.96
Portugal 728 553 (75.96%) 175 (24.04%)
€0–0.25 7.69
€0.26–0.50 7.42
€0.51–0.75 4.67
€0.76–1 3.02
€ > 1 1.24
France 335 160 (47.8%) 175 (52.2%)
€0–0.25 14.93
€0.26–0.50 17.31
€0.51–0.75 9.25
€0.76–1 7.46
€ > 1 3.28
Germany 300 126 (42%) 174 (58%)
€0–0.25 6.00
€0.26–0.50 21.33
€0.51–0.75 16.00
€0.76–1 11.00
€ > 1 3.67 Source: Calvo Dopico et al., 2016.
Hempel and Hamm (2015) examined German consumers’ preferences and WTP for organic and local attributes across a range of food products, including beef steak, butter, apples and
flour products. Based on a series of questions regarding preferences for organic and local
products, the authors segmented participants into two groups – organic-minded consumers
(OMC) and non-organic-minded consumers (NOMC). Table A8 shows differences in WTP for
local and organic attributes between OMC and NOMC, with both groups indicating the highest
WTP for local beef steak products (as opposed to ‘from a neighbouring country’)
Table A8: Willingness-to-pay (€) for organic and local attributes, Germany (N=638)
Organic-minded consumers (N=221) Non-organic-minded consumers (N=427)
Organic
Local (as
opposed to
“from Germany”)
Local (as
opposed to
“from a neighbouring
country”)
Organic
Local (as
opposed to
“from Germany”)
Local (as
opposed to
“from a neighbouring
country”) Apples (/kg) 1.22 0.63 4.25 -0.13 0.17 2.07
Butter
(/250g) 0.31 0.37 1.26 -0.01 0.12 0.56
Flour (/kg) 0.97 0.36 3.44 -0.03 0.23 1.28
Steak (/200g) 2.46 1.26 5.56 0.46 1.94 4.80 Source: Hempel and Hamm, 2015

89
Lagerkvist et al. (2017) examined Swedish consumers’ WTP for a range of credence attributes in relation to beef products using a discrete choice experiment. Attributes included country-
of-origin labelling, traceability to various parts of the supply chain, animal health and welfare,
human health, social responsibility, and production methods. As shown by Table A9 below,
participants indicated a range of positive WTP values for all attributes, particularly to move
from basic to slightly improved levels (e.g. Price 1 to Price 2).
Table A9: Willingness-to-pay (SEK) for a range of attributes in beef products (discrete price
level), Sweden (N=440) (base price=200 SEK/kg)
Attribute
Price 2:
225
SEK/kg
Price 3:
250
SEK/kg
Price 4:
275
SEK/kg
Price 5:
300
SEK/kg
Price 6:
325
SEK/kg
Reference code 2.09 0.79 0.42 0.28 0.23
Traceability to specific slaughterhouse 1.46 0.55 0.30 0.20 0.16
Traceability to group or specific animal 2.00 0.75 0.41 0.27 0.22
Traceability to specific breeder 1.49 0.56 0.30 0.20 0.17
Animal welfare 2.89 1.09 0.59 0.39 0.32
Animal medication used for preventative
purposes 2.52 0.95 0.51 0.34 0.28
Organic production 2.03 0.76 0.41 0.28 0.22
Environmental impact 1.68 0.63 0.34 0.23 0.19
Health impact 1.71 0.64 0.35 0.23 0.19
Social responsibility 1.96 0.74 0.40 0.27 0.22
Type of animal feed used 1.44 0.54 0.29 0.20 0.16 Source: Lagerkvist et al., 2017.
Balcombe et al. (2016) examined UK consumers’ WTP for country-of-origin, production
methods, product quality and certification attributes in 12 types of poultry, beef, pork and
sheep meat products. Table A10 presents mean estimates of WTP for the range of products
and attributes mentioned above. Results show that participants were willing to pay a premium
for each of the attributes across most products, with negative WTP uniformly shown for
products of non-UK origin.

90
Table A10: Mean willingness-to-pay (£) for a range of attributes in meat products, UK
(N=2,951 – approx. N=490 per choice experiment)
Product Type
Attributes
Choice* Premium* Organic UK
Origin
EU
Origin
Origin
Outside
EU
Freedom
Food
Label
Intl.
Quality
Label
Pork sausages
(/450g) 0.17 1.08 0.91 0.84 -0.27 -0.73 0.33 0.87
Pork joint
(/1.5kg) 0.46 2.40 2.62 3.15 -1.09 -2.28 1.68 2.42
Beef lasagne
(/600g) 0.87 2.55 1.92 1.68 -1.0 -0.71 0.96 1.68
Bacon
(/300g) 0.35 0.88 0.93 0.67 -0.62 -1.04 0.6 0.85
Beef burger
(/450g) 0.49 1.02 0.67 0.65 -0.77 -0.86 0.48 0.85
Chicken curry
(/400g) 0.4 1.45 1.29 1.16 -0.41 -0.87 0.52 1.19
Leg lamb
(/1.5kg) 0.5 1.69 2.03 2.85 -2.62 0.03 1.68 1.43
Chicken
breasts
(/500g)
0.63 1.4 2.06 2.23 -0.38 -1.99 1.41 1.7
Pepperoni
pizza
(/14” pizza) 0.51 1.59 1.48 0.91 -0.95 -0.5 1.35 1.31
Chicken pie
(/550g) 0.43 1.37 1.02 0.72 -0.86 -0.76 0.55 1.18
Gammon
steaks
(/225g)
0.52 1.44 1.06 1.59 -0.64 -1.31 0.8 0.75
Turkey mince
(/400g) 0.32 1.05 1.21 1.12 -0.14 -1.01 0.69 1.03
*Choice refers to improved product quality from the base product; premium refers to the top level of product
quality.
Source: Balcombe et al., 2016.
Kallas et al. (2015) designed a study using a simulated market setting to assess the impact of
a possible ban on surgical castration of pigs in the EU. This study also included a sensory
parameter by including a scent and taste test between two CEs. As Table A11 shows,
participants were willing to pay a small amount for the welfare attribute while the sensory
impact resulted in some differences in WTP estimates, such as the WTP for flavour attribute
changing from a negative to a positive WTP of 0.66 euros/package (55% premium) after
exposure to product tasting. The results also show that participants’ WTP was lower for the
manufacturer’s own brand compared to the private brand.

91
Table A11: Willingness-to-pay for pork sausage attributes, Spain (N= 150*)
Pre Sensory CE Post sensory CE
WTP
€/package
Premium
(%)*
WTP
€/package
Premium
(%)*
Flavour (vs.
Original/ non-
flavoured)
With spices and
naturally smoked -0.558 (-47%) 0.660 (55%)
Castration (vs. none)
Meat from
castrated pigs or
boars
0.340 (29%) - -
Brand (vs.
manufacturer) Private -0.252 (-21%) -0.342 (-29%)
Note: In this adapted Table, WTP was included only if the attribute was statistically significant.
*Compared to the average of the applied price vector: €1.19/package
Source: Kallas et al. (2015)
Animal welfare was also included in the Zanoli et al. (2013) investigation of consumers’ beef product preferences in Italy. In particular, the study contrasted animal welfare with
production methods, origin and quality indicators (e.g. fat content and colour). Table A12
shows that organic and domestic attributes had the highest relative WTP of between 24 and
26 euros/kg (109% and 206% of base price) respectively.
Table A12: Willingness-to-pay for beef attributes, Italy (N = 145*)
WTP €/kg Premium (%)**
Production method (vs. not
organic) Organic 26.25 (109%)
Production method (vs. not
conventional) Conventional 12.76 (106%)
Animal welfare (vs. Box) Free-range 17.29 (144%)
Place of production (vs. abroad) Italy 24.69 (206%)
Breed origin (vs. not local) Local 6.40 (53%) * Data were gathered from three different locations (medium-sized towns) in northern, central and southern
Italy, in 2008.
** Compared to the basic prices reported in study: €24/kg for the organic beef attribute, and €12/kg for other attributes
Source: Zanoli et al. (2013)
Van Loo et al. (2014) combined different environmental and ethical attributes in a CE of
chicken products, segmenting participants into income brackets. The attributes were
presented in different logos, labels and claims associated with production, with CE results
showing a consumer preference for product labels or claims over not having them at all. As
Table A13 shows, average WTP is higher for free-range claims (43-93%), with respondents also
favouring the introduction of domestic or EU-organic logos, carbon footprint and animal
welfare labels.

92
Table A13: Willingness-to-pay for chicken breast attributes, Belgium (N = 359*)
Attributes
WTP
euros/kg
Premium
(%)**
WTP
euros/kg
Premium
(%)**
Low income High Income
Organic logo
(vs. none)
Biogarantie logo (Belgium) 2.16 (23%) 3.18 (34%)
EU Organic logo 1.16 (12%) 1.70 (18%)
Animal welfare
label (vs. none) European animal welfare label 2.50 (26%) 3.67 (39%)
Free range
claims (vs.
none)
Free range 4.12 (43%) 6.06 (64%)
Traditional free range 4.77 (50%) 7.02 (74%)
Free range-total freedom 5.99 (63%) 8.81 (93%)
Carbon
footprint label
(vs. none)
20% CO2-reduction: 5.6 kg
CO2e compared to 7 kg CO2 1.73
(18%)
2.54 (27%)
30% CO2-reduction: 4.9 kg
CO2e compared to 7 kg CO2 2.31 (24%) 3.40 (36%)
* Online survey conducted in the northern Belgium, 2012.
** Compared to the average price for conventional chicken breast in Belgium in 2012 (€9.49/kg)
Source: Van Loo et al. (2014)
Viegas et al. (2014) estimated Portuguese consumers’ WTP for animal welfare in the context of testing whether premiums paid for credence attributes can justify higher associated
production costs. Specifically, the authors hypothesised that WTP for a particular attribute
(e.g. animal welfare) is conditional on the presence of other attributes (e.g. environmental
quality and/or food safety). The reference alternative included legal minimums and a status
quo price. As shown in Table A14 below, the estimated WTP suggests that the highest value
was placed on food safety, ranging from 7-16 euros/kg, followed by animal welfare and
environmental protection. An important implication was that the WTP for different
combinations of attributes should not be obtained from independent valuation and
summation due to significant interaction effects. The authors then applied a conditional
approach on estimating attribute WTP (Table A14, last column) whereby, for example, the
WTP for food safety in the presence of both animal welfare and environmental certification
decreases the average WTP (from up to 16 euros to negative or close to zero). This suggests
that animal welfare and environmental attributes may be proxies for food safety.

93
Table A14: Willingness-to-pay for beef attributes, Portugal (N = 613)
Attribute Levels Average WTP Conditional WTP**
€/kg
(premium %*)
€/kg
(premium %*)
main
effects
main +
interaction
effects
Beef safety (vs.
legal standards)
Certified additional
level:
Reduction/control of
the quantity of
antibiotic residues in
beef
7.31
(42%)
16.23
(93%)
AW =0 ENV = 0
AW = 1 ENV = 0
AW = 0 ENV = 1
AW = 1 ENV = 1
16.23
7.47
7.32
-1.43
(93%)
(43%)
(42%)
(-8%)
Animal welfare
(vs. legal
standards)
Certified additional
level
7.30
(42%)
12.07
(69%)
FS = 0
FS = 1
12.08
3.32
(69%)
(19%)
Environmental
Protection (vs.
legal standards)
Certified additional
level: Air, water, soil
pollution and
reduction/ prevention
4.81
(28%)
7.35
(42%)
FS = 0
FS = 1
7.35
-1.55
(42%)
(-9%)
*Compared to average of the applied price vector (€17.98/kg) ** 1 indicates the condition, zero otherwise: AW = Animal Welfare; ENV = Environmental Protection; FS = Food
Safety
Source: Viegas et al. (2014)
Gracia (2014) investigated Spanish consumers’ WTP for local lamb products using a simulated market environment with an additional objective of reducing the risk of hypothetical bias in
the results. The results shown in Table A15 indicate that consumers are willing to pay a
premium of between 9 and 13 per cent for local and “Ternasco” lamb, respectively, over
unlabelled or “suckling” lamb, respectively.
Table A15: Willingness-to-pay for fresh local lamb attributes, Spain (N = 133)
Attribute WTP €/package (Premium %)
Locally grown label (vs.
unlabelled)
Labelled as “Ojinegra from Teruel” 0.29 (9%)
Type of commercial lamb
(vs. “Suckling” lamb) “Ternasco” lamb 0.43 (13%)
Source: Gracia, 2014.
Van Wezemael et al. (2014) conducted a European cross-country study exploring consumer
preferences and WTP for nutrition and health claims in relation to beef steak. The study tested
an information/framing effect in a split-sample approach wherein one sample was shown
attributes with nutritional claims only (N sample) and other sample were shown both
nutritional and health claims together (NH sample). The results from Table A16 suggest that
the valuation of nutritional and health claims varies across countries. Across samples, the NH
sample had consistently higher WTP, with the exception of a “rich in protein” claim in the UK.
This indicated the existence of country-specific marketing opportunities when considering
nutrition and health claims on beef products, such as information regarding product protein
levels in the UK.

94
Table A16: Willingness-to-pay for beef steak attributes, Belgium, France, The Netherlands
and UK (N = 600/country*)
N sample WTP €/kg Premium
(%)**
Iron
(vs. no
claim)
Nutritional claim: “Source of iron”
Netherlands 5.44 (33%)
Belgium 4.26 (26%)
France 4.11 (25%)
UK 5.04 (31%)
Protein
(vs. no
claim)
Nutritional Claim: “‘Rich in protein’’
Netherlands 2.71 (16%)
Belgium 3.42 (21%)
France 4.96 (30%)
UK 5.81 (35%)
Saturated
fat (vs. no
claim)
Nutritional Claim: ‘‘poor in saturated fat’’
Netherlands 5.78 (35%)
Belgium 5.60 (34%)
France 6.73 (41%)
UK 1.20 (7%)
NH sample
Iron (vs. no
claim)
Nutritional claim: “Source of iron”
Health Claim: ‘‘Iron contributes to the normal cognitive function’’
Netherlands 5.62 (34%)
Belgium 5.89 (36%)
France 5.49 (33%)
UK 4.27 (26%)
Protein
(vs. no
claim)
Nutritional Claim: “‘Rich in protein’’ Health Claim: ‘‘Protein contributes to the growth or maintenance of muscle mass.’’
Netherlands 4.22 (26%)
Belgium 6.20 (38%)
France 9.70 (59%)
UK 4.39 (27%)
Saturated
fat (vs. no
claim)
Nutritional Claim: ‘‘poor in saturated fat’’ Health Claim: “Consumption of saturated fat increases blood cholesterol concentration.
Consumption of foods with reduced amounts of
saturated fat may help to maintain normal blood
cholesterol concentrations.’’
Netherlands 8.45 (51%)
Belgium 11.66 (71%)
France 11.71 (71%)
UK 4.60 (28%)
* Online survey in 2011 with people consuming beef at least once a month.
**Compared to average of the applied price vector (€16.5/kg) Source: Van Wezemael et al. (2014)
In Sweden, Lagerkvist et al. (2014) focused on COO and ethical cues in the presence or absence
of price attribute, the differences of which should not (in theory) impact on the preferences
and structural validity of CE. A large of range attributes with quality and ethical cues were
included in the study (see Table A17) where the absence of labelling information was used as
a reference point. In addition, a non-parametric test was used to confirm attribute ranking by
consumers. A sample of over 1,000 participants completed the survey. The WTP results in
Table A15 are only reported for that part of the sample who saw the CE with the price vector
(required for WTP calculation). These results show that consumers were willing to pay an
average 10% premium for a verified SR labelling in beef products – approximately four times
lower than COO information. COO was also found to be the top ranked attribute in both
samples. In regards to the comparison between the inclusion and exclusion of price attributes,
one of the results indicated that there was consistently less heterogeneity in the CE without
the price attribute.

95
Table A17: Willingness to pay for beef attributes, Sweden (N = 1,070*; n = 630 “no-price
sample” and n = 440 “price sample”) “Price sample”
“Price sample”
“No-price
sample”
WTP SEK/kg
Premium
(%)** Attribute ranking
Origin Information (vs. zone
of origin inside or outside EU)
COO (inside or
outside EU) 113.7 43% 1 1
Animal specific Reference
code (vs. not present)
Information on
package 15.0 6% 12 12
Traceability to specific
slaughterhouse (vs. not
present)
Information on
package 32.0 12% 6 6
Traceability to group or
specific animal (vs. not
present)
Information on
package 29.5 11% 7 9
Traceability to specific
breeder (vs. not present)
Information on
package 32.6 12% 5 4
Verified animal welfare for
livestock production (vs. not
present)
Information on
package 42.1 16% 1 1
Organic production (vs. not
present)
Information on
package 37.0 14% 4 5
Verified Environmental
impact of livestock production
(vs. not present)
Information on
package 25.6 10% 9 8
Verified health impact from
consumption of beef
production (vs. not present)
Information on
package 21.5 8% 10 10
Verified social responsibility
for livestock production (vs.
not present)
Information on
package 27.4 10% 8 7
Information about medication
use (vs. not present)
Information on
package 41.2 16% 3 3
Type of animal feed (vs. not
present)
Information on
package 18.4 7% 11 11
* Online survey in 2012 amongst beef consumers.
**compared to the average of the applied price vector: 262.5 SEK per kg
Source: Lagerkvist et al. (2014)
Paci et al. (2018) examined Italian consumers’ WTP for the inclusion of environmental and health attributes in fresh fish burger products, finding a WTP of up to an additional 0.57 Euro
for the “environment” attribute and 0.37 Euro for the “health” attribute.
Hung and Verbeke (2018) conducted a WTP analysis of the sensory attributes of cooked
sausage and cooked ham in Belgium and the Netherlands respectively. They found that WTP
was positively influenced by a higher overall liking, appearance familiarity and a better colour,
and negatively influenced by a stronger experience of aftertaste and darker colour. Figure A1
shows a pruned regression tree to highlight relative WTP for attributes.

96
Figure A1: Pruned regression tree showing willingness to pay for sensory attributes of
cooked sausage from Belgium (n=208), and cooked ham from the Netherlands (n=107).
Pruned regression trees for predicting the WTP for new cooked sausage in Study 1 (Belgium (BE), n = 208).
Complexity parameter (Cp) = 0.0283; cross-validated error = 0.853.
Pruned regression trees for predicting the WTP for new cooked ham in Study 2 (the Netherlands (NL), n = 107).
Complexity parameter (Cp) = 0.0245; cross-validated error = 0.822.
Source: Hung and Verbeke (2018)
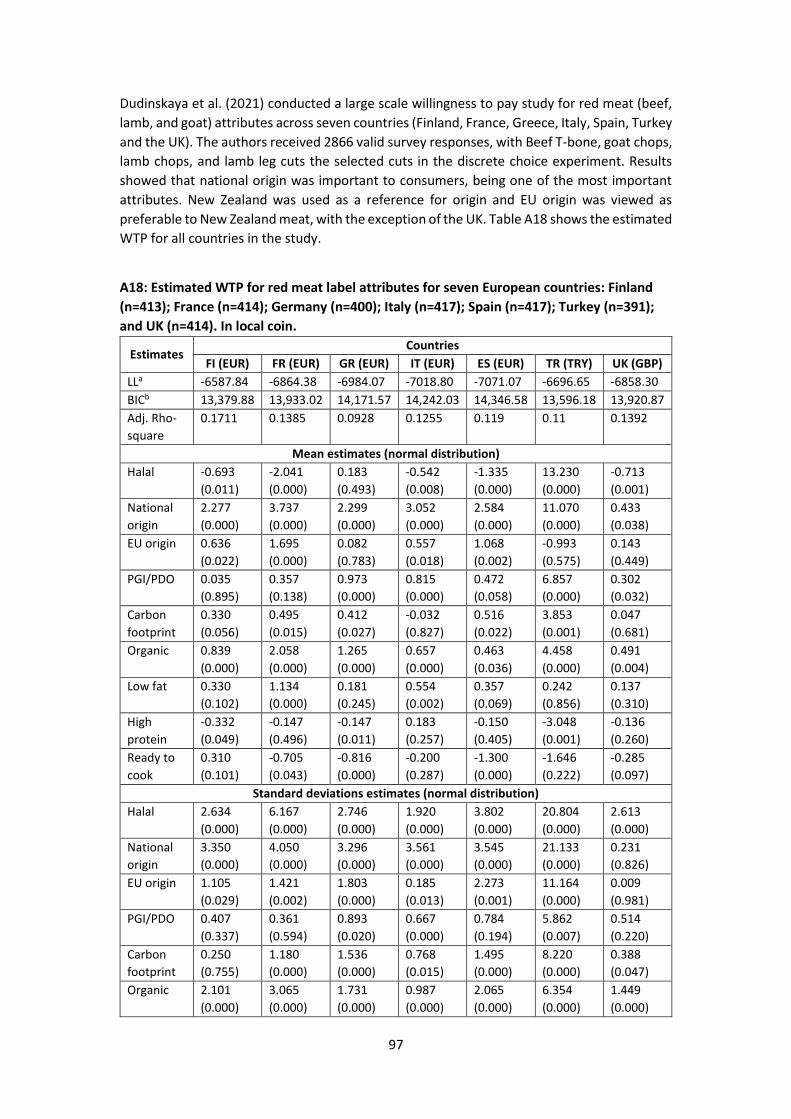
97
Dudinskaya et al. (2021) conducted a large scale willingness to pay study for red meat (beef,
lamb, and goat) attributes across seven countries (Finland, France, Greece, Italy, Spain, Turkey
and the UK). The authors received 2866 valid survey responses, with Beef T-bone, goat chops,
lamb chops, and lamb leg cuts the selected cuts in the discrete choice experiment. Results
showed that national origin was important to consumers, being one of the most important
attributes. New Zealand was used as a reference for origin and EU origin was viewed as
preferable to New Zealand meat, with the exception of the UK. Table A18 shows the estimated
WTP for all countries in the study.
A18: Estimated WTP for red meat label attributes for seven European countries: Finland
(n=413); France (n=414); Germany (n=400); Italy (n=417); Spain (n=417); Turkey (n=391);
and UK (n=414). In local coin.
Estimates Countries
FI (EUR) FR (EUR) GR (EUR) IT (EUR) ES (EUR) TR (TRY) UK (GBP)
LLa -6587.84 -6864.38 -6984.07 -7018.80 -7071.07 -6696.65 -6858.30
BICb 13,379.88 13,933.02 14,171.57 14,242.03 14,346.58 13,596.18 13,920.87
Adj. Rho-
square
0.1711 0.1385 0.0928 0.1255 0.119 0.11 0.1392
Mean estimates (normal distribution)
Halal -0.693
(0.011)
-2.041
(0.000)
0.183
(0.493)
-0.542
(0.008)
-1.335
(0.000)
13.230
(0.000)
-0.713
(0.001)
National
origin
2.277
(0.000)
3.737
(0.000)
2.299
(0.000)
3.052
(0.000)
2.584
(0.000)
11.070
(0.000)
0.433
(0.038)
EU origin 0.636
(0.022)
1.695
(0.000)
0.082
(0.783)
0.557
(0.018)
1.068
(0.002)
-0.993
(0.575)
0.143
(0.449)
PGI/PDO 0.035
(0.895)
0.357
(0.138)
0.973
(0.000)
0.815
(0.000)
0.472
(0.058)
6.857
(0.000)
0.302
(0.032)
Carbon
footprint
0.330
(0.056)
0.495
(0.015)
0.412
(0.027)
-0.032
(0.827)
0.516
(0.022)
3.853
(0.001)
0.047
(0.681)
Organic 0.839
(0.000)
2.058
(0.000)
1.265
(0.000)
0.657
(0.000)
0.463
(0.036)
4.458
(0.000)
0.491
(0.004)
Low fat 0.330
(0.102)
1.134
(0.000)
0.181
(0.245)
0.554
(0.002)
0.357
(0.069)
0.242
(0.856)
0.137
(0.310)
High
protein
-0.332
(0.049)
-0.147
(0.496)
-0.147
(0.011)
0.183
(0.257)
-0.150
(0.405)
-3.048
(0.001)
-0.136
(0.260)
Ready to
cook
0.310
(0.101)
-0.705
(0.043)
-0.816
(0.000)
-0.200
(0.287)
-1.300
(0.000)
-1.646
(0.222)
-0.285
(0.097)
Standard deviations estimates (normal distribution)
Halal 2.634
(0.000)
6.167
(0.000)
2.746
(0.000)
1.920
(0.000)
3.802
(0.000)
20.804
(0.000)
2.613
(0.000)
National
origin
3.350
(0.000)
4.050
(0.000)
3.296
(0.000)
3.561
(0.000)
3.545
(0.000)
21.133
(0.000)
0.231
(0.826)
EU origin 1.105
(0.029)
1.421
(0.002)
1.803
(0.000)
0.185
(0.013)
2.273
(0.001)
11.164
(0.000)
0.009
(0.981)
PGI/PDO 0.407
(0.337)
0.361
(0.594)
0.893
(0.020)
0.667
(0.000)
0.784
(0.194)
5.862
(0.007)
0.514
(0.220)
Carbon
footprint
0.250
(0.755)
1.180
(0.000)
1.536
(0.000)
0.768
(0.015)
1.495
(0.000)
8.220
(0.000)
0.388
(0.047)
Organic 2.101
(0.000)
3.065
(0.000)
1.731
(0.000)
0.987
(0.000)
2.065
(0.000)
6.354
(0.000)
1.449
(0.000)

98
Low fat 1.562
(0.000)
1.322
(0.000)
1.084
(0.000)
1.264
(0.000)
1.363
(0.000)
4.309
(0.084)
1.019
(0.000)
High
protein
0.358
(0.101)
0.914
(0.088)
1.015
(0.019)
-0.083
(0.550)
0.545
(0.074)
0.979
(0.569)
0.194
(0.361)
Ready to
cook
1.846
(0.000)
3.302
(0.000)
1.752
(0.000)
2.004
(0.000)
4.043
(0.000)
3.431
(0.001)
1.879
(0.000)
Numbers in parentheses are robust p-values. a LL: Value of Log Likelihood function b BIC: Bayesian information
criterion.
North American studies
The current review includes seven CE and other WTP studies examining the attributes of meat
and seafood products in the US. Attributes examined in these studies include animal health
and/or welfare, organic, different production methods, traceability, country-of-origin, food
safety, environmental condition and certification, as well as generic attributes including
product quality and appearance.
Li et al. (2016) examined US consumers’ household WTP for a programme aimed at reducing Greenhouse Gas (GHG) emissions associated with beef production. The authors created four
consumer segments based on their willingness to support a programme certifying “carbon-
friendly” beef products – ‘does not support’, ‘supports but will not pay more’, ‘supports and
will pay more’, and ‘willing to pay specific premium for certified beef’. For the latter two
segments combined, results indicated that participants in these segments would be willing to
pay an average US$306 per year to support this programme (equating to 51.6 per cent of their
average annual total beef product spend). Across all segments, including those that would not
support this programme, average annual WTP was valued at US$64 (just over 10 per cent of
all participants’ average annual total beef product spend). Average WTP was also shown to be higher for participants that donated to environmental organisations (Li et al., 2016).
Merritt et al. (2018) undertook a choice experiment to examine US consumers’ WTP for a range of beef product attributes, including quality assurance, region of origin and various
production practices, as well as a combination of these attributes. Specifically, these
attributes were Tennessee Certified Beef, Certified Angus Beef, grass-fed, Master Quality
Raised Beef and no hormones administered. In addition, WTP estimates were carried out for
two types of beef products – USDA Choice boneless ribeye beef steak, and USB Choice ground
beef (85% lean/15% fat). Furthermore, participants undertaking a choice experiment for
either product were evenly distributed into either a control treatment (who were shown no
additional information about the attributes of each product) or an information treatment
(who were shown additional information about the attributes of each product). Estimates of
WTP for each attribute within and between each of the above groups is shown in Table A19
and A20 below. Both tables show a generally higher WTP for all attributes by those in the
Information Treatment segment, with the highest overall WTP for both product types across
both segments to be for a combination of Tennessee Certified Beef (TCB) and grass-fed
attributes (Merritt et al., 2018).
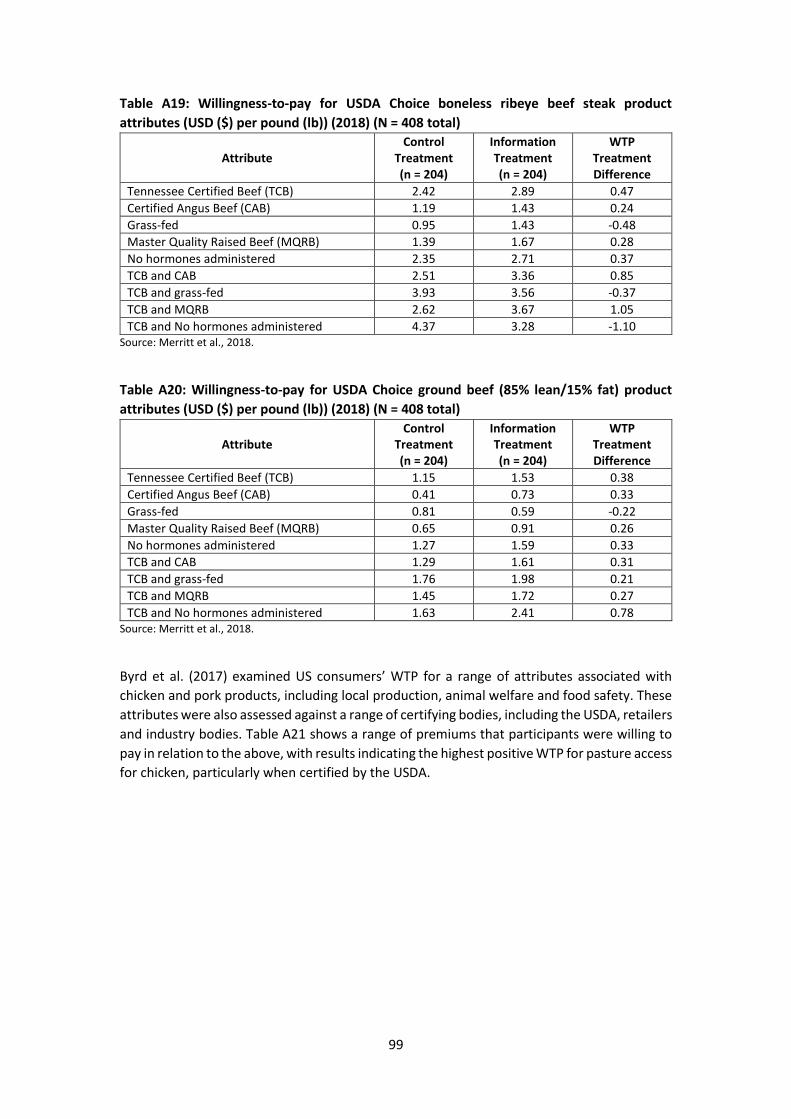
99
Table A19: Willingness-to-pay for USDA Choice boneless ribeye beef steak product
attributes (USD ($) per pound (lb)) (2018) (N = 408 total)
Attribute
Control
Treatment
(n = 204)
Information
Treatment
(n = 204)
WTP
Treatment
Difference
Tennessee Certified Beef (TCB) 2.42 2.89 0.47
Certified Angus Beef (CAB) 1.19 1.43 0.24
Grass-fed 0.95 1.43 -0.48
Master Quality Raised Beef (MQRB) 1.39 1.67 0.28
No hormones administered 2.35 2.71 0.37
TCB and CAB 2.51 3.36 0.85
TCB and grass-fed 3.93 3.56 -0.37
TCB and MQRB 2.62 3.67 1.05
TCB and No hormones administered 4.37 3.28 -1.10 Source: Merritt et al., 2018.
Table A20: Willingness-to-pay for USDA Choice ground beef (85% lean/15% fat) product
attributes (USD ($) per pound (lb)) (2018) (N = 408 total)
Attribute
Control
Treatment
(n = 204)
Information
Treatment
(n = 204)
WTP
Treatment
Difference
Tennessee Certified Beef (TCB) 1.15 1.53 0.38
Certified Angus Beef (CAB) 0.41 0.73 0.33
Grass-fed 0.81 0.59 -0.22
Master Quality Raised Beef (MQRB) 0.65 0.91 0.26
No hormones administered 1.27 1.59 0.33
TCB and CAB 1.29 1.61 0.31
TCB and grass-fed 1.76 1.98 0.21
TCB and MQRB 1.45 1.72 0.27
TCB and No hormones administered 1.63 2.41 0.78 Source: Merritt et al., 2018.
Byrd et al. (2017) examined US consumers’ WTP for a range of attributes associated with chicken and pork products, including local production, animal welfare and food safety. These
attributes were also assessed against a range of certifying bodies, including the USDA, retailers
and industry bodies. Table A21 shows a range of premiums that participants were willing to
pay in relation to the above, with results indicating the highest positive WTP for pasture access
for chicken, particularly when certified by the USDA.

100
Table A21: Willingness-to-pay for chicken and pork products with associated local, animal
welfare and food safety attributes, US (N=825) (US$/lb)
Attribute Verifier Chicken breast Pork chop
WTP % positive WTP WTP % positive WTP
Pasture access
USDA 1.78 91.7
Retailer 1.47 92.7
Industry 1.43 82.3
Individual crate
USDA 1.98 84.0
Retailer 0.27 45.5
Industry 2.34 72.6
Antibiotic use
USDA 1.87 75.0 4.55 85.7
Retailer 1.33 74.3 1.32 61.7
Industry 1.11 61.7 1.17 70.0
Local
USDA 2.06 89.6 1.44 9.4
Retailer 0.49 68.9 1.31 9.9
Industry 0.49 59.7 3.37 3.9 Source: Byrd et al., 2017.
In another pork CE, Ubilava et al. (2011) compared US consumers’ WTP for the certification of
credence attributes for branded and non-branded products. Selected credence attributes
included antibiotic use, animal welfare and environmental friendliness in the production
process where, in a split-sample, some CEs also included a product brand (Hormel, Tyson,
Store brand or no brand). Table A22 reports the WTP results which range from 4 to 28 per
cent (0.2 to 1 $/lb) for certified antibiotic-free, environmentally-friendly and animal welfare
attributes. The study also reported a greater variation in WTP for the non-branded case, which
could be related to an increased uncertainty when no brand information is provided; while it
also appears that the attributes as bundles (i.e. attribute interactions) influenced consumer
preferences.
Table A22: Willingness-to-pay for pork chop attributes, USA (N = 839*: brand CEs n = 642,
non-brand CEs n = 197)
Choices with brands Choices without brands
By brand WTP $/lb Premium
(%)** WTP $/lb
Premium
(%)**
3rd party certified
antibiotic-free production
(vs. no certification)
Hormel 0.78 22%
0.63 18% Tyson 0.35 10%
Store Brand 0.61 18%
No brand 0.98 28%
3rd party certified
environment-friendly
production: water and air
quality (vs. no
certification)
Hormel 0.76 22%
0.24 7% Tyson 0.26 7%
Store Brand 0.15 4%
No brand 0.32 9%
3rd party certified animal
welfare in the production
process (vs. no
certification)
Hormel 0.58 17%
0.42 12% Tyson 0.41 12%
Store Brand 0.18 5%
No brand 0.67 19%
ANTI*ENV Tyson 0.45 13%
0.37 11% Store Brand 0.25 7%
ANTI*WEL Hormel 0.37 11%
0.31 9% Tyson 0.40 12%
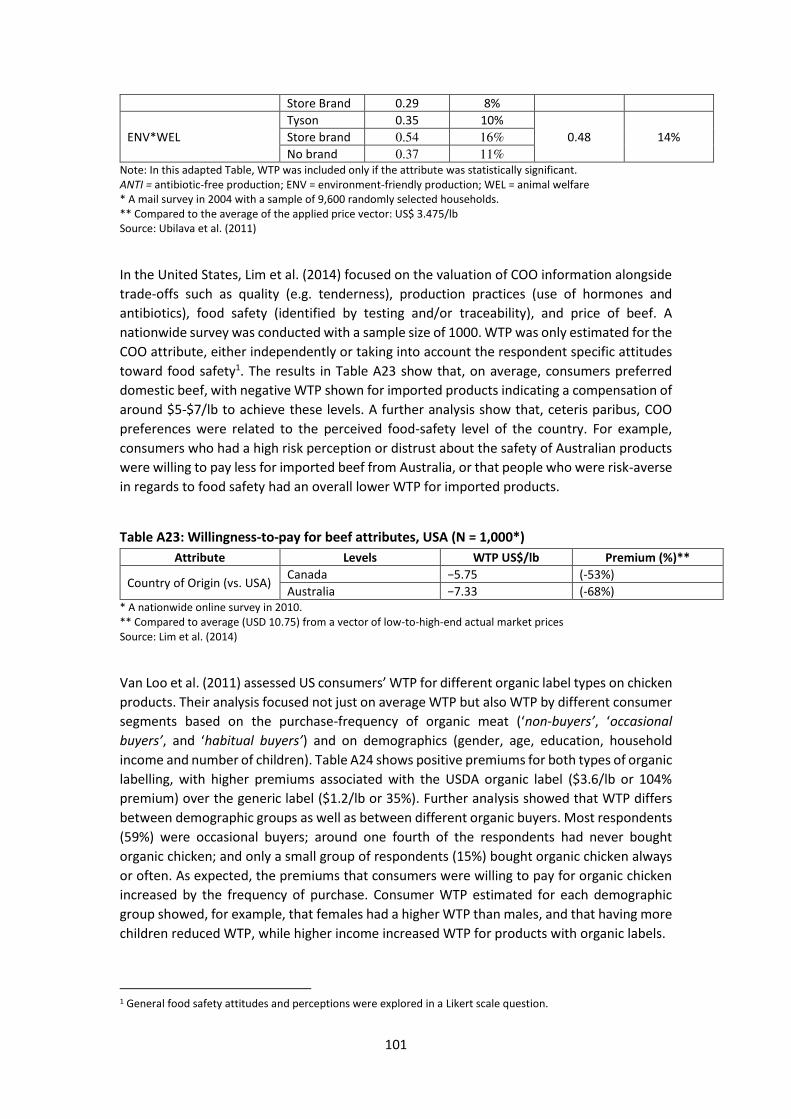
101
Store Brand 0.29 8%
ENV*WEL
Tyson 0.35 10%
0.48 14% Store brand 0.54 16%
No brand 0.37 11%
Note: In this adapted Table, WTP was included only if the attribute was statistically significant.
ANTI = antibiotic-free production; ENV = environment-friendly production; WEL = animal welfare
* A mail survey in 2004 with a sample of 9,600 randomly selected households.
** Compared to the average of the applied price vector: US$ 3.475/lb
Source: Ubilava et al. (2011)
In the United States, Lim et al. (2014) focused on the valuation of COO information alongside
trade-offs such as quality (e.g. tenderness), production practices (use of hormones and
antibiotics), food safety (identified by testing and/or traceability), and price of beef. A
nationwide survey was conducted with a sample size of 1000. WTP was only estimated for the
COO attribute, either independently or taking into account the respondent specific attitudes
toward food safety1. The results in Table A23 show that, on average, consumers preferred
domestic beef, with negative WTP shown for imported products indicating a compensation of
around $5-$7/lb to achieve these levels. A further analysis show that, ceteris paribus, COO
preferences were related to the perceived food-safety level of the country. For example,
consumers who had a high risk perception or distrust about the safety of Australian products
were willing to pay less for imported beef from Australia, or that people who were risk-averse
in regards to food safety had an overall lower WTP for imported products.
Table A23: Willingness-to-pay for beef attributes, USA (N = 1,000*)
Attribute Levels WTP US$/lb Premium (%)**
Country of Origin (vs. USA) Canada −5.75 (-53%)
Australia −7.33 (-68%) * A nationwide online survey in 2010.
** Compared to average (USD 10.75) from a vector of low-to-high-end actual market prices
Source: Lim et al. (2014)
Van Loo et al. (2011) assessed US consumers’ WTP for different organic label types on chicken
products. Their analysis focused not just on average WTP but also WTP by different consumer
segments based on the purchase-frequency of organic meat (‘non-buyers’, ‘occasional
buyers’, and ‘habitual buyers’) and on demographics (gender, age, education, household
income and number of children). Table A24 shows positive premiums for both types of organic
labelling, with higher premiums associated with the USDA organic label ($3.6/lb or 104%
premium) over the generic label ($1.2/lb or 35%). Further analysis showed that WTP differs
between demographic groups as well as between different organic buyers. Most respondents
(59%) were occasional buyers; around one fourth of the respondents had never bought
organic chicken; and only a small group of respondents (15%) bought organic chicken always
or often. As expected, the premiums that consumers were willing to pay for organic chicken
increased by the frequency of purchase. Consumer WTP estimated for each demographic
group showed, for example, that females had a higher WTP than males, and that having more
children reduced WTP, while higher income increased WTP for products with organic labels.
1 General food safety attitudes and perceptions were explored in a Likert scale question.

102
Table A24: Willingness-to-pay for chicken meat attributes, USA (N = 256 non-buyer, N =
571 occasional buyers, N = 149 habitual buyers)
WTP full
sample $/lb
Premium
(%)**
By the type of
buyer
WTP
$/lb
Premium
(%)**
Label (vs.
no label)
USDA organic
label 3.55 (104%)
Non-buyer
Occasional
Habitual
0.90
3.33
8.37
(26%)
(97%)
(244%)
Generic
organic label 1.19 (35%)
Non-buyer
Occasional
Habitual
-1.01
1.22
5.02
(-30%)
(36%)
(147%) *Online survey amongst the members of a consumer database in Arkansas.
** Compared to the average price for boneless chicken breast ($3.424/lb)
Source: Van Loo et al. (2011)
Compared to meat products, consumer preferences towards the credence attributes of
seafood products is relatively unexplored. In United States, Ortega et al. (2014) explored
consumer WTP for imported seafood products for which past food contamination and
adulteration incidents may have impacted on consumer preferences for Chinese tilapia. Two
surveys were conducted (for shrimp and Chinese tilapia products) with 335 respondents each.
The corresponding CEs included a variety of credence attributes: COO (US, China and Thailand)
information was considered only for shrimps and the verification entity (US government,
Chinese Government, US Third Party) was considered only for Chinese tilapia. The estimation
process included attribute interactions between the credence attributes and COO for shrimps,
and between credence attributes and verification entity for Chinese tilapia. The results in
Table A25 show that consumers were willing to pay more for enhanced food safety: $10.65/lb
for domestic shrimp, $3.71/lb shrimp from China, and $4.12/lb shrimp from Thailand. The
respective premiums were 118 per cent, 41 per cent and 46 per cent. A similar relationship
was found for no-antibiotic use and environmentally friendly production, which were both
associated with a higher WTP for the US product by US consumers.
WTP assessments for Chinese Tilapia, as presented in Table A26, show that consumers were,
on average, willing to pay between $4 and $6 per pound (or 89-120 per cent of the base price)
for enhanced food safety when verified by a US entity. Likewise for no-antibiotic use and
environmental friendly production claims, the only statistically significant evidence was
associated with US verification bodies. Overall, the government verification system was
valued slightly higher relative to third-party verification. These results are consistent with the
shrimp CE results wherein US consumers had a higher WTP for domestic over overseas
seafood products and verification systems.

103
Table A25: Willingness-to-pay for seafood (shrimps) attributes, USA (N = 335*)
WTP $/lb Premium (%)**
Food safety (vs. no
claim) Enhanced
US product 10.65 (118%)
Chinese product 3.71 (41%)
Thai product 4.12 (46%)
Antibiotic use (vs.
permitted) Not permitted
US product 9.83 (109%)
Thai product 2.84 (32%)
Production practice
(vs. conventional) Eco-friendly US product 5.40 (60%)
Note: In this adapted Table, WTP was included only if the attribute was statistically significant.
* An online survey in 2011.
** Compared to average of the applied price vector (US$9/lb)
Source: Ortega et al. (2014)
Table A26: Willingness-to-pay for seafood (imported tilapia) attributes, USA (N = 335*)
WTP
$/pound
Premium
(%)**
Food safety (vs.
no claim)
Enhanced US government
verified 6.02 (120%)
US third party verified 4.43 (89%)
Antibiotic use (vs.
permitted)
Not permitted US government
verified 5.39 (108%)
US third party verified 2.75 (55%)
Production
practice (vs.
conventional)
Eco-friendly US government
verified 2.67 (53%)
Note: In this adapted Table, WTP was included only if the attribute was statistically significant.
* An online survey administered by a market research company in 2011.
** Compared to the lowest given price option ($5.00/pound) in the price vector
Source: Ortega et al. (2014)
Asian studies
The current review includes seven CE and other WTP studies examining the attributes of meat
and seafood products in Asia, including the markets of China, Japan, Korea and India.
Attributes examined in these studies include animal health and/or welfare, organic, different
production methods, traceability, country-of-origin, food safety, environmental condition,
certification, water use and GM production, as well as the generic attributes of product quality
and appearance.
In Asia, Wu et al. (2015) explored consumer preferences and WTP for a traceability and
certification information for pork meat. The sample consisted of consumers in seven Chinese
cities that had been designated by the China Ministry of Commerce as pilot cities for a meat
and vegetable traceability system. Each respondent was classified by their level of income and
education, which was used in the WTP analysis. As shown in Table A27, estimated WTP across
the full sample ranged from 2.31 Yuan/kg to 15.80 Yuan/kg (or 19% to 32% premiums) for the
different product attributes. The provision of product traceability information had the highest
WTP (ranging from 42% to 91% premiums of base price) for the full traceability over no
information. Only those consumers with low income/education level were willing to pay for
the minimum level of traceability information. Likewise, regarding quality certification, most
consumers were willing to pay more (ranging from 104% to 149% premiums of base price) for
government certification over no certification. The high profile consumers were the only

104
group that valued third-party certification (over no certification), which is consistent with
findings that higher education and income are related to the WTP for traceability certification
(Zhang et al. 2012). It was also found that product freshness had a significant impact on
respondents’ meat choice preferences.
A separate consumer class-based analysis generated four distinct consumer classes based on
the respondents’ choices, thus further supporting the preference heterogeneity in the sample. These were labelled as ‘certification-preferred’, ‘price-sensitive’, ‘appearance-preferred’ and
‘scared’ consumers, whereby the first class included over half of the respondents. Overall, the
findings presented in Table A28 complement those presented above, including that WTP for
quality certification appears slightly higher than for others, apart from the ‘appearance
preference’ class; and that there are obvious class-specific preferences. The ‘scared’ class was
different to the others in that they preferred the possibility to opt-out in the given
alternatives. Furthermore, for this class, no WTP values are reported here (as the price
attribute was not statistically significant).

105
Table A27: Willingness-to-pay for pork attributes, China (N = 1,489)
Attribute
WTP full
sample
yuan/500g
(premium %**)
WTP by age and income/education level
yuan/500g (premium %**)
High Medium Low
High income
Low education
Traceability
Information
*** (vs.
none)
Full 8.32
(69%)
Age = 35 10.95 7.94 6.70 9.44
(91%) (66%) (56%) (79%)
Age = 45 9.78 6.76 5.53 8.26
(82%) (56%) (46%) (69%)
Age = 60 8.01 5.00 - 6.49
(67%) (42%) - (54)%
Partial 5.72
(48%)
Age = 35 8.13 5.72 5.00 7.96
(68%) (48%) (42%) (66%)
Age = 45 7.96 5.55 4.83 7.78
(66%) (46%) (40%) (65%)
Age = 60 7.71 5.29 4.57 7.43
(64%) (44%) (38%) (62%)
Minimum 2.31
(19%)
Age = 45 - - 2.29 -
(19%) -
Age = 60 - - 2.84 -
(24%)
Quality
Certification
(vs. no
certification)
Government 13.83
(115%)
Age = 35 11.35 14.01 15.16 12.84
(95%) (117%) (126%) (107%)
Age = 45 12.42 15.09 16.23 13.92
(104%) (126%) (135%) (116%)
Age = 60 14.04 16.70 17.85 15.53
(117%) (139%) (149%) (129%)
Domestic
third-party
15.80
(132%)
Age = 35 11.22 10.12 10.33 13.17
(94%) (84%) (86%) (110%)
Age = 45 10.19 9.09 9.30 12.15
(85%) (76%) (78%) (101%)
Age = 60 8.64 7.54 7.75 10.60
(72%) (63%) (65%) (88%)
International
third-party -
Age = 35 12.03 - - -
(100%)
Age = 45 10.86 - - -
(91%)
Age = 60 9.11 - - -
(76%)
Appearance
(vs. Bad-
looking but
edible)
Very fresh-
looking
13.74
(115%)
Fresh-
looking
11.34
(95%)
Passable-
looking -
Note: In this adapted Table, WTP was included only if the attribute was statistically significant.
* In-store intercept interviews, in 2013, in seven cities across different regions of China.
**Compared to the average price of pork hindquarters (12 yuan/500g) as reported in the study
*** Full traceability information covering farming, slaughter and processing, circulation and marketing; Partial
traceability information covering farming, slaughter and processing; Minimum traceability information covering
only farming.
Source: Wu et al. (2015)

106
Table A28: Willingness-to-pay for pork attributes, China (N = 1,489)
Attribute
Class 1* Class 2* Class 3* Class 4*
certification-
preferred price-sensitive
appearance-
preferred
scared
consumers
Class probability 52.7% 12.6% 20.8% 13.9%
WTP Yuan/500g (premium %**)
Traceability
Information
*** (vs.
none)
Full 5.24 (44%) - 3.40 (28%) -
Partial 2.68 (22%) 0.50 (4%) 2.37 (20%) -
Minimum -1.30 (-11%) - - -
Quality
Certification
(vs. no
certification)
Government 8.82 (74%) 0.78 (7%) 3.05 (25%) -
Domestic third-
party 6.28 (52%) - 2.71 (23%) -
International third-
party 4.06 (34%) 0.54 (5%) 3.64 (30%) -
Appearance
(vs. Bad-
looking but
edible)
Very fresh-looking 5.16 (42%) 0.69 (6%) 10.95 (91%) -
Fresh-looking 4.76 (40%) - 9.49 (79%) -
Passable-looking -4.18 (-35%) - -6.21 (-52%)
Note: In this adapted Table, WTP was included only if the attribute was statistically significant.
* In-store intercept interviews, in 2013, in seven cities across different regions of China.
**Compared to the average price of pork hindquarters (12 yuan/500g) as reported in the study
*** Full traceability information covering farming, slaughter and processing, circulation and marketing; Partial
traceability information covering farming, slaughter and processing; Minimum traceability information covering
only farming.
Source: Wu et al. (2015)
Wu et al. (2016) examined Chinese consumers’ WTP for the provision of traceability information in relation to pork products using real choice experiments (RCE) and experimental
auctions (EA). In particular, the authors examined WTP for different types of traceability
information, including farming, slaughter and processing, distribution and marketing, and
government certification information against a base of a pork product without traceability
information. Consistent with previous studies, Table A29 shows that mean WTP was positive
but varied between the two methods used (RCE and EA) and the types of information
provided, with consumers showing higher WTP across both experiments for government
certification information and farming information (Wu et al., 2016).
Table A29: Willingness-to-pay for traceability information in relation to pork, China
(N=108)
Information Type
Mean WTP (Yuan/500g)
(95% confidence interval)
RCE EA
Farming information 4.375 2.405
Slaughter and processing information 1.565 1.215
Distribution and marketing
information 1.071 0.735
Government certification information 4.934 2.785 Source: Wu et al., 2016.
Lai et al. (2018) used a series of choice experiments to determine Chinese consumers’ (Beijing and Shanghai) WTP for a range of attributes of pork products, including environmental, food

107
safety and animal welfare standards, as well as country of origin. Results showed a range of
premiums associated with different attributes, as shown in Table A30 below. This shows
generally higher WTP for all attributes from Shanghai participants, with food safety, Chinese
origin and environmental standards having the highest associated WTP values (Lai et al.,
2018).
Table A30: Willingness-to-pay for pork product certification attributes by Chinese
consumers (Beijing and Shanghai) (2018) (N = 480 total)
Attribute Mean WTP (RMB) – Beijing
(N = 259)
Mean WTP (RMB) – Shanghai
(N = 221)
Food Safety 32.01 32.32
Animal Welfare 7.65 13.11
Environmental Standards 11.81 20.73
Country of Origin: United States 4.31 9.61
Country of Origin: China 13.26 30.11 Source: Lai et al., 2018.
Wang et al. (2018) used a discrete choice experiment to determine urban Chinese consumers’ WTP for pork products with certified attributes. Specifically, this included certified labels for
organic production, green food production, food safety, location of origin, and free from
veterinary drug residues. Choice experiments were carried out in two Chinese provinces
(Jiangsu and Anhui) with results reported for each – these are shown in Table A31 below. This
shows a greater WTP for all attributes by Jiangsu consumers, with generally higher WTP for
organic food, followed by green food and free from veterinary drug residues across both
provinces.
Table A31: Willingness-to-pay for pork certification attributes, Jiangsu and Anhui provinces,
China (2018) (Yuan/550g)
Attribute Jiangsu
(N = 475)
Anhui
(N = 369)
Safe Food 8.10 7.21
Green Food 20.22 17.63
Organic Food 26.78 18.94
Location of Origin shown 12.77 10.99
Free from veterinary drug residues 23.18 15.40 Source: Wang et al., 2018.
Ortega et al. (2015) explored consumer preferences and WTP for chicken, pork and egg
product attributes across various retail channels in China. Retail channel types included wet
markets, domestic supermarkets, and international supermarkets, wherein the products may
vary in terms of food safety and other attributes such as animal welfare, organic, “green” foods and price. Three hundred consumers were interviewed for each food product (pork,
chicken and eggs) with an equal number of participants from each retail channel. Results
presented in Table A32 show that while consumer WTP for food safety was mostly similar
across the different retail channels, with premiums from 165 per cent to 267 per cent
compared to the base price, these varied across product types. “Green food” certification was valued higher (up to 20 RMB/product or 195% premium) than organic certification across all
products and retailers. Some differences across retail types can be observed for the WTP for

108
the animal welfare attribute as this was significant only for pork and chicken products and not
for wet markets.
Table A32: Willingness-to-pay for chicken, pork and eggs attributes, China (N=
300/product*)
Pork Chicken Eggs
WTP RMB/product Premium (%)**
Enhanced food
safety claim (vs.
no claim)
Wet market 27.73 (213%) 19.94 (199%) 9.93 (199%)
Domestic supermarket 23.68 (182%) 26.69 (267%) 9.58 (192%)
International supermarket 25.50 (196%) 21.45 (215%) 8.23 (165%)
Animal welfare
claim (vs. no
claim)
Wet market - - - - - -
Domestic supermarket 7.36 (57%) - - - -
International supermarket - - - - 2.28 (46%)
Organic
certification (vs.
no claim)
Wet market - - - - 3.28 (66%)
Domestic supermarket 11.48 (88%) 15.44 (154%) 5.37 (107%)
International supermarket 12.11 (93%) - - 3.89 (78%)
Green food
claim (vs. no
claim)
Wet market - - 5.07 (191%)
Domestic supermarket 11.79 (91%) 19.69 (197%) 6.76 (135%)
International supermarket 19.29 (148%) 16.27 (163%) 6.63 (133%) Note: In this adapted Table, WTP was included only if the attribute was statistically significant.
* In-store (at the point of purchase) interviews in Beijing, 2013.
**Compared to average of the applied price vector (pork: RMB 13/jin, chicken: 10 RMB 10/jin and eggs:, and
RMB 5/jin
Source: Ortega et al. (2015)
Chung et al. (2012) focused on heterogeneity in WTP for beef attributes. Countries-of-origin
of interest included Korea (i.e. domestic), USA and other exporting countries (e.g. New
Zealand). They conducted 1,000 interviews amongst Korean consumers, with heterogeneity
of preferences and WTP explored using a consumer segment-based approach. As Table A33
shows, the analysis resulted in three consumer segments based on the respondent’s choices regarding concerns in relation to GM-beef and the use of antibiotics in production. These
segments were labelled as ‘very concerned’ (59% of the sample), ‘moderately concerned’ (32%) and the smallest group of ‘not too concerned’ (9%). Thus, over half of the sample were
very concerned about the use of GM and antibiotics with WTP around $4.4/lb (20 per cent
premium), and about product’s origin with WTP around -$8/lb (37 per cent premium) for
imported meat. This ‘very concerned’ segment held generally higher WTP values than other
segments, and generally these were higher than the weighted averages. Overall, these results
suggest that there exists major heterogeneity in Korean (Seoul) consumer preferences
towards meat choices, in particular, regarding the use of GM ingredients and antibiotics in
production.

109
Table A33: Willingness-to-pay for beef attributes, Korea (N = 1,000*)
Very
Concerned
Moderately
Concerned
Not too
Concerned
Class probability 59% 32% 9%
WTP $/lb
Premium (%)**
Weighted
Average WTP
US$/lb
Premium (%)**
Marbling Grade
(vs. C)
Extra premium 3.01 1.58 0.88 2.35
(13%) (7%) (4%) (7%)
Premium 2.13 1.05 0.93 1.67
(9%) (5%) (4%) (7%)
Marbling Grade
(vs. not A) A
2.04 0.91 0.62 1.55
(9%) (4%) (3%) (7%)
Marbling Grade
(vs. not B) B
0.92 0.39 - 0.66
(4%) (2%) (3%)
Freshness (vs.
low)
High 2.94 1.69 1.14 2.37
(13%) (8%) (5%) (11%)
Medium 1.09 0.76 0.56 0.93
(5%) (3%) (2%) (4%)
Chilled versus
frozen (vs. yes)
No - freshly
chilled
0.63 0.53 0.24 0.56
(3%) (2%) (1%) (2%)
Free of
antibiotics (vs.
no)
Yes
4.39 1.06 0.81 3.00
(20%) (5%) (4%) (13%)
Free of GM-
feed ingredients
(vs. no)
Yes
4.35 0.95 0.59 2.92
(19%) (4%) (3%) (13%)
Country-of-
origin (vs.
Korea)
United States -8.38 -3.74 -2.85 -6.39
(-37%) (-17%) (-13%) (-28%)
Other exporting
countries
-7.25 -3.47 -2.19 -5.57
(-32%) (-15%) (-10%) (-25%) Note: In this adapted Table, WTP was included only if the attribute was statistically significant.
* In-store intercept interviews in Seoul, 2007.
**Compared to the average of the applied price vector: US$ 22.50/lb
Source: Chung et al. (2012)
Uchida et al. (2014) examined Japanese consumer preferences for salmon, taking into account
two-way interactions motivated by consumer valuations of different product attributes in
relation to ecolabel characteristics. The study included a split-sample CE across three types of
information effects regarding fisheries (specifically overfishing and the decline of fish-stock):
(1) minimal information without the source of the claim; (2) Food and Agriculture Organization
(FAO) based information with charts and graphics; and (3) scientific information accompanied
by a diagram. Hence, instead of using a conventional approach of “no information” vs. “some information”, the authors applied minimum information as the baseline. Likert-scales were
used to understand general attitudes, information credibility, and the respondents’ level of
interest. A nationwide survey included in total 3,370 responses. As shown in Table A34,
Japanese consumers were willing to pay a 27 per cent premium (90 yen/package) for the
domestic fish compared to imported fish, with a similar premium found for the ecolabel.
Considering these attributes together, the WTP was 149 yen/package which is slightly less
than sum of the independent WTP values (90 + 89 = 179). Overall, the interaction effects
revealed that the value of eco-labels increased value for the wild product, in particular for the

110
domestic product. The findings from the information effect testing revealed that compared to
baseline, added information increased the value of the eco-label, although marginally, when
the FAO or science based information were considered credible and interesting.
Table A34: Willingness-to-pay for salmon attributes, Japan (N = 3,370*: “minimal information” n = 1,122, “FAO information”, n = 1,118, and “Science information” n = 1,130)
Premium (%)**
Product origin (vs. Chile)
Hokkaido (domestic) (26%)
Alaska (8%)
Norway (7%)
Production (vs. farmed) Wild (10%)
Ecolabel (vs. no label) Labeled (26%)
Country of origin
x
Wild***
Ecolabel x Hokkaido (44%)
Ecolabel x Alaska (27%)
Ecolabel x Norway (28%)
Ecolabel x Wild (37%)
Hokkaido x Wild (52%)
Alaska x Wild (36%)
Norway x Wild (37%)
Information treatments x
Perceptions***
Ecolabel x FAO 22%
Ecolabel x Science 20%
Ecolabel x FAO x Credible 30%
Ecolabel x Science x Credible 28%
Ecolabel x FAO x Interesting 29%
Ecolabel x science x Interesting 27%
Ecolabel x FAO x Interesting 36%
Ecolabel x Science x Interesting 34% * A nationwide online survey in 2009.
**Reported in the study
***Base levels: Country of origin and wild: ‘‘Chilean farmed salmon with no ecolabel”; and Treatments and perceptions: ‘‘Minimal information perceived neither credible nor interesting’’ Source: Uchida et al. (2014)
Other regions
The current review includes four CE and other WTP studies examining the attributes of meat
and seafood products in other regions, including Australia, Peru and Lebanon. Attributes
examined in these studies include animal welfare, local foods, production quality and
certification.
Mugera et al. (2017) examined Australian consumers’ WTP for chicken and yogurt products based on their preferences for a range of attributes, including local production, free range,
product quality and the size of the producer. This was based on whether a product carried a
local food label, was certified free range, or contained other information relating to the
attributes listed. The authors examined WTP for a combination of the above attributes, as
shown in Table A35. This also shows a range of additional premiums for each of the product
types and attributes based on a range of demographic variables, including gender and type of
area.

111
Table A35: Willingness-to-pay for chicken and yoghurt products based on local production,
free range, size of producer (relative to medium) and demographic variables, Australia
(N=333)
Attribute 1 Attribute 2 Demographic
variable 1
Demographic
variable 2
WTP for product type
($AUD)
Skinless
chicken
breast
Fruit yoghurt
Local Australian
firm 5.15
Overseas firm 3.67
City 6.16
Country 8.32
Not local Australian
firm 3.84
Overseas firm 2.36
City 3.74
Country 5.91
Free range City Female 5.86
Male 3.77
Country Female 4.27
Male 2.17
Small
producer 1.55 2.64
Large
producer -1.84 -2.8
Source: Mugera et al., 2017.
Chalak and Abiad (2012) studied Lebanese consumers’ preferences and purchasing behaviour in context of shawarma sandwiches2, a Lebanese fast food, which is considered to contain a
high potential for food safety risk. The study attributes included food safety certification
(International Organization for Standardization [ISO] and “ServSafe” food handling program),
and contextual factors such as location, serving size and price. The sample included 284
respondents, wherein the information-effect was tested in a split-sampling approach by
providing half of the sample with additional descriptions of each type of safety certification.
WTP results, as summarised in Table A36, suggest that, overall, consumers appreciated the
convenience in buying sandwich from “around the corner”, and that they also preferred to pay extra 46 per cent for larger sandwich size (around US$1.12 (LBP 1,677)). The information
effect was apparent in this study, as this increased the average WTP for food safety
certification from a 282 to 314 per cent premium to a 320-431 per cent premium compared
with the average price of a small sandwich. WTP for certification was highest for the ISO 22000
type.
2 “Shawarma is a Middle Eastern beef, lamb or chicken-based fast food” (Chalak and Abiad 2012 p. 82).

112
Table A36: Willingness-to-pay for sandwich attributes, Lebanon (N = 284*: informed n =
145, uninformed n = 139)
Levels
WTP
LBP/sandwich
Premium
(%)**
Location/
Convenience (vs.
Round the corner <
5 min walk)
Within walking distance
(5+ min walk) -445 (-12%)
Need to go there by car -4,181 (-115%)
Delivery order -1,009 (-28%)
Certification (vs.
none)
ISO 9001 Uninformed 10,278 (282%)
Informed 11,667 (320%)
ISO 22000 Uninformed 11,466 (314%)
Informed 15,719 (431%)
ServSafe Uninformed 1 0,372 (284%)
Informed 14,366 (394%)
Portion size (vs.
Typical small-sized
sandwich)
Medium-sized sandwich 1,677 (46%)
LBP = Lebanese pounds; US$1 = LBP1,515
* The survey was conducted in Beirut, 2011, excluding participants who had never purchased shawarma
sandwiches.
** Compared to an average of LBP3,650 (USD2.41) for a small-sized shawarma sandwich
Source: Chalak and Abiad (2012)
Morales and Higuchi (2018) investigated how consumer beliefs about health and nutrition
affect the WTP more for fish than beef, chicken, and pork in Modern Metropolitan Lima, Peru. Factors explored were all in relation to fish, exploring knowledge, health and nutrition,
familiarity, taste preference, negative effects, and price. Based upon this it was found that
higher household income increases premiums for beef and chicken, while larger household
sizes had the opposite effect. In addition, those who were older were less likely to be willing
to pay a premium for fish. Taste preference was a significant driver for an increase in WTP for
fish versus chicken and pork, while perceptions of health and nutrition for the family increased
the WTP for fish compared to beef and chicken. A summary of the WTP extra is shown in Table
A37.

113
Table A37: Willingness to pay for fish versus other meat in Peru (N=444) Model I:
Fish vs.
beef
Model II:
Fish vs.
chicken
Model III:
fish vs.
pork
Coef. FC/OR Coef. FC/OR Coef. FC/OR
Constant 1.625*** 5.078*** 1.628*** 5.094*** 2.200*** 9.025***
Socio-demographic characteristics
Gender 0.055 1.057 0.106 1.111 0.018 1.018
Age 0.002 1.002 0.004 1.005 0.000 1.000
Years of education 0.017 1.017 0.028* 1.028* 0.005 1.005
Have children 0.056 1.057 -0.090 0.914 0.133 1.142
Household size -0.036 0.964 -0.063* 0.939* -0.099*** 0.906***
Household income (in
hundred PEN)
0.005*** 1.005*** 0.005* 1.005*** 0.003 1.003
Belief factors
BF1: Knowledge of fish 0.019 1.019 0.056 1.057 0.043 1.044
BF2: Health and nutrition of
eating fish
0.082* 1.086* 0.103** 1.109** 0.026 1.026
BF3: Familiarity with fish 0.030 1.030 -0.010 0.990 0.053 1.054
BF4: Taste preference of
fish
0.032 1.032 0.086** 1.090** 0.174*** 1.190***
BF5: Negative affects of fish 0.001 1.001 0.003 1.003 0.030 1.031
BF6: Price of fish -0.036 0.964 -0.036 0.965 -0.020 0.980
Over dispersion coefficient -1.078*** -0.962*** -1.154***
Mean willingness to pay
extra (PEN)
7.214 8.777 5.732
Total observations 444 444 444
PEN = Sol. The currency of Peru; USD 1 = PEN 4.06
FC/OR is factor change in the expected premium/odds ratio of being an always-zero respondent versus being a
non-always-zero respondent for the negative binomial and logistic components, respectively. *, **, and ***
indicate the coefficient is statistically significant at 10%, 5% and 1% level, respectively.
Source: Morales and Higuchi (2018)
Hastie, Ashman, Torrico, Ha and Warner (2020) compared perceptions towards sheepmeat
and beef in Australia. The authors used a mixed methods approach combining perceptual
mapping and sensory methodologies. Whilst not the CE method, the research offers an
interesting comparison of dry-aged and wet-aged meat, as well as different animal species
within a WTP framework. In terms of sensory perceptions, the authors asked consumers about
tenderness, overall liking, flavour, juiciness, odour liking, quality, healthiness, and
premiumness. Concentrating on quality, the authors combined WTP and likelihood to
purchase for dry-aged and wet-aged meat, as shown below in Table A38. Wet-aged beef was
most likely to be rated as “better than everyday quality”, while the dry-aged beef was most
likely to be rated as “good everyday quality”. This pattern was also seen in sheepmeat consumption. On average, consumers were willing to pay up to 50–60 AUD per kg for premium
quality beef, and 30–40 AUD per kg for premium quality sheepmeat, with prices decreasing
with quality grade.

114
Table A38: Willingness to pay and Likelihood to Purchase based on quality and price,
Australia (n=75)
Meat
Species Quality Grade
Relative frequency of
quality grade selection
(%)
Median price
category
(AUD Per kg)
Average
likelihood of
purchasing
(%) Dry-aged Wet-aged
Sheep
Unsatisfactory 0 3 0-10 16
Good everyday quality 47 22 20-30 53
Better than everyday quality 33 56 30-40 53
Premium quality 19 19 30-40 58
Beef
Unsatisfactory 3 8 10-20 32
Good everyday quality 42 21 20-30 58
Better than everyday quality 25 44 30-40 66
Premium quality 31 28 50-60 67 Source: Hastie et al (2020)
Cross-regional studies
Tait et al. (2016) conducted a cross-country analysis between developed and developing
economies (UK vs. China and India). The authors explored preferences across certified
environmental attributes (GHG, biodiversity, and water quality), animal welfare, food safety,
country-of-origin (COO) label and price in relation to lamb products. A generic framing on the
product, including a percentage price increase, was used to make the cross-country
comparison more straightforward. Results reported in Table A39 show that food safety,
followed by animal welfare, appeared to be the most valued attributes with WTP values of
between 9% and 49% more for a certified product. Another similarity across the countries was
that of different environmental attributes, the GHG certification was valued most, although
not by much. Key differences included that while UK consumers preferred domestic products,
consumers in developing markets were not likely to choose the domestic product or pay for
it. Another difference was that the Indian respondents had higher WTP for environmental
attributes compared with UK and Chinese consumers. Overall, this study shows there can be
cross-country differences when looking into food attribute preferences but also that
similarities might exist, for example, in terms of which attributes are valued the highest.
Table A39: Willingness-to-pay for lamb attributes, China, India, UK (N = 2,067*: China n =
686, India n = 695 and UK n = 686)
WTP (in %)**
China India UK
Food safety (vs. not certified) Certified 34% 49% 15%
Farm animal welfare (vs. not certified) Certified 9% 29% 18%
Water management (vs. not certified) Certified 7% 21% 6%
Greenhouse Gas (GHG) minimisation (vs. not
certified) Certified 8% 28% 6%
Biodiversity enhancement (vs. not certified) Certified 5% 26% 4%
Country of origin (vs. no label) Domestic -27% - 5%
Foreign - 13% -5% Note: In this adapted Table, WTP was included only if the attribute was statistically significant.
* Online survey in in 2012 with regular grocery shoppers who had purchased lamb at least once recently (last
month). ** Reported in the study
Source: Tait et al. (2016)
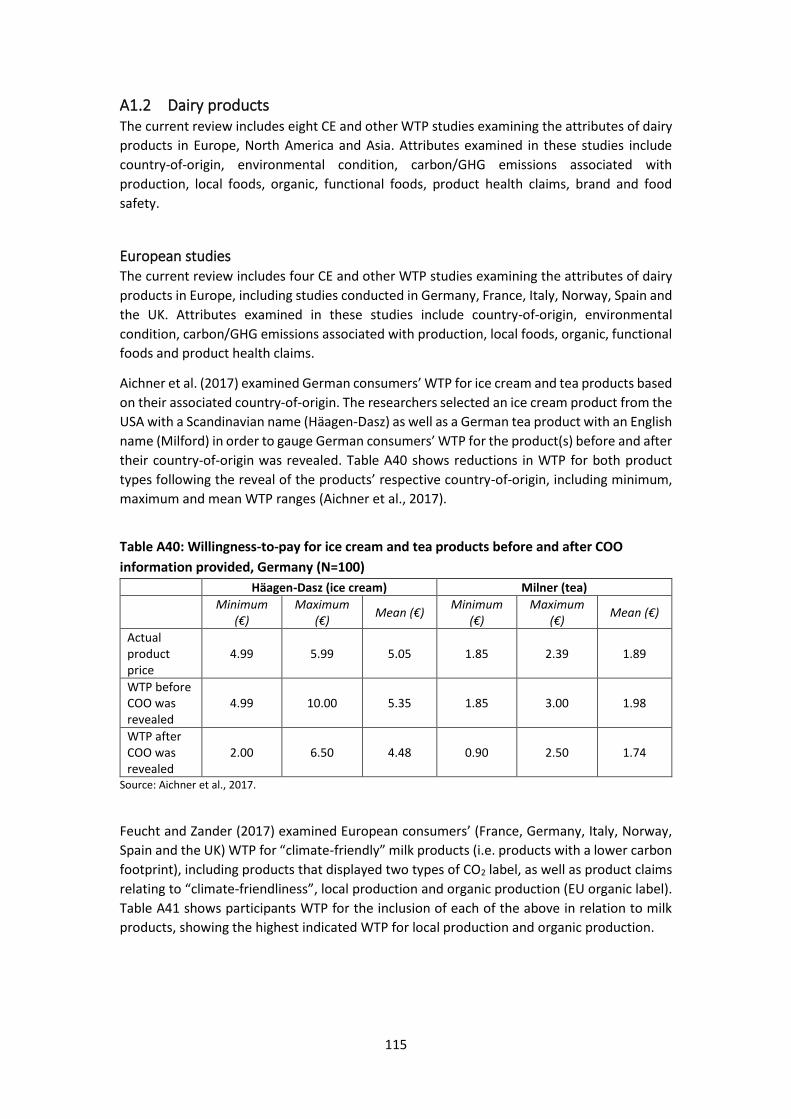
115
A1.2 Dairy products
The current review includes eight CE and other WTP studies examining the attributes of dairy
products in Europe, North America and Asia. Attributes examined in these studies include
country-of-origin, environmental condition, carbon/GHG emissions associated with
production, local foods, organic, functional foods, product health claims, brand and food
safety.
European studies
The current review includes four CE and other WTP studies examining the attributes of dairy
products in Europe, including studies conducted in Germany, France, Italy, Norway, Spain and
the UK. Attributes examined in these studies include country-of-origin, environmental
condition, carbon/GHG emissions associated with production, local foods, organic, functional
foods and product health claims.
Aichner et al. (2017) examined German consumers’ WTP for ice cream and tea products based on their associated country-of-origin. The researchers selected an ice cream product from the
USA with a Scandinavian name (Häagen-Dasz) as well as a German tea product with an English
name (Milford) in order to gauge German consumers’ WTP for the product(s) before and after their country-of-origin was revealed. Table A40 shows reductions in WTP for both product
types following the reveal of the products’ respective country-of-origin, including minimum,
maximum and mean WTP ranges (Aichner et al., 2017).
Table A40: Willingness-to-pay for ice cream and tea products before and after COO
information provided, Germany (N=100)
Häagen-Dasz (ice cream) Milner (tea)
Minimum
(€) Maximum
(€) Mean (€) Minimum
(€) Maximum
(€) Mean (€)
Actual
product
price
4.99 5.99 5.05 1.85 2.39 1.89
WTP before
COO was
revealed
4.99 10.00 5.35 1.85 3.00 1.98
WTP after
COO was
revealed
2.00 6.50 4.48 0.90 2.50 1.74
Source: Aichner et al., 2017.
Feucht and Zander (2017) examined European consumers’ (France, Germany, Italy, Norway, Spain and the UK) WTP for “climate-friendly” milk products (i.e. products with a lower carbon
footprint), including products that displayed two types of CO2 label, as well as product claims
relating to “climate-friendliness”, local production and organic production (EU organic label).
Table A41 shows participants WTP for the inclusion of each of the above in relation to milk
products, showing the highest indicated WTP for local production and organic production.

116
Table A41: Willingness-to-pay for milk products, environmental attributes, European
countries (Euro per 1-litre UHT milk product)
France
(N=1,000)
Germany
(N=1,001)
Italy
(N=1,003)
Norway
(N=1,001)
Spain
(N=1,002)
UK
(N=1,000)
CO2 Label 1 0.11 0.13 0.24 0.14 0.14 0.10
CO2 Label 2 0.03 0.03 0.09 0.00 0.11 0.06
“Climate friendly”
0.06 0.05 0.14 0.09 0.15 0.04
Local 0.19 0.20 0.27 0.27 0.15 0.15
Organic 0.12 0.10 0.23 0.14 0.16 0.09 Source: Feucht and Zander, 2017.
In Germany, Bechtold and Abdulai (2014) estimated consumer WTP for functional dairy
products (yoghurt and cream cheese) by linking the choice data with demographics and
general attitudes information. The choice alternatives were described as bundles of functional
ingredients, health claims and product prices. The data included 1,309 responses where each
respondent answering a CE for both yoghurt and cheese products. The data was analysed
using the consumer segment based approach with the class determinants including the
socioeconomic and attitudinal variables, the latter generated from principal component
analysis (PCA). The results in Tables A42 and A43 show evidence for the class-specific
preference heterogeneity when taking into account respondent attitudes, where the Class 2
was found with the most amount of statistically significant attitude and respondent-type
associated determinants in relation to the reference group. For example, it was confirmed
that “functional food skeptics” preferred non-functional dairy products, and vice versa by the
“functional food advocates”. Furthermore, the majority of consumers valued dairy products with functional ingredients, such as omega-3, highly. These WTP varied from €0.13 to €0.31/serving of yoghurt and €0.35/serving of cream cheese, or premiums of between 10 and
23 per cent.

117
Table A42: Willingness-to-pay for yoghurt attributes, Germany (N = 1,309*)
Class 1***
Functional food
sceptics
Class 2***
Functional food
advocates
Class 3***
Functional food
neutrals
(reference group)
Class probability (21.5%) (40.5%) (38%)
WTP €/200g
Premium (%)**
Functional Food
ingredient
Omega-3 fatty acids 0.31 0.24 0.13
(24%) (19%) (10%)
Oligosaccharides - 0.10 0.11
(8%) (9%)
Bioactive - -0.10 -0.11
(-8%) (-9%)
Polyphenols
Non-functional
alternative
0.47 -1.77 -
(36%) (-137%)
Health claim
Healthy blood vessels. - -0.41 -0.13
(-32%) (-10%)
Healthy blood vessels and
metabolism
- 0.23 -0.08
(18%) (-6%)
One property depending on
the ingredient
- -0.18 0.11
(-14%) (9%)
Two properties depending
on the ingredient - - -
Note: In this adapted Table, WTP was included only if the attribute was statistically significant.
* Nationwide mail survey, 2010-2011.
**Compared to the base price for conventional non-functional food as provided in the study: €1.29/500g
***Class determinants: Class 1 Reward from using Functional Foods (FF), Safety of FF, General health interest,
Natural product interest, Hysteria; Class 2 Age, Education, Reward from using FF, General health interest, Natural
product interest, Hysteria, Necessity for FF, Specific health interest
Source: Bechtold and Abdulai (2014)

118
Table A43: Willingness-to-pay for cream cheese attributes, Germany (N = 1,309*)
Class 1***
Functional food
sceptics
Class 2***
Functional food
advocates
Class 3***
Functional food
neutrals
(reference group)
Class probability (24.8%) (33.9%) (41.3%)
WTP €/200g
Premium (%)**
Functional Food
ingredient
Omega-3 fatty acids 0.35 0.35 -
(23%) (23%)
Oligosaccharides - 0.05 -
(3%)
Bioactive - -0.18 -
(-12%)
Polyphenols
Non-functional
alternative
0.97 -1.86 -0.02
(65%) (-125%) (-1%)
Health claim
Healthy blood vessels. - -0.38 -
(-26%)
Healthy blood vessels and
metabolism
- 0.24 -
(16%)
One property depending on
the ingredient
- -0.24 -
(-16%)
Two properties depending
on the ingredient
Note: In this adapted Table, WTP was included only if the attribute was statistically significant.
* Nationwide mail survey, 2010-2011.
**Compared to the base price for conventional non-functional food as provided in the study: €1.49/200g
***Class determinants: Class 1 Children aged < 12, General health interest, Natural product interest, Hysteria,
Necessity for Functional Food (FF), Confidence in FF, Safety of FF; Class 2 Gender, Children < 12years, Reward
from using FF, General health interest, Natural product interest, Hysteria, Necessity for FF, Specific health
interest, Confidence in FF
Source: Bechtold and Abdulai (2014)
Yormirzoev et al (2021) investigated whether milk certification makes a difference to consumers by examining WTP for organic versus all-natural milk in Russia. 608 consumers
were surveyed about the variables of frequency of consumption, awareness of organic
farming, belief of Russian certification adherence, belief of Western certification adherence,
food safety versus money saving, and risk attitudes. The authors found that 51 per cent of
respondents had a positive WTP for organic versus conventional milk. The major factors in this
being perceived health and environmental benefits. However, there was no statistical
difference between all-natural and organic milk – highlighting a lack of awareness of the two
products with them being used interchangeably.
North American studies
Zou and Hobbs (2010) explored consumers’ functional food choices and a labelling effect in a
context of Omega-3 enriched milk in Canada. The different health claims included heart
health, generic health claims and more specific risk reduction claims (RRC) and disease
prevention claims (DPC). The authors separated these claims from the visual cues (a red heart
symbol included in a choice set) and labelled them as full and partial functional food
attributes, respectively. The CE also considered certification and product price. The data

119
analysis used two approaches, the standard model (Table A44) and the segmented-based
approach (Table A45). These initial results suggest that consumers respond positively to
health claim labels, as well as the verification entities for these claims. Consumers were willing
to pay, on average, between $0.12 and $0.51 for different health claims (or 6% to 26% more
of the conventional milk price), being highest for the RRC. They were also willing to pay, on
average, around 12 per cent more for verification (vs. none) with little difference on WTP
across the type of verification entity. The study also found some sociodemographic influences,
such as income, increased WTP for the Omega-3 attribute.
The second analysis confirmed these preferences were consumer group-specific (Table A45).
Overall, the full health claims seemed to have a higher absolute WTP (over no claim) when
compared to the WTP value of the visual claim (over none), apart from the “health claim
challengers” group, who were minority of the sample (7%). Looking specifically at the functional ingredient attribute, people were willing to pay, on average, $0.20/litre premium
for Omega-3 enriched milk over regular milk, and this WTP was even higher for people with
higher income and those with positive attitudes toward functional food in general.
Table A44: Willingness-to-pay for milk attributes, Canada (N = 740*)
WTP $/2 Litres Premium (%)**
Omega-3 (vs. regular
milk) Contains Omega-3 0.20 (10%)
Health Claims (full
labelling) (vs. none)
Function Claim: “Good for your heart health“
0.19 (10%)
RRC: “Reduces the risk of heart disease and cancer“
0.51 (26%)
DPC: “Helps to prevent Coronary Heart Disease and Cancer“
0.33 (17%)
Symbol (partial labelling)
(vs. none) Heart Symbol 0.12 (6%)
Verification
Organization (vs. none)
Government 0.24 12%
Third party 0.23 12%
* Online survey conducted in 2009.
** Compared to the lowest price in the given price vector: $1.99/2 litres of conventional milk.
Source: Zou and Hobbs (2010)

120
Table A45: Willingness-to-pay for milk attributes: The latent class approach, Germany (N =
740*)
Note: In this adapted Table, WTP was included only if the attribute was statistically significant.
* Online survey in 2009.
** Compared to the lowest price in the given price vector: $1.99/2 litres of conventional milk.
*** Heart disease: “respondent self-reports having heart disease”; Factor 1 “positive attitudes toward and
experience consuming functional food”; Factor 2 “more awareness of health and healthy diet behaviours”; Factor 3 “higher levels of trust in health claims and nutrition labels” (Zou and Hobbs 2010 p. 10 Table 2). Source: Zou and Hobbs (2010)
WTP $/2 Litres
Premium (%)**
Conventional
milk
consumers
Functional
food
believers
Functional
milk lovers
Health claim
challengers
Class
probabilities 48.9% 21.7% 22.1% 7.3%
Omega-3 (vs.
regular milk)
Contains Omega-3 - 0.25 1.64 0.29
(13%) (82%) (15%)
Omega3 x Factor1 0.11 4.84 0.48 0.74
(6%) (243%) (24%) (37%)
Omega3 x Factor2 - -0.25 - -0.23
(-13%) (-12%)
Omega3 x Income 1.39 3.85 8.94 -4.37
(70%) (193%) (449%) (-220%)
Omega3 x Gender 0.12 3.09 0.96 0.96
(6%) (155%) (48%) (48%)
Health Claims
(full labelling)
(vs. none)
Function Claim - 0.16 0.49 -
(8%) (25%)
RRC - 0.37 1.83 -
(19%) (92%)
RRC x Factor1 - -0.14 0.36 0.26
(-7%) (18%) (13%)
RRC x Factor3 - - 0.36 -
(18%)
RRC x Heart disease
- - -0.58 -
(-29%)
RRC x Education - - -0.29 -
(-15%)
DPC - 0.46 1.74 -
(23%) (87%)
Symbol (partial
labelling) (vs.
none)
Heart Symbol
- - 0.31 0.27
Verification
Organization
(vs. none)
Government - 0.17 0.98 0.37
(9%) (49%) (19%)
Government x
Factor3
- 0.09 0.25 0.33
(5%) (13%) (17%)
Third party - 0.33 0.70 -
(17%) (35%)

121
Grashuis and Magnier (2018) used two choice experiments to assess US consumers’ WTP for a range of attributes associated with cheese and cereal products. Specifically, this included
type of company ownership (cooperative, firm), product origin (local, Wisconsin/Iowa), and
family ownership status. The researchers assessed consumers’ WTP using three models for each choice experiment, rendering different sets of results for each (i.e. Model 1 includes the
main attributes, Model 2 includes more detailed analysis of ownership type in combination
with origin, and Model 3 includes more detailed analysis of ownership type in combination
with family-owned status). Results are shown in Table A46 and A47 below. In general, WTP
for both products was shown to be higher for firm-owned production, with generic local
production favoured over specified locations (Grashuis and Magnier, 2018).
Table A46: Willingness-to-pay for cheese attributes, US (N = 298)
Attribute
Mean WTP
(USD/8oz)
(Model 1)
Mean WTP
(USD/8oz)
(Model 2)
Mean WTP
(USD/8oz)
(Model 3)
Ownership: Cooperative 0.766 1.374 0.655
Ownership: Firm 1.453 1.908 1.365
Origin: Local 0.728 1.156 0.735
Origin: Local (Cooperative) -0.672
Origin: Local (Firm) -0.489
Origin: Wisconsin 0.406 1.186 0.410
Origin: Wisconsin (Cooperative) -1.289
Origin: Wisconsin (Firm) -0.916
Family-Owned 0.501 0.504 0.385
Family-Owned (Cooperative) 0.211
Family-Owned (Firm) 0.170 Source: Grashuis and Magnier, 2018.
Table A47: Willingness-to-pay for cereal attributes, US (N = 394)
Attribute
Mean WTP
(USD/12oz)
(Model 1)
Mean WTP
(USD/12oz)
(Model 2)
Mean WTP
(USD/12oz)
(Model 3)
Ownership: Cooperative 1.001 1.014 1.400
Ownership: Firm 1.153 1.099 1.257
Origin: Local 0.411 0.335 0.404
Origin: Local (Cooperative) 0.253
Origin: Local (Firm) -0.139
Origin: Iowa 0.067 -0.255 0.063
Origin: Iowa (Cooperative) 0.092
Origin: Iowa (Firm) 0.648
Family-Owned 0.513 0.580 0.885
Family-Owned (Cooperative) -0.894
Family-Owned (Firm) -0.327 Source: Grashuis and Magnier, 2018.
Asian studies
In China, Wu et al. (2014) assessed consumers’ WTP for organic infant formula, as well as respondents’ food safety risk perceptions and level of knowledge. The CE attributes included organic label, COO brand (including two Chinese (“unknown” Dele, and well-known Yili) and
two foreign brands (European Topfer, and North American Enfamil)) and product price. The

122
design also included two-way interaction effects between the attributes in order to explain
variance in preferences. The study was conducted in Shandong province (China’s third most populous province), resulting in 1,254 completed responses. The result show, firstly, that the
respondents’ knowledge and understanding of organic food were relatively low while the perception regarding the food safety risk were relatively high. The CE results in Table A48
show that consumers had a higher average WTP of $5-$10 (or 36-69 per cent of the base price)
for the EU and US-based organic labels than for the Chinese label (vs no label). These WTP
estimates increased if the level of knowledge and the level of perceived food safety risk were
higher, up to 112 per cent and 86 per cent, respectively. Furthermore, Chinese consumers
preferred imported products and brands over domestic ones which is consistent with previous
studies (Saunders et al. 2013). Lastly, the study highlighted two of the significant and positive
findings from the attribute interactions (between the US organic label and China-COO, and
between Enfamil and China-COO), which imply a potential complementary relationship
whereby adding these labels/brands to formula produced in China could improve their value.
Table A48: Willingness-to-pay for infant formula attributes, China (N = 1,254*)
Full sample By level of
knowledge
By level of risk
perception
WTP
US$/40
0g
Premium
(%)** WTP US$/400g Premium (%)**
Organic
label (vs. no
label)
Chinese 3.23 (22%)
Low 3.49 (23%) 3.84 (26%)
Medium 3.84 (26%) 4.28 (29%)
High 1.95 (13%) 4.20 (28%)
EU 5.36 (36%)
Low 3.81 (25%) 3.75 (25%)
Medium 6.93 (46%) 6.02 (40%)
High 6.04 (40%) 6.25 (42%)
US 10.40 (69%)
Low 10.66 (71%) 9.93 (66%)
Medium 16.87 (112%) 12.58 (84%)
High 16.55 (110%) 12.89 (86%)
Brand (vs.
Dele)
Yili 4.40 (29%)
Topfer 6.17 (41%)
Enfamil 7.08 (47%)
Country of
origin (vs.
Germany)
China -2.42 (-16%)
the US 3.53 (24%)
* In-store interviews, in 2012.
** Compared to the average of the applied price vector: US$ 15/400g
Source: Wu et al. (2014)
Tait et al (2018) explored Chinese consumers WTP for New Zealand yogurt products. This
study was targeted specifically to consumers in Shanghai, with a sample size of 837. The
attributes included in the choice experiment were enhanced animal safety, enhanced animal
welfare, organic production, environmental sustainability, social responsibility, COO, price per
kg, and yogurt type. Based on these, Table A49 highlights the willingness to pay of these
attributes. This is expressed in the local currency, and as a percentage of the average price
used in the choice experiments (prices were determined by the distribution of observed
market prices in Shanghai, December 2017).

123
Table A49: Shanghai consumer WTP for selected yogurt attributes (n=837)
Attributes WTP ¥/kg
Enhanced food safety ¥44 (54%)
Enhanced animal welfare ¥37 (45%)
Environmentally sustainable ¥39 (47%)
Social responsibility ¥31 (38%)
Organic ¥42 (51%)
China ¥77 (93%)
Germany ¥70 (85%)
Spain ¥48 (58%)
Thailand ¥-9 (-11%)
New Zealand ¥118 (143%)
Note: ¥ average WTP (95 per cent confidence interval)
Source: Tait et al (2018)
A1.3 Fruit & vegetable products
The current review includes 11 CE and other WTP studies examining the attributes of fruit and
vegetable products in Europe, Asia and other regions. Attributes examined in these studies
include organic, local foods, country-of-origin, social responsibility, carbon/GHG emissions
associated with production, food safety, production methods and product quality.
European studies
The current review includes three CE and other WTP studies examining the attributes of fruit
and vegetable products in Europe, including the markets of Denmark, France, UK and the
Netherlands. Attributes examined in these studies include organic, local foods, country-of-
origin, social responsibility and carbon/GHG emissions associated with production.
Denver and Jensen (2014) focused on the organic and local food (apples) preferences in
Denmark. The study combined CE and PCA, where the latter was used to aggregate attitudinal
Likert-scale responses. The CE included attributes of food origin ranging from domestic (local
or domestic) to imported apples (within or outside of the EU); production method (organic vs.
conventional); alongside colour and taste/texture. The survey included in total 637
respondents. The PCA show two components - one related to organic products and the other
to locally produced products. While no WTP was calculated, the authors provided an
indication of WTP for these two attributes (Table A50). The participants were willing to pay
5.40 DKK/kg premium for organic apples and 19 DKK/kg for local food. These numbers
increased by 97 percentage points if the respondents hold “maximum perception” of the organic attributes based on the PCA. This suggests that, in the case of apples, consumers with
positive perceptions of organic food can also have relatively strong preferences for local food
but not necessarily vice versa. The authors suggest that this asymmetry needs to be explored
further.

124
Table A50: Willingness-to-pay for the local apple attribute, Denmark (N = 637*)
Full sample
Those with maximum perception
of the organic attributes
WTP DKK/kg Premium (%)** WTP DKK/kg Premium (%)**
Production method
(vs. conventional) Organic 5.40 77% 12.20 174%
Origin
(vs. outside EU) Local 19.00 (271%) 22.60 (323%)
* Online survey in 2010.
**Compared to current price (status quo option) of a conventional apple 7 DKK/kg
Source: Denver and Jensen (2014)
In another European study, Akaichi et al. (2015) assessed consumers WTP for fair-trade (FT),
organic and carbon footprint attributes (collectively known as ethical attributes) in bananas.
A particular objective was to identify if these attributes compete in different markets. For the
study, in total 247 consumers were interviewed in three countries. The CE results (Table A51)
show that consumers were willing to pay between €0.08 and €0.14 for fair trade and organic
bananas with French participants indicating a slightly higher, and statistically significant, WTP
compared to Scottish and Dutch participants. All respondents were also willing to pay, on
average, €0.10 (77% premium of the lowest price) to reduce carbon footprint (1kg on the transport). These WTP values were statistically significantly higher by Dutch over Scottish
participants. In order to explore these trade-offs, a within-sample test of WTP differences was
applied. These results show that, in Scotland, consumers were willing to pay significantly more
for fair trade bananas compared to other attributes, but also that they would choose organic
bananas if the FT price too high. In the Netherlands sample, there was no evidence for
different WTP for attributes; thus these attributes are competing and the price of attribute
determines choices. Lastly, French participants were willing to pay significantly more for
organic bananas than fair trade bananas, if the price is not too high. Overall, consumers in all
countries show positive WTP for all claims/labels, and although generally these ethical claims
may not be competing, this study identified that under some circumstances this may change.
Table A51: Willingness-to-pay for the banana attributes, Scotland, France and the
Netherlands (N = 247*: 100 in Edinburgh, 95 in Clermont-Ferrand and 52 in Amsterdam)
WTP by all respondents WTP by Country
€/banana Premium
(%)**
€/banana Premium
(%)**
Fairtrade
Label (vs. no
label)
0.10
77%
Scotland 0.14 108%
Netherland 0.13 100%
France 0.09 69%
Organic Label
(vs. no label) 0.09 69%
Scotland 0.08 62%
Netherland 0.09 69%
France 0.13 100%
Carbon
footprint/
reduction per
kg
0.10 77%
Scotland 0.09 69%
Netherland 0.12 92%
France 0.12 92%
* Intercept survey at public places and retail stores with occasional buyers, at minimum, of bananas
** Compared to the lowest amount of the price vector: €0.13/banana
Source: Akaichi et al. (2015)

125
Ceschi et al. (2018) used a choice experiment to analyse Italian consumers’ WTP for apple attributes, specifically their variety, production method(s) and region(s) of production. As
shown in Table A52 below, the authors found a range of premiums associated with specific
regions of production, with consumers willing to pay a higher premium for apples produced
in Trentino-Adige (+€1.44 per kg) and Emilia-Romagna (+€1.41 per kg) over imported apples
(-€2.12 per kg). Similarly, the organic attribute was shown to have only marginal increased
WTP relative to conventional apples (+€0.18 per kg) (Ceschi et al., 2018).
Table A52: Willingness-to-pay for apple attributes, Italy (N = 301)
Attribute WTP (€/kg) Organic +0.18
Bicolour -0.34
Green -1.00
Red -0.94
Trentino-Alto Adige +1.49
Emilia-Romagna +1.44
Imported -2.12 Source: Ceschi et al., 2018
North American studies
There have been some, but limited, studies of consumer WTP for attributes of fruit and
vegetable products in North American countries.
Grebitus et al. (2018) used a series of online choice experiments to determine US consumers’ WTP for Medjool dates with associated GMO, pesticide use and region of origin credentials.
In general, this showed that participants were willing to pay positive premiums for all
attributes, particularly those with GMO- and pesticide-free status, as well as a preference for
dates grown in the state of Arizona over California. Table A53 below shows the range of
premiums associated with the above attributes.
Table A53: Willingness-to-pay for date attributes, US (N = 1,411)
Attribute Mean WTP (US$/ounce)
Arizona grown +0.14
California grown +0.03
Pesticide-free +0.55
GMO-free +0.17
GMO- and pesticide-free +0.53 Source: Grebitus et al., 2018.
Tait et al (2021) investigated apple consumption by Californian consumers. The researchers
investigated a number consumer preferences such as brand, sensory and credence attributes
before conducting a WTP analysis using a choice experiment methodology. Attributes
explored in this were appearance, social responsibility, organic production, reduction in
greenhouse gas emissions, genetic engineering, and price. The choice experiment highlighted
three distinct apple consumer groups in California representing 17 percent, 27 per cent, and 56 per cent of those surveyed. Table A54 shows the results of the WTP analysis, broken down
by consumer group.

126
Table A54: Willingness to pay for apple attributes (USD per pound), California, USA
(N=1000)
Consumer
Group Attribute WTP (USD)
One
Appearance Moderately blemished -0.51
Significantly blemished -1.19
Moderately misshapen -0.59
Significantly misshapen -1.75
Reduction of GHG 15% less GHG -
30% less GHG -
Organic Organic 0.54
Social responsibility Care for workers -
Contribute to local communities -
Support farmers 0.30
Two
Appearance Moderately blemished -
Significantly blemished -0.29
Moderately misshapen -0.16
Significantly misshapen -0.56
Reduction of GHG 15% less GHG -
30% less GHG 0.26
Organic Organic 0.32
Social responsibility Care for workers 0.20
Contribute to local communities 0.41
Support farmers -
Three
Appearance Moderately blemished -2.72
Significantly blemished -4.99
Moderately misshapen -2.59
Significantly misshapen -3.88
Reduction of GHG 15% less GHG -
30% less GHG 1.42
Organic Organic 1.85
Social responsibility Care for workers 1.11
Contribute to local communities 1.35
Support farmers 1.80 Source: Tait et al (2021)
Asian studies
In a developing economy context, Wongprawmas and Canavari (2017) examined Thai
consumers’ WTP for fresh produce with associated food safety credentials, including a
product’s freshness, brand and food safety information. For product freshness, a range between 0 and 2 days post-harvest was indicated. Food safety labels used in the CE included
a generic “safe produce” claim, the well-recognised Q Mark label, as well as well-known and
trusted produce brands “Royal Project” and “Doctor’s Vegetables”, both of which may also
use the Q Mark label. Table A55 shows a range of WTP for different brand and food safety
information credentials in relation to Chinese cabbages among Thai consumers, with trusted
private brands Royal Project and Doctor’s Vegetables receiving the highest WTP.

127
Table A55: Willingness-to-pay for Chinese cabbage with food safety credentials, Thailand
(N=350)
Attribute WTP (Thai Baht/kg)
Claim “safe produce” 39.23
Q mark 68.44
Royal Project and Q mark 74.56
Doctor’s Vegetables and Q mark 79.06 Source: Wongprawmas and Canavari, 2017.
While not strictly a fruit and vegetable product, Gao et al. (2019) used a series of choice
experiments to examine urban Chinese consumers’ WTP for country of origin and genetically modified organism status of different orange juice products (orange juice drink (OJD), orange
juice from concentrate (FCOJ) and orange juice not from concentrate (NFC)). As shown in Table
A56 below, WTP estimates were produced against alternatives (e.g. a series of origins versus
Chinese origin), producing a range of premiums associated with different orange juice product
attributes. In particular, the results show a range of discounts associated with country of origin
and GM status, with price premiums associated only with changes in product types.
Table A56: Willingness-to-pay for orange juice products by type, production method and
country of origin, China (N = 646)
Category Attribute Mean WTP
(RMB)
Product Type (vs 10% Orange
Juice Drink)
50% Orange Juice Drink 5.38
Orange Juice From Concentrate 9.81
Orange Juice Not From Concentrate 13.27
Conventional Juice (Imported
vs China)
US -4.61
Brazil -1.55
Israel -2.13
Australia -3.70
GM Juice (GM vs conventional
juice from the same country)
US -4.87
Brazil -13.60
Israel -14.52
Australia -4.59
China -12.12
Brand and Manufacturer
Country of Origin (other vs
Chinese brand, made in China)
US brand, made in United States -3.05
US brand, made in China -4.66
US brand, made in Florida -5.47
Taiwanese brand (China), made in China -1.45
Australian brand, made in Australia -0.05 Source: Gao et al., 2019.
Nishimura (2021) investigated the effect of greenhouse pollination methods on consumers
WTP for tomatoes in Japan. The study was driven by the phasing out of non-native
bumblebees as greenhouse tomato pollinators in Japan. This was largely related to the
ecological risks of non-native species and the results of the WTP survey of 1250 consumers
found that consumers valued the use of non-native bumblebees’ more than hormonal treatment, and native more than non-native bees. This WTP was further increased by
informing consumers of the ecological risks of non-native bumblebees to the Japanese
ecosystem. The attributes used in this research were cultivation method, pollination method,
functional ingredients, and price. The results of the WTP are shown in Table A57.

128
Table A57: WTP for greenhouse pollination methods of Japanese tomatoes. (N=1250).
WTP estimates (Japanese ¥)
No information Only information
on quality
improvement
Only information
on ecological risk
Information on
both
HALVE 18.24 21.76 17.55 23.72
[12.84, 23.63] [17.71, 25.81] [13.45, 21.66] [16.39, 31.04]
HORMONE -16.95 -17.00 -9.48 -13.59
[-23.25, -10.66] [-22.45, -11.55] [-14.68, -4.29] [-21.28. -5.90]
NATIVE 9.81 14.57 20.29 30.64
[4.63, 15.00] [9.30, 19.83] [14.38, 26.20] [20.22, 41.05]
ENRICHED
8.29 7.50 4.56 6.59
[4.40, 12.19] [3.64, 11.35] [0.84, 8.27] [1.52, 11.67] The value of each WTP is presented with 95% confidence intervals for the mean in brackets. All values for WTP
are in Japanese yen.
Source: Nishimura (2021)
Wang, Wang and Huo (2019) conducted a double hurdle analysis to investigate consumers’ WTP of organic fruits in China. 407 surveys were collected across nine Chinese cities and the
Willingness-to-pay a premium was modelled as a function of a series of demographic, socio-
economic variables, plus fruit attributes, perceptions of fruit safety, and risk attitudes. The
results showed that the most important factors influencing willingness to pay a premium
involved positive attitudes toward organic label, attention to fruit safety, the perception of
importance of fruit attributes. Moreover, the more income consumers earn, the more likely
they would be willing to pay a premium for organic fresh fruits.
In terms of fruit attributes, two consumer groups were identified; those willing to pay a
premium (n=250) and those unwilling to pay a premium (n=157). Taste and appearance were
regarded as the most important attributes in both groups. Purchase convenience and the
variety of fruits were perceived as the second most important attributes by WTP consumers
(60.4%). The respondents in the WTP group rated the nutritional value (47.6%) comparatively
highly when compared to the UWTP group (18.5%). Further, the majority of UWTP believed
that sales price was very important (72.0%), potentially explaining their unwillingness to pay
for organic fruit (75.8%), stating it was unimportant in contrast to WTP consumers (42.0%). In
addition, wrapping appears to be less acute for all interviewees.
Other regions
The current review includes two CE and other WTP studies examining the attributes of fruit
and vegetable products in other regions, including Peru and West African nations (Benin,
Ghana and Burkina Faso). Attributes examined in these studies include organic, local foods,
food safety and production methods.
Blare et al. (2017) conducted a CE to determine Peruvian consumers’ WTP for locally grown tree fruits (avocadoes, apples and pears). Table A58 shows the percentage of participants
willing to pay a range of premiums (0%, 10%, 20%, 30%, 40% and 50% more) for locally-
produced apples, avocadoes and pears, with highest overall premiums shown for local apples,
followed by pears and avocadoes.

129
Table A58: Percentage of participants willing-to-pay for locally-grown tree fruits, Peru
(N=300)
WTP range
0% 10% 20% 30% 40% 50%
Apples (%) 26 17 24 16 6 11
Avocadoes (%) 24 29 30 12 1 4
Pears (%) 25 21 26 16 8 4 Source: Blare et al., 2017
Probst et al. (2012) explored the potential for marketing certified organic vegetables in three
West African cities (Cotonou in Benin, Accra in Ghana and Ouagadougou in Burkina Faso). In
particular, certified organic production was examined as a potential strategy to improve food
safety. Two separate CEs were developed - one for the food vendors’ choices of tomatoes (a common ingredient in meals) and another for consumer meal choices of (continental or
traditional) when eating out. The vendor CE included trade-offs across appearance (freshness,
colour and neatness), production method and price attributes, while the consumer CE
included trade-offs across taste, production method and price attributes. Both CEs targeted
different types of retailers ranging from street food vendors to restaurants, where the
interviews resulted in 180 vendor responses and 360 consumer responses. There were some
differences in sample demographics between vendors and consumers, such as consumer
sample being predominantly female whereas the vendors were mostly male. In both CEs, the
WTP was only reported for the organic production attribute. As shown in Table A59, the
vendors were willing to pay, at median, US$0.85 for organic certification of the fresh
tomatoes, which equals to a premium between 12 and 53 per cent of typical retail price. These
WTP across the cities vary depending on the season. Next, Table A60 shows they consumers
were willing to pay, at median, just over US$1 per meal if the food served contained only
certified organic vegetables. This equates to around a 19 per cent premium on average meal
price for restaurants, 75 per cent premium for small food businesses, and 177 per cent
premium on average meal price for street food vendors.
Table A59: Willingness-to-pay for basket of tomatoes attributes (by vendors), Benin,
Ghana and Burkina Faso (N = 180*, n = 60/city)
By City Lean season Peak season
WTP US$/3 kg
basket (premium %)**
(premium
%)**
How vegetables
were grown (vs. not
organic)
Certified organic $0.848
Benin (16%) (39.9%)
Burkina
Faso (26.7%) (53.4%)
Ghana (12.1%) (23.9%) Note: The WTP values were not estimated for all attributes.
* Intercept interviews, in 2009, with street food vendors, small food businesses and restaurants.
** Reported in the study.
Source: Probst et al. (2012)

130
Table A60: Willingness-to-pay for meal attributes (by consumers), Benin, Ghana and
Burkina Faso (N = 360*)
WTP
US$/plate By retailer (% premium)**
How vegetables
added to the meal
were grown (vs.
not organic)
Certified
organic
vegetables
$1.044
Street food vendor 177%
Small food business 75%
Restaurant 19%
* Intercept interviews, in 2009, with customers of the street food vendors, small food businesses and
restaurants.
** Reported in the study.
Source: Probst et al. (2012)
A1.4 Wine products
The current review includes 12 CE and other WTP studies examining the attributes of wine
products in Europe, North America, Asia and other regions. Attributes examined in these
studies include sustainability (generic), country- and region-of-origin, grape variety, vintage,
brand, social responsibility, organic, carbon/GHG emissions associated with production,
environmental condition, reduced packaging and taste.
General studies
Schaufele and Hamm (2017) conducted a review of international WTP literature regarding
WTP for the inclusion of a range of sustainability credentials in wine products. The authors
found that consumers across different countries showed a willingness to pay a premium for
wine products with associated sustainable production methods, including environmental
friendly, local and organic production methods (Schaufele and Hamm, 2017).
European studies
The current review includes four CE and other WTP studies examining the attributes of wine
products in Europe, including the markets of Spain, France, Germany and the UK. Attributes
examined in these studies include sustainability (generic), region-of-origin, grape variety,
social responsibility, organic, carbon/GHG emissions associated with production and reduced
packaging.
Sellers (2016) examined Spanish consumers’ WTP for sustainable wine products based on their market segment and levels of knowledge of wine culture. As shown in Table A61,
premiums that Spanish consumers are willing to pay may be based on their level of knowledge
of wine culture, with less participants with higher levels of knowledge of wine culture willing
to pay a premium as well as a generally lower average percentage of premium price paid. In
addition, Table A62 shows that Spanish consumers in different segments may be willing to pay
higher premiums than others. For example, a higher percentage of urban-based consumers
may be willing to pay a higher premium than consumers in the ‘traditional segment’. This study shows that relative levels of expertise as well as socio-demographic segmentation may
affect WTP for sustainability wine products in Spain.

131
Table A61: Willingness-to-pay (€) for sustainable wine by level of knowledge of wine culture, Spain (N = 553)
(1)
Beginner
(2)
(3)
(4)
(5)
Expert Global
% of consumers willing to
pay a premium price 87.2 76.5 81.2 75 61.6 77.9
Average % of premium price 18.72 15.02 10.97 8.1 5.08 12.87 Source: Sellers, 2016
Table A62: Willingness-to-pay (€) for sustainable wine by market segment, Spain (N = 553)
Traditional Urban Trendy Routine Occasional Social Global
% of consumers willing
to pay a premium price 76.9 84.6 80.2 70.2 74.3 84.1 77.9
Average % of premium
price 9.75 13.11 14.41 13.25 11.92 12.97 12.87
Source: Sellers, 2016
In a wine context, Kallas et al. (2013) focused on elements involved in wine choices for a
special occasion, such as origin, people’s experience and knowledge of wine (“wine references”), grape type and price. In the survey, the respondents were asked to complete
two separate wine CEs. The first being a so-called “forced choice task” (with no opt-out
option), and the second being “non-forced choice task” (with an added opt-out alternative).
Four hundred wine consumers participated in the study. The results, shown in Table A63,
indicate that the most preferred origins were non-imported wines, particularly the regional
Catalonian wine with WTP around 2.60-3.10 €/bottle (or around 30% of the base price). Also
experience and type of wine influenced consumers’ wine choices, as indicated by the relatively higher WTP estimates. The main differences between forced and non-forced choices involved
the significantly higher premium for regional wine and Cabernet Sauvignon wine when
allowing opting-out. However, the forced choices resulted in higher WTP for national wines
as well as lower discount or compensation (negative WTP) for prestigious wines and imported
wines. Overall, the results from the non-forced CE suggest an increasing tendency of
statistically significantly higher WTP for most preferred type and origin levels.

132
Table A63: Willingness-to-pay for wine attributes, Spain (N = 400*)
Average WTP €/bottle
(Premium %)**
“Forced choices” “Non-forced choices”
Origin
Catalonia (regional) *** 2.65 3.07
(27%) (31%)
Spain (national) *** 0.50 0.39
(5%) (4%)
Imported (international) *** -3.15 -3.46
(-32%) (-35%)
Wine
references
previously known/experienced 0.81 0.73
(8%) (7%)
Recommended wine -0.17 0.04
(-2%) (0.4%)
Prestigious wine*** -0.64 -0.78
(-6%) (-8%)
Grape variety
Cabernet Sauvignon (French
variety) ***
1.77 2.29
(18%) (23%)
Grenache (Spanish variety) -1.18 -1.33
(-12%) (-13%)
Merlot (French variety) *** -0.60 -0.96
(-6%) (-10%) * Face-to-face interviews in supermarkets and streets (central city) of Barcelona.
** Compared to average of the applied price vector: 10 €/bottle
*** Statistically significant different between the forced and non-forced choices (p < 0.01 or p < 0.10)
Source: Kallas et al. (2013)
Pomarici et al. (2018) used an experimental auction method to assess younger Italian
consumers’ (n = 200) WTP for a range of water-related attributes of wine products.
Specifically, this included three different wine products – a conventional wine product (i.e. no
water saving), a water saving front-of-pack labelled product, and a water saving back-of-pack
labelled product. The authors showed that participants bid a median price of €4.16 for the
conventional wine product, and a median price of €4.51 (€0.35 premium) and €4.32 (€0.16
premium) for the front-of-pack and back-of-pack labelled wine products respectively
(Pomarici et al., 2018).
A study in Portugal investigated the effect of region of origin on consumers WTP for wine.
Ferreira et al (2020) conducted an experimental auction in three different Portuguese wine regions. Extrinsic cues tested were region of origin, profile sensory, food pairing, grape variety,
front label design, bottle form, wine history, winemaker, brand, and medals/awards. An
experimental auction methodology was used where participants were placed in two
scenarios: a blind tasting with no information and; blind tasting with information. Results
showed that participants placed more value on wine attributes when they had previous
knowledge of the region of origin. This is likely due to the influence of wine acceptability and
expected quality. Further, as the information available to consumers increased, so too did the
WTP. Purchase frequency and less self-reported wine knowledge had a negative effect on
WTP, while taste had a positive effect.

133
Asian studies
The current review includes two CE and other WTP studies examining the attributes of wine
products in Asia (namely China). Attributes examined in these studies include country- and
region-of-origin, vintage and brand.
Xu et al. (2014) used a mixed Logit model to examine Chinese consumers’ WTP for country-
of-origin, vintage and brand attributes in relation to red wine for personal consumption and
gifting purposes. Table A64 shows that Chinese consumer WTP for red wine attributes differ
depending on context (e.g. for personal consumption or gifting), with negative WTP shown
for Chinese wines for gifting, as well as unanimously for non-branded wine products.
Table A64: Willingness-to-pay (Yuan) for red wine attributes for own consumption and
gifting, China (N=540)
Personal consumption Gift purchase
USA to China 36.07 -63.3
USA to France 83.53 101.53
2- to 5-year old 57.42 36.81
2- to 10-year old 64.51 38.82
Branded to no brand -91.32 -118.61 Source: Xu et al., 2014
Using the same dataset from the previous study, Xu and Zeng (2014) compared results using
conditional logit and mixed logit models to examine Chinese consumers’ WTP for red wine
attributes. Table A65 shows differences in WTP estimates produced through the use of each
method.
Table A65: Willingness-to-pay (Yuan) for red wine attributes for own consumption and
gifting, China (N=540)
Conditional logit Mixed logit
California to China -45.19 61.89
California to France 35.13 144.40
2- to 5-year old 35.77 39.36
2- to 10-year old 63.28 67.58
Branded to no brand -115.36 -120.69 Source: Xu and Zeng, 2014
Other regions
The current review includes four CE and other WTP studies examining the attributes of wine
products in other regions, including Australia and Russia. Attributes examined in these studies
include country-of-origin and taste.
In another special occasion wine study by Mueller et al. (2010), the objective was to
understand the importance of different wine label statements for regular wine consumers in
Australia, not calculate WTP. The CE included a relatively large number of attributes, with ten
different statements (history of the winery; local grape sources; production method; taste
descriptor; elaborate taste descriptor; food pairing between wine and type of meal;
consumption advice; environmental consciousness; website; and ingredients) either present

134
or not on the label, plus price. Each alternative was represented with an undefined Australian
wine with the same alcohol level to enhance the use of extrinsic cues in the choices. A
sociodemographic comparison indicates that the sample for this study is mostly aligned with
the general Australian wine consumer population based on a wine consumer survey from Roy
Morgan in 2007 (as cited in Mueller et al. 2010). The data was analysed with a consumer class
segmentation approach which resulted in five distinct classes that varied in terms of
preferences for certain label information and price, but not in terms of respondents’ characteristics. Overall, the most influential label attributes associated with the wine choices
were price, history, taste descriptors and food pairing. In contrast, environmental information,
ingredients and website information on the labels had a relatively smaller, or negative, impact
on choices. An additional analysis revealed that just over half of the participants, generally,
read the wine labels and found them interesting as well as helpful.
In a Russian case study, Cicia et al. (2013) explored consumer preferences and WTP for red
wine. Their CE included seven wine types varying by their geographical origin and quality-
dependent price. Based on the estimated WTP (Table A66), three distinct segments were
found: (1) high-quality-high-price Italian and French wines with WTP varying between €4.8-
5.7/bottle, or 96-113 per cent of the base price; (2) a medium-quality wines (WTP of
€2.96/bottle, or 54%); and (3) lower quality wines with WTP less than one Euro per bottle.
Moreover, the non-CE results showed that wine consumption was generally described as
occasional and that certification of origin was considered as a proxy for quality, which was
also reflected in respondents’ WTP.
Table A66: Willingness-to-pay for wine attributes, Russia (N = 388*)
WTP €/bottle Premium (%)**
Geographical
origin (vs. Chile
Cabernet)
Italy-Tuscany (Chianti) 5.66 (113%)
France (Bordeaux) 4.81 (96%)
Spain (Rioja) 2.69 (54%)
Italy-Sicily (Cabernet) 0.97 (19%)
Russia (Krasnodar Grenache dry) 0.92 (18%)
Georgia (Saperavi dry) 0.06 (1%) * Sample included Russian households located in Moscow, Saint Petersburg and Novosibirsk.
**Compared to the lowest value of the applied price vector including Chilean wine, approximately €5/bottle. Source: Cicia et al. (2013)
Tait et al (2020) explored New York wine consumers WTP for Sauvignon Blanc wine. Using a
choice experiment methodology, the authors received 495 testable survey responses,
assessing the attributes of biodiversity management, water management, by-product
management, energy management, pest and disease management, greenhouse gas
management, organic production, social responsibility, origin, Māori production, critic rating,
and price. Most respondents were concerned about pesticides and additives, and interested
in improved sustainability reporting. However, a substantial number found that reporting was
not easy to understand, and couldn’t access the information they wanted. In addition, the
researchers identified three distinct consumer groups with each group made up of 47 per cent, 22 per cent, and 31 per cent of respondents, and each of these had differing WTP for
attributes. Table A67 below shows the WTP for attributes in USD.

135
Table 67: New York Wine Consumer WTP (USD) for Sauvignon Blanc Wine (n=495)
Wine attributes Group one (47%) Group Two (22%) Group Three
(31%)
Biodiversity Management 1.11 (0.23, 1.99) 2.99 (1.43, 4.55)
Water Management
By-Product Management
Energy Management 1.14 (0.38,1.91)
Pest And Disease
Management
1.59 (0.75, 2.42) 2.04 (1.21, 2.89) 1.84 (0.57, 3.12)
Social Responsibility 1.52 (0.59, 2.44) 0.78 (-0.11, 1.66)
Greenhouse Gas
Management
1.80 (0.95, 2.65) 1.01 (0.14, 1.89) 2.59 (1.25, 3.90)
Made with Organic grapes
100% Organic 1.76 (0.69, 2.84) 2.64 (1.33, 3.95)
Critic Rating (per point >80) 0.26 (0.10, 0.50) 0.25 (0.03, 0.08)
Made in New Zealand 17.24 (10.35, 24.15) 18.86 (13.75,23.97) 5.62 (1.48, 9.77)
Made in NZ by Māori enterprise
15.15 (9.34, 20.10) 20.01 (16.10, 23.93) 4.37 (0.80, 7.94)
Made in USA 13.33 (7.55, 19.10) 17.61 (12.94, 22.27) 5.90 (2.43, 9.38)
Made in France 16.73 (9.39, 24.10) 15.04 (9.19, 20.89) 4.61 (0.35, 8.87)
Made in Australia 15.12 (9.10, 21.15) 16.50 (11.96, 21.04) 4.29 (0.75, 7.83)
Made in Italy 11.20 (5.85, 17.16) 16.60 (12.12, 21.08 Mean WTP per 750ml bottle (95% confidence interval). USD, 2019
Source: Tait et al (2020)
Another study based in the USA investigated the WTP of consumers to pay for local muscadine
wine (a variety of grape often used to make sweet red and white wines) (Everett et al., 2018).
The authors used a choice experiment methodology of wine consumers residing in Tennessee,
comparing North Carolina muscadine wine with Tennessee muscadine wine. Variables
investigates were whether the consumer likes muscadine wine, a preference to drink red (over
white), purchases from a winery, importance of purchasing local wine, and preparedness to
pay a premium for local foods.
The survey highlighted that while muscadines were a regionally important wine, many
consumers had never tried them. Those that had were more likely to be older, live in rural
areas, purchase from wineries, and prefer red wine. Overall there was a WTP a premium for
locally produced wine, and weekly wine drinkers were more likely to have tried muscadine
wine. Two consumer groups were identified: the first group viewed local wine as a 1, or “not important at all”, and the second group viewed local wine as a 4, or “very important”. The results showed that for each increase in the importance level of buying local wines, the WTP
increased by USD 1.48. In contrast, each percentage point increase in premiums paid for local food held a WTP of USD 0.38 (see Table A68).

136
Table A68: The WTP per bottle of local Muscadine wine in Tennessee (USD) (N=500)
Willingness to pay per bottle*
Variable Mean Lower level Upper level
Sample mean 17.14 15.29 21.88
Group 1 13.46 11.75 16.23
Group 2 19.80 16.93 26.66
Effect on WTP of local wine 1.48 0.46 3.10
Effect on WTP of premium local foods 0.38 0.06 0.90 *95% confidence interval. All prices are in USD.
Source: Everett et al, 2018.
Cross-regional studies
Lastly, Mueller Loose and Remaud (2013) explored North American and European consumer
preferences for wine choices which involve corporate social responsibility claims (an umbrella
term for ethical and social attributes) alongside product price. Prior to the CE, participants
were also asked about their awareness and trust of different claims in food and wine products.
The survey targeting wine consumers resulted in between 982 and 2,027 respondents in
different countries. The results show, firstly, that overall awareness, purchase penetration and
trust with regards to social and environment claims were similar across for each claim but
different across the markets. For example, compared to European markets, North American
consumers seemed to have a higher level of trust and claim awareness. As shown in Table
A69, WTP results support differences across markets, but also across the different label
claims. Over all markets, the average WTP was highest for organic claims at around
€1.20/bottle (or 14% premium) - twice as much than the WTP for the environmental claims.
Across the markets, not all attributes were statistically significant in all countries, such as for
social and environmental responsibility. In most of these markets, the organic attribute had
the highest WTP, particularly in France and Germany. Negative WTP can interpreted as a
consumer demand for a discount, or consumer dislike, if such labels exist for wine products,
such as socially responsibility in French markets or the reduced glass weight of wine bottles.
Overall, this cross-country study illustrates that differences might exist between different
developed markets.
137
Table A69: Willingness-to-pay for wine attributes, USA, Canada, France, Germany and UK
(N=11,322*: US n = 1,617 and n = 1,614, Canada n = 1,036 and n = 982, France n = 2,027,
Germany n = 2,025, UK n = 2,021)
Average all countries By country
Premium (%)** Premium (%)**
Social responsibility logo
(vs. no logo) 2.3% France -3.4%
Environmental
responsibility logo (vs. no
logo)
6.6%
US East coast 10.4%
US Midwest 7.3%
CAN Anglo 8.8%
Organic logo (vs. no logo) 14.4%
UK 3.8%
France 26.1%
Germany 27%
US East coast 17.6%
US Midwest 10.7%
CAN Anglo 12.8%
CAN Franco 2.9%
Carbon zero logo (vs. no
logo) 3.2%
UK 3.4%
France -3.1%
Germany -0.3%
US East coast 9.6%
US Midwest 5.2%
CAN Anglo 4.0%
CAN Franco 3.3%
10 per cent less
glass logo (vs. no logo) -2.9%
UK -1.4%
France -4.3%
Germany -8.1%
US East coast 1.2%
US Midwest 1.7%
CAN Anglo -4.6%
CAN Franco -4.3% Note: In this adapted Table, WTP was included only if the attribute was statistically significant.
* Online survey, in 2009Samples in US included New York metropolitan area (Northeast) and Chicago
metropolitan area (Midwest); samples in Canada included Anglophone and Francophone Canada
** reported in the study.
Source: Mueller Loose and Remaud, (2013)
A1.5 Other product categories
There has also been a number of CE and other WTP studies conducted for products that do
not strictly fit in the previous categories (meat and seafood, dairy, fruit and vegetables, and
wine) or include multiple types of food products. The current review includes 10 CE and other
WTP studies examining the attributes of other types of food products in Europe and North
America. Attributes examined in these studies include organic, local foods, GM production,
country-of-origin, product quality, landscape of the place of origin, social responsibility,
functional foods, environmental condition and carbon/GHG emissions associated with
production.
European studies
The current review includes CE and other WTP studies examining the attributes of other types
of food products (almonds, lamb, strawberries, olive oil, honey and chocolate) in Europe,
including the markets of Belgium, Italy, Spain and the UK. Attributes examined in these studies
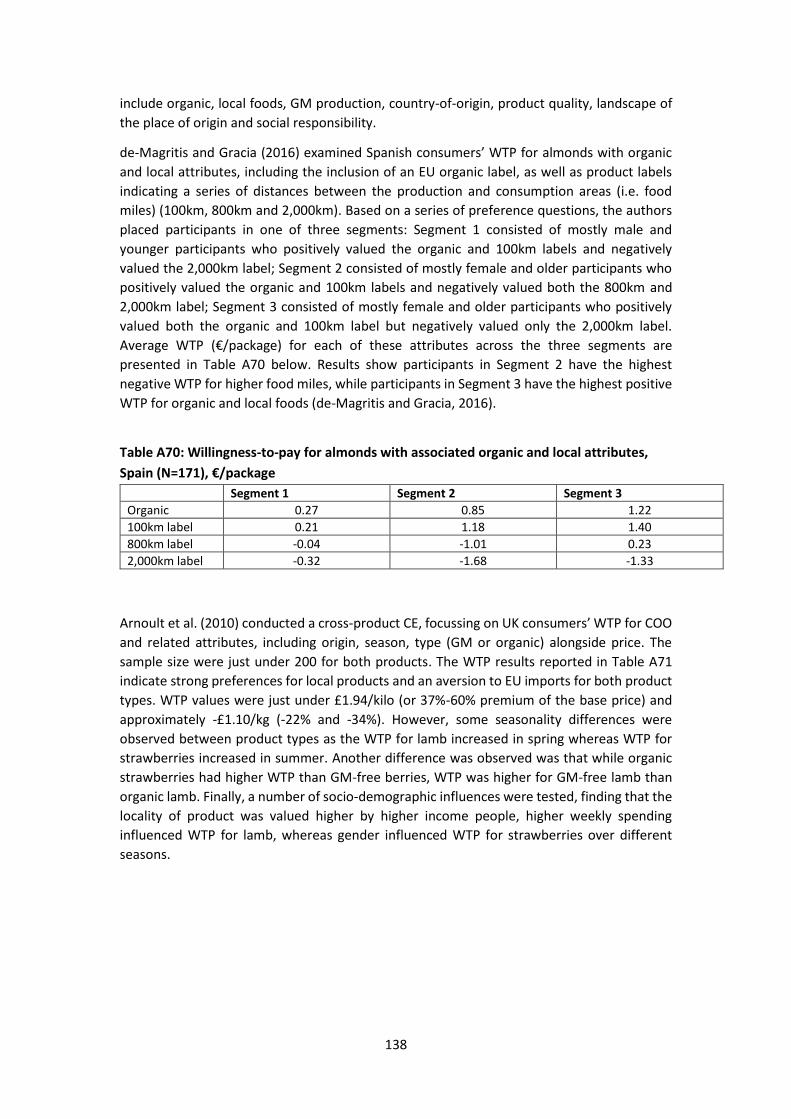
138
include organic, local foods, GM production, country-of-origin, product quality, landscape of
the place of origin and social responsibility.
de-Magritis and Gracia (2016) examined Spanish consumers’ WTP for almonds with organic and local attributes, including the inclusion of an EU organic label, as well as product labels
indicating a series of distances between the production and consumption areas (i.e. food
miles) (100km, 800km and 2,000km). Based on a series of preference questions, the authors
placed participants in one of three segments: Segment 1 consisted of mostly male and
younger participants who positively valued the organic and 100km labels and negatively
valued the 2,000km label; Segment 2 consisted of mostly female and older participants who
positively valued the organic and 100km labels and negatively valued both the 800km and
2,000km label; Segment 3 consisted of mostly female and older participants who positively
valued both the organic and 100km label but negatively valued only the 2,000km label.
Average WTP (€/package) for each of these attributes across the three segments are
presented in Table A70 below. Results show participants in Segment 2 have the highest
negative WTP for higher food miles, while participants in Segment 3 have the highest positive
WTP for organic and local foods (de-Magritis and Gracia, 2016).
Table A70: Willingness-to-pay for almonds with associated organic and local attributes,
Spain (N=171), €/package
Segment 1 Segment 2 Segment 3
Organic 0.27 0.85 1.22
100km label 0.21 1.18 1.40
800km label -0.04 -1.01 0.23
2,000km label -0.32 -1.68 -1.33
Arnoult et al. (2010) conducted a cross-product CE, focussing on UK consumers’ WTP for COO and related attributes, including origin, season, type (GM or organic) alongside price. The
sample size were just under 200 for both products. The WTP results reported in Table A71
indicate strong preferences for local products and an aversion to EU imports for both product
types. WTP values were just under £1.94/kilo (or 37%-60% premium of the base price) and
approximately -£1.10/kg (-22% and -34%). However, some seasonality differences were
observed between product types as the WTP for lamb increased in spring whereas WTP for
strawberries increased in summer. Another difference was observed was that while organic
strawberries had higher WTP than GM-free berries, WTP was higher for GM-free lamb than
organic lamb. Finally, a number of socio-demographic influences were tested, finding that the
locality of product was valued higher by higher income people, higher weekly spending
influenced WTP for lamb, whereas gender influenced WTP for strawberries over different
seasons.

139
Table A71: Willingness-to-pay for lamb and strawberry attributes, UK (N = 185 lamb CE and
N = 187 strawberry CE*)
Lamb Strawberries
WTP £/kg Premium (%)** WTP £/kg Premium (%)**
Location (vs.
Rest of the
world)
Local 1.75 37% 1.94 60%
National - - - -
European
Union -1.06 -22% -1.11 -34%
Seasonality (vs.
winter season)
Summer 0.58 18%
Autumn -0.52 -11% -0.49 -15%
Spring 0.31 7%
Type 1 (vs.
nothing stated) GM-free 0.59 12% 0.40 12%
Type 2 (vs.
nothing stated) Organic 0.29 6% 0.64 20%
* Face-to-face interviews in 2005.
** Compared to average of the applied price vectors (lamb: £4.74/kg and strawberries: £3.24/kg)
Source: Arnoult et al. (2010)
In a Spanish study, de-Magistris and Gracia (2014) used the “food miles” concept as part of the CE where alternatives vary across almonds produced between 100km and 2000km
distances, versus no such labelling at all. The survey participants completed two sets of choice
sets, where the second one was used for validity checking. In addition, at the end of this
process each participant were offered €10 with a hold-out set including a purchase option.
The estimated WTP values are described in Table A72, which shows positive preferences with
WTP of €0.62-€0.68/100g, or a 30-33 per cent premium, towards an organic label and a 100km
label. WTP values towards longer distances were negative and increased according to total
distance travelled, hence indicating preferences towards more local products.
Table A72: Willingness-to-pay for almond attributes, Spain (N = 171*)
* Random sample of respondents across the capital area of Spain.
** Compared to average of the applied price vector (€2.085/100g) based on the prices in supermarkets at the
time.
Source: de-Magistris and Gracia (2014)
Aprile et al. (2012) assessed Italian consumer values for geographical and quality labels in olive
oil products. These labels provide a tool to communicate sustainable production or products’ value-added qualities. The labels included Protected Designation of Origin (PDO), Protected
Geographical Indications (PGI) and organic farming (OF). The results suggested that all of these
Average WTP
€/100 g package
(Premium %)**
Production method
(vs. No label:
conventional)
EU organic label 0.62 (30%)
Origin of
production (vs. no
information of
distance)
100-km label: almonds were produced within
100km (i.e., within province) 0.68
(33%)
800-km label: almonds were produced around
800km (i.e., within Spanish or neighbour regions) -0.25
(-12%)
2000-km label: almonds were produced around
2000km (i.e., outside Spain but in Europe) -1.03 (-49%)

140
attributes affected consumer preferences with regards to olive oil product choices. Consumer
WTP, as summarised in Table A73, ranged from €1.52 up to €5.60 per litre, being highest for the PDO label with an 86 per cent premium compared with the base price. The second highest
WTP was found for the PF label. The authors commented higher WTP for the PDO label than
the PGI label may be due to the fact that olive oil produced in the study location is typically
PDO-certified.
Table A73: Willingness-to-pay for olive oil attributes, Italy (N = 200*)
WTP €/litre (Premium %)**
Type of olive oil/quality (vs.
Virgin) Extra virgin 4.44 (68%)
European OF label (vs. label
absent) Present 4.78 (74%)
European geographical
indication (vs. label absent)
PDO label 5.60 (86%)
PGI label 1.52 (23%) * In-store interviews in grocery stores, 2010 in Naples.
** Compared to average of the applied price vector (€6.5/litre). Source: Aprile et al. (2012)
In another Italian study, Cosmina et al. (2015) assessed consumer preference for honey
attributes including product origin, product type, landscape of the place of origin and price.
Most respondents (over 90% of the sample) were honey consumers – however, they typically
consumed honey products only occasionally. The place of purchase varies between “buying directly from producer” and supermarkets. The result presented in Table A74 are based on
the use of a consumer segmentation approach resulting in four consumer classes with similar
choice patterns. People in the first class considered only the origin attribute in their choices.
The other three classes were labelled as ‘environmentally friendly’ consumers (35% of the
sample), ‘pro-intensive production’ consumers and ‘organic’ consumers. As Table A74 shows,
environmentally friendly consumers had a WTP of between €4.76 and €3.99 (84 and 70 per cent) for organic and local honey respectively while indicating negative WTP for other
attributes, whereas pro-intensive production and organic consumers were willing to pay
between €2.54 and €8.30 (45 and 146 per cent respectively) for most attributes, with the type of honey valued the highest in both classes. Overall these WTP values indicate strong
preferences towards local and organic attributes in honey with some differences in WTP
between consumer segments. Only a small section of respondents (in Class 1) were not willing
to pay any premium for any product other than the local product.

141
Table A74: Willingness-to-pay for honey attributes, Italy (N = 427*)
Class 1 Class 2 Class 3 Class 4
N/A Environmentally
friendly
Pro-intensive
production
Organic
Class probability 19% 35% 19% 27%
WTP €/jar
(premium %) **
Geographic origin
(vs. other Italian
regions)
Friuli Venezia Giulia
(local) Region
2.88 3.99 4.53 5.41
(51%) (70%) (80%) (95%)
Other countries - -6.45 - -2.54
(-114%) (-45%)
Honey
crystallisation (vs.
semi-solid state)
Liquid (runny) state - -4.84 8.30 6.70
(-85%) (146%) (118%)
Organic (vs. no) Yes - 4.76 6.57 6.33
(84%) (116%) (112%)
Landscape (vs.
Skyscraper hives)
Evocative
landscape
- - 3.69 2.54
(65%) (45%)
Beehives near
industrial buildings
- -1.59 6.74 5.23
(-28%) (119%) (92%) * Face-to-face interviews, in 2014
** Compared to average of the applied price vector (€5.67/jar). Source: Cosmina et al. (2015)
Social responsibility attributes have been included in some, but not many, food and beverage
choice studies. Vlaeminck et al. (2016) assessed consumer WTP for a Fair Trade (FT) chocolate
product in Belgium. This was done using a within-sample test with two separate CEs: a “FT-
label experiment” including the label (FT and Bio-FT), quality & taste, origin of cocoa and price
attributes; and a “FT-characteristics experiment” with sub-attributes of FT covering
environmental standards, price paid to producers, community investment, working conditions
and product price. Half of the sample saw the FT-label CE first, with the other half seeing a
reversed order. In this sample, the general purchase habits of FT products in general, if
available, was split across (almost) never (approximately 50% of sample), regularly (42%) and
always (5%); and only quarter of respondents defined a FT-product correctly. These general
results also show that while most people (70%) believed the FT-statement, not everyone care
about these issues personally. A summary of the WTP results from the CE analysis is provided
in Tables A75 and A76. As shown in Table A75, the results of the FT-label experiment show
that consumers valued the FT-label with a positive WTP of €0.84/100g for the standard FT
label and $1.22 for the Bio-FT label. This equates to 207 per cent and 301 per cent premiums,
respectively, relative to the standard supermarket price. Average WTP for the FT-label was
then compared with different combinations of the FT-characteristics (FT-high, FT-low, BioFT-
high and BioFT-low). As shown in Table A76, WTP values for different FT-sub-attributes were
between €2.25 and €3.76 (up to 928% premium); hence consumers valued the bundle of FT
attributes more than the plain FT labels. The results of the plain FT-label valuation are
comparable to the price premium operated in supermarkets indicating that consumer surplus
is effectively captured.

142
Table A75: Willingness-to-pay for chocolate attributes, Belgium (N= 144*)
CE with a Fair Trade label
WTP €/100g Premium (%)**
Label presence (vs. no
label)
Fair trade label 0.84 (207%)
Bio-Fair trade label 1.22 (301%) * Face-to-face intercept survey, in 2013.
** Compared to supermarket price of FT chocolate (€0.81/200g or €0.45/100g) Source: Vlaeminck et al. (2016)
Table A76: Willingness-to-pay for chocolate attributes, Belgium (N= 144*)
Attribute bundles
CE with Fair Trade characteristics
WTP
(€/200g) Premium (%)**
FT highest outcomes: EU Environmental standard, price paid to
producer, high community investment and frequent controls in working
conditions
3.76 (928%)
FT lowest outcomes: EU Environmental standard, average price paid to
producer, average community investment and infrequent controls in
working conditions
2.54 (627%)
Bio-FT highest outcomes: Organic Environmental standard, fair price
paid to producer, high community investment and frequent controls in
working conditions
3.47 (857%)
Bio-FT lowest outcomes: Organic Environmental standard, average price
paid to producer, average community investment and infrequent
controls in working conditions
2.25 (556%)
* Face-to-face intercept survey, in 2013.
** Compared to supermarket price of FT chocolate (€0.81/200g or €0.45/100g) Source: Vlaeminck et al. (2016)
Boccia et al. (2019) conducted a number of choice experiments to examine Italian consumer
preferences and WTP for brand, corporate environmental and social responsibility
programme participation in relation to ready-meal products. Results indicated approximate
WTP for the inclusion of these attributes, with participants willing to pay a €2.46 premium for
products with recognisable brand names that also participate in the above programmes. In
addition, participants were willing to pay a €1.53 premium for products participating in
environmentally friendly social responsibility programmes, while they were only willing to pay
a €0.19 premium for only social responsibility programme participation (Boccia et al., 2019).
A summary of these results is shown in Table A77 below.
Table A77: Willingness-to-pay for ready meal attributes, Italy (N = 1,083)
Attribute bundles WTP (€/product)
Brand (well-known/recognised vs unknown);
environmental programme participation; social
responsibility participation programme
2.45895
Environmental programme participation; social
responsibility participation programme 1.52860
Social responsibility participation programme 0.19325 Source: Boccia et al., 2019

143
Guney and Giraldo (2020) conducted a discrete choice experiment to understand consumer
attitudes and WTP for organic eggs in Turkey. Aside socio-demographic characteristics, the
authors investigated the egg attributes of production method, brand, colour, and price.
Conducting a survey across seven regions of turkey, the researchers gathered a total of 552
responses by the household member responsible for purchases. The results showed that
consumers perceive organic eggs to be healthier, more nutritious, and better tasting than
conventional methods. Also, organic egg production was seen as being more sensitive to
animal welfare and ethical issues. Table A78 below shows the results for the WTP of egg
attributes.
Table A78: WTP (₺) of Turkish consumers’ for egg attributes Attribute WTP (Turkish Lira ₺)
Price -
Egg type: Conventional -
Egg type: enriched 0.04
Egg type: free-range 0.76
Egg type: organic 0.76
Brand: unbranded -
Brand: local 1.02
Brand: big 0.81
Colour: white -
Colour: brown 0.04 Source: Guney and Giraldo (2020)
North American studies
The current review includes CE and other WTP studies examining the attributes of other types
of food products (canola oil and coffee) in North America (US and Canada). Attributes
examined in these studies include organic, GM production, country-of-origin, social
responsibility, functional foods, environmental condition and carbon/GHG emissions
associated with production.
A comparison of GM (or genetically engineered (GE)) products and associated health-
enhancing (or functional food) benefits were explored by Ding et al. (2015) in Canada. In this
study, consumer preferences for GM-food were linked with consumer trust (generalized trust
and trust in the food system) and health-related beliefs. In the context of canola oil products,
the selected attributes covered GM or GE information, omega-3 content, COO and price.
Consumer trust and health beliefs (i.e. health locus of control (HLC)) were measured in Likert-
scale statements. The results in Table A79 show that consumers were willing to pay a premium
of between 12 and 29 per cent of the base price for domestic and/or regular/enhanced
omega-3 levels over no label. However, this WTP was relatively lower compared to the
perceived disutility, or required compensation, from the negative WTP associated with GM
products. A further analysis with the interactions show (WTP not reported here) that stronger
health concerns will increase WTP for enhanced omega-3, and that negative preferences of
GM food can be offset or linked to trust. Some additional findings included that men valued
GM products more than women, older people and those with higher education were less likely
to prefer GM products, and that people with higher income valued health benefits more.

144
Table A79: Willingness-to-pay for canola oil attributes, Canada (N = 1,009*)
WTP CAN $/1 litre Premium (%)**
Omega-3 content (vs. no
label)
Contains omega-3 0.95 19%
Enhanced omega-3 0.86 17%
Country of origin (vs. USA) Canada 1.45 29%
GM (vs. no label
information)
Non-GM 0.60 12%
Contains GM/GE -1.82 -36% * Nationwide online survey
** Compared to average of the applied price vector ($5 per 1 liter)
Source: Ding et al. (2015)
Van Loo et al. (2015) focused on consumer preferences for sustainability certification of coffee
products. The sustainability labels considered were Fair Trade (FT), Rainforest Alliance, USDA
Organic and carbon footprint, the latter of which is less common in the US coffee market. A
novelty in the study was a focus on visual attention on the choice sets (coffee packages) by
respondents. This was done by an eye-tracking exercise on areas of interest (AOI) using a
tracking device connected to the computer used to complete the surveys. From this, two
measures were calculated - time and count of total fixation. In addition, Likert-scales were
used to explore participants’ attitudes to and perceived importance of the sustainability concepts. Three consumer segments were discovered based on the cluster analysis3:
‘indifferent’, ‘sustainability and price conscious’ and “price-oriented” consumers. Relative WTP
values presented in Table A80 show that respondents, on average, were willing to pay the
most ($1.16/12oz, or 16% premium) for USDA certified coffee, and up to a 19 per cent
premium for ‘sustainability and price conscious’ consumers, which included most of the
sample. The results also showed that visual attention to attributes is related to preferences
for attributes whereby taking more time and fixating more attention on a particular attribute
related to higher WTP. Significant interactions with participants’ attention included USDA organic, Fair Trade and price attributes. Hence this study illustrated that sustainability-
motivated consumers are also likely to seek information about sustainability credentials.
3 Using the variables from the Likert scale questions and eye-tracking attention scores.

145
Table A80: Willingness-to-pay for coffee attributes, USA (N = 81*)
Full sample
By consumer segments***
Sustainability and price
conscious
(n = 47)
Price-oriented
(n = 26)
WTP $/12 oz Premium
(%)** WTP $/12 oz Premium (%)**
Fair Trade – label
(vs. label not
present)
0.68 (9%) 0.71 (10%) -
Rainforest Alliance
– label (vs. label not
present)
0.84 (12%) 0.99 (14%) -
USDA Organic –
label (vs. label not
present)
1.16 (16%) 1.41 (19%) -
Carbon Footprint –
label (vs. label not
present)
- 0.51 (7%) -
Note: In this adapted Table, WTP was included only if the attribute was statistically significant.
* Participants were recruited from a University database, in 2013.
** Compared to average of the applied price vector ($7.30/12 oz)
*** Since the “Indifferent consumer” segment consisted of only 8 participants, no WTP was calculated. Source: Van Loo et al. (2015)
A1.6 Products adopting new technology
Finally, some studies have considered the opportunities provided by technological
advancements in relation to food choices. The current review includes CE and other WTP
studies examining the attributes of food products adopting new technology in Europe (UK)
and North America (US and Canada). Attributes examined in these studies include
nanotechnology, animal welfare, food safety, traceability, country-of-origin, GM production,
functional foods, RNAi, environmental condition and taste.
European studies
Erdem (2015) explored UK consumers’ preferences for reduced food safety risk in chicken products. The authors tested the impact of incorporating nanotechnology into food product
packaging by including this attribute (as a symbol) in one CE and not in the other. Other
attributes of consideration were risk of food poisoning and animal welfare level (based on the
Welfare Quality index). Each subsample was further split into “welfare-improved” chicken consumers and “conventional” chicken consumers according to their reported purchasing
behaviour4. Other than the nanotech attribute, the levels used in the status quo option varied
according to purchasing behaviour. As Table A81 shows, consumers on average preferred
chicken with a lower food safety risk and improved animal welfare, regardless of the presence
of nanotechnology. WTP values were found to be higher for the “welfare-improved” consumers compared with “conventional” consumers. It also appeared that the presence of nanotechnology could increase WTP for food safety and chicken welfare. A choice debriefing
question revealed that around half of the respondents considered the inclusion of such
4 Approximately 30% of the respondents in both samples were welfare-improved chicken consumers.

146
nanotechnology to be “a good idea”, with the remaining responses varying from “not bothered” to “more than concerned”.
Table A81: Willingness-to-pay for chicken attributes, UK (N = 449*)
Consumer type
Nano treatment
(n = 225)
Non-nano treatment
(n = 224)
WTP
(£/chicken)
Premium
(%) **
WTP
(£/chicken)
Premium
(%) **
Food poisoning risk:
Reduction from a baseline
Conventional -0.30 (-10%) -0.30 (-3%)
Welfare-improved -0.59 (-20%) -0.52 (-5%)
Chicken welfare level (scale
0-100)
Conventional 0.09 (3%) 0.08 (1%)
Welfare-improved 0.67 (22%) 0.51 (5%)
* Online survey, in 2010
** Compared to average price (around £3/chicken).
Source: Erdem (2015)
North American studies
Lilavanichakul and Boecker (2013) explored Canadian consumer acceptance of traceability
technology in ginseng products. This was explored amongst trade-offs with the products origin
and manufacturer attributes. As summarised in Table A82, estimated WTP values implied a 16
per cent premium of the base price ($2.78/bottle) for having an internal tag for
traceability/quality assurance. However, this WTP was relatively lower than for the inclusion
of a Guarantee label or Canadian Ginseng product. The negative interaction term with a WTP
of -$1.67/bottle for the simultaneous use of the ‘Canadian Guaranteed’ and ‘Product of Canada’ labels suggest that these attributes could be seen as substitutes.
Table A82: Willingness-to-pay for ginseng product attributes, Canada (N = 1,647*)
WTP ($/bottle with
60 capsules)
Premium
(%)**
Internal tag (vs. no) Yes 2.78 (16%)
Manufacturer (vs. Ontario Association of
Ginseng Producers)
National Manufacturer
Brand -2.34 (-14%)
Canadian Ginseng Guaranteed (vs. no) Yes 9.52 (56%)
Product of Canada (vs. no) Yes 5.74 (34%)
Canadian Ginseng Guaranteed* Product
of Canada -1.67 (-10%)
* Nationwide online survey
** Compared to average of the applied price vector ($16.99/bottle)
Source: Lilavanichakul and Boecker (2013)
In the third new-technology orientated CE, Yue et al. (2015) explored US consumer
preferences for nano- and GM-food in the context of a rice product. The CE considered the
possible benefits (e.g. better food safety) that these technologies could provide. The data was
analysed using a class based approach from which four distinct consumer groups, based on
their choices and characteristics (gender, income, education, race/ethnicity, and political and
religious associations), were identified (see Table A83). Most respondents were in the ‘benefit orientated group’ with a likelihood of 40 per cent for participants to belong to this group.
Across all groups, new technologies had a negative WTP, varying between -2 and -89 percent
of the base price, thus the conventional production method was preferred. The most valued

147
benefits varies across consumer groups. ‘Price oriented’ consumers were willing to pay the
most for the enhanced nutritional elements (an approximate 10 per cent premium) and no
extra for improved taste or environmental impacts when compared to the provision of no
additional benefits. The remaining three groups were willing to pay most for improved food
safety, (premiums of between 9 and 136 per cent), with the ‘benefit oriented’ group indicating
the highest WTP. These results imply that consumers express highly heterogeneous
preferences when distinguished by their choices and consumer characteristics. While new
technologies had negative WTP values, the attached benefits were valued differently across
the groups. Thus consumer preferences towards nanotechnology can include a complex set
of trade-offs.
Table A83: Willingness-to-pay for (a bag of) white rice attributes: The latent class
approach, USA (N = 1,117*)
Class 1***
Price
oriented
Class 2***
Technology
averse
Class 3***
Benefit
oriented
Class 4***
New
technology
rejecters
Class probability 18% 17% 40% 25%
WTP ($/lb)
premium (%)**
Production
technology
(vs.
conventional)
Nanotechnology -0.09 -0.70 -0.94 -3.39
(-2%) (-16%) (-21%) (-77%)
GM -0.1 -0.78 -1.06 -3.9
(-2%) (-18%) (-24%) (-89%)
Benefit
from using the
given
technology
(vs. no
additional
benefit)
Enhanced nutrition 0.42 0.21 5.16 0.56
(10%) (5%) (118%) (13%)
Improved taste - 0.33 2.99 0.56
(8%) (68%) (13%)
Improved food
safety
0.22 0.39 5.96 1.10
(5%) (9%) (136%) (25%)
Less harmful
environmental
impact during
production
- - 4.08 0.37
(93%) (8%)
Note: In this adapted Table, WTP was included only if the attribute was statistically significant.
* Online survey, in 2013
** Compared to average of the applied price vector ($$4.375/lb)
***Statistically significant class determinants: Class 1 reference group; Class 2 Gender; Class 3 Education,
Gender, Income, Religion, Politics; Class 4 Gender, Religion
Source: Yue et al. (2015)
Britton and Tonsor (2019) investigated consumers’ WTP to pay for beef products derived from RNA interference technology. This is a new technology that is not currently used in the meat
sector, but has been successfully used in fruits and vegetables. Ribonucleic acid interference
(RNAi) is a process in which small interfering RNA is introduced into an organism’s cells and disrupts protein synthesis to alter traits such as muscle development, sex ratios and
physiological changes in livestock. This technology has the potential to reduce the level of
hormones and antibiotics used in the industry – something that consumers have been
demanding. To investigate this further, the researchers adopted a choice experiment
methodology and collected responses from an online survey of 3000 U.S. individuals. There were four choice experiment designs and respondents received one of these with an even
spread across the sample (n=750). The three non-price beef steak attributes used in the study

148
were antibiotic use (used, free, no claim), RNAi use (used, free, no claim), and USDA grade
(choice and select).
The results showed a negative association between price and the use of RNAi technology in beef steaks. This suggests that consumers will require a discount for beef products produced
using RNAi, with specific magnitudes varying substantially based on the label wording faced
by consumers. Further, when other controversial attributes are present on the labelling of
these products, such as antibiotic or hormone use, there is a potential market share to be
gained for products using RNAi technology as an alternative. as opposed to antibiotics. This is
important for the future use of the technology and its potential market viability.
A1.7 Summary
In conclusion, this review included 83 international CE and other WTP studies regarding food
and beverage choices and associated credence attributes from 2010 to 2021. This
complements and updates previous reviews (Miller et al., 2014; Saunders et al., 2016) with
the inclusion of more recent studies. Most of the studies reviewed pertained to meat and
seafood products (38), following by wine (12), fruit and vegetable (11) and dairy products (8).
Another 14 studies were reviewed in other product contexts (e.g. coffee and chocolate) or
food products adopting new technology to communicate food safety or traceability. Most
studies examined consumer preferences, typically targeting regular purchasers of the type of
product examined.

149
Appendix A: References
Aichner, T., Forza, C. and Trentin, A. (2017). The country-of-origin lie: Impact of foreign
branding on customers’ willingness to buy and willingness to pay when the product’s actual origin is disclosed. The International Review of Retail, Distribution and Consumer Research,
27(1); 43-60.
Akaichi, F., de Grauw, S. and Darmon, P. (2015). Are Fair Trade, carbon footprint and organic
attributes competing? Some evidences from Scotland, Netherland and France. Paper
presented at the International Association of Agricultural Economists Conference, August 9-
14, 2015, Milan, Italy.
Arnoult, M., Lobb, A., and Tiffin, R. (2010) Willingness to Pay for Imported and Seasonal
Foods: A UK Survey. Journal of International Food & Agribusiness Marketing, 22(3-4); 234-
251.
Balcombe, K., Bradley, D., Fraser, I. and Hussein, M. (2016). Consumer preferences regarding
country of origin for multiple meat products. Food Policy, 64; 49-62.
Bechtold, K.-B. and Abdulai, A. (2014). Combining attitudinal statements with choice
experiments to analyse preference heterogeneity for functional dairy products. Food Policy,
47; 97-106.
Blare, T., Donovan, J. and del Pozo, C. (2017). Estimates of the willingness to pay for locally
grown tree fruits in Cusco, Peru. Renewable Agriculture and Food Systems, 2017; 1-12.
Boccia, F., Manzo, R.M. and Covino, D. (2019). Consumer behaviour and corporate social
responsibility: An evaluation by a choice experiment. Corporate Social Responsibility and
Environmental Management, 26 (2019); 97-105.
Britton, L., and Tonsor, G. T. (2019). Consumers’ willingness to pay for beef products derived from RNA interference technology. Food Quality and Preference, 75; 187-197.
Byrd, E.S., Widmar, N.J.O. and Wilcox, M.D. (2017). Are consumer willing to pay for local
chicken breasts and pork chops? Journal of Food Products Marketing, 0(2017); 1-14.
Calvo Dopico, D., Mendes, R., Silva, H.A., Verrez-Bagnis, V., Perez-Martin, R. and Sotelo, C.G.
(2016). Evaluation, signalling and willingness to pay for traceability: A cross-national
comparison. Spanish Journal of Marketing – ESIC, 20(2); 93-103.
Carlsson, F., Frykblom, P., and Lagerkvist, C.J. (2005). Consumer preferences for food
product quality attributes from Swedish agriculture. AMBIO: A Journal of the Human
Environment, 34(4); 366-370.
Ceschi, S., Canavari, M. and Castellini, A. (2018). Consumer’s Preference and Willingness to Pay for Apple Attributes: A Choice Experiment in Large Retail Outlets in Bologna (Italy).
Journal of International Food and Agribusiness Marketing, 30(4); 305-322.
Chalak, A. and Abiad, M. (2012). How effective is information provision in shaping food
safety related purchasing decisions? Evidence from a choice experiment in Lebanon. Food
Quality and Preference, 26(1); 81-92.

150
Chung, C., Briggeman, B.C. and Han, S. (2012). Willingness-to-pay for beef quality attributes:
A latent segmentation analysis of Korean grocery shoppers. Journal of Agricultural and
Applied Economics, 44(4); 447-459.
Cicia, G., Cembalo, L., Del Giudice, T. and Scarpa, R. (2013). Country-of-Origin Effects on
Russian Wine Consumers. Journal of Food Products Marketing, 19(4); 247-260.
Clark, B., Stewart, G.B., Panzone, L.A., Kyriazakis, I. and Frewer, L.J. (2017). Citizens,
consumers and farm animal welfare: A meta-analysis of willingness-to-pay studies. Food
Policy, 68; 112-127.
Cosmina, M., Gallenti, G., Marangon, F. and Troiano, S. (2015). Attitudes towards honey
among Italian consumers: A choice experiment approach. Paper prepared for presentation
at the EAAE-AAEA Joint Seminar ‘Consumer Behavior in a Changing World: Food, Culture,
Society” March 25 to 27, 2015 Naples, Italy.
de-Magistris, T. and Gracia, A. (2014). Do consumers care about organic and distance labels?
An empirical analysis in Spain. International Journal of Consumer Studies, 38(6); 660-669.
de-Magritis, T. and Gracia, A. (2016). Consumers' willingness-to-pay for sustainable food
products: The case of organically and locally grown almonds in Spain. Journal of Cleaner
Production, 118; 97-104.
Denver, S. and Jensen, J.D. (2014). Consumer preferences for organically and locally
produced apples. Food Quality and Preference, 31; 129-134.
Denver, S., Sandoe, P. and Christensen, T. (2017). Consumer preferences for pig welfare –
can the market accommodate more than one level of welfare pork? Meat Science, 129; 140-
146.
Ding, Y., Veeman, M.M. and Adamowicz, W.L. (2015). Functional food choices: Impacts of
trust and health control beliefs on Canadian consumers’ choices of canola oil. Food Policy, 52; 92-98.
Dudinskaya, E., Naspetti, S., Arsenos, G., Caramelle-Holtz, E., Latvala, T., Martin-Collado, D.,
Orsini, S., Ozturk, E., and Zanoli, R. (2021). European consumers’ willingness to pay for red meat labelling attributes. Animals, 11(2); 556-571.
Erdem, S. (2015). Consumers’ Preferences for Nanotechnology in Food Packaging: A Discrete
Choice Experiment. Journal of Agricultural Economics, 66(2); 259–279.
Everett, C., Jensen, K., Boyer, C., and Hughes, D. (2018). Consumers’ willingness to pay for local muscadine wine. International Journal of Wine and Business Research, 30(1); 58-73.
Ferreira, C., Costa Pinto, L. M., and Lourenco, L. (2021). Effect of region of origin on
willingness to pay for wine: An experimental auction. Applied Economics, 52(32); 3715-3729.
Feucht, Y. and Zander, K. (2017). Consumers’ willingness to pay for climate-friendly labelled
food in Europe. 11th Igls-Forum, 13-17 February.
Gao, Z., Yu, X., Li, C., McFadden, B.R. (2019). The interaction between country of origin and
genetically modified orange juice in urban China. Food Quality and Preference, 71 (2019);
475-484.

151
Gracia, A. (2014). Consumers’ preferences for a local food product: A real choice experiment. Empirical Economics, 47; 111-128.
Grashuis, J. and Magnier, A. (2018). Product differentiation by marketing and processing
cooperatives: A choice experiment with cheese and cereal products. Agribusiness, 34 (2018);
813-830.
Grebitus, C., Peschel, A.O. and Hughner, R.S. (2018). Voluntary food labelling: The additive
effect of “free from” labels and region of origin. Agribusiness, 34 (2018); 714-727.
Guney, O. I., and Giraldo, L. (2020). Consumers’ attitudes and willingness to pay for organic eggs: A discrete choice experiment study in Turkey. British Food Journal, 122(2); 678-92.
Hanley, N., Shogren, J.F. and White, B. (2013). Introduction to environmental economics.
Oxford: Oxford University Press.
Hastie, M., Ashman, H., Torrico, D., Ha, M., and Warner, R. (2020). A mixed methods
approach for the investigation of consumer responses to sheepmeat and beef. Foods, 9(2);
126-142.
Hempel, C. and Hamm, U. (2016). How important is local food to organic-minded
consumers? Appetite, 96; 309-318.
Hensher, D.A., Rose, J.M. and Greene, W.H. (2015). Applied choice analysis (2nd Ed.).
Cambridge University Press: UK.
Hung, Y., and Verbeke, W. (2018). Sensory attributes shaping consumers’ willingness-to-pay
for newly developed processed meat products with natural compounds and a reduced level
of nitrate. Food Quality and Preference, 70; 23-31.
Kallas, Z., Borrisser-Pairó, F., Martínez, B., Vieira, C., Rubio, B., Panella, N., …, Gil, J.M. (2015). The impact of the sensory experience on scale and preference heterogeneity: The GMNL
model approach applied to pig castration and meat quality. Paper prepared for presentation
at the EAAE-AAEA Joint Seminar ‘Consumer Behavior in a Changing World: Food, Culture,
Society. March 25-27, Naples, Italy.
Kallas, Z., Escobar, C. and Gil, J.M. (2013). Analysis of consumers’ preferences for a special-occasion red wine: A dual response choice experiment approach. Food Quality and
Preference, 30(2); 156-168.
Kallas, Z., Vitale, M. and Gil, J.M. (2019). Health Innovation in Patty Products: The Role of
Food Neophobia in Consumers’ Non-Hypothetical Willingness to Pay, Purchase Intention and
Hedonic Evaluation. Nutrients, 11 (2019); doi:10.3390/nu11020444.
Khan, J., Khanal, A. R., Lim, K. H., Jan, A. U., and Shah, S. A. (2018). Willingness to pay for
pesticide free fruits: Evidence from Pakistan. Journal of International Food & Agribusiness
Marketing, 30(4); 392-408.
Lagerkvist, C.J., Berthelsen, T., Sundström, K. and Johansson, H. (2014).Country of origin or
EU/non-EU labelling of beef? Comparing structural reliability and validity of discrete choice
experiments for measurement of consumer preferences for origin and extrinsic quality cues.
Food Quality and Preference, 34; 50-61.

152
Lagerkvist, C.J., Hess, S. and Johansson, H. (2017). How Much Credence Does It Take?
Evidence on the Trade-Off between Country-Of-Origin Information and Credence Attributes
for Beef from a Choice Experiment in Sweden. Foods, 84(6); 1-19.
Lai, J., Wang, H.W, Ortega, D.L. and Widmar, N.J.O. (2018). Factoring Chinese consumers’ risk perceptions into their willingness to pay for pork safety, environmental stewardship, and
animal welfare. Food Control, 85 (2018); 423-431.
Li, X., Jensen, K.L., Clark, C.D. and Lambert, D.M. (2016). Consumer willingness to pay for
beef grown using climate friendly production practices. Food Policy, 64; 93-106.
Lilavanichakul, A. and Boecker, A. (2013). Consumer Acceptance of a New Traceability
Technology: A Discrete Choice Application to Ontario Ginseng. International Food and
Agribusiness Management Review, 16(4); 25-50.
Lim, K.H., Hu, W., Maynard, L.J. and Goddard, E. (2014). A taste for safer beef? How much
does consumers’ perceived risk influence willingness to pay for country-of-origin labeled
beef. Agribusiness, 30(1); 17-30.
Merritt, M.G., Delong, K.L., Griffith, A.P. and Jensen, K.L. (2018). Consumer willingness to pay
for Tennessee Certified Beef. Journal of Agricultural and Applied Economics, 50(2); 233-254.
Miller, S., Driver, T., Velasquez, N. and Saunders, C. (2014). Maximising Export Returns
(MER): Consumer behaviour and trends for credence attributes in key markets and a review
of how these may be communicated. AERU Research Report No. 332, July 2014. Agribusiness
& Economics Research Unit (AERU), Lincoln University: Lincoln, New Zealand.
Morales, L., and Higuchi, A. (2018). Is fish worth more than meat? How consumers’ beliefs about health and nutrition affect their willingness to pay more for fish than meat. Food
Quality and Preference, 65; 101-109.
Mueller, S., Lockshin, L., Saltman, Y. and Blanford, J. (2010). Message on a bottle: The
relative influence of wine back label information on wine choice. Food Quality and
Preference, 21(1); 22-32.
Mueller Loose, S. and Remaud, H. (2013). Impact of corporate social responsibility claims on
consumer food choice: A cross-cultural comparison. British Food Journal, 115(1); 142-166.
Mugera, A., Burton, M. and Downsborough, E. (2017). Consumer Preference and Willingness
to Pay for a Local Label Attribute in Western Australian Fresh and Processed Food Products.
Journal of Food Products Marketing, 23(4); 452-472.
Nishimura, T. (2021). The effect of greenhouse pollination methods on consumers’ willingness to pay for tomatoes in Japan. Journal of Agricultural and Applied Economics, 53;
186-208.
O’Brien, K.A. and Teisl, M.F. (2004). Eco-information and its effect on consumer values for
environmentally certified forest products. Journal of Forest Economics, 10; 75-96.
Ortega, D.L., Wang, H.H., Wu, L., and Hong, S.J. (2015). Retail channel and consumer demand
for food quality in China. China Economic Review, 36; 359-366.

153
Ortega, D.L., Wang, H.H. and Olynk Widmar, N.J. (2014). Aquaculture imports from Asia: an
analysis of U.S. consumer demand for select food quality attributes. Agricultural Economics,
45(5); 625-634.
Paci, F., Danza, A., Del Nobile, M.A. and Conte, A. (2018). Consumer acceptance and
willingness to pay for fresh fish-burger: A choice experiment. Journal of Cleaner Production,
172 (2018); 3128-3137.
Poelmans, E. and Rousseau, S. (2016). How do chocolate lovers balance taste and ethical
considerations? British Food Journal, 118(2); 343-361.
Pomarici, E., Asioli, D., Vecchio, R. and Naes, T. (2018). Young consumers’ preferences for water-saving wines: An experimental study. Wine Economics and Policy, 7 (2018); 65-76.
Probst, L., Houedjofonon, E., Ayerakwa, H.M. and Haas, R. (2012). Will they buy it? The
potential for marketing organic vegetables in the food vending sector to strengthen
vegetable safety: A choice experiment study in three West African cities. Food Policy, 37(3);
296-308.
Risius, A. and Hamm, U. (2017). The effect of information on beef husbandry systems on
consumers’ preferences and willingness to pay. Meat Science, 124; 9-14.
Saunders, C., Guenther, M., Tait, P. and Saunders, J. (2013). Assessing consumer preferences
and willingness to pay for NZ food attributes in China, India and the UK. Contributed Paper
prepared for presentation at the 87th Annual Conference of the Agricultural Economics
Society, University of Warwick, United Kingdom.
Saunders, C., Driver, T., Mowat, A., Kaye-Blake, W., Payn, T., Bayne, K., Saunders, J. … Tait, P. (2016). Driving better programme investment and accelerating challenge impact through a
prioritisation matrix of international and national perspectives. Retrieved 7th November
2017 from http://www.ourlandandwater.nz/the-challenge/greater-value-in-global-markets.
Schaufele, I. and Hamm, U. (2017). Consumers’ perceptions, preferences and willingness-to-
pay for wine with sustainability characteristics: A review. Journal of Cleaner Production, 147;
379-394.
Sellers, R. (2016). Would you pay a price premium for a sustainable wine? The voice of the
Spanish consumer. Agriculture and Agricultural Science Procedia, 8; 10-16. Florence
“Sustainability of Well-Being International Forum”. 2015: Food for Sustainability and not just
food, FlorenceSWIF2015.
Tait, P., Saunders, C., Dalziel, P., Rutherford, P., Driver, T., and Guenther, M. (2020). New
York Sauvignon Blanc wine consumer consumption behaviour and product preferences: A
Latent Class Analysis (Research Report 364). Lincoln University: Agribusiness and Economics
Research Unit.
Tait, P., Saunders, C., Dalziel, P., Rutherford, P., Driver, T., and Guenther, M. (2021).
California apple consumer consumption behaviours and product preferences: A latent class
analysis (Research Report 366). Lincoln University: Agribusiness and Economics Research
Unit.
Tait, P., Saunders, C., Guenther, M. and Rutherford, P. (2016). Emerging versus developed
economy consumer willingness to pay for environmentally sustainable food production: A

154
choice experiment approach comparing Indian, Chinese and United Kingdom lamb
consumers. Journal of Cleaner Production, 124; 65-72.
Tait, P., Rutherford, P., Driver, T., Li, X., Saunders, C., Dalziel, P., and Guenther, M. (2018).
Consumer insights and willingness to pay for attributes: New Zealand yogurt products in
Shanghai, China (Research Report No. 347). Lincoln University: Agribusiness and Economics
Research Unit.
Teratanavat, R., and Hooker, N.H. (2006). Consumer valuations and preference
heterogeneity for a novel functional food. Food Science, 71(7); S533–S541.
Ubilava, D., Foster, K.A., Lusk, J.L. and Nilsson, T. (2011). Differences in consumer
preferences when facing branded versus non-branded choices. Journal of Consumer
Behaviour, 10(2), 61-70.
Uchida, H., Onozaka, Y., Morita, T. and Managi, S. (2014). Demand for ecolabeled seafood in
the Japanese market: A conjoint analysis of the impact of information and interaction with
other labels. Food Policy, 44; 68–76.
Van Loo, E.J., Caputo, V., Nayga Jr., R.M., Meullenet, J.-F. and Ricke, S.C. (2011). Consumers’ willingness to pay for organic chicken breast: Evidence from choice experiment. Food Quality
and Preference, 22(7); 603-613.
Van Loo, E.J., Caputo, V., Nayga Jr., R.M., Seo, H.-S., Baoyue Zhang, B. and Verbeke, W.
(2015). Sustainability labels on coffee: Consumer preferences, willingness-to-pay and visual
attention to attributes. Ecological Economics, 118; 215-225.
Van Loo, E.J., Caputo, V., Nayga Jr., R.M. and Verbeke, W. (2014). Consumers’ valuation of sustainability labels on meat. Food Policy, 49; 137-150.
Van Wezemael, L., Caputo, V., Nayga Jr, R.M., Chryssochoidis, G. and Verbeke, W. (2014).
European consumer preferences for beef with nutrition and health claims: A multi-country
investigation using discrete choice experiments. Food Policy, 44; 167-176.
Viegas, I., Nunes, L.C., Madureira, L., Fontes, M.A. and Santos, J.M. (2014). Beef Credence
Attributes: Implications of Substitution Effects on Consumers’ WTP. Journal of Agricultural
Economics, 65(3); 600-615.
Vlaeminck, P., Vandoren, J. and Vranken, L. (2016). Consumers’ willingness to pay for Fair Trade chocolate. In The Economics of Chocolate by M.P. Squicciarini and J. Swinnen (Eds.)
pp. 180-191. Oxford, UK: Oxford University Press.
Wang, J., Ge, J. and Ma, Y. (2018). Urban Chinese Consumers’ Willingness to Pay for Pork with Certified Labels: A Discrete Choice Experiment. Sustainability, 10 (2018);
doi:10.3390/su10030603.
Wang, L., Wang, J., and Huo, X. (2019). Consumer’s willingness to pay a premium for organic fruits in China: A double-hurdle analysis. International Journal of Environmental Research
and Public Health, 16; 126-139.
Wongprawmas, R. and Canavari, M. (2017). Consumers’ willingness-to-pay for food safety
labels in an emerging market: The case of fresh produce in Thailand. Food Policy, 69; 25-34.

155
Wu, L., Yin, S., Xu, Y. and Zhu, D. (2014). Effectiveness of China’s organic food certification policy: Consumer preferences for infant milk formula with different organic certification
labels. Canadian Journal of Agricultural Economics, 62(4); 545-568.
Wu, L., Wang, S., Zhu, D., Hu, W. and Wang, H. (2015). Chinese consumers’ preferences and willingness to pay for traceable food quality and safety attributes: The case of pork. China
Economic Review, 35; 121-136.
Wu, L., Wang, H., Zhu, D. Hu, W. and Wang, S. (2016). Chinese consumers’ willingness to pay for pork traceability information – the case of Wuxi. Agricultural Economics, 47(1); 71-79.
Xu, P and Zeng, Y.C. (2014). Factors that affect willingness to pay for red wines in China.
Journal of International Consumer Marketing, 26(5); 426-439.
Xu, P., Zeng, Y.C., Song, S. and Lone, T. (2014). Willingness to pay for red wines in China.
Journal of Wine Research, 25(4); 265-280.
Yang, W., and Renwick, A. (2019). Consumer willingness to pay price premiums for credence
attributes of livestock products – A meta-analysis. Journal of Agricultural Economics, 70(3);
618-639.
Yormirzoev, M., Li, T., and Teuber, R. (2021). Consumers’ willingness to pay for organic versus all-natural milk – Does certification make a difference? International Journal of
Consumer Studies, 45(5); 1020-1029.
Yue, C., Zhao, S. and Kuzma, J. (2015). Heterogeneous Consumer preferences for
nanotechnology and genetic-modification technology in food products. Journal of
Agricultural Economics, 66(2); 308–328.
Zanoli, R., Scarpa, R., Napolitano, F., Piasentier, E. Naspetti, S. and Bruschi, V. (2013). Organic
label as an identifier of environmentally related quality: A consumer choice experiment on
beef in Italy. Renewable Agriculture and Food Systems, 28(1); 70-79.
Zhang, C., Bai, J. and Wahl, T.I. (2012). Consumers' willingness to pay for traceable pork,
milk, and cooking oil in Nanjing, China. Food Control, 27(1); 21-28.
Zou, N.-N. and Hobbs, J.E. (2010). The role of labelling in consumers’ functional food choices. Paper prepared for presentation at the 1st Joint EAAE/AAEA Seminar “The Economics of Food, Food Choice and Health” Freising, Germany, September 15–17, 2010.

156
Appendix B: Survey Instrument
Our Land and Water Science Challenge - Survey
Our Land and Water Science Challenge
The Drivers Project
Welcome to Our Land and Water Science Challenge survey.
We welcome your opinion on the international and domestic issues that have the
potential to influence land use change/practice in New Zealand. The results will help Our
Land and Water understand how New Zealanders prioritise the issues facing the primary
sector, and provide market intelligence and foresight into consumer trends.
This survey takes about 10 minutes to complete. You have the right to decline answering any
question or stop the survey at any time. If you do stop the survey before the end, the
information you have provided will not be used. This survey is being conducted by the
Agribusiness and Economics Research Unit (AERU) at Lincoln University in New Zealand.
The lead researcher is Professor Caroline Saunders. If you have any questions or concerns
about the research, you may contact her at [email protected]
To begin the survey, click on the >> button below.
Kind regards,
Caroline Saunders
Page Break

157
Q1 Key Issues: What do you see as the three most critical international issues that have the
potential to influence New Zealand land use change/practice?
1 (Most critical) ________________________________________________
2 ___________________________________________________________
3 ___________________________________________________________
Q2: Key Issues: What do you see as the three most critical domestic issues that have the
potential to influence New Zealand land use change/practice?
1 (Most critical) ________________________________________________
2 ___________________________________________________________
3 ___________________________________________________________
Page Break

158
Q3: International Issues
Below are some key issues that stakeholders and the team have previously identified.
Please indicate whether you think the following international issues/drivers will have a high,
medium or low impact on New Zealand land use change/practice over the coming decade:
High (1) Medium (2) Low (3) Don't know
(4)
Agricultural policy (1)
Air quality (2)
Animal health and welfare
(3)
Authentication/traceability
(4)
Biodiversity (5)
Biosecurity (6)
Brand (7)
Chemical residues (8)
Climate change (9)
Condition of the
environment (10)
Country of origin (11)
Cultural values (12)
Demographics (13)
Digital communications
systems (13)

159
High (1) Medium (2) Low (3) Don't know (4)
Emissions trading
(14)
Extreme weather
events (15)
Fair trade (16)
Family and
community
values (17)
Food safety (18)
Functional foods
(19)
GM and
nanotechnology
(20)
Greenhouse gas
emissions (21)
Health and safety
(22)
Innovative
products and
services (23)
Local foods/food
miles (24)

160
High (1) Medium (2) Low (3) Don't know (4)
Māori values (25)
Organic
production (26)
Pasture-based
production (27)
Product quality
(28)
Public health (29)
Religion (30)
Social
responsibility (31)
Soil quality (32)
Sustainable
supply (33)
Trade agreements
(34)
Trade policy (35)
Waste and
recycling (36)
Water
footprinting and
use (37)
Water quality (38)
Page Break

161
Q7: Domestic Issues
Please indicate whether you think the following domestic issues and drivers will have a high,
medium or low impact on New Zealand land use change/practice over the coming decade:
High (1) Medium
(2) Low (3)
Don't
know (4)
Agricultural policy (1)
Air quality (2)
Animal health and welfare (3)
Authentication/traceability (4)
Biodiversity (5)
Biosecurity (6)
Brand (7)
Chemical residues (8)
Climate change (9)
Condition of the environment (10)
Cultural values (11)
Demographics (12)
Digital communications systems (13)
Emissions trading (14)
Extreme weather events (15)
Family and community values (16)

162
Food safety (17)
Functional food (18)
GM and nanotechnology (19)
Greenhouse gas emissions (20)
Health and safety (21)
Innovative products and services (22)
Local foods/food miles (23)
Māori values (24)
Organic production (25)
Product quality (26)
Public health (27)
Religion (28)
Social responsibility (29)
Soil quality (30)
Sustainable supply (31)
Waste and recycling (32)
Water footprinting and use (33)
Water quality (34)
Page Break

163
Q5: Which sector are you most aligned with?
Meat (1)
Dairy (2)
Wool (3)
Viticulture/Wine (4)
Horticulture (5)
Forestry (6)
Aquaculture (7)
Government (8)
Māori enterprise (9) Science/Research (10)
Extension work (11)
Smart agriculture (12)
Other (please specify) (13)
Page Break
Q6: How important do you consider the following product attributes in achieving higher
product value from lower volume for New Zealand agricultural products?
Very
important
(1)
Important
(2)
Neutral
(3)
Unimportant
(4)
Very
unimportant
(5)
Don’t know
(6)
Animal welfare
credentials (1)
Low carbon footprint (2)
Lower environmental
impact of production (3)
Food safety (4)
Free range (5)
GM-free (6)
High quality (7)
Low level of processing
(8)
Low price (9)
Made in New Zealand
(10)

164
Very
important
(1)
Important
(2)
Neutral
(3)
Unimportant
(4)
Very
unimportant
(5)
Don’t know
(6)
No additives (11)
Organic production (12)
Personal health-
enhancing (13)
Reduced water use (14)
Reduced energy use (15)
Regenerative farming
(16)
Glysphosate-free (17)
Freshness (18)
Good reputation of
producer/grower (19)
Produced by kind,
generous people (20)
Produced by a family
enterprise (21)
Produced by a Māori enterprise (22)
Reduced chemical
residues (23)
Socially responsible
production (24)
Taste (25)
Traceability to farm (26)
Seasonal availability (27)
Care for workers (28)
Care for traditional
cultures (29)

165
Very
important
(1)
Important
(2)
Neutral
(3)
Unimportant
(4)
Very
unimportant
(5)
Don’t know
(6)
Brand (30)
Nutritional content (31)
Pasture-raised rather
than housed indoors
(32)
100% grass fed (33)
Other, please specify:
(34)
Page Break
Q7: Agribusinesses can belong to or participate in many schemes for quality assurance,
marketing, certification or other purposes. For the next few questions, we are calling all of
these ‘agribusiness schemes’. Examples of agribusiness schemes include programmes such
as New Zealand Farm Assurance Programme (NZFAP) and GlobalGAP.
Are you currently participating in an agribusiness scheme?
o Yes
o No
[If ‘No’ selected, skip to Q11]
Page Break
Q8: How many agribusiness schemes are you currently participating in?
Page Break

166
Q9: Does the agribusiness scheme(s) that you are participating in account for
environmental, social, economic, and/or cultural dimension(s)?
Is this dimension
included in the
evaluation criteria
for the
agribusiness
scheme(s) that you
participate in?
How many criteria
are used to assess
this dimension under
the agribusiness
scheme(s) that you
participate in?
How often are you audited/assessed for your
compliance with your agribusiness scheme(s)
requirements for this dimension?
Yes No Number of criteria Monthly Quarterly Annually
Less
than
annually
Environmental Social Economic Cultural
Page Break
Q10: How much does your agribusiness scheme(s) affect the prices that you get for what
you sell?
o Large increase in prices received
o Moderate increase in prices received
o Small increase in prices received
o No increase or decrease in prices o Small decrease in prices received
o Moderate decrease in prices received
o Large decrease in prices received
Page Break

167
Q11: What level of knowledge do you have concerning the following markets/regions:
Very
knowledgeable
(1)
Knowledgeable
(2)
Some
knowledge
(3)
Little
knowledge
(4)
No
knowledge
(5)
North America (Canada,
USA, Mexico) (1)
China (2)
South East Asia
(Vietnam, Thailand,
Cambodia, Indonesia,
Malaysia, Myanmar) (3)
Japan (4)
South Korea (5)
European Union (6)
Other European
countries (7)
United Kingdom (8)
Other (Please specify):
(9)
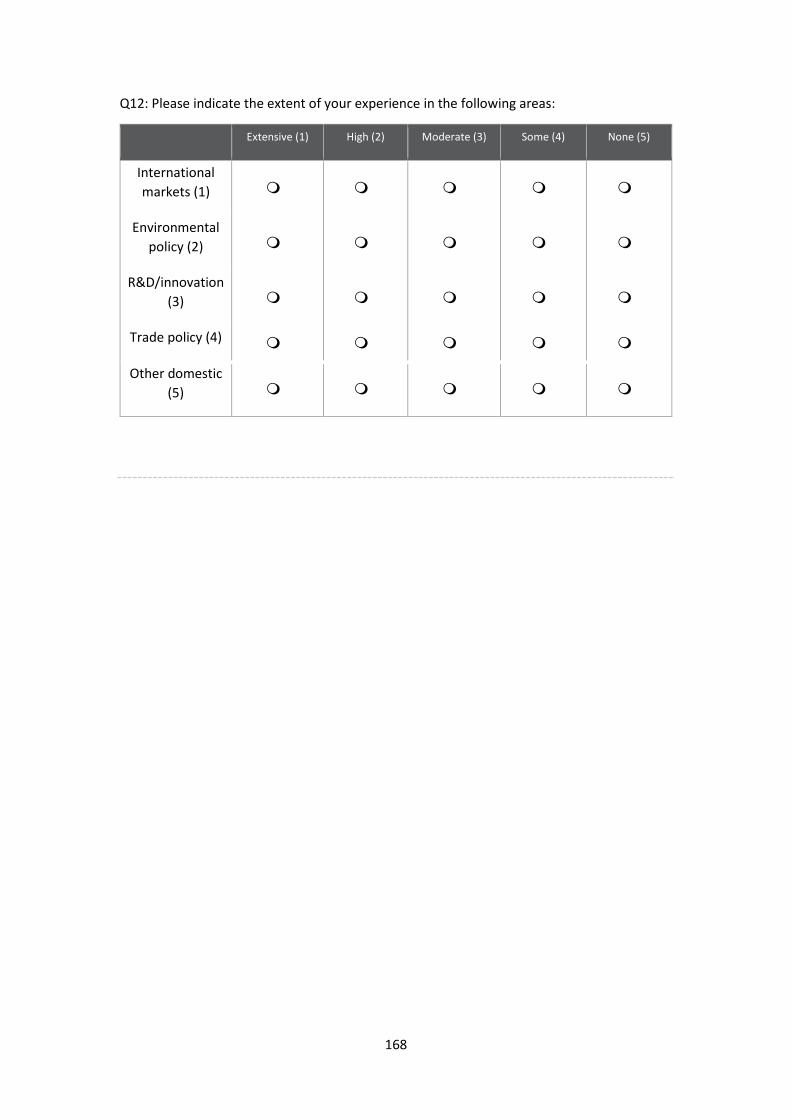
168
Q12: Please indicate the extent of your experience in the following areas:
Extensive (1) High (2) Moderate (3) Some (4) None (5)
International
markets (1)
Environmental
policy (2)
R&D/innovation
(3)
Trade policy (4)
Other domestic
(5)

169
Q13:
Thank you!
Thank you for your contribution to our research.
We value the time and contribution you have made to setting the direction of this National
Science Challenge. If you have any queries, please contact:
Professor Caroline Saunders
End of Block: Default Question Block