The Manitowoc Company, Inc. 2001 Annual Report
62
3 3 3 The Manitowoc Company, Inc. Ready 2001 Annual Report
-
Upload
khangminh22 -
Category
Documents
-
view
0 -
download
0
Transcript of The Manitowoc Company, Inc. 2001 Annual Report

3 33
TheManitowocCompany,
Inc.
Ready2001
AnnualReport

Ready to

AdaptInnovateGrow

2
Photo Credits and AcknowledgmentsIFC L0cation courtesy of St. Luke’s Medical Center, Milwaukee, WI
1 Location courtesy of Mr. Gatti’s Pizza, San Antonio, TX
4 Location courtesy of Wisconsin Maritime Museum,Manitowoc, WI
8 Manitowoc Cranes’ final assembly department, shownleft to right: Shane Deiter, assembly supervisor; Loyd Sandidge, assembly specialist
10 Manitowoc Cranes’ burning department, Gene Kelliher, journeyman burner
12 Location courtesy of Martin Fein Interests, Round Rock, TX
13 Location courtesy of Llano Estacado Wind Farm, White Deer, TX Manitowoc Cranes’ engineering department, Joel Zick, mechanical engineer
14 Manitowoc Ice demand-flow assembly line, shownleft to right: John Hamachek, Jim Cohen, Jane Baumann, certified cuber assemblers
16 Location courtesy of Northern Lights Casino, Walker, MN
17 SerVend’s Flomatic valve department, Kenny Jackson, valve assembly technician
18 Marinette Marine final assembly department, shownleft to right: John Hendrickson, superintendent; Roy Wilch,superintendent
Contents3 Financial Highlights
4 Letter to Shareholders—President and CEO TerryGrowcock reviews Manitowoc’s performance for 2001and explains how we will continue to move aheadthrough challenging times.
6 Manitowoc at a Glance—An overview of our business-es, markets, competitors, and strategic advantages.
8 Ready in Cranes—Rob Giebel discusses how newproducts and a major acquisition are helping us buildour leadership of the global crane market.
14 Ready in Foodservice—Tim Kraus explains howManitowoc has responded to a slowdown in the foodservice market, with innovative products and increasingly efficient operations.
18 Ready in Marine—Tom Byrne reviews how our marinebusiness has achieved a record performance by build-ing new ships and long-term relationships with itscustomers.
22 Building Value—Glen Tellock explains EVA, how weare using it to create value, and its impact on ourfinancial performance.
24 Management’s Discussion and Analysis of Results ofOperations and Financial Condition
35 Supplemental Quarterly Financial and Common StockInformation
36 Eleven-Year Financial Summary—A historical reviewof Manitowoc’s financial performance from 1991through 2001.
38 Consolidated Financial Statements
42 Notes to Consolidated Financial Statements
54 Management’s Report and Report of IndependentAccountants
55 Business Unit Managers
56 Officers and Directors—An introduction to Mani-towoc’s senior management team and the memberscomprising our board of directors.
58 Glossary—Financial, product, and market terms usedthroughout this report and in the industries we serve.
IBC Investor Information—How to contact us, annual meet-ing information, stock purchase plans, and quarterlyearnings dates.
Cover and Introductory Pages
Cover: The U.S. Coast Guard Cutter JUNIPER, built byour Marinette Marine subsidiary, stands watch overNew York Harbor.
Inside Front Cover: Potain Cranes, our largest acquisi-tion ever, expands our product lines and presence inthe global crane market.
Page 1: Manitowoc’s new ice machines and beveragedispensers have enabled us to expand our market-leading positions within our primary end markets.

3
For the Years Ended December 31
Thousands of dollars, except current ratio, shares, per share, return, employee, and shareholder data 2001 2000 % Change
For the Year
Net sales $1,116,580 $873,272 27.9%
Earnings from operations $«÷118,379 $112,652 5.1%
Net earnings $÷÷«45,548 $÷60,268 -24.4%
Net earnings as a percent of sales 4.1% 6.9% -40.6%
Financial Position
EVA $«÷÷19,020 $÷35,447 -46.3%
Total assets $1,080,812 $642,530 68.2%
Current ratio 1.12 0.93 20.4%
Stockholders’ equity $«÷263,795 $233,769 12.8%
Average shares outstanding (diluted) 24,548,463 25,122,795 -2.3%
Per Share
Basic earnings per share before extraordinary loss $÷÷÷÷«2.01 $÷÷÷2.42 -16.9%
Extraordinary loss–net of income tax benefit $÷÷÷÷(0.14) $«÷÷÷÷÷– –
Basic earnings per share $«÷÷÷÷1.87 $÷÷÷2.42 -22.7%
Diluted earnings per share before extraordinary loss $«÷÷÷÷1.99 $÷÷÷2.40 -17.1%
Extraordinary loss–net of income tax benefit $÷÷÷÷(0.13) $÷÷÷÷÷«– –
Diluted earnings per share $÷÷÷÷«1.86 $÷÷÷2.40 -22.5%
Dividends paid $÷÷÷÷«0.30 $÷÷÷0.30 0.0%
Net book value $÷÷÷«10.75 $÷÷÷9.30 15.6%%
Other InformationCash from operations $«÷106,615 $÷63,047 69.1%Property, plant and equipment–net $«÷175,384 $÷99,940 75.5%Capital expenditures $÷÷«29,261 $÷13,415 118.1%Depreciation $÷÷«20,471 $÷÷9,872 107.4%Business acquisitions $«÷285,533 $÷98,982 188.5%Return on invested capital 10.3% 15.7% -34.4%Return on equity 17.3% 25.8% -33.0%Return on assets 4.2% 9.4% -55.3%Number of employees 6,124 4,405 39.0%
Number of shareholders 2,719 2,765 -1.7%
9796 98 99 00 01
$554
.6
$510
.7
$703
.9 $824
.3
$873
.3
$1,1
16.6
9796
Cash from Operations($ Millions)
98 99 00 01
9796
Net Earnings($ Millions)
98 99 00 01
Net Sales($ Millions)
$36.
4
$25.
6
$51.
3
$66.
8
$60.
3
$45.
5
$43.
6
$64.
5
$56.
8
$103
.4
$63.
0
$106
.6
Net sales rose over 27% to $1.1 billion in 2001, and marked the seventh consecu-tive year of record revenues for Manitowoc.
Cash from opera-tions set a new record in 2001, improving 69% to $106.6 million to eclipse the previous record set in 1999.
Net earnings totaled $45.5 million in 2001, the fourth highest level in Manitowoc’s 100-year history.
Financial Highlights

4
Always Ready2001 was a challenging year in many ways. Even thoughwe faced difficult conditions in our end markets, we con-tinued to build value. We increased our share in all ofour major markets. Sales topped $1.1 billion, our sev-enth consecutive year of record revenues. And while netearnings fell to $45.5 million, or $1.86 per fully dilutedshare, they were still the fourth highest in our 100-yearhistory. We generated more than $106 million in cashfrom operations, providing the capital required to imple-ment our strategies and repay debt. Equally important,we added $19 million in economic value.
Adapt Our ability to succeed, even in challenging timeslike these, rests on our ability to adapt, to innovate, andto grow. At the firstsigns of a slowdown,we updated and thenput into practice prof-it assurance plans,designed to lowercosts and help main-tain our margins. Wereduced discretion-ary spending. Weincreased the use of such cost-savingmeasures as consign-ment inventories, which allow us to pay suppliers fortheir products as we use them. We also took the diffi-cult step of sizing our operations to meet current levelsof demand.
At the same time, we completed a number of strategicactions aimed at permanently removing costs. We ration-alized our boom-truck product line and consolidated ourboom-truck manufacturing operations at a single plant.The production of beverage-dispensing valves was con-solidated at our main beverage equipment facility.Additional consolidations are underway.
Innovate While we watched every dollar, and will con-tinue to do so, we did not reduce our efforts when itcame to research and development. Innovation, in ourproducts and our operations, is the lifeblood of this company. In fact, over 80% of the products we sell today have either been invented, redesigned, or ac-quired since 1998.
In 2001, we introduced or acquired more than 100new products. As always, we emphasized the front end
of the development process. We spend a great deal oftime listening to our customers, as well as to the distrib-utors, specifiers, and users of our products, to identifytheir needs. We expend an equal amount of effort identi-fying the gaps in our product lines and developing prod-ucts that help us enter new market categories.
The result is products that succeed in the market-place. One example is our new Model 555 lattice-boomcrawler crane. Introduced at the end of 2001, the 555 isthe first of our cranes that is designed to metric stan-dards—and the global market. A number of unique ben-efits, including simplified maintenance and operation,make it the crane of choice to replace some two to three thousand existing cranes. We had orders fornearly a year’s worth of 555 production before the first
unit was built. That is just one
example of many.Others include newfoodservice productsthat meet the grow-ing demand for im-proved sanitation andlower operatingcosts. A new line ofice machines thatproduce flake iceenables us to serve
healthcare facilities, supermarkets, and other new cus-tomers. With their sophisticated electronics and propul-sion systems, the ships we are launching are among themost advanced ever built.
We continue to innovate inside our operations aswell. In 2001, we finished converting all of our foodser-vice equipment manufacturing facilities to demand-flowsystems that reduce floor space requirements and inven-tories of components, raw materials, and finished goods.New plate-cutting technology at our lattice-boom craneoperation has helped drive down the time it takes to fab-ricate and assemble a crane to a matter of weeks. At ourmarine business, improved production methods havehelped us deliver every one of 22 new Coast Guard vessels on budget and on schedule.
Grow Innovative technology is vital to our growth. Butwe are not stopping there. The new products and 15acquisitions we have made since 1995 have helped usgenerate $164 million in economic value for sharehold-ers and improve our ability to weather downturns in our
“Our ability to succeed, evenin challenging times likethese, rests on our abilityto adapt, to innovate, andto grow.”
Letter to Shareholders
Terry D. GrowcockPresident & Chief Executive Officer

5
Terry D. GrowcockPresident & Chief Executive Officer
markets. Our 2000 acquisition of Marinette Marine, forexample, helped our marine business produce recordsales and earnings in 2001, even though its traditionalcustomers experienced a sharp drop in revenues.
We made another important acquisition in 2001. At cash paid of $307 million, our purchase of PotainCranes, which is based in France, is our single largestacquisition ever. It fit our acquisition standards to a “T.”Potain’s tower cranes complement our existing lattice-boom cranes, nearly double the size of our crane mar-ket, and give us the leading position in two of the threemajor segments of the global crane industry. Overnight,we dramatically increased our presence in global mar-kets, and with crane production facilities on three conti-nents, we can now reduce freight costs and make ourproducts more com-petitive with those oflocal manufacturers.
Looking AheadAggressive cost con-trols allied with inno-vation, acquisition,and global expansionwill help us make themost of a difficult en-vironment. The chal-lenges we face extendbeyond a global reces-sion to a number ofspecific issues.Declines in tourismand travel, even beforethe terrorist attacks ofSeptember 11, havehurt hotels, restau-rants, and our foodservice business. Crane utilizationand rental rates remain high, but a strong dollar hashampered margins. The troubles faced by U.S. steelmanufacturers are echoing among the lake carriersserved by our marine operations.
Conditions will remain challenging in our centennialyear of 2002. Frankly, we expect little, if any, growth inour end markets. But we do expect to continue to in-crease our value. We will once again launch a recordnumber of new products. Our efforts to manage andeliminate costs will help ensure the strongest possiblefinancial performance. We will gain additional savings,
as well as important marketing advantages, by integrat-ing our worldwide crane operations and expanding ourcombined global distribution network. Our ship con-struction business has an impressive list of orders, andwe are actively competing for other major projects.
When the economy does turn around, we will beready. Our diversification helps us manage risk and pro-vides a broad platform for growth. The money we haveinvested in developing new products will build our mar-kets and our brands and put us even farther ahead of ourcompetition. Acquisitions add to our long-term economicvalue. Global expansion opens new opportunities. Highervolumes, combined with low-cost production, will trans-late into higher profits. We will benefit from the invest-ments we are making today, just as we are now benefiting
from the expendituresmade over the pastseveral years.
What’s more, wehave a 100-year tra-dition of prevailingthrough challengingtimes. From the Wrightbrothers’ first flight tothe moon landing andbeyond, few othercompanies survivedmore of the 20th cen-tury. Fewer still are aswell prepared to leadthe way into the 21st.Our core strategieshave proven them-selves, through goodtimes and bad. Andwhether the products
are ice machines, walk-in refrigerators, cranes, or ships,we are known for building the very best. It is a reputationthat has been earned one day at time, over many gener-ations, by the thousands of people who have worked atManitowoc. It is a tradition we can all be proud of.
Now, the objective is to carry that tradition forward.We will do it by emulating our largest Marine customer,the U.S. Coast Guard, whose motto is semper paratus,“always ready.” We will continue our tradition of leader-ship by being always prepared, always ready to adapt tonew conditions, to innovate, and to grow. A century ofprogress is only the beginning.
Pre-Acquisition Sales Post-Acquisition Sales
Pre-Acquisition Earnings Post-Acquisition Earnings
Marine20%
Cranes36%
Marine13%
Cranes48%
Marine15%
Cranes52%
Marine16%
Cranes37%
Foodservice44%
Foodservice39%
Foodservice33%
Foodservice47%
The Pro Forma Impact of Potain
With the acquisition of Potain, Manitowoc’s crane segment nowbecomes our largest contributor of revenues and earnings.

6
$220
.8
$268
.4 $339
.1
$389
.5
$376
.3
$523
.396 97 98 99 00 01
$22.
6 $34.
9 $48.
1
$64.
8
$62.
9
$66.
096 97 98 99 00 01
$242
.3
$247
.1 $319
.5
$379
.6
$425
.1
$411
.6
96 97 98 99 00 01
$34.
0
$36.
7
$53.
0 $65.
4
$61.
4
$57.
9
96 97 98 99 00 01
$47.
6
$39.
2
$45.
4
$55.
2
$71.
9
$181
.7
96 97 98 99 00 01
$6.2
$5.6 $7
.0
$7.3 $8
.9
$18.
9
96 97 98 99 00 01
Business Segment Financial Results ($ Millions) Products & Services
Cranes & Related Products:Femco Machine Company, Inc.Manitowoc Boom Trucks, Inc.Manitowoc Cranes, Inc.Manitowoc Remanufacturing, Inc.Potain, S.A.S.
Crane segment salesand earnings for2001 were enhancedby the acquisition ofPotain.
Foodservice Equipment:Diversified Refrigeration, Inc.Fabbrica Apparecchiature per la
Produzione del Ghiaccio S.r.l.Harford Duracool, LLCKolpakKyees AluminumManitowoc Beverage Systems, Inc.Manitowoc (Hangzhou)
Refrigeration Co., Ltd.Manitowoc Ice, Inc.McCall RefrigerationMultiplex Company, Inc.SerVend International, Inc.
Despite prolongedmarket softness,Manitowoc’s Foodser-vice segment postedsolid results that out-paced the industryfor 2001.
Marine Operations:Bay Shipbuilding Co.Cleveland Shiprepair CompanyMarinette Marine CorporationToledo Shiprepair Company
Strong gains in salesand earnings by ourMarine operationswere driven by a fullyear of results fromMarinette Marine.
Crawler- and truck-mounted lattice-boomcranes; top-slewing and self-erectingtower cranes; hydraulically powered tele-scopic boom trucks; crane rebuilding andremanufacturing services; aftermarketreplacement parts for cranes and excava-tors; industrial repair and rebuilding services.
Brand Names:Manitowoc, Potain, CraneCARE, Femco
Commercial ice-cube machines, ice flakers,and ice-storage bins; ice/beverage dis-pensers; long-draw soft-drink and beerdispensing systems; walk-in refrigeratorsand freezers; reach-in refrigerators andfreezers; refrigerated undercounters andfood-prep tables; private label residentialrefrigerator/freezers; post-mix beveragedispensing valves; cast aluminum coldplates; compressor racks and modularrefrigeration systems; backroom beverageequipment distribution services.
Brand Names:Manitowoc, SerVend, Multiplex, Kyees,Kolpak, Harford, McCall, Koolaire, RDI,Flomatic, Compact, Icetronic, Chill-Pak
New construction services for govern-ment, military, research, and commercialvessels of all varieties, including self-unloading bulk carriers, double-hull tankbarges, integrated tug/barges, anddredges. Inspection, maintenance, con-version, and repair of freshwater and salt-water vessels. Also provides industrialrepair and maintenance services forrefineries, power plants, and heavy industrials.
Corporate Mission—Our mission is to continu-ously improve economic value for our share-holders.
Corporate Scope—The Manitowoc Company is a creator of market-leading engineered capitalgoods and support services for selected mar-ket segments which today include Cranes andRelated Products, Foodservice, and Marine.This is Manitowoc’s strength.
Corporate Purpose—The centerpiece of our efforts will continue to be high-qualitycustomer-focused products and supportservices. Research, marketing, manufactur-ing, support services, and all related ele-ments will generally be product-oriented.The company will use this in evaluating andguiding its business units.
Manitowoc at a Glance
Operating Earnings
Net Sales
Operating Earnings
Net Sales
Net Sales
Operating Earnings

7
Markets Served Primary Competition Key Advantages Industry Outlook
Heavy construction, gener-al contracting, commercialconstruction, energy explo-ration and production,infrastructure, equipmentrental, duty-cycle, dock-side, dredging, industrial,utility services, oilfieldservices, and material-handling applications.
Lattice-boom Cranes:Hitachi Kobelco LiebherrMannesman DematicSumitomo/Link-BeltTerex
Tower Cranes:ComansaGru ComedilLiebherrPeiner
Boom Trucks:National CraneTerex
� Best recognized brands in thelattice-boom crane and towercrane industry.
� Leading share of lattice-boomand tower crane marketsbased on technological inno-vation, product performance,versatility, and reliability.
� Global manufacturing anddistribution capabilities.
� A low-cost producer of high-capacity, lattice-boom crawlercranes.
� Manitowoc cranes commandthe industry’s highest resalevalues.
� Large installed base ofcrawler cranes and towercranes provides strong after-market opportunities.
� Construction equipment sales are expect-ed to increase 0.5% in the United Statesand 1.1% globally in 2002, according tothe Association of Equipment Manu-facturers annual outlook survey.
� U.S. Department of Commerce anticipatestotal construction put-in-place for 2002will reach $708.2 billion, led by energyand infrastructure projects.
� Utilization rates and crane rental ratesremain strong across virtually all marketsectors.
� The average high-capacity liftcrane ismore than 25 years old and is technologi-cally obsolete, which is driving an activereplacement cycle for 15,000 cranes inNorth America. Crane replacement cyclesin Europe, the Middle East, and Asia arelikely to follow.
Foodservice, lodging, hos-pitality, healthcare, conve-nience stores, institutions,and supermarkets; soft-drink bottling and dispens-ing; commercial ice service.
Ice Machines:HoshizakiScotsman
Ice/Beverage Dispensers & Dispensing Valves:I.M.I. CorneliusLancer
Walk-in Refrigerator/Freezers:American PanelKysor/NeedhamNor-LakeW. A. Brown
Reach-in Refrigerator/Freezers:Beverage AirDelfieldTraulsenTrue Foodservice
� Broad-line manufacturer withmulti-national manufacturingand distribution.
� Largest domestic share of commercial ice-cubemachine and walk-in refriger-ator/freezer markets.
� A low-cost producer of com-mercial ice-cube machinesand walk-in refrigerator/freezers.
� Recognized as the industryleader in ice-cube machinetechnology and innovation.
� Manufacturing operations in North America, Europe, and Asia.
� 80 distributors in 70 countries.
� According to the National RestaurantAssociation (“NRA”), restaurant industrysales are projected to reach a record$407.8 billion in 2002, up 3.9% over2001. Full-service and quick-servicerestaurants will generate over 65% of the industry’s revenue gains in 2002.
� Based on NRA data, more than 46% oftoday’s food dollar is spent away fromhome; approximately 44% of all adultsare restaurant patrons on a typical day.
� Annual foodservice equipment and sup-ply industry is forecast to exceed $10 bil-lion in 2002 due to:– more U.S. chain restaurants launching or
expanding their international presence;– continued high levels of remodeling and
renovation by domestic chain restaurants;– more women entering the workforce
helping to create higher levels of dis-posable income.
Government, research, mili-tary, and dredging opera-tions; U.S. and Canadian-flagged Great Lakes fleets;inland waterway operators;oceangoing vessels thattransit the St. LawrenceSeaway and the Great Lakes.
Alabama Shipbuilding & Drydock
Bender Shipbuilding & RepairBollinger, Lockport & LaroseFraser ShipyardsFriede Goldman HalterPort Weller Drydocks
� Adept at all phases of ship-building and ship repair forfreshwater and saltwatervessels.
� Operates the best-equippedfacilities with the most ex-perienced workforce of anyU.S. Great Lakes shipyard.
� Yards strategically locatedon the Great Lakes’ majorshipping lanes.
� Operates more than 60% ofthe U.S. drydocks servingthe Great Lakes, includingtwo of the three largest graving docks.
� OPA-90 legislation requires that all vesselshauling petroleum in U.S. waters must bereplaced with double-hull tonnage by 2015.
� Homeland security initiatives could result in a series of new vessels for the U.S.Coast Guard.
� Non-traditional “off-lakes” markets, whichrequire vessels for dredging, commercial,and specialty applications, are continuing to grow.
� The U.S. and Canadian flag fleets continueto age; creates ongoing opportunities fordry docking, inspection, maintenance, andrepair services.
Corporate Profile—Manitowoc is the leading manufacturerof high-capacity, lattice-boom cranes and tower cranes forheavy construction, energy-related, infrastructure, com-mercial, and crane-rental applications. It is also one ofAmerica’s leading producers of boom trucks. Additionally,Manitowoc is a leading manufacturer of ice machines,ice/beverage dispensers, soft-drink dispensing valves,
cast aluminum cold plates, and commercial refrigerationequipment for the foodservice, lodging, convenience-store, healthcare, beverage, and bottling industries.Manitowoc is also the dominant provider of shipbuildingand ship-repair services on the U.S. Great Lakes.

8
Cranes & Related Products
Setting New Standards. Manitowoc’s newest crawler crane,the Model 555, is a multi-purposemachine that is targeted to replacethe largest installed base ofManitowoc cranes. Introduced latein 2001, the 150-ton Model 555 isdesigned to metric standards, so itcan be manufactured and servicedanywhere in the world.

Three Times Faster. Fabricating the components fora high-capacity lattice-boomcrane requires hundreds ofindividual welds. New roboticwelding systems perform thetask more than three timesfaster than it can be performedmanually, with consistent, high-quality results.
Same Quarter Orders and Shipments(Percent of Units)
42%44
%
58%
20%
31%
66%
47%
60%
20012000Q4Q3Q2Q1 Q4Q3Q2Q1
Ready in CranesIt’s easy to be a leader whentimes are good. Our goal is tolead our markets all of the time.Industry-wide, crane sales havefallen from the peak achieved in1999. Yet, we have continued toincrease our market share—andto operate one of the most prof-itable companies in the industry.
We responded to the condi-tions we encountered in 2001 bygetting closer to customers. Wedoubled the size of our salesstaff and organized it into twodivisions, which focus all of ourproduct lines on either light orheavy lifting. We moved our prod-uct support organization from our headquarters out into thefield. Our new joint service facil-ity in Singapore, the only one ofits kind in the industry, providesfactory-direct parts, service, train-ing, and support for customers in Asia.
We are helping our customersmeet the challenges they are facing today.
Rob Giebel President
9
Building Our Competitive Edge.By building our crawler cranesand tower cranes closer to theirintended end markets, we cancut costs and deliver productsquicker. Shown here is a Potainmast section being fabricated atManitowoc Cranes for the NorthAmerican market.
Any Reason, Any Season. As Manitowoc continues to im-prove its processes and reduceits manufacturing times, custom-ers are ordering their cranesmuch closer to the intended timethey are needed on a project.
New Heights of Performance.Potain’s self-erecting towercranes can be easily towed to any project site, then bequickly deployed in a matter of minutes to provide the vertical height and horizontalreach required for many commercial construction applications.
�
�
�
�

10
Cranes & Related Products
Cutting Production Time and Costs.Innovative new production technol-ogy, including a $1.7-million plasmaand oxy fuel plate cutter, improvesour cycle times and quality. Ournew plasma capability provides asmooth, clean cut that does notrequire any additional finishing,while the oxy fuel heads can cutsteel plate up to 12 inches thick.

Doing More, Getting MoreAt a time when crane utilizationrates are high, we can helpboth contractors and crane-rental companies keep theircranes in operation. New ser-vice maintenance kits, whichprovide everything needed toperform scheduled mainte-nance, are automaticallyshipped to customers at regu-lar intervals, improving mainte-nance practices and reducingpaperwork. New supply pro-grams ship products such aswire rope directly from themanufacturers,so customersreceive them more quickly. Every one of our new cranedesigns sets a
new standard for ease of trans-portation, set-up, operation,and maintenance.
In addition to doing more forour customers, we’ve been get-ting more from our operations.Consolidating our boom-truckproduct line will reduce work-ing capital, improve margins,and make it easier to serve ourcustomers. New engineeringsystems allow us to constructcranes in cyberspace, to ensurethe design is 100% accuratebefore it goes to the shop floor.Plasma-based steel-cuttingtechnology has tripled the pro-ductivity of our plate-cuttingoperations.
11
The Mark of Quality.Our new CraneCAREsm Elite program provides aftermarket support, including OEM parts, field service, technical support,documentation, and computerizedcrane application programs, toleading crane dealers around theworld.
Raising Standards. Manitowoc’s crane simulator,the first of its kind in the indus-try, teaches operators how to liftand handle loads safely. Eachyear, more than 400 operatorstrain in the simulator, whichrecreates the action and con-trols of a Manitowoc 2250.
Designed for the Market.Manitowoc Boom Trucks respondedto changes in its market by consoli-dating its product lines and itsoperations and focusing on higher-value, high-capacity products.Consolidating two plants into oneand reducing the product line from48 models to eight reduces in-ventory costs, improves throughput,and makes it easier to distributeand service products.
�
�
�

Extending Our Reach. The first joint development projectbetween Manitowoc Cranes andPotain resulted in the S282. Thisinnovative crane concept com-bines the mobility of a boom truckwith the advantages of a towercrane, including a four-story work-ing height and an 82-foot reach—enough to place loads exactlywhere they are required inside a building under construction.
Cranes & Related Products
12

13
Changing the IndustryImprovements like these haveenabled us to build cranes closeto 30% faster than we could previously, which reduces costsand improves our ability to meetcustomers’ needs. In fact, we’ve been able to build a heavy lift-crane to a customer’s specifica-tions and deliver it faster thanforeign competitors have beenable to ship their products here.
Our acquisition of Potainchanges the industry. No othercompany offers two of the topbrands, and no one else canmatch our combined resources.
We already have combined oursales and distribution opera-tions, and we are workingtogether to develop new prod-ucts and leverage our combinedpurchasing power. Potain has 18new products in development,many of which are aimed at theU.S. market, and we have begunto manufacture portions ofPotain cranes at our Manitowoc,Wisconsin, facility. Together, ourtwo companies already haveseen the benefits of our com-bined distribution. We’re build-ing our lead.
Raising Our Share. Manitowoc’s Model 2250accounted for over 90% of the 300-ton capacity cranessold worldwide in 2001. Whileindustry-wide crane sales fellduring the year, sales of the2250 set a record, as strongdemand for high-capacitycranes, especially from cus-tomers in the energy industry,drove its success.
Virtually Perfect. Our new Pro-E engineering sys-tem provides up-to-the-minutedrawings, specifications, andchanges that can be shared withsuppliers electronically. Exploded-view drawings that once requiredweeks to develop now can be created in a few hours.
2000 Sales by Region
Other2.0%
North America93.8%
Asia2.0%
Europe2.2%
2001 Sales by Region
Other2.6%
North America78.6%
Asia2.8%
Europe16.0%
Creating Geographic Diversity.With the acquisition of Potain,more than 20% of Manitowoc’sconsolidated revenue nowcomes from the internationalmarketplace.
�
�

14
The Leader. The demand-flow productionsystems now in use across ourfoodservice equipment opera-tions make the most of all of ourresources, from raw material tolabor hours. Flow manufacturingallows different products to bemanufactured in any sequenceon the same production line.Products can be built to order,not to forecast, reducing inven-tory costs and lead times, whileimproving quality and meetingour customers’ requirements foron-time delivery.
Foodservice Equipment

15
85
Restaurant IndustryFood & Drink Sales($ Billions)
The restaurant industry is one ofAmerica’s most dynamic industries. Food and drink sales are forecast to reach $407.8 billion in 2002.
90 9580 00 02
$407
.8
$376
.0
$299
.0
$239
.0
$174
.0
$120
.0
9796
Disposable Personal Income($ Billions)
As disposable personal income continues to grow, Americans are dining out more frequently. On a typical day 44% of all adults are restaurant patrons.
98 99 00 01
$5,6
78
$5,9
68
$6,3
20
$6,6
38
$6,9
90
$7,4
55
Ready in Foodservice Our goal is to grow our business atdouble the rate of the industry. Andwhen demand is down, we expect to trail the market by half. That’sexactly what we’re doing.
We expected sales to slow in2001, so we prepared for it. We cutback on discretionary spendingwhere we could without hurting ourability to serve our customers.Then, we began to reengineer ouroperations, to permanently reduceour costs and improve our margins.It’s the beginning of a comprehen-sive operational excellence efforttargeted to improve every aspect of our products and processes.
The transition to demand-flowmanufacturing gave us a tremen-dous advantage. We build the prod-ucts that were ordered yesterday,today, virtually eliminating inven-tories of finished products, whileactually improving fill rates. We areseeing the benefits everyday.
We are building products bet-ter—and building better products.New product development effortsfocus on the most attractive seg-ments of today’s market, includingconvenience stores and institutions.
Tim KrausPresident
New Ways to Grow. Manitowoc Ice expanded its prod-uct offering by launching a line ofice flakers in 2000. This year, itexpanded that product offeringby introducing an undercounterice flaker. Flakers allow us toserve new groups of customers,including hospitals, delis, super-markets, and a host of otherfoodservice applications. �
�

16
Foodservice Equipment
Chilling Performance. Kolpak is America’s leading pro-ducer of walk-in refrigeratorsand freezers. Each unit is cus-tom built for its specific appli-cation, such as this commercialkitchen which produces thou-sands of meals each day at acasino in northern Minnesota.

17
A Smaller FootprintA new line of ice flakers gives usthe products needed to servesupermarkets and healthcarefacilities. New ice/beverage dis-pensers meet customers’ needsby offering more ice in a smallerfootprint, plus easier cleaning andsanitation. Our walk-in panelplants are extending their exper-tise by building structures forsuch non-foodservice applicationsas enclosures for generators andtelecom equipment.
In spite of softness in the food-service market over the past 18months, our long-term prospectsare bright. In Europe and NorthAmerica, the amount of moneyspent on food consumed awayfrom home or purchased to-gocontinues to grow. And while thegrowth in some segments hasslowed, other segments remainrelatively strong. Many of ourmajor quick-service restaurantchain customers are pursuing theopportunity to grow globally.
Smaller, Faster, Quieter,and More Profitable. Manitowoc’s Q-Series icemachines with patentedCVD® technology not onlyproduce more ice, moreefficiently, but also occupya smaller footprint to freefloor space for more pro-ductive and profitableuses. In this shadowboxcomparison, Manitowoc’sQ1400C is not only 5.5"shorter and 18" narrowerthan a non-CVD Q1300 icemachine, but produces anadditional 90 pounds of ice every day.
Consolidation Pays Off.During 2001, the Flomaticbeverage valve operation,which was previouslylocated in Oregon, wasconsolidated into SerVend.This consolidation becamefeasible after SerVend’simplementation of demand-flow manufacturing.
Global GrowthWe are laying the groundworknow and building the infrastruc-ture for the future. As conditionsimprove, we expect to achievesuperior rates of growth.Manufacturing, training, and ser-vice facilities in China and Europeplus a network of 80 distributors,in 70 countries, give us strongroots in global markets. We canserve customers wherever they dobusiness. Innovative new prod-ucts, including new walk-in refrig-erators, a new line of Europeanice machines, a new line of under-counter ice dispensers, and manyothers, will extend our leadership.We will offer more reasons thanever to choose our products.
A New Niche. Product development effortsbased on an in-depth analysisof our customers’ needs helpus identify new markets—and expand our product lines.During 2001, this included a -10˚F reach-in freezer by McCall(left), a frozen-beverage dis-pensing system by Multiplex(center), and a quick-serviceQSV soft-drink dispensing system by SerVend (right).
�
�
�
18
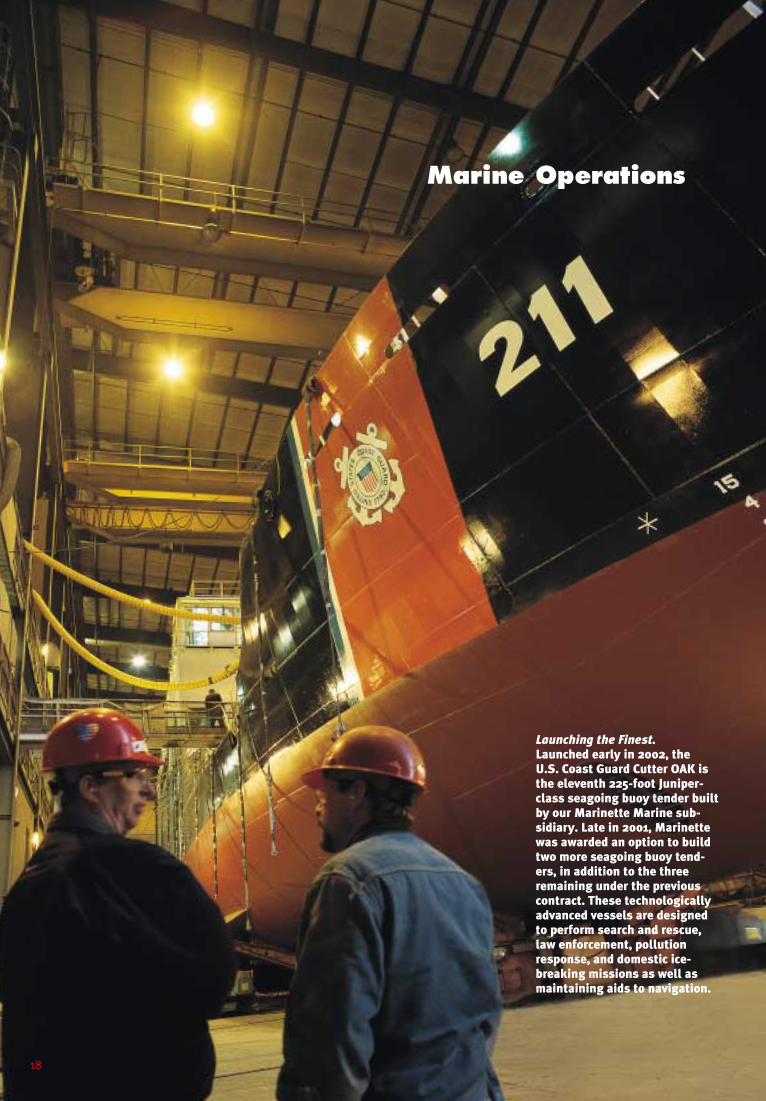
Launching the Finest.Launched early in 2002, the U.S. Coast Guard Cutter OAK isthe eleventh 225-foot Juniper-class seagoing buoy tender builtby our Marinette Marine sub-sidiary. Late in 2001, Marinettewas awarded an option to buildtwo more seagoing buoy tend-ers, in addition to the threeremaining under the previouscontract. These technologicallyadvanced vessels are designedto perform search and rescue,law enforcement, pollutionresponse, and domestic ice-breaking missions as well asmaintaining aids to navigation.
Marine Operations

Continuous Improvement.Improvements in project
management and productionprocesses have helped improve
productivity and increasethroughput. Modular construc-tion techniques allow ships to
be assembled with virtually allof their electrical wiring, pip-ing, and mechanical systems
already in-place. When vesselsare launched, they are more
than 90% complete.
Full Speed Ahead.Our backlog of new ship con-struction projects stretches into2005. More than 85% of thebacklog represents governmentwork for essential vessels.
Tom ByrnePresident
Vessel Date Awarded Anticipated Delivery
Double-Hull TankBarges
6-19-2001 Third-quarter2002
StatenIslandFerries
12-10-2001
12-10-2001
Second-quarter2003
Fourth-quarter2003
CoastGuardBuoyTenders
11-21-2001
11-21-2001
Second-quarter2004
Third-quarter2004
Great LakesIcebreaker
12-10-2001 Second-quarter2004
10-15-2001 Third-quarter2005
8-14-2001 Fourth-quarter2002
VMS1
SIF1
SIF2
WLB15
WLB16
SIF3
GLIB
VMS2
Ready in MarineThe economic situation for theGreat Lakes carriers continues todarken. The severe decline of theU.S. steel industry has drasticallyreduced shipments of iron ore andother materials. As a result, thedemand for our traditional ship-repair and inspection services has also been affected.
Even so, our marine operationsenjoyed a record year, in terms ofboth sales and earnings. We oweour strong performance to our2000 acquisition of MarinetteMarine. While our traditional re-pair business weakened in 2001,there was strong demand for ourshipbuilding capabilities. We’renot moving away from our tradi-
tional repair business—we’re byfar the largest ship-repair organi-zation on the Great Lakes—butwe have found new ways to serveour customers and to grow.
We are building more shipsthan at any time in our recent his-tory, and looking beyond theGreat Lakes. In 2001, we delivereda hopper dredge and three CoastGuard buoy tenders. Orders fornew vessels, including two dou-ble-hull tank barges, three StatenIsland ferries, a dump scow, twoadditional buoy tenders, and thenew Great Lakes icebreaker,MACKINAW, give us a backlogthat extends into 2005. New mar-keting efforts are expected to in-crease that figure even more.
�
�

20
Innovation At Work. The Marine TransportationStudy Act of 1999, which empha-sized the need to invest in ournation’s harbors and waterways,has spurred new interest indredging. We have respondedwith a number of innovative,highly specialized vessels thathave helped to build our busi-ness beyond the Great Lakes. Built at Sturgeon Bay and de-livered in December, the self-propelled 5,000-cubic-meterLIBERTY ISLAND is the first newhopper dredge built in 20 years.
Marine Operations

21
Building a Legend.The City of New York awardedManitowoc the contract to buildthree new Staten Island ferries.The new Kennedy-class ferrieswill be 310 feet long, 70 feetwide, and are capable of trans-porting 4,400 passengers and 30vehicles on each trip betweenStaten Island and Manhattan.Twin pilot houses plus state-of-the-art navigation and propul-sion systems are complementedby a design reminiscent of theferries that plied New York’s harbors decades ago.
Ahead of ScheduleTo handle the new projects, andtake on even more, we are ap-plying our total resources andinvesting to improve our process-es and operations. For example,our Sturgeon Bay shipyard isbuilding the new double-hulledtank barges that will be pro-pelled by two tugs we are build-ing in Marinette. Sophisticatedproject management and designengineering tools keep produc-tion on track and assure that allthe parts of our vessels cometogether as they should.Improved welding and paintingprocesses, coupled with modu-lar construction techniques, have significantly improved ourthroughput. In fact, we havedelivered vessels six monthsahead of schedule.
Number One.Manitowoc is the leading pro-vider of ship services on theU.S. side of the Great Lakes.Operating over 60% of the U.S.Great Lakes’ dry dock footage,including two of the three
largest graving docks, we’reequipped to provide efficientcasualty repairs, as well asscheduled maintenance, in-spection, conversion, and new-vessel construction services.
Most of all, we build with qual-ity. We have earned long-termrelationships with customerslike Great Lakes Dredge andDock, which has ordered 50vessels from us since 1906.Our project managementteams work closely with thepeople who own and operatethe ships we build. We viewourselves as their partners andwe take care of each and everycustomer.
That’s especially true forthe Coast Guard. Whether it issearch and rescue, homelandsecurity, or law enforcement,the men and women of theCoast Guard go in harm’s wayevery day. We are honored bytheir courage and devotion toduty, and are committed tobuilding them the very bestships for their job. Theydeserve nothing less.
Looking Ahead. The Oil Pollution Act of1990 requires that allpetroleum transported inU.S. waters must be car-ried in double-hulled ves-sels by 2015. Based in parton our previous success inbuilding similar vessels,we were chosen to con-struct two articulatedtug/barges, with doublehulls, to transport petro-leum along the West Coast.
�
�
�

22
Building Value Since 1993, we have managed our busi-ness according to EVA® principles. Doing so has helped us achieve superior performance, in good times and bad.
EVA, or Economic Value-Added, defines value creationas the return a business generates over and above its costof capital. Building value means operating our businessmore efficiently without using additional capital, invest-ing capital in projects that earn more than their cost ofcapital, or diverting capital from activities that do notmeet the required cost of capital expectations.
In 2001, we did allthree. Integratingrecent acquisitionsand making the mostof our combined pur-chasing power helpedour businesses oper-ate more efficientlywithout additionalcapital investments.Capital expenditures,such as the purchaseof new plasma-cutting technology, quickly paid for them-selves and produced superior returns. The consolidationof facilities allows us to allocate capital to our morestrategic assets.
The financial discipline that is built into EVA helped usmaintain our profitability in a challenging environment.EVA provides an objective benchmark for evaluating pro-posed investments and determining which offer the bestopportunities to increase margins and reduce capitalrequirements. EVA helps ensure that revenues translateinto earnings, and it encourages our employees to thinklike owners of the company—owners who are in the busi-ness for the long haul.
We believe so strongly in EVA that other than stockoption grants, it is the only incentive plan at the Mani-
towoc Company. Currently, the majority of our managersand more than 76% of our entire domestic workforce arecompensated, at least in part, based on our EVA perform-ance. Ultimately, we would like all employees to receiveincentive compensation or retirement plan contributionsbased on EVA results.
Our EVA performance in 2001 reflects the soft condi-tions in our end markets. We generated $19 million ofEVA in 2001, compared with $35.4 million for 2000. Themajority of the decrease was due to our reduction in
earnings. None-theless, we continueto invest in projectsthat will deliverreturns greater thanour cost of capital.Some of these proj-ects include ouracquisition of Potain,various manufactur-ing initiatives, capitalexpenditures, and
new product development. These investments, combinedwith a rebound in our end markets, will allow us to de-liver superior results. Like owners, we’re willing to investfor long-term success.
We have the freedom to make decisions like thatthanks to our strong cash flows. Previous EVA-basedinvestments provide the high margins and low costs thatenable us to consistently generate cash. As we have donebefore, we will use our excess cash to pay down debt andto fund innovations, acquisitions, investments, andgrowth. We are confident we can achieve those objectives.In a tumultuous period, our stock price has remained rela-tively constant, and even edged upward at the end of the2001. We believe this indicates we’re doing the right thingsfor our shareholders. We’re preparing for the future.
“The financial discipline thatis built into EVA helped usmaintain our profitability ina challenging environment.”
Manitowoc and EVA
Glen E. TellockSenior Vice President & Chief Financial Officer

23
Uses of Cash 1995–2001($136 Billion)
Sources of Cash 1995–2001($136 Billion)
Borrowings 64%Cash flow from operations 33%Proceeds from sale of fixed assets 2%Other 1%
Manitowoc Total Return(Base year = $100, December 31, 1996)
1997
$120
$140
$160
$180
$200
$220
1998 1999 2000 2001$100
Borrowings and cash flow from opera-tions represented approximately $1.3 billion of the cash Manitowoc sourced between 1995 and 2001.
Acquisitions, debt paydown, and capital expenditures, which totaled approxi-mately $1.2 billion, represented the top three uses of Manitowoc’s cash between 1995 and 2001.
Acquisitions 50%Debt paydown 34%Capital expenditures 8%Stock repurchases 4%Dividends 4%
ManitowocS&P Small Cap 600Russell 2000
Working Capital($ Millions)
($25
,296
)
$17,
573
($7,
235)
$1,6
90
($15
,983
)
$34,
929
9796 98 99 00 01
As part of its focus on EVA, Manitowoc is always striving to reduce its working capital. In 2001, working capital increased primarily due to the Potain acquisition.
Cash Gap(Days)
9796 98 99 00 01
54
57 56
53
47
21
Manitowoc’s continuing improvement in reducing its cash gap demonstrates its ability to manage working capital at its most efficient levels while still growing revenues.
EBITDA($ Millions)
Earnings before interest, taxes, depreciation, and amortization have more than doubled since 1996 and set a new record in 2001 by reaching $150.2 million.
9796 98 99 00 01
$75
.8
$62
.9
$10
5.8
$13
3.5
$12
8.7 $
150.
2
Cumulative EVA Performance($ Millions)
98 99 00 01
$33.
5
$0.5
$10.
5 $66.
1$1
09.3
$144
.7 $163
.79695 97
Since 1996, Manitowoc’s commonstock has generated a total returnthat outpaces both the S&P SmallCap 600 and Russell 2000. Manito-woc is a component of both thesewell-known indices.
Manitowoc generated $19.0million of EVA in 2001. Since1995, it has created nearly$164 million of economicvalue for its shareholders.
�
�

24
The following discussion and analysis should be read in conjunc-tion with the consolidated financial statements and related notesappearing in this annual report.
Overview The Manitowoc Company, Inc. (referred to as the “com-pany,” “MTW,” “we,” “our,” and “us”) is a leading diversified,multi-industry manufacturer of engineered capital goods and sup-port services for selected market segments which today includeCranes and Related Products, Foodservice Equipment, and Marine.The centerpiece of our efforts is and will continue to be to providecustomer-focused, quality products and services to the marketswe serve. Research, marketing, resource allocation, manufactur-ing, support services, and all related elements will generally beproducts oriented. We will do this in a manner designed to contin-uously improve economic value for our shareholders.
In the context of providing customer-focused, quality productsand services to our customers and improving economic value forour shareholders, we have established the following goals to beachieved by the end of 2002.
2002 GoalsReach $1.3 billion in sales.Generate 80% of revenues from new products/models introduced or acquired since 1998.Be EVA® accretive in each business unit each year.Supplement core businesses with strategic acquisitions.Continue to make global expansion a key priority.Pursue ISO quality certification for all non-marine operations.
On our way to realizing these goals, we are proud to report a fewkey achievements during 2001:• We surpassed $1 billion in sales for the first time in our 100-
year history, enabling us to achieve our seventh consecutiveyear of record sales.
• During 2001, more than 80% of our revenues were generatedfrom new products/models introduced or acquired since 1998.
• We achieved the fourth best earnings results in our historywith earnings of $45.5 million as earnings benefited from vari-ous initiatives over the last 18 months in all our segments.
• Cash from operations set a record, increasing 69% to $106.6million for the year.
• Despite the challenging economy, which impacted several ofour end markets, we invested $286 million in acquisitions,$29.3 million in capital expenditures, and $8.3 million in R&Dto enhance our market positions.
• We completed the largest acquisition in the company’s history.The acquisition of Potain S.A.S. (f/k/a Potain S.A.) (“Potain”)has expanded our crane product line offering as well as ourmanufacturing and distribution capabilities worldwide. Thisacquisition makes us one of the largest and most diverse lift-equipment providers in the world.
• We reduced our cash gap during the year from 47 days in 2000to 21 days at the end of 2001.
• A total of $19.0 million of EVA was generated during the year.
The following discussion and analysis covers the key driversbehind our results for 2001 and is broken down into four majorsections. First, we provide an overview of our results of operationsfor the years 1999 through 2001 on a consolidated basis and bybusiness segment. In later sections, we discuss our market condi-tions, outlook for 2002, new acquisitions, liquidity, financial condition, and our market risk management techniques. Lastly,we provide a discussion of contingent liability issues, impacts ofaccounting changes, and cautionary statements.
Results of OperationsConsolidated
In Thousands 2001 2000 1999
Net sales $1,116,580 $873,272 $824,339Cost of sales 831,768 637,538 590,627
Gross profit 284,812 235,734 233,712Engineering, selling &
administrative expenses 153,879 114,901 107,369Amortization of goodwill 12,554 8,181 7,392
Operating income 118,379 112,652 118,951Interest expense 37,478 14,508 10,790Other expense—net 1,212 2,024 2,155
Earnings before taxes andextraordinary loss 79,689 96,120 106,006
Income taxes 30,817 35,852 39,222
Earnings before extraordinary loss $÷÷«48,872 $÷60,268 $÷66,784
Extraordinary loss—net of tax 3,324 — —
Net earnings $÷÷«45,548 $÷60,268 $÷66,784
Net sales increased 27.9% in 2001 to $1.1 billion from $873.3 mil-lion in 2000. Excluding the impact of the acquisitions of Potainand Marinette Marine Corporation (“Marinette Marine”), consoli-dated net sales decreased 8.3% in 2001 compared to 2000. Netsales in 2000 increased 5.9% compared to 1999, primarily as aresult of acquisitions.
Prior to 2000, we reported chassis revenues and expenses on a net basis as a component of net sales. During 2000, we beganseparating the revenue and expense components and reportingthem as components of net sales and cost of sales, respectively.We made this change as a part of the implementation of Emer-ging Issues Task Force (EITF) No. 99-19, “Reporting RevenuesGross as a Principal versus Net as an Agent.” As a result, netsales and cost of sales were increased in the Cranes segment by $18.8 million in 1999.
Gross profit as a percent of sales decreased in 2001 to 25.5%from 27.0% in 2000 and 28.4% in 1999. This decline in 2001 ver-sus 2000 was the result of lower volumes in our Crane andFoodservice segments, inherently lower margins across Potain’sentire product line, and increased project work versus repair workin our Marine segment. The 2000 decrease in gross margin versus1999 was due to decreased volumes, inefficiencies caused byinvestments in manufacturing process improvements, and lowermargins on businesses acquired in 2000 and 1999.
Engineering, selling, and administrative expenses (“ES&A”)showed a slight increase during 2001 to 13.8% of net sales versus13.2% of net sales in 2000 and 13.0% of net sales in 1999. Thisincrease is due to lower sales volumes in the Crane and Food-service segments, the acquisition of Potain, which has a less flexible cost structure, and higher than normal quotation activitywithin our Marine segment. Despite our completion and assimila-tion of the Potain acquisition, we have successfully maintainedour ES&A ratio due to our flexible cost structure and our ability tocontrol costs in light of lower volumes. The aggressive cost controlefforts we initiated early in 2001 successfully combined to signifi-cantly reduce or maintain our ES&A in our other businesses.
We were able to maintain the ES&A ratio in 2000 because ofthe flexibility of our cost structure, which enabled us to controlcosts in light of lower volumes in all three of our segments. Wesuccessfully maintained this cost ratio during 2000 despite thefact that we completed and began assimilating five acquisitionstotaling almost $100 million and investigated others.
Management’s Discussion and Analysis of Results of Operations and Financial Condition

25
27.7% on lower sales volumes, increased pricing pressure (espe-cially in lower-tonnage units), sluggish economies in the U.S. andcertain European markets, and the consolidation of our boom-truck facilities into the Georgetown, Texas, facility. Overall grossmargins declined during 2001 primarily due to lower sales vol-umes in all of the segment’s businesses and inherently lowermargins across Potain’s entire product line. ES&A marginsincreased slightly due to the less flexible cost structure of Potain,increased investments to improve engineering systems, and prod-uct development initiatives. We believe the introduction of fivenew platforms in 2001, which was unprecedented in our industry,along with our commitment to continuous product development,will be key drivers to future growth.
Operating income in the Crane segment decreased 3.0% in2000 primarily due to lower sales volumes and the shift of prod-uct sales mix in the boom-truck business toward lower-tonnageunits. Operating margins remained consistent in 2000 with 1999levels primarily due to the offset of decreased gross margins andimproved ES&A margins. Gross margins declined during 2000 primarily due to lower sales volumes in all of the segment’s busi-nesses, the shift in boom-truck product sales mix toward lower-tonnage units, and competitive pricing pressures experienced bythe boom-truck business. ES&A margins improved during 2000 as the segment continued to take advantage of cost reductionsynergies within the boom-truck business and cost reduction ini-tiatives implemented among all Crane segment businesses.
Foodservice Equipment Segment
In Thousands 2001 2000 1999
Net sales $411,637 $425,080 $379,625Operating income $÷57,942 $÷61,368 $÷65,372Operating margin 14.1% 14.4% 17.2%
Foodservice segment net sales declined 3.2% in 2001 to $411.6million compared to 2000 levels. Organic sales growth for theFoodservice segment in 2001 was down 5.2% versus 2000 levels.This decline was primarily driven by the softness in the beverageindustry, as our ice and refrigeration units outperformed the mar-ket and completed the year at sales levels comparable to 2000.
The 12.0% increase in net sales in 2000 to $425.1 million ver-sus $379.6 million in 1999 was due exclusively to acquisitions.Organic sales growth for the Foodservice segment in 2000 wasflat versus 1999 levels.
The 5.6% decrease in operating income during 2001 comparedto 2000 was due to sales volume decreases in our businesses,primarily in the beverage industry. However, during the secondhalf of 2001, we achieved consecutive quarterly improvementswith operating margins exceeding the comparable quarters for theprior year in spite of a decline in sales. This favorable earnings-to-sales ratio highlights our process improvement and cost-reduction initiatives, coupled with higher-margin new productlaunches within the last year. The decrease in operating margin in2000 was due to volume decreases in both the beverage indus-try and refrigeration industry compounded by the historicallylower operating margins of acquired businesses.
Goodwill amortization of $12.6 million during 2001 increased53.5% over the $8.2 million reported in 2000. Amortizationexpense in 2000 increased 10.7% over the $7.4 million recordedin 1999. This increase in amortization expense in 2001 and 2000is the result of the additional acquisition goodwill recognized onacquisitions completed since the beginning of 1999. As a percent-age of net sales, amortization expense has remained constant atapproximately 1% each year since 1999.
Our operating earnings in 2001 of $118.4 million, or 10.6% ofsales, increased 5.1% versus the $112.7 million, or 12.9% of sales,reported for 2000. The decline in 2001 operating margin was pri-marily due to lower operating margins of businesses acquired inlate 2000 and 2001, as well as lower sales volumes at many of ourcore businesses in 2001 versus 2000. Operating earnings for 2000were 5.3% lower than the $119.0 million, or 14.4% of sales, report-ed for 1999. The decline in 2000 operating margin versus 1999 wasprimarily due to lower sales volumes in the Crane and Foodservicesegments and increased project work in the Marine segment.
Interest expense during 2001 of $37.5 million was 158.3%higher than the $14.5 million recorded during 2000. The interestexpense recorded in 2000 was 34.5% higher than the $10.8 mil-lion recorded in 1999. The increase in interest expense during2001 was the result of funding the Potain acquisition and relatedhigher amortization of deferred financing costs incurred to refi-nance existing indebtedness and bank fees. The 2000 increasewas due to the combination of the additional debt incurred tofund acquisitions and to buyback 1.9 million shares of our stock.The effective interest rate paid on all outstanding debt as ofDecember 31, 2001, 2000, and 1999 was 6.7%, 6.9%, and 6.7%,respectively. We controlled our exposure to interest rate increasesover this period in three ways. First, we made effective use ofinterest rate hedges on variable rate debt. Second, we benefitedfrom our favorable fixed rate borrowings. Third, we effectivelyused alternative borrowing vehicles outside our credit facility,such as euro-denominated senior subordinated notes which actas a natural hedge against our European operations, to controlour currency and interest rate exposure. (See the section belowtitled Risk Management for further information).
The 2001 effective income tax rate was 38.7%, compared to37.3% in 2000 and 37.0% in 1999. The increase in our effectiveincome tax rate over this three-year period is due to increasingamounts of nondeductible goodwill amortization expense arisingfrom acquisitions and our increased exposure to higher tax ratesin foreign countries.
Sales and Operating ProfitsCranes and Related Products Segment
In Thousands 2001 2000 1999
Net sales $523,266 $376,250 $389,510Operating income $÷66,028 $÷62,876 $÷64,840Operating margin 12.6% 16.7% 16.6%%
Crane segment net sales rose 39.1% to $523.3 million in 2001compared to 2000 levels. This increase was due exclusively to thePotain acquisition. Excluding the impact of acquisitions in 2001,sales were off 12.4%, a decrease primarily driven by weak eco-nomic conditions in our end markets. Sales of lower-capacitycranes (under 100-ton crawlers and boom trucks) were down over30% from the prior year while the larger end of the market wasrelatively flat.
The 3.4% decrease in Crane segment sales in 2000 was due todecreased domestic sales volumes in our lattice-boom crawlercrane business of lower-tonnage units. In addition, our boom-truckbusiness also experienced decreased sales volumes combined witha shift in boom-truck sales mix toward lower-tonnage units.
Operating income in the Crane segment increased 5.0% in 2001primarily due to the Potain acquisition. However, on an internalbasis without the impact of Potain, operating income declined
2001
$7.
4$9
.3 $9
.9
$8
.2
$2
0.5
$12
.9
1996
Depreciation and Amortization($ Millions)
Depreciation expense more than doubled in 2001, while amortization climbed by 58%,with both figures reflecting the impact of the Potain acquisition.
19981997 1999 2000
$3.
0
$8
.3
$8
.3
$3.
4
$9
.7
$4
.9
DepreciationAmortization

26
Management’s Discussion and Analysis of Results of Operations and Financial Condition (continued)
Marine Segment
In Thousands 2001 2000 1999
Net sales $181,677 $71,942 $55,204Operating income $÷18,924 $÷8,902 $÷7,297Operating margin 10.4% 12.4% 13.2%
Marine segment revenues increased 152.5% in 2001 versus 2000.Before considering the impact of Marinette for a full year in 2001,sales decreased 2.0%. Reported sales growth during 2001 wasdue to the acquisition of Marinette Marine in November 2000,offset by decreased repair revenues at our traditional facilitiesduring the year.
Revenues increased 30.3% during 2000 versus 1999 due toincreased project and repair revenues and the acquisition ofMarinette Marine in November 2000.
The Marine segment reported a 112.6% improvement in oper-ating income during 2001 versus 2000 levels, again due to theacquisition of Marinette Marine. However, the operating margindeclined to 10.4%, down almost 200 basis points from the 2000level, due to a larger portion of the revenues coming from lower-margin projects versus higher-margin repairs.
Marine segment operating income increased 22.0% during2000 versus 1999 levels due to the acquisition of Marinette Marinein November 2000 and the additional project and repair volumesexperienced during the year. Operating margins declined duringthe year due to the continued shift of revenues toward projectwork, and the decline was exacerbated by the acquisition ofMarinette Marine. Marinette Marine’s ship construction backlogactivities make up the bulk of our planned business in the nextfew years at lower margins than our traditional repair business.
General Corporate Expenses
In Thousands 2001 2000 1999
Net sales $1,116,580 $«873,272 $824,339Corporate expense $««««(11,961) $««(12,313) $«(11,166)Percent of sales -1.1% -1.4% -1.4%%
Corporate expenses during 2001, 2000, and 1999 were consistentas a percent of net sales at 1.1% in 2001, 1.4% in 2000, and 1.4%in 1999.
The 10.3% increase in corporate expenses during 2000 was pri-marily due to the fact that there was approximately $0.8 millionof expenses in 2000 related to costs incurred on unrealized acquisitions.
Domestic Market ConditionsMany experts reported that the United States economy sank intoa recession in March 2001. We started seeing a downturn in thecrane and foodservice markets in the latter half of 2000. TheSeptember 11 attacks are said to have had a lasting impact on thetourism and construction industries, among many others. Becauseour businesses are affected by these and other industries thatwere negatively affected by this year’s events, we experiencedweakening market conditions in all three of our business segments.
Credit tightening in the second half of 2001, as well as a weak-ened employment picture, led to declines in commercial buildingprojects, especially in the hotel industry. At the same time, someexpansion has been reported for highways, bridges, electricalpower plants, and schools. While there have been reports ofexpectations of a strengthening economy in 2002 in some areas,we do not anticipate recovery in the short term for the travel andlodging sectors. This means that hotel construction may not see a resurgence this year.
The timing and speed of the economic recovery in the UnitedStates is still hotly debated. The projections for an economicupturn have ranged from as early as the first quarter of 2002 toas late as 2003. Despite this uncertainty, we believe that we arewell positioned to take advantage of a recovery when it occurs.
Cranes—The United States market slowdown that took place inthe latter half of 2000 continued to affect our 2001 sales. Sales of lower capacity (less than 100 tons) crawler cranes and boomtrucks saw the biggest declines. Larger capacity crawler cranescontinued to have good demand, and our development of newproducts helped to reduce the impact of the decline in the overallmarket. In this environment, we maintained market share in theU.S. across our lattice-boom product line and in our ongoingboom-truck product lines.
During 2001 we consolidated our boom-truck business toadjust our manufacturing capacities, better focus our productlines, and improve our cost position in this business.
Overall crane fleet utilization appears to remain relatively high.One of the market factors that limited our ability to generate re-venues was the difficulty our customers experienced in obtainingfinancing. While we do not currently offer financing for our customers, we have taken steps to assist and actively pursuethird-party financing alternatives for them.
Foodservice—The industry slowdown that began in the thirdquarter of 2000 continued through 2001. By industry estimates,the demand for foodservice equipment in 2001 was off 10% to 15% on a year-over-year basis. In the ice machine industry—where reliable data is available—domestic cuber shipments wereoff in 2001 by 10%. However, our business units fared better thanthe industry and gained share in each of the major categories.The gain was primarily driven by aggressive new product intro-duction programs.
The recession and events in the late third and fourth quartersdamaged the traditional quick-service and lodging industry seg-ments more seriously than most other segments. Although bothof these industry segments were already showing signs of latemarket maturity, they were affected significantly by the suddendecline in travel. The upscale and fine dining industry segments,while a smaller portion of the overall market, were particularlysensitive to the general economy and employment levels and suffered as well.
On the positive side, new-store construction in the casual dining,convenience store, and institutional markets remains compara-tively strong. Upscale sandwich shops also enjoy a growingdemand supported by aging baby-boomers looking for “healthier”lunch venues.
We believe the fundamentals of the market remain solid andthere are some early signs that the economy is starting to stabi-lize. We expect the market to remain flat throughout 2002.
Marine—The Marine segment continues its growth led by thefocus on new construction projects. The integration of MarinetteMarine has enabled the Marine segment to compete nationallyfor projects of varying scopes in both the governmental and commercial markets. During this first year of our “new” Marinesegment following the acquisition of Marinette Marine, we suc-cessfully obtained contracts to build 11 new vessels. These projectswill stretch out into 2005.
We believe the fundamentals of these vessel construction mar-kets are currently quite solid, and we believe they will supportcontinued growth within our Marine segment. The demand for

27
Marine—The Marine segmentcontinues to be primarilyfocused in the United States,although during the past yearwe prepared proposals for somepotential foreign work. We con-tinue to respond to inquiriesregarding research, ferry, patrol,and defense profiles, and wewill evaluate these opportuni-ties as they arise. We also con-tinue to effectively and quicklycomplete emergency repairs forforeign flag vessels moving through the Great Lakes utilizing ourstrategically placed and efficient shipyards.
OutlookStatements regarding our outlook for 2002 are forward-lookingstatements as referred to on page 34 of this report titled, “Cau-tionary Statements About Forward-Looking Information.” This out-look is based upon our current expectations and involve risks anduncertainties that could cause the actual results for 2002 to differmaterially from these estimates. Please refer to the aforemen-tioned section regarding forward-looking statements for a moredetailed list of the risk factors involved in achieving these projec-tions.
Specific 2002We project that our sales growth for 2002 will be in the high singleto low double-digit range, including the effects of our first full yearof revenue from Potain. We anticipate the crane market will bedown 5% to 10% in 2002 versus 2001 due to continued softnessin our end markets as well as uncertainty surrounding customers’access to financial capital. However, we believe that our internalCrane segment growth will be slightly better than the market dueto new-product introductions. We expect the Crane segment de-cline will be offset by gains in the Foodservice and Marine seg-ments. We expect gains in the Foodservice segment will be drivenby new-product development and additional market share gain.Our projected revenue increases in the Marine segment are basedon current construction contracts.
On a consolidated basis, we expect gross margins to increaseto a range between 26% and 27%. We project gross margins inour Cranes to increase to between 24% and 25%; Foodservice tobetween 28% and 29%; while we expect Marine segment grossmargins to decline to between 23% and 24%. The operationalimprovements made in 2000 and 2001, such as the consolidationof our boom-truck and certain beverage facilities and reductionsin workforce within the Crane and Foodservice segments, likelywill be somewhat offset by a shift toward lower gross marginproject work in the Marine segment.
Assuming we meet our stated projections, we anticipate thatselling, engineering, and administrative expenses, as a percent ofsales, will increase in 2002 due to a full-year for Potain, alongwith increased employee-related benefits in each of the seg-ments. Therefore, based on improved consolidated gross marginsbut slightly higher SG&A, we expect that operating margins for allthree segments will improve slightly.
vessels compatible with the capacities of our shipyards and ourexperience base continues to accelerate. We expect the demandfor our ship-repair services will decline in the coming year as ourcustomers face increasing competition and economic pressure inthe domestic markets for their products and services. We expectthe U.S. steel industry to continue to struggle against foreignimports, thereby reducing cargo-carrying requirements on theGreat Lakes.
International Market ConditionsAs a result of our efforts to become more global in our existingbusinesses, demonstrated in part by the acquisition of Potain byour Crane segment during the second quarter of 2001, we arenow affected more than ever by non-domestic world economies.The economies of Europe and Asia in particular affected our inter-national performance during 2001 and likely will continue toimpact us going forward.
Within Europe the majority of our sales occur in France, Ger-many, and the United Kingdom. In Asia, we participate primarilyin the economies of Southeast Asia. During 2001, the economiesof Europe were flat to moderately down as compared to prioryears, due primarily to the continued recession in Germany,Europe’s largest economy. The Southeast Asian economy continuedto struggle coming off its crisis of 1999. The uncertainties thatplagued the U.S. economy were exacerbated by the uncertaintiesin the international and foreign economies during the year. Thesecircumstances affected all of our businesses, especially in theCrane and Foodservice segments.
Cranes—For the crawler crane portion of our Crane segment, theinternational market remained relatively flat. Our overall cranesegment historically has derived about 90% of its revenue fromsales within the U.S. Our May 2001 acquisition of Potain changedthe landscape of our overall revenue mix. Including the towercrane business of Potain, our revenue mix changed to 60% fromsales inside the U.S. and 40% from sales outside the U.S. Themarkets in France and Spain were steady in 2001, while the mar-kets in Italy and China grew. Overall, European growth was ham-pered by a significant decline in the German market in 2001. Theintegration of Potain has positioned us well to take advantage ofproviding global lifting solutions.
Foodservice—Our Foodservice segment international sales weredown from prior year. This follows double digit growth for the pre-vious three years. The major factors that negatively affected ourfoodservice businesses included the continued strength of theU.S. dollar, the global economic recession, and the breakout of“mad cow” disease that slowed quick-service restaurant expan-sion programs in Europe.
We anticipate that international new-store construction in the quick-service restaurant segment will continue to outpacedomestic construction activity. The economic and beef qualityissues have slowed the quick-service restaurant expansion pro-grams and have caused participants in that industry to reevaluatecertain markets in terms of investment priority. We anticipate thefoodservice markets in Europe and Asia will recover to previousgrowth levels in late 2002. China is attracting special attention in the foodservice industry due to continued robust economicconditions. We believe growth in the foodservice market in LatinAmerica, with few exceptions, will be delayed until economic con-ditions improve.
In response to the strong U.S. dollar, we are shifting moreattention to supplying product from our Italian and Chinese man-ufacturing operations. Our China subsidiary, which manufacturesice machines, is particularly well positioned to meet the needs ofthe fast growing quick-service restaurant and hospitality indus-tries there. This operation is also strategic as a source of supplyfor the entire Asia/Pacific region.
9796 98 99 00 01
$12
.0
$8
.4
$11
.7 $13
.7
$13
.4
$2
9.3
9796
SG&A as a Percent of Sales(Percent of Sales)
SG&A increased slightly in 2001 dueto lower volumes in the Crane andFoodservice seg-ments, the acquisi-tion of Potain, andhigher than normal quotation activityin our Marinesegment.
98 99 00 01
9796
Gross Profit($ Millions)
In 2001,Manitowoc’s grossprofit set a recordfor the eighth consecutive year,climbing to$284.8 million,up nearly 21% from the previousrecord of $235.7million in 2000.
98 99 00 01
Capital Expenditures($ Millions)
To support its futuregrowth, Manitowoc invested approxi-mately $21.2 million in process and manu-facturing improve-ments during 2001. The remaining $8.1 million represents our investment inPotain’s fleet ofrental cranes.
$15
2.6
$13
4.6
$19
5.6 $
233
.7
$2
35.7
$2
84
.8
15.415
.9
14.1
13.0
13.2 13
.8

28
Management’s Discussion and Analysis of Results of Operations and Financial Condition (continued)
We project interest expense for 2002 will be approximately $11million per quarter, while other expense should be comparable to2001 totals. In addition, we estimate the 2002 effective tax rate atbetween 39% and 40%.
Depreciation for the year is projected at nearly $25 million. Inaddition, due to the change in accounting for goodwill underStatement of Financial Accounting Standards (“SFAS”) No. 142,“Goodwill and Other Intangible Assets,” our preliminary estimateof amortization in 2002 is about $2 million.
As a result of all of this, we expect cash from operations toonce again exceed $100 million. With scheduled debt pay-downsour debt-to-capital ratio at the end of 2002 should be under 60%.However, as in 2001, we will use excess cash flows in 2002 to paydown debt. As a result, we believe our debt-to-capital levels couldbe less than 50% by the end of 2003.
Taking into consideration the new accounting rules for goodwillamortization, the current First Call consensus per share earningsestimates for our common stock in 2002 range from a low of$2.46 to a high of $2.60. Based on our visibility, current economicassumptions, and our internal analysis, we believe these projec-tions are reasonable.
We are not depending on an economic upturn to drive ourresults. Instead, we continue to focus on new-product develop-ment, operational improvements, and cost-cutting initiatives toimprove our bottom line. However, should our end markets see arebound in 2002, we are poised to take advantage of the change.
We believe our focus on EVA and cash management are tremen-dous advantages. This gives us the flexibility to be opportunistic ata time when others in our industries may not have such capability.
Special Considerations and RisksOur businesses, primarily in our Crane and Marine segments, par-ticipate in cyclical markets with the Crane businesses being moresusceptible to this cyclicality. The Foodservice businesses aremore greatly impacted by seasonality. Historically, sales of prod-ucts that we manufacture and sell have been subject to cyclicalvariations caused by changes in economic conditions. In particu-lar, our Crane segment is impacted by the strength of the econo-my generally, interest rates, and other factors that may have aneffect on construction activity. During periods of expansion inconstruction activity, we have typically benefited from increaseddemand for our products.
Conversely, during recessionary periods, we have been adverselyaffected by reduced demand for our products. The U.S. construc-tion and travel industries experienced downturns during 2001,which adversely impacted our customers and suppliers. We cannotpredict whether this downturn will continue or perhaps becomeeven more severe, so we attempt to manage our businessesthrough these periods of uncertainty by concentrating on our coreactivities, continuing to introduce new and innovative products,maintaining high levels of customer service, managing our costs,and maintaining focus on EVA results. We believe that thesepoints of focus will help us to maintain profitability during thedownturns as well as prepare us to take full advantage of anyfuture recovery.
Other external factors which we consider, evaluate, and de-velop actions to mitigate, but the root of which are out of our control, include but are not limited to the following:• We participate in industries that are intensely competitive.
Our revenues can be adversely affected from time to time byour efforts to respond to that competition and to developstrategies to combat competition. We believe that our productdesign, quality of products, and services provide counter-measures which help to mitigate this risk.
• Price increases in some of our raw materials and sources ofsupply could negatively affect our costs in the future. Weattempt to mitigate this risk with our global manufacturing andmaterial sourcing leverage, strategies that cause many suppliersto view us as a preferred customer and allow us to effectivelynegotiate competitive prices and terms.
• We increasingly manufacture and sell our products outside theUnited States, which may present additional risks to our busi-ness. These international operations are generally subject tovarious risks, including political, religious and economic insta-bility, local labor market conditions, local government regula-tions, and differences in business practices, to name a few.While these risks are significant, we believe that our manage-ment teams, as well as the relative stability of the internationallocations in which we operate, help us to mitigate our exposureto these items and to anticipate new issues on a timely basis.
In light of these and other factors that affected our performance in2001 and that likely will affect us in 2002 and beyond, we believethat our diversified business model will continue to prove its worthas the strengths and weaknesses of our businesses balance eachother through the cyclical and seasonal trends as well as cushionus against unfavorable external influences associated with oneparticular country or region.
AcquisitionsOur growth in 2001 versus 2000 was mainly due to the acquisi-tions that we made during these years. Over the past three years,we have completed nine acquisitions (the acquisition of Potain in2001 being the largest in our history) and continue to seek newstrategic acquisition candidates in each of our segments thatmeet our acquisition criteria. All of the following acquisitionswere funded with cash from our existing or refinanced credit facil-ities and recorded using the purchase method of accounting.Each of these acquisitions has been included in our ConsolidatedStatements of Earnings beginning with the date of acquisition.
Growth through acquisition is dependent upon many factors,which may impact our ability to continue this trend. A portion ofour external growth strategy is dependent upon our ability toidentify and effectively negotiate suitable acquisitions and toobtain financing for future acquisitions on satisfactory terms. Inaddition, the success of this strategy is heavily dependent uponour ability to successfully integrate the acquired businesses,operate them profitably, and accomplish our strategic objectivesunderlying these acquisitions. We attempt to address these chal-lenges by adhering to a structured acquisition assessment andintegration process, and by employing appropriate internalresources and experienced personnel to assist us in accomplishingour objectives.
2001 Acquisitions—On May 9, 2001, we completed the acquisi-tion of Potain from its former parent company, Legris IndustriesS.A., by purchasing for cash all of the outstanding capital stock ofPotain. Potain, founded in 1928, is a leading designer, manufac-turer, and supplier of tower cranes for the building and constructionindustry, with a worldwide market share at nearly 30%. Potainhad total revenues in 2000 of approximately 287 million euro(approximately $264 million) and assets at the end of 2000 equalto approximately 273 million euro (approximately $256 million).This acquisition broadens our Crane segment product line andestablishes us as a leading global manufacturer of tower cranes,a market segment in which we have not previously participated.

29
of fountain soft-drink beveragedispensers, on April 9, 1999.Based in La Mirada, California,Kyees is a technology leader inthe manufacture of cold plates—a key component used to chillsoft drinks in dispensing equip-ment. The aggregate purchaseprice paid for Kyees was $28.5million, which is net of $1.0 mil-lion cash acquired and includesdirect acquisition costs of $0.3million, assumed liabilities of$2.2 million, and the payment of a $1.3 million post-closing work-ing capital adjustment. The excess of the purchase price paid overthe estimated fair value of the net assets acquired is $24.1 million.
On January 11, 1999, we completed the acquisition of Purchas-ing Support Group, which was later renamed Manitowoc BeverageSystems, Inc. (“MBS”). MBS is a beverage systems integrator,with nationwide distribution of backroom equipment and supportsystem components serving the beverage needs of restaurants,convenience stores, and other outlets. The aggregate purchaseprice paid for MBS was $43.7 million, which is net of cashacquired of $0.8 million and includes direct acquisition costs of$0.5 million and assumed liabilities of $5.9 million. The excess ofthe purchase price over the estimated fair value of the net assetsacquired is $34.0 million.
Liquidity and Capital ResourcesCash flows from operations of $106.6 million during 2001 was up69% from $63.0 million in 2000, and up 3% from the $103.4 mil-lion reported in 1999. The following table summarizes oursources and uses of cash during 2001.
In Thousands 2001
Sources of cashNet earnings $÷45,548Noncash adjustments to income1 39,180Borrowings/refinancing 501,234Proceeds from sale of fixed assets 10,219Exercises of stock options 183Changes in operating assets and liabilities 21,887Total $618,251
Uses of cashBusiness acquisitions $285,533Capital expenditures 29,261Repayment/refinancing of debt 265,316Dividends 7,358Debt issuance costs 21,023Other 162Total 608,653
Net cash flow $÷÷9,5981
Noncash adjustments made to arrive at cash provided by operations include depreciation, amortization, deferred income taxes, deferred financing fees, extraordinary loss, and gain on sale of fixed assets.
It also significantly increases our Crane segment sales derivedoutside of North America, provides us with manufacturing ca-pacity in Europe and Asia, and adds significantly to our distribu-tion network throughout the world.
The aggregate consideration paid for Potain was $424.8 mil-lion, which includes $307.1 million paid in cash, and includesdirect acquisition costs of $3.7 million, assumed liabilities of$138.8 million, the payment of a post-closing adjustment of $3.6million in February 2002, and is less cash acquired of $28.4 mil-lion. The preliminary estimate at December 31, 2001 of the excessof cost over fair value of the net assets acquired is $203.3 million.This amount will be allocated to specific intangible assets duringthe first half of 2002. Based upon a third party appraisal report,the preliminary allocation is as follows: $53.0 million to trade-marks and tradenames with an indefinite life; $17.5 million topatents with a 15-year life; $8.8 million to engineering drawingswith a 15-year life; $5.0 million to in-place distribution networkwith an indefinite life; and the remaining $119.0 million to good-will with an indefinite life. The final determination of goodwill willbe dependent upon the finalization of a third party appraisal oftangible and other intangible assets to be completed in 2002.
During 2001, we also completed the acquisitions of certainassets of a German-based telescopic personnel platform lift com-pany, assets of a terminated Singapore-based crane equipment dis-tribution company, and assets of a local contractor for the Marinesegment. The total aggregate consideration paid for these acquisi-tions was $2.5 million, which includes direct acquisition costs andassumed liabilities, less cash acquired.
2000 Acquisitions—On November 20, 2000, we completed theacquisition of Marinette Marine, a builder of mid-sized commercial,research, and military vessels located in Marinette, Wisconsin.Marinette had total revenues in 1999 of approximately $100 mil-lion. We paid an aggregate price of $66.7 million for all the out-standing shares of the company, which includes cash paid of$48.1 million, the receipt of a post-closing working capital adjust-ment from seller of $0.9 million in September 2001, is net of$18.6 million of cash acquired and includes $1.4 million for directacquisition costs and the assumption of $17.2 million of liabilities.The excess of the purchase price over the fair value of the netassets acquired is $50.0 million.
On April 7, 2000, we acquired substantially all the net businessassets of Harford Duracool, LLC of Aberdeen, Maryland, a manu-facturer of walk-in refrigeration equipment, for an aggregate priceof $21.2 million, which includes direct acquisition costs of $0.5million, assumed liabilities of $1.4 million, and the payment of apost-closing working capital adjustment of $0.3 million. Harfordhad sales of approximately $17.0 million in 1999. The excess ofthe purchase price over the estimated fair value of the net assetsacquired is $15.0 million.
We completed the acquisition of all of the outstanding stock of Multiplex Company, Inc., of St. Louis, Missouri, on March 31,2000, by means of a merger transaction. Multiplex, which hadsales of approximately $31.0 million in 1999, is a manufacturer of beverage-dispensing equipment. We acquired Multiplex for anaggregate purchase price of $20.5 million, which is net of $3.7million of cash acquired and includes $0.4 million of acquisitioncosts and $5.3 million of assumed liabilities. The excess of thepurchase price over the estimated fair value of the net assetsacquired is $12.7 million.
During 2000, we completed other smaller acquisitions whosetotal aggregate consideration paid was $18.2 million, which is net of cash received and includes direct acquisition costs of $0.2 million and assumed liabilities of $2.8 million.
1999 Acquisitions—We acquired Kyees Aluminum, Inc., a leadingmanufacturer of cooling components for all of the major suppliers
9796
R&D Expense($ Millions)
Manitowoc hasbeen able to successfully drive its end markets with an ongoing stream of new products. In 2001, its research and development expense totaled$8.3 million.
98 99 00 01
$4
.4
$3.
5
$4
.7
$6
.9
$6
.7
$8
.3
9796 98 99 00 01
$8
6.2
$6
7.6
$78
.7
$8
6.7
$79
.4
$2
56.7
InternationalShipments ($ Millions) Manitowoc’s acqui-sition of Potain lessened its tradi-tional dependency on the U.S. market and broadened itsopportunitiesthroughout theworld. As a result, international salesclimbed nearly 225% in 2001.

30
Management’s Discussion and Analysis of Results of Operations and Financial Condition (continued)
During 2001 there was a net increase of $269.7 million in our out-standing borrowings under our existing credit facilities to $488.6million at December 31, 2001, from $218.9 million at December 31,2000. As a result, our debt-to-capital ratio at the end of 2001reached 64.9% versus 48.4% at the end of 2000. This increase in 2001 was driven primarily by the funding of the Potain acquisi-tion. In connection with the Potain acquisition, we refinanced ourthen existing revolving credit facility of $106.8 million and notespayable of $75.0 million. We also incurred $21.0 million in financ-ing fees and $5.5 million in prepayment penalties. The acquisitionand refinancing was completed via the use of a new $475 millionSenior Credit Facility and the issuance of 175 million euro(approximately $156 million at May 9, 2001) 103/8% Senior Sub-ordinated Notes. We borrowed a total of $390 million on May 9,2001 under the Senior Credit Facility at the closing of the Potainacquisition. These borrowings were comprised of $40.0 millionunder the revolver portion of the facility and $350 million underthe term loan portion. This left a remaining borrowing capacity of $85 million under the Senior Credit Facility at May 9, 2001. At December 31, 2001 availability under the credit facility was$93.3 million.
A total of $29.3 million was spent during 2001 for capitalexpenditures. The following table summarizes 2001 capitalexpenditures and depreciation by segment.
CapitalIn Thousands Expenditures Depreciation
Cranes and related products $17,189 $11,723Foodservice equipment 7,307 7,082Marine 2,908 998Corporate 1,857 668Total $29,261 $20,471
We continue to fund capital expenditures to improve the coststructure of the business, to invest in new processes and technol-ogy, and to maintain high-quality production standards. The levelof capital expenditures in the Crane and Marine segments signifi-cantly exceeded depreciation for the year. Capital expenditures inthe Crane segment included $8.1 million of cranes put into thePotain rental fleet during the year, while net book value of $4.5million of cranes were sold out of the fleet (total proceeds of $6.4 million). In addition, our domestic lattice-boom crawler cranefacility invested in new production equipment and upgraded otherexisting equipment during the year to improve its productionprocesses. With the addition of Marinette Marine for a full year in2001, the Marine segment invested in production equipment andinformation technology infrastructure to improve production effi-ciency and capacity, as well as to improve the sharing of information.
We expect that the trend in capital expenditures in 2002 willapproximate depreciation levels, at least during the first part ofthe year while we limit capital spending during a period of eco-nomic uncertainty. As a result, total capital expenditures for allthree segments (including Potain for an entire year) should rangebetween $25 million and $30 million for 2002.
The change in working capital, net of the affects of acquisitions,was a decrease of $21.9 million. The details of these changes arereflected in the Consolidated Statements of Cash Flows. The pri-mary drivers of the decrease were the following:• A $16.8 million decrease in accounts receivable primarily due to
decreases in the Crane and Marine segments, slightly offset byan increase in the Foodservice segment due to limits on the useof our accounts receivable factoring program in that segment.The decrease in the Crane segment is due to improvements atour lattice-boom and boom-truck businesses. The decrease inthe Marine segment is due to the timing of billings and revenuerecognition on our long-term construction contracts.
• A $25.6 million decrease in inventory due to considerabledecreases in all three of our segments. Inventory in the Cranesegment decreased approximately $18.6 million due to contin-ued production cycle time improvements and better matchingof production and demand mix at our lattice-boom crawlercrane unit, as well as our emphasis on inventory reductions atPotain subsequent to our acquisition. Foodservice inventoriesdecreased approximately $6.4 million due to the ongoingbenefits from the conversion to demand-flow manufacturingprocess, as well as lower production volumes. Our consolidatedtwelve-month rolling inventory turnover ratio of approximately7.5 turns at December 31, 2001, was almost one whole turnbetter than the ratio at the end of 2000.
• A $7.8 million increase in income taxes payable at the end of2001 was a result of the low level of income taxes payable atthe end of 2000 due to the timing of tax payments made in the prior year.
• A $29.4 million increase in other non-current assets due pri-marily to a $16 million increase in reimbursable tooling at ourrefrigeration contract manufacturing company to support ourcustomer’s new product introductions and product upgrade initiatives.
In an attempt to improve EVA, we will continue to focus on maxi-mizing our cash flows from operations in order to maintain work-ing capital employed in our businesses at the minimum levelrequired for efficient operations. As a result, we expect that our2002 cash from operations will again exceed $100 million.
Cash and marketable securities were $25.7 million at December31, 2001, compared with $16.0 million at the end of 2000. Of thetotal amount on hand at the end of 2001, $18.4 million was heldby our foreign operations in Europe.
In April 2001, Standard & Poor’s assigned a double-‘B’ corporatecredit rating to our company, a double-‘B’ rating to our SeniorCredit Facility, and a single-‘B’-plus rating to our Senior Sub-ordinated Notes, all with a stable outlook. Also in April 2001,Moody’s Investors Service assigned a Ba2 rating to our SeniorCredit Facility and a B2 rating to our Senior Subordinated Noteswith a positive outlook. These credit ratings have been main-tained since the initiation of coverage by these two agencies. Wedo not believe that any future adjustments to these ratings wouldhave a significant direct impact on our liquidity.
Both the Senior Credit Facility and the Senior SubordinatedNotes contain customary affirmative and negative covenants. Ingeneral, the covenants contained in the Senior Credit Facility aremore restrictive than those of the Senior Subordinated Notes.Among other restrictions, these covenants require us to meetspecified financial tests, including various debt and cash flowratios, which become more restrictive over time. These covenantsalso limit our ability to redeem or repurchase the Senior Sub-ordinated Notes, incur additional debt, make acquisitions, mergewith other entities, pay dividends or make distributions, repur-chase our stock, lend money or make advances, create or becomesubject to liens, and make capital expenditures. The Senior CreditFacility also contains cross-default provisions whereby certaindefaults under any other debt agreement would result in adefault under the Senior Credit Facility. We are in compliance withthese covenants at December 31, 2001 and based upon our cur-rent outlook, we do not believe there will be a noncomplianceissue with regard to these obligations in 2002.
Our debt position increases our vulnerability to general adverseindustry or economic conditions and results in a substantial por-tion of our cash flow from operations being used for the paymentof interest on our debt and making scheduled principal payments.
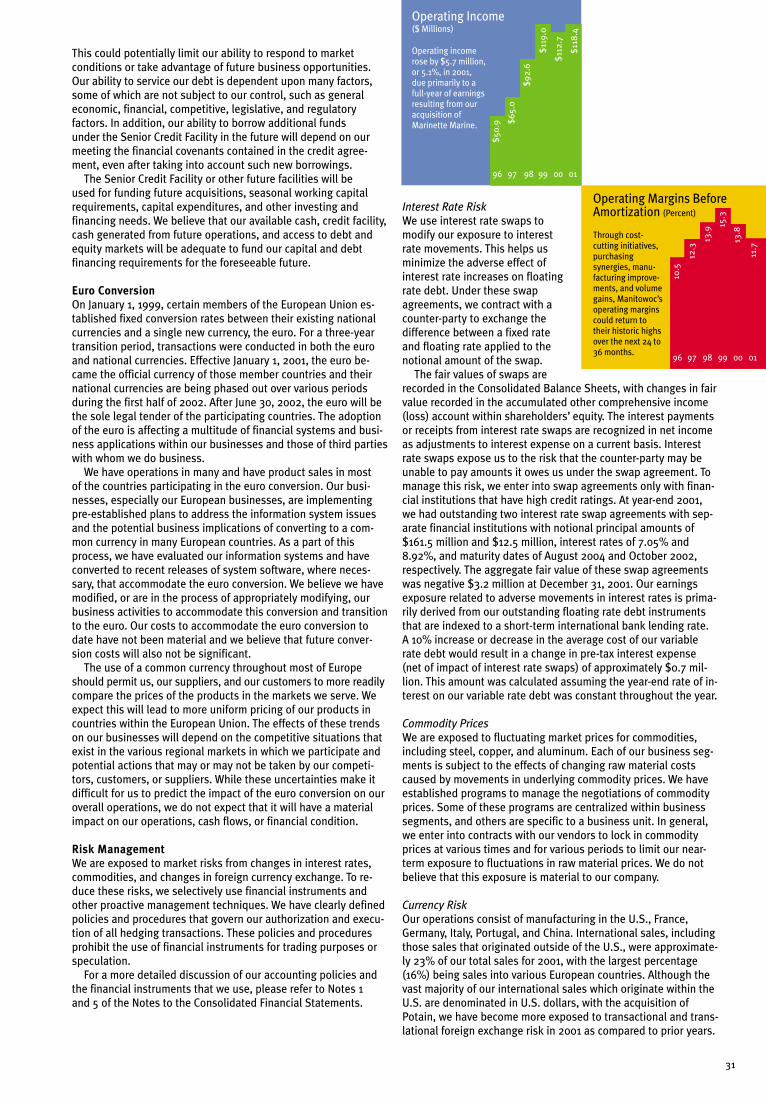
31
Interest Rate RiskWe use interest rate swaps tomodify our exposure to interestrate movements. This helps usminimize the adverse effect ofinterest rate increases on floatingrate debt. Under these swapagreements, we contract with acounter-party to exchange thedifference between a fixed rateand floating rate applied to thenotional amount of the swap.
The fair values of swaps arerecorded in the Consolidated Balance Sheets, with changes in fairvalue recorded in the accumulated other comprehensive income(loss) account within shareholders’ equity. The interest paymentsor receipts from interest rate swaps are recognized in net incomeas adjustments to interest expense on a current basis. Interestrate swaps expose us to the risk that the counter-party may beunable to pay amounts it owes us under the swap agreement. Tomanage this risk, we enter into swap agreements only with finan-cial institutions that have high credit ratings. At year-end 2001,we had outstanding two interest rate swap agreements with sep-arate financial institutions with notional principal amounts of$161.5 million and $12.5 million, interest rates of 7.05% and8.92%, and maturity dates of August 2004 and October 2002,respectively. The aggregate fair value of these swap agreementswas negative $3.2 million at December 31, 2001. Our earningsexposure related to adverse movements in interest rates is prima-rily derived from our outstanding floating rate debt instrumentsthat are indexed to a short-term international bank lending rate. A 10% increase or decrease in the average cost of our variablerate debt would result in a change in pre-tax interest expense (net of impact of interest rate swaps) of approximately $0.7 mil-lion. This amount was calculated assuming the year-end rate of in-terest on our variable rate debt was constant throughout the year.
Commodity PricesWe are exposed to fluctuating market prices for commodities,including steel, copper, and aluminum. Each of our business seg-ments is subject to the effects of changing raw material costscaused by movements in underlying commodity prices. We haveestablished programs to manage the negotiations of commodityprices. Some of these programs are centralized within businesssegments, and others are specific to a business unit. In general,we enter into contracts with our vendors to lock in commodityprices at various times and for various periods to limit our near-term exposure to fluctuations in raw material prices. We do notbelieve that this exposure is material to our company.
Currency RiskOur operations consist of manufacturing in the U.S., France,Germany, Italy, Portugal, and China. International sales, includingthose sales that originated outside of the U.S., were approximate-ly 23% of our total sales for 2001, with the largest percentage(16%) being sales into various European countries. Although thevast majority of our international sales which originate within theU.S. are denominated in U.S. dollars, with the acquisition ofPotain, we have become more exposed to transactional and trans-lational foreign exchange risk in 2001 as compared to prior years.
This could potentially limit our ability to respond to marketconditions or take advantage of future business opportunities.Our ability to service our debt is dependent upon many factors,some of which are not subject to our control, such as generaleconomic, financial, competitive, legislative, and regulatoryfactors. In addition, our ability to borrow additional fundsunder the Senior Credit Facility in the future will depend on ourmeeting the financial covenants contained in the credit agree-ment, even after taking into account such new borrowings.
The Senior Credit Facility or other future facilities will beused for funding future acquisitions, seasonal working capitalrequirements, capital expenditures, and other investing andfinancing needs. We believe that our available cash, credit facility,cash generated from future operations, and access to debt andequity markets will be adequate to fund our capital and debtfinancing requirements for the foreseeable future.
Euro ConversionOn January 1, 1999, certain members of the European Union es-tablished fixed conversion rates between their existing nationalcurrencies and a single new currency, the euro. For a three-yeartransition period, transactions were conducted in both the euroand national currencies. Effective January 1, 2001, the euro be-came the official currency of those member countries and theirnational currencies are being phased out over various periodsduring the first half of 2002. After June 30, 2002, the euro will bethe sole legal tender of the participating countries. The adoptionof the euro is affecting a multitude of financial systems and busi-ness applications within our businesses and those of third partieswith whom we do business.
We have operations in many and have product sales in most of the countries participating in the euro conversion. Our busi-nesses, especially our European businesses, are implementingpre-established plans to address the information system issuesand the potential business implications of converting to a com-mon currency in many European countries. As a part of thisprocess, we have evaluated our information systems and haveconverted to recent releases of system software, where neces-sary, that accommodate the euro conversion. We believe we havemodified, or are in the process of appropriately modifying, ourbusiness activities to accommodate this conversion and transitionto the euro. Our costs to accommodate the euro conversion todate have not been material and we believe that future conver-sion costs will also not be significant.
The use of a common currency throughout most of Europeshould permit us, our suppliers, and our customers to more readilycompare the prices of the products in the markets we serve. Weexpect this will lead to more uniform pricing of our products incountries within the European Union. The effects of these trendson our businesses will depend on the competitive situations thatexist in the various regional markets in which we participate andpotential actions that may or may not be taken by our competi-tors, customers, or suppliers. While these uncertainties make itdifficult for us to predict the impact of the euro conversion on ouroverall operations, we do not expect that it will have a materialimpact on our operations, cash flows, or financial condition.
Risk ManagementWe are exposed to market risks from changes in interest rates,commodities, and changes in foreign currency exchange. To re-duce these risks, we selectively use financial instruments andother proactive management techniques. We have clearly definedpolicies and procedures that govern our authorization and execu-tion of all hedging transactions. These policies and proceduresprohibit the use of financial instruments for trading purposes orspeculation.
For a more detailed discussion of our accounting policies andthe financial instruments that we use, please refer to Notes 1 and 5 of the Notes to the Consolidated Financial Statements.
9796
Operating Income($ Millions)
Operating incomerose by $5.7 million,or 5.1%, in 2001,due primarily to afull-year of earningsresulting from ouracquisition ofMarinette Marine.
98 99 00 01
$6
5.0
$50
.9
$9
2.6
$11
9.0
$11
2.7
$11
8.4
9796
Operating Margins BeforeAmortization (Percent)
Through cost-cutting initiatives,purchasing synergies, manu-facturing improve-ments, and volumegains, Manitowoc’soperating marginscould return totheir historic highsover the next 24 to36 months.
98 99 00 01
12.3
10.5
13.9
15.3
13.8
11.7

32
Regarding transactional foreign exchange risk, we enter intolimited forward exchange contracts to reduce the earnings andcash flow impact of nonfunctional currency denominated receiv-ables and payables, predominantly between our euro-denomi-nated operations and their customers outside the euro zone.Gains and losses resulting from hedging instruments offset theforeign exchange gains or losses on the underlying assets andliabilities being hedged. The maturities of the forward exchangecontracts generally coincide with the settlement dates of therelated transactions. We also periodically hedge anticipatedtransactions, primarily at firm order date for orders to be sold into non-euro-denominated locations, with forward exchangecontracts. These forward exchange contracts are designated ascash flow hedges in accordance with Statement of FinancialAccounting Standards No. 133, “Accounting for Derivative In-struments and Hedging Activities.” At December 31, 2001, wehave outstanding $1.7 million of forward exchange contractshedging outstanding firm orders and $9.1 million of forwardexchange contracts hedging underlying accounts receivable. Theaggregate fair value of these contracts is negative $1.6 million atDecember 31, 2001 and they mature at various dates through July2002. A 10% appreciation or depreciation of the underlying func-tional currency at December 31, 2001, would not have a signifi-cant impact on our financial position or results of operations. Thisis because any gains or losses under the foreign exchange con-tracts hedging accounts receivable balances would be offset byequal gains or losses on the underlying receivables. Any gains orlosses under the foreign exchange contracts hedging outstandingfirm orders would not have a significant impact due to the rela-tively immaterial amount of contracts outstanding.
Our primary translational exchange risk exposure at December31, 2001 was with the euro, which is the functional currency ofPotain and of certain smaller manufacturing operations within our Foodservice segment. To a much lesser extent, we are alsoexposed to translational risk with our other foreign operations,primarily in China. Our euro-denominated 175 million SeniorSubordinated Notes due in 2011 naturally hedge a significantamount of the translational risk with our operations in Europe. Inaddition, a large amount of the translational risk with our Chineseoperations is naturally hedged with locally denominated debtservice. The currency effects of these foreign-denominated debtobligations are reflected in the accumulated other comprehensiveincome (loss) account within shareholders’ equity, where they offset the translational impact of an equal amount of similarly foreign-denominated net assets of our European and Chineseoperations. A 10% appreciation or depreciation of the value of the euro to the U.S. dollar at December 31, 2001, would have theimpact of increasing or decreasing the outstanding debt balanceon our Consolidated Balance Sheet by $15.4 million. This impactwould be offset by gains or losses on our net investments in for-eign subsidiaries whose functional currency is the euro.
At December 31, 2001, there is also a portion of our foreign currency translational exposure that is not hedged. As a result,fluctuations in currency exchange rates can affect our sharehold-ers’ equity. Amounts invested in non-U.S. based subsidiaries aretranslated into U.S. dollars at the exchange rate in effect at year-end.
The resulting translation adjustments are recorded in shareholders’equity as cumulative translation adjustments. The cumulativetranslation adjustment component of shareholders’ equity atDecember 31, 2001, is a negative $1.9 million, or approximately 1%of total shareholders’ equity. Using year-end exchange rates, thetotal amount invested in foreign operations at December 31, 2001,was approximately $319.1 million, of which approximately $172.1million was naturally hedged with local, non-U.S. dollar debt.
Risk Management OutlookWe continually evaluate our risk management strategies due tochanges in our businesses, the economy, and the markets that we serve. We anticipate that our risk management strategies in2002 will be similar to those employed during 2001 but to a largerextent. This is due to increases in cross-border transactions,greater purchasing levels and leverage, and changes in our overall debt position and interest rates.
Environmental, Health, and Safety MattersOur global operations are governed by laws addressing the protec-tion of the environment, workers safety, and health. Under variouscircumstances, these laws impose civil and criminal penalties andfines, as well as injunctive and remedial relief, for noncompliance.They also may require remediation at sites where company-relatedsubstances have been released into the environment.
We have expended substantial resources globally, both finan-cial and managerial, to comply with the applicable laws and reg-ulations, and to protect the environment and our workers. Webelieve we are in substantial compliance with such laws and reg-ulations and we maintain procedures designed to foster and en-sure compliance. However, we have been, and may in the futurebe subjected to formal or informal enforcement actions or pro-ceedings regarding noncompliance with such laws or regulations,whether or not determined to be ultimately responsible, in thenormal course of business. Historically, these actions have beenresolved in various ways with the regulatory authorities withoutmaterial commitments or penalties to the company.
The United States Environmental Protection Agency (“EPA”)identified the company as a potentially responsible party (“PRP”)under the Comprehensive Environmental Response Compensationand Liability Act (“CERCLA”), liable for the costs associated withinvestigating and cleaning up the contamination at the LembergerLandfill Superfund Site near Manitowoc, Wisconsin. Eleven of thePRPs formed the Lemberger Site Remediation Group (“LSRG”)and have successfully negotiated with the EPA and WisconsinDepartment of National Resources to settle the potential liabilityat the site and fund the cleanup. Approximately 150 PRPs havebeen identified as having shipped substances to the site. The latest estimates indicate that the total cost to clean up the site isapproximately $30 million. Although liability is joint and several,we have estimated our share of the liability at 11% of the totalcleanup costs. As of December 31, 2001, we have expensed $3.3million in connection with this matter. To comply with our portionof the annual cleanup costs, the amounts we have spent eachyear from 1999 through 2001 have not been material.
Management’s Discussion and Analysis of Results of Operations and Financial Condition (continued)

33
Critical Accounting PoliciesThe Consolidated Financial Statements include accounts of thecompany and all its subsidiaries. The preparation of financialstatements in conformity with accounting principles generallyaccepted in the United States requires management to make estimates and assumptions in certain circumstances that affectamounts reported in the accompanying consolidated financialstatements and related footnotes. In preparing these financialstatements, management has made its best estimates and judg-ments of certain amounts included in the financial statements,giving due consideration to materiality. We do not believe there is a great likelihood that materially different amounts would bereported related to the accounting policies described below.However, application of these accounting policies involves theexercise of judgment and use of assumptions as to future uncer-tainties and, as a result, actual results could differ from theseestimates. Although we have listed a number accounting policiesbelow which we believe to be most critical, we also believe thatall of our accounting policies are important to the reader.Therefore, please refer also to the Notes to the ConsolidatedFinancial Statements beginning on page 42 for a more detaileddescription of these and other accounting policies of the company.
Revenue Recognition—Revenue is generally recognized andearned when all the following criteria are satisfied with regard toa specific transaction: persuasive evidence of an arrangementexists, the price is fixed and determinable, collectibility of cash isreasonably assured and delivery has occurred or services havebeen rendered. Revenues under long-term contracts, includingcontracts with the U.S. Government, are recognized using the per-centage-of-completion method of accounting. Under this method,revenues are recognized upon achievement of performance mile-stones or based on the ratio of costs incurred to estimated totalcosts at completion, and costs are expensed as incurred.
Allowance for Doubtful Accounts—Accounts receivable arereduced by an allowance for amounts that may become uncol-lectible in the future. Our estimate for the allowance for doubtfulaccounts related to trade receivables includes two estimates.First, we evaluate specific accounts where we have informationthat the customer may have an inability to meet its financial obli-gations. In these cases, we use our judgement, based upon thebest available facts and circumstances, and record a specificreserve for that customer against amounts due, to reduce thereceivable to the amount that is expected to be collected. Thesespecific reserves are evaluated and adjusted periodically as factsand circumstances change. Second, a general reserve is estab-lished for all customers based upon pre-established percentagesto specific aging categories. These percentages are applied to theoutstanding receivable balance based upon the amount of timethe receivable is past its due date. These percentages were estab-lished based upon historical collection and write-off experienceand are specific to the different countries and regions in whichour customers do business.
Inventories and Related Reserve for Obsolete and ExcessInventory—Inventories are valued at the lower of cost or marketusing both the first-in, first-out (“FIFO”) method and the last-in,first-out (“LIFO”) method and are reduced by a reserve for excessand obsolete inventories. The estimated reserve is based uponpre-established percentages applied to specific aging categoriesof inventory. These categories are evaluated based upon historicalusage, estimated future usage, and sales requiring the inventory.These percentages were established based upon historical write-off experience.
Product Liability—We are subjectin the normal course of business toproduct liability lawsuits. To theextent permitted under applicablelaw, our exposure to losses fromthese lawsuits is mitigated byinsurance with self-insured reten-tions per occurrence of $0.1 millionfor Potain tower crane accidents;$1.0 million for all other crane acci-dents; $1.0 million for foodserviceequipment accidents occurringduring 1990 to 1996; and $0.1 mil-lion for foodservice equipment accidents occurring during 1997 topresent. Our insurer’s annual contribution for product liabilitylosses is limited to $50 million. We record product liabilityreserves for our self-insured portion of any pending or threatenedproduct liability actions. Our reserve is based upon two esti-mates. First, we track the population of all outstanding pendingand threatened product liability cases to determine an appropri-ate case reserve for each based upon our best judgement and theadvice of legal counsel. These estimates are continually evalu-ated and adjusted based upon changes to the facts or circum-stances surrounding the case. Second, we obtain a third partyactuarial analysis to determine the amount of additional reserverequired to cover incurred but not reported product liabilityissues and to account for possible adverse development of theestablished case reserves (collectively referred to as “IBNR”).This actuarial analysis is performed twice annually and our IBNRreserve for product liability is adjusted based upon the results ofthat analysis. We have established a position within the actuari-ally determined range at which we will record the IBNR reserve toensure consistency in the amount reported between periods.
New Accounting PronouncementsIn June 2001, The Financial Accounting Standards Board (“FASB”)issued SFAS No. 141, “Business Combinations,” and No. 142,“Goodwill and Other Intangible Assets,” effective for fiscal yearsbeginning after December 15, 2001. These statements eliminatethe pooling-of-interests method of accounting for business com-binations and require goodwill and intangible assets with indefi-nite lives to no longer be amortized but to instead be tested forimpairment at least annually. Other intangible assets with deter-minable lives will continue to be amortized over their useful lives.We will apply the new rules on accounting for goodwill and otherintangible assets effective January 1, 2002. Subject to final analy-sis, we expect application of the non-amortization provisions ofSFAS No. 142 to result in a positive effect on net income ofapproximately $6.4 million ($0.26 per diluted share) in 2002. Wealso expect to complete the first of the required impairment testsof goodwill and indefinite-lived intangible assets during the first half of 2002.
9796
Debt to Capital(Percent)
Manitowoc’s strongcash generationcapability has enabled it to quicklypay down debt. Assuming no additional acquisi-tions, we are pro-jecting a debt-to-capital ratio in the40% to 50% rangeby the end of 2003.
98 99 00 01
50.4
46
.6
44
.7
32.5
48
.4
64
.9
9796
Invested Capital($ Millions)
As Manitowoc continues to grow, it prudently manages itsinvested capitalusing EVA principles to ensure optimumshareholderreturns.
98 99 00 01
$2
56.8
$2
43.
3 $33
9.9 $4
13.1
$4
80
.3
$74
7.3

According to SFAS No. 142, impairment of goodwill is measuredaccording to a two-step approach. In the first step, the fair valueof a reporting unit, as defined by the statement, is compared tothe carrying amount of the reporting unit, including goodwill. Ifthe carrying amount exceeds the fair value, the second step ofthe goodwill impairment test is performed to measure the amountof impairment loss, if any. In the second step, the implied fairvalue of the goodwill is estimated as the fair value of the report-ing unit less the fair values of all the other tangible and intangibleassets of the reporting unit. If the carrying amount of the good-will exceeds the implied fair value of the goodwill, an impairmentloss is recognized in an amount equal to that excess, not toexceed the carrying amount of the goodwill.
According to SFAS No. 142, impairment of indefinite-lived intan-gible assets are measured according to a one-step approach,which compares the estimated fair value of the intangible asset toits carrying amount. If the carrying amount of the intangible assetexceeds the estimated fair value, an impairment loss is recog-nized in an amount equal to that excess.
According to this statement, any impairment loss recognized asa result of its initial application will be reported as resulting froma change in accounting principle. We are in the process of meas-uring fair values of our SFAS No. 142 reporting units to determinethe amount of impairment losses, if any, using a valuation date ofJanuary 1, 2002. We are unable at this time to estimate the effectof these tests on our earnings or financial position.
In August 2001, the FASB issued SFAS No. 143, “Accounting forObligations Associated with the Retirement of Long-Lived Assets,”and SFAS No. 144, “Accounting for the Impairment or Disposal ofLong-Lived Assets.” SFAS No. 143 establishes accounting stan-dards for the recognition and measurement of an asset retirementobligation. SFAS No. 144 addresses accounting and reporting forthe impairment or disposal of long-lived assets, supersedingSFAS No. 121 and Accounting Principles Board Opinion No. 30.SFAS No. 143 and No. 144 are effective for us in the first quartersof 2003 and 2002, respectively. We do not believe they will havea material effect on our consolidated financial statements.
Cautionary Statements About Forward-Looking InformationStatements in this report and in other company communicationsthat are not historical facts are forward-looking statements,which are based upon our current expectations. These statementsinvolve risks and uncertainties that could cause actual results todiffer materially from what appears within this annual report.
Forward-looking statements include descriptions of plans andobjectives for future operations, and the assumptions behindthose plans. The words “anticipates,” “believes,” “intends,”“estimates,” and “expects,” or similar expressions, usually iden-tify forward-looking statements. Any and all projections of futureperformance, including, without limitation, all of those set forthin the section captioned “Outlook,” are forward-looking state-ments. In addition, our goals should not be viewed as guaranteesor promises of future performance. There can be no assurancethat we will be successful in achieving these goals.
In addition to the assumptions, uncertainties, and other infor-mation referred to specifically in the forward-looking statements,a number of factors relating to each business segment couldcause actual results to be significantly different from what is presented in this annual report. Those factors include, withoutlimitation, the following:
Cranes—market acceptance of new and innovative products; cyclicality of the construction industry; the effects of governmentspending on construction-related projects within the United Statesand abroad; growth in the world market for our crane productoffering; the replacement cycle of technologically obsolete cranes;and the demand for used equipment in developing countries.
Foodservice—market acceptance of new and innovative products;demographic information affecting two-income families and gen-eral population growth; household income; weather; consolida-tions within restaurant and foodservice equipment industries;global expansion of customers; the ice-cube machine replacementcycle in the United States; specialty foodservice market growth;future strength of the beverage industry; new-product introduc-tions; and the demand for quick-service restaurants and kiosks.
Marine—shipping volume fluctuations based on performance ofthe steel industry; weather and water levels on the Great Lakes;trends in government spending on new vessels; five-year surveyschedule; the replacement cycle of older marine vessels; growthof existing marine fleets; consolidation of the Great Lakes marineindustry; frequency of vessel casualties on the Great Lakes; andthe level of construction and industrial maintenance.
Corporate (including factors that may affect all three segments)—changes in laws and regulations throughout the world; the abilityto finance, complete, and successfully integrate acquisitions,strategic alliances, and joint ventures; competitive pricing;changes in domestic and international economic and industryconditions; changes in the interest rate environment; risks asso-ciated with growth; foreign currency fluctuations; worldwidepolitical risk; pressure of additional financial leverage resultingfrom the Potain acquisition; and success in increasing manufac-turing efficiencies.
Management’s Discussion and Analysis of Results of Operations and Financial Condition (continued)
34

35
2001 2000
Thousands of dollars, except per share data First Second Third Fourth First Second Third Fourth
Net sales1$229,351 $298,234 $301,011 $287,984 $205,853 $243,566 $214,531 $209,322
Gross profit 56,030 79,774 78,138 70,870 55,717 71,066 55,657 53,294Earnings before extraordinary loss 9,870 17,935 12,439 8,628 14,913 22,606 12,299 10,450Net earnings 9,870 14,611 12,439 8,628 14,913 22,606 12,299 10,450Per share amounts:Basic earnings per share before
extraordinary loss 0.41 0.74 0.51 0.36 0.58 0.91 0.50 0.43Basic earnings per share 0.41 0.60 0.51 0.36 0.58 0.91 0.50 0.43Diluted earnings per share before
extraordinary loss 0.40 0.73 0.51 0.35 0.57 0.91 0.50 0.42Diluted earnings per share 0.40 0.60 0.51 0.35 0.57 0.91 0.50 0.42
Dividends per common share20.075 — — 0.225 0.075 0.075 0.075 0.075
1Net sales for 2000 have been restated to reflect the adoption of EITF 99-19. The amounts reclassified were $3,684; $4,279; and $3,863 for the third, second, and first quar-ters of 2000, respectively.
2In February 2001, the board of directors adopted a resolution to pay cash dividends annually rather than quarterly, the amount and timing of which will be decided at its regular fall meeting each year.
Supplemental Quarterly Financial Information (unaudited)
2001 2000 1999
Year Ended December 31 High Low Close High Low Close High Low Close
1st Quarter $30.94 $23.00 $24.80 $32.63 $24.56 $27.50 $30.33 $24.21 $27.92
2nd Quarter 29.50 22.30 29.50 34.88 26.75 26.75 42.00 27.00 41.63
3rd Quarter 29.50 22.40 24.24 30.88 19.00 19.75 43.75 32.56 34.13
4th Quarter 32.84 23.00 31.10 31.06 17.63 29.00 35.63 26.00 34.00
The company’s common stock is traded on the New York Stock Exchange.The share prices shown above have been adjusted for the April 1, 1999 three-for-two stock split.
Quarterly Common Stock Price Range

36
Eleven-Year Financial Summary
Calendar
Thousands of dollars, except shares and per share data 2001 2000 1999 1998
Net Sales Cranes and related products2 $«÷523,266 $376,250 $389,510 $339,051Foodservice equipment 411,637 425,080 379,625 319,457Marine 181,677 71,942 55,204 45,412Total $1,116,580 $873,272 $824,339 $703,920Gross profit $÷«284,812 $235,734 $233,712 $195,621
Earnings (Loss) Cranes and related products $«÷««66,028 $««62,876 $÷64,840 $÷48,116From Operations Foodservice equipment 57,942 61,368 65,372 52,950
Marine 18,924 8,902 7,297 6,978General corporate (11,961) (12,313) (11,166) (10,543)Amortization (12,554) (8,181)) (7,392) (4,881)Plant relocation costs — — — —Total 118,379 112,652 118,951 92,620Other income (expense)–net (38,690) (16,532) (12,945) (11,208)Earnings (loss) before taxes on income 79,689 96,120 106,006 81,412Accounting changes — — — —Provision (benefit) for taxes on income 30,817 35,852 39,222 30,032Earnings before extraordinary loss 48,872 60,268 66,784 51,380Extraordinary loss–net of income
tax benefit ««(3,324) — — —Net earnings (loss) $««÷«45,548 $««60,268 $÷66,784 $÷51,380
Other Financial Cash from operations $«««106,615 $««63,047 $103,371 $÷56,814Information Invested capital (monthly averages):
Cranes and related products $«««345,610 $137,562 $123,757 $÷96,031Foodservice equipment3 330,376 312,842 274,378 227,863Marine 10,018 14,976 3,416 4,534General corporate3 61,262 14,885 11,520 11,476Total $«÷747,266 $480,265 $413,071 $339,904
Identifiable Assets Cranes and related products $«÷577,920 $171,867 $165,974 $178,470Foodservice equipment3 368,363 359,196 314,982 254,506Marine 77,291 75,757 10,162 7,023General corporate3 57,238 35,710 39,122 41,015Total $1,080,812 $642,530 $530,240 $481,014
Long-Term Obligations Long-term debt $«÷446,522 $137,668 $÷79,223 $÷79,834Depreciation Cranes and related products $«÷««11,723 $««««2,915 $÷÷3,661 $÷÷4,085
Foodservice equipment 7,082 6,168 ÷÷4,861 4,906Marine 998 437 415 333General corporate 668 352 384 405Total $«««««20,471 $««««9,872 $÷÷9,321 $÷÷9,729
Capital Expenditures Cranes and related products4 $«««««17,189 $««««2,883 $÷÷3,536 $÷÷2,945Foodservice equipment ««««7,307 8,883 8,974 7,415Marine 2,908 1,481 1,165 1,174General corporate4 1,857 168 39 144Total $««÷«29,261 ««$««13,415 $÷13,714 $÷11,678
Per Share5 Basic earnings per share:Basic earnings per share before
extraordinary loss $÷÷÷÷«2.01 $÷÷÷2.42 $÷÷÷2.57 $÷÷÷1.98Extraordinary loss (0.14) — — —Basic earnings per share $÷÷÷÷«1.87 $÷÷÷2.42 $÷÷÷2.57 $÷÷÷1.98Diluted earnings per share:Diluted earnings per share before
extraordinary loss $÷÷÷÷«1.99 $÷÷÷2.40 $÷÷÷2.55 $÷÷÷1.97Extraordinary loss (0.13) — — —Diluted earnings per share $÷÷÷÷«1.86 $÷÷÷2.40 $÷÷÷2.55 $÷÷÷1.97Dividends per share $÷÷÷÷«0.30 $÷÷÷0.30 $÷÷÷0.30 $÷÷÷0.30Average shares outstanding:Basic 24,269,807 24,891,387 25,991,711 25,932,356Diluted 24,548,463 25,122,795 26,200,666 26,125,067
1 The company changed its year-end to December 31, effective with the period ended December 31, 1994 (transition period). The prior fiscal year-end ended on the Saturday nearest to June 30.
2 Net sales for calendar years 1999, 1998, 1997, and 1996 have been restated to reflect the adoption of Emerging Issues Task Force (EITF)99-19, “Reporting Revenues Gross as a Principal versus Net as an Agent.” The impact of this restatement was to reclassify costs formerlyreported as a component of net sales to cost of goods sold. The amounts reclassified were $18,848, $9,098, $8,771, and $10,257 for1999, 1998, 1997, and 1996, respectively. Amounts prior to 1996 have not been restated, as the effects are not significant.

37
3 In 1997, as part of the corporate restructuring, the Shannon acquisition goodwill was transferred to the Foodservice segment.4 During 1991, certain assets were transferred from general corporate to the Cranes and Related Products segment.5 Per share data and average shares outstanding have been adjusted to reflect the three-for-two stock splits which occurred in 1999, 1997, and 1996.
Transition Period1 Fiscal
1997 1996 1995 1994 1994 1993 1992 1991
$268,416 $220,821 $169,866 $««70,958 $156,253 $178,630 $155,743 $147,554247,057 242,317 113,814 44,996 93,171 81,424 ÷«74,175 73,944
39,162 47,584 29,469 7,952 25,956 18,504 16,471 14,689$554,635 $510,722 $313,149 $123,906 $275,380 $278,558 $246,389 $236,187$152,600 $134,641 $÷75,470 $÷31,302 $÷67,924 $««55,785 $««54,443 $÷58,062$÷34,878 $÷22,582 $÷÷3,179 $÷÷÷«870 $÷÷2,275 $÷«(1,961) $÷÷÷(850) $÷««7,602
36,746 33,989 22,729 9,426 21,637 18,311 17,585 17,3645,648 6,197 4,024 (799) 2,447 593 278 (973)
(8,903) (7,678) (6,530) (3,981) (5,274) (5,296) (6,545) (5,734)(3,394) (3,000) (250) — — — — —
— (1,200) — (14,000) — (3,300) — —64,975 50,890 23,152 (8,484) 21,085 8,347 10,468 18,259(7,158) (8,384) (32) 169 1,494 582 1,104 2,233
57,817 42,506 23,120 (8,315) 22,579 8,929 11,572 20,492— — — — — (10,214) — —
21,394 16,863 8,551 (3,243) 8,536 2,612 3,315 5,06036,423 25,643 14,569 (5,072) 14,043 (3,897) 8,257 15,432
— — — — — — — —$÷36,423 $÷25,643 $÷14,569 $«÷(5,072) $÷14,043 $«÷(3,897) $÷÷8,257 $÷15,432$÷43,587 $÷64,514 $÷16,367 $÷÷÷(330) $÷36,995 $÷62,700 $÷28,250 $÷÷6,472
$÷67,596 $÷73,246 $÷85,082 $÷81,800 $÷86,288 $112,120 $137,839 $133,777171,647 68,556 32,696 21,979 25,662 26,503 23,555 25,099
6,019 7,335 9,579 11,201 13,953 17,497 16,879 14,62111,512 94,166 12,409 4,818 4,052 2,581 2,025 3,051
$256,774 $243,303 $139,766 $119,798 $129,955 $158,701 $180,298 $176,548$100,591 $÷88,174 $109,118 $÷88,068 $÷93,823 $105,750 $138,416 $136,995
249,384 90,937 90,126 27,828 31,460 29,526 25,608 28,0196,426 10,648 11,369 13,233 16,726 16,720 19,253 18,009
39,967 127,951 114,302 30,336 43,839 56,015 41,829 35,983$396,368 $317,710 $324,915 $159,465 $185,848 $208,011 $225,106 $219,006$÷66,359 $÷76,501 $101,180 $«««÷«««««— $«««÷«««««— $«««««««««— $«««÷«««««— $«««÷«««««—$÷÷4,044 $÷÷4,260 $÷««4,162 $÷÷2,288 $««««4,211 $««««3,875 $««««4,053 $««««3,691
3,613 3,377 1,606 703 1,320 1,187 1,090 «812256 600 608 316 681 756 785 792405 81 80 46 61 44 196 234
$÷÷8,318 $÷÷8,318 $÷÷6,456 $«÷«3,353 $««««6,273 $÷÷5,862 $÷÷6,124 $÷÷5,529$÷÷4,952 $÷÷2,816 $÷14,252 $«÷÷÷528 $««««3,120 $««««8,648 $««««4,047 $««««6,347
6,847 5,110 4,568 3,011 2,300 2,152 1,099 2,797233 343 383 109 (492) (463) 500 113
8 127 6 82 414 (39) (508) (2,955)$÷12,040 $÷÷8,396 $÷19,209 $÷÷3,730 $««««5,342 $÷10,298 $÷÷5,138 $÷÷6,302
$÷÷÷1.41 $÷÷÷0.99 $÷÷÷0.56 $«÷÷(0.19) $÷÷÷0.48 $«÷÷(0.12) $÷÷÷0.24 $÷÷÷0.44— — — — — — — —
$÷÷÷1.41 $÷÷÷0.99 $÷÷÷0.56 $«÷÷(0.19) $÷÷÷0.48 $«÷÷(0.12) $÷÷÷0.24 $÷÷÷0.44
$÷÷÷1.40 $÷÷÷0.99 $÷÷÷0.56 $«÷÷(0.19) $÷÷÷0.48 $«÷÷(0.12) $÷÷÷0.24 $÷÷÷0.44— — — — — — — —
$÷÷÷1.40 $÷÷÷0.99 $÷÷÷0.56 $«÷÷(0.19) $÷÷÷0.48 $«÷÷(0.12) $÷÷÷0.24 $÷÷÷0.44$÷÷÷0.30 $÷÷÷0.30 $÷÷÷0.30 $÷÷÷0.15 $÷÷÷0.30 $÷÷÷0.30 $÷÷÷0.30 $÷÷÷0.30
25,900,682 25,900,553 25,901,342 26,140,122 29,486,006 32,937,933 34,832,861 34,833,35626,096,529 25,993,848 25,906,769 26,140,122 29,486,006 32,937,933 34,832,861 34,833,356

38
For the Years Ended December 31
Thousands of dollars, except per share data 2001 2000 1999
Earnings
Net sales $1,116,580 $873,272 $824,339
Costs and expenses:
Cost of sales 831,768 637,538 590,627
Engineering, selling and administrative expenses 153,879 114,901 107,369
Amortization of goodwill 12,554 8,181 7,392
Total costs and expenses 998,201 760,620 705,388
Earnings from operations 118,379 112,652 118,951
Interest expense (37,478) (14,508) (10,790)
Other expense–net (1,212) (2,024) (2,155)
Earnings before taxes on income and extraordinary loss 79,689 96,120 106,006
Provision for taxes on income 30,817 35,852 39,222
Earnings before extraordinary loss 48,872 60,268 66,784
Extraordinary loss–net of income tax benefit (3,324) — —
Net earnings $«÷÷45,548 $÷60,268 $÷66,784
Per Share Data
Basic earnings per share:
Basic earnings per share before extraordinary loss $÷÷÷÷«2.01 $÷÷««2.42 $÷÷÷2.57
Extraordinary loss–net of income tax benefit (0.14) — —
Basic earnings per share $÷÷÷÷«1.87 $÷÷÷2.42 $÷÷÷2.57
Diluted earnings per share:
Diluted earnings per share before extraordinary loss $÷÷÷÷«1.99 $÷÷÷2.40 $÷÷÷2.55
Extraordinary loss–net of income tax benefit (0.13) — —
Diluted earnings per share $÷÷÷÷«1.86 $÷÷÷2.40 $÷÷÷2.55
The accompanying notes are an integral part of these financial statements.
Consolidated Statements of Earnings

39
As of December 31
Thousands of dollars, except share data 2001 2000
Assets
Current Assets
Cash and cash equivalents $«««««23,581 $«÷13,983
Marketable securities 2,151 2,044
Accounts receivable, less allowances of $8,295 and $3,037 141,211 88,231
Inventories 123,056 91,178
Deferred income taxes 28,346 20,592
Other 12,745 7,479
Total current assets 331,090 223,507
Intangible assets–net 525,695 308,751
Property, plant and equipment–net 175,384 99,940
Other non-current assets 48,643 10,332
Total assets $1,080,812 $«642,530
Liabilities and Stockholders’ Equity
Current Liabilities
Accounts payable and accrued expenses $«««236,131 $«144,713
Current portion of long-term debt 31,087 270
Short-term borrowings 10,961 81,000
Product warranties 17,982 13,507
Total current liabilities 296,161 239,490
Non-Current Liabilities
Long-term debt, less current portion 446,522 137,668
Postretirement health and other benefit obligations 23,071 20,341
Other non-current liabilities 51,263 11,262
Total non-current liabilities 520,856 169,271
Commitments and contingencies
Stockholders’ Equity
Common stock (36,746,482 shares issued) 367 367
Additional paid-in capital 31,670 31,602
Accumulated other comprehensive loss (3,937) (2,569)
Retained earnings 372,623 334,433
Treasury stock, at cost (12,693,397 and 12,487,019 shares, respectively) (136,928) (130,064)
Total stockholders’ equity 263,795 233,769
Total liabilities and stockholders’ equity $1,080,812 $«642,530
The accompanying notes are an integral part of these financial statements.
Consolidated Balance Sheets

40
Consolidated Statements of Cash Flows
For the Years Ended December 31
Thousands of dollars, except per share data 2001 2000 1999
Cash Flows From Operations
Net earnings $«÷45,548 $«÷60,268 $«66,784
Adjustments to reconcile net earnings to cash provided
by operating activities:
Depreciation 20,471 9,872 9,321
Amortization 12,888 8,181 7,392
Amortization of deferred financing fees 3,204 672 637
Extraordinary loss on early extinguishment of debt,
net of income tax benefit 3,324 — —
Deferred income taxes 1,667 7,148 (592)
(Gain) loss on sale of property, plant and equipment (2,374) 274 557
Changes in operating assets and liabilities, excluding effects of
business acquisitions:
Accounts receivable 16,725 (6,568) 14,057
Inventories 25,565 6,402 (4,169)
Other current assets 6,872 (17) 3,389
Non-current assets (29,435) 777 (2,935)
Current liabilities 1,445 (25,452) 9,914
Non-current liabilities 715 1,490 (984)
Net cash provided by operations 106,615 63,047 103,371
Cash Flows From Investing
Business acquisitions–net of cash acquired (285,533) (98,982) (62,104)
Capital expenditures (29,261) (13,415) (13,714)
Proceeds from sale of property, plant and equipment 10,219 3,481 6,491
Purchase of marketable securities (107) (121) (89)
Net cash used for investing (304,682) (109,037) (69,416)
Cash Flows From Financing
Proceeds from long-term debt 345,116 — —
Proceeds from senior subordinated notes 156,118 — —
Payments on long-term debt (161,889) (1,093) (11,090)
(Payments) proceeds from revolver borrowings–net (78,727) 83,319 (16,200)
(Payments) proceeds from issuance of commercial paper–net (24,700) 24,700 —
Debt acquisition costs (21,023) — (574)
Dividends paid (7,358) (7,507) (7,799)
Treasury stock purchases — (49,752) —
Exercises of stock options 183 339 1,241
Net cash provided by (used for) financing 207,720 50,006 (34,422)
Effect of exchange rate changes on cash (55) (130) (18)
Net increase (decrease) in cash and cash equivalents 9,598 3,886 (485)
Balance at beginning of year 13,983 10,097 10,582
Balance at end of year $«÷23,581 $«÷13,983 $«10,097
Supplemental Cash Flow Information
Interest paid $«÷29,717 $«÷11,837 $«10,137
Income taxes paid $«÷29,306 $«÷36,632 $«41,327
The accompanying notes are an integral part of these financial statements.

41
For the Years Ended December 31
Thousands of dollars, except shares and per share data 2001 2000 1999
Common Stock—Shares Outstanding
Balance at beginning of year 24,259,463 26,088,369 17,304,578
Treasury stock purchases — (1,882,900) —
Three-for-two stock split — — 8,652,289
Stock options exercised 21,799 68,919 144,177
Stock swaps for stock options exercised (3,736) (14,925) (12,675)
Stock held by Rabbi Trust (224,441) — —
Balance at end of year 24,053,085 24,259,463 26,088,369
Common Stock—Par Value
Balance at beginning of year $«««««««««367 $«««««««««367 $«««««««245
Three-for-two stock split — — 122
Balance at end of year $«««««««««367 $«««««««««367 $«««««««367
Additional Paid-In Capital
Balance at beginning of year $««««31,602 $««««31,476 $««31,029
Three-for-two stock split — — (122)
Stock options exercised 68 126 569
Balance at end of year $««««31,670 $««««31,602 $««31,476
Accumulated Other Comprehensive Loss
Balance at beginning of year $«««««(2,569) $««««««««(814) $««««««(212)
Other comprehensive loss:
Foreign currency translation adjustments 656 (1,755) (602)
Derivative instrument fair market value
adjustment–net of income tax benefit of $1,318 (2,024) — —
Balance at end of year $«««««(3,937) ÷÷«$«««««(2,569) $««««««(814)
Retained Earnings
Balance at beginning of year $««334,433 $««281,672 $222,687
Net earnings 45,548 60,268 66,784
Cash dividends ($0.30 per share in all years) (7,358) (7,507) (7,799)
Balance at end of year $««372,623 $««334,433 $281,672
Treasury Stock
Balance at beginning of year «$«(130,064) $«««(80,525) $«(81,197)
Treasury stock purchases — (49,752) —
Stock options exercised 227 675 1,088
Stock swaps for stock options exercised (112) (462) (416)
Stock held by Rabbi Trust (6,979) — —
Balance at end of year «$«(136,928) $«(130,064) $«(80,525)
Comprehensive Income
Net earnings $«÷«45,548 $««««60,268 $««66,784
Other comprehensive loss:
Foreign currency translation adjustments 656 (1,755) (602)
Derivative instrument fair market value
adjustment–net of income tax benefit of $1,318 (2,024) — —
Comprehensive income $««««44,180 $««««58,513 $««66,182
The accompanying notes are an integral part of these financial statements.
Consolidated Statements of Stockholders’ Equity and Comprehensive Income

42
1. Summary of Significant Accounting Policies
Operations The Manitowoc Company, Inc. and its subsidiaries(collectively referred to as the “company”) are diversified industrialmanufacturers with leading positions in their three principle mar-kets: cranes; foodservice equipment; and marine. The company’scrane business is principally conducted through its subsidiaries:Manitowoc Cranes, Inc., Potain S.A.S. (f/k/a Potain S.A.) (“Potain”),Manitowoc Boom Trucks, Inc., Femco Machine Company, Inc., andManitowoc Remanufacturing, Inc. The company’s foodservice busi-ness is principally conducted through its subsidiaries: ManitowocIce, Inc., SerVend International, Inc., Multiplex Company, Inc.,Manitowoc Beverage Systems, Inc., KMT Refrigeration, Inc. (Kolpakand McCall), Diversified Refrigeration, Inc., Harford Duracool LLC,and Manitowoc Hangzhou, as well as its partially owned sub-sidiary, Fabbrica Apparecchiature per la Produzione del GhiaccioS.r.l. (“FAG”). The company’s marine business is principally con-ducted through its subsidiaries: Manitowoc Marine Group LLC (Bay Shipbuilding Co., Toledo Shiprepair Co., Cleveland ShiprepairCo.) and Marinette Marine Corporation.
Principles of Consolidation and Presentation The consolidatedfinancial statements include the accounts of the company and itswholly and majority-owned subsidiaries. All significant intercompanybalances and transactions have been eliminated. The financialstatements of the company have been prepared in accordance withU.S. generally accepted accounting principles (“U.S. GAAP”). U.S.GAAP requires management to make estimates and assumptionsthat affect the reported amounts of assets and liabilities, disclo-sure of contingent assets and liabilities at the date of the financialstatements, and the reported amounts of revenues and expensesduring the reporting period. Actual results could differ from theseestimates.
Cash Equivalents and Marketable Securities All short-terminvestments purchased with an original maturity of three monthsor less are considered cash equivalents. Marketable securities atDecember 31, 2001 and 2000, included $2.2 million and $2.0 mil-lion, respectively, of securities which are considered “available forsale.” The difference between fair market value and cost for theseinvestments was not significant in either year.
Inventories Inventories are valued at the lower of cost or market.Approximately 79% and 57% of the company’s inventories atDecember 31, 2001 and 2000, respectively, were computed usingthe first-in, first-out (“FIFO”) method. The remaining inventorieswere computed using the last-in, first-out (“LIFO”) method. If theFIFO inventory valuation method had been used exclusively, inven-tories would have increased by $19.6 million and $21.6 million atDecember 31, 2001 and 2000, respectively. Finished goods andwork-in-process inventories include material, labor, and manufac-turing overhead costs. Customer advance payments, which are net-ted against inventories to the extent of related accumulated costs,were not significant in either year.
Intangible Assets Intangible assets at December 31, 2001 and2000 consist primarily of costs in excess of net assets of business-es acquired (goodwill). Historically, intangible assets have beenamortized using the straight-line method over their estimated ben-eficial lives, not to exceed 40 years. Subsequent to an acquisition,the company annually evaluates whether later events and circum-stances occurred that indicated the remaining estimated useful lifeof intangibles may warrant revision or that the remaining balanceof intangibles may not be recoverable. When factors indicated that
intangibles should be evaluated for possible impairment, the com-pany used an estimate of the related business’ undiscounted netcash flows over the remaining life of the intangibles in measuringwhether the intangibles were recoverable. Intangible assets atDecember 31, 2001 and 2000, are net of accumulated amortizationof $47.3 million and $29.4 million, respectively.
In June 2001, the Financial Accounting Standards Board (“FASB”)issued Statement of Financial Accounting Standards (“SFAS”) No.141, “Business Combinations” and No. 142, “Goodwill and OtherIntangible Assets,” to establish accounting and reporting stan-dards for business combinations, goodwill and intangible assets.SFAS No. 141 discontinued the use of the “pooling-of-interest”method of accounting for business combinations completed afterJune 30, 2001. According to SFAS No. 142, goodwill and intangibleassets deemed to have indefinite lives will no longer be amortizedbut will be subject to annual impairment tests in accordance withthe statement. Other intangible assets will continue to be amor-tized over their useful lives. The company adopted the new rulesfor accounting for goodwill and other intangible assets on January1, 2002. Subject to final analysis, the company expects applicationof the non-amortization provision of the statement to increaseoperating earnings by approximately $10.5 million and net incomeby approximately $6.4 million ($0.26 per diluted share) in 2002.
According to SFAS No. 142, impairment of goodwill is measuredaccording to a two-step approach. In the first step, the fair value ofa reporting unit, as defined by the statement, is compared to thecarrying amount of the reporting unit, including goodwill. If thecarrying amount exceeds the fair value, the second step of thegoodwill impairment test is performed to measure the amount ofimpairment loss, if any. In the second step, the implied fair value ofthe goodwill is estimated as the fair value of the reporting unit lessthe fair values of all the other tangible and intangible assets of thereporting unit. If the carrying amount of the goodwill exceeds theimplied fair value of the goodwill, an impairment loss is recognizedin an amount equal to that excess, not to exceed the carryingamount of the goodwill.
According to SFAS No. 142, impairment of indefinite-lived intan-gible assets, other than goodwill, are measured according to aone-step approach, which compares the estimated fair value of theintangible asset to its carrying amount. If the carrying amount ofthe intangible asset exceeds the estimated fair value, an impair-ment loss is recognized in an amount equal to that excess.
The company is in the process of performing the first of the re-quired impairment tests of goodwill and indefinite-lived intangibleassets using a valuation date of January 1, 2002. The company hasnot yet determined what the effect of these tests will be on thecompany’s earnings or financial position in future periods.
Property, Plant and Equipment Property, plant and equipment isdepreciated over the estimated useful lives of the assets primarilyusing the straight-line depreciation method. Expenditures for main-tenance, repairs, and renewals of relatively minor items are chargedto expense as incurred. Renewals of significant items that substan-tially extend the capacity or useful life of an asset are capitalized.The cost and accumulated depreciation for property, plant andequipment sold, retired, or otherwise disposed of are relieved fromthe accounts, and resulting gains or losses are reflected in income.
Property, plant and equipment is depreciated over the followingestimated useful lives:
Years
Buildings and improvements 40Drydocks and dock fronts 15–27Machinery, equipment and tooling 4–15Furniture and fixtures 10Computer hardware and software 3–5
Notes to Consolidated Financial Statements (Table information in thousands of dollars, except per share data)

43
Property, plant and equipment also includes cranes under operatinglease with others. Equipment under lease to others includes equip-ment leased directly to the customer and equipment for which thecompany has guaranteed a residual value or made a buyback com-mitment. The amount of rental equipment included in property,plant and equipment for which the company has guaranteed aresidual value or made a buyback commitment amounted to $13.4million, net of accumulated depreciation at December 31, 2001.Leased equipment transactions are accounted for as operating leaseswith the related assets capitalized and depreciated over their esti-mated economic life of 80 months for equipment leased directly tothe customer. For equipment involved in financing arrangements,the equipment is depreciated over the life of the underlying ar-rangement so that the net book value at the end of the periodequals the buyback amount or the residual value amount.
Other Non-Current Assets Other non-current assets include tool-ing assets and other project start-up costs of $23.0 million and $6.7million at December 31, 2001 and 2000, respectively. These assetsand costs are used in the development and production of certainrefrigeration equipment produced under contract with a third party.These costs are reimbursed by the customer according to the con-tract on a per unit sold basis with quarterly minimum reimburse-ments required in order to ensure reimbursement of all of the costsand tooling for a particular product over a period of time. At the endof the reimbursement period the tooling belongs to the customer.
Impairment of Long-lived Assets Property, plant, and equipment,other long-term assets, and goodwill and other intangible assets(prior to January 1, 2002 for goodwill and other intangible assets)are reviewed for impairment whenever events or changes in cir-cumstances indicate that the carrying amount may not be recover-able. If the sum of the expected undiscounted cash flows is lessthan the carrying value of the related asset or group of assets, aloss is recognized for the difference between the fair value and car-rying value of the asset or group of assets. Such analyses neces-sarily involve significant judgement.
In August 2001, the FASB issued SFAS No. 143, “Accounting forObligations Associated with the Retirement of Long-Lived Assets,”and SFAS No. 144, “Accounting for the Impairment or Disposal ofLong-Lived Assets.” SFAS No. 143 establishes accounting stan-dards for the recognition and measurement of an asset retirementobligation. SFAS No. 144 addresses accounting and reporting forthe impairment or disposal of long-lived assets, supersedingSFAS No. 121 and Accounting Principles Board Opinion No. 30.SFAS No. 143 and No. 144 are effective for us in the first quartersof 2003 and 2002, respectively. The company does not believethat the implementation of these statements will have a materialeffect on its consolidated financial statements.
Financial Instruments The carrying amounts reported in theConsolidated Balance Sheets for cash and cash equivalents,accounts receivable, accounts payable, and variable rate debtapproximated fair value at December 31, 2001 and 2000. The fairvalue of the company’s 103/8% Senior Subordinated Notes wasapproximately $160.4 million at December 31, 2001. The aggregatefair values of interest rate swaps and foreign currency forwardexchange contracts at December 31, 2001 and 2000, were negative$3.3 million and negative $1.6 million, respectively. These fair valuesare the amounts at which they could be settled, based on internalestimates and estimates obtained from financial institutions.
Warranties Estimated warranty costs are recorded in cost of salesat the time of sale of the warranted products based on historicalwarranty experience for the related product or estimates of pro-jected losses due to specific warranty issues on new products.These estimates are reviewed periodically and are adjusted basedon changes in facts, circumstances, or actual experience.
Environmental Liabilities The company accrues for losses associ-ated with environmental remediation obligations when such lossesare probable and reasonably estimable. Such accruals are adjustedas information develops or circumstances change. Costs of long-term expenditures for environmental remediation obligations arenot discounted to their present value.
Postretirement Benefits Other Than Pensions The expected costof postretirement benefits is recorded during the years that theemployees render service. The obligation for these benefits andthe related periodic costs are measured using actuarial techniquesand assumptions, including an appropriate discount rate. Actuarialgains and losses are deferred and amortized over future periods.
Foreign Currency Translation The financial statements of the com-pany’s non-U.S. subsidiaries are translated using the currentexchange rate for assets and liabilities and the weighted averageexchange rate for the year for statement of earnings items.Resulting translation adjustments are recorded directly to a sepa-rate component of stockholders’ equity referred to as accumulatedother comprehensive income.
Derivative Financial Instruments Derivative financial instrumentsare used by the company to manage risks associated with interestrate market volatility and fluctuating foreign exchange rates.Interest rate swap agreements are used to help manage the com-pany’s exposure to interest rate movements on floating rate debt.Foreign exchange rate hedge contracts are used to reduce the com-pany’s exposure to fluctuations in the value of foreign currencies.On January 1, 2001, the company adopted SFAS No. 133,“Accounting for Derivative Instruments and Hedging Activities,”which was amended by SFAS No. 137 and SFAS No. 138 (collec-tively referred to as SFAS No. 133). As a result of the adoption ofSFAS No. 133, the company recognizes all derivative financialinstruments in the consolidated financial statements at fair value.Changes in the fair value of derivatives are recorded each period incurrent earnings or comprehensive income, depending on whetherthe derivative is designated and qualifies as part of a hedge trans-action and if so, the type of hedge transaction. For interest rateswap agreements, net interest payments or receipts are recordedas adjustments to interest expense on a current basis. These activi-ties are subject to established policies that, among other matters,prohibit the use of derivative financial instruments for trading orspeculative purposes.
The adoption of SFAS No. 133 did not impact the ConsolidatedStatement of Earnings for 2001 and did not have a material impacton the Consolidated Balance Sheet.
Deferred Revenue, Buyback Commitments and GuaranteedResidual Values Prior to the acquisition, Potain entered intotransactions with customers that provided for residual value guar-antees and buyback commitments. These transactions have beenrecorded as operating leases. Net proceeds received in connectionwith the initial transactions have been recorded as deferred rev-enue and are being amortized to income on a straight-line basisover a period equal to that of the customer’s third party financingagreement. The deferred revenue included in other non-current liabilities at December 31, 2001, was $17.7 million.
If all buyback commitments outstanding were satisfied atDecember 31, 2001, the total cash cost to the company would be$14.2 million. These buyback commitments are not recorded andexpire at various times through February 2006. The potential buy-back amounts at expiration of these commitments, which are dif-ferent than the current year-end amounts, are as follows:
2002 $3,5362003 7632004 2,0122005 2,4292006 169
$8,909

44
Notes to Consolidated Financial Statements (continued)(Table information in thousands of dollars, except per share data)
The company also has outstanding $1.6 million of guarantees onresidual values of equipment sold through a third party financingcompany. These commitments are not recorded and expire at vari-ous times throughout 2002.
In case of exercise of these guarantees or buyback commit-ments, the company would either take title to the used machineryor actively participate in the remarketing of the equipment, thesale of which could mitigate the company’s ultimate loss.
Revenue Recognition and Long-Term Contracts Revenue is gener-ally recognized and earned when all the following criteria are satis-fied with regard to a specific transaction: persuasive evidence of anarrangement exists, the price is fixed or determinable, collectibilityof cash is reasonably assured, and delivery has occurred or serviceshave been rendered. Revenues under long-term contracts, includ-ing contracts with the U.S. Government, are recorded using thepercentage-of-completion method of accounting. Revenues underthese fixed-price long-term contracts are recorded upon theachievement of performance milestones, or based on the ratio ofcosts incurred to estimated total costs at completion, and costs areexpensed as incurred. Amounts representing contract changeorders, claims, or other items are included in revenue only whenthey can be reliably estimated and realization is probable. Whenadjustments in contract value or estimated costs are determined,any changes from prior estimates are reflected in earnings in thecurrent period. Anticipated losses on contracts or programs inprogress are charged to earnings when identified.
Amounts related to long-term contracts accounted for accordingto the percentage-of-completion method included in the Consoli-dated Balance Sheets at December 31 were as follows:
2001 2000
Amounts billed included in accounts receivable $2,563 $12,800Recoverable costs and accrued profit on progress
completed–not billed, included in othercurrent assets $7,728 $««1,125
Amounts billed in excess of sales, included in accounts payable and accrued expenses $8,405 $««5,084
Recoverable costs and accrued profit on progress completed but notbilled relate to amounts not billable at the balance sheet date. It isanticipated that such amounts will be billed in the first quarter of thesubsequent year. Amounts billed but not paid pursuant to retainagecontract provisions, which are due upon completion of the contracts,are not significant.
Research and Development Research and development costsare charged to expense as incurred and amounted to $8.3 million,$6.7 million and $6.9 million in 2001, 2000, and 1999, respectively.Customer-sponsored research and development costs incurred pursuant to contracts are accounted for as contract costs.
Income Taxes The company utilizes the liability method to recog-nize deferred tax assets and liabilities for the expected futureincome tax consequences of events that have been recognized inthe company’s financial statements. Under this method, deferredtax assets and liabilities are determined based on the temporarydifferences between financial statement carrying amounts and thetax basis of assets and liabilities using enacted tax rates in effect inthe years in which the temporary differences are expected toreverse. Valuation allowances are provided for deferred tax assetswhere it is considered more likely than not that the company willnot realize the benefit of such assets.
Earnings Per Share Basic earnings per share is computed bydividing net earnings by the weighted average number of commonshares outstanding during each year/period. Diluted earnings pershare is computed similar to basic earnings per share except thatthe weighted average shares outstanding is increased to includethe number of additional shares that would have been outstandingif stock options were exercised and the proceeds from such exer-cise were used to acquire shares of common stock at the averagemarket price during the year/period. Shares of common stock heldby the Rabbi Trust are not considered outstanding for computingbasic earnings per share.
Comprehensive Income Comprehensive income includes, in ad-dition to net income, other items that are reported as direct adjust-ments to stockholders’ equity. Currently, these items are foreigncurrency translation adjustments and the change in fair value ofcertain derivative instruments.
Concentration of Credit Risk Credit extended to customersthrough trade accounts receivable potentially subject the companyto risk. This risk is limited due to the large number of customersand their dispersion across various industries and many geographi-cal areas. However, a significant amount of receivables are withlarge companies in the foodservice and beverage industries, dis-tributors and contractors in the construction industry, customersservicing the U.S. steel industry, and the U.S. Government. Thecompany currently does not foresee a significant credit risk associ-ated with these receivables.
2. Property, Plant and Equipment The components of property,plant and equipment at December 31 are summarized as follows:
2001 2000
Land $«÷12,396 $«÷÷«3,888Buildings and improvements 113,943 75,430Drydocks and dock fronts 19,916 21,389Machinery, equipment, and tooling 179,856 116,950Furniture and fixtures 13,308 4,628Computer hardware and software 22,856 11,710Rental cranes 50,096 —Construction in progress 8,575 3,876
Total cost 420,946 237,871
Less accumulated depreciation (245,562) (137,931)
Property, plant and equipment–net $«175,384 $÷«99,940
3. Inventories The components of inventories at December 31 aresummarized as follows:
2001 2000
Raw materials $÷44,302 $÷33,935Work-in-process 35,517 32,914Finished goods 62,798 45,880
Total inventories at FIFO cost 142,617 112,729
Excess of FIFO cost over LIFO value (19,561) (21,551)
Total inventories $123,056 $÷91,178

45
4. Accounts Payable and Accrued Expenses Accounts payableand accrued expenses at December 31 are summarized as follows:
2001 2000
Trade accounts payable $113,098 $÷64,269Employee related expenses 27,552 13,964Income taxes payable 11,752 —Profit sharing and incentives 10,080 23,280Customer progress payments 6,997 877Accrued product liability 10,580 8,432Miscellaneous accrued expenses 56,072 33,891
Total $236,131 $144,713
5. Debt Debt at December 31 is summarized as follows:
2001 2000
Senior credit facility:Term loan A $128,000 $«÷÷÷÷«—Term loan B 174,125 —Revolving credit facility 5,900 —
Senior subordinated notes (175 million euro) 154,227 —Revolver borrowings — 115,600Notes payable — 75,000Commercial paper — 24,719Industrial revenue bonds 3,371 3,619Other 22,947 —
Total debt 488,570 218,938Less current portion (42,048) (81,270)
Long-term debt $446,522 $137,668
To finance the acquisition of Potain in May 2001 and replace itsexisting credit facilities, the company entered into a $475 millionSenior Credit Facility (“Senior Credit Facility”) maturing in May2007 and issued 175 million euro (approximately $156 million atMay 9, 2001) of its 103/8% Senior Subordinated Notes (“SeniorSubordinated Notes”) due May 2011. The company recorded anafter-tax extraordinary charge of $3.3 million ($5.5 million beforeincome taxes) in May 2001 to record the write-off of deferredfinancing costs and penalties incurred related to the prepayment of its notes payable with proceeds from its Senior Credit Facility.
The Senior Credit Facility is comprised of term loans aggregating$350 million and a $125 million revolving credit facility. Term LoanA requires quarterly principal payments of $7.5 million from June2002 through May 2006. Term Loan B requires quarterly principalpayments of $0.4 million through March 2006 and $33.3 millionfrom June 2006 through May 2007. During 2001, the company madeprepayments of principal under Term Loan A of $29.5 million, whichreduces the required principal payments in 2002. Substantially alldomestic, tangible, and intangible assets of the company and itssubsidiaries are pledged as collateral under the Senior CreditFacility.
Borrowings under the Senior Credit Facility bear interest at arate equal to the sum of a base rate or a Eurodollar rate plus anapplicable margin, which is based on the company’s consolidatedtotal leverage ratio, as defined by the Senior Credit Facility. Theweighted average interest rate for the Term Loan A was 5.03% atDecember 31, 2001. The interest rates for the Term Loan B andrevolving credit facility at December 31, 2001, were 4.85% and6.38%, respectively. The annual commitment fee in effect at theend of 2001 on the unused portion of the revolving credit facilitywas 0.5%.
The Senior Subordinated Notes are unsecured obligations of thecompany, ranking subordinate in right of payment to all senior debtof the company and are unconditionally, jointly, and severally guar-anteed by all of the company’s domestic subsidiaries (see Note 15).Interest on the Senior Subordinated Notes is payable semiannuallyin May and November of each year. The Senior Subordinated Notescan be redeemed in whole or in part by the company for a premiumafter May 15, 2006. In addition, the company may redeem for a pre-
mium at any time prior to May 15, 2004, up to 35% of the faceamount of the Senior Subordinated Notes with the proceeds fromone or more public equity offerings.
Both the Senior Credit Facility and the Senior SubordinatedNotes contain customary affirmative and negative covenants. Ingeneral, the covenants contained in the Senior Credit Facility aremore restrictive than those of the Senior Subordinated Notes.Among other restrictions, these covenants require the company tomeet specified financial tests, including various debt and cash flowratios which become more restrictive over time. These covenantsalso limit the company’s ability to redeem or repurchase the SeniorSubordinated Notes, incur additional debt, make acquisitions, mergewith other entities, pay dividends or distributions, repurchase capi-tal stock, lend money or make advances, create or become subjectto liens, and make capital expenditures. The Senior Credit Facilityalso contains cross-default provisions whereby certain defaultsunder any other debt agreements would result in a default underthe Senior Credit Facility. The company is in compliance with thesecovenants at December 31, 2001.
As of December 31, 2001, the company also had outstanding$22.9 million of other indebtedness assumed as a result of theacquisition of Potain with a weighted average interest rate of4.92%. This debt includes $6.5 million of outstanding bank debt inChina, $9.1 million of bank overdrafts, and $7.3 million of capitallease obligations and other miscellaneous debt.
Industrial revenue bonds relate to the company’s obligations ontwo properties located in Tennessee and Indiana. These obligationsare due in monthly or annual installments including principal andinterest at rates of 1.9% and 10.0%, respectively, at December 31,2001. These obligations mature at various dates through 2004.
The company enters into interest rate swap agreements toreduce the impact of changes in interest rates on its floating ratedebt. As of December 31, 2001, the company had outstanding twointerest rate swap agreements with financial institutions, havingnotional principal amounts of $161.5 million and $12.5 million.These swaps fix interest paid by the company for debt equaling thenotional values of the swaps at 7.05% and 8.92%, and mature inAugust 2004 and October 2002, respectively. The fair value ofthese arrangements, which represents the costs to settle thesecontracts, approximates a loss of $1.9 million (net of income taxes)at December 31, 2001.
The aggregate scheduled maturities of outstanding debt obliga-tions in subsequent years are as follows:
2002 $««42,0482003 34,2952004 37,0462005 34,0952006 117,736Thereafter 223,350
$488,570
On May 28, 1999, the company entered into an accounts receivablefactoring arrangement with a bank. The company factored $180.5million and $148.0 million in accounts receivable to the bank underthis arrangement during 2001 and 2000, respectively. According tothe Senior Credit Facility, the maximum amount of accounts receiv-able that can be outstanding at any one time under this arrangement,net of amounts collected from customers, was $45.0 millionthrough December 30, 2001, and is $25.0 million thereafter. Thecompany’s factoring liability, net of cash collected from customers,was $17.8 million and $23.1 million at December 31, 2001 and2000, respectively. The cash flow impact of this arrangement isreported as cash flows from operations in the 2001 and 2000Consolidated Statements of Cash Flows. Under this arrangement,the company is required to purchase from the bank the first $0.5million and amounts greater than $1.0 million of the aggregateuncollected receivables during a twelve-month period.

46
Notes to Consolidated Financial Statements (continued)(Table information in thousands of dollars, except per share data)
7. Earnings Per Share The following is a reconciliation of the average shares outstanding used to compute basic and diluted earningsper share before extraordinary loss.
Per Share Per Share Per ShareShares Amount Shares Amount Shares Amount
For the Years Ended December 31 2001 2001 2000 2000 1999 1999
Basic EPS 24,269,807 $2.01 24,891,387 $2.42 25,991,711 $2.57Effect of dilutive securities—stock options 278,656 231,408 208,955
Diluted EPS 24,548,463 $1.99 25,122,795 $2.40 26,200,666 $2.55
6. Income Taxes Components of earnings before income taxesare as follows:
For the Years Ended December 31 2001 2000 1999
Earnings (loss) before income taxes:Domestic $63,253 $94,220 $106,234Foreign 16,436 1,900 (228)
Total $79,689 $96,120 $106,006
The provision for taxes on income is as follows:
For the Years Ended December 31 2001 2000 1999
Current:Federal $16,845 $24,418 $36,715State 3,887 3,081 3,291Foreign 2,573 252 (192)
Total current 23,305 27,751 39,814
Deferred:Federal and state 5,519 8,101 (592)Foreign 1,993 — —
Total deferred 7,512 8,101 (592)
Provision for taxes on income $30,817 $35,852 $39,222
The Federal statutory income tax rate is reconciled to the company’seffective income tax rate as follows:
For the Years Ended December 31 2001 2000 1999
Federal statutory income tax rate 35.0% 35.0% 35.0%State income taxes, net of
federal income tax benefit 2.1 2.3 2.2Non-deductible goodwill amortization 4.2 1.7 1.4Tax-exempt FSC income (0.9) (0.9) (1.2)Provision for tax on foreign income,
net of foreign tax credits (0.2) (0.3) (0.1)Accrual adjustment (2.1) (0.4) (1.1)Other items 0.6 (0.1) 0.8
Effective income tax rate 38.7% 37.3% 37.0%
The deferred income tax accounts reflect the impact of temporarydifferences between the basis of assets and liabilities for financialreporting purposes and their related basis as measured by incometax regulations.
A summary of the deferred income taxes at December 31 is as follows:
2001 2000
Current deferred income tax assets:Inventories $ ÷«6,037 $ ÷«6,037Accounts receivable 1,458 1,035Product warranty reserves 4,977 4,553Product liability reserves 3,199 3,245Other employee-related benefits
and allowances 4,963 4,474Other 7,712 1,248
Deferred income tax assets, current $ «28,346 $ «20,592
Non-current deferred income tax assets (liabilities):Property, plant and equipment $ (17,513) $ (17,510)Postretirement benefits, other
than pensions 7,781 7,853Deferred employee benefits 3,741 4,938Severance benefits 1,055 1,069Product warranty reserves 1,298 1,205Net operating loss carryforwards 9,322 1,976Less valuation allowance (3,951) —Other (6,876) 1,862
Net deferred income tax assets (liabilities),non-current $ ÷(5,143) $ ÷«1,393
The company does not provide for income taxes which would bepayable if undistributed earnings of foreign subsidiaries wereremitted because the company either considers these earnings tobe invested for an indefinite period or anticipates that when suchearnings are distributed, the U.S. income taxes payable would besubstantially offset by foreign tax credits.
As of December 31, 2001, the company had approximately $52.1million of state net operating loss carryforwards, which are avail-able to reduce future state tax liabilities and expire on variousdates between 2013 and 2016. The company has federal net oper-ating losses of $1.0 million available to reduce federal taxableincome which expire in 2003. The company also has $21.1 millionforeign net operating loss carryforwards, which are available toreduce income in certain foreign jurisdictions and expire on vari-ous dates through 2006. A valuation allowance of approximately$4.0 million was recorded at December 31, 2001, to reflect the esti-mated amount of deferred assets which may not be realized due tothe possible limitation on future use of certain foreign net operatingloss carryforwards.

47
Weighted Weighted WeightedAverage Average AverageExercise Exercise Exercise
Shares Price Shares Price Shares Price
For the Years Ended December 31 2001 2001 2000 2000 1999 1999
Options outstanding, beginning of year 1,311,379 $21.79 611,881 $21.94 610,006 $18.63Options granted 95,250 28.46 934,900 21.20 221,557 25.58Options exercised (21,799) 13.50 (68,919) 11.97 (144,177) 11.50Options forfeited (110,975) 24.50 (166,483) 23.13 (75,505) 25.84
Options outstanding, end of year 1,273,855 $22.19 1,311,379 $21.79 611,881 $21.94
Options exercisable, end of year 203,939 $22.11 120,906 $19.53 47,444 $15.58
Options Outstanding Options Exercisable
WeightedAverage Weighted Weighted
Remaining Average AverageContractual Exercise Exercise
Range of Exercise Prices Outstanding Life (Years) Price Exercisable Prices
$7.78–$9.93 32,173 1.6 $÷9.41 32,173 $÷9.41$18.78–$25.57 1,061,443 8.0 21.30 113,001 21.33$28.56–$33.06 180,239 7.0 29.71 58,765 30.57
1,273,855 7.7 $22.19 203,939 $22.11
8. Stockholders’ Equity Authorized capitalization consists of 75 million shares of $.01 par value common stock and 3.5 millionshares of $.01 par value preferred stock. None of the preferredshares have been issued. Pursuant to a Rights Agreement datedAugust 5, 1996, each common share carries with it four-ninths of a Right to purchase additional stock. The Rights are not currentlyexercisable and cannot be separated from the shares unless cer-tain specified events occur, including the acquisition of 20% ormore of the company’s common stock. In the event a person orgroup actually acquires 20% or more of the common stock, or if thecompany is merged with an acquiring person, subject to approvalby the board of directors, each full Right permits the holder to pur-chase one share of common stock for $100. The Rights expire on
9. Stock Options The company maintains two stock plans, TheManitowoc Company, Inc. Stock Plan and The Manitowoc Company,Inc. Non-Employee Director Stock Plan, for the granting of stockoptions as an incentive to certain employees and to non-employeemembers of the board of directors. Under these plans, stock optionsto acquire up to 2.5 million (employees) and 0.187 million (non-employee directors) shares of common stock, in the aggregate,
The outstanding stock options at December 31, 2001, have a rangeof exercise prices of $7.78 to $33.06 per option. The following
The weighted average fair value at date of grant for optionsgranted during 2001, 2000, and 1999 was $11.65, $8.86, and$9.56 per option, respectively. The fair value of options at dateof grant was estimated using the Black-Scholes option pricingmodel with the following weighted average assumptions:
2001 2000 1999
Expected life (years) 7 7 7Risk-free interest rate 5.2% 5.5% 5.0%Expected volatility 33.6% 34.0% 30.9%Expected dividend yield 1.1% 1.0% 1.3%
10. 2001 Acquisitions On May 9, 2001, the company acquiredfrom Legris Industries S.A., all of the outstanding capital stock ofPotain. Potain is a leading designer, manufacturer, and supplier oftower cranes for the building and construction industry. The aggre-gate consideration paid was $424.8 million, which includes $307.1million paid in cash, direct acquisition costs of $3.7 million,assumed liabilities of $138.8 million, the payment of a post-closinginterim income adjustment of $3.6 million in February 2002, and isless cash acquired of $28.4 million.
September 18, 2006, and may be redeemed by the company for$.01 per Right (in cash or stock) under certain circumstances.
In March 2001 and September 2001, the company paid dividendsto shareholders of $0.075 and $0.225, respectively. Beginning in2002, the company will pay only an annual dividend. The amountand timing of this annual dividend will be determined by the boardof directors at its regular fall meeting each year.
Currently, the company has authorization to purchase up to 2.5 million shares of common stock at management’s discretion. As of December 31, 2001, the company had purchased approxi-mately 1.9 million shares at a cost of $49.8 million pursuant to this authorization. The company did not purchase any shares of its common stock during 2001.
may be granted under a time-vesting formula at an exercise priceequal to the market price of the common stock at the date of grant.The options become exercisable in equal 25% increments begin-ning on the second anniversary of the grant date over a four-yearperiod and expire ten years subsequent to the grant date. Stockoption transactions under these plans for the years endedDecember 31, 2001, 2000, and 1999 are summarized as follows:
table shows the options outstanding and exercisable by range ofexercise prices at December 31, 2001:
The company applies Accounting Principles Board Opinion No.25, under which no compensation cost has been recognized inthe Consolidated Statements of Earnings for stock options.Had compensation cost been determined under an alternativemethod suggested by SFAS No. 123, “Accounting for Stock-Based Compensation,” net income would have decreased $2.0million, $1.3 million, and $0.9 million in 2001, 2000, and 1999,respectively; and diluted earnings per share would have been$1.78, $2.35, and $2.52 in 2001, 2000, and 1999, respectively.
The preliminary estimate at December 31, 2001 of the excess ofthe cost over the fair value of the net assets acquired is $203.3 mil-lion. During 2001 from the date of acquisition, this amount wasclassified as goodwill and amortized over a 40-year life. The com-pany is currently in the process of completing its valuations of thetangible and intangible assets acquired as a result of this acquisi-tion and determining the impact on intangible asset amortizationunder SFAS No. 142, “Goodwill and Other Intangible Assets.”During the first half of 2002, the excess cost over fair value for this

48
Notes to Consolidated Financial Statements (continued)(Table information in thousands of dollars, except per share data)
acquisition will be allocated to specific intangible assets. Basedupon a third party appraisal report, the preliminary allocation isas follows: $53.0 million to trademarks and tradenames with anindefinite life; $17.5 million to patents with a 15-year life; $8.8 mil-lion to engineering drawings with a 15-year life; $5.0 million to anin-place distribution network with an indefinite life; and theremaining $119.0 million to goodwill with an indefinite life. Thefinal determination of goodwill will be dependent upon finalizationof a third party appraisal of the tangible and other intangibleassets to be completed in 2002.
During 2001, the company also completed the acquisitions ofcertain assets of a German-based telescopic personnel platform liftcompany, assets of a terminated Singapore-based crane equip-ment distribution company, and assets of a local electrical contrac-tor for the Marine segment. The total aggregate consideration paidby the company for these acquisitions was $2.5 million, whichincludes direct acquisition costs and assumed liabilities, less cashacquired.
The following unaudited pro forma financial information for theyears ended December 31, 2001 and 2000 assumes the 2001 acqui-sition of Potain occurred as of January 1 of each year.
2001 2000
Net sales $1,229,946 $1,230,843Earnings before extraordinary loss $÷«÷44,965 $«÷÷49,614Net earnings $«÷÷41,641 $«÷÷49,614Basic earnings per share
before extraordinary loss $«««««««««1.85 $«««««««««1.99Basic earnings per share $«««««««««1.72 $«««««««««1.99Diluted earnings per share before
extraordinary loss $«««««««««1.83 $«««««««««1.97Diluted earnings per share $«««««««««1.70 $«««««««««1.97
2000 Acquisitions On November 20, 2000, the company pur-chased all of the issued and outstanding shares of MMC AcquisitionCompany, the parent of Marinette Marine Corporation (“MarinetteMarine”). Marinette Marine, located in Marinette, Wisconsin, operates one of the largest shipyards on the U.S. Great Lakes.Marinette Marine is currently under a contract to build a series ofoceangoing buoy tenders for the United States Coast Guard, andpresently employs approximately 800 people and features com-plete in-house capabilities for all shipbuilding disciplines.
The aggregate consideration paid by the company for MarinetteMarine was $66.7 million, which includes $48.1 million paid incash, direct acquisition costs of $1.4 million, assumed liabilities of$17.2 million, the receipt of a post-closing working capital adjust-ment in September 2001 of $0.9 million, and is less cash acquiredof $18.6 million. The excess of the cost over the fair value of thenet assets acquired is $50.0 million. This excess was amortizedover a weighted average life of 38 years.
On April 7, 2000, the company acquired substantially all of thenet business assets of Harford Duracool, LLC (“Harford”). Harfordis a leading manufacturer of walk-in refrigerators and freezers andmaintains a 67,000-square-foot manufacturing facility in Aberdeen,Maryland. Its primary distribution channels are foodservice equip-ment dealers and commercial refrigeration distributors and itsproducts range in size from 200 to 60,000 cubic feet. Harford alsomanufactures a line of modular, temperature-controlled structuresfor other niche markets.
The aggregate consideration paid by the company for the assetsof Harford was $21.2 million, which includes direct acquisitioncosts of $0.5 million, assumed liabilities of $1.4 million, and thepayment of a post-closing working capital adjustment in Sep-
tember 2000 of $0.3 million. The excess of the cost over the fairvalue of the net assets acquired is $15.0 million. This excess wasamortized over a weighted average life of 35 years.
On March 31, 2000, the company acquired all of the issued and outstanding shares of Multiplex Company, Inc. (Multiplex).Multiplex is headquartered in St. Louis, Missouri, where its produc-tion facility is located and has operations in Frankfurt, Germany,and Glasgow, UK. Multiplex manufactures soft-drink and beer dis-pensing equipment as well as water purification systems and sup-plies leading quick-service restaurants, convenience stores, andmovie theatres. In addition, Multiplex designs and builds customapplications to meet the needs of customers with requirementsthat cannot be met by conventional dispensing equipment.
The aggregate consideration paid by the company for the sharesof Multiplex was $20.5 million, which is net of cash acquired of$3.7 million and includes direct acquisition costs of $0.4 millionand assumed liabilities of $5.3 million. The excess of the cost overthe fair value of the net assets acquired is $12.7 million. Thisexcess was amortized over a weighted average life of 37 years.
During 2000, the company completed other smaller acquisitionswhose total aggregate consideration paid was $18.2 million, whichis net of cash received and includes direct acquisition costs of $0.2million and assumed liabilities of $2.8 million.
1999 Acquisitions On April 9, 1999, the company acquired all ofthe issued and outstanding shares of Kyees Aluminum, Inc., a lead-ing supplier of cooling components for the major suppliers of foun-tain soft-drink beverage dispensers. The aggregate considerationpaid by the company was $28.5 million, which is net of cashacquired of $1.0 million and includes direct acquisition costs of$0.3 million, assumed liabilities of $2.2 million, and the paymentof a post-closing net worth adjustment during the third quarter of1999 of $1.3 million. The excess of the cost over the fair value ofthe net assets acquired is $24.1 million. This excess was amortizedover a weighted average life of 38 years.
On January 11, 1999, the company acquired all of the issued andoutstanding shares of Purchasing Support Group LLC (“PSG”), afour-member beverage service organization. The new operation,renamed Manitowoc Beverage Systems, Inc. (“MBS”), providesfull-service parts, components, and dispenser systems support tobottlers in the beverage industry. MBS is made up of companiesthat have been serving soft-drink bottling operations throughout theUnited States since the 1960s with a variety of equipment servicesfor beverage dispensing systems. MBS operates in the Northeast,Atlantic Coast, Southeast, Central, and Western United States.
The aggregate consideration paid by the company for the issuedand outstanding shares of the four member companies of PSG was$43.7 million, which is net of cash acquired of $0.8 million andincludes direct acquisition costs of $0.5 million and assumed liabil-ities of $5.9 million. The excess of the cost over the fair value ofthe net assets acquired is $34.0 million. This excess was amortizedover a weighted average life of 38 years.
The results of operations of each of the aforementioned acqui-sitions have been included in the Consolidated Statements ofEarnings since the date acquired. Each acquisition was recordedutilizing the purchase method of accounting which allocates theacquisition cost based upon the fair values of assets acquired andliabilities assumed. During 2002, goodwill amortization related tothese acquisitions will cease with the adoption of SFAS No. 142.

49
12. Employee Benefit Plans
Savings and Investment Plans The company sponsors a definedcontribution savings plan that allows substantially all employeesto contribute a portion of their pre-tax and/or after-tax income inaccordance with plan-specific guidelines. The plan requires thecompany to match 100% of the participants contributions up to 3%and match an additional 50% of the participants contributionsbetween 3% to a maximum of 6% of a participant’s compensation.The company also provides retirement benefits through noncon-tributory deferred profit sharing plans covering substantially allemployees. Company contributions to the plans are based uponformulas contained in such plans. Total costs incurred under theseplans were $10.6 million, $14.9 million and $14.3 million, in 2001,2000, and 1999, respectively.
Postretirement Health and Other Benefit Plans The companyprovides certain pension, health care and death benefits for eli-gible retirees and their dependents. The pension benefits are funded,while the health care and death benefits are not funded but arepaid as incurred. Eligibility for coverage is based on meeting cer-tain years of service and retirement qualifications. These benefitsmay be subject to deductibles, co-payment provisions, and otherlimitations. The company has reserved the right to modify thesebenefits.
The tables that follow contain the components of the periodicbenefit cost for 2001, 2000, and 1999, respectively, and the recon-ciliation of the changes in the benefit obligation, the changes inplan assets and the funded status as of December 31, 2001.Acquisition-related changes for 2001 presented in the table relateto the acquisition of Potain in May 2001. Data presented in thetable that relate to acquisitions for 2000 relate to the November2000 acquisition of Marinette Marine.
The components of the periodic benefit cost are as follows:Postretirement
Pension Health and Other
For the Years Ended December 31 2001 2000 1999 2001 2000 1999
Service cost—benefits earned during the year $÷÷324 $÷«33 $— $÷«547 $÷«409 $«÷395Interest cost on projected benefit obligation 1,005 98 — 1,667 1,521 1,325Expected return on assets (1,059) (128) —Amortization of transition amount — — — 83 3 —Amortization of prior service cost — (12) —Amortization of actuarial gain 4 3 — — — —Net periodic benefit cost $÷÷274 $÷÷(6) $— $2,297 $1,933 $1,720
11. Contingencies and Significant Estimates The United StatesEnvironmental Protection Agency (“EPA”) has identified the companyas a Potentially Responsible Party (“PRP”) under the Compre-hensive Environmental Response Compensation and Liability Act(“CERCLA”), liable for the costs associated with investigating andcleaning up contamination at the Lemberger Landfill Superfund Site(the “Site”) near Manitowoc, Wisconsin.
Approximately 150 PRPs have been identified as having shippedsubstances to the Site. Eleven of the potentially responsible partieshave formed a group (the Lemberger Site Remediation Group, or“LSRG”) and have successfully negotiated with the EPA and theWisconsin Department of Natural Resources to settle the potentialliability at the Site and fund the cleanup.
Recent estimates indicate that the remaining costs to clean upthe Site are nominal. However the ultimate allocations of cost forthe Site is not yet final. Although liability is joint and several, thecompany’s percentage share of liability is estimated to be 11% ofthe total cleanup costs. Prior to December 31, 1996, the companyaccrued $3.3 million in connection with this matter. Expensescharged against this reserve during 2001, 2000, and 1999 were notsignificant. Remediation work at the Site has been substantiallycompleted, with only long-term pumping and treating of ground-water and Site maintenance remaining. The company’s remainingestimated liability for this matter, included in other current andnon-current liabilities at December 31, 2001, is $1.0 million.
As of December 31, 2001, various product-related lawsuits werepending. To the extent permitted under applicable law, all of theseare insured with self-insurance retentions of $0.1 million for PotainCrane accidents; $1.0 million for all other Crane accidents; $1.0 mil-lion for Foodservice accidents occurring during 1990 to 1996; and$0.1 million for Foodservice accidents occurring during 1997 topresent. The insurer’s annual contribution is limited to $50.0 million.
Product liability reserves included in accounts payable andaccrued expenses at December 31, 2001, are $10.6 million; $4.0
million reserved specifically for the cases referenced above, and$6.6 million for claims incurred but not reported which were esti-mated using actuarial methods. As of December 31, 2001, the high-est current reserve for an insured claim is $1.0 million. Based on thecompany’s experience in defending itself against product liabilityclaims, management believes the current reserves are adequate forestimated settlements on aggregate self-insured and insured claims.Any recoveries from insurance carriers are dependent upon the legalsufficiency of claims and the solvency of insurance carriers.
At December 31, 2001 and 2000, the company had reserved$24.8 million and $18.8 million, respectively, for warranty claimsincluded in product warranties and other non-current liabilities inthe Consolidated Balance Sheet. Certain warranty and other re-lated claims involve matters in dispute that ultimately are resolvedby negotiation, arbitration or litigation. Infrequently, a materialwarranty issue can arise which is beyond the scope of the company’shistorical experience.
It is reasonably possible that the estimates for environmentalremediation, product liability and warranty costs may change in thenear future based upon new information that may arise or are mat-ters that are beyond the scope of the company’s historical experi-ence. Presently, there is no reliable means to estimate the amountof any such potential changes.
At December 31, 2001, the company is contingently liable underbid, performance, and specialty bonds, primarily for the Marine segment, totaling approximately $178.7 million and open standbyletters of credit issued by the company’s banks in favor of third parties totaling $34.0 million at December 31, 2001.
The company is also involved in various other legal actions arisingin the normal course of business. After taking into considerationlegal counsel’s evaluation of such actions, and the liabilities ac-crued with respect to such matters, in the opinion of management,ultimate resolution is not expected to have a material adverseeffect on the consolidated financial statements of the company.

50
Notes to Consolidated Financial Statements (continued)(Table information in thousands of dollars, except per share data)
The health care cost trend rate assumed in the determination ofthe accumulated postretirement benefit obligation is 12% for 2001declining to 5% in 2008. Increasing the assumed health care costtrend rate by one percentage point in each year would increase theaccumulated postretirement health benefit obligation by $4.5 mil-lion at December 31, 2001, and would increase the aggregate of theservice and interest cost components of net periodic postretire-ment health benefit cost by $0.3 million for 2001. Decreasing theassumed health care cost trend rate by one percentage point ineach year would decrease the accumulated postretirement healthbenefit obligation by $3.7 million at December 31, 2001, and woulddecrease the aggregate of the service and interest cost componentsof net periodic postretirement health benefit costs by $0.6 millionfor 2001.
It is reasonably possible that the estimate for future retire-ment and health care costs may change in the near future due tochanges in the health care environment or changes in interest ratesthat may arise. Presently, there is no reliable means to estimatethe amount of any such potential changes.
The company maintains a supplemental executive retirementplan (“SERP”) for certain executive officers of the company and its subsidiaries that is unfunded. Expense related to the plans of
$1.2 million and $0.6 million was recorded in fiscal 2001 and 2000,respectively. Amounts accrued as of December 31, 2001 and 2000,related to the plans were $1.8 million and $0.6 million, respectively.
The company has a deferred compensation plan that enablescertain key employees and non-employee directors to defer a por-tion of their compensation or fees on a pre-tax basis. The companymatches contributions under this plan at a rate equal to an em-ployee’s profit sharing percentage plus one percent. Deferrals andcompany contributions are placed in a Rabbi Trust which restrictsthe company’s use and access to the funds but which are also sub-ject to the claims of the company’s general creditors. The companyhas consolidated the assets and liabilities of the Rabbi Trust withinits accounts in 2001. Company stock held by the Rabbi Trust hasbeen recorded as treasury stock in accordance with the requirementsfor diversified plans. The recognition of this plan in the company’sfinancial statements results in a $7.0 million increase in treasurystock and a $7.1 million increase in other non-current assets, repre-senting the fair value of the plan’s diversified investments atDecember 31, 2001. In addition, a $14.1 million liability is includedin other non-current liabilities and represents the company’s liabilityto participants under this plan at December 31, 2001.
The following is a reconciliation of the changes in the benefit obligation, the changes in plan assets, and the funded status as ofDecember 31, 2001 and 2000, respectively.
PostretirementPension Health and Other
2001 2000 2001 2000
Change in Benefit ObligationBenefit obligation, beginning of year $10,445 $÷÷÷«— $«22,209 $«19,091Service cost 324 33 547 409Interest cost 1,005 98 1,667 1,521Acquisition 7,802 10,481 145 482Participant contributions — — 795 796Actuarial changes (489) (106) 7,723 2,509Benefits paid (751) (61) (3,193) (2,599)
Benefit obligation, end of year 18,336 10,445 29,893 «22,209
Change in Plan AssetsFair value of plan assets, beginning of year 12,052 ÷÷÷«— ÷÷÷÷«— «÷÷÷÷—Actual return on plan assets 1,264 128 — —Acquisitions 5,445 12,051 — —Employer contributions 245 — 2,398 1,803Participant contributions — — 795 796Benefits paid (751) (61) (3,193) (2,599)Actuarial changes (1,189) (66) — —
Fair value of plan assets, end of year 17,066 12,052 ««««««««— «÷÷÷÷—
Funded status «(1,270) ÷1,607 (29,893) (22,209)Unrecognized (gain) loss 1,599 1,261 9,442 1,688Unrecognized transition obligation — — 212 306
Prepaid/(accrued) benefit cost $«««««329 $÷2,868 $(20,239) $(20,215)
Amounts Recognized in the Consolidated Balance Sheet at December 31:Prepaid benefit cost $«««««329 $÷2,868 $÷÷÷÷«— $«÷÷÷÷—Accrued benefit liability — — (20,239) (20,215)
Net amount recognized $«««««329 $÷2,868 $(20,239) $(20,215)
Weighted-Average AssumptionsDiscount rate 7.75% 7.75% 7.24% 7.25%Expected return on plan assets 9.00% 9.00% N/A N/ARate of compensation increase 4.00% 4.00% N/A N/A

51
13. Leases The company leases various property, plant andequipment. Terms of the leases vary, but generally require the company to pay property taxes, insurance premiums, and mainte-nance costs associated with the leased property. Rental expenseattributable to operating leases was $15.9 million, $8.5 million,and $4.8 million in 2001, 2000, and 1999, respectively. Future mini-mum rental obligations under noncancelable operating leases, asof December 31, 2001, are payable as follows:
2002 $16,3022003 $14,6552004 $12,0772005 $10,6302006 $««9,362Thereafter $23,146
Sales and long-lived asset information by geographic area as of and for the years ended December 31 are as follows:
Sales Long-Lived Assets
2001 2000 1999 2001 2000
United States $÷«859,871 $793,843 $737,616 $470,024 $410,596Other North America 17,333 25,132 25,213 — —Europe 179,085 17,375 32,246 272,410 5,468Asia 31,264 17,393 11,174 5,575 2,959Middle East 6,905 5,479 2,113 – —Central and South America 6,468 4,873 4,073 1,216 —Africa 6,180 3,277 5,890 — —South Pacific & Caribbean 6,872 5,900 6,014 — —Australia 2,602 — — 497 —
Total $1,116,580 $873,272 $824,339 $749,722 $419,023
Foreign revenue is based upon the location of the customer. Revenue from no single foreign country was material to the consolidatedsales of the company.
14. Business Segments The company identifies its segmentsusing the “management approach,” which designates the internalorganization that is used by management for making operatingdecisions and assessing performance as the source of the com-pany’s reportable segments.
The company has three reportable segments: Cranes andRelated Products (“Cranes”), Foodservice Equipment (“Food-service”), and Marine.
Cranes’ products consist primarily of lattice-boom crawler cranes;tower cranes; truck-mounted hydraulic cranes; rough-terrain fork-lifts; and material-handling equipment. Cranes also specializes inindustrial machinery repair and rebuilding services as well as cranerebuilding and remanufacturing services. Cranes distributes itsproducts in North America (primarily the United States), Europe,Southeast Asia, and the Middle East. Cranes’ operations serve theconstruction, energy, and mining industries and are mainly impact-ed by the level of activities related to heavy construction and infra-structure projects around the world.
Foodservice products consist primarily of commercial ice-cubemachines; ice/beverage dispensers; walk-in and reach-in refrigera-tors and freezers; refrigerated undercounter and food preparationtables; private label residential refrigerators and freezers; back-room beverage equipment; and distribution services. Foodservicesells its products primarily in the United States, Europe, SoutheastAsia, and in the Middle East. Foodservice products serve the lodg-ing, restaurant, health care, convenience store and soft-drink
bottling markets, which are impacted by demographic changes andbusiness cycles.
Marine provides ship repair, maintenance, conversion, and con-struction services to foreign and domestic vessels operating on theGreat Lakes. Marine is also a leading provider of Great Lakes andoceangoing mid-sized commercial, research, and military vessels.Marine serves the Great Lakes maritime market consisting of bothU.S. and Canadian fleets, inland waterway operators, and oceango-ing vessels that transit the Great Lakes and St. Lawrence Seaway.
The accounting policies of the segments are the same as thosedescribed in the summary of significant accounting policies exceptthat certain expenses are not allocated to the segments. Theseunallocated expenses are corporate overhead, intangible assetamortization, interest expense, and income taxes. The companyevaluates segment performance based upon profit or loss beforethe aforementioned expenses.
The company is organized primarily on the basis of products andis broken down into 20 business units. Eleven of the business unitshave been aggregated into the Foodservice segment; five of thebusiness units have been aggregated into the Cranes segment; and four business units make up the Marine segment.
Information about reportable segments and a reconciliation oftotal segment assets to the consolidated totals as of December 31,2001 and 2000, and total segment sales and profits to the consoli-dated totals for the years ending December 31, 2001, 2000, and1999 are summarized on page 36.

52
Condensed Consolidating Statement of Earnings
For the Year Ended December 31, 2001 Subsidiary Non-Guarantor(In Thousands) Parent Guarantors Subsidiaries Eliminations Consolidated
Net sales $«÷÷÷÷— $903,858 $212,722 $«÷÷÷÷— $1,116,580Costs and expenses:
Cost of sales — 666,349 165,419 — 831,768Engineering, selling and administrative 11,962 115,135 26,782 — 153,879Amortization expense 336 8,870 3,348 — 12,554
Total costs and expenses 12,298 790,354 195,549 — 998,201
Earnings (loss) from operations (12,298) 113,504 17,173 — 118,379Other income (expense):
Interest expense (26,937) (8,743) (1,798) — (37,478)Management fee income (expense) 13,803 (13,803) — — —Other expense–net (1,004) (877) 669 — (1,212)
Total other income (expense) (14,138) (23,423) (1,129) — (38,690)
Earnings (loss) before taxes on income, equity in earningsof subsidiaries and extraordinary loss (26,436) 90,081 16,044 — 79,689
Provision (benefit) for taxes on income (10,904) 37,155 4,566 — 30,817
Earnings before equity in earnings of subsidiariesand extraordinary loss (15,532) 52,926 11,478 — 48,872
Equity in earnings of subsidiaries 64,404 — — (64,404) —
Earnings (loss) before extraordinary loss 48,872 52,926 11,478 (64,404) 48,872Extraordinary loss on debt extinguishment,
net of income tax benefit of $2,216 (3,324) — — — (3,324)
Net earnings (loss) $«45,548 $÷52,926 $÷11,478 $(64,404) $÷÷«45,548
Notes to Consolidated Financial Statements (continued)(Table information in thousands of dollars, except per share data)
15. Subsidiary Guarantors The following tables present2001 condensed consolidating financial information for (a)the parent company, The Manitowoc Company, Inc. (“Parent”);(b) on a combined basis, the guarantors of the Senior Sub-ordinated Notes, which include all the domestic wholly ownedsubsidiaries of the company (“Subsidiary Guarantors”); and(c) on a combined basis, the wholly and partially owned for-eign subsidiaries of the company (primarily Potain) which do not guarantee the Senior Subordinated Notes (“Non-Guarantor Subsidiaries”). Separate financial statements
of the Subsidiary Guarantors are not presented because the guarantors are unconditionally, jointly, and severally liable under the guarantees, and the company believes suchseparate statements or disclosures would not be useful to investors. The company has not presented consolidating financial information for 2000 and 1999 because the Parenthas no operations and only minor independent assets ineither year, and the direct and indirect Non-GuarantorSubsidiary amounts are considered minor in those years.

53
Condensed Consolidating Statement of Cash Flows
For the Year Ended December 31, 2001 Subsidiary Non-Guarantor(In Thousands) Parent Guarantors Subsidiaries Consolidated
Net cash provided by (used in) operations $÷(54,029) $÷«9,751 $«150,893 $«106,615
Cash Flows from Investing:Business acquisitions–net of cash acquired — (954) (284,579) (285,533)Capital expenditures (1,857) (14,058) (13,346) (29,261)Proceeds from sale of property, plant, and equipment — 662 9,557 10,219Purchase of marketable securities (107) — — (107)Intercompany investments (163,535) — 163,535 —
Net cash used for investing (165,499) (14,350) (124,833) (304,682)
Cash Flows from Financing:Proceeds from long-term debt 345,116 — — 345,116Proceeds from senior subordinated notes 156,118 — — 156,118Payments on long-term debt (159,632) — (2,257) (161,889)(Payments) proceeds from revolver borrowings–net (75,100) — (3,627) (78,727)(Payments) proceeds from issuance of commercial paper–net (24,700) — — (24,700))Debt acquisition costs (21,023) — — (21,023)Dividends paid (257) — (7,101) (7,358)Exercises of stock options 183 — — 183
Net cash provided by (used for) financing 220,705 — (12,985) 207,720
Effect of exchange rate changes on cash — — (55) (55)
Net increase (decrease) in cash and cash equivalents 1,177 (4,599) 13,020 9,598
Balance at beginning of year 3,279 4,740 5,964 13,983
Balance at end of year $÷÷«4,456 $÷÷÷141 $÷«18,984 $«÷23,581
Condensed Consolidating Balance Sheet
As of December 31, 2001 Subsidiary Non-Guarantor(In Thousands) Parent Guarantors Subsidiaries Eliminations Consolidated
AssetsCurrent Assets:
Cash and cash equivalents $÷÷÷«4,456 $÷÷÷÷141 $÷18,984 $ ««÷÷÷÷— $÷÷«23,581Marketable securities 2,151 — — — 2,151Accounts receivable 43 67,159 74,009 — 141,211Inventories — 67,005 56,051 — 123,056Deferred income taxes 18,873 — 9,473 — 28,346Other 203 10,271 2,271 — 12,745
Total current assets 25,726 144,576 160,788 — 331,090
Intangible assets–net 19,150 300,445 206,100 — 525,695Property, plant and equipment–net 5,038 98,634 71,712 — 175,384Other non-current assets 7,125 26,417 15,101 — 48,643Equity in affiliates 943,466 — — (943,466) —
Total assets $1,000,505 $«570,072 $453,701 $(943,466) $1,080,812
Liabilities and Stockholders’ EquityCurrent Liabilities:
Accounts payable and accrued expenses $÷÷«18,853 $«126,447 $÷90,831 $«÷÷÷÷÷— $«÷236,131Current portion long-term debt 24,558 — 6,529 — 31,087Short-term borrowings 5,900 — 5,061 — 10,961Product warranties — 13,575 4,407 — 17,982
Total current liabilities 49,311 140,022 106,828 — 296,161
Non-Current Liabilities:Long-term debt, less current portion 435,165 — 11,357 — 446,522Postretirement and other health benefit obligations 1,003 19,129 2,939 — 23,071Intercompany payable/(receivable)–net 231,140 (238,568) 7,428 — —Other non-current liabilities 20,091 5,068 26,104 — 51,263
Total non-current liabilities 687,399 (214,371) 47,828 — 520,856
Stockholders’ Equity 263,795 644,421 299,045 (943,466) 263,795
Total liabilities and stockholders’ equity $1,000,505 $«570,072 $453,701 $(943,466) $1,080,812

54
Report of Independent Accountants
To the Stockholders and Board of Directors ofThe Manitowoc Company, Inc. and Subsidiaries
In our opinion, the accompanying consolidated balance sheetsand the related consolidated statements of earnings, stock-holders’ equity and comprehensive income, and cash flowspresent fairly, in all material respects, the financial position of The Manitowoc Company, Inc. and its Subsidiaries atDecember 31, 2001 and 2000, and the results of their opera-tions and their cash flows for each of the three years in theperiod ended December 31, 2001 in conformity with account-ing principles generally accepted in the United States ofAmerica. These financial statements are the responsibility ofthe company’s management; our responsibility is to expressan opinion on these financial statements based on our audits.We conducted our audits of these statements in accordancewith auditing standards generally accepted in the UnitedStates of America, which require that we plan and perform
the audit to obtain reasonable assurance about whether thefinancial statements are free of material misstatement. Anaudit includes examining, on a test basis, evidence supportingthe amounts and disclosures in the financial statements,assessing the accounting principles used and significant esti-mates made by management, and evaluating the overall finan-cial statement presentation. We believe that our audits providea reasonable basis for our opinion.
PricewaterhouseCoopers LLPMilwaukee, WisconsinJanuary 25, 2002
Management’s Report on Consolidated Financial Statements
The Manitowoc Company, Inc. management is responsible forthe integrity of the consolidated financial statements andother information included in this annual report and for as-certaining that the data fairly reflect the company’s financialposition and results of operations. The company prepared theconsolidated statements in accordance with generally accept-ed accounting principles appropriate in the circumstances,and such statements necessarily include amounts that arebased on best estimates and judgements with appropriateconsiderations given to materiality.
The company maintains an internal accounting systemdesigned to provide reasonable assurance that companyassets are safeguarded from loss or unauthorized use or dis-position and that transactions are executed in accordance with
Terry D. GrowcockPresident & Chief Executive Officer
management’s authorization and are properly recorded to per-mit the preparation of the financial statements in accordancewith generally accepted accounting principles.
To further safeguard company assets, the company hasestablished an audit committee composed of directors whoare neither officers nor employees of the company. The auditcommittee is responsible for reviewing audit plans, internalcontrols, financial reports, and accounting practices andmeets regularly with the company’s internal auditors andindependent accountants, both of whom have open access to the committee.
The company’s independent accountants, Pricewaterhouse-Coopers LLP, audited the company’s consolidated financialstatements and issued the opinion below.
Glen E. TellockSenior Vice President & Chief Financial Officer

55
Business Unit Management
Cranes & Related Products Manitowoc Cranes, Inc.Manitowoc, WIBruce CollinsGeneral Manager
Manitowoc Boom Trucks, Inc.Georgetown, TXBrad RogersGeneral Manager
Manitowoc Remanufacturing, Inc.Bauxite, ARMike WoodVice President & General Manager
Potain SASEcully, FranceJean-Yves BouffaultExecutive Vice President & Chief Executive Officer
Femco Machine Company, Inc.Punxsutawney, PARandy LaCrosseVice President& General Manager
Foodservice Equipment Manitowoc Ice, Inc.Manitowoc, WIDan BrandlVice President& General Manager
Manitowoc (Hangzhou)Refrigeration Co., Ltd.Hangzhou, PRCNing WenVice President& General Manager
Fabbrica Apparecchiature per la Produzione del Ghiaccio, S.r.l.Milan, ItalyRoberto AdamoManaging Director
SerVend International, Inc.Sellersburg, INJohn HartswormVice President& General Manager
Multiplex Company, Inc.St. Louis, MOWally Kisling, Jr.Vice President & General Manager
Manitowoc BeverageSystems, Inc.Holland, OHSteve RafacExecutive Vice President& General Manager
Kyees AluminumLa Mirada, CARick KyeesGeneral Manager
KolpakParsons, TNSteve ClaytonGeneral Manager
Harford Duracool, LLCAberdeen, MDDick LemenGeneral Manager
McCall RefrigerationParsons, TNSteve ClaytonGeneral Manager
Diversified Refrigeration, Inc.Selmer, TNGerald SenionGeneral Manager
Marine Bay Shipbuilding Co.Sturgeon Bay, WIPatrick O’HernVice President & General Manager
Cleveland Shiprepair CompanyCleveland, OHPatrick O’HernVice President & General Manager
Marinette Marine CorporationMarinette, WITom ByrnePresident
Toledo Shiprepair CompanyToledo, OHPatrick O’HernVice President & General Manager

56
Terry D. Growcock, 56, president and chiefexecutive officer since 1998. Previously, presi-dent and general manager of Manitowoc Ice,Inc. (1996); also executive vice president ofManitowoc Equipment Works (1994). Prior tojoining Manitowoc, Mr. Growcock served innumerous management and executive posi-tions with Siebe plc and United Technologies. Glen E. Tellock, 40, senior vice president and
chief financial officer since 2000. Previously,vice president and chief financial officer(1999), vice president of finance and trea-surer (1998), corporate controller (1992), anddirector of accounting (1991). Prior to joiningManitowoc, Mr. Tellock served as financialplanning manager with the Denver PostCorporation and as audit manager for Ernst and Whinney.
Thomas G. Musial, 50, senior vice presidentof human resources and administration since2000. Previously, vice president of humanresources and administration (1995), man-ager of human resources (1987), and person-nel/industrial relations specialist (1976).
Maurice D. Jones, 42, general counsel andsecretary since 1999. Prior to joining Mani-towoc, Mr. Jones was a partner in the law firmof Davis & Kuelthau, S.C., and served as legalcounsel for Banta Corporation.
Carl J. Laurino, 40, treasurer since 2001.Previously, assistant treasurer (2000). Priorto joining Manitowoc, Mr. Laurino spent 15years in the commercial banking industrywith Firstar Bank Wisconsin, Associated Bank N.A., and Norwest Bank.
Robert A. Giebel, Jr., 42, vice president since2000. Also president and general manager of Manitowoc’s Crane Group. Prior to joiningManitowoc, Mr. Giebel served as vice presi-dent and general manager of P&H MineProServices and as president and chief execu-tive officer of Unit Rig, a division of TerexCorporation.Timothy J. Kraus, 48, vice president since
2000. Also president and general managerof Manitowoc’s Foodservice Group. Pre-viously, general manager of Manitowoc’sIce/Beverage Group (1999), executive vicepresident and general manager of Manito-woc Ice, Inc. (1998), vice president of salesand marketing (1995), and national salesmanager (1989). Prior to joining Manito-woc, Mr. Kraus was president of UniversalNolin.
Thomas J. Byrne, 64, vice president since2000. Also president and general manager of Manitowoc’s Marine Group. Previously,Manitowoc Company’s vice president of business development (1998). Prior to join-ing Manitowoc, Mr. Byrne served as vicepresident and general manager for theRobertshaw division of Siebe AutomotiveN.A., as vice president of operations forHamilton Industries, plus senior manage-ment positions with The Stanley Works and White Consolidated Industries.
Corporate Officers and Business Segment Management

57
1Audit Committee2Compensation & Benefit Committee3Nominating Committee & CorporateGovernance Subcommittee
Dean H. Anderson, 61, president and ownerof Dynamic Specialties, Inc., Houston, TX, anequipment and systems specialist servingfactories and the process automation indus-try. Previously, senior vice president–strategicdevelopment (1997) of ABB Vetco Gray Inc.;president (1990) of Foster Valve Corporation;also president and chief executive officer(1988) of Steego Corporation. Elected toManitowoc’s board in 1992.1, 2
Virgis W. Colbert, 62, executive vice presi-dent, since 1997, of Miller Brewing Company,Milwaukee, WI, a leading beer brewer andproducer. Since 1979, Mr. Colbert has heldseveral operational and management posi-tions with Miller Brewing. Also a director ofDelphi Automotive Systems Corporation, Troy,MI, and Weyco Group, Inc., Milwaukee, WI.Appointed to Manitowoc’s board in 2001.1
Daniel W. Duval, 65, retired vice chairman,president, and chief executive officer ofRobbins & Myers, Inc., a global manufacturerof specialized fluid management productsand systems headquartered in Dayton, OH.Previously, president and chief operating offi-cer of Midland-Ross Corp. Also a director ofArrow Electronics, Inc., Melville, NY; ABC-NACO, Inc., Downers Grove, IL; and NationalCity Bank, Cleveland, OH. Appointed toManitowoc’s board in 2000.1, 3
Terry D. Growcock, 56, president and chiefexecutive officer of The Manitowoc Company.Elected to Manitowoc’s board in 1998.
James P. McCann, 71, retired vice chairman,president, and chief operating officer ofBridgestone/Firestone, Inc., a global tire andrubber manufacturer headquartered in Nash-ville, TN. Previously, executive vice president(1989) of North American Tire for Bridgestone/Firestone, Inc.; former president and chiefexecutive officer (1988) of Bridgestone U.S.A.,Inc. Elected to Manitowoc’s board in 1990.3
James L. Packard, 59, chairman, president,and chief executive officer, since 1986, ofRegal-Beloit Corporation, Beloit, WI, a world-wide manufacturer of mechanical powertransmission equipment, electric motors,controls, and power generators. Also a direc-tor of Clarcor, Inc., Rockford, IL. Appointed toManitowoc’s board in 2000.2Gilbert F. Rankin, Jr., 69, retired director of
administration, operations, and facilities,College of Engineering, Cornell University,Ithaca, NY. Elected to Manitowoc’s boardin 1974.1, 3
Robert S. Throop, 64, retired chairman andchief executive officer of Anthem Electronics,Inc., a distributor of electronic productsheadquartered in San Jose, CA. Also a direc-tor of The Coast Distribution System, Inc.,Morgan Hill, CA, and Azerity (formerly IntelicSoftware Solutions, Inc.), San Jose, CA.Elected to Manitowoc’s board in 1992.2, 3
Robert C. Stift, 60, retired chairman, presi-dent, and chief executive officer of StrategicIndustries, LLC, Hagerstown, MD, a manufac-turer of industrial and consumer products.Previously, chairman and chief executive offi-cer (1999) of Lighting Corporation of America;chairman and chief executive officer (1998) ofUSI Diversified Products Company; also chair-man and chief executive officer (1992) ofGrove Worldwide. Elected to Manitowoc’sboard in 1998.1, 2
Board of Directors

58
Glossary
Financial Terms
Backlog – Firm, unfilled orders. An indicator of future sales.
Book Value – Another term for shareholder equity, most oftenshown on a per-share basis.
Capitalization – The total market value of a company’s out-standing stock calculated by multiplying the stock price timesthe number of shares.
Cash Flow – Funds generated by a company to operate thebusiness, make capital investments, repay debt, pay divi-dends, repurchase stock, and make acquisitions.
Cash Gap – A working capital measure that is equal toaccounts receivable days sales outstanding plus inventorydays less accounts payable days outstanding.
Cost of Capital – A weighted average of the after-tax cost ofequity and borrowed funds.
Current Ratio – Current assets divided by current liabilities,an indicator of liquidity.
Earnings per Share (basic) – Calculated by dividing thereported earnings available to common stockholders (netincome) by the weighted average shares outstanding.
Earnings per Share (diluted) – Calculated by dividing thereported earnings available to common stockholders (netincome) by the weighted average shares outstanding, includ-ing the assumption of the exercise of all potentially dilutivesecurities such as stock options. Diluted earnings per shareare always less than or equal to basic earnings per share.
EVA® (Economic Value-Added) – A financial measure to deter-mine if a company is creating or depleting value for its share-holders. EVA is calculated by taking after-tax operating profitsand subtracting a capital charge. Manitowoc uses this mea-sure to evaluate its performance, to drive its decision-making,to incentivize management, and to evaluate acquisitionopportunities.
Outsourcing – Contracting with an outside supplier to providea service or function that could be performed within the company.
Price to Earnings Ratio – The price of a stock divided by itsearnings per share. Also known as P/E, multiple, or valuation.This measure tells investors how much they are paying for acompany’s earnings.
Return on Equity – Net earnings divided by stockholders’equity, a measurement of the amount earned on the share-holder’s investment.
Return on Invested Capital – A measurement of after-taxoperating profit divided by invested capital, an indicator ofhow efficiently the company employs its assets.
Total Return – Return on an investment that includes any divi-dends or interest as well as price appreciation.
Industry Terms
Boom Truck – A hydraulic telescopic crane mounted to a com-mercial truck chassis. A boom truck differs from a truck cranebecause it can haul up to several thousand pounds of payloadon its cargo deck.
Cold Plate – An integral component of an ice/beverage dis-penser that consists of a cast aluminum block and stainlesssteel tubing that cools syrup and carbonated water to anideal serving temperature as these liquids flow through thecold plate to the beverage-dispensing valve.
Crawler Crane – Usually refers to lattice-boom cranes thatare mounted on crawlers rather than a truck chassis. Thismethod of mounting significantly reduces ground-bearingpressures and enables the crane to pick-and-carry virtuallyany rated load.
Five-Year Survey – A thorough ship inspection process thatmust be performed every five years to satisfy stringent mar-itime regulations developed by the U.S. Coast Guard, theAmerican Bureau of Shipping, and other regulatory agencies.
Graving Dock – An in-ground concrete structure in whichships can be built or repaired. A graving dock is equippedwith pumps and watertight gates. It is flooded so ships canfloat in; then it is pumped dry so crews can work on thoseportions of a ship that normally are underwater.
Hopper Dredge – A fully powered vessel that excavates under-water material using powerful suction devices. Dredged mate-rial is then stored onboard the vessel for transportation to anapproved disposal site, or can be pumped onboard dumpscows or split-hull barges.
Ice/Beverage Dispenser – A foodservice appliance that dis-penses ice and soft drinks for self-service applications in quick-service restaurants, movie theatres, and convenience stores.
Integrated Tug/Barge – A new form of bulk-cargo transporta-tion that combines a non-powered notch barge that is pushedby a high-horsepower diesel tug.
Lattice Boom – A fabricated, high-strength steel structure thatusually has four chords and tubular lacings. Lattice boomstypically weigh less and provide higher lifting capacities thantelescopic booms of similar lengths.
Reach-in – A refrigerated cabinet, typically used in foodser-vice applications, for short-term storage of perishable itemsat safe temperatures prior to preparation or serving.
Self-unloading Vessel – Refers to the fleet of ships operatingon the Great Lakes that are equipped with cargo-hold convey-ors and lattice discharge booms. This equipment enables ves-sels to offload their bulk cargoes, such as iron ore, coal, orlimestone, without requiring dockside assist equipment.
Telescopic Boom – A box-section boom, consisting of multipletelescopic sections that are extended or retracted to a desiredlength, using hydraulic or mechanical means.
Tower Crane – Refers to the category of cranes that feature avariable-length vertical tower and a fixed-length horizontaljib. Tower cranes are available in top-slewing and self-erectingconfigurations and are commonly used on commercial con-struction, high-rise, and infrastructure projects.
Truck Crane – Refers to either a hydraulic telescopic or lattice-boom crane that is mounted on a rubber-tired carrier and iscapable of traveling at highway speeds from one project tothe next.
Walk-in – A large, foamed-in-place, refrigerated structure, fre-quently used in restaurants, that can be equipped with cool-ing or freezing systems for longer term storage of foodserviceitems prior to preparation.

5
Corporate HeadquartersThe Manitowoc Company, Inc.500 South 16th StreetP.O. Box 66Manitowoc, WI 54221-0066Telephone: 920-684-4410Telefax: 920-683-8129
Independent AccountantsPricewaterhouseCoopers LLP100 East Wisconsin AvenueSuite 1500Milwaukee, WI 53202
Stock Transfer Agent and RegistrarFirst Chicago Trust CompanyA division of EquiServeP.O. Box 2500Jersey City, NJ 07303-2500Telephone: 800-519-3111
Annual Meeting & Related InformationThe annual meeting of Manitowoc Company shareholders willbe held at 9:00 a.m., CDT, Tuesday, May 7, 2002, in the ball-room of the Holiday Inn at 4601 Calumet Avenue, Manitowoc,WI. We encourage shareholders to participate in this meetingin person or by proxy.
Stock Listing Manitowoc’s common stock is traded on the New York StockExchange and is identified by the ticker symbol MTW. Currenttrading volume, share price, and related information can befound in the financial section of most daily newspapers.
Quarterly common stock price information for our threemost recent fiscal years can be found on page 35 of this annual report. Shares of Manitowoc’s common stock havebeen publicly traded since 1971.
Manitowoc ShareholdersOn December 31, 2001, there were 24,053,085 shares ofManitowoc common stock outstanding. On that date, therewere 2,719 shareholders of record.
Form 10-K ReportEach year, Manitowoc files its Annual Report on Form 10-Kwith the Securities and Exchange Commission. Most of thefinancial information contained in that report is included inthis Annual Report to Shareholders.
A copy of Form 10-K, as filed with the Securities andExchange Commission for 2001, may be obtained by anyshareholder, without charge, upon written request to:
Maurice D. JonesGeneral Counsel & SecretaryThe Manitowoc Company, Inc.P.O. Box 66Manitowoc, WI 54221-0066
DividendsManitowoc has paid continuous dividends, without interrup-tion, since 1971. On February 14, 2001, Manitowoc changedfrom a quarterly dividend determination to an annual divi-dend determination. At its regular fall meeting each year, theboard of directors will determine the amount and timing ofthe company’s dividend.
Dividend Reinvestment and Stock Purchase PlanThe Dividend Reinvestment and Stock Purchase Plan providesa convenient method to acquire additional shares of Manito-woc stock through the investment of dividends. Shareholdersmay also purchase shares by investing cash, as often as oncea month, in varying amounts from $10 up to a maximum of$60,000 each calendar year.
Participation is voluntary, and Manitowoc pays for all feesassociated with stock purchases under these plans.
To receive an information booklet and enrollment form,please contact our stock transfer agent and registrar, FirstChicago Trust Company.
Manitowoc also participates in the Own Your Share ofAmerica and the Low-Cost Stock Ownership Plans as offeredand administered by the National Association of InvestorsCorporation.
Investor InquiriesSecurity analysts, portfolio managers, individual investors,and media professionals seeking information about Mani-towoc are encouraged to visit our web site, or contact the following individuals:
Analysts & Portfolio Managers:Glen E. TellockSenior Vice President & Chief Financial OfficerTelephone: 920-683-8122Telefax: 920-683-8138
Media Inquiries:Steven C. KhailDirector of Investor Relations & Corporate CommunicationsTelephone: 920-683-8128Telefax: 920-683-8138
General Inquiries:Joan RischShareholder RelationsTelephone: 920-683-8150Telefax: 920-683-8138
Quarterly EarningsManitowoc is planning to announce its quarterly earnings forcalendar 2002 according to the following schedule. However,dates are subject to change. Please check our web site, toconfirm earnings announcement dates. 1st Quarter–April 17, 20022nd Quarter–July 18, 20023rd Quarter–October 22, 20024th Quarter–To be announced
Join MTW on the InternetManitowoc provides a variety of information about its busi-nesses, products, and markets at its web site address:www.manitowoc.com.
Equal OpportunityManitowoc believes that a diverse workforce is required tocompete successfully in today’s global markets. The companyprovides equal employment opportunities in its global opera-tions without regard to race, color, age, gender, religion,national origin, or physical disability.
Investor Information

The Manitowoc Company, Inc.500 South 16th StreetP.O. Box 66Manitowoc, WI 54221-0066