The Long-Term Effect of Slavery on Violent Crime: Evidence from US Counties
60
2 The Long-Term Effect of Slavery on Violent Crime: Evidence from US Counties 14 October 2017 Abstract: This study investigates the long-term relationship between slavery and violence in the USA. Although considerable qualitative evidence suggests that slavery has been a key factor behind the prevalence of violence, especially in Southern USA, there has been no large-N study supporting this claim so far. Using county-level data for the USA, we find that the proportion of slaves in the population in 1860 is associated with significantly higher rates of violent crime in all census years for the period 1970-2000. This relationship is robust to including state fixed effects, controlling for numerous historical and contemporary factors, as well as to instrumenting for slavery using environmental conditions. We consider three channels of transmission between slavery and violent crime: inequality, a culture of violence, and ethnic fractionalization/segregation. Although we find some evidence supporting inequality and culture as a channel, results based on data for the year 2000 suggest that ethnic fractionalization/segregation is the most important mediator. JEL Classification: J15, J71, K42, N31, Z13 Keywords: Slavery, crime, inequality, culture, fractionalization, segregation, violence, US South * Graduate School of International and Area Studies, Hankuk University of Foreign Studies. Email: [email protected]. Phone: +82(0)1099752712 † Blavatnik School of Government and the Economics Department, Oxford Centre for the Analysis of Natural Resource Rich Economies (OxCarre), University of Oxford. Email: [email protected]. We would like to thank all anonymous reviewers, Boban Aleksandrovic, Alexandra Benham, Lee Benham, Seo- Young Cho, Tom Gobien, Jerg Gutmann, Shima’a Hanafy, Bernd Hayo, Helmut Leipold, Pierre-Guillaume Méon, Florian Neumeier, Nathan Nunn, Niklas Potrafke, Mason Richey, Elisabeth Schulte, Petros Sekeris, and Christian Traxler for their helpful comments and suggestions. Special thanks to Graziella Bertocchi and Arcangelo Dimico for sharing some data. We also thank the participants at the 2013 MACIE brown bag summer seminar in Marburg, GSIAS 2015 brown bag seminar at Hankuk university of Foreign Studies, and the 2016 Annual Conference of the Society for Institutional and Organizational Economics for their helpful comments. This work is supported by Hankuk University of Foreign Studies research grant. The usual disclaimer applies. Moamen Gouda * Anouk S. Rigterink † Hankuk University of Foreign Studies University of Oxford
Transcript of The Long-Term Effect of Slavery on Violent Crime: Evidence from US Counties
2
The Long-Term Effect of Slavery on Violent Crime: Evidence from US Counties
14 October 2017
Abstract:
This study investigates the long-term relationship between slavery and violence in the USA.
Although considerable qualitative evidence suggests that slavery has been a key factor behind the
prevalence of violence, especially in Southern USA, there has been no large-N study supporting
this claim so far. Using county-level data for the USA, we find that the proportion of slaves in the
population in 1860 is associated with significantly higher rates of violent crime in all census years
for the period 1970-2000. This relationship is robust to including state fixed effects, controlling
for numerous historical and contemporary factors, as well as to instrumenting for slavery using
environmental conditions. We consider three channels of transmission between slavery and violent
crime: inequality, a culture of violence, and ethnic fractionalization/segregation. Although we find
some evidence supporting inequality and culture as a channel, results based on data for the year
2000 suggest that ethnic fractionalization/segregation is the most important mediator.
JEL Classification: J15, J71, K42, N31, Z13
Keywords: Slavery, crime, inequality, culture, fractionalization, segregation, violence, US South
* Graduate School of International and Area Studies, Hankuk University of Foreign Studies.
Email: [email protected]. Phone: +82(0)1099752712 † Blavatnik School of Government and the Economics Department, Oxford Centre for the Analysis of Natural
Resource Rich Economies (OxCarre), University of Oxford.
Email: [email protected].
We would like to thank all anonymous reviewers, Boban Aleksandrovic, Alexandra Benham, Lee Benham, Seo-
Young Cho, Tom Gobien, Jerg Gutmann, Shima’a Hanafy, Bernd Hayo, Helmut Leipold, Pierre-Guillaume Méon,
Florian Neumeier, Nathan Nunn, Niklas Potrafke, Mason Richey, Elisabeth Schulte, Petros Sekeris, and Christian
Traxler for their helpful comments and suggestions. Special thanks to Graziella Bertocchi and Arcangelo Dimico for
sharing some data. We also thank the participants at the 2013 MACIE brown bag summer seminar in Marburg, GSIAS
2015 brown bag seminar at Hankuk university of Foreign Studies, and the 2016 Annual Conference of the Society for
Institutional and Organizational Economics for their helpful comments. This work is supported by Hankuk University
of Foreign Studies research grant. The usual disclaimer applies.
Moamen Gouda* Anouk S. Rigterink†
Hankuk University of Foreign Studies University of Oxford
2
1. Introduction
Since the 18th century, it has been evident that violence is more prevalent in Southern USA than
in other parts of the United States (Ayers, 1991; Nisbett, 1993). Clarke (1998, p. 275) states that
“Violence was as much a part of the Southern landscape and culture as azalea festivals and bourbon
whiskey”. A considerable body of literature investigates the reason behind the prevalence of
violence in the region, a phenomenon for which Hackney (1969) , Gastil (1971), and Wasserman
(1977) coined the phrase “Southern violence” (Hackney, 1969; Gastil, 1971; Wasserman, 1977).
Southern violence continues up to our times. In 2011, the South was the region with the highest
violent crime rate (Federal Bureau of Investigation, 2011). According to the 2011 U.S. Peace Index
that measures the level of peacefulness, or “absence of violence” at the state level, the South was
the least peaceful region in the United States, having nine of the ten nationally most violent states
(Institute for Economics and Peace, 2011).
Considerable empirical research investigates the long-term effect of slavery on various economic
outcomes. Recent findings indicate that slavery has a persistent and long-lasting effect on income
inequality (Bertocchi & Dimico, 2014), economic development (Acemoglu, Johnson, & Robinson,
2002; Nunn, 2008; Maloney & Caicedo, 2016), racial educational inequality (Bertocchi & Dimico,
2012), and political attitudes (Acharya, Blackwell, & Sen, 2016). Investigating the long-run
development of different municipalities in Colombia, Acemoglu, García-Jimeno, and Robinson
(2012) find that the historical presence of slavery is associated with an increase in poverty rate and
a reduction in school enrollment, vaccination coverage, and public goods provision.
3
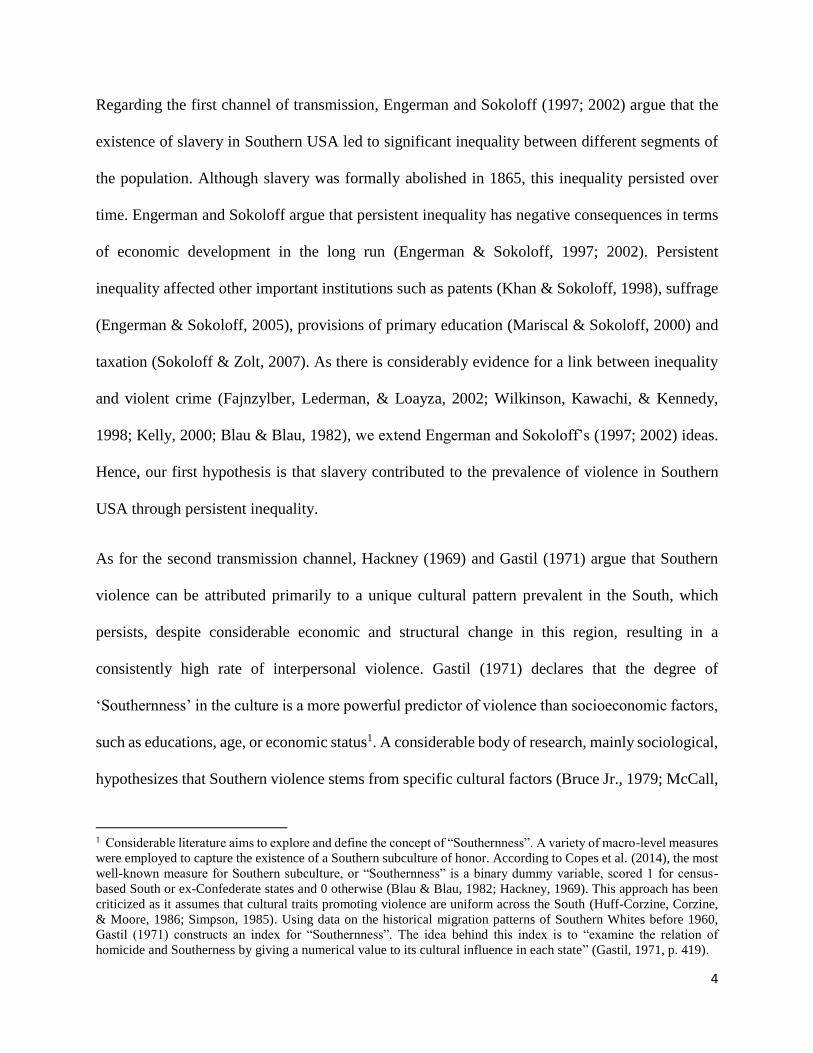
Many qualitative studies hypothesize that the institution of slavery was an important factor behind
the culture of Southern violence (Nash, Jeffrey, Frederick, Davis, & Winkler, 2003, p. 362;
Cardyn, 2002; West, 2012). However, no large-N study has supported this claim so far.
Carden (2008, p. 4) argues that slavery is “the most important aspect of Southern history”. Wright
(2006, p. 2), notes that the institution of slavery has three essential dimensions: (1) slavery as a
form of labor relations, (2) slavery as a set of property rights, and (3) slavery as a political regime,
and argues that focusing on the latter two will give a better understanding of the economic and
cultural history of slavery in the USA. Wright (2006) posits that slavery as a set of property rights
hindered economic growth by crowding out productive investment, and that it left the South with
institutions less suitable than those in the North to contractual arrangements between free men
(Wright, 1986; Carden, 2006a). Aldrich (1973, p. 400) argues that uncertainty about the structure
of property rights in the wake of emancipation expressed itself in racial violence.
This study contributes to the economic and sociological literature by empirically investigating the
long-term relationship between slavery and violent crime in the USA, especially in Southern USA.
We propose three potential channels of transmission between 19th century slavery and
contemporary violent crime; firstly, slavery led to higher levels of inequality, which could increase
violent crime. Secondly, slaveholders’ reliance on coercion to control slaves may have contributed
to an ingrained culture of violence, which contributed to the prevalence of southern violence.
Third, given the large correlation between slavery and the ratio of blacks in the population
(Lagerlöf, 2005), we hypothesize that counties with a higher number of slaves in 1860 are
nowadays more ethnically fractionalized and/or segregated. Ethnic fragmentation is well
documented as a determinant of violent crime (Avison & Loring, 1986; Chon, 2012; Fajnzylber,
Lederman, & Loayza, 2000; 2002; Hansmann & Quigley, 1982).
4
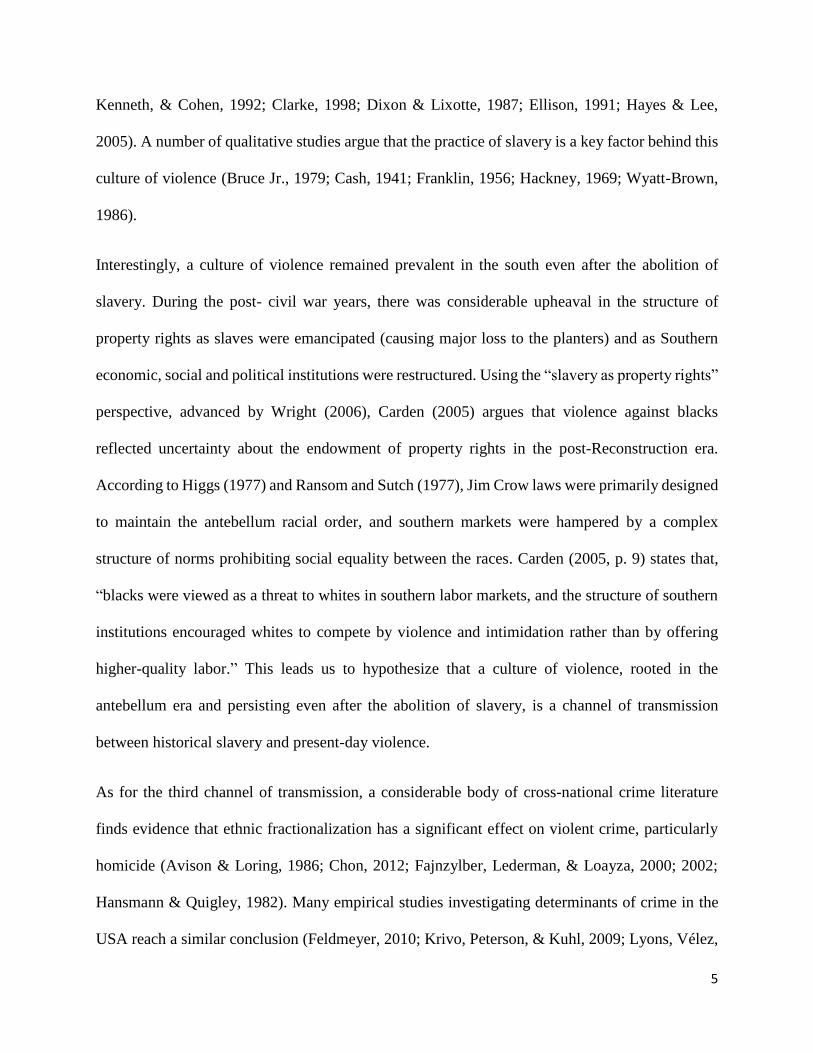
Regarding the first channel of transmission, Engerman and Sokoloff (1997; 2002) argue that the
existence of slavery in Southern USA led to significant inequality between different segments of
the population. Although slavery was formally abolished in 1865, this inequality persisted over
time. Engerman and Sokoloff argue that persistent inequality has negative consequences in terms
of economic development in the long run (Engerman & Sokoloff, 1997; 2002). Persistent
inequality affected other important institutions such as patents (Khan & Sokoloff, 1998), suffrage
(Engerman & Sokoloff, 2005), provisions of primary education (Mariscal & Sokoloff, 2000) and
taxation (Sokoloff & Zolt, 2007). As there is considerably evidence for a link between inequality
and violent crime (Fajnzylber, Lederman, & Loayza, 2002; Wilkinson, Kawachi, & Kennedy,
1998; Kelly, 2000; Blau & Blau, 1982), we extend Engerman and Sokoloff’s (1997; 2002) ideas.
Hence, our first hypothesis is that slavery contributed to the prevalence of violence in Southern
USA through persistent inequality.
As for the second transmission channel, Hackney (1969) and Gastil (1971) argue that Southern
violence can be attributed primarily to a unique cultural pattern prevalent in the South, which
persists, despite considerable economic and structural change in this region, resulting in a
consistently high rate of interpersonal violence. Gastil (1971) declares that the degree of
‘Southernness’ in the culture is a more powerful predictor of violence than socioeconomic factors,
such as educations, age, or economic status1. A considerable body of research, mainly sociological,
hypothesizes that Southern violence stems from specific cultural factors (Bruce Jr., 1979; McCall,
1 Considerable literature aims to explore and define the concept of “Southernness”. A variety of macro-level measures
were employed to capture the existence of a Southern subculture of honor. According to Copes et al. (2014), the most
well-known measure for Southern subculture, or “Southernness” is a binary dummy variable, scored 1 for census-
based South or ex-Confederate states and 0 otherwise (Blau & Blau, 1982; Hackney, 1969). This approach has been
criticized as it assumes that cultural traits promoting violence are uniform across the South (Huff-Corzine, Corzine,
& Moore, 1986; Simpson, 1985). Using data on the historical migration patterns of Southern Whites before 1960,
Gastil (1971) constructs an index for “Southernness”. The idea behind this index is to “examine the relation of
homicide and Southerness by giving a numerical value to its cultural influence in each state” (Gastil, 1971, p. 419).
5
Kenneth, & Cohen, 1992; Clarke, 1998; Dixon & Lixotte, 1987; Ellison, 1991; Hayes & Lee,
2005). A number of qualitative studies argue that the practice of slavery is a key factor behind this
culture of violence (Bruce Jr., 1979; Cash, 1941; Franklin, 1956; Hackney, 1969; Wyatt-Brown,
1986).
Interestingly, a culture of violence remained prevalent in the south even after the abolition of
slavery. During the post- civil war years, there was considerable upheaval in the structure of
property rights as slaves were emancipated (causing major loss to the planters) and as Southern
economic, social and political institutions were restructured. Using the “slavery as property rights”
perspective, advanced by Wright (2006), Carden (2005) argues that violence against blacks
reflected uncertainty about the endowment of property rights in the post-Reconstruction era.
According to Higgs (1977) and Ransom and Sutch (1977), Jim Crow laws were primarily designed
to maintain the antebellum racial order, and southern markets were hampered by a complex
structure of norms prohibiting social equality between the races. Carden (2005, p. 9) states that,
“blacks were viewed as a threat to whites in southern labor markets, and the structure of southern
institutions encouraged whites to compete by violence and intimidation rather than by offering
higher-quality labor.” This leads us to hypothesize that a culture of violence, rooted in the
antebellum era and persisting even after the abolition of slavery, is a channel of transmission
between historical slavery and present-day violence.
As for the third channel of transmission, a considerable body of cross-national crime literature
finds evidence that ethnic fractionalization has a significant effect on violent crime, particularly
homicide (Avison & Loring, 1986; Chon, 2012; Fajnzylber, Lederman, & Loayza, 2000; 2002;
Hansmann & Quigley, 1982). Many empirical studies investigating determinants of crime in the
USA reach a similar conclusion (Feldmeyer, 2010; Krivo, Peterson, & Kuhl, 2009; Lyons, Vélez,
6
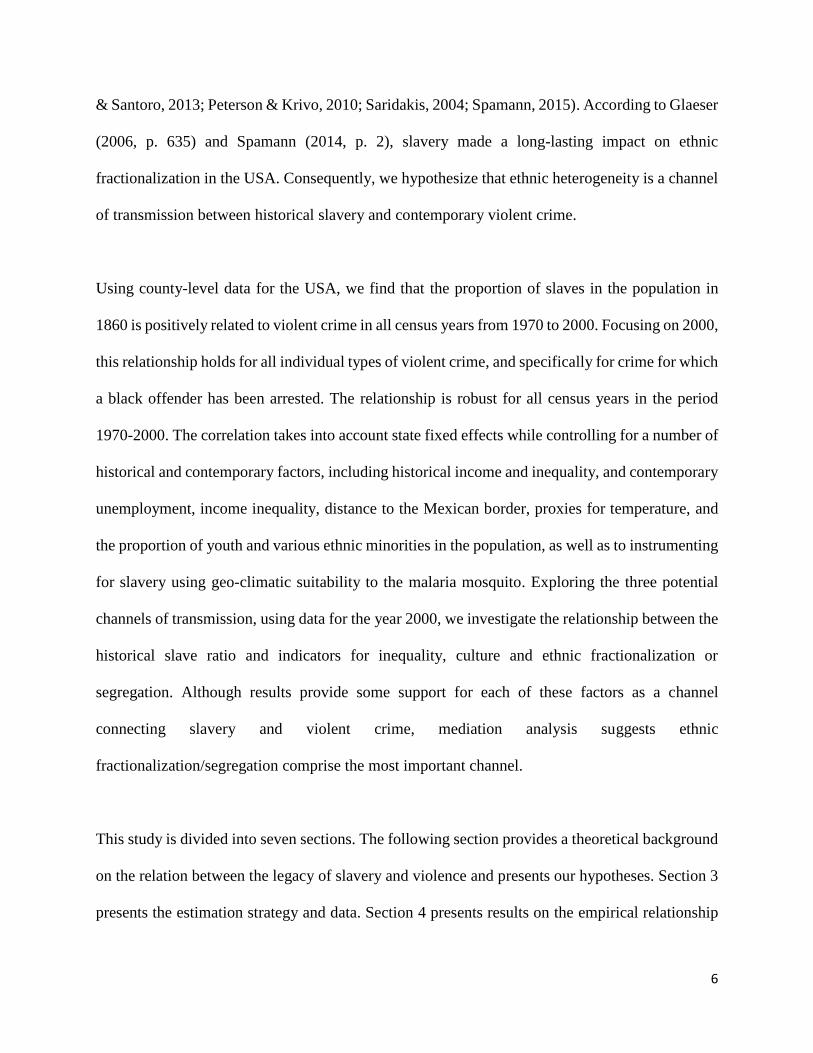
& Santoro, 2013; Peterson & Krivo, 2010; Saridakis, 2004; Spamann, 2015). According to Glaeser
(2006, p. 635) and Spamann (2014, p. 2), slavery made a long-lasting impact on ethnic
fractionalization in the USA. Consequently, we hypothesize that ethnic heterogeneity is a channel
of transmission between historical slavery and contemporary violent crime.
Using county-level data for the USA, we find that the proportion of slaves in the population in
1860 is positively related to violent crime in all census years from 1970 to 2000. Focusing on 2000,
this relationship holds for all individual types of violent crime, and specifically for crime for which
a black offender has been arrested. The relationship is robust for all census years in the period
1970-2000. The correlation takes into account state fixed effects while controlling for a number of
historical and contemporary factors, including historical income and inequality, and contemporary
unemployment, income inequality, distance to the Mexican border, proxies for temperature, and
the proportion of youth and various ethnic minorities in the population, as well as to instrumenting
for slavery using geo-climatic suitability to the malaria mosquito. Exploring the three potential
channels of transmission, using data for the year 2000, we investigate the relationship between the
historical slave ratio and indicators for inequality, culture and ethnic fractionalization or
segregation. Although results provide some support for each of these factors as a channel
connecting slavery and violent crime, mediation analysis suggests ethnic
fractionalization/segregation comprise the most important channel.
This study is divided into seven sections. The following section provides a theoretical background
on the relation between the legacy of slavery and violence and presents our hypotheses. Section 3
presents the estimation strategy and data. Section 4 presents results on the empirical relationship
7
between slavery and contemporary violent crime. Section 5 presents results on the three
hypothesized channels of transmission between slavery and violent crime, namely inequality,
culture of violence, and ethnic fractionalization. Section 6 presents results from Instrumental
Variable models. Section 7 concludes.
2. Theoretical Background and Hypotheses
There has been recent interest in investigating the long-term effects of historical institutions on
violent behavior. Jha (2008) argues that inter-ethnic medieval trade has left a lasting legacy on the
patterns of religious violence between Hindus and Muslims in India. Voigtländer and Voth (2012)
demonstrate that particular locations in Germany that saw violent attacks on Jews during the
plague also showed greater anti-Semitic attitudes over half a millennium later. As for the United
States, a considerable body of sociological literature investigates the reason behind the prevalence
of violence in the South, the phenomenon of “Southern violence” (Hackney, 1969; Gastil, 1971;
Wasserman, 1977). Since the 18th century, it was noticeable that the violence was far more
prevalent in the South than in other parts of the United States (Ayers, 1991; Nisbett, 1993).
Messner, Baller and Zevengergen (2005, p. 633) state that “distinctive historical experiences in
the South gave rise to cultural orientations conducive to violence.” According to Ousey (2000, p.
264), there is remarkable continuity in the position of the South as the most homicidal region of
the United States, having the highest homicide rate every year between 1960 and 1997.
Interestingly, this finding is identical to that of Redfield (1880), who observed that violent crime
rates were highest in the Southern United States in the mid-19th century.
In an attempt to explain the Southern culture of violence, Nisbett and Cohen (1996) propose
various explanations, including hotter climate, greater poverty, and the tradition of slavery.

8
Anderson (1989) also finds considerable relationship between temperature and violence. Blau and
Blau (1982) identify poverty and inequality as major determinants of Southern rates of violence.
In line with Nisbett and Cohen (1996), many qualitative studies propose that the institution of
slavery has been a key factor behind Southern violence (Bruce Jr., 1979; Cash, 1941; Franklin,
1956; Hackney, 1969; Wyatt-Brown, 1986).
According to Wright (2006, p. 2), the institution of slavery has three essential dimensions: (1)
slavery as a form of labor relations, (2) slavery as a set of property rights, and (3) slavery as a
political regime. A considerable body of economic literature, including, most notably, the
contribution of Fogel and Engerman (1989), see slavery as a form of labor relations. However,
Wright (2006), argues that focusing attention on the nature of slavery as a set of property rights
and as a political regime rather than on the hypothesized organizational efficiency of slavery may
result in different inferences as well as a better understanding of the economic and cultural history
of slavery in the USA.
According to Wright (2006), slavery’s advantage stemmed from the “property rights” it provided
to slave owners—“specifically, the right of a slave owner to employ the slave in a location and at
an activity of the owner’s choosing, ignoring any preferences on the part of the slave” (pp. 20-21).
Wright then proceeds to argue that the slaves’ status as human chattel had significant economic
consequences on Southern USA. Wright (2006) reasons that in the “kind of cold war” (p. 42)
between the free-labor North and the slave-labor South in the years preceding the Civil War,
southerners held their wealth mainly in the form of human property rather than land values (p. 61).
Consequently, “slave owners were justified in feeling that they were fully as successful as their
9
northern counterparts in the game of wealth accumulation, if not more so,” but this significantly
affected the South’s economic performance (Wright, 2006, p. 61).
Advancing the thesis of Ransom and Sutch (1988), Wright (2006) proposes that slavery retarded
southern economic growth by absorbing the savings of slave owners and “crowding out”
investment in physical capital. Compared to the North, urbanization, banking facilities, and
transportation improvements were lacking in the South (Wright, 2006, p. 62). Consequently, it
could be argued that the roots of southern postwar backwardness lies in the antebellum era (Wright,
2006, p. 124).
The most conspicuous change in property rights resulting from emancipation was the granting of
recognized humanity to former slaves, who have become free men and women with, supposedly,
all the rights that entails (Carden, 2008, p. 23). Nevertheless, the prevalent institutions in the south
at that time were more appropriate to the hegemonic bonds of a master-slave relationship rather
than the contractual bonds between free and equal men (Wright, 1986; Carden, 2006a). Aldrich
(1973, p. 400) argues that emancipation brought tremendous disruption; what was one day a
“species of capital” was the next day “a disorganized and unruly labor force”. Uncertainty about
the structure of property rights that emerged after the emancipation was reflected in post-war racial
violence (Carden, 2006b, p. 21).
The present study empirically investigates the long-term effect of slavery on violent crime. Our
main hypothesis is that 19th century slavery had a significant and persistent effect on violence. We
propose three possible channels of transmission between historical slavery and contemporary
violence:
10
1) Inequality
Engerman and Sokoloff (1997; 2002; 2005) and Sokoloff and Engerman (2000) argue that the
existence of certain factor endowments in the 18th and 19th centuries was detrimental to long-term
economic development in New World countries. Factor endowments are mainly soil, climate, and
the size of the labor supply, consisting primarily of slaves (Engerman & Sokoloff, 2002, p. 17).
The differences in availability of these three factors led to the use of different production processes
in different colonies, leading to different degrees of initial wealth concentration, human capital,
and political power. They state that “the greater efficiency of the very large plantations, and the
overwhelming fraction of the populations that came to be black and slave, made the distributions
of wealth and human capital extremely unequal.” (Sokoloff & Engerman, 2000, p. 221).
Initial inequalities significantly influenced the type of institutions set up in a given country. Such
institutions persisted and led to different levels of economic development in the longer run
(Engerman & Sokoloff, 1997; 2002). Wright (2006) observes that, between the period 1850-1860,
only around one-quarter of the free households in the South owned slaves. Southerners who were
free but not wealthy enough to own slaves were at a serious disadvantage. One consequence of
such inequality was that the “levels of schooling were lower in the South—“human capital” in
more modern economic terminology—even for the free southern population, and all the more so
for the slaves” (p. 62).
Relying mainly on qualitative evidence, Engerman and Sokoloff argue that historical inequalities
negatively affected important institutions such as patents (Khan & Sokoloff, 1998), suffrage
(Engerman & Sokoloff, 2005), provisions of primary education (Mariscal & Sokoloff, 2000) and
taxation (Sokoloff & Zolt, 2007). Considerable literature finds a significant positive relation
11
between inequality and violent crime (Wilkinson, Kawachi, & Kennedy, 1998; Kelly, 2000; Blau
& Blau, 1982).
As for empirical studies, Hsieh and Pugh (1993) conducted a meta-analysis on 34 studies of violent
crime, and concluded that there is a robust tendency for rates of violence to be higher in more
unequal societies. Messner and Rosenfeld (1997, p. 1394) state, “A finding that has emerged with
remarkable consistency is that high rates of homicide tend to accompany high levels of inequality
in the distribution of income”. Using data for 39 countries covering the period 1965–1994,
Fajnzylber, Lederman and Loayzan (2002) find that a small permanent decrease in inequality -
such as reducing inequality from the level found in Spain to that in Canada - would reduce
homicides by 20%. Extending Engerman and Sokoloff’s thesis (1997; 2002), we hypothesize that
slavery contributes to prevalence of violence in Southern USA through persistent historical
inequality.
2) Culture of violence
Hackney (1969) and Gastil (1971) argue that Southern violence can be attributed primarily to a
unique cultural pattern that developed in the South and which persists, despite considerable
economic and structural change in this region, producing a consistently high rate of interpersonal
violence. Gastil (1971) declares that the degree of ‘Southernness’ in the culture is a more powerful
predictor of violence than socioeconomic factors such as education, age or economic status.
Although Loftin and Hill (1974) refute Gastil’s latter claim, a considerable body of research,
mainly sociological, hypothesize that Southern violence stems from specific cultural factors
12
(Bruce Jr., 1979; McCall, Kenneth, & Cohen, 1992; Clarke, 1998; Dixon & Lixotte, 1987; Ellison,
1991; Hayes & Lee, 2005).
The practice of slavery could be such a factor behind the Southern culture of violence. Violence
was extensively used by slaveholders to control slaves for hundreds of years. Being a slaveholder
himself, Thomas Jefferson, founding father and the 3rd president of the United States, points out
that the unrestrained authority wielded by slaveholders tended to breed reckless behavior and
shortness of temper, characteristics passed from one generation of masters to the next (cited in
(Ayers, 1991). Social historians have documented the brutality and violence of African
enslavement in the South (Tolnay & Beck, 1995; Rice, 1975; Mullin, 1995; Fogel & Engerman,
1989; Campbell, 1989; Blassingame, 1972). Many qualitative studies propose that the institution
of slavery has been an important determinant of Southern violence (Bruce Jr., 1979; Cash, 1941;
Franklin, 1956; Hackney, 1969; Wyatt-Brown, 1986). John Dickinson, an eighteenth-century
revolutionary, believed that the institution of slavery led to southern pride, revenge, cruelty, and
violence (cited in (Wyatt-Brown, 2007, p. 153) . Tocqueville (1835/1969) noted that the institution
of slavery made it both demeaning and unnecessary for the whites to work and that the resulting
idleness allowed the white man to turn to “a passionate love of field sports and military exercises;
he delights in violent bodily exertion, he is familiar with the use of arms, and is accustomed from
a very early age to expose his life in single combat” (p. 379). Cash (1941) argue that the need for
plantation owners to resort to violent means to control slaves had a significant and long-lasting
effect on racial opposition and Southern violence.
13
Even after slavery was abolished, violence persisted primarily in the south. Aldrich (1973, p. 400)
argues that emancipation brought tremendous disruption, as slaves, who were perceived as a form
of capital, became a disorganized and unruly labor force. Disruption to the southern labor market
and poorly enforced property rights that emerged after the emancipation significantly contributed
to post-war racial violence (Carden, 2006b, p. 21). Using lynching as a proxy for widespread
informal institutions, as well as the type and quality of institutional enforcement in the post-civil
war South, Carden (2005, p. 15) states that “Lynching reflected fundamental uncertainty about the
structure of property rights: it reflected uncertainty in labor markets, uncertainty about the
institutions that would ultimately emerge, and uncertainty about whether the region would go back
to the old system that prevailed under slavery.” This leads us to hypothesize that a culture of
violence, rooted in the antebellum era and persisting even after the abolition of slavery, is a channel
of transmission between historical slavery and present-day violence.
Acharya, Blackwell and Sen (2016) provide empirical evidence for the persistence of historical
political and racial attitudes. These authors conclude that survey respondents in counties, with high
levels of slavery in 1860, express higher levels of ‘racial resentment’ and lower levels of support
for affirmative action, i.e., programs that give preference to racial minorities to counteract
discrimination. We, therefore, hypothesize that historical slavery played a role in forming a unique
culture of southern violence, which has persisted through time and is materializing in
contemporary violence in Southern USA.
3) Ethnic Fractionalization
14
A considerable literature relates ethnic fractionalization to violent crime, especially homicide
(Altheimer, 2008; 2011; Braithwaite & Braithwaite, 1980; Fajnzylber, Lederman, & Loayza, 2000;
2002). Regarding the USA, Wilson (1987) and Sampson and Wilson (1995), hypothesize that
segregation and the concentration of structural disadvantage lead to social isolation and the
emergence of oppositional cultures that weaken social control in urban areas, leading to high crime
rates. Massey and Denton (1993) argue that racial residential segregation has a significant, albeit
indirect, effect on crime.
Using data from the Census of Population and Federal Bureau of Investigation's homicide
incidence files for U.S. large central cities for 1980 and 1990, Peterson and Krivo (1999)
empirically investigate race-specific models of lethal violence that differentiates residential
segregation from the concentration of disadvantage within racial groups. The authors find that
racial segregation is a significant causative factor behind black but not white homicides. Using
national-level time-series data over the period 1960–2000, Saridakis (2004) empirically assesses
the effects of demographic and socio-economic variables on violent crime in the United States.
Although the results indicate that there is no long-run relationship among the examined variables,
the author finds racial composition of the male youth population to be of significant influence on
short-term trends of violent crime. Comparing the USA with OECD countries, Spamann (2015, p.
54) finds ethnic fractionalization to be among the main variables that predicts the US homicide
rate.
According to Glaeser (2006, p. 635), slavery played a significant role in making the USA far more
ethnically heterogeneous than most developed, particularly European, countries. Thus, we
15
hypothesize that ethnic fractionalization, stemming from slavery, has a significant effect on
contemporary violent crime in the USA.
3. Estimation strategy and data
3.1. Empirical Strategy
Following existing empirical literature, we conduct the analysis at the county level (Gould,
Weinberg, & Mustard, 2002; Lott & Mustard, 1997; Hull & Frederick, 1995; Hull, 2000). Our
main specification of interest, estimated by Ordinary Least Squares (OLS) regression is:
ln 𝑉𝑖𝑜𝑙𝑐𝑟𝑖𝑚𝑒𝑖 = 𝛼 + 𝛽𝑆𝑙𝑎𝑣𝑒𝑖 + 𝜹𝑯𝒊𝒔𝒕𝑿𝒊 + 𝜻𝑮𝒆𝒐𝑿𝒊 + 𝜼𝑪𝒐𝒏𝒕𝒆𝒎𝒑𝑿𝒊 + 𝜸𝑺𝒕𝒂𝒕𝒆𝑭𝑬′𝒊 + 𝜀𝑖
(I)
Counties are indicated by subscript 𝑖, 𝑉𝑖𝑜𝑙𝑐𝑟𝑖𝑚𝑒 is violent crime per 100,000 population, 𝑆𝑙𝑎𝑣𝑒
is the proportion of slaves in total population in 1860, and 𝑯𝒊𝒔𝒕𝑿′, 𝑮𝒆𝒐𝑿′ and 𝑪𝒐𝒏𝒕𝒆𝒎𝒑𝑿’ are
vectors including sets of historical, geographical and contemporary control variables respectively.
𝑺𝒕𝒂𝒕𝒆𝑭𝑬′ is a set of state-fixed effects, a vector of dummy variables, one for each US State. Our
coefficient of interest 𝛽 is thus based on variation within US States, between counties, intuitively
comparing counties within the same State with different historical levels of slavery. Standard
errors are clustered at the State level.
𝑯𝒊𝒔𝒕𝑿′ includes population density in 1860, a commonly used proxy for income (e.g., (Nunn,
2008) and, in some specifications, the Gini coefficient for land inequality in 1860. 𝑮𝒆𝒐𝑿′ includes
the straight-line distance to the US-Mexican border, potentially correlated to higher rates of drug
trafficking, as well as drug-related violence, and the longitude and latitude of each county, to

16
account for any differences in temperature, which have been associated with violence (Anderson,
1989). 𝑪𝒐𝒏𝒕𝒆𝒎𝒑𝑿’ includes contemporary variables commonly associated with crime: GDP, the
proportion of the population in poverty; the population per square mile; unemployment rate, the
proportion of the population with at least a high school degree and the proportion of youth (aged
18-34). As minorities are more likely than whites to be poor and unemployed, an extensive
empirical literature find a strong relation between minority population and homicide rates in the
USA (Blau & Blau, 1982; Phillips, 2002). Consequently, our vector of contemporary controls
includes a proportion of Hispanics, Asians, and American Indians and Pacific Islanders in the
population.
We explore numerous variations to model (I), presenting results obtained for different US
Decennial Census years (1970, 1980, 1990 and 2000), based on various sources of data on violent
crime, when splitting out violent crime by type of offense and racial identity of the offender. To
alleviate concerns relating to the endogeneity of contemporary control variables and the extent to
which this might bias the estimates of the coefficient of interest, we experiment with adding the
three sets of control variables in turn.
We aim to distinguish between different channels of transmission between slavery and violent
crime: first, slavery leading to higher levels of inequality, which could increase violent crime.
Second, slavery contributing to an ingrained culture of violence. Third, ethnic fractionalization or
segregation, stemming from a legacy of slavery, leading to higher levels of violent crime. To
explore these channels, we estimate:
17
𝐶ℎ𝑎𝑛𝑛𝑒𝑙𝑖 = 𝛼 + 𝛽𝑆𝑙𝑎𝑣𝑒𝑖 + 𝜹𝑯𝒊𝒔𝒕𝑿𝒊 + 𝜻𝑮𝒆𝒐𝑿𝒊 + 𝜼𝑪𝒐𝒏𝒕𝒆𝒎𝒑𝑿𝒊 + 𝜸𝑺𝒕𝒂𝒕𝒆𝑭𝑬′𝒊 + 𝜀𝑖 (II)
𝐶ℎ𝑎𝑛𝑛𝑒𝑙 is some county-level variable capturing inequality, a culture of violence or ethnic
fractionalization respectively. We employ a host of indicators for these three concepts, focusing
on the year 2000 for reasons of data availability. Furthermore, we run mediation analysis using
structural equation modelling2, designating 𝐶ℎ𝑎𝑛𝑛𝑒𝑙 as the mediating variable, 𝑆𝑙𝑎𝑣𝑒𝑟𝑦 as the
treatment variable and 𝑉𝑖𝑜𝑙𝑐𝑟𝑖𝑚𝑒 as the outcome variable. This results in estimates of the direct
effect of slavery on violent crime, the indirect effect of slavery on violent crime via the mediator
and the total effect of slavery on violent crime. A full set of control variables is included in these
analyses, although similar results are obtained when only including historical and geographical
controls.
In addition, we attempt to find evidence in favor of the inequality channel by distinguishing
between the percentage of slaves in the population in 1860 living on large (more than 9 slaves)
and small (less than 9 slaves) holdings, following Nunn (2008)3. We examine interracial murder
and violent hate crime and the percentage of black individuals, arrested or incarcerated, relative to
their presence in the population as dependent variables to assess culture.
2 Specifically, STATA package 𝑠𝑒𝑚 was used for results presented. In a substantial number of cases, these models
struggle to achieve convergence when state-fixed effects are included. Alternative techniques for mediation analysis
based on OLS modelling similarly do not allow for the inclusion of state-fixed effects. Therefore, we also run
mediation analysis using an OLS model and the STATA package 𝑚𝑒𝑑𝑒𝑓𝑓, excluding state-fixed effects. Conclusions
on the most important mediating variables are supported by results obtained using this technique. 3 Although varying the cut-off point for ‘large’ and ‘small’ slave holding would have been desirable, this is not
possible given data available. Nunn (2008, p. 23) states: “Because the census only reports information on the size
holding of each slave holder and not of each slave, I can only calculate the number of slaves held in each size holding
when the exact number of slaves per holder is given, which is only for holdings with less than 10 slaves.”
18
One may be concerned that the ratio of slaves in the population in 1860 is endogenous to Model
(I) and (II), in the sense that slavery is related to violent crime through other variables not
controlled for in these models and that are not or cannot be considered as channels. In order to
address these concerns, we estimate the following Instrumental Variable (IV) model. Following
Bertocchi and Dimico (2014)4, we instrument for the proportion of slaves in the population in 1860
using an index for suitability of the county to the malaria mosquito.
yi = 𝛼 + 𝛽𝑆𝑙𝑎𝑣�̂�𝑖 + 𝜹𝑯𝒊𝒔𝒕𝑿𝒊 + 𝜻𝑮𝒆𝒐𝑿𝒊 + 𝜼𝑪𝒐𝒏𝒕𝒆𝒎𝒑𝑿𝒊 + 𝜸𝑺𝒕𝒂𝒕𝒆𝑭𝑬′𝒊 + 𝜀𝑖 (III)
In this specification, 𝑦 is the dependent variable from Model (I) or (II). Mann (2012) and Esposito
(2015) postulate that, as enslaved Africans had resistance to tropical disease, specifically to
malaria, a strong cross-sectional correlation could be observed between regions suitable to malaria
and the diffusion of slavery across US counties. Bertocchi and Dimico (2014) argue that suitability
to malaria is unlikely to be related to modern-day outcomes, as malaria has been eradicated in the
US since the 1940s. Furthermore, Esposito (2015), exploiting the timing of the introduction of a
particularly aggressive strain of malaria, finds no evidence that the relationship between slavery
and malaria is driven by pre-colonial climatic factors that may be related to modern-day outcomes.
3.2. Data
Table 1 provides descriptive statistics and data sources for all variables used.
4 We are indebted to these authors for sharing their data.
19
Following a considerable economic literature5 review, our county-level data on crime comes from
The Uniform Crime Reports (UCR), published by the U.S. Federal Bureau of Investigation. These
data are compiled from reports from law enforcement agencies on a monthly basis. By 2000, there
were 19,655 law enforcement agencies contributing reports either directly or through their state
reporting programs to UCR. Data are archived at the National Archive of Criminal Justice Data
(NACJD), part of the Inter-University Consortium on Political and Social Research of the
University of Michigan.
We employ a number of UCR datasets: Offenses Known and Clearances by Arrest, Arrests by
Age, Race and Gender, Supplementary Homicide Reports and Hate Crime Data. Violent crime,
for the purpose of all these datasets, includes homicide (and non-negligent manslaughter), forcible
rape, rape, robbery and aggravated assault. Data are linked to counties using Law Enforcement
Agency identifiers Crosswalk 2000. Violent crime is expressed as the number of offenses per
100,000 relevant population (from the US Decennial Census), e.g., the violent crime rate for white
offenders is the number of crimes with a white offender per 100,000 white county population. As
reporting to UCR is voluntary and UCR datasets often make no distinction between “None” and
“None reported”, there are a number of zero values in the dataset that may, in fact, reflect missing
data. We consider a value (e.g., the number of reported homicides) to be missing if enforcement
agencies in a particular county did not report (any arrests for) any violent offenses and zero
otherwise.6 Unless indicated otherwise, all crime data is logged, where applicable adding 1 to the
5 See, for example, Gould, Weinberg and Mustard (2002), Grinols, Mustard and Staha (2011), Grosjean (2014),
Hull (2000), Hull and Fredrick (1995), Kovandzic and Vieraitis (2006), Lott (1998; 2000), Lott and Mustard (1997). 6 This leads to an inconsistent number of counties to be included in the analysis across years, compare for instance
Table 3 column (2) and Table 3 column (1)
20
number of violent crimes per 100,000 population in order to avoid classifying zeros as missing
values.
Hate crime is defined as “a criminal offense committed against a person or property that is
motivated, in whole or in part, by the offender’s bias against a race, religion, disability or sexual
orientation”.7 We restrict our analysis to violent hate crime. Instances that are classified as having
bias motivation “anti-black” (“anti-white”) and as having a white (black) offender are considered
white-on-black (black-on-white) violent hate crime. White-on-black (black-on-white) murder is
defined as homicide or non-negligent man-slaughter, where the majority of the victims is black
(white) and the majority of the offenders is white (black).8
Table 2 provides an overview of average crime rates per 100,000 population by county for the year
2000. These figures should be interpreted with some caution, as a relatively small number of
crimes (by an offender of a particular race) in a county with few inhabitants (of that race) can lead
to an artificially high crime rate per 100,000 population. Keeping this in mind, in 2000 there were
an average of 1026 violent offenses known to the police per county per 100,000 population, of
which 3.45 were murders. Aggravated assault was by far the largest category of violent crime. On
average, more white offenders than black offenders were arrested for most types of violent crime
(apart from robbery). However, reweighting these numbers by their share of the population, more
black offenders were arrested per 100,000 black population compared to the same number for
whites. The above caveat, however, applies even more strongly to these numbers, as there exist
7 Inter-University Consortium for Political and Social Research. 2000. Uniform Crime Reporting Program Data
[United States]: Hate Crime Data. Codebook. 8 This leads to the exclusion of a very small number of homicides (156 out of 13068) for which there are equal
numbers, white and black, of victims and/or perpetrators.

21
numerous counties with only a small share of black population. Considering homicide and non-
negligent man-slaughter only, the only dataset that has information on victim and offender, we can
see that inter-racial murder is rare, compared to murders with both a white (black) victim and
offender.
We also consider an alternative dataset on violent crime provided by Maltz (Ohio State University,
2013). Michael Maltz (1999; 2003; 2006), and Maltz and Targonski (2002; 2004) criticize the
UCR crime statistics, finding the quality of reporting “uneven”, as reporting to the FBI remains
voluntary in many jurisdictions and even crime reporting agencies mandated to supply data do not
always comply. Maltz and Targonski (2004, p. 1) conducted a project to clean, annotate and make
available UCR crime data. They produced data files of monthly crime counts from 1960 to 2004
for the over 17,000 police departments in the US, for the seven Index crimes (murder, rape,
robbery, aggravated assault, burglary, larceny, and auto theft) (Ohio State University, 2013). We
only use data on the first four categories. Although Maltz’s dataset potentially offers more reliable
crime statistics, it also has limitations, as it has a large number of missing observations compared
to the UCR data. Moreover, as we aggregate monthly data on a yearly basis, we use a strict standard
of dropping a county’s 9 observations if at least one month’s observations are missing.
Consequently, as the number of available observations for Maltz’s data is severely limited, we use
Maltz’s data only as a robustness check.
9 We use Law Enforcement Agency Identifiers Crosswalk for the year 2005 (National Archive of Criminal Justice
Data, 2006) to link ORI with Federal Information Processing Standards (FIPS) county code.
22
Data on slavery were taken from the US decennial census and digitized by Hains et al.10. We use
1860 slavery for two reasons; first, the 1860 US decennial census, which is the source of our data
on slavery, was the last census conducted before slavery was formally abolished in the USA in
1865. Second, the 1860 census provided data on slavery for the largest number of counties.11
For data sources for the control variables we refer to Table 1.
4. Results: Slavery and violent crime
Figure 1 explores the relationship between slavery in 1860 and violent crime in 2000. This
scatterplot shows a positive, and statistically significant bivariate relationship between slavery and
violent crime in the full sample of counties. Data for counties in Southern (“slave”) states and
Northern states are depicted separately. Although the majority of Northern states in 1860 had no
slave population, the relationship between slavery and violent crime does not obviously appear to
be caused by all Northern states clustering in the south-west quadrant and all Southern states in
the north-east quadrant of the graph. In addition, eyeballing this scatterplot, there appears to be a
positive relationship between slavery and crime also within Southern states. Maps of the level of
slavery in 1860 and the level of violent crime in 2000, presented in Figure 2 and Figure 3
respectively, visually suggest a correlation between these two variables as well.
10 Haines, Michael R., and Inter-university Consortium for Political and Social Research. Historical, Demographic,
Economic, and Social Data: The United States, 1790-2002. ICPSR02896-v3. Ann Arbor, MI: Inter-university
Consortium for Political and Social Research [distributor], 2010-05-21. https://doi.org/10.3886/ICPSR02896.v3 11 Historical counties were matched to modern-day counties using ICPSR coding scheme, which maps the ICPSR
county codes present in the historical data to present-day FIPS codes, available at:
https://usa.ipums.org/usa/volii/ICPSR.shtml, accessed 1 June 2017.
23
Table 3 investigates this relationship more formally, for census years in the period 1970-2000. It
presents the results of an OLS regression with state-fixed effects, taking log violent crime per
100,000 inhabitants as a dependent, and fraction of slaves in the population in 1860 as an
independent variable. The results show that a history of slavery is positively related to violent
crime for all census years under investigation. All estimated coefficients are significant at the 1%
level, although the size of the coefficient is smaller for the year 2000 than for other years. Estimates
for 2000 suggest that an increase in the slave population from 0% to 15.6% (the mean level in the
sample) is associated with an additional 0.12 instances of log violent crime per 100,000 population,
or an increase in violent crime of between 1.5% and 2.2%, depending on the base line level of
crime in the state at hand. Increasing the slave population by two standard deviations from its mean
level results in an estimated increase in log violent crime of 0.32 instances per 100,000 population,
representing an increase in the range of 4.2% to 6%. This is in line with our overall hypothesis
regarding the relation between slavery and violent crime. For comparison, Donohue and Levitt
(2001), in their paper about abortion and crime, find that a one standard deviation increase in the
abortion rate decreases violent crime by 13%.
Table 4 presents result obtained when splitting out violent crime in 2000 by type of offense and
the racial identity of the offender. The relationship between history of slavery and violent crime
holds for all individual types of violent crime – murder, rape, robbery and aggravated assault.
Taking into account the racial identity of the offender, the history of slavery is positively and
statistically significantly related to the number of black individuals arrested for all types of violent
crime, but negatively related to the number of white individuals arrested. Looking at murder only,
these results appear to be driven by intra-racial (rather than inter-racial) violent crime.
24
If we are to speculate about the reasons behind these results, then all three potential channels
connect a history of slavery and violent crime that might explain the results for black offenders.
Black individuals in counties with high levels of historical slavery are possibly more likely to be
on the lower end of an unequal income distribution, more affected by any culture of violence
stemming from a history of slavery, or segregated into less desirable neighborhoods. The channels
of inequality and segregation may also explain the results for white offenders: they might, more
likely, occur at the top end of an unequal income distribution or be segregated into ‘better’
neighborhoods. It is more difficult to see how the culture channel could explain results relating to
white offenders; in this case, a history of slavery has to be related to a less violent culture among
whites. Evidence in favor of each channel will be further explored in section 5.
Table 5 investigates the robustness of the main results. We present results for the year 2000 only,
but similar results are obtained for 1970, 1980 and 1990.12 One may be concerned that ‘Northern’
and ‘Southern’ US states differ in some dimension that is not captured by the state-fixed effects,
yet is related to both a history of slavery and contemporary violent crime. Therefore, we restrict
the sample to only Southern ‘slave’ states in column (1). Results are unaffected. The relationship
between a history of slavery and violent crime is also robust to controlling for income in 1860 -
using population density as a proxy for income in this year (column 2). It is also robust to including
geographical control variables, distance to the US-Mexican border and latitude and longitude as
proxies for temperature (column 3). Moving on to contemporary controls, the coefficient on the
12 Results can be obtained from the authors upon request. There are a number of minor differences in specification.
For 1970, 1980 and 1990, we use data on log GDP per capita from a different source, namely U.S. Bureau of Economic
Analysis. For 1970, we do not have data on the percentage of Hispanics, Asians or American Indians in the population
or for educational attainment. These control variables are not included in the regressions for this year.
25
fraction of slaves in 1860 remains statistically significant when controlling for income in 2000
(column 4), the proportion of minorities (Hispanics, Asians and American Indians and Pacific
Islanders) in the population (Column 5), other contemporary variables commonly associated with
crime (column 6), as well as to controlling for all historical, geographical and contemporary
variables simultaneously (column 7).
It is, however, not robust to controlling for black population as a share of the total population, as
illustrated by column (8). The coefficient on the historical fraction of slaves in the population
decreases substantially in size and is no longer statistically significant. This could mean that the
results previously obtained were spurious, for example, if there is some factor unrelated to slavery
- other than income, unemployment, poverty, educational attainment or inequality (the latter not
shown) - making counties with a high proportion of blacks in the population more likely to
experience violent crime. Alternatively, the contemporary proportion of blacks in the population
might be strongly correlated to one of the channels of transmission, particularly ethnic
fractionalization. Indeed, the correlation coefficient between the share of blacks in the population
and an ethnic fractionalization index constructed following Mauro (1995), is 0.80. 13 In this
context, it is also worth remembering the results regarding black offenders presented in Table 4: a
history of slavery is correlated to the logged number of arrests of black individuals for violent
crime, reweighted by share of blacks in the population.
Further investigating the robustness of the relationship between a history of slavery and violent
crime, we consider an alternative construction of the dependent variable, provided by Maltz (Ohio
13 We are grateful to an anonymous reviewer for pointing this out.
26
State University, 2013), for reasons illustrated in section 3. It reruns the specification in Table 3,
column 6, on the Maltz data for all census years between 1970 and 2000, and for average levels of
violent crime in the following decades: 1970s, 1980s, and 1990s. Results are presented in Table 6.
Despite a radical loss of observations, all of the estimated coefficients for the fraction of population
in slavery are positive and significant at the 1% level. As in Table 3, column 6, income per capita,
the unemployment rate and the proportion of youth in the population are other strong predictors of
violent crime. Our results are robust to using this alternative data on violent crime.
5. Results: channels of transmission
In section 2, we suggest three potential channels connecting a history of slavery and violent crime:
(1) inequality; (2) culture of violence; (3) ethnic fractionalization and segregation. In this section,
we will explore evidence for each of these three mechanisms. For each of these three channels, we
focus on the year 2000, for reasons of data availability.
5.1. Inequality as a channel of transmission
We employ four indicators of inequality. The Gini coefficient of land inequality in 1860, the Gini
coefficient for income in 2000 and what Bertocchi and Dimico (2012) coin ‘educational
inequality’, the ratio between the percentage of whites and blacks respectively with at least a high
school (bachelor) degree in 2000. It should be noted that only land ownership of free black and
white individuals feed into the first measure, and as such it may not capture the full extent of
inequality.
27
In Table 7, we consider inequality as a potential channel of transmission, taking our four measures
of inequality as dependent variables and the fraction of slaves in the population as an independent
variable. In these and all further models described in this section, the full set of control variables
used in Table 5, column (7) is included (coefficients are omitted for brevity), but results also hold
when including only historical and geographical controls (not shown). Only the relationship
between educational inequality in high school and a history of slavery is positive and statistically
significant. Counties with a higher fraction of slaves do not have significantly higher historical or
contemporary Gini coefficients. The coefficient on educational inequality at Bachelor level carries,
surprisingly, a negative sign. None of the coefficients in columns (2) to (4) of Table 7 are affected
by omitting the historical Gini coefficient as a control variable.
Mediation analysis suggests that the indirect effect of slavery through educational inequality at
High School level is statistically significant at the 10% level, but the size of the indirect effect is
very small compared to the overall effect of slavery. Results from the mediation analysis do not
suggest statistically significant indirect effects for the three other indicators of inequality.
Considering alternative measures of historical inequality, columns (5) to (7) of Table 7 take the
fraction of slaves on large and small holdings, respectively, as explanatory variables in an OLS
regression with violent crime as a dependent variable. Entered individually, both variables are
significantly related to violent crime, the fraction of slaves on large holdings being significant at a
stricter significance level, but the coefficient on the fraction of slaves on small holdings being
larger. When entering both into a single regression, only the fraction of slaves on large holdings is
statistically significantly related to modern-day violent crime, although we may worry about the
28
large standard error, and corresponding lack of precision, for the coefficient on slaves on small
holdings.
Overall, we obtain some weak evidence that inequality is a channel of transmission between
slavery and violent crime.
5.2. Culture as a channel of transmission
Turning to culture, as demonstrated in Table 8, we first consider that a culture of violence might
be expressed through interracial (hate) crime. The share of slaves in the population in 1860 is not
significantly related to white-on-black violent hate crime, as shown in column (1). The relationship
between the history of slavery and black-on-white violent hate crime, however, is positively and
weakly statistically significant at the 10% level (column 2). To the extent that incidences of racially
motivated hate crime indeed capture a culture of violence or aggression, this provides some
tentative support for culture as a channel of transmission between slavery and hate crime. These
results, however, are not replicated for white-on-black or black-on-white murder (Columns (3) and
(4)).
Columns (5) and (6) of Table 8 directly investigate the relationship between slavery and racial
attitudes, using the indicators proposed by Acharya, Blackwell and Sen (2016): support for
affirmative action and racial resentment. Support for affirmative action is the percentage of survey
respondents who express any level of agreement with the statement “programs [that] give
preference to racial minorities and to women in employment and college admissions in order to
correct for discrimination”. Racial resentment equals the average level of agreement (on a five-
point scale) with two statements: “The Irish, Italian, Jews and many other minorities overcame
29
prejudice and worked their way up. Blacks should do the same” and the inverse of “Generations
of slavery and discrimination have created conditions that make it difficult for Blacks to work their
way out of the lower class”.
Share of slavery in the population is a significant predictor of lack of support for affirmative action
only (column 5); the coefficient on slavery is not statistically significant in column (6), which takes
racial resentment as a dependent variable. Mediation analysis suggests that the indirect effect of
slavery through lack of support for affirmative action and racial resentment is statistically
significant at the 10% level. However, the size of the indirect effect for both variables is small
relative to the total effect (6.4% and 1.8% of the total effect respectively). These results suggest
that culture is a mediator between slavery and violent crime, but that it leaves a large share of the
effect unexplained.
One may be concerned that the results presented thus far are not driven by a relationship between
a history of slavery and actual violent crime, but by a relationship between a history of slavery
and measured violent crime. It is theoretically possible that counties with and without a history of
slavery experience similar levels of violent crime, but that black offenders are more likely to be
arrested for major offenses (and thus included in crime statistics) than white offenders (who may
commit the same acts but be charged with lesser offenses or not be arrested at all), leading to higher
measured levels of violent crime in areas with a history of slavery. Results presented in Table 4,
showing more arrests of black individuals relative to their share in the population and fewer arrests
of white offenders in areas with a higher historical levels of slavery, may re-enforce these
suspicions. However, these rates of arrest are not reweighted by overall level of arrests; possibly,
30
counties with a history of slavery have higher numbers of arrests of individuals from other,
unknown or mixed racial backgrounds.
To explore this possibility, we calculate a measure of ‘bias against blacks’, defined as the
percentage of arrested (incarcerated) black individuals as a percentage of all individuals arrested
(incarcerated) in 2000 divided by the share of black individuals in the total population. This is
numerically the same as reweighting the number of arrests of black individuals per 100,000 black
population by the rate of arrests by 100,000 overall population. Intuitively, the resulting indicator
for ‘bias against blacks’ x can be interpreted as: there are x times more black individuals
incarcerated than we would expect given their share in the total population. Note that data on
individuals incarcerated stems from the Annual Survey of Jails, as opposed to a census of jails,
leading to a radical loss of observations. Data on arrests does not suffer from this problem.
In columns (7) and (8) of Table 8, we observe no relationship between a history of slavery and
these two measures of ‘bias against blacks’. Excluding from the analysis observations for which
the percentage of persons incarcerated on behalf of another jail jurisdiction is larger than 25 per
cent, does not qualitatively affect the results (not shown), nor does taking the log of the measures
of bias against blacks (not shown)14. Thus, although results in Table 4 may suggest otherwise, we
find no evidence using our measures of ‘bias against blacks’ that results are driven by measured
rather than actual rates of violence.
14 In fact, taking the log of ‘bias against blacks’ based on incarceration data results in a statistically significant and
negative coefficient on the fraction of slaves in the population.
31
Overall, we find some evidence for culture as a channel of transmission between slavery and
violent crime. Although evidence for this channel may be considered stronger than that for
inequality, it is far from conclusive.
Not shown in Table 8 are two other approaches capturing a culture of violence. Following Grosjean
(2014), we experiment with using the proportion of settlers from Scottish and Irish descent in 1790
as a proxy for a culture of violence predating 1860. As this measure is only available for 144
counties, our number of observations is dramatically reduced. However, in model (I), this variable
is negatively and statistically significantly related to contemporary violent crime, regardless of
whether we include the fraction of slaves in the population in the model. Including an interaction
term between the Scottish and Irish populations and the fraction of slaves does not change this,
nor does this carry a statistically significant coefficient. As such, we must conclude that the
proportion of Scottish and Irish settlers in 1790 is not an adequate proxy for a culture of violence
at this level of analysis.
Similarly, one might hypothesize that with individuals brought over from Africa through the slave
trade, some culture of violence originating in Africa was transferred, possibly also through
enslaved individuals who had previously engaged in herding. Although data is available on the
geographic ‘home land’ of various African ethnicities and their predominant source of livelihood
(Murdock, 1959), we were not able to connect a sufficient number of slaves from herding
ethnicities to data on slave ship journeys to investigate this channel.
5.3. Ethnic fractionalization and segregation as a channel of transmission
32
Finally, we consider ethnic fractionalization and segregation as a channel of transmission. We
employ five indicators for this purpose: an ethno-linguistic fractionalization (ELF) index,
calculated following Mauro (1995), that distinguishes between the share of White, Black, Asian
and American Indian and Pacific Islanders in the population. An alternative ELF index is
calculated discriminating Hispanic and non-Hispanic White, Black etc. population. We employ
data from the RAND Center for Population Health and Health Disparities to capture segregation.
We employ the generalized dissimilarity index, which can be interpreted as the percentage of all
individuals who would have to move between census tract units to equalize the proportions of
different groups across census tracts in the county, divided by the percentage who would have to
move if the system started in a state of complete segregation. Furthermore, we employ a white
(black) isolation index that captures the percentage of white (black) individuals who live in a
census area with predominantly others of the same racial background. Further information on these
indices can be found in Reardon and Firebaugh (2002).
We present results of regressions taking these five indicators as dependent variables in Table 9.
The fraction of slaves in the population in 1860 is positively related to ethnic fractionalization as
measured by the ELF index, as shown in columns (1) and (2). We find no evidence that a history
of slavery is related to the index of dissimilarity (column (3)). However, it is negatively related to
the white isolation index (column (4)) and positively related to the black isolation index (column
(5)). Both results are statistically significant at the 1% level. From these results, it would seem that
in counties with a larger historical share of slaves in the population, black individuals are more
likely to live in exclusively ‘black’ neighborhoods, but white individuals are less likely to live in
exclusively ‘white’ neighborhoods. The latter results can be explained if we consider that the
33
historical share of slaves is strongly correlated with the contemporary percentage of blacks in the
population, which will lead to more diverse neighborhoods unless all black individuals cluster
together geographically.
Mediation analysis provides strong support for ethnic fractionalization and segregation as a
channel of transmission between slavery and violent crime. The size of the estimated indirect
effects of slavery on violent crime through both ELF indices and the index of black isolation,
equals or exceeds that of the total effect of slavery. Considering ELF and black isolation as
channels, the estimated direct effect of slavery is no longer statistically significant. No such results
are obtained for the index of dissimilarity. The mediation analysis furthermore suggests that white
isolation is also an important mediator; it suggests that slavery, through decreasing white isolation,
contributes to an increase in violent crime. Indeed, white isolation and violent crime are negatively
correlated.
Summarizing the results presented in this section, we find some evidence in favour of all channels
considered: inequality, culture, and ethnic fractionalization and segregation. However, based on
the consistency of results across indicators and the estimated size of the indirect effect obtained
through mediation analysis, we find the strongest evidence in favour of ethnic fractionalization
and segregation as a channel of transmission between a history of slavery and violent crime.
6. Robustness: IV results
To mitigate any concerns regarding the endogeneity of the share of slaves in the population in
1860, we employ an Instrumental Variable strategy, instrumenting for the share of slaves using an
index of suitability for the malaria mosquito (Bertocchi & Dimico, 2014). We use this to re-
34
estimate our main specification of interest (Table 5, column 3). Results are shown in Table 10.
Only results for the year 2000 are presented, but similar results are obtained for other census years
in the period 1970-1990. We also re-estimate those models from Table 7, 8 and 9, in which the
coefficient on the fraction of slaves in 1860 was statistically significant. Coefficients on the control
variables are omitted to promote readability.
Column (1) presents our main specification of interest. In this and all following specifications, the
index of malaria suitability is statistically significantly related to the share of slaves, and passes
the test for weak identification.15 F-statistics for the first stage are also reassuringly large. Results
of this IV model are similar to the ones obtained in OLS models and indicate a positive and
statistically significant relationship between a history of slavery and contemporary violent crime.
The coefficient on slavery in 1860 increases substantially compared to the relevant OLS coefficient
in Table (5), column (7). This is either a cause for concern regarding the validity of the instrument,
or reflects a downward bias in the OLS coefficient due to measurement error or some omitted
variable positively (negatively) related to slavery and negatively (positively) related to violent
crime. As we focus in Table 5 on controlling for omitted variables potentially biasing the
relationship between slavery and violent crime upwards, a universe of such variables exist. For
example, it was, plausibly, more difficult to transport slaves to more remote or scarcely populated
areas within a county, and these areas could, thus, be less socio-economically developed in the
present day, which could in turn be related to higher levels of violent crime.
15 Cluster-robust Kleibergen-Paap statistic used.
35
For the 2SLS model to be valid, the malaria suitability must only be related to modern-day violent
crime through slavery, and not through any other channel. We explore the sensitivity of this result
to a violation of this exclusion restriction using the union of confidence interval approach proposed
by Conley, Hansen and Rossi (2012). This requires setting an upper bound to the degree to which
malaria suitability diverges from true exogeneity, the degree to which it is related to violent crime
through other mechanisms. As an upper bound, we choose the (standardized) effect of latitude on
violent crime (0.3)16. This variable is strongly correlated to malaria suitability, is likely related to
similar omitted variables but cannot be affected by the historical slave ratio. Sensitivity analysis
suggests that for this upper bound, and for upper bounds up to 0.5, the lower bound of the estimated
effect of slavery on violent crime remains positive.
In case there is a worry that endogeneity of contemporary control variables bias the coefficients in
Table 10, column (2) replicates the result from column (1) using only historical and geographical
controls.
With the exception of the specification taking educational inequality in high school as a dependent
variable, results presented in Tables 7, 8 and 9 are robust to re-estimating the models using IV
regression. Results from Table 7, columns (5) and (6) also replicate the models (not shown).
.
16 This effect size is similar in models including and excluding state-fixed effects.
36
7. Conclusion
What are the reasons behind the prevalence of violence in Southern USA? This question is central
to many sociological and economic theories aiming to explain this phenomenon. Numerous studies
speculate that the legacy of slavery may have a significant effect on violence. From all factors
identified by Nisbett and Cohen (1996), a legacy of slavery, despite being one of the main reasons
behind the prevalence of violence in the South according to these authors, remains the only factor
that has not been empirically tested so far. This study fills this gap in the literature and provides
evidence that slavery, historically more prevalent in Southern USA, is related to present-day
violence.
The main conclusion of this paper is that slavery has a significant and positive long-term effect on
the incidence of violent crime in the Southern US. In other words, comparing US counties within
the same State, those counties that in the past had a higher share of slaves in the population
experience significantly more violent crime in the present day. We explore three potential channels
of transmission: (1) slavery leading to higher levels of inequality, which could increase violent
crime, and (2) slavery contributing to an ingrained culture of Southern violence, and (3) slavery
leading to ethnic fractionalization and segregation, which in turn leads to a higher rate of violence.
Although we find some evidence for all three of these channels, in the sense that the share of slaves
in the population in 1860 is related to some indicators of inequality, culture and ethnic
fractionalization and segregation, we find the strongest evidence in favour of the latter as a channel.
37
References
Acemoglu, D., García-Jimeno, C., & Robinson, J. A. (2012). Finding Eldorado: Slavery and long-run
development in Colombia. Journal of Comparative Economics, 40(4), 534–564.
Acemoglu, D., Johnson, S., & Robinson, J. A. (2002). Reversal of Fortune: Geography and Institutions in
the Making of the Modern World Income Distribution. Quarterly Journal of Economics, 117,
1231-1294.
Acharya, A., Blackwell, M., & Sen, M. (2016). The Political Legacy of American Slavery. The Journal of
Politics, 78(3), 621-641.
Aldrich, M. (1973). Flexible Exchange Rates, Northern Expansion, and the Market for Southern Cotton:
1866-1879. Journal of Economic History, 33(2), 399-416.
Altheimer, I. (2008). Social support, ethnic heterogeneity, and homicide: A cross-national approach.
Journal of Criminal Justice, 36(2), 103-114.
Altheimer, I. (2011). Assessing the Relevance of Ethnic Heterogeneity as a Predictor of Homicide at the
Cross‐National Level. International Journal of Comparative and Applied Criminal Justice, 31(1), 1-
20.
Altheimer, I. (2013). Herding and Homicide Across Nations. Homicide Studies, 17(1), 27-58.
Anderson, C. A. (1989). Temperature and Aggression: Ubiquitous Effects of Heat on Occurrence of
Human Violence. Psychological Bulletin, 106(1), 74-96.
Avison, W. R., & Loring, P. L. (1986). Population Diversity and Cross-National Homicide: The Effects of
Inequality and Heterogeneity. Criminology, 24(4), 733–749.
Ayers, E. L. (1991). Legacy Of Violence. American Heritage, 42(6), 102-110. Retrieved from
http://www.americanheritage.com/content/legacy-violence
Baller, R. D., Zevenbergen, M. P., & Messner, S. F. (2009). Examining the Ecological Foundations of the
Code of Honor Thesis. Journal of Research in Crime and Delinquency, 46(3), 275-300.
Bertocchi, G., & Dimico, A. (2012). The racial gap in education and the legacy of slavery. Journal of
Comparative Economics, 40 (2012), 581–595.
Bertocchi, G., & Dimico, A. (2014). Slavery, education, and inequality. European Economic Review, 70,
197-209.
Blassingame, J. W. (1972). The Slave Community: Plantation Life in the Antebellum South. New York:
Oxford University Press.
38
Blau, J. R., & Blau, P. M. (1982). The Cost of Inequality: Metropolitan Structure and Violent Crime.
American Sociological Review, 47(1), 114-129.
Braithwaite, J., & Braithwaite, V. (1980). The effect of income inequality and social democracy on
homicide: a cross-national comparison. The British Journal of Criminology, 20(1), 45-53.
Bruce Jr., D. D. (1979). Violence and culture in the antebellum South. Austin: University of Texas Press.
Campbell, R. B. (1989). Empire for Slavery: The Peculiar Institution in Texas, 1821-1865. Baton Rouge:
Louisiana State University Press.
Carden, A. (2005). Trial By Fury: Institutions and Southern Productivity. Working Paper No. 2005-07,
Contracting and Organizations Research Institute, 1-54.
Carden, A. (2006a). Inputs and Institutions as Conservative Elements. Review of Austrian Economics,
22(1), 1-19.
Carden, A. (2006b). Institutions and Southern Development: Lynching as a Signal of Insecure Property
Rights. Saint Louis: Washington University in Saint Louis.
Carden, A. (2008). Slavery, Violence, and Law in the Nineteenth-Century South. SSRN, 1-33.
doi:DOI:10.2139/ssrn.1319484
Cardyn, L. (2002). Sexualized Racism/Gendered Violence: Outraging the Body Politic in the
Reconstruction South. Michigan Law Review, 100(4), 675-867.
Cash, W. J. (1941). The Mind of the South. New York: Knopf.
Chon, D. S. (2012). The Impact of Population Heterogeneity and Income Inequality on Homicide Rates: A
Cross-National Assessment. International Journal of Offender Therapy and Comparative
Criminology, 56(5), 730-748.
Chu, R., Rivera, C., & Loftin, C. (2000). Herding and Homicide: An Examination of the Nisbett-Reaves
Hypothesis. Social Forces, 78(3), 971-987.
Clarke, J. W. (1998). Without Fear or Shame: Lynching, Capital Punishment and the Subculture of
Violence in the American South. British Journal of Political Science, 28(2), 269-289.
Cole, J. H. (2009). Homicide Rates in a Cross‐Section of Countries: Evidence and Interpretations.
Population and Development Review, 35(4), 749–776.
Conley, T. G., Hansen, C. B., & Rossi, P. E. (2012). Plausibly Exogenous. The Review of Economics and
Statistics, 94(1), 260-272.
Copes, H., Kovandzic, T. V., Miller, J. M., & Williamson, L. (2014). The Lost Cause? Examining the
Southern Culture of Honor Through Defensive Gun Use. Crime & Delinquency, 60(3), 356–378.
39
Dixon, J., & Lixotte, A. J. (1987). Gun Ownership and the Southern Subculture of Violence. American
Journal of Sociology, 93(2), 383-405.
Donohue, J. J., & Levitt, S. D. (2001). The impact of legalized abortion on crime. The Quarterly Journal of
Economics, 116(2), 379-420.
Ellison, C. G. (1991). An Eye for an Eye? A Note on the Subculture of Violence Thesis. Social Forces, 69(4),
1223-1239.
Engerman, S. L., & Sokoloff, K. L. (1997). Factor Endowments, Institutions, and Differential Paths of
Growth Among New World Economies: A View from Economic Historians of the United States. In
S. Harber, How Latin America Fell Behind (pp. 260-304). Stanford: Stanford University Press.
Engerman, S. L., & Sokoloff, K. L. (2002). Factor Endowments, Inequality, and Paths of Development
Among New World Economies. National Bureau of Economic Research, 1-53.
Engerman, S. L., & Sokoloff, K. L. (2005). The evolution of suffrage institutions in the Americas. Journal of
Economic History, 65(4), 891-921.
Esposito, E. (2015). Side effects of immunities : the African slave trade. Max Weber Programme (MWP)
Working Papers.
Fajnzylber, P., Lederman, D., & Loayza, N. (2000). Crime and Victimization: An Economic Perspective.
Economía, 1(1), 219-302.
Fajnzylber, P., Lederman, D., & Loayza, N. (2002). Inequality and Violent Crime. Journal of Law and
Economics, 45(1), 1-40.
Fede, A. J. (1985). Legitimized Violent Slave Abuse in the American South, 1619-1865: A Case Study of
Law and Social Change in Six Southern States. The American Journal of Legal History, 29(2), 93–
150.
Federal Bureau of Investigation. (2011). Crime in the United States 2011. Retrieved July 27, 2013, from
Federal Bureau of Investigation- Uniform Crime Reports: http://www.fbi.gov/about-
us/cjis/ucr/crime-in-the-u.s/2011/crime-in-the-u.s.-2011/offenses-known-to-law-
enforcement/standard-links/region
Feldmeyer, B. (2010). The Effects of Racial/Ethnic Segregation on Latino and Black Homicide. The
Sociological Quarterly, 51(4), 600–623.
Fogel, R. W., & Engerman, S. L. (1989). Time on the Cross: The Economics of American Slavery. New York:
W. W. Norton.
Franklin, J. H. (1956). The Militant South, 1800-1861. Cambridge, MA: Harvard University Press.
Gastil, R. D. (1971). Homicide and a Regional Culture of Violence. American Sociological Review, 36(3),
412-427.
40
Glaeser, E. L. (2006). Chapter 34: Inequality. In B. R. Weingast, & D. A. Wittman, The Oxford Handbook of
Political Economy (Vol. IV, pp. 624-641). New York: Oxford University Press.
Gould, E. D., Weinberg, B. A., & Mustard, D. B. (2002). Crime Rates and Local Labor Market
Opportunities in the United States: 1979–1997. Review of Economics and Statistics, 84(1), 45–
61.
Grinols, E. L., Mustard, D. B., & Staha, M. (2011). How do Visitors Affect Crime? Journal of Quantitative
Criminology, 27(2011), 363-378.
Grosjean, P. (2014). A History of Violence: The Culture of Honor and Homicide in the US South. Journal
of the European Economic Association, 12(5), 1285–1316.
Hackney, S. (1969). Southern Violence. The American Historical Review, 74(3), 906-925.
Hansmann, H. B., & Quigley, J. M. (1982). Population Heterogeneity and the Sociogenesis of Homicide.
Social Forces, 61(1), 206-224.
Hayes, T. C., & Lee, M. R. (2005). The Southern Culture of Honor and Violent Attitudes. Sociological
Spectrum, 25(5), 593-617.
Hicks, R., & Tingley, D. (2011). Causal mediation analysis. The Stata Journal, 11(4), 1-15.
Higgs, R. (1977). Competition and Coercion: Blacks in the American Economy, 1865-1914. Chicago:
University of Chicago Press.
Hsieh, C.-C., & Pugh, M. D. (1993). Poverty, Income Inequality, and Violent Crime: A Meta-Analysis of
Recent Aggregate Data Studies. Criminal Justice Review, 18(2), 182-202.
Huff-Corzine, L., Corzine, J., & Moore, D. C. (1986). Southern Exposure: Deciphering the South's
Influence on Homicide Rates. Social Forces, 64(4), 906–924.
Hull, B. B. (2000). Religion Still Matters. The Journal of Economics, XXVI(2), 35-48.
Hull, B. B., & Frederick, B. (1995). Preaching matters: Replication and extension. Journal of Economic
Behavior and Organization, 27(1995), 143-149.
Institute for Economics and Peace. (2011). United States Peace Index - 2011. Sydney, Australia: Institute
for Economics and Peace. Retrieved from http://economicsandpeace.org/wp-
content/uploads/2011/09/United-States-Peace-Index-Report-2011.pdf
Jha, S. (2008). Trade, Institutions and Religious Tolerance: Evidence from India. Stanford GSB Working
Paper No. 2004, 1-48.
Kelly, M. (2000). Inequality and crime. Review of Economics and Statistics, 82(4), 530–539.
41
Khan, B. Z., & Sokoloff, K. L. (1998). Patent Institutions, Industrial Organization and Early Technological
Change: Britain and the United States, 1790-1850. In M. Berg, & K. Bruland, Technological
Revolutions in Europe: Historical Perspectives (pp. 292-313). London: Edward Elgar.
Kovandzic, T. V., & Vieraitis, L. M. (2006). The effect of county-level prison population growth on crime
rates. Criminology & Public Policy, 5(2), 213–244.
Krivo, L. J., Peterson, R. D., & Kuhl, D. C. (2009). Segregation, racial structure, and neighborhood violent
crime. American Journal of Sociology, 114(6), 1765-802.
Lagerlöf, N.-P. (2005). Geography, institutions, and growth: The united states as a microcosm. (. .).
Unpublished Manuscript, 1-64. Retrieved from
http://www.nippelagerlof.com/research/happening/WithCoverPage.pdf
Loftin, C., & Hill, R. H. (1974). Regional Subculture and Homicide: An Examination of the Gastil-Hackney
Thesis. American Sociological Review, 39(5), 714-724.
Lott, J. R. (1998). More Guns, Less Crime. Chicago: University of Chicago Press.
Lott, J. R. (2000). More Guns, Less Crime (second ed.). Chicago: University of Chicago Press.
Lott, J. R., & Mustard, D. B. (1997). Crime, Deterrence and the Right-to-Carry Concealed Handguns.
Journal of Legal Studies, 26(1), 1-68.
Lyons, C. J., Vélez, M. B., & Santoro, W. A. (2013). Neighborhood Immigration, Violence, and City-Level
Immigrant Political Opportunities. American Sociological Review, 78(4), 604–632.
Maloney, W. F., & Caicedo, F. V. (2016). The Persistence of (Subnational) Fortune. The Economic Journal,
1-39. doi:10.1111/ecoj.12276
Maltz, M. D. (1999). Bridging Gaps in Police Crime Data: a discussion paper from the BJS Fellows
Program. Washington, DC: U.S. Department of Justice.
Maltz, M. D. (2003). Measurement and Other Errors in County-Level UCR Data: A Reply to Lott and
Whitley. Journal of Quantitative Criminology, 19(2), 199-206.
Maltz, M. D. (2006). Analysis of Missingness in UCR Crime Data. Washington, DC: U.S. Department of
Justice.
Maltz, M. D., & Targonski, J. (2002). A Note on the Use of County-Level UCR Data. Journal of
Quantitative Criminology, 18(3), 297-318.
Maltz, M. D., & Targonski, J. (2004). Making UCR Data Useful and Accessible. Washington, DC: U.S.
Department of Justice.
Mann, C. (2012). 1493: How Europe's Discovery of the Americas Revolutionized Trade, Ecology and Life
on Earth. London: Granta Books.
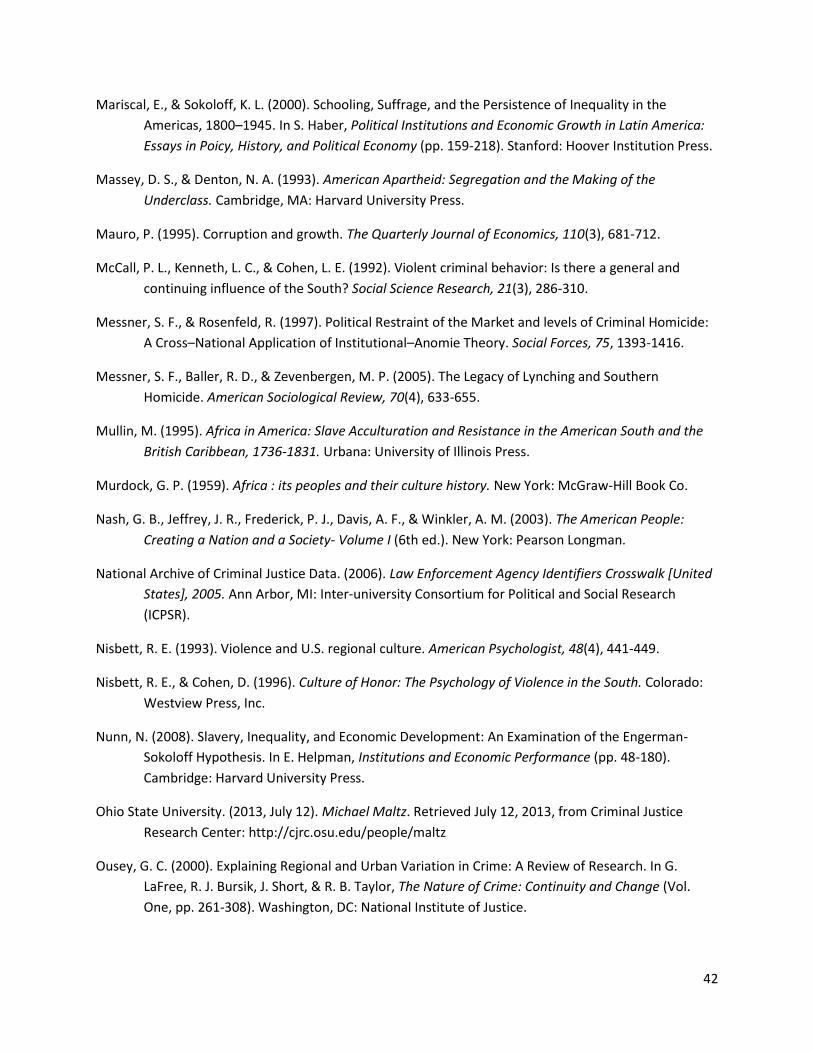
42
Mariscal, E., & Sokoloff, K. L. (2000). Schooling, Suffrage, and the Persistence of Inequality in the
Americas, 1800–1945. In S. Haber, Political Institutions and Economic Growth in Latin America:
Essays in Poicy, History, and Political Economy (pp. 159-218). Stanford: Hoover Institution Press.
Massey, D. S., & Denton, N. A. (1993). American Apartheid: Segregation and the Making of the
Underclass. Cambridge, MA: Harvard University Press.
Mauro, P. (1995). Corruption and growth. The Quarterly Journal of Economics, 110(3), 681-712.
McCall, P. L., Kenneth, L. C., & Cohen, L. E. (1992). Violent criminal behavior: Is there a general and
continuing influence of the South? Social Science Research, 21(3), 286-310.
Messner, S. F., & Rosenfeld, R. (1997). Political Restraint of the Market and levels of Criminal Homicide:
A Cross–National Application of Institutional–Anomie Theory. Social Forces, 75, 1393-1416.
Messner, S. F., Baller, R. D., & Zevenbergen, M. P. (2005). The Legacy of Lynching and Southern
Homicide. American Sociological Review, 70(4), 633-655.
Mullin, M. (1995). Africa in America: Slave Acculturation and Resistance in the American South and the
British Caribbean, 1736-1831. Urbana: University of Illinois Press.
Murdock, G. P. (1959). Africa : its peoples and their culture history. New York: McGraw-Hill Book Co.
Nash, G. B., Jeffrey, J. R., Frederick, P. J., Davis, A. F., & Winkler, A. M. (2003). The American People:
Creating a Nation and a Society- Volume I (6th ed.). New York: Pearson Longman.
National Archive of Criminal Justice Data. (2006). Law Enforcement Agency Identifiers Crosswalk [United
States], 2005. Ann Arbor, MI: Inter-university Consortium for Political and Social Research
(ICPSR).
Nisbett, R. E. (1993). Violence and U.S. regional culture. American Psychologist, 48(4), 441-449.
Nisbett, R. E., & Cohen, D. (1996). Culture of Honor: The Psychology of Violence in the South. Colorado:
Westview Press, Inc.
Nunn, N. (2008). Slavery, Inequality, and Economic Development: An Examination of the Engerman-
Sokoloff Hypothesis. In E. Helpman, Institutions and Economic Performance (pp. 48-180).
Cambridge: Harvard University Press.
Ohio State University. (2013, July 12). Michael Maltz. Retrieved July 12, 2013, from Criminal Justice
Research Center: http://cjrc.osu.edu/people/maltz
Ousey, G. C. (2000). Explaining Regional and Urban Variation in Crime: A Review of Research. In G.
LaFree, R. J. Bursik, J. Short, & R. B. Taylor, The Nature of Crime: Continuity and Change (Vol.
One, pp. 261-308). Washington, DC: National Institute of Justice.
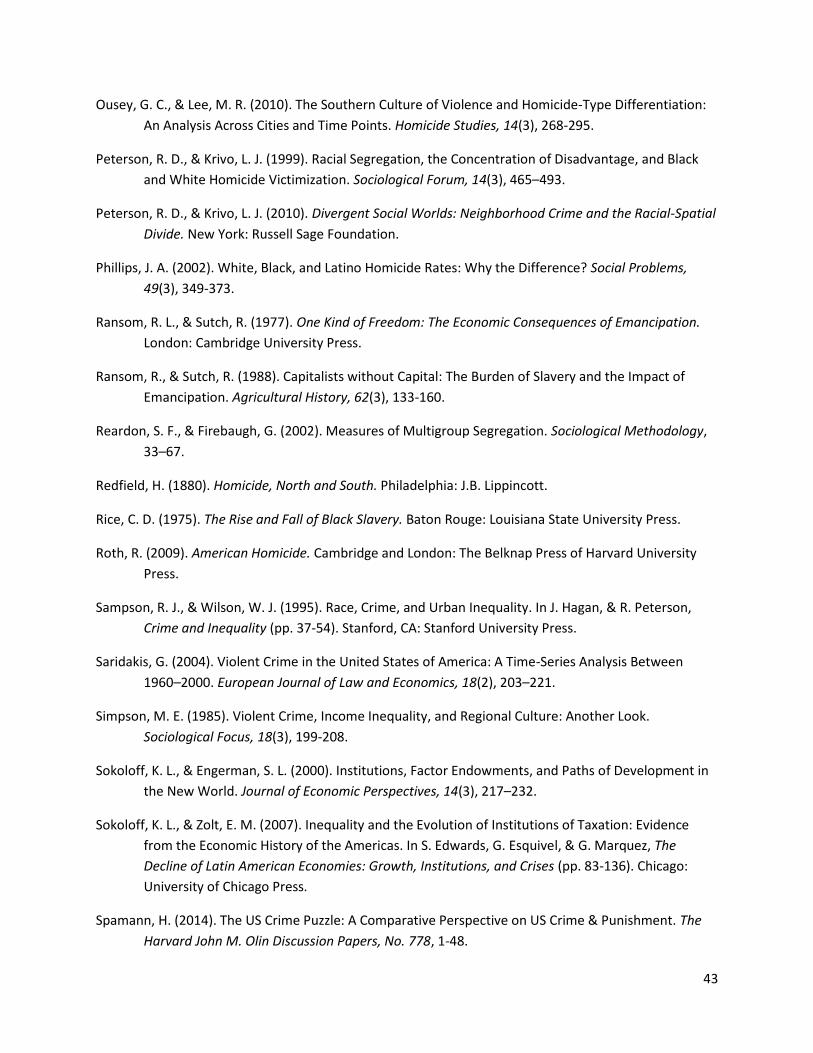
43
Ousey, G. C., & Lee, M. R. (2010). The Southern Culture of Violence and Homicide-Type Differentiation:
An Analysis Across Cities and Time Points. Homicide Studies, 14(3), 268-295.
Peterson, R. D., & Krivo, L. J. (1999). Racial Segregation, the Concentration of Disadvantage, and Black
and White Homicide Victimization. Sociological Forum, 14(3), 465–493.
Peterson, R. D., & Krivo, L. J. (2010). Divergent Social Worlds: Neighborhood Crime and the Racial-Spatial
Divide. New York: Russell Sage Foundation.
Phillips, J. A. (2002). White, Black, and Latino Homicide Rates: Why the Difference? Social Problems,
49(3), 349-373.
Ransom, R. L., & Sutch, R. (1977). One Kind of Freedom: The Economic Consequences of Emancipation.
London: Cambridge University Press.
Ransom, R., & Sutch, R. (1988). Capitalists without Capital: The Burden of Slavery and the Impact of
Emancipation. Agricultural History, 62(3), 133-160.
Reardon, S. F., & Firebaugh, G. (2002). Measures of Multigroup Segregation. Sociological Methodology,
33–67.
Redfield, H. (1880). Homicide, North and South. Philadelphia: J.B. Lippincott.
Rice, C. D. (1975). The Rise and Fall of Black Slavery. Baton Rouge: Louisiana State University Press.
Roth, R. (2009). American Homicide. Cambridge and London: The Belknap Press of Harvard University
Press.
Sampson, R. J., & Wilson, W. J. (1995). Race, Crime, and Urban Inequality. In J. Hagan, & R. Peterson,
Crime and Inequality (pp. 37-54). Stanford, CA: Stanford University Press.
Saridakis, G. (2004). Violent Crime in the United States of America: A Time-Series Analysis Between
1960–2000. European Journal of Law and Economics, 18(2), 203–221.
Simpson, M. E. (1985). Violent Crime, Income Inequality, and Regional Culture: Another Look.
Sociological Focus, 18(3), 199-208.
Sokoloff, K. L., & Engerman, S. L. (2000). Institutions, Factor Endowments, and Paths of Development in
the New World. Journal of Economic Perspectives, 14(3), 217–232.
Sokoloff, K. L., & Zolt, E. M. (2007). Inequality and the Evolution of Institutions of Taxation: Evidence
from the Economic History of the Americas. In S. Edwards, G. Esquivel, & G. Marquez, The
Decline of Latin American Economies: Growth, Institutions, and Crises (pp. 83-136). Chicago:
University of Chicago Press.
Spamann, H. (2014). The US Crime Puzzle: A Comparative Perspective on US Crime & Punishment. The
Harvard John M. Olin Discussion Papers, No. 778, 1-48.
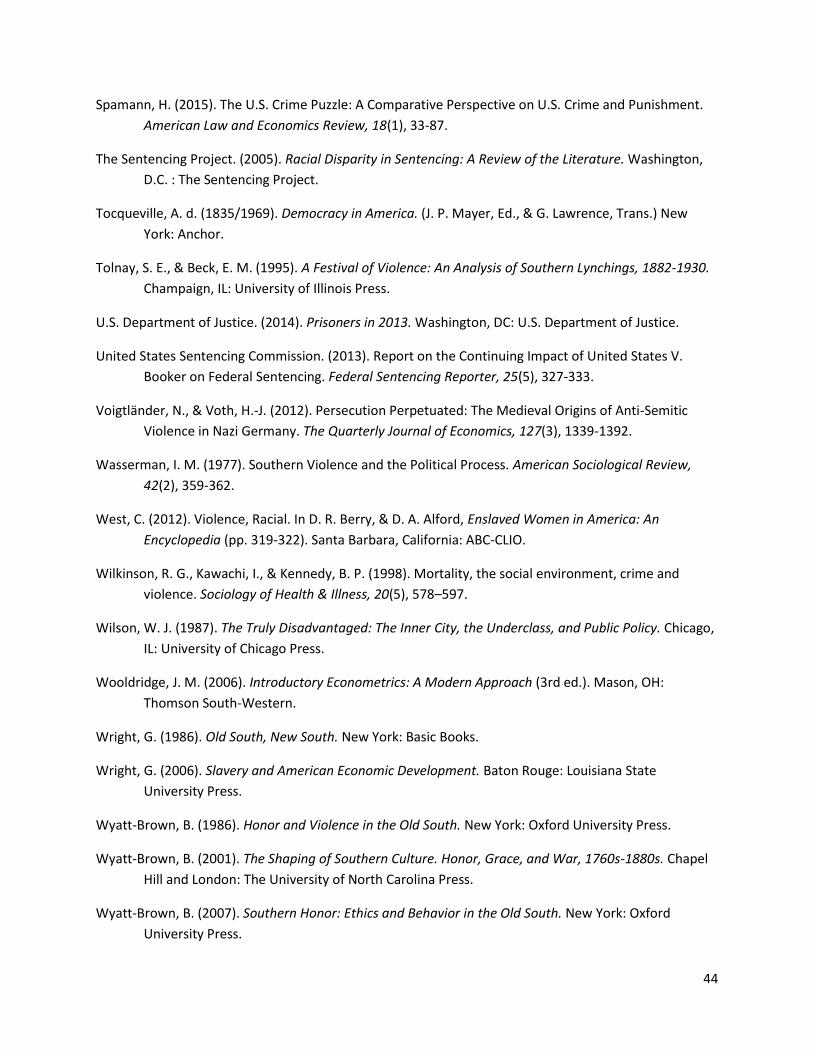
44
Spamann, H. (2015). The U.S. Crime Puzzle: A Comparative Perspective on U.S. Crime and Punishment.
American Law and Economics Review, 18(1), 33-87.
The Sentencing Project. (2005). Racial Disparity in Sentencing: A Review of the Literature. Washington,
D.C. : The Sentencing Project.
Tocqueville, A. d. (1835/1969). Democracy in America. (J. P. Mayer, Ed., & G. Lawrence, Trans.) New
York: Anchor.
Tolnay, S. E., & Beck, E. M. (1995). A Festival of Violence: An Analysis of Southern Lynchings, 1882-1930.
Champaign, IL: University of Illinois Press.
U.S. Department of Justice. (2014). Prisoners in 2013. Washington, DC: U.S. Department of Justice.
United States Sentencing Commission. (2013). Report on the Continuing Impact of United States V.
Booker on Federal Sentencing. Federal Sentencing Reporter, 25(5), 327-333.
Voigtländer, N., & Voth, H.-J. (2012). Persecution Perpetuated: The Medieval Origins of Anti-Semitic
Violence in Nazi Germany. The Quarterly Journal of Economics, 127(3), 1339-1392.
Wasserman, I. M. (1977). Southern Violence and the Political Process. American Sociological Review,
42(2), 359-362.
West, C. (2012). Violence, Racial. In D. R. Berry, & D. A. Alford, Enslaved Women in America: An
Encyclopedia (pp. 319-322). Santa Barbara, California: ABC-CLIO.
Wilkinson, R. G., Kawachi, I., & Kennedy, B. P. (1998). Mortality, the social environment, crime and
violence. Sociology of Health & Illness, 20(5), 578–597.
Wilson, W. J. (1987). The Truly Disadvantaged: The Inner City, the Underclass, and Public Policy. Chicago,
IL: University of Chicago Press.
Wooldridge, J. M. (2006). Introductory Econometrics: A Modern Approach (3rd ed.). Mason, OH:
Thomson South-Western.
Wright, G. (1986). Old South, New South. New York: Basic Books.
Wright, G. (2006). Slavery and American Economic Development. Baton Rouge: Louisiana State
University Press.
Wyatt-Brown, B. (1986). Honor and Violence in the Old South. New York: Oxford University Press.
Wyatt-Brown, B. (2001). The Shaping of Southern Culture. Honor, Grace, and War, 1760s-1880s. Chapel
Hill and London: The University of North Carolina Press.
Wyatt-Brown, B. (2007). Southern Honor: Ethics and Behavior in the Old South. New York: Oxford
University Press.

45
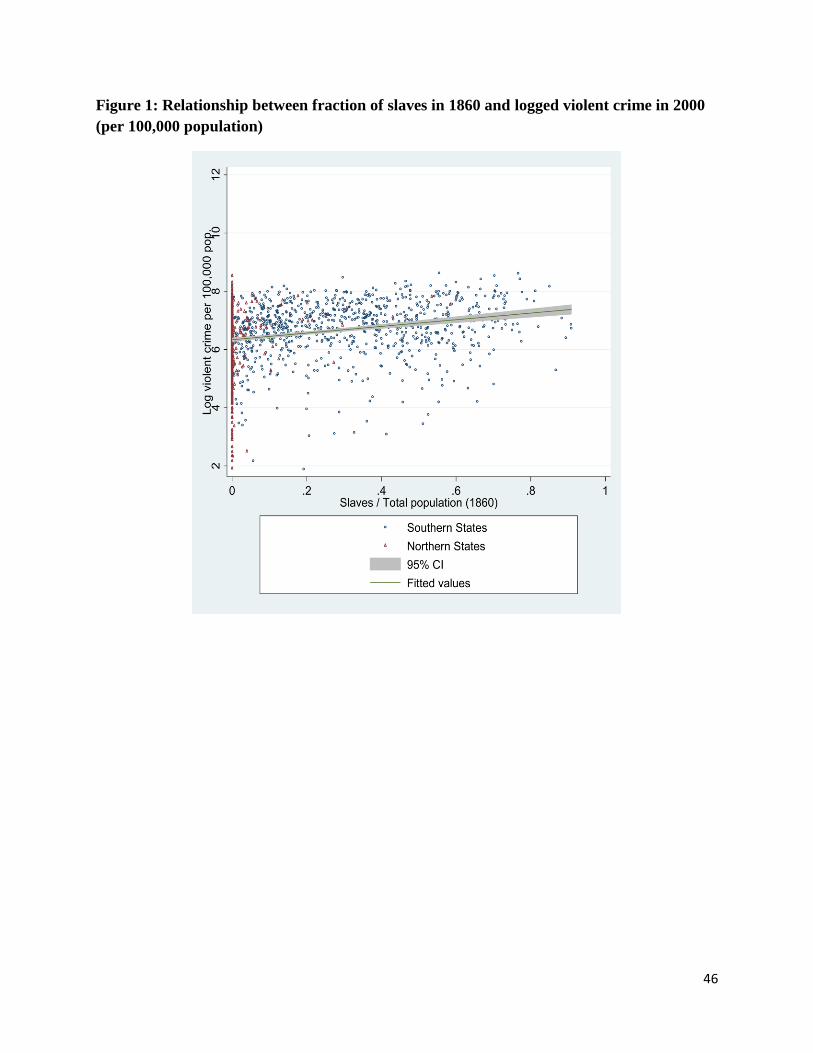
46
Figure 1: Relationship between fraction of slaves in 1860 and logged violent crime in 2000
(per 100,000 population)
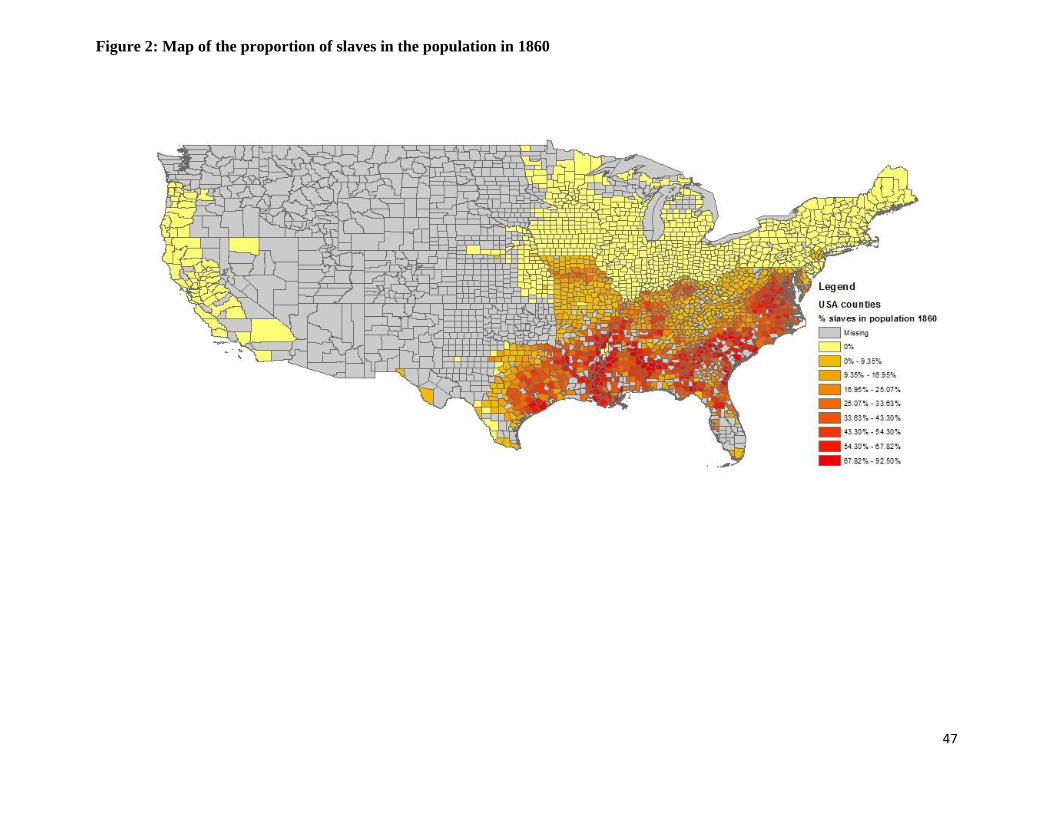
47
Figure 2: Map of the proportion of slaves in the population in 1860
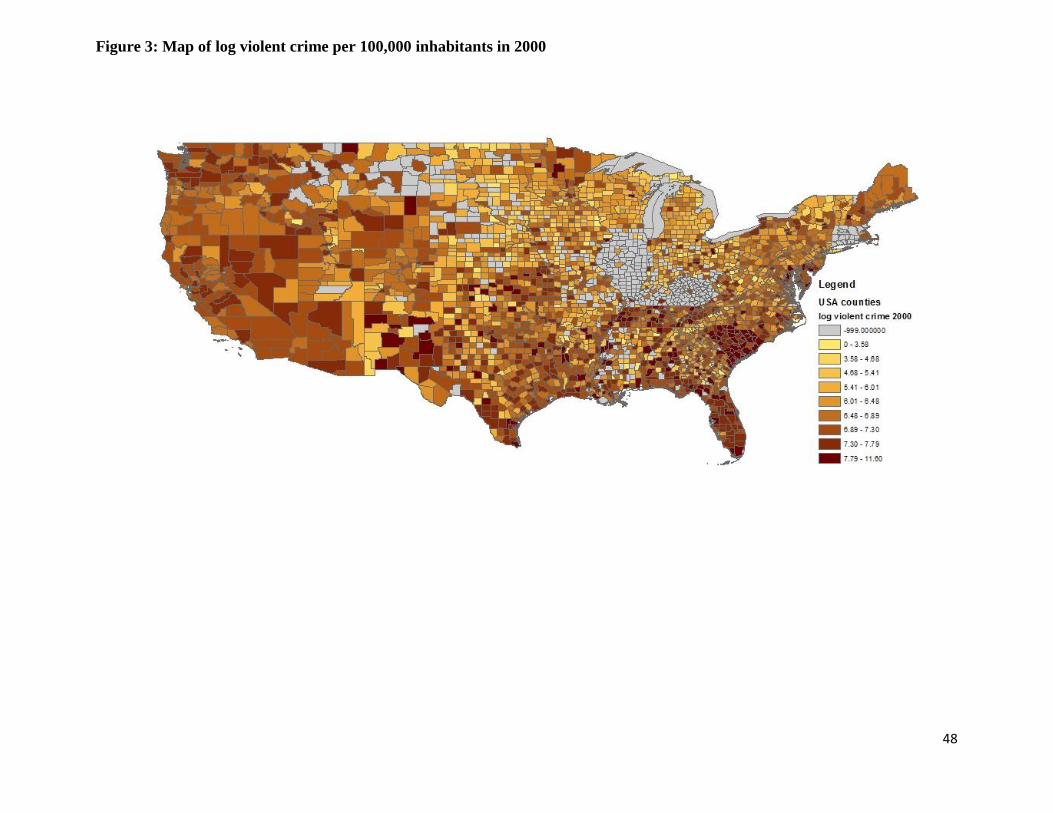
48
Figure 3: Map of log violent crime per 100,000 inhabitants in 2000

49
Table 1: Descriptive statistics and sources of the variables
Variable Obs Mean Std. Dev. Min Max Source
Violent crime (per 100,000 population) UCR (2000) 2,633 6.524 0.990 1.894 11.600
Logged
County-level data
Uniform Crime Reporting Program- U.S.
Department of Justice-Federal Bureau of
investigation. Population statistics from U.S.
Decennial Census.
Violent crime (per 100,000 population) UCR (1990) 2,777 6.117 1.084 0.697 11.540
Violent crime (per 100,000 population) UCR (1980) 2,839 5.541 1.096 1.338 11.378
Violent crime (per 100,000 population) UCR (1970) 2,179 4.252 1.096 0.091 7.154
Violent crime (per 100,000 population) Maltz (2000) 834 5.264 0.886 2.145 8.759
Logged
County-level data
Michael Maltz's Revisions on UCR data. Data
can be downloaded from:
http://cjrc.osu.edu/researchprojects/hvd/usa/ucrf
bi/
Population statistics from U.S. Decennial
Census.
Violent crime (per 100,000 population) Maltz (1990) 1,032 5.227 0.955 2.136 8.148
Violent crime (per 100,000 population) Maltz (1980) 1,327 5.008 1.005 1.743 7.815
Violent crime (per 100,000 population) Maltz (1970) 860 4.496 1.019 1.171 7.597
Whites/blacks arrested for
murder/rape/robbery/assault (per 100,000
white/black population) Means (not logged) provided in Table 2
Logged after adding 1, unless all crime types
missing.
Uniform Crime Reporting Program: Arrests by
Age, Sex, and Race, 2000.
White-on-white, black-on-black, white-on-black and
black-on-white murder (100,000 white and black
population) Means (not logged) provided in Table2
Logged, after adding 1, unless all violent crime
UCR 2000 is zero.
Uniform Crime Reporting Supplementary
Homicide Reports 2000.
Fraction slaves in total population (1860) 2,013 0.156 0.216 0.000 0.925 Nunn (2008), U.S. Decennial Census.
Fraction of slaves on small holdings (9 slaves or
less) in total population (1860)
2,013 0.043 0.049 0.000 0.205 Nunn (2008), U.S. Decennial Census.
Fraction of slaves on large holdings (10 slaves or
more) in total population (1860)
2,013 0.113 0.181 0.000 0.914 Nunn (2008), U.S. Decennial Census.
Slave state dummy (1860)
3,137 0.336 0.472 0.000 1.000 Equals one if state is Alabama, Arkansas, Delaware,
Florida, Georgia, Kentucky, Louisiana, Mississippi,
Missouri, North Carolina, South Carolina,
Tennessee, Texas or Virginia.
Gini coefficient of land inequality (1860)
1,932 0.432 0.074 0.044 0.643 Nunn (2008), Land area for U.S. states and
counties are from U.S. Bureau of the Census
(2006).
Population density (1860) 2,032 0.551 8.018 0.000 353.769 Nunn (2008), U.S. Decennial Census.
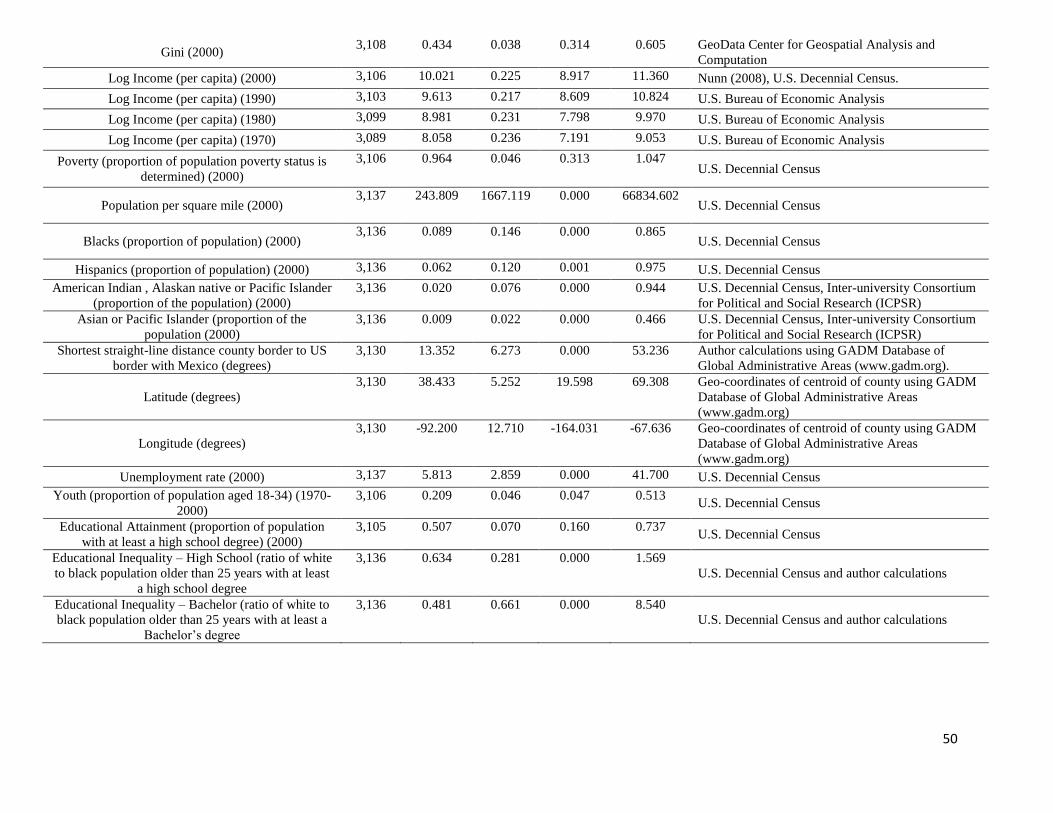
50
Gini (2000) 3,108 0.434 0.038 0.314 0.605 GeoData Center for Geospatial Analysis and
Computation
Log Income (per capita) (2000) 3,106 10.021 0.225 8.917 11.360 Nunn (2008), U.S. Decennial Census.
Log Income (per capita) (1990) 3,103 9.613 0.217 8.609 10.824 U.S. Bureau of Economic Analysis
Log Income (per capita) (1980) 3,099 8.981 0.231 7.798 9.970 U.S. Bureau of Economic Analysis
Log Income (per capita) (1970) 3,089 8.058 0.236 7.191 9.053 U.S. Bureau of Economic Analysis
Poverty (proportion of population poverty status is
determined) (2000)
3,106 0.964 0.046 0.313 1.047 U.S. Decennial Census
Population per square mile (2000) 3,137 243.809 1667.119 0.000 66834.602
U.S. Decennial Census
Blacks (proportion of population) (2000) 3,136 0.089 0.146 0.000 0.865
U.S. Decennial Census
Hispanics (proportion of population) (2000) 3,136 0.062 0.120 0.001 0.975 U.S. Decennial Census
American Indian , Alaskan native or Pacific Islander
(proportion of the population) (2000)
3,136 0.020 0.076 0.000 0.944 U.S. Decennial Census, Inter-university Consortium
for Political and Social Research (ICPSR)
Asian or Pacific Islander (proportion of the
population (2000)
3,136 0.009 0.022 0.000 0.466 U.S. Decennial Census, Inter-university Consortium
for Political and Social Research (ICPSR)
Shortest straight-line distance county border to US
border with Mexico (degrees)
3,130 13.352 6.273 0.000 53.236 Author calculations using GADM Database of
Global Administrative Areas (www.gadm.org).
Latitude (degrees)
3,130 38.433 5.252 19.598 69.308 Geo-coordinates of centroid of county using GADM
Database of Global Administrative Areas
(www.gadm.org)
Longitude (degrees)
3,130 -92.200 12.710 -164.031 -67.636 Geo-coordinates of centroid of county using GADM
Database of Global Administrative Areas
(www.gadm.org)
Unemployment rate (2000) 3,137 5.813 2.859 0.000 41.700 U.S. Decennial Census
Youth (proportion of population aged 18-34) (1970-
2000)
3,106 0.209 0.046 0.047 0.513 U.S. Decennial Census
Educational Attainment (proportion of population
with at least a high school degree) (2000)
3,105 0.507 0.070 0.160 0.737 U.S. Decennial Census
Educational Inequality – High School (ratio of white
to black population older than 25 years with at least
a high school degree
3,136 0.634 0.281 0.000 1.569
U.S. Decennial Census and author calculations
Educational Inequality – Bachelor (ratio of white to
black population older than 25 years with at least a
Bachelor’s degree
3,136 0.481 0.661 0.000 8.540
U.S. Decennial Census and author calculations

51
Support for affirmative action (proportion of
surveyed population expressing (strong) support for
“programs [that] give preference to racial minorities
and to women in employment and college
admissions in order to correct for discrimination”)
2,925 0.244 0.220 0.000 1.000
Acharya, Blackwell and Sen (2016), Cooperative
Congressional Election Study (CCES) pooled 2006,
2008, 2009, 2010 and 2011 data.
Downloaded from:
https://dataverse.harvard.edu/dataset.xhtml?persisten
tId=doi:10.7910/DVN/CAEEG7
Racial resentment (average agreement, on a five-
point scale of the surveyed population with
statement “The Irish, Italian, Jews and many other
minorities overcame prejudice and worked their way
up. Blacks should do the same.” and the inverse of
“Generations of slavery and discrimination have
created conditions that make it difficult for Blacks to
work their way out of the lower class.”
2,584 3.993 0.700 1.000 5.000
Bias against blacks (percentage of black population
incarcerated / percentage of blacks in the population)
(2000)
843 6.182 14.484 0.000 224.840 ICPSR: Annual Survey of Jails, 2000.
U.S. Decennial Census
Bias against blacks
2,436 6.443 45.571 0.000 1876.333 UCR Arrests by Age, Sex and Race, 2000
U.S. Decennial Census
White on black violent hate crime (per 100.000
black and white population) (2000)
2,974 0.031 0.181 0.000 2.584 Logged.
ICPSR 23783. Uniform Crime Reporting Program
Data [United States]: Hate Crime Data, 2000.
Black on white violent hate crime (per 100.000 black
and white population) (2000)
2,974 0.015 0.126 0.000 2.224
Ethno-Linguistic Fractionalization (2000) 3,136 0.177 0.163 0.000 0.800 U.S. Decennial Census, author calculations
following Mauro (1995). Ethno-Linguistic Fractionalization (including
Hispanics) (2000)
3,136 0.248 0.185 0.008 0.826
Dissimilarity index (2000) 3,093 0.250 0.150 0.000 0.863 RAND Center for Population Health and Health
Disparities (CPHHD) Data Core Series: Segregation
Indices - Cross-Sectional Data by Geographic
County, 2000
White isolation index (2000) 3,093 0.837 0.167 0.024 0.996
Black isolation index (2000) 3,093 0.132 0.184 0.000 0.877
Malaria suitability 1,898 0.136 0.079 0.001 0.404 Bertocchi and Dimico (2014), Malaria Atlas Project
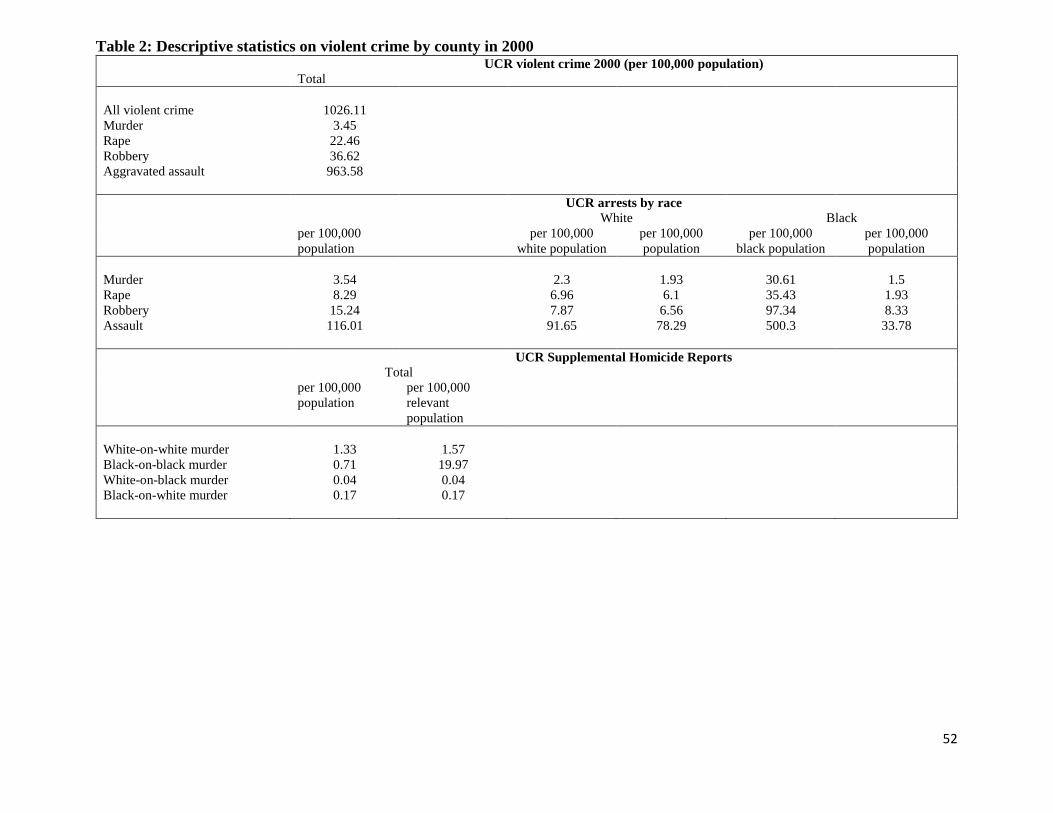
52
Table 2: Descriptive statistics on violent crime by county in 2000 UCR violent crime 2000 (per 100,000 population)
Total
All violent crime 1026.11
Murder 3.45
Rape 22.46
Robbery 36.62
Aggravated assault 963.58
UCR arrests by race
White Black
per 100,000
population
per 100,000
white population
per 100,000
population
per 100,000
black population
per 100,000
population
Murder 3.54 2.3 1.93 30.61 1.5
Rape 8.29 6.96 6.1 35.43 1.93
Robbery 15.24 7.87 6.56 97.34 8.33
Assault 116.01 91.65 78.29 500.3 33.78
UCR Supplemental Homicide Reports
Total
per 100,000
population
per 100,000
relevant
population
White-on-white murder 1.33 1.57
Black-on-black murder 0.71 19.97
White-on-black murder 0.04 0.04
Black-on-white murder 0.17 0.17
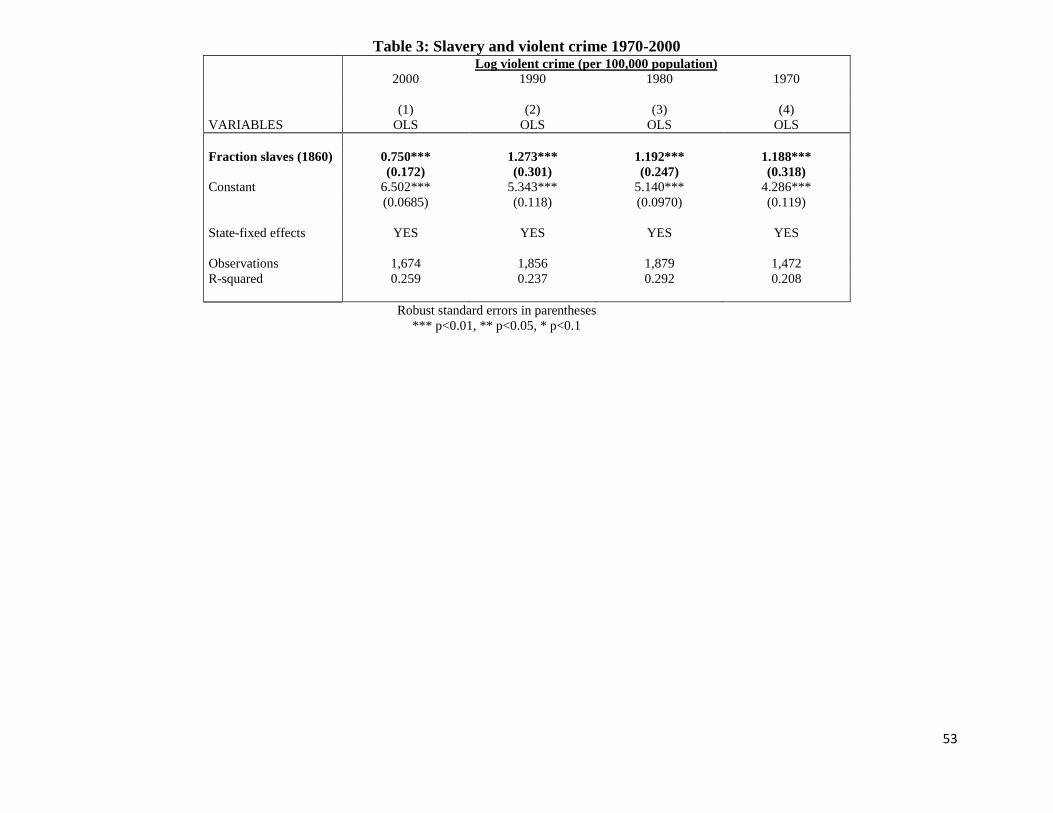
53
Table 3: Slavery and violent crime 1970-2000 Log violent crime (per 100,000 population) 2000 1990 1980 1970
(1) (2) (3) (4)
VARIABLES OLS OLS OLS OLS
Fraction slaves (1860) 0.750*** 1.273*** 1.192*** 1.188***
(0.172) (0.301) (0.247) (0.318)
Constant 6.502*** 5.343*** 5.140*** 4.286***
(0.0685) (0.118) (0.0970) (0.119)
State-fixed effects YES YES YES YES
Observations 1,674 1,856 1,879 1,472
R-squared 0.259 0.237 0.292 0.208
Robust standard errors in parentheses
*** p<0.01, ** p<0.05, * p<0.1
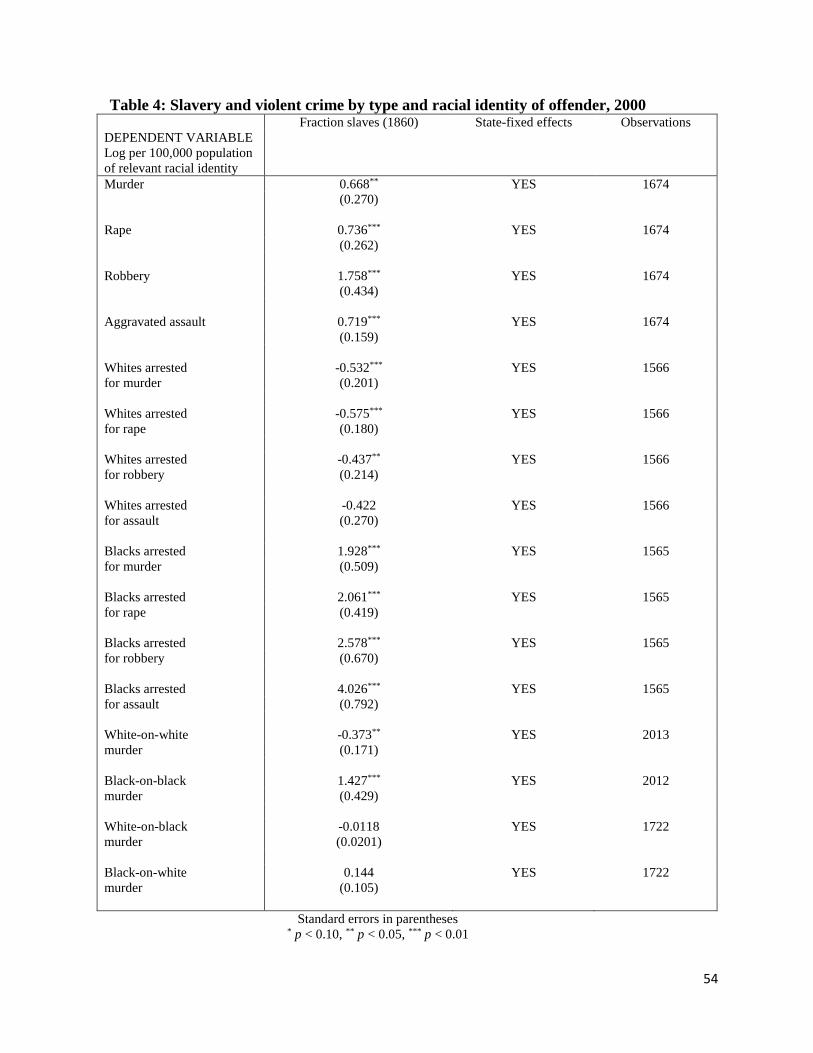
54
Table 4: Slavery and violent crime by type and racial identity of offender, 2000 Fraction slaves (1860) State-fixed effects Observations
DEPENDENT VARIABLE
Log per 100,000 population
of relevant racial identity
Murder 0.668** YES 1674
(0.270)
Rape 0.736*** YES 1674
(0.262)
Robbery 1.758*** YES 1674
(0.434)
Aggravated assault 0.719*** YES 1674
(0.159)
Whites arrested -0.532*** YES 1566
for murder (0.201)
Whites arrested -0.575*** YES 1566
for rape (0.180)
Whites arrested -0.437** YES 1566
for robbery (0.214)
Whites arrested -0.422 YES 1566
for assault (0.270)
Blacks arrested 1.928*** YES 1565
for murder (0.509)
Blacks arrested 2.061*** YES 1565
for rape (0.419)
Blacks arrested 2.578*** YES 1565
for robbery (0.670)
Blacks arrested 4.026*** YES 1565
for assault (0.792)
White-on-white -0.373** YES 2013
murder (0.171)
Black-on-black 1.427*** YES 2012
murder (0.429)
White-on-black -0.0118 YES 1722
murder (0.0201)
Black-on-white 0.144 YES 1722
murder (0.105)
Standard errors in parentheses * p < 0.10, ** p < 0.05, *** p < 0.01
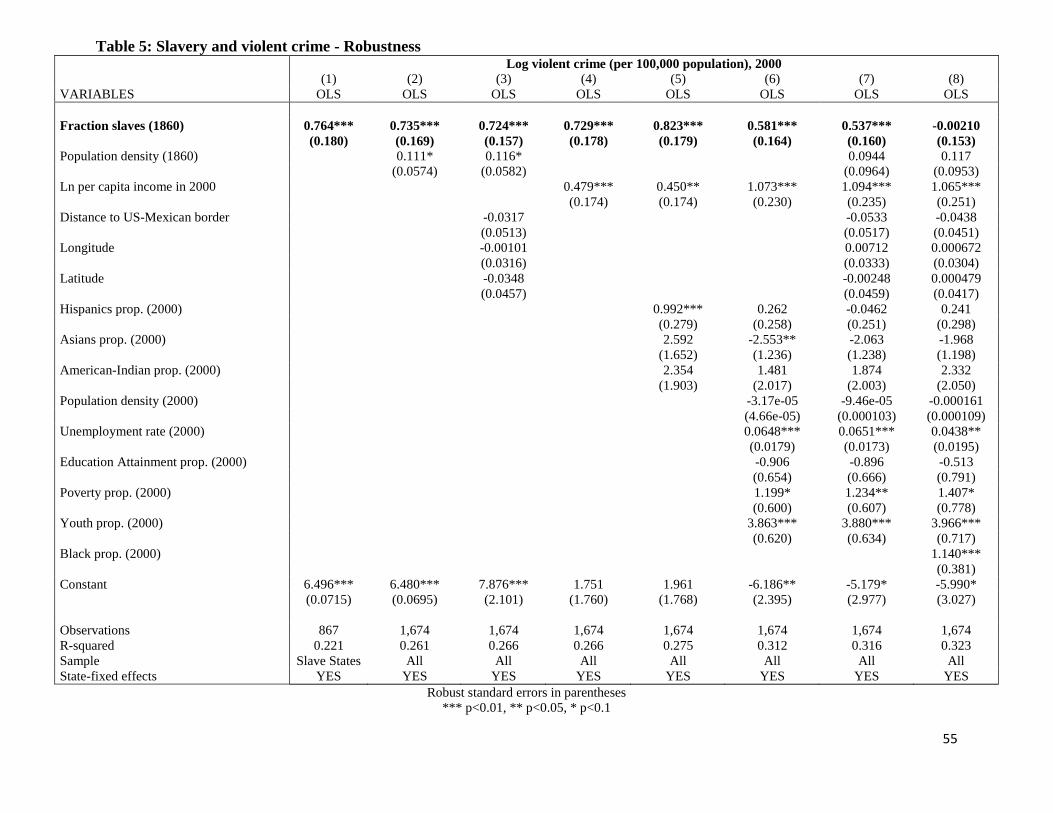
55
Table 5: Slavery and violent crime - Robustness
Log violent crime (per 100,000 population), 2000
(1) (2) (3) (4) (5) (6) (7) (8)
VARIABLES OLS OLS OLS OLS OLS OLS OLS OLS
Fraction slaves (1860) 0.764*** 0.735*** 0.724*** 0.729*** 0.823*** 0.581*** 0.537*** -0.00210
(0.180) (0.169) (0.157) (0.178) (0.179) (0.164) (0.160) (0.153)
Population density (1860) 0.111* 0.116* 0.0944 0.117
(0.0574) (0.0582) (0.0964) (0.0953)
Ln per capita income in 2000 0.479*** 0.450** 1.073*** 1.094*** 1.065***
(0.174) (0.174) (0.230) (0.235) (0.251)
Distance to US-Mexican border -0.0317 -0.0533 -0.0438
(0.0513) (0.0517) (0.0451)
Longitude -0.00101 0.00712 0.000672
(0.0316) (0.0333) (0.0304)
Latitude -0.0348 -0.00248 0.000479
(0.0457) (0.0459) (0.0417)
Hispanics prop. (2000) 0.992*** 0.262 -0.0462 0.241
(0.279) (0.258) (0.251) (0.298)
Asians prop. (2000) 2.592 -2.553** -2.063 -1.968
(1.652) (1.236) (1.238) (1.198)
American-Indian prop. (2000) 2.354 1.481 1.874 2.332
(1.903) (2.017) (2.003) (2.050)
Population density (2000) -3.17e-05 -9.46e-05 -0.000161
(4.66e-05) (0.000103) (0.000109)
Unemployment rate (2000) 0.0648*** 0.0651*** 0.0438**
(0.0179) (0.0173) (0.0195)
Education Attainment prop. (2000) -0.906 -0.896 -0.513
(0.654) (0.666) (0.791)
Poverty prop. (2000) 1.199* 1.234** 1.407*
(0.600) (0.607) (0.778)
Youth prop. (2000) 3.863*** 3.880*** 3.966***
(0.620) (0.634) (0.717)
Black prop. (2000) 1.140***
(0.381)
Constant 6.496*** 6.480*** 7.876*** 1.751 1.961 -6.186** -5.179* -5.990*
(0.0715) (0.0695) (2.101) (1.760) (1.768) (2.395) (2.977) (3.027)
Observations 867 1,674 1,674 1,674 1,674 1,674 1,674 1,674
R-squared 0.221 0.261 0.266 0.266 0.275 0.312 0.316 0.323
Sample Slave States All All All All All All All
State-fixed effects YES YES YES YES YES YES YES YES
Robust standard errors in parentheses
*** p<0.01, ** p<0.05, * p<0.1

56
Table 6: Slavery and violent crime: Maltz data
Log violent crime (per 100,000 population), Maltz 1970 1970s 1980 1980s 1990 1990s 2000
(1) (2) (3) (4) (5) (6) (7)
VARIABLES OLS OLS OLS OLS OLS OLS OLS
Fraction slaves (1860) 2.138*** 1.306*** 1.195*** 1.141*** 1.320*** 1.111*** 0.745**
(0.418) (0.240) (0.336) (0.201) (0.279) (0.312) (0.295)
Population density (1860) 0.0674 -0.0412 0.268 0.00851 0.208 0.168 0.163
(0.201) (0.107) (0.245) (0.225) (0.394) (0.276) (0.398)
Ln Income (year) 0.532 0.700*** 0.990*** 0.903*** 1.517*** 1.440*** 0.102
(0.339) (0.169) (0.282) (0.199) (0.454) (0.291) (0.274)
Distance to US-Mexican border -0.121 -0.0333 -0.134* -0.169** -0.0964 -0.0987 -0.146*
(0.0735) (0.0512) (0.0744) (0.0799) (0.0976) (0.0910) (0.0789)
Longitude 0.0606* 0.0225 0.0572* 0.0812** 0.00771 0.0273 0.0513
(0.0301) (0.0278) (0.0335) (0.0381) (0.0439) (0.0395) (0.0378)
Latitude 0.0784 -0.0587 0.0105 0.0588 0.0474 0.0184 0.0160
(0.0718) (0.0561) (0.0606) (0.0533) (0.0795) (0.0793) (0.0724)
Hispanics prop. (year) -0.336 0.328 -0.0625 -0.0982 -1.177***
(0.343) (0.223) (0.265) (0.286) (0.361) Asians prop. (2000) 53.29 117.5 -0.104 -0.700 7.448
(53.04) (85.73) (3.393) (3.395) (6.714) American Indian prop. (2000) -0.710 1.298 -0.573 1.091 4.179
(6.615) (5.957) (2.786) (0.919) (3.173)
Population per square mile (year) 0.00140*** 0.00140*** 0.00136*** 0.000885** 0.000726** 0.000592** 0.000866*
(0.000281) (0.000228) (0.000388) (0.000332) (0.000320) (0.000230) (0.000468)
Unemployment rate (year) 0.0742** 0.0565*** 0.0449*** 0.0447*** 0.0697*** 0.0803*** 0.0240
(0.0289) (0.0119) (0.0135) (0.0106) (0.0197) (0.0182) (0.0225)
Educational Attainment prop. (year) -0.165 -0.302 -1.838* -1.799** -3.074***
(0.776) (0.653) (1.028) (0.794) (0.902)
Poverty prop. (year) 0.757 1.195*** 1.009*** 1.335*** 1.556*** 1.632*** 2.689***
(0.633) (0.340) (0.365) (0.394) (0.515) (0.387) (0.482)
Youth prop. (year) 3.602*** 2.443*** 3.597*** 2.557*** 2.519*** 3.114*** 1.344
(0.899) (0.775) (0.689) (0.930) (0.890) (0.717) (1.115)
Constant 2.078 1.722 -0.177 1.615 -11.05*** -7.897** 7.850**
(3.002) (2.904) (3.762) (2.996) (3.789) (3.302) (3.573)
State-fixed effects YES YES YES YES YES YES YES
Observations 499 1,076 792 941 614 792 463
R-squared 0.490 0.554 0.484 0.525 0.475 0.537 0.435
Clustered standard errors (state level) in parentheses
*** p<0.01, ** p<0.05, * p<0.1
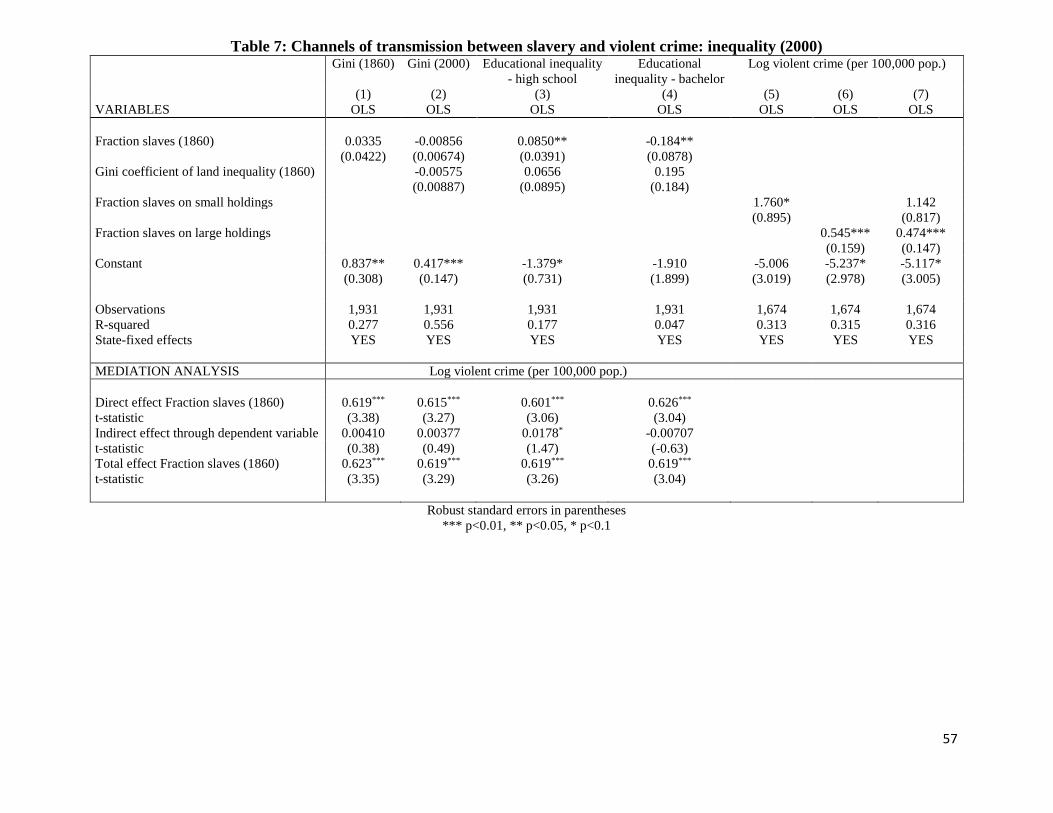
57
Table 7: Channels of transmission between slavery and violent crime: inequality (2000) Gini (1860) Gini (2000) Educational inequality
- high school
Educational
inequality - bachelor
Log violent crime (per 100,000 pop.)
(1) (2) (3) (4) (5) (6) (7)
VARIABLES OLS OLS OLS OLS OLS OLS OLS
Fraction slaves (1860) 0.0335 -0.00856 0.0850** -0.184**
(0.0422) (0.00674) (0.0391) (0.0878)
Gini coefficient of land inequality (1860) -0.00575 0.0656 0.195
(0.00887) (0.0895) (0.184)
Fraction slaves on small holdings 1.760* 1.142
(0.895) (0.817)
Fraction slaves on large holdings 0.545*** 0.474***
(0.159) (0.147)
Constant 0.837** 0.417*** -1.379* -1.910 -5.006 -5.237* -5.117*
(0.308) (0.147) (0.731) (1.899) (3.019) (2.978) (3.005)
Observations 1,931 1,931 1,931 1,931 1,674 1,674 1,674
R-squared 0.277 0.556 0.177 0.047 0.313 0.315 0.316
State-fixed effects YES YES YES YES YES YES YES
MEDIATION ANALYSIS Log violent crime (per 100,000 pop.)
Direct effect Fraction slaves (1860) 0.619*** 0.615*** 0.601*** 0.626***
t-statistic (3.38) (3.27) (3.06) (3.04)
Indirect effect through dependent variable 0.00410 0.00377 0.0178* -0.00707
t-statistic (0.38) (0.49) (1.47) (-0.63)
Total effect Fraction slaves (1860) 0.623*** 0.619*** 0.619*** 0.619***
t-statistic (3.35) (3.29) (3.26) (3.04)
Robust standard errors in parentheses
*** p<0.01, ** p<0.05, * p<0.1
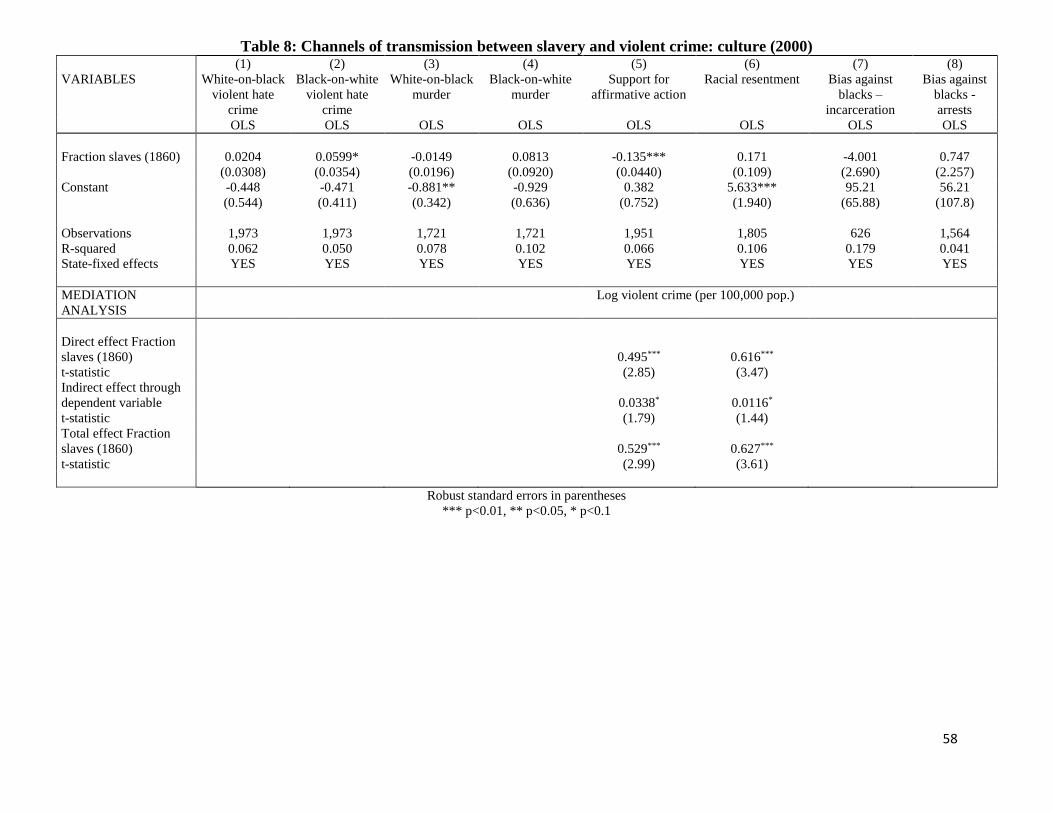
58
Table 8: Channels of transmission between slavery and violent crime: culture (2000) (1) (2) (3) (4) (5) (6) (7) (8)
VARIABLES White-on-black
violent hate
crime
Black-on-white
violent hate
crime
White-on-black
murder
Black-on-white
murder
Support for
affirmative action
Racial resentment Bias against
blacks –
incarceration
Bias against
blacks -
arrests
OLS OLS OLS OLS OLS OLS OLS OLS
Fraction slaves (1860) 0.0204 0.0599* -0.0149 0.0813 -0.135*** 0.171 -4.001 0.747
(0.0308) (0.0354) (0.0196) (0.0920) (0.0440) (0.109) (2.690) (2.257)
Constant -0.448 -0.471 -0.881** -0.929 0.382 5.633*** 95.21 56.21
(0.544) (0.411) (0.342) (0.636) (0.752) (1.940) (65.88) (107.8)
Observations 1,973 1,973 1,721 1,721 1,951 1,805 626 1,564
R-squared 0.062 0.050 0.078 0.102 0.066 0.106 0.179 0.041
State-fixed effects YES YES YES YES YES YES YES YES
MEDIATION
ANALYSIS
Log violent crime (per 100,000 pop.)
Direct effect Fraction
slaves (1860)
0.495*** 0.616***
t-statistic (2.85) (3.47)
Indirect effect through
dependent variable
0.0338* 0.0116*
t-statistic (1.79) (1.44)
Total effect Fraction
slaves (1860)
0.529*** 0.627***
t-statistic (2.99) (3.61)
Robust standard errors in parentheses
*** p<0.01, ** p<0.05, * p<0.1
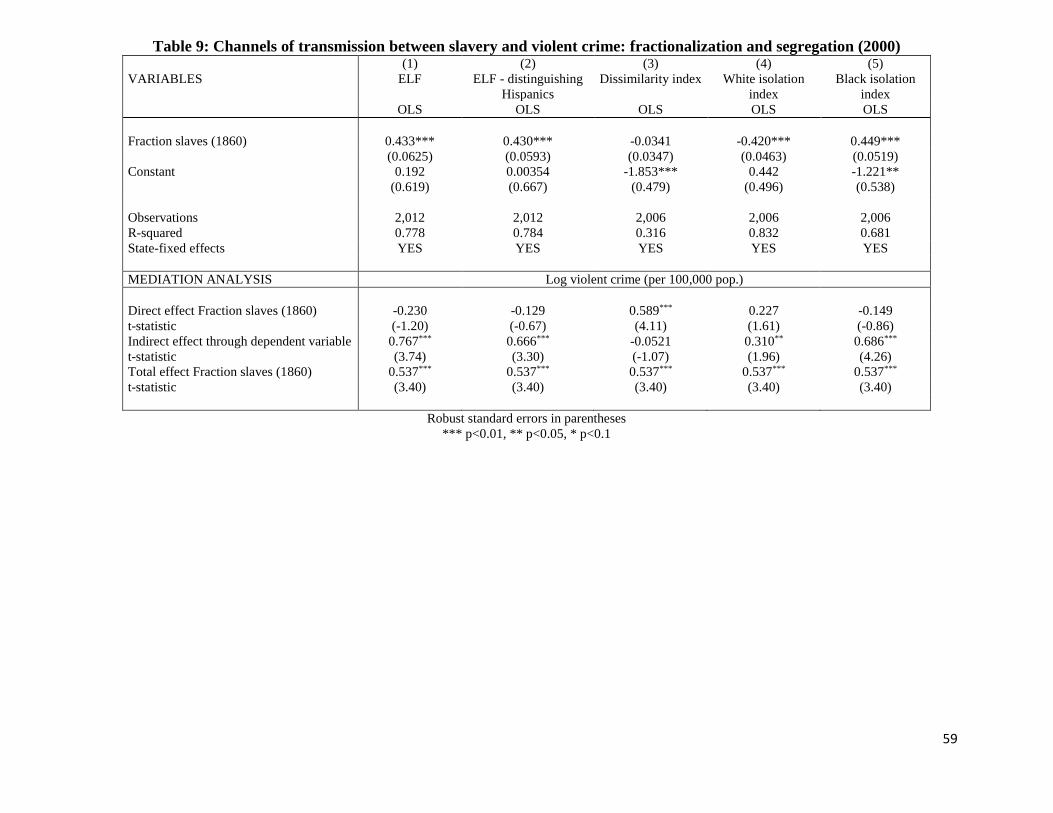
59
Table 9: Channels of transmission between slavery and violent crime: fractionalization and segregation (2000) (1) (2) (3) (4) (5)
VARIABLES ELF ELF - distinguishing
Hispanics
Dissimilarity index White isolation
index
Black isolation
index
OLS OLS OLS OLS OLS
Fraction slaves (1860) 0.433*** 0.430*** -0.0341 -0.420*** 0.449***
(0.0625) (0.0593) (0.0347) (0.0463) (0.0519)
Constant 0.192 0.00354 -1.853*** 0.442 -1.221**
(0.619) (0.667) (0.479) (0.496) (0.538)
Observations 2,012 2,012 2,006 2,006 2,006
R-squared 0.778 0.784 0.316 0.832 0.681
State-fixed effects YES YES YES YES YES
MEDIATION ANALYSIS Log violent crime (per 100,000 pop.)
Direct effect Fraction slaves (1860) -0.230 -0.129 0.589*** 0.227 -0.149
t-statistic (-1.20) (-0.67) (4.11) (1.61) (-0.86)
Indirect effect through dependent variable 0.767*** 0.666*** -0.0521 0.310** 0.686***
t-statistic (3.74) (3.30) (-1.07) (1.96) (4.26)
Total effect Fraction slaves (1860) 0.537*** 0.537*** 0.537*** 0.537*** 0.537***
t-statistic (3.40) (3.40) (3.40) (3.40) (3.40)
Robust standard errors in parentheses
*** p<0.01, ** p<0.05, * p<0.1
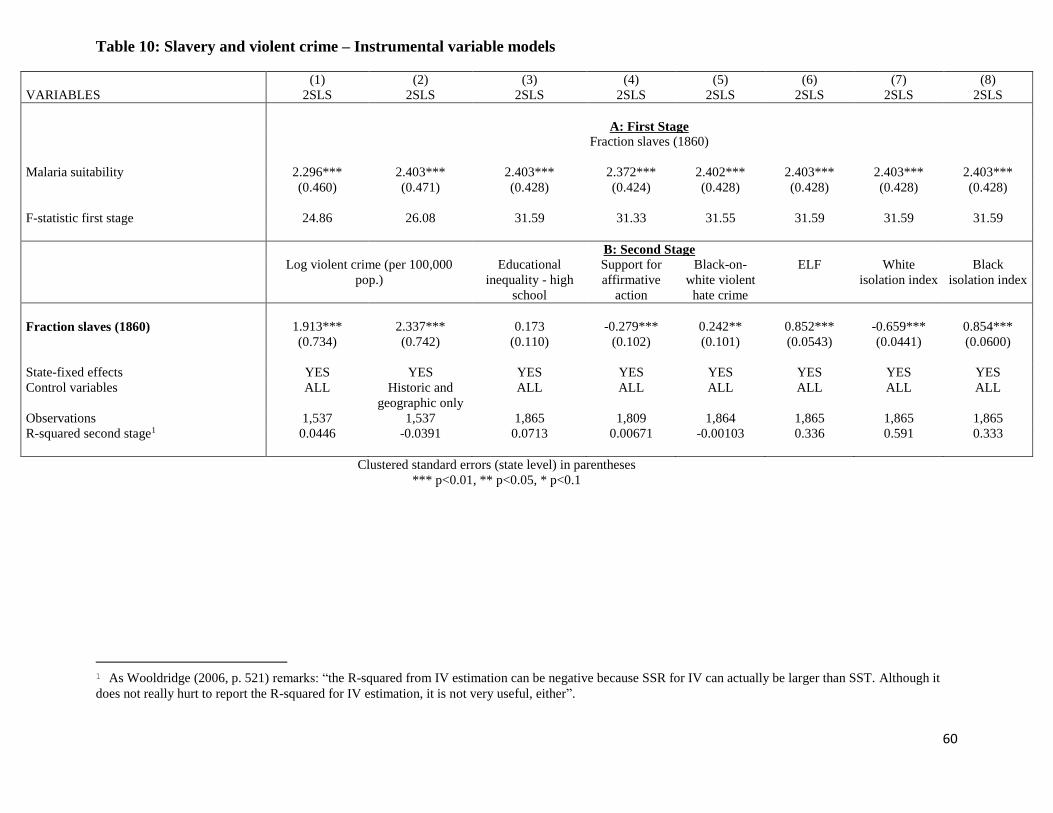
60
Table 10: Slavery and violent crime – Instrumental variable models
(1) (2) (3) (4) (5) (6) (7) (8)
VARIABLES 2SLS 2SLS 2SLS 2SLS 2SLS 2SLS 2SLS 2SLS
A: First Stage
Fraction slaves (1860)
Malaria suitability 2.296*** 2.403*** 2.403*** 2.372*** 2.402*** 2.403*** 2.403*** 2.403***
(0.460) (0.471) (0.428) (0.424) (0.428) (0.428) (0.428) (0.428)
F-statistic first stage 24.86 26.08 31.59 31.33 31.55 31.59 31.59 31.59
B: Second Stage
Log violent crime (per 100,000
pop.) Educational
inequality - high
school
Support for
affirmative
action
Black-on-
white violent
hate crime
ELF White
isolation index
Black
isolation index
Fraction slaves (1860) 1.913*** 2.337*** 0.173 -0.279*** 0.242** 0.852*** -0.659*** 0.854***
(0.734) (0.742) (0.110) (0.102) (0.101) (0.0543) (0.0441) (0.0600)
State-fixed effects YES YES YES YES YES YES YES YES
Control variables ALL Historic and
geographic only
ALL ALL ALL ALL ALL ALL
Observations 1,537 1,537 1,865 1,809 1,864 1,865 1,865 1,865
R-squared second stage1 0.0446 -0.0391 0.0713 0.00671 -0.00103 0.336 0.591 0.333
Clustered standard errors (state level) in parentheses
*** p<0.01, ** p<0.05, * p<0.1
1 As Wooldridge (2006, p. 521) remarks: “the R-squared from IV estimation can be negative because SSR for IV can actually be larger than SST. Although it
does not really hurt to report the R-squared for IV estimation, it is not very useful, either”.