
wonderful to train - young's flying filly - Racing & Wagering WA
Upload
independentCategory
view
1download
0
The Latent Factor Structure of Young’s Early Maladaptive Schemas:Are Schemas Organized Into Domains?
Levente Kriston,1∗ Janina Schafer,2 Alessa von Wolff,1 Martin Harter,1and Lars P. Holzel2
1University Medical Center Hamburg-Eppendorf, Germany,2University Medical Center Freiburg, Germany,
Objective: In previous research it has not been clarified whether the first-order schema factors ofthe Young Schema Questionnaire (YSQ) can be structured into higher order domains. We examinedwhether investigators’ subjective choices between complex models of the YSQ or chance as opposedto clinical diversity of the samples may be responsible for the heterogeneity of results reported in theliterature. Method: We used confirmatory factor analysis to compare several a priori defined do-main models in a sample of 542 undergraduate students (82.8% female; mean age 24.1 years) and 590nonstudent adults (73.9% female; mean age 34.5 years) form an Internet survey. An additional MonteCarlo simulation study was performed to gain further insights on model selection. Results: Theanalyses did not provide unequivocal support for the presence of a second-order domain structure.However, study findings suggested that the structure of the YSQ could be represented by a bifactormodel including a first-order generic factor on which all items load and correlated first-order specificschema factors on which only the items load that were meant to measure the respective schemas.Conclusion: In the YSQ either several second-order domain structures are present that cannot beranked by statistical measures alone or a first-order generic factor is present making second-orderdomains dispensable. Future research should include theoretical arguments and incorporate the clinicalexperience of practitioners. C© 2012 Wiley Periodicals, Inc. J. Clin. Psychol. 00:1–15, 2012.
Keywords: early maladaptive schema; Young Schema Questionnaire; factor structure; confirmatoryfactor analysis; reliability; validity
Beck introduced cognitive functions into the theory of mental disorders (1967; Beck, Rush,Shaw, & Emery, 1979) by proposing a hierarchical model of cognition. He focused his researchmainly on the surface and middle level of conditional cognitive contents (e.g., core beliefs).At a deeper level of cognitive representations, rather unconditional and unconscious schemasorganize perception and behavior. Young (1990) proposed a classification system for schemasand identified a set of early maladaptive schemas. Early maladaptive schemas can be describedas stable and enduring themes regarding oneself, one’s relationship with others, and the worldthat developed during childhood and became elaborated throughout the course of a lifetime. Itwas assumed that although these schemas were present in asymptomatic populations, they wereparticularly distorted, rigid, and dysfunctional in symptomatic individuals. Currently, Young’stheory includes 18 early maladaptive schemas organized into five domains. The complete list,classification scheme, and definitions are available at http://schematherapy.com/id73.htm.
Young (1990) developed the Young Schema Questionnaire (YSQ) to measure early mal-adaptive schemas. This self-report instrument was revised several times; shorter versions of theoriginal 205-item scale have been developed, and the current version, the YSQ-Short Form3 (YSQ-SF3), includes 90 items. As Oei and Baranoff (2007) have reviewed the psychomet-ric research on this instrument, we summarize the central findings of previous research briefly.
∗We thank two anonymous reviewers for their helpful comments on the manuscript and all those whoparticipated in the online survey.
Please address correspondence to: Dr. phil. Levente Kriston, Department of Medical Psychology,University Medical Center Hamburg-Eppendorf, Martinistr. 52, D-20246 Hamburg, Germany. E-mail:[email protected]
JOURNAL OF CLINICAL PSYCHOLOGY, Vol. 00(00), 1–15 (2012) C© 2012 Wiley Periodicals, Inc.Published online in Wiley Online Library (wileyonlinelibrary.com/journal/jclp). DOI: 10.1002/jclp.21846
2 JOURNAL OF CLINICAL PSYCHOLOGY, Vol. xx(x), XXX-XXX (2012)
Research findings have been consistent despite considerable variation in the versions (long, short,versions 1 to 3), languages (e.g., English, French, Turkish), settings (e.g., students, nonclinicaland clinical samples), and the statistical techniques used (exploratory factor analysis [EFA] andconfirmatory factor analysis [CFA]). Measures of internal consistency have found most schemasubscales to be reliable. Although some items and subscales exhibited unsatisfactory charac-teristics, most studies confirmed the first-order factor structure at the schema level. However,the consistent finding of high intercorrelations among the first-order schema factors suggestedthat these strong associations might reflect a hierarchical organization of schemas into domains(Lockwood, 2011). Table 1 presents a brief summary of research investigating the second-orderfactor structure of the YSQ and reveals that findings of a number of studies are conflicting.
The goal of the present study was to investigate the second-order factor structure of the YSQto determine the extent to which the first-order schema factors could be structured into higherorder domains.
First, we compared several second-order models using data from an online sample of con-venience. The tested models included Young’s model with five domains, a global factor modelwith a single domain, and models with two to five second-order domains identified in previousresearch. A bifactor model was also investigated as a possible explanation for the strong schemafactor associations (Holzinger & Swineford, 1937; Reise, Morizot, & Hays, 2007). In a bifac-tor model, all items load on a first-order generic factor, and the items associated with specificschemas load on the associated first-order schema factors. This type of factor structure does notappear to have been considered to describe the latent structure of the YSQ in previous research.
Second, because different structural equation models might fit a particular dataset equallywell (Lee & Hershberger, 1990; MacCallum, Wegener, Uchino, & Fabrigar, 1993), we performeda small-scale Monte Carlo simulation study to examine the extent to which other than clin-ical factors (e.g., chance or investigators’ subjective choices between complex models of theYSQ) might be responsible for the heterogeneity of the results reported in the literature. Weassumed that because of the complexity of the models of the latent structure of schemas, whichincluded a large number of observed and latent variables with multiple unidirectional and/orbidirectional associations, varying findings might have reflected sampling fluctuation or the sub-jective decisions of the investigator rather than “true” clinical variation in the factorial structure(MacCallum, Roznowski, & Necowitz, 1992).
Methods
Study Design and Sample Characteristics
Data were collected in a cross-sectional Internet survey of one month’s duration in June and July2009. The survey link was distributed via e-mail to psychology faculties at German universities,several Internet forums, and other contacts of the authors. The invitation to participate includeda brief description of the study, a guarantee of anonymity, the time needed to complete the survey,a request for further dissemination of the invitation to participate, and contact information forquestions and comments. No reimbursement or other incentives were provided and no personaldata (e.g., IP addresses) were recorded. The local institutional review board approved the studyprotocol.
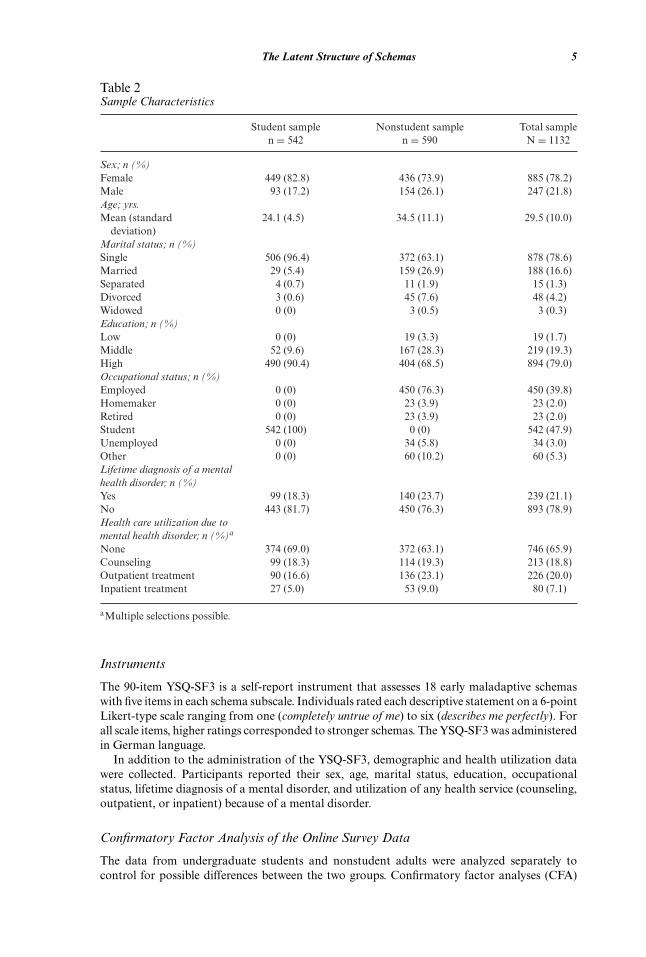
The online questionnaire was accessed 2608 times and 1150 individuals completed the survey.Participants younger than 18 years were excluded and data from the remaining 1132 participantswere included in the analysis. Table 2 presents the demographic and clinical characteristics ofthe sample and reveals that most participants tended to be either students (47.9%) or employed(39.8%). Most were female (78.2%), young (mean age 29.5 years), single (78.6%), and highlyeducated (79.0%). Approximately one of five participants (21.1%) reported a lifetime diagnosisof a mental disorder. Affective disorders (n = 134), anxiety disorders (n = 43), eating disorders(n = 32), and borderline personality disorders (n = 25) occurred the most frequently. A substan-tial proportion of the sample reported treatment in an outpatient (20.0%) or inpatient (7.1%)setting.

The Latent Structure of Schemas 3
Tab
le1
Sum
mar
yof
stud
ies
asso
ciat
ing
sche
mas
wit
hdo
mai
ns
You
ng’s
You
ng’s
orig
inal
Schm
idt
Mih
aesc
uM
ihae
scu
Lee
revi
sed
Cec
ero
Cal
vete
Hof
fart
Soyg
utSa
aria
hoSa
aria
hoC
sukl
yth
eory
etal
.et
al.I
etal
.II
etal
.th
eory
etal
.et
al.
etal
.et
al.
etal
.Iet
al.I
Iet
al.
Stud
y(1
990)
(199
5)(1
997)
(199
7)(1
999)
(200
3)(2
004)
(200
5)(2
006)
(200
9)(2
010)
(201
0)(2
011)
Sam
ple
Stud
ents
Out
pati
ents
and
heal
thy
cont
rols
Out
pati
ents
wit
hpe
rson
alit
ydi
sord
ers
Pat
ient
sw
ith
men
tal
diso
rder
s
Stud
ents
Stud
ents
Pat
ient
sw
ith
men
tal
diso
rder
s
Stud
ents
Pat
ient
sw
ith
chro
nic
pain
Adu
lts
Inpa
tien
tsw
ith
depr
essi
on
Cou
ntry
USA
Fra
nce
Fra
nce
Aus
tral
iaU
SASp
ain
Nor
way
Tur
key
Fin
land
Fin
land
Hun
gary
Sam
ple
size
1129
167
6043
329
240
787
110
7127
133
110
7Fa
ctor
anal
ysis
met
hod
(rot
atio
n)P
CA
(Var
imax
)P
CA
(non
e)P
CA
(non
e)P
CA
(Var
imax
)P
CA
(Obl
imin
)P
CA
/CFA
(Var
imax
)C
FAP
CA
(Equ
amax
)P
CA
(Pro
max
)P
CA
(Pro
max
)P
CA
(Var
imax
)N
umbe
rof
item
s/sc
hem
asc
ales
inas
sess
men
tin
stru
men
t
205/
1612
3/15
123/
1520
5/16
75/1
575
/15
75/1
590
/18
90/1
890
/18
240/
19
Sch
emas
Em
otio
nalD
epri
vati
onD
CD
CFA
FA/E
MD
DC
DC
DC
DC
DC
DC
LO
SL
ON
F3
Aba
ndon
men
t/In
stab
ility
DC
DC
FAFA
DC
/IA
DC
IAIA
IAIA
LO
SE
ND
/L
ON
F1/
F2
Mis
trus
t/A
buse
DC
DC
FAFA
/NA
DC
DC
DC
DC
DC
DC
LO
SL
ON
F2/
F3
Soci
alIs
olat
ion/
Alie
nati
onD
C-
FAFA
DC
DC
DC
DC
DC
DC
LO
SL
ON
F1/
F3
Soci
alU
ndes
irab
ility
UD
-FA
FA-
--
--
--
-F
1/F
3D
efec
tive
ness
/Sha
me
UD
DC
FAFA
DC
DC
-D
CD
CD
CL
OS
EN
DF
1/F
3

4 JOURNAL OF CLINICAL PSYCHOLOGY, Vol. xx(x), XXX-XXX (2012)
Tab
le1
cont
inue
You
ng’s
You
ng’s
orig
inal
Schm
idt
Mih
aesc
uM
ihae
scu
Lee
revi
sed
Cec
ero
Cal
vete
Hof
fart
Soyg
utSa
aria
hoSa
aria
hoC
sukl
yth
eory
etal
.et
al.I
etal
.II
etal
.th
eory
etal
.et
al.
etal
.et
al.
etal
.Iet
al.I
Iet
al.
Stud
y(1
990)
(199
5)(1
997)
(199
7)(1
999)
(200
3)(2
004)
(200
5)(2
006)
(200
9)(2
010)
(201
0)(2
011)
Fai
lure
toA
chie
veU
DO
CFA
FAIA
IAIA
IAIA
IAL
OS
EN
DF
1D
epen
denc
e/In
com
pete
nce
IAO
CFA
FAIA
IAO
D-E
VI
IAIA
IAL
OS
EN
DF
1V
ulne
rabi
lity
toH
arm
orIl
lnes
sIA
OC
FAFA
IAIA
IAIA
IAIA
LO
SE
ND
F4
Enm
eshm
ent/
Und
evel
oped
Self
IAO
CFA
FAIA
IAIA
IAIA
IAL
OS
EN
DF
1
Ent
itle
men
t/G
rand
iosi
tyIL
-FA
/NA
FA/N
AIL
ILIL
ES-
OC
LIL
ILE
NC
EN
CF
2In
suffi
cien
tSe
lf-C
ontr
olIL
DC
/ES/
OC
--
IA/I
LIL
OD
-EV
IIA
IA/I
LIL
LO
SE
ND
F1/
F2
Subj
ugat
ion
IA-
--
IAO
DIA
IAIA
-L
OS
EN
DF
1/F
4Se
lf-S
acri
fice
RSE
ES
--
OC
LO
DO
D-E
VI
ES-
OC
LE
SO
DE
NC
EN
CF
4A
ppro
val-
Seek
ing
--
--
-O
D-
--
ES
EN
CE
NC
F1/
F4
Em
otio
nalI
nhib
itio
nR
SED
CFA
FAD
CE
VI
DC
DC
DC
DC
LO
SL
ON
F1/
F3
Fea
rof
Los
ing
Con
trol
-D
CFA
FAIL
--
--
--
--
Unr
elen
ting
Stan
dard
sR
SEE
SFA
/NA
FA/N
AO
CL
EV
IO
D-E
VI
ES-
OC
LE
SE
SE
NC
EN
CF
4N
egat
ivit
y/P
essi
mis
m-
--
--
EV
I-
--
IAE
NC
EN
DF
1/F
3P
unit
iven
ess
--
FAFA
-E
VI
--
-O
DE
NC
EN
CF
2/F
4
Not
eIf
mor
eth
anon
em
odel
was
repo
rted
,th
eau
thor
s’ch
oice
was
adop
ted;
ifno
defin
ite
asso
ciat
ions
wer
em
ade,
all
sche
mas
wit
hst
anda
rdiz
edlo
adin
gs>
.4w
ere
asso
ciat
edw
ith
the
resp
ecti
vedo
mai
n;“/
“st
ands
for
cros
s-lo
adin
g.D
C=
Dis
conn
ecti
on;E
ND
=E
ndan
gere
d;E
MD
=E
mot
iona
lDep
riva
tion
;EN
C=
Enc
umbe
red;
ES
=E
xagg
erat
edSt
anda
rds;
EV
I=
Exa
gger
ated
Vig
ilanc
ean
dIn
hibi
tion
;F1-
F4
=U
nlab
eled
Fac
tors
;FA
=F
ailu
re;I
A=
Impa
ired
Aut
onom
y;IL
=Im
pair
edL
imit
s;L
ON
=L
onel
y;L
OS
=L
oser
;NA
=N
arci
ssis
m;O
C=
Ove
rcon
nect
ion;
OC
L=
Ove
rcon
trol
;OD
=O
ther
-Dir
ecte
dnes
s;R
SE=
Res
tric
ted
Self
-Exp
ress
ion;
UD
=U
ndes
irab
ility
.
The Latent Structure of Schemas 5
Table 2Sample Characteristics
Student sample Nonstudent sample Total samplen = 542 n = 590 N = 1132
Sex; n (%)Female 449 (82.8) 436 (73.9) 885 (78.2)Male 93 (17.2) 154 (26.1) 247 (21.8)Age; yrs.Mean (standard
deviation)24.1 (4.5) 34.5 (11.1) 29.5 (10.0)
Marital status; n (%)Single 506 (96.4) 372 (63.1) 878 (78.6)Married 29 (5.4) 159 (26.9) 188 (16.6)Separated 4 (0.7) 11 (1.9) 15 (1.3)Divorced 3 (0.6) 45 (7.6) 48 (4.2)Widowed 0 (0) 3 (0.5) 3 (0.3)Education; n (%)Low 0 (0) 19 (3.3) 19 (1.7)Middle 52 (9.6) 167 (28.3) 219 (19.3)High 490 (90.4) 404 (68.5) 894 (79.0)Occupational status; n (%)Employed 0 (0) 450 (76.3) 450 (39.8)Homemaker 0 (0) 23 (3.9) 23 (2.0)Retired 0 (0) 23 (3.9) 23 (2.0)Student 542 (100) 0 (0) 542 (47.9)Unemployed 0 (0) 34 (5.8) 34 (3.0)Other 0 (0) 60 (10.2) 60 (5.3)Lifetime diagnosis of a mentalhealth disorder; n (%)Yes 99 (18.3) 140 (23.7) 239 (21.1)No 443 (81.7) 450 (76.3) 893 (78.9)Health care utilization due tomental health disorder; n (%)a
None 374 (69.0) 372 (63.1) 746 (65.9)Counseling 99 (18.3) 114 (19.3) 213 (18.8)Outpatient treatment 90 (16.6) 136 (23.1) 226 (20.0)Inpatient treatment 27 (5.0) 53 (9.0) 80 (7.1)
aMultiple selections possible.
Instruments
The 90-item YSQ-SF3 is a self-report instrument that assesses 18 early maladaptive schemaswith five items in each schema subscale. Individuals rated each descriptive statement on a 6-pointLikert-type scale ranging from one (completely untrue of me) to six (describes me perfectly). Forall scale items, higher ratings corresponded to stronger schemas. The YSQ-SF3 was administeredin German language.
In addition to the administration of the YSQ-SF3, demographic and health utilization datawere collected. Participants reported their sex, age, marital status, education, occupationalstatus, lifetime diagnosis of a mental disorder, and utilization of any health service (counseling,outpatient, or inpatient) because of a mental disorder.
Confirmatory Factor Analysis of the Online Survey Data
The data from undergraduate students and nonstudent adults were analyzed separately tocontrol for possible differences between the two groups. Confirmatory factor analyses (CFA)

6 JOURNAL OF CLINICAL PSYCHOLOGY, Vol. xx(x), XXX-XXX (2012)
assessed the fit of several a priori defined models, which were chosen to be clinically andmethodologically heterogeneous with different factor structures. Models obtained using theYSQ-SF3 were preferred. Table 1 presents the information used to define the models derivedfrom previous studies.
The baseline model, which was based on Young’s revised theory (Young, Klosko, & Weishaar,2003), assumed 18 correlated first-order schema factors. A theory-driven model with five second-order factors that was consistent with Young’s revised theory (Young et al., 2003) was also fitted,as well as a model empirically derived from a student sample with five second-order domainfactors (Soygut, Karaosmanoglu, & Cakir, 2009). The influential four-domain model originallydeveloped by Lee, Taylor, and Dunn (1999) and confirmed by Hoffart et al. (2005) in patientswith mental disorders (referred to as the “Lee-Hoffart model” in the present study) was the onlytested model that had been independently confirmed. Because this model defined domains foronly 15 schemas, the remaining three first-order schema factors were allowed to freely correlatewith each other and the second-order domains. A two-domain and a three-domain model basedon samples of adults with and without chronic pain were also fitted (Saariaho, Saariaho, Karila,& Joukamaa, 2010), as well as a model with a single global domain. Finally, bifactor modelswith and without correlations between the first-order schema factors were examined.
In the CFA, we applied the maximum likelihood estimation method to analyze the covariancematrix of the items. A robust estimator was used to account for possible non-normality ofobservations yielding adjusted chi-squared statistics and robust standard errors. Latent variableswere scaled by fixing the loading of one indicator for each latent variable.
To evaluate and compare models, both local and global goodness-of-fit measures were cal-culated. Because previous research had found that the first-order local fit characteristics (e.g.,the intercorrelations of items within schemas) of the YSQ were satisfactory, we focused on theglobal fit indexes, although we also report some rarely investigated local fit indexes. The discrep-ancy chi-squared statistic, the normed chi-squared statistic, the comparative fit index (CFI), theTucker-Lewis index (TLI), the root mean squared error of approximation (RMSEA), the stan-dardized root mean squared residual (SRMR), and the Bayes information criterion (BIC) werechosen as fit indexes for the structural equation models (Hair, Black, Babin, & Anderson, 2009;Hu & Bentler, 1999; Schermelleh-Engel, Moosbrugger, & Muller, 2003). However, it should benoted that the CFI and TLI were unlikely to reach acceptable levels when modeling at item leveldue to the large number of items (Hair et al., 2009).
Because the online survey required that all questions be answered, the data included in theanalyses were complete. All analyses were performed using Mplus 5.1 (Muthen & Muthen,1998).
The Monte Carlo Simulation Study
We performed a small-scale Monte Carlo simulation study with 2000 generated samples of 500subjects each, which approximated the median sample size in the studies displayed in Table 1.The data-generating model included 15 normally distributed first-order (schema) factors andfour normally distributed second-order (domain) factors, following the standardized estimatesreported in Hoffart et al. (2005). We chose the Lee-Hoffart model as the data-generating modelbecause of its popularity and because the reported model characteristics provided sufficientdetail to replicate the correlation matrix of the 15 first-order schema factors. We investigated theglobal fit of all of the models presented in Table 1 to the 2000 simulated data sets, with the meanfit indexes reported for evaluation.
In addition to the models described above, the set of models tested included the following: thefive-domain model based on Young’s original theory (Young, 1990), a three-domain model froma student sample (Schmidt, Joiner, Young, & Telch, 1995), a two-domain and a three-domainmodel from a sample of psychiatric outpatients and healthy controls (Mihaescu et al., 1997),a four-domain model from a student sample (Cecero, Nelson, & Gillie, 2004), a three-domainmodel from a student sample (Calvete, Estevez, Arroyabe, & Ruiz, 2005), and a four-domainmodel from a sample of inpatients with depression (Csukly et al., 2011). If the tested model hadoriginally investigated the factor structure of more or less than 15 schemas, the nonoverlapping

The Latent Structure of Schemas 7
schemas of the data-generating and the tested models were omitted from the analyses. Becausein the Monte Carlo study the first-order factor (schema-level) data were simulated, the resultingmeasures of fit were not directly comparable to the measures of fit obtained using the onlinesurvey data (item-level).
Results
CFA of the Online Survey Data
First, univariate and bivariate item descriptive statistics of the total sample were examined todetermine whether the assumptions of CFA were met. On a scale from one to six, the means ofthe 90 items ranged from 1.4 to 4.5 with a median of 2.6. Skewness and kurtosis values rangedfrom -1.0 to 2.6 and -1.1 to 6.4 with medians of 0.6 and -0.5, respectively. Most of the Pearsonproduct-moment correlations of items (99.6%) were positive, with a small proportion (0.5%)exceeding 0.70. The median correlation between items was 0.30.
In general, analyses of the student and nonstudent samples provided comparable estimates,with the normed chi-squared and RMSEA exhibiting a modestly superior model fit for thestudent sample and the CFI, TLI, and SRMR exhibiting a marginally better fit for the nonstudentsample. The relative ranking of the models based on their fit to the data, however, remainedconstant across the samples. Table 3 presents the global goodness-of-fit indexes of the testedmodels.
Young’s revised theoretical model (S1 and N1 in Table 3) with 18 correlated first-order schemafactors without second-order domains exhibited an acceptable fit in both samples. Althoughneither the CFI nor the TLI reached the threshold for an acceptable model (≥0.90), the normedchi-squared statistic (<3), the RMSEA(<.05), and the SRMR (<.08) indicated that the model fitthe data. The first-order schema factors exhibited internal consistency. For the student sample,the factor reliability coefficients ranged from 0.65 for “Entitlement/Grandiosity” to 0.91 for“Defectiveness/Shame” with a median of 0.80, while the coefficients for the nonstudent sampleranged from 0.66 for “Punitiveness” to 0.92 for “Defectiveness/Shame” with a median of 0.83.The median explained variance of items within factors was 0.45 for students and 0.50 fornonstudent adults. Thus, on average, the model explained approximately half of the varianceof the item responses. Of the 153 inter-factor correlations, 24 in the student sample and 44 inthe nonstudent sample were 0.70 or higher. The median inter-schema correlation was 0.52 forstudents and 0.63 for nonstudent adults.
In both samples, all models with second-order domains (S2 to S7, and N2 to N7 in Table 3)were inferior to the models without second-order schema domains, even though their absolutefit was satisfactory with regard to all the indexes but the CFI and TLI. Among the second-orderdomain models, the Lee-Hoffart model (S4 and N4) exhibited marginally better fit comparedwith the other models.
The bifactor model with uncorrelated specific factors (S8 and N8 in Table 3) exhibited agood fit that was comparable to the model with correlated first-order schema factors withoutsecond-order domains (S1 and N1). This indicates that modeling the intercorrelations of the first-level schema factors could be “replaced” by the inclusion of a generic factor without seriouslyendangering the model fit. However, due to the parsimonious nature of the bifactor model,complexity-adjusted measures such as the BIC (where lower values indicate better fit) clearlysupported it over the baseline model with correlated first-order factors.
An even better fit was achieved with the bifactor structure that included the correlationsbetween the specific factors (S9 and N9), which was the model with the best fit in both groups. Theinclusion of a generic factor, on which all items loaded considerably reduced the intercorrelationsof the first-order schema factors; the median of the intercorrelations was zero in the studentsample and 0.10 in the nonstudent adult sample. In the student sample, the loadings on thegeneric factor ranged from 0.03 to 0.77 with a median of 0.51, while in the nonstudent sample thecorresponding values were 0.08, 0.77, and 0.54, respectively. The amount of variance explainedby the generic factor was 0.22 in the student sample and 0.23 in the nonstudent sample, while theaverage variance explained by the specific factors was 0.27 for students and 0.30 for nonstudents.

8 JOURNAL OF CLINICAL PSYCHOLOGY, Vol. xx(x), XXX-XXX (2012)
Tab
le3
Glo
balG
oodn
ess-
of-F
itIn
dexe
sof
the
Test
edM
odel
s
Chi
-sq
(df)
Chi
-sq/
dfC
FI
TL
IR
MSE
ASR
MR
BIC
Thr
esho
ldfo
rgo
odm
odel
sna
≤2≥.
95≥.
95≤.
05≤.
05na
Thr
esho
ldfo
rac
cept
able
mod
els
na≤3
≥.90
≥.90
≤.08
≤.08
na
SSt
uden
tsa
mpl
eS1
18co
rrel
ated
first
-ord
erfa
ctor
s(Y
oung
’ssc
hem
as)
7703
(376
2)2.
047
.830
.819
.044
.066
1471
74.0
40S2
5co
rrel
ated
seco
nd-o
rder
fact
ors
(You
ng’s
revi
sed
theo
ry,2
003)
8616
(388
7)2.
217
.796
.790
.047
.077
1474
27.3
25S3
5co
rrel
ated
seco
nd-o
rder
fact
ors
(Soy
gut
etal
.,20
09)
8480
(388
3)2.
184
.802
.796
.047
.074
1473
02.9
33S4
4co
rrel
ated
seco
nd-o
rder
fact
ors
(Lee
-Hof
fart
mod
el,1
999/
2006
)84
08(3
878)
2.16
8.8
05.7
98.0
46.0
7314
7238
.346
S53
corr
elat
edse
cond
-ord
erfa
ctor
s(S
aari
aho
etal
.II,
2010
)85
93(3
893)
2.20
7.7
97.7
92.0
47.0
7614
7367
.490
S62
corr
elat
edse
cond
-ord
erfa
ctor
s(S
aari
aho
etal
.I,2
010)
8679
(389
6)2.
228
.794
.788
.048
.076
1474
47.9
25S7
1gl
obal
seco
nd-o
rder
fact
or87
46(3
897)
2.24
4.7
91.7
85.0
48.0
7714
7514
.660
S8U
ncor
rela
ted
bifa
ctor
stru
ctur
e78
29(3
825)
2.04
7.8
27.8
19.0
44.0
5914
6927
.601
S9C
orre
late
dbi
fact
orst
ruct
ure
6839
(367
2)1.
862
.863
.851
.040
.044
1467
04.7
17
NN
onst
uden
tsa
mpl
eN
118
corr
elat
edfir
st-o
rder
fact
ors
(You
ng’s
sche
mas
)83
93(3
762)
2.23
1.8
37.8
26.0
46.0
6216
1904
.334
N2
5co
rrel
ated
seco
nd-o
rder
fact
ors
(You
ng’s
revi
sed
theo
ry,2
003)
9452
(388
8)2.
431
.804
.798
.049
.073
1623
53.2
81N
35
corr
elat
edse
cond
-ord
erfa
ctor
s(S
oygu
tet
al.,
2009
)93
02(3
883)
2.39
6.8
09.8
03.0
49.0
7016
2212
.970
N4
4co
rrel
ated
seco
nd-o
rder
fact
ors
(Lee
-Hof
fart
mod
el,1
999/
2006
)92
10(3
878)
2.37
5.8
12.8
06.0
48.0
7016
2135
.647
N5
3co
rrel
ated
seco
nd-o
rder
fact
ors
(Saa
riah
oet
al.I
I,20
10)
9396
(389
3)2.
414
.806
.800
.049
.072
1622
58.0
67N
62
corr
elat
edse
cond
-ord
erfa
ctor
s(S
aari
aho
etal
.I,2
010)
9527
(389
6)2.
445
.801
.796
.049
.073
1623
94.9
17N
71
glob
alse
cond
-ord
erfa
ctor
9580
(389
7)2.
458
.799
.794
.050
.073
1624
50.0
92N
8U
ncor
rela
ted
bifa
ctor
stru
ctur
e86
50(3
826)
2.26
1.8
30.8
22.0
46.0
5816
1786
.844
N9
Cor
rela
ted
bifa
ctor
stru
ctur
e74
62(3
672)
2.03
2.8
66.8
54.0
42.0
4316
1301
.247
Not
e.C
hi-s
q=
disc
repa
ncy
chi-
squa
red
stat
isti
c;df
=de
gree
sof
free
dom
;Chi
-sq/
df=
norm
edch
i-sq
uare
dst
atis
tic;
CF
I=
com
para
tive
fitin
dex;
TL
I=
Tuc
ker-
Lew
isin
dex;
RM
SEA
=ro
otm
ean
squa
red
erro
rof
appr
oxim
atio
n;SR
MR
=st
anda
rdiz
edro
otm
ean
squa
red
resi
dual
;BIC
=B
ayes
info
rmat
ion
crit
erio
n;na
=no
tap
plic
able
(no
abso
lute
thre
shol
dde
finab
le).

The Latent Structure of Schemas 9
Figure 1. Average explained variance by the generic and specific factors of the bifactor model in thenonstudent adult sample.Note. ED = Emotional Deprivation; AB = Abandonment/Instability; MA = Mistrust/Abuse; SI = So-cial Isolation/Alienation; DS = Defectiveness/Shame; FA = Failure; DI = Dependence/Incompetence;VH = Vulnerability to Harm or Illness; EM = Enmeshment/Undeveloped Self; SB = Subjugation; SS =Self-Sacrifice; EI = Emotional Inhibition; US = Unrelenting Standards/Hypercriticalness; ET = Entitle-ment/Grandiosity; IS = Insufficient Self-Control/Self-Discipline; AS = Approval-Seeking/Recognition-Seeking; NP = Negativity/Pessimism; PU = Punitiveness.
For example, Figure 1 displays the average variance explained by the generic and specific factorsin the nonstudent group. The generic factor explained a fifth to a quarter of the total variance; thespecific factors explained another quarter to third of the variance, although there was substantialvariation across the schemas.
The reliability of the specific schema factors was considerably diminished by the inclusion ofthe generic factor. The reliability coefficients ranged from 0.40 to 0.78 with a median of 0.67in the student sample and from 0.27 to 0.82 with a median of 0.70 in the nonstudent adultsample. Thus, several schema factors did not reach the threshold of 0.70 typically required forinternal consistency. The lowest reliability estimates were observed for the schemas of “Depen-dence/Incompetence” (0.40 for students and 0.27 for nonstudents) and “Subjugation” (0.41 forstudents and 0.49 for nonstudents).
The Monte Carlo Simulation Study
The Lee-Hoffart model (Hoffart et al., 2005) with 15 first-order schema factors and foursecond-order domains was used to generate each of the 2000 data sets with 500 cases inthe Monte Carlo simulation study. Table 4 displays the study results. On average, the data-generating model (M0) exhibited a very good fit to the data, confirming that the data gen-eration was successful. For the mean normed chi-squared index, four models (M2, M4, M5,and M6) exhibited an acceptable fit and two models (M3 and M12) exhibited a good fit. Ac-cording to the mean CFI and the mean TLI, all models provided at least an acceptable fit(≥.90) and several (M2, M3, M4, M5, M6, M8, and M12) provided a good fit (≥.95). Forthe mean RMSEA, all but two of the models (M1 and M11) exhibited an acceptable (≤.08)fit. For the mean SRMR, all but one model (M9) provided a good fit (≤.05). For the meanBIC (where lower values indicate better fit), some of the fitted models exhibited a complexity-adjusted fit that was superior to the data-generating model (particularly M3, M4, M5, M7, M9,and M11).

10 JOURNAL OF CLINICAL PSYCHOLOGY, Vol. xx(x), XXX-XXX (2012)
Tab
le4
Mea
nF
itIn
dexe
sfo
rM
odel
sF
itte
dto
Sim
ulat
edL
ee-H
offa
rtD
ata
ina
Mon
teC
arlo
Sim
ulat
ion
Stu
dy
Num
ber
ofN
umbe
rof
Mea
nM
ean
Mea
nM
ean
Mea
nM
ean
Mea
ndo
mai
nses
tim
ated
para
met
ers
Chi
-sq
(df)
Chi
-sq/
dfC
FI
TL
IR
MSE
ASR
MR
BIC
Thr
esho
ldfo
rgo
odm
odel
sna
≤2≥.
95≥.
95≤.
05≤.
05na
Thr
esho
ldfo
rac
cept
able
mod
els
na≤3
≥.90
≥.90
≤.08
≤.08
na
M0
Lee
-Hof
fart
mod
el(1
999/
2006
)4
5185
.972
(84)
1.02
3.9
991.
000
.008
.016
1651
8.17
3M
1G
loba
ldom
ain
mod
el1
4542
9.19
6(9
0)5.
667
.932
.921
.087
.040
1682
2.25
3M
2Y
oung
’sor
igin
alth
eory
(199
0)5
5522
8.10
6(8
0)2.
851
.970
.961
.061
.031
1668
2.54
1M
3Sc
hmid
tet
al.(
1995
)3
4173
.716
(49)
1.50
4.9
93.9
90.0
30.0
2013
842.
797
M4
Mih
aesc
uet
al.I
(199
7)2
3713
5.39
7(5
3)2.
555
.978
.972
.055
.025
1358
7.76
6M
5M
ihae
scu
etal
.II
(199
7)3
3913
1.83
0(5
1)2.
585
.978
.972
.056
.025
1359
6.63
4M
6Y
oung
’sre
vise
dth
eory
(200
3)5
5521
3.20
4(8
0)2.
665
.973
.965
.057
.030
1666
9.08
7M
7C
ecer
oet
al.(
2004
)4
4625
9.31
8(7
3)3.
552
.958
.947
.071
.037
1586
2.98
2M
8C
alve
teet
al.(
2005
)3
4827
5.26
6(8
7)3.
164
.962
.955
.066
.038
1668
7.19
6M
9So
ygut
etal
.(20
09)
547
289.
226
(72)
4.01
7.9
51.9
38.0
78.1
0315
898.
193
M10
Saar
iaho
etal
.I(2
010)
246
378.
606
(89)
4.25
4.9
42.9
32.0
80.0
4116
777.
260
M11
Saar
iaho
etal
.II
(201
0)3
4532
2.38
3(7
4)4.
357
.947
.935
.082
.041
1563
6.49
7M
12C
sukl
yet
al.(
2011
)4
5714
9.66
4(7
8)1.
919
.986
.981
.041
.024
1661
7.48
5
Not
e.C
hi-s
q=
disc
repa
ncy
chi-
squa
red
stat
isti
c;df
=de
gree
sof
free
dom
;Chi
-sq/
df=
norm
edch
i-sq
uare
dst
atis
tic;
CF
I=
com
para
tive
fitin
dex;
TL
I=
Tuc
ker-
Lew
isin
dex;
RM
SEA
=ro
otm
ean
squa
red
erro
rof
appr
oxim
atio
n;SR
MR
=st
anda
rdiz
edro
otm
ean
squa
red
resi
dual
;BIC
=B
ayes
info
rmat
ion
crit
erio
n;na
=no
tap
plic
able
(no
abso
lute
thre
shol
dde
finab
le).
The Latent Structure of Schemas 11
Discussion
We performed CFA of data from an online survey and a Monte Carlo simulation study toinvestigate the dimensionality of the YSQ, with a particular focus on its second-order factorstructure.
The present study appears to have been one of the few investigations testing the YSQ-SF3,as well as the first study to examine the psychometric properties of the German version of thisinstrument. An advantage of the study was its design, which compared the results provided bydifferent a priori defined models. In addition, the study was preceded by a review of previousempirical findings on the second-order factor structure of the instrument, and the model-fittingapproach involved only confirmatory analyses of theoretically or empirically based modelswithout model modifications.
A major limitation of the confirmatory analyses of the data obtained from the online surveyconcerns the generalizability of the findings. Although the survey provided complete data from alarge sample, the online format allowed no control over the selection of the participants. However,despite the largely nonclinical sample, findings of the present study may contribute to clinicalpractice for several reasons. First, Young’s schema theory assumes a continuum from “normal”functioning to the clinically relevant manifestation of schemas. Second, a nonnegligible propor-tion of the sample had received treatment for a diagnosed mental disorder. Finally, responses inthe sample reflected the frequent occurrence of schemas with a presence ranging from minimalto pronounced, which provided a solid basis for the analysis of variance-covariance structures.Nevertheless, the heterogeneous nature of the sample and the broad range of demographic andclinical characteristics of respondents did not provide a distinct population to which the studyfindings could be generalized.
The data did meet the assumptions for CFA. The results of the analyses were consistent withprevious research and provided evidence supporting the first-order factor structure of Young’sscale with 18 correlated schema factors that exhibited acceptable internal consistency.
Our central finding was that the analysis of the online survey data provided no support for aparticular second-order factor structure of the measure. The results of the CFA suggested thata model with correlated first-order schema factors provided a better fit than the models thatdefined second-order domains both for the student and nonstudent adult groups. Calvete et al.(2005), who also performed a CFA with a student sample, reported similar findings. However,the findings of the present study conflicted with those of Hoffart et al. (2005), who reported thata higher order four-domain model provided a somewhat better fit than the correlated first-ordermodel without domains for a clinical sample. In the present study, most higher order domainmodels provided an acceptable fit to the empirical data. A detailed examination of the Hoffartet al. (2005) findings reveals that their study also identified several higher order models with anacceptable fit with only minor differences among the models. Unfortunately, this issue cannotbe resolved completely at present because these appear to be the only studies applying CFA tothe investigation of the hierarchical factor structure of maladaptive schemas.
We performed a Monte Carlo simulation study to determine whether previous findings re-garding the domain structure of the YSQ should be attributed to chance, sample fluctuation,or inconsistent methodology rather than clinical sample characteristics. Because the Hoffartet al. (2005) study was the only independently confirmed higher order domain structure modeland because the reported findings were sufficiently detailed, this model was chosen to generatethe Monte Carlo data. Surprisingly, almost all tested models provided an acceptable fit to thisdata, regardless of features such as the language or version of the instrument, the number ofhigher order domains, the factor rotation method, the nature of the sample, or the presence ofcross-loadings. One may interpret these findings as clear evidence that the Lee-Hoffart model isthe best approximation of the “true” population model. However, one may also assume that thechoice of the model is arbitrary and similar findings would have been obtained if another modelfor data generation had been chosen. Unfortunately, because of low reporting quality, we couldnot test if another data generation model had behaved the same way.
Thus, our conclusion is somewhere between these two extremes stating that whatever thepopulation model (the “true” domain structure) is, several models can be identified that fit to

12 JOURNAL OF CLINICAL PSYCHOLOGY, Vol. xx(x), XXX-XXX (2012)
it. Thus, one cannot exclude that the seemingly different findings on the domain structure ofschemas may be attributed to other than clinical factors. For example, most studies used EFAtechniques, which may result in a kind of “overfitting” of the resulting models and overempha-sizing their generalizability. Research on personality traits (Eysenck, 1991) and on the SymptomChecklist-90 (Cyr, McKenna-Foley, & Peacock, 1985; Derogatis, 1983; Vassend & Skrondal,1999) has demonstrated that in the search for dimensions underlying psychosocial constructs,the choice of the number of factors to extract is not always straightforward.
In the present study, a bifactor model in which all items loaded onto a single generic factor aswell as on Young’s first-order schema factors fit the data better than any other tested model. Thisfactor structure for the YSQ does not appear to have been considered in previous research. Inaddition to its beneficial statistical properties (e.g., partitioning the explained variance betweenthe generic and specific factors), this model also has implications for practical measurementissues and hypotheses regarding the organization of schemas. The fit of this model to the dataprovided clear empirical support for the existence of a first-order generic factor that accountedfor approximately half of the explained variance in the test items.
In the case of the SCL-90-R, a similarly emerging generic factor has been primarily viewed asgeneral distress (Cyr et al., 1985; Vassend & Skrondal, 1999). However, it would not be straight-forward to interpret the generic factor of the YSQ as general distress or global psychopathology,because these terms refer to alterable states rather than prevailing traits and are incompatiblewith the conception of the schema as a stable pattern. In agreement with empirical findings sup-porting a weak to moderate association of schema scores and global psychopathology (Soygutet al., 2009; Stopa, Thorne, Waters, & Preston, 2001; Welburn, Coristine, Dagg, Pontefract, &Jordan, 2002), we rather suppose that the generic schema factor can be considered a relativelystable trait that influences the development of psychopathological characteristics. FollowingVassernd and Skrondal (1999), we presume that it is likely that dispositional characteristicsunderlie the generic schema factor, such as neuroticism (Eysenck, 1947) or negative affectivity(Watson & Clark, 1984). Other investigations that report stability of schemas over time as well asa substantial overlap between schemas and neuroticism (Muris, 2006; Riso et al., 2006; Thimm,2010a; Wang, Halvorsen, Eisemann, & Waterloo, 2010) support this view.
It is also possible that the generic factor is artifactual and reflects participant differencesin test-taking habits, such as a “response level shift” due to interpersonal differences in theperceived difficulty of scale items or different connotations of the response category labelsfor respondents. This explanation cannot be ruled out without further investigation becausethe imprecise wording of responses (e.g., “moderately true of me”) allows for differences ininterpretation.
Based on our findings, we recommend clinicians who use the YSQ not to focus solely on theabsolute scores (or other quantitative summaries) reported on each schema scale, but also toconsider the global response pattern as an indicator of the generic factor. By analyzing graphicalprofiles it would mean not only to scan for high values exceeding a certain threshold, but alsoto look for peaks in the profile, i.e., values above the average score of the individual.
We encourage researchers to test the bifactor model either prospectively or even retrospectivelyon existing data collected with the YSQ. As most researchers probably would not decide to extractonly one factor in EFA when the amount of explained variance is below 30% or even 50%, it isnot surprising that this structure has not been considered before. However, our findings suggestthat the presence of a bifactor structure is possible in every explorative factor analytical study onthe item level, where the first factor in the unrotated solution accounts for around 20% or morevariance. If the findings of the present study were replicated, then they would raise concernsabout the reliability of the different schema subscales once the generic factor was partitionedout. However, in contrast to the SCL-90 research, the presence of a generic factor does notpreclude the need to identify first-order schema factors. Although the reliability of the schemasubscales was reduced after the generic factor was included, it was still substantial in severalcases, and further research would clarify the extent to which the reliability of these factors wasmaintained.
On the other hand, the fact that the influence of the generic factor on items varied betweenschemas should not be ignored. This complex “blending” may be responsible for the frequently

The Latent Structure of Schemas 13
reported inconsistence, or even inconsequence, in studies that seek to identify unique schemaprofiles for certain disorders or disorder subtypes (Oei & Baranoff, 2007; Specht, Chapman, &Cellucci, 2009; Thimm, 2010b; Zeigler-Hill, Green, Arnau, Sisemore, & Myers, 2011). In general,the findings of the present study strongly suggest that future analyses should employ confirma-tory factor techniques, model first-order and second-order factor structures simultaneously, andcompare several a priori defined models instead of assessing the fit of a single model.
Conclusions
In the present study, we were unable to definitively determine whether higher order schemadomains exist. However, extending the model to include a generic first-order factor in addition tofirst-order schema factors proved to be informative. If the bifactor model proves to be superior toother models also in future studies, then this would provide strong evidence against the existenceof higher order domains. At the moment, it is only possible to conclude either that several higherorder domain structures are present but cannot be ranked by statistical measures alone or that afirst-order generic factor is present and higher order domains are dispensable. Although we didnot directly address this issue, our findings also suggest questioning the hypothesis that clinicaland nonclinical populations differ with regard to their schema structure. In clinical populations,schemas are likely to have a more pronounced presence, but the associational structure ofthe schemas can still be similar to that in nonclinical populations. Although further empiricalresearch seems necessary, we go along with the conclusions of Vassend and Skrondal (1999, p.699): “As should be clear by now, statistical arguments alone are in principle incapable of leadingto final decisions about choice of model.” Accordingly, future empirical research should includeconceptual and theoretical arguments that incorporate the clinical experience of practitioners.
References
Beck, A. T. (1967). Depression: Clinical, experimental, and theoretical aspects. New York, NY: Harper andRow.
Beck, A. T., Rush, A. J., Shaw, B. F., & Emery, G. (1979). Cognitive therapy of depression. New York, NY:Guilford Press.
Calvete, E., Estevez, A., Arroyabe, E. L. de, & Ruiz, P. (2005). The Schema Questionnaire–Short Form:Structure and relationship with automatic thoughts and symptoms of affective disorders. EuropeanJournal of Psychological Assessment, 21(2), 90–99.
Cecero, J. J., Nelson, J. D., & Gillie, J. M. (2004). Tools and tenets of schema therapy: Toward the constructvalidity of the early maladaptive schema questionnaire-research version (EMSQ-R). Clinical Psychology& Psychotherapy, 11(5), 344–357.
Csukly, G., Telek, R., Filipovits, D., Takacs, B., Unoka, Z., & Simon, L. (2011). What is the relationshipbetween the recognition of emotions and core beliefs: Associations between the recognition of emotionsin facial expressions and the maladaptive schemas in depressed patients. Journal of Behavior Therapyand Experimental Psychiatry, 42(1), 129–137.
Cyr, J. J., McKenna-Foley, J. M., & Peacock, E. (1985). Factor structure of the SCL-90-R: Is there one?Journal of Personality Assessment, 49(6), 571–578.
Derogatis, L. R. (1983). SCL-90-R administration, scoring, and procedures manual-II. Towson, MD: Clin-ical Psychometric Research.
Eysenck, H. J. (1947). Dimensions of personality. New York, NY: Praeger.
Eysenck, H. J. (1991). Dimensions of personality: 16, 5 or 3?—Criteria for a taxonomic paradigm. Personalityand Individual Differences, 12(8), 773–790.
Hair, J. F., Black, W. C., Babin, B. J., & Anderson, R. E. (2009). Multivariate data analysis (7th ed.). UpperSaddle River, NJ: Prentice Hall.
Hoffart, A., Sexton, H., Hedley, L. M., Wang, C. E., Holthe, H., Haugum, J. A., . . . Holte, A. (2005).The structure of maladaptive schemas: A confirmatory factor analysis and a psychometric evaluation offactor-derived scales. Cognitive Therapy and Research, 29(6), 627–644.
Holzinger, K. J., & Swineford, F. (1937). The bi-factor method. Psychometrika, 2(1), 41–54.
Hu, L., & Bentler, P. M. (1999). Cutoff criteria for fit indexes in covariance structure analysis: Conventional

14 JOURNAL OF CLINICAL PSYCHOLOGY, Vol. xx(x), XXX-XXX (2012)
criteria versus new alternatives. Structural Equation Modeling: A Multidisciplinary Journal, 6(1), 1–55.
Lee, C. W., Taylor, G., & Dunn, J. (1999). Factor structure of the Schema Questionnaire in a large clinicalsample. Cognitive Therapy and Research, 23(4), 441–451.
Lee, S., & Hershberger, S. (1990). A simple rule for generating equivalent models in covariance structuremodeling. Multivariate Behavioral Research, 25(3), 313–334.
Lockwood, G. (2011). Do domains exist? [online blog]. Retrieved from http://www.isst-online.com/node/226
MacCallum, R. C., Roznowski, M., & Necowitz, L. B. (1992). Model modifications in covariance structureanalysis: The problem of capitalization on chance. Psychological Bulletin, 111(3), 490–504.
MacCallum, R. C., Wegener, D. T., Uchino, B. N., & Fabrigar, L. R. (1993). The problem of equiv-alent models in applications of covariance structure analysis. Psychological Bulletin, 114(1), 185–199.
Mihaescu, G., Sechaud, M., Cottraux, J., Velardi, A., Heinze, X., Finot, S. C., & Baettig, D. (1997).Le questionnaire des schemas cognitifs de Young: traduction et validation preliminaire [The YoungCognitive Schema Questionnaire: Translation and preliminary validation]. [French]. L’Encephale, 23(3),200–208.
Muris, P. (2006). Maladaptive schemas in non-clinical adolescents: Relations to perceived parental rearingbehaviours, Big Five personality factors and psychopathological symptoms. Clinical Psychology &Psychotherapy, 13(6), 405–413.
Muthen, L. K., & Muthen, B. O. (1998). Mplus User’s Guide. Los Angeles, CA: Muthen & Muthen.
Oei, T. P. S., & Baranoff, J. (2007). Young Schema Questionnaire: Review of psychometric and measurementissues. Australian Journal of Psychology, 59(2), 78–86.
Reise, S. P., Morizot, J., & Hays, R. D. (2007). The role of the bifactor model in resolving dimensionalityissues in health outcomes measures. Quality of Life Research: An International Journal of Quality ofLife Aspects of Treatment, Care and Rehabilitation, 16(suppl 1), 19–31.
Riso, L. P., Froman, S. E., Raouf, M., Gable, P., Maddux, R. E., Turini-Santorelli, N., . . . Cherry, M.(2006). The long-term stability of early maladaptive schemas. Cognitive Therapy and Research, 30(4),515–529.
Saariaho, T., Saariaho, A., Karila, I., & Joukamaa, M. (2010). Early maladaptive schema factors,chronic pain and depressiveness: A study with 271 chronic pain patients and 331 control participants.doi:10.1002/cpp.737
Schermelleh-Engel, K., Moosbrugger, H., & Muller, H. (2003). Evaluating the fit of structural equation mod-els: Tests of significance and descriptive goodness-of-fit measures. Methods of Psychological ResearchOnline, 8(2), 23–74.
Schmidt, N. B., Joiner, T. E., Young, J. E., & Telch, M. J. (1995). The Schema Questionnaire: Investigation ofpsychometric properties and the hierarchical structure of a measure of maladaptive schemas. CognitiveTherapy and Research, 19(3), 295–321.
Soygut, G., Karaosmanoglu, A., & Cakir, Z. (2009). Assessment of early maladaptive schemas: A psy-chometric study of the Turkish Young Schema Questionnaire-Short Form-3. Turk Psikiyatri Dergisi =Turkish Journal of Psychiatry, 20(1), 75–84.
Specht, M. W., Chapman, A., & Cellucci, T. (2009). Schemas and borderline personality disorder symp-toms in incarcerated women. Journal of Behavior Therapy and Experimental Psychiatry, 40(2), 256–264.
Stopa, L., Thorne, P., Waters, A., & Preston, J. (2001). Are the short and long forms of the Young SchemaQuestionnaire comparable and how well does each version predict psychopathology scores? Journal ofCognitive Psychotherapy, 15(3), 253–272.
Thimm, J. C. (2010a). Personality and early maladaptive schemas: A five-factor model perspective. Journalof Behavior Therapy and Experimental Psychiatry. 41(4), 373–380.
Thimm, J. C. (2010b). Mediation of early maladaptive schemas between perceptions of parental rearing styleand personality disorder symptoms. Journal of Behavior Therapy and Experimental Psychiatry, 41(1),52–59.
Vassend, O., & Skrondal, A. (1999). The problem of structural indeterminacy in multidimensional symptomreport instruments. The case of SCL-90-R. Behaviour Research and Therapy, 37(7), 685–701.
Wang, C. E. A., Halvorsen, M., Eisemann, M., & Waterloo, K. (2010). Stability of dysfunctional attitudesand early maladaptive schemas: A 9-year follow-up study of clinically depressed subjects. Journal ofBehavior Therapy and Experimental Psychiatry, 41(4), 389–396.

The Latent Structure of Schemas 15
Watson, D., & Clark, L. A. (1984). Negative affectivity: The disposition to experience aversive emotionalstates. Psychological Bulletin, 96(3), 465–490.
Welburn, K., Coristine, M., Dagg, P., Pontefract, A., & Jordan, S. (2002). The Schema Questionnaire—Short Form: Factor analysis and relationship between schemas and symptoms. Cognitive Therapy andResearch, 26(4), 519–530.
Young, J. E. (1990). Cognitive therapy for personality disorders: A schema-focused approach. Sarasota, FL:Professional Resource Exchange.
Young, J. E., Klosko, J. S., & Weishaar, M. (2003). Schema therapy: A practitioner’s guide. New York, NY:Guilford Publications.
Zeigler-Hill, V., Green, B. A., Arnau, R. C., Sisemore, T. B., & Myers, E. M. (2011). Trouble ahead, troublebehind: Narcissism and early maladaptive schemas. Journal of Behavior Therapy and ExperimentalPsychiatry, 42(1), 96–103.
Copyright © 2022 FDOKUMEN