The Journal of Physical Chemistry 1959 Volume.63 No.12
131
Vol. 63 December, 1959 No. 12 THE JOURNAL OF PHYSICAL CHEMISTRY (Registered in U . S. Patent Office) CONTENTS Yukio Yoneda, Aldo Fujimoto and Shoji Makishima: Exchange of Deuterium and Heavy Oxygen among Hydrogen, Water Vapor and Oxide Catalysts of Spinel Type ........................................................................................................................................... 1987 J. H. Badley: The Calorimetric Determination o: Purity— Theory and Calculation Methods....................................................... 1991 Leo J. Paridon and George E. MacWood: Vapor Pressure of Diborane................................................................................................. 1997 Leo J. Paridon, George E. MacWood and Jih-Heng H u : The Heat of Vaporization of Diborane.................................................... 1998 J. H. Shaffer, W. R. Grimes and G. M. Watson: Solubility of H F in Molten Fluorides. I. In Mixtures of NaF-ZrF, ............ 1999 J. B. Kinsinger and R. E. Hughes: Intrinsic Viscosity-Molecular Weight Relationships for Isotactic and Atactic Polypropylene. 2002 John G. Foss and John A. Schellman: The Thermal Transition of Ribonuclease in Urea Solutions............................................... 2007 A. W. Smith and H . Wieder: Oxygen Sorption and Electrical Conductivity of Copper Oxide Films.......................................... 2013 V. Bali ah and Sp. Shanmuganathan: Kinetics of Bromine Addition to Some Unsaturated Sulfones.......................................... 2016 Edward J. Goon: The Non-Stoichiometry of Lanthanum Hydride ....................................................................................................... 2018 Benjamin Chu and Richard M . Diamond: The “BC 1 Effect” in Anion-Resin Exchange.................................................................... 2021 P. F. Kong and H. H . Uhlig: Passivity in the Iron-Chromium Binary Alloys...................................... ................................................ 2026 J. R. Sams, Jr., C. W. Lees and D. C. Grahame: Properties of the Electrical Double Layer in Concentrated Potassium Chloride Solutions.......................................................................................................................................................................... 2032 Lee D. LaGrange, L. J. Dykstra, John M. Dixon and Ulrich Merten: A Study of the Zirconium-Hydrogen and Zirconium- Hydrogen-Uranium Systems between 600 and 800 °............................................................................................................................ 2035 Russell H. Johnsen: Some Aspects of the Radiation Chemistry of Liquid Aliphatic Carboxylic Acids........................................... 2041 E. J. Du well and J. W. Shepard: The Preparation and Properties of some Synthetic Inorganic Anon Exchangers................... 2044 Evald L. Skau and August V. Bailey: Correlation of Solubility Data for Long Chain Compounds. II. The Isopleth Method of Predicting Solubilities of Missing Members ®f Homologous Series................................................................................................ 2047 Graeme E. Cheney, Quintus Fernando and Henry Freiser: Some Metal Chelates of Mercaptosuccnic Acid ............................... 2055 NOTES Yokio Yoneda, Toshio Uchijima and Shoji Makishima: Separation of Boron Isotopes by Ion Exchange....................................... Robert J. Peavler ana C. Gerard Beck, J r .: The High-Temperature Transformation of MoGe, ....................................................... A. P. Hardt, D. K. Anderson, R. Rathbun, B. W. Mar and A. L. Babb: Self-Diffusion in Liquids. II. Comparison between Mutual and Self-Diffusion Coefficients.............. ............................................. ........................................................................................ S. Brownstein and A. E. Stillman: Proton Resonance Shifts of Acids in Liquid Sulfur Dioxide..................................................... G. C. Sinke: The Heat of Formation of Formic Acid.. i ‘ . ....................................................................................................................... Robert L. Adamczak, J. Arthur Mattern and Howard Tieckelmann: A Partial Phase Study of the System N a F -H F .................. D. A. Williams-Wynn: Diffusion Coefficients of Z reonium(IV) in Hydrochloric Acid Solution at 25 ° ........................................... C. A. Guderjahn, D. A. Paynter, P. E. Berghausen and R. J. Good: The Slow Evolution of Heat in Heat of Immersion Calori- metry.............................................................................................................................................................................................................. Reginald Mills and L. A. Wooif: Tracer-Diffusion Coefficients of Cesium Ion in Aqueous Alkali Chloride Solutions at 25 °... Frederick A. Bettelheim: An X -R a y Diffraction Investigation of Sodium Hyaluronate.................................................................... Philip L. Hanst and Jack G. Calvert: On the Mechanism of Ozone Production in the Photo-oxidation of Alkyl Nitrites.......... J. A. Perri, E. Banks and B. Post: Polymorphism of Rare Earth Disilicides......................................................................................... Glyn O. Pritchard and Glenn H. Miller: The Reaction of Perfluoro-n-propyl Radicals with Cyclohexane in the Gas Phase.. P. A. Agron and R. D. Ellison: A Structure Proposal for NaiZriFn ......................................................................................................... F. R. Duke and N. C. Peterson: The Sn(II) Reduction of Methyl Orange......................................................................................... Richard M. Roberts, Cyril Barter and Henry Stone: Silica-Alumina-Catalyzed Oxidation of Anthracene by Oxygen................ Herbert S. Harned and Milton Blander: A Glass Conductance Cell for the Measurement of Diffusion Coefficients................... Herbert S. Harned and Alan B. Gancy: The Activity Coefficient of Hydrochloric Acid in Thorium Chloride Solutions at 25 ° ................................................................................................................................................................................................................... F. A. Trumbore and C. D. Thurmond: Heats of Solution from the Temperature Dependence of the Distribution Coefficient. Robert J. Fallon, Joseph T . Vanderslice and Edward A. Mason: Quenching of Excited Hg(»Pi) by N O ......................................... Michael T. Pope and Louis C. W. Baker: The Hydrodynamic Volume of the Heteropoly Hexamolybdocobaltate (III) Anion from Viscosity Measurements........................................................................................................................................................ Robert G. Charles, W . M . Hickam and Joan von Haene: The Pyrolysis of Acetylacetone................................................................ F. P. Glasser: The System GaiOs-SiCh......................................................................................................................................................... A. G. Pinkus and L. H . Piette:Electron Paramagnetic Resonance Studies on Carbon Disulfide- Insoluble Sulfur...................... Herbert S. Harned and Robert Gary: The Activity Coefficient of Hydrochloric Acid in Cadmium Chloride Solutions at 5 M Total Ionic Strength............................................ ............... J .......................................................................................................... Frederick R. Duke and Walter W. Lawrence: •psjnpleij Fo^rftaijotir C$nptqpts of Lead and Cadmium Ions with Chloride in Fused Lithium Perchlorate.............................. •.„*>. .*.•.• . . .«.< >*.• ............................................................................................ • • • • • •• •••• • • ••• * • •• • • • • « • Communication (o, the Editor Russell H . Johnsen: Photolysis of Gamma-Ray produced Free Radifals in Ethanol at Lo>#’Temperatures................................. Additions and Corrections..................... .............. ... , ................................. *..............• ................. * ............................................................ Author Index...................................... ? . . . . » .j .«.i ............................................................... Subject Index.................................. .»;.:.. .*. .* ..; .j.«» r .. .* ............................................................... 2057 2058 2059 2061 2063 2063 2065 2066 2068 2069 2071 2073 2074 2076 2076 2077 2078 2079 2080 2082 2083 2084 2085 2086 2086 2087 2088 2089 2091 2104
-
Upload
khangminh22 -
Category
Documents
-
view
5 -
download
0
Transcript of The Journal of Physical Chemistry 1959 Volume.63 No.12
V ol. 63 D ecem b er, 1959 N o . 12
THE JOURNAL OF
PHYSICAL CHEMISTRY(Registered in U. S. Patent Office)
CONTENTSYukio Yoneda, Aldo Fujimoto and Shoji Makishima: Exchange of Deuterium and Heavy Oxygen among Hydrogen, Water
Vapor and Oxide Catalysts of Spinel Typ e ........................................................................................................................................... 1987J. H . Badley: The Calorimetric Determination o: Purity— Theory and Calculation Methods....................................................... 1991Leo J. Paridon and George E . M acW ood: Vapor Pressure of Diborane................................................................................................. 1997Leo J. Paridon, George E . MacWood and Jih -H eng H u : The Heat of Vaporization of Diborane.................................................... 1998J. H . Shaffer, W . R. Grimes and G. M . Watson: Solubility of H F in Molten Fluorides. I . In Mixtures of N a F -Z rF ,............ 1999J. B. Kinsinger and R. E. Hughes: Intrinsic Viscosity-Molecular Weight Relationships for Isotactic and Atactic Polypropylene. 2002John G. Foss and John A. Schellman: The Thermal Transition of Ribonuclease in Urea Solutions............................................... 2007A. W . Smith and H . W ieder: Oxygen Sorption and Electrical Conductivity of Copper Oxide Films.......................................... 2013V. Bali ah and Sp. Shanmuganathan: Kinetics of Bromine Addition to Some Unsaturated Sulfones.......................................... 2016Edward J. Goon: The Non-Stoichiometry of Lanthanum Hydride....................................................................................................... 2018Benjamin Chu and Richard M . Diamond: The “ B C 1 Effect” in Anion-Resin Exchange.................................................................... 2021P. F. Kong and H . H . U hlig : Passivity in the Iron-Chromium Binary Alloys...................................... ................................................ 2026J . R. Sams, Jr., C. W . Lees and D . C. Grahame: Properties of the Electrical Double Layer in Concentrated Potassium
Chloride Solutions.......................................................................................................................................................................... 2032Lee D . LaGrange, L . J . Dykstra, John M . Dixon and Ulrich M erten: A Study of the Zirconium-Hydrogen and Zirconium-
Hydrogen-Uranium Systems between 600 and 800°............................................................................................................................ 2035Russell H . Johnsen: Some Aspects of the Radiation Chemistry of Liquid Aliphatic Carboxylic Acids........................................... 2041E . J. Du well and J. W . Shepard: The Preparation and Properties of some Synthetic Inorganic A n on Exchangers................... 2044Evald L. Skau and August V. Bailey: Correlation of Solubility Data for Long Chain Compounds. I I . The Isopleth Method
of Predicting Solubilities of Missing Members ®f Homologous Series................................................................................................ 2047Graeme E. Cheney, Quintus Fernando and Henry Freiser: Some Metal Chelates of Mercaptosuccnic Acid............................... 2055
N O T E SYokio Yoneda, Toshio Uchijima and Shoji Makishima: Separation of Boron Isotopes by Ion Exchange.......................................Robert J. Peavler ana C. Gerard Beck, J r . : The High-Temperature Transformation of M oGe,.......................................................A. P. Hardt, D . K . Anderson, R. Rathbun, B. W . M ar and A. L . Babb: Self-Diffusion in Liquids. I I . Comparison between
Mutual and Self-Diffusion Coefficients........................................................... ........................................................................................S. Brownstein and A. E . Stillman: Proton Resonance Shifts of Acids in Liquid Sulfur Dioxide.....................................................G . C. Sinke: The Heat of Formation of Formic Acid.. i ‘. .......................................................................................................................Robert L. Adamczak, J. Arthur Mattern and Howard Tieckelmann: A Partial Phase Study of the System N a F -H F ..................D . A. W illiam s-W ynn: Diffusion Coefficients of Z reonium(IV) in Hydrochloric Acid Solution at 25°...........................................C. A . Guderjahn, D . A. Paynter, P. E . Berghausen and R. J. Good: The Slow Evolution of Heat in Heat of Immersion Calori
metry..............................................................................................................................................................................................................Reginald Mills and L. A. Wooif: Tracer-Diffusion Coefficients of Cesium Ion in Aqueous Alkali Chloride Solutions at 25°...Frederick A . Bettelheim: A n X -R a y Diffraction Investigation of Sodium Hyaluronate....................................................................Philip L. Hanst and Jack G . Calvert: On the Mechanism of Ozone Production in the Photo-oxidation of A lkyl Nitrites..........J. A. Perri, E . Banks and B. Post: Polymorphism of Rare Earth Disilicides.........................................................................................Glyn O. Pritchard and Glenn H . M ille r: The Reaction of Perfluoro-n-propyl Radicals with Cyclohexane in the Gas Phase..P. A. Agron and R. D . Ellison: A Structure Proposal for N aiZriFn .........................................................................................................F . R. Duke and N. C. Peterson: The S n (II) Reduction of M ethyl Orange.........................................................................................Richard M . Roberts, Cyril Barter and Henry Stone: Silica-Alumina-Catalyzed Oxidation of Anthracene by Oxygen................Herbert S. Harned and Milton Blander: A Glass Conductance Cell for the Measurement of Diffusion Coefficients...................Herbert S. Harned and Alan B. Gancy: The Activity Coefficient of Hydrochloric Acid in Thorium Chloride Solutions at25°...................................................................................................................................................................................................................F. A. Trumbore and C. D . Thurm ond: Heats of Solution from the Temperature Dependence of the Distribution Coefficient.Robert J. Fallon, Joseph T . Vanderslice and Edward A. M ason: Quenching of Excited Hg(»Pi) by N O .........................................Michael T . Pope and Louis C. W . Baker: T h e Hydrodynamic Volume of the Heteropoly Hexamolybdocobaltate ( I I I )
Anion from Viscosity Measurements........................................................................................................................................................Robert G. Charles, W . M . Hickam and Joan von Haene: The Pyrolysis of Acetylacetone................................................................F. P. Glasser: The System GaiOs-SiCh.........................................................................................................................................................A. G . Pinkus and L. H . Piette: Electron Paramagnetic Resonance Studies on Carbon Disulfide- Insoluble Sulfur......................Herbert S. Harned and Robert G ary: The Activity Coefficient of Hydrochloric Acid in Cadmium Chloride Solutions at 5M
Total Ionic Strength............................................ ...............J ..........................................................................................................Frederick R. Duke and Walter W . Lawrence: • psjnpleij Fo^rftaijotir C$nptqpts of Lead and Cadmium Ions with Chloride in
Fused Lithium Perchlorate..............................•.„*>. .*.•.• . . .«.< >*.• ............................................................................................• • • • • •• ••••• • • • • * • • • • • • • « •Communication (o, the Editor
Russell H . Johnsen: Photolysis of Gamma-Ray produced Free Radifals in Ethanol at Lo>#’Temperatures.................................Additions and Corrections..................... .............. . . . , ................................. *..............•.................* ............................................................Author Index......................................? . . . . » . j .«.i ...............................................................Subject Index.................................. . » ; . : . . .*. .*..; .j.«» r . . .*...............................................................
205720582059 2061 2063 206320652066 2068 2069 207120732074 207620762077207820792080 2082208320842085208620862087
2088208920912104
T H E J O U R N A L O F P H Y S I C A L C H E M I S T R Y(Registered in U. S. Patent Office)
W. Albert Notes, Jr., Editor
Allen D. Bliss Assistant Editors A. B. F. Duncan
C. E. H. Bawn R. W. Dodson John D. Ferry G. D. Halsey, Jr.
Editorial Board S. C. Lind R. G. W. Norrish W. H. Stockmayer
G. B. B. M. Sutherland A. R. Ubbelohde E. R. Van Abtsdalen Edgar F. Westrum, Jr.
Published monthly by the American Chemical Society at 20th and Northampton Sts., Easton, Pa.
Second-class mail privileges authorized at Easton, Pa. This publication is authorized to be mailed at the special rates of postage prescribed by Section 131.122.
The Journal of P h ysica l C hem istry is devoted to the publication of selected symposia in the broad field of physical chemistry and to other contributed papers.
Manuscripts originating in the British Isles, Europe and Africa should be sent to F. C. Tompkins, The Faraday Society, 6 Gray’s Inn Square, London W. C. 1, England.
Manuscripts originating elsewhere should be sent to W. Albert Noyes, Jr., Department of Chemistry, University of Rochester, Rochester 20, N. Y.
Correspondence regarding accepted copy, proofs and reprints should be directed to Assistant Editor, Allen D . Bliss, Department of Chemistry, Simmons College, 300 the Fenway, Boston 15, Mass.
Business Office: Alden H. Emery, Executive Secretary, American Chemical Society, 1155 Sixteenth St., N. W., Washington 6, D. C.
Advertising Office: Reinhold Publishing Corporation, 430 Park Avenue, New York 22, N. Y.
Articles must be submitted in duplicate, typed and double spaced. They should have at the beginning a brief Abstract, in no case exceeding 300 words. Original drawings should accompany the manuscript. Lettering at the sides of graphs (black on white or blue) may be pencilled in and will be typeset. Figures and tables should be held to a minimum consistent with adequate presentation of information. Photographs will not be printed on glossy paper except by special arrangement. All footnotes and references to the literature should be numbered consecutively and placed in the manuscript at the proper places. Initials of authors referred to in citations should be given. Nomenclature should conform to that used in Chem ical A bstracts, mathematical characters marked for italic, Greek letters carefully made or annotated, and subscripts and superscripts clearly shown. Articles should be written as briefly as possible consistent with clarity and should avoid historical background unnecessary for specialists.
N otes describe fragmentary or incomplete studies but d<5 • not otherwise differ fundamentally from articles aftd&iq Sub}. jected to the same editorial appraisal as are attfcjkfc.; J ff. their preparation particular attention should be paid.to brevity and conciseness. Material included jn Notes ifiust be definitive and may not be republished subsequently.
C om m unications to the E ditor are de^gnjdtq afford prompt preliminary publication of observations or liacovsries ¡whose value to science is so great that immediate publication is
imperative. The appearance of related work from other laboratories is in itself not considered sufficient justification for the publication of a Communication, which must in addition meet special requirements of timeliness and significance. Their total length may in no case exceed 500 words or their equivalent. They differ from Articles and Notes in that their subject matter may be republished.
Symposium papers should be sent in all cases to Secretaries of Divisions sponsoring the symposium, who will be responsible for their transmittal to the Editor. The Secretary of the Division by agreement with the Editor will specify a time after which symposium papers cannot be accepted. The Editor reserves the right to refuse to publish symposium articles, for valid scientific reasons. Each symposium paper may not exceed four printed pages (about sixteen double spaced typewritten pages) in length except by prior arrangement with the Editor.
Remittances and orders for subscriptions and for single copies, notices of changes of address and new professional connections, and claims for missing numbers should be sent to the American Chemical Society, 1155 Sixteenth St.,N. W., Washington 6, D. C. Changes of address for the Journal o f P h ysica l Chem istry must be received on or before the 30th of the preceding month.
Claims for missing numbers will not be allowed (1) if received more than sixty days from date of issue (because of delivery hazards, no claims can be honored from subscribers in Central Europe, Asia, or Pacific Islands other than Hawaii), (2) if loss was due to failure of notice of change of address to be received before the date specified in the preceding paragraph, or (3) if the reason for the claim is “ missing from files.”
Subscription Rates (1959): members of American Chemical Society, $8.00 for 1 year; to non-members, $16.00 for 1 year. Postage free to countries in the Pan American Union; Canada, $0.40; all other countries, $1.20. Single copies, current volume, $1.35; foreign postage, $0.15; Canadian postage $0.05. Back volumes (Vol. 56-59) $15.00 per volume; (starting with Vol. 60) $18.00 per volume; foreign postage, per volume $1.20, Canadian, $0.15; Pan- American Union, $0.25. Single copies: back issues, $1.75; for current year, $1.35; postage, single copies: foreign, $0.15; Canadian, $0.05; Pan American Union, $0.05.
• •Tha .American Chemical Society and the Editors of the
• Journal o f P h ysica l C hem istry assume no responsibility for; tha ptertenVjita and opinions advanced by contributors to• 4& S dÓlWfÍAL.
The American Chemical Society also publishes J ou rn al o f the A m erfcah 'C hem ical S ociety, Chem ical A bstracts, In du strial
• p,ti4 filt9 iM ¿ri}ig t C héifiistry, Chem ical and E n gin eerin g N ew s,t/Hc m C hem istry, Journal o f A gricultural and F ood Chem
istry , J ow m aíoJ Vrgahiic Chem istry and J ou rn al o f Chem ical and. E n gin eerin g D ata. Rates on request.
18 p . 2503
THE JOURNAL OF
PHYSICAL CHEMISTRY
VOL. LXIII*959
A llen D . Bliss
C. E. H. Baw n R. W . D odson Paul M . D oty John D . Ferry
W A lbert N oyes, Jr., E ditor
A ssistant E ditors A. B. F. D uncan
E ditorial B oard
G. D. Halsey , Jr.S. C. L ind
H. W . M elville
R. G. W . N orrish A. R. Ubbelohde
E. R. V an A rtsdalen
E. F. W estrum, Jr.
EASTON, PA.MACK PRINTING COMPANY
1959
THE JOURNAL OFPHYSICAL CHEMISTRY
(R eg istered in U. S. P aten t O ffice) ((C ) C op yrigh t, 1959, b y the A m erican C hem ical S ocie ty )
V olume 63 DECEMBER 30, 1959 N umber 12
EXCHANGE OF DEUTERIUM AND HEAVY OXYGEN AMONG HYDROGEN, WATER VAPOR AND OXIDE CATALYSTS OF SPINEL TYPE
By Y ukio Y oneda, A kio F ujimoto1 and Shoji M akishima
Department of Applied Chemistry, Faculty of Engineering, University of Tokyo, Tokyo, JapanR eceiv ed J a n u a r y 1 4 , 1959
The exchange of D and 180 among H2, D 2lsO and oxide catalysts of the spinel type, MgAl204, MgCr204, ZnCr204 and ZnFe20 4 was studied by a flow method. The total exchange rate of hydrogen, R, and that of oxygen, R', were calculated. R'/R of a catalyst is approximate!}' independent of temperature, was about 0.1 for MgAl20 4 and 0.2-0.4 for the other catalysts. It was concluded that the common rate-determining step in the exchange of hydrogen and of oxygen in the regeneration of oxygen vacancies in the catalyst which _s accompanied by the release of water molecules. There is a correlation between the exchange rate and the oxidizing power of the catalyst, i.e., ZnFe2C>4 > ZrCr2C>4 > MgCr2C>4 > MgAl20 4. The mechanism of hydrogen exchange on the surface of the catalyst is discussed.
IntroductionIt has been desired to discover an active catalyst
for hydrogen exchange in a dual temperature method.2 Although there is considerable literature on the catalytic exchange reaction between H 2 and Z>2,3 little work has been done on the exchange between hydrogen and water, especially with oxide catalysts.
In a previous study of the exchange of oxygen atoms among carbon dioxide, carbon monoxide and oxide catalysts,4 the authors concluded that the catalyst should be considered to be a reactant and not merely as a field for a heterogeneous reaction.
In the present paper, we have tried to elucidate the mechanism by which the catalyst, a solid phase, takes part in the catalytic reaction. Simultaneous measurements were made of the exchange rate of hydrogen atoms between hydrogen and water vapor and that of oxygen atoms between the bulk of the catalyst and water vapor, with D 2180 as one of the starting materials.
ExperimentalMaterials.—Four oxide spinels, MgALO,, MgCr20 4,
ZnCr20 4 and ZnFe20 4, were prepared by a solid phase reac(1) Asahi K asei K o g y o , L td ., N obeok a , M iyazak i-ken , Japan.(2) M . B enedict, First Intern. C on f. cm P eacefu l Uses o f A tom ic
E nergy, 1955, Publ. 819.(3) A . H . K im ball, et a “ B ib liograp h y o f R esearch on H eavy
H ydrogen C om p ou n d s,” N N E S , I I I -4 C , 1949, M cG ra w -H ill B ook C o ., N ew Y ork , N , Y . ; N B S C ircular, N o . 562 (1956).
(4) Y . Y on ed a , S. M akish im a and K . Hirasa, J . A m . C h em . S o c ., 80, 4503 (1958).
tion between appropriate pairs of simple compounds: Mg, basic magnesium carbonate precipitated with sodium carbonate; Al, Cr and Fe, respective hydroxides precipitated with NH4OH; Zn, Zn(OH)2 of A .R . grade. The spinels were obtained by heating a stoichiometric, well-ground mixture of above-mentioned materials at temperatures and durations indicated in parentheses: MgAl20 4 (1300°, 4 hr.), MgCr20 3 and ZnCr20 4 (1200°, 5 hr.), ZnFe20 4 (1100°, 3 hr.). X -Ray diffraction analyses showed that the spinel formation was complete except in the case of MgAl20 4, which contained a small quantity of MgO and A120 3.
The heavy water contained 9.49% of D and 0.332% of180 .
Exchange Reaction System and Procedures.— The exchange reaction was studied by a flow method. A weighed amount of the catalyst (volume 3 cc.) which had been out- gassed for 50 min. at 400° and 10- 2-1 0 ” 3 mm. was placed on a sintered glass disk in a glass reactor. Tank hydrogen, purified in a common train of heated palladium asbestos and a trap, was saturated with the vapor of heavy water in a saturator kept at the boiling point of ethanol. After the temperature of the reactor had been adjusted, a stream of saturated hydrogen was introduced at a rate of 28 cc./m in. for 75 min. The calculated value of the flow rate of heavy water was 1.265 g./75 min., the ratio hydrogen/water being 57/43; the observed values agreed with those calculated within ± 1 .5 % . After the reaction the heavy water was separated by a trap kept at —78°, and hydrogen was sampled when necessary. The isotope content of trapped water was measured in the form of hydrogen or carbon dioxide with a mass spectrometer, Model 21-103A of Consolidated Electrodynamics, Inc.; the accuracy of the determination was ± 1 % . The surface area was measured by theB .E .T . method with carbon dioxide as the adsorbate; this method is not sufficiently accurate for areas smaller than0.5 m .2/g .
CalculationIn this calculation, all the heavy water molecules
are assumed as HDO. Following the conventional1987

1988 Y ukio Y oneda, Akio Fujimoto and Shoji Makishima Voi. 63
Reaction temp. (°C .).450 380 300
Pig. 1.— Total exchange rate, R or R' vs. temperature.
calculation of a flow reaction, we have rate equation 2 for the deuterium exchange 1
RHDO + Hi H20 + HD (1)
« 1 — P R , 1 — a /3— a0wda = [R «(l - (3) - i ir( l - a)/3] dS (2)
where a and /3 represent the atomic fractions of deuterium of water vapor and hydrogen, respectively; a°w is gram atoms of hydrogen in the passed water per unit time, 3.035 X 10 ~s g. atom/sec. ; and S is the surface area of the catalyst, (m.2). Then since R / R r = l / K where 1 / K is the equilibrium constant of eq. 1 ( K — 1.38 — 1.75 at these temperatures), and a and /3 are less than 0.1, we can abbreviate eq. 2 to eq. 3, a term ( K — 1) a/3 being neglected
—a°w da = R(a - K(S) dS (3)
When the isotopic effect between hydrogen and deuterium is neglected, the forward total exchange rate of hydrogen without discrimination between isotopes is to be represented by R . As
the hydrogen exchange ratio in water vapor, x , must be equal to that in gaseous hydrogen, we have eq. 4.X = ( a o — a ) / ( a o — a c o ) = (/3 ^ o ) / (^ a > &o)
(4)where the suffixes 0 and » denote the beginning of the reaction and equilibrium, respectively; /Jo = 0.005% is neglected in the last term. Substituting ¡8 from eq. 4 in eq. 3 and remembering K = a»/ ,800, which is derived from eq. 3 at da/d$ = 0, we have
— O0w da = ao/(ao — a » ) X R{ct — « » ) diS (5) Integration gives
R = (ao — a » )/a o X (o°w/S )[ —lll(l — Sf)] (6 )
where suffix f denotes the end of reaction, e.g., x t is the hydrogen exchange ratio of the trapped water.
It is shown readily thatR = (ao — a o ) /a i X aVr/Ce/S (7,1
where ke is the experimental rate constant (sec.-1) so that — da/d( = fce(a — a»), and r is an average contact time (sec.). The values of K , a and r are summarized in Table I.
T able IH yd r o g e n E x c h a n g e
1 /K is the equilibrium constant, a ra the atomic fraction of D in the water vapor at equilibrium, and r the average contact time
Temp. (°C .) 450 380 300K 1.38 1.53 1.75
(% ) 4.77 5.00 5.29t (see.) 1.46 1.61 1,84
Exchange Rate of Heavy Oxygen.— If we express the exchange reaction of heavy oxygen as
R'H D 180 + 16O s H D 160 + 18O a ( 8 )
a ' 1 - 0 ' R't 1 - a ' /S'
and assume that there is no appeciable isotope effect and that a', which is not less than 0.9a',,, is equal to a'o throughout the reaction, R ' = R 'r and the velocity of the exchange is
a't&f}'/dt = R '(a 'o - fS')S (9)
where Os is an oxygen atom in the catalyst, a ’ and ¡3' are the atomic fractions of 180 of water vapor and the catalysts, respectively, a 's is gram atoms of oxygen in the catalyst, and R ' represents the total exchange rate of oxygen, without discrimination between isotopes (g. atom/sec. m.2).
From a material balance of 180a's(d'f — /3'o) = <z'w(a'o — a t ) ( 10)
where a'f and /3'f are the atomic fractions of ,80 of the trapped water and the catalyst, respectively, after the reaction, and a 'w is gram atoms of oxygen in the passed water. Since /S'» = a'o at equilibrium, the oxygen exchange ratio after the reaction, x 't , isx ’ , = (/S', - 0 'o)/(/3 '« - /S'0) =
( /S 'f - ( ! ' „ ) / ( « ' „ - /s 'o ) ( 1 1 )
Integrating eq. 9, we haveR ’ = (a '. /iS n —ln(l - x't)] ( 12)
Dec., 1959 Exchange op D euterium and H eavy Oxygen among H2, H20 and Oxide Catalysts 1989
It is readily shown thatR ' = aa'k'e/S (13)
where k 'e is the experimental rate constant (sec.-1) so thatd/3'/d( = k ' e(J3 ' „ — f} ' ) .
Results and DiscussionThe experimental results are summarized
in Table II and Figs. 1 and 2; the apparent heat of activation A H * and the frequency factor R 0, where R = Ru exp( —AH * / R T ) , are given in Table III.
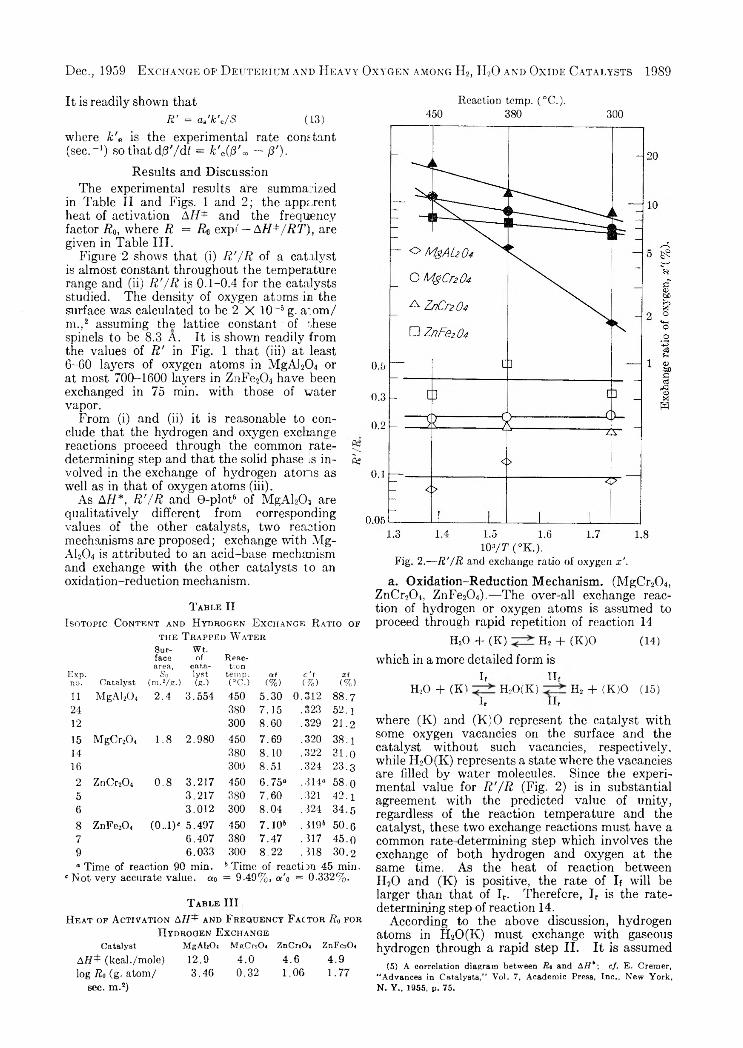
Figure '2 shows that (i) R '/ R of a catalyst is almost constant throughout the temperature range and (ii) R '/ R is 0 .1-0.4 for the catalysts studied. The density of oxygen atoms in the surface was calculated to be 2 X 10 ~6 g. a:om/ m. ,2 assuming the lattice constant of r,hese spinels to be 8.3 A. It is shown readily from the values of R ' in Fig. 1 that (iii) at least6-60 layers of oxygen atoms in MgAl204 or at most 700-1600 layers in ZnFe204 have been exchanged in 75 min. with those of water vapor.
From (i) and (ii) it is reasonable to conclude that the hydrogen and oxygen exchange reactions proceed through the common rate- 5; determining step and that the solid phase is in- S3 volved in the exchange of hydrogen atoms as well as in that of oxygen atoms (iii).
As A H *, R '/ R and 0-plot6 of MgAl2Oj are qualitatively different from corresponding values of the other catalysts, two reaction mechanisms are proposed; exchange with Mg- AI2O4 is attributed to an acid-base mechanism and exchange with the other catalysts to an oxidation-reduction mechanism.
T a b l e III s o t o p ic C o n t e n t a n d H y d r o g e n E x c h a n g e R a t io o f
t h e T r a p p e d W a t e r
Exp.no. Catalyst
Surfacearea,
So(m. Vs.)
Wt.of
catalyst(g.)
Reaction
temp.( ° C .)
af(% >
c ' f(%)
Xi(%)
11 MgAl20 4 2.4 3.554 450 5.30 0.312 88.724 380 7.15 .323 52.112 300 8.60 .329 21.215 MgCuCu 1.8 2.980 450 7.69 .320 38.114 380 8.10 .322 31.016 300 8.51 .324 23.32 ZnCuOi 0.8 3.217 450 6.75“ .314“ 58.05 3.217 380 7.60 .321 4 2 _ i6 3.012 300 8.04 .324 34.58 Z dF g20 4 ( 0 - 1 ) ' 5.497 450 7 .106 . 3 19 5 50.67 6.407 380 7.47 .317 45.09 6.033 300 8.22 .318 30.2“ Time of reaction 90 min. 6 Time of reactiin 45 min.
c Not very accurate value. <*o = 9.49%, a'o = 0.332%.
T a b l e I I I
H e a t o f A c t iv a t io n AH * a n d F r e q u e n c y F a c t o r R0 f o r H y d r o g e n E x c h a n g e
Catalyst MgAUO* MgCr2C>4 ZnCriO* ZnFe20<AH* (kcal./mole) 12.9 4 .0 4 .6 4.9log ffi0 (g -a tom / 3.46 0.32 1.06 1.77
sec. m .2)
Reaction temp. (°C .).450 380 300
Fig. 2.— R'/R and exchange ratio of oxygen x ’.
a. Oxidation-Reduction Mechanism. (MgCr204, ZnCr204, ZnFe204).— The over-all exchange reaction of hydrogen or oxygen atoms is assumed to proceed through rapid repetition of reaction 14
H20 + (K) H2 + (K)O (14)
which in a more detailed form is If Ih
H20 + (K) H20(K) II2 + (K)O (15)Ir Ih
where (K) and (K)O represent the catalyst with some oxygen vacancies on the surface and the catalyst without such vacancies, respectively, while H20(K) represents a state where the vacancies are filled by water molecules. Since the experimental value for R '/ R (Fig. 2) is in substantial agreement with the predicted value of unity, regardless of the reaction temperature and the catalyst, these two exchange reactions must have a common rate determining step which involves the exchange of both hydrogen and oxygen at the same time. As the heat of reaction between H20 and (K) is positive, the rate of If will be larger than that of Ir. Therefore, Ir is the rate- determining step of reaction 14.
According to the above discussion, hydrogen atoms in H20(K) must exchange with gaseous hydrogen through a rapid step II. It is assumed
(5) A correlation diagram between Ro and AH*; c/. E . Cremer, “ Advances in C atalysts," Vol. 7, Academic Press, Inc., New York,N . Y .r 1955, p. 75.

1990 Y ukio Y oneda, Akio Fttjimoto and Shoji M akishima Vol. 63
that the step Ir is a process whereby a vacancy of oxygen is reproduced by fluctuation somewhere else on the surface, releasing a water molecule. If an oxygen atom in H20(K) were rapidly exchanged with oxygen in the bulk and never returned to the gaseous phase, R '/ R would be unity. The values of R '/ R in Fig. 2 are understandable if 0.2- 0.4 of oxygen atoms in H20(K) are assumed to exchange with those in the bulk, while the remainder returns to the gaseous phase.
The concentration of oxygen vacancies in a catalyst may increase with its oxidizing power, MgCr204 < ZnCr204 < ZnFe204. This concentration may be particularly high in ZnFe204, as this spinel is reduced or oxidized by an hydrogen- water vapor mixture depending upon the composition and temperature. Since R and R ' should also increase with the concentration of oxygen vacancies, it is reasonable that R and R '/ R are in qualitative agreement with the order of the oxidizing power of the catalysts.
We shall now consider the oxygen exchange ratio x 'f. Cameron, Farkas and Litz6 found that the rate of oxygen exchange in a V205-H2180 system was 20-30 times more rapid than in a V205- 1802 or V205-H2180-0 2 system. Weller and Voltz7 reported that oxygen exchange between Cr203 (surface area = 200 m.2/g.) and H2180 at 350° occurred to a depth of 2-3 atomic layers in a 30 minutes run. However, our results (Figs. 1 and 2) show that the exchange occurred to a depth of about 250 layers in a ZnCr204-D 2I80-H2 system at 350° in the same period of time.
Apparently the more reductive is the atmosphere around a catalyst, the more rapid is the rate of regeneration of vacancies on the surface and in the bulk, a tendency which is readily understood.
b. Acid-Base Mechanism (MgAl20 4).— Exchange reactions on acid catalysts between water and D28 and between H2180 and oxygen atoms of
(6) W. G . Cameron, A . Farkas and L. M . Litz, T h is Jottknal, 57, 229 (1953).
(7) S. W. Weller and S. E. Voltz, J. Am. Chem. Soc., 76, 4695 (1954).
(S) H. S. Taylor and H. Diamond, ibid., 57, 1256 (1935).
the catalysts9 have been observed; Wright, Weller and Mills10 reported that heterolytic splitting is the mechanism by which hydrogen exchange occurs between D2 and water on an aluminum chloride catalyst.
As is shown in a previous paper11 the work function of alumina is decreased by the adsorption of water vapor. It is certain, therefore, that in the case of a water molecule in an oxygen vacancy on the surface the hydrogen atom is oriented above the plane of the catalyst. Such a water molecule may cause heterolytic splitting of a hydrogen molecule and exchange a proton with it according to reaction 16, which is similar to the reaction on aluminum chloride.s
H-H + D +[H O (K )] ^ H + H - + D+[HO(K)]D-H + II + [HO(K)I (16)
Equation 16 is merely a substitution for II in (15); if a rapid exchange of protons on the surface through prototropy is assumed, Ir, in this case also, may be a rate-determining step. The large heat of activation and the small value of R '/ R of MgAl204 are due to the low concentration and the small rate of regeneration of the vacancies, characteristics which one might predict from the relatively low oxidizing power and high melting point of this spinel.
Acknowledgments.— The authors are indebted to Dr. Shun Araki for help with isotopic analyses and for making the mass spectrometer available, to Mr. Fujio Mochizuki for technical assistance and Mrs. Weissberger for her elaborate revising of the manuscript. Messrs. Akira Kumai, Katsu- yoshi Hirasa and Hitoshi Hirokane collaborated with us in the preliminary experiments. The expenses were partially defrayed by a Grant in Aid from the Ministry of Education, Japan.
(9) G. A, Mills and S. G. Hindin, ibid., 72, 5549 (1950).(10) L. W. Wright, S. W. Weller and G. A. Mills, Ind. Eng. Chem.,
49, 1054 (1957).(11) Y. Yoneda, Oyo-Buturi (J. Applied Phys., Japan), 22, 307'
(1953).

Dec., 1959 Calorimetric D etermination of Purity 1991
THE CALORIMETRIC DETERMINATION OF PURITY. THEORY AND CALCULATION METHODS
B y J. H. Badley Shell Levelopment Co., Emeryville, Calif.
R ece iv ed F eb ru a ry 2 , 1959
The theoretical basis for purity calculation is extended to include samples forming moderately non-ideal solutions. Two cases are considered involving: ( 1) moderately concentrated, solid-insoluble impurities, and (2) a single, dilute, solid-soluble impurity. Equations relating fraction melted or heat content of the sample and temperature are developed from mass and energy conservation equations and thermocynamic relations for solid-liquid phase compositions. A new purity calculating method (designated the HOT method) is described which appears to be superior to methods in current use. An experimental study of known mixtures showed that this method gives reliable results for samples containing as much as 2 mole per cent, of a solid-insoluble impurity. Tests of known mixtures of solid-soluble components failed to give good results, presumably because the solid formed during sample freezing was non-uniform in composition.
IntroductionThe melting or freezing behavior of organic
compounds has been used for judging their purity for over 35 years. Reviews of the literature are given by Sturtevant, 1 Cines2 and Mathieu. 3 Two general experimental methods have evolved; in one, the sample is placed in a controlled environment, either hotter or colder than the sample, and the temperature of the sample measured as a function of time. Under suitable conditions, the time-temperature curve gives useful information about the purity of the sample. The second experimental method employs a calorimeter to measure the increase in heat content of Hie sample during melting over that of the corresponding solid. This quantity is used to calculate the melting curve, i.e ., the fraction melted as a function of temperature. The melting curve is related through general thermodynamic relations to the purity of the sample, provided that certain experimental conditions are met. The major concern of the present work is the extension of calorimetric pur.ty calculation methods to cover a wider range of systems and experimental conditions than is now accessible. While parallel methods could be developed for time-temperature data, they are not considered in this paper.
In previous derivations of purity calculation methods, it has been assumed that the major component and impurity form ideal solutions. In this work, equations are derived which are valid for systems showing moderate departures from ideality. Two cases are considered: (1)the impurity is solid-insoluble, moderately nonideal and its concentration is less than 0 .2 mole fraction, and (2) the impurity is a single component which is solid-soluble, dilute, ideal in the liquid phase and non-ideal in the solid phase. While these conditions are, of course, not completely general, they include many real systems for which the ideal solution treatment is not valid. The derivations are based on three types cf relations. The first two are conservation equations for mass
(1) J. M . S tu rtevant, “ C a lorim etry” in “ T ech n iqu e of O rganic C h em istry ,” A . W eissberger, E d itor , V o l. I , 2 n d E d ., In terscien ce P u b lishers, In c ., N ew Y o r k , N . Y . , 1949, part 1, page 731.
(2) M . R . C ines, “ S o lid -L iq u id E qu ilib ria o f H yd roca rb on s” in “ P hysica l C h em istry o f H y d roca rb on s ,” A . Parkas, E d itor , V o l. I, A cadem ic Press, In c ., N ew Y o rk , N . Y . , 1950, C hapter 8 .
(3) M . P. M ath ieu , A c a d . r o y . B e lg ., M e m o ir e s (S c ie n c e s ) , 28, N o . 2 (1953).
and for energy, and the third is a relation between phase composition and temperature. Specific phase composition relations for each of the two cases described above are combined with the mass conservation equation to yield relations between the fraction melted and the temperature. By substituting these latter equations into the energy conservation equation, new relations are obtained between the temperature and heat content of the calorimeter and sample. Both the fraction melted and heat content equations contain the sample impurity content as a parameter which can be evaluated by curve fitting methods.
Somewhat surprisingly, the heat content-temperature equations for both non-ideal cases are, to an acceptable degree of approximation, identical to each other, and to a similar equation derived for the limiting case of ideal, dilute solutions. Furthermore, there exists a relatively simple method for evaluating the parameter of the equation related to the sample impurity content. This evaluation method serves as a more general, yet no more laborious calculation of purity from calorimetric data. The wider range of applicability of the heat content-temperature equation makes possible the quantitative estimation of markedly greater impurity concentrations than were accessible before. In fact, it is applicable to impurity contents which frequently make determination of the heat of fusion difficult or impossible. However, the heat content-temperature equation does not include the heat of fusion explicitly so it is not made inapplicable by this experimental difficulty. The method developed for using the heat content-temperature equation for the analysis of calorimetric purity data has been designated the HCT method.
TheoryConservation of Mass During Melting.— Con
sider a system consisting of N moles of test sample and a container. The sample consists of N i moles of a major component and W2 moles of a minor component or of several minor components which together behave as a single quasi-component. The pressure is constant and the temperature is within the range for which the sample is a mixture of solid and liquid with a negligible fraction in the vapor phase. Then
N‘ + N' = N (1)

1992 J. H. Badley Vol. 63
N*Xi’ .+ X 'X ,! = N X ,0 (2)X>X23 + N'XJ = X X 2°
whereNB = moles of solid sample TV1 = moles of liquid sample N = total moles of samplesX ,3, X 23 = mole fractions of components 1 and 2 in the
solid phaseX ,1, X 2' = mole fractions of components 1 and 2 in the
liquid phaseXi°, X 2° = mole fractions of components 1 and 2 in the
total sampleConservation of Energy During Melting.— Add
ing heat to the sample and container results in the melting of a small portion of the solid and a rise in temperature of the system. When component 2 is solid-insoluble or dilute, its contribution to the heat of melting is zero or negligible. Assuming that the liquid molal heat can be represented by that of the major component, the conservation equation becomes d h = A Hi d N l +
(X C 3 + N'C' + C°) dT + d(N'//°>) (3)where
dh = increment of heatAHi — heat of fusion of component 1 at temp. T AN1 = increase in the no. of moles of liquid C° = heat capacity of the sample container C’ = molal heat of solid component 1 C1 = molal heat of liquid component 1 d T — temperature riseHm = excess molal heat content of liquid soln.Hildebrand and Scott4 discuss theoretical expres
sions for estimating H m. Sufficient for the present purpose is
= Bi'RTXJXz (4)whereB,1 = second Margules coefficient for component 1 in the
liquidTaking the partial derivative of (4) with respect to the amount of component 1 leads to a curtailed Margules equation which Hildebrand4 has found useful in expressing the solution behavior of a large number of binary systems. As this term is only a small part of the heat added and AV is postulated to be less than 0.2, equation 4 can be approximated by an expression in which X ]1 = 1. When the components form non-ideal liquid solutions, it is very unlikely that they will form solid solutions. Hence from (2)
y l X 2°JVX2 = ~ w
andN'H™ = NBJRTXJi (5)
The change in N lH m on melting a portion of the solid is
d ( M ” ) = NBJRXJ1 AT (6)Now letting Y equal the fraction melted and substituting Y N for N l and equation 6 in 3 and writing the heat of fusion in terms of its value at the freezing point of the major component, ACp, and the temperature gives
(4) J. H . H ildebrand and R . L . S co tt, “ T h e S olu bility of N on - E lec tro ly tes ,” 3 rd E d ., R e in h o ld P u b l. C o rp ., N ew Y o rk , N . Y . , 1950, C hapters 3, 17 and 18.
Ah = N(Aff,° - ACpAT)dY +[.N(C3 + ACpY + Bi'RXt?) + Cq]AT (7)
whereACp = C' - C*AT = IV - TTi° = freezing point of the major component AHi0 = molal heat of fusion of the major component at
Ti°A,0 = ABY>/.R(Ti0)2
Over the temperature ranges employed in purity testing ACp can be assumed constant. Integration of (7) givesh = N(AHJ _ a Cva T )Y +
[N(C3 + BSRXJ) + C°]T + Const. (8)Evaluating the integration constant at a point ha, T a, Fa yieldsh - h* = N(AHJ - a Cpa T )(Y - F a) +
[N(C* + F “ACp + B1'B X 2») + C°)](T - T*) (9)
This equation holds for 0 < Y < 1 and T greater than the eutectic temperature. The principal approximations made in its derivation are: (1) the excess heat content of the sample is assumed proportional to the impurity concentration in the total sample, (2) the liquid molal heat of the sample is assumed equal to that of the major component, (3) the molal heats of the solid and liquid major component are assumed to be independent of temperature. These approximations seem unlikely to impair the validity of equation 9 when applied to the systems postulated at the beginning of the derivation.
Phase Composition Relations.— In a two-phase condensed system at equilibrium, the compositions of the phases are related through the fact that the partial molal free energy of each component is the same in both phases. By writing separate expressions for this quantity for each component in each phase and equating, the desired relations are obtained. For real systems, the appropriate partial molal free energy equations differ in detail according to the kind of interaction between components and the concentration range of interest. Hildebrand and Scott4 discuss this approach to the derivation of phase composition relations. For the two cases considered here, the composition of the liquid or liquid and solid phases is related to the temperature by the equations shown below. For case 1, postulating solid insoluble impurities with X 2' < 0.2 and — 2 < B xl < 2
-In X ,' = A#i°R
r _ b _ n n _ +L7V> rJL 2Aifi° J 'B,' (1 - X , ')2 ( 10)
and for case 2 postulating a dilute, solid-soluble impurity which is ideal in the liquid phase but nonideal in the solid phase with — 2 < I h a < 2
In XVX,'
A f f d R [ ¿ - aTfi \ + B," (1 — X ,*)2 ( 11)
In the latter case, by writing an additional equation of the form of (11) for the minor component, a relation is found between X 18 and X 11. Although this shows that the ratio X 27X 11, conventionally defined as the distribution ratio k, is theoretically temperature dependent, the temperature variation is small in a purity test involving the postulated

Dec., 1959 Calorimetric D etermination of Purity 1993
dilute solutions, so k can be assumed constant without error.
Combinations of Basic EquationsThe basic equations derived or stated above can
be combined to yield relations between either fraction melted or heat content of the sample and temperature.
Fraction Melted—Temperature Relations.— Considering first case 1, employing XP + X 2' = 1, expansion of the —In Xp in a power series gives
-In X,i = IV + \ ( X W + l (X2'P + ... (12)
For X2‘ < 0.2, the sum of the cubic and higher terms amounts to less than 1.6% of X2' and therefore may be discarded for the present work. Substituting in equation 10
X 1 + ( g - B d ) (X 2'P a e i n - ± \ ~r \ r t j )
( i _ a T\V 2Afiï» )
(13)
Rearranging the right-hand side of the equation
X 2i + (| - B p ) (X 2>)2 = AMT(1 + AY AT) (14)
whereA / _ _____
1 TJ 2Afflo
Because A Y A T is always small compared to one, it can be shown that equation 14 can be written with little loss in validity as
X i + Q ~ % - B ^ ( X W = AJAT (15)
Provided the temperature is always above that of the highest eutectic temperature inv living the major component
Y,oX»' = - y CO)
For an ideal solid solution B Y = 0 and equation 20 reduces to
Xj>
Y +AJ AT (21)
This equation has been previously derived by Mastrangelo and Dornte.6
Heat Content-Temperature Relations.— Asshown earlier, the heat content of the calorimeter and sample in the melting region is given by equation 9. By substituting a relation between T and Y , appropriate for the system under consideration, equations for heat content as a function of temperature can be derived. Considering in turn the cases discussed above, these results are obtained.
For case 1, the fraction melted-temperature relation is given by equation 17. For the present derivation it is necessary to solve this equation for Y in a form which avoids the square root term obtained by use of the general quadratic equation formula. Many approximate solutions are possible because the ranges of A ¡° A T and the term (Vs — A i'/ A i° — BP), denoted henceforth by E , can be fairly well defined. For the present purposes, the maximum value of X 2! is postulated to be 0.2. With E — 0, this corresponds to A Y A T — 0.2 also. The value of Bp is postulated to fall within the range — 2 < BP < 2. The value of A Y / A Y is generally small compared to l/2. Consequently, the limits for E can be reasonably assigned to be — 1.5 < E < 2.5. Within these limits for A i° A T and E , it can be shown that the approximation
XP _ AJAT(1 + EAJAT)2 Y (1 + 2EAJAT) { ]
Substitution in (16) gives
AJAT (17)
When the solution is ideal, RP = 0 , henceX £ , / I _ A J \ ( X j y Y + \2 A ,« A î7 )
AJAT (18)
In case 2, in order to justify the assumption that the heat of melting of the solid solution is the heat of fusion of the major component, it is necessary to limit the discussion to dilute solutions. Hence the quadratic term in the expansion of In Xi becomes negligible. Expanding equation 11 one obtains
X 21 - X 2" = AJAT + B j(X -fy (19)
The magnitude of the proportionality constant B Y is difficult to estimate and no data appear to be available for organic systems. Although development of cryoscopic equations containing this constant is thus of qualitative interest only at the present time, such equations are more general than those based solely on the laws of dilute solutions. Eliminating X2* and X2S one obtains
yields results for X 2°/F with 5% error or less. Equation 22 arises from the continued fraction expansion of (17).
XJ = A J a TY 1 + EAJAT____
1 + EAJAT { ’1 + .. .
Substituting in (9) givesh _ hh _ NR{TJYXJ{T - T -)
(TJ — T*)(Ti° — T) A( ( E W U m T J - T){TJ - TA )r [i + - m i + e m j i t j - m f+ | N{C* + F aACp + B iR X J] + O ) [T - T a] (24)
This equation is a good approximation to the relation between the heat content and temperature under the following conditions: (1) equation 9 is valid. The validity of this equation has already been discussed, (2) the impurity is solid-insoluble and forms liquid solutions with —2 .0 < RP < 2.0 and less than 0 .2 mole fraction in concentration, and (3) the temperature is always above that of
(5) S. V. R. Mastrangelo and R. W. Dornte, J. Am. Chem. S oc., 77, 6200 (1955).
1994 J. H. Badley Voi. 63
the highest eutectic temperature involving the major component. Under certain additional conditions the term
( £ 11)2(di»)s(2,il) - T)(TJ> - 7’a)[l + EMiKTi9 - F )][ l -I- EMATt0 - 7 + ]
in equation 24 becomes small compared to 1. These correspond to values of E/A ¡°A T between — 0.1 and +0.4 and are realized when the solutions are relatively dilute, or — 1.0 < B d < 1.5 and A / ’A T = X2‘ is less than 0.2. Under these further conditions, and dropping the sub and superscript for B , the systems described in case 1 are adequately represented by
N R(TJ°yX ,B T - T-) n (Ti° - - T) ^
[7V{C3 + FaACp + BRX.?\ + C'J [T - T '] (25)In case 2, solving equation 20 for [X2°/Y + k
(1 — A)] by the approximation used in case 1 and substituting for F in (9) with the heat of mixing term = 0 , one obtains an equation of the form of equation 24. Provided that —1.5 < B ia(k/1 — A) 2 < 2.5, this equation is a good approximation to the heat content-temperature relation. The range of validity of equation 25 for this case is similar to that in case 1.
The preceding discussion has shown that equation 25 is a valid relation between the heat content and temperature under the following conditions: (1) the concentration of the minor component is less than 0 .2 mole fraction throughout the melting of the sample, (2 ) the reference temperature used to evaluate the integration constant is selected to be not too far from the freezing point of the sample,(3) the liquid or solid solutions formed do not depart too far from ideality. It is interesting to see that equation 25 is, except for the unimportant term in B , identical to the heat content-temperature relation derived assuming dilute ideal liquid solutions. The preceding development has established that the range of validity of this equation is greater than one might suspect if he derived it only on the simplest but most restrictive assumptions. It is particularly noteworthy that it is applicable to equilibrium data for dilute binary systems which form solid solutions. It is not, however, applicable to multicomponent systems in which one or more components form solid solutions.
Purity CalculationMethods Based on the Fraction Melted Trans
form.— Solving equation 9 for the fraction melted, one obtainsY = F a +
h — h‘ - im C ’ + F aACp + Bt'RXX) + C°][T - 7'»] AX At/ ,0 - ACpAT)
(26)Conventionally, the point Fa, Aa, T & is taken as the freezing point of the sample, i.e ., 1, h{, 7,f, and the heat of mixing and ACp are assumed to be negligible. Hence
F = 1 - h< - h - (NC° + C°)(T - 7 + N AH,0 (27)
Many numerical procedures utilizing the fraction melted transform have been described for
reducing experimental data for the ideal binary or quasi-binary systems. These are discussed in one or more of the review papers cited earlier. 1-3 More complicated systems are best treated by elimination of the parameter T / in terms of the coordinates of a point on the T , Y curve. Then it frequently becomes possible to find pairs of functions of Y and T which give linear plots with each other and involve the impurity concentration as a parameter. For case 1, this treatment results in the transformation of equation 17 to give
X, , ( F ~ Y)Y ‘ Y + 6 - + ? - ^ ) W)>x
[(F + - F 2](F aF )2 = - T) (28)
A plot of [F(Ta — T )/ {Y & — F)] versus (Fa + F)/F is a straight line with intercept X 2°/Ai°Fa and slope [V, - A x/A t0 - B xl] (X?V / F a)lM i°. Means for applying the limiting ideal solution equation have been discussed elsewhere.6-8
The ideal solution form of case 2 has been discussed by Mastrangelo and Dornte.6 An alternative calculation method based on their equation can be obtained by elimination of the parameter Tx° in terms of the point Ta, Fa. This shows that a plot of (Fa — Y )/ (T a — T ) versus Y is a straight line with intercept k/( 1 — k) and slope X 2°/ [A x°(Y a + k/1 - A)].
Methods Based on the Heat Content-Temperature Relation.— In view of the generality of equation 25 it is unnecessary to distinguish between the two cases based on differing phase composition relations in utilizing the heat content-temperature relation for the calculation of purity. It can be transformed in at least three ways to obtain practical data reduction methods. The first was discussed over 40 years ago by Dickinson and Osborne9 and by Sturtevant.1 The second method is similar to the earlier calculation procedure in that it is based on the derivative of the heat content- temperature equation; that is
dA = N R jT W Xo“<1T (7Y> - T )2 + J (29)
whereJ-3 = AXO + F aACp + BRXJ>) + C°
Solving for the temperature, one obtains
T = I NRX?° \ \ dh/dT - J“) (30)
This shows that a plot of 1/y/ d h / d T — J s versus T is linear and has the slope T 10\ 'N R X 2° and intercept Ti°. While this computation method has several inherent advantages stemming from the broad range of validity of the parent equation, the derivative form is probably not the most satisfactory one for evaluation of new experimental
(6) F. W. Schwab and E. Wichers, “ Precise Measurement of the Freezing Range as a Means of Determining the Purity of a Substance” in “ Temperature— Its Measurement and Control in Science and Industry,” Reinhold Publ. Corp., New York, N. Y., 1941, p. 256.
(7) B. J. Mair, A. R. Glasgow, Jr., and F. D. Rossini, J. Research Natl. Bur. Standards, 26, 591 (1941).
(8) W. J. Taylor and F. D. Rossini, ibid., 32, 197 (1944).(9) H. C. Dickinson and N. S. Osborne, Bull. Natl. Bur. Standards,
12, 49 (1915).
Dec., 1959 Calorimetric D etermination of Purity 1995
data. It has little to recommend it in preference to the transform described below when the experimentally measured quantities are heat content and temperature.
The HCT Method.— Equation 25 can be rearranged as
N R i w y x t 1 _1 TV - T* h - h'
f _ ya *'Sm ( T W X 2°
T <1 — T a U (31)
The variable 1 /[(h — ha)/ (T — Ta) — J a] is represented by the symbol U in the following discussion. A plot of U versus T has slope — [N R - (T 1°)2X 2°/ (T i0 — T &)] and intercept Ti°. Denoting the slope of the line through a set of experimental points by W , the concentration of impurity in the sample is given by
( —w )(Ti° - r » )2 NR(Ti0)2 (32)
The experimental evaluation of the terms in equation 31 is clear for all except J s. For most of the melting region (h — h&)/ (T — Ta) is large compared to J s. Consequently, J s need not be accurately evaluated. Usually the approximation J s = N C 1 + Cc is sufficiently accurate.
Failure of this approximation is most likely when the heat of fusion of the sample is abnormally low and the amount of impurity is relatively high. Then accurate estimation of the specific heat of the solid is required in order to evaluate J s. The term B ^ R X ^ is nearly always negligible compared to C s under the conditions of this discussion. A reasonably linear plot of T vs. U is good evidence that the estimate of J a employed is sufficiently accurate. However, the contrary, i .e ., curvature in the T, U plot is not proof that J s is in error.
The freezing point of the sample is found by solving equation 31 and the equation relating heat content and temperature for the liquid sample for the temperature at which both equations are satisfied by the same value of the heat content. Provided the liquid specific heat is constant near the melting point and AC p is negligible
Ts = F (7V - T-) K — W
(33)
whereK = hb - h* - J '(T b - 7’“ )hb, Tb = coordinates of a point on the heat content-
temperature curve for the liquid sampleJ 1 = heat capacity of calorimeter plus the liquid
sample = NC1 + C°Equation 25 holds for binary systems which
form a solid solution. Provided that an independent estimate of the heat of fusion is available, and the solid solution is ideal, the distribution ratio of the impurity can be estimated. The freezing point depression caused by the impurity is given by
g(7V )«A V (1 - k) 1 1 1 Aff,« (34)
Eliminating 72(T1°)2X20 between equations 25, 33 and 34 gives
k = 1K - WiV A ff,« (35)
The relation between the variable U and the fraction melted, Y , is found from the defining equations for them. This is
U = T — T*( Y - Y ^ N A H f (36)
Calorimetric data for purity calculation generally have been published in the form of temperature- fraction melted values. Equation 36 suggests an improved means for analyzing such data. Combination of equations 36 and 31 to elminate U and N gives
7Y>)2X 20( r - T») A ff.odV - T*)(Y - T a) (37)
In the light of the broader basis of the validity of equation 31, computations based or this equation should yield more reliable values for the impurity concentration than does the conventional plot of 1/F vs. T or the method of Mastrangelo and Dornte.6
In addition to its broad range o: validity, the calculation scheme outlined here has at least two additional advantages when compiared to conventional purity calculation methods. The parent equation does not require the explicit evaluation of heat of fusion. This is quite important for a method intended for use with impure samples, as the heat of fusion of the major component frequently cannot be evaluated easily for such materials. Secondly, the new functions can be calculated directly from the heat cortent-tempera- ture data without an intervening step such as the evaluation of the heat of fusion of the sample. This results in a simp.er and shorter calculation procedure compared to che conventicnal computing method.
ExperimentalThe apparatus and procedure employee were essentially
those of Tunnicliff and Stone.10 This apparatus, while not suitable nor intended for accurate specific heat or heat of fusion measurement, is equipped with a sensitive temperature difference measuring cfevice and prov des heat content measurements of sufficient reliability for the determination of purity.
A special means for pretreating the sample in the calorimeter cell was found necessary to avo:d systematic departure from thermodynamic equilibrium during melting of the sample. This consisted in melting die sample in the cell, mixing it thoroughly by partially removing the cell and replacing, then chilling the sample rapidly by immersing the cell in liquid nitrogen. This process fe called “ quick freezing” and is practical only in an apparatus in which the well-mixed sample is distributed in a thin film which can be chilled by withdrawing heat in a direction perpendicular to the film surface. Tunnicl.ff and Stone’s 1/ 2-ml. cell was used in tests reported here involving quick freezing.
The materials employed were: 1,4-bromochlorobenzene, 1,4-dibromobenzene, bibenzyl, irares-stilbene and benzene. The first four were purified by zone melting in a single zone, vertical tube, multiple pass apparatus. A dye was added to the samples and zone refining continued until about 80% of the sample was water white. The benzene was a highly purified material of petroleum origin.
Mixtures of known compusition were prepared by weight. Homogeneity of the stock solution and samples taken from it was ensured by taking all samples in the liquid state.
(10) D. D. Tunnicliff and H. Stone, Anal. Chem., 27, 73 (1955).
1996 J. H. Badley Vol. 63
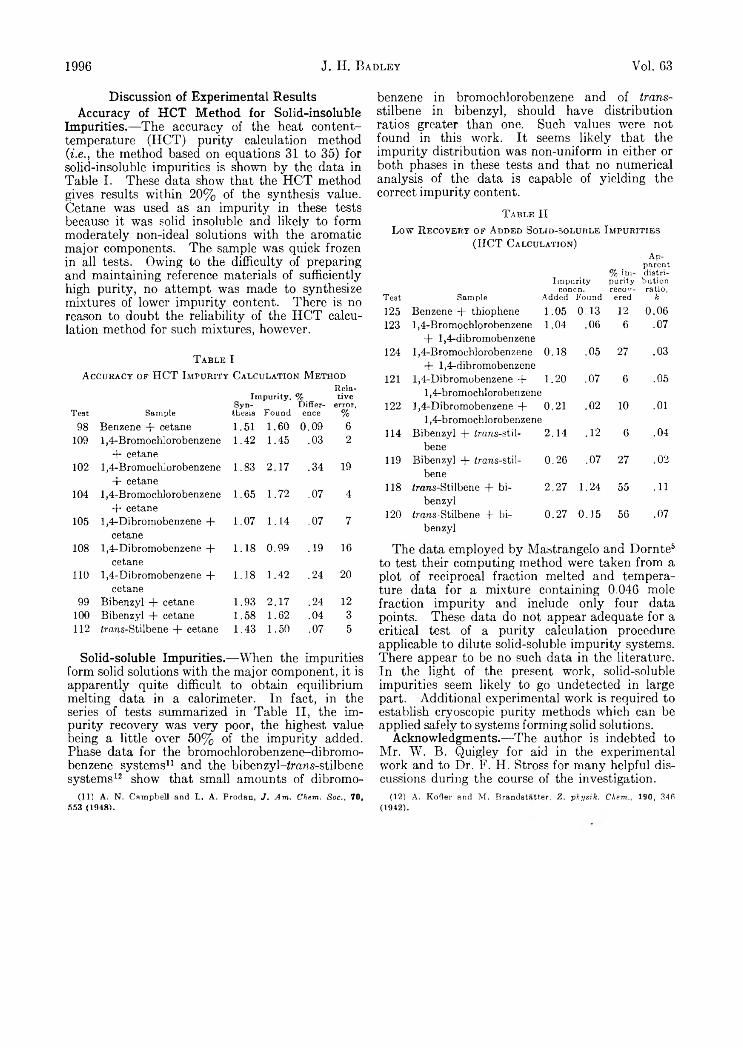
Discussion of Experimental Results Accuracy of HCT Method for Solid-insoluble
Impurities.— The accuracy of the heat content- temperature (HCT) purity calculation method (i.e ., the method based on equations 31 to 35) for solid-insoluble impurities is shown by the data in Table I. These data show that the HCT method gives results within 20% of the synthesis value. Cetane was used as an impurity in these tests because it was solid insoluble and likely to form moderately non-ideal solutions with the aromatic major components. The sample was quick frozen in all tests. Owing to the difficulty of preparing and maintaining reference materials of sufficiently high purity, no attempt was made to synthesize mixtures of lower impurity content. There is no reason to doubt the reliability of the HCT calculation method for such mixtures, however.
T a b l e IA c c u r a c y o p HCT I m p u r it y C a lc u l a tio n M eth od
Rela-Impurity, % tive
Syn- Differ- error,Test Sample thesis Found ence %
98 Benzene + cetane 1.51 1.60 0.09 6109 1,4-Bromochlorobenzene
+ cetane1.42 1.45 .03 2
102 1,4-Bromochlorobenzene + cetane
1.83 2.17 .34 19
104 1,4-Bromochlorobenzene + cetane
1.65 1.72 .07 4
105 1,4-Dibromobenzene + cetane
1.07 1.14 .07 7
108 1,4-Dibromobenzene + cetane
1.18 0.99 .19 16
110 1,4-Dibromobenzene + cetane
1.18 1.42 .24 20
99 Bibenzyl + cetane 1.93 2.17 .24 12100 Bibenzyl + cetane 1.58 1.62 .04 3112 Zrans-Stilbene -j- cetane 1.43 1.50 .07 5
Solid-soluble Impurities.— When the impurities form solid solutions with the major component, it is apparently quite difficult to obtain equilibrium melting data in a calorimeter. In fact, in the series of tests summarized in Table II, the impurity recovery was very poor, the highest value being a little over 50% of the impurity added. Phase data for the bromochlorobenzene-dibromo- benzene systems11 and the b iben zyl-2rans-stil bene systems12 show that small amounts of dibromo-
(11) A. N. Campbell and L. A. Prodan, J. Am. Chem. Soc., 70, 553 (1948).
benzene in bromochlorobenzene and of trans- stilbene in bibenzyl, should have distribution ratios greater than one. Such values were not found in this work. It seems likely that the impurity distribution was non-uniform in either or both phases in these tests and that no numerical analysis of the data is capable of yielding the correct impurity content.
T a b l e IILow R e c o v e r y o f A d ded So lid - so l u b le I m p u r it ie s
(H CT C a lc u l a tio n )Ap-
parent % im- distri-
Impurity purity bution
Test Sampleconcn.
Added Foundrecovered
ratio,k
125 Benzene + thiophene 1.05 0 13 12 0.06123 1,4-Bromochlorobenzene
+ 1,4-dibromobenzene1.04 .06 6 .07
124 1,4-Bromochlorobenzene + 1,4-dibromobenzene
0.18 .05 27 .03
121 1,4-Dibromobenzene + 1,4-bromochlorobenzene
1.20 .07 6 .05
122 1,4-Dibromobenzene +1,4-bromochlorobenzene
0.21 .02 10 .01
114 Bibenzyl + irons-stil- bene
2.14 .12 6 .04
119 Bibenzyl + Zrcms-stil- bene
0.26 .07 27 .02
118 irans-Stilbene + bibenzyl
2.27 1.24 55 .11
120 ¿rcms-Stilbene T bibenzyl
0.27 0.15 56 .07
The data employed by Mastrangelo and Dornte5 to test their computing method were taken from a plot of reciprocal fraction melted and temperature data for a mixture containing 0.046 mole fraction impurity and include only four data points. These data do not appear adequate for a critical test of a purity calculation procedure applicable to dilute solid-soluble impurity systems. There appear to be no such data in the literature. In the light of the present work, solid-soluble impurities seem likely to go undetected in large part. Additional experimental work is required to establish cryoscopic purity methods which can be applied safely to systems forming solid solutions.
Acknowledgments.— The author is indebted to Mr. W. B. Quigley for aid in the experimental work and to Dr. F. H. Stross for many helpful discussions during the course of the investigation.
(12) A. Kofler and M. Brandstatter, Z. physik. Chem., 190, 346 (1942).

Dec., 1959 T he Vapor Pressure of D iborane 1997
VAPOR PRESSURE OF DIBORANEBy Leo J. Paridon and G eorge E. M acW ood
Contribution from the McPherson Chemical Laboratory, The Ohio Slate University, Columbus 10, OhioReceived February S7, 1969
The vapor pressure of diborane has been measured from 151.2 to 288.5°K. In this range, it varied from 0.14 to 38.3 atm. The normal boiling point was found to be 180.59 ± 0.04°K.
IntroductionAs a part of the program to obtain the necessary
data for the construction of a Mollier diagram for diborane, it was decided to remeasure the vapor pressure on carefully purified diborane The vapor pressure had previously been measured by Stock, 1 Clarke, Rifkin and Johnston,2 Rifkin, Kerr and Johnston, 3 and Wirth and Palmer.4
ExperimentalThe equipment used for these measurements is the same
as that described by Johnston and White.6 Pressures below 3 atm. were read from a mercury manometer, while above 3 atm. a MIT-type dead-weight gage was used.
Diborane of 99.91 mole % purity was condensed into the pipet until it was approximately one-haf filled. The pipet temperature was adjusted to the desired operating temperature as were the upper, lower and auxiliary blocks and can. Pressure and temperature readings were recorded at one-minute intervals over a ten-minute period. The precision of the pressure readings was 0.01% The normal temperature drift during this time was less than 0.02°K.
After completion of a Bet of measurements, the valve at the top of the pipet was closed and the material above it removed. In this way subsequent measurements did not involve material which had been at room temperature for more than approximately one hour. Operaring difficulties made it impractical to remove the material above the pipet valve when the temperature of the measurements exceeded 250°K. Measurements above this temperature involved some diborane which had been at room temperature for four hours. That decomposition is slight at th s temperature over this period of time is evidenced from the inability to detect any non-condensable gas in the sample at the end of the measurements.
Results
T a b l e IV a p o r P r e ssu r e o f D ib o r a n e
Run No. Temp., °K . Pressure, atm.1 151.23 0.13752 160.39 0.27874 169.92 0.53253 180.64 1.00255 194.54 2.03396 205.17 3.25237 209.96 3.95688 219.75 5.71679 229.58 8.0182
10 240.15 11.173516 246.07 13.292411 251.39 15.441815 251.40 15.475617 256.02 17.511812 260.47 19.655320 260.49 19.696021 264.53 21.852019 268.53 24.109018 273.16 26.985913 273.19 26.973427 276.31 29.088828 279.85 31.667625 282.89 33.844324 285.63 36.067714 288.46 38.3354
219.75°K., the vapor pressure data were fitted by the equation
The vapor pressure results are given in Table I. Pressures below 3 atm. are measured with a precision of 0.05 mm., while the precision at greater pressures varied from approximately 0.05% below 10 atm. to 0.01% at the higher pressures. The accuracy is limited by the purity of the diborane. This is shown by the results of duplicate determinations made at 251, 260 and 273°K. on different samples. The material used was of the same initial purity, but the amount of decomposition which could occur in the pipet and measuring system during each determination could vary, since the time required for each measurement was dependent upon the rapidity with which equilibrium was attained. It is estimated that the measurements above 250°K. are accurate to 0.1% and those at the lower temperatures to 0.05%.
In the temperature range 151.23CK. ^ T ^(1) A. Stock and E. Kaas, Ber., -56, 789 (1923).(2) John T. Clarke, E. C. Kerr and H. L. Johnston, J. Am. Chem.
Soc., 75, 781 (1953).(3) E. B. Rifkin and II. L. Johnston, ibid., 75, 785 (1953).(4) Henry E. Wirth and Emiel D. Palmer, Tins J o u r n a l , 60, 911
(1956).(5) II. L. Johnston and David White, Trans. S.M.E ., 77, 785
(1950).
log p — 3.8262 598.30 1.6733 X 10⁴ 2"2 (D
with an average deviation of 0.02%. In the range 151.2°K. T ^ 288.46°K., the data were fitted bymeans of the equation
log p = 4.8000 1236.2 , 1.2215 X 10⁶T + 1.2247 X
yi3
J’î107
+3.4141 X 10³
T 1 (2)
with an average deviation 0.06%.The calculated value of the normal boiling point
using eq. 1 is 180.59 ± 0.04°K.Discussion
The low pressure values are in good agreement with those of Wirth and Palmer, 4 and the value of the normal boiling point agrees with their value, 180.63 °K., within the precision of the temperature scale in this temperature range.
The high pressure values are somewhat higher than those of Rifkin, Kerr and Johnston.2 Considering the greater precision in the measurement of pressure in this research, the differences are about what one should expect.
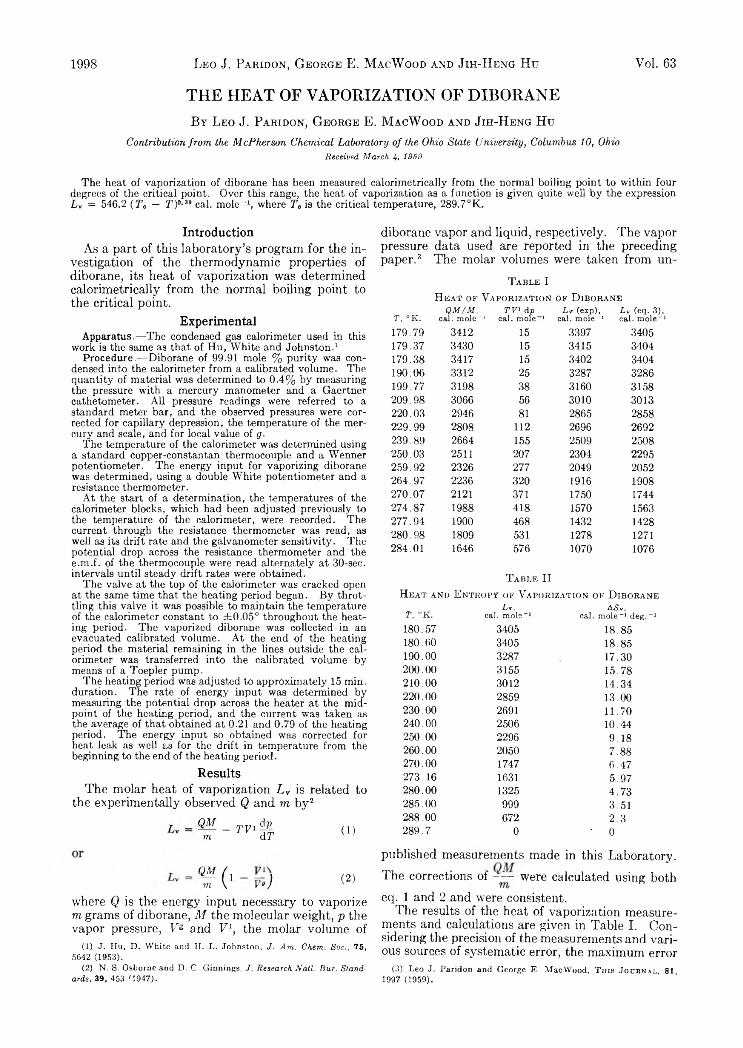
THE HEAT OF VAPORIZATION OF DIBORANE
By Leo J. Paridon, George E. MacWood and Jih-Heng Hu
Contribution from the McPherson Chemical Laboratory of the Ohio State University, Columbus 10, OhioReceived March 4. 1959
1998 Leo J. Paridon, George E. M acW ood and Jih-H eng Hu VoI. 63
The heat of vaporization of diborane has been measured calorimetrically from the normal boiling point to within four degrees of the critical point. Over this range, the heat of vaporization as a function is given quite well by the expression Lt = 546.2 (T 0 — J7)0-39 cal. mole-1, where T<, is the critical temperature, 289.7°K.
IntroductionAs a part of this laboratory’s program for the in
vestigation of the thermodynamic properties of diborane, its heat of vaporization was determined calorimetrically from the normal boiling point to the critical point.
ExperimentalApparatus.—The condensed gas calorimeter used in this
work is the same as that of Hu, White and Johnston.1Procedure.— Diborane of 99.91 mole % purity was con
densed into the calorimeter from a calibrated volume. The quantity of material was determined to 0.4% by measuring the pressure with a mercury manometer and a Gaertner cathetometer. All pressure readings were referred to a standard meter bar, and the observed pressures were corrected for capillary depression, the temperature of the mercury and scale, and for local value of g.
The temperature of the calorimeter was determined using a standard copper-constantan thermocouple and a Wenner potentiometer. The energy input for vaporizing diborane was determined, using a double White potentiometer and a resistance thermometer.
At the start of a determination, the temperatures of the calorimeter blocks, which had been adjusted previously to the temperature of the calorimeter, were recorded. The current through the resistance thermometer was read, as well as its drift rate and the galvanometer sensitivity. The potential drop across the resistance thermometer and the e.m.f. of the thermocouple were read alternately at 30-sec. intervals until steady drift rates were obtained.
The valve at the top of the calorimeter was cracked open at the same time that the heating period began. By throttling this valve it was possible to maintain the temperature of the calorimeter constant to ±0 .05° throughout the heating period. The vaporized diborane was collected in an evacuated calibrated volume. At the end of the heating period the material remaining in the lines outside the calorimeter was transferred into the calibrated volume by means of a Toepler pump.
The heating period was adjusted to approximately 15 min. duration. The rate of energy input was determined by measuring the potential drop across the heater at the midpoint of the heating period, and the current was taken as the average of that obtained at 0.21 and 0.79 of the heating period. The energy input so obtained was corrected for heat leak as well as for the drift in temperature from the beginning to the end of the heating period.
ResultsThe molar heat of vaporization L v is related to
the experimentally observed Q and m by2
q m _m
p y i ÉL dT ( 1)
QM ( ,(2)— ( 1 m \ V ")
where Q is the energy input necessary to vaporize m grams of diborane, M the molecular weight, p the vapor pressure, V e and F 1, the molar volume of
(1) J. Hu, D. White and H. L. Johnston, «7. Am. Chem. Soc., 75, 5642 (1953).
(2) N. S. Osborne and D. C. Ginnings, J. Research Natl. Bur. Standards, 39, 453 G 947).
diborane vapor and liquid, respectively. The vapor pressure data used are reported in the preceding paper.3 The molar volumes were taken from un-
T a b l e IH e a t of V a p o r iza t io n of D ib o r a n e
T, °K . iQM/M,
cal. mole-TV' dp
1 cal. mole 1Lv (exp), Lv (eq. 3),
cal. mole-1 cal. mole-1179.79 3412 15 3397 3405179.37 3430 15 3415 3404179.38 3417 15 3402 3404190.06 3312 25 3287 3286199.77 3198 38 3160 3158209.98 3066 56 3010 3013220.03 2946 81 2865 2858229.99 2808 112 2696 2692239.89 2664 155 2509 2508250.03 2511 207 2304 2295259.92 2326 277 2049 2052264.97 2236 320 1916 1908270.07 2121 371 1750 1744274.87 1988 418 1570 1563277.94 1900 468 1432 1428280.98 1809 531 1278 1271284.01 1646 576 1070 1076
T a b l e IIH e a t an d E n t r o p y of V a p o r iza t io n of D ib o r a n e
T, °K.Ly,
cal. mole-1A Sv.
cal. mole-1 deg.-1180.57 3405 18.85180.60 3405 18.85190.00 3287 17.30200.00 3155 15.78210.00 3012 14.34220.00 2859 13.00230.00 2691 11.70240.00 2506 10.44250.00 2296 9.18260.00 2050 7.88270.00 1747 6.47273.16 1631 5.97280.00 1325 4.73285.00 999 3.51288.00 672 2.3289.7 0 • 0
published measurements made in this Laboratory.
The corrections of - - - were calculated using both
eq. 1 and 2 and were consistent.The results of the heat of vaporization measure
ments and calculations are given in Table I. Considering the precision of the measurements and various sources of systematic error, the maximum error
(3) Leo J. Paridon and George E MacWood, T his Journal, 81, 1997 (1959).

Dec., 1959 Solubility of Hydrogen Fluoride in NaF -Z rF4 M ixtures 1999
in the molar heat of vaporization is estimated to be ± 1 0 cal./mole.
To smooth the data, they were fitted to the equation
Lv = 546.2 (T„ — T f - U cal. mole-1 (3)
where T c = 289.7°K. Table II gives the values of Lv, calculated using eq. 3, and ASV, the entropy of vaporization.
There have been several previous determinations of the heat of vaporization of diborane at the normal boiling point.4'6 Clarke, et al., determined it both calorimetrically and from their vapor pressure
measurements, reporting 3412 and 3431 cal./mole, respectively. The first value is in good agreement with the value reported here considering the uncertainty in the two values. Wirth and Palmer calculated a value of the heat of vaporization at the normal boiling point from their vapor pressure measurements, estimating the gas imperfection using the Bertholet equation. Their value is 3413 cal./mole and is in exceptional agreement with the other two.
(4 ) John T . C larke, E . B . R ifk in and H . L . Johnston , J . A m . C h em . S o c ., 75, 781 (1953),
(5) H enry E . W irth and E m iel D . Palm er, T h is J o u r n a l , 60, 911 (1956).
SOLUBILITY OF HYDROGEN FLUORIDE IN MOLTEN FLUORIDES.I. IN MIXTURES OF NaF-ZrF4
By J. H. Shaffer , W. R. Grimes and G. M. W atson
Oak Ridge National Laboratory,1 Oak Ridge, TennesseeR eceiv ed M a rch 6 , 1 95 9
Solubilities of HF have been determined at pressures from 0.5 to 3 atmospheres over a temperature range 550 to 800° in NaF-ZrF4 mixtures containing 45 to 80.5 mole % NaF. Henry’s law is obeyed and the solubility decreases with increasing temperature. The solubility of HF increases approximately tenfold as the mole % of NaF in the solvent is increased from 45 to 80.5 mole %. Henrv’s law constants in moles HF per cc. of solution per atmosphere at 600, 700 and 800° are (1.23 ± 0.04) X 10-5 and (0.93 ± 0.02) X 10-i and (0.73 ± 0.01) X 10-5 in NaF-ZrF, (53 mole % NaF). The enthalpies of solution in kcal. per mole also increase in magnitude from —3.85 to —9.70 as the mole % of NaF is changed from 45 to 80.5. The entropies of solution vary from —5.2 to —6.5 e.u. over the same range of solvent compositions.
IntroductionThis investigation constitutes part of a sys
tematic study of the solubilities of gases in molten salts. In this study an attempt is being made to elucidate the solvent characteristics which have an effect on gas solubility. The results cf measurements on the solubility of HF in various mixtures of NaF-ZrF4 at pressures from 0.5 to 3 atmospheres over the temperature range 550 to 800° are presented here.
Solubilities of gases in liquids have been studied by many investigators; reviews covering much of this work are available.2-4 Solubilities of noble gases in molten fluoride mixtures have been reported.6 Burkhard and Corbett6 recently determined the solubility of water in molten LiCl-KCl mixtures and presented an approximate value of the solubility of HC1 at 480° in a mixture containing 60% LiCl. No information regarding the solubilities of HF in molten fluorides in the range of pressures, temperatures and solvent compositions presented here has been found in the literature. Related investigations on some of the properties and phase behavior of acid fluorides of LiF ,7
(1) O perated fo r the U nited States A tom ic E nergy C om m ission b y the U nion C arbide C orporation .
(2) A . E . M arkham and K . A . K ob e , C h em . Revs., 28, 519 (1941),(3) J. H. H ildebrand and R . L . S cott, “ T he S olu bility of N on-
E lectrolytes,” C hapter X V , 3rd E d ., R ein h old P ubl. C orp ., N ew Y ork , N . Y „ 1950.
(4) M , W . C ook , U . S. A tom ic E nergy C om m ission , U C R L -2 4 59(1954).
(5) (a) W . R . Grim es, N . V. Sm ith and G . M . W atson , T hisJo u r n a l , 62, 862 (1958 ); (b ) M . B lander, W . R . Grim es, N . V.Smith and G . M . W atson , ib id ., 63, 1164 (1959).
(6 ) W . J. B urkhard and J. D . C orbett, J . A m . C h em . S o c ., 79 , 6361 (1957).
NaF,8" 10 KF , 11 RbF , 12 CsF13and NH4 F 14 have been reported. Information on liquid-liquid solubilities and liquid-vapor equilibrium of HF-UF6 mixtures is available. 16'16
Mixtures of NaF and ZrF4 were chosen for this investigation because of their value in nuclear fuel element reprocessing17 21 and their use (with added UF4) as fuel for an experimental nuclear reactor.22
(7) H . V. W artenberg and O. Bosse, Z . E lek troch em ,, 28, 386 (1922).(8 ) J. F. F roning, M . K . R ichards, T . W . Stricklin and S. G . T u rn -
bull, I n d . E n g . C h em ., 39, 275 (1947).(9) D . G . H ill, unpublished w ork, Oak R id g e N ational L aboratory ,
Oak R idge, Tennessee.(10) W . D avis, Jr., K L I-2 5 52 , “ V apor Pressure-Tem perature R e la
tions in the System N a F -H F ,” U nion C arbide N uclear C om p an y , Oak R id ge G aseous D iffusion Plant.
(11) G . H . C ady , J . A m . C h em . S o c ., 56, 1431 (1934).0 2 ) E . B. R . Prideaux and K . R . W ebb , J . C h em . S o c ., 1 (1937);
111 (1939).(13) R . V. W insor and G . H . C ad y , J . A m . C h em . S oc ., 70, 1500
(1948).(14) O. R u ff and L. Staub, Z . a n o rg . a llg em . C h em ., 212, 399 (1933).(15) G . P. R utledge, R . L. Jarry and W . D avis , Jr., This Journal,
57, 541 (1953).(16) R . L . Jarry, F. D . R osen , C . F. H ale and W . D av is , J r., ib id .,
57, 905 (1953).(17) G . I . Cathers and R . E . Leuze, “ A V olatilization Process for
U ranium R ecovery in R ea ctor O perational P rob lem s,” V o l. II , P ergam on Press, N ew Y ork , N . Y ., 1957, pp. 157-163.
( ] 8 ) G . I . Cathers, N u clea r S c i . and E n g ., 2 , 768 (1957).(19) R . P. M ilford , I n d . E n g . C h em ., 50, 187 (1958).(20) S. Law roski, “ N on-aqueous Processing— A n In trod u ction ,”
Sym posium on the R eprocessing o f Irradiated Fuels H eld a t Brussels, B elgium , M a y 2 0-25 , 1957, pp. 4 79 -497 , B ook I I , T ID -7 5 3 4 .
(21) R . C . V ogel and R . K . Steunenberg, “ F luoride V o la tility Processes for L ow A lloy Fuels,” ref. 20, pp. 498 -5 5 9 .
f22) A . M . W einberg and R . C . Briant, N u clea r S c i . and E n g ., 2, 795 (1957).

2000 J. H. Shaffer, W. R. G rimes and G. M. W atson Vol. 63
ExperimentalMaterials.—The HP was obtained from cylinders each
containing 6 lb. of anhydrous liquid hydrogen fluoride supplied by the Harshaw Chemical Company, Cincinnati, Ohio, th e liquid HF had a specified minimum purity of 99.9%. The vapor was found to contain less than 0.2 mole % of gases insoluble in aqueous KOH solution; it was used without purification.
The fluoride mixtures were prepared from sodium fluoride of reagent grade and ZrF4 which had been prepared by hydro- fluorination of ZrCh at 500° in equipment of nickel. The mixtures were purified, transferred, sampled and analyzed by procedures previously described.6
Apparatus.—The apparatus consists of saturating and stripping sections connected by a section of metal tubing which could be sealed as desired by freezing a portion of the fluoride. All sections of the apparatus in contact with the molten fluoride or at high temperature were of nickel; welded construction and commercial Swagelok fittings were used throughout this metal portion. Some sections that the gas contacted only at low temperature were of copper or Teflon tubing. The saturatior and accessories, the connecting tube, the nickel vessel into which the solution was transferred, and the furnace assembly were identical to those used in a previous study.6
Pressures were measured on Bourdon pressure indicators of bronze, known as Ashcroft Laboratory Test Gauges. Pressures above atmospheric were read from a gage of 4.5 in. diameter face reading 0-30 lb ./sq . in. in 0.1 Ib./sq. in. subdivisions. Low pressures were read from a gage with a 7-in. diameter face showing 0-30 in. Hg in Va-in. subdivisions. These gages were calibrated in place by periodic comparison with a mercury U-tube manometer having a scale graduated in 1 mm. subdivisions.
The line through which HF was admitted to the saturator contained a filter made from a disc of sintered nickel (0.0004- in.-diameter pores) and a 2-liter surge tank of nickel. The filter effectively removed finely divided solid particles which were detached from the surfaces of heated lines carrying HF vapor. The surge tank diminished the pressure decrease when a portion of the melt was transferred to the stripping section.
Temperatures were controlled and recorded from ohromel- alumel thermocouples as in previous investigations.6 Once per day the melt temperature was checked with a standard platinum to platinum-rhodium thermocouple connected to a Leeds & Northrop type K-2 potentiometer. The temperatures probably were known to 5°.
Procedure.—The internal surfaces of the empty saturator, stripping section and connecting tube were treated at 600° with flowing hydrogen for 2 hours. A charge of approximately 2.5 1. (5 to 7.5 kg.) of molten salt was transferred to the saturator which was then isolated from the empty stripping section by establishing the frozen seal. The internal surfaces of the stripping section were conditioned by treatment at 600° with anhydrous HF vapor. The empty stripping section and the saturator containing the molten charge were flushed with He until the HF concentrations in the effluent streams diminished to values below 4 X 10 ~6 mole HF/1. The melt, at thermal equilibrium in the saturator, was saturated by sparging with HF at the desired pressure for 6 hours. After sparging was discontinued the HF was maintained at pressure as a covering atmosphere. The liquid level was measured by use of the electrical probe.6 Meanwhile the stripping section, which had been continually flushed with a stream of He, was closed and filled with He at a predetermined pressure such that about one-half the salt would transfer from the saturator when the frozen seal was destroyed. The frozen seal was melted and the molten salt was allowed to transfer until hydrostatic equilibrium was achieved. The frozen seal was immediately re-established and the final liquid level in the saturator was determined. The dissolved HF was stripped from the salt and absorbed in a standard solution of KOH in water. Stripping with He was discontinued (after about 75 1. had been passed) when the concentration of HF in the effluent stream dropped to about 4 X 10~6 mole/1. The 1IF absorbed in the KOH solution was determined by back titration with standard acid solution.
No attempts were made in the routine determinations to continue the final stripping until negligibly small quantities of HF remained in the molten salt. Instead, in several
T able ISolubility op HF in M olten NaF-ZrF, (53 mole % NaF)
Saturatingtem perature,
°C.Saturatingpressure,
(atm .)
H F solub ility X 105,
m oles/C cc. m elt)
K X io*, m oles H F
(cc . m e lt)(a tm .)
550 2.09 2.91 1.392.56 3.62 1.412.96 3.98 1.35
Av. 1.38 ± 0.02Caled, from eq. 1 1.45
G00 0.494 0.57 1.160.550 0.66 1.190.565 0.69 1.231.05 1.39 1.321.05 1.33 1.271.34 1.62 1.211.50 1.75 1.171.55 1.92 1.242.05 2.72 1.332.05 2.45 1.192.52 3.07 1.222.52 3.02 1.202.53 3.11 1.232.95 3.52 1.20
Av. 1.23 ± 0 .0 4Caled, from eq. 1 1.22
650 0.43 0.47 1.101.03 1.02 1.001.47 1.49 1.012.14 2.20 1.032.36 2.41 1.022.74 2.81 1.03
Av. 1.03 ± 0.02Caled, from eq. 1 1.06
700 0.62 0.58 0.931.16 1.08 .931.40 1.32 .951.79 1.68 .941.86 1.80 .972.75 2.42 .88 .
Av. .93 ± 0.02Caled, from eq. 1 .93
750 0.83 0.73 .881.15 1.00 .871.96 1.63 .84
Av. .86 ± 0.02Caled, from eq. 1 .83
800 0.42 0.31 .740.84 0.62 .741.51 1.14 .752.18 1.54 .732.48 1.75 .71
Av. .73 ± 0 .0 1Caled, from eq. 1 .74
separate experiments, a portion of molten salt which had been transferred under identical experimental conditions of temperature and pressure, but which had been saturated with helium instead of HF, was used to establish that about 0.3 mmole of HF was recovered by sparging with 75 1. of helium. This “ blank,” which amounted to 1 to 2% of the HF recovered by the regular procedure, was used to correct all the data presented in this report.
The volume of transferred salt was established from the
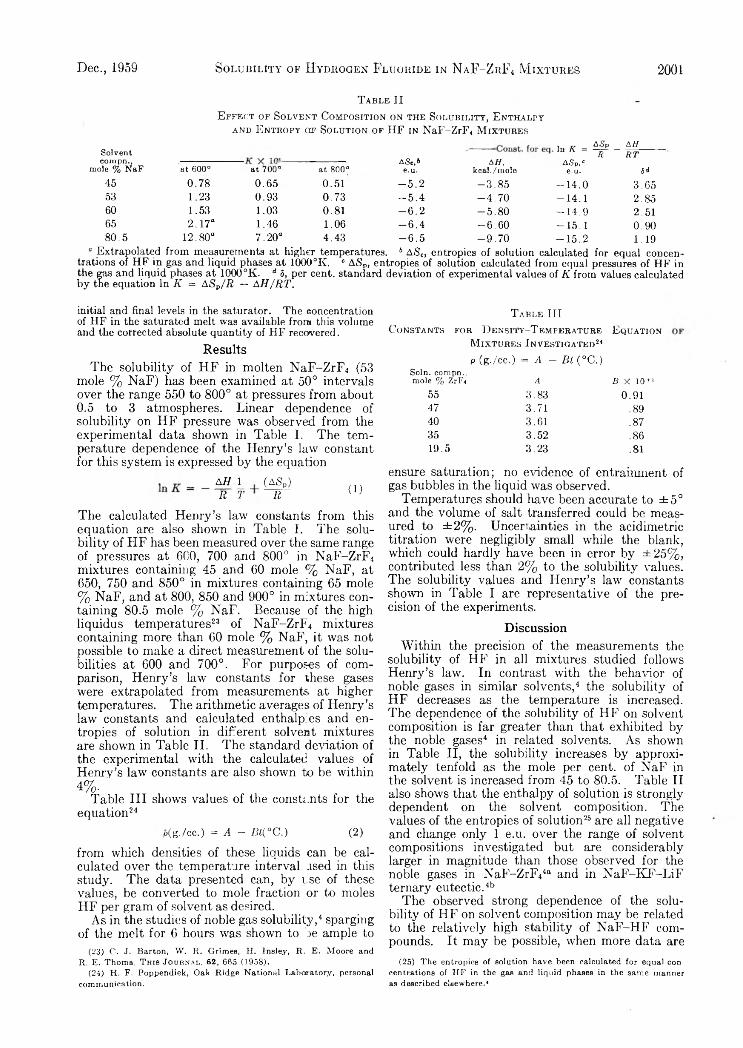
Dec., 1959 Solubility of Hydrogen Fluoride in NaF -Z rF4 M ixtures 2001
T a b l e IIE ff ect o f S o l v e n t C o m po sit io n on the So l u b il it y , E n th a lp y
and E n t r o p y o r So lu tio n o f HF in NaF-ZrF4 M ix t u r e s
Solvent compn.,
mole % NaF
in k = AJh _itASp,ce.u.
AH
ASc,&e.u.
AH,kcal./mole
RTat 600° at 700° at 800° Òd
45 0.78 0.65 0.51 - 5 . 2 -3 .8 5 -1 4 .0 3.6553 1.23 0.93 0.73 - 5 . 4 -4 .7 0 -1 4 .1 2.8560 1.53 1.03 0.81 - 6.2 -5 .8 0 -1 4 .9 2.5165 2.17“ 1.46 1.06 - 6 . 4 -6 .6 0 -1 5 .1 0.9080.5 12.80“ 7.20“ 4.43 - 6 . 5 -9 .7 0 -1 5 .2 1.19
“ Extrapolated from measurements at higher temperatures. b ASc, entropies of solution calculated for equal concentrations of HF in gas and liquid phases at 1000°K. * ASp, entropies of solution calculated from equal pressures of HF in the gas and liquid phases at 1000 “K. d 6, per cent, standard deviation of experimental values of K from values calculated by the equation In K = ASp/R — AH/RT.
initial and final levels in the saturator. The concentration of HF in the saturated melt was available from this volume and the corrected absolute quantity of HF recovered.
ResultsThe solubility of HF in molten NaF-ZrF4 (53
mole % NaF) has been examined at 50° intervals over the range 550 to 800° at pressures from about 0.5 to 3 atmospheres. Linear dependence of solubility on HF pressure was observed from the experimental data shown in Table I. The temperature dependence of the Henry’s law constant for this system is expressed by the equation
AH 1_ R T
(ASP)R ( 1)
The calculated Henry’s law constants from this equation are also shown in Table I. The solubility of HF has been measured over the same range of pressures at 600, 700 and 800° in NaF-ZrF4 mixtures containing 45 and 60 mole % NaF, at 650, 750 and 850° in mixtures containing 65 mole % NaF, and at 800, 850 and 900° in mixtures containing 80.5 mole % NaF. Because of the high liquidus temperatures23 of NaF-ZrF4 mixtures containing more than 60 mole % NaF, it was not possible to make a direct measurement of the solubilities at 600 and 700°. For purposes of comparison, Henry’s law constants for these gases were extrapolated from measurements at higher temperatures. The arithmetic averages of Henry’s law constants and calculated enthalpies and entropies of solution in different solvent mixtures are shown in Table II. The standard deviation of the experimental with the calculated values of Henry’s law constants are also shown to be within4%.
Table III shows values of the constants for the equation24
p(g./cc.) = A — Bi{° C.) (2)
from which densities of these liquids can be calculated over the temperature interval used in this study. The data presented can, by use of these values, be converted to mole fraction or to moles HF per gram of solvent as desired.
As in the studies of noble gas solubility, 4 sparging of the melt for 6 hours was shown to be ample to
(23) C. J. Barton, W. R. Grimes, H. Insley, R. E. Moore and R. E. Thoma, T his J o u r n a l , 62, 665 (1958).
(24) H. F. Poppendiek, Oak Ridge National Laboratory, personal communication.
T a b l e IIIC o n st a n t s fo r D e n sit y - T e m p e r a t u r e E q u a tio n
Soln. compn., mole % ZrL
M ix t u r e s I n v e st ig a t e d 24
p (g ./c c .) = A - B l(°C .)
A B X 10+»55 3.83 0.9147 3.71 .8940 3.61 .8735 3.52 .8619.5 3.23 .81
ensure saturation; no evidence of entrainment of gas bubbles in the liquid was observed.
Temperatures should have been accurate to ±5° and the volume of salt transferred could be measured to ± 2%. Uncertainties in the acidimetric titration were negligibly small while the blank, which could hardly have been in error by ±25%, contributed less than 2 % to the solubility values. The solubility values and Henry’s law constants shown in Table I are representative of the precision of the experiments.
DiscussionWithin the precision of the measurements the
solubility of HF in all mixtures studied follows Henry’s law. In contrast with the behavior of noble gases in similar solvents,4 the solubility of HF decreases as the temperature is increased. The dependence of the solubility of HF on solvent composition is far greater than that exhibited by the noble gases4 in related solvents. As shown in Table II, the solubility increases by approximately tenfold as the mole per cent, of NaF in the solvent is increased from 45 to 80.5. Table II also shows that the enthalpy of solution is strongly dependent on the solvent composition. The values of the entropies of solution25 are all negative and change only 1 e.u. over the range of solvent compositions investigated but are considerably larger in magnitude than those observed for the noble gases in NaF-ZrF44a and in NaF-KF-LiF ternary eutectic.4b
The observed strong dependence of the solubility of HF on solvent composition may be related to the relatively high stability of NaF-HF compounds. It may be possible, when more data are
(25) The entropies of solution have been calculated for equal concentrations of HF in the gas and liquid phases in the same manner as described elsewhere.4
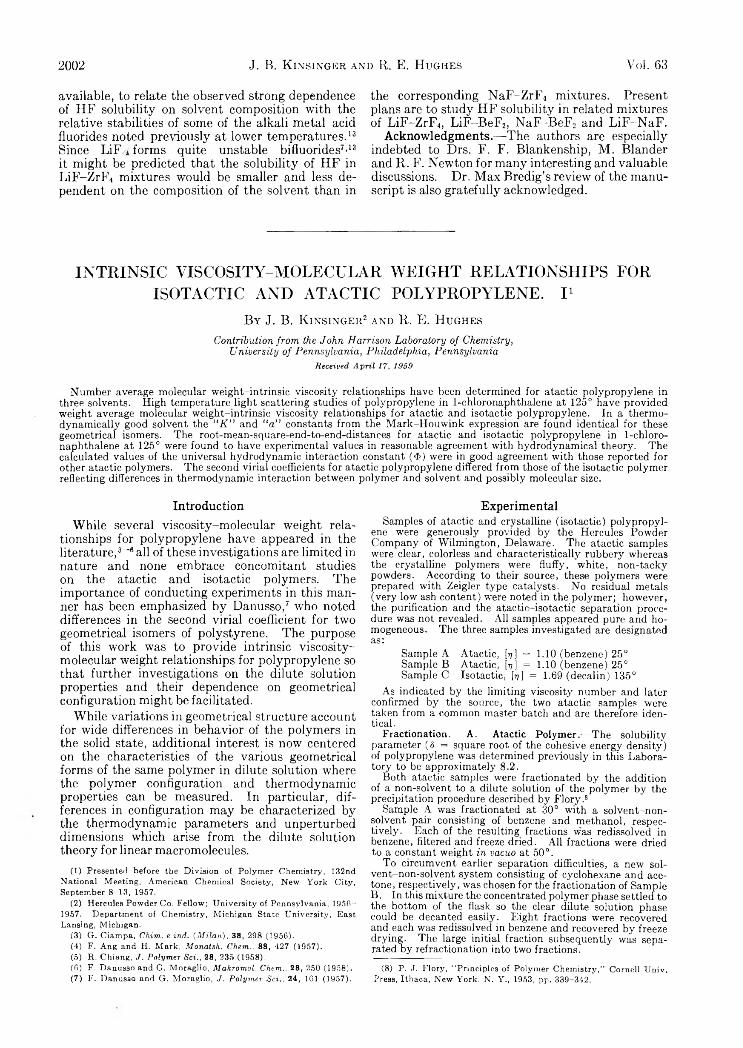
2002 J. B. K insinger and R. E. Hughes Vol. 63
available, to relate the observed strong dependence of HF solubility on solvent composition with the relative stabilities of some of the alkali metal acid fluorides noted previously at lower temperatures. 13 Since LiF j forms quite unstable bifluorides7'13 it might be predicted that the solubility of HF in LiF-ZrF4 mixtures would be smaller and less dependent on the composition of the solvent than in
the corresponding NaF-ZrF4 mixtures. Present plans are to study HF solubility in related mixtures of LiF-ZrF4, LiF BeP2, NaF -BeF2 and LiF-NaF.
Acknowledgments.— The authors are especially indebted to Drs. F. F. Blankenship, M. Blander and R. F. Newton for many interesting and valuable discussions. Dr. Max Bredig’s review of the manuscript is also gratefully acknowledged.
INTRINSIC VISCOSITY-MOLECULAR WEIGHT RELATIONSHIPS FOR ISOTACTIC AND ATACTIC POLYPROPYLENE. I 1
By J. B. K i n s i n g e r 2 a n d R. E. H u g h e s
Contribution from the John Harrison Laboratory of Chemistry,University of Pennsylvania, Philadelphia, Pennsylvania
Received April 17, 1959
Number average molecular weight-intrinsic viscosity relationships have been determined for atactic polypropylene in three solvents. High temperature light scattering studies of polypropylene in 1-chloronaphthalene at 125° have provided weight average molecular weight-intrinsic viscosity relationships for atactic and isotactic polypropylene. In a thermodynamically good solvent the “ K ” and “ a” constants from the Mark-Houwink expression are found identical for these geometrical isomers. The root-mean-square-end-to-end-distances for atactic and isotactic polypropylene in 1-chloronaphthalene at 125° were found to have experimental values in reasonable agreement with hydrodynamics! theory. The calculated values of the universal hydrodynamic interaction constant (<i>) were in good agreement with those reported for other atactic polymers. The second virial coefficients for atactic polypropylene differed from those of the isotactic polymer reflecting differences in thermodynamic interaction between polymer and solvent and possibly molecular size.
IntroductionWhile several viscosity-molecular weight rela
tionships for polypropylene have appeared in the literature, 3-15 all of these investigations are limited in nature and none embrace concomitant studies on the atactic and isotactic polymers. The importance of conducting experiments in this manner has been emphasized by Danusso,7 who noted differences in the second virial coefficient for two geometrical isomers of polystyrene. The purpose of this work was to provide intrinsic viscosity- molecular weight relationships for polypropylene so that further investigations on the dilute solution properties and their dependence on geometrical configuration might be facilitated.
While variations in geometrical structure account for wide differences in behavior of the polymers in the solid state, additional interest is now centered on the characteristics of the various geometrical forms of the same polymer in dilute solution where the polymer configuration and thermodynamic properties can be measured. In particular, differences in configuration may be characterized by the thermodynamic parameters and unperturbed dimensions which arise from the dilute solution theory for linear macromolecules.
(1) Presented before the Division of Polymer Chemistry, 132nd National Meeting, American Chemical Society, New York City, September 8-13, 1957.
(2) Hercules Powder Co. Fellow; University of Pennsylvania, 1956- 1957. Department of Chemistry, Michigan State University, East Lansing, Michigan.
(3) G. Ciampa, Chim. e ind. (Milan), 38, 298 (1956).(4) F. Ang and H. Mark, Monalsh. Chem., 88, 427 (1957).(5) R. Chiang, J. Polymer Sci., 28, 235 (1958).(6) F. Danusso and G. Moraglio, Makromol. Chem., 28, 250 (1958).(7) F. Danusso and G. Moraglio, J. Polymer Sci., 24, 161 (1957).
ExperimentalSamples of atactic and crystalline (isotactic) polypropyl
ene were generously provided by the Hercules Powder Company of Wilmington, Delaware. The atactic samples were clear, colorless and characteristically rubbery whereas the crystalline polymers were fluffy, white, non-tacky powders. According to their source, these polymers were prepared with Zeigler type catalysts. No residual metals (very low ash content) were noted in the polymer; however, the purification and the atactic-isotactic separation procedure was not revealed. All samples appeared pure and homogeneous. The three samples investigated are designated as:
Sample A Atactic, [j?] = 1.10 (benzene) 25°Sample B Atactic, [17] = 1.10 (benzene) 25°Sample C Isotactic, fo] = 1.69 (decalin) 135°
As indicated by the limiting viscosity number and later confirmed by the source, the two atactic samples were taken from a common master batch and are therefore identical .
Fractionation. A . Atactic Polym er.— The solubilityparameter (5 = square root of the cohesive energy density) of polypropylene was determined previously in this Laboratory to be approximately 8 .2 .
Both atactic samples were fractionated by the addition of a non-solvent to a dilute solution of the polymer by the precipitation procedure described by Fiory.8
Sample A was fractionated at 30° with a solvent-nonsolvent pair consisting of benzene and methanol, respectively. Each of the resulting fractions was redissolved in benzene, filtered and freeze dried. All fractions were dried to a constant weight in vacuo at 50°.
To circumvent earlier separation difficulties, a new solvent-non-solvent system consisting of cyclohexane and acetone, respectively, was chosen for the fractionation of Sample B. In this mixture the concentrated polymer phase settled to the bottom of the flask so the clear dilute solution phase could be decanted easily. Eight fractions were recovered and each was redissolved in benzene and recovered by freeze drying. The large initial fraction subsequently was separated by refractionation into two fractions.
(8) P. J. Fiory, “ Principles of Polymer Chemistry,” Cornell Univ. Press, Ithaca, New York. N. Y., 1953, pp. 339-342.
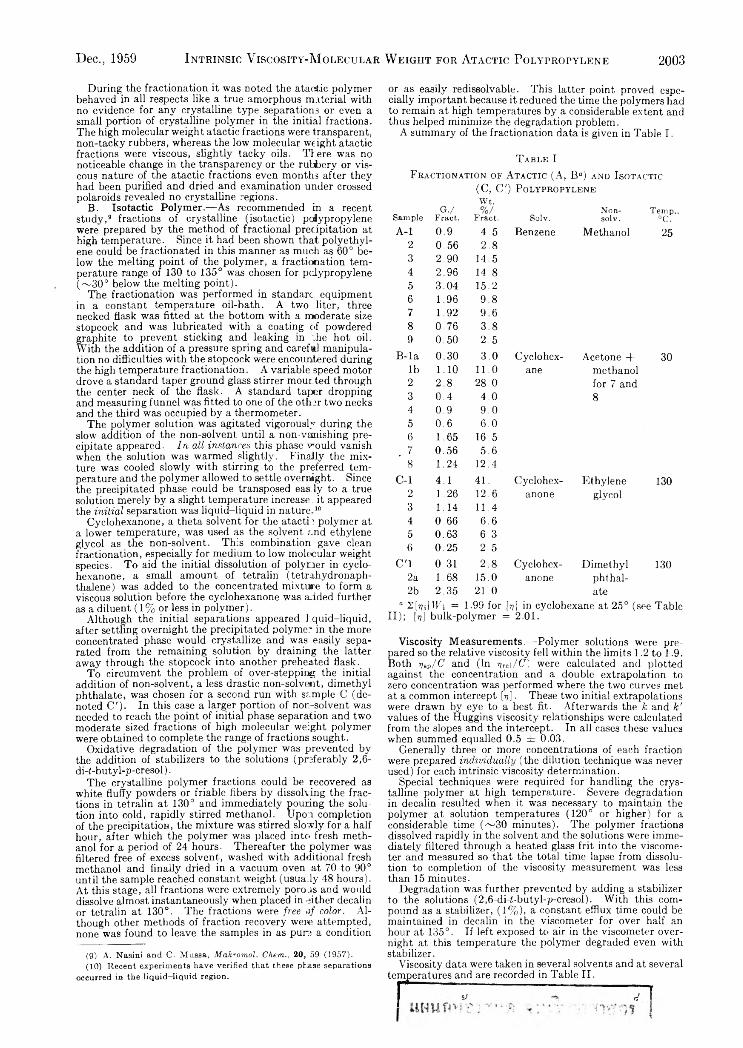
Dec., 1959 I ntrinsic V iscosity-M olecular W eight for Atactic Polypropylene 2003
During the fractionation it was noted the atactic polymer behaved in all respects like a true amorphous material with no evidence for any crystalline type separations or even a small portion of crystalline polymer in the initial fractions. The high molecular weight atactic fractions were transparent, non-tacky rubbers, whereas the low molecular weight atactic fractions were viscous, slightly tacky oils. There was no noticeable change in the transparency or the rubfoery or viscous nature of the atactic fractions even months after they had been purified and dried and examination under crossed polaroids revealed no crystalline regions.
B . Isotactic Polym er.— As recommended in a recent study,9 fractions of crystalline (isotactic) polypropylene were prepared by the method of fractional precipitation at high temperature. Since it had been shown that polyethylene could be fractionated in this manner as much as 60° below the melting point of the polymer, a fractionation temperature range of 130 to 135° was chosen for polypropylene (~ 3 0 ° below the melting point).
The fractionation was performed in standarc equipment in a constant temperature oil-bath. A two liter, three necked flask was fitted at the bottom with a moderate size stopcock and was lubricated with a coating of powdered graphite to prevent sticking and leaking in ffle hot oil. With the addition of a pressure spring and carefml manipulation no difficulties with the stopcock were encountered during the high temperature fractionation. A variable speed motor drove a standard taper ground glass stirrer mounted through the center neck of the flask. A standard taper dropping and measuring funnel was fitted to one of the other two necks and the third was occupied by a thermometer.
The polymer solution was agitated vigorously during the slow addition of the non-solvent until a non-vanishing precipitate appeared. In all instances this phase would vanish when the solution was warmed slightly. Finally the mixture was cooled slowly with stirring to the preferred temperature and the polymer allowed to settle overnight. Since the precipitated phase could be transposed eas.ly to a true solution merely by a slight temperature increase. it appeared the initial separation was liquid-liquid in nature-10
Cyclohexanone, a theta solvent for the atactic polymer at a lower temperature, was used as the solvent and ethylene glycol as the non-solvent. This combination gave clean fractionation, especially for medium to low molecular weight species. To aid the initial dissolution of polymer in cyclohexanone, a small amount of tetralin ( tetrahydronaph- thalene) was added to the concentrated mixture to form a viscous solution before the cyclohexanone was added further as a diluent (1 % or less in polymer).
Although the initial separations appeared 1.quid-liquid, after settling overnight the precipitated polymer in the more concentrated phase would crystallize and was easily separated from the remaining solution by draining the latter away through the stopcock into another preheated flask.
To circumvent the problem of over-stepping the initial addition of non-solvent, a less drastic non-solvent, dimethyl phthalate, was chosen for a second run with sample C (denoted C '). In this case a larger portion of non-solvent was needed to reach the point of initial phase separation and two moderate sized fractions of high molecular weight polymer were obtained to complete the range of fractions sought.
Oxidative degradation of the polymer was prevented by the addition of stabilizers to the solutions (preferably 2 ,6- di-f-buty 1-p-cresol).
The crystalline polymer fractions could be recovered as white fluffy powders or friable fibers by dissolving the fractions in tetralin at 130° and immediately pouring the solution into cold, rapidly stirred methanol. Upon completion of the precipitation, the mixture was stirred slowly for a half hour, after which the polymer was placed into fresh methanol for a period of 24 hours. Thereafter the polymer was filtered free of excess solvent, washed with additional fresh methanol and finally dried in a vacuum oven at 70 to 90° until the sample reached constant weight (usually 48 hours). At this stage, all fractions were extremely poro.is and would dissolve almost instantaneously when placed in either decalin or tetralin at 130°. The fractions were free of color. Although other methods of fraction recovery were attempted, none was found to leave the samples in as pure a condition
(9) A. Nasini and C. Mussa, Makromol. Chem., 20, 59 (1957).(10) Recent experiments have verified that these phase separations
occurred in the liquid-liquid region.
or as easily redissolvable. This latter point proved especially important because it reduced the time the polymers had to remain at high temperatures by a considerable extent and thus helped minimize the degradation problem.
A summary of the fractionation data is given in Table I .
T a b l e I
F r a c t io n a t io n o f A t a c t ic (A , B ° ) a n d I s o t a c t ic (C, C ') P o l y p r o p y l e n e
wt.G./ % / Non- Temp.,
Sample Fract. Fract. Solv. solv. °C.A -l 0.9 4 .5 Benzene Methanol 25
2 0.56 2.83 2.90 14.54 2.96 14.85 3.04 15.26 1.96 9.87 1.92 9.68 0 76 3.89 0.50 2.5
B-la 0.30 3.0 Cyclohex Acetone + 30lb 1.10 11.0 ane methanol2 2.8 28.0 for 7 and3 0.4 4.0 84 0.9 9.05 0.6 6.06 1.65 16.5
. 7 0.56 5.68 1.24 12.4
C-l 4.1 41. Cyclohex Ethylene 1302 1 26 12.6 anone glycol3 1.14 11.44 0.66 6.65 0.63 6.36 0.25 2.5
CT 0.31 2.8 Cyclohex Dimethyl 1302a 1.68 15.0 anone phthal2b 2.35 21.0 ate
. “ S M IF i = 1.99 for M in cyclohexane at 25° (see TableII); [tj] bulk-polymer = 2.01.
Viscosity Measurements.— Polymer solutions were prepared so the relative viscosity fell within the limits 1.2 to 1.9. Both ijap/C and (In r]rei/C) were calculated anil plotted against the concentration and a double extrapolation to zero concentration was performed where the two curves met at a common intercept [77]. These two initial extrapolations were drawn by eye to a best fit. Afterwards the k and k' values of the Huggins viscosity relationships were calculated from the slopes and the intercept. In all cases these values when summed equalled 0.5 ± 0.03.
Generally three or more concentrations of each fraction were prepared individually (the dilution technique was never used) for each intrinsic viscosity determination.
Special techniques were required for handling the crystalline polymer at high temperature. Severe degradation in decalin resulted when it was necessary to maintain the polymer at solution temperatures ( 120° or higher) for a considerable time (~ 3 0 minutes). The polymer fractions dissolved rapidly in the solvent and the solutions were immediately filtered through a heated glass frit into the viscometer and measured so that the total time lapse from dissolution to completion of the viscosity measurement was less than 15 minutes.
Degradation was further prevented by adding a stabilizer to the solutions (2,6-di-f-butyl-p-cresol). With this compound as a stabilizer, ( 1% ), a constant efflux time could be maintained in decalin in the viscometer for over half an hour at 135°. If left exposed to air in the viscometer overnight at this temperature the polymer degraded even with stabilizer.
Viscosity data were taken in several solvents and at several temperatures and are recorded in Table II.
f ; 7 1
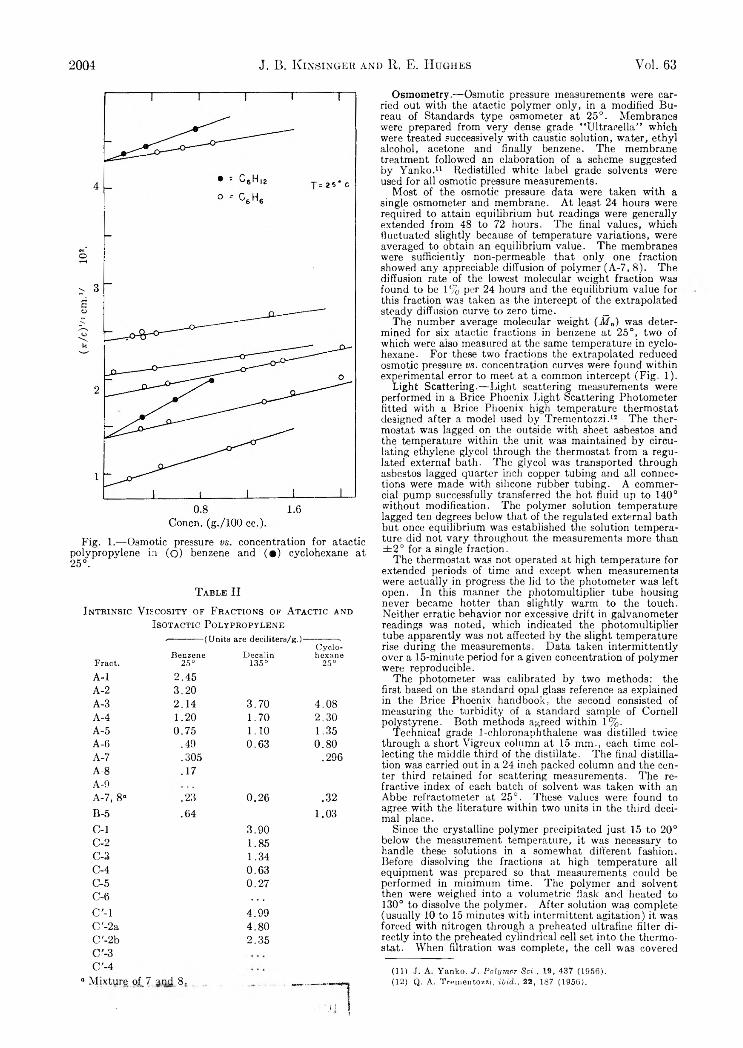
(3r/
c)‘/a
cm
.'/
102.
2004 J. B. K insinger and R. E. Hughes Vol. 63
Fig. 1.— Osmotic pressure vs. concentration for atactic polypropylene in (6 ) benzene and (®) cyclohexane at 25°.
T a b l e I I
I n tr in sic V isc o sit y o f F r a c t io n s o f A t a c t ic an d I sotactic P o l y p r o p y l e n e
--------------(Units are deciliters/g.)-------------.
Fract.Benzene
25°Decalin
135°Cyclohexane
25°A-l 2.45A-2 3.20A-3 2.14 3.70 4.08A-4 1.20 1.70 2.30A-5 0.75 1.10 1.35A-6 .49 0.63 0.80A-7 .305 .296A-8 .17A-9A-7, 8" .23 0.26 .32B-5 .64 1.03C-l 3.90C-2 1.85C-3 1.34C-4 0.63C-5 0.27C-6 • • .C '-l 4.99C '-2a 4.80C '-2bC'-3C'-4
2.35
° Mixture of.7 and_8. .
Osm om etry.— Osmotic pressure measurements were carried out with the atactic polymer only, in a modified Bureau of Standards type osmometer at 25°. Membranes were prepared from very dense grade “ Ultracella” which were treated successively with caustic solution, water, ethyl alcohol, acetone and finally benzene. The membrane treatment followed an elaboration of a scheme suggested by Yanko.11 Redistilled white label grade solvents were used for all osmotic pressure measurements.
Most of the osmotic pressure data were taken with a single osmometer and membrane. At least 24 hours were required to attain equilibrium but readings were generally extended from 48 to 72 hours. The final values, which fluctuated slightly because of temperature variations, were averaged to obtain an equilibrium value. The membranes were sufficiently non-permeable that only one fraction showed any appreciable diffusion of polymer (A-7, 8_). The diffusion rate of the lowest molecular weight fraction was found to be 1% per 24 hours and the equilibrium value for this fraction was taken as the intercept of the extrapolated steady diffusion curve to zero time. _
The number average molecular weight (M a) was determined for six atactic fractions in benzene at 25°, two of which were also measured at the same temperature in cyclohexane. For these two fractions the extrapolated reduced osmotic pressure vs. concentration curves were found within experimental error to meet at a common intercept (Fig. 1).
Light Scattering.— Light scattering measurements were performed in a Brice Phoenix Light Scattering Photometer fitted with a Brice Phoenix high temperature thermostat designed after a model used by Trementozzi.12 The thermostat was lagged on the outside with sheet asbestos and the temperature within the unit was maintained by circulating ethylene glycol through the thermostat from a regulated external bath. The glycol was transported through asbestos lagged quarter inch copper tubing and all connections were made with silicone rubber tubing. A commercial pump successfully transferred the hot fluid up to 140° without modification. The polymer solution temperature lagged ten degrees below that of the regulated external bath but once equilibrium was established the solution temperature did not vary throughout the measurements more than ± 2 ° for a single fraction.
The thermostat was not operated at high temperature for extended periods of time and except when measurements were actually in progress the lid to the photometer was left open. In this manner the photomultiplier tube housing never became hotter than slightly warm to the touch. Neither erratic behavior nor excessive drift in galvanometer readings was noted, which indicated the photomultiplier tube apparently was not affected by the slight temperature rise during the measurements. Data taken intermittently over a 15-minute period for a given concentration of polymer were reproducible.
The photometer was calibrated by two methods: the first based on the standard opal glass reference as explained in the Brice Phoenix handbook, the second consisted of measuring the turbidity of a standard sample of Cornell polystyrene. Both methods agreed within 1%.
Technical grade 1-chloronaphthalene was distilled twice through a short Vigreux column at 15 mm., each time collecting the middle third of the distillate. The final distillation was carried out in a 24 inch packed column and the center third retained for scattering measurements. The refractive index of each batch of solvent was taken with an Abbe refractometer at 25°. These values were found to agree with the literature within two units in the third decimal place.
Since the crystalline polymer precipitated just 15 to 20° below the measurement temperature, it was necessary to handle these solutions in a somewhat different fashion. Before dissolving the fractions at high temperature all equipment was prepared so that measurements could be performed in minimum time. The polymer and solvent then were weighed into a volumetric flask and heated to 130° to dissolve the polymer. After solution was complete (usually 10 to 15 minutes with intermittent agitation) it was forced with nitrogen through a preheated ultrafme filter directly into the preheated cylindrical cell set into the thermostat. When filtration was complete, the cell was covered
(11) J. A. Yanko, J. Polymer Sei., 19, 437 (1956).(12) Q. A. Trementozzi, ibid., 22, 187 (1956).

Dec., 1959 Intrinsic V iscosity-M olecular W eight for Atactic Polypropylene 2005
with a ground glass plate and the measurements taken after allowing ten minutes for temperature equilibrium. The heated filter was later flushed three times at high temperature with hot xylene and dried with air.
After the first concentration was measured, the cell was quickly removed, weighed and returned to the thermostat. Preheated, filtered solvent then was added to the cell, the amount measured by difference in weight of the solvent flask. If during successive additions, dust contaminated the solution, it was refiltered into the cell and the contents reweighed. The measurement of a fraction took from 30 minutes to an hour to complete. Although solvent was generally added to the initial polymer solution, one run was carried out by adding concentrated polymer solution to pure solvent. There was no indication from the data taken by these two methods that degradation was occurring. A single pass through the ultrafine filter was sufficient to clarify the 1-chloronaphthalene solutions.
All light scattering measurements were taken with unpolarized light in the Wittnauer type cell sold by the Phoenix Instrument Company. Angular deviations due to cell imperfections were checked by measuring the scattering of a dilute solution of fluorescein in water.
A Zeiss-Rayleigh type interferometer was used to measure the refractive index increment at two temperatures (25 and 50°) for solutions of atactic polypropylene ki 1-chloro- naphthalene and the data extrapolated to 125° to obtain (dn/dc). This extrapolated value also agreed clcsely with a value calculated with the Dale-Gladstone relationship using measured densities for both the polymer and tne solvent. However, the uncertainty in the high temperature refractive index increment values represent the major source of error in the weight average values for the various atact.c and crystalline fractions in this study (dra/dc in 1-chloronaphthalene at 125°; 5460 A. = -0 .22 7 , 4380 A. = -0 .228 ).
Considerable fluorescence in blue light develop sd in the 1- chloronaphthalene solutions when they were exposed to air at 140° or higher for short periods. Considerable effort was expended to restrict access of air to the solut-ons and all measurements were made with green light (546 mu).
At the high temperature the 1-chloronaphthalene produced strong penetrating fumes when the cell was opened at the top to add solvent. These vapors condensed inside the apparatus and were especially noticeable on the working standard which thus required regular cleaning before each run.
Results and DiscussionNumber Average Molecular Weight.— Several
equations relating the reduced osmotic pressure to concentration appear in the literature. In particular the two virial expansions used are
( tt/C) = ( t/C)0[1 + r 2C2 + g r 2C22 + .. ] ( l )
(t /C) = RT [ ¿ - + A tC + A tCt* + . . . ] (2)
By neglecting terms higher than C 2 in the expansion and setting g = l/i, equation 1 can he reduced to
M C )'h = U /Q o'M 1 + D C /21 (3)
where the second virial coefficients of (1) and (2) are related as A s — T2/ M n. According to the simple polymer theory A 2 = (v2/ V 1) ( l/2— x i) where v is the specific volume of the polymer, V i is the molar volume of the polymer and \i is the thermodynamic interaction parameter.
The number average molecular weight and second virial coefficients were determined for six atactic fractions from data plotted according tc equation 3 (Fig. 1). The values of ( 7t/C) were always less than three times (ir/C)o as suggested for this procedure. 13 The data which are given in Table III show a twenty-fold molecular weight range for the fractions measured.
Fig. 2.— (C /to) at (6) = 0 vs. concentration for two (®) atactic fractions and 6 (O) isotactic fractions of polypropylene. Solvent was 1-chloronaphthalene at 125°.
T a b l e IIIO sm otic P r e ssu r e D a t a a t 25°
f o r A ta c tic P o l y p r o p y l e n e
Fract. Solv. Mn X 10"*n
(cc./g.)A s (cc.
mole/'g.2) X 10* XI
A-3 Benzene 30 8 75 2.44 0.498A-4 Benzene 13.8 30 2.72 .498A-5 Benzene 7.58 25 3.30 .498A-6 Benzene 4.38 16 3.65 .497A-7, 8 Benzene 1.42 8 5.60 .496B-5 Benzene 6.00 15 2.52 .498A-7, 8 Cyclohexane 1.42 23 9.0 .35A-4 Cyclohexane 13.8 124 16.5 .42
Weight Average Molecular Weight.— M w wasobtained graphically by plotting (C/ r) against sin2 0/2 for each concentration and extrapolating the resulting curves to 0 — 0. The zero angle values (C / r0) were then plotted against concentration and the resulting curves extrapolated to zero concentration (C/t) 0 in accordance with the relationship
( C / r „ ) = ( C / r 0)» ( l + 2D C + . . . ) ( 4 )
The weight average molecular weight then was calculated from the relationship
Mw = H(C/r„y (5)(13) See ref. 7, Chapter . where

2006 J. B. K insinger and R. E. Hughes Vol. 63
_Mw.Fig. 3.—log [tj] vs. log M w for atactic (• ) and isotactic
(O, this work; o , ref. 3) polypropylene fractions in decalin at 135°.
Fig. 4.— Second virial coefficient A 2 vs. log M for atactic polypropylene in benzene (©), cyclohexane (c f ) at 25° and 1-chloronapthalene (• ) at 135°. Open circles are for isotactic polypropylene in 1-chloronaphthalene (o) at 125°.
H = 327rW (dre/dc)V3XW
Examples of these data are shown in Fig. 2. From the slopes and the values of M v ,_ A 2 was calculated from the relationship A 2 — T2/ M w. The pertinent light scattering results are summarized in Table IV where the data of Chiang6 are included for comparison.
Although Chiang’s light scattering data were taken in the same solvent at 140° our values of the second virial coefficient appear to be in reasonable agreement.
Intrinsic viscosity-molecular weight relationships were established by combining the viscosity data of Table A with the M n and M w of Tables III and IV, respectively, on a log-log plot. The two constants a and K from the empirical Mark- Houwink expression
[„] = KM* (6 )were evaluated from the slope and intercept respectively and are summarized for both weight and number average molecular weights in Table V. The two constants for benzene and cyclohexane in
the weight average value relationship were calculated from intrinsic viscosity data alone.
T a b l e IVL ig h t Sc a t t e b in g D a t a in 1 -C h l o r o n a p h t h a l e n e a t
125°
Fract. Afw M w/Mnr,
(cc./g.)At (cc.
m ole/g.2) X 10«
C '-2a 618,000 31.5 5.1C '-2b 235,000 15.5 6 .6A-3 383,000 1.23 22.4 5 .8A-4 170,000 1.26 14.1 8.3C-2 200,000 13.2 6.6C-3 124,000 8.5 6.8C-4 49,000 2.9 6.0C-5 16,500 1.1 6.9B-6 39,500 1.27 4.1 10.2F -l° 107,000 4.5 4.2F-2« 333,000 12.6 3.8F-3“ 500,000 17.5 3.5F-4“ 1 , 100,000 45.0 4.1; From ref. 5 (data taken in 1-chloronaphthalene at
140°).
T a b l e V Mu
Solv.Temp.,
°C.K x 10* “ a” Fract.
Benzene 25 2.70 0.71 6Cyclohexane 25 1.60 .80 6Decalin 135 1.38 .80 5
Decalin 135Mw
1.10 0.80 8Benzene 250 2.55 .70 5Cyclohexane 25 1.43 .80 5
The weight average molecular weight relationship for decalin taken from Fig. 3 shows excellent agreement with the relationship given by Chiang5 and his data are found to correspond closely to ours. This good correlation obtains despite the fact that our reported (dn/dc) values differ by enough to allow a 40% error in measured molecular weights. Since the agreement is generally good this variation in (dn/dc) must result from differences in measurement temperature plus solvent preparation and purity.
The high values of “ a ” for cyclohexane and decalin reflect their behavior as thermodynamically good solvents. This is expected since the cohesive energy density parameter of polypropylene, cyclohexane and decalin are nearly identical. The lower value for K in decalin at 135° suggests the chain is somewhat smaller under these conditions as the polymer molecule would possess greater flexibility at the higher temperature. 14 Benzene is only a moderately good solvent for atactic polypropylene and dissolution is slow unless the sample is warmed.
The data in decalin confirm the work of Danusso7 and Krigbaum15 on atactic and isotactic polystyrene that the intrinsic viscosity-molecular weight relationships for the two conformations are identical in a thermodynamically good solvent. This is especially gratifying since the measure-
(14) See ref. 7, Chapter 14.(15) W. R. Krigbaum. D. K. Carpenter and S. Newman, This
Journal, 62, 1586 (1958).

Dec., 1959 T hermal T ransition of R ibonucléase in Urea Solutions 2007
ments with isotactic polystyrene were taken while the polymer was in a metastable condition with respect to crystallization from solution.
The molecular weight heterogeneity of the fractions as shown in column 3 of Table IV. indicate a fairly narrow molecular weight distribution. There was no evidence from the fractionation or molecular weight data that either conformation of the polymer chain was highly branched.
The Second Virial Coefficients.— The dependence of the second virial coefficient A 2 on the conformation of the polymer chain recently has been confirmed by Krigbaum, Carpenter and Newman. 16 The work of these authors shows the second virial coefficient of the atactic polystyrene chain to be larger than an isotactic chain of identical molecular weight. They further propose that these data can be justified if the unperturbed dimensions (L 02/ M ) of the isotactic polystyrene are larger than those of the atactic polymer.
In Fig. 4 our log A 2 values as measured both osmotically and by light scattering are plotted against log M . The slight dependence of A 2 on molecular weight noted in most other synthetic polymers is verified for polypropylene. The curves for 1-chloronaphthalene at 125° show a noticeable difference in slope for the atactic and isotactic polymer; however, the general scatter in the data which reflects the high temperature and general experimental problems associated with light scattering measurements on crystalline polymers does not justify further comment on the relative chain dimensions from these data. The postulation that the isotactic polymer may have large unperturbed dimensions implies that, (1) the theta or “Flory” temperature may differ from the atactic and (2) either the second coefficient or the d temperature may ultimately reflect the degree of stereoregularity within the polymer chain. In a future paper we plan to discuss the results in thermodynamically poor solvents where segment-segment interactions are favored.
Size of the Polymer Chain.— The < z > average radius of gyration has been calculated from both Zimm plots (for the highest molecular weights) and by the dissymmetry technique. Table VI com
piles this data where the <2> average radius of gyration is given in cm.
T able VI
Fract.®
(«a2) '/ ! Zimm X 10», cm.
(Rx2)W2 Dissy. X 10*,
cm.<ï> X 10-21
(av. value)C '-2A 920 852 2.35C'-2B 860 855 1.90A-3 900 835A-4 520 485 2.1C-2 452C-3 350 2.5
“ Solvent is 1-chloronaphthalene at 125°.
The Zimm plots gave a somewhat larger radius of the polymer and for dimensions of chains this size little advantage was found in using this type of evaluation to determine the radius of the molecule. The dissymmetry method was simpler and gave radii which resulted in a calculated $ value somewhat nearer the accepted value measured for other polymer-solvent systems. An especially large <z> average radius value was obtained for the atactic sample A-3 and the reason for this is unknown.
The data show some variation in the value of the universal hydrodynamic interaction parameter $; however, the average value corresponds to that measured in other systems. 12 Under these conditions, the distribution of segments about the center of gravity of the molecule appears to remain Gaussian whether the polymer is atactic or isotactic. There is no evidence that the isotactic polymer is assuming the shape of stiff rods but this does not mean that some extended segments in the chain may not already be in the helical conformation found in the crystalline state. The viscosity also shows no sign of an overt change near the precipitation temperature as has been observed for cellulose polymers near the critical miscibility temperature. A transition from a Gaussian distribution of segments to a stiff rod-like molecule for the cellulosics under these conditions has been proposed to account for the sizable increase in the viscosity of the polymer. 16
(16) A. M. Holtzer, H. Benoit and P. Doty, T his Jottbnal. 5 8 , 624, 635 (1954).
THE THERMAL TRANSITION OF RIBONUCLEASE IN UREA SOLUTIONS
By John G. Foss and John A. Schellman
Department of Chemistry, University of Oregon, Eugene, Oregon • Received May 4* 1969
The temperature dependence of optical activity of ribonuclease has been measured in water and in several concentrated urea solutions. The observed features of the rotation-temperature curves are discussed qualitatively in terms of an “ inverted transition” followed by a “ normal transition.” The importance of refractive index corrections in the interpretation of rotation data is demonstrated.
The heat and urea dénaturations of proteins have been widely investigated as separate phenomena. If the hypothesis of Kauzmann is accepted1 that in most cases the effect of urea or of
(1) W. Kauzmann, “ Mechanism of Enzyme Action,” W. McElroy and B. Glass. Eds., John Hopkins Press, Baltimore, Md,, 1954.
high temperature is to destroy the stability of a hydrogen-bonded structure in favor of a flexible polypeptide chain, it must be concluded that the processes are closely related. In fact a qualitative description of dénaturation in agreement with most facts can be obtained with the simple as
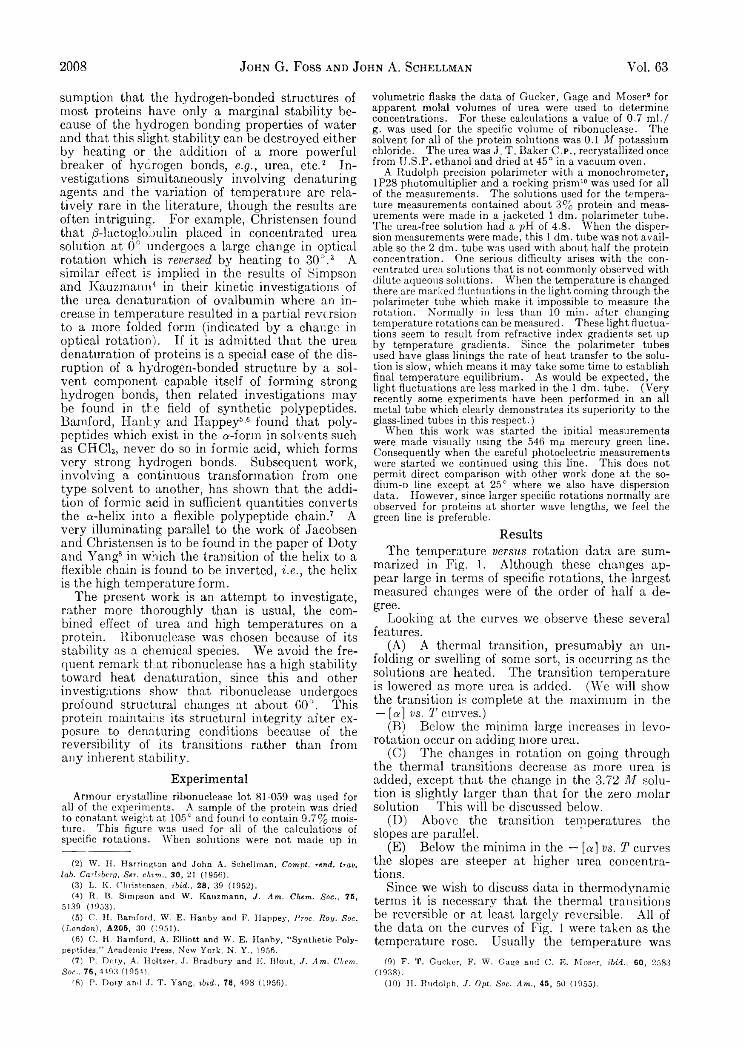
2008 John G. Foss and John A. Schellman Vol. 63
sumption that the hydrogen-bonded structures of most proteins have only a marginal stability because of the hydrogen bonding properties of water and that this slight stability can be destroyed either by heating or the addition of a more powerful breaker of hydrogen bonds, e.g ., urea, etc. 2 3 Investigations simultaneously involving denaturing agents and the variation of temperature are relatively rare in the literature, though the results are often intriguing. For example, Christensen found that /3-lactoglobulin placed in concentrated urea solution at 0 ° undergoes a large change in optical rotation which is reversed by heating to 30°.8 A similar effect is implied in the results of Simpson and Kauzmann4 5 in their kinetic investigations of the urea dénaturation of ovalbumin where an increase in temperature resulted in a partial reversion to a more folded form (indicated by a change in optical rotation). If it is admitted that the urea dénaturation of proteins is a special case of the disruption of a hydrogen-bonded structure by a solvent component capable itself of forming strong hydrogen bonds, then related investigations may be found in the field of synthetic polypeptides. Bamford, Hanby and Iiappey6’6 found that polypeptides which exist in the a-form in solvents such as CHCU, never do so in formic acid, which forms very strong hydrogen bonds. Subsequent work, involving a continuous transformation from one type solvent to another, has shown that the addition of formic acid in sufficient quantities converts the a-helix into a flexible polypeptide chain.7 A very illuminating parallel to the work of Jacobsen and Christensen is to be found in the paper of Doty and Yang8 in which the transition of the helix to a flexible chain is found to be inverted, i.e ., the helix is the high temperature form.
The present work is an attempt to investigate, rather more thoroughly than is usual, the combined effect of urea and high temperatures on a protein. Ribonucléase was chosen because of its stability as a chemical species. We avoid the frequent remark that ribonucléase has a high stability toward heat dénaturation, since this and other investigations show that ribonucléase undergoes profound structural changes at about 60°. This protein maintains its structural integrity after exposure to denaturing conditions because of the reversibility of its transitions rather than from any inherent stability.
ExperimentalArmour crystalline ribonucléase lot 81-059 was used for
all of the experiments. A sample of the protein was dried to constant weight at 105° and found to contain 9.7% moisture. This figure was used for all of the calculations of specific rotations. When solutions were not made up in
(2) W. H. Harrington and John A. Schellman, Compt. rend. trav. lab. Carlsberg, Ser. chim., 30, 21 (1956).
(3) L. K. Christensen, ibid., 28, 39 (1952).(4) R. B. Simpson and W. Kauzmann, J. Am. Chem. Soc.t 75,
5139 (1953).(5) C. H. Bamford, W. E. Hanby and F. Happey, Proc. Roy. Soc.
(London), A205, 30 (1951).(6) C. H. Bamford, A. Elliott and W. E. Hanby, “ Synthetic Poly
peptides," Academic Press, New York, N. Y., 1956.(7) P. Doty, A. Holtzer, J. Bradbury and E. Blout, J . Am. Chem.
Soc., 76,4493 (1954).(8) P- Doty and J. T. Yang, ibid., 78, 498 (1956).
volumetric flasks the data of Gucker, Gage and Moser9 for apparent molal volumes of urea were used to determine concentrations. For these calculations a value of 0.7 m l./ g. was used for the specific volume of ribonuclease. The solvent for all of the protein solutions was 0.1 M potassium chloride. The urea was J. T . Baker C.P., recrystallized once from U.S.P. ethanol and dried at 45° in a vacuum oven.
A Rudolph precision polarimeter with a monochrometer, 1P28 photomultiplier and a rocking prism10 was used for all of the measurements. The solutions used for the temperature measurements contained about 3% protein and measurements were made in a jacketed 1 dm. polarimeter tube. The urea-free solution had a pH of 4.8. When the dispersion measurements were made, this 1 dm. tube was not available so the 2 dm. tube was used with about half the protein concentration. One serious difficulty arises with the concentrated urea solutions that is not commonly observed with dilute aqueous solutions. When the temperature is changed there are marked fluctuations in the light coming through the polarimeter tube which make it impossible to measure the rotation. Normally in less than 10 min. after changing temperature rotations can be measured. These light fluctuations seem to result from refractive index gradients set up by temperature gradients. Since the polarimeter tubes used have glass linings the rate of heat transfer to the solution is slow, which means it may take some time to establish final temperature equilibrium. As would be expected, the light fluctuations are less marked in the 1 dm. tube. (Very recently some experiments have been performed in an all metal tube which clearly demonstrates its superiority to the glass-lined tubes in this respect.)
When this work was started the initial measurements were made visually using the 546 mix mercury green line. Consequently when the careful photoelectric measurements were started we continued using this line. This does not permit direct comparison with other work done at the so- dium-D line except at 25° where we also have dispersion data. However, since larger specific rotations normally are observed for proteins at shorter wave lengths, we feel the green line is preferable.
ResultsThe temperature versus rotation data are sum
marized in Fig. 1. Although these changes appear large in terms of specific rotations, the largest measured changes were of the order of half a degree.
Looking at the curves we observe these several features.
(A) A thermal transition, presumably an unfolding or swelling of some sort, is occurring as the solutions are heated. The transition temperature is lowered as more urea is added. (We will show the transition is complete at the maximum in the — [a] vs. T curves.)
(B) Below the minima large increases in levo- rotation occur on adding more urea.
(C) The changes in rotation on going through the thermal transitions decrease as more urea is added, except that the change in the 3.72 M solution is slightly larger than that for the zero molar solution This will be discussed below.
( D ) A b o v e t h e t r a n s i t i o n t e m p e r a t u r e s t h e s l o p e s a r e p a r a l l e l .
(E) Below the minima in the — [a] vs. T curves the slopes are steeper at higher urea concentrations.
Since we wish to discuss data in thermodynamic terms it is necessary that the thermal transitions be reversible or at least largely reversible. All of the data on the curves of Fig. 1 were taken as the temperature rose. Usually the temperature was
(9) F. T. Gucker, F. W. Gage and C. E. Moser, ibid., 60, 2583 (1938).
(10) H. Rudolph, J. Opt. Soc. Am., 45, 50 (1955).

Dec., 1959 Thermal T ransition of R ibonucléase in Urea Solutions 2009
permitted to rise as rapidly as possible but occasionally the temperature would be fixed for intervals ranging from 15 minutes to an hour to see whether the rotations remained constant. In all cases they did.
On cooling rapidly the rotations generally did not return to their original values immediately. The slowness of the reversal is not surprising since there must be a large decrease in entropy in going from the unfolded states to the intermediate activated complexes. The most carefully studied case was in 6.79 M urea. Here the temperature was quickly changed from 50 to 20° by running tap water through the polarimeter tube jaiket. The first measured rotation almost coincided with an extension of the high temperature slope of Fig. 1 to 20°. Apparently the protein was temporarily trapped in a thermodynamically unstable state. After 90 minutes the rotation was exactly that found on the way up. The 3.72 M urea solution was cooled rapidly from 70 to 20° and ;n 20 minutes the levorotation was +97° (about 77% reversed to its original value). With no urea the levorotation went to +93° (over 60% reversed) in 20 minutes on being cooled from 78 to 20°. All of this suggests that the reaction is probably almost completely reversible.
However, as with most protein kinetics, there are some interesting complications. Fcr example, in the 3.72 M solution the rotation was within 23% of its value on the ascending curve after 20 minutes. No more measurements were made that evening but the next morning the levorotation had increased to about 125°. Furthermore, the apparently well behaved 6.79 M solution did not continue behaving. At the end of the 90 minute period mentioned above the solution was rapidly cooled to 6 °. After 2 minutes the levorotation had changed from 114.0 to 118.8°. Nine minutes later it was at +117.5° and when left overnight at 6 ° it went to +113.4°.
We do regard these difficulties as important but the reactions apparently are largely reversible over a period of a few hours. So for simplicity we will neglect these peculiarities in most of our discussion.
The rotatory dispersions of the four solutions were measured. (Only four wave lengths were used: 546, 436, 365 and 313 m .) These data fitted a Heller plot11 with values of 232, 234, 220 and 223 m,u for X0 for the 0, 3.72, 6.79, and 7.75 molar solutions. Since the Xc values were based on only four points and a line fitted visually they are not too accurate but they should be useful for extrapolations.
DiscussionIn order to interpret the results in a reasonably
simple way we have chosen to use a two state model, i.e ., the protein is either native or denatured. This is almost certainly an approximation since there will be a number of intermediate, partially unfolded molecules. 12-13 But this sim-
(11) W. Heller, T his Journal, 62, 1569 (1958).(12) J. A. Schellman, ibid., 62, 1485 (1958).(13) J. A. Schellman, Compt. rend. trav. lab. Carlsberg, Ser. chim.,
30, 363 (1958).
Temp., °C.Fig. 1.— The temperature dependence of levorotation of
ribonuclease. Refractive index corrections are indicated for three points by arrows.
pie model is adequate to explain the observations of Fig. 1. We assume
[ « ] = / i [ « ] i + (1 — / i ) [ « ] e (1 )
where fi is the fraction of the protein molecules internally hydrogen bonded, i.e ., in the native state. 14 [a]i and [q;]e are the specific rotations of the native and denatured states. The subscripts I and E represent the state of peptide hydrogen bonding, partially internal for native ribonuclease, according to current beliefs, mostly external for the denatured form. Rearranging the equation gives
. [a] — M eJl [a], - [a]B
which may be used to evaluate a thermodynamic variable fi from the observed rotations. In order to do this we need to know the values of [a]i and [cc]e as functions of temperature.
The protein will be most stable at low temperatures in the absence of urea. Looking at Fig. 1 it can be seen that from 5 to 32° the levorotation is approximately constant at 87.3°. This value will be used as the specific rotation of the native ribonuclease.
In the high temperature, high urea concentration region there is a striking similarity in the slopes which we attribute to the intrinsic temperature dependence of rotation for the denatured protein.
(14) This is the equivalent of /h used previously in a discussion of helices.

2010 John G. Foss and John A. Schellman Vol. 63
Temp., °C.Fig. 2.— The temperature dependence of levorotation of
denatured ribonucléase corrected for refractive index differences.
The upper slopes do not lie on a common line because the refractive index differences of the urea solutions give rise to differences in the absolute values of rotations. By multiplying each rotation by
Ww2 + 2«u2 + 2
(where n w and nu are the refractive indices of the water and urea solutions) we are effectively comparing the rotations of the denatured protein molecules when they are in water. 13 Figure 2 shows the slopes above the maxima corrected in this way. The straight line is given by [« ]e = —128.5 + 0.33T(°C.).
One important conclusion to be drawn from the continuity of this upper slope through a large range of temperatures and urea concentration is that the specific rotation of the denatured form is completely independent of the presence of urea. The urea serves only to destroy the internally hydrogen- bonded protein structure. Once the protein is unfolded it makes no difference in rotation whether few or many urea molecules are combined with it. Further evidence for the view that the upper slope represents the temperature dependence of rotation of a random polypeptide chain comes from a consideration of the rotation-temperature data already in the literature. Oxidized ribonucléase lacks the stabilizing influence of the four disulfide links in native ribonucléase and should behave as a random chain in water. Recently reported data for its temperature dependence2 show a value of 0.25 between 20 and 30° compared to our value of 0.33 for denatured ribonucléase. Clupein in 0.1 M potassium chloride, chymotryp- sinogen in 8 M urea and a-chymotrypsin in 8 M urea all have a similar temperature coefficient of
rotation. 13 (All of these values were measured at the sodium-D line while our measurements were made at the 546 m/i mercury green line where the slopes will be about 20% greater. This difference may be calculated from a single Drude equation with the Ac value given above of 223 mp.)
Figure 3 shows/i versus temperature (with refractive index corrections applied to all the urea values). The most interesting feature of these curves is that in the urea solutions f i increases with temperature at low temperatures. This means that some of the denatured protein is being refolded as the temperature is increased ! Since this behavior is contrary to that normally observed with proteins it has been termed an “inverted transition.” 8 It can be seen in Fig. 3 that these inverted transitions are followed by “normal transitions” as the temperature is raised. We will now discuss qualitatively the reasons for this behavior in terms of a two state model.
When a protein is reversibly denatured we may represent the reaction occurring by
P(folded) > P(unfolded)
If there is only one solvent present, e.g ., water, what happens when this reaction takes place is that internal hydrogen bonds are replaced by external hydrogen bonds to water. This is, of course, a very crude picture which neglects, among other things, the possible effects of side chains, ionization, etc., on dénaturation. The free energy of unfolding in pure solvent will be designated by AFUnf(s) and is given by
AFunf(s) = Aflcnffs) - TASUnt(.s)
It is known that for proteins AjTunf(s) is positive, i.e ., energy is required to break the internal bonds and replace them with water. 1 However, there is a large increase in entropy on unfolding so that as the temperature is raised this term will eventually predominate as in any typical endothermic reaction.
If a denaturing agent such as urea is present this unfolding can be followed by a second step
P(unfolded) + rD < > PD r(unfolded)
in which r dénaturant molecules displace water and are adsorbed on some of the v adsorption sites which were not available on the unfolded protein. Although we have written this as a simple combination of r dénaturant molecules with each unfolded protein molecule, this only represents an average number. There can be from zero to v dénaturant molecules adsorbed on the unfolded protein molecules, assuming one dénaturant per site. The free energy for this reaction depends on r. This dependence is stressed by designating the free energy of combination by A F comb(r).
The over-all A F unf will now be given byAF unf = AFunf(s) + AFcomb(r) (2)
This new AFUnf will differ from the original value in pure solvent for two reasons. If the dénaturant is more strongly adsorbed than the water it will decrease the heat of the unfolding. On the other hand, whenever a dénaturant is adsorbed from solution it loses a good deal of its freedom and therefore there will be a decrease in entropy favoring
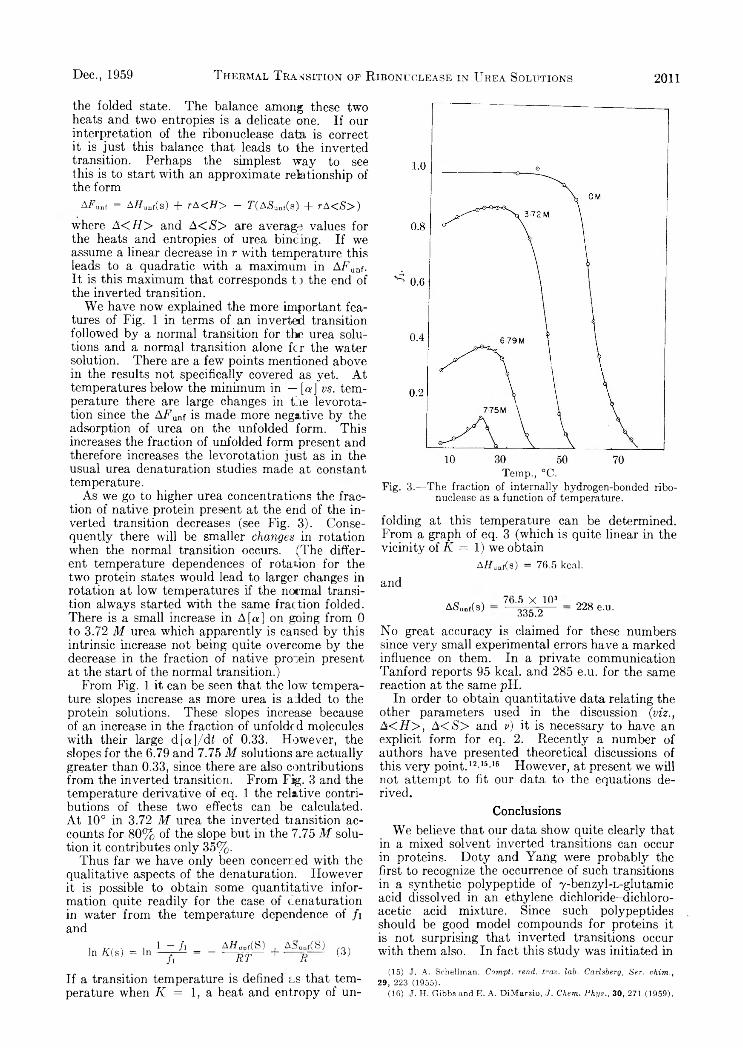
Dec., 1959 T hebmal T ransition of R ibonuolease in Urea Solutions 2011
the folded state. The balance among these two heats and two entropies is a delicate one. If our interpretation of the ribonucléase data is correct it is just this balance that leads to the inverted transition. Perhaps the simplest way to see this is to start with an approximate relationship of the form
AFunt = Affunf(s) + rA < H > — T(ASuni(s) + rA<S> )
where A < H > and A<»S'> are average values for the heats and entropies of urea bincing. If we assume a linear decrease in r with temperature this leads to a quadratic with a maximum in AFunf. It is this maximum that corresponds to the end of the inverted transition.
We have now explained the more important features of Fig. 1 in terms of an invert«! transition followed by a normal transition for the urea solutions and a normal transition alone fcr the water solution. There are a few points mentioned above in the results not specifically covered as yet. At temperatures below the minimum in — [a] vs. temperature there are large changes in the levorota- tion since the AFunf is made more negative by the adsorption of urea on the unfolded form. This increases the fraction of unfolded form present and therefore increases the levorotation just as in the usual urea dénaturation studies made at constant temperature.
As we go to higher urea concentrations the fraction of native protein present at the end of the inverted transition decreases (see Fig. 3). Consequently there will be smaller changes in rotation when the normal transition occurs. (The different temperature dependences of rotation for the two protein states would lead to larger changes in rotation at low temperatures if the normal transition always started with the same fraction folded. There is a small increase in A [a] on going from 0 to 3.72 M urea which apparently is caused by this intrinsic increase not being quite overcome by the decrease in the fraction of native protein present at the start of the normal transition.)
From Fig. 1 it can be seen that the low temperature slopes increase as more urea is added to the protein solutions. These slopes increase because of an increase in the fraction of unfolded molecules with their large d [«]/di of 0.33. However, the slopes for the 6.79 and 7.75 M solutions are actually greater than 0.33, since there are also contributions from the inverted transition. From Fig. 3 and the temperature derivative of eq. 1 the relative contributions of these two effects can be calculated. At 10° in 3.72 M urea the inverted transition accounts for 80% of the slope but in the 7.75 M solution it contributes only 35%.
Thus far we have only been concerned with the qualitative aspects of the dénaturation. However it is possible to obtain some quantitative information quite readily for the case of cenaturation in water from the temperature dependence of f\ and
In K (s) = In 1 — 7i _ _ A7/„rf(S) fi ~ RT
+ A 5Unf( fe)R (3)
If a transition temperature is defined as that temperature when K = 1, a heat and entropy of un
Temp., °C.Fig. 3.—The fraction of internally hydrogen-bonded ribo
nucléase as a function of temperature.
folding at this temperature can be determined. From a graph of eq. 3 (which is quite linear in the vicinity of K = 1) we obtain
Aifunf(s) = 76.5 kcal.and
A$unf( s)76.5 X 10³
335.2 228 e.u.
No great accuracy is claimed for these numbers since very small experimental errors have a marked influence on them. In a private communication Tanford reports 95 kcal. and 285 e.u. for the same reaction at the same pH.
In order to obtain quantitative data relating the other parameters used in the discussion (viz., & < H > , A < S > and v) it is necessary to have an explicit form for eq. 2. Recently a number of authors have presented theoretical discussions of this very point. 12’15’16 However, at present we will not attempt to fit our data to the equations derived.
ConclusionsWe believe that our data show quite clearly that
in a mixed solvent inverted transitions can occur in proteins. Doty and Yang were probably the first to recognize the occurrence of such transitions in a synthetic polypeptide of y-benzyl-L-glutamic acid dissolved in an ethylene dichloride-dichloro- acetic acid mixture. Since such polypeptides should be good model compounds for proteins it is not surprising that inverted transitions occur with them also. In fact this study was initiated in
(15) J. A. Schellman, Compt. rend, trav. lab. Carlsberg, Ser. chim., 29, 223 (1955).
(16) J. H. Gibbs and E. A. DiM arzio, J . Chem. P h ys., 30, 271 (1959).

2012 John G. Foss and John A. Schoolman Vol. 63
an attempt to find such a transition after Doty and Yang’s results were first reported.
One of the differences between our results and theirs is that with ribonucléase the inverted transition is followed by a normal transition. In retrospect it now seems quite clear that all inverted transitions must be followed by a normal transition if the temperature is raised sufficiently. This is implicit in Doty and Yang’s discussion of inverted transitions and is stated quite explicitly by Gibbs and DiMarzio. We are currently studying the temperature dependence of rotation and viscosity for lysozyme to see whether its behavior parallels that of ribonucléase in this respect.
If we now examine the data of L. K. Christensen3 mentioned in the Introduction it is apparent that it can also be interpreted as the result of an inverted transition. One of the main differences between ribonucléase and lactoglobulin is that the latter exhibits irreversible effects more quickly. Christensen found that lactoglobulin in 38% urea underwent a slow change in rotation at 30°. The levorotation at the sodium-D line went from approximately 40 to 63° in six hours. Twice during this interval the solution was rapidly cooled to 1 0° and an increase was observed in levorotation. This brought its value to coincidence with a curve of a rotation-time experiment carried out at 10°. In terms of our Fig. 1 this would indicate that the 30° measurements were made near one of the minima. On cooling, an inverted transition occurred and levorotation increased as more denatured protein appeared. (Jacobsen and Christensen17 have reported parallel measurements in which solubility changes were used as a criterion for dénaturation. The results were essentially the same.)
Simpson and Kauzmann have reported an extensive series of measurements on the kinetics of the urea dénaturation of ovalbumin.4 This protein also appears to exhibit an inverted transition since heating an 8.3 M urea solution of ovalbumin from 0 to 30° causes a decrease in the levorotation. It should be emphasized that our results and interpretations are thermodynamic and not offered as an explanation of kinetic data. However it seems very probable that there is a connection between the maxima in our Fig. 3 and minima found by Simpson and Kauzmann in their rate-temperature
(17) C. F. Jacobsen and L. K. Christensen, Nature, 161, 30 (1948).
data for ovalbumin (see their Fig. 4); but we will not attempt to interpret this point at present.
We have pointed out already that the data presented for ribonuclease, plus what published data are available, suggest that the observed marked temperature dependence of rotation for the unfolded protein may be generally true. In addition, the rules of Kauzmann and Eyring18 also point to a larger temperature dependence of rotation for the unfolded compared to the folded form. (Briefly, these rules state that raising the temperature permits greater rotation about the bonds involved in optical activity which decreases their average asymmetry and therefore their contribution to the activity. The temperature effect on ring structures will be less marked since the rotation is more restricted. These rules have been shown to hold for a great many smaller molecules.) This temperature dependence is worth emphasizing since being unaware of it can lead to the erroneous interpretation of rotation data. An example of what we believe to be such an erroneous interpretation has just been published16 in a discussion of Doty and Yang’s data for poly-7 -benzyl-L-glutamate. As already mentioned, this polypeptide undergoes an inverted transition similar to that reported in this paper. However, they did not go to high enough temperatures to observe the normal transition and the large temperature of rotation for the unfolded polypeptide which we believe follows. If this prediction is correct then the values for the fraction of polypeptide folded as a function of temperature calculated by Gibbs and DiMarzio would be very badly in error. However, in this case they were only interested in showing that an explicit form of our eq. 2 could be made to fit a set of experimental data using reasonable parameters and this calculation is a minor point in their paper.
Finally, we would like to emphasize the potential importance of refractive index corrections for such studies. Figures 1 and 2 show that applying such corrections can largely eliminate solvent effects and thus permit legitimate comparison of rotations in different solvents. Unfortunately, refractom- eters for the ultraviolet are not commonly available at present.
Acknowledgment.— The authors wish to acknowledge the generous financial support of the National Institutes of Health.
(18) W. Kauzmann and H. Eyring, J, Chem. Phys., 9, 41 (1941).
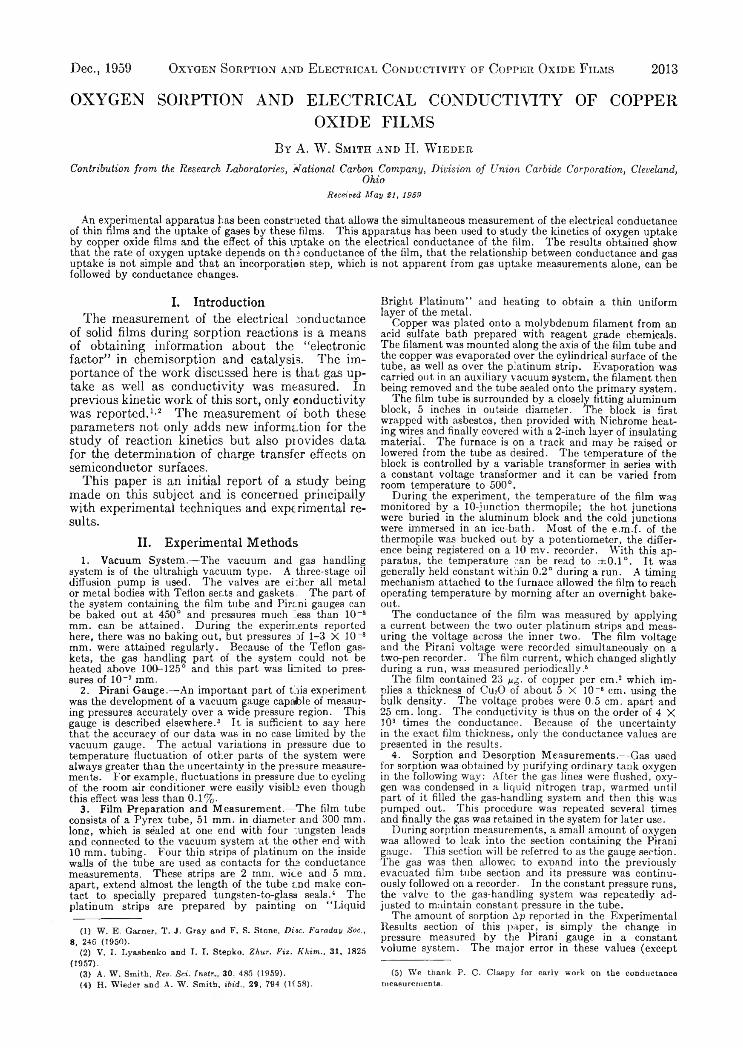
OXYGEN SORPTION AND ELECTRICAL CONDUCTIVITY OF COPPEROXIDE FILMS
By A. W. S m i t h a n d H. W i e d e r
Contribution from the Research Laboratories, National Carbon Company, Division of Union Carbide Corporation, Cleveland,Ohio
Received May $1, 1959
An experimental apparatus has been constructed that allows the simultaneous measurement of the electrical conductance of thin films and the uptake of gases by these films. This apparatus has been used to study the kinetics of oxygen uptake by copper oxide films and the effect of this uptake on the electrical conductance of the film. The results obtained show that the rate of oxygen uptake depends on the conductance of the film, that the relationship between conductance and gas uptake is not simple and that an incorporation step, which is not apparent from gas uptake measurements alone, can be followed by conductance changes.
Dec., 1959 Oxygen Sorption and Electrical Conductivity of Copper Oxide Films 2013
I. IntroductionThe measurement of the electrical conductance
of solid films during sorption reactions is a means of obtaining information about the “electronic factor” in chemisorption and catalysis. The importance of the work discussed here is that gas uptake as well as conductivity was measured. In previous kinetic work of this sort, only conductivity was reported.1'2 The measurement of both these parameters not only adds new information for the study of reaction kinetics but also provides data for the determination of charge transfer effects on semiconductor surfaces.
This paper is an initial report of a study being made on this subject and is concerned principally with experimental techniques and experimental results.
II. Experimental Methods1. Vacuum System.— The vacuum and gas handling
system is of the ultrahigh vacuum type. A three-stage oil diffusion pump is used. The valves are ebher all metal or metal bodies with Teflon seats and gaskets The part of the system containing the film tube and Pirani gauges can be baked out at 450° and pressures much ess than 10-8 mm. can be attained. During the experiments reported here, there was no baking out, but pressures of 1-3 X 10⁻⁸ mm. were attained regularly. Because of the Teflon gaskets, the gas handling part of the system could not be heated above 100-125° and this part was limited to pressures of 10-7 mm.
2. Pirani Gauge.— An important part of this experiment was the development of a vacuum gauge capable of measuring pressures accurately over a wide pressure region. This gauge is described elsewhere.3 It is sufficient to say here that the accuracy of our data was in no case limited by the vacuum gauge. The actual variations in pressure due to temperature fluctuation of other parts of the system were always greater than the uncertainty in the pressure measurements. For example, fluctuations in pressure due to cycling of the room air conditioner were easily visibb even though this effect was less than 0 .1% .
3. Film Preparation and Measurement.—The film tube consists of a Pyrex tube, 51 mm. in diameter and 300 mm. long, which is sealed at one end with four mngsten leads and connected to the vacuum system at the other end with 10 mm. tubing. Four thin strips of platinum on the inside walls of the tube are used as contacts for the conductance measurements. These strips are 2 mm. wice and 5 mm. apart, extend almost the length of the tube and make contact to specially prepared tungsten-to-glass seals.4 The platinum strips are prepared by painting on “ Liquid
(1) W. E. Garner, T. J. Gray and F. S. Stone, Disc. Faraday Soc., 8, 246 (1950).
(2) V. I. Lyashenko and I. I. Stepko, Zhur. Fiz. Khim., 31, 1825 (1957).
(3) A. W. Smith, Rev. Sci. I n s l r 30. 485 (1959).(4) H. Wieder and A. W. Smith, ibid., 29, 794 (1158).
Bright Platinum” and heating to obtain a thin uniform layer of the metal.
Copper was plated onto a molybdenum filament from an acid sulfate bath prepared with reagent grade chemicals. The filament was mounted along the axis of the film tube and the copper was evaporated over the cylindrical surface of the tube, as well as over the platinum strip. Evaporation was carried out in an auxiliary vacuum system, the filament then being removed and the tube sealed onto the primary system.
The film tube is surrounded by a closely fitting aluminum block, 5 inches in outside diameter. The block is first wrapped with asbestos, then provided with Nichrome heating wires and finally covered with a 2-inch layer of insulating material. The furnace is on a track and may be raised or lowered from the tube as desired. The temperature of the block is controlled by a variable transformer in series with a constant voltage transformer and it can be varied from room temperature to 500°.
During the experiment, the temperature of the film was monitored by a 10-junction thermopile; the hot junctions were buried in the aluminum block and the cold junctions were immersed in an ice-bath. Most of the e.m.f. of the thermopile was bucked out by a potentiometer, the difference being registered on a 10 mv. recorder. With this apparatus, the temperature can be read to ± 0 .1 ° . It was generally held constant within 0.2° during a run. A timing mechanism attached to the furnace allowed the film to reach operating temperature by morning after an overnight bake- out.
The conductance of the film was measured by applying a current between the two outer platinum strips and measuring the voltage across the inner two. The film voltage and the Pirani voltage were recorded simultaneously on a two-pen recorder. The film current, which changed slightly during a run, was measured periodically.5
The film contained 23 ng. of copper per cm.2 which implies a thickness of 0u 2O of about 5 X 10~6 cm. using the bulk density. The voltage probes were 0.5 cm. apart and 25 cm. long. The conductivity is thus on the order of 4 X 10s times the conductance. Because of the uncertainty in the exact film thickness, only the conductance values are presented in the results.
4. Sorption and Desorption Measurements.— Gas used for sorption was obtained by purifying ordinary tank oxygen in the following way: After the gas lines were flushed, oxygen was condensed in a liquid nitrogen trap, warmed until part of it filled the gas-handling system and then this was pumped out. This procedure was repeated several times and finally the gas was retained in the system for later use.
During sorption measurements, a small amount of oxygen was allowed to leak into the section containing the Pirani gauge. This section will be referred to as the gauge section. The gas was then allowed to expand into the previously evacuated film tube section and its pressure was continuously followed on a recorder. In the constant pressure runs, the valve to the gas-handling system was repeatedly adjusted to maintain constant pressure in the tube.
The amount of sorption Ap reported in the Experimental Results section of this paper, is simply the change in pressure measured by the Pirani _ gauge in a constant volume system. The major error in these values (except
(5) We thank P. C. Claapy for early work on the conductance measurements.
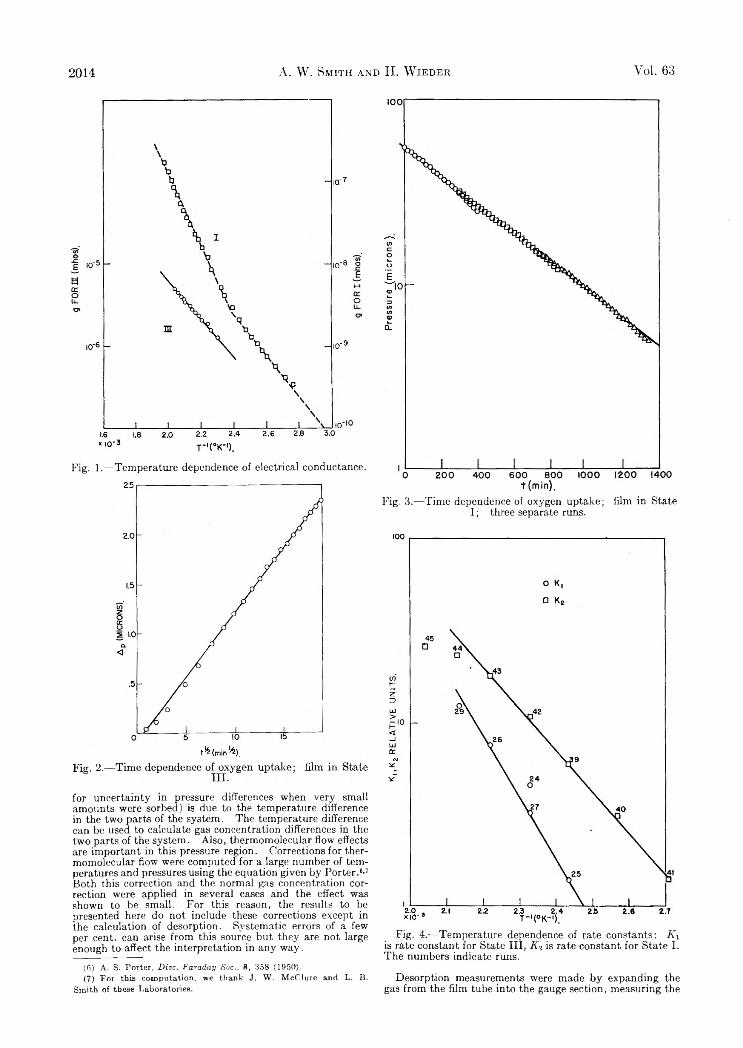
2014 A. W. Smith and H. W ieder Vol. 63
Fig. 1.— Temperature dependence of electrical conductance.
for uncertainty in pressure differences when very small amounts were sorbed) is due to the temperature difference in the two parts of the system. The temperature difference can be used to calculate gas concentration differences in the two parts of the system. Also, thermomolecular flow effects are important in this pressure region. Corrections for thermomolecular flow were computed for a large number of temperatures and pressures using the equation given by Porter.6-7 Both this correction and the normal gas concentration correction were applied in several cases and the effect was shown to be small. For this reason, the results to be presented here do not include these corrections except in the calculation of desorption. S3'stematic errors of a few per cent, can arise from this source but they are not large enough to affect the interpretation in any way.
(6) A. S. Porter, Disc. Faraday Soc., 8, 358 (1950).(7) For this computation, we thank J. W. McClure and L. B.
Smith of these Laboratories.
Fig. 3.— Time dependence of oxygen uptake; film in State I; three separate runs.
Fig. 4.— Temperature dependence of rate constants: Kj is rate constant for State III, Ki is rate constant for State I. The numbers indicate runs.
Desorption measurements were made by expanding the gas from the film tube into the gauge section, measuring the

Dec., 1959 Oxygen Sorption and Electrical Conductivity of Copper Oxide Films 2015
new over-all pressure, and then pumping out just the gauge section, the cycles continuing until the pressure was too low to be measured.
HE. Experimental ResultsThe copper oxide films are light yellow when first
oxidized, becoming darker with further oxidation and ultimately reaching a dark brown color. Reduced to their lowest conductivity using hydrogen at 200°, the films have a reddish cast. In terms of sorption and conductance behavior, we can distinguish four states. In the reduced state (State I), there is rapid sorption of oxygen accompanied by negligible conductance change. After some oxygen is incorporated into the film, State II is reached, at which point rapid oxygen sorption is now accompanied by a definite conductance change, the two being related almost parabolically. With further incorporation of oxygen, State III is reached, as determined by the nearly linear relationship between sorption and conductance. State IV, which appears after strong oxidation, shows negligible oxygen sorption and conductance change, while for the first time permitting rapid hydrogen sorption.
In passing from the reduced state to the oxidized state, the electrical conductance changes in a way typical of polycrystalline oxides, which is described by Meyer’s rule.8 This states that the increased conductivity upon departure from stoichiometry is due largely to a decrease in the exponential temperature factor, the activation energy for conduction. For the copper oxide film, the conduction in all cases was p-type, determined both by the sign of the conductance change during sorption of oxygen or hydrogen and in a, few cases by the sign of the thermoelectric power.
The results to be presented here refer to one film in States I, II and III. The electrical conductance measured in States I and III is plotted logarithmically versus the reciprocal temperature in Fig. 1. Activation energies for conduction determined from the slopes of these lines yield values of 0.87 and 0.50 e.v. for State I and 0.45 e.v. foi State III. Results for other films indicate that the break in the curve for State I is atypical.
The kinetics of the uptake of oxygen on copper oxides has been studied by the Bristol workers.9 Both a Langmuir type adsorption curve and an Elovich (also called Rojinski-Zeldowich) type curve have been used. In some cases an Elovich type plot fits our data, but a better and less arbitrary fit is a simple parabolic curve for State III and a simple first-order curve of logarithm pressure versus time for State I. These curves are shown in Figs. 2 and 3. The.small amount of scatter to these points shows the accuracy of the pressure measurements. An attempt has been made to relate the experimental kinetics to a reaction mechanism. This problem will be discussed in a late r communication, since these data alone do not establish an unequivocal mechanism. Since surface areas were measured only on subsequent films, one can only estimate that in the present case the largest uptake of oxygen during a run corresponded to less than 0 .2 monolayer.
(8) W. Meyer and H. Neldel, Z. Tech. Phys., 18, 388 '1937).(9) T. J. Jennings and F. S. Stone, Adv. in Catalys s, 9, 441 (1957).
Ap (microns) ÏÏE.0 .5 1.0 1.5 2.0
Fig. 5.— Conductance change versus gas uptake.
Fig. 6.— Variation of rate constant with initial conductance; film in State III; the numbers indicate the runs.
Fig. 7.— Conductance change during sorption and incorporation.
Data of the type shown in Figs. 2 and 3 have been recorded at a number of temperatures and the resultant curves are used to obtain rate constants from which activation energies may be calculated. The plots of the logarithm of the rate constants

2016 V. Baliah and Sp. Shanmuganathan Vol. 63
K i and K 2 v e r s u s reciprocal temperature, shown in Fig. 4, yield activation energies for sorption of 10 and 16 kcal. for States I and III, respectively. This does not imply that only one activation energy would be found in each state; more likely the activation energy increases continuously as oxygen is incorporated. Jennings and Stone found an activation energy of 7 kcal. for cuprous oxide on copper metal.9
The electrical conductance may be plotted against time or against gas uptake. Figure 5 shows typical plots of the conductance change v e r s u s the gas uptake. In State II, this is more or less parabolic while the data for State III can be fit by a more complex function. The most important point is that the conductance change is not directly proportional to the gas uptake, the shape of the curve depending strongly on the state of the film.
Many measurements were made to show that the rate of oxygen sorption depends on the stoichiometry of the film as determined by the conductance. Figure 6 shows how the rate constant in State III varies with the conductance at the beginning of a sorption run. Since each run followed an overnight bakeout in vacuum, the initial conductance is due to changes in the bulk stoichiometry rather than being just a surface effect. The good fit of the data as shown in Fig. 6 is typical of these results.
An interesting and unexpected consequence of these measurements was the conductance change observed at the end of a run when the oxygen was pumped out of the system. The conductance change at that point reversed direction and started to decrease. This effect is shown in Fig. 7. In one run, the desorption was followed carefully. In six hours the conductance decrease was 75% of the original increase while only 5% of the adsorbed gas was desorbed. This behavior was noticed
particularly in State II. In State III, there was little change in conductance on pumping out the oxygen. This effect can only be explained by some incorporation process in which the oxygen is presumably diffusing into the film.
Adsorption-incorporation runs similar to those shown hr Fig. 7 were made for varying durations of sorption. The effect was present even for very short times. This shows that adsorption and incorporation occtu simultaneously even at very low coverages. Thus the conductance change normally measured is a result of both adsorption and incorporation.
IV. ConclusionsThe results presented here show the interesting
possibilities resulting from the measurement of the electrical conductance simultaneously with the usual reaction kinetics. While these results cannot be applied rigorously to any theory, due to uncertainties in such factors as electron mobility and film porosity, they do show the role of the electronic factor in chemisorption. With further knowledge of these presently uncertain factors, the results can be used in a quantitative way.
The results do show that measurements of conductance alone cannot be used for kinetic expressions based on an assumed relation of conductance change to gas uptake since different relations are obtained for even one sample under different oxidation conditions. On the other hand, measurement of gas uptake alone will not reveal the presence or extent of electronic interactions.
The significant decrease in conductance without a correspondingly significant desorption during oxygen pump-out shows the presence of an additional, incorporation step in the gas uptake. It also shows the need for both measurements in correctly distinguishing between desorption and incorporation.
KINETICS OF BROMINE ADDITION TO SOME UNSATURATED SULFONES
B y V . B aliah an d S p . S h an m u g an ath an
Department of Chemistry, Annamalai University, Annamalainagar, Madras State, IndiaReceived May 26, 1969
The kinetics of bromine addition to a,0- and /3, y-unsaturated sulfones in carbon tetrachloride at 30° has been studied. It is found to be approximately second order. a,/3-Unsaturated sulfones add bromine at a slightly lower rate than /3,y- unsaturated sulfones. There is no evidence of any significant conjugation between the sulfonyl and ethenyl groups in a,/3-unsaturated sulfones in the ground state. The data obtained can be interpreted on the basis of the inductive effect of the sulfonyl group.
IntroductionSudborough and Gittins,1 from a study of rates
of esterification of a,/3-unsaturated acids, showed that conjugation of a carboxyl group with an ethylenic linkage decreases the reactivity of the carboxyl group. Similarly the effect of conjugation with a carboxyl group on the reactivity of an ethylenic linkage was established by the deter-
(1) J. J. Sudborough and J. M. Gittins, J. Chem. Soc.’, 95, 315 (1909).
ruination of the rates of addition of bromine to unsaturated acids; a,/3~unsaturated acids add bromine at a much lower rate than 8 , y - or 7,5-unsaturated acids.2 Furthermore, the addition of hypochlorous acid to ethylenic double bonds is also much retarded if the double bonds are conjugated with the carboxyl group.3-6
(2) J. J. Sudborough and J. Thomas, ibid., 97, 715, 2450 (1910).(3) G. F. Bloomfield, E. H. Farmer and C. G. B. Hose, ibid., 800
(1933).
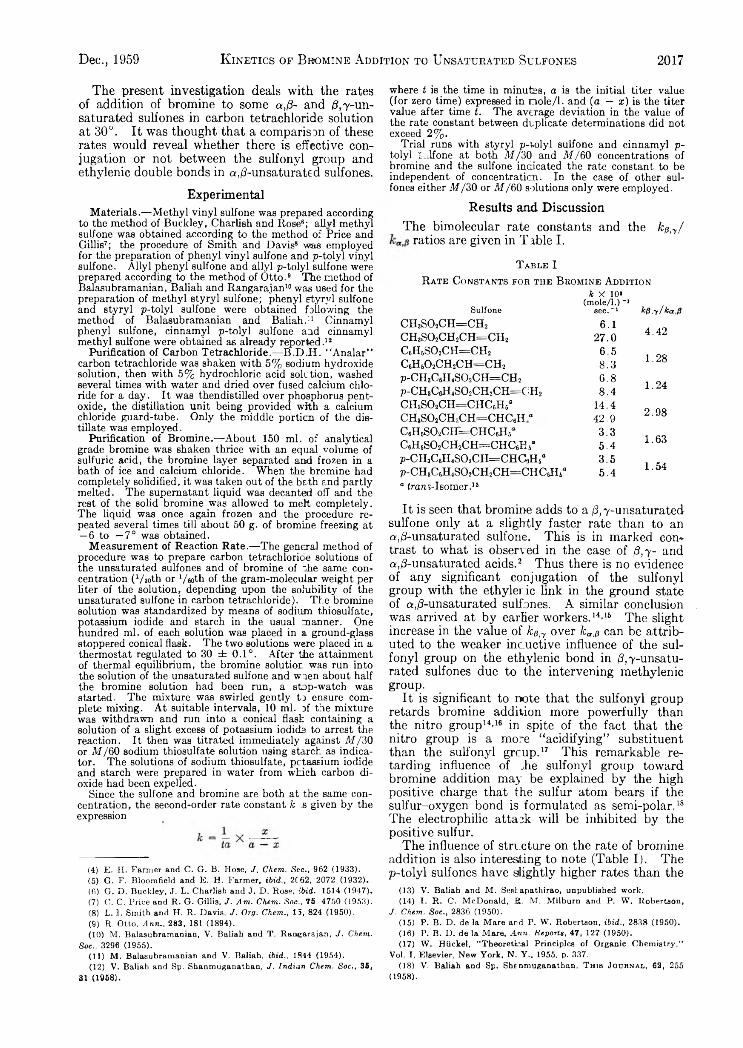
Dec., 1959 K inetics of Bbomine Addition to Unsaturated Sulfones 2017
The present investigation deals with the rates of addition of bromine to some a,t3- and /8 ,7 -un- saturated sulfones in carbon tetrachloride solution at 30°. It was thought that a comparison of these rates would reveal whether there is effective conjugation or not between the sulfonyl group and ethylenic double bonds in «,/3-unsaturated sulfones.
ExperimentalMaterials.— Methyl vinyl sulfone was prepared according
to the method of Buckley, Charlish and Rose4 5 6; allvl methyl sulfone was obtained according to the method of Price and Gillis7; the procedure of Smith and Davis8 was employed for the preparation of phenyl vinyl sulfone and p-tolyl vinyl sulfone. Allyl phenyl sulfone and allyl p-tolyl sulfone were prepared according to the method of Otto.9 The method of Balasubramanian, Baliah and Rangarajan10 11 was used for the preparation of methyl styryl sulfone; phenyl s t y r y l sulfone and styryl p-tolyl sulfone were obtained following the method of Balasubramanian and Baliah.:1 Cinnamyl phenyl sulfone, cinnamyl p-tolyl sulfone and cinnamyl methyl sulfone were obtained as already reported.12
Purification of Carbon Tetrachloride.— B.D .H . “ Analar” carbon tetrachloride was shaken with 5% sodium hydroxide solution, then with 5% hydrochloric acid solution, washed several times with water and dried over fused calcium chloride for a day. It was thendistilled over phosphorus pent- oxide, the distillation unit being provided with a calcium chloride guard-tube. Only the middle portion of the distillate was employed.
Purification of Bromine.— About 150 ml. of analytical grade bromine was shaken thrice with an equal volume of sulfuric acid, the bromine layer separated and frozen in a bath of ice and calcium chloride. When the bromine had completely solidified, it was taken out of the bath and partly melted. The supernatant liquid was decanted off and the rest of the solid bromine was allowed to melt completely. The liquid was once again frozen and the procedure repeated several times till about 50 g. of bromine freezing at — 6 to —7° was obtained.
Measurement of Reaction Rate.— The general method of procedure was to prepare carbon tetrachloride solutions of the unsaturated sulfones and of bromine of "he same concentration (Vaoth or ‘ /« th of the gram-molecular weight per liter of the solution, depending upon the solubility of the unsaturated sulfone in carbon tetrachloride). The bromine solution was standardized by means of sodium thiosulfate, potassium iodide and starch in the usual manner. One hundred ml. of each solution was placed in a ground-glass stoppered conical flask. The two solutions were placed in a thermostat regulated to 30 ± 0.1°. After the attainment of thermal equilibrium, the bromine solution was run into the solution of the unsaturated sulfone and waen about half the bromine solution had been run, a stop-watch was started. The mixture was swirled gently to ensure complete mixing. At suitable intervals, 10 ml. of the mixture was withdrawn and run into a conical flask containing a solution of a slight excess of potassium iodide to arrest the reaction. It then was titrated immediately against 117/30 or M /60 sodium thiosulfate solution using starch as indicator. The solutions of sodium thiosulfate, potassium iodide and starch were prepared in water from which carbon dioxide had been expelled.
Since the sulfone and bromine are both at the same concentration, the second-order rate constant k .s given by the expression
(4) E. H. Farmer and C. G. B. Hose, J. Chem. Sec., 962 (1933).(5) G. F. Bloomfield and E. H. Farmer, ibid., 2062, 2072 (1932).(6) G. D. Buckley, J. L. Charlish and J. D. Hose, ibid.: 1514 (1947),(7) C. C. Price and R. G. Gillis, J. Am. Chem. Soc., 75, 4750 (1953).(8) L. I. Smith and H. R. Davis, J. Org. Chem., 15, 824 (1950).(9) R. Otto, Ann., 283, 181 (1894).(10) M. Balasubramanian, V. Baliah and T. Rangarajan, J. Chem.
Soc., 3296 (1955).(11) M, Balasubramanian and V. Baliah, ibid., 1844 (1954).(12) V. Baliah and Sp. Shanmuganathan, J. Indian Chem. Soc., 35,
31 (1958).
where f is the time in minutes, a is the initial titer value (for zero time) expressed in m ole/1. and (a — x) is the titer value after time t. The average deviation in the value of the rate constant between duplicate determinations did notexceed 2% .
Trial runs with styryl p-t,olyl sulfone and cinnamyl p- tolyl Sulfone at both M /30 and 117/60 concentrations of bromine and the sulfone indicated the rate constant to be independent of concentration. In the case of other sulfones either M / 30 or 217/60 solutions only were employed.
Results and DiscussionThe bimolecular rate constants and the ke,y /
ratios are given in Table I.T a b l e I
R a t e C o n st a n t s fo b th e B r o m in e A d d it io n
Sulfonek X 10*
(mole/1.)-l sec.“ 1 kß,y/ka,ß
c h 3s o 2c h = c h , 6.1 4.42c h 3s o 2c h 2c h = c h 2 27.0c 6h 6s o 2c h = c h 2 6.5 1.28c 6h 6o 2c h 2c h = c h 2 8.3p-c h ,c 6h 4s o 2c h = c h 2 6.8 1.24P-CH3C6H4S02CH2C H =C H 2 8.4CH8S02C H = C H C 6H6a 14.4
2.98CH8S02CH2C H = C H C 6H.“ 42.9C6H6S02CBr=CHC6H5a 3.3C6H6S02CH2C H =C H C 6E 6“ 5 .4 1.63
p-CH8C6H4S02CH=CH<AHs'* 3.5 1.54p-CH8C6H4S02CH2CH=CHCeIl5“ 5.4“ trans-Isomer.18
It is seen that bromine adds to a /3,y-unsaturated sulfone only at a slightly faster rate than to an a,/S-unsaturated sulfone. This is in marked con» trast to what is observ ed in the case of p , y - and a,/3-unsaturated acids.2 Thus there is no evidence of any significant conjugation of the sulfonyl group with the ethyler ic link in the ground state of a,/?-unsaturated sulfones. A similar conclusion was arrived at by earher workers.14’16 The slight increase in the value of kp ,y over lca ,p can be attributed to the weaker incuctive influence of the sulfonyl group on the ethylenic bond in /3,7-unsaturated sulfones due to the intervening methylenic group.
It is significant to note that the sulfonyl group retards bromine addition more powerfully than the nitro group14-16 in spite of the fact that the nitro group is a more “acidifying” substituent than the sulfonyl grcup.17 This remarkable retarding influence of die sulfonyl group toward bromine addition may be explained by the high positive charge that the sulfur atom bears if the sulfur-oxygen bond is formulated as semi-polar.18 The electrophilic attack will be inhibited by the positive sulfur.
The influence of structure on the rate of bromine addition is also interesting to note (Table I). The p-tolyl sulfones have slightly higher rates than the
(13) Y. Baliah and M. Sest apathirao, unpublished work.(14) I. R. C. McDonald, R. M. Milburn and P. W. Robertson,
J. Chem. Soc., 2836 (1950).(15) P. B. D. de la Mare and P. W. Robertson, ibid., 2838 (1950).(16) P. B. D. de la Mare, Ann. Reports, 47, 127 (1950).(17) W„ Hiickel, “ Theoretical Principles of Organic Chemistry,’ '
Vol. I, Elsevier, New York, N. Y .f 1955, p. 337.(18) V. Baliah and Sp. Shanmuganathan. T his Jo u r n a l , 62, 255
(1958).
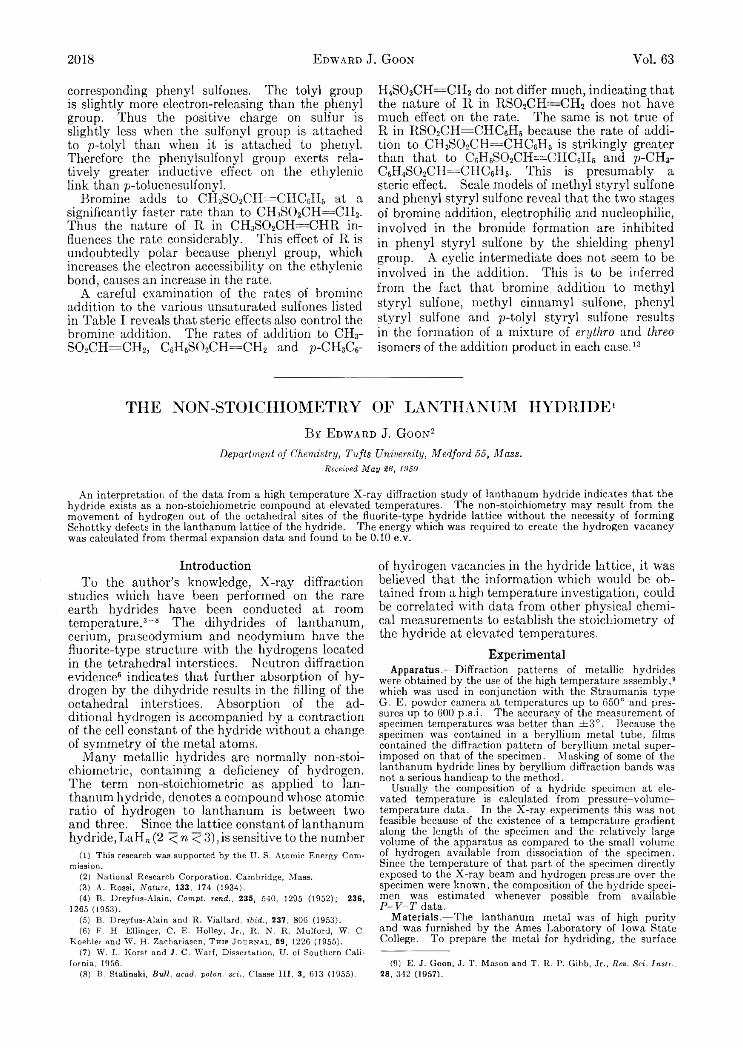
2018 E dward J. Goon Vol. 63
corresponding phenyl sulfones. The tolyl group is slightly more electron-releasing than the phenyl group. Thus the positive charge on sulfur is slightly less when the sulfonyl group is attached to p-tolyl than when it is attached to phenyl. Therefore the phenylsulfonyl group exerts relatively greater inductive effect on the ethylenic link than p-toluenesulfonyl.
Bromine adds to CH3S02CH=CHC6H6 at a significantly faster rate than to CH3S02CH=CH2. Thus the nature of R in CH3S02CH=CHR influences the rate considerably. This effect of R is undoubtedly polar because phenyl group, which increases the electron accessibility on the ethylenic bond, causes an increase in the rate.
A careful examination of the rates of bromine addition to the various unsaturated sulfones listed in Table I reveals that steric effects also control the bromine addition. The rates of addition to CH3- S02CH=CH2, C6H6S02CH=CH2 and p-CH3C6-
H4S02CH=CH2 do not differ much, indicating that the nature of R in RS02CH—CH2 does not have much effect on the rate. The same is not true of R in RS02CH=CHC6H6 because the rate of addition to CH3S02CH=CHC6H6 is strikingly greater than that to C6H6S02CH=:=CHC6HB and p-CH3- C6H4S02CH==CHC6H5. This is presumably a steric effect. Scale models of methyl styryl sulfone and phenyl styryl sulfone reveal that the two stages of bromine addition, electrophilic and nucleophilic, involved in the bromide formation are inhibited in phenyl styryl sulfone by the shielding phenyl group. A cyclic intermediate does not seem to be involved in the addition. This is to be inferred from the fact that bromine addition to methyl styryl sulfone, methyl cinnamyl sulfone, phenyl styryl sulfone and p-tolyl styryl sulfone results in the formation of a mixture of eryth.ro and Ihreo isomers of the addition product in each case.13
THE NON-STOICHIOMETRY OF LANTHANUM HYDRIDE1B y E dward J. G oon2
Department of Chemistry, Tufts University, Medford 55, Mass.Received May 26, 1959
An interpretation of the data from a high temperature X-ray diffraction study of lanthanum hydride indicates that the hydride exists as a non-stoichiometric compound at elevated temperatures. The non-stoichiometry may result from the movement of hydrogen out of the octahedral sites of the fluorite-type hydride lattice without the necessity of forming Schottky defects in the lanthanum lattice of the hydride. The energy which was required to create the hydrogen vacancy was calculated from thermal expansion data and found to be 0.10 e.v.
IntroductionTo the author’s knowledge, X-ray diffraction
studies which have been performed on the rare earth hydrides have been conducted at room temperature. 8 “ 8 The dihydrides of lanthanum, cerium, praseodymium and neodymium have the fluorite-type structure with the hydrogens located in the tetrahedral interstices. Neutron diffraction evidence6 indicates that further absorption of hydrogen by the dihydride results in the filling of the octahedral interstices. Absorption of the additional hydrogen is accompanied by a contraction of the cell constant of the hydride without a change of symmetry of the metal atoms.
Many metallic hydrides are normally non-stoichiometric, containing a deficiency of hydrogen. The term non-stoichiometric as applied to lanthanum hydride, denotes a compound whose atomic ratio of hydrogen to lanthanum is between two and three. Since the lattice constant of lanthanum hydride, LaH„ (2 < n < 3), is sensitive to the number
(1) This research was supported by the U. S. Atomic Energy Commission.
(2) National Research Corporation, Cambridge, Mass.(3) A. Rossi, Nature, 133, 174 (1934).(4) B. Dreyfus-Alain, Compì. rend., 235, 540, 1295 (1952); 236,
1265 (1953).(5) B. Dreyfus-Alain and R. Viallard, ibid., 237, 806 (1953).(6) F. H. Ellinger, C. E. Holley, Jr., R. N. R. Mulford, W. C.
Koehler and W. H. Zachariasen, T h is J o u r n a l , 59, 1226 (1955).(7) W. L. Korst and J. C. Warf, Dissertation, U. of Southern Cali
fornia, 1956.(8) B. Stalinski, Bull. acad. polon. sci., Classe III, 3, 613 (1955).
of hydrogen vacancies in the hydride lattice, it was believed that the information which would be obtained from a high temperature investigation, could be correlated with data from other physical chemical measurements to establish the stoichiometry of the hydride at elevated temperatures.
ExperimentalApparatus.— Diffraction patterns of metallic hydrides
were obtained by the use of the high temperature assembly,9 which was used in conjunction with the Straumanis typeG. E. powder camera at temperatures up to 650° and pressures up to 600 p.s.i. The accuracy of the measurement of specimen temperatures was better than ± 3 ° . Because the specimen was contained in a beryllium metal tube, films contained the diffraction pattern of beryllium metal superimposed on that of the specimen. Masking of some of the lanthanum hydride lines by beryllium diffraction bands was not a serious handicap to the method.
Usually the composition of a hydride specimen at elevated temperature is calculated from pressure-volume- temperature data. In the X-ray experiments this was not feasible because of the existence of a temperature gradient along the length of the specimen and the relatively large volume of the apparatus as compared to the small volume of hydrogen available from dissociation of the specimen. Since the temperature of that part of the specimen directly exposed to the X-ray beam and hydrogen pressure over the specimen were known, the composition of the hydride specimen was estimated whenever possible from available P -V -T data.
Materials.— The lanthanum metal was of high purity and was furnished by the Ames Laboratory of Iowa State College. To prepare the metal for hydriding, the surface
(9) E. J. Goon, J. T. Mason and T. R. P. Gibb, Jr., Rev. Sci. Instr.,28, 342 (1957).
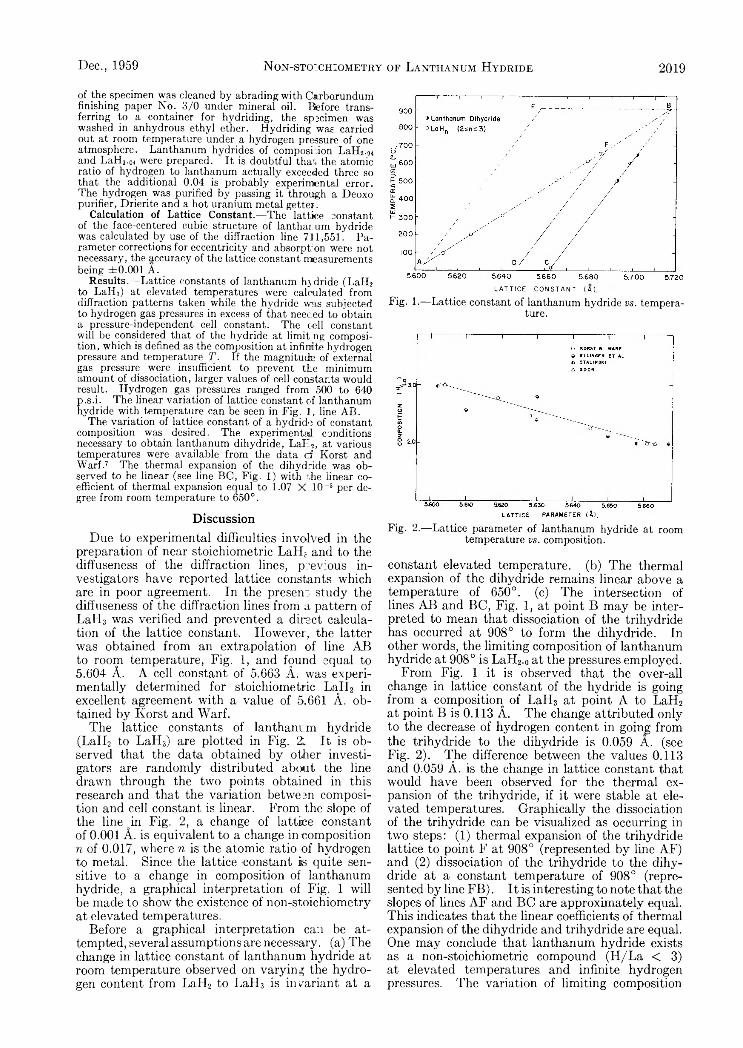
Dec., 1959 Non-sto:chiometry of Lanthanum Hydride 2019
of the specimen was cleaned by abrading with Carborundum finishing paper No. 3 /0 under mineral oil. Before transferring to a container for hydriding, the specimen was washed in anhydrous ethyl ether. Hydriding was carried out at room temperature under a hydrogen pressure of one atmosphere. Lanthanum hydrides of composition LaH2.94 and LaH3.04 were prepared. It is doubtful that, the atomic ratio of hydrogen to lanthanum actually exceeded three so that the additional 0.04 is probably experimental error. The hydrogen was purified by passing it through a Deoxo purifier, Drierite and a hot uranium metal getter.
Calculation of Lattice Constant.—The lattice constant of the face-centered cubic structure of lanthanum hydride was calculated Ijy use of the diffraction line 711,551. Parameter corrections for eccentricity and absorption were not necessary, the accuracy of the lattice constant measurements being ±0.001 A.
Results.— Lattice constants of lanthanum hydride (LaH2 to LaH3) at elevated temperatures were calculated from diffraction patterns taken while the hydride was subjected to hydrogen gas pressures in excess of that neecled to obtain a pressure-independent cell constant. The cell constant will be considered that of the hydride at limituig composition, which is defined as the composition at infinite hydrogen pressure and temperature T . If the magnitude of external gas pressure were insufficient to prevent the minimum amount of dissociation, larger values of cell constants would result. Hydrogen gas pressures ranged from 500 to 640 p.s.i. The linear variation of lattice constant of lanthanum hydride with temperature can be seen in Fig. 1, line AB.
The variation of lattice constant of a hydride of constant composition was desired. The experimental conditions necessary to obtain lanthanum dihydride, LaE2, at various temperatures were available from the data cf Korst and Warf.7 The thermal expansion of the dihydride was observed to be linear (see line BC, Fig. 1) with r,he linear coefficient of thermal expansion equal to 1.07 X 10 ~5 per degree from room temperature to 650°.
DiscussionDue to experimental difficulties involved in the
preparation of near stoichiometric LaH£ and to the diffuseness of the diffraction lines, previous investigators have reported lattice constants which are in poor agreement. In the present study the diffuseness of the diffraction lines from a pattern of Lali3 was verified and prevented a direct calculation of the lattice constant. However, the latter was obtained from an extrapolation of line AB to room temperature, Fig. 1, and found equal to 5.604 Â. A cell constant of 5.663 À. was experimentally determined for stoichiometric LaH2 in excellent agreement with a value of 5.661 A. obtained by Korst and Warf.
The lattice constants of lanthanum hydride (LaH2 to LaH3) are plotted in Fig. 2 . It is observed that the data obtained by other investigators are randomly distributed about the line drawn through the two points obtained in this research and that the variation betwesn composition and cell constant is linear. From the slope of the line oin Fig. 2, a change of lattice constant of 0.001 Â. is equivalent to a change in composition n of 0.017, where n is the atomic ratio of hydrogen to metal. Since the lattice constant is quite sensitive to a change in composition of lanthanum hydride, a graphical interpretation of Fig. 1 will be made to show the existence of non-stoichiometry at elevated temperatures.
Before a graphical interpretation can be attempted, several assumptions are necessary, (a) The change in lattice constant of lanthanum hydride at room temperature observed on varying the hydrogen content from LaH2 to LaH3 is invariant at a
LATTICE CONSTANT ( A ).
Fig. 1.— Lattice constant of lanthanum hydride vs. temperature.
Fig. 2.— Lattice parameter of lanthanum hydride at room temperature vs. composition.
constant elevated temperature, (b) The thermal expansion of the dihydride remains linear above a temperature of 650°. (c) The intersection oflines AB and BC, Fig. 1, at point B may be interpreted to mean that dissociation of the trihydride has occurred at 908° to form the dihydride. In other words, the limiting composition of lanthanum hydride at 908° is LaH2.0 at the pressures employed.
From Fig. 1 it is observed that the over-all change in lattice constant of the hydride is going from a composition of LaHs at point A to LaH2 at point B is 0.113 A. The change attributed only to the decrease of hydrogen content in going from the trihydride to the dihydride is 0.059 A. (see Fig. 2). The difference between the values 0.113 and 0.059 A. is the change in lattice constant that would have been observed for the thermal expansion of the trihydride, if it were stable at elevated temperatures. Graphically the dissociation of the trihydride can be visualized as occurring in two steps: (1) thermal expansion of the trihydride lattice to point F at 908° (represented by line AF) and (2) dissociation of the trihydride to the dihydride at a constant temperature of 908° (represented by line FB). It is interesting to note that the slopes of fines AF and BC are approximately equal. This indicates that the linear coefficients of thermal expansion of the dihydride and trihydride are equal. One may conclude that lanthanum hydride exists as a non-stoichiometric compound (H/La < 3) at elevated temperatures and infinite hydrogen pressures. The variation of limiting composition
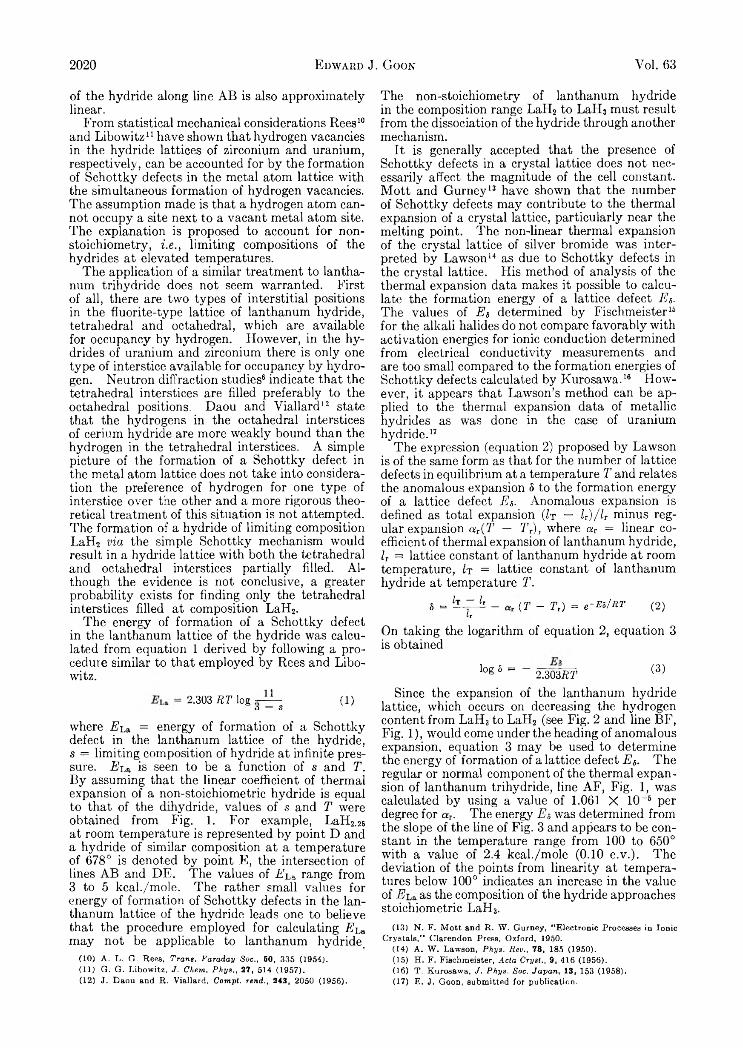
2020 Edward J. Goon Vol. 63
of the hydride along line AB is also approximately linear.
From statistical mechanical considerations Rees10 and Libowitz11 have shown that hydrogen vacancies in the hydride lattices of zirconium and uranium, respectively, can be accounted for by the formation of Schottky defects in the metal atom lattice with the simultaneous formation of hydrogen vacancies. The assumption made is that a hydrogen atom cannot occupy a site next to a vacant metal atom site. The explanation is proposed to account for nonstoichiometry, i . e . , limiting compositions of the hydrides at elevated temperatures.
The application of a similar treatment to lanthanum trihydride does not seem warranted. First of all, there are two types of interstitial positions in the fluorite-type lattice of lanthanum hydride, tetrahedral and octahedral, which are available for occupancy by hydrogen. However, in the hydrides of uranium and zirconium there is only one type of interstice available for occupancy by hydrogen. Neutron diffraction studies6 indicate that the tetrahedral interstices are filled preferably to the octahedral positions. Daou and Viallard12 state that the hydrogens in the octahedral interstices of cerium hydride are more weakly bound than the hydrogen in the tetrahedral interstices. A simple picture of the formation of a Schottky defect in the metal atom lattice does not take into consideration the preference of hydrogen for one type of interstice over the other and a more rigorous theoretical treatment of this situation is not attempted. The formation of a hydride of limiting composition LaH2 v ia the simple Schottky mechanism would result in a hydride lattice with both the tetrahedral and octahedral interstices partially filled. Although the evidence is not conclusive, a greater probability exists for finding only the tetrahedral interstices filled at composition LaH2.
The energy of formation of a Schottky defect in the lanthanum lattice of the hydride was calculated from equation 1 derived by following a procedure similar to that employed by Rees and Libowitz.
= 2.303 RT log ; A L (1)o S
where E h * = energy of formation of a Schottky defect in the lanthanum lattice of the hydride, s = limiting composition of hydride at infinite pressure. I?La is seen to be a function of s and T . By assuming that the linear coefficient of thermal expansion of a non-stoichiometric hydride is equal to that of the dihydride, values of s and T were obtained from Fig. 1. For example, LaH2 . 2 5
at room temperature is represented by point D and a hydride of similar composition at a temperature of 678° is denoted by point E, the intersection of lines AB and DE. The values of E h * range from 3 to 5 kcal./mole. The rather small values for energy of formation of Schottky defects in the lanthanum lattice of the hydride leads one to believe that the procedure employed for calculating E h a may not be applicable to lanthanum hydride.
(10) A. L. G. Rees, Trans. Faraday Soc., 50, 335 (1954).(11) G. G. Libowitz, J. Chem, Phys,, 27, 514 (1957).(12) J. Daou and R. Viallard, Compt. rend., 243, 2050 (1956).
The non-stoichiometry of lanthanum hydride in the composition range LaH2 to LaH3 must result from the dissociation of the hydride through another mechanism.
It is generally accepted that the presence of Schottky defects in a crystal lattice does not necessarily affect the magnitude of the cell constant. Mott and Gurney13 have shown that the number of Schottky defects may contribute to the thermal expansion of a crystal lattice, particularly near the melting point. The non-linear thermal expansion of the crystal lattice of silver bromide was interpreted by Lawson14 as due to Schottky defects in the crystal lattice. His method of analysis of the thermal expansion data makes it possible to calculate the formation energy of a lattice defect E g . The values of E s determined by Fischmeister16 for the alkali halides do not compare favorably with activation energies for ionic conduction determined from electrical conductivity measurements and are too small compared to the formation energies of Schottky defects calculated by Kurosawa.16 However, it appears that Lawson’s method can be applied to the thermal expansion data of metallic hydrides as was done hi the case of uranium hydride.17
The expression (equation 2) proposed by Lawson is of the same form as that for the number of lattice defects in equilibrium at a temperature T and relates the anomalous expansion S to the formation energy of a lattice defect E s - Anomalous expansion is defined as total expansion (It — lT) / h minus regular expansion a r( T — T r), where a r = linear coefficient of thermal expansion of lanthanum hydride, Zr = lattice constant of lanthanum hydride at room temperature, Zt = lattice constant of lanthanum hydride at temperature T .
5 = h -IL k - ( f - Tt ) = e -^ / R T (2 )¿r
On taking the logarithm of equation 2, equation 3 is obtained
log 6 “ “ 2.303/ii’ (3)Since the expansion of the lanthanum hydride
lattice, which occurs on decreasing the hydrogen content from LaH3 to LaH2 (see Fig. 2 and line BF, Fig. 1), would come under the heading of anomalous expansion, equation 3 may be used to determine the energy of formation of a lattice defect E s . The regular or normal component of the thermal expansion of lanthanum trihydride, line AF, Fig. 1, was calculated by using a value of 1.061 X 10~6 per degree for a r. The energy E s was determined from the slope of the fine of Fig. 3 and appears to be constant in the temperature range from 100 to 650° with a value of 2.4 kcal./mole (0.10 e.v.). The deviation of the points from linearity at temperatures below 100° indicates an increase in the value of E h * as the composition of the hydride approaches stoichiometric LaH3.
(13) N. F. Mott and R. W. Gurney, "Electronic Processes in Ionic Crystals,” Clarendon Press, Oxford, 1950.
(14) A, W. Lawson, Phys. Rev., 78, 185 (1950).(15) H. F. Fischmeister, Acta Cryst., 9, 416 (1956).(16) T. Kurosawa, J. Phys. Soc. Japan, 13, 153 (1958).(17) E. J. Goon, submitted for publication.
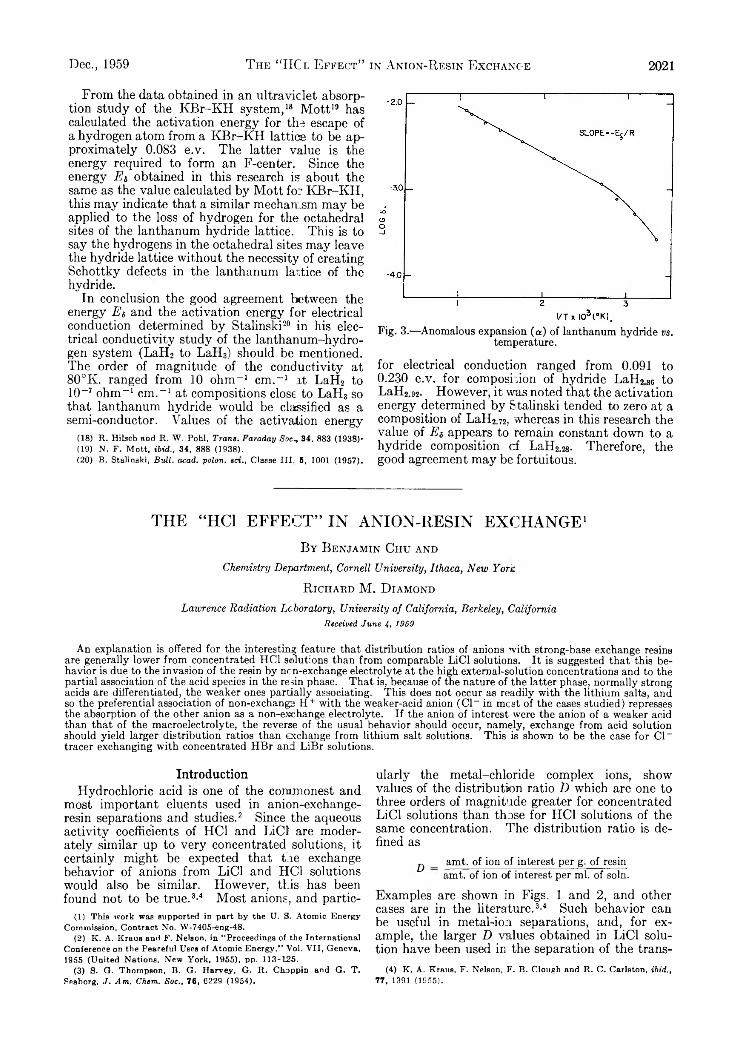
Dec., 1959 T he “HCl Effect” in Anion-R esin Exchange 2 0 2 1
From the data obtained in an ultraviolet absorption study of the KBr-KH system,18 Mott19 has calculated the activation energy for the escape of a hydrogen atom from a KBr-KH lattice to be approximately 0.083 e.v. The latter value is the energy required to form an F-center. Since the energy E s obtained in this research is about the same as the value calculated by Mott for KBr-KH, this may indicate that a similar mechan sm may be applied to the loss of hydrogen for the octahedral sites of the lanthanum hydride lattice. This is to say the hydrogens in the octahedral sites may leave the hydride lattice without the necessity of creating Schottky defects in the lanthanum lattice of the hydride.
In conclusion the good agreement between the energy E , and the activation energy for electrical conduction determined by Stalinski20 in his electrical conductivity study of the lanthanum-hydrogen system (LaH2 to LaH3) should be mentioned. The order of magnitude of the conductivity at 80°K. ranged from 10 ohm-1 cm.-1 at LaH2 to 10-7 ohm-1 cm.-1 at compositions close to LaH3 so that lanthanum hydride would be classified as a semi-conductor. Values of the activation energy
(18) R. Hilseh and R. W. Pohl, Trans. Faraday Soc*, 84, 883 (1938)*(19) N. F. Mott, ibid., 34, 888 (1938).(20) B. Stalinski, Bull. acad. polon. set., Classe III. 6, 1001 (1957).
Fig. 3.— Anomalous expansion (a ) of lanthanum hydride vs. temperature.
for electrical conduction ranged from 0.091 to 0.230 e.v. for composition of hydride LaH286 to LaH2 .92. However, it was noted that the activation energy determined by Stalinski tended to zero at a composition of LaH2.72, whereas in this research the value of E s appears to remain constant down to a hydride composition cf LaH ^. Therefore, the good agreement may be fortuitous.
THE “HC1 EFFECT” IN ANION-RESIN EXCHANGE1B y B enjam in C h u and
Chemistry Department, Cornell University, Ithaca, New Yore,R ichard M. D iam ond
Lawrence Radiation Laboratory, University of California, Berkeley, California Received June 4» 1959
An explanation is offered for the interesting feature that distribution ratios of anions with strong-base exchange resins are generally lower from concentrated HC1 solutions than from comparable LiCl solutions. It is suggested that this behavior is due to the invasion of the resin by ncn-exchange electrolyte at the high external-solution concentrations and to the partial association of the acid species in the resin phase. That is, because of the nature of the latter phase, normally strong acids are differentiated, the weaker ones partially associating. This does not occur as readily with the lithium salts, and so the preferential association of non-exchange H + with the weaker-acid anion (C l- in mest of the cases studied) represses the absorption of the other anion as a non-exchange electrolyte. If the anion of interest were the anion of a weaker acid than that of the macroelectrolyte, the reverse of the usual behavior should occur, namely, exchange from acid solution should yield larger distribution ratios than exchange from lithium salt solutions. This is shown to be the case for C l- tracer exchanging with concentrated HBr and LiBr solutions.
IntroductionHydrochloric acid is one of the commonest and
most important eluents used in anion-exchange- resin separations and studies.2 Since the aqueous activity coefficients of HC1 and LiCl are moderately similar up to very concentrated solutions, it certainly might be expected that the exchange behavior of anions from LiCl and HC1 solutions would also be similar. However, this has been found not to be true.3-4 Most anions, and partic-
(1) This work was supported in part by the U. S. Atomic Energy Commission, Contract No. W-7405-eng~48.
(2) K . A. Kraus and F. Nelson, in “ Proceedings of the International Conference on the Peaceful Uses of Atomic Energy," Vol. V II, Geneva, 1955 (United Nations, New York, 1955), pp. 113-125.
(3) S. G. Thompson, B, G. Harvey, G. R . Choppin and G. T. Seaborg, J. Am. Chem. Soc., 76, 6229 (1954).
ularly the metal-chloride complex ions, show values of the distribution ratio D which are one to three orders of magnitude greater for concentrated LiCl solutions than those for HC1 solutions of the same concentration. The distribution ratio is defined as
■Q _ amt. of ion of interest per g. of resin amt. of ion of interest per ml. of soln.
Examples are shown in Figs. 1 and 2, and other cases are in the literature.3-4 Such behavior can be useful in metal-ion separations, and, for example, the larger D values obtained in LiCl solution have been used in the separation of the trans-
(4) K . A. Kraus, F. Nelson, F. B. Clough and R. C . Carlston, ibid., 77, 1391 (1955).

2022 Benjamin Chu and R ichard U. D iamond Vol. 63
Fig. 1.— Distribution ratio vs. chloride molality for tracer bromide, A — A , and for tracer perrhenate, O— O- Opensymbols are L id solutions; closed symbols are HC1 solutions.
Fig. 2.— Distribution ratio vs. chloride molality for tracer indium(III), O — O, and for tracer cobalt(II), A — A . Open symbols arc LiCl solutions; closed symbols are HC1 solutions.
plutonium ions from the rare earth ions.3 But this difference in behavior is also an interesting feature to be explained in understanding the ion-exchange- resin process. An explanation that has been tentatively advanced2'8 is that the complex metal anions are the anions of somewhat weak acids, and that at high HC1 concentrations the undissociated complex acid forms in the external aqueous solution. Such association would lower the concentration of the distributing metal anion and so would lead to the observed lower value of D in HC1 solutions.
But there are difficulties with this explanation. First the extraction behavior of the complex metal acids into oxygenated organic solvents indicates that they are not weak, but are very strong acids, stronger than HC1.5 6 7'6 Their strength is of the order of that of HCIO4 , which is indeed a good model acid for the metal-complex acids. Secondly, the distribution ratio of bromide ion is also larger from LiCl than from HC1 solutions (ref. 2 and Fig. 1). But HBr is certainly a strong acid, stronger than HC1, and so by the above explanation should have a higher value of D from the HC1 solution than from the LiCl solution. Curiously, the difference in the values of D for Br_ with HC1 and LiCl is not as great as those for the chlorometallic complex ions such as GaCh- , FeCLr and InCh- . In fact, it appears that the magnitude of the difference in D between HC1 and LiCl solutions increases with increasing acid strength of the anion under consideration. This is just the reverse behavior of that to be expected from the above explanation, but a clue to an alternative explanation to be presented in this paper.
ExperimentalResins.—The resins used in this work were of the strongly
basic quaternary amine type, namely, Dowex-1 resins of 10 and 16% divinylbenzene content.’ They were conditioned before use by alternate repeated washings with 3 M HC1 and water and were then dried at 98 ± 1° overnight. After cooling, they were dry-sieved (10% DVB to 60 to 100 US mesh; 16% DVB to 200 to 400 US mesh), and stored in a desiccator over anhydrous M g(C104)2-
Tracers.— The (R e18«04) - (T ./s = 89 hr.) and (Br82) “ {T i/ 2 = 36 hr.) were obtained from Union Carbide Nuclear Company, Oak Ridge, Tennessee. The (Cl34) - (*2nr,/i — 32 min.) was produced by irradiating sodium hydrogen phosphate in the Berkeley 60-inch cyclotron. No detectable change in the 7-ray spectra of the tracers occurred during the period of their use, and the tracers decayed with the correct half lives, indicating that no appreciable radioactive impurities were present. The radioactive samples were counted with a well-type Nal scintillation counter employing a single-channel analyzer.
Method.—The values of D for R e04~ were obtained by the batch equilibration method, those for C l- by the column technique and those for Br~ by both methods. In the batch method, 50 j*l. of the tracer in 10 ml. of the macroelectrolyte solution was shaken for 4 to 12 hr. with small amounts (0.03-0.2 g.) of resin. Duplicate 3-ml. aliquots of the solution were withdrawn through glass-wool filters and gamma-counted. After correction for background, comparison of the counting rates with those of aliquots of the initial solution before the introduction of the resin
(5) R . M . D iam ond , This Journal, 61, 75 (1957), and unpublished w ork.
(6) E . R udzitis, J. W . Irvine, Jr., and J. M endez, “ Annual Progress R ep ort ,” June 1957 to M ay 1958, L aboratory for N uclear Science, M assachusetts Institu te o f T ech n ology .
(7) Thanks are expressed to the D ow Chem ical C om pany, M id land,M ichigan , for sam ples o f the J 0 % D V B resin.
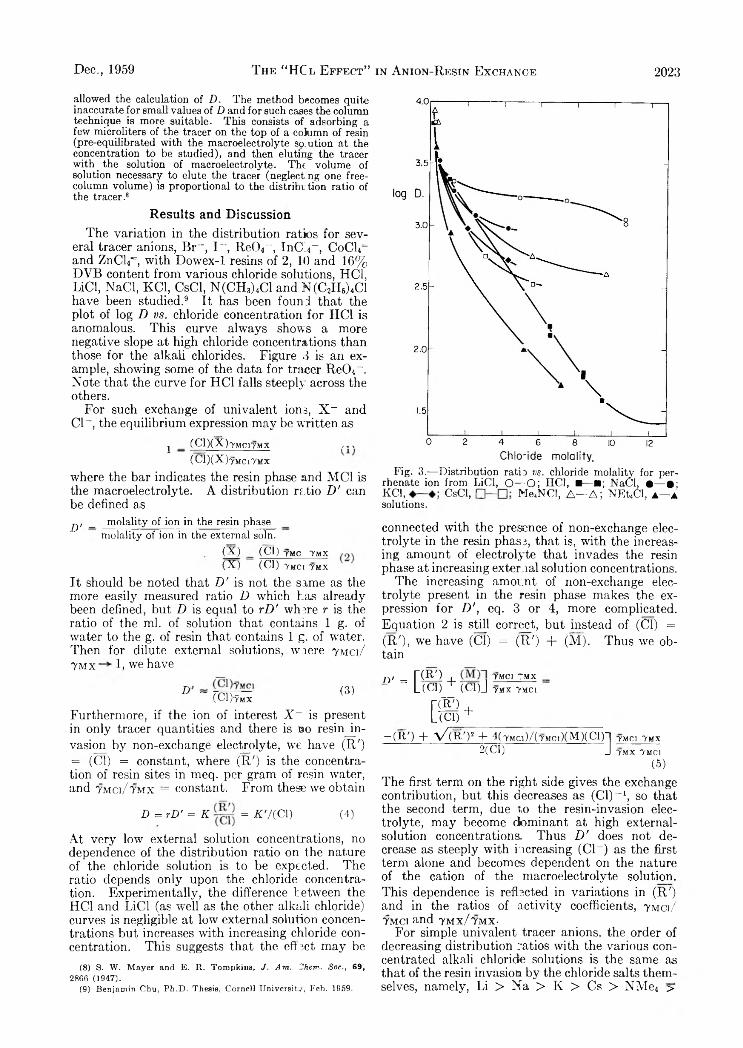
Dec., 1959 T he “HCl Effect” in Anion-R esin Exchange 2023
allowed the calculation of D. The method becomes quite inaccurate for small values of D and for such cases the column technique is more suitable. This consists of adsorbing a few microliters of the tracer on the top of a column of resin (pre-equilibrated with the macroelectrolyte solution at the concentration to be studied), and then eluting the tracer with the solution of macroelectrolyte. The volume of solution necessary to elute the tracer (neglecting one free- column volume) is proportional to the distribution ratio of the tracer.8
Results and DiscussionThe variation in the distribution ratios for sev
eral tracer anions, Br~, I - , Re04- , InCi4- , CoCl4“ and ZnCl<T, with Dowex-1 resins of 2, 10 and 16% DVB content from various chloride solutions, HCl, LiCl, NaCl, KC1, CsCl, N(CH3)4C1 and M(C2H6)4C1 have been studied.9 It has been found that the plot of log D v s . chloride concentration for HCl is anomalous. This curve always shows a more negative slope at high chloride concentrations than those for the alkali chlorides. Figure 3 is an example, showing some of the data for tracer Re04- . Note that the curve for HCl falls steeply across the others.
For such exchange of univalent ions, X - and Cl- , the equilibrium expression may be written as
_ (Cl)(X)-yMC17MX , , ,(C i)(X )7M C l7M X
where the bar indicates the resin phase and MCI is the macroelectrolyte. A distribution ratio D ' can be defined as
Fig. 3.— Distribution rati 3 vs. chloride molality for per- rhenate ion from LiCl, O — O ; HCl, ■— ■; NaCl, • — • ; KC1, CsCl, Me4NCl, A — A ; NEt4Cl, a — asolutions.
j y _ molality of ion in the resin phase_ _ molality of ion in the external soln.
(X ) (Cl) 7MC 7MX(X ) (Cl) 7MC1 7M X
It should be noted that D ' is not the same as the more easily measured ratio D which has already been defined, but D is equal to r D ' where r is the ratio of the ml. of solution that contains 1 g. of water to the g. of resin that contains 1 g. of water. Then for dilute external solutions, wiiere tmci/ 7mx 1, we have
D ~ ( C T W (3)Furthermore, if the ion of interest X ~ is present in only tracer quantities and there is no resin invasion by non-exchange electrolyte, we have (R') = (Cl) = constant, where (R') is the concentration of resin sites in meq. per gram of resin water, and 7mci/7mx = constant. From these we obtain
D = rD' = K = K'/{Cl) (4)
At very low external solution concentrations, no dependence of the distribution ratio on the nature of the chloride solution is to be expected. The ratio depends only upon the chloride concentration. Experimentally, the difference between the HCl and LiCl (as well as the other alkali chloride) curves is negligible at low external solution concentrations but increases with increasing chloride concentration. This suggests that the effect may be
(8) S. W. M ayer and E. R. Tompkins, J . A m . 7 h em . Soc., 69, 28C6 (1947).
(9) Benjamin Chu, Ph.D. Thesis, Cornell University, Feb. 1959.
connected with the presence of non-exchange electrolyte in the resin phase, that is, with the increasing amount of electrolyte that invades the resin phase at increasing external solution concentrations.
The increasing amount of non-exchange electrolyte present in the resin phase makes the expression for D ', eq. 3 or 4, more complicated. Equation 2 is still correct, but m_stead of (Cl) = (R'), we have (Cl) = (R') + (M). Thus we obtain
r>' = n R ' ) 4 - t m c i t m x
L(C1)_J (CD-I TMX 7MCI
v m +L ( c i ) + __________________________
~ (R ') + \ / ( R T + 4( 7Mq ) / ( 7Mci)(M)(Cl)-j 7MC1 7MX
2(C1) J 7M X 7MC1(5)
The first term on the right side gives the exchange contribution, but this decreases as (Cl)-1, so that the second term, due t,o the resin-invasion electrolyte, may become dominant at high external- solution concentrations. Thus D ' does not decrease as steeply with increasing (Cl- ) as the first term alone and becomes dependent on the nature of the cation of the macroelectrolyte solution. This dependence is reflected in variations in (R') and in the ratios of activity coefficients, 7 m c i /
7 mci and 7 m x / 7 m x -For simple univalent tracer anions, the order of
decreasing distribution ratios with the various concentrated alkali chloride solutions is the same as that of the resin invasion by the chloride salts themselves, namely, Li > Na > K > Cs > NMe4 >

2024 Benjamin Chu and R ichard M. D iamond Vol. 63
are for lithium salts; closed symbols are for acids.
NEt4 . 9 This is not surprising, as from eq. 5 it can be seen that the order of the distribution ratios depends upon the relative amount of resin-invasion cation, ( M ) . The reasons for the differing amounts of resin invasion and what effect this has on the distribution ratios will be discussed in greater detail in a later paper, 9 but for the present it is sufficient to point out the parallel between the amount of resin invasion by the macroelectrolyte, and the order of distribution ratios of a given tracer. In contrast to this general behavior, the distribution ratios for most tracer anions are lower from HC1 than from LiCl solutions, even though the solubility of HC1 in the resin phase is greater than that of LiCl from solutions of the same concentration. 9 - 10 This behavior becomes more marked as the external solution concentration increases. We believe that the origin of this anomaly lies in the formation of undissociated HC1 in the resin- phase solution. This undissociated HC1 may be either molecular HC1 or an ion pair; it has not been possible to differentiate these cases. But there are several reasons for believing that association occurs. First, there is some association in any concentrated HC1 solution and the amount increases with increasing total concentration. The resin phase solution is a very concentrated electrolyte. For example, when the external aqueous HC1 concentration is ~ 1 2 m, the total ionic strength of the internal resin-phase solution is about double that, ~ 16 m in HC1 and ~ 8 m in
(10) F. Nelson and K. A. Kraus, J. Am. Chem. Soc., 80, 4154 (1958)
resin chloride. There is thus relatively less water in the resin phase than in the external solution to solvate the ions and keep the H+ and Cl- apart. Furthermore, the lower effective dielectric constant of the resin phase increases the electrostatic interaction between ions. The suggested association of HC1 in the resin phase explains its greater solubility there than that of LiCl. In fact, this association explains both the greater amount of HC1 over LiCl absorbed per unit weight of resin from solutions of the same molality, and the curious feature that the concentration of total HC1 inside the resin is greater than that of the equilibrating solution, at high HC1 concentrations. The resin solution contains more HC1 in the form of a new (associated) species than the external solution. Experimentally, such acid association also has been observed with S04” , since HS04_ appears to be a weaker acid in the resin phase than in an ordinary aqueous solution, 10 and should be a perfectly general phenomenon in the resin phase.
Of more importance for this discussion, it provides an explanation for the anomalously low values of the distribution ratios of tracer anions from concentrated HC1 solutions. The association of the HC1 in the resin phase results in a smaller number of “free” non-exchange cations there than with LiCl solutions. If the tracer anion of interest is from a stronger acid than HC1, few of these anions can enter the resin phase as non-exchange electrolyte from HC1 solutions, because the chloride ion preferentially unites with the non-exchange hydrogen ion. A much smaller amount of association occurs with the non-exchange lithium ion in the resin phase and so the distribution ratio from HC1 solutions falls increasingly below that from LiCl solutions as the amount of non-exchange electrolyte in the resin increases with increasing external solution concentration.
Such behavior follows directly from the present hypothesis that 7hci is less than 7rici as long as the tracer anion is derived from an acid stronger than HC1. This can be seen from eq. 5 because 7 Lix and 7LiCi are approximately equal to 7hx and 7 hci, respectively, so that D 'liCi/ D ' hci a 7Lici THx/fLiX 7nci- The difference in D between HC1 and LiCl solutions should, in fact, increase with the strength of the acid H X and it appears that the magnitude of the “HC1 effect” does increase from Br~ to I - to Re04- to InCL- . This is the order of increasing acid strength for HC1, HBr and HI, and that expected for HRe04 and HInCh. However, it is difficult to test this point with other anions from such strong acids as, because of their great strengths, they would not be expected to show great differences from each other in their resin behavior, and their exact acid strengths are not usually known.
However, if the hypothesis of relatively greater acid association in the resin phase than in the external solution is correct, the relative distribution ratios for a tracer anion from lithium and acid macroelectrolyte solutions should also be a function of the relative strength of the macroelectrolyte acid, as can be seen from eq. 5. If a weaker acid than HCl and its lithium salt were used, a greater
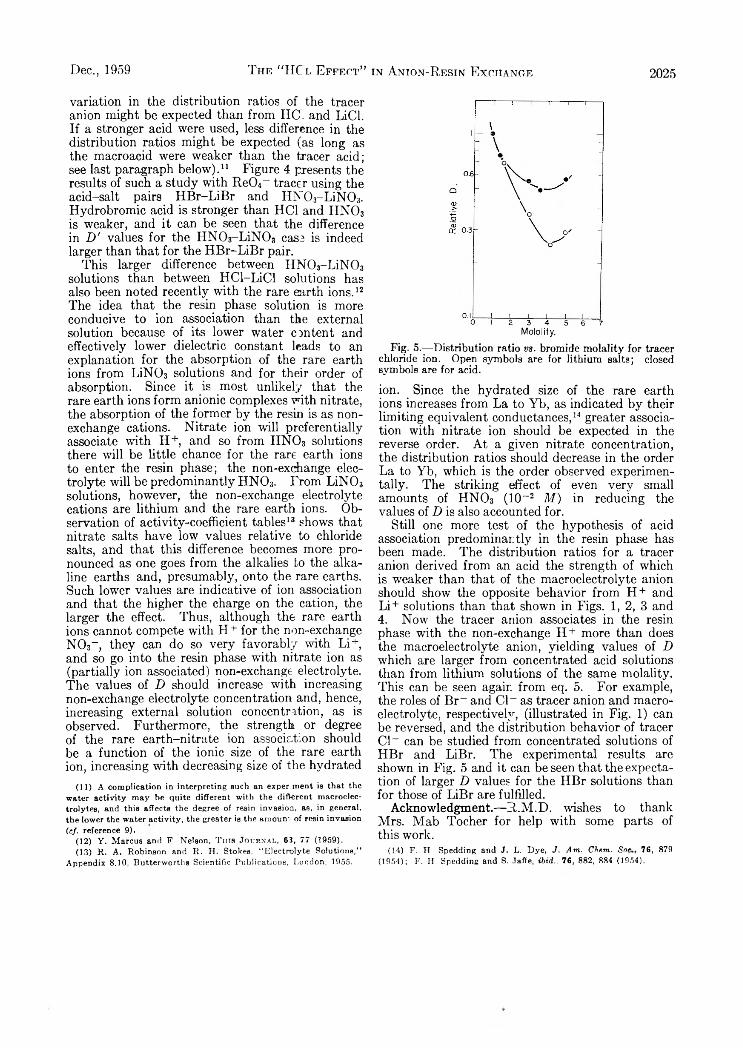
Dec., 1959 T he "TTC l Effect” in Anion-R esin Exchange 2025
variation in the distribution ratios of the tracer anion might be expected than from HCi and LiCl. If a stronger acid were used, less difference in the distribution ratios might be expected (as long as the macroacid were weaker than the tracer acid; see last paragraph below) . 11 Figure 4 presents the results of such a study with Re04~ tracer using the acid-salt pairs HBr-LiBr and HN0 3-L iN 03. Hydrobromic acid is stronger than HC1 and HN0 3
is weaker, and it can be seen that the difference in D ' values for the HN0 3 f-LiN0 3 case is indeed larger than that for the HBr-LiBr pair.
This larger difference between H N 0 3-LiN 0 3
solutions than between HCl-LiCl solutions has also been noted recently with the rare earth ions. 12
The idea that the resin phase solution is more conducive to ion association than the external solution because of its lower water content and effectively lower dielectric constant leads to an explanation for the absorption of the rare earth ions from LiN03 solutions and for their order of absorption. Since it is most unlikely that the rare earth ions form anionic complexes with nitrate, the absorption of the former by the resin is as nonexchange cations. Nitrate ion will preferentially associate with H +, and so from HN0 3 solutions there will be little chance for the rare earth ions to enter the resin phase; the non-exchange electrolyte will be predominantly HN03. From LiN03
solutions, however, the non-exchange electrolyte cations are lithium and the rare earth ions. Observation of activity-coefficient tables1* shows that nitrate salts have low values relative to chloride salts, and that this difference becomes more pronounced as one goes from the alkalies to the alkaline earths and, presumably, onto the rare earths. Such lower values are indicative of ion association and that the higher the charge on the cation, the larger the effect. Thus, although the rare earth ions cannot compete with H+ for the non-exchange N 03_, they can do so very favorably with Li+, and so go into the resin phase with nitrate ion as (partially ion associated) non-exchange electrolyte. The values of D should increase with increasing non-exchange electrolyte concentration and, hence, increasing external solution concentration, as is observed. Furthermore, the strength or degree of the rare earth-nitrate ion association should be a function of the ionic size of the rare earth ion, increasing with decreasing size of the hydrated
(11) A complication in interpreting such an exper .ment is that the water activity may be quite different with the different macroelectrolytes, and this affects the degree of resin invasion, as, in general, the lower the water activity, the greater is the amount of resin invasion (c/. reference 9).
(12) Y, Marcus and F. Nelson, This Journal, 63, 77 (1959).(13) It. A. Robinson and R. H. Stokes, “ Electrolyte Solutions,”
Appendix 8.10, Butterworths Scientific Publications, London, 1955.
Fig. 5.— Distribution ratio vs. bromide molality for tracer chloride ion. Open symbols are for lithium salts; closed symbols are for acid.
ion. Since the hydrated size of the rare earth ions increases from La to Yb, as indicated by their limiting equivalent conductances, 14 greater association with nitrate ion should be expected in the reverse order. At a given nitrate concentration, the distribution ratios should decrease in the order La to Yb, which is the order observed experimentally. The striking effect of even very small amounts of H N 0 3 (10~ 2 M ) in reducing the values of D is also accounted for.
Still one more test of the hypothesis of acid association predominantly in the resin phase has been made. The distribution ratios for a tracer anion derived from an acid the strength of which is weaker than that of the macroelectrolyte anion should show the opposite behavior from H + and Li+ solutions than that shown in Figs. 1 , 2, 3 and4. Now the tracer anion associates in the resin phase with the non-exchange H+ more than does the macroelectrolyte anion, yielding values of D which are larger from concentrated acid solutions than from lithium solutions of the same molality. This can be seen again from eq. 5. For example, the roles of Br“ and Cl - as tracer anion and macroelectrolyte, respectively, (illustrated in Fig. 1) can be reversed, and the distribution behavior of tracer Cl- can be studied from concentrated solutions of HBr and LiBr. The experimental results are shown in Fig. 5 and it can be seen that the expectation of larger D values for the HBr solutions than for those of LiBr are fulfilled.
Acknowledgment.—R.M.D. wishes to thank Mrs. Mab Tocher for help with some parts of this work.
(14) F. H. Spedding and J. L. Dye, J. Am. Ckem. S o c 76, 879 (1954); F. H. Spedding and S. Jaffe, ibid., 76, 882, 884 (1954).
2026 P. F. K ing and H. H. Uhlig Vol. 63
PASSIVITY IN THE IRON-CHROMIUM BINARY ALLOYSBy P. F. K ing and H. H. U hlig
Corrosion Laboratory, Department of Metallurgy, Massachusetts Institute of Technology, Cambridge, MassachusettsReceived June 8, 1959
Information is reported contributing to further knowledge of passivity in the Cr-Fe alloys containing up to 29% Cr. Data include (1) critical current densities for anodic passivation at pH 3 and 7 at 25°, and for pH 7 at 4, 25 and 50°, (2) coulombs of passive film substance per unit area, (3) activation potentials at which passivity breaks down. Critical current densities decrease with increasing Cr content, reaching a value equivalent to or less than the normal corrosion rate of iron at > 12% Cr-Fe, hence these alloys are self-passivating (stainless steels). The equivalents of passive film substance on iron and Cr-Fe alloys average 0.01 coulom b/cm.1 2 If it is assumed that (1) the anodic passivation reaction is in accord with M + 2H20 -*■ 0 2M + 4H + + 4eG where 0 2M signifies oxygen associated with metal as oxide or adsorbed gas, and (2) activation potentials correspond to equilibrium conditions for this reaction, then the calculated free energy of formation of 0 2M is not in accord with the free energy of formation of any known iron oxide. It is concluded that the passive film on Fe, Cr and the stainless steels consists of a chemisorbed oxygen or oxygen-complex film.
Passivity in iron can be induced by concentrated HNO3 or by anodic polarization in sulfuric acid, but the resulting resistance to chemical reaction is temporary, the metal reverting in short time to its original state. When 12 or more per cent. Cr is alloyed with Fe, passivity can be induced by simple air-exposure of the alloy and the resulting decrease in corrosion rate is relatively permanent. Alloys in this category are the basis of the so- called stainless steels.
The possible structure and composition of films on Cr-Fr alloys responsible for their passivity are still being discussed and constitute the basis of the present paper. Information is obtained from data presented herewith on the critical anodic current densities necessary to induce passivity in deaerated 3% Na2S0 4 solution at pH 3 and 7 at 25°, and pH 7 at 4 and 50°. Data are also presented on the equivalent coulombs of passive film substance necessary to achieve passivity. Finally, the activation potentials (Flade potentials) at which the passive film breaks down are reported for 9.0, 18.6 and 29.1% Cr. This information combined with data by other investigators closely defines certain properties of the passive film with which any assumed structure and composition must be in accord.
Experimental ProcedureAlloys from which electrodes were prepared were melted
in a vacuum induction furnace starting with pure iron (Ferro vac E, National Research Corporation) and electrolytic chromium. No deoxidizers were added. The alloys were cast by drawing into Vycor tubes, homogenized at il0 0 ° in helium for 1 hour, rolled into strips, water-quenched from 1000°, cut to size and pickled.
The electrodes measuring about 1 cm.2 and 2 mm. thick were assembled with a nickel wire, silver soldered (keeping the alloy cold) to a stem machined on the alloy specimen. The wire was enclosed by an 8 mm. diameter glass tube. A Teflon gasket maintained a water-tight seal between electrode and glass at one end, with constant contact being effected by means of a screw, nut and rubber grommet attached to the wire at the other end.
Critical current densities for passivity were determined in an all-glass one-compartment cell, two components of which were joined by a ground glass seal. Two platinum electrodes about 3 cm. diameter were equally spaced on either side of the alloy anode. The probe of a salt bridge filled with 3% Na2S04 was positioned near the surface of the alloy electrode. The salt bridge in turn made contact with a test- tube partly filled with the same solution and into which the tip of an Ag-AgCl, 0.1 N KC1 electrode was immersed. The cell was similar to that described by Uhlig and Woodside1 with the improvement that the alloy electrodes could be
pickled within the cell using warm 15 vol. % HNOs, 5 vol. % HF, washed three times with deaerated II20 , and finally filled with deaerated 3% Na»S04 without the electrode coming into contact with air. Deaeration of solutions was accomplished by bubbling through them, for 6 hours or more, nitrogen previously purified over copper turnings at 400°. Critical current densities obtained in this cell were somewhat higher than current densities determined after short exposure of the electrodes to air and were better reproducible. The cell and accompanying reservoirs of solutions, except for the pickle solution, were kept within a large constant temperature chamber maintained at 25 ± 0.2°, or at 4° or 50 ± 2°.
Activation or Flade potentials were recorded either by observing the final potential just before passivity spontaneously decayed in water of known pH (adjusted using H.SO4), or by cathodically reducing the alloy surface at slowly changing potentials until a sudden change of current through the cell indicated breakdown of passivity. The latter method was essential for the high chromium alloys which exhibited stable passivity even in acid media. Muller and Cupr2 reported activation potentials of chromium which showed more active (less noble) values when the metal was cathodically activated, than when self-activated by simple immersion in acids of pH —0.2 to + 1 . Also the slope of activation potential, Er vs. pH, for cathodically activated chromium was approximately twice (2 X 0.058) that for self-activated Cr. Rocha and Lennartz3 similarly found a slope of about 2 X 0.058 volt for cathodically activated alloys of more than 14% Cr, and decreasing slopes for lower Cr alloys, eventually reaching a slope of 0.058 for Fe. One of us suggested4 that the variation of slope with method of activation may be caused by differing chemical equilibria accompanying breakdown of passivity, triggered by a film thinning within pores in the case of self-activation, but thinning more generally over the surface in the case of cathodic activation. General thinning of the film may favor reaction of the passive film with the base metal and measurement of the corresponding potential involving reaction products, whereas with self-activation the potential is measured instead corresponding to equilibrium of only the passive film with electrolyte. An explanation along these lines is supported by the fact, as we found, that the slope can be altered by speed of cathodic reduction, higher speeds favoring local rather than general breakdown of the film, and hence accounting for lower slopes of E f vs. pH. For currently reported measurements, we chose a speed of reduction which gave the same slope (0.059 volt, 25°) as is obtained for the same or neighboring alloys when self-activated. The same pH dependence of E? indicates that passivity probably breaks down similarly by both methods of activation, and that the same chemical reactions are involved; hence the data are comparable. The method employed which gave the approximately correct slope consisted first of slightly polarizing the passive alloy specimen cathodically and retaining passivity at some definite potential with
(1 ) H . H . U hlig and G . E . W oodside , This Journal, 57, 280 (1953).
(2) E . M üller and V. C upr, Z. Elektrochem., 43, 42 (1937).(3) IT. R och a and G . Lennartz, Arch. Eisenhiillenw., 26, 117 (1955).(4) II. H . Uhlig, Z. Elektrochem., 62, 626 (1958).
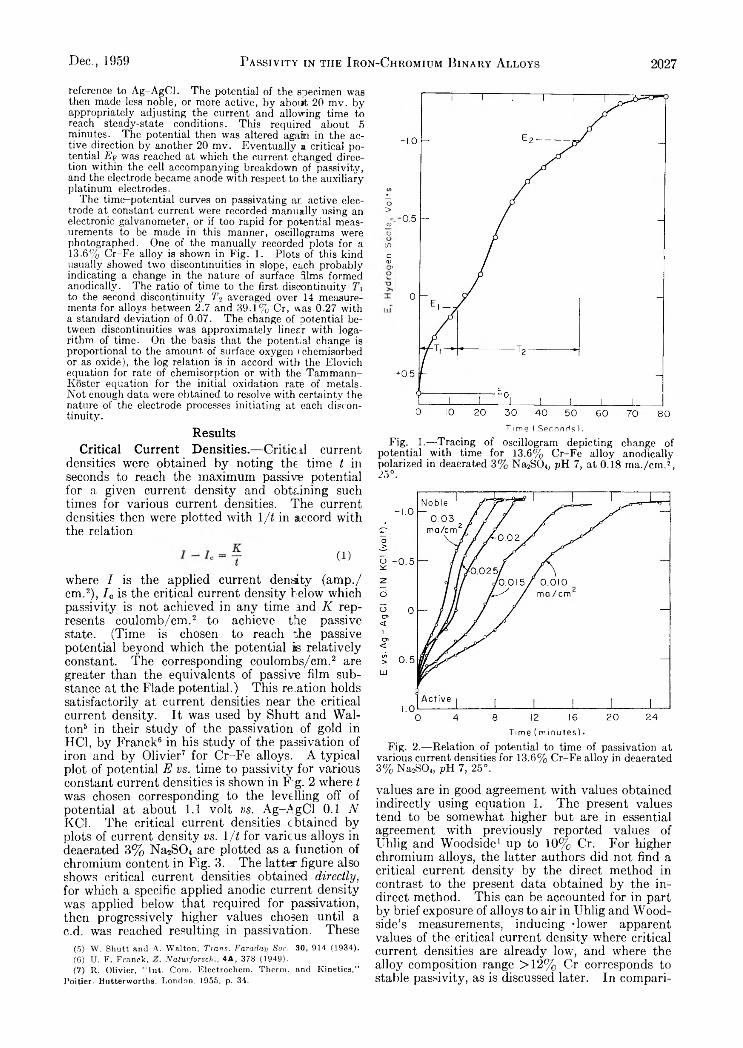
Dec., 1959 P assivity in the I ron-Chromium B inary Alloys 2027
reference to Ag-AgCl. The potential of the specimen was then made less noble, or more active, by about 20 mv. by appropriately adjusting the current and allowing time to reach steady-state conditions. This required about 5 minutes. The potential then was altered again in the active direction by another 20 mv. Eventually a critical potential Ep was reached at which the current changed direction within the cell accompanying breakdown of passivity, and the electrode became anode with respect to the auxiliary platinum electrodes. ■/>
The time-potential curves on passivating ar. active elec- ^ trode at constant current were recorded manually using an > electronic galvanometer, or if too rapid for potential meas- m urements to be made in this manner, oscillograms were o photographed. One of the manually recorded plots for a <n 13.6% Cr-Fe alloy is shown in Fig. 1. Plots of this kind crisually showed two discontinuities in slope, each probably S>indicating a change in the nature of surface dims formed anodically. The ratio of time to the first discontinuity T\ to the second discontinuity To averaged over 14 measurements for alloys between 2.7 and 39.1% Cr, was 0.27 with a standard deviation of 0.07. The change of potential between discontinuities was approximately linear with logarithm of time. On the basis that the potent.al change is proportional to the amount of surface oxygen »chemisorbed or as oxide), the log relation is in accord with the Elovich equation for rate of chemisorption or with the Tammann- Koster equation for the initial oxidation rat® of metals.Not enough data were obtained to resolve with certainty the nature of the electrode processes initiating at each discontinuity.
ResultsCritical Current Densities.—Critical current
densities were obtained by noting the time t in seconds to reach the maximum passive potential for a given current density and obtaining such times for various current densities. The current densities then were plotted with \ / t in accord with the relation
<*>where I is the applied current density (amp./ cm.2), I a is the critical current density below which passivity is not achieved in any time and K represents coulomb/cm. 2 to achieve the passive state. (Time is chosen to reach the passive potential beyond which the potential is relatively constant. The corresponding coulombs/cm. 2 are greater than the equivalents of passive film substance at the Flade potential.) This relation holds satisfactorily at current densities near the critical current density. It was used by Shutt and Walton6 in their study of the passivation of gold in HC1, by Franck6 in his study of the passivation of iron and by Olivier7 for Cr-Fe alloys. A typical plot of potential E vs. time to passivity for various constant current densities is shown in F:g. 2 where t was chosen corresponding to the levelling off of potential at about 1.1 volt vs. Ag-AgCl 0.1 N
KC1. The critical current densities obtained by plots of current density vs. 1 / t for various alloys in deaerated 3% Na SCh are plotted as a function of chromium content in Fig. 3. The latter figure also shows critical current densities obtained d irectly ,
for which a specific applied anodic current density was applied below that required for passivation, then progressively higher values chosen until ac.d. was reached resulting in passivation. These
(5) W. Shutt and A. Walton, Trans. Faraday Soc. 30, 914 (1934).(6) U. F. Franck, Naturforsch., 4A, 378 (1949).(7) R. Olivier, “ Int. Com. Electrochem. Therm, and Kinetics,”
Poitier- Butter worths, London, 1955, p. 34,
Time ( Seconds).Fig. 1.—Tracing of oscillogram depicting change of
potential with time for 13.6% Cr-Fe alloy anodically polarized in deaerated 3% Na2S04, pH 7, at 0.18 m a./cm .1, 25°.
Time (minutes).Fig. 2.— Relation of potential to time of passivation at
various current densities for 13.6% Cr-Fe alloy in deaerated 3% Na2SO„ pH 7, 25°.
values are in good agreement with values obtained indirectly using equation 1. The present values tend to be somewhat higher but are in essential agreement with previously reported values of Uhlig and Woodside1 up to 10% Cr. For higher chromium alloys, the latter authors did not find a critical current density by the direct method in contrast to the present data obtained by the indirect method. This can be accounted for in part by brief exposure of alloys to air in Uhlig and Wood- side’s measurements, inducing -lower apparent values of the critical current density where critical current densities are already low, and where the alloy composition range >12% Cr corresponds to stable passivity, as is discussed later. In compari-
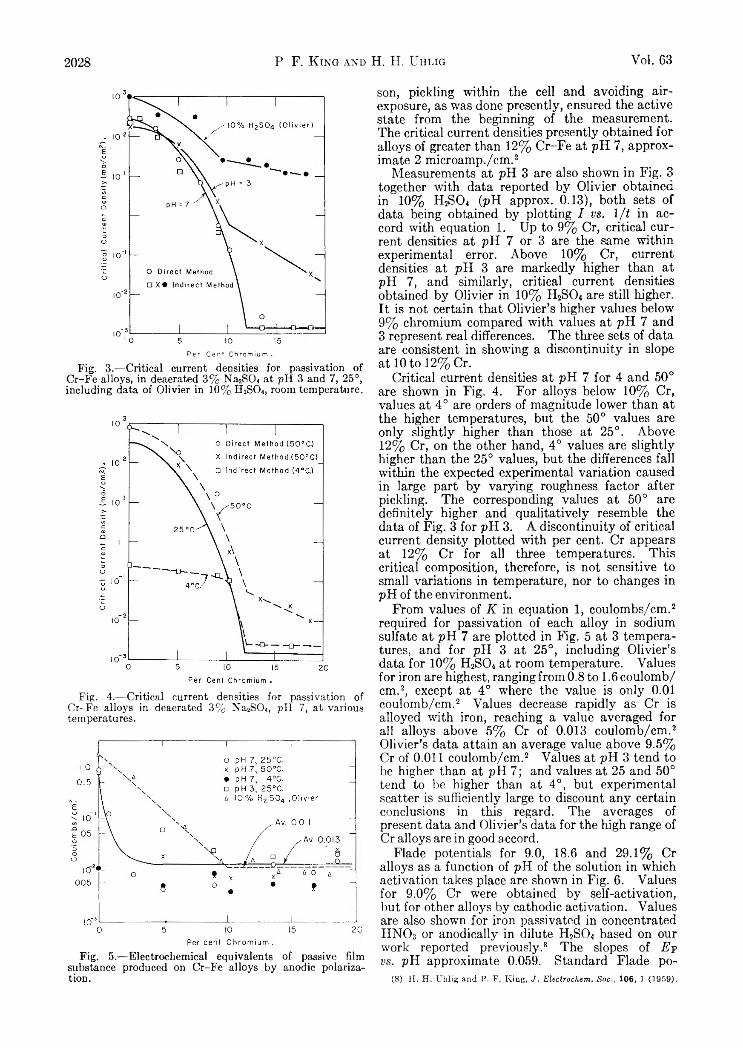
2028 P. F. K ing a n d H. H. Uhlig Vol. 63
Per Cent Chromium.Fig. 3.— Critical current densities for passivation of
Cr-Fe alloys, in deaerated 3% Na2SC>4 at pH 3 and 7, 25°, including data of Olivier in 10% H2SO4, room temperature.
Fig. 4.— Critical current densities for passivation of Cr-Fe alloys in deaerated 3% Na2S04, pH 7, at various temperatures.
Fig. 5.— Electrochemical equivalents of passive film substance produced on Cr-Fe alloys by anodic polarization.
son, pickling within the cell and avoiding air- exposure, as was done presently, ensured the active state from the beginning of the measurement. The critical current densities presently obtained for alloys of greater than 12% Cr-Fe at pH 7, approximate 2 microamp./cm. 2
Measurements at pH 3 are also shown in Fig. 3 together with data reported by Olivier obtained in 10% H2S0 4 (pH approx. 0.13), both sets of data being obtained by plotting I v s . 1 / 2 in accord with equation 1. Up to 9% Cr, critical current densities at pH 7 or 3 are the same within experimental error. Above 10% Cr, current densities at pH 3 are markedly higher than at pH 7, and similarly, critical current densities obtained by Olivier in 10% H2S0 4 are still higher. It is not certain that Olivier’s higher values below 9% chromium compared with values at pH 7 and 3 represent real differences. The three sets of data are consistent in showing a discontinuity in slope at 10 to 12% Cr.
Critical current densities at pH 7 for 4 and 50° are shown in Fig. 4. For alloys below 10% Cr, values at 4° are orders of magnitude lower than at the higher temperatures, but the 50° values are only slightly higher than those at 25°. Above 12% Cr, on the other hand, 4° values are slightly higher than the 25° values, but the differences fall within the expected experimental variation caused in large part by varying roughness factor after pickling. The corresponding values at 50° are definitely higher and qualitatively resemble the data of Fig. 3 for pH 3. A discontinuity of critical current density plotted with per cent. Cr appears at 12% Cr for all three temperatures. This critical composition, therefore, is not sensitive to small variations in temperature, nor to changes in pH of the environment.
From values of K in equation 1 , coulombs/cm. 2
required for passivation of each alloy in sodium sulfate at pH 7 are plotted in Fig. 5 at 3 temperatures, and for pH 3 at 25°, including Olivier’s data for 10% H2S0 4 at room temperature. Values for iron are highest, ranging from 0 . 8 to 1 . 6 coulomb/ cm.2, except at 4° wdiere the value is only 0.01 coulomb/cm. 2 Values decrease rapidly as Cr is alloyed with iron, reaching a value averaged for all alloys above 5% Cr of 0.013 coulomb/cm. 2
Olivier’s data attain an average value above 9.5% Cr of 0.011 coulomb/cm. 2 Values at pH 3 tend to be higher than at pH 7; and values at 25 and 50° tend to be higher than at 4°, but experimental scatter is sufficiently large to discount any certain conclusions in this regard. The averages of present data and Olivier’s data for the high range of Cr alloys are in good accord.
Flade potentials for 9.0, 18.6 and 29.1% Cr alloys as a function of pH of the solution in which activation takes place are shown in Fig. 6 . Values for 9.0% Cr were obtained by self-activation, but for other alloys by cathodic activation. Values are also shown for iron passivated in concentrated HNO3 or anodically in dilute H2S0 4 based on our work reported previously. 8 The slopes of E f v s . pH approximate 0.059. Standard Flade po-
(8) II. H. Uhlig and P. F. King, J. Electrochem. Soe., 106, 1 (1959).
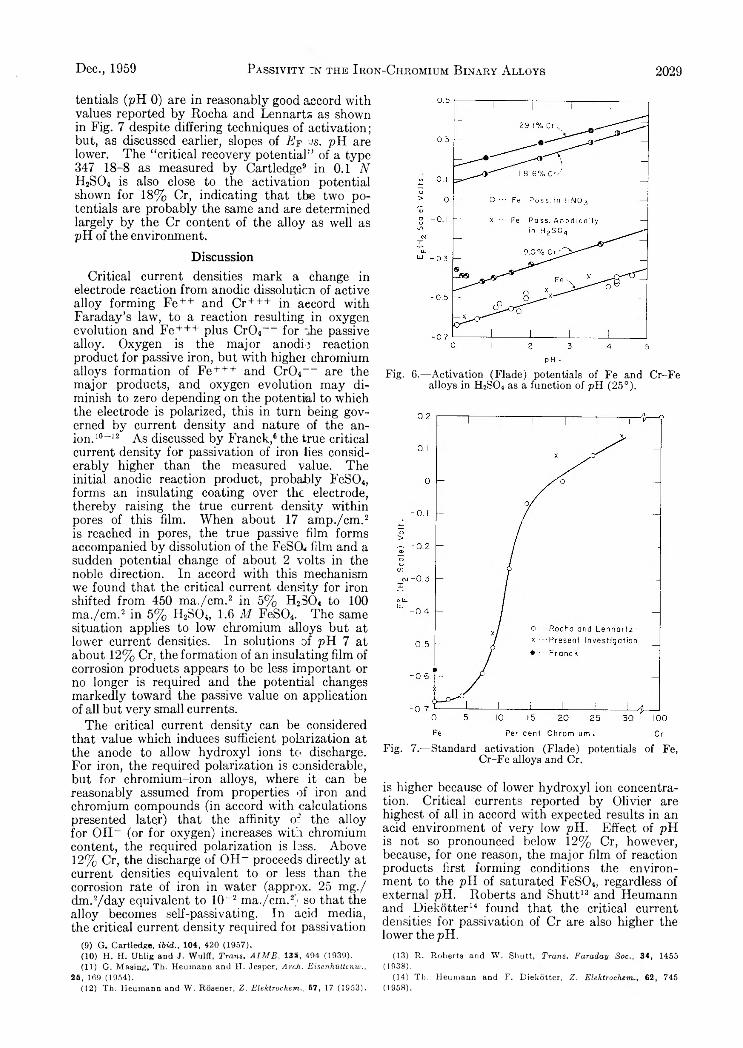
Dec., 1959 Passivity _n the Iron-Chromium B inary Alloys 2029
tentials (pH 0) are in reasonably good accord with values reported by Rocha and Lennarts as shown in Fig. 7 despite differing techniques of activation; but, as discussed earlier, slopes of E f j s . pH are lower. The “critical recovery potential''’ of a type 347 18-8 as measured by Cartledge9 in 0.1 N H2SO4 is also close to the activation potential shown for 18% Cr, indicating that the two potentials are probably the same and are determined largely by the Cr content of the alloy as well as pH of the environment.
DiscussionCritical current densities mark a change in
electrode reaction from anodic dissolution of active alloy forming Fe++ and Cr+++ in accord with Faraday’s law, to a reaction resulting in oxygen evolution and Fe+++ plus Cr04 for *he passive alloy. Oxygen is the major anodic reaction product for passive iron, but with higher chromium alloys formation of Fe+++ and CrOi— are the major products, and oxygen evolution may diminish to zero depending on the potential to which the electrode is polarized, this in turn being governed by current density and nature of the anion. 1 0 - 1 2 As discussed by Franck, 6 the true critical current density for passivation of iron lies considerably higher than the measured value. The initial anodic reaction product, probably FeS04, forms an insulating coating over the electrode, thereby raising the true current density within pores of this film. When about 17 amp./cm. 2
is reached in pores, the true passive film forms accompanied by dissolution of the FeSOu film and a sudden potential change of about 2 volts in the noble direction. In accord with this mechanism we found that the critical current density for iron shifted from 450 ma./cm . 2 in 5% H2304 to 1 0 0
ma./cm . 2 in 5% H2S04, 1.6 M FeS04. The same situation applies to low chromium alloys but at lower current densities. In solutions of pH 7 at about 12% Cr, the formation of an insulating film of corrosion products appears to be less important or no longer is required and the potential changes markedly toward the passive value on application of all but very small currents.
The critical current density can be considered that value which induces sufficient polarization at the anode to allow hydroxyl ions to discharge. For iron, the required polarization is considerable, but for chromium-iron alloys, where it can be reasonably assumed from properties of iron and chromium compounds (in accord with calculations presented late.r) that the affinity o: the alloy for OH- (or for oxygen) increases with chromium content, the required polarization is less. Above 12% Cr, the discharge of OH- proceeds directly at current densities equivalent to or less than the corrosion rate of iron in water (approx. 25 mg./ dm.2/day equivalent to 1 0 - 2 ma./cm.2) so that the alloy becomes self-passivating. In acid media, the critical current density required for passivation
(9) G. Cartledge, ibid., 104, 420 (1957).(10) H . H . Uhlig and J. Wulff, Trans. AIME, 13S, 494 (1939).(11) G . M asing, T h , H eum ann and H . Jesper, Arch. EisenhiUtenw.,
25, 169 (1954).(12) T h . H eum ann and W . R osen er, Z. Elektrochem., 57, 17 (1953).
Fig. 6.— Activation (Flade) potentials of Fe and Cr-Fe alloys in H2S04 as a function of pH (25°).
Fig. 7.— Standard activation (Flade) potentials of Fe, Cr-Fe alloys and Cr.
is higher because of lower hydroxyl ion concentration. Critical currents reported by Olivier are highest of all in accord with expected results in an acid environment of very low pH. Effect of pH is not so pronounced below 1 2 % Cr, however, because, for one reason, the major film of reaction products first forming conditions the environment to the pH of saturated FeS04, regardless of external pH. Roberts and Shutt13 and Heumann and Diekotter14 found that the critical current densities for passivation of Cr are also higher the lower the pH.
(13 ) R . R ob erts and W . Shutt, Trans. Faraday Soc., 34, 1455 (1938).
(14) T h . H eum ann and F . D iek otter , Z. E lektrochem 62, 745 (1958).

2030 P. F. K ing and H. H. Uhlig Vol. 63
T a b l e IE q u iv a l e n t s o f P a ssiv e F il m Su b st a n c e p e r U n it A r e a (A pp a r e n t Su r f a c e )
Equiv. of pass. film,
Metal Method coulombs/cm.2 Ref.Iron Coulometry 0.008 Weil17Iron Max. oxidation of Cr02~ to CrC>4~-
by passive film.012 Uhlig and O’Connor15
Iron Anal, of iron entering soln. < .003 Snavely and Hackerman20> 9 % Cr-Fe alloys and 18-8 Coulometry .011 Olivier7> 5 % Cr-Fe alloys Coulometry .013 Present work18-8 Consumption of 0 2 on exposure of al- .013 Uhlig and Lord19
loy to aerated H20° Based on alloy pickled in HCI-H2SO4, which gave a measured roughness factor of 4. The value for a measured rough
ness factor of 1.2 (18-8 pickled in HNO3-H F ) is 0.004 coulomb/em.2 The roughness factors of other metals listed in the table above have not been determined, but are expected to fall within the range 1.2-4.0.
At low temperatures, the initial film of ferrous sulfate is more viscous, diffusion is retarded, and the passive film forms at lower applied current densities. The corresponding critical current densities at 25° are lower than at 50° and still lower at 4°. Above 12% Cr, where the initial insulating film of reaction products is less important, critical current densities at 4 and 25° are about the same. But at 50° the values are higher, suggesting that passivity is less stable at this temperature, and that a reaction-product film must first partially insulate the surface before the true critical current density for passivity is attained.
The discontinuity in slopes at 10 to 12% chromium corresponds to the critical minimum concentration of Cr observed in practice for air- stable passivity. This critical chromium composition has been described by one of us15’16 as the composition marking the filling of the surface d band of chromium energy levels by electrons of alloyed iron below 12% Cr but with d- electron vacancies present above 12% Cr. It is assumed that chromium d-electron vacancies favor optimum chemisorption of the environment ( e .g . , 0 2,), the resulting chemisorbed film constituting the passive layer.
Apparent coulombs required for passivity are higher for iron than for Cr-Fe alloys, because of the accompanying formation of a temporary FeSCh film. For Cr-Fe alloys, the initial insulating film is less important, and coulombs for passivity diminish as Cr content increases (or as temperature decreases), finally reaching at 5 to 10% Cr an average constant value of about 0.01 coulomb/ cm.2 This value is also the order of magnitude for the equivalents of the true passive film on iron as obtained from coulometric measurements of Weil17 or from maximum oxidizing capacity of the passive film by Uhlig and O’Connor,18 and is the value measured for 18-8 stainless steels as reported by Olivier by the same indirect method as was used in obtaining data for Cr-Fe alloys. It is also the value obtained by Uhlig and Lord19 for the equiv
(15) H. II. Uhlipi, ibid., 61, 700 (1958).(10) “ Corrosion Handbook,” Edited by Id. H. Uhlig, John Wiley
and Sons, Inc., New York, N. Y., 1948, p. 20.(17) K. Weil, Z. Elektrochem., 59, 11 (1955). (There has been dis
cussion as to what Weil actually measured, the suggestion being made that he measured only the thickness of film supplementary to the passive film existing at the activation potential.)
(18) H. Uhlig and T. O’Connor, J. Electrochem. Soc., 102, 562(1955)-
alent amount of oxygen consumed in forming the passive film on 18-8 stainless steel, first pickled, then washed in N2-saturated H20 and subsequently exposed to aerated water for several minutes up to several hours. Snavely and Hackerman20
found 0.003 coulomb/cm. 2 based on a comparison of iron entering solution in a 0.1 M Na2S0 4 + H2SO4 , pH 3, and total coulombs passed during anodic passivation. They also state that the value at the Flade potential, based on cathodic reduction measurements, is much less than 0.003 coulomb/cm. 2 Several experimental factors, including local cell action during cathodic reduction, and factors entering anodic polarization as mentioned by the authors, may have combined to make their reported values too low. Except for this work, the total amount of passive film substance appears to be of the same order of magnitude whether the alloy is passivated by air exposure requiring up to 6 hours for complete passivity, 19
or by anodic polarization within as short a time as seconds or minutes. Data are summarized in Table I. The amount of passive film substance (0 . 0 1 coulomb/cm.2), allowing for a roughness factor of 4 as measured by the BET method2 1
for 18-8 pickled in HCI-H2SO4, is equivalent to an oxide film about 17 A. thick or an adsorbed close- packed nonatomic layer of O through gaps of which a monomolecular 0 2 layer is chemisorbed. It is of interest in this connection that a two-layer structure has been suggested for 0 2 adsorbed on W , 2 2
and for N2 adsorbed on W, Mo, Ta, Kb, Cr and Fe. 2 3
Structure of the Passive Film.— It can beassumed that the passivation of metal involves a typical anodic oxidation reaction
M + 2 H 20 — ^ 0 2M + 4 H + + 4 e ~ ( 2 )
where 0 2M signifies oxygen associated with metal as oxide or adsorbed gas. If it is further assumed that this reaction is at equilibrium at the activation potential, then the passive film is neither formed nor reduced at this potential. This assumption is consistent with the demonstration by others2 4 that passivity cannot exist at potential
(19) H. Uhlig and S. Lord, Jr., ibid., 100, 216 (1953).(20) E. Snavely and N. Hackerman, Can. J. Chem., 37, 268 (1959).(21) T. O’Connor and H. Uhlig, This Journal, 61, 402 (1957).(22) J. Becker, Ann. N. Y. Acad. S c i ., 58, 723 (1954).(23) E. Greenhalgh, N. Slack and B. Trapnell, Trans. Faraday
Soc., 52, 865 (1956).(24) K. F. Bonhoeffer, Z. Metallic., 44, 77 (1953).
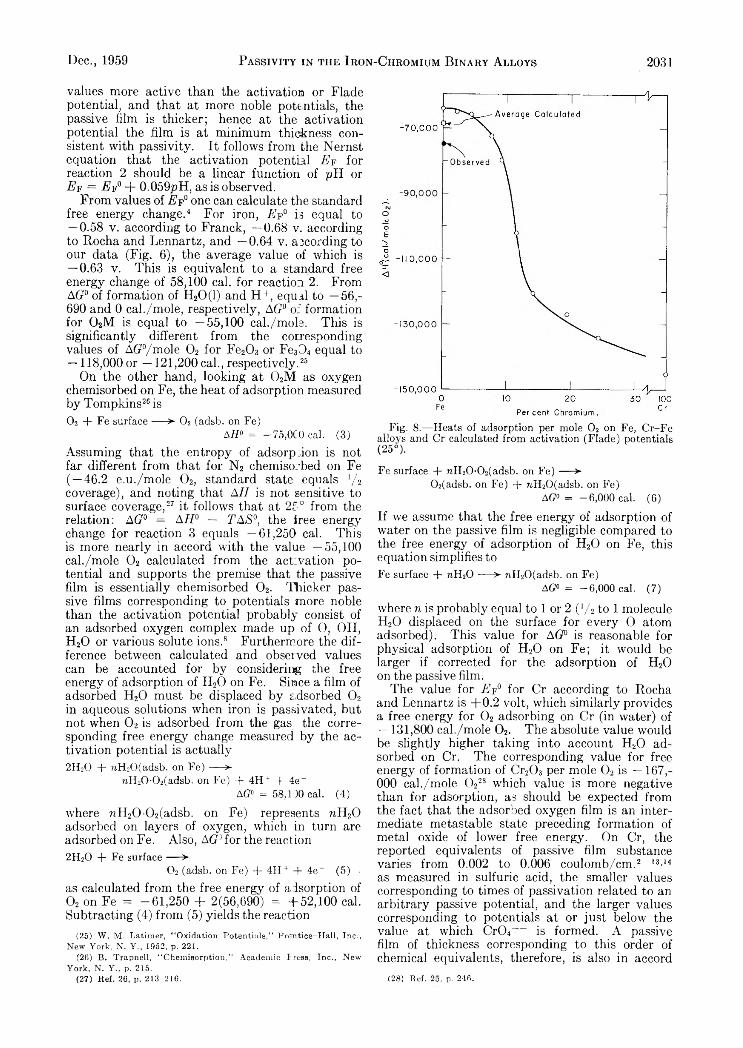
Dec., 1959 Passivity in the Iron-Chromium B inary Alloys 2031
values more active than the activation or Flade potential, and that at more noble potentials, the passive film is thicker; hence at the activation potential the film is at minimum thickness consistent with passivity. It follows from the Nernst equation that the activation potential E -p for reaction 2 should be a linear function of pH or E p = i?F° + 0.059pH, as is observed.
From values of E f° one can calculate the standard free energy change.4 For iron, E f° is equal to— 0.58 v. according to Franck, —0.68 v. according to Rocha and Lennartz, and —0.64 v. according to our data (Fig. 6), the average value of which is— 0.63 v. This is equivalent to a standard free energy change of 58,100 cal. for reaction 2. From A(?° of formation of H20(1) and H+, equal to —56,- 690 and 0 cal./mole, respectively, AG ° of formation for 0 2M is equal to —55,100 cal./mole. This is significantly different from the corresponding values of AG°/mole 0 2 for Fe20 3 or Fe304 equal to —118,000 or —121,200 cal., respectively.26
On the other hand, looking at 0 2M as oxygen chemisorbed on Fe, the heat of adsorption measured by Tompkins26 is0 2 + Fe surface — > 0 2 (adsb. on Fe)
AH0 = — 75,0C0 cal. (3)Assuming that the entropy of adsorption is not far different from that for N2 chemisorbed on Fe ( — 46.2 e.u./mole 0 2, standard state equals l/ 2 coverage), and noting that A H is not sensitive to surface coverage,27 it follows that at 25° from the relation: AG ° = AH ° — T A S ° , the free energy change for reaction 3 equals —61,250 cal. This is more nearly in accord with the value —55,100 cal./mole 0 2 calculated from the activation potential and supports the premise that the passive film is essentially chemisorbed 0 2. Thicker passive films corresponding to potentials more noble than the activation potential probably consist of an adsorbed oxygen complex made up of O, OH, H20 or various solute ions.8 Furthermore the difference between calculated and observed values can be accounted for by considering the free energy of adsorption of H20 on Fe. Since a film of adsorbed H20 must be displaced by adsorbed 0 2 in aqueous solutions when iron is passivated, but not when 0 2 is adsorbed from the gas. the corresponding free energy change measured by the activation potential is actually2H20 + raH20(adsb. on F e ) ---- >■
7iH20 -0 2(adsb. on Fe) + 4H + + 4e"AG» = 58,130 cal. (4)
where wH20 -0 2(adsb. on Fe) represents nH20 adsorbed on layers of oxygen, which in turn are adsorbed on Fe. Also, A(7° for the reaction 2H20 + Fe surface — >•
0 2 (adsb. on Fe) + 4H + + 4e~ (5) .as calculated from the free energy of adsorption of 0 2 on Fe = -61,250 + 2(56,690) = + 52,100 cal. Subtracting (4) from (5) yields the reaction
(25) W. M. Latimer, “ Oxidation Potentials,” Prentice-Hall, Inc., New York, N. Y., 1952, p. 221.
(26) B. Trapnell, “ Chemisorption,” Academic Press, Inc., New York, N. Y., p. 215.
(27) Ref. 26, p. 213-216.
Fig. 8.— Heats of adsorption per mole 0 2 on Fe, Cr-Fe alloys and Cr calculated from activation (Flade) potentials(25°).
Fe surface + rcH20 -0 2(adsb. on Fe) — >■0 2(adsb. on Fe) + wH20(adsb. on Fe)
AG« = -6 ,00 0 cal. (6)
If we assume that the free energy of adsorption of water on the passive film is negligible compared to the free energy of adsorption of H20 on Fe, this equation simplifies to Fe surface + reH20 — > raH20(adsb. on Fe)
AG» = -6 ,000 cal. (7)
where n is probably equal to 1 or 2 (‘/ 2 to 1 molecule H20 displaced on the surface for every O atom adsorbed). This value for AG ° is reasonable for physical adsorption of H20 on Fe; it would be larger if corrected for the adsorption of H20 on the passive film.
The value for E f° for Cr according to Rocha and Lennartz is +0.2 volt, which similarly provides a free energy for 0 2 adsorbing on Cr (in water) of —131,800 cal./mole 0 2. The absolute value would be slightly higher taking into account H20 adsorbed on Cr. The corresponding value for free energy of formation of Cr20 3 per mole 0 2 is —167,- 000 cal./mole 0 228 which value is more negative than for adsorption, as should be expected from the fact that the adsorbed oxygen film is an intermediate metastable state preceding formation of metal oxide of lower free energy. On Cr, the reported equivalents of passive film substance varies from 0.002 to 0.006 coulomb/cm.2 13-14 as measured in sulfuric acid, the smaller values corresponding to times of passivation related to an arbitrary passive potential, and the larger values corresponding to potentials at or just below the value at which Cr04 is formed. A passive film of thickness corresponding to this order of chemical equivalents, therefore, is also in accord
(28) l ie f . 2o, p. 210.
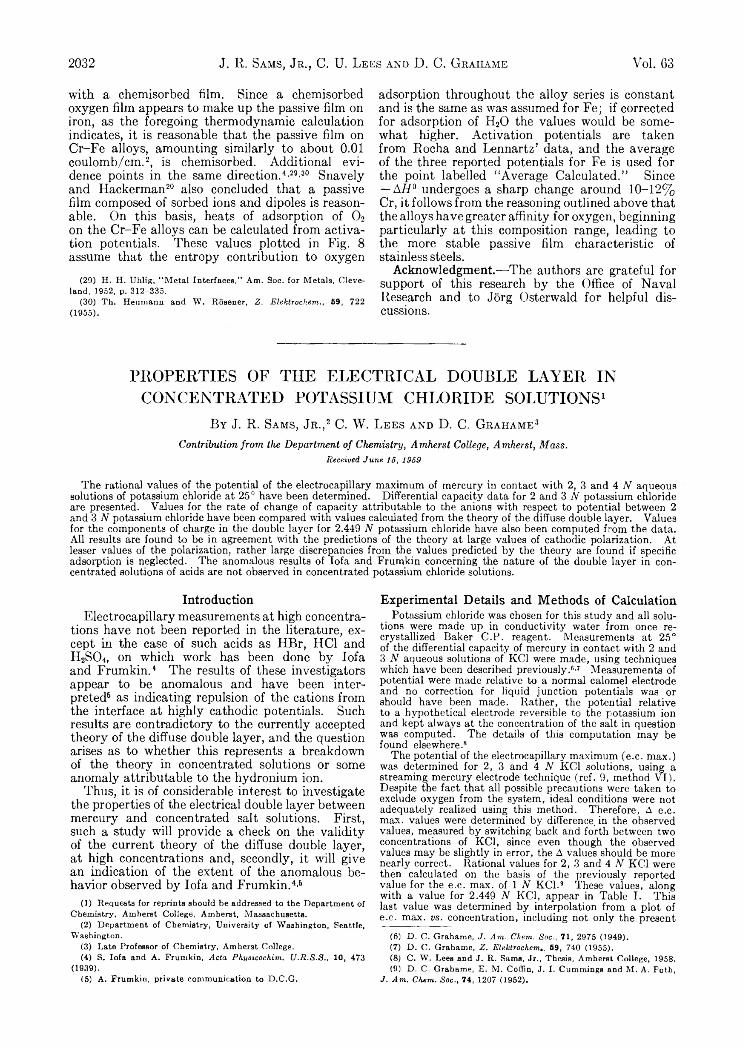
2032 J. R. Sams, Jr., C. U. Lees and D. C. Grahame Vol. 63
with a chemisorbed film. Since a chemisorbed oxygen film appears to make up the passive film on iron, as the foregoing thermodynamic calculation indicates, it is reasonable that the passive film on Cr-Fe alloys, amounting similarly to about 0.01 coulomb/cm.2, is chemisorbed. Additional evidence points in the same direction.4’29'30 Snavely and Hackerman20 also concluded that a passive film composed of sorbed ions and dipoles is reasonable. On this basis, heats of adsorption of 0 2 on the Cr-Fe alloys can be calculated from activation potentials. These values plotted in Fig. 8 assume that the entropy contribution to oxygen
(29) H. H. Uhlig, “ Metal Interfaces,” Am, Soc. for Metals, Cleveland, 1952, p. 312-335.
(30) Tho Heumana and W. Rosener, Z. Elektrochem., 59, 722 (1955).
adsorption throughout the alloy series is constant and is the same as was assumed for Fe; if corrected for adsorption of H20 the values would be somewhat higher. Activation potentials are taken from Rocha and Lennartz’ data, and the average of the three reported potentials for Fe is used for the point labelled “Average Calculated.” Since — A H 0 undergoes a sharp change around 10-12% Cr, it follows from the reasoning outlined above that the alloys have greater affinity for oxygen, beginning particularly at this composition range, leading to the more stable passive film characteristic of stainless steels.
Acknowledgment.— The authors are grateful for support of this research by the Office of Naval Research and to Jorg Osterwald for helpful discussions.
PROPERTIES OF THE ELECTRICAL DOUBLE LAYER IN CONCENTRATED POTASSIUM CHLORIDE SOLUTIONS1
By J. R. Sa m s , Jr.,2 C. W. L e e s a n d D. C. G r a h a m e 3
Contribution from the Department of Chemistry, Amherst College, Amherst, Mass.Received June 16, 1969
The rational values of the potential of the electrocapillary maximum of mercury in contact with 2, 3 and 4 N aqueous solutions of potassium chloride at 25° have been determined. Differential capacity data for 2 and 3 N potassium chloride are presented. Values for the rate of change of capacity attributable to the anions with respect to potential between 2 and 3 N potassium chloride have been compared with values calculated from the theory of the diffuse double layer. Values for the components of charge in the double layer for 2.449 N potassium chloride have also been computed from the data. All results are found to be in agreement with the predictions of the theory at large values of cathodic polarization. At lesser values of the polarization, rather large discrepancies from the values predicted by the theory are found if specific adsorption is neglected. The anomalous results of Iofa and Frumkin concerning the nature of the double layer in concentrated solutions of acids are not observed in concentrated potassium chloride solutions.
IntroductionElectrocapillary measurements at high concentra
tions have not been reported in the literature, except in the case of such acids as HBr, HC1 and H2S04, on which work has been done by Iofa and Frumkin.4 The results of these investigators appear to be anomalous and have been interpreted6 as indicating repulsion of the cations from the interface at highly cathodic potentials. Such results are contradictory to the currently accepted theory of the diffuse double layer, and the question arises as to whether this represents a breakdown of the theory in concentrated solutions or some anomaly attributable to the hydronium ion.
Thus, it is of considerable interest to investigate the properties of the electrical double layer between mercury and concentrated salt solutions. First, such a study will provide a check on the validity of the current theory of the diffuse double layer, at high concentrations and, secondly, it will give an indication of the extent of the anomalous behavior observed by Iofa and Frumkin.4’6
(1) Requests for reprints should be addressed to the Department of Chemistry, Amherst College, Amherst, Massachusetts.
(2) Department of Chemistry, University of Washington, Seattle, Washington.
(3) Late Professor of Chemistry, Amherst College.(4) S. Iofa and A. Frumkin, Acta Physicochim. U.R.S.S., 10, 473
(1939).(5) A. Frumkin, private communication to D.C.G.
Experimental Details and Methods of CalculationPotassium chloride was chosen for this study and all solu
tions were made up in conductivity water from once recrystallized Baker C.P. reagent. Measurements at 25° of the differential capacity of mercury in contact with 2 and 3 N aqueous solutions of KC1 were made, using techniques which have been described previously.6’7 Measurements of potential were made relative to a normal calomel electrode and no correction for liquid junction potentials was or should have been made. Rather, the potential relative to a hypothetical electrode reversible to the potassium ion and kept always at the concentration of the salt in question was computed. The details of this computation may be found elsewhere.8
The potential of the electrocapillary maximum (e.c. max.) was determined for 2, 3 and 4 N KC1 solutions, using a streaming mercury electrode technique (ref. 9, method VI). Despite the fact that all possible precautions were taken to exclude oxygen from the system, ideal conditions were not adequately realized using this method. Therefore, A e.c. max. values were determined by difference, in the observed values, measured by switching back and forth between two concentrations of KC1, since even though the observed values may be slightly in error, the A values should be more nearly correct. Rational values for 2 , 3 and 4 N KC1 were then calculated on the basis of the previously reported value for the e.c. max. of 1 N KC1.9 These values, along with a value for 2.449 N KC1, appear in Table I. This last value was determined by interpolation from a plot of e.c. max. vs. concentration, including not only the present
(6) D. C. Grahame, J. Am. Chem. Soc., 71, 2975 (1949).(7) D. C. Grahame, Z. Elektrochem,, 59, 740 (1955).(8) C. W. Lees and J. R. Sams, Jr., Thesis, Amherst College, 1958.(9) D. C. Grahame, E. M. Coffin, J. I. Cummings and M. A. Poth,
J. Am. Chem. Soc.t 74, 1207 (1952).
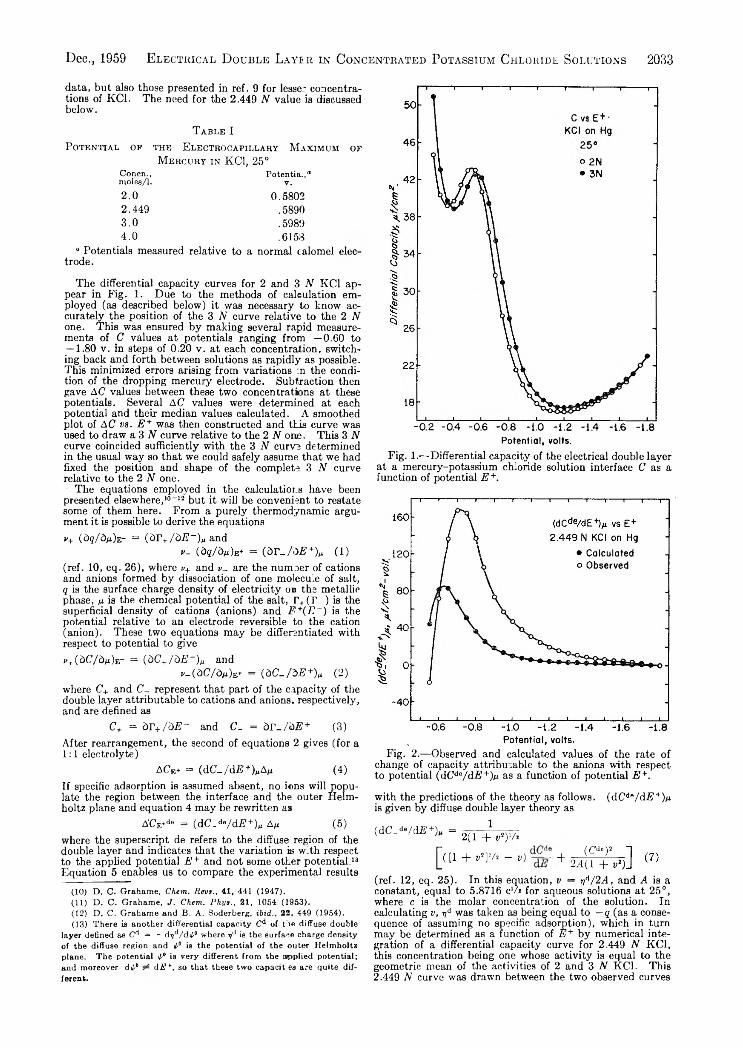
Dec., 1959 Electrical D ouble Layer in Concentrated Potassium Chloride Solutions 2033
data, but also those presented in ref. 9 for lesse- concentrations of KC1. The need for the 2.449 N value is discussed below.
T a b l e I
P o t e n t ia l o f t h e E l e c t r o c a p il l a r y M a x im u m o f M e r c u r y in KC1, 25°
Concn., Potentia.,0moles/1. V.2.0 0.58022.449 .58903.0 .59894.0 .6158
* Potentials measured relative to a normal calomel electrode.
The differential capacity curves for 2 and 3 N KC1 appear in Fig. 1. Due to the methods of calculation employed (as described below) it was necessary to know accurately the position of the 3 N curve relative to the 2 N one. This was ensured by making several rapid measurements of C values at potentials ranging from —0.60 to — 1.80 v. in steps of 0.20 v. at each concentration, switching back and forth between solutions as rapidly as possible. This minimized errors arising from variations :n the condition of the dropping mercury electrode. Subtraction then gave AC values between these two concentrations at these potentials. Several AC values were determined at each potential and their median values calculated. A smoothed plot of AC vs. E + was then constructed and this curve was used to draw a 3 N curve relative to the 2 N one. This 3 N curve coincided sufficiently with the 3 N curve determined in the usual way so that we could safely assume that we had fixed the position and shape of the complete 3 N curve relative to the 2 N one.
The equations employed in the calculations have been presented elsewhere,10-12 but it will be convenient to restate some of them here. From a purely thermodynamic argument it is possible to derive the equationsv+ (dq/dfx)e- = (Dr+ /d E “ )w and
v- (dq/bn)e* = (d r_ /A E +)f. ( 1) (ref. 10, eq. 26), where v+ and »<_ are the numoer of cations and anions formed by dissociation of one molecule of salt, q is the surface charge density of electricity on the metallic phase, iu is the chemical potential of the salt, r +(r _ ) is the superficial density of cations (anions) and E +(E~) is the potential relative to an electrode reversible to the cation (anion). These two equations may be differentiated with respect to potential to give^(bC/d/DE- = (i>C+/dE~)n and
v_(dC/dM)B+ = (dC_AE+)„ (2)where C+ and C_ represent that part of the capacity of the double layer attributable to cations and anions, respectively, and are defined as
C+ = 2>r+/dl?- and C . = & r _ /a £ + (3)After rearrangement, the second of equations 2 gives (for a 1:1 electrolyte)
A CE+ = (dC-M F+LAn (4)If specific adsorption is assumed absent, no ions will populate the region between the interface and the outer Helmholtz plane and equation 4 may be rewritten as
ACVd» = (dC_de/cLE,+) AM (5)where the superscript de refers to the diffuse region of the double layer and indicates that the variation is with respect to the applied potential E + and not some other potential.13 Equation 5 enables us to compare the experimental results 10 11 12 13
(10) D. C. Grahame, Chem. Revs., 41, 441 (1947).(11) D. C. Grahame, J. Chem. Phys., 21, 1054 (1953).(12) D. C. Grahame and B. A. Soderberg, ibid., 22, 449 (1954).(13) There is another differential capacity Cd of tile diffuse double
layer defined as Cd = ~dr)d/dipQ where V1 is the surface charge density of the diffuse region and t/f is the potential of the outer Helmholtz plane. The potential 7-° is very different from the applied potential; and moreover d 7° dE +, so that these two capacit es are quite different.
Potential, volts.Fig. 1.— Differential capacity of the electrical double layer
at a mercury-potassium chloride solution interface C as a function of potential E +.
Fig. 2.— Observed and calculated values of the rate of change of capacity attributable to the anions with respect to potential (dCie/dE+)/i as a function of potential E +.
with the predictions of the theory as follows. (dC6‘ /dE+)ii is given by diffuse double layer theory as
(d C -de/dE+)n =
[ « *
12(1 + t»2)1/»
+ V2]'/' - V ) ~ +( C d=)2
2A (1 + v1)(ref. 12, eq. 25). In this equation, v — t)d/2A, and A is a constant, equal to 5.8716 c‘/> for aqueous solutions at 25°, where c is the molar concentration of the solution. In calculating v, jjd was taken as being equal to — q (as a consequence of assuming no specific adsorption), which in turn may be determined as a function of E + by numerical integration of a differential capacity curve for 2.449 N KC1, this concentration being one whose activity is equal to the geometric mean of the activities of 2 and 3 N KC1. This 2.449 N curve was drawn between the two observed curves

2034 J. R. Sams, Jr., C. W. Lees and D. C. Grahame Vol. 63
Potential, volts.Fig. 3.— Components of charge in the double layer be
tween mercury and 2.449 N potassium chloride solution as a function of potential, —q is total charge; yd is total charge in the diffuse double layer; r+ is charge attributable to cations in the double layer. yd is charge attributable to anions in the diffuse double layer; y' is charge attributable to anions adsorbed on the mercury surface; is the sum of these two.
Fig. 4.— Observed and calculated values of the rate of change of capacity attributable to the anions with respect to potential (dCd6/d .S+)/r as a function of potential E + calculated from data of Grahame and Soderberg.12
by plotting average values of the 2 and 3 N curves. The integration was carried out starting at the e.c. max., thus setting the constant of integration equal to zero. Values of C and dC/dE were also obtained from the 2.449 N curve by direct reading and by graphical tangential slope measurements, respectively, it being assumed that C = Cde and dC/dE = dCie/dE (again as a consequence of our assumption of no specific adsorption). Experimental values for (dCde/d i i+)>j were obtained from AC values through equation 5. Figure 2 shows observed and calculated values of this quantity.
From the data it is also possible to calculate the components of charge in the double layer. A numerical integra
tion of the observed (dC-/dE+)n curve with respect to potential gives C- as a function of E +. The constant of integration is obtained by calculating the value of C_ at — 1.805 v. by use of equation 62 of ref. 11. This potential is selected because the convergence of the two curves in Fig. 2 indicates that the diffuse double layer theory upon which the calculation is based holds best in the highly cathodic region. An integration of the C_ vs. E + curve gives T _ . Again it is necessary to determine the constant of integration, this time by calculating r_ at a potential of —1.81 v. (the most cathodic value obtainable without extrapolation), from equations 43 and 72 of ref. 10. r+ is otained by difference from q and r _ . The surface excess of specifically adsorbed anions y' is found by subtracting from r_ the surface excess of anions in the diffuse part of the double layer 1jd. The latter is found from T+ using equations 72 and 73 of ref. 10. The validity of these calculations rests on the requirement that cations be present solely in the diffuse part of the double layer. Summing T+ and yd- gives yd. This quantity can also be obtained from the relation
r)d = —2A smh(zetp°/2kT) (8 )and this was used as a check on the numerical accuracy of the results. All the components of charge are shown in Fig. 3.
Discussion of ResultsThe differential capacity curves for 2 and 3 N
KC1 (Fig. 1) exhibit the same general shape characteristic of lower concentrations of the same salt, and the 2 N curve agrees quite well with independent data obtained at this concentration.14 The good agreement between the points calculated from AC values and those obtained directly for 3 N KC1 indicates that the shape and position of this curve relative to the 2 N curve have been closely established.
It is clear that the discrepancy between the two curves in Fig. 2 is due to specific adsorption of the chloride ion on the mercury surface. It will be remembered that in the calculation of (dCde/di?+)il by equation 7 it was assumed that specific adsorption was absent. However, if anions are present in the inner region in the cathodic branch of the curve, this causes an increase in the negative charge on the metallic phase and hence an increase in the capacity of the double layer. This accounts for the fact that the observed values are greater than the calculated ones.
The curves converge as the potential becomes more cathodic, due to the fact that the bonds between the adsorbed anions and the mercury are weakened by the increasingly negative charge on the mercury and anions are repelled from the interface. Thus, the discrepancy due to specific adsorption decreases.
It may finally be noted that both curves approach zero as the potential becomes more cathodic. What is actually observed is that ( d C / d y ) e + equals zero at some highly cathodic E + (see Fig. 1). But by equation 2, this is equivalent to observing that (dC_/dFJ+)^ equals zero. Since the quantity (7- is the differential of r_ with respect to E + , one observes that (52r_/5£’+2) approaches zero. This phenomenon is also predicted by the theory of the diffuse double layer. From equation 73 of ref. 10 it may be seen that
( d V d/<h/2) = - ( 4 / 4 ) exp(j//2) (9)
where y is a monotonic function of E + . Hence as y approaches a large negative value, d 2y ^ d/ d E + 2
(14) D. C. Grahame, unpublished results.
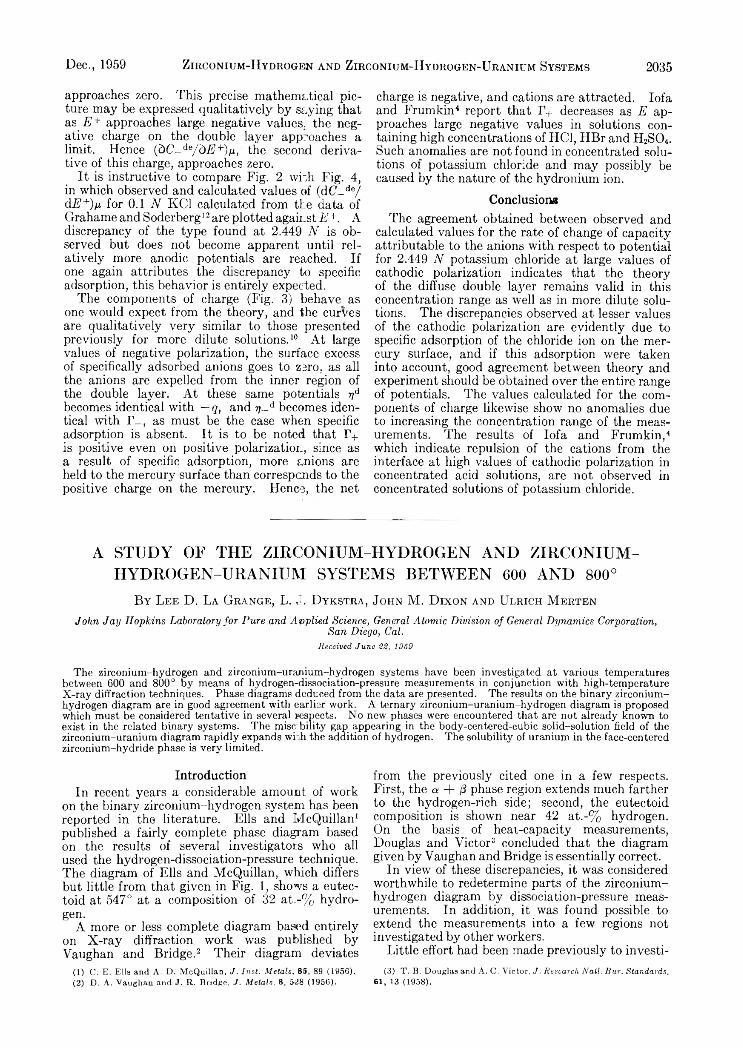
Dec., 1959 Zirconium-Hydrogen and Zirconium-Hydrogen-Uranium Systems 2035
approaches zero. This precise mathematical picture may be expressed qualitatively by saying that as E + approaches large negative values, the negative charge on the double layer approaches a limit. Hence (ò C - ie / ò E + ) n , the second derivative of this charge, approaches zero.
It is instructive to compare Fig. 2 wbh Fig. 4, in which observed and calculated values of (dC_de/ cLE+V for 0.1 N KC1 calculated from the data of Grahame and Soderberg12 are plotted against E + . A discrepancy of the type found at 2.449 N is observed but does not become apparent until relatively more anodic potentials are reached. If one again attributes the discrepancy to specific adsorption, this behavior is entirely expected.
The components of charge (Fig. 3) behave as one would expect from the theory, and the curves are qualitatively very similar to those presented previously for more dilute solutions.10 At large values of negative polarization, the surface excess of specifically adsorbed anions goes to zero, as all the anions are expelled from the inner region of the double layer. At these same potentials i?d becomes identical with — q , and r/.J1 becomes identical with r_, as must be the case when specific adsorption is absent. It is to be noted that T+ is positive even on positive polarization, since as a result of specific adsorption, more anions are held to the mercury surface than corresponds to the positive charge on the mercury. Hence, the net
charge is negative, and cations are attracted. Iofa and Frumkin4 report that 1+ decreases as E approaches large negative values in solutions containing high concentrations of HC1, HBr and H2S04. Such anomalies are not found in concentrated solutions of potassium chloride and may possibly be caused by the nature of the hydronium ion.
ConclusionsThe agreement obtained between observed and
calculated values for the rate of change of capacity attributable to the anions with respect to potential for 2.449 N potassium chloride at large values of cathodic polarization indicates that the theory of the diffuse double layer remains valid in this concentration range as well as in more dilute solutions. The discrepancies observed at lesser values of the cathodic polarization are evidently due to specific adsorption of the chloride ion on the mercury surface, and if this adsorption were taken into account, good agreement between theory and experiment should be obtained over the entire range of potentials. The values calculated for the components of charge likewise show no anomalies due to increasing the concentration range of the measurements. The results of Iofa and Frumkin,4 which indicate repulsion of the cations from the interface at high values of cathodic polarization in concentrated acid solutions, are not observed in concentrated solutions of potassium chloride.
A STUDY OF THE ZIRCONIUM-HYDROGEN AND ZIRCONIUM- HYDROGEN-URANIUM SYSTEMS BETWEEN 600 AND 800°
B y Lee D . La Grange, L. J. D ykstra, John M . D ixon and U lrich M erten
John Jay Hopkins Laboratory for Pure and Applied Science, General Atomic Division of General Dynamics Corporation,San Diego, Cal.
Received June 22, 1959
The zirconium-hydrogen and zirconium-uranium-hydrogen systems have been investigated at various temperatures between 600 and 800° by means of hydrogen-dissociation-pressure measurements in conjunction with high-temperature X-ray diffraction techniques. Phase diagrams deduced from the data are presented. The results on the binary zirconium- hydrogen diagram are in good agreement with earlier work. A ternary zirconium-uranium-hydrogen diagram is proposed which must be considered tentative in several respects. No new phases were encountered that are not already known to exist in the related binary systems. The misc-bility gap appearing in the body-centered-cubic solid-solution field of the zirconium-uranium diagram rapidly expands wi~h the addition of hydrogen. The solubility of uranium in the face-centered zirconium-hydride phase is very limited.
IntroductionIn recent years a considerable amount of work
on the binary zirconium-hydrogen system has been reported in the literature. Ells and McQuillan1 published a fairly complete phase diagram based on the results of several investigators who all used the hydrogen-dissociation-pressure technique. The diagram of Ells and McQuillan, which differs but little from that given in Fig. 1, shows a eutec- toid at 547° at a composition of 32 at.-% hydro- gen.
A more or less complete diagram based entirely on X-ray diffraction work was published by Vaughan and Bridge.2 Their diagram deviates
(1) C. E. Ells and A. D. McQuillan, J. Inst. Metals, 85, 89 (1950).(2) D. A. Vaughan and. J. R. Bridge, J. Metals, 8, 5-28 (1956).
from the previously cited one in a few respects. First, the a + ¡3 phase region extends much farther to the hydrogen-rich side; second, the eutectoid composition is shown near 42 at.-% hydrogen. On the basis of heat-capacity measurements, Douglas and Victor3 concluded that the diagram given by Vaughan and Bridge is essentially correct.
In view of these discrepancies, it was considered worthwhile to redetermine parts of the zirconium- hydrogen diagram by dissociation-pressure measurements. In addition, it was found possible to extend the measurements into a few regions not investigated by other workers.
Little effort had been made previously to investi-(3) T. B. Douglas and A. C. Victor, J. Research Nail. Bur. Standards,
61, 13 (1958).
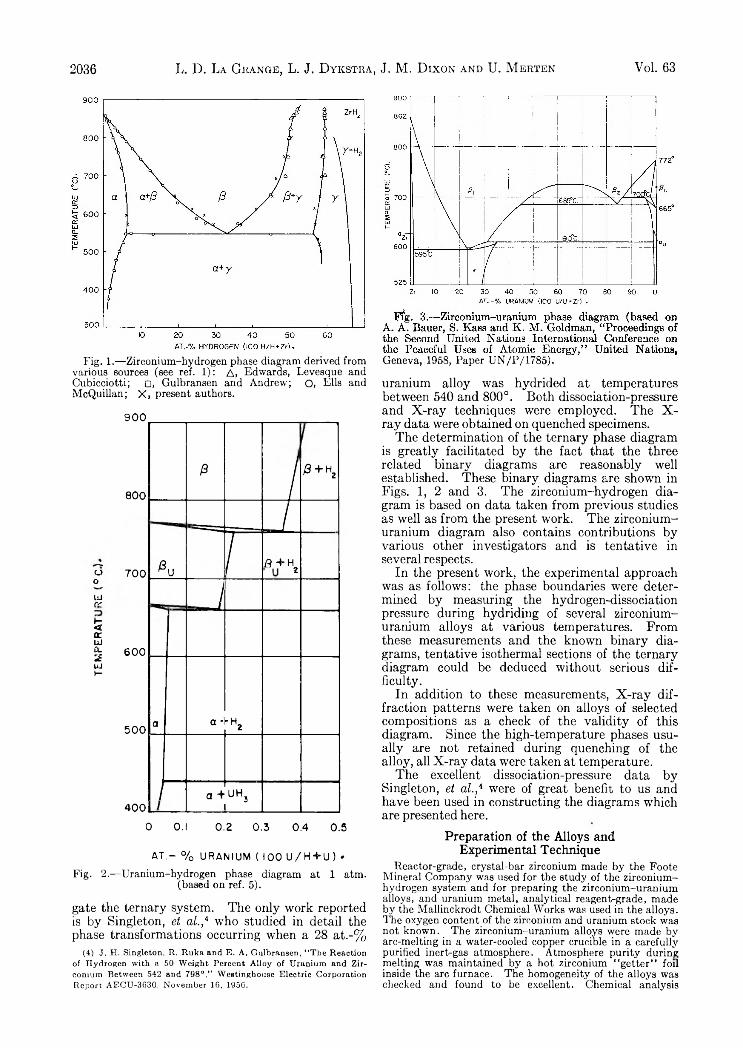
2036 L. D. La Grange, L. J. D ykstra, J. M. D ixon and U. M erten Vol. 63
Fig. 1.— Zirconium-hydrogen phase diagram derived from various sources (see ref. 1): A, Edwards, Levesque and Cubicciotti; □, Gulbransen and Andrew; O, Ells and McQuillan; X , present authors.
9 0 0
800
ooUJre
¡5<rto£L2LUH
700
6 0 0
5 0 0
4 0 0
ß/
ß + Hz
/
U / B + H 2
1
a a-hHz
a +____ UH3____
0 0.1 0.2 0.3 0.4 0.5
A T .- % URANIUM ( 100 U /H + U) •Fig. 2.— Uranium-hydrogen phase diagram at 1 atm.
(based on ref. 5).
gate the ternary system. The only work reported is by Singleton, e t o(.,4 who studied in detail the phase transformations occurring when a 28 at.-%
(4) J. H. Singleton, R. Ruka and E. A. Gulbransen, “ The Reaction of Hydrogen with a 50 Weight Percent Alloy of Uranium and Zirconium Between 542 and 798°,” Westinghouse Electric Corporation Report AECU-3G30, November 16, 1956.
Geneva, 1958, Paper UN/P/1785).
uranium alloy was hydrided at temperatures between 540 and 800°. Both dissociation-pressure and X-ray techniques were employed. The X - ray data were obtained on quenched specimens.
The determination of the ternary phase diagram is greatly facilitated by the fact that the three related binary diagrams are reasonably well established. These binary diagrams are shown in Figs. 1, 2 and 3. The zirconium-hydrogen diagram is based on data taken from previous studies as well as from the present work. The zirconium- uranium diagram also contains contributions by various other investigators and is tentative in several respects.
In the present work, the experimental approach was as follows: the phase boundaries were determined by measuring the hydrogen-dissociation pressure during hydriding of several zirconium- uranium alloys at various temperatures. From these measurements and the known binary diagrams, tentative isothermal sections of the ternary diagram could be deduced without serious difficulty.
In addition to these measurements, X-ray diffraction patterns were taken on alloys of selected compositions as a check of the validity of this diagram. Since the high-temperature phases usually are not retained during quenching of the alloy, all X-ray data were taken at temperature.
The excellent dissociation-pressure data by Singleton, e t a l ,,4 were of great benefit to us and have been used in constructing the diagrams which are presented here.
Preparation of the Alloys and Experimental Technique
Reactor-grade, crystal-bar zirconium made by the Foote Mineral Company was used for the study of the zirconium- hydrogen system and for preparing the zirconium-uranium alloys, and uranium metal, analytical reagent-grade, made by the Mallinckrodt Chemical Works was used in the alloys. The oxygen content of the zirconium and uranium stock was not known. The zirconium-uranium alloys were made by arc-melting in a water-cooled copper crucible in a carefully purified inert-gas atmosphere. Atmosphere purity during melting was maintained by a hot zirconium “ getter” foil inside the arc furnace. The homogeneity of the alloys was checked and found to be excellent. Chemical analysis
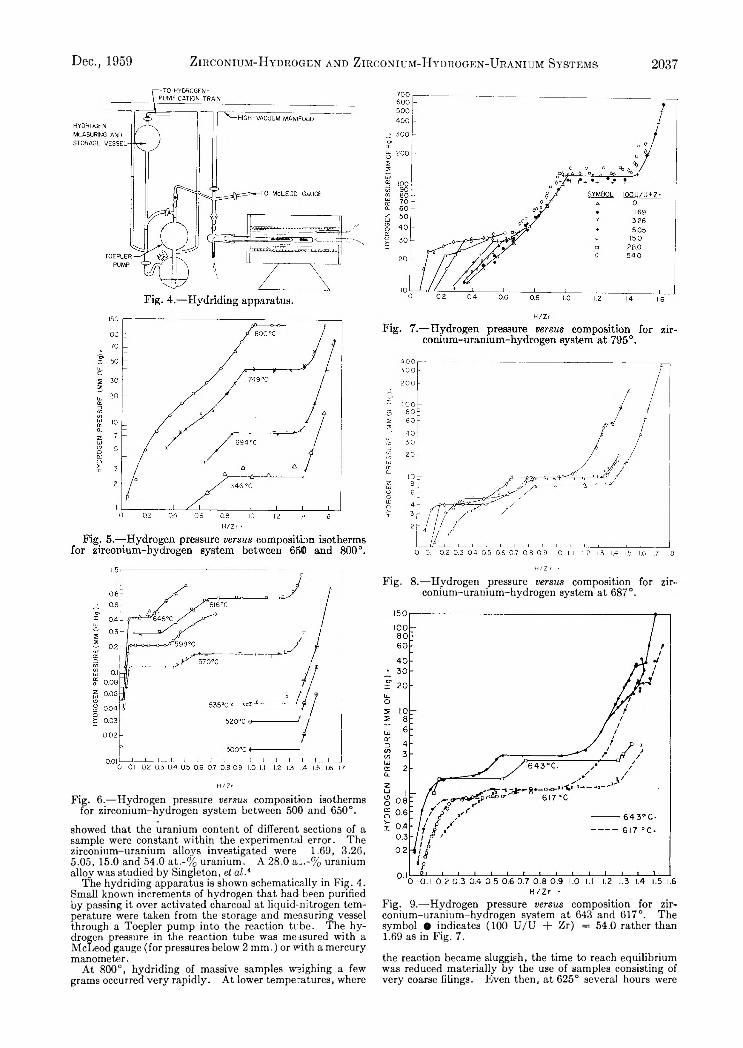
Dec., 1959 Zirconium-Hydrogen and Zirconium-Hydrogen-Uranium Systems 2037
H/ Z r
Fig. 6.— Hydrogen pressure versus composition isotherms for zirconium-hydrogen system between 500 and 650°.
showed that the uranium content of different sections of a sample were constant within the experimental error. The zirconium-uranium alloys investigated were 1.69, 3.26,5.05, 15.0 and 54.0 at.-% uranium. A 28.0 a i.-% uranium alloy was studied by Singleton, ef ai.4
The hydriding apparatus is shown schematically in Fig. 4. Small known increments of hydrogen that had been purified by passing it over activated charcoal at liquid-nitrogen temperature were taken from the storage and measuring vessel through a Toepler pump into the reaction tube. The hydrogen pressure in the reaction tube was measured with a McLeod gauge (for pressures below 2 mm.) or with a mercury manometer.
At 800°, hydriding of massive samples weighing a few grams occurred very rapidly. At lower temperatures, where
H/Z r ■Fig. 8.—Hydrogen pressure versus composition for zir-
conium-uranium-hydrogen System at 687°.
Fig. 9.— Hydrogen pressure versus composition for zir- conium-uranium-hydrogen system at 643 and 617°. The symbol • indicates (100 U /U + Zr) = 54.0 rather than 1.69 as in Fig. 7.
the reaction became sluggish, the time to reach equilibrium was reduced materially by the use of samples consisting of very coarse filings. Even then, at 625° several hours were
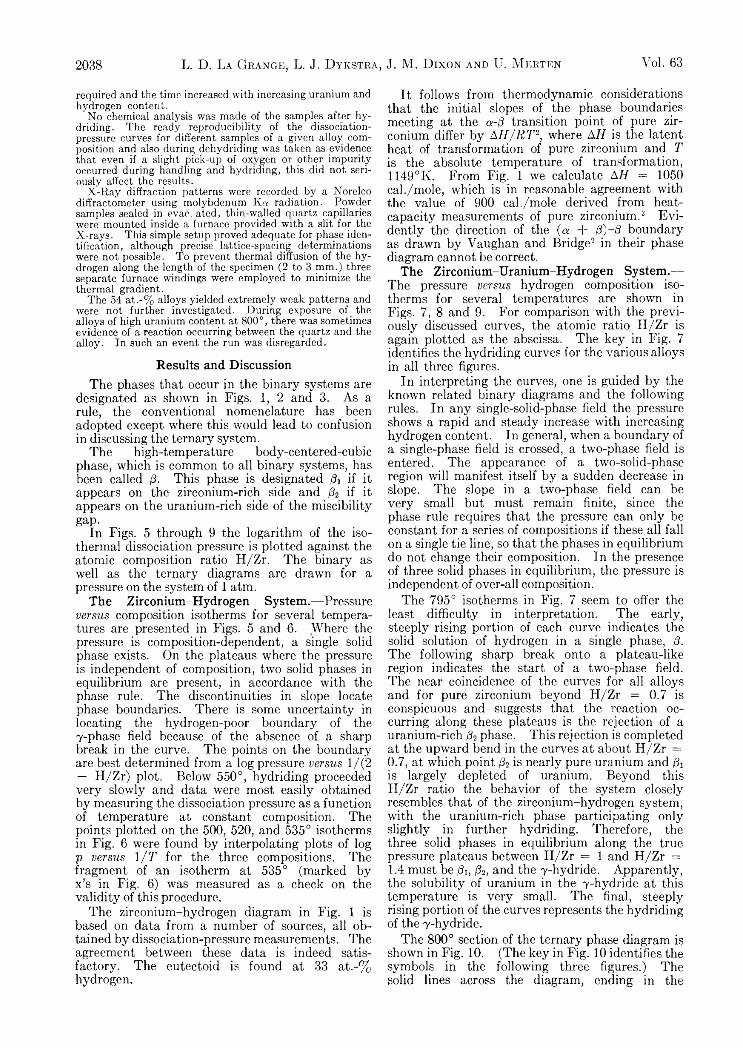
2038 L. D. La Grange, L. J. D ykstra, J. M. D ixon and U. M erten Vol. 63
required and tbe time increased with increasing uranium and hydrogen content.
' No chemical analysis was made of the samples after hy- driding. The ready reproducibility of the dissociation- pressure curves for different samples of a given alloy composition and also during dehydriding was taken as evidence that even if a slight pick-up of oxygen or other impurity occurred during handling and hydriding, this did not seriously affect the results.
X-Ray diffraction patterns were recorded by a Norelco diffractometer using molybdenum Ka radiation. Powder samples sealed in evae, ated, thin-walled quartz capillaries were mounted inside a furnace provided with a slit for the X-rays. This simple setup proved adequate for phase identification, although precise lattice-spacing determinations were not possible. To prevent thermal diffusion of the hydrogen along the length of the specimen (2 to 3 mm.) three separate furnace windings were employed to minimize the thermal gradient.
The 54 at.-% alloys yielded extremely weak patterns and were not further investigated. During exposure of the alloys of high uranium content at 800°, there was sometimes evidence of a reaction occurring between the quartz and the alloy. In such an event the run was disregarded.
Results and DiscussionThe phases that occur in the binary systems are
designated as shown in Figs. 1, 2 and 3. As a rule, the conventional nomenclature has been adopted except where this would lead to confusion in discussing the ternary system.
The high-temperature body-centered-cubic phase, which is common to all binary systems, has been called ft This phase is designated ft if it appears on the zirconium-rich side and ft if it appears on the uranium-rich side of the miscibility gap.
In Figs. 5 through 9 the logarithm of the isothermal dissociation pressure is plotted against the atomic composition ratio H/Zr. The binary as well as the ternary diagrams are drawn for a pressure on the system of 1 atm.
The Zirconium-Hydrogen System.— Pressure v e r s u s composition isotherms for several temperatures are presented in Figs. 5 and 6. Where the pressure is composition-dependent, a single solid phase exists. On the plateaus where the pressure is independent of composition, two solid phases in equilibrium are present, in accordance with the phase rule. The discontinuities in slope locate phase boundaries. There is some uncertainty in locating the hydrogen-poor boundary of the Y-phase field because of the absence of a sharp break in the curve. The points on the boundary are best determined from a log pressure v e r s u s 1/(2 — H/Zr) plot. Below 550°, hydriding proceeded very slowly and data were most easily obtained by measuring the dissociation pressure as a function of temperature at constant composition. The points plotted on the 500, 520, and 535° isotherms in Fig. 6 were found by interpolating plots of log p v e r s u s l / T for the three compositions. The fragment of an isotherm at 535° (marked by x’s in Fig. 6) was measured as a check on the validity of this procedure.
The zirconium-hydrogen diagram in Fig. 1 is based on data from a number of sources, all obtained by dissociation-pressure measurements. The agreement between these data is indeed satisfactory. The eutectoid is found at 33 at.-% hydrogen.
It follows from thermodynamic considerations that the initial slopes of the phase boundaries meeting at the aft? transition point of pure zirconium differ by AH / R T 2, where A H is the latent heat of transformation of pure zirconium and T is the absolute temperature of transformation, 1149°K. From Fig. 1 we calculate A H = 1050 cal./mole, which is in reasonable agreement with the value of 900 cal./mole derived from heat- capacity measurements of pure zirconium.3 Evidently the direction of the ( a + ft-/3 boundary as drawn by Vaughan and Bridge2 in their phase diagram cannot be correct.
The Zirconium-Uranium-Hydrogen System.— The pressure v e r s u s hydrogen composition isotherms for several temperatures are shown in Figs. 7, 8 and 9. For comparison with the previously discussed curves, the atomic ratio H/Zr is again plotted as the abscissa. The key in Fig. 7 identifies the hydriding curves for the various alloys in all three figures.
In interpreting the curves, one is guided by the known related binary diagrams and the following rules. In any single-solid-phase field the pressure shows a rapid and steady increase with increasing hydrogen content. In general, when a boundary of a single-phase field is crossed, a two-phase field is entered. The appearance of a two-solid-phase region will manifest itself by a sudden decrease in slope. The slope in a two-phase field can be very small but must remain finite, since the phase rule requires that the pressure can only be constant for a series of compositions if these all fall on a single tie line, so that the phases in equilibrium do not change their composition. In the presence of three solid phases in equilibrium, the pressure is independent of over-all composition.
The 795° isotherms in Fig. 7 seem to offer the least difficulty in interpretation. The early, steeply rising portion of each curve indicates the solid solution of hydrogen in a single phase, ft The following sharp break onto a plateau-like region indicates the start of a two-phase field. The near coincidence of the curves for all alloys and for pure zirconium beyond H/Zr = 0.7 is conspicuous and suggests that the reaction occurring along these plateaus is the rejection of a uranium-rich ft phase. This rejection is completed at the upward bend in the curves at about H/Zr = 0.7, at which point ft is nearly pure uranium and ft is largely depleted of uranium. Beyond this H/Zr ratio the behavior of the system closely resembles that of the zirconium-hydrogen system, with the uranium-rich phase participating only slightly in further hydriding. Therefore, the three solid phases in equilibrium along the true pressure plateaus between H/Zr = 1 and H/Zr =1.4 must be ft, ft, and the Y-hydride. Apparently, the solubility of uranium in the Y-hydride at this temperature is very small. The final, steeply rising portion of the curves represents the hydriding of the Y-hydride.
The 800° section of the ternary phase diagram is shown in Fig. 10. (The key in Fig. 10 identifies the symbols in the following three figures.) The Solid lines across the diagram, ending in the
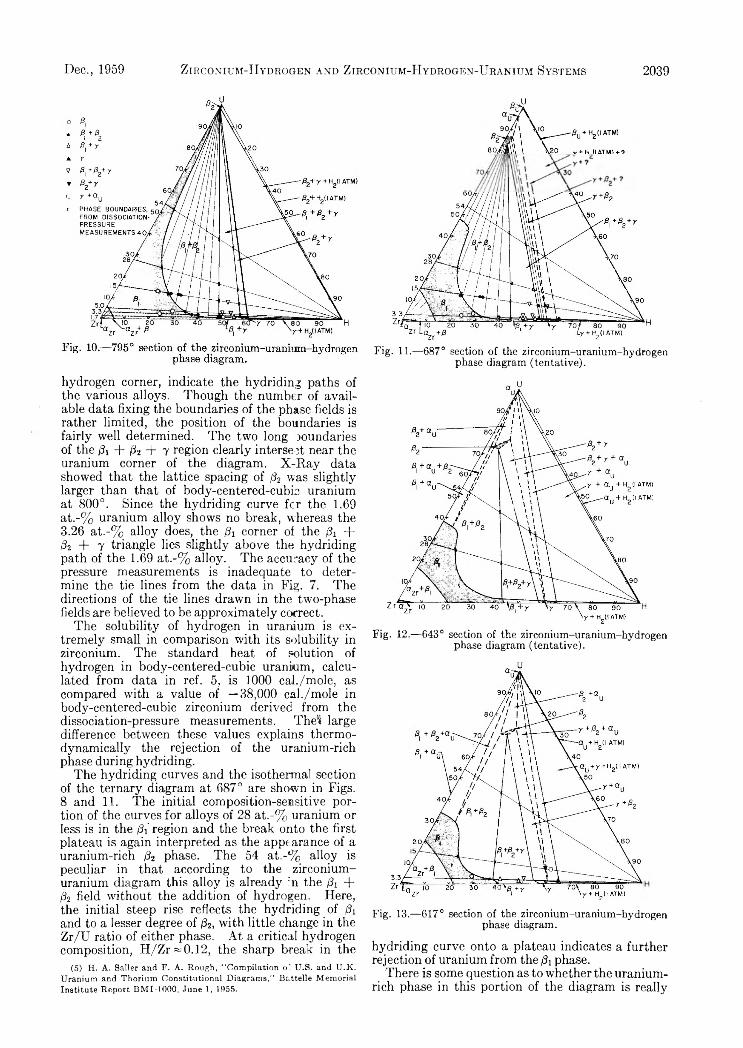
Dec., 1959 Z irconium-Hydrogen and Zirconium-Hydrogen-Uranium Systems 2039
hydrogen corner, indicate the hydriding paths of the various alloys. Though the number of available data fixing the boundaries of the phase fields is rather limited, the position of the boundaries is fairly well determined. The two long xmndaries of the ft + ft + 7 region clearly intersect near the uranium corner of the diagram. X-Ray data showed that the lattice spacing of ft was slightly larger than that of body-centered-cubic uranium at 800°. Since the hydriding curve fcr the 1.69 at.-% uranium alloy shows no break, whereas the3.26 at.-% alloy does, the ft corner of the ft + ft + y triangle lies slightly above the hydriding path of the 1.69 at.-% alloy. The accuracy of the pressure measurements is inadequate to determine the tie lines from the data in Fig. 7. The directions of the tie lines drawn in the two-phase fields are believed to be approximately correct.
The solubility of hydrogen in uranium is extremely small in comparison with its solubility in zirconium. The standard heat of solution of hydrogen in body-centered-cubic uranium, calculated from data in ref. 5, is 1000 cal./mole, as compared with a value of —38,000 cal./mole in body-centered-cubic zirconium derived from the dissociation-pressure measurements. The1» large difference between these values explains thermodynamically the rejection of the uranium-rich phase during hydriding.
The hydriding curves and the isothermal section of the ternary diagram at 687° are shown in Figs. 8 and 11. The initial composition-sensitive portion of the curves for alloys of 28 at.-% uranium or less is in the ft' region and the break onto the first plateau is again interpreted as the appearance of a uranium-rich ft phase. The 54 at.-% alloy is peculiar in that according to the zirconium- uranium diagram this alloy is already in the ft + ft field without the addition of hydrogen. Here, the initial steep rise reflects the hydriding of ft and to a lesser degree of ft, with little change in the Zr/U ratio of either phase. At a critical hydrogen composition, H/Zr «0.12, the sharp break in the
(5) H. A. Sailer and F. A. Rough, “ Compilation o' U.S. and TJ.K. Uranium and Thorium Constitutional Diagrams,” Battelle Memorial Institute Report BMI-1000, June 1, 1955.
Fig. 11.— 687° section of the zirconium-uranium-hydrogen phase diagram (tentative).
Fig. 12.— 643° section of the zirconium-uranium-hydrogen phase diagram (tentative).
Fig. 13.— 617° section of the zirconium-uranium-hydrogen phase diagram.
hydriding curve onto a plateau indicates a further rejection of uranium from the ft phase.
There is some question as to whether the uranium- rich phase in this portion of the diagram is really

2040 L. D. La Grange, L. J. D ykstra, J. M. D ixon and U. M erten Vol. 63
T a b l e IP h ases D e t e r m in e d b y X - R a y D if fr a c t io n
Sample Compn. (atom ratio) Phases at Phases at Phases atno. U/U + Zr H /H + Zr 625° 700° 800°
1 0.017 0.49 7 + tr 0i 0 i + tr 7 0i + tr 02
2 .017 .51 7 + 01 0 i3 .017 .55 7 + 01 7 + 014 .033 .24 01 01
5 .033 .40 7 + 01 0 i + tr 0 s 01 + 02
6 .033 .65 7 7 + tr a u f? )0 7 + tr 0 2
7 .050 .29 0 i 0 i 0 i8 .050 .50 0 i + 02 + tr 7 0i + 02 + tr 7
9 .050 .51 0i + 7 + 0i(?)“10 .050 .54 7 + tr 0 i + tr 02 01 + 0 2 + 711 .050 .66 7 + tr 02
12 .15 .20 01 + 02 0 i13 .15 .30 0 * 01 + 02 01 + 02
14 .15 .31 01 + 02 01 + 02
15 .15 .32 01 + 02
16 .15 .32 01 + 0 2(?)“17 .15 .45 01 + 7 + &(?)*18 .15 .53 01 + 0 2 + 7 0 i + 02 + tr 7
19 .15 .61 0J + 7 0 2 + 720 .15 .63 7 - f -a u
° Doubtful if 02 or an- 6 Single body-centered-cubic phase with broadened lines.
8 2 , since in the binary zirconium-uranium system at 687°, at least two uranium-rich phases— 8 2
and 8 u and possibly a third one, au—appear. However, according to Figs. 2 and 3, both 8 u and au have a relatively small solubility for zirconium as well as for hydrogen, and the top of the three- phase triangle in Fig. 11 is clearly located near the p i region. The extent of the P i field was not precisely determined. The break in the hydriding curve for the 3.26 at.-% alloy is not clearly discernible and the P i corner of the 8 i + 8 2 + Y three- phase triangle is therefore drawn just below the hydriding path of this alloy.
Beyond the P i + P i field the interpretation is much the same as at 795°, except that the 54 at.-% alloy breaks into a narrow second three-phase plateau. Two of the three phases in equilibrium have to be P i and y , but the third phase may be either au or 8 u• The curves for the low-uranium alloys either were not extended far enough to intercept this plateau or the region is too narrow to be seen on these curves. The dissociation pressure of the alloy beyond this three-phase region is considerably higher than for pure zirconium of equal H/Zr ratio. This indicates some solubility of uranium in the 7 -hydride at this temperature.
The hydriding curves at 643 and 617° differ but slightly from those at 687° and are shown in Fig. 9. The corresponding isothermal sections of the ternary diagram are shown in Figs. 1 2 and13.
These temperatures are well below the 8 2 - eutectoid temperature of 685° in the zirconium- uranium system, and the P i phase appears as an island at the top of the 181 + 1 8 2 + 7 three-phase triangle. The extent and precise location of this island are not well defined. The narrow Pi + P i + au three-phase region which necessarily exists between the P i + au and 8 1 + P i phase fields is beyond detection. The final, narrow,
three-phase plateau, which appears at 687° on the 54 at.-% alloy curve, is again unmistakably present on the curves for this alloy both at 643 and 617°. It is here believed to be a 8 2 + 7 + au region since the existence of 8 u at these temperatures is not likely.
The hydriding and dehydriding curves around this final plateau did not coincide as they did in Fig. 9. This hysteresis phenomenon, which was not observed at the higher temperatures, is apparently caused by nucleation difficulties in the 8 2 phase.
X-Ray Diffraction Data.—X-Ray data were obtained on only a limited number of samples, the compositions of which were chosen in those phase fields which were considered to be of most interest. Identification of the phases was often difficult because of the weak diffraction patterns and the close overlap of several of the principal diffraction lines of some of the phases. Sometimes, especially in the higher-uranium samples, traces of U 0 2 were detected.
The results are shown in Table I and the points obtained are plotted in the isothermal sections in Figs. 11,12 and 13. The temperatures at which the X-ray data were taken for each isothermal section are slightly higher than those for the dissociation- pressure measurements. In general, the X-ray data confirm our other results, although a number of uncertainties remain, mainly at 625°. In particular, the diffraction pattern of sample 13 at 625° showed only the lines of a single 8 -phase with a lattice parameter intermediate between those for 8 1 and 8 2 . The line-broadening was considerable, however, and suggested that segregation of a second phase, presumably 8 2 , had occurred, though on a very small scale. Sample 16, similar to sample 13, therefore was annealed for thirty days at 625°, and this treatment resulted indeed in a complete splitting of the (llO)-reflec- tion. Unfortunately, because of high background

Dec., 1959 R adiation Chemistry of Liquid Aliphatic Carboxylic Acids 2041
scattering, the other lines were too weak for one Acknowledgment.— We are indebted to F. D. to decide conclusively whether the second phase Carpenter for preparing the zirconium-uranium was / ? 2 or au- alloys.
SOME ASPECTS OF THE RADIATION CHEMISTRY OF LIQUID ALIPHATICCARBOXYLIC ACIDS1
B y R ussell H . Johnsen
Contribution from the Chemistry Department, Florida Stale University, Tallahassee, FloridaReceived June 29, 1959
The decomposition of ten aliphatic carboxylic acids by -y-radiation has been studied with particular reference to their relative rates of decarboxylation. The effects of structural variation, added iodine and temperature have been investigated as well as the distribution of free radicals for one of the acids as determined by radio-iodine trapping techniques. It is suggested that the mechanism of decarboxylation involves the intermediate formation of free alkyl and carboxyl radicals.
IntroductionThe radiolysis of carboxylic acids in the pure
state has been studied previously by Whitehead, 2
Newton3 and Burr. 4 5
Aqueous solutions of varying concentration of acetic acid up to 16 M have been investigated by Garrison. 6
With the exception of the work by Burr, all investigations have involved the use of heavy particle radiation, either alphas from naturally radioactive materials or cyclotron beams.
The volatile products of radiolysis of compounds of this class are generally agreed to be carbon dioxide, the saturated hydrocarbon of one carbon less than the parent acid, smaller amounts of hydrogen, carbon monoxide, water, methane (for compounds of higher molecular weight than acetic acid) and traces of other hydrocarbons of chain length both greater and smaller than that of the parent acid. In addition unsaturatec acids and unsaturated hydrocarbons are observed. However, no detailed mechanism has been developed and it was felt, therefore, that an investigation of the 7 -ray induced decomposition would be of value in providing further information leading to a clarification of the mechanism of decomposition.
ExperimentalTen carboxylic acids were irradiated. These were acetic,
propionic, ra-butyric, isobutyric, n-valeric, isovaleric, tri- methylaeetic, a-methylbutyric, re-caproic and isocaproic acids. The acetic acid was analytical grade. The others were Eastman Kodak “ white label” grade. All were distilled through a 30-em. spinning band or equivalent column and center cuts having boiling range of less than 0 .2° were collected. The center fraction was redistilled after drying for 24 hr. by stirring with “ Drierite.” The acids were distilled from “ Drierite” into the irradiation vessels, which were Pyrex ampoules, on a vacuum line. Samples were thoroughly degassed by repeated freezing, pumping and thawing. Samples were irradiated in the FSU Cobalt-60 irradiator, which is of the type described by Burton, Hoch- anadel and Ghormley.6
(1) This work was supported in part by the USAEC under contract AT-(40-1)-2001 and in part by the FSU Research Council.
(2) W. L. Whitehead, C. Goodman and I. A. Breger, J, Chem. Phys., 48, 184-189 (1951).
(3) A. Newton, ibid., 26, 1764 (1957).(4) J. Burr, T his Journal, 61, 1481 (1955).(5) W. Garrison, J. Am. Chem. Soc.t 77, 2720 (1955).(6) M. Burton, J. A. Ghormley and C. J. Hochanadei, Nucleonics,
13, 10 (1955).
The mixture of gaseous decomposition products was analyzed either by a modification of the technique of Saunders and Taylor,7 employing differential vapor pressure and chemical absorption techniques for the separation of the reported constituent, or by vapor phase chromatography. Reproducibility with duplicate samples by these means was of the order of ± 5 % of the “ C?” -value.
Dose rates were calculated from atomic density and absorption coefficients of the solution referred to a standard absorption in 0.8 N sulfuric acid of 3.0 X 10²⁰ e.v./l.-m in. This calibration was obtained by use of the aqueous ferrous sulfate dosimeter, with a specific yield of 15.6 ferric ions per 100 e.v. The radical trapping experiments were carried out using the technique of McCbuley and Schuler.8
Results and Discussion1. The Effect of Temperature during Irradia
tion.—The range of temperatures studied was limited by the desire to consider irradiation effects only in the liquid state. The yield of carbon dioxide from acetic acid was studied for the temperature range 0° (super cooled) to + 105°. For propionic acid the temperature range was —20° to 88°. The yields of other gaseous decomposition products from acetic acid and propionic acid were also studied. The data are presented in Table I. Carbon dioxide yields from the other eight acids are shown in Table II
Above room temperature the effect of temperature in the case of both acids is slight and the yield of all products shows a linear increase with temperature. The yield of C02 at 0° for both acetic and propionic acid is anomalous. In both cases a rather sharp increase in (?(C0 2 ) over the value at 27° is seen. This is in accord with the observation of Whitehead, e t a l . , 2 who observed in their study on behenic acid (C22) the same unexpected rise in yields at 0°.
If one postulates that the combined yields of carbon dioxide and carbon monoxide represents a measure of the total decomposition of acetic acid l e a d i n g to t h e f o r m a t i o n o f m e t h y l r a d i c a l s , then the ratio [G(CH4) + 2G(C2H,)]/[G(C02) + G - (CO)] will have a value of one if a ll of the methyl radicals produced by the decomposition react to form methane or ethane. It is of interest to consider the value of this ratio and its variation with temperature. At 27° the value of this ratio is
(7) K. W. Saunders and H. A. Taylor, J. Chem. Phys., 9, 616 (1941).(8) C. E. McCauley and R. ~T. Schuler, J. Am. Chem. Soc., 79, 4008
(1957).
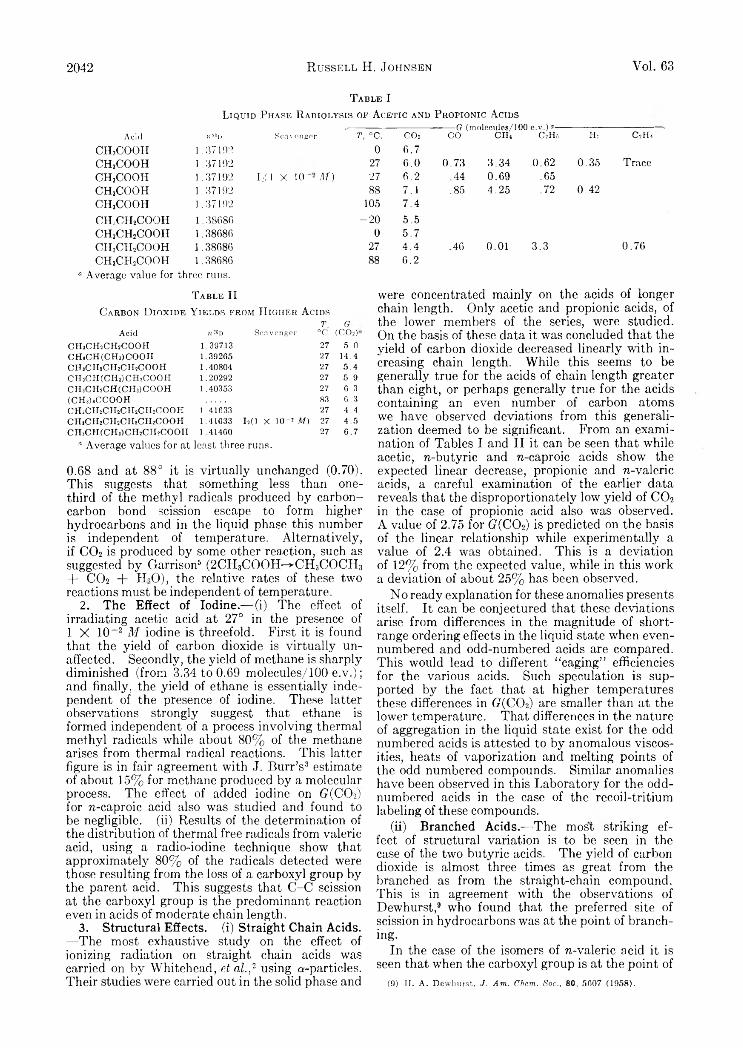
2042 R ussell H. Johnsen Voi. 63
T a b l e IL iq u id P h ase R a d io l y sis of A cetic an d P r o pio n ic A cids
■G (molecules/100 e .v .)a■Acid n %:> Scavenger T, °c. CO2 CO CII4 C2H0 He C2H4
CHsCOOH 1 .3710:1 0 6.7CH3COOH 1.37192 27 6.0 0.73 3.34 0.62 0.35 TraceCH3COOH 1.37192 Ijf 1 X RH- IT) 27 6.2 .44 0.69 .65CH3COOH 1.37192 88 7.1 .85 4.25 .72 0.42CH3COOH 1.37192 105 7.4c h .,c h ,c o o h 1.38080 - 2 0 5.5c h 3c h 2c o o h 1.38080 0 5.7c h ,c h 2c o o h 1.38080 27 4.4 .46 0.01 3.3 0.76CH3CH2COOH 1.38686 88 6.2
a Average value for three runs.
T a b l e IIC a rbo n D io x id e Y ie l d s from H ig h e r A cids
Acid 7t2»DT,
Scavenger °C.G-
(C 02 )'CHjCHîCHîCOOH 1.39713 27 5.0CHäCH(CHä)COOH 1.39265 27 14.4CHjCHeCHeCHeCOOH 1.40804 27 5.4CmcmCHalCHüCOOH 1.20292 27 5.9CH3CH!CH(CHj)COOH 1.40353 27 6.3(CHjUCCOOH 83 6.3CHsCHeCHeCHeCHeCOOH 1.41633 27 4.4CH.CHîCIIeCHîCHeCOOH 1.41633 Ie(1 X 10-* M) 27 4.5CHjCH(CH i)CH.CH3COOII 1.41460 27 6.7
“ Average values for at least three runs.
0.68 and at 88° it is virtually unchanged (0.70). This suggests that something less than one- third of the methyl radicals produced by carbon- carbon bond scission escape to form higher hydrocarbons and in the liquid phase this number is independent of temperature. Alternatively, if CO2 is produced by some other reaction, such as suggested by Garrison6 (2CH3COOH-^-CH3COCH3 + C 02 + H,0), the relative rates of these two reactions must be independent of temperature.
2. The Effect of Iodine.— (i) The effect of irradiating acetic acid at 27° in the presence of 1 X 10~2 M iodine is threefold. First it is found that the yield of carbon dioxide is virtually unaffected. Secondly, the yield of methane is sharply diminished (from 3.34 to 0.69 molecules/100 e.v.); and finally, the yield of ethane is essentially independent of the presence of iodine. These latter observations strongly suggest that ethane is formed independent of a process involving thermal methyl radicals while about 80% of the methane arises from thermal radical reactions. This latter figure is in fair agreement with J. Burr’s3 estimate of about 15% for methane produced by a molecular process. The effect of added iodine on G ( C O i ) for n-caproic acid also was studied and found to be negligible, (ii) Results of the determination of the distribution of thermal free radicals from valeric acid, using a radio-iodine technique show that approximately 80% of the radicals detected were those resulting from the loss of a carboxyl group by the parent acid. This suggests that C-C scission at the carboxyl group is the predominant reaction even in acids of moderate chain length.
3. Structural Effects, (i) Straight Chain Acids. —The most exhaustive study on the effect of ionizing radiation on straight chain acids was carried on by Whitehead, e t a l . , 2 using «-particles. Their studies were carried out in the solid phase and
were concentrated mainly on the acids of longer chain length. Only acetic and propionic acids, of the lower members of the series, were studied. On the basis of these data it was concluded that the yield of carbon dioxide decreased linearly with increasing chain length. While this seems to be generally true for the acids of chain length greater than eight, or perhaps generally true for the acids containing an even number of carbon atoms we have observed deviations from this generalization deemed to be significant. From an examination of Tables I and II it can be seen that while acetic, n-butyric and n-caproic acids show the expected linear decrease, propionic and n-valeric acids, a careful examination of the earlier data reveals that the disproportionately low yield of C02 in the case of propionic acid also was observed. A value of 2.75 for G ( CO2) is predicted on the basis of the linear relationship while experimentally a value of 2.4 was obtained. This is a deviation of 12% from the expected value, while in this work a deviation of about 25% has been observed.
No ready explanation for these anomalies presents itself. It can be conjectured that these deviations arise from differences in the magnitude of short- range ordering effects in the liquid state when even- numbered and odd-numbered acids are compared. This would lead to different “caging” efficiencies for the various acids. Such speculation is supported by the fact that at higher temperatures these differences in G { CO2) are smaller than at the lower temperature. That, differences in the nature of aggregation in the liquid state exist for the odd numbered acids is attested to by anomalous viscosities, heats of vaporization and melting points of the odd numbered compounds. Similar anomalies have been observed in this Laboratory for the odd- numbered acids in the case of the recoil-tritium labeling of these compounds.
(ii) Branched Acids.—The most striking effect of structural variation is to be seen in the case of the two butyric acids. The yield of carbon dioxide is almost three times as great from the branched as from the straight-chain compound. This is in agreement with the observations of Dewhurst,9 who found that the preferred site of scission in hydrocarbons was at the point of branching.
In the case of the isomers of n-valeric acid it is seen that when the carboxyl group is at the point of
(9) IT. A. Dewhurst, J . Am. Chem. Soc., 80, 5007 (1958).
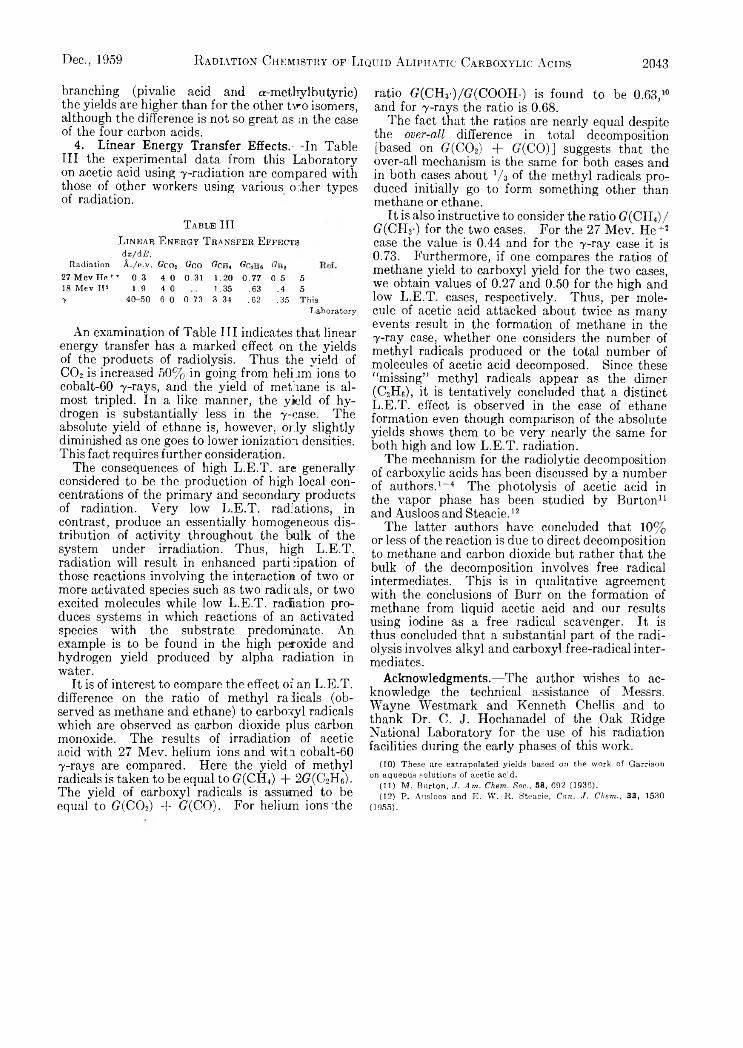
Dec., 1959 R adiation Chemistry of Liquid Aliphatic Carboxylic Acids 2043
branching (pivalic acid and a-metbylbutyric) the yields are higher than for the other two isomers, although the difference is not so great as in the case of the four carbon acids.
4. Linear Energy Transfer Effects.— In Table III the experimental data from this Laboratory on acetic acid using y-radiation are compared with those of other workers using various o:,her types of radiation.
T able IIIL in e a r E n e r g y T r a n sf e r E ffects
Radiationdx/dE,Â./e.v. Gcoz Geo <?ch4 Gc2Hb Gh*
27 Mev H e+ + 0.3 4.0 0.31 1.20 0.77 0.5 518 Mev H2 1.9 4.0 1.35 .63 .4 57 40-50 6.0 0.73 3.34 .62 .35 This
Laboratory
An examination of Table III indicates that linear energy transfer has a marked effect on the yields of the products of radiolysis. Thus the yield of C02 is increased 50% in going from heliam ions to cobalt-60 y-rays, and the yield of methane is almost tripled. In a like manner, the yield of hydrogen is substantially less in the y-ease. The absolute yield of ethane is, however, only slightly diminished as one goes to lower ionization densities. This fact requires further consideration.
The consequences of high L.E.T. are generally considered to be the production of high local concentrations of the primary and secondary products of radiation. Very low L.E.T. radiations, in contrast, produce an essentially homogeneous distribution of activity throughout the bulk of the system under irradiation. Thus, high L.E.T. radiation will result in enhanced participation of those reactions involving the interaction of two or more activated species such as two radicals, or two excited molecules while low L.E.T. radiation produces systems in which reactions of an activated species with the substrate predominate. An example is to be found in the high peroxide and hydrogen yield produced by alpha radiation in water.
It is of interest to compare the effect of an L.E.T. difference on the ratio of methyl radicals (observed as methane and ethane) to carboxyl radicals which are observed as carbon dioxide plus carbon monoxide. The results of irradiation of acetic acid with 27 Mev. helium ions and witn cobalt-60 y-rays are compared. Here the yield of methyl radicals is taken to be equal to G (Cfi4) + 2G(C2He) . The yield of carboxyl radicals is assumed to be equal to G(C02) + G(CO). For helium ions’the
ratio G(CHr)/G(COOH) is found to be 0.63,10 and for y-rays the ratio is 0.68.
The fact that the ratios are nearly equal despite the o v e r -a l l difference in total decomposition [based on G(C02) + G(CO)] suggests that the over-all mechanism is the same for both cases and in both cases about */* of the methyl radicals produced initially go to form something other than methane or ethane.
It is also instructive to consider the ratio G(CH4)/ G(CH.y) for the two cases. For the 27 Mev. He+2 case the value is 0.44 and for the y-ray case it is 0.73. Furthermore, if one compares the ratios of methane yield to carboxyl yield for the two cases, we obtain values of 0.27 and 0.50 for the high and low L.E.T. cases, respectively. Thus, per molecule of acetic acid attacked about twice as many events result in the formation of methane in the y-ray case, whether one considers the number of methyl radicals produced or the total number of molecules of acetic acid decomposed. Since these “missing” methyl radicals appear as the dimer (C2H6), it is tentatively concluded that a distinctL.E.T. effect is observed in the case of ethane formation even though comparison of the absolute yields shows them to be very nearly the same for both high and low L.E.T. radiation.
The mechanism for the radiolytic decomposition of carboxylic acids has been discussed by a number of authors.1-4 The photolysis of acetic acid in the vapor phase has been studied by Burton11 and Ausloos and Steacie.12
The latter authors have concluded that 10% or less of the reaction is due to direct decomposition to methane and carbon dioxide but rather that the bulk of the decomposition involves free radical intermediates. This is in qualitative agreement with the conclusions of Burr on the formation of methane from liquid acetic acid and our results using iodine as a free radical scavenger. It is thus concluded that a substantial part of the radiolysis involves alkyl and carboxyl free-radical intermediates.
Acknowledgments.— The author wishes to acknowledge the technical assistance of Messrs. Wayne Westmark and Kenneth Chellis and to thank Dr. C. J. Hochanadel of the Oak Ridge National Laboratory for the use of his radiation facilities during the early phases of this work.
(10) These are extrapolated yields based on the work of Garrison on aqueous solutions of acetic acid.
(11) M. Burton, J. Am. Chem. Soc., 58, 692 (1936).(12) P. Ausloos and E. W. R. Steacie, Can. J. Chem., 33, 1530
(1955).
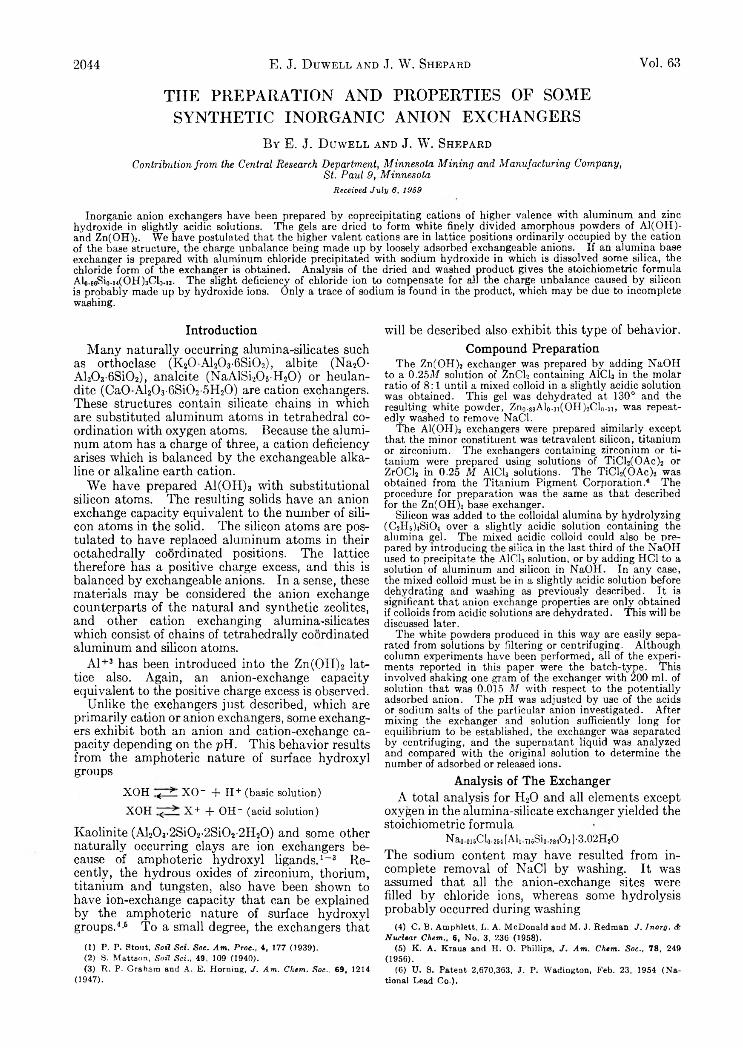
2044 E. J. D w e l l and J. W. Shepard Vol. 63
THE PREPARATION AND PROPERTIES OF SOME SYNTHETIC INORGANIC ANION EXCHANGERS
By E. J. D u w ell and J. W . Shepard
Contribution from the Central Research, Department, Minnesota Mining and Manufacturing Company,St. Paul 9, Minnesota
R ece iv ed J u ly 6 , 1 9 5 9
Inorganic anion exchangers have been prepared by coprecipitating cations of higher valence with aluminum and zinc hydroxide in slightly acidic solutions. The gels are dried to form white finely divided amorphous powders of Al(OH)- and Zn(OH)2. We have postulated that the higher valent cations are in lattice positions ordinarily occupied by the cation of the base structure, the charge unbalance being made up by loosely adsorbed exchangeable anions. If an alumina base exchanger is prepared with aluminum chloride precipitated with sodium hydroxide in which is dissolved some silica, the chloride form of the exchanger is obtained. Analysis of the dried and washed product gives the stoichiometric formula Alo.86Sio.i4(OH)3ClM3. The slight deficiency of chloride ion to compensate for all the charge unbalance caused by silicon is probably made up by hydroxide ions. Only a trace of sodium is found in the product, which may be due to incomplete washing.
IntroductionMany naturally occurring alumina-silicates such
as orthoclase (K20 A l20 3’6Si02), albite (Na20- Al20 3-6Si02), analcite (NaAlSi20 6 H20) or heulan- dite (Ca0 Al20 3-6Si02-5H20) are cation exchangers. These structures contain silicate chains in which are substituted aluminum atoms in tetrahedral coordination with oxygen atoms. Because the aluminum atom has a charge of three, a cation deficiency arises which is balanced by the exchangeable alkaline or alkaline earth cation.
We have prepared Al(OH)3 with substitutional silicon atoms. The resulting solids have an anion exchange capacity equivalent to the number of silicon atoms in the solid. The silicon atoms are postulated to have replaced aluminum atoms in their octahedrally coordinated positions. The lattice therefore has a positive charge excess, and this is balanced by exchangeable anions. In a sense, these materials may be considered the anion exchange counterparts of the natural and synthetic zeolites, and other cation exchanging alumina-silicates which consist of chains of tetrahedrally coordinated aluminum and silicon atoms.
A1+3 has been introduced into the Zn(OH)2 lattice also. Again, an anion-exchange capacity equivalent to the positive charge excess is observed.
Unlike the exchangers just described, which are primarily cation or anion exchangers, some exchangers exhibit both an anion and cation-exchange capacity depending on the pH. This behavior results from the amphoteric nature of surface hydroxyl groups
XOH < > XO~ + H + (basic solution)
XOH X + + O H " (acid solution)
Kaolinite (Al20 3-2Si02-2Si02-2H20) and some other naturally occurring clays are ion exchangers because of amphoteric hydroxyl ligands.1“ 3 Recently, the hydrous oxides of zirconium, thorium, titanium and tungsten, also have been shown to have ion-exchange capacity that can be explained by the amphoteric nature of surface hydroxyl groups.4’6 To a small degree, the exchangers that
(1) P. P. Stout, Soil Set. Soc. Am. Proc., 4, 177 (1939).(2) S. Mattson, Soil Sci., 49, 109 (1940).(3) R. P- Graham and A. E. Horning, J. Am. Chem. Soc., 69, 1214
(1947).
will be described also exhibit this type of behavior. Compound Preparation
The Zn(OH)2 exchanger was prepared by adding NaOH to a 0.25M solution of ZnCl2 containing A1C13 in the molar ratio of 8:1 until a mixed colloid in a slightly acidic solution was obtained. This gel was dehydrated at 130° and the resulting white powder, Zno.s9Alo.u(OH)2Clo.ii, was repeatedly washed to remove NaCl.
The Al(OH)3 exchangers were prepared similarly except that the minor constituent was tetravalent silicon, titanium or zirconium. The exchangers containing zirconium or titanium were prepared using solutions of TiCl2(OAc)2 or ZrOCl2 in 0.25 M AlCh solutions. The TiCl2(OAc)2 was obtained from the Titanium Pigment Corporation.6 The procedure for preparation was the same as that described for the Zn(OH)2 base exchanger.
Silicon was added to the colloidal alumina by hydrolyzing (CsEhhSiO, over a slightly acidic solution containing the alumina gel. The mixed acidic colloid could also be prepared by introducing the silica in the last third of the NaOH used to precipitate the A1C13 solution, or by adding HC1 to a solution of aluminum and silicon in NaOH. In any case, the mixed colloid must be in a slightly acidic solution before dehydrating and washing as previously described. It is significant that anion-exchange properties are only obtained if colloids from acidic solutions are dehydrated. This will be discussed later.
The white powders produced in this way are easily separated from solutions by filtering or centrifuging. Although column experiments have been performed, all of the experiments reported in this paper were the batch-type. This involved shaking one gram of the exchanger with 200 ml. of solution that was 0.015 M with respect to the potentially adsorbed anion. The pH was adjusted by use of the acids or sodium salts of the particular anion investigated. After mixing the exchanger and solution sufficiently long for equilibrium to be established, the exchanger was separated by centrifuging, and the supernatant liquid was analyzed and compared with the original solution to determine the number of adsorbed or released ions.
Analysis of The ExchangerA total analysis for H20 and all elements except
oxygen in the alumina-silicate exchanger yielded the stoichiometric formula
N a „ .o i6C W A U n 5 S i 0.!>840 ,]’ 3 . 0 2 H 20
The sodium content may have resulted from incomplete removal of NaCl by washing. It was assumed that all the anion-exchange sites were filled by chloride ions, whereas some hydrolysis probably occurred during washing
(4) C. B. Amphlett, L. A. McDonald and M. J. Redman, J. I n o r g . & Nuclear Chem., 6, No. 3, 236 (1958).
(5) K. A. Kraus and H. O. Phillips, J . Am. Chem. S o c ., 78, 249(1956).
(6) U. S. Patent 2,670,363, J. P. Wadington, Feb. 23, 1954 (National Lead Co.).
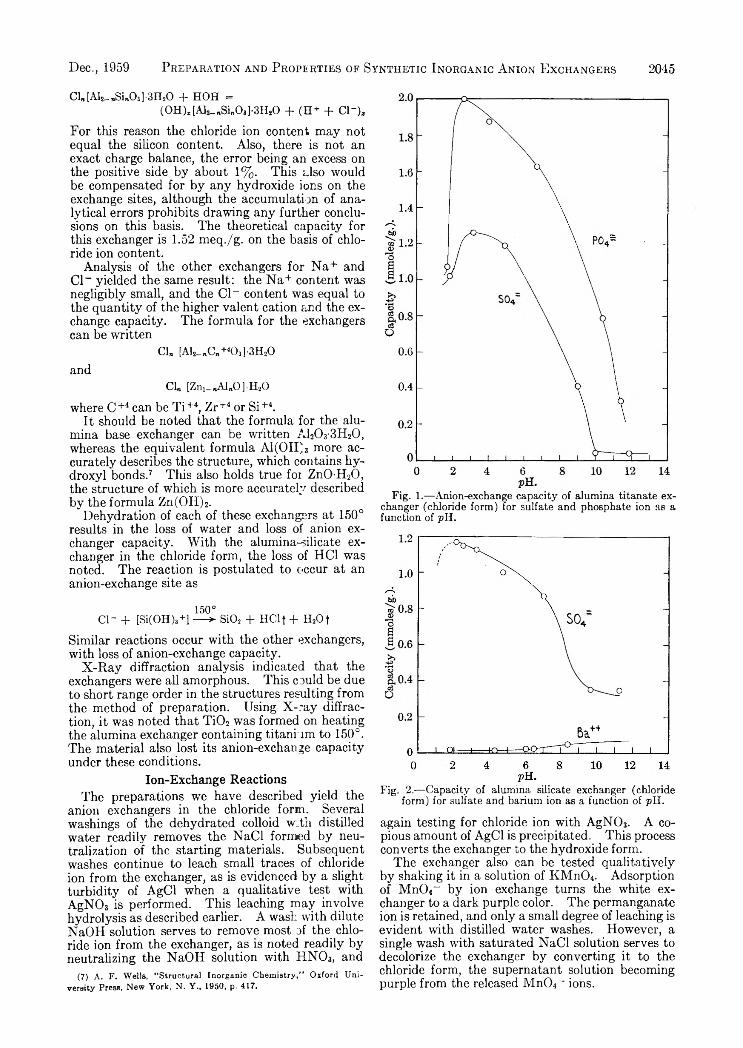
P reparatio n and P roperties of Synthetic I norganic A nion E xchangers 2045Dec., 1959
Cl„[Al2_„S i„03]-3H20 + HOH =(0 H )i [Al2_„Si„0,]-3H 20 + (H + + C l“ )*
For this reason the chloride ion content may not equal the silicon content. Also, there is not an exact charge balance, the error being an excess on the positive side by about 1%. This also would be compensated for by any hydroxide ions on the exchange sites, although the accumulation of analytical errors prohibits drawing any further conclusions on this basis. The theoretical capacity for this exchanger is 1.52 meq./g. on the basis of chloride ion content.
Analysis of the other exchangers for Na+ and Cl- yielded the same result: the Na+ content was negligibly small, and the Cl- content was equal to the quantity of the higher valent cation and the exchange capacity. The formula for the exchangers can be written
Cl„ [Al2_ „C „+i0 3]-3H20
andCl„ [Zni-nAbO] H20
where C+4 can be Ti+4, Zr+4 or Si+4.It should be noted that the formula for the alu
mina base exchanger can be written A120 3-3H20, whereas the equivalent formula AI(OII)3 more accurately describes the structure, which contains hydroxyl bonds.7 This also holds true for ZnO-H20, the structure of which is more accurately described by the formula Zn(OH)2.
Dehydration of each of these exchangers at 150° results in the loss of water and loss of anion exchanger capacity. With the alumina-silicate exchanger in the chloride form, the loss of HC1 was noted. The reaction is postulated to occur at an anion-exchange site as
150°C l- + [Si(OH)a+l — > Si02 + H Clf + H2O f
Similar reactions occur with the other exchangers, with loss of anion-exchange capacity.
X-Ray diffraction analysis indicated that the exchangers were all amorphous. This could be due to short range order in the structures resulting from the method of preparation. Using X-ray diffraction, it was noted that Ti02 was formed on heating the alumina exchanger containing titanium to 150°. The material also lost its anion-exchange capacity under these conditions.
Ion-Exchange ReactionsThe preparations we have described yield the
anion exchangers in the chloride form. Several washings of the dehydrated colloid with distilled water readily removes the NaCl formed by neutralization of the starting materials. Subsequent washes continue to leach small traces of chloride ion from the exchanger, as is evidenced by a slight turbidity of AgCl when a qualitative test with AgN03 is performed. This leaching may involve hydrolysis as described earlier. A wash with dilute NaOH solution serves to remove most of the chloride ion from the exchanger, as is noted readily by neutralizing the NaOH solution with H N 03, and
(7) A. F. Wella, "Structural Inorganic Chemistry,” Oxford University Press, New York, N. Y., 1950, p. 417.
Fig. 1.— Anion-exchange capacity of alumina titanate exchanger (chloride form) for sulfate and phosphate ion as a function of pH.
Fig. 2.— Capacity of alumina silicate exchanger (chloride form) for sulfate and barium ion as a function of pH.
again testing for chloride ion with AgN03. A copious amount of AgCl is precipitated. This process converts the exchanger to the hydroxide form.
The exchanger also can be tested qualitatively by shaking it in a solution of KMn04. Adsorption of Mn04~ by ion exchange turns the white exchanger to a dark purple color. The permanganate ion is retained, and only a small degree of leaching is evident with distilled water washes. However, a single wash with saturated NaCl solution serves to decolorize the exchanger by converting it to the chloride form, the supernatant solution becoming purple from the released Mn04~ ions.

2046 E. J. D uwell and J. W. Shepard Vol. 63
Fig. 3.— Capacity of the zineate aluminate exchanger (chloride form) for sulfate ion. as a function of pH.
Fig. 4.— Titration of the chloride form of the alumina silicate anion exchanger with NaOH in distilled water and 1 M NaCl solution.
The capacity of the exchanger Ab.soTio.u(OH) 3- Clo.ii for sulfate and phosphate ion was determined as a function of pH (Fig. 1). In basic solutions the capacity decreases because hydroxide ions begin to occupy the exchange sites. The capacity also tends to decrease in acid solutions because these anions are largely present in the lower valence acid forms, which are less strongly adsorbed than the higher valence forms simply because of the lesser degree of coulombic attraction to the exchange site.
The exchange capacity of the alumina-silicate exchanger for sulfate ion (Fig. 2) closely parallels that of the titanium analog (Fig. 1). The capacity of the alumina-silicate exchanger for Ba++ also was
Fig. 5.— Titration of the hydroxide form of the alumina silicate anion exchanger with HC1 in water and 1 M NaCl solution.
noted as a function of pH. A small amount of exchange capacity for Ba++ in basic solutions was noted. This may arise from some degree of amphoteric character in the exchanger.
Adsorption of sulfate ion by the Zn(OH) 2 structure containing aluminum (Fig. 3) was similar to that observed for the alumina base exchangers, except that the capacity decreased more rapidly in acid solutions.
The alumina-silicate exchangers were titrated in the chloride form with NaOH (Fig. 4) and in the hydroxide form with HC1 (Fig. 5). The hydroxide form was prepared by shaking one gram of the chloride form with 200 ml. of 0.1 N NaOH for two hours. When the titrations are carried out in 1 M NaCl solution, the titration curves tend toward neutral from either the basic or acid side, i . e . , the solutions containing NaCl are less acid in acid solutions and less basic in basic solutions. This is a result of the amphoteric character of hydroxyl groups at the edges or surfaces of the exchanger. The reactions are
XOH + N a+ = XONa + H + (basic solution)XOH + C l- = XC1 + O H " (acid solution)
Exchange capacity on these sites is small compared with sites arising from isostructural substitution of a foreign cation of higher valence. The small amount of barium adsorption in basic solution (Fig. 2 ) may result from these exchange sites.
Exchange of sulfate for chloride ion also has been performed at 1 0 0 ° under reflux with both the zinc and aluminum base exchangers. No appreciable change in capacity was noted for any of the exchangers.
Thickening agents, such as those formed by adsorbing quaternary ammonium salts by cation exchange on clays, can be formed by adsorbing high molecular weight organic anions (sodium stearate) by anion exchange. The resulting solids are hydro- phobic and can be used to increase the viscosity of hydrocarbon solutions.
DiscussionIt is significant that exchangers with anion-ex
change capacities as large as those observed are only obtained from the dehydration of acidic gels

Dec., 1959 Correlation of S olubility D ata for Long Chain Compounds 2047
containing the proper higher valent cation. In the presence of excess hydroxide ions, the higher valent cations probably coordinate with their usual number and arrangement of hydroxyl bonds and therefore do not contribute to the anion exchange capacity. When the hydroxide concentration is low, the cation in excess may determine the arrangement and number of hydroxyl groups around the occluded impurity cation, if this cation is capable of coordinating in the same manner as the excess cation.
Although the exchangers do not give diffraction patterns, the Al(OH)3 base exchangers probably have short range order corresponding to the hy- drargillite structure (octahedral arrangement of hydroxide groups around aluminum). Ti+4 and Zr+4 commonly coordinate in this manner. Si+4 does not, however, ordinarily coordinate octahe- drally, but is found tetrahedrally coordinated in all
the common silicates. This may be due to the small size of the silicon ion, around which six ligands are not accommodated easily. Since octahedral coordination is observed with the small fluoride ion (K2SiF6) and also in SiP20 7, the assumption that Si+4 has coordinated octahedrally in the hydrargillite structure is not unreasonable.
Zinc is tetrahedrally coordinated in Zn(OH)2, and although aluminum ordinarily coordinates octahedrally in aqueous systems, it does coordinate tetrahedrally in the zeolites, AlBr3, and other structures. Again, isostructural substitution of the foreign atom in the base structure may occur, although in both cases this may consist of imperfectly coordinated atoms at the^surfaces.
Acknowledgment.—We wish to thank A. Duncan and J. J. Gavenda for carrying out the chemical analyses and W. E. Thatcher for making the X-ray diffraction analyses.
CORRELATION OF SOLUBILITY DATA FOR LONG CHAIN COMPOUNDS. II. THE ISOPLETH METHOD OF PREDICTING SOLUBILITIES OF MISSING
MEMBERS OF HOMOLOGOUS SERIESBy E vald L. Skau and A ugust V. Bailey
Southern Regional Research Laboratory,1 New Orleans, Louisiana Received July 6, 1959
A new graphical method of correlating solubility data for homologous series of compounds and for predicting the solubilities of missing members of the series is described. It supplements the “ isotherm method” so that solubility prediction can be extended over a wider range of temperatures and concentrations and applied to additional homologous series. It is based upon the linear relationship 1/T = a (l /n ) + 6, derived from the approximate freesing point depression equation and empirical relationships between the numbe' of carbon atoms n and the heats and entropies of fusion of the members of a homologous series. T represents the absolute temperature at which the saturated solutions of the various homologs in a given solvent contain the same mole fraction of solute. The coefficients a and b are constants. The validity of the isopleth method was established by the fact that the 1/T vs. 1 /n “ isopleth” plots based upon accurate literature data for a number of systems consisted of a family of straight or only slightly curved lines. The isopleth method can be used (1) to smooth out experimental solubility data, (2) to locate discrepancies and (3) by graphical interpolation or extrapolation to predict the solubilities of missing members ol a series. The published solubility data for the normal hydrocarbons containing 8, 12, 16 and 32 carbon atoms were used to predict the solubilities of those containing 10, 14, 18, 20, 22, 24, 26, 28, 30 and 34 carbon atoms at a number of temperatures in 9 solvents. Similar predictions were made for the solubilities of the normal alkyl methyl ketones containing 11, 15, 17 and 21 carbon atoms in 13 solvents and for the following compounds in «-hexane: the symmetrical normal alkyl ketones containing 27 and 39 carbon atoms; the symmetrical normal secondary amines containing 18, 20, 22, 26, 30, 32, 34 and 38 carbon atoms; the symmetrical normal tertiary amines containing 30, 42, 48 and 60 carbon atoms; the normal fatty acids containing 11, 13 and 19 carbon atoms; and the fatty acid methyl esters containing 11 and 21 carbon atoms. The combined use of the isopleth and isotherm methods of correlation makes it possible to obtain similar complete solubility data for other solvents and other homologous series on the basis of a minimum of experimental measurements.
In a recent publication2 from this Laboratory, an interpolative method was developed for predicting the solubilities of the missing members of a homologous series. This was based upon the observation that a smooth curve is obtained by plotting the logarithm of the molar solubilities of the higher members of a homologous series in a given solvent and at a given temperature against the total number of carbon atoms in the molecule. ItVas shown that these isotherms can be drawn accurately on the basis of the experimentally determined solubilities of a few members of a series and used to. determine the solubilities of the missing intermediate members
(1) One of the laboratories of the Southern Utilization Research and Development Division, Agricultural Research Service, U. S. Department of Agriculture.
(2) E. L. Skau and R. E. Boucher, Tins Journal, 53, 400 (3 954).
by interpolation. Though this method of prediction is applicable to a laige number of homologous series in a large variety of solvents,3 its use is limited to temperature ranges and to systems for which sufficient experimental data are available to establish the isotherms. The present paper deals with a second method of correlation on the basis of which solubility prediction can be extended over a wider range of temperatures and concentrations and applied to additional homologous series.
It was shown by Garner and co-workers4'5 that(3) R. E. Boucher and Evald L. Skau, “ Solubility Charts for
Homologous Long-Chain Organic Compounds," U. S. Dept. Agr., ARS-72-1, 1954.
(4) W. E. Garner, F. C. Madden and J. E. Rushbrooke, J. Chem. Soc., 2491 (1926).
(5) W. E. Garner and A. M. King, ibid., 1849 (1929).
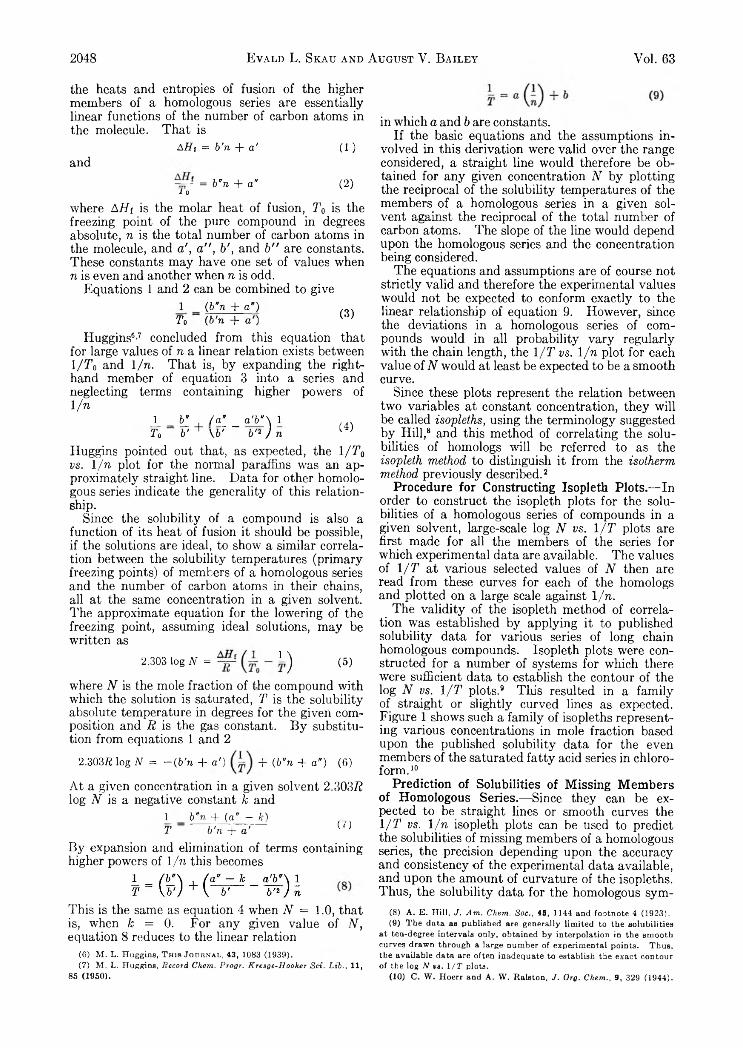
2048 Evald L. Skau and August V. Bailey Vol. 63
the heats and entropies of fusion of the higher members of a homologous series are essentially linear functions of the number of carbon atoms in the molecule. That is
andAH, = b'n + a' (1 )
~ = b’ n + a" (2)i 0where AH, is the molar heat of fusion, To is the freezing point of the pure compound in degrees absolute, n is the total number of carbon atoms in the molecule, and a', a", b', and b" are constants. These constants may have one set of values when n is even and another when n is odd.
Equations 1 and 2 can be combined to give1 (b’ n + o ')To (b'n + a') (3)
Huggins6’7 concluded from this equation that for large values of n a linear relation exists between l/T0 and l/n. That is, by expanding the right- hand member of equation 3 into a series and neglecting terms containing higher powers of l/n
i_ _ hl , / « ! _ a'b"\ l To b' + \b' b'1 ) n (4)
Huggins pointed out that, as expected, the 1 /T 0 vs. l/n plot for the normal paraffins was an approximately straight line. Data for other homologous series indicate the generality of this relationship.
Since the solubility of a compound is also a function of its heat of fusion it should be possible, if the solutions are ideal, to show a similar correlation between the solubility temperatures (primary freezing points) of members of a homologous series and the number of carbon atoms in their chains, all at the same concentration in a given solvent. The approximate equation for the lowering of the freezing point, assuming ideal solutions, may be written as
2.303 l o g » - (1-I) (5)
where N is the mole fraction of the compound with which the solution is saturated, T is the solubility absolute temperature in degrees for the given composition and R is the gas constant. By substitution from equations 1 and 2
2.303ft log N = - ( b ’n + a') + (b’ n + a”) (6)
At a given concentration in a given solvent 2.303/? log A is a negative constant k and
1 b’ n + (a’ — k) .T ~ t/vT+h' ( 0
By expansion and elimination of terms containing higher powers of l /n this becomes
This is the same as equation 4 when N = 1.0, that is, when k = 0. For any given value of N, equation 8 reduces to the linear relation
(6) M . L . H uggins, T h i s J o u r n a l , 43, 1083 (1939).(7) M . L . Huggins, Record Chem. Progr. K resge-H ooker Set. L ib ., 11,
85 (1950).
in which a and b are constants.If the basic equations and the assumptions in
volved in this derivation were valid over the range considered, a straight line would therefore be obtained for any given concentration A7 by plotting the reciprocal of the solubility temperatures of the members of a homologous series in a given solvent against the reciprocal of the total number of carbon atoms. The slope of the line would depend upon the homologous series and the concentration being considered.
The equations and assumptions are of course not strictly valid and therefore the experimental values would not be expected to conform exactly to the linear relationship of equation 9. However, since the deviations in a homologous series of compounds would in all probability vary regularly with the chain length, the 1/T vs. l/n plot for each value of N would at least be expected to be a smooth curve.
Since these plots represent the relation between two variables at constant concentration, they will be called isopleths, using the terminology suggested by Hill,8 and this method of correlating the solubilities of homologs will be referred to as the isopleth method to distinguish it from the isotherm method previously described.2
Procedure for Constructing Isopleth Plots.— In order to construct the isopleth plots for the solubilities of a homologous series of compounds in a given solvent, large-scale log N vs. 1/T plots are first made for all the members of the series for which experimental data are available. The values of 1/T at various selected values of N then are read from these curves for each of the homologs and plotted on a large scale against l/n.
The validity of the isopleth method of correlation was established by applying it to published solubility data for various series of long chain homologous compounds. Isopleth plots were constructed for a number of systems for which there were sufficient data to establish the contour of the log N vs. 1/T plots.9 This resulted in a family of straight or slightly curved lines as expected. Figure 1 shows such a family of isopleths representing various concentrations in mole fraction based upon the published solubility data for the even members of the saturated fatty acid series in chloroform .10
Prediction of Solubilities of Missing Members of Homologous Series.— Since they can be expected to be straight fines or smooth curves the 1/T vs. l/n isopleth plots can be used to predict the solubilities of missing members of a homologous series, the precision depending upon the accuracy and consistency o f the experimental data available, and upon the amount of curvature of the isopleths. Thus, the solubility data for the homologous sym-
(8) A . E . H ill, J. A m . C h e m . Soc., 45, 1144 and footnote 4 (1923).(9) T h e d ata as published are generally lim ited to the solubilities
a t ten-degree intervals only, obtained b y interpolation in the sm ooth curves draw n through a large num ber of experim ental points. T hus, the available d ata are often inadequate to establish the exact contour of the log N vs. 1/T plots.
(10) C . W . Hoerr and A . W . Ralston, J. Org. C h e m ., 9, 329 (1944).
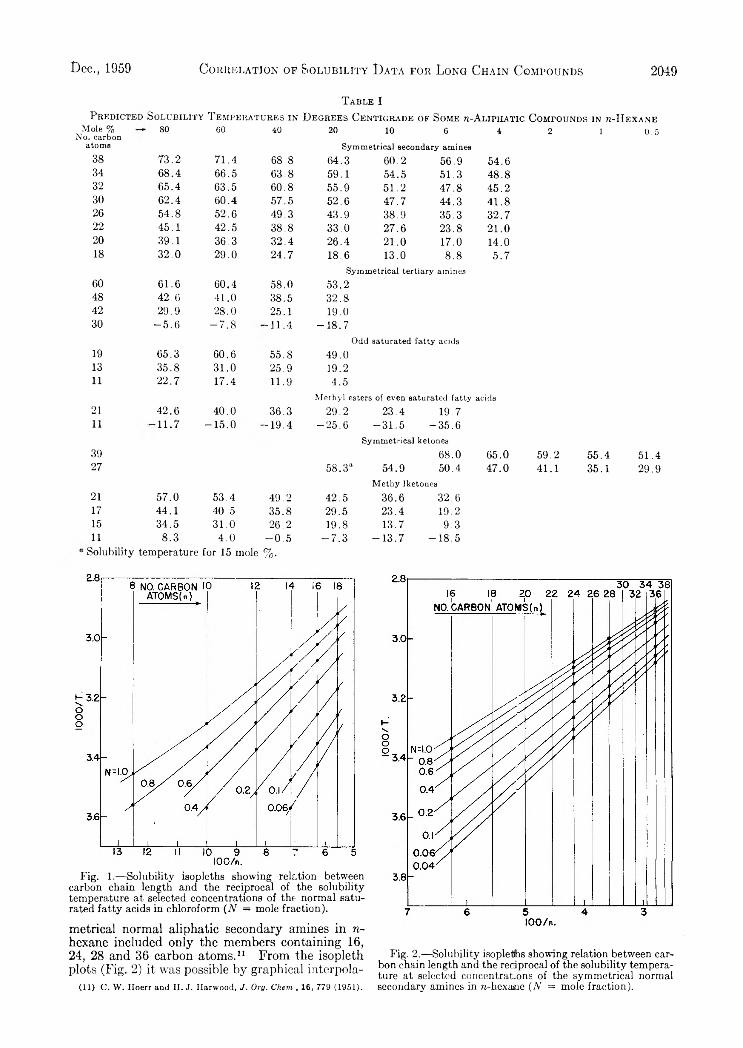
Dec., 1959 Correlation op Solubility D ata for Long Chain Compounds 2049
T a b l e IP r e d i c t e d S o l u b i l i t y T e m p e r a t u r e s i n D e g r e e s C e n t i g r a d e o f S o m e » - A l i p h a t i c C o m p o u n d s i n » - H e x a n e
4 2 1 0 .5M ole % N o. carbon
atom s
38 34 32 30 26 22 20 18
60484230
191311
2111
39 27
21171511
80
73.268.465.462.454.845.139.1 32.0
61.642.629.9
- 5 .6
65.3 35.822.7
42.6-1 1 .7
57.044.1 34.58.3
60
71.466.563.560.452.642.536.329.0
60.441.028.0
- 7 .8
60.631.017.4
40.0 -1 5 .0
53.440.5 31.04.0
40
68.863.860.8 57.549.3 38.832.424.7
58.038.525.1
-11.4
55.825.911.9
36.3-19.4
49.2 35.826.2
- 0 .5
20 10 6
54.648.8 45.241.832.7 21.0 14.05.7
Sym m etrical secondary amines
64.3 60.2 56.959.1 54.5 51.355.9 51.2 47.852.6 47.7 44.343.9 38.9 35.333.0 27.6 23.826.4 21.0 17.018.6 13.0 8.8
Sym m etrical tertiary amines
53.2 32.819.0
-1 8 .7Odd saturated fa tty acids
49.019.2 4.5
M eth yl esters of even saturated fa tty acids
29.2 23.4 19.7-2 5 .6 -3 1 .5 -3 5 .6
Sym m etrical ketones
68.0 65.054.9 50.4 47.0
M eth y 1 ketones
36.6 32.623.4 19.213.7 9.3
-1 3 .7 -1 8 .5
58.3“
42.529.5 19.8
- 7 .3
59.241.1
55.435.1
51.429.9
‘ Solubility temperature for 15 mole %.
Fig. 1.—Solubility isopleths showing relation between carbon chain length and the reciprocal of the solubility temperature at selected concentrations of the normal saturated fatty acids in chloroform (N = mole fraction).
metrical normal aliphatic secondary amines in n- hexane included only the members containing 16, 24, 28 and 36 carbon atoms.11 From the isopleth plots (Fig. 2) it was possible by graphical interpola-
(11) C . W . Hoerr and H. J. Harwood, J. Org. Chem., 16, 779 (1951).
Fig. 2.—Solubility isopleihs showing relation between carbon chain length and the reciprocal of the solubility temperature at selected concentrations of the symmetrical normal secondary amines in n-hexime (N = mole fraction).
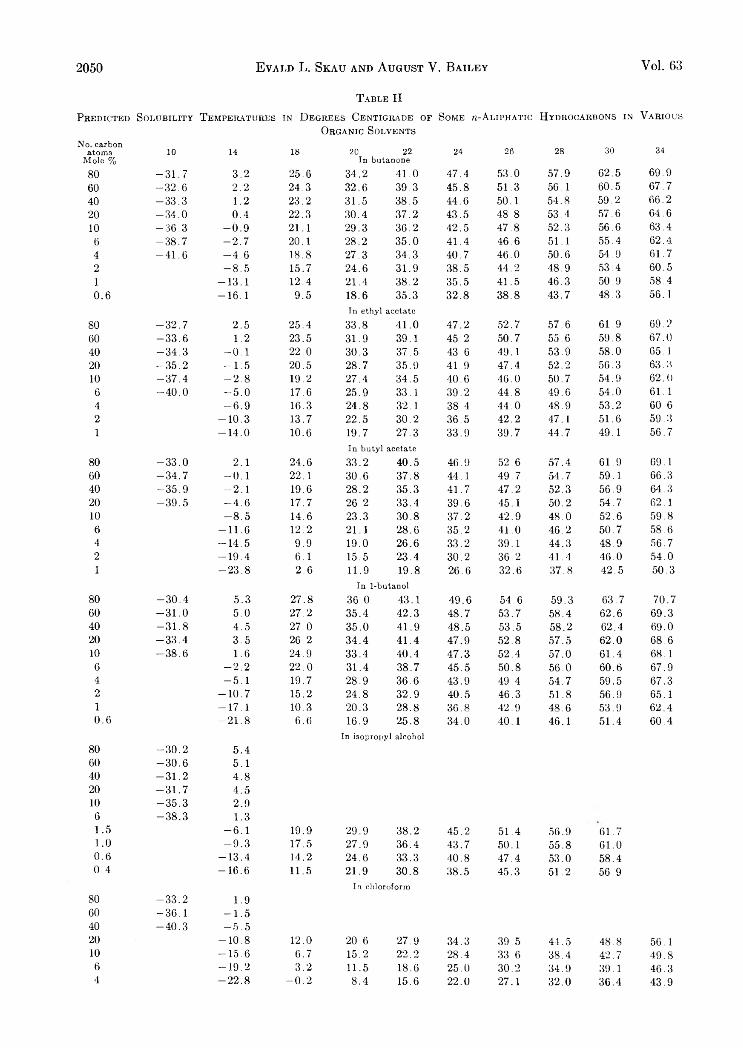
2050 Evald L. Skau and August V. Bailey Vol. 63
T a b l e II
P r e d i c t e d S o l u b i l i t y T e m p e r a t u r e s i n D e g r e e s C e n t i g r a d e o f S o m e « - A l i p h a t i c H y d r o c a r b o n s in V a r i o u s
O r g a n i c S o l v e n t s
N o . c a r b o n a t o m s
M o l e %10 14 18 20 22
I n b u t a n o n e24 26 28 30 34
8 0 - 3 1 . 7 3 . 2 2 5 . 6 3 4 . 2 4 1 . 0 4 7 . 4 5 3 . 0 5 7 . 9 6 2 . 5 6 9 . 9
6 0 - 3 2 . 6 2 . 2 2 4 . 3 3 2 . 6 3 9 . 3 4 5 . 8 5 1 . 3 5 6 . 1 6 0 . 5 6 7 . 7
4 0 - 3 3 . 3 1 . 2 2 3 . 2 3 1 . 5 3 8 . 5 4 4 . 6 5 0 . 1 5 4 . 8 5 9 . 2 6 6 . 2
2 0 - 3 4 . 0 0 . 4 2 2 . 3 3 0 . 4 3 7 . 2 4 3 . 5 4 8 . 8 5 3 . 4 5 7 . 6 6 4 . 6
1 0 - 3 6 . 3 - 0 . 9 2 1 . 1 2 9 . 3 3 6 . 2 4 2 . 5 4 7 . 8 5 2 . 3 5 6 . 6 6 3 . 4
6 - 3 8 . 7 - 2 . 7 2 0 . 1 2 8 . 2 3 5 . 0 4 1 . 4 4 6 . 6 5 1 . 1 5 5 . 4 6 2 . 4
4 - 4 1 . 6 - 4 . 6 1 8 . 8 2 7 . 3 3 4 . 3 4 0 . 7 4 6 . 0 5 0 . 6 5 4 . 9 6 1 . 7
2 - 8 . 5 1 5 . 7 2 4 . 6 3 1 . 9 3 8 . 5 4 4 . 2 4 8 . 9 5 3 . 4 6 0 . 5
1 - 1 3 . 1 1 2 . 4 2 1 . 4 3 8 . 2 3 5 . 5 4 1 . 5 4 6 . 3 5 0 . 9 5 8 . 4
0 . 6 - 1 6 . 1 9 . 5 1 8 . 6 3 5 . 3 3 2 . 8 3 8 . 8 4 3 . 7 4 8 . 3 5 6 . 1
I n e t h y l a c e t a t e
8 0 - 3 2 . 7 2 . 5 2 5 . 4 3 3 . 8 4 1 . 0 4 7 . 2 5 2 . 7 5 7 . 6 6 1 . 9 6 9 . 2
6 0 - 3 3 . 6 1 . 2 2 3 . 5 3 1 . 9 3 9 . 1 4 5 . 2 5 0 . 7 5 5 . 6 5 9 . 8 6 7 . 0
4 0 - 3 4 . 3 - 0 . 1 2 2 . 0 3 0 . 3 3 7 . 5 4 3 . 6 4 9 . 1 5 3 . 9 5 8 . 0 0 5 . 1
2 0 - 3 5 . 2 - 1 . 5 2 0 . 5 2 8 . 7 3 5 . 9 4 1 . 9 4 7 . 4 5 2 . 2 5 6 . 3 6 3 . 3
1 0 - 3 7 . 4 - 2 . 8 1 9 . 2 2 7 . 4 3 4 . 5 4 0 . 6 4 6 . 0 5 0 . 7 5 4 . 9 6 2 . 0
6 - 4 0 . 0 - 5 . 0 1 7 . 6 2 5 . 9 3 3 . 1 3 9 . 2 4 4 . 8 4 9 . 6 5 4 . 0 6 1 . 1
4 - 6 . 9 1 6 . 3 2 4 . 8 3 2 . 1 3 8 . 4 4 4 . 0 4 8 . 9 5 3 . 2 6 0 . 6
2 - 1 0 . 3 1 3 . 7 2 2 . 5 3 0 . 2 3 6 . 5 4 2 . 2 4 7 . 1 5 1 . 6 5 9 . 3
1 - 1 4 . 0 1 0 . 6 1 9 . 7 2 7 . 3 3 3 . 9 3 9 . 7 4 4 . 7 4 9 . 1 5 6 . 7
I n b u t y l a c e t a t e
8 0 - 3 3 . 0 2 . 1 2 4 . 6 3 3 . 2 4 0 . 5 4 6 . 9 5 2 . 6 5 7 . 4 6 1 . 9 6 9 . 1
6 0 - 3 4 . 7 - 0 . 1 2 2 . 1 3 0 . 6 3 7 . 8 4 4 . 1 4 9 . 7 5 4 . 7 5 9 . 1 6 6 . 3
4 0 - 3 5 . 9 - 2 . 1 1 9 . 6 2 8 . 2 3 5 . 3 4 1 . 7 4 7 . 2 5 2 . 3 5 6 . 9 6 4 . 3
2 0 - 3 9 . 5 - 4 . 6 1 7 . 7 2 6 . 2 3 3 . 4 3 9 . 6 4 5 . 1 5 0 . 2 5 4 . 7 6 2 . 1
1 0 - 8 . 5 1 4 . 6 2 3 . 3 3 0 . 8 3 7 . 2 4 2 . 9 4 8 . 0 5 2 . 6 5 9 . 8
6 - 1 1 . 6 1 2 . 2 2 1 . 1 2 8 . 6 3 5 . 2 4 1 . 0 4 6 . 2 5 0 . 7 5 8 . 6
4 - 1 4 . 5 9 . 9 1 9 . 0 2 6 . 6 3 3 . 2 3 9 . 1 4 4 . 3 4 8 . 9 5 6 . 7
2 - 1 9 . 4 6 . 1 1 5 . 5 2 3 . 4 3 0 . 2 3 6 . 2 4 1 . 4 4 6 . 0 5 4 . 0
1 - 2 3 . 8 2 . 6 1 1 . 9 1 9 . 8 2 6 . 6 3 2 . 6 3 7 . 8 4 2 . 5 5 0 . 3
I n 1 - b u t a n o l
8 0 - 3 0 . 4 5 . 3 2 7 . 8 3 6 . 0 4 3 . 1 4 9 . 6 5 4 . 6 5 9 . 3 6 3 . 7 7 0 . 7
6 0 - 3 1 . 0 5 . 0 2 7 . 2 3 5 . 4 4 2 . 3 4 8 . 7 5 3 . 7 5 8 . 4 6 2 . 6 6 9 . 3
4 0 - 3 1 . 8 4 . 5 2 7 . 0 3 5 . 0 4 1 . 9 4 8 . 5 5 3 . 5 5 8 . 2 6 2 . 4 6 9 . 0
2 0 - 3 3 . 4 3 . 5 2 6 . 2 3 4 . 4 4 1 . 4 4 7 . 9 5 2 . 8 5 7 . 5 6 2 . 0 6 8 . 6
1 0 - 3 8 . 6 1 . 6 2 4 . 9 3 3 . 4 4 0 . 4 4 7 . 3 5 2 . 4 5 7 . 0 6 1 . 4 6 8 . 1
6 - 2 . 2 2 2 . 0 3 1 . 4 3 8 . 7 4 5 . 5 5 0 . 8 5 6 . 0 6 0 . 6 6 7 . 94 - 5 . 1 1 9 . 7 2 8 . 9 3 6 . 6 4 3 . 9 4 9 . 4 5 4 . 7 5 9 . 5 6 7 . 32 - 1 0 . 7 1 5 . 2 2 4 . 8 3 2 . 9 4 0 . 5 4 6 . 3 5 1 . 8 5 6 . 9 6 5 . 11 - 1 7 . 1 1 0 . 3 2 0 . 3 2 8 . 8 3 6 . 8 4 2 . 9 4 8 . 6 5 3 . 9 6 2 . 40 . 6 - 2 1 . 8 6 . 6 1 6 . 9 2 5 . 8 3 4 . 0 4 0 . 1 4 6 . 1 5 1 . 4 6 0 . 4
I n i s o p r o p y l a l c o h o l
8 0 - 3 0 . 2 5 . 4
6 0 - 3 0 . 6 5 . 14 0 - 3 1 . 2 4 . 82 0 - 3 1 . 7 4 . 5
1 0 - 3 5 . 3 2 . 9
6 - 3 8 . 3 1 . 3
1 . 5 - 6 . 1 1 9 . 9 2 9 . 9 3 8 . 2 4 5 . 2 5 1 . 4 5 6 . 9 6 1 . 71 . 0 - 9 . 3 1 7 . 5 2 7 . 9 3 6 . 4 4 3 . 7 5 0 . 1 5 5 . 8 6 1 . 00 . 6 - 1 3 . 4 1 4 . 2 2 4 . 6 3 3 . 3 4 0 . 8 4 7 . 4 5 3 . 0 5 8 . 40 . 4 - 1 0 . 6 1 1 . 5 2 1 . 9 3 0 . 8 3 8 . 5 4 5 . 3 5 1 . 2 5 6 . 9
I n c h l o r o f o r m
8 0 - 3 3 . 2 1 . 96 0 - 3 6 . 1 - 1 . 5
4 0 - 4 0 . 3 - 5 . 5
2 0 - 1 0 . 8 1 2 . 0 2 0 . 6 2 7 . 9 3 4 . 3 3 9 . 5 4 4 . 5 4 8 . 8 5 6 . 11 0 - 1 5 . 6 6 . 7 1 5 . 2 2 2 . 2 2 8 . 4 3 3 . 6 3 8 . 4 4 2 . 7 4 9 . 8
6 - 1 9 . 2 3 . 2 1 1 . 5 1 8 . 6 2 5 . 0 3 0 . 2 3 4 . 9 3 9 . 1 4 6 . 34 - 2 2 . 8 - 0 . 2 8 . 4 1 5 . 6 2 2 . 0 2 7 . 1 3 2 . 0 3 6 . 4 4 3 . 9
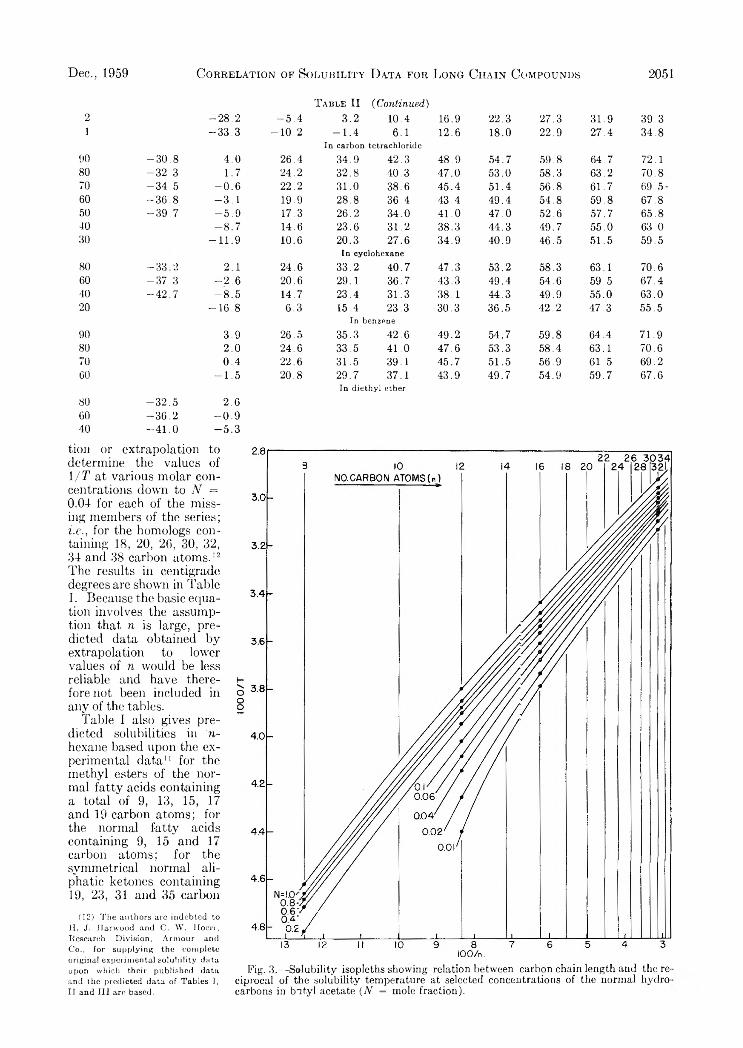
Dec., 1959 Correlation of Solubility Data for Long Chain Compounds 2051
2 -2 8 .21 -3 3 .3
90 -3 0 .8 4.080 -3 2 .3 1.770 -3 4 .5 -0 .660 -3 6 .8 -3 .150 -3 9 .7 -5 .940 -8 .730 -1 1 .9
80 'NCOCO! 2.160 - 3 7 . 3 - 2 .640 -4 2 .7 -8 .520 -1 6 .8
90 3.980 2.070 0.460 - 1 .5
80 -3 2 .5 2.660 -3 6 .2 - 0 .940 -4 1 .0 - 5 .3
T a b l e II (Continued)-5 .4 3.2 10.4 16.9
-1 0 .2 -1 .4 6.1 12.6I n c a r b o n t e t ra c h lo r i d e
26.4 3 4 . 9 42.3 48.924.2 32.8 40.3 47.022.2 31.0 38.6 45.419.9 28.8 36.4 43.417.3 26.2 34.0 41.014.6 23.6 31.2 38.310.6 20.3 27.6 34.9
I n c y c l o h e x a n e
24.6 3 3 . 2 40.7 47.320.6 29.1 36.7 43.314.7 23.4 31.3 38.16.3 15.4 23.3 30.3
I n b e n z e n e
26.5 3 5 . 3 42.6 49.224.6 3 3 . 5 41.0 47.622.6 31.5 39.1 45.720.8 29.7 37.1 43.9
I n d i e t h y l e th e r
22.3 27.3 31.9 39.318.0 22.9 27.4 34.8
54.7 59.8 64.7 72.153.0 58.3 63.2 70.851.4 56.8 61.7 69.549.4 54.8 59.8 67.847.0 52.6 57.7 65.844.3 49.7 55.0 63.040.9 46.5 51.5 59.5
53.2 58.3 63.1 70.649.4 54.6 59.5 67.444.3 49.9 55.0 63.036.5 42.2 47.3 55.5
54.7 59.8 64.4 71.953.3 58.4 63.1 70.651.5 56.9 61.5 69.249.7 54.9 59.7 67.6
tion or extrapolation to determine the values of 1/71 at various molar concentrations down to N =0. 04 for each of the missing members of the series;1. e., for the homologs containing 18, 20, 26, 30, 32, 34 and 38 carbon atoms.12 The results in centigrade degrees are shown in Table I. Because the basic equation involves the assumption that n is large, predicted data obtained by- extrapolation to lower values of n would be less reliable and have therefore not been included in any of the tables.
Table I also gives predicted solubilities in 71- hexane based upon the experimental data11 for the methyl esters of the normal fatty acids containing a total of 9, 13, 15, 17 and 19 carbon atoms; for the normal fatty acids containing 9, 15 and 17 carbon atoms; for the symmetrical normal aliphatic ketones containing 19, 23, 31 and 35 carbon
(1 2 ) T h e a u t h o r s a re i n d e b t e d t o H . I . H a r w o o d a n d C , W . H o e rr , R e s e a rc h D iv i s i o n , A r m o u r a n d C o . , f o r s u p p l y i n g t h e c o m p l e t e or ig in a l e x p e r i m e n t a l s o l u b i l i t y d a t a u p o n w h ic h the ir p u b l i s h e d d a t a a n d t h e p r e d i c t e d d a t a o f T a b l e s I, I I a n d I I I a re b a s e d .
Fig. 3.—Solubility isopleths showing relation between carbon chain length and the reciprocal of the solubility temperature at selected concentrations of the normal hydrocarbons in butyl acetate (N = mole fraction).
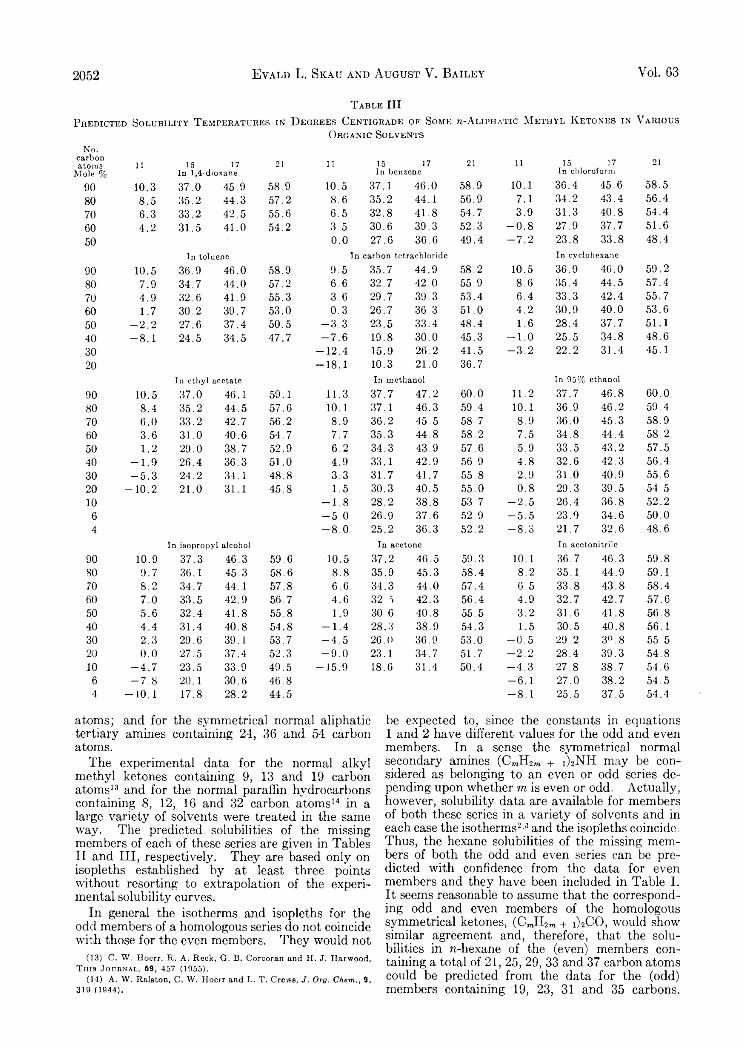
2052 Evald L. Skau and August V. Bailey Yol. 63
T a b l e IIIP r e d i c t e d S o l u b i l i t y T e m p e r a t u r e s i n D e g r e e s C e n t i g r a d e o f S o m e ^ - A l i p h a t i c M e t h y l K e t o n e s i n V a r i o u s
O r g a n i c S o l v e n t s
N o.carbon atoms
M ole %U 15 _ 17
In l,4~dioxane21 l l 15 17
In benzene21 l l 15 17
In chloroform21
9 0 1 0 . 3 3 7 . 0 4 5 . 9 5 8 . 9 1 0 . 5 3 7 . 1 4 6 . 0 5 8 . 9 1 0 . 1 3 6 . 4 4 5 . 6 5 8 . 5
8 0 8 . 5 3 5 . 2 4 4 . 3 5 7 . 2 8 . 6 3 5 . 2 4 4 . 1 5 6 . 9 7 . 1 3 4 . 2 4 3 . 4 5 6 . 4
7 0 6 . 3 3 3 . 2 4 2 . 5 5 5 . 6 6 . 5 3 2 . 8 4 1 . 8 5 4 . 7 3 . 9 3 1 . 3 4 0 . 8 5 4 . 4
6 0 4 . 2 3 1 . 5 4 1 . 0 5 4 . 2 3 . 5 3 0 . 6 3 9 . 3 5 2 . 3 - 0 . 8 2 7 . 9 3 7 . 7 5 1 . 6
5 0 0.0 2 7 . 6 3 6 . 6 4 9 . 4 - 7 . 2 2 3 . 8 3 3 . 8 4 8 . 4
In toluene In carbon tetrachloride In cyclohexane
9 0 1 0 . 5 3 6 . 9 4 6 . 0 5 8 . 9 9 . 5 3 5 . 7 4 4 . 9 5 8 . 2 1 0 . 5 3 6 . 9 4 6 . 0 5 9 . 2
8 0 7 . 9 3 4 . 7 4 4 . 0 5 7 . 2 6 . 6 3 2 . 7 4 2 . 0 5 5 . 9 8 . 6 3 5 . 4 4 4 . 5 5 7 . 4
7 0 4 . 9 3 2 . 6 4 1 . 9 5 5 . 3 3 . 6 2 9 . 7 3 9 . 3 5 3 . 4 6 . 4 3 3 . 3 4 2 . 4 5 5 . 7
6 0 1 . 7 3 0 . 2 3 9 . 7 5 3 . 0 0 . 3 2 6 . 7 3 6 . 3 5 1 . 0 4 . 2 3 0 . 9 4 0 . 0 5 3 . 6
5 0 - 2 . 2 2 7 . 6 3 7 . 4 5 0 . 5 - 3 . 3 2 3 . 5 3 3 . 4 4 8 . 4 1 . 6 2 8 . 4 3 7 . 7 5 1 . 1
4 0 - 8 . 1 2 4 . 5 3 4 . 5 4 7 . 7 - 7 . 6 1 9 . 8 3 0 . 0 4 5 . 3 - 1 . 0 2 5 . 5 3 4 . 8 4 8 . 6
3 0 - 1 2 . 4 1 5 . 9 2 6 . 2 4 1 . 5 - 3 . 2 2 2 . 2 3 1 . 4 4 5 . 1
2 0 - 1 8 . 1 1 0 . 3 2 1 . 0 3 6 . 7
In ethyl acetate In methanol In 95% ethanol
9 0 1 0 . 5 3 7 . 0 4 6 . 1 5 9 . 1 1 1 . 3 3 7 . 7 4 7 . 2 6 0 . 0 1 1 . 2 3 7 . 7 4 6 . 8 6 0 . 0
8 0 8 . 4 3 5 . 2 4 4 . 5 5 7 . 6 1 0 . 1 3 7 . 1 4 6 . 3 5 9 . 4 1 0 . 1 3 6 . 9 4 6 . 2 5 9 . 4
7 0 6 . 0 3 3 . 2 4 2 . 7 5 6 . 2 8 . 9 3 6 . 2 4 5 . 5 5 8 . 7 8 . 9 3 6 . 0 4 5 . 3 5 8 . 9
6 0 3 . 6 3 1 . 0 4 0 . 6 5 4 . 7 7 . 7 3 5 . 3 4 4 . 8 5 8 . 2 7 . 5 3 4 . 8 4 4 . 4 5 8 . 2
5 0 1 . 2 2 9 . 0 3 8 . 7 5 2 . 9 6 . 2 3 4 . 3 4 3 . 9 5 7 . 6 5 . 9 3 3 . 5 4 3 . 2 5 7 . 5
4 0 - 1 . 9 2 6 . 4 3 6 . 3 5 1 . 0 4 . 9 3 3 . 1 4 2 . 9 5 6 . 9 4 . 8 3 2 . 6 4 2 . 3 5 6 . 4
3 0 - 5 . 3 2 4 . 2 3 4 . 1 4 8 . 8 3 . 3 3 1 . 7 4 1 . 7 5 5 . 8 2 . 9 3 1 . 0 4 0 . 9 5 5 . 6
2 0 - 1 0 . 2 2 1 . 0 3 1 . 1 4 5 . 8 1 . 5 3 0 . 3 4 0 . 5 5 5 . 0 0 . 8 2 9 . 3 3 9 . 5 5 4 . 5
1 0 - 1 . 8 2 8 . 2 3 8 . 8 5 3 . 7 - 2 . 5 2 6 . 4 3 6 . 8 5 2 . 2
6 - 5 . 0 2 6 . 9 3 7 . 6 5 2 . 9 - 5 . 5 2 3 . 9 3 4 . 6 5 0 . 0
4 - 8 . 0 2 5 . 2 3 6 . 3 5 2 . 2 - 8 . 3 2 1 . 7 3 2 . 6 4 8 . 6
In isopropyl alcohol In acetone In acetonitrile
9 0 1 0 . 9 3 7 . 3 4 6 . 3 5 9 . 6 1 0 . 5 3 7 . 2 4 6 . 5 5 9 . 3 1 0 . 1 3 6 . 7 4 6 . 3 5 9 . 8
8 0 9 . 7 3 6 . 1 4 5 . 3 5 8 . 6 8 . 8 3 5 . 9 4 5 . 3 5 8 . 4 8 . 2 3 5 . 1 4 4 . 9 5 9 . 1
7 0 8 .2 3 4 . 7 4 4 . 1 5 7 . 8 6 . 6 3 4 . 3 4 4 . 0 5 7 . 4 6 . 5 3 3 . 8 4 3 . 8 5 8 . 4
6 0 7 . 0 3 3 . 5 4 2 . 9 5 6 . 7 4 . 6 3 2 . 5 4 2 . 3 5 6 . 4 4 . 9 3 2 . 7 4 2 . 7 5 7 . 6
5 0 5 . 6 3 2 . 4 4 1 . 8 5 5 . 8 1 . 9 3 0 6 4 0 . 8 5 5 . 5 3 . 2 3 1 . 6 4 1 . 8 5 6 . 8
4 0 4 . 4 3 1 . 4 4 0 . 8 5 4 . 8 - 1 . 4 2 8 . 3 3 8 . 9 5 4 . 3 1 . 5 3 0 . 5 4 0 . 8 5 6 . 1
3 0 2 . 3 2 9 . 6 3 9 . 1 5 3 . 7 - 4 . 5 2 6 . 0 3 6 . 9 5 3 . 0 - 0 . 5 2 9 . 2 3 9 . 8 5 5 . 5
20 0.0 2 7 . 5 3 7 . 4 5 2 . 3 - 9 . 0 2 3 . 1 3 4 . 7 5 1 . 7 - 2 . 2 2 8 . 4 3 9 . 3 5 4 . 8
1 0 - 4 . 7 2 3 . 5 3 3 . 9 4 9 . 5 - 1 5 . 9 1 8 . 6 3 1 . 4 5 0 . 4 - 4 . 3 2 7 . 8 3 8 . 7 5 4 . 6
6 - 7 . 8 2 0 .1 3 0 . 6 4 6 . 8 - 6 . 1 2 7 . 0 3 8 . 2 5 4 . 5
4 - 1 0 . 1 1 7 . 8 2 8 . 2 4 4 . 5 - 8 . 1 2 5 . 5 3 7 . 5 5 4 . 4
atoms; and for the symmetrical normal aliphatic tertiary amines containing 24, 36 and 54 carbon atoms.
The experimental data for the normal alkyl methyl ketones containing 9, 13 and 19 carbon atoms13 and for the normal paraffin hydrocarbons containing 8, 12, 16 and 32 carbon atoms14 in a large variety of solvents were treated in the same way. The predicted solubilities of the missing members of each of these series are given in Tables II and III, respectively. They are based only on isopleths established by at least three points without resorting to extrapolation of the experimental solubility curves.
In general the isotherms and isopleths for the odd members of a homologous series do not coincide with those for the even members. They would not
(13) C. W . Hoerr, R . A . Reck, G , B. Corcoran and H. J. Harwood, This Journal, 59, 457 (1955).
(14) A. W. Ralston, C. W. Hoerr and L. T . Crews, J . O r g . C k e m . , 9, 319 (1944).
be expected to, since the constants in equations 1 and 2 have different values for the odd and even members. In a sense the symmetrical normal secondary amines (CmH2m + i)2N Ii may be considered as belonging to an even or odd series depending upon whether m is even or odd. Actually, however, solubility data are available for members of both these series in a variety of solvents and in each case the isotherms2'3 and the isopleths coincide. Thus, the hexane solubilities of the missing members of both the odd and even series can be predicted with confidence from the data for even members and they have been included in Table I. It seems reasonable to assume that the corresponding odd and even members of the homologous symmetrical ketones, (CmH2m + i)2CO, would show similar agreement and, therefore, that the solubilities in n-hexane of the (even) members containing a total of 21, 25, 29, 33 and 37 carbon atoms could be predicted from the data for the (odd) members containing 19, 23, 31 and 35 carbons.

Dec., 1959 Correlation of Solubility D ata for Long Chain Compounds 2053
However, since there are no solubility data for any of the even members to confirm this assumption, predictions have been made for the missing members of the odd series only.
The isopleth plots for many of the systems for which predictions were made consisted of straight or almost straight lines. In no case was the deviation from linearity very great. The isopleth plot for the normal hydrocarbons in butyl acetate (Fig. 3) is typical of the systems in which the greatest curvature was observed. Here the isopleth for IV = 1, which coincides wit a that obtained by plotting the reciprocal of t ie melting points of all the members of the series, 6 is almost straight. The deviation from linearity is greatest at the lower values of n, as might be expected since the derivation of equation 9 involves the assumption that n is large.
Relative Applicability of Isotherm amd Isopleth Methods.— The relative applicability of the isotherm and isopleth methods for correlating or predicting solubilities of homologous series depends upon the nature of the experimental data. Three points are required to establish the contour of a log N vs. n isotherm or a 1/T vs. 1/n isopleth. If a non-linear relationship is involved, additional points will usually be necessary, especially when marked degrees of curvature or large gaps in the data are involved.
M ost of the experimental data from which the solubilities in Tables I, II and III were predicted are such that only the isopleth method is applicable. This is apparent from Fig. 4, representing the solubility curves for the normal hydrocarbons in butyl acetate, which can be considered more or less typical of these systems. Since fewer than three solubilities are known at any given temperature, isotherms cannot be drawn. Three or more points, however, are available for plotting isopleths representing the whole range of concentrations from N = 1.0 to N = 0.01 (Fig. 3).
Generally, however, the isopleth and isotherm methods are both applicable, each over a different range of concentration and temperature. Since the two ranges overlap, more extensive predicted data usually can be obtained by applying both methods. Consider, for example, the prediction of the solubilities of the normal fatty acids containing 14 and 20 carbon atoms in chloroform on the basis of the solubility curves for those containing 10 , 1 2 , 16 and 18 carbon atoms, represented by Fig. 5. A t least three points are available for plotting isotherms for all temperatures below 43.9°. Similarly, three or more points are available for plotting isopleths for all concentrations between 19 and 100 mole % . Since these isotherms and isopleths are straight or only slightly curved lines they can be used to predict the solubilities of the Cj4 and C20 acids within these respective overlapping ranges. Thus, that portion of the C14 and C2o solubility curves which falls in the rectangular area representing temperatures below 43.9° and compositions above 19 mole % can be predicted by both methods. The portion of these
(15) N ational Bureau of Siandards-A m eriean Petroleum In stitu te Research Project 44, T a b le 20a, P ts. 1 -2 .
Fig. 4.—Solubility curves for normal hydrocarbons in butyl acetate used for predictions, illustrating the inapplicability of the isotherm method of prediction.
Fig. 5.-—Solubility curves for capric, lauric, palmitic and stearic acids in chloroform, illustrating the overlapping of the isotherm and isopleth methods of prediction.
two curves representing solubilities above 43.9° can be predicted by the isopleth method only and that portion representing solubilities of less than 19 mole % can be predicted by the isotherm method only. In the range where both methods are applicable, that method should be used which gives the more linear relationship in the given range.
Having predicted the solubilities of the missing homologs listed in Tables I, II and III, it was now possible in most instances to apply the isotherm
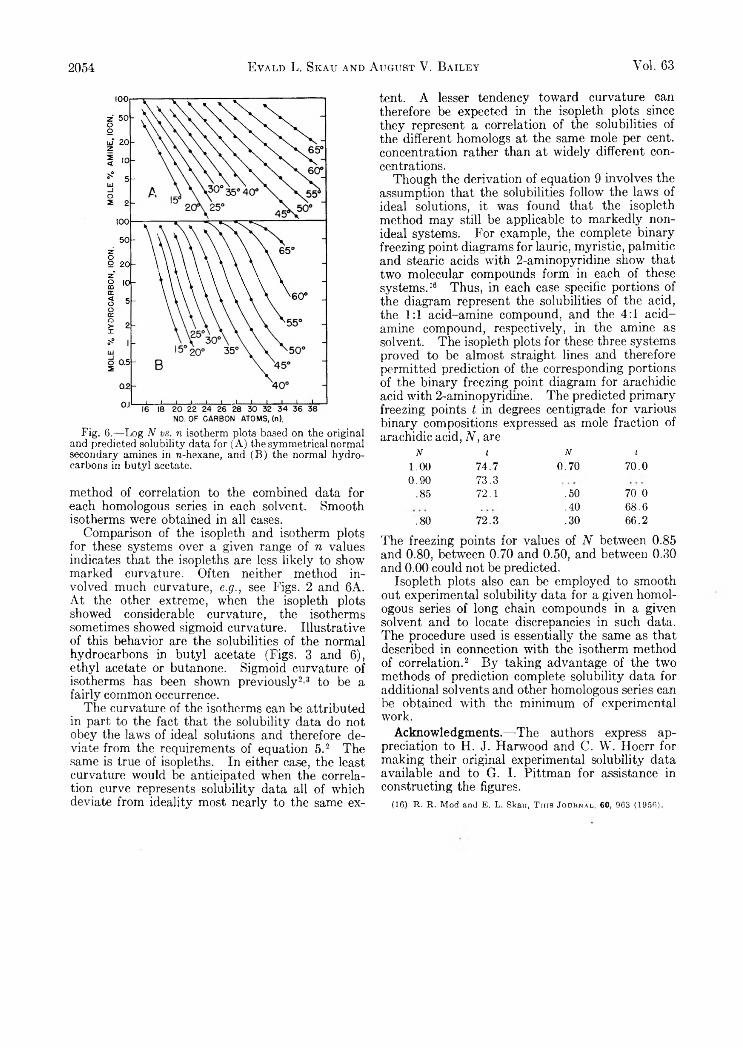
2054 Evald L. Skaij and August V. Bailey Vol. 63
Fig. 6.—Log N vs. n isotherm plots based on the original and predicted solubility data for (A) the symmetrical normal secondary amines in w-hexane, and (B) the normal hydrocarbons in butyl acetate.
method of correlation to the combined data for each homologous series in each solvent. Smooth isotherms were obtained in all cases.
Comparison of the isopleth and isotherm plots for these systems over a given range of n values indicates that the isopleths are less likely to show marked curvature. Often neither method involved much curvature, e.g., see Figs. 2 and 6A. At the other extreme, when the isopleth plots showed considerable curvature, the isotherms sometimes showed sigmoid curvature. Illustrative of this behavior are the solubilities of the normal hydrocarbons in butyl acetate (Figs. 3 and 6), ethyl acetate or butanone. Sigmoid curvature of isotherms has been shown previously2’3 to be a fairly common occurrence.
The curvature of the isotherms can be attributed in part to the fact that the solubility data do not obey the laws of ideal solutions and therefore deviate from the requirements of equation 5.2 The same is true of isopleths. In either case, the least curvature would be anticipated when the correlation curve represents solubility data all of which deviate from ideality most nearly to the same ex
tent. A lesser tendency toward curvature can therefore be expected in the isopleth plots since they represent a correlation of the solubilities of the different homologs at the same mole per cent, concentration rather than at widely different concentrations.
Though the derivation of equation 9 involves the assumption that the solubilities follow the laws of ideal solutions, it was found that the isopleth method may still be applicable to markedly nonideal systems. For example, the complete binary freezing point diagrams for lauric, myristic, palmitic and stearic acids with 2-aminopyridine show that two molecular compounds form in each of these systems.16 Thus, in each case specific portions of the diagram represent the solubilities of the acid, the 1:1 acid-amine compound, and the 4:1 acid- amine compound, respectively, in the amine as solvent. The isopleth plots for these three systems proved to be almost straight lines and therefore permitted prediction of the corresponding portions of the binary freezing point diagram for arachidic acid with 2-aminopyridme. The predicted primary freezing points t in degrees centigrade for various binary compositions expressed as mole fraction of arachidic acid, N, are
N t N t
1 . 0 0 7 4 . 7 0 . 7 0 7 0 . 0
0 . 9 0 7 3 . 3
. 8 5 7 2 . 1 . 5 0 7 0 . 0
. 4 0 6 8 . 6
. 8 0 7 2 . 3 . 3 0 6 6 . 2
The freezing points for values of N between 0.85 and 0.80, between 0.70 and 0.50, and between 0.30 and 0.00 could not be predicted.
Isopleth plots also can be employed to smooth out experimental solubility data for a given homologous series of long chain compounds in a given solvent and to locate discrepancies in such data. The procedure used is essentially the same as that described in connection with the isotherm method of correlation.2 By taking advantage of the two methods of prediction complete solubility data for additional solvents and other homologous series can be obtained with the minimum of experimental work.
Acknowledgments.— The authors express appreciation to H. J. Harwood and C. W. Hoerr for making their original experimental solubility data available and to G. I. Pittman for assistance in constructing the figures.
( 1 6 ) R . R . M od and E . L . Skau, T h is J o u r n a l , 60, 9 6 3 ( 1 9 5 6 ) .

Dec., 1959 M etal Chelates of M ercaptosuccinic Acid 2055
SOME METAL CHELATES OF MERCAPTOSUCCINIC ACID1B y G r a e m e E. C h e n e y , Q u i n t u s F e r n a n d o a n d H e n r y F r e i s e r
Department of Chemistry, University of Pittsburgh, Pittsburgh IS, PennsylvaniaR eceived J u ly IS , 1969
The acid dissociation constants of mercaptosuccinic acid and the stability constants of its chelates with zinc(II), cobalt(II) and nickel(II) have been determined. The zi*c(II) chelate is more stable than the nickel(II) chelate; this is usually the case when a sulfur—metal bond is present in a metal chelate. Mercaptosuccinic acid, like most mercaptans, reduces copper- (II) to copper(I).
This investigation was undertaken :n order to obtain more information on the manner in which the mercaptide sulfur complexes with divalent metal ions. The Calvin^Bjerrum 3 potentiometric titration technique has been used to study the behavior of cobalt(II), nickel(II), copper(II), manganese(II) and zinc(II) with mercaptosuccinic acid. Previous work on the chelate stabilities of mercaptoacetic acid,4 /3-mercaptopropâonic acid5 and 6-mercaptopurine6 have shown that zinc(II) is more stable than the corresponding nickel (II) complex; in addition, these mercaptans tend to reduce copper(II) to copper(I). As revealed by this study, mercaptosuccinic acid behaves in a similar manner toward these three metal ions.
H3R ^ I ± H+ + H .R -, K_ = [H + ][H2R - ] / [H 3R ] (1) H2R - ^ ± H + + H R “ , K i = [H +][HR°"]/[H2R - ] (2)
H R " H+ + R -, K3 = [H + ] [R -] /[H R -] (3)where H3R represents mercaptosuccinic acid and parentheses denote molar concentrations.
In the titration of mercaptosuccinic acid with sodium hydroxide, the first two buffer regions overlap; the third buffer region occurs at a sufficiently high pH so that the equilibrium involving Kz may be considered independently of K\ and K2.
Considering the equilibria involving only K, and K2 it can be shown that
H+ + N a + - O H " K 1(H+ + 2K,)2 W (H +2) + H +-K, + K,K2
where T ihr is the total concentration of mercaptosuccinic acid and if
ExperimentalApparatus and Materials.— The titration apparatus, and
standardization of sodium hydroxide and metal perchlorate solutions have been described previously.7
Potentiometric measurements of pH values were made with a Beckman Model “ G ” pH meter equipped with an external glass-saturated calomel electrode pa.r and standardized with Beckman buffers at pH 4.00 anc. 7.00 at 25°.
Mercaptosuccinic acid, kindly supplied by Evans Chem- etics Inc., New York, was purified by extractien with ether, and dried in a vacuum desiccator. The equivalent weight found by titrating the two carboxylic acid protons was 75 .2 (theoretical 75.1).
Neocuproine was obtained from G. F . Smith Chemical Co. and used without further purification.
Procedure.—The general procedure employed for the de
T n3R
< H 2 | + H, . K, ( | - ) + K i/K , = 0
a plot of (H+)2N /(S - 2) against H+[(S - 1 )(S - 2)] will give a straight line of slope equal to Ki and intercept equal to K,K2. K3 was evaluated from the part of the neutralization curve pertaining to the species H R- in the usual manner.8
Calculation of Stepwise Formation Constants.— If K , andKz are the acid dissociation constants of the carboxylic acid functionalities and K 3 is that pertaining to the mercaptan dissociation in mercaptosuccinic acid, it can be shown that h, the average number of anions (0 2-C H S-C II2-C 0 2) " 3 bound to a divalent metal ion is given by
' H+(3[H + ]2 + 2H A K i + K Æ ) + [H+P-Ah + 2H +-K,Kj + 3K¡K2K3 , H -(3[U -'i2 + 2-II+fv, + KiKz )]n = Tfr i~3Th3r — Q<M L
termination of the chelate formation constants in this work was to add 105.0 ml. of water and 5.0 ml. of metal perchlorate to a weighed amount of mercaptosuccinic acid in the titration vessel, degas the solution with prepurified nitrogen, and then titrate with standard sodium hydroxide (0.1 N) maintaining an atmosphere of nitrogen in the titration vessel throughout the titration. The ratio of reagent to metal ion was varied from 1:1 to 6:1 and the reported values of chelate formation constants are an average of four determinations for zinc(II) and nickel(II) and two ~or cobalt(II).
In the determination of the acid dissociation constants of mercaptosuccinic acid, 110 ml. of water was added to a weighed amount of reagent and the titration carried out withO. 1 N sodium hydroxide in a nitrogen atmosphere.
Calculation of Acid Dissociation Constants.—The aciddissociation constants of mercaptosuccinic ac.d were calculated from the potentiometric titration data as described. The equilibria involved are
(1) A bstracted fre r the thesis subm itted b y G . E Cheney in par- tial fulfillm ent of the requirements for th e P h .D . degree a t the U nivers ity of Pittsburgh, June, 1959.
(2) M . C alvin and K . W ilson, J . A m . Chem. Soc., 67, 2003 (1945).(3) J. Bjerrum , “ M etal Am m ine Form ation in Aqueous Solution,”
P. H aase and Son, Copenhagen, 1941.(4) D . L . Leussing, J. A m . Chem. Soc., 80, 4180 (-958).(5) Q. Fernando and H. Freiser, i b i d . , 80, 4929 (1958).(0) G . Cheney, H. Freiser and Q. Fernando, i b i d . , 81, 2611 (i9 59 ).(7) H. Freiser, R. G. Charles and W . D. Johnston, i b id . , 74, i383
(1952).
where Tm = total metal ion concentration, 7'h,r = total mercaptosuccinic acid concentration, Q = 3 T h sr — H + — N a+ + O H - . The stepwise formation constants for the chelates of zinc(II), nickel(II) and cobalt(II) were obtained by plotting ra against — log R whereR = (0 ,C -C H S-C H 2-C 0 2) -8 =
__________ QKiKzKz__________H+(3[H + P + 2H+Ai + KiKz)
The values of — log R at n = 0.5 and 1.0 gave the first stepwise formation constant as log K, and the useful comparative constant log K"av, respectively. The second stepwise formation constant, log K2, was evaluated from the relation
2 log A-.,. = log K, + log K2since the maximum value of n obtainable below the metal hydrolysis region was 1.3.
Results and DiscussionTitration Curves.-—The titration curve of mer-
captosuccinic acid against sodium hydroxide indicates that the two carboxylic acid groups have “ overlapping” dissociation constants since there are only two buffer regions, one between pH 3 and 5, and the other beyond pH 10. Further, a strong
(8) A . E . M artell and M . Calvin, “ C hem istry of the M etal C helate Com pounds,” Pi-entice-H all Inc., N ew York* N , Y ., 1952.

2056 Graeme E. Cheney, Quintus F ernando and Henry Freiser Vol. 63
inflection point, between pH 6 and 9 corresponds to the formation of the disodium salt of mercapto- succinic acid. Thus, the first buffer region is attributed to the two carboxylic acid groups and the second to the sulfhydryl group. The acid dissociation constants determined on this basis are given in Table I together with values for similar carboxylic acids for purposes of comparison; pKa3 and pK&2 refer to carboxylic acid group dissociations, pKa3 refers to the mercaptan group dissociation.
A comparison of the dissociation constants of the sulfhydryl groups in mercaptosuccinic, mer- captoacetic and /3-mercaptopropionic acids reveals that pKg.3 of mercaptosuccinic acid is somewhat lower than might be expected on the basis that the dissociation involved is from a dinegatively charged anion.
Table IAcid Dissociation Constants of Some Carboxylic
Acids at 25.0° in WaterpK*i VKc2 P Ku
Mercaptoacetic acid4 3.60 10.55/S-Mercaptopropionic acid6 4.38 10.38Mercaptosuccinic acid 3.30 4.94 10.64Aminosuccinic acid8 1.94 3.70 9.62*Malic acid10 3.26 4.68Succinic acid10 4.07 5.28° Refers to amino group.
The titration curves in the presence of metalions reveal the over-all stoichiometry of the reactions between these ions and mercaptosuccinic acid. In order to neutralize the protons released by the two carboxylic acid groups of the reagent,6.4 ml. of 0.1 N sodium hydroxide are required; consequently, the displacement of the reagent ion curve at 6.4 ml. of base and pH 8.5 from the reagent curve must be due to proton release, which in the absence of metal hydrolysis must depend on the reaction between the mercaptan group and the metal ion. Since nickel(II) and zinc(II) show an equivalent weight corresponding to one-half the atomic weight at this pH, whereas cobalt(II) shows an equivalent weight corresponding to its atomic weight, it may be concluded that the nickel and zinc chelates are 2:1, mercaptosuccinic acid to metal ion, while the cobalt chelate is 1:1.
The titration curve of mercaptosuccinic acid in the presence of manganese(II) does not correspond to a stoichiometry of either 1:1 or 2:1 mercaptosuccinic acid to manganese(II). Further, the displacement from the mercaptosuccinic acid curve occurred in the metal hydrolysis region; thus, this reaction was not further considered.
The titration curve with copper(II) and mercaptosuccinic acid shows the same displacement from the reagent curve as that of the similar curves for nickel(II) and zinc(II) at pH 8.5, however, this is misleading and the reaction is discussed below.
Chelate Formation Constants.— Table II gives the stepwise formation constants for zinc(II) and nickel(II) with mercaptosuccinic acid, and log K\ for cobalt(II). Values of log K2 are calcu-
(9) R . F . Lum b and A . E . M artell, T h is J o u r n a l , 57, 690 (1953).(10) R . K . Cannan and A . K ib rick , J . A m . Chem. S o c 60, 2314
(1938).
lated from the values of log Ki and log Kav since the maximum value of n obtainable below the metal hydrolysis region was 1.3. Formation constants of structurally similar compounds have been added for comparison.
As would be expected if mercaptosuccinic acid is tridentate, there is a large difference, A, between log Ki and log Ki (Table II) for the nickel(II) and zinc(II) chelates. This value is much larger than the corresponding values for the mercapto- acetic and /3-mercaptopropionic acid chelates. Further log Ki for mercaptosuccinic acid is larger than the corresponding values for the other carboxylic acids, and since Chaberek and Martell11 have suggested that aminosuccinic acid is tridentate by comparing formation constant values of it and other amino carboxylic acids with various transition metal ions, it seems probable that mercaptosuccinic acid behaves as a tridentate ligand with nickel(II) and zinc (II). In this connection it is noteworthy that Sidgwick12 has compared the relative donor
Table IIChelate Formation Constants at 25.0° in Water for M ercaptosuccinic and Structurally Related Car
boxylic Acids
M etal ion
M ercaptoaceticacid4
/S-Mer-capto-
propionicacid8
M ercap tosuccinic
acid
A m inosuc
cinic0acid ÎS
Co(II)log A, 5.84 6.31 5.90log Ki 4.282 log Key 12.15 10.18
Ni(II)log K, 6.98 5.21 7.97 7.12log Ki 6.55 4.39 4.90 5.272 log Kav 13.51 9.60 12.87 12.39
Zn(II)log Ki 7.86 6.75 8.47 5.84log Ki 7.18 6.05 5.28 4.312 log Kcv 15.04 12.80 13.75 10.15
A = log Ki — log KiNi(II) 0.43 0.82 3.07 1.85Zn(II) 0.68 0.70 3.19 1.53° At 30° in water.
properties of oxygen and sulfur and in general showed that the donor properties of sulfur are dependent to a greater extent on the acceptor properties of the metal; on the other hand, according to Sidgwick, oxygen and nitrogen may be considered quite similar with respect to their tendency to complex with metal ions. Therefore, it is not surprising that the mercaptosuccinic acid-zinc (II) chelate is more stable than the aminosuccinic acid-zinc(II) chelate, nor is the fact that there is a reversal in order of stabilities between the corresponding nickel(II) and zinc(II) chelates of mercapto- and aminosuccinic acids, since zinc (II) would appear to accept sulfur as the donor atom
(11) S. Chaberek and A . E . M artell, J . A m . Chem. S oc., 74 , 6021 (1952).
(12) N . V . Sidgw ick, J . Chem. S o c , 433 (1941).(13) S. Chaberek and A . E . M artell, J. A m . Chem. S oc., 74, 6021
(1952).

Dec., 1959 Notes 2057
in its coordination sphere more readily than would nickel (II). I t is suggested that this may be attributed to a steric effect since sulfur is larger than nitrogen.
It is interesting to note that values of 2 log Kav for mercaptosuccinic acid with nickel(II) and zinc-(II) are less than the corresponding values for mercaptoacetic acid (Table II). This is readily understandable in view of the fact that the 2:1 chelate with mercaptosuccinic acid requires that there be four negative charges on it; consequently, it would be expected to be less stabh, over-all, than a dinegatively charged chelate; further, the values of 2 log K;iV for mercaptosuccinic acid are greater than those of /J-mercaptopropionic acid. This is understandable since it has been shown5 that six-membered sulfur-containingc helate rings are much less stable than five-membered sulfur- containing chelate rings.
The Copper(II) Reaction.— When copper(II) was added rapidly to a solution of mercaptosuccinic acid previously degassed with nitrogen, a transient blue-purple color was observed initially, and the solution developed a yellow cole r when the addition of the copper(II) was completed. The
development of the yellow color indicated that copper(II) was reduced to copper(I) and the presence of the latter in solution was confirmed by reaction with neocuproine and subsequent extraction into chloroform.14
A consideration of the titration curve of copper- (II) and mercaptosuccinic acid with sodium hydroxide shows that two protons are released from the mercaptan functionality per mole of cop- per(II) present. These data would fit the overall stoichiometry represented by these equations postulated by Klotz, et al.16
2RSH" + 2Cu + + = RSSR“ 4 5 + 2Cu+ + 2H + (4)RSH“ + Cu+ = RSCu- 2 + H+ (5)
Over-all4RSH- + 2Cu++ = RSSR“ 4 + 2RSCu“ 1 2 + 4H+ (6 )
where RSH represents mercaptosuccinic acid and RSSR represents the corresponding disulfide.
Acknowledgment.— -The authors gratefully acknowledge the financial assistance of the U. S. Public Health Service.
(14) G , H. Morrison and H. Freiser, “ Solvent E xtraction in A n a lytical C hem istry,” John W iley and Sons, Inc., N ew Y o rk , N . Y ., 1957.
(15) I. M . K lotz, G. H. Czerlinski and H. A . Fiess, J. A m . Chem. Soc., 80, 2920 (1958).
N O T E S
SE PA R A T IO N OF BORON ISOTOPES B Y IO N E X C H A N G E
By Y ukio Yoneda, Toshio Uchijima ■ and Shoji Makishima
D epartm ent o f A p p lied Chemistry, Faculty o f Engineering, U niversity o f T ok yo , Tokyo, Japan
R eceived January 14, 1969
Various methods have been tried for separating boron isotopes,2 some of which are used industrially. In this work we determined the separation factor of boron isotopes in the exchange reaction between an aqueous solution of boric acid and an anion-exchange resin. Such an icn-exchange method has been used for the separation of nitrogen isotopes.3
ExperimentalTwo ion-exchange columns (about 120 cm. in height) were
prepared from 100-200 mesh spheres of Amberlite CG-400-I (polystyrene-quaternary amine type, strong base for chromatographic use); the capacities of the columns were about 650 and 900 meq. of H2BO3“ , respectively. After the usual pretreatment, the bed was restored to the OH “-cycle. Experimental procedures and the method of analysis have been described by Spedding, et al.*
An aqueous 0.03 M H3BO3 solution (I) or an aqueous 0.1 M H3BO3 solution containing 8 wt. % purified glycerol (II) was passed through a resin column at a flow rate of 0.5-0.7 ml./min. at room temperature. The OH“ ion is completely
(1) T o k a i L aboratory, Japan A tom ic E n erg y R essarch In stitu te, T okai-m ura, near M ito , Japan.
(2 ) See, S. M akishim a, Y . Y o n ed a and T . T ajim a, T h is J o u r n a l , 61, 1618 (1957); or “ Proc. of th e Intern. Sym posium on Isotope Separation,” N orth-H olland P u b l. C o ., A m sterdam , 1958.
(3) F . H . Spedding, J. E . Pow ell and H . J. Svec, J. A m . Chem. Soc.f 77, 6125 (1955).
replaced by a certain form of borate ion due to the large reaction constant. When all the OH“ ion on the resin has been replaced by borate ion, boric acid solution begins to flow from the resin bed. The front boundary is somewhat diffuse because of the weak acidity of boric acid solution, even in the presence of glycerol. The amount of boric acid and the isotopic ratio of boron in each fraction of the effluent were analyzed. Isotopic analyses of boron isotopes were carried out by the usual method; B2O3, prepared from the sample, was fluorinated with C0 F34 to give BF3 and the ratio of boron isotopes was measured with a mass spectrometer designed for isotopic analysis.6
In Fig. 1 the atomic fraction of 10B (N % ) in successive fractions of the effluent is plotted against the sum of the
Fig. 1.—Atomic fraction of 10B in effluent v s . equivalents in effluent.
milliequivalents of H2B03“ in the effluent expressed as percentage of the column capacity. The form of the adsorbed
(4) I . K irschenbaum , U . S. P a ten t 2,622,014 (D ee. 16, 1952).(5) A report of th is m ass spectrom eter w ill appear soon.

2058 Notes Vol. 63
ions was assumed to be H0BO3” , as boric acid is a very weak acid. The natural abundance of I0B in our boric acid sample was 19.70%.6 In both runs, the lighter isotope was enriched in the resin phase. The exchange capacity of the resin used with these solutions was measured as follows; as the boric acid on a resin bed was eluted with rinsing water in an ordinary column method, resin after being filtered off with dry filter paper was equilibrated with a solution of a certain concentration. The exchange capacity at a specific concentration of boric acid was obtained by interpolation between the values at known concentration, as it varies with concentration. The exchange capacities of the resin when used with solutions I and II were 4.36 and 4.65 meq. (H2B03“ )/g. resin (dry), respectively; the capacity with O il” was 2.65 meq./g.
DiscussionFrom the exchange capacity of the resin and the
data in Fig. 1, the separation factor a for the exchange reaction
R-H 2>1B03” + H3>»B03 R -H 2J»B03- + H311B03was calculated according to Spedding, et al.3; the curves in Fig. 1 were extrapolated to the point where the atomic fraction N becomes equal to the atomic fraction of the original boron sample N0. The following values were obtained for a = ( 10B / 11B ) r / ( 10B / 1iB ) s , where R and S denote the resin and solution phases, respectively, a (I, 0.03 M H3B 0 3) = l.OlOo, and a (II, 0.1 M H3B 0 3 with glycerine (8w t. % )) = 1.0166.
As a preliminary experiment has shown, a in simple aqueous boric acid solutions increases with decreasing concentration, the difference between the a-values of I and II is probably related to the presence of glycerol which is known to increase the acidity of boric acid solutions; the pKn. values of I and II were 10.2 and 7.6, respectively. This effect on acidity has been attributed to a difference in the ionization of boric acid which would also account for the difference in a-values.
Further experiments are in progress concerning the effect of concentration and acidity on a, and the separation of boron isotopes from other ions in various solvents and from the borate complex.
Acknowledgment.— The authors are indebted to Dr. Shun Araki for his help with the isotopic analysis, to Mr. Fujio Mochizuki for technical assistance and to Mr. Tetsuya Miyake for the measurement of exchange capacity. Ion-exchange resin and cobalt trifluoride were supplied by Nippon Organo Co., Ltd., and Osaka Kinzoku Kogyo Co., Ltd., respectively. The expense of this research was defrayed by a Grant in Aid from the Ministry of Education, Japan.
i.6) T h e natural abundance of boron varies som ew hat w idely according to the origin of th e reagent.
TH E H IG H -TEM PE R A TU RE TRAN SFO RM ATIO N OF M oG e2
B y R o b e r t J. P e a v l e r a n d C. G e r a r d B e c k , J r .
Contribution from the M ateria ls Engineering D epartm ents, W estinghouse E lectric Corporation, E ast Pittsburgh, P a .
Received A p ril 20, 1959
During an X -ray diffraction study of the molybdenum-germanium system, Searcy and Peavler1
(1) A . W . Searcy and R . J, P eavler, J . A m . Chem. S oc., 75, 5657(1953),
found two forms of M oG e2: a-M oGe2, whichconstituted the whole of specimens prepared at 980°, and /3-MoGe2, always found mixed with a-M oGe2 in specimens prepared at 1350°. These facts were first explained by assuming_/3-MoGe2 to be the high-temperature form, which did not transform completely on rapid cooling to room temperature. Later, Searcy and Carpenter,2 from studies of specimens quenched from high temperatures, concluded that a-M oGe2 decomposed above 1095 ± 20°, forming M o2Ge3 and liquid. They therefore held that d-M oGe2 was not a stable phase of the system but a metastable phase formed during rapid cooling of the M o2Ge3-liquid mixture.
The behavior of M oG e2, if confirmed, would be of great interest, for /3-MoGe2 is isostructural with MoSi2, a stable phase of the molybdenum-silicon system. This fact suggests that /3-MoGe2 will be stable under the proper conditions of temperature and pressure. A study of M oG e2 at high temperature was therefore desirable to test the results of quenching experiments.
ExperimentsA specimen of a-M oGe2 was prepared by the re
action of the necessary quantities of thoroughly mixed molybdenum and germanium powders at 1000° in an evacuated sealed Vycor tube. A specimen for X-ray diffraction analysis was placed in a thin-wall capillary and sealed to prevent loss of germanium by evaporation. Diffraction patterns at temperatures from 970 to 1155° were made by use of a Unicam high-temperature diffraction camera of 19 cm. diameter. Copper radiation was used.
Results and ConclusionsThe study showed that a-M oGe2 is stable up to
1080 ± 15°, decomposing above this temperature to a mixture of M o2Ge3 and liquid. In all diffraction patterns made up to 1065°, a-M oGe2 was the only phase observed. In patterns made at 1095° or above, a-M oGe2 had disappeared and was replaced by M o2Ge3. The liquid phase could not be detected by X-ray diffraction methods, but liquid must have been present to meet phase rule requirements. The conclusions of Searcy and Carpenter are therefore fully confirmed by this study.
From the results of this work and the results oi Searcy and Carpenter, it seems assured that ,S-MoGe2 cannot appear in equilibrium diagrams of the M o-G e system at low pressure. In work done by Searcy and Peavler, by Searcy and Carpenter, and in these experiments, pressure was low, never exceeding the vapor pressure of germanium.
While the place of /LMoGe2 in the M o-G e system is not yet established, we believe that it will be stable at high pressures. Searcy and Peavler found the pycnometric density of a mixture of a-M oGe2 and ¡3-M oG e2 to be 6.9 g. ec., and found the X -ray density of d-M oGe2 to be 8.91 g. cc. Although pycnometric densities of powders tend to be lower than X-ray densities, the difference between these values indicates that /3-MoGe2 is more dense than a-M oG e2 and high pressures would promote the stability of /3-MoGe2. The presence of
(2) A , W 4 Searcy and H. Carpenter* Unpublished worki
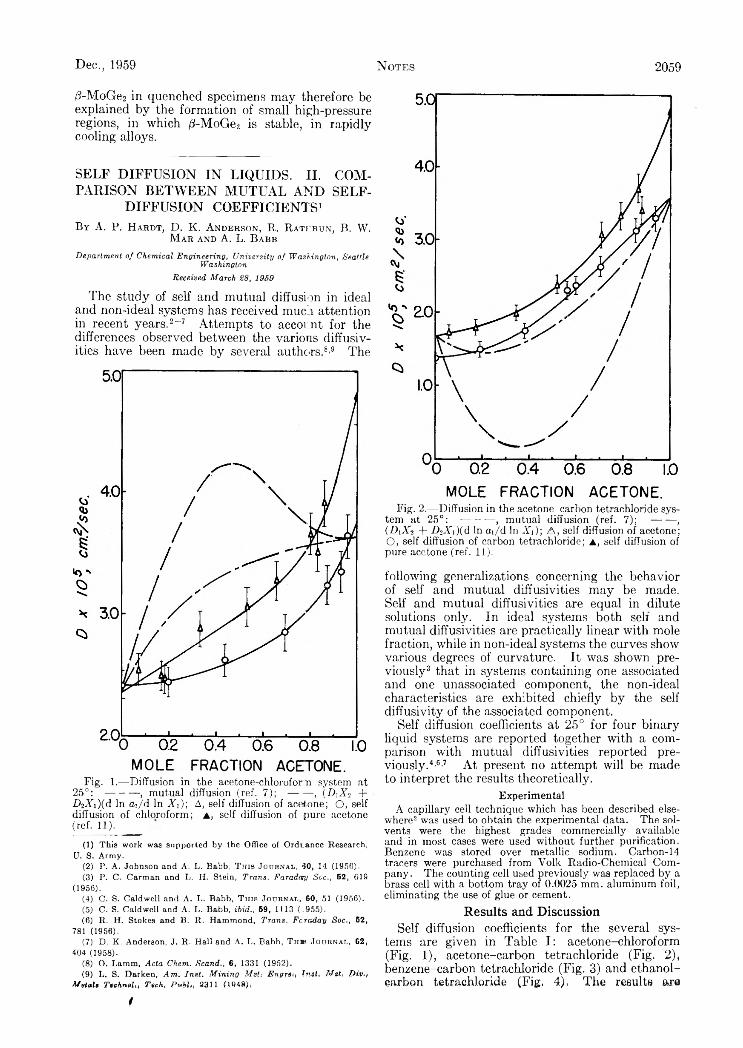
Dec., 1959 Notes 2059
/?-MoGe2 in quenched specimens may therefore be explained by the formation of small high-pressure regions, in which /3-MoGe2 is stable, in rapidly cooling alloys.
SELF DIFFU SION IN LIQUIDS. II. COM PARISON BETW EEN M U TU AL AN D SELF
DIFFUSION CO EFFICIEN TS1B y A. P. H a r d t , D. K. A n d e r s o n , R. R a t k b u n , B. W.
M a r a n d A. L. B a b b
D epartm ent o f Chem ical E ngineering, U niversity o f W ashington, Seattle W ashington
Received M arch £8, 1959
The study of self and mutual diffusion in ideal and non-ideal systems has received much attention in recent years.2-7 Attempts to account for the differences observed between the various diffusiv- ities have been made by several authors.8'9 The
Fig. 1.—Diffusion in the acetone-chlorofor n system at2 5 ° : ----------, mutual diffusion (ref. 7 ) ; ------- , (A W +A W )(d In cii/d In Xi); A , self diffusion of acetone; O, self diffusion of chloroform; a , self diffusion of pure acetone (ref. 11).
(1) This work was supported b y the Office of Ordnance Research, U. S. A rm y,
(2) P . A . Johnson and A . L . Babb, This Journal, 50, 14 (1956).(3) P . C . Carm an and L . H. Stein, T rans. Faradary Sec., 52, 619
(1956).(4) C . S. C ald w ell and A . L . B abb, This Journal, 60, 51 (1956).(5) C . S. Caldw ell and A . L . Babb, ibid., 59, 1113 ( ,955).(6) R . H. Stokes and B . R . Hammond, T ran s . Faraday Soc., 52,
781 (1956).(7) D . K . Anderson, J. R . H all and A . L . B abb, T h is Journal, 62,
404 (1958).(8) O. Lam m , A cta Chem . Scand., 6, 1331 (1952).(9) L . S. D arken, A m . In st. M in in g MeU Engreii tm t* M et, D iv,i
M etaU TechnoU, Tegh. P vH u 3311 (1048)«
i
M O LE F R A C T IO N A C E T O N E .Fig. 2.—Diffusion in the acetone-carbon tetrachloride sys
tem at 2 5 ° : ----------, mutual diffusion (ref. 7 ) ; ------- ,(A W + AA"i)(d In oi/d In W ) ; A, self diffusion of acetone; O, self diffusion of carbon tetrachloride; a , self diffusion of pure acetone (ref. 11).
following generalizations concerning the behavior of self and mutual diffusivities may be made. Self and mutual diffusivities are equal in dilute solutions only. In ideal systems both self and mutual diffusivities are practically linear with mole fraction, while in non-ideal systems the curves show various degrees of curvature. It was shown previously3 that in systems containing one associated and one unassociated component, the non-ideal characteristics are exhibited chiefly by the self diffusivity of the associated component.
Self diffusion coefficients at 25° for four binary liquid systems are reported together with a comparison with mutual diffusivities reported previously. 4 5-6'7 At present no attempt will be made to interpret the results theoretically.
E x p e r im e n ta lA capillary cell technique which has been described else
where2 was used to obtain the experimental data. The solvents were the highest grades commercially available and in most cases were used without further purification. Benzene was stored over metallic sodium. Carbon-14 tracers were purchased from Volk Radio-Chemical Company. The counting cell used previously was replaced by a brass cell with a bottom tray of 0.0025 mm. aluminum foil, eliminating the use of glue or cement.
Results and DiscussionSelf diffusion coefficients for the several sys
tems are given in Table I: acetone-chloroform (Fig. 1), acetone-carbon tetrachloride (Fig. 2), benzene-carbon tetrachloride (Fig. 3) and ethanol- carbon tetrachloride (Fig. 4). The results are
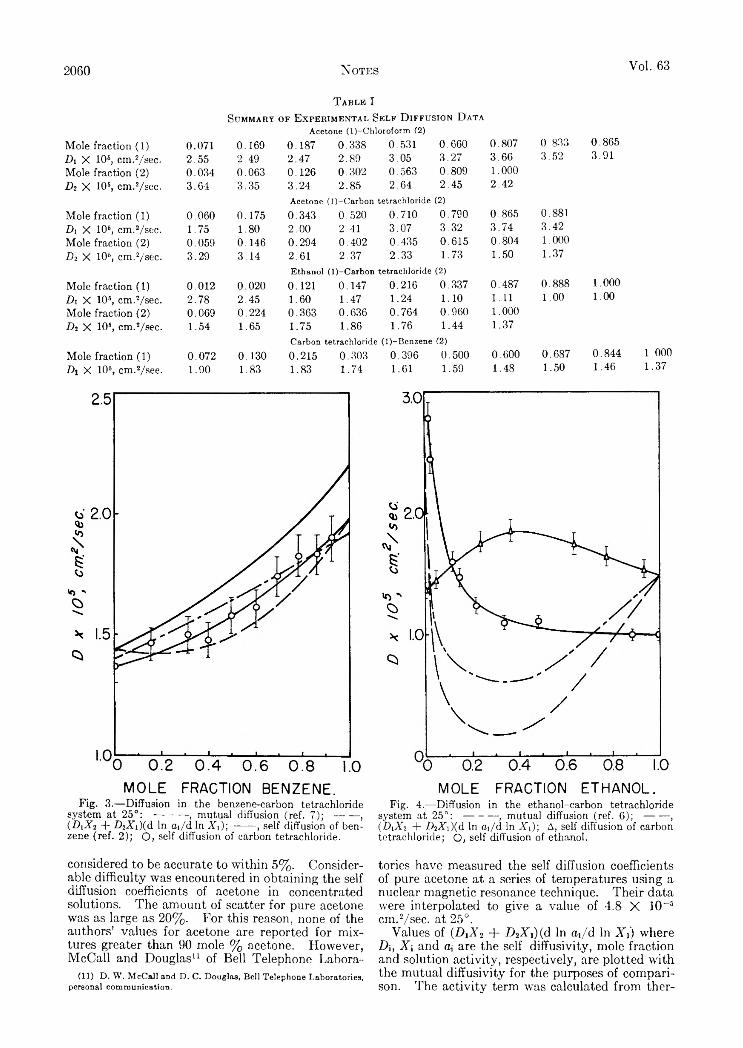
2060 Notes Vol. 63
T a b l e IS u m m a r y o f E x p e r i m e n t a l S e l f D i f f u s i o n D a t a
A cetone (l)-C h lo ro fo rm (2)
Mole fraction (1) 0.071 0.169 0.187 0.338 0.531 0.660 0.807 0.833 0.865A X 106, cm.2/sec. 2.55 2.49 2.47 2.89 3.05 3.27 3.66 3.52 3.91Mole fraction (2) 0.034 0.063 0.126 0.302 0.563 0.809 1.000A X IO5, cm.2/sec. 3.64 3.35 3.24 2.85 2.64 2.45 2.42
A cetone ( l)-C a rb o n tetrachloride (2)
Mole fraction (1) 0.060 0.175 0.343 0.520 0.710 0.790 0.865 0.881Di X 106, cm.2/sec. 1.75 1.80 2.00 2.41 3.07 3.32 3.74 3.42Mole fraction (2) 0.059 0.146 0.294 0.402 0.435 0.615 0.804 1.000Dì X 106, cm.2/sec. 3.29 3.14 2.61 2.37 2.33 1.73 1.50 1.37
E thanol (l)-C a rb o n tetrachloride (2)
Mole fraction (1) 0.012 0.020 0.121 0.147 0.216 0.337 0.487 0.888 1.000A X 105, cm.2/sec. 2.78 2.45 1.60 1.47 1.24 1.10 1.11 1.00 1.00Mole fraction (2) 0.069 0.224 0.363 0.636 0.764 0.960 1.000Dì X 10s, cm.2/sec. 1.54 1.65 1.75 1.86 1.76 1.44 1.37
Carbon tetrachloride ( l)-B en zen e (2)
Mole fraction (1) 0.072 0.130 0.215 0.303 0.396 0.500 0.600 0.687 0.844A X 106, cm.2/see. 1.90 1.83 1.83 1.74 1.61 1.59 1.48 1.50 1.46
1.0001.37
M O L E FRACTIO N B E N Z E N E .Fig. 3.—Diffusion in the benzene-carbon tetrachloride
system at 25°: ---------- , mutual diffusion (ref. 7 ) ; ------- ,( A X 2 + Z)2Xi)(d In ai/d In Xi); ------ , self diffusion of benzene (ref. 2); O, self diffusion of carbon tetrachloride.
M O L E FR A C TIO N E T H A N O L .Fig. 4.—Diffusion in the ethanol-carbon tetrachloride
system at 2 5 ° : ----------, mutual diffusion (ref. 6 ) ; ------- ,(A X 2 + D2A’ i)(d In m/d In Xi); A, self diffusion of carbon tetrachloride; O, self diffusion of ethanol.
considered to be accurate to within 5%. Considerable difficulty was encountered in obtaining the self diffusion coefficients of acetone in concentrated solutions. The amount of scatter for pure acetone was as large as 20% . For this reason, none of the authors’ values for acetone are reported for mixtures greater than 90 mole % acetone. However, McCall and Douglas11 of Bell Telephone Labora-
(11) D . W . M cC all and D . C„ D ouglas, B ell Telephone Laboratories, personal com m unication.
tories have measured the self diffusion coefficients of pure acetone at a series of temperatures using a nuclear magnetic resonance technique. Their data were interpolated to give a value of 4.8 X 10~s cm .2/sec. at 25°.
Values of ( A V 2 + A V x)(d In ax/d In Xi) where A , A and a; are the self diffusivity, mole fraction and solution activity, respectively, are plotted with the mutual diffusivity for the purposes of comparison. The activity term was calculated from ther
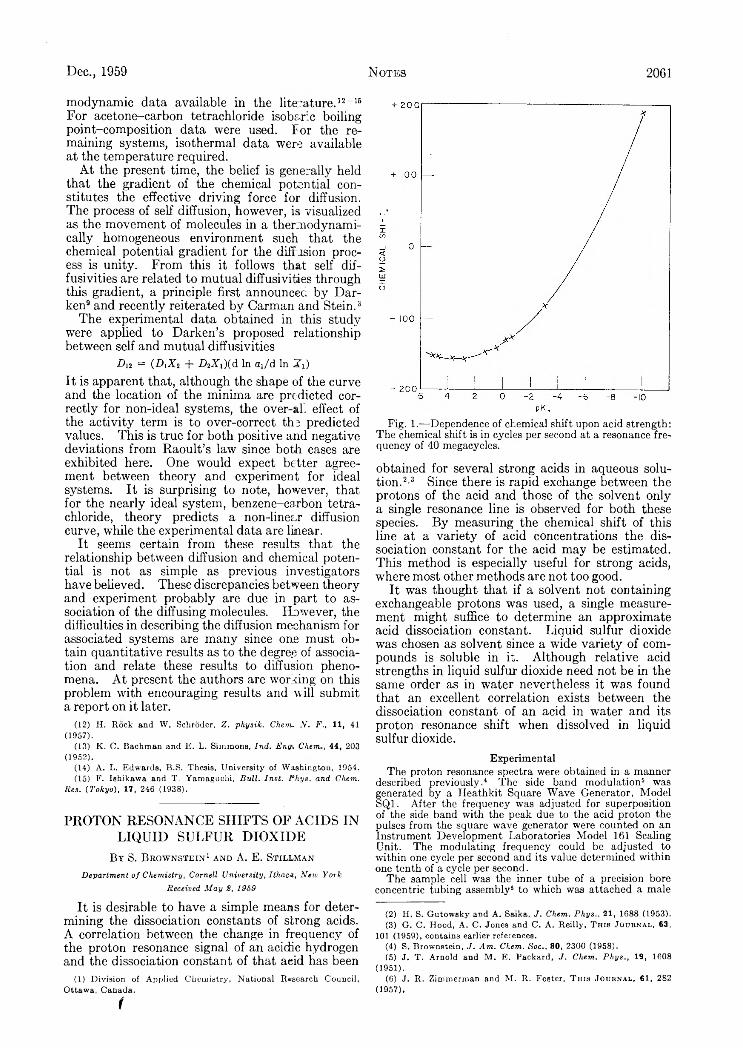
Dec., 1959 Notes 2061
modynamic data available in the literature.12-15 For acetone-carbon tetrachloride isobaric boiling point-composition data were used. For the remaining systems, isothermal data were available at the temperature required.
A t the present time, the belief is generally held that the gradient of the chemical potential constitutes the effective driving force for diffusion. The process of self diffusion, however, is visualized as the movement of molecules in a thermodynamically homogeneous environment such that the chemical potential gradient for the diff usion process is unity. From this it follows that self dif- fusivities are related to mutual diffusivities through this gradient, a principle first announced by Darken9 and recently reiterated by Carman and Stein.2 3
The experimental data obtained in this study were applied to Darken’s proposed relationship between self and mutual diffusivities
D i2 = (D i X 2 T D zX i) (d In (7i/d In X i )
It is apparent that, although the shape of the curve and the location of the minima are predicted correctly for non-ideal systems, the over-all effect of the activity term is to over-correct the predicted values. This is true for both positive and negative deviations from Raoult’s law since both cases are exhibited here. One would expect better agreement between theory and experiment for ideal systems. It is surprising to note, however, that for the nearly ideal system, benzene-carbon tetrachloride, theory predicts a non-linear diffusion curve, while the experimental data are linear.
It seems certain from these results that the relationship between diffusion and chemical potential is not as simple as previous investigators have believed. These discrepancies between theory and experiment probably are due in part to association of the diffusing molecules. However, the difficulties in describing the diffusion mechanism for associated systems are many since one must obtain quantitative results as to the degre.e of association and relate these results to diffusion phenomena. A t present the authors are working on this problem with encouraging results and will submit a report on it later.
(12) H. R ock and W . Schröder, Z . physik. Chum. N . F „ 1 1 , 41(1957).
(13) K . C. Bachm an and E . L . Simmons, In d . Engk C h e m 44, 203 (1952).
(14) A . L . Edw ards, B .S , Thesis, U n iversity of W ashington, 1954.(15) F. Ishikaw a and T. Yam aguchi, B u ll. In st. P h ys. and C h e m .
R e s . {T okyo ), 17 , 246 (1938).
PRO TO N RESO N AN CE SH IFTS OF A C ID S IN LIQ U ID SU LFU R D IO X ID E
By S. B r o w n s t e i n 1 a n d A. E. S t il l m a n
D ep a r tm en t o f C h em is try , C o rn e ll U n iv er s ity , I th a ca , N ew Y o r k
R ece iv ed M a y 8 , 1959
It is desirable to have a simple means for determining the dissociation constants of strong acids. A correlation between the change in frequency of the proton resonance signal of an acidic hydrogen and the dissociation constant of that aeid has been
(1) D ivision of A pplied C hem istry, N ational R esearch C ouncil, O ttaw a, C anada.
(
Fig. 1.—Dependence of chemical shift upon acid strength: The chemical shift is in cycles per second at a resonance frequency of 40 megacycles.
obtained for several strong acids in aqueous solution.2'3 Since there is rapid exchange between the protons of the acid and those of the solvent only a single resonance line is observed for both these species. B y measuring the chemical shift of this line at a variety of acid concentrations the dissociation constant for the acid may be estimated. This method is especially useful for strong acids, where most other methods are not too good.
It was thought that if a solvent not containing exchangeable protons was used, a single measurement might suffice to determine an approximate acid dissociation constant. Liquid sulfur dioxide was chosen as solvent since a wide variety of compounds is soluble in it. Although relative acid strengths in liquid sulfur dioxide need not be in the same order as in water nevertheless it was found that an excellent correlation exists between the dissociation constant of an acid in water and its proton resonance shift when dissolved in liquid sulfur dioxide.
ExperimentalThe proton resonance spectra were obtained in a manner
described previously.4 The side band modulation5 was generated by a Heathkit Square Wave Generator, Model SQ1. After the frequency was adjusted for superposition of the side band with the peak due to the acid proton the pulses from the square wave generator were counted on an Instrument Development Laboratories Model 161 Scaling Unit. The modulating frequency could be adjusted to within one cycle per second and its value determined within one tenth of a cycle per second.
The sample cell was the inner tube of a precision bore concentric tubing assembly6 to which was attached a male
(2) H . S. G u to w sk y and A . Saika, J . C h em . P h y s . , 21, 1688 (1953).(3) G . C . Hood, A . C . Jones and C . A . R eilly , This Journal, 63,
101 (1959), contains earlier references.(4) S , Brow nstein , J . A m . C h em . S o c . , 80, 2300 (1958).(5) J. T . A rnold and M . E . P ackard , J . C h em . P h y s . , 19, 1608
(1951).(6) J. R . Zim m erm an and M . R . Foster, This Journal, 61, 282
(1957).

2062 Notes Vol. 63
6/20 standard taper joint. With a known weight of acid in it, the cell was plaeed on a vacuum line and sulfur dioxide condensed into it at — 60 ° . The cell was capped quickly and the weight of sulfur dioxide determined.
The reference for the chemical shifts was benzene in the annular space between the concentric tubes. The shifts are in cycles per second with the more positive values at higher field. Diamagnetic susceptibility corrections were made in the usual manner.7 The volume magnetic susceptibilities of the solutions were calculated from those of the pure components assuming ideal behavior. Even if the diamagnetic susceptibilities are not exactly additive only a small error would be introduced.
ResultsThe correlation between chemical shifts of the
acidic proton and the pK of the acid in aqueous solution are shown in Fig. 1 and in Table I. The chemical shift for acetic acid was found to be constant up to a concentration of at least 7.40 molal. None of the determinations listed were made for concentration higher than 4.70 molal to assure the absence of concentration effects on the chemical shift.
T a b l e IR e s o n a n c e P o s it io n o f A c id ic P r o t o n s in L iq u id S u l f u r
D io x id e
Acid V K MolalityObsd.shift
Cor.shift
(CH+C-COOH 5.1 1.46 -139 .8 -152.1CH3COOH 4.75 2 15 -132 .3 -154 .2HCOOH 3.68 4.05 -134 .9 -156 .2CH2C1C00H 2.81 0.98 -135 .6 -156 .7CHCkCOOH 1.30 2.16 -129 .5 -147 .3CChCOOH 0.52 2.19 -127 .5 -143 .6CF3COOH -0 .2 6 4.70 -114 .6 -128 .9c h 3so3h - 0 . 6 1.71 -117 .5 -126 .6h 2so 4 - 3 1.03 - 59.0 - 83.2HCIO4 (70%) - 1 0 2 . 1 2 + 207 + 189HBr - 9 18.4 + 380 +375HI - 1 0 + 203 + 2 0 2
Spectra of 51, 60, 65 and 70% aqueous perchloric acid dissolved in liquid sulfur dioxide were obtained. A single line, due to rapid exchange of the acid and water hydrogens, was observed at the lowest concentration. A t higher concentrations two lines are observed with the one at highest field attributed to perchloric acid because of its lesser intensity. The data are given in Table II. It is assumed that the chemical shift of 100% HCIO4 dissolved in liquid sulfur dioxide would be that shown by the 70% acid since the rate of
T a b l e IIP r o t o n R e s o n a n c e o f A q u e o u s P e r c h l o r ic A c id in
Aq. acid,L iq u id S u l f u r D io x id e
M olality in% concn. SO2 soin. Cord, shift
51 2.33 h 2oh c io 4
- 15.0- 15 0
60 2.13 h 2oHC10„
+ 15.8 + 18.7
65 2.51 h 2oh c 1 0 4
+ 28.7 + 189
70 2 .12 HoOHC104
+ 45 + 189
(7) A. A. Bothner-By and R. E. Glick, J . C h e m . P h y s . , 26, 1651 (1957).
exchange of acid and water protons is no longer affecting the observed chemical shift.
A general treatment of shifts in line positions due to proton exchange has been presented.8 Simplifying assumptions were made and an equation obtained that related displacement of the lines of two species in equal concentration with the rate of exchange of the two species. For the case where the mole fractions of the exchanging species are not equal, but the line widths are small compared with the distance between them, one obtains
Am[4t2(Aw)2 — t2(5o>)2 + 2] = 5(j(pB — Pa )
The symbols have the same meaning as in ref. 8 . From this one may calculate that a 2.13 molal solution of 60% perchloric acid in liquid sulfur dioxide has the proton exchange rates
£h2o = 2.05 sec.-1Aiic 104 = 15.0 sec.-1
These exchange rates are in a convenient region for measurement by proton resonance spectroscopy. It is likely that they would depend upon the molality of the aqueous acid in sulfur dioxide and upon the concentration of the aqueous acid. The exchange rates might be related to the concentration of ion pairs in the solution.
All the acids shown in the figure have the acidic proton attached to oxygen. If the proton is bonded directly to another element different magnetic anisotropy effects would overshadow the change in shielding of the proton due to its different acidity. One such example is hydrogen bromide. An 18.4 molal solution in liquid sulfur dioxide has a corrected chemical shift of +375 cycles. This is much higher than would be expected from its acid strength alone and is considerably higher than that for the pure liquid .9 There is evidence for 1 :1 complexes of SO2 and hydrogen halides in aqueous solution and such a complex if present in liquid sulfur dioxide could easily give unusual shielding effects. 10 It was necessary to keep the sample in a D ry Ice-bath until shortly before running the spectra since at room temperature it reacted fairly quickly to give bromine, sulfur and water. Hydrogen iodide in liquid sulfur dioxide had a corrected chemical shift of + 2 0 2 cycles, in agreement with its acid strength. This is much lower than the value observed for the pure liquid.9 In this case no chemical reaction is observed for the solution in sulfur dioxide.
DiscussionIt appears that there may be a correlation
between the chemical shift of an acidic proton in liquid sulfur dioxide solution and the dissociation constant of the corresponding acid in aqueous solution. Therefore this method might be useful as an easy way to get approximate dissociation constants of strong acids. If concentrated aqueous solutions of strong acids are dissolved in sulfur dioxide, one may determine the exchange rates between the water and the acidic protons.
(8) H. S. Gutowsky and C. II. Holm, ib id ., 25, 1228 (1956).(9) W. G . Schneider, H. J. Bernstein and J. A. Pople, ib id ., 28, 601
(1958).(10) S. Witekowa, T . Paryjozak and T . Witek, Z e s z t y N a u k
Politech. Lodz., N o. 2 2 , Chein., 7, 17 (1958); C .A ., 53, 1975e (1959).
s
TH E H E A T OF FO R M A TIO N OF FO R M IC A C ID
B y G. C. S i n k e
Thermal Laboratory, The D ow Chemical C om pany, M idland, M ichigan R eceived A p ril 21 , 1959
The heat of formation of formic acid derived by Waring1 from equilibrium studies is not in agreement with the heat of combustion (determined prior to 1900). The disagreement is unusual in that the equilibrium data indicate the heat of combustion to be too high, while most of the older heat of combustion values tend to be too low. A new determination of the heat of combustion is in agreement with the equilibrium values.
ExperimentalCommercial formic acid was purified by frac donai crystal
lization until freezing curve analysis indicated a purity of better than 99.8 mole %. Analysis of the combustion gases indicated the sample had a carbon content of 99.9 ± 0.1% of theoretical.
The calorimetric system and technique was the same as that used previously2 except that the sample was enclosed in a small bag of Mylar film. The film had a heat of combustion of A (7 r / M = 5461.7 ± 1 .8 cal. g ± ‘ and analyzed 62.12% carbon and 4.18% hydrogen. The remainder was assumed to be oxygen. Washburn corrections were calculated by the method of Prosen.3 Results are given in Table I. The sample mass is based on the mass of carbon dioxide produced, after correction for the carbon dioxide calculitec from the weighed Mylar bag. Results based on sample weight were slightly lower which would be expected if the impurity was water.
Dec., 1959
T a b l e IS a m p l e m ass , - A U r/M ,
QTotal <2My lar &HN03 y Washburn g- c a l . g . -1
6 2 2 4 . 3 6 9 0 5 . 2 2 0 . 1 6 1 4 . 4 0 3 . 9 9 1 4 8 1 3 2 9 . 0
6 3 1 3 . 5 4 9 5 0 . 1 2 . 0 0 1 4 . 4 3 4 . 0 2 5 5 8 1 3 2 8 . 8
6 1 6 8 . 0 3 9 0 7 . 3 0 . 3 2 1 3 . 8 1 3 . 9 5 4 4 2 1 3 2 6 . 8
6 0 0 8 . 0 6 9 4 7 . 8 2 . 1 6 1 3 . 0 4 3 . 7 9 5 8 5
A V .
1 3 2 9 6
1 3 2 8 . 6
S t a n d , d e v . 0 .6
Results and DiscussionEmploying a molecular weight of 46.027 and
calculating to constant pressure gives A R °o298(1) = — 60.86 ± 0.06 kcal. mole“ 1. From heats of formation of liquid water and gaseous carbon dioxide2 the heat of formation is calculated as AH°i 298 (1) = -10 1.5 2 ± 0.06 kcal. mole“ 1. The entropy of liquid formic acid at 298 °K. is given by Stout and Fisher4 5 and of carbon, hydrogen and oxygen by Stull and Sinke,6 7 iro n which the free energy of liquid formic acid is —86.38 ± 0.06 kcal. mole“ 1. Waring derived —86.45 and — 86.39 kcal. mole“ 1 from two different dissociation equilibria. The excellent agreement is evidence against the existence of residual entropy
(1) W . W aring, Chem. R evs., 51, 171 (1952).(2) G . C . Sinke, D . L . H üdenbrand, R . A . M cD onald , W . R .
K ram er and D . R . Stull, T h is Journal, 62, 1461 (1&58).(3) E . J. Prosen, C h ap ter 6 in "E xp erim en tal Therm ochem istry,”
edited b y F . D . Rossini, Interscience Publishers, Now Y o rk , N . Y . , 1956.
(4) J. W . Stout and L. H . Fisher, J. Chem. R hys., 9 , 163 (1941).(5) D , R . Stu ll and G . C . Sinke, “ Therm odynam ic Properties of the
Elem ents, N o. 18 of the A dvances in Chem istry Series, E dited b y the Staff of Industrial and Engineering C h em istry,” Am erican Chem ical Society, W ashington, D . C .
i
in formic acid and supports recent spectroscopic and X-ray studies.6 The most likely explanation for the high previous combustion data is that the formic acid contained some acetic acid, a common impurity which has a considerably higher heat of combustion.
(6) R . C . M illikan and K . S. P itzer, J . Chem. P h ys., 27, 1305 (1957).
Notes 2063
A P A R T IA L PHASE S T U D Y OF TH E SY ST E M N aF -H F
B y R o b e r t L . A d a m c z a k , 1 J . A r t h u r M a t t e b n a n d H o w a r d T i e c k e l m a n n
Contribution from the D epartm ent o f Chem istry , U niversity o f Buffalo, B uffalo, N . Y .
R eceived M a y 4 , 1959
Although phase studies have been performed for the binary systems K F -IIF ,2 R b F -H F 3 and C sF- H F,4 little work has been done on the system N aF - HF. Several investigators6-7 have studied the ternary system NaF-HF- 1120 in part. Tananaev,8 studied this system more completely. He found that the solubility curves in the system showed an analogy to the K F -H F -H 20 system.9 His 0° isotherm consisted of five branches corresponding to the solid phases NaF, NaF-HF, NaF-2HF, NaF- 3HF and NaF-4HF. Unlike the acid fluorides of potassium, those of sodium had no congruent melting points but decomposed into LIF and NaF-HF. The latter was stable up to 90° but decomposed completely at 150°. Jache and C ady10 reported the solubility of N aF in liquid H F as follows: 30.1 ± 0.1 g. of N aF per 100 g. of H F at 11.0°, 25.1 ± 0.1 g. at — 9.8° and 22.1 ± 0.1 g. at — 24.3°. War- tenberg and Bosse11 reported the decomposition temperature of NaF-HF to be approximately 270° while Froning, cl al. , 12 reported 278°. In this Laboratory, phase studies of the system N aF -H F were made in the range of mole fraction 0.75 to 0.87 HF.
ExperimentalThe sodium fluoride was Mallinckrodt reagent grade
(99.4%). The anhydrous hydrogen fluoride (99.9%) was obtained from Harshaw Chemical Company and was distilled before addition to the sodium fluoride.
A known amount of sodium fluoride was weighed into a reaction vessel of 200 to 250-ml. capacity. The reaction vessels were constructed of monel with needle valves machined from solid monel stock. Teflon gaskets were used to ensure air-tight seals. The hydrogen fluoride was distilled into the reaction vessel using a multipurpose manifold constructed of iU in. copper tubing and brass needle valves. The vessels weighed about 700 g. when empty and usually held about a 300 g. charge of NaF and HF.
(1) From the M .A . thesis of R obert L . A dam czak, U niversity of Buffalo, 1955.
(2) G . H. C a d y, J . A m . Chem. Soc., 56, 1431 (1934).(3) K . R . W ebb and E . B. R . Prideaux, J . Chem. Soc., I l l (1939).(4) R . V. W insor and G . H. C a d y, J . A m . Chem. Soc., 70, 1500
(1948).(5) A . D itte, A n n. chim. -phys., [73 10, 556 (1897).(6) D . B. Jehu and L . J. Hudleston, J . Chem. Soc., 125, 1451 (1924).(7) N . D . N agorskaya and A . V . N ovoselova, J . Gen. Chem. ( XJ.S.-
S .R .), 5, 182 (1935).(8) I. V. T ananaev, ibid ., 11, 267 (1941).(9) I. V. T ananaev, J . A p p l. Chem. {U .S .S .R .), 1 1 , 214 (1938).(10) A . W . Jache and G . H. Cady, This Journal, 56, 1106 (1952).(11) V. H. N . W artenberg and O. Bosse, Z . Elektrochem ., 28, 386
(1922).(12) J. F . Froning, M . K . Richards, T . W . Stricklin and S. G.
Turnbull, I n i . Eng. Chem., 39, 275 (1947).
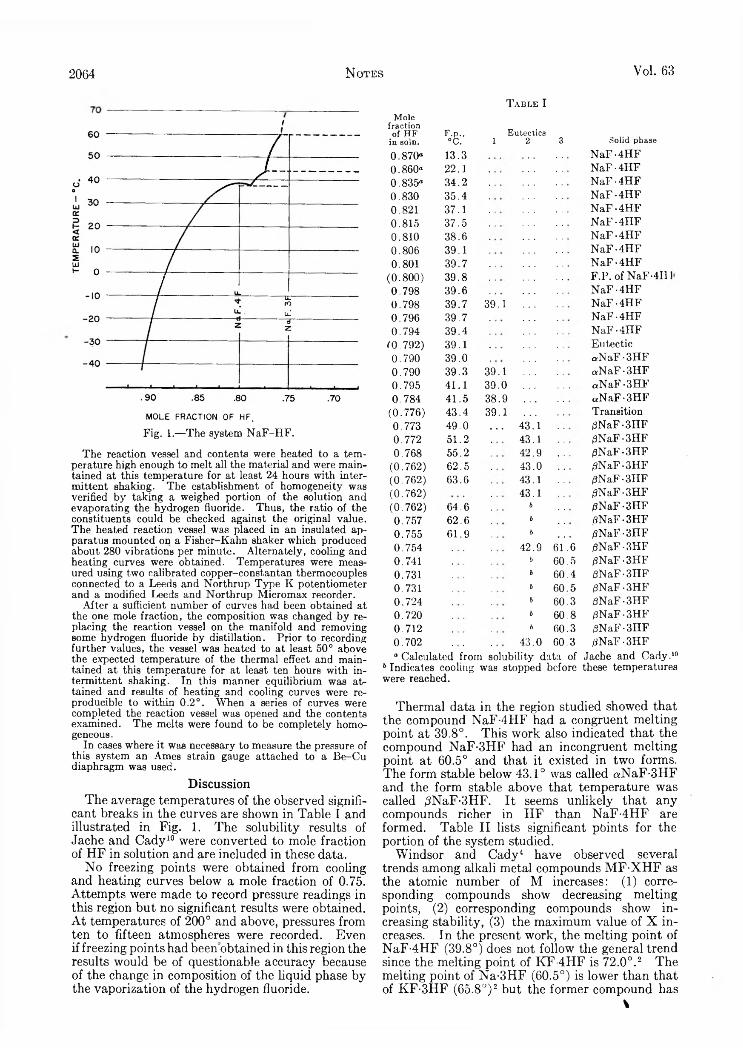
2064 N otes
I
MOLE FRACTION OF HF,Fig. 1.—The system NaF-HF.
The reaction vessel and contents were heated to a temperature high enough to melt all the material and were maintained at this temperature for at least 24 hours with intermittent shaking. The establishment of homogeneity was verified by taking a weighed portion of the solution and evaporating the hydrogen fluoride. Thus, the ratio of the constituents could be checked against the original value. The heated reaction vessel was placed in an insulated apparatus mounted on a Fisher-Kahn shaker which produced about 280 vibrations per minute. Alternately, cooling and heating curves were obtained. Temperatures were measured using two calibrated copper-constantan thermocouples connected to a Leeds and Northrup Type K potentiometer and a modified Leeds and Northrup Micromax recorder.
After a sufficient number of curves had been obtained at the one mole fraction, the composition was changed by replacing the reaction vessel on the manifold and removing some hydrogen fluoride by distillation. Prior to recording further values, the vessel was heated to at least 50° above the expected temperature of the thermal effect and maintained at this temperature for at least ten hours with intermittent shaking. In this manner equilibrium was attained and results of heating and cooling curves were reproducible to within 0.2°. When a series of curves were completed the reaction vessel was opened and the contents examined. The melts were found to be completely homogeneous.
In cases where it was necessary to measure the pressure of this system an Ames strain gauge attached to a Be-Cu diaphragm was used.
DiscussionThe average temperatures of the observed signifi
cant breaks in the curves are shown in Table I and illustrated in Fig. 1. The solubility results of Jache and Cady10 were converted to mole fraction of HF in solution and are included in these data.
No freezing points were obtained from cooling and heating curves below a mole fraction of 0.75. Attempts were made to record pressure readings in this region but no significant results were obtained. A t temperatures of 200° and above, pressures from ten to fifteen atmospheres were recorded. Even if freezing points had beenobtained in this region the results would be of questionable accuracy because of the change in composition of the liquid phase by the vaporization of the hydrogen fluoride.
Yol. 63
Mole fraction of HF in soin. F.p.,
°C.
T a b l e I
Eutectics 1 2 3 Solid phase
0.870« 13.3 NaF-4HF0.860« 22.1 NaF-4HF0.835» 34.2 NaF-4HF0.830 35.4 NaF-4HF0.821 37.1 NaF -4HF0.815 37.5 NaF-4HF0.810 38.6 NaF-4HF0.806 39.1 NaF-4HF0.801 39.7 NaF-4HF
(0.800) 39.8 F.P. of NaF'4H0.798 39.6 NaF-4HF0.798 39.7 39.1 NaF-4HF0.796 39.7 NaF-4HF0.794 39.4 NaF-4HF
CO.792) 39.1 Eutectic0.790 39.0 aNaF-3HF0.790 39.3 39.1 «NaF -3HF0.795 41.1 39.0 <*NaF-3HF0.784 41.5 38.9 «N aF ■ 3HF
(0.776) 43.4 39.1 Transition0.773 49.0 , , . 43.1 0NaF-3HF0.772 51.2 43.1 /3NaF -3HF0.768 55.2 42.9 |3NaF -3HF
(0.762) 62.5 43.0 |SNaF-3HF(0.762) 63.6 43.1 (SNaF-3HF(0.762) 43.1 (SNaF -3HF(0.762) 64.6 b |SNaF -3HF0.757 62.6 b j3NaF-3HF0.755 61.9 b (3NaF-3HF0.754 42.9 61.6 ßNaF-3HF0.741 b 60.5 |3NaF-3HF0.731 b 60.4 /3NaF-3HF0.731 b 60.5 0NaF-3HF0.724 b 60.3 |3NaF-3HF0.720 b 60.8 /SNaF-3HF0.712 b 60.3 iSNaF-3HF0.702 43.0 60.3 |3NaF-3HF“ Calculated from solubility data of Jache and Cady.10
b Indicates cooling was stopped before these temperatures were reached.
Thermal data in the region studied showed that the compound NaF-4HF had a congruent melting point at 39.8°. This work also indicated that the compound NaF-3HF had an incongruent melting point at 60.5° and that it existed in two forms. The form stable below 43.1° was called aNaF-3HF and the form stable above that temperature was called ,3NaF-3HF. It seems unlikely that any compounds richer in HF than NaF-4HF are formed. Table II lists significant points for the portion of the system studied.
Windsor and Cady4 have observed several trends among alkali metal compounds M F -X H F as the atomic number of M increases: (1) corresponding compounds show decreasing melting points, (2) corresponding compounds show increasing stability, (3) the maximum value of X increases. In the present work, the melting point of NaF-4HF (39.8°) does not follow the general trend since the melting point of KF-4HF is 72.0°.2 The melting point of Na-3HF (60.5°) is lower than that of KF-3HF (65.8°)2 but the former compound has
\

Notes 2065Dec., 1959
M olefraction
T a b l e II
H F in T em p ., T y p e of Solid phasessoin. °C . point pussent
0.800 39.8 Freezing NaF-4HF0.792 39.1 Eutectic NaF-4HF and
<*NaF-3HF.776 43.1 Transition «NaF -3HF and
/3NaF-3HF.762 60.5 Peri tec tic 0NaF-SHF and
(NaF-2HF)
an incongruent melting point. The “ actual” melting point would be much higher. It appears from this work that the trend in stability is as expected with NaF-3HF less stable than KF-3HF. That NaF-4HF seems to be the highest acid fluoride of the N aF-H F system does not contradict the general trend of increasing maximum values for X .
Summary.— In the range of mole fraction of HF 0.75 to 0.87, sodium fluoride and hydrogen fluoride form the compounds NaF-4HF, aNaF-3HF and /3NaF-3HF.
DIFFUSION COEFFICIENTS OF ZIR C O N IU M (IV ) IN H YD RO CH LO RIC
A C ID SOLUTION A T 25 °-By D. A. W illiams-Wynn
Leather Industries Research Institu te, Rhodes U niversity Grahamstown, South A fr ica
R eceived M a y 6, 1959
Diffusion coefficients of zirconium in nitric and perchloric acid solutions have been reported by previous workers using a somewhat limited range of time, concentration and acidity.2 3 In the present work, diffusion coefficients of zirconium oxychloride have been determined over a wide range, using the porous glass diaphragm method previously developed.4“ 7 In order to nullify the effect of the electric charge on the movement of the zirconium ion, a relatively high concentration of electrolyte was used as “ swamping agent.” 6'8 Sodium nitrate was used as supporting electrolyte because no complex nitrates of zirconium are known.9
ExperimentalReagents.—The solutions of zirconium oxychloride and
supporting electrolyte (swamping agent) were made up in de-ionized distilled water. Purified zirconium oxychloride octahydrate was prepared from commercial salt, by repeated reerystallizations from 9 N hydrochloric acid aid was found by analysis to be more than 99.5% pure. All other reagents used for the supporting electrolyte or for pE adjustment were of C.p. grade.
(1) P a rt of a thesis to be subm itted to the F a c u lty of Science, Rhodes U niversity, G raham stow n, in p artial f u l f i l l m e n t of the requirem ents for the degree of M aster of Science.
(2) G . Jander and K . F . Jahr, K ollo id -B eih ,, 43, 295 (1936).(3) B . A . J. L ister and L . A . M cD on ald , J . Chem. Sac., 4315 (1952).(4) J . H . N orthrop and M . L . Anson, J . Gen. P h ysio l ., 12 , 543
(1929).(5) J. W . M cB a in and T . H . Liu, J . A m . Chem. S o c 53, 59 (1931).(6) G . S. H artley and D . F . R unnicles, P roc. R o y . Soc. (London)
A 1 68 , 420 (1938).(7) R . H. Stokes, J . A m . Chem. S oc., 72, 763 (1950).(8) A . D oyle A b b o tt and H. V . T a rta r, This Journal, 59, 1193
(1955).(9) W. B. Blumenthal, “ The Chemical Behavior of Zirconium ,’ '
J>. Van Nostrand C o., Inc., New York, N. Y ., 1958, p*. 288.
(
Apparatus.—The magnetically-stirred diffusion cell employed in this work was similar to that described by Stokes7 except that the pore size of the sintered-glass disc was 30-40 p. All measurements were made in a thermostat at 25 ± 0.025°.
Procedure.—For the first series of measurements, 0.5 and 0.1 M solutions were prepared in 1.0 M sodium nitrate solution. Diffusion measurements were made at the natural pH of the oxychloride after storage at 21 ± 1° for varying periods up to 12 weeks. The second series was an investigation of the effect of concentration on the rate of diffusion. The solutions were a 11 aged for 5 to 6 weeks before diffusion measurements were made.
The effect of acidity on the diffusion coefficient was investigated in the third series cf measurements. In this case, acid was used as supporting electrolyte. When the concentration of the acid was <1 M , additional supporting electrolyte was added.
In all determinations the de-aerated zirconium solution was introduced into the lower cell compartment while the upper compartment was filled with supporting electrolyte of the same concentration and pH. Diffusion was permitted to proceed until 8 to 10% of the diffusing material had entered the upper compartment. The solutions were then removed and analyzed lor zirconium by the Alizarin-S spectrophotometric method modified by the writer.10 The diffusion coefficient was calculated in accordance with the equation given by Stokes.11 The cell was calibrated using 0.1 N potassium chloride solution, the diffusion coefficient of which is 1.873 X 10⁻⁶ cm.1 sec.-1.12
Results and DiscussionDiffusion Coefficient as a Function of Time.—
The diffusion coefficient is relatively large initially (Table I) but rapidly decreases with increasing time. Within a period of 4 to 5 weeks the diffusion coefficient reaches a limiting value which changes only slightly with further aging up to 12 weeks. For the more concentrated solution (0.5 M), the decrease of the diffusion coefficient and the attainment of equilibrium is more rapid than with the 0.1 M solution. The effect of concentration on rate of diffusion is given in detail below.
T a b l e IV a r i a t i o n s i n t h e D i f f u s i o n C o e f f i c i e n t o f Z i r c o n i u m
O x y c h l o r i d e w i t h A g e o f S o l u t i o n
Supporting electrolyte 1.0 M sodium nitrate; D in cm.2 sec.-1.
0 .5 M Z r solution 0 .1 M Z r solutionA ge of soin.,
days D X 10«A ge of soin.,
days D X 10«
1.5 4 30 1.5 4.704 3.96 4 4.398 3.86 6 4.11
16 3.85 14 3.6524 3.85 21 3.5428 3.84 28 3.4740 3.78 42 3.4056 3.81 56 3.4084 3.80 84 3.40
Diffusion Coefficient as a Function of Concentration.— The effect of zirconium concentration on the diffusion coefficient is given in Table II. Dilute solutions aged for 5 to 6 weeks were shown to have a lower diffusion coefficient than the more concentrated solutions aged far the same period, when measured at the natural pH. This indicates that the particles were less mobile in dilute solution than in concentrated solution. When the solu-
(10) D . A . W illiam s-W ynn, J . Soc. Leather Trades’ Chem ists, 42 , 360 (1958).
(11) R . II. Stokes, J . A m . Chtm . S oc., 72, 2243 (1950).(12) R . H. Stokes, ibid ., 73, 3527 (195 1).

2066 N otes Vol. 63
tions were diluted while maintaining the pH at the original value of the 0.8 M solution by addition of hydrochloric acid, and then aged, diffusion was much more rapid. The rate of diffusion is dependent less on the zirconium concentration than on acidity.
T a b l e I I
V a r i a t i o n s i n t h e D i f f u s i o n C o e f f i c i e n t o f Z i r c o n i u m O x y c h l o r i d e w i t h C o n c e n t r a t i o n o f S o l u t i o n
Supporting electrolyte 1.0 M_ sodium nitrate; solutions aged 5-6 weeks; c in moles/1., D in cm.2 sec.-1.
N o pH adjustm ent pH adjusted to 0.38c pH D X 10® C pH D X 10®
0.856 0.38 3.86 0.856 0.38 3.86.558 .47 3.84.494 .50 3.84.281 .65 3.71.280 .65 3.71.236 .72 3.65 .200 .38 4.01.185 .86 3.69.110 1.00 3.47 .110 .38 4.17.097 1.08 3.48.052 1.32 3.27 .055 .38 4.49
Diffusion Coefficient as a Function of Acidity.—Diffusion coefficients obtained in hydrochloric acid solutions are given in Table III together with coefficients for zirconium particles in solutions to which alkali had been added. The presence of acid increases the diffusion coefficient of zirconium but a limiting value is reached quickly. This value is attained when the acid concentration is 1 M or greater. By comparison, the results found by Lister and M cDonald3 in nitric acid solution show no limiting value. The addition of alkali on the other hand rapidly reduces the rate of diffusion. These results are probably in agreement with the formation of highly aggregated hydrolysis products. The highly basic solutions, particularly those that are faintly opalescent, contain particles that are probably markedly asymmetric and of high molecular weight, in which case the calibration of the cell by low molecular weight substances is not necessarily valid.13
T a b l e I I I
V a r i a t i o n s i n t h e D i f f u s i o n C o e f f i c i e n t o f 0.05 M Z i r c o n i u m O x y c h l o r i d e w i t h A c i d i t y o f S o l u t i o n
Solutions aged 8 weeks; c in moles/1., D in cm.2 sec.-1Added
supporting electrolyte N a N 0 3, M
Acitlc D X 10®
5.00 4.632.00 4.631.00 4.59
0.5 0.50 4.57.63 .37 4.49.8 .20 4.46.9 .10 4.30
1.0 .00 3.27A lkali
c
1.0 0.02 2.751.0 .04 2.441.0 .05 2.21
(13) A . E . A lexander and P. Johnson, “ Collo id Science,” Oxford U niversity Press, O xford, 1950, p . 242,
General Discussion.— A complete theoretical treatment of the relation between diffusion coefficient in liquid systems and ionic or molecular weight is lacking.3 Approximate values of particle weight can be calculated from the Sutherland- Einstein equation and the equation expressing radius in terms of particle weight and partial specific volume.14 Although these values are no more than approximate, it is interesting to examine the effect of various solution conditions on the particle size of zirconium, even if the results are regarded as only qualitatively correct. The particle weight of 730, calculated from the diffusion coefficients of 0.5 M zirconium in acid solutions of1.0 to 5.0 M , indicate a degree of polymerization in the region of 3.7 (particle weight of the monomer15 is taken to be 196). This is in close agreement with the values of 3 to 4 obtained by other methods.16“ 18 In connection with the above, aggregation of zirconium particles by oxygen bridges19 to give asymmetric linear polymers imposes severe limitations on the validity of particle weights calculated from diffusion data, particularly when the diffusion coefficients are small.
Acknowledgment.— The author wishes to thank Dr. R. L. Sykes for useful suggestions and constructive criticism during the course of this work.
(14) R ef. 13, p. 259.(15) R ef. 9, p. 124.(16) K . A . K raus and J. S. Johnson, J. A m . Chem. Soc., 75, 5769
(1953).(17) J. S. Johnson and K . A . K raus, ibid ., 78, 3937 (1956).(18) A . J. Zielen and R . E . Connick, ib id ., 78, 5785 (1956).(19) W . B . Blum enthal, In d . E ng. Chem., 46, 528 (1954).
TH E SLOW EVOLUTION OF H EAT IN H EAT OF IM M ERSIO N C A L O R IM E T R Y 1
B y C. A. G u d e r j a h n , D. A. P a y n t e r , P. E. B e r g h a u s l n a n d R. J. G o o d 2
U niversity o f C incinnati, D epartm ent o f A p p lied Science, C incinnati Ohio
Received M a y 22, 1959
Since the time of Pouillet3 thermal data in studies of heats of immersion have been analyzed assuming that the “ heat of immersion” is released all at once, and that effects of appreciable duration are due to thermal transients of the system.4 5
During measurements of the heat of immersion of alumina in water, heat release was observed for a period of several hours— a time far greater than that required for thermal transients to die out. This note reports our efforts to analyze this phenomenon.
ExperimentalOur twin calorimeter has been described elsewhere5; it
was run adiabatically. All runs stretched over periods of several hours. Results are reported for immersion at 20°.
The solids were extracted with distilled water and acti- * 1195(1) From the P h .D . theses of C . A . G uderjahn (1955) and D . A .
P a yn ter (1954).(2) C on vair Scientific Research L aboratory, 5001 K earn ey V illa
Road, San Diego 11, California.(3) M . Pouillet, A n n. chim. ph ys., 10, 141 (1822).(4) G . E . B o yd and W . D . H arkins, J . A m . Chem. S oc., 64, 1190,
1195 (1942).(5) P . E . Berghausen, in “ Adhesion and A dhesives,” F . C lark ,
J. E . R u tzler and R . L . Savage, editors, John W iley and Sons, Inc., N ew Y o rk , N , Y . , 1954, p. 225.

Dec., 1959 Notes 2067
vated under vacuum. Fifteen- m l . sanrple bulbs were used. Correction for heat of bulb breaking was made 6 Heat of stirring was measured separately for each run. Areas were measured by N2 adsorption.7
J. T. Baker and Co. A120 3 was activated at 130 to 300°, commercial Davidson Co. Si02 was activated at 250°, du Pont “ Ti-Pure” anatase and rutile were activated at 150 to 350° and Godfrey L. Cabot Co. Graphon was activated at 300°. Of the five solids, only the Si02 was porous as indicated by a Type 4 adsorption isotherm.7
Analysis of Data.— T o facilitate estimation of slow heat from time-temperature curves, we assumed the rate of release of slow heat decayed exponentially with time. With this hypothesis, the expression for total heat evolved up to time t takes the form
r = hi + h,( 1 — e~X<) + m AT ct (1)
ha = total slow heat hi = total immediate heat r(t) = total heat released up to time t m = heat leakage coefficient (measured separately, as
a function of differential temp.). The last term on the right is the cumulative heat leakage
AT = absolute temp, difference between flask and bath X = time constant for the process
A typical graph of raw data for alumina (a sample activated at 150°) is given in Fig. 1; also shown are the raw data corrected for heat leakage. (In the absence of slow heat, the curve for the open circles would approach a straight line after about 5 minutes.) Figure 2 shows result of the treatment eq. 1, rearranged to the form
(hi + ha) — r + J'q tn AT At = hae~ t (2)
Extrapolation to t = 0 yields 105 ergs/cm .2 for ha, and the half-life for the slow heat U/t is 67 minutes. The satisfactory fit to a straight line is evident, indicating that over the intervals employed the analysis is valid.
When the slow heat is known as a function of time, its contribution to the temperature rise may be deducted. The resulting curve resembles temperature traces obtained when thare is no slow heat, and the usual extrapolation tc zero time can be made accurately.
Results.— Table I summarizes our results. Probable errors (50% confidence limits for mean values) are reported where five or more runs under constant experimental conditions were made.
T a b l e IH e a t s o f I m m e r s i o n i n W a t e r
Substance
Act.temp.,
°C.Surface
area,m-Vg.
Immed.heat,
erg/cm.2Slow heat, erg/cm.2
Half-life of slow heat, min.
AI2O3 150 7.16 427 86 70250 7 .94 582 319 51300 8 .3 679 ± 7 332 ± 39 139 ± 27
s io 2 250 701 165 ± 0 .3 6 .3 ± 0 .1 34 ± 4TiO»Anatase 300 11.06 441 ± 14 < 5 < 8Rutile 300 7.50 406 ± 2 < 7 < 8Graphon 300 95 .0 31 .2 7 .5 (60-120)
(6) C. A. Guderjahn, D . A. Paynter, P. E. Berghausen and R. J.Good, J. Chem. P h y s ., 28, 520 (1958).
(7) S. Brunauer, “ T h e Adsorption of Gases and V ap ors,” Princeton U niversity Press, Princeton, N . J., 1945.
Minutes.Fig. 1.—-Calorimeter differential temperature vs. time for
immersion of alumina in water: O, raw data; •, data corrected for heat leakage; A120 3 activated at 150°.
50 100 150 200 250Minutes.
Fig. 2.—Semilog plot of total heat minus heat evolved up to time t vs. time; A120 3 activated at 150°.
It may be seen that for alumina, the slow heat was very appreciable, c f long duration, and increased with activation temperature. There was no sensible dependence cf slow heat, or of its half- life, on immersion temperature. For a series of A120 3 samples activated simultaneously at 300°, it appeared that iy2 increased linearly with hs.
For silica gel, slow heat also was evolved over a long period of time, but the magnitude of the heat, per cm .2, was much smaller than with alumina. (Since the area was very large, a small heat per cm.2 represented a large total heat.) fy, appeared to be independent of the magnitude of the slow heat.
With rutile and anatase, no slow heat was observed. If any was present, its time constant was less than the time for thermal transients to die out, and its magnitude was too small (less than 2% of the fast heat) to be detected.
With Graphon, slow heat was observed both with oxvgen-saturated and oxygen-free water. The uncertainty in U/t (60 or 120 minutes) was caused at least in part by the small absolute magnitude of hs: the total slow heat, in joules, was less than
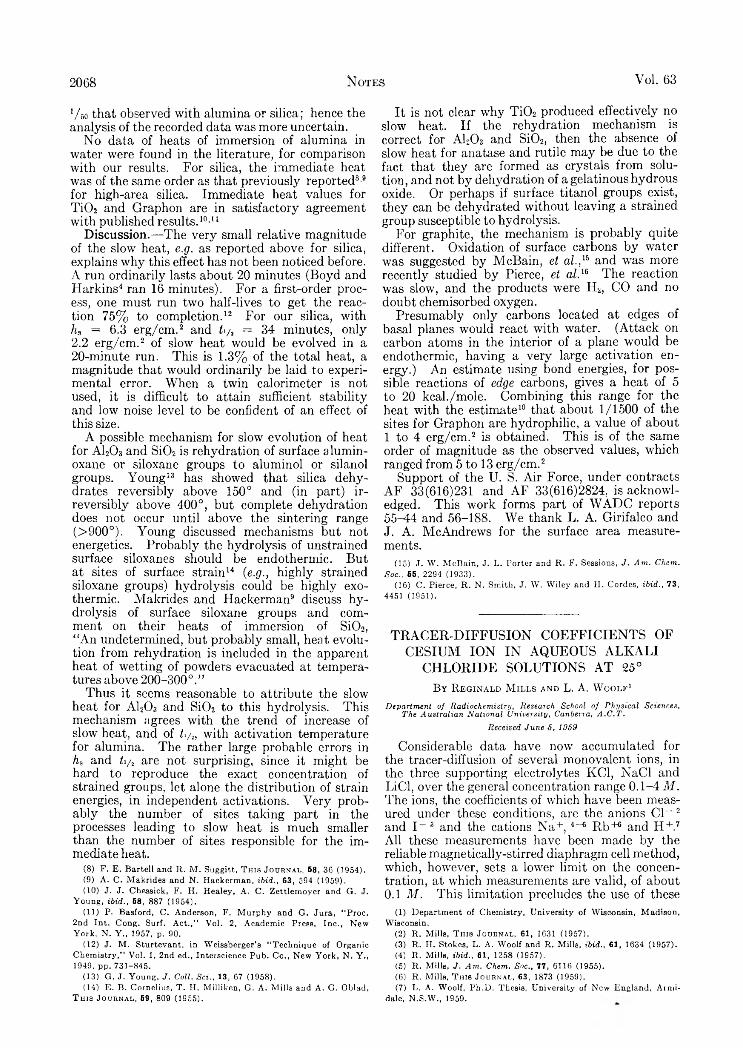
2068 Notes Vol. 63
'/so that observed with alumina or silica; hence the analysis of the recorded data was more uncertain.
N o data of heats of immersion of alumina in water were found in the literature, for comparison with our results. For silica, the immediate heat was of the same order as that previously reported8’9 for high-area silica. Immediate heat values for T i0 2 and Graphon are in satisfactory agreement with published results. 10'11
Discussion.— The very small relative magnitude of the slow heat, e.g. as reported above for silica, explains why this effect has not been noticed before. A run ordinarily lasts about 20 minutes (Boyd and Harkins4 ran 16 minutes). For a first-order process, one must run two half-lives to get the reaction 75% to completion .12 For our silica, with hs = 6.3 erg /cm .2 and U/, = 34 minutes, only2 .2 erg/cm .2 of slow heat would be evolved in a 20-minute run. This is 1.3% of the total heat, a magnitude that would ordinarily be laid to experimental error. When a twin calorimeter is not used, it is difficult to attain sufficient stability and low noise level to be confident of an effect of this size.
A possible mechanism for slow evolution of heat for AI2O3 and S i02 is rehydration of surface alumin- oxane or siloxane groups to aluminol or silanol groups. Young13 has showed that silica dehydrates reversibly above 150° and (in part) irreversibly above 400°, but complete dehydration does not occur until above the sintering range (>900°). Young discussed mechanisms but not energetics. Probably the hydrolysis of unstrained surface siloxanes should be endothermic. But at sites of surface strain14 (e.g., highly strained siloxane groups) hydrolysis could be highly exothermic. Makrides and Hackerman9 discuss hydrolysis of surface siloxane groups and comment on their heats of immersion of S i02, “ An undetermined, but probably small, heat evolution from rehydration is included in the apparent heat of wetting of powders evacuated at temperatures above 200-300°.”
Thus it seems reasonable to attribute the slow heat for AI2O3 and S i02 to this hydrolysis. This mechanism agrees with the trend of increase of slow heat, and of U/„ with activation temperature for alumina. The rather large probable errors in ha and U/2 are not surprising, since it might be hard to reproduce the exact concentration of strained groups, let alone the distribution of strain energies, in independent activations. Very probably the number of sites taking part in the processes leading to slow heat is much smaller than the number of sites responsible for the immediate heat.
(8) F . E . B a rte ll and R . M . Su ggitt, This Journal, 58, 36 (1954),(9) A . C . M akrides and N . H ackerm an, ibid ., 63, 594 (1959).(10) J. J, Chessick, F . H. H ealey, A . C . Zettlem oyer and G . J.
Y o u n g , ib id ., 58, 887 (1954).(11) P . Basford, C . A nderson, F . M u rp h y and G . Jura, “ Proc.
2nd In t. Cong. Surf. A c t ./ ’ V ol. 2, A cadem ic Press, In c., N ew Y o rk , N . Y . , 1957, p. 90.
(12) J. M . Sfcurtevant, in W eissberger’s “ Technique of Organic C h em istry ,” V ol, 1 , 2nd ed., Interscience P ub, Co., N ew Y o rk , N . Y ., 1 9 4 9 , p p . 7 3 1 - 8 4 5 .
(13) G . J. Y o u n g , J . C o l l . S c i . , 13, 67 (1958).(14) E . B. Cornelius, T. H. M illiken, G . A . M ills and A . G . Oblad,
This Journal, 59, 809 (1955).
It is not clear why T i0 2 produced effectively no slow heat. If the rehydration mechanism is correct for A120 3 and S i02, then the absence of slow heat for anatase and rutile may be due to the fact that they are formed as crystals from solution, and not by dehydration of a gelatinous hydrous oxide. Or perhaps if surface titanol groups exist, they can be dehydrated without leaving a strained group susceptible to hydrolysis.
For graphite, the mechanism is probably quite different. Oxidation of surface carbons by water was suggested by McBain, et ol.,1& and was more recently studied by Pierce, et aZ.16 The reaction was slow, and the products were H2, CO and no doubt chemisorbed oxygen.
Presumably only carbons located at edges of basal planes would react with water. (Attack on carbon atoms in the interior of a plane would be endothermic, having a very large activation energy.) An estimate using bond energies, for possible reactions of edge carbons, gives a heat of 5 to 20 kcal./mole. Combining this range for the heat with the estimate10 that about 1/1500 of the sites for Graphon are hydrophilic, a value of about 1 to 4 erg/cm .2 is obtained. This is of the same order of magnitude as the observed values, which ranged from 5 to 13 erg/cm .2
Support of the U. S. Air Force, under contracts AF 33(616)231 and AF 33(616)2824, is acknowledged. This work forms part of W AD C reports 55-44 and 56-188. We thank L. A. Girifalco andJ. A. McAndrews for the surface area measurements.
(15) J. W . McBain, J. L. Porter and R . F. Sessions, J . A m . C h e m .
S o c . , 55, 2294 (1933).(16) C. Pierce, R . N. Smith, J. W . W iley and H. Cordes, i b i d . , 73,
4451 (1951).
TRACER-D IFFU SIO N COEFFICIENTS OF CESIUM ION IN AQUEOUS A LK ALI
CHLORIDE SOLUTIONS A T 25°B y R e g i n a l d M i l l s a n d L . A . W o o l f 1
D e p a r t m e n t o f R a d i o c h e m i s t r y , R e s e a r c h S c h o o l o f P h y s i c a l S c i e n c e s , T h e A u s t r a l i a n N a t i o n a l U n i v e r s i t y , C a n b e r r a , A . C . T .
R e c e i v e d J u n e 6 , 1 9 6 9
Considerable data have now accumulated for the tracer-diffusion of several monovalent ions, in the three supporting electrolytes KC1, NaCl and Li Cl, over the general concentration range 0.1-4 M. The ions, the coefficients of which have been measured under these conditions, are the anions C l“ 2 and 1“ 3 and the cations N a+, 4“ 6 R b +6 and H +.7 All these measurements have been made by the reliable magnetically-stirred diaphragm cell method, which, however, sets a lower limit on the concentration, at which measurements are valid, of about 0.1 M. This limitation precludes the use of these
(1) Department o f Chemistry, University o f Wisconsin, Madison, Wisconsin.
(2) R . Mills, This Journal, 61, 1631 (1957).(3) R . H. Stokes, L. A. W oolf and R . Mills, ibid., 61, 1634 (1957).(4) R . Mills, ibid., 61, 1258 (1957).(5) R . Mills, J . A m . C h e m . S o c . , 77, 6116 (1955).(6) R . Mills, T his Journal, 63, 1873 (1959).(7) L. A. W oolf, Ph.D. Thesis, University of New England, Armi-
dale, N .S.W ., 1959.
Dec., 1959 Notes 2069
V C , m o le s / l .Fig. 1.—Ca+ ion diffusion in KC1, NaCl and LiCl: O, KC1;
•, NaCl; 9, L iC l;-------- , Rb + ion diffusion curves.
data for the testing of the Onsager limiting law.8 Measurements in the very dilute region are, however, now being made with the continual monitoring capillary method9'10 and data in the’concentra- tion range up to 0.1 M for the above ions should soon be forthcoming. Such complementary data ought to allow formulation of theoretical and empirical extensions to the limiting law covering both dilute and concentrated solutions as in the analogous conductivity case.11 In the meantime, accumulation of data such as are reported in this paper is justified for the intercomparison of cations and anions in the same supporting medium. In particular, the testing of semi-empirical viscosity corrections should prove very useful when the limiting laws can be extended.
ExperimentalThe potassium chloride and sodium chloride solutions
were prepared by weighing calculated amounts of the analytical quality reagent and diluting to volume. Lithium chloride was prepared by a similar method to tnat of Stokes and Stokes.12 The concentration of the initial lithium chloride stock solution was determined by conductance measurements after appropriate weight dilution and this then was diluted by volume to give solutions covering the concentration range studied. These procedures were checked by conductance measurements with a Leeds and Northrup Jones bridge and shown to give an accuracy in concentration of better than 0.1%. Diaphragm cell manipulation has been adequately described in previous papers.3-6
The radiotracer was Cs134 which was obtained in the form of aqueous cesium chloride from the Radiochemical Centre, Amersham, England. As in previous studies,3-4 scintillation counting techniques were used.
(8) L . Onsager, A n n . N . Y. Acad . S ei., 46, 241 (1945).(9) R . M ills and E . W . Godbole, Awsf. J . Chem., 1 - , 1 (1958),(10) R . M ills and E . W . Godbole, ibid., 12 , 102 (1959).(11) R . A . Robinson and R . H. Stokes, “ Electrofyte Solutions,’ *
B u tterw orth 's Scientific Publications, London, England, 1955, p. 153.(12) J. M . Stokes and R . H. Stokes, This Journal, 60, 217 (1956).
t
ResultsThe results of the work are given in Table I.
The estimated accuracy in D is 0.4%. D"cs * has been calculated to be 2.057 X 10“~5 cm .2/sec., taking X°c8 + = 77.26/ohm /cm .13
(IS) R ef. H , p. 452.
T a b l e IT r a c e r - d i f f u s i o n C o e f f i c i e n t s o f C s + i n A q u e o u s
A l k a l i C h l o r i d e S o l u t i o n s a t 25°C,moles/l. D X IO*,cm.2/see.
KClD /D °
0.1 1.981 0.9630.5 1.957 .9511.0 1.951 .9482.0 1.897 .9223.0 1.810 .8804.0 1.707
NaCl.830
0.1 1.936 0.9410.5 1.892 .9201.0 1.828 .8892.0 1.651 .8033.0 1.504 .7314.0 1.315
LiCl.639
0.0805 1.890 0.9190.4025 1.801 .8760.805 1.744 .8481.610 1.607 .7813.221 1.351 .6573.990 1.216 .5914.025 1.208
Discussion.587
In Fig. 1, the present data for Cs+ are compared with tracer-diffusion results for R b+ taken from a previous publication.6 The concentration dependence of the two ions is seen to be very similar and the values of the coefficients are in fact the same within the stated limits of error at all points of the curves. This might have been expected since both ions are probably unhydrated and of comparable size. This similarity means that D/D° (Cs+) can be compared to D/D° (Na+) in similar terms to D/D° (Rb+). The reader is therefore advised to consult the discussion of reference (6) for this comparison.
Acknowledgments.— L.A.W . wishes to express his gratitude to the Australian National University for permission to use their facilities and also to the University of New England for leave to undertake the work.
AN X -R A Y D IF FR A C TIO N IN VESTIG ATIO N OF SOD IUM H YA LU R O N ATE 1
B y F r e d e r i c k A . B e t t e l h e i m
Chem istry D epartm ent, A d elp k i College, Garden C ity , N . Y . Received J u n e 16, 1969
The purpose of this note is to elucidate the structure of crystalline sodium hyaluronate. D if-
(1) Supported in p art b y a grant (C-3984 B B C ) of th e N ational Cancer Institute, Public H ealth Service.
2070 N otes Yol. 63
ferent preparations of sodium hyaluronate show different degrees of crystallinity depending on the isolation techniques. To obtain crystalline samples one has to remove completely the complexed proteins.2 However, hyaluronic acid samples of different origin (umbilical cord, Streptococci and liposarcoma) free of proteins and having molecular weights of millions were found to be amorphous.3 These same preparations once subjected to an acidic pepsin digestion (pH 2 at 37°) showed different degrees of crystallinity depending on the length of the acidic treatment. Meyer4 suggested that high molecular weight hyaluronates may contain a few non-glycosidic linkages acting as branching points. The removal of these branches by acidic treatment may cause depolymerization and at the same time enable crystalline organization.
ExperimentalCrystalline sodium hyaluronate was isolated from um
bilical cords. The procedure and the analytical data were given earlier.2 Partial orientation of the sample was achieved by stretching the hyaluronate film in a swollen condition in a 82:18 mixture of ethanol and water. The stretched film was clamped in a jig, dried and humidified to 9.55% water content. X-Ray diffraction pattern was taken by Cu Ka radiation. The density of the highly crystalline powder and that of the oriented film was determined by the flotation method using carbon tetrachloride and iodo- benzene. Both had a density of 1.66 ± 0.01 g./cm .3. The density of the amorphous hyaluronates provided by Prof. Meyer3 was 1.51 ± 0.01 g./cm .3. Hyaluronate preparations having different degrees of crystallinity had densities which fall between these two values.
The analysis of crystal symmetry indicated a hexagonal unit cell. The partial orientation was insufficient to resolve adequately the layer lines, hence a direct determination of the fiber identity period was not possible. One assumes, however, that the long axis of the polyuronide chain is orienting in the direction of stretch. Two reflections corresponding to interplanar spacings of 5.99 and 2.99 A. had definite meridional orientation, hence they were tentatively assigned as 001 reflections.
In Table I, the X-ray data are summarized. In the first column the interplanar spacings are given as calculated from observed reflections. Column 2 lists the (2 sin 0/X)2 values obtained from the photographs, while column 5 gives the estimated intensities of the reflections. Considering the chemical structure of hyaluronates and especially the 1-3 and 1-4 |3-glycosidic linkages, the meridional interplanar spacing of 5.99 A. was assigned as a possible 002 reflection. An identity period of 11.98 A. is in good agreement with the atomic scale projection of a N-acetyl sodium hyalobiuronate moiety along the chain axis. Indexing the powder photographs with the aid of reciprocal lattice was done the usual way.6 The strongest equatorial reflection was assumed to be 200. The hexagonal unit cell calculated on this basis, therefore, has the dimensions a = 12.66 A., c = 11.98 A. (fiber axis), volume = 1662.84 A.3 The calculated (2 sin 0/A)2 based on such an hexagonal unit cell is in good agreement with the observed values. This is given in column 3 of Table I, while column 4 indicates the indexing of the obtained reflections in the hexagonal unit cell.
DiscussionThe number of hyaluronate chains per hexagonal
unit cell is 3.75 calculated on the basis of the experimental density, 1.66 g ./cm .3. However, it is well known that even highly crystalline natural
(2) F . A . Bettelheim , N ature, 182, 1301 (1958).(3) These sam ples were generously provided b y D r. K . M eyer of
Colum bia U niversity.(4) K . M eyer, Federation P roc., 17 , 1075 (1958).(5) L . V. A zaroff and M . J. Buerger, ‘ ‘T h e Pow der M ethod in X -ra y
C rystallograp h y,’* MsQ.raw-AfUM Book C oij Ine,, N ew York* N* Yu* J O S S , p p , 1 Q 6 -1 5 !# !
T a b l e IX - R a y D i f f r a c t i o n D a t a o f S o d i u m H y a l u r o n a t e
d (obsd.), (2 sin e/X) 1 X io* hkl l a
Â. Obsd. C alcd. (hexag.) (est.)
6.33 24.9 24.9 200 s7.20 19.3 18.7 110 w4.83 42.8 43.6 210 w3.48 82.6 81.1 310 w3.17 99.6 99.8 400 w
8.82 12.8 13.2 101 M3.99 62.8 63.1 301 w3.09 104 106 401 s2.83 125 125 321 w1.78 315 314 531 VW
5.99 27.8 27.8 002 s3.72 72.3 71.5 212 MS2.61 147 146 322 VW2.22 202 202 422 VW
2.35 181 181 323 VW
2.99 111 111 004 s2.42 170 168 304 VW2.18 210 210 404 VW2.09 229 230 324 VW1.94 266 267 504 VW
1.90 277 276 405 w1.74 330 330 505 VW
“ M, medium, S, strong, VW, very weak, W, weak.
polymers contain a certain amount of amorphous material. Hence the density of the crystalline portion of the polymer may be higher than that found experimentally. Therefore, one may assume that the hexagonal unit cell contains four hyaluronate chains. The calculated density of such a unit cell is 1.77 g ./cm .3. Using this value and the 1.51 g ./cm .3 found experimentally for the amorphous hyaluronate the estimated degree of crystallinity of the partially oriented film was 58%.
The fiber axis identity period of 11.98 A- is considerably longer than, for instance, a corresponding two glucose period (10.30 A.) would be in the case of cellulose. This means that the hyaluronate chain is more stretched out, hence more rigid, than cellulose, probably due to the steric hindrance caused by the bulky N-acetyl- amine groups. The position occupied by the sodium ions in the 001 planes cannot be determined because of lack of sufficient hk0 reflections. However, the intense 002 and 004 reflections suggest that the carboxyl groups and their associated sodium ions lie in planes which halve the fiber identity period. This indicates that the repeating unit in the identity period is a N-acetyl sodium hyalobiuronate moiety.
The stiffness of the hyaluronate chain can partly explain the absence of crystallinity in the presence of a few branches. It also can account for the difficulty one encounters in stretching crystalline hyaluronate films. The unusually high anisotropy one observes in birefringence measurements,6 viscom- etry7 and electron microscopic observation8
(6) B . Sylven and E . J. Ambrose, Biochim . B iophys. Acta, 18, 587 (1955).
(7) V , C , Laurent, J , B iol, GXtm,, BIS, 203 £1955),

Dec., 1959 Notes 2071
substantiates the great rigidity of the hyaluronate chain deduced from the X -ray diffraction data.
The relative orientation of the pyranose rings in adjacent chains of sodium hyaluronate cannot be established definitely at the present time. Nevertheless these tentative conclusions can be made. The width of the sodiurn glucuronide unit is calculated to be about 10 A. while that o f the N - acetylglucosamine moiety is 12 A. Since the stiff hyaluronate chain forms a ribbon-like structure of an average thickness of 4 A. the only way to pack four chains in the hexagonal unit cell is to allow the residues of the adjacent chains to lie with the plane of their ring parallel to the line connecting the adjacent chains.
Acknowledgment.— The author wishes to thank Prof. I. Fankuchen of the Polytechnic Institute of Brooklyn for the X -ray diffraction facilities and for the valuable criticism of the manuscript; Mr. V. DerSarkissian for the technical help in the isolation of the sodium hyaluronate.
(8) F . A . Bettelheim and D . Philpott, Biockim . B iophys. Acta, 34, 1 2 4 (1 9 5 9 ) .
ON TH E M E C H AN ISM OF OZONE PRODUCTION IN TH E PH O TO O XID ATIO N
OF A LK Y L N ITR ITE SB y P h i l i p L. H a n s t 1 a n d J a c k G. C a l v e r t
T h e O hio S tate U n iv er s ity , C olu m bu s 10, O hio
R eceiv ed J u n e 10, 1959
The formation of ozone when organic nitrites are photolyzed in air with near ultraviolet light has been demonstrated by Haagen-Smh, et al.,2 Stephens, et al.,3 and others. Other substances reported to produce ozone on photooxidation include N 0 2-hydrocarbon mixtures,2’4 diacetyl2’3 and azomethane.6
It has been proposed by Stephens, et al., that in the photooxidation of the N 0 2-hydrocarbon mixtures the reaction N 0 2 + hv -*■ NO + 0 precedes the ozone forming reaction 0 2 + 0 -► 0 3. The diacetyl and azomethane, however, must produce the ozone by a mechanism not involving N 0 2. It seemed to us worthwhile to attempt to establish which type of mechanism is involved in ozone production from nitrites.
If the nitrites followed the mechanism of the N 0 2-hydrocarbon mixtures, they would either have to yield N 0 2 on photolysis at least part of the time
R O N O + hv — > R + N O ,
N 0 2 + hv — >- N O + O
O + 0 2 — p- O3
or they would have to yield oxygen atoms on photolysis
(1) Physics Department, AVCO Research and Advanced Development, Wilmington, Mass.
(2) A . J. H aagen-Sm it, C . E . B rad ley and M . M . Fox, I n d . E n g . C h em ., 45, 2086 (1953).
(3) E. R . Stephens, W . E . Scott, P. L. Hanst and R . C. Doerr, P r o c . A m . P e tr o l . I n s t . , Sec. I l l , 36, 288 (1956).
(4) E . R . Stephens, P . L . H anst, R . C. D oerr a rd W . E . Scott, Ind. E ng. Chem., 48, 1498 (1956).
(5) P , L . h ^ n st and J , G . C a lvert, This Journal 63, 71 (1959)*
/ RONO + hv — R + NO + 0 \1 RONO + hv — >■ RON + 0 /
0 + 0» -— >- 0 3If this were the case, it would account for the fact that the nitrites and the N 0 2-hydrocarbon mixtures can be classed together as fast ozone producers while the other compounds are slower.
If the nitrites do not yield N 0 2 or oxygen atoms on photolysis, then it seems to us reasonable to assume that the ozone is produced in free radical reactions similar to those which occur in the photooxidation of the diacetyl and azomethane.
RONO + hv — >- RO + NO RO + RH — >- ROH + R
R + Og — >- R 0 2 RO2 + O2 ---- — RO + O3, etc.
Our method of attempting to choose between these alternatives is ~.o analyze the products obtained when methyl mtrite is photolyzed both in the presence and absence of oxygen and in the presence of excess NO, to see what reactions must be assumed to explain these products, and to compare these products with the products of the reaction of methyl radicals aaid nitric oxide.
The photolyses were conducted at room temperature in a5-liter Pyrex flask. The flask was immersed in water, and in its center was located a 550-watt medium pressure Hanovia mercury arc surrounded by a water cooling jacket. This jacket was made of Pyrex §pass which absorbed practically all of the light of wave length shorter than 3130 A., thus minimizing photolyses of reaction products.
Pressures of reactants in tie range of a few millimeters of mercury were measured on g manometer containing silicone vacuum pump oil. Higher pressures were measured on a mercury manometer. A reaction was started when the lighted arc was lowered into its place at the center of the 5 liter chamber and was ended when the arc was raised.
Analyses were made by means of infrared absorption spectroscopy using ten centimeter and one meter gas absorption cells on a Perkin-Elmer Model 21 double beam spectrophotometer.
Measurements of concentrations of products were made by comparisons to reference spectra run on pure compounds under conditions of resolution, pressure broadening, per cent, absorption, etc., as near as possible to those existing during the analysis. No major infrared bands remained unidentified.
Methyl nitrite was prepared by dropping sulfuric acid into a mixture of methanol, water and sodium nitrite. The evolved gas was collected in a Dry Ice trap and then distilled into the storage bulb.
Azomethane was prepare! by the reduction of dimethyl- hydrazine with mercuric oxide according to the method of Renaud and Leitch.6
The nitric oxide, oxygen and nitrogen were taken directly from commercial tanks.
The methyl nitrite was photolyzed both in the absence and presence of oxygen an! also in the presence of excess nitric oxide. The results of the infrared analyses are shown in Table I.
When azomethane was photolyzed in the presence of a small amount of nitric oxide with no oxygen present, the resulting spectra indicated that nitroso- methane and its isomer formaldoxime were form ed.
CH3—N = N —CH3 + hv — >- 2CH3 + N2 CHS + NO — > CHsNO — ^ H2CNOH
These spectra were similar to those recently reported for CH3NO and ts isomerization product by Luttke.7 He observed that the characteristic infra-
(6) R . R enaud and L . C . L e i t c h , Can. J . Chem ., 32, 545 (1954).(7) W . LU ttke, Z , Elektrochemt, 61, 302 (1957)*

T a b l e IP r o d u c t s o f t h e P h o t o l y s is o f M e t h y l N it r i t e
Exposure time, 5 min.; pressures in mm.
2072 Notes Vol. 63
8 mm. CHsONO,1 atm. N2
Formaldehyde 3 . 6Methanol 0 . 6Carbon monoxide 0 . 0Nitrous oxide 1 . 1Nitric oxide 1 . 7Nitrogen dioxide 0 . 0Methyl nitrate 0 . 0Methyl nitrite 4 . 1Total C 8 . 3Total N 8 . 0
red band of the monomer of nitrosomethane (1564 cm .-1) formed when nitrosomethane dimer was heated at 160°, but quickly disappeared as the absorption bands due to formaldoxime appeared. In our case similar phenomena were observed. The nitroso band at 6.4 p was large when the gases were first admitted to the absorption cell, but it decreased with time (a few minutes), while the OH band at 2.8 p. and a characteristic structure between 10 and 12 p increased. If even a small amount of oxygen was present (e.g., 2.4 mm. of azomethane,4.8 mm. of nitric oxide and 4.8 mm. of oxygen), no nitrosomethane or formaldoxime was formed and the products were methyl nitrite and its photolysis products, primarily methyl nitrate, formaldehyde, and nitrous oxide.
The observed products of the photolysis of methyl nitrite can be explained by the mechanisms(1) In the absence of large amounts of oxygen:
CHbONO + hv -— > CH30 + NO CH30 + NO — ^ CHbONO
CHsO + NO — ^ H2CO + HNO 2HNO — > N20 + H20
2CH30 — > H2CO + CHjOH CH30 + HNO — > CH3OH + NO
(2) In the presence of one atmosphere of oxygen:CH3ONO + hv — > CHsO + NO
2NO + 0 2 — 2N02 CHsO + N 02 — s- CH30N 02
In mechanism 1 most of the CH30 radicals recombine with NO but, in some cases, NO abstracts a hydrogen from CH30 to yield 1TCO and HNO. N 20 and H 20 then are formed by reaction of HNO radicals. The methanol and a small part of the formaldehyde result from interaction of pairs of CH30 radicals. This is a reaction indicated by the results of the photooxidation of methyl radicals.6 The observation that added NO does not significantly change the yield of H2CO and N 20 supports this nitrite photolysis mechanism on the basis of the following reasoning. Newly-formed CH30 radicals can react in two ways; they can disproportionate to yield H 2CO and CH3OH, or they can react with NO to yield usually CH3ONO, but sometimes H2CO and HNO. The disproportionation is only important in the experiments without added NO, and then only during the very first stages of the photolysis. The only effect of added NO ought to be a nearly complete suppression of C Ii3OH formation and a
Reactants 8 mm. CHsONO,8 mm. NO,1 atm. N2
8 mm. CHaONO, 8 mm. O2,1 atm. N2
8 mm. CHaONO, I atm. O2
4 . 0 3 .0 1 .00 .15 0 .3 0 .00 .0 0 .0 1.71 .4 0 .9 0 .0
10.0 1.8 0 .00 .0 0 .0 2 .60 .0 0 .0 4 .04 .6 4 .1 1.38 .7 7 .4 8 .0
17.4 7 .7 7 .9
shortening of the lifetime of the CH30 radicals. This is in fact the observed result, as is shown in Table I.
The formation of methyl nitrate in the photolysis of methyl nitrite in one atmosphere of oxygen is explained by the second mechanism above. The greater decomposition of methyl nitrite when oxygen is present supports our contention that in the absence of oxygen there was a good deal of recombination of methoxy and NO to regenerate the methyl nitrite. The lack of formation of methyl nitrate when the oxygen pressure was low was undoubtedly due to the fact that under these conditions the NO was not oxidized appreciably to N 0 2 during the course of the experiment.
The complete absence of nitrosomethane and formaldoxime from the products of the no-oxygen photolysis of methyl nitrite indicates that there is no significant amount of cleavage at the carbon- oxygen bond. In other words, methyl nitrite is photolyzed only into CH30 and NO and not into CH 3 and N 0 2, CH3, NO and 0 , nor CH3OH and 0 .
Since the C -0 and O -N bond strengths are not greatly affected by the length of the hydrocarbon chain, and since the light absorption process will be essentially the same for all the members of the homologous series, we feel that what is indicated here for the photolysis of methyl nitrite also applies to n-butyl nitrite. W e conclude, then, that the relatively large yield of ozone obtained on photolysis of n-butyl nitrite in air is not due to N 0 2 formation and its subsequent photolysis (remembering that 2NO + 0 2 2N 02 is very slow at low NOpressure), but is due to free radical reactions started by the butoxy radicals.CH3CH2CH2CH2ONO + hv — > CH3CH2CH2CH20 + NO
CH3CH2CH2CH20 + RH — > CH3CH2CH2CH2OH + R R “p 0 2 — >- R 02
R 02 + Oa — > RO + 0 3 RO -f- RH — ROH + R
continue chain reaction
In the above mechanism, the molecule R H might be the starting material, the alcohol product, the butoxy radicals, aldehydes formed by the interaction of butoxy radicals, or any other organic molecule formed in the variety of reactions which could follow the initial photolysis.
One possible explanation of the fact that the ozone is easier to observe in the photooxidation of
Dec., 1959 Notes 2073
a nitrite than in the photooxidations of diacetyl and azomethane may be that the nitrites have a higher absorption coefficient in the near ultraviolet. This will result in a fast photolysis with a cc pious production of free radicals.
The authors greatfully acknowledge the financial support of the National Institutes of Health, Bethesda, Maryland.
PO LYM O RPH ISM OF RA RE E A R T H D IS ILIC ID E S1
B y J. A. P e r r i , E. B a n k s a n d B. P o s t
Departm ent o f Chem istry, P olytechnic Institu te o f B rooklyn , N ew York R eceived J u n e 15, 1959
An X -ray diffraction investigation by Brauer and Haag2 established that the disilicides of some of the rare earth metals crystallize with the tetragonal, ThSi2 type, structure. More recent work3 indicates that the disilicides of the smaller rare earth metal atoms are actually orthorhombic and that their structures are slightly distorted versions of the “ normal” tetragonal structure; of the rare earth metals only La, Ce, Pr and Eu were found to form tetragonal disilicides. YbSia was not prepared but it is probably tetragonal like EuSi2. The degree of distortion from the tetragonal structure appears to increase monotoni- cally with decrease in the size of the metal atom.
In this paper we describe the results of an X -ray diffraction study of the ranges of stability of the two polymorphic forms of this phase. Reversible transformations have been observed; the temperatures of these transformations appear to be simply related to the atomic radii of the metals.
ExperimentalA Norelco diffractometer adapted for studies at both low
and high temperatures ( — 160 to 1,200°) was used for the X-ray diffraction studies. The high temperature camera has been described previously.4 A helium atmosphere was maintained in the camera at elevated temperatures to prevent oxidation of the specimens. For work below room temperature, the powdered samples were dusted onto glass slides coated with thin layers of Vaseline; cooling was accomplished by blowing cold nitrogen gas (cooled by bubbling through liquid nitrogen) over the specimens. The temperature was controlled by mixing the cold gas with warm, dry nitrogen gas.
The preparation and some of the properties of the disilicides have been described previously.* The X-ray diffraction patterns obtained were generally of poor quality; high angle peaks, on which attention would normally have been focussed, were broad and weak and difficult to measure with precision. It was found most convenient to concentrate on measurements of the (004), (101), (001), (013) and (103) reflections .of the orthorhombic phases and the corresponding peaks of the tetragonal phases. Although these reflections occur at relatively low Bragg angles when Cu radiation is used, they were relatively sharp and free from interference from neighboring peaks; in general their angular locations were relatively easy to measure.
The progress of the structure transformations was followed by observing the variations of the reflection ingles of these peaks over suitable ranges of temperature. When these
(1) Supported b y A ir Force Office of Scientific Research.(2) V . G . Brauer and H. H aag, Z. anorg. allgem . Chem., 267, 198
(1952).(3) J. A . Perri, I . Binder and B. Post, This J oubnal, 63, 616
(1959).(4) J. A . Perri, E . B a n ts and B. Post, J . Ap-pl. P h ys ., 28, 1272
(1957).
measurements indicated that a transformation had been completed, a trace of the entire X-ray diffraction pattern of the new phase was obtained. To check on the reversibility of the transformations, patterns were re-recorded at room temperature after each high or low temperature run. All the transformations observed were reversible.
Specimens were prepared in finely powdered form. Ni filtered Cu K radiation was used; peaks were scanned at a speed of y 4° (20) per minute. Dimensions of the “ c” axes of the unit cells were obtained generally from measurements of (004); “ a” and “ b” dimensions were obtained from (101), (Oil), (103) and (013); the latter also furnished independent checks on the values of “ c.”
Although the transitions probably occur within relatively narrow temperature ranges, the X-ray diffraction data did not permit precise determination of these ranges. The onset of the transformations was obscured by Beveral factors: in most instances the (101), (011) and the (103), (013) orthorhombic pairs of peaks merged gradually into single broad peaks as the transition temperature was approached, as the temperature was raised further, the peaks sharpened and acquired shapes characteristic of “ single” reflections, indicating that the transition had taken place.
The (004) peak which was expected to serve as a sensitive indicator of the transformations did not prove to be one. Even at room temperature (004) was generally weak; at the elevated temperatures at which most of the transformations occurred, it was even weaker and changes in its reflection angle were very difficult to measure. As a result only relatively broad temperature ranges, within which the transformations were known to take place, are reported here.
The atomic radii of the metal atoms and the transition temperature ranges are shown in Table I. The orthorhombic form is stable below the indicated temperatures. The approximate transition temperatures clearly increase with decreasing atomic radius of the parent metal.
T a b l e IT r a n s i t i o n T e m p e r a t u r e s o f
R a r e E a r t h “ D i s i l i c i d e s ”
A tom ic
A veragem etallicradius
Transition tem p, of disilicide,
M eta no. (A.) "C .
Eu 63 1.99 -150»Pr 59 1.83 -120 ± 15Nd 60 1.82 b
Sm 62 1.81 380 ± 40Gd 64 1.81 400 ± 25Y 39 1.80 450 ± 50Dy 66 1.77 540 ± 40
“ (200) peak broadened indicating beginning of transition. b Transformation occurs somewhere between room temperature and 150°.
It was not possible to determine the transition temperature of neodymium disilicide. It appears to be orthorhombic at room temperature but the distortion from tetragonal is very slight and the point at which complete conversion to tetragonal occurred could not be established though it is apparent that the transformation occurs somewhere between room temperature and 150°.
The (101) and (103) reflections of tetragonal PrSi2 broaden as the temperature is lowered and are resolved into two peaks below —120°, indicating a transformation to the orthorhombic form.
In the case of EuSi2, the (200) reflection of the tetragonal form was most convenient to study. It was observed that the peak began to broaden noticeably at —150°. Little additional broadening occurred between that temperature and —160°. Our experimental procedure did not permit investigations at still lower temperatures. It was evident, though, that the onset of the orthorhombic distortion was responsible for the broadening of the peak. At that temperature the (200) and (020) reflections were separating but were not completely resolved. Unfortunately reflections at higher angles were too broad to be useful.
No comparable broadening of any peaks was detected in the cases of LaSi2 or CeSi2 at —160°. Presumably a

2074 Notes Vol. 63
T a b l e IIU n i t C e l l D i m e n s i o n s o p R a r e E a r t h D i s i l i c i d e P o l y m o r p h s “
T em p., L ow tem p , form® High tem p, form®Com pound °C . a (Â.) b (Â.) c (Â.) a (A.) c (A.)
PrSi2 -130 4.23 4.20 13.68 (4.20) (13.76)SmSÌ2 470 (4.105) (4.035) (13.46) 4.08 13.51GdSi2 460 (4.09) (4.01) (13.44) 4.10 13.61DySi2 585 (4.04) (3.95) (13.33) 4.03 13.38YSi2 545 (4.04)
Parentheses indicate room temperature form.(3.95) (13.33) 4.04 13.42
transformation similar to that noted above occurs in the cases of these compounds at still lower temperatures. Lattice dimensions of the polymorphs which could be measured with reasonable precision are shown in Table II.
TH E R E ACTIO N OF PERFLUORO-n-PROPYL R AD ICALS W ITH CYCLO H EXAN E IN TH E
GAS PHASE1B y G l y n O. P r i t c h a r d a n d G l e n n H. M i l l e r
Departm ent o f Chemistry, University o f C aliforn ia , Santa Barbara, Goleta, California
Received June 22, 1959
Recently Giacometti and Steacie2 have measured the rates of reaction of C3F7 radicals with methane and ethane. They obtained ki/fc21/2 = 9.7 X 10³ exp [— (9.5 ± 0.5) X W/RT] (m ole/cc.)“ * see.~1/2 for methane, and A-I//c21/i = 1.7 X 10⁶ exp[— (9.2 ± 0.5) X 103/RT] (m ole/cc.)~1/2sec._I/! for ethane, where subscript 1 refers to the hydrogen abstraction reaction and subscript 2 to the radical recombination reaction.
It is seen that these results are in contradistinction to similar CH3 and CF3 radical systems where the difference in rate constants is reflected almost entirely in the activation energies of the processes, the pre-exponential factors being approximately constant for either series. Further, in methyl radical systems the activation energies of the hydrogen abstraction reactions exhibit a stepwise decrease along the series methane, ethane, compounds containing secondary hydrogen atoms, and compounds containing tertiary hydrogen atoms, which demonstrates that the activation energy is dependent on the nature of the hydrogen atom which is abstracted.3'4
In view of this discrepancy we have studied the reaction between C3F7 radicals and a compound, here cyclohexane, containing secondary hydrogen atoms. The rates of abstraction from cyclohexane, where there is little strain in the ring, will be almost exactly the same as that for a secondary hydrogen in a paraffin.
Pcrfluoro-w,-propyl ketone was used as a photo- lytic source of C3F7 radicals. Its preparation and purification, the apparatus and procedure were identical to that described previously5 except that the reaction cell was 174 ml. The cyclohexane was
(1) T his work was supported b y a grant from the N ational Science Foundation.
(2) G . G iacom etti and E . W . R . Steacie, Can. J . Chem., 36, 1493 (1958).
(3) E . W . R . Steacie, J . Chem. Soc., 3986 (1956).(4) G . O. Pritchard, H . O. Pritchard, H. I. Schiff and A . F . T rot-
m an-Dickenson, T rans. Faraday Soc., 52, 849 (1956).(5) G . H. M iller and E . W . R . Steacie, J . A m . Chem. Soc,, 80, 6486
(1958),
Phillips research grade, and was purified and out- gassed before use. CO and C3F7H were the only products which were collected and measured. Mass spectrographic analysis showed that there was no carry over of any other products or reactants in the respective samples at the temperatures at which they were collected. It is not possible to separate and measure the C6F i4 under the conditions of our experiment.6
The results of the experiments are summarized in Table I.
The reaction mechanism for the temperature range 25 to 290° is assumed to be
C-dbCOCffl, + hv — > 2C3H7 + COC3F, + RH — >- C3F7H + R (1)
C3F7 H- C3P7 ■— c 6f „ (2)C3F7 -j- R — c 3f ,r (3)
R -j- R — ^ R2 (4)wdiere R H is cyclohexane and R is cyclohexyl radical.
For steady-state conditions, that is constant light intensity and small percentage decomposition of the ketone (in these experiments less than 3% ), hi/fc2'A = E c3F,h/ S i/!c,f1«[RH] where the rate of formation of perfluorohexane K c ,f ,< = Rco — W (.Rc,f,s + RcMn) from radical balance. W e were unable to measure the C3F7R formed, so it has been assumed that Rc,t7r = 0. The amounts of C6F14 given in Table I have been calculated iii this manner. A least squares plot of the data is shown in Fig. 1. The rate expression is k\/h?lz = 1.2 X 10⁴ exp [ - (5.2 ± 0.1) X 10*/RT] (m o le /cc .)- '/ ’ sec.~1/2.
There is good agreement between the pre-exponential factors for the methane and cyclohexane systems, 9.7 X 10³ and 1.2 X 10⁴ (m ole/cc.)l/2 sec.~I/2, respectively. Giacometti and Steacie found in their experiments with methane that the quantities of C3F7CH3 formed were too small for accurate analysis and putting Rof-cti, — 0 did not affect the fci/A2,/2 values by more than 1%.
However, their treatment for ethane is more complex due to radical-radical disproportionation reactions which can occur in higher hydrocarbon radical systems. In addition to reactions V, 2', 3' and 4' (identical to reactions 1, 2, 3 and 4, except that R H is ethane and R is ethyl radical).
C3F7 -j- C2ÎÏ5 ----■> c 2h 4 + c 3f ,h (5 ')
c 2h 5 + c 2h 5 - - > c 2h 4 + c 2h 6 (6 ')must be considered. They analyzed for C6F7H6 (from reaction 3 ') and for butane (from 4 ') , and
(6) G . H. M iller, G . O. Pritchard and E , W , R . Steacie, Z. p h yeik , C h e m ,, 15, 262 (1958),

T a b l e I/■-----------------------------Products----------------------- -— ----- •
Dec., 1959 Notes 2075
Tem p.,°C .
Cyclohexane,moles/cc.
X 10«
Ketone, moles/cc.
X 10*
CO ,moles/cc.
X 10»
23.5 1.33 1.92 5.7977.5 2.77 3.27 39.6
152.5 1.29 2.61 71.2172.0 1.32 2.77 50.8208.8 1.74 3.11 46.3250.0 1.67 3.69 52.0293.0 0.702 2.47 46.8
knowing that k% /kA' is 0 .12 , independent )f temperature and pressure, correction for the C3F7H formed in reaction 5 ' can be made. The justification for this procedure is demonstrated by the constancy of the ratio ks /k3 = 0.40 over the whole temperature range. i2c6Fn was obtained from the radical balance Rco — V 2(-Kc3FvH + RcsVim) •
The methane and ethane systems are unique in that it is possible to separate out easily the products of the type 3 reaction and measure them. In the cyclohexane system, the CaF7-cyclohexyl is lost and masked in the vast excess of unused reactants. To assess the accuracy of our result we must consider first any error introduced by assuming that reaction 3 is negligible, and second the effect of additional C3F7H formed in reaction 5, if reactions 5 and 6 are operative in the system
C3F7 + R — >- R( -H ) + C3F7E (5)R + R — >- R( —H) + RH (6)
Whether reaction 5 occurs or not, the Rc*Vu is given by R c o - ‘ACRc FtH + R c * v ,n )- As reaction 1 is temperature dependent, higher temperatures will lead to greater R radical concentrations, and hence, for the competitive removal of C3F7 radicals from the system, R c t f - u will gain over R c ,f „- So the assumption that 7?c3f7e. = 0 leads to an increasing error in Rctfu with temperature. Recalculating Giacometti and Steacie’s results for the C3F7 + ethane system on the basis that .RciF,Hs = 0 gives an activation energy for reaction 1' of about8 .0 kcal./mole, an error of 1.2 kcal. in their result, which means our result is low if reaction 3 is important.
N ot correcting the rate expression for the C3F7H contribution from reaction 5 seems tc have little effect on the activation energy for reaction 1 . A consideration of this correction to tne C3F7 + ethane system involves a subtraction of 21.5 ± 0 .5% from the total C3F7H formed in the reaction. (This is for 6 -of the 10 runs reported; the other runs involve subtractions of 14, 19, 11 and 30% .) In a logarithmic plot this shows up as virtually a constant increment, which does not alter the slope of the line, so that the activation energy for reaction 1' is unaltered, whether the correction is made or not. On this basis we can assume that no appreciable error is introduced by equating the C3F7H total to that formed in reaction 1 , due to the similarity in the two systems. From a steady-state treatment it is not obvious why the ratio of C3F7H by(5 )/C 3F7H by (1) should be a constant, unless at very high C8F7 radical concentrations (conditions
/
C3F7H,moles/cc.
(CO - V sC sF ii:) or CeFu,
moles/cc. Tim e,ki/kz1!2,
(m ole/cc.) -1 /2X 10» X 1 0 » sec. sec. ~lfz
3.36 4.11 540 1.6943.1 18.0 360 6.1297.3 22.5 180 3 7 . 672.7 14.4 120 41.975.1 8.82 120 41.992.2 5.88 120 65.970.3 11.7 120 84.6
Fig. 1.—Arrhenius plot for the reaction of C3F7 radicals with cyclahexane.
which do not hold in these experiments) we assume that reactions 3 and 5 swamp reactions 4 and 6 for the removal of R radicals. Then the ratio reduces to k5/(k3 + k6) .
Hence, any error in our result is reflected almost entirely in the assumption that reaction 3 does not make a significant contribution to the reaction scheme. For C2H 5 and C 3F7 radicals k3 /k3 = 0.40. It is probable that the ratio k-Jk3 for cyclohexyl and C3F7 radicals is the same or even bigger, which implies a reduction in .Rci&r and also to the correction to /¿c:6f„. We consider therefore that our result of5.2 kcal./m ole for C3F7 + cyclohexane is in error, but at the most is low by about 1.0 kcal., so that we can estimate that in general C3F7 radicals abstract a secondary H-atom from a hydrocarbon with an activation energy of abou~ 6 kcal./mole.
Thus it appears that there is a discrepancy in the; results for C3F7 with CH4 and C 3F7 with C2H 6, but further work along the lines of these experiments is unjustified until some more precise method of determining RctFu is found, other than radical balance.

2076 Notes Vol. 63
A STRU CTU RE PROPOSAL FOR Na7Zr6F31B y P. A. A g r o n a n d R. D. E l l i s o n
Chem istry D ivision , Oak Ridge N ational Laboratory,1 Oak R idge, Tennessee
Received J u n e 18, 1969
A structure for one of the binary phase compounds occurring in the N aF-ZrF4 system2 is proposed. Powder diffraction3 data of samples crystallized from melts of the composition 50 mole % NaF-50 mole % ZrF4 have indicated that these crystals are isomorphous with crystals of NaUF5. The latter were found by Zachariasen and reported by Katz and Rabinowitch4 to be rhombohedral with space group R 3 -(C 28i) and 6 molecules per unit cell. The metal ions are in the sixfold general positions(f): ± (XYZ); (ZXY) ; ( YZX) with the parameters
X Y ZU 3/13 1/13 9/13Na 6/13 2/13 5/13
Density measurements made on the single solid phase produced from large melts of slightly different compositions, namely, 52 mole % N aF - 48 mole % ZrF4 and 53 mole % NaF-47 mole % ZrF4, indicate the existence of a stoichiometry different from NaZrF5. The densities observed are
52 mole % NaF: 4.14 ± 0.03 g./cc.53 mole % NaF: 4.11 ± 0.01 g./cc.5
while the calculated density for NaZrF6 is 4.01 g ./cc . The unit cell volumes of the solids crystallized from melts of compositions in the region 50 mole % NaF to 53.8 mole % NaF differ by less than 0.5%. In order to satisfy the requirements of a greater density with a greater amount of the lighter component in a substantially constant volume, it is necessary to assume the addition of an NaF molecule to the unit cell, rather than the substitution of a lighter sodium for a zirconium ion with the accompanying fluorine vacancies even further reducing the density. It is significant that the additional N a+ cation could fit into the vacant special position, (000), without changing the space group. This would yield a unit cell of the stoichiometric composition Na7Zr6F31 (7NaF-6ZrF4) with a calculated density of 4.16 g ./cc ., in reasonable agreement with the above measured values.
Single crystals obtained from melts of the 53 mole % NaF composition have become available. Diffraction patterns obtained by using film techniques on the Buerger precession and the Weis- senberg cameras have confirmed that the space group R3 is still possible for this composition. It is hoped that further measurements of the diffracted intensities using counting techniques will yield the fluorine positions, as well as confirm the suggested position (000) for the added Na+.
(1) W ork performed for the U . S. A tom ic E n ergy Comm ission at the O ak R idge N ational L aboratory, operated b y the Union Carbide Corporation, O ak R idge, Tennessee.
(2) C . J. Barton, W . R . Grimes, H . Insley, R . E . M oore and R . E . Thom a, T h is J o u r n a i*, 62, 665 (1958).
(3) P . A . Agron and M . A . Bredig, O R N L -1729, 47, 1954.(4) J. J. K a tz and E . Rabinow itch, “ T h e C hem istry of U ranium ,”
M cG raw -H ill Book C o ., Inc., N ew Y o rk , N . Y ., 1951, p. 379.(5) S. I . Cohen, O ak R idge N ational Laboratory, personal com
m unication.
In the course of this study, an accurate cell size for this compound was obtained. T o refine the accuracy of the cell size measurement, two Debye-Scherrer patterns were taken, using Cr-Ka radiation. The samples were prepared by grinding several of the above mentioned single crystals. These patterns were measured with a steel scale and vernier and corrections were made for film shrinkage and sample absorption. All clearly resolved and unambiguously indexed reflections in the range 18° < 26 < 142° were used to obtain a least squares fit of the cell size to the data by a method described elsewhere.6 The refined hexagonal cell size was found to be
a = 13.802 ± 0.002 A. c = 9.420 ± 0.001 A.
The corresponding rhombohedral unit cell is a = 8.565 A., a = 107°21'
(6) W . R . Busing and H. A . L e v y , A c t a C r y s t . , 1 1 , 798 (1958).
TH E T IN (II) RED U CTIO N OF M E T H Y L O RAN G E1
B y F. R. D u k e a n d N. C. P e t e r s o n
I n s t i t u t e f o r A t o m i c R e s e a r c h a n d D e p a r t m e n t o f C h e m i s t r y , I o w a S ta t e U n iv e r s i t y , A m e s , I o w a
R e c e i v e d J u n e 2 2 , 1 9 6 9
The possibility that one particular Sn(II) chloride complex might have high reactivity relative to others led to this kinetic study of the reduction of an azo compound to the amine8C1 + 4H+ + Ar—N = N —Ar + 2Sn(II) — >-
2ArNHs + 2SnCl4
The rates of reduction of a number of such compounds were measured by Goldschmidt and Braa- naas,2 who reported a variable order in chloride ion, first order in azo compound and first order in Sn(II). The recent equilibrium data for the Sn- (II) chloride complexes3 allow a more precise interpretation of the mechanism of the reaction relative to the role played by the chloride. The reduction of methyl orange was found to proceed at a convenient rate and, thus, was selected for study.
ExperimentalSn(II) perchlorate was prepared by dissolving A.C.S.
reagent grade Sn(II) chloride in 2 A HC104 and passing the solution through a column of Dowex 50 exchange resin in the acid form, followed by an elution with 2.0 m perchloric acid. Chloride ion was shown to be absent from the solution.
Commercial methyl orange was recrystallized twice from water and dried in a desiccator over anhydrous calcium sulfate. Perchloric and hydrochloric acid solutions were prepared by diluting the concentrated reagents to 2.00 M with water distilled from alkaline permanganate.
A model 6A Coleman Junior Spectrophotometer was used to follow absorbancy for all rate measurements, with Pyrex 1 cm. cells.
(1) C ontribution N o. 768. W ork was performed in the Ames L aboratory of th e U . S. A tom ic E n ergy Comm ission and D epartm ent of Chem istry a t Iow a State U niversity.
(2) H . G oldschm idt and A . B raanaas, Z . p h y s i k . C h e m ., 96, 180 (1920).
(3) C . E . Vanderzee and D . E . Rhodes, J . A m . C h e m . S o c . , 74,3552 (1952),
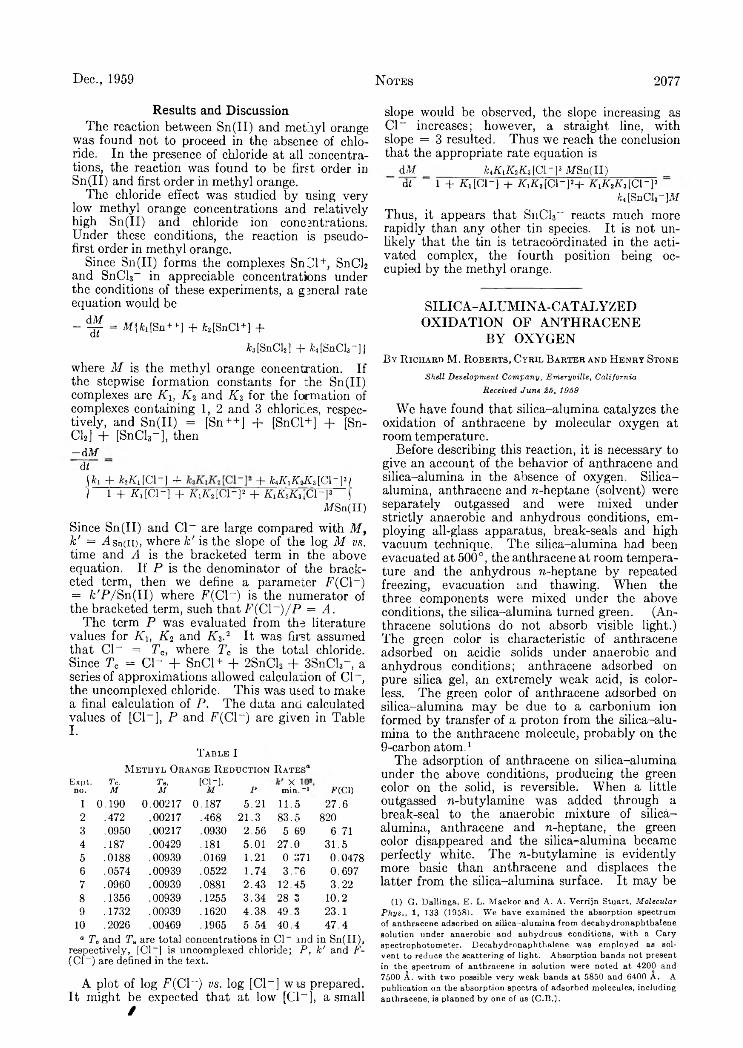
Dec., 1959 Notes 2077
Results and DiscussionThe reaction between Sn(II) and methyl orange
was found not to proceed in the absence of chloride. In the presence of chloride at all concentrations, the reaction was found to be first order in Sn(II) and first order in methyl orange.
The chloride effect was studied by using very low methyl orange concentrations and relatively high Sn(II) and chloride ion concentrations. Under these conditions, the reaction is pseudo- first order in methyl orange.
Since Sn(II) forms the complexes Snhl+, SnCI2 and SnCl3“ in appreciable concentrations under the conditions of these experiments, a general rate equation would be
- ^ = M { h [Sn ++] + fe[SnCl+] +
¿3[SnCl2J + ^[SnCl3-]|where M is the methyl orange concentration. If the stepwise formation constants for the Sn(II) complexes are Ki, K% and Kz for the formation of complexes containing 1, 2 and 3 chlorines, respectively, and Sn(II) = [Sn++] + [SnCl+ ] + [Sn- Cl2] + fSnCU-], then —AM
d t\kj + A2Ki [C1“ ] + + kiKiKJCACl-}3!i 1 + X dC l-] + KJCt [C l-]2 + KJizKtlCl-Y 5
MSn(II)
Since Sn(II) and C l“ are large compared with M, k' = Usn(ii), where k' is the slope of the log M vs. time and A is the bracketed term in the above equation. If P is the denominator of the bracketed term, then we define a parameter F(C1“ ) = fc'P /Sn(II) where F(C l“ ) is the numerator of the bracketed term, such that F(C\~)/P = A.
The term P was evaluated from the literature values for Kh Ki and K3.2 It was first assumed that C l“ = Te, where Ta is the total chloride. Since Tc = C l“ + SnCl+ + 2SnCl2 + 3SnCl3“ , a series of approximations allowed calculation of C l“ , the uncomplexed chloride. This was used to make a final calculation of P. The data and calculated values of [Cl“ ], P and F(C1“ ) are given in Table I.
T a b l e IM e t h y l O r a n g e R e d u c t io n R a t e s '*
E x p t . T c . T „ [ C l - 1 , X o
n o . M M M P m i n . _I F (C 1 )
1 0 . 1 9 0 0 . 0 0 2 1 7 0 . 1 8 7 5 . 2 1 1 1 . 5 2 7 . 6
2 . 4 7 2 . 0 0 2 1 7 . 4 6 8 2 1 . 3 8 3 . 5 8 2 0
3 . 0 9 5 0 . 0 0 2 1 7 . 0 9 3 0 2 . 5 6 5 . 6 9 6 . 7 1
4 . 1 8 7 . 0 0 4 2 9 . 1 8 1 5 . 0 1 2 7 . 0 3 1 . 5
5 . 0 1 8 8 . 0 0 9 3 9 . 0 1 6 9 1.21 0 . 3 7 1 0 . 0 4 7 8
6 . 0 5 7 4 . 0 0 9 3 9 . 0 5 2 2 1 . 7 4 3 . " 6 0 . 6 9 7
7 . 0 9 6 0 . 0 0 9 3 9 . 0 8 8 1 2 . 4 3 1 2 . 4 5 3 . 2 2
8 . 1 3 5 6 . 0 0 9 3 9 . 1 2 5 5 3 . 3 4 2 8 . 3 10.29 . 1 7 3 2 . 0 0 9 3 9 . 1 6 2 0 4 . 3 8 4 9 . 3 2 3 . 1
10 . 2 0 2 6 . 0 0 4 6 9 . 1 9 6 5 5 . 5 4 4 0 . 4 4 7 . 4
° T„ and T„ are total concentrations in Cl- and in Sn(II), respectively, [Cl- ] is uncomplexed chloride; P, k' and F- (Cl~) are defined in the text.
A plot of log P(C1“ ) vs. log [Cl“ ] was prepared. It might be expected that at low [Cl“ ], a small
/
slope would be observed, the slope increasing as C l“ increases; however, a straight line, with slope = 3 resulted. Thus we reach the conclusion that the appropriate rate equation is
dM _ ktKJCzKACl-}3 MSn(II)di 1 + P,[C1-] + X ,A 2[C1“ ]2+ K,KJL,[ Cl“ ]3
ki [SnCl3“ ]MThus, it appears that S1 1 CI3 “ reacts much more rapidly than any other tin species. It is not unlikely that the tin is tetracoòrdinated in the activated complex, the fourth position being occupied by the methyl orange.
SILIC A-A LU M IN A -C A TA LYZE D O X ID A TIO N OF A N TH RACEN E
B Y O X Y G E NB y R ic h a r d M . R o b e r t s , C y r il B a r t e r a n d H e n r y St o n e
S h e l l D e v e l o p m e n t C o m p a n y , E m e r y v i l l e , C a l i f o r n i a
R e c e i v e d J u n e 2 5 , 1 9 6 9
We have found that silica-alumina catalyzes the oxidation of anthracene by molecular oxygen at room temperature.
Before describing this reaction, it is necessary to give an account of the behavior of anthracene and silica-alumina in the absence of oxygen. Silica- alumina, anthracene and n-heptane (solvent) were separately outgassed and were mixed under strictly anaerobic and anhydrous conditions, employing all-glass apparatus, break-seals and high vacuum technique. The silica-alumina had been evacuated at 500°, the anthracene at room temperature and the anhydrous n-heptane by repeated freezing, evacuation and thawing. When the three components were mixed under the above conditions, the silica-alumina turned green. (Anthracene solutions do not absorb visible light.) The green color is characteristic of anthracene adsorbed on acidic solids under anaerobic and anhydrous conditions; anthracene adsorbed on pure silica gel, an extremely weak acid, is colorless. The green color of anthracene adsorbed on silica-alumina may be due to a carbonium ion formed by transfer of a proton from the silica-alumina to the anthracene molecule, probably on the9-carbon atom .1
The adsorption of anthracene on silica-alumina under the above conditions, producing the green color on the solid, is reversible. When a little outgassed n-butylamine was added through a break-seal to the anaerobic mixture of silica- alumina, anthracene and n-heptane, the green color disappeared and the silica-alumina became perfectly white. The n-butylamine is evidently more basic than anthracene and displaces the latter from the silica-alumina surface. It may be
(1) G. Dallinga, E. L. Mackor and A. A. Verrijn Stuart, M o l e c u l a r
P h y s . , 1, 133 (1958). We have examined the absorption spectrum of anthracene adsorbed on silica-alumina from decahydronaphthalene solution under anaerobic and anhydrous conditions, with a Cary spectrophotometer. Decahydronaphthalene was employed as solvent to reduce the scattering of light. Absorption bands not present in the spectrum of anthracene in solution were noted at 4200 and 7500 A. with two possible very weak bands at 5850 and 6400 A. A publication on the absorption spectra of adsorbed molecules, including anthracene, is planned by one of us (C.B.).

2078 Notes Vol. 63
remarked that water also displaces anthracene from silica-alumina.
Now when oxygen was admitted at room temperature to the anaerobic system containing green silica-alumina, the color of the solid rapidly changed from green to very dark brown. On addition of n-butylamine to this mixture, the solid did not revert to its original white appearance, but remained brown, suggesting that in this case the adsorbed material may have been more basic than the amine. Anthracene adsorbed on pure silica gel is not oxidized by oxygen under the present conditions.
A quantitative oxidation experiment was made in a static system consisting of a glass reaction vessel connected through a Kovar seal to a metal packless valve, and then to an all- metal pressure gage through a stainless steel line. Silica- alumina (1.03 g.) was evacuated at 550° for 1.5 hr.; 10 ml. of n-heptane and 2 0 mg. of anthracene were separately thoroughly outgassed; the three components then were mixed by break-seal technique. Oxygen was admitted to the reaction vessel at room temperature at a pressure of 540 mm. and the vessel was shaken. A gradual decrease in pressure was observed, the green silica-alumina began to darken and in three minutes was almost black. After one hour there was no further decrease in pressure. The remaining oxygen was removed and measured, and the solution was analyzed for anthracene by ultraviolet spectroscopy before and after treatment of the silica-alumina with n-butyl- amine. There was 73% conversion of anthracene, and 1 .6 moles of 0 2 was consumed per mole of anthracene converted. The absorption spectrum of the brown silica-alumina was not obtained. However, at the conclusion of an experiment similar to that described above, the brown catalyst was eluted with methanol (all the adsorbed material was not removed by this treatment), giving a red solution witli an absorption maximum at 5550 A. This solution turned yellow on standing in air for a few hours.
It should be emphasized that anthracene in re-heptane solution is completely unreactive with oxygen at room temperature in the absence of a catalyst.
Eastman Kodak Company “ blue-violet fluorescent” anthracene was employed in the above experiments. The n-heptane was treated with an excess of NO2-N 2O4 to remove traces of olefins and then was chromatographed on silica gel. The silica-alumina was American Cyanamid Company Aerocat cracking catalyst, with the following properties: 22.1% A120 3, 0.92% S04, 0.032% Fe, 0.009% Na and B.E.T. surface area of 526 m.2/g. Before use, this catalyst was heated in air for five hours and was perfectly white after this treatment.
The reaction reported above appears at first sight to be anomalous because there seems to be agreement that hydrocarbon reactions catalyzed by silica-alumina involve ionic or polar intermediates,2 while hydrocarbon autoxidations are generally believed to proceed by homolytic mechanisms.3 As far as is known, hydrocarbon oxidations catalyzed by the solid acid, silica-alumina, have not been reported.
We find two reports in the literature which appear to demonstrate acid-catalyzed oxidation of hydrocarbons. Friedel and Crafts found that phenol was formed when air was bubbled through a refluxing mixture of benzene and aluminum chloride.4 Dallinga, Maekor and Verrijn Stuart reported that the spectra of solutions of perylene, pyrene and naphthacene in hydrogen fluoride were greatly altered by the presence of oxygen and suggested
(2) II. II. Voge in “ C a ta ly s is ,” V ol. V I, P. II. E m m ett, Editor, Reinhold Publ. Corp., New Y o rk , N. Y ., 1958, pp. 407-493.
(3) G . A . Russell, J . Chem. E d ., 36, 111 (1959).(4) C . Friedel and J. M . C rafts, Com pt. rend.. 86, 885 (1878). T h e
conversion of benzene and the yield of phenol were not reported.
that oxidation to a free radical positive ion was responsible for the alteration in spectrum in the case of perylene.6
Matsumoto and Funakubo observed a small amount of oxidation of anthracene to anthra- quinone during chromatography of a benzene solution of anthracene on activated alumina.6 This observation may be an example of the reaction reported here, although alumina is considered a very weak solid acid.
The present experiments raise a warning that oxidation may interfere with the chromatographic separation of aromatic hydrocarbons. B y the same token studies of hydrocarbon catalysis by acidic solids may involve errors due to an attenuation of catalytic activity by products of oxidation or other basic molecules such as water. The latter may be especially true when catalysts are “ regenerated” by contact with air immediately before use.
The experimental assistance of R. M. Ross is gratefully acknowledged.
(5) G . D allinga, E . L . M aekor and A . A . Verrijn Stuart, M olecular P h ys., 1 , 125, 137 (1958).
(6) Y . M atsum oto and E . Funakubo, J. Chem. Soc. Japan, P u re Chem. S ect., 731 (1951); Y . M atsum oto, ibid ., 733 (1951).
A GLASS C O N D U CTA N C E C E L L FO R TH E M E A SU R E M E N T OF D IFFU SIO N
CO E FFIC IE N T S
B y H e r b e r t S. H a r n e d a n d M i l t o n B l a n d e r
Contribution N o. 1556 from the D epartm ent o f Chem istry o f Yale U ni- versity . N ew H aven, Conn.
Received June 25, 1959
The determination of diffusion coefficients of electrolytes by the conductance method has been carried out in Lucite cells of types described by Harned and N uttall.1 To avoid the disadvantages of the use of Lucite and of grease in the region of the electrodes, the glass cell, the cross section of which is shown in Fig. 1, was constructed.
The cell is of soft glass tubing of 8 mm. internal diameter. The electrodes at positions C are platinum tubes about 2 cm. in length and 3 mm. in diameter. The ends of these tubes were closed and made flat by spinning. They are sealed at positions C at a distance from the top and bottom of the cell of one sixth its depth. The tup of the tube was flanged at B. A glass plate A ground to this flange serves when clamped to seal off the top of the cell. The bottom of the cell is attached to a special stopcock E with a hole only half way through it. This hole or cup D in the stopcock can be turned to any position and serves to introduce salt solution into the cell. The cell, with lead wires from the conductance bridge attached to electrodes, is mounted on a brass block in a Lucite box which is covered and submerged in a water-bath. A cork was sealed to the stopcock handle and Nylon cord was attached to the cork so that the stopcock could be turned from outside the Lucite box.
The sequence of manipulation of the glass cell is similar to that previously used with the cells made of Lucite. After the electrodes were platinized, the cell was repeatedly washed with distilled water until the resistance between any pair of electrodes after standing overnight was over 500,000 ohms. The cell in the upright position was filled with fresh distilled water. The flange was greased lightly. A mound of water above the surface of the flange was built up so that by sliding the glass plate along the ground surface of the flange, the liquid could be sheared off completely. Care was exer-
(1) H. S. Harned and R. L. Nuttall, J. Am. Chem. Soc., 69, 730(1947).
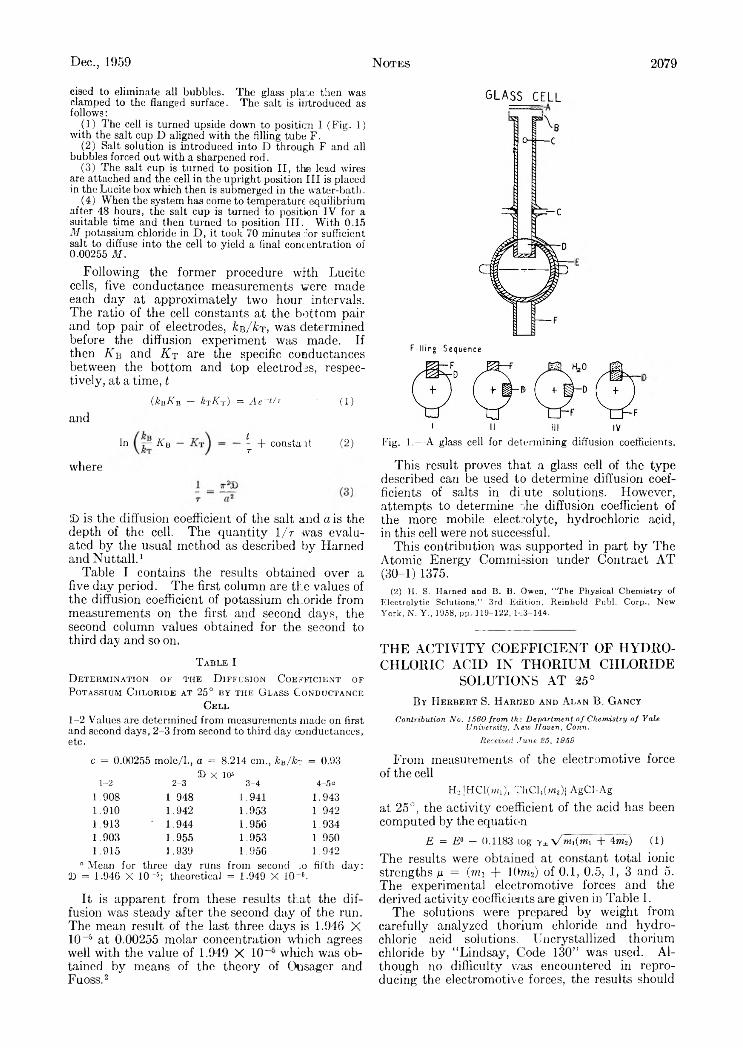
Dec., 1959 Notes 2079
eised to eliminate all bubbles. The glass plaie then was clamped to the flanged surface. The salt is introduced as follows:
(1) The cell is turned upside down to position I (Fig. 1) with the salt cup D aligned with the filling tube F.
(2) Salt solution is introduced into D through F and all bubbles forced out with a sharpened rod.
(3) The salt cup is turned to position II, the lead wires are attached and the cell in the upright position III is placed in the Lucite box which then is submerged in the water-bath.
(4) When the system has come to temperature equilibrium after 48 hours, the salt cup is turned to position IV for a suitable time and then turned to position III. With 0.15 M potassium chloride in D, it took 70 minutes :7or sufficient salt to diffuse into the cell to yield a final concentration of 0.00255 M.
Following the former procedure with Lucite cells, five conductance measurements were made each day at approximately two hour intervals. The ratio of the cell constants at the bottom pair and top pair of electrodes, /cb/At , was determined before the diffusion experiment was made. If then Ks and K t are the specific conductances between the bottom and top electrodes, respectively, at a time, t
(kBKB — krKv) = Ae~t/T (1)and
In K b — + constant (2)
where
£> is the diffusion coefficient of the salt and a is the depth of the cell. The quantity 1 /r was evaluated by the usual method as described by Harned and Nuttall.1
Table I contains the results obtained over a five day period. The first column are the values of the diffusion coefficient of potassium ch oride from measurements on the first and second days, the second column values obtained for the second to third day and so on.
T a b l e I
D e t e r m i n a t i o n o f t h e D i f f u s i o n C o e f f i c i e n t o f
P o t a s s i u m C h l o r i d e a t 25° b y t h e G l a s s C o n d u c t a n c e
C e l l
1-2 Values are determined from measurements made on first and second days, 2-3 from second to third day conductances, etc.
GLASS CELL
Filling Sequence
Fig. 1.—A glass cell for determining diffusion coefficients.
This result proves that a glass cell of the type described can be used to determine diffusion coefficients of salts in dilute solutions. However, attempts to determine uhe diffusion coefficient of the more mobile electrolyte, hydrochloric acid, in this cell were not successful.
This contribution was supported in part by The Atomic Energy Commission under Contract A T (30-1) 1375.
(2) H. S. Harned and B. B. Owen, “ The Physical Chemistry of Electrolytic Solutions,” 3rd Edition, Reinhold Publ. Corp., New York, N. Y ., 1958, pp. 119-122, 1*3-144.
TH E A C T IV IT Y COEFFICIENT OF H Y D R O CHLORIC A C ID IN TH O R IU M CHLORIDE
SOLUTIONS A T 25°B y H e r b e r t S. H a r m e d a n d A l a n B . G a n c y
C o n t r i b u t i o n N o . 1 5 6 0 f r o m t h e D e p a r t m e n t o f C h e m i s t r y o f Y a l e U n i v e r s i t y , N e w H a v e n , C o n n .
R e c e i v e d J u n e 2 5 , 1 9 5 9
c = 0.00255 mole/L, a = 8.214 cm., kB/k-: = 0.93 SO X 10«
1-2 2-3 3-4 4 -5«1.908 1 948 1.941 1.9431.910 1.942 1.953 1.9421.913 ' 1.944 1.956 1 9341.903 1.955 1.953 1.9501.915 ] .939 1.956 1.942
“ Mean for three day runs from second ;o fifth day: 20 = 1.946 X 10~5; theoretical = 1.949 X lO"6.
It is apparent from these results that the diffusion was steady after the second day of the run. The mean result of the last three days is 1.946 X10⁻⁵ at 0.00255 molar concentration which agrees well with the value of 1.949 X 10 which was obtained by means of the theory of Onsager and Fuoss.2
From measurements o f the electromotive force of the cell
H2 |HC1(wi), ThChCwffi AgCl-Agat 25°, the activity coefficient of the acid has been computed by the equation
E = E° — 0.1183 log y±\/mi(mi + 4m2) (1)The results were obtained at constant total ionic strengths m = (mi + 10m2) of 0.1, 0.5, 1, 3 and 5. The experimental electromotive forces and the derived activity coefficients are given in Table I.
The solutions were prepared by weight from carefully analyzed thorium chloride and hydrochloric acid solutions. Un crystallized thorium chloride by “ Lindsay, Code 130” was used. Although no difficulty was encountered in reproducing the electromotive forces, the results should
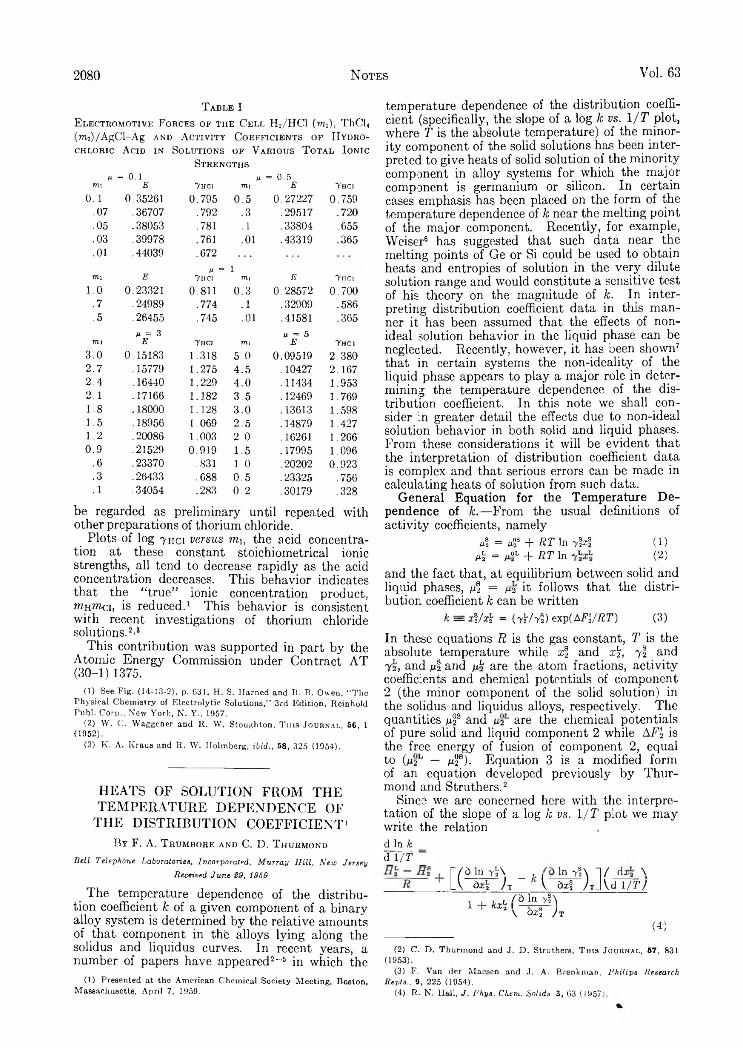
2080 N otes Vol. 63
T a b l e IE l e c tr o m o tiv e F orces o f th e C e l l H j/H C I ( m i ) , ThCl4 (raO/AgCl-Ag an d A c t iv it y C o e ff ic ie n t s o f H y d ro c h lo ric A cid in So lu tio n s o f V a r io u s T o t a l I onic
Str e n g t h s
Mm i
= 0.1E 7 hci
ßm i
= 0.5 E 7 hci
0.1 0.35261 0.795 0.5 0.27227 0.759.07 .36707 .792 .3 .29517 .720.05 .38053 .781 .1 .33804 .655.03 .39978 .761 .01 .43319 .365.01 .44039 .672
m i Eg =
7 hcil
m i E Yhci
1.0 0.23321 0.811 0.3 0.28572 0.700.7 .24989 .774 .1 .32009 .586.5 .26455 .745 .01 .41581 .365
m iH = 3
E Tiret m ili = 5
E Thoi3.0 0.15183 1.318 5.0 0.09519 2.3802.7 .15779 1.275 4.5 .10427 2.1672.4 .16440 1.229 4.0 .11434 1.9532.1 .17166 1.182 3 5 .12469 1.7691.8 .18000 1.128 3.0 .13613 1.5981.5 .18956 1.069 2.5 .14879 1.4271.2 .20086 1.003 2 0 .16261 1.2660.9 .21529 0.919 1.5 .17995 1.096
.6 .23370 .831 1 0 .20202 0.923
.3 .26433 .688 0.5 .23325 .756
.1 .34054 .283 0.2 .30179 .328
be regarded as preliminary until repeated with other preparations of thorium chloride._ Plots of log thci v e r s u s m1; the acid concentra
tion at these constant stoichiometrical ionic strengths, all tend to decrease rapidly as the acid concentration decreases. This behavior indicates that the “true” ionic concentration product, r r i n m a , is reduced. 1 This behavior is consistent with recent investigations of thorium chloride solutions. 2 ’ 3
This contribution was supported in part by the Atomic Energy Commission under Contract AT (30-1) 1375.
(1) See Fig. (14-13-2), p. 631, H. S. Harned and B. B. Owen, "T he Physical Chemistry of Electrolytic Solutions,” 3rd Edition, Reinhold Publ. Corp., New York, N. Y ., 1957.
(2) W . C. Waggoner and R. W . Stoughton, T his Journal, 5 6 , 1 (1952).
(3) K . A. Kraus and R . W. Ilolmberg, ibid ., 5 8 , 325 (1954).
HEATS OF SOLUTION FROM THE TEMPERATURE DEPENDENCE OF
THE DISTRIBUTION COEFFICIENT1
By F. A. T r u m b o r e an d C, D. T h urm o nd
B e l l T e lep h o n e L a b o ra to r ies , In co rp o ra ted , M u r r a y H il l , N ew J e r s ey
R eceived J u n e 2 9 , 1 95 9
The temperature dependence of the distribution coefficient k of a given component of a binary alloy system is determined by the relative amounts of that component in the alloys lying along the solidus and liquidus curves. In recent years, a number of papers have appeared2 “ 6 in which the
(1) Presented at the American Chemical Society Meeting, Boston, Massachusetts, April 7, 1959.
temperature dependence of the distribution coefficient (specifically, the slope of a log k v s . 1 / T plot, where T is the absolute temperature) of the minority component of the solid solutions has been interpreted to give heats of solid solution of the minority component in alloy systems for which the major component is germanium or silicon. In certain cases emphasis has been placed on the form of the temperature dependence of k near the melting point of the major component. Recently, for example, Weiser6 has suggested that such data near the melting points of Ge or Si could be used to obtain heats and entropies of solution in the very dilute solution range and would constitute a sensitive test of his theory on the magnitude of k . In interpreting distribution coefficient data in this manner it has been assumed that the effects of nonideal solution behavior in the liquid phase can be neglected. Recently, however, it has been shown7
that in certain systems the non-ideality of the liquid phase appears to play a major role in determining the temperature dependence of the distribution coefficient. In this note we shall consider in greater detail the effects due to non-ideal solution behavior in both solid and liquid phases. From these considerations it will be evident that the interpretation of distribution coefficient data is complex and that serious errors can be made in calculating heats of solution from such data.
General Equation for the Temperature Dependence of k .— From the usual definitions of activity coefficients, namely
u.i = ixf + R T ln-yfzl (1)A = m»1- + R T In (2)
and the fact that, at equilibrium between solid and liquid phases, p| = M2 it follows that the distribution coefficient k can be written
k = x l / x l = (72y y!) exp(AF 'J R T ) (3)In these equations R is the gas constant, T is the absolute temperature while xl and x \ , 7 ! and 7 2 , and u l and ¿A are the atom fractions, activity coefficients and chemical potentials of component 2 (the minor component of the solid solution) in the solidus and liquidus alloys, respectively. The quantities y T and P2 L are the chemical potentials of pure solid and liquid component 2 while A F l is the free energy of fusion of component 2 , equal to (/j.2h — /A8)- Equation 3 is a modified form of an equation developed previously by Thurmond and Struthers. 2
Since we are concerned here with the interpretation of the slope of a log k v s . l / T plot we may write the relationd In kd lJ f
['( à In 7 \ V, òx 'i )■r - * '
ln 7 f>l a*i ) Ü
/ dlta \Vd 1/77
1 + kx\/Ò In\ cte!* )
(4)
(2) C . D . Thurmond and J. D . Struthers, T his Journal, 57, 831 (1953).
(3) F. Van der Maesen and J. A. Brenkman, P h il ip s R esea rch R ep ts ., 9 , 225 (1954).
(4) R. N. Hail, J . P h y s . C h em . Solids 3 , G3 (1957).
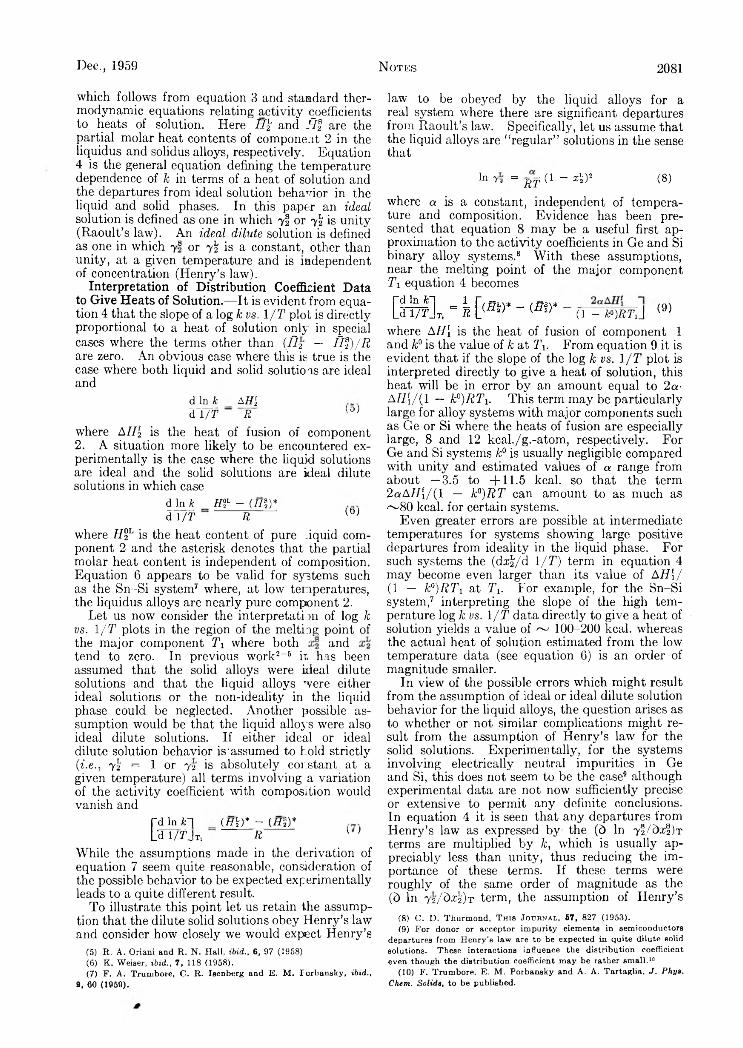
Dec., 1959 N otes 2081
which follows from equation 3 and standard thermodynamic equations relating activity coefficients to heats of solution. Here H \ and 5 f are the partial molar heat contents of component 2 in the liquidus and solidus alloys, respectively. Equation 4 is the general equation defining the temperature dependence of k in terms of a heat of solution and the departures from ideal solution behavior in the liquid and solid phases. In this paper an i d e a l solution is defined as one in which yl or y£ is unity (Raoult’s law). An i d e a l d i lu t e solution is defined as one in which y® or y£ is a constant, other than unity, at a given temperature and is independent of concentration (Henry’s law).
Interpretation of Distribution Coefficient Data to Give Heats of Solution.— It is evident from equation 4 that the slope of a log k v s . l / T plot is directly proportional to a heat of solution only in special cases where the terms other than ( S # — R f ) / R are zero. An obvious case where this is true is the case where both liquid and solid solutions are ideal and
d In k _ AH [
d l / T R Wwhere A H i is the heat of fusion of component2. A situation more likely to be encountered experimentally is the case where the liquid solutions are ideal and the solid solutions are ideal dilute solutions in which case
d In ft H f* — ( H I ) * d l / T R W
where H f J is the heat content of pure liquid component 2 and the asterisk denotes that the partial molar heat content is independent of composition. Equation 6 appears to be valid for systems such as the Sn-Si system7 where, at low temperatures, the liquidus alloys are nearly pure component 2.
Let us now consider the interpretatiDn of log 7c v s . l / T plots in the region of the melting point of the major component T \ where both and tend to zero. In previous work2-5 it has been assumed that the solid alloys were ideal dilute solutions and that the liquid alloys were either ideal solutions or the non-ideality in the liquid phase could be neglected. Another possible assumption would be that the liquid alloys were also ideal dilute solutions. If either ideal or ideal dilute solution behavior is'assumed to hold strictly (i . e ., yj = 1 or ya is absolutely constant at a given temperature) all terms involving a variation of the activity coefficient with composition would vanish and
|-d In ftd ( H \ ) * - ( H i ) *
L'd 1/TJt, R ( )
While the assumptions made in the derivation of equation 7 seem quite reasonable, consideration of the possible behavior to be expected experimentally leads to a quite different result.
To illustrate this point let us retain the assumption that the dilute solid solutions obey Henry’s law and consider how closely we would expect Henry’s
(5) R. A. Oriani and R. N. Hall, ibid., 6, 97 (1958)(6) K. Weiser, ibid., 7, 118 (1958).(7) F. A, Trumbore, C. R . Isenberg and E. M . Forbansky, ibid.,
9, 60 (1959).
law to be obeyed by the liquid alloys for a real system where there are significant departures from Raoult’s law. Specifically, let us assume that the liquid alloys are “regular” solutions in the sense that
ln 72 = -R f (t - x \ y (8)
where a is a constant, independent of temperature and composition. Evidence has been presented that equation 8 may be a useful first approximation to the activity coefficients in Ge and Si binary alloy systems.8 With these assumptions, near the melting point of the major component T i equation 4 becomes
(1 - fc0)ßrj (9)
where AH [ is the heat of fusion of component 1 and k ° is the value of k at 7 \ . From equation 9 it is evident that if the slope of the log k v s . l / T plot is interpreted directly to give a heat of solution, this heat will be in error by an amount equal to 2a- AH [ / (1 — k ° ) R T i . This term may be particularly large for alloy systems with major components such as Ge or Si where the heats of fusion are especially large, 8 and 12 kcal./g.-atom, respectively. For Ge and Si systems k ° is usually negligible compared with unity and estimated values of a range from about —3.5 to +11.5 kcal. so that the term 2aAH[/(l — k ° ) R T can amount to as much as ^ 80 kcal. for certain systems.
Even greater errors are possible at intermediate temperatures for systems showing large positive departures from ideality in the liquid phase. For such systems the (& x \ /& l / T ) term in equation 4 may become even larger than its value of AH \ / (1 — k ° ) R T i at T \ . For example, for the Sn-Si system,7 interpreting the slope of the high temperature log k v s . 1/ T data directly to give a heat of solution yields a value of ~ 100-200 kcal. whereas the actual heat of solution estimated from the low temperature data (see equation 6) is an order of magnitude smaller.
In view of the possible errors which might result from the assumption of ideal or ideal dilute solution behavior for the liquid alloys, the question arises as to whether or not similar complications might result from the assumption of Henry’s law for the solid solutions. Experimentally, for the systems involving electrically neutral impurities in Ge and Si, this does not seem to be the case9 although experimental data are not now sufficiently precise or extensive to permit any definite conclusions. In equation 4 it is seen that any departures from Henry’s law as expressed by the (d ln vl/dxijT terms are multiplied by k , which is usually appreciably less than unity, thus reducing the importance of these terms. If these terms were roughly of the same order of magnitude as the (d ln y z / d x t y r term, the assumption of Henry’s
(8) C. D . Thurmond, T his Journal, 57, 827 (1953).(9) For donor or acceptor impurity elements in semiconductors
departures from Henry’s law are to be expected in quite dilute Bolid solutions. These interactions influence the distribution coefficient even though the distribution coefficient may be rather small.10
(10) F. Trumbore, E. M . Porbansky and A. A. Tartaglia, «7. P h ys. Chem. Solids, to be published.

2082 N otes Vol. 63
law would be an appreciably better approximation for the solid solutions than for the liquid solutions. Some estimates have been made, assuming the regular solution model for the solid solutions, which indicate that as k becomes smaller the (ò In tÌ /òzDt term becomes larger. However, the k term tends to dominate the activity coefficient term thus reducing the latter’s importance.
Summary.— A general equation for the temperature dependence of the distribution coefficient has been given which indicates the complications inherent in the interpretation of log k v s . 1 / T plots to give heats of solution. A simple solution model has been used to indicate the magnitude of the errors which might result if the experimental data are not properly interpreted.
QUENCHING OF EXCITED Hg(3P9 BY NO1B y R obert J. F allon , Joseph T. V anderslice
and E dward A. M ason
In s t itu te f o r M o le c u la r P h y s ic s , U n iv ers ity o f M a ry la n d , C ollege P a rk , M a ry la n d
R eceiv ed J u ly 6 , 1959
Noyes2 has studied the mercury photosensitized reaction of NO and, after a careful analysis of the experimental data, has concluded that the overall process corresponds to the reaction
2Hg + 2NO -— >- 2HgO + N2 (1)and that the rate-determining step is
Hg* + NO — > Hg + NO* (2)Bates3 has measured the cross section for the quenching of excited Hg(3P0 by NO and found the extremely large value of 24.7 A.2, which indicates a resonant process. On the basis of the then known potential curves for NO, both Bates and Noyes were forced to conclude that the NO* formed in reaction 2 was most likely in a highly excited vibrational level of the ground X 2 II state. In order to explain the kinetics, Noyes postulated that the lifetime of the NO* was appreciably longer than the average time between collisions, even at the low pressures used in the experiments. A highly vibrationally excited molecule in the X 2n electronic state would have a long lifetime. Noyes stated, however, that one would expect the formation of such a highly excited (about v = 26) state by collision to be rare in the absence of some special resonant effect.
Recently, a large number of potential curves for the different states of NO have been calculated from spectroscopic data and quantum-mechanical theory.4 Two of these, the X 2n and the 4n, are shown in Fig. 1 . These are the only ones which will be of importance in the subsequent discussion. The lowest vibrational level of the 4n state is estimated to lie 4.64 ± 0 . 1 0 e.v. above the lowest vibrational level of the X 2n state. Since 4.88 e.v. is transferred from the Hg* to the NO in reaction 2,
(1) This research was supported in part by the National Aeronautics and Space Administration.
(2) W . A. Noyes, Jr., J . A m . C h em . S o c ., 53, 514 (1931).(3) J. K. Bates, ib id ., 54, 569 (1932).(4) J. T. Vanderslice, E. A. Mason and W. G. Maisch, J . Chem .
P h y s . , 31, 738 (1959).
it is quite possible from an energy point of view for the NO to end up in one of the lower vibrational levels of this 4II state. This transition from the 2n to the 4n also satisfies the correlation rules for such processes.6 Furthermore, a transition to the 4n state would result in an excited molecule with a long lifetime, since the radiative transition back to the 2n state has an exceptionally low transition probability.6 This is in agreement with Noyes’ suggestion regarding the lifetime of the NO*. A transition to this state also agrees with Laidler’s suggestion7 that a process involving the least net change in electronic energy is the most likely. Finally, a transition to one of the lower vibrational levels of the 4n state is in accord with the Franck- Condon principle, since there would be a very small change in internuclear distance. Because the quenching cross section is so large, the transition must occur readily and one would expect that this would not happen if a large change in internuclear distance had to occur during the process. In short, a transition between the 2n and 4n states of NO by collision with Hg(sPi) would be essentially a resonant process.
In conclusion, we should like to propose that the NO* formed in reaction 2 might be in the 4n state rather than in the vibrationally excited X 2n state, the one suggested by Noyes on the basis of the then known potential curves of NO. If our suggestion can be verified, it would be added experimental confirmation that the 4n state lies in the region first proposed by Mulliken,8 later tentatively confirmed by Ogawa9 on the basis of his experimental data and recently reconfirmed4 on
(5) K . E . Shuler, ib id ., 2 1 , 624 (1953).(6) ft. S. Mulliken, “ The Threshold of Space,” Pergamon Press,
Ltd., New York, N. Y ,, 1957, p. 123.(7) K. J. Laidler, “ The Chemical Kineties of Excited States,”
Oxford University Press, London, England, 1955, p. 101.(8) R. S. Mulliken, Revs. Modem Phys., 4, 1 (1932).(9) M . Ogawa, Science o f Light (Tokyo), 3 , 39 (1954).
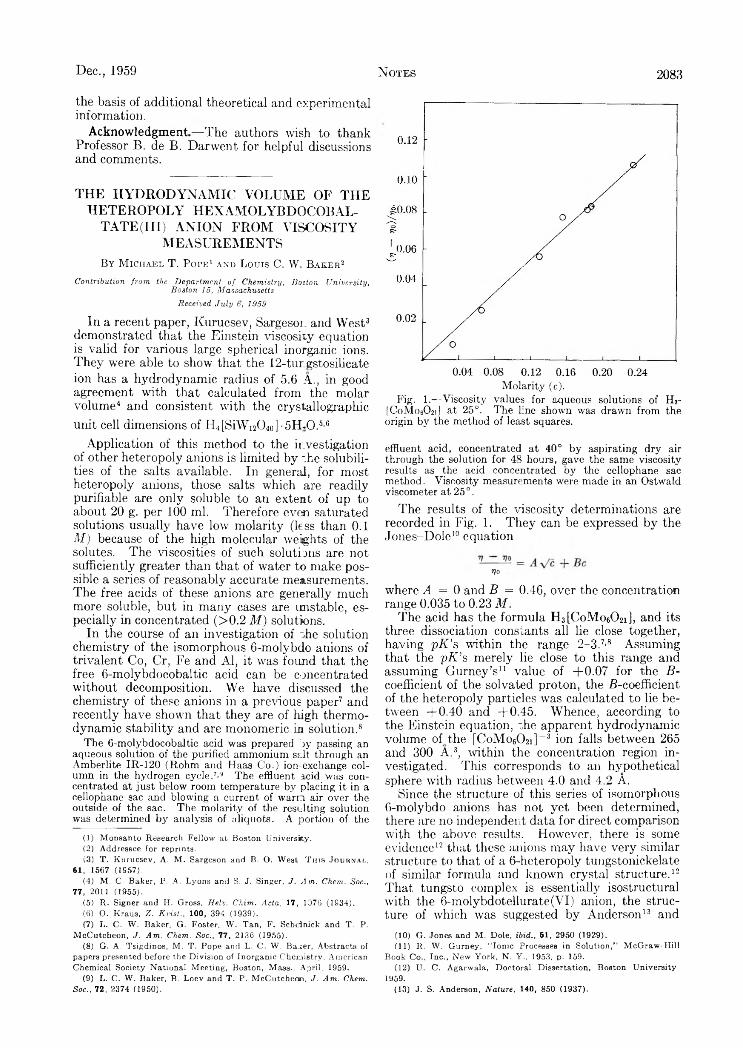
Dec., 1959 N otes 2083
the basis of additional theoretical and experimental information.
Acknowledgment—The authors wish to thank Professor B. de B. Darwent for helpful discussions and comments.
THE HYDRODYNAMIC VOLUME OF THE HETEROPOLY HEXAMOLYBDOCOBAL-
TATE (III) ANION FROM VISCOSITY MEASUREMENTS
B y M ic h a e l T. P o r E 1 a n d L o u is C. W . B a k e r 2
Contribution from the D epartm ent o f Chemistry, B oston University, Boston 15, M assachusetts
Received J u ly 6, 1959
In a recent paper, Kurucsev, Sargeson and West3 demonstrated that the Einstein viscosity equation is valid for various large spherical inorganic ions. They were able to show that the 12-tur_gstosilicate ion has a hydrodynamic radius of 5.6 A., in good agreement with that calculated from the molar volume4 and consistent with the crystallographicunit cell dimensions of PI4[SiWi204o] -5H-0.5’6
Application of this method to the investigation of other heteropoly anions is limited by ".he solubilities of the salts available. In general, for most heteropoly anions, those salts which are readily purifiable are only soluble to an extent of up to about 20 g. per 100 ml. Therefore even saturated solutions usually have low molarity (less than 0.1 M ) because of the high molecular weights of the solutes. The viscosities of such solutims are not sufficiently greater than that of water to make possible a series of reasonably accurate measurements. The free acids of these anions are generally much more soluble, but in many cases are unstable, especially in concentrated (>0.2 M ) solutions.
In the course of an investigation of "he solution chemistry of the isomorphous 6-molybdo anions of trivalent Co, Cr, Fe and Al, it was found that the free 6-molybdocobaltic acid can be concentrated without decomposition. We have discussed the chemistry of these anions in a previous paper7 and recently have shown that they are of high thermodynamic stability and are monomeric in solution.8
The 6 -molybdocobaltic acid was prepared by passing an aqueous solution of the purified ammonium salt through an Amberlite IR-120 (Rohm and Haas Co.) ion-exchange column in the hydrogen cycle. 7. 9 The effluent acid was concentrated at just below room temperature by placing it in a cellophane sac and blowing a current of warn air over the outside of the sac. The molarity of the resulting solution was determined by analysis of aliquots. A portion of the
(1) Monsanto Research Fellow at Boston University.(2) Addressee for reprints.(3) T. Kurucsev, A. M. Sargeson and B. O. West T his Journal,
61, 1567 (1957).(4) M. C. Baker, P. A. Lyons and S. J. Singer, J . A m . Chem . Soc.,
77, 2011 (1955).(5) R. Signer and H. Gross, Helv. Chim. Acta, 17, 1076 (1S34).(6) O. Kraus, Z . K rist., 100, 394 (1939).(7) L. C. W. Baker, G. Foster, W. Tan, F. Schdnick and T. P.
McCutcheon, J. A m . Chem. Soc., 77, 2136 (1955).(8) G. A. Tsigdinos, M. T. Pope and L. C. W. Baker, Abstracts of
papers presented before the Division of Inorganic Chemistry, American Chemical Society National Meeting, Boston, Mass., April, 1959.
(9) L. C. W. Baker, B. Loev and T. P. McCutcheon, J. A m . Chem.Soc., 72, 2374 (1950).
Molarity (c).Fig. 1 .—Viscosity values for aqueous solutions of H3-
[CoM o60 21] at 25°. The line shown was drawn from the origin by the method of least squares.
effluent acid, concentrated at 4 0 ° by aspirating dry air through the solution for 48 hours, gave the same viscosity results as the acid concentrated by the cellophane sac method. Viscosity measurements were made in an Ostwald viscometer at 25 °.
The results of the viscosity determinations are recorded in Fig. 1. They can be expressed by the Jones-Dole10 equation
no
where A = 0 and B = 0.46, over the concentration range 0.035 to 0.23 M .
The acid has the formula H3[CoMo602i], and itsthree dissociation constants all lie close together, having p K ’ s within the range 2-3.7,8 Assuming that the p K ’ s merely lie close to this range and assuming Gurney’s11 value of +0.07 for the 13- coefficient of the solvated proton, the B-eoefficient of the heteropoly particles was calculated to he between +0.40 and +0.45. Whence, according to the Einstein equation, the apparent hydrodynamic volume of the [CoMo602ip3 ion falls between 265 and 300 A.3, within the concentration region investigated. This corresponds to an hypothetical sphere with radius between 4.0 and 4.2 A.
Since the structure of this series of isomorphous6-molybdo anions has not yet been determined, there are no independent data for direct comparison with the above results. However, there is some evidence12 that these anions may have very similar structure to that of a 6-heteropoly tungstonickelate of similar formula and known crystal structure.12 That tungsto complex is essentially isostructural with the 6-molybdotellurate(VI) anion, the structure of which was suggested by Anderson13 and
(10) G. Jones and M. Dole, ibid., 5 1 , 2950 (1929).(11) R. W . Gurney, “ Ionic Processes in Solution,” M cGraw-Hill
B ook Co., Inc., New York, N. Y., 1953, p. 159.(12) U. C. Agarwala, Doctoral Dissertation, Boston University.
1959.(13) J. S. Anderson, Nature, 1 4 0 , 850 (1937).
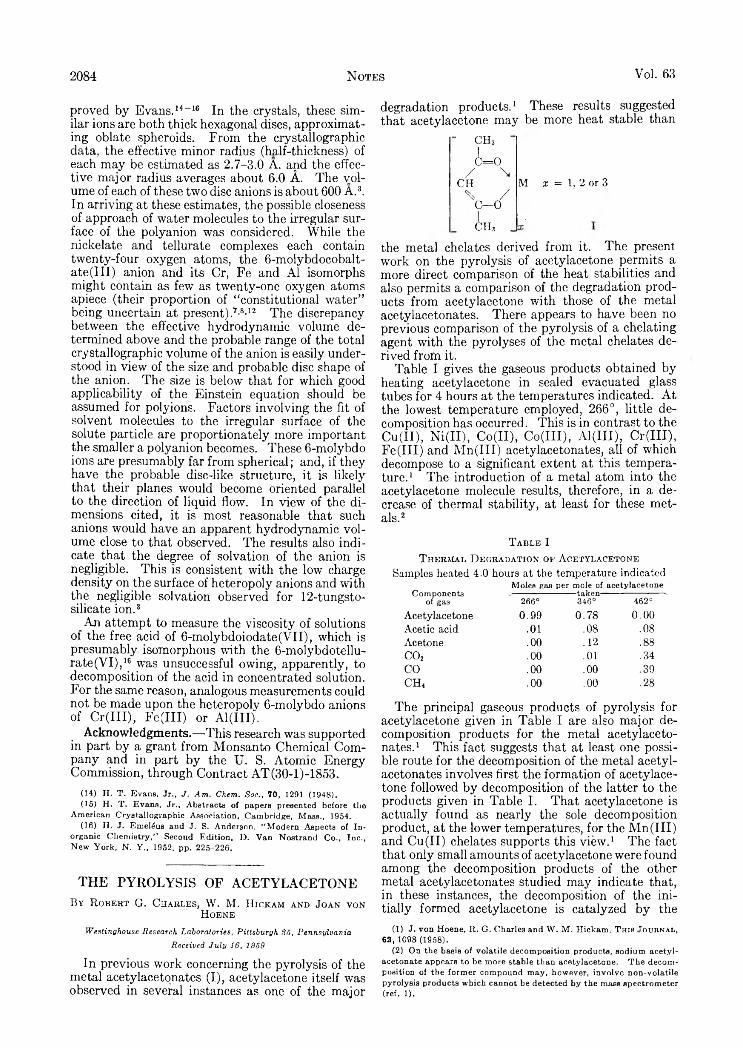
2084 N otes Vol. 63
proved by Evans.14“ 16 In the crystals, these similar ions are both thick hexagonal discs, approximating oblate spheroids. From the crystallographic data, the effective minor radius (half-thickness) of each may be estimated as 2.7-3.0 A. and the effective major radius averages about 6.0 A. The volume of each of these two disc anions is about 600 A.3. In arriving at these estimates, the possible closeness of approach of water molecules to the irregular surface of the polyanion was considered. While the nickelate and tellurate complexes each contain twenty-four oxygen atoms, the 6-molybdocobalt- ate(III) anion and its Cr, Fe and A1 isomorphs might contain as few as twenty-one oxygen atoms apiece (their proportion of “constitutional water” being uncertain at present).7'8'12 The discrepancy between the effective hydrodynamic volume determined above and the probable range of the total crystallographic volume of the anion is easily understood in view of the size and probable disc shape of the anion. The size is below that for which good applicability of the Einstein equation should be assumed for polyions. Factors involving the fit of solvent molecules to the irregular surface of the solute particle are proportionately more important the smaller a polyanion becomes. These 6-molybdo ions are presumably far from spherical; and, if they have the probable disc-like structure, it is likely that their planes would become oriented parallel to the direction of liquid flow. In view of the dimensions cited, it is most reasonable that such anions would have an apparent hydrodynamic volume close to that observed. The results also indicate that the degree of solvation of the anion is negligible. This is consistent with the low charge density on the surface of heteropoly anions and with the negligible solvation observed for 12-tungsto- silicate ion.3
An attempt to measure the viscosity of solutions of the free acid of 6-molybdoiodate(VII), which is presumably isomorphous with the 6-molybdotellu- rate(VI),16 was unsuccessful owing, apparently, to decomposition of the acid in concentrated solution. For the same reason, analogous measurements could not be made upon the heteropoly 6-molybdo anions of Cr(III), Fe(III) or Al(III).
Acknowledgments.— This research was supported in part by a grant from Monsanto Chemical Company and in part by the U. S. Atomic Energy Commission, through Contract AT(30-1)-1853.
(14) H. T . Evans, Jr., J . A m . C h e m . S o c ., 7 0 , 1291 (1948).(15) H. T . Evans, Jr., Abstracts of papers presented before the
American Crystallographic Association, Cambridge, Mass., 1954.(16) H. J. EmeI6u8 and J. S. Anderson, “ Modern Aspects of In
organic Chemistry,” Second Edition, D. Van Nostrand Co., Inc., New York, N. Y., 1952, pp. 225-226.
THE PYROLYSIS OF ACETYLACETONEB y R o b e r t G. C h a r l e s , W. M. H ic k a m an d J oan von
H oen e
degradation products.1 These results suggested that acetylacetone may be more heat stable than
- ch3 ■¿ = 0
/ NCH
\ /C—0ch 3 J
M X = 1, 2 or 3
the metal chelates derived from it. The present work on the pyrolysis of acetylacetone permits a more direct comparison of the heat stabilities and also permits a comparison of the degradation products from acetylacetone with those of the metal acetylacetonates. There appears to have been no previous comparison of the pyrolysis of a chelating agent with the pyrolyses of the metal chelates derived from it.
Table I gives the gaseous products obtained by heating acetylacetone in sealed evacuated glass tubes for 4 hours at the temperatures indicated. At the lowest temperature employed, 266°, little decomposition has occurred. This is in contrast to the Cu(II), Ni(II), Co(II), Co(III), Al(III), Cr(III), Fe(III) and Mn(III) acetylacetonates, all of which decompose to a significant extent at this temperature.1 The introduction of a metal atom into the acetylacetone molecule results, therefore, in a decrease of thermal stability, at least for these metals.2
T a b l e IT h e r m a l D e g r a d a t io n o f A c e t y la c e t o n e
Samples heated 4.0 hours at the temperature indicatedMoles gas per mole of acetylacetone
Components of ga9 266°
------ taken------346° 462°
Acetylacetone 0.99 0.78 0 . 0 0
Acetic acid . 0 1 .08 .08Acetone . 0 0 . 1 2 . 8 8
C02 . 0 0 . 0 1 .34CO . 0 0 . 0 0 .39CH, . 0 0 . 0 0 .28
The principal gaseous products of pyrolysis for acetylacetone given in Table I are also major decomposition products for the metal acetylacetonates.1 This fact suggests that at least one possible route for the decomposition of the metal acetylacetonates involves first the formation of acetylacetone followed by decomposition of the latter to the products given in Table I. That acetylacetone is actually found as nearly the sole decomposition product, at the lower temperatures, for the Mn(III) and Cu(II) chelates supports this view.1 The fact that only small amounts of acetylacetone were found among the decomposition products of the other metal acetylacetonates studied may indicate that, in these instances, the decomposition of the initially formed acetylacetone is catalyzed by the
W e s tin g h o u se R e se a r c h L a b o r a to r ie s , P itts b u r g h 3 5 , P e n n s y lv a n ia
R e c e iv e d J u l y 1 6 , 1 9 5 9
In previous work concerning the pyrolysis of the metal acetylacetonates (I), acetylacetone itself was observed in several instances as one of the major
(1) J. von Hoene, R. G. Charles and W. M. Hickam, T his Journal, 62, 1098 (1958).
(2) On the basis of volatile decomposition products, sodium aeetyl- acetonate appears to be more stable than acetylacetone. The decomposition of the former compound may, however, involve non-volatile pyrolysis products which cannot be detected by the mass spectrometer (ref. 1).
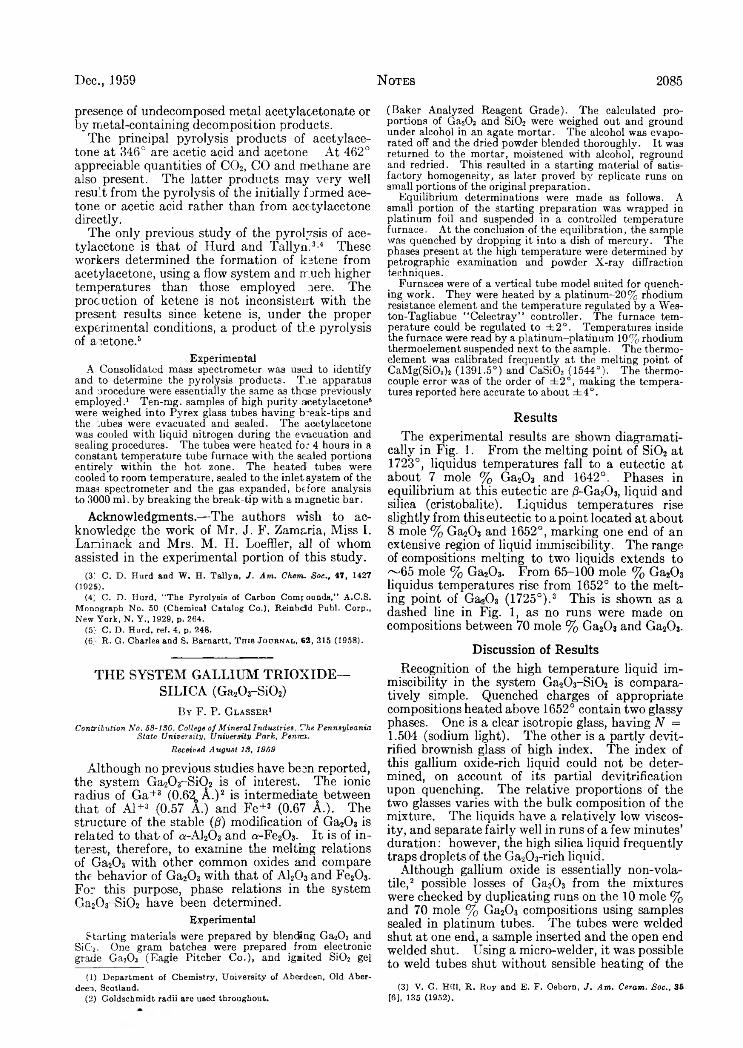
Dec., 1959 N otes 2085
presence of undecomposed metal acetylacetonate or by metal-containing decomposition products.
The principal pyrolysis products of acetylace- tone at 346° are acetic acid and acetone At 462° appreciable quantities of C02, CO and methane are also present. The latter products may very well result from the pyrolysis of the initially farmed acetone or acetic acid rather than from acetylacetone directly.
The only previous study of the pyrolysis of acetylacetone is that of Hurd and Tallyn.3-4 These workers determined the formation of ketene from acetylacetone, using a flow system and much higher temperatures than those employed lere. The procuction of ketene is not inconsistent with the present results since ketene is, under the proper experimental conditions, a product of the pyrolysis of acetone.6
ExperimentalA Consolidated mass spectrometer was used to identify
and to determine the pyrolysis products. The apparatus and procedure were essentially the same as those previously employed. 1 Ten-mg. samples of high purity acetylacetone6
were weighed into Pyrex glass tubes having break-tips and the rubes were evacuated and sealed. The acetylacetone was cooled with liquid nitrogen during the evacuation and sealing procedures. The tubes were heated for 4 hours in a constant temperature tube furnace with the sealed portions entirely within the hot zone. The heated tubes were cooled to room temperature, sealed to the inlet system of the mass spectrometer and the gas expanded, before analysis to 3000 ml. by breaking the break-tip with a magnetic bar.
Acknowledgments.— The authors wish to acknowledge the work of Mr. J. F. Zamaria, Miss I. Laminack and Mrs. M. H. Loeffler, all of whom assisted in the experimental portion of this study.
(31 C. D . Hurd and W. H . Tallyn, J . A m . Chum . S o c . , 47 , 1427(1925).
(4' G. D. Hurd, “The PyrolyBis of Carbon Compounds,“ A.C.S. Monograph No. 50 (Chemical Catalog Co.), Reinhcdd Publ. Corp., New York, N. Y „ 1929, p. 264.
(5} C. D. Hurd, ref. 4, p. 248.(6) R. G. Charles and S. Barnartt, T h is J o u r n a l , 62 , 315 (1958).
THE SYSTEM GALLIUM TRIOXIDE— SILICA (Ga20x-Si02)
By F. P. G l a s s e s 1
C o n tr ib u tio n N o . 5 8 -1 8 0 , C ollege o f M in e r a l I n d u s tr ie s , T h e P e n n sy lv a n ia S ta te U n iv er s ity , U n iv er s ity P a rk , P e n r a .
R ece iv ed A u g u s t 1 8 , 1 9 5 9
Although no previous studies have been reported, the system Ga20 3-Si02 is of interest. The ionic radius of Ga+3 (0.62oA.)2 is intermediate between that of Al+S (0.57 A.) and Fe+3 (0.67 A.). The structure of the stable (jS) modification of Ga20 3 is related to that- of a-Al20 3 and a-Fe20 3. It is of interest, therefore, to examine the melting relations of Ga20 3 with other common oxides and compare the behavior of Ga20 3 with that of A120 3 and Fe20 3. For this purpose, phase relations in the system Ga20 3-Si02 have been determined.
ExperimentalStarting materials were prepared by blending; Ga20 3 and
SiG2. One gram batches were prepared from electronic grade Ga20 3 (Eagle Pitcher Co.), and ignited Si02 gel
(1) Department of Chemistry, University of Aberdeen, Old Aberdeen. Scotland.
(2) Goldschmidt radii are used throughout.
(Baker Analyzed Reagent Grade). The calculated proportions of Ga20 3 and Si02 were weighed out and ground under alcohol in an agate mortar. The alcohol was evaporated off and the dried powder blended thoroughly. It was returned to the mortar, moistened with alcohol, reground and redried. This resulted in a starting material of satisfactory homogeneity, as later proved by replicate runs on small portions of the original preparation.
Equilibrium determinations were made as follows. A small portion of the starting preparation was wrapped in platinum foil and suspended in a controlled temperature furnace. At the conclusion of the equilibration, the sample was quenched by dropping it into a dish of mercury. The phases present at the high temperature were determined by petrographic examination and powder X-ray diffraction techniques.
Furnaces were of a vertical tube model suited for quenching work. They were heated by a platinum-20% rhodium resistance element and the temperature regulated by a Wes- ton-Tagliabue “Celectray” controller. The furnace temperature could be regulated to ±2°. Temperatures inside the furnace were read by a platinum-platinum 1 0 % rhodium thermoelement suspended next to the sample. The thermoelement was calibrated freauently at the melting point of CaMg(Si03 ) 2 (1391.5°) and CaSi03 (1544°). The thermocouple error was of the order of ± 2 °, making the temperatures reported here accurate to about ±4°.
ResultsThe experimental results are shown diagramati-
cally in Fig. 1. From the melting point of Si02 at 1723°, liquidus temperatures fall to a eutectic at about 7 mole % Ga20 3 and 1642°. Phases in equilibrium at this eutectic are /3-Ga20 3, liquid and silica (cristobalite). Liquidus temperatures rise slightly from this eutectic to a point located at about 8 mole % Ga20 3 and 1652°, marking one end of an extensive region of liquid immiscibility. The range of compositions melting to two liquids extends to ■~65 mole % Ga20 3. From 65-100 mole % Ga20 3 liquidus temperatures rise from 1652° to the melting point of Ga-Ah (1725°).3 This is shown as a dashed line in Fig. 1, as no runs were made on compositions between 70 mole % Ga20 3 and Ga20 3.
Discussion of ResultsRecognition of the high temperature liquid im
miscibility in the system Ga20 3-Si02 is comparatively simple. Quenched charges of appropriate compositions heated above 1652° contain two glassy phases. One is a clear isotropic glass, having N = 1.504 (sodium light). The other is a partly devit- rified brownish glass of high index. The index of this gallium oxide-rich liquid could not be determined, on account of its partial devitrification upon quenching. The relative proportions of the two glasses varies with the bulk composition of the mixture. The liquids have a relatively low viscosity, and separate fairly well in runs of a few minutes’ duration: however, the high silica liquid frequently traps droplets of the Ga20 3-rich liquid.
Although gallium oxide is essentially non-volatile,2 possible losses of Ga20 3 from the mixtures were checked by duplicating runs on the 10 mole % and 70 mole % Ga20 3 compositions using samples sealed in platinum tubes. The tubes were welded shut at one end, a sample inserted and the open end welded shut. Using a micro-welder, it was possible to weld tubes shut without sensible heating of the
(3) V. G. Hill, R . Roy and E. F. Osborn, J . A m . C era m . Soc., 35 [6], 135 (1952),
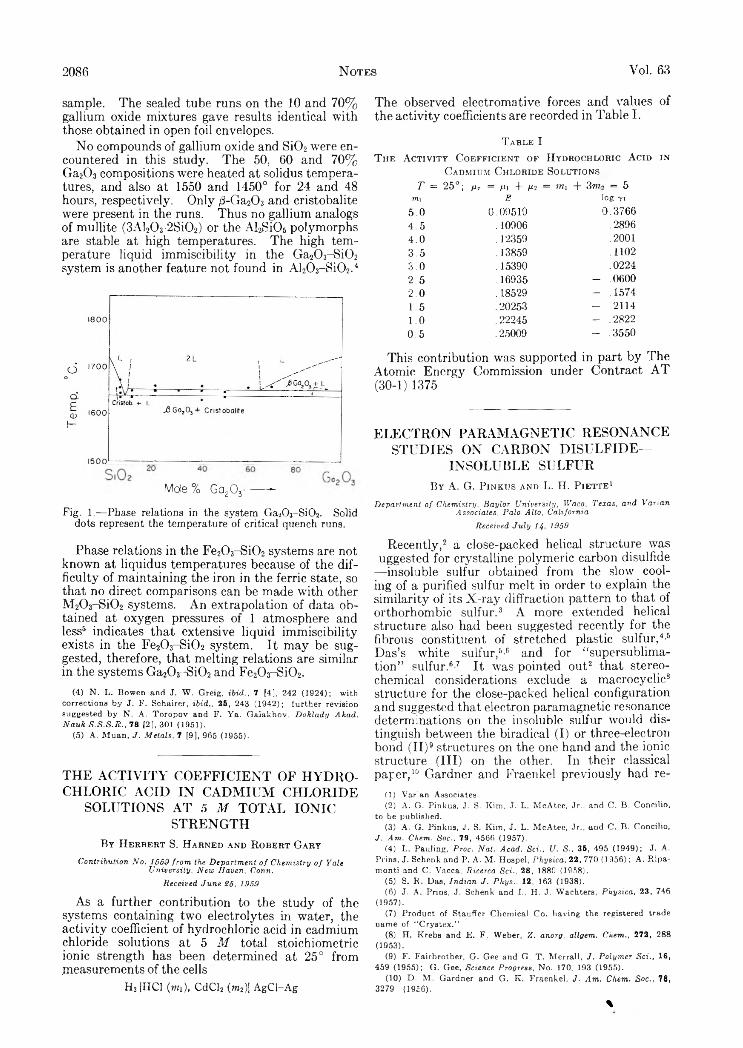
2086 N otes Vol. 63
sample. The sealed tube runs on the 10 and 70% gallium oxide mixtures gave results identical with those obtained in open foil envelopes.
No compounds of gallium oxide and Si02 were encountered in this study. The 50, 60 and 70% Ga20 3 compositions were heated at solidus temperatures, and also at 1550 and 1450° for 24 and 48 hours, respectively. Only ¡3 -Ga20 3 and cristobalite were present in the runs. Thus no gallium analogs of mullite (3Al20 3-2Si02) or the ARSiOs polymorphs are stable at high temperatures. The high temperature liquid immiscibility in the Ga20 3-Si02 system is another feature not found in Al20 3-Si02.4
Mole % GcijOj------ -
Fig. 1 .—Phase relations in the system Ga20 3-Si0 2 . Soliddots represent the temperature of critical quench runs.
Phase relations in the Fe20 3-Si02 systems are not known at liquidus temperatures because of the difficulty of maintaining the iron in the ferric state, so that no direct comparisons can be made with other M20 3-Si02 systems. An extrapolation of data obtained at oxygen pressures of 1 atmosphere and less6 indicates that extensive liquid immiscibility exists in the Fe20 3-Si02 system. It may be suggested, therefore, that melting relations are similar in the systems Ga20 3-Si02 and Fe20 3-Si02.
(4) N. L. Bowen and J. W . Greig, ib id ., 7 [4], 242 (1924); with corrections by J. F. Schairer, ibid ., 25, 243 (1942); further revision suggested b y N. A. T oropov and F. Ya. Galakhov, D oklady Akad. N auk S .S .S .R ., 78 [2], 301 (1951).
(5) A. Muan, J . M eta ls, 7 [9], 965 (1955).
THE ACTIVITY COEFFICIENT OF HYDROCHLORIC ACID IN CADMIUM CHLORIDE
SOLUTIONS AT 5 M TOTAL IONIC STRENGTH
B y H e r b e r t S. H a r n e d a n d R o b e r t G a r y
Contribution N o. 1559 from the D epartm ent o f Chem istry o f Yale U niversity, N ew H aven, Conn.
R eceived Jun e £5, 1959
As a further contribution to the study of the systems containing two electrolytes in water, the activity coefficient of hydrochloric acid in cadmium chloride solutions at 5 M total stoichiometric ionic strength has been determined at 25° from .measurements of the cells
H2 |HC1 («*,), CdCl2 (m 2)\ AgCl-Ag
The observed electromative forces and values of the activity coefficients are recorded in Table I.
T a b l e IT h e A c t i v i t y C o e f f ic i e n t o f H y d r o c h l o r ic A c id in
C a d m iu m C h l o r id e S o l u t io n s
T = 25°; Mr = AH T M2 = ?«i + 3 m . = 5mi E log YI
5.0 0.09510 0.37664.5 .10906 .28964.0 .12359 . 2 0 0 1
3.5 .13859 . 1 1 0 2
3.0 .15390 .02242.5 .16935 - .06002 . 0 .18529 - .15741.5 .20253 - .21141 . 0 .22245 - .28220.5 .25009 - .3550
This contribution was supported in part by The Atomic Energy Commission under Contract AT (30-1) 1375
ELECTRON PARAMAGNETIC RESONANCE STUDIES ON CARBON DISULFIDE—
INSOLUBLE SULFURBy A. G. P i n k u s a n d L. H. P i e t t e 1
D epartm ent o f Chemistry, B aylor University, W aco, Texas, and Varían Associates, Palo Alto, California
Received J u ly 14, 1959
Recently,2 a close-packed helical structure was uggested for crystalline polymeric carbon disulfide
—insoluble sulfur obtained from the slow cooling of a purified sulfur melt in order to explain the similarity of its X-ray diffraction pattern to that of orthorhombic sulfur.3 A more extended helical structure also had been suggested recently for the fibrous constituent of stretched plastic sulfur,4'5 Das’s white sulfur,5'6 and for “supersublimation” sulfur.6'7 It was pointed out2 that stereochemical considerations exclude a macrocyclic8 structure for the close-packed helical configuration and suggested that electron paramagnetic resonance determinations on the insoluble sulfur would distinguish between the biradical (I) or three-electron bond (II)9 structures on the one hand and the ionic structure (III) on the other. In their classical paper,10 Gardner and Fraenkel previously had re-
(1) Varían Associates.(2) A. G. Pinkus, J. S. Kim, J. L. McAtee, Jr., and C. B. Concilio,
to be published.(3) A. G. Pinkus, J. S. Kim, J. L. McAtee, Jr., and C. B. Concilio,
J. A m . Chem. Soc., 79, 4566 (1957).(4) L. Pauling, Proc. N at. Acad. Sci., U . S., 35, 495 (1949); J. A.
Prins, J. Schenk and P. A. M . Hospel, Physica, 22, 770 (1956); A. Ripa- monti and C. Vacca, R icerca Sci., 28, 1880 (1958).
(5) S. R . Das, Indian J . P hys.. 12, 163 (1938).(6) J. A. Prins, J. Schenk and L. H . J. Wachters, P hysica, 23, 746
(1957).(7) Product of Stauffer Chemical Co. having the registered trade
name of “ C rystex.'’(8) H. Krebs and E. F. Weber, Z. anorg. allgem. Chem., 272, 288
(1953).(9) F. Fairbrother, G . Gee and G. T . Merrall, J . Polym er S ci., 16,
459 (1955); G. Gee, Science Progress, No. 170, 193 (1955).(10) D . M . Gardner and G. K . Fraenkel, J . A m . Chem. S oc., 78,
3279 (1956).
%
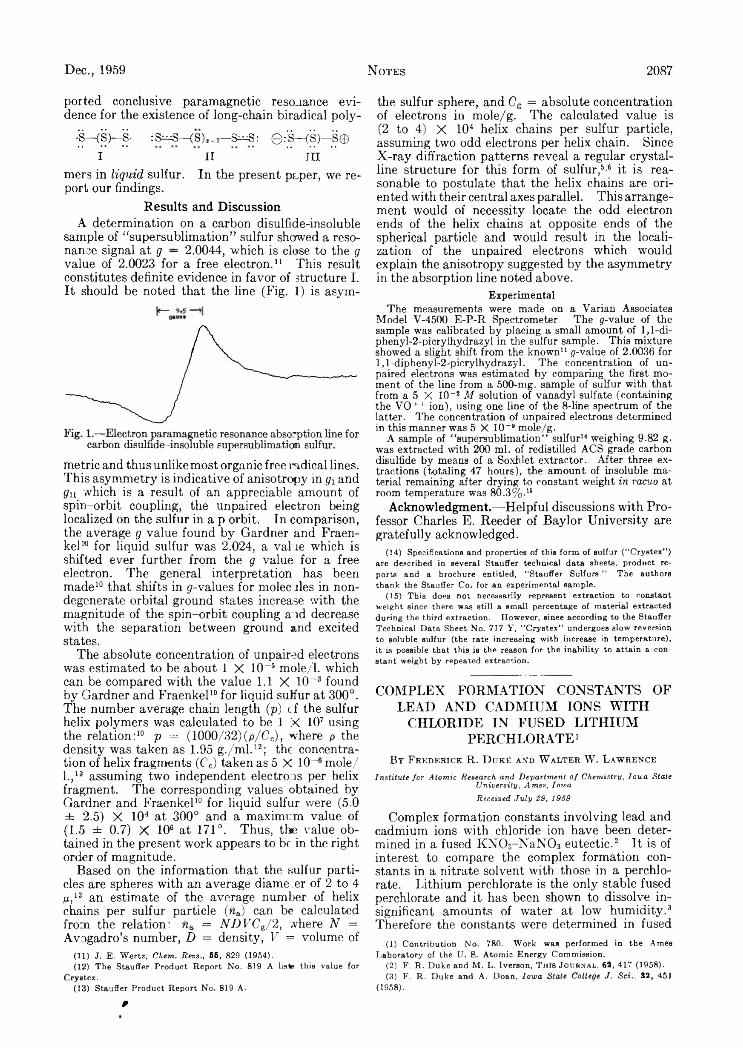
Dec., 1959 N otes 2087
ported conclusive paramagnetic resonance evidence for the existence of long-chain biradical poly-
43— ( S ) — S - : S ^ S — ( S ) i _ 2 — S ^ S : Q : ' S — ( S ) — S ©
I II ’ mmers in l i q u i d sulfur. In the present paper, we report our findings.
Results and DiscussionA determination on a carbon disulfide-insoluble
sample of “supersublimation” sulfur showed a resonance signal at g — 2.0044, which is close to the g value of 2.0023 for a free electron.11 This result constitutes definite evidence in favor of structure I. It should be noted that the line (Fig. 1) is asym
metric and thus unlike most organic free radical lines. This asymmetry is indicative of anisotropy in g x and g n which is a result of an appreciable amount of spin-orbit coupling, the unpaired electron being localized on the sulfur in a p orbit. In comparison, the average g value found by Gardner and Fraen- kel10 for liquid sulfur was 2.024, a value which is shifted ever further from the g value for a free electron. The general interpretation has been made10 that shifts in g-valucs for molecules in nondegenerate orbital ground states increase with the magnitude of the spin-orbit coupling and decrease with the separation between ground and excited states.
The absolute concentration of unpaired electrons was estimated to be about 1 X 10⁻⁵ mole/1. which can be compared with the value 1.1 X lO“-3 found by Gardner and Fraenkel10 for liquid sulfur at 300°. The number average chain length (p) cf the sulfur helix polymers was calculated to be 1 X 10⁷ using the relation:10 p = (1000/32) (p/Cc), where p the density was taken as 1.95 g./ml.12; the concentration of helix fragments (Cc) taken as 5 X 10 mole/l.,13 assuming two independent electrons per helix fragment. The corresponding values obtained by Gardner and Fraenkel10 for liquid sulfur were (5.0 ± 2.5) X 104 at 300° and a maximum value of (1.5 ± 0.7) X 106 at 171°. Thus, the value obtained in the present work appears to be in the right order of magnitude.
Based on the information that the sulfur particles are spheres with an average diameter of 2 to 4 p,13 an estimate of the average number of helix chains per sulfur particle ( n a) can be calculated from the relation: wa = N D V C J 2 , where N = Avogadro’s number, D = density, V = volume of
(11) J. E . Wertz, Chem. Revs., 5 5 , 829 (1954).(12) The Stauffer Product Report N o. 819 A lists this value for
Crystex.(13) Stauffer Product Report No. 819 A.
the sulfur sphere, and Cg = absolute concentration of electrons in mole/g. The calculated value is (2 to 4) X 104 helix chains per sulfur particle, assuming two odd electrons per helix chain. Since X-ray diffraction patterns reveal a regular crystalline structure for this form of sulfur,5’6 it is reasonable to postulate that the helix chains are oriented with their central axes parallel. This arrangement would of necessity locate the odd electron ends of the helix chains at opposite ends of the spherical particle and would result in the localization of the unpaired electrons which would explain the anisotropy suggested by the asymmetry in the absorption line noted above.
ExperimentalThe measurements were made on a Varian Associates
Model V-4500 E-P-R Spectrometer. The -value of the sample was calibrated by placing a small amount of 1 ,1 -di- phenyl-2-picrylhydrazyl in the sulfur sample. This mixture showed a slight shift from the known11 0 -value of 2.0036 for l,l-diphenyl-2-picrylhydrazyl. The concentration of unpaired electrons was estimated by comparing the first moment of the line from a 500-mg. sample of sulfur with that from a 5 X 10 ~ 2 M solution of vanadyl sulfate (containing the VO++ ion), using one line of the 8 -line spectrum of the latter. The concentration of unpaired electrons determined in this manner was 5 X 10"* mole/g.
A sample of “supersublimation” sulfur14 weighing 9.82 g. was extracted with 200 ml. of redistilled ACS grade carbon disulfide by means of a Soxhlet extractor. After three extractions (totaling 47 hours), the amount of insoluble material remaining after drying to constant weight in vacuo at room temperature was 80.3%.15
Acknowledgment.—Helpful discussions with Professor Charles E. Reeder of Baylor University are gratefully acknowledged.
(14) Specifications and properties o f this form of sulfur (“ Crystex") are described in several Stauffer technical data sheets, product reports and a brochure entitled, "Stauffer Sulfurs." The authors thank the Stauffer Co. for an experimental sample.
(15) This does not necessarily represent extraction to constant weight since there was still a small percentage of material extracted during the third extraction. However, sinee according to the Stauffer Technical Data Sheet No. 717 Y , “ Crystex" undergoes slow reversion to soluble sulfur (the rate increasing with increase in temperature), it is possible that this is the reason for the inability to attain a constant weight by repeated extraction.
COMPLEX FORMATION CONSTANTS OF LEAD AND CADMIUM IONS WITH
CHLORIDE IN FUSED LITHIUM PERCHLORATE1
B y F r e d e r ic k R. D u k e a n d W a l t e r W . L a w r e n c e
Institute fo r A tom ic Research and D epartm ent o f Chemistry, Iow a State U niversity , A m es, Iow a
R eceived J u ly 29, 1959
Complex formation constants involving lead and cadmium ions with chloride ion have been determined in a fused KNOs-N aN 03 eutectic.2 It is of interest to compare the complex formation constants in a nitrate solvent with those in a perchlorate. Lithium perchlorate is the only stable fused perchlorate and it has been shown to dissolve insignificant amounts of water at low humidity.3 Therefore the constants were determined in fused
(1) Contribution N o. 780. W ork was performed in the Ames Laboratory of the U. S. Atom ic Energy Commission.
(2) F. R. Duke and M . L. Iverson, T his Journal, 6 2 , 417 (1958).(3) F. R . Duke and A. Doan, Iow a State College J . S et., 3 2 , 451
(1958).
P
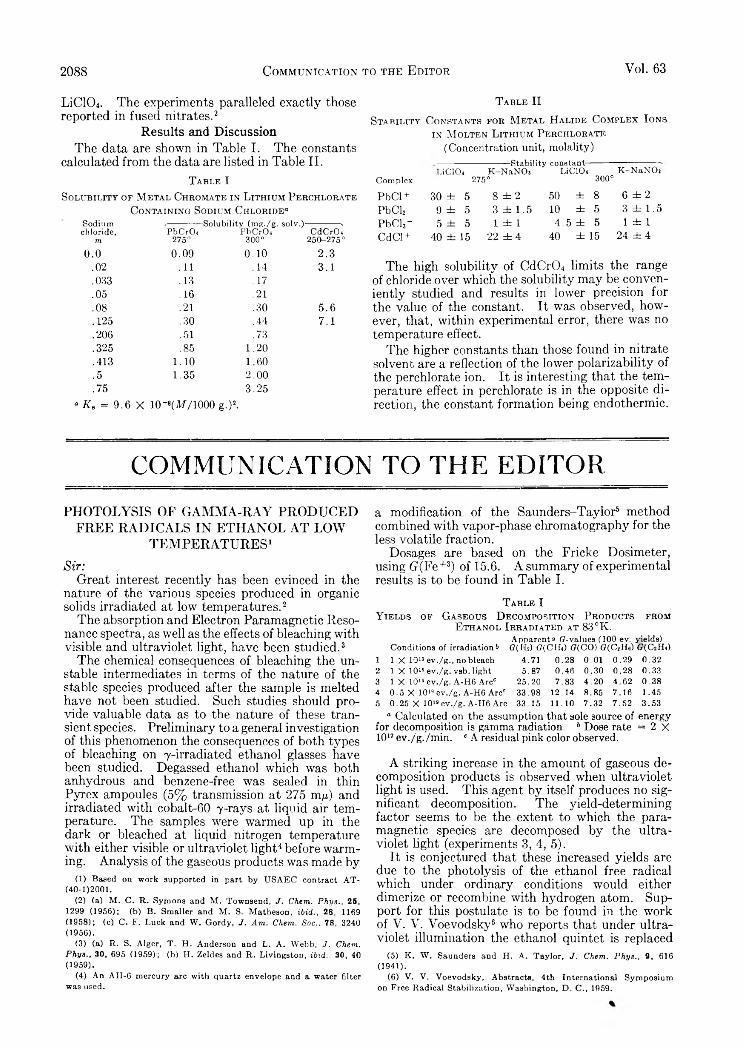
2088 Communication to the E ditor Voi. 63
LiC1 0 4 . The experiments paralleled exactly those reported in fused nitrates.2
Results and DiscussionThe data are shown in Table I. The constants
calculated from the data are listed in Table II.T a b l e I
S o l u b il it y o f M e t a l C h r o m a t e in L it h iu m P e r c h l o r a t e C o n t a in in g S o d iu m C h l o r id e “
Sodiumchloride,
mPbCrOi
275°
-Solubility (m g./g . solv.)- PbCrO*
300°CdCrOl
250-275°0.0 0.09 0.10 2.3
.02 .11 .14 3.1
.033 .13 .17
.05 .16 .21
.08 .21 .30 5.6
.125 .30 .44 7.1
.206 .51 .73
.325 .85 1.20
.413 1.10 1.60
.5 1.35 2.00
.75 3.25“ Ks = 9.6 X 10⁻⁸(M/1000 g.)2.
T a b l e I I
S t a b i l i t y C o n s t a n t s f o r M e t a l H a l id e C o m p l e x I o n s in M o l t e n L it h iu m P e r c h l o r a t e
(Concentration unit, molality)
LiClOi-------------- Stability constant—
K -N aN O , LiClOi K -N aN O iComplex 275° 300°
PbCl + 3 0 ± 5 8 ± 2 5 0 ± 8 6 ± 2
PbCl2 9 ± 5 3 ± 1 . 5 10 ± 5 3 ± 1 . 5
PbCl3- 5 ± 5 1 ± 1 4 . 5 ± 5 1 ± 1
CdCl + 4 0 ± 1 5 2 2 ± 4 4 0 ± 1 5 2 4 ± 4
The high solubility of CdCr04 limits the range of chloride over which the solubility may be conveniently studied and results in lower precision for the value of the constant. It was observed, however, that, within experimental error, there was no temperature effect.
The higher constants than those found in nitrate solvent are a reflection of the lower polarizability of the perchlorate ion. It is interesting that the temperature effect in perchlorate is in the opposite direction, the constant formation being endothermic.
COMMUNICATION TO THE EDITORPHOTOLYSIS OF GAMMA-RAY PRODUCED
FREE RADICALS IN ETHANOL AT LOW TEMPERATURES1
S i r :
Great interest recently has been evinced in the nature of the various species produced in organic solids irradiated at low temperatures.2
The absorption and Electron Paramagnetic Resonance spectra, as well as the effects of bleaching with visible and ultraviolet light, have been studied.3
The chemical consequences of bleaching the unstable intermediates in terms of the nature of the stable species produced after the sample is melted have not been studied. Such studies should provide valuable data as to the nature of these transient species. Preliminary to a general investigation of this phenomenon the consequences of both types of bleaching on y-irradiated ethanol glasses have been studied. Degassed ethanol which was both anhydrous and benzene-free was sealed in thin Pyrex ampoules (5% transmission at 275 m/t) and irradiated with cobalt-60 y-rays at liquid air temperature. The samples were warmed up in the dark or bleached at liquid nitrogen temperature with either visible or ultraviolet light4 before warming. Analysis of the gaseous products was made by
(1) Based on work supported in part b y USAEC contract A T- (40-1)2001.
(2) (a) M . C. R . Symons and M . Townsend, J, Chem. P h ys., 2 5 ,1299 (1956); (b) B. Smaller and M . S. Matheson, ib id ., 2 8 , 1169(1958) ; (c) C. F. Luck and W . Gordy, J . A m . Chem. S oc., 7 8 , 3240 (1956).
(3) (a) R. S. Alger, T . H. Anderson and L. A. Webb, J. Chem . Phys., 3 0 , 695 (1959); (b) H. Zeldes and R . Livingston, ib id ., 3 0 , 40(1959) .
(4) An AII-6 mercury arc with quartz envelope and a water filter was used.
a modification of the Saunders-Taylor5 method combined with vapor-phase chromatography for the less volatile fraction.
Dosages are based on the Fricke Dosimeter, using (?(Fe+3) of 15.6. A summary of experimental results is to be found in Table I.
T a b l e IY ie l d s o f G a s e o u s D e c o m p o s it io n P r o d u c t s f r o m
E t h a n o l I r r a d ia t e d a t 83 °K.Apparent“ (?-values (100 ev. yields)
Conditions of irradiation b G( Hz) (7( C f ft) G (G O ) G(CaHa) (.(GzH,)1 1 X 10¹⁹ ev ./g ., no bleach 4.71 0.28 0.01 0 .29 0.322 1 X 10¹⁹ ev ./g . vsb. light 5.87 0.46 0 .30 0.28 0.333 1 X IO*9 ev ./g . A-H6 Arc' 25.20 7.83 4.20 4.62 0.384 0 .5 X 101» ev ./g . A-H6 A rc' 33.98 12.14 8.85 7.16 1.455 0 .25 X 10>9ev ./g . A-H6 Arc 33.15 11.10 7.32 7.52 3 .53
“ Calculated on the assumption that sole source of energy for decomposition is gamma radiation. 6 Dose rate = 2 X 10¹⁷ ev./g./min. ' A residual pink color observed.
A striking increase in the amount of gaseous decomposition products is observed when ultraviolet light is used. This agent by itself produces no significant decomposition. The yield-determining factor seems to be the extent to which the paramagnetic species are decomposed by the ultraviolet light (experiments 3, 4, 5).
It is conjectured that these increased yields are due to the photolysis of the ethanol free radical which under ordinary conditions would either dimerize or recombine with hydrogen atom. Support for this postulate is to be found in the work of V. V. Voevodsky6 who reports that under ultraviolet illumination the ethanol quintet is replaced
(5) K . W . Saunders and H. A. Taylor, J . Chem. P h ys., 9 , 616 (1941).
(6) V. V. Voevodsky, Abstracts, 4th International Symposium on Free Radical Stabilization, Washington, D . C ., 1959.

Dec,, 1959 Communication to the E ditor 2089
by a quartet with hfs splitting similar tc that found for the methyl radical.
hvCH3CHOH — > CH,- + HCH
Bleaching of the color centers with visible light results in slightly increased yields of CO, H2, CH4
and C02. The yields of ethane and ethylene are unaffected. A likely reaction leading to these enhancements is the transformation of some photosensitive species to the ethanol free radical.C h e m i s t r y D e p a r t m e n t
F l o r i d a S t a t e U n i v e r s i t y R u s s e l l H. J o h n s e n
T a l l a h a s s e e , F l o r i d a
R e c e i v e d S e p t e m b e r 28, 1959
ADDITIONS AND CORRECTIONS
1956, V ol. 60Donald G. Miller. An Analytical Proof that the Ex
tremum of the Thermodynamic Probability it a Maximum.Page 538. After equation (13), insert “Equation (13)
may be written more simply as
A? = ( -1 )‘ Sy=i
D o n a l d G. M i l l e r .
Donald G. Miller. On the Stokes-Robinton Hydration Model for Solutions.
Page 1299. In the paragraph after equation (16), replace the three occurrences of z by s.—D o n a l d G. M i l l e r .
£i=l(«J ~ «0 1n
i =i
Page 257. The numerator part of equation (3) should read “(Mei)/(Me2).”
Page 259. In Table I, the headings reading “oift and 0 n3 ” should read “052 and <*52-” Also, in Table II, the headings reading “« 3 , «nj, 0 n3 , 5?d” should read “0 prd, 052, off, o c i i ” Then in Table II, Expt. 12, last column, for “1.36” read “1.86.”—P. K r u m h o l z .
Concetto R. Giuliano, Newton Schwartz and W. K. Wil- marth. The Aqueous Chemistry of Inorganic Free Radicals. II. The Peroxydisulfate Induced Exchange of Oxygen Atoms between Water and Molecular Oxygen and Evidence Regarding the Acidity Constant of the Hydroxyl Radical.
Page 354. Equation (3) should read
I In (1 - F )k
[1 + (Fg/F 8A)]1958, V ol. 62
Richard F. Porter and Richard C. Schoonmaker. Gaseous Species in the Sodium Hydroxide-Potassium Hydroxide System.
Page 489. In Table V, in the reaction Na2(OH)2(g) = 2NaOH(g), Aif“ (kcal.) should read “52.3” instead of “51.4.”—R i c h a r d C. S c h o o n m a k e r .
Jean M. Stokes and R. H. Stokes. The Conductances of Some Electrolytes in Aqueous Sucrose and Mannitol Solutions at 25°.
Page 498. In Table I, the entries for HC1 in 20% sucrose should read: “A° = 287.4, R = 0.674/’ ; and those for HC1 in 40% sucrose should read: “A" = 153.8, R = 0.361.” —R. H. S t o k e s .
Donald G. Miller. The Validity of Onsager’s Reciprocal Relations in Ternary Diffusion.
Page 767. In equation (1 ), “ ad — be = 0” should read “ ad — be ^ 0 .” In the equations below equation (1 ), there should be spaces before c, d, 0 and S. In Table I, the headings LHS3 and RHS _should read LIIS (1), RHS (1). In footnote (8 ), M i and Fi should read M , and V ,. In footnote(9). line 5, the two subscript l’s should be replaced by i’s.— D o n a l d G. M i l l e r .
B. J. Steel, Jean M. Stokes and R. H. Stokes. Individual Ion Mobilities in Mixtures of Non-electrolytes and Water.
Page 1515. The first entry in Table IV (lor H+ in 20% sucrose) should read “H +, X° = 239.2, R = 0.684 (see correction on p . 498).—R . H. S t o k e s .
1959, V ol. 63Virginia D. Hogan and Saul Gordon. A Thermoanalytical
Study of the Binary Oxidant System Barium Perchlorate- Potassium Nitrate.
Page 94. The authors state: “A value of —13.5 kcal./ mole was given for the heat of the reaction 2KN03 + Ba(C1 0 4 )2 -*■ Ba(N03 ) 2 + 2KC104 at 325°C. The corrected value i s —16.5 kcal./mole. The entropy change necessary to make the free energy change of this reaction zero was given as —22.5 cal./deg./mole, whereas the corrected value i s —27.5 cal./deg./mole.—S a u l G o r d o n .
K. Bril, S. Bril and P. Krumholz. Separation of Metal Ions by Means of Ion Exchange Membranes. I. Separation of Rare Earth Mixtures, and of Thorium-Rare Earth Mixtures Using Ethylenediaminetetraacetic Acid.
Page 355. A revised Fig. 1 should be substituted:
io-3 io-2 10—3 1.0(OH-), H/.
Fig. 1.W . K . W T l m a r t h
Donald G. Miller. Ternary Isothermal Diffusion and the Validity of the Onsager Reciprocity Relations.
Page 570. The author notes that: “Equations 5, 13, 14 and 15, and the Ly entries in Table III all have the wrong sign. This does not affect the conclusions nor the absolute numerical values of any tabulated quantities.” In Tables II and V the roman numeral I should be supplied in the headings. In footnote a of Table V, 10 ~2R T should read 10 ~*RT. In equation (11A) on page 578, j i should read j\. In the equalities (23A), the 5 should be replaced by a .—D o n a l d G. M i l l e r .
Peter J. Dunlop. Data for Diffusion in a Concentrated Solution of the System NaCl-KCMEO at 25°. A Test of the Onsager Reciprocal Relation for this Composition.
Page 612. In col. 1, last line of paragraph 3, for “ref. 1” read “ref. 2.” In col. 2, line 3, for “ D a” read “ D a -”
Page 614. In equation (6 b) for subscript “Ck o.j” read “ Ci& o.i-” In Table III, B n should be 0.05732 and ft21
should be 0.03892. The values in Table IV now become:

2090 Communication to the E ditor Vol. 63
I 'l l 0.037s m u / ( R T ) 1.243sr ,2 0.013! W ( R T ) 0.4826r 21 0.013! M 2 , / ( R T ) 0 .4500T22 0.005, W ( R T ) 1 .103s(L12)o X R T X 109 -3 .9s (Ln)0 X R T X 109 13.1s(LîOo X R T X 109 -3 .6s (L22)o X R T X 109 18.79
% ^ e x p - 7 . 9
Page 615. In col. 2 , line 19, for “ 7 .4 % ” read “ — 7.9%.” In col. 2, line 15 from the end, for “KCl-urea-H20 ” read “raffinose-urea-H20.”—P e t e r J. D u n l o p .
C. Botre, V. L. Crescenzi and A. Mele. A Study on Micelle Formation in Colloidal Electrolyte Solutions.
Page 652. Equations (1) and (2) should read:a = y{Ct) naCm)
, 7Co(l — Qt)= ya i --------- Q
P. Krumholz. Spectroscopic Studies on Rare Earth Compounds. III. The Interaction between Neodymium and Perchlorate Ions.
Page 1314. In Table I, the term “(e — eo) X 103” in the table headings should read “ (<= — eo) X 102.”—P. K r u m h o l z .
Kurt A. Kraus and Richard J. Raridon. TemperatureDependence of Some Cation Exchange Equilibria in the Range 0 to 200°.
Page 1903. In col. 2, line 9 below Fig. 1, for “0.7%” read “0.04%.”(1)
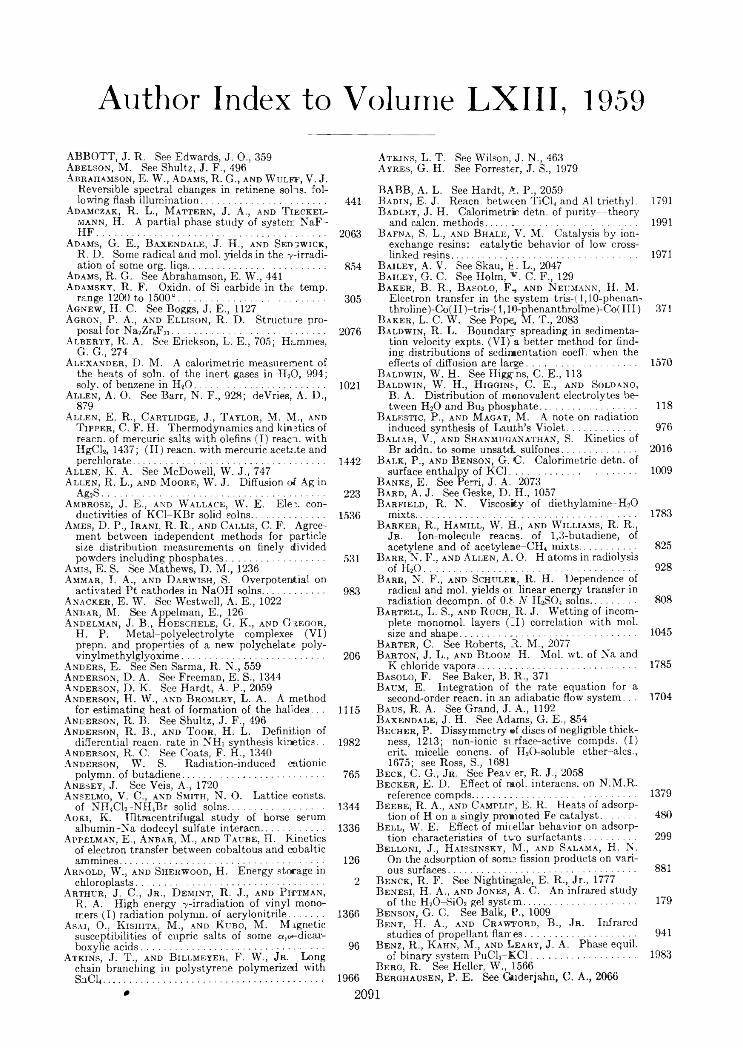
Author Index to Volume LXIII, 1959ABBOTT, J. R. See Edwards, J. O., 359 Abelson, M. See Shultz, J. F., 496 Abrahamson, E. W., Adams, R. G., and W ulff, Y. J.
Reversible spectral changes in retinene solus, following flash illumination..................................... 441
Adamczak, R. L., M attern, J. A., and T ieckel- mann, H. A partial phase study of system NaF-HF..................................................................... 2063
Adams, G. E., B axendale, J. H., and Sedgwick,R. D. Some radical and mol. yields in the 7 -irradi-ation of some org. liqs.................................................. 854
Adams, R. G. See Abrahamson, E. W., 441 Adamsky, R. F. Oxidn. of Si carbide in the temp.
range 1200 to 1500°............................................ 305Agnew, H. C. See Boggs, J. E., 1127 Agron, P. A., a n d E llison, R. D. Structure pro
posal for Na7Zr6F3i.............................................. 2076A l b e r t y , R. A. See Erickson, L. E., 705; Hammes,
G. G., 274Alexander, D. M. A calorimetric measurement of
the heats of soin, of the inert gases in H20, 994;soly. of benzene in H20 ....................................... 1021
Allen, A. O. See Barr, N. F., 928; deVries, A. D.,879
Allen, E. R., Cartlidge, J., T aylor, M. M., and T ipper, C. F. H. Thermodynamics and kinetics of reacn. of mercuric salts with olefins (I) reacn. withHgCl2, 1437; (II) reacn. with mercuric acetate andperchlorate......................................................... 1442
Allen, K. A. See McDowell, W. J., 747 Allen, R. L., and M oore, W. J. Diffusion of Ag in
Ag2S..................................................................... 223Ambrose, J. E., and W allace, W. E. Elei. con
ductivities of K Cl-K Br solid solns........................... 1536Ames, D. P., Irani, R. R., and Callis, C. F. Agree
ment between independent methods for particle size distribution measurements on finely dividedpowders including phosphates................................ 531
Amis, E. S. See Mathews, D. M., 1236 Ammar, I. A., and D arwish, S. Overpotenitial on
activated Pt cathodes in NaOH solns..................... 983Anacker, E. W. See Westwell, A. E., 1022 A n b a r , M. See Appelman, E., 126 Andelman, J. B., H oeschele, G. K., a n d Gregor,
H. P. Metal-polyelectrolyte complexes (VI) prepn. and properties of a new polychelate-poly-vinylmethylglyoxime.......................................... 206
Anders, E. See Sen Sarma, R. N., 559 Anderson, D. A. See Freeman, E. S., 1344 Anderson, D. K. See Hardt, A. P., 2059 Anderson, H. W., and Bromley, L. A. A method
for estimating heat of formation of the halides.. . 1115Anderson, R. B. See Shultz, J. F., 496 Anderson, R. B., and T oor, H. L. Definition of
differential reacn. rate in NH3 synthesis kinetics. . 1982Anderson, R. C. See Coats, F. H., 1340 Anderson, W. S. Radiation-induced cationic
polymn. of butadiene.......................................... 765A nbsey, J. See Veis, A., 1720Anselmo, V. C., and Smith, N. O. Lattice consts.
of N H iC L - N H jB r solid solns............................ 1344A OKI, K. Ultracentrifugal study of horse serum
albumin-Na dodecyl sulfate interacn.................... 1336Appelman, E., Anbar, M., and T attbe, H. Kinetics
of electron transfer between cobaltous and oobalticammines............................................................. 126
Arnold, W., and Sherwood, H. Energy storage inchloroplasts........................................................ 2
Arthur, J. C., Jr ., D emint, R. J., and P ittman,R. A. High energy 7 -irradiation of vinyl monomers (I) radiation polymn. of acrylonitrile............ 1366
Asai, 0., K ishita, M., and K ubo, M. Magnetic susceptibilities of cupric salts of some a,«-dicar-boxylic acids.............................................. 96
Atkins, J. T., and B illmeyer, F. W., Jr. Long chain branching in polystyrene polymerized with SaCL,.................................................................. 1966
A t k in s , L. T. See Wilson, J. N., 463 A y r e s , G. H. See Forrester, J. S., 1979BABB, A. L. See Hardt, A. P., 2059B a d in , E . J. Reacn. between TiCL and A1 triethyl. 1791B a d l e y , J. H. Calorimetric detn. of purity—theory
and calcn. methods............................................. 1991B a f n a ., S. L., a n d B h a l e , V. M. Catalysis by ion-
exchange resins: catalytic behavior of low cross- linked resins....................................................... 1971
B ailey, A. V. See Skau, E. L., 2047 Bailey, G. C. See Holm, v . C. F., 129 B aker, B. R., B asolo, F„ and N eumann, H. M.
Electron transfer in the system tris-(l,10-phenan- throline)-Co(II)-tris-(l,10-phenanthrolme)-Co(III) 371
B aker, L. C. W. See Pope, M. T., 2083 B aldwin, R. L. Boundary spreading in sedimenta
tion velocity expts. (VI) a better method for finding distributions of sedimentation coeff. when theeffects of diffusion are large........................................ 1570
Baldwin, W. H. See Higgms, C. E., 113 Baldwin, W. H., H ig g in s , C. E., and Soldano,
B. A. Distribution of menovalent electrolytes between H2O and Bu3 phosphate............................. 118
Balestic, P., and M agat, M. A note on radiationinduced synthesis of Lauih’s Violet.................... 976
Baliah, V., and Shanmuganathan, S. Kinetics ofBr addn. to some unsatci. sulfones...................... 2016
B alk, P., and Benson, G. C. Calorimetric detn. ofsurface enthalpy of KC1...................................... 1009
B anks, E. See Perri, J. A. 2073B ard, A. J. See Geske, D. H., 1057Barfield, R. N. Viscosity of diethylamine-H20
mixts.................................................................. 1783Barker, R., Hamill, W. EL, and W illiams, R. R.,
Jr. Ion-molecule reacns. of 1,3-butadiene, ofacetylene and of acetylene-CH4 mixts................. 825
Barr, N. F., and Allen, A. 0. H atoms in radiolysisof 1LO............................................................... 928
B arr, N. F., and Schulek, R. H. Dependence of radical and mol. yields on linear energy transfer inradiation decompn. of 0.8 N H0SO4 solns............. 808
B artell, L. S., and Ruch, R. J. Wetting of incomplete monomol. layers (_I) correlation with mol.size and shape................ 1045
Barter, C. See Roberts, R. M., 2077Barton, J. L., and B loom H. Mol. wt. of Na and
K chloride vapors.......... ..................................... 1785Basolo, F. See Baker, B. R., 371Baum, E. Integration of the rate equation for a
second-order reacn. in an adiabatic flow system. . . 1704Baus, R. A. See Grand, J. A., 1192 Baxendale, J. H. See Adams, G. E., 854 Becher, P. Dissymmetry ef discs of negligible thick
ness, 1213; non-ionic surface-active compds. (I) crit. micelle concns. of H20-soluble ether-ales., 1675; see Ross, S., 1681
Beck, C. G., Jr . See Peav.er, R. J., 2058 Becker, E. D. Effect of mol. interaens. on N.M.R.
reference compds................................................. 1379Beebe, R. A., and Campliit, E. R. Heats of adsorp
tion of H on a singly promoted Fe catalyst.......... 480Bell, W. E. Effect of micellar behavior on adsorp
tion characteristics of two surfactants............... 299Belloni, J., H aissinsky, M., and Salama, H. N.
On the adsorption of some fission products on various surfaces........................................................ 881
Benck, R. F. See Nightingale, E. R., Jr., 1777 Benesi, H. A., and Jones, A. C. An infrared study
of the H20-Si02 gel system................................. 179Benson, G. C. See Balk, P., 1009Bent, H. A., and Crawford, B., Jr . Infrared
studies of propellant flair es................................. 941Benz, R., K ahn, M., and Leahy, J. A. Phase equil.
of binary system PuC13-EC1............................... 1983Berg, R. See Heller, W., 1566 Berghausen, P. E. See Older)ahn, C. A., 2066
2091#
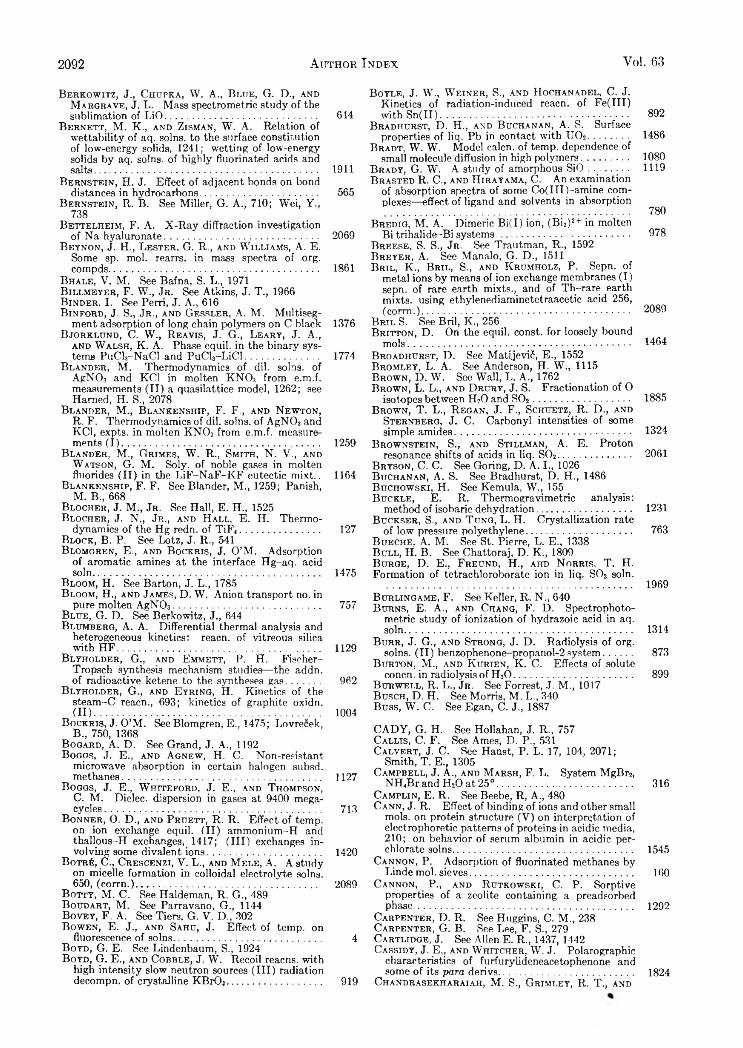
2092 Author I ndex Vol. 63
B e r k o w i t z , J., C h u p k a , W . A., B e u e , G. D., a n d M a r g r a v e , J. L. Mass spectrométrie study of thesublimation of LiO............................................. 6-14
B e r n e t t , M. K., a n d Z i s m a n , W. A. Relation of wettability of aq. soins, to the surface constitution of low-energy solids, 1241; wetting of low-energy solids by aq. soins, of highly fluorinated acids andsalts................................................................... 1911
B e r n s t e i n , H. J. Effect of adjacent bonds on bonddistances in hydrocarbons................................... 565
B e r n s t e i n , R. B. See Miller, G. A., 710; Wei, Y.,738
B e t t e l h e i m , F. A. X-Ray diffraction investigationof Na hyaluronate................................................ 2069
B e y n o n , J. H . , L e s t e r , G. R., a n d W i l l i a m s , A. E.Some sp. mol. rearrs. in mass spectra of org.compds................................................................. 1861
B h a l e , V. M. See Bafna, S. L., 1971 B i l l m e y e r , F. W., J r . See Atkins, J. T., 1966 B i n d e r , I. See Pern, J. A., 616B i n f o r d , J. S., J r ., a n d G e s s l e r , A. M. Multiseg
ment adsorption of long chain polymers on C black 1376 B j o r k l u n d , C. W., R e a v i s , J. G., L e a r y , J. A.,
a n d W a l s h , K . A. Phase equil. in the binary systems PuCh-NaCl and PuCl3-LiCl...................... 1774
B l a n d e r , M. Thermodynamics of dil. solns. of AgN03 and KC1 in molten KN03 from e.m.f. measurements (II) a quasilattice model, 1262; see Hamed, H. S., 2078
B l a n d e r , M., B l a n k e n s h i p , F. F., a n d N e w t o n ,R. F. Thermodynamics of dil. solns. of AgN03 and KC1, expts. in molten KN03 from e.m.f. measurements (I)........................................................... 1259
B l a n d e r , M., G r i m e s , W. R., S m i t h , N. V., a n d W a t s o n , G. M. Soly. of noble gases in molten fluorides (II) in the LiF-NaF-ICF eutectic mixt.. 1164
B l a n k e n s h i p , F. F. See Blander, M., 1259; Panish,M. B., 6 6 8
B l o c h e r , J. M., J r . See Hall, E. H., 1525 B l o c h e r , J. N., Jr., a n d H a l l , E. H. Thermo
dynamics of the Hg redn. of TiF(....................... 127B l o c k , B. P. See Lotz, J. R., 541 B l o m g r e n , E., a n d B o c k r i s , J. O’M. Adsorption
of aromatic amines at the interface Hg-aq. acidsoln...................................................................... 1475
B l o o m , H. See Barton, J. L., 1785B l o o m , H., a n d J a m e s , D. W. Anion transport no. in
pure molten AgN03 ........................................... 757B l u e , G. D. See Berkowitz, J., 644 B l i j m b e r g , A. A. Differential thermal analysis and
heterogeneous kinetics: reacn. of vitreous silicawith HF............................................................... 1129
B l y h o l d e r , G., a n d E m m e t t , P. H. Fischer- Tropsch synthesis mechanism studies—the addn.of radioactive ketene to the syntheses gas.......... 962
B l y h o l d e r , G., a n d E y r i n g , H. Kinetics of the steam-C reacn., 693; kinetics of graphite oxidn.(II).................................................................... 1004
B o c k r i s , J. O’M. See Blomgren, E., 1475; Lovrecek,B„ 750, 1368
B o g a r d , A. D. See Grand, J. A., 1192 B o g g s , J . E., a n d A g n e w , H . C. Non-resistant
microwave absorption in certain halogen subsd.methanes............................................................ 1127
B o g g s , J. E., W h i t e f o r d , J. E . , a n d T h o m p s o n ,C. M. Dielec, dispersion in gases at 9400 megacycles................................................................. 713
B o n n e r , O . D., a n d P r u e t t , R. R. Effect of temp, on ion exchange equil. (II) ammonium-H and thallous-H exchanges, 1417; (III) exchanges involving some divalent ions.................................. 1420
B o t r 6 , C., C r e s c e n z i , V. L., a n d M e l e , A. A study on micelle formation in colloidal electrolyte solns.650, (corrn.)...................................................... 2089
B o t t y , M. C. See Haldeman, R. G., 489B o u d a r t , M. See Parravano, G., 1144B o v e y , F. A. See Tiers, G. V. D., 302B o w e n , E. J., a n d S a h u , J. Effect of temp, on
fluorescence of solns............................................ 4
B o y d , G. E. See Lindenbaum, S., 1924 B o y d , G. E., a n d C o b b l e , J. W. Recoil reaens. with
high intensity slow neutron sources (III) radiation decompn. of crystalline KBrOj............................ 919
B o y l e , J. W., W e i n e r , S., a n d H o c h a n a d e l , C. J. Kinetics of radiation-induced reacn. of Fe(III)with Sn(II)........................................................ 892
B r a d h u r s t , D. H . , a n d B u c h a n a n , A. S . Surfaceproperties of liq. Pb in contact -with U02 ............ 1486
B r a d t , W. W. Model calcn. of temp, dependence ofsmall molecule diffusion in high polymers.............. 1080
B r a d y , G. W. A study of amorphous SiO............ 1119B r a s t e d R. C., a n d H i r a y a m a , C. An examination
of absorption spectra of some Co(ITI)-amine complexes—effect of ligand and solvents in absorption
.......................................................... ............. 780B r e d i g , M. A. Dimeric Bi(I) ion, (Bi2 ) 2 + in molten
Bi trihalide-Bi systems........................................ 978B r e e s e , S. S., Jr. See Trautman, R., 1592 B r e y e r , A. See Manalo, G. D., 1511 B r i l , K., B r i l , S., a n d K r u m h o l z , P. Sepn. of
metal ions by means of ion exchange membranes (I) sepn. of rare earth mixts., and of Th-rare earth mixts. using ethylenediaminetetraacetic acid 256,(corm.).............................................................. 2089
B r i l S. See Bril, K., 256B r i t t o n , D. On the equil. const, for loosely bound
mois................................................................... 1464B r o a d h u r s t , D. See Matijevii, E., 1552 B r o m l e y , L. A. See Anderson, H. W., 1115 B r o w n , D. W. See Wall, L. A., 1762 B r o w n , L. L., a n d D r u r y , J. S. Fractionation of O
isotopes between H20 and S02 ............................. 1885B r o w n , T. L., R e g a n , J. F., S c h u e t z , R. D., a n d
S t e r n b e r g , J. C. Carbonyl intensities of somesimple amides..................................................... 1324
B r o w n s t e i n , S., a n d S t i l l m a n , A. E. Protonresonance shifts of acids in liq. S02 ....................... 2061
B r y s o n , C. C. See Goring, D. A. I., 1026 B u c h a n a n , A. S. See Bradhurst, D. H., 1486 B u c h o w s k i , H. See Kemula, W., 155B u c k l e , E. R. Thermogravimetric analysis:
method of isobaric dehydration................ . .......... 1231B u c k s e r , S . , a n d T u n g , L. H. Crystallization rate
of low pressure polyethylene............................... 763B u e c h e , A. M. See St. Pierre, L. E., 1338 B u l l , H. B. See Chattoraj, D. K., 1809 B u r g e , D. E., F r e u n d , H., a h d N o r r i s , T. H. Formation of tetrachloroborate ion in liq. S02 soin.
.......................................................................... 1969B u r l i n g a m e , F. See Keller, R. N., 640 B u r n s , E. A., a n d C h a n g , F. D. Spectrophoto-
metric study of ionization of hydrazoic acid in aq.soln.................................................................... 1314
B u r r , J. G., a n d S t r o n g , J. D. Radiolysis of org.solns. (II) benzophenone-propanol-2 system........ 873
B u r t o n , M., a n d K u r i e n , K. C. Effects of soluteconen. in rad iolysis of H20 ...................................... 899
B u r w e l l , R. L., Jr. See Forrest, J. M., 1017 B u s c h , D. H. See Morris, M. L., 340 Buss, W. C. See Egan, C. J., 1887
CADY, G. H. See Hollahan, J. R„ 757 C a l l i s , C. F. See Ames, D. P., 531 C a l v e r t , J. C. See Hanst, P. L. 17, 104, 2071;
Smith, T. E., 1305C a m p b e l l , J. A., a n d M a r s h , F. L. System MgBr2,
NH4BrandH20at25°......................................... 316C a m p l i n , E. R. See Beebe, R, A., 480 C a n n , J. R. Effect of binding of ions and other small
mols. on protein structure (V) on interpretation of electrophoretic patterns of proteins in acidic media,2 1 0 ; on behavior of serum albumin in acidic per-chlorate solns...................................................... 1545
C a n n o n , P. Adsorption of fluorinated methanes byLinde mol. sieves................................................. 160
C a n n o n , P., a n d R u t k o w s k i , C . P. Sorptive properties of a zeolite containing a preadsorbedphase................................................................ 1292
C a r p e n t e r , D. R. See Huggins, C. M., 238 C a r p e n t e r , G. B. See Lee, F. S., 279 C a r t l i d g e , J. See Allen E. R., 1437, 1442 C a s s i d y , J. E . , a n d W h i t c h e r , W . J. Polarographie
characteristics of furfurylideneacetophenone andsome of its para derivs........................................ 1824
C h a n d r a s e k h a r a i a h , M. S., G r i m l e y , R. T., a n d

Dec., 1959 A uthor I ndex 2093
Margrave, J. L. Heat capacity of Na202 at hightemps................................................................. 1505
Chang, F. D. See Burns, E. A., 1314Chapiro, A. Detn. of free radical yields in radiclysis
of mixts. by the polymn. method.......................... 801Charles, R. G., Hickam, W. M., and von B oene, J.
Pyrolysis of acetylacetone................................... 2084Charles, R. G., and Langer, A. Heat s .abilities
and volatilities of metal chelates derived from8 -hydroxyquinoline............................................. 603
Charlesby, A., Davison, W. H. T., and Lloyd,D. G. Intensity and concn. dependence of someradiation induced reaens. in anthracene soins....... 970
Chattoraj, D. K., and B ull, H. B. Electrophoresisand surface charge.............................................. 1809
Chen, E. S. See Ross, S., 1681Cheney, G. E. See Freiser, H., 250Cheney, G. E., Fernando, Q., and Fre:ser, Ii.
Some metal chelates of mercaptosuccinic s,cid...... 2055Cheselske, F. J., Wallace, W. E., an d Hall, W. K.
Exchange of D gas with the H associated with solidcatalysts (I) model T a-H system.......................... 505
Chessick, J. J. See Yu, Y-F., 1626Chia, Y., and Connick, R. E. Rate of oxidn. of 1“
to hypoiodite ion by hypochlorite ion.................. 1518Chilton, H. T. J., an d Porter, G. Radiation
chem. processes in rigid solus............................... 904Cbu, B., and D iamond, R. M. “HC1 effect” in
anion-resin exchange.................................................... 2021Chupka, W. A. See Berkowitz, J., 644 C iapetta, F. G. See Myers, C. G., 1032 Clark, A. See Holm, V. C. F., 129 Clark, L. W. Mechanism of decompn. of trichloro
acetic acid in aromatics amines, 99; effect if mono- carboxylic acids and their derivs. on the trichloro-acetate ion.......................................................... 1760
Clay, P. G., Johnson, G. R. A., and Weiss, J.Action of “Co -/-radiation on aq. soins, of acetylene .................................................................... 682
Cleveland, J. M. See Keller, R. N., 640Clifford, A. F. Electronegativity of groups.......... 1227Coats, F. H., a n d Anderson, R. C. Mass spectro
métrie studies of thermal reaens. in acetylene-Dand acetylene-d2-H mixts.................................... 1340
Cobble, J. W. See Boyd, G. E., 919Coleman, J. W., a n d R abinowitch, E. Ev dcnce of
photoredn. of chlorophyll in v iv o ........................... 30Collinson, E., D ainton, F. S., a n d G illis, II. A.
Radiation-induced polymn. of isobutene: a liq.phase ionic reacn................................................. 909
Connick, R. E. See Chia, Y., 1518 Connick, R. E., and Poulson, R. E. F 1" nuclear
magnetic resonance of various metal-fluoride complexes in aq. soin................................................ 568
Constabaris, G., Singleton, J. H., and Halsey, G.D., Jr. A precision adsorption apparatus for study of interaens. between gas atoms and surfaces 1350
Cook, H. D., and R ies, H. E., Jr. Adsorption of radiostearic acid and radiostearyl ale. from n-hexa-decane onto solid surfaces................................... 226
Cooke, S. R. B. See Iwasaki, I., 1321 Corcoran, W. H. See Rinker, R. G., 302 Cotton, F. A. See Fischer, A. K., 154 Coughlin, J. P. See Koehler, M. F., 605 Craven, B. M. Mol. configuration of erucis and cis-
nervonic acids in the crystal structures.................. 1296Crawford, B., Jr. See Bent, H. A., 941 Crescenzi, V. L. See Botré, C., 650, (corrr..) 2089 Croft, W. Se'e Wold, A., 447 C’jbicciotti, D. See Keneshea, F. J., Jr. 1112, 1472 Cubicciotti, D., and K eneshea, F. J., Jr Vapor
pressures of Bila over liq. Bi-BiL soins.................. 295C ulbertson, J. L. See Thompson, A. C., 1917 Czanderna, A. W., and Honig, J. M. Internen, of O
with Ti02 ........................................................... 620Czapski, G., Jortner, J., a n d Stein, G. Oxicn. of
iodide ions in aq. soin, by at. H............................. 1769Czapski, G., and Stein, G. Oxidn. of ferrous ions
in aq. soin, by at. H................................... . . . . 850
DAINTON, F. S. Sec Collinson, E., 909 Daniels, F. See Heidt, L. J., 1; Mason, F H.. 300;
Yuan, E. L., 952
D arnell, A. J. See Yosim, S. J., 230 D arnell, A. J., and Y osim, S. J. Some thermo
dynamic properties of solid Bi chlorides............... 1813D arwish, S. See Ammar, I. A., 983Datz, S., and Smith, W. T., Jr . Mol. compn. of Nal
vapor from mol. wt. measurements.......................... 938D avis, R. E. Temp, as a variable during a kinetic
expt....................................................................... 307D avis, W., Jr . See Rutledge, G. P., 166 D avison, W. H. T. See Charlesby, A., 970 D awson, J. P. See Good W. D., 1133 D e Crescente, M. A. See Janz, G. J., 1470 D emint, R. J. See Arthur, J. C., Jr., 1366 D eshpande, K. B., and Marshall, C. E. An inter
pretation of electrochem. measurements on amontmorillonite clay.......................................... 1659
D e s p ic , A. See Lovreêek, B., 750 D e V r ie s , D. B. See Dirkse, T. P., 107 D e w h u r s t , H. A. Radiation chemistry of org.
compds (IV) cyclohexane, 813; chem. reaens. of active N................................................................ 1976
D ia m o n d , R. M. Salting effects in solvent extraction behavior of in org. compds., 659; see Chu, B., 2021
D ia m o n d , W. J. Effect of temp, on the phase equil.of polyphosphates............................................... 123
D ia m o n d , W. J., a n d G r o v e , J. E. Compn. of solidphase in the NaJ\Oio-CaC 1 2-H20 system............. 1528
D il l s , D . H. See Rabinovitch, B. S., 1523 D i r k s e , T. P., a n d D e V r i e s , D . B. Effect of con
tinuously changing potential on the Ag electrode inalkaline soins...................................................... 107
D is m u k e s , E. B. Effect of drop size on the accuracy of surface tension detns. by the sessile dropmethod............................................................... 312
D i x o n , J. M. See La Grange L. D., 2035 D o d d , C. G., a n d K i e l , O. G. Evaluation of Monte
Carlo methods in studying fluid-fluid displacementand wettability in porous rocks............................. 1646
D o l e , M. See Matsuo, H., 837 D o n d e s , S. See Harteck, P., 956 D o r f m a n , L. M., a n d Noble, P. C. Reaens. of gase
ous ions-ammonium ion formation in ionized NH3 980 D o r f m a n , L. M., a n d W il z b a c h , K. E. T labeling
of org. compds. by means of elec, discharge......... 799D r o e g e , J. W. See Wirth, H. E., 149, 152 D o u g h e r t y , T. J., a n d K r i e g e r , I. M. Potential
around a charged colloidal sphere.......................... 1869D o u s l in , D. R. See Good, W. D., 1133 D o u s l in , D. R., M o o r e , R. T., a n d W a d d in g t o n , G.
P -V -T properties of perfluorocyclobutane: equations of state, virial coeffs. and intermol. potentialenergy functions................................................. 1959
D r u r y , J. S. See Brown, L. L., 1885D u b o is , J. T. Sensitized fluorescence of /3-naphthyl-
amine—a study in transfer of electronic energy. . . . 8
D u k e , F. R., a n d L a w r e n c e , W. W, Complex formation consts. of Pb and Cd ions withchloride in fused LiClO*..................................... 2087
D u k e , F. R., a n d P e t e r s o n , N. C. Sn(II) redn. ofMe orange.......................................................... 2076
D u n l o p , P. J. Data for diffusion in a coned, soin, of the system NaCl-CKl-H20 at 25°—a test of the Onsager reciprocal relation for this comp.612, (corrn.)....................................................... 2089
D u n l o p , P. J., a n d C o s t in g , L. J. Use of diffusion and thermodynamic data to test the Onsager reciprocal relation for isothermal diffusion in thesystem NaCl-KCl-H20 at 25°............................ 8 6
D u n n in g , H. N. See Heydegger, H. R., 1613 D u w e l l , E. J., a n d S h e p a r d , J. W. Prepn. and
properties of some synthetic inorg. anion exchangers ............................................................ 2044
Dux, J. P., a n d S t e ig m a n , J. Tracer diffusion coeffs. of Sr ion in aq. polystyrene sulfonic acidsoins................................................................... 269
D y k s t r a , L. J. See La Grange, L. D., 2035
EBSWORTH, E. A. V., a n d W e i l , J. A. Paramagnetic resonance absorption in peroxo-dicobalt complexes ................................................................. 1890
E c k s t r o m , H. C. See Pickering, H. L., 512 E d e l h o c h , H. Dénaturation of pepsin (V) electro
static free energy of native and denatured pepsin 1535
2094 A uthor Index Vol. 63
Edelson, M. R., and Plane, R. A. Photochem.aquation of Cr(NH3 ) 6 + 3 and Cr(NH3)5H20 + 3 ........ 327
Edwards, J. O., Abbott, J. R., E llison, H. R., and Nyberg, J. Coordination no. changes during oxidn.-redn. reacns. of oxyanions—kinetics of the aniline nitrosation and of the glycol telluratereacn.................................................................. 359
Edwards, O. W., and Huffman, E. 0. Diffusion ofaq. solns. of H3P04 at 25°..................................... 1830
E gan, C. J., a n d B uss, W. C. Detn. of equil. for hydrogenation of mesitylene—thermodynamicproperties of 1,3,5-tri-methylcyclohexanes............ 1887
E ggert, J. Ignition of explosives by radiation........ 11E ggertsen, F. T., and R oberts R. M. MoS2 of
high surface area................................................ 1981E isenberg, H., a n d R am M ohan, G. Aq. solns. of
polyvinylsulfonie acid: phase sepn. and sp. interacn. with ions, viscosity, conductance andpotentiometry.................................................... 671
E lliott, J. S., Sharp, R. F., a n d Lewis, L. Effect of the molar Ca/P ratio upon crystallization ofbrushite and apatite........................................... 725
Ellison, A. H., a n d Zisman, W. A. Adsorption of soluble fluorocarbon derivs. at the org. liq.-air interface............................................................. 1 1 2 1
Ellison, H. R. See Edwards, J. O., 359 Ellison, R. D. See Agron, P. A., 2076 El-T antawt, Y. A. See Khalafalla, S. E., 1252;
Shams El Din, A. M., 1224 Elving, P. J. See Kaufman, D. C., 217 Emmett, P. H. Adsorption and catalysis, 449;
see Blyholder, G., 962: Hall, W. K., 1102; Mac- Iver, D. S., 484
Erickson, L. E., a n d Albertt, R. A. Kinetics and mechanism of the base-catalyzed hydration offumarate to malate............................................. 705
Espenson, J. H. See lung, E. L., 755Evans, S. See King, C. V., 1816Eyring, H. See Blyholder, G., 693, 1004; Fueno, T.,
1940
FALLON, R. J., Vanderslice, J. T., and M ason,E. A. Quenching of excited Hg(3Pi) by NO....... 2082
Farr, J. D., Huber, E. J., Js., Head, E. L., and H olley, C. E., Jr . Prepn. of UC and its heat offormation........................................................... 1455
Fatt, I. Pore structure of sintered glass fromdiffusion and resistance measurements................. 751
Fatt, I., and Selim, M. A. Chromatographic frontal advance of an adsorbate that has an adsorption maximum.............................................. 1641
Feilchenfeld, H. A relation between lengths ofsingle, double and triple bonds............................ 1346
Feilchenfeld, H., and Jeselson, M. Kinetics of polymn. of C2H4 with triethylaluminum and TiCl4
catalysts............................................................. 720Feng, P. Y., and T obey, S. W. Radiation induced
racemization of 1-mandelic acid in aq. soln............. 759F enimore, C. P., and Jones, G. W. Rate of reacn.
in H, N20 and in some other flames, 1154; consumption of O mols. in hydrocarbon flames chieflyby reacn. with H atoms...................................... 1834
Fernandez, L. P., and Hepler, L. G. Thermodynamics of aq. benzoic acid and the entropy of aq. benzoate ion....................................................... 1 1 0
F e r n a n d o , Q. See Cheney, G. E., 2055; Freiser, H., 250
F e r n e l iu s , W. C. See Goldberg, D. E., 1246, 1328; Lotz, J. R., 541
F e r r e i r a , R. d e C . A method for calcn. of bondmoments from electronegativity data...................... 745
Ferry, J. D. See Morton, S. D., 1335 F ilipovich, G., and T iers, G. V. D. F N.S.R.
spectroscopy (I) reliable shielding values <f>: by useof CC13F as solvent and internal reference............. 761
Fischer, A. K., Cotton, F. A., and W ilkinson, G.Heats of combustion and formation of bis-ben-zenechromium.................................................... 154
Fishman, E., and Vassiliades, T. Self-diffusioncoeffs. of isomeric pentanes................................. 1217
Fishman, M. See Huque, M. M., 766 F leischer, D., and Freiser, H. Calorimetric detn.
of heats of coordination reacns............................... 260
Florin, R. E. See Wall, L. A., 1762 Flory, P. J. See Orofino, T. A., 283 Folman, M., and Y ates, D. J. C. Infrared studies
of physically adsorbed polar mols. and of the surface of a Si02 adsorbent containing hydroxylgroups................................................................
Fontana, C. M. Hydride transfer and mol. wt.distribution of polypropylene............................._• 1167
Forman, E. J., and Hume, D. N. Heats of neutralization and strengths of amines in acetonitrile...... 1949
Forrest, J. M., B urwell, R. L., J r ., and Shim,B. K. C. Isotopic exchange between ethers andD on metallic catalysts....................................... 1017
F orrester, J. S., and Ayres, G. H. Rh(III) in aq.solns.................................................................. 1979
Foss, J. G., and Schellman, J. A. Thermal transition of ribonucléase in urea solns......................... 2007
F owkes, F. M., R onay, G. S., and Schick, M. J. Monolayers in equil. with lenses of oil on H20 (II) dependence of equil. pressures on pH and on concn.of surfactant...................................................... 1681
Fox, W. Fluid phases in mutual contact: furtherexptl. considerations........................................... 1977
Francis, A. W. Miscibility relations of liq. HCN......................................................................... 753
Frasson, E. Panattoni, C ., a n d Sacconi, L.Studies in coordination chemistry (V) structure of diamagnetic bis-(N-methylsalicylaldimine)-Ni(II)complex............................................................. 1908
Frederick, H. G. See Parravano, G., 1144 Freeark, C. W., and H ardwick, R. Long range
energy transfer and self-absorption in fluorescentsolns.................................................................. 194
Freeman, E. S., and A nderson, D. A. Use of differential thermal analysis for investigating effects of high energy radiation on crystalline ammoniumperchlorate......................................................... 1344
Freiser, H. See Cheney, G. E., 2055; Fleischer, D.,260; Harkins, T. R., 309
Freiser, H., F ernando, Q., and Cheney, G. E. A new approach to comparison of metal chelate stability consts............................................................ 250
F reund, H. See Burge, D. E., 1969Fricke, H., Landmann, W., Leone, C., and V in
c e n t , J. Application of optical rotation measurements in studying the structural degradation ofY-irradiated ovalbumin....................................... 932
Friedman, H. A. See Thoma, R. E., 1266 Friend, J. A., and Smith, P. W. Polarographie
behavior of chromammines and Cr(III) salts in anacetate buffer..................................................... 314
Frisch, H. L. Time lag in diffusion (IV), 1249; see Poliak, H. 0., 1022
Fueno, T., R ee, T., and Eyring, H. Quantum- mechanical studies on oxidn. potentials and antioxidizing action of phenolic eompds..................... 1940
F u g u it t , R. E. See Hawkins, J. E., 1531 F u j im o t o , A. See Yoneda, Y., 1987 F u j it a , H. Restricted diffusion in three-component
systems with interacting flows, 242; evaluation of diffusion coeffs. from sedimentation velocitymeasurements, 1092; on detn. of the sedimentationequil. second virial coeff. in polymeric solns........... 1326
F u l l e r , W. H bond lengths and angles obsd. incrystals.............................................................. 1705
Fuoss, R. M. Velocity field in electrolytic solns...... 633GAINES, G. L., Jr. Observations on resin-deionized
H20 as a substrate for monolayer studies!........... 1322Gallagher, P. K. See King, E. L., 1073 Gancy, A. B. See Harned, H. S., 2079 Garcia, G. See Marshall, C. E., 1663 G a r l a n d , C. W. Effect of poisoning on infrared
spectrum of CO adsorbed on Ni.......................... 1423Garner, C. S. See Slaten, L. E., 1214Gary, R. See Harned, H. S., 2086Gaskins, F. H. See Philippoff, W., 985Gazith, M. See Sandler, Y. L., 1095Gehman, W. G. See Yosim, S. J., 230George, A. See Good, W. D., 1133George, P., and Irvine, D. H. Ferrimyoglobin
catalyzed oxidn. of ferrocyanide ion by H20 2 ....... 415Geske, D. H. Electrooxidn. of the tetraphenylbo-

Dec., 1959 A uthor I ndex 2095
rate ion; an example of a secondary chen:. reacn.following the primary electrode process................
Geske, D. H., and Bard, A. J. Evaluation of effect of secondary reacns. in controlled potentialcoulometry......................................................................
Gessder, A. M. See Binford, J. S., Jr., 137& Gilbert, T. W., Jr . Detn. of assocn. equil. by the
method of continuous variations...............................Gillis, H. A. See Collinson, E., 909 G ilmer, T. E., Jr . See Line, L. E., Jr., 290 G ilmore, E. H., and Lim, E. C. Method fo:' evalu
ating rate consts. in the Jablonski model of excitedspecies in rigid glasses..................................................
Gittliano, C. R., Schwartz, N , and W iimarth, W. K. Aq. chemistry of inorg. free radicals (II) peroxydisulfate induced exchange of 0 atoms between H20 and mol. O and evidence regarding theconst, of the hydroxyl radical 353, (corrn.) ..........
Glasser, F. P. System Ga20 3-S i0 2...........................Glockler, G. C-halogen bond energies a id bond
distances.........................................................................Goates, J. R., Sullivan, R. J., and Ott, J. B.
Heats of mixing in the system CCh-cycloliexane-benzene...........................................................................
Goldberg, D. R., and Fernelius, W. C. A thermodynamic study of some coordination complexes of metal ions with diprotic N compds. containing one heterocyclic N atom, 1246; formation consts. of methylbis-(3-aminopropyl)-amine with Cu, Ni andC d...................................................................... ..........
Goldman, G. K. See Rao, C. N. R., 1311 Goldstein, H. W., N eilson, E. F., W alsh P. N.,
and W hite, D. Heat capacities of Y oxide (Y 20 3), La oxide (La20 3) and Nd oxide (Nd20 3) from 16 to300° K .............................................................................
Gomer, R. Adsorption and diffusion of A o i W . . . Gompertz, G., and Orville-T homas, W. J. Calcd.
vibrational frequencies for H20 18 and D2Ob ..........Good, R. J. See Guderjahn, C. A., 2066 Good, W. D., D ouslin, D. R., Scott, D. W.,
George, A., Lacina, J. L., D awson, J. P., and W addington, G. Thermochemistry anc vapor pressure of aliphatic fluorocarbons— a comparison of the C -F and C -H thermochem. bond energies.
Good, W. D., Scott, D. W., Lacina, J. and M cCullough, J. P. Tetramethyllead: heat offormation by rotating-bomb calorimetry..............
Goodkin, J. See Janz, G. J., 1975Goon, E. J. Non-stoichiometry of La hydride... . . .G opal, R. See Meeks, F. R., 992Gordon, S. See Hogan, V. D., 93, (corrn.) 2089Gordon, T. P. See Rinker, R. G., 302Goring, D. A. I. See Huque, M. M., 766Goring, D. A. I., and Bryson, C. C. A photoelec.
method for observing sedimentation at low eoncn.. Gosting, L. J. See Dunlop, P. J., 86; Wench, R. P.,
1287Gottlieb, M. H. Bubble stability in dimethylsili-
cone solns........................................................................Graham, R. L., and Hepler, L. G. Heats o: forma
tion of Mo oxychlorides .......................................Graham, W. H. See Leffler, J. E., 687 Graham, W. H., and Leffler, J. E. Salt elects in
racemization of a biphenyl having a cationic barrier group ....................................................... .............
Ghahame, D. C. See Sams, J. R.. Jr., 2032 Grand, J. A. See Williams, D. D., 68 Grand, J. A., B aus, R. A., B ogard, A. E ., Wil
liams, D. D.; Lockhart, L. B., Jr ., and M iller, R. R. Soly. of Ta and Co in Na by activationanalysis............................................................................
Gray, T. J., M cCain, C. C., and M asse N. G. Defect structure and catalysis in the T i02 system(semi-conducting and magnetic properties).............
Graybill, B. M. See Leffler, J. E., 1457 Graybill, B. M., and Leffler, J. E. Solvent
effects in racemization of 2,2'-dimethoxy-6,6'-di-carboxyphenyl and its derivs......................................
Ghaziano, F. D., and Harris, G. M. Subsn reacns. of oxalato complex ions (I) oxalate exchange reacns. of the tris-oxalato-Co(III) and Cr(III)complex anions..............................................................
Green, L. G. See Gunn, S. R., 1787
1062
1057
1788
15
20892085828
589
1328
1445468
1331
1133
11392018
1026
1687723
1274
1192
472
1461
330
G r e e n e , F. T. See Randall, S. P., 758 G r e e n w a l d , I. Complexes of bicarbonate with Mg
and Ca............................................................... 1328G r e g o r , H. P. See Andelman, J. B., 206G r e g o r y , N . W, See Stern, J. H., 556G r im e s , W. R. See Blander, M., 1164; Panish,
M. B., 6 6 8 ; Shaffer, J. H., 1999; Thoma, R. E.,1266
G r im l e y , R. T. See Chandrasekharaiah, M. S., 1505G r o v e , J. E. See Diamond, W. J., 1528G r u b b , W. T. Ionic migration in ion-exchange mem
branes ............................................................. 55G r u e n , D. M., a n d M cB e t h , R. L. Tetrahedral
NiCh“ ion in crystals and in fused salts—spectro- photometric study of chloro complexes of Ni(II)in fused salts...................................................... 393
G u d e r j a h n , C. A., P a y n t e r , D. A., B e r g h a u s e n ,P. E., a n d G o o d , R. J. Slow evolution of heat inheat of immersion calorimetry............................. 2066
G u e n t n e r , W. S. See Hardwick, T. J., 896 G u n n , S. R., G r e e n , L. G., a n d V o n E g id y , A. I.
Heat of chlorination of B2Ch............................... 1787G u t m a n n , V. Ionic reacns. in sohis. of certain chlo
rides and oxychlorides......................................... 378HACKERMAN, N. See Makrides, A. C., 594;
Wade, W. H., 1639H a h n , W. C., Jr. See Muan, A., 1826 H a is s in b k y , M. See Belloni, J., 881 H a l d e m a n , R. G., a n d B o t t y , M. C. On the nature
of the C deposit of cracking catalysts.................Hall, E. H. See Blocher, J. N., Jr., 127 Hall, E. H., and Blocher, J. M., Jr. Thermo
dynamics of the disproportionation of TiBr3 .......Hall, W. K. See Cheselske, F. J., 505 Hall, W. K., and Emmett, P. H. Studies of hydro
genation of C2H4 over Cu-Ni alloys....................Halpern, J. Homogeneous catalytic activation of
mol. H by metal ions and complexes....................Halsey, G. D., Jr . See Constabaris, G., 1350;
Pierotti, R. A., 680Hamill, W. H. See Barker, R., 825; Pottie, R. F.,
877Hammes, G. G., and Alberty, R. A. Influence of
the net protein charge on rate of formation ofenzyme substrate complexes................................
H a n s e n , R . S . Film and substrate flow in surface channels, 637; virial treatment of interacn. of gasmols. with solid surfaces.....................................
H ansen, R. S., and W allace, T. C. Kinetics of adsorption of org. acids at the H20-air interface. .
Hanst, P. L., and Calvert, J. G. Oxidn. of Me radicals at room temp., 71; thermal decompn. of Me2 peroxide: 0-0 bond strength of dialkyl peroxides, 104; on mechanism of ozone production inphotooxidn. of alkyl nitrites................................
Hardt, A. P., Anderson, D. K., R athbun, R., M ar , B. W., and B abb, A. L. Self-diffusion in liqs. (II) comparison between mutual and self-diffusioncoeffs..................................................................
Hardwick, R. See Freeark, C. W., 194 Hardwick, T. J., a n d Guentner, W. S. On the use
of aq. Na formate as a chem. dosimeter...............Harkins, T. R., and Freiser, H. Chelating tend
ency of riboflavin...............................................Harle, O. L. See Thomas, J. R., 1027Harned, H. S. Thermodynamic properties of the
system: HC1, NaCl and H20 from 0 to 50°........Harned, H. S., and Blander, M. Glass conduct
ance cell for measurement of diffusion coeffs........Harned, H. S., and Gancy, A. B. Activity coeff. of
HC1 in ThCl4 solns. at 25°..................................H arned, H. S., and G ary, R. The act. cocff. of HC1
in CdCl2 solns. at 5 M total ionic strength..........Harris, D. M., N ielsen, M. L., and Skinner, G. B.
Thermal dissocn. of Til2 .....................................Harris, G. M. See Graziano, F. D., 330 Harris, L. A., W hite, G. D., and Thoma, R. E.
X-Ray analyses of solid phases in system LiF-ThF4
Harris, R. F. See Markowitz, M. M., 1325, 1519 Harris, W. E., M cFadden, W. H., and M cIntosh,
R . G. Chem. effects of (n, y ) activation of Br in
489
1525
1102398
274
743
1085
2071
2059
896309
12992078207920861484
1974

2096 A uthor I ndex Vol. 63
the alkyl bromides: a new method for detn. of org.retention.............................................................. 1784
Harrison, A. J., and Lake, J. S. (I) Photolysis of low mol. wt. 0 compds. in the far ultraviolet region 1489
Harrold, S. P. Effect of excess salt on minima obsd. in 7 /log C curves for surface active agents. . 317
Hart, E. J. See Riesz, P., 858; Trumbore, C. N.,867
Harteck, P., and D ondes, S. Kinetic radiationequil. of air........................................................ 956
Hatchard, C. G. See Parker, C. A., 22 H awkins, J. E., and Fuguitt, R. E. Rate of
dimerization of ailoocimene................................... 1531Head, E. L. See Farr, J. D., 1455 Healy, J. W. See Saroff, H. A., 1178'Hefley, J. D. See Mathews, D. M., 1236 Heidt, L. J., L ivingston, R. S., R abinowitch, E.,
and D aniels, F. Introduction to symposium onphotochemistry of liqs. and solids........................ 1
Heller, W., R owe, E., B erg, R., and AVatson, J.H. L. Effect of partial coagulation upon the size distribution curve in heterodisperse colloidalsystems.............................................................. 1566
Hellman, N. N. See Taylor, N. W., 599 H elmholz, L. See McLaren, E. H., 1279 Hemley, J. J. Hydrolysis of K-feldspar and mica at
elevated temps, and pressures............................. 320Henglein, A. Crosslinking of polymers in soln.
under influence of 7 -radiation............................. 1852H englein, A., Langhoff, J., and Schmidt, G.
Tetranitromethane as a radical scavenger in radiation chem. studies............................................. 980
H ensel, W. E., Jr . See Massoth, F. E., 697 Hepler, L. G. See Fernandez, L. P., 110; Graham,
R. L., 723Hermans, J., Jr. Soln. properties of desoxyribo
nucleic acid (DNA) (II) light scattering.............. 175Hermans, J., Jr., and Hermans, J. J. Soln. proper
ties of desoxyribonucleic acid (DNA) (I) hydrodynamic behavior ............................................. 170
Hermans, J. J. See Hermans, J., Jr., 170; Prins, W..716
Hersh, C. K., Platz, G. M., and Swehla, R. J.Dielee. const, of liq. ozone and liq. ozone-0 mixts. 1968
Heydegcier, H. R., and D unning, H. N. A radio- tracer study of adsorption of an ethylene oxide- propylene oxide condensate on quartz powders.. . 1613
H ickam, W. M. See Charles, R. G., 2084 H iggins, C. E. See Baldwin, W. H., 118 Higgins, C. E., Baldwin, AV. H., and Soldano, B. A.
Effects of electrolytes and temp, on soly. of Bu3
phosphate in H20 ............................................... 113Higuchi, T. See Higuchi, AV. I., 996 Higuchi, AV. I., Schwartz, M. A., R ippie, E. G.,
and Higuchi, T. A thermometric method for thermodynamics studies and mol. wt. detns. insolns................................................................... 996
IIildenbrand, D. L., and M cD onald, R. A. Heat of vaporization and vapor pressure of CCL; entropy from calorimetric data........................................ 1521
Hildebrand, J. H. See. Schmidt, H., 297; Smith,E. B., 703; AValkley, J., 1174
H ill, P. See AVolff, AV. F., 1161 Hill, T. L. Relations between different definitions
of phys. adsorption, 456; see Stigter, D., 551 H illig, AV. B. See Hudson, J. B., 1012 H immelblau, D. M. Partial molal heats and
entropies of soln. for gases dissolved in H20 fromthe freezing to near the crit. point....................... 1803
Hindman, J. C. See Sullivan, J. C., 1332 Hinkebein, J. A. See Peterson, D. T., 1360 Hirayama, C. See Brasted, R. C., 780 H nojewyj, AV. S., and R eyerson, L. H. Sorption
of H20 and D20 by lyophilized lysozvme............ 1653Hochanadel, C. J. See Boyle, J. AV., 892 von H oene, J. See Charles, R. G., 2084 H oeschele, G. K. See Andelman, J. B., 206 Hogan, V. D., and Gordon, S. A thermoanalytical
study of the binary oxidant system Ba(C104)2-KNOs.................................................. 93, (corrn.) 2089
H ollahan, J. R., and Cady, G. H. F. ps. of mixts. of H20 with heptafluorobutyric acid................... 757
H olley, C. E., Jr. See Farr, J. D., 1455
Holm, V. C. F., B ailey, G. C., and Clark, A.Acidity studies of Si02-Al203 catalysts................. 129
H onig, J. M. See Czanderna, A. AV., 620 Hood, G. C., Jones, A. C., and R eilly, C. A.
Ionization of strong electrolyes (VII) proton magnetic resonance and Raman spectrum of iodic acid 101
H oward, K. S., and P ike, F. P. Desiccation and d.of acetone ......................................................... 311
Hu, J.-H. See Paridon, L. J., 1998; AVhite, D., 1181 H uber, E. J., Jr . See Farr, J. D.Hudson, J. B., Hillig, AV. B., and Strong, R. M.
Solidification kinetics of benzene.......................... 1012H uffman, E. O. See Edwards, O. AV.H uggins, C. M., and Carpenter, D. R. A proton
magnetic resonance comparison of silicochloroformand chloroform in basic solvents......................... 238
H ughes, R. E. See Kinsinger, J. B., 2002 H ultgren, R. See Kendall, AV. B., 1158 H ume, D. N. See Forman, E. J., 1949 H unt, H. R., and T aube, H. Relative acidity of
H20 18 and H20 16 coordinated to a tripositive ion. . 124Huque, M. M., Fishman, M., and Goring, D. A. I.
Sorption effect of cellulose trinitrate in capillaryviscometry......................................................... 766
H uston, J. L. Exchange reacns. in certain acidicsolvents.............................................................. 389
IMPERIAL, G. R. See Walker, P. L., Jr., 133, 140 I nsley, H. See Thoma, R. E., 1266 Irani, R. R. Interpretation of abnormalities in the
log-normal distribution of particle size, 1603; see Ames, D. P., 531
Irvine, D. H. See George, P., 415Iwamoto, R. T. Chronopotentiometric study of the
disproportionation of U(V)................................. 303Iwasaki, I., and Cooke, S. R. B. Dissocn. const, of
xanthic acid as detd. by spectrophotometric method.............................................................. 1321
JAMES, D. W. See Bloom, H., 757 Janz, G. J., and D e Crescente, M. A. Dimeriza
tion of gaseous butadiene-equil. study............... 1470Janz, G. J., and Goodkin, J. Heat and entropy of
fusion of HgBr2 .................................................. 1975Jarvis, N. L., and Zisman, W. A. Surface activity
of fluorinated org. compds. at org. liq.-air interfaces (I) surface tension, parachor and spread- ability................................................................ 727
Jasper, J. J., and Seitz, H. R. Temp.-interfacial tension studies of some alkylbenzenes against H20 1429
Jeselson, M. See Feilchenfeld, H., 720 Johnsen, R. H. Some aspects of radiation chemistry
of liq. aliphatic carboxylic acids, 2041; photol. of7 -ray prod, free radicals in EtOH at low temps....... 2088
Johnson, G. R. A. See Clay, P. G., 862 Johnson, J. F. See Porter, R. S., 202 Johnson, J. S., and K raus, K. A. Hydrolytic be
havior of metal ions (IX) ultracentrifugation ofSn(IV) in acidic chloride and perchlorate soins.. . 440
Johnson, J. S., Scatchard, G., and K raus, K. A.Use of interference optics in equil. ultracentrifugations of charged systems................................... . 787
Johnson, R. E., Jr . Conflicts between Gibbsian thermodynamics and recent treatments of interfacial energies in solid-liq.-vapor systems......... 1655
Johnson, R. E., and M iller, C. E., Jr . Radiation-induced exchange of HCl-Cl3e and Pr chlorides.. . 641
Johnson, S. See Sullivan, E. A., 233 Johnston, F. J. See Kenney, R. A., 1426 •Johnston, H. L. See White, D., 1181 Johnston, W. D., M iller, R. C., and M azelsky, R.
A study of several systems of the type Lis[Coy-NU-yJl-xO................................................................ 198
Jona, F. Prepn. and dielec, properties of syntheticboracite-like compds............................................ 1750
Jonassen, H. B., and R amanujam, V. V. Binuclearcomplexes as catalysts ....................................... 411
Jones, A. C. See Benesi, H. A., 179; Hood, G. C., 101
Jones, G. W. See Fenimore, C. P., 1154, 1834 Jortner, J. See Czapski, G., 1769 Jumper, C. F. See Lindenbaum, S., 1924 Jura, G. See Schmidt, H., 297

Dec., 1959 A uthor I ndex 2097
J u r i n a k , J. J., a n d V o l m a n , D. H. Acid-base interacn. in adsorption of olefins on Al kaolinite.. 1373
KAHN, M. See Benz, R., 1983K arg , G. See Rosano, H. L., 1692K aufman , D . C., Loveland , J. W., and E tving,
P. J. An improved apparatus for oscillographic observation of polarographic phenomena—cxidn.- redn. pattern of Cd(II): effects of 0 and gelatin. 217
K eller , R. N., C leveland , J. M., and B urlingame, F. Two liq. scintillators........................... 640
K emula, W., and B uchowski, H. Effect of acidity and concn. of buffers on partition cocffs. of dil. solns. of acids and bases and on selectivity of aliq.-liq. system................................................... 155
K endall, W. B., and H ultgren , R. Thermodynamics of the Pb-Sn system.................................. 1158
K eneshea , F. J., J r . See Cubicciotti, D., 295 K enbshea , F. J., Jr ., and C ubicciotti, D. Vol.
effects on mixing in the liq. Bi-BiBr2 system, 1112; vol. effects on mixing in the liq. Bi-BiR system. . 1472
K enney , R. A., and Johnston, F. J. Kinetics of Cl exchange between HC1 and chloroacetic acid in aq.soln.................................................................... 1426
K e r k e r , M. See Matijevic, E., 1552 K eulemans, A. I. M., and V oge, H. H. Reactivities
of naphthenes over a Pt re-forming catalyst by agas chromatographic technique.................. 476
K halafalla , S. E. See Shams El Din, A. M, 1224 K halafalla , S. E., Shams E l-D in , A. ML, and
E l - T a n t a w y , Y. A. Studies on anodic and cathodic polarization of amalgams (III) passivation ofZn amalgam in alkaline solns.............................. 1252
K iel , 0. G. See D odd, C. G., 1646K ilb, R. W. Effect of simultaneous crosslinking and
degradation on intrinsic viscosity of a polymer.. . 1838K ing , C. V., and E vans, S. Radiotracer studies of
Zn-Zn ion exchange ........................................... 1816K ing, C. V., and Skomoroski, R. Radiotracer
studies of Cd-Cd ion exchange, 1819; radiotracerstudies of Fe in Fe salt solns................................ 1822
K ing , E. L. Some comments on values of AS0 for ionic reacns. and values of the entropy of soln. ofions.................................................................... 1070
K ing , E. L., E spenson, J. H., and V isco, R. E. A spectrophotometric investigation of outer-sphere assocn. of hexamminecobalt(III) ion and halide ion 755
King, E. L., a n d G a l l a g h e r , P. K. Thermodynamics of Al(III) fluoride complex ion reacns.—evaluation of equil. quotients from ra([X]).......... 1073
K ing , P. F., a n d Uhlig , H. H. Passivity in Fe-Crbinary alloys...................................................... 2026
K inoshita, K. See Shinoda, K., 648 Ivinsinger, J. B., and H ughes, R. E. I»trinsic
viscosity-mol. wt. relationships for isotacaic andatactic polypropylene (I).................................... 2 0 0 2
K irschenbaum , D. M. See Parker, F. S., 1242 K ishimoto, A., and M atsumoto, K. Diffusion of
allyl chloride in polyvinyl acetate at 40°............. 1529K ishita , M. See Asai, O., 96 K lein , R. See Scheer, M. D., 1517 K leppa , O. J., a n d T h alm ayer , C. R. E.m.f. in
vestigation of binary liq. alloys rich in Zn............ 1953K lin e , R. J. See Rabideau, S. W., 1502 K oehler , M. F., and C oughlin , J. P. Heats of
formation of FeCl2, FeCb and MnCIj................... 605K oerner , W. E. See Yuan, E. L., 952 K ohlm aier , G., and R abinovitch , B. S. Kinetics
of thermal isomn. of p-tolyl isocyanide............... 1793K ohn, H. W., and T aylor , E. H. Effect of ionizing
radiation upon 7 -AI2O3 as a catalyst for H2-D 2 exchange, 500; H-D exchange activity and ri diaiionbehavior of some Si02 catalysts......................... 966
K olthoff, I. M., and van ’t R iet , B. Studies on formation and aging of ppts. (XLVI) pt>tn ofPbS04 at room temp........................................... 817
K raus, K. A. See Johnson, J. S., 440, 787 K raus, K . A., and R aridon , R . J. Temp, depend
ence of some cation exchange equil. in rar ge 0 to200°; (corm.) 2090.............................................. 1901
Ivreider , H. B. See Uehida, H. S., 1414 K rieger , I. M. See Dougherty, T. J., 1869 K rik orian , N. H. See Storms, E. K., 1747
K ronman , M. J., and T imashefb’, S. N. Light scattering investigation of ordering effects in silico-tungstic acid solns............................................... 629
K rumholz, P. Spectroscopic studies on rare earth compds. (Ill) interacn. between Nd and perchlorate ions, 1313, (corm.) 2089; see Bril, K., 256, (corrn.) 2089
K ubo , M. See Asai, O., 96K ummer, J. T. Chemisorption of 0 on Ag............ 460K urien , K. C. See Burton, M., 899
LACINA, J. L. See Good, W. D., 1133, 1139 L a G range , L. D ., D ykstra , L. J., D ixo n , J. M.,
and M erten , U. Study of Zr-H and Zr-H-U systems between 600 and 800°.................................
L ah r , P. H., and W illiams, H. L. Properties ofsome rare gas clathrate compds...........................
L aity , R. W. An application of irreversible thermodynamics to the study of diffusion......................
L a k e , J. S. See Harrison, A. J., 1489 L al , H. See Mathur, R., 439 La Mer, V. K. See Wachtel, R. E., 768 L ampe, F. W. On radiation-induced polymn. of iso
butylene in liq. phase.........................................Landau , B. S. See Insley, H., 1266 L andesman, H. See Onak, T. P., 1533 Landmann, W. See Fricke, H., 932 Langer , A. See Charles, R. G., 603 Langhoff, J. See Henglein, A., 980 L arson , N. R. See Rabinovitch, B. S., 1523 L aw rence , W. W. See Duke, F. R., 2087 L eary , J. A. See Benz, R., 1983; Bjorklund, C. W.,
1774Lee, F. S., and C arpen ter , G. B. Crystal structure
of HCIO4 monohydrate.......................................Lees, C. W. See Sams, J. R., Jr., 2032 L effler , J. E. See Graham, W. H., 1274; Graybill,
B. M., 1461Leffler , J. E., and G raham , W. H. Medium
effects in the racemization of a biphenyl having acationic barrier group.........................................
L effler , J. E., and G raybill , B. M. Salt effects in racemization of a biphenyl having anionic barriergroups.............. '................................................
Lefort, M., and T arrago , X. Radiolysis of H20 by particles of high linear energy transfer—the primary c.hnm. yields in aq. acid solns. of FeS04, andin mixts. of thallous and ceric ions......................
L eone, C. See Fricke, H., 932 L esnini, D. See Smith, R. N., 544 L ester , G. R. See Beynon, J. H., 1861 L ew is , L. See Elliott, J. S., 725 L ew is, P. H. Structure and gas persorption sites of
a synthetic zeolite detd. by Fourier radial analysis L ichtin , N. N. Radiolysis of MeOH and methanolic
solns. by Co60 7 -rays and 1.95 X 10⁶ volt Van deGraaff electrons..................................................
L ietzke , M. K., and Stoughton, R. W. Soly. of Ag2S04 in electrolyte solns. (I) soly. in KN03
solns., 1183; (II) soly. in K2S03 solns., 1186; (III) soly. in H2S04 solns., 1188; (IV) soly. inHN03 solns., 1190; (V) soly. in MgS04 solns......
Lim, E. C. See Gilmore, E. H., 15 Lindenbaum , S., Jumper, C. F., and B oyd, G. E.
Selectivity coeff. measurements with variablecapacity cation and anion exchangers.................
L ine , L. E., Jr., R hodes, H. A., and G ilm er , T. E.,Jr. Spark ignition of dust clouds........................
L ipscomb, W. N. See Mathews, F. S., 845 L ittle , L. II. Infrared spectra of hydrocarbons
adsorbed on silica supported metal oxides............L ivingston , R ., and Subba R ao, V. A further
study of photochcm. autooxidn. of anthracenes.. . L ivingston , R . S. See Heidt, L. J., 1 L loyd, D. G. See Charlesby, A., 970 L ockhart, L. B., Jr. See Grand, J. A. 1192 L otz, J. R., B lock, B. P., and Fernelius , W. C. A
thermodynamic study of some coordination compds. of metal ions with amines containing O. .
L oveland , J. W. See Kaufman, D. C-, 217 Lovrecek , B. Kinetics of electrode processes in
volving more than 1 step....................................Lovrecek , B., a n d B ockris, J. O’M. Potential of
20351432
80
1986
279
687
1457
833
527
1449
1984
1924290
1616794
541
1795

2098 A uthor I ndex Vol. 63
the semiconductor-soln. interface in the absence ofnet current flow: Ge.......................................... 1368
Lovrecek, B., D espic, A., a n d B ockris, J. O’M.Electrolytic junctions with rectifying properties. . 750
Lovrien, R. E.; and T anford, C. Rapid flow titration and the rate of the acid expansion of bovineserum albumin................................................... 1025
Low, M. J. D., a n d T aylor, H. A. Rates of adsorption of H20 and CO by ZnO............................... 1317
Ltjder, W. F. See Zuffanti, S.Lundberg, J. L. See Nelson, L. S., 433 Lurie, C. See Rao, C. N. R., 1311Lyons, V. J. Dissocn. pressure of ZnAs2 ............... 1142
MAATMAN, R. W., a n d Prater, C. D. Cumene cracking activity of co-gelled silica-alumina catalysts as a function of surface area........................ 1312
M acIver, D. S., Zabor, R. C., and Emmett, P. H. Adsorption of normal olefins on silica-aluminacatalysts............................................................ 484
M ack, J. L. See Siegel, B., 1212 M ackenzie, J. D. Structure of liq. B20.?, 1875 M acW ood, G. E. See Paridon, L. J., 1997, 1998 M acW ood, G. E., and Paridon, L. J. Vapor-liq.
equil. for the diborane-Et ether system............... 1302M agat, M. See Balestic, P., 976M ajumdar, A. J., and R oy, R. Exptl. study of
polymorphism of Agl.......................................... 1858Makishima, S. See Y oneda, Y., 1987, 2057M akrides, A. C. Thermal aging of Si02 gels........ 1789M akrides, A. C., and Hackerman, N. Heats of
immersion (I) system Si02-H20 .......................... 594M alden, P. J., and Marsh, J. D. F. Detn. of sur
face areas from Kr adsorption isotherms.............. 1309M analo, G. D., Breyer, A., Sherma, J., and
R ieman, W., III. Salting-out chromatography (V)special resins...................................................... 1511
M anno, P. J. See Yang, K., 752Mar, B. W. See Hardt, A. P., 2059M arcus, Y. Anion exchange of metal complexes
(III) Cd-chloride system.................................... 1000M arcus, Y., and Nelson, F. Anion-exchange
studies (XXV) rare earths in nitrate solns........... 77Margerum, D. W. Coordination kinetics of ethyl-
enediaminetetraacetate complexes...................... 336M a r g r a v e , J. L. See Berkowitz, J., 644; Chandra-
sekharaiah, M. S., 1505; Randall, S. P., 758 M a r k o w i t z , M. M., a n d H a r r i s , R. F. Differential
thermal analysis of perchlorates (III) systemLÌCIO4-NH4CIO4 ...................................... ......... 1519
M a r k o w i t z , M. M., H a r r i s , R. F., a n d S t e w a r t ,H., Jr . Heat of formation of anhyd. LiC104 ........ 1325
M a r s h , F. L. See Campbell, J. A., 316 M a r s h , J. D. F. See Malden, P. J., 1309 M a r s h a l l , C. E. See Deshpande, K. B., 1659 M a r s h a l l , C. E., a n d G a r c i a , G . Exchange equil.
in a carboxylic resin and in attapulgite clay........ 1663M a r t i n , W . H., a n d V a n W i n k l e , Q . A study of
the transference method for detn. of counterion assocn. with polyelectrolytes and its application to poly-4-vinyl-N,n-butylpyridinium bromide in HBrsolns................................................................................. 1359
M a r t in e z , J. M. See Walton, H. F., 1318 M a s i , J. F. See Uchida, H. S., 1414 M a s o n , D. M. See Rinker, R. G., 302 M a s o n , E. A. See Fallon, R. J., 2082 M a s o n , H. F., a n d D a n ie l s , F. Reacn. of reciprocal
salt pairs during crystallization from the gaseousphase.................................................................... 300
M asse, N. G. See Gray, T. J., 472 M assoth, F. E., and Hensel, W. E., Jr . Kinetics of
reacn. between UF6 and NaF (II) NaF pellets andcrushed pellets................................................... 697
M astrangelo, S. V. R. Equation of soly. of nonelectrolytes which possess a sp. interacn................ 608
Mathews, D. M., Hefley, J. D., and A m is , E . S.Rates of electron exchange reacn. between U(IV) and U(VI) ions in H20, EtOH and H20-Et0Hsolvents............................................................. 1236
M athews, F. S., and Lipscomb, W. N. Structure ofAg cycloôctatetraene nitrate................................. 845
M athur, R., and Lal, H. Interacn. of imidazole with Co(II)........................................................... 439
M a t ij e v ic , E., B r o a d h u r s t , D., a n d K e r k e r , M . On coagulation effects of highly charged counter-ions................................................................... 1552
M a t s u m o t o , K. See Kishimoto, A., 1529 M a t s u o , H., a n d D o l e , M . Irradiation of poly
ethylene (IV) oxidn. effects................................. 837M a t t e r n , J. A. See Adamczak, R. L., 2063 M a x w e l l , C. R., a n d P e t e r s o n , D. C. Effect of
a-radiation on aq. glycine................................... 935Mayer, S. W. See Yosim, S. J., 230 M azelsky, R. See Johnston, W. D., 198 M azumder, B. R. See Shereshefsky, J. L., 1630 M cBeth, R. L. See Gruen, D. M., 393 M cCain, C. C. See Gray, T. J, 472 M cCullough, J. P. See Good, W. D., 1139 M cD onald, R. A. See Hildenbrand, D. L., 1521 M cD owell, W. J., and Allen, K. A. Dipole
moments of some amine extractants in benzene. .. . 747M cFadden, W. H. See Harris, W. E., 1784 M cIntosh, R. G. See Harris, W. E., 1784 M cI ntyre, D. See O’Mara, J. H., 1435 M cK ee, D. W. Sorption of hydrocarbon vapors by
silica gel............................................................. 1256M cLaren, E. H., and Helmholz, L. Crystal and
mol. structure of triamminochromium tetroxide. . 1279M cM illan, G. R. Photooxidn. of isopropyl iodide. 1526M eeks, F. R., Gopal, R., and R ice, O. K. Crit.
phenomena in the cyclohexane-aniline system:effect of H20 at definite activity......................... 992
M ele, A. See Botre, C., 650, (corrn.) 2089 M ellors, G. W., and Senderoff, S. Phase di
agram of the Ce-CeCh system........................... 1110M elton, C. E. See Rudolph, P. S., 916 M ercer, P. D., and Pritchard, H. 0. Gas phase
fluorination of H-CH4 mixts................................ 1468M e r t e n , U. Diffusion effects in transpiration
method of vapor pressure measurement, 443; see La Grange, L. D., 2035
M e s c h i , D. J., a n d S e a r c y , A. W. Dissocn. p re s -sure of A1 carbide................................................. 1175
M i k h a i l , R. S. See Razouk, R. I., 1050 M i l b e r g , M. E. C formation in an acetylene-air
diffusion flame.................................................... 578M il g r o m , J. Inclusion complexes of methylnaph-
thalenes............................................................. 1843M i l l e r , A. A. Radiation chemistry of polyvinyl
chloride................................................................ 1755M iller. C. E., Jr . See Johnson, R. E., 641 M iller, D. G. Ternary isothermal diffusion and
the validity of the Onsager reciprocity relations,570, (corrn.) 2089; validity of Onsager’s reciprocal relations in ternary diffusion, (corrn.) 2089; anal, proof that the extremum of the thermodynamic probability is a max., (corrn.) 2089; on the Stokes-Robinson hydration model for solns.. (corrn.) 2089
M i l l e r , G. A., a n d B e r n s t e in , R. B. Gas-kineticcollision diameters of the halomethanes............... 710
M iller, G. H. See Pritchard, G. O., 2074 M iller, J. M. See Sen Sarma, R. N., 559 M iller, N. See Weiss, J., 888 M iller, R. C. See Johnston, W. D., 198 M iller, R. 0. Detonation propagation in liq.
ozone-0............................................................. 1054M iller, R. R. See Grand, J. A., 1192; Williams,
D. D., 6 8
M ills, G. A., W eller, S., and W heeler, A. Catalytic activation of mol. H by CoCN solns........... 403
M ills, R. Tracer diffusion of Na and Rb ions in aq.alkali chloride solns. at 25°................................. 1873
M ills, R., a n d W oolf, L. A. Tracer-diffusion coeffs.of Cs ion in aq. alkali chloride solns. at 25°........ 2068
M itchell, J. J. See Webb, A. N., 1878 M oore, It. T. See Douslin, D. It., 1959 M oore, W. J. See Alien, R. L., 223 M oore, W. J., and W illiams, E. L. Decompn. of
ZnO by Zn vapor.................................................. 1516M orris, M. L., a n d B usch, D. H. The rates of acid
“hydrolysis” of the pentadentate Co(III) complexes of ethylenediaminetetraacetic acid and hy-droxyethylethylenediaminetriacetic acid.............. 340
M orton, S. D., and Ferry, J. D. Translational friction of microscopic spheres in coned, polymer solns..................................................................... 1335
Dec., 1959 A uthor Index 2099
Muan, A., and Hahn, W. C., Jr. Some energy relations in solid state reacns. involving crystallinephases of variable eompns................................... 1826
Mtorchison, A. See Uehida, H. S., 1414 M yers, C. G., Sibbett, D. J., and Ciapetta, F. G.
D exchange activities of some supported Pt catalysts................................................................... 1032
M ysels, K. J. See Princen, L. H., 1781 M ysels, K. J., and Princen, L. H. Light scattering
by some lauryl sulfate solns................................. 1699
NAEASIMHAN, P. T., and R ogers, M. T. Nuclear magnetic shielding of protons in amides and themagnetic anisotropy of the C=0 bond................ 1388
Neilson, E. F. See Goldstein, H. W., 1445 Neilson, E. F., and W hite, D. Heat of vaporiza
tion and soln. of a binary mixt. of fluorocarbons. . 1363Nelson, F. See Marcus, Y., 77 Nelson, L. S., and Lundberg, J. L. Heterogeneous
flash initiation of thermal reacns............................. 4 3 3
Neumann, H. M. See Baker, B. R., 371 Neuwirth, O. S. Photolysis of nitrosyl chloride and
the storage of solar energy.................................. 17Newton, R. F. See Blander, M., 1259: Fanish,
M. B., 6 6 8
Newton, T. W. Kinetics of reacn. between Pu(IV)and U(IV).......................................................... 1493
Newton, T. W., and R abideau, S. W. A review of the kinetics of the aq. oxidn.-redn. reacns. of U,No and Pu......................................................... 365
N ielsen, M. L. See Harris, D. M., 1484 N ightingale, E. R., Jr. Viscosity of aq. >aC104
solns., 742; phenomenological theory of ion solvation;—effective radii of hydrated ions.................. 1381
Nightingale, E. R., Jr., and Bench, R. F. Viscosity of aq. NaF and NaI04 solns.—ionic energies and entropies of activation for viscous flow ....... 1777
Noble, P. C. See Dorfman, L. M., 980 Norris, T. H. Isotopic exchange reacns. in liq. S02
and related non-aq. systems, 383; see Burge,D. E., 1969
Noyes, R. N. Kinetic complications associated withphotochem. storage of energy.............................. 19
Noyes, W. A., Jr . See Serewicz, A., 843 Nueoer, J. F. W. See Thomas, J. B., 39 Nyberg, J. See Edwards, J. 0., 359
OGG, R. A., Jr. See Ray, J. D., 1522 Ohlberg, S. M. Stable crystal structures cf pure
«-paraffins containing an even no. of C atoms inthe range C20 to C36.................................. - ....... 248
O’K onski, C. T., Y oshioka, K., and Orttung,W. H. Elec, properties of macromols. (IV) detn. of elec, and optical parameters from satn. ©f elec.birefringence in solns........................................... 1558
Oliver, R. T. See Zuffanti, S., 1537 Olivier, J. P. See Ross, S., 1671 O’Mara, J. H., and M cIntyre, D. Temp, depend
ence of the refractive index increment o: polystyrene in soln.................................................... 1435
Onak, T. P., Landesman, H., W illiams, R. E., and Shapiro, I. B11 n.m.r. chem. shifts and spin coupling values for various compds............................. 1533
Orofino, T. A., and Flory, P. J. Seconc virialcoeff. for polyelectrolytes—theory and expt........ 283
Ore, C. H., and W urth, H. E. Cathode current distribution in solns. of Ag salts (I) equivalent conductance of solns. of AgN03 and of KAg(CN) 2 as a function of vol. concn. and temp., 1147; (II) cathode current distribution over a plane cathode, parallel to and some distance from a plane anode. 1150
O r t t u n g , W. H. See O’Konski, C. T ., 1558 O r v il l e - T h o m a s , W. J. See Gompertz, G., 1331 Ott, J. B. See Goates, J. R., 589PACE, E. L., and Siebert, A. R. Heat of adsorption
of parahydrogen and orthodeuterium on graphon. 1398 Panattoni, C. See Frasson, E., 1908 Panish, M. B. Elec, conductivity of molten Si02. . 1337Panish, M. B., Newton, R. F., Grimes, W. R., and
Blankenship, F. F. Thermodynamic propertiesof molten and solid solns. of AgCl and LiCS........ 6 6 8
Paridon, L. J. See MacWood, G. E., 1302
Paridon, L. J., and M acW ood, G. E. Vapor pressure of diborane.................................................. 1997
Paridon, L. J., M acW ood, G. E., and Hu, J-H.Heat of vaporization of diborane......................... 1998
Parker, C. A. Photoredn. of methylene blue—somepreliminary expts. by flash photolysis.................. 26
Parker, C. A., and Hatchard, C. G. Photode- compn. of complex oxalates—some preliminaryexpts. by flash photolysis.................................... 2 2
Parker, F. S., and K irschenbaum, D. M. An infrared spectrophotometric study of the phenol-phenoxide dissocn................................................ 1342
Parker, R. A., and W asik, S. P. Diffusion coeff. of dodecyltrimethylammonium chloride in aq. solns.at 23°................................................................ 1921
Parravano, G. See Rheaume, L., 264 Parravano, G., Friedrick, H. G., and Boudart, M.
Slow step in chemisorptinn—possible role of thesolid adsorbent (II)............................................ 1144
Paynter, D. A. See Guderjahn, C. A., 2066 Pearson, R. G. Nature of subsn. reacns. in inorg.
chemistry......................... 321Peavler, R. J., and B eck, C. G., Jr. High-temp.
transformation of MoGe2 .................................... 2058Peebles, L. H., Jr ., and W agner, W. S. Kinetic
analysis of a distilling system and its application to preliminary data on the transesterification of Me2
terephthalate by ethylene glycol......................... 1206Peller, L. On a model for the Helix-Random coil
transition in polypeptides (I) model and its thermal behavior, 1194; (II) influence of solvent compn.and charge interacns. on the transition................ 1199
Perlmutter-H ayman, B., and Stein, G. Kinetics of decompn. of alkaline sclns. of hypobromite—sp. ionic effects on reacn. rate................................... 734
Perri, J. A., Banks, E., and Post, B. Polymorphism of rare earth disiliddes.............................. 2073
Perri, J. A., Binder, I., and Post, B. Rare earthmetal “ disilicides” ........................................................ 616
Peterson, D. C. See Maxwell, C. R., 935 Peterson, D. L. See Redlich, O., 1024 Peterson, D. T., a n d Hinkebein, J. A. Equil. in
reacn. of Ba with CaCl2 ...................................... 1360Peterson, D. T., and W estlake, D. G. Rate of
reacn. of H with Th............................................ 1514Peterson, N. C. See Duke, F. R., 2076 Philippoff, W., and Gaskins, F. H. Exptl. check
of theories of the viscosities of solns.................... 985Pickering, H. L., and Eckstrom, H. C. Hetero
geneous reacn. studies by infrared absorption. . . . 512Pierce, C. Effects of interparticle condensation on
heats of adsorption and isotherms of powder samples...................................................................... 1076
P ierotti, R. A., and Halsey, G. D., Jr. Interacn. of Kr with metals—an appraisal of several interacn.theories.............................................................. 680
P iette, L. H. See Pinkus, A. G., 2086 P ike, F. P. See Howard, K. S., 311 P inkus, A. G., and Piette, -a H. Electron paramag
netic resonance studies on CS2—insoluble S............ 2086Pitt, D. A., and Smyth, C. P. Microwave absorp
tion and mol. structure in liqs. (XXVI) dielec. relaxation times of twc large oblate ellipsoidalmols. in benzene soln............................................. 582
P ittman, R. A. See Arthur, J. C., Jr., 1366 P izzarello, F. Purification of Lil by zone melting. 1785 Plane, R. A. See Edelson M. R., 327 Platz, G. M. See Hersh, O. K.Pollak, H. 0., and Frisch, H. L. Time lag in dif
fusion (III)............................................... 1022Pollock, B. D. Dissocn. pressure and stability of
Be carbide............................................................ 587P o p e , M. T., a n d B a k e r , L. C. W. Hydrodynamic
vol. of heteropoly hexamolybdocobaltate(III)anion from viscosity measurements..................... 2083
P o r t e r , G. See Chilton, H. T. J., 904 P o r t e r , R. F., a n d S c h o o n m a k e r , R. C. A mass
spectrometric study of the vaporization of FeBr2,626; gaseous species in L aOH-KOH system........................................................................ (corrn.) 2089
P o r t e r , R. S., a n d J o h n s o n , J. F. Laminar f lo wdegradation of polyisobutene...............................
P o s t , B. See Perri, J. A., 616, 2073
2 1 0 0 Author I ndex Vol. 63
Postelnbk, W. B. ps. of normal perfluoroalkanes. 746Pottie, R. F., and H amill, W. H. Persistent ion-
molecule collision complexes of alkyl halides....... 877Poulson, R. E. See Connick, R. E., 568 Powers, J. E. A reacn. mechanism for hydrogena
tion of CO including a reversible catalyst reacn.. . 1219Prater, C. D. See Maatman, R. W., 1312 Prince, L. M. See Schulman, J. H., 1677 Princen, L. H. See Mysels, K. J., 1699 Princen, L. H., and M ysels, K. J. Some effects of
lauryl ale. on light scattering by Na lauryl sulfate. 1781P rins, W., and Hermans, J. J. Theory of perme-
ation through metal coated polymer films............ 716Pritchard, G. O., and M iller, G. H. Reacn. of
perfluoro-n-Pr radicals with cyclohexane in the gasphase................................................................. 2074
Pritchard, H. O. See Mercer, P. D., 1468 Pruett, R. R. See Bonner, O. D., 1417, 1420
RABIDEAU, S. W. See Newton, T. W., 365 R abideau, S. W., and K line, R. J. Kinetics of
reacn. between Pu(VI) and Ti(III) in perchloratesoln.................................................................... 1502
R abinovitch, B. S. See Kohlmaier, G., 1793 R abinovitch, B. S., D ills, D. H., and Larson, N. R.
Thermal decompn. of solid Ag Me and Ag Et....... 1523R abinowitch, E. See Coleman, J. W., 30; Heidt,
L. J., 1R agle, J. L. On temp, dependence of the pure
quadrupole spectrum of solid 1,2-dichloroethane. 1395R akszawski, J. F. See Walker, P. L., Jr., 133, 140 R amanujam, V. V. See Jonassen, H. B., 411 R am M ohan, G. See Eisenberg, H., 671 R anauto, H. J. See Ross, S., 1681 R andall, S. P., Greene, F. T., and Margrave,
J. L. Infrared spectra of gaseous MgCl2, MgBr2
and NiCl2 at elevated temps................................ 758R ao, C. N. R., Goldman, G. K., and Lurie, C.
Polar effects in infrared and near ultraviolet absorption spectra of aliphatic ketones.................... 1311
R aridon, R. J. See Kraus, K. A., 1901, 2090 R athbun, R. See Hardt, A. P., 2059R ay, J. D. Conversion of N02 to NO................... 1782R ay, J. D., a n d Ogg, R. A., Jr. Heat of formation
of Me nitrate..................................................... 1522R azouk, R. I., and M ikhail, R. S. Surface proper
ties of MgO (II)................................................. 1050R eavis, J. G. See Bjorklund, C. W., 1774 R edlich, 0., and Peterson, D. L. A useful adsorp
tion isotherm...................................................... 1024R ee, T. See Fueno, T., 1940R eed, T. M., III. Polarizabilities of mols. in liq.
mixts.................................................................. 1798R eed, T. M., Ill, and T aylor, T. E. Viscosities of
liq. mixts............................................................ 58R egan, J. F. See Brown, T. L., 1324 R eich, I., and Vold, R. D. Flocculation-defloccu
lation in agitated suspensions (I) C and Fe20 3 inH20 ................................................................... 1497
R eichmann, M. E. Effect of polydispersity on non-Newtonian viscosity of polymeric solns............... 638
R eilly, C. A. See Hood, G. C., 101 R eyerson,%L. H. See Hnojewyj, W. S., 1653;
Solbakken, A., 1622R heaume, L., and Parravano, G. Decompn. ki
netics of N20 on a-Mn203 ...................................... 264R hodes, H. A. See Line, L. E., Jr., 290 R ice, O. K. See Meeks, F. R., 992 R ichards, E. G., and Schachman, II. K. Ultra
centrifuge studies with Rayleigh interferenceoptics (I) general applications............................. 1578
R ieman, W., III. See Manalo, G. D., 1511Ries, H. E., Jr. See Cook, H. I)., 226R iesz, P., and H art, E. J. Absolute rate consts. for
H atom reaens. in aq. solns.................................... 858van’t R iet, B. See Kolthoff, I. M., 817 R inker, R. G., Gordon, T. P., M ason, D. M., and
Corcoran, W. H. Presence of the S02 radical ionin aq. solns. of Na dithionite............................... 302
R ippie, E. G. See Higuchi, W. I., 996 R oberts, R. M. Catalytic isomn. of cyclopropane,
1400; see Eggertsen, F. T., 1981
R oberts, R. M., Barter, C., and Stone, II. Si02
Al203-catalyzed oxidn. of anthracene by O.......... 2077R ogers, C. E., Stannett, V., and Szwarc, M. Sorp
tion of org. vapors by polyethylene..................... 1406R ogers, M. T. See Narasimhan, P. T., 1388 R onay, G. S. See Fowkes, F. M., 1684 R oof, J. G. See Rutherford, W. M., 1506 R osano, H. L., and K arg, G. Desorption of Na
dodecyl sulfate spread on an aq. substrate.......... 1692R osenstreich, J. See Sundheim, B. R., 419 Ross, S., Chen, E. S., Becher, P., and R anauto,
H. J. Spreading coeffs. and hydrophile-lipophilebalance of aq. solns. of emulsifying agents.......... 1681
Ross, S., and Olivier, J. P. A new method for detn. of crit. micelle concns. of un-ionized assocn. colloids in aq. or in non-aq. soln.............................. 1671
R osser, W. A., Jr., and W ise, H. Kinetics ofoxidn. of IIBr..................................................... 1753
R ossotti, H. See Rossotti, F. J. C., 1041 R ossotti, F. J. C., and R ossotti, II. Calcn. of
stability consts. from cryoscopic measurements bythe projection strip method...................... 1041
R othen, A. Enzymatic reacn. across a thin membrane ................................................................. 1629
R owe, E. See Heller, W., 1566R oy, R. See Majumdar, A. J., 1858R ubalcava, H. Spectroscopic evidence of triphenyl-
methyl cations in a cracking catalyst.................... 1517R uch, R. J. See Bartell, L. S., 1045 R udolph, P. S., and Melton, C. E. Mass spectro-
metric studies of ionic intermediates in the a-parti- cle radiolysis of the C2 hydrocarbons (I) acetylene. 916
R uehrwein, R. A. See Skinner, G. B., 1736 R utherford, W. M., and R oof, J. G. Thermal dif
fusion in CH4-?i-butane mixts. in the crit. region. . 1506R utkowski, C. P. See Cannon, P., 1292 R utledge, G. P., and D avis, W., Jr. Solid-liq. and
liq.-liq. equil. of the ternary system UF6-C1F3-HF 166 R yan, J. P. See Shepard, J. W., 1729
SACCONI, L. See Frasson, E., 1908 Sahu, J. See Bowen, E. J., 4 Salama, H. N. See Belloni, J., 881 Sams, J. R., Jr ., Lees, C. W., and Grahame, D. C.
Properties of elec, double layer in coned. KC1solns................................................................... 2032
Sandell, E. B. See Surasiti, C., 890Sandler, Y. L., and Gazitii, M. Surface properties
of Ge ............................................................. . . . 1095Saroff, H. A., a n d Healy, J. W. Binding of Cl to
alkyl amines....................................................... 1178Sastri, M. V. C., V iswanathan, T. S., and Nagar-
junan, T. S. Influence of a chemisorbed layer ofCO on subsequent phys. adsorption...................... 518
Saunders, V. I. See West, W., 45 Scatchard, G. See Johnson, J. S., 787 Schachman, H. K. See Richards, E. G., 1578 Scheer, M. D., and K lein, R. Double bond isomn.
of olefins by H atoms at —195°.......................... 1517Schellman, J. A. See Foss, J. G., 2007 Schick, M. J. See Fowkes, F. M., 1684 Schmidt, G. See Henglein, A., 980 Schmidt, H., Jura, G., and Hildebrand, J. H.
Heat capacity of the system CCl4-perfluoromethyl-cyclohexane through the critical region............... 297
Schoonmaker, R. C. See Porter, R. F., 626; (corrn.)2089
Schuele, W. J. Prepn. of fine particles from bimetaloxalates.............................................. '.............. 83
Schuetz, R. D. See Brown, T. L., 1324 Schuldiner, S. Application of Vetter’s criterion for
detg. II overvoltage mechanism.......................... 1971Schuler, R. H. Radical production in hydrocarbons
by heavy particle radiations, 925; see Barr, N. F.,808
Schulman, J. H., Stoeckenius, W., and Prince,L. M. Mechanism of formation and structure ofmicro emulsions by electron microscopy.............. 1677
Schwartz, M. A. Sec Higuchi, W. I., 996 Schwartz, N. See Giuliano, C. R., 353, (corrn.) 2089 Scott, D. W. See Good, W. D., 1133, 1139 Searcy, A. W. See Meschi, D. J., 1175 Sedgwick, R. D. See Adams, G. E., 854
Dec., 1959 A uthor I ndex 2101
Seitz, H. R. See Jasper, J. J., 1429 Selim, M. A. See Fatt, I., 1641 Senderoff, S. See Mellors, G. W., 1110 Sen Sarma, R. N., A nders, E., and Miller, J. M.
Deviations from plate theory in the ion-exc rangesepn. of Tc and R e .......................................................
Senti, F. R. See Taylor, N. W., 599Serewicz, A., and N otes, W. A., Jr . Photolysis of
NH3 in the presence of N O .........................................Seward, R. P. Soly. of AgCl in nitrate melts..........Shaffer, J. H., Grimes, W. R., and W atson, G. M.
Soly. of HF in molten fluorides (I) in mixts. of NaF-ZrF4..................................................................................
Shams El-D in, A. M. See Khalafalla, S. E., 1252 Shams El D in, A. M., K halafalla, S. E. and
El-T antawt, Y. A. Studies on anodic and cathodic polarization of amalgams (II) Hg in NII4OHsolns..................................................................................
Shanmttganathan, S. See Baliah, V., 2016Shapiro, I. See Onak, T. P., 1533Shapiro, I., and W eiss, H. G. Alcoholysis of B -B
bonds to form hydrides................................................Sharp, R. F. See Elliott, J. S., 725 Shepard, J. W. See Duwell, E. J., 2044 Shepard, J. W., and R tan, J. P. A radioactive
tracer study of the adsorption of fluorinated compds. on solid planar surfaces (I) perluoro-omanoic acid..................................................................
Shereshefsky, J. L., and Mazttmder, B. R.. Adsorption of some gases on evaporated metal filmsand on oxidized films of N i.........................................
Sheema, J. See Manalo, G. D., 1511 Sherwood, H. See Arnold, W., 2 Shim, B. K. C. See Forrest, J. M., 1017 Shin, H. K. See Stewart, G. H., 1972 Shinoda, K ., Y amanaka, T., and K inoshiia, K.
Surface chem. properties in aq. solns. of non-ionic surfactants: octyl glycol ether, a-octyl glycerylether and octyl glucoside.................................. ..........
Shultz, J. F., Abelson, M., Stein, K. C., and Anderson, R. B. Studies of the Fischer-Tropsch synthesis (X V III) influence of catalyst geometryon synthesis on Fe catalysts.....................................
Sibbett, D. J. See Myers, C. G., 1032Siebert, A. R. See Pace, E. L., 1398Siegel, B., and M ack, J. L. Chromatography of
decaborane and subsd. decaboranes..........................Simons, J. H., and T aylor, E. H. Action of reactor
radiation on satd. fluorocarbons .........................Singleton, J. H. See Constabaris, G., 1350Si nee, G. C. Heat of formation of formic acid........Sivertz, C. Studies of photoinitiated addn. cf mer-
captans to olefins (IV ) general comments on kinetics of mercaptan addn. reacns. to olefins including c is -tr a n s forms........................................................
Skau, E. L., and B ailey, A. V. Correlation cf soly. data for long chain compds. (II) isopleth method of predicting solys. of missing members of homologous series.......................................................................
Skinner, G. B. See Harris, D. M., 1484 Skinner, G. B., and R uehrwein, R. A. Shock tube
studies on pyrolysis and oxidn. of CH4...................Skomoroski, R. See King, C. V., 1819, 1822 SLA3AUGH, W. H. Adsorption characteristics of
homoionic bentonites, 436; heats of immersion ofpreheated homoionic clays..........................................
Slaten, L. E., And Garner, C. S. cis-tra n s Isomn. and solvolysis of dichlorobis(ethylenediamiae)-Cr-(III) chloride in nearly anhyd. M eOH.....................
Slaughter, J. I. See Yuan, E. L., 952Smith, A. E. See Wilson, J. N., 463Smith, A. W., and W ieder, H. O sorption and elec.K conductivity of Cu oxide films .................................Smith, E. A. See Smith, T. S., 1701Smith, E. B., W alkley, J., and Hildebrane, J. H.
Intermol. forces involving chlorofluoroearbons. . . Smith, H. A. See Thomas, C. O., 427 Smith, H. A., and T homas, C. O. Sepn. of mixts. of
ordinary and heavy H2O by zone refining..............Smith, N. 0 . See Anselmo, V. C., 1344 Smith, N. V. See Blander, M., 1164 Smith, P. W. See Friend, J. A., 314
559
843760
1999
1224
1319
1729
1630
648
496
1212636
2063
34
2047
1736
1333
1214
2013
703
445
Smith, R. N., Swinehart, J., and Lesnini, D.Oxidn. of C by N02 ............................................
Smith, T. E., and Calvert, J. G. Thermal de-compn. of 2 -nitropropane....................................
Smith, T. S., an d Smith, E. A. Nuclear magneticshielding of F19 in some chlorofluoroearbons.........
Smith, W. T., Jr . See Datz, S., 938 Smyth, C. P. See Pitt, D. A., 582 SolbakkEn, A., and R eyerson, L. H. Sorption and
magnetic susceptibility studies on NO-Si O2 gelsystems at a no. of temps....................................
Soldano, B. A. See Baldwin, W. H., 118; Higgins,C. E., 113
Stannett, V. See Rogers, C. E., 1406 Steel, B. J., Stokes, J. M., and Stokes, R. H.
Individual ion mobilities in mixts. of non-electrolytes and H20 (corm)..........................................
Steigman, J. See Dux, J. P., 269 Stein, G. See Czapski, G., 850, 1769; Perlmutter-
Hayman, B., 734Stein, K. C. See Shultz, J. F., 496Stephens, S. J. Surface reacns. on evaporated Pd
films...................................................................Stern, J. H., and Gregory, N. W. Vaporization
characteristics of p-dibromobenzene....................Stern, K. H. Electrode potentials in fused system
(V) cells with transference.................................Sternberg, J. C. See Brown, T. L., 1324 Stevenson, D. P. See Wilson, J. N., 463 Stewart, D. F., and Wendlandt, W. W. Soly. and
heat of soln. of La(N03 )s-6H20 in non-aq. solvents Stewart, G. H., and Shin, H. K. Stationary phase
in paper chromatography....................................Stewart, H., Jr . See Markowitz, M. M., 1325 Stigter, D., and Hill, T. L. Theory of the Donnan
membrane equil. (II) calcn. of osmotic pressure and of salt distribution in a Donnan system withhighly charged colloid particles............................
Stillman, A. E. See Brownstein, S., 2061 Stoeckenius, W. See Schulman, J. H., 1677 Stokes, J. M., and Stokes, R. H. Conductances of
some electrolytes in aq. sucrose and mannitol solns.at 25° (corm.)....................................................
Stokes, R. H. See Steel, B. J., (corm.) 2089Stone, H. See Roberts, R. M., 2077Storms, E. K., and K rikorian, N. H. Variation of
lattice parameter with C content of NbC............Stoughton, R. W. See Lietzke, M. H., 1183, 1186,
1188, 1190, 1984St. P ierre, L. E., and B ueche, A. M. Role of C02
in catalyzed siloxane cleavage.............................Strehlow, R. A. See Wires, R., 989 Strong, J. D. See Burr, J. G., 873 Strong, R. M. See Hudson, J. B., 1012 Subba R ao, V. See Livingston, R., 794 Sullivan, E. A., and Johnson, S. LiBH4-NH3
system: pressure-compn.-temp. relationships andds......................................................................................
Sullivan, J. C., and Hindman, J. C. Hydrolysis ofNp(IV)..............................................................
Sullivan, R. J. See Goates, J. R., 589 Sundheim, B. R., and R osenstreich, J. Molten
salt thermocells...................................................Surasitt, C., and Sandell, E. B. Kinetics of Ru-
catalyzed As(III)-Ce(IV) reacn...........................Sutherland, K. L. Collector-depressant equil. in
flotation.............................................................Swehla, R. J. See Hersh, C. K., 1968 Swinehart, J. See Smith, R. N., 544 Sworski, T. J. Redn. of dichromate ion by thallous
ion induced by 7 -radiation..................................Szwarc, M. See Rogers, C. E., 1406
544
13051701
1622
2089
188556741
13301972
551
2089
1747
1338
233
1332
419
890
1717
823
TALBOT, E. L. Surface tension of perfluoro sulfonates in strong and oxidizing acid media.............. 1666
T a l l e y , C. P. Thermal conductivity of polycrystalline B................................................................. 311
T a m a i , Y. Structure and lubricity of adsorbed fatty films..................................................................... 1283
T a n f o r d , C. See Lovrien, R. E., 1025T a r r a g o , X. See Lefort, M., 833T a u b e , H. See Appelman, E., 126; Hunt, H. R., 124

2 1 0 2 A uthor I ndex Vol. 63
T aylor, E. H. Obituary of Lind, S. C., 773; see Kohn, H. W., 500, 966; Simons, J. H., 636
T aylor, H. A. See Low, M. J. D., 1317 T aylor, M. M. See Allen, E. R., 1437, 1442 T aylor, N. W., Zobel, H. F., Hellman, N. N., and
Senti, F. R. Effect of structure and crystallinityon H20 sorption of dextrans................................
T aylor, T. E. See Reed, T. M., Ill, 58 T halmayer, C. E. See Kleppa, O. J., 1953 T homa, R. E. See Harris, L. A., 1974 Thoma, R. E., Insley, H., Landau, B. S., Fried
man, H. A., and Grimes, W. R. Phase equil. in thefused salt systems LiF-ThF4 and NaF-ThF4 .......
T homas, C. O. See Smith, H. A., 445 T homas, C. O., and Smith, H. A. Gas chromatog
raphy with H and D...........................................T homas, J. B., and Nuboer, J. F. W. Fluorescence
induction phenomena in granular and lamellatechloroplasts........................................................
T homas, J. R. Sonic degradation of high polymersin soln................................................................
T homas, J. R., and Harle, O. L. Substrate effects on decompn. of alkyl hydroperoxides and theirinfluence upon autoxidation................................
T homas, J. R., and deVries, L. Sonically inducedheterolytic cleavage of polymethylsiloxane..........
T hompson, A. C., and Culbertson, J. L. Acidicproperties of bentonite........................................
T hompson, C. M. See Boggs, J. E., 713 T hurmond, C. D. See Trumbore, F. A. T ieckelmann, H. See Adamczak, R. L., 2063 T iers, G. V. D. See Filipovich, G., 761 T iers, G. V. D., and Bovey, F. A. Proton N.S.R.
spectroscopy (III) annihilation of N quadrupole broadening by means of strong mol. elec, fieldgradients.........................................................................
T imasheff, S. N. See Kronman, M. J., 629 T inoco, I., Jr ., and Y amaoka, K . Reversing pulse
technique in elec, birefringence............................T ipper, C. F. H. See Allen, E. R., 1437, 1442 T obey, S. W. See Feng, P. Y., 759 T oor, H. L. See Anderson, R. B., 1982 T rautman, R., and Breese, S. S., Jr . Moving
boundary theory applied to preparative ultracentrifugation .....................................................
T rimble, R. F., Jr . Soly. in 2-methoxyethanol (I)1 - 1 alkali metal salts..........................................
T routner, V. H. Phase relationships in mixts. of the simple polyphenyls and condensed ring aromatics—a survey of org. reactor coolant mixts.. . .
T rumbore, C. N., and Hart, E. J. a-Ray oxidn. of FeS04 in 0.4 M H2S04 solns.—the effect of 0 to 0.4M oxygen...........................................................
T rumbore, F. A., and T hurmond, C. D. Heats of soln. from temp, dependence of the distributioncoeff...................................................................
T sao, M., and W ilmarth, W. K. Aq. chemistry of inorg. free radicals (I) mechanism of the photolytic decompn. of aq. persulfate ion and evidence regarding the sulfate-hydroxyl radical interconversionequil...................................................................
T ung, L. H. See Buckser, S., 763
599
1266
427
391725
1027254
1917
302
423
1592
318
1356
867
2080
346
UCHIDA, H. S., K r e i d e r , H. B., M u r c h is o n , A., a n d M a s i , J. F. Kinetics of gas phase disproportionation of dimethoxyborane............................. 1414
U c h ij im a , T. See Yoneda, Y., 2057 U h l ig , H. H. See King, P. F., 2026
VANDERSLICE J. T. See Fallon, R. J., 2082 V a n H o l d e , K. E . Sedimentation velocity of O s 0 4
in aq. soln........................................................... 1574V a n W i n k l e , Q. See Martin, W. H., 1539V a s s il ia d e s , T. See Fishman, E., 1217V e i s , A., a n d A n e s e y , J. Configurational transitions
in gelatins in non-aq. solns.................................. 1720V i l l a r s , D. S. A method of successive approxima
tions for computing combustion equil. on a highspeed digital computer........................................... 521
V i n c e n t , J. See Fricke, H., 932 Visco, R. E. See King, E. L., 755 V i s w a n a t h a n , T. S. See Sastri, M. V. C., 518
V o g e , H. H. See Keulemans, A. I. M., 476; Wilson, J. N., 463
V o l d , M. J. Sédiment vol. and structure in dispersions of anisometric particles...............................
V o l d , R. D. See Reich, I., 1497 V o l m a n , D. H. See Jurinak, J. J., 1373 V o n E g id y , A. I. See Gunn, S. R., 1787 d e V r i e s , A. D., a n d A l l e n , A. O. Radiolysisof liq.
n-pentane...........................................................d e V r i e s , L. See Thomas, J. R., 254WACHTEL, R. E., and La Mer, V. K. Prepn. of
monodispersed emulsions....................................Waddington, G. See Douslin, D. R., 1959; Good,
W. D„ 1133Wade, W. H., and Hackerman, N. Heats of immer
sion (II) caloite and kaolinite—effect of pretreatment .................................................; ..........
Wagner, E. L. Calcd. bond characters in oxamideand other amines................................................
Wagner, W. S. See Peebles, L. H., Jr., 1206 Walker, P. L., Jr., Rakszawski, J. F., and Im-
perlvl, G. R. C formation from CO-H mixts. over Fe catalysts (I) properties of C formed, 133;(II) rates of C formation...................................
Walkley J. See Smith, E. B.Walkley, J., and Hildebrand, J. H. Partial vapor
pressure and entropy of soln. of I ........................Wall, L. A., Brown, D. W., and Florin, R. E.
Atoms and free radicals by Y-irradiation at 4.2°K. Wallace, T. C. See Hansen, R. S., 1085 Wallace, W. E. See Ambrose, J. E., 1536;
Cheselske, F. J., 505Walsh, K. A. See Bjorklund, C. W., 1774 Walsh, P. N. See Goldstein, H. W., 1445 Walton, H. F., and Martinez, J. M. Reacns. of
Hg(II) with a cation-exchange resin...................Wasik, S. P. See Parker, R. A., 1921 Watermeier, L. A. See Wires, R., 989 Watson, G. M. See Blander, M., 1164; Shaffer,
J. H., 1999Watson, J. H. L. See Heller, W., 1566Webb, A. N., and Mitchell, J. J. CO exchange of
Fe carbonyls......................................................Wei, Y., and Bernstein, R. B. D exchange be
tween H20 and boehmite (a-Al2C>3 -H20 )—activation energy for proton diffusion in boehmite........
Weil, J. A. See Ebsworth, E. A. V.Weiner, S. See Boyle, J. W., 892Weiss, H. G. See Shapiro, I., 1319Weiss, J. See Clay, P. G., 862Weiss, J., and Miller, N. Redn. of ceric ions by
Po210 «-particles..................................................Weller, S. See Mills, G. A., 403Wells, P. R. Kinetics of consecutive competitive
2 nd-order reacns.................................................Wendlandt, W. W. See Stewart, D. F., 1330 Wendt. R. P., and Costing, L. J. Diffusion coeff.
of Iactamide in dil. aq. solns. at 25° as measuredwith the Gouy diffusiometer................................
Wentorf, R. H., Jr. Condensed systems at highpressures and temps............................................
West, W., and Saunders, V. I. Photochem. processes in thin single crystals of AgBr: the distribution and behavior of latent-image and of photolytic Ag in pure crystals and in crystals containingforeign cations....................................................
Westlake, D. G. See Peterson, D. T., 1514 Westwell, A. E., and Anacker, E. W. Adsorption
of cetylpyridinium chloride on glass....................Wheeler, A. See Mills, G. A., 403 Whitcher, W. J. See Cassidy, J. E., 1824 White, D. See Goldstein, H. W., 1445; Neilson,
E. F., 1363White, D., Hu, J-H., and Johnston, H. L. Heats
of vaporization of para-H and ortho-D from theirb. ps. to their critical temps................................
White, G. D. See Harris, L. A., 1974 Whiteford, J. E. See Boggs, J. E., 713 Wieder, H. See Smith, A. W., 2013 Wilkinson, G. See Fischer, A. K., 154 Williams, A. E. See Beynon, J. H., 1861 Williams, D. D. Sec Grand, J. A., 1192
768
16391403
140
11741762
1318
1878
738
888
1978
1287
1934
45
1022
1181

Dec., 1959 A uthor I ndex 2103
Williams, D. D., Grand, J. A., and Miller, R. R.Detn. of soly. of 0 bearing impurities in Na, K andtheir alloys......................................................... 6 8
Williams, E. L. See Moore, W. J., 1516 Williams, G. Measurement of dielec. const, and loss
factor of liqs. and soins, between 250 and 920 Mc./sec. by means of a coaxial transmission line,534; evaluation of dielec. data for liqs. and soins.. 537
Williams, H. L. See Lahr, P. H., 1432 Williams, R. E. See Onak, T. P., 1533 Williams, R. R., Jr. Chem. effects of low energy
electrons, 776; see Barker, R., 825 Williams-Wynn, D. A. Diffusion coeffs. of Zr(IV)
in HC1 soln. at 25°............................................. 2065Wilmarth, W. K. See Giuliano, C. R.., 353 (eorrn.)
2089; Tsao, M., 346Wilson, E. B., Jr. Conditions required for non-
resonant absorption in asymmetric rotor mols.. . . 1339Wilson, J. N., Voge, H. H., Stevenson, D. P.,
Smith, A. E., and Atkins, L. T. Phys. techniques in the study of Ag catalysts for ethylene oxiIn.. . . 463
Wilzbach, K. E. See Dorfman, L. M., 799 Wires, R., Watermeier, L. A., and Strehlow,
R. A. Dry CO-02 flame................................... 989Wirth, H. E. See Orr, C. H., 1147, 1150 Wirth, H. E., Droege, J. W., and Wood, J. H.
Heat capacities and thermodynamic functions for5- and u-Na palmitate...................................... 152
Wirth, H. E., Wood, J. H., and Droege, J. W.Low temp, heat capacities and thermodynamicfunctions of hydrous Na palmitate............ 149
Wise, H. See Rosser, W. A., Jr., 1753 Wold, A., and Croft, W. Prepn. and properties of
the systems LnFcxCr, ~z0 3 and LaFexCoi _*Oa.. . . 447Wolff, W. F. A model of active C, 653; adsorption
on conducting surfaces—hydrolysis of K on activeC....................................................................... 1848
Wolff, W. F., and Hill, P. Adsorption o: inertgases by modified carbons................................... 1161
Wood, J. H. See Wirth, H. E., 149, 152
Wood, R. E. Expts. with the cell Bi, Bi203, ZnCl2/ZnCL/ZnCL, Zn between 450 and 510°............... 525
Wood, R. H. Entropies of diln. of strong electrolytes .................................................................. 1347
Woolf, L. A. See Mills, R., 2068Work, R. N. A convenient new form of Onsager’s
equation for the dielec. const, of polar solns.......... 548Wulff, V. J. See Abrahamson, E. W., 441YAMANAKA, T. See Shinoda, K„ 648 Yamaoka, K. See Tinoco, I., Jr., 423 Yang, K., and Manno, P. J. -y-Radiolysis of C2H4. 752Yates, D. J. C. See Folman, M., 183 Yoneda, Y., Fujimoto, A., and Makishima, S. Ex
change of D and heavy' O among H, H20 vaporand oxide catalysts of spinel type........................ 1987
Yoneda, Y., Uchijima, T., and Makishima, S.Sepn. of B isotopes by ion exchange.................... 2057
Yoshioka, K. See O’Konski, C. T., 1558Yosim, S. J. See Darnell, A. J., 1813Yosim, S. J., Darnell, A. J., Gehman, W. G., and
Mayer, S. W. Bi-BiCU system.......................... 230Yphantis, D. A. Ultracentrifugal mol. wt. averages
during the approach to equil............................... 1742Yu, Y-F., Chessick, J. J., and Zettlemoyer, A. C.
Adsorption studies on metals (VIII) monofunctional org. mols. on reduced and oxide-coated Niand Cu............................................................... 1626
Yuan, E. L., Slaughter, J. I., Koerner, W. E., and Daniels, F. Kinetics of decompn. of NO in the range 700-1800°.................................................... 952
ZABOR, R. C. See Maclver, D. S., 484 Zettlemoyer, A. C. See Yu, Y-F., 1626 Zisman, W. A. See Bemett, M. K., 1241, 1911;
Ellison, A. H., 1121; Jarvis, N. L., 727 Zobel, H. F. See Taylor, N. W., 599 Zuffanti, S., Oliver, R. T., and Luder, W. F.
Acids and bases (XI) reacns. of borates and B acetate as Lewis acids.............................................. 1537
Subject Index to Volume LXIII, 1959ACETALDEHYDE, photolysis of low mol. wt.
compds...............................................................Acetamide, carbonyl intensities of simple amides.. . Acetic acid, decompn. of trichloro-, in aromatic
amines, 99; kinetics of Cl exchange between HC1 and chloro-, 1426; effect of monocarboxylic acids on trichloroacetate ion, 1760; radiation chemistryof liq. aliphatic carboxylic acids.........................
Acetone, desiccation and d. of, 311; polar effects in infrared and ultraviolet absorption spectra of aliphatic ketones, 1311; comparison between mutualand self-diffusion coeffs.......................................
Acetonitrile, heats of neutralization and strengths ofamines in...........................................................
Acetylacetone, pyrolysis of.....................................Acetyl alcohol, surface chem. properties in aq. soin.
of non-ionic surfactants......................................Acetylene, C formation in air-, diffusion flame, 578;
ion-mol. reacns. of, 825; action of Co-60 7 -radiation on aq. soins, of, 862; o-particle radiolysis of, 916; mass spectrometric studies of thermal reacns.in D -.................................................................
Acrylonitrile, radiation polymn. of..........................Activity coefficient, thermodynamic properties of
system HCl-NaCl-HsO, 1299; of HC1 in ThCfisoins., 2079; of HC1 in CdCl2 soin.......................
Adsorption, characteristics of homoionic bentonites, 436; and catalysis, 449; relations between different definitions of phys., 456; chemisorption of O on Ag, 460; diffusion of A on W, 468; defect structure and catalysis in Ti02 system, 472; heats of, of H on a singly promoted Fe catalyst, 480; of normal olefins on Si02-Al203 catalysts, 484; heterogeneous reacn. studies by infrared absorption, 512; influence of chemisorbed layer of CO on subsequent phys., 518; useful isotherm, 1024; kinetics of, of org. acids at H20-air interface, 1085; of soluble fluorocarbon derivs. at org. liq.-air interface, 1 1 2 1 ; possible role of solid adsorbent in chemisorption, 1144; detn. of surface areas from Kr, isotherms, 1309; apparatus for study of inter-acns. between gas atoms and surfaces...................
Air, kinetic radiation equil. of................................Albumin, moving boundary theory applied to pre
parative ultracentrifugation................................Alloòcimene, rate of dimerization of........................Allyl compounds, diffusion of allyl chloride in poly
vinyl acetate......................................................Alumina, acidity studies of Si02-, catalysts, 129;
adsorption of normal olefins on Si02-, catalysts, 484; nature of C deposit of cracking catalysts, 489; ionizing radiation on 7 -, as catalyst for H2-D 2 exchange, 500; cumene cracking activity of co-gelledSiOsr-, catalysts..................................................
Aluminum, structure of synthetic zeolite, 527; kinetics of polymn. of C2H4 with Et-r, and TiCl4 catalysts, 720; D exchange between H20 and boehmite, 738; thermodynamics of Al(III) fluoride complex ion reacns., 1073; dissocn. pressure of Al carbide, 1175; acid-base interacn. in adsorption of olefins on AJ kaolinite, 1373; reacn. between TiCfi and Al triethyl, 1791; synthetic inorg. anion exchangers .............................................................
Amines, heats of neutralization and strengths of, inacetonitrile.........................................................
Ammonia, LiBH4-, system, 233; photolysis of, in presence of NO, 843; ammonium ion formation in ionized, 980; differential reacn. rate in, synthesiskinetics..............................................................
Ammonium bromide, system MgBr2, H20 and, 316;lattice consts. of NH3CI-, solid soins....................
Ammonium perchlorate, use of differential thermal analysis for investigating effects of high energyradiation on crystalline.......................................
Aniline, decompn. of trichloroacetic acid in aromatic amines, 99; partition coeffs. of dii. soins, of acids and bases, 155; kinetics of, nitrosation, 359; effect of H20 at definite activity in cyclohexane-,
system, 992; adsorption of aromatic amines at an1489 acid-Hg interface...............................................1324 Anthracene, effect of temp, on fluorescence of solns.,
4; photochem. autooxidn. of some, 794; radiation- induced reacns. in, solns., 970; Si02-Al20 3-cata-alyzed oxidn. of, by O........................................
Anthranilic acid, two liq. scintillators......................2041 Anthraquinone, sp. mol. rearrs. in mass spectra of
org. compds........................................................Argon, adsorption and diffusion on W, 468; heat of
soln. in H20, 994; adsorption of, by modified car- 2059 bons, 1161; solv. in LiF-NaF-KF eutectic mixt.,
1164; zeolite containing a preadsorbed phase,1949 1292; properties of rare gas clathrate compds......2084 Arsenic, ionic reacns. in solns. of chlorides and oxy
chlorides, 378; kinetics of Ru-catalyzed As(III)- 0 4 g Ce(IV) reacn., 890; dissocn. pressure of ZnAs2. . . .
Attapulgite clay, exchange equil. in........................Association equilibria, detn. of, by continuous vari
ations ................................................................Asymmetric rotor molecules, conditions required for
1340 non-resonant absorption in.................................1366
BARIUM, binary oxidant system Ba(C104)2-KN03, 93, (corm.) 2089; equil. in reacn. of CaCl2 with. .
2088 Bentonite, adsorption characteristics of homoionic,436; acidic properties of.....................................
Benzene, vaporization characteristics of p-dibromo-, 556; heats of mixing in system CCl4-cyclohex- ane-, 589; solidification kinetics of, 1012; soly. in H20, 1021; temp.-interfacial tension studies ofalkyl-, against H20 .............................................
Benzoic acid, thermodynamics of aq.......................Benzophenone, radiolysis of, -propanol-2-system. . . Beryllium, dissocn. pressure and stability of, carbide Biphenyl, racemization of a, having a cationic barrier
group, 687, 1274; survey of org. reactor coolant mixts., 1356; racemization of a, having anionic barrier groups, 1457; racemization of 2,2'-dimeth-oxy-6 ,6 '-dicarboxydiphenyl.................................
Birefringence, reversing pulse technique in elec......1350 Bismuth, Bi-BiCl3 system, 230; vapor pressures of 956 Bil3 over liq. Bi-Bil3 solns., 295; cells having a
fused ZnCl2 electrolyte, 525; dimeric Bi(I) ion, 1592 (Bi2)2+ in molten Bi trihalide-Bi systems, 978;1531 vol. effects on mixing in liq. Bi-BiBr2 system, 1112;
vol. effects on mixing in liq. Bi-Bil3 system, 1472;1529 thermodynamic properties of solid, chlorides........
Bond distances, effect of adjacent bonds on, in hydrocarbons ..............................................................
Bond energies, C-halogen, and bond distances, 828;comparison of C-F and C-H thermochem............
Bond moments, calcn. of, from electronegativity1312 data....................................................................
Borane, chromatography of deca-, 1212; vapor-liq. equil. for Et ether-, system, 1302; kinetics of gas phase disproportionation of dimethoxy-, 1414; vapor pressure of di-, 1997; heat of vaporizationof di-.................................................................
Boric acid, electrooxidation of tetraphenylborate ion, 1062; reacns. of borates and B acetate as Lewis acids, 1537; dielec, properties of synthetic bora-
2044 cite-like compds., 1750; formation of tetrachloro-borate ion in liq. S02 ..........................................
1949 Boron, LiBH4-NH3 system, 233; thermal conductivity of polycrystalline, 311; alcoholysis of B-B bonds to form hydrides, 1319; B11 n.m.r. chem. shifts and spin coupling values, 1533; heat of
1982 chlorination of B2C14, 1787; structure of liq. B203, 1875; condensed BN systems at high pressures
1344 and temps., 1934; sepn. of, isotopes by ion exchange ...............................................................
Bromine, radiation decompn. of crystalline KBrOs, 1344 919; chem. effects of (n, 7 ) activation in alkyl bro
mides, 1784; kinetics of, addn. to unsatd. sulfones Bushy stunt virus, ultracentrifuge studies with
Rayleigh interference optics................................Butadiene, radiation-induced cationic polymn. of,
2104
2077640
1861
1475
1432
11421663
1788
1339
1360
1917
1429110873587
1461423
1813
565
1133
745
1998
1969
2057
2016
1578
Dec., 1959 Subject I ndex 2105
765; ion-mol. reacns. of 1,3-, 825; dimerization ofgaseous, equil. study........................................... 1470
n-Butane, thermal diffusion in CH4-, mixts. La crit.region................................................................ 1506
Butene, laminar flow degradation of polyiso-........... 2021 -Butene, adsorption of normal olefins on SiOj-AUOs
catalysts............................................................... 484Butyric acid, f. ps. of mixts. of H20 with nepta-
fluoro-................................................................... 7 5 7
Cadmium, oxidn.-redn. pattern of Cd(II), 217; anion exchange of metal complexes, Cd-cMoride,1000; complex formation consts. of Pb and, ions with chloride in fused LiC104, 2087; act. eceff. ofHC1 in CdCl2 ........_............................................ 2088
Cadmium, Cd115, radiotracer studies of Cd-Cd ionexchange..................................................... 1819
Calcium, effect of molar Ca/P on crystallization of brushite and apatite, 725; complexes of bicarbonate with Mg and, 1328; equil. in reacn. of Ba with CaCl2, I860; heats of immersion of calcite andkaolinite ........................................................... 1639
Calorimetric determination of purity, theory andcalcn. methods......................................... 1991
ra-Caproic acid, radiation chemistry of liq. aliphaticcarboxylic acids.................................................. 2041
Carbon, nature of, deposit of cracking catalysts, 489; oxidn. by NO, 544; formation in acetylene-air diffusion flame, 578; a model of active, 653; kinetics of the steam-, reacn., 693; kinetics of graphite oxidn., 1004; heats of adsorption and isotherms of pcwder samples, 1076; adsorption of inert gases by modified, 1161; interacns. between gas atoms and surfaces, 1350; multisegment adsorption of long chain polymers on C black, 1376; heat of adsorption of parahydrogen and orthodeuterium on graphon, 1398; flocculation of, and Fe203 in H20, 1497; variation of lattice parameter with, contentof NbC, 1747; hydrolysis of K on active............. 1848
Carbon bonds, effect of adjacent bonds on bond distances in hydrocarbons, 565; relation betweenlengths of single, double and triple bonds............. 1346
Carbon dioxide, in catalyzed siloxane cleavage....... 1338Carbon disulfide, electron paramagnetic resonance
studies on. -insoluble S....................................... 2085Carbon monoxide, C formation from CO-H mixts.,
133, 140; influence of chemisorbed layer of, on subsequent phys. adsorption, 518; dry CO-02
flame, 989; reacn. mechanism for hydrogenation of, 1219; adsorption of H20 and, by ZnO, 13X7; effect of poisoning on spectrum of, adsorbed on Ni,1423; exchange of Fe carbonyls.......................... 1878
Carbon tetrachloride, heat capacity of system CC14- perfluoromethylcyclohexane, 297; heats of mixing in system cyclohexane-benzene-, 589; hjat ofvaporization of................................................... 1521
Catalysis, adsorption and....................................... 449Cathode current distribution, in soins, of Ag salts.. .
Cellulose, sorption effect on, trinitrate in capillaryviscometry......................................................... 766
Cerium, in nitrate solns., 77; rare earth metal “di- sihcides”, 616; radiolysis of H20 by parties of high linear energy transfer, 833; adsorption of fission products on various surfaces, 881; rain, of ceric ions by Po810 a-particles, 8 8 8 ; kinetics of Ru- catalyzed As(III)-Ce(IV) reacn., 890; phase di-agram of Ce-CeCl3 system.................................. 1110
Cesium, temp, dependence of cation exchange equil.,1901 ; selectivity coeff. measurements with variable capacity cation and anion exchangers, 1924; tracer- diffusion coeffs. of Cs ion in alkali chloride soins. . 2068
Cetyl alcohol, adsorption of cetylpyridinium chloride or. glass, 1 0 2 2 ; structure and lubricity of adsorbed fatty films, 1283; structure of micro emulsions by electron microscopy............................................ 1677
Chelates, tendency of riboflavin, 309; heat staoilities of metal, 603; spectrophotometry of outer-sphere assocn. of hexammine-cobalt(III) ion and halide ion, 755; structure of diamagnetic bis-(N-raethyI- salicylaldimine)-Ni(II) complex, 1908; metal, ofmercaptosuccinic acid......................................... 2055
Chlorine, Cl38, radiation exchange of HC1-CP5 and .Pr chlorides........................................................ 641
Chloroform, comparison with silico-, in basic solvents, 238; conditions required for non-resonant absorption in asymmetric rotor mols., 1339; comparison between mutual and self-diffusion coeffs..
Chlorophyll, evidence of photoredn. of, in v iv o ........Chloroplasts, energy storage in, 2; fluorescence in
duction phenomena in.........................................Chromatography, of decaborane, 1212; salting-out,
of special resins, 1511; frontal advance of anadsorbate, 1641; stationary phase in paper........
Chromium, heats of combustion and formation of bis- benzene-, 154; polarographic behavior of chrom- ammines and Cr(III) salts in an acetate buffer, 314; photochem. aquation of Cr(NH3 ) 6 + 3 and Cr(NH3)6- H20 +3, 327; redn. of dichromate ion by thallous ion induced by -/-radiation, 823; cis-tra n s isomn. and solvolysis of dichlorobis-(ethylenediamine)- Cr(III) chloride, 1214; crystal and mol. structure of triammino-, tetroxide, 1279; exchange of D and heavy O among H, H20 vapor and oxide catalysts of spinel type, 1987; passivity in Fe-,binary alloys......................................................
Chronopotentiometry, of disproportionation of U(V) Clays, heats of immersion of preheated homoionic. . Cobalt, kinetics of electron transfer between cobaltous
and cobaltic ammines, 126; study of systems of type LiT¡CoyN(l-i/)](l-x)0, 198; subsn. reacns. of oxalato complex ions, 330; coordination kinetics of ethylcnediaminetetraacetate complexes, 336; rates of acid “hydrolysis” of Co(III) complexes, 340; electron transfer in Co systems, 371; catalytic activation of mol. H by CoCN, 403; internen. of imidazole with Co(II), 439; prepn. and properties of systems LnFexCr,- ,^ and LaFex- Coi_i03, 447; influence of chemisorbed layer of CO on subsequent phys. adsorption, 518; heat stabilities of metal chelates, 603; spectrophotometry of outer-sphere assocn. of hexamminecobalt- (III) ion, 755; effect of ligand and solvents in absorption, 780; soly. in Na by activation analysis, 1192; paramagnetic resonance absorption in peroxo-dicobalt complexes, 1890; temp, dependence of cation exchange equil., 1901; metal chelates of mercaptosuccinic acid, 2055; hydrodynamic vol. of heteropoly hexamolybdoeobaltate(III)anion from viscosity measurements.....................
Collector-depressant equilibria, in flotation.............Collision complexes, persistent ion-mol., of alkyl
halides...............................................................Collision diameters, gas-kinetic, of halomethanes. . . . Combustion equilibria, computing on high speed
digital computer.................................................Conductance, equivalent, of solns. of AgN03 and
KAg(CN)2, 1147; elec., of molten Si02, 1337; elec, conductivities of KCl-KBr solid solns., 1536; electrochem. measurements on a montmorillonite clay, 1659; of electrolytes in sucrose and mannitolsolns. (corrn.).....................................................
Copper, magnetic susceptibilities of cupric salts of a,w-dicarboxylic acids, 96; catalytic activation of mol. H by metal ions, 398; hydrogenation of C2H4
over Cu-Ni alloys, 1102; coordination complexes of metal ions with N compds., 1246; formation consts. of methylbis-(3 -aminopropyl)-amine with, 1328; exchanges involving divalent ions, 1420; adsorption studies on, 1626; e.m.f. investigation of binary liq. alloys rich in Zn, 1953; O sorptionand elec, conductivity of, oxide films...................
Coulometry, effect of secondary reacns. in controlledpotential............................................................
Critical micelle concentrations, detn. of, of assocn.colloids, 1671; of H20-soIuble ether-ales.............
Cumene, cracldng activity of co-gelled Si02-Al20scatalysts............................................................
Cyclobutane, P - V - T properties of perfluoro-..........Cyclohexane, heat capacity of system OCl4-per-
fluoromethylcyclo-, 297; heats of mixing in system CCl4-benzene-, 589; radiation chemistry of, 813; radical production in hydrocarbons by heavy particle radiations, 925; effect of H20 at definite activity in aniline-, 992; system thermochemistry and vapor pressure of aliphatic fluorocarbons, 1133;
20593039
1972
2026303
1333
20831717877710521
2089
20131057
167513121959
2106 Subject I ndex Vol. 63
thermodynamic properties of 1,3,5-Me8-, 1887;reacn. of perfluoro-re-Pr radicals with................... 2074
Cycloôctatetraene, structure of Ag, nitrate............. 845Cyclopropane, catalytic isomn. of........................... 1400
DECYLAMMONIUM compounds, binding of Cl~to alkyl amines..................................................
Desoxyribonucleic acid, soln. properties of, 170;light scattering of...............................................
Detonation propagation, in liq. ozone-0.................Deuterium, gas chromatography with H and, 427;
sepn. of mixts. of ordinary and heavy H20 by zone refining, 445; ionizing radiation on -y-Al20 8 as catalyst for H2-D 2 exchange, 500; exchange of D gas with H associated with solid catalysts, 505; exchange between H20 and boehmite, 738; radiation decompn. of H2S04 solns., 808; H-, exchange and radiation behavior of Si02 catalysts, 966; isooptic exchange between ethers and, on metallic catalysts, 1017; exchange activities of supported Pt catalysts, 1032; possible role of solid adsorbent in chemisorption, 1144; heats of vaporization of ortho-, 1181; mass spectrometric studies of thermal reacns. in acetylene-, 1340; heat of adsorption of ortho-, on graphon, 1398; sorption of H20 and D20 by lyophilized lysozyme, 1653; exchange of heavy O and, among H, H20 and oxide catalysts ofspinel type.........................................................
Dextrans, effect of structure on H20 sorption of... . Dielectric constant, measurements of, by a coaxial
transmission line, 534; evaluation of data for liqs. and solns., 537; Onsager’s equation for, of polarsolns...................................................................
Dielectric dispersion, in gases at 9400 megacycles. ..Diethylamine, viscosity of H20-, mixts..................Differential thermal analysis, reacn. of vitreous Si02
with HF, 1129; use for investigating effects of high energy radiation on crystalline ammonium perchlorate, 1344; of perchlorates...........................
Diffusion, application of thermodynamics to, study, 80; tests of the Onsager reciprocal relation for isothermal, 8 6 ; of Ag in Ag2S, 223; restricted, in 3- component systems, 242; tracer eoeffs. of Sr ion in aq. polystyrene sulfonic acid solns., 269; ternary isothermal, 570, (corrn.) 2089; time lag in, 1022, 1249; temp, dependence of small molecule, in high polymers, 1080; of aq. H3P04 solns., 1830; self, in liqs., 2059; validity of Onsager’s reciprocal relations in ternary (corrn.)......................................
Diffusion coefficients, from sedimentation velocity measurements, 1092; of lactamide in dil. aq. solns., 1287; of dodecyltrimethylammonium chloride, 1921; glass conductance cell for measurementof.......................................................................
Dioxaoctane, coordination compds. of metal ions withamines containing O...........................................
Dissociation constant, of xanthic acid as detd. byspectrophotometric method.................................
Dissymmetry, of discs of negligible thickness..........Dithionite, S02 radical ion in aq. solns. of Na..........Dodecyl alcohol, ultracentrifugal study of horse
serum albumin-Na dodecyl sulfate interacn., 1336; desorption of Na dodecyl sulfate spread on aq. substrate .................................................................
Dodecyltrimethylammonium chloride, diffusion coeff.of........................................ .............................
Donnan membrane, theory of, equil.......................
1178175
1054
1987599
548713
1783
1519
2089
2078541
13211213302
16921921551
ELECTRICAL double layer, properties of, in KC1solns............................................................... 2032
Electric birefringence, detn. of parameters from satn.of........................................................................ 1558
Electric moments, of amine extractants in benzene. . 747Electrode processes, kinetics of, involving more than
1 step. .................................................................. 1795Electrolytic junctions, with rectifying properties. . . 750Electron, chem. effects of low energy, 776; radiation
chemistry of cyclohexane, 813; radiolysis of liq.n-pentane........................................................... 879
Electronegativity, of groups..................................... 1227Electron microscopy, structure of micro emulsions by 1677Electron polarizability, of mols. in liq. mixts.............. 1798Electrophoresis, and surface charge........................... 1809
Emulsions, prepn. of monodispersed........................ 786Energy, storage in chloroplasts, 2; photochem. stor
age of, 19; transfer in fluorescent solns................ 194Enthalpy, calorimetric detn. of surface, of KC1....... 1009Entropy, of aq. benzoate ion, 110; values of AS0 for
ionic reacns......................................................... 1070Entropy of dilution, of strong electrolytes.............. 1347Equilibrium constant, for loosely bound mols.......... 1464Erucic acid, crystal structure of............... ........... . 1296Ethane, pure quadrupole spectrum of solid 1,2-di-
chloro-, 1395; nuclear magnetic shielding of F19 inchlorofluorocarbons..............................• ....... 1701
Ethanol, radical and mol. yields in 7 -irradiation of org. liqs., 854; photolysis of 7 -ray produced freeradicals in............................................ , ............ 2088
Ethyl alcohol, persistent ion-molecular collision complexes of alkyl halides......................................... 877
Ethylene, phys. techniques of Ag catalysts for, oxidn., 463; heterogeneous reacn. studies by infrared absorption, 512; kinetics of polymn of, 720; 7 -radiolysis of, 752; crystallization rate of low pressure poly-, 763; oxidn. effects in irradiation of poly-, 837; hydrogenation of, over Cu-Ni alloys,1 1 0 2 ; spectra of hydrocarbons adsorbed on Si02
supported metal oxides, 1616; acid-base interacn. in adsorption of olefins on A1 kaolinite, 1373; kinetics of reacns. of mercuric salts with olefins. . . ....................................................................1437, 1442
Ethylenediaminetetraacetic acid, sepn. of rare earth and Th-rare earth mixts. by, 256, (corrn.) 2089; coordination kinetics of, complexes, 336; rates ofacid “hydrolysis” of Co(III) complexes of.......... 340
Ethylene glycol, transesterification of Me2 terephtha-late by................................................................. 1206
Ethylene oxide, adsorption of propylene oxide-, condensate on quartz powders.................................... 1613
Ethyl ether, vapor-liq. equil. for diborane-, system. 1302Europium, polymorphism of rare earth disilicides. . . 2073
FELDSPAR, hydrolysis of K-, at elevated temps.and pressures........................................ 320
Ferrocyanide, ferrimyoglobin catalyzed oxidn. of, ionby H A ............................................................. 415
Film, and substrate flow in surface channels, 637; theory of permeation through metal coated polymer.................................................................... 716
Fischer-Tropsch synthesis, catalyst geometry onsynthesis on Fe catalysts..................................... 496
Flames, infrared studies of propellant, 941 ; consumption of O mois, in hydrocarbon, chiefly by reacn.with H atoms..................................................... 1834
Flash initiation, heterogeneous, of thermal reacns. . . 433Flotation, collector-depressant equil. in................... 1717Fluorescence, effect of temp, on, of solns., 4; sensi
tized, of /3-naphthylamine, 8 ; induction phenomena in chloroplasts, 39; energy transfer and self-absorption in, solns....................................... 194
Fluorine compounds, adsorption of fluorinated methanes by Linde mol. sieves, 160; ternary system UF6-C1F3-HF, 166; heat capacity of system CCfi-perfluoromethylcyclohexane, 297; F19
nuclear magnetic resonance of metal-fluoride complexes, 568; reactor radiation on satd. fluorocarbons, 636; reacn. between UF6 and NaF, 697; intermol. forces involving chlorofluorocarbons, 703; surface activity of fluorinated compds. at org. liq.— air interfaces, 727; b.ps. of normal perfluoro- alkanes, 746; f.ps. of mixts. of H20 with hepta- fluorobutyric acid, 757; n.s.r. spectroscopy, 761; thermodynamics of Al(III) fluoride complex ion reacns., 1073; adsorption of soluble fluorocarbon derivs. at org. liq.-air interface, 1 1 2 1 ; thermochemistry and vapor pressure of aliphatic fluorocarbons, 1133; sofy. in LiF-NaF-KF eutectic mixt., 1164; phase equil. in fused Li, Na, Th salt systems, 1266; heat of vaporization and soln. of a binary mixt. of fluorocarbons, 1363; gas phase fluorination of H-CH4 mixts., 1468; surface tension of perfluoro sulfonates, 1666; nuclear magnetic shielding of F19 in chlorofluorocarbons, 1701; adsorption of fluorinated compd. on solid planar surfaces, 1729; polarizabilities -of mols. in liq. mixts., 1798; wetting of low-energy solids by aq.
Dec., 1959 Subject I ndex 2107
highly fluorinated acids and salts, 1911; P - V - T properties of perfluorocyelobutane, 1951; soly. of HF in NaF-ZrF4 mixts., 1999; partial phase of NaF-HF system, 2063; reacn. of perfluoro-n-Prradicals with cyclohexane, 2074; structure proposal for Na7Zr&F3 1 ................................................ 2076
Formamide, calcd. bond characters in oxamide and. . 1403Formic acid, use of aq. Na formate as a chem. do
simeter, 896; heat of formation of...................... 2063Friction, translational, of microscopic spheres in
coned, polymer solns............................................. 1335Fumaric acid, mechanism of base-catalyzed nydra-
tion of fumarate to maleate................................... 705Furfurylideneacetophenone, polarographic charac
teristics of, and derivs......................................... 8124
GALLIUM, system Ga20 3-Si02 .............................. 2086Gas chromatography, with H and D, 427; naph
thenes reactivity over Pt by................................... 476Gases, dielec, dispersion in, at 9400 megacycles....... 713Gas molecules, virial treatment of interacn. of, with
solid surfaces...................................................... 743Gelatin, oxidn.-redn. pattern of Cd(II), effects of 0
and, 217; configurational transitions in, in non.-aq.solns....................................................... ’. ........ 1720
Germanium, surface properties of, 1095; potential of semiconductor-soln. interface, 1368; high-temp.transformation of MoGe2 .................................... 2058
Glass, rate consts. in Jablonski model of excited species in rigid, 15; pore structure of sinterec, fromdiffusion and resistance measurements................. 751
Glycine, effect of a-radiation on aq.......................... 935
HALIDES, estimating heat of formation of, 1115;■ entropies of diln. of strong electrolytes................ 1347
Hea capacity, of hydr. Na palmitate, 149; for 5- and u-Na palmitate, 152; of system CCl4-perfluoro- methylcyclohexane, 297; coordination complexes of metal ions with N compds., 1246; of Na202
at high temps.................................................... 1505Heat of adsorption, of powder samples................... 1076Heat of combustion, of bis-benzenechromium ....... 154Heat of coordination reactions, calorimetric detn. of. 260Heat of formation, of Mo oxychlorides, 723; estimat
ing, of halides, 1115; of anhydr. LiC104, 1325; of Mfe nitrate, 1522; and entropy of fusion of HgBr2. 1975
Heat of immersion, system Si02-H20, 594; of preheated homoionic clays, 1333; of calcits and kaolinite, 1639; slow evolution of heat, in. calo-rimetry.............................................................. 2066
Heat of neutralization, and strengths of amkies inacetonitrile......................................................... 1949
Heat of solution, of inert gases in H20, 994; partial molai heats and entropies of soln. of gases im H20,1803; from temp, dependence of distrib. raeff... 2080
Heat of vaporization, of para-H and ortho-D, 1181; of a binary mixt. of fluorocarbons, 1363; of OCL,1521; of diborane................................................. 1998
Helium, soly. in LiF-NaF-KF eutectic mixt., 1164; partial molai heats and entropies of soln. for gasesin H20 .................................................................. 1803
Heptane, reactor radiation on satd. fluorocarbons,636; intermol. forces involving chlorofluorooirbons 703
n-Hexadecane, adsorption of radiostearic acid from,226; wetting of incomplete monomol. layers........ 1045
Hexane, radical production in hydrocarbons byheavy particle, radiations..................................... 925
re-Hexane, sorption of hydrocarbon vapors by S0 2 gel 1256 Hyaluronic acid, X-ray diffraction investigation of
N% salt of........................................................... 2069Hydration, Stokes-Robinson, for solns. (corrr..). . . . 2089Hydrazoic acid, spectrophotometric study of .oniza-
tion of.................................................................. 1314Hydrobromic acid, kinetics of oxidn. of..................... 1753Hydrochloric acid, thermodynamic properties of
system HCl-NaCl-H20, 1299; activity coeff. of,in ThCL solns....................................................... 2079
Hydrofluoric acid, reacn. of vitreous Si02 with 1129;soly. in NaF-ZrF4 mixts........................................ 1999
Hydrogen, C formation from CO-H mixts., 133, 140; catalytic activation of mol., by metal ions, 398; catalytic activation of mol. H by CoCN, 403; gas
chromatography with D and, 427; sepn. of mixts. of ordinary and heavy H20 by zone refining, 445; heats of adsorption of H on a singly promoted Fe catalyst, 480; model Ta-H system, 505; oxidn. of ferrous ions in aq. solus, by at., 850; absolute rate consts. for, atom reaens. in aq. solns., 858; D-, exchange and radiation behavior of Si02 catalysts, 966; rate of reacn. .n, flames, 1154; heats of vaporization of para-, 1181; heat of adsorption of para-, on graphon, 1398; ammonium-H and thal- lous-H exchange, 1417; gas phase fluorination of H-CH4 mixts., 1468; rate of reacn. with Th, 1514; double bond isomn. of ohfins by H atoms, 1517; atoms and free radicals by 7 -irradiation, 1762; oxidn. of iodide ions in aq. soln. by at., 1769; consumption of 0 mols. in hydrocarbon flames by reacn. with, atoms, 183 ; detn. of, overvoltage mechanism, 1971; Zr H and Zr-H-U sytems. .. .
Hydrogen bond lengths, and angles obsd. in crystals.Hydrogen cyanide, miscibility relations of liq..........Hydrogen peroxide, ferrimyoglobin catalyzed oxidn.
of ferrocyanide ion by.........................................Hydroperoxides, substrate effects on decompn. of
alkyl..................................................................Hypobromic acid, specific ionic effects in decompn.
of hypobromite solns...........................................
20351705753415
1027734
IMIDAZOLE, interacn. witii Co(II)...................... 439Indium, salting effects in so.vent extraction of inorg.
compds................................................. ............. 659Inorganic chemistry, nature of subsn. reaens. in. . . . 321Interfacial energy, in solid-Mq.-vapor systems....... 1655Interfacial tension, temp.-, studies of alkylbenzenes
against H20 ........................................................ 1429Interference optics, ultraeentrifuge studies with
Rayleigh............................................................ 1578Iodic acid, proton magnetic resonance and Raman
spectrum of........................................................... 1 0 1
Iodine, ionic reaens. in solr.s. of chlorides and oxychlorides, 378; mol. compn. of Nal vapor by mol. wt. measurements, 938; partial vapor pressure andentropy of soln. of, 1174;_thermal dissocn. of TiL,1484; rate of oxidn. of __ to hypoiodite ion by hypochlorite ion, 1518; detn. of critical micelle concns. of assocn. colloids, 1671; oxidn. of iodideions in aq. soln. by at. H.......................... _......... 1769
Ion exchange membranes, ionic migration in, 55;sepn. of metal ions by, membranes, 256 (corrn.)., . 2089
Ion mobilities, individual, in mixts. of non-electrolytes and H20 (corrn.)........................................ 2089
Ion radii, phenomenological theory of ion solvation. 1381Iron, prepn. of fine particles from bimetal oxalates,
83; C formation from CO-H mixts. over Fe catalysts, 133, 140; prepn. and properties of systems LnFexCri_ j03 and LaFe*Coi-Â, 447; influence of catalyst geometry on synthesis on Fe catalysts, 496; spectrometric study of vaporization of FeBr2, 626; heats of formation of ferrous and ferric chlorides, 605; interacn. of Ku with, 680; radiolysis of H20 by particles of high linear energy transfer, 833; oxidn. of ferrous ion in aq. soln. by at. H, 850: a-ray FeS04 oxidn. in H»S04 solns., 867; kinetics of radiation-induced react., of Fe(III) with Sn(II), 892; flocculation-deflooeulation of Fe20 3 in agitated suspension, 1497 ; CD exchange of, carbonyls,1878; passivity in Cr-, binary alloys................... 2026
Iron, Fe59, radiotracer studies of Fe in Fe salt solns.. 1822Isobutene, radiation-induced polymn. of................. 909Isobutylene, radiation-induced polymn. of................ 1986Isopropyl iodide, photooxidn. of............................... 1526
KETENE, addn. of radioactive, to synthesis gas,962; photolysis of low mcl. wt. O compds........... 1489
Krypton, interacn. with metals, 680; detn. of surface areas from, adsorption isotherms, 1309; adsorption of gases on evaporated metal films............... 1630
LACTAMIDE, diffusion cooff. of, in dil. aq. solns... 1287Lanthanum, in nitrate solns., 77; prepn. and proper
ties of systems LnFexCri_x03 and LaFexCoi_x03,447; heat of soln. of La(N03)3 .6H20, 1330; heat capacity of La203, 1445; temp, dependence of

2108 Subject I ndex Vol. 63
cation exchange equil., 1901; non-stoichometry of,hydride............................................. .................
Lauryl alcohol, micelle formation in colloidal electrolyte soins., 650 (corrn.), 2089; detn. of critical micelle concns. of assocn. colloids, 1671; crit. micelle concns. of H20-soluble ether-ales., 1675; light scattering by lauryl sulfate soins., 1699; effects on light scattering by Na lauryl sulfate. . . .
Lead, pptn. of PbS04 at room temp., 817; heat of formation of Me4-, 1139; thermodynamics of Pb-Sn system, 1158; exchanges involving divalent ions, 1420; surface properties of liq. Pb with U02, 1486; complex formation consta, of Cd and, ionswith chloride in fused LiC104 ...........................
Light scattering, ordering effects in silicotungstic acid solus., 629; by lauryl sulfate soins., 1699; effects oflauryl ale. on, by Na lauryl sulfate......................
Lind, obituary of Samuel Colville, by Ellison H.Taylor................................................................
Liquid scintillators, two.........................................Lithium, study of systems of type Lix[Coyu_y)-
d_I)0, 198; LiBH4-NH3 system, 233; mass spectrométrie study of sublimation of LiO, 644; thermodynamic properties of molten and solid soins, of LiCl, 6 6 8 ; soly. in LiP-NaF-KF eutectic mixt., 1164; phase equil. in fused system LiF-ThF4, 1266; heat of formation of anhyd. LiC104, 1325; entropies of diln. of strong electrolytes, 1347 ; purification of Lil by zone melting, 1785; X-ray analyses of solidphases in LiF-ThF4 system.................................
Lycopodium dust, spark ignition of dust clouds.......Lysozyme, sorption of H20 and D20 by lyophilized..
2018
1781
2087
1781773640
1974290
1653
MAGNESIUM, system MgBr2, NH4Br and H20, 316; infrared spectra of gaseous, chloride and bromide, 758; surface properties of MgO, 1050; complexes of bicarbonate with Ca and, 1328; exchanges involving divalent ions, 1420; dielec.properties of synthetic boraeite-like compds.........
Magnetic anisotropy, of C=0 bond........................Magnetic susceptibility, of cupric salts of a,w-dicar-
boxylic acids, 96; on NO-Si02 gel systems..........Malic acid, mechanism of base-catalyzed hydration
of fumarate to malate.........................................Malonic acid, magnetic susceptibilities of cupric salts
of a,w-dicarboxylic acids.....................................1- Mandelic acid, radiation induced racemization of, in
aq. soln..............................................................Manganese, a-MnjOs, decompn. of N20 on, 264;
heats of formation of MnCl2, 605; energy relationsin solid state reaens. of crystalline phases............
Mass spectra, sp. mol. rearrs. in, or org. compds......Mercaptosuccinic acid, metal chelates of................Mercury, thermodynamics of Hg redn. of TiF4, 127;
in NHhOH solns., 1224; passivation of Zn amalgam in alkaline solns., 1252; reaens. of Hg(II) with a cation-exchange resin, 1318; kinetics of reaens. of mercuric salts with olefins, 1437, 1442; adsorption of aromatic amines at an acid-, interface, 1475; heat and entropy of fusion of HgBr2, 1975; quenching of excited Hg(3Pi) by NO..............................
Mesitylene, detn. of equil. consts. for hydrogenationof.......................................................................
Methacrylic acid, sonic degradation of high polymersin soln................................................................
Methane, adsorption of fluorinated, by Linde mol. sieves, 160; eq. of soly. of nonelectrolytes, 608; gas-kinetic collision diameters of halo-, 710; b. ps. of normal perfluoroalkanes, 746; tetranitro-, as radical scavenger in radiation chem. studies, 980; non-resonant microwave absorption in halogen subsd., 1127; heat of vaporization and soln. of a binary mixt. of fluorocarbons, 1363; gas phase fluorination of H-CH4 mixts., 1468; thermal dif-
[ fusion in n-butane-, mixts. in crit. region, 1506;adsorption of gases on evaporated metal films,
[ 1630; shock tube studies on pyrolysis and oxidn.of.......................................................................
Methanol, radiolysis of, and methanolic solns. by Co ■y-rays................................................................
2- Methoxyethanol, solys. in.................................Methylene blue, photoredn. of................................Methyl nitrate, heat of formation of.......................
175013881622
70596
759
182618612055
208218871725
1736144931826
1522
Methyl orange, Sn(II) redn. of............................... 2076Methyl radicals, oxidn. at room temp...................... 71Mica, hydrolysis of, at elevated temps, and pressures 320 Micelle, behavior on adsorption of two surfactants,
299; formation in colloidal electrolyte solns., 650,(corrn.)............................................... 2089
Microwave absorption, dielec, relaxation times of two large oblate ellipsoidal mois., 582; non-resonant, inhalogen subsd. methanes.................................... 1127
Molecular weight determinations, thermometricmethod for, in solns....................................... • • • 996
Molybdenum, heats of formation of Mo oxychlorides,723; MoS2 of high surface area, 1981 ; high-temp, transformation of MoGe2, 2058; hydrodynamic vol. of heteropoly hexamolybdocobaltate(III) anionfrom viscosity measurements............................... 2083
Montmorillonite clay, electrochem. measurements ona........................................................................ 1659
Moving boundary theory, applied to preparativeultracentrifugation.......................................... 1592
Myoglobin, ferri-, catalyzed oxidn. of ferrocyanideion by H20 2 ........................................................ 415
Myristic acid, structure and lubricity of adsorbed fatty films............................................................ 1283
NAPHTHALENE, sensitized fluorescence of d-naph- thylamine, 8 ; T labeling of org. compds. by elec, discharge, 799; survey of org. reactor coolant mixts., 1356; inclusion complexes of Me-, 1843; quantum-mechanical studies of oxidn. potentials ofphenolic compds.................................................. 1940
Naphthenes, reactivity of, over Pt by gas chromatography............................................................ 476
Naphthenic acid, dependence of equil. pressures onpH and surfactant.............................................. 1684
Neodymium, interacn. between perchlorate and, ions,1313, (corrn.) 2089; heat capacity of Nd20 3 ......... 1445
Neon, heat of soln. in H20 ..................................... 994Neptunium, kinetics of aq. oxidn.-redn. reaens. of,
365; hydrolysis of Np(IV).................................. 1332cis-Nervonic acid, crystal structure of..................... 1296Neutron, recoil reaens. with high intensity slow,
sources............................................................... 919Nickel, study of systems of type LixfCo Nio-,,)]-
(l— *)0, 198; comparison of metal chelate stability consts., 250; tetrahedral NiCl4~ ion in crystals and in fused salts, 393; binuclear complexes as catalysts, 411; infrared spectra of gaseous NiCl2, 758; effect of poisoning on spectrum of CO adsorbed on, 1423; spectra of hydrocarbons adsorbed on Si02
supported metal oxides, 1616; adsorption studieson, 1626; adsorption of gases on evaporated metal films, 1630; structure of diamagnetic bis-(N-methylsalicylaldimine)-Ni(II) complex................ 1908
Niobium, variation of lattice parameter with C content of NbC....................................................... 1747
Nitrogen, annihilation of, quadrupole broadening by strong mol. elec, field gradients, 302; adsorption of, by modified carbons, 1161; atoms and free radicals by y-irradiation, 1762; chem. reaens. of active 1976
Nitrogen iodide, ignition of explosives by radiation. . 11Nitrogen oxides, decompn. of N20 on a-Mn203, 264;
oxidn. of C by NO, 544; photolysis of NH3 in presence of NO, 843; kinetics of decompn. of NO, 952; rate of reacn. in N20, 1154; sorption of NO by Si02 gel, 1622; conversion of N02 to NO, 1782;quenching of excited Hg( 3Pi ) by NO...... ............. 2082
Nitrosyl chloride, photolysis of................... 17Nitrous acid, mechanism of ozone production in
photooxidn. of alkyl nitrites................................ 2071Nuclear magnetic resonance, F19, of metal-fluoride
complexes, 568; mol. interaens. on, reference compds., 1379; B11 n.m.r. chem. shifts and spin coupling values for various compds., 1533; shielding of F19 in chlorofluorocarbons.......................... 1701
Nuclear magnetic shielding, of protons in amides.. . 1388
OCTACOSANE, stable crystal structures of purera-paraffins.......................................................... 248
B-Octadecylamine, wetting of incomplete monomol.layers................................................................. 1045
Octanoic acid, surface tension of perfluoro sulfonates,

Dec., 1959 Subject I ndex 2109
1666; adsorption of fluorinated compds. oa solidplanar surfaces...................................................
Onsager equation, for dielec, const, of polar solas.,548; ternary isothermal diffusion, 570, (corrn.)2089; diffusion in coned, soln. of system NaCl- KC1-H20, 612, (corrn.) 2089; validity of, reciprocalrelations in ternary diffusion (corrn.)...................
Osmium, sedimentation velocity of 0s04 in aq soln.. Osmotic pressure, calcn. of, in a Donnan system... . Ovalbumin, structural degradation of 7 -irradiated...Oxalic acid, photodecompn. of complex oxalates, 2 2 ;
prepn. of fine particles from bimetal oxalates, 83;subsn. reaens. of oxalato complex ions.................
Oxygen, soly. of, bearing impurities in Na, K and alloys, 6 8 ; 0 - 0 bond strength of dialkyl peroxides,104; oxidn.-redn. pattern of Cd(II), effects of gelatin and, 217; chemisorption on Ag, 460; interacn. with Ti02, 620; a-ray FeS04 oxidn. in H2S04 solns., 867; dry CO-02 flame, 989; detonation propagation in liq. ozone-, 1054; partial molal heats and entropies of soln. for gases in H2Q, 1803; consumption of, mols. in hydrocarbon flames chiefly by reacn. with H atoms, 1834; fractic nation of, isotopes between H20 and S02, 1885; dielec, const, of liq. ozone and liq. ozone-, mixts. 1968; exchange of D and heavy, among H, H20 vapor and oxide catalysts of spinel type, 1987; sorptionand elec, conductivity of Cu oxide films.............
Oxygen, O18, relative activity of H20 18 and H20 ls coordinated to a tripositive ion, 124; peroxydisul- fate-induced exchange of O atoms between H«0 and 02, 353, (corrn.) 2089; ealed. vibrational frequencies for H20 18 and D20 1 8..............................
Ozone, dielec, const, of liq., and liq. 0-, mixts, 1968; mechanism of, production in photooxidn. of alkyl nitrites ...............................................................
PALLADIUM, surface reaens. on evaporated, films. Palmitic acid, heat capacities and thermodynamic
functions of hydrous Na palmitate, 149 heat capacities and thermodynamic functions for 5- andu-Na palmitate...................................................
Paraffin, radiation chem. processes in rigid solns... . Particle size, distribution measurements of powdered
substances, 531; interpretation of abnormalities inlog-normal distribution of...................................
Partition coefficients, of dil. solns. of acids and bases.Pentane, self-diffusion coeffs. of isomeric................n-Pentane, radiolysis of liq.....................................Pentanoic acid, kinetics of adsorption of, at H20-air
interface.............................................................Pepsin, denaturation of..........................................Perchloric acid, binary oxidant system Ba(C104)2-
KNO 3, 93, (corrn.) 2089; crystal structure of, monohydrate, 279; viscosity of aq. NaClC4, 742; interacn. between Nd and perchlorate ions, 1313, (corrn.) 2089; differential thermal analysis ofsystem LiC104-NH4C104 ..................................... 1519
Peroxides, 0 -0 bond strength of dialkyl................. 104Persulfuric acid, aq. chemistry of inorg. free radicals,
346; peroxydisulfate-induced exchange of C atoms between H20 and 0 2 ...........................353, (corrn.) 2089
1,10-Phenanthroline, electron transfer in Co systems. 371Phenol, infrared speetrophotometric study of rhenox-
ide-, dissocn, 1342; properties of rare gas clithrate compds., 1432; quantum-mechanical studies ofoxidn. potentials of some..................................... 1940
p-Phenylenediamine, radiation induced synthesis ofLauth’s Violet 1................................................... 976
Phosphine, temp, as a variable during a kinetic expt.. 307Phosphoric acid, soly. of Bu3 phosphate in H2 3, 113;
distribution of electrolytes between H20 and Bu3
phosphate, 118; effect of temp, on phase equil. of polyphosphates, 123; particle size distribution measurements of powdered substances, 531: effect of molar Ca/P on crystallization of brush:te and apatite, 725; compn. of solid phase in Na®P3Oio- CaCl2-H20 system, 1528; diffusion of aq., solns. . 1830
Photochemistry, symposium on, of liqs. and sc lids, 1; of nitrosyl chloride, 17; storage of energy, 19; photodecompn. of complex oxalates, 2 2 ; photo- redn. of methylene blue, 26; evidence of photo- redn. of chlorophyll in vivo, 30; photoinitiated
addn. of mercaptans to olefins, 34; processes in thin 1729 single crystals of AgBr, 45; aquation of Cr-
(NH3)6+3and Cr(NH3 )f,H20 +3, 327; aq. chemistry of inorg. free radicals, 346; autooxidn. of anthracenes.
Photolysis, of NH3 in presence of NO, 843; of low mol. wt. 0 compds., 1488; of isopropyl iodide. . . .
2089 2-Picolylamine, coordination complexes of metal ions1574 with N compds....................................................551 Platinum, reactivities of naphthenes over, by gas 932 chromatography, 478; overpotential on activated,
cathodes in NaOH solns.. 983; D exchange activities of supported, catalysts..................................
330 Plutonium, kinetics of aq. oxidn.-redn. reaens. of, 305; kinetics of reacn. between Pu(IV) and U(IV), 1493; kinetics of reacn. between Pu(VI) and Ti(III), 1502; phase equil. in binary systems PuCl3-NaCl and PuClj-LiCl, 1774; phase equil.of binary system PuCls-KCl...............................
Polarography, oscillographic observations of, phenomena, 217; behavior of chromammines and Cr(III) salts in an acetate buffer, 314; characteristics of furfurvlideneacetophenone and derivs....
Polyethylene, crystallization rate of low pressure, 763; sorption of org. vapors by, 1406; wetting of low-energy solids by aq. highly fluorinated acidsand salts............................................................
Polyisobutene, laminar flow' degradation of............2013 Polyisobutylene, mult.isegment adsorption of long
chain polymers on C black..................................Polymer, effect of simultaneous crosslinking and
degradation on intrinsic viscosity of a, 1838; cross- linking of, in soln. under influence of -y-radiation. .
1331 Polypeptides, Helix-Random coil transition in. .. 1194, Polypropylene, hydride transfer and mol. wt. distri
bution of, 1167; intrinsic viscosity-mol. wt. rela-2071 tionships for isotactic and atactic poly-...............
Polyvinylmethylglyoxime, metal-polyelectrolyte188 complexes...........................................................
Pore structure, of sintered glass from diffusion andresistance measurements.....................................
Porphyrazine, heptaphenylchlorophenyl-, and ferric152 octaphenyl-.........................................................9 0 4 Potassium, soly. of O bearing impurities in, 6 8 ; tests
of Onsager reciprocal relation for isothermal diffusion, 8 6 ; binary oxidant system Ba.(C104)»-
1603 KN03, 93, (corm.) 2089; reacn. of reciprocal saltI5 5 pairs during crystallization from the gaseous phase,
1217 300; diffusion in coned, soln. of system NaCl-8 7 9 KC1-H20, 612, (corrn.) 2089; calorimetric detn. of
surface enthalpy of KC1, 1009; thermodynamics of 1085 dil. molten KN03 solns., 1259, 1262; elec, con
ductivities of KCl-KBr solid solns., 1536; mol. wt. of KC1 vapors, 1785: hydrolysis on active C, 1848; phase equil. of PuCl3-KCl system, 1983; properties of elec, double layer in coned. KOI solns........
Potential, change on Ag electrode in alkaline soln., 107; electrode, in fused system, cells with transference, 741; around a charged colloidal sphere, 1869; quantum-mechanical studies ofoxidn., of phenolic compds..................................
Promethium, adsorption of fission products on various surfaces........................................................
Propane, thermal decompn. of 2-nitro-....................Propanol-2, radiolysis of the benzophenone- system. Propyl alcohol, radiation exchange of HCl-Ci36 and
Pr chlorides, 641; isotopic exchange between ethers and D on metallic catalysts, 1017; adsorptionstudies on metals................................................
Propylene, double bond isomn. of olefins by II atoms. Proteins, electrophoretic patterns of, in acidic media,
2 1 0 ; rate of formation of enzyme substrate complexes, 274; enzymatic reacn. across a thin membrane .................................................................
Proton magnetic resonance, of iodic acid, 101; comparison of silicochloroform and chloroform in basicsolvents..............................................................
Proton nuclear spin resonance, spectroscopy.............Proton resonance spectra, shifts of acids in liq. SO». . Pyridine, tetrahedral NiCl4~ ion in crystals and in
fused salts, 393; adsorption of cetylpyridinium chloride on glass, 1 0 2 2 ; transference method forstudy of counterion assocn..................................
Pyrolysis, thermal decompn. of 2-nitropropane, 1305;
79415261246
1032
1983
1824
1911202
1376
18521199
2002206751582
2032
1940881
1305873
16261517
1929
238302
2061
1539
[
2110 Subject I ndex Vol. 63
thermal decompn. of solid Ag Me and Ag Et, 1523; shock tube studies on, of CH4 ............................. 1736
QUADRUPOLE spectrum, of solid 1,2-dichloro-ethane................................................................ 1395
Quinoline, heat stabilities of metal chelates............ 603
RADIATION, ignition of explosives by.................. 11Radiolysis, of mixts. by polymn. method................ 801Raman spectrum, of iodic acid............................... 101Rare earths, in nitrate solns., 77; sepn. of, mixts. by
ethylenediaminetetraacetic acid.......... 256, (corrn.) 2089«-Rays, radiolysis of H20 by particles of high linear
energy transfer, 833; redn. of ceric ions by Po210
«-particles, 8 8 8 ; «-particle radiolysis of acetylene,916; effect of «-radiation on aq. glycine............. 935
|3-Rays, radiation chemistry of polyvinyl chloride. . . 17557 -Rays, radical and mol. yields in 7 -irradiation of org.
liqs., 854; action of Co-60 7 -radiation on aq. solns. of acetylene, 862; FeS04 oxidn. in H2S04 solns., 867; radiolysis of the benzophenone-propanol- 2 system,873; kinetics of radiation-induced reacn. of Fe(III) with Sn(II), 892; effects of solute concn. in radiolysis of HoO, 899; radiation chem. processes in rigid solns., 904; radiation-induced polymn. of isobutene, 909; radical production in hydrocarbons by heavy particle radiations, 925; H atoms in radiolysis of H20, 928; structural degradation of y-irradi- ated ovalbumin, 932; radiation-induced reacns. in anthracene solns., 970; radiation induced synthesis of Lauth’s Violet, 976; radiolysis of MeOH and methanolic solns. by Co, 1449; atoms and free radicals by 7 -irradiation, 1762; crosslinking of polymers in soin, under influence of, 1852; radiation chemistry of liq. aliphatic carboxylic acids, 2041 ; photolysis of, produced free radicals in EtOH. . . . 2088
X-Rays, redn. of dichromate ion by t.hallous ion induced by 7 -radiation, 823; oxidn. effects of irradiation of polyethylene.......................................... 837
Reaction velocity, rate consts. in Jablonski model of excited species in rigid glasses, 15; photochem. storage of energy, 19; photoinitiated addn. of mer- captans to olefins, 34; decompn. of trichloroacetic acid in aromatic amines, 99; of electron transfer between cobaltous and cobaltic ammines, 126; decompn. of N20 on «-Mn203, 264; temp, as a variable during a kinetic expt., 307; nature of subsn. reacns. in inorg. chemistry, 321; photochem. aquation of Cr(NH3 ) 6 + 3 and Cr(NH3)5H,0+3,327; subsn. reacns. of oxalato complex ions, 330; coordination kinetics of ethylenediaminetetraace- tate complexes, 336; rates of acid “hydrolysis” of Co(III) complexes, 340; aq. chemistry of inorg. free radicals, 346; peroxydisulfate-induced oxchange of O atoms between H20 and 02, 353, (corrn.) 2089; of aniline nitrosation, 359; of aq. oxidn.-redn. reacns. of U, Np and Pu, 365; electron transfer in Co systems, 371; ionic reacns. in solns. of chlorides and oxychlorides, 378; isotopic exchange reacns. in liq. SOo, 383; exchange reacns. in acidic solvents,389; catalytic activation of mol. H by metal ions,398; of the steam-C reacn., 693; of reacn. between UFg and NaF, 697; of base-catalyzed hydration of fumarate to malate, 705; of polymn. of C2H4, 720; specific ionic effects in decompn. of hypobromite solns., 734; absolute rate consts. for H atom reacns. in aq. solns., 858; of Ru-catalyzed As(III)-Ce(IV) reacn., 890; of radiation-induced reacn. of Fe(III) with Sn(II), 892; use of aq. Na formate as a chem. dosimeter, 896; of decompn. of NO, 952; radiation equil. of air, 956; of graphite oxidn., 1004; solidification kinetics of benzene,1 0 1 2 ; substrate effects on decompn. of alkyl hydroperoxides, 1027; in H, N20 and other flames,1154; of gas phase disproportionation of dimeth- oxyborane, 1414 ; of Cl exchange between HC1 and chloroacetic acid, 1426; of mercuric salts with olefins, 1437, 1442; dimerization of gaseous butadiene, equil. study, 1470; ol reacn. between Pu (IV) and U (IV), 1493; of reacn. between Pu(VI) and Ti(III), 1502; of H with Tb, 1514; oxidn. of 1“ to hypoiodite ion by hypochlorite ion, 1518; of dimerization of alloôcimene, 1531; integration
of rate equation for a second-order reacn. in an adiabatic flow system, 1704; of oxidn. of HBr,1753; effect of monocarboxylic acids on the trichloroacetate ion, 1760; of thermal isomn. of p-tolyl isocyanide, 1793; of electrode processes involving more than 1 step, 1795; catalytic behavior of low cross-linked resins, 1971; o i consecutive competitive 2 nd-order reacns., 1978; differential reacn. rate in NH3 synthesis kinetics,1982; of Br addn. to unsatd. sulfones...................
Resins, anion exchange of metal complexes, Cd-chlo- ride, 1000; reacns. of Hg(II) with a cation-exchange, 1318; -deionized H20 as a substrate for monolayer studies, 1322; exchange equil. in carboxylic ion exchange, 1663; temp, dependence of cation exchange equil., 1901 (corrn.) 1090; catalysis by ion-exchange: catalytic behavior of low cross-linked, 1971; “HC1 effect” in anion-, exchange----
Retinene, reversible spectral changes in, solns. following flash illuminations.........................................
Rhenium, ion-exchange sepn. of Tc and...... ...........Rhodium, heterogeneous reacn. studies by infrared
absorption, 512; Rh(III) in aq. solns..................Riboflavin, chelating tendency of............................Ribonuclease, thermal transition of, in urea solns.. . . Rubidium, tracer diffusion of, ions in aq. alkali chlo
ride solns.......................................................Ruthenium, adsorption of fission products on various
surfaces..............................................................
SEDIMENTATION, photoelec, method for observing, at low concn............................ _................
Sedimentation equilibrium, second virial coeff. inpolymeric solns...................................................
Sedimentation velocity, diffusion coeffs. from, measurements, 1092; boundary spreading in, expts.,1570; of Os04 in aq. sohn............. .........._..........
Sediment volume, in dispersions of anisometric particles....................................... ..............._............
Serum albumin, rapid flow titration and acid expansion of bovine, 1025; ultracentrifugal study of horse, -Na dodecyl sulfate interacn., 1336; behavior in acidic perchlorate solns.........................
Sessile drop method, surface tension detns. by........Silica, acidity studies of A1203-, catalysts, 129;
infrared study of H20-, gel system, 179; infrared studies of physically adsorbed mols., 183; adsorption of normal olefins on A1203-, catalysts, 484; nature of C deposit of cracking catalysts, 489; structure of synthetic zeolite, 527; heats of immersion of system H20-, 594; H-D exchange and radiation behavior of, catalysts, 966; reacn. of vitreous, with HF, 1129; sorption of hydrocarbon vapors by, gel, 1256; cumene cracking activity of eo-gelled, A1203-, catalysts, 1312; elec, conductivity of molten, 1337; adsorption of ethylene oxide- propylene oxide condensate on quartz powders,1613; spectra of hydrocarbons adsorbed on, supported metal oxides, 1616; sorption of NO by,1622; thermal aging of, gels, 1789; system Ga203- . 2086
Silicon compounds, comparison of silieochloroform, with chloroform in basic solvents, 238; sonically induced heterolytic cleavage of polymethylsiloxane,254; oxidn. of SiC, 305; rare earth metal “disilici- cides,” 616; light scattering ordering effects in silicotungstic acid solns., 629; study of amorphous SiO, 1119; role of C02 in catalyzed siloxane cleavage, 1338; tetramethyl silane, mol. interacns. onn.m.r. reference compds., 1379; bubble Stability in dimethylsilicone solns., 1687; polymorphism ofrare earth disilicides............................................ 2073
Silver, photochemistry processes in the single crystals of AgBr, 45; potential change on Ag electrode in alkaline soln., 107; diffusion of, in Ag2S,223; reacn. of reciprocal salt pairs during crystallization from the gaseous phase, 300; molten salt thermocells, 419; chemisorption of O on, 460; phys. techniques of Ag catalysts for ethylene oxidn.,463; thermodynamic properties of molten and solid solns. of AgCl, 6 6 8 ; electrode potentials in fused system, cells with transference, 741; anion transport no. in pure molten AgN03, 757; soly. of AgCl in nitrate melts, 760; structure of Ag cyclo-
2016
2021441559
1979309
20071873
881
10261326
1574
1608
1545312
Dec., 1959 Subject I ndexI
octatetraene nitrate, 845; cathode current distribution in soins, of Ag salts, 1147, 1150; soly. of Ag2S04 in electrolyte solns., 1183, 1186, 1188. 1190,1984; thermodynamics of dil. molten AgN03 soins.,1259, 1262; thermal decompn. of solid Ag Me andAgEt, 1523; polymorphism of Agi.................... 1858
Silver chloride sol, coagulation effects of highlycharged counterions............................................ 1552
Sodium, soly. of O bearing impurities in, 6 8 ; tests of Onsager reciprocal relation for isothermal diffusion, 8 6 ; reacn. of reciprocal salt pairs during crystallization from the gaseous phase, 300; diffusion in coned, soln. of systems KaOl KC1H20 612, (corrn.) 2089; overpotential on activated P*, cathodes in NaOH solns., 983; soly. of Ta and Co in, by activation analysis, 1192; heat capacity of Na20 2 at high temps., 1505; viscosity of NaF soln., 1777; mol. wt. of NaCl vapors, 1785; tracer diffusion of, ions in aq. alkali chloride solns., 1873; selectivity coeff. measurements with variable capacity cation and anion exchangers, 1924; gaseous species in NaOH-IvOH system (corrn.)......... 2089
Sonic degradation, of high polymers in soln........... 1725Sonic reactions, heterolytic cleavage of polymethyl-
siloxa.ne.............................................................. 254Solubility, equation of, of nonelectrolytes............... 608Solubility data for long chain compounds, correlation
of...................................................................... 2047Sorbitan monooleate, spreading coeffs. of aq. sc Ins. of
emulsifying agents.............................................. 1681Spark ignition, of dust clouds.................................... 290Spheres, translational friction of microscopic, in
coned, polymer solns........................................... 1335Spreading coefficients, of aq. solns. of emulsifying
agents, 1681; dependence of equil. pressures on pHai d surfactant.................................................... 1684
Stability constants, comparison of metal chelate, 250;calcn. from cryoscopie measurements................... 1041
Stearic acid, adsorption of radio-, from n-hexadecane,226; sediment vol. in dispersions of aniso- metric particles, 1608; electrophoresis and surfacecharge................................................................ 1809
Strontium, tracer diffusion coeffs. of Sr ion in aq.polystyrene sulfonic acid solns............................... 269
Styrene, tracer diffusion coeffs. of Sr ion in aq. poly-, sulfonic acid solns., 269; refractive index increment of poly-, in soln., 1435; salting-out chromatography of special resins, 1511; effect of partial coagulation on colloidal particles, 1566; sonic degradation of high polymers in soln., 1725; crosslinking of polymers in soln. under influence of 7 -radiation, 1852; long chain branching in poly-,pc-lymerized with SnCl4 ....................................... 1966
Substitution reactions, in inorg. chemistry.............. 321Succinic acid, wettability of low-energy solids by aq.
solns................................................................... 1241Sulfur compounds, photoinitiated addn. of rr.ercap-
tans to olefins, 34; temp, as a variable during a kinetic expt., 307; electron paramagnetic resonance studies on CS2-insoluble S........................... 2085
Sulfur dioxide, isotopic exchange reaens. in lie., 383; exchange reaens. in acidic solvents, 389; fractionation of O isotopes between H20 and, 1885; formation of tetrachloroborate ion in liq., soln., 1969;proton resonance shifts of acids in liq.................. 2061
Sulfuric acid, radiation decompn. of, solns............... 808Surface channels, film and substrate flow in............ 637Surface tension, detn. by sessile drop method, 312;
effect of exces's salt on minima obsd. in y/log C curves for surface active agents, 317; in aq solns. of non-ionic surfactants, 648; activity of fluori- nated compels, at org. liq.-air interfaces, 727; of perfluoro sulfonates, 1666; fluid phases in mutualcontact................................................................. 1977
TANTALUM, model H-, system, 505; soly. in Na byactivation analysis................................................ 1192
Technetium, ion-exchange sepn. of Re and............. 559Tellurium, kinetics of aniline nitrosation................. 359Terephthalic acid, transesterification of Me2, by
ethylene glycol................................................... 1206Tetramethyllead, heat of formation of...................... 1139Thallium, redn. of dichromate ion by thallous ion
induced by y-radiation, 823; ammonium-H and
2111
thallous-H exchange........................................... 1417Thermal reactions, heterogeneous flash initiation of. 433Thermocells, molten salt......................................... 419Thermodynamic probability, anal, proof that the
extremum of, is a max. (corrn.)........................... 2089Thermogravimetric analysis, method of isobaric dehy
dration ............................................................... 1231Thiaoctane, coordination compds. of metal ions with
amines containing O........................................... 541Thorium, sepn. of, -rare earth mixts. using ethylene-
diaminetetraacetic acid, 256, (corrn.) 2089; phase equil. in fused Li, Na, Th salt systems, 1266; rate of reacn. of H with, 1514; X-ray analyses of solid phases in LiF-ThF4 system, 1974; activity coeff.of HC1 in ThCl4 solns.......................................... 2079
Thyroglobulin, boundary spreading in sedimentationvelocity expts...................................................... 1570
Tin, ultracentrifugation of 3n(IV) in acidic chloride and perchlorate solns., 4t0; kinetics of radiation- induced reacn. of Fe(III) with Sn(II), 892; thermodynamics of Pb-Sn system, 1158; long chain branching in polystyrene polymerized with SnCL,1966; Sn(II) redn. of Me orange........................ 2076
Titanium, thermodynamics of Hg redn. of TiF4, 127; defect structure and catalysis in Ti02 system, 472; interacn. of O with Ti02, 620; kinetics of the polymn. C2H4 with triethylaluminum and TiCLcatalysts, 720; thermal dissocn. of Tils, 1484; kinetics of reacn. between Pu(VI) and Ti(III),1502; thermodynamics of disproportionation of TiBr3, 1525; reacn. between TiCU and A1 triethyl. 1791
Toluene, kinetics of thermal isomn. of p-tolyl isocyanide................................................................. 1793
Transference method, for study of counterion assocn. 1539 Triphenylmethyl, spectroscopic evidence of, cations
on a cracking catalyst........................................... 1517Tritium, labeling of org. compds. by elec, discharge. . 799Trypsin, enzymatic reacn. across a thin membrane. . 1929Tungsten, adsorption and diffusion of Ar on, 468;
light scattering ordering effects in silicotungstic acid solns., 629; coagulation affects of highly charged counterions........................................................... 1552
ULTRACENTRIFUGE, equil. ultracentrifugations of charged systems, 787 studies with Rayleigh interference optics, 1578; moving boundary theory applied to preparative ultracentrifugation, 1592;mol. wt. averages during approach to equil.......... 1742
Uranium, ternary system UF6-C1F3-HF, 166; chrono- potentiometric study o: disproportionation ofU(V), 303; kinetics of aq. oxiden.-redn. reaens. of,365; reacn. between UFe and NaF, 697; rates of electron reacn. between U(IV) and U(VI) ions,1236; prepn. and heat of formation of UC, 1455; surface properties of liq. Pb with U02, 1486; kinetics of reacn. between Pu(IV) and U(IV), 1943;Zr-H and Zr-H-U systems................................. 2035
Urea, ealed. bond characters in oxamide and.......... 1403
VAPOR pressures, of Bil3 over liq. Bi-Bil3 solns., 295; diffusion effects in transpiration method of, measurement, 443; of p-dibromobenzene, 556; partial,of I, 1174; of diborane....................................... 1997
Velocity field, in electrolytic solns......................... 633Vibrational frequencies, ealed. for H20 18 and D20 18. 1331Vinyl compounds, aq. solns. of polyvinylsulfonic acid,
671; radiolysis of mixts. by polymn. method, 801; high energy 7 -irradiation of vinyl monomers, 1366; transference method for study of counterion assocn., 1539; radiation chemistry of polyvinyl chloride, 1755; kinetics of Br addn. to unsatd. sul-fones.................................................................. 2016
Virial coefficient, second, for polyelectrolytes.......... 283Viscosity, of liq. mixts., 58; effect of polydispersity
on non-Newtonian, of polymeric solns., 638; aq. solns. of polyvinylsulfonic acid, 671; of aq. NaC104
solns., 742; sorption effect of cellulose trinitrate in capillary viscometry, 766; exptl. check of theories of, of solns., 985; of aq. NaF soln., 1777; of di- ethylamine-H20 mixts., 1783 ; effect of simultaneous crosslinking and degradation on intrinsic, of a polymer, 1838; intrinsic mol. wt.-, relationships for
IS u b j e c t I n d e x Vol. 632112
isotactic and atactic polypropylene, 2002; hydro- dynamic vol. of heteropoly hexamolybodobaltate- (III) anion from, measurements................................ 2033
WATER, effects of solute concn. in radiolysis of, 899;H atoms in radiolysis of, 928; resin-deionized, as a substrate for monolayer studies................................. 1322
Wetting, of incomplete mono mol. layers, 1045; of low-energy solids by aq. solns., 1241; fluid-fluid displacement and wettability in porous rocks. .. . 1046
XAN TH IC acid, dissocn. const, of, by spectrophoto- metic method................................................................. 1321
YTTRIUM , heat capacity of Y20 3............................... 1445
ZEOLITE, structure of synthetic, 527; containing apreadsorbed phase........................................................
Zinc, tetrahedral NiCL" ion in crystals and in fused salts, 393; cells having a fused ZnCl2 electrolyte, 525; dissocn. pressure of ZnAs2, 1142; possible role of solid adsorbent in chemisorption, 1144; passivation of Zn amalgam in alkaline solns., 1252; adsorption of H20 and CO by ZnO, 1317; decompn. of ZnO by Zn vapor, 1516; e.m.f. investigation of binary liq. alloys rich in, 1953; synthetic inorg.anion exchangers...........................................................
Zinc, Zn66, radiotracer studies of Zn-Zn ion exchange Zirconium, H -, and H -U -, systems, 2035; diffusion
coeffs. of Zr(IV) in HC1, 2065; structure proposal for Na7Zr6F3i ..................................................................
1292
20441816
2076
I
THE PRODUCTION OF CHEMICAL ABSTRACTS
This inform ative 130 page clothbound volume describes for the reader the interworkings o f the w orld ’s largest and m ost successful abstracting undertaking.
All scientists and organizations interested in producing abstracts an d /or indexes wall find this book on the production o f C H E M IC A L A B S T R A C T S an invaluable aid.
• Increasingly , au thors are asked to prepare abstracts o f their papers to a ccom pan y th e com p lete papers w hen pu blished in prim ary jo u r nals.
• Scientists m ust frequ en tly index th eir ow n books.
• Industria l organ izations rou tinely bu ild co llection s o f abstracts and indexes w ith em phasis on their ow n special interests.
C A T oday tells how source material is gathered, explains the assignment o f abstracts, and the problems o f recording, editing, and classifying abstracts. Indexing procedures are explained, methods o f printing are discussed, and research, administration, housing and equipment, nomenclature, and records are am ply described in separate chapters. T he total concept behind the developm ent o f successful abstracting is presented for the first tim e in one reference,
v
C lo th b o u n d ............ 130 p a ges ............. $3.50
order from
Special Issues Sales
A M E R I C A N C H E M I C A L S O C I E T Y
1155 16th Street, N . W ., W ashington, D . C.
Announcing a new book by a renowned investigator.,.
C l a r k ’ s O X I D A T I O N -
R E D U C T I O N
P O T E N T I A L S O F
O R G A N I C S Y S T E M S
“Although more than 100 tables are required to summarize existing data on groups of organic oxidation-reduction systems, the number of systems so far studied successfully by the methods here outlined is very small relative to the number in the whole field of organic chemistry. On the other hand are two exciting facts. With the increasing number of enzymes being isolated in nearly homogeneous states, biochemists have at hand enlarging means of bringing about equilibrium between two oxidation- reduction systems. If the standard potential of one of these systems is known, it and the constant for the equilibrium may be used to calculate the standard free energy change for the other. Also it may happen that an enzyme will accelerate to a state of equilibrium a reaction between an electro- motively inactive system and a ‘mediator’ that is electromotively active. In such a case potentiometric measurements can, under proper conditions, be interpreted as applying to the inactive system.” — Preface
C o n t e n t s : Pertinent thermodynamics. Conventions and definitions. E lectrom otive force and cell reaction. Rectification o f titration curves. M odifications o f primary equations in form ation o f dimers (and) intermediate free radicals (“ semiquinones” ). Form ation o f coordination compounds. Junctions between dissimilar solutions. Standard hydrogen half-cell and standardization o f oxidation-reduction potentials and pH numbers. Techniques. Criteria o f reliability. Compilations o f data.
B y W . M a n s f i e l d C l a r k , Ph.D ., Se.D., De- Lamar Professor Emeritus o f Physiological Chemistry and Research Professor o f Chemistry, The Johns Hopkins University
R eady early 1960 • Approx. 600 pp., 83 figs., 100 tables • Probable Price: $10.00
BALTIMORE 2, MARYLAND
I n t e r e s t i n g R e s e a r c h P o s i t i o n s f o r
C H E M I S T SA T L O C K H E E D
Lockheed Missiles and Space Division has a number of important, research positions for experienced chemists at its new facilities in the Stanford Industrial Park, Palo Alto, and Sunnyvale, California. This location, on the beautiful San Francisco Peninsula, is one of the choicest living areas in the nation.
The Division is widely diversified in its work, with complete capability in more than 40 areas of science and technology—from concept to operation.
Career opportunities are available for chemists with the following background:
p h y s ic a l - o r g a n icCHEMISTRY
P h.D . required w ith post-d octora l experience in instrumental analytical techniques including infrared, ultraviolet and mass spectroscopy. Experience in gas chromatography, X -ray and electron diffraction work desirable.
INORGANIC CHEMISTRYPh.D. with 5 years’ experience in gas solid reaction kinetics, intermetallic compounds and electronic properties of matter.
ANALYTICAL CHEMISTRYM .S. or Ph.D . w ith several years’ experience in the developm en t o f m icrochem ical techniques. Experience in X -ray and electron diffraction work desirable.
ELECTROCHEMISTRYM .S. with background in corrosion effects. For work in the development of surface treatments o f metals and basic work on surface reaction kinetics. Knowledge of X -ray and electron diffraction techniques desirable.
ORGANIC CHEMISTRYM .S. or Ph.D . with background in formulation of elastomers. Should be thoroughly grounded in the molecular resistance of substances to various environments.
ORGANIC CHEMISTRYPh.D. with experience in reinforced plastic area. Should have ability to relate physical requirements to modifications in molecular structures.
* P H O T O C H E M I S T R YPh.D . with background in experimental techniques in the field o f photo chemistry.
* P H Y S I C A L C H E M I S T R YM .S . or P h .D . w ith stron g b a ck ground in the theory of catalysis and experience in developing catalysts. Fundam ental know ledge in so lid state chemistry, physics or surface chemistry desirable.
* E L E C T R O C H E M I S T R YPh.D. required.
* For work on a high priority project in the field o f energy conversion.
FO R INFORM ATION regarding these positions, please write Research and Development Staff, Lockheed Missiles and Space Division, Dept. L-99, 962 West El Camino Real, Sunnyvale, California. U. S. citizenship required.
L o c k h e e d , M I S S I L E S A N D S P A C E D I V I S I O N
Sunnyvale, Palo Alto, Van Nuys, Santa Cruz, Santa Marla, California Cape Canaveral, Florida—Alamogordo, New Mexico —Hawaii


![Kings Mountain Telephone Directory [1959] - DigitalNC](https://static.fdokumen.com/doc/165x107/63204c5aeb38487f6b0f9149/kings-mountain-telephone-directory-1959-digitalnc.jpg)