The IRAS PSC/FSC Combined Catalogue
8
Astronomy and Computing 10 (2015) 99–106 Contents lists available at ScienceDirect Astronomy and Computing journal homepage: www.elsevier.com/locate/ascom Full length article The IRAS PSC/FSC Combined Catalogue H.V. Abrahamyan a , A.M. Mickaelian a,∗ , A.V. Knyazyan b a Byurakan Astrophysical Observatory (BAO), Byurakan 0213, Aragatzotn province, Armenia b Institute for Informatics and Automation Problems, National Academy of Sciences, Armenia article info Article history: Received 9 May 2014 Accepted 3 December 2014 Available online 11 December 2014 Keywords: Infrared sources Stars: general Galaxies: general Cross-correlations Virtual Observatories abstract Optical identifications of a few thousands of IRAS sources showed that IRAS Point Source and IRAS Faint Source catalogues (PSC and FSC, respectively) contain many quasars and active galactic nuclei, late-type stars, planetary nebulae, variables, etc. To increase the efficiency of using IRAS PSC and FSC, which contain a lot of common sources, one needs a joint catalogue of all IRAS point sources with improved data based on both catalogues. However, cross-correlation of the catalogues is not so easy, as the association of many sources is relative, and not always it is obvious, whose source from one catalogue corresponds to the other one in the second catalogue. This problem exists in case of using standard cross-correlation tools like VizieR. Therefore, we have created a tool for cross-matching astronomical catalogues and we have applied it to IRAS PSC and FSC. Using this tool we have carried out identifications with a search radius corresponding to 3 σ of errors for each source individually rather than a standard radius for all sources. As a result, we obtained 73,770 associations. We showed that in case of cross-correlation of these catalogues by VizieR, we had to take 161.95 arcseconds radius not to lose any association; however, in this case a lot of false associations appear for many sources. In addition, we have made cross-correlations with AKARI- IRC, AKARI-FIS and WISE catalogues. As a result we created a catalogue with high positional accuracy and with 17 photometric measurements from 1.25 to 160 µm range, providing a detailed catalogue for IRAS point sources. © 2015 Elsevier B.V. All rights reserved. 1. Introduction Optical identification of IRAS sources revealed that IRAS Point Source Catalogue (PSC) and Faint Source Catalogue (FSC) contain many quasars and other active galactic nuclei (AGN), late-type stars, planetary nebulae (PN), variables, etc. To be able to effec- tively use the IRAS catalogues containing many common sources, it is desirable to have a joint catalogue of all IRAS point sources with improved data on the basis of both databases. However, the cross- correlation of catalogues is a tricky task, since many associations of sources are relative and it is not always clear what sources from one database coincide with another database. To study the IR point sources we took IRAS PSC and FSC cata- logues. They were created in 1986 (IRAS PSC) and 1989 (IRAS FSC), and provide information of fluxes at wavelengths 12, 25, 60 and 100 µm. IRAS PSC contains 245,889 sources and IRAS FSC contains 173,044 sources at galactic latitude |b| > 10°. ∗ Corresponding author. E-mail addresses: [email protected] (H.V. Abrahamyan), [email protected] (A.M. Mickaelian), [email protected] (A.V. Knyazyan). Each source in these catalogues has coordinate errors. We did a cross-correlation between IRAS PSC and FSC and considered errors for each source; we took those identifications having positional er- rors between the sources not exceeding 3σ (which corresponds to 99.73% probability). For that, in frame of the Armenian Virtual Ob- servatory (ArVO), we created a software through which we made cross-correlations (Knyazyan et al., 2011). To obtain information about fluxes in other IR bands we did cross-correlation using the same method with AKARI-IRC All-Sky Survey Point Source Cata- logue (Ishihara et al., 2010), AKARI-FIS All-Sky Survey Bright Source Catalogue (Yamamura et al., 2010) and used VizieR for WISE cat- alogue (Wright et al. 2012) having very accurate positions. We give in Table 1 the main characteristics of the catalogues IRAS-PSC, IRAS-FSC, AKARI-IRC, AKARI-FIS and WISE, including the number of sources. WISE also gives 2MASS point source JHK data (Cutri et al., 2003), given in Table 1 WISE photometric bands. Though IRAS sensitivity is much smaller than that of WISE and may also be worse than that of AKARI (however, AKARI fluxes are not always reliable), IRAS provides data for longer wavelengths absent in WISE; this is especially useful for extragalactic studies. That is why IRAS data still remains helpful. http://dx.doi.org/10.1016/j.ascom.2014.12.002 2213-1337/© 2015 Elsevier B.V. All rights reserved.
-
Upload
independent -
Category
Documents
-
view
5 -
download
0
Transcript of The IRAS PSC/FSC Combined Catalogue

Astronomy and Computing 10 (2015) 99–106
Contents lists available at ScienceDirect
Astronomy and Computing
journal homepage: www.elsevier.com/locate/ascom
Full length article
The IRAS PSC/FSC Combined CatalogueH.V. Abrahamyan a, A.M. Mickaelian a,∗, A.V. Knyazyan b
a Byurakan Astrophysical Observatory (BAO), Byurakan 0213, Aragatzotn province, Armeniab Institute for Informatics and Automation Problems, National Academy of Sciences, Armenia
a r t i c l e i n f o
Article history:Received 9 May 2014Accepted 3 December 2014Available online 11 December 2014
Keywords:Infrared sourcesStars: generalGalaxies: generalCross-correlationsVirtual Observatories
a b s t r a c t
Optical identifications of a few thousands of IRAS sources showed that IRAS Point Source and IRAS FaintSource catalogues (PSC and FSC, respectively) contain many quasars and active galactic nuclei, late-typestars, planetary nebulae, variables, etc. To increase the efficiency of using IRAS PSC and FSC, which containa lot of common sources, one needs a joint catalogue of all IRAS point sourceswith improved data based onboth catalogues. However, cross-correlation of the catalogues is not so easy, as the association of manysources is relative, and not always it is obvious, whose source from one catalogue corresponds to theother one in the second catalogue. This problem exists in case of using standard cross-correlation toolslike VizieR. Therefore, we have created a tool for cross-matching astronomical catalogues and we haveapplied it to IRAS PSC and FSC. Using this tool we have carried out identifications with a search radiuscorresponding to 3 σ of errors for each source individually rather than a standard radius for all sources. Asa result, we obtained 73,770 associations. We showed that in case of cross-correlation of these cataloguesby VizieR, we had to take 161.95 arcseconds radius not to lose any association; however, in this case a lotof false associations appear for many sources. In addition, we have made cross-correlations with AKARI-IRC, AKARI-FIS andWISE catalogues. As a result we created a catalogue with high positional accuracy andwith 17 photometric measurements from 1.25 to 160 µm range, providing a detailed catalogue for IRASpoint sources.
© 2015 Elsevier B.V. All rights reserved.
1. Introduction
Optical identification of IRAS sources revealed that IRAS PointSource Catalogue (PSC) and Faint Source Catalogue (FSC) containmany quasars and other active galactic nuclei (AGN), late-typestars, planetary nebulae (PN), variables, etc. To be able to effec-tively use the IRAS catalogues containingmany common sources, itis desirable to have a joint catalogue of all IRAS point sources withimproved data on the basis of both databases. However, the cross-correlation of catalogues is a tricky task, since many associationsof sources are relative and it is not always clear what sources fromone database coincide with another database.
To study the IR point sources we took IRAS PSC and FSC cata-logues. They were created in 1986 (IRAS PSC) and 1989 (IRAS FSC),and provide information of fluxes at wavelengths 12, 25, 60 and100 µm. IRAS PSC contains 245,889 sources and IRAS FSC contains173,044 sources at galactic latitude |b| > 10°.
∗ Corresponding author.E-mail addresses: [email protected] (H.V. Abrahamyan),
[email protected] (A.M. Mickaelian), [email protected] (A.V. Knyazyan).
http://dx.doi.org/10.1016/j.ascom.2014.12.0022213-1337/© 2015 Elsevier B.V. All rights reserved.
Each source in these catalogues has coordinate errors. We did across-correlation between IRAS PSC and FSC and considered errorsfor each source; we took those identifications having positional er-rors between the sources not exceeding 3σ (which corresponds to99.73% probability). For that, in frame of the Armenian Virtual Ob-servatory (ArVO), we created a software through which we madecross-correlations (Knyazyan et al., 2011). To obtain informationabout fluxes in other IR bands we did cross-correlation using thesame method with AKARI-IRC All-Sky Survey Point Source Cata-logue (Ishihara et al., 2010), AKARI-FIS All-Sky SurveyBright SourceCatalogue (Yamamura et al., 2010) and used VizieR for WISE cat-alogue (Wright et al. 2012) having very accurate positions. Wegive in Table 1 themain characteristics of the catalogues IRAS-PSC,IRAS-FSC, AKARI-IRC, AKARI-FIS and WISE, including the numberof sources.
WISE also gives 2MASS point source JHK data (Cutri et al., 2003),given in Table 1 WISE photometric bands.
Though IRAS sensitivity is much smaller than that of WISE andmay also be worse than that of AKARI (however, AKARI fluxes arenot always reliable), IRAS provides data for longer wavelengthsabsent in WISE; this is especially useful for extragalactic studies.That is why IRAS data still remains helpful.
100 H.V. Abrahamyan et al. / Astronomy and Computing 10 (2015) 99–106
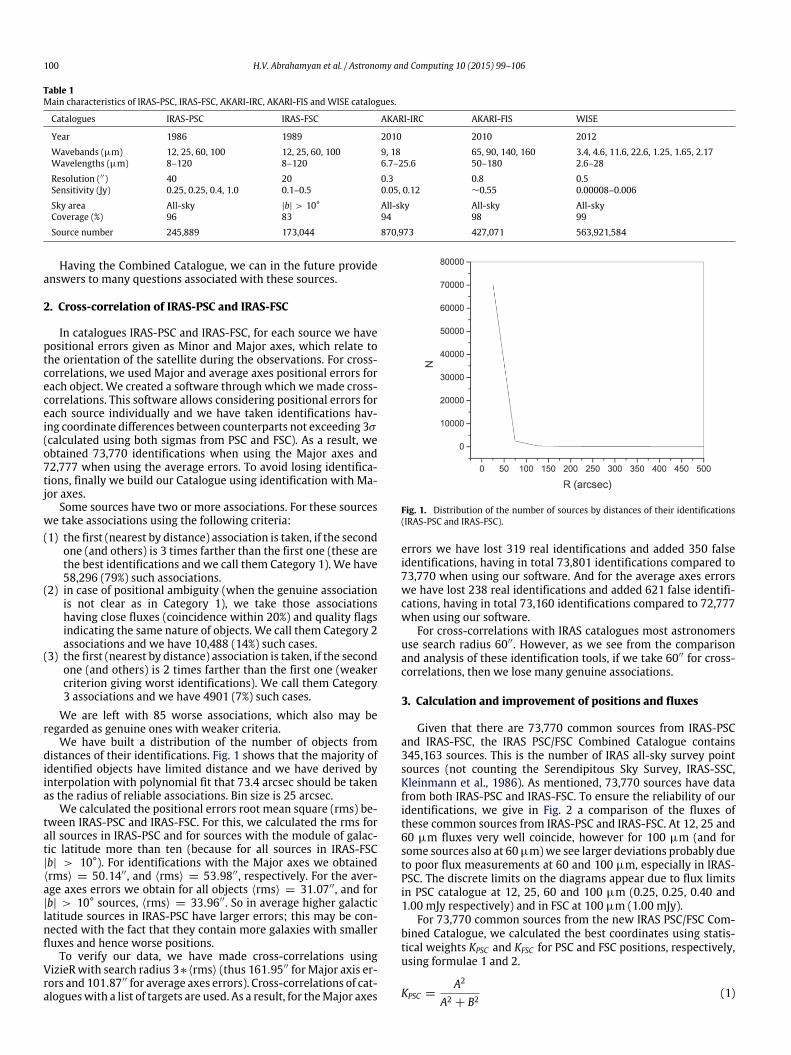
Table 1Main characteristics of IRAS-PSC, IRAS-FSC, AKARI-IRC, AKARI-FIS and WISE catalogues.
Catalogues IRAS-PSC IRAS-FSC AKARI-IRC AKARI-FIS WISE
Year 1986 1989 2010 2010 2012
Wavebands (µm) 12, 25, 60, 100 12, 25, 60, 100 9, 18 65, 90, 140, 160 3.4, 4.6, 11.6, 22.6, 1.25, 1.65, 2.17Wavelengths (µm) 8–120 8–120 6.7–25.6 50–180 2.6–28
Resolution (′′) 40 20 0.3 0.8 0.5Sensitivity (Jy) 0.25, 0.25, 0.4, 1.0 0.1–0.5 0.05, 0.12 ∼0.55 0.00008–0.006
Sky area All-sky |b| > 10° All-sky All-sky All-skyCoverage (%) 96 83 94 98 99
Source number 245,889 173,044 870,973 427,071 563,921,584
Having the Combined Catalogue, we can in the future provideanswers to many questions associated with these sources.
2. Cross-correlation of IRAS-PSC and IRAS-FSC
In catalogues IRAS-PSC and IRAS-FSC, for each source we havepositional errors given as Minor and Major axes, which relate tothe orientation of the satellite during the observations. For cross-correlations, we used Major and average axes positional errors foreach object. We created a software through which wemade cross-correlations. This software allows considering positional errors foreach source individually and we have taken identifications hav-ing coordinate differences between counterparts not exceeding 3σ(calculated using both sigmas from PSC and FSC). As a result, weobtained 73,770 identifications when using the Major axes and72,777 when using the average errors. To avoid losing identifica-tions, finally we build our Catalogue using identification with Ma-jor axes.
Some sources have two or more associations. For these sourceswe take associations using the following criteria:(1) the first (nearest by distance) association is taken, if the second
one (and others) is 3 times farther than the first one (these arethe best identifications and we call them Category 1). We have58,296 (79%) such associations.
(2) in case of positional ambiguity (when the genuine associationis not clear as in Category 1), we take those associationshaving close fluxes (coincidence within 20%) and quality flagsindicating the same nature of objects. We call them Category 2associations and we have 10,488 (14%) such cases.
(3) the first (nearest by distance) association is taken, if the secondone (and others) is 2 times farther than the first one (weakercriterion giving worst identifications). We call them Category3 associations and we have 4901 (7%) such cases.We are left with 85 worse associations, which also may be
regarded as genuine ones with weaker criteria.We have built a distribution of the number of objects from
distances of their identifications. Fig. 1 shows that the majority ofidentified objects have limited distance and we have derived byinterpolation with polynomial fit that 73.4 arcsec should be takenas the radius of reliable associations. Bin size is 25 arcsec.
We calculated the positional errors root mean square (rms) be-tween IRAS-PSC and IRAS-FSC. For this, we calculated the rms forall sources in IRAS-PSC and for sources with the module of galac-tic latitude more than ten (because for all sources in IRAS-FSC|b| > 10°). For identifications with the Major axes we obtained⟨rms⟩ = 50.14′′, and ⟨rms⟩ = 53.98′′, respectively. For the aver-age axes errors we obtain for all objects ⟨rms⟩ = 31.07′′, and for|b| > 10° sources, ⟨rms⟩ = 33.96′′. So in average higher galacticlatitude sources in IRAS-PSC have larger errors; this may be con-nected with the fact that they contain more galaxies with smallerfluxes and hence worse positions.
To verify our data, we have made cross-correlations usingVizieRwith search radius 3∗⟨rms⟩ (thus 161.95′′ forMajor axis er-rors and 101.87′′ for average axes errors). Cross-correlations of cat-alogueswith a list of targets are used. As a result, for theMajor axes
Fig. 1. Distribution of the number of sources by distances of their identifications(IRAS-PSC and IRAS-FSC).
errors we have lost 319 real identifications and added 350 falseidentifications, having in total 73,801 identifications compared to73,770 when using our software. And for the average axes errorswe have lost 238 real identifications and added 621 false identifi-cations, having in total 73,160 identifications compared to 72,777when using our software.
For cross-correlations with IRAS catalogues most astronomersuse search radius 60′′. However, as we see from the comparisonand analysis of these identification tools, if we take 60′′ for cross-correlations, then we lose many genuine associations.
3. Calculation and improvement of positions and fluxes
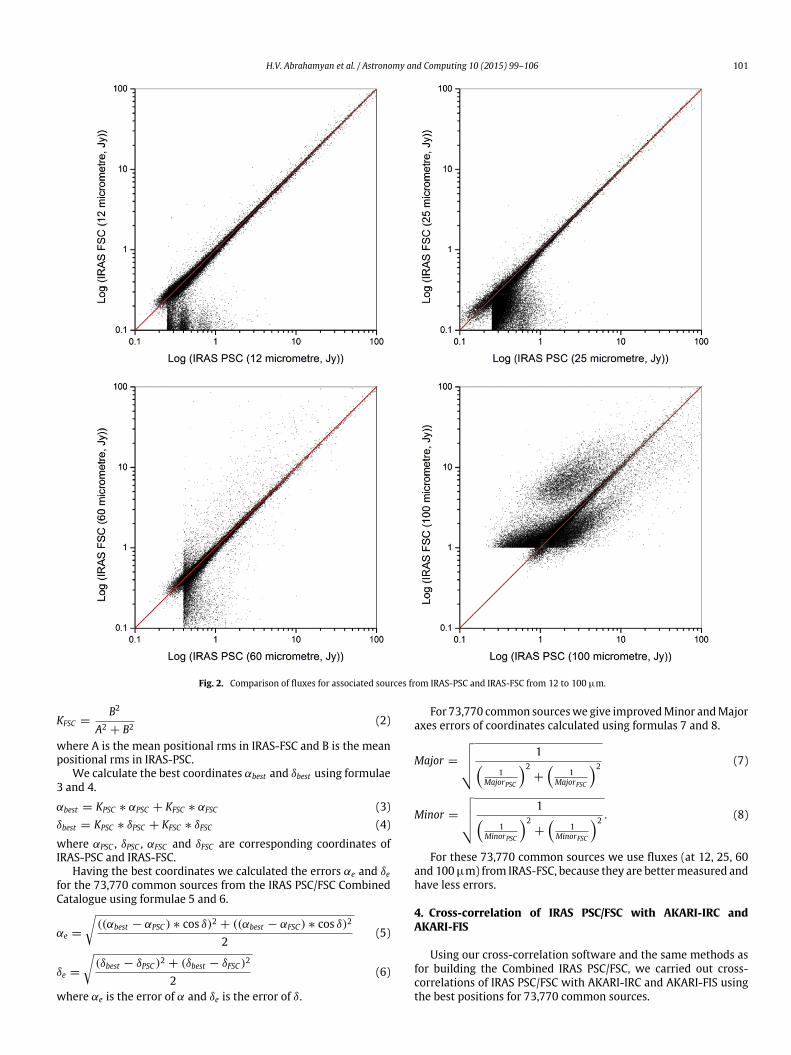
Given that there are 73,770 common sources from IRAS-PSCand IRAS-FSC, the IRAS PSC/FSC Combined Catalogue contains345,163 sources. This is the number of IRAS all-sky survey pointsources (not counting the Serendipitous Sky Survey, IRAS-SSC,Kleinmann et al., 1986). As mentioned, 73,770 sources have datafrom both IRAS-PSC and IRAS-FSC. To ensure the reliability of ouridentifications, we give in Fig. 2 a comparison of the fluxes ofthese common sources from IRAS-PSC and IRAS-FSC. At 12, 25 and60 µm fluxes very well coincide, however for 100 µm (and forsome sources also at 60µm)we see larger deviations probably dueto poor flux measurements at 60 and 100 µm, especially in IRAS-PSC. The discrete limits on the diagrams appear due to flux limitsin PSC catalogue at 12, 25, 60 and 100 µm (0.25, 0.25, 0.40 and1.00 mJy respectively) and in FSC at 100 µm (1.00 mJy).
For 73,770 common sources from the new IRAS PSC/FSC Com-bined Catalogue, we calculated the best coordinates using statis-tical weights KPSC and KFSC for PSC and FSC positions, respectively,using formulae 1 and 2.
KPSC =A2
A2 + B2(1)
H.V. Abrahamyan et al. / Astronomy and Computing 10 (2015) 99–106 101
Fig. 2. Comparison of fluxes for associated sources from IRAS-PSC and IRAS-FSC from 12 to 100 µm.
KFSC =B2
A2 + B2(2)
where A is the mean positional rms in IRAS-FSC and B is the meanpositional rms in IRAS-PSC.
We calculate the best coordinates αbest and δbest using formulae3 and 4.
αbest = KPSC ∗ αPSC + KFSC ∗ αFSC (3)δbest = KPSC ∗ δPSC + KFSC ∗ δFSC (4)
where αPSC , δPSC , αFSC and δFSC are corresponding coordinates ofIRAS-PSC and IRAS-FSC.
Having the best coordinates we calculated the errors αe and δefor the 73,770 common sources from the IRAS PSC/FSC CombinedCatalogue using formulae 5 and 6.
αe =
((αbest − αPSC ) ∗ cos δ)2 + ((αbest − αFSC ) ∗ cos δ)2
2(5)
δe =
(δbest − δPSC )2 + (δbest − δFSC )2
2(6)
where αe is the error of α and δe is the error of δ.
For 73,770 common sourceswe give improvedMinor andMajoraxes errors of coordinates calculated using formulas 7 and 8.
Major =
11
MajorPSC
2+
1
MajorFSC
2 (7)
Minor =
11
MinorPSC
2+
1
MinorFSC
2 . (8)
For these 73,770 common sources we use fluxes (at 12, 25, 60and 100µm) from IRAS-FSC, because they are bettermeasured andhave less errors.
4. Cross-correlation of IRAS PSC/FSC with AKARI-IRC andAKARI-FIS
Using our cross-correlation software and the same methods asfor building the Combined IRAS PSC/FSC, we carried out cross-correlations of IRAS PSC/FSC with AKARI-IRC and AKARI-FIS usingthe best positions for 73,770 common sources.

102 H.V. Abrahamyan et al. / Astronomy and Computing 10 (2015) 99–106
Fig. 3. Distribution of the number of objects by their positional distances between AKARI-IRC, AKARI-FIS and IRAS.
With this software, we took for each source as real associationsonly those having positional distance between the sources notexceeding 3σ of individual errors.
As a result, we obtained 225,165 identified sources fromAKARI-IRC and 90,946 ones from AKARI-FIS. There are sources having twoor more identifications; we select the appropriate identificationwith the same criteria as in case of building the IRAS PSC/FSCCombined Catalogue.
In Fig. 3 we have built the distribution of the number of sourcesfor AKARI-IRC and AKARI-FIS by positional distances betweenAKARI sources and IRAS common 73,770 sources and all IRASsources.
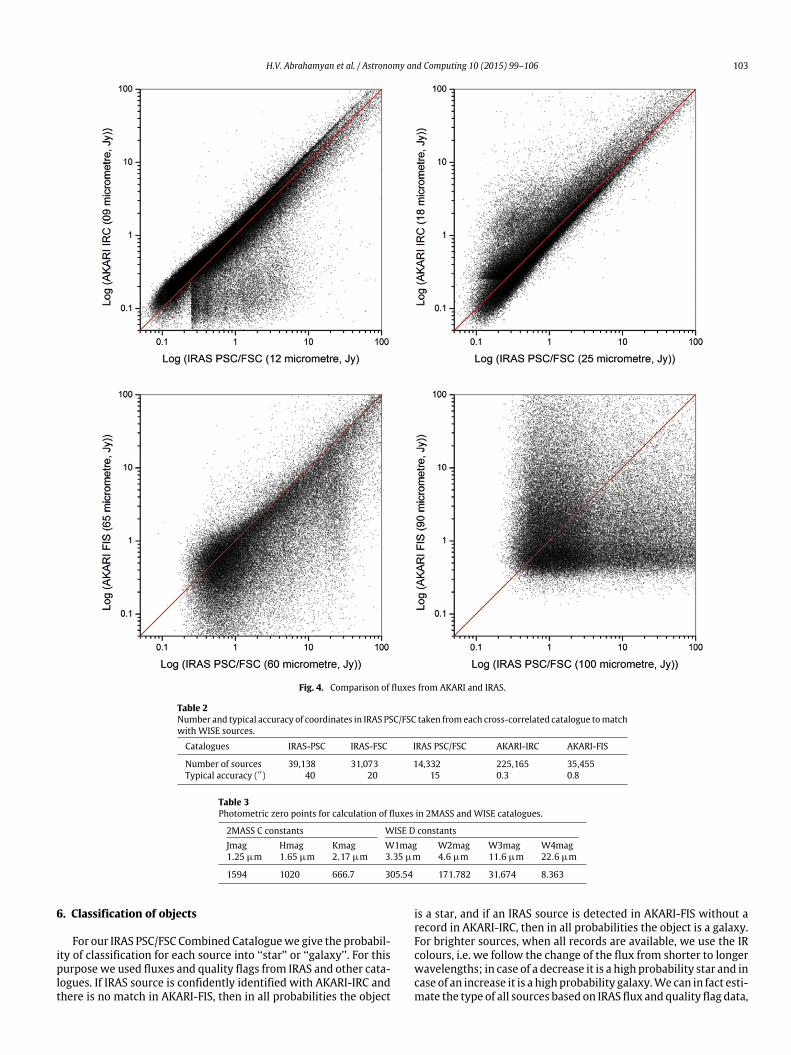
From the AKARI-IRC catalogue, we have fluxes at 9 and 18 µm,and the AKARI-FIS catalogue gives fluxes for 65, 90, 140 and160 µm. For comparison of IRAS and AKARI fluxes we use 12, 25,60 and 100 µm fluxes from IRAS and 9, 18, 65 and 90 µm fluxesfrom AKARI, which are more or less close to IRAS. The comparisonof these fluxes is given in Fig. 4. These fluxes better coincide forIRAS 12 and AKARI 9 µm, and more or less for IRAS 25 and AKARI18µm.We see larger errors for IRAS 60 andAKARI 65µmand thereis no match for IRAS 100 and AKARI 90 µm. By comparison withsome other data, particularly with Spitzer (at 24µm), we concludethat AKARI catalogues have large flux errors, especially at largerwavelengths. However, cross-matching with AKARI cataloguesprovided very reliable coordinates compared to IRAS ones.
5. Cross-correlation of IRAS PSC/FSC with WISE
Cross-correlation of IRAS PSC/FSC withWISE allows us comple-ment the photometric data for IRAS sources, particularly fluxes at3.35, 4.6, 11.6 and 22.1 µm, as well as JHK 1.25, 1.65 and 2.17 µm(2MASS) also given in WISE. In order to make cross-correlationwith WISE we again refined the IRAS PSC/FSC coordinates; theywere taken in the following order: (1) AKARI-IRC when available,(2) AKARI-FIS when available and in case AKARI-IRC were absent,(3) improved coordinates for IRAS PSC/FSC common sources, (4)IRAS FSC, and (5) IRAS PSC (Table 2).
Due to large number of entries in WISE, cross-correlation wasnot possible with our software. That was why we made the cross-correlation using VizieR and the following criteria: (1) with asearch radius of 3′′ with coordinates from AKARI-IRC, (2) with asearch radius of 15′′ with coordinates from AKARI-FIS, (3) with asearch radius of 20′′ with coordinates from IRAS PSC/FSC, and (4)with a search radius of 30′′ with coordinates from IRAS PSC or IRASFSC.
As a result, out of 345,163 sources from the IRAS PSC/FSC Com-bined Catalogue, only 240 do not have identifications in WISE. Wenow have 17 photometric bands with IR fluxes ranging from 1.25to 160 µm.
In all used catalogues, photometric measurements are given influxes, and only in WISE they are in magnitude units. To be able tocompare the fluxes, we have transformed magnitudes to fluxes inJy using formula 9 for 2MASS fluxes and formula 10 forWISE fluxes.
Fυ = C ∗ 2.512−Fm (9)
Fυ = D ∗ 10−Fm2.5 (10)
where Fυ and−Fm are fluxes accordingly in units of ‘‘Jy’’ and ‘‘mag’’,and C and D are constants (zero points) which are given in Table 3.
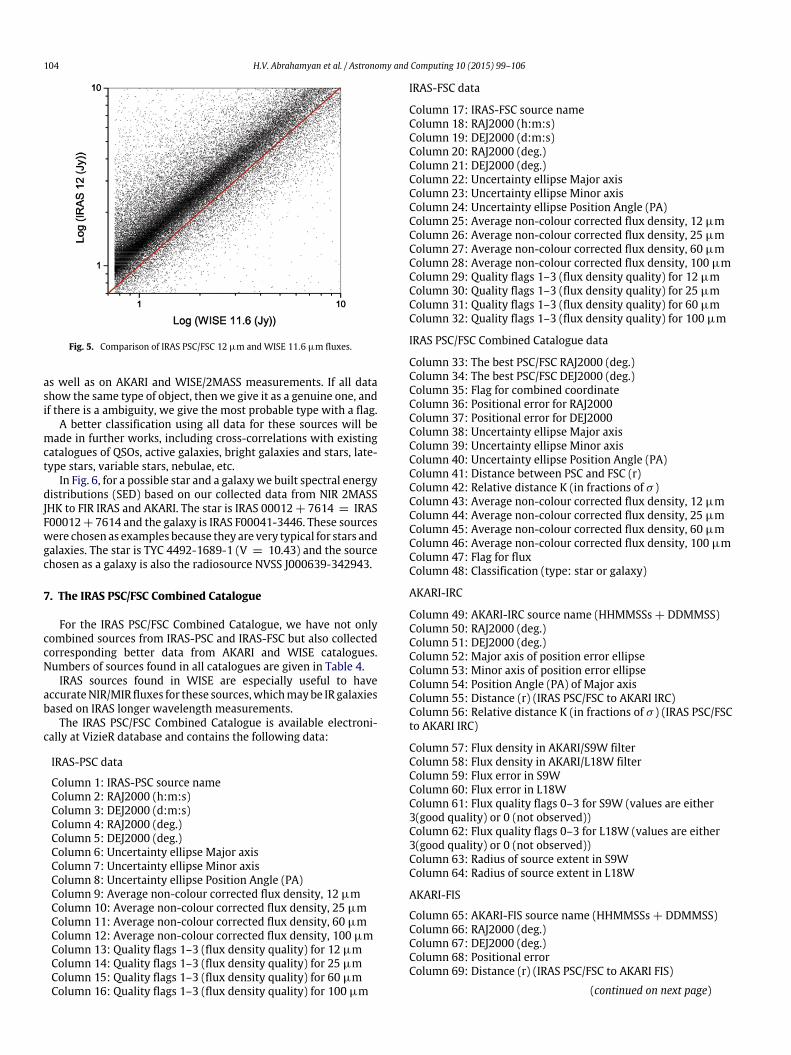
We have built the distribution of flux differences between theIRAS PSC/FSC 12 and WISE 11.6 µm (Fig. 5). Though the scatter isvery large, the figure shows that there is no systematic shift in IRASdata and they may be taken into account for rough calculations(slight systematic shift may be due to difference in IRAS and WISEphotometric bands, 12 µm compared to 11.6 µm). Most probably,large differences should be related not only to large measurementerrors, but also to the existence of some variable sources.
We group identified WISE sources into 3 categories:(1) Best identifications. These have similar fluxes at 11.6 and
12µmand having identification distance nomore than 1σ andthe distance of the second identification is more than 3σ ,
(2) Reliable identifications. They have similar fluxes at 11.6 and12 µm and identification distance no more than 3σ ,
(3) Probable identifications. They have similar fluxes at 11.6 and12 µm and identification distance greater than 3σ .
There are 173,804 sources in the first category, 134,244 in thesecond category and36,875 ones in the third category.We consideridentifications in the third category questionable.
WISE coordinates compared to IRAS and AKARI have very highaccuracy, so for our joint catalogue of IRAS PSC/FSC, the coordinatesare taken in the following order:(1) coordinates fromWISE (for the first and the second category of
identifications) (typical accuracy <1′′),(2) coordinates from AKARI/IRC (typical accuracy <1′′),(3) coordinates from AKARI/FIS (typical accuracy <1′′),(4) improved IRAS PSC/FSC coordinates (typical accuracy 15′′),(5) coordinates from IRAS FSC (typical accuracy 20′′),(6) coordinates from IRAS PSC (typical accuracy 40′′).
H.V. Abrahamyan et al. / Astronomy and Computing 10 (2015) 99–106 103
Fig. 4. Comparison of fluxes from AKARI and IRAS.
Table 2Number and typical accuracy of coordinates in IRAS PSC/FSC taken fromeach cross-correlated catalogue tomatchwith WISE sources.
Catalogues IRAS-PSC IRAS-FSC IRAS PSC/FSC AKARI-IRC AKARI-FIS
Number of sources 39,138 31,073 14,332 225,165 35,455Typical accuracy (′′) 40 20 15 0.3 0.8
Table 3Photometric zero points for calculation of fluxes in 2MASS and WISE catalogues.
2MASS C constants WISE D constantsJmag Hmag Kmag W1mag W2mag W3mag W4mag1.25 µm 1.65 µm 2.17 µm 3.35 µm 4.6 µm 11.6 µm 22.6 µm
1594 1020 666.7 305.54 171.782 31.674 8.363
6. Classification of objects
For our IRAS PSC/FSC Combined Cataloguewe give the probabil-ity of classification for each source into ‘‘star’’ or ‘‘galaxy’’. For thispurpose we used fluxes and quality flags from IRAS and other cata-logues. If IRAS source is confidently identified with AKARI-IRC andthere is no match in AKARI-FIS, then in all probabilities the object
is a star, and if an IRAS source is detected in AKARI-FIS without arecord in AKARI-IRC, then in all probabilities the object is a galaxy.For brighter sources, when all records are available, we use the IRcolours, i.e. we follow the change of the flux from shorter to longerwavelengths; in case of a decrease it is a high probability star and incase of an increase it is a highprobability galaxy.We can in fact esti-mate the type of all sources based on IRAS flux and quality flag data,
104 H.V. Abrahamyan et al. / Astronomy and Computing 10 (2015) 99–106
Fig. 5. Comparison of IRAS PSC/FSC 12 µm andWISE 11.6 µm fluxes.
as well as on AKARI and WISE/2MASS measurements. If all datashow the same type of object, then we give it as a genuine one, andif there is a ambiguity, we give the most probable type with a flag.
A better classification using all data for these sources will bemade in further works, including cross-correlations with existingcatalogues of QSOs, active galaxies, bright galaxies and stars, late-type stars, variable stars, nebulae, etc.
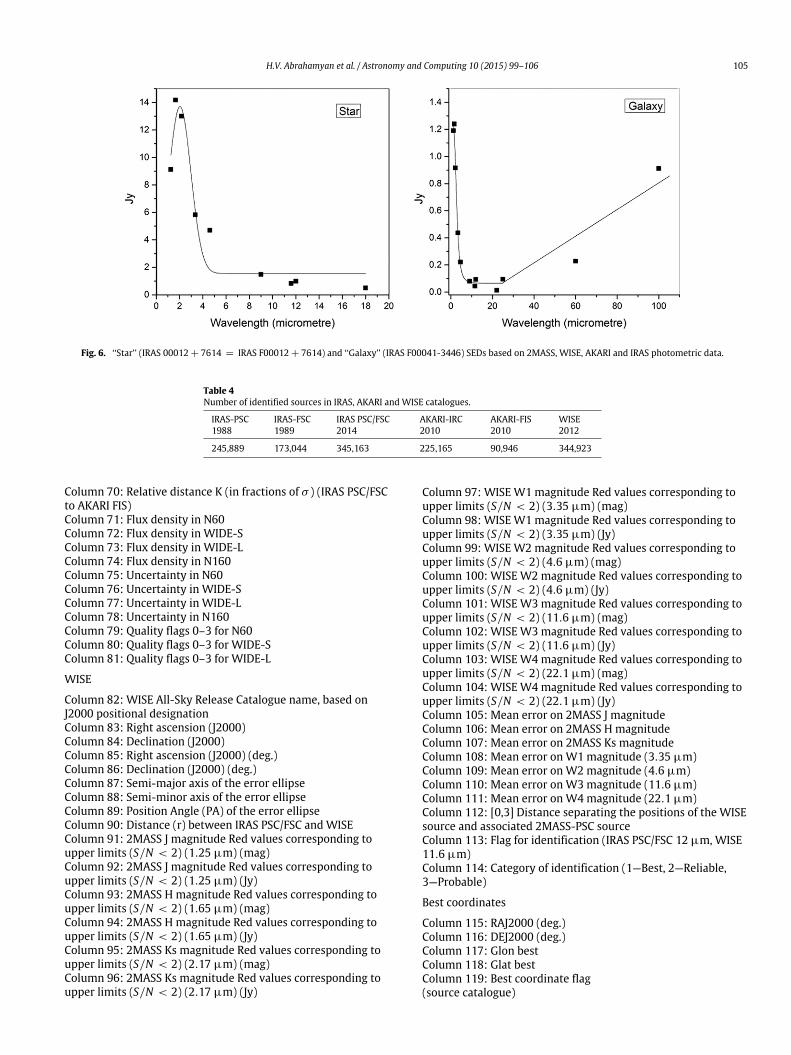
In Fig. 6, for a possible star and a galaxywe built spectral energydistributions (SED) based on our collected data from NIR 2MASSJHK to FIR IRAS and AKARI. The star is IRAS 00012 + 7614 = IRASF00012+ 7614 and the galaxy is IRAS F00041-3446. These sourceswere chosen as examples because they are very typical for stars andgalaxies. The star is TYC 4492-1689-1 (V = 10.43) and the sourcechosen as a galaxy is also the radiosource NVSS J000639-342943.
7. The IRAS PSC/FSC Combined Catalogue
For the IRAS PSC/FSC Combined Catalogue, we have not onlycombined sources from IRAS-PSC and IRAS-FSC but also collectedcorresponding better data from AKARI and WISE catalogues.Numbers of sources found in all catalogues are given in Table 4.
IRAS sources found in WISE are especially useful to haveaccurateNIR/MIR fluxes for these sources,whichmaybe IR galaxiesbased on IRAS longer wavelength measurements.
The IRAS PSC/FSC Combined Catalogue is available electroni-cally at VizieR database and contains the following data:
IRAS-PSC data
Column 1: IRAS-PSC source nameColumn 2: RAJ2000 (h:m:s)Column 3: DEJ2000 (d:m:s)Column 4: RAJ2000 (deg.)Column 5: DEJ2000 (deg.)Column 6: Uncertainty ellipse Major axisColumn 7: Uncertainty ellipse Minor axisColumn 8: Uncertainty ellipse Position Angle (PA)Column 9: Average non-colour corrected flux density, 12 µmColumn 10: Average non-colour corrected flux density, 25 µmColumn 11: Average non-colour corrected flux density, 60 µmColumn 12: Average non-colour corrected flux density, 100 µmColumn 13: Quality flags 1–3 (flux density quality) for 12 µmColumn 14: Quality flags 1–3 (flux density quality) for 25 µmColumn 15: Quality flags 1–3 (flux density quality) for 60 µmColumn 16: Quality flags 1–3 (flux density quality) for 100 µm
IRAS-FSC data
Column 17: IRAS-FSC source nameColumn 18: RAJ2000 (h:m:s)Column 19: DEJ2000 (d:m:s)Column 20: RAJ2000 (deg.)Column 21: DEJ2000 (deg.)Column 22: Uncertainty ellipse Major axisColumn 23: Uncertainty ellipse Minor axisColumn 24: Uncertainty ellipse Position Angle (PA)Column 25: Average non-colour corrected flux density, 12 µmColumn 26: Average non-colour corrected flux density, 25 µmColumn 27: Average non-colour corrected flux density, 60 µmColumn 28: Average non-colour corrected flux density, 100 µmColumn 29: Quality flags 1–3 (flux density quality) for 12 µmColumn 30: Quality flags 1–3 (flux density quality) for 25 µmColumn 31: Quality flags 1–3 (flux density quality) for 60 µmColumn 32: Quality flags 1–3 (flux density quality) for 100 µm
IRAS PSC/FSC Combined Catalogue data
Column 33: The best PSC/FSC RAJ2000 (deg.)Column 34: The best PSC/FSC DEJ2000 (deg.)Column 35: Flag for combined coordinateColumn 36: Positional error for RAJ2000Column 37: Positional error for DEJ2000Column 38: Uncertainty ellipse Major axisColumn 39: Uncertainty ellipse Minor axisColumn 40: Uncertainty ellipse Position Angle (PA)Column 41: Distance between PSC and FSC (r)Column 42: Relative distance K (in fractions of σ )Column 43: Average non-colour corrected flux density, 12 µmColumn 44: Average non-colour corrected flux density, 25 µmColumn 45: Average non-colour corrected flux density, 60 µmColumn 46: Average non-colour corrected flux density, 100 µmColumn 47: Flag for fluxColumn 48: Classification (type: star or galaxy)
AKARI-IRC
Column 49: AKARI-IRC source name (HHMMSSs + DDMMSS)Column 50: RAJ2000 (deg.)Column 51: DEJ2000 (deg.)Column 52: Major axis of position error ellipseColumn 53: Minor axis of position error ellipseColumn 54: Position Angle (PA) of Major axisColumn 55: Distance (r) (IRAS PSC/FSC to AKARI IRC)Column 56: Relative distance K (in fractions of σ ) (IRAS PSC/FSCto AKARI IRC)
Column 57: Flux density in AKARI/S9W filterColumn 58: Flux density in AKARI/L18W filterColumn 59: Flux error in S9WColumn 60: Flux error in L18WColumn 61: Flux quality flags 0–3 for S9W (values are either3(good quality) or 0 (not observed))Column 62: Flux quality flags 0–3 for L18W (values are either3(good quality) or 0 (not observed))Column 63: Radius of source extent in S9WColumn 64: Radius of source extent in L18W
AKARI-FIS
Column 65: AKARI-FIS source name (HHMMSSs + DDMMSS)Column 66: RAJ2000 (deg.)Column 67: DEJ2000 (deg.)Column 68: Positional errorColumn 69: Distance (r) (IRAS PSC/FSC to AKARI FIS)
(continued on next page)
H.V. Abrahamyan et al. / Astronomy and Computing 10 (2015) 99–106 105
Fig. 6. ‘‘Star’’ (IRAS 00012 + 7614 = IRAS F00012 + 7614) and ‘‘Galaxy’’ (IRAS F00041-3446) SEDs based on 2MASS, WISE, AKARI and IRAS photometric data.
Table 4Number of identified sources in IRAS, AKARI and WISE catalogues.
IRAS-PSC IRAS-FSC IRAS PSC/FSC AKARI-IRC AKARI-FIS WISE1988 1989 2014 2010 2010 2012
245,889 173,044 345,163 225,165 90,946 344,923
Column 70: Relative distance K (in fractions of σ ) (IRAS PSC/FSCto AKARI FIS)Column 71: Flux density in N60Column 72: Flux density in WIDE-SColumn 73: Flux density in WIDE-LColumn 74: Flux density in N160Column 75: Uncertainty in N60Column 76: Uncertainty in WIDE-SColumn 77: Uncertainty in WIDE-LColumn 78: Uncertainty in N160Column 79: Quality flags 0–3 for N60Column 80: Quality flags 0–3 for WIDE-SColumn 81: Quality flags 0–3 for WIDE-L
WISE
Column 82: WISE All-Sky Release Catalogue name, based onJ2000 positional designationColumn 83: Right ascension (J2000)Column 84: Declination (J2000)Column 85: Right ascension (J2000) (deg.)Column 86: Declination (J2000) (deg.)Column 87: Semi-major axis of the error ellipseColumn 88: Semi-minor axis of the error ellipseColumn 89: Position Angle (PA) of the error ellipseColumn 90: Distance (r) between IRAS PSC/FSC and WISEColumn 91: 2MASS J magnitude Red values corresponding toupper limits (S/N < 2) (1.25 µm) (mag)Column 92: 2MASS J magnitude Red values corresponding toupper limits (S/N < 2) (1.25 µm) (Jy)Column 93: 2MASS H magnitude Red values corresponding toupper limits (S/N < 2) (1.65 µm) (mag)Column 94: 2MASS H magnitude Red values corresponding toupper limits (S/N < 2) (1.65 µm) (Jy)Column 95: 2MASS Ks magnitude Red values corresponding toupper limits (S/N < 2) (2.17 µm) (mag)Column 96: 2MASS Ks magnitude Red values corresponding toupper limits (S/N < 2) (2.17 µm) (Jy)
Column 97: WISE W1 magnitude Red values corresponding toupper limits (S/N < 2) (3.35 µm) (mag)Column 98: WISE W1 magnitude Red values corresponding toupper limits (S/N < 2) (3.35 µm) (Jy)Column 99: WISE W2 magnitude Red values corresponding toupper limits (S/N < 2) (4.6 µm) (mag)Column 100: WISE W2 magnitude Red values corresponding toupper limits (S/N < 2) (4.6 µm) (Jy)Column 101: WISE W3 magnitude Red values corresponding toupper limits (S/N < 2) (11.6 µm) (mag)Column 102: WISE W3 magnitude Red values corresponding toupper limits (S/N < 2) (11.6 µm) (Jy)Column 103: WISE W4 magnitude Red values corresponding toupper limits (S/N < 2) (22.1 µm) (mag)Column 104: WISE W4 magnitude Red values corresponding toupper limits (S/N < 2) (22.1 µm) (Jy)Column 105: Mean error on 2MASS J magnitudeColumn 106: Mean error on 2MASS H magnitudeColumn 107: Mean error on 2MASS Ks magnitudeColumn 108: Mean error on W1 magnitude (3.35 µm)Column 109: Mean error on W2 magnitude (4.6 µm)Column 110: Mean error on W3 magnitude (11.6 µm)Column 111: Mean error on W4 magnitude (22.1 µm)Column 112: [0,3] Distance separating the positions of the WISEsource and associated 2MASS-PSC sourceColumn 113: Flag for identification (IRAS PSC/FSC 12 µm, WISE11.6 µm)Column 114: Category of identification (1—Best, 2—Reliable,3—Probable)
Best coordinates
Column 115: RAJ2000 (deg.)Column 116: DEJ2000 (deg.)Column 117: Glon bestColumn 118: Glat bestColumn 119: Best coordinate flag(source catalogue)
106 H.V. Abrahamyan et al. / Astronomy and Computing 10 (2015) 99–106
8. Summary and results
We have created a software through which we made cross-correlations with search radius for each source individually basedon its positional error, taking only those associations havingpositional distance between sources not exceeding 3σ .
We have created the IRAS PSC/FSC Combined Catalogue to showthe efficiency of the software and to have a joint IRAS catalogue forfurther statistical studies and investigations of individual sources.IRAS PSC/FSC contains 345,163 sources, including 73,770 commonones from both catalogues (IRAS-PSC and IRAS-FSC).We calculatedthe improved coordinates for these 73,770 sources, as well asindividual positional errors based on shifts of IRAS-PSC and IRAS-FSC positions. We also have calculated improved Minor and Majoraxes coordinates errors.
For all sources of IRAS-FSC the module of galactic latitudes ismore than ten (|b| > 10°). Cross-correlations between the IRAS-PSC and IRAS-FSC showed that 28,379 sources from IRAS-PSC with|b| > 10° do not have identification in IRAS-FSC, which shouldnot happen as IRAS-FSC is deeper. The reasons for this could be:(1) these entries have very poor quality fluxes and are not reliablesources, so they are not included in IRAS-FSC, (2) these are variableobjects, and (3) these are false sources (cirruses; they are notdetected in 12 and 25 µm and in 60 and 100 µm they are givenwith upper limits of fluxes).
We have shown that in case of the cross-correlations of IRAS-PSC and IRAS-FSC catalogues with VizieR, not to lose any associa-tions, we need to take a search radius of 161.95′′. With the VizieRcross-correlation system, we also have proved that our softwareworks satisfactorily.
With the same software we complemented our CombinedCatalogue with more IR fluxes from AKARI and WISE catalogues.Thus we have 17 IR fluxes in the range from 1.25 to 160 µm: 4from IRAS, 6 from AKARI, 4 fromWISE and 3 from 2MASS.
For our IRAS PSC/FSC Combined Catalogue we give theprobability of classifying each source into star or galaxy.
We show that AKARI-IRC covers 85% and AKARI-FIS covers 26%of the IRAS PSC/FSC Combined Catalogue, which underlines theshallow depth of AKARI data.
For the IRAS PSC/FSC Combined Catalogue we refined coordi-nates usingWISE, AKARI-IRC, AKARI-FIS and improved coordinatesfrom IRAS PSC/FSC.
In the future, we are going to carry out the following studies:
(1) a thorough classification of these objects using data fromSDSS,
(2) building SEDs of these objects in the IR range to understandwhat types of SEDs have stars and galaxies and if it is possibleto classify star and galaxies using IR SEDs,
(3) having X-ray (ROSAT, Chandra, XMM), optical (SDSS) and radio(FIRST, NVSS, GB6) data, we will try to understand how IRfluxes relate to optical, X-ray and radio fluxes, which IR sourcesare bright radio and X-ray sources and what it involves.
Acknowledgements
The authors thank ANSEF foundation for the support of thisresearch by grants PS-2968 (in 2012) and PS-3605 (in 2014).
This publication has made use of data products from the TwoMicron All Sky Survey, which is a joint project of the Universityof Massachusetts and the Infrared Processing and AnalysisCenter/California Institute of Technology, funded by the NationalAeronautics and Space Administration and the National ScienceFoundation.
This publication makes use of data products from the Wide-field Infrared Survey Explorer, which is a joint project of theUniversity of California, Los Angeles, and the Jet PropulsionLaboratory/California Institute of Technology, funded by theNational Aeronautics and Space Administration.
References
Cutri, R.M., Skrutskie, M.F., van Dyk, S., et al. 2003. IPAC/CalTech.Ishihara, D., Onaka, T., Kataza, H., Salama, A., Alfageme, C., Cassatella, A., Cox, N.,
Garcia-Lario, P., et al., 2010. The AKARI/IRCmid-infrared all-sky survey (Version1). Astronom. Astrophys. 514, A1.
Kleinmann, S.G., Cutri, R.M., Young, E.T., Low, F.J., Gillett, F.C., 1986. IRASSerendipitous Survey Catalog, <Joint IRAS Science W.G..
Knyazyan, A.M., Mickaelian, A.M., Astsatryan, H.V., 2011. In: Proceedings of CSIT-2011 Conference, Astronomical Catalogs Cross-Correlation Objectives andIllustration of a New Correlation Algorithm.
Yamamura, I., Makiuti, S., Ikeda, N., Fukuda, Y., Oyabu, S., Koga, T., White, G.J., 2010.AKARI/FIS All-Sky Survey Bright Source Catalogue Version 1.0, ISAS/JAXA.
Further reading
Adelman-McCarthy, J.K., Ahn, C.P.C., Alexandroff, R., et al., 2012. Astrophys. J. Suppl.Ser. 203, 21.
Cutri, R.M., Wright, E.L., Conrow, T., Bauer, J., Benford, D., Brandenburg, H., Dailey, J.,Eisenhardt, P.R.M., et al. 2012. WISE All-Sky Data Release, VizieR On-line DataCatalog: II/311. Originally published in: 2012yCat.2311....0C.
Joint IRAS Science, W.G., 1986. IRAS Catalog of Point Sources, Version 2.0. IPAC.Moshir, M., Copan, G., Conrow, T., McCallon, H., Hacking, P., Gregorich, D., Rohrbach,
G., Melnyk, M., et al. 1989. IRAS Faint Source Catalogue, version 2.0.