Social skills in adolescence: psychopathology and sociodemographic variables
Upload
independentCategory
view
0download
0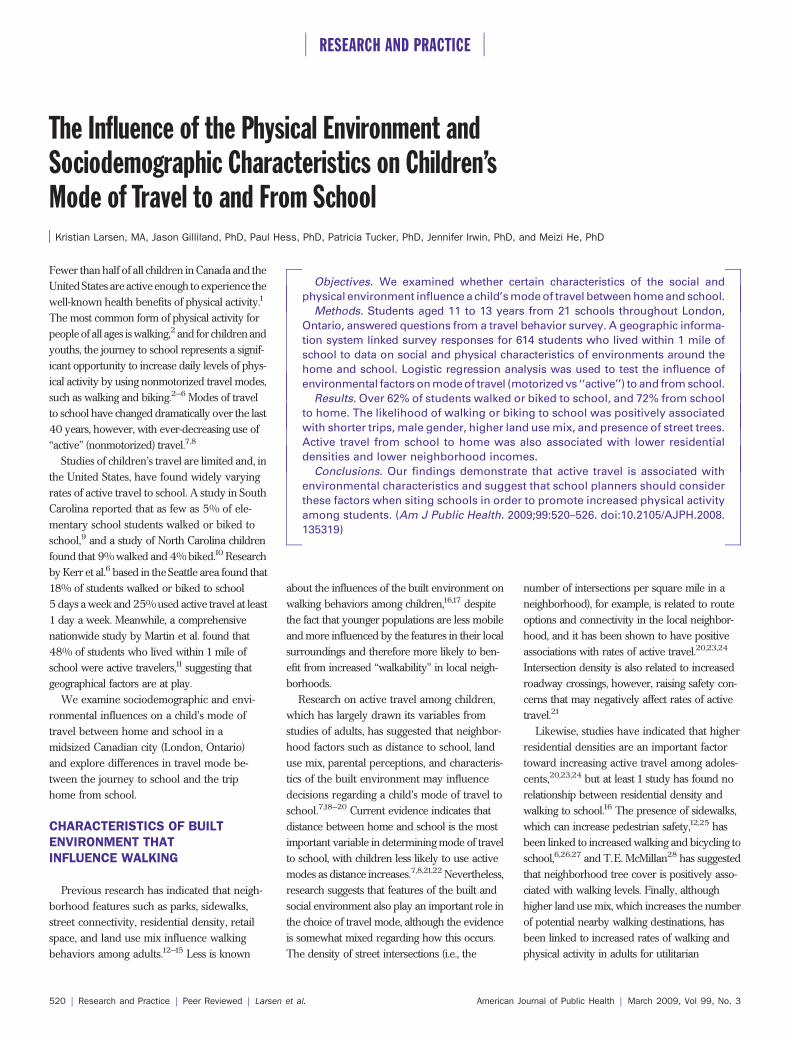
The Influence of the Physical Environment andSociodemographic Characteristics on Children’sMode of Travel to and From SchoolKristian Larsen, MA, Jason Gilliland, PhD, Paul Hess, PhD, Patricia Tucker, PhD, Jennifer Irwin, PhD, and Meizi He, PhD
Fewer than half of all children in Canada and theUnited States are active enough to experience thewell-known health benefits of physical activity.1
The most common form of physical activity forpeople of all ages is walking,2 and for children andyouths, the journey to school represents a signif-icant opportunity to increase daily levels of phys-ical activity by using nonmotorized travel modes,such as walking and biking.2–6 Modes of travelto school have changed dramatically over the last40 years, however, with ever-decreasing use of‘‘active’’ (nonmotorized) travel.7,8
Studies of children’s travel are limited and, inthe United States, have found widely varyingrates of active travel to school. A study in SouthCarolina reported that as few as 5% of ele-mentary school students walked or biked toschool,9 and a study of North Carolina childrenfound that 9% walked and 4% biked.10 Researchby Kerr et al.6 based in the Seattle area found that18% of students walked or biked to school5 days a week and 25% used active travel at least1 day a week. Meanwhile, a comprehensivenationwide study by Martin et al. found that48% of students who lived within 1 mile ofschool were active travelers,11 suggesting thatgeographical factors are at play.
We examine sociodemographic and envi-ronmental influences on a child’s mode oftravel between home and school in amidsized Canadian city (London, Ontario)and explore differences in travel mode be-tween the journey to school and the triphome from school.
CHARACTERISTICS OF BUILTENVIRONMENT THATINFLUENCE WALKING
Previous research has indicated that neigh-borhood features such as parks, sidewalks,street connectivity, residential density, retailspace, and land use mix influence walkingbehaviors among adults.12–15 Less is known
about the influences of the built environment onwalking behaviors among children,16,17 despitethe fact that younger populations are less mobileand more influenced by the features in their localsurroundings and therefore more likely to ben-efit from increased ‘‘walkability’’ in local neigh-borhoods.
Research on active travel among children,which has largely drawn its variables fromstudies of adults, has suggested that neighbor-hood factors such as distance to school, landuse mix, parental perceptions, and characteris-tics of the built environment may influencedecisions regarding a child’s mode of travel toschool.7,18–20 Current evidence indicates thatdistance between home and school is the mostimportant variable in determining mode of travelto school, with children less likely to use activemodes as distance increases.7,8,21,22 Nevertheless,research suggests that features of the built andsocial environment also play an important role inthe choice of travel mode, although the evidenceis somewhat mixed regarding how this occurs.The density of street intersections (i.e., the
number of intersections per square mile in aneighborhood), for example, is related to routeoptions and connectivity in the local neighbor-hood, and it has been shown to have positiveassociations with rates of active travel.20,23,24
Intersection density is also related to increasedroadway crossings, however, raising safety con-cerns that may negatively affect rates of activetravel.21
Likewise, studies have indicated that higherresidential densities are an important factortoward increasing active travel among adoles-cents,20,23,24 but at least 1 study has found norelationship between residential density andwalking to school.16 The presence of sidewalks,which can increase pedestrian safety,12,25 hasbeen linked to increased walking and bicycling toschool,6,26,27 and T.E. McMillan28 has suggestedthat neighborhood tree cover is positively asso-ciated with walking levels. Finally, althoughhigher land use mix, which increases the numberof potential nearby walking destinations, hasbeen linked to increased rates of walking andphysical activity in adults for utilitarian
Objectives. We examined whether certain characteristics of the social and
physical environment influence a child’s mode of travel between home and school.
Methods. Students aged 11 to 13 years from 21 schools throughout London,
Ontario, answered questions from a travel behavior survey. A geographic informa-
tion system linked survey responses for 614 students who lived within 1 mile of
school to data on social and physical characteristics of environments around the
home and school. Logistic regression analysis was used to test the influence of
environmental factors on mode of travel (motorized vs ‘‘active’’) to and from school.
Results. Over 62% of students walked or biked to school, and 72% from school
to home. The likelihood of walking or biking to school was positively associated
with shorter trips, male gender, higher land use mix, and presence of street trees.
Active travel from school to home was also associated with lower residential
densities and lower neighborhood incomes.
Conclusions. Our findings demonstrate that active travel is associated with
environmental characteristics and suggest that school planners should consider
these factors when siting schools in order to promote increased physical activity
among students. (Am J Public Health. 2009;99:520–526. doi:10.2105/AJPH.2008.
135319)
RESEARCH AND PRACTICE
520 | Research and Practice | Peer Reviewed | Larsen et al. American Journal of Public Health | March 2009, Vol 99, No. 3
travel,2,13,29,30 the relationship between land usemix and children’s travel is less clear. Kerr et al.6
found a positive correlation between land usemix and nonmotorized travel to school, butEwing et al.16 found the opposite. At this point,results are inconclusive, and more work needs tobe done on younger populations before certainenvironmental factors can be confirmed as pre-dictors of active travel to school.
SOCIODEMOGRAPHIC FACTORSTHAT INFLUENCE WALKING
The sociodemographic characteristics of in-dividuals and neighborhoods have also beenshown to influence parental decisions on chil-dren’s travel to school. Gender has been iden-tified as an important factor, with girls lesslikely than boys to walk to school and after-school activities.27,31,32 Research also indicatesthat use of nonmotorized travel among childrendecreases as the education levels of parentsincreases11 and, similarly, that rates of activetravel to school are often higher in low-incomethan in high-income neighborhoods.24,31 Al-though relatively understudied, single parent-hood has also been related to increased rates ofactive travel among children.27 In an attempt tofurther develop researchers’ understanding of achild’s journey to school, we examine a combi-nation of environmental and social predictors inrelation to mode of travel.
METHODS
School-Based Survey Examining Journey
Between Home and School
A comprehensive travel behavior surveywas completed by students in grades 7 and 8(aged 11–13 years) at a heterogeneous sampleof elementary schools varying by income andbuilt environment (Figure 1 shows the sampledistribution) throughout the city of London,Ontario. Of the 51 schools eligible for study, 21(41%) chose to participate, 11 from the LondonDistrict Catholic School Board and 10 from theThames Valley District School Board. A total of1666 students were recruited to participate;810 students received parental consent andwere present on the day of data collection, for aresponse rate of 49%. The survey was con-ducted from October to December in 2006and in April and May in 2007.
The survey asked students about their modeof travel both to and from school and neigh-borhood characteristics, as well as behavioral,demographic, and environmental questions. Toobtain the demographic characteristics of in-dividual households, parental questionnaireswere distributed at the same time as formsrequesting permission for their children’s par-ticipation. Because previous research has sug-gested that children are more likely to walk toschool if the distance is no more than1mile (1.6km),7,8,19,21 we included only children livingwithin 1 mile of school (n=614) in our analysis.In addition, London school boards provide busservice to students who live more than 1 milefrom school.
Geographic Information System Analysis
of Home and School Neighborhoods
Questionnaire data for survey respondentswere geocoded to the geographic center oftheir home postal code with ArcGIS 9.2 (En-vironmental Systems Research Institute Inc,Redlands, CA). Postal codes were used insteadof exact home addresses to maintain the ano-nymity of respondents. Canadian postal codesrepresent much smaller geographic units thanAmerican zip codes, and previous researchindicates that Canadian postal codes are suit-able proxies of home neighborhoods in urbanenvironments.35 In our study, the median areaof a postal code is 9699 m2 (11560 sq yd;maximum=154402 m2, or 184663 sq yd).
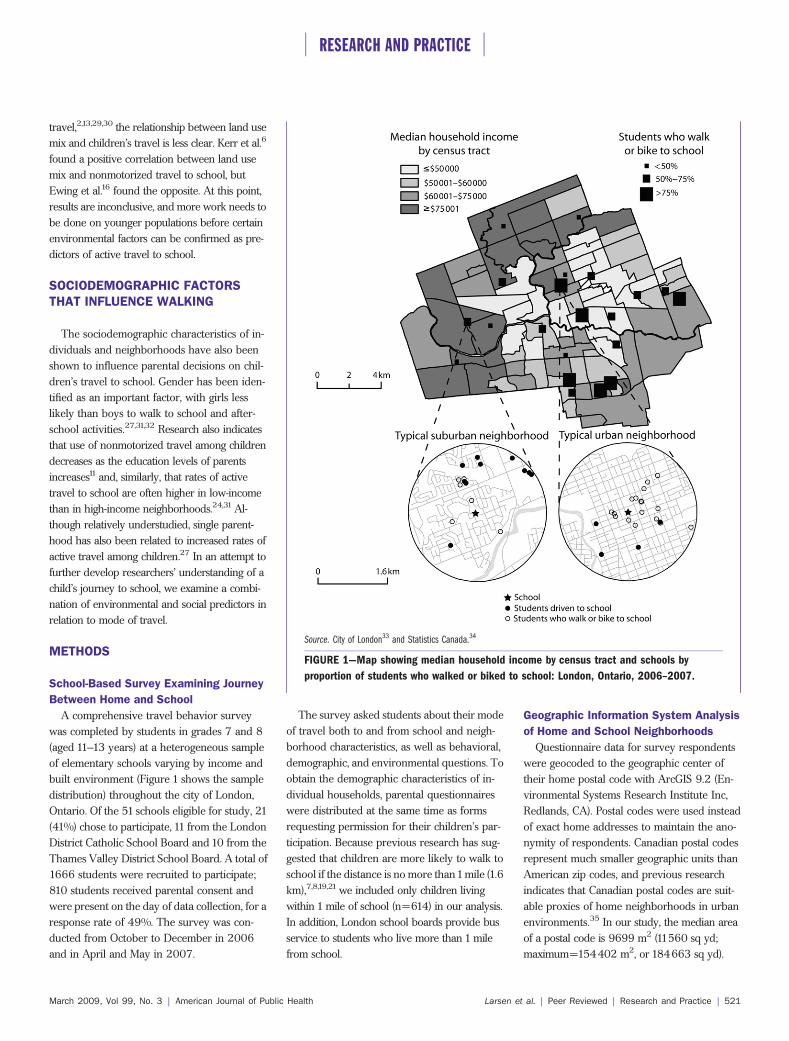
Source. City of London33 and Statistics Canada.34
FIGURE 1—Map showing median household income by census tract and schools by
proportion of students who walked or biked to school: London, Ontario, 2006–2007.
RESEARCH AND PRACTICE
March 2009, Vol 99, No. 3 | American Journal of Public Health Larsen et al. | Peer Reviewed | Research and Practice | 521
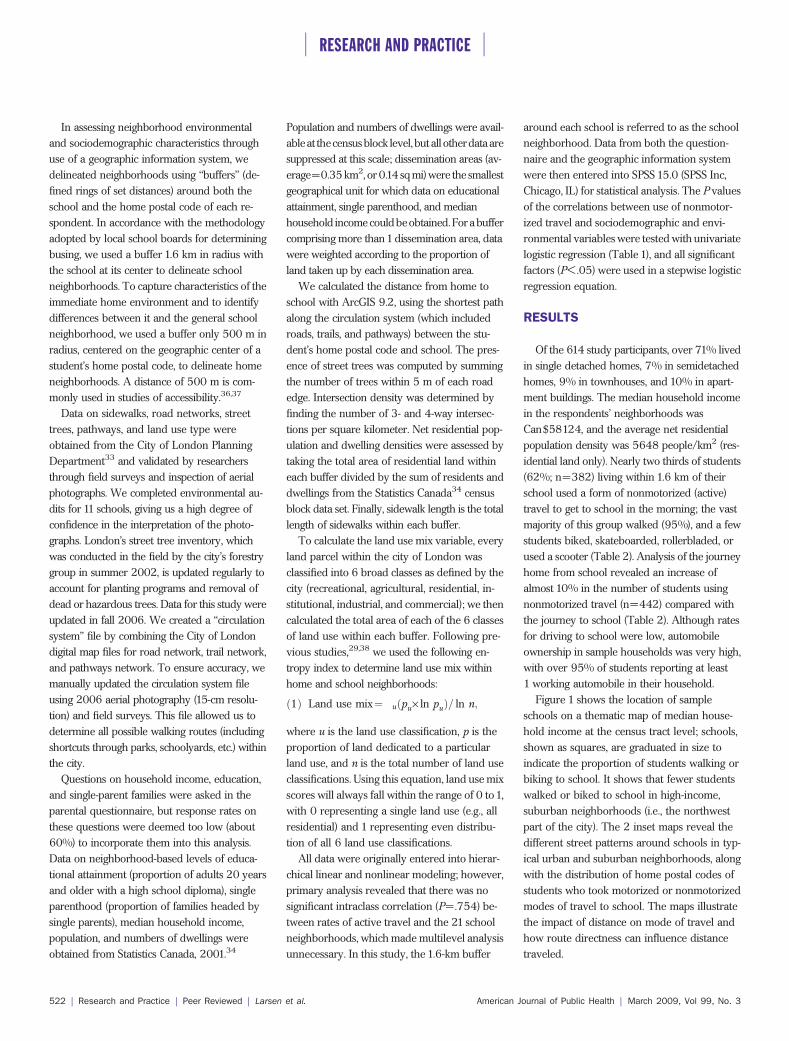
In assessing neighborhood environmentaland sociodemographic characteristics throughuse of a geographic information system, wedelineated neighborhoods using ‘‘buffers’’ (de-fined rings of set distances) around both theschool and the home postal code of each re-spondent. In accordance with the methodologyadopted by local school boards for determiningbusing, we used a buffer 1.6 km in radius withthe school at its center to delineate schoolneighborhoods. To capture characteristics of theimmediate home environment and to identifydifferences between it and the general schoolneighborhood, we used a buffer only 500 m inradius, centered on the geographic center of astudent’s home postal code, to delineate homeneighborhoods. A distance of 500 m is com-monly used in studies of accessibility.36,37
Data on sidewalks, road networks, streettrees, pathways, and land use type wereobtained from the City of London PlanningDepartment33 and validated by researchersthrough field surveys and inspection of aerialphotographs. We completed environmental au-dits for 11 schools, giving us a high degree ofconfidence in the interpretation of the photo-graphs. London’s street tree inventory, whichwas conducted in the field by the city’s forestrygroup in summer 2002, is updated regularly toaccount for planting programs and removal ofdead or hazardous trees. Data for this study wereupdated in fall 2006. We created a ‘‘circulationsystem’’ file by combining the City of Londondigital map files for road network, trail network,and pathways network. To ensure accuracy, wemanually updated the circulation system fileusing 2006 aerial photography (15-cm resolu-tion) and field surveys. This file allowed us todetermine all possible walking routes (includingshortcuts through parks, schoolyards, etc.) withinthe city.
Questions on household income, education,and single-parent families were asked in theparental questionnaire, but response rates onthese questions were deemed too low (about60%) to incorporate them into this analysis.Data on neighborhood-based levels of educa-tional attainment (proportion of adults 20 yearsand older with a high school diploma), singleparenthood (proportion of families headed bysingle parents), median household income,population, and numbers of dwellings wereobtained from Statistics Canada, 2001.34
Population and numbers of dwellings were avail-able at thecensusblock level, but all otherdata aresuppressed at this scale; dissemination areas (av-erage=0.35 km2, or 0.14 sq mi) were the smallestgeographical unit for which data on educationalattainment, single parenthood, and medianhousehold income couldbeobtained.For a buffercomprising more than1dissemination area, datawere weighted according to the proportion ofland taken up by each dissemination area.
We calculated the distance from home toschool with ArcGIS 9.2, using the shortest pathalong the circulation system (which includedroads, trails, and pathways) between the stu-dent’s home postal code and school. The pres-ence of street trees was computed by summingthe number of trees within 5 m of each roadedge. Intersection density was determined byfinding the number of 3- and 4-way intersec-tions per square kilometer. Net residential pop-ulation and dwelling densities were assessed bytaking the total area of residential land withineach buffer divided by the sum of residents anddwellings from the Statistics Canada34 censusblock data set. Finally, sidewalk length is the totallength of sidewalks within each buffer.
To calculate the land use mix variable, everyland parcel within the city of London wasclassified into 6 broad classes as defined by thecity (recreational, agricultural, residential, in-stitutional, industrial, and commercial); we thencalculated the total area of each of the 6 classesof land use within each buffer. Following pre-vious studies,29,38 we used the following en-tropy index to determine land use mix withinhome and school neighborhoods:
ð1Þ Land use mix¼�uðpu· ln puÞ= ln n;
where u is the land use classification, p is theproportion of land dedicated to a particularland use, and n is the total number of land useclassifications. Using this equation, land use mixscores will always fall within the range of 0 to1,with 0 representing a single land use (e.g., allresidential) and 1 representing even distribu-tion of all 6 land use classifications.
All data were originally entered into hierar-chical linear and nonlinear modeling; however,primary analysis revealed that there was nosignificant intraclass correlation (P=.754) be-tween rates of active travel and the 21 schoolneighborhoods, which made multilevel analysisunnecessary. In this study, the 1.6-km buffer
around each school is referred to as the schoolneighborhood. Data from both the question-naire and the geographic information systemwere then entered into SPSS 15.0 (SPSS Inc,Chicago, IL) for statistical analysis. The P valuesof the correlations between use of nonmotor-ized travel and sociodemographic and envi-ronmental variables were tested with univariatelogistic regression (Table 1), and all significantfactors (P<.05) were used in a stepwise logisticregression equation.
RESULTS
Of the 614 study participants, over 71% livedin single detached homes, 7% in semidetachedhomes, 9% in townhouses, and 10% in apart-ment buildings. The median household incomein the respondents’ neighborhoods wasCan$58124, and the average net residentialpopulation density was 5648 people/km2 (res-idential land only). Nearly two thirds of students(62%; n=382) living within 1.6 km of theirschool used a form of nonmotorized (active)travel to get to school in the morning; the vastmajority of this group walked (95%), and a fewstudents biked, skateboarded, rollerbladed, orused a scooter (Table 2). Analysis of the journeyhome from school revealed an increase ofalmost 10% in the number of students usingnonmotorized travel (n=442) compared withthe journey to school (Table 2). Although ratesfor driving to school were low, automobileownership in sample households was very high,with over 95% of students reporting at least1 working automobile in their household.
Figure 1 shows the location of sampleschools on a thematic map of median house-hold income at the census tract level; schools,shown as squares, are graduated in size toindicate the proportion of students walking orbiking to school. It shows that fewer studentswalked or biked to school in high-income,suburban neighborhoods (i.e., the northwestpart of the city). The 2 inset maps reveal thedifferent street patterns around schools in typ-ical urban and suburban neighborhoods, alongwith the distribution of home postal codes ofstudents who took motorized or nonmotorizedmodes of travel to school. The maps illustratethe impact of distance on mode of travel andhow route directness can influence distancetraveled.
RESEARCH AND PRACTICE
522 | Research and Practice | Peer Reviewed | Larsen et al. American Journal of Public Health | March 2009, Vol 99, No. 3
Asexpected, logistic regression analysis for thejourney to school indicated that distance be-tween home and school was the most importantfactor in determining whether a child used anonmotorized form of travel to school (Table 3).Gender was the only sociodemographic variablethat influenced choice of travel mode; boys were1.5 times more likely to use nonmotorized travelthan were girls. Land use mix and presence ofstreet trees were the only significant physicalenvironment variables; the likelihood of activetravel rose with both increased land use mix andgreater number of street trees. Intersection den-sity was not shown to play a role.
Analysis of the journey home from schoolrevealed similar results: gender, land use mix,and distance influenced choice of travel mode(Table 3); however, a few differences do appearin the model. The presence of street trees is nolonger important, whereas active travel
decreased with both higher residential densityand greater median household income in theschool neighborhood.
DISCUSSION
Our findings contribute to the understandingof how neighborhood characteristics influence achild’s journey to and from school. Mix of landuses around the school, the presence of streettrees, residential population density, distancebetween home and school, and gender were themost important determinants of active travel.These findings have implications for decisionsregarding the siting of schools, planning andmanagement of the urban environment, and theempowerment of girls and their parents.
New strategies to increase physical activitythrough active travel should consider empow-ering and targeting girls and their parents. Boys
were 1.5 times more likely than were girls toparticipate in active travel to and from school;similar findings were reported in a study con-ducted in California.32 Improving parental per-ceptions of how safe a neighborhood is forwalking, and increasing independence for girls,have the potential to significantly raise levels ofphysical activity.39
Some of our results were similar to those ofprevious research conducted on adults, andothers were different. In studies of adults, land
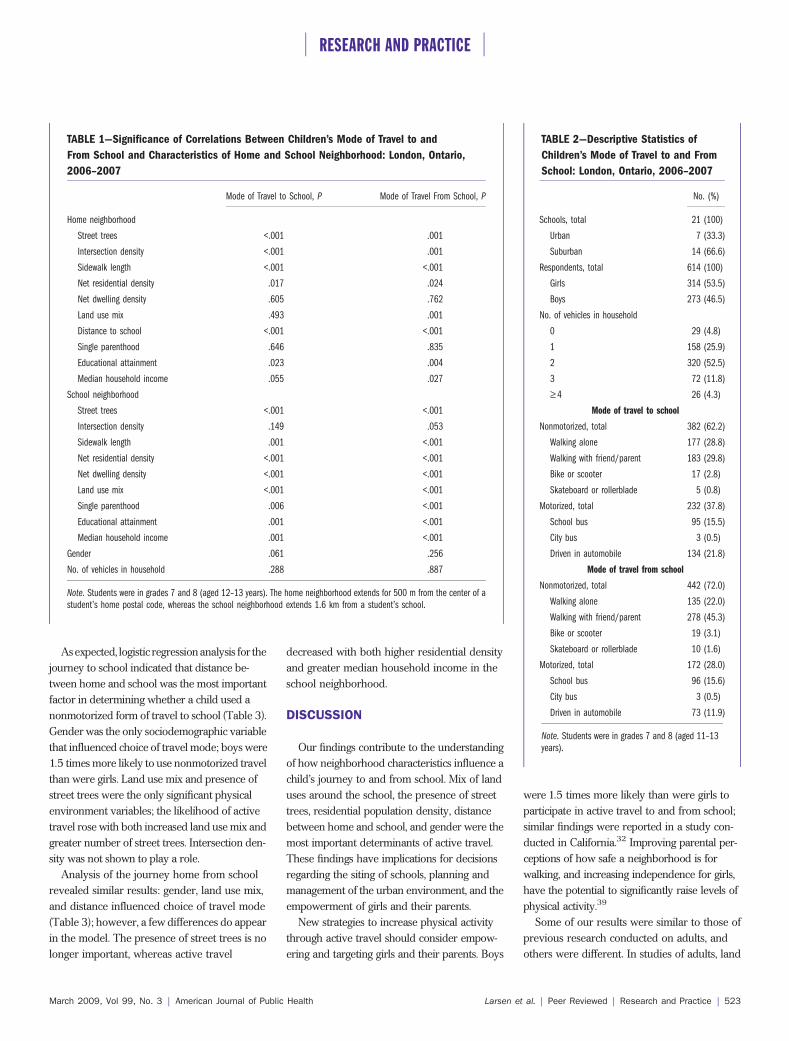
TABLE 1—Significance of Correlations Between Children’s Mode of Travel to and
From School and Characteristics of Home and School Neighborhood: London, Ontario,
2006–2007
Mode of Travel to School, P Mode of Travel From School, P
Home neighborhood
Street trees <.001 .001
Intersection density <.001 .001
Sidewalk length <.001 <.001
Net residential density .017 .024
Net dwelling density .605 .762
Land use mix .493 .001
Distance to school <.001 <.001
Single parenthood .646 .835
Educational attainment .023 .004
Median household income .055 .027
School neighborhood
Street trees <.001 <.001
Intersection density .149 .053
Sidewalk length .001 <.001
Net residential density <.001 <.001
Net dwelling density <.001 <.001
Land use mix <.001 <.001
Single parenthood .006 <.001
Educational attainment .001 <.001
Median household income .001 <.001
Gender .061 .256
No. of vehicles in household .288 .887
Note. Students were in grades 7 and 8 (aged 12–13 years). The home neighborhood extends for 500 m from the center of astudent’s home postal code, whereas the school neighborhood extends 1.6 km from a student’s school.
TABLE 2—Descriptive Statistics of
Children’s Mode of Travel to and From
School: London, Ontario, 2006–2007
No. (%)
Schools, total 21 (100)
Urban 7 (33.3)
Suburban 14 (66.6)
Respondents, total 614 (100)
Girls 314 (53.5)
Boys 273 (46.5)
No. of vehicles in household
0 29 (4.8)
1 158 (25.9)
2 320 (52.5)
3 72 (11.8)
‡ 4 26 (4.3)
Mode of travel to school
Nonmotorized, total 382 (62.2)
Walking alone 177 (28.8)
Walking with friend/parent 183 (29.8)
Bike or scooter 17 (2.8)
Skateboard or rollerblade 5 (0.8)
Motorized, total 232 (37.8)
School bus 95 (15.5)
City bus 3 (0.5)
Driven in automobile 134 (21.8)
Mode of travel from school
Nonmotorized, total 442 (72.0)
Walking alone 135 (22.0)
Walking with friend/parent 278 (45.3)
Bike or scooter 19 (3.1)
Skateboard or rollerblade 10 (1.6)
Motorized, total 172 (28.0)
School bus 96 (15.6)
City bus 3 (0.5)
Driven in automobile 73 (11.9)
Note. Students were in grades 7 and 8 (aged 11–13years).
RESEARCH AND PRACTICE
March 2009, Vol 99, No. 3 | American Journal of Public Health Larsen et al. | Peer Reviewed | Research and Practice | 523

use mix is often reported as a predictor ofwalking for utilitarian travel, because it in-creases the variety of destinations availablewithin short distances.12,13,40 In our study, landuse mix was also found to be an importantpredictor of active travel for adolescents. Landuse mix may contribute to a more appealingwalking environment for youths, or it may be aproxy for other environmental or social factors;the reasons that mixed land uses are related towalking are not as clear for youths as for adultsand need further theorizing and study. Althoughincreased residential densities are often associ-ated with increased walking levels among adults,we found that as residential density increased,the probability that a child would walk homefrom school decreased. It is unclear why thispattern has emerged, but it may be that
increased residential densities are associatedwith increased levels of automobile traffic andcrime,41 which increases danger (real and per-ceived) and might be a deterrent to walking forchildren.19
We found that the rate of active travel wasnearly 10% higher on the journey home fromschool than on the trip to school, and auto-motive travel dropped by nearly10% (Table1).This difference highlights how children’s travelpatterns are linked to parental scheduling andtravel. In this case, the 10% difference in thejourney to and from school was probably be-cause some parents drove their children in themorning, before work, but were still at workwhen their children left school in the afternoon.This finding highlights the need for more workon the relationship between parents’
commuting patterns and children’s mode oftravel to school.
For the trip home from school, many chil-dren had fewer options for mode of travel andwere more likely to use nonmotorized travel.Higher neighborhood income was associatedwith lower rates of active travel on the journeyhome. Higher-income households may haveonly 1 parent working, or more flexible work-ing hours, which allow parents to pick up theirchildren after school. Furthermore, somehigher-income households may employ care-givers to drive their children home from school,an option that may be financially unavailable tolower-income households.
Street trees provide shade and can contrib-ute to a neighborhood’s esthetic quality. Al-though higher numbers of street trees in-creased the likelihood of walking to school,they did not seem to affect the journey home.Perhaps the natural environment plays a moreimportant role in the morning trip, when chil-dren may have more options for mode oftravel. This finding suggests the potential healthbenefits of well-targeted tree-planting efforts.
Local school boards are currently ponderingthe closure of certain schools in older, inner-city neighborhoods; closure decisions are ap-parently based solely on the Ontario Ministryof Education’s estimates of too much availablefloor space per student.42 School capacities arecalculated on the basis of total floor space in aschool (including gyms, libraries, and unoccupiedareas) and number of students. These unoccu-pied areas of schools are commonly used forcommunity activities such as child care or inner-city health networks, not as classroom spaces forteaching.42
The closing of schools in older neighbor-hoods is not just a problem for Ontario resi-dents; school boards and districts throughoutCanada and the United States are dealing withsimilar issues. The potential negative healthconsequences associated with closing schoolsneed to be weighed in these decisions. Olderneighborhood schools commonly have ahigher mix of land uses and shorter distances totravel, which increase the odds of childrenwalking. Schools built on the urban fringe,which require most students to be bused,increase transportation costs43 and limit theopportunity for children to participate in physi-cally active travel.2–6
TABLE 3—Results of Stepwise Logistic Regression Estimation for Children’s Mode of Travel
to and From School: London, Ontario, 2006–2007
Coefficient (SE) Wald Test P OR (95.0% CI)
To school
Gendera 0.468 (0.190) 6.081 .014 1.597 (1.101, 2.318)
Street trees in home neighborhoodb 0.263 (0.117) 5.047 .025 1.300 (1.034, 1.635)
Distance to school,c km –0.647 (0.123) 27.846 <.001 0.523 (0.412, 0.666)
Land use mix in school neighborhoodd
Second quartile 0.307 (0.236) 1.699 .192 1.360 (0.857, 2.159)
Third quartile 0.826 (0.264) 9.788 .002 2.284 (1.361, 3.833)
Upper quartile 1.062 (0.291) 13.293 <.001 2.891 (1.634, 5.117)
Constant 0.036 (0.392) 0.009 .926 1.037
Home from school
Gendera 0.437 (0.219) 3.985 .046 1.548 (1.008, 2.376)
Net residential density in home neighborhoodd
Second quartile –0.782 (0.338) 5.363 .021 0.457 (0.236, 0.887)
Third quartile –1.142 (0.365) 9.808 .002 0.319 (0.156, 0.652)
Upper quartile –1.351 (0.382) 12.525 <.001 0.259 (0.123, 0.547)
Distance to school,c km –0.816 (0.123) 44.215 <.001 0.442 (0.348, 0.562)
Land use mix in school neighborhoodd
Second quartile 0.418 (0.278) 2.257 .133 1.518 (0.881, 2.617)
Third quartile 1.152 (0.346) 11.088 .001 3.165 (1.606, 6.236)
Upper quartile 1.240 (0.393) 9.960 .002 3.457 (1.600, 7.468)
Median household income in school neighborhood,
Can $1000
–0.050 (0.011) 18.616 <.001 0.952 (0.930, 0.973)
Constant 5.284 (0.936) 31.841 <.001 197.091
Note. OR = odds ratio; CI = confidence interval. Students were in grades 7 and 8 (aged 11–13 years). Nonmotorized travel wasthe dependent variable throughout. Only significant variables are displayed. The home neighborhood extends for 500 m fromthe center of a student’s home postal code, whereas the school neighborhood extends 1.6 km from a student’s school.aGirl as referent.bNumber of street trees (in groups of 10) within 5 m of road edge.cShortest path from home postal code to school.dFirst (lower) quartile as referent.
RESEARCH AND PRACTICE
524 | Research and Practice | Peer Reviewed | Larsen et al. American Journal of Public Health | March 2009, Vol 99, No. 3

Limitations
Although this research moves beyond thetypical ecological study, a number of limita-tions exist. We did not identify the actual routea child takes to school. Because of ethicsboard requirements, we used home postalcodes rather than exact addresses; this proce-dure may have reduced the variability in thedata, or in some cases, slightly altered distanceestimates. In addition, parental response rateson certain social variables such as incomeand educational attainment were too low forthis study, so neighborhood-level census datawere employed for social variables. Finally,the questionnaire was completed by 49%of eligible students, and it may be that theother 51% were less or more ‘‘active’’ thanthe study participants. Future research willexamine other factors such as parentalconcerns and characteristics of the route toschool.
Conclusions
School siting should be an important issuenot only for school boards but also for planningand public health professionals. School locationdetermines the distances students must travelbetween home and school, and shorter dis-tances are the best way to encourage physicallyactive journeys to school. Consolidating schoolswill probably harm children’s health. Althoughland use mix and population density shouldalso be considered with regard to increasingrates of nonmotorized travel, planting treesmay be the most efficient and cost-effectiveenvironmental intervention to encouragewalking to school.
Given that the rate of active travel was 10%higher for the journey home from school thanfor the trip to school, there is a need for moreresearch on the relationship between parents’commuting patterns and children’s mode oftravel to school. The use of nonmotorizedtravel to school is one step toward increasingdaily levels of physical activity among chil-dren. Our study contributes to the growingbody of research on how local environmentsand school location can influence mode oftravel among children. Furthermore, ourfindings on environmental determinants ofhealthful behaviors such as active travel pro-vide justification for greater collaboration be-tween urban planning and public health
professionals to provide healthful cities forall.44–46
j
About the AuthorsAt the time of the study, Kristian Larsen is with theDepartment of Geography, University of Western Ontario,London. Jason Gilliland is with the Children’s HealthResearch Institute and the Department of Geography,University of Western Ontario, London. Paul Hess is withthe Department of Geography and Program in Planning,University of Toronto, Toronto, Ontario. Patricia Tucker iswith the Middlesex–London Health Unit, London, Ontario.Jennifer Irwin is with the Faculty of Health Sciences,University of Western Ontario, London. Meizi He is withthe Department of Health and Kinesiology, University ofTexas, San Antonio.
Requests for reprints should be sent to Jason Gilliland,PhD, Department of Geography, Social Science Centre,University of Western Ontario, London, Ontario, N6A5C2 (e-mail: [email protected]).
This article was accepted June 15, 2008.
ContributorsK. Larsen assisted with data collection, conducted thedata analysis and cowrote the article. J. Gilliland con-ceived, designed, and supervised the study, secured thegeographical information system data, assisted with thedata analysis and interpretation, and cowrote the article.P. Hess assisted with the study design and interpretationof the findings, and edited the text. P. Tucker collectedsurvey data and contributed to the study design. J. Irwinand M. He contributed to the study design.
AcknowledgmentsThis research was funded by the Canadian Institutes ofHealth Research and the Social Science and HumanitiesResearch Council of Canada.
We thank the students, parents, teachers, principals,and research boards of the Thames Valley District SchoolBoard and the London District Catholic School Board.We also thank Kevin VanLierop and Janet Loebach fortheir efforts on the larger project.
Human Participant ProtectionThis study was approved by the research ethics boards ofthe University of Western Ontario, the Thames ValleyDistrict School Board, and the London District CatholicSchool Board.
References1. Craig C, Cameron C, Russell SJ, Beaulieu A. In-creasing Physical Activity: Supporting Children’s Partici-pation. Ottawa, Ontario: Canadian Fitness and LifestyleResearch Institute; 2001.
2. Saelens B, Sallis J, Frank L. Environmental corre-lates of walking and cycling: findings from the trans-portation, urban design, and planning literatures. AnnBehav Med. 2003;25:80–91.
3. Tudor-Locke C, Ainsworth BE, Thompson RW,Matthews CE. Comparison of pedometer and acceler-ometer measures of free-living physical activity. Med SciSports Exerc. 2002;34:2045–2051.
4. Cooper AR, Page AS, Foster LJ, Qahwaji D. Com-muting to school: are children who walk more physicallyactive? Am J Prev Med. 2003;25:273–276.
5. Cooper AR, Andersen LB, Wedderkopp N, PaigeAS, Froberg K. Physical activity levels of children whowalk, cycle, or are driven to school. Am J Prev Med.2005;29:179–184.
6. Kerr J, Rosenberg D, Sallis JF, Saelens BE, Frank LD,Conway TL. Active commuting to school: associationswith environment and parental concerns. Med Sci SportsExerc. 2006;38:787–794.
7. Schlossberg M, Greene J, Phillips PP, Johnson B,Parker B. School trips: effects of urban form and distanceon travel mode. J Am Plann Assoc. 2006;72:337–346.
8. McDonald NC. Active transportation to school:trends among US schoolchildren, 1969–2001. Am J PrevMed. 2007;32:509–516.
9. Sirard JR, Ainsworth BE, Mclver KL, Pate RR.Prevalence of active commuting at urban and suburbanelementary schools in Columbia, SC. Am J Public Health.2005;95:236–237.
10. Evenson KR, Huston SL, McMillen BJ, Bors P, WardDS. Statewide prevalence and correlates of walking andbicycling to school. Arch Pediatr Adolesc Med. 2003;157:887–892.
11. Martin SL, Lee SM, Lowry R. National prevalenceand correlates of walking and bicycling to school. Am JPrev Med. 2007;33:98–105.
12. Frank LD, Engelke P, Schmid T. Health and Com-munity Design: The Impact of the Built Environment onPhysical Activity. Washington, DC: Island Press; 2003.
13. Owen N, Humpel N, Leslie E, Bauman A, Sallis J.Understanding environmental influences on walking. AmJ Prev Med. 2004;27:67–76.
14. Li F, Fisher K, Brownson R, Bosworth M. Multilevelmodelling of built environment characteristics related toneighbourhood walking activity in older adults. J Epide-miol Community Health. 2005;59:558–564.
15. Frank LD, Sallis JF, Conway TL, Chapman JE,Saelens BE, Bachman W. Many pathways from land useto health—associations between neighborhood walkabil-ity and active transportation, body mass index, and airquality. J Am Plann Assoc. 2006;2:75–87.
16. Ewing R, Schroeer W, Greene W. School locationand student travel: analysis of factors affecting modechoice. Transport Res Rec. 2004;1895:55–63.
17. McMillan TE. Urban form and a child’s trip toschool: the current literature and a framework for futureresearch. J Plann Lit. 2005;19:440–456.
18. Boarnet MG, Anderson CL, Day K, McMillan T,AlfonzoM.Evaluationof theCaliforniaSafeRoutes toSchoollegislation: urban form changes and children’s active trans-portation to school. Am J Prev Med. 2005;28:134–140.
19. McMillan TE. The relative influence of urban formon a child’s travel mode to school. Transport Res A.2007;41:69–79.
20. Kerr J, Frank L, Sallis JF, Chapman J. Urban formcorrelates of pedestrian travel in youth: difference bygender, race-ethnicity and household attributes. Trans-port Res D. 2007;12:177–182.
21. Timperio A, Crawford D, Telford A, Salmon J.Perceptions about local neighborhood and walking andcycling among children. Prev Med. 2004;38:39–47.
22. Merom D, Tudor-Locke C, Bauman A, Rissel C.Active commuting to school among NSW primary schoolchildren: implications for public health. Health Place.2006;12:678–687.
RESEARCH AND PRACTICE
March 2009, Vol 99, No. 3 | American Journal of Public Health Larsen et al. | Peer Reviewed | Research and Practice | 525
23. Braza M, Shoemaker W, Seeley A. Neighborhooddesign and rates of walking and biking to elementaryschool in 34 California communities. Am J Health Promot.2004;19:128–136.
24. Frank L, Kerr J, Chapman J, Sallis J. Urban formrelationships with walk trip frequency and distanceamong youth. Am J Health Promot. 2007;21(4 suppl):305–311.
25. Frumkin H, Frank L, Jackson R. Urban Sprawl andPublic Health: Designing, Planning, and Building for HealthyCommunities. Washington, DC: Island Press; 2004.
26. Boarnet MG, Day K, Anderson C, McMillan T,Alfonzo M. California’s Safe Routes to School program:impacts on walking, bicycling, and pedestrian safety. J AmPlann Assoc. 2005;71:301–317.
27. Fulton JE, Shisler JL, Yore MM, Caspersen CJ. Activetransportation to school: findings from a national survey.Res Q Exerc Sport. 2005;76:352–357.
28. McMillan TE. Walking and Urban Form: Modelingand Testing Parental Decisions About Children’s Travel[dissertation]. Irvine: University of California, Irvine;2003.
29. Frank LD, Andresen MA, Schmid TL. Obesityrelationships with community design, physical activity,and time spent in cars. Am J Prev Med. 2004;27:87–96.
30. Saelens BE, Sallis JF, Black JB, Chen D. Neighbor-hood-based differences in physical activity: an environ-ment scale evaluation. Am J Public Health. 2003;93:1552–1558.
31. Clifton K. Independent mobility among teenagers:exploration of travel to after-school activities. TransportRes Rec. 2003;1854:74–80.
32. McMillan T, Day K, Boarnet M, Alfonzo M,Anderson C. Johnny walks to school—does Jane? Sexdifferences in children’s active travel to school. ChildYouth Environ. 2006;16:75–89.
33. Mapping Data Distribution. London, Ontario: Geo-matics Division, Corporation of the City of London; 2005.
34. Census of Canada, 2001. Ottawa, Ontario: StatisticsCanada; 2001.
35. Bow CJD, Waters NM, Faris PD, et al. Accuracy ofcity postal code coordinates as a proxy for location ofresidence. Int J Health Geogr. 2004;3:5.
36. Wrigley N. ‘‘Food deserts’’ in British cities: policycontext and research priorities. Urban Stud. 2002;39:2029–2040.
37. Larsen K, Gilliland J. Mapping the evolution of ‘‘fooddeserts’’ in a Canadian city: supermarket accessibility inLondon, Ontario, 1961–2005. Int J Health Geogr.2008;7:16.
38. Leslie E, Coffee N, Frank L, Owen N, Bauman A,Hugo G. Walkability of local communities: using geo-graphic information systems to objectively assess relevantenvironmental attributes. Health Place. 2007;13:111–122.
39. Tucker P, Gilliland J, Irwin J. Splashpads, swings, andshade: parents’ preferences for neighbourhood parks.Can J Public Health. 2007;98:198–202.
40. Powell KE, Martin LM, Chowdhury PP. Places towalk: convenience and regular physical activity. Am JPublic Health. 2003;93:1519–1521.
41. Malczewski J, Poetz A. Residential burglaries andneighborhood socioeconomic context in London,
Ontario: global and local regression analysis. Prof Geogr.2005;57:516–529.
42. Simunac D. Schools’ capacity balance off kilter:some are operating at a third capacity while others areoverfilled to almost bursting. London Free Press. January1, 2008:A1, A8.
43. Beaumont CE. Bring schools back into walkableneighborhoods. In: Planetizen’s Contemporary Debates inUrban Planning. Washington, DC: Island Press; 2007:161–165.
44. Northridge ME, Sclar ED, Biswas P. Sorting out theconnections between the built environment and health: aconceptual framework for navigating pathways andplanning healthy cities. J Urban Health. 2003;80:556–568.
45. Northridge ME, Sclar ED. A joint urban planningand public health framework: contributions to healthimpact assessment. Am J Public Health. 2003;93:118–121.
46. Tucker P, Irwin JD, Gilliland J, He M, Larsen K, HessP. Environmental influences on physical activity in youth.Health Place. 2009;15:357–363.
RESEARCH AND PRACTICE
526 | Research and Practice | Peer Reviewed | Larsen et al. American Journal of Public Health | March 2009, Vol 99, No. 3
Copyright © 2022 FDOKUMEN