In the Wake of Terror: Class, Race, Nation, Ethnicity in the Postmodern World--by E. San Juan, Jr.
Upload
khangminh22Category
view
0download
0
The author(s) shown below used Federal funds provided by the U.S.Department of Justice and prepared the following final report:
Document Title: Perceptions of the Courts in Your Community:The Influence of Experience, Race and Ethnicity,Final Report
Author(s): David B. Rottman Ph.D. ; Randall Hansen ;Nicole Mott Ph.D. ; Lynn Grimes
Document No.: 201302
Date Received: 08/15/2003
Award Number: 1999-IJ-CX-0021
This report has not been published by the U.S. Department of Justice.To provide better customer service, NCJRS has made this Federally-funded grant final report available electronically in addition totraditional paper copies.
Opinions or points of view expressed are thoseof the author(s) and do not necessarily reflect
the official position or policies of the U.S.Department of Justice.

PERCEPTIONS OF THE COURTS IN YOUR COMMUNITY:
THE INFLUENCE OF EXPERIENCE, RACE AND ETHNICITY
Final Report
National Center for State Courts
David B. Rottman, Ph.D.Randall Hansen
Nicole Mott, Ph.D.Lynn Grimes
January 31, 2003
This project was supported by Grant No. 1999-IJ-CX-0021 awarded by the NationalInstitute of Justice, Office of Justice Programs, U.S. Department of Justice. Points ofview in this document are those of the author and do not necessarily represent the officialposition or policies of the U.S. Department of Justice or the National Center for StateCourts.

ii

iii
Table of Contents
Chapter 1 Public Opinion on the State Courts: Content, Variation, andPerpetuation
Overview ..................................................................................................................... 1
Relevant Conceptual and Empirical Studies ................................................................. 2
I. Relatively little is known about the public image of state and local courts.The lack of knowledge is not attributable to a lack of data; rather, there hasbeen insufficient analysis of the relevant evidence and inadequate conceptualthinking to guide the analysis............................................................................... 2
II. The core public image of state and local courts is a stereotype—one thatseems to change little over time or differ from state to state or locality tolocality.................................................................................................................. 5
III. The durability of the court stereotype is in large measure attributable to lowinterest in the courts and a belief that they are not important in solving majorsocial problems..................................................................................................... 7
IV. One consequence of the lack of public attentiveness is that national media—not local media—effects are strong in shaping the image of courts ............... 9
V. Despite the national stereotype, distinctive views of the courts are associated with race and ethnic groups .............................................................. 10
VI. Demographic variables, including race and ethnicity, tend to lose theirpredictive power when measures of perceived procedural justice areconsidered........................................................................................................... 12
VII. The strongest and more conceptually interesting features of racial andethnic differences are found in the relative importance of various factorsas predictors of opinions on the courts............................................................... 14
VIII. The effect of direct court experience on the opinions of jurors, litigants,and others is not established............................................................................... 15
IX. There is evidence from cross-sectional surveys that direct court contactsuppresses the influence of media depictions on orientations toward thecourt. However, the durability of that influence has not been identifiedthrough longitudinal research............................................................................. 16
X. The link between satisfaction with treatments in and by the court and theexpressed willingness to use the courts to resolve future disputes is weakat best.................................................................................................................. 19
XI. The apparent lack of significant change in public opinion about courts iscurious given the sea change that took place in the relationship betweencourts and the public since the late 1970s .......................................................... 20
Conclusion................................................................................................................... 22

iv
Chapter 2 MethodologyBackground ................................................................................................................. 25
Survey Instrument ....................................................................................................... 26
Sampling ................................................................................................................... 27
The Final Sample ........................................................................................................ 28
Attitudinal Scales ........................................................................................................ 31
Chapter 3 In the Eye of the Beholder: Racial, Ethnic and Experience-BasedDifferences in Perceptions of “the Courts in Your Community”
Introduction ................................................................................................................. 35
How fair are the Courts? ............................................................................................. 35
What Aspects of Court Procedures are Fair? .............................................................. 37
Are Some Groups Treated Worse than Others by the Court? ..................................... 40
Does the Public Support a Changing Role for Courts?............................................... 44
How Much Support is there for the Courts? ............................................................... 48
What Underlies Support for the Courts? ..................................................................... 53
Is there a “Minority” Perspective on the State Courts?............................................... 59
In the Eyes of the Beholder: Patterns in Public Opinion About Courts...................... 60
Chapter 4 The Voice of Experience: Jurors, Litigants, and Witnesses LookBack on Their Time in Court
Introduction ................................................................................................................. 63
Who Has Court Experience? ....................................................................................... 64
Perceptions of Fairness in the Courts.......................................................................... 65
How do Former Court Users Rate the Courts ............................................................. 71
How Fair Are the Courts Likely To Be in a Future Case?.......................................... 75
How Likely Are Recent Court Users to Return to Court in a Future Dispute? .......... 76
Do Experiences Affect Decisions to Use Courts in the Future? ................................. 77
What Sources of Information Shaped Opinions of Courts?........................................ 80
The Distinctiveness of Latino Perceptions about the Courts ...................................... 81
A Look Back ............................................................................................................... 85
Chapter 5 Conclusions and ImplicationsOverview ................................................................................................................... 87
Contributions to Research ........................................................................................... 87
Contributions to Policy and Practice........................................................................... 91

v
TablesTable 1.1: National And State Random Polls Of Public Opinion On The Courts ........ 4
Table 1.2: Self-Rated Familiarity with the State Courts ............................................... 9
Table 2.1: The Distribution of Respondents in the Overall Sample ........................... 29
Table 2.2: The Distribution of Respondents by Court Role and Race/Ethnicity ........ 29
Table 2.3: Cooperation Rates for the National Sample and Oversamples .................. 30
Table 2.4: Scales ......................................................................................................... 31
Table 3.1: The Frequency of Fair Outcomes and Procedures: Views by Race andRecent Court Contact .................................................................................................. 36
Table 3.2: The Proportion of Respondents Agreeing that “Courts are concernedwith people’s rights,” “Courts treat people with dignity and respect” and “Courtstreat people politely” ................................................................................................... 38
Table 3.3: The Proportion of Respondents Agreeing that “Courts make decisionsbased on the facts” and “Judges are honest in their case decisions”........................... 38
Table 3.4: The Proportion of Respondents Agreeing that “Courts listen carefullyto what people have to say”......................................................................................... 39
Table 3.5: The Proportion of Respondents Agreeing that “Courts take the needsof people into account” and “Courts are sensitive to the concerns of the averagecitizen” ........................................................................................................................ 39
Table 3.6: The Proportion of Respondents Agreeing that Courts are Timely andAffordable ................................................................................................................... 41
Table 3.7: How Frequently are African-Americans Treated Worse than OtherGroups? ....................................................................................................................... 41
Table 3.8: How Frequently are Latinos Treated Worse than Other Groups? ............. 41
Table 3.9: How Frequently are Non-English Speaking Treated Worse than OtherGroups? ....................................................................................................................... 42
Table 3.10: How Frequently are People with Low Incomes Treated Worse thanOther Groups? ............................................................................................................. 42
Table 3.11a: Proportion of Respondents Agreeing that America Provides EqualOpportunities............................................................................................................... 43
Table 3.11b: Proportion of Respondents Agreeing that “I have beendiscriminated against in my dealings with police”...................................................... 44
Table 3.12: Should Courts Hire Treatment Counselors and Social Workers asCourt Staff Members? ................................................................................................. 45
Table 3.13: Solve Problems by Having the Offender Report Back to the Judge onhis Progress ................................................................................................................. 45

vi
Table 3.14: Should Courts Solve Problems by Coordinating the Work of LocalAgencies? .................................................................................................................... 46
Table 3.15: Should Courts Solve Problems Using the Knowledge ofPsychologists and Doctors?......................................................................................... 47
Table 3.16: Average Scores on Support for Non-Traditional Court Roles................. 48
Table 3.17: Average Scores on How Well Courts Handle Types of Cases ................ 50
Table 3.18: Non-Response Rate by Racial or Ethnic Groups ..................................... 52
Table 3.19: Non-Response Rate by Racial or Ethnic Groups ..................................... 52
Table 3.20: Predictors of Court Favorability: All Respondents.................................. 53
Table 3.21: Predictors of Court Favorability: By Race............................................... 54
Table 3.22: Predictors of Equal Treatment of Groups: All Respondents.................... 55
Table 3.23: Predictors of Equal Treatment of Groups: By Race ................................ 56
Table 3.24: Predictors of Favorability of Courts: By Race......................................... 56
Table 3.25: Predictors of How Well Courts Handle Various Types of Cases ............ 57
Table 3.26: Predictors of Overall Evaluation of Courts: All Respondents ................. 58
Table 3.27: Predictors of Overall Support for Courts: By Race ................................. 58
Table 3.28: Discriminant Analysis Results ................................................................. 60
Table 4.1: What was your role in the case?................................................................. 64
Table 4.2: The Frequency of Fair Outcomes and Procedures: The Views ofRecent Court Users...................................................................................................... 66
Table 4.3: The Proportion of Court Users with a Positive View of Fairness inOutcomes and Procedures ........................................................................................... 67
Table 4.4.1: The Percentage of Court Users with a Positive View of HowRespectfully They Were Treated................................................................................. 68
Table 4.4.2: The Percentage of Court Users with a Positive View of HowNeutrally They Were Treated...................................................................................... 69
Table 4.4.3: The Percentage of Court Users with a Positive View of their Abilityto Participate................................................................................................................ 69
Table 4.4.4: The Percentage of Court Users with a Positive View of theTrustworthiness of Courts ........................................................................................... 70
Table 4.5: Average Procedural Justice Experienced by Role in Court and byRace............................................................................................................................. 71
Table 4.6: Average Ratings for How Respondents Feel About Courts ...................... 71
Table 4.7: Average Ratings of how Well Cases are Handled, by Race/Ethnicityand Type of Court Experience .................................................................................... 73

vii
Table 4.8: Logistic Regression: Influences on the Favorability Toward theCourts .......................................................................................................................... 74
Table 4.9: Influences on Ratings of How Well Courts Handle Kinds of Cases ......... 75
Table 4.10: The Proportion of Court Users with a Positive View of Fairness inOutcomes and Procedures ........................................................................................... 76
Table 4.11: How Likely are Recent Court Users to Go to the Courts in a FutureDispute?....................................................................................................................... 76
Table 4.12: Likelihood of Future Court Use ............................................................... 77
Table 4.13: Antecedents of Likelihood of Returning to Court: LogisticRegressions by Race/Ethnicity.................................................................................... 79
Table 4.14: Proportion of Respondents Rating Various Information Sources as “Very Important” .................................................................................................... 80
Table 4.15: Percent Rating Source as “Very Important” on Overall Impression ofCourts .......................................................................................................................... 81
Table 4.16: Beta Coefficients: Antecedents of Perceived Favorability Towardsthe Courts .................................................................................................................... 84
ChartsChart 2.1: Overall Sample........................................................................................... 28
Chart 3.1: Perceived Favorability of Courts................................................................ 28
Chart 3.2: Perceived Favorability of Schools.............................................................. 49
Chart 3.3: Perceived Favorability of Police ................................................................ 49
Chart 3.4: Mean Overall Evaluation of How Well Courts Handle Cases ................... 51
Chart 4.1: Comparison of Race and Education Level on Importance of TVJudge Shows................................................................................................................ 81
Chart 4.2: How Do Latinos Compare to Whites and African-Americans?................. 83
References ..............................................................................................................97
AppendicesAppendix A: Survey Instrument with Response Frequency ..................................... 105

viii

Chapter 1
Public Opinion on the State Courts: Content, Variation, and Perpetuation
Overview
This report addresses two questions fundamental to understanding public opinionabout the courts. First, do African-Americans, Latinos, and Whites view the state courtsdifferently? Second, what impact does recent direct court experience have on people’sopinions about the state courts? The relevant differences are found in the perceivedquality with which courts handle cases, the fairness of court procedures and courtoutcomes, and the willingness of individuals with recent court experience to return tocourt on a similar matter in the future.
The distinctive contribution of this report is the exploration of where race andethnicity intersect with court experience: Does court experience influence the views ofracial and ethnic groups in a similar or a different manner. Previous studies examinedthat intersection in cities (Tyler, 1990; 2001) or states (e.g., Benesh and Howell, 2001).The findings reported here are based on the first national survey designed to consider raceand experience effects simultaneously.
This joint emphasis has two rationales. First, the survey was conceived as a wayto provide the information core for a major national conference sponsored by theNational Association for Court Management, “Symposium 2000: Meeting the JusticeNeeds of a Multi-Cultural Society in the 21st Century” (held in August 2000). Second,the emphasis corresponds to major unanswered, or not definitively answered, questionsfrom the extant literature. The priorities of practitioners and scholars coincided.
The survey had several noteworthy features:
• A random sample of American adults (954 respondents)
• A random sample of individuals with court experience during the preceding12 months (570 respondents)
• A common set of questions asked of both the general random sample and thecourt user samples
• A special block of questions was asked through which court users coulddescribe and evaluate their experience in court
• Oversamples of the two largest minority groups in the United States, African-Americans and Latinos, selected to augment both the general and court usersamples
• Extensive reference to concepts derived from the procedural justice literature

2
• Limited overlap with the kind of descriptive questions asked in the 1998(American Bar Association) and 1999 (National Center for State Courts)national surveys about the courts and legal system
This chapter summarizes the relevant theoretical and research literature. Chapter2 describes the survey methodology, noting strengths and weaknesses. Chapter 3 isdevoted to racial and ethnic differences in perceptions of the courts held by court usersand non-users. Chapter 4 is devoted to the influence of experience and the interaction ofexperience with race/ethnicity. Chapter 5 returns to the literature review to assess whatthe new survey and its analysis adds what we know about public opinion about the statecourts, both for practitioners and scholars.
Relevant Conceptual and Empirical Studies
This review of prior writings on public opinion concerning the state courts isstructured around 11 assertions. The assertions begin with general observations but thenhone in on specific topics central to the concerns that motivated the 2000 national survey.
I. Relatively little is known about the public image of state and local courts. Thelack of knowledge is not attributable to a lack of data; rather, there has beeninsufficient analysis of the relevant evidence and inadequate conceptual thinkingto guide analysis.
There is no golden age of conceptual and empirical work on public opinionregarding state and local courts.1 However, the 1970s stand out as a high mark in therather flat terrain of opinion research on state courts. The ambitious 1977 Public Imageof the Courts Survey2 commissioned by the National Center for State Courts and, to alesser extent, the ABA’s 1973 Legal Needs of the Poor survey were the empirical highpoints. At the conceptual level, Sarat (1977) provided a framework based on Americanlegal culture within which research on other legal institutions could be integrated withresearch on opinions about the courts.
The storehouse of existing opinion data relevant to the state courts is described inTable 1.1 (on the next page). Six national and 29 state surveys have been devoted inwhole or in large part to the study of public perceptions of state courts. Five states have
1 Testimonials to that assertion include: “Few studies deal expressly with the impact of state courts [on thewillingness of the public to comply with authority] in the 1950s and 1960s” (Clark, et. al., 1972:27).“Pollsters and scholars have paid little attention to the relationship between court and public for the statecourts” (Caldeira, 1993:303). “Since 1980, little research has been conducted on the public’s perceptionsof the fairness of decisionmaking in local courts” (Roberts and Stalans, 1997:140).2 The Public Image of the Courts survey was a massive enterprise; certainly no subsequent survey about thecourts or the legal system approaches its breadth and depth. Interviews were conducted face-to-face with1,931 randomly selected adults (with over samples from states seen as having accomplished significantcourt reform agendas). Similar questions were asked of 317 “active” attorneys, 194 state and local judges,and 278 community leaders (mayors, state and local legislators serving on judiciary committees, localmedia staff, etc.).

3
asked the same questions two or more times and another five states have replicated thesurvey questions first asked in the 1999 national How the Public Views the State Courtssurvey.3
The cumulative value of the data collected in these surveys is less than might beanticipated. Few state surveys have been analyzed to a point beyond displays offrequencies or simple cross-tabulations. There is little consistency in the questions theyasked or the wording of questions. Also, few state-specific data sets were archived, andthus were unavailable for secondary analysis.
The limited accumulation of empirical evidence is matched with, and certainlyrelated to, the limited conceptual development of ideas relating to opinion about statecourts. The dominance of the United States Supreme Court in the study of public opinionon the court is a major reason for the lack of strong theoretical guidance. This isanomalous because:
“Public support, then, is especially important for state and local judges, yet ourknowledge about public support for courts is based very heavily on support for theU.S. Supreme Court . . . ” (Olson and Huth, 1998:42).4
Public support for the U.S. Supreme Court, which is high relative to other nationalinstitutions, may rest on a different foundation than that for local courts.
One explanation offered for the Court’s consistently high level of public support (relativeto the other branches of government) is its unique national institutional role as guarantorof freedom. There appears to be a predisposition to support the U.S. Supreme Court,rooted in how people learn about our political system (Mondak and Smithey, 1997). Atany given time, dissatisfaction with the Court may be high among particular populationsegments based on reactions to specific court opinions. However, the effect is short-livedbecause the Court is seen as protecting basic democratic values and as a champion ofjustice. In this view, the U.S. Supreme Court has legitimacy—it enjoys public supportthat is not contingent on satisfying specific demands. Ultimately the legitimacy of theU.S. Supreme Court rests primarily on the willingness to submit disputes to it foradjudication and acceptance of its decisions rather than on specific outcomes to disputes(see, also, Gibson, 1989:469).5
3 In addition, several state surveys have provided the data for academic studies: Washington State (Fagan.1981), Utah (Olson and Huth, 1998), New Jersey (Silbey et al., 1993), and Louisiana (Benesh and Howell,2001).4 Discussion of the applicability of findings drawn from research on the U.S. Supreme Court to state courtscan be found in Olson and Huth (1998), Benesh and Howell (2001), and Rottman (1998).5 Recent events support such a view. The controversial and politicized decision in Bush v. Gore did notdiminish overall public support for the Court. Rather, support from some groups (Democrats) declined butwere cancelled out by an increase in support from other groups (Republicans) (Kritzer, 2001; see, also,Gibson, Caldeira, and Spence, 2001).

4
Table 1.1NATIONAL AND STATE RANDOM POLLS OF PUBLIC OPINION ON THE COURTS
Year State or National Sample Size Survey Type Pollster Type Name of National Survey1977 National* 1931 In Person Commercial Public Image of the
Courts1978 Utah 600 Telephone Commercial1983 National 1004 Telephone Commercial The American Public,
The Media and theJudicial System: A HearstReport
1984 New Jersey 800 Telephone University1986 Michigan 789 Telephone University1988 Washington 800 Telephone Commercial1989 Alabama 422 Questionnaire University1989 Rhode Island 404 Telephone Commercial1990 Utah 600 Telephone Commercial1991 Massachusetts 400 Telephone Commercial1991 Utah* 600 Telephone Commercial1992 California* 1488 Telephone Commercial1992 New Jersey 800 Telephone University1992 Virginia* 1600 Telephone Commercial1995 Iowa 803 Telephone University1995 Mississippi 670 Telephone University1995 North Carolina 800 Telephone Commercial1995 Wisconsin 522 Telephone University1996 National 1085 Telephone University National Opinion Survey
on Crime and Justice1996 Florida 1042 Telephone Commercial1997 Arizona 511 Telephone Commercial1997 New Mexico 403 Telephone Commercial1998 National 1000 Telephone Commercial Perceptions of the US
Justice System1998 Connecticut 1200 Telephone University1998 Kansas 1226 Telephone University1998 Louisiana* 1200 Telephone University1998 Maryland 600 Telephone Commercial1998 Texas* 1215 Telephone University1999 National* 1200 Telephone University How the Public Views the
State Courts, a nationalsurvey funded by TheHearst Corporation
1999 Minnesota 1,100 Telephone Commercial1999 New Mexico 601 Telephone Commercial1999 Washington 1825 Telephone Commercial2000 National* 1574 Telephone University Public Opinion on the
Courts: A NationalPortrait andInterpretation
2000 Virginia 600 Telephone Commercial2002 Nebraska 1,473 Telephone University
* The random sample was supplemented through oversampling of members of minority groups, opinion leaders,judges, lawyers, persons with recent court experience, or residents in states with and without particular courtreforms.
States in italics indicate that the survey replicated some or all of the questions in the 1999 “How the PublicViews the State Courts” survey.

5
Two theoretical perspectives guide current research on public perceptions of stateand local courts. One perspective begins by reviewing the applicability of theoriesdeveloped in the course of studying support for the U.S. Supreme Court (e.g., Olson andHuth, 1997; Benesh and Howell, 2001). The potential for direct contact with trial courtsis the starting point for generating testable hypotheses.
The second perspective is based on procedural justice, a theoretical frameworkrooted in social psychology that has been applied to many organizational and hierarchicalsettings after a beginning in criminal justice-related research (see, especially, the recentwork of Tom Tyler and his associates in Kramer and Tyler, 1996 and Braithwaite andLevi, 1998, and also the work of Hibbing and Theiss-Morse, 2001). The proceduraljustice perspective is reviewed in section VI below.
Both perspectives generate expectations of how evaluations of courts will differamong racial and ethnic groups and between those with and those without courtexperience. In practice, the two paths have converged during the 1990s due to consensusthat procedural fairness is the criterion by which people evaluate state and local courts.
II. The core public image of state and local courts is a stereotype—one that seems tochange little over time or differ from state to state or locality to locality.
By stereotype we refer to the fixed, narrow “pictures we carry about in our head”that resist easy change (Lippman, 1922/97:59).6 In this conceptual sense, stereotype is notpejorative; rather, it describes social psychological processes necessary to function in acomplex society.7 Stereotypes are “cognitive consolidations” of how the world works(Glynn, 1999:150).8
The stereotype of courts is evident in the same negative and positive images thatrecur with varying degrees of forcefulness in all of the national and state surveys goingback to 1973. Perceptions of key features of the courts do not vary across geographicregions, judicial selection system (Waxman, Lovrich, and Sheldon, 1986), investment incourt reform (Yankelovich et al., 1978), or among the individual states.9 All or many ofthe questions from a 1999 national survey (How the Public Views the State Courts) havebeen replicated in five state-specific surveys (Georgia, Minnesota, New Mexico,
6 Lippman’s depiction and understanding remains influential in sociology (e.g., Marshall, 1994:512; Glynnet. al., 1999:149-59).7 “In putting together our public opinions, not only do we have to picture more space than we can see withour eyes, and more time than we can feel, but we have to describe and judge more people, more actions,more things than we can ever count, or vividly imagine. We have to summarize and generalize” (Lippman,1922/97:95).8 Toharia (2001) and Olson and Huth (1998:56) also apply the label of stereotype to public perceptions ofthe courts.9 Plans are afoot to carry out opinion surveys in localities saturated with community-based court reformefforts. In large urban areas, the impact of even locally based and sweeping reform efforts may not filterdown to public opinion.

6
Virginia, and Washington). State differences from the national parameter estimates tendto be slight. A common, stylized public image of the courts appears to be present.10
There is little evidence of change over long stretches of time in the public’s perceptionson components of the stereotype. For example, some of the same questions were askedin the 1973 Public Needs of the Poor survey and the 1999 How the Public Views the StateCourts survey. The pattern of responses given in 1973 and 1999 are very similar.11
What is that image? The negative image centers on perceived inaccessibility dueto cost and complexity, delays, unfairness in the treatment of racial and ethnic minorities,leniency toward criminals, and a lack of concern about the problems of ordinary people.12
Specific concerns include perceived leniency in sentencing and favoritism toward thecorporate sector and the wealthy in the civil justice system. There also is strong evidencefrom recent surveys of public concern that political considerations, and especiallycampaign fundraising, exert an undue influence on the judiciary.
The stereotype of local courts also contains a strongly positive image. The core ofthat image is a perception that judges are honest and fair in case decisions and welltrained, that the jury system works, and that judges and court personnel treat members ofthe public with courtesy and respect.
A mix of positive and negative components is to be expected: “Stereotypes arequite cognitively complex, often containing both positive and negative elements” (Glynnet al., 1999:149). One striking aspect of that complexity is the glaring inconsistencies inperceptions. For example, the public overwhelmingly believes that judges are honest andfair in case decisions; by an equally overwhelming margin, however, the public alsobelieves that judges’ decisions are influenced by “political considerations” (e.g., NationalCenter for State Courts, 1999).
Respondents in telephone opinion surveys, which gather more emotional thanreasoned responses, appear to answer questions based on the stereotypical image ofcourts in their head.13 Their responses reference a generic image; they are not primarilyabout a particular court or a particular state’s courts. It may also be national media
10 Indeed, international comparisons suggest that such an image may be broadly shared across the Westerndemocracies. Some of the How the Public Views the State Courts survey questions were also included in apublic opinion survey in Spain (Toharia, 2001). The distribution of responses to questions about fairness inthe courts is similar across the two countries.11 The replicated questions to which respondents were asked to agree or disagree were “Judges aregenerally honest and fair in deciding each case” and “Judges do not give adequate time and attention toeach individual case.”12 For a summary of the positive and negative images of courts, see David B. Rottman, “On Public Trustand Confidence: Does Experience with the Courts Promote or Diminish It?” Court Review 35, No. 4.p.14.13 This is not a reason for dismissing opinion about the courts as unimportant: “The public in America (andelsewhere) is generally quite sophisticated in its reactions to crime and criminal justice . . . This is trueeven though the knowledge base on which the public draws is frequently poor” (Roberts and Stalans,1998:54).

7
depictions have more influence as a source and reinforcer of opinion about courts thanabout most other public institutions.
The core image of courts may be similar but the standing of the courts (in terms ofapproval, support, or confidence) is less constant over time and across space.14 Publicsupport may fluctuate in reaction to particular court cases or decisions. For the most part,this relates to what political scientists term “specific support,” that resting on policyoutputs. Some observers claim to discern a secular trend toward greater public approval(Miethe, l995: American Bar Association 1998). Other observers are skeptical (Rottman,1998).
There is also evidence of differences in the level of support across the UnitedStates. The clearest such tendency is for the judiciaries of states in the Midwest toregister higher ratings from the public than do states in other regions. However, there isevidence that the level of support can be very different in states within the same region.Survey questions replicated in a number of New England states offer a glimpse of intra-regional diversity in support for the courts (Doble and Greene, 2000:38-9). The question:“How would you rate the job being done by (the state’s) judges in an overall sense?” Thefavorable (excellent or good) responses summed to 29 percent in Delaware (1991), 61percent in New Hampshire (1998), 17 percent in Pennsylvania (1993), and 53 percent inVermont (1999). The proportion of the public with a favorable view of the judiciary inVermont had grown from 46 percent in an earlier survey (in 1994).
III. The durability of the court stereotype is in large measure attributable to lowinterest in the courts and a belief that they are not important in solving majorsocial problems.
Courts lack an “attentive public,” one concerned and informed about theiroperations and policy outputs; courts are not “visible or salient to the American people”(Sarat, 1977:438).15 The reasons for this disinterest have been explored mainly for thespecial case of the U.S. Supreme Court. Recent theory and research suggests that thepublic perceives the Court as of limited relevance to solving the problems it regards asmost important (Hibbing and Theiss-Morse, 1995:54). The mystery of the processsurrounding the process through which the Court reaches decisions may also contribute tokeeping the Court in its day-to-day operations out of the limelight (Hibbing and Theiss-Morse, 1995: 148; see also Franklin and Kosaki, 1995:373).16
14 The same conclusion might be made about the courts as seen in the various European countries.European data reported by Toharia shows a wide range of approval levels among EU countries: rangingfrom Finland (61%) to Italy (8%) in the proportion of the general population that considers courtperformance “good.”15 Attentiveness has been linked to levels of support for the U.S. Supreme Court—the greater the amount ofattention, the more positive the support (Gibson and Caldeira, 1992:1136).16 Lower expectations of the Courts relative to those held for other government institutions and a publicface of the decision-making process that corresponds to the process by which people want governmentbodies to reach decisions contribute to the (relatively) high regard in which the Court is held (Hibbing andTheiss-Morse, 1995:44 and 143). Institutions tend to attract higher public support than do the members ofthose institutions for the legislative and congressional branches, but not for the judicial branch. The Court

8
Low levels of attentiveness in part reflect the way young people are taught aboutgovernment. The judicial branch is given limited and disconnected treatment intextbooks on American government: “The not very subliminal message conveyed by thisbrief coverage and quick progression to other topics is that the courts are not veryimportant to understanding our system of government” (Zemans, 1991:727).
Public attentiveness to the state courts is lower still than that afforded to the U.S.Supreme Court. A quasi-experimental study with “before” and “after” public opinionsurveys indexes the lack of public attentiveness to a state’s courts. Through a federalgrant, the State of Utah took steps to encourage and facilitate local media coverage of thatstate’s courts. Those efforts yielded more than 100 newspaper articles and 50 televisionprograms on topics related to the courts (Olson and Huth, 1998:48). The newspapercoverage was found to have reached 9 percent and the television coverage 11 percent ofthe Utah public.
Another case in point is the Midtown Community Court in the Times Square Areaof Manhattan. Five years after the Court opened to considerable fanfare and massive cityand neighborhood media coverage, only 20 percent of residents in local neighborhoodshad heard of it. And, of those who knew about the court, one-half said they “were not atall familiar” with it; a mere 7 percent of those who had heard of the Court claimed to bevery familiar with it (Sviridoff et al., 2001:7.23).
Attentiveness can be thought of as distinct from the knowledge that a person hasor believes that they have about an institution (Olson and Huth, 1998:47-48).17 Indeed,while attentiveness is seen as being associated with high levels of approval, greaterknowledge is seen as being associated with low level of support or confidence.However, a large number of studies claim to find that self-rated or tested knowledge has anegative relationship to support for trial courts (see Rottman, 1998).
Whatever the impact of knowledge about the courts, it is a rare commodity. Thelow level of self-rated court knowledge does not appear to have changed over time. Anational and two state surveys used the same question to measure knowledge of thecourts (see Table 1.2).
is “associated with the constitutional system but is viewed as being above the Washington system;decisions seem firm and clear, with bickering and deal making sheltered from public view, notwithstandingan occasional aberration or expose.” (148)17 Attentiveness was measured by two survey questions. One question asked if the respondent had “seen orread any media coverage of the state courts during the past month;” the other question asked if they “wereaware of any changes in the court system in the past five years.”

9
Table 1.2: Self-Rated Familiarity with the State CourtsPlease tell me how familiar you are with state courts?
USA1977
California1992
Florida1996
Percentages
Intimately 1 4 4Broadly 6 13 7Familiar 19 22 10Somewhat familiar 44 40 48Not familiar at all 30 21 31
A recent national survey shows a public only modestly confident in what it knowsabout the state courts (National Center for State Courts, 1999). The following responseswere given to the question, “How much would you say you know about the courts?”
PercentagesA lot 14Some 48A little 31Nothing at all 6
Knowledge levels measured by a short test reveal low levels of public knowledge.The available evidence suggests that the pool of citizens knowledgeable about the courtshas not become larger over time (ABA, 1998:23).
The import of attentiveness and knowledge in understanding variation in the levelof support for the state courts is not clearly established. For example, the direct effects ofawareness and knowledge were not statistically significant as predictors of support for theUtah courts in the research carried out by Olson and Huth (1998).18
IV. One consequence of the lack of public attentiveness is that national media—notlocal media—effects are strong in shaping the image of courts.
Media coverage of the courts is sporadic and unrepresentative (“There is evidencethat people’s opinions about crime and punishment often are based on the unusual,dramatic and unrepresentative cases that they learn about from the mass media”) (Tonry,1998:24) and also inaccurate (“the public is regularly exposed to misrepresentation of thejudicial process [by the media]”) (Zemans, 1991:727). Indeed, it is reasonable toconclude that the media misrepresent what the public wants of the criminal justice system(Roberts and Stalans, 1998:55).
18 The extent of public ignorance about the U.S. Supreme Court is itself a matter of contention. Two recentstudies suggest that the tests used to date tend to understate public knowledge (Gibson et al., 2001; Kritzer,2001).

10
The relevant media appears to be national, not local. The Utah experiment inusing the media to increase awareness of the state courts suggests that the public’s pointof reference is national and, arguably, stereotypical. The kind of local coverage courtsreceive centers on issues like crime and family dysfunction. However, “issues involvingchronic problems like crime show little correlation between media coverage and publicattention” (Neuman, 1990 as quoted in Franklin and Kosaki, 1995:354).
Media-driven images are not challenged because of low public attentiveness andinterest in the courts. The considerable power of the media is suggested in a surveydesigned to predict future litigative intent. “Persons reporting greater contact with mediasources about lawyers and the legal system . . . were more likely than their counterpartsto reject legal solutions to their future problems” (Miethe, 1995:578). Exposure to themedia was the only influence that created personal barriers to use of the law.
More generally, Sherman (2000:17) notes, “for the majority of Americans whohave little if any personal contact with the criminal justice system, the level of trust incriminal justice may depend on how legal agencies are portrayed in entertainment andnews media.” About one-half (53 percent) of American adults have had some directcontact with the courts (National Center for State Courts, 1999). The entertainmentindustry fills the information gap for the other half of the population. A 1983 survey(Hearst Corporation, 1983:21) asked a random sample of adults who were not employedby law enforcement or criminal justice, “Where do you most frequently get informationabout courts.” The fourth most common source (out of 11 possible ones) was “televisiondrama” (after television news, newspapers, and radio news).
V. Despite the national stereotype, distinctive views of the courts are associated withrace and ethnic groups.
African-Americans tend to have distinctly lower evaluations than do Whites ofthe performance, trustworthiness, and fairness of courts. Latinos emerge as generallyholding the most positive assessments of the state courts, but present a mixed picture interms of specifics: in some respects they share the more positive assessments of Whitesand in other respects they share the negative assessments of African-Americans. Thispattern is strongly present in the national 1977 Public Image of the Courts survey(1978:102) and 1999 How the Public Views the State Courts survey (National Center forState Courts, 2000), as well as in state surveys conducted in Arizona (1997), California(1992), New Jersey (1992, as reported in Silbey et al., 1993), Texas (1998), andWashington State (1999).
Foreign- and native-born Latinos have similar levels of support for the courts, arate higher than for African-Americans or Whites (de la Garza and DeSipio, 2001,reproduced in Appendix B below). The general sense of unfairness in the courts amongAfrican-Americans is evident in the fact that African-Americans perceive a greaterlikelihood of unfair treatment to Latinos than do Latinos themselves (National Center forState Courts, 1999; Roberts and Stalans, 1997:174; Silbey et al., 1993).

11
One recent survey came to a different conclusion about race/ethnic differentials insupport for the courts. An analysis of data collected in the 1995 National Opinion Surveyon Crime and Justice concluded, “Although African-Americans were more concernedwith specific issues, Hispanic respondents were more dissatisfied overall” (Myers,1996:59). Despite this dissenting view, the overwhelming weight of empirical evidencefinds African-American and Latino opinions about the court are substantively different.Moreover, the direction and substance of the differences are consistent with the largercontext of the Latino experience in the United States and Latino political and culturalopinions generally (de la Garza and DeSipio, 2001).19
Mapping those differences is hindered by a tendency (or necessity) in mostsurveys about the courts to combine all minority group members into an omnibus“minority” category. Asians, the only other ethnic group for which relevant survey dataexist (e.g., California, 1992) appear to hold views on the courts that are similar to those ofWhites (Roberts and Stalans, 1997:154). However, by focusing only on the African-American/White divide “we are in danger of overlooking critical and importantdifferences in culture, history, experiences, and resources among racial groups (Silbey etal., 1993:108; see also Roberts and Stalans, 1997:153).
Within race (non-linear) effects of class, income, and education effects have beenidentified. The most noteworthy such effect is for high income, well-educated African-Americans to express less specific support (that is, support based on policy outputs) forthe courts than do less well-off African-Americans:
Higher-income African-Americans express more skepticism about thechances of blacks to receive equal treatment in the courts. Additionally,better-off African Americans have less confidence in the court’s handlingof specific types of cases (Brooks and Jeon-Slaughter, 2001:261).20
However, when it comes to diffuse support (as measured through the question, how muchconfidence do you have in the “courts in your community” or in the U.S. Supreme Court)the pattern is reversed. Confidence is highest among better-off African-Americans; theyhave the greatest good will and respect for the judicial system. Based on the analysis of a1999 national opinion survey, they conclude, “the general pattern of black middle-classdissatisfaction with American political, economic and legal institutions may stop short of
19 The generally positive perception about courts attributed to Latinos is contrary to the objectiveexperiences of Latinos as a group in the courts. Latinos receive harsher sentences in the federal courts(Steffensmeier and Demuth, 2000) and in the Pennsylvania Courts (Steffensmeier and Demuth, 2001). The“main finding is that Hispanic defendants are the defendant subgroup most at risk to receive the harshestpenalty.” (2001:170). Latinos are also the racial/ethnic group most likely to become a crime victim(Rennison, 2001:9).20 Brooks (2000) put forward a cost/benefit explanation for this pattern in which higher income African-Americans perceived the high costs (violation of civil liberties, aggressive policing) in low income blackcommunities but do not perceive the benefits residents experience in the form of crime reduction.

12
the judiciary” (261).21
There is evidence that the pattern for middle-class African-Americans to be themost critical of the courts applies to Latinos. The relationship between income level andsupport for the courts is non-linear among Latinos, albeit to a weaker degree than amongAfrican-Americans. By contrast, the relationship among Whites between income andsupport was linear (Brooks and Jeon-Slaughter, 2001).
An age cohort effect has been identified in the relationship of African-Americansto the U.S. Supreme Court: “those who were most clearly and directly influenced by theSupreme Court during their early adult years are the most supportive of the institution”(Gibson and Caldeira, 1992:1135). A reservoir of good will that the U.S. Supreme Courtgarnered from African-Americans during the Warren Court era is one possibleexplanation. Similar cohort effects have not been found for opinions about the statecourts (Olson and Huth, 1997).
There also is some evidence of a gender within race effect. Among African-Americans, women were less confident than men in the courts (Brooks and Jeon-Slaughter, 2001).
The media’s influence on opinions may also vary by race. In part, this followsfrom differential patterns of media consumption (de la Garza and DeSipio, 2001).African-Americans, Latinos, and Whites tend to rely on different media for informationabout the courts (National Center for State Courts, 1999). Racial and ethnic groups alsoform “interpretive communities” within which people make sense of what is presented inthe media (Hunt, 1998:133-5). There is tentative evidence suggesting that African-Americans and Latinos are more likely than Whites to challenge media depictions ofcriminal justice issues (Hunt, 148).
VI. Demographic variables, including race and ethnicity, tend to lose their predictivepower when measures of perceived procedural justice are considered.
Recent work on public support for government finds that “demographic variablesare not particularly useful in specifying the kind of person likely to be dissatisfied withgovernment (Hibbing and Theiss-Morse, 2001:150). The literature on the courts hasmoved in much the same direction, while making allowance for some specificdemographic effects.
The early (1970s and 1980s) literature on public perceptions of the courtsexamined the relative predictive weight of demographic and attitudinal factors (Fagan,1981; Flanagan, et al., 1985) without conclusive results, although attitudinal variables
21 This is consistent with Gibson and Caldeira’s findings about support for the U.S. Supreme Court. Theyargue that African-American attitudes toward the political system tend to be more reality-based attitudesthan do the attitudes of Latinos or Whites (Gibson and Caldeira, 1992:1125). As a result, the diffusesupport of African-Americans for the Court is a function of their specific support.

13
explained more of the variation in confidence than did demographics. 22 Age emerged asthe most useful demographic factor after attitudinal variables had been considered. Self-reported social class was also significant. Contrary to findings in studies of the U.S.Supreme Court, race “has not been related to views about fair procedures or honesty atthe local level” (Roberts and Stalans, 1997: 142).
The lingering significance of demographics largely rests on the extent to whichthey are correlates of attitudes not included in explanatory models or have indirectinfluences expressed through “effects within race” or “effects within class of courtuser.”23
In the court context, attitudes toward leniency in sentencing and access to civiljustice have been found to be influential, but not consistently so (see the discussion of theimpact of court experience below). After 1990, the attitudinal variables given weightconcerned fairness, and particularly the fairness of procedures (procedural justice). “Theprocedural justice argument is that, on the general level, the key concerns that peoplehave about the police and the courts center around whether these authorities treat peoplefairly, recognize citizen rights, treat people with dignity, and care about people’sconcerns” (Tyler, 2001:216).
Four elements of procedural justice are given prominence in the recent literature:
Interpersonal Respect: Being treated with dignity and respect, and havingone’s rights protected.
Neutrality: Decision-makers that are honest, impartial and base decisionson facts.
Participation (voice): The opportunity to express one’s views to decision-makers.
Trustworthiness: Benevolence of the motives of authorities: Decision-makers that are motivated to treat you fairly, sincerely concerned withyour needs, and consider your side of the story.
Tyler’s recent writing gives emphasis to trust as the key element in shapingjudgments of procedural fairness (Tyler, 1998:273).
22 “Unlike previous studies, our findings indicate that demographic characteristics are significant correlatesof public perceptions of courts. However, the influence of these demographic characteristics is outweighedby the effect of related social attitudes” (Flanagan et. al., 1985:66).23 A recent appraisal started with the expectation that age, education, income, gender, and race were “notexpected to have direct effects on confidence their effects are expected to be mediated by the attitudinalvariables.” Demographic variables were included in their models to control for other, unmeasured,attitudinal variables correlated with demographic characteristics” (Benesh and Howell, 2001:203). Otherformulations allow room for demographics to matter (that is, to be significant once procedural justicemeasures have been considered) for some kinds of cases and in other contexts.

14
The perception of procedural fairness is more important than favorability of courtoutcomes to litigant satisfaction with those outcomes, willingness to comply with courtorders, and having confidence in the judiciary. The impact of fair procedures is powerfulindeed: “When police acted in a procedurally fair manner when arresting assaultsuspects, the rate of subsequent domestic violence was significantly lower than whenthey did not” (Paternoster et al., 1997:163).24
Various government entities have been associated in the public mind with high orlow levels of procedural justice. There is evidence that the public tends to give the courtslow rankings on the access elements of procedural justice and higher marks on neutralityin the sense that they assemble full information before making a decision, relative toother institutions (specifically, local legislatures). (Gibson, 1989:484).
VII. The strongest and more conceptually interesting features of racial and ethnicdifferences are found in the relative importance of various factors as predictors ofopinions on the courts.
Procedural justice considerations dominate the evaluations that all segments of thepopulation make of the courts: “expectations about fairness and values about proceduraljustice are the influences” (Roberts and Stalans, 1997:148). Group differences in whatmatters most in explaining support for the courts have been identified, however.
African-American respondents are especially likely to be influenced bytheir judgments about whether the Courts treat different groups unfairly[in terms of outcomes]; while Hispanics and Whites are especially likelyto be affected by their judgments about the quality of treatment that peoplereceive from the Courts. The strongest impact of performanceassessments is found among Whites. White respondents are affected bytheir judgments concerning the structural problems in the courts [e.g.,orders not enforced, inadequate attention is paid to cases]. No one seemsparticularly influenced by cost related evaluations (Tyler, 2001:227-8,content of brackets added).
Models predicting support for the courts tend to generate higher proportions ofexplained variance for Whites than for either African-Americans or Latinos(Tyler, 2001:228).
In terms of the elements of procedural justice, there is evidence thatWhites and African-Americans are particularly attentive to issues of respect andtrust, while Latinos rely particularly on indicators of neutrality in reachingevaluations of the courts (Tyler, 2001:232).
24Sherman (2000) describes a set of field tests of the procedural justice thesis in the criminal justice arena.

15
There is also evidence that groups of recent immigrants (Cubans are cited as anexample) tend to have higher expectations for the extent to which the criminal justicesystem can control crime (Roberts and Stalans, 1997:142).
VIII. The effect of direct court experience on the opinions of jurors, litigants, andothers is not established.
The most ambitious survey of opinion on the courts (conducted in 1977) reacheda dramatic conclusion about the impact of experience: “Those having knowledge andexperience with the courts voiced the greatest dissatisfaction and criticism” (Yankelovichet al., 1978: 21).
Whether the original data justify such a conclusion has been challenged(Mahoney et. al., 1978; Kritzer and Vokleh, 1999) and supported (Benesh, 2000) basedon secondary analysis of the 1977 data set. However, the negative relationship betweencontact and approval The Public Image of the Courts survey was consistent withcontemporary readings of American legal culture. Arguing by extension from the largerresearch literature on police and lawyers (Sarat, 1977:438) concluded, “widespreadpublic ignorance should enhance their support [for the courts].” The direct evidence fromcourt-specific research in the 1970s pointed toward the same conclusions, that “support iseroded by experience with or knowledge about them. This is especially true for thosewho are involved in a lawsuit.” (Sarat, 1977:439).
State surveys conducted since 1984 made comparisons between the attitudes andratings of those with and those without court experience, often differentiating by the typeof court contact. The most straightforward assessment was to ask litigants, jurors andothers whether their experience had a positive or negative effect on the image of thecourts. In Arizona, a 1997 survey found that forty-eight percent of court users cameaway with a more positive impression of the courts and thirty-nine percent had a morenegative impression. Generally, court users in New Jersey (1984 and 1992), Virginia(1992), and Connecticut (1998) tended to say that their experience did not change theirimage of the courts. Where a change in opinion was reported, it tended to be in anegative direction (people reporting a negative change outnumbered those reporting apositive change by two to one in New Jersey and by three to two in Connecticut andVirginia).25
Less direct, but still relevant, evidence is available from six states that comparedthe ratings and attitudes of court users in various categories to those of respondents whoreported no court contact. The simplest comparison is in terms of the overall ratings of 25 The difference between Arizona and the other two states is likely to be attributable to question wording.Arizona did not offer survey respondents the choice of “no change,” recording it only if volunteered by therespondent. The New Jersey and Virginia surveys included “unchanged” as an option read to therespondents. This is a good lesson: survey findings rarely, if ever, speak for themselves and differencesacross surveys need to begin with an examination of the question wording, placement in the survey (whatkinds of questions preceded the question being examined), and the way “don’t know” responses werehandled. There is often no “right” approach to question wording but even a slight difference in wordingcan drastically alter the way the question is understood by survey respondents.

16
the courts, which can be made for three states (California, Michigan, and New Mexico).Here, jurors (in one state) and litigants (in two states) tended to rate the courts lower thandid those without court experience. These differences were not substantial, however, andno difference existed for one-half of the comparisons. All in all, state surveys suggest areduction since 1977 in the ratings gap between court users and non-users, but the gappersists.
IX. There is evidence from cross-sectional surveys that direct court contactsuppresses the influence of media depictions on orientations toward the court.However, the durability of that influence has not been identified throughlongitudinal research.
There is some agreement on why and how direct experience shapes or changesopinions abut the courts. In particular, most researchers argue that experience changes therank ordering of a common set of criteria used by the experienced and inexperienced.The fundamental divide in the literature, however, is that between scholars andresearchers that emphasize a general “experience” effect and other scholars andresearchers who stress the polarizing effect of court experience.
General Influences
The nature of the “general effect” is considered first. A strongly stated claim forthe effect of court experience is found in Olson and Huth’s (1998:56) secondary analysisof a Utah state survey. “When people do have access to in-court experience, they appearto rely on it more and rely relatively less on socialized attitudes or stereotypes.” Thechange in point of reference can have a dramatic impact: in the Utah survey, a perceptionthe judges sentence criminals leniently was a statistically significant influence on supportfor the courts only for individuals without prior court experience. There was no influenceon the level of support offered by individuals with experience. Procedural fairnessconcerns dominated (were the strongest predictor of) the evaluations offered by personswith court experience.
Silbey and her associates offer a more subtle formulation of the experience-to-opinion link based on their secondary analysis of a 1992 New Jersey state survey(1993:100). They found that although experience “does not affect the overall assessment,it does seem to affect particular attitudes, although the direction is not uniform” (Silbey etal., 1993:100). For example, experience makes people more likely to see the legal systemas responsive to needs of ordinary citizens and less likely to see it as needlesslycomplicating problems. This view does make a strong claim for the directionality of theexperience-to-opinion relationship: legal experience shapes attitudes, not the reverse(Silbey, 1993:103).
Personal and direct court experience has been linked to a number of effects thatmight be expected to modify opinions and evaluations:

17
• The importance of fairness as an evaluative criterion is amplified (Olson andHuth, 1998; Tyler, 2001). Procedural fairness concepts explain significantlymore of the variation (generate a higher R-Squared) in opinions of court-usersthan in the opinions of non-users.
• Courts are demystified through experience (Silbey et al., 1993).
• Direct legal experience trumps media effects. The frequency of exposure tomedia sources about the legal system influences litigative intentions only forpeople without direct experience of the system (Miethe, 1995:579).
• Those with experience in a local court will use it when evaluating courts;those without such experience will differentiate less between local andnational courts (Olson and Huth, 1998:52).
• The relative importance people attach to performance issues like efficiencyand delay is changed. Here, there are two views on the nature of that effect.Tyler (2001) concludes that cost and delay considerations are of diminishedimportance for people with prior court experience; Olson and Huth (1998)conclude that experience sensitizes people to the problems courts face in thoseareas.
• The civil side of trial court business is emphasized (Olson and Huth, 1998).Media depictions of courts focus on criminal justice. People’s business beforethe courts concerns civil justice matters.
• “Experiences may serve as filters that distort interpretations to confirm whatpeople expected to receive. Positive value placed on the proceduresdetermines the influence procedural justice considerations have on a specificexperience in changing diffuse support” (Roberts and Stalans, 1997:149-50).
Court Experience as a Polarizer of Opinions
All court experiences are not equal (e.g., Benesh and Howell, 2001). It is likely,for example, that experiences differ systematically based on the role the person playedand whether the experience was positive or negative. 26
Benesh and Howell (2001:204) offer a conceptual framework in which the size ofthe stakes involved and the amount of control a participant has in court shapes the impactof their experience. In this schema, low control and high stakes promote the lowerevaluations (applicable to criminal defendants, civil litigants, victims, and parties todomestic relations disputes); low stakes and high control promote higher evaluations(applicable to jurors, lawyers, and court staff); and medium stakes and medium control 26 Another way of slicing the courts’ clientele for analytical purposes contrasts the criteria used by thosewho ask the court for help with people who are involved in a “police or court-initiated” encounter: “Peoplewho ask the court for help were more concerned with accuracy, impartiality, and correctability of decisions(Roberts and Stalans, 1997:148).

18
promote a neutral influence (applicable to witnesses, courtroom observers, and trafficcase defendants).27
There is evidence that jury service tends to improve support for the courts(Antonio and Hans, 2001:79). The conclusion is supported by a recent study ofsatisfaction levels of North Carolina jurors before and after their service. Of the jurors,20 percent changed their views in a positive direction and the proportion giving a neutralrating of performance (the mid-point of a five-point scale), declined. Most people,however, did not change their level of satisfaction (Cutler and Hughes, 2001). Otherstudies report modest positive change (Schuman and Hamilton, 1992) or no change (to astatistically significant degree) among former jurors (Diamond, 1993).
Another way of slicing the courts’ clientele for analytical purposes contrasts thecriteria used by those who ask the court for help with people who are involved in a“police or court-initiated” encounter: “People who ask the court for help were moreconcerned with accuracy, impartiality, and correctability of decisions” (Roberts andStalans, 1997:148 drawing upon Tyler’s Chicago study of 1990).
Negative court experiences are assumed to be more consequential for people’sopinions than positive experiences. There is evidence, however, that positive experiencescan be influential (e.g., American Bar Association, 1998).
Finally, “any explanation of how positive and negative experiences changediffuse support cannot ignore the possibility that different ethnic groups may base diffusesupport on different criteria” (Roberts and Stalans, 1997:151). The research evidencesuggests that the different criteria fall within the narrow range of fairness of processevaluations—different elements of fairness matter more to some groups than to others.However, Roberts and Stalans (148-9) claim that the meaning of procedural justice variesmore across situations than across people—expectations about fairness and values aboutprocedural justice make a difference (for example, people who value civil liberties morethan they value crime control may define procedural justice differently than others).
Despite the primacy of differences based on elements of procedural fairness otherdifferences have emerged. For example, one study concluded that jurors of all racial andethnic groups have a positive response to jury service. However, in the context of highlevels of satisfaction with jury service, minorities, including Latinos “experience thedynamics of trial deliberations differently” (for example, they perceive less conflict thando Whites) and are less positive about jury service than Whites (Antonio and Hans,2001:79). There is some evidence that African-American jurors see the justice system asless fair than do African-Americans without jury service experience (Schuman andHamilton, 1992—the difference was not statistically significant, however).
27 They derive from this an ordinal scale in which a score of one indexes low stakes/high control; twoindexes medium stakes/medium control; and a three indexes high stakes/low control.

19
A Conundrum
The effect of court experience on opinions appears to be slightly negative orneutral whether assessed in terms of support or perceived procedural justice in the courts.The lack of a strong experience-based effect, however, coincides with importantdifferences in how court users and non-users evaluate the courts. The research by Olsonand Huth and by Silbey and her colleagues point to differences in what is a statisticallysignificant influence on opinions between those who have had any type of experience andat any time in their life and all others who lack court experience. Most court contactsinvolve minor rather than life altering issues and outcomes. Court contact also does notappear to dramatically change people’s support for the courts. It is striking, therefore,that cross-sectional surveys of randomly selected adults show such a strong difference inwhat factors influence opinion about the courts.
We lack data from longitudinal studies that tracks the duration of court experienceeffects. From one (State of Wisconsin) study, it appears that more people leave thecourthouse with a positive image of the courts than emerge with a negative image.However, that body of positive experiences does not translate into a positive public imageof state courts. One approach to an explanation stresses the durable power of negativeperceptions formed through the mass media. Court experience tends to promote trust andconfidence. But the positive influence erodes rapidly, giving way to the negative imageof courts promoted by the media. The evidence for this perspective is weak, based on asingle state and a clever but opportunistic research design. Exit surveys of jurors andother court users find relatively high levels of satisfaction. Follow-up surveys with courtusers a few months later find that levels of satisfaction have declined. A still lowersatisfaction level is found in random opinion surveys of the state’s general population(Kritzer and Voelker, 1998).
X. The link between satisfaction with treatment in and by the court and the expressedwillingness to use the courts to resolve future disputes is weak at best.
“Past legal experiences significantly influenced future intentions but that thedirection of the observed effects varied by the type and nature of those experiences.”(Miethe, 1995: 578). Persons who used lawyers before are more likely than persons withno direct experience to have litgative intentions; persons reporting greater contact withmedia sources are less likely to have such intentions.
Experience, then, seems to erode citizens’ faith in the fairness, that is, thecolor and gender blindness, of law, as well as the responsiveness of legalinstitutions. It does not, by contrast, erode their view of law as a useful oreffective problem-solving instrument (Silbey et al., 1003:103-4, emphasisadded).
African-Americans and Latinos have a greater preference than Whites to solveproblems formally rather than informally (Silbey et al., 1993) and, indeed, report feelingmore willing and able than Whites to use the courts (National Center for State Courts,

20
1999, unpublished analysis). The strongest antecedent to willingness to go to law is theperception that the courts are effective problem solvers (Silbey et al., 1993:93-6). Therewas no observed difference, however, in the use of law and legal remedies by the three-racial/ethnic groups in New Jersey. A similar conclusion emerged from a study ofligitative intentions, “White respondents (not the non-Whites) were less likely to endorsehiring a lawyer for future problems” (Miethe, 1995:579).
XI. The apparent lack of significant change in public opinion about courts is curiousgiven the sea change that took place in the relationship between courts and thepublic since the late 1970s.
The environment in which opinions on the courts are formed and maintained haschanged dramatically over the last two decades. Since 1977 the nature of the disputesthat bring people to the courthouse has changed, the proportion of Americans with juryexperience may have quadrupled, small claims dockets have become universal, offering akind of people’s court, and many Americans have the experience of representingthemselves in court.
The changing nature of disputes is evident in trends in court workload. Between1984 and 1996, civil case filings increased by thirty-one percent, criminal filings byforty-one percent, and small claims cases by forty-one percent. The largest increases,however, were in the areas of domestic relations, where case filings grew by seventy-fourpercent, and in juvenile cases, which rose by sixty-three percent. Traffic cases, once amajor reason for court contact, declined by fifteen percent. As a point of comparison, theUnited States population increased by twelve percent over those years.28 National andstate surveys indicate the public’s experience with courts is mainly on the civil side of thecourt’s business.
Jury service has become far more prevalent and representative of the generalpopulation. The 1977 national survey estimated that six percent of Americans had servedas a juror;29 state and national surveys in the late 1990s estimate that between 20 and 30percent of Americans have experienced jury service (Rottman, 1998:17). Over the sameperiod, jury pools have become more representative of the adult population through
28 Brian Ostrom, et. al., Examining the Work of the State Courts 1996, 1997.29 The report prepared based on the 1977 survey offers conflicting estimates of the proportion of theAmerican public that has served as jurors: at various points rates of 6, 8, and 12 percent are offered. SeeMahoney, supra note 1, at 94 n. 20. The 6 percent figure is cited here because it is based on responses tothe most direct question, which asked if the interviewee had ever served on a jury. The jury serviceestimates cited from state surveys refer to that or a very similarly worded question. Variations include"served on a jury in a case" (Massachusetts) and "ever been a juror" (Iowa). It is uncertain if such wordingallowed respondents to clearly distinguish having served on a jury from having received a jury summonsbut not served. However, the North Carolina (1995) survey offers reassurance: while 22 percent reportedhaving been called and served as a juror, an additional 31 percent reported being called but not havingserved "in the past, but not in the last year" (7 percent said they had been called but did not serve in the last12 months, and 2 percent that they had been called and served). See Wilkerson and Associates, NorthCarolina Court System Research, 34, 1995.

21
reform of jury source lists and reductions as discriminatory.30 Overall estimates of theproportion of the adult population with a court experience tend to hover around 55 (the1999 ABA survey appears to be an outlier, claiming that 78 percent of the public “havebeen in court as an active participant”).
Third, more people are representing themselves in court. By the mid-1990s, atleast one party was self-represented in more than two-thirds domestic relations cases inCalifornia and in nearly 90 percent of divorce cases in Phoenix, Arizona, and WashingtonDC (Goldschmidt, 1998:8-9).31 As noted, the largest increase in court caseloads hasoccurred in areas of the law like domestic relations in which self-represented litigants areprevalent.
Fourth, the extent and content of exposure to fictional depictions of courtproceedings has been transformed. “Reality-based” television shows have proliferated,building on the older “Divorce Court” and Judge Wapner’s People’s Court, and the“veneer of realism” makes such programs dangerous (Zemans, 1991 quoting AbnerMikva). The confrontational and rude manner of the “judge” may reinforce people’sfears about how judges act (Sherman, 2000:18).32 However, the negative effect ofexposure to such programs may be overstated: in a recent national survey, viewers of“reality-based” television were significantly less likely than non-viewers to agree withthe statement, “It would be possible for me to represent myself in court if I wanted to”(National Center for State Courts, 1999:25).
Finally, a new and largely negative source of media images of judges and courtsemerged in the 1990s: television ads run in judicial election campaigns. Television adsrun by candidates themselves and by political parties, and special interest groups arecommon in many of the 39 states that elect all or some of their judges (Champagne, 2002
30 The expanding pool of former jurors is the product of an era of reform that featured the removal of legalprohibitions to jury service by women and members of minority groups and the practice of lawyers usingexemptions to discourage their jury service. In 1977, the impact of the “key-man” system, in which jurycommissioners selected their jury pools from persons, essentially men, known to them as honest,upstanding members of their community was still pervasive. The federal courts abolished the “key-man”system in 1968. States followed the federal court’s lead with varying degrees of speed. The cumulativeeffect of court opinions and new statutory provisions opened up jury service to an extent never beforeexperienced. In 1977, the probability that an adult of any age had ever served on a jury was slight;thereafter, that probability grew—and it rose from near zero for many minority groups to rates roughlycomparable to those for Whites (Munsterman and Hannaford, 1997).31 Even in tort and contract cases in courts of general jurisdiction many courts report over five percent oflitigants were self-represented in many large urban courts, rising to 13 percent (Goerdt et al., 1995:43); aconsiderable proportion of misdemeanor defendants in state and federal courts also appear to appear pro se(Harlow, 2000).32 A 1989 survey found that only 29 percent of Americans could name a member of the U.S. SupremeCourt but 54 percent were able to name the judge of the TV show “The People’s Court.” Two recentsurveys suggest that the public’s ignorance may be exaggerated (Gibson, Caldeira, and Spence, 2001;Kritzer, 2001).

22
Iyengar, 2002).33 Attack ads, mainly run by special interest groups, appear to have beeneffective in winning elections. The nastiness and injudicious nature of the ads becamemajor news stories in Alabama, Michigan, and Ohio. The long-term effect, however, islikely to be growing cynicism about the judicial process and the courts.
In sum, the world of the state courts has changed in fundamental ways since the1977 Public Image of the Courts Survey. There is little evidence that public opinion hasshifted greatly thus far in response to those changes.
Conclusion
The review of the existing literature identifies some questions that the currentsurvey is well placed to answer. The survey is the first national study since 1977 that canlook simultaneously at the influences on opinion about the courts associated withrace/ethnicity and with prior court experience.
First, the opinions and reactions to court experience of Latinos needs to be placedin the context of those found among Whites and African-Americans. Most research todate relies on comparing majority to minority views. Such a practice is questionablegiven the tendency of Latinos to find common ground with Whites on some issues andwith African-Americans on others. The research question, then, is whether Latinosrepresent a distinct group or are more closely tied to views of Whites or African-Americans.
Second, the impact of court experience remains uncertain. Typically, conclusionshave been drawn on that topic based on comparisons between those with any courtexperience (undifferentiated by time or kind) and those without it. The current surveysets a specific timeframe—the previous 12 months. Do individuals with recent courtexperience differ from those with more distant experience in the antecedents and natureof their views?
Third, the influence of experience needs to be understood in the context of raceand ethnicity. The survey permits comparisons to be made within racial groups amongjurors, litigants, and witnesses (although with tentative results for Latinos). Does thepresumed positive influence of jury service on opinions extend to African-Americans?To Latinos?
Fourth, the extent and nature of contact that members of the public have with thecourts have changed markedly over the last two decades. Trial courts are changing tocope with and improve the response to court cases that involve complex emotional andsocial problems. Substance abuse and mental illness are two examples. No study haslooked at the extent to which the public supports such changes or whether publicdissatisfaction with traditional ways of doing business feeds public discontent. In
33 Gibson (1989:492) foresaw a decline in the perceived legitimacy of judicial institutions because ofcompetitive elections for judicial posts.

23
addition to measuring the support for non-traditional court roles, the current study caninvestigate whether such support promotes positive or negative views of the courts asthey currently stand.
Fifth, the media has a role in forming and sustaining opinion on the courts that isintriguing but not well understood. There is evidence for strong media influences,influences that appear to be national rather than local in source. Indeed, some students ofopinion on the courts claim that court experience trumps media influences. The currentsurvey can assess the importance people attach to their recent experience against othercommonly cited influence on opinions about the courts.
Sixth, and finally, the existing literature has little advice to offer judges and courtmanagers interested in increasing public support for the courts. One way in which thecurrent survey can help fill that gap is by identifying factors that make people willing toreturn to the courts in the future and by establishing whether such factors work in asimilar manner across racial and ethnic groups.

24

25
Chapter 2
Methodology
Background
A new national survey was proposed for two main purposes. The first purposewas to inform court administrators, judges, and community leaders about “meeting thejustice needs of a multicultural society,” the theme for a national symposium convenedevery ten years to take stock of the problems facing the state judiciaries. The secondpurpose was to build upon a series of national and state surveys of opinion on state courtsconducted since 1995: to pursue promising lines of inquiry and to fill gaps in what wasknown.
The broad parameters for the methodology were set in consultation with anadvisory committee of experienced survey researchers:1
• The survey should focus on individuals with court experience
• The court experience should have taken place within the previous 12 months
• The views of African-Americans, Latinos, and Whites should be compared tothe extent possible
• The opinions of persons with recent court experience should be compared toindividuals without such contact
• The main elements of procedural justice should be considered in depth
• The diversity of the Latino population (foreign vs. native born, nation oforigin, etc.) should be accommodated
• Public expectations of the courts should be investigated in relation to thechanging role of judges
The survey instrument and the sampling strategy adopted were a compromisebetween these ambitious objectives and what the budget for the project could support.
This chapter incorporates material on “sampling” and “composition of the finalsample” drawn from a report prepared by the Indiana University Public OpinionLaboratory staff (Vargas et al., 2000).
1 Advisory Committee Members: Louis DeSipio (University of Illinois at Chicago), Rodolfo de la Garza(University of Texas at Austin), Larry Heuer (Barnard College), Barry Mahoney (Justice ManagementInstitute), Alan Tomkins University of Nebraska at Lincoln, and Tom Tyler (New York University).

26
Survey Instrument
The project staff at the National Center for State Courts designed the surveyinstrument and revised it based on a review by the advisory committee members and stafffrom the Indiana University Public Opinion Laboratory.
The final survey instrument is reproduced in Appendix A. There were in effecttwo questionnaires. The first set of questions (questions 1-8 and 14-21) was asked of allrespondents. Respondents with recent court experience were asked an additional set ofquestions (9-13) about their experience in court.
The interviewers began with a statement of the purpose of the survey designed tofocus the respondent’s attention on the courts rather than on other parts of the justicesystem and on the specific courts in their state. The statement read:
Hello, my name is (INSERT NAME) and I’m calling from the IndianaUniversity Public Opinion Laboratory. We are conducting a nationalsurvey of 1,500 adults to help trial courts around the country better servethe public. We would very much like to learn your opinions about thecourts in your community. I promise we are not trying to sell anything.Please be assured that your individual answers will be kept in strictestconfidence–nothing that you say will be identified with you in any way.
First, I would like for you to think about the courts in your community.By courts, I mean the judges, their staff, and clerks who work in thecourthouse, but not the police, prosecutors, or lawyers in courtrepresenting clients.
A translator under contract to the Indiana University Public Opinion Laboratoryprepared a Spanish version of the survey instrument. That translation was reviewed andrevised by two certified Spanish court interpreters, first independently and then jointly.Both court interpreters had extensive experience constructing tests for certifying courtinterpreters as competent in Spanish. Revisions were made to the wording of questionsand response categories to ensure that the language was specific to the court environment.
Pre-tests refined the survey instrument, which was revised before thequestionnaire was implemented in its entirety. The interviews were conducted byprofessional interviewers at the Indiana University Public Opinion Laboratory fromspecial facilities on the Indiana University-Purdue University Indianapolis campus. Allinterviewers received at least four hours of general interviewer training, in addition tospecific training for this particular project instrument (the questionnaire). Most of theinterviewers were experienced interviewers having participated in many other surveyresearch projects.
Interviews with the general population averaged about eight minutes. Interviewswith persons who had recent court experience averaged 15 minutes.

27
Up to 20 attempts were made on some phone numbers. A number was not calledagain if:
− The respondent refused to participate on three separate occasions
− A disconnected or not in-service number was encountered
− Attempts to the number yielded a no answer, busy or answering machine on20 separate occasions
Each interviewer was given a set of answers—“What the Respondent Might Like toKnow”—to provide standard responses to any questions asked by the people contactedfor an interview.
Sampling
The basic sample was a national random digit-dialing sample with quotas basedupon the Troldahl-Carter-Bryant method of respondent selection (see Troldahl and Carter(1964); and Bryant (1975), reprinted in Lavrakas, 1987). Survey Sampling provided arandom sample of United States residences. Public Opinion Laboratory interviewerscompleted telephone interviews with 1,005 residents across the United States.
In addition to a target sample of 1,000 randomly selected respondents, there weretwo supplemental over-samples of about 300 African-Americans and about 250 Latino-Americans. Survey Sampling also provided the samples for the African-American over-sample and the Latino over-sample.
The sampling strategy sought to correct for the tendency of telephone surveys tounder represent members of minority groups. Such under representation creates twosignificant problems. First, the force of minority group opinions is not adequatelyrepresented in the survey findings. Second, there are too few minority respondents tostudy variation in African-American and Latino opinions.
Among all groups, approximately one-half of the participants were to be selectedbased upon recent (within the past twelve months) experience with the courts in theirarea. This proved difficult to implement. The probability that an adult will have contactwith the courts in any given year is small. Reliable national estimates of that probabilityare not available. However, it is reasonable to assume that somewhere in the range of 2to 4 percent of the adult population has contact with the court in any given year. Thesampling procedures adopted and the resulting racial composition of the national samplescan be found in Chart 2.1.
Latinos with recent court experience and who were willing to be interviewedproved difficult to locate. A very large number of telephone calls were required toidentify a single Latino or Latina with recent court experience. The cost per interviewreached a point where it was necessary to stop the data collection process for that

28
subgroup. As a result, 40 percent rather than the desired 50 percent of Latinos in thesample had had a recent court experience.
The number of African-Americans and Latinos with recent court experienceincluded in the sample is small, particularly for Latinos. Findings based on theirresponses should be viewed as indicative rather than definitive. This important caution isrepeated at appropriate points in the text of this report.
Chart 2.1
Overall Sample(N=1567)
Random Sample(N=705)
Oversample of Oversample of Oversample ofAfrican-Americans Latinos Those with Court(N=308) (N=254) Experience
(N=300)
The Final Sample
The maximum margin of error in the general national sample (when comparingsub-cells) is 3.15 percent. That means if the same questions were asked of a similarsample, 19 out of 20 times you would receive answers within +/- 3.15 percentage pointsof those reported in this document. “Of course there are other possible errors in additionto sampling error, including question order and wording, respondent inattention, pace ofspeech of interviewer and numerous other factors. Each of these potential sources oferror was given special attention during data collection so they are minimized as much aspossible. We have no reason to believe there are any significant biases in the datacollected for this research” (Vargas et. al., 2000).
The African-American over-sample included 308 interviews with a margin oferror of 5.7 percent and 254 interviews were conducted for the Latino over-sample with amargin of 6.3 percent. Sampling errors rise significantly for each of the sub-samples andare indicated in the report when applicable.

29
Table 2.1: The Distribution of Respondents in the Overall Sample
Court ContactYes No Total
White 311 684 995African-American 166 117 283Latino 95 114 209Total 572 915 1487
Table 2.1 shows the number of respondents in each of the subgroups considered inChapter 3, which compares respondents with recent court experience with those withoutsuch experience, differentiating among Whites, African-Americans, and Latinos.
Table 2.2: The Distribution of Respondents by Court Role and Race/EthnicityType of Court Contact
Litigant Juror Witness/other TotalWhite 155 85 45 285African-American 100 41 14 155Latino 60 21 12 93Total 315 147 71 533
Table 2.2 shows the number of respondents in the principle subgroups considered inChapter 4. Respondents with court contact are divided into three categories based onwhy they were in court (juror, witness, litigant), with distinctions made among African-Americans, Latinos, and Whites.
The survey data was independently analyzed by two prominent students of Latinopolitics—Rudolfo de la Garza and Louis DeSipio—to place the survey findings in thecontext of Latino history and general perceptions of American institutions. In theiranalysis they noted two concerns about the Latino subsample. First, the sample under-represents foreign-born Latinos, who represent 40 percent of the national Latinopopulation but 22 percent of the Latinos included in the sample. Second, Latinos residentoutside of Texas are underrepresented: 55 percent of the Latino sample resides in Texas,the home to 21 percent of Latinos nationally. They also note: “On a number of otherdemographic characteristics—education, number of people residing in respondent’shousehold, income, and age, the sample is roughly representative of the Latino adultpopulation” (de la Garza and DeSipio, 2001:247).
The data were collected from March 22, 2000 through May 3, 2000. Thecooperation rate for this survey was acceptable, according to the AAPOR formula (seewww.aapor.org), as established by the American Association for Pubic OpinionResearch. The information necessary for calculating the cooperation rate can be found inTable 2.3 below. The response rates are affected by the quotas implicit in the researchdesign. The purpose of many of the telephone calls was to identify extremely rarehouseholds such as Latinos with court experience during the preceding 12-month period.

30
Table 2.3: Cooperation Rates for the National Sample and Oversamples
National Sample
DISPOSITIONSNo Answer 19282 35.75%Busy 4843 8.98%Answering Machine 11873 22.01%Refusal* 3389 6.28%Not in Quota 7854 14.56%Disconnected 1370 2.54%Not in Service 768 1.42%Break-off 275 0.51%Callback 2866 5.31%Need Spanish-speaking Inter.
408 0.76%
Complete 1005 1.86%
TOTAL DIALINGS 53933
African-AmericanOver-sample
LatinoOver-sample
DISPOSITIONS DISPOSITIONSNo Answer 8468 38.25% No Answer 14011 42.41%Busy 1249 5.64% Busy 2061 6.24%AnsweringMachine 3987 18.01%
AnsweringMachine 4146 12.55%
Refusal* 1430 6.46% Refusal* 1254 3.80%Not in Quota 3108 14.04% Not in Quota 3558 10.77%Disconnected 807 3.64% Disconnected 770 2.33%Not in Service 419 1.89% Not in Service 372 1.13%Break-off 145 0.65% Break-off 69 0.21%Callback 2146 9.69% Callback 1851 5.60%NeedSpanish-speakingInter.
73 0.33% Need Spanish-speaking Inter.
4688
14.19%Complete 308 1.39% Complete 254 0.77%
TOTALDIALINGS:
22140 TOTALDIALINGS:
33034
* This number reflects total number of refusals. A single telephone number could have up to three refusals.
Attitudinal Scales

31
The concepts being considered in this report—support for the courts, proceduralfairness, court performance—are complex, and thus poorly measured by any onequestion. The following “summated” scales were created to support the analysis,combining questions on a topic into a single index:
Table 2.4: ScalesAlpha Mean St. Dev. (Min,Max)
Discrimination in Society 0.78 5.78 2.38 3, 12Discrimination by the Courts 0.86 11.79 3.66 4, 20Overall Evaluation Index 0.86 18.56 5.22 6, 30Performance Index 0.63 7.20 2.25 3, 12Quality of Treatment 0.88 19.59 5.18 7, 28Support Changing Role for Courts 0.73 12.97 2.79 4, 16Procedural Justice Index 0.88 3.07 0.93 1, 4
Chronbach’s Alpha coefficient measures a scale’s reliability. Alpha ranges from a low of0 to a high of 1.0. All of the scales meet conventional standards for reliability.
The first scale, Discrimination in Society, includes the following questions: DoesAmerica provide equal opportunity for African-Americans, for Latinos, and for you to getahead in life? Another scale focused on how the courts treat particular sub-groups wasused. This scale, Discrimination by the Courts, asked respondents whether courts treatAfrican-Americans worse, Latinos worse, non-English speakers worse, and people with alow income worse than the courts treat other sub-groups.
Several scales measure how the respondents felt about the courts. An OverallEvaluative Index (developed in Tyler, 2001) asks respondents how they feel in generalabout courts in their community (favorability), and how they feel courts handle specificcase types (criminal cases involving violence such as robbery, criminal cases involvingdrug abusers or drunk drivers, civil cases such as auto accidents and medical malpracticeclaims, and family relation cases such as divorce and child custody). For some analyses,the five questions on case handling are combined into a scale (that is, excluding thefavorability rating)..
Courts also were judged on their performance in more practical matters. Thus,the Performance Index (also developed by Tyler, 2001) asked if respondents thought it isaffordable to bring a case to court, court cases are resolved in timely manner, and courtsmake decisions based on facts.
Other scales measure the concept of procedural justice. The first, generalmeasure, the Quality of Treatment Index, was asked of all respondents (with and withoutcourt experience). The reference is to how courts usually treat people. Seven questionsasked whether courts are concerned with people’s rights; courts treat people with dignityand respect; courts treat people politely; judges are honest in their case decisions; courtstake the needs of people into account; courts listen carefully to what people have to say;and, courts are sensitive to the concerns of average citizens.

32
Another measure of procedural justice was constructed for individuals who hadrecent court experience. Sixteen variables contribute to the Procedural Justice Index.The constituent questions asked if respondents agreed based on their recent courtexperience that: people were treated politely; court staff showed concern with people’srights; people were treated with dignity and respect; decisions were made based on thefacts; judges were neutral in the way people were treated; the court staff was neutral inthe way people were treated; differing views of people were taken into account; and, theneeds of people were taken into account. Another set of procedural justice questionsincluded in the scale asked for agreement or disagreement with: I was treated politely; Iwas able to say what was on my mind; my views were considered; I was treated the sameas everyone else; the judge and court staff cared about my concerns; I was able to makemy views known; I was treated with dignity and respect; and my rights were taken intoaccount.
Finally, respondents were asked whether they supported a less traditional, morechanging role for the courts. The Support for Changing Role for Courts scale was basedon four statements with which the respondents were asked to agree or disagree: whethercourts should hire drug treatment counselors and social workers as court staff; courtsshould order a person to go back to court and talk to the judge about treatment progress;courts should take responsibility for enforcing local agencies to provide help with drugabuse problems; and, courts should consider what psychologists and doctors know aboutemotional problems when making decisions about people in court.
A Note on the Statistical Analysis
The two chapters that follow rely upon a number of statistical procedures todescribe and compare responses to the survey questions. This section offers a briefoverview of those procedures for those not familiar with social science statistics.
Patterns of responses to questions are described in two ways. First, percentagesshow the proportion of respondents choosing each possible response option. Percentagesmake intuitive sense to most readers but are cumbersome to display and do not takeadvantage of the power of descriptive statistics. Second, the “mean” (the arithmeticaverage) offers comparisons based on a measure of the central tendency in the surveyresponses. The mean often is accompanied by the standard deviation, a measure of howtightly the respondents’ answers cluster around the average (the higher the standarddeviation relative to the mean value, the more widely distributed are the responses).
Comparisons among race\ethnic group or between those with and those withoutcourt experience are made to establish whether any differences in the proportions ormeans we observe are statistically significant (unlikely to be due to chance or randomfactors). Two-Way Analysis of Variance is the usual method for determining if observeddifferences are statistically significant. In Chapter 3, two influences are considered: (a)the race\ethnicity of the respondent and (b) whether the respondent had been to courtwithin the previous 12 months. In Chapter 4, the important influences are race\ethnicity

33
and the role a person played during their court experience (e.g., juror, witness, criminaldefendant). In Two-Way Analysis of Variance, race\ethnicity and experience each has anindependent, direct influence that we test for significance. The two possible influencesconsidered may also interact. In this instance, a statistically significant interaction effectwould indicate that the influence of having court experience differs depending onwhether you are African-American, Latino, or White.
In both Chapters 3 and 4 special statistical analyses are used to establish which ofvarious factors influence people’s responses to the main concerns of the report: supportfor the courts, court performance, perceptions of equal treatment, and support for courtstaking on non-traditional roles as problem-solvers. Two forms of regression analysis areused.
The most frequently used type of regression analysis is multiple regression (morespecifically, ordinary least squares regression). A model is put forward indicating, forexample, specific factors as likely to influence how strongly people support the courts.The usefulness of that model is measured in terms of how much of the total variationamong respondents in their support for the courts (the dependent variable). The measureof usefulness is the “R-squared statistic”, which ranges from zero (no influence) to 100percent (can predict all of the responses exactly). This report uses “Adjusted R-Squared”statistics. 2
Each multiple regression model reports the strength of the relationship eachinfluence has on what we are trying to predict. The larger the “beta” coefficient, astandardized measure of influence, the stronger the relationship. However, betacoefficients may not be statistically significant. An asterisk indicates which betacoefficients have a statistically significant relationship to the what we are predicting.
In a few instances, another form of regression is used to test a model ofinfluences. Logistic regression is used here when the factor we are trying to predictconsists of a binary set of categories (e.g., would or would not go to court again). Theinterpretation of logistic regression is less straightforward than multiple regression (itestimates probabilities), but the report’s text will note the statistical significance of theindividual influences considered in the model and of the model’s success as a whole.
Finally, a technique called Discriminant Analysis is used in Chapter 3 to make anoverall assessment of whether the views of African-Americans, Latinos, and Whitesdiffer systematically. The basic question is, if we know how a person responded toquestions about the courts, can we predict their racial\ethnic group?
2 This report uses “Adjusted R-Squared” statistics. The adjustment takes into consideration the number ofpossible influences included in the regression model. There is a tendency for R-Squared to increase as thenumber of influences considered increases, an artificial contribution to the size of the coefficient.

34

35
Chapter 3
In the Eye of the Beholder: Racial, Ethnic and Experience-BasedDifferences in Perceptions of “the Courts in Your Community”
Introduction
This chapter is devoted to presenting and analyzing the survey questions askedboth of respondents with and without recent court contact (Questions 1-9 and 14-18).The principal objective is to compare opinions across racial and ethnic groups, lookingseparately at recent court-users and non-court users. Particular attention is placed onlocating the views of Latinos in relation to White and African-American respondents.Responses on two evaluative measures are also compared: the first is a measure of diffusesupport (the reservoir of good will afforded the courts) and the second is a measure ofspecific support (tied to specific policy outputs) for how well courts are perceived tohandle various types of cases.
This chapter is organized to answer the following research questions.
• How fair are court outcomes and procedures perceived to be? What aspects ofcourt procedures are viewed most positively?
• Are some groups viewed as being treated worse than others by the courts?
• Does the public support a changing role for courts?
• How strong is public support for the courts?
• Who supports the courts?
• Are Latinos closer to Whites or to African-Americans in their views of thecourts?
Chapter 4 provides a more nuanced portrait of the views held by people withrecent court experience, distinguishing among jurors, litigants, and witnesses and amongthose involved in civil, criminal, or family cases. That chapter draws on the body ofquestions asked only of persons with recent court experience (Questions 10-13).
How fair are the Courts?
The survey included a number of questions that inquired directly about theperceived fairness of (a) court outcomes and (b) court procedures. Answers weresolicited from three points of reference:
• How courts usually act• How a court acted in a particular case• How a court might act in a future case

36
The first set of questions about how courts usually act was asked of all surveyrespondents; the other questions were asked only of persons who had been a litigant,juror, or witness within the previous year and will therefore be considered in Chapter 4.
How often are courts fair?
Survey respondents both with and without recent court contact were asked (a)“How often do you think people receive fair outcomes when they deal with the courts?”and (b) “How often do you think the courts use fair procedures in handling cases?” Thepossible responses were “always,” “usually,” “sometimes,” “seldom,” and “never.” Thedistribution of answers is shown in Table 3.1.
Table 3.1: The Frequency of Fair Outcomes and Procedures: Views by Race and Recent Court Contact
White African-American Latinos
How often are outcomes fair?No CourtContact Court Contact
No CourtContact Court Contact
No CourtContact Court Contact
Always/Usually 57% 49% 21% 15% 35% 40%Sometimes 35% 35% 61% 52% 52% 37%Seldom/Never 7% 15% 18% 33% 13% 23%
How often are procedures fair?Always/Usually 64% 57% 27% 25% 53% 40%Sometimes 29% 27% 54% 50% 40% 42%Seldom/Never 7% 16% 19% 25% 8% 18%
Overall, respondents see procedures as slightly fairer than outcomes. Perceptionsof fairness differ by race and ethnicity. For example, among recent court users, nearlyhalf of Whites (49 percent), just over one-seventh of African-Americans (15 percent), andfour out of ten Latinos (40 percent) believe that court outcomes are always or usually fair.It is striking to find that twice as many African-Americans with recent court contactbelieve that outcomes are seldom or never fair than believe that outcomes are always orusually fair. Whites are twice as likely as African-Americans to say that court proceduresare “always” or “usually” fair.
Whether individuals had court experience within the last 12 months influencestheir perceptions of the fairness of courts. In each racial/ethnic group, those with recentcourt experience viewed courts as less fair than did those with court experience. Theindependent effects of race and court experience on perceived fairness of both outcomesand processes are statistically significant. Their interaction effect is not significant,though (indicating that the relationship between court experience and perceptions is notmediated by one’s race). 1
1 Unless otherwise noted, group differences cited in the report are statistically significant based on Two-Way Analysis of Variance or MANOVA tests.

37
What Aspects of Court Procedures are Fair?
A number of specific elements are seen as underlying a perception that proceduresare fair or unfair. Previous research suggests four elements—interpersonal respect,neutrality, participation, and trustworthiness—are of particular relevance tounderstanding public evaluations of the courts.2
The survey asked all respondents one or more question related to each element.The series of questions began “I am going to read you a list of statements about courts inyour community. Please tell me how strongly you agree or disagree with each.”
The following tables display the responses to eight procedural justice statementssubdivided into the relevant element of fairness. Percentages indicate the proportion ofrespondents in agreement with a statement. The differences associated with recent courtexperience and race emerge clearly from a comparative review of the proportion ofrespondents that “strongly disagrees” with each statement. All statements are coded sothat high values index a sense that courts are fair. The effects of court experience andrace are consistently statistically significant for all measures of procedural justice, withone exception: responses to the statement “Judges are honest in their case decisions” didnot differ to a statistically significant degree between those with and those without recentcourt experience. The race by experience interaction was never significant.
Interpersonal Respect
Interpersonal respect is the sense that decision-makers treat you politely and withdignity and respect. Respect also follows from the sense that one’s rights are beingprotected. Three of the survey questions seek to tap this aspect of fairness (Table 3.2).
A perception that courts treat people with respect is strongest among Whites,somewhat less strong for Latinos, and considerably less evident among African-Americans. Indeed, a slight majority of African-American respondents with recent courtexperience disagree with two of the statements concerning respect (that people are treatedwith respect and that courts treat people politely).
Differences among the three racial and ethnic groups are similar for both thosewith recent court experience and those without such experience.
2 There are many formulations of the elements. See Tom Tyler, “Citizen Discontent with LegalProcedures: A Social Science Perspective on Civil Procedure Reform, American Journal of ComparativeLaw 45 (4), Fall, 1997, pp. 887-92.

38
Table 3.2: The Proportion of Respondents Agreeing that “Courts are concerned with people’srights”, “Courts treat people with dignity and respect” and “Courts treat people politely”
WhiteAfrican-
American LatinosNo CourtContact
CourtContact
No CourtContact
CourtContact
No CourtContact
CourtContact
Concerned with rightsStrongly Agree 31.2% 34.4% 20.2% 18.9% 38.7% 27.7%Somewhat Agree 53.2% 36.4% 45.6% 36.6% 42.3% 40.4%Somewhat Disagree 10.1% 13.6% 21.1% 17.1% 11.7% 18.1%Strongly Disagree 5.5% 15.6% 13.2% 27.4% 7.2% 13.8%
Treat with respectStrongly Agree 26.8% 26.1% 19.1% 13.0% 35.5% 28.0%Somewhat Agree 52.0% 42.3% 39.1% 36.4% 42.7% 38.7%Somewhat Disagree 15.7% 16.8% 20.0% 22.2% 14.5% 19.4%Strongly Disagree 5.5% 14.8% 21.7% 28.4% 7.3% 14.0%
Treat politelyStrongly Agree 26.6% 32.7% 15.2% 13.3% 28.6% 22.3%Somewhat Agree 55.1% 42.8% 45.5% 33.9% 47.3% 41.5%Somewhat Disagree 13.1% 11.4% 19.6% 26.7% 14.3% 14.9%Strongly Disagree 5.2% 13.1% 19.6% 26.1% 9.8% 21.3%
Neutrality
The neutrality element of procedural fairness refers to a sense that decision-makers are honest and impartial, and base their decisions on the facts.
Table 3.3: The Proportion of Respondents Agreeing that “Courts make decisions based on thefacts” and “Judges are honest in their case decisions”
WhiteAfrican-
American LatinosNo CourtContact Court Contact
No CourtContact Court Contact
No CourtContact Court Contact
Decide on factsStrongly Agree 26.2% 28.4% 20.4% 19.4% 33.6% 35.9%Somewhat Agree 58.2% 45.1% 46.0% 34.5% 46.4% 37.0%Somewhat Disagree 10.6% 10.8% 19.5% 21.2% 12.7% 13.0%Strongly Disagree 5.0% 15.7% 14.2% 24.8% 7.3% 14.1%
Honest in decisionsStrongly Agree 30.9% 29.4% 17.0% 15.6% 28.44% 33.7%Somewhat Agree 53.9% 42.8% 53.6% 40.0% 48.6% 41.3%Somewhat Disagree 9.8% 14.4% 19.6% 23.8% 15.6% 15.2%Strongly Disagree 5.4% 13.4% 9.8% 20.6% 7.3% 9.8%
African-American respondents are less likely than others to agree that the courtsare neutral. African-Americans with court experience are about as likely to disagree asagree that courts decide on the facts or that judges are honest in their decisions.

39
Participation
A sense of participation follows when litigants have an opportunity to expresstheir views to decision-makers. Only one statement relevant to participation was asked ofall survey respondents: “Courts listen carefully to what people have to say.”
Table 3.4: The Proportion of Respondents Agreeing that“Courts listen carefully to what people have to say”
WhiteAfrican-
American LatinosNo CourtContact Court Contact
No CourtContact Court Contact
No CourtContact Court Contact
Listen carefullyStrongly Agree 21.1% 23.1% 19.3% 17.7% 28.2% 18.1%Somewhat Agree 52.6% 41.9% 42.1% 31.1% 47.3% 48.9%Somewhat Disagree 18.6% 19.8% 21.1% 18.9% 14.5% 12.8%Strongly Disagree 7.7% 15.3% 17.5% 32.3% 10.0% 20.2%
A perception that courts listen carefully is equally present among Whites andLatinos (between two-third and three-quarter agree with the statement). African-Americans, and particularly those with recent court experience, are less positive in theirrating of whether courts do or do not allow meaningful participation.
Trustworthiness
Trustworthiness refers to the sense people have of the decision-maker’smotivation and sincerity—to his or her benevolence. A trustworthy decision-maker ismotivated to treat litigants fairly, to be concerned with their needs, and to consider theirside of the story.
Table 3.5: The Proportion of Respondents Agreeing that “Courts take the needs of people intoaccount” and “Courts are sensitive to the concerns of the average citizen.”
WhiteAfrican-
American LatinosNo CourtContact
CourtContact
No CourtContact
CourtContact
No CourtContact
CourtContact
Needs into accountStrongly Agree 15.1% 13.0% 8.1% 7.9% 21.3% 22.6%Somewhat Agree 55.1% 48.2% 46.8% 37.0% 48.1% 46.2%Somewhat Disagree 19.4% 20.7% 25.2% 25.5% 20.4% 12.9%Strongly Disagree 10.4% 18.1% 19.8% 29.7% 10.2% 18.3%
Sensitive to concernsStrongly Agree 16.1% 15.7% 12.3% 11.4% 26.9% 23.1%Somewhat Agree 56.5% 46.2% 43.0% 28.9% 50.9% 42.9%Somewhat Disagree 17.7% 19.7% 24.6% 28.9% 10.2% 14.3%Strongly Disagree 9.7% 18.4% 20.2% 30.7% 12.0% 19.8%
Generally, fewer respondents agree with statements indicating the trustworthinessof courts than agreed that courts are respectful and neutral. The lack of trust in the courts

40
among African-American respondents is striking. The majority of recent African-American litigants disagreed with the two statements that relate to trustworthiness (courtstake needs into account and courts are sensitive to concern).
Overall, the responses viewed comparatively give emphasis to the importance ofrace and ethnicity in perceptions of fairness in court procedures. For example, African-Americans with court experience agreed on average with 49 percent of the statements,compared to average agreement levels of 64 percent for Whites and 69 percent forLatinos. The responses to the questions also suggest that in each racial or ethnic grouppeople with recent court experience are less convinced of procedural justice in “the courtsin their community.” Differences in perceptions associated with race/ethnicity arestatistically significant. Differences based on recent court experience also weresignificant with the exception of the statement “Judges are honest and fair in their casedecisions.” 3
Cost and Delay
The set of statements to which respondents were asked to agree or disagreeextended to the traditional core concerns of court administration—cost and delay. Thestatements read:
• It is affordable to bring a case to court• Court cases are resolved in a timely manner
Levels of agreement with those statements varied by court experience and byrace/ethnicity (Table 3.6). Recent court experience was associated with a perception thatcourts are not affordable or timely in all three groups (that is, disagreement with thestatement). This applies to all three racial and ethnic groups. There is also a trend inwhich Latinos are the most likely to agree with the statements, Whites the next mostlikely, and African-Americans the least likely to agree (with one exception: the averageratings of Whites and African-Americans are the same for people with recent courtexperience). The influences of court experience and race/ethnicity are statisticallysignificant; the race by experience interaction is not significant.
Are Some Groups Treated Worse than Others by the Courts?
All of the survey respondents were asked to indicate how frequently African-Americans, Latinos, non-English speakers, and people with low incomes are treatedworse than other groups by the courts. The questions have been regarded as indicators ofdistributional justice: the fairness of case outcomes (Tyler, 2001).
The specific question read: “Some people say that the courts treat everyoneequally, while others say that the courts treat certain people differently than others. Howoften is each of the following groups of people treated worse than others by the courts?”
3 Based on a MANOVA test.

41
Table 3.6: The Proportion of Respondents Agreeing that Courts are Timely and Affordable
WhiteAfrican-
American LatinosNo CourtContact Court Contact
No CourtContact Court Contact
No CourtContact Court Contact
TimelyStrongly Agree 10.3% 14.1% 8.4% 8.0% 24.0% 20.7%Somewhat Agree 37.9% 28.8% 27.0% 20.9% 32.7% 23.9%Somewhat Disagree 29.1% 23.9% 26.1% 23.9% 20.4% 17.4%Strongly Disagree 22.8% 33.3% 38.5% 47.2% 23.0% 38.0%
AffordableStrongly Agree 7.8% 5.8% 12.3% 9.5% 18.2% 12.4%Somewhat Agree 27.7% 25.1% 29.2% 20.3% 33.9% 19.1%Somewhat Disagree 30.6% 23.4% 23.3% 21.5% 23.4% 24.7%Strongly Disagree 33.9% 45.7% 35.2% 48.7% 24.5% 43.8%
The answers given by Whites, African-Americans, and Latinos are compared inthe following four tables that distinguish respondents from those without recent courtexperience.
Across racial lines, those with court experience believe that courts treat certaingroups worse more often than do those without recent court exposure. However, Whitestend to see unequal treatment as infrequent relative to the perceptions of widespreadunequal treatment characteristic of African-Americans and Latinos.
Table 3.7: How Frequently are African-Americans Treated Worse than Other Groups?
WhiteAfrican-
American LatinosNo CourtContact Court Contact
No CourtContact Court Contact
No CourtContact Court Contact
Always/Often 19% 23% 45% 52% 31% 31%Sometimes 46% 39% 42% 35% 42% 41%Rarely/Never 35% 38% 13% 13% 26% 28%
Table 3.8: How Frequently are Latinos Treated Worse than Other Groups?
WhiteAfrican-
American LatinosNo CourtContact Court Contact
No CourtContact Court Contact
No CourtContact Court Contact
Always/Often 16% 23% 35% 37% 27% 38%Sometimes 49% 37% 50% 47% 48% 32%Rarely/Never 35% 41% 15% 16% 26% 30%

42
Table 3.9: How Frequently are Non-English Speaking Treated Worse than Other Groups?
WhiteAfrican-
American LatinosNo CourtContact Court Contact
No CourtContact Court Contact
No CourtContact Court Contact
Always/Often 18% 22% 28% 38% 36% 39%Sometimes 48% 39% 48% 39% 36% 34%Rarely/Never 33% 39% 25% 24% 28% 27%
Table 3.10: How Frequently are People with Low Incomes Treated Worse than Other Groups?
WhiteAfrican-
American LatinosNo CourtContact Court Contact
No CourtContact Court Contact
No CourtContact Court Contact
Always/Often 24% 31% 43% 52% 36% 44%Sometimes 46% 38% 38% 32% 42% 31%Rarely/Never 30% 30% 18% 16% 22% 24%
The strongest sense of worse treatment is found for “someone with a lowincome.” This emerges from the ratings offered by all three groups. African-Americanrespondents with court experience were as likely to perceive discrimination against low-income people as they were against African-Americans as a group. Still, one-half ofAfrican-Americans (52 percent of those with recent court contact and 45 percent of thosewithout it) believe that their group is “always” or “often” treated worse than other groups.Perceptions by African-Americans of discriminatory treatment by the courts are broadbased: African-Americans are close to Latinos in the extent to which they believe that“Latinos as a group are treated worse than other groups.”
Latinos perceived more discrimination against low-income people than againstLatinos as a group and perceived the same level of discrimination against low-incomepeople and non-English speakers.
African-Americans believed the courts treated them, as a group, worse moreoften.4 Similarly, Latinos perceived the court’s treatment of Latinos to be worse moreoften than did members of other racial groups.5 However, a person’s household incomedid not influence assessments of whether low-income people were treated worse thanother groups. Respondents from low-income groups were not more likely than thosefrom high-income groups to agree that courts treated persons of low income worse thanothers.
Perceptions of unequal treatment by the courts can be compared to the generalsense people have of discrimination in American society. A summated scale was createdof three questions that asked whether America had provided various people with equalopportunities to get ahead in life. The questions were prefaced with:
4 (t(1289) = 10.92, p < .05)5 (t(1229) = 2.36, p < .05)
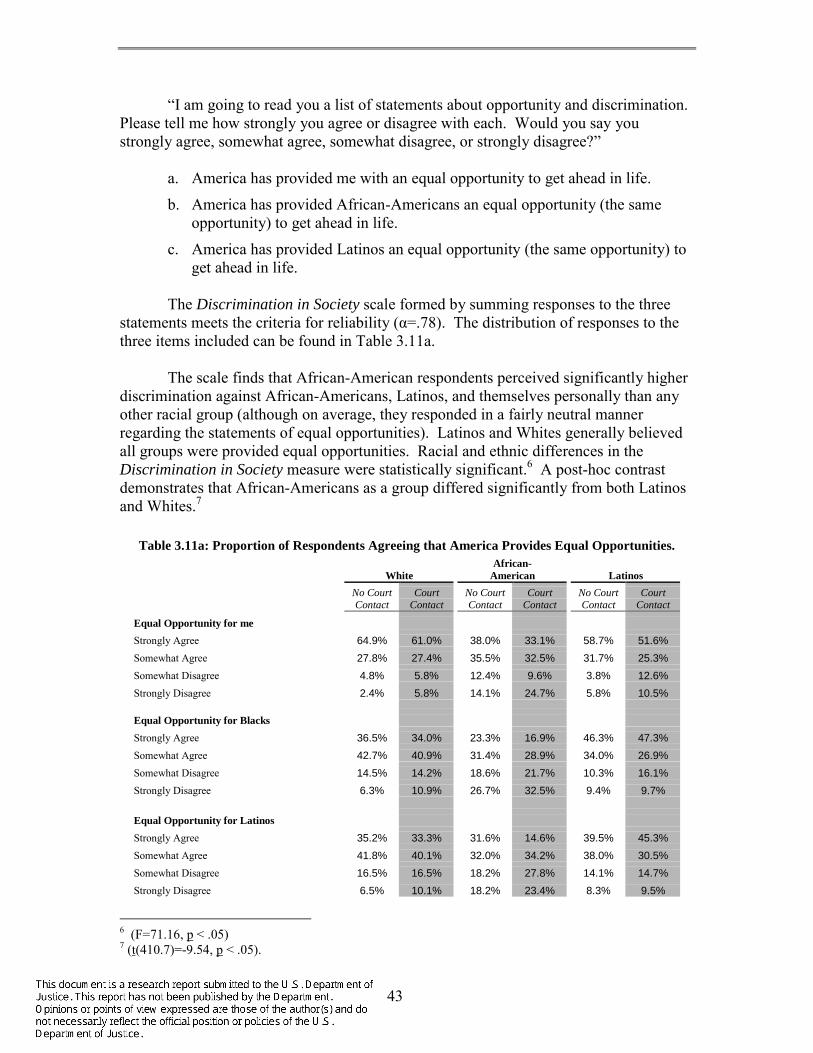
43
“I am going to read you a list of statements about opportunity and discrimination.Please tell me how strongly you agree or disagree with each. Would you say youstrongly agree, somewhat agree, somewhat disagree, or strongly disagree?”
a. America has provided me with an equal opportunity to get ahead in life.
b. America has provided African-Americans an equal opportunity (the sameopportunity) to get ahead in life.
c. America has provided Latinos an equal opportunity (the same opportunity) toget ahead in life.
The Discrimination in Society scale formed by summing responses to the threestatements meets the criteria for reliability (α=.78). The distribution of responses to thethree items included can be found in Table 3.11a.
The scale finds that African-American respondents perceived significantly higherdiscrimination against African-Americans, Latinos, and themselves personally than anyother racial group (although on average, they responded in a fairly neutral mannerregarding the statements of equal opportunities). Latinos and Whites generally believedall groups were provided equal opportunities. Racial and ethnic differences in theDiscrimination in Society measure were statistically significant.6 A post-hoc contrastdemonstrates that African-Americans as a group differed significantly from both Latinosand Whites.7
Table 3.11a: Proportion of Respondents Agreeing that America Provides Equal Opportunities.
WhiteAfrican-
American LatinosNo CourtContact
CourtContact
No CourtContact
CourtContact
No CourtContact
CourtContact
Equal Opportunity for meStrongly Agree 64.9% 61.0% 38.0% 33.1% 58.7% 51.6%Somewhat Agree 27.8% 27.4% 35.5% 32.5% 31.7% 25.3%Somewhat Disagree 4.8% 5.8% 12.4% 9.6% 3.8% 12.6%Strongly Disagree 2.4% 5.8% 14.1% 24.7% 5.8% 10.5%
Equal Opportunity for BlacksStrongly Agree 36.5% 34.0% 23.3% 16.9% 46.3% 47.3%Somewhat Agree 42.7% 40.9% 31.4% 28.9% 34.0% 26.9%Somewhat Disagree 14.5% 14.2% 18.6% 21.7% 10.3% 16.1%Strongly Disagree 6.3% 10.9% 26.7% 32.5% 9.4% 9.7%
Equal Opportunity for LatinosStrongly Agree 35.2% 33.3% 31.6% 14.6% 39.5% 45.3%Somewhat Agree 41.8% 40.1% 32.0% 34.2% 38.0% 30.5%Somewhat Disagree 16.5% 16.5% 18.2% 27.8% 14.1% 14.7%Strongly Disagree 6.5% 10.1% 18.2% 23.4% 8.3% 9.5%
6 (F=71.16, p < .05)7 (t(410.7)=-9.54, p < .05).

44
Latinos, therefore, appear to assess unequal treatment by the courts differentlythan they assess inequality of opportunities in American society. Latinos are similar toAfrican-Americans in their assessment that courts treat groups unequally. However,Latinos are similar to Whites in their assessment that there is a low level of unequalgroup treatment in American society.8
The survey asked another question relevant to understanding the link betweenperceived society discrimination and opinions about the courts (See Table 3.11b). Thequestion took the form of agreement or disagreement with the statement, “In the past Ihave been discriminated against in my dealings with the police.”
African-Americans answered affirmatively 62 percent of the time if they hadrecent court experience (of any kind) and 49 percent of the time if they did not. Thecomparable percentages for Whites are 20 percent and 34 percent. The responses ofLatinos tended to be closer to those given by African-Americans than to those offered byWhites: 50 percent of Latinos with court experience and 40 percent of those withoutcourt experience stated that they had been discriminated against by the police. Theeffects of both court experience and race on perceived discrimination, but not theirinteraction, are statistically significant.
Table 3.11b: Proportion of Respondents Agreeing that “I have been discriminated against in mydealings with police.”
WhiteAfrican-
American LatinosNo CourtContact
CourtContact
No CourtContact
CourtContact
No CourtContact
CourtContact
Police DiscriminationStrongly Agree 6.2% 17.9% 37.4% 47.9% 21.9% 28.4%Somewhat Agree 13.6% 16.4% 11.8% 14.6% 19.9% 21.6%Somewhat Disagree 13.0% 9.9% 19.5% 9.7% 14.6% 9.1%Strongly Disagree 67.2% 55.7% 31.3% 27.8% 43.7% 40.9%
Does the Public Support a Changing Role for Courts?
One purpose of the survey was to take stock of public support for changesto the traditional role and operations of trial courts. Previous research suggeststhat there tends to be strong support for non-traditional approaches to caseadjudication (see Doble and Greene, 2000, on community reparation boards inVermont and Sviridoff et al., 2001 on the community court model in New YorkCity’s Midtown Community Court).
8 A multiple regression model was used to establish if demographic characteristics were useful in predictingvariation in people’s perceptions of societal discrimination. The overall association of such factors withperceived discrimination was weak (Adjusted R2 = .025). The only significant demographic influencesinvolved a greater likelihood that African-American and better-educated respondents perceive societaldiscrimination.

45
The specific changes considered by the survey respondents relate to drugtreatment courts and, more generally, to therapeutic justice concepts (Rottman andCasey, 1999). In non-traditional processes persons are more important than cases,needs-based considerations are balanced against rights-based considerations, theprocess is more collaborative than adversarial, and the attention paid tointerpretation and application of social science knowledge rivals that given tointerpretation and application of the law (see Rottman and Casey, 1999:140).
The preamble to the question read: “Some people think that courts shouldstick to their traditional role of looking at the facts in a specific case and thenapplying the law. Other people think that it is now necessary for the courts to gobeyond that role and try to solve the problems that bring people into court. I amgoing to read you a few statements about the role of the court. Do you stronglyagree, somewhat agree, somewhat disagree, or strongly disagree that courtsshould . . .”
a. Should courts hire drug treatment counselors and social workers as courtstaff members?
Table 3.12: Should Courts Hire Treatment Counselors and Social Workers as Court StaffMembers?
WhiteAfrican-
American LatinosNo CourtContact Court Contact
No CourtContact Court Contact
No CourtContact Court Contact
Strongly agree 35% 34% 59% 60% 55% 46%Somewhat agree 33% 26% 22% 25% 24% 24%Somewhat disagree 13% 15% 10% 9% 7% 13%Strongly disagree 20% 25% 9% 7% 13% 17%
b. Should courts order a person to go back to court and talk to the judgeabout their progress in a treatment program?
Table 3.13: Solve Problems by Having the Offender Report Back to the Judge on hisProgress
WhiteAfrican-
American LatinosNo CourtContact
CourtContact
No CourtContact
CourtContact
No CourtContact
CourtContact
Strongly agree 55% 54% 67% 69% 68% 59%Somewhat agree 31% 29% 23% 20% 23% 27%Somewhat disagree 7% 9% 5% 7% 4% 4%Strongly disagree 7% 9% 4% 4% 5% 10%
c. Should courts take responsibility for making sure local agencies providehelp to people with drug abuse and/or alcohol problems?
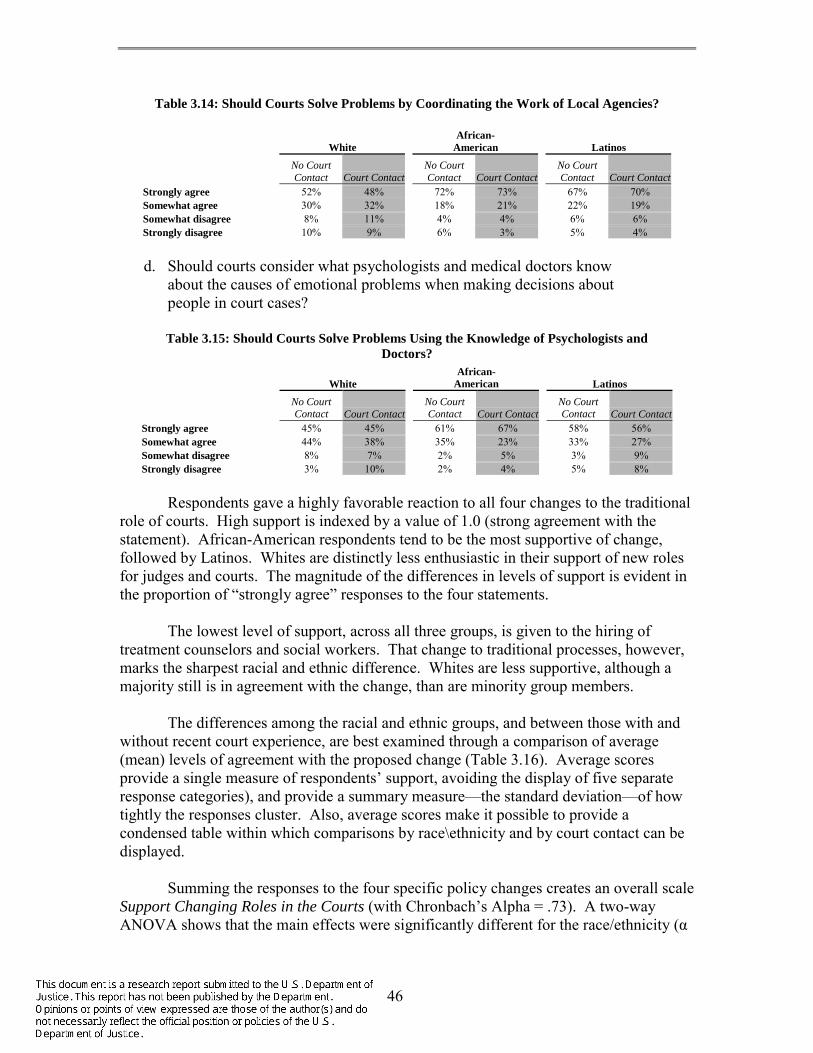
46
Table 3.14: Should Courts Solve Problems by Coordinating the Work of Local Agencies?
WhiteAfrican-
American LatinosNo CourtContact Court Contact
No CourtContact Court Contact
No CourtContact Court Contact
Strongly agree 52% 48% 72% 73% 67% 70%Somewhat agree 30% 32% 18% 21% 22% 19%Somewhat disagree 8% 11% 4% 4% 6% 6%Strongly disagree 10% 9% 6% 3% 5% 4%
d. Should courts consider what psychologists and medical doctors knowabout the causes of emotional problems when making decisions aboutpeople in court cases?
Table 3.15: Should Courts Solve Problems Using the Knowledge of Psychologists andDoctors?
WhiteAfrican-
American LatinosNo CourtContact Court Contact
No CourtContact Court Contact
No CourtContact Court Contact
Strongly agree 45% 45% 61% 67% 58% 56%Somewhat agree 44% 38% 35% 23% 33% 27%Somewhat disagree 8% 7% 2% 5% 3% 9%Strongly disagree 3% 10% 2% 4% 5% 8%
Respondents gave a highly favorable reaction to all four changes to the traditionalrole of courts. High support is indexed by a value of 1.0 (strong agreement with thestatement). African-American respondents tend to be the most supportive of change,followed by Latinos. Whites are distinctly less enthusiastic in their support of new rolesfor judges and courts. The magnitude of the differences in levels of support is evident inthe proportion of “strongly agree” responses to the four statements.
The lowest level of support, across all three groups, is given to the hiring oftreatment counselors and social workers. That change to traditional processes, however,marks the sharpest racial and ethnic difference. Whites are less supportive, although amajority still is in agreement with the change, than are minority group members.
The differences among the racial and ethnic groups, and between those with andwithout recent court experience, are best examined through a comparison of average(mean) levels of agreement with the proposed change (Table 3.16). Average scoresprovide a single measure of respondents’ support, avoiding the display of five separateresponse categories), and provide a summary measure—the standard deviation—of howtightly the responses cluster. Also, average scores make it possible to provide acondensed table within which comparisons by race\ethnicity and by court contact can bedisplayed.
Summing the responses to the four specific policy changes creates an overall scaleSupport Changing Roles in the Courts (with Chronbach’s Alpha = .73). A two-wayANOVA shows that the main effects were significantly different for the race/ethnicity (α

47
= .000) and (marginally) significant for court contact (α = .058). The interaction betweenrace/ethnicity and experience was not significant.
Table 3.16: Average Scores on Support for Non-Traditional Court Roles*
Courtcontact-recoded
Respondent raceor ethnicity
Solveproblems byhiring drugtreatment
counselors?
Solveproblems bytelling judge
progress?
Solveproblemsby agencyoversight?
Solveproblems bypsychologyand medical
advice?No CourtContact
White MeanStd. Deviation
2.181.11
1.67.89
1.76.97
1.68.74
African-American MeanStd. Deviation
1.69.98
1.46.78
1.42.81
1.44.64
Latinos MeanStd. Deviation
1.791.06
1.47.80
1.50.83
1.56.80
CourtContact
White MeanStd. Deviation
2.311.18
1.71.94
1.82.96
1.80.93
African-American MeanStd. Deviation
1.64.92
1.46.80
1.37.70
1.46.78
Latinos MeanStd. Deviation
2.011.14
1.65.95
1.45.80
1.69.94
* 1 = Strong support; 4 = Low support
The favorable public reaction to a problem-solving orientation is consistent withwhat we know about public expectations of the judiciary. The emphasis in legal trainingon a “rights perspective may account in part for the growing schism between the courtsand the public which tends to rely on both a rights and a care perspective in theirdecision-making (Daicoff, 1997: 1411).”9
How Much Support is there for the Courts?
The survey established strong support for a change in the traditional role of thecourts. That finding may be taken as good or bad news for the courts. It is good news tothe extent that the public believes that the courts are able to make an importantcontribution to solving some of our most difficult social problems. It is bad news to theextent that the desire for change is rooted in unhappiness with current levels of courtperformance.
The survey included two basic indicators of the current extent of support for the“courts in your community.” The first indicator is general and seeks to establish howfavorably people report they feel towards the courts. The second indicator is formedfrom a set of questions asking respondents to rate how well the courts in their communityhandle specific kinds of cases. Scores on those indicators are compared based on 9 “Lawyers are actually more like engineers than they are like nurses or teachers, being logical andunemotional, yet unlike engineers in that their work is inextricably involved in interpersonal conflicts andissues” (Daicoff, 1997:1412). Research on the attributes of lawyers suggests that they relydisproportionately on analytic, rational thought to make decisions and are not “interpersonally sensitive,meaning not attuned to the emotions, needs, and concerns of other people and not concerned withinterpersonal issues or harmony” (Daicoff, 1997).

48
race/ethnicity and recent court experience of the respondents. The next section considersalternative models for understanding the basis of variation in support for thoseinstitutions.
How do you feel about the courts in your community?
The first direct evaluation was a measure of how favorably people feel about thecourts in their community. The question read, “On a scale from 1 to 5, with 1 being theleast favorable and 5 being the most favorable, how would you rate how you feel aboutthe courts in your community? If you feel neutral, use 3.” The same question was askedof how people feel about their local police and their local schools. The responses can beinterpreted as an indicator of diffuse support for the courts.
The answers to questions about all three institutions (see the charts below) suggestthat courts are rated less favorably than the police or schools and that they were rated in avery distinct manner. In terms of the perceived favorability toward the courts, 26 percentof Whites without recent court contact rated the courts in a positive manner (score of 4 or5). This compares with 60 percent positive ratings the same group gave to police andschools. African-Americans and Latinos without recent court experience also were lesslikely to give favorable ratings to the courts but the margin of difference was not so largeas among Whites (18 percent for courts versus 29 percent for the police and 37 percentfor schools among African-Americans). Among Latinos, 28 percent rated the courtspositively and 53 and 52 percent, respectively, rated the police and schools positively.
While the courts attracted fewer positive ratings (scores of 4 or 5) than the policeor schools, the courts also tended to receive fewer negative ratings (scores of 1 and 2)among minority group members. For example, 22 percent of African-Americans withoutrecent court contact gave the courts a negative rating. This compares to the 43 percentnegative ratings African-Americans gave to the police and 34 percent to schools.
Chart 3.1: Perceived Favorability of Courts
0%
20%
40%
60%
80%
100%
W A L W A L
No Court Contact Court Contact
Negative Neutral Positive
Legend: W=White; A = African-American; L = Latino

49
Chart 3.3: Perceived Favorability of Police
0%
20%
40%
60%
80%
100%
W A L W A L
No Court Contact Court Contact
Negative Neutral Positive
Chart 3.2: Perceived Favorability of Schools
0%
20%
40%
60%
80%
100%
W A L W A L
No Court Contact Court Contact
Negative Neutral Positive
The trend in opinions leaves the courts with a large proportion of neutral ratings(3 on the rating scale), twice the proportion of neutral ratings received by the police orschools. The courts appear to elicit less passion than some other public institutions.
The responses of persons with recent court contact tend to be less favorabletoward the courts than those given by respondents with no such contact. People withrecent court contact are also less favorably inclined toward the police but not toward theschools. A substantial proportion of recent court users were defendants in criminal cases.People with recent court experience are less likely than those without experience to givethe courts a neutral rating.
The favorability ratings given to schools, police and courts are moderatelyinterrelated. There is a statistically significant correlation between schools and police(r = .332) and a slightly stronger correlation between courts and police (r = .399).Ratings of courts and schools are correlated (r = .268).10
How well do courts handle types of cases?
The survey offers several specific measures of public support for the courts basedon questions about how well “the courts in your community” handle five kinds of cases.The responses can be interpreted as indicating the level of specific support afforded to thecourts.
10 Together, the favorability ratings of schools and police predict 17 percent of the variation in the ratingsgiven to the “courts in your community,” based on a multiple regression model.
Legend:W=White; A = African-American; L = Latino

50
The survey interviewers asked each respondent, “On a scale from 1 to 5 with 1being the very lowest rating and 5 being the very highest, please tell me how well youthink the courts in your community handle each of the following kinds of cases:
• Criminal cases involving violence, such as robbery• Criminal cases involving drug abusers or drunk drivers• Civil cases, such as auto accidents and medical malpractice claims• Family relations cases, such as divorce, child custody, etc. and• Juvenile delinquency cases.”
The interviewers were given a separate category to note where the respondent said thatthey lacked sufficient information to answer a “court handling” question.
Average (mean) ratings were calculated for each type of case (see Table 3.17),along with the standard deviations associated with the average. Generally, respondentsrated the courts’ treatment of violent criminal cases and civil cases best on average. Onthe other hand, courts were thought to have handled juvenile cases the worst, whereasrespondents judged the courts’ performance more neutrally in family and drug cases.
Table 3.17: Average Scores on How Well Courts Handle Types of Cases*
Courtcontact-recoded
Respondentrace orethnicity
DrugCrimes
ViolentCrimes
JuvenileCrimes
FamilyCases
CivilCases
No CourtContact
White MeanStd. Deviation
3.151.26
3.431.15
3.051.16
3.211.11
3.31.98
African-American
MeanStd. Deviation
3.001.35
3.071.26
2.801.26
3.031.30
3.241.17
Latinos MeanStd. Deviation
3.271.28
3.281.18
2.971.29
3.221.06
3.221.09
CourtContact
White MeanStd. Deviation
3.051.32
3.341.22
2.831.20
3.051.27
3.231.09
African-American
MeanStd. Deviation
2.651.28
2.881.33
2.541.19
2.731.32
2.991.24
Latinos MeanStd. Deviation
3.301.31
3.301.28
2.911.25
3.301.12
3.391.08
* 5 = highest rating; 1 = lowest rating
African-Americans consistently gave the lowest ratings. That tendency isstronger for African-Americans with recent court experience than for those without suchan experience. Latinos typically provided the highest ratings. Latino ratings also did notdiffer based on whether the respondent had been to court recently.
Average ratings tend to be near the midpoint value of three. Still, there isvariation by race and by court involvement. The highest average rating on a scale of 1-5where five is the highest rating is 3.4 (by Whites without court contact for violent crimes)and the lowest is 2.5 (by African-Americans with court contact for juvenile cases). Smallbut noteworthy differences exist nonetheless between those with and without recent courtexperience and, within each level of experience, across racial and ethnic groups.

51
Respondents with recent court experience tended to rate the courts somewhat lower inhow they handled cases; the difference was most evident in the ratings of family casesand, to a lesser degree, of juvenile cases. Overall, race/ethnicity effects are statisticallysignificant. Recent court experience is not statistically significant in its influence on howpeople rate court handling of cases. The interaction between race/ethnicity and courtexperience is also not significant (based on a Multivariate Analysis of Variance test).
An overall measure of how well courts handle cases was formed by taking thesum of the answers to the five questions and dividing by the number of questions that arespondent answered (that is, did not respond “Don”t Know” or “Not familiar”)The resulting scale is reliable (Cronbach’s Alpha = .79). High values on the scalerepresent a perception that courts handle cases well.
Latinos, on average, give the courts the highest ratings on how well cases arehandled, African-Americans the lowest (Chart 3.4). The average scores in all groupshover around the middle value of three in the range (from one to five). Latinos aredistinctive in that, on average, recent court users have a higher evaluation than non-usersof how courts handle cases. The effects of both race/ethnicity and whether therespondent had been to court recently were statistically significant. The interactionbetween those influences was not significant.
A Note on Confidence in Ability to Rate the Courts
Questions tapping specific case types reveal the topics on which the generalpublic is most informed and concerned. There are a large (relative to other questions inthe survey) proportion of “Don’t Know” and “Non-Response” answers. The largestproportion of missing responses was for civil cases (22 percent did not respond).Substance abuse cases were the most frequently evaluated; still more than one person inten did not answer that question.11
11 The “Don’t Know”/ “No Answer” responses reflect two types of answers. Respondents who stated thatthey lacked sufficient information to respond were coded as “Not Familiar.” The “Don’t Know”
Chart 3.4: Mean Overall Evaluation of How Well Courts Handle Cases
1
2
3
4
5
White African-American
Hispanic
No Court Contact Court Contact

52
Table 3.18: Non-Response Rate by Racial or Ethnic Groups
Whites African-Americans LatinosTotal by
Case TypeDrug Crimes 17.3% 6.8% 8.3% 10.8%Violent Crimes 21.6% 7.2% 9.4% 12.8%Family Cases 25.8% 11.4% 14.8% 17.3%Juvenile Cases 28.7% 10.5% 11.2% 16.8%Civil Cases 30.7% 13.7% 20.8% 21.7%Total Race 24.8% 9.9% 12.9%
The real story, however, is the difference between majority group and minority grouppatterns of “Don’t Know” responses. Overall, Whites did not answer the court handlingquestions approximately one-quarter of the time. Latinos did not answer 13 percent ofthe time and African-Americans 10 percent.
Whites by a substantial margin are less likely than Latinos or African-Americansto give an answer to questions on how cases are handled. The gap between the twominority groups is largest for civil cases (14 percent of African-Americans and 21percent of Latinos did not provide a rating). The gap between Whites and African-Americans is great. The rate of non-response for Whites is about three times as great asfor African-Americans when drug, violent, and juvenile cases were the subject.
Table 3.19: Non-Response Rate by Racial or Ethnic Groups
Whites African-Americans Latinos Total byCase Type
No CourtContact
CourtContact
No CourtContact
CourtContact
No CourtContact
CourtContact
Drug Crimes 20.8% 10.3% 7.3% 6.4% 8.6% 8.0% 10.2%Violent Crimes 24.8% 15.2% 8.3% 6.4% 10.7% 8.0% 12.2%Family Cases 29.8 17.8% 15.8% 8.5% 14.0% 15.9% 17.0%Juvenile Cases 31.3% 23.4% 14.7% 7.8% 12.9% 9.2% 16.6%Civil Cases 32.3% 27.5% 13.6% 13.7% 17.5% 25.0% 21.6%Total by Race 27.8% 18.8% 11.9% 8.6% 12.7% 13.2%
More of the story is revealed by looking at non-response rates to questionsconcerning how well courts handle kinds of cases. African-Americans and Latinos withrecent court experience are not significantly more likely to answer such questions thantheir counterparts who lack that experience. Things are different for White respondents.There is a consistent pattern, most pronounced for drug crimes but strong for violent,family, and juvenile cases as well, in which Whites without court contact are far lesslikely to answer the rating questions.12
proportions shown in the preceding two tables consist of about equal numbers of “Not Familiar” and“Don’t Know” responses (see pages 3 and 4 in Appendix A for the percentages falling into each category).12 A somewhat similar pattern for “Don’t Know” responses was found for the four questions in the surveyasking respondent whether courts treat some groups worse than others. “Don’t Know” responses rangedfrom 6 percent to 17 percent, with the treatment of non-English speakers attracting the highest rate of“Don’t Know.” Rates of “Don’t Know/Non-Response” for other sets of questions were small, generally inthe 2–5 percent range (see the frequencies in Appendix A). Procedural justice and similar questions tended
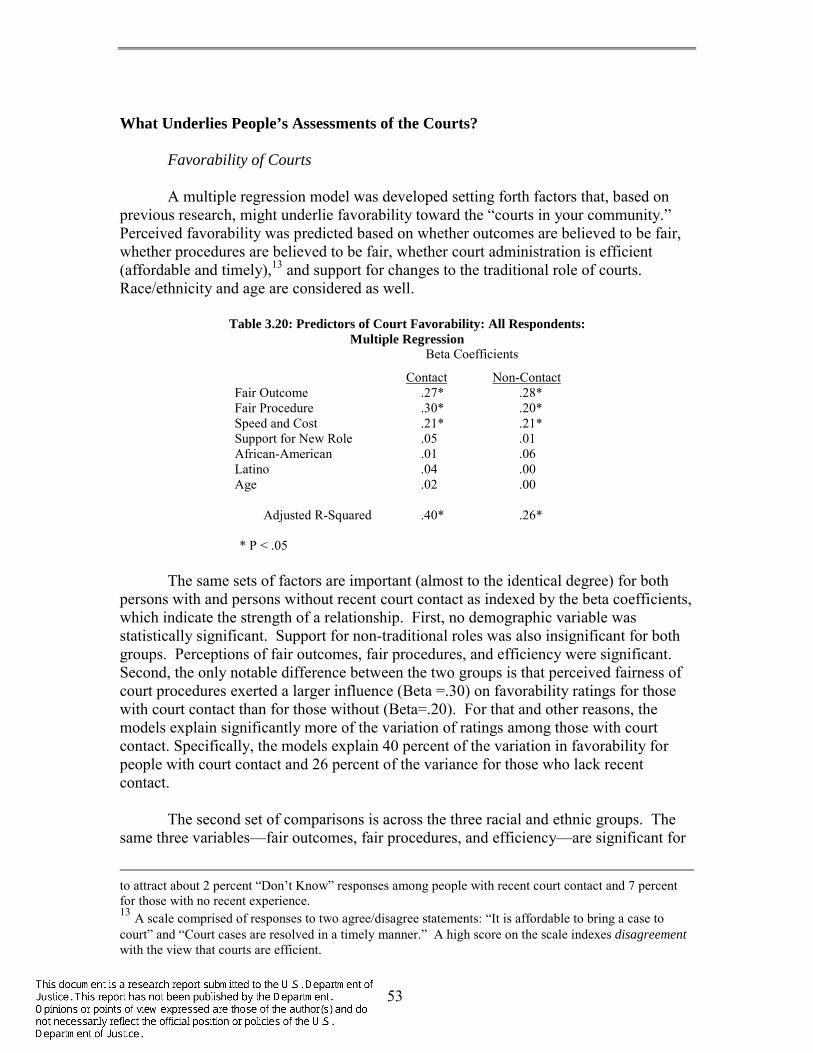
53
What Underlies People’s Assessments of the Courts?
Favorability of Courts
A multiple regression model was developed setting forth factors that, based onprevious research, might underlie favorability toward the “courts in your community.”Perceived favorability was predicted based on whether outcomes are believed to be fair,whether procedures are believed to be fair, whether court administration is efficient(affordable and timely),13 and support for changes to the traditional role of courts.Race/ethnicity and age are considered as well.
Table 3.20: Predictors of Court Favorability: All Respondents:Multiple Regression
Beta Coefficients
Contact Non-ContactFair Outcome .27* .28*Fair Procedure .30* .20*Speed and Cost .21* .21*Support for New Role .05 .01African-American .01 .06Latino .04 .00Age .02 .00
Adjusted R-Squared .40* .26*
* P < .05
The same sets of factors are important (almost to the identical degree) for bothpersons with and persons without recent court contact as indexed by the beta coefficients,which indicate the strength of a relationship. First, no demographic variable wasstatistically significant. Support for non-traditional roles was also insignificant for bothgroups. Perceptions of fair outcomes, fair procedures, and efficiency were significant.Second, the only notable difference between the two groups is that perceived fairness ofcourt procedures exerted a larger influence (Beta =.30) on favorability ratings for thosewith court contact than for those without (Beta=.20). For that and other reasons, themodels explain significantly more of the variation of ratings among those with courtcontact. Specifically, the models explain 40 percent of the variation in favorability forpeople with court contact and 26 percent of the variance for those who lack recentcontact.
The second set of comparisons is across the three racial and ethnic groups. Thesame three variables—fair outcomes, fair procedures, and efficiency—are significant for
to attract about 2 percent “Don’t Know” responses among people with recent court contact and 7 percentfor those with no recent experience.13 A scale comprised of responses to two agree/disagree statements: “It is affordable to bring a case tocourt” and “Court cases are resolved in a timely manner.” A high score on the scale indexes disagreementwith the view that courts are efficient.

54
all three racial/ethnic groups and support for non-traditional roles is not significant forany group.
The beta weights for Whites are stronger than for African-Americans or Latinos.The difference is striking: the simple model accounts for 41 percent of the variation infavorability among Whites, 30 percent of the variation among African-Americans, and 16percent of Latinos. The latter Adjusted R-Square is not statistically significant.
Table 3.21: Predictors of Court Favorability: By Race:Multiple Regression
Beta Coefficients
WhiteAfrican-
American LatinoFair Outcomes .29* .22* .16*Fair Procedures .25* .13* .19*Speed and Cost .21* .18* .15*Support New Role .001 .06 .06
AdjustedR-Squared
.41* .30* .16
* P < .05
Equal treatment
The importance of basic set of demographic and attitudinal factors on opinionswas also considered in the context of what influences perceptions of unequal grouptreatment. An overall measure of perceived unequal group treatment (Discrimination inthe Courts) was formed by creating a summated scale using the four group treatmentquestions included in the survey (α=.86). A high value indicates a belief that groups aretreated unequally). The average score on the scale varies among racial/ethnic groups.African-Americans perceived discrimination more often than Latinos or Whites. 14
The results (Table 3.22) differ from what was found when the favorability ofcourts was at issue. The fairness of court outcomes, as indexed by a single surveyquestion, did not make a difference in people’s views of how equally groups are treated.That variable had a stronger relationship to how favorably people viewed the court thandid the question about fair procedures.15
The statistically significant influence of procedural justice is equaled by theinfluence of whether courts are seen as efficient (that is, timely and affordable). The
14F(2,1110)=44.99, p <.0515 Other socio-demographic factors are not included in the model. As in prior research, gender, age,income, and educational attainment are unrelated to perceptions of discrimination. When combined in amultiple regression model with the race\ethnicity of the respondent, the following beta weights wereobtained: Gender (.00), age (.03), income (05), education (.05), African-American (.27 and statisticallysignificant at the .05 level), and Latino (.14 and statistically significant at the .05 level). The Adjusted R-Squared was .068.

55
more people believe that courts are neither procedurally fair nor efficient, the more likelythey are to perceive unequal court treatment of minority and low-income groups. Supportfor non-traditional roles is associated with a greater sense of unequal group treatment to astatistically significant degree for respondents without recent court contact. Similarsupport does not influence the assessments of unequal treatment made by people withrecent court contact. Such a finding is consistent with findings from other studies thatpeople with court experience rely less on political beliefs or social philosophy than dothose without experience when evaluating court performance.
African-Americans and Latinos are more likely than Whites to perceive unequalgroup treatment. Age, the other demographic factor considered, is not statisticallysignificant.
Table 3.22: Predictors of Equal Treatment of Groups: All Respondents:Multiple Regression
Beta Coefficients
Contact Non-ContactFair Outcome .01 .07Fair Procedure .18* .16*Efficiency .19* .17*New Role .05 .14*African-American .22* .15*Latino .09* .12*Age .08 .06
Adjusted R-Squared .17* .15*
* P < .05
The models were run separately for Whites, African-Americans, and Latinos. Thesame predictors are statistically significant for Whites and African-Americans. Theexception is support for new court roles, which is significant only for Whites. Novariable makes a statistically significant contribution to explaining the perceptions byLatinos, and the model explains 2 percent of the variation (compared to 12 and 11percent, respectively, for Whites and African-Americans).

56
Table 3.23: Predictors of Equal Treatment of Groups: By Race:Multiple Regression
Beta Coefficients
WhiteAfrican-
American LatinoFair Outcomes .04 .12 .16Fair Procedures .19* .19* .06Efficiency .15* .27* .02Support New Roles .15* .06 .05
Adjusted R-Square .12* .11* .02
* P < .05
The intersection of race and court experience can be pursued further by addingperceived discrimination by police to the mix of other factors taken into account. Asimple model was developed and run separately for each racial/ethnic group.Favorability toward the courts was predicted by favorability toward the police,discrimination by the police, and recent court contact.
Table 3.24: Predictors of Favorability of Courts: By Race:Multiple Regression
Beta Coefficients
Predictors WhitesAfrican-
Americans LatinosPolice Favorability .31* .41* .40*Yes Court Contact .03 -.18* .03Not Discriminated Against by Police .20* .22* .11
Adjusted R-Squared .18* .31* .19*
* P < .05
Perceived police discrimination has a strong, statistically significant negativerelationship to favorablity ratings for Whites and for African-Americans, but not forLatinos. Favorability toward the police has a positive influence on court favorability forall three groups, but it is stronger (based on a comparison of the beta weights) forAfrican-Americans and Latinos than for Whites. Court contact is statistically significantonly for African-Americans; African-Americans with recent court contact have morenegative views of the courts than do their counterparts without such contact.
How well specific kinds of cases are handled
To examine the basis for people’s evaluations of how well courts handle cases,demographic characteristics (race/ethnicity, age, gender, education, and income),assessments of procedural and outcome fairness in the courts, and support for non-traditional court roles were included in a predictive model. A high score on the casehandling scale indicates approval for the courts.

57
Combined, these variables explain between one-fifth and one-sixth of variation inratings of how well courts handle cases. The variables had a stronger linear relationshipto assessments for cases involving drugs and cases of violent crime.
Table 3.25: Predictors of How Well Courts Handle Various Types of Cases:Multiple Regression
Beta Coefficients
Violent Drugs Civil Family JuvenileOutcomes are fair .24* .22* .24* .21* .22*Procedures are fair .27* .27* .18* .24* .23*Support new roles -.12* -.08* -.02 -.07* -.06*Age -.01 -.00 .04 .02 -.01African-American -.04 .02 .04 .01 -.00Latinos -.02 .07* .02 .07* .00Gender -.02 .00 .03 .03 .03Education -.07* -.06* -.08* -.03 -.05 Adjusted R-Squared .22* .20* .14* .17* .16*
Perceptions of how fair are court outcomes and court procedures mattered inabout equal measure as factors underlying the ratings people gave to how all five types ofcases are handled (Table 3.25). There also were statistically significant relationshipsbetween support for non-traditional court roles and how cases are handled: the greaterthe support for non-traditional roles, the more negatively courts’ handling of cases wasviewed (with the exception of civil cases). The influence was strongest for evaluationsof how well courts handle violent crimes. This is an intriguing finding. Oneinterpretation is that the kinds of role changes included in the scale are unmetexpectations for what courts should be doing.
Some demographic influences were found. Latinos tend to have a more favorableview than African-Americans or Whites of how well courts handle drug offenses andfamily cases. The more formal education a person has completed, the less positive theview of how violent offense cases, drug cases, and civil cases are handled.
Overall evaluation: The Tyler index
The five court-handling questions and the question on how favorably peopleviewed the court can serve as an overall index of court performance (Tyler, 2001:228).The impact of demographic, procedural justice, and other factors on that evaluation wascompared in two ways. The first comparison involved people with and people withoutrecent court experience (Table 3.26). The same factors are tied to the performanceevaluations that were made by both groups, and are of similar levels of importance (asindexed by the size of the beta coefficients).

58
Table 3.26: Predictors of Overall Evaluation of Courts: All Respondents:Multiple Regression
Beta Coefficients
Contact Non-ContactFair Outcome .32* .27*Fair Procedure .25* .25*Efficiency .28* .28*New Role -.10* -.07*African-Americans -.03 -.04Latinos .06 .01A-Squared .06 .05
Adjusted R-Squared .48* .39*
* P < .05
The statistically significant factors include support for non-traditional court roles(a negative relationship). Stronger relationships are present from perceived fairness ofoutcomes and procedures and from efficiency (cost and speed). Race is not a significantfactor, nor is age. The factors combined explain a substantial proportion of the variationin how people evaluate the courts (48 percent for recent court users and 39 percent forpeople without such court contact).
A second set of comparisons is by racial and ethnic groups. All of the factorsconsidered, including support for new roles for courts, are statistically significant forWhites and African-Americans. Weaker relationships to support levels exist amongAfrican-Americans for perceived fairness of outcomes, fairness of procedures, andcost/delay. Support for new court roles was not significant, which may reflect the lack ofvariation among African-Americans in the views on that topic. For Latinos, only fairnessof outcomes proved statistically significant.
Table 3.27: Predictors of Overall Support for Courts: By Race:Multiple Regression
Beta Coefficients
WhiteAfrican-
American LatinoFair Outcome .29* .22* .30*Fair Procedure .27* .23* .14Efficiency .31* .24* .19New Role -.10* -.06* -.13AdjustedR-Squared
.50* .39* .25*
* P < .05
The four factors taken together explained one half (50%) of the variation in Whiteperceptions, 39 percent of African-American perceptions, and one-quarter (25%) ofLatino perceptions.

59
Is there a “Minority” Perspective on the State Courts?
A question-by-question review of the extent to which African-Americans,Latinos, and Whites differ in their evaluations of the courts does not reveal a clear patternin which Latino views are more closely aligned with Whites or with African-Americans.It depends on the topic. A multivariate test of statistical differences is needed to establishif there is an overall pattern—one that simultaneously considers whether the three groupsdiffer in their opinions.
Discriminant Analysis is a formal statistical method for detecting the presence ofgroup differences. In this application, the technique is used to predict membership inracial and ethnic groups based on the responses that were given on various questions (inthis case attitudes about the quality of treatment). The measure of success is theproportion of cases in which respondents were classified correctly (or, more specifically,how much that information improves on what would be predicted based on chance).
Applying Discriminant Analysis to the three groups (White, Latino, or African-American) using attitudes of the quality of treatment by the courts through discriminantanalysis found very low classification percentages (46.7%). In other words, based onattitude scores of treatment by the courts predicting racial group was successful less thanhalf of the time. Using this model, Latinos were the most difficult to classify (see the leftsection of Table 3.28).
The Discriminant Analysis was re-run for only African-American and Whiterespondents. Classification improved drastically, with 70.4 percent of the respondentscorrectly classified. Latinos altered between sharing opinions with African-Americansand Whites. Thus, when they were removed the groups in the analysis the two racialgroups (Whites and African-Americans) were more distinctly classified. The results ofthe analysis are shown in right hand section of the table.
Latinos, therefore, do not hold opinions about the fairness of court procedures thatplace them either in the minority or majority side of a schema in which the views ofWhites are to be contrasted to those of all people of color. However, although on manymeasures Latinos fall between the views of African-Americans and Whites, there is littleevidence that they cohere particularly well as a distinct group. This may reflect thediversity within the Latino-American community itself (based on nation and place oforigin, for example).16
16 This survey, however, does not, however, highlight sharp differences along those dimensions (see De laGarza and DeSipio, 2001). However, Latino respondents to the survey on which this report is based are notas diverse as the national Latino population. As noted previously, native born and Texas residents are over-represented. A far larger survey would be needed to consider the various sub-groups in the Latinocommunity formed by nation of origin, place of birth, and region of residence. Also, the survey respondentsdo not reflect the diversity in the national Latino population. Survey respondents over-represent the nativeborn and Texas-resident segments of the Latino national population.

60
Table 3.28: Discriminant Analysis Results
All Racial Groups No LatinosFunction I Function II Function I
Wilk’s Lambda 0.91 0.98 0.91χ2 123.50** 24.18** 99.03**Canonic correlation 0.28 0.14 0.30Correlations between discriminantfunction and variableCourts concerned with people’s rights 0.24 -0.30 0.24Courts treat people with respect 0.20 0.40 0.19Courts treat people politely 0.64 -0.96 0.65Courts make decisions based on fact 0.16 0.23 0.14Judges are honest in decisions 0.16 -0.04 0.15Courts take people’s needs into account -0.08 0.53 -0.07Courts listen carefully to people 0.018 -0.23 -0.17Courts are sensitive to concerns 0.04 0.74 0.04Percent of Correct ClassificationAfrican-American 46.9 56.7White 48.0 74.7Latino 40.9 --Overall 46.7 70.4**p<.001
In the Eyes of the Beholder: Patterns in Public Opinion About Courts
This chapter provides a descriptive overview of findings from a national publicopinion survey conducted in the spring of 2000. The survey was designed tosimultaneously examine the influence of race and recent court experience on perceptionsabout court procedures and outcomes and on support for the “courts in your community.”
Some of the findings are clear. African-Americans do not have a high opinion ofthe state courts. People with recent court experience tend to hold less positive views ofthe courts than do those without that experience. The effects of race/ethnicity onopinions of the courts are to some degree intertwined with those associated with courtexperience. It is notable, for example, that the difference in views between African-Americans with and without court experience is slim compared to differences amongWhites or Latinos.
The findings also support the claim that perceptions that courts use fairprocedures and treat groups equally are the strongest predictors of favorable evaluationsof court performance. This applies across racial and ethnic groups and for recent courtusers as well as non-users. However, perceptions that courts are timely and affordableat times contribute substantially to the support that people give to the courts. Thedominance of procedural justice considerations may not be as overwhelming as otherstudies have concluded.
Procedural justice and other factors considered in this report can explain more ofthe variation in the views of those with recent court experience. The same factors usually

61
are significant statistically as predictors of views among the general population but therelationships are weaker. Also, the models tested tended to work best for predicting theviews of Whites; the models tended to work least well when predicting the views ofLatinos. We appear to know little about what moves Latino opinion about the courts.
Public support is strong for non-traditional judicial and court roles that help solvethe problems that bring people into court. That support extends to solving problemsusing the knowledge of psychologists and doctors and to bringing offenders to reportback to the judge on their progress. Support for non-traditional court roles is strongestamong African-Americans, the group most critical of the courts in their communities.
Some of the findings are not clear. The position of Latinos is a prime example.Latinos sometimes share the concerns of African-Americans over the fairness ofoutcomes and procedures but tend overall to be close to the positive views that Whiteshold about the courts. Overall, models predicting support for the courts or the fairness ofcourt outcomes fare less well for Latinos than for other groups.
The interpretation and policy implications of the high support for non-traditionalcourt roles also are unclear. Some insight is provided by the nature of the statisticalrelationship between support for non-traditional roles and support for the courtsgenerally. A positive statistical relationship (with individuals with high support for thecourts being the most likely to favor the courts assuming non-traditional roles) suggeststhat confidence in the courts leads people to give courts a larger role in solving complexsocial problems. The statistical relationship, however, is negative. Support for non-traditional roles tends to be associated with having low levels of support for courts asthey now operate. Arguably, support for non-traditional roles is fed to a large extent byunmet expectations that people have about what courts should do.
Other findings also are speculative. Courts do not appear to weigh heavily on thepublic mind. Average ratings of support tended to lie close to the mid-point of the rangeof choices that respondents were given. Neutral ratings dominated the responses peoplegave about the courts but were infrequently used in rating the police or schools. Theresult is that courts may have both fewer supporters and fewer critics than other publicinstitutions. Overall, it seems that questions concerning the job being done by judges andcourts arouse little passion when people respond.
The lack of passion in people’s views of the court may reflect a lack ofattentiveness. Specific questions about how courts handle kinds of cases led to arelatively large proportion of respondents saying that they did not know enough toanswer. The proportion not responding was highest among Whites, who did not answerone quarter of the time.

62

63
Chapter 4
The Voice of Experience:Jurors, Litigants, and Witnesses Look Back on their Time in Court
Introduction
This chapter relates the perceptions of those survey respondents who had been tocourt within the previous 12-month period. The perceptions of primary interest are howfairly they were treated and how fairly they would be treated in a future court appearance.The likelihood that recent court users would go to the courts to resolve a similar, futuredispute is treated as a bottom-line indicator of the overall effect of experience with thecourts.
The specific topics examined are:
• Who has court experience• Perceptions of fairness in the courts• How much support former court users give to the courts• How fair are courts likely to be in a future case• The most important information sources shaping opinions of the courts• The likelihood recent court users will return to court• The distinctiveness of Latino perceptions about the courts• The uniqueness of recent court experience
The last chapter offered some support for claims that court experience tends tohave a neutral or mildly negative influence on support for the court. The comparisonsthat provided that support were crude, however, pitting those with any kind of experiencewithin the previous year against all those without such experience. The current chapterlooks at how specific kinds of court experience are related to the assessments peoplemake of how fairly they were treated when in court. A three-fold distinction is madeamong those with experience according to the type of court experience: jurors, litigants,and witnesses/others.
The previous chapter also lumped together individuals with no court experienceof any kind with individuals who had prior court experience at some more distant point intheir lives. A more refined look is taken in this chapter by distinguishing for somepurposes among those with recent experience, with more distant experience, and with noexperience.
In taking a more detailed look at court experience, the primary concern remainson the extent to which the impact of that experience is mediated by race and ethnicity.There are limits on what the current survey can accomplish in that respect. Few Latinosare included (93 out of the 533 respondents for whom their role in court could beidentified) for reasons explained in Chapter 2. The main limit comes in differentiating

64
the views of witnesses from those held by jurors and litigants. A very small number ofAfrican-Americans (14) and Latinos (12) were identified in the survey as having beenwitnesses.
Who Has Court Experience?
Two roles dominated the pool of people in the survey with court experience (seeTable 4.1). Serving on a jury was the most frequent role (30.2%). Being a defendant in acriminal case ran a very close second (28.8%). Other reasons included appearing as awitness (12.0 percent), a plaintiff in a civil case (8.8 percent) and a defendant in a civilcase (10.2 percent).1
Nearly one-half of the respondents were involved in a criminal matter (45.5%).Another fifth had experiences with either civil cases (22.8%) or family matters (18.0%).Another five percent of respondents listed traffic court experience under a separatecategory.
The reason for the recent court experience varied somewhat by race and ethnicity(also see Table 4.1). Points of difference include the proportion of respondents with juryexperience (with the highest proportion being among Whites and the lowest amongLatinos) and criminal defendants (the highest proportion being among Latinos and thelowest proportion among Whites).
Table 4.1: What was your role in the case?
Percentage Distribution by Race/Ethnicity
WhiteAfrican-
American Latino All
The defendant in a criminal case 26.5%
(84)
30.0%
(45)
34.8%
(32)
28.8%
The person being sued 10.1(32)
12.7(19)
6.5(6)
10.2
The person filing the lawsuit 18.6(59)
18.7(28)
19.6(18)
18.8
A juror 31.5(100)
29.3(44)
27.2(25)
30.2
A witness 13.2(42)
9.3(14)
12.0(11)
12.0
100% 100% 100% 100%
1 That distribution of experiences across roles is broadly consistent with other state and national surveys(Rottman, 1998; Sweeney, 1998) except for the proportion of former criminal defendants, which is highrelative to their presence in other surveys, and the proportion of traffic court defendants, which is lowrelative to other surveys. Chapter 5 makes some recommendations on how the screening questions used toidentify people with prior court experience could be standardized across surveys to promote consistency inwho is included in the “experienced” category.

65
There is evidence from other studies that under representation on juries is mostpronounced for income or class rather than race or ethnicity. Middle class and upperincome African-Americans and Latinos are as likely as are their White counterparts toserve as jurors. The net effect is for the poorest members of minority groups to be thetruly excluded from the jury pool (Fukurai, 1996). 2
The current national survey supports that characterization of jurors for African-Americans but not for Latinos. More than half of the former jurors in the current survey(59 percent) reported annual household incomes of larger than $50,000. A smallerproportion—43 percent—of the general population sample fell in that higher incomegroup. African-Americans and Whites in the higher income group were overrepresentedto the same substantial degree: the proportion of former jurors in the high-income groupwas about 58 percent larger than the proportion in the general population. Thecomparable percentage among Latinos was 15 percent.
Perceptions of Fairness in the Courts
General Perceptions
The survey instrument was structured to begin with a set of questions about theperceived fairness of court outcomes and court procedures. The reference is to howcourts usually act.3 In this chapter, the same questions offer a generalized view ofcourts—one not tied by wording to a specific experience with the courts. It is unlikelythat the views of recent court users are monolithic within racial and ethnic group. Abasic distinction to consider is the difference between recent litigants, recent jurors andwitnesses or others with court experience (the relevant comparisons are in Table 4.2).
A cautionary note is necessary. The percentages in the table, and all otherslooking separately at jurors and especially witnesses/other court users, are based on arelatively small number of African-American and Latino respondents. The smallnumbers reduce our confidence that we would find the same pattern of findings if thesurvey were to be repeated at a future point in time.
The results show that White jurors are more likely than African-American orLatino jurors to perceive fair outcomes. The difference between the perceptions of Whiteand African-American jurors is deep: 63 percent of White and 21 percent of African-American (former) jurors believe that outcomes are always or usually fair. Latinosoccupy a middle ground with 48 percent of former jurors believing that outcomes arealways or usually fair.
2 A single jurisdiction study (Orange County, California) concluded, “Those with lower occupational statusand lower annual incomes are particularly significantly underrepresented” (Fukurai, 1996:82-3). Minoritygroup jury pools were found to especially overrepresent more affluent group members.3 However, the screening question used to identify people with recent court experience for inclusion in thequota might have been prompted to think about that experience when answering the initial bank of fairnessquestions despite the wording of those questions.

66
Table 4.2: The Frequency of Fair Outcomes and Procedures: The Views of Recent Court UsersWhite African-American Latinos
Litigant JurorWitness/
Other Litigant JurorWitness/
Other Litigant JurorWitness/
OtherHow often areoutcomes fair?Always/Usually 40.5 63.4 60.9 12.5 20.9 6.9 34.1 47.8 39.9Sometimes 42.7 25.1 29.2 48.6 58.1 58.6 36.0 52.2 31.9Seldom/Never 16.8 10.4 9.9 38.9 21.0 34.5 30.0 0.0 28.3
How often areprocedures fair?Always/Usually 49.2 71.8 60.8 23.0 26.4 20.7 28.0 67.6 60.6Sometimes 31.9 17.9 29.0 47.5 56.3 58.6 50.4 28.1 22.0Seldom/Never 19.0 10.3 10.1 29.5 17.2 20.7 21.6 4.3 17.3
Furthermore, there is a slight difference between the perceptions of African-American litigants and African-American jurors; jurors are more positive. AmongWhites and Latinos, however, jurors are far more likely than litigants to perceive fairprocedures. African-American jurors are far less positive about the fairness of outcomesand procedures than their White and Latino counterparts. Only one in four seesprocedures and one in five sees outcomes as “always” or “usually” fair.
Among recent litigants, the perceptions of African-Americans and Latinos tend tobe more negative than Whites. African-Americans again are highly negative: 39 percentsee outcomes and nearly one-third see procedures as seldom or never fair.
The main effects of race and type of court experience were statistically significant(at the .0001 level). Main effects refer to the influence of one variable when the other isheld constant, as measured through a Two-Way ANOVA. The interaction between raceand type of experience was not significant.
How fair was the court in your case?
Survey respondents with a recent court experience were read two statementsdescribing the extent to which court outcomes and court procedures were fair. They werethen asked, “Based on what you saw judges or court staff do or say, please tell mewhether you strongly agree, somewhat agree, somewhat disagree or strongly disagreewith each statement:”
• Fair procedures were used to make decisions about how to handle the situation• The outcome of those procedures was fair
The proportion of respondents that strongly or somewhat agree with those statements isshown in Table 4.3.

67
Table 4.3: The Proportion of Court Users with a Positive View of Fairness in Outcomes and ProceduresWhite African-American Latinos
Litigant JurorWitness/
Other Litigant JurorWitness/
Other Litigant JurorWitness/
OtherSaw Fair OutcomesStrongly Agree 44.3 69.0 54.1 27.5 70.3 45.5 41.5 76.2 54.5Somewhat Agree 16.4 21.1 16.2 18.7 13.5 18.2 24.5 19.0 18.2Somewhat Disagree 12.9 7.0 5.4 12.1 9.1 5.7 4.8 18.2Strongly Disagree 26.4 2.8 24.3 41.8 16.2 27.3 28.3 0.0 9.1
Saw Fair ProceduresStrongly Agree 41.0 68.0 52.5 32.0 54.3 61.5 44.6 85.7 75.0Somewhat Agree 21.5 24.0 17.5 26.8 37.1 0.0 21.4 14.3 16.7Somewhat Disagree 13.9 4.0 12.5 10.3 2.9 7.7 7.1 0.0 0.0Strongly Disagree 23.6 4.0 17.5 30.9 5.7 30.8 26.8 0.0 8.3
The majority of White and Latino respondents believe that they observed fairoutcomes and fair procedures when in court. While Latinos tended to be more positivethan Whites in their perceptions of procedural fairness, African-Americans weredistinctly less positive, particularly in reference to fairness of outcomes. The influence ofrace/ethnicity was not statistically significant, however. The influence of race/ethnicityon whether procedures were fair came close to significance (.06).
When asked about the court case in which they were involved, jurors are oftendramatically (for African-Americans) more likely than litigants to agree that they saw fairoutcomes and procedures. Witnesses and those with other court involvement experiencedboth outcomes and procedures as more fair than litigants, but less fair than jurors. Theinfluence of court role was statistically significant for both aspects of fairness. (NB: thebase of African-Americans and Latinos in the witness/other category is very small, andthus an unstable base on which to calculate a percentage. However, this is the best, if notonly, data that speak to the influence of serving as a witness as it might vary by race orethnic group. )
Procedural Justice Evaluations
Survey respondents with recent court experience were asked to say whether theyagreed or disagreed with a set of statements drafted to represent various elements ofprocedural justice. This statement prefaced the questions:
11. Now I am going to ask you about how you think you were personallytreated in that court case. I am going to read you a list of statements aboutthat court case. Based on what you saw judges or court staff do or say,please tell me whether you strongly agree, somewhat agree, somewhatdisagree or strongly disagree with each statement. Remember we areasking about how you were treated personally.
The percentages in Table 4.4 indicate the proportion of favorable responses(strongly agreeing or agreeing that they were favorably treated). The statements are

68
presented according to the element of procedural fairness that they were designed tomeasure. 4
Table 4.4.1: The Percentage of Court Users with a Positive View of How Respectfully They Were Treated
White African-American LatinosRESPECT Litigant Juror Witness Litigant Juror Witness Litigant Juror WitnessI was treated politelyStrongly Agree 57.4 83.3 70.5 38.8 81.6 69.2 49.2 90.5 58.3Somewhat Agree 23.0 15.5 20.5 25.5 10.5 23.1 25.4 4.8 33.3Somewhat Disagree 7.4 1.2 4.5 11.2 2.6 0.0 11.9 4.8 8.3Strongly Disagree 12.2 0.0 4.5 24.5 5.3 7.7 13.6 0.0 0.0
I was treated with respectand dignityStrongly Agree 53.1 79.5 72.7 37.8 71.1 69.2 48.3 85.7 75.0Somewhat Agree 21.8 19.3 6.8 25.5 15.8 23.1 25.9 9.5 25.0Somewhat Disagree 10.9 0.0 11.4 9.2 5.3 0.0 10.3 0.0 0.0Strongly Disagree 14.3 1.2 9.1 27.6 7.9 7.7 15.5 4.8 0.0
My rights taken intoaccountStrongly Agree 42.6 74.7 73.2 36.8 61.8 75.0 46.7 85.7 75.0Somewhat Agree 25.7 16.5 9.8 23.2 26.5 8.3 20.0 14.3 25.0Somewhat Disagree 12.2 5.1 7.3 8.4 2.9 0.0 8.3 0.0 0.0Strongly Disagree 19.6 3.8 9.8 31.6 8.8 16.7 25.0 0.0 0.0
Litigants consistently perceived the least amount of respect. Jurors tended to bethe most positive, although in some instances witnesses perceived the same or evenslightly higher levels of respectful treatment. The highest levels of agreement to all threequestions were by Latino jurors. The gap between litigants and jurors was large forAfrican-Americans and Latinos; at times, that gap came close to being two to one inagreement levels.
Only the kind of court experience exerted a statistically significant influence forall the variables indexing the respect element of procedural fairness. The exception wasthe relationship of race to the statement “The judge and staff did not care about myconcerns.” The main effects of role in court were significant for all variables relating torespect. There was an interaction between race and court role in agreement with thestatement, “I was able to say what was on my mind.” There, the influence of court rolewas conditioned upon the respondents racial/ethnic group.
4 A similar pattern of findings emerges from a series of statements describing what the respondent observedin the courtroom rather than what they experienced (for example, “People were treated politely” and “Aperson’s race or ethnic group made no difference in how the court treated them”).

69
Table 4.4.2: The Percentage of Court Users with a Positive View of How Neutrally They Were Treated
White African-American LatinosNEUTRALITY Litigant Juror Witness Litigant Juror Witness Litigant Juror WitnessMy race made a differenceStrongly Agree 10.4 8.5 12.5 26.3 11.4 30.8 26.3 14.3 8.3Somewhat Agree 8.1 9.8 5.0 20.0 17.1 0.0 12.3 19.0 8.3Somewhat Disagree 10.4 7.3 7.5 13.7 14.3 7.7 17.5 4.8 16.7Strongly Disagree 71.1 74.4 75.0 40.0 57.1 61.5 43.9 61.9 66.7
I was treated the same asothersStrongly Agree 53.6 82.1 69.0 40.0 74.4 61.5 41.1 85.7 91.7Somewhat Agree 17.1 13.1 11.9 20.0 5.1 15.4 28.6 9.5 8.3Somewhat Disagree 14.3 2.4 2.4 12.2 12.8 0.0 5.4 4.8 0.0Strongly Disagree 15.0 2.4 16.7 27.8 7.7 23.1 25.0 0.0 0.0
The two questions chosen to index the element of neutrality dealt with race, onedirectly and one indirectly. African-American and Latino former litigants had relativelysimilar views on whether they were treated the same as others. A substantial proportionof respondents in those groups perceived unfairness based on their racial or ethnic group.There is a similar pattern for former jurors in the response given to the statement, “Myrace made a difference.” Overall, though, the majority of respondents in eachsubcategory agreed that the courts had treated them neutrally. The influence of both raceand role in court were statistically significant. That significance was marginal in theinfluence of race on the statement “I was treated the same as everyone else” and theinfluence of court role on the statement “My race made a difference in how I wastreated.”
Table 4.4.3: The Percentage of Court Users with a Positive View of Their Ability to Participate
White African-American LatinosPARTICIPATION Litigant Juror Witness Litigant Juror Witness Litigant Juror WitnessI was able to speak mymindStrongly Agree 43.1 77.5 47.6 41.5 73.0 92.3 30.4 81.0 72.7Somewhat Agree 17.4 12.5 23.8 13.8 10.8 0.0 17.9 14.3 18.2Somewhat Disagree 12.5 2.5 4.8 7.4 5.4 0.0 7.1 4.8 0.0Strongly Disagree 27.1 7.5 23.8 37.2 10.8 7.7 44.6 0.0 9.1
My views were expressedStrongly Agree 41.8 82.5 59.5 39.6 76.3 76.9 32.1 80.0 75.0Somewhat Agree 23.3 10.0 11.9 14.6 7.9 15.4 23.2 15.0 25.0Somewhat Disagree 13.7 2.5 7.1 6.3 2.6 0.0 12.5 0.0 0.0Strongly Disagree 21.2 5.0 21.4 39.6 13.2 7.7 32.1 5.0 0.0
Jurors tended to believe that they were able to participate. There is no realdifference among racial and ethnic groups. Litigants were less positive. A significantproportion of litigants consistently disagreed with the statements positing that they had avoice in the proceedings.

70
Table 4.4.4: The Percentage of Court Users with a Positive View of the Trustworthiness of Courts
White African-American LatinosTRUST Litigant Juror Witness Litigant Juror Witness Litigant Juror WitnessMy views were consideredStrongly Agree 37.4 80.2 64.3 32.6 66.7 53.8 36.2 65.0 75.0Somewhat Agree 22.4 9.9 14.3 23.2 12.8 15.4 24.1 25.0 25.0Somewhat Disagree 11.6 1.2 7.1 8.4 7.7 7.7 10.3 5.0 0.0Strongly Disagree 28.6 8.6 14.3 35.8 12.8 23.1 29.3 5.0 0.0
The judge and staff did notcare about concernsStrongly Agree 26.6 2.5 16.3 34.4 22.9 23.1 33.3 4.8 8.3Somewhat Agree 11.9 1.3 16.3 15.6 5.7 15.4 19.3 4.8 8.3Somewhat Disagree 20.3 16.5 9.3 12.5 8.6 23.1 10.5 28.6 8.3Strongly Disagree 41.3 79.7 58.1 37.5 62.9 38.5 36.8 61.9 75.0
Former litigants tended to perceive low levels of trustworthiness in the courts.There were no significant racial/ethnic group differences. A distinctive pattern alsopresent for all three racial/ethnic groups is the polarized nature of levels of agreement tothe statements. Responses were clustered in the two “strongly” options (agree ordisagree).
Former jurors and witnesses, on the other hand, tended to agree that the court wastrustworthy. That trend was less pronounced for African-Americans than for their Whiteor Latino counterparts.
African-American and Latino litigants responded less positively than Whites tostatements regarding neutrality and participation. Jurors across all racial and ethnicgroups rated the courts as treating them very fair overall. However, jurors expressed themost negative rating on whether courts treated people differently based on their race orethnicity.
We can step back from the responses to individual questions or individualelements of procedural justice to glimpse the forest from the trees. Overall, respondentswith recent court experience tend to have a generally positive view of how fairly theywere treated. On average, Whites responded in a positive manner to 78 percent of thestatements included in Table 4.4, African-Americans to 66 percent, and Latinos to 71percent.
An overall index Procedural Justice Index combines responses the questionsconsidered into a summated (Questions 10 and 11, with Chronbachs Alpha = .88). Thelow value on the scale is one and the high value a four. The average scores reinforce thepoints made above (see Table 4.5). Recent jurors and witnesses in all racial and ethniccategories have a positive view of how they were treated by the courts; recent litigantshave gloomier assessments, especially African-Americans and Latinos.

71
Table 4.5: Average Procedural Justice Experienced
by Role in Court and by Race*
Litigant JurorWitness/
OtherWhite 2.92
(.91)3.68(.49)
3.23(.92)
African-American 2.61(1.05)
3.42(.71)
3.23(.84)
Latino 2.77(.91)
3.68(.42)
3.57(.52)
*Parentheses contain the standard deviation for each average
The influence of both race/ethnicity and role in court are statistically significant, theinteraction term is not.
How do Former Court Users Rate the Courts
Favorability
Respondents with recent court experience were shown in the last chapter to viewthe courts in their community less favorably than did the general population. Favorabilitywas rated on a scale of one to five, with five the highest rating. Respondents with recentcourt contact scored, on average, 2.9 (standard deviation, 1.1) and those withoutexperience scored an average of 3.1 (standard deviation, .9). The average scores for eachcombination of race/ethnicity with role in court are found in Table 4.6 (parentheses reportstandard deviations).
Table 4.6: Average Ratings for How Respondents Feel About Courts
Litigant JurorWitness/Other
White 2.81(1.07)
3.18(1.03)
3.15(1.02)
African-American 2.41(1.09)
2.73(.95)
2.59(.64)
Latino 2.92(.98)
3.24(.81)
2.92(.77)
All averages lie close to the middle value of 3.0. Among former jurors, Latinosare the most favorably inclined and African-Americans, by a considerable margin, theleast favorably inclined. The direct influences of race/ethnicity and court role onfavorability toward the courts are statistically significant. The race/ethnicity by court roleinteraction is not significant.

72
Handling of Cases
Support for the court of a more specific kind was rated based on how well courtswere perceived to handle five types of cases. The survey offers several specificmeasures of public support for the courts based on questions about how well “the courtsin your community” handle five kinds of cases. Interviewers at the Public Opinion Labasked each respondent, “On a scale from 1 to 5, with 1 being the very lowest rating and 5being the very highest, please tell me how well you think the courts in your communityhandle each of the following kinds of cases” (see Table 4.7 for the list of cases).
The last chapter identified a tendency for respondents with recent court contact tohave less specific support for the courts. The gap in support based on court experiencewas not great and was in the reverse direction for Latinos: those with recent court contactprovided more support than those without such experience (based on a summated scalecombining the responses to the five relevant questions).
Looking at the role respondents played in court indicates some associationbetween type of court experience and how well cases are perceived to be handled.Moreover, there were distinctive patterns associated with the three racial and ethnicgroups being considered. The direction and magnitude of the differences can be gaugedin Table 4.7 (see next page).
Former jurors and witnesses are more positive in their ratings than were litigantsamong Whites and African-Americans. There is no clear difference in the averages ofthe ratings given by Latino jurors and litigants. Both groups provide high, in a relativesense, ratings of 3.4 (litigants) and 3.2 (jurors/witnesses). Few differences arestatistically significant. Race effects are significant for violent offenses (and close to the.05 level of significance for drug and juvenile cases). Role in court matters to astatistically significant degree for ratings of the handling of violent offenses and juvenilecases. Interaction effects are not significant (based on Two-Way Analysis of Variancetests).
Antecedents to Evaluations about the Courts
The antecedents of feelings of favorability toward the courts among former courtusers were examined in a logistic (binary outcome variable) regression including aspredictors demographic variables, the role a person played in court (distinguishing civilfrom criminal), their support for non-traditional court roles, perceived procedural justicethat they experienced, and whether courts are timely and affordable (speed and cost).5The array of demographic variables is more extensive than in previous regressions.Income and education are included as categorical variables. The dependent variable has avalue of one if the respondent is favorably inclined and zero if unfavorably inclinedtoward the courts
5 An OLS regression was run with the same variables, with equivalent results.
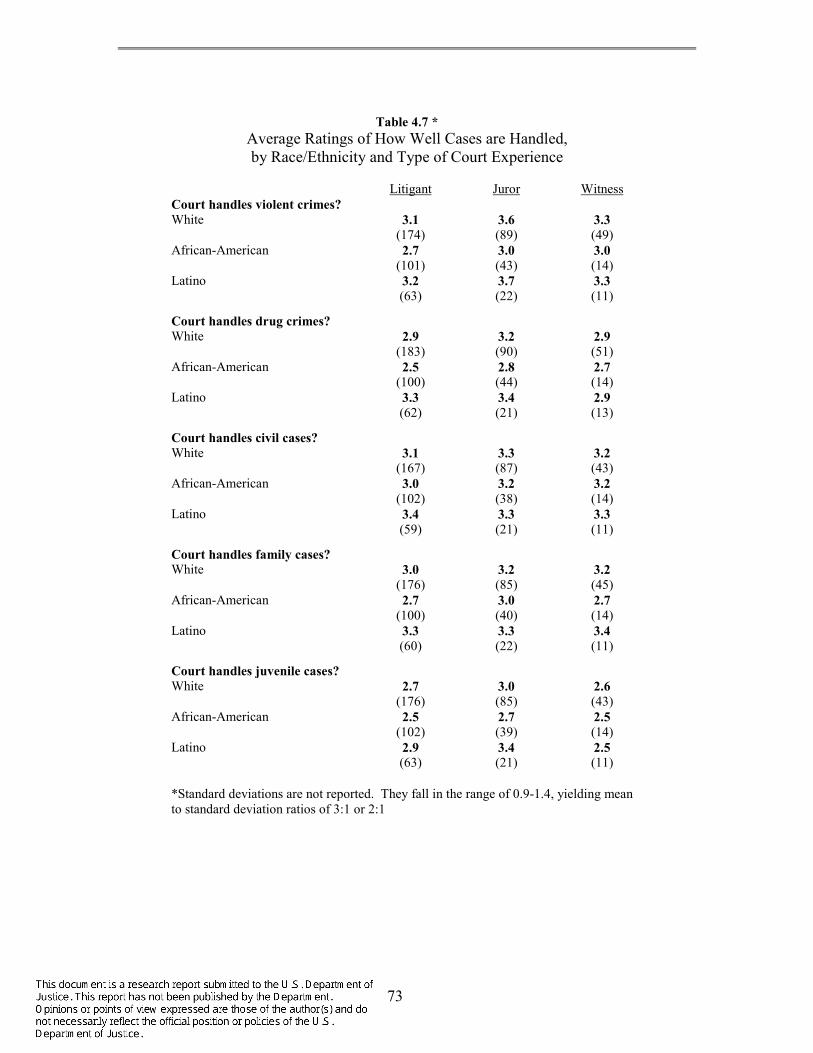
73
Table 4.7 *Average Ratings of How Well Cases are Handled,by Race/Ethnicity and Type of Court Experience
Litigant Juror WitnessCourt handles violent crimes?White 3.1
(174)3.6(89)
3.3(49)
African-American 2.7(101)
3.0(43)
3.0(14)
Latino 3.2(63)
3.7(22)
3.3(11)
Court handles drug crimes?White 2.9
(183)3.2(90)
2.9(51)
African-American 2.5(100)
2.8(44)
2.7(14)
Latino 3.3(62)
3.4(21)
2.9(13)
Court handles civil cases?White 3.1
(167)3.3(87)
3.2(43)
African-American 3.0(102)
3.2(38)
3.2(14)
Latino 3.4(59)
3.3(21)
3.3(11)
Court handles family cases?White 3.0
(176)3.2(85)
3.2(45)
African-American 2.7(100)
3.0(40)
2.7(14)
Latino 3.3(60)
3.3(22)
3.4(11)
Court handles juvenile cases?White 2.7
(176)3.0(85)
2.6(43)
African-American 2.5(102)
2.7(39)
2.5(14)
Latino 2.9(63)
3.4(21)
2.5(11)
*Standard deviations are not reported. They fall in the range of 0.9-1.4, yielding meanto standard deviation ratios of 3:1 or 2:1

74
Table 4.8 Logistic Regression: Influences on the Favorability Toward the Courts
Variable B Sign. Exp (B)Constant -1.370 .382 .254Procedural justice 1.359* .000 3.893Cost and Speed -.187* .028 .829Support for New Roles .040 .378 1.040
Juror .254 .498 1.289Civil defendant .045 .899 1.046Civil Plaintiff -.131 .784 .877Criminal Defendant -.542 .173 .582
Education .906 Level 1 -.059 .900 .942 Level 2 -.219 .613 .803 Level 3 -.018 .969 .982
Income .563 Level 1 -.355 .341 .701 Level 2 .013 .963 1.013
Age -.007 .489 .993African-American .202 .473 1.224Latino -.728 .065 .483Log Likelihood 426.057LRχ2 165.169
Logistic regression models are evaluated by goodness of fit measurements shownat the bottom of the table. The models fit the data. Overall, 80 percent of the time thismodel can predict who is favorable toward the courts. Nonetheless, only two variables,both attitudinal, are statistically significant. The stronger a person’s perception ofprocedural justice, the higher the favorability rating. Perceptions of cost and delay lowerfavorability. Demographic characteristics and the role a person played in court were notrelated to favorability ratings. Therefore, the results are nearly identical to those found inChapter 3 for people with recent court experience. At least in this analysis, whether aperson was a juror, witness, or litigant does not appreciably affect how favorably theyview the courts in their community.
Factors other than court role and race/ethnicity also underlie differences in howpeople rate the way courts handle various kinds of cases. A series of multiple regressionswas carried out, one for each kind of case6. The equations included other demographiccharacteristics (gender, age, education, household income), support for non-traditionalcourt roles, perceptions of procedural justice, as well as whether the respondent had beena juror, litigant, or witness.
6 Multiple regression is the appropriate statistical technique because the variable being predicted, how wellcourts handle cases I not binary: possible scores range from 1 to 5.

75
The models explain a moderate amount of the variation in the ratings people gave(from a low of 8 percent for juvenile cases to 20 percent for violent offenses likerobbery). Procedural justice dominates all of the models (Table 4.9). It is the solesignificant variable in the model for family cases. Role in court was significant for noneof the types of court cases. Race was significant in predicting ratings of how courtshandle drug cases and violent offenses: African-Americans tended to give lower ratingsto the courts for those cases.
Support for non-traditional court roles has a negative relationship to ratings onhow well courts handle cases, suggesting that support comes from people disaffectedfrom the courts as they currently operate. That relationship is marginally significant forjuvenile, civil, and drug cases (at 0.10 level), and significant for violent offenses (at .05level).7
Table 4.9: Influences on Ratings of How Well Courts Handle Kinds of Cases:Multiple Regression
Beta Coefficients
Violent Drug Civil Family JuvenileRespondent gender (high=female) -.07 -.10* -.08 .03 -.04Respondent age -.03 -.09 -.03 -.06 -.07Grouped education levels -.04 -.04 -.04 -.02 -.02Grouped income -.05 .02 -.07 -.02 .01African-American -.11* -.09* -.06 -.05 -.07Latino -.01 .09 .01 .06 .01Criminal defendant -.07 .02 .01 .05 .01Civil defendant -.05 .10* .09 -.03 .06Civil plaintiff -.06 .02 .03 .00 -.02Juror -.07 -.01 .02 .01 .01Support new roles -.09* -.09* -.04 -.03 -.07Procedural justice (higher more pj) .43* .37* .32* .41* .31* Adjusted R-Squared .20* .15* .10* .17* .08*
P < .05
How Fair Are the Courts Likely To Be in a Future Case?
After respondents were asked to rate the fairness of their court experience, therespondents were asked: “Based on your experience in that recent court case, if youappeared in court as a party in the same kind of case in the future: How fair do you thinkthe outcome you received from the court would be? And how fair do you think the judgewould be in the way he or she treated you and handled your case? Would you say veryfair, somewhat fair, somewhat unfair, or very unfair?”
Recent litigants and jurors anticipate fair outcomes and fair treatment if theyreturned to court on a similar matter (Table 4.10). African-Americans are less optimistic,but the influences on expected treatment coming from race/ethnicity are not statistically 7 Other variables of marginal significant (that is, at .10 level) include gender in the model for violentoffenses (women tend to give lower ratings, other things being equal) and a negative influence on ratingsfor drug crimes from having been a civil defendant.

76
significant. However the influence of role in court is significant for expectations recentcourt users hold of both outcomes and treatment. There is a tendency for respondentswith all kinds of recent court contact to give the courts higher marks for proceduralfairness than for outcome fairness.8
Table 4.10: The Proportion of Court Users with a Positive View ofFairness in Outcomes and Procedures
White African-American Latinos
Litigant JurorWitness/
Other Litigant JurorWitness/
Other Litigant JurorWitness/
OtherExpect FairOutcomesStrongly Agree 30.5% 54.4% 38.1% 22.7% 47.2% 28.6% 14.8% 60.0% 50.0%Somewhat Agree 41.8 36.7 35.7 34.0 36.1 35.7 51.9 30.0 41.7Somewhat Disagree 9.9 7.6 9.5 19.6 8.3 28.6 16.7 10.0 8.3Strongly Disagree 17.7 1.3 16.7 23.7 8.3 7.1 16.7 0.0 0.0
Expect FairProceduresVery Fair 39.2 57.8 46.7 24.7 47.2 28.6 25.5 73.7 66.7Somewhat Fair 32.2 34.9 31.1 34.0 44.4 57.1 43.6 21.1 25.0Somewhat Unfair 14.0 6.0 11.1 30.9 2.8 7.1 14.5 5.3 8.3Very Unfair 14.7 1.2 11.1 10.3 5.6 7.1 16.4 0.0 0.0
How Likely are Recent Court Users to Return to Court in a Future Dispute?A telling assessment of someone’s recent court experience comes in response to a
question about one’s behavioral intentions. “How likely would you be to go to the courtsto resolve a similar dispute you became involved in at some point in the future?” Asignificant minority (44 percent overall) replied that they were “very unlikely” or“unlikely” to return to court. 9
Table 4.11: How Likely are Recent Court Users to Go to the Courts in a Future Dispute?White African-American Latino*
Litigant JurorWitness/
Other Litigant JurorWitness/
Other Litigant JurorWitness/
OtherVery Likely 30.7 28.4 54.8 37.8 36.8 42.9 19.0 30.0 41.7Likely 19.0 29.6 19.0 19.4 13.2 21.4 22.4 30.0 33.3Unlikely 19.6 24.7 4.8 11.2 18.4 0.0 24.1 15.0 8.3Very Unlikely 30.7 17.3 21.4 31.6 31.6 35.7 34.5 25.0 16.7
*NB: Percentages for witnesses/others are based on very small numbers.
8 The category of litigant contains a higher proportion of former criminal defendants among Latinos,relative to African-Americans and Whites.9 The question (No. 20 in the survey) about likelihood of returning to court was asked of all respondentswith court experience, litigants, jurors and witnesses alike. The question’s wording references “a similardispute you became involved in at some point in the future?” Participation in a “similar dispute” istypically not voluntary—few of the respondents in the survey chose to have the contact with the court thatled to their inclusion in the present survey. The question nonetheless has value as an index of how peopleevaluated their court experience. Only 3 percent of respondents did not answer the question. The contextof the question provides confidence in its utility. It was asked after 25 questions specifically based on therespondent’s court experience. Also, the question was the third in a set of questions about expectations oftreatment in a future court case, prefaced by, “Based on your experience in that recent court case, if youappeared in a court as a party in the same kind of case in the future . . .”

77
Latinos are the least likely litigants (41 percent are “very likely” or “likely”) and,by a slim margin, the most likely jurors or witnesses (60 percent) to be willing (that is,“very likely” or “likely”) to return to court.
African-Americans are about equally likely to return to court whether theirexperience was as a litigant (57 percent) or as a juror (50 percent). Among whites, 50percent of litigants and 58 percent of the former jurors felt that they were likely to returnto court.
Neither role in court nor race are very consequential, however, for predictingwhich recent court users are likely to use the courts in the future. The influenceassociated with race/ethnicity is not statistically significant, while that based on court roleis significant at the .05 level (.034). It is noteworthy that there is little apparententhusiasm for returning to court even among former jurors.
Do Experiences Affect Decisions to Use Courts in the Future?
There have been claims that negative court experience leads to lower support forthe courts, but that positive experiences have no lasting influence on orientations towardthe courts. Respondents in the current survey were not asked directly to rate theirexperience as positive or negative. They were, however, asked to rate the fairness of theprocedures they encountered and the kind of treatment they expected to receive in afuture encounter with the courts. The two questions used, on expected fairness ofprocedures and on expected fairness of outcomes, were combined into a single scale.That scale was combined with the role a person played in court and their demographiccharacteristics into a model predicting the likelihood of going to court again (Table 4.12).
Table 4.12 Likelihood of Future Court Use: Logistic Regression
[0 = not likely; 1 = likely]Variable Coeff Sign. Exp (B)Constant -.900 .336 .407Procedural justice .779* .000 2.179Expect Fairness -177* .037 .837Juror -.983* .001 .374Litigant -.559* .031 .572African-American .325 .178 1.384Latino -.239 .413 .788Age -.007 .369 .993Education .060 Education 1 .624* .010 1.865 Education 2 .093 .761 1.097 Education 3 .286 .439 1.331Log Likelihood 572.020LRχ2 105.670
A logistic (binary outcome variable) regression analysis was conducted on howlikely respondents would be to go to court again (see Table 4.12). Logistic regressionmodels are evaluated by goodness of fit measurements shown at the bottom of the table.

78
Overall, 71 percent of the time this model can predict who will be likely to return to thecourts at a later date to resolve a dispute.
The index of perceived procedural justice strongly affected the likelihood ofreturning to court to resolve a future dispute. The better treatment, the more likely theywere to return, regardless of other demographic characteristics. Expectations for futuretreatment—fairness of outcomes and procedures—were also influential. The relationshipis negative due to the way expectations are measured: the scale is constructed so that alow value means the respondent expects fairness.
In addition to the quality of treatment experienced, the court users’ role was animportant predictor of future court use. When controlling for how well the participantswere treated and saw others treated by the courts, jurors and litigants were less likely touse the courts in the future compared to witnesses. Plaintiffs from civil suits were mostlikely to return to court in the future. Criminal defendants and defendants in civil caseswere less likely than plaintiffs (but not quite to a significant degree).
Logistic regressions also were run separately for African-Americans, Latinos, andWhites (Table 4.13). There are some common findings from the three models. Ifrespondents believed that courts were procedurally fair, they were more likely to return tocourt regardless of the racial/ethnic group. Former court users expectations of fairoutcomes and procedures also contributed to a likelihood of returning to court.
The respondent’s role in court also made a difference to the likelihood ofreturning to court. However, the nature of that influence varied across groups. Latinosand Whites who had been criminal defendants were less likely to return (relative to themissing role of witness). Jurors were less likely than witnesses by a statisticallysignificant degree to return among African-Americans and Whites, but not amongLatinos. African-American respondents were least likely to return, regardless of whetherthey appeared as a criminal defendant or not. It is notable that having been an African-American juror was strongly and negatively related to the likelihood of returning to courtin the future.
Overall, these models can predict the percentage of responses indicating that therespondent will return to court in the future based on the individual factors included inthe model.10 The percentage of correctly classified responses is listed in the table. Themodel best predicts African-American and White responses at 72.3 percent and 71.4percent, respectively. The model as applied to Latinos was less successful, predictinglikelihood correctly for 65.1 percent of the respondents. All three models do a better jobat predicting the responses given by respondents than does the null hypothesis, which isthe frequency of respondents saying they will return to court in the future (rangesbetween 52.3 and 58.4 percent).
10 A goodness of fit measurement often used with logistic regression is the ‘-2 log likelihood’. All threemodels meet the accepted standard set by the Chi-square tests with 8 degrees of freedom (there are 8variables in the model).

79
Table 4.13: Antecedents of Likelihood of Returning to Court: Logistic Regressionsby Race/Ethnicity
White, Non-Hispanic B S.E. Exp (β)
Gender (high=female) -.040 .292 .961Age -.012 .012 .988Procedural Justice .531* .263 1.701Expectation for Future -314* .120 .731 Court Experience
Role in Court Criminal Defendant -1.117* .451 .327 Civil Defendant -.992 .544 .371 Civil Plaintiff -.181 .451 .835 Juror -.906* .410 .404 [Reference Witness]
Log Likelihood 298.707 LR χ2 (8) 57.078 Constant .339
African-American B S.E. Exp (β)
Gender -.208 .412 .812Age -.013 .014 .987Procedural Justice .801* .315 2.227Expectation for Future .213 .163 .808 Court Experience
Role in Court Criminal Defendant -.287 .590 .751 Civil Defendant -.646 .680 .524 Civil Plaintiff .571 .675 1.770 Juror -1.201* .584 .301 [Reference Witness]
Log Likelihood 163.926 LR χ2 (8) 37.963 Constant .300
White, Hispanic B S.E. Exp (β)
Gender .255 .509 1.290Age -.010 .021 .990Procedural Justice 1.270* .480 3.560Expectation for Future -.268 .228 1.308 Court Experience
Role in Court Criminal Defendant -1.488* .749 .226 Civil Defendant -1.298 1.152 .273 Civil Plaintiff -.928 .832 .395 Juror -1.125 .736 .325 [Reference Witness]
Log Likelihood 101.497 LR χ2 (8) 17.538 Constant .093*p<.05

80
What Sources of Information Shaped Opinions of Courts?
Respondents with recent court experience were asked to rate the relativeimportance to their overall impression of the courts of ten possible sources ofinformation. The question was: “How important to you are the following sources ofinformation to your overall impression of how the courts in your community work? Arethey very important, somewhat important, or not at all important?”
All of the respondents considered here had been to court for some reason duringthe past year. Nearly one in four was a defendant in a criminal case. The self-ratedimportance of experience in court is high. However, it does not dominate other sourcesabsolutely—or even largely. Vicarious experience a friend or relative had was veryimportant to the respondents, but so is the person’s own job (see Table 4.14).
Table 4.14: Proportion of Respondents Rating Various InformationSources as “Very Important”
Source
Your experience in court 71%Experience by a household member 58Your lawyer 62Experience by a close relative 49Experience of a friend 38Experience of someone you work with 32Your job 46What you see on TV news 23What you read in newspapers 27What happens during TV Judge Programs 8
Ratings of “not at all important” were rare (based on analysis not presented here).That response was given by less than 10 percent of respondents for the first five sourcesreferenced. Less than one in five respondents gave a “not at all important” rating forsomeone you work with, your job, and what you read in the newspapers. One respondentin four did not see “what you see on TV news” as unimportant. However, 68 percentrated “what happens during TV Judge programs” as of no importance.
There are differences associated with race and ethnicity (Table 4.15). Their ownexperience in court was cited most frequently as very important to their overallimpression of courts.11 This was less common among Latinos, however. Other highlyimportant sources were court experiences of family or friends, news media and theirlawyers. Less important for some people was one’s job or one’s colleagues’ experience.
11 Experience in court was a very strong correlate of how favorably people view the courts. A summatedscale measuring how positive respondents’ personal experience was (in terms of procedural justice) has acorrelation of .56 with ratings of favorability.

81
Table 4.15: Percent Rating Source as “Very Important” on OverallImpression of Courts
WhitesAfrican-
Americans LatinosYour experience in court 70.4 77.0 55.0Experience by a household member 59.0 63.0 53.0Your lawyer 61.0 66.0 59.0Experience by a close relative 46.0 65.0 54.0Experience of a friend 39.0 41.0 33.0Experience of someone you work with 29.0 32.0 28.0Your job 41.0 61.0 53.0What you see on TV news 21.0 33.0 42.0What you read in newspapers 25.0 34.0 46.0What happens during TV Judge Program 3.0 15.0 21.0
Generally, the three racial and ethnic groups report similar patterns of informationsources. There are exceptions, however. African-Americans and Latinos tend to attachgreater importance than Whites to print and electronic news media. The strongestdifference is in the importance attached to “Judge Judy” or “The People’s Court”. Few (3percent) Whites reported that these types of shows were very important to what theythought of the courts, compared to 15 percent and 21 percent, respectively, of African-Americans and Latinos.12 Evidence from other surveys suggests that viewers distinguishbetween the “real” courts and those operating under the auspices of television networks.For example, viewers of “reality-based” television are less likely to agree with thestatement: “It would be possible for me to represent myself in court if I wanted to”(National Center for State Courts, 1999:25).
The difference between Whites and minority group members is striking, but thereis another noteworthy aspect to the rates at which groups rely on TV reality programs forinformation. Overall, respondents with lower education levels were the most likely toattach importance to TV judges. However, the relationship between educational level andreliance on TV programs differs by (that is, interacts with) race/ethnicity (see Chart 4.1).The negative relationship between education level and importance of TV judges as aninformation source is not as strong for African-Americans and (especially) for Latinosrelative to Whites.
12 If we combine the response categories of very important and important, we find that 18 percent ofWhites, 43 percent of African-Americans and 47 percent of Latinos rely on TV judges as a source ofinformation about the courts. A similar pattern (based on the frequency with which people report gettinginformation about the courts) emerged from the 1999 national survey, How the Public Views the StateCourts (National Center for State Courts, 1999:20) of the adult population (not only those with recent courtexperience). The same survey found that Latinos were significantly more likely than Whites to agree withthe statement “The media’s portrayal of the courts is mostly accurate (page 21).” However, the comparisonof the present findings to those from the 1999 survey suggests that reliance on TV judges is considerablyhigher among those with recent court experience, a reflection, no doubt, of selection effects associated withdrawing a sample of recent court users rather than a precursor or consequence of court experience.

82
Chart 4.1: Comparison of Race and Education Level on Importance of TV Judge Shows
0102030405060
White African-American
Latino
HSCollegeGraduate School
The Distinctiveness of Latino Perceptions about the Courts
The previous chapter considered whether Latinos could be characterized asholding views about the courts that were distinctive from the views of African-Americansand Whites. Here, the analysis is extended to include responses that were given toquestions based on a recent personal court experience.
What our data say about whether Latinos hold beliefs that are more similar toNon-Hispanic Whites or African-Americans is summarized in Chart 4.2. The pattern ofopinions held by Latinos for each factor listed is categorized based on previouslyreported analyses either with African-Americans or Whites. In one instance, for theoverall procedural justice index, Latino views did not match those held by either of theother racial\ethnic groups sufficiently to allow categorization.
The chart’s first section illustrates that within the general population, Latinos aremore likely to respond in a manner similar to Whites than to African-Americans. This isconsistent with the tendency for Latinos as a group to share the views of Whitesconcerning the amount of discrimination in society at large. The only exception at thegeneral level is that Latinos, like African-Americans, very strongly support changes tothe traditional role of the courts.
Whites were less likely to support changes in the traditional court role and wereless likely to perceive discrimination by the courts than African-Americans. However,Whites were more likely than African-Americans to rate the performance of the courts,quality of treatment by the courts, and an overall evaluation of the courts in various casetypes as positive. Latinos were more likely to respond in a manner similar to Whites onmost of the predictor variables. Yet, Latinos were more closely aligned to African-Americans in terms of support for a change to the traditional hands-off approach bycourts to underlying social and psychological problems.

83
The second section in Chart 4.2 specifies how Latino respondents with courtexperience compared to other racial groups. Overall, Latino court users reported thatthey saw fair treatment for the most part. However, when asked how well courts treatedthe respondents personally, both Latinos and African-Americans reported worsetreatment than was reported by Whites. Latinos, like African-Americans, believed theirrace made a difference in how they were treated.
Although Latinos report that they anticipated being treated fairly in the future (asdo Whites), they were unlikely, as is consistent with African-Americans, to feel it islikely that they would turn to the courts to resolve future disputes.
All court users were asked which sources of information were influential of theiropinion of the courts. All three major racial and ethnic groups rated their own personalexperience as most influential. Respondents only varied on a couple sources. Forinstance, African-Americans and Latinos were both more likely than Whites to report thatthe media (TV and newspapers) and TV Judge Shows (e.g., Judge Judy) was aninfluential source for opinions of the local courts.
Chart 4.2: How Do Latinos Compare to Whites and African-Americans?
Whites MiddleAfrican-
AmericansGeneral PopulationDiscrimination in Society ▲Discrimination by the Courts Index ▲Overall Evaluative Index ▲Performance Index ▲Quality of Treatment Index ▲Support for Changing Roles of Courts ▲Court ExperienceSaw fair outcomes/procedures ▲Procedural Justice Index ▲Personal treatment ▲Personally discriminated against ▲FutureExpect fair outcome/treatment future ▲Likely to use courts future ▲SourcesTV Judge Shows ▲
Latinos, thus, hold a distinctive profile of opinions about the courts in theircommunity. There is no empirical basis for treating Latinos as consistently more likeWhites or like African-Americans in matters related to the courts. There is some, but notconclusive evidence, that being in court is experienced similarly by African-Americansand Latinos, even if their overall support for the courts differ.

84
The Effect of Recentness
The focus of this report is on people with recent court experience. It was assumedthat the impact of court experience would be most strongly present in the immediateaftermath of being to court. Previous research suggests that the influence of courtexperience is more lasting. People with any court contact, no matter how distant in thepast, have been found, in comparison to people with no contact, to (a) rely on differentcriteria in forming their evaluations of the courts, (b) to rely more heavily on proceduraljustice considerations in making their assessments, and (c) to have opinions that areeasier to predict (see Olson and Huth, 1998).
It is possible to test for the extent to which the same pattern of generalized anddurable effects of court experience is present in the current survey. The general sampleof randomly selected adults yielded 295 individuals with prior court experience that datesback more than 12 months previously and no more recent experience.
The findings from the current survey provide some support for the claims madeby other researchers. The variables under consideration explain more of the variation ofopinions for those with recent court contact, but not for those with more distant contact(see Table 4.16). That is consistent with findings from other studies (e.g., Olson andHuth, 1998).
Table 4.16:
Antecedents of Perceived Favorability Towards the Court:Multiple Repression*
Beta weights
No courtcontact
Court contactnot in last 12
monthsRecent court
contactHow often do people receive fairoutcomes in court? -.31* -.24* -.28*How often do courts use fairprocedures? -.18* -.24* -.28*Cost and speediness of courts -.23* -.19* -.21*Support changing roles -.06
.05 -.02African-American -.04 .07 .00Latino -.01 -.02 .04
Adjusted R-Squared .28* .24* .38*
* P < .05*Low values indicate favorability.
In other respects, the three-fold distinction is unenlightening. There is nocontinuum in which people with some, but not recent, court experience represent amiddle group between those with no prior contact and those with recent contact. Thereare, however, a few affinities that differentiate courts users as a group from respondentswithout any prior court experience. Procedural justice is a stronger influence among

85
court users on people’s assessments and fair outcomes a weaker influence for court usersrelative than for non-court users (see also Tyler, 2001:229-30).
A Look Back
The data and analysis presented in this chapter supports in part and questions inpart findings from previous studies of the joint influence of court experience and race onopinions about courts. In still other respects, the data and analysis point to directions notdirectly considered by previous studies.
Latinos and African-Americans are more positive about the fairness of outcomesand procedures they personally experienced than about how fairly courts in general treatpeople.
Perceptions of fairness tended to be moderately positive. Former jurors perceivedhigher levels of procedural justice when in court than did witnesses or litigants. African-Americans with recent jury experience, however, tended to rate the courts lower than didWhites or Latinos.
Respondents with court experience were neither very favorable nor unfavorabletoward the courts in their community. The average score was just below the midpointvalue of 3.0 on the five-point favorability measure. Latinos were the most favorableamong former jurors and litigants and African-Americans the least favorable. However,favorability ratings were influenced positively by the fairness of procedures experiencedand the affordability and timeliness of courts. Race and role in court did not influencefavorability ratings.
Ratings of how well courts handle cases were shaped by perceptions of theprocedural justice respondents themselves experienced. Demographic variables and therole a person played in their court experience did not influence ratings. However, supportfor non-traditional court roles was associated with lower ratings for how well violentcrimes and substance abuse cases are handled.
As in other studies, procedural justice considerations are of great consequence inpeople’s evaluations of the courts. However, the limited information available onefficiency issues like cost and speed suggests that procedural justice concerns vie withmore practical concerns in molding opinions.
A person’s race or ethnicity was not a consistent influence on support for thecourts or for the likelihood of returning to court. Court role, at least as could bemeasured in the current survey, also did not consistently influence opinions.
Where race/ethnicity and court role were influential, there effect was direct (withone exception out of numerous criterion variables). The effect of the type of role oneplayed in court was not conditioned upon racial or ethnic group membership. The same

86
conclusion emerged in Chapter 3 for the overall influence of whether the respondent hadhad a recent court experience.
Recent court users anticipated fair treatment if they were to be a party to the samekind of case in the future. Former jurors and witnesses anticipated fairness byoverwhelming margins. Litigants were less optimistic, but a majority believed that theywould be treated fairly. This was true among the least positive group, African-Americanlitigants.
Although most respondents believed that they would receive fair outcomes andfair procedures in a future court experience, there was limited enthusiasm for using thecourts as an institution in the future. A majority of former jurors and witnesses reportedbeing likely to go to court to resolve a similar dispute at some point in the future. Formerlitigants tended to be equally divided between those likely and unlikely to go to courtagain.
Race and ethnicity do not influence the likelihood of using the court in the future.Instead, the greatest influence comes from the perceived level of procedural justicerespondents experienced. Role in court makes a difference, too. Former jurors were thegroup least inclined to return to court (relative to former litigants and witnesses). Thiswas not the case among Latinos. The factors considered in this study did not fare verywell in predicting whether Latinos say that they are likely to return to court if involved ina similar kind of case.
All in all, Latinos hold distinctive views of the courts. An omnibus category ofminority group members, a necessity in most surveys of public opinion on the courts, isinherently unsound. Latinos tend to be similar to Whites in their overall orientationtoward the courts. The only clear difference is that Latinos often are more positive thanWhites. Latinos, however, experience the courts in a manner similar to African-Americans.
Finally, respondents rated their recent court experience as the most importantinfluence on their overall impression of courts. This was not true for Latinos, however,who appear to regard a wider range of sources as very important in their influence. BothAfrican-Americans and Latinos rated electronic and print news media as more importantsources than did Whites. The strongest group difference came in the importance attachedto programs like “Judge Judy” or “The People’s Court” as sources of information byminority group members.
These findings about the influence of the media for Latinos can be tied to findingsfrom other surveys. Specifically, Latinos are significantly more likely than Whites toagree with the statement “The media’s portrayal of the courts is mostly accurate.”Twenty-two percent strongly agreed and 42 percent agreed. The comparable proportionsfor Whites were 12 and 34 percent (National Center for State Courts, 1999:21; see alsoTexas, 1998).
87
Chapter 5
Conclusions and Implications
Overview
This chapter looks beyond the array of specific findings drawn from the survey,Public Opinion on the Courts: A National Portrait and Interpretation, conducted inMarch and April 2000. It looks in two directions. The first direction is back to thereview in Chapter 1 of findings from other research on opinions about the state courts.The purpose is to assess what had been learned that might benefit the scholarly literature.Findings from the survey are consistent with some conclusions drawn from previousstudies but inconsistent with others.
The second direction is to the future, and the purpose is practical. The targetaudience is people who work in the state courts. Implications for policy and for courtoperations are considered. Suggestions are made on how to incorporate opinion surveysinto the judicial branch’s policy-making process.
Contributions to Research
The report addressed two primary research questions.
• What differences exist in how African-Americans, Latinos, and Whites viewthe state courts?
• What influence does recent and direct court experience have on opinionsabout the state courts?
The survey and sampling strategy were designed to look at the interrelationshipbetween racial and ethnic group membership and court experience. Previous researchhad not looked extensively or with national data at the possibility that court experienceinfluences the views of racial and ethnic groups in a similar manner.
The influences associated with race, ethnicity, and court experience were testedbased on a number of indicators. The primary indicators were levels of support for thecourts, the perceived quality with which courts handle cases, the fairness of courtprocedures and court outcomes, and the willingness of individuals with recent courtexperience to return to court on a similar matter in the future.
Main Findings
Specific conclusions drawn from the survey data were summarized at the end ofboth Chapters 3 and 4. Taken together, public opinion of the courts can be characterizedas follows. The public gives the courts middling ratings of support and low ratings offairness in procedures, outcomes, and equality of group treatment. A sense of unequal

88
treatment of people with low income was more pronounced than inequality in thetreatment of African-Americans or Latinos. The survey also highlighted the continuingimportance of perceptions that courts are too costly and slow (with delay seen as a majorcontributing factor to cost in other surveys) for people’s overall support for the courts andevaluations of how well they perform.
As a group, people with recent court experience are slightly more negative aboutthe courts, even though they tend to rate their own experiences rather positively. Themost telling observation from the survey may be the general lack of enthusiasm for beinga party to a future case of a similar kind. It is also curious, and disconcerting to thoseinterested in how to improve public support for the courts, that recent court users had amore positive view of how they would be treated in the future than in the extent to whichpeople generally and usually are treated fairly. To some extent this supports theconclusion from other studies that positive experience with the courts does not contributeto a favorable image of the courts.
There was variation within these broad tendencies in how people regarded thecourts in their community. The direct association between race/ethnicity on opinionstended to be moderate to low, and rarely significant when other factors, like perceptionsof procedural justice, were taken into account. Exceptions include the strong associationbetween race and beliefs that courts treat some groups worse than others.
The influence from court experience was stronger than that from race. Still,neither having been recently to court nor the type of experience one had (as could bemeasured in this survey) were strong influences consistently on support or other opinions.The absence of a strong effect from experience differs from the conclusions drawn fromother cross-sectional survey of opinion on the courts (e.g., Silbey, et al., 1993; Miethe,1995).
Where present, influences on opinion associated with race and with courtexperience were independent. That is, the effect of one influence was not conditioned onthe other. In technical terms, race by experience interaction effects were not statisticallysignificant.
Whether the respondent had been a juror, litigant, or witness was associated insome measure with how they viewed their experience. Jurors tended to be the mostpositive in their ratings of their experience in court but unenthusiastic about the prospectsof having a similar experience in the future.
A more refined approach, distinguishing between plaintiffs and defendants in civilcases and between jurors in civil and criminal cases might prove more illuminating. Thesample had too few respondents with recent court experience to make such distinctionsfeasible. Even the broad, three-fold division of people with recent court experiencerested on very small numbers of respondents who were witnesses and small numbers ofAfrican-Americans and Latinos who had been jurors or litigants.

89
As in other studies, procedural justice considerations tend to dominate influencesfrom demographic factors, including race and ethnicity. Other influences vied withprocedural justice as influences on support for the courts, notably concerns about thespeed and cost of court proceedings.
The analysis presented in this report suggests that recent court experience may bequalitatively different from court experience that occurred in the past. The factorsinfluencing opinions held by recent court users appear to be different in some significantways from those operative for people with no experience or with prior but not recentexperience.
The survey demonstrates that it is incorrect to speak of a minority viewpoint onthe courts. African-Americans and Latinos appear to reach somewhat similar conclusionsabout the fairness of court procedures from their experience in court. For the most part,however, Latinos share the general perceptions of Whites. Indeed, Latinos in manyrespects rate the courts in their community more highly than do Whites. This isconsistent with other recent national and state surveys (e.g., National Center for StateCourts (1999) and state surveys in Arizona (1997), California (1992), Minnesota (1991),New Mexico (1999), Texas (1998), and Washington (1999)).1 The conclusion of thereport on another national survey (Myers, 1995) that Latinos are the group least satisfiedwith the courts must be viewed with caution.
Implications for Research
The current survey has strengths and weaknesses that have implications for thepractice of studying public opinion on the courts. The survey’s strengths are therelatively large number of African-American and Latino respondents in the sample andthe availability of data on respondents with recent court experience from both minoritygroups. Another strength is the detailed assessments by recent court users of the mannerin which they were treated while in court.
The survey’s weaknesses follow from the strengths. A primary weakness is thesmall number of African-Americans and Latinos in the three types of roles in court usedin the analysis. The category with the largest number of minority group members withexperience—litigants—mixes together criminal defendants with civil plaintiffs, alongwith civil defendants. Similarly, the large number of procedural justice questions used inthe survey took up space that might otherwise have been devoted to questions concerningother aspects of court experience and to more detailed descriptions of the kinds of casesin which respondents were involved.
A number of methodological issues were raised by the survey. One issue is thelack of a standard practice for identifying persons with court experience. The existing set
1This survey represents the best look at Latino opinion on the courts available to date. However, it does notreflect differences within the Latino community based on place of residence, national origin, or place ofbirth. A large national survey of Latinos with recent court experience will be necessary to reflect thevariation within the Latino population.

90
of national surveys of opinion about the courts yield very different estimates of theproportion of adults with court experience. The 1998 Perception of the Justice Systemsurvey (ABA, 1998) found that 89 percent of respondents had ever had court experience.The following year, the How the Public Views the State Courts survey (National Centerfor State Courts, 1999) estimated that 53 percent of the adult population had ever been tocourt. (The 1977 Public Image of the Courts survey produced an estimate of 43 percent).
These differences in the proportion of court users can to some extent bereconciled. The ABA survey included persons summoned for jury duty as having hadcourt experience, while the National Center surveys (1999 and the current survey)included only persons who had served as a member of a jury.
The reason for other differences in who gets included in the pool of persons withcourt experience may be more difficult to identify. The ABA survey, for example,contains, relative to the National Center surveys, a very large proportion of persons whohad been involved in a traffic case, as well as very large proportions of persons reportingthat they had been spectators in court or had gone on a courthouse tour.
The wording of questions used to identify persons with court experience will tosome extent depend on the purpose of a survey. That said, the varying approaches takenby existing surveys to screening places formidable obstacles in the way of comparingfindings across surveys.
Another methodological issue is finding ways to measure the intensity of contactwith the court. Intensity might be treated as having two dimensions. One dimension isthe frequency of court contact. The second dimension is the seriousness of the matterthat brought the person to court. To litigants, seriousness is relative to the potentialconsequences of the court’s decision and, perhaps, to the kinds of emotions tied to thecase. An intensity dimension also applies to jurors, some of whom helped reach verdictsin capital murder cases and others in misdemeanor theft cases.
Attempts at measuring the intensity of past court experience will present much thesame set of problems encountered by crime victimization surveys, such as selectiverecall. Some of the methodological advances made in surveys of crime victims can beapplied to the task of measuring the frequency and nature of court experiences. It isunlikely, though, that any agency or foundation can be interested in supporting researchthat would be specific to improving the study of people’s encounters with the state courts.
A different strategy might be needed to advance the art of studying courtexperience. One line of approach is to use large-scale, continuous telephone surveyenterprises to identify persons with very recent court experience. Persons so identifiedcould be contacted later and asked to participate in a court-specific survey. A financialpayment should suffice to obtain a good rate of response to such a survey.
Another approach might be a research design that starts in the courthouse.Researchers might randomly select courts and times of day to recruit participants in

91
surveys about their experience in court. The potential of such a strategy has been shownby work in Wisconsin (Kritzer and Voelker, 1998). Again, it is likely, however, that afinancial inducement comparable to that given to focus group participants would need tobe offered to secure an acceptable response rate.
On the other hand, it may be that some research questions require a depth ofinformation and thoughtfulness in responses that cannot be obtained in a telephonesurvey. The multi-methodology study in New Jersey by Silbey and her colleagues (1993)offers a model to build upon.
Some new lines of inquiry were opened by the analysis. The concept of aproblem-solving judge is much in the news. There is evidence from this survey that thereis strong public support for the non-traditional roles that problem-solving implies.Support is strongest among African-Americans and Latinos.
Support for non-traditional court roles is associated with dissatisfaction with thecourts. That association needs to be refined into more than a correlation. It appears fromthe analysis presented in this and in the last chapter that the willingness to give the courtsnew responsibilities is not a reflection of trust in the motivations of judges and courts.Support for new roles might instead be viewed as unmet expectations people hold of thecourts.
Contributions to Policy and Practice
What the public wants from the courts is in large measure what it wants fromgovernment in general: “A process that matches a person’s preferences for how theprocess should work increases approval of government” (Hibbing and Theiss-Morse(2001:150).
The findings from the present survey provide some insight into the potentialimpact of approaches to improving the fit between the current judicial process and howthe public prefers decisions to be made. Approaches to be considered include using themedia more astutely to educate and woo the public, having courts work collaborativelywith community-based organizations, enhancing the quality of judicial interaction withpersons in the courtroom, and integrating opinion surveys into the judicial policy-makingprocess.
The Media
Electronic media are cited as important sources of information about the courts,even among individuals with recent court experience. The importance extends in somemeasure to TV dramas and TV judges, which appear to be more frequent sources ofinformation among African-Americans and Latinos than among Whites.
The content of the electronic image of the courts is not conducive to promoting animage of procedural justice. Arguably, TV judges would receive low ratings on the

92
elements of procedural justice concerned with respect, neutrality, and trustworthiness.However, litigants on television programs seem to have more opportunities than reallitigants to make their views known—the participation element of procedural justice.
The content of electronic information about the courts is of considerableimportance to court leaders. The stakes are high, as Lawrence Sherman recentlyobserved:
The future authority of the criminal justice system may well depend onhow it appears not just to those directly involved in the system, but to allcitizens. That, in turn, may depend very heavily on how criminal justicemanages its image in the electronic media (Sherman, 2000:17).
But courts are poorly placed to influence their image in electronic media. People drawupon a stereotypical image in their heads of courts when answering survey questionsabout the courts. Their point of reference appears to be a generic image; they are notprimarily about a particular court or a particular state’s courts. National media depictionsin our view have more influence as a source and reinforcer of opinion about courts thanabout most other public institutions. This is consistent with the limited change over thelast quarter century in levels of support for the courts and in the views people hold abouthow courts conduct their business. Public opinion on the state courts seems highlyresistant to change.
A root cause of the difficulty in making a dent in the opinions people have of thestate courts is a lack of attentiveness. Courts do not weigh heavily on the public mind.This was clear, for example, in the large proportion of survey respondents choosing aneutral rating for the courts when given that choice. Far fewer respondents used theneutral category to rate the other institutions considered, the police and the schools.
What can be done in the face of these obstacles? The key concern here is to getthe public’s attention. At the national level, court leaders may need to call uponmarketing researchers to do the kind of background research through which a messagecan be crafted that resonates with the public, one that connects the work of the “courts inyour community” to values and concerns that rank high in the public mind. This will be achallenge.
Courts can take steps to promote and improve their local image. Some earlierefforts to get the attention of the local public fared poorly. The best-documented attemptto use the media as a source of positive information, carried out in the early 1990s inUtah, produced many print and electronic stories about the court but little notice from theviewer audience (Olson and Huth, 1998). Similarly, ambitious community-based courtreform efforts widely covered by city and neighborhood news media go largely unnoticedin the surrounding neighborhoods. Good news about the courts does not appear to travelfar or make a lasting impression.

93
There nonetheless are reasons for at least modest optimism. A number of localcourt reform efforts appear to have mobilized widespread public involvement andawareness. Two examples are the Franklin County, Massachusetts Reinventing Justiceproject (active since 1994) and the Oakland County, Michigan Youth Assistance Program(active continuously since 1953).2 Research is needed to measure the public profile ofthose efforts and, if warranted, help unravel the reasons for their success.
If such efforts have succeeded in engaging the local public, the usual pattern oflow interest and low awareness can be given a positive spin. The courts have both fewersupporters and fewer critics than other public institutions. The public image of the courtmay prove susceptible to change after all.
Court and Community Collaboration
The survey’s findings provide encouragement to individual trial courts and statecourt systems engaged in programs of court and community collaboration (Rottman et al.,1998). Collaboration extends beyond the community court model to encompass the wayin which an entire trial court relates to the public.
The generic traits of court and community collaboration are:
♦ Commitment to Solving Community Problems. This commitment is thehallmark of community-focused courts in general and, thus, an essentialelement of court and community collaboration.
♦ On-going two-way consultation with the public about how the court shouldoperate. The public, or the community, becomes a part of a dialogue ratherthan merely a recipient of information or services from the court. Discussionsdeal with court operations without interfering with judicial independence orcase decision-making.
♦ Continuity. Community involvement is integrated into the court’s operationalstructure. Examples include the formation of standing citizen advisorycommittee or periodic public consultation meetings.
Collaboration offers trial courts access to resources necessary to adjudicate newtypes of disputes, including volunteers, and appears to enhance public understanding andsupport of the court. A specific benefit is the creation of a constituency that will speak insupport of the courts. For present purposes, the main benefit may be to counter thenegative image courts have of the element of participation in procedural justice—theperception that one can tell directly or through an intermediary one’s side of the story(Gibson, 1989). Collaboration gives the public a legitimate and influential voice in theirlocal courts.
2 Profiles of these and other examples of successful court and community collaborations can be found inRottman et al., 1998.

94
Successes at the local level have led several states to establish multi-site orstatewide programs of court and community collaboration. The most developedexamples are in California, Massachusetts, and New York State (Rottman, Efkeman, andStump, 2002). The California model incorporates an ethos of court and communitycollaboration at the state policy-making level.
Courtroom Conduct
Greater attentiveness on the part of judges to procedural justice issues offers aground up approach to enhancing the public standing of the courts. Other research tellsus, for example, that a judge’s demeanor while on the bench can affect how litigantsevaluate their experience. One study, for example, found that the satisfaction of domesticviolence victims, a difficult audience to sell on the fairness of the courts, improved “inpart because they were surprised by friendliness and care shown by judges” (Roberts andStalans, 1997:146).
Findings from the current survey highlight the crucial role that procedural justiceplays in shaping people’s views of the courts. People without court experience areinfluenced by their views on how people generally are treated by the courts. People withrecent court experience based their support for the courts on the procedural justice theypersonally experienced. The procedural justice influence was particularly strong forrecent court users.
Courts face two main challenges in using the courtroom to demonstrate the degreeto which they are procedurally fair. One obvious challenge is to adopt, where consistentwith due process considerations, the kinds of behaviors and practices that are consistentwith public expectations of fair decision-making processes.
The second challenge facing the courts is to make positive experiences in courtsmore durable. Survey respondents with recent court experience tended to see themselvesas having been treated rather fairly. The index of perceived procedural justice stronglyinfluenced the likelihood of returning to court to resolve a future dispute. The better thetreatment, the more likely respondents were to say they would return, regardless of theirdemographic characteristics. Yet, as a group, people with recent court experience tendedto be more negative about the courts than were people without such experience.
Also, although most respondents believed that they would receive fair outcomesand fair procedures in a future court experience, there was limited enthusiasm for usingthe courts as an institution in the future. A significant minority (44 percent overall) ofthose with recent court experience said that they were “very unlikely” or “unlikely” to goto the courts to resolve a similar dispute.
Courts are responding to the first challenge in a number of ways. The academicliterature on procedural justice has found its way into periodicals and newsletters aimedat audiences of judges and court administrators (e.g., Warren, 2000). Prominentprocedural justice scholars like Tom Tyler appear on panels and make presentations at

95
the annual meetings of the largest judicial and court management associations.Awareness of the importance of procedural justice is now widely distributed in the statecourt community.
Some individual trial courts are moving from awareness into action programsinvolving procedural justice. For example, the District Court in Hennepin Count,Minnesota (Minneapolis) has conducted workshops specifically aimed at improving thecourt’s performance or procedural justice matters.
The apparent success of drug courts in keeping clients in treatment and refrainingfrom recidivism also encourages the adoption of an approach to courtroom interactionthat meet the criteria of procedural justice. Some of the success of drug courts wouldappear to rest on the extent to which the drug court judge role conforms to the elementsof procedural justice. As in many other contexts, procedural fairness by authorities indrug courts improves compliance with court decisions.
Courts as Problem-Solvers
The survey found strong public backing for non-traditional judicial and courtroles that contribute to solving the problems that bring people into the court. The linkidentified in this report between high support for non-traditional court roles and lowlevels of support for the courts as they currently stand is a correlation. It seems clear,however, from the analysis presented in this and in the last chapter that the willingness togive the courts new responsibilities is not a reflection of trust in the motivations of judgesand courts. Support for new roles might instead be viewed as unmet expectations peoplehold of the courts.
Such an interpretation is consistent with research on the legal profession. Therights based approach given emphasis by the legal system neglects the caring dimensionthat the public values in decision-making. A problem-solving approach to how courtsshould conduct their business brings the courts closer to the public’s preferences forreaching decisions. Research on the attributes of lawyers suggests that they relydisproportionately on analytic, rational though to make decisions are not “interpersonallysensitive, meaning not attuned to the emotions, needs, and concerns of other people andnot concerned with interpersonal issues or harmony” (Daicoff, 1997:46). Adoption ofnon-traditional roles for judges and courts responds to the “ethic of care” dimension thatpeople value in decision-making.
Opinion Surveys as Guides to Policy
The majority of state judicial branches have commissioned a public opinionsurvey. Most of those surveys date from the mid-1990s. The surveys have contributed tothe work of task forces and futures commissions, and, in some states, have fosteredsignificant policy changes. More typically, the survey findings have a short shelf life.They are not incorporated into ongoing processes of policy development.

96
Many reports based on state surveys barely scratch the surface of things, reportingbasic frequencies and a few of the more obvious cross-tabulations that might beundertaken. Only a few states have carried out more than one opinion surveys.
Statewide surveys are expensive. Survey findings need to be placed in a contextto justify the investment of resources they require and to make the findings useful toolsfor policy-makers. A way forward toward more sophisticated use of survey results hasbeen proposed and partly implemented in Spain by Jose Toharia (2001). Tohariaproposes the systematic incorporation of opinion research into court administration. Sixaspects of court performance could be measured in this manner: independence, fairness,accountability, professional competence, accessibility, and efficiency (Toharia, 2001:16).
Surveys of the general public would provide insight into the views of potentialcourt users. The other four publics Toharia distinguishes are operators (court staff),experts (legal scholars, journalists covering the courts, and legislators), and actual users.Public opinion surveys can be combined with information sources on the opinions of theother publics to obtain a balanced measure of how well the courts are performing.
One use Toharia proposes for public opinion surveys is to serve as a “repertoireof symptoms.” Such a repertoire has practiced applications:
If the citizens’ evaluation deviates significantly from expert assessmentson the operation of a given institution (for instance, on the way the Justicesystem is performing) the urgent need arises to redress the public image ofthe institution—lest its legitimacy finally suffer. The adoption of a aninformative or ‘public relations’ policy on the part of the system of Justiceis more likely to be effective if the symptoms of discontent provided bythe analysis of opinion are adequately recorded and taken intoconsideration (Toharia, 2001:12).
The survey reported here provided a partial test of the usefulness of such anexercise by comparing the views of two publics, potential users and actual users.Members of the two publics tend to agree more than they disagree on theproblems that they believe exist in the “courts in your community.”

97
References
Antonio, M. E. & Hans, V. P., (2001). Race and the Civil Jury: How Does aJuror’s Race Shape the Jury Experience? In Roesch, R., Corrado, R. R., & Demputer, R.(Eds.), Psychology in the Courts: International Advances in Knowledge (pp. 69-81).Routledge, NY.
Benesh, S., (2001). Are These the Unloved?: The Correlations of Confidence inAmerica’s Lower Courts. Working paper – Program for Law and Judicial Politics,Michigan State University.
Benesh, S. C., & Howell, S. E., (2001). Confidence in the Courts: A Comparisonof Users and Non-users. Behavioral Sciences & the Law 19 Number 2, 199-214.
Boyum, K. O., (1992) What is Known About General Citizen Attitudes andKnowledge About the Courts: Report to the Judicial Council of California. SanFrancisco: Administrative Office of the Courts of California.
Braithwaite, V. & Levi, M., eds., (1998) , Trust and Governance. New York:Russell Sage Foundation. Pp. 269-294.
Brooks, R. R. W. & Jeon-Slaughter, H., (2001). Race, Income and Perceptions ofthe U.S. Court System. Behavioral Sciences & the Law 19 Number 2, 261.
Calderia, G. A., (1991). Courts and Public Opinion. In Gates & Johnson (Eds.),The American Courts: A Critical Assessment (pp. 303-334). Washington, DC: CQ Press.
Champagne, A., (2002). Television Ads in Judicial Campaigns. Indiana LawReview 35 Number 3, 669.
Clark, J. Boyum, K, Krislov, S., and Shaeffer, R. (1972). Compliance,Obedience, and Revolt. In S. Krislov et al. (eds.) Compliance and the Law: AMultidisciplinary Approach. Sage.
Curran, B.A., & Fryklund, I. (Barbara A. Curran, 1977). Opinions andPerceptions, The Legal Needs of the Public: The Final Report of a National Survey 236,235 tbl. 6.8.
Cutler, B. L. & Hughes, D. M., (2001). Judging Jury Service: Results of theNorth Carolina Administrative Office of the Courts Juror Survey. Behavioral Sciences &the Law 19 Number 2, 305-320.
Daicoff, S., (1997) Lawyer, know thyself: a review of empirical research onattorney attributes bearing on professionalism, The American University Law Review 46,1337-1427

98
De la Garza, R. O. & DeSipio, L., (2001). A Satisfied Clientele Seeking MoreDiverse Services: Latinos and the Courts. Behavioral Sciences & the Law 19 Number 2,237-248.
Diamond, S. (1993). What Jurors Think: Expectations and Reactions of CitizensWho Serve as Jurors. In (Litan, R. ed.) Verdict: Assessing the Civil Justice System,Washington DC: Brookings Institute, 282-305.
Doble, J. and Green, J. (2000) Attitudes towards Crime and Punishment inVermont: Public Opinion about an Experiment with Restorative Justice. EnglewoodCliffs, NJ: John Doble Research Associates.
Ewick, P. & Silbey, S. S., (1998). The Common Place of Law: Stories fromEveryday Life. 47-49.
Fagan, R. W., (1981). Public support for the courts: An examination ofalternative explanations. Journal of Criminal Justice, 9, 403-418.
Flanagan, T. J., (1996). Public Opinion on Crime and Justice: History,Development, and Trends. In Flanagan and Longmire (Eds.), Americans View Crime andJustice: A National Public Opinion Survey (pp. 1-15). Thousand Oaks, CA: SagePublications, Inc.
Flanagan, T.J., McGarrell, E.F., & Brown, E., (1985). Public perceptions of thecriminal courts: The role of demographic and related attitudinal variables. Journal ofResearch in Crime and Delinquency, 22, 66-82.
Franklin, C. H. & Kosaki, L. C., (1995). Media, Knowledge, and PublicEvaluations of the Supreme Court. In Epstein (Ed.), Contemplating Courts (p. 373).Washington, DC: CQ Press.
Fukurai, H., (1996). Race, Social Class, and Jury Participation: New Dimensionsfor Evaluating Discrimination in Jury Service and Jury Selection, Journal of CriminalJustice, 24, No. 1, 71-88.
Gibson, J. L., (1989). Understanding of Justice: Institutional Legitimacy,Procedural Justice, and Political Tolerance, Law & Society Review, 23, 469.
Gibson, J. L. & Caldeira, G. A., (1992). Blacks and the United States SupremeCourt: Models of Diffuse Support, The Journal of Politics, 54, No. 4, 1120-1145.
Gibson, J. L., Caldeira, G. A., & Spence, L. (2001). Public Knowledge of theUnited States Supreme Court, 2001.http://www.artsci.wustl.edu/~legit/Courtknowledge.pdf

99
Goerdt, J., Ostrom, B., Rottman, D., LaFountain, N., & Kauder, N., (1995)Litigation Dimensions: Torts and Contracts in Large Urban Counties, State CourtJournal 19, No. 1, 1-47.
Goldschmidt, J., Mahoney, B., Solomon, H., and Green, J. (1998). Meeting theChallenge of Pro Se Litigation. Chicago: American Judicature Society.
Glynn, C. J., Herbst, S., O’Keefe, G. J., & Shapiro, R. Y., (1999). Public Opinion.Westview Press.
Hagan, J., Albonetti, C., (1982). Race, Class, and the Perception of CriminalInjustice in America, American Journal of Sociology, 88, No. 2, 329-355.
Harlow, C. W., (2000). Defense Counsel in Criminal Cases. Bureau of JusticeStatistics Special Report. U.S. Department of Justice, Office of Justice Programs.
Hengstler, G. A., (1993). The public perception of lawyers: ABA poll. ABAJournal, 97, 60-65.
Hetherington, M. J., (1998). The Political Relevance of Political Trust, AmericanPolitical Science Review, 92, 791.
Hibbing, J. R. & Theiss-Morse, E., (1995). Congress as Public Enemy: PublicAttitudes toward American Political Institutions.
Hibbing, J.R. & Theiss-Morse, E., (2001). Process Preferences and AmericanPolitics: What the People Want Government To Be. American Political Science Review95, 145-154.
Hindelang, M. J., (1974). Public opinion regarding crime, criminal justice, andrelated topics, Journal of Research in Crime and Delinquency, 11, 101-116.
Howell, S.E., (1998). Citizen Evaluation of the Louisiana Courts: A Report to theLouisiana Supreme Court. New Orleans, LA: University of New Orleans.
Hunt, D. M., (1997). Screening the Los Angeles “riots”: Race, seeing, andresistance. Cambridge University Press.
Iyengar, S., (2001). The Effects of Media-Based Campaigns on Candidate andVoter Behavior: Implications for Judicial Elections. Indiana Law Review 35, Number 3,691.
Kramer, R. & Tyler T., eds. (1996) Trust in Organizations: Frontiers of Theoryand Research.

100
Kritzer, H. M., & Voelker, J. (1998). Familiarity Breeds Respects: HowWisconsin Citizens View their Court, Judicature, 82, 59, 64.
Kritzer, H. M., (2001). The impact of Bush v. Gore on public perceptions andknowledge of the Supreme Court, Judicature 85, No. 1. 32-38.
Lippmann, W., (1922/97). Public Opinion. Free Press Paperbacks (Published bySimon & Schuster).
Mahoney, B., Sarat, A. & Weller, S., (1978). Courts and the Public: SomeFurther Reflections on Data from a National Survey, State Courts: A Blueprint for theFuture, (T. Fetter, ed.) National Center for State Courts, 83-102.
Marshall, G., (Ed.) (1994). The Concise Oxford Dictionary of Sociology. Oxford,NY: Oxford University Press.
Mayron, Amy (2003). “Judges are on trial in the court of public opinion:Hennepin County is the 1st in U.S. to survey its ‘customers,’ including criminals, on theircourt experience, The Pioneer Press, January 12.
Miethe, T. D., (1995). Predicting Future Litigiousness, Justice Quarterly, 12, 563,578.
Mondak, J. & Smithey, S., (1997). The dynamics of public support for theSupreme Court, The Journal of Politics 59 No. 4.
Munsterman, G. T. & Hannaford, P., (1997). Reshaping the Bedrock ofDemocracy: American Jury Reform During the Last 30 Years, Judges’ Journal 36, 5.
Myers, L. B. (1996). Bringing the Offender to Heel: Views of the CriminalCourts, Americans View Crime And Justice: A National Public Opinion Survey 46, 56.
National Center for State Courts, (1999). How the Public Views the State Courts: A 1999 National Survey. Funded by The Hearst Corporation.
Nye, J., Zelikow, P. & King, D., (Eds) (1998). Why People Don’t TrustGovernment. Cambridge: Harvard University Press.
Olson, S. M., & Huth, D. A., (1998). Explaining Public Attitudes Toward LocalCourts, Justice System Journal, 20, 41.
Ostrom, B., & Kauder, N., Eds., (1997). Examining the Work of the State Courts,1996: A National Perspective from the Court Statistics Project. National Center for StateCourts. Williamsburg, VA.

101
Paternoster, R., Brame R., Bachman R., & Sherman L. W., (1997). “Do FairProcedures Matter? The Effect of Procedural Justice on Spouse Assault.” Law andSociety Review 31, No. 1, 163-204.
Rennison, C. M., (2001). Criminal Victimization 2000: Changes 1999-2000 withTrends 1993-2000, Bureau of Justice Statistics: National Crime Victimization Survey.U.S. Department of Justices. Office of Justice Programs.
Roberts, J. V. & Stalans, L. J., (1997) Public Opinion, Crime and CriminalJustice. Boulder CO: Westview Press.
Roberts, J. V. & Stalans, L. J., (1998) Crime, Criminal Justice, and PublicOpinion. In Tonry, M. (Ed.) The Handbook of Crime and Punishment. New York:Oxford University Press.
Rottman, D.B. & Casey, P. (1999). “Therapeutic Jurisprudence and the Rise ofProblem-Solving Courts,” National Institute of Justice Journal, (Summer).
Rottman, D. B. (1998). A Compilation of State Court Surveys on Public Trust andConfidence. Williamsburg, VA: National Center for State Courts.
Rottman, D. B., (1999). On Public Trust and Confidence: Does Experience withthe Courts Promote or Diminish It? Court Review, 35, No. 4, 14.
Rottman, D. B., (2000). “Public Opinion on the Courts: A Primer” The CourtManager, 15, No. 3.
Rottman, D.R., Efkeman, H. S., & Casey, P., (1998). A Guide to Court andCommunity Collaboration. Williamsburg, VA: National Center for State Courts.
Rottman, D. R., & Tomkins, A., (1999). “Public Trust and Confidence in theCourts: What Public Opinion Surveys Mean to Judges,” Court Review, 36, No. 3 (Fall).
Sarat, A., (1977). Studying American legal culture: An assessment of surveyevidence, Law and Society Review, 11, 427-488.
Schuman, D. W., & Hamilton, J. A., (1992). Jury Service – It May Change YourMind: Perceptions of Fairness of Jurors and Nonjurors, Southern Methodist Law Review,Fall, 449-479.
Sherman, Lawrence (2002). Trust and confidence in criminal justice, NIJ Journal248, 23-31.
Silbey, S. S., Ewick, P., & Schuster, E., (1993). Differential Use of Courts byMinority and Non-Minority Populations in New Jersey. Report from Supreme Court Task

102
Force on Minority Concerns of the New Jersey Judiciary. Developed under a grant from theState Justice Institute.
Steffensmeier, D. & Demuth, S., (2000). Ethnicity and Sentencing Outcomes in U.S.Federal Courts: Who is Punished More Harshly? American Sociological Review, 65, 705-729.
Steffensmeier, D. & Demuth, S., (2001). Ethnicity and Judges’ SentencingDecisions: Hispanic-Black-White Comparisons. Criminology 39, 145-178.
Sviridoff, M., Rottman, D., Weidner, R., Cheesman, F., Curtis, R., Hansen, R.,and Ostrom, B. (2001). Dispensing Justice Locally: The Impacts, Cost and Benefits of theMidtown Community Court. New York: Center for Court Innovation (report to NIJ).
Sweeney, J. (1998) Bar Public Opinion Surveys Concerning Lawyers and the JusticeSystem. Chicago, IL: American Bar Association Office of Justice Initiatives.
Thomas, R. (1990). A Special Analysis of the Public’s Opinions about the Courtsand Implications for Future Development, Courts, Health Science & the Law 1, No. 2, 224-250.
Toharia, J. J., (2001). Assessing a Judiciary’s Performance Through Public Opinion.Paper presented at the “Rule of Law Workshop: Legal and Judicial Reform in DevelopingCountries.” Stanford Law School, Stanford University.
Tonry, (1998) Crime and Justice in America. In Tonry, M. (Ed.) (1998). TheHandbook of Crime and Punishment. New York: Oxford University Press.
Tyler, (1990) Why People Obey the Law. New Haven: Yale University Press.
Tyler, T. R., (1998), Trust and Democratic Governance, Trust and Governance (V.Braithwaite and M. Levi, eds),New York: Russell Sage Foundation. Pp. 269-294.
Tyler, T. R., (2001). Public Trust and Confidence in Legal Authorities: What doMajority and Minority Group Members Want from the Law and Legal Institutions.Behavioral Sciences & the Law 19 Number 2, 215-236.
Walker, D., (1977). Citizen Contact and Legal System Support, Social ScienceQuarterly, 58 3, 3-14.
Walker, D., (1972). Contact and Support: An Empirical Assessment of PublicAttitudes Toward the Police and the Courts, North Carolina Law Review, 51, 43-79.
Warren, Roger (2000). Public Trust and Procedural Justice, Court Review 37, 3, 12-16).

103
Wasmann, E., Lovrich, N. P., & Sheldon, C. H., (1986). Perceptions of State andLocal Courts: A Comparison Across Selection Systems, The Justice System Journal, 11, No.2, 168-185.
Wilkerson and Associates (1995). North Carolina Court System Research.
Yankelovich et al., (1978). Highlights of a National Survey of the General Public,Judges, and Community Leaders, National Center for State Courts, State Courts: A blueprintfor the Future, 21.
Zemans, F. K., (1991). In the Eye of the Beholder: The Relationship Between thePublic and the Courts, The Justice System Journal 15, No. 2, 722-740.

104
Copyright © 2022 FDOKUMEN