Consumer Acceptance of Online Agent Advice: Extremity and Positivity Effects
The Influence of Altering Push Force Effectiveness on UpperExtremity Demand during Wheelchair Propulsion
Jeffery W. Rankin1, Andrew M. Kwarciak2, W. Mark Richter2, and Richard R. Neptune1
1 Dept. of Mechanical Engineering, The University of Texas at Austin, Austin, TX, USA2 MAX Mobility, LLC, Antioch, TN, USA
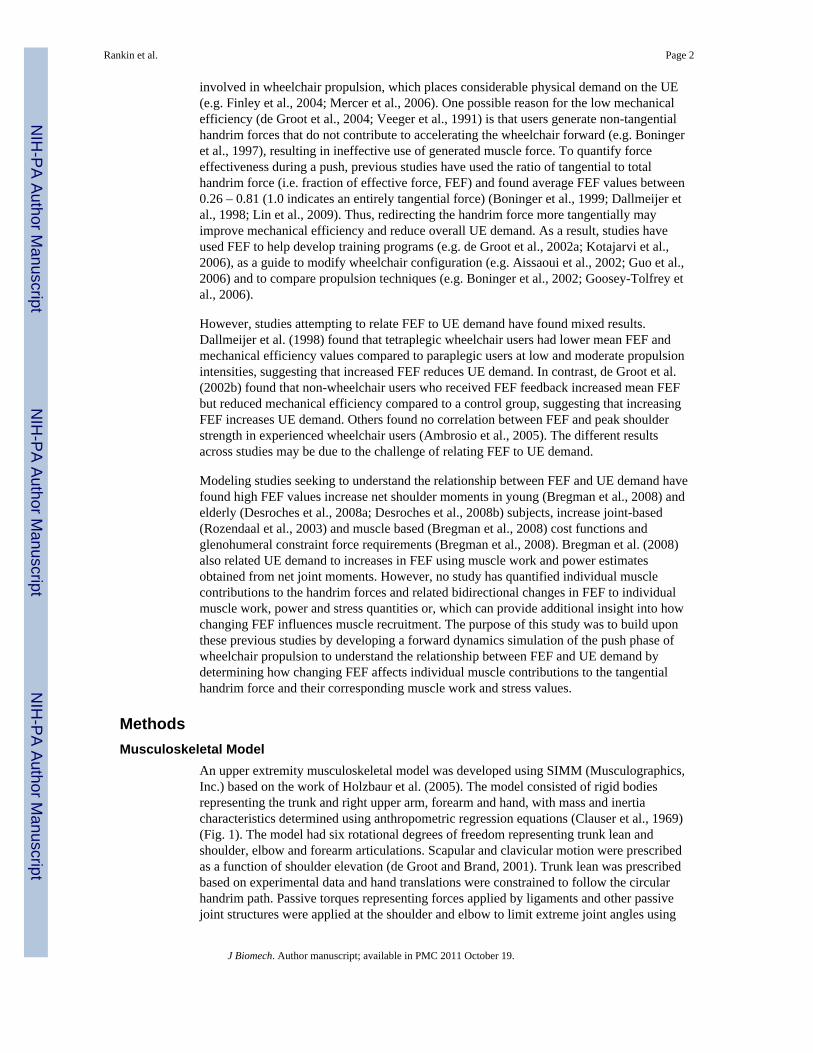
AbstractManual wheelchair propulsion has been linked to a high incidence of overuse injury and pain inthe upper extremity, which may be caused by the high load requirements and low mechanicalefficiency of the task. Previous studies have suggested that poor mechanical efficiency may be dueto a low effective handrim force (i.e. applied force that is not directed tangential to the handrim).As a result, studies attempting to reduce upper extremity demand have used various measures offorce effectiveness (e.g. fraction effective force, FEF) as a guide for modifying propulsiontechnique, developing rehabilitation programs and configuring wheelchairs. However, therelationship between FEF and upper extremity demand is not well understood. The purpose of thisstudy was to use forward dynamics simulations of wheelchair propulsion to determine theinfluence of FEF on upper extremity demand by quantifying individual muscle stress, work andhandrim force contributions at different values of FEF. Simulations maximizing and minimizingFEF resulted in higher average muscle stresses (23% and 112%) and total muscle work (28% and71%) compared to a nominal FEF simulation. The maximal FEF simulation also shifted muscleuse from muscles crossing the elbow to those at the shoulder (e.g. rotator cuff muscles), placinggreater demand on shoulder muscles during propulsion. The optimal FEF value appears torepresent a balance between increasing push force effectiveness to increase mechanical efficiencyand minimizing upper extremity demand. Thus, care should be taken in using force effectivenessas a metric to reduce upper extremity demand.
Keywordsforward dynamics simulation; push technique; musculoskeletal model; handrim force;biomechanics
IntroductionUp to 70% of manual wheelchair will develop upper extremity (UE) overuse injuries and/orpain (Finley and Rodgers, 2004). This high incidence is associated with the high loadrequirements and low mechanical efficiency (i.e. ratio of external work to metabolic cost)
Please address correspondence to: Richard R. Neptune, Ph.D., Department of Mechanical Engineering, University of Texas at Austin,1 University Station C2200, Austin, TX 78712 USA, Telephone: 512.471.0848, Fax: 512.471.8727, [email protected] of Interest statementThere is no conflict of interest regarding the publication of this manuscript.Publisher's Disclaimer: This is a PDF file of an unedited manuscript that has been accepted for publication. As a service to ourcustomers we are providing this early version of the manuscript. The manuscript will undergo copyediting, typesetting, and review ofthe resulting proof before it is published in its final citable form. Please note that during the production process errors may bediscovered which could affect the content, and all legal disclaimers that apply to the journal pertain.
NIH Public AccessAuthor ManuscriptJ Biomech. Author manuscript; available in PMC 2011 October 19.
Published in final edited form as:J Biomech. 2010 October 19; 43(14): 2771–2779. doi:10.1016/j.jbiomech.2010.06.020.
NIH
-PA Author Manuscript
NIH
-PA Author Manuscript
NIH
-PA Author Manuscript
involved in wheelchair propulsion, which places considerable physical demand on the UE(e.g. Finley et al., 2004; Mercer et al., 2006). One possible reason for the low mechanicalefficiency (de Groot et al., 2004; Veeger et al., 1991) is that users generate non-tangentialhandrim forces that do not contribute to accelerating the wheelchair forward (e.g. Boningeret al., 1997), resulting in ineffective use of generated muscle force. To quantify forceeffectiveness during a push, previous studies have used the ratio of tangential to totalhandrim force (i.e. fraction of effective force, FEF) and found average FEF values between0.26 – 0.81 (1.0 indicates an entirely tangential force) (Boninger et al., 1999; Dallmeijer etal., 1998; Lin et al., 2009). Thus, redirecting the handrim force more tangentially mayimprove mechanical efficiency and reduce overall UE demand. As a result, studies haveused FEF to help develop training programs (e.g. de Groot et al., 2002a; Kotajarvi et al.,2006), as a guide to modify wheelchair configuration (e.g. Aissaoui et al., 2002; Guo et al.,2006) and to compare propulsion techniques (e.g. Boninger et al., 2002; Goosey-Tolfrey etal., 2006).
However, studies attempting to relate FEF to UE demand have found mixed results.Dallmeijer et al. (1998) found that tetraplegic wheelchair users had lower mean FEF andmechanical efficiency values compared to paraplegic users at low and moderate propulsionintensities, suggesting that increased FEF reduces UE demand. In contrast, de Groot et al.(2002b) found that non-wheelchair users who received FEF feedback increased mean FEFbut reduced mechanical efficiency compared to a control group, suggesting that increasingFEF increases UE demand. Others found no correlation between FEF and peak shoulderstrength in experienced wheelchair users (Ambrosio et al., 2005). The different resultsacross studies may be due to the challenge of relating FEF to UE demand.
Modeling studies seeking to understand the relationship between FEF and UE demand havefound high FEF values increase net shoulder moments in young (Bregman et al., 2008) andelderly (Desroches et al., 2008a; Desroches et al., 2008b) subjects, increase joint-based(Rozendaal et al., 2003) and muscle based (Bregman et al., 2008) cost functions andglenohumeral constraint force requirements (Bregman et al., 2008). Bregman et al. (2008)also related UE demand to increases in FEF using muscle work and power estimatesobtained from net joint moments. However, no study has quantified individual musclecontributions to the handrim forces and related bidirectional changes in FEF to individualmuscle work, power and stress quantities or, which can provide additional insight into howchanging FEF influences muscle recruitment. The purpose of this study was to build uponthese previous studies by developing a forward dynamics simulation of the push phase ofwheelchair propulsion to understand the relationship between FEF and UE demand bydetermining how changing FEF affects individual muscle contributions to the tangentialhandrim force and their corresponding muscle work and stress values.
MethodsMusculoskeletal Model
An upper extremity musculoskeletal model was developed using SIMM (Musculographics,Inc.) based on the work of Holzbaur et al. (2005). The model consisted of rigid bodiesrepresenting the trunk and right upper arm, forearm and hand, with mass and inertiacharacteristics determined using anthropometric regression equations (Clauser et al., 1969)(Fig. 1). The model had six rotational degrees of freedom representing trunk lean andshoulder, elbow and forearm articulations. Scapular and clavicular motion were prescribedas a function of shoulder elevation (de Groot and Brand, 2001). Trunk lean was prescribedbased on experimental data and hand translations were constrained to follow the circularhandrim path. Passive torques representing forces applied by ligaments and other passivejoint structures were applied at the shoulder and elbow to limit extreme joint angles using
Rankin et al. Page 2
J Biomech. Author manuscript; available in PMC 2011 October 19.
NIH
-PA Author Manuscript
NIH
-PA Author Manuscript
NIH
-PA Author Manuscript
equations similar to those developed for the lower limb (Davy and Audu, 1987). Thedynamic equations of motion were generated using SD/FAST (Parametric TechnologyCorp.).
Twenty-six Hill-type musculotendon actuators with parameters derived from Holzbaur et al.(2005) and governed by intrinsic muscle force-length-velocity relationships (Zajac, 1989)were used to represent the major UE muscles crossing the shoulder and elbow joints.Musculotendon lengths and moment arms were fit with polynomial equations (Menegaldo etal., 2004) over the complete range of motion for each joint during wheelchair propulsion.The order of each polynomial equation was increased until fit errors during the simulationswere either less than ten percent of the corresponding maximal value of the musculotendonlength (moment arm) or 3mm, whichever was greater. Actuators were combined into sixteenmuscle groups based on similar anatomical classification and electromyographic (EMG)data, with muscles within each group receiving the same excitation signal (Fig. 1, Table 1).When EMG data was not available or limited, independent excitation patterns were used.Muscle excitation-activation dynamics were modeled using a first order differential equation(Raasch et al., 1997) with muscle specific activation and deactivation time constants(Happee and Van der Helm, 1995; Winters and Stark, 1988).
Dynamic OptimizationA global optimization algorithm (simulated annealing, Goffe et al., 1994) was used toperform three optimizations. First, a nominal forward dynamics simulation of the push phaseof a representative wheelchair user was generated using the optimization algorithm with anoptimal tracking cost function (Neptune et al., 2001) to identify the muscle excitationpatterns that minimized the difference between the simulation and experimentally measuredpush phase data (see experimental data below). Cost function quantities included the UEjoint kinematics and three-dimensional handrim forces. Two additional optimizations wereperformed that maximized and minimized FEF over the push phase while minimizingdifferences between the experimental joint kinematics and tangential handrim force.
Neural excitation patterns were defined using the linear sum of two parameterized Henningpatterns, which required six excitation parameters (two magnitudes, onset and offset values)for each muscle group, resulting in a total of ninety-six parameters to be optimized. Theexcitation timing parameters for muscle groups with EMG data available were constrainedto correspond with the experimental data. Timing parameters for groups without EMG datawere left unconstrained.
Experimental DataExperimental data were collected from a representative manual wheelchair user who was a36 year old male with paraplegia (T12) and had over 13 years of wheelchair experience. Thesubject’s height and weight were 177.8 cm and 80.7 kg, respectively. Prior to datacollection, the subject provided informed consent. All data collection procedures wereperformed at MAX Mobility, LLC (Antioch, TN).
Testing was conducted on a custom-built wheelchair treadmill while the subject propelledhis own wheelchair at his self-selected speed of 0.84 m/s and cadence of 51.1 pushes/minute. Shoulder and elbow kinematics were obtained using a 3-camera motion capturesystem (Phoenix Technologies) and an active marker set (Fig. 2). Marker data werecollected at 100 Hz and low-pass filtered (10 Hz) using an eighth-order Butterworth filter.Handrim kinetics and wheel angle were recorded at 200 Hz using an OptiPush force sensingwheel (MAX Mobility, LLC; Richter and Axelson, 2005) and low-pass filtered (20 Hz)using an eighth-order Butterworth filter. Raw EMG data were collected from the anterior,
Rankin et al. Page 3
J Biomech. Author manuscript; available in PMC 2011 October 19.
NIH
-PA Author Manuscript
NIH
-PA Author Manuscript
NIH
-PA Author Manuscript
middle, and posterior portions of the deltoid, sternal portion of the pectoralis major, bicepsbrachii and medial and lateral portions of the triceps brachii (Fig. 2) at 1500 Hz usingsurface electrodes and then rectified, band-pass filtered (10 – 500 Hz) and smoothed using a100 ms moving average window.
Data were collected for 10 complete strokes, with stroke limits defined by kinetic data fromthe wheel. Each stroke began when a discernible radial or tangential force was applied to thehandrim and ended at the start of the following stroke. The end of the push phase wasdefined as the time when the handrim forces returned to the baseline value. Data for eachstroke were normalized to 100 percent of the stroke using cubic spline interpolation andaveraged over all strokes to create representative biomechanical and muscle excitationprofiles.
AnalysisThree consecutive propulsion cycles were simulated for each optimization and data wereanalyzed during the third push phase to assure the simulation reached steady-state. For eachsimulation, the minimum, maximum and average FEF values were determined. Individualmuscle contributions to the handrim forces and how these contributions change with FEFwere determined by independently applying each muscle force to the model and calculatingthe resultant handrim forces. The push phase was divided into three equal regions thatapproximate regions of 1) increasing, 2) peak and 3) decreasing upper extremity power(Price et al., 2007) and average muscle contributions were determined within each region.To determine if the resulting simulation muscle activity was consistent with each muscle’scapacity to contribute to the handrim forces, an additional analysis was performed thatcalculated each muscle’s average contribution to the handrim forces during each regionwhen applying a constant muscle force of 100N.
To assess the influence of FEF on upper extremity demand, muscle stress was calculated asthe percentage of maximum isometric force generated by each muscle at every time step andaverage and maximum values were determined. Total, positive and negative muscle workwas quantified by integrating the positive and negative musculotendon power.
ResultsAll simulations replicated well the experimental joint kinematics and handrim tangentialforce (Fig. 3) with average errors of 1.12° and 2.36 N, respectively. The simulations alsoproduced different average FEF values, with the nominal, maximal, and minimal FEFsimulations having values of 0.61, 0.80 and 0.30, respectively. The maximal FEF simulationproduced an entirely tangential force (i.e. FEF >0.99) for 29% of the push (region: 41–70%push phase), while peak FEF for the minimal FEF simulation was 0.45. The nominalsimulation followed the experimental FEF values over the push, peaking at 0.87. All threesimulations had a small initial region (3%–5% of the push phase) where FEF did not surpass0.10. The average stress across all muscles was lowest for the nominal FEF simulation(9.2% versus 11.3% and 19.5% for the maximal and minimal simulations). Anterior deltoid(ADELT), posterior deltoid (PDELT), pronator quadratus (PQ) and subscapularus (SUBSC)consistently had higher stress values, surpassing 12% in all three simulations (Fig. 4A).Infraspinatus (INFSP) and teres minor (TMIN) had high average stress values in themaximal and minimal FEF simulations (> 13%). Peak stresses exceeded 50% for many ofthese muscles, with some stress values surpassing 100% due to active stretching (Fig. 4B).
Total muscle work was lowest in the nominal simulation, with muscle work increasing by28% and 71% in the maximal and minimal FEF simulations, respectively. The increasedwork was due primarily to additional positive work generated by INFSP and negative work
Rankin et al. Page 4
J Biomech. Author manuscript; available in PMC 2011 October 19.
NIH
-PA Author Manuscript
NIH
-PA Author Manuscript
NIH
-PA Author Manuscript
generated by PDELT and middle deltoid (MDELT) (Fig. 5). There was also increasedpositive work generated by pectoralis major (PECM) in the maximal FEF simulation andSUBSC in the minimal FEF simulation (Fig. 5). The triceps group (TRI) increased positiveand negative work when minimizing FEF, but reduced total work when maximizing FEF(Fig. 5).
Muscle contributions to the handrim forces during the simulations were consistent with theircapacity with the exception of MDELT, which can generate tangential force during region 1but was not utilized (Figs. 6 and 7). For all simulations, the biceps group (combinedBICshort and BIClong, BIC) and brachioradialis (BRD) had the highest averagecontributions to the tangential force during region 1 and TRI and ADELT during regions 2and 3 (Fig. 6). Muscles contributing most to the radial force were ADELT during regions 1and 2, MDELT during region 3 and TRI over all regions (Fig. 7). Muscle contributions tothe handrim forces changed with FEF. The maximal FEF simulation increased tangentialforce contributions from BRD during region 1 and PECM, CORB and INFSP during region2 (Fig. 6). BRD and INFSP had larger negative contributions to the radial force duringregions 1 and 3, respectively, while PECM and CORB increased their radial forcecontributions during region 2. In the minimal FEF simulation, BRD reduced and SUBSCincreased their contributions to the positive tangential force during region 1 (Fig. 6). Duringregions 2 and 3, TRI increased positive contributions and MDELT and PDELT increasednegative contributions to the tangential force (Fig. 6). TRI also increased its positivecontributions to the radial force during all regions in the minimal FEF simulation (Fig. 7).All other muscle groups had minimal ability to influence the handrim forces.
DiscussionComparisons between the three simulations revealed that FEF strongly influences musclework and stress and overall UE demand during wheelchair propulsion. While the tangentialforce was maintained in all three simulations to generate the required wheelchair speed, themaximal and minimal FEF simulations greatly altered the lateral and radial forces, whichresulted in increases in total muscle work. Maximizing FEF increased muscle workprimarily through increased work by the shoulder muscles, with additional positive workgenerated by INFSP and PECM and increased negative work generated by MDELT andPDELT (Fig. 5). The work generated by the elbow muscles decreased, primarily throughreduced TRI negative work (Fig. 5). These results are consistent with previous studies thatshowed higher FEF values increased shoulder moments (Desroches et al., 2008a;Desrocheset al., 2008b) and rotator cuff muscle power generation (Bregman et al., 2008). In theminimal FEF simulation, INFSP, SUBSC and TRI increased positive muscle work whileMDELT, PDELT and TRI increased negative work (Fig. 5), suggesting that minimizing FEFincreases muscle co-contraction.
In all simulations, there were multiple muscles with high average stresses, supporting thenotion that wheelchair propulsion exerts a high physical demand on the UE. Peak stressesfor PQ, TMIN, SUBSC, ADELT and PDELT were greater than 40% in all three simulations,with average stresses exceeding 25% in many cases (Fig. 4). These results are consistentwith previous studies showing high recruitment of ADELT and PDELT (e.g. Mulroy et al.,2004) and others predicting high SUBSC, PQ, ADELT and PDELT forces during nominalwheelchair propulsion (Lin et al., 2004;van Drongelen et al., 2005;Veeger et al., 2002).Although none of these studies showed a high TMIN force, there were high forces in otherrotator cuff muscles (e.g. INFSP) not present in the nominal simulation of this study. Thissuggests that TMIN may replace the functions performed by the other rotator cuff musclesin previous studies. Both maximizing and minimizing FEF increased average stress in thesemuscles, with the exception of ADELT, which only increased when minimizing FEF. In
Rankin et al. Page 5
J Biomech. Author manuscript; available in PMC 2011 October 19.
NIH
-PA Author Manuscript
NIH
-PA Author Manuscript
NIH
-PA Author Manuscript
addition, altering FEF greatly increased INFSP stress from less than 5% in the nominalsimulation to almost 20% when FEF was minimized. Previous studies have shown highforces in this muscle (Lin et al., 2004;Veeger et al., 2002), suggesting that INFSP may playan important role in propulsion. The high stress in the rotator cuff muscles (SUBSC, TMINand INFSP) during the push phase may explain the high prevalence of rotator cuff injuriesand pain in wheelchair users.
There were some differences in muscle activity between this study and those previouslyreported. While average and peak ADELT stresses were similar to previous findings, thismuscle was not active during the initial region of the push phase (region 1, Fig. 6). PECMactivity also occurred later in the push phase. These results are different from previous EMGstudies that show high PECM and ADELT activity during early push (e.g., Mulroy et al.,2004;Mulroy et al., 2005). However, both muscles had excitation pattern timing constrainedto match the EMG of our wheelchair user, who did not show high activity for either muscleduring early push. SUBSC was active over the entire push phase. Although unusual inparaplegic wheelchair users, prolonged SUBSC activity is observed in tetraplegicwheelchair users, which suggests that this is a potentially viable method to provide musclepower during propulsion. Average and peak SUPSP stresses were also low compared tosome studies (e.g., Veeger et al., 2002), but were similar to the values reported by Mulroy etal., (2005).
The analysis showed that most muscles exert forces in both the tangential and radialdirections simultaneously at some point during the push (Figs. 6, 7), suggesting that pushingalong a circular path is not optimal for converting muscle force into a tangential handrimforce. This inefficiency is highlighted by the changes in BIC and TRI that occur across FEFconditions. In the nominal simulation, the BIC group contributes to the tangential force earlyin the push phase followed by contributions by the TRI group (Fig. 6). However, both ofthese groups exert a radial force that is similar in magnitude to their tangential forcecontributions (Fig. 7). This may explain why TRI is used less in the maximal FEFsimulation, instead being replaced by shoulder muscles (i.e. PECM and INFSP) thatgenerate greater tangential and less radial force (Figs. 6, 7). The decreased use of the elbowextensors and increased use of rotator cuff muscles is consistent with the findings ofBregman et al. (2008), who found the elbow joint moment changed from having a peakextensor moment to a peak flexor moment when increasing FEF. This result is alsoconsistent with the suggestion by Veeger (1999) and supported by the study of de Groot etal. (2002b) that force generation must switch from muscles spanning the elbow to those thatcross the shoulder to produce a more effective force, which may result in an overall increasein muscle activity and higher metabolic cost. The analysis of the average and peak musclestresses performed in our study indeed showed that most of the increases occurred inshoulder muscles when maximizing FEF (Fig. 5).
During the push phase, the direction of the tangential force constantly changes as the handfollows the handrim (Fig. 8). When the tangential force has an upward component (region 1,Fig. 8), the reaction force moves the humerus inferiorly, which may reduce the need forrotator cuff muscle activity to stabilize the joint. This reaction force is then systematicallyredirected downward as the hand moves forward, resulting in a superiorly directed shoulderforce at the end of the push, which has been associated with shoulder pathologies (Mercer etal., 2006). As a result, increasing the tangential force during the end of the push phase mayincrease the likelihood of shoulder injury by amplifying the superiorly directed shoulderforce. The maximal FEF simulation increased FEF mainly during regions 2 and 3, whichsuggests that encouraging wheelchair users to increase FEF will likely increase the superiorshoulder force over much of the push and the likelihood of sustaining a shoulder injury.
Rankin et al. Page 6
J Biomech. Author manuscript; available in PMC 2011 October 19.
NIH
-PA Author Manuscript
NIH
-PA Author Manuscript
NIH
-PA Author Manuscript
Wheelchair propulsion is similar to pedaling a bicycle in that the motion is constrained tofollow a circular path. Previous pedaling studies have shown that increasing pedal forceeffectiveness reduces maximal power output (Doorenbosch et al., 1997) and gross efficiency(Korff et al., 2007). These results and those analyzing wheelchair propulsion suggest thatincreasing FEF does not reduce neuromuscular demand. Instead, there appears to be abalance between satisfying the competing demands of increasing the effective force to meetthe wheelchair propulsion requirements and reducing total UE demand.
A potential limitation of this study was that the wrist joint was fixed in the model. Previousstudies have shown that the hand can apply a pure moment about the wheel axis (e.g.,Veeger, 1999), which is usually associated with wrist movement and has the potential toinfluence muscle force requirements during the push phase. Veeger et al., (1999)investigated the potential consequences of removing the hand moment and found an increasein elbow extensor muscle requirements. However, the present study used a consistent modelbetween the different conditions to investigate relative changes in muscle demand. As aresult, differences between FEF values would likely be similar when using a model with awrist joint. In addition, previous studies have shown that peak and average wrist jointmoments during propulsion are much lower than those at the elbow and shoulder joints (e.g.,Robertson et al., 1996; Sabick et al., 2004). Thus, the influence of using a fixed wrist on thestudy results is expected to be minimal.
In summary, there appears to be an optimal FEF value that minimizes UE demand.Maximizing FEF resulted in higher muscle stress and total muscle work. Muscle use alsoshifted from the elbow to the shoulder, which adds to the already high demands placed onthese muscles. Minimizing FEF also increased total muscle work due to an increased needfor higher muscle forces, resulting in more muscle co-contraction. Therefore, the optimalFEF value appears to represent a balance between increasing push force effectiveness toincrease mechanical efficiency and minimizing overall UE demand. While likely to besimilar among users, the specific optimal value will be unique to each individual due todifferences in push mechanics and neuromusculoskeletal systems. Thus, care should betaken in using FEF as a metric to reduce UE demand.
AcknowledgmentsThis work was supported by NIH grant R01HD053732.
ReferencesAissaoui R, Arabi H, Lacoste M, Zalzal V, Dansereau J. Biomechanics of manual wheelchair
propulsion in elderly: system tilt and back recline angles. American Journal of Physical Medicineand Rehabilitation. 2002; 81:94–100. [PubMed: 11807343]
Ambrosio F, Boninger ML, Souza AL, Fitzgerald SG, Koontz AM, Cooper RA. Biomechanics andstrength of manual wheelchair users. The Journal of Spinal Cord Medicine. 2005; 28:407–414.[PubMed: 16869087]
Boninger ML, Cooper RA, Baldwin MA, Shimada SD, Koontz A. Wheelchair pushrim kinetics: bodyweight and median nerve function. Archives of Physical Medicine and Rehabilitation. 1999;80:910–915. [PubMed: 10453767]
Boninger ML, Cooper RA, Robertson RN, Shimada SD. Three-dimensional pushrim forces during twospeeds of wheelchair propulsion. American Journal of Physical Medicine and Rehabilitation. 1997;76:420–426. [PubMed: 9354497]
Boninger ML, Souza AL, Cooper RA, Fitzgerald SG, Koontz AM, Fay BT. Propulsion patterns andpushrim biomechanics in manual wheelchair propulsion. Archives of Physical Medicine andRehabilitation. 2002; 83:718–723. [PubMed: 11994814]
Rankin et al. Page 7
J Biomech. Author manuscript; available in PMC 2011 October 19.
NIH
-PA Author Manuscript
NIH
-PA Author Manuscript
NIH
-PA Author Manuscript
Bregman DJ, Drongelen SV, Veeger HE. Is effective force application in handrim wheelchairpropulsion also efficient? Clinical Biomechanics. 2008
Clauser, CE.; McConville, JT.; Young, JW. Weight, Volume, and Center of Mass of Segments of theHuman Body. Wright-Patterson Air Force Base; Dayton, OH: 1969.
Dallmeijer AJ, van der Woude LH, Veeger HE, Hollander AP. Effectiveness of force application inmanual wheelchair propulsion in persons with spinal cord injuries. American Journal of PhysicalMedicine and Rehabilitation. 1998; 77:213–221. [PubMed: 9635556]
Davy DT, Audu ML. A dynamic optimization technique for predicting muscle forces in the swingphase of gait. Journal of Biomechanics. 1987; 20:187–201. [PubMed: 3571299]
de Groot JH, Brand R. A three-dimensional regression model of the shoulder rhythm. ClinicalBiomechanics. 2001; 16:735–743. [PubMed: 11714550]
de Groot S, Veeger DH, Hollander AP, Van der Woude LH. Wheelchair propulsion technique andmechanical efficiency after 3 weeks of practice. Medicine and Science in Sports and Exercise.2002a; 34:756–766. [PubMed: 11984291]
de Groot S, Veeger HE, Hollander AP, van der Woude LH. Consequence of feedback-based learningof an effective hand rim wheelchair force production on mechanical efficiency. ClinicalBiomechanics. 2002b; 17:219–226. [PubMed: 11937260]
de Groot S, Veeger HE, Hollander AP, van der Woude LH. Effect of wheelchair stroke pattern onmechanical efficiency. American Journal of Physical Medicine and Rehabilitation. 2004; 83:640–649. [PubMed: 15277966]
Desroches G, Aissaoui R, Bourbonnais D. The effect of resultant force at the pushrim on shoulderkinetics during manual wheelchair propulsion: a simulation study. IEEE Transactions onBiomedical Engineering. 2008a; 55:1423–1431. [PubMed: 18390334]
Desroches G, Aissaoui R, Bourbonnais D. Relationship between resultant force at the pushrim and thenet shoulder joint moments during manual wheelchair propulsion in elderly persons. Archives ofPhysical Medicine and Rehabilitation. 2008b; 89:1155–1161. [PubMed: 18503814]
Doorenbosch CA, Veeger DH, van Zandwijk JP, van Ingen Schenau GJ. On the effectiveness of forceapplication in guided leg movements. Journal of Motor Behavior. 1997; 29:27–34. [PubMed:20037007]
Finley MA, Rasch EK, Keyser RE, Rodgers MM. The biomechanics of wheelchair propulsion inindividuals with and without upper-limb impairment. Journal of Rehabilitation Research andDevelopment. 2004; 41:385–394. [PubMed: 15543456]
Finley MA, Rodgers MM. Prevalence and identification of shoulder pathology in athletic andnonathletic wheelchair users with shoulder pain: A pilot study. Journal of Rehabilitation Researchand Development. 2004; 41:395–402. [PubMed: 15543457]
Goffe WL, Ferrier GD, Rogers J. Global Optimization of Statistical Functions With SimulatedAnnealing. Journal of Econometrics. 1994; 60:65–99.
Goosey-Tolfrey VL, Lenton JP, Fowler N, van der woude L, Nicholson G, Batterham A. TheInfluence of push frequency on force application during steady-state hand-rim wheelchairpropulsion. Medicine and Science in Sports and Exercise. 2006; 38:S395–S396.
Guo LY, Su FC, An KN. Effect of handrim diameter on manual wheelchair propulsion: mechanicalenergy and power flow analysis. Clinical Biomechanics. 2006; 21:107–115. [PubMed: 16226359]
Happee R, Van der Helm FC. The control of shoulder muscles during goal directed movements, aninverse dynamic analysis. Journal of Biomechanics. 1995; 28:1179–1191. [PubMed: 8550636]
Holzbaur KR, Murray WM, Delp SL. A model of the upper extremity for simulating musculoskeletalsurgery and analyzing neuromuscular control. Annals of Biomedical Engineering. 2005; 33:829–840. [PubMed: 16078622]
Korff T, Romer LM, Mayhew I, Martin JC. Effect of pedaling technique on mechanical effectivenessand efficiency in cyclists. Medicine and Science in Sports and Exercise. 2007; 39:991–995.[PubMed: 17545890]
Kotajarvi BR, Basford JR, An KN, Morrow DA, Kaufman KR. The effect of visual biofeedback on thepropulsion effectiveness of experienced wheelchair users. Archives of Physical Medicine andRehabilitation. 2006; 87:510–515. [PubMed: 16571390]
Rankin et al. Page 8
J Biomech. Author manuscript; available in PMC 2011 October 19.
NIH
-PA Author Manuscript
NIH
-PA Author Manuscript
NIH
-PA Author Manuscript
Lin CJ, Lin PC, Su FC, An KN. Biomechanics of Wheelchair Propulsion. Journal of Mechanics inMedicine and Biology. 2009; 9:229–242.
Lin HT, Su FC, Wu HW, An KN. Muscle forces analysis in the shoulder mechanism duringwheelchair propulsion. Proceedings of the Institution of Mechanical Engineers Part H-Journal ofEngineering in Medicine. 2004; 218:213–221.
Menegaldo LL, de Toledo Fleury A, Weber HI. Moment arms and musculotendon lengths estimationfor a three-dimensional lower-limb model. Journal of Biomechanics. 2004; 37:1447–1453.[PubMed: 15275854]
Mercer JL, Boninger M, Koontz A, Ren D, Dyson-Hudson T, Cooper R. Shoulder joint kinetics andpathology in manual wheelchair users. Clinical Biomechanics. 2006; 21:781–789. [PubMed:16808992]
Mulroy SJ, Farrokhi S, Newsam CJ, Perry J. Effects of spinal cord injury level on the activity ofshoulder muscles during wheelchair propulsion: an electromyographic study. Arch Phys MedRehabil. 2004; 85:925–934. [PubMed: 15179646]
Mulroy SJ, Newsam CJ, Gutierrez DD, Requejo P, Gronley JK, Haubert LL, Perry J. Effect of fore-aftseat position on shoulder demands during wheelchair propulsion: part 1. A kinetic analysis. TheJournal of Spinal Cord Medicine. 2005; 28:214–221. [PubMed: 16048139]
Neptune RR, Kautz SA, Zajac FE. Contributions of the individual ankle plantar flexors to support,forward progression and swing initiation during walking. Journal of Biomechanics. 2001;34:1387–1398. [PubMed: 11672713]
Price R, Ashwell ZR, Chang MW, Boninger ML, Koontz AM, Sisto SA. Upper-limb joint power andits distribution in spinal cord injured wheelchair users: steady-state self-selected speed versusmaximal acceleration trials. Archives of Physical Medicine and Rehabilitation. 2007; 88:456–463.[PubMed: 17398246]
Raasch CC, Zajac FE, Ma B, Levine WS. Muscle coordination of maximum-speed pedaling. Journalof Biomechanics. 1997; 30:595–602. [PubMed: 9165393]
Richter WM, Axelson PW. Low-impact wheelchair propulsion: achievable and acceptable. Journal ofRehabilitation Research and Development. 2005; 42:21–33. [PubMed: 16195960]
Robertson RN, Boninger ML, Cooper RA, Shimada SD. Pushrim forces and joint kinetics duringwheelchair propulsion. Archives of Physical Medicine and Rehabilitation. 1996; 77:856–864.[PubMed: 8822674]
Rozendaal LA, Veeger HE, van der Woude LH. The push force pattern in manual wheelchairpropulsion as a balance between cost and effect. Journal of Biomechanics. 2003; 36:239–247.[PubMed: 12547361]
Sabick MB, Kotajarvi BR, An KN. A new method to quantify demand on the upper extremity duringmanual wheelchair propulsion. Archives of Physical Medicine and Rehabilitation. 2004; 85:1151–1159. [PubMed: 15241767]
van Drongelen S, van der Woude LH, Janssen TW, Angenot EL, Chadwick EK, Veeger DH.Glenohumeral contact forces and muscle forces evaluated in wheelchair-related activities of dailyliving in able-bodied subjects versus subjects with paraplegia and tetraplegia. Archives of PhysicalMedicine and Rehabilitation. 2005; 86:1434–1440. [PubMed: 16003677]
Veeger, HE. Biomechanics of Manual Wheelchair Propulsion. In: Van der Woude, LH.; Hopman,MT.; Kemenade, CH., editors. Biomedical Aspects of Manual Wheelchair Propulsion: The Stateof the Art II. IOS Press; Amsterdam, The Netherlands: 1999. p. 86-95.
Veeger HE, Hadj Yahmed M, van der Woude LH, Charpentier P. Peak oxygen uptake and maximalpower output of Olympic wheelchair-dependent athletes. Medicine and Science in Sports andExercise. 1991; 23:1201–1209. [PubMed: 1836828]
Veeger HE, Rozendaal LA, van der Helm FC. Load on the shoulder in low intensity wheelchairpropulsion. Clinical Biomechanics. 2002; 17:211–218. [PubMed: 11937259]
Winters JM, Stark L. Estimated mechanical properties of synergistic muscles involved in movementsof a variety of human joints. Journal of Biomechanics. 1988; 21:1027–1041. [PubMed: 2577949]
Zajac FE. Muscle and tendon: properties, models, scaling, and application to biomechanics and motorcontrol. Critical Reviews in Biomedical Engineering. 1989; 17:359–411. [PubMed: 2676342]
Rankin et al. Page 9
J Biomech. Author manuscript; available in PMC 2011 October 19.
NIH
-PA Author Manuscript
NIH
-PA Author Manuscript
NIH
-PA Author Manuscript
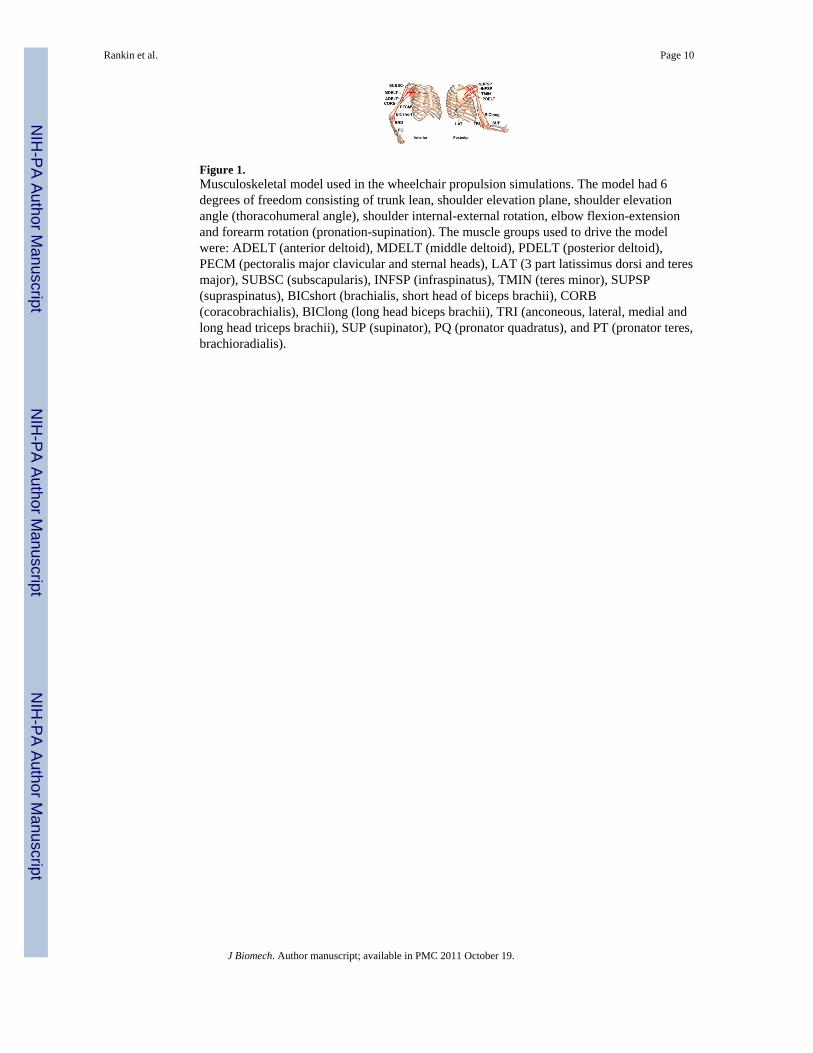
Figure 1.Musculoskeletal model used in the wheelchair propulsion simulations. The model had 6degrees of freedom consisting of trunk lean, shoulder elevation plane, shoulder elevationangle (thoracohumeral angle), shoulder internal-external rotation, elbow flexion-extensionand forearm rotation (pronation-supination). The muscle groups used to drive the modelwere: ADELT (anterior deltoid), MDELT (middle deltoid), PDELT (posterior deltoid),PECM (pectoralis major clavicular and sternal heads), LAT (3 part latissimus dorsi and teresmajor), SUBSC (subscapularis), INFSP (infraspinatus), TMIN (teres minor), SUPSP(supraspinatus), BICshort (brachialis, short head of biceps brachii), CORB(coracobrachialis), BIClong (long head biceps brachii), TRI (anconeous, lateral, medial andlong head triceps brachii), SUP (supinator), PQ (pronator quadratus), and PT (pronator teres,brachioradialis).
Rankin et al. Page 10
J Biomech. Author manuscript; available in PMC 2011 October 19.
NIH
-PA Author Manuscript
NIH
-PA Author Manuscript
NIH
-PA Author Manuscript
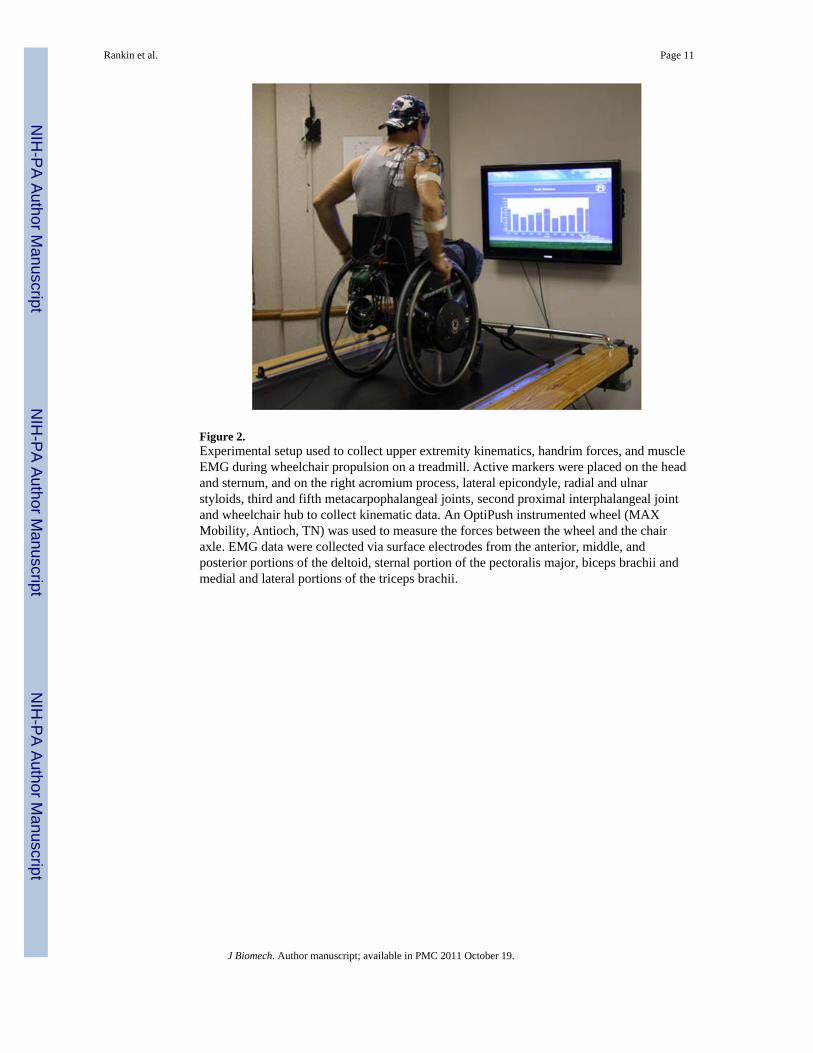
Figure 2.Experimental setup used to collect upper extremity kinematics, handrim forces, and muscleEMG during wheelchair propulsion on a treadmill. Active markers were placed on the headand sternum, and on the right acromium process, lateral epicondyle, radial and ulnarstyloids, third and fifth metacarpophalangeal joints, second proximal interphalangeal jointand wheelchair hub to collect kinematic data. An OptiPush instrumented wheel (MAXMobility, Antioch, TN) was used to measure the forces between the wheel and the chairaxle. EMG data were collected via surface electrodes from the anterior, middle, andposterior portions of the deltoid, sternal portion of the pectoralis major, biceps brachii andmedial and lateral portions of the triceps brachii.
Rankin et al. Page 11
J Biomech. Author manuscript; available in PMC 2011 October 19.
NIH
-PA Author Manuscript
NIH
-PA Author Manuscript
NIH
-PA Author Manuscript
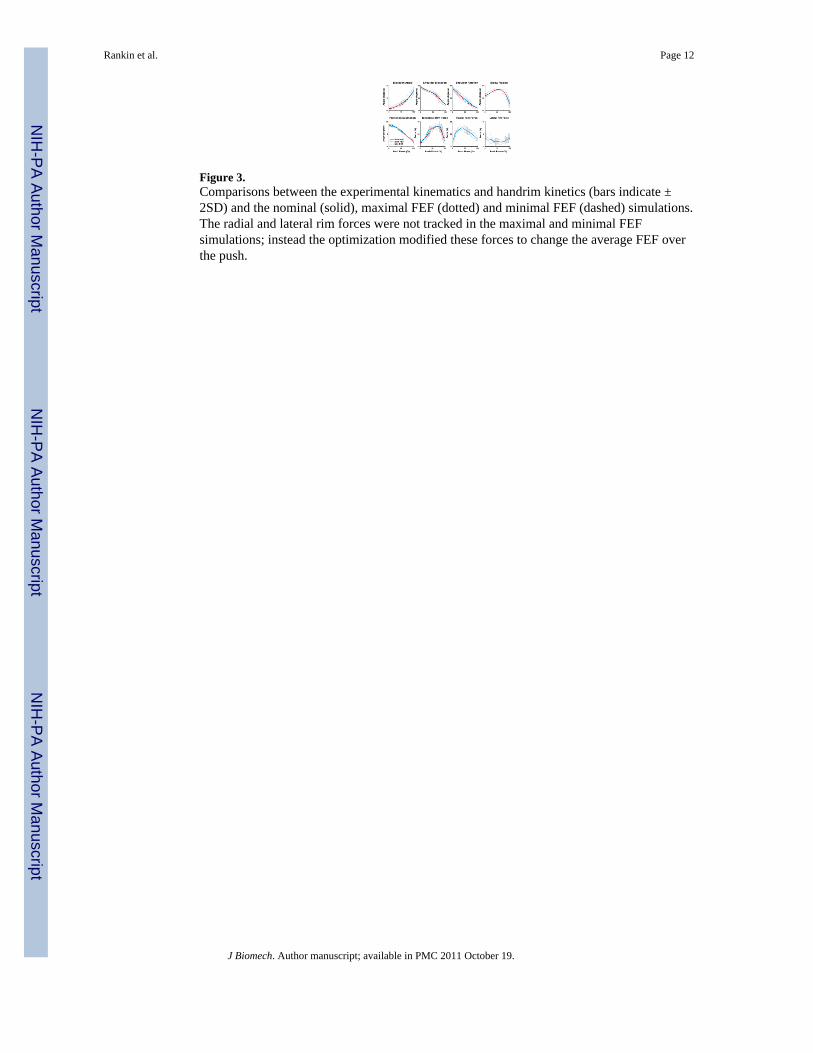
Figure 3.Comparisons between the experimental kinematics and handrim kinetics (bars indicate ±2SD) and the nominal (solid), maximal FEF (dotted) and minimal FEF (dashed) simulations.The radial and lateral rim forces were not tracked in the maximal and minimal FEFsimulations; instead the optimization modified these forces to change the average FEF overthe push.
Rankin et al. Page 12
J Biomech. Author manuscript; available in PMC 2011 October 19.
NIH
-PA Author Manuscript
NIH
-PA Author Manuscript
NIH
-PA Author Manuscript
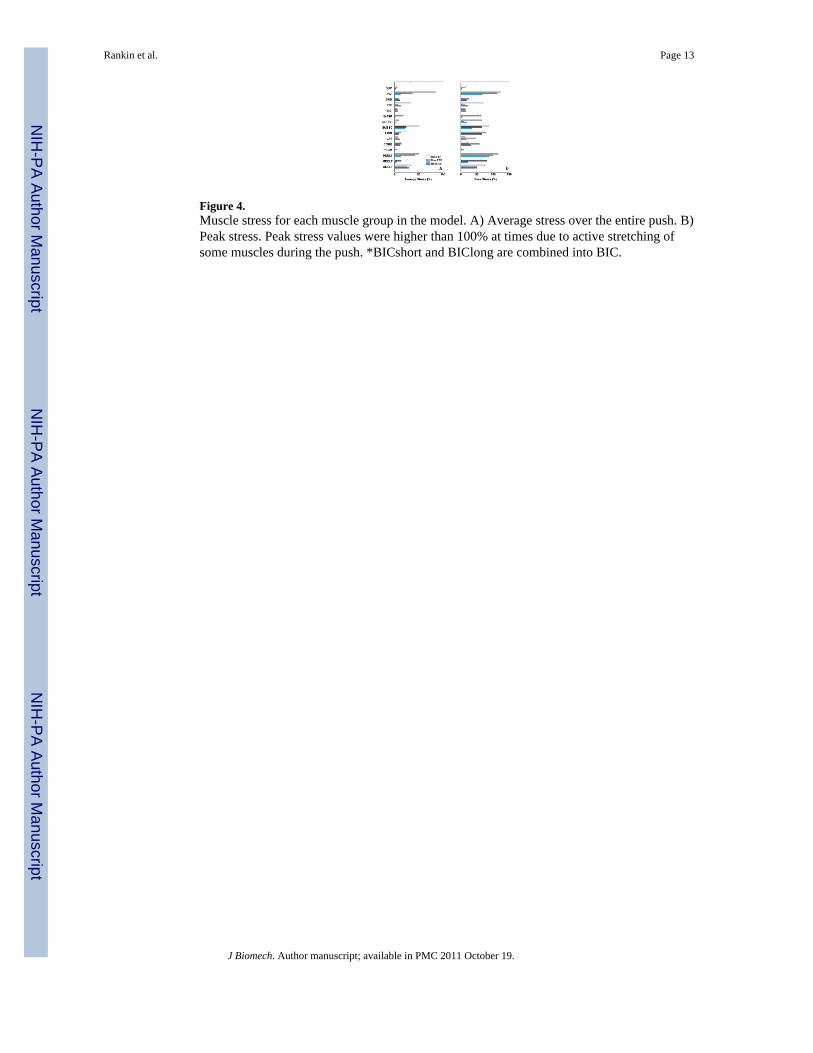
Figure 4.Muscle stress for each muscle group in the model. A) Average stress over the entire push. B)Peak stress. Peak stress values were higher than 100% at times due to active stretching ofsome muscles during the push. *BICshort and BIClong are combined into BIC.
Rankin et al. Page 13
J Biomech. Author manuscript; available in PMC 2011 October 19.
NIH
-PA Author Manuscript
NIH
-PA Author Manuscript
NIH
-PA Author Manuscript
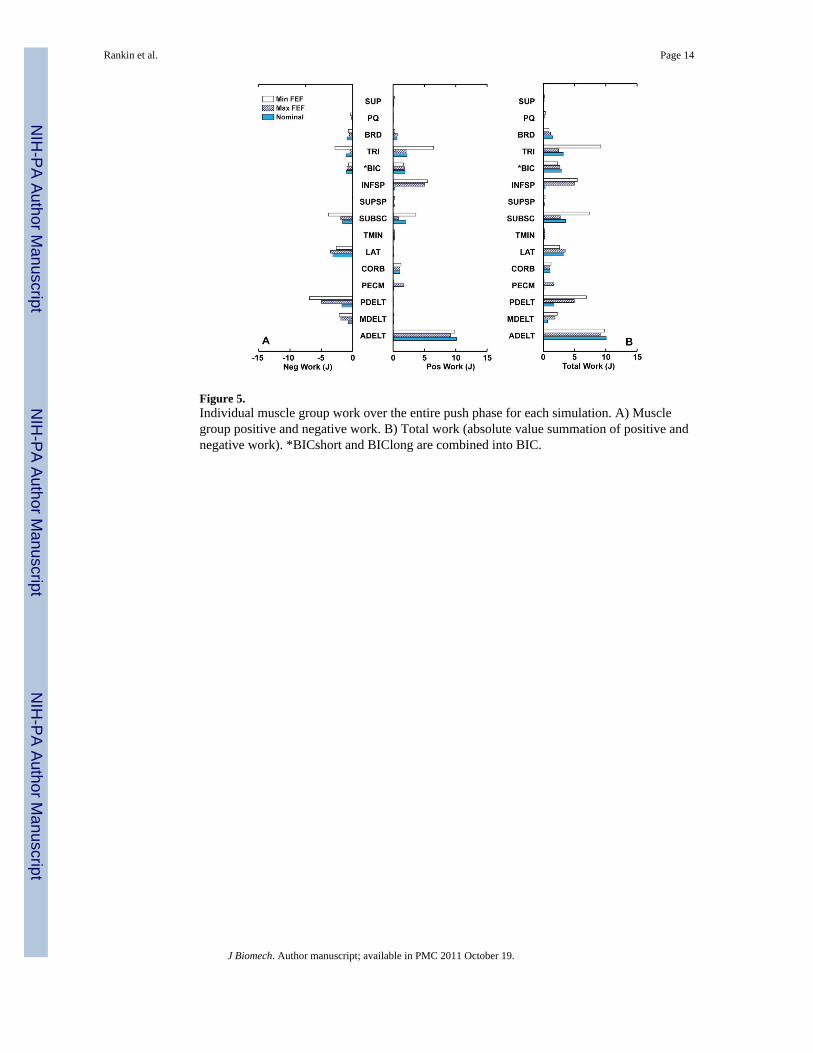
Figure 5.Individual muscle group work over the entire push phase for each simulation. A) Musclegroup positive and negative work. B) Total work (absolute value summation of positive andnegative work). *BICshort and BIClong are combined into BIC.
Rankin et al. Page 14
J Biomech. Author manuscript; available in PMC 2011 October 19.
NIH
-PA Author Manuscript
NIH
-PA Author Manuscript
NIH
-PA Author Manuscript
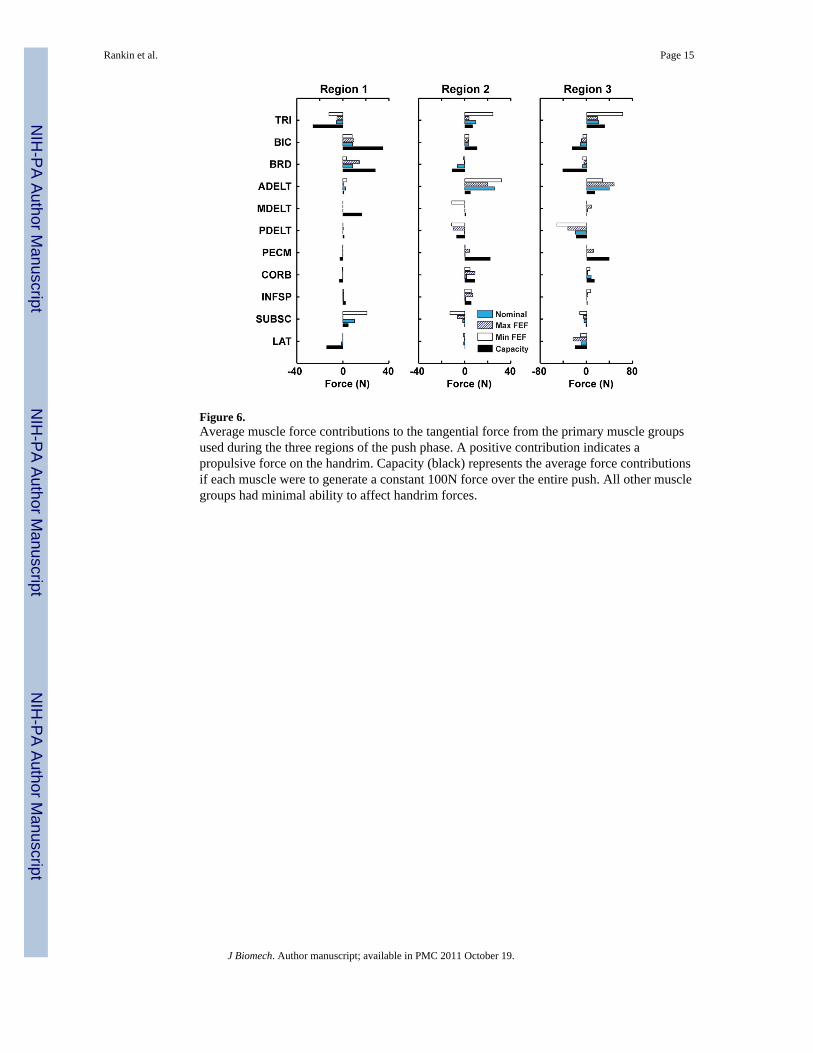
Figure 6.Average muscle force contributions to the tangential force from the primary muscle groupsused during the three regions of the push phase. A positive contribution indicates apropulsive force on the handrim. Capacity (black) represents the average force contributionsif each muscle were to generate a constant 100N force over the entire push. All other musclegroups had minimal ability to affect handrim forces.
Rankin et al. Page 15
J Biomech. Author manuscript; available in PMC 2011 October 19.
NIH
-PA Author Manuscript
NIH
-PA Author Manuscript
NIH
-PA Author Manuscript
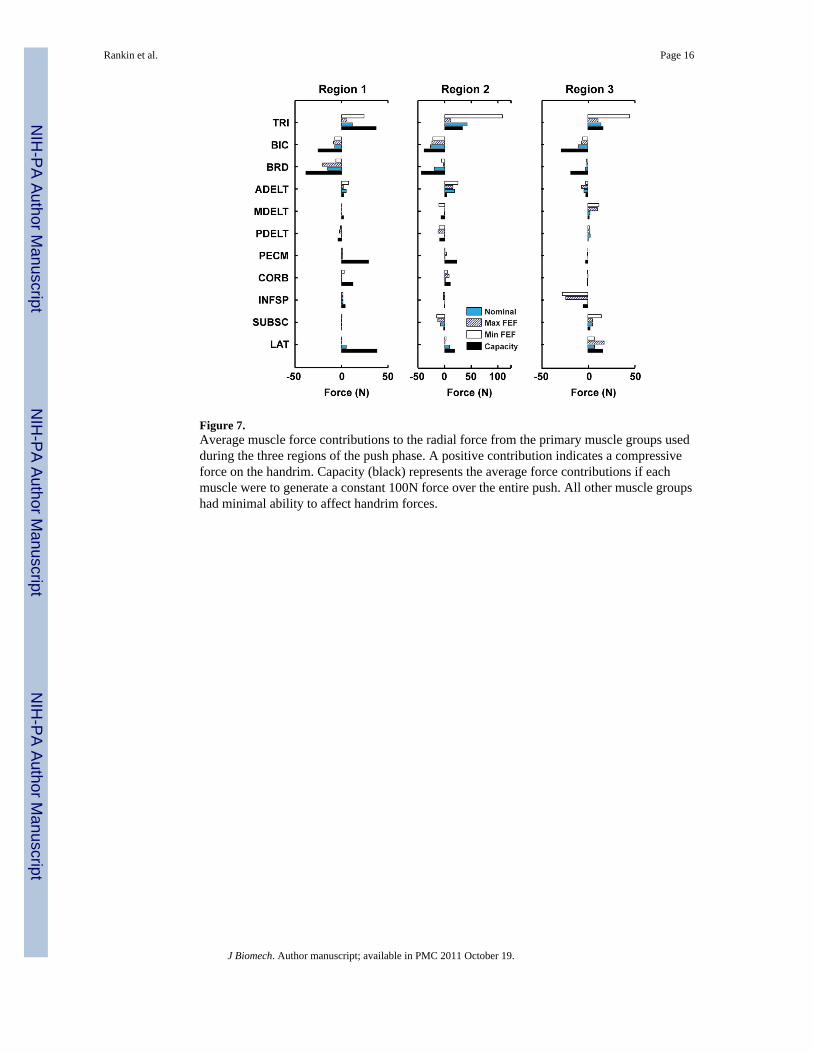
Figure 7.Average muscle force contributions to the radial force from the primary muscle groups usedduring the three regions of the push phase. A positive contribution indicates a compressiveforce on the handrim. Capacity (black) represents the average force contributions if eachmuscle were to generate a constant 100N force over the entire push. All other muscle groupshad minimal ability to affect handrim forces.
Rankin et al. Page 16
J Biomech. Author manuscript; available in PMC 2011 October 19.
NIH
-PA Author Manuscript
NIH
-PA Author Manuscript
NIH
-PA Author Manuscript

Figure 8.Tangential force directions during the three regions defined in the push phase. Light grey,grey and black represent regions 1, 2 and 3, respectively.
Rankin et al. Page 17
J Biomech. Author manuscript; available in PMC 2011 October 19.
NIH
-PA Author Manuscript
NIH
-PA Author Manuscript
NIH
-PA Author Manuscript
NIH
-PA Author Manuscript
NIH
-PA Author Manuscript
NIH
-PA Author Manuscript
Rankin et al. Page 18
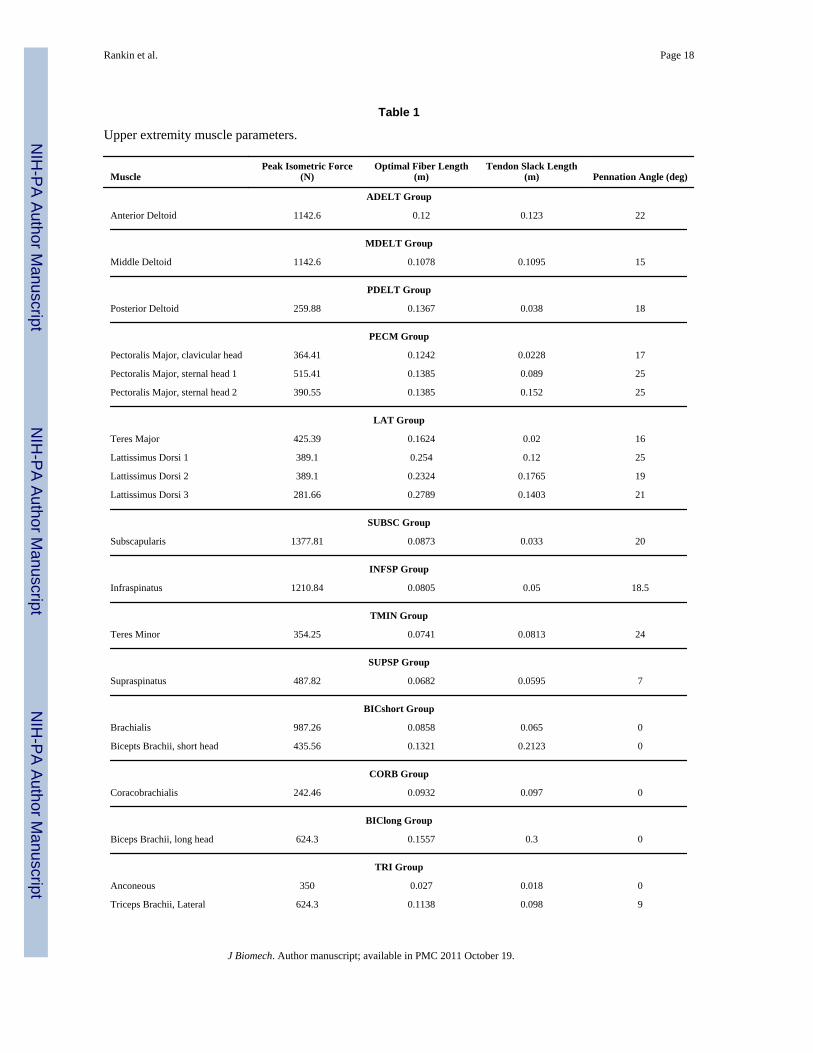
Table 1
Upper extremity muscle parameters.
MusclePeak Isometric Force
(N)Optimal Fiber Length
(m)Tendon Slack Length
(m) Pennation Angle (deg)
ADELT Group
Anterior Deltoid 1142.6 0.12 0.123 22
MDELT Group
Middle Deltoid 1142.6 0.1078 0.1095 15
PDELT Group
Posterior Deltoid 259.88 0.1367 0.038 18
PECM Group
Pectoralis Major, clavicular head 364.41 0.1242 0.0228 17
Pectoralis Major, sternal head 1 515.41 0.1385 0.089 25
Pectoralis Major, sternal head 2 390.55 0.1385 0.152 25
LAT Group
Teres Major 425.39 0.1624 0.02 16
Lattissimus Dorsi 1 389.1 0.254 0.12 25
Lattissimus Dorsi 2 389.1 0.2324 0.1765 19
Lattissimus Dorsi 3 281.66 0.2789 0.1403 21
SUBSC Group
Subscapularis 1377.81 0.0873 0.033 20
INFSP Group
Infraspinatus 1210.84 0.0805 0.05 18.5
TMIN Group
Teres Minor 354.25 0.0741 0.0813 24
SUPSP Group
Supraspinatus 487.82 0.0682 0.0595 7
BICshort Group
Brachialis 987.26 0.0858 0.065 0
Bicepts Brachii, short head 435.56 0.1321 0.2123 0
CORB Group
Coracobrachialis 242.46 0.0932 0.097 0
BIClong Group
Biceps Brachii, long head 624.3 0.1557 0.3 0
TRI Group
Anconeous 350 0.027 0.018 0
Triceps Brachii, Lateral 624.3 0.1138 0.098 9
J Biomech. Author manuscript; available in PMC 2011 October 19.
NIH
-PA Author Manuscript
NIH
-PA Author Manuscript
NIH
-PA Author Manuscript
Rankin et al. Page 19
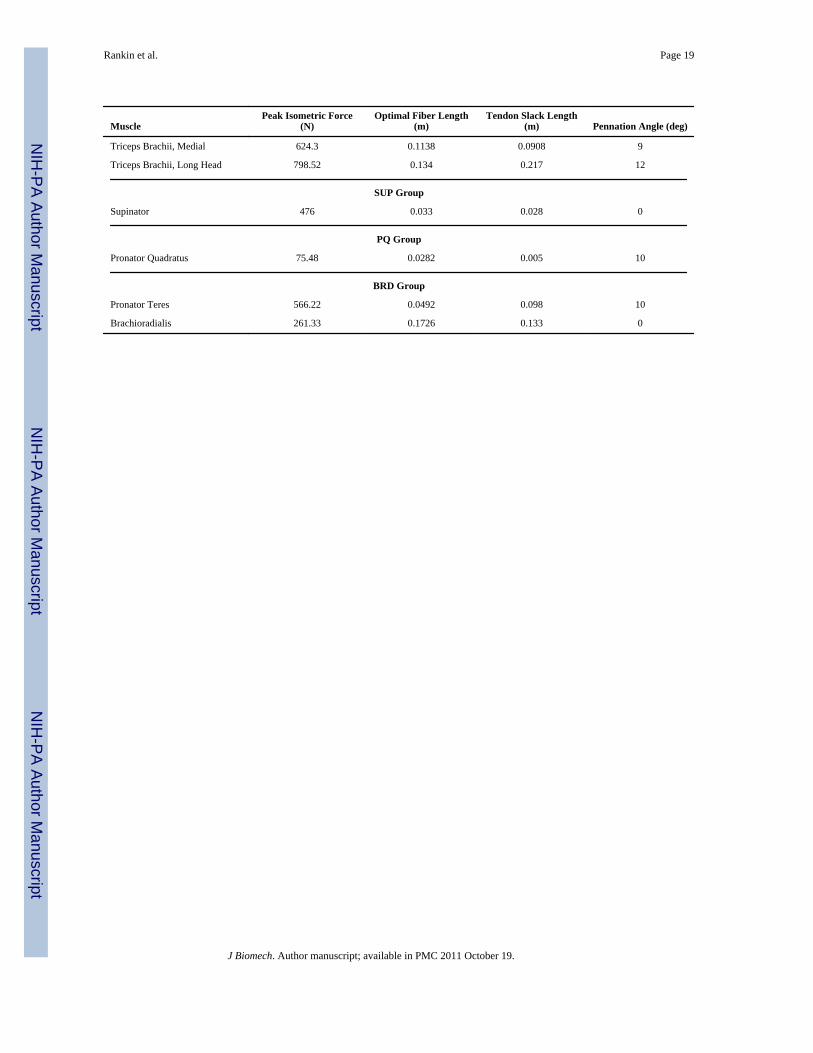
MusclePeak Isometric Force
(N)Optimal Fiber Length
(m)Tendon Slack Length
(m) Pennation Angle (deg)
Triceps Brachii, Medial 624.3 0.1138 0.0908 9
Triceps Brachii, Long Head 798.52 0.134 0.217 12
SUP Group
Supinator 476 0.033 0.028 0
PQ Group
Pronator Quadratus 75.48 0.0282 0.005 10
BRD Group
Pronator Teres 566.22 0.0492 0.098 10
Brachioradialis 261.33 0.1726 0.133 0
J Biomech. Author manuscript; available in PMC 2011 October 19.
Copyright © 2022 FDOKUMEN