The Incidence of Match and Training Injuries in Rugby League: A Pooled Data Analysis of Published...
17
The Incidence of Match and Training Injuries in Rugby League: A Pooled Data Analysis of Published Studies by Doug King, Conor Gissane, Trevor Clark and Stephen W. Marshall Reprinted from International Journal of Sports Science & Coaching Volume 9 · Number 2 · 2014
-
Upload
stmarystwickenham -
Category
Documents
-
view
1 -
download
0
Transcript of The Incidence of Match and Training Injuries in Rugby League: A Pooled Data Analysis of Published...

The Incidence of Match and TrainingInjuries in Rugby League: A Pooled DataAnalysis of Published Studiesby
Doug King, Conor Gissane, Trevor Clark andStephen W. Marshall
Reprinted from
International Journal of
Sports Science & CoachingVolume 9 · Number 2 · 2014
International Journal of Sports Science & Coaching Volume 9 · Number 2 · 2014 417
The Incidence of Match and TrainingInjuries in Rugby League: A Pooled Data
Analysis of Published StudiesDoug King1, Conor Gissane2, Trevor Clark3 and
Stephen W. Marshall4,5
1Sports Performance Research Institute New ZealandSchool of Sport and Recreation
Faculty of Health and Environmental ScienceAuckland University of Technology, New Zealand
E-mail: [email protected] of Sport, Health and Applied Science,
St Mary’s University College,Twickenham, Middlesex, UK
3Australian College of Physical Education,Human Movement Discipline, Sydney Olympic Park,
NSW, Australia4Injury Prevention Research Center
University of North Carolina at Chapel HillChapel Hill, North Carolina, USA
5Department of EpidemiologyGillings School of Global Public Health
University of North Carolina at Chapel HillChapel Hill, North Carolina, USA
ABSTRACT
Studies reporting on injuries in rugby league have shown that the injury
incidence increases as the participation level increases. To provide pooled
estimates for the incidence of rugby league injuries in match and training
activities at all levels of performance and by gender. Searches of PubMed,
CINHAL, Ovid, MEDLINE, SCOPUS, ScienceDirect and SportDiscus®
databases were performed to identify studies published in English prior to
November 2012. Bibliographic searches were also carried out without
language restrictions. A pooled analysis of published studies which have
reported the incidences of rugby league match and/or training injuries. Two
reviewers extracted the study characteristics, numerical data and
assessed the quality, by adhering to the protocol for systematic review of
observational studies (MOOSE). A total of 34 studies (from 1,422 identified
in the initial search) were identified that reported data collection of rugby
league injuries that met the inclusion criteria. The data provided information
from a total of 5,785 match events totalling 87,185 match exposure hr. and
242,754 training exposure hr. The pooled analysis injury incidence for
match injuries was 148 (95% CI: 145 to 150) per 1,000 match hr. The lower
limb (69; 95% CI: 67 to 72 per 1,000 match hr.) was the most common
injury region recorded. Although contusions were the most common
pooled injury type (34.0; 95% CI: 32.3 to 35.8 per 1,000 match hr.) this
varied by participation level. The pooled analysis injury incidence for training
injuries was 12.6 per 1,000 training hr. The lower limb was again the most
common injury region recorded (5.7; 95% CI: 5.1 to 5.8 per 1,000 training
injuries) for all training studies and strains (3.1; 95% CI: 2.8 to 3.3 per 1,000
training hours) were the most common training injury type recorded. These
findings are indicative of the physical demands placed on players across
many levels of participation and in time further additions to this analysis are
warranted to provide a more detailed picture of the sport from an injury
prevention perspective.
Keywords: Epidemiology, Rugby League, Sports Injuries
INTRODUCTIONRugby league has a high incidence of injury, especially when compared with rugby union.1
Studies reporting on injuries in rugby league have shown that the injury incidence increasesas the participation level increases.2 In reviews of match and training injuries in rugbyleague,2-4 it was reported that match injuries varied from 15 to 8252, 6 per 1,000 match hourswhile training injuries ranged from 12.27 to 1068 per 1000 training hours. Limitations tothese individual studies are that they rely on small number of players, typically are only fromone club or competition, utilize different injury definitions and methodological approachesand usually are conducted over a short duration.9 As a result, the generalizability of theseindividual studies for the identification of the injury incidence in rugby league is limited.10
A strategy previously utilised10 is to combine the information provided by epidemiologicalstudies into a single estimate,11, 12 termed a pooled analysis.13 To achieve this technique it isrecommended that all the studies included in the analysis be on common grounds, havesimilar definitions, have a comparable population and have adequacy and specificity ofexposure data.14 By pooling the data, the information provided can then be statistically re-analysed providing more precise injury data.11 This has been previously undertaken onprofessional rugby league studies10 with the results identifying that the injury incidence forprofessional rugby league participation was 40 per 1,000 player hours. To date this is the onlypublished study reporting on combined data of rugby league injuries. This study10 onlyreported on the available studies at the professional level of participation. As such there havebeen no published studies reporting on the pooled analysis of semi-professional, amateur orjunior match or training injuries.
The purpose of this study was to review and update the pooled data estimates on rugbyleague injury epidemiology and add information for semi-professional, amateur and juniorlevels of participation in both match and training environments. Specifically, this includedestimates of injury incidence, injury severity, site and type and the comparison of injury ratesfor; player positions and groups for the different rugby league participation levels.
METHODThe methodology utilised in this study is similar to previous pooled analysis studiesreporting rugby league injuries10 and using the steps as described by Friedenreich.11, 15
418 The Incidence of Match and Training Injuries in Rugby League: A Pooled Data Analysis of Published Studies

SEARCH STRATEGY FOR IDENTIFICATION OF DATABASESSearches of PubMed, CINHAL, Ovid, MEDLINE, SCOPUS, ScienceDirect and SportDiscus®
databases were performed to identify studies published in English prior to November 2012. Thecomputer databases provided access to sports-oriented and biomedical journals, serialpublications, books, theses, conference papers, and related research published since 1948. Termsutilized for the search of relevant research studies included rugby AND league AND injur*.Bibliographies of all papers retrieved for evaluation were also examined for additional references.All articles that met the inclusion criteria were entered in an EndNote X4.0.2 database.
INCLUSION CRITERIAPublished studies that reported the incidence of injury in rugby league match and trainingactivities were collated. These studies were included in the analysis if they were:
1) Published later than 1990;2) Reported the match or training time exposure enabling calculation of player time
injury rates;3) Reported transient and/or missed match rates;4) More than one study reporting injuries at the identified participation level.
PROCEDURESAs all of the studies included in the pooled analysis were observational in design, tworeviewers extracted the study characteristics, numerical data and assessed the quality, byadhering to the protocol for systematic review of observational studies (MOOSE).16 Thisapproach was utilised as it enables a more precise estimate of effects of influential factors,takes into account confounding factors (participation level and age) and the heterogeneity ofthe studies.17 An additional advantage to utilising a pooled analysis approach is that the samestatistical model can be utilised with data from methodologically diverse studies.17
A total of 1,422 studies were initially identified through the database searches. Thisconsisted of 333 studies identified in PubMed, 43 in CINHAL, 679 in Ovid Medline, 186 inSCOPUS and 181 in Sports Discus (see Fig I). Some studies reviewed were initiallyidentified as being eligible for inclusion in the pooled analysis, but were excluded due to avariety of reasons. The exclusion of these studies were identified as being: a) Older than1990;18-20 b) Reporting of data as means;21, 22 c) Non reporting of all injuries or totalexposure times;21, 23-29 d) Use of a previously reported injury database;30 e) A review paper,2-
4, 31-35 and f) Self-reported injuries.36
A total of 34 studies were identified that reported data collection of rugby league injuries.This consisted of 26 studies1, 5-8, 37-57 reporting on rugby league match injuries and 11studies6, 8, 27, 45, 58-64 reporting rugby league training injuries (see Table I). Three studies6, 8, 45
reported both match and training injuries. One match injury study51 re-reported the samesource data, but also included additional data. The additional data was extracted ensuring thatthere were no replications. Injuries were separated into time-loss (TL) injuries (injuries thatresult in players missing the subsequent match or training session) and non-time-loss (NTL)injuries (injuries that do-not result in the player missing the subsequent match or trainingsession).4, 9, 65, 66 By including NTL injuries, it enabled a broader scope of data to analyse. Inaddition the injury site, type, playing position, playing group and match time were alsorecorded.49, 54, 64 Data pertaining to the participation level were reviewed and the studieswere grouped into professional, including reserve and elite;1, 7, 37, 44-48, 56, 57, 59, 60, 63 semi-professional, including sub-elite;6, 8, 38-40, 49, 61, 62, 67 amateur42, 43, 51-54, 58, 64 and junior.5, 41, 55
International Journal of Sports Science & Coaching Volume 9 · Number 2 · 2014 419
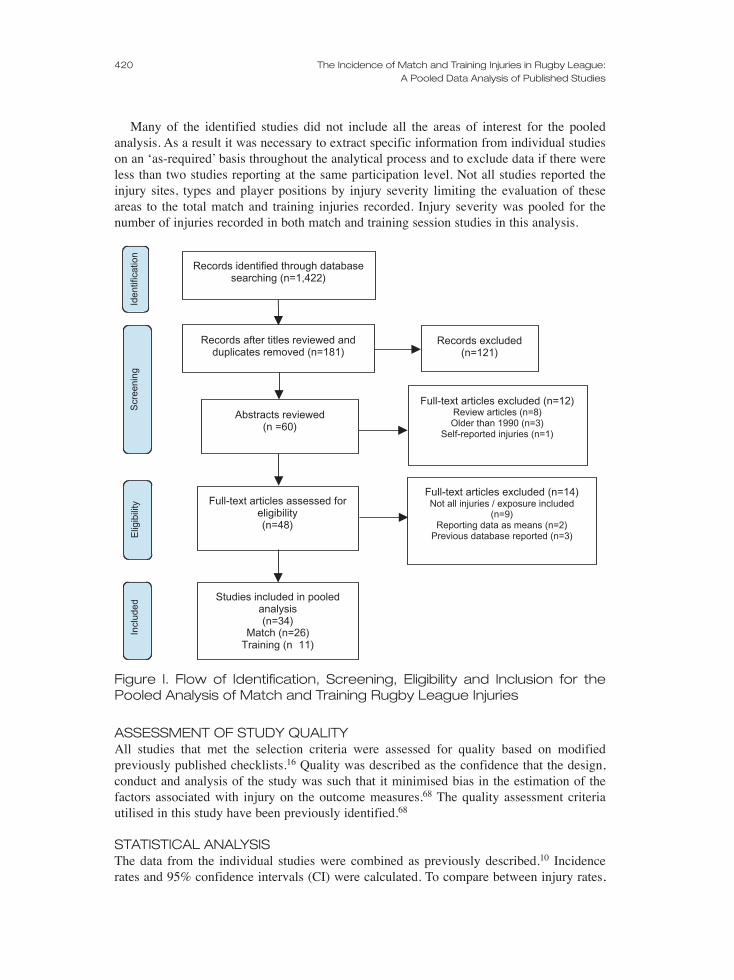
Many of the identified studies did not include all the areas of interest for the pooledanalysis. As a result it was necessary to extract specific information from individual studieson an ‘as-required’ basis throughout the analytical process and to exclude data if there wereless than two studies reporting at the same participation level. Not all studies reported theinjury sites, types and player positions by injury severity limiting the evaluation of theseareas to the total match and training injuries recorded. Injury severity was pooled for thenumber of injuries recorded in both match and training session studies in this analysis.
ASSESSMENT OF STUDY QUALITY All studies that met the selection criteria were assessed for quality based on modifiedpreviously published checklists.16 Quality was described as the confidence that the design,conduct and analysis of the study was such that it minimised bias in the estimation of thefactors associated with injury on the outcome measures.68 The quality assessment criteriautilised in this study have been previously identified.68
STATISTICAL ANALYSISThe data from the individual studies were combined as previously described.10 Incidencerates and 95% confidence intervals (CI) were calculated. To compare between injury rates,
420 The Incidence of Match and Training Injuries in Rugby League: A Pooled Data Analysis of Published Studies
Records after titles reviewed andduplicates removed (n=181)
Abstracts reviewed(n =60)
Records excluded(n=121)
Full-text articles assessed foreligibility(n=48)
Full-text articles excluded (n=12)Review articles (n=8)Older than 1990 (n=3)
Self-reported injuries (n=1)
Studies included in pooledanalysis(n=34)
Match (n=26)Training (n 11)
Records identified through databasesearching (n=1,422)
Full-text articles excluded (n=14)Not all injuries / exposure included
(n=9)Reporting data as means (n=2)
Previous database reported (n=3)
Scr
eeni
ngIn
clud
edE
ligib
ility
Iden
tific
atio
n
Figure I. Flow of Identification, Screening, Eligibility and Inclusion for thePooled Analysis of Match and Training Rugby League Injuries

International Journal of Sports Science & Coaching Volume 9 · Number 2 · 2014 421
risk ratios (RRs) were used. The RRs were assumed to be significant at p<0.05. To test forsignificant difference, chi-squared (χ2) goodness-of-fit tests were utilised.
RESULTSThe studies reported match injury data from a total of 5,785 match events totalling 87,185match exposure hr. (Professional: 2,226 matches; 41,736 match hr; Semi-professional: 713matches; 11,093 match hr; Amateur: 331 matches; 7,416 match hr; Junior: 2,515 matches;26,940 match hr). Studies reporting on training injury data were drawn from 242,754 trainingexposure hr. (Professional: 196,877 training hr; Semi-professional: 32,796 training hr;Amateur: 13,080 training hr). There were no published studies identified that reported onjunior training injuries.
Overall quality of the studies included in the pooled analysis was good (median 5/6; range4-5). Not all studies were prospective and no study had a blinded outcome.
POOLED ANALYSISThe pooled analysis injury incidence for match injuries was 148 (95% CI: 145 to 150) per1,000 match hr. (see Table 1). Semi-professional studies recorded more match injuries thanprofessional (RR: 2.5; 95% CI: 2.4 to 2.6; p<0.0001), amateur (RR: 1.2; 95% CI: 1.2 to 1.3;p<0.0001) and junior (RR: 2.6; 95% CI: 2.1 to 3.2; p<0.0001).There were more NTL thanTL (RR: 2.8; 2.7 to 2.9; p<0.0001) injuries recorded. This was similar for professional (RR:3.5; 95% CI: 3.3 to 3.7; p<0.0001) semi-professional (RR: 3.0; 95% CI: 2.8 to 3.2; p<0.0001)and amateur (RR: 1.5; 95% CI: 1.2 to 1.8; p=0.0003) studies.
Table 1. Rugby League Match and Training Injury Studies Utilised in thePooled Analysis by Number of Injuries Reported, Hours of Exposure andRate per 1,000 Hours with 95% Confidence Intervals
InjuriesNo. Hours Rate (95% CI)
Match injuriesa
Total 12,817 86,821 148 (145 to 150)Gender
Male1, 5-8, 37-52, 54-57 12,716 86,492 147 (145 to 150)Female53 101 329.2 307 (253 to 373)
Level of ParticipationProfessional1, 7, 37, 44-48, 56, 57 7,113 41,374 172 (168 to 176)Semi-Professional6, 8, 38-40, 49 3,977 11,093 359 (348 to 370)Amateur42, 43, 50-54 1,339 7,416 181 (171 to 191)Junior5, 41, 55 388 26,940 14 (13 to 16)
Training injuriesb
Total 3,070 242,754 12.6 (12.2 to 13.1)Gender
Male6, 8, 27, 45, 58-64 3,070 242,754 12.6 (12.2 to 13.1)Level of Participation
Professional45, 59, 60, 63 755 96,877 3.8 (3.6 to 4.1)Semi-Professional6, 8, 27, 61, 62 2,138 2,796 65.2 (62.5 to 68.0)Amateur58, 64 177 4,529 12.2 (10.5 to 14.1)
CI = Confidence Interval; (a) = rate reported per 1,000 match hours; (b) = rate reported per 1,000 training hours

The pooled analysis injury incidence for training injuries was 12.6 (95% CI: 12.2 to 13.1)per 1,000 training hr. (see Table 1). Semi-professional training session studies recorded moreinjuries than professional (RR: 18.7; 95% CI: 17.1 to 20.4; p<0.0001) and amateur (RR: 4.8;95% CI: 4.1 to 5.6; p<0.0001) studies. Semi-professional training studies recorded moreNTL (RR: 37.5; 95% CI: 33.8 to 41.7; p<0.0001) and TL (RR: 15.5; 95% CI: 12.6 to 19.2;p<0.0001) injuries than professional studies.
MATCH INJURIESThe tackler recorded more injuries than the ball carrier at the professional (RR: 2.2; 95% CI1.9 to 2.6; p<0.0001), semi-professional (RR: 1.3; 95% CI: 0.9 to 1.9; p=0.2393), amateur(RR: 1.4; 95% CI: 1.2 to 1.6; p=0.0003) and junior (RR: 4.3; 95% CI: 2.3 to 8.1; p<0.0001)levels of participation (see Table 2). The lower limb (69; 95% CI: 67 to 72 per 1,000 matchhours) was the most common total injury region recorded. Total lower limb injuries wererecorded more commonly in amateur than semi-professional (RR: 1.9; 95% CI: 1.7 to 2.0;p<0.0001), professional (RR: 3.2; 95% CI: 2.8 to 3.8; p<0.0001) and junior (RR: 4.7; 95%CI: 3.5 to 6.3; p<0.0001) rugby league. More injuries were recorded in the first than thesecond half (RR: 1.1; 95% CI: 1.0 to 1.2; p=0.0246) of pooled matches. Amateur studiesreported more injuries in the second half of matches (RR: 1.5; 95% CI: 1.4 to 1.7; p<0.0001)than semi-professional studies.
Table 2. Pooled Analysis Summary of Match Injuries by Participation Leveland Total Pooled Analysis for Total Injury Rate, Cause, site, Player Groupand Match Time per 1,000 Match Hours with 95% Confidence Intervals andNumber of Studies in Pooled Analysis
Total Professional Semi-Professional Amateur JuniorRate (95% CI)n Rate (95% CI)n Rate (95% CI)n Rate (95% CI)n Rate (95% CI)n
Total IR148 (145 to 150)26 172 (168 to 176)10 359 (348 to 370)6 181 (171 to 1915)7 14 (13 to 16)3
Injury CauseTackler 28e (25 to 30)14 17bcde (15 to 20)5 11ac (8 to 14)2 175abe (152 to 202)5 8ace (5 to 15)2
Ball Carrier 49 (46 to 53)14 37.7bc (34 to 42)5 13acd (10 to 17)2 230abd (203 to 261)5 36bc(28 to 48)2
Injury siteHead/Neck 34hi (33 to 36)20 29bcdghi (27 to 31)8 42adghi (38 to 46)4 46adghi (41 to 51)6 14abcgh (9 to 22)2
Upper Limb 35hi (33 to 37)20 26bcfhi (24 to 27)8 58acdfhi (53 to 63)4 122abdfhi (100 to 148)6 28cdfi (21 to 38)2
Lower Limb 69fgi (67 to 72)20 55bcdfgi (52 to 57)8 105acdfgi (98 to 112)4180abdfgi (153 to 211)6 38abcfi (30 to 50)2
Chest/Back 18fgh (17 to 20)20 17bfgh (15 to 18)8 23afgh (98 to 26)4 25ghi (16 to 38)6 15gh (10 to 23)2
Player GroupForwards 156 (148 to 164)10 75 (68 to 83)3 228 (208 to 249)2 547 (491 to 608)4 *1Backs 112k (106 to 119)10 54k (48 to 60)3 166k (150 to 183)2 385k (342 to 433)4 *1
Match TimeFirst Half 461 (438 to 486)8 NR 521cl (491 to 552)2 327bl (2897 to 371)5 *1Second Half 423 (401 to 447)8 NR 371c (346 to 397)2 586b (533 to 644)5 *1
CI: Confidence Interval; n= number of studies; IR = Injury rate; NR=Not reported; *= unable to complete pooledanalysis; Significant difference (p<0.05) than (a)=Professional; (b)=Semi-professional; (c)=Amateur; (d)=Junior;(e)=Ball carrier; (f)=Head/Neck; (g)=Upper Limb; (h)=Lower Limb; (i)=Chest/Back; (j)=Non-time loss;(k)=Forwards; (l)=Second Half
422 The Incidence of Match and Training Injuries in Rugby League: A Pooled Data Analysis of Published Studies

International Journal of Sports Science & Coaching Volume 9 · Number 2 · 2014 423
Although sprains were the most common match injury type (34; 95% CI: 32 to 36 per1,000 match hr.) this varied by participation level (see Table 3). Strains (35; 95% CI: 31 to40 per 1,000 match hr.) were more commonly reported at the semi-professional level whilecontusions (183; 95% CI: 162 to 206 per 1,000 match hr.) were more commonly reported atthe amateur level of participation. Amateur studies reported more fracture-dislocations (46;95% CI: 35 to 61 per 1,000 match hr.) than professional (RR: 1.2; 95% CI: 1.0 to 1.4;p<0.0001) and semi-professional (RR: 2.4; 95% CI: 1.8 to 3.3; p<0.0001) studies. Moreconcussions were recorded in amateur than professional (RR 2.4: 95% CI: 1.5 to 3.8;p=0.0002), semi-professional (RR: 3.0; 95% CI: 1.8 to 5.1; p<0.0001) and junior (RR: 2.5;95% CI: 1.2 to 5.5; p=0.0132) studies.
Table 3. Pooled Analysis Summary of Match injuries by Injury Type per1,000 Match Hours with 95% Confidence Intervals and Number of Studiesin Pooled Analysis
Injury type Total Professional Semi-Professional Amateur JuniorRate (95% CI)n Rate (95% CI)n Rate (95% CI)n Rate (95% CI)n Rate (95% CI)n
Contusions 28 (27 to 30)17 27 (25 to 29)7 19 (16 to 22)4 183 (162 to 206)5 *1Fracture/Dislocations 16 (15 to 18)17 24c (22 to 25)7 9c (8 to 12)4 47ab (37 to 59)5 *1Sprains 33 (32 to 35)17 50 (47 to 52)7 27 (24 to 31)4 84 (71 to 100)5 *1Strains 28 (26 to 29)17 42 (39 to 44)7 35 (32 to 40)4 70 (58 to 85)5 *1Wounds 13 (12 to 14)17 20 (19 to 22)7 9 (7 to 11)4 44 (34 to 56)5 *1Concussion 8 (7 to 9)18 7c (7 to 9)7 6c (5 to 8)4 18abd (12 to 26)5 7c (4 to 13)2
CI: Confidence Interval; n= number of studies; *= unable to complete pooled analysis; Significant difference(p<0.05) than (a)=Professional; (b)=Semi-professional; (c)=Amateur; (d)=Junior;
Although the hooker playing position recorded most injuries (Total: 380; 95% CI: 237 to442 per 1,000 match hr; Semi-professional: 372; 95% CI: 312 to 443 per 1,000 match hr.)the prop (595; 95% CI 487 to 727 per 1,000 match hr.) recorded the most injuries at theamateur level of participation (see Table 4).
Table 4. Pooled Analysis Summary of Match Injuries by Participation Leveland Player Position per 1,000 Match Hours with 95% Confidence Intervalsand Number of Studies in Pooled Analysis
Player Position Total Semi-Professional Amateur JuniorRate (95% CI)n Rate (95% CI)n Rate (95% CI)n Rate (95% CI)n
Prop 281 (248 to 318)6 210 (178 to 247)2 595 (487 to 727)3 *1Hooker 380 (327 to 442)6 372 (312 to 443)2 476 (346 to 654)3 *1Second Row Forward 242 (211 to 276)6 180 (151 to 215)2 482 (386 to 603)3 *1Loose Forward 245 (203 to 296)6 215 (171 to 271)2 388 (273 to 552)3 *1Half-back 187 (150 to 231)6 183 (1436 to 235)2 250 (162 to 388)3 *1Stand Off 263 (219 to 315)6 233 (187 to 291)2 188 (131 to 269)3 *1Centre 211 (183 to 244)6 164 (136 to 197)2 407 (319 to 519)3 *1Wing 163 (139 to 192)6 121 (97 to 150)2 338 (259 to 442)3 *1Full Back 225 (185 to 273)6 174 (135 to 225)2 451 (325 to 625)3 *1
CI: Confidence Interval; n= number of studies; *= unable to complete pooled analysis; Significant difference(p<0.05) than (a)=Semi-professional; (b)=Amateur;

TRAINING INJURIESThe tackler recorded more injuries than the ball carrier (RR: 1.6; 95% CI: 1.0 to 2.6;p=0.0754) in amateur training session studies (see Table 5). The lower limb was the mostcommon injury recorded (5.7; 95% CI: 5.1 to 5.8 per 1,000 training injuries) for all studiesreporting training sessions. Professional (RR: 37.5; 95% CI: 33.8 to 41.7; p<0.0001) andamateur (RR: 18.4; 95% CI: 14.5 to 23.4; p<0.0001) training session studies reported fewerlower limb training injuries than semi-professional training session studies. There were moreinjuries recorded in the second than the first half (RR: 1.4; 95% CI: 1.0 to 1.8; p=0.0413) ofamateur training sessions.
Table 5. Pooled Analysis Summary of Training Injuries by Participation Leveland Total Pooled Analysis for Total Injury Rate, Cause, Site, Player Groupand Match Time per 1,000 Training Hours with 95% Confidence Intervalsand Number of Studies in Pooled Analysis
Total Professional Semi-Professional AmateurRate (95% CI)n Rate (95% CI)n Rate (95% CI)n Rate (95% CI)n
Total IR12.6 (12.2 to 13.1)11 3.8 (3.6 to 4.1)4 65.2 (62.5 to 68.0)5 13.5 (11.7 to 15.7)2
Injury CauseTackler 10.2d (8.9 to 11.8)4 NR 20.6cd I17.7 to 24.1)2 2.9b (2.1 to 4.0)2
Ball Carrier 12.6 (11.1 to 14.3)4 NR 28.3c (24.8 to 32.3)2 1.8b (1.2 to 2.7)2
Injury siteHead/Neck 0.7gh (0.6 to 0.9)8 0.3bcgh (0.2 to 0.4)4 9.0acgh (7.1 to 11.4)2 1.2abfg (0.7 to 2.0)2
Upper Limb 0.9gh (0.8 to 1.0)8 0.3bcgh (0.2 to 0.4)4 10.2acgh (8.2 to 12.7)2 2.8abegh (2.0 to 3.9)2
Lower Limb 5.7efh (5.4 to 6.1)8 2.0bcefh (1.8 to 2.2)4 75.4acefh (69.5 to 81.7)2 8.6abefh (7.2 to 10.4)2
Chest/Back 1.4efg (1.3 to 1.6)8 0.8befg (0.7 to 1.0)4 13.8acefg (11.4 to 16.7)2 0.8bfg (0.4 to 1.4)2
Player GroupForwards 8.5 (6.9 to 10.3)2 NR NR 8.5 (6.9 to 10.3)2
Backs 6.7 (5.3 to 8.3)2 NR NR 6.7 (5.3 to 8.3)2
Match TimeFirst Half 11.3k (9.0 to 14.2)2 NR NR 11.3k (9.0 to 14.2)2
Second Half 15.4 (12.7 to 18.8)2 NR NR 15.4 (12.7 to 18.8)2
CI: Confidence Interval; n= number of studies; IR = Injury rate; NR=Not reported; Significant difference (p<0.05)than (a)=Professional; (b)=Semi-professional; (c)=Amateur; (d)= Ball carrier; (e)=Head/Neck; (f)=Upper Limb;(g)=Lower Limb; (h)=Chest/Back; (i)= Non-time loss; (j)=Forwards; (k)=Second Half
Strains (3.6; 95% CI: 3.4 to 3.9 per 1,000 training hr.) were the most common traininginjury recorded (see Table 6). This was similar for professional (0.8; 95% CI: 0.6 to 0.9 per1,000 training hr.) and amateur (5.0; 95% CI: 3.9 to 6.3 per 1,000 training hr.) studies.Contusions (30.4; 95% CI: 27.7 to 33.4 per 1,000 training hr.) were more commonly reportedfor semi-professional training studies. There were more fracture-dislocations recorded forsemi-professional studies than professional (RR: 37.8; 95% CI: 18.6 to 76.9; p<0.0001) andamateur (RR: 3.7; 95% CI: 1.7 to 8.0; p<0.001). There were more concussions were recordedin semi-professional than amateur (RR: 13.5; 4.2 to 43.9; p<0.0001) training session studies.
424 The Incidence of Match and Training Injuries in Rugby League: A Pooled Data Analysis of Published Studies
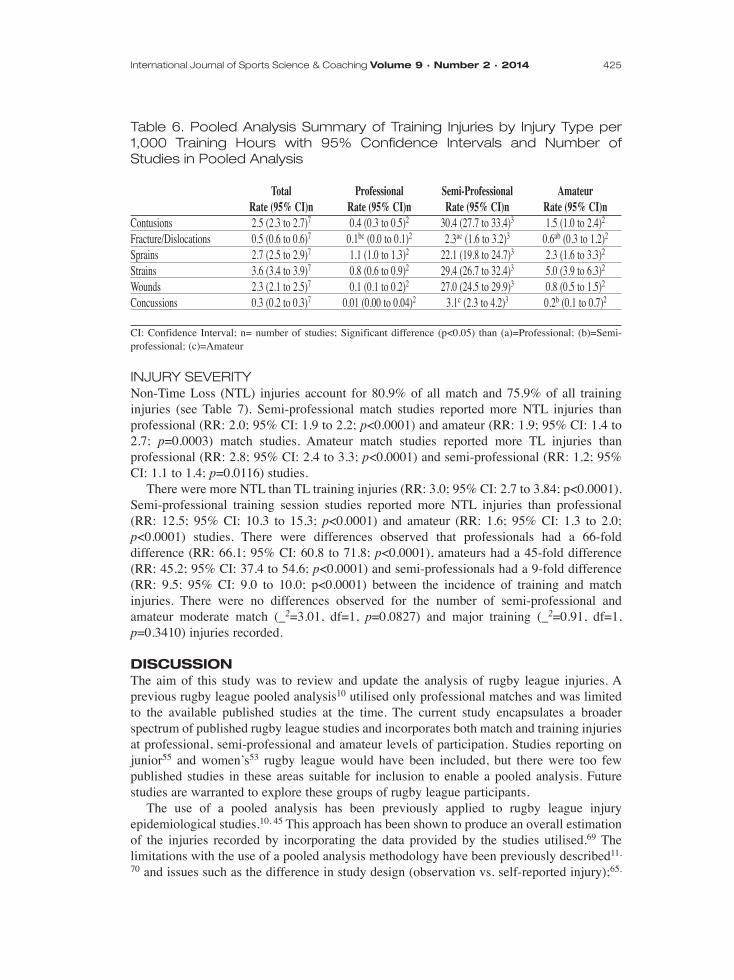
Table 6. Pooled Analysis Summary of Training Injuries by Injury Type per1,000 Training Hours with 95% Confidence Intervals and Number ofStudies in Pooled Analysis
Total Professional Semi-Professional AmateurRate (95% CI)n Rate (95% CI)n Rate (95% CI)n Rate (95% CI)n
Contusions 2.5 (2.3 to 2.7)7 0.4 (0.3 to 0.5)2 30.4 (27.7 to 33.4)3 1.5 (1.0 to 2.4)2
Fracture/Dislocations 0.5 (0.6 to 0.6)7 0.1bc (0.0 to 0.1)2 2.3ac (1.6 to 3.2)3 0.6ab (0.3 to 1.2)2
Sprains 2.7 (2.5 to 2.9)7 1.1 (1.0 to 1.3)2 22.1 (19.8 to 24.7)3 2.3 (1.6 to 3.3)2
Strains 3.6 (3.4 to 3.9)7 0.8 (0.6 to 0.9)2 29.4 (26.7 to 32.4)3 5.0 (3.9 to 6.3)2
Wounds 2.3 (2.1 to 2.5)7 0.1 (0.1 to 0.2)2 27.0 (24.5 to 29.9)3 0.8 (0.5 to 1.5)2
Concussions 0.3 (0.2 to 0.3)7 0.01 (0.00 to 0.04)2 3.1c (2.3 to 4.2)3 0.2b (0.1 to 0.7)2
CI: Confidence Interval; n= number of studies; Significant difference (p<0.05) than (a)=Professional; (b)=Semi-professional; (c)=Amateur
INJURY SEVERITYNon-Time Loss (NTL) injuries account for 80.9% of all match and 75.9% of all traininginjuries (see Table 7). Semi-professional match studies reported more NTL injuries thanprofessional (RR: 2.0; 95% CI: 1.9 to 2.2; p<0.0001) and amateur (RR: 1.9; 95% CI: 1.4 to2.7; p=0.0003) match studies. Amateur match studies reported more TL injuries thanprofessional (RR: 2.8; 95% CI: 2.4 to 3.3; p<0.0001) and semi-professional (RR: 1.2; 95%CI: 1.1 to 1.4; p=0.0116) studies.
There were more NTL than TL training injuries (RR: 3.0; 95% CI: 2.7 to 3.84; p<0.0001).Semi-professional training session studies reported more NTL injuries than professional(RR: 12.5; 95% CI: 10.3 to 15.3; p<0.0001) and amateur (RR: 1.6; 95% CI: 1.3 to 2.0;p<0.0001) studies. There were differences observed that professionals had a 66-folddifference (RR: 66.1; 95% CI: 60.8 to 71.8; p<0.0001), amateurs had a 45-fold difference(RR: 45.2; 95% CI: 37.4 to 54.6; p<0.0001) and semi-professionals had a 9-fold difference(RR: 9.5; 95% CI: 9.0 to 10.0; p<0.0001) between the incidence of training and matchinjuries. There were no differences observed for the number of semi-professional andamateur moderate match (_2=3.01, df=1, p=0.0827) and major training (_2=0.91, df=1,p=0.3410) injuries recorded.
DISCUSSIONThe aim of this study was to review and update the analysis of rugby league injuries. Aprevious rugby league pooled analysis10 utilised only professional matches and was limitedto the available published studies at the time. The current study encapsulates a broaderspectrum of published rugby league studies and incorporates both match and training injuriesat professional, semi-professional and amateur levels of participation. Studies reporting onjunior55 and women’s53 rugby league would have been included, but there were too fewpublished studies in these areas suitable for inclusion to enable a pooled analysis. Futurestudies are warranted to explore these groups of rugby league participants.
The use of a pooled analysis has been previously applied to rugby league injuryepidemiological studies.10, 45 This approach has been shown to produce an overall estimationof the injuries recorded by incorporating the data provided by the studies utilised.69 Thelimitations with the use of a pooled analysis methodology have been previously described11,
70 and issues such as the difference in study design (observation vs. self-reported injury);65,
International Journal of Sports Science & Coaching Volume 9 · Number 2 · 2014 425

426 The Incidence of Match and Training Injuries in Rugby League: A Pooled Data Analysis of Published Studies
Tab
le 7
. P
oo
led
An
aly
sis
Su
mm
ary
of
Ma
tch
an
d T
rain
ing
In
jurie
s b
y In
jury
Se
verit
y p
er
1,0
00
Ma
tch
an
d T
rain
ing
Ho
urs
with
95
% C
on
fide
nc
e In
terv
als
, Pe
rce
nta
ge
of
Tota
l In
jurie
s a
nd
Nu
mb
er
of
Stu
die
s in
Po
ole
d A
na
lysi
s
Non T
ime L
oss
Mild
Mod
erat
eM
ajor
Tim
e Los
sRa
te (9
5% C
I)n%
Rate
(95%
CI)n
%Ra
te (9
5% C
I)n%
Rate
(95%
CI)n
%Ra
te (9
5% C
I)n%
Matc
h Inju
riesa
Poole
d24
2 (23
6 to 2
47)18
80.9
34 (3
2 to 3
6)18
1114
(14 t
o 16)
184.9
9 (8 t
o 10)
1815
.657
(55 t
o 60)
1819
.1Pr
ofes
siona
l18
1de(1
75 to
186)
879
.528
de(2
6 to 3
0)8
12.3
12de
(10 t
o 13)
85.1
7de(6
to 8)
814
.847
de(4
4 to 1
9)8
20.5
Semi
-Pro
fessio
nal
490ce
(472
to 50
8)4
87.1
40ce
(35 t
o 45)
47.1
23c
(19 t
o 27)
44.0
11ce
(8 to
14)4
14.5
72.8ce
(66 t
o 80)
412
.9Am
ateur
305cd
(278
to 33
5)5
66.8cd
87 (7
3 to 1
03)5
19.0
30c
(23 t
o 41)
56.6
34cd
(26 t
o 45)
522
.715
2cd(1
33 to
173)
533
.2Ju
nior
*1*1
*1*1
*1Tr
aining
Injur
iesb
Poole
d8.5
(8.1
to 8.9
)975
.91.7
(1.6
to 1.9
)915
.70.6
(0.5
to 0.7
)95.6
0.3 (0
.2 to
0.4)9
2.82.7
(2.5
to 2.9
)924
.1Pr
ofes
siona
l2.6
gh(2
.4 to
2.9)3
75.7
0.5gh
(0.4
to 0.6
)314
.10.2
gh(0
.2 to
0.3)3
6.40.1
gh(0
.1 to
0.2)3
3.90.8
gh(0
.7 to
1.0)3
24.3
Semi
-Pro
fessio
nal
47.6fh
(45.0
to 50
.3)4
80.0
8.5fh
(7.4
to 9.6
)414
.22.4
fg(1
.9 to
3.1)4
4.11.0
f (0.7
to 1.5
)41.7
11.9fh
(10.7
to 13
.3)4
20.0
Amate
ur6.2
fg(4
.9 to
7.8)2
40.7
5.2fg
(4.0
to 6.7
)233
.92.5
fg(1
.7 to
3.6)2
16.4
1.4f (0
.8 to
2.3)2
9.09.1
fg(7
.5 to
11.0)
259
.3
CI:
Con
fide
nce
Inte
rval
; n=
num
ber
of s
tudi
es;
(a)=
rat
e pe
r 1,
000
mat
ch h
ours
; (b
)= r
ate
per
1,00
0 tr
aini
ng h
ours
; *=
una
ble
to c
ompl
ete
pool
ed a
naly
sis;
Sig
nifi
cant
dif
fere
nce
(p<
0.05
) th
an (
c)=
Pro
fess
iona
l mat
ch; (
d)=
Sem
i-pr
ofes
sion
al m
atch
; (e)
= A
mat
eur
mat
ch; (
f)=
Pro
fess
iona
l tra
inin
g; (
g)=
Sem
i-pr
ofes
sion
al tr
aini
ng; (
h)=
Am
ateu
r tr
aini
ng
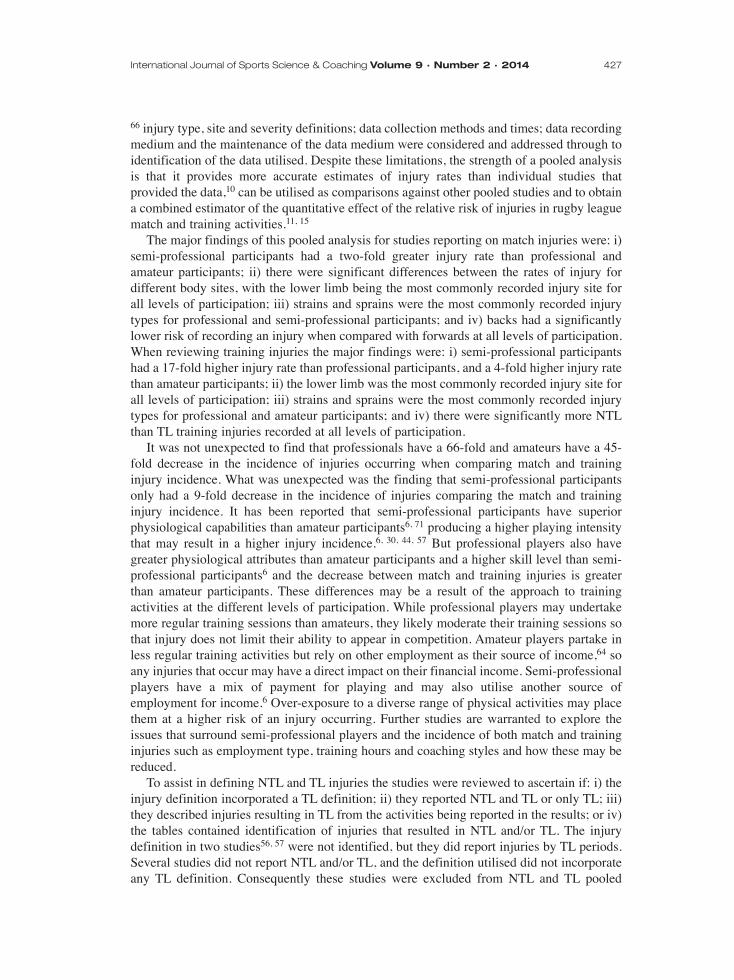
66 injury type, site and severity definitions; data collection methods and times; data recordingmedium and the maintenance of the data medium were considered and addressed through toidentification of the data utilised. Despite these limitations, the strength of a pooled analysisis that it provides more accurate estimates of injury rates than individual studies thatprovided the data,10 can be utilised as comparisons against other pooled studies and to obtaina combined estimator of the quantitative effect of the relative risk of injuries in rugby leaguematch and training activities.11, 15
The major findings of this pooled analysis for studies reporting on match injuries were: i)semi-professional participants had a two-fold greater injury rate than professional andamateur participants; ii) there were significant differences between the rates of injury fordifferent body sites, with the lower limb being the most commonly recorded injury site forall levels of participation; iii) strains and sprains were the most commonly recorded injurytypes for professional and semi-professional participants; and iv) backs had a significantlylower risk of recording an injury when compared with forwards at all levels of participation.When reviewing training injuries the major findings were: i) semi-professional participantshad a 17-fold higher injury rate than professional participants, and a 4-fold higher injury ratethan amateur participants; ii) the lower limb was the most commonly recorded injury site forall levels of participation; iii) strains and sprains were the most commonly recorded injurytypes for professional and amateur participants; and iv) there were significantly more NTLthan TL training injuries recorded at all levels of participation.
It was not unexpected to find that professionals have a 66-fold and amateurs have a 45-fold decrease in the incidence of injuries occurring when comparing match and traininginjury incidence. What was unexpected was the finding that semi-professional participantsonly had a 9-fold decrease in the incidence of injuries comparing the match and traininginjury incidence. It has been reported that semi-professional participants have superiorphysiological capabilities than amateur participants6, 71 producing a higher playing intensitythat may result in a higher injury incidence.6, 30, 44, 57 But professional players also havegreater physiological attributes than amateur participants and a higher skill level than semi-professional participants6 and the decrease between match and training injuries is greaterthan amateur participants. These differences may be a result of the approach to trainingactivities at the different levels of participation. While professional players may undertakemore regular training sessions than amateurs, they likely moderate their training sessions sothat injury does not limit their ability to appear in competition. Amateur players partake inless regular training activities but rely on other employment as their source of income,64 soany injuries that occur may have a direct impact on their financial income. Semi-professionalplayers have a mix of payment for playing and may also utilise another source ofemployment for income.6 Over-exposure to a diverse range of physical activities may placethem at a higher risk of an injury occurring. Further studies are warranted to explore theissues that surround semi-professional players and the incidence of both match and traininginjuries such as employment type, training hours and coaching styles and how these may bereduced.
To assist in defining NTL and TL injuries the studies were reviewed to ascertain if: i) theinjury definition incorporated a TL definition; ii) they reported NTL and TL or only TL; iii)they described injuries resulting in TL from the activities being reported in the results; or iv)the tables contained identification of injuries that resulted in NTL and/or TL. The injurydefinition in two studies56, 57 were not identified, but they did report injuries by TL periods.Several studies did not report NTL and/or TL, and the definition utilised did not incorporateany TL definition. Consequently these studies were excluded from NTL and TL pooled
International Journal of Sports Science & Coaching Volume 9 · Number 2 · 2014 427

analysis. Future studies reporting on rugby league match and/or training injuries shouldconsider including an injury definition that includes a time loss definition.
The inclusion of NTL injuries in the pooled analysis was undertaken as previous studieshave reported between 70%57 and 92%42 of injuries do not meet the TL definition.Unfortunately a majority of the match and training studies reviewed in this pooled analysisreported the NTL and TL as a total number of the injuries recorded and did not specify theseby injury site, type, playing position, cause and match time. This is seen as a limitation tothis pooled analysis. Future studies reporting on match and training rugby league injuriesshould consider including this data. The inclusion of both TL and NTL injuries in rugbyleague studies has been previously suggested9 as it also acts as a guide to the health caremanagement and appointment of essential primary care personnel.66 Non-time loss injuriesstill require assessment, management and sometimes onward-referral to other health careservice providers.66 This has resource implications on the health-care practitioner whendealing with these injuries.65 As shown by this pooled analysis, NTL injuries accounted for80.9% of pooled match injuries and 75.9% of pooled training injuries.
As shown in this pooled analysis it can be seen that in match activities semi-professionalrugby league participants have a higher reported injury rate than professional and amateurparticipants, the ball carrier records more injuries than the tackler to the lower limbs inforward playing groups during the first half of matches and sprains were the most commoninjury type. In training activities it can be seen that strains are the most common traininginjury, the ball carrier is more commonly injured than the tackler and more training injuriesoccur in the second than the first half of matches. Awareness of this can assist in injuryreduction programmes and further studies reporting on interventions to assist in the reductionof these injuries are warranted.
CONCLUSIONA combined estimate of injuries within a specific sport through pooled analysis providesmore precise evidence and meaningful information about the sport, while controlling forbetween-study variation due to individual sub-cohort characteristics. This synthesis hasilluminated differences in injury rates at several levels in the game, along with informationabout the differences in injury between playing and training for rugby league. These findingsare indicative of the varying physical demands placed on players across many levels ofparticipation.
REFERENCES1. Seward, H., Orchard, J., Hazard, H. and Collinson, D., Football Injuries in Australia at the Elite Level,
Medical Journal of Australia, 1993, 159(5), 298-301.
2. Gabbett, T., Incidence of Injury in Junior and Senior Rugby League Players, Sports Medicine, 2004, 34(12),849-859.
3. Gabbett, T., Science of Rugby League Football: A Review, Journal of Sports Sciences, 2005, 23(9), 961-976.
4. King, D., Hume, P., Milburn, P. and Guttenbeil, D., Match and Training Injuries in Rugby League: A Reviewof Published Studies, Sports Medicine, 2010, 40(2),163-178.
5. Raftery, M., Parker, R., Stacey, E., Peat, J. and Wang, H., Incidence of Injury in Junior Rugby League in thePenrith and District Junior Rugby League Area: A Report Submitted to the NSW Sporting Injuries Committeeand Australian Rugby League, Children’s Hospital Institute of Sports Medicine; Research and DevelopmentOffice, The New Children’s Hospital, Westmead. 1999:1-22.
6. Gabbett, T., Incidence of Injury in Semi Professional Rugby League Players, British Journal of SportsMedicine, 2003, 37(1), 36-44.
428 The Incidence of Match and Training Injuries in Rugby League: A Pooled Data Analysis of Published Studies
International Journal of Sports Science & Coaching Volume 9 · Number 2 · 2014 429
7. Hodgson Phillips, L., Standen, P. and Batt, M., Effects of Seasonal Change in Rugby League on the Incidenceof Injury, British Journal of Sports Medicine, 1998, 32(2),144-148.
8. Gabbett, T., Influence of Training and Match Intensity on Injuries in Rugby League, Journal of SportsScience, 2004, 22, 409-17.
9. King, D., Gabbett, T., Gissane, C. and Hodgson, L., Epidemiological Studies of Injuries in Rugby League:Suggestions for Definitions, Data Collection and Reporting Methods, Journal of Science and Medicine inSport, 2009, 12(1), 12-9
10 Gissane, C., Jennings, D., Kerr K. and White, J., A Pooled Data Analysis of Injury Incidence in RugbyLeague Football, Sports Medicine, 2002, 32(3), 211-6.
11. Blettner, M., Sauerbrei, W., Schlehofer, B., Scheuchenpflug, T. and Friedenreich, C., Traditional Reviews,Meta-Analyses and Pooled Analyses in Epidemiology, International Journal of Epidemiology, 1999, 28(1),1-9.
12. McElvenny, D., Armstrong, B., Järup, L. and Higgins, J., Meta-Analysis in Occupational Epidemiology: AReview of Practice, Occupational Medicine, 2004, 54(5), 336-344.
13. Checkoway, H., Data Pooling in Occupational Studies, Journal of Occupational Medicine, 1991, 33(12),1257-1260.
14. Wong, O. and Raabe, G., Application of Meta-Analysis in Reviewing Occupational Cohort Studies,Occupational and Environmental Medicine, 1996, 53(12), 793-800.
15. Friedenreich, C., Methods for Pooled Analyses of Epidemiologic Studies, Epidemiology, 1993, 4(4), 295-302.
16. Stroup, D., Berlin, J., Morton, S., Olkin, I., Williamson, G., Rennie, D., Moher, D., Becker, B., Sipe, T. andThacker, S., Meta-Analysis of Observational Studies in Epidemiology: A Proposal for Reporting, Journal ofthe American Medical Association, 2000, 283(15), 2008-2012.
17. Giacco, D., McCabe, R., Kallert, T., Hansson, L., Fiorillo, A. and Priebe, S., Friends and SymptomDimensions in Patients with Psychosis: A Pooled Analysis, PLoS ONE, 2012, 7(11), e50119.
18. Alexander, D., Kennedy, M. and Kennedy, J., Injuries in Rugby League Football, Medical Journal ofAustralia, 1979, 2, 341-342.
19. Alexander, D., Kennedy, M. and Kennedy, J., Rugby League Football Injuries over Two CompetitiveSeasons, Medical Journal of Australia, 1980; 2, 334-345.
20. Walker, R., Sports Injuries: Rugby League May Be Less Dangerous Than Union, Practitioner, 1985,229(March), 205-206.
21. Gabbett, T., Minbashian, A. and Finch, C., Influence of Environmental and Ground Conditions on InjuryRisk in Rugby League, Journal of Science and Medicine in Sport, 2007, 10(4), 211-218.
22. Kinchington, M., Ball, K. and Naughton, G., Effects of Footwear on Comfort and Injury in ProfessionalRugby League, Journal of Sports Sciences, 2011, 29(13), 1407-1415.
23. Gabbett, T., Jenkins, D. and Abernethy, B., Physical Collisions and Injury During Professional Rugby LeagueSkills Training, Journal of Science and Medicine in Sport, 2010, 13(6), 578-583.
24. Gabbett, T., Jenkins, D. and Abernethy, B., Physical Collisions and Injury in Professional Rugby LeagueMatch-Play, Journal of Science and Medicine in Sport, 2011, 14(3), 210-215.
25. Gabbett, T., Ullah, S., Jenkins, D. and Abernethy, B., Skill Qualities as Risk Factors for Contact Injury inProfessional Rugby League Players, Journal of Sports Sciences, 2012, 30(13), 1421-1427.
26. Gabbett, T., Ullah, S. and Finch, C., Identifying Risk Factors for Contact Injury in Professional RugbyLeague Players – Application of a Frailty Model for Recurrent Injury, Journal of Science and Medicine inSport, 2012, 15(6), 496-504.
27. Gabbett, T. and Jenkins, D., Relationship Between Training Load and Injury in Professional Rugby LeaguePlayers, Journal of Science and Medicine in Sport, 2011, 14(3), 204-209.
28. King, D., Hume, P. and Clark, T., Nature of Tackles That Result in Injury in Professional Rugby League,Research in Sports Medicine, 2012, 20(2), 87-105.
430 The Incidence of Match and Training Injuries in Rugby League: A Pooled Data Analysis of Published Studies
29. King, D., Hume, P. and Clark, T., The Effect of Player Positional Groups on the Nature of Tackles that Resultin Tackle-Related Injuries in Professional Rugby League Matches, Journal of Sports Medicine and PhysicalFitness, 2011, 51(3), 435-443.
30. Gissane, C., Jennings, D. and Standing, P., Incidence of Injury in Rugby League Football, Physiotherapist,1993; 79:305-10.
31. Gibbs, N., Common Rugby League Injuries: Recommendations for Treatment and Preventative Measures,Sports Medicine, 1994, 18(6), 438-450.
32. Hoskins, W., Pollard, H., Hough, K. and Tully, C., Injury in Rugby League, Journal of Science and Medicinein Sport, 2006, 9(1-2), 46-56.
33. Lythe, M. and Norton, R., Rugby League Injuries in New Zealand, New Zealand Journal of Sports Medicine,1992, 20, 6-7.
34. King, D., Hume, P., Milburn, P. and Gianotti, S., Rugby League Injuries in New Zealand: Variations in InjuryClaims and Costs by Ethnicity, Gender, Age, District, Body Site, Injury Type and Occupation, New ZealandJournal of Sports Medicine, 2009, 36(2), 48-55.
35. King, D., Hume, P., Milburn, P. and Gianotti, S., Rugby League Injuries in New Zealand: A Review of 8Years of Accident Compensation Corporation Injury Entitlement Claims and Costs, British Journal of SportsMedicine, 2009, 43(8), 595-602.
36. Norton, R. and Wilson, M., Rugby League Injuries and Patterns, New Zealand Journal of Sports Medicine,1995, 22, 37-38.
37. Estell, J., Shenstone, B. and Barnsley, L., Frequency of Injuries in Different Age-Groups in an Elite RugbyLeague Club, Australian Journal of Science and Medicine in Sport, 1995, 27(4), 95-97.
38. Gabbett, T. and Domrow, N., Risk Factors for Injury in Subelite Rugby League Players, American Journalof Sports Medicine, 2005, 33(3), 428-434.
39. Gabbett, T., Influence of Playing Position on the Site, Nature and Cause of Rugby League Injuries, Journalof Strength and Conditioning Research, 2005, 19(4), 749-755.
40. Gabbett, T., Influence of Injuries on Team Playing Performance in Rugby League, Journal of Science andMedicine in Sport, 2004, 7(3), 340-346.
41. Gabbett, T., Incidence of Injury in Junior Rugby League Players Over Four Competitive Seasons, Journal ofScience and Medicine in Sport, 2008, 11(3), 323-328.
42. Gabbett, T., Incidence of Injury in Amateur Rugby League Sevens, British Journal of Sports Medicine, 2002,36(1), 23-27.
43. Gabbett, T., Incidence, Site, and Nature of Injuries in Amateur Rugby League Over Three ConsecutiveSeasons, British Journal of Sports Medicine, 2000, 34(2), 98-103.
44. Gibbs, N., Injuries in Professional Rugby League. A Three-Year Prospective Study of the South SydneyProfessional Rugby League Football Club, American Journal of Sports Medicine, 1993, 21(5), 696-700.
45. Gissane, C., Hodgson, L. and Jennings, D., Time-Loss Injuries Versus Non–Time-Loss Injuries in the FirstTeam Rugby League Football: A Pooled Data Analysis, Clinical Journal of Sport Medicine, 2012, 22(5), 414-417.
46. Gissane, C., Jennings, D., White, J. and Cumine, A., Injury in Summer Rugby League Football: TheExperiences of One Club, British Journal of Sports Medicine, 1998, 32(2), 149-152.
47. Gissane, C., Jennings, D., Kerr, K. and White, J., Injury Rates in Rugby League Football: Impact of Changein Playing Season, American Journal of Sports Medicine, 2003, 31(6), 954-958.
48. Hodgson, L., Standen, P. and Batt, M., An Analysis of Injury Rates After Seasonal Change in Rugby League,Clinical Journal of Sports Medicine, 2006, 16(4), 305-310.
49. King, D. and Gabbett, T., Injuries in the New Zealand Semi-Professional Rugby League Competition, NewZealand Journal of Sports Medicine, 2009, 36(1), 6-15.
50. King, D. and Clark, T., Injuries in Amateur Representative Rugby League Over Three Years, New ZealandJournal of Sports Medicine, 2012, 39(2), 48-51.

51. King, D. and Gissane, C., Injuries in Amateur Rugby League Matches in New Zealand: A ComparisonBetween a Division One and a Division Two Premier Grade Team, Clinical Journal of Sport Medicine, 2009,19(4), 277-281.
52. King, D. and Gabbett, T., Amateur Rugby League Match Injuries in New Zealand, New Zealand Journal ofSports Medicine, 2009, 36(1), 16-21.
53. King, D. and Gabbett, T., Injuries in a National Women’s Rugby League Tournament: An InitialInvestigation, New Zealand Journal of Sports Medicine, 2007, 34(2), 18-22.
54. King, D., Gabbett, T., Dreyer, C. and Gerrard, D., Incidence of Injuries in the New Zealand National RugbyLeague Sevens Tournament, Journal of Science and Medicine in Sport, 2006, 9(1-2), 110-118.
55. King, D., Incidence of Injuries in the 2005 New Zealand National Junior Rugby League Competition, NewZealand Journal of Sports Medicine, 2006, 34(1),21-7.
56. Orchard, J. and Hoskins, W., Rugby League Injuries at State of Origin Level, Sport Health, 2007, 27(2), 19-24.
57. Stephenson. S., Gissane, C. and Jennings, D., Injury in Rugby League: A Four Year Prospective Survey,British Journal of Sports Medicine, 1996, 30(4), 331-334.
58. Clark, T. and King, D., Incidence of Training Injuries in a New Zealand Amateur Rugby League Team OverThree Consecutive Years, Unpublished Data.
59. Gabbett, T. and Godbolt, R., Training Injuries in Professional Rugby League, Journal of Strength andConditioning Research, 2010, 24(7), 1948-1953.
60. Gabbett, T., The Development and Application of an Injury Prediction Model for Noncontact, Soft-TissueInjuries in Elite Collision Sport Athletes, Journal of Strength and Conditioning Research, 2010, 24(10),2593-2603
61. Gabbett, T., Training Injuries in Rugby League: An Evaluation of Skill-Based Conditioning Games, Journalof Strength and Conditioning Research, 2002, 16(2), 236-241.
62. Gabbett, T., Reductions in Pre-Season Training Loads Reduce Training Injury Rates in Rugby LeaguePlayers, British Journal of Sports Medicine, 2004, 38(6), 743-749.
63. Killen, N., Gabbett, T. and Jenkins, D., Training Loads and Incidence of Injury During the Preseason inProfessional Rugby League Players, Journal of Strength and Conditioning Research, 2010, 24(8), 2079-2084.
64. King, D. and Gabbett, T., Training Injuries in New Zealand Amateur Rugby League Players, Journal ofScience and Medicine in Sport, 2008, 11(6), 562-565.
65. Dompier, T., Powell, J., Barron, M. and Moore, M., Time-Loss and Non-Time-Loss Injuries in YouthFootball Players, Journal of Athletic Training, 2007, 42(3), 395-402.
66. Powell, J. and Dompier, T., Analysis of Injury Rates and Treatment Patterns for Time-Loss and Non-Time-Loss Injuries Among Collegiate Student Athletes, Journal of Athletic Training, 2004, 39(1), 56-70.
67. Gabbett, T. and Domrow, N., Relationships Between Training Load, Injury, and Fitness in Sub-Elite CollisionSport Athletes, Journal of Sports Sciences, 2007, 25(13), 1507-1519.
68. Loosemore, M., Knowles, C. and Whyte, G., Amateur Boxing and Risk of Chronic Traumatic Brain Injury:Systematic Review of Observational Studies, British Medical Journal, 2007, 335(7624), 809-812.
69. Elwood, M., Critical Apprasial of Epidemiological Studies and Clinical Trials, 3rd edn., Oxford UniversityPress Inc, New York, 2007.
70. Shapiro, S., Meta-Analysis/Shmeta-Analysis, American Journal of Epidemiology, 1994, 140(9), 771-778.
71. Gabbett, T., Influence of Physiological Characteristics on Selection in a Semi-Professional First GradeRugby League Team: A Case Study, Journal of Sports Sciences, 2002, 20(5), 399-406
International Journal of Sports Science & Coaching Volume 9 · Number 2 · 2014 431