The impacts of aquaculture development on food security: lessons from Bangladesh
15
The impacts of aquaculture development on food security: lessons from Bangladesh Khondker Murshed^e-Jahan 1 , Mahfuzuddin Ahmed 2 & Ben Belton 3 1 The WorldFish Center, Bangladesh and South Asia, Banani, Dhaka, Bangladesh 2 Asian Development Bank, Manila, Philippines 3 University of Stirling, Stirling, UK Correspondence: K M Jahan, The WorldFish Center, Bangladesh and South Asia, House No. 22B, Road No. 7, Block F, Banani, Dhaka1213, Bangladesh. E-mails: [email protected], [email protected] Abstract Fish contribute a signi¢cant amount of animal pro- tein to the diets of people in Bangladesh, about 63% of which comes from aquatic animals. In Bangla- desh, ¢sh is mainly derived from two sources: capture and culture. Aquaculture has shown tremendous growth in the last two decades, exhibiting by about 10% average annual growth in production. Capture ¢sheries, although still the major source of supply of ¢sh, have become static or are in decline due to over- ¢shing and environmental degradation, and it is now believed that aquaculture has the greatest potential to meet the growing demand for ¢sh from the in- creasing population. At present, aquaculture produc- tion accounts for about one-third of the total ¢sh production in Bangladesh. This paper examines the impact of an aquaculture development project in Bangladesh on food security, with particular empha- sis on the poor. The analysis shows a positive impact of aquaculture development on employment, income and consumption. A number of implications for pol- icy in areas that might strengthen these outcomes are discussed and recommendations are presented. Keywords: aquaculture, food security, poor, poverty, Bangladesh Introduction Bangladesh is one of the most densely populated countries in the world, with 143 million people living in a land mass of only 147500 km 2 . Approximately 76% of the people live in rural areas, of which about one half lives below the national poverty line (the minimum daily food intake is 2122 kilo calorie capita 1 day 1 ) (Government of Bangladesh and United Nation 2007). According to FAO statistics, about 43.1 million su¡er from under-nutrition, equivalent to 5% of the total undernourished people in the world. Estimates also show that around 36% of the population of Bangladesh spends oUS$1day 1 and are unable to access food as required, even if it is available (FAO 2006a). Therefore, to achieve the tar- get of the United Nations Millennium development goals, food security has emerged as the main chal- lenge for the Bangladesh government. Attaining self-su⁄ciency in the production of cer- eals and other staple food commodities has domi- nated the debate over food security in developing countries like Bangladesh over recent decades. The recognition that food insecurity can result from pov- erty and lack of access to su⁄cient nutritious food is relatively recent (Ahmed & Lorica 2002; Maxwell & Slater 2003; Hishamunda & Ridler 2006; Thorpe, Reid, Anrooy, Brugere & Becker 2006; Bose & Dey 2007). This is because food self-su⁄ciency is neither necessary nor su⁄cient to guarantee food security. Self-su⁄ciency is not necessary because there is scope in an open economy for food imports to meet demand. On the other hand, poverty can prevent the poor from accessing nutritious food due to their lim- ited purchasing power. Like many other developing countries, Bangladesh therefore places emphasis on diversi¢ed production, employment and income generation on farms as a means of achieving food security in its Poverty Reduction Strategy Paper (PRSP) (Bangladesh Planning Commission 2005). Aquaculture Research, 2010, 41 , 481^495 doi: 10.1111/j.1365-2109.2009.02337.x r 2009 The Authors Journal Compilation r 2009 Blackwell Publishing Ltd 481
-
Upload
worldfishcenter -
Category
Documents
-
view
1 -
download
0
Transcript of The impacts of aquaculture development on food security: lessons from Bangladesh
The impacts of aquaculture development on food
security: lessons from Bangladesh
Khondker Murshed^e-Jahan1, Mahfuzuddin Ahmed2 & Ben Belton3
1TheWorldFish Center, Bangladesh and South Asia, Banani, Dhaka, Bangladesh2Asian Development Bank, Manila, Philippines3University of Stirling, Stirling, UK
Correspondence: K M Jahan, The WorldFish Center, Bangladesh and South Asia, House No. 22B, Road No. 7, Block F, Banani,
Dhaka1213, Bangladesh. E-mails: [email protected], [email protected]
Abstract
Fish contribute a signi¢cant amount of animal pro-tein to the diets of people in Bangladesh, about 63%of which comes from aquatic animals. In Bangla-desh, ¢sh is mainlyderived from two sources: captureand culture. Aquaculture has shown tremendousgrowth in the last two decades, exhibiting by about10% average annual growth in production. Capture¢sheries, although still the major source of supply of¢sh, have become static or are in decline due to over-¢shing and environmental degradation, and it is nowbelieved that aquaculture has the greatest potentialto meet the growing demand for ¢sh from the in-creasing population. At present, aquaculture produc-tion accounts for about one-third of the total ¢shproduction in Bangladesh. This paper examines theimpact of an aquaculture development project inBangladesh on food security, with particular empha-sis on the poor. The analysis shows a positive impactof aquaculture development on employment, incomeand consumption. A number of implications for pol-icy in areas that might strengthen these outcomesare discussed and recommendations are presented.
Keywords: aquaculture, food security, poor, poverty,Bangladesh
Introduction
Bangladesh is one of the most densely populatedcountries in the world, with143 million people livingin a land mass of only 147500 km2. Approximately76% of the people live in rural areas, of which about
one half lives below the national poverty line (theminimum daily food intake is � 2122 kilo caloriecapita�1day�1) (Government of Bangladesh andUnited Nation 2007). According to FAO statistics,about 43.1 million su¡er from under-nutrition,equivalent to 5% of the total undernourished peoplein theworld. Estimates also show that around 36% ofthe population of Bangladesh spends oUS$1day�1
and are unable to access food as required, even if it isavailable (FAO 2006a). Therefore, to achieve the tar-get of the United Nations Millennium developmentgoals, food security has emerged as the main chal-lenge for the Bangladesh government.Attaining self-su⁄ciency in the production of cer-
eals and other staple food commodities has domi-nated the debate over food security in developingcountries like Bangladesh over recent decades. Therecognition that food insecurity can result from pov-erty and lack of access to su⁄cient nutritious food isrelatively recent (Ahmed & Lorica 2002; Maxwell &Slater 2003; Hishamunda & Ridler 2006; Thorpe,Reid, Anrooy, Brugere & Becker 2006; Bose & Dey2007). This is because food self-su⁄ciency is neithernecessary nor su⁄cient to guarantee food security.Self-su⁄ciency is not necessary because there isscope in an open economy for food imports to meetdemand. On the other hand, poverty can prevent thepoor from accessing nutritious food due to their lim-ited purchasing power. Like many other developingcountries, Bangladesh therefore places emphasison diversi¢ed production, employment and incomegeneration on farms as a means of achieving foodsecurity in its Poverty Reduction Strategy Paper(PRSP) (Bangladesh Planning Commission 2005).
Aquaculture Research, 2010, 41, 481^495 doi:10.1111/j.1365-2109.2009.02337.x
r 2009 TheAuthorsJournal Compilationr 2009 Blackwell Publishing Ltd 481
Aquaculture is the fastest-growing food-producingsector in Bangladesh and has demonstrated continu-ous increases in total production throughout the re-cent decades. By contrast, cereals and similarcommodities have shown a relatively slow growth.Estimates show that from 1983/1984 to 2005/2006,aquaculture production increased by an average an-nual growth rate of 10%. In contrast, cereal produc-tion exhibited anaverage growth rate of only 3% overthis period (BBS 2006; FSYB 2006).Widespread adop-tion of new aquaculture technologies and improve-ments in farming techniques have helped aquacultureto maintain a high growth rate. In Bangladesh, aqua-culture is mainly a rural activity, where about 73% ofrural households engage in some form of freshwateraquaculture (Mazid1999).Because of its rapid expansion (both in Bangladesh
and in many other Asian countries), aquaculture isoften considered to have the potential to enhancefood security among adopters and the population atlarge. Aquaculture is claimed to enhance food secur-ity directly by the production of ¢sh for householdconsumption and by improving the supply and redu-cing the price of ¢sh in the market, and indirectly bycontributing to farm diversi¢cation and the creationof new employment opportunities and incomestreams. As a result of this logic, aquaculture hasbeenpromoted as amechanism for rural developmentwith a poverty alleviation focus for several decades(Edwards 1999; Dey, Rab, Paraguas, Piumsombun,Bhatta, Alam & Ahmed 2005;World Bank 2006).These interlocking claims possess an intuitive ap-
peal and are repeatedly stated in a voluminous greyand academic literature (Halwart, Funge-smith &Moehl 2003; FAO 2006b; for example). However, witha handful of exceptions (Thompson, Firoz Khan &Sultana 2006; Irz, Stevenson,Tanoy,Villarante &Mor-issens 2007;To¢que & Gregory 2008), peer-reviewedresearch based on primary data and dealing with theimpacts of speci¢c projects designed to promoteaquaculture has been limited. This paper aims toaugment this body of knowledge by examining thepotential of aquaculture to impact food securityusing data returned from themonitoring and evalua-tion of a development project implemented by theWorldFish Center in Bangladesh, namely the Devel-opment of Sustainable Aquaculture Project (DSAP).The intention of doing so is to evaluate the validity ofassumptions about aquaculture (which playa signi¢-cant role in the policy formulation of numerous do-nor, state and third sector institutions), and toidentify mechanisms by which aquaculture’s theore-
tical contribution to food security may be enhancedin practice.The paper comprises six sections. The next section
presents an overview of the ¢sheries sector of Ban-gladesh. Section three outlines the analytical frame-work for the study, including a discussion ofhypotheses concerning the role of aquaculture vis-a-vis food security. Section four presents the ¢ndingsof the study and explains the farm- and household-level impacts of aquaculture adoption with respectto income, employment and ¢sh consumption. Fac-tors that mediate the impacts of aquaculture adop-tion with respect to food security, and theirassociated policy implications are discussed in the¢fth section. The conclusions are discussed in the¢nal section.
Fisheries sector of Bangladesh
The ¢sheries sector has played an increasingly im-portant role in e¡orts to uplift the economy of Ban-gladesh. The ¢sheries sector accounted for about 3%of the country’s GDP, 28% of the value added in agri-cultural production and 6% of total export earningsin 2003/2004 (Bangladesh Economic Review 2005).It is a labour-intensive and quick-yielding sector inwhich an estimated 1.3 million of the rural popula-tion are directly employed (Karim, Ahmed,Talukder,Taslim & Rahman 2006). Fish have highly desirablenutrient pro¢les, provide an excellent source ofhigh-quality animal protein that is easily digestibleand of high biological value and are rich in vitaminsand minerals (especially calcium, phosphorus, iron,selenium and iodine in marine products). Fish is themain source of animal protein in Bangladesh,around 63% of animal protein intake being derivedfrom ¢sh and ¢sheries products (Bangladesh Eco-nomic Review 2005).In Bangladesh, ¢sh comes from two sources: in-
land and marine. The inland ¢shery is classi¢ed intotwo broad categories: capture (also called open) andculture (also called closed). Aquaculture plays a sig-ni¢cant and increasingly promising role in the coun-try’s total ¢sh production. According to the statistics,the total output of aquaculture in 2005/2006amounted to 892049 t, comprising 38.3% of the total¢sh production, as compared with 117025 t (15.5%)in 1983/1984. Table 1 shows that the production ofaquaculture has grown at a higher rate than of in-land and marine capture ¢sheries. The slow growthof capture ¢sheries is mainly due to environmental
Aquaculture development and food security KM Jahan et al. Aquaculture Research, 2010, 41, 481^495
r 2009 TheAuthors482 Journal Compilationr 2009 Blackwell Publishing Ltd, Aquaculture Research, 41, 481^495
degradation by progressive physical degradation,shrinkage and pollution of natural water bodies andoverexploitation of resources. Aquaculture thereforehas a potentially major role to play in the comingyears in ful¢lling the growing demand for ¢sh.Although aquaculture has grown signi¢cantly
over the years, its full potential is yet to be realized.Sub-optimal productivity in ponds already under cul-ture, the existence of huge areas of derelict ponds andthe dominance of extensive culture practices over in-tensi¢ed ones all point to the existence of unutilizedpotential in ¢sh farming (Alam, Jahan, Kamal, Rah-man & Janssen 2004). Estimates show that about24% of cultivable ponds in Bangladesh remain un-used for this purpose (Karim et al. 2006). A numberof factors including a lack of appropriate extensionapproaches and technological know-how, high pricesof feed and other inputs, lackof quality ¢ngerlings (ju-venile ¢sh) and the limited economic capital of manyfarmers are thought to limit the sector’s expansion(Alam et al. 2004; Sarker, Chowdhury & Itohara2006). The expansion of low-cost aquaculture tech-nologies that are feasible anda¡ordable for poor farm-ers might, therefore, have an important role to play insatisfying subsistence needs and/or providing sourcesof income for farming households in Bangladesh.
Methodology and data
Analytical framework
It is believed that aquaculture can contribute to im-proved food security and nutrition of the poor house-holds in several ways; ¢rstly, by generating incomefor the purchase of food (¢sh as a source of income);secondly, by creating alternative employment-gener-ating activities and increasing labour productivity;and thirdly, by increasing available food supply and
consumption (¢sh as food) (Edwards1999; Ahmed &Lorica 2002). The issues are examined in the studyusing the following framework (Fig.1).One of the driving forces behind household food
demand is income and purchasing power (Dey et al.2005). DawsonandTi⁄n (1998) show that signi¢cantimprovements in calorie intake occur as economiesgrow. Evidence suggests that as incomes rise, consu-mers reallocate their food budget away from starchystaple food items suchas rice andmaize towards non-staple food items such fruits, vegetables and animalproducts (¢sh and meat) (Bouis, De La Briere, Gutier-rez, Hallman, Hassan, Hels, Quabili, Quisumbing,Tilsted, Zihad & Zohir 1998; Miah 2000). The adop-tion^income hypothesis therefore assumes thatadoption of aquaculture will increase the income ofhouseholds and will thereby generate increases in¢sh consumption.Intensi¢cation of any agricultural sector will exert
an in£uence on the overall employment in a commu-nity. Hence, adoption of aquaculture is expected toincrease the demand for family as well as hired la-bour. Family labour is themost important productionfactor in developing country agriculture, and main-tenance and enhancement of labour productivity iscentral to securing and increasing income (WorldBank1986; Zeller & Sharma1998). A household’s abil-ity to earn income depends mainly on the nutritionalhealth of the household labour force. Adoption^em-ployment linkages to food security are based on thehypothesis that adoption of aquaculture will in-crease the productivity of agricultural labour andhence engender higher earnings for both family andhired labour, which in turn will improve the nutri-tional health of the labour force.The existence of adoption^consumption linkages
is hypothesized as follows: (i) adopting householdsconsume a disproportionately higher amount of ¢sh
Table 1 Aquaculture growth rate and percentage contribution to total ¢sh production from1983/1984 to 2005/2006
Years
Fish production (metric tonnes)�
Inland capture Aquaculture Marine capture Total
1983–1984 471 595 (62.59) 117 025 (15.53) 164 882 (21.88) 753 502
1987–1988 423 598 (51.21) 175 925 (21.27) 227 582 (27.52) 827 105
1992–1993 532 419 (52.16) 237 743 (23.29) 250 492 (24.54) 1020 654
1997–1998 615 949 (42.09) 574 812 (39.27) 272 818 (18.64) 1463 579
2002–2003 709 333 (35.50) 857 046 (42.89) 431 908 (21.61) 1998 287
2005–2006 956 686 (41.09) 892 049 (38.31) 479 810 (20.61) 2328 545
Average annual growth rate (%) 3.24 9.47 4.84 5.05
�Aquaculture production before 1983/1984 is not available in the statistics.Source: Mazid (2002) and FSYB (2006).
Aquaculture Research, 2010, 41, 481^495 Aquaculture development and food security KM Jahan et al.
r 2009 TheAuthorsJournal Compilationr 2009 Blackwell Publishing Ltd, Aquaculture Research, 41, 481^495 483
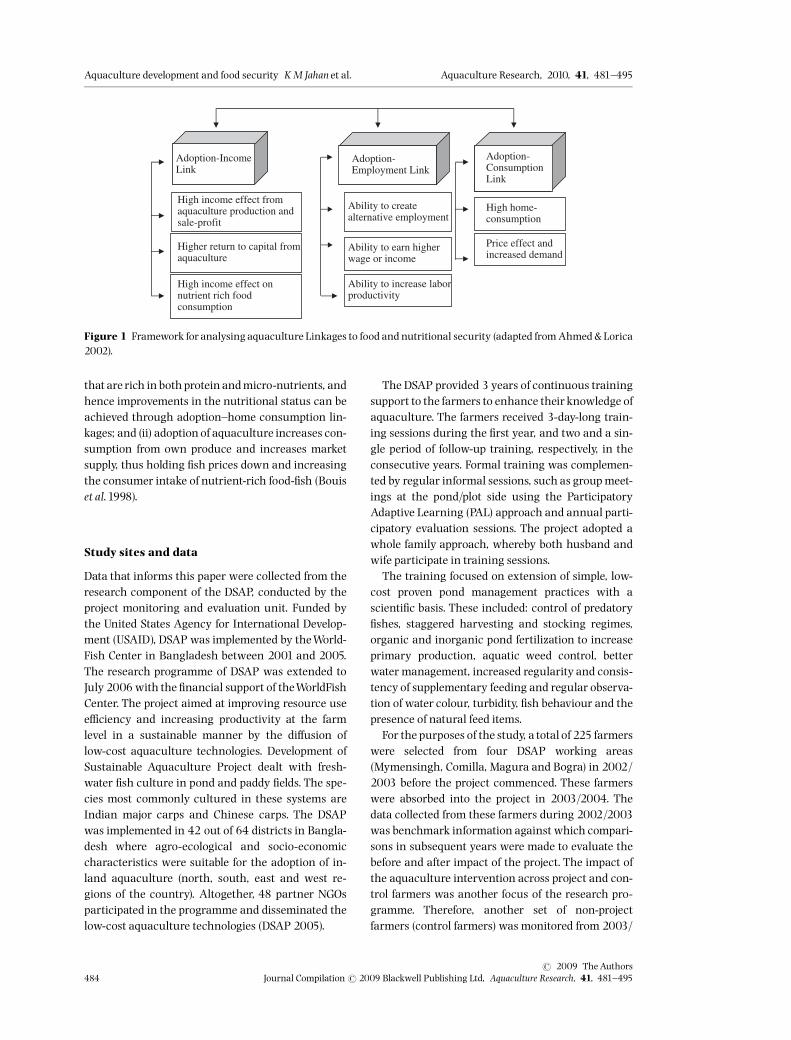
that are rich in both proteinandmicro-nutrients, andhence improvements in the nutritional status can beachieved through adoption^home consumption lin-kages; and (ii) adoptionof aquaculture increases con-sumption from own produce and increases marketsupply, thus holding ¢sh prices down and increasingthe consumer intake of nutrient-rich food-¢sh (Bouiset al.1998).
Study sites and data
Data that informs this paper were collected from theresearch component of the DSAP, conducted by theproject monitoring and evaluation unit. Funded bythe United States Agency for International Develop-ment (USAID), DSAP was implemented by theWorld-Fish Center in Bangladesh between 2001 and 2005.The research programme of DSAP was extended toJuly 2006with the ¢nancial support of theWorldFishCenter. The project aimed at improving resource usee⁄ciency and increasing productivity at the farmlevel in a sustainable manner by the di¡usion oflow-cost aquaculture technologies. Development ofSustainable Aquaculture Project dealt with fresh-water ¢sh culture in pond and paddy ¢elds. The spe-cies most commonly cultured in these systems areIndian major carps and Chinese carps. The DSAPwas implemented in 42 out of 64 districts in Bangla-desh where agro-ecological and socio-economiccharacteristics were suitable for the adoption of in-land aquaculture (north, south, east and west re-gions of the country). Altogether, 48 partner NGOsparticipated in the programme and disseminated thelow-cost aquaculture technologies (DSAP 2005).
The DSAP provided 3 years of continuous trainingsupport to the farmers to enhance their knowledge ofaquaculture. The farmers received 3-day-long train-ing sessions during the ¢rst year, and two and a sin-gle period of follow-up training, respectively, in theconsecutive years. Formal training was complemen-ted by regular informal sessions, such as group meet-ings at the pond/plot side using the ParticipatoryAdaptive Learning (PAL) approach and annual parti-cipatory evaluation sessions. The project adopted awhole family approach, whereby both husband andwife participate in training sessions.The training focused on extension of simple, low-
cost proven pond management practices with ascienti¢c basis. These included: control of predatory¢shes, staggered harvesting and stocking regimes,organic and inorganic pond fertilization to increaseprimary production, aquatic weed control, betterwater management, increased regularity and consis-tency of supplementary feeding and regular observa-tion of water colour, turbidity, ¢sh behaviour and thepresence of natural feed items.For the purposes of the study, a total of 225 farmers
were selected from four DSAP working areas(Mymensingh, Comilla, Magura and Bogra) in 2002/2003 before the project commenced. These farmerswere absorbed into the project in 2003/2004. Thedata collected from these farmers during 2002/2003was benchmark information against which compari-sons in subsequent years were made to evaluate thebefore and after impact of the project. The impact ofthe aquaculture intervention across project and con-trol farmers was another focus of the research pro-gramme. Therefore, another set of non-projectfarmers (control farmers) was monitored from 2003/
Adoption-Employment Link
Adoption-ConsumptionLink
Ability to createalternative employment
Ability to increase laborproductivity
Ability to earn higherwage or income
High income effect fromaquaculture production andsale-profit
Higher return to capital fromaquaculture
High home-consumption
Price effect andincreased demand
Adoption-IncomeLink
High income effect onnutrient rich foodconsumption
Figure 1 Framework for analysingaquaculture Linkages to food and nutritional security (adapted fromAhmed & Lorica2002).
Aquaculture development and food security KM Jahan et al. Aquaculture Research, 2010, 41, 481^495
r 2009 TheAuthors484 Journal Compilationr 2009 Blackwell Publishing Ltd, Aquaculture Research, 41, 481^495
2004 for this purpose. One hundred and twentythree such farmers, to whom no technical supportwas given, were selected from the samefour working areas as a control group. These controlfarmers were selected from locations where no pro-ject interventions promoting aquaculture had takenplace in the past.The farmers were selected in such away that farm-
ers of di¡erent wealth ranks were represented. A par-ticipatory wealth-ranking exercise was undertakenin the study sites to select the farmers for the study.The participants took land holdings of the house-holds as the criteria for wealth ranking. The house-holds of the village were short-listed based on theavailabilityof natural resource types and their oppor-tunities for integration with aquaculture. Farmerswith an existing high-level knowledge of aquacul-ture techniques were excluded. Farmers having� 0.20 hectare (ha) of land were considered func-tionally landless; farmers having 0.21^0.60 ha ofland were considered to be poor; farmers having0.61^1.21ha of land were considered to be mediumfarmers; and farmers having 41.21ha of land wereconsidered to be rich.A number of surveys were conducted in the area to
provide a detailed picture of the impacts of project in-tervention. Awhole farm monitoring survey that in-cluded input and output information for the farmenterprize was started in 2002/2003. In order to cap-ture other important socio-economic changes as aresult of project intervention, livelihood and house-hold consumption surveys were started from 2003to 2004. In addition to these surveys, a census ofponds was conducted in the study area in 2006 toget an idea of the wealth status of the pond owners,ownership patterns and technologies practiced. Dur-ing the study period, £ooding occurred in 2004/2005and a¡ected 60% of project farmers (135 out of 225farmers) and control farmers (73 out 126 farmers).The ponds of a¡ected farmers were inundated by£ood water, which led to damage of the pond dykesand stock losses. Estimates shows that on averagethe a¡ected farmers received 30% less production in2004/2005 than non-a¡ected farmers.The study was based on a ‘before-and-after, with-
and-without’experimental design. Data collected fromrespondents were tabulated and analysed in accor-dance with the objective of the study. Mostly descrip-tive analyses were performed to present the ¢ndings ofthe survey. The one-way analysis of variance (ANOVA)procedure was used to observe the signi¢cant changeover the years among the project and control farmers.
On the otherhand, t-tests were also conducted to com-pare the di¡erences between control and project farm-ers in a speci¢c year. The Consumer Price Index (CPI)was used to adjust the income ¢gures of 2003/2004,2004/2005 and 2005/2006 to 2002/2003 prices (1US$558 BangladeshTaka in 2002/2003).
Results and discussions
Sample characteristics
The average age of farmers in the study was around40. On average, project farmers were younger (44.1years) than control farmers (47.0 years), with a highpercentage of farmers in the former category beingin the 30^45-year age brackets and the latter in the45^60-year age brackets. The average number ofcompleted years of education of project farmers (6.9years) was signi¢cantly higher than among controlfarmers (5.8 years). About 6% of project farmers and4% of control farmers had completed a college degree.The average household size of six persons was similarfor both groups and was higher than that of the na-tion as a whole (4.5; source BBS 2006). The resultsshow that members of both groups had practiced ¢shculture for around 8 years; however, on average pro-ject farmers received 3 years of technical supportfrom DSAP during this 8-year period. The averagefarm size of the project and control farmers wasaround 0.97 and 0.85 ha, respectively, with no signi¢-cant variation across groups. The average sizes of thepond area of project and control farmers were 0.13and 0.15 ha respectively.Therewas no signi¢cant var-iationwith respect to pond size between groups.During the survey, it was observed that the major-
ity of farmers cultured Indian major carps such asrohu, Labeo rohita (project farmer: 98% and controlfarmer: 97%); catla, Catla catla (project farmer: 75%and control farmer: 62%); and mrigal, Cirrhinus mri-gala (project farmer:87% and control farmer:85%). Asigni¢cant number of the sample farmers also cul-tured Chinese carps such as silver carp, Hypophthal-michthys molitrix (project farmer: 92% and controlfarmer: 85%); common carp, Cyprinus carpio (projectfarmer: 54% and control farmer: 59%); and grasscarp, Ctenopharyngodon idella (project farmer: 31%and control farmer: 20%). In addition, rajpunti, Pun-tius gonionotus (project farmer: 72% and controlfarmer: 59%), and tilapia, Oreochromis niloticus (pro-ject farmer: 2% and control farmer: 2%) were alsocultured bya number of sample farmers.
Aquaculture Research, 2010, 41, 481^495 Aquaculture development and food security KM Jahan et al.
r 2009 TheAuthorsJournal Compilationr 2009 Blackwell Publishing Ltd, Aquaculture Research, 41, 481^495 485
Impacts of aquaculture at the farm andhousehold level
The extent to which adoption of improved aquacul-ture techniques can be considered to have impactedon food security at the farm and the household levelamong project and non-project (control) participantsis examined in the following sections in terms of in-come, employment and consumption, using data re-turned from the project’s monitoring activities.
Income e¡ects
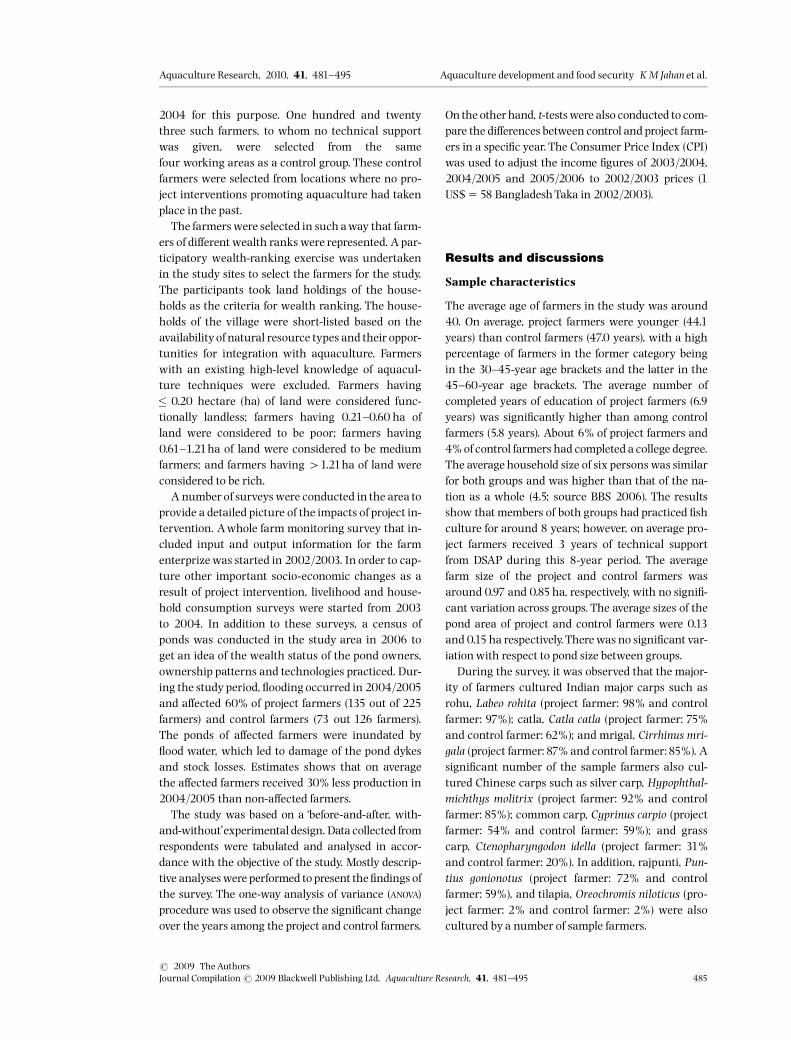
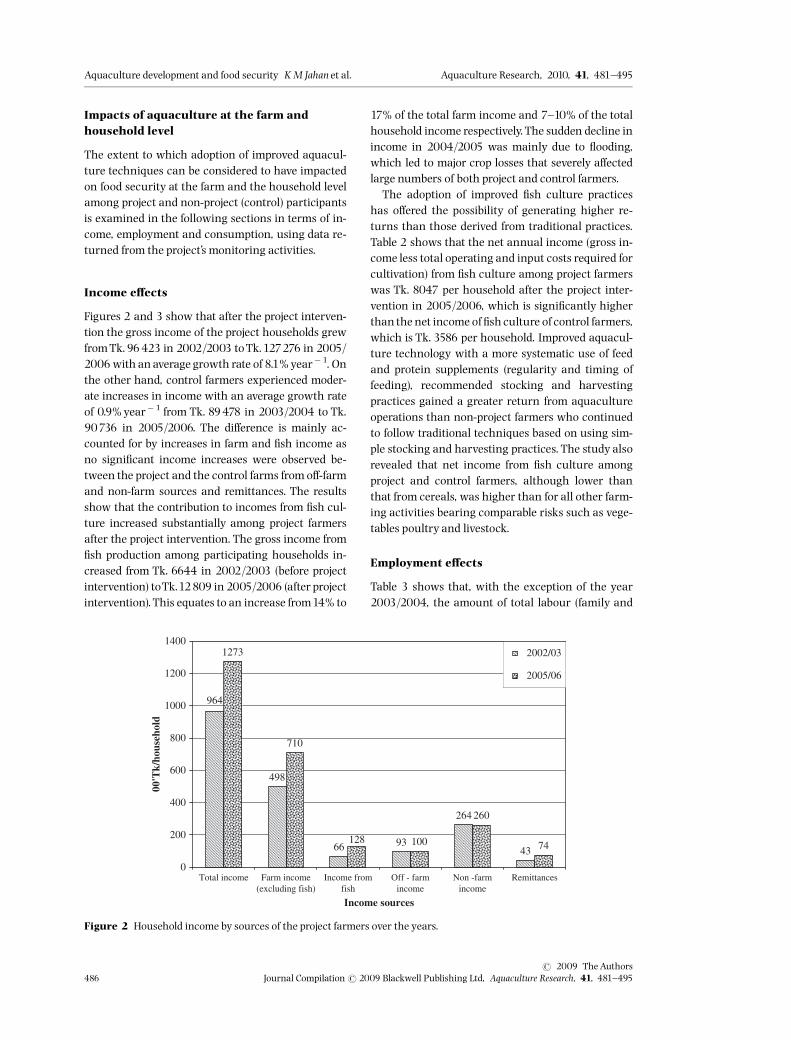
Figures 2 and 3 show that after the project interven-tion the gross income of the project households grewfromTk.96423 in 2002/2003 toTk.127276 in 2005/2006with anaverage growth rate of 8.1% year�1. Onthe other hand, control farmers experienced moder-ate increases in income with an average growth rateof 0.9% year�1 from Tk. 89478 in 2003/2004 to Tk.90736 in 2005/2006. The di¡erence is mainly ac-counted for by increases in farm and ¢sh income asno signi¢cant income increases were observed be-tween the project and the control farms from o¡-farmand non-farm sources and remittances. The resultsshow that the contribution to incomes from ¢sh cul-ture increased substantially among project farmersafter the project intervention. The gross income from¢sh production among participating households in-creased from Tk. 6644 in 2002/2003 (before projectintervention) toTk.12809 in 2005/2006 (after projectintervention).This equates to an increase from14% to
17% of the total farm income and 7^10% of the totalhousehold income respectively.The sudden decline inincome in 2004/2005 was mainly due to £ooding,which led to major crop losses that severely a¡ectedlarge numbers of both project and control farmers.The adoption of improved ¢sh culture practices
has o¡ered the possibility of generating higher re-turns than those derived from traditional practices.Table 2 shows that the net annual income (gross in-come less total operating and input costs required forcultivation) from ¢sh culture among project farmerswas Tk. 8047 per household after the project inter-vention in 2005/2006, which is signi¢cantly higherthan the net income of ¢sh culture of control farmers,which is Tk. 3586 per household. Improved aquacul-ture technology with a more systematic use of feedand protein supplements (regularity and timing offeeding), recommended stocking and harvestingpractices gained a greater return from aquacultureoperations than non-project farmers who continuedto follow traditional techniques based on using sim-ple stocking and harvesting practices. The study alsorevealed that net income from ¢sh culture amongproject and control farmers, although lower thanthat from cereals, was higher than for all other farm-ing activities bearing comparable risks such as vege-tables poultry and livestock.
Employment e¡ects
Table 3 shows that, with the exception of the year2003/2004, the amount of total labour (family and
964
498
66 93
264
43
1273
710
128 100
260
74
0
200
400
600
800
1000
1200
1400
Farm income(excluding fish)
Total income Off - farmincome
Income fromfish
Non -farmincome
Remittances
Income sources
00'T
k/ho
useh
old
2002/03
2005/06
Figure 2 Household income by sources of the project farmers over the years.
Aquaculture development and food security KM Jahan et al. Aquaculture Research, 2010, 41, 481^495
r 2009 TheAuthors486 Journal Compilationr 2009 Blackwell Publishing Ltd, Aquaculture Research, 41, 481^495
hired) employed is signi¢cantly higher on projectfarms than on control farms. The average growth oflabour use on project farms increased at a higher rateover the years than that of control farms. This canbe explained by the improved technologies used byproject farms that require that more time is spent onimplementing improved management practices thanon control farms. This evidence tends to support stu-dies that ¢nd that although the labour e¡ort required
for aquaculture is lower than that of other farmingactivities (the present study showed that only10% offarm labour is utilized for aquaculture), adoption ofintensi¢ed culture practices has the potential to in-crease the total labour requirement to some extent(Ahmed, Abdur Rab & Bimbao 1995; Dey 2000;Ahmed & Lorica 2002)Another direct way inwhich the poor stand to ben-
e¢t from adoption of aquaculture is by improving re-
895
468
65 74
228
60
907
491
68 87
195
67
0
200
400
600
800
1000
1200
1400
Farm income(excluding fish)
Total income Income fromfish
Off - farmincome
Non - farmincome
Remittances
Income sources
00'T
k/ho
useh
old
2003/04
2005/06
Figure 3 Household income by sources of the control farmers over the years.
Table 2 Income from di¡erent farming enterprises in 2005/2006
Enterprises Items (Tk. per household) Project farmer (n5 225) Control farmer (n5123)Mean difference test betweenproject and control farmers
Cereals Gross income 32 082 26 892 1.9�
Operating costs 19 551 14 978 2.2��
Net income 12 531 11 914 0.2
Vegetable Gross income 2680 2111 1.1
Operating costs 1203 798 1.5
Net income 1477 1313 0.5
Poultry Gross income 3081 2043 1.8�
Operating costs 1731 1411 1.4
Net income 1350 633 1.3
Livestock Gross income 6663 5030 2.1�
Operating costs 4612 4179 0.91
Net income 2051 851 1.7�
Fish culture Gross income 12 809 6797 3.2���
Operating costs 4762 3211 2.1��
Net income 8047 3586 2.7���
�Signi¢cant at a50.10.��Signi¢cant at a50.05.���Signi¢cant at a50.01.
Aquaculture Research, 2010, 41, 481^495 Aquaculture development and food security KM Jahan et al.
r 2009 TheAuthorsJournal Compilationr 2009 Blackwell Publishing Ltd, Aquaculture Research, 41, 481^495 487
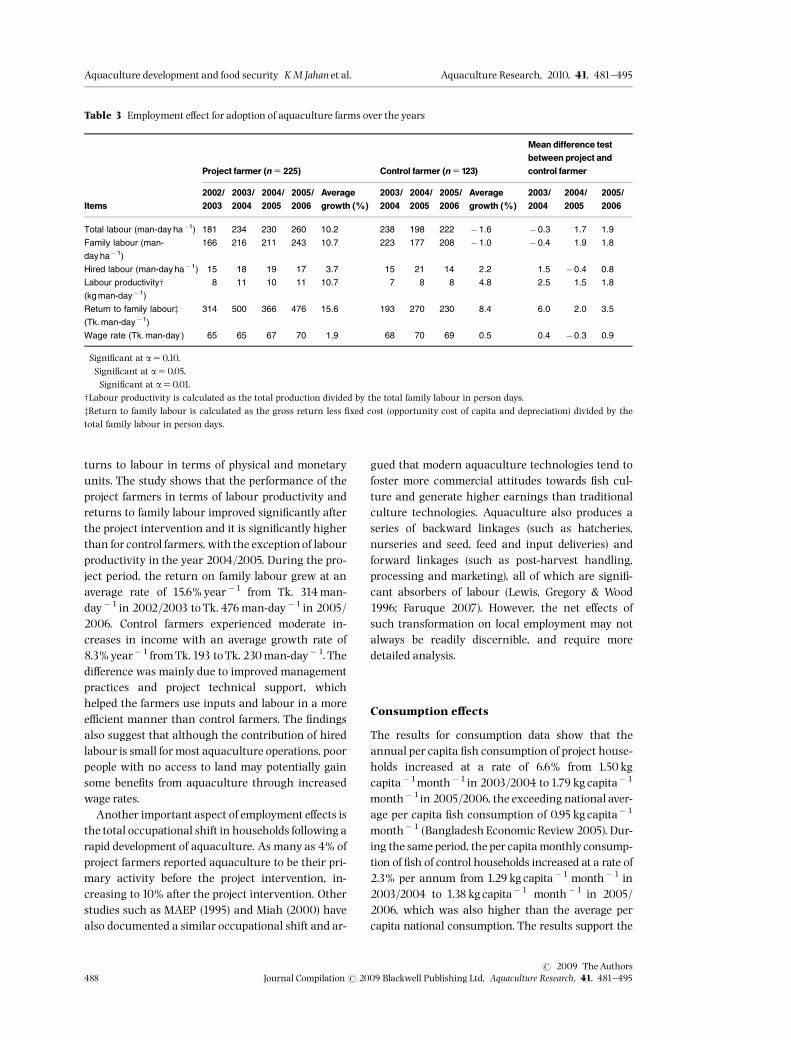
turns to labour in terms of physical and monetaryunits. The study shows that the performance of theproject farmers in terms of labour productivity andreturns to family labour improved signi¢cantly afterthe project intervention and it is signi¢cantly higherthan for control farmers, with the exceptionof labourproductivity in the year 2004/2005. During the pro-ject period, the return on family labour grew at anaverage rate of 15.6% year�1 from Tk. 314man-day�1 in 2002/2003 to Tk. 476man-day�1 in 2005/2006. Control farmers experienced moderate in-creases in income with an average growth rate of8.3% year�1 fromTk.193 toTk. 230man-day�1. Thedi¡erence was mainly due to improved managementpractices and project technical support, whichhelped the farmers use inputs and labour in a moree⁄cient manner than control farmers. The ¢ndingsalso suggest that although the contribution of hiredlabour is small for most aquaculture operations, poorpeople with no access to land may potentially gainsome bene¢ts from aquaculture through increasedwage rates.Another important aspect of employment e¡ects is
the total occupational shift in households following arapid development of aquaculture. As many as 4% ofproject farmers reported aquaculture to be their pri-mary activity before the project intervention, in-creasing to 10% after the project intervention. Otherstudies such as MAEP (1995) and Miah (2000) havealso documented a similar occupational shift and ar-
gued that modern aquaculture technologies tend tofoster more commercial attitudes towards ¢sh cul-ture and generate higher earnings than traditionalculture technologies. Aquaculture also produces aseries of backward linkages (such as hatcheries,nurseries and seed, feed and input deliveries) andforward linkages (such as post-harvest handling,processing and marketing), all of which are signi¢-cant absorbers of labour (Lewis, Gregory & Wood1996; Faruque 2007). However, the net e¡ects ofsuch transformation on local employment may notalways be readily discernible, and require moredetailed analysis.
Consumption e¡ects
The results for consumption data show that theannual per capita ¢sh consumption of project house-holds increased at a rate of 6.6% from 1.50 kgcapita�1month�1 in 2003/2004 to1.79 kg capita�1
month�1in 2005/2006, the exceeding national aver-age per capita ¢sh consumption of 0.95 kg capita�1
month�1 (Bangladesh Economic Review 2005). Dur-ing the same period, the per capita monthly consump-tion of ¢sh of control households increased at a rate of2.3% per annum from 1.29 kg capita�1 month�1 in2003/2004 to 1.38 kgcapita�1 month�1 in 2005/2006, which was also higher than the average percapita national consumption. The results support the
Table 3 Employment e¡ect for adoption of aquaculture farms over the years
Items
Project farmer (n5 225) Control farmer (n5123)
Mean difference testbetween project andcontrol farmer
2002/2003
2003/2004
2004/2005
2005/2006
Averagegrowth (%)
2003/2004
2004/2005
2005/2006
Averagegrowth (%)
2003/2004
2004/2005
2005/2006
Total labour (man-day ha�1) 181 234 230 260 10.2��� 238 198 222 � 1.6 � 0.3 1.7� 1.9�
Family labour (man-
day ha� 1)
166 216 211 243 10.7��� 223 177 208 � 1.0�� � 0.4 1.9� 1.8�
Hired labour (man-day ha� 1) 15 18 19 17 3.7 15 21 14 2.2 1.5 � 0.4 0.8
Labour productivityw
(kg man-day� 1)
8 11 10 11 10.7�� 7 8 8 4.8�� 2.5��� 1.5 1.8�
Return to family labourz(Tk. man-day�1)
314 500 366 476 15.6�� 193 270 230 8.4 6.0��� 2.0�� 3.5���
Wage rate (Tk. man-day ) 65 65 67 70 1.9�� 68 70 69 0.5 0.4 � 0.3 0.9
�Signi¢cant at a50.10.��Signi¢cant at a50.05.���Signi¢cant at a50.01.wLabour productivity is calculated as the total production divided by the total family labour in person days.zReturn to family labour is calculated as the gross return less ¢xed cost (opportunity cost of capita and depreciation) divided by thetotal family labour in person days.
Aquaculture development and food security KM Jahan et al. Aquaculture Research, 2010, 41, 481^495
r 2009 TheAuthors488 Journal Compilationr 2009 Blackwell Publishing Ltd, Aquaculture Research, 41, 481^495
argument of Dey (2000) and Ahmed et al. (1995)that per capita consumption of ¢sh in rural areas isnoticeably higher for producing households than fornon-producers.The study also reveals that consumption of staple
foods such as cereals increased at a rate of 0.6%per annum for project households (15.52 kg capita�1
month�1 in 2003/2004 to 15.78 kg capita�1
month�1in 2005/2006) and1.5% for the non-projecthouseholds (15.05 kg capita�1month�1 in 2003/2004 to 15.13 kg capita�1month�1 in 2005/2006).A higher price elasticityand income elasticity for ¢shcompared with rice documented by other studies(Ahmed & Shams 1994; Alam 1999; Dey 2000; Deyet al. 2005) in rural Bangladesh may account for thehigher ¢sh consumption among the project farmersafter the intervention. The ¢ndings of the study re-vealed that during the study period, ¢sh prices in-creased at a rate of 4%, while at the same time riceprices increased at a rate of17%.Table 4 demonstrates that increases in productiv-
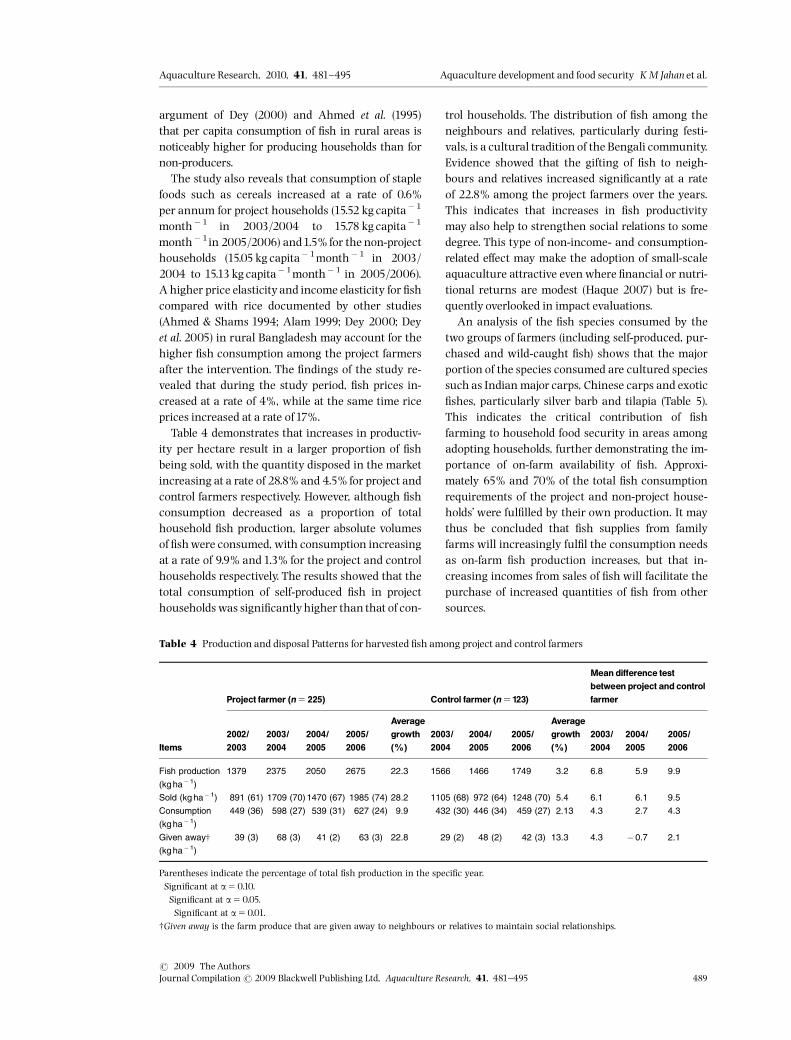
ity per hectare result in a larger proportion of ¢shbeing sold, with the quantity disposed in the marketincreasing at a rate of 28.8% and 4.5% for project andcontrol farmers respectively. However, although ¢shconsumption decreased as a proportion of totalhousehold ¢sh production, larger absolute volumesof ¢shwere consumed, with consumption increasingat a rate of 9.9% and1.3% for the project and controlhouseholds respectively. The results showed that thetotal consumption of self-produced ¢sh in projecthouseholds was signi¢cantlyhigher than that of con-
trol households. The distribution of ¢sh among theneighbours and relatives, particularly during festi-vals, is a cultural tradition of the Bengali community.Evidence showed that the gifting of ¢sh to neigh-bours and relatives increased signi¢cantly at a rateof 22.8% among the project farmers over the years.This indicates that increases in ¢sh productivitymay also help to strengthen social relations to somedegree. This type of non-income- and consumption-related e¡ect may make the adoption of small-scaleaquaculture attractive evenwhere ¢nancial or nutri-tional returns are modest (Haque 2007) but is fre-quently overlooked in impact evaluations.An analysis of the ¢sh species consumed by the
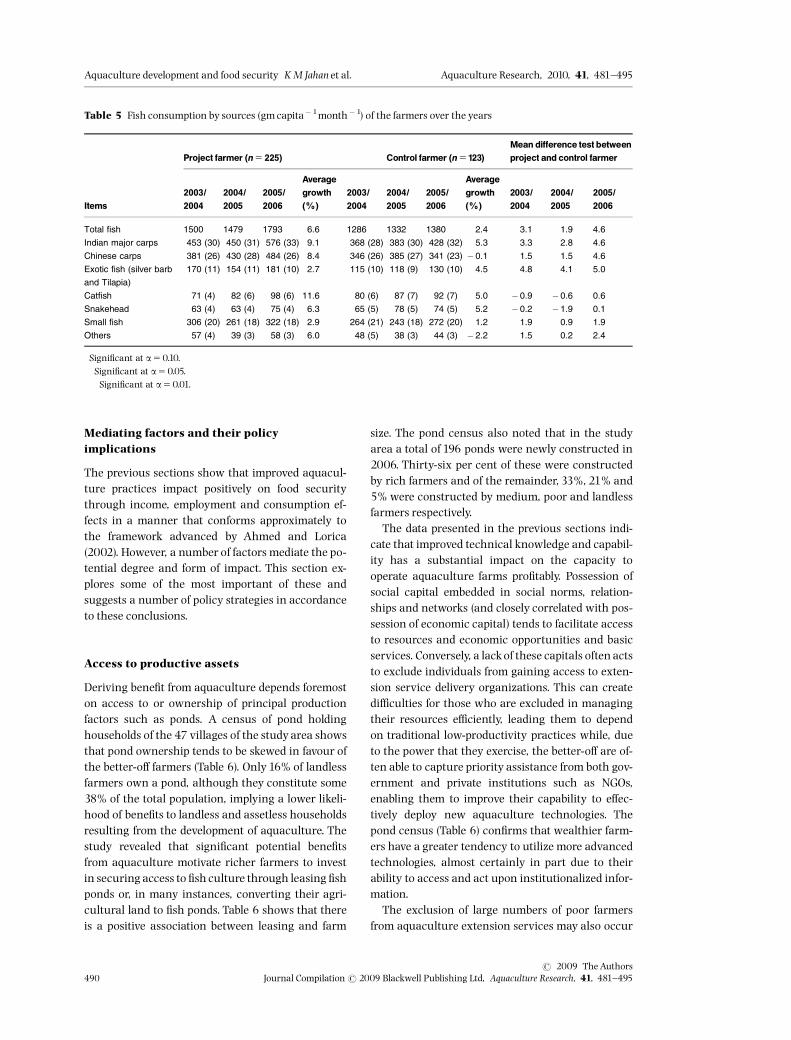
two groups of farmers (including self-produced, pur-chased and wild-caught ¢sh) shows that the majorportion of the species consumed are cultured speciessuch as Indian major carps, Chinese carps and exotic¢shes, particularly silver barb and tilapia (Table 5).This indicates the critical contribution of ¢shfarming to household food security in areas amongadopting households, further demonstrating the im-portance of on-farm availability of ¢sh. Approxi-mately 65% and 70% of the total ¢sh consumptionrequirements of the project and non-project house-holds’ were ful¢lled by their own production. It maythus be concluded that ¢sh supplies from familyfarms will increasingly ful¢l the consumption needsas on-farm ¢sh production increases, but that in-creasing incomes from sales of ¢sh will facilitate thepurchase of increased quantities of ¢sh from othersources.
Table 4 Production and disposal Patterns for harvested ¢sh among project and control farmers
Items
Project farmer (n5 225) Control farmer (n5123)
Mean difference testbetween project and controlfarmer
2002/2003
2003/2004
2004/2005
2005/2006
Averagegrowth(%)
2003/2004
2004/2005
2005/2006
Averagegrowth(%)
2003/2004
2004/2005
2005/2006
Fish production
(kg ha�1)
1379 2375 2050 2675 22.3��� 1566 1466 1749 3.2�� 6.8��� 5.9��� 9.9���
Sold (kg ha� 1) 891 (61) 1709 (70) 1470 (67) 1985 (74) 28.2��� 1105 (68) 972 (64) 1248 (70) 5.4��� 6.1��� 6.1��� 9.5���
Consumption
(kg ha�1)
449 (36) 598 (27) 539 (31) 627 (24) 9.9��� 432 (30) 446 (34) 459 (27) 2.13 4.3��� 2.7��� 4.3���
Given awayw
(kg ha�1)
39 (3) 68 (3) 41 (2) 63 (3) 22.8��� 29 (2) 48 (2) 42 (3) 13.3� 4.3��� � 0.7 2.1��
Parentheses indicate the percentage of total ¢sh production in the speci¢c year.�Signi¢cant at a50.10.��Signi¢cant at a50.05.���Signi¢cant at a50.01.wGiven away is the farm produce that are given away to neighbours or relatives to maintain social relationships.
Aquaculture Research, 2010, 41, 481^495 Aquaculture development and food security KM Jahan et al.
r 2009 TheAuthorsJournal Compilationr 2009 Blackwell Publishing Ltd, Aquaculture Research, 41, 481^495 489
Mediating factors and their policyimplications
The previous sections show that improved aquacul-ture practices impact positively on food securitythrough income, employment and consumption ef-fects in a manner that conforms approximately tothe framework advanced by Ahmed and Lorica(2002). However, a number of factors mediate the po-tential degree and form of impact. This section ex-plores some of the most important of these andsuggests a number of policy strategies in accordanceto these conclusions.
Access to productive assets
Deriving bene¢t from aquaculture depends foremoston access to or ownership of principal productionfactors such as ponds. A census of pond holdinghouseholds of the 47 villages of the studyarea showsthat pond ownership tends to be skewed in favour ofthe better-o¡ farmers (Table 6). Only16% of landlessfarmers own a pond, although they constitute some38% of the total population, implying a lower likeli-hood of bene¢ts to landless and assetless householdsresulting from the development of aquaculture. Thestudy revealed that signi¢cant potential bene¢tsfrom aquaculture motivate richer farmers to investin securing access to ¢sh culture through leasing ¢shponds or, in many instances, converting their agri-cultural land to ¢sh ponds. Table 6 shows that thereis a positive association between leasing and farm
size. The pond census also noted that in the studyarea a total of 196 ponds were newly constructed in2006. Thirty-six per cent of these were constructedby rich farmers and of the remainder, 33%, 21% and5% were constructed by medium, poor and landlessfarmers respectively.The data presented in the previous sections indi-
cate that improved technical knowledge and capabil-ity has a substantial impact on the capacity tooperate aquaculture farms pro¢tably. Possession ofsocial capital embedded in social norms, relation-ships and networks (and closely correlated with pos-session of economic capital) tends to facilitate accessto resources and economic opportunities and basicservices. Conversely, a lackof these capitals oftenactsto exclude individuals from gaining access to exten-sion service delivery organizations. This can createdi⁄culties for those who are excluded in managingtheir resources e⁄ciently, leading them to dependon traditional low-productivity practices while, dueto the power that they exercise, the better-o¡ are of-ten able to capture priority assistance from both gov-ernment and private institutions such as NGOs,enabling them to improve their capability to e¡ec-tively deploy new aquaculture technologies. Thepond census (Table 6) con¢rms that wealthier farm-ers have a greater tendency to utilize more advancedtechnologies, almost certainly in part due to theirability to access and act upon institutionalized infor-mation.The exclusion of large numbers of poor farmers
from aquaculture extension services may also occur
Table 5 Fish consumption by sources (gmcapita�1month�1) of the farmers over the years
Items
Project farmer (n5 225) Control farmer (n5123)Mean difference test betweenproject and control farmer
2003/2004
2004/2005
2005/2006
Averagegrowth(%)
2003/2004
2004/2005
2005/2006
Averagegrowth(%)
2003/2004
2004/2005
2005/2006
Total fish 1500 1479 1793 6.6��� 1286 1332 1380 2.4 3.1��� 1.9� 4.6���
Indian major carps 453 (30) 450 (31) 576 (33) 9.1��� 368 (28) 383 (30) 428 (32) 5.3� 3.3��� 2.8��� 4.6���
Chinese carps 381 (26) 430 (28) 484 (26) 8.4��� 346 (26) 385 (27) 341 (23) � 0.1 1.5 1.5 4.6���
Exotic fish (silver barb
and Tilapia)
170 (11) 154 (11) 181 (10) 2.7�� 115 (10) 118 (9) 130 (10) 4.5 4.8��� 4.1��� 5.0���
Catfish 71 (4) 82 (6) 98 (6) 11.6��� 80 (6) 87 (7) 92 (7) 5.0 � 0.9 � 0.6 0.6
Snakehead 63 (4) 63 (4) 75 (4) 6.3� 65 (5) 78 (5) 74 (5) 5.2 � 0.2 � 1.9� 0.1
Small fish 306 (20) 261 (18) 322 (18) 2.9�� 264 (21) 243 (18) 272 (20) 1.2 1.9� 0.9 1.9�
Others 57 (4) 39 (3) 58 (3) 6.0��� 48 (5) 38 (3) 44 (3) � 2.2 1.5��� 0.2 2.4��
�Signi¢cant at a50.10.��Signi¢cant at a50.05.���Signi¢cant at a50.01.
Aquaculture development and food security KM Jahan et al. Aquaculture Research, 2010, 41, 481^495
r 2009 TheAuthors490 Journal Compilationr 2009 Blackwell Publishing Ltd, Aquaculture Research, 41, 481^495
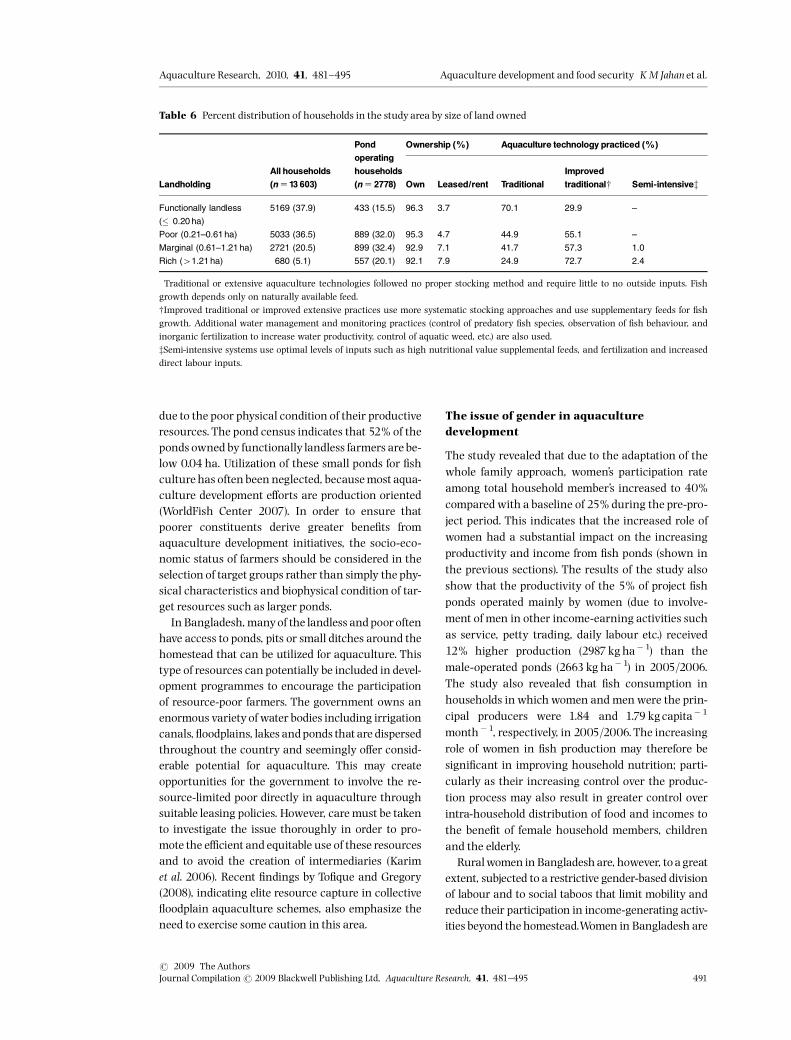
due to the poor physical condition of their productiveresources. The pond census indicates that 52% of theponds owned by functionally landless farmers are be-low 0.04 ha. Utilization of these small ponds for ¢shculture has often been neglected, becausemost aqua-culture development e¡orts are production oriented(WorldFish Center 2007). In order to ensure thatpoorer constituents derive greater bene¢ts fromaquaculture development initiatives, the socio-eco-nomic status of farmers should be considered in theselection of target groups rather than simply the phy-sical characteristics and biophysical condition of tar-get resources such as larger ponds.In Bangladesh, manyof the landless and poor often
have access to ponds, pits or small ditches around thehomestead that can be utilized for aquaculture. Thistype of resources can potentially be included in devel-opment programmes to encourage the participationof resource-poor farmers. The government owns anenormous variety of water bodies including irrigationcanals, £oodplains, lakes andponds that are dispersedthroughout the country and seemingly o¡er consid-erable potential for aquaculture. This may createopportunities for the government to involve the re-source-limited poor directly in aquaculture throughsuitable leasing policies. However, care must be takento investigate the issue thoroughly in order to pro-mote the e⁄cient and equitable use of these resourcesand to avoid the creation of intermediaries (Karimet al. 2006). Recent ¢ndings by To¢que and Gregory(2008), indicating elite resource capture in collective£oodplain aquaculture schemes, also emphasize theneed to exercise some caution in this area.
The issue of gender in aquaculturedevelopment
The study revealed that due to the adaptation of thewhole family approach, women’s participation rateamong total household member’s increased to 40%compared with a baseline of 25% during the pre-pro-ject period. This indicates that the increased role ofwomen had a substantial impact on the increasingproductivity and income from ¢sh ponds (shown inthe previous sections). The results of the study alsoshow that the productivity of the 5% of project ¢shponds operated mainly by women (due to involve-ment of men in other income-earning activities suchas service, petty trading, daily labour etc.) received12% higher production (2987 kgha�1) than themale-operated ponds (2663 kg ha�1) in 2005/2006.The study also revealed that ¢sh consumption inhouseholds in which women and menwere the prin-cipal producers were 1.84 and 1.79 kgcapita�1
month�1, respectively, in 2005/2006.The increasingrole of women in ¢sh production may therefore besigni¢cant in improving household nutrition; parti-cularly as their increasing control over the produc-tion process may also result in greater control overintra-household distribution of food and incomes tothe bene¢t of female household members, childrenand the elderly.Ruralwomen in Bangladeshare, however, toagreat
extent, subjected to a restrictive gender-based divisionof labour and to social taboos that limit mobility andreduce their participation in income-generating activ-ities beyond the homestead.Women in Bangladesh are
Table 6 Percent distribution of households in the studyarea by size of land owned
LandholdingAll households(n513 603)
Pondoperatinghouseholds(n5 2778)
Ownership (%) Aquaculture technology practiced (%)
Own Leased/rent Traditional�Improvedtraditionalw Semi-intensivez
Functionally landless
(� 0.20 ha)
5169 (37.9) 433 (15.5) 96.3 3.7 70.1 29.9 –
Poor (0.21–0.61 ha) 5033 (36.5) 889 (32.0) 95.3 4.7 44.9 55.1 –
Marginal (0.61–1.21 ha) 2721 (20.5) 899 (32.4) 92.9 7.1 41.7 57.3 1.0
Rich (41.21 ha) 680 (5.1) 557 (20.1) 92.1 7.9 24.9 72.7 2.4
�Traditional or extensive aquaculture technologies followed no proper stocking method and require little to no outside inputs. Fishgrowth depends only on naturally available feed.wImproved traditional or improved extensive practices use more systematic stocking approaches and use supplementary feeds for ¢shgrowth. Additional water management and monitoring practices (control of predatory ¢sh species, observation of ¢sh behaviour, andinorganic fertilization to increase water productivity, control of aquatic weed, etc.) are also used.zSemi-intensive systems use optimal levels of inputs such as high nutritional value supplemental feeds, and fertilization and increaseddirect labour inputs.
Aquaculture Research, 2010, 41, 481^495 Aquaculture development and food security KM Jahan et al.
r 2009 TheAuthorsJournal Compilationr 2009 Blackwell Publishing Ltd, Aquaculture Research, 41, 481^495 491
primarily involved in household-based activities,which include child care, cooking, washing, cleaning,collecting of cooking fuel, etc.Women are also tradi-tionally involved in a variety of agricultural activitieswithin the homestead such as poultry and livestockrearing, vegetable gardening, grain and seed proces-sing and storage (Faruque 2007).These results demonstrate that women can become
successfully involved in and take ownership of aqua-culture if they receive targeted training, in part be-cause it is largely a homestead-based activity thatintegrates well with prevailing cultural norms. This¢nding supports those of a number of other studiesthat report women to be actively involved in the feed-ing and harvesting of ¢sh and the processing of ¢shcatch (Hamid & Alauddin1998; Faruque 2007). How-ever, despite the important role that women can playin aquaculture, most of them still lack access to physi-cal and capital resources and training and education.
Accessibility of ¢sh for poor and speciesdiversity
An additional important consideration with respectto food security is to strike a balance between foodsupply and nutritional quality. Several authors haveshown that small indigenous ¢sh [supplies of whichhave declined in recent years due to over¢shing andthe degradation of natural habitats in Bangladesh(Karim et al. 2006)] make a particularly importantcontribution inmeeting the nutritional requirementsof the rural poor because micro-nutrient de¢cienciesare widely apparent in the population (Bouis 2000;Faruk-Ul-Islam 2007; Roos, Wahab, Chamnan &Thilsted 2007). These authors argue that small ¢shmake a greater contribution to the rural poor interms of Vitamin A, calcium, iron and zinc than thelarger cultured species as they are consumed whole,including bones.The ¢ndings of the pond census described earlier
(which documented 3420 ponds in 49 villages)showed 94% of the ponds to be under polyculture ofcarp species. The e¡ects of polyculture dominated bylarger ¢sh species (e.g. carp) have been argued tohave a negative impact on small ¢sh production aswell as dietary quality as small ¢sh are usually notpreferred for aquaculture (Bouis 2000). It mighttherefore be argued that aquaculture might make agreater contribution towards reducing the e¡ects ofpoverty if the production of small ¢sh was promotedalong with carps. A number of authors have also
noted that the large carp species often promoted byprojects such as DSAP often remain out of reach ofthe poor due to their relatively high market value(e.g. Lewis1998). Thus, the impacts of such interven-tions might be enhanced by appropriately targetingthe production of smaller species (whether exoticspecies such as tilapias or, where technically feasible,indigenous ¢sh) alongside large higher value ones.
Quality ¢sh seed production
Seventy per cent of the project and 76% of the controlfarmers identi¢ed ‘lack of quality ¢sh fry and ¢nger-lings’ as a major barrier of pond ¢sh culture in thearea. The study also indicates that 82% of farmerspurchase ¢ngerlings from traders. Because of thelong distances from centrally clustered hatcheriesand nurseries, and to avoid risks during the transpor-tation of ¢ngerlings, ¢sh farmers generally depend ontraders for fry and ¢ngerling supplies. However, ac-cording to project farmers, traders often supplypoor-quality ¢ngerlings. Therefore, building the ca-pacity of traders by providing them with appropriateknowledge of ¢ngerling handling and managementmight improve both ¢sh seed quality and farmproductivity.Sixty-three per cent of the project and 68% of the
control farmers also identi¢ed timely availability ofthe desired ¢sh species as a major problem of ¢sh cul-ture. As an example, both project and control farmersexpressed interest in culturing common carp and ti-lapia during focus group discussions but these spe-cies were among the least commonly stocked speciesby both, suggesting possible under-supply, particu-larly because hatchery production of these speciesdi¡ers signi¢cantly from that of the more widelyavailable major carps. Decentralized models of ¢shseed production may therefore have considerable po-tential to complement existing aquaculture systemswhile creating new opportunities for participationamong marginal farming households (Little, Bar-man, Haque & Wahab 2007). Owing to their physiol-ogy, both tilapia and common carp do not requirespecialized hatchery techniques to facilitate repro-duction. Production of seed of both these species inrice ¢elds in the village may, using very simple low-cost techniques, o¡er considerable bene¢ts, allowingrice farming households without access to ponds toengage in seed production while bene¢ting ¢sh pro-ducers by improving the timely availability of large-size, good-quality (and less costly) ¢ngerlings.
Aquaculture development and food security KM Jahan et al. Aquaculture Research, 2010, 41, 481^495
r 2009 TheAuthors492 Journal Compilationr 2009 Blackwell Publishing Ltd, Aquaculture Research, 41, 481^495
Access to markets
The results of the study show that about 74% of thefarmers sell their ¢sh directly to the market (auctionmarket, retail market, directly to consumer, etc.),while 26% sell their produce to the middle men (har-vesting teams and other intermediaries known asnikari or faria) at the farm gate. Poor communicationand storage facilities, long distances to marketsand lack of market information are likewise cited asproblems by the majority of the farmers not partici-pating directly in ¢shmarketing.The ¢ndings are alsosupported by other studies conducted in Bangladesh(ADB 2005; Sarker et al. 2006; Faruque 2007). Only asmall portion of the project (2%) and control farmers(4%) reported that the traders provide capital to ¢shproducers as operating costs against the commitmentthat they will sell their produce to them.The major constraint faced by Bangladeshi ¢sh
farmers at the market level is a lack of bargainingpower. The results from the present study show thatfarmers who sell their products at the farm gate re-ceived 53% of the consumer-paid price, whereas thosewho sell directly in the market receive on averageabout 66% of the consumer-paid price.The remainingmargin is channelled to intermediaries performingdi¡erent market functions. During a focus group dis-cussion, ¢sh producers reported that they are alwaysin aweak position in marketing their products due tolack of information on patterns of supply, demand andprices. Thus. there may be potential in promoting in-stitutional development for dissemination of marketinformation, and encouragement of co-operativegroup action and participation by small-scale produ-cers to strengthen their bargaining position.Amajorityof the ¢sh farmers sell their produce close
to their locality. These local markets are dominated bya few large-scale traders who control the market. Thisleads to imperfect market competition between the fewlarge traders andmany small producers, and results inthe lowering of prices received by producers. Ahmedand Lorica (2002) note that if farmers depend only onlocal village markets to sell their products withoutknowing the demand for ¢sh, there will be a tendencyfor oversupply of ¢sh in rural markets. Oversupply of¢sh greatly reduces the ¢sh price in rural areas, willprobably not proportionately increase household con-sumption due to low purchasing power and the lowerincome elasticity of demand in rural areas (Ahmedet al. 1995). This implies that ¢sh farmers are unlikelyto recieve better prices for their produce unless theyexpand market outlets (e.g. to urban areas).
Concluding remarks
Evidence presented in this paper clearly shows thataquaculture has the potential to supply vital nutri-tion to poorhouseholds, and contribute to poverty re-duction and improvements in the overall welfare oflow-income and resource-poor households. Thestudy shows that the uptake of improved aquaculturepractices has had a signi¢cant and positive impact onincome, employment and household nutrition foradopters, along with additional bene¢ts such as theaccumulation of social capital through gifting of ¢shto community members. The paper also demon-strates that incomes, return to labour and ¢sh con-sumption were signi¢cantly higher among adoptinghouseholds than among control farmers. As therewere no major di¡erences between the two groups interms of socio-economic parameters such as house-hold size, farm size, pond size and experience, andbecause no other project intervention took place dur-ing this time, it is concluded that the productionprac-tices of project farmers resulted from the projectintervention.The poverty reduction potential of aquaculture
has attracted the attention of policy makers in Ban-gladesh (Bangladesh Planning Commission 2005).Considering the role that aquaculture has played inproviding income, employment and nutrition of therural poor, a much greater contribution from aqua-culture may be obtained if future governmentpolicies encourage improvement of productivity, ex-pansion of aquaculture and the implementation ofworkable strategies to encourage further gainful par-ticipation by the poor. There is a genuine need to fo-cus on policy measures and regulatory frameworksthat facilitate small-scale and resource-poor farmers’access to resources such as publicly owned land andwater. Public services should be e¡ectively regulatedto ensure that the poor gain better access toextension services. The results of the study also de-monstrate that gender-sensitive approaches can ef-fectively increase women’s participation in andaccess to ¢sh culture. The e⁄ciency and pro¢tabilityof female labour may therefore be improved by poli-cies designed to provide greater access to critical re-sources training and services for female members ofthe household.A precondition for realizing the bene¢t of aquacul-
ture is the availability of quality ¢ngerlings. Fish seedtraders are the most critical actors in ¢ngerling dis-tribution, linking hatcheries and seed nurseries to¢sh farmers. Therefore, aquaculture development
Aquaculture Research, 2010, 41, 481^495 Aquaculture development and food security KM Jahan et al.
r 2009 TheAuthorsJournal Compilationr 2009 Blackwell Publishing Ltd, Aquaculture Research, 41, 481^495 493
programmes should also focus on the capacitydevelopment of the ¢ngerling traders for ¢ngerlinghandling and quality ¢sh seed management. Decen-tralization of ¢sh seed networks and local productionof the seed of easily bred, fast-growing species suchas common carp, silver barb and tilapia, which areappropriate for farming by the poor, can reduce theneed for long-distance seed transport, thereby lower-ing delivery cost and improving seed survival.Technological improvements in the culture of
small indigenous ¢sh species can be expected to in-crease the welfare of poor. As poor householdsmainly consume small ¢sh, depletion of these stockswill seriously a¡ect the poorest sections of the so-ciety. Research should increasingly focus on the con-straints to technology adoption, the socio-economicimpacts of each technology, costs and bene¢ts of al-ternative species,and problems relating to product(¢sh) marketing. It will be di⁄cult to purposely re-duce the exploitation by organized marketing agentsthat small farmers and ¢shers experience when mar-keting their aquaculture products. However, contin-ued ongoing developments in improved transportand marketing infrastructure and better means ofstorage and informational £ows can be expected tobe positive for small- and medium-scale producerswith respect to market competitiveness, accessibilityand bargaining power.
Acknowledgment
The authors are grateful to the USAID andWorldFishCenter Head Quarters for providing ¢nancial supportto the research programme of DSAP. The authorswould like to express their gratefulness to two anon-ymous reviewers for their fruitful comments andsuggestions that helped considerably to improve themanuscript. The authors would like to acknowledgeAlan C. Brooks, regional director, WorldFish CenterBangladesh and South Asia, and Malcolm C. M. Bev-eridge, discipline director, aquaculture, WorldFishCenter, for valuable comments.This isWorldFish Cen-ter publication number1919.
References
ADB (2005) An Evaluation of Small-Scale Freshwater RuralAquaculture Development for Poverty Reduction. ISBN971^561^550^3. Operations Evaluation Department,
Asian Development Bank, Asian Development BankPublications, Manila, Philippines.
Ahmed A.U. & ShamsV. (1994) Demand elasticities in ruralBangladesh: an application of AIDS model. BangladeshDevelopment Studies 22,14^23.
Ahmed M. & Lorica M.H. (2002) Improving developingcountry food security through aquaculture development^ lessons from Asia. Food Policy 27,125^141.
Ahmed M.M., Abdur Rab M. & Bimbao M.P. (1995) Aquacul-ture technology adoption in Kapasia Thana, Bangladesh:some preliminary results from farm record-keeping data.ICLARM Technical Report,Vol. 44, p. 43.
Alam F., JahanK.M., Kamal K.M.S., RahmanM.M. & JanssenJ. (2004) Carp polyculture: a comparative study betweenDSAP supported demonstration farmers and control farmer.TheWorldFish Center Bangladesh and South Asia,Work-ing Paper no. 2004/2027.
Alam S. (1999) A Study on Production, Accessibility and Con-sumption Pattern of Aquaculture Practices in Bangladesh.ICLARM, Manila, Phillipines.
BBS (2006) Statistical Pocket Book of Bangladesh. BangladeshBureau of statistics, Planning Division, Ministry of Plan-ning, Dhaka, Bangladesh.
Bangladesh Economic Review (2005) Bangladesh EconomicReview. Economic AdvisersWing, Finance Division, Min-istry of Finance, Dhaka, Bangladesh.
Bangladesh Planning Commission (2005) Unlocking the Po-tential: National Strategy forAccelerated Poverty Reduction.Planning Commission, Government of People’s Republicof Bangladesh, Dhaka, Bangladesh.
Bose M.L. & Dey M.M. (2007) Food and nutritional securityin Bangladesh: going beyond carbohydrate counts. Agri-cultural Economics Research Review 20, 203^225.
Bouis H. (2000) Commercial vegetable and polyculture ¢shproduction in Bangladesh: their impacts on householdincome and dietary quality. Food and Nutrition Bulletin21, 482^487.
Bouis H., de la Briere B., Gutierrez L., Hallman K., HassanN., Hels O., QuabiliW., Quisumbing A.,Tilsted S., Zihad Z.& Zohir S. (1998) CommercialVegetable and Polyculture FishProduction in Bangladesh: Their Impacts on Household In-come and Dietary Quality.Vol.1: Report.Vol.2:Tables.. Inter-national Food Policy Research Institute,Washington, DC,USA.
Dawson P.J. & Ti⁄n R. (1998) Estimating the Demand forCalories in India. AmericanJournal of Agriculture Econom-ics 80, 474^481.
Dey M.M. (2000) Analysis of demand of ¢sh in Bangladesh.Aquaculture Economics andManagement 4,63^82.
Dey M.M., Rab M.A., Paraguas J.P., Piumsombun S., BhattaR., Alam M.F. & Ahmed M. (2005) Fish consumption andfood security: a disaggregated analysis by types of ¢shand classes of consumers in selected Asia countries.Aquaculture Economics andManagement 9,89^111.
DSAP) (2005) Final report of the Development of SustainableAquaculture Project (DSAP). Prepared by the WorldFish
Aquaculture development and food security KM Jahan et al. Aquaculture Research, 2010, 41, 481^495
r 2009 TheAuthors494 Journal Compilationr 2009 Blackwell Publishing Ltd, Aquaculture Research, 41, 481^495
Center, Bangladesh and South Asia O⁄ce, Dhaka, Octo-ber 2005, p.41.
Edwards P. (1999) Aquaculture and poverty: past, present andfuture prospects of impact. A discussion paper prepared forthe Fifth Fisheries Development Donor Consultation,Rome, Italy, 22^24 February1999.
Faruk-Ul-Islam A.T.M. (2007) Self-recruiting species (SRS) inaquaculture: their role in rural livelihoods in two areas ofBangladesh. PhD thesis, Universityof Stirling, Stirling, UK.
Faruque G. (2007)An exploration of impacts of aquaculture pro-duction and marketing on rural livelihoods in three regions inBangladesh. PhD thesis, University of Stirling, Stirling, UK.
FAO (2006a) The State of Food Insecurity in theWorld. FAO,Rome, Italy.
FAO (2006b) Regional Review on Aquaculture Development 3.Asia and the Paci¢c ^ 2005. FAOFisheries Circular No.1017/3 FAO, Rome, Italy.
FSYB (2006) Fishery Statistics Year Book of Bangladesh.Fisheries Survey System, Department of Fisheries, Dhaka,Bangladesh.
Government of Bangladesh and United Nation (2007)Meet-ing the Challenge: A Mid-Term Report on Achieving MDG-1in Bangladesh. Government of Bangladesh and UnitedNation, Dhaka, Bangladesh.
Halwart M., Funge-Smith S. & Moehl J. (2003) The Role ofAquaculture inRural Development, in FAOFisheries CircularNo.886 (Revision 2), FAO, Rome, Italy.
Hamid A. & Alauddin M. (1998) Coming out of their home-steads? Employment for rural women in shrimp aquacul-ture in coastal Bangladesh. International Journal of SocialEconomics 25,314^337.
Haque M.M. (2007) Decentralized seed production strategies inBangladesh: a new approach to developing quality ¢sh seedsupply for sustainable rural aquaculture and livelihoods.PhD thesis, University of Stirling, Stirling, UK.
HishamundaN. & Ridler N.B. (2006) Farming ¢sh for pro¢ts:a small step towards food security in sub-Saharan Africa.Food Policy 31, 401^414.
Irz X., Stevenson JR., TanoyA., Villarante P. & Morissens P.(2007) The equityand poverty impacts of aquaculture: in-sights from the Philippines. Development Policy Review 25,495^516.
KarimM., Ahmed M.,Talukder R.K.,Taslim M.A. & RahmanH.Z. (2006) Policy working paper: dynamic agribusiness-fo-cused aquaculture for poverty reduction and economic growthin Bangladesh. WorldFish Center Discussion series no. 1,p. 44.
Lewis D. (1998) Rethinking aquaculture for resource poorfarmers: perspectives form Bangladesh. Food Policy 22,533^546.
Lewis D.J., Gregory R. & Wood G.D. (1996) Trading the SilverSeed: Local Knowledge and Market Mortalities in Aquacul-ture Development. Intermediate Technology Publicationsand University Press Limited, Dhaka, Bangladesh.
Little D.C., Barman B.K., Haque M.M. & Wahab M.A. (2007)Decentralized Nile tilapia seed production. In: Fish pondsin Farming Systems (ed. by A.J. van der Zijpp, J.A.J.
Verreth, L.Q. Tri, M.E.F. van Mensvoort, R.H. Bosma
& M.C.M. Beveridge), pp. 49–58. Wageningen Aca-
demic Publishers, the Netherlands.
MAEP (1995) Impact Study on Mymensingh Aquaculture Ex-tension Project-I (MAEP-I). Ministry of Fisheries and Live-stock and Department of Fisheries of People’s Republic ofBangladesh and Danish International DevelopmentAgency, Dhaka, Bangladesh.
Maxwell S. & Slater R. (2003) Food policy old and new. Devel-opment Policy Review 21,531^553.
Mazid M.A. (1999) Rural and coastal aquaculture in povertyreduction. Proceedings of a seminar organized on the oc-casion of ¢sh week 1999. Department of Fisheries,
Dhaka, Bangladesh: 79pp.
Mazid M.A. (2002) Development of Fisheries in Bangla-desh. Plans and Strategies for Income Generation andPoverty Alleviation. Momin O¡set Press, Dhaka, Bangla-desh.
Miah T.H. (2000) Consultancy Report on AgriculturalEconomics, Agricultural Research Management Project.Bangladesh Agricultural Research Council (BRAC)andWinrock International Institute for Agricultural De-velopment, Dhaka, Bangladesh.
Roos N.,Wahab M.A., Chamnan C. & Thilsted S.H. (2007)The role of ¢sh in food-based strategies to combat vitaminA and mineral de¢ciencies in developing countries. Jour-nal of Nutrition137,1106^1109.
Sarker M.A., ChowdhuryA.H. & ItoharaY. (2006) Entrepre-neurships barriers of pond ¢sh culture in Bangladesh ^ acase study from Mymensingh district. Journal of SocialSciences 2,68^73.
Thompson P.M., Firoz Khan A.K.M. & Sultana P. (2006)Comparison of aquaculture extension impacts in Bangla-desh. Aquaculture Economics and Management 10,15^31.
ThorpeA., Reid C., Anrooy R., Brugere C. & Becker D. (2006)Asian development and poverty reduction strategies: in-tegrating ¢sheries into the development discourse. FoodPolicy 31,385^400.
To¢que K.A. & Gregory R. (2008) Common waters and pri-vate lands: distributional impacts of £oodplain aquacul-ture in Bangladesh. Food Policy 33,587^594.
World Bank (1986) Poverty and hunger. In aWorld Bank PolicyStudy.World Bank,Washington, DC, USA,41pp.
World Bank (2006) Aquaculture: Changing the Face of theWaters.World Bank,Washington, DC, USA,136pp.
WorldFish Center (2007) Inception Report of theAdivasi Fish-eries Project.WorldFish Center, Bangladesh.
Zeller M. & Sharma M. (1998) Rural Finance and PovertyAlleviation. Food Policy report. International Food PolicyResearch Institute,Washington, DC, USA:32pp.
Aquaculture Research, 2010, 41, 481^495 Aquaculture development and food security KM Jahan et al.
r 2009 TheAuthorsJournal Compilationr 2009 Blackwell Publishing Ltd, Aquaculture Research, 41, 481^495 495