Urbanization Trends and Urban Planning in West Bengal, India
1
FIFTH AFRICAN POPULATION CONFERENCE 2007
ARUSHA, TANZANIA, 10-14 DECEMBER 2007
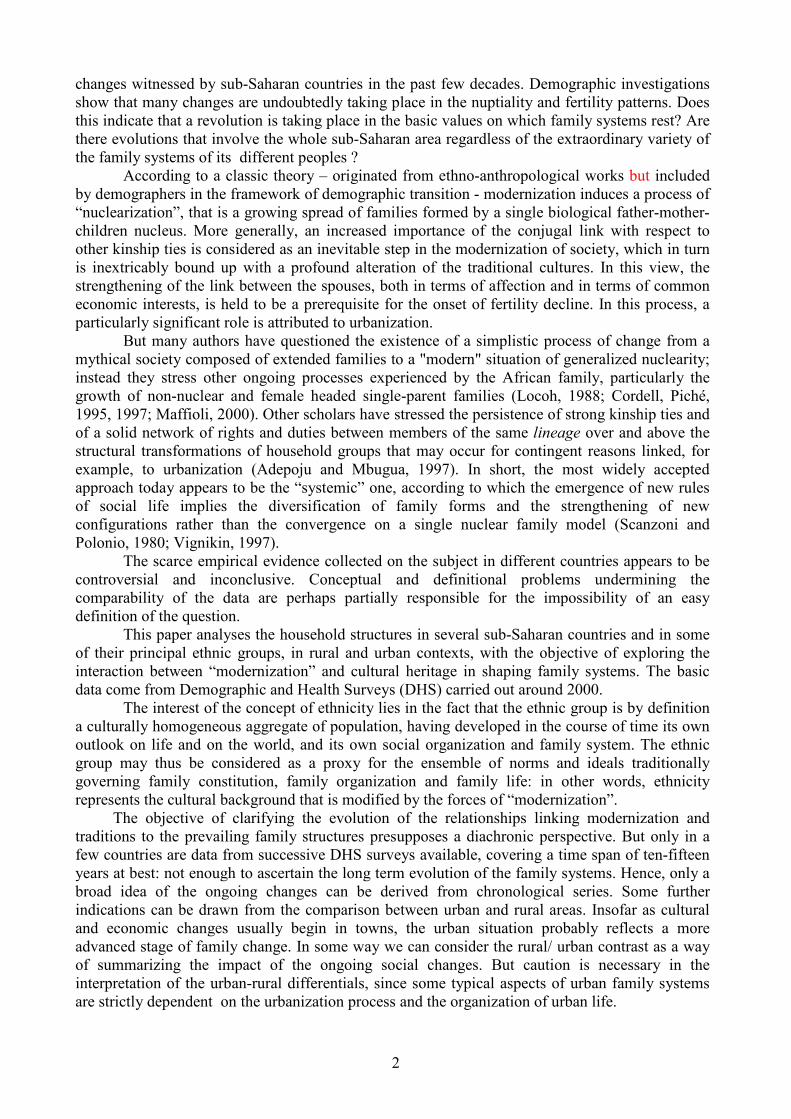
The Impact of Urbanization on The Traditional Family Systems
in Sub-Saharan Africa (provisional paper)
by
Dionisia Maffioli, Pietro Sacco, Giuseppe Gabrielli1
University of Bari (Italy)
1. Introduction
In sub-Saharan Africa the phenomenology of the family and marriage is of great interest
owing to the extraordinary diversification and complexity of the traditional family systems and to
the variety and novelty of the ongoing changes, which have been submitted to relatively little
study. Patrilineal, matrilineal or bilateral lineage systems, co-residential or non co-residential
polygamy, systems for the adoption or fostering children, precocity and fragility of marriages and
the frequency of re-marriages, are all aspects largely ignored by demographers despite their
potential relevant consequences for demographic behaviour, and for women’s and children’s
status. The cultural substrate of ancient Animistic traditions, that assume a world populated by
spiritual entities which intervene at the crucial moments in the lives of humans, can cause - even
where new religions are now preponderant – behaviours not conforming to western categories,
which are difficult to capture through large scale international surveys. The continuous evolution,
which is brought by “globalization” - that is by the ever more intense contacts and exchanges
between each country and the rest of the world - interacts with these cultural contexts introducing
further elements of complexity and developing new dynamics with respect to the historical
experience of western countries. The course of changes brought on by the shared historical forces
of urbanization, spread of education, etc., will be inevitably marked to some extent by these
starting conditions.
The predominance of lineage, the enlarged family2 and its interests with respect to the
biological family (parents and their children) are overall features that traditionally distinguish the
conception and the organization of the family in sub-Saharan Africa. Cultural systems and customs
that developed in the framework of traditional religions and the particular economic arrangements
that regulate family life, above all, but not exclusively, in matrilineal regimes are at the basis of
these conceptions and organizations (Goody, 1963; Caldwell, 1987). It is a debatable question
whether these features remain stable over time or evolve alongside the deep economic and social
1 The paper is the result of a close collaboration among the authors. As for the actual text, D. Maffioli wrote Sections
1, 4 and 7; P. Sacco wrote Sections 2, 3 and 5; G. Gabrielli wrote Section 6. All the descriptive elaborations are
conducted by P. Sacco; G.Gabrielli conducted Factor analysis and Cluster analysis. 2 That is a family which includes members who are not part of the biological group mother-father-children. P. Laslett
(1972) classified ‘enlarged families’ in two categories: extended (lineally) and expanded (laterally). Many authors,
however, use the term ‘extended families’ to indicate both categories, as a synonym for ‘enlarged families’. The latter
criterion is followed here
2
changes witnessed by sub-Saharan countries in the past few decades. Demographic investigations
show that many changes are undoubtedly taking place in the nuptiality and fertility patterns. Does
this indicate that a revolution is taking place in the basic values on which family systems rest? Are
there evolutions that involve the whole sub-Saharan area regardless of the extraordinary variety of
the family systems of its different peoples ?
According to a classic theory – originated from ethno-anthropological works but included
by demographers in the framework of demographic transition - modernization induces a process of
“nuclearization”, that is a growing spread of families formed by a single biological father-mother-
children nucleus. More generally, an increased importance of the conjugal link with respect to
other kinship ties is considered as an inevitable step in the modernization of society, which in turn
is inextricably bound up with a profound alteration of the traditional cultures. In this view, the
strengthening of the link between the spouses, both in terms of affection and in terms of common
economic interests, is held to be a prerequisite for the onset of fertility decline. In this process, a
particularly significant role is attributed to urbanization.
But many authors have questioned the existence of a simplistic process of change from a
mythical society composed of extended families to a "modern" situation of generalized nuclearity;
instead they stress other ongoing processes experienced by the African family, particularly the
growth of non-nuclear and female headed single-parent families (Locoh, 1988; Cordell, Piché,
1995, 1997; Maffioli, 2000). Other scholars have stressed the persistence of strong kinship ties and
of a solid network of rights and duties between members of the same lineage over and above the
structural transformations of household groups that may occur for contingent reasons linked, for
example, to urbanization (Adepoju and Mbugua, 1997). In short, the most widely accepted
approach today appears to be the “systemic” one, according to which the emergence of new rules
of social life implies the diversification of family forms and the strengthening of new
configurations rather than the convergence on a single nuclear family model (Scanzoni and
Polonio, 1980; Vignikin, 1997).
The scarce empirical evidence collected on the subject in different countries appears to be
controversial and inconclusive. Conceptual and definitional problems undermining the
comparability of the data are perhaps partially responsible for the impossibility of an easy
definition of the question.
This paper analyses the household structures in several sub-Saharan countries and in some
of their principal ethnic groups, in rural and urban contexts, with the objective of exploring the
interaction between “modernization” and cultural heritage in shaping family systems. The basic
data come from Demographic and Health Surveys (DHS) carried out around 2000.
The interest of the concept of ethnicity lies in the fact that the ethnic group is by definition
a culturally homogeneous aggregate of population, having developed in the course of time its own
outlook on life and on the world, and its own social organization and family system. The ethnic
group may thus be considered as a proxy for the ensemble of norms and ideals traditionally
governing family constitution, family organization and family life: in other words, ethnicity
represents the cultural background that is modified by the forces of “modernization”.
The objective of clarifying the evolution of the relationships linking modernization and
traditions to the prevailing family structures presupposes a diachronic perspective. But only in a
few countries are data from successive DHS surveys available, covering a time span of ten-fifteen
years at best: not enough to ascertain the long term evolution of the family systems. Hence, only a
broad idea of the ongoing changes can be derived from chronological series. Some further
indications can be drawn from the comparison between urban and rural areas. Insofar as cultural
and economic changes usually begin in towns, the urban situation probably reflects a more
advanced stage of family change. In some way we can consider the rural/ urban contrast as a way
of summarizing the impact of the ongoing social changes. But caution is necessary in the
interpretation of the urban-rural differentials, since some typical aspects of urban family systems
are strictly dependent on the urbanization process and the organization of urban life.
3
2. Data and methods
Internationally comparable data provided by Demographic and Health Surveys (DHS)
made it possible to explore at least some aspects of these issues. In fact, despite being designed for
other purposes, DHS have gathered a wealth of information on the structure of households, and
this permits the identification and the description of the family systems: a description that can be
considered an important goal in itself, since quite scarce previous information is available on
family structures in sub-Saharan Africa to date.
A drawback inherent to this kind of data is that it only throws light on co-residential groups
of related or non-related persons and does not allow any appraisal of the entire kinship network
and the reciprocal rights and duties between its members. This is a very general problem, which
hinders family studies everywhere in the world, but which appears especially serious in Africa
given the relevance of kinship ties.
Thus this paper is not concerned with the family as a network of kinship, but with the
family as a group of persons living together, or a household. This can also be defined as a “co-
resident domestic group”3 and is the only type of family that can be studied with DHS data
4.
With the information available we constructed a household typology loosely inspired by
that proposed by Laslett in the 1970s. This typology seeks to clarify the kinship structure within
the household and provides an evaluation of the degree of "nuclearity" of the family. Particular
emphasis is also given to single parenthood, women-headed families, non-nuclear and single
persons families, polygamy.
A further analysis was conducted in order to identify the possible relationships between
family systems, fertility, modernization and cultural background. This was done through a factor
analysis and a cluster analysis, that allows us to classify ethnic groups on the basis of similarity
with respect to several indicators used to describe their demographic, socio-economic and family
situation.
3. Countries and ethnic groups: an overview
The countries which were selected for the analysis belong to different geographical areas of
the Sub-Saharan Africa and differ from each other in historical experience, present degree of
economic and social development and demographic conditions. They cannot represent the whole
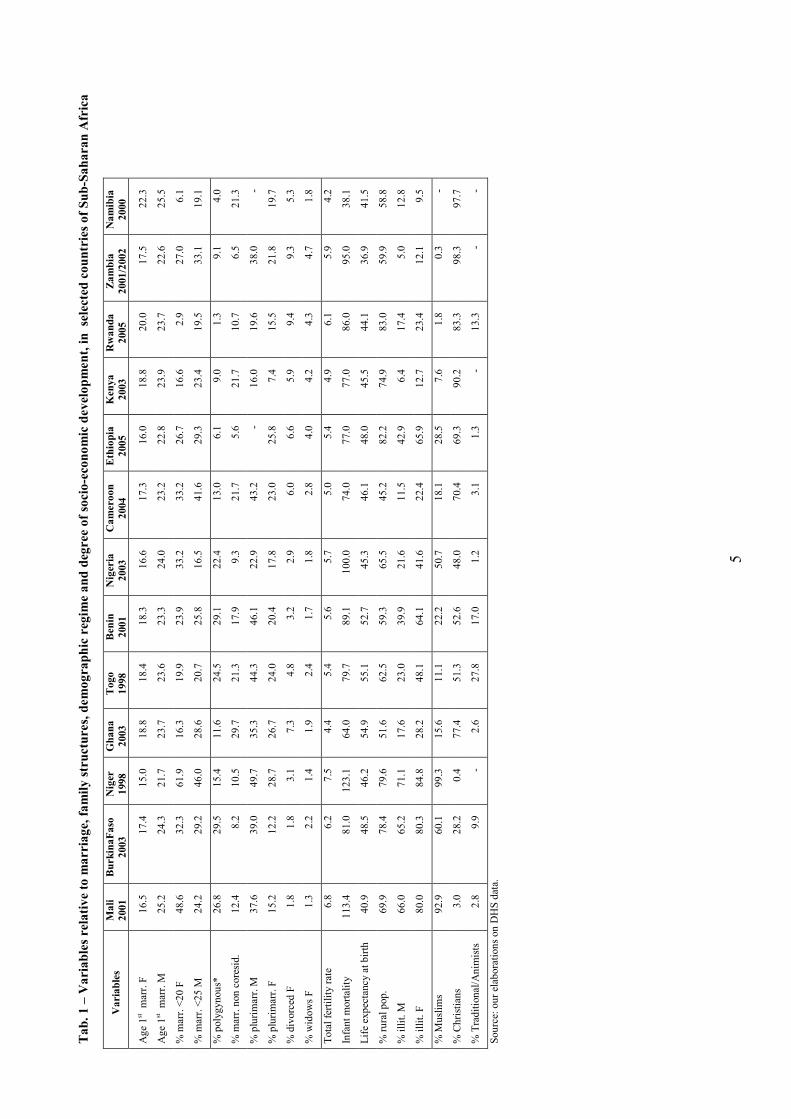
Sub-Saharan area, but certainly give an effective picture of widely prevalent situations. Tab.1
collects a range of information for each country, related as much to nuptiality, fertility and the
family, as to socio-cultural and economic conditions.
The 43 ethnic groups that were taken into consideration5 are those that include the higher
population percentages of the examined countries, in order to ensure the reliability of the sample
survey data.
3 As a further possible drawback, the meaning of “co-resident domestic group” can in some way differ from one
country to another, despite the reference to a common core questionnaire and common definitions. 4 “A household consists of a person or a group of related or unrelated persons, who live together in the same dwelling
unit, who acknowledge one adult male or female as the head of the household, who share the same housekeeping
arrangements and are considered as one unit. In some cases one may find a group of people living together in the
same house, but each person has separate eating arrangements; they should then be counted as a separate one-person
household” from DHS, Sampling Manual, Phase III, Basic Documentation-6, Macro International Inc., Calverton,
Maryland, Nov. 1996, p.48. 5 The following ethnic groups are considered: Bambara, Peul, Sanakole/Soninke/Marka, Malike, Senufo/Minianka,
Dogon, Sonrai, Bobo in Mali; Mossi, Lobi, Dioula in Burkina Faso; Haoussa, Djerma, Tuareg in Niger; Akan, Ewe,
Mole-Dagani in Ghana; Fon, Adja, Yoruba, Bariba, Peul in Benin; Oromo, Amhara, Guraje, Tigray, Sidama in
Ethiopia; Kikuyu, Luhya, Luo, Kamba, Kalenjin in Kenya; Bemba, Tonga, Kewa, Lozi in Zambia; Oshiwambo,
Damara/Nama, Herero, Kavango (languages) in Namibia; Adja-Ewe, Kabye-Tem, Para-Gourma (Akan) in Togo;
Bamilike, Bei, Mboum in Cameroon. The other ethnic groups, despite having particular behavioural characteristics
4
The analysed ethnic groups differ from each other for many characteristics that are critical
for the purposes of exploring the family systems, including lineage and the traditional residence of
the newly-formed couple. For example, the Oromo (Ethiopia), the Bambara (Mali), the Fon
(Benin), the Ewe (Ghana), and the Kikuyu (Kenya) are patrilinear and patrilocal, while the Bemba
(Zambia), and the Oshiwambo (Namibia) speaking people are matrilinear and matrilocal. The
Amhara (Ethiopia) and the Akan (Ghana) are patrilocal, but their lineage can be either patrilinear
or matrilinear (Murdock, 1967). Matrilineal societies recognize matrilineal descent which gives
women special status because the line of rule and inheritance passes through them. In this case
authority is generally held by maternal family men (confusion must be avoided between matriliny
and matriarchy) and the ties with the paternal family can be tenuous. Clearly, when family systems
are as radically dissimilar as patrilinear and matrilinear systems, there are completely different
problems concerning marital arrangements, family life, relations between relatives, cohesion of the
family nucleus, marriage formation and dissolution.
The wide differences between ethnic groups are also evident in classical variables such as
literacy, religion and rural/urban residence, which reflect different historical experiences and
specific cultural references (see Appendix table 2). The ethnic groups resident in the eastern and
southern regions of Africa show higher literacy levels and relatively low proportions of rural
population compared to the others and are prevalently of Christian religions; in this region
different ethnic groups have traditions of matriliny and sometimes also of matrilocality. The
Sahelian ethnic groups are prevalently patrilineal, patrilocal and Islamic, and they have lower
literacy levels and higher rurality. The ethnic groups of the region of the Gulf of Guinea have
intermediate situations with regard to the level of socio-economic development, religious
background is greatly diversified, there is a strong persistence of Animistic traditions, and the
lineage systems may be as much patrilineal as matrilineal.
Within each country ethnic groups can be very similar to each other from the point of view of
all the aspects examined – as is natural since geographical contiguity may mean the belonging to a
unified cultural complex of shared historical and/or contemporary experience. But it is also
possible to find ethnic groups markedly different from those around them for one or more
characteristics. For example, in Ethiopia the Amhara and the Tigray are distinguished by a
precocity of female marriages and a spread of women’s multiple marriages that are not to be
found in the other ethnic groups. In Ghana the Mole/Dagbani differ from the other groups
examined for the high incidence of polygamy. In Namibia both the male and female marriage age
of the Oshiwambo is much higher than it is in other groups, etc.
4. Household typology
Family structures are generally not well documented in Africa for both conceptual and
practical reasons. The main problem is that the operational concepts employed in censuses and
surveys are often derived from western experience: hence their adequacy in describing real African
situations is dubious and this is probably the reason why data on family structures, usually
gathered in all censuses, are often neglected and are not analysed in depth.
The classical definition of "family" or "household" – statistically intended as a group of
persons who live together sharing the common goods necessary to satisfy basic needs – is
appropriate in situations in which the family unit and the residential unit tend to closely coincide,
so that the concept is easily transferable to an operational level. Though widely used, a similar
concept is often inadequate in contexts where, in relying on the concept of co-residence, there is a
risk of not even covering the whole central family nucleus - husband, wife or wives and children -
though including many other figures. The DHS data, by their nature, do not overcome these
problems, so that caution is required in comparisons and interpretation.
that contribute significantly to the various national situations, cannot be analysed separately because they are not
statistically representative.
5
Tab. 1 – Variables relative to marriage, family structures, demographic regime and degree of socio-economic development, in selected countries of Sub-Saharan Africa
Variables
Mali
2001
BurkinaFaso
2003
Niger
1998
Ghana
2003
Togo
1998
Benin
2001
Nigeria
2003
Cameroon
2004
Ethiopia
2005
Kenya
2003
Rwanda
2005
Zambia
2001/2002
Namibia
2000
Age 1st marr. F
16.5
17.4
15.0
18.8
18.4
18.3
16.6
17.3
16.0
18.8
20.0
17.5
22.3
Age 1st marr. M
25.2
24.3
21.7
23.7
23.6
23.3
24.0
23.2
22.8
23.9
23.7
22.6
25.5
% m
arr. <20 F
48.6
32.3
61.9
16.3
19.9
23.9
33.2
33.2
26.7
16.6
2.9
27.0
6.1
% m
arr. <25 M
24.2
29.2
46.0
28.6
20.7
25.8
16.5
41.6
29.3
23.4
19.5
33.1
19.1
% polygynous*
26.8
29.5
15.4
11.6
24.5
29.1
22.4
13.0
6.1
9.0
1.3
9.1
4.0
% m
arr. non coresid.
12.4
8.2
10.5
29.7
21.3
17.9
9.3
21.7
5.6
21.7
10.7
6.5
21.3
% plurimarr. M
37.6
39.0
49.7
35.3
44.3
46.1
22.9
43.2
- 16.0
19.6
38.0
-
% plurimarr. F
15.2
12.2
28.7
26.7
24.0
20.4
17.8
23.0
25.8
7.4
15.5
21.8
19.7
% divorced
F
1.8
1.8
3.1
7.3
4.8
3.2
2.9
6.0
6.6
5.9
9.4
9.3
5.3
% w
idows F
1.3
2.2
1.4
1.9
2.4
1.7
1.8
2.8
4.0
4.2
4.3
4.7
1.8
Total fertility rate
6.8
6.2
7.5
4.4
5.4
5.6
5.7
5.0
5.4
4.9
6.1
5.9
4.2
Infant mortality
113.4
81.0
123.1
64.0
79.7
89.1
100.0
74.0
77.0
77.0
86.0
95.0
38.1
Life ex
pectancy
at birth
40.9
48.5
46.2
54.9
55.1
52.7
45.3
46.1
48.0
45.5
44.1
36.9
41.5
% rural pop.
69.9
78.4
79.6
51.6
62.5
59.3
65.5
45.2
82.2
74.9
83.0
59.9
58.8
% illit. M
66.0
65.2
71.1
17.6
23.0
39.9
21.6
11.5
42.9
6.4
17.4
5.0
12.8
% illit. F
80.0
80.3
84.8
28.2
48.1
64.1
41.6
22.4
65.9
12.7
23.4
12.1
9.5
% M
uslim
s 92.9
60.1
99.3
15.6
11.1
22.2
50.7
18.1
28.5
7.6
1.8
0.3
-
% C
hristians
3.0
28.2
0.4
77.4
51.3
52.6
48.0
70.4
69.3
90.2
83.3
98.3
97.7
% Traditional/A
nim
ists
2.8
9.9
- 2.6
27.8
17.0
1.2
3.1
1.3
- 13.3
- -
Source: our elab
orations on D
HS data.
6
The reconstruction of the household structure rests on knowledge of the kinship ties that link
each member to the person considered to be the head of the family. There is only indirect and
partial information on the links between the other members of the family. This is an important
limitation which reduces the possibility of fully understanding the most complex household
structures that include more than one family nucleus (as in the case in which the family of the
married son or daughter lives with the parent’s family).
An additional, but not irrelevant problem, is that the kinship ties may have the same names
(in translation) but not necessarily denote the same realities. The concept of brotherhood is
possibly different in patrilineal and matrilineal regimes. But this problem almost disappears if the
classification of parenthood is limited to three categories: parents, children, and other relatives.
Despite all the limitations we have mentioned, the available information made it possible to
construct a household typology which clarifies the overall kinship structure of the household and
provides an evaluation of its degree of "nuclearity"6. At the basis of this typology lies the concept
of "family nucleus", defined as a group of persons linked by a relationship of reproduction or a
conjugal tie: i.e., a couple, or a couple with children, or only one parent with children. All the
households which do not contain one or the other of these groups are classified as non-nuclear.
Among the family forms containing a family nucleus, we distinguish three different categories: the
“single-parent household” (which are mostly headed by women), the “conjugal household”,
formed by a couple or a couple with offspring, and the “extended family”, that is the conjugal
household with the addition of other related or not related persons7 or a polygynous household.
The extended families may or may not be multinuclear.
To summarize, the following households classification has been adopted:
a) Non-nuclear household
1- solitaries (singles, divorced, widowed persons alone)
2- non-family nucleus (co-resident relatives or persons not evidently related)
b) One-parent family household
3- single parents with offspring
4- single parents with offspring + ORN
c) Conjugal family household (in the literature also referred to as: nuclear, simple,
elementary, biological or nuclear family)
5- couples
6- couples with offspring
d) Extended family household (a nuclear family with the addition of one or more persons
other than spouse and offspring or a polygynous family).
7- couples + ORN
8- couples with offspring + ORN
9- Polygynous families + ORN
(ORN=other related and not related persons).
It must be stressed that in our approach, one-parent families have been left in a separate
category, without considering them to be extended families even if they host ORNs. Naturally this
gives to the category of the “extended family” a narrower significance, which is considered to be
6 The classification of the households adopted in this study is loosely inspired by that which Laslett (1972) proposed
for European families in the past, in order to clarify their kinship structure. 7 In our classification, the “extended family households” also include those with more than one family nucleus, that
usually constitute the distinct category of the “multi-nuclear family households”. This is because the available
information does not allow us to identify the presence of secondary family nuclei with certainty. In any case, we
attempted to provide a rough evaluation of the spread of the multi-nuclear family households, on the basis of the
information on the number of cohabiting children and husbands available for each woman.

7
more adapted to the present analysis. In fact, the theory of nuclearization hypothesized a
progressive polarization on the conjugal family not hosting other relatives and a corresponding
reduction of the families with ORNs: in this contraposition the place of one-parent families, with
or without ORNs, is not clearly defined.
4.1 Differences between countries
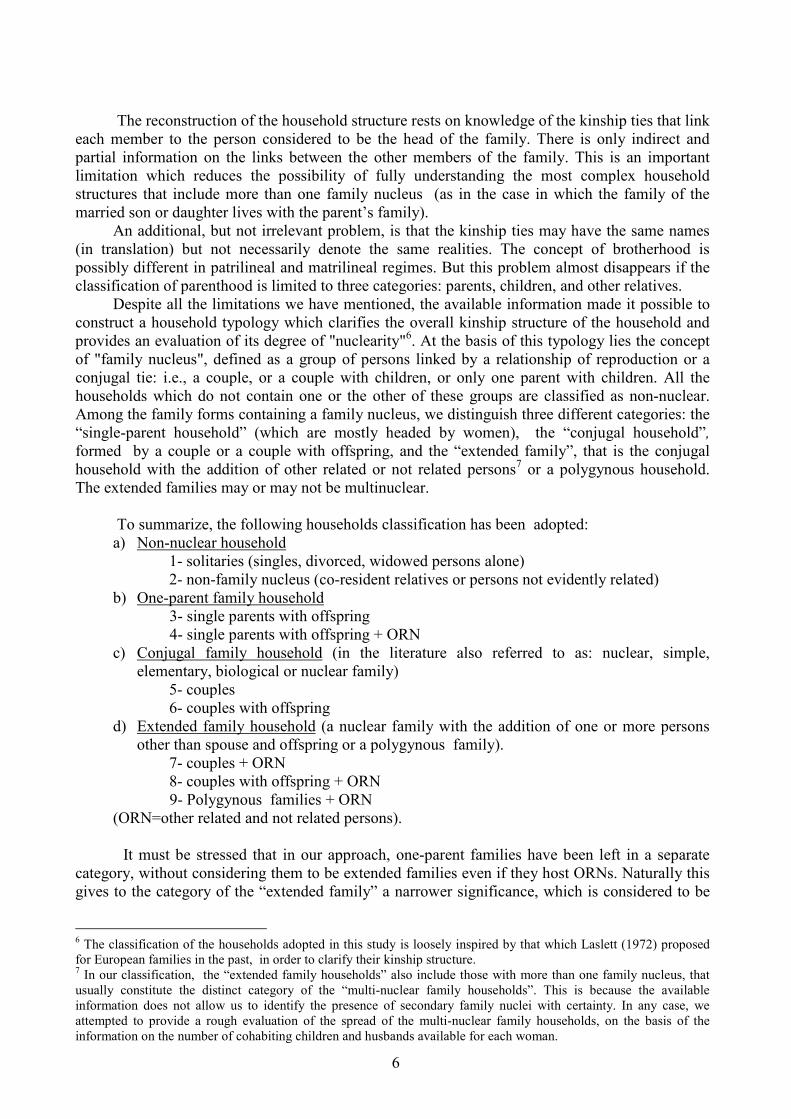
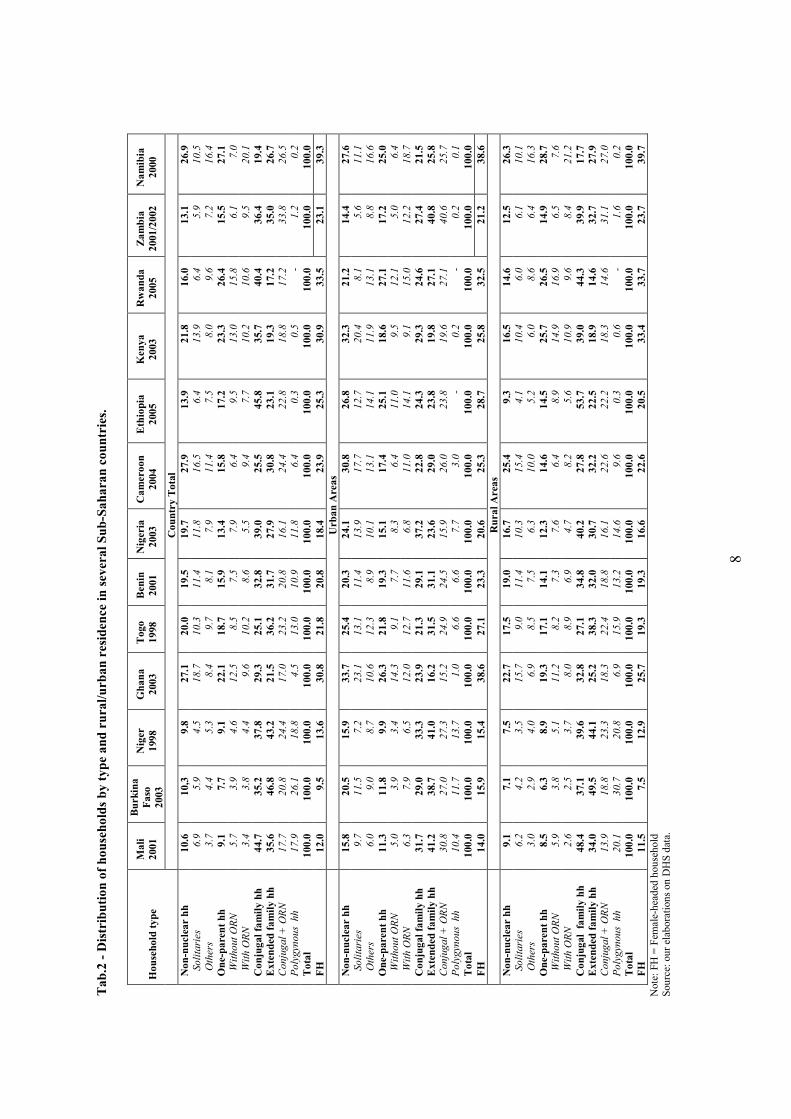
The first general observation derived from available data (Tab.2 and Fig.1) is that the
considerable variability of family systems from one country to another is such as to exclude the
existence of a single African family pattern.
The “conjugal households” are in many cases the most common family type, but represent
only a minority of the total, ranging from 45% in Ethiopia to just 19% in Namibia. They are
outnumbered by extended families in Burkina (47%), Niger (43%), Togo (36%), and Cameroon
(31%), while in Namibia, this category is by far the smallest.
The “extended households” are the second category in order of numerical importance in
Mali, Benin, Nigeria, Ethiopia, and Zambia, with values of between 36% (Mali) and 23%
(Ethiopia); but in Kenya, Rwanda, Ghana and Namibia they are exceeded by one-parent
households, or non-nuclear households, or both. However, within this category the balance
between polygynic and not polygynic households is very varied. A high proportion of “extended
households” is generally linked to the spread of polygamy. But if only the non-polygynic extended
households are considered, Zambia with 33% and Namibia with the 26% are at the top list.
Polygynous households are more than a quarter of the total households in Burkina Faso (26%),
have a significant position in Niger (19%) and in Mali (18%), and are substantial also in Togo
(13%), Nigeria (12%), and Benin (11%), but elsewhere they are marginal (Cameroon, Ghana) or
almost inexistent.
The single-parent households are widespread in Rwanda and Namibia (26-27%) and also in
Kenya (23%) and Ghana (22%) but fall to 7-9% in Burkina, Niger, and Mali. In the other countries
they are concentrated around 13-19%.
The non-nuclear households include a significant portion of the family systems, with values
of between 10% in Mali, Burkina, and Niger and almost three-times that (27%) in Ghana and
Namibia. Elsewhere they vary between 13% and 22%. Within this category, the distinction
between solitaries and other non-nuclear groups highlights further possible differentiations. For
example, Ghana and Namibia have roughly the same proportion of non-nuclear families, but in the
former case these are above all solitaries, while in the latter they are cohabiting groups.
8
Tab.2 - Distribution of households by type and rural/urban residence in several Sub-Saharan countries.
Mali
2001
Burkina
Faso
2003
Niger
1998
Ghana
2003
Togo
1998
Benin
2001
Nigeria
2003
Cameroon
2004
Ethiopia
2005
Kenya
2003
Rwanda
2005
Zambia
2001/2002
Namibia
2000
Household type
Country Total
Non-nuclear hh
10.6
10,3
9.8
27.1
20.0
19.5
19.7
27.9
13.9
21.8
16.0
13.1
26.9
Solitaries
6.9
5.9
4.5
18.7
10.3
11.4
11.8
16.5
6.4
13.9
6.4
5.9
10.5
Others
3.7
4.4
5.3
8.4
9.7
8.1
7.9
11.4
7.5
8.0
9.6
7.2
16.4
One-parent hh
9.1
7.7
9.1
22.1
18.7
15.9
13.4
15.8
17.2
23.3
26.4
15.5
27.1
Without ORN
5.7
3.9
4.6
12.5
8.5
7.5
7.9
6.4
9.5
13.0
15.8
6.1
7.0
With ORN
3.4
3.8
4.4
9.6
10.2
8.6
5.5
9.4
7.7
10.2
10.6
9.5
20.1
Conjugal family hh
44.7
35.2
37.8
29.3
25.1
32.8
39.0
25.5
45.8
35.7
40.4
36.4
19.4
Extended family hh
35.6
46.8
43.2
21.5
36.2
31.7
27.9
30.8
23.1
19.3
17.2
35.0
26.7
Conjugal + ORN
17.7
20.8
24.4
17.0
23.2
20.8
16.1
24.4
22.8
18.8
17.2
33.8
26.5
Polygynous hh
17.9
26.1
18.8
4.5
13.0
10.9
11.8
6.4
0.3
0.5
- 1.2
0.2
Total
100.0
100.0
100.0
100.0
100.0
100.0
100.0
100.0
100.0
100.0
100.0
100.0
100.0
FH
12.0
9.5
13.6
30.8
21.8
20.8
18.4
23.9
25.3
30.9
33.5
23.1
39.3
Urban Areas
Non-nuclear hh
15.8
20.5
15.9
33.7
25.4
20.3
24.1
30.8
26.8
32.3
21.2
14.4
27.6
Solitaries
9.7
11.5
7.2
23.1
13.1
11.4
13.9
17.7
12.7
20.4
8.1
5.6
11.1
Others
6.0
9.0
8.7
10.6
12.3
8.9
10.1
13.1
14.1
11.9
13.1
8.8
16.6
One-parent hh
11.3
11.8
9.9
26.3
21.8
19.3
15.1
17.4
25.1
18.6
27.1
17.2
25.0
Without ORN
5.0
3.9
3.4
14.3
9.1
7.7
8.3
6.4
11.0
9.5
12.1
5.0
6.4
With ORN
6.3
7.9
6.5
12.0
12.7
11.6
6.8
11.0
14.1
9.1
15.0
12.2
18.7
Conjugal family hh
31.7
29.0
33.3
23.9
21.3
29.1
37.2
22.8
24.3
29.3
24.6
27.4
21.5
Extended family hh
41.2
38.7
41.0
16.2
31.5
31.1
23.6
29.0
23.8
19.8
27.1
40.8
25.8
Conjugal + ORN
30.8
27.0
27.3
15.2
24.9
24.5
15.9
26.0
23.8
19.6
27.1
40.6
25.7
Polygynous hh
10.4
11.7
13.7
1.0
6.6
6.6
7.7
3.0
- 0.2
- 0.2
0.1
Total
100.0
100.0
100.0
100.0
100.0
100.0
100.0
100.0
100.0
100.0
100.0
100.0
100.0
FH
14.0
15.9
15.4
38.6
27.1
23.3
20.6
25.3
28.7
25.8
32.5
21.2
38.6
Rural Areas
Non-nuclear hh
9.1
7.1
7.5
22.7
17.5
19.0
16.7
25.4
9.3
16.5
14.6
12.5
26.3
Solitaries
6.2
4.2
3.5
15.7
9.0
11.4
10.3
15.4
4.1
10.4
6.0
6.1
10.1
Others
3.0
2.9
4.0
6.9
8.5
7.5
6.3
10.0
5.2
6.0
8.6
6.4
16.3
One-parent hh
8.5
6.3
8.9
19.3
17.1
14.1
12.3
14.6
14.5
25.7
26.5
14.9
28.7
Without ORN
5.9
3.8
5.1
11.2
8.2
7.3
7.6
6.4
8.9
14.9
16.9
6.5
7.6
With ORN
2.6
2.5
3.7
8.0
8.9
6.9
4.7
8.2
5.6
10.9
9.6
8.4
21.2
Conjugal family hh
48.4
37.1
39.6
32.8
27.1
34.8
40.2
27.8
53.7
39.0
44.3
39.9
17.7
Extended family hh
34.0
49.5
44.1
25.2
38.3
32.0
30.7
32.2
22.5
18.9
14.6
32.7
27.9
Conjugal + ORN
13.9
18.8
23.3
18.3
22.4
18.8
16.1
22.6
22.2
18.3
14.6
31.1
27.0
Polygynous hh
20.1
30.7
20.8
6.9
15.9
13.2
14.6
9.6
0.3
0.6
- 1.6
0.2
Total
100.0
100.0
100.0
100.0
100.0
100.0
100.0
100.0
100.0
100.0
100.0
100.0
100.0
FH
11.5
7.5
12.9
25.7
19.3
19.3
16.6
22.6
20.5
33.4
33.7
23.7
39.7
Note: FH = Fem
ale-headed
household
Source: our elab
orations on D
HS data.

9
Fig.1 – Distribution of households by type and rural/urban residence in several Sub-Saharan countries
Country total
Mali
01020
30
40
50
60
Burkina Faso
01020
30
40
50
60
Niger
01020
30
40
50
60
3
Ghana
01020
30
40
50
60
Togo
01020
30
40
50
60
Benin
01020
30
40
50
60
Nigeria
01020
30
40
50
60
Cam
eroon
01020
30
40
50
60
Ethiopia
01020
30
40
50
60
Kenya
01020
30
40
50
60
Rwanda
01020
30
40
50
60
Zam
bia
01020
30
40
50
60
Nam
ibia
01020
30
40
50
60
Urban Areas
Mali
01020
30
40
50
60
Burkina Faso
01020
30
40
50
60
Niger
01020
30
40
50
60
Ghana
0
10
20
30
40
50
60
Togo
01020
30
40
50
60
Benin
01020
30
40
50
60
Nigeria
01020
30
40
50
60
Cam
eroon
01020
30
40
50
60
Ethiopia
01020
30
40
50
60
Kenya
01020
30
40
50
60
Rwanda
01020
30
40
50
60
Zam
bia
01020
30
40
50
60
Nam
ibia
01020
30
40
50
60
Rural Areas
Mali
01020
30
40
50
60
Burkina Faso
01020
30
40
50
60
Niger
0
10
20
30
40
50
60
Ghana
01020
30
40
50
60
Togo
01020
30
40
50
60
Benin
01020
30
40
50
60
Nigeria
01020
30
40
50
60
Cam
eroon
01020
30
40
50
60
Ethiopia
01020
30
40
50
60
Kenya
01020
30
40
50
60
Rwanda
01020
30
40
50
60
Zam
bia
01020
30
40
50
60
Nam
ibia
01020
30
40
50
60

10
In conclusion, every country shows a characteristic pattern, a special mix of family forms
which is the result of the internal rural/urban and ethnic differentials. However, certain analogies
can be seen that reflect similarities of historical and cultural background and levels of development
rather than geographical proximity.
A similarity is found between Mali, Burkina, and Niger, where many extended and
polygynous families are found, while non-nuclearity, single-parenthood and female-headed
families are quite rare.
Togo, Benin and Nigeria form another quite similar group, with intermediate values for all
the family categories, but while in Togo extended families prevail over nuclear families, in Nigeria
the opposite is found.
Ghana, Cameroon, Kenya and Rwanda are similar for the large number of one-parent and
non-nuclear households and for the comparative rarity of extended families (Cameroon is an
exception in this regard), as well as for the high proportion of female-headed families.
Ethiopia and Zambia resemble each other in the high prevalence of the nuclear family,
which in Zambia however, and not in Ethiopia, is paralleled by a strong presence also of the
extended family.
Namibia is a case apart in that it combines the maximum levels of single-parenthood, non-
nuclearity and female headed families with a significant number of extended families. It is to be
noted that this country presents the maximum frequency of one-parent families hosting other
relatives. Since these households are generally female-headed it is perhaps possible to speak of
“female extended families”.
In such a complex and diversified picture, what is the indicator which best highlights a
tendency towards nuclearization? There is no sense in adopting for this purpose the proportion of
nuclear families: it might assume high values where also the prevalence of extended families is
high; or, on the contrary, it may assume very low values where the extended family is not the
predominant family type, as happens in Namibia. The proportion of extended families, which
reflects a more or less widespread custom of offering hospitality to relatives and the frequency of
polygyny, seems to be a good index of the other side of the medal and thus it can measure the
permanence traditional systems (based on extended family?). But how can we consider the case of
countries where high proportion of extended family are sided by high proportion of non nuclear
and one-parent households (Namibia, Togo, Cameroon)?. We should not ignore the information
deriving from the spread these types of household which may perhaps be interpreted as a sign of
the destabilization of traditional family systems, even if it cannot be considered in rigorous terms
as a sign of nuclearization. But, which place must be assigned to one-parent families hosting
relatives, a category so largely present in Namibia ?
All elements considered in this mixed picture, the family systems of Ghana, Kenya,
Rwanda, Ethiopia, and Namibia appear to be the farther from the stereotype, be it for traditional
customs or because of a more advanced phase in a process of nuclearization and/or
“individualization”. In the absence of historical information, elements for a discussion of this point
can be drawn from an analysis of the major factors of differentiation within each country:
rural/urban residence and ethnic background.
4.2. Differential Factors: urban versus rural residence
The differences between urban and rural family systems are very marked in all the
countries, but they differ in sign and meaning. The only feature that is shared by all countries is
the greater number of urban non-nuclear households. This characteristic is partially linked to the
fact that urban population is largely composed of non-native persons detached from their original
family nucleus, but it could also be caused by deeper lifestyle changes. Another general difference
is that conjugal families are significantly more frequent in rural areas in all countries, except in
Namibia.
11
It is, however, not possible to generalize about other family types. Single-parent
households and extended families may be more frequent either in urban or in rural areas.
This picture does not support the classical theories on family change. If the traditional
family systems break up in the rural-urban passage, this surely does not occur with a process of
progressive concentration on the conjugal family, this being the only family form which in none of
the countries (with the exception of Namibia) is more common in urban than in the rural
communities.
The contrasting opinion that urbanization implies an increase and not the disappearance of
extended families (because better off urban families are more likely to offer hospitality to relatives
than their rural counterpart) receives a good albeit not complete support. Leaving aside polygamy
- which is always less frequent in urban areas, be it a real change due to urbanization, or a simple
statistical artefact linked to the habitat typologies or other factors – the spread of other extended
families (i.e. conjugal families hosting ORNs) is clearly greater in towns, with the exception of
Ghana, Nigeria and Namibia
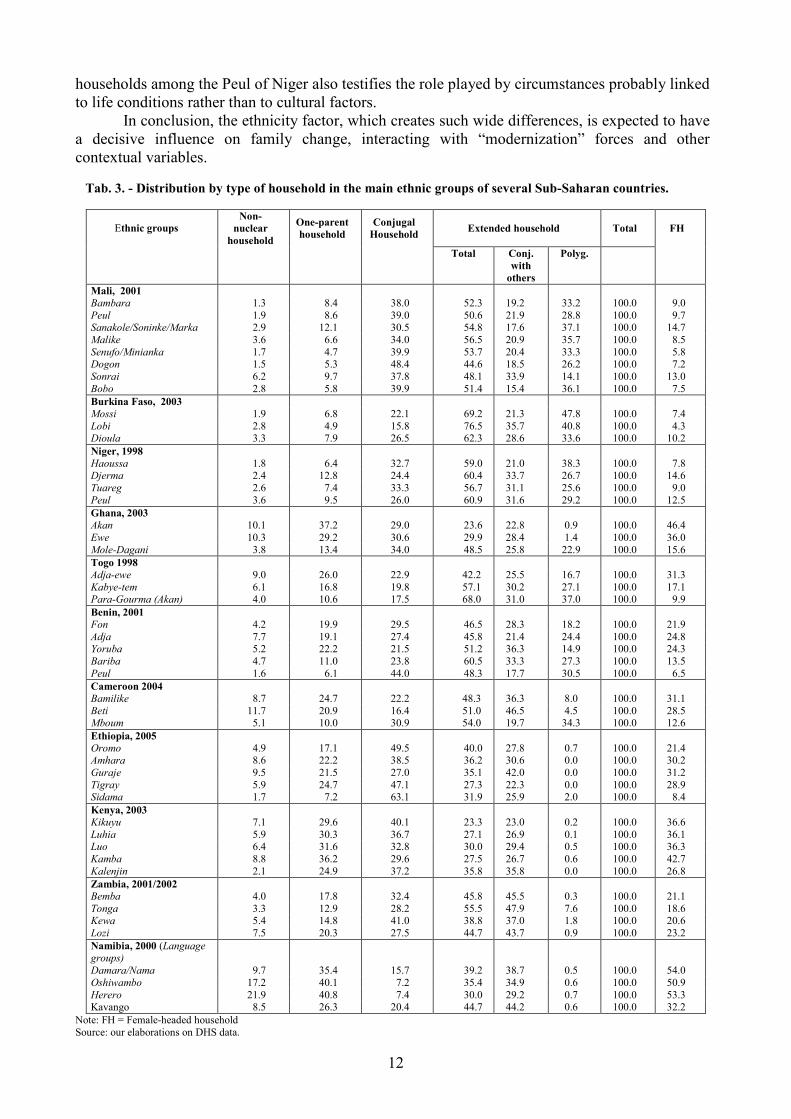
4.3 Differential factors: ethnicity
For reason of data availability on ethnicity, the observation will shift from the entire
population to the respondent women and the families which they belong to8. It is a different, but
equally significant point of view for cross-cultural comparisons. As expected, family systems are
highly differentiated by ethnic group. The proportion women in conjugal households varies
between the 7.2% of the Oshiwambo (Namibia) and the 52% of the Sidama (Ethiopia). Those in
extended households are 23% among the Kikuyu (Kenya) and 76% among the Lobi (Burkina).
Women in non-nuclear households range from the 1.3% of the Bambara (Mali) to the 22% of the
Herero (Namibia); those in one-parent households vary between the 4.7% of the Senoufo/Minianka
(Mali) and the 41% of the Herero (Namibia). The percentage of households headed by women is
6% among the Senufo and 53% among the Herero (Tab.3)
These very wide ranges of variation confirm the powerful effect of ethnicity or, in other
terms, of cultural factors and traditional norms and values concerning the family. As was seen for
the socio-economic variables and the characteristics of nuptiality (see par. 3), also for the
household structures, in many cases the ethnic groups within each country reveal some
homogeneity, but in other cases specific characteristics clearly distinguish contiguous groups from
each other. It is so in Ghana, where the Akan family system – with single-parenthood as the most
frequent family form (37% ) – contrasts with that of the Mole-Dagani, where extended families are
almost half of the total (48.5%). In Namibia a similar contrast is observed between the Herero and
Oshiwambo on one hand - with more than 40% of single-parent families and very small
proportions of conjugal families (7%) - and the Kavango, on the other, who concentrate in
extended households (44.7%). In Ethiopia the Tigray and the Amhara stand out for a higher
proportion of single-parenthood than in the other ethnic groups. In Benin the Peul are distinguished
from the Yoruba for the opposite reason (6% single-parent families in the latter case, 22% in the
former).
The case of the Peul, who have been examined in Mali as well as Niger and Benin, is an
example of cultural unity in diversity. A clear similarity in their family systems, in which extended
households prevail while cases of non-nuclearity are marginal and single-parenthood is not
widespread, testifies a basic cultural homogeneity. But a significant lesser presence of conjugal
8 Information on countries’ family systems is not directly comparable with those for ethnic groups. In fact, in the
former case, data are taken from the “family data sets” and concern the total population, while in the latter the only
available data come from a linkage between the “family data sets” and the “women data sets” and concern the families
which respondent women belong to. Thus solitary men are excluded and the category of non-nuclear households is
slightly underestimated, while the opposite is true for female headed families. However, comparisons between ethnic
groups are not compromised.
12
households among the Peul of Niger also testifies the role played by circumstances probably linked
to life conditions rather than to cultural factors.
In conclusion, the ethnicity factor, which creates such wide differences, is expected to have
a decisive influence on family change, interacting with “modernization” forces and other
contextual variables.
Tab. 3. - Distribution by type of household in the main ethnic groups of several Sub-Saharan countries.
Ethnic groups Non-
nuclear
household
One-parent
household
Conjugal
Household Extended household Total FH
Total Conj.
with
others
Polyg.
Mali, 2001
Bambara 1.3 8.4 38.0 52.3 19.2 33.2 100.0 9.0
Peul 1.9 8.6 39.0 50.6 21.9 28.8 100.0 9.7 Sanakole/Soninke/Marka 2.9 12.1 30.5 54.8 17.6 37.1 100.0 14.7
Malike 3.6 6.6 34.0 56.5 20.9 35.7 100.0 8.5
Senufo/Minianka 1.7 4.7 39.9 53.7 20.4 33.3 100.0 5.8 Dogon 1.5 5.3 48.4 44.6 18.5 26.2 100.0 7.2
Sonrai 6.2 9.7 37.8 48.1 33.9 14.1 100.0 13.0
Bobo 2.8 5.8 39.9 51.4 15.4 36.1 100.0 7.5
Burkina Faso, 2003
Mossi 1.9 6.8 22.1 69.2 21.3 47.8 100.0 7.4
Lobi 2.8 4.9 15.8 76.5 35.7 40.8 100.0 4.3 Dioula 3.3 7.9 26.5 62.3 28.6 33.6 100.0 10.2
Niger, 1998
Haoussa 1.8 6.4 32.7 59.0 21.0 38.3 100.0 7.8 Djerma 2.4 12.8 24.4 60.4 33.7 26.7 100.0 14.6
Tuareg 2.6 7.4 33.3 56.7 31.1 25.6 100.0 9.0
Peul 3.6 9.5 26.0 60.9 31.6 29.2 100.0 12.5
Ghana, 2003
Akan 10.1 37.2 29.0 23.6 22.8 0.9 100.0 46.4
Ewe 10.3 29.2 30.6 29.9 28.4 1.4 100.0 36.0
Mole-Dagani 3.8 13.4 34.0 48.5 25.8 22.9 100.0 15.6
Togo 1998
Adja-ewe 9.0 26.0 22.9 42.2 25.5 16.7 100.0 31.3
Kabye-tem 6.1 16.8 19.8 57.1 30.2 27.1 100.0 17.1 Para-Gourma (Akan) 4.0 10.6 17.5 68.0 31.0 37.0 100.0 9.9
Benin, 2001
Fon 4.2 19.9 29.5 46.5 28.3 18.2 100.0 21.9
Adja 7.7 19.1 27.4 45.8 21.4 24.4 100.0 24.8 Yoruba 5.2 22.2 21.5 51.2 36.3 14.9 100.0 24.3
Bariba 4.7 11.0 23.8 60.5 33.3 27.3 100.0 13.5
Peul 1.6 6.1 44.0 48.3 17.7 30.5 100.0 6.5
Cameroon 2004
Bamilike 8.7 24.7 22.2 48.3 36.3 8.0 100.0 31.1
Beti 11.7 20.9 16.4 51.0 46.5 4.5 100.0 28.5 Mboum 5.1 10.0 30.9 54.0 19.7 34.3 100.0 12.6
Ethiopia, 2005
Oromo 4.9 17.1 49.5 40.0 27.8 0.7 100.0 21.4 Amhara 8.6 22.2 38.5 36.2 30.6 0.0 100.0 30.2
Guraje 9.5 21.5 27.0 35.1 42.0 0.0 100.0 31.2
Tigray 5.9 24.7 47.1 27.3 22.3 0.0 100.0 28.9 Sidama 1.7 7.2 63.1 31.9 25.9 2.0 100.0 8.4
Kenya, 2003
Kikuyu 7.1 29.6 40.1 23.3 23.0 0.2 100.0 36.6
Luhia 5.9 30.3 36.7 27.1 26.9 0.1 100.0 36.1 Luo 6.4 31.6 32.8 30.0 29.4 0.5 100.0 36.3
Kamba 8.8 36.2 29.6 27.5 26.7 0.6 100.0 42.7
Kalenjin 2.1 24.9 37.2 35.8 35.8 0.0 100.0 26.8
Zambia, 2001/2002
Bemba 4.0 17.8 32.4 45.8 45.5 0.3 100.0 21.1
Tonga 3.3 12.9 28.2 55.5 47.9 7.6 100.0 18.6 Kewa 5.4 14.8 41.0 38.8 37.0 1.8 100.0 20.6
Lozi 7.5 20.3 27.5 44.7 43.7 0.9 100.0 23.2
Namibia, 2000 (Language groups)
Damara/Nama 9.7 35.4 15.7 39.2 38.7 0.5 100.0 54.0
Oshiwambo 17.2 40.1 7.2 35.4 34.9 0.6 100.0 50.9
Herero 21.9 40.8 7.4 30.0 29.2 0.7 100.0 53.3 Kavango 8.5 26.3 20.4 44.7 44.2 0.6 100.0 32.2
Note: FH = Female-headed household
Source: our elaborations on DHS data.
13
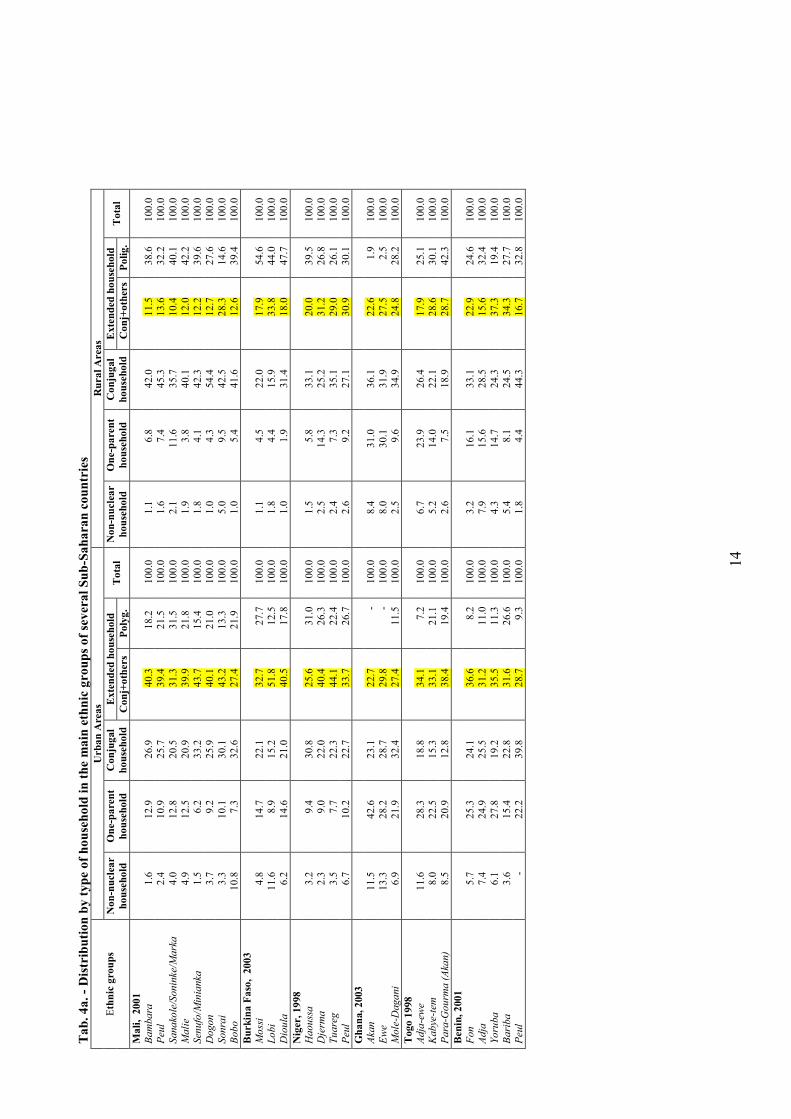
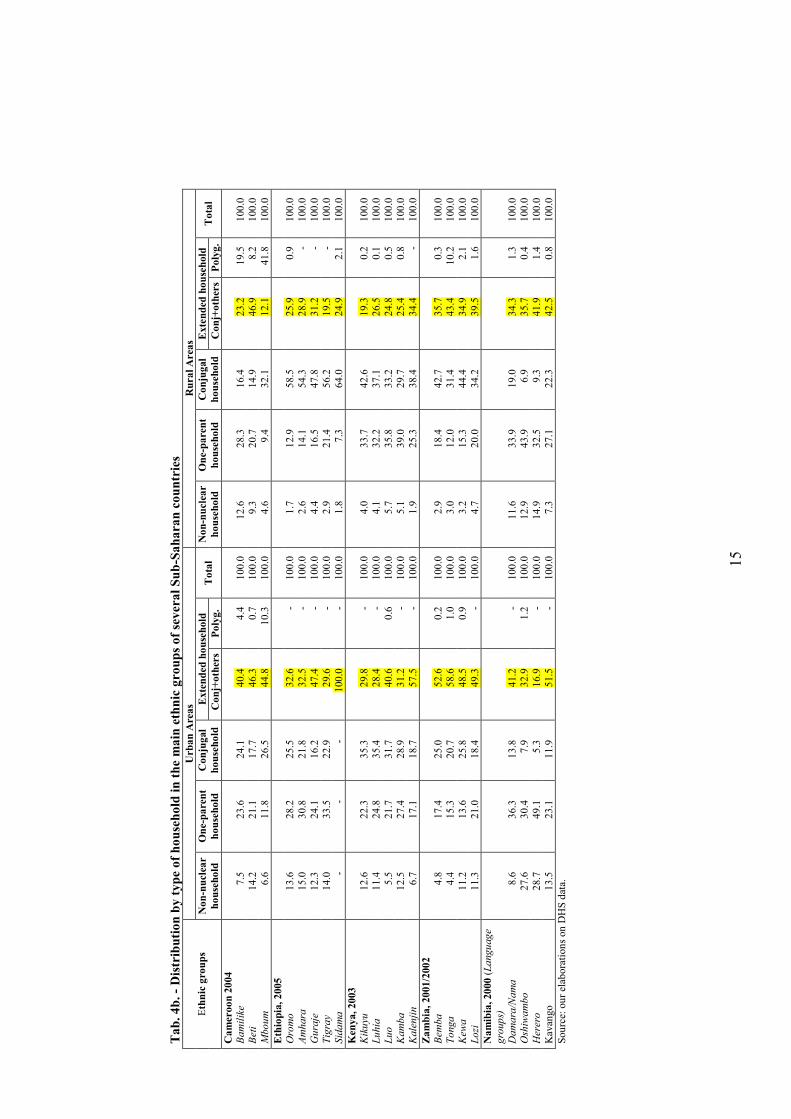
It should be emphasized that the prevalence of extended families, if we exclude polygynous
households, is greater in towns than in rural environments in virtually all the considered ethnic
groups (Tab.4a, Tab.4b). The exceptions to this scheme are very limited – Yoruba et Bariba in
Nigeria, Oshiwambo and Herero in Namibia, and probably Beti in Cameroun - and appear to be
attributable to traditional characteristics of the family systems of these ethnic groups, while the
changes brought about by urbanization are the same observed at the level of countries.
In conclusion, the greater number of extended family households in the urban areas
certainly does not suggest the existence of a process of nuclearization, but rather the persistence of
traditional customs of family solidarity and the exchange of services among relatives. The
rationale and functioning of the traditional family system implies hospitality to relatives in
exchange for their work, or vice versa to support their projects for social improvement, or in order
to maintain alliances and social relations. As the flow towards urban areas forms migratory chains,
it is well possible that in some cases large urban and small rural households can be the two sides
of a single medal: a result of the splitting of the family due to urbanization.
5. Is there a process of family nuclearization in Sub-Saharan Africa ?
The most direct way to try to understand whether nuclear family forms are growing at the
expense of extended families, according to the hypotheses of classical theory, would obviously be
a comparison between family typologies at sufficiently long term intervals. But direct comparisons
are extremely delicate. Possible differences in criteria and methods of data collection and
classification may conceal the ongoing changes, inasmuch they may require more than a decade to
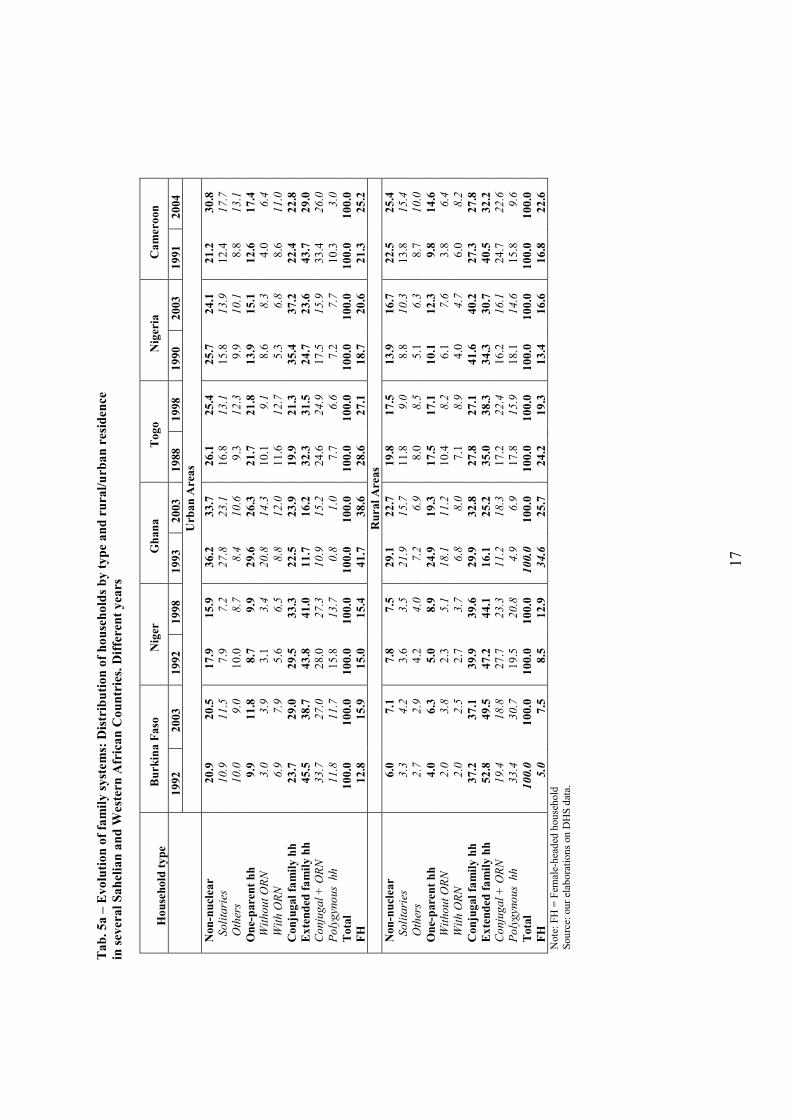
clearly reveal themselves. However some broad ideas of the ongoing changes can be drawn from
Tab.5a and Tab.5b.
From these data a picture seems to emerge that to some extent supports the hypothesis of
nuclearization, contrary to what suggested by the dynamics linked to urbanization. A progressive
concentration on the complete and isolated nuclear family form seems really to occur everywhere,
as much in urban as in rural areas, at the same time as a contraction of the extended family and the
spread of single-par.ent families. A few exceptions to this overall picture concern urban Ghana,
rural Togo, and urban Kenya, which present minor increases in extended households. Therefore,
the observed greater spread of extended families in towns is probably a manifestation of the
arrangements accomplished by families confronted with urbanization, but not a trend developing in
time.
The solitaries and non-nuclear groups do not reveal any systematic trends and remain of the
same size in both rural and urban areas: with the exceptions, perhaps linked to different phases of
the urbanization movements, of urban Cameroon, and rural Namibia, where significant increases
of the category are registered, as well as in urban Kenya where the opposite is found.
This result partly corrects the suggestions of a growing “individualization” of the family
drawn from the rural-urban comparison. In fact, it is now clear that the solitaries and non-nuclear
groups are linked to the dynamics of migration and inherent to the organization of urban life. But,
at present, they are unlikely to spread beyond urban boundaries. In other words, if there is a
tendency towards the disruption of traditional family systems, this is not through an
“individualization” of the households. Except, maybe, in the form of single parent families.
14
Tab. 4a. - Distribution by type of household in the main ethnic groups of several Sub-Saharan countries
Urban Areas
Rural Areas
Extended household
Extended household
Ethnic groups
Non-nuclear
household
One-parent
household
Conjugal
household
Conj+others
Polyg.
Total
Non-nuclear
household
One-parent
household
Conjugal
household
Conj+others
Polig.
Total
Mali, 2001
Bambara
1.6
12.9
26.9
40.3
18.2
100.0
1.1
6.8
42.0
11.5
38.6
100.0
Peul
2.4
10.9
25.7
39.4
21.5
100.0
1.6
7.4
45.3
13.6
32.2
100.0
Sanakole/Soninke/M
arka
4.0
12.8
20.5
31.3
31.5
100.0
2.1
11.6
35.7
10.4
40.1
100.0
Malie
4.9
12.5
20.9
39.9
21.8
100.0
1.9
3.8
40.1
12.0
42.2
100.0
Senufo/M
inianka
1.5
6.2
33.2
43.7
15.4
100.0
1.8
4.1
42.3
12.2
39.6
100.0
Dogon
3.7
9.2
25.9
40.1
21.0
100.0
1.0
4.3
54.4
12.7
27.6
100.0
Sonrai
3.3
10.1
30.1
43.2
13.3
100.0
5.0
9.5
42.5
28.3
14.6
100.0
Bobo
10.8
7.3
32.6
27.4
21.9
100.0
1.0
5.4
41.6
12.6
39.4
100.0
Burkina Faso, 2003
Mossi
4.8
14.7
22.1
32.7
27.7
100.0
1.1
4.5
22.0
17.9
54.6
100.0
Lobi
11.6
8.9
15.2
51.8
12.5
100.0
1.8
4.4
15.9
33.8
44.0
100.0
Dioula
6.2
14.6
21.0
40.5
17.8
100.0
1.0
1.9
31.4
18.0
47.7
100.0
Niger, 1998
Haoussa
3.2
9.4
30.8
25.6
31.0
100.0
1.5
5.8
33.1
20.0
39.5
100.0
Djerm
a
2.3
9.0
22.0
40.4
26.3
100.0
2.5
14.3
25.2
31.2
26.8
100.0
Tuareg
3.5
7.7
22.3
44.1
22.4
100.0
2.4
7.3
35.1
29.0
26.1
100.0
Peul
6.7
10.2
22.7
33.7
26.7
100.0
2.6
9.2
27.1
30.9
30.1
100.0
Ghana, 2003
Akan
11.5
42.6
23.1
22.7
- 100.0
8.4
31.0
36.1
22.6
1.9
100.0
Ewe
13.3
28.2
28.7
29.8
- 100.0
8.0
30.1
31.9
27.5
2.5
100.0
Mole-D
agani
6.9
21.9
32.4
27.4
11.5
100.0
2.5
9.6
34.9
24.8
28.2
100.0
Togo 1998
Adja-ewe
11.6
28.3
18.8
34.1
7.2
100.0
6.7
23.9
26.4
17.9
25.1
100.0
Kabye-tem
8.0
22.5
15.3
33.1
21.1
100.0
5.2
14.0
22.1
28.6
30.1
100.0
Para-G
ourm
a (Akan)
8.5
20.9
12.8
38.4
19.4
100.0
2.6
7.5
18.9
28.7
42.3
100.0
Benin, 2001
Fon
5.7
25.3
24.1
36.6
8.2
100.0
3.2
16.1
33.1
22.9
24.6
100.0
Adja
7.4
24.9
25.5
31.2
11.0
100.0
7.9
15.6
28.5
15.6
32.4
100.0
Yoruba
6.1
27.8
19.2
35.5
11.3
100.0
4.3
14.7
24.3
37.3
19.4
100.0
Bariba
3.6
15.4
22.8
31.6
26.6
100.0
5.4
8.1
24.5
34.3
27.7
100.0
Peul
- 22.2
39.8
28.7
9.3
100.0
1.8
4.4
44.3
16.7
32.8
100.0
15
Tab. 4b. - Distribution by type of household in the main ethnic groups of several Sub-Saharan countries
Urban Areas
Rural Areas
Extended household
Extended household
Ethnic groups
Non-nuclear
household
One-parent
household
Conjugal
household
Conj+others
Polyg.
Total
Non-nuclear
household
One-parent
household
Conjugal
household
Conj+others
Polyg.
Total
Cameroon 2004
Bamilike
7.5
23.6
24.1
40.4
4.4
100.0
12.6
28.3
16.4
23.2
19.5
100.0
Beti
14.2
21.1
17.7
46.3
0.7
100.0
9.3
20.7
14.9
46.9
8.2
100.0
Mboum
6.6
11.8
26.5
44.8
10.3
100.0
4.6
9.4
32.1
12.1
41.8
100.0
Ethiopia, 2005
Oromo
13.6
28.2
25.5
32.6
- 100.0
1.7
12.9
58.5
25.9
0.9
100.0
Amhara
15.0
30.8
21.8
32.5
- 100.0
2.6
14.1
54.3
28.9
- 100.0
Guraje
12.3
24.1
16.2
47.4
- 100.0
4.4
16.5
47.8
31.2
- 100.0
Tigray
14.0
33.5
22.9
29.6
- 100.0
2.9
21.4
56.2
19.5
- 100.0
Sidama
- -
- 100.0
- 100.0
1.8
7.3
64.0
24.9
2.1
100.0
Kenya, 2003
Kikuyu
12.6
22.3
35.3
29.8
- 100.0
4.0
33.7
42.6
19.3
0.2
100.0
Luhia
11.4
24.8
35.4
28.4
- 100.0
4.1
32.2
37.1
26.5
0.1
100.0
Luo
5.5
21.7
31.7
40.6
0.6
100.0
5.7
35.8
33.2
24.8
0.5
100.0
Kamba
12.5
27.4
28.9
31.2
- 100.0
5.1
39.0
29.7
25.4
0.8
100.0
Kalenjin
6.7
17.1
18.7
57.5
- 100.0
1.9
25.3
38.4
34.4
- 100.0
Zambia, 2001/2002
Bem
ba
4.8
17.4
25.0
52.6
0.2
100.0
2.9
18.4
42.7
35.7
0.3
100.0
Tonga
4.4
15.3
20.7
58.6
1.0
100.0
3.0
12.0
31.4
43.4
10.2
100.0
Kew
a
11.2
13.6
25.8
48.5
0.9
100.0
3.2
15.3
44.4
34.9
2.1
100.0
Lozi
11.3
21.0
18.4
49.3
- 100.0
4.7
20.0
34.2
39.5
1.6
100.0
Namibia, 2000 (Language
groups)
Damara/Nama
8.6
36.3
13.8
41.2
- 100.0
11.6
33.9
19.0
34.3
1.3
100.0
Oshiwambo
27.6
30.4
7.9
32.9
1.2
100.0
12.9
43.9
6.9
35.7
0.4
100.0
Herero
28.7
49.1
5.3
16.9
- 100.0
14.9
32.5
9.3
41.9
1.4
100.0
Kav
ango
13.5
23.1
11.9
51.5
- 100.0
7.3
27.1
22.3
42.5
0.8
100.0
Source: our elab
orations on D
HS data.
16
In fact, the tendency to growth over time also involves the single parent families, be they
more frequent in urban or rural areas (among the very few exceptions, the more relevant concerns
Ghana, which however, despite a slight decline, maintains the top position of the spread of one-
parent families). This general growing trend constitutes a very important change, but it is debatable
whether it can be seen as a sign of “individualization” or “nuclearization”, because also the single-
parent families hosting other relatives are in expansion. What does seem certain is that the changes
that are taking place appear to involve the assumption of an increasing degree of responsibility by
women (Tab.6 and 7) : a development which may have either positive or negative connotations
(autonomy and independence or social isolation and impoverishment)
On the basis of the data considered so far, only provisional conclusions are reached on the
nuclearization of the sub-Saharan family. This is because of the limited coverage of the data in
time and space, but also, as we stressed from the beginning, because we are dealing only with the
household structure and we have no way of investigating the complex network of relationships and
mutual obligations that exist within the kinship network. The households that we have defined as
nuclear are not necessarily independent of the enlarged family, with which links and dependence
may exist apart from common residence and shared cooking arrangements. The extended family
can maintain all its traditional efficiency in governing the lives of its members, despite the
structural changes of its basic nuclear cells. These changes are, however, not without significance,
and may foreshadow important changes in family relationships. Obviously, a general appraisal of
the whole kinship network and the links between its members could help reach a better
understanding of the ongoing changes.
6. Family systems, fertility and modernization: a factor analysis
In order to discover how the characteristics of family systems combine with the level of
fertility and the degree of socio-economic development and how countries and ethnic groups
resemble each other or differ with regard to these aspects, the classical procedure of factor analysis
was used with the principal components method, followed by an hierarchical classification analysis
(cluster analysis). The former was used to summarize the variables – very numerous and not
independent of each other – initially adopted for description of countries and ethnic groups (see
Annex), through the construction of new synthetic variables (principal components) obtained by
the linear combination of the original ones, so that they represent the widest possible portion of the
total variability. This facilitated the exploration of the associations between variables and also,
thanks to suitable graphical representation, the collocation of ethnic group in relation to those
variable on the factor plane. Cluster analysis – a method that assigns the cases being examined to a
limited number of relatively homogeneous groups, ensuring the minimum intraclass and maximum
interclass variability – made it possible to highlight some typologies of ethnic groups, defined not
with respect to the starting parameters, but on the basis of the principal components emerging from
the PCA.
The cluster analysis was performed using “Ward’s method” which creates partitions that
ensure the minimum intraclass and maximum interclass variability. Obviously, in this type of
analysis, the greater is the level of aggregation (with a lesser number of groups individuated) the
greater is the level of variability observed within each group.
17
Tab. 5a – Evolution of family systems: Distribution of households by type and rural/urban residence
in several Sahelian and W
estern African Countries. Different years
Household type
Burkina Faso
Niger
Ghana
Togo
Nigeria
Cameroon
1992
2003
1992
1998
1993
2003
1988
1998
1990
2003
1991
2004
Urban Areas
Non-nuclear
20.9
20.5
17.9
15.9
36.2
33.7
26.1
25.4
25.7
24.1
21.2
30.8
Solitaries
10.9
11.5
7.9
7.2
27.8
23.1
16.8
13.1
15.8
13.9
12.4
17.7
Others
10.0
9.0
10.0
8.7
8.4
10.6
9.3
12.3
9.9
10.1
8.8
13.1
One-parent hh
9.9
11.8
8.7
9.9
29.6
26.3
21.7
21.8
13.9
15.1
12.6
17.4
Without ORN
3.0
3.9
3.1
3.4
20.8
14.3
10.1
9.1
8.6
8.3
4.0
6.4
With ORN
6.9
7.9
5.6
6.5
8.8
12.0
11.6
12.7
5.3
6.8
8.6
11.0
Conjugal family hh
23.7
29.0
29.5
33.3
22.5
23.9
19.9
21.3
35.4
37.2
22.4
22.8
Extended family hh
45.5
38.7
43.8
41.0
11.7
16.2
32.3
31.5
24.7
23.6
43.7
29.0
Conjugal + ORN
33.7
27.0
28.0
27.3
10.9
15.2
24.6
24.9
17.5
15.9
33.4
26.0
Polygynous hh
11.8
11.7
15.8
13.7
0.8
1.0
7.7
6.6
7.2
7.7
10.3
3.0
Total
100.0
100.0
100.0
100.0
100.0
100.0
100.0
100.0
100.0
100.0
100.0
100.0
FH
12.8
15.9
15.0
15.4
41.7
38.6
28.6
27.1
18.7
20.6
21.3
25.2
Rural Areas
Non-nuclear
6.0
7.1
7.8
7.5
29.1
22.7
19.8
17.5
13.9
16.7
22.5
25.4
Solitaries
3.3
4.2
3.6
3.5
21.9
15.7
11.8
9.0
8.8
10.3
13.8
15.4
Others
2.7
2.9
4.2
4.0
7.2
6.9
8.0
8.5
5.1
6.3
8.7
10.0
One-parent hh
4.0
6.3
5.0
8.9
24.9
19.3
17.5
17.1
10.1
12.3
9.8
14.6
Without ORN
2.0
3.8
2.3
5.1
18.1
11.2
10.4
8.2
6.1
7.6
3.8
6.4
With ORN
2.0
2.5
2.7
3.7
6.8
8.0
7.1
8.9
4.0
4.7
6.0
8.2
Conjugal family hh
37.2
37.1
39.9
39.6
29.9
32.8
27.8
27.1
41.6
40.2
27.3
27.8
Extended family hh
52.8
49.5
47.2
44.1
16.1
25.2
35.0
38.3
34.3
30.7
40.5
32.2
Conjugal + ORN
19.4
18.8
27.7
23.3
11.2
18.3
17.2
22.4
16.2
16.1
24.7
22.6
Polygynous hh
33.4
30.7
19.5
20.8
4.9
6.9
17.8
15.9
18.1
14.6
15.8
9.6
Total
100.0
100.0
100.0
100.0
100.0
100.0
100.0
100.0
100.0
100.0
100.0
100.0
FH
5.0
7.5
8.5
12.9
34.6
25.7
24.2
19.3
13.4
16.6
16.8
22.6
Note: FH = Fem
ale-headed
household
Source: our elab
orations on D
HS data.
18
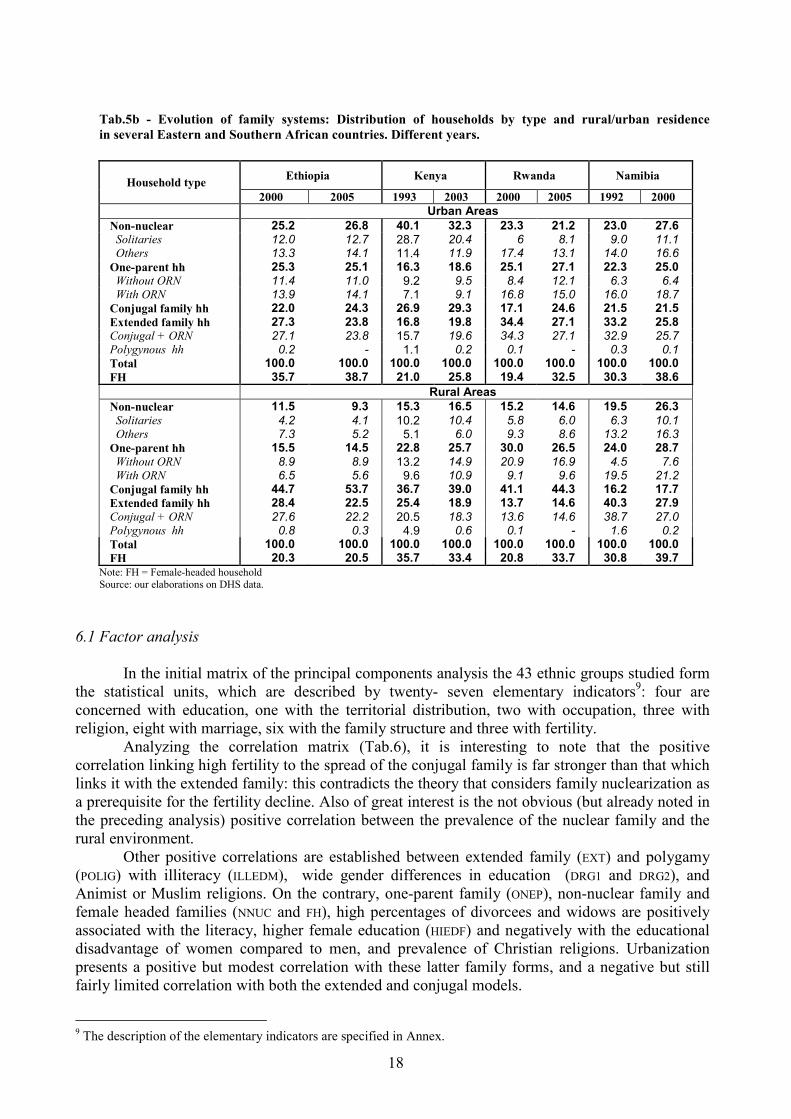
Tab.5b - Evolution of family systems: Distribution of households by type and rural/urban residence
in several Eastern and Southern African countries. Different years.
Household type Ethiopia Kenya Rwanda Namibia
2000 2005 1993 2003 2000 2005 1992 2000
Urban Areas
Non-nuclear 25.2 26.8 40.1 32.3 23.3 21.2 23.0 27.6 Solitaries 12.0 12.7 28.7 20.4 6 8.1 9.0 11.1
Others 13.3 14.1 11.4 11.9 17.4 13.1 14.0 16.6
One-parent hh 25.3 25.1 16.3 18.6 25.1 27.1 22.3 25.0 Without ORN 11.4 11.0 9.2 9.5 8.4 12.1 6.3 6.4
With ORN 13.9 14.1 7.1 9.1 16.8 15.0 16.0 18.7
Conjugal family hh 22.0 24.3 26.9 29.3 17.1 24.6 21.5 21.5
Extended family hh 27.3 23.8 16.8 19.8 34.4 27.1 33.2 25.8 Conjugal + ORN 27.1 23.8 15.7 19.6 34.3 27.1 32.9 25.7
Polygynous hh 0.2 - 1.1 0.2 0.1 - 0.3 0.1
Total 100.0 100.0 100.0 100.0 100.0 100.0 100.0 100.0
FH 35.7 38.7 21.0 25.8 19.4 32.5 30.3 38.6
Rural Areas
Non-nuclear 11.5 9.3 15.3 16.5 15.2 14.6 19.5 26.3 Solitaries 4.2 4.1 10.2 10.4 5.8 6.0 6.3 10.1
Others 7.3 5.2 5.1 6.0 9.3 8.6 13.2 16.3
One-parent hh 15.5 14.5 22.8 25.7 30.0 26.5 24.0 28.7 Without ORN 8.9 8.9 13.2 14.9 20.9 16.9 4.5 7.6
With ORN 6.5 5.6 9.6 10.9 9.1 9.6 19.5 21.2
Conjugal family hh 44.7 53.7 36.7 39.0 41.1 44.3 16.2 17.7
Extended family hh 28.4 22.5 25.4 18.9 13.7 14.6 40.3 27.9 Conjugal + ORN 27.6 22.2 20.5 18.3 13.6 14.6 38.7 27.0
Polygynous hh 0.8 0.3 4.9 0.6 0.1 - 1.6 0.2
Total 100.0 100.0 100.0 100.0 100.0 100.0 100.0 100.0
FH 20.3 20.5 35.7 33.4 20.8 33.7 30.8 39.7 Note: FH = Female-headed household Source: our elaborations on DHS data.
6.1 Factor analysis
In the initial matrix of the principal components analysis the 43 ethnic groups studied form
the statistical units, which are described by twenty- seven elementary indicators9: four are
concerned with education, one with the territorial distribution, two with occupation, three with
religion, eight with marriage, six with the family structure and three with fertility.
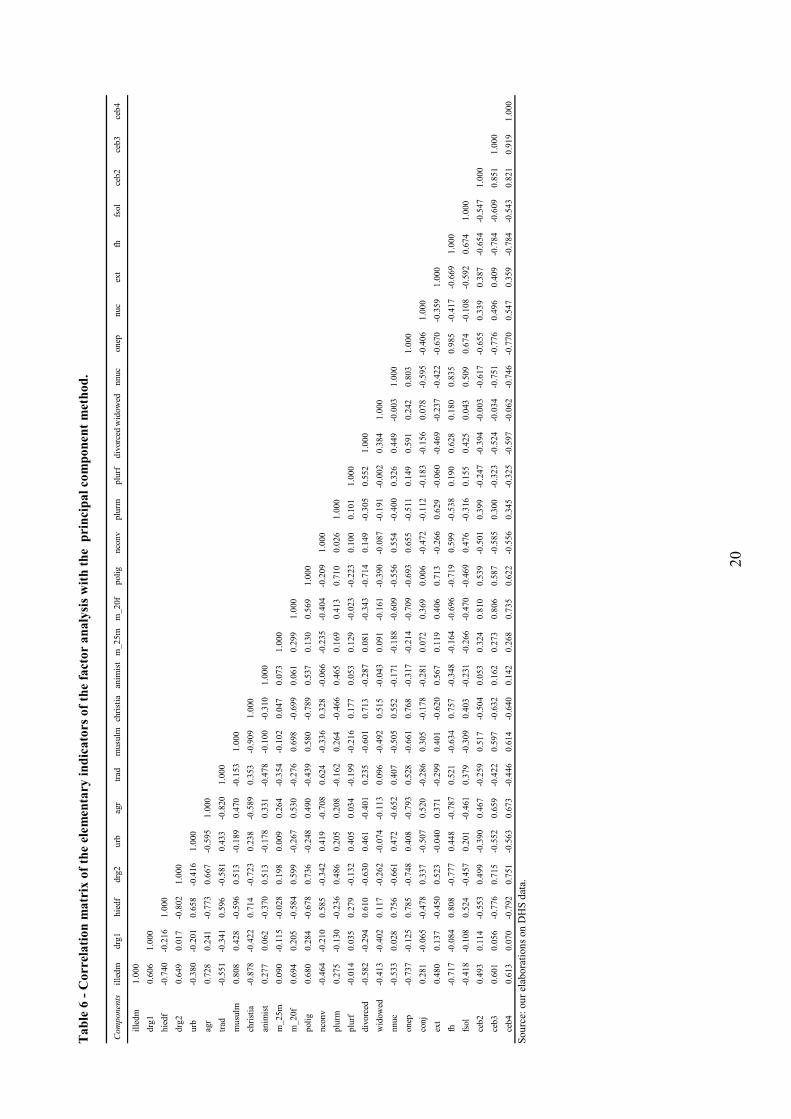
Analyzing the correlation matrix (Tab.6), it is interesting to note that the positive
correlation linking high fertility to the spread of the conjugal family is far stronger than that which
links it with the extended family: this contradicts the theory that considers family nuclearization as
a prerequisite for the fertility decline. Also of great interest is the not obvious (but already noted in
the preceding analysis) positive correlation between the prevalence of the nuclear family and the
rural environment.
Other positive correlations are established between extended family (EXT) and polygamy
(POLIG) with illiteracy (ILLEDM), wide gender differences in education (DRG1 and DRG2), and
Animist or Muslim religions. On the contrary, one-parent family (ONEP), non-nuclear family and
female headed families (NNUC and FH), high percentages of divorcees and widows are positively
associated with the literacy, higher female education (HIEDF) and negatively with the educational
disadvantage of women compared to men, and prevalence of Christian religions. Urbanization
presents a positive but modest correlation with these latter family forms, and a negative but still
fairly limited correlation with both the extended and conjugal models.
9 The description of the elementary indicators are specified in Annex.
19
On the basis of the existing correlations, the family systems of the ethnic groups shows a
threefold configuration. On one hand there is the prevalently rural and highly fertile conjugal
family, that is not especially linked to cultural/religious areas; on the other hand there is the
extended family typical of rural society of Animistic and, to a lesser extent, Islamic religion.
Finally, there is a low fertility family structure centered on the role of the woman which is found in
a progressed and urbanized society, of Christian confession.
It is not necessary to emphasize that these correlations do not necessarily imply a relation
of causality, but rather reflect an existing reality: some of the ethnic groups associate greater
development and widespread Christian profession with matrilineal traditions which generally
enhance women’s status (Gage, 1995). These associations do not clarify the basic question as to
whether it is the cultural background, the socio-economic development or the spread of female
education which is the main determinant of the family systems, nor which of these three factors is
most important for reproductive behaviour. In particular, it does not seem possible to define the
role of urbanization without considering the interweaving of factors linked to cultural background.
A more complete and precise interpretation of the available data is given by the selection of
synthetic indicators (or factors) taking account of all the correlations at the same time. The factor
analysis led to the selection of three factors with an autovalue greater than one10, that explains 67%
of the total variability overall. The factor loadings recorded in Tab.7 express the correlation that
exists between these three principle components (or synthetic factors) and the elementary
indicators included in the factor analysis.
This table makes it possible to give a meaning to the three synthetic factors that emerged
from the analysis. The first factor, which absorbs almost half the total variability (47.6%),
contrasts the conjugal family system (positive correlation) with single-parent, non-nuclear or
female-headed family systems (negative correlation). As has been shown in the analysis of the
simple correlations, the former are associated with high fertility, precocity of female marriage,
rural environment, and illiteracy, while the latter are associated with the opposite characteristics.
The second factor, which explains slightly more than 10% of the variability, expresses a
positive correlation with the prevailing of the extended family system, which is particularly
associated with the spread of Animism, as well as with polygamy and - for obvious structural
reasons - with male multiple marriages.
Finally, the third factor, which explains around 8.5% of the variability, can be interpreted
in terms of the spread of the polygamous family, associated with strong educational inequalities
between men and women, according to the characteristic gender roles, as well as with the
prevalence of Islam .
These results are of particular interest because they show how the classical factors of
modernization (urbanization, education, non-agricultural professions) that characterize the contrast
between conjugal families on one hand and non-nuclear or single-parent families on the other, do
not play determining roles in the diffusion of family systems considered as traditional (extended
and polygynous families) that are instead linked to cultural factors (in this framework religious
background is taken into account for its cultural correlates).
In order to obtain a synthetic representation of the collocation of the 43 communities
studied with respect to their family systems, it is possible to place them on a Cartesian plane,
assuming their factor scores as coordinates (Fig.2 e 3).
The considerable dispersion of the groups on the factor planes testifies to the wide variety
of possible combinations of family systems and explicative factors and thus to the great ethnical
heterogeneity to this respect.
10 Six factors were originally individuated; it was decided to extract only the first three of these so as to synthesize the
results of the analysis further.
20
Table 6 - Correlation matrix of the elementary indicators of the factor analysis with the principal component method.
Components
illedm
drg1
hiedf
drg2
urb
agr
trad
musu
lmch
ristia
anim
ist
m_25m
m_20f
polig
nco
nv
plurm
plurf
divorced
widowed
nnuc
onep
nuc
ext
fhfsol
ceb2
ceb3
ceb4
illedm
1.000
drg1
0.606
1.000
hiedf
-0.740
-0.216
1.000
drg2
0.649
0.017
-0.802
1.000
urb
-0.380
-0.201
0.658
-0.416
1.000
agr
0.728
0.241
-0.773
0.667
-0.595
1.000
trad
-0.551
-0.341
0.596
-0.581
0.433
-0.820
1.000
musu
lm0.808
0.428
-0.596
0.513
-0.189
0.470
-0.153
1.000
christia
-0.878
-0.422
0.714
-0.723
0.238
-0.589
0.353
-0.909
1.000
anim
ist
0.277
0.062
-0.370
0.513
-0.178
0.331
-0.478
-0.100
-0.310
1.000
m_25m
0.090
-0.115
-0.028
0.198
0.009
0.264
-0.354
-0.102
0.047
0.073
1.000
m_20f
0.694
0.205
-0.584
0.599
-0.267
0.530
-0.276
0.698
-0.699
0.061
0.299
1.000
polig
0.680
0.284
-0.678
0.736
-0.248
0.490
-0.439
0.580
-0.789
0.537
0.130
0.569
1.000
nco
nv
-0.464
-0.210
0.585
-0.342
0.419
-0.708
0.624
-0.336
0.328
-0.066
-0.235
-0.404
-0.209
1.000
plurm
0.275
-0.130
-0.236
0.486
0.205
0.208
-0.162
0.264
-0.466
0.465
0.169
0.413
0.710
0.026
1.000
plurf
-0.014
0.035
0.279
-0.132
0.405
0.034
-0.199
-0.216
0.177
0.053
0.129
-0.023
-0.223
0.100
0.101
1.000
divorced
-0.582
-0.294
0.610
-0.630
0.461
-0.401
0.235
-0.601
0.713
-0.287
0.081
-0.343
-0.714
0.149
-0.305
0.552
1.000
widowed
-0.413
-0.402
0.117
-0.262
-0.074
-0.113
0.096
-0.492
0.515
-0.043
0.091
-0.161
-0.390
-0.087
-0.191
-0.002
0.384
1.000
nnuc
-0.533
0.028
0.756
-0.661
0.472
-0.652
0.407
-0.505
0.552
-0.171
-0.188
-0.609
-0.556
0.554
-0.400
0.326
0.449
-0.003
1.000
onep
-0.737
-0.125
0.785
-0.748
0.408
-0.793
0.528
-0.661
0.768
-0.317
-0.214
-0.709
-0.693
0.655
-0.511
0.149
0.591
0.242
0.803
1.000
conj
0.281
-0.065
-0.478
0.337
-0.507
0.520
-0.286
0.305
-0.178
-0.281
0.072
0.369
0.006
-0.472
-0.112
-0.183
-0.156
0.078
-0.595
-0.406
1.000
ext
0.480
0.137
-0.450
0.523
-0.040
0.371
-0.299
0.401
-0.620
0.567
0.119
0.406
0.713
-0.266
0.629
-0.060
-0.469
-0.237
-0.422
-0.670
-0.359
1.000
fh-0.717
-0.084
0.808
-0.777
0.448
-0.787
0.521
-0.634
0.757
-0.348
-0.164
-0.696
-0.719
0.599
-0.538
0.190
0.628
0.180
0.835
0.985
-0.417
-0.669
1.000
fsol
-0.418
-0.108
0.524
-0.457
0.201
-0.461
0.379
-0.309
0.403
-0.231
-0.266
-0.470
-0.469
0.476
-0.316
0.155
0.425
0.043
0.509
0.674
-0.108
-0.592
0.674
1.000
ceb2
0.493
0.114
-0.553
0.499
-0.390
0.467
-0.259
0.517
-0.504
0.053
0.324
0.810
0.539
-0.501
0.399
-0.247
-0.394
-0.003
-0.617
-0.655
0.339
0.387
-0.654
-0.547
1.000
ceb3
0.601
0.056
-0.776
0.715
-0.552
0.659
-0.422
0.597
-0.632
0.162
0.273
0.806
0.587
-0.585
0.300
-0.323
-0.524
-0.034
-0.751
-0.776
0.496
0.409
-0.784
-0.609
0.851
1.000
ceb4
0.613
0.070
-0.792
0.751
-0.563
0.673
-0.446
0.614
-0.640
0.142
0.268
0.735
0.622
-0.556
0.345
-0.325
-0.597
-0.062
-0.746
-0.770
0.547
0.359
-0.784
-0.543
0.821
0.919
1.000
Source: our elab
orations on D
HS data.
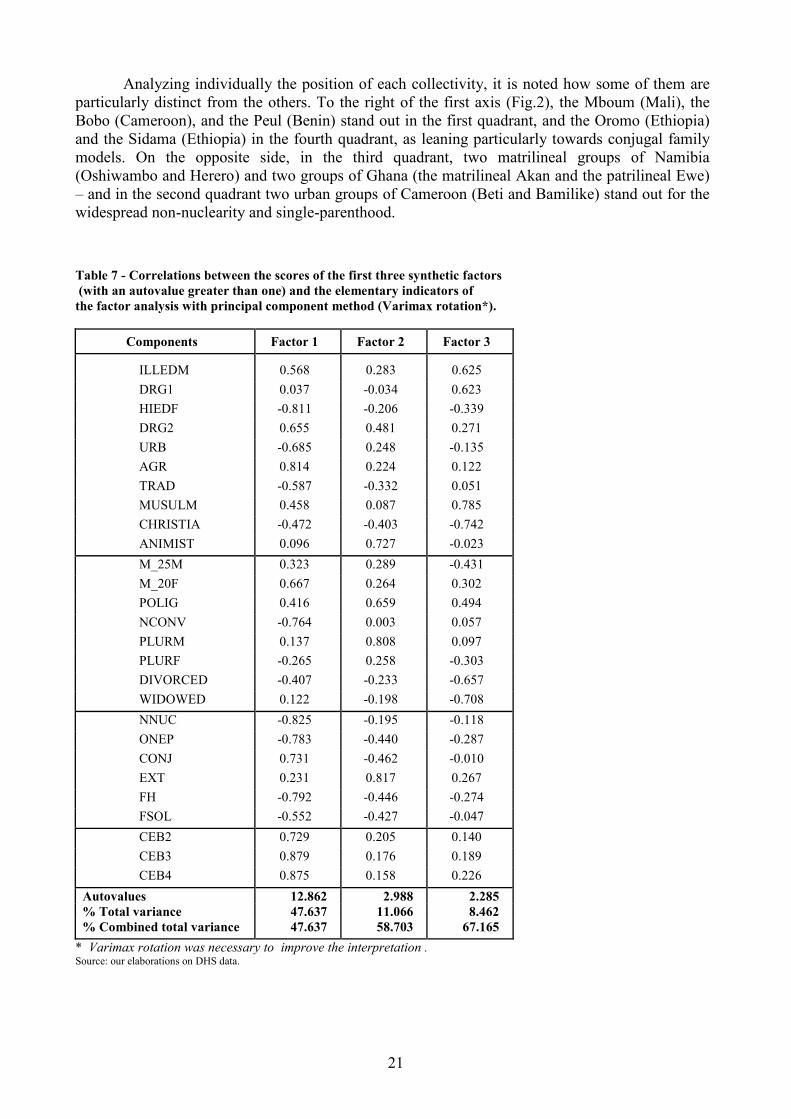
21
Analyzing individually the position of each collectivity, it is noted how some of them are
particularly distinct from the others. To the right of the first axis (Fig.2), the Mboum (Mali), the
Bobo (Cameroon), and the Peul (Benin) stand out in the first quadrant, and the Oromo (Ethiopia)
and the Sidama (Ethiopia) in the fourth quadrant, as leaning particularly towards conjugal family
models. On the opposite side, in the third quadrant, two matrilineal groups of Namibia
(Oshiwambo and Herero) and two groups of Ghana (the matrilineal Akan and the patrilineal Ewe)
– and in the second quadrant two urban groups of Cameroon (Beti and Bamilike) stand out for the
widespread non-nuclearity and single-parenthood.
Table 7 - Correlations between the scores of the first three synthetic factors
(with an autovalue greater than one) and the elementary indicators of
the factor analysis with principal component method (Varimax rotation*).
Components Factor 1 Factor 2 Factor 3
ILLEDM 0.568 0.283 0.625
DRG1 0.037 -0.034 0.623
HIEDF -0.811 -0.206 -0.339
DRG2 0.655 0.481 0.271
URB -0.685 0.248 -0.135
AGR 0.814 0.224 0.122
TRAD -0.587 -0.332 0.051
MUSULM 0.458 0.087 0.785
CHRISTIA -0.472 -0.403 -0.742
ANIMIST 0.096 0.727 -0.023
M_25M 0.323 0.289 -0.431
M_20F 0.667 0.264 0.302
POLIG 0.416 0.659 0.494
NCONV -0.764 0.003 0.057
PLURM 0.137 0.808 0.097
PLURF -0.265 0.258 -0.303
DIVORCED -0.407 -0.233 -0.657
WIDOWED 0.122 -0.198 -0.708
NNUC -0.825 -0.195 -0.118
ONEP -0.783 -0.440 -0.287
CONJ 0.731 -0.462 -0.010
EXT 0.231 0.817 0.267
FH -0.792 -0.446 -0.274
FSOL -0.552 -0.427 -0.047
CEB2 0.729 0.205 0.140
CEB3 0.879 0.176 0.189
CEB4 0.875 0.158 0.226
Autovalues 12.862 2.988 2.285
% Total variance 47.637 11.066 8.462
% Combined total variance 47.637 58.703 67.165
* Varimax rotation was necessary to improve the interpretation . Source: our elaborations on DHS data.
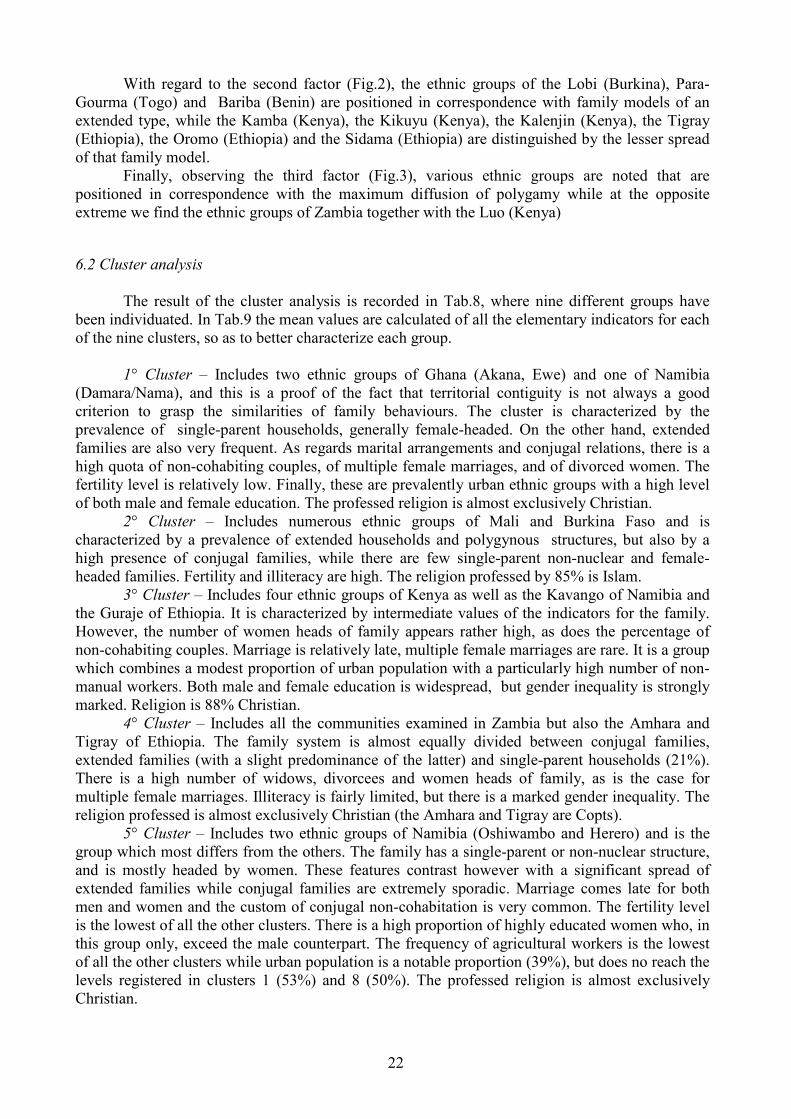
22
With regard to the second factor (Fig.2), the ethnic groups of the Lobi (Burkina), Para-
Gourma (Togo) and Bariba (Benin) are positioned in correspondence with family models of an
extended type, while the Kamba (Kenya), the Kikuyu (Kenya), the Kalenjin (Kenya), the Tigray
(Ethiopia), the Oromo (Ethiopia) and the Sidama (Ethiopia) are distinguished by the lesser spread
of that family model.
Finally, observing the third factor (Fig.3), various ethnic groups are noted that are
positioned in correspondence with the maximum diffusion of polygamy while at the opposite
extreme we find the ethnic groups of Zambia together with the Luo (Kenya)
6.2 Cluster analysis
The result of the cluster analysis is recorded in Tab.8, where nine different groups have
been individuated. In Tab.9 the mean values are calculated of all the elementary indicators for each
of the nine clusters, so as to better characterize each group.
1° Cluster – Includes two ethnic groups of Ghana (Akana, Ewe) and one of Namibia
(Damara/Nama), and this is a proof of the fact that territorial contiguity is not always a good
criterion to grasp the similarities of family behaviours. The cluster is characterized by the
prevalence of single-parent households, generally female-headed. On the other hand, extended
families are also very frequent. As regards marital arrangements and conjugal relations, there is a
high quota of non-cohabiting couples, of multiple female marriages, and of divorced women. The
fertility level is relatively low. Finally, these are prevalently urban ethnic groups with a high level
of both male and female education. The professed religion is almost exclusively Christian.
2° Cluster – Includes numerous ethnic groups of Mali and Burkina Faso and is
characterized by a prevalence of extended households and polygynous structures, but also by a
high presence of conjugal families, while there are few single-parent non-nuclear and female-
headed families. Fertility and illiteracy are high. The religion professed by 85% is Islam.
3° Cluster – Includes four ethnic groups of Kenya as well as the Kavango of Namibia and
the Guraje of Ethiopia. It is characterized by intermediate values of the indicators for the family.
However, the number of women heads of family appears rather high, as does the percentage of
non-cohabiting couples. Marriage is relatively late, multiple female marriages are rare. It is a group
which combines a modest proportion of urban population with a particularly high number of non-
manual workers. Both male and female education is widespread, but gender inequality is strongly
marked. Religion is 88% Christian.
4° Cluster – Includes all the communities examined in Zambia but also the Amhara and
Tigray of Ethiopia. The family system is almost equally divided between conjugal families,
extended families (with a slight predominance of the latter) and single-parent households (21%).
There is a high number of widows, divorcees and women heads of family, as is the case for
multiple female marriages. Illiteracy is fairly limited, but there is a marked gender inequality. The
religion professed is almost exclusively Christian (the Amhara and Tigray are Copts).
5° Cluster – Includes two ethnic groups of Namibia (Oshiwambo and Herero) and is the
group which most differs from the others. The family has a single-parent or non-nuclear structure,
and is mostly headed by women. These features contrast however with a significant spread of
extended families while conjugal families are extremely sporadic. Marriage comes late for both
men and women and the custom of conjugal non-cohabitation is very common. The fertility level
is the lowest of all the other clusters. There is a high proportion of highly educated women who, in
this group only, exceed the male counterpart. The frequency of agricultural workers is the lowest
of all the other clusters while urban population is a notable proportion (39%), but does no reach the
levels registered in clusters 1 (53%) and 8 (50%). The professed religion is almost exclusively
Christian.
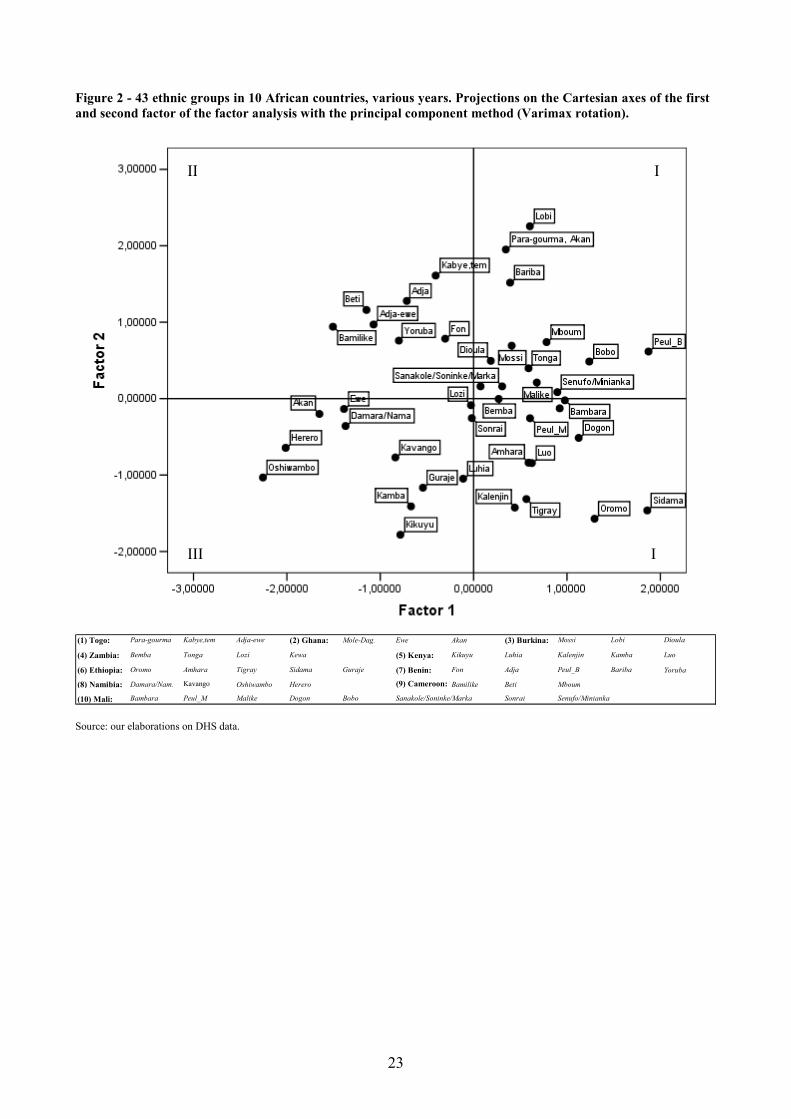
23
Figure 2 - 43 ethnic groups in 10 African countries, various years. Projections on the Cartesian axes of the first
and second factor of the factor analysis with the principal component method (Varimax rotation).
(1) Togo: Para-gourma Kabye,tem Adja-ewe (2) Ghana: Mole-Dag. Ewe Akan (3) Burkina: Mossi Lobi Dioula
(4) Zambia: Bemba Tonga Lozi Kewa (5) Kenya: Kikuyu Luhia Kalenjin Kamba Luo
(6) Ethiopia: Oromo Amhara Tigray Sidama Guraje (7) Benin: Fon Adja Peul_B Bariba Yoruba
(8) Namibia: Damara/Nam. Kavango Oshiwambo Herero (9) Cameroon: Bamilike Beti Mboum
(10) Mali: Bambara Peul_M Malike Dogon Bobo Sanakole/Soninke/Marka Sonrai Senufo/Minianka Source: our elaborations on DHS data.
I II
III I
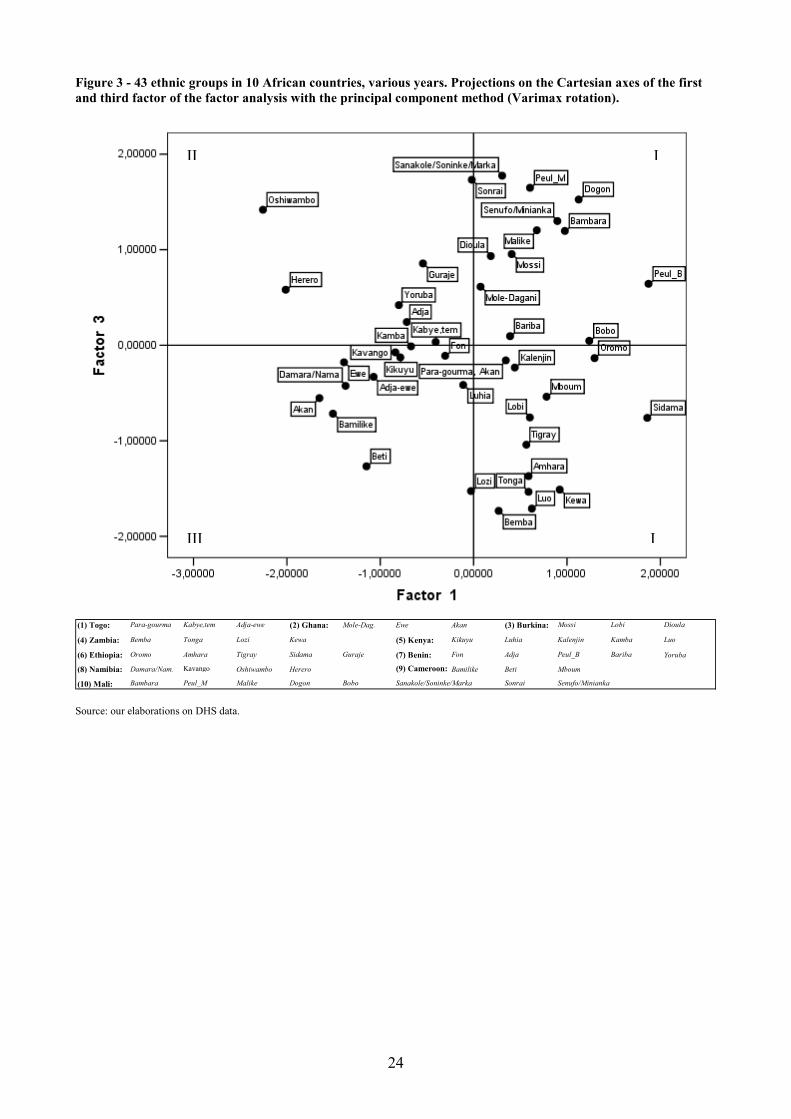
24
Figure 3 - 43 ethnic groups in 10 African countries, various years. Projections on the Cartesian axes of the first
and third factor of the factor analysis with the principal component method (Varimax rotation).
(1) Togo: Para-gourma Kabye,tem Adja-ewe (2) Ghana: Mole-Dag. Ewe Akan (3) Burkina: Mossi Lobi Dioula
(4) Zambia: Bemba Tonga Lozi Kewa (5) Kenya: Kikuyu Luhia Kalenjin Kamba Luo
(6) Ethiopia: Oromo Amhara Tigray Sidama Guraje (7) Benin: Fon Adja Peul_B Bariba Yoruba
(8) Namibia: Damara/Nam. Kavango Oshiwambo Herero (9) Cameroon: Bamilike Beti Mboum
(10) Mali: Bambara Peul_M Malike Dogon Bobo Sanakole/Soninke/Marka Sonrai Senufo/Minianka Source: our elaborations on DHS data.
I II
III I
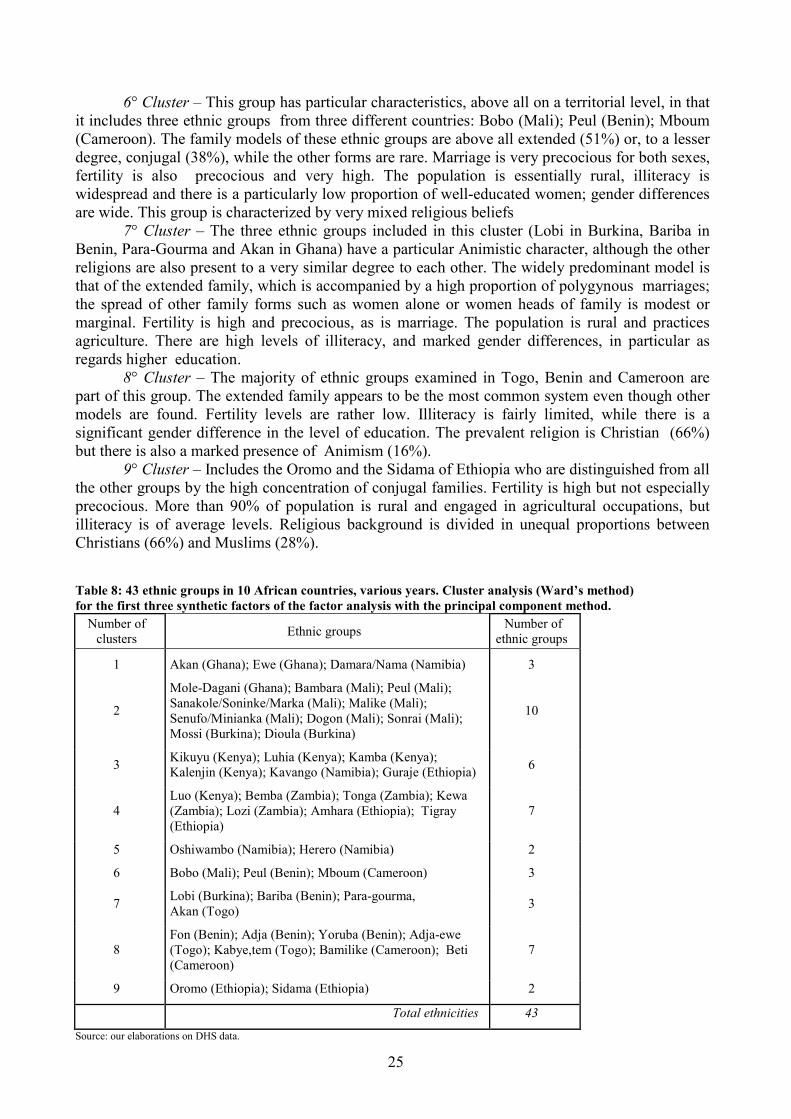
25
6° Cluster – This group has particular characteristics, above all on a territorial level, in that
it includes three ethnic groups from three different countries: Bobo (Mali); Peul (Benin); Mboum
(Cameroon). The family models of these ethnic groups are above all extended (51%) or, to a lesser
degree, conjugal (38%), while the other forms are rare. Marriage is very precocious for both sexes,
fertility is also precocious and very high. The population is essentially rural, illiteracy is
widespread and there is a particularly low proportion of well-educated women; gender differences
are wide. This group is characterized by very mixed religious beliefs
7° Cluster – The three ethnic groups included in this cluster (Lobi in Burkina, Bariba in
Benin, Para-Gourma and Akan in Ghana) have a particular Animistic character, although the other
religions are also present to a very similar degree to each other. The widely predominant model is
that of the extended family, which is accompanied by a high proportion of polygynous marriages;
the spread of other family forms such as women alone or women heads of family is modest or
marginal. Fertility is high and precocious, as is marriage. The population is rural and practices
agriculture. There are high levels of illiteracy, and marked gender differences, in particular as
regards higher education.
8° Cluster – The majority of ethnic groups examined in Togo, Benin and Cameroon are
part of this group. The extended family appears to be the most common system even though other
models are found. Fertility levels are rather low. Illiteracy is fairly limited, while there is a
significant gender difference in the level of education. The prevalent religion is Christian (66%)
but there is also a marked presence of Animism (16%).
9° Cluster – Includes the Oromo and the Sidama of Ethiopia who are distinguished from all
the other groups by the high concentration of conjugal families. Fertility is high but not especially
precocious. More than 90% of population is rural and engaged in agricultural occupations, but
illiteracy is of average levels. Religious background is divided in unequal proportions between
Christians (66%) and Muslims (28%).
Table 8: 43 ethnic groups in 10 African countries, various years. Cluster analysis (Ward’s method)
for the first three synthetic factors of the factor analysis with the principal component method.
Number of
clusters Ethnic groups
Number of
ethnic groups
1 Akan (Ghana); Ewe (Ghana); Damara/Nama (Namibia) 3
2
Mole-Dagani (Ghana); Bambara (Mali); Peul (Mali);
Sanakole/Soninke/Marka (Mali); Malike (Mali);
Senufo/Minianka (Mali); Dogon (Mali); Sonrai (Mali);
Mossi (Burkina); Dioula (Burkina)
10
3 Kikuyu (Kenya); Luhia (Kenya); Kamba (Kenya);
Kalenjin (Kenya); Kavango (Namibia); Guraje (Ethiopia) 6
4
Luo (Kenya); Bemba (Zambia); Tonga (Zambia); Kewa
(Zambia); Lozi (Zambia); Amhara (Ethiopia); Tigray
(Ethiopia)
7
5 Oshiwambo (Namibia); Herero (Namibia) 2
6 Bobo (Mali); Peul (Benin); Mboum (Cameroon) 3
7 Lobi (Burkina); Bariba (Benin); Para-gourma,
Akan (Togo) 3
8
Fon (Benin); Adja (Benin); Yoruba (Benin); Adja-ewe
(Togo); Kabye,tem (Togo); Bamilike (Cameroon); Beti
(Cameroon)
7
9 Oromo (Ethiopia); Sidama (Ethiopia) 2
Total ethnicities 43
Source: our elaborations on DHS data.
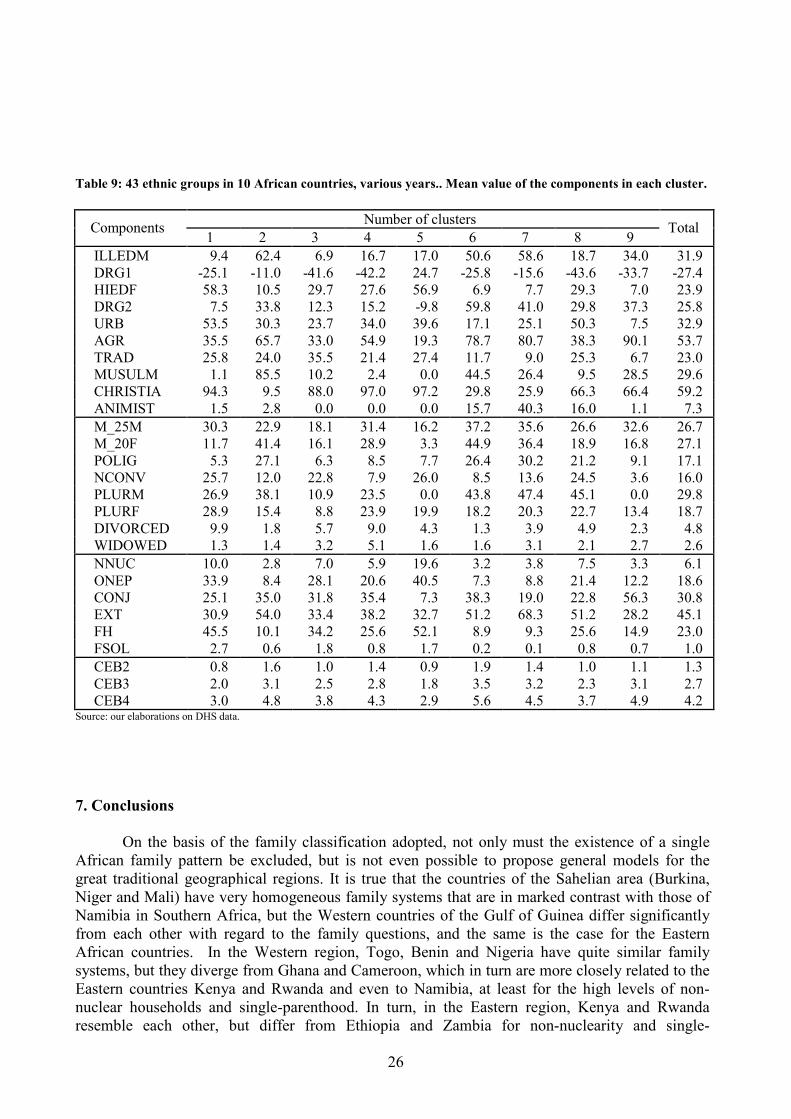
26
Table 9: 43 ethnic groups in 10 African countries, various years.. Mean value of the components in each cluster.
Number of clusters Components
1 2 3 4 5 6 7 8 9 Total
ILLEDM 9.4 62.4 6.9 16.7 17.0 50.6 58.6 18.7 34.0 31.9
DRG1 -25.1 -11.0 -41.6 -42.2 24.7 -25.8 -15.6 -43.6 -33.7 -27.4
HIEDF 58.3 10.5 29.7 27.6 56.9 6.9 7.7 29.3 7.0 23.9
DRG2 7.5 33.8 12.3 15.2 -9.8 59.8 41.0 29.8 37.3 25.8
URB 53.5 30.3 23.7 34.0 39.6 17.1 25.1 50.3 7.5 32.9
AGR 35.5 65.7 33.0 54.9 19.3 78.7 80.7 38.3 90.1 53.7
TRAD 25.8 24.0 35.5 21.4 27.4 11.7 9.0 25.3 6.7 23.0
MUSULM 1.1 85.5 10.2 2.4 0.0 44.5 26.4 9.5 28.5 29.6
CHRISTIA 94.3 9.5 88.0 97.0 97.2 29.8 25.9 66.3 66.4 59.2
ANIMIST 1.5 2.8 0.0 0.0 0.0 15.7 40.3 16.0 1.1 7.3
M_25M 30.3 22.9 18.1 31.4 16.2 37.2 35.6 26.6 32.6 26.7
M_20F 11.7 41.4 16.1 28.9 3.3 44.9 36.4 18.9 16.8 27.1
POLIG 5.3 27.1 6.3 8.5 7.7 26.4 30.2 21.2 9.1 17.1
NCONV 25.7 12.0 22.8 7.9 26.0 8.5 13.6 24.5 3.6 16.0
PLURM 26.9 38.1 10.9 23.5 0.0 43.8 47.4 45.1 0.0 29.8
PLURF 28.9 15.4 8.8 23.9 19.9 18.2 20.3 22.7 13.4 18.7
DIVORCED 9.9 1.8 5.7 9.0 4.3 1.3 3.9 4.9 2.3 4.8
WIDOWED 1.3 1.4 3.2 5.1 1.6 1.6 3.1 2.1 2.7 2.6
NNUC 10.0 2.8 7.0 5.9 19.6 3.2 3.8 7.5 3.3 6.1
ONEP 33.9 8.4 28.1 20.6 40.5 7.3 8.8 21.4 12.2 18.6
CONJ 25.1 35.0 31.8 35.4 7.3 38.3 19.0 22.8 56.3 30.8
EXT 30.9 54.0 33.4 38.2 32.7 51.2 68.3 51.2 28.2 45.1
FH 45.5 10.1 34.2 25.6 52.1 8.9 9.3 25.6 14.9 23.0
FSOL 2.7 0.6 1.8 0.8 1.7 0.2 0.1 0.8 0.7 1.0
CEB2 0.8 1.6 1.0 1.4 0.9 1.9 1.4 1.0 1.1 1.3
CEB3 2.0 3.1 2.5 2.8 1.8 3.5 3.2 2.3 3.1 2.7
CEB4 3.0 4.8 3.8 4.3 2.9 5.6 4.5 3.7 4.9 4.2 Source: our elaborations on DHS data.
7. Conclusions
On the basis of the family classification adopted, not only must the existence of a single
African family pattern be excluded, but is not even possible to propose general models for the
great traditional geographical regions. It is true that the countries of the Sahelian area (Burkina,
Niger and Mali) have very homogeneous family systems that are in marked contrast with those of
Namibia in Southern Africa, but the Western countries of the Gulf of Guinea differ significantly
from each other with regard to the family questions, and the same is the case for the Eastern
African countries. In the Western region, Togo, Benin and Nigeria have quite similar family
systems, but they diverge from Ghana and Cameroon, which in turn are more closely related to the
Eastern countries Kenya and Rwanda and even to Namibia, at least for the high levels of non-
nuclear households and single-parenthood. In turn, in the Eastern region, Kenya and Rwanda
resemble each other, but differ from Ethiopia and Zambia for non-nuclearity and single-

27
parenthood, aspects for which they are close to Namibia and Ghana. Thus, the three great family
models of the extended, conjugal, and single-parent household do not have a clear territorial
collocation, nor are they connected in a simple way to the degree to of urbanization and
development. In each country, the considerable rural/urban differentials create a different picture
and have a particular meaning, that is not strictly linked to socio-cultural factors. Only the spread
of a marginal category such as the non-nuclear family seems definitely to be linked to urban
residence.
Overall, the great variability of family systems and conjugal behaviour observed on a
national level is not satisfactorily explained by modernization factors nor by the spread of the
different religious confessions. It is in the underlying behavioural heterogeneity of ethnic groups
within each country that the national differences are rooted. In effect, the distinct data for ethnic
groups and the factor analysis carried out at their level fully highlight the importance of this factor.
The suggestion derived from the modalities of the clusterization is that each ethnic group has a
coherent body of norms that are still capable of guiding individual behaviour in such a way that, on
an aggregate level, the imprint of the basic culture is evident also independently of circumstances
of great weight and significance such as residence, religious affiliation or educational level. Ethnic
background is, therefore, confirmed as an extremely valid interpretative key, that should
accompany the classical variables of modernization (urban/rural residence, literacy), in order to
understand the cultural substrate on which the evolutive factors brought by globalization act .
As regards whether or not there exists a process of nuclearization and to what extent it can
be attributed to the impact of urbanization, a set of contrasting tendencies was observed. The urban
contexts are undoubtedly characterized by the spread of what we have called somewhat
imprecisely ”individual” family forms, (single-person, non-nuclear and single-parent households).
But at the moment there is no sign that the rural family will follow this example, at least if we limit
our observation to the structural aspects and do not consider changes in values and norms
regulating family relationships among family members.
Moreover, we can also observe an opposite tendency, with the extended households more
widespread in towns than in rural areas. It seems, in fact, that the offering of hospitality to relatives
external to the family nucleus is a custom of the better off families, which are more frequently
found in towns. For this reason the process of urbanization can sometimes lead to an increase -
though not absolutely general and perhaps transitory - of the extended families. It should be
emphasized that the greater frequency of extended families in the city is found in virtually all the
ethnic groups, with very few exceptions. This suggests that in many cases extended and conjugal
non polygynic family households do not constitute separate and opposed systems but constitute
parts of enlarged networks of kinship relations, that are still capable of efficient forms of solidarity.
If this hypothesis corresponds to reality, we could well argue that extended families are actually
playing an important role in determining the forms of adjustment to the social modifications
produced by the process of modernization.
Nevertheless, the diachronic analyses, though of dubious reliability for the brevity of the
observed time span, and for the uncertainty of data, do highlight a general tendency towards the
contraction of the proportion of extended families. This seems to indicate that, despite everything,
a process of nuclearization really has begun. Notwithstanding this, on the basis of the overall
results of the factor investigation on the interrelationships between modernization, family
structures and fertility behaviour, we must conclude that the propositions of the classical theory do
not really reflect the Sub-Saharan situations and dynamics: at best, the process of family
nuclearization is in its very early stages and it is not observable in urban realities, where it is
eventually hidden by dynamics linked to urbanization movements; moreover, it is accompanied by
a growing presence of one-parent and female-headed families, whose meaning in term of
nuclearization is far from clear. On the other hand a predominance of conjugal families does not
involve to date a declining fertility, which is on the contrary far more associated with higher
fertility than is predominance of extended families. However, these results do not justify the
definitive exclusion of the hypotheses formulated by the classical theory. A general appraisal of
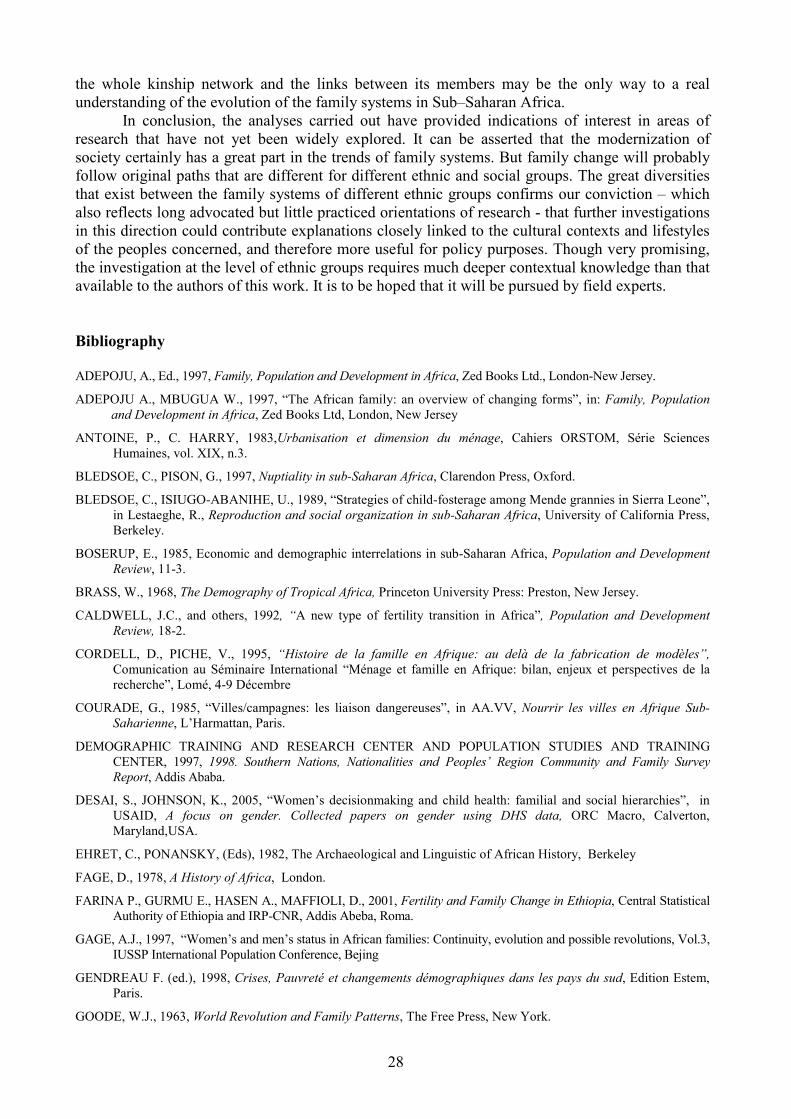
28
the whole kinship network and the links between its members may be the only way to a real
understanding of the evolution of the family systems in Sub–Saharan Africa.
In conclusion, the analyses carried out have provided indications of interest in areas of
research that have not yet been widely explored. It can be asserted that the modernization of
society certainly has a great part in the trends of family systems. But family change will probably
follow original paths that are different for different ethnic and social groups. The great diversities
that exist between the family systems of different ethnic groups confirms our conviction – which
also reflects long advocated but little practiced orientations of research - that further investigations
in this direction could contribute explanations closely linked to the cultural contexts and lifestyles
of the peoples concerned, and therefore more useful for policy purposes. Though very promising,
the investigation at the level of ethnic groups requires much deeper contextual knowledge than that
available to the authors of this work. It is to be hoped that it will be pursued by field experts.
Bibliography
ADEPOJU, A., Ed., 1997, Family, Population and Development in Africa, Zed Books Ltd., London-New Jersey.
ADEPOJU A., MBUGUA W., 1997, “The African family: an overview of changing forms”, in: Family, Population
and Development in Africa, Zed Books Ltd, London, New Jersey
ANTOINE, P., C. HARRY, 1983,Urbanisation et dimension du ménage, Cahiers ORSTOM, Série Sciences
Humaines, vol. XIX, n.3.
BLEDSOE, C., PISON, G., 1997, Nuptiality in sub-Saharan Africa, Clarendon Press, Oxford.
BLEDSOE, C., ISIUGO-ABANIHE, U., 1989, “Strategies of child-fosterage among Mende grannies in Sierra Leone”,
in Lestaeghe, R., Reproduction and social organization in sub-Saharan Africa, University of California Press,
Berkeley.
BOSERUP, E., 1985, Economic and demographic interrelations in sub-Saharan Africa, Population and Development
Review, 11-3.
BRASS, W., 1968, The Demography of Tropical Africa, Princeton University Press: Preston, New Jersey.
CALDWELL, J.C., and others, 1992, “A new type of fertility transition in Africa”, Population and Development
Review, 18-2.
CORDELL, D., PICHE, V., 1995, “Histoire de la famille en Afrique: au delà de la fabrication de modèles”,
Comunication au Séminaire International “Ménage et famille en Afrique: bilan, enjeux et perspectives de la
recherche”, Lomé, 4-9 Décembre
COURADE, G., 1985, “Villes/campagnes: les liaison dangereuses”, in AA.VV, Nourrir les villes en Afrique Sub-
Saharienne, L’Harmattan, Paris.
DEMOGRAPHIC TRAINING AND RESEARCH CENTER AND POPULATION STUDIES AND TRAINING
CENTER, 1997, 1998. Southern Nations, Nationalities and Peoples’ Region Community and Family Survey
Report, Addis Ababa.
DESAI, S., JOHNSON, K., 2005, “Women’s decisionmaking and child health: familial and social hierarchies”, in
USAID, A focus on gender. Collected papers on gender using DHS data, ORC Macro, Calverton,
Maryland,USA.
EHRET, C., PONANSKY, (Eds), 1982, The Archaeological and Linguistic of African History, Berkeley
FAGE, D., 1978, A History of Africa, London.
FARINA P., GURMU E., HASEN A., MAFFIOLI, D., 2001, Fertility and Family Change in Ethiopia, Central Statistical
Authority of Ethiopia and IRP-CNR, Addis Abeba, Roma.
GAGE, A.J., 1997, “Women’s and men’s status in African families: Continuity, evolution and possible revolutions, Vol.3,
IUSSP International Population Conference, Bejing
GENDREAU F. (ed.), 1998, Crises, Pauvreté et changements démographiques dans les pays du sud, Edition Estem,
Paris.
GOODE, W.J., 1963, World Revolution and Family Patterns, The Free Press, New York.
29
GOODY, J., 1972, “The evolution of the family”, in: LASLETT, P., Editor (with the assistance of R. Wall),
Household and Family in the Past Time, Cambridge University Press, London.
GREENALGH, S., 1989, “New directions in fertility research: Anthropological Perspective”, IUSSP International
Population Conference, New Delhi.
GRIFFITH, P., MATTHEWS, Z., HINDE, A., 2002, “Gender, family and the nutritional status of children in three
culturally contrasting states of India”, Social Science and Medecine, 55, (5), 775-790.
HINDIN, M.J., 2005, “Women’s autonomy, status, and nutrition in Zimbabwe, Zambia, and Malawi”, USAID, A
focus on gender. Collected papers on gender using DHS data, ORC Macro, Calverton, Maryland,USA.
JONCKERS, D., 1997, “Les enfants confiés”, in: PILON, M., LOCOH, T., VIGNIKIN, E., VIMARD, P., Ménages et
familles en Afrique. Approches des dinamiques contemporaine, Les Etudes du CEPED n° 15, Paris.
KISHOR, S., JOHNSON, K., 2005, “Women at the nexus of poverty violence: how unique is their disadvantege” in
USAID, A focus on gender. Collected papers on gender using DHS data, ORC Macro, Calverton,
Maryland,USA.
KREAGER, P., 1993, “Anthropological demography and the limits of diffusionism”, IUSSP Population Conference,
Montreal.
LASLETT, P., 1972, “Introduction: The history of the family”, in: Peter LASLETT editor (with the assistance of R.
WALL), Household and Family in the Past Time, Cambridge University Press, London.
LASLETT, P., editor (with the assistance of R. Wall), 1972, Household and Family in the Past Time, Cambridge
University Press, London.
LESTHAEGHE, R., H.J. PAGE AND O. ADEGBOLA, 1981, “Child Spacing and Fertility in Lagos” in H. J. PAGE and
LASTHAEGHE R. (eds). Child-Spacing in tropical Africa.
LESTHEAGHE, R., 1989, Reproduction and social organization in sub-Saharan Africa, University of California
Press, Berkeley.
LOCOH, Th., 1984, Fecondité et famille en Afrique de l'Ouest. Le Togo méridional contemporain, INED, Cahier n.
107, PUF, Paris.
LOCOH, Th., 1988a, “L’analyse comparative de la taille et de la structure des familles en Afrique sub-saharienne", in
Actes du Congrès de Démographie, Dakar, UIESP, Liège.
LOCOH, Th., 1988b, “Structures familiales et changements sociaux”, in: TABUTIN, D., Editor, Population et societé
en Afrique au sud du Sahara, Academia-L’Harmattan, Louvain-la-Neuve.
LOCOH, Th., 1995a, Familles africaines, population et qualité de vie, Les Dossiers du CEPED n. 31, Paris.
LOCOH, Th., 1995b, “Paupérisation et transitions démographiques en Afrique sub-saharienne” in TABUTIN, D., et
al., eds, Transitions démografiques et société.Chaire Quetelet 1992, L’Harmattan, Paris.
LORIMER, F., 1954, Culture and Human Fertility, UNESCO, Population and Culture.
MAFFIOLI, D., 1971, La fecondità delle popolazioni Guen dell’Alto Volta, Istituto di Demografia, University of
Rome “La Sapienza”.
MAFFIOLI, D., DELL’ATTI A., 2000, “Fertility and family formation of migrant population in Italy”, International
Conference on International Migration, Challenges for European Populations, Bari, Italy, 25-27 June 1998.
Quaderni del Dipartimento di Statistica, n. 4, Bari, pp.37-80.
MAFFIOLI, D., 2000, “La famiglia in Africa sub-sahariana fra tradizione e mutamento. Urbanizzazione e
modificazione delle tipologie familiari nell’Africa sub-sahariana. Un tentativo di valorizzazione di dati poco
sfruttati ”, Quaderni del Dipartimento di Statistica, n. 4, Bari, pp. 143-186.
MAFFIOLI, D., 2001, Family and Household Structure and Fertility Change, in: FARINA P., GURMU E., HASEN A.,
MAFFIOLI, D. Fertility and Family Change in Ethiopia, Central Statistical Authority of Ethiopia and IRP-CNR,
Addis Ababa, Roma, pp. 51-110.
MAFFIOLI, D., 2003, “La famiglia africana fra tradizione e mutamento”, Annali del Dipartimento di Statistica, vol.II,
pp.169-222, Bari.
MAFFIOLI, D., Dell’ATTI A, 2004, “Matrimonio e famiglia in Etiopia”, Quaderni del Dipartimento di Statistica, n.
10, pp. 61, Bari.
MAFFIOLI, D., Dell’ATTI A, SACCO P., MINGOLLA G., 2005, “Matrimonio, divorzio e vedovanza nell’Africa
sub-sahariana”, Annali del Dipartimento di Scienze Statistiche, Università degli Studi di Bari, Vol.IV.
30
MARCOUX, R., 1997 “Le travail, un jeu d’enfant ? A propos de la contribution des enfants à la subsistance des
ménages au Mali”, in: PILON, M., LOCOH, T., VIGNIKIN, E., VIMARD, P., Ménages et familles en Afrique.
Approches des dinamiques contemporaine, Les Etudes du CEPED n° 15, Paris.
MARIE, A., 1997, “Les structures familiales à l’épreuve de l’individualisation citadine”, in: PILON, M., LOCOH, T.,
VIGNIKIN, E., VIMARD, P., Ménages et familles en Afrique. Approches des dinamiques contemporaine, Les
Etudes du CEPED n° 15, Paris.
MURDOCK, G.P., 1967, Ethnographic Atlas : a summary, Ethnology, vol.6, n.2
NATIONS UNIES, 1992, Condition de la femme et population, le cas de l’Afrique francophone, Paris, co-édition
FNUAP, CEPED, URD.
PAGE, H., 1989, “Child rearing versus childbearing: coresidence of mother and child in sub-Saharan Africa”, in
LESTHAEGHE, R., Reproduction and social organization in sub-Saharan Africa, University of California
Press, Berkeley.
PILON, M., 1995, “L’importance du lien de parenté: recueil, codification et exploitation”, Communication au
Séminaire International Ménage et famille en Afrique: bilan, enjeux et perspectives de la recherche, Lomé, 4-9
Décembre.
PILON, M., LOCOH, T., VIGNIKIN, E., VIMARD, P., 1997, Ménages et familles en Afrique. Approches des
dinamiques contemporaines, Les Etudes du CEPED n° 15, Paris.
PISON, G., 1988, “Polygamie, fécondité et structures familiales”, in TABUTIN, D., sous la direction de, Population et
societé en Afrique au sud du Sahara, L’Harmattan, Paris.
RETEL-LAURENTIN, A., 1974, Infécondité en Afrique Noire. Maladies et consequences sociales, Masson et C.ie
Editeurs, Paris.
ROMANIUK, A., 1968, La fécondité des populations congolaises, Mouton et I.R.E.S., Paris.
ROUSSEL, L., 1986, Evolution récente de la structure des ménages dans quelques pays industriels, Population, 41,6.
SALA-DIAKANDA, M., 1988, Problèmes conceptuels et pratiques liés aux informations disponibles sur la structure
des ménage en Afrique ainsi qu'à son analyse, African Population Conference, IUSSP, Dakar.
SELLIER, J., 2003, Atlas des peuples d’Afrique, La Découverte, Paris
TABUTIN D., 1988, Population et Societés en Afrique au sud du Sahara, L'Harmattan, Paris.
TARVER, J.D., H.M. MILLER, “Women Head Botswana’s Households”, Population Today, Population Reference
Bureau, 14.
TARVER, J.D., H.M. MILLER, 1994, “La fécondité hors mariage dans un pays en développement: le Botswana”,
Population, n.3, Paris.
TRACUZZI, T., 1995, Strutture familiari e condizione della donna in Togo e in Camerun, Tesi di laurea della Facoltà
di Scienze Statistiche, Demografiche e Attuariali dell’Università degli Studi di Roma ‘La Sapienza’, Relatore
D. Maffioli.
USAID, 2005, A focus on gender. Collected papers on gender using DHS data, ORC Macro, Calverton, Maryland,
USA.
VAKAM, J., 1997, “Différenciation socio-économique et structures familiales au Camerun”, in: PILON, M., LOCOH,
T., VIGNIKIN, E., VIMARD, P., 1997, Ménages et familles en Afrique. Approches des dinamiques
contemporaine, Les Etudes du CEPED n° 15, Paris.
VAN DE WALLE, E., A. D. FOSTER, 1990, Fertility decline in Africa: Assessment and Prospect, World Bank
Technical Paper n. 125, Africa Technical Department Series, Washington D.C.
VAN DE WALLE, FRANCINE AND OMIDEYI, KEHINDE 1988 “The Cultural Roots of African Fertility Regime” in
IUSSP African Population Conference, Dakar, Senegal 7-12 November 1988.
VIGNIKIN, K., 1997, “Structures familiales en Afrique et conséquences démographiques et socio-economiques”,
IUSSP Population Conference, Beijing.
VIMARD, P., 1995, “De quelques typologies de ménage”, Communication au Séminaire International Ménage et
famille en Afrique: bilan, enjeux et perspectives de la recherche, Lomé, 4-9 Décembre.
VIMARD, P., 1996, “Evolution de la fécondité et crises africaines”, in COUSSY J., VALLIN J., Editors, Crise et
population en Afrique, Les Etudes du CEPED n° 13, Paris.
31
VIMARD, P., N’CHO S., 1997, “Evolution de la structure des ménages et différenciation des modéles familiaux en
Cote d’Ivoire 1975-1993”, in: PILON, M., LOCOH, T., VIGNIKIN, E., VIMARD, P., Ménages et familles en
Afrique. Approches des dinamiques contemporaine, Les Etudes du CEPED n° 15, Paris.
WALL, R., 1983, Editor, in collaboration with J. ROBIN AND P. LASLETT, Family Forms in Historic Europe,
Cambridge University Press, London.
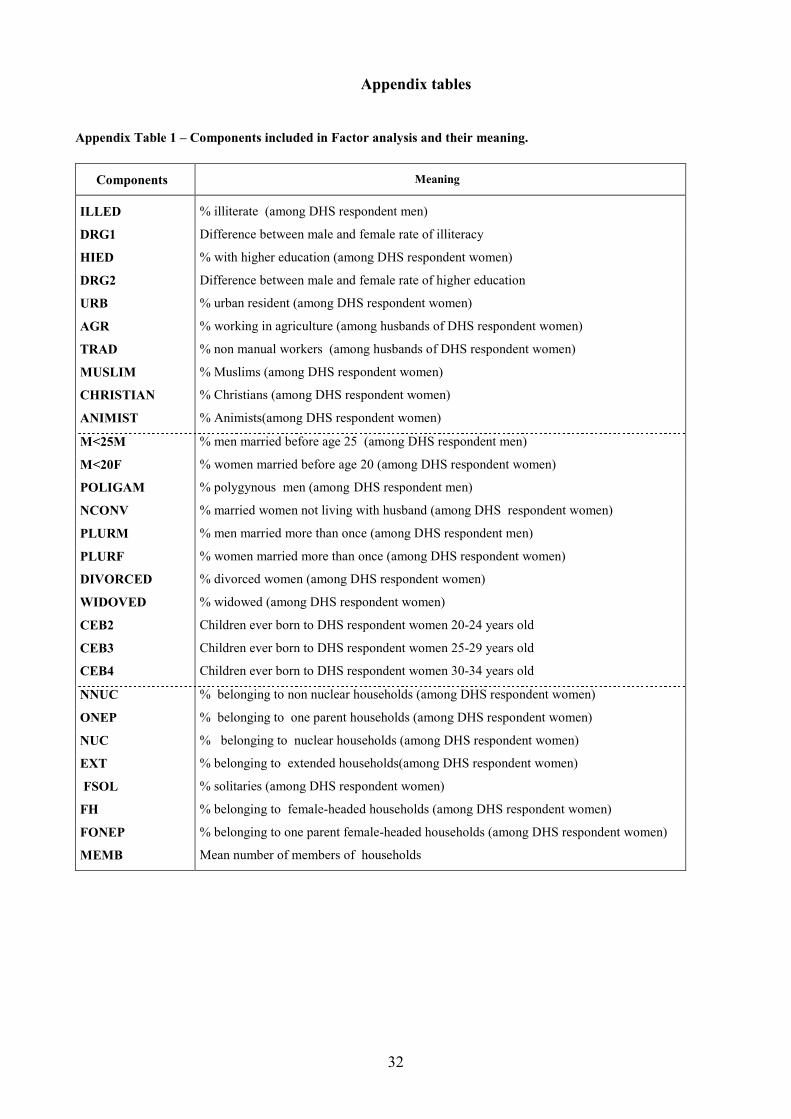
32
Appendix tables
Appendix Table 1 – Components included in Factor analysis and their meaning.
Components Meaning
ILLED % illiterate (among DHS respondent men)
DRG1 Difference between male and female rate of illiteracy
HIED % with higher education (among DHS respondent women)
DRG2 Difference between male and female rate of higher education
URB % urban resident (among DHS respondent women)
AGR % working in agriculture (among husbands of DHS respondent women)
TRAD % non manual workers (among husbands of DHS respondent women)
MUSLIM % Muslims (among DHS respondent women)
CHRISTIAN % Christians (among DHS respondent women)
ANIMIST % Animists(among DHS respondent women)
M<25M % men married before age 25 (among DHS respondent men)
M<20F % women married before age 20 (among DHS respondent women)
POLIGAM % polygynous men (among DHS respondent men)
NCONV % married women not living with husband (among DHS respondent women)
PLURM % men married more than once (among DHS respondent men)
PLURF % women married more than once (among DHS respondent women)
DIVORCED % divorced women (among DHS respondent women)
WIDOVED % widowed (among DHS respondent women)
CEB2 Children ever born to DHS respondent women 20-24 years old
CEB3 Children ever born to DHS respondent women 25-29 years old
CEB4 Children ever born to DHS respondent women 30-34 years old
NNUC % belonging to non nuclear households (among DHS respondent women)
ONEP % belonging to one parent households (among DHS respondent women)
NUC % belonging to nuclear households (among DHS respondent women)
EXT % belonging to extended households(among DHS respondent women)
FSOL % solitaries (among DHS respondent women)
FH % belonging to female-headed households (among DHS respondent women)
FONEP % belonging to one parent female-headed households (among DHS respondent women)
MEMB Mean number of members of households
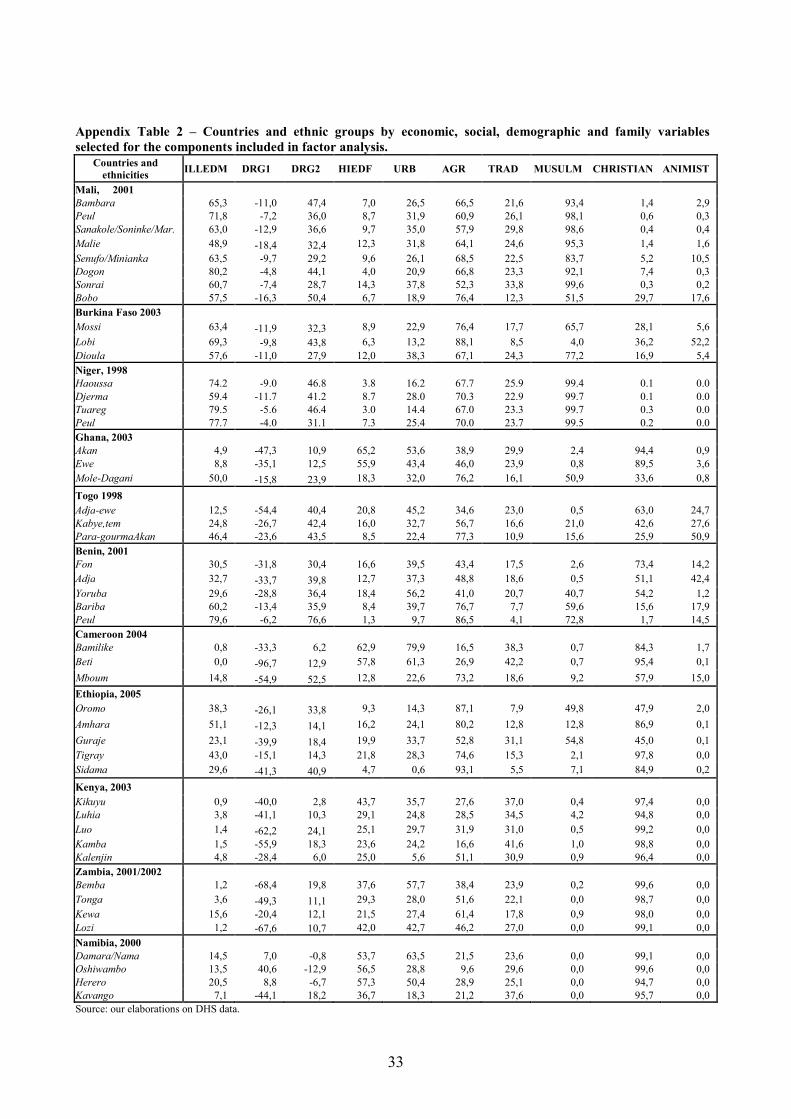
33
Appendix Table 2 – Countries and ethnic groups by economic, social, demographic and family variables
selected for the components included in factor analysis.
Countries and
ethnicities ILLEDM DRG1 DRG2 HIEDF URB AGR TRAD MUSULM CHRISTIAN ANIMIST
Mali, 2001
Bambara 65,3 -11,0 47,4 7,0 26,5 66,5 21,6 93,4 1,4 2,9
Peul 71,8 -7,2 36,0 8,7 31,9 60,9 26,1 98,1 0,6 0,3
Sanakole/Soninke/Mar. 63,0 -12,9 36,6 9,7 35,0 57,9 29,8 98,6 0,4 0,4
Malie 48,9 -18,4 32,4 12,3 31,8 64,1 24,6 95,3 1,4 1,6
Senufo/Minianka 63,5 -9,7 29,2 9,6 26,1 68,5 22,5 83,7 5,2 10,5
Dogon 80,2 -4,8 44,1 4,0 20,9 66,8 23,3 92,1 7,4 0,3
Sonrai 60,7 -7,4 28,7 14,3 37,8 52,3 33,8 99,6 0,3 0,2
Bobo 57,5 -16,3 50,4 6,7 18,9 76,4 12,3 51,5 29,7 17,6
Burkina Faso 2003
Mossi 63,4 -11,9 32,3 8,9 22,9 76,4 17,7 65,7 28,1 5,6
Lobi 69,3 -9,8 43,8 6,3 13,2 88,1 8,5 4,0 36,2 52,2
Dioula 57,6 -11,0 27,9 12,0 38,3 67,1 24,3 77,2 16,9 5,4
Niger, 1998
Haoussa 74.2 -9.0 46.8 3.8 16.2 67.7 25.9 99.4 0.1 0.0
Djerma 59.4 -11.7 41.2 8.7 28.0 70.3 22.9 99.7 0.1 0.0
Tuareg 79.5 -5.6 46.4 3.0 14.4 67.0 23.3 99.7 0.3 0.0
Peul 77.7 -4.0 31.1 7.3 25.4 70.0 23.7 99.5 0.2 0.0
Ghana, 2003
Akan 4,9 -47,3 10,9 65,2 53,6 38,9 29,9 2,4 94,4 0,9
Ewe 8,8 -35,1 12,5 55,9 43,4 46,0 23,9 0,8 89,5 3,6
Mole-Dagani 50,0 -15,8 23,9 18,3 32,0 76,2 16,1 50,9 33,6 0,8
Togo 1998
Adja-ewe 12,5 -54,4 40,4 20,8 45,2 34,6 23,0 0,5 63,0 24,7
Kabye,tem 24,8 -26,7 42,4 16,0 32,7 56,7 16,6 21,0 42,6 27,6
Para-gourmaAkan 46,4 -23,6 43,5 8,5 22,4 77,3 10,9 15,6 25,9 50,9
Benin, 2001
Fon 30,5 -31,8 30,4 16,6 39,5 43,4 17,5 2,6 73,4 14,2
Adja 32,7 -33,7 39,8 12,7 37,3 48,8 18,6 0,5 51,1 42,4
Yoruba 29,6 -28,8 36,4 18,4 56,2 41,0 20,7 40,7 54,2 1,2
Bariba 60,2 -13,4 35,9 8,4 39,7 76,7 7,7 59,6 15,6 17,9
Peul 79,6 -6,2 76,6 1,3 9,7 86,5 4,1 72,8 1,7 14,5
Cameroon 2004
Bamilike 0,8 -33,3 6,2 62,9 79,9 16,5 38,3 0,7 84,3 1,7
Beti 0,0 -96,7 12,9 57,8 61,3 26,9 42,2 0,7 95,4 0,1
Mboum 14,8 -54,9 52,5 12,8 22,6 73,2 18,6 9,2 57,9 15,0
Ethiopia, 2005
Oromo 38,3 -26,1 33,8 9,3 14,3 87,1 7,9 49,8 47,9 2,0
Amhara 51,1 -12,3 14,1 16,2 24,1 80,2 12,8 12,8 86,9 0,1
Guraje 23,1 -39,9 18,4 19,9 33,7 52,8 31,1 54,8 45,0 0,1
Tigray 43,0 -15,1 14,3 21,8 28,3 74,6 15,3 2,1 97,8 0,0
Sidama 29,6 -41,3 40,9 4,7 0,6 93,1 5,5 7,1 84,9 0,2
Kenya, 2003
Kikuyu 0,9 -40,0 2,8 43,7 35,7 27,6 37,0 0,4 97,4 0,0
Luhia 3,8 -41,1 10,3 29,1 24,8 28,5 34,5 4,2 94,8 0,0
Luo 1,4 -62,2 24,1 25,1 29,7 31,9 31,0 0,5 99,2 0,0
Kamba 1,5 -55,9 18,3 23,6 24,2 16,6 41,6 1,0 98,8 0,0
Kalenjin 4,8 -28,4 6,0 25,0 5,6 51,1 30,9 0,9 96,4 0,0
Zambia, 2001/2002
Bemba 1,2 -68,4 19,8 37,6 57,7 38,4 23,9 0,2 99,6 0,0
Tonga 3,6 -49,3 11,1 29,3 28,0 51,6 22,1 0,0 98,7 0,0
Kewa 15,6 -20,4 12,1 21,5 27,4 61,4 17,8 0,9 98,0 0,0
Lozi 1,2 -67,6 10,7 42,0 42,7 46,2 27,0 0,0 99,1 0,0
Namibia, 2000
Damara/Nama 14,5 7,0 -0,8 53,7 63,5 21,5 23,6 0,0 99,1 0,0
Oshiwambo 13,5 40,6 -12,9 56,5 28,8 9,6 29,6 0,0 99,6 0,0
Herero 20,5 8,8 -6,7 57,3 50,4 28,9 25,1 0,0 94,7 0,0
Kavango 7,1 -44,1 18,2 36,7 18,3 21,2 37,6 0,0 95,7 0,0
Source: our elaborations on DHS data.
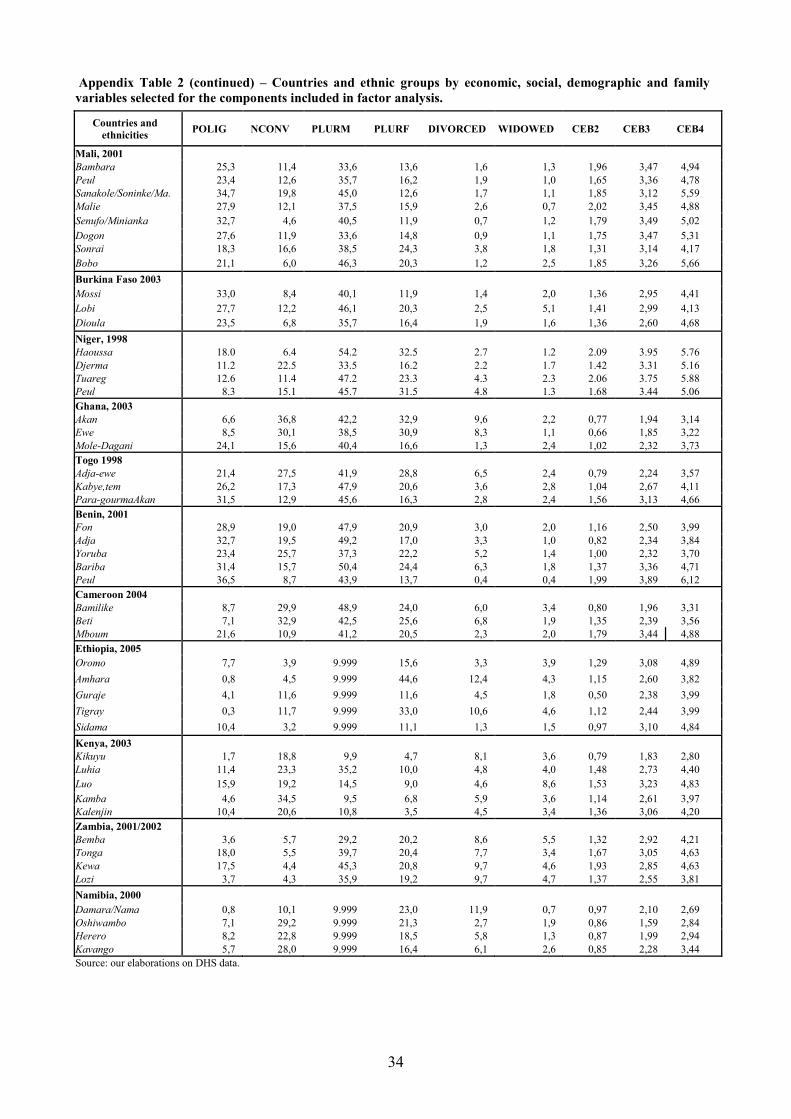
34
Appendix Table 2 (continued) – Countries and ethnic groups by economic, social, demographic and family
variables selected for the components included in factor analysis.
Source: our elaborations on DHS data.
Countries and
ethnicities POLIG NCONV PLURM PLURF DIVORCED WIDOWED CEB2 CEB3 CEB4
Mali, 2001
Bambara 25,3 11,4 33,6 13,6 1,6 1,3 1,96 3,47 4,94
Peul 23,4 12,6 35,7 16,2 1,9 1,0 1,65 3,36 4,78
Sanakole/Soninke/Ma. 34,7 19,8 45,0 12,6 1,7 1,1 1,85 3,12 5,59
Malie 27,9 12,1 37,5 15,9 2,6 0,7 2,02 3,45 4,88
Senufo/Minianka 32,7 4,6 40,5 11,9 0,7 1,2 1,79 3,49 5,02
Dogon 27,6 11,9 33,6 14,8 0,9 1,1 1,75 3,47 5,31
Sonrai 18,3 16,6 38,5 24,3 3,8 1,8 1,31 3,14 4,17
Bobo 21,1 6,0 46,3 20,3 1,2 2,5 1,85 3,26 5,66
Burkina Faso 2003
Mossi 33,0 8,4 40,1 11,9 1,4 2,0 1,36 2,95 4,41
Lobi 27,7 12,2 46,1 20,3 2,5 5,1 1,41 2,99 4,13
Dioula 23,5 6,8 35,7 16,4 1,9 1,6 1,36 2,60 4,68
Niger, 1998
Haoussa 18.0 6.4 54.2 32.5 2.7 1.2 2.09 3.95 5.76
Djerma 11.2 22.5 33.5 16.2 2.2 1.7 1.42 3.31 5.16
Tuareg 12.6 11.4 47.2 23.3 4.3 2.3 2.06 3.75 5.88
Peul 8.3 15.1 45.7 31.5 4.8 1.3 1.68 3.44 5.06
Ghana, 2003
Akan 6,6 36,8 42,2 32,9 9,6 2,2 0,77 1,94 3,14
Ewe 8,5 30,1 38,5 30,9 8,3 1,1 0,66 1,85 3,22
Mole-Dagani 24,1 15,6 40,4 16,6 1,3 2,4 1,02 2,32 3,73
Togo 1998
Adja-ewe 21,4 27,5 41,9 28,8 6,5 2,4 0,79 2,24 3,57
Kabye,tem 26,2 17,3 47,9 20,6 3,6 2,8 1,04 2,67 4,11
Para-gourmaAkan 31,5 12,9 45,6 16,3 2,8 2,4 1,56 3,13 4,66
Benin, 2001
Fon 28,9 19,0 47,9 20,9 3,0 2,0 1,16 2,50 3,99
Adja 32,7 19,5 49,2 17,0 3,3 1,0 0,82 2,34 3,84
Yoruba 23,4 25,7 37,3 22,2 5,2 1,4 1,00 2,32 3,70
Bariba 31,4 15,7 50,4 24,4 6,3 1,8 1,37 3,36 4,71
Peul 36,5 8,7 43,9 13,7 0,4 0,4 1,99 3,89 6,12
Cameroon 2004
Bamilike 8,7 29,9 48,9 24,0 6,0 3,4 0,80 1,96 3,31
Beti 7,1 32,9 42,5 25,6 6,8 1,9 1,35 2,39 3,56
Mboum 21,6 10,9 41,2 20,5 2,3 2,0 1,79 3,44 4,88
Ethiopia, 2005
Oromo 7,7 3,9 9.999 15,6 3,3 3,9 1,29 3,08 4,89
Amhara 0,8 4,5 9.999 44,6 12,4 4,3 1,15 2,60 3,82
Guraje 4,1 11,6 9.999 11,6 4,5 1,8 0,50 2,38 3,99
Tigray 0,3 11,7 9.999 33,0 10,6 4,6 1,12 2,44 3,99
Sidama 10,4 3,2 9.999 11,1 1,3 1,5 0,97 3,10 4,84
Kenya, 2003
Kikuyu 1,7 18,8 9,9 4,7 8,1 3,6 0,79 1,83 2,80
Luhia 11,4 23,3 35,2 10,0 4,8 4,0 1,48 2,73 4,40
Luo 15,9 19,2 14,5 9,0 4,6 8,6 1,53 3,23 4,83
Kamba 4,6 34,5 9,5 6,8 5,9 3,6 1,14 2,61 3,97
Kalenjin 10,4 20,6 10,8 3,5 4,5 3,4 1,36 3,06 4,20
Zambia, 2001/2002
Bemba 3,6 5,7 29,2 20,2 8,6 5,5 1,32 2,92 4,21
Tonga 18,0 5,5 39,7 20,4 7,7 3,4 1,67 3,05 4,63
Kewa 17,5 4,4 45,3 20,8 9,7 4,6 1,93 2,85 4,63
Lozi 3,7 4,3 35,9 19,2 9,7 4,7 1,37 2,55 3,81
Namibia, 2000
Damara/Nama 0,8 10,1 9.999 23,0 11,9 0,7 0,97 2,10 2,69
Oshiwambo 7,1 29,2 9.999 21,3 2,7 1,9 0,86 1,59 2,84
Herero 8,2 22,8 9.999 18,5 5,8 1,3 0,87 1,99 2,94
Kavango 5,7 28,0 9.999 16,4 6,1 2,6 0,85 2,28 3,44
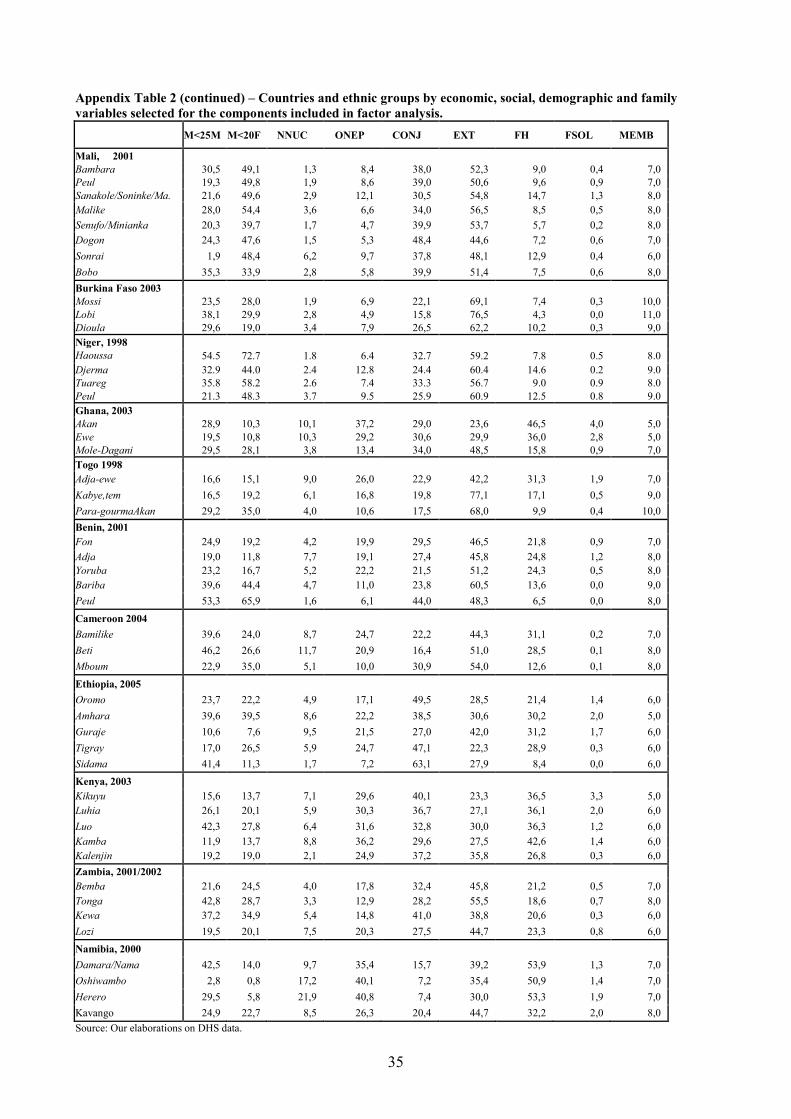
35
Appendix Table 2 (continued) – Countries and ethnic groups by economic, social, demographic and family
variables selected for the components included in factor analysis.
M<25M M<20F NNUC ONEP CONJ EXT FH FSOL MEMB
Mali, 2001
Bambara 30,5 49,1 1,3 8,4 38,0 52,3 9,0 0,4 7,0
Peul 19,3 49,8 1,9 8,6 39,0 50,6 9,6 0,9 7,0
Sanakole/Soninke/Ma. 21,6 49,6 2,9 12,1 30,5 54,8 14,7 1,3 8,0
Malike 28,0 54,4 3,6 6,6 34,0 56,5 8,5 0,5 8,0
Senufo/Minianka 20,3 39,7 1,7 4,7 39,9 53,7 5,7 0,2 8,0
Dogon 24,3 47,6 1,5 5,3 48,4 44,6 7,2 0,6 7,0
Sonrai 1,9 48,4 6,2 9,7 37,8 48,1 12,9 0,4 6,0
Bobo 35,3 33,9 2,8 5,8 39,9 51,4 7,5 0,6 8,0
Burkina Faso 2003
Mossi 23,5 28,0 1,9 6,9 22,1 69,1 7,4 0,3 10,0
Lobi 38,1 29,9 2,8 4,9 15,8 76,5 4,3 0,0 11,0
Dioula 29,6 19,0 3,4 7,9 26,5 62,2 10,2 0,3 9,0
Niger, 1998
Haoussa 54.5 72.7 1.8 6.4 32.7 59.2 7.8 0.5 8.0
Djerma 32.9 44.0 2.4 12.8 24.4 60.4 14.6 0.2 9.0
Tuareg 35.8 58.2 2.6 7.4 33.3 56.7 9.0 0.9 8.0
Peul 21.3 48.3 3.7 9.5 25.9 60.9 12.5 0.8 9.0
Ghana, 2003
Akan 28,9 10,3 10,1 37,2 29,0 23,6 46,5 4,0 5,0
Ewe 19,5 10,8 10,3 29,2 30,6 29,9 36,0 2,8 5,0
Mole-Dagani 29,5 28,1 3,8 13,4 34,0 48,5 15,8 0,9 7,0
Togo 1998
Adja-ewe 16,6 15,1 9,0 26,0 22,9 42,2 31,3 1,9 7,0
Kabye,tem 16,5 19,2 6,1 16,8 19,8 77,1 17,1 0,5 9,0
Para-gourmaAkan 29,2 35,0 4,0 10,6 17,5 68,0 9,9 0,4 10,0
Benin, 2001
Fon 24,9 19,2 4,2 19,9 29,5 46,5 21,8 0,9 7,0
Adja 19,0 11,8 7,7 19,1 27,4 45,8 24,8 1,2 8,0
Yoruba 23,2 16,7 5,2 22,2 21,5 51,2 24,3 0,5 8,0
Bariba 39,6 44,4 4,7 11,0 23,8 60,5 13,6 0,0 9,0
Peul 53,3 65,9 1,6 6,1 44,0 48,3 6,5 0,0 8,0
Cameroon 2004
Bamilike 39,6 24,0 8,7 24,7 22,2 44,3 31,1 0,2 7,0
Beti 46,2 26,6 11,7 20,9 16,4 51,0 28,5 0,1 8,0
Mboum 22,9 35,0 5,1 10,0 30,9 54,0 12,6 0,1 8,0
Ethiopia, 2005
Oromo 23,7 22,2 4,9 17,1 49,5 28,5 21,4 1,4 6,0
Amhara 39,6 39,5 8,6 22,2 38,5 30,6 30,2 2,0 5,0
Guraje 10,6 7,6 9,5 21,5 27,0 42,0 31,2 1,7 6,0
Tigray 17,0 26,5 5,9 24,7 47,1 22,3 28,9 0,3 6,0
Sidama 41,4 11,3 1,7 7,2 63,1 27,9 8,4 0,0 6,0
Kenya, 2003
Kikuyu 15,6 13,7 7,1 29,6 40,1 23,3 36,5 3,3 5,0
Luhia 26,1 20,1 5,9 30,3 36,7 27,1 36,1 2,0 6,0
Luo 42,3 27,8 6,4 31,6 32,8 30,0 36,3 1,2 6,0
Kamba 11,9 13,7 8,8 36,2 29,6 27,5 42,6 1,4 6,0
Kalenjin 19,2 19,0 2,1 24,9 37,2 35,8 26,8 0,3 6,0
Zambia, 2001/2002
Bemba 21,6 24,5 4,0 17,8 32,4 45,8 21,2 0,5 7,0
Tonga 42,8 28,7 3,3 12,9 28,2 55,5 18,6 0,7 8,0
Kewa 37,2 34,9 5,4 14,8 41,0 38,8 20,6 0,3 6,0
Lozi 19,5 20,1 7,5 20,3 27,5 44,7 23,3 0,8 6,0
Namibia, 2000
Damara/Nama 42,5 14,0 9,7 35,4 15,7 39,2 53,9 1,3 7,0
Oshiwambo 2,8 0,8 17,2 40,1 7,2 35,4 50,9 1,4 7,0
Herero 29,5 5,8 21,9 40,8 7,4 30,0 53,3 1,9 7,0
Kavango 24,9 22,7 8,5 26,3 20,4 44,7 32,2 2,0 8,0
Source: Our elaborations on DHS data.
Copyright © 2022 FDOKUMEN