THE IMPACT OF THE EU BLUE CARD POLICY ON ECONOMIC GROWTH IN THE AFRICAN SENDING COUNTRIES
31
EERI Economics and Econometrics Research Institute EERI Research Paper Series No 10/2010 ISSN: 2031-4892 Copyright © 2010 by d'Artis Kancs and Pavel Ciaian The Impact of the EU Blue Card Policy on Economic Growth in the African Sending Countries d'Artis Kancs and Pavel Ciaian EERI Economics and Econometrics Research Institute Avenue de Beaulieu 1160 Brussels Belgium Tel: +322 299 3523 Fax: +322 299 3523 www.eeri.eu
-
Upload
independent -
Category
Documents
-
view
4 -
download
0
Transcript of THE IMPACT OF THE EU BLUE CARD POLICY ON ECONOMIC GROWTH IN THE AFRICAN SENDING COUNTRIES

EERIEconomics and Econometrics Research Institute
EERI Research Paper Series No 10/2010
ISSN: 2031-4892
Copyright © 2010 by d'Artis Kancs and Pavel Ciaian
The Impact of the EU Blue Card Policy on Economic Growth in the African Sending Countries
d'Artis Kancs and Pavel Ciaian
EERIEconomics and Econometrics Research Institute Avenue de Beaulieu 1160 Brussels Belgium
Tel: +322 299 3523 Fax: +322 299 3523 www.eeri.eu

1
The Impact of the EU Blue Card Policy on Economic Growth in the African Sending Countries1
d’Artis Kancs2 and Pavel Ciaian3
August 2010
Abstract: In 2009 the EU adopted a new migration policy instrument - the Blue Cards (BC) - for attracting highly skilled workers to the EU. The present paper examines the potential impacts, which BC may cause on the less developed sending countries (LDC). According to the adopted framework of innovative capital, the BC will reduce human capital in LDC. In addition, BC will also have a negative impact on knowledge capital. These findings suggest that the BC is not coherent with the EU’s development policy. Without appropriate policy responses, BC fade the developing country growth prospects away. In order to address the skill drain issues, we propose and examine alternative migration policy options for the LDC.
Keywords: African sending countries, high-skill migration, EU Blue Cards, innovative capital, economic growth, LDC.
JEL classification: F02, F22, J24, J61, O15.
������������������������������������������������������������1The authors acknowledge helpful comments from Julda Kielyte and participants of the European Society for Population Economics (ESPE) conference in Seville. The authors wish to thank anonymous reviewers for their valuable contributions and comments on earlier versions of this article. The authors are solely responsible for the content of the paper. The views expressed are purely those of the authors and may not in any circumstances be regarded as stating an official position of the European Commission. 2 European Commission (DG Joint Research Centre), Catholic University of Leuven (LICOS), and Economics and Econometrics Research Institute (EERI). Correspondence Address: European Commission, DG JRC, B-1049 Brussels, Belgium. E-mail: d'[email protected]. 3 European Commission (DG Joint Research Centre IPTS), Catholic University of Leuven (LICOS), and Economics and Econometrics Research Institute (EERI). E-mail: [email protected].

2
1. Introduction
In May 2009 the Council of the European Union adopted a directive aimed at facilitating conditions of entry and residence in the EU of highly skilled migrants for the purpose of highly qualified employment (European Commission 2009). The directive establishes more attractive conditions for highly skilled third-country workers to take up highly qualified employment in the member states of the Union, by creating a fast-track procedure for issuing a special residence and work permit called the "EU Blue Card" to highly skilled applicants. With the EU Blue Card (BC) scheme the European Union wants to attract the best-qualified labour from the developing world, which is increasingly important to overcome the labour shortages in the ageing European Union.
The Blue Card has two sides, however, and has already provoked controversial political discussions since its adoption. On the one side, the skilled labour attracted to the EU will certainly boost European competitiveness and economic growth. This is clearly expressed by the President of European Commission José Manuel Barroso:
"Skilled labour migration into Europe boosts our competitiveness and therefore our economic growth. It also helps tackle demographic problems resulting from our ageing population. This is particularly the case for highly skilled labour. With today's directive on EU Blue Card we send a clear signal: highly skilled migrants are welcome in the EU!"
The other side of the Card is that it might harm the less developed sending countries (LDC), as it will increase the brain drain from developing countries and make it even more difficult for LDC to improve their innovative capital which, according to recent growth theory findings, is one of the key drivers of the long-term economic growth. Not surprisingly, the recently adopted BC has been sharply criticised in the developing world. The Moroccan international economic law professor Tajeddine El Husseini brings it on the point:
"This is a new form of colonisation, of discrimination, and it will be very hard to find support for it among southern countries. Developing countries spend a lot of money educating and training technical students and then in the end the northern countries will cream off the best... it is a big mistake and a criminal act of the north to drain the south of its brainpower."
Among others, these reactions are caused by the fact that the adopted BC is much more complex migration policy instruments than simply opening the 'doors' for (poor) people from the developing world. BC not only relaxes migration restrictions, which under certain circumstances might be even beneficial for LDC sending countries, it will also destroy the natural self-selection of migrants by distorting migration incentives arising from the trade-off between wage differences and migration costs.
More precisely, the adopted BC is both a selective and discriminatory policy instrument. BC aims neither

3
at 'opening doors' for all poor people from LDC, nor at attracting labour from LDC in general. Instead, only the most skilled workers will be eligible for BC. In addition, the EU Blue Card can be revoked, if its holder has lost his job and was unemployed for more than three months! This mechanism implies a double-selection. At a first stage, only the most skilled workers from the total workforce in LDC will be selected and recruited to the EU. Second, only the most talented and successful of all recruited migrants will be allowed to stay and work in EU.4
Second, BC is discriminatory because it targets especially young male workers from LDC. For example, those highly skilled workers which are under 30 would need to earn only twice the minimum wage to be entitled to the scheme (for the rest the requirements is at least three times the minimum wage in the country concerned plus health insurance). Moreover, EU receiving country governments could decide to waive the salary requirement altogether, if the potential migrant is young enough and skilled enough. Thus, accounting for the gender wage gap, for young males it will be considerably easier to obtain BC than for older workers and women. This implies that EU aims at diverting the net tax income flow from LDC to EU.
Third, BC will distort international labour market price signals by reducing migration costs for highly skilled and, hence, increasing the net wage difference between EU and LDC. For example, fast-track procedure to obtain work and residence permits for highly skilled and single application procedure adopted by the European Council will lower the transaction costs for skilled migrants. In addition, BC holders will be treated favourably regarding tax benefits, social assistance, payment of pensions and access to public housing in the receiving countries.
Hence, BC will 'open the doors' only to a small share of selected persons from LDC, the moral aspects of what are highly questionable from a developing policy's perspective. In view of these and related controversies, the adopted BC raises several questions for the less developed sending countries. For example, what kind and size of socio-economic impacts of skilled worker emigration can be expected in LDC? What will be the long-term impacts of BC on growth and development in LDC?
The main objective of this study is to analyse the impacts of the recently adopted Blue Card scheme on the key drivers of economic growth in the less developed sending economies and, based on the gained insights, to propose appropriate policy instruments for dealing with the negative externalities caused by skilled worker emigration, which will be accelerated by the EU Blue cards.
The paper is structured as follows. Section 2 presents the underlying conceptual framework. In section 3 we analyse theoretically how BC and the associated skilled labour migration affects the main
������������������������������������������������������������4 This also suggests that LDC may have been financing education for human capital, who contributes to growth and tax payments in EU.

4
determinants of innovative capital in LDC: educated labour force, international distribution of skilled workers, domestic knowledge accumulation, and international knowledge flows. Analysing the impacts of BC we rely mainly on theoretical and graphical devices, the main reason of which is that the BC directive was adopted only two months ago, there is no empirical evidence about its impacts available yet and hence it is too early for an empirical assessment. Section 4 draws policy recommendations for LDC in order to address the adverse impacts of skilled labour emigration. Section 5 concludes.
2. Conceptual framework
Innovative capital in general and human capital in particular takes a central role in most theories of economic growth and development. Both the augmented neo-classical growth models (Solow 1956; Mankiw et al 1992) and endogenous growth models (Lucas 1988; Romer 1990) stress the importance of innovative capital in economic development in one way or another. For reasons explained below, we rely on the Romer's (1990) model.
2.1. Endogenous growth
The endogenous growth model of Romer (1990) has three sectors: a technology producing sector, an intermediate goods producing sector where capital goods are produced, and a final output producing sector. The production function is given by
dixLLQ i
I
UH����
����� 1
0 (1)
Where UL is share of unskilled labour and �HL is the share of human capital employed in the production sector, which depends on the overall stock of human capital HHHT LLL �� � , with the latter denoting the share of human capital devoted to the accumulation of technology, I . The part of human capital that is not used for producing goods and services, HL , is used for creating new technologies. The level of human capital, HL , has thus a positive effect on the growth of technology, I , the level of which determines the number of differentiated intermediate goods, x .
The innovation sector operates according to a national innovation production function:
21 �� KLI H�� (2)
where I� is a sustainable rate of innovation. According to equation (2), the sustainable rate of innovation,
I� , is an increasing function of the number of skilled workers, HL , and the stock of knowledge available to these skilled workers, K . The two coefficients ( 1� and 2� ) measure the relative contribution of the two innovative inputs: human capital and knowledge capital. Parameter 1� determines whether the marginal product of an additional invention is increasing (the so-called 'standing on shoulders' effect, Caballero and Jaffe 1993) or decreasing (the so-called 'fishing out' hypothesis) in the stock of human capital, and parameter 2� determines the returns to scale with respect to the stock of existing knowledge.

5
Coefficient is a productivity parameter, which captures all other factors affecting the creation of innovative capital but not captured by variables HL and K .
Romer's (1990) model is particularly attractive for our study for two reasons. First, the rate of technological change is endogenous because the share of the economy devoted to the innovation sector is a function of the skilled workforce (determining HL ), and the allocation of resources to innovative activities depends on the R&D productivity. Second, the rate of technological change is endogenous because the productivity of innovation creation is sensitive to the stock of knowledge capital, K , created by past innovations. Although, there is neither a general agreement on the precise values of these parameters nor on the functional form linking innovations to economy-wide long-term productivity growth, there is a relatively broad agreement that these factors are, indeed, crucial in explaining the realised level of economy-wide innovation (Furman at al 2002).
2.2. Determinants of growth: the innovative capital
Applying a logarithmic transformation to equation (2) and rewriting the growth rate in form of stock changes we obtain innovation production for a closed economy:
KLI H lnlnln 21 �� ��� (3)
According to equation (3), the national innovative output, I , is an increasing function of the size of skilled workforce, HL , and the stock of knowledge available to workers, K . Given that both innovative inputs ( HL and K ) are accumulable, their endowment is determined endogenously in the model. The size of the human capital, HL , is determined by skilled labour wage, Hw , and the size of knowledge capital, K , depends on national R&D.
In open economies with international flows of knowledge and human capital, the national innovative capital depends not only on country's endowment with skilled workers and technology, but also on the net migration of skilled labour (Sjaastad 1962; Bhagwati and Rodriguez 1975) and international knowledge spillovers (Krugman 1979). Not accounting for skilled labour emigration would underestimate the return to education (human capital), whereas not accounting for international knowledge spillovers would underestimate the marginal revenue of national R&D expenditure (knowledge capital). Therefore, we introduce high-skill migration and international knowledge flows into equation (3), which yields:
� �mSmH
SH
SS KKLLI ����� lnlnlnln 21 �� (4)
According to equation (4), open economy S 's innovative output, SI , depends on the size of skilled workforce, S
HL , net migration of skilled workers, mHL , domestic knowledge production through R&D,
SK , inward knowledge spillover, mK , and parameters of the model.5 The relative contribution of the
������������������������������������������������������������5 For the sake of simplicity, we assume that national knowledge spillovers are already accounted for in the domestic knowledge

6
four components to national innovative supply, SI , depends on the equilibrium strategies of economic actors.
2.4. Human capital
Assume that sending country S is endowed with �SU
SH
S LLL �� units of labour, which is shown on the horizontal axis in the left panel of Figure 1. Skilled labour, S
HL , is measured from the left to right, whereas unskilled labour, S
UL , from the right to the left. Curves SHD and S
UD represent the demand for skilled and unskilled labour, respectively, and S
HS is the supply of skilled labour in S .
According to equation (4), workers decide on two issues: education and migration.6 First, we consider the education decision in autarky, where workers choose between offering unskilled labour versus investing in education and offering skilled labour. According to Averett and Burton (1996), the education decision is determined by a trade-off between skill premium (difference between skilled wage, S
Hw , and unskilled wage, S
Uw ), the cost of education, SEC , and the stock of knowledge, SK . Thus, in equation (5) we explicitly assume that education is costly for workers. These costs capture both direct costs of education, such as tuition fees, as well as indirect costs, such as worker opportunity costs and education effort (which is different across individuals).
),,,( SSSH
SU
SH
SH KECwwLL � (5)
Given that education is costly, workers invest in education only if education increases their net income.7
Thus, net of education costs, workers must earn at least the unskilled labour wage, which in equilibrium is equal to �S
Uw . The vertical difference between skilled labour supply, SHS , and the equilibrium unskilled
wage rate, �SUw , represents the cost of acquiring education (Figure 1, left panel). Its slope is increasing
because workers are not equally talented, they are heterogeneous in their ability to acquire education (Cameron and Heckman 1998). In line with Willis and Rosen (1979), the last skilled worker, who enters education at �S
HL , is just able to compensate the education costs, his skill premium is equal to zero. Assuming full employment, the rest of workers, *S
HS LL � , stay unskilled. The equilibrium wage of
unskilled workers without migration, �SUw , is at the point where the demand for unskilled labour, S
UD ,intersects the vertical line at �S
HL . The equilibrium stock of skilled labour is �SHL and skilled labour wage
rate is �SHw . In equilibrium the education cost of the marginal worker, who enters education, is equal to
�EC .8
������������������������������������������������������������������������������������������������������������������������������������������������������������������������������������������������production function, KS. The LDC sending country is denoted with superscript S and the EU receiving country with superscript R.6 We recognise that in reality there are many more decisions to make, e.g. labour-leisure, consumption, etc. 7 We implicitly assume that all workers, for whom it pays off to become skilled, invest in education. 8 For the sake of graphical tractability, we assume that the elasticity of unskilled labour demand is infinitely elastic. If the

7
The equilibrium for receiving country, R , is analogous. In absence of migration, the equilibrium skilled wage, unskilled wage and the stock of skilled labour are �R
Hw , �RUw , and �R
HL , respectively (Figure 1, right panel).
Second, we consider the skilled worker decision where to offer their work, at home or abroad, which determines the short-run equilibrium migration. According to Sjaastad (1962), the trade-off, which workers face here, is given by the expected income increase through migration versus migration costs, MC, (equation 6).9 Workers migrate if the expected benefits arising from migration are higher than the migration costs.10
),,( MCwwLL RH
SH
mH
mH � (6)
where mHL is skilled labour migration, R
Hw is skilled wage rate in R , and MC are migration costs.
Due to cross-country differences in knowledge capital, SR KK , the receiving country, R , is more developed than sending country, S . Differences in country development and hence wage levels trigger migration from S to R . In the presence of positive migration costs, 0 MC , the net wage, which migrant workers earn, is lower than the skilled incumbent wage in R , because the net wage of migrants is equal to skilled wage in destination country, R
Hw , minus migration costs, MC .
According to migration network theory and the empirical evidence (Carrington, Detriagiache and Vishwanath 1996), migration costs are not constant, they decrease in the number of migrants from Sresiding in R . In Figure 1 (middle panel) these network effects are captured by a decreasing vertical distance between curves m
MCS and mS . The curve mS is migrant work supply on the international labour market, which is derived by subtracting skilled labour supply, S
HS , from skilled labour demand, SHD , in
S . The curve mMCS is migrant supply adjusted by migration costs MC .
In equilibrium mHL skilled workers migrate incurring migration cost, �MC , and receiving net wage,
��� �� MCww RHo
mH . The equilibrium wage rate of skilled labour, �R
How , is determined by the intersection of migration supply, m
MCS , and migration demand mD (Figure 1, middle panel). Migration demand, mD ,is derived by subtracting skilled labour demand, R
HD , from supply, RHS , in R. (right panel in Figure 1).
Immigration reduces skilled wage in R from �RHw (skilled equilibrium wage without migration) to �R
How
������������������������������������������������������������������������������������������������������������������������������������������������������������������������������������������������elasticity of unskilled labour demand would be partially elastic, then there would be additional unskilled labour wage effect, which would affect the ratio of skilled/unskilled workers in S. However, the obtained results with partially elastic unskilled labour demand would be qualitatively similar to those presented above. 9 These costs include not only the direct transportation costs to the destination country, but also employment uncertainty (whichis higher abroad than at home), social costs of leaving family and/or friends behind, cultural adjustment costs, language barriers, etc. (Straubhaar 1986). 10 We recognise that in reality the migration decision of workers is driven not only by wage differences but also by non-economicconsiderations. However, in the present study we abstract from all other determinants of migration and consider cross-country wages differences as the only force driving labour migration.

8
(skilled equilibrium wage with migration). The magnitude of the wage effect depends on the sending country S 's relative size - the larger is S relative to R , the bigger is the wage effect in R . If S is sufficiently small, then migration does not affect the equilibrium wage rate in R at all. This would be the case if S faces perfectly elastic skilled labour demand in R , such as R
HD 1 (Figure 1, right panel). In this case, the equilibrium skilled labour wage in R would be equal to �R
How both with and without migration and migration would be equal to m
HL .
Workers from S migrate to R as long as ��� � SH
RH wMCw . The mass of skilled workers that emigrate,
SnH
SmH LL � , is determined by the slope of migrant work supply curve, m
MCS . Due to emigration, the stock of skilled and unskilled labour in S decreases from �S
HL to SnHL , and from �� S
HS LL to Sm
HS LL � ,
respectively. Given that the stock of skilled workers decreases relatively more than that of unskilled, the return to education increases. As a result, the equilibrium mass of workers who acquire education increases from �S
HL to SmHL , with Sm
HSH LL �� .11
In Figure 1 we have assumed that only skilled workers have a migration option. Abstracting from the unskilled worker migration is motivated by two considerations: the focus of the study and the empirical evidence (Salt 1997). Moreover, it can be easily verified that, as long as the condition �S
USH LL / m
HL mUL/
holds, the results with unskilled labour migration would be qualitatively equal to those presented here.
2.4. Knowledge capital
According to equation (4), the level of knowledge available in S is determined by domestic knowledge production and foreign knowledge spillovers. Knowledge creation involves production of new knowledge, whereas knowledge adoption is uptake of knowledge developed in other countries (both are
������������������������������������������������������������11 In many LDC (particularly in African economies) the labour force participation rate is very low in terms of percentage of the working age population, which implies potentially high elasticity of total labour supply, LS; contrary to our assumption of fixed labour supply. However, the general results of the paper would not be affected if we relax the assumption of fixed total laboursupply. The intuition is the same as in the case of the elasticity of unskilled labour demand. This is due to the fact that we implicitly assume that all workers, for whom it pays off to become skilled, invest in education and become skilled. Hence, at the margin the size of the total labour supply elasticity affects the wage and the stock of the unskilled labour and not of the skilled labour. Note, that an increase in the elasticity of total labour supply has an equivalent effect (in terms of the unskilled labourwage adjustment) as an increase in the elasticity of unskilled labour demand. If both elasticities (the total labour supply and the unskilled labour demand) are perfectly elastic then the wage of skilled labour would be fixed.
However, Easterly and Nyarko (2008) argue that migration may actually increase the stock of skilled labour in the sending LDC country as incentives to acquire human capital increase. This is contrary to our theoretical findings. In Figure 1 we have shownthat the equilibrium stock of labour which acquires education increases, from �S
HL to SmHL , but the stock of skilled labour in the
sending country decreases, from �SHL to Sn
HL . The increase in the skilled labour in the sending LDC country in the presence of migration could arise for instance due to heterogeneity in transaction costs related to the skilled labour participation in thedomestic and the migration market, due to skilled labour supply differentiation between the domestic and migration markets and/or due to other factors. These factors would certainly bring additional insights into the analyses. However, they are outside the scope of the present paper, and are a promising avenue for future research.

9
costly). In order to increase the level of knowledge, sending country, S , can invest in knowledge production (new knowledge) or in knowledge adoption of inward spillovers (adopted knowledge).
In equation (7) the level of technology (knowledge) available in S is determined by a total (private and public) expenditure on knowledge, STR , and skilled workforce, S
HL . Knowledge, SK , increases in both R&D expenditure, STR , and human capital, S
HL , which increases the productivity of knowledge.12
),( SH
SSS LTRKK � (7)
In absence of knowledge flows between countries (autarky), the only source of country S 's knowledge improvement is innovation through investment in R&D. The autarky equilibrium knowledge in S is shown upper panel of Figure 2, where the horizontal axis measures the level of knowledge, SK , and the vertical axes measures units of expenditure spent on knowledge accumulation, )/( SSS KTRtr � . We assume that marginal costs of knowledge creation, S
CMC , are increasing in technological development, and marginal productivity (benefit) of knowledge demand, SMB , is decreasing in technological development (both new and adopted knowledge). This is represented by the upward and downward sloping marginal cost and productivity curves, SMC , and SMB , respectively (upper panel in Figure 2). In absence of international knowledge flows, the equilibrium domestic innovation, �S
CK , is at the point where marginal costs of knowledge creation, S
CMC , and marginal productivity of knowledge, SMB are equal. The equilibrium innovation, �S
CK , implies �Str units of R&D expenditure.
Analogously, knowledge for receiving country, R , is shown in bottom panel of Figure 2. The intersection between receiving country, R 's, marginal cost of knowledge creation, R
CMC , and marginal productivity of knowledge, RMB , yields equilibrium domestic innovation and per unit expenditure �R
CK and �Rtr ,respectively. Assuming higher skilled/unskilled worker ratio in R implies higher equilibrium knowledge in R than in S , ( �� S
CRC KK ).
Next, consider the opening of borders for international knowledge flows. As shown in Figure 2, in open economy equilibrium more knowledge available in R allows S to adopt inward knowledge spillovers from the more developed R . The maximum level of spillover knowledge which can be adopted in S is equal to the R 's equilibrium knowledge production, �R
CK . On the other hand, in a two country model Rcannot benefit from knowledge spillovers from S , because the technological development in S is lower than in R .
We assume that S 's marginal costs of knowledge adoption are constant, given along the horizontal line SAMC , which implies that in absence of knowledge flows between countries, the equilibrium expenditure
of knowledge creation, �Str , is higher than the marginal costs of knowledge adoption, �� SSA trMC in
������������������������������������������������������������12 This follows from equation (2).

10
equilibrium.13,14 This assures that in the presence of knowledge flows between countries, the knowledge adoption may yield positive profits. The total equilibrium knowledge in S is m
TK , which is a sum of domestically created knowledge, m
CK , and the adopted foreign knowledge, )( mC
mT
mA KKK �� . Hence, in
the presence of international knowledge spillovers the equilibrium knowledge production is lower in S ,�� S
CmC KK (though the total knowledge in S is higher, � S
CmT KK ). Note that knowledge equilibrium in
R is not affected by international spillovers, because due to country development gap, knowledge spillovers are one-directional: from the more developed receiving country, R , to the less developed sending country, S .
3. The impact of BC on innovative capital in LDC
BC affects the innovative capital equilibrium, by reducing migration costs and improving access to skilled jobs in EU, which in short-run leads to a positive skilled wage gap between EU and LDC.15 Positive net of migration cost wage differences trigger migration of skilled workers from LDC to EU. In the long-run, in addition to these direct labour market effects, migration also induces adjustments in the stock and accumulation of innovative capital (knowledge and human capital). Applying the innovative capital framework from section 2 we analyse graphically how BC would affect innovative capital in LDC: human capital accumulation through workforce education, long-run migration and inter-regional distribution of skilled workforce, and domestic knowledge accumulation through R&D and international knowledge spillovers.
3.1. BC impact on human capital accumulation in LDC
BC affects the long-run education equilibrium, which determines the share of educated workforce, through several channels. According to Freeman (1986), the four most important effects are changes in skilled/unskilled wage ratio in LDC, job and wage upgrading effect in EU, increased education cost per worker, and remittance-flow induced changes in worker income and education costs.
First, through skilled worker emigration, BC induces changes in relative wages in LDC, which in turn affects education incentives. Given that under BC only skilled workers can migrate or, alternatively, more skilled workers migrate than unskilled, m
UmH
SU
SH LLLL // � , the ratio of skilled/unskilled workers will
������������������������������������������������������������13 Note that we assume differences in marginal costs between knowledge creation and knowledge adoption. This is consistent with the finding in the literature. According to Mansfield (1981), on average imitation costs are about 65 percent of the original innovation costs. Further, we assume that both new and adopted knowledge are homogenous in production, i.e. they do not differ with respect to marginal productivities. 14 In reality the marginal costs of knowledge adoption may increase with the additional knowledge adopted. However, the slope of the marginal costs of knowledge adoption should be lower than the marginal costs of knowledge creation (Mansfield 1981). To simplify the figures we assume constant marginal costs of knowledge adoption, but the results hold in general. 15 In line with the empirical evidence, we assume that LDC sending country, S , is less developed than EU receiving country, R , (i.e.
�
� RC
SmT KK ) and hence skilled wage in LDC is lower than in EU,
��
SH
RH ww .

11
decrease in LDC. A declining supply of skilled labour will exert upward pressure on the wage rate for skilled labour. The increased skilled/unskilled wage gap will induce additional unskilled workers to obtain education. Thus, through wage adjustments in LDC, BC will increase the long-run education equilibrium in LDC. The education effect of skilled/unskilled wage ratio is shown in Figure 1. In absence of BC the equilibrium wage of skilled labour is m
Hw and the equilibrium wage of unskilled labour is �SUw
in LDC (Figure 1, left panel). BC reduces migration costs. To simplify the graphical exposition we assume that BC reduces migration costs, MC, to zero. As a result, the excess supply of skilled labour increases from m
MCS to mS and the equilibrium skilled labour wage in LDC increases to mHBw , implying
that the wedge between skilled and unskilled labour wage in LDC increases.16 Because of higher skill premium, more workers obtain education under BC. The mass of LDC workers who acquire education increases from Sm
HL to SmHBL .
Second, through the job and skill upgrading, BC increases the average earnings of skilled migrants in EU, which affects worker education decisions in LDC. The empirical evidence from the Western European and the North American destination countries suggest that in absence of BC only a small part of highly skilled immigrants from LDC are employed in skilled jobs (Salt 1997). The majority of skilled migrants from LDC work in sectors and jobs requiring little qualification, such as agriculture, transport or construction.17 The downgrading of migrant skills in EU affects the education decision of unskilled workers in LDC. With upward sloping labour supply and downward sloping labour demand as in Figure 1, international labour migration equalises the skilled wage in LDC with unskilled wage in EU (net of migration costs), as migrant skills are downgraded in EU. The equilibrium wage, m
Uw , is determined by the intersection of unskilled wage in EU, �R
Uw , and skilled migrant supply, mMCS , and reduced by
migration costs vertically along the mS , yielding the equilibrium net wage of skilled labour in the presence of migrant skill downgrading in LDC equal to m
Uw . The equilibrium migration is mHL 1 .18
BC stops the brain waste by allowing skilled migrants from LDC to work in skilled jobs in EU. This increases their wage to the EU skilled wage, implying that the incentives for education and migration are considerably higher under BC. In Figure 1 BC shifts the equilibrium skilled wage to m
HBw . Under BC there is more migration, m
HBmH LL �1 , and less skilled workers stay in LDC, Sn
HBSnH LL 1 . On the other hand,
the incentives for acquiring education in LDC also increase, because under BC the wage rate of skilled labour is higher in LDC, m
HBmU ww � , resulting in more educated labour force, Sm
HBmH
SnH LLL �� 11 . Thus,
������������������������������������������������������������16 The exact magnitude of this wage ratio effect depends on the elasticity of unskilled labour demand. In Figure 1 the elasticity of unskilled labour demand is assumed to be infinitely elastic implying no unskilled wage effect. 17Data from the US and Swiss censuses show that because of labour segmentation in destination countries only about one third of migrants from the Balkans with tertiary education have obtained skilled jobs. 18 Note that in the presence of migrant skill downgrading the stock of skilled labour in EU is not affected by migration from LDC.

12
because of higher average wages, which migrants from LDC get in EU, skilled labour wages increase also in LDC, which in turn increases the education equilibrium.
Third, being double-selective, BC will increase the average education cost per worker and hence decrease the share of educated workforce. It is well known that people are not equally talented, they are heterogeneous in their abilities. The life-time utility maximisation of workers implies that, in the presence of positive education costs, only the most talented individuals obtain education (Willis and Rosen 1979, Cameron and Heckman 1998). More precisely, only those workers enter education, whose post-education productivity is sufficiently high to cover the fixed cost of schooling. In Figure 1 worker heterogeneity is represented by the upward sloping skilled labour supply curve, S
HS . In absence of BC the share of skilled workforce in LDC is Sm
HL . Hence, those workers which were unskilled before introduction of BC, have not only less skills, but, on average, they are also less talented than those workers who have first obtained education. Education is more costly for the remaining workforce (because on average it is less talented and less productive even after becoming skilled). Given that in terms of productivity gains the education costs per less talented worker are higher than per talented worker, there will be less human capital at each given skilled/unskilled wage gap. In Figure 1 the upward sloping education cost curve, S
HS , implies that the average cost of education under BC is higher,
��
�� �� SU
mH
mmB
SU
mHB wwECECww , and the
average net gain from schooling is lower (Card 1995)
Finally, BC affects the education equilibrium in LDC also through remittances. Depending whether remittances are invested in education and whether workers consider them as an additional stream of income in their lifetime utility maximisation problem, remittances may have a positive or a negative impact on education equilibrium in LDC. In both cases the changes are caused by rents, which emigrants receive in EU and, as other groups of migrants, remit part to their families in LDC. Both remittance effects find support in the literature (Edwards and Ureta 2003; Chami, Fullenkamp and Jahjah 2003).
According to World Bank (2000), remittances of skilled migrants are more often spent on investment goods, e.g. fixed assets and education, compared to unskilled worker remittances, which usually are spent on consumption goods.19 Hence, BC remittances may move upward or remove completely the liquidity constraint of education in LDC. As a result, more workers, particularly those which were restrained from education by a binding liquidity constraint, are able to acquire skills through the education (Carneiro and Heckman 2002, Cao 2008, Stinebrickner and Stinebrickner 2008). The effect of remittances is shown in Figure 3. Similar to Figure 1, the equilibrium skilled wage in LDC without BC is m
Hw and with BC - mHBw
������������������������������������������������������������19 According to Cox (1987), skilled worker remittances differ from unskilled worker remittances in at least two respects: quality and quantity. On the one hand, highly-skilled migrants remit less than unskilled because skilled migrants are more likely to settle and to reunite with their family in EU. On the other hand, in contrast to unskilled worker remittances, which are mostly spent for consumption goods, remittances of skilled migrants are more often invested in production, fixed assets and education (World Bank 2000).

13
. Through migration BC increases worker welfare by area ab . The worker's welfare increases because of remittances (area b ) and because of the increased skilled labour wage in LDC (area a ). Remittances invested in education shift the skilled labour supply from S
HS to SHS 1 and migration from m
HBL to mHL 1 ,
with mH
mHB LL 1� . In the same time, because of lower skilled labour wage, the stock of skilled labour in
LDC increases from SnHBL to Sn
HL 1 , with SnH
SnHB LL 1� .
On the other hand, remittances may also have the opposite effect; they may decrease skill accumulation through education. Through cash inflow from remittances, BC increases disposable worker income in LDC. Given that work supply curve is U-shaped in worker income, higher total income may also reduce education attendance and work supply in LDC. In Figure 3 this is represented by a decreasing supply of skilled labour from S
HS to SHS 2 and migration from m
HBL to mHL 2 . As a result, the LDC's human capital
stock decreases from SnHBL to Sn
HL 2 , with SnH
SnHB LL 2 .
In summary, the two effects (the increased skilled/unskilled wage ratio in LDC, and the job and wage upgrading effect in EU) have positive impact on worker education, one negative (increased education cost per worker), and one ambiguous (the remittance-induced changes in worker income and education costs), which implies that the total impact of BC on the education equilibrium in LDC is ambiguous.
3.2. BC impact on international distribution of labour force
As noted above, in the short-run through the reduced migration costs and the improved access to skilled jobs in EU, BC increases the net of migration cost wage gap between EU and LDC, and hence it affects the international labour market equilibrium. The increased wage differences trigger skill migration - driven by higher expected earnings in EU skilled labour market - from LDC to EU. In the long-run, in addition to this direct short-run effect on skilled labour force distribution between LDC and EU, migration itself affects determinants which drive migration, e.g. international wage differences and migration costs. Both the direct brain drain effect and the induced second-round migration effects (changes in relative wages in LDC and EU and changes in migration costs) are examined in this section.20
The direct and most visible effect induced by BC is transfer of human capital embodied in migrant labour from LDC to EU.21 Given that skilled migrants embody private productive skills, the excludability character of human capital implies that the increase in the stock of human capital in EU is proportional to a decrease in the stock of human capital in LDC. In Figure 3 BC increases skilled labour migration from
mHL to m
HBL (middle panel). In the BC equilibrium the LDC has less skilled workers SnHBL , with
������������������������������������������������������������20 In reality, there many more forces at work. For example, the economic geography and urban systems literature stress that because of agglomeration economies, firms in the larger region will be able to pay higher wages attracting in such a way even more workers. We abstract from these effects, as at international scale they are less pronounced. 21 Given that the human capital embodied in skilled workers is draining out of country, in the migration literature this effect isoften referred to as a 'brain drain'.

14
SnH
SnHB LL � (left panel). Thus, because of brain drain, BC has a strictly negative impact on human capital
in LDC.
In the long-run, the skilled worker migration affects wages in LDC. By reducing labour supply in LDC, the skilled worker emigration will exert upward pressure on wages in LDC (if the labour demand does not change). This will narrow the migration-driving wage gap between LDC and EU, implying less migration in the long-run. Thus, because of increasing skill premium in LDC, the long-run losses of human capital induced by BC are lower compared to the short-run.
According to Borjas (1994), international labour migration affects wage rate not only in the sending countries but also in the receiving countries. Through the increased labour supply of skilled workers in EU, emigration will exert downward pressure on skilled wages. Lower skilled/unskilled wage ratio in EU will narrow the migration-driving wage gap between LDC and EU, which in turn will attract fewer Blue Card migrants. Thus, because of decreasing skill premium in EU, the long-run losses of human capital induced by BC are lower compared to the short-run.
Both wage effects on the international distribution of labour force are shown in Figure 3, where in the long-run migration equalises the wage rate between LDC and EU. Through the skilled migration, BC reduces the skilled wage in EU from �R
How to mHw . In contrast, in LDC the skilled wage increases from
mHw to m
HBw (Figure 3). In the long-run the equilibrium wage rate for skilled labour, mHBw , is equalised
across countries and the equilibrium migration equals to mHBL . Hence, because of LDC and EU wage
effects, the long-run losses of human capital induced by BC are lower compared to short-run.
Both wage effects depend on the relative country size and size of the migrating population. The larger is LDC, the bigger is the wage effect in EU, and the larger is the share of migrating population, the more significant is wage effect in LDC. Analogously, if LDC is small relative to EU, then the labour migration does not affect (affects little) skilled labour wage in EU. In Figure 3 the small LDC country case implies perfectly elastic skilled labour demand in the EU given by R
HD 1 . In this case the equilibrium skilled labour wage in EU would be equal to �R
How , both with BC and without BC. The equilibrium skilled labour migration would equal to m
HL without BC and mHoL with BC. Compared to migration from a large LDC,
more skilled workers emigrate, mHB
mHo LL , implying less human capital in LDC. Thus, the long-run
losses of human capital induced by BC are lower in the long-run compared to the short-run; and from a large LDC compared to a small LDC.
Blue Card holders base their migration decision on the net wage differences between EU and LDC, i.e. gross wage difference minus migration costs (Sjaastad 1962).22 Workers migrate if the expected benefits
������������������������������������������������������������22 Migration costs include not only the physical relocation costs but also employment uncertainty (which is higher abroad than athome), social costs of leaving family and/or friends behind, cultural adjustment costs, etc.
15
arising from migration are higher than migration costs. According to Carrington, Detriagiache and Vishwanath (1996), migration costs are decreasing in the migrant stock from LDC in EU. The declining migration costs in turn widen the net wage gap between LDC and EU attracting more skilled migrants.
The migrant network effect on migration decision is shown in Figure 4, where the starting point is equilibrium migration with endogenous migration costs, MC , given along the migrant supply curve m
MCS. With constant migration costs, 1MC , skilled labour migration supply is m
MCS 1 . For both types of migration costs the equilibrium skilled labour wage in LDC and the equilibrium skilled migration without BC is m
Hw and mHL , respectively. We assume that BC reduces migration costs by c . This implies that the
skilled migrant supply with constant migration costs shifts to mMCBS 1 and the skilled migrant supply with
endogenous migration costs shifts to mMCBS . The skilled wage rate in LDC decreases to m
HBw 1 and mHBw ,
respectively. This implies that with constant migration costs, 1MC , the effect is weaker on both the skilled migration and the skilled wage rate than if migrant networks reduce migration costs, MC , with
mHB
mHB
mH LLL �� 1 and m
HBmHB
mH www �� 1 , respectively. With constant migration costs BC leads to a
smaller decline of the skilled labour force in LDC than with endogenous migration costs, SnHB
SnHB
SnH LLL 1 . Thus, in the presence of migration networks and decreasing migration costs the impact
of BC on brain drain is stronger than with constant migration costs.
In summary, the direct brain drain effect is magnified by decreasing migration costs. On the other hand, adjustments in the skilled/unskilled wage ratio in LDC and EU reduce the direct brain drain effect on the human capital in LDC. These findings are in line with previous migration literature (Lowell and Findlay2001; Lucas 2004; Katseli, Lucas and Xenogiani 2006; Kancs and Kielyte 2010). Depending on the relative strength of the three induced supply side effects, the size of skilled work force migrating from LDC to EU can be either higher or lower in the long-run compared to the short-run. In either case, it is important for migration policy planning to be aware of potentially sizeable differences between the short-run and the long-run migration and hence the impact of BC on the distribution of skilled workforce between LDC and EU.
3.3. BC impact on R&D and innovation in LDC
BC affects both the level and the productivity of knowledge capital. The two key determinants of national R&D activities is the size of budget (government revenue) and the budget share spent on R&D. Directly, BC affects the size of the government budget which in turn affects the R&D investments and hence knowledge accumulation equilibrium. Indirectly, BC affects also the structure of the government budget (Kancs and Ciaian 2007). Through changes in the skilled labour force, BC also affects the productivity of knowledge production.
First, through the emigration of skilled workers, BC reduces the number of taxpayers and hence the tax

16
revenue in LDC. Given that, on average, skilled workers are higher net contributors than unskilled workers, government revenue decreases both due to fewer tax contributors and due to fewer taxpayers with high taxes.23 Lower tax revenue reduces government expenditure on science, research and development. On the other hand, higher skilled/unskilled wage ratio (due to upward pressure on skilled wages) increases government tax revenue per skilled worker. Thus, because of smaller government budget but larger budget per capita, the impact of BC might be both reducing or increasing R&D and hence the accumulation of knowledge capital.
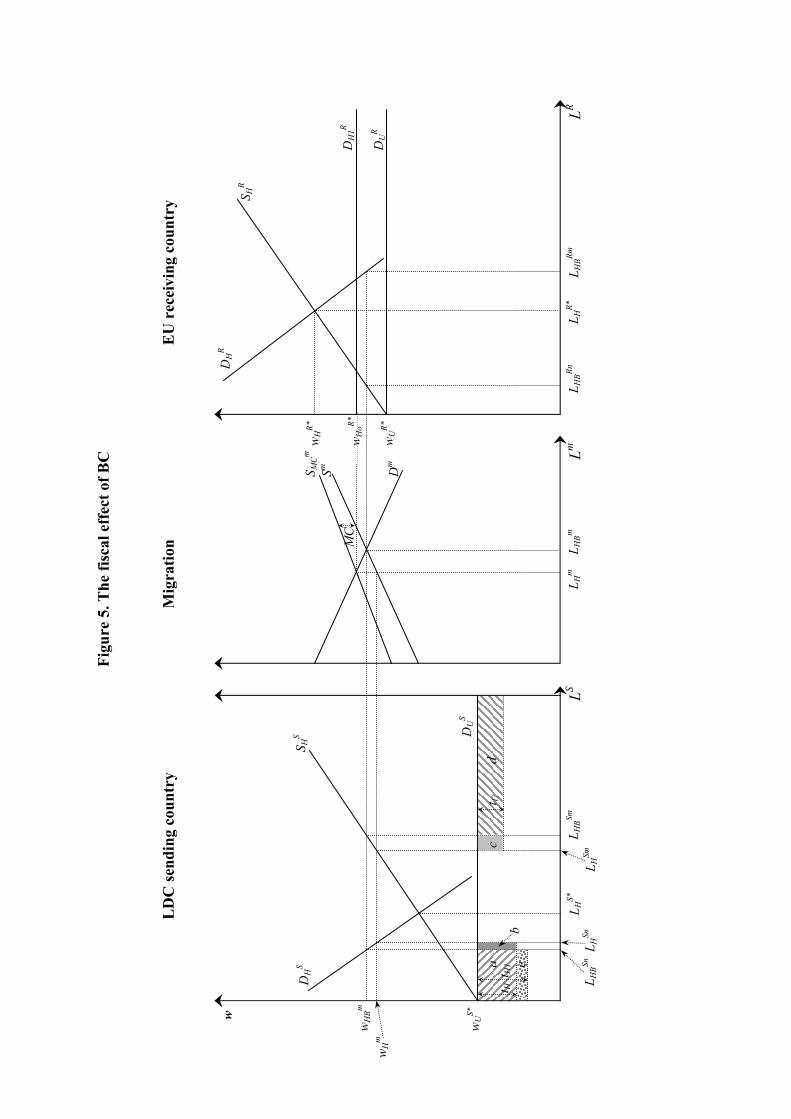
The fiscal impact of BC is shown in Figure 5. The income taxes paid by skilled and unskilled workers are
Ht and Ut , respectively, where UH tt . If taxes are paid as a fixed rate of gross wages, then the absolute value of taxes paid by skilled labour increases under BC, 1Ht , because of higher wage, 1HH tt � . The total tax revenue without BC is equal to area abcd , and to area ade with BC. With BC the number of individuals who pay taxes declines by Sn
HBSnH LL � for skilled labour and by Sm
HSmHB LL � for unskilled
labour, which reduces tax revenues by area bc . Because the skilled labour wage increases with migration, the tax revenue increases by area e . If area bc is larger than area e , then tax revenue declines, otherwise it increases with the introduction of BC. Thus, the total fiscal impact of BC depends on the relative size of these areas, which in turn depends on the size of brain drain, spillover effect, public technical knowledge transfer effect, unskilled labour productivity effect and remittance effect.
Second, knowledge productivity in LDC decreases, because after the introduction of BC part of skilled labour from LDC migrates to EU, implying that fewer skilled workers are available in LDC. As a result, the absorptive capacity decreases (Cohen and Levinthal 1990). In Figure 6 (upper panel) this implies that the marginal productivity curve shifts downward from SMB to S
BMB and the equilibrium knowledge decreases from m
TK to mTBK 1 . On the other hand, BC increases knowledge productivity in EU, because
immigration increases skilled labour supply. In Figure 6 (lower panel) higher stock of skilled labour increases EU's marginal productivity of knowledge from RMB to R
BMB and the equilibrium knowledge increases from �R
CK to �RCBK . More knowledge in EU does not affect the knowledge level in LDC,
because the LDC's absorptive capacity is constraining absorption of more foreign knowledge - both with and without BC not all knowledge produced in EU is absorbed by LDC, �� R
CmT KK and �� R
CBmTB KK 1 ,
respectively.
3.4. BC impact on international knowledge flows
The key channel through which skilled migration affects knowledge transmission barriers is the diaspora effect. The limiting effect of spatial barriers, such as distance, on knowledge spillovers has been
������������������������������������������������������������23 Because on average the wage rate for skilled work is higher than for unskilled and the unemployment rate among the skilled workers is lower, per capita, skilled workers contribute more to tax revenue than unskilled workers.

17
confirmed both nationally and internationally. E.g. Jaffe et al (1993), Acs et al (1994), and Audretsch and Feldman (1996) argue that knowledge spillovers are rather localised. Among the first papers employing patent citations for studying the issue of cross-border mobility of knowledge are Jaffe et al (1993) and Jaffe and Trajtenberg (2002). They find that a patent is typically 30 to 80 percent more likely to cite other patents whose inventors reside in the same country, than patents from other countries. This suggests that the cross-border mobility of knowledge is limited and that knowledge spillovers are spatially localised. Maurseth and Verspagen (2002) use citations between European regions to estimate the effect of distance on knowledge flows. Their results indicate that distance has a negative impact on knowledge flows and that this impact is substantial. They find knowledge flows to be larger within countries than between regions located in separate countries, as well as within regions sharing the same language (but not necessarily belonging to the same country). In a similar study, using the NBER patent and citations data, Peri (2003) finds that only fifteen percent of average knowledge is learned outside the region of origin and only nine percent outside the country of origin. Findings from these studies suggest that knowledge flows locally more easily than at a distance.
Kapur (2001) argues that skilled worker migration facilitates the spillover of knowledge, technology and business contacts from destination countries, by interacting as a carrier between knowledge producing country and knowledge absorbing country. In migration literature this effect is known as diaspora effect. This in turn suggests that skilled worker migration induced by BC will reduce the barriers of EU's knowledge flows to LDC and increase the absorptive capacity. In Figure 6 (upper panel) the marginal costs of knowledge adoption decreases from S
AMC to SABMC and the equilibrium total knowledge shifts
from mTBK 1 to m
TBK . Thus, through the reduced knowledge transmission barriers, BC will increase the productive inward knowledge spillovers.
In summary, the diaspora effect induced by BC will increase the inward knowledge spillovers and reduce the costs of foreign knowledge absorption. This result is in line with empirical evidence (Kapur 2001).
4 Policy recommendations
Often migration policy studies propose either (i) infeasible policy recommendations, such as to restrict emigration (Abella 1992); (ii) rather general policy recommendations, such as to improve the economic situation in LDC (Lowell and Findlay 2001); (iii) or both infeasible and general, such as to increase investment and trade with developed countries (IMF 2007). Although, efficient from migration theory's perspective, they are of little help for policymakers in LDC.
Recognising these insufficiencies, in this section we regroup migration policy instruments according to their effectiveness and implementation costs. Generally, policies that address the supply side of skilled

18
labour market (e.g., direct education subsidy, direct skill subsidy) are the least efficient. This is especially the case when the LDC is small relative to EU, as such policies enhance migration, but they do not have a direct impact on skilled labour stock in LDC. Only if the LDC is large enough compared to EU, supply side policies may increase the stock of skilled labour in LDC, as skilled migration decreases the international wage rate for skilled labour. Only this indirect wage effect will increase the stock of skilled labour in LDC. Because of lower wage rate, less skilled workers will have an incentive to migrate. If, however, LDC is small, there will be no wage effect and the stock of skilled labour will not be affected by direct subsidies at all. The key issue of policies that address the supply side of skilled labour market is that these policies do not distinguish between skilled labour that migrates and skilled labour that stays. Being targeted at both potential migrants and non-migrants, they help also the potential migrants to buy the 'skill migration ticket' - BC.24
The efficiency of migration policies in LDC can be improved through a better targeting: (i) directly on the demand side of skilled labour market (e.g. through skill subsidy granted to firms, or subsidising education at firm level); or (ii) directly on migrants only (e.g. through Bhagwati tax, conditional education subsidy). Whereas the former changes incentives only of those that stay, the latter does the reverse - it changes the incentives of those that migrate. In terms of the implementation feasibility, the policy that addresses the demand side of skilled labour market appears to be less costly. The enforcement costs of a policy that addresses only migrants are higher and may require cooperation with the receiving country, which may not be desired by the EU.
Figure 7 classifies LDC policy options according to two criteria. The vertical axes shows the political implementation costs, IC , which capture administrative implementation cost and political support, which decreases in taxes. The horizontal axes shows policy efficiency in increasing the stock of skilled labour,
SnHL , and of decreasing skilled labour migration, m
HL .25
The most efficient policies are located in quadrant IV. Indirect education subsidy, indirect skill subsidy to firms and investment in knowledge adoption are the most efficient policies in terms of political implementation costs and in terms of increasing the distribution of skilled labour between LDC and EU,
mH
SnH LL / . They have relatively low costs of implementation and lead to a high increase in the stock of
skilled labour by decreasing brain drain. However, these policies do not have the highest political support after migration, i.e. they are not at the bottom of quadrant IV. With skilled worker emigration, the political support for redistributive policies increases (Kancs and Ciaian 2010). Investment in new
������������������������������������������������������������24 The role of the supply side policy might be different, if skill supply (educated labour force) is an issue, e.g. due to financial constrains. This might be the case particularly in poor African economies. The role of supply side policy instruments may also increase in the presence of return migration. 25 The horizontal axes shows the ratio of the skilled labour stock to migration, m
HSnH LL / .

19
knowledge has the same political implementation costs as the other two policies in quadrant IV, but is less efficient in increasing the m
HSnH LL / ratio than investment in knowledge adoption.
Quadrant I shows the least efficient policies - they have low efficiency in increasing the mH
SnH LL / ratio
and are politically infeasible. The policy that targets remittances spent on education is costly in terms of implementation, as it requires cooperation with EU, which may be rather limited. In the same time it increases migration, because it encourages to acquire education and to emigrate (it will be easer to 'buy' BC). It increases the stock of skilled labour only indirectly through wage effect if LDC is large. If LDC is small, then this policy will not have any impact on the stock of skilled labour in LDC.
Quadrant III in Figure 7 shows policies that are politically feasible but inefficient in maintaining the innovative capital. These policies include: direct skill subsidy paid to workers, direct education subsidy, and skill-biased income tax. They all have the same effect on the m
HSnH LL / ratio, as a policy that targets
remittances to be spent on education. According to Kancs and Ciaian (2010), the direct skill subsidy is politically more feasible than the direct education subsidy, and the skill-biased tax, because after migration there is less political support for polices that target growth related issues as well, as the share of unskilled labour in voting population increases, which will make it difficult to introduce higher tax rate for unskilled labour.
Quadrant II shows policies which are efficient in increasing the mH
SnH LL / ratio but are politically
infeasible. There are two policies in this quadrant: Bhagwati tax and migration quota/restriction. Both the Bhagwati tax and migration quota/restriction efficiently increase the stock of skilled labour and decreases migration. However, their implementation is very costly, because they both require cooperation with EU and expensive border control measures. The EU cooperation is questionable since it would contradict the objectives of BC.
5. Conclusions
In May 2009 the EU adopted a Blue Card directive, which will facilitate the entry, highly qualified employment, and residence of highly skilled LDC workers in EU. The present paper examines the potential impacts, which BC may cause on knowledge and human capital in the least developed migrant sending countries.
The conceptual framework we adopt in the present study is based on the theory of innovative capital (Furman et al 2002), which combines insights from several theories, which in our view are important for LDC growth prospects: investment in education and skill premium stressed by labour economics, brain drain, brain waste and brain gain, stressed by different migration theories, R&D and innovation role and knowledge capital, and knowledge spillovers literature.

20
In line with previous studies (Lowell and Findlay 2001; Lucas 2004; Katseli, Lucas and Xenogiani 2006; Kancs and Kielyte 2010), we found that BC will reduce human capital in LDC. In addition, BC will also have a negative impact on knowledge capital. Although important for LDC growth and development, the link between skill migration and knowledge capital has been studied to a much lesser extent. In addition, through mutual interaction of the two components of innovative capital (knowledge and human capital), the long-run equilibrium will likely be different from a partial equilibrium short-run perspective.
Based on the identified impacts on selected growth drivers, we propose and examine alternative policy instruments for LDC. Our findings suggest that policies implemented on the demand side of skilled labour market (e.g. through skill subsidy granted to firms, or subsidising education at firm level) are the most efficient, followed by policies targeted only to migrants (e.g. through Bhagwati tax, conditional education subsidy). Policies that address the supply side of skilled labour market (e.g., direct education subsidy, direct skill subsidy) are the least efficient, although their implementation feasibility is higher.
Turning to limitations of our study, we recognise that, although accounting for most important aspects of skilled labour migration on innovative capital in LDC, the performed graphical analysis cannot provide us with a quantitative assessment of BC impacts on LDC growth prospects. For example, for simplicity, we assume full employment both for skilled and unskilled labour. In reality, however, among existing educated citizens in African economies, especially those with high rates of brain drain, there is unemployment or underemployment of many graduates of tertiary institutions. Nevertheless, by pointing to the adverse growth issues arising from BC in LDC, our study offers a blueprint for deriving a formal general equilibrium framework with endogenous growth and location engines by linking innovative capital to technological development and economic growth in LDC for assessing the impact of BC. This is a promising area for future research.
Summarising our findings we conclude that without appropriate policy responses, the adopted EU Blue Card makes developing country growth prospects rather bleak than blue.
References
Acs, Z. J., Audretsch, D. B. and Feldman, M. P. (1994). R&D spillovers and recipient firm size. Review of Economics and Statistics, 76, 336-340.
Audretsch, D. B. and Feldman, M. P. (1996). R&D spillovers and the geography of innovation and production. American Economic Review, 86, 630-640.
Averett, S. L. and Burton M. L. (1996). College attendance and the college wage premium: Differences by gender. Economics of Education Review, 15, 37-49.

21
Kancs, D. and Kielyte, J. (2010). "Education in the East, Emigrating to the West?," European Review, 18, 133-154.
Bhagwati, J. N. and Rodriguez, C. (1975). Welfare theoretic analyses of the brain drain. Journal of Development Economics, 2, 195-221.
Borjas, G. J. (1994). The Economics of immigration. Journal of Economic Literature, 32, 1667-1717.
Caballero, R. and Jaffe, A. B. (1993). How high are the giant's shoulders. NBER Working Paper No W4370.
Cameron, S. V. and Heckman, J. J. (1998). Life-cycle schooling and dynamic selection bias: models and evidence for five cohorts of American males. Journal of Political Economy, 106, 262 -333.
Cao, H. (2008). Credit constraints and human capital investment in college education. Journal of Family and Economic Issues. 29, 41-54.
Card, D. (1995). Earnings, schooling, and ability revisited. In S. Polachek (ed), Research in Labor Economics, Greenwich, Connecticut: JAI.
Carneiro, P. and Heckman, J. J. (2002). The evidence on credit constraints in post-secondary schooling. Economic Journal, 112, 705-734.
Carrington, W. J., Detriagiache, E. and Vishwanath, T. (1996). Migration with endogenous moving costs. American Economic Review, 86, 909-930.
Chami, R., Fullenkamp, C. and Jahjah, S. (2003). Are immigrant remittance flows a source of capital for development? IMF Working Paper, 03/189, International Monetary Fund, Washington DC.
Cohen, W. M. and Levinthal, D. A. (1990). Absorptive capacity: A new perspective on learning and innovation. Administrative Science Quarterly, 35, 128-152.
Cox, D. (1987). Motives for private income transfers. Journal of Political Economy, 95, 508-546.
Edwards, A. C. and Ureta, M. (2003). International migration, remittances and schooling: Evidence from El Salvador. Journal of Development Economics, 72, 429-461.
Easterly, W. and Nyarko, Y. (2008). Is the brain drain good for Africa? The Brookings Global Economy and Development, Working Paper No. 19.
European Commission (2009),). Council Directive on the conditions of entry and residence of third-country nationals for the purposes of highly qualified employment. 9057/09, Brussels.
Freeman, R. B. (1986). Demand for education. In O. Ashenfelter, and R. Layard (eds), Handbook of Labour Economics, Vol. 1, North Holland: Amsterdam.
22
Furman, J. L., Porter, M. E. and Stern, S. (2002). The determinants of national innovative capacity. Research Policy, 31, 899-933.
Jaffe, A. B. and Trajtenberg, M. (2002). Patents, citations & innovations: A window on the knowledge economy. MIT Press.
Jaffe, A. B., Tratjenberg, M. and Henderson, R. (1993). Geographic localisation of knowledge spillovers as evidenced by patent citations. Quarterly Journal of Economics, 108, 577-598.
Kancs, D. and Ciaian, P. (2007). Blue Cards, Blue Prospects?, LSE Research Paper in Environmental and Spatial Analysis No 127, London, London School of Economics and Political Science.
Kancs, D. and Ciaian, P. (2010). The political economy of skill migration. EERI Research Paper 2010-07, Brussels, Economics and Econometrics Research Institute.
Kapur, D. (2001). Diasporas and technology transfer. Journal of Human Development, 2, 265-286.
Katseli, L. T., Lucas, R. E. B. and Xenogiani, T. (2006). Effects of migration on sending countries: What do we know? OECD Development Centre Working Paper No. 250, Paris.
Krugman, P. (1979). A Model of innovation, technology transfer, and the world distribution of income. Journal of Political Economy, 87, 253-266.
Lowell, B. L. and Findlay, A. (2001). Migration of highly skilled persons from developing countries: Impact and policy responses, International Migration Papers No 44, International Labour Office, Geneva.
Lucas, R. E. B. (1988). On the mechanics of economic development. Journal of Monetary Economics, 22, 3-42.
Lucas, R. E. B. (2004). International migration to the high income countries: Some consequences for economic development in LDC. Annual Bank Conference on Development Economics.
Mankiw, N. G., Romer, D. and Weil, D. N. (1992). A contribution to the empirics of economic growth. Quarterly Journal of Economics, 107, 407-437.
Mansfield, E. (1981). Imitation Costs and Patents: An Empirical Study, Economic Journal, 91, 907-918.
Maurseth, P. B. and Verspagen, B. (2002). Knowledge spillovers in Europe: A patent citations analysis. Scandinavian Journal of Economics, 104, 531-545.
Peri, G. (2003). Knowledge flows, R&D spillovers and innovation. ZEW Discussion Papers 03-40, Center for European Economic Research.
Romer, P. M. (1990). Endogenous technological change. Journal of Political Economy, 98, 71-102.

23
Salt, J. (1997). International movements of the highly skilled. OECD Social Employment and Migration Working Papers No 3, Paris: OECD.
Sjaastad, L. A. (1962). The costs and returns of human migration. Journal of Political Economy, 70, 80-93.
Solow, R. M. (1956). A contribution to the theory of economic growth. Quarterly Journal of Economics, 70, 65-94.
Stinebrickner, T. R. and Stinebrickner, R. (2008). The effect of credit constraints on the college drop-out decision: A direct approach using a new panel study. American Economic Review, 98, 2163-2184.
Straubhaar, (1986). The Causes of International Labour Migrations: A Demand Determined Approach, International Migration Review, 20, 835-856.
Willis, R. J. and Rosen, S. (1979). Education and self-selection. Journal of Political Economy, 87, 7 -36.
World Bank (2000). Higher education in developing countries: Peril and promise. Report of the Task Force on Higher Education and Society, Washington D.C: World Bank.

Figu
re 1
. Hum
an c
apita
l mod
el
MC
wH
oR*
Send
ing
coun
try
Rec
eivi
ng c
ount
ry
Mig
ratio
n
DU
S
LSL H
S*
wH
S*
wU
S*
L HBSm
S HS
S HR
wU
R*
L HBRnD
HR
L HR*
Sm
DH
S
DU
R
Dm
L HBRm
wH
Bm
wH
R*
L Hm
L HBm
L HSn
LR
w
S MC
m
wH
m
L H1m
wU
m
L HBSn
L HSm
Lm
MC
*
EC*
DH
1R
L H1Sn

Figure 2. Knowledge model
Sending country
trS*
MCCS
trS
KCS*
MBS
Receiving country
trR*
trR
MCCR
KS
KR
MBR
KCR*
KCR*
KTm
Transmission barriers = marginal costs of knowledge addoption
KCm
Maximum knowledge which can be adopted from EU
MCAS

Figu
re 3
. The
impa
ct o
f mig
ratio
n on
edu
catio
n eq
uilib
rium
in L
DC
MC
wH
oR*
LD
C se
ndin
g co
untr
y E
U r
ecei
ving
cou
ntry
M
igra
tion
S H1S D
US
LSL H
S*
wH
S*
wU
S*
L HBSm
S HS
S HR
wU
R*
L HBRnD
HR
L HR*
Sm
DH
S
S 1m
DU
R
Dm
L HBRm
wH
Bm
L HSn
wH
R*
L H1m
L HBm
ab
wH
1m
L H1Sm
L H1Sn
S H2S
L H2Sn
S 2m
wH
2m
LR
w
S MC
m
wH
m
L Hm
L HBSn
L HSm
LmL H
2m
DH
1R
L Hom

Figu
re 4
. The
impa
ct o
f BC
on
inte
rnat
iona
l dis
trib
utio
n of
labo
ur fo
rce
with
con
stan
t and
end
ogen
ous m
igra
tion
cost
s
LD
C se
ndin
g co
untr
y E
U r
ecei
ving
cou
ntry
M
igra
tion
DU
S
LSL H
S*
wH
S*
wU
S*
S HS
S HR
wU
R*
L HRn
DH
R
L HR*
Sm
DH
S
DU
R
Dm
L HRm
wH
m
wH
R*
L Hm
L HBm
L HB1
SnLR
w
S MC
m
wH
Bm
L HB1
m
wH
B1m
L HBSn
Lm
L HSn
S MC
1m
S MC
Bm
S MC
B1m
c
Figu
re 5
. The
fisc
al e
ffec
t of B
C
e
MC
wH
oR*
LD
C se
ndin
g co
untr
y E
U r
ecei
ving
cou
ntry
M
igra
tion
DU
S
LSL H
S*
wU
S*
L HBSm
S HS
S HR
wU
R*
L HBRnD
HR
L HR*
Sm
DH
S
DU
R
Dm
L HBRm
wH
Bm
wH
R*
L Hm
L HBm
L HSn
LR
w
S MC
m
wH
m
L HBSn
L HSm
Lm
DH
1R
a
b
dc
t Ut H
t H1

Figure 6. The impact of BC on knowledge
KCS*
LDC sending country
trS*
MCCS
trS
MBS
EU receiving country
trR*
trR
MCCR
KS
KR
MBR
KCR*
KCR*
KTmKC
m
MCAS
KCBR*
KCBR*
MCABS
MBBS
KTB1m
KTBmKCB
m
MBBR
trBR*

Figure 7. Policy classification
Direct skill subsidy
0 LHSn/LHm
Low
Veryhigh
Verylow
IC
High
Bhagwati tax
Indirect skill subsidy
II
III
I
IV
Education remittances
Knowledgecreation
Direct education subsidy
Verylow
High
Veryhigh
Low
Skill-biased tax
Knowledge adoption
Migration quota/restriction
Indirect education subsidy