The Impact of Teacher Privileging on Learning Differentiation with Technology
33
1 Margaret Kendal and Kaye Stacey THE IMPACT OF TEACHER PRIVILEGING ON LEARNING DIFFERENTIATION WITH TECHNOLOGY ABSTRACT. This study examines how two teachers taught differentiation using a hand held computer algebra system, which made numerical, graphical and symbolic representations of the derivative readily available. The teachers planned the lessons together but taught their Year 11 classes in very different ways. They had fundamentally different conceptions of mathematics with associated teaching practices, innate ″privileging″ of representations, and of technology use. This study links these instructional differences to the different differentiation competencies that the classes acquired. Students of the teacher who privileged conceptual understanding and student construction of meaning were more able to interpret derivatives. Students of the teacher who privileged performance of routines made better use of the CAS for solving routine problems. Comparison of the results with an earlier study showed that although each teacher’s teaching approach was stable over two years, each used technology differently with further experience of CAS. The teacher who stressed understanding moved away from using CAS, whilst the teacher who stressed rules, adopted it more. The study highlights that within similar overall attainment on student tests, there can be substantial variations of what students know. New technologies provide more approaches to teaching and so greater variations between teaching and the consequent learning may become evident. KEYWORDS: calculus, computer algebra systems (CAS), symbolic calculators, multiple representations of derivative, teacher privileging, classroom teaching practices.
Transcript of The Impact of Teacher Privileging on Learning Differentiation with Technology

1
Margaret Kendal and Kaye Stacey
THE IMPACT OF TEACHER PRIVILEGING ON LEARNING DIFFERENTIATION WITH TECHNOLOGY
ABSTRACT. This study examines how two teachers taught differentiation using a hand
held computer algebra system, which made numerical, graphical and symbolic
representations of the derivative readily available. The teachers planned the lessons
together but taught their Year 11 classes in very different ways. They had fundamentally
different conceptions of mathematics with associated teaching practices, innate
″privileging″ of representations, and of technology use. This study links these
instructional differences to the different differentiation competencies that the classes
acquired. Students of the teacher who privileged conceptual understanding and student
construction of meaning were more able to interpret derivatives. Students of the teacher
who privileged performance of routines made better use of the CAS for solving routine
problems. Comparison of the results with an earlier study showed that although each
teacher’s teaching approach was stable over two years, each used technology differently
with further experience of CAS. The teacher who stressed understanding moved away
from using CAS, whilst the teacher who stressed rules, adopted it more. The study
highlights that within similar overall attainment on student tests, there can be substantial
variations of what students know. New technologies provide more approaches to
teaching and so greater variations between teaching and the consequent learning may
become evident.
KEYWORDS: calculus, computer algebra systems (CAS), symbolic calculators,
multiple representations of derivative, teacher privileging, classroom teaching practices.

2
INTRODUCTION The recent availability of Computer Algebra Systems (CAS) offers teachers the
opportunity to make mathematics accessible to a wider range of students, and students
the chance to develop a more holistic understanding of fundamental concepts. Of
special relevance to the teaching of calculus is the facility of computer algebra systems
to support and link numerical, graphical and symbolic representations of function that
authors such as Dick (1996), Hillel (1993), and Tall (1996) suggest should enhance
conceptual understanding. Many studies have made claims that using a CAS improves
understanding of calculus concepts (e.g., Heid, 1988; Palmiter, 1991; & Repo, 1994;
and others) but this is not always the case (Penglase & Arnold, 1996). For example,
Ellison (1994) found that while most students improved their conceptual understanding
(in a calculus course that focused on multiple representations and links between them)
some students developed only partial conceptual understanding. Reasons for this lack of
success cannot be determined due to a lack of information about the ″context″ of the
teaching.
As observed by Penglase and Arnold (1996), for resolution of this issue, it is
essential to distinguish the use of the tool from the effect of teaching. The present study
aims to explore the impact of using a CAS on understanding calculus concepts in the
context of a detailed analysis of the teaching process.
Computer algebra systems may change many methods of problem solving from
being methods ″in principle″ to being methods ″in practice″. Whereas symbolic
methods using standard rules have been overwhelmingly the most practical methods of
differentiation without technology, with a CAS, graphical and numerical methods which
were previously impractical can now be quick and easy. For example, quite short
3
sequences of button presses using a modern hand-held CAS such as the Texas
Instruments calculator TI-92 will (usually) find the derivative of a function at a point by
any of the following methods:
• symbolic differentiation followed by substitution,
• finding the value of a limit expression using symbolic manipulation,
• drawing a graph and the tangent at a point (an automated process) and deducing the
gradient of the tangent from its equation,
• drawing a graph and some nearby secants from which the limit of their gradients can
be guessed,
• calculating difference quotients using nearby values of the function and estimating
the limit.
The growth in options for solving problems is accompanied by a growth in options
for teaching. This study sets out to observe how two teachers dealt with these widened
options as they taught introductory differential calculus and how their choices (e.g., of
how to explain ideas, representations to stress, and degree of emphasis on by-hand
techniques) were reflected in what their students learned.
The present study arose from an exploratory study where we analysed the ways in
which three teachers taught a twenty lesson unit on introductory differential calculus to
Year 11 (16-17 years old) students with a Texas Instruments TI-92 CAS calculator in
1998. There were three teachers and classes; A and B at one school, and C at another.
Teachers B and C were invited to participate in the study as a consequence of their
participation in professional development activities related to technology. Teacher A,
who taught the only parallel class to teacher B, volunteered as a personal challenge. We
reported (Kendal & Stacey, 1999a & 1999b) how the ways each class used the CAS

4
impacted on their understanding of calculus and was related to their teacher’s
″privileging″ (see below).
In 1999, the opportunity arose to repeat the 1998 study with Teachers A and B and
their next cohort of Year 11 students. This enabled us to observe more closely the
lessons of two teachers whom we knew were distinctly different, using refined
assessment instruments. It also enabled observation of the teachers using the CAS
calculators for the second time, looking for the features of teaching and of privileging
that were stable or changed. This study clearly identifies the teaching context including
the teachers and constraints. It reports on the types of differentiation competencies
acquired by each class and relates differences between the classes to observed
differences in teacher privileging.
Teacher privileging in a technological environment Privileging is a term adopted by Wertsch (1990) who explained how different forms of
mental functioning dominate in different socio-cultural contexts. Privileging is a
construct to describe a teacher’s individual way of teaching and includes decisions
about what is taught and how it is taught. Teaching decisions are influenced by a variety
of ″context″ factors such as the teachers’ pedagogical content knowledge, teachers’
beliefs together with a range of school related cultural factors (Fennema & Franke,
1992).
In a comprehensive literature review of teachers’ beliefs and conceptions of
mathematics, Thompson (1992) discusses the importance of teachers’ conceptions of
mathematics to their instructional practices. Several studies are reported where teachers’
professed beliefs about the nature of mathematics are consistent with their teaching
practices, including her 1984 study that concludes:

5
Although the complexity of the relationship between conceptions [of the nature of
mathematics] and practice defies simplicity of cause and effect, much of the contrast in
teachers’ instructional emphases may be explained by differences in their prevailing views
of mathematics.(p. 119)
Hoyles (1992) made similar observations in relation to a Microworlds project which
explored the ″interactions of the teachers with the computer activities . . . and the ways
they incorporated them into their practice [provided] a window on their views and
beliefs about mathematics teaching″(p.39). Noss and Hoyles (1996) observe that ″there
is a mutually constructive relationship between what teachers believe and what they
do″(p.201). Additional factors, related to the teacher’s attitude towards technology, also
impinge on instructional choices (Thomas, Tyrrell, & Bullock, 1996).
Simmt (1997) observed six teachers and concluded that they used graphics
calculators as an extension of their normal teaching practices. They used similar
activities, but their differing conceptions of mathematics affected how they followed up
those activities with questions and summary notes. Jost (1992), in a comparative case
study of teachers’ beliefs and practices teaching calculus, found that teachers who
believed the purpose of the graphical calculator was computational tended to view
learning as listening while teachers who believed the purpose was instructional adopted
student-centred teaching approaches. Tharp, Fitsimmons and Brown Ayers (1997)
studied 261 teachers participating in a support course for introducing graphics
calculators. They noted that teachers generally came to see the graphics calculators as
enhancing understanding and promoting exploration. However, teachers with a rule-
based conception of mathematics tended to control the amount and type of calculator
use by students, and tended to believe that the graphical calculators may hinder
learning.

6
In turn, instructional emphases are reflected in student achievement. Some studies
are now appearing which link instructional choices of teachers using technology to
student learning outcomes. Keller, Russell, and Thompson (1999) report on a study
where use of a CAS calculator and student-centred instruction had a positive effect on
students’ calculus exam scores. Teaching mathematics with technology opens up new
questions about how teachers’ beliefs and conceptions, and consequent instructional
choices and technological privileging, impact on student learning outcomes.
Analysis of the lessons of Teachers A, B and C in the 1998 study (Kendal & Stacey,
1999a, 1999b) indicates that three aspects of privileging impacted significantly on
student learning; teaching approach, emphasis given to different representations of
differentiation, and use of technology. Teacher A privileged procedures for standard
tasks and symbolic algebra using technology. In class and in assessments, Class A used
computer algebra more frequently, was more successful with symbolic items, and less
successful with conceptual items. Teacher B privileged conceptual understanding and
by-hand algebra while Teacher C privileged conceptual understanding and calculator
graphical methods. Both Classes B and C were more successful than Class A with
conceptual items. Class B was more successful with by-hand algebra whereas Class C
used graphical (non-calculus) methods more frequently and was able to solve many of
the test items using conceptually simpler graphical methods as an alternative to
symbolic procedures. These three aspects; teaching approach, emphasis given to
different representations of differentiation (calculus content), and use of technology, are
the key aspects of privileging featured in this paper.

7
METHODOLOGY As noted above, Teachers A and B from the 1998 study (Kendal & Stacey, 1999a &
1999b) volunteered to repeat the study in 1999. Both teachers helped revise the twenty-
lesson introductory calculus program and greater emphasis was placed on the concept of
derivative in numerical, graphical and symbolic representations and links between them.
The teachers subsequently taught the program to (new) Classes A and B, shared ideas
about lessons, and used the common teaching program, lesson notes and work sheets
that they helped prepare, except for two revision lessons at the end of the unit, which
they prepared separately. Both teachers were now experienced in teaching with the TI-
92 calculator, having used it in the prior study. The first author observed and audiotaped
all the lessons, maintained a journal, and interviewed the teachers individually before
and after the program. Ten weeks after the completion of the unit, the teachers were
interviewed individually by the first author.
Before undertaking the calculus unit, the thirty-three Year 11 female students (aged
approximately 17 years) in Classes A and B learned how to use the TI-92 which was
theirs to use during the teaching program for all class work, homework, and tests. In
contrast to the first study, where the attainment levels of students in the three classes
were approximately normally distributed and evenly matched, the two 1999 classes had
different distributions of attainment. School assessments over two years showed that
both classes had a majority of lower attaining students. However Class A had a larger
number of highly competent students, which resulted in average school attainments
higher than that of Class B in most topics including the directly relevant topics of
algebra and graphs. This was verified by a pre-test.

8
Students completed questionnaires, challenging assignment questions and completed
two written tests. The first author also conducted task-based interviews with fifteen
students at the end of the unit, although these are not reported on in this paper.
Testing in 1998 used standard school questions and in consequence over-represented
symbolic items, so a major aim of the repeat study was to assess competence in calculus
in a balanced way across all three representations (the numerical, graphical and
symbolic). A Differentiation Competency Framework was developed to provide
direction and organise data collection, analysis and interpretation. The framework
identifies competence within and between pairs of representations. It is fully described
by Kendal & Stacey (submitted). The framework is concerned with two parts of
mathematical modelling with differentiation:
• Formulating the problem in terms of differentiation either exactly or approximately
at a point, or as a derivative function.
• Interpreting the derivative either in natural language, in a real world setting (e.g.,
speed) or in another representation.
Formulating and interpreting can be carried out numerically, graphically or
symbolically. Sometimes this is within one representation and sometimes, data from one
representation needs to be translated for formulation or interpretation in another. Thus,
in total, the Differentiation Competency Framework consists of eighteen basic
competencies involving formulation and interpretation processes, six within a single
representation (3 per process) and twelve with translation between two representations
(6 per process).
A Differentiation Competency Test (DCT), consisting of eighteen items, was
designed to test each of these basic differentiation competencies. Sample items are

9
given in Figure 1. In marking DCT items procedural errors (such as “careless”
algebraic, graphical, calculation, or transcription mistakes) were ignored, as the
intention was to assess conceptual understanding. Time available for testing limited the
number of items to one per competency, so results about individual competencies need
to be interpreted cautiously and in the light of information from other sources. However,
stronger data is available from grouping items by process or representation. A
Preference of Representation Test was also used to assess students’ preferences for
representations, their ability to carry out accurate symbolic differentiation, and their
problem solving skills. Where appropriate the results of some Preference for
Representation Test items are included in this paper but it is not fully reported here.

10
Formulation Interpretation Within a representation
Q.1 [Formulation within the symbolic representation] Find the derivative of y = x5 + 4x3 – x – 10
Q. 3 [Interpretation within the numerical representation] At 1.00p.m., the rate of change of the temperature of your house is +3 degrees Celsius (°C) per hour. Immediately after 1.00p.m., is the temperature most likely to: decrease, stay the same, or increase? Give a reason for your answer.
Q.2 [Formulation within the graphical representation] Use a graph of y = x2 + x – 10 to find the gradient of the curve at x = 3.
Q. 4 [ Interpretation within the graphical representation] A graph of y = f(x) is sketched below. y y = f(x) H D G E I C F O B J x A A series of points A to J are marked along the curve. Consider the statements below and decide if they are true or false. The gradient of the curve at F is greater than at B. The gradient of the curve at A is greater than at H. The gradient of the curve at I is less than at F. The gradients of the curve at O and J are approximately equal.
Translation between two representations Q. 5 [Translation of graphical formulation to answer a symbolic question]
Q.7 [Translation for interpretation of numerical derivative as symbolic derivative]
y h(x) (8, 6) P (4.862, 2.862) (0, 0.862) (2, 0) x The graph of the function h(x) is sketched above. The tangent at the point P on the curve of h(x) has also been drawn. Find the value of the derivative of h(x) at P.
An eagle follows a flight path where its height depends on the time since it flew out of its nest. The rule for finding the height of the bird (H in metres) above its nest is a function f(t) of t the flight time (in seconds). Five seconds after take-off, the 4kg eagle was observed to be 100m above its nest and climbing at the rate of 3 metres/second. What is the value of f ′(5)?
Q.6 [Translation of numerical formulation to answer a symbolic question] The values of a function close to x = 5 are shown in the table below. x 4.997 4.998 5.000 5.001 5.002 5.003 f(x) 15.470 15.482 15.500 15.508 15.515 15.520 Find the best estimate of the derivative f ′(x) at x = 5.
Q.8 [Translation for interpretation of symbolic derivative as graphical derivative] The derivative function of f(x) is given by f ′(x) = x3 – 5x + 3. What is the gradient of the tangent to the curve y = f(x) when x = 1?
Figure 1. Sample questions from DCT, testing formulation and interpretation
competencies of differentiation within and between (with translation) representations.

11
THE TEACHING PROGRAM Role of the CAS Calculator The 20 lesson calculus unit relied on CAS facilities of the TI-92, an advanced calculator
that made readily available numerical, graphical and representations of derivative, and
easy determination of limits and complex symbolic derivatives. With the TI-92, it is
also relatively easy to move flexibly between these representations using its split screen
facility. The calculators were available at all times including for both tests. Compared
with the first study, the strong conceptual focus of the curriculum resulted in an overall
reduced emphasis on use of symbolic algebra. This is discussed later in this paper.
During the teaching program, the CAS calculator was used both functionally and
pedagogically, terms used by Etlinger (1974). Pedagogically it was used for concept
development in the following ways:
• showing local linearity of curves, zooming in and demonstrating the apparent co-
incidence of the zoomed-in curve and the tangent,
• showing the relationship between gradients of secant, curve and tangent by
demonstrating, with a dynamic program, that the limit of the secant line is the
tangent to the curve at the point,
• plotting gradients/derivatives of points as a function to predict or check the
derivative rules,
• building up patterns amongst calculated gradients and/or derivatives to guess
symbolic rules,
• using the split screen to emphasize the links between different representations.
Functionally, it was used to carry out routine procedures including: differentiating
algebraic expression, obtaining limits for a first principles approach, finding numerical
difference quotients, and algebraic manipulation. A menu item was also used to find the

12
gradient of the tangent at a point. The calculator obtains this from a difference quotient,
so it is an approximation, but in practice in normal school questions, it is
indistinguishable from the exact value.
SAMPLE LESSON 1 To illustrate differences in the approaches of the two teachers, two 45-minute lessons
are described in detail. The aim of the first lesson is to teach the general rule for
differentiating a power function (i.e. that d(axn)/dx = n.ax(n-1)) and to apply it to positive
and negative powers. In an earlier lesson, the gradients of tangent lines to the curve f(x)
= 3x2 had been found at x = {-2, -1, 0, 1, 2} using CAS. This had been compared with
the results from the one-line CAS symbolic generation of derivatives and substitution
(given a set of x values), d(3x^2,x) //// x = {-2, -1, 0, 1, 2}, thereby linking gradients of
functions with symbolic derivatives. The notation d(3x^2,x) indicates the differentiation
of 3x^2 with respect to x and the notation / x = {-2, -1, 0, 1, 2}, indicates that the
derivative is to be evaluated at each of these points.
Outline of Teacher A’s Method Teacher A presented carefully planned mathematical content with a lecture and
demonstration style. Students observed the teacher carry out the CAS procedures, which
they imitated with help from a flow chart (see Figure 2) that the teacher had written on
the white board.
• Using the TI-92 displayed on an overhead projector, Teacher A generated a set of
derivative values for f(x) = 3x2 symbolically, and listed the values of the derivative
in a table on the board (See Figure 2).
• Students were invited to guess the rule and a group response of “Multiply by 6” for
the derivative pattern (6x) was accepted.
13
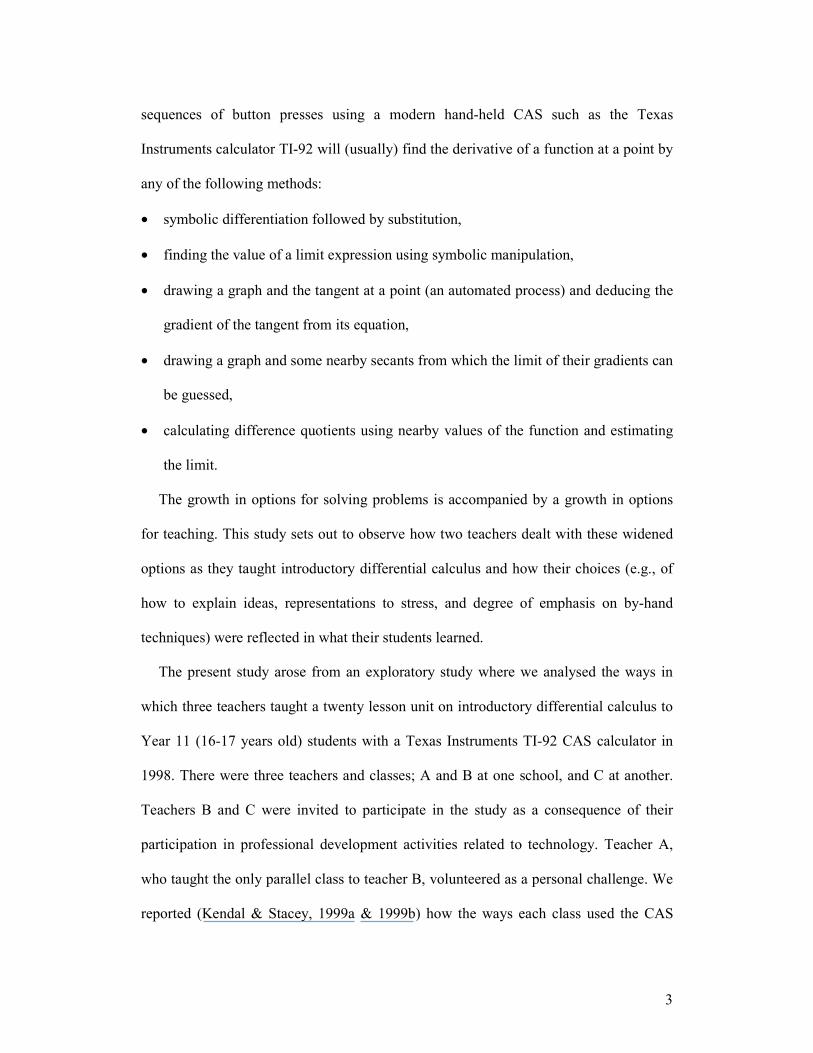
• The demonstration was repeated for f(x) = x3 and a student guessed the pattern 3x2.
• Without generating further tables, and with minimal student input, the teacher
quickly wrote on the board the derivative rules for f(x) = x4, 3x5, 3x3.
• A summary table of f(x) and f′(x) was constructed and one student identified the
derivative rule for the polynomial power as n.axn-1.
• An example requiring finding f′(2) for f(x) = 3x3 was worked with and without CAS.
Firstly, the formula f′(x) = n.axn-1 was applied and x = 2 substituted. Then the
differentiation and substitution in a one-step CAS routine was performed, which was
also recorded on the board using a flow chart (see Figure 2). Most students imitated
the CAS procedure then copied down the detailed board notes.
• Practice problems were set including the differentiation of 1/x5, the first negative
power encountered, and the students began to work on them using the formula or
CAS. Unfinished problems were set for homework.
• When a student asked for help, the teacher (as usual) worked another example.
f(x) = 3x2 f(x) = x3 x f ′(x) x f ′(x) f(x) f ′(x) -2 -12 -2 12 3x2 6x -1 -6 -1 3 x3 3x2 0 0 0 0 x4 4x3 1 6 1 3 3x5 15x4 2 12 2 12 3x3 9x2
Multiply by 6 Pattern 3x2 axn n.axn-1
Flow chart for TI-92 procedure Push buttons in given order
1. F3 2. 1 & Enter (E)
3. (3 x ^ 2, x) (2nd K) /x = {-2, -1, 0 ,1, 2} & E
Figure 2. Teacher A’s board notes.
Outline of Teacher B’s Method Teacher B explored carefully planned mathematical content through a teacher-led class
discussion, drawing on individual student’s contributions.
• Students generated the values of the derivative of f(x) = x2 at five points using the
CAS command to differentiate and then substitute the given set of x values in one

14
line, d(x^2,x) //// x = {-2, -1, 0, 1, 2} The teacher moved around the classroom
checking individual’s screens and giving help with the calculator.
• Student generated values were written on the board (see Figure 3) and individual
students were challenged to find and explain how the pattern was developed, and to
verify the resultant symbolic pattern, derivative = 2x.
• The procedure was repeated for f(x) = 2x2 and 3x2. For f(x) = ax2 the derivative rule
f′(x) = 2ax was spontaneously suggested by one student and confirmed by others.
• A student observed that quadratic function gave a linear derivative. This was
observed from a sketch of f(x) = 2x2 drawn on the board, and awareness that the
derivative, 4x, represented a linear function and straight line.
• Another student posed the question ″What about x3?″ Students generated a table of
derivative values using the TI-92 and guessed the derivative rule for f(x) = x3.
• Teacher B asked individuals to predict the derivative rules for f(x) = 2x3,
f(x) = 3x3, and eventually for f(x) = ax3.
• A student observed that a cubic function gave a quadratic derivative and the teacher
helped all the students understand why. (Diagrams were drawn on the board and
links with gradients made). The algebraic patterns were revised again.
• Students generated the derivative rule for f(x) = x4 assisted by a tables of derivative
values which they generated using the TI-92 (see board notes in Figure 3).
• Individual students predicted the derivative rule for f(x) = 2x4, f(x) = 3x4, and
eventually for f(x) = ax4.
• Using the summary table of f(x) and f′(x) for the general expressions, for quadratic,
cubic and quartic polynomials, after class discussion a student volunteered the
derivative rule for the polynomial axn.

15
• Teacher B carefully explained the f′(x) notation and checked students’
understanding by nominating individuals to explain to the class how to use it. He
again revised the general rule for differentiation of a polynomial function.
• Students progressively copied the notes and sketches from the board including a
section devoted to alternative notations, f′(x) and dy/dx.
• The special functions f(x) = ax and f(x) = c were sketched on the board, the gradients
determined, and the outcomes linked to the formula n.axn-1.
• Examples using the rule were worked by-hand, including f(x) = 5x7 and f(x) = 1/x4.
• Practice problems were set for homework and included the differentiation of 1/x5.
• Students were instructed to do the items by-hand and to check their answers by
repeating the items with the TI-92.
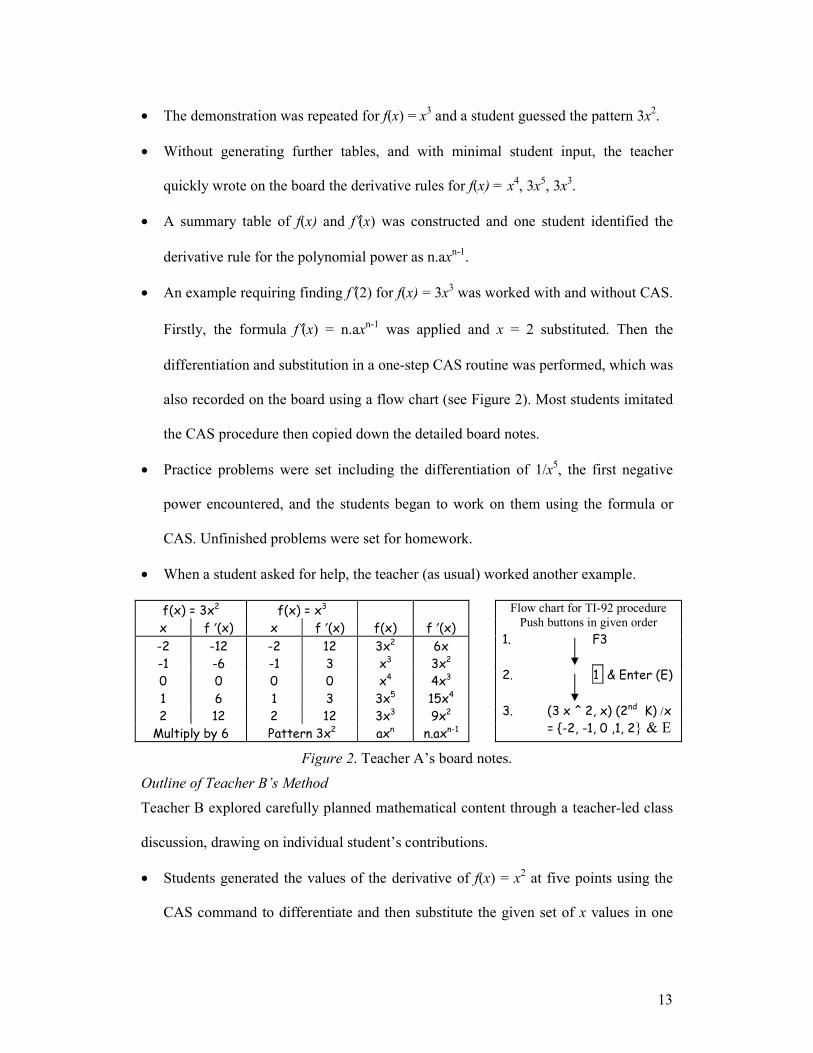
f(x) = x2 f(x) = x3 f(x) = x4 f(x) = axn Patterns x f ′(x) x f ′(x) x f ′(x) x f ′(x) f(x) f ′(x)
-2 -4 -2 12 -2 -32 a x2 2.ax quadratic linear -1 -2 -1 3 -1 -4 ax3 3.ax2 cubic quadratic 0 0 0 0 0 0 ax4 4.ax3 quartic cubic 1 2 1 3 1 4 axn n.axn-1 Examples
2 4 2 12 2 32 1. f(x) = 5x7
f ′(x) = 2x f ′(x) = 3x2 f ′(x) = 4x3 f ′(axn) = n.axn-1 f ′(x) = 35x6 f(x) = 2x2 f(x) = 2x3 f(x) = 2x4 Special cases also for f ′(x) = 4x f ′(x) = 6x2 f ′(x) = 8x3 with diagrams y = 5x7 f(x) = 3x2 f(x) = 3x3 f(x) = 3x4 f(x) = ax = ax1 dy/dx = 35x6 f ′(x) = 6x f ′(x) = 9x2 f ′(x) = 12x3 f ′(x) = a 2. f(x) = 1/x4 f(x) = ax2 f(x) = ax3 f(x) = ax4 f(x) = a = ax0 f(x) = x-4
f ′(x) = 2.ax f ′(x) = 3.ax2 f ′(x) = 4.ax3 f ′(x) = 0 f ′(x) = - 4x-5
Figure 3. Teacher B’s board notes (diagrams, notation section, with some examples omitted).
SAMPLE LESSON 2 This lesson introduced maximum and minimum problems using the following standard
textbook problem:
16
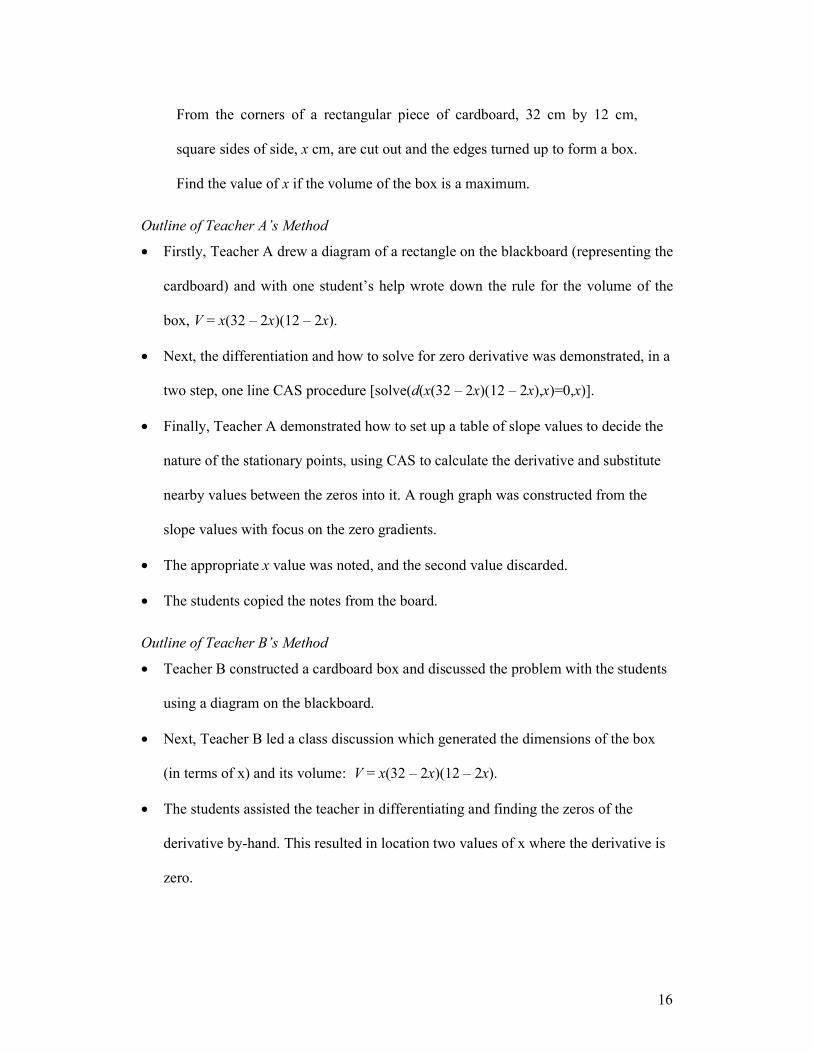
From the corners of a rectangular piece of cardboard, 32 cm by 12 cm,
square sides of side, x cm, are cut out and the edges turned up to form a box.
Find the value of x if the volume of the box is a maximum.
Outline of Teacher A’s Method
• Firstly, Teacher A drew a diagram of a rectangle on the blackboard (representing the
cardboard) and with one student’s help wrote down the rule for the volume of the
box, V = x(32 – 2x)(12 – 2x).
• Next, the differentiation and how to solve for zero derivative was demonstrated, in a
two step, one line CAS procedure [solve(d(x(32 – 2x)(12 – 2x),x)=0,x)].
• Finally, Teacher A demonstrated how to set up a table of slope values to decide the
nature of the stationary points, using CAS to calculate the derivative and substitute
nearby values between the zeros into it. A rough graph was constructed from the
slope values with focus on the zero gradients.
• The appropriate x value was noted, and the second value discarded.
• The students copied the notes from the board.
Outline of Teacher B’s Method
• Teacher B constructed a cardboard box and discussed the problem with the students
using a diagram on the blackboard.
• Next, Teacher B led a class discussion which generated the dimensions of the box
(in terms of x) and its volume: V = x(32 – 2x)(12 – 2x).
• The students assisted the teacher in differentiating and finding the zeros of the
derivative by-hand. This resulted in location two values of x where the derivative is
zero.
17
• Students graphed the function on their calculators, and Teacher B illustrated the
algebraic result graphically from a white board sketch of the graph.
• Finally, the necessity to ignore one of the algebraic solutions (for the real box) was
discussed.
TEACHER PRIVILEGING These two Sample Lessons clearly highlight differences between the teachers with
respect to their teaching approaches, emphasis given to different representations, and
use of technology, the three aspects of privileging of interest in this paper. Both teachers
worked through the planned teaching program that they had helped develop, but during
its implementation they made pedagogical choices about what was important to teach
and how to teach it, what was important to emphasize including representations of
differentiation, and how to incorporate CAS into their lessons. These choices about
working with CAS were consistent with their fundamental conceptions of mathematics,
and innate privileging.
Differences in teaching approaches From a range of possible classifications of teachers’ conceptions of mathematics and
teaching approaches, Thompson (1992) identifies Kuhn and Ball’s (1986) model of
mathematics teaching ″as constituting a consensual knowledge base regarding models
of teaching″(p.137). Their model identifies four different teaching approaches:
Learner focused: mathematics teaching that focuses on the learner’s personal construction
of mathematics knowledge;
Content-focused with an emphasis on conceptual understanding: mathematics teaching that
is driven by the content itself but emphasizes conceptual understanding;
Content-focused with an emphasis on performance: mathematics teaching that emphasizes
student performance and mastery of mathematical rules and procedures; and
18
Classroom focused: mathematics teaching based on knowledge about effective classrooms.
(Thompson, 1992, p.136)
Based on this model, Teacher A’s teaching approach is best characterized as content-
focused with an emphasis on performance. He emphasized mathematical rules and
procedures, generally lectured the students and demonstrated procedures, had relatively
little interaction with students, and conducted little interactive class discussion. He
″automatized″ computational procedures and taught Class A to respond to a range of
specific data cues, the words and/or context clues of the question. In the interview he
explained:
I’d say, when you see these words it means between two points, and when you see this
word that means at a point, and a maximum means that you let the derivative equal zero . . .
[I am] giving them strategies.
Teacher B’s teaching approach is best characterized as content-focused with an
emphasis on conceptual understanding described by Thompson (1992, p.136) with its
distinguishing feature, the ″dual influence of content and learner. On one hand, content
is focal, but on the other, understanding is viewed as constructed by the
individual″(Kuhn & Ball, 1986, p.15). Teacher B perceived mathematics as a logical
coherent body of knowledge waiting to be discovered by students. He taught for
conceptual understanding and encouraged students to develop their intuitive ideas about
rate of change, slope and the limit concept. His style of teaching was student-centred.
He orchestrated interactive class discussions (in which each student participated and
shared ideas) to explore the mathematical content and logical construction of the
concept being developed. Each student appeared to conjecture, analyze, negotiate
meaning with other students in the class, make decisions, draw conclusions, and prove

19
ideas. Teacher B made regular checks that all the students understood what was being
discussed (e.g., in Sample Lesson 1 above, how the derivative rules fitted the patterns of
numbers).
In summary, Teacher A (content-focused with an emphasis on performance)
privileged knowledge of routine procedures and rules (using a lecture style of teaching)
while Teacher B (content-focused with an emphasis on conceptual understanding)
privileged conceptual understanding of mathematical ideas and student construction of
meaning (using student-centred style of teaching). These two different teaching
approaches are consistent with Joss’ (1992) observations that teachers who used
calculators for procedures viewed learning as listening and those who used calculators
for learning used student-centred teaching styles.
Privileging of representations Teacher A supported use of all three representations but had a strong personal
preference for the symbolic representation. This is illustrated by Sample Lessons 1 and
2 above, which are both entirely in the symbolic representation. The obvious link
between the graphical and symbolic, evident in Teacher B’s lessons, is not evident for
Teacher A. In an interview, he indicated that although he had a strong preference for the
symbolic representation he began to use the graphical (and numerical) representations
of derivative when he realized that the CAS calculator would give an “exact” gradient
for the tangent to a curve. Although the gradient is actually an excellent approximation,
Teacher A thought it was exact.
Teacher B privileged both symbolic and graphical representations of derivative. In an
interview, Teacher B stated that he strongly directed his students towards the symbolic
representation because of his personal beliefs that it was the most important and useful

20
representation of derivative, and that by-hand algebra was crucial for understanding. He
also revealed his conviction that his current cohort of students, being less able than
other groups he had taught, would not cope successfully with more than one
representation. Hence his primary teaching focus was the symbolic representation.
Thus, the relatively good symbolic competencies of Class B (see below) are particularly
significant in light of their weaker algebraic background and lower school
performances. However, he frequently used a graphical representation to interpret the
symbolic derivative visually. Both Sample Lessons 1 and 2 illustrate this. Teacher B
frequently used physical representations of slope and speed, and linked differentiation
ideas to the real world. He consistently and deliberately gave the symbolic derivative
meaning by linking it to the slopes of tangent through enactive arm movements and to
rates of change (thereby linking the symbolic representation to the graphical and
numerical representations).
Further evidence for different privileging of representations came from two other
observations. First, each teacher allocated different amounts of teaching time to
connecting different representations. Teacher A allocated a total of 86 minutes to the
graphical-numerical connection and Teacher B allocated 5 minutes. For the graphical-
symbolic connection, Teacher A allocated 60 minutes and Teacher B allocated 185
minutes. Second, the teachers organized their own revision programs differently.
Teacher A spent one lesson revising CAS procedures across the three representations
and a second, by-hand procedures. Teacher B used 1995 – 1997 revision sheets,
previously prepared for use with the former traditional curriculum, and mainly
involving by-hand symbolic procedures.

21
Privileging related to use of technology In an interview, Teacher A indicated his dissatisfaction with the normally used non-
CAS graphics calculator, so it was a surprise that during the first trial he stated a strong
preference for the symbolic capability on the calculators and he permitted his students
free use of the symbolic calculator. In the second trial, he continued to privilege the use
symbolic differentiation with technology and extended his functional use of CAS to
differentiate graphically and numerically. He embraced the new procedures and taught
students to use them. Teacher A may have been expected to resist relinquishing control
of valued ″by-hand″ routine procedures, but rather he seemed comfortable including a
whole new range of technical procedures in his teaching practices. He demonstrated use
of the technology to the students using an overhead projector, listed step by step
routines for each calculator procedure, and then allowed students free use of the
calculator. Sample Lesson 1 demonstrates this. At the interview, Teacher A commented:
I used it . . . because it was so easy. I hooked it up at the beginning of the lesson and used it
much more than I would use a graphics calculator in the classroom. We just used it (the TI-
92) all the time, . . . routine procedures like the product rule and the chain rule, umm, yes, .
. . They actually hadn’t made the distinction that there were functions that they could only
find the derivative of on their calculator.
His preference for the symbolic representation had an unexpected consequence in
giving a strong emphasis to aspects of the numerical representation of differentiation.
He showed his students how to use CAS substitution procedures to find ordered pairs,
for use in a difference quotient calculation, for an “excellent” approximation to the
gradient of the curve and gradient of the tangent. He therefore privileged the link
between the numerical representation and the graphical representations of derivative. He

22
also used CAS pedagogically to link numerical and graphical representations of
derivative.
In contrast, Teacher B’s focus was on conceptual understanding and he privileged
pedagogical use of CAS for activities that linked the symbolic and graphical derivatives.
At the interview, he said a highlight was
getting the tangent idea through to them, what the gradient actually represents, what the
derivative represents and the relationship between them - I think we’ve done very nicely
with the calculator.
He allowed Class B to use the graphics capabilities of the calculator, but restricted
use of symbolic algebra to procedures that supported conceptual understanding. For
example, in Sample Lesson 1, Class B students used CAS to quickly and accurately
gather symbolic data from which the rules of differentiation were inferred. However,
they did the practice exercises by hand. Teacher B explained his position thus:
I liked the routine procedures. For example, when you’re trying to induce symbolic rules,
you haven’t got all that time wasting. You can very nicely do a lot of the algebra so simply
on the calculator and you’re avoiding wasting time doing a lot of repetitive calculations.
It’s [the CAS] good for discovery because it takes a lot of the hack work out of teaching for
understanding but you still need to teach pen and paper skill. I think there’s certain skills
that the kids have to have, even if you can use the technology to do it. I think the kids have
to have the (algebraic) skills as well, without the technology. I think that’s essential for
their understanding. It’s not sufficient to just use the calculator; they have to have the
understanding, what’s behind it.
Teacher B believed that symbolic routines carried out in a ″black box″ did not assist
understanding and insisted that (apart from the use described above) students perform
algebraic procedures by-hand. He also warned his students not to become dependent on

23
CAS since they would not be permitted to use it for exams after this experimental unit.
In contrast, he strongly supported use of graphics calculators (permitted in the state
examination system) and had downloaded a set of programs onto his students’ graphics
calculators including some symbolic programs (e.g., solution of quadratic equations).
Changes in curriculum and teaching with experience During the repeat study, less time was available for the teaching program (due to school
time constraints), so fewer lessons were devoted to concept development prior to
learning symbolic differentiation procedures. In addition, the teachers gave less
emphasis to the construction of tables for numerical differentiation since the students in
the previous study had experienced a variety of time-consuming technical difficulties.
During their second teaching experience the teachers made changes to technology
privileging (discussed above). Table I summarizes these changes and the reasons for
them. These reasons have been constructed by the authors from the evidence in the
interviews. While neither teacher changed his teaching approach (method or style), both
made changes to their privileging of technology in ways that were consistent with their
fundamental conceptions. Teacher A increased his use of technology to include new
procedures for numerical and graphical differentiation and pedagogical activities that
linked the numerical and graphical representations. In contrast, Teacher B reduced
student use of CAS for symbolic and numerical differentiation.

24
Table I Changes in Technology Privileging (and Reason for Change) by Each Teacher During Trial 2
Changes in technology privileging Reason Teacher A
• Adopted numerical and graphical differentiation procedures
Realized numerical and graphical procedures would be tested and came to believe that numerical and graphical differentiation procedures were “exact”.
• Incorporated pedagogical activities that linked the numerical and graphical representations
Liked demonstrating ideas with technology
• Gave more emphasis to by-hand symbolic differentiation
Responded to influence of Teacher B
Teacher B • Reduced use of CAS for symbolic
differentiation and rejected use of CAS for numerical differentiation
Believed that his less able cohort of students would not cope with three representations
LEARNING OUTCOMES AND DIFFERENCES BETWEEN CLASSES In this section, differences on the achievement of students in Classes A and B is
reported with respect to success on the 18 DCT competencies and on various groups of
competencies (viz., each representation and each type of competency by representation).
Differences in class achievement and frequency of CAS use on the six symbolic items
on the Preference for Representation Test is also reported. Then in the final section of
the paper, the information about the teaching and the teachers is considered together
with the information on learning so that the consequences of the teachers’ privileging
can be examined and discussed.
Differences in attainment of the competencies The classes achieved a similar average number of competencies on the DCT: the
average for Class A (N = 14) students was 8.3 (SD 3.6) and for Class B (N = 19) it was
8.5 (SD 3.3). This almost identical class achievement of the 18 competencies was
unexpected since Class A had a higher proportion of highly academically competent

25
students and would have been expected to do better. However, the overall low
achievement of each class was consistent with previous school testing.
Differences in superiority on different types of competencies Average class achievement for different types of competencies (the percentage of
students in each class who demonstrated the competencies) was determined. On the
group of six competencies associated with each representation, both classes achieved
best on the symbolic representation particularly Class B whose achievement was
superior to Class A. Superiority is reported if there is a greater class achievement of at
least 10%. Both classes achieved second best on the group of graphical representation
competencies and least well on numerical competencies.
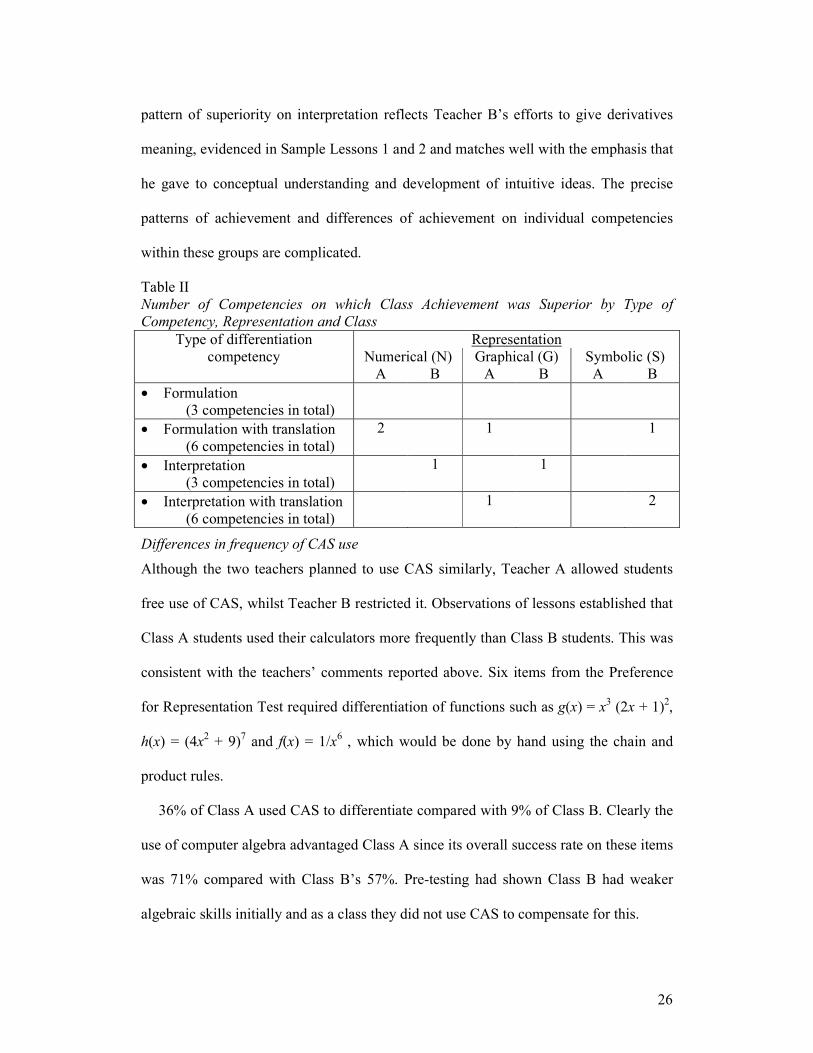
Table II below, displays the number of competencies on which each class was
superior in each type of competency by representation. For example, Class A was
superior (by 20.3%) on both of the formulation with translation competencies in the
numerical representation. None of the differences in class achievement was statistically
significant, but the pattern of differences reflected the different teaching emphasis that
we observed, increasing our confidence in the results.
Table II shows that:
• Overall, Class B was superior on 5 competencies and Class B was superior on 4.
• Class A was superior on both N and G competencies, Class B on S competencies.
• Overall, Class A’s superiority was on formulation with translation competencies,
whereas Class B’s superiority was on interpretation.
Class A’s superiority pattern reflects Teacher A’s willingness to embrace the
numerical and graphical representations during the second teaching trial and his
emphasis on functional routine procedures associated with formulation. Class B’s
26
pattern of superiority on interpretation reflects Teacher B’s efforts to give derivatives
meaning, evidenced in Sample Lessons 1 and 2 and matches well with the emphasis that
he gave to conceptual understanding and development of intuitive ideas. The precise
patterns of achievement and differences of achievement on individual competencies
within these groups are complicated.
Table II Number of Competencies on which Class Achievement was Superior by Type of Competency, Representation and Class
Type of differentiation Representation competency Numerical (N) Graphical (G) Symbolic (S)
A B A B A B • Formulation (3 competencies in total)
• Formulation with translation (6 competencies in total)
2
1
1
• Interpretation (3 competencies in total)
1
1
• Interpretation with translation (6 competencies in total)
1 2
Differences in frequency of CAS use Although the two teachers planned to use CAS similarly, Teacher A allowed students
free use of CAS, whilst Teacher B restricted it. Observations of lessons established that
Class A students used their calculators more frequently than Class B students. This was
consistent with the teachers’ comments reported above. Six items from the Preference
for Representation Test required differentiation of functions such as g(x) = x3 (2x + 1)2,
h(x) = (4x2 + 9)7 and f(x) = 1/x6 , which would be done by hand using the chain and
product rules.
36% of Class A used CAS to differentiate compared with 9% of Class B. Clearly the
use of computer algebra advantaged Class A since its overall success rate on these items
was 71% compared with Class B’s 57%. Pre-testing had shown Class B had weaker
algebraic skills initially and as a class they did not use CAS to compensate for this.

27
DISCUSSION This case study approach provides an example of how two practising teachers
incorporated technology into their pedagogy in different ways, consistent with their
different beliefs. Teaching introductory calculus with a CAS calculator provided the
teachers with a viable range of ″in practice″ pedagogy previously accessible only ″in
principle″ in the classroom. Both teachers intended to teach the same curriculum
material in the same way but they made different pedagogical choices from the range of
options. They had fundamentally different conceptions of mathematics with associated
teaching approaches and innate privileging which influenced their particular choices
while using technology, about what to emphasize, and how to incorporate the graphical
and symbolic algebra capabilities of the calculator into their lessons. These choices
directly affected what they taught, how they taught it and what their students learned.
Although both classes achieved almost identical achievement of differentiation
competencies on the DCT, they showed quite different strengths.
Teacher A (content-focused with an emphasis on performance) had expressed
dissatisfaction about teaching with graphics calculators, and used them only when
essential in his standard teaching (probably because of a preference for “exactness”).
This was in accordance with the behaviour of the rule-based teachers in the study
reported by Tharp et al. (1997). However, with CAS available, Teacher A
enthusiastically embraced use of the technology. It appears that he was able to increase
his repertoire of ways of teaching procedures for achievement in a manner that was
consistent with his innate privileging of teaching rules and procedures and preference
for exactness. He added a set of functional CAS procedures for “exact” differentiation
in the numerical and graphical representations to the rules he already used for exact

28
symbolic differentiation. In consequence, Class A was superior at using CAS for
symbolic differentiation and with translating between representations for formulation.
In contrast, Teacher B (content-focused with an emphasis on conceptual
understanding) used the symbolic capability of the CAS less in the second study than in
the first and turned back towards traditional practice. He privileged conceptual
understanding of mathematical ideas and student construction of meaning (both with
and without technology) and Class B students were superior on more interpretation
competencies. Teacher B used the CAS calculator principally for pedagogical purposes.
Possibly the lack of functional use was because this introductory course did not provide
him with sufficient opportunity to utilize the computational capabilities of the CAS
calculator as creatively as he did with the graphical calculator in his normal teaching
practices. Moreover, there was no move within this introductory unit (with its focus on
understanding) to extend the computational demands beyond normal by-hand
expectations. He gave the symbolic representation the highest status and in
consequence, Class B displayed a preference for the symbolic representation and was
superior on symbolic competencies, significant when considering their weaker
mathematical and algebraic background.
Teacher B’s reluctance to give up by-hand algebra leads us to question how
important by-hand practice is for success on the essentially conceptual items of the
DCT. Although CAS use was optional, symbolic manipulation was hardly needed on
the DCT as the algebraic demands of items were simple. Lagrange (1999), working in
the French tradition, suggests that ″techniques″ play an important role in conceptual
understanding. Techniques in this sense involve both the conceptualization of the steps
required and their execution. Is Class B’s greater facility with the symbolic

29
representation of derivative due in part to Teacher B’s insistence on by-hand practice?
In future CAS studies, the French notion of ″techniques″ could be further explored.
In this study neither class developed a truly holistic approach to the concept of
derivative. Is there a teaching style, privileging and consequent pedagogical choices
under which all students could acquire the complete set of numerical, graphical and
symbolic competencies associated with the concept of derivative, within the time
allotted in the curriculum? Alternatively, if choices are to be made, which skills and
representations and links between them are most important? Technology is providing a
growth in options for doing and teaching mathematics. This study has contributed to
understanding how greater options will manifest themselves in practice and what the
consequences are for students.
ACKNOWLEDGEMENT
We wish to thank the two volunteer teachers for their enthusiastic assistance over two
years, and the students for their co-operation.
REFERENCES
Dick, T. P.: 1996, 'Much more than a toy. Graphing calculators in secondary school
calculus', in P. Gomez and B. Waits (eds.), Roles of calculators in the classroom,
Una Empressa Docente, USA, pp. 31-46.
Ellison, M.:1994, 'The effect of computer and calculator graphics on students' ability to
mentally construct calculus concepts'. (Doctoral dissertation, The University of
Minnesota, 1993). Dissertation Abstracts International, 51/11, 4020.
Etlinger, L.: 1974, 'The electronic calculator: A new trend in school mathematics.'
Educational Technology XIV(12), 43-45.

30
Fennema, E. and Franke, M.:1992 ,'Teachers' knowledge and its impact', in D. A.
Grouws (ed), Handbook of Research on Mathematics Teaching and Learning,
Macmillan, New York, pp. 147-164.
Heid, M. K.: 1988, 'Resequencing skills and concepts in applied calculus using the
computer as a tool'. Journal for Research in Mathematics Education 19(1), 3-25.
Hillel, J.: 1993, 'Computer algebra systems as cognitive technologies: Implications for
the practice of mathematics education', in C. Keitel and K. Ruthven (eds), Learning
from computers: Mathematics education and technology, Springer-Verlag, Berlin,
pp. 18-47.
Hoyles, C.:1992, 'Mathematics teaching and mathematics teachers: A meta-case study'.
For the Learning of Mathematics 12(3), 32-44.
Jost, K. L. E.: 1992, 'The implementation of technology in the calculus classroom: An
examination of teacher beliefs, practice and curriculum change'. (Doctoral
dissertation, Syracuse University, 1992). Dissertation Abstracts International, 53/06,
1876.
Keller, B., Russell, C. and Thompson, H.: 1999, 'A large-scale study clarifying the roles
of the TI-92 and instructional format on student success in calculus'. International
Journal of Computer Algebra in Mathematics Education 6(3), 191-207.
Kendal, M.and Stacey, K.: 1999a, 'CAS, calculus and classrooms', in O. Zaslavsky (ed),
Proceedings of the 23rd annual conference of the International Group for the
Psychology of Mathematics Education, PME, Haifa, Israel, 3, pp.129-136.
Kendal, M. and Stacey, K.: 1999b, 'Varieties of teacher privileging for teaching calculus
with computer algebra systems'. International Journal of Computer Algebra in
Mathematics Education 6(4), 233-247.

31
Kendal, M. and Stacey, K.: Submitted.'Tracing learning of three representations of
differentiation with the derivative competency framework'.
Kuhn, T. and Ball, D.: 1986, Approaches to teaching mathematics: Mapping the
domains of knowledge, skills and dispositions, East Lansing: Michigan State
University, Center on Teacher Education.
Lagrange, J.: 1999, 'Complex calculators in the classroom: Theoretical and practical
reflections on teaching precalculus'. International Journal of Computers for
Mathematical Learning 4, 51-81.
Noss, R. and Hoyles.: 1996, Windows on Mathematical Meanings: Learning cultures
and computers, Kluwer Academic, Dordrecht. Netherlands.
Palmiter, J.: 1991, 'Effects of computer algebra systems on concept and skill acquisition
in calculus'. Journal for Research in Mathematics Education 22(2), 151-156.
Penglase, M. and Arnold, S.: 1996, 'The graphics calculator in mathematics education:
A critical review of recent research'. Mathematics Education Research Journal 8 (1),
58-90.
Repo, S.: 1994, 'Understanding and reflective abstraction: Learning the concept of
derivative in a computer environment'. International DERIVE Journal 1(1), 97-113.
Simmt, E.: 1997, 'Graphing calculators in High School mathematics'. Journal of
Computers in Mathematics and Science Teaching 16(2/3), 269-289.
Tall, D.: 1996, Functions and Calculus (Vol. 1), Kluwer Academic, Dordrecht,
Netherlands.
Tharp, M., Fitzsimmons, J. and Brown Ayers, R.: 1997, 'Negotiating a technological
shift: Teacher perception of the implementation of graphing calculators'. Journal of
Computers in Mathematics and Science Teaching 16(4), 551-575.

32
Thomas, M., Tyrrell, J. and Bullock, J.:1996, 'Using computers in the mathematics
classroom: The role of the teacher'. Mathematics Education Research Journal 8(1),
38-57.
Thompson, A.: 1984, 'The relationship of teachers' conceptions of mathematics to
instructional practice'. Educational Studies in Mathematics 15, 105-127.
Thompson, A. G.: 1992, 'Teachers’ beliefs and conceptions: A synthesis of the
research',
in D. A. Grouws (ed), Handbook of Research on Mathematics Teaching and
Learning, Macmillan, New York, pp. 127-146.
Wertsch, J.: 1990, The Voice of Rationality in a Sociocultural Approach to Mind,
Cambridge University Press, Cambridge.

33
Professor Kaye Stacey and Margaret Kendal are both affiliated with the
Department of Mathematics and Science Education
The University of Melbourne
Parkville, Victoria, 3010
AUSTRALIA
Telephone Australia 03 8344 8443
International 61 3 8344 8443
Fax Australia 03 8344 8739
International 61 3 8344 8739
E-mail Kaye Stacey [email protected]
Margaret Kendal [email protected]