Strategic Decisions in Setting Up Child Rights Impact Assessments
Upload
khangminh22Category
view
1download
0
THE IMPACT OF STRATEGIC HUMAN RESOURCE MANAGEMENT
ON EMPLOYEE ATTITUDE BEHAVIOR AND WORK OUTCOME
THROUGH PERCEIVED ORGANIZATION SUPPORT
Suthi Suthiphan
A Dissertation Submitted in Partial
Fulfillment of the Requirements for the Degree of
Doctor of Philosophy (Development Administration)
School of Public Administration
National Institute of Development Administration
2010

ABSTRACT
Title of Dissertation The Impact of Strategic Human Resource Management
on Employee Attitudes Behavior and Work Outcome
through Perceived Organization Support Author Suthi Suthiphan
Degree Doctor of Philosophy (Development Administration)
Year 2011
_____________________________________________________________________
Strategic human resource management becomes more important as the
organization has to ensure its well-being in the industry amidst environmental
changes. Base on the resource-based view of the firm, firms should look inward to
their resources as the sources of strategies. Resources that are valuable, rare,
inimitable, and non-substitutable will lead to competitive advantage. However,
employee attitude, behavior, and work outcome are influenced by human resource
practice. Based on social exchange theory and perceived organizational support
theory, employee attitude and behavior can be predicted as a result of such practices,
as they respond in return to organization with affective commitment and felt
obligation in performing work. The study tests this relationship among the constructs,
which are strategic human resource management, perceived organizational support,
affective commitment, felt obligation and employee attitude and behavior. The results
of the study prove that there is a significantly positive relationship among these
variables. It is suggested that to a certain extent human resource strategy has a direct
effect on employee attitude and behavior: and an indirect effect through psychological
factors such as perceived organizational support, affective commitment and felt
obligation. The human resource strategy has a strong correlation with perceived
organizational support. Among the observed variables of this strategy, organization
rewards and procedural justice have a strong validity. The theoretical framework of
the relationship among the five constructs based on theory is proven for its validity by
empirical study of the airline industry in Thailand.
ACKNOWLEDGEMENTS I would like to extend my sincere gratitude to the persons that provided
valuable advice and guidance to me in completing this dissertation.
My appreciation and heartful thanks go to Associate Professor Dr. Chindalak
Vadhanasindhu, who really supported and gave me valuable guidance to proceed with
this dissertation during hard times till its completion. My highest thankfulness owed
to the Committee Chairman, Associate Professor Dr. Uthai Laohavichien, for his valuable
suggestions and recommendations. I also would like to thank Assistant Professor Dr.
Werawat Punnitamai who guided through the dissertation.
My highest appreciation also owed to Associate Professor Dr. Polapat, who
really encouraged and supported my work particularly during critical times so I could
proceed with the dissertation successfully.
I will never forget all friends in class 11 who always supported and provide
me with their cheerfulness throughout the process until its accomplishment.
This dissertation would not have been successful without the utmost support
from my family, my beloved twin son and daughter, Suthidon (Team) and Panthisa
Suthiphan (Tan), and my wife, Amornrat Kantatham who make my life most beautiful,
happy, and full of inspiration.
Suthi Suthiphan
February 2011

TABLE OF CONTENTS
Page
ABSTRACT iii
ACKNOWLEDGEMENTS iv
TABLE OF CONTENTS v
LIST OF TABLES viii
LIST OF FIGURES x
ABBREVIATIONS AND SYMBOLS xi
CHAPTER 1 INTRODUCTION 1
1.1 Introduction 1
1.2 The Objectives of this Study 4
1.3 Research Questions 5
1.4 Significance of the Study 6
1.5 Definition of Terms 8
CHAPTER 2 BACKGROUND OF THAI AIRWAYS INTERNATIONAL 12
2.1 The Organization 13
2.2 The Role of Human Resource Management Department 18
2.3 The Role of Human Resources Planning and Development 23
2.4 Corporate Strategy of HRM 24
CHAPTER 3 LITERATURE REVIEW 29
3.1 Strategic Human Resource Management 29
3.2 High Performance Work System 36
3.3 Perceived organizational Support and Social Exchange Theory 38
3.4 Organizational Commitment 43
3.5 Employees’ Attitudes Performance Job Involvement and 48
Withdrawal Behavior

vi
CHAPTER 4 THEORETICAL FRAMEWORK AND HYPOTHESES 55
4.1 The Relationship Between SHRM and Perceived Organizational 55
Support
4.2 The Relationship Between Perceived Organizational Support, 58
Affective Commitment, and Felt Obligation
4.3 The Relationship Between Affective Commitment and 60
Employee Outcome
4.4 The Mediating Role of Perceived Organizational Support 62
CHAPTER 5 RESEARCH METHODOLOGY 65
5.1 Measures and Unit of Analysis 68
5.2 Participants and Response Rate 69
5.3 Sample Size and Sampling 70
5.4 Instrumentation 72
5.5 Methods of Data Analysis 75
5.6 Measurement of Reliability and Validity 87
5.7 Operationalization 92
CHAPTER 6 DATA ANALYSIS AND FINDINGS 96
6.1 Results of Descriptive Statistics 96
6.2 Reliability Analysis 98
6.3 Convergent Validity and Discriminant Validity 99
6.4 Multicollinearity 109
6.5 Model Assessment 113
6.6 Proposed Models and Test of Fit 114
6.7 Testing of Research Hypotheses 128
CHAPTER 7 CONCLUSION 140
7.1 Research Findings 140
7.2 Discussion 142
7.3 Contributions of the Study 145
7.4 Implications for the State-Owned Enterprise 151
7.5 Limitations 152
7.6 Recommendations for Future Research 153
7.7 Conclusion 154

vii
BIBLIOGRAPHY 155
APPENDICES
Appendix A Questionnaire 187
Appendix B Reliability Statistics 194
Appendix C Structural Equation Modeling Testing by Amos 199
BIOGRAPHY 212

viii
LIST OF TABLES
Tables Page
5.1 Characteristics of Quantitative Research 66
5.2 Sample size for ±3%, ±5%, ±7% and ±10% 70
5.3 Measures of the Structural Model Fit 87
5.4 Questions from the Pre-Testing Questionnaire 88
5.5 The Reliability Analysis of the Questionnaire from Pre-Testing 90
5.6 Definitions and Operationalization of Variables 92
6.1 Descriptive Statistics of Observed Variables 97
6.2 Summary of the Mean of All Constructs 98
6.3 Constructs and Reliability Analysis (Cronbach’s alpha) 99
6.4 Construct Measurement Model 1 102
6.5 Construct Measurement Model 2 104
6.7 Pairwise Analysis of Discriminant Validity 108
6.8 Summary of Discriminant Validity Analysis 108
6.9 Collinearity Statistics 110
6.10 Correlation Matrix 112
6.11 Measures of the Structural Model Fit 114
6.12 Summary of Proposed Models 115
6.13 Construct Measurement Model A 116
6.14 The Results of Proposed Model A 117
6.15 The Relation of Parameters and Parameter Estimates of Proposed 119
Model A
6.16 Measurement Model B 121
6.17 The Results of Proposed Model B 122
6.18 The Relation of Parameters Standardized Estimates of Proposed 123
Model B
6.19 Construct Measurement Model C 125

ix
6.20 The Results of Measurement Model C 126
6.21 The Relation of Parameters and Parameter Estimates of Proposed 126
Model C
6.22 Fit Indices Model C1 129
6.23 Standardized Total Effects 129
6.24 Standardized Direct Effects 129
6.25 Standardized Indirect Effects 130
6.26 Path Coefficient – Regression Weights 130
6.27 Parameter Eelationships and Standardized Regression Weights 130
6.28 Fit Indices Model C2 132
6.29 Standardized Total Effects 133
6.30 Standardized Direct Effects 133
6.31 Standardized Indirect Effects 133
6.32 Path coefficient – Regression Weights 134
6.33 Standardized Regression Weights 134
6.34 Conclusion of Hypothesis 135
6.35 Comparison of Alternative Models and Test of Fit 137
6.36 Effect of SHRM on Attitude & Behavior 138

x
LIST OF FIGURES
Figures Page
2.1 The Organization of Thai Airways International PLC 17
2.2 The Organization of Human Resource Development and Management 19
2.3 The Organization of Human Resource Planning and Development 22
3.1 The Contextual Perspective 31
3.2 Model of Relationships Among Work Experience, Perceived 39
Organizational Support (POS), and Affective Commitment
3.3 Basic Relationship Among Human Resource Practice, Emplyee’s 54
Work Experience and Attitudes and Behavior
4.1 A Perspective on Business Strategy and Human Resource Strategy 55
Interdependence
4.2 The Effect of HRM 56
4.3 Conceptual Framework 63
5.1 Formative and Reflective Models 79
5.2 Path Diagram of a Simple Structural Theory 80
5.3 Path Diagram of a Complex Structural Model 81
5.4 Simplified Research Process 94
6.1 Construct Measurement Model 1 101
6.2 Construct Measurement Model 2 104
6.3 Fixed and Free Model for Testing Discriminant Validity 107
6.4 Measurement Model A 116
6.5 Structural Model A 118
6.6 Proposed Model B 120
6.7 Structural Model B 123
6.8 Measurement Model C 124
6.9 Structural Model C1 128
6.10 Structural Model C2 132
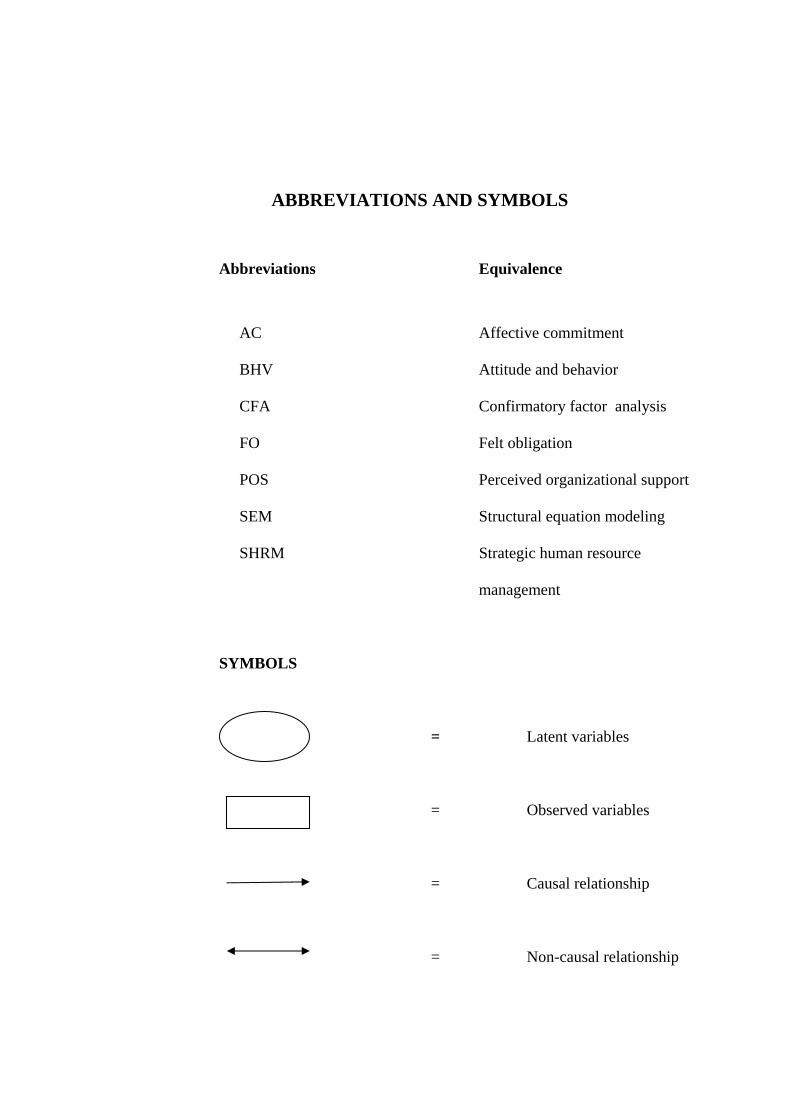
ABBREVIATIONS AND SYMBOLS
Abbreviations Equivalence
AC Affective commitment
BHV Attitude and behavior
CFA Confirmatory factor analysis
FO Felt obligation
POS Perceived organizational support
SEM Structural equation modeling
SHRM Strategic human resource
management
SYMBOLS
= Latent variables
= Observed variables
= Causal relationship
= Non-causal relationship

CHAPTER 1
INTRODUCTION
In the current fast changing environment affecting the competence of large
corporations, organizations have developed corporate strategies and have aligned
strategic human resource practices to achieve a company’s goals and objectives
through human resources. Environmental factors such as uncertainty (Ellis, 1982),
technological innovation (Maiter, 1982) and demographic changes (Fombrun, 1982)
affect these human resource strategy. Many environmental characteristics have been
investigated concerning how they constrain strategy formulation. Competitive
advantage encompasses those capabilities, resources relationships, and the decisions
that permit a firm to capitalize on opportunities and avoid threats within its industry
(Holfer and Schendel, 1978).
1.1 Introduction
Organizations today face many conflicting problems that they must strategically
manage in order to operate successfully in the world of economic non-stability. They
must continually improve performance by reducing costs, innovating processes and
products, and improving quality and productivity (Becker and Gerhart, 1996). At the
same time, there is great concern about recruiting, retaining, managing, and
motivating the workforce because of the changing relationships between employers
and employees and a labor market that has been tight. Over the past ten to fifteen
years, various arguments have been made that the firm’s human resources may be its
sole source of sustainable competitive advantage (Ferris, Hochwarter, Buckley,
Harrell-Cook and Frink, 1999). These arguments are drawn from the resource-based
view of the firm (Barney, 1991, 1995). According to this point of view, human
resources create value in a way that is rare, cannot be imitated, and cannot be substituted

2
(Ferris, Hochwarter, Buckley, Harrell-Cook and Frink, 1999). These arguments lay
the foundation for the study of strategic human resource management (SHRM).
However, due to the rising uncertain ability of organization to sustain their
competition in the current environment, organizations have established broader
strategic human resource practice for strategy fit along with contingency plans, and
employees feel about career development, earnings, benefits and employment due to
fact that human resource practices are aimed at work outcome, financial performance
and contribution from employees while the organizations’ support, in the view of
employees is ambiguous in terms of perception of their well being.
Many empirical human resource studies have suggested that strategic human
resource impact employee attitudes and behavior towards organizational support,
which results in employee outcomes such as performance and, withdrawal behavior.
The model generally argues that SHRM in the form of HR practices directly impacts
employees, either by increasing human capital or motivation. This also has led an
impact on operational outcomes such as quality, customer service, withdrawal
behavior and other operational-level outcomes. According to Delaney and Huselid
(1996), the implementation of human resource practices affecting motivation, skill
and behavior can create a strategic advantage for the organization. However, the
implementation of human resource practice has a relationship with the perception of
employees in terms of how they feel that the organization can support or care about
them in terms of well-being. According to social exchange theory (Blau, 1964) and
organizational support theory (Eisenberger, Huntington, Hutchinson and Sowa, 1986),
the roles of perceived organizational support (POS) and the employees’ perceptions of
HR practices and work outcomes are correlated. The perception of organizational
support leads to the employee in return feeling an obligation to perform his or her
duties through affective commitment accordingly.
Empirical studies suggest that set of human resource practices, including
comprehensive recruitment and selection, compensation and performance management
systems, training and extensive employee involvement, can improve acquisition and
retention of a talented and motivated workforce. These HR practice are usually
referred to as a High Performance Work System (HPWS) or in terms of high
involvement or high commitment. The analysis of the HPWS stems from the study of

3
strategic human resource management (SHRM). The HPWS will explore how a broad
set of management practices include how SHRM and workplace partnerships relate to
employee outcome through organizational support or have a direct impact on an
outcome. It is increasingly apparent that one of keys to successful organizational
performance is the people within organizations, and management systems that
develop their talent and capabilities. A model of the High Performance Work Systems
(HPWS) focuses on key elements of workplace innovation, employee involvement
and participation, and equality and diversity of systems.
In many cases, the term SHRM is used interchangeably with HPWS. The
common understanding in the SHRM literature is that it a set of practices that provide
employees with skills, information and latitude to be a source of competitive
advantage.
The behavioral perspective (Jackson, Schuler, & Rivero, 1987) suggests that
an effective HR management system will acquire, develop and motivate the behaviors
necessary to enhance firm performance (Bailey, 1993; Jackson et al.,1987; Pfeffer,
1994; Schuler and MacMillan, 1984). The behavioral perspective describe how the
HR management system creates new firm capabilities, while resource-based theory
emphasizes the attributes required for these capabilities to generate competitive
advantage. These are consistent with the theoretical work in the field of strategic
management (Amit and Shoemaker, 1993).
Empirical studies, have examined the impact of HR practices (HRPs) on
various aspects of� organizational� performance (Guest, Michie, Conway Sheehan
2003; Huselid, 1995; Ichniowski et al., 1997; Wall and Wood, 2005; Wright and
Boswell, 2002), as well as on a range of employee attitudes and behaviours at work
(Appelbaum et al., 2000; Guest, 2002; Godard, 2001; Ramsey et al., 2000;). However,
the mechanisms linking HR practices to both organizational performance and
employee related outcomes have not received systematic research attention (Guest,
1997; Wright and Gardner, 2003). The present study focuses on the relationship
between HR practices and employee attitudes and behavior, and on the mediating role
played by employee work experiences in this relationship.
Specifically, based on the explanatory model proposed by Peccei (2004)
regarding social exchange theory (Blau, 1964), it asserted that the exchange relationships

4
between two parties are beyond economic exchange such as with respect, support and
approval. (Eisenberger, Armeli, Rexwinkel, Lynch, & Rhoades, 2001). Based on
social exchange and reciprocity, Eisenberger implied that perceived organizational
support (POS), which refers to employees’ perceptions about the degree to which the
organization cares about their well-being and values their contribution, describes the
social exchange relationship between the organization and its employees. Employees
with higher levels of POS are likely to have positive attitudes and behaviors. Mainly
drawing on social exchange theory and organizational support theory, as well as other
relevant literature in human resource management and organizational behavior
research, this dissertation will examine the antecedents and outcomes of POS and
affective commitment and the relationship between strategic human resource management
and the employee’s outcome with perceived organizational support as the mediator.
1.2 The Objectives of this Study
The objective of the study are first, to understand the relationship between
strategic human resource management (SHRM) and employee outcome in terms of
attitudes and behavior; second, to test perceived organizational support as to whether
it will be the mediator between strategic human resource practice and attitude and
behavior. Affective commitment refers to the employee’s attitudes towards the
organization. The study will prove the elements of perceived organizational support as
playing a mediating role of the SHRM and employee’s affective commitment and felt
obligation as well.
This dissertation has the potential to contribute to the literature in the
following aspects. First, the dissertation will test SHRM in terms of the antecedents of
POS and their relationships. Some human resource practices have been tested before;
however, it would be interesting to understand if SHRM aims to achieve
organizational performance, how employees respond to the organization through
organizational support and whether affective commitment will be changed or not.
There are a few studies that have explored the link between SHRM and perceived
organizational support. The implementation of different SHR practices often
communicate the degree to which the organization cares about its employees and

5
values their contribution, and POS is often treated as a topic of Organization Behavior
topic. In OB study, it is assumed that employee motivation and behavior are the
mediators between HR practices and firm performance (Jackson, Schuler, & Rivero,
1989; Schuler and Jackson, 1987; Wright and McMahan, 1992). The HR literature,
however, has focused only on the relationship between HR practices and firm
performance (Arthur, 1992, 1994; Becker and Huselid, 1998; Delery and Doty, 1996;
Huselid, 1995). There is little research regarding the effects of the implementation of HR
practices on employee attitudes and behaviors. In this dissertation, how employees’
evaluation of HR practices can influence their perceptions of the level of support from
the organization which affects their work attitudes and behavior will be tested. The
antecedents of individual job performance are also tested, looking at such elements
for example as affective commitment and organizational rewards, which are believed
to be related to work effort and performance. This dissertation validates the proposition of
social exchange theory (Blau, 1964) and organizational support theory (Eisenberger et al.,
1986; Rhoades and Eisenberger, 2002) regarding the norm of reciprocity in the
employer-employee relationship, by investigating the mediating role of affective
commitment and employee job involvement in the POS-outcome relationship.
In this dissertation, the hypothesis will be tested regarding the employee’s
perceptions of SHR practices, aligned with corporate strategies that are implemented,
and whether it has an impact on employee attitude and behavior and work outcome
through perceived organizational support and affective commitment as mediators.
1.3 Research Questions
In order to fulfill the objectives of the study, the following research questions
have been used:
1) Does SHRM, as a set of HR practices, have a direct impact on employee
attitude and behavior?
2) Does perceived organizational support mediate SHRM and employee
attitude and behavior?
3) Is perceived organizational support the antecedent of affective commitment
and felt obligation?

6
4) Does affective commitment mediate SHRM and employee attitude and
behavior?
5) Does felt obligation mediate perceived organizational support and affective
commitment ?
6) Does felt obligation mediate perceived organizational support and affective
commitment ?
7) Does felt obligation have the direct impact on employee attitude and
behavior?
1.4 Significance of the Study
Major threats to employee commitment mean the fact that organizations are
less able, or willing, to provide support than was the case in the past (Baruch, 1998).
According to Meyer (1990), threats to commitment can be classified into four areas:
perceived organizational support, organizational justice, person-organization (P-O) fit,
and psychological contract fulfillment.
A firm with a strategic commitment to the well-being of employees operating
in an economic downturn or time of increased competition may be forced to make
choices between commitment to employees and a need for restructuring, layoffs, or
other non-friendly actions towards employees in order to remain solvent ( Allen and
Wright, 2006). According to Meyer (2009), the major threat to commitment is change,
e.g. changes in technology, global competition, and consumer demands.
Organizational changes sensitize employees to the procedure used in making
allocation decision and to the treatment of those affected by the changes (Gopinath
and Baker, 2000; Korsgaard, Sapienza and Schweiger, 2002).
Organizations encounters pressure for increased flexibility and efficiency, and
they sometimes intentionally or inadvertently violate their contracts in the eyes of
employee by eliminating jobs, cutting salaries, increasing workloads and the like
(Rousseau, 1996). As a consequence of the organizations’ measures in response to
change, the testing of perceived organizational support is therefore interesting in
terms of consistency.

7
POS suggests that some work experiences may contribute to affective
commitment by means other than POS. For example, work experiences intrinsic to the
job itself (autonomy, variety and challenge) might be attributed more to the job’s
nature than to organizational support (Rhoades, Eisenberger, Stephen Armeli, 2001).
A positive relationship was found between intrinsic job conditions and AC (Colarelli,
Dean and Konstan, 1987; Dunhan, Grube and Casteneda, 1994; Hackett at al., 1994).
This dissertation is aimed at finding the relationships between strategic human
resource practices and employee behavior, attitudes and work outcome through
perceived organizational support. Strategic human resource management is aligned
with corporate strategy which is contingent on situational factors. Whether perceived
organizational support will change depends on the contingent relationship which
affects employee outcome. There are few studies relating strategic human resource
practices and perceived organizational support, although there have been some studies
regarding the casual relationship between SHRM and organizational commitment.
However, in modern terms, such work commitment is integrated with SHRM and
becomes a high performance work system where usually both terms are used
interchangeably.
The non-stability of employment is the result of the changing nature of the
employment relationship and the current business environment, characterized by
mergers, spin-offs, layoffs, outsourcing, and flexibility. Commitment cannot be
viewed the same way it was when employees could expect to spend their entire career
with a single company (Meyer, Allen, and Topolnytsky, 1998). Mowday (1998: 394)
notes that with the composition of organizations changing so rapidly, it is not clear
“whether employees know from one day to the next who they are working for, let
alone what organization they are committed to, if any”. Some have argued that
commitment is losing relevance (Baruch, 1998); others suggest that it is more
important than ever (Mowday, 1998). Social exchange theory (the basis for Bartlett’s
hypotheses) would suggest that companies show less loyalty to employees. Invited
reaction employees should not be as loyal to employers. The “free agent” mentality
that exists in today’s workforce may make it difficult to build strong attachments to
organizations, regardless of the investments made in HRD. The counterargument has
also been made that, within this environment, the most competitive organizations are

8
those that adopt a high-performance, high-commitment strategy (Mowday, 1998;
Tsui, Pearce, Porter, and Tripoli, 1997).
The dissertation will study the relationship between perceived organizational
support and strategic human resource management as its antecedent. Also, the
relationship between SHRM and employee attitudes and behavior will be investigated. A
field study was carried by collecting data and information from various functions in
the organization.
1.5 Definition of Terms
Strategic human resource management refers to practices that are responsive
to a strategic change in the environment (Ellis, 1982; Fombrun, 1982; Lindroth,1982;
Maier, 1982; Warner, 1984). Strategic human resource management is also defined as
matching human resources to strategic or organizational conditions (Gerstein &
Reiseman, 1983; Harvey, 1983; Leontiades, 1982; Migliore, 1982; Miles and Snow,
1978), selection and retention (Galosy,1983), compensation system (Migliore, 1982),
domain choice (Miles and Snow, 1978) and productivity (Deutsch, 1982).
According to Alcazar, Fernandez, and Gardey, (2005), HRM can be defined as
the integrated set of practices, policies and strategies through which organizations
manage their human capital that influences and are influenced by business strategy,
organizational context and the socio-economic context. Agarwal and Ferratt (1999)
found recognition, empowerment, distributive and procedural justice, competence
development, work-life policies, and information-sharing to be the critical HR practices in
the software industry. Delery and Doty (1996) identified seven human resource
practices considered to be strategic: career opportunities, formal training systems,
appraisal measures, profit sharing, employment security, voice mechanisms, and job
definition.
The High Performance Work Systems (HPWS) is an advanced form of strategic
human resource management composed of employee involvement, empowerment and
responsibility. It has been described in terms of high involvement management, high
commitment workplaces and high trust workplaces ( Ramsay, Scholaries and Harley,
2000).

9
Perceived organizational support theory asserts that employees are likely to
develop higher levels of POS when the organization cares about their well-being and
values their contributions (Eisenberger et al., 1986; Eisenberger et al., 2001; Rhoades
and Eisenberger, 2002).
Procedural justice concerns the perceived fairness of the means used to
determine the amount and distribution of resources among employees (Greenberg,
1990). Procedural justice has two aspects (Skarlicki and Folger, 1997): one aspect
refers to the fairness of organizational procedures, while the other, called interactional
justice (Bies and Moag, 1986) focuses on the employee’s perceptions of the quality of
interpersonal treatment received during the enactment of organizational procedures.
Folger and Konovsky, 1989; Kovolsky and Pugh, 1994; Moorman, 1991) found that
procedural justice, especially interactional justice, provides a better explanation of
employee attitudes and behavior than distributive justice.
Affective commitment is seen as the employees’ emotional bond to the
organization. The sense of belonging and identification that increases involvement in
the organization’s activities (Eisenberger et al., 2001). Mowday, Porter, and Steer
(1982) characterized organizational commitment as follows: first, strong belief in,
and acceptance of, organizational goals and values; second, willingness to exert
considerable effort on behalf of the organization; and third, the strong desire to
maintain membership in the organization. Meyer and Allen (1990, 1991, 1996) have
proposed the conceptualization of organizational commitment consisting of affective,
normative, and continuance commitment.
Felt Obligation is based on employee’s reciprocity with the organization in
caring about the organization and in helping the organization to reach its goals and
objectives (Eisenberger et al., 2001). Work attitudes were defined by Staw and
Salanick in terms of the individual developing an attitude that is consistent with
behavior; this attitude can be considered one manifestation of a commitment mindset.
Attitudinal variable i.e. job satisfaction represent work attitude in the study. Job
involvement refers to identification with, and interest in, the specific work that one
performs (Cropanzano et al., 1997; O Driscoll & Randall, 1999). Performance and
productivity are defined as the result of the pattern of actions carried out to satisfy an
objective according to some standard (Bailey, 1982). Withdrawal behavior concerns

10
the employee’s avoiding work and included such concepts as tardiness, absenteeism
and voluntary turnover (Allen, 1977).
Set of Strategic Human Resource Practices
Employee-focused studies are a welcome occurrence, due to this apparent lack
of investigation into the effect that HRM practice has on employees (Grant and
Shields, 2002). Recent studies in employee centred literature have focused primarily
on bundles of HRM (and non-HRM) employment practices (Grant and Shields, 2002).
The study of these bundles indeed provides good insight into the general effect that
HRM practices have on employees; however the effects of individual practices on
their own have not been investigated. Therefore, the purpose of this study is to do just
that, by focusing primarily on the reactions that employees have towards strategic
human resource management. This paper will critically analyze the research conducted
on the reactions employees have towards strategic human resource management in an
attempt to ascertain whether or not SHRM is indeed useful. Prior to delving into the
literature, it is important for the purposes of this paper to determine how the
organization develop the practices and also to highlight what these practices
constitute. There are many labels given to this area of HRM. The predominant labels
include “high performance management” (White, Hill, McGovern, Mills and Smeaton,
2003), “high involvement management” (Lawler, 1986) and ‘high commitment
management” (Wood and deMenezes, 1998). “High involvement” is used by some to
emphasize the importance of enhanced opportunities for employees to make decisions
and exercise discretion. Others, as highlighted, prefer to use the term ‘high
commitment’ to highlight the role of effective management in enhancing employee
commitment and thereby reducing the need for managerial control. Nonetheless, there
remains considerable overlap between the practices associated with each approach.
For the purposes of this study, and given the nature of its aim to collate themes that
arise from employee reactions, the term HPWS (high performance work systems) will
be used on the basis that it is sufficiently broad enough to encompass the range of
practices by different approaches (Ramsay, Scholaries and Harley, 2000). Prior work
on withdrawal behavior has examined the determinants of both individual employees’
departures and aggregate organizational turnover (Huselid, 1995). Previous research
concluded that perceptions of job security, the presence of a union, job satisfaction,
11
organizational tenure, demographic variables such as age, gender, education, and
number of dependents, organizational� commitment, whether a job meets an individual’s
expectations, and the expressed intention to search for another job were all predictive
of the employee’s decision to leave (Arnold and Feldman 1982; Cotton & Tuttle,
1986).
High performance work systems aim at reducing turnover, absenteeism and
costs through a reduction in the need for control and monitoring (Ramsay et al.,
2000). Furthermore, so-called HPWS create high trust, high involvement, high
intrinsic satisfaction, and high skill and control and as a result, high commitment
(Scholarios and Ramsay, 1999; Harley, 1999). With these “objectives” as they may be
termed, it is important to analyse the actual effect of HPWS on organizational
commitment.
“Taken together, the studies reviewed show that specific practices such as
training, alternative pay systems, and employee involvement often are correlated with
higher productivity. These and other practices are associated with even greater
productivity improvements when implemented together in systems” (Kling 1995: 32).
The implementation of HRM systems is more important than individual characteristics
because there are synergies and complementarities in HRM practices (Kandel and
Lazear, 1992; and Milgrom and Roberts, 1995).
Although researchers have made strong theoretical arguments for bundling
human resource practices, conceptualization and measurement of a configuration
remains inconsistent and problematic (Becker and Gerhart, 1996; Dyer and Reeves,
1995).

CHAPTER 2
BACKGROUND OF THAI AIRWAYS INTERNATIONAL PLC.
Thai Airways International is a listed company on Stock Exchange of Thailand
and become owned by the government through the Ministry of Finance by 53.98
percent at the end of 2006. Having been operated in the aviation business since 1960,
the company has grown steadily in terms of operations, sales, staff and capital. The
registered capital now is 17,000 million Baht. Revenue reached 170,000 million Baht
by fiscal year 2005/06. The human resource is tremendous with employees totaling
25,000, with a non-permanent staff from an outsourced-channel at approximately 5,000
persons.
Human Resource Development and Management has played a significant role
in leading the company to be at the forefront of the aviation industry. In the past,
THAI’s performance relied on the effective working system established by cooperation
with the European carrier, Scandinavian Airline System. Competition in the industry
from foundation of the airline till the 1980s seemed to be more resilient than it was in
the 1990’s onward. The globalization effect, liberalization policies, and a more “open
sky” resulting from the world trade agreement have forced the country to relax on air
transport restrictions, which means that competition in aviation has become fiercely.
Although the liberalization policy is highly effective in North America traffic demand
has increased in Europe with more emerging airlines, especially low cost carriers, the
company has had to adapt to this tremendous change in the industry since prices are
going down, with competition and fuel costs affected by world consumption for growth in
China and, India. It has spiked the competition in every area. Human Resource
Development in the company has changed its role from personnel management to be a
more strategic function to enhance staff competency in order to survive and remain at
the top of the industry. The major change became more apparent when the company
was listed in the capital market in 2000 and after the currency crisis due to flotation of
the Baht in 1997.

13
2.1 The Organization
Thai Airways International Public Company Limited is the national carrier of
the Kingdom of Thailand. It operates domestically, regionally, with intercontinental
flights radiating from its home base in Bangkok to key destinations around the world
and within Thailand. The company's fully paid up share of capital amounts to
16,988,765,500 Baht (9 May 2005) and is 53.77% owned by the Ministry of Finance
of the Thai Government. At the end of September 2004, consolidated total assets of
the company amounted to 193,211 million Baht. In its operations, THAI has achieved
profitability every year for the last 48 consecutive years.
Thai Airways International was founded in 1960 as a joint venture between
Thailand's domestic carrier, Thai Airways Company (TAC), and Scandinavian
Airlines System (SAS), with the Scandinavian carrier initially providing a 30% share
capital of two million Baht. SAS also provided operations and managerial and
marketing expertise, with training assistance aiming at building a fully independent
national airline within the shortest possible time. Thai nationals, through training and
experience, were gradually able to assume full managerial responsibility and the
number of expatriate staff duly reduced until, in 1987, expatriates accounted for less
than one percent of staff based in Thailand.
On April 1, 1977, after a 17 - year capital participation partnership with SAS,
the Thai Government bought out SAS’s remaining 15% holding and THAI became
fully owned by the Thai people.
In 1960, flights were inaugurated from Bangkok to 9 overseas destinations all
within the Asian region. Intercontinental services were launched in 1971, to Australia,
followed by flights to Europe in 1972, and to North America in 1980. Thai Airways
International growth was greatly accelerated on April 1, 1988 as a result of its merger
with Thai Airways Company (TAC), the domestic airline, which raised the company's
share capital from 1,400 million to 2,230 million Baht . Under Cabinet policy, as
authorized by General Prem Tinsulanonda, Prime Minister at the time, Thai Airways
International was responsible for commercial aviation, both international and domestic.
Thai Airways International can now rightfully be called Thailand's only national
carrier. On June 25, 1991, Thailand’s Cabinet approved a resolution enabling THAI to

14
list its shares on the Stock Exchange of Thailand (SET). The resolution authorized
THAI to convert Baht 10.77 billion of retained earnings into capital, and to increase
its capital by an additional Baht 3 billion with a first issue of 100 million shares. Of
those 100 million shares, five million were reserved for THAI employees at par Baht
10 and 95 million shares were to be offered to the public.
The listing of THAI shares commenced on July 19, 1991. By converting the
retained earnings into capital and increasing its share capital upon Cabinet approval,
THAI registered that its share capital had risen from Baht 2,230 million to a total of
Baht 14,000 million. This has made the total amount of the THAI share listing to be
the largest in the history of SET. Moreover, the THAI public offering of shares was
the single largest ever undertaken in Thailand.
The main purposes of listing on the SET and offering shares to the public were
to obtain the additional funds needed to keep the airline at a competitive edge in the
international market and to allow member of the general public and THAI employees
to become shareholders in this national flag carrier. On November 20-21, 2003, THAI
offered for sale the company's 442.75 million ordinary shares, comprising 285 million
capital increase ordinary shares and 157.75 million existing ordinary shares held by
the Ministry of Finance upon Cabinet approval. The proceeds generated by the sales
were used as investment for the Suvarnabhumi Airport project, and for upgrading
inflight services ranging from passenger seats to other amenities. Since September,
2004, the company has sold THAI shares to its employee through the Employee
Securities Option Plan (ESOP) for a total of 13,896,150 shares at 15 Baht per share.
The company continued to sell its shares to those employees that were holding
warrants until the end of the plan in April 2007. On September 2010, THAI
announced its plan to make a public offering of no more than 1,000 million newly-
issued shares with a subscription scheduled for 16-17 September 2010 at nationwide
branches of Bangkok Bank (except Micro branches) and Krung Thai Bank. The
offering proceeds were to strengthen the company’s financial status and support its
business expansion projects, as well as products and service improvement that would
elevate THAI to consistently rank among the top three airlines in Asia and top five in
the world.

15
2.1.1 Vision
The First Choice Carrier with Touches of Thai.
2.1.2 Mandates
1) To offer domestic and international air travel and related services that
are safe, convenient, and of quality to ensure customer satisfaction and trust.
2) To be committed to international standards of management efficiency,
transparency, and integrity, and to achieve satisfactory operating results in order to
maximize benefits for shareholders.
3) To create a suitable working environment and offer appropriate
salaries and wages as an incentive for staff to learn and work to the fullest of their
potential and to take pride in their contribution to the company's success.
4) To be socially responsible, as the national airline.
2.1.3 Policies
As the national airline, the company represents the Kingdom of Thailand in
protecting and augmenting the country's aviation rights and participates in promoting
and developing the tourism industry as means of generating additional income, both
in Thai baht and foreign currencies. The company also encourages its human resources
to acquire new skills and to attain international standards of professionalism. Thai
Airways contributes to the advancement of all types of technology related to the
world's commercial aviation industry. Finally, the company aims to play a part in
spreading awareness around the world of the uniqueness of Thai culture, its customs,
and traditions.
2.1.4 Environment Policy
Thai Airways International Public Company Limited, as the national carrier
and one of the world’s leading airlines, is fully aware of its role and responsibility
towards the nation and society regarding environmental conservation. The Company
has continued to ensure that overall business operations and the processes involved
produce minimum environmental impact. This has allowed THAI to offer products
and services to customers that are environmentally friendly while achieving the

16
company's vision of being "The First Choice Carrier with Touches of Thai". THAI
has, therefore, established environmental policies as follows: -
1) To develop environmental management systems to meet international
standards in order to ensure that all activities and operations are in accordance with
the standard and related environmental rules and regulations.
2) To develop and promote environmental management systems to be
applied to all of the company's activities in order to reduce pollution and
environmental impact on a continual basis, with clear objectives, action plans and
evaluation procedures.
3) To incorporate environmental impact considerations in every process
of all the company's activities and operations, starting from design, purchasing,
production and service delivery. Resources should be used effectively and provide
the highest benefit for the company and society.
4) To increase environmental awareness among employees through
training programs in order to ensure that the company's environmental systems are
effectively implemented
5) To provide support towards environmental protection programs
including giving accurate news and information to staff, customers and the public and
private sector in order to enhance better understanding of the company's efforts
regarding environmental preservation and conservation.
All of these functions are required to adapt these policies to determine the
objectives, goals, and guidelines of their respective functions in order accomplish the
company's objectives.
Ethics
The company pledges to operate fairly and ethnically protecting its rightfully-
earned profits and appreciating the importance of its staff as valuable resources and
representatives of the company. All of their employees have a role to play in
contributing to the company's success. In order to achieve the goals above, the
company has established the following set of general business ethics as well as
instructions and warnings specific to the various employee positions throughout the
organization:

17
1) Treat all clients and business associates fairly and honestly and
protect the interests of all our customers.
2) Be politically impartial for the sake of the nation and society.
3) Run our business on the basis of fair competition.
4) Support the efficient use of domestic resources while preserving
natural resources and the environment.
Figure 2.1 The Organization of Thai Airways International PLC

18
2.2 The Role of Human Resource Management Department
Human Resource Development and Management is one of the most important
functions at the Executive Vice President level. Along with other functions,
commercial, customer services, operations, finance and accounting, standards and
general administration, corporate planning and information technology services,
HRD&M was upgraded from the Personnel Department at the Vice President level as
a result of the reengineering of company in 1997. The role of HRD & M changed
from personnel management focusing on fringe and benefits, rules and regulation
regarding personnel discipline to be a modern management system, with staff
competency, manpower management, cost control and so on. The organization is
shown in chart 1.
Human Resource Development and Management (HRD&M) consists of two
functions that are at the Vice president level. They are Human Resource Management
Department and Human Resource Planning and Development Department. The
responsibility of Human Resource Development and Management is as follows:
1) policy planning and administration regarding personnel management
and human resource development
2) manpower planning
3) development of organization and work process
4) evaluation and development of staff potentiality and enhancement
of corporate culture
5) creativity of working morale for service personnel
6) administration of fringe and benefits
7) administration of rules and regulation for general management to
reach company target in accordance with laws, rules and regulations and company
policy
8) administration of responsible functions for the company target

19
Figure 2.2 The Organization of Human Resource Development and Management
There are two functions at the director level under the HRM department. They
are Personnel Management Department and Fringe and Benefits Department. Most of
the jobs under the Personnel Management Department related to planning and analysis
of personnel work, recruitment, statistics and registration, personnel discipline, station
personnel administration. Meanwhile, the Fringe and Benefits Department is responsible
for planning and analysis of fringe benefits, salary and benefits administration,
welfare, staff travel services and medical service. The organization chart is shown in
the chart 2.
Both functions seem to be responsible for the backbone of the human resource
work relevant to administration of the fringe benefits of the staff. However, according

20
to Vice President of HRM, one of the company’s mandates concerning human
resource management is “to provide a sound working environment, an attractive
incentive, and opportunities for the employees to perform their work at their best
potential.” The scope of HRM work does not cover the above-mentioned mandate or
strategy.
Currently, Thai Airways International is in the process of reorganization in the
direction to downsizing of company in terms of line of command for work
effectiveness, and the extensive role of HRM is to communicate with staff for better
understanding as per the message of HRM Vice President: “Now that change seems
inevitable for those doing business in this turbulence business world. To enhance our
competitive advantage, changes in various aspects - policies, leadership, working
system, restructuring and so on - have been introduced. However, the timely
introduction of such changes is significant to reposition THAI at a higher level and to
sustain our dynamic growth that we have undergone in the previous years. To
accomplish our goal, all staff is supposed to welcome the ongoing re-organization
with positive attitude.” However, the communication seems to be unclear for the staff
and misleading regarding the role of HRM as stated in the HRM job description.
Currently there are two challenges to the Human Resource Development; first,
the complication and complexity of fringe benefits among different careers in various
function ranging from operation level such as drivers, porters, back office staff e.g.
accountant, personnel, sales, marketing to specific careers such as pilot and cabin
crew. This complexity results in benefit adjustments, i.e. salary, allowance for several
times since 2003. However it is not up to satisfactory level by personnel.
Another greater challenge for Human Resource Management regarding staff
benefits is the individual tax reimbursed by the company. Staff employed before
January 2006 will get a net salary and income while the company pays the Revenue
Department personnel tax. This benefit is regarded as a specific privilege that the
Office of Audit Bureau signals to the company to lift up this benefit due to the non-
standard practice of a State Owned Enterprise. It means that the benefit program has
to be changed significantly since this indirect benefit accounts for on average 10-30
percent of basic income. This expense has aggressively increased over the past few
years due to the adjustment of salary and high overtime payment.

21
Both challenges have no solution now, although there have been certain
proposals for the issues; but experts unanimously agree with such proposals. One of
the corporate strategies is to control personnel costs for the longer term. However,
there is a great concerns over this expense and government agencies still push hard for
the solution. Then, “Strategic outsourcing is advocated where 1) world class capabilities
and a strategic advantage cannot be developed, 2) the resources devoted to services
performed internally will be greater than those needed to outsource the service, and 3)
excessive dependency on suppliers can be avoided. When an activity is performed
internally at a higher cost, the mislocated resources will put the company at a
disadvantage to its competitors.” (Greer, 2001)

22
Figure 2.3 The Organization of Human Resource Planning and Development

23
2.3 The Role of Human Resources Planning and Development
The main role of Human Resources Planning & Development is basically
training in order to increase personnel capability for competence in the airline
industry. However, it also aims to ensure the core competency of the staff in the area
of aviation as explicit knowledge rather than implicit knowledge. This is still the
conventional type of personnel management regarding the administration of fringe
benefits and training.
There are five major functions under HR Planning and Development:
Organization Structure & Work Process Analysis, Airline Industry Training, Ground
Service training, General Management Training, and the Language and Culture
Institute. There are two other functions at the departmental level: Organization
Communication and Organization Culture and Competency Development. The
organization is shown in chart 3.
As stated in the corporate strategy, Vision of Human Resources Planning and
Development is “Corporate Strategic Partner in Human Resource Planning and
Development for Sustainable Competitive Advantages”. Meanwhile, the Mission is
“Human Resource and Corporate Planning and Development for Sustainable and
Optimal Efficiency in compliance with the Company’s Policies.”
The job description of Human Resources Planning and Development is as the
following:
1) planning and development of organization structure
2) planning and analysis of work process, job evaluation and
manpower planning
3) planning and policy set-up for staff career path and succession plan
4) planning and policy set-up for training in the area of aviation
business including language and culture
5) planning and policy set-up for performance management in
compliance with vision, mission, target, and corporate strategy
6) planning and policy set-up for corporate competency management
and determining appropriate staff competency for company business

24
2.4 Corporate Strategy of HRM
“Strategic human resources management is largely about integration and
adaption. Its concerns is to ensure that: human resource 1) HR management in fully
integrated with the strategy and the strategic needs of the firm; 2) HR policies cohere
both across policy areas and across hierarchies; and 3) HR practices are adjusted,
accepted, and used by line managers and employees as part of their everyday work”.
(Greer, 2001)
Human resource strategy focuses on the alignment of the organization’s
human resource practices, policies, and programs with corporate and strategic
business unit plans. (Greer, 2001: 128).
According to the Annual report, “With the goal of becoming the world’s
leading airline in services and customer satisfaction, THAI has spearheaded personnel
development plans to assist staff in all departments in order to achieve higher levels of
professionalism and service efficiency, while retaining THAI’s unique charm for an
added competitive edge. To achieve its goals, THAI focuses on important strategies
and development plans. Requests for organizational changes and additional staff are
carefully examined to ensure appropriateness and optimal suitability for operation and
sizes. The company has initiated Manpower Planning programs in order to allocate
manpower that is consistent with quality and workload, also taking into consideration
the types of operation, work overlap and efficiency in managing personnel cost. In
addition, Career Path and Succession planning are conducted to prepare staff for
future growth with business expansion”.
The main mechanism driving management and personnel development is the
competency-based management system, which supports professionalism and
principles of good governance. THAI has linked this with its information technology
system so that training and assessment of individuals, functions, and organizations
can be stored and assessed, with the aim of managing human resources and creating
strategies to instill core values and attitudes in line with the company’s vision and
mission.
Recognizing the value of good personnel to serve industries in these
competitive times, THAI provides comprehensive training to its staff in the form of

25
required and complementary courses based on core competency and management
skills. THAI has combined the diverse training units of various departments into a
centralized Training Center for greater efficiency and effectiveness. Professional
courses cover Passenger Service, Airport Services, Security in Passenger and Cargo
Transport, Marketing, language, Culture, Commerce, and General Management.
Courses give the staff of all levels the opportunity to broaden their knowledge,
sharpen their skills and exchange ideas and experiences with fellow employees. THAI
also partners with leading educational institutes locally and abroad to organize
training and seminars on a regular basis.
THAI organized the Orientation and Familiarization Coach Team (OFCT)
project to brief staff moving to Suvarnabhumi Airport on the facilities and operational
scope in order to improve efficiency and to create an information network.
A Language and Culture Institute was also established to improve the
language skills of its staff. Frontline staff, in particular, are encouraged to develop
multilingual skills so that they can communicate appropriately and intelligibly with
passengers of different nationalities and cultures to create customer delight. THAI
considers English language proficiency a core competency, requiring staff to attend
English language development courses and achieve a certain level of proficiency.
The company’s international language programs cover training in Chinese,
Japanese, French, German, Korean, Hindi, Italian and Spanish. Russian language
courses will be offered to correspond with the introduction of Bangkok-Moscow
flights. The focus is on communicating clearly with passengers. Language training is
supplemented with courses on culture.
Electronic learning or e-learning has also been incorporated into all training
programs to help economize on expenses and investments.
The Performance Management System is constantly being improved through
systematic evaluation and merit-based reward systems. The performance management
project helps executives develop transparent and fair systems to reward outstanding
performance, and in meeting deadlines, in line with the objectives, strategies, and the
vision of the company.
The Company has a strong focus on good governance and has established a
Good Corporate Governance Committee to ensure good ethics. THAI strives to make
good governance an integral part of its corporate culture, ensuring that every staff

26
member understands the importance of ethical behavior in the workplace. A video
tape about good governance is shown before every training course. In addition,
Coaching Teams from various Departments are trained and serve as role models.
THAI has various internal communication channels to update its staff on
current events and important information. Communication channels are chosen as
appropriate and include news releases, posters, leaflets, “DB News” newsletter, an
electronic board, public address announcements, Inteactive Voice Response (IVR),
and the THAISphere internet system. In this electronic age, communication is rapid
and widespread. Due to the popularity of the THAISphere intranet system, the HR
Homepage was developed in 2005.
THAI realizes the importance of its human resource, which is the single most
important asset for the Company in contributing to THAI’s success story. THAI seeks
to recruit and employ a knowledgeable, capable, and experienced staff. Ongoing
personnel development programs are provided to supplement staff knowledge and
capabilities with higher levels of skill. A key indicator that has been set to assess
THAI’s commitment to developing the staff’s skills is the number of days of training
attendance. Salaries have been adjusted to be comparable to leading companies in
Thailand and its peers in the aviation industry. All permanent staff are entitled to
benefits as practiced in the international aviation industry. The Company also offer
fringe benefits to the staff, such as contribution to employee’s provident fund, support
of the Thai Airways International Clubs and Thai Employees’ Savings and Credit
Cooperations Ltd. THAI also provides benefits such as medical care and other fringe
benefits to members of the staff’s immediate family.
THAI offers professional development courses to help the staff enhance its
competencies to better complete tasks at hand and to improve service standards in
order to provide greater customer satisfaction. A revision of the Human Resource
Development Plan support staff in learning new knowledge and skills, e.g.
accounting, special bachelor’s degree programs. Lecturers have also been used to
teach courses on modern management methods e.g. the Balanced Scorecard.
Concepts and principles in management for organizational success
1) Visionary leadership
2) Customer-driven excellence
3) Organizational and personnel learning

27
4) Valuing employees and partners
5) Agility
6) Focus on the future
7) Managing for innovation
8) Management by fact
9) Social responsibility
10) Focus on results and creating value
11) Systems perspective
THAI believes in conducting its business with transparency, honesty, and
morality. The board, management and staff are jointly responsible to the company and
its stakeholders to act honestly, uphold applicable laws, and comply with THAI’s own
internal rules on the principles of good corporate governance. A booklet entitled
“Thai Airways International Ethics” was produced and distributed to all of THAI’s
staff. The booklet is constantly reviewed and updated by the Code of Conduct and
good Corporate Governance Promotion Sub-Committee. The content of the booklet
was also posted on THAI’s website for staff reference. Staff feedback was also sought
via the webboard. Activities have been undertaken to promote ethics and good
corporate governance within the organization. The issues on business ethics in the
Company are staff reshuffle and conflict of interest. It seems that HRD has no
measures or participation in this agenda. The key issue is relevant to procurement
transparency that HRD has no concerns so far.
The Human Resource Development and Management of Thai Airways
International has two departments, Human Resource Management Department and
Human Resource Planning and Development Department. The role of the Human
Resource Development and Management still heavily relies on the classic role of the
personnel management as in the past. The main responsibilities are twofolds: fringe
benefits administration and training. While the former Has become the responsibility
of Human Resource Management, the latter belongs to Human Resource Planning and
Development. There is no distinctive role that makes Human Resource Management
different from personnel management, although the leader has the vision regarding
change management but it seems to be the responsibility of another function, Human
Resource Planning and Development.

28
Competency-based development is the vision and mission of Human Resource
Planning and Development; however, there is lack of evidence to demonstrate the
ability of functions to lead the organization to be a competency-based one. There is
company-wide training regarding competency but so far there is no measurement of
effectiveness between basic skill training as performed by the previous personnel
management and competency-based training by the modern Human Resource
Planning and Development. The implicit knowledge of skillful staff and expert is still
unrevealed. It is probable that the measurement of staff competence and company
competence is difficult because of its abstract nature.
There is a loophole in Human Resource Development and Management
regarding non permanent staff which the company outsources services from external.
It is the out-sourcing of staff management of more than 5,000 personnel compared to
approximately 25,000 permanent staff member. This staff is increasing important as
the members are skillful and work in the core business at the operational level in
association with airport activity and some have direct contact with passengers.
Problems such the high turnover of staff member, cost of training, service quality and
responsibility are pending for resolution. Fringe benefits are still in-commensurate
with work without any welfare. The challenges to Human Resource Development and
Management are to find the correct solutions for increasing staff competency amidst
fierce competition in the aviation business, personnel performance and measurement,
personnel cost control as a result of the complexity of fringe benefits, and personnel
tax burden. Sooner or later these issues require definite solutions, and Human
resource experts need appropriate human resource strategies to cope with these
business challenges.
The company has developed organizational effectiveness strategies involving
human resource management, which are: improving structural personnel cost
effectiveness, build performance-based culture, revising policies and processes,
enhance governance, increasing cross-functional integration and information sharing,
and developing the best talent for mission- critical positions. A literature review of
relevant human resource theories in conjunction with company strategies has led to
the development of observed variables in the strategic human resource management
construct, and these are: organizational rewards, training and development, procedural
justice and work participation.

CHAPTER 3
LITERATURE REVIEW
The study of the impact of strategic human resource management on employees’
attitudes, behaviors and employee outcome is significantly based on the theory of
strategic human resource management, social exchange theory, perceived organizational
support, and organizational commitment.
3.1 Strategic Human Resource Management
Delery and Doty (1996) have identified seven human resource practices
considered to be strategic: career opportunities, formal training systems, appraisal
measures, profit sharing, employment security voice mechanisms, and job definition.
The human resource of an organization is conceptually realized it terms of it
playing a strategic role in the success of the organization. This leads to the field study
of strategic human resource management (SHRM). There is an intersection between
strategic management and human resource management with relatively early studies
(Boxall, 1998; Boxall and Purcell, 2000). Wright and Mcmahan (1992) defined
strategic human resource management as “ the pattern of planned human resource
deployments and activities intended to enable the firm to achieve its goals” (1992:
298).
Strategic human resource management is focused on the internal factors (the
human resource) in the organization rather than external factors that influence the
organizational performance. It is based on the resource-based view of the firm
(Barney, 1991), which suggests that firms should look inward to their resources as the
sources of strategies. Barney (1991) specifically explicated that firm resources
contribute to the sustained competitive advantage of the firm and suggested that
resources that are valuable, rare, inimitable, and non-substitutable will lead to

30
competitive advantage. Inimitability refers to the fact it is difficult for other firms to
copy or otherwise reproduce the resources for their own use, while non-substitutability
means that other resources cannot be used by competitors in order to replicate the
benefit (Barney, 1991). The resource-based view has become the guiding paradigm on
which virtually all strategic human resource management (SHRM) research is based
(Wright, Dunford, and Snell, 2001). Wright (1998) suggested that focusing on a fit
between generic HRM practices and strategies still lacks empirical support which
should be focused on outcomes or products of the HRM practices (skills, behavior,
etc.). Although the literature has pointed out many best human resource management
practices, it is possible to identify topics that emerge repeatedly, which, in general
terms, represent the core of the universalistic contribution. At first sight, we can
observe that this perspective focuses mainly on certain practices oriented to
reinforcing employees’ abilities, for example, variable compensation (Gerhart and
Milkovich, 1990), certain methods of recruitment and selection (Terpstra and Rozell,
1993), comprehensive training (Russell et al., 1985) or performance appraisal (Borman,
1991). The universalistic and contingency perspectives study SHRM without
considering the integration of the practices that build the system. In this sense, the
effects on the performance of these sets of practices are defined in a cumulative way
and, therefore, the possibility of synergic effects between them is implicitly denied.
The human resource management system is therefore considered as a “black box”.
Interest has recently shifted towards aspects much more related to commitment and
participation of the workforce, consensus in problem solving, teamwork and work
incentives, job redesign or the establishment of new mechanisms of compensation
(Youndt et al., 1996).
The arguments of the configurational perspective are used to explore the
human resource system. Based on the propositions of Tichy et al. (1982), Devanna et
al. (1981), Miles and Snow (1984), Guest (1989), Wright and Snell (1991), Peck
(1994) and Jackson and Schuler (1995), one can conclude that this organizational
function consists of three interrelated elements: HR strategy, HR policies, and HR
practices. The human resource strategy describes the orientation of the company in
the management of the human factor, giving cohesion to the set of practices through
which it is implemented. On the other hand, practices are limited to more concrete

31
functional areas, whereas policies are placed at an intermediate level because they
describe the coordination of two or more practices to achieve objectives, such as
employee involvement, security, or the improvement of communication channels
within the workforce (Walton, 1985; Guest, 1989). It can be concluded that SHRM is
integrated in an internal framework defined by a certain organizational climate and
culture (Hendry and Pettigrew, 1990; Ferris et al., 1998), and also by the firm’s size
and structure, its productive technology, orientation to innovation, as well as by the
diverse interests of the different stakeholders involved (Jackson and Schuler, 1995).
Figure 3.1 The Contextual Perspective
Source: Fenando et.al, 2005.
Human resource management (HRM) practices likely operate through their
effects on more proximal influences, such as perceived organizational support
(Rhoades and Eisenberger, 2002), organizational justice (Colquitt, Conlon, Wesson,
Porter, and Ng,2001), organizational identification (Riketta, 2005), and person-

32
organizational fit (Kristof-Brown, Zimmerman, and Johnson, 2005; Verquer, Beehr,
and Wagner, 2003). Strategic human resource management is enhanced to be fit with
the corporate strategy.
Strategic human resource management has focused on specific areas, as seen in
the following:
1) Human resource accounting, which attempts to assign value to
human resources in an effort to quantify the organization capacity (Flamholtz,1971;
Frantzreb, Landau, and Lundberg, 1974).
2) Human resources planning (Baird, and DeGive, 1983; Desanto,
1983:Galosy, 1983; Olian and Rynes, 1984; Russ, 1982; Stumpf and Hanrahan, 1984)
3) Response to a strategic change in the environment (Ellis, 1982;
Fombrun, 1982; Lindroth, 1982; Maier,1982; Warner, 1984), or
4) Matching human resources to strategic or organizational conditions
(Gerstein and Reiseman, 1983; Harvey, 1983; Leontiades, 1982; Migliore, 1982;
Miles and Snow, 1978). In this category, recruitment, selection, and retention
(Galosy, 1983), compensation system ( Migliore, 1982); domain choice (Miles and
Snow, 1978); productivity (Deutsch, 1982); and others are examined.
Researchers can, therefore, identify the best human resource management
practices that, following Becker and Gerhart (1996), are characterized by: 1) having
demonstrated the capacity to improve organizational performance and 2) being
generalizable.
The configurational perspective contributes to the explanation of SHRM with
a useful insight into the internal aspects of the function by means of the analysis of the
synergic integration of the elements that build it. In this sense, the HRM system is
defined as a multidimensional set of elements that can be combined in different ways
to obtain an infinite number of possible configurations. From among them,
researchers can extract management patterns that represent different ideal possibilities
for managing human resources (Miller and Friesen, 1984; Ketchen et al., 1993). Thus,
the system must not only be consistent with the environmental and organizational
conditions, but also internally coherent (Venkatraman and Prescott, 1990; Doty et al.,
1996; Delery and Doty, 1993). It is important to notice that these configurational
patterns, rather than empirically observable phenomena, are ideal types in the same

33
way as those proposed by sociological theory (Weber, 1949), to which real
organizations tend to a certain extent (Meyer et al., 1993; Doty and Glick, 1994). The
arguments of the configurational perspective are used to “open the black box” of the
human resource system. From the analysis of the literature it follows that there is no
consensus about the practices that should be integrated into the human resource
system. In this sense, the work of Dyer and Reeves (1995) proves to be quite
illuminating. Based on an analysis of the four most cited papers in HRM, they found
that there were twenty-eight different practices. Nevertheless, we can observe that
certain functional areas are steadily stressed in the literature, in many cases just with
different labels. Following the patterns proposed by Tichy et al. (1982), Devanna et
al. (1981), Miles and Snow (1984), Walton (1985), Schuler and Jackson (1987a,
1987b), Delery and Shaw (2001) and Wright et al. (2001), it is considered in the
model that the HR system can be divided into the following functional areas: job
design, staffing, recruitment and selection, socialization, performance appraisal,
motivation, compensation, training and development, and dismissal/retirement
management. The universalistic approach, which uses mainly financial performance
measures, has been complemented with the inclusion of other variables focused on the
final purpose, where the contingency and contextual perspectives play a relevant role.
Similarly, the model proposed here is based on Guest (1989), Wright and McMahan
(1992), Jackson and Schuler (1995), and Ferris et al. (1998). It concludes that the
effects of the human resource management system take place at three levels: (1)
individual level: most of the literature has pointed out the encouragement of those
behaviors and attitudes that reinforce organizational performance as a main objective
of HR practices (Wright and McMahan, 1992; Ferris et al., 1998), but, at the same
time, it is necessary to consider that they can also have effects on other individual
issues, such as satisfaction, commitment or learning (Guest, 1989; Jackson and
Schuler, 1995); (2) organizational level: HR decisions also have influence on aspects
such as cohesion, adaptability, and innovation or problem-solving capabilities (Beer et
al., 1984, 1985; Guest, 1989; Jackson and Schuler, 1995), but, roughly speaking, they
are designed to reinforce organizational performance (Wright and McMahan, 1992),
following Rogers and Wright (1998), and (3): the social level, which refers to the
effect of the human resource management system on the external context that frames

34
the organizational activity (Brewster and Bournois, 1991; Brewster, 1993). SHRM is
defined as the integrated set of practices, policies and strategies through which
organizations manage their human capital, and that influences and is influenced by the
business strategy, the organizational context and the socio-economic context. Both the
model and this definition highlight the main dimensions of SHRM: 1) horizontally,
SHRM is presented not only as the formulation of a certain HR strategy but as a
congruent pattern of activities. The strategy, policies, and practices that define this
system relate to each other in a synergic way to manage and develop the stock of
knowledge, skills and abilities of the organization. In this sense, human capital is
considered the object of SHRM. Finally, the effects of the system are considered with
regard not only to internal aspects of the organization, but also to the consequences of
SHRM decisions on the individual and social level; 2) vertically: in addition to the
classical explanation of the business strategy as a contingency variable, the model
considers a contextual framework for SHRM characterized by a certain set of
organizational and socioeconomic variables. The bidirectional sense of these relationships
lets the model explain the dynamic nature of SHRM.
One of the key factors which affect employee outcome, attitude and behavior
is trust between organization and employee. Research has shown that individuals rely
on their perceptions of procedural fairness to make inferences about their relationship
with the other party, including how much to trust the other party (Lind and Tyler,
1988). The greater the individuals’ perceptions of procedural fairness, the more likely
they are to trust the other party (Konovsky and Pugh, 1994). Furthermore, trust in the
other party has been shown to interact with outcome favorability, such that high levels
of trust reduce the influence of outcome favorability on a variety of work attitudes and
behaviors, such as organizational commitment (Brockner, Siegel, Daly, Tyler, and
Martin, 1997). In short, because high procedural fairness serves as a signal to
employees that their employer is trustworthy, high procedural fairness reduces
employees’ tendencies to respond negatively to unfavorable outcomes. Specifically,
employees have been shown to respond more positively (their organizational
commitment is higher) to the degree that outcomes are perceived to be favorable
(Homans, 1961) and to the extent that the procedures associated with the outcomes
are viewed as fair (Lind and Tyler, 1988; Thibaut and Walker, 1975). Of particular
relevance to the present studies is that outcome favorability and procedural fairness

35
have been shown to combine interactively to influence a variety of significant
employee attitudes and behaviors, including (but not limited to) organizational
commitment (Brockner and Wiesenfeld, 1996).
HRM practices have been considered to be effective tools for enhancing
organizational commitment (Ulrich, 1997). Ogilvie (1986) perceives HRM practices
as concrete, tangible programs designed to develop commitment. HRM practices promote,
reinforce, and influence commitment through selection, placement, development,
rewards, and retention (Wimalasiri, 1995). Among various HRM practices, it has been
found that rewards have a greater influence on organizational commitment (Angle,
1983; Mottaz, 1988; Mowday, Porter, and Steers, 1982; Steers and Spencer, 1977).
Jaiswal (1982) and Ogilvie (1986) found relationships between specific practices,
such as performance evaluation, promotion policies, compensation, benefits, and
affective commitment.
It has been found that training activities not only develop employees and
improve their skills and abilities but also enhance their satisfaction with the job and
their commitment to the organization (Harel and Tzafrir, 1999; Kalleberg and Moody,
1994; McEvoy, 1997). Laabs (1997) found that a training program at Bell Helicopter
reduced employee withdrawal behavior.
Based on the literature review, it can be noted that the characteristics of
strategic human resource management are first, that the models emphasize implementation
over strategy formulation. Second, traditional models focus on matching people to
strategy, but not strategy to people. Third, many models rely on organization or
product life cycles as single and uncontrollable catalysts of change. Fourth, most
SHRM models emphasize fit, or congruence, and do not recognize the need for lack
of fit during organization transitions and when organizations have multiple and
conflicting goals.
The increasing role of SHRM can be seen in how it responds to strategic
changes in the environment. Many environmental characteristics have been studied to
determine how they constrain human resources or strategy formulation. According to
Fombrun (1982) the study how changes in information processing, automation,
inflation, productivity, demographics, elitism, and interest-group politics affects
organizational structure and human resource issues. He asserted that changes in the

36
technological environment have the greatest effects on service section. Further
changes in economic environment mostly affect compensation and training. Changes
in the social environment will be related to changing in organizational development,
promotion, appraisal system. Political environmental change affects the organization’s
success, organizational commitment. Ellis(1982) identified environmental challenges
such as demand, international competition, and social activities and recommended a
generic solution rather than differential responses to specific problems. He suggested
that the pragmatic, active rather than passive, sensitive rather than stoic, and relied on
generating alternatives and initiatives. Organizational climate that is conductive to
flexibility, practicality, and participation as created by human resource management is
viewed.
The way in which human resource strategies match strategic or organizational
conditions are described as developing a match between certain strategic or
organizational conditions and certain specified aspects of human resource processes
or skills (Gerstein and Reisman(1983), Harvey (1983), Leontiades (1982), Migliore
(1982), and Sweet (1982). Gerstein and Reisman (1983) recommended a diagnosis of
the “business situation” primarily in terms of the product life cycle as a precondition
for matching executive characteristics to situational requirements. However, it is
argued that there is no study indicating the shift of inevitable need for change as new
products and technologies enter the market place (Cooper and Schendel, 1976). This
happens to such need as cost drivers or sources of differentiation, which contribute to
a product’s unique value (Porter, 1985) as well.
Becker et al., (2009) asserted that based on theories of commitment and
strategic HRM, HRM policies and practices are expected to influence perceptions of
these practices (e.g. fairness) and the organization (e.g. organizational support), which
in turn shape employees’ commitment influences.
3.2 High Performance Work System
Management scholars and practitioners alike have become increasingly
interested in learning more about the ability of certain “progressive” or “high-
performance” human resource management (HRM) practices to enhance organizational

37
effectiveness. “Progressive” HRM practices which included a workplace climate that
strongly values employee participation, empowerment and accountability tended to be
perceived to generally perform better on a number of valued organizational outcomes.
It is essential before going through literature to determine how to charaterize
the practices under discussion. There are many terms in the area of human resource
management: “high performance management” (White, hill, McGovern, Mills, and
Smeaton, 2003), “high involvement management” (Lawer,1986) and “high commitment
management” (Wood and deMenezes, 1998). The term High Performance Work
Systems (HPWS) will be used on the basis that that is broad enough to encompass the
range of practices emphasized by different approaches (Ramsay, Scholaries, and
Harley, 2000). According to Pfeffer (1996), high performance work systems embrace
employment security and high wages as well as communication and involvement
schemes. High Performance Work Systems as an advanced form of HRM composed
of employee involvement, empowerment, and responsibility. It is described in terms
of high involvement management, high commitment workplaces, high trust workplaces,
partnerships at work, total quality management, and strategic HRM.
HPWS theoretical models assumes that performance gains are necessarily
attributable to a positive impact on employees, mainly through increased job
autonomy, satisfaction, and commitment (Harley, 2002). Harley asserted that
improved performance may be driven by factors other than HRM practice and may
cause negative outcomes for workers.
Individual responsibilities are expected to be adaptable to changing conditions
and teams rather than the individual. The perceptions of employees regarding
organizational support, organizational commitment, organizational justice, participative
decision making, and workload are related to job satisfaction and intention to quit.
The causal path assumed by proponents of HPWS is that “Systems… are
established; they influence workplace practice; employee attitude change, with
increased satisfaction or commitment; there is a consequence effect on behavior; and
this in turn feeds through to the performance of the work unit and eventually the
company…” (Edwards and Wright, 2001: 570).
HPWS aim at reducing turnover, absenteeism and costs through a reduction in
the need for control and monitoring (Ramsay, 2000). This implies the need for

38
participation of the decision making of employees. Also HPWS may have a
marginally positive effect on employee attitudes to commitment (Ramsay, 2000). The
adoption of HPWS has resulted in a dramatically lower turnover rate compared to
control systems and increased performance (Arthur, 1994).
Huselid (1995) has stated that HPWS increase performance through a number
of revenues, with one of these being employee behavior. This employee behavior
affects turnover and labor productivity within the organizations, thus eliciting
employee commitment, which is in indirect contrast to turnover. HPWS also increase
the discretion of employees (Harvey, 2002; White et al., 2003) which is the
employees’ ability to make good choices, be careful, and have the freedom of choice.
The effectiveness of HPWS is diminished through the lack of continuance
commitment which can be directly related to the increased discretion.
High-performance work systems assume that employees are a primary source
of competitive advantage that is difficult for others to imitate and that workers are
capable of continuous improvement and will perform at higher levels if they are
motivated to do so (Pfeffer, 1998). This is achieved by encouraging practices such as
participative decision making, providing high-quality training, and sharing
information. By treating workers with respect and as capable and intelligent
individuals, organizations will find that workers will be more committed to the
organization and more trusting of management, which will result in improved
performance (Walton, 1985; Wheatley, 1997). Whitener (2001) proposed a social-
exchange framework to explain this relationship. Employees view human resource
practices and trustworthiness of management as indicative of the organization’s
commitment to them. In turn, employees reciprocate with appropriate attitudes and
behaviors.
3.3 Perceived organizational Support and Social Exchange Theory
Organizational support theory (OST: Eisenberger, Huntington, Hutchinson, and
Sowa, 1986; Rhoades and Eisenberger, 2002; Shore and Shore, 1995) holds that in
order to meet socio-emotional needs and to assess the benefits of increased work
effort, employees form a general perception concerning the extent to which the

39
organization values their contributions and cares about their well-being. The concept
of POS is based on a social exchange theory whereby employees extend their effort
and loyalties in return for the material commodities and social rewards given to them
by the organization (Blau, 1964). Based on the norm of reciprocity (Gouldner, 1960),
POS is theorized to indirectly impact employee attitudes and behaviors by creating a
sense of obligation within individuals that results in reciprocation (Eisenberger et al.,
1986).
Perceived organizational support (POS) would increase employees’ felt
obligation to help the organization reach its objectives, their affective commitment to
the organization, and their expectation that improved performance would be
rewarded. Behavioral outcomes of POS would include increases in job performance
and job satisfaction and decreases in turnover.
Figure 3.2 Model of relationships among work experience, perceived organizational
support (POS), and affective commitment adapted from affective
commitment to the organization,,Linda Rhoades, Robert Eisenberger, and
Stephen Armeli).
According to Mowday, Steers and Porter, (1979), the relative strength of the
individual’s identification with and involvement in a particular organization’ is
characterized by three related factors: strong belief in and acceptance of the
organization’s goal, a willingness to exert considerable effort on behalf of the
organization, and a strong desire to maintain membership in the organization.
Organizational rewards
Procedural justice
Supervisor support
Perceived organization
support
Affective commitment

40
Organizational support theory (Eisenberger et al., 1986; Eisenberger et al.,
2001; Rhoades and Eisenberger, 2002) suggests that employees are likely to develop
higher levels of POS when the organization cares about their well-being and values
their contributions; however, little research has been carried out on the factors that
contribute to POS, particularly high performance work system elements such as
workplace partnerships. The implementation of appropriate and strategic human
resource (HR) practices can develop high levels of POS, which in turn, contribute to
positive work attitudes and organizational behaviors.
Shore and Shore (1995) identified two types of HRs related to POS; first,
discretionary practices that imply organizational caring but are not mandated by
company policy or union contract; second, HR practices that symbolize organizational
recognition of the employee’s contribution. This proposition suggests that those HR
practices that represent different ways in which the organization shows concern for
the employees and values their contributions may be particularly critical for the
development of high POS in order to satisfy their needs accordingly. First,
satisfactory pay is necessary for meeting individuals’ physiological or existence
needs. Second, growth needs can be met by sufficient career development
opportunities that help employees extend their potential and expand their capabilities.
Third, HR practices that provide social support, such as job security and family
relationships, can meet.
It is suggested that because the organization is often too abstract to the
employees (Reichers, 1985), POS is developed through a process of “personification”
(Shore and Shore, 1995; Wayne et al., 1997). That is, employees “personalize” the
organization by accumulation of their experiences over time of the rewards and
punishments that they receive from other more powerful organizational members
(Shore and Shore, 1995; Wayne et al., 1997). Since employees’ direct leaders are
often in charge of administrating and allocating discretionary rewards, support, and
resources, it is likely that the relationship between the leader and the employee plays
an important role in influencing employee POS (Settoon et al., 1996; Wayne et al.,
1997).
Procedural justice is the fairness of the ways used to determine the distribution
of resources among employees (Greenberg, 1990). It has been suggested that repeated

41
instances of fairness in decisions concerning resource distribution should have a
strong cumulative effect on POS by indicating a concern for employees’
welfare.(Shore and Shore, 1995). There are structural and social aspects of procedural
justice and they can be distinguished by formal rules and policies and quality of
interpersonal treatment in resource allocation. Cropanzano (1997) has suggested that
procedural justice is the concept of perceived organizational politics referring to
attempts to influence others in ways that promote self-interest, often at the expense of
rewards for individual merit or the betterment of the organization. The organization
establishes a code of ethics, which is defined as a set of principles of conduct within
an organization that guide decision making and behavior. The purpose is to provide
members and other interested persons with guidelines for making choices in the
conduct of their work. Professional integrity is the cornerstone of the credibility of
many employees. Member of an organization adopt a code of ethics to share a
dedication to behavior and adopt this code to declare the organization’s principles and
standards of practice.
As previously mentioned, according to organizational support theory, POS can
have a positive impact on employees’ attitudes and behaviors mainly because it
creates a sense of obligation within the individuals to repay the organization
(Eisenberger et al., 1986; Eisenberger et al., 1990). Despite this contention, most POS
studies have only examined the direct effect of POS on various outcomes, while little
research has been conducted to investigate the mediating mechanisms through which
POS influences employee behaviors and attitudes. One exception is Eisenberger et
al.’s (2001) recent research, which specifically examined the role reciprocation in the
relationships of POS with employee commitment and job performance. Their research
suggests that an important mediator of the POS-outcome relationship is felt
obligation, which refers to an employee’s belief regarding whether he or she should
care about the organization’s well-being and should help the organization obtain its
goals (Eisenberger et al., 2001).
The research’s findings support social exchange theory (Blau, 1964) and
organizational support theories (Eisenberger et al., 1986; Rhoades and Eisenberger,
2002) with the assertion that the norm of reciprocity applies to the employer-
employee relationship. Specifically, employees respond to favorable treatment by the

42
organization with feelings of obligation to care about the organization’s welfare and
to act in the organization’s behalf, which, in turn, enhance positive work attitudes and
behaviors. In order to validate the role of the reciprocity norm in explaining the
mediating, the employee’s obligation as mediators of the effects of POS will be tested
for employee’s work attitudes and behaviors.
There are many types of antecedents of the POS that are HRM practices.
Delaney and Huselid (1996) have suggested that progressive HR practices should
include those practices that affect employees’ skills and ability, motivation, and
structure of work. Huselid (1995: 635) used the phrase “high-performance work practices”
to refer to what are usually considered HR practices, and suggested that these
practices “can improve the knowledge, skills, and abilities of a firm’s current and
potential employees, increase their motivation, reduce shirking, and enhance retention
of quality employees while encouraging nonperformers to leave the firm”. On the
other hand, Uhl-Bien et al. (2000) stressed the relational aspects of HR practices, and
pointed out that HR approaches that do not focus enough on relationships and that the
social context may have potential problems. It is argued that the way in which
individuals interact within organizations through interpersonal relationships comprises
social capital, and the contribution of employees’ human capital to firm performance
largely depends on social capital (Burt, 1997; Uhl-Bien et al., 2000). HR practices are
defined as the set of practices implemented by the organization to utilize employees’
human capital and social capital through developing their knowledge and skills,
increasing work motivation, and fostering effective social interactions.
Shore and Shore (1995) have asserted that organizational actions that are
interpreted by the employee as symbolic of appreciation, recognition, and discretionary
rewards are more likely to contribute to POS. HR practices that would meet
individuals’ needs for existence, relatedness, and growth will be selected. These HR
practices include organizational rewards, training and development, procedural
justice, and workplace partnership. As the development of POS beliefs is based on
individual employees’ perceptions of the HR practices implemented by the organization,
level of satisfaction with wages, training and development, procedural justice, and
partnership will be evaluated.

43
Although the POS literature regards organizational commitment, employee
attitudes and employee behavior as the set of outcome variables which are related to
POS, this dissertation will be focused on work outcome, e.g. performance and
productivity, job involvement, and withdrawal behavior or turnover.
According to Harter, Schmidt, and Hayes (2002), effective management of a
firm’s human resources would be able to generate and increase knowledge,
motivation, synergy, and commitment, resulting in a source of sustained competitive
advantage for the firm. This suggestion is in tandem with that of Huselid (1995), who
argued that HRM practices represent one avenue that can be used by organizations in
shaping their employees’ attitudes and behaviors. This is because HRM practices
create conditions where employees become highly involved in the organization and
work hard to accomplish the organization’s goals. According to Morrison (1996), how
an organization manages its human resources (as reflected by its HRM practices)
establishes the tone and conditions of the employee-employer relationship. When
such a relationship is seen as that of social exchange (Blau, 1964) where the norm of
reciprocity (Gouldner, 1960) is central, employees would be more inclined to engage
in positive work attitudes and behaviors. In total, HRM practices affect organizational
performance through their effect on individual employee performance. Gutteridge,
Leibowitz, and Shore (1993) found that organizational leaders perceive the following
significant results because of organizational development efforts: enhanced employee
retention, enhanced employee skills and morale, employee empowerment, improved
HR planning and selection, and greater strategic advantage.
3.4 Organizational Commitment
Organizational commitment has been the subject of continued research interest
for almost four decades because of its impact on individual performance and
organizational effectiveness (Allen and Meyer, 1996; Beck and Wilson, 2000; Becker,
1960; Mowday, 1998). Researchers across the globe have always been keen to
measure the organizational commitment of people in various professions and have
outlined strategies to develop it. Lifelong commitment to the organization was once
the tradition for employees in many organizations such as those in Japan. Globalization,

44
deregulation, and digitalization have changed the organizational tradition of employment
to be more flexible and competitive. Researchers in organizational behavior have
defined organizational commitment in terms of the nature of relationship (Grusky,
1996), loyalty to employer (Kanter, 1968; Kim, Price, Mueller and Watson, 1996),
integration of individual and organizational goals (Hall, Schneider and Nygren, 1970),
identification with or attachment to the organization (Porter, Steers, Mowday and
Boulian, 1974; Romzek, 1989; Sheldon, 1971), readiness to exert considerable effort
on behalf of the organization, and the strong desire to remain a member of the
organization (Balaji, 1992; Mowday, Steers and Porter, 1979). Meyer and Allen
(1991) classified organizational commitment into three categories: affective
commitment, continuance commitment, and normative commitment. Employees with
strong affective commitment remain with the organization because they want to, those
with a strong continuance commitment remain because they need to, and those with a
strong normative commitment remain because they feel they ought to. Affective
commitment seemed to be more positively related to job performance, and this has been
confirmed by different empirical studies (Jaros, 1997; Meyer, Allen and Smith, 1993;
Sommers, 1995; Whitener and Walz, 1993). Affective commitment can be understood
as a strong belief in and acceptance of the goals and values of the organization and
readiness to exert considerable effort on behalf of the organization, as well as a strong
desire to remain a member of the organization (Mowday et al., 1979; Porter et al.,
1974).
Despite the work by Hung, Ansari, and Aafaqi (2004) which focuses
on the direct relationships between fairness of HRM practices (employee relations and
compensation, performance management and promotion, procedures, and training),
leader-member exchange, and commitment, empirical evidence on this issue remains
scant. Additionally, the potential impact of HRM practices on employees’ commitment
has received far less attention than it deserves (Meyer and Smith, 2000).
Although there have been two primary perspectives of HRM, the “universal”
or “best practices” approach have received more empirical support than the
“contingency” approach (Huselid, 1995). Researchers that adopted the former
approach have argued that some HR practices are always better than others (Delery
and Doty, 1996). Employees’ perceptions of their organization’s HRM practices are

45
crucial in influencing their attitudes and perceived organizational support behaviors as
argued by scholars (Allen, Shore and Griffeth, 2003; Whitener, 2001), and our first
aim is to examine whether beliefs about certain HRM practices (performance
appraisal, training, and career development) have positive effects on organizational
commitment. According to Meyer and Smith (2000), there is some evidence to
suggest that the nature and strength of the relationship between HRM practices and
commitment may be determined by how employees perceive these practices.
Commitment has various definitions according to its different aspects, e.g.
commitment as an attitude, a force, a bond, investment /exchange, identification,
congruence and motivation. Klein et al., 2006 asserted that commitment viewed as a
bond is distinct from force, investments, identification, or congruence, which are best
viewed as potential antecedents of commitment and is also distinct from such
outcomes as motivation, continuance, and affect toward the target. Scholars have
conceptualized organizational commitment as one’s psychological attachment to the
organization (Buchanan, 1974; O’Reilly and Chatman, 1986). Meyer and Herscovitch
(2001) conceived organizational commitment as a “force that binds an individual to a
course of action of relevance to one or more target”, perceiving a bond between
oneself and the organization does not incorporate the force(s) that create(s) the bond.
Mowday et al., (1982) use the term attitudinal commitment in differentiating the
psychological aspects of commitment from the economic (H.S. Becker, 1960) and
behavioral (Salanick, 1977) views of commitment, and they defined commitment as
identification and involvement. Angle and Perry (1981) define commitment in terms
of “one’s reciprocation for the organization satisfying important past, present and
future needs, including intangible social needs (work relationships, pride from
membership)”. Gaertner and Nollen (1989) supported the idea that more favorable
perceptions of organizational employment practices were associated with stronger
organizational commitment. Sheldon (1971) defined commitment as an attitude
toward the organization that links or attaches the identity of the person to the
organization. Allen and Meyer (1990) viewed it as a mindset e.g. desire–affective
commitment, obligation–normative commitment and perceived cost – continuance
commitment or the combination of these.

46
One method of studying the concept of organizational commitment is through
an individuals’ attitudes and feelings (perceptions) toward the organization. Mathews
and Shepherd (2002) have asserted that committed employees have a strong belief in
and acceptance of the organization’s goals and values, show a willingness to exert
considerable effort on behalf of the organization, and have a strong desire to maintain
membership with the organization.
Meyer and Allen, (1991) defined three types of organizational commitment.
First, affective commitment refers to the employment’s emotional attachment to,
identification with, and involvement with the organization. Employees with a strong
affective commitment continue employment with the organization because they want
to do so. Second, normative commitment refers to a feeling of obligation to continue
employment; employees with a high level of normative commitment feel that they
ought to remain with the organization. Third, continuance commitment refers to an
awareness of the costs associated with leaving the organization. Employees whose
primary link to the organization is based on continuance commitment remain because
they need to do so.
Cohan (1996) found that among these three types of commitment, affective
commitment was more highly correlated than others to work involvement, job
involvement, and career commitment. Irving, Coleman and Cooper’s (1997) findings
strengthen the study by indicating that job satisfaction is positively relates to both
affective and normative commitment.
The empirical studies reveal that commitment is strongly related to turnover
intention and turnover (Mathieu and Zajac, 1990; Randall, 1990), but not more
strongly than job satisfaction (Tett and Meyer, 1993). Mathieu and Zajac, Randall
(1990) found that commitment positively relate to job performance and attendance,
and negatively with tardiness.
Meta-analyses found the factors that have a strong link with commitment as
antecedents; they are perceived organizational support, organizational justice, person-
organization (P.O.) fit, and psychological contract fulfillment. According to organizational
support theory (Eisenberger et al., 1986), organizations show their support for their
employees by meeting their socioemotional needs and valuing their contributions.
Organizational justice in the form of distributive (i.e. fair distribution of resource) or

47
procedural (i.e. fair allocation and decision making procedures), or interactional (i.e.,
humane treatment) influence employee commitment (Colquitt, Conlon, Wesson,
Porter and Ng, 2002). Employee whose values are compatible with the organization or
have a better “fit” will develop stronger commitment than those whose values conflict
(Chatman 1989; Kristof, 1996). Rousseau (1995) has characterized the perception of
the mutual obligations between employee and organization as “psychological
contract”.
Based on new form of evidence beyond the typical correlation between
individual-level measures to show the benefits of organizational commitment, Meyer
(2009) found that studies have been conducted to demonstrate the effects of
commitment-oriented human resource management (HRM) systems on organizational
effectiveness. He asserted that it might provide stronger justification for the
investment in the HRM systems needed to foster commitment than will evidence for
links between individual-level commitment and behavior. MacDuffie (1995) found
that the use of high-commitment HRM practices as associated with higher levels of
productivity and quality particularly integrated with work systems. These high
performance practices included in a commitment system (Arthur, 1994) were found to
be associated with lower levels of turnover and higher level of productivity and
corporate financial success.
Numerous antecedents to commitment have been identified and that are
multiple bases (e.g. internalization, identification, compliance; O’Reilly and Chatman,
1986) that can lead to the formation of commitment. There are more kinds of
commitment, e.g. a multitude of work related commitments, where employees commit
to the organization that employs them, other organizations such as unions,
professional associations, client organizations, individuals within the organization,
e.g. coworkers, supervisors, and outside the organization, e.g. customers, suppliers,
and various ideas and initiatives, e.g. goals, policies, and change programs (Beckeret
al.,2009).
According to Becker, Klein and Meyer (2009), many of the factors presumed
to influence commitment (e.g. HRM policies and practices) are organization-level
variables (although they influence individuals via perceptions). There has been little
cross-level research conducted. Based on theories of commitment and strategic HRM,

48
it is expected that HRM policies and practices will influence perceptions of these
practices, which, in turn, shape employee commitment, and employees’ commitment
influences their behavior and performance. It is encouraged. More multi- and cross-
level analysis is encouraged (Becker et al., 2009). Individuals’ reactions and response
to commitments are affective, cognitive, and behavioral outcomes (Becker et al.,
2009).
3.5 Employees’ Attitudes Performance Job Involvement and Withdrawal
Behavior
Employees’ attitudes and behaviors, such as job satisfaction, organizational
commitment, trust in management, and well-being have been discussed in various
studies (Appelbaum et al., 2000; Guest, 2002; Godard, 2001). An employee’s attitude
can be defined as a mental and neural representation which is organized through
experience that has a directive or dynamic influence on behavior. Attitude theory has
traditionally emphasized the affective nature of attitudes. This is evident in the
myriad of attitude definitions that make reference to affect, emotions, and feelings
(e.g. Insko and Schopler, 1967; Petty and Cacioppo, 1981; Rosenberg, 1956; Smith,
1947. This approach places attitudes in the context of personality processes and
behavior (e.g. Synder and DeBono). There are studies of the attitude-behavior
relationship focused primarily on propositional controls of behavior (Ajzen and
Fishbein, 1977). Better behavioral prediction might be achieved, however, if more
emphasis is placed on non-rational and emotional determinants of behavior (Miller
and Tesser, 1986; Zanna and Rempel).
The environment refers to the factors that can affect a person’s behavior.
There are social and physical environments. Social environment include family
members, friends, and colleagues. Physical environment is the size of a room, or the
ambient temperature or the availability of certain foods. Environment and situation
provide the framework for understanding behavior (Parraga, 1990). Situation refers to
the cognitive or mental representations of the environment that may affect a person’s
behavior. The situation is a person’s perception of lace, time, physical features, and
activity (Glanz et al., 2002).

49
The three factors of environment, people and behavior are constantly
influencing each other. Behavior is not simply the result of the environment and the
person, just as the environment is not simply the result of the person and behavior
(Glanz et al., 2002). The environment provides models for behavior. Observational
learning occurs when a person watches the actions of another person and the
reinforcements that the person receives (Bandura, 1997). The concept of behavior can
be viewed in many ways. Behavioral capability means that if a person is to perform a
behavior, he must know what the behavior is and have the skills to perform it.
In order to describe behavior more explicitly, social exchange theory refers to
the social psychological and sociological perspective that explains social change and
stability as a process of negotiated exchanges between parties. Social exchange theory
posits that all human relationships are formed by the use of a subjective cost-benefit
analysis and the comparison of alternatives. For example, when a person perceives the
costs of a relationship as outweighing the perceived benefits, then the theory predicts
that the person will choose to leave the relationship. The theory has roots in
economics, psychology and sociology. According to social exchange theory,
committed behavior can be approached from an individual differences approach and
from a situational approach. The former considers exchanged-related dispositions as
determinants of ensuing committed behavior (e.g. Hom and Griffeth, 1995; Judge and
Ilies, 2002; Lee, Ashford, Walsh, andMowday, 1992; Orvis, Dudley and Cortina,
2008; Zimmerman, 2008), whereas the latter views committed behavior as a response
to the environment (Rhoades and Eisenberger, 2002; Sheppard, Lewwicki and
Minton, 1992; Skarlicki and Folger, 1997). Human resource practices that adopt the
former focus on identification and assessment of personal features that predict
subsequent committed behavior (Landy and Conte, 2007). Human resource practice
adopts a situational approach focusing on the design of commitment generating
environments right from the start, and on projecting an image of the organization to
which members feel obliged to contribute (Baker and Dutton, 2007; Edwards, Scully,
and Brteck, 2000; Huselid, 1995; Nishii, lepak, and Schneider, 2008; Phillips, 1998;
Turban and Cable, 2003). Committed behavior is a course of action that contributes to
attainning core organizational goals (Lawler, Thye, and Yoon, 2006). The focus on
behavior distinguishes this concept from the prevalent conceptualisation of commitment as
an attitude (Meyer, Becker, and Vandenberghe, 2004; Meyer and Herscovitch, 2001).

50
According to Hormans (1958), the initiator of the theory, it was developed to
understand the social behavior of humans in economic undertakings. The fundamental
difference between economic exchange and social exchange theory is in the way
actors are viewed. Exchange theory “views actors (person or firm) as dealing not with
another actor but with a market” (Emerson, 1987: 11), responding to various market
characteristics, while social exchange theory views the exchange relationship between
specific actors as “actions contingent on rewarding reactions from others” (Blau,
1964: 91).
The theory of psychology that attempts to explain human behavior by
understanding thought processes. The assumption is that humans are logical beings
that make the choices that make the most sense to them. Social cognitive theory
explains how people acquire and maintain certain behavioral patterns, while also
providing the basis for intervention strategies (Bandura, 1997). Evaluating behavioral
change depends on the factors of environment, people, and behavior. Social cognitive
theory provides a framework for designing, implementing, and evaluating programs.
Herzberg, a psychologist, proposed a theory concerning the job factors that
motivate employees. Maslow, a behavioral scientist and contemporary of Herzberg,
developed a theory about the rank and satisfaction of various human needs and how
people pursue these needs. These theories are widely cited in the business literature.
According to Herzberg’s theory of motivators and hygiene factors (1959), there is a
two-dimensional paradigm of factors affecting people’s attitudes about work.
Herzberg concluded that such factors as company policy, supervision, interpersonal
relations, working conditions, and salary are hygiene factors rather than motivators.
According to the theory, the absence of hygiene factors can create job dissatisfaction,
but their presence does not motivate or create satisfaction.
In contrast, Herzberg determined from the data that the motivators were
elements that enriched a person’s job; he found five factors in particular that were
strong determiners of job satisfaction: achievement, recognition, the work itself,
responsibility, and advancement. These motivators (satisfiers) were associated with
long-term positive effects in job performance, while the hygiene factors (dissatisfiers)
consistently produced only short-term changes in job attitudes and performance,
which quickly fell back to their previous level. Satisfiers describe a person’s

51
relationship with what she or he does, many related to the tasks being performed.
Dissatisfiers, on the other hand, have to do with a person’s relationship to the context
or environment in which she or he performs the job. The satisfiers relate to what a
person does while the dissatisfiers relate to the situation in which the person does
what he or she does.
Based on various literature on motivation, individuals often have problems
consistently articulating what they want from a job. Therefore, employers have
ignored what individuals say that they want, instead telling employees what they
want, based on what managers believe most people want under the circumstances.
Frequently, these decisions have been based on Maslow’s needs hierarchy, including
the factor of prepotency. In addition, Eisenberger et al. (1997) have suggested that
higher levels of POS would meet individuals’ needs for approval, esteem, social
identity, recognition, and rewards.
The idea that satisfied employees are more productive was held through the
1970s. However, it was difficult to obtain support for the view that job satisfaction
has a significant effect on job performance. As a result, the reverse (that an
employee’s job performance affects his or her job satisfaction) became the focus of
research in the area (Lawler and Porter, 1967). Although the idea that an employee’s
job performance affects his or her job satisfaction is consistent with several
psychological theories, such as intrinsic motivation theory (Deci and Ryan, 1985),
few studies have found support for it (Iaffaldano and Muchinsky, 1985). Similarly,
organizational studies on the sales force in marketing invariably find that the
relationship between job performance and job satisfaction is weak (Bagozzi 1980;
Brown and Peterson 1993). As Brown and Peterson (1993) note, if the effect of job
performance on job satisfaction is insignificant, firm actions designed to increase job
performance should not have a direct effect on job satisfaction and related outcomes,
such as employee turnover. Conversely, there seems to be consensus that many
antecedents of job satisfaction and job performance are common (effort,
compensation, quality of supervision, clarity of job responsibilities). Consequently, it
is essential to account for both the direct and indirect effects of common antecedents
to reach the conclusion that the effect of job performance on job satisfaction is
insignificant. The literature suggests that the antecedents of job satisfaction can be

52
categorized into personal characteristics, role perceptions, and organizational variables
(Brown and Peterson, 1993). It is intuitive that effort and compensation are critical
determinants for the viability of any employment situation. An employee will not be
willing to exert effort unless he or she is paid, and the employer will not be willing to
pay unless the employee works.
Job involvement is defined as type of work-related attitude which directly
affects an employee’s job performance (Allport, 1943). Kanungo (1982) has
suggested that job involvement concerns the cognitive dimension of attitudes towards
a job. The studies have also suggested that job involvement is different to other
constructs, such as intrinsic motivation, job satisfaction and organizational commitment
(Shore, Newton, and Thornton, 1990). The initial definition of job involvement is the
degree to which one actively participates in one’s job (Allport, 1943). Such a
definition has been extended as the degree to which a person identifies with a job,
actively participate in it, and considers the performance important to self-worth.
(Robbins and Judge, 2007).
There is a substantial researches that claims economic returns can be obtained
through the implementation of a high performance work system (Pfeffer and Veiga,
1999). The indicator is the actual behavior of employees, through the way in which
they affect turnover and labour productivity (Huselid, 1995). Employees’
performance comes from a high performance work system in the form of developing
individuals to their full potential and motivating these individuals to apply their skills
and abilities to their work-related activities (Way, 2002). Way (2002) has suggested
that a high performance work system result in an increase in labour productivity in
small U.S. firms. More evidence comes from Delaney and Huselid (1996: 965),
concluding that “the widely asserted assumption that people are the pre-eminent
organizational resource and the key to achieving outstanding performance was indeed
a credible observation.”
Harley (2002) suggested that there is consensus amongst researches that have
sought to demonstrate the link between HRM systems and organizational performance
that the performance outcomes arises because the HRM practices improve employee
orientations to work, which in turn makes them more productive. Edwards and Wright
(2001) asserted the causal path “System are established; they influence workplace

53
practice; employee attitudes change with increased satisfaction or commitment; there
is a consequent effect on behavior; and this in turn feeds through to the performance
of work unit and eventually the company…”
Huselid (1995) has stated that a high performance work system increase
performance through a number of avenues, one of these being employee behavior.
This employee behavior affects turnover and labour productivity within the
organizations (Huselid, 1995) thus eliciting employee commitment, which is in direct
contrast to turnover. Pecci and Innocenti (2004) asserted that HR practices affect
employees’ experiences which, in turn, affect their attitudes and behavior. The model
will therefore focus on the relationship between three components. First, a set of HR
practices which are the systematic selection and socialization of employees, training
and development opportunities, job decentralization, information sharing, employment
security, and so on. From various studies, it has shown the influence on organizational
and employee outcomes(Huslid, 1995; Guest, 1999; Appelbaum, 2002). Second, a set
of employee work experiences, which are perceived management support, perceived
reward equity, job security, and so on, that, Peccei (2004) suggests are likely to be
affected by HR practices and are also likeky to have an influence on employee related
outcomes (GodARD, 2001; Guest,1999). Third is a set of employee attitudes and
behaviors, which are job satisfaction, organizational commitment, trust in management,
and well-being; they are direct interest and have been discussed in various studies
(Appelbaum et al., 2000; Guest, 2002; Godard, 2001).
From the relevant theories, in short, SHRM practices are the antecedents of
perceived organizational support and affective commitment. Among various HRM
practices , it has been found that rewards have a greater influence on organizational
commitment (Angle, 1983; Mottaz, 1988; Mowday, Porter, and Steers, 1982; Steers
and Spencer, 1977). Pare, Tremllay, and Lalonde (2000) found that HRM practices
such as recognition, empowerment, and competence development, had a significant
positive effect on organizational commitment. Employee attitudes and behavior are
the consequence of perceived organizational support. Therefore, the relationship of
the three main constructs is developed in the following framework.

54
Figure 3.3 Basic Relationship Among Human Resource Practice, Emplyee’s Work
Experience and Attitudes and Behavior
Human resource practices
Employee’s work
experience
Employee’s attitudes and
behavior

CHAPTER 4
THEORETICAL FRAMEWORK AND HYPOTHESES
This chapter describes the conceptual foundation that underpins this dissertation. It
aims to identify the impact of strategic human resource management (SHRM) with
perceived organizational support and organizational commitment as a mediating roles
in employee’s attitude and behavior which are job satisfaction, performance, job
involvement, and withdrawal behavior.
4.1 The Relationship Between SHRM and Perceived Organizational Support
Strategic human resource strategy is a set of practices aligned with corporate
strategy for strategy fit to respond to the external environment.
Figure 4.1 A Perspective on Business Strategy and Human Resource Strategy
Interdependence (adapted from Strategic human resource management,
CynthiaA.Lengnick-Hall and Mark L.Lengnick-Hall)
Competitive strategy
Human resource strategy
Economic conditions
Distinct competence
Industry structure
Competitive advantage
Product/Market scope
Labor market
Skills and values
Culture Economic conditions
Demand for skills and labor Organization availability and readiness

56
Figure 4.2 The Effect of HRM
Source: Wright and Mcmahan, 1992; Ferris et al, 1998.
The implementation of appropriate and strategic human resource (HR)
practices can develop high levels of POS, which in turn, contribute to positive work
attitudes and organizational behaviors (Eisenberger et al., 1986; Eisenberger et al.,
2001; Rhoades & Eisenberger, 2002).
In this dissertation, employees’ attitude and behavior are hypothesized as
having a causal relationship with SHRM through perceived organizational support.
This attitude and behavior implies the felt obligation and affective commitment of the
employee. However there are few empirical studies of SHRM and perceived
organizational support.
SHRM as a high performance work system has theoretical models which
assume that performance gains are necessarily attributable to a positive impact on
employees, chiefly through increased autonomy, satisfaction and commitment
(Harley, 2002). Harley asserted that improved performance may be driven by factors
other than HRM practice and may cause negative outcomes for workers.
4.1.1 The relationship between strategic human resource management
and perceived organizational support
From empirical studies the relationship between organizational rewards,
procedural justice and POS are as follows:
Effects of
HRM Strategies,
policies
and
practices
Organizational effects- Cohesion - Adaptability - Problem resolution - performance
Social effects- Productivity - Quality of life - Human capital development
Individual effects- Performance - Satisfaction - Commitment - Learning

57
1) POS provides an important mechanism by which positive work
experiences lead to affective commitment ( Meyer and Allen, 1997).
2) Three major work experiences, organizational rewards, procedural
justice, and supervisory support have been found to be positively related to affective
commitment (Rhoades et al., 2001).
3) Gaertner and Nollen (1989) suggested that rewards increase
employees’ perception of organizational support.
4) Fasolo (1995) reported that procedural justice was positively related
to POS.
5) Ogilvie (1986) perceives HRM practices as concrete, tangible
programs designed to develop commitment.
6) Among HRM practices, it has been found that rewards have a
greater influence on organizational commitment (Angle, 1983; Mottaz, 1988; Mowday,
Porter, and Steers, 1982; Steer and Spencer, 1977).
7) Jaiswal (1982) and Ogilvie (1986) found relationships between
specific practices, e.g. performance evaluation, promotion policies, compensation, and
benefits and affective commitment.
8) Wright et al. (2005) demonstrated that a similar relationship
between a system of human resource practices and a concurrent commitment
measure. In individual-level studies, HR system have been found to relate to
commitment in sample of frontline employees (Browning, 2006, Paul and
Anantharaman, 2004).
9) Folger and Konovsky (1989); Moorman et al. (1998); Moorman,
Niehoff and Organ (1993) asserted that procedural justice is instrumentally the means
to fair distributive outcomes and non-instrumentally implies respect for the rights of
employees. Moorman et al. (1998) found a positive relationship between procedural
justice and POS.
10) Ulrich (1997) asserted that HRM practices have been considered
to be effective tools for enhancing organizational commitment.
11) HRM practices promote, reinforce, and influence commitment
through selection, placement, development, rewards, and retention (Wimalasiri,
1995).

58
4.1.2 Training and Development and POS
Training and development has little impact on affective commitment. Employees
feel that there is no obligation to commit their performance to such training. They
could turn to other organizations for career development.
1) Gardner and Wright (2007) found that bundles of HR practices
focused on enhancing motivation and empowerment related to commitment but that
those focusing on enhancing skills were unrelated to commitment.
2) Changes that require employees to acquire new knowledge and
skills might threaten employees’ self-efficacy and perceptions of person-job fit, both
of which are linked to commitment (Meyer, 1997). The impact of HR practices has an
influence on organizational and employee outcomes (Huselid, 1995; Guest 1999;
Applebaum, 2002). The practices involved include selection and socialization of
employee, training and development, and employment security. Employee attitudes
and behaviors, for example, job satisfaction, organizational commitment, trust in
management, and well-being) have been discussed in various studies (Appelbaum et
al., 2000; Guest, 2002; Godard,2001).
3) Lincoln and Kalleberg (1990) have argued that the rewards offered
by an organizational� may have a powerful effect on employees’ attitudes regarding
their job and the company for which they work.
4) Employees with higher levels of training motivation will report
higher levels of organizational commitment; as an example, it seems likely that high
training motivation results from high organizational commitment rather than the
reverse (Colquitt, LePine, and Noe, 2000).
4.2 The Relationship Between Perceived Organizational Support, Affective
Commitment, and Felt Obligation
4.2.1 POS and Affective Commitment
1) Numerous studies have reported that POS and AC are strongly
associated empirically distinct (e.g. D.Allen, Shore and Griffeth, 1999; Eisenberger,
Fasolo and Davis-LaMastro, 1990; Guzzo,Noonam and Elron, 1994; Hutchison &

59
Garstka, 1996; Jones, Flynn and Kelloway, 1995; Settoon, Bennett and Liden, 1996;
Shore and Tetrick, 1991; Shore and Wayne, 1993; Wayne et.al., 1997).
2) POS and AC have also been found to have similar antecedents and
consequences; the two constructs have been measured simultaneously so that the
direction of causality is uncertain (Rhoades, Eisenberger, Armeli, 2001).
3) POS increases AC partly by creating an obligation to care about the
organization’s welfare (Eisenberger et al., 2001).
4.2.2 POS and Felt Obligation
Felt obligation will act as a mediator between POS and affective commitment
by partly increasing the employee’s commitment. This is based on the normative
commitment that employee think that they should return their employee with the
obligation to perform their work.
1) Organizational support theory argues that it is the employees’
feelings of obligation to reciprocate based on perceived organizational support that
leads to better performance (Eisenberger et al., 1986). As expected, Eisenberger et al.
(2001) found that the relationship between POS and in-role performance was
mediated by felt obligation.
2) POS fosters affective commitment by meeting employees’ socio-
economical needs and by creating felt obligation to the organization (Armeli et al.,
1998,; Eisenberger et al.,1986).
3) POS is held to create a felt obligation to care about the
organization’s welfare and to help the organization reach its objectives. Employees
can fulfill this debt through greater affective commitment and greater effort to help
the organization.
4) Felt obligation is viewed as an outcome of POS and depends on
employees’ acceptance of the reciprocity norm as applied to work (Wayne et al.,
1997).
4.2.3 POS and Individual Outcomes
Employees with POS experience their employment more favorably (e.g.
demonstrating increased job satisfaction and positive mood and reduced stress) and

60
are more invested in their work organization (e.g. demonstrating increased affective
organizational commitment, increased performance, and reduced turnover (Rhodes
and Eisenberger, 2002).
4.3 The Relationship Between Affective Commitment and Employee
Outcome
4.3.1 Affective Commitment and Job Involvement
Affective commitment is hypothesized to have a causal relationship with job
involvement, productivity, attitudes and withdrawal behavior. In formal study, these
variables are correlated with human resource practice. This dissertation will test the
relationship of these independent variables with strategic human resource management
through perceived organizational support.
1) Macey and Schneider argue that commitment is one facet of the
state of engagement. Commitment is cited as a major component of engagement.
2) Brown, 1996 and Hackettt, Lapierre and Hausdorf, 2001 have
postulated that job involvement causes affective organizational commitment.
3) Job involvement has been defined as psychological identification
with one’s work and the degree to which the job situation is central to the person and
his identity (Lawler and Hall, 1970).
4) POS causes employees to become more involved in their work
activities and to take a greater intrinsic interest in them, resulting in greater affective
and normative commitment ( future research).
5) Good, Page and Young, 1996; Goulet and Singh,2002; Tompson and
Werner, 1997; Yon and Thye, 2002; Zangaro, 2001) found a relationship between
organizational commitment and organization support, job satisfaction, job involvement,
and loyalty.
4.3.2 Affective Commitment and Performance/Productivity
1) Affective commitment is positively related to job performance
confirmed by various empirical studies (Jaros, 1997; Meyer, Allen, and Smith, 1993;
Sommers, 1995; Whitener and Walz, 1993).

61
2) Commitment leads to performance, and the opposite may be likely as
well (Wright et al., 2005).
3) Employees reciprocate favorable treatment with greater commitment
and performance (Eisenberger et al., 1986; Meyer and Allen, 1997; Mowday et al.,
1982; Rousseau, 1989; Schein, 1980; Shore and Shore, 1995; Wayne et al., 1997).
4) Organizational commitment does relate to performance, albeit
weakly (Riketta, 2002). Commitment is indeed the antecedent to performance and the
strength of that association is greater when the time lag is relatively short (Riketta,
2008).
5) The impact of workplace commitments has been shown to have
individual-level outcomes important to organizations, such as absenteeism, turnover,
motivation, performance, and prosocial behaviors (Cooper-Hakim & Viswesvaran,
2005; Mathieu and Zajac, 1990; Meyer and Allen, 1997; Meyer,Becker and
Vandenberghe, 2004; Mowday,1998).
6) Individual performance is likely to be affected by a variety of factors
that are unique to the individual such as situational influences, ability, and personality
(Wright & Kehoe, 2005).
7) Commitment positively influences various organizational outcomes
such as employee motivation (Naquin and Holton, 2002) and performance
(Kontoghtorghes and Bryant, 2001), tenure on the job (reduced turnover and
absenteeism), and accomplishment of organizational goals (Meyer and Allen, 1997;
Pratt and Rosa, 2003).
4.3.3 Affective Commitment and Withdrawal Behavior
1) POS has been found to influence turnover through its influence on
affective commitment (D.G. Allen, Shore and Griffeth, 2003).
2) Angle and Perry (1981), Garner et al. (2007) found a strong negative
relationship between affective commitment and withdrawal behavior.
4.3.4 Affective Commitment and Work Attitudes
1) Commitment is often referred to as an attitudes (e.g.Solinger, Van
Olffen, & Roe, 2008) and it is commonly presented as a work attitude in OB and IB
psychology textbooks.

62
2) Chusmir (1982) depicted of job commitment as an “attitude or
orientation toward the job”.
3) Mowday et al. (1982) used the term attitudinal commitment in
differentiating the psychological aspects of commitment as identification and
involvement.
4) Porter defined commitment as an inner bond, or attachment, to the
target, and coined the term attitudinal commitment as a construct.
5) Staw and Salanick asserted that the individual develops an attitude
that is consistent with the behavior. This attitude can be considered one manifestation
of a commitment mindset.
6) Empirical studies have concluded that three constructs i.e.
identification, involvement and satisfaction have substantial conceptual overlap with
commitment especially with affective organizational commitment. These constructs
are divided into three categories; job attitudes, work context and work behavior.
7) Organizational identification, the congruence of individual and
organizational values (Hall, Schneider and Nygren, 1970; Pratt, 1998) clearly overlaps
with affective organizational commitment which is commonly defined as “employees’
emotional attachment to, identification with, and involvement in, the organization
(Allen and Meyer, 1990).
8) Koys (2001 and Harter et al. (2002) studied the relationship among
job satisfaction, engagement and commitment, and it was found that the relationships
of these variables with various correlates are nearly identical (Ryan et al., 1996;
Fulmer et al., 2003).
4.4 The Mediating Role of Perceived Organizational Support
1) POS appears to mediate the relationship between work experiences and
affective commitment. (Wayne et al.,1997).
2) POS provides an important mechanism by which positive work experiences
lead to affective commitment (Meyer&Allen, 1997).
3) Gaertner and Nollen (1989) found that more favorable perceptions of
organizational employments practices were associated with stronger organizational
commitment.

63
From empirical studies of the relationship of variables, a conceptual model
demonstrating the link between SHRM, perceived organizational support, affective
commitment and employee attitude, and behavior and outcome is exhibited as
follows.
Figure 4.3 Conceptual framework
The following hypotheses are proposed in order to evaluate the relationship of
variables as follows:
Hypothesis
H1: There is a significant direct and positive relationship between strategic
human resource (SHRM) and affective commitment (AC).
H2: There is a significant direct and positive relationship between felt
obligation (FO) and affective commitment (AC).

64
H3: There is a significant direct and positive relationship between perceived
organizational support (POS) and affective commitment (AC).
H4: There is a significant direct and positive relationship between affective
commitment (AC) and employee attitude and behavior (ATT & BHV).
H5: There is a significant direct and positive relationship between felt
obligation (FO) and employee attitude and behavior (BHV).
H6: There is a significant direct and positive relationship between strategic
human resource management (SHRM) and employee attitude and behavior (BHV).
H7: There is a significant indirect, positive relationship between strategic
human resource management (SHRM) and attitude and behavior (BHV) as mediated
by perceived organizational support (POS), affective commitment (AC), and felt
obligation (FO).
H8: There is a significant indirect, positive relationship between strategic
human resource management (SHRM) and felt obligation as mediated by perceived
organizational support (POS).
H9: There is a significant indirect, positive relationship between perceived
organizational support(POS) and affective commitment (AC) as mediated by felt
obligation (FO).
H10: There is a significant indirect, positive relationship between strategic
human resource management (SHRM) and affective commitment (AC ) as mediated
by perceived organizational support (POS).
H11: There is a significant indirect, positive relationship between perceived
organizational support (POS) and attitude and behavior (BHV) as mediated by felt
obligation (FO) and affective commitment (AC).
H12: There is a significant indirect, positive relationship between felt obligation
(FO) and attitude and behavior as mediated by affective commitment (AC).
The structural models will be developed to test the hypotheses by structural
equation modeling (SEM).

CHAPTER 5
RESEARCH METHODOLOGY
This chapter describes the procedure used for data collection, the measures for
the variables in the conceptual model, and the analytic techniques which is structural
equation modeling (SEM), to test the hypotheses. The author discusses the research
methodology applied in analyzing the relationship of factors affecting employee
attitude and behavior and work outcome. Prior to conducting a research, several
important issues have to be clear, such as the type of research, the purposes of the
study, and the techniques employed for data collection. Neuman (2003) asserts that
the dimensions for researchers to consider before starting to conduct any research will
indicate the type of research. When the dimension is the purpose of study, the major
type will be exploratory, descriptive, or explanatory. If time is of concern, the major
types will be cross-sectional or longitudinal. If the dimension of study is the technique
for collecting quantitative data, then experiment, surveys, content analysis, study of
existing statistics will be performed. According to Neuman, W.L. (1997), quantitative
measurement is a deductive process. It involves taking a concept, construct, or idea,
then developing a measure (a device, procedure, or instrument) to observe it empirically.
The process begins with concepts and ends with specific, concrete indicators. A
researcher then uses the measures to produce data in the form of numbers. In
conclusion, quantitative research is concerned with the issues of design, measurement,
and sampling because it is based upon a deductive approach, which focuses on
detailed planning before data collection and data analysis.
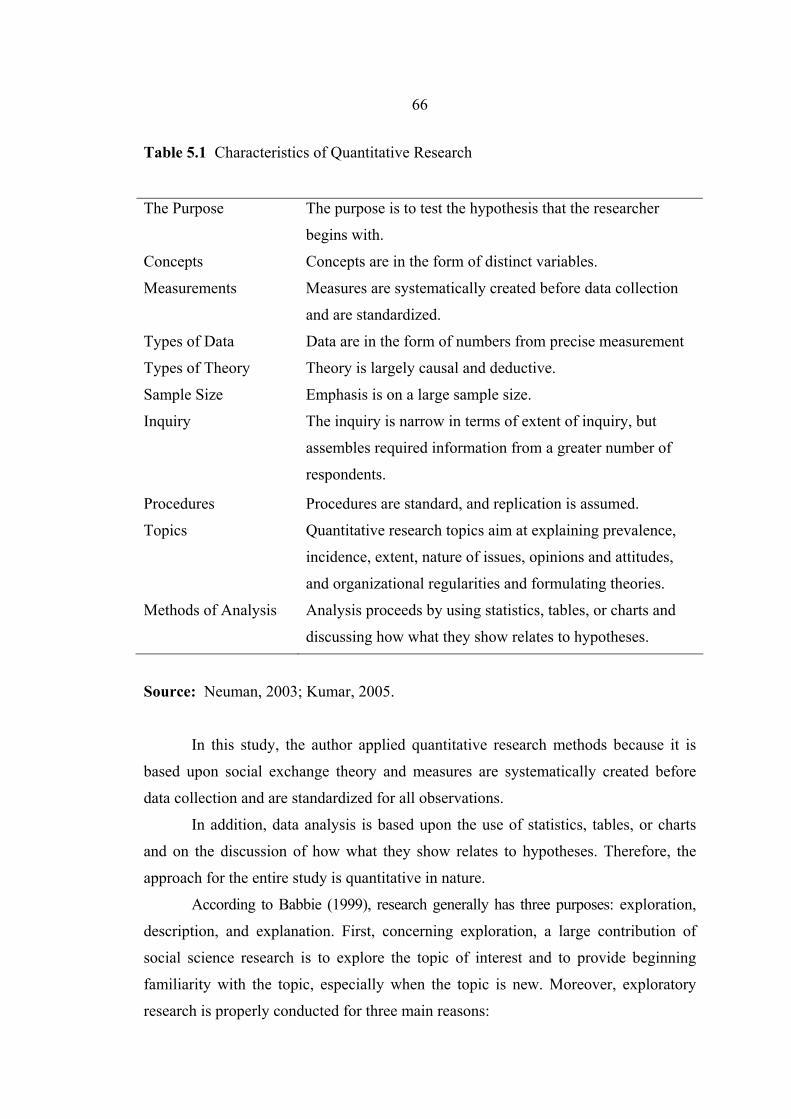
66
Table 5.1 Characteristics of Quantitative Research
The Purpose
The purpose is to test the hypothesis that the researcher
begins with.
Concepts Concepts are in the form of distinct variables.
Measurements Measures are systematically created before data collection
and are standardized.
Types of Data Data are in the form of numbers from precise measurement
Types of Theory Theory is largely causal and deductive.
Sample Size Emphasis is on a large sample size.
Inquiry The inquiry is narrow in terms of extent of inquiry, but
assembles required information from a greater number of
respondents.
Procedures Procedures are standard, and replication is assumed.
Topics Quantitative research topics aim at explaining prevalence,
incidence, extent, nature of issues, opinions and attitudes,
and organizational regularities and formulating theories.
Methods of Analysis Analysis proceeds by using statistics, tables, or charts and
discussing how what they show relates to hypotheses.
Source: Neuman, 2003; Kumar, 2005.
In this study, the author applied quantitative research methods because it is
based upon social exchange theory and measures are systematically created before
data collection and are standardized for all observations.
In addition, data analysis is based upon the use of statistics, tables, or charts
and on the discussion of how what they show relates to hypotheses. Therefore, the
approach for the entire study is quantitative in nature.
According to Babbie (1999), research generally has three purposes: exploration,
description, and explanation. First, concerning exploration, a large contribution of
social science research is to explore the topic of interest and to provide beginning
familiarity with the topic, especially when the topic is new. Moreover, exploratory
research is properly conducted for three main reasons:

67
1) to satisfy the researcher’s curiosity and desire for better understanding of
the topic
2) to test the feasibility of conducting a more careful study
3) to develop the methods to be applied in future study
Second, concerning description, much social science research works is aimed
at describing situations, activities and events, and researchers need to observe and
describe what was observed. Scientific observation involves careful, deliberate, and
scientific descriptions that are more accurate than causal descriptions.
Third, concerning the explanatory purpose of research, this purpose aims at
explaining things. The research findings are expected to provide an explanation of
phenomena or events. In this type of research, the goal is to answer the question
“why.”
Conducting a research is a systematic approach. There are seven steps in the
research sequence for the research process (Gill and Johnson, 1991).
Basic Research Process:
1) Identify Broad Area
2) Select Research Topic
3) Analyze Data
4) Collect Information
5) Formulate Plan
6) Decide Approach
7) Present Findings
These steps help to identify the activities to be conducted in implementing the
research project. In addition, the research design should include important components, as
follows:
1) a priori hypothesis
2) a priori criteria which can be used to measure the acceptability of
the priori hypothesis
3) isolation and control of the variables under the research study
4) methods of measuring, validating, and verifying the variables or
constructs in the research

68
5.1 Measures and Unit of Analysis
The unit of analysis for this study is at the individual level, which is the
employee. Although strategic human resource management in a set of human resource
practices is examined as the antecedent of POS, where affective commitment and felt
obligation are the consequence of POS, it is the individual employee’s perceptions
about how these practices are implemented that influence their beliefs in POS and
their attitude and behavior. Therefore, these variables are operationalized as individuals’
evaluations of their satisfaction with these practices or the level of these practices they
receive. The outcome variables examined in this study are affective commitment,
individual employees’ attitudes and behaviors, performance and productivity and job
involvement and withdrawal behavior as a response to perceived support from the
organization. Therefore, it is appropriate to measure all the variables in the conceptual
model at the individual level of analysis.
The unit of analysis (or level of analysis) is very important and needs to be
specified for a study. The units of analysis are the entities or objects of the study.
These entities are generally formed in a hierarchical order in that higher levels such as
the organizational level include the lower levels (such as the individual level). Babbie
(1999) has mentioned that for social scientists, most of the units of analysis are
individuals and the observations made to describe the characteristics of a number of
individuals, such as sex, age, regions of birth, and attitudes. However, there are
actually four types of units of analysis; namely, individuals, groups, organizations and
social artifacts. The organization is a larger unit of analysis, compared to individuals
and groups. An example of organizations is corporations, which can be characterized
by number of employees, net annual profits, and gross assets. Other examples are
colleges, academic departments, and supermarkets. The unit of analysis of this study
is at the individual level.
In general, organizations consist of many layers, and it can be seen that
individuals work in dyads, groups, and teams within organizations as well as in the
context of one organization relating to other organizations in the same industry or a
different industry. Moreover, the level of analysis is crucial for organizational theory
and research, because each construct is attached to one or more organizational levels

69
or entity, including individuals, dyads, groups, organizations, industries, and markets.
In addition, the level of theory is related to the level of analysis that a researcher
attempts to explain. In other words, it refers to the level at which generalizations are
expected to be made (Klein, Dansereau and Hall, 1994; Yammarino, Dionne, Chun
and Dansereau, 2005).
Data will be collected from the national carrier in the airline business which is
a legacy airline with 50-years established in the business and representing a major
share of the airline business in Thailand. The collection of data is with a random
sample of employee working in various departments of Thai Airways International
PLC: the technical department, cargo department, airport ground handling department,
cabin crew, finance, and sales office. The reason is that the personnel have different
working environments and backgrounds. With long-established and ongoing concerns,
the organization is the largest airline in Thailand in terms of revenue and personnel.
An endorsement letter was required from the institute. The information on the
employees with different levels of position was provided from the company records
by the human resource department. Confidentiality of the completed surveys was
guaranteed to all respondents. It has been argued that obtaining support from the
management is helpful for gaining trust from the respondents, confirming the
purported use of the surveys, and increasing the probability of returning the
questionnaires (Dillman, 1978, 2000; Roth and BeVier, 1998). However, it was
emphasized to the employees that their participation was completely voluntary and
the company would not have access to their individual responses.
5.2 Participants and Response Rate
The target population of the study is employees of Thai Airways International
PLC. working at various locations: the headquarters, Suvanabhumi Airport, and the
sales branch office as mentioned above representing total number of the population.
A survey questionnaire was distributed to various working areas such as
Suvanabhumi airport, head offices, the sales branch office, the training centre, and so
on. Data were collected from individual employee and respondents provided data
directly. Once all the responses were received, they were registered in the data base
using SPSS17 for further analysis.

70
5.3 Sample Size and Sampling
There are several methods for estimating the number of samples required. Hair
et al. (2010) recommended a sample size of 200 and stated that when the sample size
is large (exceeding 400-500), the method will become too sensitive and almost any
difference is detected, making all goodness-of-fit measure indicate a poor fit. Garson
(2009) recommended that the minimum acceptable size for SEM is 100-150. Also,
other scholars (Hoyle and Panter, 1995, Loehlin, 1992) recommended a sample size
of 200. Taro Yamane, in his book Elementary Sampling Theory (1967), University of
Florida (2006), the appropriate sample size is shown in the following table.
Table 5.2 Sample size for ±3%, ±5%, ±7% and ±10% Precision Levels where the
Confidence Level Is 95% and P=.05
Size of Population Sample Size (n) for Precision (e)
±3% ±5% ±7% ±10%
500 a 222 145 83
600 a 240 152 86
700 a 255 158 88
800 a 267 163 89
900 a 322 166 90
1,000 a 286 169 91
2,000 714 333 185 96
3,000 811 353 191 97
4.000 870 364 194 98
5,000 909 370 196 98
6,000 938 375 197 98
7,000 959 378 198 99
8,000 976 381 199 99
9,000 989 383 200 99
10,000 1,000 385 200 99

71
Table 5.2 (Continued)
Size of Population Sample Size (n) for Precision (e)
±3% ±5% ±7% ±10%
15,000 1,034 390 201 99
20,000 1,053 392 204 100
25,000 1,064 394 204 100
50.000 1,087 397 204 100
100,000 1,099 398 204 100
>100,000 1,111 400 204 100
Note: a = Assumption of Normal Population is Poor (Yamane, 1967). The entire
Population Should be Sampled.
The population of the employee of the national carrier in Thailand representing
more than 90 percent of total employee excluding outsource employee. Therefore, in
this study, the population is 25,000. The table indicates that if the size of the
population is 25,000-50,000 for a ±7% precision level, where the confidence level is
95%, the sample size will be 204.
In the study, the structural equation model will be used and sample size will
correspond to the method. Additionally, Anderson and Gerbing (1988) have suggested
that for structural equation modeling, the minimum sample size is 150, while Hair,
Black, Babin suggest 200. Anderson and Tatham (2006) have concluded that a sample
size of 200 is small but reasonable. In this study, 350 questionnaires were distributed,
327 of which were returned with a response rate of 93 percent. Then, the sample size
was 327, which passed the criteria of a sample size of 200. Samples were from
various functions, i.e. operations (124), finance (68), sales (45), human resources (40),
and others (60).

72
5.4 Instrumentation
Most of the tools are well developed by scholars, for example, the Survey of
Perceived Organizational Support (SPOS; Eisenberger et al., 1986), the Organization
Commitment Questionaire (ORQ; Porter and Smith, 1970). Survey data were
collected from employees. All of the variables except demographic data were
measured by the subjects’ responses based on 7-point Likert-type scales (1 = strongly
disagree, 7 = strongly agree).
5.4.1 Strategic Human Resource Management:
5.4.1.1 Organizational rewards
The degree to which the employees were satisfied with their current
wages and benefit level was measured by selected items from the satisfaction scale
developed by Henaman and Schwab (1985). A sample item is “ I am satisfied with the
remuneration package” and “The employee has the opportunity to advance in his
career”. Respondents were asked to indicate their feelings on a 7-point Likert type
scale (1=very dissatisfied, 7=very satisfied). The Cronbach’s alpha for this scale was .90.
5.4.1.2 Training & Development
To examine the quality of training & development, Graen and Scandura’s
(1987) scale was used for measurement. A sample item is “I have been trained for
career development occasionally.” The Cronbach’s alpha for this scale was .81.
5.4.1.3 Procedural justice / Equality
Procedural justice concerns the perceived fairness of means used to
determine the amount and distribution of resources among employees (Greenberg,
1990). Procedural justice was measured with seven items from the scale reported in
Moorman (1991) and Niehoff and Moorman (1993). Survey data were collected from
employee and measured by the subjects’ responses based on 7-point Likert-type
scales (1 = strongly disagree, 7 = strongly agree). A sample item is “The organization
has fairness in procedures and regulations.” The Cronbach’s alpha for this scale was .92.
5.4.1.4 Workplace participation
Workplace participation concerns information sharing, job autonomy
and empowerment. Survey data were collected from employees and measured by the

73
subjects’ responses based on 7-points (1 = strongly disagree, 7 = strongly agree). A
sample item is “The employee has the opportunity to work with multi-skill abilities.”.
The Cronbach’s alpha for this scale was .76.
5.4.1.5 Perceived Organizational Support (POS)
Following recent research on Perceived Organizational Support (e.g.
Eisenberger et al., 2001; Lynch et al., 1999; Rhoades et al., 2001), high-loading items
from the Survey of Perceived Organizational Support (SPOS; Eisenberger et al.,
1986) were selected to measure employees’ perceived organizational support. The
validity and unidimensionality of this scale has been substantiated by previous
research (e.g. Eisenberger et al., 1990; Shore & Wayne, 1993). Therefore, as Rhoades
and Eisenberger (2002) have suggested, although practical reasons many studies have
used shortened versions of the original SPOS scale, this practice is not problematic.
Survey data were collected from employee and measured by the
subjects’ responses based on 7-point. (1 = strongly disagree, 7 = strongly agree). A
sample item is “My organization values my contribution to its well-being.” The
Cronbach’s alpha for this scale was .835.
5.1.4.6 Affective Commitment
Affective commitment is the employees’ commitment to help the
organization reach its goals as a result from perceived organizational support. This
was measured by three top-loading items from the scale developed by Eisenberger et
al. (2001) and the Organization Commitment Questionnaire (ORQ) developed by
Porter and Smith, 1970. Survey data will be collected from employee and measured
by the subjects’ responses based on 7-point. (1 = strongly disagree, 7 = strongly
agree). A sample item is “I will perform my best in whatever way I can to help my
company achieve its goals.” The Cronbach’s alpha for this scale was .74.
Felt Obligation
Employees’ felt obligation to care about the organization and to help the
organization reach its goals was measured by three top-loading items from the scale
developed by Eisenberger et al. (2001). Survey data were collected from employees
and measured by the subjects’ responses based on 7-point. (1 = strongly disagree, 7 =
strongly agree). A sample item is “I feel a personal obligation to do whatever I can to
help my company achieve its goals.” The Cronbach’s alpha for this scale was .88.
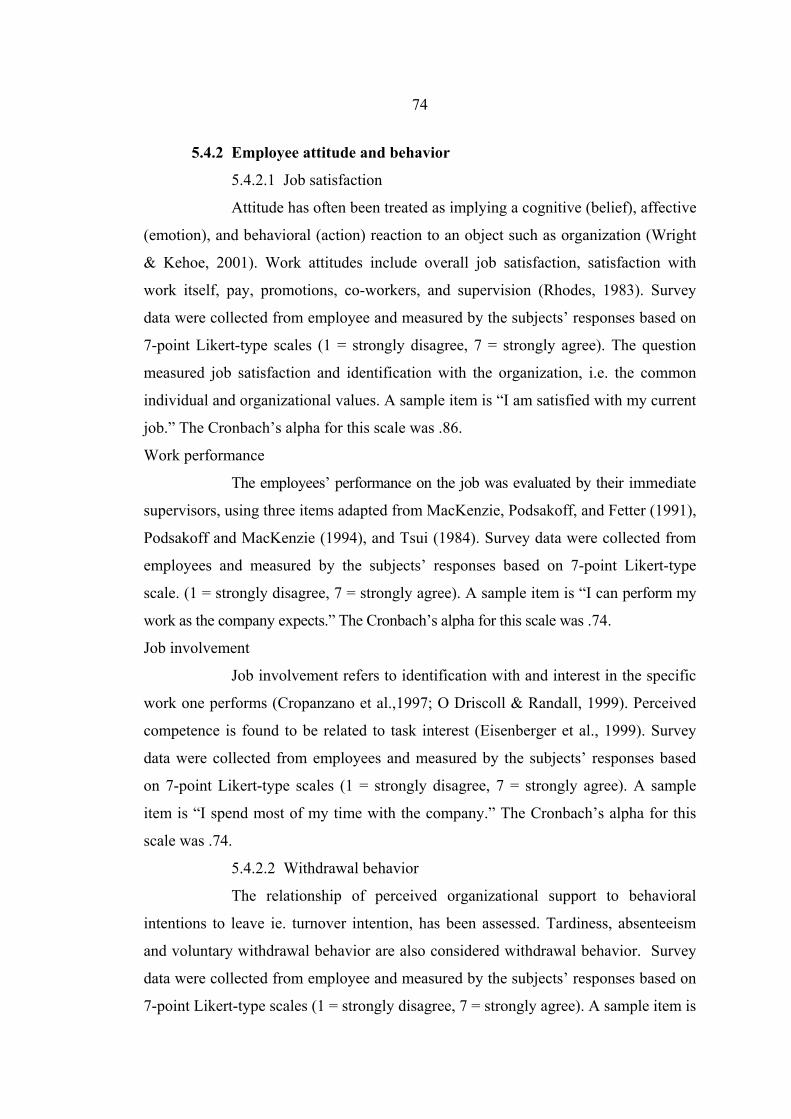
74
5.4.2 Employee attitude and behavior
5.4.2.1 Job satisfaction
Attitude has often been treated as implying a cognitive (belief), affective
(emotion), and behavioral (action) reaction to an object such as organization (Wright
& Kehoe, 2001). Work attitudes include overall job satisfaction, satisfaction with
work itself, pay, promotions, co-workers, and supervision (Rhodes, 1983). Survey
data were collected from employee and measured by the subjects’ responses based on
7-point Likert-type scales (1 = strongly disagree, 7 = strongly agree). The question
measured job satisfaction and identification with the organization, i.e. the common
individual and organizational values. A sample item is “I am satisfied with my current
job.” The Cronbach’s alpha for this scale was .86.
Work performance
The employees’ performance on the job was evaluated by their immediate
supervisors, using three items adapted from MacKenzie, Podsakoff, and Fetter (1991),
Podsakoff and MacKenzie (1994), and Tsui (1984). Survey data were collected from
employees and measured by the subjects’ responses based on 7-point Likert-type
scale. (1 = strongly disagree, 7 = strongly agree). A sample item is “I can perform my
work as the company expects.” The Cronbach’s alpha for this scale was .74.
Job involvement
Job involvement refers to identification with and interest in the specific
work one performs (Cropanzano et al.,1997; O Driscoll & Randall, 1999). Perceived
competence is found to be related to task interest (Eisenberger et al., 1999). Survey
data were collected from employees and measured by the subjects’ responses based
on 7-point Likert-type scales (1 = strongly disagree, 7 = strongly agree). A sample
item is “I spend most of my time with the company.” The Cronbach’s alpha for this
scale was .74.
5.4.2.2 Withdrawal behavior
The relationship of perceived organizational support to behavioral
intentions to leave ie. turnover intention, has been assessed. Tardiness, absenteeism
and voluntary withdrawal behavior are also considered withdrawal behavior. Survey
data were collected from employee and measured by the subjects’ responses based on
7-point Likert-type scales (1 = strongly disagree, 7 = strongly agree). A sample item is

75
“If there is a chance, I will avoid doing my work.” The Cronbach’s alpha for this scale
was .85.
5.4.2.3 Data Collection Method
The study used questionnaires as a tool to collect the data for the data
analysis. A total 350 questionnaires were sent to various functions and different
locations in Bangkok, but the major collection was from the Headquarter and
Suwanabhumi Airport. Finally, the author collected 327 questionnaires. The total time
spent on the data collection was approximately 40 days, from October to November
2010.
5.5 Methods of Data Analysis
In this study, the author analyzed the data using descriptive statistics and
structural equation modeling (SEM).
Data were analyzed through analytic procedures. The path analysis model
containing direct and mediated effects was examined via structural equation modeling
using SPSS17/Amos18.
Structural equation modeling can be used to test the entire system of variables
in the hypothesized model to determine the extent to which it is consistent with the
data (Byrne, 1994). The maximum likelihood estimation technique was used to
estimate the models, because this technique has generally been found to generate
reliable results even in situations where the data may violate the assumptions of
structural equation modeling, such as with normal distribution and large sample size
(Chou & Bentler, 1995; Hoyle & Panter, 1995). To run the structural models, a
correlation matrix containing the appropriate variables and the standard deviations of
those variables was generated using SPSS17/Amos18 to generate the standardized
estimate and the covariance matrix of the model.
5.5.1 Structural Equation Modeling (SEM)
According to Hair et al. (2010), structural equation modeling is a multivariate
technique combining dimensions of factor analysis and multiple regression and
allowing researchers to simultaneously study a series of interrelated dependence

76
relationships among the measures or observed variables and latent constructs, and also
the relationships between or among many latent constructs. Structural equation
modeling has three main characteristics that are different from other multivariate
techniques.
1) It provides simultaneous estimation of multiple and interrelated
dependence relationships.
2) It has the ability to represent unobserved (latent) concepts in these
relationships and to correct for measurement error in the estimation process.
3) It can define a model to explain the entire set of relationships.
Structural equation modeling has been one of the most widely used in research
due to its many advantages and benefits and because it has outperformed traditional
(multiple) regression analysis. Raykov and Marcoulides (2006) have stated that
structural equation modeling provides a mechanism for taking into account
measurement error in the observed variables in a model of study. This is different
from the traditional regression analysis, which ignores potential measurement error in
the independent variables. Therefore, the result of a regression analysis can be
incorrect and misleading in terms of the conclusion of the study. Additionally,
structural equation modeling allows researchers to develop, estimate, and test
complex models and indicates the direct and indirect the effects of the variables in the
model. These direct effects are those occurring directly on another variable, while
indirect effects are the effects occurring between two variables mediated by one or
more mediating variables. The total effects are the combined effects of both direct and
indirect effects on the dependent variables. Moreover, Kline (2005) has stated that
total standardized effects can be used to represent the path coefficient of structural
equation models by including all presumed direct and indirect causal links between
the factors or constructs. Therefore, in this study of the several proposed models for
theory testing to be discussed in the next chapter, the path coefficients were
represented by total effects. Traditional regression analysis can also be used in order
to estimate indirect effects, and this can be seen as appropriate when no measurement
errors occur in the independent variables. However, this assumption appears
unrealistic, and it is difficult for standard errors of related estimates to be accurately
computed by applying regression analysis. For this reason, structural equation
modeling is a straightforward method for the study of total effects.

77
Structural equation modeling is also known as a technique for theory testing.
Hair et al. (2010) stated that theory can be thought of as a systematic set of
relationships providing a consistent and comprehensive explanation of phenomena
and the model is used to represent the theory.
Ullman’s (2006) structural equation modeling (SEM) can be seen as a
collection of statistical techniques allowing a set of relations between one or more
independent variables and one or more dependent variables to be analyzed and
studied. In addition, structural equation modeling is also known as causal modeling,
causal analysis, simultaneous equation modeling, and analysis of covariance
structures. In SEM, constructs (or latent variables) are shown in circles and the
observed variables (or measured variables) are depicted in rectangles. From the early
1980s, researchers in organizational and management studies increasingly used the
latent variable method for model testing (Williams, Edwards, and Vandenberg, 2003;
Petter and Straub, 2007). In addition, the frequent use of the latent variable technique
has been predicted to increase in the next decades.
Sabherwal and Becerra-Fernandez (2003) have stated that structural equation
modeling helps to provide simultaneously an overall assessment of the fit of a
hypothesized model to the data and tests of each hypothesis. In addition, it permits
the joint specification and estimation of measurement and structural models to explain
the observed data.
Structural equation modeling provides a unique ability to extract information
about causal relationships from correlational data. Moreover, SEM has helped to
facilitate and enhance theory development and testing (MacKenzie, 2001). With
SEM, researchers have to specify explicitly measurement relationships as well as
structural relationships, leading to the careful process of forming the relationships
between latent variables and observed variables, and considering these relationships
as hypotheses. For this reason, SEM offers a method of estimating and testing
complex theoretical structures, helping to broaden the scope of theoretical models by
considering the conditions of the entire system of conceptual relationships.
Furthermore, SEM can assist in simplifying the tests of mediating processes,
studying the systematic effects of non-hypothesized factors—both methodological
and theoretical—on hypothesized relationships. Moreover, researchers can also

78
compare hierarchically related theoretical structures, supporting the test of an
alternative theory or model against another to advance theoretical knowledge in the
field.
5.5.2 Types of Constructs
According to Petter and Straub (2007), it asserted that many researchers using
structural equation modeling (SEM) study the measurement and structural model
without paying enough attention to the relationship between measures and latent
constructs. Two types of constructs—formative and reflective—should be identified
in research in order to demonstrate the relationship between measures and latent
constructs.
According to Edwards and Bagozzi (2000), measures, indicators, or items are
observable, quantifiable scores acquired from self-reports, interviews, observation, or
other empirical methods of study. These measures or items can be used to examine a
construct—also known as an abstraction describing a phenomenon of theoretical
interest in a particular study.
In social science, constructs are used to describe observable phenomena, such
as employee performance, or unobservable ones, such as attitude. Hair et al. (2006)
stated that constructs are unobservable or latent factors shown by multiple variables.
According to Petter and Straub (2007), before discussing the differences
between formative and reflective constructs, it is important to define the various terms
that we use throughout the study. In addition, when indicators are used to study a
construct that is not observable (also called a latent variable), the indicators are
referred to as reflective indicators or effect indicators. In other words, it can be seen
that with reflective models, causality flows from the latent construct to the indicators.
In contrast, constructs consisting of “causal” indicators or measures, together
with a disturbance term, are called formative constructs or composite variables, while
those measures or indicators determining a construct are called causal or formative
indicators. When constructing a structural model, if all of the constructs in the model
are reflective, the model is called a reflective model, but if at least one construct is
formative, the model will then be called a formative model. Moreover, for reflective
constructs, internal consistency is very important and therefore Cronbach’s alpha or

79
other reliability measures can be applied to ensure that the measures are reliable
(Bollen and Lennox, 1991). One important aspect of the differences between reflective
and formative models is the direction of arrows. For reflective constructs, η (eta) is
seen as causing the indicators, but for formative constructs, η is seen as being caused
by the indicators.
Formative model Reflective model
Figure 5.1 Formative and Reflective Models
Note: Yi and Xi = item scores/observations
η = endogenous construct or latent construct
ei = measurement error for indicator i
res (ζ) = a disturbance term
5.5.3 The Structural Equation Model
Hair et al. (2010) have stated that in structural equation models, equations are
used to explain the observed variables and latent variables. In the case of the
regression analysis, the goal is to create a model that predicts a single dependent
variable; in the structural equation model, however, the researcher tries to predict and
explain a set of endogenous constructs and also needs equations that explain
endogenous constructs (η) in addition to those explaining the observed variables.

80
Moreover, equations in structural equation models are similar to those in
regression analysis in that the equation explains the dependent variable (y) with
multiple independent variables, such as x1 and x2.
Figure 5.2 Path Diagram of a Simple Structural Theory
Note: ξ is a construct associated with measured x variables.
η represents the endogenous constructs in a model. Moreover, η can be on
both sides of the equation because endogenous constructs can be dependent
onone another.
λΧ is a path representing the factor loading between a latent construct and a
measured x variable.
λY is a path representing the factor loading between a latent construct and a
measured y variable.
δ is the error term associated with an estimated, measured x variables.
ε is the error term associated with an estimated, measured y variables.
γ1 is a path representing a causal relationship (regression coefficient) from a ξ
to an η.
β is a path representing a causal relationship (regression coefficient) from one
η construct to another η construct.

81
Figure 5.3 Path Diagram of a Complex Structural Model
The structural equation can be expressed as
η = β η + Гξ + ζ
β represents the parameter efficient linking endogenous constructs with other
endogenous constructs.
Г represents the corresponding matrix of parameter coefficient linking the
exogenous constructs (η) with the endogenous constructs (η).
ζ represents the error in the prediction of η.
Hayduk, Cummings, Boadu, Pazdeka-Robinson, and Boulianne (2007) concluded
that structural equation models show specific theory-based causal connections
between the latent and related observed or measured variables. The estimations of
parameters of the models indicated an indicator variance/covariance matrix, which is
possible to data variance/covariance matrix. Moreover, the similarity (or dissimilarity)
of these variance/covariance matrices is shown as the likelihood of observing the data
covariance matrix in the case that the model, having causal estimates, comprised the
population from which the data were collected. Therefore, the model showed that the
covariance matrix could be the population covariance matrix if the model fit well with
the data.

82
5.5.4 Exploratory and Confirmatory Factor Analysis
According to Hair et al. (2010), Confirmatory Factor Analysis or CFA is
similar to Explanatory Factor Analysis or EFA in some respects, but philosophically it
is quite different. Since this study focuses on the use of confirmatory factor analysis,
it is necessary to identify clearly the difference between exploratory and confirmatory
factor analyses. Hair et al. (2010) have stated that exploratory factor analysis is used
to explore data and offers the information about how many factors are necessary to
best represent the data. In addition, all measured or observable variables are related to
every factor according to the value of a factor loading estimate. The main
characteristic of exploratory factor analysis is that all factors are derived only from
statistical results, not from any theory, and then these factors can be named after the
factor analysis is performed. In other words, exploratory factor analysis can be
analyzed without knowing how many factors really exist in the study or which
variables belong to which constructs. For confirmatory factor analysis, researchers
have to identify the number of factors existing within a set of variables and which
factor each measured variable will load highly on before the final estimated results
will be done. Therefore, structural equation modeling provides a pattern for factor
loadings that represent actual data, not the assignment of the variables to factors.
Barrett (2007) has indicated that confirmatory factor analysis (CFA) is
different from exploratory factor analysis (EFA), whose latent variables are constructed
mechanically or blindly from data only by the process of eigenvalue decomposition.
In contrast, CFA focuses on the idea that theory or prior knowledge is the foundation
used to create latent variables. Anderson and Gerbing (1991) implied that one of the
important characteristics of confirmatory factor analysis with structural equation
modeling is used to facilitate theory testing.
5.5.5 Three Strategies in Structural Equation Modeling (SEM)
Hair et al. (2010) have stated that there are three different strategies in SEM
application: confirmatory modeling strategy, competing models strategy, and model
development strategy.
1) Confirmatory modeling strategy is the most direct application of
SEM, where a researcher can create a single model or a set of relationships and apply

83
SEM to evaluating how well the model fits the data collected. When the proposed
model achieves an acceptable fit using fit indices, the researcher can only confirm that
the model is one of the acceptable models to explain the phenomena.
2) The competing models strategy focuses on comparing the estimated
model or the proposed model or also called the alternative models. This strategy
identifies competing models which represent different theoretical structural relationships.
With this strategy, researchers approach the testing of competing theories instead of
only modifying some aspects of a single theory.
3) Model development strategy aims at improving the model by
modifying the structural or measurement models. However, SEM is a theory-based
approach, and theory should be applied as a basis of model respecification in order to
justify the changes that have occurred in the models instead of researchers simply
empirically trying to fit the data with the models.
In this study, the author uses the confirmatory model strategy by developing
alternative structural models, then test the models in order to understand and confirm
the relationship of constructs. In addition, the model development strategy as applied
by adding and/or changing constructs to test their relationship as well.
5.5.6 Model Fit Indices
In structural equation modeling, the validity of the measurement model relies
on the goodness of the fit of the measurement model and the sufficient evidence of
construct validity. This goodness of fit shows how well the proposed or specified
model can reproduce the covariance matrix among the indicator items.
There are several fit indices for model assessment. According to Hair et al.
(2010), Hu and Bentler (1999), MacCallum and Austin (2002), main fit indices are
used for model assessment, including the ratio of chi-square and degree of freedom
(χ2/ df), Comparative Fit Index (CFI), Normed Fit Index (NFI), Non-Normed Fit
Index (NNFI), and Root Mean Square Error of Approximation (RMSEA).
Barrett (2007) has stated that the chi-square exact fit test is a substantive test
of fit for structural equation modeling. The problem with chi-square is that it is
sensitive to discrepancies when sample size increases, meaning that if a researcher has
a large size sample (n>200), the chi-square test tends to indicate that the proposed

84
model does not fit the empirical data. Basically, for a certain model, model fit is about
testing whether the discrepancies or residuals are higher than those that might occur
by chance. The aim for the chi-square test in model fit is not to reject the null
hypothesis. In this case, if the discrepancy between the model implied covariances
and the observed sample covariances is higher than the expected distribution value by
a probability, which is normally at 0.05, then the model is considered "not-fitting."
According to Hair (2010), when sample size is greater than 250, the goodness
of fits indices in accordance with the number of observed variables is as the
following:
1) number of observed variables < 12, insignificant p-value, CFI or TLI =
.95 or better, RMSEA <.07 with CFI of .97 or higher
2) number of observed variables greater than 12 and less than 30,
significant p-values expected, CFI or TLI > .92 , RMSEA <.07 with CFI of .92 or
higher
3) number of observed variables equal or greater than 30, significant p-
values expected, CFI or TLI > .90, RMSEA <.07 with CFI of .90 or higher
As sample size seems to indicate problems for chi-square in measuring model
fit, fit indices have been developed by many scholars in order to provide systematic
methods of determining whether the models fit the data. As a result, several fit indices
are used widely, including CFI, NFI, NNFI and RMSEA, which are normally used to
indicate model fit. In addition, these indices are used in this study to measure whether
the proposed models fit the collected data or not.
Hair et al. (2010) has provided guidelines for establishing acceptable fit indices
since there are many different types of fit indices. Hair et al. (2010) recommended that
using three to four fit indices adequately shows evidence of model fit. It is unnecessary to
report all of the fit indices because they are simply redundant.
However, the researcher should report at least one incremental index, one
absolute index. In conclusion, Hair et al. (2006) and Katsikea, Theodosiou, Morgan,
and Papavassiliou (2005) have suggested that in general a model provides the fit
indices of χ2 value and degrees of freedom, and CFI and RMSEA can provide
appropriate unique information to assess model fit.
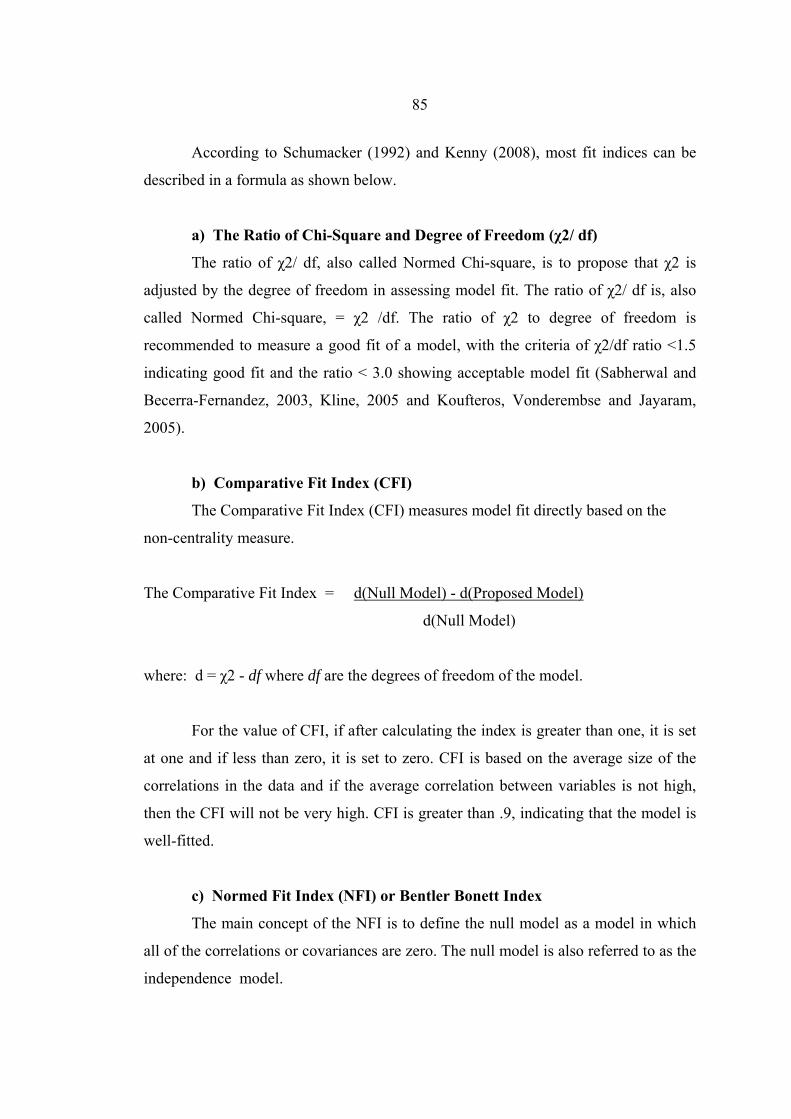
85
According to Schumacker (1992) and Kenny (2008), most fit indices can be
described in a formula as shown below.
a) The Ratio of Chi-Square and Degree of Freedom (χ2/ df)
The ratio of χ2/ df, also called Normed Chi-square, is to propose that χ2 is
adjusted by the degree of freedom in assessing model fit. The ratio of χ2/ df is, also
called Normed Chi-square, = χ2 /df. The ratio of χ2 to degree of freedom is
recommended to measure a good fit of a model, with the criteria of χ2/df ratio <1.5
indicating good fit and the ratio < 3.0 showing acceptable model fit (Sabherwal and
Becerra-Fernandez, 2003, Kline, 2005 and Koufteros, Vonderembse and Jayaram,
2005).
b) Comparative Fit Index (CFI)
The Comparative Fit Index (CFI) measures model fit directly based on the
non-centrality measure.
The Comparative Fit Index = d(Null Model) - d(Proposed Model)
d(Null Model)
where: d = χ2 - df where df are the degrees of freedom of the model.
For the value of CFI, if after calculating the index is greater than one, it is set
at one and if less than zero, it is set to zero. CFI is based on the average size of the
correlations in the data and if the average correlation between variables is not high,
then the CFI will not be very high. CFI is greater than .9, indicating that the model is
well-fitted.
c) Normed Fit Index (NFI) or Bentler Bonett Index
The main concept of the NFI is to define the null model as a model in which
all of the correlations or covariances are zero. The null model is also referred to as the
independence model.

86
NFI = χ2(Null Model) - χ2(Proposed Model)
χ2(Null Model)
An NFI of .90 to .95 is acceptable, and above .95 is good.
d) Tucker Lewis Index (TLI) or Non-Normed Fit Index (NNFI)
One of the limitations of the NFI is that there is no penalty for adding
parameters. NNFI adds χ2/df (the ratio of chi square to its degrees of freedom) and
therefore, the NNFI formula is
NNFI = χ2/df(Null Model) - χ2/df(Proposed Model)
χ2/df(Null Model) - 1
When NNFI is larger than one, it is set at one. NNFI of .90 to .95 is
acceptable, and above .95 is good.
e) Root Mean Square Error of Approximation (RMSEA)
The formula of the RMSEA is
RMSEA= [(χ 2/df - 1) /(N - 1)]
Where N is the sample size and d.f. is the degrees of freedom of the model. (If χ2 is
less than d.f., then the RMSEA is set to zero.) The RMSEA is less than .08, indicating
acceptable model fit.
According to MacCallum and Austin (2002), RMSEA (Root Mean Square
Error of Approximation) is strongly recommended for use as one of the fit indices for
structural equation modeling for the following reasons:
1) RMSEA appears to be appropriately sensitive to model
misspecification.
2) RMSEA is a commonly used interpretative guideline providing
appropriate conclusions about model quality.
3) RMSEA is helpful for building confidence intervals around the
RMSEA values.

87
Therefore, the author of this study reports five fit indices, as follows: χ2 value
and degrees of freedom, CFI, RMSEA, NFI and NNFI in order to indicate the model
fit and in this way the author can analyze other aspects of the model after identifying
the model fit.
Table 5.3 Measures of the Structural Model Fit
Items Criteria
χ2/ df <3
Comparative Fit Index (CFI) >0.90
Normed Fit Index (NFI) >0.90
Non-Normed Fit Index (NNFI) or TLI >0.90
Root Mean Square Error of Approximation (RMSEA) <0.08
Source: Hair et al., 2010; Hu and Bentler, 1999.
5.6 Measurement of Reliability and Validity
In this part of the current study, the author will discuss the reliability and
validity of the research.
5.6.1 Reliability
According to Hair et al. (2010), and Katsikea et al. (2005), reliability means
the degree to which measures are free from error and therefore yield consistent
results. Hair et al. (2010) have also suggested that Cronbach’s alpha can be used as a
measurement. To be reliable, the Cronbach’s alpha should exceed the threshold of .70,
although a .60 level can be used in exploratory research.
5.6.2 Pretesting
In order to test the reliability of the questionnaires, the pretest was conducted
for 30 samples to test the reliability and these data were used only for the pretesting
and were not included in the study or as part of the data analysis.
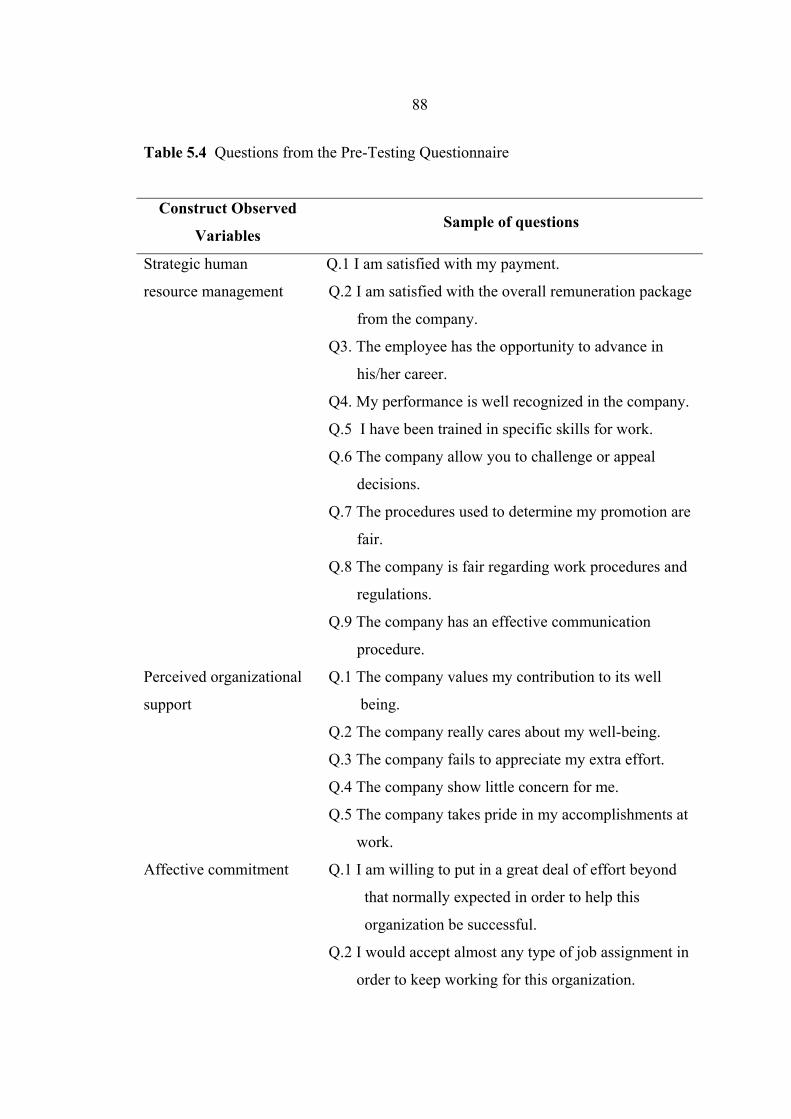
88
Table 5.4 Questions from the Pre-Testing Questionnaire
Construct Observed
Variables Sample of questions
Strategic human
resource management
Q.1 I am satisfied with my payment.
Q.2 I am satisfied with the overall remuneration package
from the company.
Q3. The employee has the opportunity to advance in
his/her career.
Q4. My performance is well recognized in the company.
Q.5 I have been trained in specific skills for work.
Q.6 The company allow you to challenge or appeal
decisions.
Q.7 The procedures used to determine my promotion are
fair.
Q.8 The company is fair regarding work procedures and
regulations.
Q.9 The company has an effective communication
procedure.
Perceived organizational
support
Q.1 The company values my contribution to its well
being.
Q.2 The company really cares about my well-being.
Q.3 The company fails to appreciate my extra effort.
Q.4 The company show little concern for me.
Q.5 The company takes pride in my accomplishments at
work.
Affective commitment
Q.1 I am willing to put in a great deal of effort beyond
that normally expected in order to help this
organization be successful.
Q.2 I would accept almost any type of job assignment in
order to keep working for this organization.

89
Table 5.4 (Continued)
Construct Observed
Variables Sample of questions
Q.3 I am proud to tell others that I am part of this
organization.
Q.4 I really care about the fate of this organization.
Felt obligation
Q.1 I feel a personal obligation to do whatever I can to
help my company achieve its goal.
Q.2 I owe it to my company to give 100% of my energy
to my company’s goals while I am at work.
Q.3 I have an obligation to my company to ensure that I
produce high quality work.
Employee attitude and
behavior
Q.1 I am satisfied with my current work.
Q.2 My job is well supported with a good working
environment.
Q.3 My performance meets company expectations.
Q.4 My team performs the job the way I like to see it
perform.
Q.5 I am one of the company’s most valuable employees.
Q.6 I spend most of my time with the company.
Q.7 My major target in life is concerning work.
Q.8 I have concerns other than work.
Q.9 If I can avoid doing work, I will do so.
Q.10 If I have my way I will be working for my current
company in …..
1. three months
2. 12 months from now.

90
Table 5.5 The Reliability Analysis of the Questionnaire from Pre-Testing
Construct’s Cronbach’s alpha
Construct Cronbach’s Coefficient Estimate
Strategic human resource management
.926
Perceived organizational support .901 Affective commitment .718 Felt obligation .838 Employee attitude and behavior .727
Note: The Pre-Testing was Conducted and Excluded from the Study
From the reliability analysis of the pre-testing, the construct of strategic human
resource management, perceived organizational support, affective commitment, and
employee work outcome, strategic human resource management has a Cronbach’s
alpha of .926 (5 items). Second, perceived organizational support with three items had
a Cronbach’s alpha of .901, affective commitment with three items had a Cronbach’s
alpha of .718, and employee work outcome with three items had a Cronbach’s alpha
of .927. However, all constructs provided high reliability with a Cronbach’s alpha
greater than .70. The construct with the lowest Cronbach’s alpha was .727.
5.6.3 Measurement Validity
Validity means the ability of the scale or measuring instrument to measure
what it is intended to measure (Hair et al., 2010). In structure equation modeling, the
construct validity will be measured prior to further study and analysis. According to
Neuman, W.L. (1997), construct validity is for measures with multiple indicators. It
addresses the question: If the measure is valid, do the various indicators operate in a
consistent manner? It requires a definition with clearly specified conceptual boundaries.
In addition, with reliability established, two major types of validity will be assessed:
1) Convergent validity – scale correlates with other like scales
2) Discriminant validity – scale is sufficiently different from other
related scales

91
According to Neuman, W.L.(1997), convergent validity is the kind of validity
when multiple indicators converge or are associated with one another. It means that
multiple measures of the same construct hang together or operate in similar ways.
Hair et al. (2010) have stated that construct validity is the ability of a measure to
confirm a network of related hypotheses generated from a theory based on the
concepts. It also implies that the empirical evidence generated by a measure is
consistent with the theoretical logic about the concepts. Convergent validity is the
extent to which the scale correlates positively with other measures of the same
construct. Furthermore, convergent validity is assessed by using the t-statistics for the
path coefficients for the latent construct to the corresponding items of the observed
data (Anderson and Gerbing, 1988; Sabherwal and Becerra-Fernandez, 2003). In
addition, Sin, Tse and Yim (2005) have stated that convergent validity represents the
degree of agreement in at least two measures or observed variables of the same
construct. Forrel and Larcker (1981) have suggested that convergent validity is
established when the variance extracted value is higher than .5 for one factor.
According to Neuman, W.L. (1997), discriminant validity, also called
divergent validity, is the opposite of convergent validity. It means that the indicators
of one construct hang together or converge, but also diverge or are negatively
associated with opposing constructs. It is simply to say that if two constructs A and B
are very different, then measures of A and B should not be associated. Hair (2010)
stated that discriminant validity means the ability of some measures to have a low
correlation with measures of dissimilar concepts. Discriminant validity is the extent to
which a measure does not correlate with other constructs from which it is supposed to
differ. For Discriminant validity, Forrel and Larcker (1981) and, Sin, Tse and Yim
(2005) have indicated that discriminant validity showed the degree to which measures
of conceptually distinct construct are different from one another. The pairwise
correlations between constructs or factors received from the factor-correlated model
were compared with the variance extracted estimates for the dimensions constituting
each possible pair. To prove the existence of discriminant validity, variance extracted
estimates must be higher than the square of the correlation between the factors
constituting each pair.

92
According to Neuman W.L. (1997), validity and reliability are usually
complementary concepts, but not always, such as the case where the construct has a
highly abstract and not easily observable definition. Highly precise questions in a
questionnaire give reliable measures, but there is a danger of losing the subjective
essence of the concept. Reliability is necessary for validity and is easier to achieve
than validity. Although reliability is necessary in order to have a valid measure of a
concept, it does not guarantee that a measure will be valid (Neuman, 1997).
Therefore, both measures have to be carried out done to complement each other as
such. In the study, the author uses both reliability and validity test to assure that the
constructs and all indicators are appropriate and good for further study and analysis to
test for model fit by fit indexes.
5.7 Operationalization
In order to describe how the author operationalized the construct or variables,
the tables below demonstrate the operationalization for each variable.
Table 5.6 Definitions and Operationalization of Variables
Variables Definitions Operationalization References
Organization
rewards
The degree to which
employees were
satisfied with their
current reward ie.
wages level
Recognition, pay and
promotion
Level of satisfaction
Henaman
and Schwab
(1985)
Training and
development
Employees’ opportunity
to be improved skills
and talent
Skill training, course
attending
Blau, G. (1988)
Procedural
justice/fairness
The ways used to
determine the distribution
of resources among
employees
Information
sharing,decision in
work
Level of agreement
Greenberg,
1990

93
Table 5.6 (Continued)
Variables Definitions Operationalization References
Workplace
partnership
Work participation
and decision making,
empowerment
Information sharing,
shared decision
making, level of
agreement
Gelattly et
al,2007
Perceived
organizational
support
A general perception
concerning the extent
to which the
organization values
their contributions
and cares about their
well-being
Valuing contribution,
Caring for well-being,
Level of agreement
Eisenberger,
Huntington,
Hutchinson, &
Sowa, 1986
Affective
commitment
Employees’ emotional
bond to the
organization. The sense
of belonging and
identification that
increases involvement
in the organization’s
activities.
Sense of belonging to
organization, attachment
to organization,
identification with
organization, involvement,
Level of agreement
Eisenberger et
al., 2001
Felt Obligation An employee’s belief
regarding whether he or
she should care about
the organization’s well-
being and should help
the organization obtain
its goals
Goal participation,
Level of agreement
Eisenberger et
al., 2001
performance The result of the
pattern of actions
Level of agreement Bailey(1982)

94
Table 5.6 (Continued)
Variables Definitions Operationalization References
carried out to satisfy
an objective
according to some
standard
Job satisfaction Identification,
involvement and
satisfaction
Job satisfaction,
Level of satisfaction
Mowday,2002
Job involvement Identification with
and interest in the
specific work one
performs
Involvement
activities,
Level of agreement
Cropanzana et
al., 1977
Withdrawal
behavior
Tardiness, absenteeism
and voluntary
withdrawal behavior
Level of agreement Tuma and
Grimes (1981),
Wayne et
al.(1997)
The simplified research process is shown in the following.
Figure 5.4 Simplified Research Process

95
It is important for each researcher to adjust the research process to fit the
objectives and methodology of the study. Therefore, to conclude the research
methodology, the research process of this study is shown below.
1) Conceptual framework
2) Development of construct
3) Data collection
4) Reliability analysis
5) CFA model developed and assessment (Model 1 and 2)
6) Validity test : convergent validity and discriminant validity
7) Measurement model tested with fit indexes
8) Data meet criteria for further analysis with SEM
9) Proposed structural model and assessment with fit indexes
(Model A, B, C1 and C2)
10) Research Findings
11) Conclusions and Implications
In summary, this chapter discussed the research process and indicated the
sampling methods with the appropriate sample size for structural equation modeling
(n>200). The results of the pretesting showed that the questions in the questionnaires
provided a Cronbach’s alpha greater than .70, representing high reliability of the
construct. Moreover, the author discussed the convergent and discriminant validity to
be tested in order to ensure that the data were suitable for further analyses with
structural equation modeling. Additionally, the fit indices, such as CFI, NFI, and
RMSEA, were identified and the criteria for the use of each fit index were elaborated.

CHAPTER 6
DATA ANALYSIS AND FINDINGS
This chapter will analyze whether data fit the measurement models. Then
structural models or causal models will be developed after the measurement models
have been proven for validity and model fit. The methodology consists of confirmatory
factor analysis (CFA) and structural equation modeling(SEM) for path analysis. The
details include the results of the reliability analysis, convergent validity, and
discriminant validity for testing whether the constructs are appropriate for further
analysis. Then, the author develops models with four main constructs, including
strategic human resource management, perceived organizational support, affective
commitment and employee attitude, and behavior and outcome.
In this process, two CFA or measurement models were developed in a step-by
step process, showing how each model had met the criteria of model fit. Then, four
structural models were developed and identified to help test the research hypotheses.
In the last part, the author shows how the results can adequately explain and support
the research hypothesis proposed in the previous chapter.
6.1 Results of Descriptive Statistics
In this chapter, the results of the data analysis are elaborated in detail.
Discriminant and convergent validity are analyzed to measure the validity of the
construct. The data analysis through structural equation modeling (SEM) using
SPSS17/Amos18 is also described. In addition, the proposed model is tested by fit
indices to determine whether the proposed models and data fit together well. Last, an
alternative model is also discussed.

97
Table 6.1 Descriptive Statistics of Observed Variables
From the descriptive results, it can be seen that there are many constructs:
namely, human resource management, organization rewards, training and development,
procedural justice, felt obligation, job satisfaction, performance, job involvement,
withdrawal behavior, perceived organizational support, affective commitment and
employee work outcome, and attitude and behavior. From the observed variables, the
scale was from 1 to 7. The mean of all data was in the range of 3.24 to 4.82. The
average mean of the strategic human resource management construct (4 items) was
3.865. The average mean of the “organization rewards” construct was 3.29. The
average mean of training and development was 4.39. The average mean of procedural
justice was 3.24. The average mean of work participation was 4.54. The average mean of
perceived organizational support (2 items) was 3.448. The average mean of affective
Construct Observed variables Min Max Mean S.D.
Organization rewards 1 7 3.29 1.898
Training and development 1 7 4.39 1.819
Procedural justice 1 7 3.24 1.953
strategic human
resource management
(SHRM)
Work participation 1 7 4.54 1.601
Well-being 1 7 3.52 1.830 perceived
organizational support
(POS) Contribution value 1 7 3.44 1.766
felt obligation (FO) Obligation 1 7 5.00 1.593
Contribution 1 7 5.07 1.538
Work commitment 1 7 4.37 2.044
Ownership 1 7 4.50 1.898
affective commitment
(AC)
Partnership 1 7 4.82 1.919
Job satisfaction 1 7 3.28 2.232
Performance 1 7 4.14 1.858
Job involvement 1 7 4.70 1.693
employee behavior
and outcome
(BHV)
Withdrawal behavior 1 7 3.89 1.982

98
commitment (3 items) was 4.563. The average mean of the employee behavior
construct (4 items) was 4.00. The average mean of job satisfaction was 3.28. The
average mean of performance was 4.14. The average mean of job involvement was
4.70. The average mean of turnover was 3.89.
The questions with the highest mean (4.70) of job satisfaction was “I am
satisfied with my salary.” The question with the lowest mean (3.24) of procedural
justice was “The company is fair justice regarding work procedure and regulation”
Table 6.2 Summary of the Mean of All Constructs
Construct Mean Standard Deviation
Strategic Human Resource Mangaement
organization rewards 3.29 1.898
Training and development 4.39 1.819
procedural justice 3.24 1.953
Work participation 4.54 1.601
perceived organizational support 3.47 1.798
affective commitment 4.56 1.954
Attitude & Behavior
job satisfaction 3.28 2.232
performance 4.14 1.858
job involvement 4.70 1.693
Withdrawal behavior 3.89 1.982
From all respondents (327), the highest mean score was felt obligation (5.07)
with lowest, followed by job involvement (4.70), and affective commitment (4.56).
This standard deviation (S.D.= 1.593) indicated that felt obligation was one of the
most important factors of employee attitude and behavior.
6.2 Reliability Analysis
Hair et al. (2010) have stated that reliability is one of the indicators of
convergent validity. High reliability shows that internal consistency exists, indicating

99
that measures can represent the same latent construct. The reliability estimate of .70
or higher shows good reliability. For this study, there were five main constructs with
fifteen observed variables, as shown in the table below.
Table 6.3 Constructs and Reliability Analysis (Cronbach’s alpha)
The Cronbach alpha of these constructs indicated that all constructs were
highly reliable because all constructs were higher than .7, ranging from the lowest
reliability of .735 (performance) to the highest reliable construct of .921 (procedural
justice).
6.3 Convergent Validity and Discriminant Validity
6.3.1 Convergent validity
According to Hair et al. (2010), convergent validity means the ability of some
measures to have convergent validity when they are highly correlated with different
measures of similar constructs. In other words, convergent validity is the extent to
which the scale correlates positively with other measures of the same construct. The
results shown as convergent validity were tested by evaluating the magnitude of factor
loadings of observed variables on the proposed constructs or latent variables.
Constructs Cronbach’s alpha
organization rewards .900
training and development .812
procedural justice .921
work participation .760
perceived organizational support (2 variables) .835
affective commitment (3 variables) .739
felt obligation (2 variables) .875
job satisfaction .861
performance .735
job involvement .742
withdrawal behavior .848
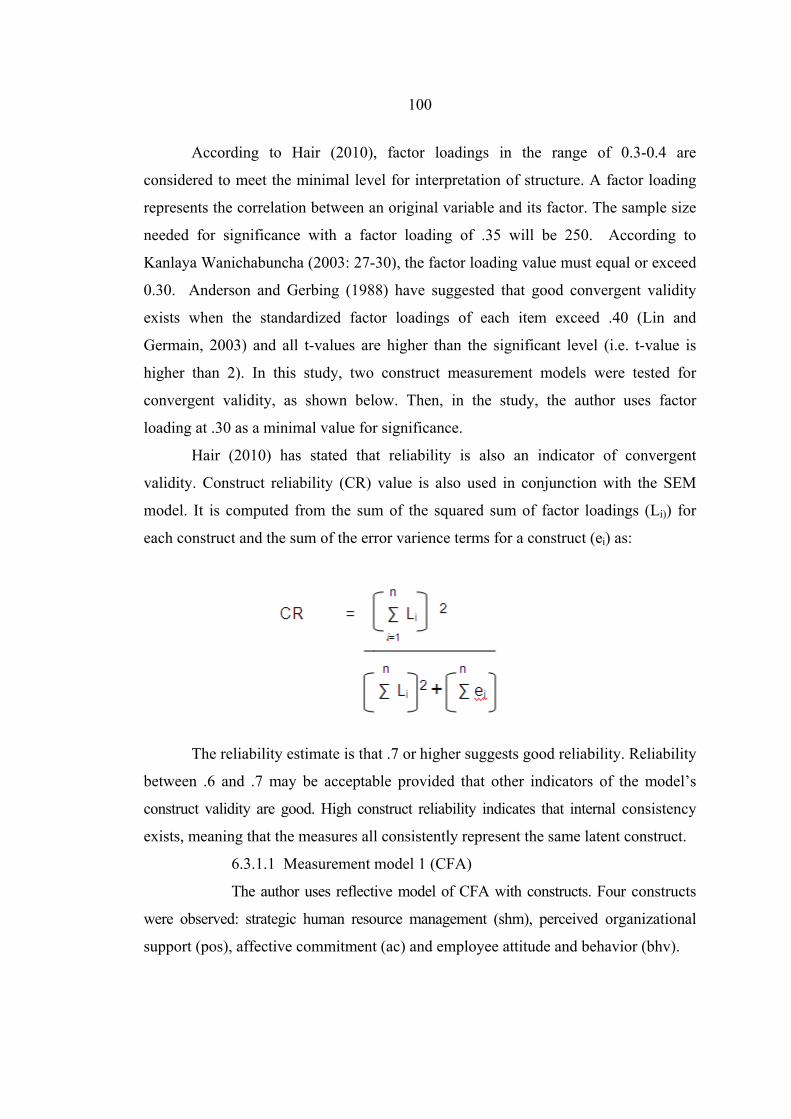
100
According to Hair (2010), factor loadings in the range of 0.3-0.4 are
considered to meet the minimal level for interpretation of structure. A factor loading
represents the correlation between an original variable and its factor. The sample size
needed for significance with a factor loading of .35 will be 250. According to
Kanlaya Wanichabuncha (2003: 27-30), the factor loading value must equal or exceed
0.30. Anderson and Gerbing (1988) have suggested that good convergent validity
exists when the standardized factor loadings of each item exceed .40 (Lin and
Germain, 2003) and all t-values are higher than the significant level (i.e. t-value is
higher than 2). In this study, two construct measurement models were tested for
convergent validity, as shown below. Then, in the study, the author uses factor
loading at .30 as a minimal value for significance.
Hair (2010) has stated that reliability is also an indicator of convergent
validity. Construct reliability (CR) value is also used in conjunction with the SEM
model. It is computed from the sum of the squared sum of factor loadings (Li)) for
each construct and the sum of the error varience terms for a construct (ei) as:
The reliability estimate is that .7 or higher suggests good reliability. Reliability
between .6 and .7 may be acceptable provided that other indicators of the model’s
construct validity are good. High construct reliability indicates that internal consistency
exists, meaning that the measures all consistently represent the same latent construct.
6.3.1.1 Measurement model 1 (CFA)
The author uses reflective model of CFA with constructs. Four constructs
were observed: strategic human resource management (shm), perceived organizational
support (pos), affective commitment (ac) and employee attitude and behavior (bhv).

101
Figure 6.1 Construct Measurement Model 1

102
Table 6.4 Construct Measurement Model 1
Measurement Model 1: First-Order Constructs
Factor Standardized loadinga
Human resource management (shm)
SHM1 .634 (6.303)
SHM2 .611 (5.866)
SHM3 .434b
SHM4 .477 (7.385)
Perceived organizational support (pos)
POS1 .823 (9.583)
POS2 .758b
Affective commitment (ac)
AC1 .730 (14.711)
AC2 .887b
AC3 .853 (17.593)
Employee attitude and behavior (bhv)
BHV1 -.762 (-5.396)
BHV2 -.633 (-5.206)
BHV3 -.522 (-4.913)
BHV4 .345b
Note: a. t-value is in the parenthesis
b.fixed parameter
Goodness-of-Fit Statistics (Model 1)
χ2 59 = 114.675, p =.000 ,
χ2/df = 1.944,
CFI=. 955 ,
NFI = .914, TLI = .931, RMSEA =.054

103
For the first model of first-order constructs, there were 13 items, measuring
four constructs. The fit criteria were as follows: χ2/degree of freedom (d.f.) = 1.944;
comparative fit index (CFI) = .955; normed fit index (NFI) = .914; TLI = .931, and
root mean square error of approximation (RMSEA) = .054. All of these indices
confirmed good model fit.
There were four first-ordered constructs tested for convergent validity, human
resource management, perceived organizational support, affective commitment and
employee’s behavior and outcome. All standardized estimates (or loadings) exceeded
.300, and all associated t-values were significant, suggesting convergent validity.
Therefore, the structural model 1 was developed as shown in the following.
Structural Model 1
6.3.1.2 Measurement Model 2
The second model was the model for testing the convergent validity of
the first-ordered constructs of perceived organizational support, felt organizational
support, and affective commitment, as shown in Figure 5.2. This model was
developed to support model 1 for validity and model fit in order to further develop
alternative structural models.

104
Table 6.5 Construct Measurement Model 2
Measurement Model 2
Factor Standardized loadinga
Perceived organizational support (pos)
POS1 0.859 (10.282)
POS2 0.517b
POS3 0.726 (8.787)
Felt obligation
FO1 0.835 (17.631)
Figure 6.2 Construct Measurement Model 2
104

105
Table 6.5 (Continued)
Factor Standardized loadinga
FO2 0.904b
FO3 0.780 (16.330)
Affective commitment
AC1 0.734 (14.605)
AC2 0.880b
AC3 0.857 (17.185)
Note: a. t-value is in the parenthesis
b.fixed parameter
Goodness-of-Fit Statistics (Model 2)
χ2 /d.f.24 = 35.745, p = .058
χ2/df = 1.489
CFI= .991, NFI = .974
TLI = .983
RMSEA =.039
For the second model of constructs, there were 9 observed variables,
measuring three constructs. The fit criteria were as follows: χ2/degree of freedom
(d.f.) = 1.489; comparative fit index (CFI) = 0.991; normed fit index (NFI) = .974;
Tucker-Lewis Index(TLI) = .983 and root mean square error of approximation
(RMSEA) = .039. All of these indices confirmed good model fit. There were three
first-ordered constructs tested for convergent validity, perceived organizational
support, felt obligation, and affective commitment. All standardized estimates (or
loadings) exceeded .300, and all associated t-values were significant, suggesting
convergent validity. According to Hair (2010), when the observed variables are less
than twelve and the sample larger than 250, insignificant p-value even with good fit is
expected; goodness-of-fit will have CFI or TLI = .95 or better and RMSEA is less

106
than .07 with CFI of .97 or higher. The measurement model 2 exhibits goodness-of-fit
indices: however, p-value of chi-square was significant.
Construct reliability was tested to support the convergent validity of measurement
model 1 as shown in the following.
Table 6.6 Construct Reliability
Construct Construct Reliability
SHM 0.72
POS 0.86
AC 0.92
BHV 0.75
The construct reliability of strategic human resource management is 0.72;
perceived organizational support was .86, affective commitment was .92, attitude and
behavior was .75. All constructs had the reliability higher than .7 indicating good
reliability and supporting convergent validity for further study.
To conclude concerning the convergent validity in this study, the tables above
show two construct measurement models for testing convergent validity, constructs
with fit indices. As depicted in the table above, each items loaded on the priori
specified factor, whereas underlying constructs were permitted to correlate (Gerbing
and Anderson, 1988). Anderson and Gerbing (1998) stated that when all the t-values
exceed the standard of 2.00, satisfactory convergent validity is indicated. The chi-
square statistic tests of both measurement models were significant as anticipated when
the sample size became large. Other fit indices, both absolute fit index and incremental fit
index, demonstrated good fit of the models.
6.3.2 Discriminant Validity
To measure that a construct is truly distinct from another constructs,
discriminant validity was used to provide evidence that a construct was unique from
the other. Discriminant validity shows that different instruments are used to measure
different constructs. In other words, discriminant validity provides a test to assure that

107
each construct is different from another. According to Anderson and Gerbing (1988)
and Jiang, Klein, and Crampton (2000), the result should exceed χ2 (1, 0.05) = 3.841
in order to conclude that two constructs have discriminant validity. In addition,
another useful measure for assessing discriminant validity between two constructs is
related to computing a confidence interval of ± 2 standard errors around the
correlation of those two constructs, and if the interval does not include 1.0, it can be
concluded that discriminant validity exists between those constructs.
Free model
Fixed model
Figure 6.3 Fixed and Free Model for Testing Discriminant Validity

108
In order to identify whether two constructs are different, the chi-square values
of the fixed model and free model were compared and a chi-square difference greater
than 3.841 (p<.05) indicates that two constructs were statistically different and that
discriminant validity existed.
Table 6.7 Pairwise Analysis of Discriminant Validity
Construct Construct χ2
fixed
χ2
free
χ2
difference
Strategic human
resource management
Perceived
organizational support
19.828 41.994 22.166
Affective commitment 53.022 24.159 28.863
Felt obligation 36.774 22.025 14.749
Attitude and behavior 251.805 61.226 190.579
Perceived organizational
support
Affective commitment 38.085 15.234 22.851
Felt obligation 36.642 10.865 25.777
Attitude and behavior 189.806 20.840 168.966
Affective commitment Felt obligation 14.162 6.201 7.961
Attitude and behavior 241.023 20.16 220.863
Felt obligation Attitude and behavior 191.851 16.905 174.946
Table 6.8 Summary of Discriminant Validity Analysis
Constructs SHM POS FO AC
SHM
POS .47a
22.166b
19.828c
FO .22
14.749
22.025
.26
25.777
10.865

109
Table 6.8 (Continued)
Constructs SHM POS FO AC
AC .45
28.863
24.159
.395
22.851
15.234
.39
7.961
6.201
BHV -.67
190.579
61.226
-.63
168.966
20.840
-.55
174.946
16.905
-.83
220.863
20.160
Note: figures show a. correlation b. Δ χ2 between fixed (ø =1.00) model and free (ø
estimated) model and c. X2 free model
According to discriminant validity analysis, all constructs indicated that they
were distinct from one another, meeting the criteria of the chi-square difference of
each pair of constructs exceeding 3.841. For these reasons, each construct was tested
and sufficient evidence was indicated to determine that each construct was distinct
from the others (Katsikea et al.).
6.4 Multicollinearity
According to Lauridsen and Mur (2006), multicollinearity is an intriguing and
common property of data, having the consequences for estimation and inference in the
respect of unreliable estimation results, high standard errors, and coefficients with
wrong signs. The problem of multicollinearity or high degree of correlation among
factors in the model of study cannot be solved easily. The effect of multicollinearity
results in the reduction of the efficiency of the coefficient estimates. In addition,
multicollinearity can refer to the inclusion of additional variables, which raise the
collinearity of independent variables (or predictors) to an unfavorable level. This
unfavorable condition is of concern in two cases. First, it is the case when the
additional variables closely correlate with one or more linear combination of the
variables existing in the equation or model. Second, it is when the additional variables

110
contribute relatively little to the prediction in spite of what is provided by the
variables already in the model of study. The normal cutoff for multicollinearity is at
VIF <10 or tolerance value > .10 (Katsikea et al., 2005; O’brien, 2007; Hair et al.,
2010). From the table below, the results showed that the data in this study had shown
no multicollinearity, as no data had a tolerance value lower than .1 or a VIF higher
than 10. The tolerance value had a range of .342 (lowest) to .899 (highest). The range
of the VIF was from 1.112 to 2.925.
Table 6.9 Collinearity Statistics
Collinearity Statistics Variables
Tolerance VIF
SHM1 .722 1.385
SHM2 .844 1.184
SHM3 .748 1.337
SHM4 .832 1.202
POS1 .550 1.819
POS2 .577 1.734
AC1 .510 1.959
AC2 .357 2.801
AC3 .381 2.625
FO1 .399 2.509
FO2 .342 2.923
FO3 .463 2.161
Note: Dependent Variable is Employee Attitude and Behavior.
Correlation among independent variables was observed as well. Correlation
exceeding .80 can be indicative of problems (Hair et al., 1998). Table 5.18 shows that
the correlation of variables was less than.80: therefore, there were no multicollinearity
problems.

111
From all of the measurements discussed above, the measurement models have
been assessed for the validity of reliability, convergent and discriminant. All measures
showed adequate evidence for reliability and validity, and the constructs, including
observed variables, had appropriate characteristics and could be used for further
analysis.

Table 6.10 Correlation Matrix
POS1 POS2 POS3 SHM1 SHM2 SHM3 SHM4 B1 B2 B3 B4 FO1 FO2 FO3 FO4
POS1 1
POS2 .625** 1
POS3 -.159** -.058 1
SHM1 .423** .406** -.117* 1
SHM2 .117* .149** -.045 .238** 1
SHM3 .285** .272** -.135* .363** .189** 1
SHM4 .191** .044 .100 .073 .137* .108 1
B1 .452** .415** -.104 .572** .208** .390** .147** 1
B2 .304** .285** .057 .364** .106 .247** .077 .441** 1
B3 .106 .101 .041 .199** .266** .047 .199** .264** .110 1
B4 -.077 -.047 .162** -.159** -.060 .015 .127* -.226** -.071 -.129* 1
FO1 .373** .279** -.068 .347** .195** .151** .098 .355** .319** .241** -.110 1
FO2 .342** .287** -.061 .362** .174** .205** .057 .392** .399** .256** -.153** .642** 1
FO3 .221** .171** .075 .283** .171** .056 .058 .301** .298** .284** -.138* .297** .275** 1
FO4 .206** .171** .014 .239** .155** .094 .097 .286** .284** .299** -.158** .301** .286** .755** 1
Note: ** Correalation is Significant at the 0.01 Level (2-tailed)
* Correalation is Significant at the 0.05 Level (2-tailed)
112

113
6.5 Model Assessment
The assessment of the model for identifying how well the observed data fit the
proposed model of the researcher is one of the main goals of the use of the
confirmatory factor analysis. Nevertheless, there is no one absolute method of
statistical significance test for assessing the goodness-of-fit of the model to the
observed data of researchers. It is crucial to use multiple criteria and to assess model
fit on the basis of several measures or criteria simultaneously.
In this study, the data were analyzed by using structural equation modeling
(SEM) and the confirmatory factor analysis (CFA) technique. The author analyzed
data with SPSS17 / AMOS18. With the research questions proposed, structural
equation modeling and confirmatory factor analysis were chosen as the most
appropriate methods because they offered the most appropriate and most efficient
estimation technique (Hair et al., 2010).
According to Hair et al. (2010), guidelines for establishing acceptable fit
suggest that at least three to four fit indices must be used to exhibit model fit; at least,
one absolute index and one incremental index. Thus, in reporting the X2 value and the
degrees of freedom, the CFI or TLI and the RMSEA will usually provide sufficient
unique information to evaluate the model. In this study, at least three fit indices were
used to measure the model, including χ2/df ratio, CFI (comparative fit index), or NFI
(normed fit index), or TLI (Tucker-Lewis Index), and RMSEA (root mean square
error of approximation). NFI, TLI and CFI are not sensitive to sample size (Bentler,
1990). According to Byrne (2006), NFI, TLI, and CFI with a value of 0.90 or higher
indicate a well-fitting model. For RMSEA, also known as the badness of fit index,
when the values are 0.05 or lower, it suggests that the model has a good fit, and values
of more than 0.05 to 0.10 indicate that the model has an average fit. In addition,
MacCallum, Browne and Sugawara (1996) have suggested that the cutpoint for
RMSEA is the range of 0.80- 0.10, indicating mediocre fit and when the RMSEA is
higher than .1, the model has poor fit. Furthermore, Jiménez-Jimenez, Valle, and
Hernandez-Espallardo (2008) also suggest that a RMSEA below 0.08 should be
considered acceptable. In this study, the author has proposed criteria to measure
model fit, as discussed in Chapter three and shown in the table below.

114
Table 6.11 Measures of the Structural Model Fit
_____________________________________________________________________
Items Criteria for good fit
X2 /df <3.0
Root Mean Square Error of Approximation (RMSEA) <0.08
and increental fit index:
Tucker-Lewis coefficient (TLI ) or Non-Normed Fit Index: NNFI
or Comparative Fit Index (CFI) >0.90
_____________________________________________________________________
6.6 Proposed Models and Test of Fit
The author used confirmatory modeling strategy to confirm the theories. There
are four models developed to test the relationships among exogenous variables, which
are strategic human resource management, employee attitude and behavior with
mediating factors namely perceived organizational support, affective commitment,
and felt obligation. The models are as follows :
1) The first proposed model (Model A) of the three factors (strategic
human resource management, perceived organizational support and attitude and
behavior). The objective was to test the antecedent and the consequence of perceived
organizational support.
2) The second proposed model (Model B) of the four factors (strategic
human resource management, perceived organizational support, felt obligation and
attitude and behavior ). Felt obligation is normative commitment; the model tested the
relations among constructs and compared them with the affective commitment as the
consequence of perceived organizational support.
3) The third proposed model (Model C1) of the five factors (strategic
human resource management, perceived organizational support, affective commitment,
felt obligation and attitude and behavior). The three constructs strategic human
resource management, perceived organizational support and felt obligation were
tested for their covariance as inputs. Further, perceived organizational support was the

115
antecedent of affective commitment. The model tested how POS and felt obligation
provided feedback for SHRM and then attitude and behavior.
4) The forth proposed model (Model C2) of the five factors (strategic
human resource management, perceived organizational support, affective
commitment, felt obligation and attitude and behavior). The model exhibited and
tested the causal relationship between SHRM and attitude and behavior, SHRM and
POS, POS and affective commitment, POS and felt obligation, POS and attitude and
behavior, and felt obligation and attitude and behavior. This model was aimed at
testing all aspects of the hypothesis from the results of the effect of all constructs on
employee attitude and behavior.
Table 6.12 Summary of Proposed Models
Model construct
Structural Model
(construct) Assessment
A 3 constructs shm,pos,bhv Minimum constructs
B 4 constructs shm,pos,fo,bhv Felt obligation construct
C1 5 constructs shm,pos,ac,fo,bhv
(covariance shm, pos, fo)
Felt obligation and
affective commitment
C2 5 constructs shm,pos,ac,fo,bhv
(causal model)
Felt obligation and
affective commitment
with casual relationship
The purpose of the proposed models was to confirm that all constructs were
related and how well data fit each model.
6.6.1 Proposed Model A
The first proposed model of the three factors (strategic human resource
management, perceived organizational support, and employee behavior and outcome)
is shown as follows:

116
Figure 6.4 Measurement Model A
Table 6.13 Construct Measurement Model A
Measurement Proposed Model A
First-Order Constructs
Factor Standardized loadinga
Human resource management (shm)
SHM1 .611(7.316)
SHM2 .430(5.787)

117
Table 6.13 (Continued)
Factor Standardized loadinga
SHM3 .639b
SHM4 .471(6.211)
Perceived organizational support (pos)
POS1 .820(9.401)
POS2 0.770b
Employee behavior and outcome
BHV1 -.806(-4.98)
BHV2 -.597(-4.779)
BHV3 -.510(-4.571)
BHV4 0.321b
Note: a. t-value is in the parenthesis
b. fixed parameter
Goodness-of-Fit Statistics (Model A)
χ2 32 = 74.935, p = .000
χ2 /df =2.342
CFI= .934,
NFI = .895
RMSEA =.064
Table 6.14 The Results of Proposed Model A
Items FIT Indices Criteria
Χ2/df 2.342 < 3
Comparative Fit Index .934 >0.90
Root Mean Square Error of
Approximation(RMSEA) .064 <0.08

118
For the first model, there were 10 observed variables, measuring three constructs.
The fit criteria are as follows: χ2/degree of freedom (d.f.) = 2.342, comparative fit
index (CFI) = .934, and root mean square error of approximation (RMSEA) = .064.
According to Hair (2010), if the number of observed variables is less than 12,
when n>250, p-value is non-significant, then the model will be a good fit. For model
A, although the fit indices were acceptable, the p-value of chi-square was significant,
so the model does not meet all criteria of fit, then three construct model might not fit
well with the data.
Figure 6.5 Structural Model A
There were four first-ordered constructs tested for convergent validity: human
resource management, perceived organizational support, affective commitment, and
employees’ behavior and outcome. All standardized estimates (or loadings) exceeded
.300, and all associated t-values were significant, suggesting convergent validity.

119
Table 6.15 The Relation of Parameters and Parameter Estimates of Proposed Model A
The Relation of Parameters Standardized Estimates
Human resource management (shm) Perceived
organizational support
.54 (5.626)
Human resource management(shm) Attitude and
behavior (bhv)
.46 (4.450)
Perceived organizational support (pos) Attitude
and behavior (bhv)
.38 (4.316)
Note: * Indicated Statistical Significance at .05 and t-values are Shown in Parentheses.
Human resource management had the highest positive influence on perceived
organizational support (path coefficient = .54). Human resource management had a
positive influence on attitude and behavior (path coefficient = .46). Perceived
organizational support had a positive influence on attitude and behavior (path
coefficient = .38).
5.6.2 Proposed Model B The second proposed model of the four factors
(strategic human resource management, perceived organizational support, felt obligation
and employee attitude and behavior) is shown as follows.

120
Figure 6.6 Proposed Model B

121
Table 6.16 Measurement Model B
Measurement Model B : First-Order Constructs
Factor Standardized loadinga
Human resource management (shm)
SHM1 .616 (7.362)
SHM2 .429 (6.786)
SHM3 .638 a
SHM4 .471 (6.210)
Perceived organizational support (pos)
POS1 .809 (9.724)
POS2 .770a
Felt obligation
FO1 .897 (9.724)
FO2 .841a
Employee behavior and outcome
BHV1 -.770 (-6.162)
BHV2 -.623 (-4.971)
BHV3 -.639 (-4.779)
BHV4 .329a
Note: a. t-value is in the Parenthesis
b. Fixed Parameter
Goodness-of-Fit Statistics (Model B)
χ2 48 = 98.783, p =.000
χ2 /d.f. =2.060
CFI=. 948, NFI = .907, TLI = .916
RMSEA =.067

122
Table 6.17 The Results of Proposed Model B
Items FIT Indices Criteria
Χ2/df 2.060 < 3
Comparative Fit Index .948 >0.90
Normed Fit Index (NFI) .907 >0.90
Non-Normed Fit Index (NNFI) .916 >0.90
Root Mean Square Error of Approximation (RMSEA) .067 <0.08
For the first model of the first-order constructs, there were 11 items,
measuring four constructs. The fit criteria are as follows: χ2/degree of freedom (d.f.) =
2.060, comparative fit index (CFI) = .948, normed fit index (NFI) = .907, Non-
Normed Fit Index (NNFI) = .916 and root mean square error of approximation
(RMSEA) = .067. All of these indices confirmed good model fit.
There were four first-ordered constructs tested for convergent validity: human
resource management, perceived organizational support, affective commitment and
employees’ behavior and outcome. All standardized estimates (or loadings) exceeded
.300, and all associated t-values were significant, suggesting convergent validity.

123
Figure 6.7 Structural Model B
Table 6.18 The Relation of Parameters Standardized Estimates of Proposed Model B
The Relation of Parameters Standardized Estimates
Human resource management (shm) Perceived
organizational support
.646 (6.467)
Human resource management (shm) Attitude
and behavior (bhv)
.439 (4.419)
Perceived organizational support Felt obligation .291 (4.117)
Felt obligation Attitude and behavior (bhv) .346 (6.468)
Perceived organizational support Attitude and
behavior (bhv)
.296 (3.361)
Note: * Indicated Statistical Significance at .05 and t-values are Shown in Parentheses.

124
This model showed a correlation between human resource management (shm)
and perceived organizational support (estimate = .646). It showed the effects of the
factors of human resource management on attitude and behavior (path coefficient =
.439). Perceived organizational support had a positive effect on felt obligation (path
coefficient = .291). Felt obligation had a positive effect on attitude and behavior (path
coefficient = .346). Perceived organizational support had a positive effect on attitude
and behavior (path coefficient = .296). From the model, the relationship between
SHRM and felt obligation was not statistically significant, therefore, the path between
them was eliminated.
6.6.3 Proposed Model C
The third proposed model of the five factors (strategic human resource
management, perceived organizational support, affective commitment, felt obligation
and employee behavior and outcome) is shown as follows.
Figure 6.8 Measurement Model C

125
Table 6.19 Construct Measurement Model C
Measurement Model C
Factor Standardized loadinga
Human resource management (shm)
SHM1 .476b
SHM2 .618 (6.264)
SHM3 .430 (6.188)
SHM4 .634 (6.298)
Perceived organizational support (pos)
POS1 .822 (9.666)
POS2 .768b
Affective commitment
AC1 .733 (14.783)
AC2 .883b
AC3 .866 (17.689)
Felt obligation
FO1 .876b
FO2 .862 (10.666)
Employee behavior and outcome
BHV1 .749 (6.643)
BHV2 .639 (6.367)
BHV3 .638 (6.081)
BHV4 -.361b
Note: a. t-value is in the Parenthesis
b. Fixed Parameter

126
Goodness-of-Fit Statistics (Model 1)
χ2 80 = 139.867, p=.000
χ2/df = 1.748, CFI=. 962
NFI = .918, TLI = .943, RMSEA =.048
Table 6.20 The Results of Measurement Model C
Items FIT Indices Criteria
Χ2/df 1.748 < 3
Comparative Fit Index (CFI) .962 >0.90
Normed Fit Index (NFI) .918 >0.90
Non-Normed Fit Index (NNFI) .943 >0.90
Root Mean Square Error of Approximation(RMSEA) .048 <0.08
For the first model of first-order constructs, there were 16 items, measuring
four constructs. The fit criteria are as follows: χ2/degree of freedom (d.f.) = 1.748;
comparative fit index (CFI) = .962; normed fit index (NFI) = .918; Non-Normed Fit
Index (NNFI) = .943 and root mean square error of approximation (RMSEA) = .048.
All of these indices confirmed good model fit. There were four first-order constructs
tested for convergent validity: human resource management, perceived organizational
support, affective commitment and employee’s behavior and outcome. All
standardized estimates (or loadings) exceeded .300, suggesting convergent validity.
Model C indicated adequate fit indices, showing that the data fit well with the
proposed model.
Table 6.21 The Relation of Parameters and Parameter Estimates of Proposed Model C
The Relation of Parameters Standardized Estimates*
Human resource management (shm)
Affective commitment (ac) .326 (3.269)

127
Table 6.21 (Continued)
The Relation of Parameters Standardized Estimates*
Felt obligation (fo)
Affective commitment (ac) .264 (4.310)
Perceived organizational support
Affective commitment (ac) .190 (2.127)
Affective commitment (ac)
Attitude and behavior (bhv) .266 (3.376)
Human resource management (shm)
Attitude and behavior (bhv) .613 (6.294)
Felt obligation (fo)
Attitude and behavior (bhv) .308 (4.603)
Human resource management Perceived
organizational support .693 (6.924)
Human resource management Felt
obligation .228 (2.868)
Perceived organizational support (POS)
Felt obligation .291 (4.006)
Note: * Indicated Statistical Significance at .06
t-value is in Parentheses
The results show that human resource management had the highest
statistically significant influence on attitude and behavior (path coefficient = .613),
followed by a significant influence on affective commitment (path coefficient =
.326). Felt obligation had a statically significant influence on attitude and behavior
(path coefficient = .308) and affective commitment (path coefficient = .264) and
perceived organizational support had a statistically significant influence on affective
commitment (path coefficient = .190).

128
6.7 Testing of Research Hypotheses
From measurement Model C, indicating good fit, the author formulated a
structural model (hypothesize model) to test the hypothesis one.
The structural model had two models: model C1 and model C2. Model C1:
POS was antecedent to affective commitment and had no direct relationship with
employee attitude and behavior. Model C1 was a non-recursive model. Model C2:
POS had a direct effect on employee attitude and behavior. POS mediated between
SHRM and attitude and behavior. Affective commitment mediated between POS and
attitude and behavior. FO mediated between POS and attitude and behavior. FO
mediated between POS and affective commitment. Model C1 was a recursive model.
6.7.1 Structural Model C1
Figure 6.9 Structural Model C1

129
Table 6.22 Fit Indices Model C1
Items FIT Indices Criteria
Χ2/df 1.830 < 3
Comparative Fit Index (CFI) .967 >0.90
Normed Fit Index (NFI) .913 >0.90
Non-Normed Fit Index (NNFI) .937 >0.90
Root Mean Square Error of Approximation(RMSEA) .06 <0.08
For the first model of first-order constructs, there were 16 items, measuring
four constructs. The fit criteria are as follows: χ2/degree of freedom (d.f.) = 1.830,
comparative fit index (CFI) = .967; normed fit index (NFI) = .913, Non-Normed Fit
Index (NNFI) = .937 and root mean square error of approximation (RMSEA) = .060.
All of these indices confirmed good model fit.
Table 6.23 Standardized Total Effects
Table 6.24 Standardized Direct Effects
FO SHRM POS AC BHV
AC .264 .326 .190 0 0
BHV .378 .600 .061 .266 0
FO SHRM POS AC BHV
AC .264 .326 .190 0 0
BHV .308 .613 0 .266 0

130
Table 6.25 Standardized Indirect Effects
Table 6.26 Path Coefficient – Regression Weights
Estimate S.E. C.R. P
AC < ----------- SHRM .484 .148 3.269 .001
AC < ----------- FO .336 .078 4.310 ******
AC < ----------- POS .212 .100 2.127 .033
BHV < --------- AC .261 .077 3.371 ******
BHV < --------- FO .748 .141 6.294 ******
BHV < ------- SHRM .383 .087 4.603 ******
Note: SHRM = Strategic human resource management
POS = Perceived organizational support
AC= Affective commitment
FO= Felt obligation
BHV = Attitude & behavior
**** p <.000
Table 6.27 Parameter Relationships and Standardized Regression Weights
Estimate
POS < -----------> SHRM .693
FO < -----------> SHRM .228
POS < -----------> FO .291
AC < ----------- SHRM .326
AC < ----------- FO .264
FO SHRM POS AC BHV
AC 0 0 0 0 0
BHV .070 .086 .061 0 0

131
Table 6.27 (Continued)
Estimate
AC < ----------- POS .190
BHV < ----------- AC .266
BHV < ----------- FO .308
BHV < ----------- SHRM .613
6.7.2 Structural model C2
Model C supported the relationship between strategic human resource
management and perceived organizational support and felt obligation as shown by
parameter estimates but do not test the causal effect. In addition to structural model
C, structural model C2 was proposed as a causal model while model C1 exhibited a
correlation among strategic human resource management, perceived organizational
support and felt obligation, and model C was modified to be C1 to test the causal
relationships among POS and affective commitment, POS and attitude and behavior,
felt obligation, and attitude and behavior. POS and affective commitment mediated
between SHRM and attitude and behavior while felt obligation mediated between
POS and affective commitment, further it mediates POS and attitude and behavior as
well. The following structural model (C2) was tested to support the hypothesis one, as
demonstrated below.

132
Figure 6.10 Structural Model C2
Table 6.28 Fit Indices Model C2
Items FIT Indices Criteria
Χ2/df 1.740 < 3
Comparative Fit Index (CFI) .962 >0.90
Normed Fit Index (NFI) .917 >0.90
Non-Normed Fit Index (NNFI) .944 >0.90
Root Mean Square Error of Approximation (RMSEA) .048 <0.08

133
For the first model of first-order constructs, there were 16 items, measuring
four constructs. The fit criteria are as follows: χ2/degree of freedom (d.f.) = 1.740,
comparative fit index (CFI) = .962; normed fit index (NFI) = .917, Non-Normed Fit
Index (NNFI) = .944, and root mean square error of approximation (RMSEA) = .048.
All of these indices confirmed good model fit.
Table 6.29 Standardized Total Effects
Table 6.30 Standardized Direct Effects
Table 6.31 Standardized Indirect Effects
SHRM POS FO AC BHV
POS 0.643 0 0 0 0
FO 0.169 0.293 0 0 0
AC 0.477 0.286 0.272 0 0
BHV 0.661 0.397 0.364 0.242 0
SHRM POS FO AC BHV
POS 0.643 0 0 0 0
FO 0 0.293 0 0 0
AC 0.322 0.206 0.272 0 0
BHV 0.367 0.243 0.288 0.242 0
SHRM POS FO AC BHV
POS 0 0 0 0 0
FO 0.169 0 0 0 0
AC 0.166 0.08 0 0 0
BHV 0.293 0.163 0.066 0 0

134
Table 6.32 Path Coefficient – Regression Weights
Estimate S.E. C.R. P
POS < ----------- SHRM 0.928 0.182 6.109 ***
FO < ------------- POS 0.306 0.072 4.229 ***
AC < ----------- SHRM 0.686 0.204 3.367 ***
AC < ----------- POS 0.266 0.106 2.438 0.016
AC < ----------- FO 0.326 0.073 4.448 ***
BHV < ----------- AC 0.241 0.076 3.216 0.001
BHV < ----------- POS 0.302 0.106 2.878 0.004
BHV < ----------- FO 0.343 0.078 4.409 ***
BHV < ---------- SHRM 0.769 0.219 3.466 ***
Note: *** = p<.000
Table 6.33 Standardized Regression Weights
Estimate
POS < ----------- SHRM 0.643
FO < ----------- POS 0.293
AC < ----------- SHRM 0.322
AC < ----------- POS 0.206
AC < ----------- FO 0.272
BHV < ----------- AC 0.242
BHV < ----------- POS 0.243
BHV < ----------- FO 0.288
BHV < ----------- SHRM 0.367
The hypothesis is concluded as the following.

135
Table 6.34 Conclusion of Hypothesis
Hypothesis Test statistic Decision
H1: There is a significant direct and
positive relationship between
strategic human resource
management(SHRM) and affective
commitment (AC)
a significant path
coefficient = .322 (p<.06)
Accepted
H2: There is a significant direct and
positive relationship between felt
obligation (FO) and affective
commitment (AC).
a significant path
coefficient = .272 (p<.06)
Accepted
H3: There is a significant direct and
positive relationship between
perceived organizational support
(POS) and affective commitment
(AC).
a significant path
coefficient = .206 (p<.06)
Accepted
H4: There is a significant direct and
positive relationship between
affective commitment (AC) and
employee attitude and behavior
(ATT & BHV).
a significant path
coefficient = .242 (p<.06)
Accepted
H5: There is a significantly direct and
positive relationship between felt
obligation (FO) and employee
attitude and behavior (BHV).
a significant path
coefficient = .288 (p<.06)
Accepted
H6: There is a significant direct and
positive relationship between
strategic human resource
management (SHRM) and employee
attitude and behavior (BHV).
a significant path
coefficient = .367 (p<.06)
Accepted

136
Table 6.34 (Continued)
Hypothesis Test statistic Decision
H7: There is a significant indirect,
positive relationship between
strategic human resource
management (SHRM) and attitude
and behavior (BHV) as mediated by
perceived organizational support
(POS), affective commitment (AC)
and felt obligation (FO).
a significant path
coefficient = .661 (p<.06)
and indirect effect =.293
Accepted
H8: There is a significant indirect,
positive relationship between
strategic human resource
management (SHRM) and felt
obligation as mediated by perceived
organizational support (POS).
a significant path
coefficient = .169 (p<.06)
and indirect effect = .169
Accepted
H9: There is a significant indirect,
positive relationship between
perceived organizational
support(POS) and affective
commitment (AC) as mediated by
felt obligation (FO)
a significant path
coefficient = .286 (p<.06)
and indirect effect = .08
Accepted
H10: There is a significantly indirect,
positive relationship between
strategic human resource
management (SHRM) and affective
commitment (AC ) as mediated by
perceived organizational support
(POS).
a significant path
coefficient = .477 (p<.06)
and indirect effect = .166
Accepted

137
Table 6.34 (Continued)
Hypothesis Test statistic Decision
H11: There is a significant indirect,
positive relationship between
perceived organizational support
(POS) and attitude and behavior
(BHV) as mediated by felt
obligation (FO) and affective
commitment (AC).
a significant path
coefficient = .397 (p<.06)
and indirect effect = .163
Accepted
H12: There is a significant indirect,
positive relationship between felt
obligation (FO) and attitude and
behavior as mediated by affective
commitment (AC).
a significant path
coefficient = .364 (p<.06)
and indirect effect = .066
Accepted
6.7.3 Comparison of structural model
According to Hair (2010), modeling strategy compares the proposed model
with a number of alternative models in an attempt to demonstrate that no better-fitting
model exists. SEM demonstrates a model with acceptable fit, but acceptable fit alone
does not guarantee that another model will not fit better or equally well. Consequently,
alternative models were compared for model fit as shown below.
Table 6.35 Comparison of Alternative Models and Test of Fit
Model Construct
Structural
Model Χ2/df CFI NFI TLI RMSEA
1 4 constructs shm,pos,ac,bhv 1.944 0.966 0.914 0.931 0.064
A 3 constructs shm,pos,bhv 2.342 0.934 0.896 0.877 0.064 B 4 constructs shm,pos,fo,bhv 2.06 0.948 0.907 0.916 0.067
C1 6 constructs shm,pos,ac,fo,bhv
(covariance shm,
1.83 0.967 0.913 0.937 0.06

138
Table 6.35 (Continued)
Model Construct
Structural
Model Χ2/df CFI NFI TLI RMSEA
C2 6 constructs shm,pos,ac,fo,bhv
(causal model) 1.74 0.962 0.917 0.944 0.048
Note: p-value of chi-square of each models was significant.
Measurement model 1 confirmed the validity of the model, and the author
developed a structural model from the measurement models: structural model 1, A, B,
C1 and C2. All structural models, model 1, A, B, C1 and C2, indicated model fit
according to the chi-square and good-fit indices except model A with the p-value of
chi-square being significant indicating a non-proper model fit. Model C2 had a better
fit index than others and supported both theories of perceived organizational support
and organization commitment. From the summary table above, the results indicated
that all research hypotheses were supported by empirical tests from the data collected
from correspondents to measure the relationships among strategic human resource
management, perceived organizational support, affective commitment, felt obligation,
and employee attitude and behavior.
Table 6.36 Effect of SHRM on Attitude & Behavior
Model construct Structural Model
(constructs)
Standardized
total effect
Standardiz
ed direct
effect
Standardized
indirect effect
1 4 constructs shm,pos,ac,bhv 0.463 0.349 0.114
A 3 constructs shm,pos,bhv 0.666 0.467 0.208
B 4 constructs shm,pos,fo,bhv 0.470 0.437 0.033
C1 6 constructs shm,pos,ac,fo,bhv
(covariance shm, pos, fo) 0.600 0.613 0.086
C2 6 constructs shm,pos,ac,fo,bhv
(causal model) 0.661 0.367 0.293

139
From table 6.36, it can be seen that Model A exhibits the highest standardized
total effect of SHRM on attitude and behavior = .666, direct effect = .467 and indirect
effect = .208. Model 1 exhibits the lowest standardized total effect of SHRM on
attitude and behavior = .463, with indirect effect = .114. It can be concluded that
strategic human resource management had an impact on employee attitude and
behavior and work outcome through perceived organizational support. According to
Model C2, the causal model shows that the standardized total effect = .661, the direct
effect = .367 and the indirect effect = .293 compared with Model A, where the
constructs had no affective commitment or felt obligation, and the SHRM from Model
C2 had a greater indirect effect than that of Model A and the others as well. This
indicated that when the constructs of perceived organizational support, affective
commitment and felt obligation were the mediators as from the causal relationship,
the indirect effect of the SHRM on attitude and behavior increased.
In conclusion, this chapter described the data characteristics and characteristics of
the respondents. A reliability analysis of the constructs in the study and Cronbach’s
alpha were provided to confirm the reliability of each construct.
Before conducting the model assessment, both discriminant and convergent
validity were tested in order to prove that the constructs met the criteria of validity. In
addition, four structural equation modeling were proposed. All four models
satisfactorily met the criteria of fit indices, including χ2/df, CFI, NFI, NNFI, and
RMSEA. Then, the results from the model testing were used to support the research
hypotheses, which are clearly supported by the findings of this empirical study.

CHAPTER 7
CONCLUSIONS
The purpose of this chapter is to conclude all of the important aspects of the
study. In addition, the author discusses the findings in relation to the objectives of the
dissertation. It is also important to identify the contributions, both in theoretical and
practical aspects. Furthermore, the author provides managerial implications on the
state-owned enterprise since this study is based on data from the THAI national
carrier, which is a state-owned organization. In this chapter, the author summarizes
the results of the study, the theoretical and practical contributions, and recommendation
and suggestions for further study.
7.1 Research Findings
The study began with the social exchange theory and perceived organizational
support by focusing on human resources, particularly management practice in the
human resources in the organization. However, many constructs were introduced in
order to measure employee attitude, behavior, and outcome. This research aims at
answering questions in relation to organizational research, mainly in terms of
understanding the factors affecting employee attitude, behavior, and outcome. Certain
findings of this study have been unexplored by previous research.
Furthermore, the study examined and identified the factors or constructs
affecting employee attitude, behavior, and outcome. The hypotheses were tested with
empirical data in order to understand how the data fit with the proposed models.
According to the findings of this study, according to the data on the respondents, all
hypotheses were supported by the empirical test one. Employee attitude, behavior,
and work outcome were influenced by strategic human resource management, with
perceived organizational support, affective commitment and felt obligation acting as

141
the mediating role. In addition, this study also included the control variables of
demographic, ie. age, gender, education.
It is important for the research to answer clearly the study’s objectives. The
first objective of this research was to investigate the influence of strategic human
resource management on employee attitude, behavior, and work outcome. The
outcome was job satisfaction, performance, job involvement and withdrawal behavior.
The results indicated that strategic human resource management had a statistically
significant positive influence on employee attitude, behavior, and work outcome, with
a path coefficient = .36, and with a total effect = 0.661. Another essential objective
was to study the mediating role of perceived organizational support, affective
commitment and felt obligation affecting employee attitude and behavior. Three
factors, including strategic human resource management, affective commitment, and
felt obligation, had a statistically significant positive relationship or influence on
employee attitude and behavior.
Also it is important to test the model of perceived organizational support,
affective commitment, and felt obligation. The model was successfully tested in that
the proposed model fit well with the data collected from the respondents.
In order to test the model, the author used the structural equation modeling
technique, where all relationships in the model were tested simultaneously. The fit
indices were the ratio of chi-square to degree of freedom, the Comparative Fit Index
(CFI), the Tucker-Lewis Index (TLI) or Normed Fit Index (NFI), and the Root Mean
Square Error of Approximation (RMSEA). To conclude this objective, all of the fit
indices indicated that the model fit well with the data. Therefore, this objective was
satisfied by the results of the study.
The study was based upon the social exchange theory of the firm, which
explaines that employees extend their effort and loyalties in return for the material
commodities and social rewards given to them by the organization (Blau, 1964).
Based on the norm of reciprocity (Gouldner, 1960), perceived organizational support
theory (POS) is theorized to indirectly impact employee attitudes and behaviors by
creating a sense of obligation within individuals that results in reciprocation
(Eisenberger et al., 1986).

142
This research showed the importance of strategic human resource management,
which is a set of practices. In this study, the practices are organizational rewards,
training and development, procedural justice and work participation which were
represented by endogenous variables. The significance of the strategic human resource
management was clearly identified in that an organization with effective human
resource management can achieve an employee’s positive attitude and behavior, for
example, in high job satisfaction, good performance, high job involvement and low
withdrawal behavior rate.
7.2 Discussion
7.2.1 The Relationship Between Strategic Human Resource Management
and Employee Attitude, Behavior, and Outcome
The study supported that strategic human resource management has a significant
impact on employee outcome, attitude and behavior, with perceived organizational
support as the mediator. The results of all structural models indicate the strong effect
of SHRM on attitude and behavior. The path coefficient from Model C2 was .36
while other models were in the range of .36 and .61. However, there are factors need
to be addressed for further analysis such as the organization’s age and employee year
of service, organization’s policy.
From model 1, A, B and C, the results show that strategic human resource
management has a direct and indirect effect on employee’s attitude and behavior and
work outcome. The indirect effect is mediated by perceived organizational support
and/or affective commitment. According to model C2 which has a better model fit
than others due to fit indices, both perceived organizational support and affective
commitment mediated strategic human resource management and attitude and
behavior. From model B, there was non-significant relationship between SHRM and
attitude and behavior.
The antecedents of perceived organizational support were human resource
practices, which in the study were organizational rewards, training and development,
procedural justice and work participation however, work participation or organization
participation showed a lower parameter estimate than the others, and for this analysis,

143
the drop-off observed variable made a better model fit. The results of the study
supported that there was a strong relationship between latent variables: strategic
human resource management, perceived organizational support, and employee attitude and
behavior. Among these observed variables of SHRM, organization rewards had a
higher construct validity to strategic human resource management than the others,
followed by procedural justice, training and development and work participation
which had a least coefficient.
The consequence of perceived organizational support was employee attitudes
and behavior. The observed variables of attitude and behaviors were job satisfaction,
performance, job involvement and withdrawal behavior. Job satisfaction had a higher
standardized estimate to attitude and behavior than the other observed variables,
followed by performance, job involvement while withdrawal behavior exhibited a
negative coefficient.
The influential factor mentioned in the previous chapter regarding the
changing environment of the organization indicated that the longer the organization
has been established, the change from time to time or its cycle, the organization would
have the strategic contingency to respond to changing environment. This nevertheless
involves strategic human resource management, for example, in pay and wages,
remuneration package, training and development from which the organization expects
effective productivity and performance in return. In consequence, employees’ work
experience in terms of perceived organizational support will change from time to time
accordingly or being matured. This is a threat to commitment, as Baruch (1998) stated
one of the major threats to employee commitment is the fact that organizations are
less able, or willing, to provide support than was the case in the past. In their efforts to
cut costs, increase flexibility, and improve efficiencies, organizations have cut jobs,
increased workloads, and made other changes that undermine the trust required to
maintain reciprocal commitment from employees; while some organizations have
made such changes a part of their corporate strategy, others have been forced to make
cuts and/or reduce commitments due to uncertainties in their environment (Cappllii,
1999). In either case, such changes threaten to reduce POS and make it difficult for
employers to foster, or even expect, affective or normative commitment from their
employees (Meyer, 2009).

144
7.2.2 The Relationship Between Perceived Organizational Support,
Affective Commitment and Felt Obligation
According to organization support theory (Eisenberger et al., 1986; Rhoades &
Eisenberger, 2002), organizations show their support for employees by meeting their
socioemotional needs and by valuing their contributions. According to Eisenberger
and Rhoades, it is through this supportive efforts that organizations demonstrate their
commitment to employees. To the extent that employees perceive this support, they
are expected to reciprocate with commitment to the organization (Wayne et al, 1996).
Affective commitment and felt obligation are the consequences of perceived
organizational support. From the study, according to model 2, it is evident that the
relationship between perceived organizational support, affective commitment, and felt
obligation is significantly strong. The results indicated that perceived organizational
support had a statistically significant positive influence on affective commitment,
with a path coefficient of 0.32, on felt obligation with a path coefficient = 0.22, while
felt obligation had a statistically significant influence on affective commitment, with a
path coefficient of 0.33. Perceived organizational support had a direct and indirect
effect on affective commitment, as shown by results of model 2 and model C2. This
was mediated by felt obligation.
7.2.3 The Relationship Between Strategic Human Resource Management
and Employee Attitude, Behavior and Outcome, with Perceived
Organizational Support, Affective Commitment, and Felt Obligation
as Mediators
From the study, it was evident that the relationship between strategic human
resource management and employee attitude, behavior, and outcome with perceived
organizational support and affective commitment as mediators, was significantly
strong. Although felt obligation was not the mediator, it provided input to SHRM for
a strong direct effect on attitude and behavior.
From hypothesized model C1, the results indicated that strategic human
resource management had a strong correlation with perceived organizational support,
with a correlation coefficient =.69, and a strong correlation with felt obligation, with a
correlation coefficient = .23. Strategic human resource management had a statistically

145
significant positive influence on affective commitment with a path coefficient of 0.33.
Perceived organizational support had a correlation with felt obligation with
correlation coefficient =.29 and had a statistically significant positive influence on
affective commitment, with a path coefficient of 0.19. Felt obligation had a statistically
significant positive influence on affective commitment, with a path coefficient of
0.26. Affective commitment had a statistically significant positive influence on
employee attitude, behavior, and outcome with a path coefficient of 0.27.
According to the results, strategic human resource management had an impact
on perceived organizational support and affective commitment, while the felt
obligation of the employee was the input due to their correlation. Both perceived
organizational support and affective commitment has a significantly positive influence on
attitude and behavior.
The implications from the study are that employees realize and perceive the
organizational support indicated by the strong correlation with human resource
strategy and attitude and behavior. In addition, both affective commitment and felt
obligation also have a strong correlation with behavior as a result of strategic human
resource practice.
7.3 Contributions of the Study
As stated in an early chapter of this research, the theoretical and practical
contributions of this work were greatly significant in enhancing the study in the areas
of the strategic human resource management, which are linked to employee attitude,
behavior and work outcome.
7.3.1 Theoretical Contribution
Basically, one of the most important aspects of the research was its contribute
to theory and to the field of study. In terms of theoretical contribution, this study has
made a strong contribution to human resource management theory, perceived
organizational support theory and organizational commitment. Fundamentally, this
dissertation was based on both social exchange theory and the resource-based view
theory.

146
This dissertation provided many contributions to the theory. It provided an
integrated framework for assessing the constructs contributing to perceived organizational
support. The author has developed models to test the relationship between all relevant
constructs. They are the sets of human resource practices as an antecedent of
perceived organizational support, and the observed variable of work participation as
suggested to be one of the elements of high performance working system was
included in the study. With a successful empirical test, the author showed that
perceived organizational support theory can support the study of strategic human
resource management. The application of perceived organizational support can lead to
understanding the outcomes of employees in terms of their attitude and behavior;
namely, job satisfaction, work performance, job involvement, and withdrawal
behavior. Changes in human resource practice will impact employee perception,
which result in changes in their attitude and behavior. However, this research has
provided an empirical test to support the fact that perceived organizational support
and organization commitment theory can be tested empirically and has suggest results
to meet the objectives of the research.
Additionally, this research provided a crucial relationship between human
resource management and employee outcomes. In addition, the findings highlighted
the importance of such mediators as perceived organizational support, affective
commitment, and felt obligation. At this point, this is a major contribution to the
understanding of the mediators between strategic human resource management and
employee attitude and behavior. The resource-based view theory stated the
importance of the individual valuable, rare, non-substitutable and imperfectly imitable
resources. The results showed that when organizations integrated several practices, it
can improve competitiveness in performance and job involvement.
Importantly, this study supported the application of organizational commitment,
which was argued to be similar to the role of perceived organizational support. In
addition it offered substantiation of employee outcome is from their commitment.
The contribution of this research has proven that perceived organizational
support has evidently guidelines in that empirical tests can be conducted based on the
theory. With the proposed model, the collected data indicated that the perceived
organizational support and organization commitment model fit well with the data, as
indicated by the fit indices.

147
Moreover, this study provided evidence to extend organizational commitment
theory in its assumptions. From the assumptions of organization commitment theory,
researchers in organizational behavior have defined organizational commitment in
terms of the nature of relationship (Grusky, 1996), loyalty to employer (Kanter, 1968;
Kim, Price, Mueller and Watson, 1996), integration of individual and organizational
goals (Hall, Schneider and Nygren, 1970), identification with or attachment to the
organization (Porter, Steers, Mowday and Boulian, 1974; Romzek, 1989; Sheldon,
1971), readiness to exert considerable effort on behalf of the organization, and strong
desire to remain a member of the organization (Balaji, 1992; Mowday, Steers, &
Porter, 1979). Meyer and Allen (1991) classified organizational commitment into
three categories: affective commitment, continuance commitment, and normative
commitment. Employees with strong affective commitment remain with the organization
because they want to, those with a strong continuance commitment remain because
they need to, and those with a strong normative commitment remain because they feel
they ought to. Affective commitment seemed to be more positively related to job
performance, and this was confirmed by different empirical studies (Jaros, 1997;
Meyer, Allen and Smith, 1993; Sommers, 1996; Whitener & Walz, 1993). Affective
commitment can be understood as a strong belief in and acceptance of the goals and
values of the organization, and readiness to exert considerable effort on behalf of the
organization, as well as a strong desire to remain a member of the organization
(Mowday et al., 1979; Porter et al., 1974). Despite the work by Hung, Ansari, and
Aafaqi (2004) which focuses on the direct relationships between fairness of HRM
practices (employee relations and compensation, performance management and
promotion, procedures, and training), leader-member exchange, and commitment,
empirical evidence on this issue remains scant. Additionally, the potential impact of
HRM practices on employees' commitment has received far less attention than it
deserves (Meyer and Smith, 2000).
This study also indicates that the influence of human resource practice on job
satisfaction is higher than the influences of other constructs on job satisfaction. The
three major human resources include training and development, procedural justice,
and work participation. Moreover, the relationships of all the constructs were
simultaneously tested in the model at the same time with structural equation modeling

148
(SEM). Therefore, the results of the study provided a clear and significant influence
among constructs, as proposed in the hypotheses. Compared to the multiple regression
technique, the result from the structural equation modeling provided greater clarity in
terms of comparing the influences of human resource practices on support the theory.
This study has clearly extended the perceived organizational support and
organization commitment theory in that instead of emphasizing only outcomes,
organizations should explore appropriate human resource practices which have a
positive relationship with employee attitude and behavior. In other words, it is
obvious that organizations expect high trust, high performance, and high commitment
from employees, which will lead to a high performance work system. It has to
develop the most suitable practices which employee perception or work experience
will lead to such high performance in return to organization support by organization
rewards, training and development, procedural justice and work participation.
Organizational commitment has three forms: affective commitment, normative
commitment, and continuance commitment. According to Meyer and Allen’s three
component model (Allen and Meyer), organizational commitment is composed of
three mindsets: affective commitment (AC), which represents an emotional attachment
in, and identification with, the organization (e.g., Buchanan, 1974; Kanter, 1968;
Mowday, Porter and Steers, 1982; Porter, Steers, Mowday and Boulian, 1974);
normative commitment (NC), which refers to a sense of loyalty driven by a feeling of
obligation toward the organization (cf. Wiener, 1982); and continuance commitment
(CC), which is an attachment derived from the recognition of the costs associated with
leaving and/or perceived lack of employment alternatives (Allen and Meyer, 1996;
Meyer and Allen, 1991). Felt obligation as a consequence of perceived organizational
support, according to Eisenberger et al, 1996, and the factor of organizational commitment,
have an influence on employee attitude and behavior like affective commitment.
Allen et al., 1996, argued that affective commitment has a more effective role than
normative commitment.
Such factors as strategic human resource management, perceived organizational
support, felt obligation and affective commitment in the organization were addressed,
and these factors affect employee attitude and behavior, imply that these factors are
crucial for organizational competitiveness in the aspect of human resource performance.

149
This research also conceptualized and tested the conceptual frameworks, and
the results indicated that employee attitude and behavior can be created by major
factors and strengthened by focusing on each construct in this study. The results
suggested that among all factors, strategic human resource management had the
greatest positive relationship with employee attitude and behavior, with direct effect
equaling .367 and indirect effect equaling .293. This finding again highlights the
importance of human resource management. In addition, these constructs were
validated with discriminant validity and convergent validity in order to ascertain that
the constructs were distinct from other constructs and really measured what they
should have measured.
7.3.2 Practical Contributions
According to the study, there are crucial implications for managerial applications:
first, strategic human resource management and effective HRM practice in response to
change; second, understanding the relationship of perceived organizational support,
affective commitment, and felt obligation; and, third, understanding employee attitude and
behavior regarding organization’s human resource strategy as a result.
First, strategic human resource management is set of practices aligning its
strategy with corporate strategy to achieve an organization’s goals and objectives.
According to the empirical study, from parameter estimates and convergence,
organizational rewards have the most influence both direct on attitudes and behavior,
such as work performance and, withdrawal behavior. Procedural justice in the
organization plays an important role in behavior as well. Training and development
have a moderate influence on behavior. It is noteworthy that elements of the high
performance work system (high trust, high engagement, and high commitment,
leading to high organization performance) are suggested to be the observed variable in
strategic human resource management. In the study, work participation was included
but did not exhibit a strong impact compared with other variables. It is probably that
employee needs to fulfill their socio-emotional needs before upper needs and the high
performance working system will be effective when employee’s perception of full
organization support on their basic need.

150
Second, in a fast changing environment, an organization has to adapt itself to
respond to the environment to survive in the community. It implies that corporate
strategy will affect strategic human resource management by cost-cutting, down-
sizing the organization, lowering payment, and so on. Therefore, perceived
organizational support will dwindle as a result. In organizations that have been
established for a longtime, employees with long working years and that have
experienced changes will hardly perceive positive organization support all the time.
According to the study, affective commitment seems to become a dominant factor in
response to an organization’s HRM practice as a relevant short-term factor than
perceived organizational support, proven by a higher correlation and stronger
influence on employee attitude and behavior. In the empirical study, HRM practice
was the antecedent of organizational commitment and acted as a mediator with
employee attitude and behavior. It can be noted that from the meta-analysis, perceived
organizational support and affective commitment can be interchangeable. According
to the results of the study, strategic HRM has the same influence on perceived
organizational support and affective commitment based on their path coefficients.
The difference concerned the impact on employee attitude and behavior, where
affective commitment was comparatively stronger than perceived organizational
support.
However, organizational culture was suggested to be taken into consideration
for further study for its influence on organizational commitment, particularly
compared with that of affective commitment. In this study, a model with felt
obligation in place of affective commitment was tested, and the result shows that its
effect on employee attitude and behavior was not significantly different from affective
commitment.
Third, to analyze employee behavior and attitude in response to SHRM by
work experience must be cautious due to various factors. According to POS and
organizational commitment theories, it depends on how the organization imposes its
strategies and their impact on employee well-being and value on their contribution to
the organization. Work experience in the context indicates time and effect which
organization age and employee year servicing will has an effect on attitude and
behavior. In the shorter term, it is more validity according to cross sectional study.

151
7.4 Implications for the State-Owned Enterprise
According to study, it was found that strategic human resource management
had an impact on employee attitude and behavior in state-owned enterprises such as
Thai airways International PLC. Among the observed variables of strategies,
organizational rewards and procedural justice have a strong correlation compared with
training and development and work participation. The withdrawal behavior in terms
of turnover rate of employee in state-owned enterprises is relatively low compared
with private organization. Thai Airways International has turnover rate of less than
one percent per annum. According to finding, job satisfaction has a strong correlation
with attitude and behavior or its convergent is better than others. Rewards and job
satisfaction imply continuance commitment. Therefore, it has to be proven that
continuance commitment will have an influence than what happened in the private
organization which allow employee to move more freely than state-owned organization
due to organization policy, competitive environment and flexible regulation.
Employee attitude and behavior are more realistic, as withdrawal behavior is affected
by continuance commitment.
In general, according to Al-Obaidan and Scully (1992), state-owned enterprises
and private firms differ dramatically with respect to the objective function specified
for maximization. Moreover, shareholders of private firms aim at maximizing the
value of the firm by specifying that the firms should distribute and utilize their
resources for the value creating activities. In addition, with the different goals
between state-owned enterprises and private firms, ownership may play important
roles in terms of decision making in organizations in order to increase the efficiency
of the firm.
Moreover, Al-Obaidan and Scully (1992) have indicated that state-owned
enterprises differ from traditional government units in that they are subject to market
pressure, because basically state-owned enterprises have to compete with private
firms in the industry in which they operate. In addition, the different types of industry
can also affect how state-owned enterprises effectively operate. In addition, state-
owned enterprises also differ from private enterprises in that there is government
intervention to soften the pressure of the market and requirements to achieve certain

152
non-economic goals. State-owned enterprises are expected to cooperate with the
government to achieve certain political and business goals, including adopting
government policies and adapting to the market environment at the same time. It is
obvious that state-owned enterprises serve many stakeholders and pursue multiple
goals, some of which are mutually exclusive. Moreover, these enterprises are
influenced and controlled by government ministries and the managers of the public
enterprise itself.
For these reasons, some of past research works (such as Omran, 2006) has
concluded that the degree of government or state-ownership affects the performance
of state-enterprises and therefore greater performance depends on a lower degree of
state-ownership involvement. Omran (2006) suggested that reducing state-ownership
stakes should be encouraged in order to improve the performance and profitability of
the state-owned enterprises.
According to O’Neill et al. (2004), empirical research has been conducted on
the differences in corporate entrepreneurship among state-owned enterprises and
private enterprises among different industries, including telecommunications and
petroleum. Their results indicated that some of the state-owned enterprises can have a
greater degree of corporate entrepreneurship than private enterprises.
From the present study, it was seen that state-owned enterprise employee
attitudes and behaviors consistent with those of private organizations in terms of
interaction with strategic human resource management. Employees of Thai Airways
International PLC regard perceived organizational support as a factor that is
influential on their attitude and behavior through affective commitment. The felt
obligation of personnel positively supports and mediates perceived organizational
support and affective commitment.
7.5 Limitations
The results and findings of this research contributes to both theoretical and
practical aspects. However, there are limitations of the study. First, this research is a
cross-sectional study, using data from questionnaires and collected from Thai airways
international; therefore the relationship of constructs from this study should be

153
considered and applied with caution, and future studies may consider longitudinal
study in order to confirm the results of this study. Second, the area of study was the
airline industry, in this case Thai Airways International, as a major organization
representing more than 80 percent of the industry in terms of employees, production,
and so on. As an airline industry has a few organizations and varies by age, size,
number of employees, therefore as these variables cannot be controlled, then specific
case is selected for the airline industry. Third, one of the limitations of the research
was that it was conducted in Thailand which is different from other western countries
in terms of Thai culture and organizational culture. To support the generalization of
the research findings, study in other industries with a controllable variable can be
further conducted to confirm the results.
7.6 Recommendations for Future Research
This research has achieved its objectives in understanding the important
factors affecting employee attitude and behavior, and also the relationship between
SHRM and attitude and behavior, which are job satisfaction, performance, job
involvement and withdrawal behavior. However, there are many other aspects to be
studied further in the area of employee work outcomes.
Future research, for example, could concentrate on many dimensions related to
this study. Since the study was carried out on one national airline in the country which
represents more than 80 percent of the industry in terms of production, employee,
revenue, and so on. It is suggested to conduct the comparative study with the younger
airlines. Other industries with a fast-changing environment are also worth further
study, for example, the travel industry, the hotel industry, the real estate industry, and
the banking industry. The study on state-owned enterprises and public organizations
could be further conducted to observe the role of perceived organizational support and
organization commitment.
The observed variables, particularly the set of human resource practices such
as trust and factors surrounding high performance work system, are suggested to be
included in future study. An organization’s size, age and culture are also regarded as
influential factors in relation to employee attitude and behavior.

154
7.7 Conclusion
The findings of the study support that strategic human resource management
has a strong impact on employee attitude, behavior, and work outcomes.
Perceived organizational support has shown a slightly indirect effect on
attitude and behavior, while affective commitment has shown a more indirect effect
on attitude and behavior. Felt obligation as a form of normative commitment has
shown more indirect effect on attitude and behavior than perceived organizational
support as well. This supports the notion that organizational commitment can be in
any cases interchangeable with perceived organizational support.
Threat to perceived organizational support are change as strategic human
resource management has to be contingent to such change by formulation of set of
human resource practices which has an impact on employee well-being and their
value of contribution. The impact of strategic human resource management on
employee attitude and behavior through perceived organizational support was
supported by the empirical study. It is well noted that perceived organizational
support although indicate consistent with previous findings but be cautious as the
study was carried out on one of the fast changing environment industry. Further
study is suggested to be carried out on the public sector or other fast-changing
industry environments in order to strengthen perceived organizational support and
organization commitment theories and to confirm the impact of strategic human
resource management on employees’ attitudes, behavior, and work outcome.

BIBLIOGRAPHY
Agarwal, R. and Ferratt, T. W. 1999. Coping with Labor Scarcity in Information
Technology: Strategies and Practices for Effective Recruitment and
Retention. Cincinnati, OH: Pinnaflex.
Ajzen, I. and Fishbein, M. 1977. Attitude-Behavior Relations: A Theoretical
Analysis and Review of Empirical Research. Psychological Bulletin.
84 (5): 888-918.
Al-Obaidan, A. M. and Scully, G. W. 1992. Efficiency Differences between Private
and State-Owned Enterprises in the International Petroleum Industry.
Applied Economics. Taylor and Francis Journals. 24 (2): 237-46.
Allen, D.; Shore, L. and Griffeth, R. 1999. A Model of Perceived Organizational
Support. Unpublished manuscript. University of Memphis and Georgia
State University.
Allen, D. G.; Shore, L. M. and Griffeth, R. W. 2003. The Role of Perceived
Organizational Support and Supportive Human Resource Practices in the
Turnover Process. Journal of Management. 29 (1): 99-118.
Allen, M.R. and Wright, P.M. 2006. Strategic Management and HRM. Ithaca,
NY: Cornell University ILR School.
Allen, N. J. and Meyer, J. P. 1990. The Measurement and Antecedents of Affective,
Continuance and Normative Commitment to the Organization. An
Examination of Construct Validity. Journal of Vocational Behavior.
49 (3): 252-276.
Allen, N. J. and Meyer, J. P. 1996. Affective, Continuance and Normative
Commitment to the Organization. Journal of Occupational Psychology.
63 (1): 1-18.
Allen, T. J. 1977. Managing the Flow of Technology. Cambridge, MA: The MIT
Press.
Allport, G. W. 1943. The Ego in Contemporary Psychology. Psychology Review.
50 (5): 451-476.

156
Amit, R. and Schoemaker, P. J. H. 1993. Strategic Asset and Organizational Rent.
Strategic Management Journal, 14 (1): 33-46.
Anderson, J. C. and Gerbing, D. W. 1988. Structural Equation Modeling in Practice:
A Review and Recommended Two-Step Approach. Psychological Bulletin.
103 (3): 411-423.
Anderson, J. C. and Gerbing, D. W. 1991. Predicting the Performance of Measures
in a Confirmatory Factor Analysis with a Pretest Assessment of Their
Substantive Validities. Journal of Applied Psychology. 76 (5): 732-740.
Angle, H. L. and Perry, J. L. 1981. An Empirical Assessment of Organizational
Commitment and Organizational Effectiveness. Administrative Science
Quarterly. 26 (1): 1-14.
Angle, H. 1983. Organizational Commitment: Individual and Organizational
Influences. Work and Occupations: An International Sociology
Journal. 10 (2): 123-146.
Appelbaum, E.; Bailey T.; Berg P. and Kalleberg A. 2000. Manufacturing
Advantage: Why High Performance Work System Pay Off. Itacha,
NY: Cornell University Press.
Appelbaum, E. 2002. The Impact of New Forms of Work Organizations on Workers.
In Work Employment Relations in the High Performance. G. Murray,
Belanger, A. Giles and P.A. Lapointe. London: Continuam. Pp.120-149.
Armeli, S.; Eisenberger, R.; Fasolo, P. and Lynch, P. 1998. Perceived Organizational
Support and Police Performance: The Moderating Influence of
Socioemotional Needs. Journal of Applied Psychology. 83 (2): 288–297.
Arnold, H. J. and Feldman, D. C. 1982. A Multivariate Analysis of the Determinants
of Job Turnover. Journal of Applied Psychology. 67 (3): 350-360.
Arthur, J. B. 1994. Effects of Human Resource Systems on Manufacturing
Performance and Turnover. Acedemy of Management Journal. 37 (3):
670-687.
Babbie, E. R. 1999. The Practice of Social Research. Belmont, CA: Wadsworth.
Bagozzi, R. P. 1980. Performance and Satisfaction in an Industrial Sales Force: An
Examination of Their Antecedents and Simultaneity. Journal of
Marketing. 44 (Spring): 65–77.

157
Bagozzi, R. P. and Yi, Y. 1988. On the Evaluation of Structural Equation Models.
Journal of the Academy of Marketing Science. 16 (1): 74-94.
Baird, L.; Meshoulam, L. and DeGive, G. 1983. Meshing Human Resource Planning
with Strategic Business Planning: A Model Approach. Personnel. 60 (5):
14-25.
Bailey, R. 1982. Human Performance Engineering: A Guide for System
Designers. Englewood Cliffs, NJ: Prentice Hall.
Bailey, T. 1993. Discretionary Effort and The Organization of Work: Employee
Participation and Work Reform Since Hawthorne. Working paper.
New York: Columbia University.
Baker, W. and Dutton, J. E. 2007. Enabling Positive Social Capital in Organizations.
In Exploring Positive Relationships at Work. J.E. Dutton & B.R.
Ragins, eds. Hilsade, NJ: Lawrence Erlbaum. Pp. 325-346.
Bandura, A. 1997. Self-Efficacy: The Exercise of Control. New York: Freeman.
Barney, J. 1991. Firm Resources and Sustained Competitive Advantage. Journal of
Management. 17 (1): 99-120.
Barrett, P. 2007. Structural Equation Modeling: Adjudging Model Fit. Personality
and Individual Differences. 42 (5): 815- 824.
Balaji, C. 1992. As Organizational Commitment Decomposes: Issue in Measuring
Multiple Organizational Commitment. Indian Journal of Industrial
Relations. 28 (2): 155-160.
Baruch, Y. 1998. The Rise and Fall of Organizational Commitment. Human
Systems Management. 17 (2): 135-143.
Becker, B. and Gerhart, B. 1996. The Impact of Human Resource Management on
Organizational Perfonnance: Progress and Prospects. Academy of
Management Journal. 39 (4): 779-801.
Becker, B. E. and Huselid, M. A. 1998. High Performance Work Systems and Firm
Performance: A Synthesis of Research and Managerial Implications. In
Research in Personnel and Human Resource Management. G. R.
Ferris, ed. Greenwich, CT: JAI Press. Pp. 53-101.
Becker, H. S. 1960. Notes on The Concept of Commitment. American Journal of
Sociology. 66 (1): 32-42.

158
Becker, T. E.; Klein, H. J. and Meyer, J. P. 2009. Commitments in Organization:
Accumulated Wisdom and New Directions. Florence, KY: Routledge.
Taylor and Francis Group.
Beer, M.; Lawrence, P. R.; Mill, Q. D. and Walton, R. E. 1984. Human Resource
Management. New York: Free Press.
Beer, M.; Spector, B.; Lawrence, P. R.; Mill, Q. D. and Walton, R. E. 1984.
Managing Human Asset. New York: Free Press.
Bies, R. J. and Moag, J. F. 1986. Interactional Justice: Communication Criteria of
Fairness. In Research on Negotiations in Organizations. R. J. Lewicki,
B. H. Sheppard and M. H. Bazerman, eds. Greenwich, CT: JAI Press. Pp.
43-55.
Blau, G. 1985. The Measurement and Prediction of Career Commitment. Journal of
Occupational Psychology. 58 (4): 277-288.
Blau, G. 1988. Further Exploring the Meaning and Measurement of Career
Commitment. Journal of Vocational Behavior. 32 (3): 284-297.
Blau, P. M. 1964. Exchange and Power in Social Life. New York: Wiley.
Borman, W. C. 1991. Job Behavior, Performance and Effectiveness. In Handbook
of Industrial and Organizational Psychology. M.D. Dunnette and L.M.
Hough, eds. 2nd ed. Palo Alto, CA: Consulting Psychologists Press.
Pp. 271-326.
Boxall, P. 1998. Achieving Competitive Advantage Through Human Resource
Strategy: Towards a Theory of Industry Dynamics. Human Resource
Management Review. 8 (3): 265-288.
Boxall, P. and Purcell, J. 2000. Strategic Human Resource Management: Where
Have We Come From and Where Should We be Going? International
Journal of Management Reviews. 2 (2): 183.
Brewster, C. 1993. Developing “European” Model of Human Resource
Management. International Journal of Human Resource Management.
4 (4): 765-84.
Brewster, C. and Bournoirs, F. 1991. Human Resource Management: A European
Perspective. Personnel Review. 20 (6): 4-13.

159
Brockner, J. and Wiesenfeld, B. M. 1996. An Integrative Framework for Explaining
Reactions to Decisions: The Interactive Effects of Outcomes and
Procedures. Psychological Bulletin. 120 (2): 189–208.
Brockner, J.; Siegel, P. A.;Daly, J.; Tyler, T. R. and Martin, C. 1997. When Trust
Matters: The Moderating Effect of Outcome Favorability. Administrative
Science Quarterly. 42 (3): 558–583.
Brown, D. 1996. Brown’s Values-Based, Holistic Model of Career and Life-Role
Choices and Satisfaction. In Career Choice and Development. D.
Brown and L. Brooks, eds. San Francisco: Jossey-Bass. Pp. 337-372.
Brown, S.P. and Peterson, R.A. 1993. Antecedents and Consequences of Salesperson
Job Satisfaction: A Meta-Analysis and Assessment of Causal Effects.
Journal of Marketing. 30 (1): 63-77.
Browning, V. 2006. The Relationship between HRM Practices and Service Behavior
in South Africa Service Organization. International Journal of Human
Resource Management. 17 (7): 1321-1338.
Buchanan, B. 1974. Building Organizational Commitment: The Socialization of
Managers in Work Organization. Administrative Science Quarterly.
19 (40): 533-546.
Burt, R. 1997. The Contingent Value of Social Capital. Administrative Science
Quaterly. 42 (2): 339-365.
Byrne, B. M. 1994. Burnout: Testing for the Validity, Replication and Invariance of
Causal Structure Across Elementary, Intermediate and Secondary
Teachers. American Educational Research Journal. 31 (3): 645-673.
Byrne, B. M. 2010. Structural Equation Modeling with AMOS: Basic Concepts,
Applications and Programming. 2nd ed. New York: Routledge.
Cappelli, P. 1999. The New Deal at Work: Managing the Market Driven
Workforce. Boston, MA: Harvard Business School Press.
Chatman, J.A. 1989. Improving Interactional Organizational Research: A Model of
Person-Organization Fit. Academy of Management Review. 14 (3):
333-349.
160
Chou, C. P. and Bentler, P. M. 1995. Estimates and Tests in Structural Equation
Modeling. In Structural Equation Modeling: Concepts, Issues and
Applications. R.H. Hoyle, ed. London: Sage. Pp. 37-55.
Chusmir, L. H. 1982. Job Commitment and the Organizational Woman. Academy
of Management Review. 7 (4): 595-602.
Cohen, A. 1996. On the Discriminant Validity of The Meyer and Allen Measures of
Organizational Commitment: How does It Fit with The Work Commitment
Construct? Educational & Psychological Measurement. 56 (3): 494–
504.
Colarelli, S. M.; Dean, R. A. and Konstans. C. 1987. Comparative Effects of
Personal and Situational Influences on Job Outcomes of New
Professionals. Joumal of Applied Psychology. 72 (4): 558-566.
Cooper, A. C. and Schendel, D. 1976. Strategic Responses to Technological Threats.
Business Horizon. 19 (1): 1-9.
Cooper-Harkim, A. and Viswesvaran, C. 2005. The Construct of Work
Commitment: Testing an Integrative Framework. Psychological Bulletin.
131 (2): 241-259.
Colquitt, J. A.; Conlon, D. E.; Wesson, M. J.; Porter, C. O. L. H. and Ng, K. Y. 2001.
Justice at the Millennium: A Meta-Analytic Review of 25 Years of
Organizational Justice Research. Journal of Applied Psychology. 86 (3):
425-445.
Colquitt, J. A.; LePine, J. A. and Noe, R. A. 2000. Toward and Integrative Theory of
Training Motivation: A Meta-Analytic Path Analysis of 20 Years of
Research. Journal of Applied Psychology. 85 (5): 678-707.
Cotton, J. L. and Tuttle, J. M. 1986. Employee Turnover: A Meta-Analysis and
Review with Implications for Research. Academy of Management
Review. 11 (1): 55-70.
Cropanzano, R.; Howes, J. C.; Grandey, A. A. and Toth, P. 1997. The Relationship
of Organizational Politics and Support to Work Behaviors, Attitudes and
Stress. Journal of Organizational Behavior. 18 (2): 159-180.

161
De Cuyper, N. 2008. Claudia Bernhard-Oettel and Erik Berntson, Hans De Witte and
Barbara Alarco, Employabilty and Employees’ Well-Being: Mediation by
Job Insecurity. Journal of Applied Psychology. 57 (3): 488-509)
Deci, E. L. and Ryan, R. M. 1985. Intrinsic Motivation and Self-Determination in
Human-Behavior. Journal of Personality and Social Psychology.
18 (1): 105-115.
Delaney, J. T. and Huselid, M. A. 1996. The Impact of Human Resource
Management Practices on Perceptions of Organizational Performance.
Academy of Management Journal. 39 (4): 949-969.
Delery, J. E. and Doty, D.G. 1996. Modes of Theorizing in Strategic Human
Resource Management: Tests of Universalistic, Contingency and
Configurational Performance Predictions. Academy of Management
Journal. 39 (4): 802-835.
Delery, J. E. and Shaw, J. D. 2001. The Strategic Management of People in Work
Organizations: Review, Synthesis and Extension. In Research in
Personnel and Human Resource Management. J. Martocchio, H. Liao
and A. Joshi, eds. Bingley: Emerald. Pp. 165–197.
DeSanto, J. F. 1983. Work Force Planning and Corporate Strategy. Personnel
Administrator. 28 (10): 33-42.
Deutch, A. 1982. How Employee Retention Strategies Can Aid Productivity.
Journal of Business Strategy. 2 (4): 106-109.
Devanna, M.; Fombrun, C. and Tichy, N. 1981. Human Resource Management: A
Strategic Perspective. Organizational Dynamics. (Winter): 51-67.
Dillman, D. 1978. Mail and telephone surveys. New York: John Wiley & Sons.
Dillman, D. 2000. Constructing the Questionnaire: Mail and Internet Surveys.
New York: John Wiley & Sons.
Doty, D .H. and Glick, W. H. 1994. Typologies as a Unique Form of Theory
Building: Toward Improved Understanding and Modeling. The Academy
of Management Journal. 36 (6): 1196-1250.
Dunham, R. B.; Grube, J. A. and Castaneda, M. B. 1994. Organizational
Commitment: The Utility of an Integrative Definition. Journal of
Applied Psychology. 79 (3): 370-380.

162
Dyer, L. and Reeves, T. 1995. HR Strategies and Firm Performance: What do We
Know and Where do We Need to Go? International Journal of Human
Resource Management. 6 (3): 656-670.
Edwards, J. R. and Bagozzi, R. P. 2000. On the Nature and Direction of
Relationships Between Constructs. Psychological Methods. 5 (2):155-
174.
Edwards, J. R.; Scully, J.A. and Brteck, M.D. 2000. The Nature and Outcomes of
Work: A Replication and Extension of Interdisciplinary Work-Redesign
Research. Journal of Applied Psychology. 85 (6): 860-868.
Edwards, M. R. and Pecci, R. 2010. King’s College London, UK. Journal of
Personnel Psychology. 9 (1): 17-26.
Edwards, P. and Wright, M. 2001. High-Involvement Work Systems and
Performance Outcomes: The Strength of Variable, Contingent and Context
Bound Relationships. International Journal of Human Resource
Management. 12 (4): 565-85.
Eisenberger, R.; Huntington, R.; Hutchinson, S. and Sowa, D. 1986. Perceived
Organizational Support. Journal of Applied Psychology. 71 (3): 500-
507.
Eisenberger, R.; Rhoades, L. and Cameron, J. 1999. Does Pay for Performance
Increase or Decrease Perceived Self-Determination and Intrinsic
Motivation? Journal of Personality and Social Psychology. 77 (5):
1026-1040.
Eisenberger, R.; Armeli, S.; Rexwinkel, B.; Lynch, P. D. and Rhoades, L. 2001.
Reciprocation of Perceived Organizational Support. Journal of Applied
Psychology. 86 (1): 42-51.
Eisenberger, R.; Cummings, J.; Armeli, S. and Lynch, P. 1997. Perceived
Organizational Support, Discretionary Treatment and Job Satisfaction.
Journal of Applied Psychology. 82 (5): 812-820.
Eisenberger, R.; Fasolo, P. and Davis-LaMastro, V. 1990. Perceived Organizational
Support and Employee Diligence, Commitment and Innovation. Journal
of Applied Psychology. 75 (1): 51-59.

163
Eisenberger, R.; Stinglhamber, F.; Vandenberghe, C.; Sucharski, I. and Rhoades, L.
2002. Perceived Supervisor Support: Contributions to Perceived
Organizational Support and Employee Retention. Journal of Applied
Psychology. 87 (3): 565-573.
Ellis, R. J. 1982. Improving Management Response in Turbulent Times. Sloan
Management Review. 23 (2): 3-12.
Ellemers, N.; De Gilder, D. and Van den Heuvel, H. 1998. Career-Oriented Versus
TeamOriented Commitment and Behavior at Work. Journal of Applied
Psychology. 83 (5): 717-730.
Emerson, R. M. 1976. Social Exchange Theory. In Annual review of sociology. A.
Inkeles, ed. Palo Alto, CA: Annual Reviews. Pp. 335–362.
Fornell, C. and Larcker, D. F. 1981. Structural Equation Models with Unobservable
Variables and Measurement Error: Algebra and Statistics. Journal of
Marketing Research. 18 (3): 382-388.
Fasolo, P. M. 1995. Procedural Justice and Perceived Organizational Support:
Hypothesized Effects on Job Performance. In Organizational Politics,
Justice and Support: Managing Social Climate at Work. R.
Cropanzano and K. M. Kacmar, eds. Westport, CT: Quorum Press.
Pp.185-195.
Fernando M.A.; Pedro M. R. and Gonzalo S. G. 2005. Strategic Human Resource
Management: Integrating the Universalistic, Contingent, Configurational
and contextual perspectives. The International Journal of Human
Resource Management. 16 (5): 633 – 659.
Ferris, G.F.; Arthur, M.M.; Berkson, H.M.; Kaplan, D.M.; Harrell-Cook, G. and
Frink, D.D. 1998. Toward a Society Context Theory of the Human
Resource Management – Organization Effectiveness Relationship.
Human Resource Management Review. 8 (3): 235-64.
Ferris, G. R.; Hochwarter, W A.; Buckley M. R.; Harrell-Cook, G. and Frank, D. D.
1999. Human Resources Management: Some New Directions. Journal of
Management. 25 (3): 385-415.
Flamholtz, E. 1971. A Model for Human Resource Valuation: A Stochastic Process
with Service Rewards. Accounting Review. 46 (2): 253-267.

164
Flood, P. C.; Mkamwa, T.; O’Regan, C.; Guthrie, J. P.; Liu, W.; Armstrong, C. and
MacCurtain, S. 2008. New Models of High Performance Working
System. Dublin: National Centre for Partnership and Performance.
Folger, R. and Konovsky, M.A. 1989. Effects of Procedural and Distributive Justice
on Reactions to Pay Raise Decisions. Academy of Management
Journal. 32 (1): 115-130.
Formbrun, C. 1982. Environmental Trends Create New Pressures on Human
Resources. Journal of Business Strategy. 3 (1): 61-69.
Frantzreb, R. B.: Landau, L.T. and Lundberg, D. P. 1974. The Valuations of Human
Resource. Business Horizons. 17 (3): 73-80.
Fulmer, I. S.; Gerhant, B. and Scott, K. S. 2003. Are the 100 Best Better? An
Empirical Investigation of the Relationship Between being a Great Place
to Work and Firm Performance. Personnel Psychology. 56 (4): 965-993.
Gaertner, K. N. and Nollen, S. D. 1989. Career Experiences, Perception of
Employment Practices and Psychological Commitment to Organization.
Human Relations. 42 (11): 975-991.
Galosy, J. R. 1983. Meshing Human Resource Planning with Strategic Business
Planning: One’s Company Experience. Personnel. 60 (5): 26-35.
Gardner, T. L. and Wright, P. 2007. The Influence of Human Resource Practices
and Collective Affective Organizational Commitment on Aggregate
Voluntary Turnover. CAHRS Working Paper. Ithaca, NY: Cornell
University.
Gerhart, B. and Milkovich, G. T. 1990. Organizational Differences in Managerial
Compensation and Financial Performance. The Academy of Managerial
Journal. 33 (4): 846-860.
Gerstein, M. and Reisman, H. 1983. Strategic Selection: Matching Executives to
Business Conditions. Sloan Management Review Association.
(Winter): 33-49.
Gill, J. and Johnson, P. 1991. Research Methods for Managers. London: Paul
Chapman.
Glanz, F. M. Lewis and B. K. Rimer, eds. 2002. Health Behavior and Health
Education. San Francisco: Jossey-Bass.

165
Grant, D. and Shields, J. 2002. Researching Employee Reactions to Human
Resource Management. The Journal of Industrial Relations. 44 (3):
313-334.
Godard, J. 2001. High Performance and the Transformation of Work? The
Implication of Alternative Work Practices for Work Experience and
Outcomes. Industrial and Labor Relations Review. 54 (4): 776-805.
Good, L. K.; Page, T. J. and Young, C. E. 1996. Assessing Hierarchical Differences
in Job-Related Attitudes and Turnover Among Retail Managers. Journal
of the Academy of Marketing Science. 24 (2): 148-156.
Gopinath, C. and Becker T. 2000. Communication, Procedural Justice and Employee
Attitudes: Relationships Under Conditions of Divestiture. Journal of
Management. 26 (1): 63-80.
Goulet, L.R. and Singh, P. 2002. Career Commitment: A Reexamination and an
Extension. Journal of Vocational Behaior. 6 (11): 73-91.
Greer, C. R. 2001. Strategic Human Resource Management: A General Managerial
Approach. 2nd ed. Upper Saddle River, NJ: Prentice Hall.
Greenberg, J. 1990. Organizational Justice: Yesterday, Today and Tomorrow.
Journal of Management. 16 (2): 399-432.
Goulder, A. W. 1960. The Norm of Reciprocity. American Sociological Review.
25 (2): 161-178.
Grusky, O. 1996. Career Mobility and Organizational Commitment.
Administrative Science Quarterly. 10 (4): 488-503.
Guest, D. E. 1989. Personnel and HRM: Can You Tell the Difference? Personnel
Management. 21 (1): 48-51.
Guest, D. E. 1997. Human Resource Management and Performance: a Review and
Research Agenda. International Journal of Human Resource
Management. 8 (3): 263-276.
Guest, D. E. 1999. Human Resource Management – The Workers’ Verdict. Human
Resource Management Journal. 9 (3): 5-25.
Guest, D. E. 2002. Human Resource Management, Corporate Performance and
Employee Wellbeing: Building the Worker into HRM. The Journal of
Industrial Relations. 44 (3): 335-358.

166
Guest, D. E.; Michie, J.; Conway, N. and Sheehan, M. 2003. Human Resource
Management and Corporate Performance in the UK. British Journal of
Industrial Relations. 41 (2): 291-314.
Gutteridge, T. G.; Leibowitz, Z. B. and Shore, J. E. 1993. When Careers Flower,
Organizations Flourish. Training and Development Journal. 47 (11):
24-29.
Guzzo, R. A.; Noonan, K. A. and Elron, E. 1994. Expatriate Managers and the
Psychological Contract. Journal of Applied Psychology. 79 (4): 617–
626.
Hackett, R. D.; Lapierre, L.M. and Hausdorf, P.A. 2001. Understanding the Link
Between Work Commitment Constructs. Journal of Vocational
Behavior. 58 (3): 392-413.
Hair, J. F.; Black, W. C.; Babin, B. J.; Anderson, R. E. and Tatham, R. L. 2006.
Multivariate Data Analysis. 6th ed. Englewood Cliffs, NJ: Prentice
Hall.
Hair, J. F.; William, J.C.; Black, B.J.; Babin, R.E. and Anderson. 2010.
Multivariate Data Analysis: A Global Perspective. 7th ed. Delhi:
Pearson.
Hall, D. T.; Schneider, B. and Nygren, H. T. 1970. Personal Factors in
Organizational Identification. Administrative Science Quarterly. 15 (2):
176-190.
Harel, G. H. and Tzafrir, S.S. 1999. The Effect of Human Resource Management
Practices on the Perceptions of Organizational and Market Performance of
the Firm. Human Resource Management. 38 (3): 185-200.
Harley, B. 2002. Employee Responses to High Performance Work System Practices:
An Analysis of the AWIRS95 Data. Journal of Industrial Relations.
44 (3): 418-34.
Harter, J. K.; Schmidt, F. L. and Hayes, T. L. 2002. Business Unit Level
Relationship Between Employee Satisfaction, Employee Engagement and
Business Outcomes: A Meta-Analysis. Journal of Applied Psychology.
87 (2): 268-279.

167
Harvey, R. J. 1982. The Future of Partial Correlation as a Means to Reduce Halo in
Performance Ratings. Journal of Applied Psychology. 67 (2): 171–176.
Harvey, L. J. 1983. Effective Planning for Human Resource Development.
Personnel Administrator. 28 (10): 45-52.
Hayduk, L.; Cummings, G.; Boadu, K.; Pazdeka-Robinson, H. and Boulianne, S.
2007. Personality and Individual Differences. 42 (4): 841-850.
Hendry, C. and Pettigrew, A. 1990. HRM: An Agenda for the 1990s. International
Journal of Human Resource Management. 1 (1): 17-25.
Herzberg, F. H. 1966. Work and the nature of man. Cleland, OH: World
Publishing.
Hofer, C. W. and Schendel, D. 1978. Strategy Formulation: Analytic Concepts.
St. Paul, MN: West Publishing.
Hom, P. W. and Griffeth, R.W. 1995. Emploee Turnover. Cincinnati, OH: South-
Western College Publishing.
Homans, G. C. 1961. Social Behavior: Its Elementary Forms. London: Routledge
and Kegan Paul.
Hoyle, R. H. and Panter, A. T. 1995. Writing About Structural Equation Models. In
Structural Equation Modeling: Concepts, Issues and Applications. R.
H. Hoyle, ed. Thousand Oaks, CA: Sage Publications. Pp. 158-176.
Hu, L. and Bentler, P. M. 1999. Cutoff Criteria for Fit Indexes in Covariance
Structure Analysis: Conventional Criteria Versus New Alternatives.
Structural Equation Modeling: A Multidisciplinary Journal. 6 (1): 1-55.
Hung, D. K. M.; Ansari, M. A. and Aafaqi, R. 2004. Fairness of Human Resource
Management Practices, Leader-Member Exchange and Organizational
Commitment. Asian Academy of Management Journal. 9 1): 99-120.
Huselid, M. A. 1995. The Impact of Human Resource Management Practices on
Turnover, Productivity and Corporate Financial Performance. Academy
of Management Journal. 38 (3): 635-672.
Hutchison, S. and Garstka, M. 1996. Sources of Perceived Organizational Support:
Goal Setting and Feedback. Journal of Applied Psychology. 26 (15):
1351-1366.

168
Iaffaldano, M. T. and Paul M. M. 1985. Job Satisfaction and Job Performance: A
Meta-Analysis. Psychological Bulletin. 97 (2): 251-73.
Ichniowski, C.; Shaw, K. and Prennushi, G. 1997. The Effects of Human Resource
Management Practices on Productivity: A Study of Steel Finishing Lines.
The American Economic Review. 87 (3): 291-313.
Insko, C. A. and Schopler, J. 1967. Tridadics Consistency: A Statement of Affective-
Cgnitive-Conative Consistency. Psychological Review. (74): 361-376.
Irving, P.G.; Coleman, D.F. and Cooper, C. L. 1977. Further Assessment of a Three
Component Model of Occupational Commitment: Generalizability and
Differences Across Occupations. Journal of Applied Psychology.
82 (3): 444-452.
Jackson, S. E.; Schuler, R. and Rivero, J. C. 1989. Organizational Characteristics as
Predictors of Personnel Practices. Personnel Psychology. 42 (4): 727-
736.
Jackson, S. E. and Schuler, R. 1995. Understanding Human Resource Management
in the Context of Organizations and Their Environments. In Annual
Review of Psychology. J.T. Spence, J.M. Darley and D.J. Foss, eds.
46 (2): 237-264.
Jaiswal, S. R. 1982. Impact of Organizational Culture on Commitment to Work.
Lok Udyog. 16: 3-14.
Jaros, S. J. 1997. An Assessment of Meyer and Allen’s Three-Component Model of
Organizational Commitment and Turnover Intentions. Journal of
Vocational Behavior. 51 (3): 319-337.
Jauch, L. R.; Glueck, W. F. and Osborn, R. N. 1978. Organizational Loyalty,
Professional Commitment and Academic Research Productivity.
Academy of Management Journal. 21 (1): 84-92.
Jiang, J. J.; Klein, G. and Crampton, S. M. 2000. A Note on SERVQUAL Reliability
and Validity in Information System Service Quality Measurement.
Decision Sciences. 31 (3): 725 – 744.
Jiménez-Jimenez, D.; Valle, R. S. and Hernandez-Espallardo, M. 2008. Fostering
Innovation. European Journal of Innovation Management. 11 (3):
389-412.

169
Jones, B.; Flynn, D.M. and Kelloway, E. K. 1995. Perception of Support from the
Organization in Relation to Work Stress, Satisfaction and Commitment. In
Organizational Risk Factor for Job Stress. S. L. Sauter and L.R.
Murphy, eds. Washington, DC: American Psychological Association.
Pp. 41-52.
Judge, T. A. and Ilies, R. 2002. Relationship of Personality to Performance
Motivation: A Meta-Analysis Review. Journal of Applied Psychology.
87 (4): 797-807.
Judith W. Tansky, Debra J.Cohen. 2001. The Relationship Between Organizational
Support, Employee Development and Organizational Commitment: An
Empirical Study: Human Resource Development Quarterly 12 (3): 285-
300
Kagitcibasi, C. 2002. Psychology and Human Competence Development. Journal
of Applied Psychology: An International Review. 51 (1): 5-22.
Kandel, E. and Lazear, E. 1992. Peer Pressure and Partnerships. Journal of
Political Economy. 100 (4): 801–817.
Kanlaya Wanichbuncha. 2003. Advanced Statistic for SPSS. 3rd ed. Bangkok:
Chulalongkorn University Publishing.
Kanter, R. M. 1968. Commitment and Social Organization: A Study of Commitment
Mechanisms in Utopian Countries. American Sociological Review.
33 (3): 499-517.
Kanungo R. 1982. Measurement of Job and Work Involvement. Journal of Applied
Psychology. 67 (2): 341-349.
Katsikea, E. S.; Theodosiou, M.; Morgan, R. E. and Papavassiliou, N. 2005. Export
Market Expansion Strategies of Direct-Selling Small and Medium- Sized
Firms: Implications for Export Sales Management Activities. Journal of
International Marketing. 13 (2): 57-92.
Kenny, D. A. 2008. Measuring Model Fit. Retrieved March 13, 2008 from
http://davidakenny.net/cm/fit.htm.
Ketchen, D. J.; Thomas, J. B. and Snow, C. C. 1993. Organizational Configurations
and Performance: A Comparison of Theoretical Approaches. The
Academy of Management Review. 36 (4): 1278-1313.

170
Klein, K. J.; Dansereau, F. and Hall, R. J. 1994. Levels Issues in Theory
Development, Data Collection and Analysis. The Academy of
Management Review. 19 (2): 195-229.
Kim, S. W; Price, J.L; Mueller, C.W. and Watson, T.W. 1996. The Determinants of
Career Intent Among Physicians at a U.S. Air Force Hospital. Human
Relations. 49 (4): 947-976.
Korsgaard, M.A; Sapienza, H.J. and Schweiger, D.M. 2002. Beaten Before Begun:
The Role of Procedural Justice in Planning Change. Journal of
Management. 28 (4): 497-516.
Kline, R. B. 2005. Principles and Practice of Structural Equation Modeling. 2nd
ed. New York: Guilford Press.
Klein, H.J; Brinsfield, C.T. and Molley, J.C. 2006. Understanding Workplace
Commitment Independent of Antecedents, Foci, Rationales and
Consequences. Paper Presented at The Academy of Management Annual
Meeting, Atlanta, GA.
Klien, H. J; Becker, T. H. and Meyer, J. P. 2009. Commitment in Organizations,
Accumulated Wisdom and New Directions. Florence, KY: Routledge,
Taylor & Francis Group.
Kling, J. 1995. High Performance Work Systems and Firm Performance. Monthly
Labor Review. 118 (1): 29–36.
Kontoghiorghes, C. and Bryant, N. 2001. Exploring Organization Commitment in
a Non-Profit Service Organization. Paper Presented at The Academy of
Human Resource Development Conference.
Konovsky, M. A. and Pugh, S. D. 1994. Citizenship Behavior and Social Exchange.
Academy of Management Journal. 37 (4): 656-669
Koys, D. J. 2001. The Effects of Employee Satisfaction, Organizational Citizenship
Behavior and Turnover on Organizational Effectiveness: A Unit-Level,
Longitudinal Study. Personnel Psychology. 54: 101-114.
Kristof, A. L. 1996. Person-Organization Fit: An Integrative Review of Its
Conceptualizations, Measurement and Implications. Personnel
Psychology. 49 (1): 1-49.

171
Kristof-Brown, A; Zimmerman, R. and Johnson, E. 2005. Consequences of
Individuals’ Fit at Work: A Meta-Analysis. Personnel Psychology.
58 (2): 281-342
Kumar, R. 2005. Research Methodology: A Step-By-Step Guide for Beginners.
2nd ed. London: Sage Publications.
Landy, F. J. and Conte, J. M. 2007. Work in The 21st Century: An Introduction to
Industrial and Organizational Psychology. 2nd ed. Malden, MA:
Blackwell.
Lauridsen, J. and Mur, J. 2006. Multicollinearity in Cross-Sectional Regressions.
Journal of Geographical Systems. 8 (4): 317-333.
Lawler, E. E. 1986. High Involvement Management. San Francisco, C.A.: Jossey-
Bass.
Lawler, E. J; Thye, S. R. and Yoon, J. 2006. Commitment in Structurally Enabled
and Induced Exchange Relations. Social Psychology Quarterly. 69 (2):
183-200.
Lawler, E. and Hall, D. 1970. Relationship of Job Characteristics to Job
Involvement, Satisfaction and Intrinsic Motivation. Journal of Applied
Psychology. 54 (2): 305-312.
Lee, T.W; Ashford, S.J; Walsh, J.P. and Mowday, R.T. 1992. Commitment
Propensity, Organizational Commitment and Voluntary Turnover: A
Longitudinal Study of Organizational Entry Processes. Journal of
Management. 18 (1): 15-32.
Lengnick-Hall, C. A. and Lengnick-Hall, M. L. 1988. Strategic Human Resource
Management: a Review of the Literature and a Proposed Typology.
Academy of Management Review. 13 (3): 29-48.
Lengnick-Hall, M.L. & Lengnick-Hall, C.A. 2006. HR, ERP and Competitive
Advantage. Human Resource Management. 45 (2): 179-194.
Leontiades, M. 1982. Choosing the Right Manager to Fit the Strategy. Journal of
Business Strategy. 2 (1): 58-69.
Lin, X. and Germain, R. 2003. Product Quality Orientation and Its Performance
Implications in Chinese State-Owned Enterprises. Journal of
International Marketing. 11 (2): 59–78.

172
Lincoln, J.R. & Kalleberg, A.L. 1990. Culture, Control and Commitment.
Cambridge: Cambridge University Press.
Lind, E. A. & Tyler, T. R. 1988. The Social Psychology of Procedural Justice.
New York : Plenum.
Lindroth, J. 1982. How to Beat the Coming Labor Shortage. Personnel Journal.
61 (4): 268-72.
Loehlin, J. C. 1992. Latent Variable Models: An Introduction to Factor, Path
and Structural Analyses. Hillsdale, NJ: Erlbaum.
Lynch, P; Eisenberger, R. and Armeli, S. 1999. Perceived Organizational Support:
Inferior-Versus-Superior Performance by Wary Employees. Journal of
Applied Psychology. 84: 467–483.
MacCallum, R. C. and Austin, J. T. 2000. Applications of Structural Equation
Modeling in Psychological Research. Annual Review of Psychology.
51: 201-226.
MacCallum, R. C; Browne, M. W. and Sugawara, H. M. 1996. Power Analysis and
Determination of Sample Size for Covariance Structure Modeling.
Psychological Methods. 1 (2): 130- 149.
MacDuffie, J. P. 1995. Human Resource Bundles and Manufacturing Performance:
Organizational Logic and Flexible Production Systems in the Word of
Auto Industry. Industrial and Labor Relations Review. 48: 197-221.
MacKenzie, S. B. 2001. Opportunities for Improving Consumer Research through
Latent Variable Structural Equation Modeling Opportunities. The Journal
of Consumer Research. 28 (1): 159-166.
MacKenzie, S. B; Podsakoff, P. M. and Fetter, R. 1991. Organizational Citizenship
Behavior and Objective Productivity as Determinants of Managerial
Evaluations of Salespersons’ Performance. Organizational Behavior and
Human Decision Processes. 50 (1): 123–150.
Macey, W. H. and Schneider, B. 2008. The Meaning of The Employee Engagement.
Industrial and Organizational Psychology. Perspectives on Science and
Practice. 1 (1): 3-30.

173
Maier, H. 1982. Innovation, Effeiciency and The Quantitative and Qualitative
Demand for Human Resources. Technological Forecasting and Social
Change. 21 (1): 15-31.
Martin-Alcazar, F.; Romero-Fernandez, P. M. and Sanchez-Gardey, G. 2005.
Strategic Human Resource Management: Integrating the Universalistic,
Contingent, Configurational and Contextual Perspectives. Journal of
Human Resource Management. 16 (5): 633-659
Mathew, R. Allen, Patrick M. 2006. Right: Strategic Management and HRM,
Working Paper Series Working Paper 06-04.
Mathews, B. P. and Sheherd, J. L. 2002. Dimensionality of Cook and Wall’s 1990)
Bristich Organizational Commitment Scale. Journal of Occupational
and Organizational Psychology. 75: 369-375.
Mathieu, J. E. and Zajac, D. 1990. A Review and Meta-Analysis of The
Antecedents, Correlates and Consequences of Organizational
Commitment. Psychological Bulletin. 108: 171-194
Meyer, J; Allen, N. and Gellatly, I. 1990. Affective and Continuance Commitment to
the Organization. Journal of Applied Psychology. 75: 710-720.
Meyer, J. P. and Allen, N. J. 1991. A Three-Component Conceptualization of
Organizational Commitment. Human Resource Management Review.
1 (1): 61-89.
Meyer, J. P. 1997. Organizational Commitment. In International Review of
Industrial and Organizational Psychology. C.L. Cooper and I.T.
Robinson, eds. 12: 175-228.
Meyer, J. P. and Allen, N. J. 1997. Commitment in the Workplace: Theory,
research and Application. Thousand Oaks, CA: Sage.
Meyer, J. P, Allen, N. J. and Topolnytsky L. 1998. Commitment in a Changing
World of Work. Canadian Psychology-Psychology Canadienne. 39 (1):
83-93.
Meyer, J. P. and Allen, N. J; and Smith, C. A. 1993. Commitment to Organizations
and Occupations: Extension and test of a Three-Component
Conceptualization. Journal of Applied Psychology. 78: 538-551.

174
Meyer, J. P; Becker, T. E. and Klein, H. J. 2009. Commitments in Organization:
Accumulated Wisdom and New Directions. Florence, KY:
Routledge/Taylor and Francis Group.
Meyer, J. P; Becker, T. E. and Vandenberghe, C. 2004. Employee Commitment and
Motivation: A Conceptual Analysis and Integrative Model. Journal of
Applied Psychology. 89 (6): 991-1007.
Meyer, J. P. and Herscovitch, L. 2001. Commitment in The Workplace: Toward a
General Model. Human Resource Management Review. 11 (3): 299-
326.
Meyer, J. P. and Smith, C. A. 2000. HRM Practices and Organizational
Commitment: Test of Mediation Model. Canadian Journal of
Administrative Sciences. 17 (4): 319-331.
Migliore, R. H. 1982. Linking Strategy, Performance and Pay. Journal of Business
Strategy. 3 (1): 90-94.
Miles, R. and Swow, C. 1978. Organizational Structure, Strategy and Process.
New York: McGraw-Hill.
Miller, M. and Friesen, P.H. 1984. Organizations: A Quantum View. Englewood
Cliffs, NJ: Prentice-Hall.
Milgrom, P. and Roberts, J. 1995. Complementarities and Fit: Strategy, Structure
and Organizational Change in Manufacturing. Journal of Accounting
and Economics. 19: 179–208.
Moorman, R. H. 1991. Relationship between Organizational Justice and Organizational
Citizenship Behaviors: Do Fairness Perceptions Influence Employee
Citizenship? Journal of Applied Psychology. 76 (6): 845-855.
Moorman, R. H; Blakely, G. L. and Niehoff, B. P. 1998. Does Perceived
Organizational Support Mediate The Relationship between Procedural
Justice and Organizational Citizenship Behavior? Academy of
Management Journal. 41: 351–357.
Moorman, R. H; Niehoff, B. P. and Organ, D. W. 1993. Treating Employees Fairly
and Organizational Citizenship Behaviors: Sorting the Effects of Job
Satisfaction, Organizational Commitment and Procedural Justice.
Employee Responsibilities and Rights Journal. 6: 209-225.

175
Morrison, E. W. 1996. Organizational Citizenship Behavior as a Critical Link
between HRM Practices and Service Quality. Human Resource
Management. 34 (4): 493-512.
Mottaz, C. J. 1988. Determinants of Organizational Commitment. Human Relations.
41 (6): 467-482.
Mowday, R. T. 1998. Reflections on The Study and Relevance of Organizational
Commitment. Human Resource Management Review. 4: 387-401.
Mowday, R. T; Porter, L. W; Steers, R.M; and Boulian, P. V. 1974. Organizational
Commitment, Job Satisfaction and Turnover among Psychiatric
Technicians. Journal of Applied Psychology. 59 (5): 603-609.
Mowday, R. T; Steers, R.M. and Porter, L. W. 1979. The Measurement of
Organizational Commitment. Journal of Vocational Behavior. 14: 224-
247.
Mowday, R. T; Porter, L. W; and Steers, R. M. 1982. Employee-Organization
Linkage: The Psychology of Commitment, Absenteeism and
Turnover. New York: Academic Press
Naquin, S. S. and Holton, E.F., III. 2002. The Effect of Personality, Affectivity and
Work Commitment on Motivation to Improve Work through Learning.
Human Resource Management Quarterly. 13: 357-376.
Neuman, W. L. 2003. Social Research Methods: Qualitative and Quantitative
Approaches. 5th ed. Boston: Allyn & Bacon.
Niehoff, B. P. and Moorman, R. H. 1993. Fairness in Performance Monitoring: The
Role of Justice in Mediating the Relationship between Monitoring and
Organizational Citizenship Behavior. Acedemt of Management Journal.
36: 527-556.
Nishii, L. H; Lepak, D. P. and Schneider, B. 2008. Employee Attributions of the
“why” of HR Practices: Their Effects on Employee Attitudes and
Behaviors and Customer Satisfaction. Personnel Psychology. 61 (3):
503–545.
Ogilvie, J. R. 1986. The Role of Human Resource Management Practices in
Predicting Organizational Commitment. Group & Organization
Studies. 11: 335-359.

176
Olian, J. D. and Rynes, S. L. 1984. Organizational Staffing: Integrating Practice with
Strategy. Industrial Relations. 23: 170-183.
Omran, M. 2006. Privatization, State Ownership and Bank Performance in Egypt.
World Development. 35 (4): 714-733.
O’Neill, H. M; Rondinelli, D.A. and Wattanakul, T. 2004. Ownership and its Impact
on Coping with Financial Crisis: Differences in State-, Mixed- and
Privately-Owned Enterprises in Thailand. Asia Pacific Journal of
Management. 21 (1): 49-74.
O’Reilly, C. and Chatman, J. 1986. Organizational Commitment and Psychological
Attachment: The Effects of Compliance, Identification and Internalization
on Prosocial Behavior. Journal of Applied Psychology. 34: 487-516.
O'Driscoll, M. P and Randall, D. M. 1999. Perceived Organisational Support,
Satisfaction with Rewards and Employee Job Involvement and
Organisational Commitment. Applied Psychology: An International
Review. 18: 197-209.
Orvis, K.A; Dudley, N.M. and Cortina, J.M. 2008. Conscientiousness and Reactions
to Psychological Contract Breach: A Longitudinal Field Study. Journal
of Applied Psychology. 93 (5): 1183–1193.
Parraga, I. M. 1990. Determinats of Food Consumption. Journal of American
Dietetics Association. 90: 661-663.
Pare, G; Tremblay, M. and Lalonde, P. 2000. The Impact of Human Resource
Management Practices on IT Personnel Commitment, Citizen
Behaviors and Turnover Intentions. Working paper. Montreal, Quebec,
Canada: Hautes Etudes Commerciales de Montreal.
Paul, A. K. and Anantharaman, R.N. 2004. Influence of HRM Practices on
Organizational Commitment: A Study Among Software Professionals in
India. Human Resource Development Quarterly. 15 (1): 77-89
Pazy, A. and Ganzach, Y. 2010. Predicting Committed Behavior: Exchange
Ideology and Pre-entry Perceived Organizational Support. Journal of
Applied Psychology: An International Review. 59 (2): 339-359.

177
Peccei, R. and Innocenti, L. 2004. The Impact of Human Resource Practices on
Employee Work Experiences, Attitudes and Behavior: An Occupational
Group Analysis. Journal of Applied Psychology. 50: 510-516.
Peck, S. R. 1994. Exploring the Link between Organizational Strategy and the
Employment Relationship: The Role of Human Resource Policies.
Journal of Management Studies. 31 (5): 715-36.
Petter, S. and Straub, D. 2007. Specifying Formative Constructs in Information
Systems Research. MIS Quarterly. 31 (4): 623-656.
Petty, R. E. and Cacioppo, J. T. 1986. Communication and Persuasion: Central
and Peripheral Routes to Attitude Change. New York: Springer-
Verlag.
Pfeffer, J. 1994. Competitive Advantage through People: Unclosing the Power of
the Work Force. Boston, MA: Harvard Business School Press.
Pfeffer, J. 1996. When it comes to “Best Practice”: Why do Smart Organizations
Occasionally do Dumb Things? Organizational Dynamics. 25
(Summer): 33-44.
Pfeffer, J. 1998. The Human Equation: Building Profits by Putting People First.
Boston: Harvard Business School Press.
Pfeffer, J. and Veiga, J.F. 1999. Putting People First for Organizational Success.
Academy of Management Executive. 13 (2): 37-48.
Phillips, J. M. 1998. Effects of Realistic Job Previews on Multiple Organizational
Outcomes: A Meta-Analysis. Academy of Management Journal. 41
(6): 673-690.
Podsakoff, P. M. and MacKenzie, S. B. 1994. Organizational Citizenship Behaviors
and Sales Unit Effectiveness. Journal of Marketing Research. 3: 351–
363.
Porter, L.W. and Smith, F.J. 1970. The Etiology of Organizational Commitment.
Unpublished paper. University of California, Irvine.
Porter, L; Steers, R; Mowday, R.T. and Boulian, P.V. 1974. Organizational
Commitment, Job Satisfaction and Turnover Among Psychiatric
Technicians. Journal of Applied Psychology. 59: 603-609.
178
Porter, M. E. 1985. Competitive Advantage: Creating and Sustaining Superior
Performance. New York: Free Press.
Pratt, M. G. 1998. To be or not to be? Central Questions in Organizational
Identification. In Identity in Organizations: Building Theory Through
Conversations. D.A. Whetten and P.C. Godfrey, eds. Thousand Oaks,
CA: Sage. Pp. 171-207.
Pratt, M.G. and Rosa, J.A. 2003. Transforming Work-Family Conflict into
Commitment in Network Marketing Organizations. Academy of
Management Journal. 46: 395-418.
Ramsay, H; Scholarios, D; and Harley, B. 2000. Employees and High Performance
Work System: Testing Inside the Black Box. British Journal of
Industrial Relations. 38: 501-531.
Randall, D. 1990. The Consequences of Organizational Commitment: Methodological
Investigation. Journal of Organizational Behavior. 11: 361-378.
Rakov, T. and Marcoulides, G. A. 2006. A First Course in Structural Equation
Modeling. 2nd ed. Mawwah, NJ: Erlebaum.
Rego, A. and Cunha, M. P. Organizational Justice and Citizenship Behaviors: A Study
in the Portuguese Cultural Context. Journal of Applied Psychology: An
International Review. 59 (3): 404-430.
Riketta, M. 2002. Attitudinal Organizational Commitment and Job Performance: A
Meta-analysis. Journal of Organizational Behavior. 23: 257-266.
Riketta, M. 2008. The Causal Relationship between Job Attitudes and Performance.
Journal of Applied Psychology. 93: 472-481.
Romzek, B. S. 1989. Personal Consequences of Employee Commitment. Academy
of Management Journal. 32: 649-661.
Roth, P. L. and BeVier, C. S. 1998. Response Rate in HRM/OB Survey Research:
Norms and Correlates. Journal of Management. 24 (1): 97-117.
Rousseau, D. M. 1995. Psychological Contracts in Organization: Understanding
Written and Unwritten Agreements. Thousand Oaks, CA: Sage
Publications.
Reichers, A. E. 1995. A Review and Reconceptualization of Organizational
Commitment. Academy of Management Review. 10: 465-476.

179
Rhoades, L. and Eisenberger, R. 2002. Perceived Organizational Support: A Review
of Literature. Journal of Applied Psychology. 87: 698-714.
Rhoades, L. and Eisenberger, R. and Armeli, S. 2001. Affective Commitment to
Organization: The Contribution of Perceived Organizational Support.
Journal of Applied Psychology. 86: 825-836.
Riketta, M. 2005. Organizational Identification: A meta-analysis. Journal of
Vocational Behavior. 66: 358-384.
Rogers, E. W. and Wright, P. M. 1998. Measuring Organizational Performance in
Strategic Human Resource Management: Problems, Prospects and
Performance Information Markets. Human Resource Management
Review. 8: 311-331.
Rosenberg, M. 1965. Society and Adolescent Self-Image. Princton NJ: Princeton
University Press.
Rousseau, D. M. 1989. Psychological and Implied Contracts in Organizations.
Employee Right and Responsibility Journal. 2 (1): 121-139.
Rousseau, D. M. 1995. Psychological Contracts in Organizations. Thousand
Oaks, CA: Sage.
Russ, C. F. 1982. Manpower Planning System. Part I. Personnel Journal.
(January): 40-5.
Russell, J. S; Terborg, J. R. and Powers, M. L. 1995. Organizational Performances
and Organizational Level Training and Support. Personnel Psychology,
38: 849-863.
Ryan, A. M; Schmidt M. J. and Johnson, R. 1996. Attitudes and Effectiveness:
Examining Relations at an Organizational Level. Personnel Psychology.
49: 853-882.
Sabherwal, R. and Becerra, F. 2003. An Empirical Study of the Effect of Knowledge
Management Processes at Individual, Group and Organizational Levels.
Decision Sciences. 34 (2): 225-260.
Salancik, G. R. 1977. Commitment and the Control of Organizational Behavior and
Belief. In New Directions in Organizational Behavior. B.M. Staw and
G.R. Salancik, eds. Chicago: St. Clair Press.

180
Schumacker, R. E. 1992. Goodness of Fit Criteria in Structural Equation Models. In
The Annual Meeting of the American Educational Research
Association. Chicago, IL: American Educational Research Association.
Pp. 20-24.
Scholarios, D; Ramsay, H. and Harley, B. 1999. High Commitment Management
Practices and Employee Outcomes: Evidence from Britain and
Australia. Working Paper in HRM. Melbourne: University of Melbourne.
Schuler, R.S and Jackson, S.E. 1987. Linking Competitive Strategies with Human
Resource Management Practices. Academy of Management Executive.
1 (3), 207.
Settoon, R. P; Benett, N. and Liden, R. C. 1996. Social Exchange in Organizations:
Perceived Organizational Support, Leader-Member Exchange and
Employee Reciprocity. Journal of Applied Psychology. 81: 219-227.
Sheppard, B. H; Lewicki, R. J. and Minton, J. W. 1992. Organizational Justice:
The Search for Fairness in The Workplace. New York: Lexington.
Skarlicki and Folger, R. 1997. Retaliation in The Workplace: The Role of Distributive,
Procedural and Interactional Justice. Journal of Applied Psychology. 78:
774-780.
Schein, E. H. 1980. Organizational Psychology. 3rd ed. New Jersey: Prentice-Hall.
Schuler, R. S. and MacMillan, I. C. 1984. Gaining Competitive Advantage through
Human Resource Practices. Human Resource Management. 23 (2):
241-255.
Sheldon, M. E. 1971. Investments and Involvements as Mechanism Producing
Commitment to the Organization. Administrative Science Quarterly.
16 (1): 142-150.
Shore, L. M. and Shore, T. H. 1995. Perceived Organizational Support and
Organizational Justice. In Organizational Politics, Justice and Support:
Managing The Social Climate of The Workplace. R.S. Cropanzano and
K.M. Kacmar, eds. Westport, CT: Quorum. Pp. 149-164.
Shore, L. M; Newton, L. A. and Thornton, G. C. 1990. Job and Organizational
Attitudes in Relation to Employee Behavioral Intentions. Journal of
Occupational Behavior. 11 (1): 57-67.

181
Shore, L. M. and Tetrick, L. E. 1991. A Construct Validity Study of The Survey of
Perceived Organizational Support. Journal of Applied Psychology.
76: 637–643.
Shore, L. M. and Wayne, S. J. 1993. Commitment and Employee Behavior: Comparison
of Affective Commitment and Continuance Commitment with Perceived
Organizational Support. Journal of Applied Psychology. 78: 774–780.
Schuler, R. S. and MacMillan, I. C. 1984. Gaining Competitive Advantage through
Human Resource Management Practices. Human Resource
Management, 23 (3): 241-255.
Skar, S.; Sniehotta, F. F.; Araujo-Soares, V. and Molloy, G. J. 2008. Prediction of
Behavior vs. Prediction of Behavior Change: The Role of Motivational
Moderators in the Theory of Planned Behavior. Journal of Applied
Psychology: An International Review. 57 (4): 609-627
Sin, L.Y.M; Tse, A. C. B. and Yim, F. H. K. 2005. CRM: Conceptualization and
Scale Development. European Journal of Marketing. 39 (11/12): 1264-
1290.
Smith, M. B. 1947. The Personal Setting of Public Opinions: A Study of Attitudes
Towards Russia. Public Opinion Quarterly. 11: 507-523.
Solinger, O. N; Van Olffen, W. and Roe, R.A. 2008. Beyond the Three Component
Model of Organizational Commitment. Journal of Applied Psychology.
93 (1): 70-83.
Sommers, M. 1995. Organizational Commitment, Turnover and Absenteeism: An
Examination of Direction and Interaction Effects. Journal of
Organizational Behavior. 16 (1): 49-58.
Sorensen, J. E. and Sorensen, T. L. 1974. The Conflict of Professionals in Bureaucratic
Organizations. Administrative Science Quarterly. 19 (1): 98-106.
Sparrowe, R. T. and Liden, R. C. 1997. Process and Structure in Leader-Member
Exchange. Academy of Management Review. 22: 522-552.
Spector, P. E. and Fox. S. 2010. Counterproductive Work Behavior and
Organizational Citizenship Behavior: Are They Opposite Forms of Active
Behavior? Journal of Applied Psychology: An International Review.
59 (1): 21-39.

182
Steers, R. and Spencer, D. 1977. The Role of Achievement Motivation in Job
Design. Journal of Applied Psychology. 62: 472-479.
Straw, B. M. and Salancik, G. R. 1977. New Directions in Organizational Behavior.
Chicago: St. Clair Press.
Stumpf, S. A. and Hanrahan, N. M. 1984. Designing Organizational Career
Management Practices to Fit the Management Objectives. In Readings in
Personnel and Human Resource Management. 2nd ed. R.S. Schuler and
S.A. Youngblood, eds. St.Paul: West. Pp.326-348.
Sweet, J. 1982. How Manpower Development can Support your Strategic Plan.
Journal of Business Strategy. 31 (1): 77-81.
Snyder, M. and DeBono, K. G. 1985. Appeals to Image and Claims About Quality:
Understanding The Psychological of Advertising. Journal of Personality
and Social Psychology. 49: 586-597.
Tacq, J. 1997. Multivariate Analysis Techniques in Social Science Research
from Problem to Analysis. London: Sage Publications.
Terpstra, D. E. and Rozell, E. J. 1993. The Relationship of Staffing Practices to
Organizational Level Measures of Performance. Personnel Psychology.
46 (1): 27-28.
Tett, R. P. and Meyer, J. P. 1993. Job Satisfaction, Organizational Commitment,
Turnover Intention and Turnover: Path Analyses Based on Meta-Analytic
Findings. Personnel Psychology. 46: 259-293,
Thibaut, J. and Walker, L. 1975. Procedural Justice: A Psychological Analysis.
Hillsdale, NJ: Erlbaum.
Thompson, H. B. and Werner, J. M. 1997. The Impact of Role Conflict/Facilitation
on Core and Discretionary Behaviors: Testing a Mediated Model. Journal
of Management. 23: 583-601.
Tichy, N; Fombrun, C. and Devanna M. 1982. Strategic Human Resource Management.
Sloan Management Review. 23 (2): 47-61.
Tsui, A. S. 1984. A Role Set Analysis of Managerial Reputation. Organizational
Behavior and Human Performance. 36 (1): 64–96.
183
Tsui, A. S; Pearce, J. L; Porter, L. W. and Tripoli, A. M. 1997. Alternative
Approaches to The Employee-Organization Relationship: Does Investment
in Employees pay off? Academy of Management Journal. 40: 1089–
1121.
Turban, D. B. and Cable D. M. 2003. Firm Reputation and Applicant Pool
Characteristics. Journal of Vocational Behavior. 24 (6): 733-751.
Ullman, J. B. 2006. Structural Equation Modeling: Reviewing the Basics and
Moving Forward. Journal of Personality Assessment. 87 (1): 35-50.
Unnikammu, B.; Blau, G.; Kumar, R. and Nalakath, A. 2001. Perceived
Organizational Support as A Mediator of The Relationship of Perceived
Situational Factors to Affective Organizational Commitment. Journal of
Applied Psychology: An International Review. 50 (4): 615-634.
Uhl-Bien, M; Graen, G. B. and Scandura, T. A. 2000. Implications of Leader-
Member Exchange (LMX) for Strategic Human Resource Management
Systems: Relationships as Social Capital for Competitive Advantage. In
Research in Personnel and Human Resources Management. G. R.
Ferris, ed. 18: 137-185.
Ulrich, D. 1997. Measuring Human Resources: An Overview of Practice and A
Prescription for Results. Human Resource Management. 36: 303-320.
Venkatraman, N. and Prescott, J. E. 1990. Environment–Strategy Coalignment: An
Empirical Text of its Performance Implications. Strategic Management
Journal. 11 (1): 1–23.
Verquer, M. T; Beehr, T. A. and Wagner, S. H. 2003. A Meta-Analysis of the
Relationship between Person-Organization Fit and Work-Related
Attitudes. Journal of Vocational Behavior. 63: 473-489.
Walton, R. E. 1985. Toward a Strategy of Eliciting Employee Commitment Based
on Policies of Mutuality. In HRM Trends and Challenges. Walton, R.E.
and Lawrence, P.R., eds. Boston, MA: Harvard Business School Press.
Wanichbuncha, K. 2003. Advance Statistics for SPSS. 3rd ed. Bangkok:
Chulalongkorn University Publishing.

184
Wall, T. D. and Wood, S. J. 2005. The Romance of Human Resource Management
and Business Performance and the Case for Big Science. Human
Relations. 58 (4): 429-462.
Warner, M. 1984. New Technology, Work Organizations and Industrial Relations.
Omega. 12 (3): 203-210.
Way, A. S. 2002. High Performance Work Systems and Intermediate Indicators of
Firm Performance within the US Small Business Sector. Journal of
Management. 28 (6): 765-785
Wayne, S. J; Shore, L. M. and Liden, R. C. 1997. Perceived Organizational Support
and Leader-Member Exchange: A Social Exchange Perspective.
Academy of Management Journal. 40 (1): 82-111.
Weber, M. 1947. The Theory of Social and Economic Organizations. T. Parsons,
trans. New York: Free Press.
Wheatley, M. 1997. Goodbye, Command and Control. Leader to Leader. 5
(Summer): 21–28.
White, M.; Hill, S.; McGovern, P.; Mills, C. and Smeaton, D. 2003. High
Performance Management Practices, Working Hours and Work-Life
Balance. British Journal of Industrial Relations. 41 (2): 175-195
Whitener, E. M. 2001. Do “High Commitment” Human Resource Practices Affect
Employee Commitment? A Cross Level Analysis Using Hierarchical
Linear Modeling. Journal of Management. 27: 515-535.
Whitener, E. M. and Walz, P. 1993. Exchange Theory Determinants of Affective and
Continuance Commitment and Turnover. Journal of Vocational
Behavior. 42: 265-282.
Wiener, Y. 1982. Commitment in Organizations: A Normative View. Academy of
Management Review. 7: 418-428.
Williams, L. J.; Edwards, J. R. and Vandenberg, R. J. 2003. Recent Advances in
Causal Modeling Methods for Organizational and Management Research.
Journal of Management. 29 (6): 903 -936.
Wimalasiri, J. S. 1995. An Examination of the Influence of Human Resource
Practices, Organization Commitment and Job Satisfaction on Work
Performance. International Journal of Management. 12: 352-363.
185
Wiratchai, N. 1999. Path Analysis: Statistics for Social Science. Bangkok:
Chulalongkorn University Publishing.
Wood, S. J. and deMenezes, L. 1998. High Commitment Management in The UK:
Evidence f rom the Workplace Industrial Relations Survey and Employers’
Manpower and Skill Practices Survey. Human Relations. 51 (4): 485-515
Wright, P. M and Boswell, W. 2002. Desegregating HRM: A Review and Synthesis
of Micro and Macro Human Resource Management Research. Journal of
Management. 28 (3): 247-276.
Wright, P. 1998. Strategy-HR Fit: Does it really matter? Human Resource
Planning. 21 (4): 56-57.
Wright, P. M; Dunford, B. B. and Snell, S.A. 2001. Human Resource and The Resource
Based View of The Firm. Journal of Management. 27: 701-21.
Wright, P. M. and Kehoe, R. R. 2001. In Commitment in Organizations. Florence,
KY: Routledge, Taylor & Francis Group.
Wright, P. M. and Gardner, T. M. 2003. Theoretical and Empirical Challenges in
Studying the HR Practice-Firm Performance Relationship. In The New
Workplace: People Technology and Organisation. D. Holman, T. D.
Wall, C. Clegg, P. Sparrow and A. Howard, eds. Sussex, UK: Wiley.
Wright, P. M; Gardner, T. M; Moynihan, L. M. and Allen, M. R. 2005. The
Relationship between HR Practices and Firm Performance: Examining
Causal Order. Personnel Psychology. 5: 409-446.
Wright, P. M. and McMahan, G. C. 1992. Theoritical Perspectives for Strategic
Human Resource Management. Journal of Management. 18 (2): 295-320.
Wright, P. M. and Snell, S. A. 1991. Toward an Integrate View of Strategic Human
Resource Management. Human Resource Management Review. 1:
203-25.
Yammarino, F. J; Dionne, S. D; Chun, J. U. and Dansereau, F. 2005. Leadership and
Levels of Analysis: A State-of-The-Science Review. The Leadership
Quarterly. 16: 879– 919.
Yoon, J. and Thye S. 2002. A Dual Process Model of Organizational Commitment:
Job Satisfaction and Organizational Support. Work and Occupations.
29 (1): 97-124.
186
Youndt, M. A; Snell, S. A; Dean, J. W. and Lepak, D. P. 1996. Human Resource
Management, Manufacturing Strategy and Firm Performance. Academy
of Management Journal. 39 (4): 836-866.
Zangaro, G. A. 2001. Organizational Commitment: A Concept Analysis. Nursing
Forum. 36 (2): 14-22.
Zanna, M. P. and Rempel, J. K. 1988. Attitudes: A New Look at an Old Concept. In
The Social Psychology of Knowledge. D. Bartal and A.W. Kruglanski, eds.
Cambridge: Cambridge University Press. Pp. 315-334.
Zimmerman, R. D. 2008. Understanding the Impact of Personality Traits on
Individuals’ Turnover Decisions: A Meta-Analytic Model. Personnel
Psychology. 61: 309-348.

APPENDIX A
QUESTIONNAIRE
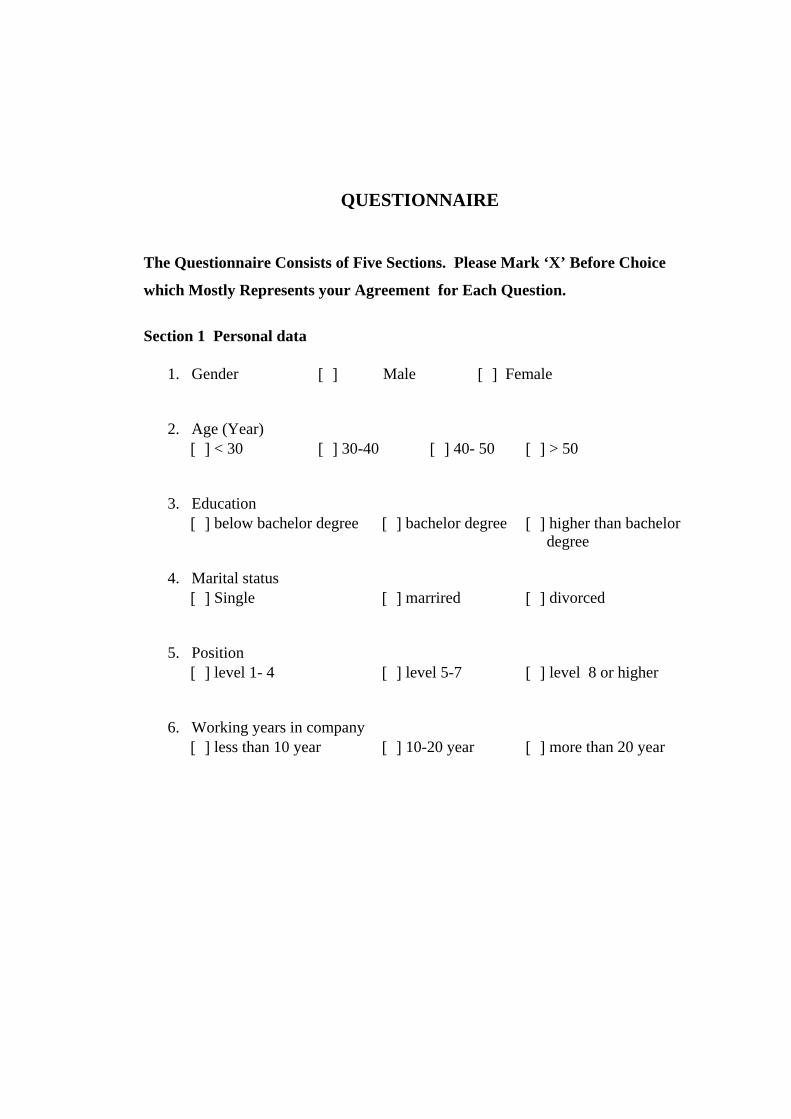
188
QUESTIONNAIRE
The Questionnaire Consists of Five Sections. Please Mark ‘X’ Before Choice
which Mostly Represents your Agreement for Each Question.
Section 1 Personal data
1. Gender [ ] Male [ ] Female
2. Age (Year)
[ ] < 30 [ ] 30-40 [ ] 40- 50 [ ] > 50
3. Education [ ] below bachelor degree [ ] bachelor degree [ ] higher than bachelor degree
4. Marital status [ ] Single [ ] marrired [ ] divorced
5. Position [ ] level 1- 4 [ ] level 5-7 [ ] level 8 or higher
6. Working years in company [ ] less than 10 year [ ] 10-20 year [ ] more than 20 year

189
Section 2 Perceived Organizational Support
Please indicate level of your agreement on current work regarding Perceived
organizational Support. There are 7 scales which are 1 = strongly disagree, 2=moderate
disagree, 3=slightly disagree 4 = neither disagree nor agree, 5=slightly agree, 6=
moderately agree, 7= strongly agree
Level of Agreement
Item
1 2 3 4 5 6 7 1. The company values my
contribution to its growth.
2. If the company could hire anyone with lower wage, it will.
3. The company care for my well-being.
4. The company disregard my complaint.
5. The company does not care whatever decision affects me.
6. The company is willing to help my work.
7. The company does not recognize my contribution.
8. If there is effective way to fulfill work, it will replace employee.
9. The company gives little chance to promote employee.
10. Although I do my best, the company ignores to know.
11. The company grant to change employment condition, if I request.
12. The company is willing to help me if I have a special request.
13. The company is interested to my job satisfaction.
14. The company would take the most advantage from employee.
15. The company shows little concerns to me.
16. If I resign, the company will convince me to stay.

190
Level of Agreement
Item
1 2 3 4 5 6 7 17. The company cares for my opinion. 18. The company is proud of my
success.
19. The company is interested in profit than employee.
20. If there is more profit, the company will raise salary.
21. The company does not want to pay up to my performance.
22. The company give my chance to perform to the best ability.
23. The company try to make my work most interesting.
Section 3 Affective Commitment and Felt Obligation
Please indicate level of your agreement on current work regarding affective
commitment and felt obligation . There are 7 scales which are 1 = strongly disagree,
2=moderate disagree, 3=slightly disagree 4 = neither disagree nor agree, 5=slightly
agree, 6= moderately agree, 7= strongly agree
Level of agreement
Item
1 2 3 4 5 6 7 1. I perform my best and beyond
expected for the company success.
2. I fell little loyalty to the company. 3. I accept to do any job just to keep
working in the company.
4. I am proud to tell anybody to be part of company.
5. The company inspires me to work. 6. If my status change, I will resign. 7. I am glad to choose the company to
work with since the beginning.
8. I will not get much benefit to work with company.

191
Level of agreement
Item
1 2 3 4 5 6 7 9. I often do not agree with company’s
key policy concerning me.
10 I am concerned with future of company.
11 I am glad to work with company till entire carrer.
12 I feel obligation to do for company success.
13 I work 100 percent for company goal.
14 I feel obligation to do quality work.
Section 4 Strategic Human Resource Management
Please indicate level of your agreement on current work regarding strategic human
resource management. There are 7 scales which are 1 = strongly disagree, 2=moderate
disagree, 3=slightly disagree 4 = neither disagree nor agree, 5=slightly agree, 6=
moderately agree, 7= strongly agree
Level of agreement
Item
1 2 3 4 5 6 7 1 I am satisfied with salary. 2 I am satisfied with total packages. 3 My benefit package is appropriate
with responsibility.
4. My good performance is recognized generally.
5 The employee has a chance to advance career.
6 The employee has opportunity to get good salary and benefits.
7 My benefits depend on group performance.
8. Benefit scheme depend on skill and knowledge, not special work.
9. I am trained with multi-skill to do more than one job as usual.

192
Level of agreement
Item
1 2 3 4 5 6 7 10.
I am trained hard for specific skill for work.
11 I am trained hard for general skill. 12.
The company tries to understand my opinion on benefit scheme.
13 The employee is trained equally. 14 Equality is company strategy. 15 The company has equality policy
written.
16 Promotion depends on work experience. 17 Usually I am not told what important
things happen in company.
18.
I get to know management viewpoint and opinion.
19.
The management accepts my opinion and viewpoint.
20.
Work participation happens in entire company.
21 Benefit is fair compared with peers in division.
22 The company allows to appeal whatever decision concerns my work.
23 The company treat employee with respect and honor whenever decision concerns.
24 The company has job rotation and proper promotion.
25 The company has conduct in procedural justice.
26 The company has procedural justice in operation and regulation.
27 The company has effective communication.
28 The company has proper benefits to work efficiency.
29 I have the whole responsibility to decide how and when to work.
30 I have opportunity to work with multi skill.
31 My work affects others and feeing. 32 My supervisor and colleague give
me feedback usually.
33 My work is routine and result is respected..

193
Section 5 Work attitude and behavior
Please indicate level of your agreement on current work regarding work attitude and
behavior. There are 7 scales which are 1 = strongly disagree, 2=moderate disagree,
3=slightly disagree 4 = neither disagree nor agree, 5=slightly agree, 6= moderately
agree, 7= strongly agree
Level of agreement
Item
1 2 3 4 5 6 7 1 I am satisfied with my work. 2 The working environment supports
my work.
3 I have tool and equipment to assist work.
4 I am outstanding than others in general.
5 I work as company requirement and expectation.
6 I expect team performance better than this.
7 My team work as required and expected.
8 I am one of valuable employee. 9 I spend most of time working. 10 My major goal concerns work 11 The most importance to me
concerns current work.
12 To me, work is a small part of life. 13 I personally involve with work a lot. 14 Every breath is work. 15 My most interesting things are
work.
16 I involve with work and it is hard to separate from work.
17 Normally, I feel not involved with work.
18 I avoid accepting special work or more responsibility.
19 I has other concerns than work. 20 If there is a chance, I will avoid to
work.

194
APPENDIX B
RELIABILITY STATISTICS

195
RELIABILITY STATISTICS
Table B1 Cronbach’s Alpha Total (All Items Included)
Reliability Statistics
Cronbach's Alpha
Cronbach's Alpha Based on Standardized
Items
N of Items
.918 .929 94
Item-Total Statistics
Scale Mean if
Item Deleted
Scale Variance
if Item Deleted
Corrected Item-Total Correlation
Squared Multiple
Correlation
Cronbach's Alpha if Item
Deleted
POS1 377.33 3928.143 .399 .734 .917
POS2 377.39 3946.939 .311 .698 .917
POS3 377.45 3938.098 .366 .761 .917
POS4 377.33 3971.433 .217 .778 .918
POS5 377.19 3976.293 .196 .774 .918
POS6 376.96 3928.844 .423 .762 .916
POS7 376.88 3951.132 .301 .750 .917
POS8 376.51 3945.286 .319 .706 .917
POS9 376.30 3954.920 .280 .762 .917
POS10 376.55 3982.913 .157 .784 .918
POS11 376.69 3955.055 .278 .809 .917

196
Scale Mean if
Item Deleted
Scale Variance
if Item Deleted
Corrected Item-Total Correlation
Squared Multiple
Correlation
Cronbach's Alpha if Item
Deleted
POS12 376.50 3943.499 .339 .847 .917
POS13 376.59 3936.446 .366 .778 .917
POS14 376.86 3965.800 .228 .781 .917
POS15 376.56 3967.902 .228 .779 .917
POS16 376.69 3957.667 .288 .759 .917
POS17 376.67 3920.123 .468 .792 .916
POS18 376.67 3929.470 .401 .816 .917
POS19 376.41 3962.757 .244 .777 .917
POS20 376.04 3851.746 .280 .369 .919
POS21 376.46 3968.267 .230 .780 .917
POS22 376.65 3926.185 .432 .824 .916
POS23 376.74 3951.832 .314 .737 .917
FO1 376.51 3944.986 .280 .803 .917
FO2 377.75 4002.941 .065 .765 .918
FO3 376.38 3918.723 .412 .807 .916
FO4 376.04 3941.370 .316 .793 .917
FO5 376.90 3940.525 .355 .671 .917
FO6 377.09 3989.890 .127 .766 .918
FO7 376.22 3949.993 .308 .698 .917
FO8 376.95 3995.971 .099 .647 .918
FO9 375.93 3943.726 .363 .757 .917
FO10 376.39 3960.787 .288 .685 .917
FO11 376.10 3950.743 .332 .772 .917
FO12 375.84 3954.624 .332 .827 .917
FO13 375.75 3957.215 .334 .821 .917
FO14 375.77 3968.646 .268 .750 .917
SHM1 378.15 3910.231 .430 .855 .916
SHM2 377.64 3909.188 .467 .861 .916

197
Scale Mean if
Item Deleted
Scale Variance
if Item Deleted
Corrected Item-Total Correlation
Squared Multiple
Correlation
Cronbach's Alpha if Item
Deleted
SHM3 377.70 3905.335 .458 .804 .916
SHM4 377.19 3902.800 .505 .766 .916
SHM5 377.33 3904.300 .494 .776 .916
SHM6 377.28 3900.593 .505 .792 .916
SHM7 377.22 3926.865 .403 .733 .917
SHM8 376.90 3934.035 .378 .676 .917
SHM9 376.52 3931.932 .381 .779 .917
SHM10 376.55 3933.125 .395 .815 .917
SHM11 376.46 3944.798 .358 .794 .917
SHM12 376.55 3945.231 .375 .773 .917
SHM13 376.66 3927.668 .403 .777 .917
SHM14 376.68 3933.784 .382 .815 .917
SHM15 376.73 3939.180 .364 .795 .917
SHM16 376.72 3922.194 .401 .719 .916
SHM17 376.95 3958.790 .273 .666 .917
SHM18 376.87 3935.496 .368 .819 .917
SHM19 377.11 3935.721 .361 .820 .917
SHM20 376.89 3926.252 .419 .809 .916
SHM21 376.94 3949.359 .306 .756 .917
SHM22 376.75 3936.844 .372 .822 .917
SHM23 376.61 3940.637 .405 .786 .917
SHM24 377.90 3909.109 .407 .875 .916
SHM25 377.67 3899.240 .488 .898 .916
SHM26 377.66 3908.014 .455 .869 .916
SHM27 377.09 3903.107 .475 .821 .916
SHM28 377.30 3899.120 .507 .807 .916
SHM29 376.93 3922.637 .419 .747 .916
SHM30 376.62 3938.025 .387 .778 .917

198
Scale Mean if
Item Deleted
Scale Variance
if Item Deleted
Corrected Item-Total Correlation
Squared Multiple
Correlation
Cronbach's Alpha if Item
Deleted
SHM31 376.57 3942.095 .370 .746 .917
SHM32 376.29 3952.152 .335 .802 .917
SHM33 376.25 3958.003 .301 .694 .917
B1 377.69 3901.110 .428 .813 .916
B2 377.39 3914.486 .426 .772 .916
B3 377.30 3925.682 .366 .771 .917
B4 377.30 3927.761 .397 .760 .917
B5 376.78 3909.529 .449 .839 .916
B6 376.73 3930.934 .381 .811 .917
B7 376.66 3910.137 .473 .750 .916
B8 376.07 3949.211 .163 .589 .919
B9 376.29 3927.490 .412 .778 .916
B10 376.14 3926.756 .419 .820 .916
B11 376.26 3943.308 .360 .771 .917
B12 377.13 3990.634 .115 .728 .918
B13 376.28 3924.060 .451 .788 .916
B14 376.61 3930.787 .379 .817 .917
B15 376.43 3931.511 .414 .813 .917
B16 376.80 3933.463 .389 .809 .917
B17 377.19 3983.063 .152 .818 .918
B18 377.00 3977.341 .172 .764 .918
B19 376.42 3958.404 .256 .629 .917
B20 376.67 3991.716 .123 .661 .918
B21 377.30 3985.361 .130 .789 .918
B22 376.88 3981.498 .152 .825 .918
B23 377.02 3989.097 .132 .809 .918
B24 375.81 3923.240 .070 .452 .926

199
APPENDIX C
STRUCTURAL EQUATION MODELING TESTING BY AMOS

200
STRUCTURAL EQUATION MODELING TESTING BY AMOS
Model 1 Four Constructs (SHM, POS, AC, BHV)
Table C1 Maximum Likelihood Estimate
Note: *** p < .001
Regression Weights: (Group number 1 - Default model)
Estimate S.E. C.R. P Label
ac <--- shm 0.453 0.126 3.595 ***
ac <--- pos 0.299 0.095 3.168 0.002
bhv <--- ac 0.374 0.086 4.349 ***
bhv <--- pos 0.372 0.108 3.452 ***
bhv <--- shm 0.518 0.149 3.465 ***
pos3 <--- pos 1
pos1 <--- pos 1.125 0.117 9.583 ***
b1 <--- bhv 1
b6 <--- bhv 0.691 0.073 9.513 ***
b9 <--- bhv 0.557 0.069 8.038 ***
b21 <--- bhv -0.412 0.076 -5.396 ***
shm5 <--- shm 1
shm9 <--- shm 0.69 0.119 5.807 ***
shm27 <--- shm 1.07 0.145 7.385 ***
shm30 <--- shm 0.694 0.111 6.235 ***
fo4 <--- ac 1.097 0.076 14.461 ***
fo3 <--- ac 1.127 0.077 14.711 ***
fo1 <--- ac 1

201
Standardized Regression Weights: (Group number 1 - Default model)
Estimate
ac <--- shm 0.347
ac <--- pos 0.268
bhv <--- ac 0.329
bhv <--- pos 0.292
bhv <--- shm 0.349
pos3 <--- pos 0.758
pos1 <--- pos 0.823
b1 <--- bhv 0.762
b6 <--- bhv 0.633
b9 <--- bhv 0.522
b21 <--- bhv -0.345
shm5 <--- shm 0.611
shm9 <--- shm 0.434
shm27 <--- shm 0.634
shm30 <--- shm 0.477
fo4 <--- ac 0.853
Fo3 <--- ac 0.887
Fo1 <--- ac 0.73
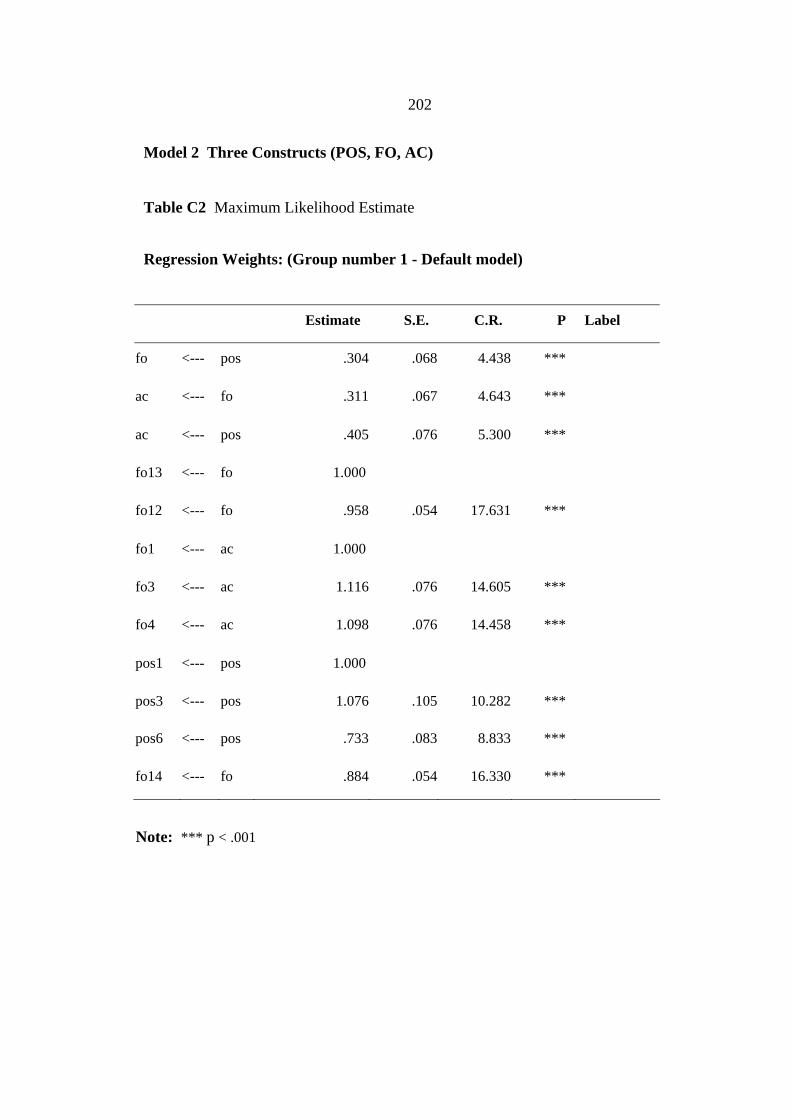
202
Model 2 Three Constructs (POS, FO, AC)
Table C2 Maximum Likelihood Estimate
Regression Weights: (Group number 1 - Default model)
Estimate S.E. C.R. P Label
fo <--- pos .304 .068 4.438 ***
ac <--- fo .311 .067 4.643 ***
ac <--- pos .405 .076 5.300 ***
fo13 <--- fo 1.000
fo12 <--- fo .958 .054 17.631 ***
fo1 <--- ac 1.000
fo3 <--- ac 1.116 .076 14.605 ***
fo4 <--- ac 1.098 .076 14.458 ***
pos1 <--- pos 1.000
pos3 <--- pos 1.076 .105 10.282 ***
pos6 <--- pos .733 .083 8.833 ***
fo14 <--- fo .884 .054 16.330 ***
Note: *** p < .001

203
Standardized Regression Weights: (Group number 1 - Default model)
Estimate
fo <--- pos .297
ac <--- fo .288
ac <--- pos .367
fo13 <--- fo .903
fo12 <--- fo .835
fo1 <--- ac .733
fo3 <--- ac .882
fo4 <--- ac .857
pos1 <--- pos .742
pos3 <--- pos .827
pos6 <--- pos .565
fo14 <--- fo .781

204
Model A Three Constructs (SHM, POS, BHV)
Table C3 Maximum Likelihood Estimate
Note: *** p < .001
Regression Weights: (Group number 1 - Default model)
Estimate S.E. C.R. P Label
pos <--- shm 0.642 0.114 5.626 ***
bhv <--- shm 0.718 0.161 4.45 ***
bhv <--- pos 0.509 0.118 4.316 ***
pos3 <--- pos 1
pos1 <--- pos 1.09 0.116 9.401 ***
shm9 <--- shm 0.683 0.119 5.719 ***
shm27 <--- shm 1.078 0.147 7.316 ***
shm30 <--- shm 0.686 0.112 6.134 ***
shm5 <--- shm 1
b21 <--- bhv -0.362 0.073 -4.98 ***
b9 <--- bhv 0.515 0.067 7.705 ***
b6 <--- bhv 0.617 0.07 8.777 ***
b1 <--- bhv 1

205
Standardized Regression Weights: (Group number 1 - Default model)
Estimate
pos <--- shm 0.54
bhv <--- shm 0.457
bhv <--- pos 0.385
pos3 <--- pos 0.77
pos1 <--- pos 0.81
shm9 <--- shm 0.43
shm27 <--- shm 0.639
shm30 <--- shm 0.471
shm5 <--- shm 0.611
b21 <--- bhv -0.321
b9 <--- bhv 0.51
b6 <--- bhv 0.597
b1 <--- bhv 0.806

206
Model B Four Constructs (SHM, POS, FO, BHV)
Table C4 Maximum Likelihood Estimate
Note: *** p < .001
Regression Weights: (Group number 1 - Default model)
Estimate S.E. C.R. P Label
fo <--- pos 0.276 0.067 4.117 ***
bhv <--- fo 0.461 0.084 5.468 ***
bhv <--- shm 0.646 0.146 4.419 ***
bhv <--- pos 0.373 0.111 3.351 ***
shm5 <--- shm 1
shm9 <--- shm 0.663 0.116 5.695 ***
shm27 <--- shm 1.059 0.143 7.384 ***
pos3 <--- pos 1
pos1 <--- pos 1.088 0.115 9.493 ***
b1 <--- bhv 1
b6 <--- bhv 0.673 0.072 9.382 ***
b9 <--- bhv 0.569 0.069 8.268 ***
b21 <--- bhv -0.388 0.076 -5.128 ***
shm30 <--- shm 0.667 0.109 6.133 ***
fo12 <--- fo 1.114 0.116 9.64 ***
fo13 <--- fo 1
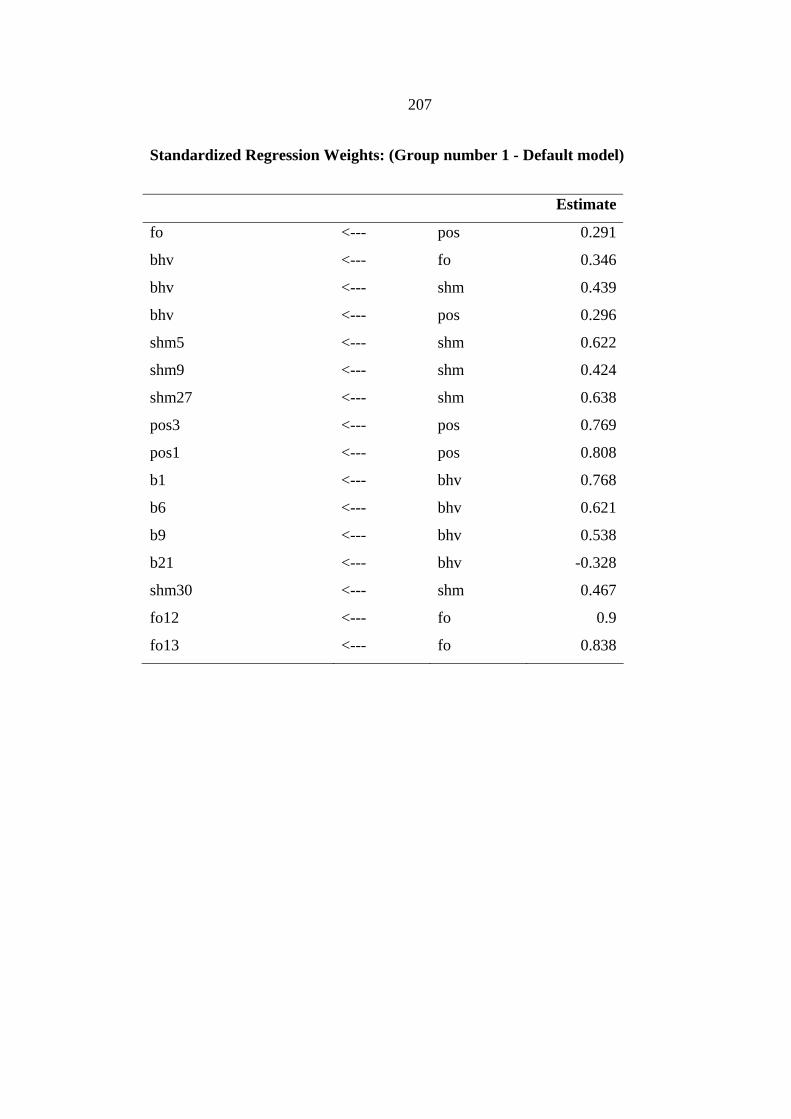
207
Standardized Regression Weights: (Group number 1 - Default model)
Estimate
fo <--- pos 0.291
bhv <--- fo 0.346
bhv <--- shm 0.439
bhv <--- pos 0.296
shm5 <--- shm 0.622
shm9 <--- shm 0.424
shm27 <--- shm 0.638
pos3 <--- pos 0.769
pos1 <--- pos 0.808
b1 <--- bhv 0.768
b6 <--- bhv 0.621
b9 <--- bhv 0.538
b21 <--- bhv -0.328
shm30 <--- shm 0.467
fo12 <--- fo 0.9
fo13 <--- fo 0.838

208
Model C1 Five Constructs (SHM, POS, AC, FO, BHV)
Table C5 Maximum Likelihood Estimate
Standardized Regression Weights: (Group number 1 - Default model)
Estimate
ac <--- shm 0.326
ac <--- fo 0.264
ac <--- pos 0.19
bhv <--- ac 0.265
bhv <--- shm 0.513
bhv <--- fo 0.308
shm5 <--- shm 0.602
shm9 <--- shm 0.415
shm27 <--- shm 0.621
fo13 <--- fo 0.859
fo12 <--- fo 0.878
b1 <--- bhv 0.736
b6 <--- bhv 0.646
b9 <--- bhv 0.547
b21 <--- bhv -0.358
shm30 <--- shm 0.472
pos1 <--- pos 0.822
pos3 <--- pos 0.759
fo4 <--- ac 0.855
fo1 <--- ac 0.734
fo3 <--- ac 0.883

209
Standardized Total Effects (Group number 1 - Default model)
fo shm pos ac bhv
ac 0.264 0.326 0.19 0 0
bhv 0.378 0.6 0.051 0.265 0
fo13 0.859 0 0 0 0
fo4 0.226 0.278 0.163 0.855 0
pos3 0 0 0.759 0 0
pos1 0 0 0.822 0 0
shm30 0 0.472 0 0 0
b21 -0.135 -0.215 -0.018 -0.095 -0.358
b9 0.207 0.328 0.028 0.145 0.547
b6 0.244 0.388 0.033 0.171 0.646
b1 0.278 0.441 0.037 0.195 0.736
fo1 0.194 0.239 0.14 0.734 0
fo3 0.233 0.288 0.168 0.883 0
fo12 0.878 0 0 0 0
shm27 0 0.621 0 0 0
shm9 0 0.415 0 0 0
shm5 0 0.602 0 0 0

210
Model C2 Five Constructs (SHM, POS, AC, FO, BHV) Table C6 Maximum likelihood estimate
Causal Model C2 Regression Weights:
Estimate S.E. C.R. P Label
pos <--- shm 0.928 0.182 5.109 ***
fo <--- pos 0.306 0.072 4.229 ***
ac <--- shm 0.686 0.204 3.367 ***
ac <--- pos 0.256 0.105 2.438 0.015
ac <--- fo 0.325 0.073 4.448 ***
bhv <--- ac 0.241 0.075 3.216 0.001
bhv <--- pos 0.302 0.105 2.878 0.004
bhv <--- fo 0.343 0.078 4.409 ***
bhv <--- shm 0.759 0.219 3.466 ***
pos3 <--- pos 1
pos1 <--- pos 1.119 0.115 9.703 ***
b1 <--- bhv 1
shm30 <--- shm 1
shm5 <--- shm 1.491 0.239 6.238 ***
fo1 <--- ac 0.895 0.061 14.732 ***
fo3 <--- ac 1
fo4 <--- ac 0.98 0.056 17.616 ***
shm9 <--- shm 0.986 0.192 5.128 ***
shm27 <--- shm 1.562 0.25 6.259 ***
fo12 <--- fo 1
fo13 <--- fo 0.945 0.09 10.502 ***
b6 <--- bhv 0.711 0.073 9.748 ***
b9 <--- bhv 0.584 0.07 8.332 ***
b21 <--- bhv -0.425 0.077 -5.509 ***
Note: ***p<.000

211
Standardized Regression Weights: (Group number 1 - Default model)
Estimate
pos <--- shm 0.543
fo <--- pos 0.293
ac <--- shm 0.322
ac <--- pos 0.205
ac <--- fo 0.272
bhv <--- ac 0.242
bhv <--- pos 0.243
bhv <--- fo 0.288
bhv <--- shm 0.357
pos3 <--- pos 0.759
pos1 <--- pos 0.82
b1 <--- bhv 0.747
shm30 <--- shm 0.471
shm5 <--- shm 0.625
fo1 <--- ac 0.732
fo3 <--- ac 0.883
fo4 <--- ac 0.855
shm9 <--- shm 0.425
shm27 <--- shm 0.634
fo12 <--- fo 0.878
fo13 <--- fo 0.86
b6 <--- bhv 0.638
b9 <--- bhv 0.536
b21 <--- bhv -0.35

212
BIOGRAPHY
NAME Suthi Suthiphan
ACADEMIC BACKGROUND B.ENG (Mechanical Engineering)
Chulalongkorn University,
Thailand
M.B.A. Thammasat University,
Thailand
PRESENT POSITION Department Manager
Thai Airways International PLC.
89 Vibhavadi Rangsit Rd.
Bangkok, Thailand
Copyright © 2022 FDOKUMEN