The Impact of Self-Generated Analogy Instruction on At-Risk ...
268
Florida State University Libraries Electronic Theses, Treatises and Dissertations The Graduate School 2005 The Impact of Self-Generated Analogy Instruction on at-Risk Students' Interest and Motivation to Learn Ciana B. Bennett-Clarke Follow this and additional works at the FSU Digital Library. For more information, please contact [email protected]
-
Upload
khangminh22 -
Category
Documents
-
view
0 -
download
0
Transcript of The Impact of Self-Generated Analogy Instruction on At-Risk ...
Florida State University Libraries
Electronic Theses, Treatises and Dissertations The Graduate School
2005
The Impact of Self-Generated AnalogyInstruction on at-Risk Students' Interest andMotivation to LearnCiana B. Bennett-Clarke
Follow this and additional works at the FSU Digital Library. For more information, please contact [email protected]
THE FLORIDA STATE UNIVERSITY
COLLEGE OF EDUCATION
THE IMPACT OF SELF-GENERATED ANALOGY INSTRUCTION ON
AT-RISK STUDENTS’ INTEREST AND MOTIVATION TO LEARN
By
CIANA B. BENNETT-CLARKE
A Dissertation submitted to the
Department of Educational Psychology and Learning Systems
in partial fulfillment of the
requirements for the degree of
Doctor of Philosophy
Degree Awarded:
Fall Semester, 2005
Copyright©2005
Ciana B. Bennett-Clarke
All Rights Reserved
The members of the Committee approve the Dissertation of Ciana B. Bennett-Clarke defended
on July 29, 2005
_______________________________
Marcy Driscoll
Professor Co-Directing Dissertation
_______________________________
Alysia Roehrig
Professor Co-Directing Dissertation
_______________________________
Sherry Southerland
Outside Committee Member
_______________________________
Akihito Kamata
Committee Member
Approved:
________________________________
Frances Prevatt, Chair, Educational Psychology and Learning Systems
The Office of Graduate Studies has verified and approved the above named committee
members
ii

This work is dedicated to my beloved father, the late John J. Bennett and my beloved
mother, Hermie M Bennett for their life long investment in my learning and to my husband Jerry
A. Clarke and three children Jude, James, and Ciara for their patience, understanding and love
during the process of writing this paper.
iii
ACKNOWLEDGEMENTS
Thank you especially to my major advisor of five years, Dr. Marcy Driscoll whose hard
work, dedication, patience and support, has made a positive influence in the progression of my
original ideas and commitment to this project and my overall experiences as a student at Florida
State University. Thank you also to my co-advisor Dr. Alysia Roehrig for her valuable input,
detailed editing and continuous encouragement in this project, and to Dr Aki Kamata and Dr.
Sherry Southerland for their valued time and commitment in serving as my committee members.
I greatly appreciate the opportunity that I have I had to work with you all.
iv
TABLE OF CONTENTS
List of Tables.........................................................................................................................
List of Figures ......................................................................................................................
Abstract.................................................................................................................................
1. CHAPTER ONE: Introduction ........................................................................................
Purpose of the Study....................................................................................................
Research Questions......................................................................................................
2. CHAPTER TWO: Background Literature.......................................................................
Intrinsic Motivation to Learn.......................................................................................
Interest..........................................................................................................................
Situational Interest..................................................................................................
Individual Interest...................................................................................................
Summary: Relationship Between Situational Interest,
Individual Interest and Intrinsic Motivation to Learn..................................................
Environments that Stimulate Students’ Interest and Motivation to Learn...................
Analogies as Instructional Tools..................................................................................
Text-based and teacher-constructed analogies ......................................................
Self-generated analogies as instructional tools......................................................
3. CHAPTER THREE: Method...........................................................................................
Participants...................................................................................................................
The school..............................................................................................................
Participant consent............... ..................................................................................
At-risk criteria........................................................................................................
Data Gathering and Instrumentation............................................................................
Engagement and boredom behaviors markers for observation –
Observing and documenting individual interest and
motivation to learn behaviors................................................................................
Surveys...................................................................................................................
Focus Group Interviews.........................................................................................
Procedure......................................................................................................................
Issues of Validity and Reliability.................................................................................
4. CHAPTER FOUR: Results..............................................................................................
Demographic Data .......................................................................................................
Research Question 1a – Situational Interest.................................................................
Research Question 1b – Individual Interest.................................................................
Research Question 2 – Motivation to Learn.................................................................
vii
xi
xiii
1
3
5
6
6
8
9
10
11
13
14
14
16
20
20
22
22
23
25
26
31
34
40
40
57
60
61
66
78
105
v
Research Question 3 – Relationship Between Variables.............................................
Research Question 4 – Males versus Females .............................................................
Research Question 5 – At-risk versus Regular ............................................................
Research Question 6 – Student Perspective on analogy use........................................
Summary of Findings...................................................................................................
5. CHAPTER FIVE: Discussion..........................................................................................
Discussion of Findings ................................................................................................
Limitations..................... ..............................................................................................
Conclusion....................................................................................................................
Implications for Teacher Education.......................................................................
Recommendations for Further Research................................................................
APPENDICES ................................................................................................................
A: Clearance and Consent...........................................................................................
B: Data Gathering Instruments ...................................................................................
C: Intervention-related Materials................................................................................
D: Additional Results Data..........................................................................................
REFERENCES............... ......................................................................................................
BIOGRAPHICAL SKETCH................................................................................................
122
140
153
166
168
170
171
186
188
189
190
192
193
197
221
240
251
259
vi

LIST OF TABLES
Table 3-1: Overview of Data Collection............................................................................
Table 3-2: Individual Interest Behaviors Observed in Course Activities..........................
Table 3-3: Motivation to Learn Behaviors Observed in Course Activities.......................
Table 3-4: General Procedures for the Intervention..........................................................
Table 4-1: Percentage of student responses to Pre-DIS questions related to
motivating students’ to attend or do well in school..........................................
Table 4-2: Percentage of student responses for Pre-DIS items 8-14.................................
Table 4-3: Frequency of student responses within categories of attitudes
towards science.................................................................................................
Table 4-4: Ratings of situational interest levels based on SIS
survey item-values...........................................................................................
Table 4-5: Distribution of At-risk Participant SIS scores..................................................
Table 4-6: Descriptive summary of SIS group data..........................................................
Table 4-7: Factor Strength: Summary of SIS group factor scores and
other descriptive data.......................................................................................
Table 4-8: Percentage of SIS item responses per catch and hold factor
within pre-set situational interest item ranges ...............................................
Table 4-9: Follow-up analogy activity reflection..............................................................
Table 4-10: Analogy Activity Participant Reflection Responses per
category level of situational interest scores.....................................................
Table 4-11: A comparison of participant means scores for situational
interest from Form A (original SIS) and Form B............................................
Table 4-12: Evidence of post-intervention situational interest
in student responses........................................................................................
21
30
30
47
63
64
65
68
69
69
70
70
72
73
76
77
vii

Table 4-13: Summary of Student Responses to Individual Interest Items.........................
Table 4-14: Student responses to multiple response and interest
items #1 and #2 on the IMLS.........................................................................
Table 4-15: Participant Responses Regarding Personal Engagement
and Boredom Behaviors..................................................................................
Table 4-16: Coding of Pre-set Interest-related Engagement Behaviors.............................
Table 4-17: Coding of Pre-set Interest-related Boredom Behaviors..................................
Table 4-18: Comparison of whole group general engagement and
boredom data before and during the intervention...........................................
Table 4-19: Summary of Participant General Pre-intervention and Intervention
Engagement and Boredom Rates...................................................................
Table 4-20: Comparison of pre-intervention and intervention general
pre-set behaviors rate......................................................................................
Table 4-21: Comparison of pre-intervention and intervention detailed
pre-set behaviors rates....................................................................................
Table 4-22: Summary Comparison of Focus Group Participants’ IMLS
and Direct Observation Data..........................................................................
Table 4-23: Summary of whole group general boredom and engagement
data per teacher for the pre-intervention period.............................................
Table 4-24: General Use of Instructional Methods Per Intervention period......................
Table 4-25: Percentage of Group Responses to IMLS Motivation-to-learn
Items 4-8.........................................................................................................
Table 4-26: Summary of student responses to motivation-to-learn
items 4-8 on the IMLS....................................................................................
Table 4-27: The percentage of observed motivation-to-learn behaviors and
differences between the pre-intervention and intervention periods...............
Table 4-28: Summary of Teacher’s perceptions of patterns in whole group
motivation-to-learn behavior..........................................................................
Table 4-29: Case-ordered Effects Matrix of Individual Participants’ findings..................
79
80
82
83
84
89
90
92
96
100
103
104
107
109
111
114
124
viii
Table 4-30: Levels of impact on students’ situational interest, individual interest
and motivation to learn at the time of the intervention...................................
Table 4-31: Levels of the intervention’s impact on students’ motivation
to learn after the intervention..........................................................................
Table 4-32: Summary of Individual Interest and Motivation to Learn
support data....................................................................................................
Table 4-33: Summary of original and post –intervention situational
interest scores.................................................................................................
Table 4-34: Comparative Summary of SIS Group Scores for Male
and Female At-risk Participants....................................................................
Table 4-35: Distribution of SIS Scores for of Male and Female At-risk
Participants.....................................................................................................
Table 4-36 :The Percentage of Male and Female SIS item responses
per catch and hold factor ................................................................................
Table 4-37: Comparison of Gender Responses to IMLS Individual
Interest Items 1 and 2......................................................................................
Table 4-38: Comparison of Male and Female Pre-intervention and Intervention
General Engagement and Boredom Rates......................................................
Table 4-39: Comparison of Male and Female detailed Behaviors Rates...........................
Table 4-40: Comparison of Male and Female Responses to IMLS
Motivation-to-learn items 4-6.........................................................................
Table 4-41: Checklist Data: Comparison of Male and Female observed
motivation-to-learn behaviors.........................................................................
Table 4-42: Comparison of Teacher’s motivation-to-learn behavior and
differences in means for male and female students........................................
Table 4-43: Comparison of Male and Female Post MLS Responses.................................
Table 4-44: Comparison of At-risk and Regular Whole Group SIS Data..........................
Table 4-45: Distribution of At-risk and Regular Student SIS Scores.................................
125
125
126
136
141
141
142
143
144
146
147
149
150
152
153
154
ix

Table 4-46: Percentage of SIS Item Responses per Catch and Hold Factor
for At-risk and Regular Students...................................................................
Table 4-47: At-risk and Regular ~ Percentage of SIS item responses
per catch and hold factor ...............................................................................
Table 4-48: Comparison of Regular Student Original and Post SIS
scores to At-risk SIS data................................................................................
Table 4-49: IMLS ~ Summary of Student Responses to Individual
Interest Items..................................................................................................
Table 4-50: Comparison of At-risk and Regular Pre-intervention and
Intervention General Engagement and Boredom Rates..................................
Table 4-51: Comparison of At-risk and Regular Pre-intervention and Intervention
Detailed Behaviors Rates................................................................................
Table 4-52:Comparison of Regular and At-risk Group Responses to IMLS
Motivation-to-learn items 4-8...........................................................................
Table 4-53: Checklist Data: The percentage of observed motivation-to-learn
behaviors and differences in rate....................................................................
Table 4-54: Comparison of Teacher’s Motivation-to-learn Behavior
and Differences in means for At-risk and Regular Students..........................
155
156
157
158
159
160
162
163
164
x

LIST OF FIGURES
Figure 2-1: A Flow chart showing a theoretical relationship between
situational Interest individual interest and motivation to learn......................
Figure 3-1: Illustrating the connection of engagement behaviors
to interest and motivation to learn .................................................................
Figure 3-2: Example of off-task seating chart ..................................................................
Figure 4-1a: Percentage of participants per at-risk category .............................................
Figure 4-1b: Percentage of participants per total number of at-risk factors ......................
Figure 4-2: Comparison of Mean SIE and Form B SIS item scores for
teacher –constructed and student generated analogies ...................................
Figure 4-3: Example of summary general engagement/ boredom observation
chart for individual participants per observation day......................................
Figure 4-4: Example of summary engagement /boredom observation chart for
whole participant group per observation day for days 1-3..............................
Figure 4-5: Example of a general engagement and boredom summary chart per
participant for the pre-intervention period.......................................................
Figure 4-6: Example of engagement and boredom summary chart per whole
group observation days 1-3............................................................................
Figure 4-7: Comparison of participant pre-intervention and
intervention engagement rates .......................................................................
Figure 4-8: Example of a summary frequency grid of pre-set detailed
interest behavior for observation days 1-5.....................................................
Figure 4-9: Summary of general on/off-task and detailed behavior
rates during the pre-intervention and intervention periods............................
Figure 4-10: Comparison of pre-intervention and intervention general
on/off-task and detailed behaviors rate ........................................................
12
28
32
62
62
76
85
86
87
88
90
91
93
94
xi

Figure 4-11: Comparison of whole detailed boredom and engagement rates for the
pre-intervention and intervention periods.....................................................
Figure 4-12: Comparison of specific detailed boredom and engagement rates for the
pre-intervention and intervention periods.....................................................
Figure 4-13: Summary of general instructional methods used and the percentage of
observational days in which they were used by the classroom teacher.........
Figure 4-14a: Change in behavior summary chart for Carrie, code # 305.........................
Figure 4-14b: Change in behavior summary chart for Sandra, code # 309........................
Figure 4-14c: Change in behavior summary chart for Michael, code # 312......................
Figure 4-14d: Change in behavior summary chart for Freeda, code # 605........................
Figure 4-14e: Change in behavior summary chart for Justin, code # 305..........................
Figure 4-15a: Change in behavior summary chart for Charles, code # 303.......................
Figure 4-15b: Change in behavior summary chart for Lori, code # 315............................
95
97
105
127
129
131
132
134
137
138
xii
ABSTRACT
The problem of students leaving school before graduation is a national crisis. In the
United States it is estimated that there are 39.7 million individuals 18 years of age or older who
have never completed high school. Survey research on high school dropouts identified dropouts’
“dislike of school” as the most common reason attributed to their leaving school. In addition,
contemporary qualitative studies, examining reasons dropouts give for leaving traditional school
settings, showed that “Did not like school” often translated into feelings of classroom boredom
for students. In combating this phenomenon of “classroom boredom”, dropout prevention
researchers suggest that educators and researchers working with at-risk students try “current,
innovative, cognitively based methods of motivating students” (Di Cintio & Gee, 1999, p.235).
In addition, because disinterest in learning is a primary manifestation of lack of motivation to
learn (Mitchell, 1993), “classroom boredom” may be prevented and students’ learning in the
classroom empirically examined through the perspective of the variables, situational interest
(interest that is generated primarily by certain conditions, stimuli, and/or concrete objects in the
environment that focus attention), individual interest (a personal form of interest that is specific
to the individual, relatively stable and develops over time) and intrinsic motivation to learn ( a
drive to engage in the learning process or engage in school-related activities for their own sake).
Given these considerations, the purpose of this study was to examine the impact of an
intervention – self-generated analogy instruction -- on situational interest, individual interest and
motivation to learn of students who are at-risk of dropping out of high school.
In this study, self-generated analogy instruction, based on Generative Learning Theory
(Wittrock, 1990), was presumed to be a potentially effective classroom teaching tool that
exhibits recommended characteristics for meeting the instructional needs of at-risk students.
Self-generated analogy instruction was introduced as an intervention within two intact high-
school biology classrooms, and its effectiveness was investigated through a mixed method
research design comprised of both qualitative and quantitative techniques for collecting data.
xiii
The major dependent variables in this study were at-risk students’ levels of individual
interest in the course and learning in general, and motivation to learn inside and outside of class.
In addition, at-risk students’ level of situational interest in the analogy intervention activities was
examined as a minor dependent variable. The major independent variable was instructional
strategy examined on two levels 1. Pre-intervention instruction (general teaching methods before
the introduction of the intervention, including the use of text or teacher instructional analogies)
and 2. A self-generated analogy teaching intervention that emphasizes the application of student-
directed self-generated analogies. In addition, at-riskness and gender, was examined as minor
independent variables that may mediate the outcome of the study.
General and direct classroom observations as well as four student and two teacher survey
instruments and a post-intervention focus group interview was used to obtain pre-intervention,
intervention, and post-intervention data. Listed below are a summary of the three major and three
minor research questions addressed by the study and a summary of their findings.
Major questions
1) To what extent did the analogy intervention impact:
a) Students’ situational interest in the analogy activities?
Overall level of situational interest for the group was high. The hold factor “Understanding”
was reported as the strongest factor.
b) Students’ individual interest in the course or learning in general?
Majority of participants felt the analogy intervention had a high to very high impact on their
interest in the course and learning in general, with evidence of a general increase and
decrease in general engagement and boredom for all participants.
2) To what extent did the analogy intervention impact student’s motivation to learn inside and
outside of class during and after the intervention period?
Majority of participants felt that the analogy intervention had a high to very high level of
impact on some facet of their motivation to learn during the intervention period with
evidence of a general pattern of increase and decrease in motivation-related engagement and
boredom, respectively.
xiv
3) Based on the outcome study, to what extent can we say that situational interest, individual
interest, and motivation to learn are related; and if related, did the findings confirm Hidi &
Harackiewicz’s (2000) theory that individual interest can be influenced by continued
situational interest over time and Schiefele’s (1991) theory that individual interest can be
viewed as a pre-condition of intrinsic motivation?
The findings of this study provided evidence suggesting the existence of a relationship
between the variables, one that supports the theories of Hidi and Harackiewicz (2000) and
Schiefele (1991).
Minor questions
4) How did the study’s findings regarding at-risk students’ situational interest, individual
interest and motivation to learn compare to that of regular students?
Data for both groups were similar for situational interest and post-intervention motivation to
learn, but different for individual interest and motivation to learn.
5) Within the at-risk group, how did the study’s findings regarding situational interest,
individual interest and motivation to learn compare between female and male students?
Data for both groups were similar for individual interest, motivation to learn, and post-
intervention motivation to learn, but different for situational interest.
6) What were some general student attitudes and preferences regarding the use of self-
generated analogies compared to pre-intervention teacher-constructed analogies as
instructional tools for promoting interest and motivation to learn?
All students reported that teacher analogies used during the intervention period helped them
learn more than those used by the teacher before the intervention and most students reported
that they preferred self–generated analogies over teacher-constructed analogies.
xv
CHAPTER ONE
Introduction
The problem of students leaving school before graduation is a national crisis. In the
United States it is estimated that there are 39.7 million individuals 18 years of age or older who
have never completed high school, although about 55 percent did complete at least some high
school (McMillen & Kaufman, 1993). In 2000, 10.9 percent of youth ages 16 to 24 were reported
to be dropouts, representing 3.8 million youth nationally (Kauffman, Alt, & Chapman, 2001); in
addition, about three-fourths (75.8 percent) of those dropouts were ages 15 through 18
(Kauffman et al., 2001). Currently a new study on national graduation rates done by the
Manhattan Institute for Policy Research (which does not include GED or other alternative
credentials), found that only 69 percent of the class of 2000 in public schools graduated (Greene,
2002). This rate was even lower for most minority groups, the largest disparities being between
White (79 percent) and African-American (55 percent), Hispanic (53 percent), and Native
American Students (57 percent). In fact for each minority group there were six different states
with graduation rates below 50 percent (Greene, 2002).
It has been reported that there are economic and other societal problems that are caused
by the dropout rate. Catterall (1985) found that not completing high school increases the
likelihood of being arrested, having out-of-wedlock births and being unemployed. These
circumstances, Catterall (1985) states, translate into substantial societal costs for the criminal
justice, welfare, and health care systems. Moreover, just as this crisis is vast, identifying the
cause for dropping out has also been problematic; potential risk factors for dropping out can
differ by type of community, family background, type of school attended, enculturation and
socialization experiences, age and even gender (Ianni & Orr, 1996). However, these factors when
closely examined hold the keys to developing effective measures that will promote drop out
prevention.
Rumberger (1987) reviewed the literature on high school dropouts and identified
economic, personal, and school-related factors that contributed to students leaving school. Of
the four school-related factors identified, students’ “dislike of school” was chosen by the largest
percentage of dropouts across ethnicity and gender (Rumberger, 1987). In fact, according to the
most recent survey study done by the U.S. Department of Education, National Education
1

Longitudinal Study (NELS) of 1988: First Follow-up Study of 1990, “Did not like school,” at
51%, was reported as the most common reason 8th
to 10th
grade dropouts attributed to their
leaving school. This was followed by “Was failing school” (40%) and “Could not get along with
teachers” (35%) (McMillen & Kaufman, 1993). Contemporary qualitative studies, examining
reasons dropouts give for leaving traditional school settings, show that “Did not like school”
often translated into feelings of boredom (Epstein, 1989; Farrell, 1990). In a recent study, Engel
(1994) found that dropouts reported school as being boring, uninteresting, and unimportant.
Likewise in his study of at-risk teens, Farrell (1990) found that in voicing their complaints about
school, “boring” was the word his respondents used most. These findings support educational
research on classroom boredom that has been documented for several decades (e.g. Buxton,
1973; Csikszentmihalyi & Larson, 1984; Haberman, 1991; Jackson, 1968; Sarason, 1983).
In response to the early recordings of dropout rates in the 1970’s and 80’s, many states
and school districts, realizing the economic and social impact involved in the dropout problem,
began to establish separate educational programs for at-risk students. These programs, known
today as alternative schools, have grown nationally in both quality and number (Knutson, 1999).
While standardized, “bureaucratized” high schools, according to Knutson (1999), tend to offer a
“curricular assortment of isolated subject matter taught with an emphasis on rote memory and
with a student management system focusing on compliance with authority” (p1), alternative
schools acknowledge the call for reform of the traditional methods of teaching. Most of these
schools, catering to students at-risk of dropping out, recognize that the learning process of these
students needs to be handled differently. In light of this need, many alternative schools have
focused on the social structure and affective domains of their instructional program, offering
smaller classes, individualized attention, and counseling. In some cases infrastructure alone, such
as caring teachers and administrators and student centered classroom environments, has helped
to get some students to return or remain in school (Nichols & Steffy, 1999; Wood, 1989;
Worrell, 2000). However, despite the affective infrastructure of many alternative schools,
classroom teaching, for the most part, has remained traditional (Dynarski & Gleason, 1999).
In dealing with at-risk students, dropping out of school before completion therefore
remains a major concern for alternative as well as traditional schools (Dynarski & Gleason,
1999). In a recent study evaluating federal dropout prevention programs, Dynarski & Gleason
(1998) assert that dropout prevention programs may be addressing only symptoms without
knowing what the real problems are for specific schools or student populations and that
restructuring of schools has more promise when it focuses on changing a student’s classroom
2
Is the problem a lack of motivation to learn in school?
According to (Mitchell, 1993), the phenomenon of classroom boredom may not be
specific for any one type of school but may be the indication of a larger schooling problem,
namely the lack of motivation to learn. Specifically, feelings of boredom can lead to
“unmotivation” and frustration, which can especially result when students are placed in programs
where the curriculum is not challenging enough for them (Egyed, McIntosh, & Bull, 1998).
DiCintio & Gee (1999) argue that many times, students who are labeled “at-risk of dropping out”
simply demonstrate a lack of motivation to learn in school. The potential dropout, Ianni and Orr
(1996) explains, usually comes to school lacking self-reinforcing motivation and other important
ingredients that lead to school success. It is characteristic of such students to exhibit this lack of
motivation in behaviors such as not doing classwork or assignments, putting heads down on
desks, attending school but “hanging around the school” instead of going to certain classes
(DiCintio & Gee, 1999; Ianni & Orr 1996). In most traditional schools and some alternative
schools, learning environments for at-risk students who are failing have been teacher controlled
and have provided low-level, routine tasks (DiCintio & Gee, 1999; McDermott, 1997;
Haberman, 1991). This type of learning situation goes against current theory and research
regarding environments that enhance students’ motivation to learn. Instead, DiCintio & Gee
(1999) assert “that when the label of at-risk learner changes to ‘lacking motivation to learn’ the
solution strategies become more apparent” (p.231) and that “if students are unmotivated to learn,
teachers must create the conditions to support self-motivation” (p231).
Purpose of the Study
In combating “classroom boredom,” DiCintio & Gee (1999) encourage educators and
researchers working with at-risk students to try “current, innovative, cognitively based methods
of motivating students” (p.235). In addition, because disinterest in learning is a primary
manifestation of lack of motivation to learn (Mitchell, 1993), we may combat “classroom
boredom” and empirically examine students’ learning in the classroom through the perspective
of two separate but related intrinsic motivational variables, interest and motivation to learn.
Given these considerations, the purpose of this study is to examine the impact of an intervention
– self-generated analogy instruction -- on the interest and motivation to learn of students who are
at-risk of dropping out of high school. In this study, self-generated analogy instruction, based on
Generative Learning Theory (Wittrock, 1990), is presumed to be a potentially effective
3
classroom teaching tool that exhibits recommended characteristics for meeting the instructional
needs of at-risk students. Self-generated analogy instruction will be introduced as an intervention
within two intact high-school biology classrooms, and its effectiveness will be investigated
through a mixed method research design comprised of both qualitative and quantitative
techniques for collecting data. Pre-intervention, intervention and post-intervention data will be
obtained during the course of the study.
Major and Minor Variables
The major dependent variables in this study are at-risk students’ levels of individual
interest in the course, and motivation to learn inside and outside of class. In addition, at-risk
students’ levels of situational interest in the analogy intervention activities will be examined as a
minor dependent variable.
The major independent variable is instructional strategy to be examined on two levels 1.
Pre-intervention instruction (general teaching methods before the introduction of the
intervention, including the use of text or teacher instructional analogies) and 2. A self-generated
analogy teaching intervention that emphasizes the application of student-directed self-generated
analogies. In addition, there are also two factors that will be examined as minor independent
variables that may mediate the outcome of the study. These are:
1. At-riskness: Whether or not students are considered at-risk or not at risk may
have a mediating effect on the outcome student self-report data. Compared to a
regular student (a student who is not at-risk), many of these students have
established histories of academic failure and /or truancy, and some may have
developed learned helplessness (Stipek, 1998) and may not be as motivated to
perform well in school. Also regular students may prove to have a different goal
orientation than at-risk students who generally tend to exhibit mastery goals or
no goals at all.
2. Gender: This factor may prove to be a significant factor in determining the
effectiveness of the analogy strategy training and presentation. For example, in
a study by Pittman (1999), even though all students preferred using analogies
over traditional methods, 60% of the girls preferred teacher-constructed
analogies because they did not trust their own summary explanations of protein
synthesis. This is supported by studies that confirm the tendency of adolescent
girls to lack self-esteem and underestimate their performance in science.
4
Research Questions
Major questions to be addressed by the study:
1. To what extent does the analogy intervention impact:
a. Students’ situational interest in the analogy activities?
b. Students’ individual interest in the course and in learning?
2. To what extent does the analogy intervention impact student’s motivation to learn
inside and outside of class during and after the intervention period?
3. Based on the outcome of the study, to what extent can we say that situational
interest, individual interest, and motivation to learn are related; and if related, do the
findings confirm Hidi & Harackiewicz’s (2000) theory that individual interest can
be influenced by continued situational interest over time and Schiefele’s (1991)
theory that individual interest can be viewed as a pre-condition of intrinsic
motivation?
Minor questions
4. Within the at-risk group, how do the study’s findings regarding situational interest,
individual interest and motivation to learn compare between female and male
students?
5. How do the study’s findings regarding at-risk students’ situational interest,
individual interest and motivation to learn compare to that of regular students?
6. What are some general student attitudes and preferences regarding the use of self-
generated analogies compared to pre-intervention teacher-constructed analogies as
instructional tools for promoting interest and motivation to learn?
5
CHAPTER TWO
Background Literature
Educational researchers have long theorized that classroom boredom, at-risk students’
number one reason for dropping out, can be combated with strategies that promote student
interest and motivation to learn (i.e. Buxton, 1973; Dewey ,1913; DiCintio & Gee, 1999; Hidi &
Harackiewicz, 2000; Krapp, Hidi & Renninger, 1992; Means & Knapp, 1991; Sarason, 1983). In
one elementary school study conducted by Means & Knapp (1991), it was shown that by not
challenging at-risk students or not encouraging them to use complex thinking skills, teachers
underestimated students’ capabilities and, as a result, discouraged their exploration of interests
and engagement in work that was meaningful to the children. In addition, DiCintio and Gee
(1999) present findings that “at-risk adolescents are unmotivated to learn because the tasks they
are asked to complete are not motivating to them” (p.231).
In educational psychology, a great deal of research in motivational theory has focused on
perceptions of ability (self-efficacy, attributions), student achievement goal orientations (task vs.
ego), the learning climate (mastery vs. performance), and their impact on student motivation.
Although this research has provided us with a better understanding of some factors that may
impact students’ motivation to learn in general, their motivational effects on learning specific
content are still in question (Chen & Darst, 2001). For example, current motivational research
has shown that factors such as goal orientation and learning climate seem less effective than task
values, specified as “interest, utility, and importance,” in predicting student motivation and
achievement in the academic subjects of math, English, and social studies (Pintrich, Ryan, &
Patrick, 1998). In this present study interest will be examined in relation to student motivation to
learn in the discipline of science.
Intrinsic Motivation to Learn
The term “intrinsic motivation to learn,” as opposed to the terms achievement motivation
or academic motivation, implies that within an academic setting students are motivated to engage
in the learning process or engage in school-related activities for their own sake. Through the
perspective of self-determination theory (which proposes that people have an intrinsic desire to
6
explore, understand, and assimilate their environment), Deci and Ryan (2000) define intrinsic
motivation to learn as “the inherent tendency to seek out novelty and challenges, to extend and
exercise one’s capacities, to explore, and to learn” (p.70). In addition, Rigby, Deci, Patrick &
Ryan (1992) describe intrinsically motivated behaviors as being performed out of interest and
require “no ‘reward’ other than the spontaneous experience of interest and enjoyment that
accompanies them” (p.167); and learning, in their view, is a “life-long” process which naturally
occurs as people “engage the environment and attend to what interests them” (Rigby et. al, 1992
p. 166). Once the student’s interest develops, an activity is no longer externally imposed on the
student, but becomes self-determined, autonomous, and enjoyable (Deci,1992; and Rigby et. al
1992). At this point, according to Deci (1992), the student’s motivation to learn is said to be
intrinsic. From another theoretical perspective, Brophy (1987) defines student motivation to
learn as “a student’s tendency to find academic activities meaningful and worthwhile and to try
to derive the intended academic benefits from them” (p.205). Furthermore, he characterizes this
type of motivation as stemming from students’ intrinsic motivation and personal self-
actualization, rather than the view that successful performance will earn extrinsic rewards
(Brophy, 1987).
Both Brophy (1987) and Deci (1992) describe intrinsic motivation to learn in terms of an
experiential or state component (in relation to a task or environment) and a dispositional or trait
component. However, their views on what comprises these components differ, and delineation of
these views is important in clarifying the theoretical perspective of intrinsic motivation to learn
in this paper. Although Deci (1992) typifies the state component of motivation as consisting of
focused task engagement, involvement and the experience of enjoyment, interest and excitement,
Brophy (1987) asserts that a state of motivation to learn exists when students’ engagement in an
academic activity is guided by the goal or intention of acquiring the knowledge of mastering the
skill that the activity is designed to teach whether or not a specific activity is interesting or
enjoyable to them. Deci (1992) identifies this type of state motivation as extrinsic because there
is a goal separate from the interest and enjoyment of the activity itself. However, having similar
views on the trait component, Deci (1992) describes the trait motivation to learn as a desire to
continue engaging in activities that one finds interesting and enjoyable; and Brophy (1987) refers
to it as an “enduring disposition to strive for knowledge and mastery in learning situations” (p.
206) and states that this trait is most characteristic of “individuals who find learning intrinsically
rewarding, who value it as worthwhile and satisfying activity and enjoy expanding their store of
information” (p.206).
In view of these two perspectives on motivation, it is the position of this paper that state
7
intrinsic motivation to learn can be defined as being both affective (using Deci’s [1992] category
of focused task engagement, involvement, and the experience of enjoyment, interest and
excitement), and cognitive (applying Brophy’s [1987] description of engagement in an activity
“guided by the goal or intention of acquiring the knowledge or mastering the skill that the
activity is designed to teach whether or not a specific activity is interesting or enjoyable to
them”(p.206)). Likewise, trait intrinsic motivation to learn can be defined as the desire to
continue engaging in activities that one finds interesting and enjoyable (Deci, 1992) and can be
characterized by an “enduring disposition to strive for knowledge and mastery in learning
situations” (Brophy,1987, p.206).
In this study, I intend to examine the impact of a self-generated analogy intervention on
the affective and cognitive elements of trait motivation to learn and the affective element of state
motivation to learn as they are influenced by students’ level of situational interest in the
intervention activities and Individual interest in the Biology course in general. It is a premise of
this study that continued interest can have a positive long lasting effect on these affective and
cognitive elements of at-risk student motivation to learn. In addition (and beyond the scope of
this study), it is the researcher’s position that over an extended period of time when a strong
motivation in learning has been established, at risk students will begin to approach school
activities with a desire to engage in them whether a specific activity is interesting or enjoyable to
them or not (cognitive state motivation).
Interest
To some contemporary psychologists the term interest is still believed to be a somewhat
vague construct under the category of intrinsic motivation. Some theorists use the term interest
interchangeably as a lay term for intrinsic motivation and others such as Deci and Ryan (1985,
2000) use the term interest within their explanation of intrinsic motivation. For example, interest
is referred by Deci and Ryan (1985) as “an important directive role in intrinsically motivated
behavior in that people naturally approach activities that interest them”(p.34). Schiefele (1991),
on the contrary, maintains that there are many aspects of interest that intrinsic motivation does
not capture, aspects that have been neglected by contemporary motivational psychologists.
Most educational psychologists have long asserted that interest directs attention and
enhances learning (Dewey, 1913; Mitchell, 1993; Schiefele, 1991). Current research has
demonstrated that interest has a powerful facilitative effect on cognitive influence (such as the
8
development of meaningful goals) (Hidi, 1990; Renninger, Hoffmann, & Krapp, 1998). More
specifically, contemporary interest researchers propose the following:
Interest emerges from interaction with one’s environment and is content-specific
rather than a general construct. It is always related to specific topics, task, or
activities.
Interest is made up of cognitive as well as affective components in the form of
value-related and feeling-related valences attached to a topic or activity (discussed
later).
Subject-matter specific interest is probably more amenable to instructional
influences than are general motives or motivational orientations (i.e. goal
orientations)
(Adapted from Schiefele,1991).
There are two distinct types of interest (a) individual interest (also referred to as personal
interest), which emerges from one’s history of interaction with an object or a stimulus over time
(Hidi, 1990) and are always specific to individuals (Krapp, Hidi, & Renninger, 1992); and (b)
situational interest, which pertains to the specific characteristics of an event or object that capture
one’s interest (Hidi, 1990) and tend to be shared among individuals (Krapp, Hidi, & Renninger,
1992).
Situational Interest
Situational interest is generated primarily by certain conditions, stimuli, and/or concrete
objects in the environment that focus attention, and compared to individual interest it represents
“a more immediate affective reaction that may or may not last” (Hidi, 1990). However, in some
instances, Renninger, Hoffmann, & Krapp, (1998) state, the experience of situational interest can
give rise to relatively enduring or repeated affective reactions which are more likely to be evoked
in the moment of an interesting situation. For this reason, it has been suggested by interest
researchers that individual interest “emerges from this longer-lasting and/or repeated state of an
object-specific situational interest” (Renninger, Hoffmann, & Krapp, 1998, p.12; also see Hidi &
Anderson, 1992; Krapp, 1998).
In reference to the nature of situational interest Hidi and Baird (1986) noted, “interest has
a durational aspect -- there are triggering factors [that evoke immediate affective responses] and
there are conditions which ensure the continuation of interest”(p191). Mitchell (1993), adopting
Dewey’s (1913) terms for describing interest, labeled these two subcategories of situational
interest as “catch” factors (those that trigger immediate situational interest) and “hold” factors
9
(those that promote the maintenance of situational interest over time). Mitchell (1993) proposed
that the essence of catching lies in finding various ways to stimulate students, whereas the
essence of holding lies in finding variables that empower students. He based these labels on his
definitions of stimulant, as “a variable that temporarily increases the activity of an organism”,
and empower, as “bestowing power for an end of purpose” (Mitchell, 1993, p.426).
In a study conducted in a math class, Mitchell (1993) further identified concrete examples
of catch and hold factors. Mitchell used these examples, which he described as being specific to
the academic subject of math, to define general conditions and processes attributed to catch and
hold factors. For instance, “groupwork”, “computers”, and “puzzles” all acted as catch factors in
his study because students’ primary reason for mentioning these was that they provided a change
of pace and variety to their math classroom. “Meaningfulness” and “Involvement” were
identified by Mitchell (1993) as hold factors in his study because content or activities that are
perceived to be personally meaningful or involving to students is a direct way to empower
students and thereby hold their interest. In addition, Mitchell noted that Involvement appeared
especially effective primarily because when learning is experienced as absorbing, then that
process is perceived as empowering to students and will therefore tend to hold their interest
(Mitchell, 1993).
Individual Interest
Investigations focusing on individual interest have shown that children as well as adults
who are interested in particular activities or topics pay closer attention, persist for longer periods
of time, learn more and enjoy their involvement to a greater degree than individuals without such
interest (Hidi & Harackiewicz, 2000). Individual interest is thought to be a relatively stable
motivational frame of mind that develops over time and is associated with increased knowledge,
value, and positive feelings (Schiefele, 1991). In describing individual interest, Schiefele (1991)
distinguished between two forms of individual interest: interest as a latent characteristic (referred
to as dispositional interest) and interest as an actualized characteristic (referred to as actualized
interest).
Dispositional interests are said to be relatively enduring characteristics or general
orientations of individuals toward a type of object, and activity, or an area of knowledge
(Schiefele, 1991; Krapp, Hidi, & Renninger, 1992). They are also said to be intrinsic in character
and composed of two components: feeling-related valences and value-related valences. Schiefele
(1991) referred to feeling-related valences as “feelings that are associated with a topic or an
object,” usually feelings of enjoyment and involvement (p.302), and value-related valences as
10
“the attribution of personal significance ascribed to an object or activity” such as the contribution
of an activity to one’s personal development or competency in a particular area” (p.302). Based
on the supposition that dispositional interests endure over the long term, theoretical models and
empirical research studies in specific content areas often use measures of dispositional interest as
predictors of academic achievement. In addition this type of interest is thought to influence
learning especially in situations where learners are given an opportunity for voluntary
engagement (Krapp, Hidi, Renninger, 1992).
Schiefele (1991) described actualized interests as “content-specific intrinsic motivational
orientations” (p. 302) or the state of being interested in a certain topic and wanting to learn about
that topic for its own sake. This type of interest is usually the focus of process-oriented theories
and studies regarding the conditions of learning and is said to express itself outwardly in actual
or concrete behaviors such as “focused, prolonged, relatively effortless attention” which are most
often accompanied by feelings of “pleasure and concentration” (Krapp, Hidi, & Renninger, 1992,
p.7). Interest theorists differentiate actualized interest from situational interest in that actualized
interest is specific to individuals and is believed to arise out of an interaction between a person
(with his or her personality, attitudes, and general orientations) and the learning situation which
contains sources that elicit interest; these include not only the characteristics of principal objects
(i.e. learning activities) but other factors which influence interest such as social relationships to
teachers and peers (Hidi & Baird 1986). Situational interest in individuals, on the other hand, is
said to be elicited by stimulating characteristics (i.e. interestingness) of the learning environment
(i.e. textbook, learning activities) and may be common across individuals.
Summary: Relationship between Situational Interest,
Individual Interest and Intrinsic Motivation to Learn
Based on interest theory and research, Schiefele (1991) proposed that individual interest
can be viewed as a pre-condition of intrinsic motivation. Once established, individual interest
leads students to adopt an intrinsic motivation orientation towards a specific task or learning-
orientation which in turn will impact learning outcomes, and more specifically impact learning
processes in areas such as level of comprehension and the use of “deep-level” learning strategies
(Schiefele, 1991). Situational interest, which has the potential to promote continued and
persistent activity that becomes self-initiated (Mitchell, 1993), can be an influential factor in
developing individual interests over time. Furthermore, because situational interest is believed to
precede the development of long-lasting individual interest, it is also said to contribute to the
11
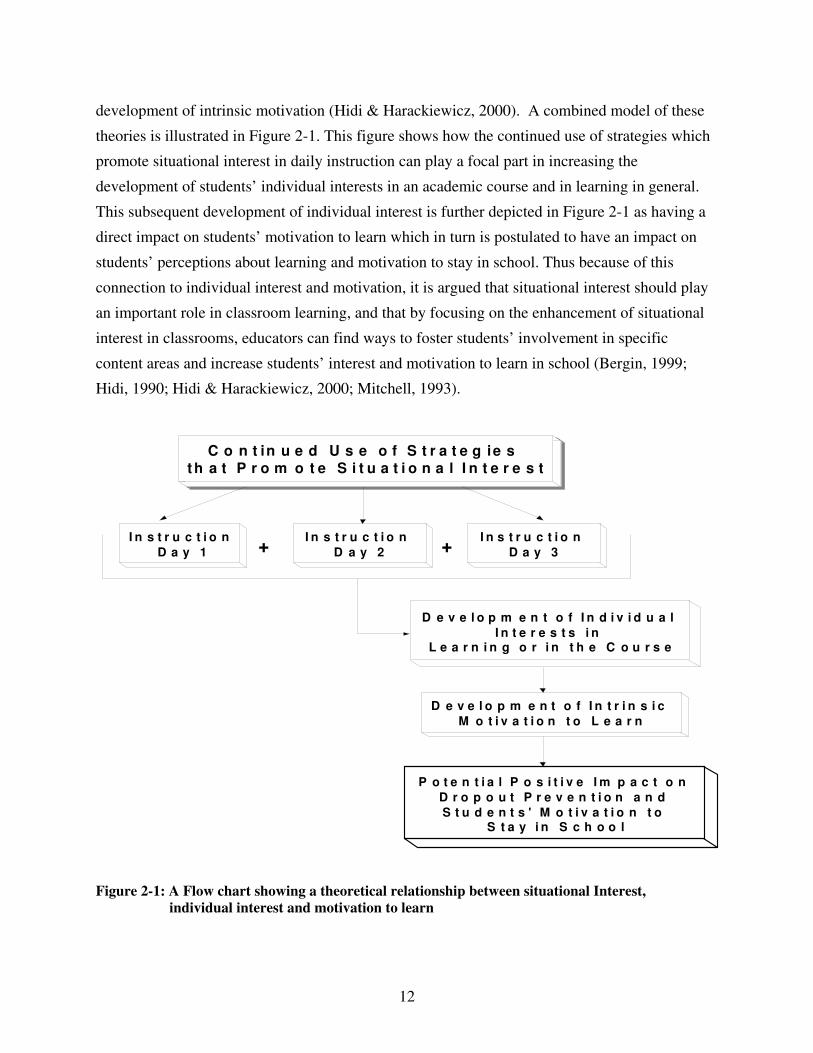
development of intrinsic motivation (Hidi & Harackiewicz, 2000). A combined model of these
theories is illustrated in Figure 2-1. This figure shows how the continued use of strategies which
promote situational interest in daily instruction can play a focal part in increasing the
development of students’ individual interests in an academic course and in learning in general.
This subsequent development of individual interest is further depicted in Figure 2-1 as having a
direct impact on students’ motivation to learn which in turn is postulated to have an impact on
students’ perceptions about learning and motivation to stay in school. Thus because of this
connection to individual interest and motivation, it is argued that situational interest should play
an important role in classroom learning, and that by focusing on the enhancement of situational
interest in classrooms, educators can find ways to foster students’ involvement in specific
content areas and increase students’ interest and motivation to learn in school (Bergin, 1999;
Hidi, 1990; Hidi & Harackiewicz, 2000; Mitchell, 1993).
I n s t r u c t i o n
D a y 2
I n s t r u c t i o n
D a y 3
P o t e n t i a l P o s i t i v e I m p a c t o n
D r o p o u t P r e v e n t i o n a n d
S t u d e n t s ' M o t i v a t i o n t o S t a y i n S c h o o l
+
C o n t in u e d U s e o f S t r a t e g ie s
t h a t P r o m o t e S i t u a t i o n a l I n t e r e s t
D e v e l o p m e n t o f I n t r i n s i c
M o t i v a t i o n t o L e a r n
+I n s t r u c t i o n
D a y 1
D e v e l o p m e n t o f I n d i v i d u a l
I n t e r e s t s i n L e a r n i n g o r i n t h e C o u r s e
Figure 2-1: A Flow chart showing a theoretical relationship between situational Interest,
individual interest and motivation to learn
12
Environments that Stimulate Students’ Interest and Motivation to Learn
Mitchell (1993) noted that though teachers have little influence over the individual
interests (or disinterests) students bring to class they can influence the development of such
interests by creating appropriate environmental settings which foster situational interest. Sansone
and Morgan (1992) and Krapp et al. (1992) agree with Mitchell (1993) that creating situational
interest may work to enhance individual interest in some students; in addition, along with other
researchers (Brophy, 1987; Deci, 1992) they support the notion that effective classrooms may
also promote the development of intrinsic motivation to learn.
Although most students begin their schooling experience as kindergarteners full of
curiosity and interest to learn new things, this motivation to learn routinely dissipates by the end
of their primary school years (Pressley & McCormick, 1995). Many argue that classroom
structures built around teachers’ control of knowledge – emphasizing correct answers over the
generation of understanding – often replace curiosity with compliance, undermine motivation,
and impede autonomous learning (Haberman, 1991; McNeil, 1988). Motivation to learn, Day
(2002) contends, “is crucial for at-risk students, who can be discouraged by constant lower-level
drills and practice sessions” (p.22). Fortunately, there is evidence from educational psychology
research that students can regain or develop a sense of intrinsic motivation to learn while
working within certain classroom structures.
Educational psychology research examining interest and motivation to learn have shown
that student control, challenging activities, provoking curiosity, personalization of content, and
interactive teaching are fundamental to facilitating the development of interest in academic
subjects and increased intrinsic motivation (Brophy, 1986; DiCintio & Gee, 1999; Lepper,1988;
Lepper and Chabay, 1995; Nichols & Utesch, 1998). For example, in one study, DiCintio & Gee
(1999) examined the quality of instructional tasks and its relationship to at-risk students’
motivation to learn. They collected motivational data on at-risk students when they were engaged
in various instructional activities and found that students’ motivation was significantly associated
with the amount of control perceived by them over their learning situations. In the same study,
students reported being “less bored, less confused and less interested in doing something else”
(DiCintio & Gee, 1999, p. 233) in those learning situations. DiCintio & Gee (1999) conclude in
this study that an autonomy-supportive instructional environment, one where at-risk students can
learn the skills of self-determination and adaptive motivation in school, may be a starting point in
unlocking a true motivation to learn in at-risk students.
In recent studies, it has been demonstrated that certain aspects of the learning
13
environment, such as modification of teaching materials and strategies, and /or how tasks are
presented, can contribute to the development of situational interest (Hidi & Harackiewicz, 2000).
For example, some researchers have sought to stimulate situational interest by presenting
educational materials in more meaningful contexts that show the utility in learning, or by making
it more personally relevant (Mitchell, 1993; Parker & Lepper, 1992). On the other hand, interest
researchers also propose that an effective way of stimulating situational interest in activities can
depend not only on the quality of instructional tasks but on students’ self-regulatory processes.
Sansone, Wiebe and Morgan (1999) demonstrated that students can work actively to control their
ongoing effort and maintain situational interest in important or required tasks. Students can
engage in strategies to make their performance of tasks more interesting and eventually develop
interest in an activity that had been uninteresting (Sansone et al., 1999; Wolters, 1998).
Specifically, they can generate and use strategies to make boring tasks more interesting and
meaningful (such as by making a game out of them), particularly when provided a reason to
value the activities (Sansone et al., 1999). In turn when students perceive themselves as
participating and taking greater control of their learning, their individual interest and motivation
is also said to increase (Brophy, 1986; DiCintio & Gee, 1999; Lepper,1988; Mitchell 1993;
Nichols & Utesch, 1998).
Analogies as Instructional Tools
In educational settings, analogical teaching is claimed by its proponents to bring about
five major outcomes: enjoyment, motivation, mnemonics, meaning, and problem solving
(Duit,1999; Glynn,1991; Wong, 1993a,b). An analogy is generally defined as a process of
identifying similarities between two concepts, the familiar concept being the analog and the
unfamiliar concept referred to as the target (Glynn, 1991). In science classrooms, three types of
analogies are used as instructional strategies to promote comprehension and knowledge
acquisition: textbook-based analogies (text-based), analogies that are constructed and/or
presented by the teacher (hereafter referred to as teacher-constructed analogies), and analogies
that are generated by the student (self-generated analogies).
Text-based and teacher-constructed analogies
Text-based and teacher-constructed analogies are cognitive instructional strategies that
have their foundation in Schema and Mapping Theories. For these strategies, analogical
reasoning is associated with mapping new information to be learned (target domain) to
14
appropriate pre-existing organized schema (the analog). For example, a science teacher
introducing a science lesson on the parts and function of the eye, presents the following analogy
statement: “The human eye is like a camera.” The eye and its major parts (the target domain) is
compared to similar features on a camera (the analog), something that the teacher believes is
already familiar to students. The students then are expected to map this new information of the
eye into pre-existing cognitive schema consisting of prior-knowledge of the camera and its
functional parts. However, the effectiveness of this type of analogy depends greatly on the
degree of exposure and familiarity that the students have with the analog (Dagher, 1995; Duit,
1991; Thagard, 1992).
Unfortunately, despite their potential as powerful tools for learning, there is much
empirical evidence that text-based and teacher-constructed analogy use often fail because (a)
students do not have a sufficient understanding of the analog, and (b) students are not able to
make appropriate connections to the target domain, a cognitive task that the pre-constructed
analogy was supposed to help them do (Pittman, 1999). For example, in his study on text-based
analogies in a 9th
and 10th
grade high school biology unit, Gilbert (1989) concluded that no
evidence was found to support the assertion that the general use of text-based / written analogies
was effective in either promoting conceptual retention or in improving students’ attitudes. In
addition, Gabel and Sherwood (1980) found, in a year-long study within a high school chemistry
course, that text and teacher analogies were reported as not helpful to all students. In fact it was
shown in the study that 48% of the subjects did not fully understand the analogies used to teach
the content. Also, in another study observing an Australian biology classroom, Venville and
Treagust (1997) observed a teacher presenting an analogy that red blood cells were shaped like a
particular brand of candy with “an indent on each side of a disc” (p. 285). Later, it was
discovered by the researchers that that particular brand of candy was no longer round in shape as
the teacher supposed but was now square in shape and consequently may have resulted in the
teacher’s students being confused about the shape of red blood cells.
Venville and Treagust (1997) contend that problems in using text and/or teacher based
analogies arise because it is often the teacher or textbook author who generates the analogy and
subsequently neglects to ensure student understanding of the analog. Duit, Roth, Komorek, and
Wilbers (2001) agree with this view. They explain that these types of analogical relations, have
“clear and fixed meaning[s] from the perspective of the analogy provider…meanings [that] are
often not shared with the students” (Duit, et al., 2001, p. 58). Furthermore, Venville and Treagust
(1997) interpret such unsuccessful findings in analogy research to mean that teachers need to
play a more active role in helping students connect analogies to specific science concepts and
15
that it may be an advantage to students to receive direct training on how to use analogies when
learning science.
In light of these findings related to text-based and teacher constructed analogies, Flick
(1991) suggests that science education can benefit from a better understanding of how personal
experience can be applied to instruction and that although using specific text or teacher-based
analogies is a common instructional tool, teachers need to be sensitive to spontaneous, intuitive
analogies created by students. Analogy theorists categorize such analogies as self-generated (or
student-generated) analogies. Wong (1993) and Pitman (1999) point out that much of the
research on analogies consists of externally (teacher) supplied analogies and that further research
is needed in the area of self-generated analogies. In this study, self-generated analogies will be
examined as the central instructional tool for promoting interest and motivation to learn in at-risk
high school biology students.
Self-generated analogies as instructional tools
Self-generated analogies are metacognitive strategies founded on the Generative
Learning Theory. They are known to facilitate understanding of abstract ideas by pointing to
similarities familiar to the learner in the real world, promote self-generation of meaning and
autonomy in learning, and arouse student interest and motivation to learn (Duit, 1991; Wittrock
& Alesandrini, 1990; Wong, 1993a,b). The use of self-generated analogies as an instructional
tool has proven to exhibit factors considered to be essential in meeting the instructional needs of
at-risk students.
It is generally recognized by analogy theorists that analogies created by learners generate
meaning through a constructivist pathway (Duit, 1991; Mayo, 2001; Wong, 1993a,b). Founded
on constructivist philosophy, a premise of the Generative Learning Theory proposed by Merlin
Wittrock (1986) is that to learn with understanding, a learner must actively construct meaning.
Based on this principle, analogies that are constructed by someone who does not yet have a full
understanding of the phenomenon (target domain) are said to be self-generated and occur in the
absence of a specific pre-existing schema where an individual’s prior knowledge is incomplete
or poorly organized (Wong, 1993b). For the learner in these instances, generating analogies
becomes a process of grounding abstract ideas in concrete experiences (Flick, 1991).
When learning a new concept, Flick (1991) argues, we use analogies to anchor it to
something we know about. These self-generated analogies connect our familiar knowledge and
experiences with unfamiliar concepts or ideas and acts as a cognitive tool for generating new
understandings (Gordon , 1968). Such conditions or situations for learning are said to have the
16
potential to promote meaningful construction of knowledge, sustained interest, a sense of
autonomy in learning, and motivation to learn (Duit, 1991; Middleton, 1991). Analogies “are
valuable tools in conceptual learning,” Duit (1991, p. 666) says. “They may provoke student’s
interest and may therefore motivate them (Duit, 1991, p. 666). In a study done by Boujaoude and
Tamim (2000), fifty-one middle school students were asked to generate analogies during a
biology unit of study, and to complete a Perceptions Questionnaire about the instructional
usefulness of analogies. Thirty-three percent of students in the study said that they liked
generating analogies, and out of this group the top four reasons that students gave for liking this
process were: 1) the analogies were [situationally] interesting (35.3%); 2) helped them to study
by comparing things from different domains (23.5%); 3) were easy (23.5%); and were new to
them (11.8%) (Boujaoude and Tamim, 2000, p. 62). Furthermore, in relation to motivation to
learn, 17.6 % of the students in the study also reported that they would use analogies without the
teacher’s advice because they were “[situationally] interesting, easy to create, quick to produce,
and helped them understand” (Boujaoude and Tamim, 2000, p. 62).
Wittrock’s Generative Learning Model (GLM) implies that students are active learners
and are responsible for constructing meaningful relations between what they know and the
information they are learning (Wittrock, 1990). In addition, the model emphasizes generative
teaching, where teachers take on a role as facilitator in this generative process by encouraging
students to actively engage in classroom learning activities and to attribute their degree of
success to their own generative efforts (Kourilsky & Wittrock, 1992; Wittrock,1990). According
to the model, teachers can teach the learners how to increase their ability to control their
generative processes so that comprehension and construction of meaning from instruction
becomes increasingly independent for them. Ultimately an important goal in generative teaching
is for learners to learn to control their own generative processes and strategy use (Wittrock,
1990) and thus be equipped to regulate their own interest and motivation to learn in school. Only
when students attribute successful learning to their own effort at generating relations among new
information and prior knowledge, Kourilsky & Wittrock (1992) assert, will teachers’ actions
“enhance motivation in the sense of persistence and sustained interest in learning” (p. 349). In
this present study, the self-generated analogy intervention emphasizes the tenets of Generative
Teaching and Learning Theories and aims to promote students’ motivation through a sustained
interest in learning in biology class.
Literature on the education of at-risk students repeatedly calls for a change from
remediation instruction, usually in the form of “constant lower-level drills and practice sessions
that seem to focus on [students’] short comings and repeated failures” (Day, 2002, p.22), to
17

instruction that builds on the “strengths of at-risk students” (Levin and Hoffenberg, 1991, p.89)
and makes connections to prior knowledge and experiences that they bring to school (Cuban,
1989). “Meaningful learning,” Mayo (2001) states, “involves integrating new knowledge with
knowledge that already exists in long term memory [and] students do this efficiently when they
learn concepts relationally, not by rote” (p.187). In addition, Day (2002) emphasizes that the act
of not challenging at-risk students or not encouraging them to use complex thinking skills in
class could discourage their exploration of interest and meaningful task, dampen their motivation
to learn and make it unlikely that students will transfer learned skills to real-world tasks.
Furthermore, Means and Knapp (1991) call for a reshaping of remedial curricula and among
guidelines for instruction they include: embedding basic skills instruction within the context of
more global learning tasks, making connections with students’ out-of school experiences and
cultures, and modeling powerful thinking strategies.
Evidence, from research on generative teaching and learning, has shown that the use of
self-generated analogies as an instructional tool potentially fosters an effective learning
environment for at-risk students -- one that exhibits essential characteristics for nurturing
meaningful learning and promoting at-risk students’ interest and motivation to learn (Cosgrove,
1995; Hooper, Sales, & Rysavy, 1994; Mayo, 2001; Wittrock & Alesendrini, 1990; Wong,
1993a,b). For example, Wong (1993a), contends that generating analogies helps learners to
make new situations familiar, helps them to represent problems by using prior knowledge, and
stimulates abstract high-order thinking. In his study on self-generated analogies as tool for
explanation of scientific phenomenon, Wong (1993b) presented a scientific phenomenon (a
medicine syringe as a model of air pressure) to eleven undergraduates from the school of
education and ask them to explain it. When they encountered problems in their explanations, the
students were directed to create and apply their own analogies as a means of addressing their
conceptual difficulties and then evaluate and modify the analogies based on their change in
understanding of the phenomenon. From the outcome of the study, Wong (1993b) concluded that
self-generated analogies stimulated students’ inferences and insight and helped them take control
of their learning by creating and refining their own analogies to advance their understanding of a
concept.
In another study, Pittman (1999) taught eighth grade students how to generate their own
analogies after receiving traditional instruction on the topic of protein synthesis (lecture /
discussion format) and familiarizing students with understanding and using teacher-constructed
analogies. In applying self-generated analogies, students worked in groups of three to four for
three days to create individual analogies to represent protein synthesis and were asked to
18

illustrate and label the relationships in their analogies. The following week the students shared
their created analogies with the class and received comments and feedback from the students and
teacher. When interviewed at the end of the unit, students reported that as opposed to teacher-
constructed analogies, self-generated analogies were more meaningful and interesting to them.
They also reported that sometimes they didn’t understand the teacher’s analogies and that in
many cases the teacher’s analogies were confusing to them. In Pittman’s study, these findings
were supported by comments made by students during individual interviews. Students
commented that they preferred student-generated analogies because:
♦ “They are our own ideas.”
♦ “You remember what you have made. Teacher [constructed] analogies
are just another thing to cram into your head.”
♦ “We are more familiar with our lives and mind than teachers are.”
♦ “We like different stuff than teachers; therefore, ours are more
interesting and fun. (Pittman, 1999, p. 13)
Lastly, through the application of generative teaching, Cosgrove (1995) conducted a
study examining the use of self-generated analogies in a high school physics class. He designed a
teaching strategy that provided an opportunity for students to generate and modify their own
analogies and found that the practice of generating and fine-tuning analogies for electricity gave
students a framework within which they could reason (Cosgrove, 1995). Cosgrove concluded
that over time the students began to demonstrate the ability to take control of their learning. They
stopped asking the teacher for all the answers, being more confident that they could work
problems out for themselves; they looked forward to opportunities to reason through to a
conclusion and to take part in extended class debates and discussions; and they showed that they
were capable of “mature and sustained thinking” (Cosgrove, 1995 p. 307). Thus in Cosgrove’s
study, teaching and learning by way of self-generated analogies provided an opportunity not only
for cognitive growth, but also interactive teaching, challenging activities, student control, and a
sustained interest and motivation to learn in physics.
These studies utilizing self-generated analogies and the Generative learning Model
demonstrate that self-generation of analogies in learning empowers students by way of
meaningful connections and autonomy in learning and confirms that the use of self-generated
analogies in instructional can be a powerful and effective tool in promoting interest and
motivation to learn in at risk students (BouJaoude & Tamim, 2000; Cosgrove, 1995; Pittman,
1999; Wong 1993a,b).
19
CHAPTER THREE
Method
The purpose of this study was to examine the impact of self-generated analogy
instruction on the situational interest, individual interest and motivation to learn in students who
are at-risk of dropping out of high school. This study utilized a mixed method research design
comprised of both qualitative and quantitative techniques for obtaining and measuring data.
Having theoretical foundations in interest, intrinsic motivation and generative teaching and
learning theories, the goal of this study was to better understand and confirm the dynamic
relationships between situational interest, individual interest and intrinsic motivation to learn and
to confirm whether or not self-generated analogy instruction proved to be an effective tool in
nurturing at-risk students’ interest and motivation to learn.
The research procedures in this study involved the introduction of an intervention, self-
generated analogy instruction, within two intact high-school Biology classrooms. The duration of
the study was approximately 13 weeks and consisted of three major research periods:
1) A pre-intervention period (4 weeks), which included systematic classroom observations
(approx 16 sessions per class), a demographic and baseline individual interest survey, a
teacher questionnaire regarding student past performance in class and other data
collection consisting of a review of students’ performance from the previous semester;
2) The intervention period (5 1/2 weeks) – included analogy instruction, self-generated
analogy construction, systematic classroom observations (approximately 15 sessions per
class), and situational and individual interest and motivation-to-learn surveys; and
3) A post-intervention period (2 1/2 weeks) – included general classroom observations,
focus group interviews, a post-intervention motivation-to-learn survey and teacher
questionnaire and (see Table 3-1 for summary).
Participants
The participants were 22 students enrolled in two high school Biology classes at a public
kindergarten through 12th
grade (K-12) Developmental Research School (DRS) of a major
university in the Southeastern United States. The total number of students in the two Biology
20

TABLE 3-1: OVERVIEW OF DATA COLLECTION
PRE-INTERVENTION PERIOD
Duration Major Research Focus Classroom events Research Method Employed
4 weeks
• To set a baseline for the study with
regards to general student
characteristics and interest and
motivation learn behaviors
No changes to the classroom
General classroom observations
Direct observations
Pre-Intervention Demographic and Interest
Survey
Pre-Intervention Teacher Questionnaire
INTERVENTION PERIOD
Duration Major Research Focus Classroom events Research Methods employed
5 1/2
weeks
Monitor and investigate the influence
of the intervention on student’s
Situational Interest, Individual Interest
and Motivation to Learn.
Identify changes in students Individual
Interest and Motivation to Learn due
the intervention
Intervention begins:
Analogy Tutorial
Student Identification of the teachers use
of pre-constructed analogies
Analogy Journals: Students practice
identifying and explaining teacher
analogies
Transition period: Students practice self-
generation of analogies in groups and on
their own.
Student presentations of self-generated
analogies.
General classroom observations
Direct observations
Situational Interest Survey
Individual Interest and Motivation to Learn
Survey
POST-INTERVENTION PERIOD
Duration Major Research Focus Classroom events Research Methods employed
2 ½
weeks
Identify changes in student’s sustained
motivation to learn
Investigate the transfer of student
motivation to learn by way of self-
generated analogy or other learning
strategy use
No changes to classroom
General classroom observations
Focus group interviews.
Post-Intervention Student Motivation to
Learn Survey
Post-Intervention Teacher Questionnaire
21
classes comprised the total population of students enrolled in Biology at the school for the 2003-
2004 term. At the beginning of the study, participants ranged in age from 14.25 to 18.25, and
represented students from all secondary grades (9th
-12th
), with the majority enrolled in 9th
grade.
All participants were of African-American descent.
The School
Enrollment at the K-12 school consisted of approximately 475 students. The school is not
a mandatory-zoned local district school, but is categorized as a public school of choice and is
governed by its associated university as a single school district within the state in which it is
located. The entire school district (K-12) is under the direction of a Superintendent and is
separated into two school divisions, primary (K-5th
grades) and secondary (6th
-12th
grades), with
each school division having its own Primary (K-5th
) or Secondary (6-12th
) Principal.
School terms were approximately 36 weeks long and divided into two 18 week semesters.
In addition, each semester was divided into two consecutive nine week grading periods. At the
school, the grading periods were referred to as the 1st and 2
nd nine weeks (first semester) and the
3rd
and 4th
nine weeks (second semester). Both Biology classes were taught by the same
instructor for the majority of the school term, with the exception of a six-week period in the
second semester when the classes were taught mainly by a student intern under the supervision
of the regular classroom teacher.
Research for this study began during the second semester of the term. Implementation of
the intervention, self-generated analogy instruction, began in the middle of the second semester,
at the start of the fourth nine weeks of the term. Due to the scheduling of the student teaching
internship, both the regular Biology teacher and the intern (under the supervision of the regular
teacher) served as lead teachers at different times during the study.
Participant Consent
During the third week of the second semester, parental consent forms were sent home
with the students requesting permission to obtain and use student data (i.e. interviews,
questionnaire responses, class observation, and performance data) for analysis in the study. At
the time that parental consent forms were returned to the researcher or classroom teacher, the
researcher individually gave each student an assent form requesting their signature for
participation. The researcher explained to the students that their participation was voluntary but
that their signature in addition to their parents was also needed for participation in the study. The
22
classroom teacher allotted five minutes at the start of the class period for the students to obtain
the form, voluntarily sign it and then return it to the classroom teacher or researcher.
Because the intervention was scheduled to be a part of the classroom teacher’s regular
course curriculum, students were reminded that as usual all students registered in the class would
be held accountable for completing all course work and meeting other requirements of the
course, whether or not consent was given for their data to be obtained and used in the study and
that participation in the study would in no way affect their course grade. It was explained to
students that in signing assent forms they were giving permission for their data to be used in the
study for purposes of research and that this inclusion of their data in the study was voluntary. In
addition, students were told that at the end of the study (during the post intervention period),
those who allowed permission for use of their information in the study would be given a special
token of thanks (such as a famous labeled flashlight key chain).
It is to be noted that confidentiality of all subjects was maintained by the researcher and
will remain confidential to the extent allowed by law. Student information was kept confidential
by use of a four digit code chosen by students at the start of the study. These codes were placed
on all student-related paperwork handled by the researcher. In addition, a special three-digit
observation code (based on the students’ assigned classroom seating) and a two-digit record
book code were assigned to the students to assist in documenting observational data and to
facilitate the recording of student project grades into the teacher’s administrative grade book. For
all interviews and audio recordings of interviews, students were identified by self-chosen
pseudonyms. During the study, audiotapes were kept and used by the researcher for data analysis
only and were destroyed one month after the conclusion of the oral defense.
At-Risk Criteria
Because the focus of this study was the impact of a self-generated analogy intervention
on students who are at-risk for dropping out of high school, predetermined categories were
developed to categorize students as being at-risk or not at-risk of dropping out of school for the
purposes of this study. These categories were based on theories and research found in drop-out
prevention literature.
According to literature on at-risk students and H. S. dropout prevention, there are no set
factors or formulas in determining who will drop out of school (Kaufman et al., 2000; Wells,
Bechard, & Hamby, 1989). However, several risk factors have been identified from retrospective
studies of high school dropouts. These risk factors are based on general characteristics and
behaviors of these former students and are classified into two categories: status risk factors,
23
referring to demographic and historical characteristics, often used to classify large groups of
people and generally outside a student’s control (i.e., race/ethnicity, primary language, or
socioeconomic conditions of the home), and behavioral risk factors, based on participatory
actions of students that cause them to be unsuccessful in school (i.e., not attending school,
undesirable behavior, teen pregnancy).
According to the U.S. Department of Education, the two leading risk factors in
determining who is at-risk for dropping out of school are 1) low socioeconomic status and 2)
history of academic failure. In relation to the status factor, Knapp and Shields (1990) report that
children from families with low socioeconomic status make up a disproportionate number of
those most at-risk for school failure and dropping out. Often this failure is attributed to lack of
school readiness and begins when a child enters kindergarten. Purcell-Gates, McIntyre, and
Freppon (1995) state that these children often begin school with “significantly less implicit
linguistic knowledge of books, as compared to well-read-to kindergarteners” (p. 659). In
addition, it is reported that children from families of low socioeconomic status often live in
poorer, less thriving neighborhoods and attend schools facing multiple problems (NCREL,
2003).
As students get older, participatory behaviors begin to play a greater role in determining
students’ at-riskness. For example, Lloyd (1978) found that absences as early as grade 6 were
related to academic failure and dropping out of school. Fin (1993) suggested that while younger
children have little choice but to attend school, as students get older and progress through the
grades, they choose to miss classes or not show up at school at all. It is evident that students who
do not remain active participants in class and school are at-risk of school failure and of dropping
out regardless of the risk that may be implied by status characteristics (Finn, 1993).
In this study, risk factors from both status and behavior categories were used to determine
if students are at-risk of dropping out. Students were classified based on United States
Department of Education criteria of having one or more risk factors:
1) eligible for receiving free or reduced lunch (socioeconomic status)
2) academic failure (defined in this study as having obtained a failing grade in
science for the first and/or second marking periods in the previous semester
and/or having failed two or more classes in other subjects in the previous
semester)
3) retention (whether or not they have been left back one grade or more or are
repeating the course)
24
4) history of suspension/detention (related to disruptive behaviors)
5) truancy (non-attendance of school) and poor attendance records (includes
legitimate excused absences due to medical illnesses, as well as unexcused
absences to class)
6) teen pregnancy
7) English as a second language (In this study, this status factor was used
conservatively as a secondary risk factor, in combination with one ore more risk
factors previously discussed in this section. For example, students for whom
English is a second language were considered at-risk if they also had a history of
truancy or were eligible for the free or reduced lunch plan. They were not
considered at risk if they exhibited this factor alone).
(Kauffman et al., 2001; National Dropout Prevention Center, 2002).
With the assistance of the classroom teacher, this information was obtained confidentially from
the school’s guidance, attendance, and administrative offices by use of pre-assigned four digit
student code numbers. In addition, for purposes of this study only, students with no known risk
factors were classified as regular students; students with one or more risk factors were classified
as at-risk and were the focus of the study.
Data Gathering and Instrumentation
Three dependent variables were examined in relationship to the intervention, self-
generated analogy instruction. These variables included situational interest, individual interest
and motivation to learn.
Situational interest is defined as interest generated primarily by certain conditions,
stimuli, and/or concrete objects in the environment that focus attention (Hidi, 1990). In addition,
compared to individual interest it represents a more immediate affective reaction that may or
may not last (Hidi, 1990). In this study, the variable situational interest was operationalized as
the self-reported level of perceived interestingness in the analogy activities (i.e. the extent to
which students felt the activity stimulated their interest and helped them remember, understand,
and personally connect to the information they are learning).
Individual interest was defined in this study as an affective disposition or actualized state
which emerges from one’s history of interaction with an object or a stimulus over time (Hidi,
25
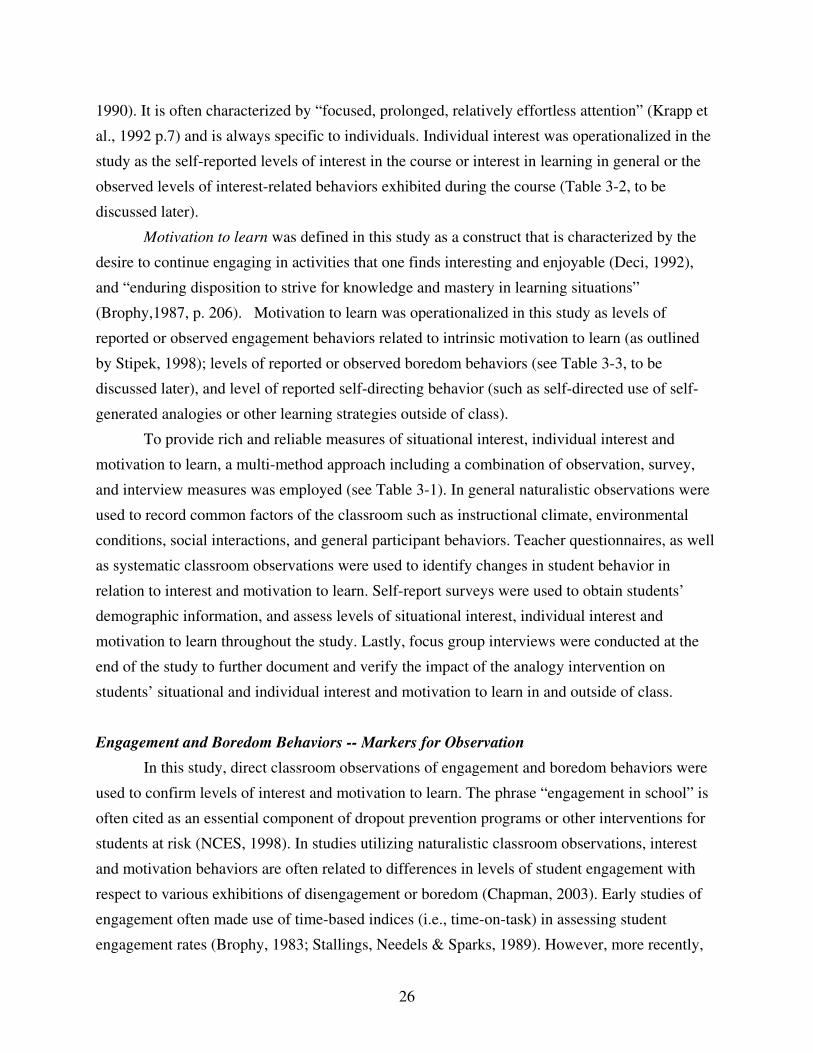
1990). It is often characterized by “focused, prolonged, relatively effortless attention” (Krapp et
al., 1992 p.7) and is always specific to individuals. Individual interest was operationalized in the
study as the self-reported levels of interest in the course or interest in learning in general or the
observed levels of interest-related behaviors exhibited during the course (Table 3-2, to be
discussed later).
Motivation to learn was defined in this study as a construct that is characterized by the
desire to continue engaging in activities that one finds interesting and enjoyable (Deci, 1992),
and “enduring disposition to strive for knowledge and mastery in learning situations”
(Brophy,1987, p. 206). Motivation to learn was operationalized in this study as levels of
reported or observed engagement behaviors related to intrinsic motivation to learn (as outlined
by Stipek, 1998); levels of reported or observed boredom behaviors (see Table 3-3, to be
discussed later), and level of reported self-directing behavior (such as self-directed use of self-
generated analogies or other learning strategies outside of class).
To provide rich and reliable measures of situational interest, individual interest and
motivation to learn, a multi-method approach including a combination of observation, survey,
and interview measures was employed (see Table 3-1). In general naturalistic observations were
used to record common factors of the classroom such as instructional climate, environmental
conditions, social interactions, and general participant behaviors. Teacher questionnaires, as well
as systematic classroom observations were used to identify changes in student behavior in
relation to interest and motivation to learn. Self-report surveys were used to obtain students’
demographic information, and assess levels of situational interest, individual interest and
motivation to learn throughout the study. Lastly, focus group interviews were conducted at the
end of the study to further document and verify the impact of the analogy intervention on
students’ situational and individual interest and motivation to learn in and outside of class.
Engagement and Boredom Behaviors -- Markers for Observation
In this study, direct classroom observations of engagement and boredom behaviors were
used to confirm levels of interest and motivation to learn. The phrase “engagement in school” is
often cited as an essential component of dropout prevention programs or other interventions for
students at risk (NCES, 1998). In studies utilizing naturalistic classroom observations, interest
and motivation behaviors are often related to differences in levels of student engagement with
respect to various exhibitions of disengagement or boredom (Chapman, 2003). Early studies of
engagement often made use of time-based indices (i.e., time-on-task) in assessing student
engagement rates (Brophy, 1983; Stallings, Needels & Sparks, 1989). However, more recently,
26
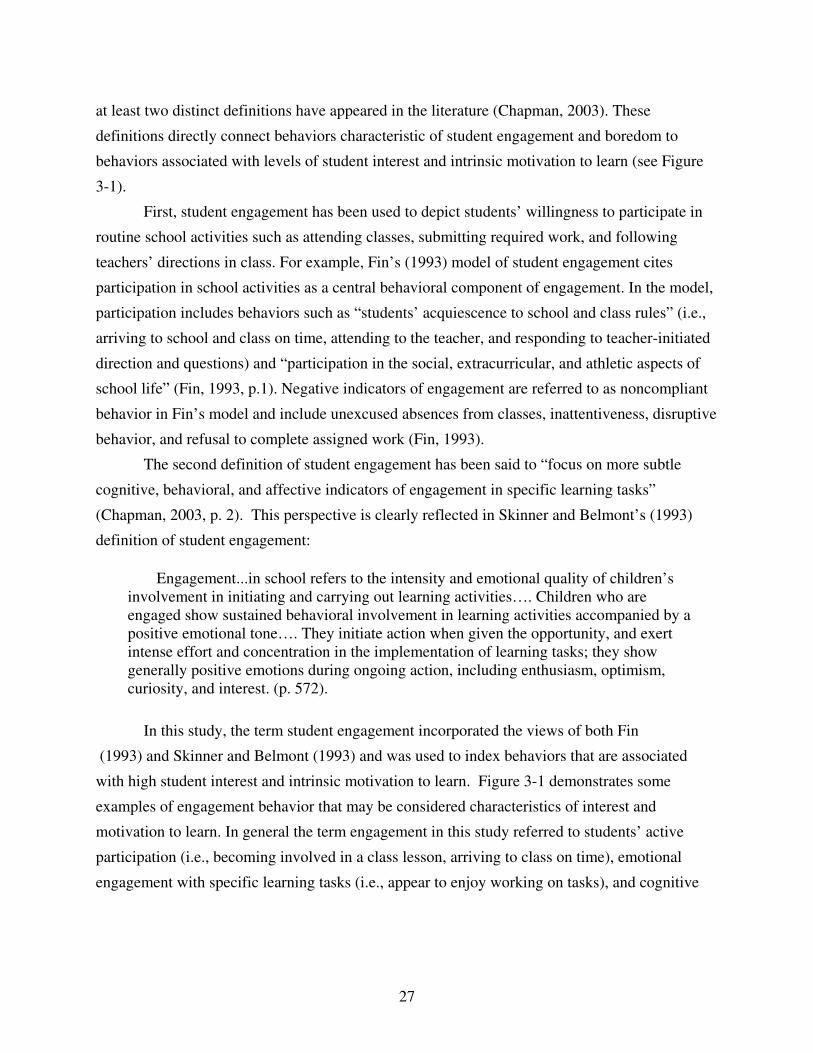
at least two distinct definitions have appeared in the literature (Chapman, 2003). These
definitions directly connect behaviors characteristic of student engagement and boredom to
behaviors associated with levels of student interest and intrinsic motivation to learn (see Figure
3-1).
First, student engagement has been used to depict students’ willingness to participate in
routine school activities such as attending classes, submitting required work, and following
teachers’ directions in class. For example, Fin’s (1993) model of student engagement cites
participation in school activities as a central behavioral component of engagement. In the model,
participation includes behaviors such as “students’ acquiescence to school and class rules” (i.e.,
arriving to school and class on time, attending to the teacher, and responding to teacher-initiated
direction and questions) and “participation in the social, extracurricular, and athletic aspects of
school life” (Fin, 1993, p.1). Negative indicators of engagement are referred to as noncompliant
behavior in Fin’s model and include unexcused absences from classes, inattentiveness, disruptive
behavior, and refusal to complete assigned work (Fin, 1993).
The second definition of student engagement has been said to “focus on more subtle
cognitive, behavioral, and affective indicators of engagement in specific learning tasks”
(Chapman, 2003, p. 2). This perspective is clearly reflected in Skinner and Belmont’s (1993)
definition of student engagement:
Engagement...in school refers to the intensity and emotional quality of children’s
involvement in initiating and carrying out learning activities…. Children who are
engaged show sustained behavioral involvement in learning activities accompanied by a
positive emotional tone…. They initiate action when given the opportunity, and exert
intense effort and concentration in the implementation of learning tasks; they show
generally positive emotions during ongoing action, including enthusiasm, optimism,
curiosity, and interest. (p. 572).
In this study, the term student engagement incorporated the views of both Fin
(1993) and Skinner and Belmont (1993) and was used to index behaviors that are associated
with high student interest and intrinsic motivation to learn. Figure 3-1 demonstrates some
examples of engagement behavior that may be considered characteristics of interest and
motivation to learn. In general the term engagement in this study referred to students’ active
participation (i.e., becoming involved in a class lesson, arriving to class on time), emotional
engagement with specific learning tasks (i.e., appear to enjoy working on tasks), and cognitive
27

Some Behaviors that Define Student Engagement
Finn (1993): engagement is defined as
“students’ acquiescence to school and
class rules.” For example…
arriving to school and
class on time
attending to the teacher
responding to teacher-
initiated direction and
questions
Skinner and Belmont (1993):
engagement is defined as--
initiate action when
given the opportunity
sustained behavioral
involvement in learning
activities accompanied by a
positive emotional tone
exert intense effort and
concentration in the
implementation of learning
tasks
show generally positive
emotions during ongoing
action
Examples of behaviors
that may characterize
intrinsic motivation
to learn
Some behaviors that
characterize high
individual interest
Figure 3-1: Illustrating the connection of engagement behaviors to interest and motivation to learn.
28
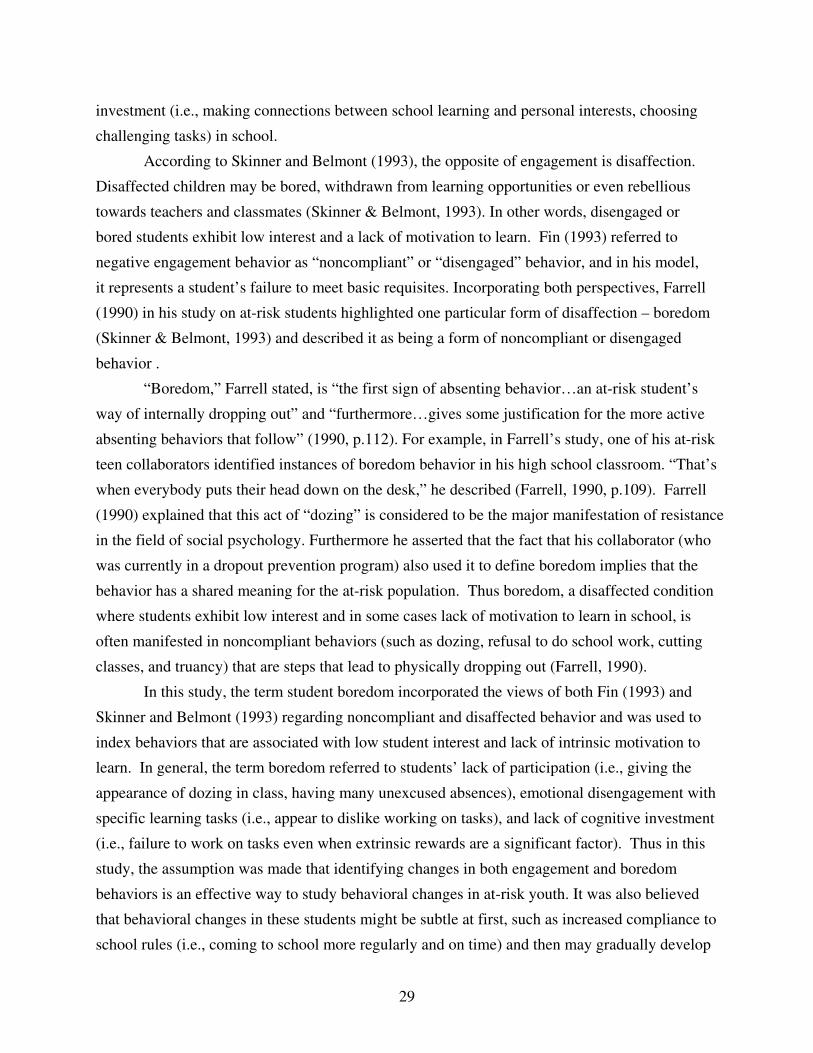
investment (i.e., making connections between school learning and personal interests, choosing
challenging tasks) in school.
According to Skinner and Belmont (1993), the opposite of engagement is disaffection.
Disaffected children may be bored, withdrawn from learning opportunities or even rebellious
towards teachers and classmates (Skinner & Belmont, 1993). In other words, disengaged or
bored students exhibit low interest and a lack of motivation to learn. Fin (1993) referred to
negative engagement behavior as “noncompliant” or “disengaged” behavior, and in his model,
it represents a student’s failure to meet basic requisites. Incorporating both perspectives, Farrell
(1990) in his study on at-risk students highlighted one particular form of disaffection – boredom
(Skinner & Belmont, 1993) and described it as being a form of noncompliant or disengaged
behavior .
“Boredom,” Farrell stated, is “the first sign of absenting behavior…an at-risk student’s
way of internally dropping out” and “furthermore…gives some justification for the more active
absenting behaviors that follow” (1990, p.112). For example, in Farrell’s study, one of his at-risk
teen collaborators identified instances of boredom behavior in his high school classroom. “That’s
when everybody puts their head down on the desk,” he described (Farrell, 1990, p.109). Farrell
(1990) explained that this act of “dozing” is considered to be the major manifestation of resistance
in the field of social psychology. Furthermore he asserted that the fact that his collaborator (who
was currently in a dropout prevention program) also used it to define boredom implies that the
behavior has a shared meaning for the at-risk population. Thus boredom, a disaffected condition
where students exhibit low interest and in some cases lack of motivation to learn in school, is
often manifested in noncompliant behaviors (such as dozing, refusal to do school work, cutting
classes, and truancy) that are steps that lead to physically dropping out (Farrell, 1990).
In this study, the term student boredom incorporated the views of both Fin (1993) and
Skinner and Belmont (1993) regarding noncompliant and disaffected behavior and was used to
index behaviors that are associated with low student interest and lack of intrinsic motivation to
learn. In general, the term boredom referred to students’ lack of participation (i.e., giving the
appearance of dozing in class, having many unexcused absences), emotional disengagement with
specific learning tasks (i.e., appear to dislike working on tasks), and lack of cognitive investment
(i.e., failure to work on tasks even when extrinsic rewards are a significant factor). Thus in this
study, the assumption was made that identifying changes in both engagement and boredom
behaviors is an effective way to study behavioral changes in at-risk youth. It was also believed
that behavioral changes in these students might be subtle at first, such as increased compliance to
school rules (i.e., coming to school more regularly and on time) and then may gradually develop
29
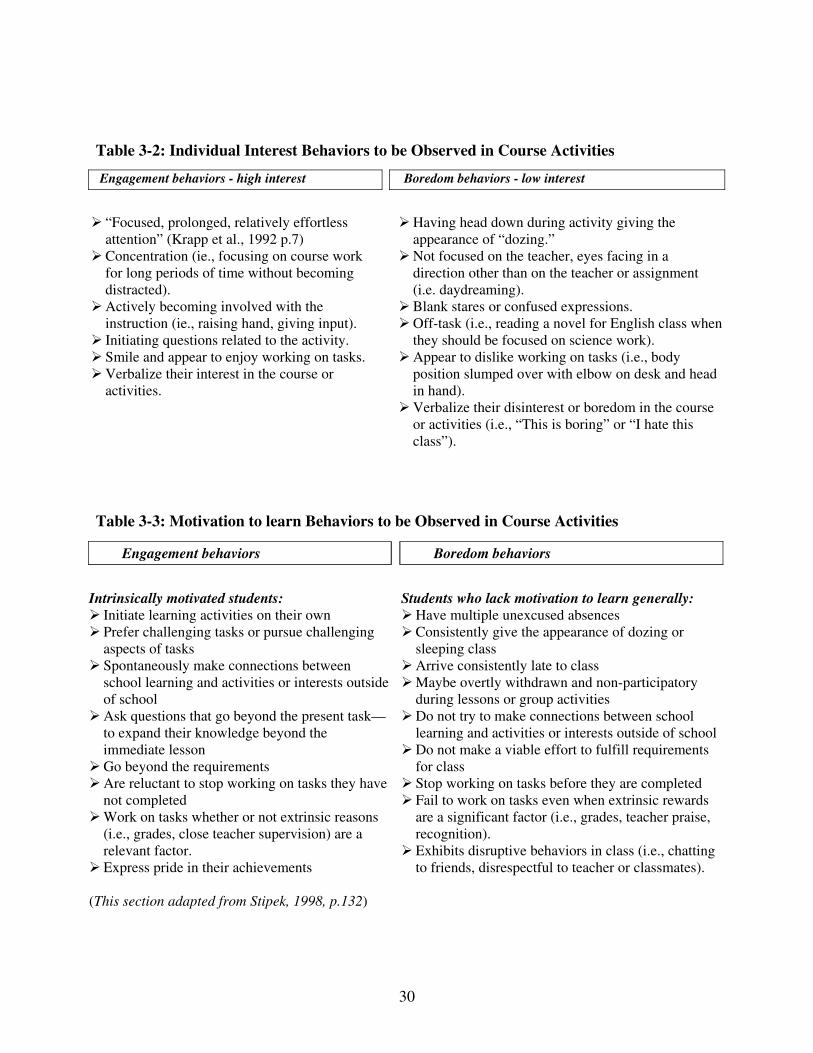
Table 3-2: Individual Interest Behaviors to be Observed in Course Activities
Engagement behaviors - high interest Boredom behaviors - low interest
“Focused, prolonged, relatively effortless
attention” (Krapp et al., 1992 p.7)
Concentration (ie., focusing on course work
for long periods of time without becoming
distracted).
Actively becoming involved with the
instruction (ie., raising hand, giving input).
Initiating questions related to the activity.
Smile and appear to enjoy working on tasks.
Verbalize their interest in the course or
activities.
Having head down during activity giving the
appearance of “dozing.”
Not focused on the teacher, eyes facing in a
direction other than on the teacher or assignment
(i.e. daydreaming).
Blank stares or confused expressions.
Off-task (i.e., reading a novel for English class when
they should be focused on science work).
Appear to dislike working on tasks (i.e., body
position slumped over with elbow on desk and head
in hand).
Verbalize their disinterest or boredom in the course
or activities (i.e., “This is boring” or “I hate this
class”).
Table 3-3: Motivation to learn Behaviors to be Observed in Course Activities
Engagement behaviors Boredom behaviors
Intrinsically motivated students:
Initiate learning activities on their own
Prefer challenging tasks or pursue challenging
aspects of tasks
Spontaneously make connections between
school learning and activities or interests outside
of school
Ask questions that go beyond the present task—
to expand their knowledge beyond the
immediate lesson
Go beyond the requirements
Are reluctant to stop working on tasks they have
not completed
Work on tasks whether or not extrinsic reasons
(i.e., grades, close teacher supervision) are a
relevant factor.
Express pride in their achievements
(This section adapted from Stipek, 1998, p.132)
Students who lack motivation to learn generally:
Have multiple unexcused absences
Consistently give the appearance of dozing or
sleeping class
Arrive consistently late to class
Maybe overtly withdrawn and non-participatory
during lessons or group activities
Do not try to make connections between school
learning and activities or interests outside of school
Do not make a viable effort to fulfill requirements
for class
Stop working on tasks before they are completed
Fail to work on tasks even when extrinsic rewards
are a significant factor (i.e., grades, teacher praise,
recognition).
Exhibits disruptive behaviors in class (i.e., chatting
to friends, disrespectful to teacher or classmates).
30
into more obvious engagement-related behaviors such as actively becoming involved with the
instruction (i.e., raising hands more often). Based on these assumptions, several engagement and
boredom behaviors that were used to identify interest and motivation to learn in this study are
identified in Tables 3-2 and 3-3 respectively.
Observing and Documenting Individual Interest and Motivation-to-Learn Behaviors
Direct Observation. In observing specific behaviors as they occur during a class period,
Stallings, Needels and Sparks (1989) suggest the use of a time sampling technique referred to as
the Off-Task Seating Chart (see Figure 3-2). This technique was used to observe and document
engagement and boredom behaviors related to students’ individual interest in the course. It was
employed to obtain data of a whole class of students at one time.
In general, the Off-task Seating Chart has been used to provide teachers with exact
information about students’ engagement rates. In this study, the design of the Off-Task Seating
chart was modified to include boredom behaviors. It was also modified to record 1) the types of
engagement or boredom behaviors during course activities (see Table 3-2), 2) the nature of the
classroom activities (lecture, lab, seatwork, etc.) in which students were most engaged or bored,
and 3) whether or not the activities were intervention-related. A detailed view of the actual off-
task seating chart that was used in this study (labeled the Direct Engagement Boredom
Observation form or the DEBO form) is included in Appendix B-1.
The classroom, designed as a Biology lab, had two and one half large lab tables bolted to
the floor. Lab tables were equipped with two sinks and four gas vents in the center and were
designed to seat four students on each side. In addition, there was a fixed demonstration lab table
at the front of the classroom for use by the teacher and a second large sturdy portable wooden
table (that seated up to six people) positioned on the left side of the room nearest the exit door.
Only three chairs were placed at this table at any one time. The front of the table (the side closest
to the students) was left void of chairs to maintain a clear path from students’ lab table to the exit
door and also to provide the teacher a clear view of the students while she worked at the desk.
When she was not teaching in front of the class, or working at the computer on the other side of
the room, the teacher often sat at this table to grade papers or complete administrative
paperwork. In addition, any guests who visited the classroom usually sat in one of the chairs
situated at the side ends of the table. When conducting classroom observations, the researcher
most often sat in the side chair nearest the door because it provided a clear view of most of the
students’ faces. All except three students’ faces were visible to me at this position. Because of
their seat positions and the position of the teacher in the classroom during lessons, these students
31

Bla
ckb
oard
Counter and Sink S
up
ply
R
oo
m
Fil
ing
Cab
inet
s
-----------------------------Wooden Cabinets---------------------------
Large Wooden
Observing Table
Win
do
w a
nd A
ir C
on
dit
ion
ing U
nit
Exit door
S/Le/X A/Le/X I/Le/X
Q/LE/X F/Le/X A/Le/X
A/Le/X B/Le/X A/Le/x
I/Le/X O/Le/X C/Le/X
C/Le/X
---------- Wooden Cabinets----------------------------- --------------------
One
Co
mp
ute
r
Des
k
Overhead
Projector
Teacher
Demo
Lab
Table
Sink
O/Le/XB/Le/X
Sink
314 313 315
301
Sink
Sink
302 303
304 305
309 308 307
310 311 312
306
Door to other
Science lab
# 301 – 315 Student observation codes i.e. 301= Jessica H.
Engagement Codes Boredom Codes Activity Codes Observation
SweepsA= attention
C = concentration
I = involved
Q = ask or answer question
S = smile/laugh/enjoy
VI = verbalize interest
Doz = dozing
NF = not focused
Bl = blank or confused stare
Off = off task
Dis = distracted
VD = verbalize disinterest
La=lab
Le = lecture
GW = group work
SW = seat work
Av = audiovisual
X = intervention
Figure 3-2: Example of an On/ Off-task Seating Chart for documenting engagement and boredom
behaviors related to individual interest.
32
usually had their backs turned to the wooden table where the researcher was sitting. In order to
see the faces of these students, the researcher sometimes alternated her seat position at
appropriate times during the class session to a chair positioned in front of the class computer on
the opposite side of the classroom.
Because the classroom was constructed as a Biology laboratory, the students had been
given assigned seats at the start of the school term. The diagram in Figure 3-2 (not drawn to
scale) shows the position of 15 students present in the classroom. Approximately seven to eight
observation sweeps were made during a 45-50 minute class session in six minute increments. At
times, in instances where there was a change in class schedule (i.e., special school activity
schedule) and/or lessons were shortened, the number of sweeps changed to five or six but with
the same six minute increments. During a sweep, an entry was made for a student depicting
either an engagement or boredom behavior code.
The general coding system for the behaviors is shown in Figure 3-2. It included 12
possible behaviors that were used to indicate what a student was doing during a sweep. For
example, during sweep , student 301 exhibited focused prolonged attention during a lecture
that incorporated the self-generated analogy intervention. If a student exhibited a specific
reoccurring engagement or boredom behavior that was not included on the pre-coded list (such
as disrespect to the teacher or a classmate), the behavior would be coded and added to the list. If
the student’s behavior was not easily generalized as engagement or boredom, this factor was
noted and the behavior was later categorized as engagement or boredom in collaboration with the
classroom teacher.
To gather data regarding students’ in-class interest behavior before and during the
intervention, systematic observation was employed by the researcher during both the pre-
intervention period (4 weeks, approximately 15 sessions) and the intervention period (5 1/2
weeks, approximately 15 sessions). During both observation periods, this technique was
employed on almost all consecutive days that the class met, excluding exam or special activities
days, or days in which the instructor was not present.
Identifying motivation-to-learn behaviors. In general, both “state” and “trait” forms of
motivation to learn can be defined and measured in terms of specific engagement and/or
boredom behaviors. Stipek (1998) identified nine engagement behaviors that are generally
exhibited by intrinsically motivated students (see Table 3-3). In relation to these behaviors,
several opposite boredom behaviors can be identified (Table 3-3). In this study, these sets of
engagement and boredom behaviors were used as a contextual framework for identifying
changes in students’ intrinsic motivation to learn. During the entire period of the study, these
33
behaviors were monitored in the classroom during direct class observations and when possible,
outside the classroom (such as in the lunch room). Classroom behaviors related to motivation
were documented during direct observation periods on classroom observation sheets. Motivation
behaviors that occurred outside of the classroom were documented on the researcher’s general
observation notes. In addition, approximately every two – three weeks, these observed
motivation behaviors were documented in the form of a summary motivation-to-learn
observation checklist (see Appendix B-2). These periodic motivation-to-learn checklists were
completed by the researcher in collaboration with the student intern and the regular classroom
teacher. Any specific motivation-to-learn engagement and boredom behaviors not included on
the list were categorized or added to the preset list of behaviors as they emerged from the
classroom observation data.
Surveys
According to Stipek (1998), when examining ways to assess student interest and
motivation to learn, the most straightforward strategy is to ask students how interested they are in
various school tasks. She says that teachers can create brief, anonymous questionnaires that ask
students to rate their interest and/or motivation in an activity or classwork they have been doing.
Wittrock (1986) substantiates this type of data gathering strategy. He reports in his findings on
educational measurement that measures of students’ thought processes, including self-report data
have proven to be useful and accurate in predicting achievement at a statistically significant level
(Wittrock, 1986).
In addition to student self-report data, Stipek (1998) also warrants the use of teacher
observations of specific behaviors as effective instruments in determining levels of student
motivation to learn. For this reason, four student and two teacher survey instruments were
designed by the researcher to collect data specific to this study (see Appendix B-3 to 8). They are
listed below in the order that they were presented in the actual study.
1) The Pre-Intervention Demographic and Interest Survey (Pre-DIS)
2) The Pre-Intervention Teacher Questionnaire (Pre-TQ)
3) The Situational Interest Survey (SIS)
4) The Individual Interest and Motivation to Learn Survey (IMLS)
5) The Post-Intervention Motivation to Learn Survey (Post-MLS)
6) The Post-Intervention Teacher Questionnaire (Post-TQ)
34
The Pre-Intervention Demographic and Interest Survey (Pre-DIS).
This survey was designed to obtain information about the participants to set a baseline for
the study in terms of demographic similarities and/or differences between participants (e.g., 50%
of students attend after school tutoring), and obtain baseline and supporting data in relation to
changes in students general interest and attitudes towards the course, and discernment of their
own interest and boredom behaviors in school (see Appendix B-3). Demographic items asked
students to report information such as the month and year they were born (to confirm their age
and whether or not they have ever been retained), current grade and grade level at the time they
entered the school and whether or not they received homework help (such as tutoring) after
school, were involved with extracurricular activities, or had a parent or guardian working at the
school or university.
The interest portion of the survey consisted of a mixture of open and closed-ended items
and one multiple response item The multiple response portion, adapted from a student activity
designed by Rogers, Ludington, and Graham (1999) for use by teachers in surveying student
attitudes about a course, class activity, or project, was used as supporting data related to changes
in individual interest. Participant responses to open-ended items, which surveyed discernment of
their own interest and boredom behaviors in school, were used to facilitate documentation and
analysis of systematic classroom observations.
Pre and Post Intervention Teacher Questionnaires
At the beginning of the pre-intervention period and then again towards the end of the
post- intervention period, the classroom teacher was asked to complete a Teacher questionnaire
asking specific questions regarding students’ behavior in Biology class (see Appendix B-3 and
B-8). In this study, the teacher’s responses to these surveys in collaboration with data from the
summary motivation-to-learn observation checklist (Appendix B-2), was used to identify
changes in students’ motivation-to-learn behavior as well as provide supporting evidence for
students’ self-report data related to motivation to learn.
The first survey, the Pre-Intervention Teacher Questionnaire (Pre-TQ, see Appendix B-3)
asked the classroom teacher to complete the items based on her knowledge of students’ previous
semester’s performance in science class, judgment of students’ level of previous motivation-to-
learn behaviors (based on behaviors in Table 3-3), and general instructional methods that were
used. Survey questions included “How often did this student complete homework assignments?”
and “How often was this student disruptive in class?” These questions were scored on a five-
point Likert-type scale from 1-Never to 5-All the time. The classroom teacher was given the
35
survey at the start of the pre-intervention period (which began five weeks into the 3rd
nine weeks
grading period) and asked to base her responses in relation to students’ motivation-to-learn
behavior during the previous semester (1st and 2
nd nine weeks) and the first half of the 3
rd nine
weeks grading period (the period of time the students were in class before the start of the study).
Behavioral items in the survey included “Initiated learning activities on his/her own”, “Went
beyond the requirements of class”, and “Often gave an appearance of dozing in class” (i.e., head
down on desk). These questions were scored on a five-point Likert-type scale from 1-Strongly
disagree to 5-Strongly agree.
The Post-Intervention Teacher Questionnaire (Post-TQ, Appendix B-8) was identical to
the Pre-TQ except for minor modifications in wording to reflect the difference in the time period
that the teacher was asked to reflect upon. The classroom teacher was given the survey towards
the end of the post-intervention period and asked to base her responses in relation to students’
motivation-to-learn behavior during the current semester’s final nine week grading period (the
period of time incorporating the intervention and post intervention periods).
These instruments provided summative pre-intervention data, helpful in creating a
baseline of students’ past semester’s performance, and summative post-intervention data for the
current semester, helpful in substantiating this study’s findings in relation to changes in student
interest and motivation-to-learn. Some survey questions were adapted from the National
Education Longitudinal Study Teacher Questionnaire for base year 1988 and follow-up years
1990 and 1992 (see Parts I and III of the survey).
The Situational Interest Survey
In this study, situational interest in the analogy activities (i.e., identification, generation)
was measured in terms of student responses to four Situational Interest Survey (SIS) items
relating to catch and hold factors. The SIS was incorporated into each page of students’ Analogy
Journals (designed by the researcher as an enhancement to the regular Biology curriculum).
According to interest researchers Hidi and Anderson (1992), situational interest should be
measured at the individual level when the individual is interacting with an activity. Therefore
students were asked to record their situational interest in individual analogy journals at the end of
lessons that contained an analogy for identification or at the time of self-generated analogy
construction. The four SIS items were included on the bottom half of each journal page (see
Appendix B-5). For purposes of classroom instruction only, the top half of each journal page
consisted of two open-ended items used to aid students in identifying the analogy and
demonstrating their understanding of the relationship between the analog (the object of
36
comparison) and target (concept) and have not been used for the purpose of analysis in this
study.
Catch and Hold Factors. The first SIS item measured the catch factor “interestingness of
the analogy” in the form of the question,
“How much do you feel this analogy stimulated your interest in the lesson?”
The second, third, and fourth items measured the hold factors memory retention,
understanding, and personal connection (or personal meaning) respectively in the form of the
questions:
“How much do you feel this analogy will help you remember the concept?”
(memory retention)
“How much do you feel this analogy has helped you to understand the concept?”
(understanding)
“How much do you feel this analogy makes a personal connection to you?”
(personal connection)
Students received instruction on the meaning of each survey item (i.e., personal
connection may refer to the connection to the analogy to aspects of students’ culture, interests,
prior knowledge or experiences). Each item was scored on a four-point Likert-type scale from
1- Not at all to 4 -Very much (see Appendix B-5).
In this study, interestingness of the analogy was chosen as a catch factor based on current
situational interest research. The term “interestingness” (not to be confused here with situational
interest in the analogy activity) is a term taken from interest theory and represents how much the
analogy appealed to the students in terms of the features or elements used in presentation of the
analogy (i.e., imagery, surprise, challenge) and or relative subject matter used in the analog (i.e.,
cars, sports, candy). According to Frick (1992) and Hidi and Baird (1986), a person evaluates
interestingness in a learning activity based on a judgment as to whether or not a particular
activity or whatever they are involved in is appealing or interesting to them. Mitchell (1993)
stated that interest theory and research leads us to propose that the essence of “catching” lies in
finding various ways to “stimulate” (or temporarily increase a desired behavior) in students.
Furthermore, in expounding on this process Malone and Lepper (1987) submitted that there are
at least two kinds of stimulation, sensory and cognitive. When presenting analogies, teachers will
often use imagery, hands on materials and other sensory stimulants to catch students’ interest.
They also may choose analogs that they feel relate best to their students’ prior knowledge and/or
culture experiences thus stimulating students’ cognitive thought processes as they try to make
37
sense of the comparison presented. Whether or not information to be learned is of interest to the
students, how a teacher presents this information will often influence how it is received by the
students and may have an impact on their judgment of how interesting it is.
Memory retention, comprehension, and personal connectedness were used as hold
factors. In this study Memory as a hold factor was defined as the level that students perceive the
analogy as helping them remember the concept, understanding was defined as the level that
students perceive the analogy as helping them understand the concept, and personal
connectedness was defined as the level that students perceive the analogy as being meaningful to
them. Mitchell (1993) contends that the essence of “holding” lies in variables that “empower”
students (or is “perceived by students as giving them power to achieve personal goals” (p. 426).
Empowerment is described as the underlying variable behind “holding interest” because even
when the source of empowerment is removed (analogies in this case), it is likely that the student
will still find the subject (genetics) or activity (learning) interesting to them (Mitchell, 1993).
Memory retention, comprehension, and personal connection were chosen as hold factors
based on classroom observations and focus group interviews conducted in a recent pilot study
highlighting analogy instruction and secondary Biology students from the same school (Clarke,
2003). In the pilot study, students verbalized that being able to better understand and remember
the concepts being taught would give them more confidence and help them to perform better on
unit exams and ultimately help them to pass or perform better in the class. Also when asked why
they chose a particular analogy as their favorite, students replied that the analogy made a
personal connection to something that they were familiar with or were interested in. For
example, an analogy that compared human chromosomes to two Lamborghinis (popular foreign
cars) parked in a garage maintained the interest of students who had a prior interest in cars.
Students found these hold factors to be empowering in the sense that memory and understanding
would help students fulfill a goal of passing the course, and personal connection caused them to
become more interested in the course material such that students reported that it was easier for
them to retain the information they learned in class.
Individual Interest and Motivation to Learn Survey
This survey was given at the end of the intervention period and used to assess students’
perception of the impact of the intervention on their individual interest in the course and
motivation to learn in class and outside of class. In addition, several items from the Pre-DIS were
modified and used to reflect students’ current responses in relation to a personal preference for
the course, positive feelings and perception of personal utility towards the course.
38

Individual interest. Students were asked to respond to seven survey items in relation to
the impact of the intervention on their individual interest in the course (see Appendix B-6). The
first two questions were scored on a five point Likert-type scale from 1= No, not at all to 5= Yes,
definitely. The third were multiple response items repeated from the Pre-DIS. The last four were
modified items from the Pre-DIS changed to reflect students’ responses to personal preference
for the course, positive feelings and perception of personal utility towards the course for the
semester.
Motivation to learn. Motivation to learn was measured by five self-report items surveying
the impact of the self-generated analogy intervention on students’ motivation to learn in class
and outside of class. These items, shown below, were scored on a five point Likert-type scale
from 1= No, not at all to 5= Yes, definitely.
Motivation to Learn Items:
♦ Did learning about analogies help motivate you to learn in class?
♦ Did learning about analogies help motivate you to learn more on your own?
♦ Did creating a your own analogies help motivate you to learn in class?
(i.e. pay more attention to the teacher, able to answer questions when asked, more
involved in class lessons)
♦ Did creating your own analogies help motivate you to learn more on your own in
class? (i.e. Asking more questions when you don’t understand, thinking more deeply
about what is being taught, reading or taking notes from the text book to help you
remember and understand?)
♦ Did creating your own analogies help motivate you to learn more on your own outside
of class? (i.e Coming to class prepared, completing homework. or classwork
assignments or reading at home)
Post-Intervention Motivation to Learn Survey
This survey, given during the post-intervention period, asked students to respond to two
open-ended questions regarding the analogy intervention and their motivation to learn (see
Appendix B-7). These questions provided data on whether or not students’ motivation to learn
was sustained within a two to three week period after the intervention and whether or not
students’ motivation to learn was transferred to other areas outside of class by way of self-
directed analogy or other learning strategy use. The questions on this survey were:
1. Now that the analogy project is complete, do you think making your own analogies
helped motivate you to learn new information in Science class? Explain your answer.
39
2. Has the analogy project motivated you to create new analogies or use other learning
strategies to help you learn in other classes or outside of school? Please explain or
give an example.
Focus Group Interviews
Focus group interviews as proposed by Morgan (1997) were used as a qualitative
measure to corroborate observations and survey responses and were chosen over other interview
techniques because focus groups 1). Offer greater efficiency in data collection with regards to
time (i.e. students had limited time during and after school) and 2). provide direct evidence with
regards to similarities and differences in the perspectives and experiences of the participants
(Morgan 1997). In this study, two focus groups were formed (one from each class) and two
sessions were held (one during each class period). During the focus group sessions, the
researcher acted as facilitator and led the groups in discussion about their participation in the
research study. Students discussed the degree to which they felt learning about analogies was
worthwhile to them, the degree to which the activities were interesting to them and caused them
to think about their learning, and the degree to which learning about analogies helped motivate
them to learn. Some questions were “What made the process of generating your own analogies
interesting to you? Did creating your own analogies help motivate you to learn more in class?
Did creating your own analogies help motivate you to learn outside of class?”
Focus group interviews were conducted at the end of the intervention period and sessions
were audio-taped and transcribed for analysis. Volunteers from each class were recruited and
groups comprised four and five students in the third and sixth period classes respectively.
Refreshments were provided for the students’ participation.
Procedure
Preparing for the Pre-intervention Period
This study began in the fifth week of the second semester, during the 3rd
nine weeks of
the school term. The intervention began in the second half of the semester or the fourth nine
weeks of the term. Before the start of the study, the researcher made three site visits to the
school. The first was a scheduled visit made between the Fall and Spring semesters (when school
was out of session). It was arranged by the host teacher (the lead classroom teacher in this study)
and its purpose was to meet with the directors of the school, to obtain their approval of the study,
40

and to gain access to the school for the following semester. The second and third visits were
made during the second and third weeks of the Spring semester. The purpose of these visits was
to survey the physical aspects of the classroom, including the seating arrangement of the
students, to consult with the classroom teacher regarding the time frame and integration of the
study into the scheduled curriculum, and to meet the new intern teacher.
During the third visit, the teacher and the researcher scheduled the study (which begins
with the pre-intervention period) to start in the fifth week of the semester during the 3rd
nine-
week marking period. This plan allowed the pre-intervention period to end at the close of the 3rd
nine-week marking period and intervention period to begin at the start of the 4th
nine-week
grading period. In addition, this time frame enabled the study to incorporate both the planned
teaching schedule of the intern teacher and the regular classroom teacher. During the study the
intern teacher taught the Biology classes for six consecutive weeks, three weeks during the pre-
intervention and three weeks during the intervention period. The regular classroom teacher
taught at all other times during the pre-intervention, intervention and post-intervention periods.
During the fourth week of the semester the researcher gave out parental consent forms to
students and began a period of daily visits to the classroom. In the beginning of the week, the
classroom teacher introduced the researcher to the students as a guest instructor/researcher (a
role that was assumed by the researcher throughout the study). After the introduction, the
researcher spoke to the students about the study and told them that later in the semester as a part
of the regular Biology curriculum they would be learning about analogies and would be working
on a special project that involved creating their our own analogies to help them learn in class.
Then the researcher, with the help of the classroom teacher, handed out parental consent forms to
each student. The researcher reviewed the consent form with the students and explained to them
that it was a letter informing their parents of the study and requesting their parents’ permission to
obtain and use the students’ data in the study (including responses to questionnaires, class
observation data, focus group interviews and grades, etc.). The researcher asked the students to
take the consent forms home, discuss it with their parents, and bring the form back to school the
next day with a signature of consent or a signed note on the form signifying refusal from their
parents. At that time, the classroom teacher spoke again to the students and encouraged them to
bring the consent form back the next day and told them to have their parents contact her if there
was any question about the form.
During the period of time that the consent forms were sent home with the students and
the time that the study began (approximately one week), the researcher attended class sessions
each day to prepare for direct observation of the students and to organize administrative data
41

(such as a checked list of names of students who handed in consent forms and assent forms). In
order to facilitate record keeping, the researcher requested from the teacher a list of names of
students enrolled in both Biology class in the order that they appeared in her grade book. The
names of these students were given a number in order from 1 to 26. These numbers are referred
to by the researcher as record-book codes and were used later in the course for record keeping
and grading purposes.
In addition to the record-book code, students were also given a code based on their
assigned seating. These codes are referred to by the researcher as the students’ observation code.
For example the student in the third period class sitting in a seat identified by the researcher as
seat one was given the observation code 301. A student in the sixth period class sitting in a seat
identified by the researcher as seat five was given the code 605. These codes were used on direct
student observation forms and used to identify students based on their original assigned seat. If a
student worked in a group or sat away from his assigned seat during a particular class session,
the code did not change but remained the same for that student throughout the duration of the
research period. If a student dropped out of the study, that student’s observation code remained a
part of his or her identity in the study and was no longer used.
Also during this time, the researcher drafted several editions of the Direct Engagement
and Boredom Observation (DEBO) form that was used in the study. Depending on the number of
students in each class, the final form consisted of one to three 8 X 14 sheets (landscape view).
Each sheet contained of a grid table of six boxes with eight horizontal lines (see Appendix B-1).
Each grid table represented a lab table consisting of six students. Each box represented the seat
of an individual student and the eight lines represented the number of observation sweeps for that
period (eight maximum). The space on each line were used to record engagement and boredom
codes as well as researcher comments about student behavior. At the side of the grid table was a
2 ½ -inch margin at the side for detailed observation notes, such as the type of activity that
occurred during observation sweeps, lesson notes, student activities, researcher comments, etc.
On top of the table a one-inch space was used for writing down the number of sweeps, the time
direct observation began and the time each sweep was scheduled to be carried out. (Class periods
were 50 minutes long and for most class sessions in this study, eight observation sweeps were
planned, one every six minutes). Researcher-assigned student observation codes were placed in
the top left corner of each box to maintain the identity of the student.
Depending on the number of students and seating arrangement in each class, copies of
DEBO sheets were stapled together and used as a mini-booklet to record the daily direct
observations made in each class. On top of the first DEBO sheet of each booklet, the class
42
period, number of the observation (i.e. 3 of 15), date the observation took place, and the total
number of students present in class that day were recorded. The last DEBO sheet usually
consisted of a table of three to four boxes, representing students at the end lab table and a pre-
recorded list of engagement, boredom, and activity codes to be used as reference during the
observation sweeps. Before direct observations began, sixty observations booklets (thirty per
class period) were constructed and pre-labeled in preparation for the pre-intervention and
intervention observation periods.
Part1: The Pre-intervention Period (4 weeks)
Once parental consent and student assent were obtained for the majority of the students,
the researcher began the pre-intervention period of the study. (All students, with the exception of
one third period student, returned signed consent and assent forms a week after they were
distributed.) At the start of this period, the classroom teacher was asked to fill-out the Pre-
intervention Teacher Questionnaire (to be completed at her convenience) and all students who
had completed and returned signed parental consent and student assent forms were asked to fill-
out a Pre-intervention Demographic and Interest Survey (to be completed during class time). In
addition, direct observations of student engagement and boredom behavior and general
observations of interactions in the classroom were conducted by the researcher. Also other data
in relation to at-risk criteria such as students’ past school performance, attendance etc. were
gathered by the researcher with the aid of the classroom teacher.
Pre-intervention demographic and interest survey (Pre-DIS).
To facilitate administration of the pre-intervention student survey, the teacher and
researcher scheduled a specific day when both classes would be available to take the survey
during their regularly scheduled class period. On that particular day, the teacher set aside
approximately fifteen minutes at the beginning of the period for the administration of the survey.
At the start of each class, the researcher greeted the students and introduced the survey. The
researcher explained that the survey would be used to help get to know a little about them and
their interests and/or disinterests in school and science class and reminded them that the survey
had no connection to their class grade and that their responses would in no way affect their
grade. The students were told not to put their names on the paper but instead asked to give
themselves a four-digit code that they would be able to remember (such the last four digits of
their telephone number). (For confidentiality and record keeping purposes, these codes were later
recorded by the researcher on a separate sheet and kept in a special administration file with
43
students’ names, parental consent and student assent forms, research observation codes, and
record codes for record keeping and analysis purposes later in the study).
The researcher asked the students to read the questions carefully and to be open and
honest when answering the questions. They were told that the survey would take about ten to
fifteen minutes to complete, but that they would be given more time if needed. When finished,
students handed in their survey to the researcher. Most students completed the survey in less than
ten minutes. The researcher used the remaining time to receive and check all student survey
forms individually for item completion and clarity. If a response to an item was missing the
researcher asked the student if he or she meant to “leave it blank or wished to respond to the
item.” The student would then get another opportunity to complete the item if he or she desired
to do so. If a student’s response to an item was not clear (either because of a discrepancy in item
choices or incomplete and/or illegible writing, the researcher asked the student for clarification
and either made a written note next to the item(s) or in the case of the open ended items, asked
the student to add to the response to make it more exact or clear. After fifteen minutes all
participating students present in class that day had completed their surveys and returned them to
the researcher who thanked them for participating in the study. Students who were absent from
class the day the survey was given were administered the survey one on one by the researcher
either in class on the day they returned or during a specially arranged time during the school day
depending on the class schedule. As previously done, the researcher checked all student survey
forms individually for item completion and clarity and resolved any discrepancies in the same
manner as previously stated.
Soon after administration of the Pre-DIS, a preliminary analysis of student responses to
items regarding discernment of their own interest and boredom behaviors in school was
conducted. This analysis was conducted for purposes of adding to and more accurately defining
the pre-coded list of behaviors used in direct observations.
Direct observations.
In the pre-intervention period, direct observations of each class were conducted (17
sessions for third period, 16 sessions for sixth period). Direct observations were limited to
regular class sessions where the intern or regular teacher were the lead presenters of the class
lesson. Class sessions that consisted of a school-wide activity, or visits to the media lab were not
included in the systematic observations. During the observation period, five consecutive class
sessions were taught by the regular classroom teacher in the beginning of the pre-intervention
period and the remaining sessions were taught by the intern teacher (under the supervision of the
44
lead teacher) later in the pre-intervention period. The procedures of direct systematic
observations discussed below were the same for both teachers and for both class periods.
Using the pre-formed observation booklets, the researcher systematically scanned and
recorded student behavior during class sessions at six minute intervals (sweeps). Observation
sessions (usually consisting of seven or eight per session) began at the beginning of the period at
the time that the teacher called the students to attention or began a lesson or activity. During each
session, the exact time of the start of the first observation sweep was recorded and the six-minute
time intervals of the sweeps remaining were based on that start time until the end of the period.
So for example, if during observation session one the teacher began her lesson at 10:10 A.M. and
sweep one was recorded two minutes into the lesson at 10:12 A.M., the sweeps following would
be recorded at the intervals 10:18, 10:24, 10:30, 10:36 A.M. etc.. Also, to assure accuracy, the
researcher often conducted observations at two locations in the classroom, at the wooden table
and at the computer chair on the opposite side of the room. In addition, at the end of the lesson
the researcher conferred with the teacher who conducted the lesson to verify a particular
student’s behavior if that student’s seat position was such that much of the individual’s face and
body was blocked from view during the session.
Part II: The Intervention Period ( 5 ½ weeks)
During the intervention period the researcher continued the role of guest instructor/
researcher. Analogy instruction began and students completed situational interest survey items
based in their analogy journals. In addition, the researcher conducted the Individual Interest and
Motivation to Learn Survey (IMLS) and direct observations continued in the same manner as
they were conducted in the pre-intervention stage.
Direct observations.
Direct observations occurred throughout the intervention period (sixteen sessions for the
third period class and fourteen sessions for the sixth period class) and were limited to regular
class sessions where the intern teacher and regular teacher were the lead teachers presenting the
class lessons. Class sessions that consisted of a school-wide activity, visit to the media lab or
where the researcher was the main presenter were not included in systematic observation.
However, general classroom observations were conducted at these times and throughout the
intervention period.
Planning for the intervention period with the classroom teachers.
Approximately three weeks before the intervention period began, a portion of time (30
45
46
minutes for approximately three sessions) was set aside for planning during the teachers’ free
period. This time was used to coordinate the integration of the intervention, self-generated
analogy instruction, into the Biology unit the teachers projected to be teaching at that time.
During this time the researcher reviewed the general procedures of the self-generated analogy
intervention with the teachers (see Table 3-4). In addition the teachers were given two articles to
read which discussed the use of teacher-constructed analogies (Glynn, 1991) and student-
generated analogies (BouJaoude & Tamim, 2000), which gave tangible illustrations of analogies
in the science classroom. Also, because the supervising classroom teacher had participated in a
similar pilot study utilizing self-generated analogies (Clarke, 1993) and was a veteran science
teacher who had more experience in using analogies in her teaching, she agreed to model teacher
constructed-analogy use in the classroom for the intern teacher who would be the lead teacher for
the first three weeks of the intervention.
Phases of the intervention.
For purposes of application and integration within the course curriculum, the intervention
period was divided into two consecutive phases.
Phase I: Analogy Instruction consisting of:
♦ The Analogy Tutorial (one or two class sessions)
♦ Identifying Teacher-constructed Analogies and beginning the analogy journal and
situational interest survey (one and a 1/2 weeks or approximately seven class sessions)
♦ Self-generated Analogy Transition Period (two class sessions)
♦ Reflection, Review and Revision ( two to three class sessions)
Phase II: Self-generation of Analogies consisting of:
♦ The Self-generated analogy project and presentation (2 1/2 weeks or 12 class sessions)
and the end of intervention period.
It is important to note that, except for the analogy tutorial and follow-up activity, the
periods of time listed refer only to the duration of time that the classroom teacher focused on a
particular part of the intervention within the curriculum. It does not represent the amount of time
expended by the implementation of intervention activities. During Phase I of the intervention
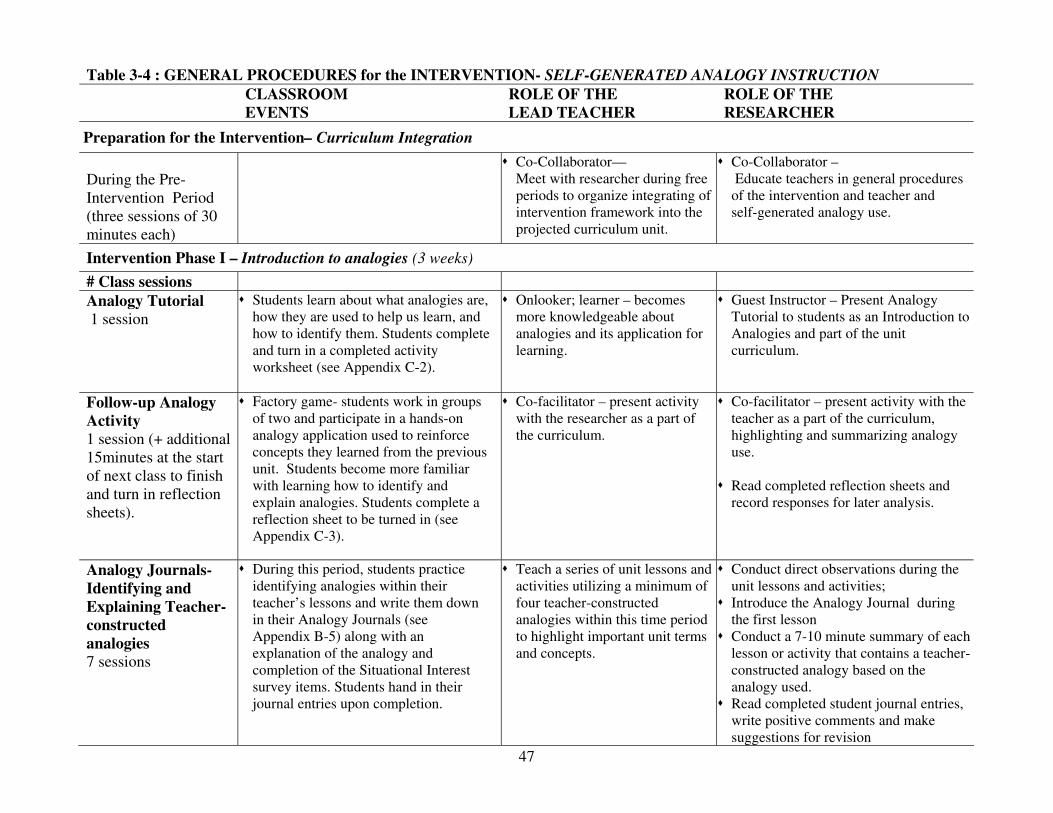
47
Table 3-4 : GENERAL PROCEDURES for the INTERVENTION- SELF-GENERATED ANALOGY INSTRUCTION
CLASSROOM
EVENTS
ROLE OF THE
LEAD TEACHER
ROLE OF THE
RESEARCHER
Preparation for the Intervention– Curriculum Integration
During the Pre-
Intervention Period
(three sessions of 30
minutes each)
Co-Collaborator—
Meet with researcher during free
periods to organize integrating of
intervention framework into the
projected curriculum unit.
Co-Collaborator –
Educate teachers in general procedures
of the intervention and teacher and
self-generated analogy use.
Intervention Phase I – Introduction to analogies (3 weeks)
# Class sessions
Analogy Tutorial
1 session
Students learn about what analogies are,
how they are used to help us learn, and
how to identify them. Students complete
and turn in a completed activity
worksheet (see Appendix C-2).
Onlooker; learner – becomes
more knowledgeable about
analogies and its application for
learning.
Guest Instructor – Present Analogy
Tutorial to students as an Introduction to
Analogies and part of the unit
curriculum.
Follow-up Analogy
Activity
1 session (+ additional
15minutes at the start
of next class to finish
and turn in reflection
sheets).
Factory game- students work in groups
of two and participate in a hands-on
analogy application used to reinforce
concepts they learned from the previous
unit. Students become more familiar
with learning how to identify and
explain analogies. Students complete a
reflection sheet to be turned in (see
Appendix C-3).
Co-facilitator – present activity
with the researcher as a part of
the curriculum.
Co-facilitator – present activity with the
teacher as a part of the curriculum,
highlighting and summarizing analogy
use.
Read completed reflection sheets and
record responses for later analysis.
Analogy Journals-
Identifying and
Explaining Teacher-
constructed
analogies
7 sessions
During this period, students practice
identifying analogies within their
teacher’s lessons and write them down
in their Analogy Journals (see
Appendix B-5) along with an
explanation of the analogy and
completion of the Situational Interest
survey items. Students hand in their
journal entries upon completion.
Teach a series of unit lessons and
activities utilizing a minimum of
four teacher-constructed
analogies within this time period
to highlight important unit terms
and concepts.
Conduct direct observations during the
unit lessons and activities;
Introduce the Analogy Journal during
the first lesson
Conduct a 7-10 minute summary of each
lesson or activity that contains a teacher-
constructed analogy based on the
analogy used.
Read completed student journal entries,
write positive comments and make
suggestions for revision
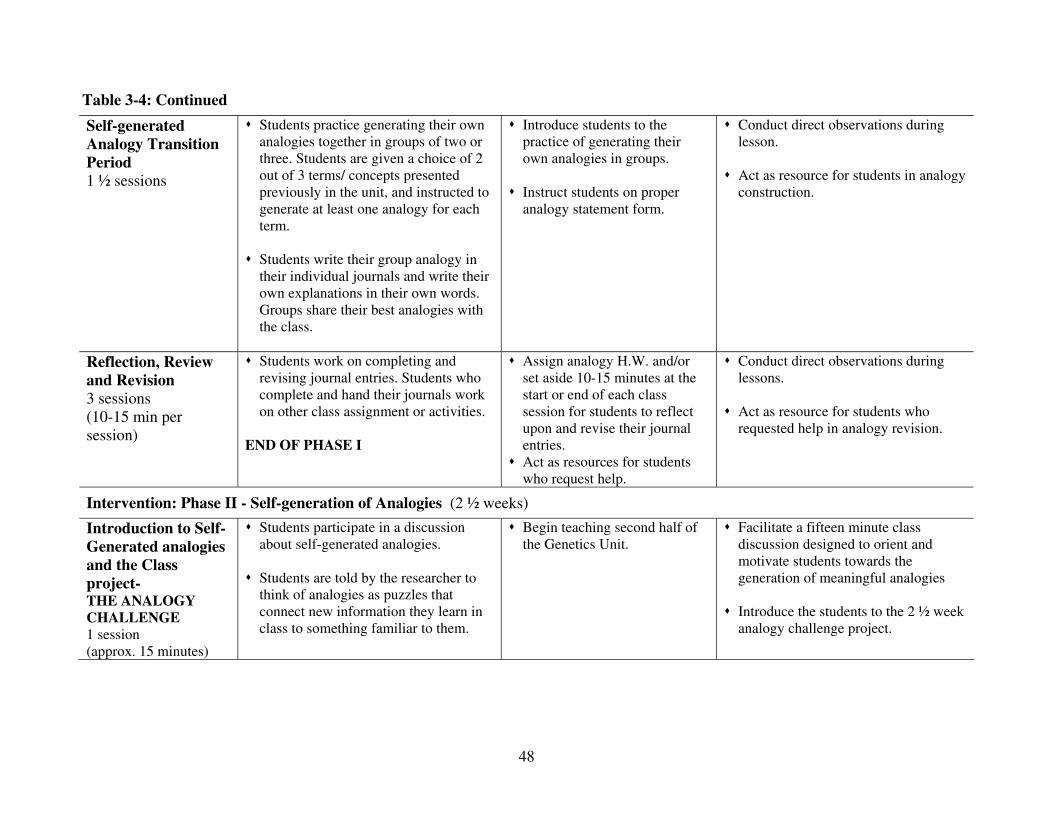
48
Table 3-4: Continued
Self-generated
Analogy Transition
Period
1 ½ sessions
Students practice generating their own
analogies together in groups of two or
three. Students are given a choice of 2
out of 3 terms/ concepts presented
previously in the unit, and instructed to
generate at least one analogy for each
term.
Students write their group analogy in
their individual journals and write their
own explanations in their own words.
Groups share their best analogies with
the class.
Introduce students to the
practice of generating their
own analogies in groups.
Instruct students on proper
analogy statement form.
Conduct direct observations during
lesson.
Act as resource for students in analogy
construction.
Reflection, Review
and Revision
3 sessions
(10-15 min per
session)
Students work on completing and
revising journal entries. Students who
complete and hand their journals work
on other class assignment or activities.
END OF PHASE I
Assign analogy H.W. and/or
set aside 10-15 minutes at the
start or end of each class
session for students to reflect
upon and revise their journal
entries.
Act as resources for students
who request help.
Conduct direct observations during
lessons.
Act as resource for students who
requested help in analogy revision.
Intervention: Phase II - Self-generation of Analogies (2 ½ weeks)
Introduction to Self-
Generated analogies
and the Class
project- THE ANALOGY
CHALLENGE 1 session
(approx. 15 minutes)
Students participate in a discussion
about self-generated analogies.
Students are told by the researcher to
think of analogies as puzzles that
connect new information they learn in
class to something familiar to them.
Begin teaching second half of
the Genetics Unit.
Facilitate a fifteen minute class
discussion designed to orient and
motivate students towards the
generation of meaningful analogies
Introduce the students to the 2 ½ week
analogy challenge project.

49
Table 3-4: Continued
ANALOGY LIST
approximately 8
sessions
Students create a list of their self-
generated analogies individually in
class and for H.W. based on concepts
covered in class. They are encouraged
by their teacher to generate more than
one analogy for a particular concept,
and instructed to use the textbook, their
notes, the teacher and/or the researcher
as resources.
Goal: to produce a classroom
environment where students’ would
feel encouraged and more confident to
generate analogies when prompted by
the teacher and on their own.
Integrate generative teaching
into her daily genetics lessons
and activities by incorporating
and encouraging students’
generation of analogies.
Include her own teacher-
constructed analogies in
lessons as a model for students’
generation of analogies.
Promote students generation of
analogies by assigning H.W.
and allotting class time for
analogy construction.
Conduct direct observations during
lessons.
Act as resource person to students in
their generation of analogies.
Encourage the teacher to think of self-
generated analogies as a teaching tool
that can be woven into her own style
and method of teaching.
BEST ANALOGIES
2 sessions
(25minutes, ½ period
allotted in class)
Students choose their three best
analogies and enter them into their
Analogy journal
Students choose their best/ favorite
analogy and plan a proposal of how
they will present it.
Facilitator of students learning/
Resource person
Conduct direct observation during
lesson
Available as resource for students
STUDENT
PRESENTATIONS
1 session
Students orally present their
best/favorite analogy to the class. They
include poster board and visual display
in their presentation to help illustrate
their analogy.
Students evaluate each others’ work
and are asked to write down the
analogy that they thought was the most
interesting and why.
Evaluate Presentations Conduct direct observation during
lesson
Participate in evaluating Presentations
END OF
INTERVENTION
1/2 session
Students recognized for effort in project
and 1st, 2
nd , and 3
rd place Project Prizes
awarded.
LAST DAY OF INTERVENTION
Award Project Prizes
Assist in awarding project prizes.
period (the first three weeks), the student teaching intern served as the lead teacher for both
Biology classes. Her role as lead teacher concluded on the last day of phase I, which was also the
last day of her student teaching internship. The remaining two ½ weeks of the intervention and
Biology instruction (phase II), were taught by the regularly appointed classroom science teacher.
A detailed discussion of procedures for each phase of the intervention is presented below.
Phase I: Analogy Instruction.
At the start of the intervention period, the researcher presented a forty-five minute
introductory lesson to both classes during their regularly scheduled class period. This introductory
lesson was referred to as the Analogy Tutorial (see Appendices C-2, tutorial outline, C-3 tutorial
lesson guide and C-4 optional application). In this study, the analogy tutorial signified the start of
the intervention. Its objective was to teach students how to identify and explain teacher
constructed analogies in order to facilitate their learning of self-generated analogy construction
later in the intervention. In addition, the tutorial was scheduled to be part of the classroom
teacher’s regularly scheduled curriculum unit and students were required to complete all classwork
and assignments whether or not consent had been given for their performance records to be used in
the study.
To orient the teachers towards the study, the researcher held informal discussions with
teacher and intern and spent one planning period with the intern teacher in constructing a follow-
up lesson/activity (see Appendix C-5) to complement and reinforce information presented to
students in the analogy tutorial. For the students, the purpose of the follow-up lesson/activity was
to:
Help students bridge the information that they learned about analogies during the
tutorial to Biology information that they had learned from the previous unit
(entitled “Cell Division: Mitosis and Meiosis”).
Help reinforce students’ learning from the previous Biology unit with the aim of
preparing them for the upcoming Biology unit (“Genetics: The study of
heredity”).
For classroom teacher and intern the teachers, the intended purpose of the activity was to:
Demonstrate application of a teacher-constructed analogy,
Inspire them to use visual aids and imagery in presenting analogies, and incorporate
student input in both the generation and explanation of the analogies.
In addition to this analogy demonstration, I, the researcher asked the classroom teacher and
intern to emphasize and encourage students in their lessons to think about and start making
50

analogies on their own. As an instructional tool, students were asked to write a reflection with
regards to their interest in the analogy activity (see Appendix C-3, reflection questions). Student
responses were collected as general data and held for use as possible supporting evidence of
students’ interest in the analogy activity.
Analogy journals. In preparation for this phase, the researcher sent a memo via email to
the intern (the lead teacher in the Biology classes for the first three weeks of the intervention)
discussing a general plan for phase II of the study and suggestions for including teacher-
constructed analogies in her lessons and activities. After the introductory sessions (the tutorial and
activity), the intern teacher was asked to purposely use at least three analogies in her daily lessons
or activities for the following week to highlight or explain concepts in the Biology lesson.
Because using analogies as a teaching tool was new to the intern, during two class sessions
the supervising teacher modeled pre-constructed teacher analogy use for the intern during both
class periods. She did so by participating briefly in class discussions during the lesson. For
example, during one lesson when students were discussing the function of a gene on a
chromosome, the teacher joined in and elaborated on the concept by comparing the
medals/insignia on a soldier to the genes on a chromosome and elicited from the students how the
two ideas were similar. In this case the teacher’s analogy was pre-constructed and her interjection
was both useful in training the intern teacher and predisposing students to identifying teacher-
constructed analogy use in the classroom.
At the end of each lesson or activity that consisted of a teacher-constructed analogy (4
sessions), the researcher conducted a five minute summary of the lesson by generating a
discussion, asking students to identify and briefly summarize the analogy that was used in that
day’s lesson. Students were allotted approximately three to five minutes at the end of the lesson
summary to record the analogy in their analogy journals (see Appendix B-5) and complete the
journal entry page. In summary, each journal page asked them to identify the analogy that their
teacher presented, briefly explain the relationship between the analogy and the concept, and
complete the four self-report items for situational interest. (The situational interest self-report
items are used for purposes of data collection only). All students were asked to complete analogy
journal entries for at least three teacher-constructed analogies. Students needing more time than
that allotted in class were allowed to finish their responses during study hall or after school for
homework. Journals were collected anonymously by using student numbers instead of names and
by having students place their work on the teacher’s desk as they left the room. Students were
required to complete their journals for a project grade whether or not they gave consent for their
performance records and other data to be used in the study.
51
Self-generated analogy transition period. This phase consisted of a brief transition period,
where the intern teacher introduced students to the practice of generating their own analogies in
small groups of two or three. Most of this transition period occurred during one class activity
where the intern teacher engaged the groups in a brainstorming/analogy-generating activity.
At the start of the class session, the intern teacher wrote down three science concepts on
the blackboard that were covered previously in class and had been illustrated with a teacher-
constructed analogy. Next to each concept the intern wrote the words, “is like” or “are like…”
(e.g. “A gene on a chromosome is like…”). She then had students form groups of two or three of
their choice and instructed them to choose two out of three concepts written on the black board. In
groups, students were instructed to generate at least one analogy for each term by completing the
analogy statement. From this point, when generating their own analogies, students were required
to use this structure in writing analogy statements. The function of this uniform analogy statement
was to simplify students’ written expression of their self-generated analogies, helping them clearly
state the connection of the target science concept to their personal analog, and keeping the form of
the analogy statement consistent and easy to understand to the reader.
If, within their groups, students did not understand the concept or could not think of an
analogy, it was suggested to the group that they reread the definition and/or textbook section on
their topic. If help was still needed, the researcher and intern served as facilitators of the
brainstorming process by helping groups connect the definition of the concepts to the students’
prior knowledge, to something more familiar to them. For example, the researcher and intern
would ask group members questions such as “After reading the definition again, what does the
concept remind you of?” “What do you think of when you hear the term…?” and “How does it
relate to...?”
At the end of this activity, students were asked to write their group generated analogies
(identical for each student in the group) in their individual analogy journal. Each student was
responsible for recording their group’s analogies in their journal and completing their own journal
entries for the analogies. At the end of the activity, each group shared “their best or most favorite”
analogy with the class. While groups shared their analogies, remaining groups were asked to
evaluate their classmates’ analogies by choosing and write down their most favorite analogy
shared by a group in class that day. After all groups presented their analogies, each group was
asked to reveal their favorite analogy to the class. The analogies that had the most group votes
were given recognition and applause by the class.
The researcher used this instructional activity to help guided students on how to
individually generate their own analogies using previous concepts and analogies presented and
52

modeled in class. Though this part of the transition period occurred mostly during this in-class
activity, the students were given an additional period of three transition days (at home and for
brief periods in class before or after the lesson) to reflect upon, revise and hand in their analogy
journal entries on their own. Students were encouraged to seek help from the researcher or other
teachers in doing their revisions as needed. Some students used this time to acquire help in
rewriting or expanding their explanations for their analogy entries.
The last day of Phase I concluded with the end of the analogy transition period and the
completion of the intern teacher’s student teaching experience. Student analogy journals were
collected for evaluation and grading and data collection of student responses to the situational
interest survey. In summary, at the end of Phase I, all students were expected to complete five
analogy journal entries, three teacher-constructed analogies and two group-constructed analogies.
(Each entry contained a set of situational interest survey items for the analogy specified). Students
were required to complete their journals for a class project grade whether or not consent was given
for their performance records and other data to be used in this study.
Phase II: Generating Analogies-The Self-generated Analogy Student Project.
On the first day of Phase II, the next class session immediately following the end of Phase
I, the researcher facilitated a fifteen minute class discussion designed to orient and motivate
students towards the generation of meaningful analogies (analogies that make a personal
connection to their prior knowledge). In the discussion, students were asked to identify strategies
they used in class to help them learn and remember new information. The researcher explained
that just as teachers used analogies to help explain science concepts to their students, they would
begin to generate their own analogies to help them learn and understand concepts their teacher
presented in class.
The researcher then proceeded to introduce the students to a 2 ½ week class project entitled
“The Analogy Challenge” (see Appendix C-6) The goal of the project, designed as a part of the
planned curriculum unit on genetics, was to promote students to think more deeply about new
concepts presented to them by their teacher and to have them practice connecting their
understanding of the concepts to their prior knowledge through the generation of their own
analogies. For purposes of the project, students were invited to think of analogies as puzzles that
connect new information they learn in class to something familiar in their own lives, some
experience that is interesting to them or something that they already know about or like to do. In
the discussion of the project, students were told that analogies are often used as learning strategies
to help students remember and understand new information, that most times the best analogies are
the ones that we create and use for ourselves to aid our understanding, and that students often
53
create analogies to help make learning fun. In addition they were told that at the end of the
project, awards would be given to the students with the most analogies, the best analogy and the
most interesting analogy presentation.
For the next two weeks of the course, students were asked to generate their own analogies
independently in class and outside of class based on concepts covered in class. Analogies that
students were expected to generate during the intervention period were mainly simple surface
analogies (where analog and domain are connected on two or three main points) to help them
remember and clarify their understandings of a concept. Students were also expected to choose
analogies that connected to their prior knowledge and were meaningful to them.
In detail, the Analogy Challenge Project consisted of three parts:
Self-generated Analogy List -- For two weeks students were instructed to generate and
record new analogies on their own based on concepts covered by the teacher in class.
During this time, the goal or challenge proposed to them by the project was to create
as many analogies as they could from the concepts presented by their teacher.
Students were allowed to generate more than one analogy for a concept but they had
to be different in the ideas that they were presenting. For example, the analogy,
“Genotype and Phenotype are like making pancakes,” would be considered the same
as the analogy “Genotype and Phenotype are like baking a cake,” because both
analogies are using analogs with the same cooking/baking idea. An analogy
considered to have a different idea would be “Genotype and Phenotype are like
making paper out of wood. ”For the project students recorded their analogies in their
notebooks for two weeks and then transferred all their analogies onto one sheet of
computer lined paper designed especially for the project (see Appendix C-6).
Three Best Analogies -- From their list of recorded analogies, students were instructed
to choose three analogies that they considered their best or most favorite and
complete self-generated analogy journal entries for them.
Presentations -- From the three analogies that students chose as their best or favorite,
students were instructed to choose one to present to the class. For their presentations
students were required to have a poster and some other visual display such as pictures
or three dimensional object to help illustrate their analogy. During analogy
presentations, students evaluated their peers’ presentations by rating them on a peer
evaluation form designed by the researcher for purposes of the intervention. The form
asked students to rate their peers based on their overall interest in the analogy
presentation on a numbered scale from one to five (one being the lowest and five
being the highest) (see Appendix C-7). At the end of all presentations students were
asked to write down the analogy that they thought was the most interesting and why.
These evaluations were used along with the evaluations of the teacher and researcher
54
as guest educator (see Appendix C-8) in determining which students would be
granted the “most interesting analogy presentation” award. (Student peer evaluation
forms (Appendix C-7) and teacher evaluations forms (Appendix C-8) were used
solely for instructional assessment and not used in anyway for data collection in this
study.)
At the completion of the project presentations, time was allotted to recognize students’
effort and hard work in completing their projects and first, second, and third place prizes were
awarded. This signified the end of the Intervention.
Intervention Phase II –The teacher’s role. Because the classroom teacher was more
familiar with the students’ academic ability, the manner in which self-generated analogies was
used as a generative teaching strategy was left up to the classroom teacher. The teacher was
encouraged by the researcher to think of the strategy as a teaching tool, one that can be woven into
her own unique style and methods of teaching. The researcher informed the teacher that in
implementing the strategy, the goal would be to produce a classroom environment where students’
feel encouraged and more confident to generate analogies when prompted by the teacher and on
their own.
As a teaching strategy and as a part of the planned curriculum, the classroom teacher began
to incorporate and encourage the students’ self-generation of analogies. She did this by integrating
generative teaching into her daily genetics lessons. For example, as a generative teaching strategy,
the classroom teacher would often highlight an important term or concept during a lesson by
writing it on the blackboard and after providing a brief definition asking the students to create an
analogy for the concept. Also, at times the teacher would generate a discussion of the concept by
asking the students to compare it to something they experienced or know something about; the
teacher would say, “What does this remind you of?” or “Make an analogy to illustrate this concept
to someone who doesn’t know much about genetics?” In addition, sometimes the teacher would
highlight the concept by modeling her own teacher-constructed analogy during a lesson and then
prompting students to create their own analogy for the concept as an in class assignment or for
homework.
To promote students’ generation of analogies, the teacher encouraged them to generate
more that one analogy for a particular concept to demonstrate their level understanding. In
addition, students were instructed to use the textbook, their notes, the teacher and/or the researcher
as resources in helping them to understand the concepts and to check the accuracy of their
analogies.
55
Conducting the IMLS.
At the end of the intervention, the day after students presented their analogy projects, the
researcher conducted the two-page Individual Interest and Motivation-to-Learn survey (IMLS).
The survey took place during the students’ regularly scheduled class period. Participants took 12 -
15 minutes to complete the survey. The researcher checked each survey for clarity and completion
of student responses and answered any questions students had regarding the items. In addition, on
the bottom of the second page of the survey, students were asked to respond to a question asking
whether or not they would like to participate in a focus group that would meet for one class period
during class time. Students responded by checking yes or no. After all surveys were collected, the
researcher verbally thanked the participants and gave each one a special emblem flashlight key
chain as a token of appreciation for their involvement in the study.
Part III: Post-Intervention Period (2½ weeks)
The Post-Intervention period began four class sessions after the conclusion of the
intervention period. (This was due to the unavailability of the classroom teacher who was away at
a conference). During this period, general observations of students were conducted to assess
exhibited behaviors of learning independently and making connections to new information
(sustained motivation to learn). In addition, two focus groups, one of four students from the 3rd
period class and one of five students from the 6th
period class were assembled and interviews
conducted during the students assigned class periods.
Focus groups.
Focus groups consisted of student volunteers who indicated their interest in being a part of
the focus group. (Students indicated their interest on the Interest and Motivation-to-learn survey
taken at the end of the intervention). The researcher arranged with the classroom teacher for focus
group interviews to occur during class on a day that she would be away from school and that a
substitute would be present. Also, the researcher reserved a conference room in the guidance
office to hold the interviews.
On the day of the interviews, the researcher met the students in their classroom during their
regularly scheduled class period and escorted them to the guidance office. Students who were not
participating in the focus groups remained in the classroom with the substitute. During the focus
group session, the researcher and students sat around a wooden oval conference table. Students
were first given a shortened version of the Interest and motivation-to-learn survey consisting of
seven sample questions for use in of reliability analysis. Once students completed the survey,
discussions began.
56
For purposes of anonymity during audio-taping, students were asked to write a code name
for themselves on a folded letter-sized sheet of paper given to them by the researcher. These
papers were used as code name labels to allow ease of identification by the researcher and other
group members. In addition, to welcome students and to thank them for their participation and
time, the researcher provided light refreshments (fruit, cookies, and juice) that they could either
eat during the discussion or take with them at the end of the session. Focus group interviews for
both the 3rd
period and 6th
period classes lasted approximately 45 minutes and ended at the end of
the class period at the sounding of the school bell.
Post-intervention surveys.
Towards the end of the post intervention period, the teacher was asked to complete the
Post–intervention Teacher Questionnaire and return it to the researcher (Post-TQ). On the last day
of the post-intervention period, the researcher administered the Post-intervention Motivation-to-
Learn Survey (Post-MLS) to the students during their regularly scheduled class period. Before the
students responded to the survey items, the researcher reviewed the questions with them and
answered any questions that they had regarding the items. The researcher also was also on hand to
answer any questions students might have while taking the survey. The majority of the students
completed the open-ended two-question survey in 10 -12 minutes. As students handed in their
surveys, each survey item response was checked for clarity and completeness.
Issues of Validity and Reliability
Quantitative Instruments
Both student and teacher questionnaires were used as instruments in this study. To assess
reliability and validity of these questionnaires several procedures were in place. These procedures
are discussed below for each questionnaire:
Pre and Post intervention teacher questionnaires--
Reliability was assessed by conducting an informal oral survey with the classroom teacher.
This oral survey consisted of reviewing a sample of items from the teacher questionnaire. The
teacher’s oral responses were compared to her written responses for these items in order to
determine a degree of consistency in her responses.
Questionnaires were validated by examining past and current academic and behavioral
performances for a random sample of students in each Biology class (i.e. handing in homework,
attendance, passive or active participation in class lessons or activities) to determine the degree to
57
which the teacher’s responses were consistent with actual student performance data.
The Individual Interest and Motivation to Learn Survey (IMLS)
Reliability for these instruments was assessed through an oral and written examination of
sample questionnaire items during the focus group interviews. Students were given a written form
of the sample items and asked to respond to the items orally and in writing within the groups.
Student responses were compared to their original written questionnaire responses and evaluated
for consistency.
These questionnaires were validated by comparing written responses to observed
classroom data for a sample of participants to determine the degree to which their actual behavior
was consistent with their self-reported responses.
The Pre-Intervention Demographic and Interest Survey (Pre DIS) and The Post-
Intervention Motivation to Learn Survey (Post MLS)
Reliability for these instruments was assessed through an oral examination of sample
questionnaire items during brief informal interviews within the classroom. Students were asked to
orally explain their responses and expand their explanation in writing at the time of examination.
Student responses were compared to their original written questionnaire responses and evaluated
for consistency.
These questionnaires were validated by comparing written responses to observed
classroom data for a sample of participants to determine the degree to which their actual behavior
was consistent with their self-reported responses.
The Situational Interest Survey (SIS)—
Reliability for this survey was assessed by administering a brief summative questionnaire
at the end of the instructional unit. Students were asked to give one rating score for each analogy
that they completed in their journal. Rating scores were based on students’ perception of the
analogy’s interestingness, as an aid to memory and understanding, and connection to them. In
addition, ratings ranged from 1(not at all) to 7(very much) with whole step increments. For each
student, rating scores were averaged and compared to and analyzed for consistency with students’
total situational interest score.
The items in this survey have face validity which were strengthened by 1) discussing the
survey with the participants as a group beforehand to clarify any items that they did not
understand and 2) giving specific directions for answering the survey items.
58
Qualitative methods
According to qualitative research literature there are several strategies that can be used to
enhance the reliability and internal and external validity of studies that employ qualitative methods
(Merriam, 1998). In this study five basic strategies were used to enhance validity and reliability
and are discussed below:
♦ Triangulation refers to the use of multiple investigators, multiple sources of data, or multiple
methods of data collection and analysis to confirm the study’s findings. In this study, teacher
and student questionnaires as well as group interviews were used to confirm findings from
systematic observation of participants.
♦ Repeated observations of the same phenomenon refers to gathering data over a period of
time in order to increase the validity of the findings. In this study data were gathered over a
three and a half month period and systematic observations of specific students and student
behaviors were repeated several times.
♦ Peer Examination refers to asking colleagues to comment on the findings as they emerge. In
this study the classroom teacher and teacher intern served as collaborators in clarifying
student data and classroom observations.
♦ Audit Trail refers to authenticating the findings of the study by describing in detail how data
were collected, how categories were derived, and how decisions were made throughout the
study.
♦ Rich, Thick Description is used in the reporting of this study to enhance external validity
(the extent that the findings of the study may be generalizable to other settings). According
to Merriam (1998), this strategy implies providing enough description so that readers will be
able to determine how closely their situations match the research situation, and whether
findings can be transferred.
59
CHAPTER FOUR
Results
The purpose of this study was to examine the impact of self-generated analogy
instruction on the interest and motivation to learn of students who are at-risk of dropping out of
high school. The study involved 22 high school students from two sections of a two-semester
General Biology course. The study took place during the spring semester (3rd
and 4th
nine weeks)
of the school term. Student demographic data related to pre-determined risk factors were
gathered during the pre-intervention phase of the study and are listed below:
♦ Eligible for receiving free or reduced lunch (refers to socioeconomic status, i.e student
had a family income that qualified them to participate in the federal free or reduced-cost
lunch program).
♦ Academic failure (defined in this study as having obtained a failing grade in science for
the first and/or second marking periods in the previous semester and/or having failed two
or more classes in other subjects in the previous semester).
♦ Grade retention (whether or not they have been left back one or more grade(s) or are
repeating the course).
♦ History of suspension/detention (related to disruptive behaviors).
♦ Truancy (non-attendance of school), poor attendance records (includes legitimate excused
absences due to medical illnesses, as well as unexcused absences to class).
♦ Teen pregnancy
♦ English as a second language (categorized only as a secondary risk factor if student has
one or more additional risk factors above).
For purposes of the study, students possessing one or more of these factors were
categorized as at-risk (referred to as participants, at-risk participants, or at-risk students in this
study) and the outcome of their data regarded as the focus of this study. The remaining students,
those who did not have any risk factors were categorized in the study as regular students
(referred to as regular participants or regular students in this study). These students participated
in all aspects of the study, but during final analysis their data was separated and held for later
60
61
analysis and comparison to that of the at-risk participants.
Demographic Data
At-risk participant demographics
At the beginning of the study, 17 students (eleven female and six male) were found to
have one or more risk factors and were categorized as at-risk. However, before the start of the
intervention period, three at-risk students were dropped from the study due to their expulsion
from the school and a fourth at-risk student was dropped during the third week of the
intervention period due to extensive truancy (He did not attend class at any time during the
intervention or post-intervention periods). In addition, during a preliminary analysis of survey
data, the researcher made a decision to remove all numerical data for a fifth at-risk student due to
invalid self-reporting. (It was discovered early during the intervention period, that this student
had pre-completed the situational interest survey portion for six out of eight analogy journal
entries before the analogies were introduced. The researcher decided, that for this student, only
certain demographic data (age, gender, and at-risk categories), as well as limited qualitative data
(open-ended written responses in the student’s own voice) would remain because it held valuable
data pertinent to the study; and that any data reported which reflected this student would be noted
accordingly.
The thirteen remaining at-risk participants (8 female and 5 male), ranged in age from
14.8 - 18.1 years with a median age of 16.3 years. Approximately 85% of the participants (n=11)
entered the school during middle and secondary grades, with the majority of participants (54%,
n=7), in the ninth grade at the time of the study. With regards to at-risk factors, Figure 4-1a
summarizes the percentage of participant representation within each of the seven at-risk
categories. All categories except English as a second language had student representation. Risk
factors with the greatest representation were academic failure (54%, n=7), grade retention (46%,
n=6), and eligible for receiving free or reduced lunch (46%, n=6). In addition Figure 4-1b
summarizes the percentage of participants per total number of at-risk factors. According to the
data, the majority of participants, 54%(n=7) had only one risk factor, with 46% (n=6) having two
or more.
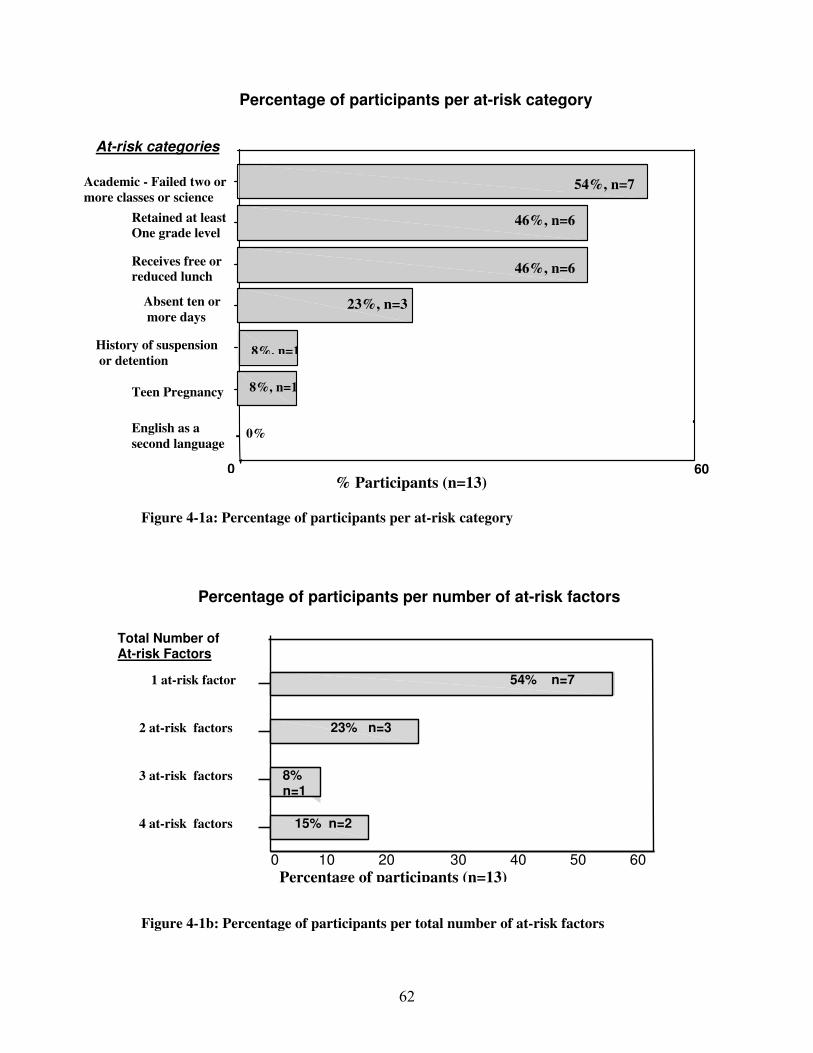
Percentage of participants per at-risk category
Academic - Failed two or
more classes or science
Retained at least
One grade level Receives free or
reduced lunch
Absent ten or
more days History of suspension
or detention
Teen Pregnancy
% Participants (n=13) 60
50 4030
0
8%, n=1
8%, n=1
23%, n=3
46%, n=6
54%, n=7
English as a
second language 0% -
At-risk categories
46%, n=6
Figure 4-1a: Percentage of participants per at-risk category
Total Number of At-risk Factors
1 at-risk factor
2 at-risk factors
3 at-risk factors
4 at-risk factors
403020100
15% n=2
8% n=1
23% n=3
54% n=7
Percentage of participants per number of at-risk factors
50 60
Percentage of participants (n=13)
Figure 4-1b: Percentage of participants per total number of at-risk factors
62
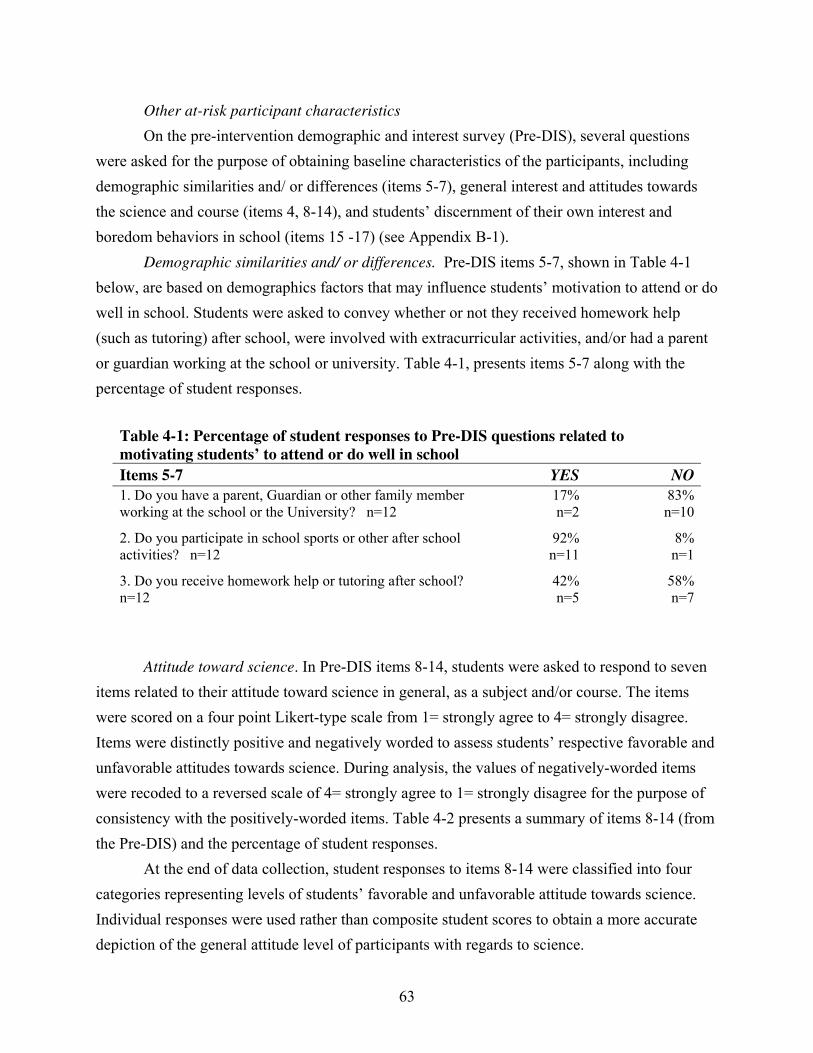
Other at-risk participant characteristics
On the pre-intervention demographic and interest survey (Pre-DIS), several questions
were asked for the purpose of obtaining baseline characteristics of the participants, including
demographic similarities and/ or differences (items 5-7), general interest and attitudes towards
the science and course (items 4, 8-14), and students’ discernment of their own interest and
boredom behaviors in school (items 15 -17) (see Appendix B-1).
Demographic similarities and/ or differences. Pre-DIS items 5-7, shown in Table 4-1
below, are based on demographics factors that may influence students’ motivation to attend or do
well in school. Students were asked to convey whether or not they received homework help
(such as tutoring) after school, were involved with extracurricular activities, and/or had a parent
or guardian working at the school or university. Table 4-1, presents items 5-7 along with the
percentage of student responses.
Table 4-1: Percentage of student responses to Pre-DIS questions related to
motivating students’ to attend or do well in school
Items 5-7 YES NO
1. Do you have a parent, Guardian or other family member
working at the school or the University? n=12
17%
n=2
83%
n=10
2. Do you participate in school sports or other after school
activities? n=12
92%
n=11
8%
n=1
3. Do you receive homework help or tutoring after school?
n=12
42%
n=5
58%
n=7
Attitude toward science. In Pre-DIS items 8-14, students were asked to respond to seven
items related to their attitude toward science in general, as a subject and/or course. The items
were scored on a four point Likert-type scale from 1= strongly agree to 4= strongly disagree.
Items were distinctly positive and negatively worded to assess students’ respective favorable and
unfavorable attitudes towards science. During analysis, the values of negatively-worded items
were recoded to a reversed scale of 4= strongly agree to 1= strongly disagree for the purpose of
consistency with the positively-worded items. Table 4-2 presents a summary of items 8-14 (from
the Pre-DIS) and the percentage of student responses.
At the end of data collection, student responses to items 8-14 were classified into four
categories representing levels of students’ favorable and unfavorable attitude towards science.
Individual responses were used rather than composite student scores to obtain a more accurate
depiction of the general attitude level of participants with regards to science.
63

Table 4-2: Percentage of student responses for Pre-DIS items 8-14 (based on n=12 students)
Positive Items
Strongly
Agree
1
Agree
2
Disagree
3
Strongly
Disagree
4
I usually look forward to science class...
n=12
50%
n=6
50%
n=6
It is important to know some science in
order to get a good job...
n=12
8%
n=1
75%
n=9
17%
n=2
Science is interesting to me...
n=12
8%
n=1
67%
n=8
17%
n=2
8%
n=1
I get good grades in science...
n=12
50%
n=6
50%
n=6
Science will be useful in my future...
n=12
17%
n= 2
42%
n=5
42%
n=5
Negative items
Strongly
Disagree
1
Disagree
2
Agree
3
Strongly Agree
4
I often am afraid to ask questions in science
class...
n=12
41%
n=5
17%
n=2
25%
n=3
17%
n=2
Science is boring to me...
n=12
8%
n=1
67%
n=8
17%
n=2
8%
n=1
Classification levels of the four categories were based on the item’s original response
values (and recoded values, in the case of the negatively worded items). For instance, for all
items student responses with a numerical value of 1 would fall into the category of highly
favorable attitude towards science; student responses with a numerical value of 2 would fall into
the category of favorable attitude towards science; student responses with a numerical value of 3
would fall into the category of unfavorable attitude towards science; and student responses with
a numerical value of 4 would fall into the category of highly unfavorable attitude towards
science. The sum and percentage of student responses was then calculated for each category.
Table 4-3 displays the four categories with their corresponding item response values and the
frequency of student responses within each category.
64
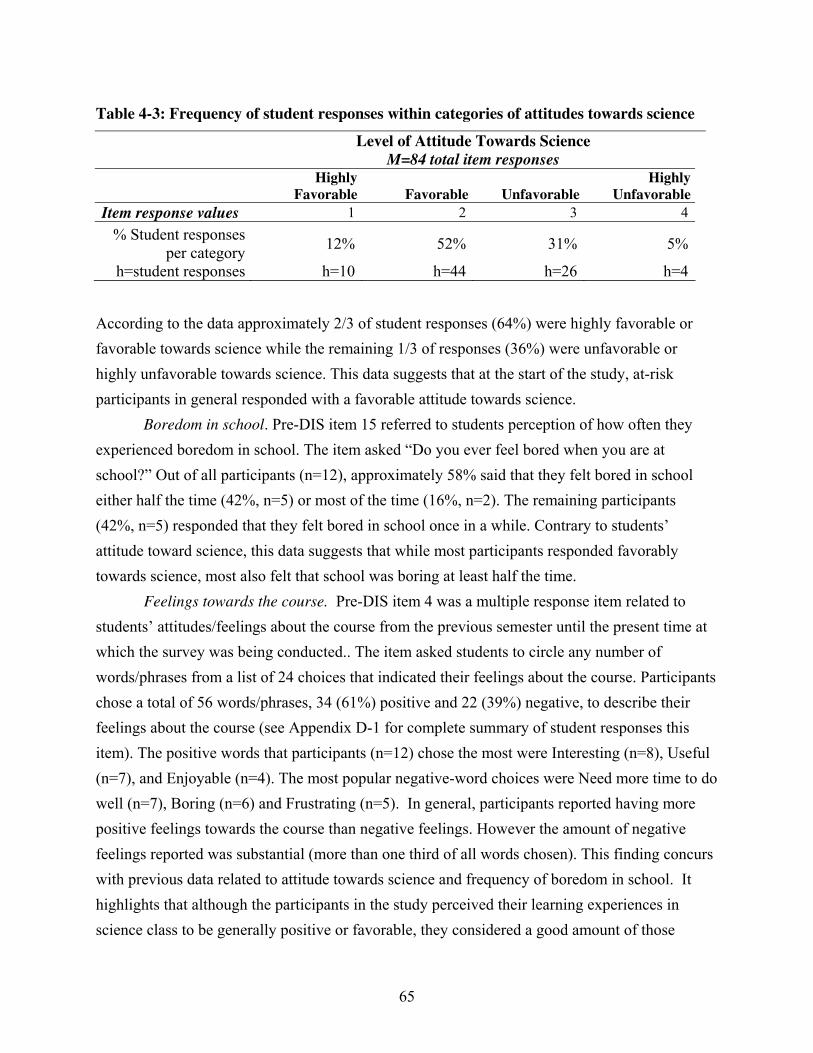
Table 4-3: Frequency of student responses within categories of attitudes towards science
Level of Attitude Towards Science
M=84 total item responses
Highly
Favorable Favorable Unfavorable
Highly
Unfavorable
Item response values 1 2 3 4
% Student responses
per category
h=student responses
12%
h=10
52%
h=44
31%
h=26
5%
h=4
According to the data approximately 2/3 of student responses (64%) were highly favorable or
favorable towards science while the remaining 1/3 of responses (36%) were unfavorable or
highly unfavorable towards science. This data suggests that at the start of the study, at-risk
participants in general responded with a favorable attitude towards science.
Boredom in school. Pre-DIS item 15 referred to students perception of how often they
experienced boredom in school. The item asked “Do you ever feel bored when you are at
school?” Out of all participants (n=12), approximately 58% said that they felt bored in school
either half the time (42%, n=5) or most of the time (16%, n=2). The remaining participants
(42%, n=5) responded that they felt bored in school once in a while. Contrary to students’
attitude toward science, this data suggests that while most participants responded favorably
towards science, most also felt that school was boring at least half the time.
Feelings towards the course. Pre-DIS item 4 was a multiple response item related to
students’ attitudes/feelings about the course from the previous semester until the present time at
which the survey was being conducted.. The item asked students to circle any number of
words/phrases from a list of 24 choices that indicated their feelings about the course. Participants
chose a total of 56 words/phrases, 34 (61%) positive and 22 (39%) negative, to describe their
feelings about the course (see Appendix D-1 for complete summary of student responses this
item). The positive words that participants (n=12) chose the most were Interesting (n=8), Useful
(n=7), and Enjoyable (n=4). The most popular negative-word choices were Need more time to do
well (n=7), Boring (n=6) and Frustrating (n=5). In general, participants reported having more
positive feelings towards the course than negative feelings. However the amount of negative
feelings reported was substantial (more than one third of all words chosen). This finding concurs
with previous data related to attitude towards science and frequency of boredom in school. It
highlights that although the participants in the study perceived their learning experiences in
science class to be generally positive or favorable, they considered a good amount of those
65
experiences to be negative or unfavorable. For these students the unfavorable experiences are
ones which may subsequently lead to negative feelings for the course and in turn translate into
feelings of boredom in school.
Research Questions – Findings
The central focus of this study encompassed six research questions related to at-risk
students’ situational and individual interest, and motivation to learn. The remainder of this
chapter presents the results of the study organized according to these questions.
Research question 1a: To what extent does the analogy intervention impact students’
situational interest in the analogy activities?
Information on students’ situational interest in relation to the analogy activities was
obtained from their responses on the Situational Interest Survey (SIS), analogy tutorial follow-up
activity reflection sheet, and focus group interviews. It was predicted that situational interest in
the analogy activities would be moderate to high. (In this study the term analogy activity, is used
to refer to the learning processes involved in identifying, generating, and/or utilizing analogies as
a teaching and learning strategy).
Situational Interest Survey (SIS).
At the end of the intervention period, the at-risk participants submitted thirteen Analogy
Journals in total, each consisting of eight situational survey entry forms. The four items of the
situational interest survey were located on the bottom half of the journal entry page in order to
facilitate students recording of their situational interest at the time of analogy identification or
self-generation. The journal entry format followed a set format of six questions, two questions
assessing students ability to identify/ generate an analogy and explain its meaning with relation
to a concept presented in class, and the four-item situational interest survey used to assess
students feelings of situational interest in reference to that analogy.
Analysis. The SIS was based on a Likert-type scale, from one being the lowest to four
being the highest value. Each item focused on a particular catch or hold factor of situational
interest and students responded to each item by circling the number corresponding to their choice
of written response. Students numbered responses for each item were then entered into SPSS and
66
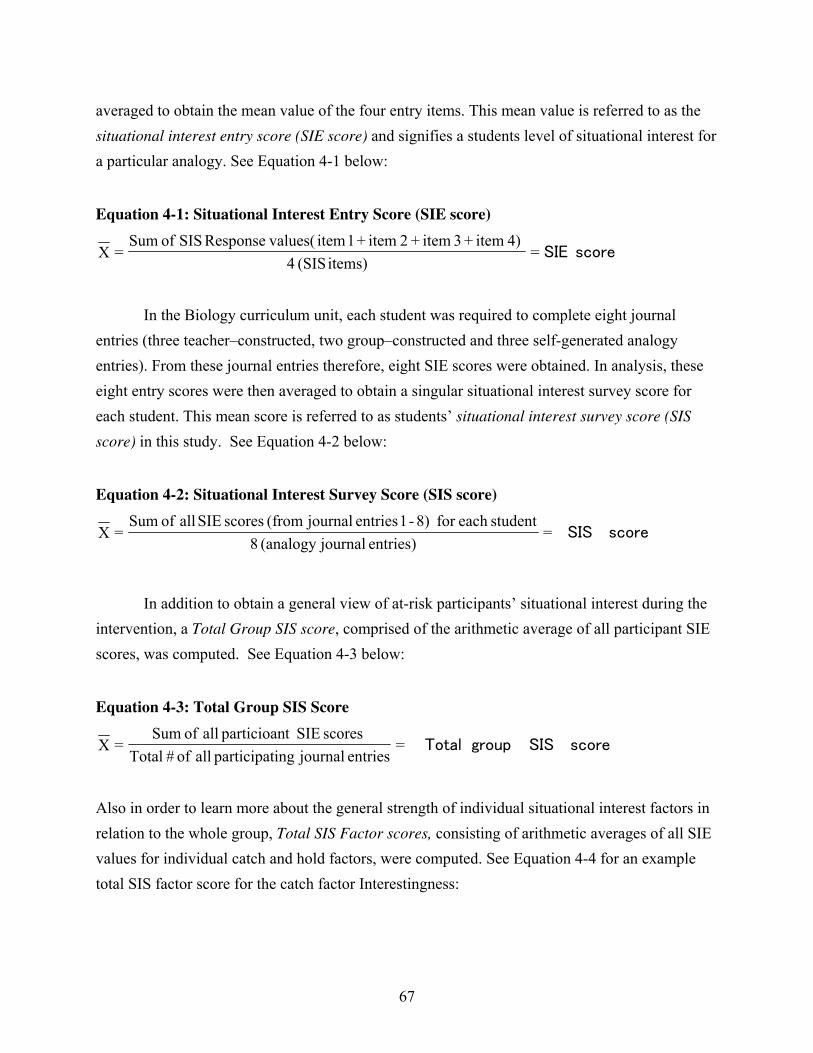
averaged to obtain the mean value of the four entry items. This mean value is referred to as the
situational interest entry score (SIE score) and signifies a students level of situational interest for
a particular analogy. See Equation 4-1 below:
Equation 4-1: Situational Interest Entry Score (SIE score)
c IE=items) (SIS 4
4) item +3 item +2 item + 1 item values(Response SIS of Sum=Χ
In the Biology curriculum unit, each student was required to complete eight journal
entries (three teacher–constructed, two group–constructed and three self-generated analogy
entries). From these journal entries therefore, eight SIE scores were obtained. In analysis, these
eight entry scores were then averaged to obtain a singular situational interest survey score for
each student. This mean score is referred to as
students’ situational interest survey score (SIS
score) in this study. See Equation 4-2 below:
Equation 4-2: Situational Interest Survey Score (SIS score)
c I =entries) journal(analogy 8
studenteach for 8)-1 entries journal (from scores SIE all of Sum=Χ
In addition to obtain a general view of at-risk participants’ situational interest during the
intervention, a Total Group SIS score, comprised of the arithmetic average of all participant SIE
scores, was computed. See Equation 4-3 below:
Equation 4-3: Total Group SIS Score
c I al =entries journal ingparticipat all of # Total
=Χ
Also in order to learn more about the general strength of individual situational interest factors in
relation to the whole group, Total SIS Factor scores, consi
scores SIEt particioan all of Sum
sting of arithmetic averages of all SIE
alues for individual catch and hold factors, were computed. See Equation 4-4 for an example
tal SIS factor score for the catch factor Interestingness:
v
to
67
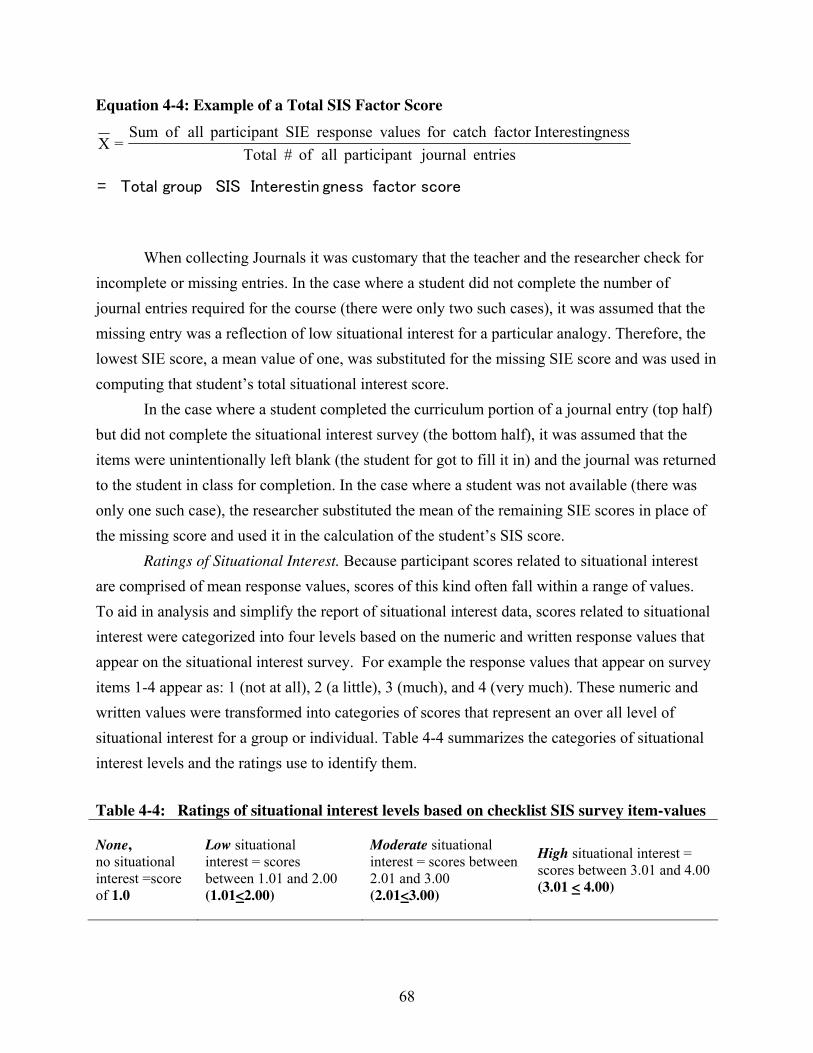
Equation 4-4: Example of a Total SIS Factor Score
c ac I i I al =
entries journalt participan all of # Total
gnessInterestinfactor catch for valuesresponse SIEt participan all of Sum=Χ
When collecting Journals it was customary that the teacher and the researcher check
incomplete or missing entries. In the case where a student did not complete the number of
journal entries required for the course (there were only two such cases), it was assumed that the
missing entry was a reflection of low situational interest for a particular analogy. Therefore, the
lowest SIE score, a mean value of one, was substituted fo
for
r the missing SIE score and was used in
compu
lf)
d
E scores in place of
the mis
nd
-4 summarizes the categories of situational
interest levels and the ratings use to identify them.
-4: Rat al intere ecklist SIS survey item-values
=score
of 1.0
and 2.00
(1.01<
ting that student’s total situational interest score.
In the case where a student completed the curriculum portion of a journal entry (top ha
but did not complete the situational interest survey (the bottom half), it was assumed that the
items were unintentionally left blank (the student for got to fill it in) and the journal was returne
to the student in class for completion. In the case where a student was not available (there was
only one such case), the researcher substituted the mean of the remaining SI
sing score and used it in the calculation of the student’s SIS score.
Ratings of Situational Interest. Because participant scores related to situational interest
are comprised of mean response values, scores of this kind often fall within a range of values.
To aid in analysis and simplify the report of situational interest data, scores related to situational
interest were categorized into four levels based on the numeric and written response values that
appear on the situational interest survey. For example the response values that appear on survey
items 1-4 appear as: 1 (not at all), 2 (a little), 3 (much), and 4 (very much). These numeric a
written values were transformed into categories of scores that represent an over all level of
situational interest for a group or individual. Table 4
Table 4 ings of situation st levels based on ch
None,
no situational
interest
Low situational
res interest = sco
between 1.01
2.00)
s between
(2.01<
Moderate situational
reinterest = sco
2.01 and 3.00
3.00)
3.01 and 4.00
(3.01 <
High situation
scores between
al interest =
4.00)
68
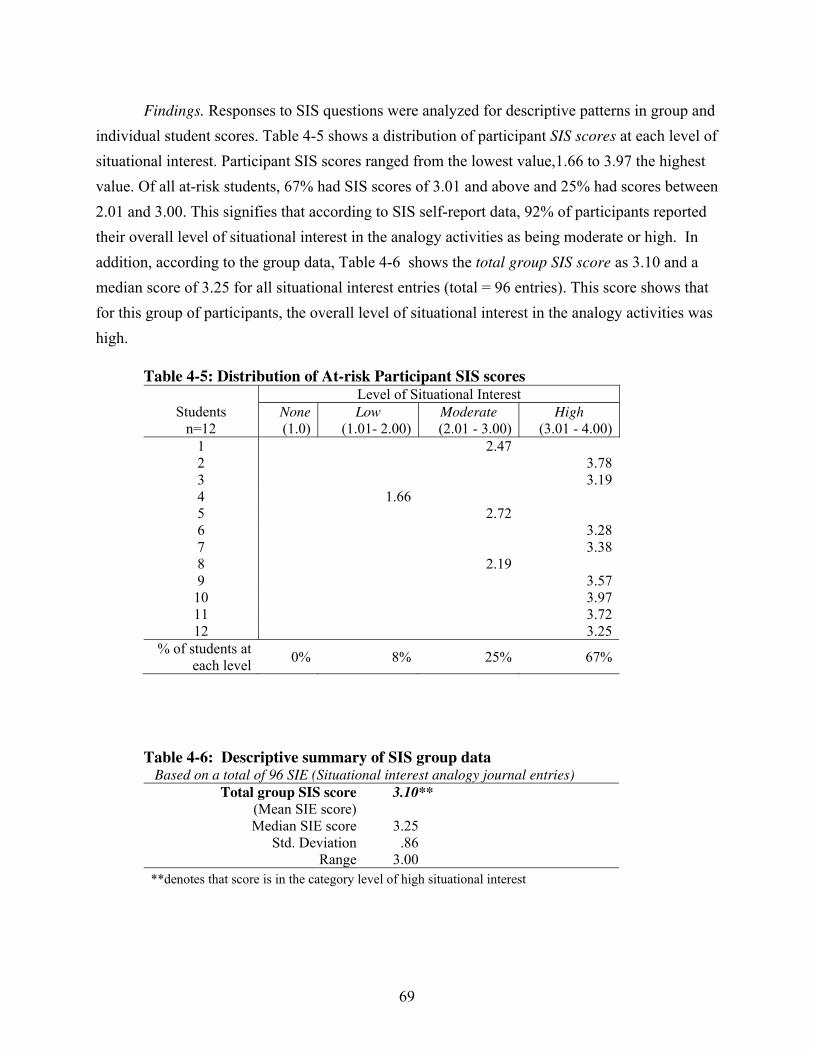
Findings. Responses to SIS questions were analyzed for descriptive patterns in group and
individual student scores. Table 4-5 shows a distribution of participant SIS scores at each level o
situational interest. Participant SIS scores ranged from the lowest value,1.66 to 3.97 the highest
value. Of all at-risk students, 67% had SIS scores of 3.01 and above and 25% had scores between
2.01 and 3.00. This signifies that according to SIS self-report data, 92% of participants reported
their overall level of situational interest in the analogy activities as being moderate or high. In
addition, according to the group data, Table 4-6 shows the total group SIS score as 3.10 and a
median score of 3.25 for all situational interest entries (total = 96 entries). This score shows that
for this
f
group of participants, the overall level of situational interest in the analogy activities was
high.
Table 4-5: Distribution of At-ri itua t
sk Participant SIS scores Level of S tional Interes
Students
n=12 (1.0) (1.01- 2.00) (2.01 - 3 (3.01 - 4
None
Low Moderate
.00)
High
.00)
1 2.47
2 3.78
3 3.19
4 1.66
5 2.72
6 3.28
7 3.38
8 2.19
9 3.57
10 3.97
11 3.72
12 3.25
% of
each level 0% 8% 25% 67%
students at
Based on a n nalogy journal entries)
Tota *
Ta le 4-6: y up data b Descriptive summar total
of SIS groal interest aof 96 SIE (Situatio
l group SIS score
(Mean SIE score)
3.10*
Me
**denotes that score is in the category level of high situational interest
dian SIE score
viation
3.25
.86 Std. De
Range 3.00
69
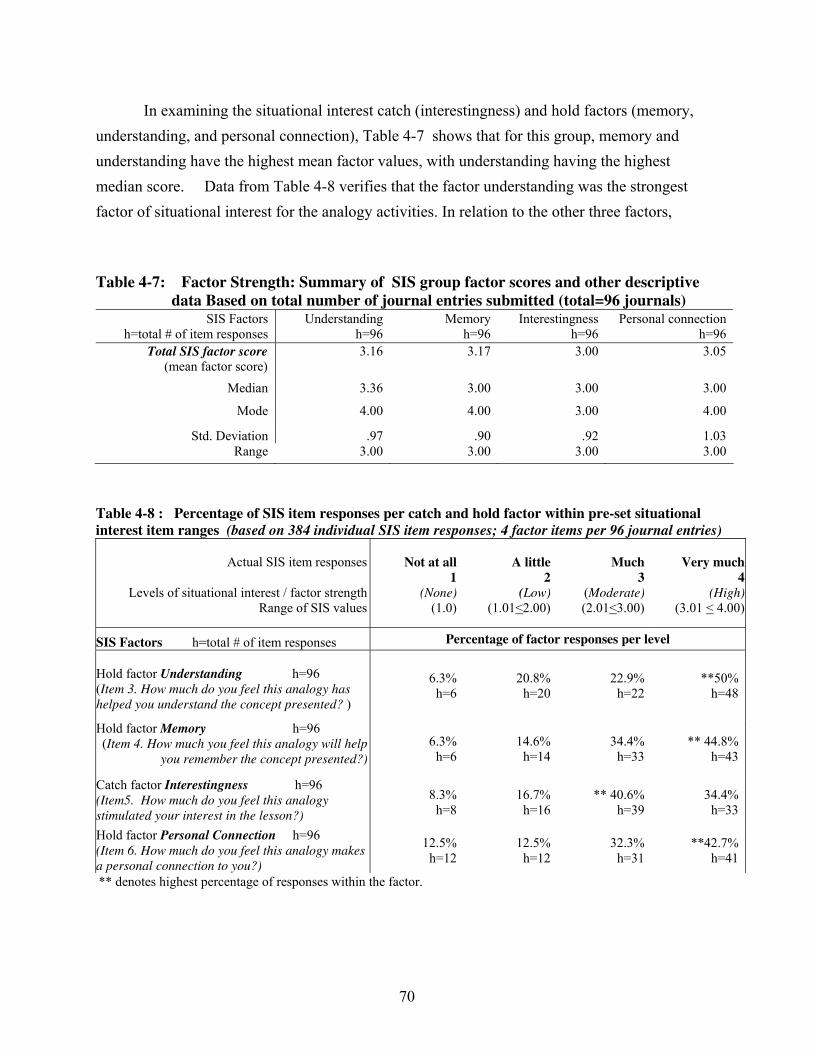
In examining the situational interest catch (interestingness) and hold factors (memory,
understanding, and personal connection), Table 4-7 shows that for this group, memory and
understanding have the highest mean factor values, with understanding having the highest
median score. Data from Table 4-8 verifies that the factor understanding was the strongest
ctor of situational interest for the analogy activities. In relation to the other three factors,
e
otal urnal e bm 96
h=to
Understan Me Interesting Personal conne
fa
Table 4-7: Factor Strength: Summary of SIS group factor scores and other descriptiv
data Based on t number of jo ntries sum
itted (total= journals) SIS Factors
tal # of item responses
ding
h=96
ory
h=96
ness
h=96
ction
h=96
To(mean facto
3.16 3.17 3.00 3.05 tal SIS factor score r score)
Median 3.36 3.00 3.00 3.00
Mode 4 4 3.00 .00 .00 4.00
Std. Deviation .97 .90 .92 1.03
Range 3.00 3.00 3.00 3.00
interest item ranges l SIS nses; 4 factor items per nal e
Table 4-8 : Percentage of SIS item responses per catch and hold factor within pre-set situational
(based on 384 individua item respo 96 jour ntries)
Actual SIS item responses
Levels of situational interest / factor streng
N
(Non
(1
th
Range of SIS values
ot at all
1
e)
.0) (1.01
A little
2
(Low)
<2.00) (2.01
Much
3
(Moderate)
<3.00) (3
Very
.01 <
much
4
(High)
4.00)
SIS Factors h=total # of item responses Percentage of factor responses per level
Hold factor Understanding h=96
(Item 3. How much do you feel this analogy has
helped you understand the concept presented? )
6.
h=6
20
h=20
22
h=22
**50
h=48
3% .8% .9% %
Hol
(
d factor Memory h=96
Item 4. H
nted?)
6.
h=6
14
h=14
34
h=33
** 4
h=43 ow much you feel this analogy will help
you remember the concept prese
3% .6% .4% 4.8%
Catch factor Interestingness h=96
(Item5. How much do you feel this analogy
stimulated your interest in the lesson?)
8. 16 ** 4 34
3%
h=8
.7%
h=16
0.6%
h=39
.4%
h=33
Hold factor Personal Connection h=96
(Item 6. How much do you feel this analogy makes
a personal connection to you?)
12
h=12
12
h=12
32
h=31
**42
h=41
.5% .5% .3% .7%
** deno s highest percentage of responses within the factor. te
70
understanding had the highest percentage of student responses within the high situational interest
level category. In other words, on most situational interest entries, students reported that they
the analogy activities were interesting because it
felt
helped promote their understanding of the
concep
rnate
ly
hole
SIS (Form A)
em values and student SIE scores. For example, the values of Form B below:
(lowest) 1 2 3 4 5 6 7 ( highest)
ansformed to
(lowest ) 1 1.5 2 2.5 3 3.5 4 ( highest)
t very much (see Table 4-8, category 4).
Reliability of the SIS. Reliability of the SIS (Form A) was assessed by use of an alte
format survey (Form B) that was administered to the students at the end of the intervention
period. This survey was integrated with and placed on the bottom portion of the intervention
interest and motivation survey (see Appendix B-5). The format consisted of a sample list of six
analogies, three teacher-constructed and three self-generated analogies, which were previous
completed by students in their journals and were specific to each student. (Transition/group
analogies were omitted from the list due to time constraints related to the classroom). Students
were asked to rate each analogy from 1 (lowest value) to 7 (highest value). Ratings were w
step increments and based on students’ perception of the analogy’s interestingness, aid to
memory, aid to understanding, and personal connection. At the start of analysis, value ratings of
Form B were transformed into half-step increments for consistency with original
it
Original Form B values:
tr :
Ratings for the six analogies were averaged for each student and these mean scores were
analyzed for consistency with students’ SIS entry scores. It was anticipated that scores on the
alternate format test compared to the original would indicate a moderate to strong reliability
(correlation coefficient, r =.60 > .90). However, the reliability index for the Situational Interest
weeks
survey was .374 (based on 71 journal entries), a lower index than was expected.
Possible explanation. Students completed original SIS survey over the 5 ½ week
intervention period at specific times of analogy identification or self-generation. The time period
between completion of the original survey and the alternate survey items varied from 3 ½
(earlier analogies) to 1 week (later analogies). Because the two forms of the survey were
administered at different times during the intervention period, the reliability method used
represented not just one reliability measure but a combination of two reliability measures, an
alternate form reliability and a test-retest reliability. These measures therefore assessed both the
71

stability of the students’ responses overtime as well as the generalizability of the sets of items.
According to Gay (1992), there was a greater possibility for sources of error in using
combination of reliability methods. The resulting coefficient in this case (referred to as the
coefficient of stability and equivalence (Gay, 1992)) represents a lower conservative estimate
reliability. Thus both the time intervals and equivalence were sources of measurement error.
According to the reliability data, either the analogy intervention continued to have a lingering
impact on students’ situational interest past the time that students handed in their analogy journ
entries, the format of measuring reliability was not effective, or both. However, this technique
may be corrected by using only analogies that students completed during the last week and a-half
of the intervention period, thus reducing the interval between the administration times of the
forms. Therefore upon examination of student responses to only later analogies
this
of
al
two
, we obtain a
ines in
ts
n
higher and more adequate reliability coefficient of .629 (based on 36 entries).
Evidences of Validity. Through the process of triangulation, supporting data provide
evidence of strong validity of the situational interest survey. Supporting data consists of a one
paragraph student reflections from the Analogy tutorial follow-up activity: “You are mach
a Factory game” (see Appendix C-2), and focus group data related to situational interest.
Student Activity Reflections. In the second week of the intervention period, students
participated in an instructional analogy activity titled: “You are a machine in a factory game.”
The purpose of this activity was to review previously learned material and to transition studen
from the former unit on Meiosis and Mitosis to the upcoming Genetics unit. In this activity,
students were asked to simulate the steps of meiosis (division and replication of chromosomes i
production of egg and sperm cells) that occurs in the Nucleus of an animal cell. Students were
given the analogy, The process of meiosis in an animal cell is like manufacturing products i
factory. At the conclusion of the activity, students were asked to complete a one paragraph
reflection responding to five questions. Question one was used for instructional purposes.
Questions two through five relate to situational interest catch and hold factors and w
n a
ere used to
ssess students’ general situational interest in the analogy activity. See Table 4-9:
ty reflection sheet; items related to situational
est (questions 2-5)
Ite
a
Table 4-9: Follow-up analogy activi
inter
m question #
2) How interesting was this analogy activity to you? (catch factor: interestingness)
3) How much do you think the analogy helped you to understand Meiosis better? (hold factor: understanding)
4) Do you think the analogy will help you remember Meiosis better? Explain (hold factor: memory)
5) Do you think the activity help make the concept of Meiosis more real to you? Explain. (hold factor: personal
connection)
72
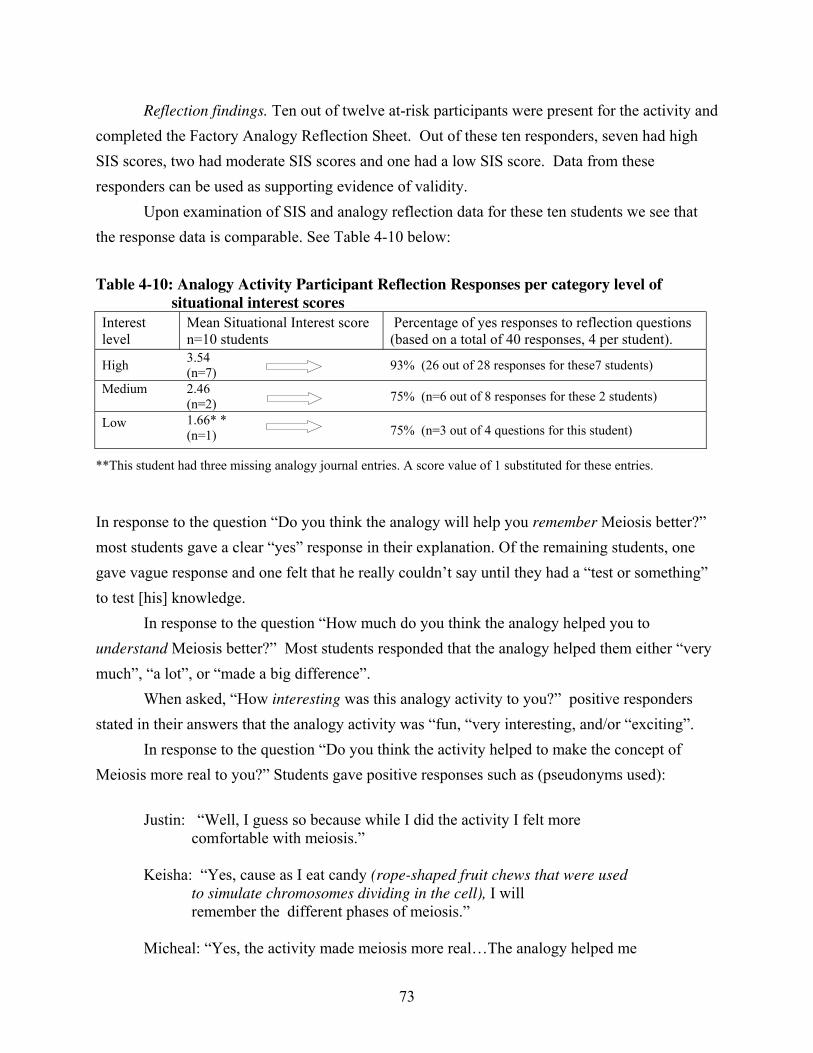
Reflection findings. Ten out of twelve at-risk participants were present for the activity an
completed the Factory Analogy Reflection Sheet. Out of these ten responders, seven had
SIS scores, two had moderate SIS scores and one had a low
d
high
SIS score. Data from these
data for these ten students we see that
e response data is comparable. See Table 4-10 below:
nt Reflection Responses per category level of
sit
st al Interest score
tudents
ns
t).
responders can be used as supporting evidence of validity.
Upon examination of SIS and analogy reflection
th
Table 4-10: Analogy Activity Participa
Intere
uational interest scores
level
Mean Situation
n=10 s
Percentage of yes responses to reflection questio
(based on a total of 40 responses, 4 per studen
High 3.54
(n=7) 93% (26 out of 28 responses for these7 students)
Medium s)
2.46
(n=2) 75% (n=6 out of 8 responses for these 2 student
Low
(n=1) 75% (n=3 out of 4 questions for this student) 1.66* *
**This student had three missing analogy journal entries. A score value of 1 substituted for these entries.
In response to the question “Do you think the analogy will help you remember Meiosis better?”
most students gave a clear “yes” response in their explanation. Of the remaining students, one
gave vague response and
one felt that he really couldn’t say until they had a “test or something”
sponded that the analogy helped them either “very
.
f
eiosis more real to you?” Students gave positive responses such as (pseudonyms used):
id the activity I felt more
hat w re used
, I will
e
to test [his] knowledge.
In response to the question “How much do you think the analogy helped you to
understand Meiosis better?” Most students re
much”, “a lot”, or “made a big difference”.
When asked, “How interesting was this analogy activity to you?” positive responders
stated in their answers that the analogy activity was “fun, “very interesting, and/or “exciting”
In response to the question “Do you think the activity helped to make the concept o
M
Justin: “Well, I guess so because while I d
comfortable with meiosis.”
Keisha: “Yes, cause as I eat candy (rope-shaped fruit chews t e
to simulate chromosomes dividing in the cell)
remember the different phases of meiosis.”
Micheal: “Yes, the activity made meiosis more real…The analogy helped m
73
to understand by comparing it to what I know best, comparing it to
something I will remember forever.”
iew, students made several statements regarding their interest in
nalogies (pseudonyms used):
e’re
stand definitions more and
help my learning ability more.”
harle
,
analogies. So it helped me understand it better
[by] breaking it down.”
Carrie: “When we do analogies... [it] helps me get a better understanding.”
or
ing had a major bearing on the situational interest in the analogy activities for these
ing
dents identified these features in addition to the main catch and hold factors
,
better understanding of them. Two students specifically identified groupwork as a feature of the
Focus Group Findings
Focus group interview transcripts were coded and analyzed for students’ perception of
the analogy generating process and well as their perception of the entire intervention process in
relation to its impact on their situational interest in the analogy activities, individual interest in
the course, and motivation to learn. Focus group interview data on situational interest support the
validity of the SIS. In the interv
a
Freeda: “[Using Analogies] makes me understand the concept what w
talking about and helps me under
C s:“The analogies did help me learn because, before analogies it [the
class] was kind of boring because we didn’t have nothing to kind of,
you know, motivate us…It is interesting because, like if I learn something
I can break it down using
On the survey, all these students all had high SIS scores and high SIS factor scores for the hold
factor, understanding. As in the group SIS data, it was evident in student responses that the fact
understand
students.
Other focus group findings related to situational interest. During the focus group
interviews, the identification of three other aspects or features of the analogy activities emerged
from the discussion. The identification of these features may help to further our understand
of participant’s situational interest in the analogy activities. It should be noted that in their
responses, these stu
used in this study.
One feature mentioned by the students in addition to the main catch and hold factors
was groupwork. In the beginning of the intervention, groupwork was used in the follow-up
tutorial activity and in the transition period to help students practice using analogies and gain a
74

analogy activities that was interesting to them. Charles, a focus group participant from the 3rd
period class said “working with a partner started out real nice, made it fun and that’s how you get
some ideas, with a partner.” Also Tasha, a 6th
period participant said, “It’s fun to do it as a group,
how we talk about it and understand where each other is coming from.”
In addition, Charles identified that the analogies were like a puzzle to him, “Like a
puzzle, a little game to me, like in the mind.” Also, Charles expressed that he enjoyed the
element of competition used in the final Analogy Project. Charles said, “also what made it fun
was the competition. Alright, I love that competition! That’s how I got my little prize.”
However, more investigation would need to be done to determine the function if these
features in situational interest. Though there is evidence of their existence, it is not clear whether
these features would be considered aspects of the main catch factor, “Interestingness” (features
of the analogy activity that make it interesting to others), or if they would be treated as separate
catch or hold factors based on their role in the stimulation of situational interest.
Post Hoc Findings of Situational Interest
In this study the variable situational interest was operationalized as the self-reported level
of perceived interestingness of the analogy activities (i.e. the extent to which students felt the
activity stimulated their interest, help them remember, understand, and personally connect to the
information they were learning). The original SIS, was designed by the researcher to obtain
information regarding students’ situational interest at the individual level at the time of analogy
identification or generation. However upon careful examination of participant data, evidence of
the possible existence of another form of situational interest emerged from the data. In this study,
this form of situational interest was observed at the end of the intervention (after the period of
time allotted to active analogy identification and generation in class) and can be referred to as
post-intervention situational interest. Post-intervention situational interest can be
operationalized specifically as the self-reported level of perceived interestingness in the analogy
activities obtained at the end of the intervention period (after the completion all intervention-
related/directed analogy activities) or thereafter.
Evidences: Comparison of Form A and Form B means. Some evidence of post-
intervention situational interest can be seen in pos hoc comparison data of Form A (original SIS
from student analogy journals) and Form B (student specific situational interest items from the
Interest and Motivation to Learn Survey (IMLS)). Table 4-11 below shows a comparison of
whole group means for participant scores from Form A and Form B. In addition, Figure 4-2
presents a graphic display of mean participant SIE scores (Form A) and mean situational interest
75
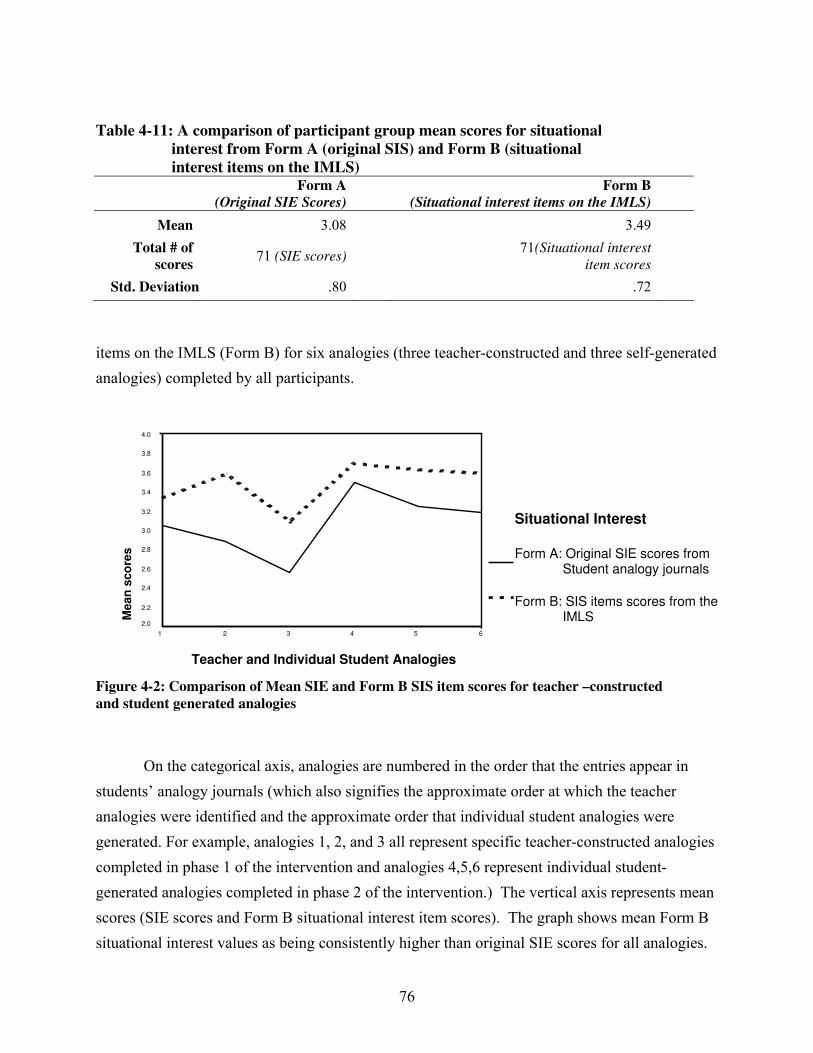
Table 4-11: A comparison of participant group mean scores for situational
interest from Form A (original SIS) and Form B (situational
interest items on the IMLS) Form A
(Original SIE Scores)
Form B
(Situational interest items on the IMLS)
Mean 3.08 3.49
Total # of
scores 71 (SIE scores)
71(Situational interest
item scores
Std. Deviation .80 .72
items on the IMLS (Form B) for six analogies (three teacher-constructed and three self-generated
analogies) completed by all participants.
Teacher and Individual Student Analogies
Figure 4-2: Comparison of Mean SIE and Form B SIS item scores for teacher –constructed
and student generated analogies
65432 1
4.0
3.8
3.6
3.4
3.2
3.0
2.8
2.6
2.4
2.2 2.0
Situational Interest
Form A: Original SIE scores from Student analogy journals
Form B: SIS items scores from the IMLS
Mean
sco
res
On the categorical axis, analogies are numbered in the order that the entries appear in
students’ analogy journals (which also signifies the approximate order at which the teacher
analogies were identified and the approximate order that individual student analogies were
generated. For example, analogies 1, 2, and 3 all represent specific teacher-constructed analogies
completed in phase 1 of the intervention and analogies 4,5,6 represent individual student-
generated analogies completed in phase 2 of the intervention.) The vertical axis represents mean
scores (SIE scores and Form B situational interest item scores). The graph shows mean Form B
situational interest values as being consistently higher than original SIE scores for all analogies.
76
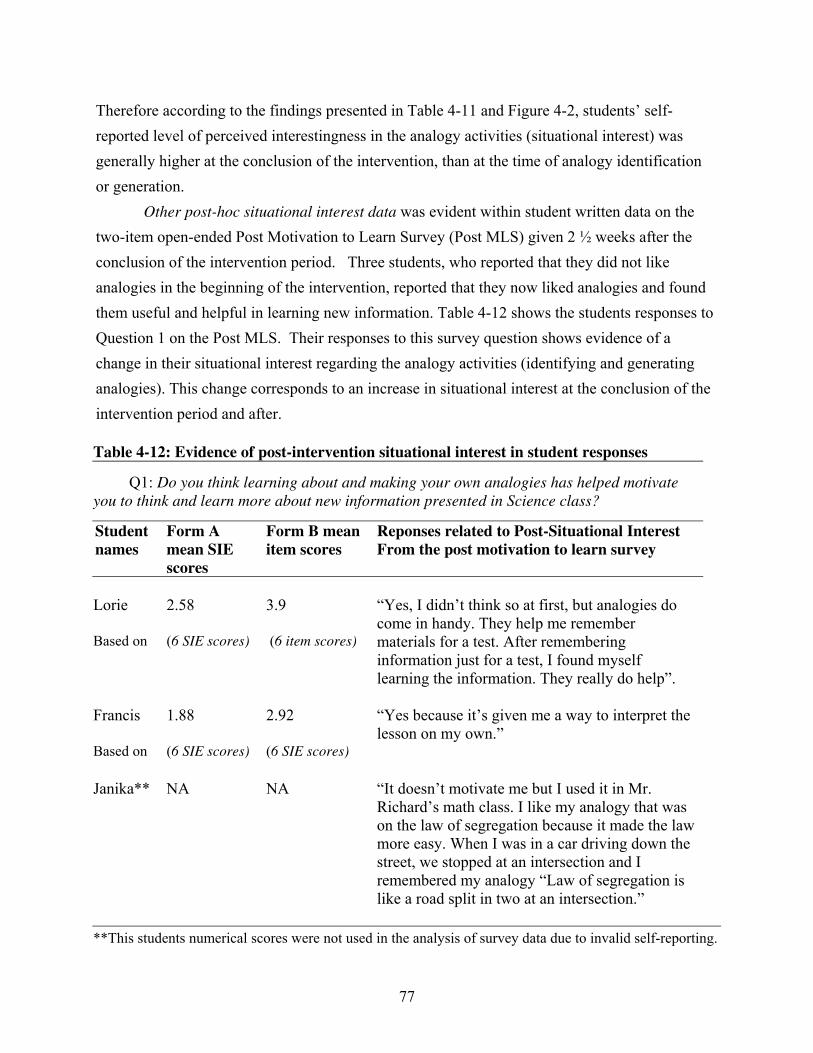
Therefore according to the findings presented in Table 4-11 and Figure 4-2, students’ self-
reported level of perceived interestingness in the analogy activities (situational interest) was
generally higher at the conclusion of the intervention, than at the time of analogy identification
or generation.
Other post-hoc situational interest data was evident within student written data on the
two-item open-ended Post Motivation to Learn Survey (Post MLS) given 2 ½ weeks after the
conclusion of the intervention period. Three students, who reported that they did not like
analogies in the beginning of the intervention, reported that they now liked analogies and found
them useful and helpful in learning new information. Table 4-12 shows the students responses to
Question 1 on the Post MLS. Their responses to this survey question shows evidence of a
change in their situational interest regarding the analogy activities (identifying and generating
analogies). This change corresponds to an increase in situational interest at the conclusion of the
intervention period and after.
Table 4-12: Evidence of post-intervention situational interest in student responses
Q1: Do you think learning about and making your own analogies has helped motivate
you to think and learn more about new information presented in Science class?
Student
names
Form A
mean SIE
scores
Form B mean
item scores
Reponses related to Post-Situational Interest
From the post motivation to learn survey
Lorie
Based on
2.58
(6 SIE scores)
3.9
(6 item scores)
“Yes, I didn’t think so at first, but analogies do
come in handy. They help me remember
materials for a test. After remembering
information just for a test, I found myself
learning the information. They really do help”.
Francis
Based on
1.88
(6 SIE scores)
2.92
(6 SIE scores)
“Yes because it’s given me a way to interpret the
lesson on my own.”
Janika** NA
NA
“It doesn’t motivate me but I used it in Mr.
Richard’s math class. I like my analogy that was
on the law of segregation because it made the law
more easy. When I was in a car driving down the
street, we stopped at an intersection and I
remembered my analogy “Law of segregation is
like a road split in two at an intersection.”
**This students numerical scores were not used in the analysis of survey data due to invalid self-reporting.
77

Question 1b: To what extent does the analogy intervention impact students’ individual
interest in the Biology course?
Individual interest data were obtained by way of direct/systematic classroom
observations, student responses to individual interest items on the intervention Interest and
Motivation to Learn Survey (IMLS), and focus group interviews. Individual interest on the self-
report items was predicted to be moderate to high (depicted by a student response value of three
or above) with a majority of students reporting a high level interest (value of four or above). In
correspondence with a high level of individual interest on the IMLS, observed interest-related
behavior was predicted to improve during the intervention period as compared to that of the pre-
intervention period (as indicated by an increase in interest-related engagement and a decrease in
interest-related boredom behaviors during the intervention period). In addition, focus group
interview data regarding individual interest were predicted to substantiate both self-report and
direct observation data. Other data such as general observation data and general survey data
related to changes in feelings towards the course and attitude towards science were used to help
supporting or explain survey and direct observation findings.
Findings from the IMLS related to Individual Interest
On the IMLS, students were asked to respond to two survey items in relation to the
impact of the intervention on their individual interest in the course (see Appendix B-6, items 1
and 2). The two questions were scored on a five point Likert-type scale from 1= no, not at all to
5= yes, definitely. Student responses to the items were entered into SPSS for analysis of group
frequencies, mean and other descriptive data. Reliability for these items was assessed through an
examination of written questionnaire items collected during the focus group interviews
conducted one week after the administration of the IMLS. The reliability index of the items was
adequate at r = .57.
Table 4-13 shows the percentage of participant responses for each item. When asked
“Did learning about analogies in class help to make learning (in general) more interesting for
you?” (item 1) 58% (n=7) of at-risk participants responded very much or yes, definitely to the
survey question. When asked “Did learning to create your own analogies help increase your
interest in the course?” (item 2), 67% (n=8) responded either very much or yes, definitely. For
both items, all remaining students answered somewhat.
78
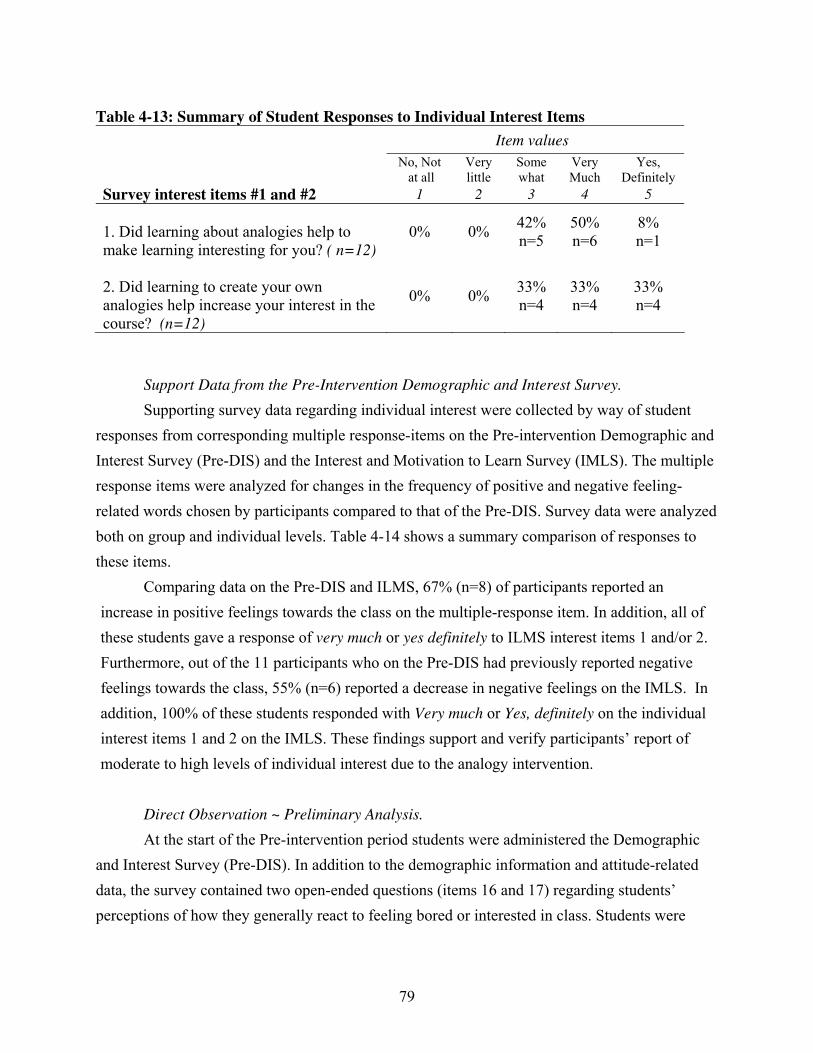
Table 4-13: Summary of Student Responses to Individual Interest Items
Item values
No, Not
at all
Very
little
Some
what
Very
Much
Yes,
Definitely
Survey interest items #1 and #2 1 2 3 4 5
1. Did learning about analogies help to
make learning interesting for you? ( n=12)
0% 0% 42%
n=5
50%
n=6
8%
n=1
2. Did learning to create your own
analogies help increase your interest in the
course? (n=12)
0% 0% 33%
n=4
33%
n=4
33%
n=4
Support Data from the Pre-Intervention Demographic and Interest Survey.
Supporting survey data regarding individual interest were collected by way of student
responses from corresponding multiple response-items on the Pre-intervention Demographic and
Interest Survey (Pre-DIS) and the Interest and Motivation to Learn Survey (IMLS). The multiple
response items were analyzed for changes in the frequency of positive and negative feeling-
related words chosen by participants compared to that of the Pre-DIS. Survey data were analyzed
both on group and individual levels. Table 4-14 shows a summary comparison of responses to
these items.
Comparing data on the Pre-DIS and ILMS, 67% (n=8) of participants reported an
increase in positive feelings towards the class on the multiple-response item. In addition, all of
these students gave a response of very much or yes definitely to ILMS interest items 1 and/or 2.
Furthermore, out of the 11 participants who on the Pre-DIS had previously reported negative
feelings towards the class, 55% (n=6) reported a decrease in negative feelings on the IMLS. In
addition, 100% of these students responded with Very much or Yes, definitely on the individual
interest items 1 and 2 on the IMLS. These findings support and verify participants’ report of
moderate to high levels of individual interest due to the analogy intervention.
Direct Observation ~ Preliminary Analysis.
At the start of the Pre-intervention period students were administered the Demographic
and Interest Survey (Pre-DIS). In addition to the demographic information and attitude-related
data, the survey contained two open-ended questions (items 16 and 17) regarding students’
perceptions of how they generally react to feeling bored or interested in class. Students were
79
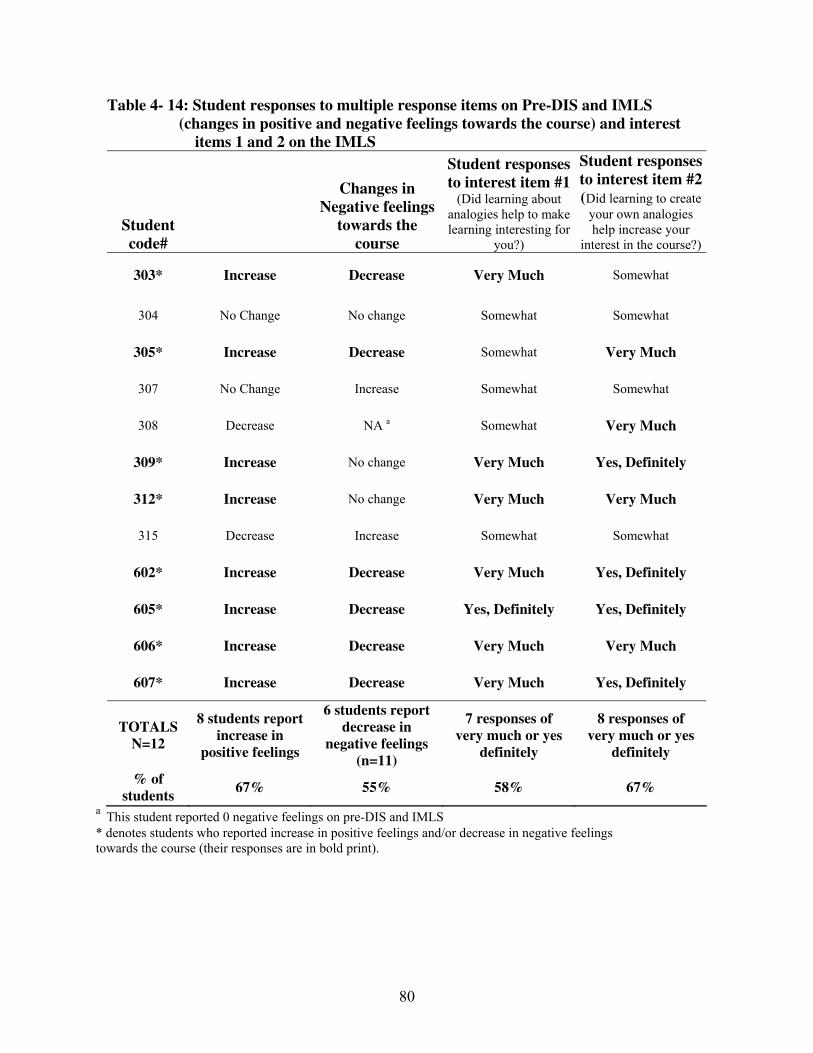
Table 4- 14: Student responses to multiple response items on Pre-DIS and IMLS
(changes in positive and negative feelings towards the course) and interest
items 1 and 2 on the IMLS
Student
code#
Changes in
Negative feelings
towards the
course
Student responses
to interest item #1 (Did learning about
analogies help to make
learning interesting for
you?)
Student responses
to interest item #2
(Did learning to create
your own analogies
help increase your
interest in the course?)
303* Increase Decrease Very Much Somewhat
304 No Change No change Somewhat Somewhat
305* Increase Decrease Somewhat Very Much
307 No Change Increase Somewhat Somewhat
308 Decrease NA a Somewhat Very Much
309* Increase No change Very Much Yes, Definitely
312* Increase No change Very Much Very Much
315 Decrease Increase Somewhat Somewhat
602* Increase Decrease Very Much Yes, Definitely
605* Increase Decrease Yes, Definitely Yes, Definitely
606* Increase Decrease Very Much Very Much
607* Increase Decrease Very Much Yes, Definitely
TOTALS
N=12
8 students report
increase in
positive feelings
6 students report
decrease in
negative feelings
(n=11)
7 responses of
very much or yes
definitely
8 responses of
very much or yes
definitely
% of
students 67% 55% 58% 67%
a This student reported 0 negative feelings on pre-DIS and IMLS
* denotes students who reported increase in positive feelings and/or decrease in negative feelings
towards the course (their responses are in bold print).
80
asked:
Item 16: “When you are interested in something going on in class, how do you
usually react? Or how do you show it? Describe two ways”
and
Item 17: “When you are bored in school, how do you usually react or how
do you show you are bored?”
Table 4-15 lists students’ responses to Pre-DIS items 16 and 17 regarding behaviors they cite as
being representative examples of their interest and boredom behavior in school. Student
responses to these questions were used to modify, confirm, or more accurately define the original
pre-set list of interest-related engagement and boredom behaviors for direct observation (see
Table 3-2). Using students’ responses to these items, a modified list of behaviors and codes were
developed for used in direct observation of participants. Table 4-16 “Coding of Pre-set Interest-
related Engagement Behaviors” and Table 4-17 “Coding of Pre-set Interest-related Boredom
Behaviors” show the original list behavior descriptions and the modified list of behaviors, codes
and their descriptions used in direct observation data collection and analysis. The modified list
includes one additional engagement and one additional boredom behavior not included on the
original list. (From this point on, the behaviors on the modified list, are labeled and referred to in
general as pre-set).
In observing specific behaviors as they occur during a class period, a modified version of
the time sample technique referred to as the Off-Task seating chart (Stallings, Needels & Sparks,
1989) was used. In this study, the modified design is referred to as the Direct Engagement/
Boredom Observation form (DEBO form, see Appendix B-1) and is used to document 1) the
occurrence of participant engagement or boredom behaviors during course lessons and activities,
2) the nature of the classroom activities (lecture, lab, seatwork, etc.) and 3) whether or not the
activities were intervention-related.
Direct Observation ~ Analyzing General Interest-related Engagement and
Boredom behavior
Direct observation data were analyzed for pattern changes in the rate of general interest-
related engagement and boredom behaviors as well as changes in the frequency of the specific
engagement and boredom behaviors presented in Tables 4-16 and 4-17. Direct observation data
were gathered for a total of thirty-three days spanning the pre-intervention (17 days) and
81
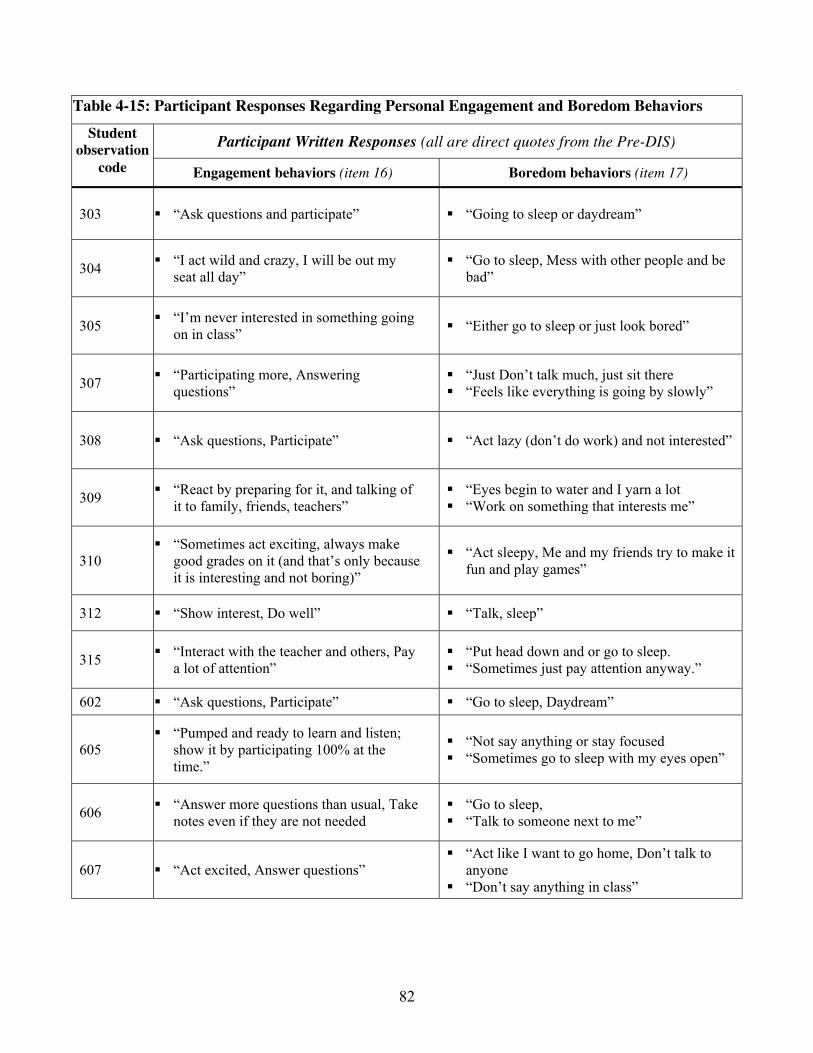
82
Table 4-15: Participant Responses Regarding Personal Engagement and Boredom Behaviors
Student
observation Participant Written Responses (all are direct quotes from the Pre-DIS)
code Engagement behaviors (item 16) Boredom behaviors (item 17)
303 “Ask questions and participate” “Going to sleep or daydream”
304 “I act wild and crazy, I will be out my
seat all day”
“Go to sleep, Mess with other people and be
bad”
305 “I’m never interested in something going
on in class” “Either go to sleep or just look bored”
307 “Participating more, Answering
questions”
“Just Don’t talk much, just sit there
“Feels like everything is going by slowly”
308 “Ask questions, Participate” “Act lazy (don’t do work) and not interested”
309 “React by preparing for it, and talking of
it to family, friends, teachers”
“Eyes begin to water and I yarn a lot
“Work on something that interests me”
310
“Sometimes act exciting, always make
good grades on it (and that’s only because
it is interesting and not boring)”
“Act sleepy, Me and my friends try to make it
fun and play games”
312 “Show interest, Do well” “Talk, sleep”
315 “Interact with the teacher and others, Pay
a lot of attention”
“Put head down and or go to sleep.
“Sometimes just pay attention anyway.”
602 “Ask questions, Participate” “Go to sleep, Daydream”
605
“Pumped and ready to learn and listen;
show it by participating 100% at the
time.”
“Not say anything or stay focused
“Sometimes go to sleep with my eyes open”
606 “Answer more questions than usual, Take
notes even if they are not needed
“Go to sleep,
“Talk to someone next to me”
607 “Act excited, Answer questions”
“Act like I want to go home, Don’t talk to
anyone
“Don’t say anything in class”
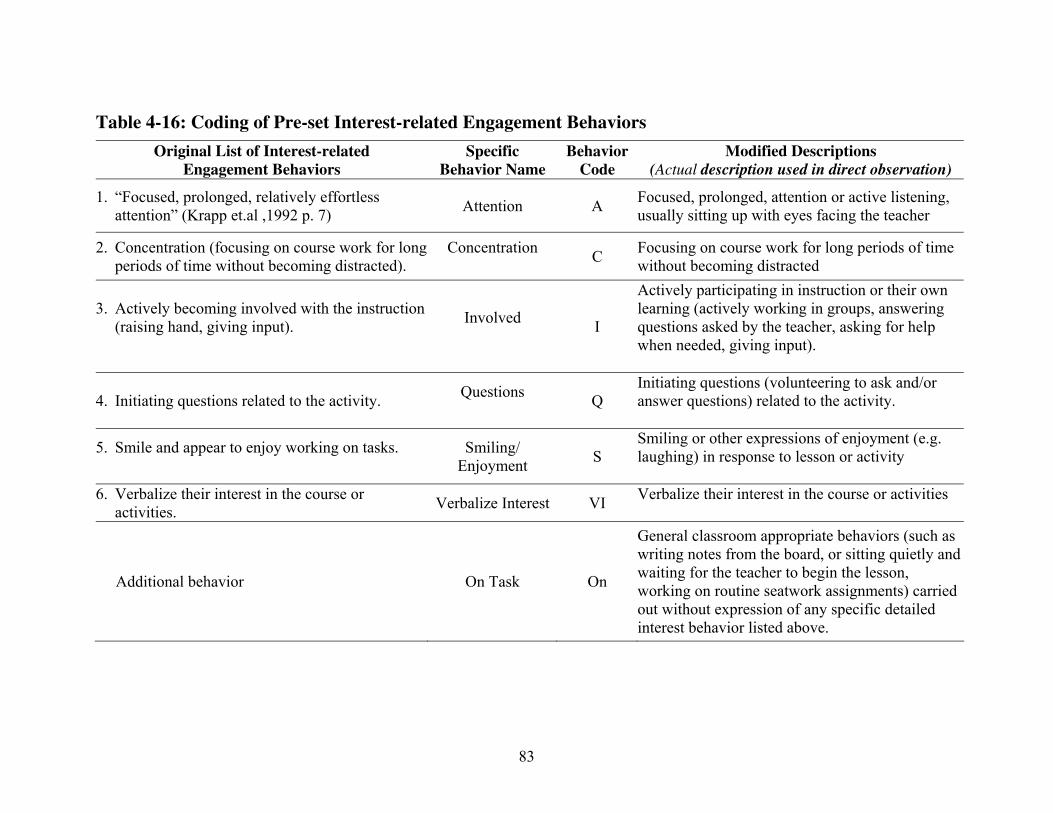
Table 4-16: Coding of Pre-set Interest-related Engagement Behaviors
Original List of Interest-related
Engagement Behaviors
Specific
Behavior Name
Behavior
Code
Modified Descriptions
(Actual description used in direct observation)
1. “Focused, prolonged, relatively effortless
attention” (Krapp et.al ,1992 p. 7) Attention A
Focused, prolonged, attention or active listening,
usually sitting up with eyes facing the teacher
2. Concentration (focusing on course work for long
periods of time without becoming distracted).
Concentration
C
Focusing on course work for long periods of time
without becoming distracted
3. Actively becoming involved with the instruction
(raising hand, giving input).
Involved
I
Actively participating in instruction or their own
learning (actively working in groups, answering
questions asked by the teacher, asking for help
when needed, giving input).
4. Initiating questions related to the activity.
Questions
Q
Initiating questions (volunteering to ask and/or
answer questions) related to the activity.
5. Smile and appear to enjoy working on tasks.
Smiling/
Enjoyment S
Smiling or other expressions of enjoyment (e.g.
laughing) in response to lesson or activity
6. Verbalize their interest in the course or
activities. Verbalize Interest VI
Verbalize their interest in the course or activities
Additional behavior On Task On
General classroom appropriate behaviors (such as
writing notes from the board, or sitting quietly and
waiting for the teacher to begin the lesson,
working on routine seatwork assignments) carried
out without expression of any specific detailed
interest behavior listed above.
83

Original List of Interest-related
Boredom Behaviors
Specific
Behavior Name
Behavior
Code
Actual Modified Description
(used in direct observation)
1. Having head down during activity giving the
appearance of “dozing. Dozing Doz
Having head down during activity giving the appearance
of “dozing or actual sleeping in class
2. Not focused on the teacher, eyes facing in a
direction other than on the teacher or
assignment (i.e. daydreaming).
Not Focused NF
Not focused on the lesson, eyes facing in a direction other
than on the teacher or assignment (includes daydreaming,
and grooming behaviors such as twirling or brushing hair)
.
3. Blank stares or confused expressions. Blank Stare BL Blank stares or confused expressions usually in response
to the lesson or activity.
4. Appear to dislike working on tasks, distracted
by friends, etc. (i.e. body position slumped
over with elbow on desk and head in hand).
Distracted Dis
Appear to dislike working on tasks, distracted by friends,
etc. (i.e. body position slumped over with elbow on desk
and head in hand).
5. Verbalize their disinterest or boredom in the
course or activities (i.e. “This is boring” or “I
hate this class”).
Verbalize
Disinterest VD
Verbalize their disinterest or boredom in the course or
activities (i.e. “This is boring” or “I hate this class”)
6. Off-task (i.e. reading a novel for English class
when they should be focused on science work).Off Task Off
General boredom behavior, usually any inappropriate
classroom behavior not included as a specific boredom
behavior on this list (such as working on an assignment
not related to the lesson or the class, not following proper
classroom or lesson procedures and not present in the
classroom due to late arrival).
Additional Behavior Talking or Disruptive T
Talking in loud tones to classmates (loud enough for the
researcher to hear) or having loud outbursts such as
making irrelevant verbal comments directed to the
teacher or classmate, leaving their seat without
permission, intentionally distracting other students, or
being verbally or physically disrespectful to teacher or
classmate.
Table 4-17: Coding of Pre-set Interest-related Boredom Behaviors
84

Participant Observation code 3rd period O
bse
rva
tio
n
da
y #
Ob
serv
ati
on
date
& t
ime
# o
f S
tud
ents
pre
sen
t
swee
ps
3 0 3
3 0 4
3 0 5
3 0 7
3 0 8
3 0 9
3 1 2
3 1 5
T
O
day 1
2/9
(50 mins)
11 1
2
3
4
5
6
7
8
B
E
E
E
B
E
B
E
E
E
E
E
B
E
E
E
E
E
E
E
E
E
E
E
E
E
E
E
B
E
E
E
E
E
E
E
B
E
B
B
E
B
B
E
B
B
E
B
E
B
E
E
E
E
B
B
A
b
s
e
n
t
T
A
L
S
# of engagement behaviors 5 7 8 7 5 3 5 NA 40
# of boredom behaviors 3 1 0 1 3 5 3 NA 16
Figure 4- 3: Example of summary general engagement/ boredom observation
chart for individual participants per observation day
of summary time sample data gathered during a 50 minute 3rd period class session. Observation
days were numbered from 1- 33 and labeled in accordance to the order in which direct
observations were conducted. For example, Figure 4-3 above shows that on day 1 of direct
observations (February 9th
), ten students were present in the third period class and a total of eight
observation sweeps (one sweep every six minutes) were made. In addition, the summary shows
the number of engagement and boredom behaviors recorded for each student. Equations 4-5 and
4-6 show examples of how engagement and boredom rates were computed for participant 303 for
observation day 1. (See Appendix D-2 for an example of the general engagement/boredom
summary form used in this study):
Equation 4-5: Computing of the engagement rate for individual students per day
(Example: Student 303/ observation day one)
1 day nobservatio for
Engagement %62.5 =100 ×
sweepsn Observatio 8
behaviors Boredom 5
1day n observatiofor
Engagement % =100×
1day n observatiofor sweepsn Observatio of #
1day n observatiofor behaviors Engagement of #
85
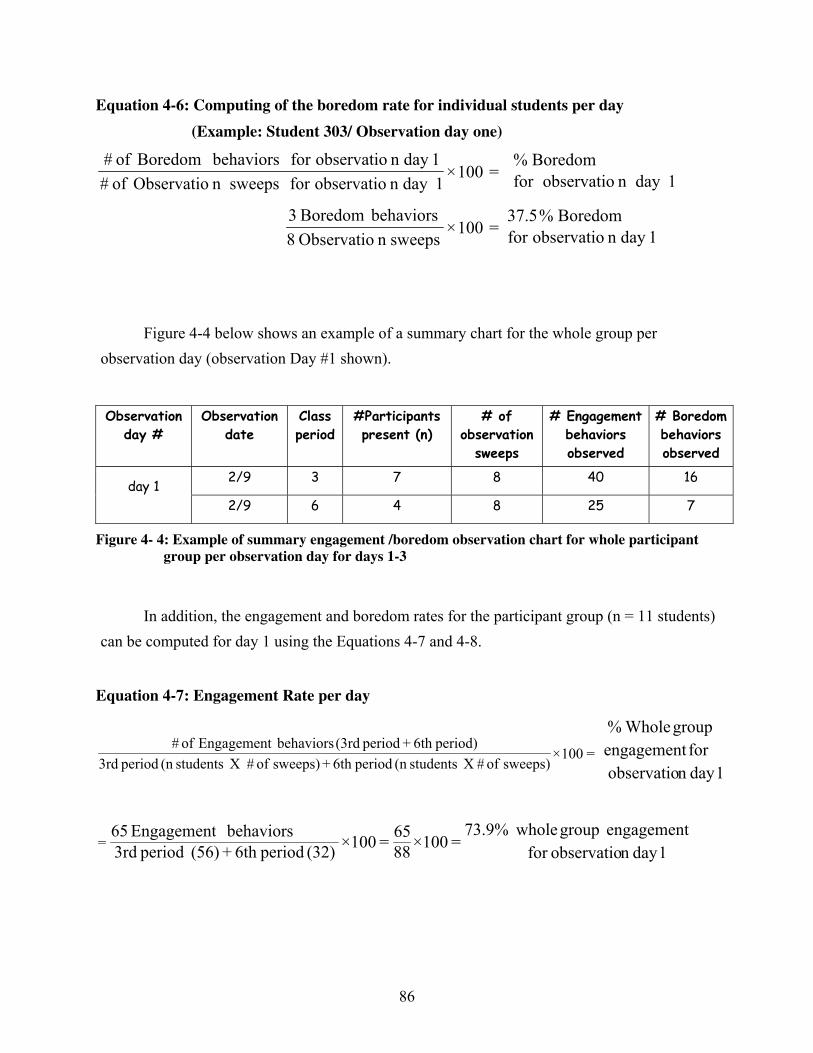
Equation 4-6: Computing of the boredom rate for individual students per day
(Example: Student 303/ Observation day one)
1 day nobservatio for
Boredom %37.5 =100 ×
sweepsn Observatio 8
behaviors Boredom 3
1day n observatiofor
Boredom % =100×
1day n observatiofor sweepsn Observatio of #
1day n observatiofor behaviors Boredom of #
Figure 4-4 below shows an example of a summary chart for the whole group per
observation day (observation Day #1 shown).
Observation
day #
Observation
date
Class
period
#Participants
present (n)
# of
observation
sweeps
# Engagement
behaviors
observed
# Boredom
behaviors
observed
day 1 2/9 3 7 8 40 16
2/9 6 4 8 25 7
Figure 4- 4: Example of summary engagement /boredom observation chart for whole participant
group per observation day for days 1-3
In addition, the engagement and boredom rates for the participant group (n = 11 students)
can be computed for day 1 using the Equations 4-7 and 4-8.
Equation 4-7: Engagement Rate per day
1day n observatiofor
engagement group whole73.9%=100×
88
65=100×
(32) period6th + (56) period 3rd
behaviors Engagement 65
1day n observatio
for engagement
group Whole%
=
=100×sweeps) of # X students(n period6th + sweeps) of # X students(n period 3rd
period)6th + period (3rd behaviors Engagement of #
86
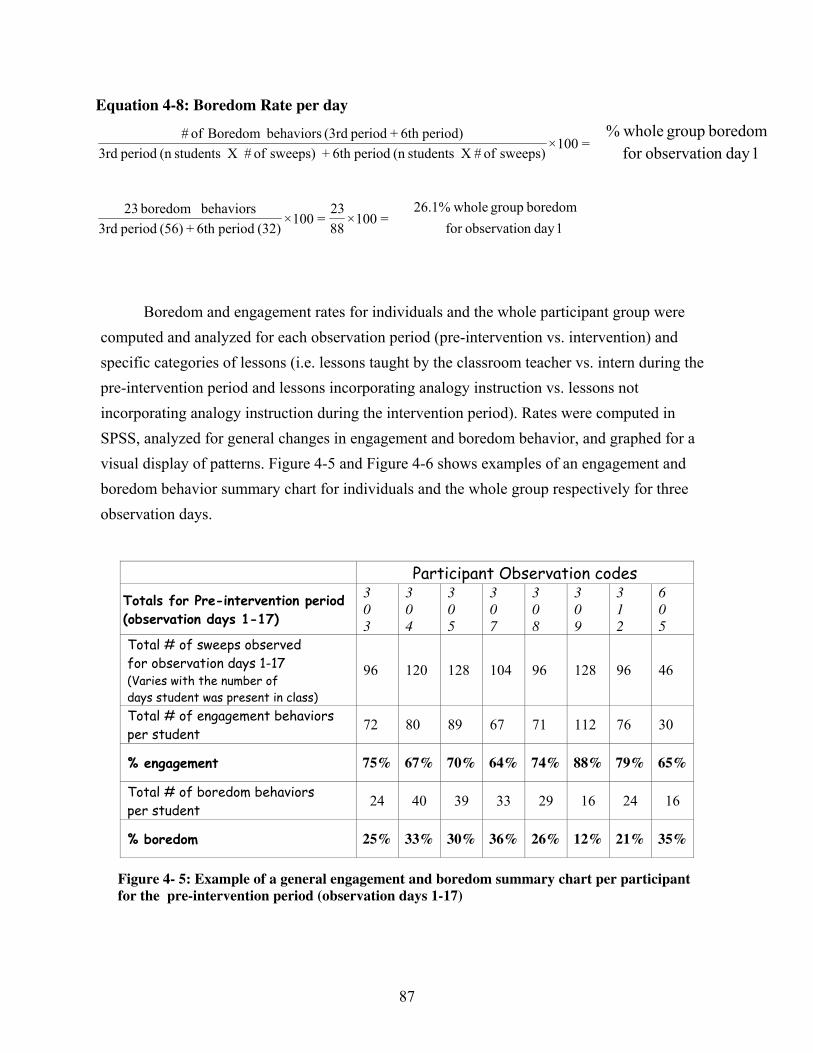
Equation 4-8: Boredom Rate per day
1day n observatiofor
boredom group whole26.1% =100×
88
23=100×
(32) period6th + (56) period 3rd
behaviors boredom 23
=100×sweeps) of # X students(n period6th + sweeps) of # X students(n period 3rd
period)6th + period (3rd behaviors Boredom of #
1day n observatiofor
boredomgroup whole%
Boredom and engagement rates for individuals and the whole participant group were
computed and analyzed for each observation period (pre-intervention vs. intervention) and
specific categories of lessons (i.e. lessons taught by the classroom teacher vs. intern during the
pre-intervention period and lessons incorporating analogy instruction vs. lessons not
incorporating analogy instruction during the intervention period). Rates were computed in
SPSS, analyzed for general changes in engagement and boredom behavior, and graphed for a
visual display of patterns. Figure 4-5 and Figure 4-6 shows examples of an engagement and
boredom behavior summary chart for individuals and the whole group respectively for three
observation days.
Participant Observation codes
Totals for Pre-intervention period
(observation days 1-17)
3
0
3
3
0
4
3
0
5
3
0
7
3
0
8
3
0
9
3
1
2
6
0
5
Total # of sweeps observed
for observation days 1-17 (Varies with the number of
days student was present in class)
96 120 128 104 96 128 96 46
Total # of engagement behaviors
per student 72 80 89 67 71 112 76 30
% engagement 75% 67% 70% 64% 74% 88% 79% 65%
Total # of boredom behaviors
per student 24 40 39 33 29 16 24 16
% boredom 25% 33% 30% 36% 26% 12% 21% 35%
Figure 4- 5: Example of a general engagement and boredom summary chart per participant
for the pre-intervention period (observation days 1-17)
87
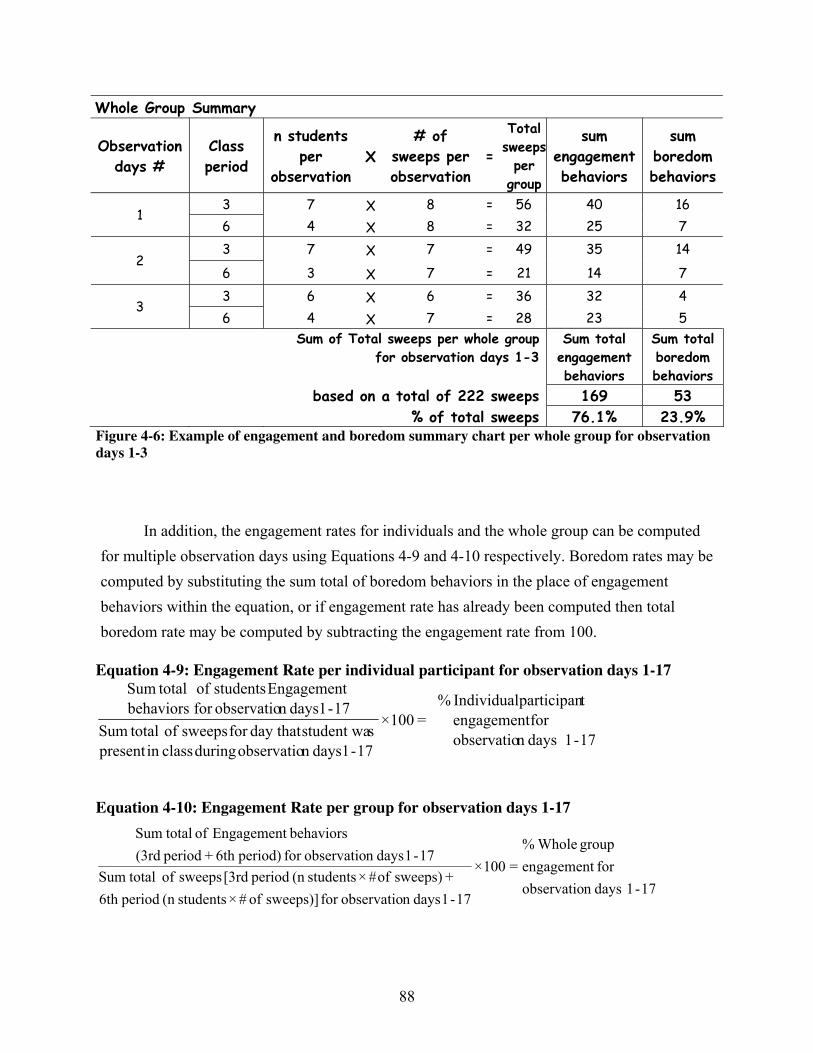
Whole Group Summary
Observation
days #
Class
period
n students
per
observation
X
# of
sweeps per
observation
=
Total
sweeps
per
group
sum
engagement
behaviors
sum
boredom
behaviors
3 7 X
8 = 56 40 16 1
6 4 X
8 = 32 25 7
3 7 X
7 = 49 35 14 2
6 3 X
7 = 21 14 7
3 6 X
6 = 36 32 4 3
6 4 X
7 = 28 23 5
Sum of Total sweeps per whole group
for observation days 1-3
Sum total
engagement
behaviors
Sum total
boredom
behaviors
based on a total of 222 sweeps 169 53
% of total sweeps 76.1% 23.9% Figure 4-6: Example of engagement and boredom summary chart per whole group for observation
days 1-3
In addition, the engagement rates for individuals and the whole group can be computed
for multiple observation days using Equations 4-9 and 4-10 respectively. Boredom rates may be
computed by substituting the sum total of boredom behaviors in the place of engagement
behaviors within the equation, or if engagement rate has already been computed then total
boredom rate may be computed by subtracting the engagement rate from 100.
Equation 4-9: Engagement Rate per individual participant for observation days 1-17
17-1 daysn observatio
for engagement
t participan Individual %
=100×
17-1 daysn observatio during classin present
sstudent waday that for sweeps of totalSum
17-1 daysn observatiofor behaviors
Engagement students of totalSum
Equation 4-10: Engagement Rate per group for observation days 1-17
17-1 daysn observatio
for engagement
group Whole%
=100×
17-1 daysn observatiofor sweeps)] of # × students(n period6th
+ sweeps) of# × students(n period [3rd sweeps of totalSum
17-1 daysn observatiofor period)6th + period (3rd
behaviors Engagement of totalSum
88
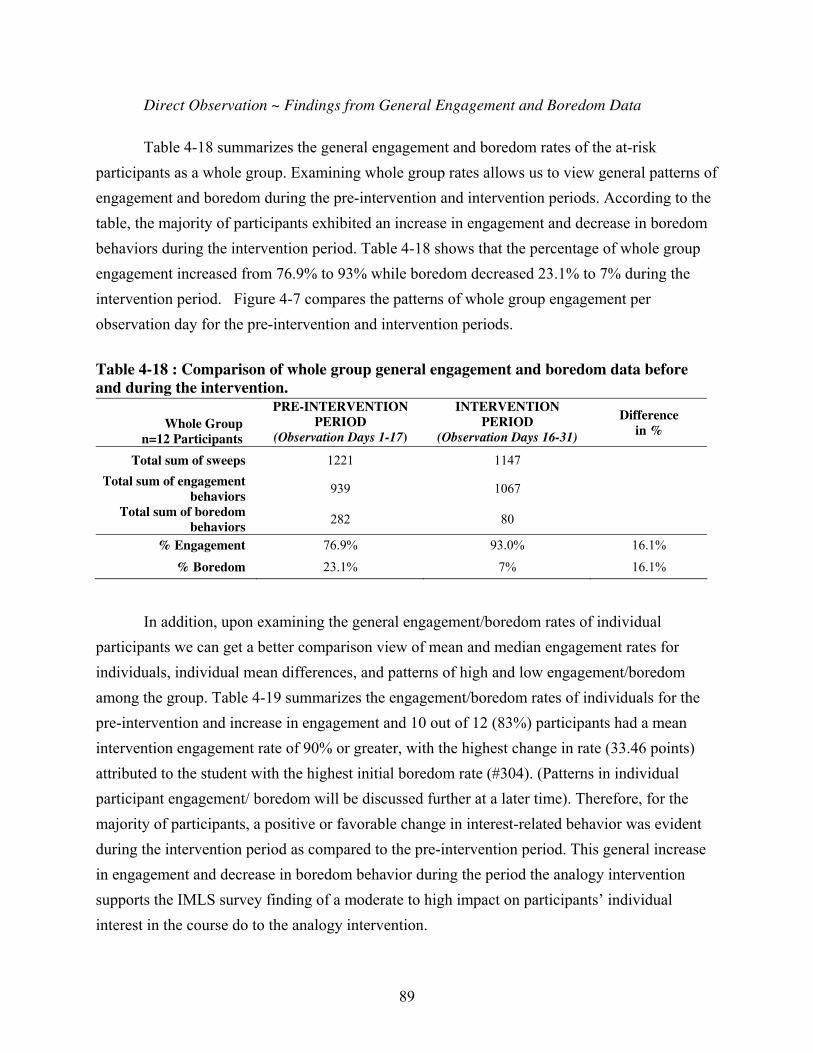
Direct Observation ~ Findings from General Engagement and Boredom Data
Table 4-18 summarizes the general engagement and boredom rates of the at-risk
participants as a whole group. Examining whole group rates allows us to view general patterns of
engagement and boredom during the pre-intervention and intervention periods. According to the
table, the majority of participants exhibited an increase in engagement and decrease in boredom
behaviors during the intervention period. Table 4-18 shows that the percentage of whole group
engagement increased from 76.9% to 93% while boredom decreased 23.1% to 7% during the
intervention period. Figure 4-7 compares the patterns of whole group engagement per
observation day for the pre-intervention and intervention periods.
Table 4-18 : Comparison of whole group general engagement and boredom data before
and during the intervention.
Whole Group
n=12 Participants
PRE-INTERVENTION
PERIOD
(Observation Days 1-17)
INTERVENTION
PERIOD
(Observation Days 16-31)
Difference
in %
Total sum of sweeps 1221 1147
Total sum of engagement
behaviors 939 1067
Total sum of boredom
behaviors 282 80
% Engagement 76.9% 93.0% 16.1%
% Boredom 23.1% 7% 16.1%
In addition, upon examining the general engagement/boredom rates of individual
participants we can get a better comparison view of mean and median engagement rates for
individuals, individual mean differences, and patterns of high and low engagement/boredom
among the group. Table 4-19 summarizes the engagement/boredom rates of individuals for the
pre-intervention and increase in engagement and 10 out of 12 (83%) participants had a mean
intervention engagement rate of 90% or greater, with the highest change in rate (33.46 points)
attributed to the student with the highest initial boredom rate (#304). (Patterns in individual
participant engagement/ boredom will be discussed further at a later time). Therefore, for the
majority of participants, a positive or favorable change in interest-related behavior was evident
during the intervention period as compared to the pre-intervention period. This general increase
in engagement and decrease in boredom behavior during the period the analogy intervention
supports the IMLS survey finding of a moderate to high impact on participants’ individual
interest in the course do to the analogy intervention.
89
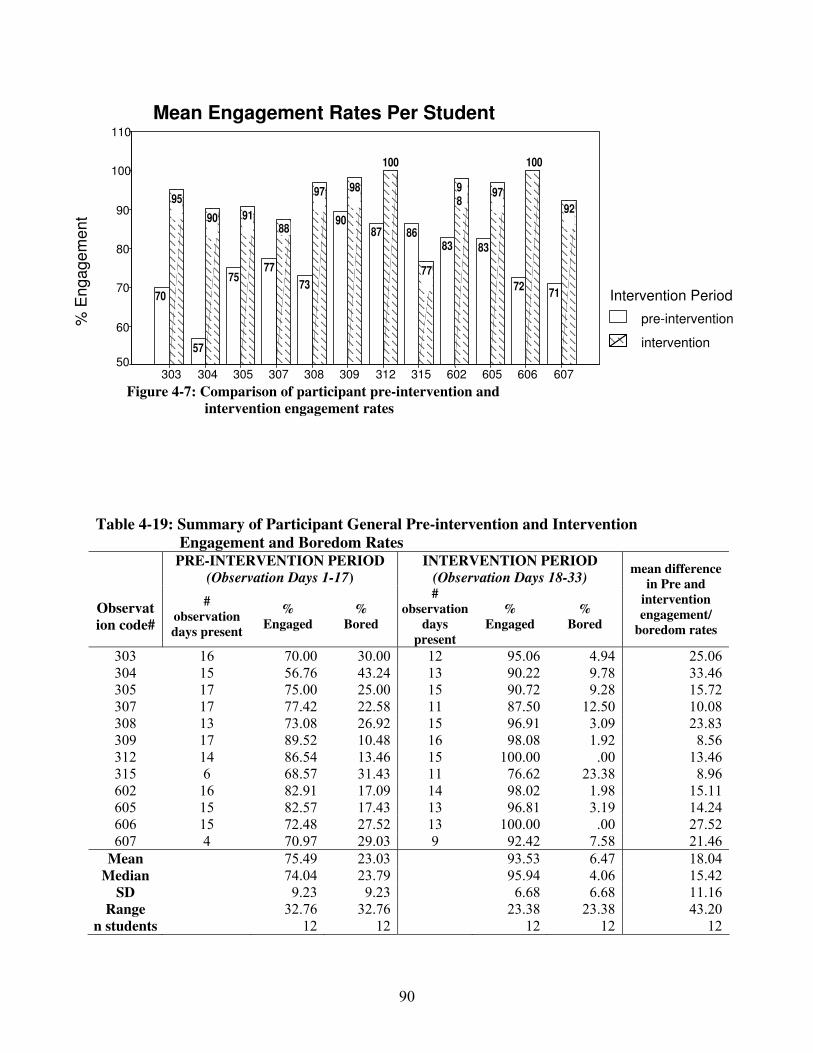
Mean Engagement Rates Per Student
Student Observation Codes
607 606605602315312 309308 307 305 304 303
110
100
90
80
70
60
50
Intervention Period
pre-intervention
intervention
92
100
9798
77
100
9897
88 9190
95
7172
83838687
90
73
7775
57
70
Figure 4-7: Comparison of participant pre-intervention and
intervention engagement rates
%
Engagem
ent
Table 4-19: Summary of Participant General Pre-intervention and Intervention
Engagement and Boredom Rates
PRE-INTERVENTION PERIOD
(Observation Days 1-17)
INTERVENTION PERIOD
(Observation Days 18-33)
Observat
ion code#
#
observation
days present
%
Engaged
%
Bored
#
observation
days
present
%
Engaged
%
Bored
mean difference
in Pre and
intervention
engagement/
boredom rates
303 16 70.00 30.00 12 95.06 4.94 25.06
304 15 56.76 43.24 13 90.22 9.78 33.46
305 17 75.00 25.00 15 90.72 9.28 15.72
307 17 77.42 22.58 11 87.50 12.50 10.08
308 13 73.08 26.92 15 96.91 3.09 23.83
309 17 89.52 10.48 16 98.08 1.92 8.56
312 14 86.54 13.46 15 100.00 .00 13.46
315 6 68.57 31.43 11 76.62 23.38 8.96
602 16 82.91 17.09 14 98.02 1.98 15.11
605 15 82.57 17.43 13 96.81 3.19 14.24
606 15 72.48 27.52 13 100.00 .00 27.52
607 4 70.97 29.03 9 92.42 7.58 21.46
Mean 75.49 23.03 93.53 6.47 18.04
Median 74.04 23.79 95.94 4.06 15.42
SD 9.23 9.23 6.68 6.68 11.16
Range 32.76 32.76 23.38 23.38 43.20
n students 12 12 12 12 12
90
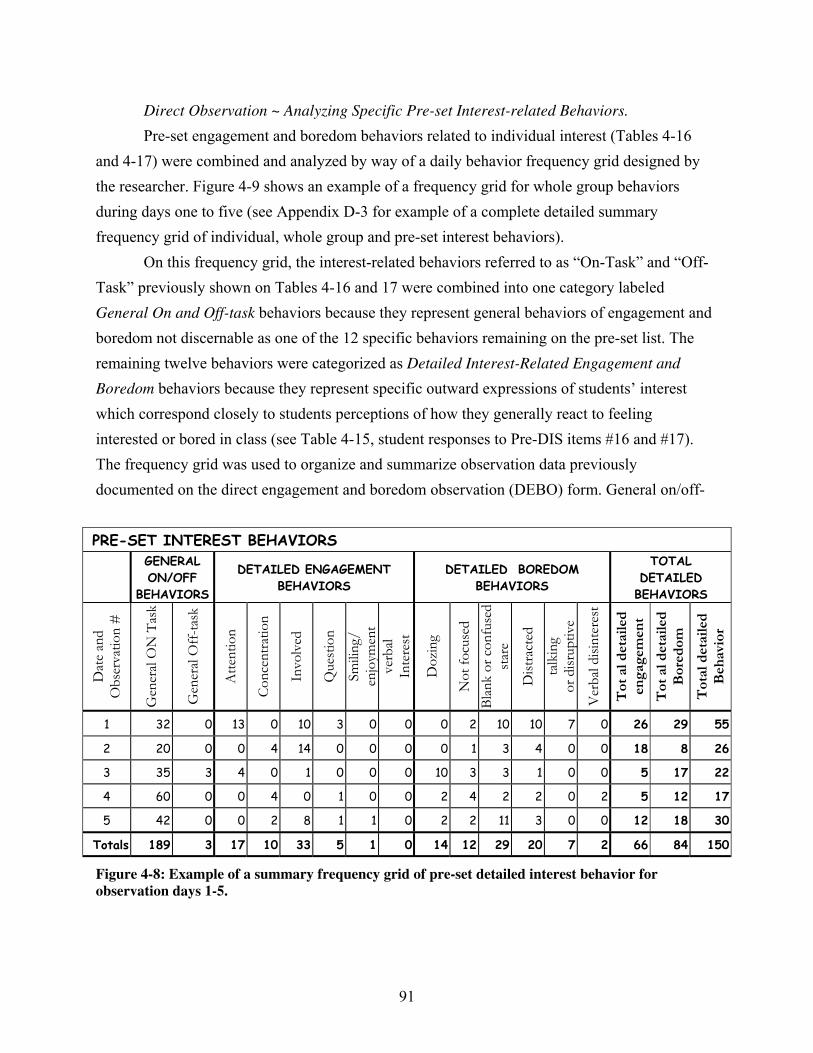
Direct Observation ~ Analyzing Specific Pre-set Interest-related Behaviors.
Pre-set engagement and boredom behaviors related to individual interest (Tables 4-16
and 4-17) were combined and analyzed by way of a daily behavior frequency grid designed by
the researcher. Figure 4-9 shows an example of a frequency grid for whole group behaviors
during days one to five (see Appendix D-3 for example of a complete detailed summary
frequency grid of individual, whole group and pre-set interest behaviors).
On this frequency grid, the interest-related behaviors referred to as “On-Task” and “Off-
Task” previously shown on Tables 4-16 and 17 were combined into one category labeled
General On and Off-task behaviors because they represent general behaviors of engagement and
boredom not discernable as one of the 12 specific behaviors remaining on the pre-set list. The
remaining twelve behaviors were categorized as Detailed Interest-Related Engagement and
Boredom behaviors because they represent specific outward expressions of students’ interest
which correspond closely to students perceptions of how they generally react to feeling
interested or bored in class (see Table 4-15, student responses to Pre-DIS items #16 and #17).
The frequency grid was used to organize and summarize observation data previously
documented on the direct engagement and boredom observation (DEBO) form. General on/off-
PRE-SET INTEREST BEHAVIORS
GENERAL
ON/OFF
BEHAVIORS
DETAILED ENGAGEMENT
BEHAVIORS
DETAILED BOREDOM
BEHAVIORS
TOTAL
DETAILED
BEHAVIORS
Dat
e an
d
Ob
serv
atio
n #
Gen
eral
ON
Tas
k
Gen
eral
Off
-tas
k
Att
enti
on
Co
nce
ntr
atio
n
Invo
lved
Ques
tio
n
Smili
ng/
en
joym
ent
verb
al
Inte
rest
Do
zin
g
No
t fo
cuse
d
Bla
nk
or
con
fuse
d
star
e
Dis
trac
ted
talk
ing
or
dis
rup
tive
Ver
bal
dis
inte
rest
To
t al
deta
iled
en
gag
em
en
t
To
t al
deta
iled
Bo
red
om
To
tal
deta
iled
Beh
avio
r 1 32 0 13 0 10 3 0 0 0 2 10 10 7 0 26 29 55
2 20 0 0 4 14 0 0 0 0 1 3 4 0 0 18 8 26
3 35 3 4 0 1 0 0 0 10 3 3 1 0 0 5 17 22
4 60 0 0 4 0 1 0 0 2 4 2 2 0 2 5 12 17
5 42 0 0 2 8 1 1 0 2 2 11 3 0 0 12 18 30
Totals 189 3 17 10 33 5 1 0 14 12 29 20 7 2 66 84 150
Figure 4-8: Example of a summary frequency grid of pre-set detailed interest behavior for
observation days 1-5.
91
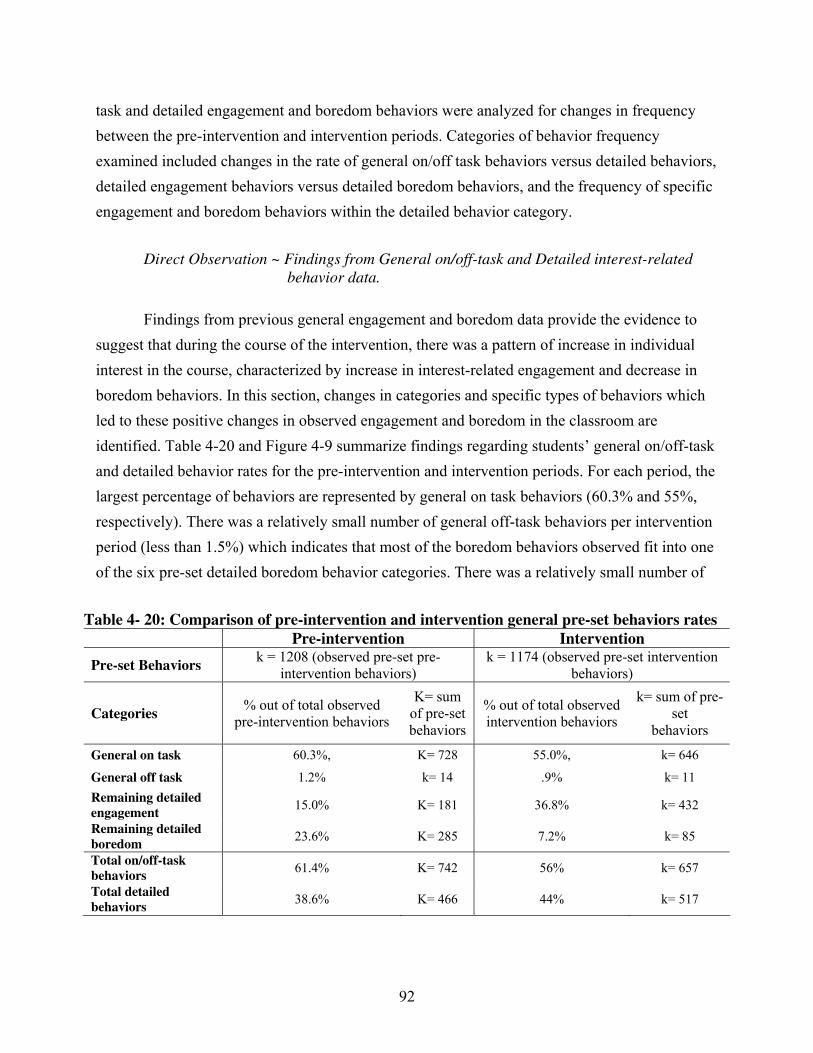
task and detailed engagement and boredom behaviors were analyzed for changes in frequency
between the pre-intervention and intervention periods. Categories of behavior frequency
examined included changes in the rate of general on/off task behaviors versus detailed behaviors,
detailed engagement behaviors versus detailed boredom behaviors, and the frequency of specific
engagement and boredom behaviors within the detailed behavior category.
Direct Observation ~ Findings from General on/off-task and Detailed interest-related
behavior data.
Findings from previous general engagement and boredom data provide the evidence to
suggest that during the course of the intervention, there was a pattern of increase in individual
interest in the course, characterized by increase in interest-related engagement and decrease in
boredom behaviors. In this section, changes in categories and specific types of behaviors which
led to these positive changes in observed engagement and boredom in the classroom are
identified. Table 4-20 and Figure 4-9 summarize findings regarding students’ general on/off-task
and detailed behavior rates for the pre-intervention and intervention periods. For each period, the
largest percentage of behaviors are represented by general on task behaviors (60.3% and 55%,
respectively). There was a relatively small number of general off-task behaviors per intervention
period (less than 1.5%) which indicates that most of the boredom behaviors observed fit into one
of the six pre-set detailed boredom behavior categories. There was a relatively small number of
Table 4- 20: Comparison of pre-intervention and intervention general pre-set behaviors rates
Pre-intervention Intervention
Pre-set Behaviors k = 1208 (observed pre-set pre-
intervention behaviors)
k = 1174 (observed pre-set intervention
behaviors)
Categories % out of total observed
pre-intervention behaviors
K= sum
of pre-set
behaviors
% out of total observed
intervention behaviors
k= sum of pre-
set
behaviors
General on task 60.3%, K= 728 55.0%, k= 646
General off task 1.2% k= 14 .9% k= 11
Remaining detailed
engagement 15.0% K= 181 36.8% k= 432
Remaining detailed
boredom 23.6% K= 285 7.2% k= 85
Total on/off-task
behaviors 61.4% K= 742 56% k= 657
Total detailed
behaviors 38.6% K= 466 44% k= 517
92

Intervention period k = 1174 behaviors
pre-intervention period k = 1208 behaviors
% E
ngag
emen
t and
bor
edom
beh
avio
rs
70
60
50
40
30
20
10
0
Interest Behaviors
General On Task
Detailed Engagement
General Off Task
Detailed Boredom7%
24%
37%
20%
55%
60%
Summary of general and detailed behavior rates
1.2% .9%
Figure 4-9: Summary of general on/off-task and detailed behavior rates during the
pre-intervention and intervention periods
general off-task behaviors per intervention period (less than 1.5%) which indicates that most of
the boredom behaviors observed fit into one of the six pre-set detailed boredom behavior
categories. The remaining detailed engagement and boredom behaviors combined make-up a
substantial amount of the behaviors observed during each period (38.6% and 44%, respectively).
An examination of pre-set pre-intervention behaviors showed that the combined rate of
on/off-task behaviors was 61.4% (k= 742) and the combined rate of detailed engagement/
boredom behaviors was 38.6% (k= 466). For the intervention period, the combined rate of
on/off-task behaviors was 56.0% (k= 657) and the combined rate of detailed engagement/boredom
behaviors was 44.0% (k= 517). A comparison of these rates is illustrated in Figure 4-10. The
difference in rate within each combined category was 5.4 percentage points which signifies that
between the pre-intervention and intervention periods, the rate of behavior within the two
categories relatively remained the same. In other words the rate of change within the general
on/off-task and within the combined detailed behavior categories was small and suggests that the
intervention had little impact on the change in proportion between general on/off-task and pre-set
detailed behaviors during the intervention period.
93
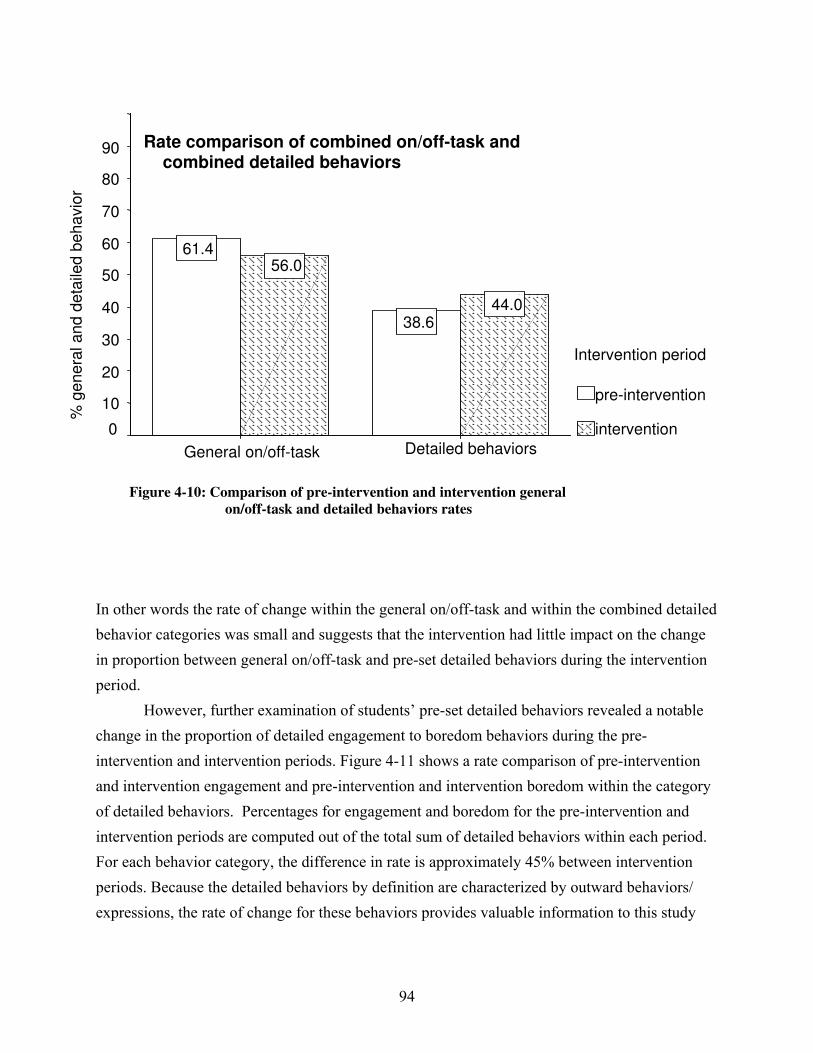
Detailed behaviors
% g
enera
l and d
eta
iled b
ehavio
r
90
80
70
60
50
40
30
20
10
0
Intervention period
pre-intervention
intervention
44.0
56.0
38.6
61.4
General on/off-task
Rate comparison of combined on/off-task and combined detailed behaviors
Figure 4-10: Comparison of pre-intervention and intervention general
on/off-task and detailed behaviors rates
In other words the rate of change within the general on/off-task and within the combined detailed
behavior categories was small and suggests that the intervention had little impact on the change
in proportion between general on/off-task and pre-set detailed behaviors during the intervention
period.
However, further examination of students’ pre-set detailed behaviors revealed a notable
change in the proportion of detailed engagement to boredom behaviors during the pre-
intervention and intervention periods. Figure 4-11 shows a rate comparison of pre-intervention
and intervention engagement and pre-intervention and intervention boredom within the category
of detailed behaviors. Percentages for engagement and boredom for the pre-intervention and
intervention periods are computed out of the total sum of detailed behaviors within each period.
For each behavior category, the difference in rate is approximately 45% between intervention
periods. Because the detailed behaviors by definition are characterized by outward behaviors/
expressions, the rate of change for these behaviors provides valuable information to this study
94

% D
eta
iled
beh
avio
r
100
80
60
40
20
0
Intervention period
Pre-intervention, k = 466 behaviors
Intervention, k = 517 behaviors
16%k=85
84% k=423
61% k=285
39% k=181
Detailed Engagement Detailed
Boredom
Figure 4-11: Comparison of whole detailed boredom and engagement rates for the
pre-intervention and intervention periods
with regard to students’ level of individual interest in the course. Table 4-21 summarizes the
engagement rates of specific engagement and boredom behaviors and their difference in rate
between the pre-intervention period and the intervention period. Figure 4-12 highlights patterns
of change within specific detailed behaviors. These data show that during the pre-intervention
period, the behavior with the highest rate of occurrence was the boredom behavior labeled as
distracted (16.3%). This is followed by the behaviors labeled involved (15.9%), talking and
disruptive (13.7%), dozing (12.9%), and blank and confused stare (12.2%). Commensurate with
a total detailed boredom rate of 61.2%, most of the behaviors with the highest percentages are in
the boredom behavior category. In other words, during the pre-intervention period, the majority
of the detailed behaviors observed by the researcher and experienced by the classroom teacher as
outward student behavior were those expressed as boredom.
Although the on/off-task (general classroom appropriate/ inappropriate) behaviors
provide some information regarding students’ engagement and boredom related to interest, they
95
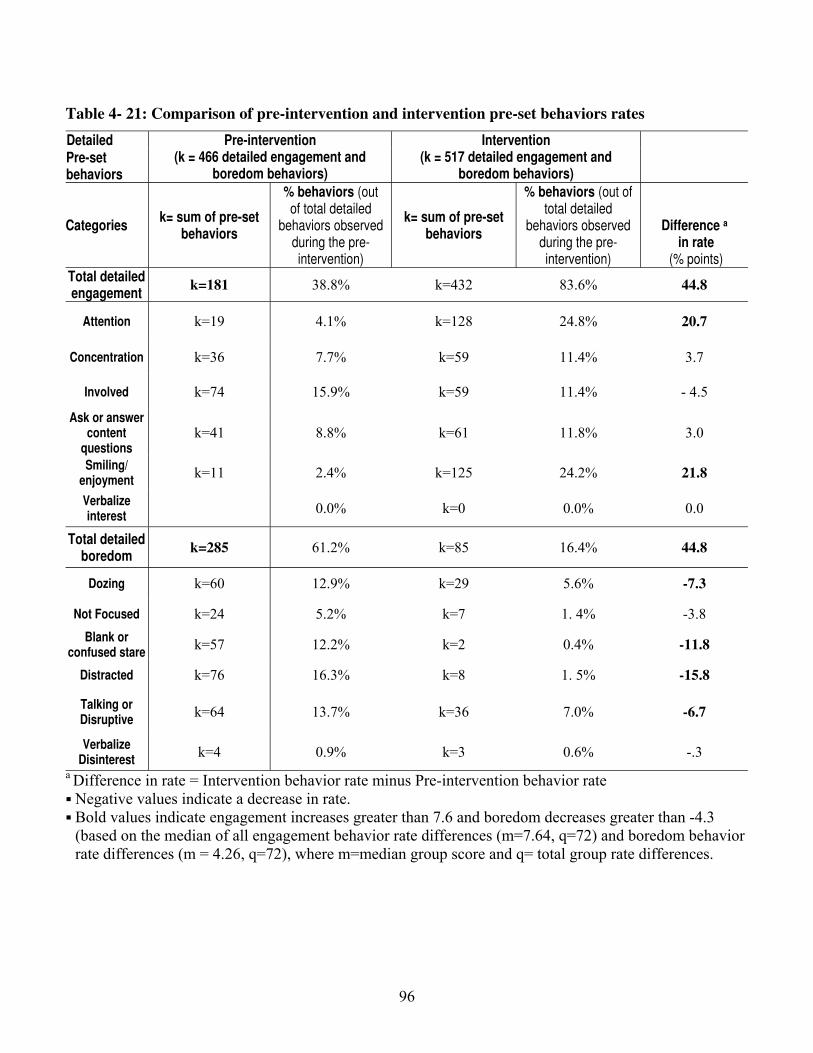
Table 4- 21: Comparison of pre-intervention and intervention pre-set behaviors rates
Detailed Pre-set behaviors
Pre-intervention (k = 466 detailed engagement and
boredom behaviors)
Intervention (k = 517 detailed engagement and
boredom behaviors)
Categories k= sum of pre-set
behaviors
% behaviors (out of total detailed
behaviors observed during the pre-intervention)
k= sum of pre-set behaviors
% behaviors (out of total detailed
behaviors observed during the pre-intervention)
Difference a
in rate (% points)
Total detailed engagement
k=181 38.8% k=432 83.6% 44.8
Attention k=19 4.1% k=128 24.8% 20.7
Concentration k=36 7.7% k=59 11.4% 3.7
Involved k=74 15.9% k=59 11.4% - 4.5
Ask or answer content
questions k=41 8.8% k=61 11.8% 3.0
Smiling/ enjoyment
k=11 2.4% k=125 24.2% 21.8
Verbalize interest
0.0% k=0 0.0% 0.0
Total detailed boredom
k=285 61.2% k=85 16.4% 44.8
Dozing k=60 12.9% k=29 5.6% -7.3
Not Focused k=24 5.2% k=7 1. 4% -3.8
Blank or confused stare
k=57 12.2% k=2 0.4% -11.8
Distracted k=76 16.3% k=8 1. 5% -15.8
Talking or Disruptive
k=64 13.7% k=36 7.0% -6.7
Verbalize Disinterest
k=4 0.9% k=3 0.6% -.3
a Difference in rate = Intervention behavior rate minus Pre-intervention behavior rate
Negative values indicate a decrease in rate.
Bold values indicate engagement increases greater than 7.6 and boredom decreases greater than -4.3
(based on the median of all engagement behavior rate differences (m=7.64, q=72) and boredom behavior
rate differences (m = 4.26, q=72), where m=median group score and q= total group rate differences.
96

Detailed Engagement and Boredom Behavior
verb
al d
isin
tere
st
talk
ing
or d
isru
ptiv
e
dist
ract
ed
blan
k st
are
not f
ocus
ed
dozi
ng
verb
al in
tere
st
smile
/enj
oy
ques
tions
invo
lved
conc
entr
atio
n
atte
ntio
nApp
roxi
mat
ely
% r
ate
of d
etai
led
spec
ific
beha
vior
s
30
20
10
0
Intervention period
pre-intervention
k = 466 behaviors
intervention
k = 517 behaviors
76
24
12 1111
25
14
16
12
5
13
2
9
16
8
4
Figure 4-12: Comparison of specific detailed boredom and engagement behaviors for
the pre-intervention and intervention periods
usually do not involve outward expressions discernable as interest. Detailed behaviors, on the
other hand, are characterized as expressions of interest or boredom and correspond closely to
student perceptions of how they generally react to feeling bored or interested in class (see Table
4-15, responses to items 16 and 17). Therefore, these findings suggest that as a group, the
behaviors most outwardly expressed by participants during the pre-intervention period were
those that conveyed their feelings of boredom.
An examination of behavior rates for the intervention period (see Table 4-21) shows that
the percentage of total detailed engagement behaviors increased from 38.8 to 83.6% and that of
boredom decreased from 61.2 to 16.4%. More specifically, the largest rate increases were seen in
the engagement behaviors smile/enjoy and attention (21.8 and 20.7 points, respectively). These
were followed by substantial rate decreases in the boredom behaviors distracted (15.8 points),
blank or confused stare (11.8 points), dozing (7.3 points), and talking or disruptive (6.7 points).
In addition, as illustrated by Figure 4-12, the behaviors with the highest rates of occurrence,
97
attention (24.8%), smiling/ enjoyment (24.2%), asking or answering content question (11.8%),
concentration (11.4%), involved (11.4%) are all within the detailed engagement behavior
category. These findings show that during the intervention period, engagement became the
prevailing outward behavior signifying an important shift in students’ outward expression of
interest and boredom. Thus, instead of becoming distracted, disruptive to other students, sleeping
or giving an appearance of sleeping in class, or having a blank expression, students were much
more attentive, looking up and having more direct contact with the teacher as she taught. In
addition, students smiled more often and exhibited expressions of enjoyment, asked and
answered more questions during the lesson without being prompted, and appeared to
concentrate/ focus more on their work for longer periods of time without becoming distracted.
Focus group findings
During focus group interviews, nine students (seven at-risk, two regular) were asked to
discuss as a group their responses to individual interest items 1. “Did learning about analogies
help to make learning interesting for you?” and 2. “Did learning to create your own analogies
help increase your interest in the course?” As students spoke in the interview, the researcher
facilitated the group session by further questioning and directing group members to respond to
each others’ comments. Below are six focus group responses given by six at-risk participants
regarding their learning experience during the analogy intervention and the impact of the
intervention on their individual interest in the course. Responses are identified by pseudonyms
and researcher assigned observation codes.
Carrie: Science to me is very boring and I don’t like Science. So when
(305) we started doing analogies then it kind of made me like more into
classwork and stuff...because it help us understand more about what we
are learning.
Charles: I say yes, because [analogies] made things more fun. Cause
(303) working with a partner, started out real nice, made it fun and that’s how
you get some ideas with a partner...It got me interested because it got me
more involved in with enthusiasm, made me want to learn more.
Sandra: To me learning is always interesting…because, there’s a lot
(309) of stuff that I don’t know, but there is a lot of stuff that I do know. So
when I do learn something new I apply it to almost everything I come in
contact with. So it was very interesting to bring something from biology
into something that I do everyday or connect with everyday. So that was
interesting.
98
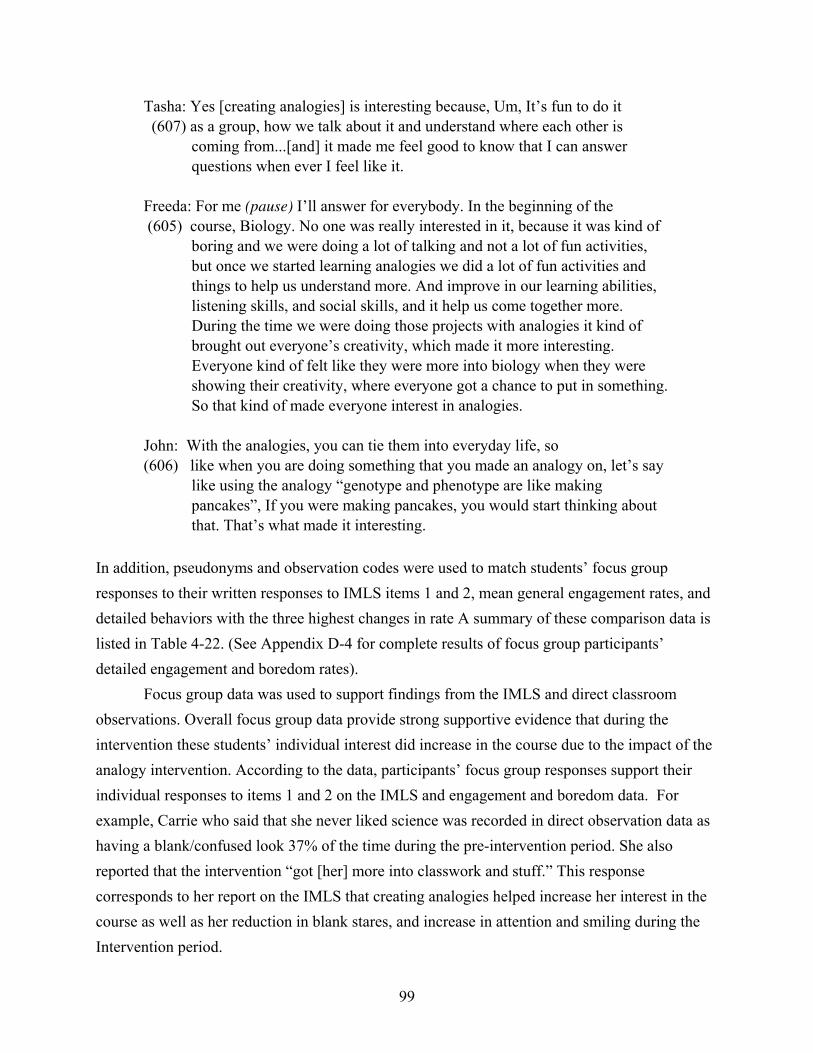
99
Tasha: Yes [creating analogies] is interesting because, Um, It’s fun to do it
(607) as a group, how we talk about it and understand where each other is
coming from...[and] it made me feel good to know that I can answer
questions when ever I feel like it.
Freeda: For me (pause) I’ll answer for everybody. In the beginning of the
(605) course, Biology. No one was really interested in it, because it was kind of
boring and we were doing a lot of talking and not a lot of fun activities,
but once we started learning analogies we did a lot of fun activities and
things to help us understand more. And improve in our learning abilities,
listening skills, and social skills, and it help us come together more.
During the time we were doing those projects with analogies it kind of
brought out everyone’s creativity, which made it more interesting.
Everyone kind of felt like they were more into biology when they were
showing their creativity, where everyone got a chance to put in something.
So that kind of made everyone interest in analogies.
John: With the analogies, you can tie them into everyday life, so
(606) like when you are doing something that you made an analogy on, let’s say
like using the analogy “genotype and phenotype are like making
pancakes”, If you were making pancakes, you would start thinking about
that. That’s what made it interesting.
In addition, pseudonyms and observation codes were used to match students’ focus group
responses to their written responses to IMLS items 1 and 2, mean general engagement rates, and
detailed behaviors with the three highest changes in rate A summary of these comparison data is
listed in Table 4-22. (See Appendix D-4 for complete results of focus group participants’
detailed engagement and boredom rates).
Focus group data was used to support findings from the IMLS and direct classroom
observations. Overall focus group data provide strong supportive evidence that during the
intervention these students’ individual interest did increase in the course due to the impact of the
analogy intervention. According to the data, participants’ focus group responses support their
individual responses to items 1 and 2 on the IMLS and engagement and boredom data. For
example, Carrie who said that she never liked science was recorded in direct observation data as
having a blank/confused look 37% of the time during the pre-intervention period. She also
reported that the intervention “got [her] more into classwork and stuff.” This response
corresponds to her report on the IMLS that creating analogies helped increase her interest in the
course as well as her reduction in blank stares, and increase in attention and smiling during the
Intervention period.
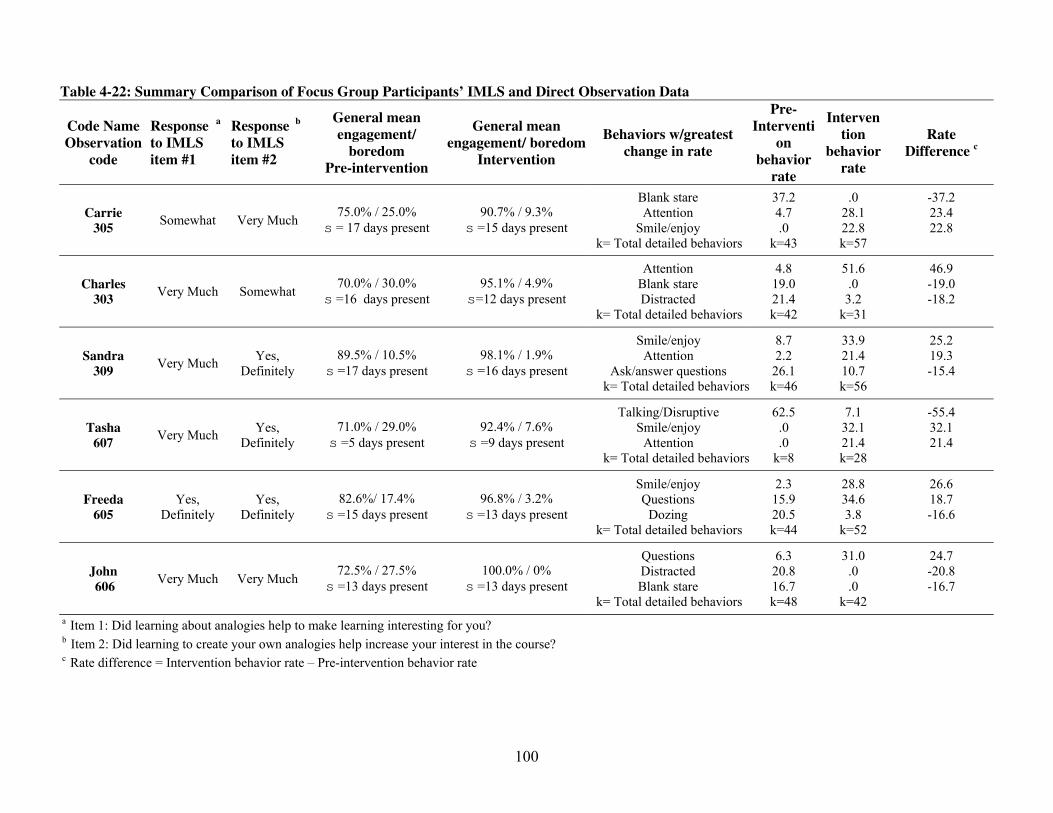
100
Table 4-22: Summary Comparison of Focus Group Participants’ IMLS and Direct Observation Data
Code Name
Observation
code
Response a
to IMLS
item #1
Response b
to IMLS
item #2
General mean
engagement/
boredom
Pre-intervention
General mean
engagement/ boredom
Intervention
Behaviors w/greatest
change in rate
Pre-
Interventi
on
behavior
rate
Interven
tion
behavior
rate
Rate
Difference c
Carrie
305 Somewhat Very Much
75.0% / 25.0%
s = 17 days present
90.7% / 9.3%
s =15 days present
Blank stare
Attention
Smile/enjoy
k= Total detailed behaviors
37.2
4.7
.0
k=43
.0
28.1
22.8
k=57
-37.2
23.4
22.8
Charles
303 Very Much Somewhat
70.0% / 30.0%
s =16 days present
95.1% / 4.9%
s=12 days present
Attention
Blank stare
Distracted
k= Total detailed behaviors
4.8
19.0
21.4
k=42
51.6
.0
3.2
k=31
46.9
-19.0
-18.2
Sandra
309 Very Much
Yes,
Definitely
89.5% / 10.5%
s =17 days present
98.1% / 1.9%
s =16 days present
Smile/enjoy
Attention Ask/answer questions
k= Total detailed behaviors
8.7
2.2
26.1
k=46
33.9
21.4
10.7
k=56
25.2
19.3
-15.4
Tasha
607 Very Much
Yes,
Definitely
71.0% / 29.0%
s =5 days present
92.4% / 7.6%
s =9 days present
Talking/Disruptive
Smile/enjoy
Attention
k= Total detailed behaviors
62.5
.0
.0
k=8
7.1
32.1
21.4
k=28
-55.4
32.1
21.4
Freeda
605
Yes,
Definitely
Yes,
Definitely
82.6%/ 17.4%
s =15 days present
96.8% / 3.2%
s =13 days present
Smile/enjoy
Questions
Dozing
k= Total detailed behaviors
2.3
15.9
20.5
k=44
28.8
34.6
3.8
k=52
26.6
18.7
-16.6
John
606 Very Much Very Much
72.5% / 27.5%
s =13 days present
100.0% / 0%
s =13 days present
Questions
Distracted
Blank stare
k= Total detailed behaviors
6.3
20.8
16.7
k=48
31.0
.0
.0
k=42
24.7
-20.8
-16.7
a Item 1: Did learning about analogies help to make learning interesting for you? b Item 2: Did learning to create your own analogies help increase your interest in the course?c Rate difference = Intervention behavior rate – Pre-intervention behavior rate
Another student, Charles, reported that analogies “made things fun” and made him “want
to learn more.” These statements support his IMLS response of “very much” to item #1 and his
increase in attention, and decrease in blank stares and distraction during the intervention period.
During direct observation in the pre-intervention period, Junior would often sit up in class but
have his neck bent and his head and eyes facing downward, rarely making eye contact with the
teacher. He did not speak much but was often distracted by those who were talking and
disruptive. When he was asked a question, he was silent and often gave a blank stare. During the
intervention period, he was observed sitting at attention when the teacher spoke and often make
eye contact with her as if he was listening or anticipating what she was going to say. Because of
this he showed less signs of being distracted and had a blank stare less often. Instead, his
behavior appeared to indicate that he was thinking about the lesson because was able to answer
more questions and often volunteered to share his answers with the class.
Each of the responses given by focus group students corresponds to their IMLS data as
well as findings of an increase in general/detailed engagement and a decrease in general/detailed
boredom. However, one participant, Sandra, had a notable discrepancy within her detailed
behavior findings. Sandra had an increase in most engagement behaviors and on both items on
the IMLS reported that the intervention helped to increase her interest in the course, but she was
observed as having a 15.4 % decrease in the ask/answer questions category. Sandra, who had the
highest engagement rate during the pre-intervention period, had a notable pattern of asking and
answering questions frequently in class. She was usually one of the few who would raise their
hands in an attempt to answer questions posed by the teacher during the lesson and sometimes
the only one who ask a question regarding the content of the lesson. Findings related to Sandra’s
pattern of asking and answering questions suggest that during the intervention period she was
still highly motivated to answer questions but that she may have been more challenged in
formulating responses. Her continued desire to answer questions in class during the intervention
period was evidenced by a comment she made during a focus group discussion regarding her
behavior:
Sandra: “Creating my own analogies, it sort of gave me a more drive to be the
first to answer the question or try to answer the question. Cause I know
it’s not a lot of people who try to answer the questions. It’s only one or
two people but I want to be the first out of that one or two people who try
to answer the questions. I do know it made me want to do that because I
thought I had a better analogy.”
101
However, during the early part of the intervention period, the researcher noticed a
difference in the frequency at which she would ask/answer questions. She appeared to be
challenged with regards to learning how to identify and generate analogies because she often
took a longer time to give an answer and seemed to be thinking more deeply about her responses.
On one occasion, after a lesson that involved generating analogies, the researcher made a
comment to the Intern teacher regarding a change in Sandra’s behavior that was observed that
day. The comment was recorded in the researcher’s observation notes and read:
“[Sandra] was stumped today!”
This comment referred to the observation that on that day, Sandra did not answer questions
quickly as she usually did, but seemed to think about the question more deeply and took a longer
time to formulate her answer. This change in behavior may be explained by another focus group
comment she made regarding analogies:
Sandra: “Well it did make me think about more stuff. And it made me pay more
attention to more of the stuff ms. --- was saying about her analogies and I
would notice them more when she used them. Because when she first used
them, I didn’t really notice them until we started doing analogies.
Later in the intervention period a fellow student gave her one of his analogies during an activity
involving self-generated analogies. Sandra then modified it and used it for her own. She then
went on to generate other analogies and went on to win best Analogy and Best Analogy
Presentation.
Other factors of consideration
Teacher factor. Because the intern and regular classroom teachers both taught at different
times during the course of this study, engagement and boredom rates were computed for the
period of time that they each taught during the pre-intervention period, the period of time prior to
implementation of the intervention during which no changes were made to the classroom. These
rates provide evidence to verify whether or not the difference in instructors interacted with
students’ general engagement and boredom behaviors during the pre-intervention period. Table
4-23 summarizes whole group engagement and boredom rates for the observation days during
the pre-intervention period in which the regular teacher and intern teacher served as lead
instructors. According to the data in Table 4-23, there was a .8% difference in engagement and
boredom between the two categories of teachers. This difference is small and does not provide
102
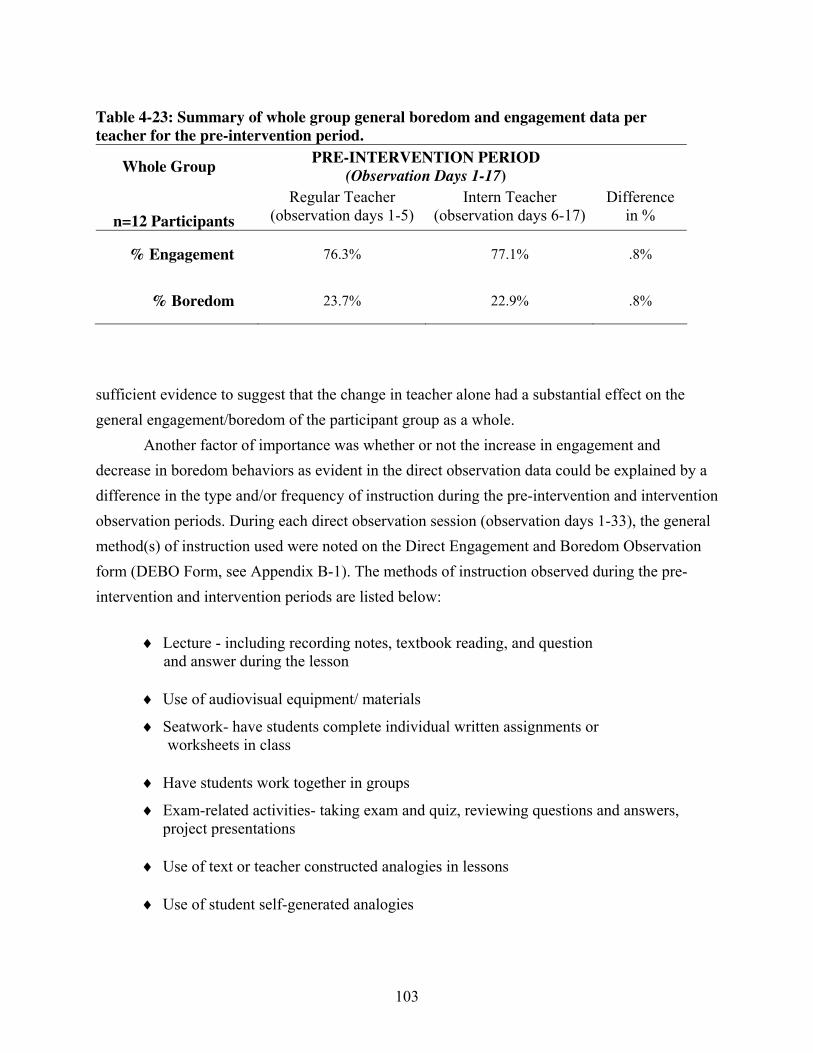
Table 4-23: Summary of whole group general boredom and engagement data per
teacher for the pre-intervention period.
Whole Group PRE-INTERVENTION PERIOD
(Observation Days 1-17)
n=12 Participants
Regular Teacher
(observation days 1-5)
Intern Teacher
(observation days 6-17)
Difference
in %
% Engagement 76.3% 77.1% .8%
% Boredom 23.7% 22.9% .8%
sufficient evidence to suggest that the change in teacher alone had a substantial effect on the
general engagement/boredom of the participant group as a whole.
Another factor of importance was whether or not the increase in engagement and
decrease in boredom behaviors as evident in the direct observation data could be explained by a
difference in the type and/or frequency of instruction during the pre-intervention and intervention
observation periods. During each direct observation session (observation days 1-33), the general
method(s) of instruction used were noted on the Direct Engagement and Boredom Observation
form (DEBO Form, see Appendix B-1). The methods of instruction observed during the pre-
intervention and intervention periods are listed below:
♦ Lecture - including recording notes, textbook reading, and question
and answer during the lesson
♦ Use of audiovisual equipment/ materials
♦ Seatwork- have students complete individual written assignments or
worksheets in class
♦ Have students work together in groups
♦ Exam-related activities- taking exam and quiz, reviewing questions and answers,
project presentations
♦ Use of text or teacher constructed analogies in lessons
♦ Use of student self-generated analogies
103
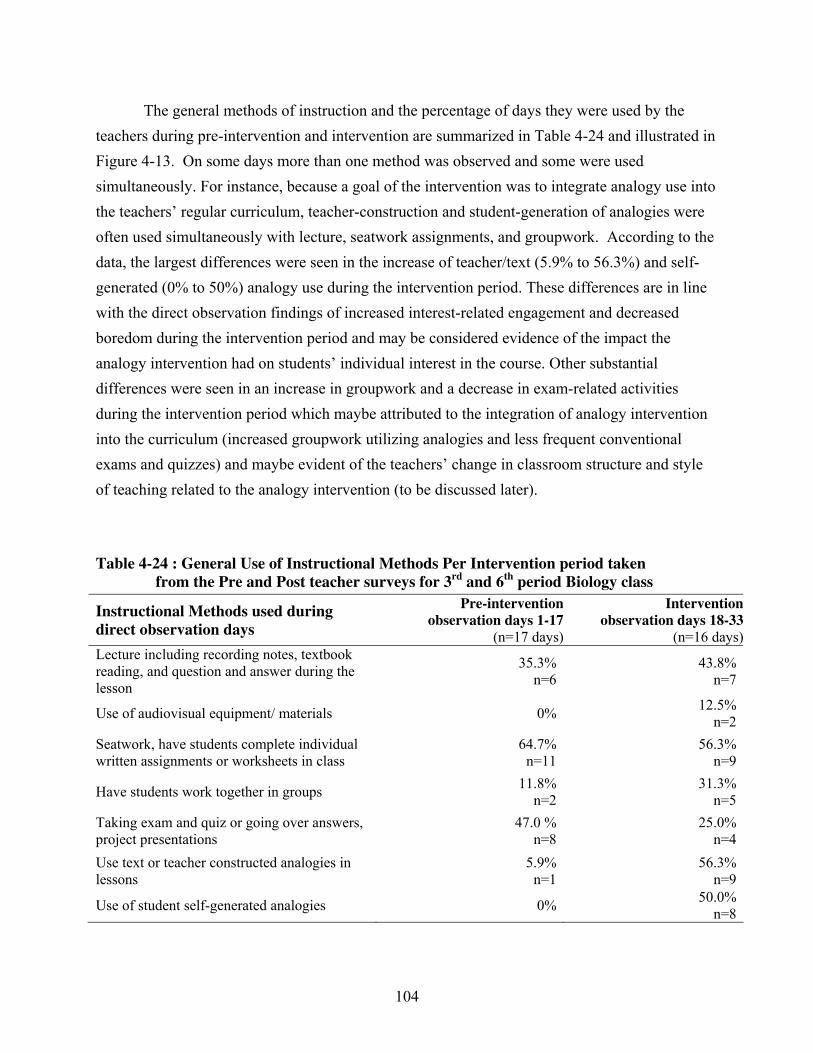
The general methods of instruction and the percentage of days they were used by the
teachers during pre-intervention and intervention are summarized in Table 4-24 and illustrated in
Figure 4-13. On some days more than one method was observed and some were used
simultaneously. For instance, because a goal of the intervention was to integrate analogy use into
the teachers’ regular curriculum, teacher-construction and student-generation of analogies were
often used simultaneously with lecture, seatwork assignments, and groupwork. According to the
data, the largest differences were seen in the increase of teacher/text (5.9% to 56.3%) and self-
generated (0% to 50%) analogy use during the intervention period. These differences are in line
with the direct observation findings of increased interest-related engagement and decreased
boredom during the intervention period and may be considered evidence of the impact the
analogy intervention had on students’ individual interest in the course. Other substantial
differences were seen in an increase in groupwork and a decrease in exam-related activities
during the intervention period which maybe attributed to the integration of analogy intervention
into the curriculum (increased groupwork utilizing analogies and less frequent conventional
exams and quizzes) and maybe evident of the teachers’ change in classroom structure and style
of teaching related to the analogy intervention (to be discussed later).
Table 4-24 : General Use of Instructional Methods Per Intervention period taken
from the Pre and Post teacher surveys for 3rd
and 6th
period Biology class
Instructional Methods used during
direct observation days
Pre-intervention
observation days 1-17
(n=17 days)
Intervention
observation days 18-33
(n=16 days)
Lecture including recording notes, textbook
reading, and question and answer during the
lesson
35.3%
n=6
43.8%
n=7
Use of audiovisual equipment/ materials 0% 12.5%
n=2
Seatwork, have students complete individual
written assignments or worksheets in class
64.7%
n=11
56.3%
n=9
Have students work together in groups 11.8%
n=2
31.3%
n=5
Taking exam and quiz or going over answers,
project presentations
47.0 %
n=8
25.0%
n=4
Use text or teacher constructed analogies in
lessons
5.9%
n=1
56.3%
n=9
Use of student self-generated analogies 0% 50.0%
n=8
104
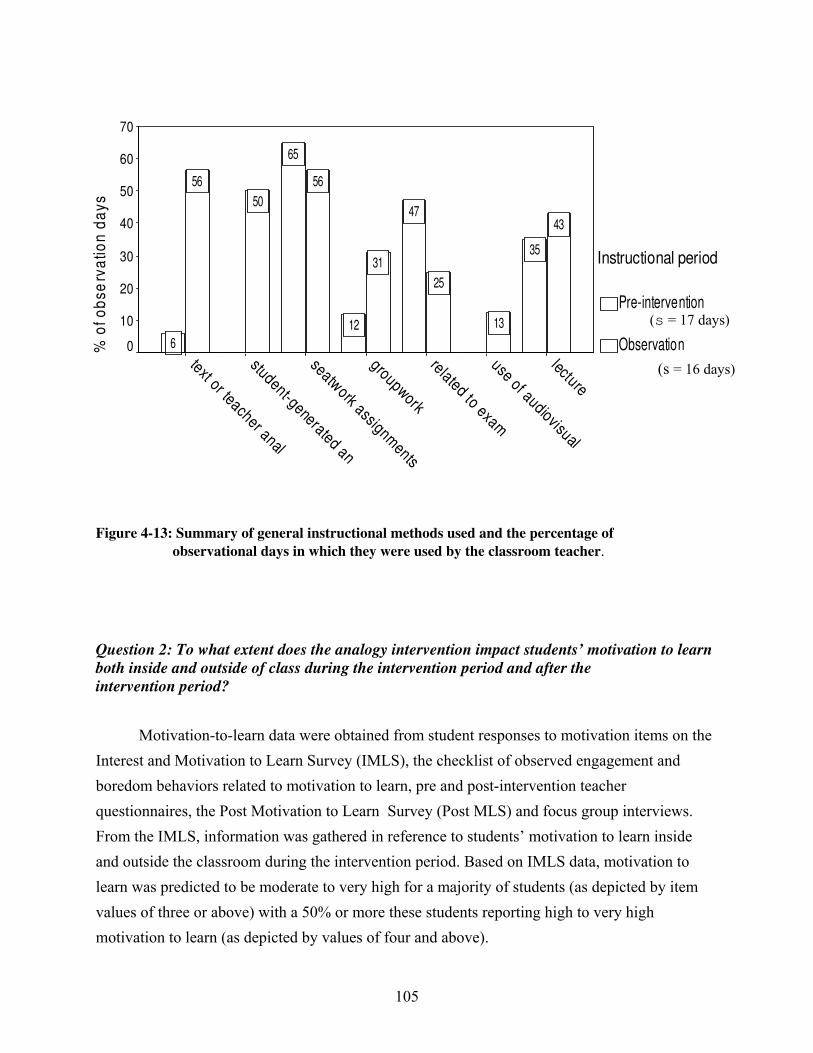
lecture
use of audiovisual
related to exam
groupwork
seatwork assignm
ents
student-generated an
text or teacher anal
% o
f o
bs
erv
ati
on
da
ys
70
60
50
40
30
20
10
0
Instructional period
Pre-intervention
Observation
43
13
25
31
56
50
56
35
47
12
65
6
(s = 17 days)
(s = 16 days)
Figure 4-13: Summary of general instructional methods used and the percentage of
observational days in which they were used by the classroom teacher.
Question 2: To what extent does the analogy intervention impact students’ motivation to learn
both inside and outside of class during the intervention period and after the
intervention period?
Motivation-to-learn data were obtained from student responses to motivation items on the
Interest and Motivation to Learn Survey (IMLS), the checklist of observed engagement and
boredom behaviors related to motivation to learn, pre and post-intervention teacher
questionnaires, the Post Motivation to Learn Survey (Post MLS) and focus group interviews.
From the IMLS, information was gathered in reference to students’ motivation to learn inside
and outside the classroom during the intervention period. Based on IMLS data, motivation to
learn was predicted to be moderate to very high for a majority of students (as depicted by item
values of three or above) with a 50% or more these students reporting high to very high
motivation to learn (as depicted by values of four and above).
105

From the Post MLS, information was gathered in reference to students’ motivation to
learn after the intervention period. It was predicted that student responses to Post IML open-
ended items would confirm their increase in motivation to learn due to the analogy intervention
and affirm the continued impact of the analogy intervention on their motivation to learn inside
and outside the classroom after the conclusion of the intervention.
In correspondence with student self-report survey data, observed motivation-to-learn
behaviors (observation-checklist data) and the responses given by the teacher on the Pre and
Post-intervention teacher questionnaires were predicted to reflect an improvement in student
motivation to learn behavior during the intervention and post-intervention periods as compared
to the pre-intervention (indicated by an increase and decrease in motivation-to-learn engagement
and boredom behaviors, respectively). In addition, focus group data were predicted to confirm
these findings of improved motivation to learn. Other data such as those from general
observations and a post hoc classroom teacher interview were used to further support or clarify
survey reports and observation-checklist findings.
Findings from the IMLS ~ Motivation to Learn During the Intervention Period
On the IMLS, students were asked to respond to five survey items in relation to the
impact of the intervention on their motivation to learn during the intervention period (see
Appendix B-6, items 4 - 8). The questions were scored on a five point Likert-type scale from 1=
no, not at all to 5= yes, definitely. For purposes of reporting, survey item value labels were later
changed to, no impact =1, low=2, moderate=3, high=4, very high=5, to reflect levels of impact
due to the intervention. For example, a survey item response of two would be translated as a low
level of impact and a survey item response of four would be translated as a high level of impact
due to the analogy intervention, Student responses to the items were entered into SPSS software
for analysis of group and individual frequencies. In addition, reliability for IMLS items 4-8 was
assessed by way of a second written examination of the questionnaire items during the focus
group interviews conducted one week after the administration of the IMLS. The reliability index
of the items was adequate at r = .64.
Whole group findings. Table 4-25 summarizes the percentages of whole group responses
to each IMLS motivation-to-learn item. According to the data, 92% (h=55) of all participant
responses were reported values of three and above, with 53% of those responses (h=29) reported
as four and above. These data signify that in general, the majority of participant responses
identify the analogy intervention as having moderate to very high levels of impact on their
motivation to learn during the intervention period.
106
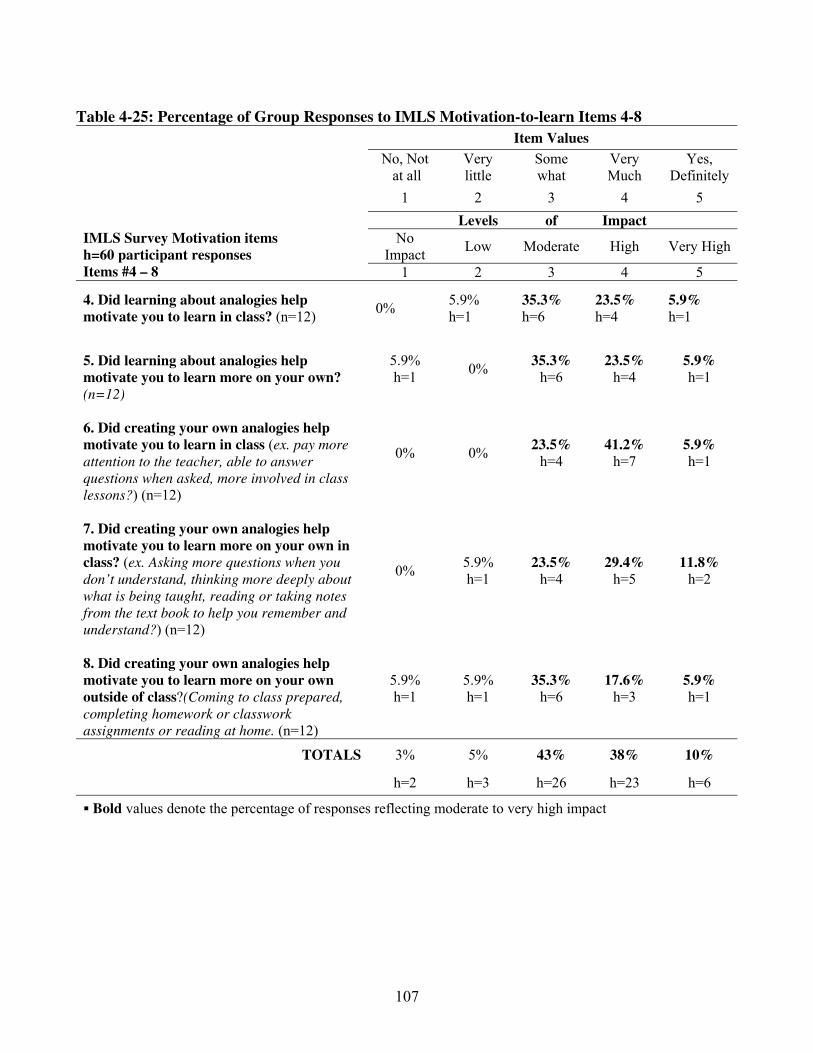
Table 4-25: Percentage of Group Responses to IMLS Motivation-to-learn Items 4-8
Item Values
No, Not
at all
Very
little
Some
what
Very
Much
Yes,
Definitely
1 2 3 4 5
Levels of Impact
No
Impact Low Moderate High Very High
IMLS Survey Motivation items
h=60 participant responses
Items #4 – 8 1 2 3 4 5
4. Did learning about analogies help
motivate you to learn in class? (n=12) 0%
5.9%
h=1
35.3%
h=6
23.5%
h=4
5.9%
h=1
5. Did learning about analogies help
motivate you to learn more on your own?
(n=12)
5.9%
h=1 0%
35.3%
h=6
23.5%
h=4
5.9%
h=1
6. Did creating your own analogies help
motivate you to learn in class (ex. pay more
attention to the teacher, able to answer
questions when asked, more involved in class
lessons?) (n=12)
0% 0% 23.5%
h=4
41.2%
h=7
5.9%
h=1
7. Did creating your own analogies help
motivate you to learn more on your own in
class? (ex. Asking more questions when you
don’t understand, thinking more deeply about
what is being taught, reading or taking notes
from the text book to help you remember and
understand?) (n=12)
0% 5.9%
h=1
23.5%
h=4
29.4%
h=5
11.8%
h=2
8. Did creating your own analogies help
motivate you to learn more on your own
outside of class?(Coming to class prepared,
completing homework or classwork
assignments or reading at home. (n=12)
5.9%
h=1
5.9%
h=1
35.3%
h=6
17.6%
h=3
5.9%
h=1
TOTALS 3% 5% 43% 38% 10%
h=2 h=3 h=26 h=23 h=6
Bold values denote the percentage of responses reflecting moderate to very high impact
107

Individual participant findings. Table 4-26 lists the responses of individual participants
for each of the five motivation-to-learn IMLS items. In general, the data show that 92% (n=11)
of individual participants most often reported values of three and above (represented by
responses for three or more items). Of these students 55% (n=6) most often reported values of
four and above. In addition, out of all participants, 83% (n =10, denoted by an asterisk on student
codes) reported high values of four or above for one or more of the five IMLS items. Therefore,
in general, not only did most students report a moderate to very high impact but this data
signifies that there was a strong agreement among the majority of participants that the analogy
intervention had a high to very high level of impact on some facet of their motivation to learn
during the intervention period
Motivation to learn inside and outside the classroom. In general, results show that while
some students felt that the analogy intervention had a high to very high level of impact on some
aspect of their motivation to learn both inside and outside the classroom, a majority of students
felt the intervention had the greatest impact on their motivation to learn inside the classroom.
Upon examining students’ individual responses to IMLS items regarding motivation to learn
inside the classroom (items four, six and seven), Table 4-26 shows that 83% (n=10) of
participants reported values of four or above to one or more of these items. More specifically, in
reference to self-generated analogy use in the classroom (items six and seven), a majority of
students (67%, n=8 and 58%, n=7 respectively) responded that the portion of the intervention
directly dealing with the active self-generation of analogies had a high to very high level of
impact on their motivation to learn within the classroom (indicated by responses of four and
above for these items). This can be compared to participant responses to items regarding
students’ motivation to learn on their own and outside of the classroom during the intervention
(items five and eight). For these items 42% (n=5) and 33% (n=4) of participants reported that the
intervention had a high to very high level of impact, respectively.
Motivation-to-learn Checklist Data: Pattern Changes during the Intervention Period
Motivation-to-learn engagement and boredom behaviors were documented for each
participant as they were observed in the classroom (for approximately 17 days during the pre-
intervention period and 16 days during the intervention period). All behaviors observed were
categorized within the checklist of motivation-to-learn behaviors shown in Table 3-3. No
additional behavior categories were added. Recorded behaviors were summarized on the
motivation-to-learn checklist form (see Appendix B-2), entered into SPSS and analyzed for
general pattern changes in engagement and boredom behaviors.
108

Table 4-26: Summary of student responses to motivation-to-learn items 4-8 on the IMLS
Student responses to motivation-to-learn items and corresponding levels of impact
Levels of impact: no impact =1, low=2, moderate=3, high=4, very high=5
Stu
den
t co
de#
4. Did
learning about
analogies help
motivate you
to learn in
class? (n=12) lev
els
of
im
pa
ct 5. Did
learning about
analogies help
motivate you
to learn more
on your own?
(n=12) lev
els
of
im
pa
ct
6. Did creating
a your own
analogies help
motivate you
to learn in
class (n=12) lev
els
of
im
pa
ct 7. Did creating
your own
analogies help
motivate you to
learn more on
your own in
class? (n=12) lev
els
of
im
pa
ct
8. Did creating
your own
analogies help
motivate you to
learn more on
your own
outside of
class? (n=12) lev
els
of
im
pa
ct
303* Very Much 4 Somewhat 3 Somewhat 3 Somewhat 3 Somewhat 3
304 Somewhat 3 Somewhat 3 Somewhat 3 Somewhat 3 Somewhat 3
305* Somewhat 3 Somewhat 3 Somewhat 3 Very Much 4 Somewhat 3
307 Somewhat 3 Somewhat 3 Somewhat 3 Somewhat 3 Somewhat 3
308* Somewhat 3 Somewhat 3 Very Much 4 Somewhat 3 Somewhat 3
309* Somewhat 3 Very Much 4 Very Much 4 Very Much 4 Very Much 4
312* Very Much 4 Somewhat 3 Very Much 4 Very Much 4 No, Not at all 1
315* Very Little 2 No, Not at all 1 Very Much 4 Very Little 2 Very little 2
602* Very Much 4 Very Much 4 Very Much 4 Yes,
Definitely 5 Very Much 4
605* Yes,
Definitely 5
Yes,
Definitely 5
Yes,
Definitely 5
Yes,
Definitely 5
Yes,
Definitely 5
606* Very Much 4 Very Much 4 Very Much 4 Very Much 4 Very Much 4
607* Somewhat 3 Very Much 4 Very Much 4 Very Much 4 Somewhat 3
Summary of Participant Item Responses
% Response values 3 and
above (levels of impact
moderate to very high)
92%
n=11
92%
n=11
100%
n=12
92%
n=11
83%
n=10
% Response values 4 and
above (levels of impact
high to very high)
42%
n=5
42%
n=5
67%
n=8
58%
n=7
33%
n=4
General Summary of Participant Responses
% Response values of 3 and above on a majority (three or more) of items = 92%, n=11
% Response values of 4 and above on a majority (three or more) of items = 50%, n=6
Bold item responses, denotes values 4 and above
Asterisk denotes students who gave a response of 4 or above to at least one motivation-to-learn item (83%, n=10)
109
110
Motivation-to-learn checklist findings. According to checklist data, there was a general
pattern of increase and decrease in motivation-related engagement and boredom, respectively.
Table 4-27 summarizes the general findings regarding the frequency of checklist motivation-to-
learn behaviors during the pre-intervention and intervention periods. Behavior rates for each
category were calculated based on the total number of motivation-to-learn behaviors observed
within the pre-intervention or intervention period. The difference in rate was calculated by
subtracting the percentage of intervention behaviors from the percentage of pre-intervention
behaviors (intervention behavior rate - pre-intervention behavior rate). Highlighted differences
represent favorable changes in behavior (increase in engagement and decrease in boredom).
According to the data in Table 4-27, favorable changes in rate for the participant group
was observed in 68.8% (n=11) of the 16 motivation-to-learn behavior categories. The categories
with the greatest change were, “Often smiled and appeared to enjoy working on tasks” (33%),
“Usually became distracted during lessons or classwork” (-12.6%), “Had multiple unexcused
absences” (-6.8%), and “Often gave an appearance of dozing in class” (-5.6%). The table also
illustrates that during the intervention period the occurrence of motivation-related engagement to
boredom behavior compared with that of the pre-intervention period shifted in proportion.
During the pre-intervention period, observed motivation-related boredom behaviors were
recorded at a rate of more that two times that of engagement behaviors. However during the
intervention period, engagement increased 34.2% and boredom decreased -33.5% points,
resulting in the rate of engagement behaviors to be almost twice that of boredom behaviors
during that period. This pattern of change illustrates an increase in observed motivation-to-learn
engagement behaviors and a decrease in unfavorable boredom behaviors and thus is indicative of
a general shift during the intervention period towards the exhibition of more favorable in-class
motivation-to-learn behaviors among participants.
Pre and Post-intervention Teacher Questionnaire
At the start of the pre-intervention period and towards the end of the post-intervention period, the
classroom teacher was asked to complete a Teacher questionnaire asking specific questions
regarding students’ past and current behaviors in Biology class (see Appendix B-2 and B-7). In
this study, changes of levels of motivation to learn were determined in terms of the teacher’s
responses to Part II of these surveys. Whole group data were analyzed by calculating the mean
group score for each item and examining scores for changes or patterns. Individual data were
analyzed for changes in engagement and boredom in relation to the teacher’s perception of
students’ motivation-to-learn behaviors. Reliability was assessed by conducting an informal oral
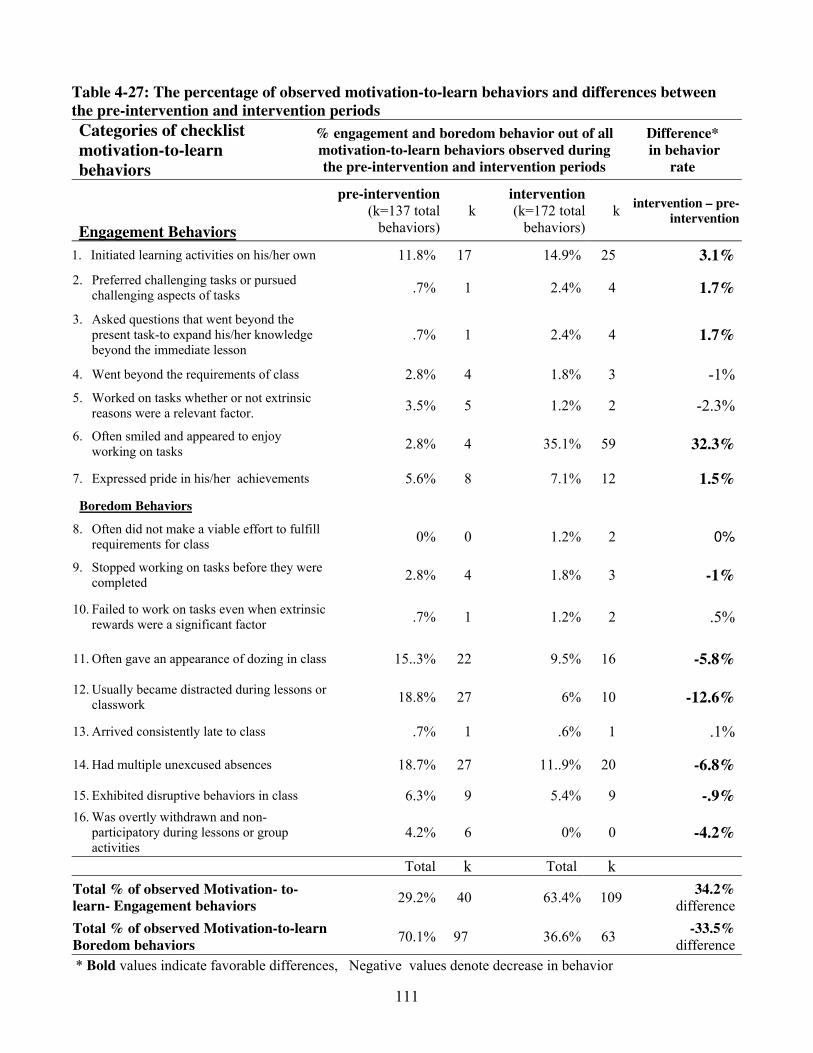
Table 4-27: The percentage of observed motivation-to-learn behaviors and differences between
the pre-intervention and intervention periods
Categories of checklist
motivation-to-learn
behaviors
% engagement and boredom behavior out of all
motivation-to-learn behaviors observed during
the pre-intervention and intervention periods
Difference*
in behavior
rate
Engagement Behaviors
pre-intervention
(k=137 total
behaviors)
k
intervention
(k=172 total
behaviors)
k intervention – pre-
intervention
1. Initiated learning activities on his/her own 11.8% 17 14.9% 25 3.1%
2. Preferred challenging tasks or pursued
challenging aspects of tasks .7% 1 2.4% 4 1.7%
3. Asked questions that went beyond the
present task-to expand his/her knowledge
beyond the immediate lesson .7% 1 2.4% 4 1.7%
4. Went beyond the requirements of class 2.8% 4 1.8% 3 -1%
5. Worked on tasks whether or not extrinsic
reasons were a relevant factor. 3.5% 5 1.2% 2 -2.3%
6. Often smiled and appeared to enjoy
working on tasks 2.8% 4 35.1% 59 32.3%
7. Expressed pride in his/her achievements 5.6% 8 7.1% 12 1.5%
Boredom Behaviors
8. Often did not make a viable effort to fulfill
requirements for class 0% 0 1.2% 2 0%
9. Stopped working on tasks before they were
completed 2.8% 4 1.8% 3 -1%
10. Failed to work on tasks even when extrinsic
rewards were a significant factor .7% 1 1.2% 2 .5%
11. Often gave an appearance of dozing in class 15..3% 22 9.5% 16 -5.8%
12. Usually became distracted during lessons or
classwork 18.8% 27 6% 10 -12.6%
13. Arrived consistently late to class .7% 1 .6% 1 .1%
14. Had multiple unexcused absences 18.7% 27 11..9% 20 -6.8%
15. Exhibited disruptive behaviors in class 6.3% 9 5.4% 9 -.9%
16. Was overtly withdrawn and non-
participatory during lessons or group
activities 4.2% 6 0% 0 -4.2%
Total k Total k
Total % of observed Motivation- to-
learn- Engagement behaviors 29.2% 40 63.4% 109
34.2%
difference
Total % of observed Motivation-to-learn
Boredom behaviors 70.1% 97 36.6% 63
-33.5%
difference
* Bold values indicate favorable differences, Negative values denote decrease in behavior
111
survey with the classroom teacher. This oral survey consisted of reviewing a sample of items
from the teacher questionnaire. The teacher’s oral responses were compared to her written
responses for these items in order to determine a degree of consistency conducting an informal
oral survey with the classroom teacher. The sample items used were items 6 and 7 on Part I of
the Pre and Post teacher questionnaire (see Appendix B-2 and B-7). The teachers’ responses to
these items included responses for 12 at-risk participants (24 responses per questionnaire).
Because many of the response values were the same across items and students, the percentage of
agreement in responses was calculated for each survey rather than a correlation index.
Agreement in responses for at-risk students was determined to be 88.1% for the Pre-TQ and
73.1% for the Post-TQ.
The first survey, the Pre-Intervention Teacher Questionnaire (Pre-TQ) asked the
classroom teacher to complete the items based on her knowledge of students’ previous and
current semester’s performance in science class at the time of the survey as well as judgment of
students’ level of previous motivation-to-learn behaviors (based on motivation-related
engagement and boredom behaviors listed on the checklist and in Table 3-3). The second survey,
the Post-Intervention Teacher Questionnaire (Post-TQ) was given to the teacher towards the end
of the post-intervention period. The teacher was instructed to base her responses in reference to
students’ motivation-to-learn behavior during the current semester’s final nine week grading
period (the period of time incorporating the intervention and post-intervention periods).
Questions regarding the teacher’s perception of motivation to learn were scored on the five-point
Likert-type scale shown below (see Part II of Appendix B-2 and B-7):
1=Strongly disagree, 2=Disagree, 3=Not sure, 4=Agree, 5=Strongly agree.
In a discussion with the teacher regarding her understanding of the original Likert-type
scale the teacher clarified that she understood the scale and in addition perceived the
intermediate value (value 3) as meaning “Sometimes” rather than the original survey label of
“Not sure.” Based on the response values and her perception of these values in relation to levels
of motivation to learn, a new scale was designed for purposes of analysis and discussion to
reflect the teacher’s perception of students’ engagement and boredom level as it relates to
motivation to learn. The new scale with values reflecting levels of motivation to learn behavior is
shown below. (These categories are only used to classify mean engagement and boredom
behaviors, not mean differences):
Levels of motivation-to learn behavior:
1.00 to 1.99 = Little to none 3.00 to 3.99 = Medium
2.00 to 2.99 = Low 4.00 to 5.00= High
112
Regarding whole group patterns of increased favorable motivation-to-learn behaviors
(consisting of increased engagement and decreased boredom), Table 4-28 summarizes the mean
values of the teacher’s responses to Part II of the Pre and Post-TQ. The items used on the surveys
are the same as those used in the motivation-to-learn observation check list but the time frame
that the teacher is asked to reflect upon goes beyond the period of observation that the researcher
conducted during the study. Because the teacher was more familiar with each student’s
performance during the past and current semesters as compared to the researcher, responses may
reflect a more extensive level of change with respect to time.
According to the summary of motivation-related engagement and boredom on the bottom
of Table 4-28, the group engagement score increased from a mean of 3.21 (SD=.68) during the
pre-intervention to a mean of 4.37 (SD=.49) during the intervention. This change is an indicator
of the teachers’ perception of an increase in the level of student engagement from a category of
medium engagement to high engagement. In addition, Table 4-28 also shows a decrease in
means for boredom during the intervention period from 2.09 (SD.18) to 1.50 (.48). These data
reflects the teacher’s perception of a decrease in boredom from a low level of boredom to the
lowest level where boredom behaviors are characterized as occurring very little to not at all.
Examining mean differences for behavior categories Table 4-28 shows evidence of a
widespread increase and decrease in group engagement and boredom behaviors respectively, for
all categories. Based on her current and prior semesters’ experiences with the students and her
knowledge of their general patterns of their engagement and boredom in the classroom, the
teacher perceived an increase in that five out of seven engagement categories and a decrease in
all nine categories of boredom. In addition, according to the data, the teacher perceived the
greatest mean differences in the engagement behavior “Initiated learning activities on his/her
own” (mean difference= 1.58) and the boredom behavior, “Was overtly withdrawn and non-
participatory during lessons or group activities” (mean difference 1.00).
Focus Group Findings of Motivation to Learn
Focus group interviews were used as a qualitative measure to corroborate checklist
observations and student survey responses of motivation to learn during the intervention period.
During the focus group sessions, students discussed the degree to which learning about analogies
helped motivate them to learn. Motivation-related items from the IMLS was used as interview
questions to help generate a discussion regarding the intervention’s impact on students’
motivation to learn. Some questions asked were, “Did learning about analogies help motivate
you to learn more in class?” and “Did creating your own analogies help motivate you to learn
outside of class?”
113

Table 4-28: Summary of Teacher’s perceptions of patterns in whole group motivation-to-
learn behavior from the Pre and Post-intervention teacher questionnaire
Based on n=12 students Levels of Motivation-to-learn Behavior
(based on teacher survey response values)
1.00- 1.99 = little to none 3.01-4 =medium
2.00-2.99 =low 4.01-5 = high Pre-
Intervention Intervention
Mean*
Difference
Engagement Behavior Mean SD Mean SD Mean SD
1. Initiated learning activities on his/her own 2.92 1.00 4.50 .67 1.58 1.16
2. Preferred challenging tasks or pursued
challenging aspects of tasks 2.75 .75 4.25 .62 1.50 .80
3. Asked questions that went beyond the present
task-to expand his/her knowledge beyond the
immediate lesson 3.33 .89 3.83 .94 .50 .67
4. Went beyond the requirements of class 2.42 .79 3.92 1.00 1.50 1.45
5. Worked on tasks whether or not extrinsic
reasons were a relevant factor. 3.33 .98 4.75 .45 1.42 1.24
6. Often smiled and appeared to enjoy working
on tasks 3.42 .90 4.42 .67 1.00 1.21
7. Expressed pride in his/her achievements 4.33 .65 4.92 .29 .58 .67
Boredom Behavior
8. Often did not make a viable effort to fulfill
requirements for class 2.00 .00 1.67 .89 -.33 .89
9. Stopped working on tasks before they were
completed 2.00 .00 1.58 .51 -.42 .51
10. Failed to work on tasks even when extrinsic
rewards were a significant factor 2.00 .00 1.58 .51 -.42 -.33
11. Often gave an appearance of dozing in class 2.33 .78 1.92 1.08 -.42 -.42
12. Usually became distracted during lessons or
classwork 2.17 .58 1.83 1.11 -.33 -.42
13. Arrived consistently late to class 2.17 .58 1.25 .45 -.92 -.42
14. Had multiple unexcused absences 2.17 .58 1.33 1.15 -.83 -.33
15. Exhibited disruptive behaviors in class 2.00 .00 1.33 1.15 -.67 -.92
16. Was overtly withdrawn and non-participatory
during lessons or group activities 2.00 .00 1.00 .00 -1.00 -.83
Summary of Motivation Engagement 3.21 .68 4.37 .49 1.16 .79
Summary of Motivation Boredom 2.09 .18 1.50 .48 -.59 .46
*Negative values denote decrease in behavior
Bold values denote mean values
114
Below are a set of focus group responses given by at-risk participants regarding their
learning experience during the intervention period and the impact the intervention had on their
motivation to learn in class and outside of class. Responses are organized by themes and are
identified by pseudonyms and researcher assigned observation codes. In two instances the
comments from one regular student (identified as Sherry) was used because it was a central part
of the discussion. In the focus groups students affirmed that the analogy intervention:
Helped motivate them to learn more in class...
Carrie: “Yes analogies helped to motivate me more and to learn...by paying
more attention to the teacher and answering the questions...It got me
more involved in class...in raising my hand and asking for help and
doing my own analogies...because usually I’m not involved.”
Charles: “I say [it helped me] pay more attention to the teacher because
when I say my analogy that I think is right and compare it to what the
teacher said and it sounds more like it, then I ask the teacher, “Well,
Is this Analogy right?” If they say yeah, then I know I’m on the right
[track] and I keep paying attention to the teacher.”
Tasha: “Yes, it motivated me to learn more just not that but about anything
we talked about in the class...When I first learned about
analogies...(spoken in a hurried voice, with a bit of excitement) I
wanted to come and write down those analogies everyday. I wanted to
do something about analogies all the time. I would come into class,
get stuff off the board and that ain’t even our work.”
Helped motivate them to learn more on their own in class...
Sherry (Regular student): Well I felt that the analogies were all good in
general and they help me learn more in class and when we were
taking notes they help me. Like sometimes Ms. Brown’s notes were
kind of vague and then it help me like look in the book, look it up to
understand it more.
Sandra: I’m agreeing with Sherry. It did make me want to write more
definitions and stuff. When I read the definitions out the book [and]
had to try to make my own analogy, it seems as if I broke down every
part of the definition and tried to fix it towards my own analogy.
Charles: Ok, in a way it did [help me learn on my own], because, if I don’t
know some stuff...like Sandra and Sherry said, I looked it up in the
book and read up more about it... Like the teacher didn’t have to sit
115
there and tell [me] look up something. Like she put up a definition on
the board and if I didn’t know it and she’s finished writing, I looked
in the book to see what the word means.
John: Yes, it did. It helped me want to learn more about the information that I
was talking about so that I could make more analogies.
Helped motivate them to learn more on their own outside of class...
Sherry (Regular student): We’ll, it did motivate me to learn more on my own
outside of class...Now with the analogies helping me, I always come to
class prepared and every time I get homework I always do it and more. I
always tend to get the answers right now a days.
Sandra: Mostly everything Sherry said I am in agreement with. Because, about
relating it to the homework assignments, analogies helped... (About her
analogy project) ...The volcano, the Magma, at first I had a little trouble
with it... The dictionaries I had, or the encyclopedias, they didn’t help at
all. So I had to go to the library to get on the internet and it broke every
thing down. That’s what made it easier to compare polygenic traits to the
volcano’s magma.
Carrie: Yes, it help me motivate outside of class...It helps me complete my
assignments and stuff like that when I get home. Because before I really
didn’t do my homework and stuff like that. I [used to] do it [in school]
before I come to the class.
In addition, one focus group student said that during the intervention period, the analogy
intervention helped her study and learn in other classes...
Freeda: It helped motivate me. It helped increase my studying habits. It helped
me understand stuff in other classes...in all my classes. [For example] in
Spanish class it help me understand more things like conjugating
verbs...After learning analogies, my grades improved.. I had made an
analogy that conjugating verbs are like an exercise, and you know when
you do exercise, first you do sit ups, then you do pushups, and third, like
that.
Towards the end of the focus group discussion, another theme that emerged was the
agreement between some students, especially in the 6th
period class that the analogy intervention
especially motivated them to ask more questions in class when they didn’t understand, help them
116
understand so they could answer more questions posed by the teacher, and increased their
confidence in answering questions. During the pre-intervention period, I, the researcher,
observed that some students in the 3rd
period class and most students in the 6th
period class rarely
asked questions in class and when the teacher did asked a question, they usually exhibited a
blank facial expression and remained silent. Most students in both classes improved in this area
but students in the 6th
period class exhibited the greatest change in motivation during the
intervention. One focus group participant from the 6th
period class, Tasha, told of her experience
in asking and answering questions in class:
Tasha: In the beginning of the year, I use to ask no questions. It was because of
Ms. Brown and because I didn’t know [the answer]. Ms Brown, she’s ok
but, if you say something wrong...she love to holler and [say] (imitating
the teacher) “Why don’t you know and understand that?” [But] it’s not
that. We probably forgot it... But after we did those analogies? I was
raising my hand. I knew it. I knew some of [the answers].
Findings from general observations and a post hoc classroom teacher interview.
This engagement behavior continued after the intervention period ended and appeared to
be part a greater shift in motivation-related engagement and boredom as demonstrated by
participants increase in engagement and decrease in boredom rates during the intervention. To
gain a greater understanding of this shift in behavior, an informal post hoc interview was
conducted with the classroom teacher regarding patterns of a change in student behavior during
and after the intervention period. The teacher’s interview comments related to change during
these periods were compared to the researcher’s records of comments made by the teacher during
the pre-intervention period and the researcher’s records of general classroom observations.
Consistent with the teacher’s responses on the Post-TQ, the teacher interview showed that that
she perceived a positive increase in the students’ favorable motivation-to-learn behaviors during
and after the intervention as compared to the pre-intervention period. The following data
illustrate the differences in the teacher’s perspective on the students’ motivation to learn before
and after the pre-intervention period. These data were taken from the researcher’s notes during
the pre-intervention and intervention periods and the transcript from the post hoc teacher
interview.
117
During the pre-intervention period:
(Excerpts from the researcher’s general classroom observation notes)
3rd
period class.
Ms. Brown gave the class a quiz based on last night’s reading H.W. After
reviewing the quiz with the students, the teacher spoke to them about their
disappointing performance on the quiz. Because many of the students did not do
their homework, she told the students,
“...You are too sorry!...If you had read you would have known
that we were talking about the cell membrane…Ok, now we’ll
have to treat you like 5th
graders.”
Then she asked the students to read out loud form the text book pages
assigned to them for homework from the previous night and proceeded to teach
using a question and answer technique.
6th
period class.
During a question and answer session, Ms. Brown addressed the class,
“...Maybe you all need to give me suggestions on how to
teach you...Anybody have anything to say?”
During this time, the students were looking down and were quiet. No one
said anything. “Explain what you have Trisha.” Ms. Brown said. Trisha
continued to look down and said nothing. The teacher put her own paper down
and said to the students, “I’m not going to tap dance on the table…We have zero
motivation!”
During the post intervention period
(From general observation notes and post hoc teacher interview transcript)
One week after the end of the Intervention
A week after the intervention period, on a day when the researcher
was not present in class, something occurred during the 6th
period class
session that caused Ms. Brown to become both frustrated and then amazed.
Ms Brown discussed the episode with the researcher the following day.
During this class session, Ms. Brown was trying to review the concepts
“genotype” and “phenotype” that the students had learned previously in the
unit. The students needed to understand these concepts in order to go on to
118

the next section, Heredity. When Ms. Brown brought up the concepts to the
class Ms. Brown said they stared at her with blank faces, until she
mentioned the analogy they had learned.
Ms. Brown: “Oh yeah, I started the discussion. They were looking at me
[with] blank faces...[Then] I referred back to when they did the
analogy for genotype phenotype, and had them think back, gave
them a little time to think. Then Freeda and John started giving
feedback and then from there it began a discussion. “So from
[students saying], ‘Oh, Ms. Brown, we didn’t…’ to ‘Oh, I see now!’
That’s when we started doing the Punnett square and the [genetic]
ratios.”
Ms. Brown agreed that during that class session she got the students to take
charge of their own learning.
“Yeah” Ms. Brown said. “With the process they went through, of
them being able to share their thoughts, not receiving thoughts
from me or you, they were able to put themselves in it [the
learning process].”
Regarding their previous lack of answering questions, Ms. Brown said:
“And you know I think they were afraid. Before the analogies,
sharing themselves, having some input, they were afraid...But
yes, since [then], the analogies has put some courage in there.
We accept [their input], not saying ‘Oh, that’s wrong’... But I
think them taking charge of themselves had a lot to do with it,
you know... we accepting what they have. It might not be all the
way correct, but we worked with what they have so they could
go to that positive side. That played a big part in it.”
Post-Intervention Motivation to Learn Survey(Post MLS)
Approximately 2 ½ weeks after the conclusion of the Intervention period, during the
post-intervention period, the Post-MLS survey was administered. Students were asked to respond
to two open-ended questions regarding the analogy intervention and their sustained motivation to
learn (see Appendix B-7). These questions provided data related to whether or not students’
motivation to learn was sustained within the 2 ½ week period after the intervention and whether
or not students’ motivation to learn was transferred to other areas outside of class by way of
119
continued use of self-generated analogies or other learning strategies. The questions on this
survey were:
1. “Now that the analogy project is complete, do you think that learning about
analogies and making your own analogies helped motivate you to learn new
information in Science class? Explain your answer.
2. Has the analogy project motivated you to create new analogies or use other
learning strategies to help you learn in other classes or outside of school?
Please explain or give an example.
Student Post Motivation to Learn survey responses were coded and analyzed in relation to the
impact of the intervention on students’ motivation to learn. Eleven at-risk participants completed
the Post-MLS. (One student was not available during the time the survey was administered).
Findings from the Post-MLS. Student responses to item #1 on the Post MLS presented
evidence of thinking independently and connecting to new information after the intervention.
Students were able to figure out things more on their own, initiated questions to help them
understand more, studied more and took charge of their own learning. In response to the survey
question #1, all eleven students affirmed that the analogy intervention helped motivate them to
learn new information in class since the conclusion of the intervention period. In addition, 55%
(n=6) of this group said that the intervention has help them learn how to think and learn more for
themselves in class, 36%(n=4) said that the intervention and the use of analogies has helped them
learn how to connect to new information on their own, to break down the information for
themselves, and to help them remember and understand new information better, and 9%(n=1)
said he believed that what he learned from the analogies will help him later in the future. Below
are representative samples of student responses to question #1 (pseudonyms used):
Carrie: “Yes, it has helped me to motivate more in class because in science class
sometimes I don’t understand the work. But now I could understand it. I
began to ask question when I didn’t understand.”
Charles: “Yes, because now that I know about analogies, I used them when I need
to break something down.”
Michael:. “Yes, because analogies are so easy to help you remember anything for
any subject. In biology I said that a punnett square is like probability or
pulling names out of a bag. Analogies helped me out a lot. Before, we
learned how to do analogies, I had to work and study hard. But with
120
analogies, I can compare school work with things of my nature things I see
every day. So I remember.”
Francis: “Yes, because it’s given me a way to interpret the lesson on my own.
John: Yes, because analogies can be fun so you would want to make up some new
ones. The new ones were easy for me to come up with.”
For Post MLS item #2, ten out of 11 at-risk participants who completed the survey
affirmed that the analogy intervention motivated them to create new analogies or use other
learning strategies to help them learn outside of school or in other classes besides Biology. Fifty-
five percent (n=6) of students said the intervention has motivated them and gave evidence of
creating new analogies or using other learning strategies to help them learn in other classes.
(Other learning strategies that students commonly use such as mnemonics were discussed briefly
at the time the self-generated project was being introduced). In addition, 36% (n=5) said that it
has motivated them or has encouraged them to want to use analogies outside of Biology class or
outside of school but that they have not actually done so, 9% (n=1) said that it help the in
Biology class but has not motivated them to use analogies outside of Biology because it is the
end of the school year. Representative samples of student responses to question #2 are shown
below:
Michael. “Yes, I use analogies for books I read in English. I used analogies in
Geometry to remember the shapes we have to learn. For example in
Geometry: An octagon is like a stop sign. English I: Richard Wright is like a
curious cat, always asking questions.”
Sandra. “Yes, I have used analogies outside of science but I have also used other
learning strategies (such as think past or outside the box or use logic skills).”
Lori. “Yes, I used analogies in Spanish class. I made up my own analogies and put it
in a song so I could remember when I took a test. I passed the test with an A.
I still remember what the two Spanish words mean.”
John. “Yes, because the analogies are so easy to come up with it makes it easier to
tie it into every day life or for other classes. No, I have not used analogies yet
in other classes, but when I do I feel that it will make my learning better.”
121
Question 3a: Based on the outcome study, to what extent can we say that situational interest,
individual interest, and motivation to learn are related; and if related, do the findings
regarding the relationship of these variables confirm Hidi and Harackiewicz’s (2000) theory
that individual interest can be influenced by continued situational interest and Schiefele’s
(1991) theory that individual interest can be viewed as a pre-condition of intrinsic motivation
to learn?
According to Hidi and Harackiewicz (2000) situational interest is believed to precede the
development of long-lasting individual interest and contribute to the development of intrinsic
motivation. In addition, Schiefele (1991) proposed that individual interest can be viewed as a
pre-condition of intrinsic motivation and that, once established, may lead students to adopt an
intrinsic motivation orientation towards a specific task or learning-orientation which in turn will
impact learning outcomes, and more specifically impact learning processes in areas such as level
of comprehension and the use of “deep-level” learning strategies (Schiefele, 1991). In this study,
the goal was to introduce a 5 ½ -week long intervention, namely self-generated analogy
instruction, that would stimulate students’ situational interest in the classroom. It was believed
that a high level of impact on situational interest from the intervention would eventually promote
a high level of individual interest in students; and that once individual interest was established, it
would later promote a high level of motivation to learn. In this section, I first examine the
findings regarding the level of impact of the intervention on situational interest, individual
interest and motivation-to-learn for the group and a sample of individual at-risk students, and the
extent to which these variables appear to be related. Second, based on the data presented, I
evaluate whether or not the findings for this group of students confirm Hidi and Harackiewicz’s
(2000) theory that individual interest can be influenced by continued situational interest and
Schiefele’s (1991) theory that individual interest can be viewed as a pre-condition of intrinsic
motivation to learn. It was predicted that the findings from this study would provide sufficient
evidence to suggest a strong association between situational interest, individual interest, and
motivation to learn, and confirm Hidi and Harackiewicz’s (2000) and Schiefele’s (1991) theories
and provide a basis for other research studies on interest and motivation to learn.
Summary of Individual Data and the Relationship Between Situational Interest,
Individual Interest, and Motivation to Learn.
Case-ordered effects matrix. Individual Participant data were placed in a qualitative
case-ordered effects matrix (Miles & Huberman, 1994) and the impact of the self-generated
analogy intervention on each dependent variable was compared for each participant. The matrix
122
123
presented in Table 4-29 was used because it provides a holistic view of the impact of the
intervention on all three dependent variables. Tables 4-30 and 4-31 explain the symbols used in
the matrix. These symbols represent levels of impact or the degree of influence that the analogy
intervention had on participants’ situational interest, individual interest and motivation to learn. In
this analysis, impact levels of high or greater were considered most favorable and were used to
gauge the weight of association between the three variables. So, for example, data that show a
high level of impact on situational interest and at least one category within both individual interest
and motivation to learn would be considered stronger evidence of an association between the three
variables than data that show medium levels of impact within all categories.
Matrix data consist of self-report data from the Situational Interest Survey (SIS scores),
Interest and Motivation to Learn Survey (IMLS), and the Post-Intervention Motivation to Learn
Survey (Post-MLS). Only self-report data are used in the matrix because they represent
participants’ own perceptions of the level of impact of the intervention on their situational and
individual interest and motivation to learn. In addition to student self-report, other data from direct
classroom observations, the Motivation-to-learn Checklist, Teacher Questionnaires, focus group
interviews, additional survey findings and general observations were used to support and validate
student data and provide evidence of the possible existence of an association between students’
situational interest, individual interest, and motivation to learn.
Case-ordered matrix findings. In general, the case-ordered matrix shows that 58% (n=7)
of the participants indicated high or greater levels of impact in situational interest and one or more
categories of individual interest and motivation to learn. In addition, three other students reported
medium levels of situational interest but high levels of impact on one or more categories of
individual interest and motivation to learn. Lastly, one student reported low situational interest and
medium level of impact on her individual interest and motivation to learn. According to these data,
there is some evidence to suggest that, for these participants, some relationship exists among
situational interest, individual interest, and motivation to learn.
On Table 4-32, a summary of general engagement and boredom rates that occurred during
the intervention period and the number of behaviors with favorable changes (increase in
engagement and decrease in boredom) is shown for each participant. (Also see Appendix D-4 to
D-8 for individual Interest and Motivation behavior data). In addition, the following section
includes a sample of five participant profiles. Profiles consist of students’ who indicated a high
level of impact on their situational interest and are thought to be representative of the whole group.
Each student profile consists of a brief discussion of matrix data and other findings, a summary
chart of interest and motivation-to-learn behaviors with the greatest favorable change (referred to
as change in behavior summary charts), and a statement evaluating the strength of the data and a
likelihood of an association among the three variables for each student. Profiles are organized by
student’s name and code number and consist of students who indicated a high level of impact on
their situational interest.

Table 4-29: Case-ordered Effects Matrix of Individual Participants’ findings related to Situational Interest, Individual Interest and
Motivation to Learn
During the Intervention After the Intervention
Individual Interest:
IMLS response
values
Motivation to Learn: IMLS response values Post-MLS
Situational
Interest
item 1 item 2 item 4 item 5 item 6 item 7 item 8 Item 1 Item 2
Participants
Code
Names* Code#
SIS Score
1.Did learning about
analogies help
increase you interest in learning?
2. Did learning to create your
own analogies
help increase
your interest in the
course?
4. Did learning about analogies help motivate you to learn in class?
5. Did learning about analogies help motivate you to learn more on your own?
6. Did creating your own analogies help motivate you to learn in class
7. Did creating your own analogies help motivate you to learn more on your own in class?
8. Did creating your own analogies help motivate you to learn more on your own outside of class?
Do you think that learning
about analogies and making yourown analogies
helped motivate you to learn new
information in Science class?
Has the analogy project motivated youto create new analogies or use other
learning strategiesto help you learn
in other classes or outside of school?
Charles 303 m + m + m m m m * * * *
Justin 304 + m m m m m m m * * +
Carrie 305 + m + m m m + m * * +
Francis 307 l m m m m m m m * * +
Kevin 308 m m + m m + m m * * * *
Sandra 309 + + * * m + + + + * * * *
Michael 312 + + + + m + + 0 * * * *
Lori 315 m m m l 0 + l l * * * *
Keisha 602 + + * * + + + * * + n/ a n/ a
Freeda 605 + * * * * * * * * * * * * * * * * * *
John 606 + + + + + + + + * * +
Tasha 607 + + * * m + + + m * * 0
* code names are represented by pseudonyms ; n/ a – student was unavailable to take the survey
124
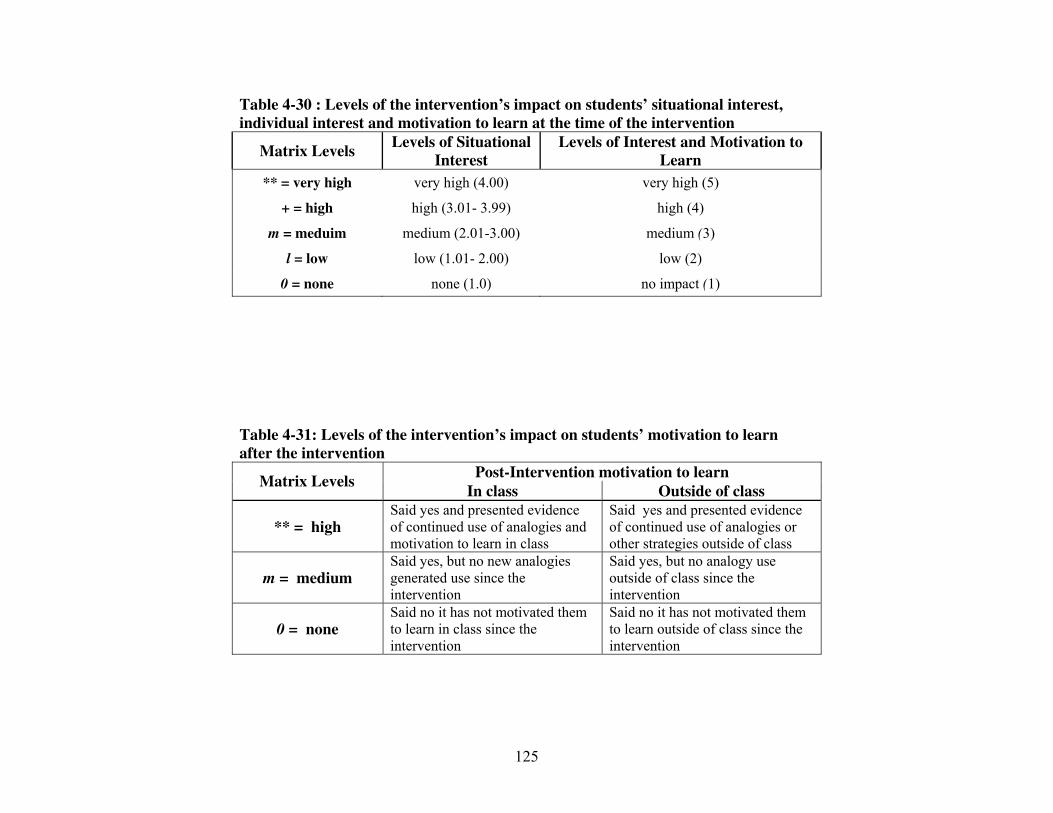
Table 4-30 : Levels of the intervention’s impact on students’ situational interest,
individual interest and motivation to learn at the time of the intervention
Matrix Levels Levels of Situational
Interest
Levels of Interest and Motivation to
Learn
** = very high very high (4.00) very high (5)
+ = high high (3.01- 3.99) high (4)
m = meduim medium (2.01-3.00) medium (3)
l = low low (1.01- 2.00) low (2)
0 = none none (1.0) no impact (1)
Table 4-31: Levels of the intervention’s impact on students’ motivation to learn
after the intervention
Post-Intervention motivation to learn Matrix Levels
In class Outside of class
** = high Said yes and presented evidence
of continued use of analogies and
motivation to learn in class
Said yes and presented evidence
of continued use of analogies or
other strategies outside of class
m = medium Said yes, but no new analogies
generated use since the
intervention
Said yes, but no analogy use
outside of class since the
intervention
0 = none Said no it has not motivated them
to learn in class since the
intervention
Said no it has not motivated them
to learn outside of class since the
intervention
125
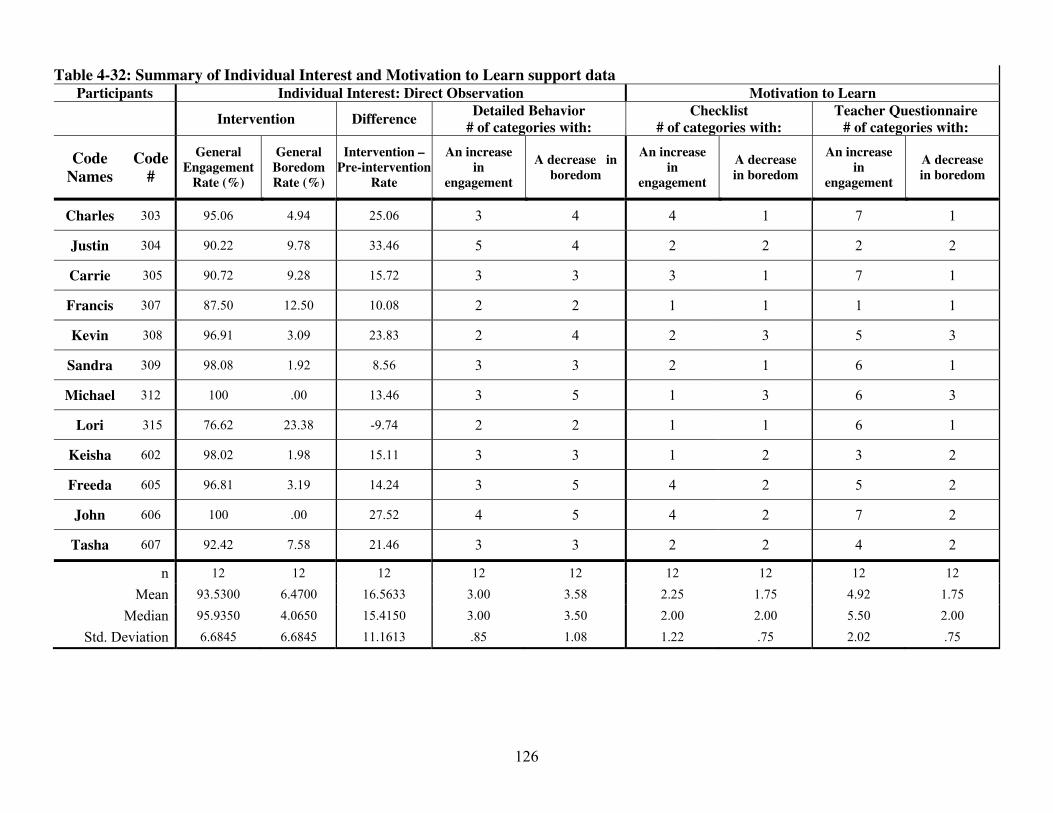
126
Table 4-32: Summary of Individual Interest and Motivation to Learn support data Participants Individual Interest: Direct Observation Motivation to Learn
Intervention Difference
Detailed Behavior
# of categories with:
Checklist
# of categories with:
Teacher Questionnaire
# of categories with:
Code
Names
Code
#
General
Engagement
Rate (%)
General
Boredom
Rate (%)
Intervention –
Pre-intervention
Rate
An increase
in
engagement
A decrease in
boredom
An increase
in
engagement
A decrease
in boredom
An increase
in
engagement
A decrease
in boredom
Charles 303 95.06 4.94 25.06 3 4 4 1 7 1
Justin 304 90.22 9.78 33.46 5 4 2 2 2 2
Carrie 305 90.72 9.28 15.72 3 3 3 1 7 1
Francis 307 87.50 12.50 10.08 2 2 1 1 1 1
Kevin 308 96.91 3.09 23.83 2 4 2 3 5 3
Sandra 309 98.08 1.92 8.56 3 3 2 1 6 1
Michael 312 100 .00 13.46 3 5 1 3 6 3
Lori 315 76.62 23.38 -9.74 2 2 1 1 6 1
Keisha 602 98.02 1.98 15.11 3 3 1 2 3 2
Freeda 605 96.81 3.19 14.24 3 5 4 2 5 2
John 606 100 .00 27.52 4 5 4 2 7 2
Tasha 607 92.42 7.58 21.46 3 3 2 2 4 2
n 12 12 12 12 12 12 12 12 12
Mean 93.5300 6.4700 16.5633 3.00 3.58 2.25 1.75 4.92 1.75
Median 95.9350 4.0650 15.4150 3.00 3.50 2.00 2.00 5.50 2.00
Std. Deviation 6.6845 6.6845 11.1613 .85 1.08 1.22 .75 2.02 .75

Student Profiles: Students who reported a high level of impact on situational interest and
one or more categories of individual interest and motivation to learn
Profile1. Carrie. According to the matrix, Carrie reported high levels of impact on her
situational interest, individual interest in the course and motivation to learn on her own in class.
These responses are supported by other findings summarized on Table 4-32. According to the
data, Carrie exhibited substantial increases in her engagement and decreases in boredom.
Specifically, regarding changes in interest-related behaviors, Carrie’s Change in behavior
summary chart (Figure 4-14a) below shows that she was observed paying attention,
concentrating on her work and smiling more. In addition she was not as distracted and did not
exhibit blank stares in class. These changes led to increases in motivation-related engagement
and a decrease in boredom during the intervention period.
More specifically, during the pre-intervention period, this student was observed to be
withdrawn in class. She did not willingly participate in lesson or group activities, and often sat in
class with a blank, confused, or sad expression on her face. The classroom teacher also
Change in behavior summary chart for Carrie, Code # 305
1. Interest-related direct observation detailed behaviors with the greatest change in rate
(Intervention – Pre-intervention):
Increase in Engagement Decrease in Boredom
Attention , Smile/Enjoy, Concentration Blank Stare, Distracted
2. Motivation-to-learn) behaviors with the greatest change in rate (Intervention – Pre-
intervention) from checklist and teacher questionnaire (TQ) data:
Increase in Engagement Checklist TQ
Often smiled and appeared to enjoy working on tasks X X
Initiated learning activities on his/her own X X
Worked on tasks whether or not extrinsic reasons were a relevant factor X
Went beyond the requirements of class X
Decrease in Boredom
Was overtly withdrawn and non-participatory during lessons or group activities X X
Figure 4-14a: Change in behavior summary chart for Carrie, code # 305
127

acknowledged a change in this student towards the end of the intervention. During an informal
interview, the teacher, Ms. Brown was asked if she noticed a change in Carrie during the
intervention. Ms. Brown commented:
“Oh definitely, definitely. When she got here [she entered the school the middle
of the fall semester], she was real reserved. She’s still a little reserved but not as
reserved as she was. And now.... she’s more verbal. Yes, she is more verbal.”
In addition, during a focus group interview, Carrie acknowledged a change in her behavior due
to the impact of the intervention. She commented, “It got me more involved in class. Because,
usually I’m not involved.” This response corresponds to her report on the IMLS that creating
analogies helped increase her interest in the course as well as her reduction in blank stares, and
increase in attention and smiling during the Intervention period.
During the post intervention period, there was evidence that Carrie’s change in
motivation to learn was sustained. From the researchers general observation notes taken after the
intervention it was recorded that during the post motivation period Carrie was observed having
her hand up initiating help from the teacher, working within a group with two other students,
attempting a difficult genetics problem involving traits, and explaining work on the board in a
“shaky but confident” voice, “loud enough for everyone to hear.” On the Post-MLS Carrie
reported that the intervention helped her to become motivated in class because “...in science
class sometimes I don’t understand the work,” Carrie said. “But now I could understand it. I
began to ask questions when I didn’t understand.”
These findings related to Carrie’s interest and motivation to learn provide evidence that
the high level of impact of the intervention (especially the portion dealing with the self-
generation of analogies) on her situational interest impacted her interest in the course and later
her motivation to learn on her own in class. According to Carrie, the analogy strategies became a
tool which helped to increase her understanding of concepts in the course. Her increased
understanding led to increased interest in the course. This ultimately boosted her motivation to
learn in class where she became confident enough to ask questions when she did not understand.
Profile 2. Sandra. According to the matrix, Sandra reported high or greater levels of
impact on her situational interest, individual interest and on all motivation to learn items except
one, item 4: “Did learning about analogies help motivate you to learn in class?” During the pre-
intervention period, Sandra was observed as one of the more motivated students in the class.
(Her pre-intervention engagement rate was the highest in the class at 89.5%). She was always
alert, made eye contact with the teacher during the lesson and most often had her hand raised
128
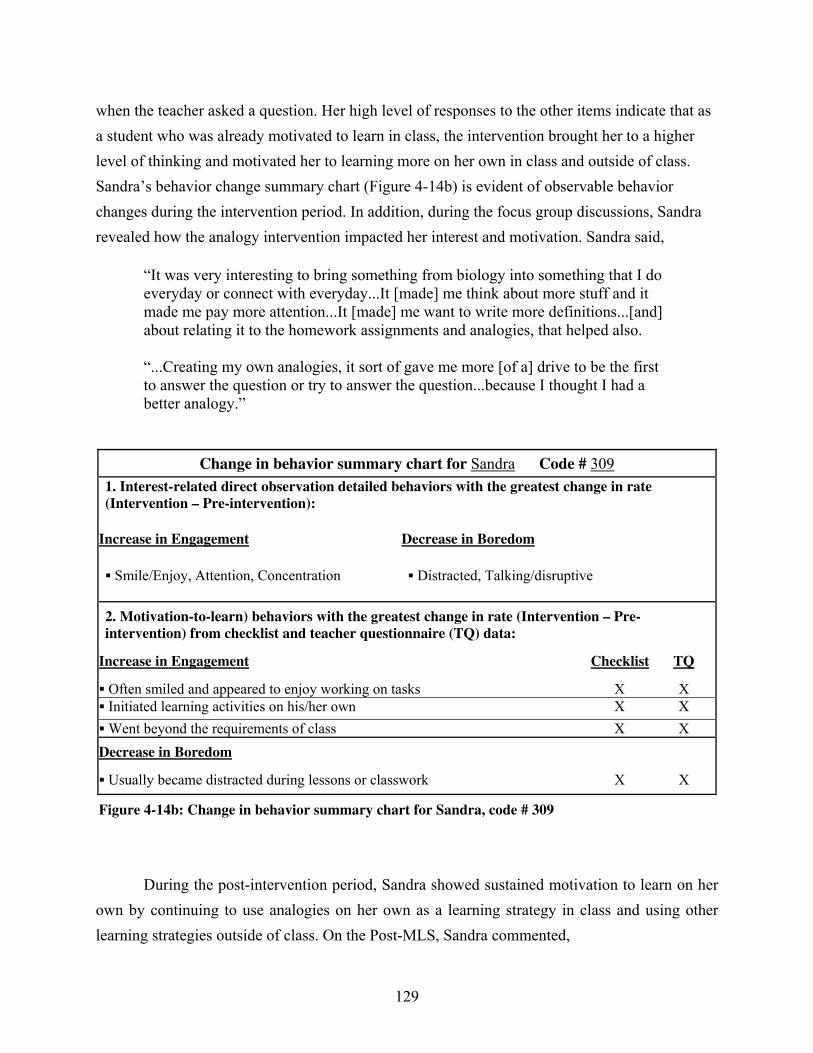
when the teacher asked a question. Her high level of responses to the other items indicate that as
a student who was already motivated to learn in class, the intervention brought her to a higher
level of thinking and motivated her to learning more on her own in class and outside of class.
Sandra’s behavior change summary chart (Figure 4-14b) is evident of observable behavior
changes during the intervention period. In addition, during the focus group discussions, Sandra
revealed how the analogy intervention impacted her interest and motivation. Sandra said,
“It was very interesting to bring something from biology into something that I do
everyday or connect with everyday...It [made] me think about more stuff and it
made me pay more attention...It [made] me want to write more definitions...[and]
about relating it to the homework assignments and analogies, that helped also.
“...Creating my own analogies, it sort of gave me more [of a] drive to be the first
to answer the question or try to answer the question...because I thought I had a
better analogy.”
Change in behavior summary chart for Sandra Code # 309
1. Interest-related direct observation detailed behaviors with the greatest change in rate
(Intervention – Pre-intervention):
Increase in Engagement Decrease in Boredom
Smile/Enjoy, Attention, Concentration Distracted, Talking/disruptive
2. Motivation-to-learn) behaviors with the greatest change in rate (Intervention – Pre-
intervention) from checklist and teacher questionnaire (TQ) data:
Increase in Engagement Checklist TQ
Often smiled and appeared to enjoy working on tasks X X
Initiated learning activities on his/her own X X
Went beyond the requirements of class X X
Decrease in Boredom
Usually became distracted during lessons or classwork X X
Figure 4-14b: Change in behavior summary chart for Sandra, code # 309
During the post-intervention period, Sandra showed sustained motivation to learn on her
own by continuing to use analogies on her own as a learning strategy in class and using other
learning strategies outside of class. On the Post-MLS, Sandra commented,
129
“The more I think about the analogies and the new information that I learn,
Punnett squares became much more easy to do especially with two traits...Yes, I
have used analogies outside of science but I have also used other learning
strategies such as think past or outside the box or use logic skills.”
These findings related to Sandra’s interest and motivation to learn provide evidence that
the intervention had a high level of impact on her situational interest and that this impact was
strongly associated with her increased interest in the course because she was challenged to
personally connect new concepts that she was learning in biology to her everyday life and that
this was something that she enjoyed doing. In addition, this interest in the course, in creating
personal connections (her own analogies), led to an increased motivation (or “drive”) to learn
and to excel in the course.
Profile 3. Michael. According to the matrix, Michael indicated high levels of impact in
all areas except two categories of Motivation-to-learn. These categories were item 5: “Did
learning about analogies help motivate you to learn more on your own?” And item 8: “Did
creating your own analogies help motivate you to learn more on your own outside of class?” This
is an indication that during the intervention period, Michael felt that the Intervention had a high
level of impact on his interest and motivation to learn in class, but not on his own outside of
class.
During the pre-intervention period, Michael was observed to be very quiet and reserved
(he did not speak much and when he did it was a very low volume). During class lessons he was
easily distracted, not focused on his work and often gave the appearance that he was dozing.
However, during the intervention, he became less reserved and it was evident that his interest in
the course was increasing. His change in behavior summary chart (Figure 4-13c) illustrates that
instead of dozing and being distracted, he began paying attention to the teacher and the lesson,
smiling often and concentrated more on his work. As recorded on Table 4-32, he was one of
only two students recorded has having 100% engagement during the intervention period.
There was also evidence that Michael’s motivation to learn in class was impacted on a
greater level than his motivation to learn outside of class. In class, Michael was noted for
generating some of the best analogies and written explanations for them. During class sessions
where students got to share their analogies, his analogies were usually among the most favored
by his peers and on one occasion (with his permission) the researcher used his analogy
130
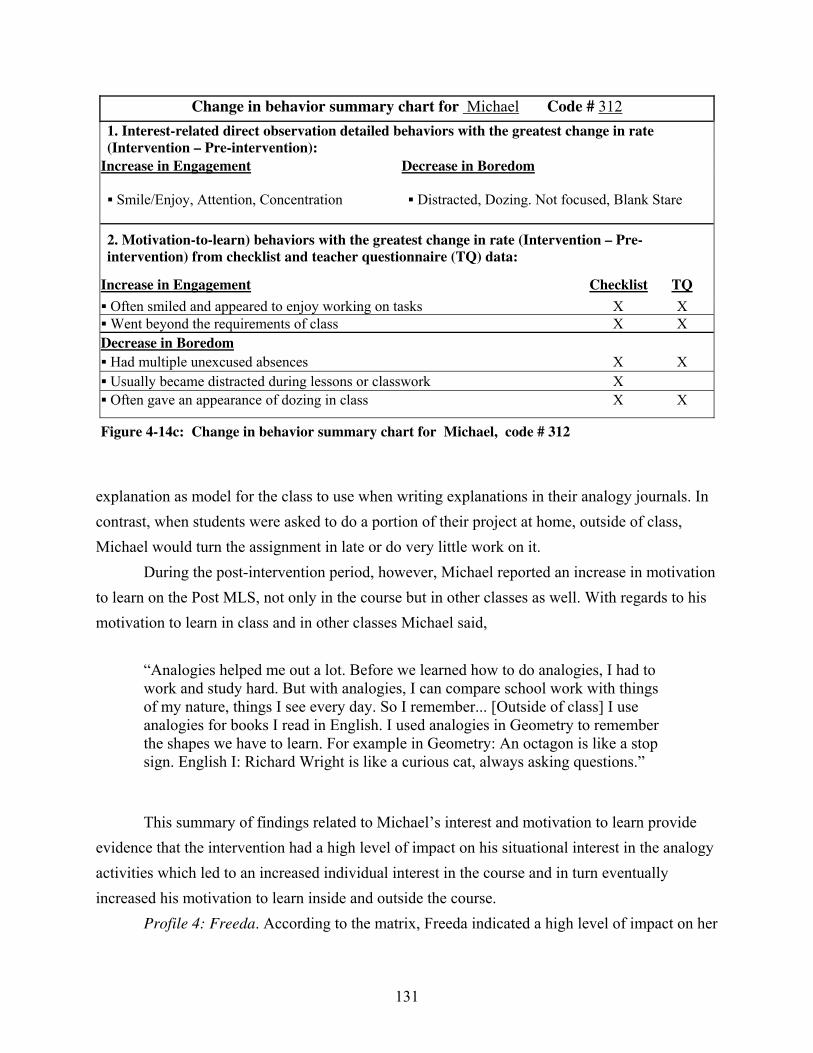
Change in behavior summary chart for Michael Code # 312
1. Interest-related direct observation detailed behaviors with the greatest change in rate
(Intervention – Pre-intervention):
Increase in Engagement Decrease in Boredom
Smile/Enjoy, Attention, Concentration Distracted, Dozing. Not focused, Blank Stare
2. Motivation-to-learn) behaviors with the greatest change in rate (Intervention – Pre-
intervention) from checklist and teacher questionnaire (TQ) data:
Increase in Engagement Checklist TQ
Often smiled and appeared to enjoy working on tasks X X
Went beyond the requirements of class X X
Decrease in Boredom
Had multiple unexcused absences X X
Usually became distracted during lessons or classwork X
Often gave an appearance of dozing in class X X
Figure 4-14c: Change in behavior summary chart for Michael, code # 312
explanation as model for the class to use when writing explanations in their analogy journals. In
contrast, when students were asked to do a portion of their project at home, outside of class,
Michael would turn the assignment in late or do very little work on it.
During the post-intervention period, however, Michael reported an increase in motivation
to learn on the Post MLS, not only in the course but in other classes as well. With regards to his
motivation to learn in class and in other classes Michael said,
“Analogies helped me out a lot. Before we learned how to do analogies, I had to
work and study hard. But with analogies, I can compare school work with things
of my nature, things I see every day. So I remember... [Outside of class] I use
analogies for books I read in English. I used analogies in Geometry to remember
the shapes we have to learn. For example in Geometry: An octagon is like a stop
sign. English I: Richard Wright is like a curious cat, always asking questions.”
This summary of findings related to Michael’s interest and motivation to learn provide
evidence that the intervention had a high level of impact on his situational interest in the analogy
activities which led to an increased individual interest in the course and in turn eventually
increased his motivation to learn inside and outside the course.
Profile 4: Freeda. According to the matrix, Freeda indicated a high level of impact on her
131

situational interest, and the highest level of impact for all categories of interest and motivation to
learn. Other data related to Freeda’s interest and motivation to learn support her responses. The
change in behaviors summary chart (Figure 4-14d) shows evidence of Freeda’s favorable
behavioral changes in several interest and motivation categories. During the pre-intervention
period, Freeda was observed to be one of the most outspoken students in the sixth period biology
class. Most times during question and answer sessions with the teacher, Freeda was the first one
with her hand raised. She appeared to enjoy learning and seemed to be enthusiastic about doing
new things in class. On the other hand, Freeda was also observed putting her head down in her
hand on the desk often. Dozing was recorded as her most frequent detailed interest-related
behavior during the pre-intervention. Freeda was often observed exhibiting this behavior during
class sessions where there was less interaction during the lesson, such as seatwork assignments
or extended lectures.
Change in behavior summary chart for Freeda Code # 605
1. Interest-related direct observation detailed behaviors with the greatest change in rate
(Intervention – Pre-intervention):
Increase in Engagement Decrease in Boredom
Smile/Enjoy, Questions, Attention Dozing, Blank Stare, Talking/ Disruptive
2. Motivation-to-learn) behaviors with the greatest change in rate (Intervention – Pre-
intervention) from checklist and teacher questionnaire (TQ) data:
Increase in Engagement Checklist TQ
Often smiled and appeared to enjoy working on tasks X
Preferred challenging tasks or pursued challenging aspects of tasks X X
Initiated learning activities on his/her own X
Expressed pride in her achievements X
Decrease in Boredom
Often gave an appearance of dozing in class X
Usually became distracted during lessons or classwork X X
Arrived consistently late to class X
Figure 4-14d: Change in behavior summary chart for Freeda, Code # 605
During the intervention period, her dozing behavior decreased and the behavior, asking
and answering questions became her most frequent interest-related behavior. In addition, she
was often observed diligently working and concentrating on her analogy seat-work assignments
without putting her head down. In addition, during lessons involving a lecture she would ask
132
questions related to her analogies and concepts in the lesson. Also, during the focus group
interview, Freeda, reported that the intervention impacted her interest and motivation to learn not
just in Biology class but in other classes as well. She began generating analogies in other classes
to help her to “remember and understand.” During the focus group, Freeda explained how her
interest in analogies increased her interest in learning in the biology course and that it increased
her motivation to learn in class and on her own outside of class. Regarding her individual interest
in the course she stated:
“In the beginning of the course, Biology, noone was really interested in it,
because it was kind of boring and we were doing a lot of talking and not a lot of
fun activities...During the time we were doing those projects with analogies it
kind of brought out everyone’s creativity, which made it more interesting.”
Regarding her situational interest in the analogy intervention she said:
“Everyone kind of felt like they were more into biology when they were showing
their creativity where everyone got a chance to put in something. So that kind of
made [me] interested in analogies.”
Regarding her motivation to learn she stated:
“It helped motivate me. It helped increase my studying habits. It help me
understand stuff in other classes...”
These findings regarding the intervention’s impact on Freeda’s interest and motivation to
learn confirm her survey responses which indicate high levels of impact and above. Furthermore,
they provide strong evidence of association between Freeda’s high situational interest in the
analogy activities, increased individual interest in the course, and increased motivation to learn
inside and outside of class.
Profile 5. Justin. According to the matrix, Justin indicated a high level of impact on his
situational interest but only a medium impact on his individual interest and motivation to learn.
Other data regarding Justin’s interest and motivation to learn support his responses. During the
intervention, especially during lessons that involved the generation of analogies (either group or
individual), Justin had increased attention, smiled and got excited about his analogies, and raised
his hand often to asked questions. The summary of behavior changes (Figure 4-14e) shows
evidence of some change in Justin’s behavior. However, during lessons where self-generated
analogies were not used, his behavior reverted back to that of the pre-intervention period.
133
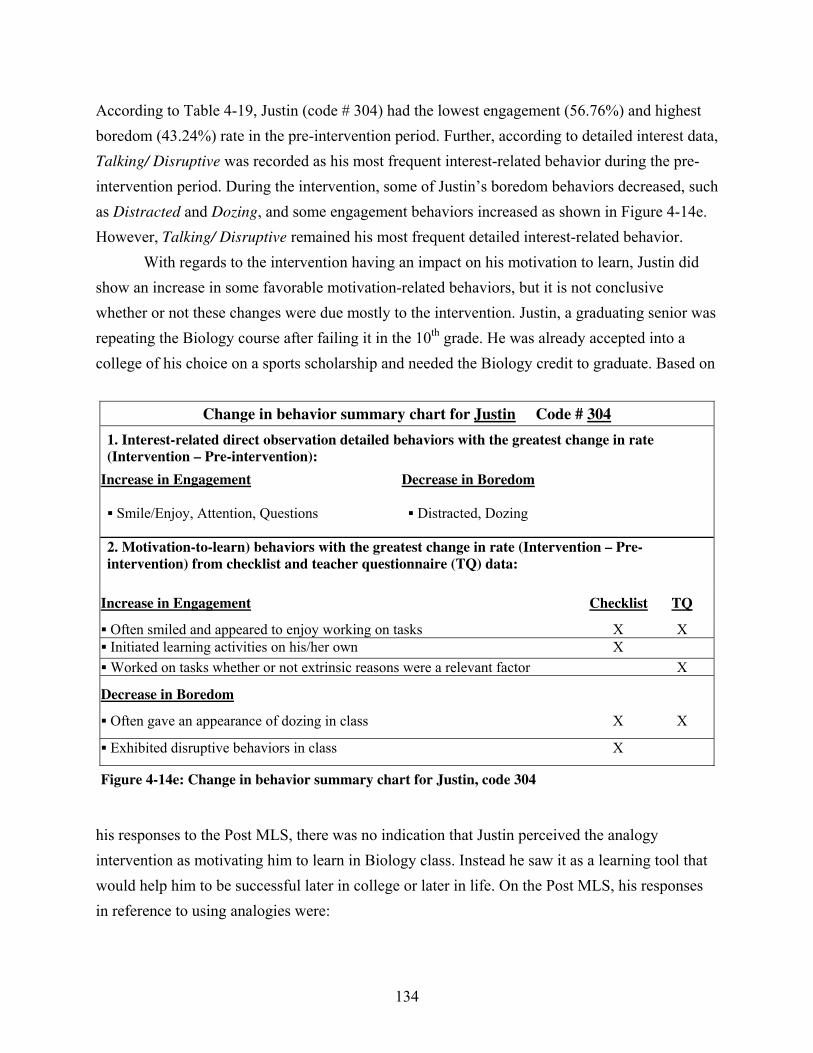
According to Table 4-19, Justin (code # 304) had the lowest engagement (56.76%) and highest
boredom (43.24%) rate in the pre-intervention period. Further, according to detailed interest data,
Talking/ Disruptive was recorded as his most frequent interest-related behavior during the pre-
intervention period. During the intervention, some of Justin’s boredom behaviors decreased, such
as Distracted and Dozing, and some engagement behaviors increased as shown in Figure 4-14e.
However, Talking/ Disruptive remained his most frequent detailed interest-related behavior.
With regards to the intervention having an impact on his motivation to learn, Justin did
show an increase in some favorable motivation-related behaviors, but it is not conclusive
whether or not these changes were due mostly to the intervention. Justin, a graduating senior was
repeating the Biology course after failing it in the 10th
grade. He was already accepted into a
college of his choice on a sports scholarship and needed the Biology credit to graduate. Based on
Change in behavior summary chart for Justin Code # 304
1. Interest-related direct observation detailed behaviors with the greatest change in rate
(Intervention – Pre-intervention):
Increase in Engagement Decrease in Boredom
Smile/Enjoy, Attention, Questions Distracted, Dozing
2. Motivation-to-learn) behaviors with the greatest change in rate (Intervention – Pre-
intervention) from checklist and teacher questionnaire (TQ) data:
Increase in Engagement Checklist TQ
Often smiled and appeared to enjoy working on tasks X X
Initiated learning activities on his/her own X
Worked on tasks whether or not extrinsic reasons were a relevant factor X
Decrease in Boredom
Often gave an appearance of dozing in class X X
Exhibited disruptive behaviors in class X
Figure 4-14e: Change in behavior summary chart for Justin, code 304
his responses to the Post MLS, there was no indication that Justin perceived the analogy
intervention as motivating him to learn in Biology class. Instead he saw it as a learning tool that
would help him to be successful later in college or later in life. On the Post MLS, his responses
in reference to using analogies were:
134
“It will help me when I make it to science when I get into college.”
and
“It [will] help me outside of school when trying to learn something like for a job
or something.”
These findings regarding the intervention’s impact on Justin’s interest and motivation to
learn, confirm his survey responses. His situational interest was greatly impacted by the
intervention but his interest and motivation to learn were not as strongly impacted. However,
based on these findings there is no evidence to suggest that for Justin, any association exists
between his high situational interest in the analogy activities, individual interest in the course,
and motivation to learn.
Post Hoc findings. Evidence of the intervention’s impact on post-intervention situational
interest and its influence on individual interest and motivation to learn.
Earlier in the section on findings related to situational interest, the possibility of the
existence of another form of situational interest, referred to as post-intervention situational
interest (or post-situational interest), was discussed. This form of situational interest was
observed at the end of the intervention and was operationalized specifically as the self-reported
level of perceived “interestingness” in the analogy activities obtained at the end of the
intervention period or thereafter. Although the original variable, situational interest, obtained at
the time of analogy identification or generation, is the focus of this study, there is evidence to
suggest that for some students the intervention’s impact on their post-intervention situational
interest may have influenced their individual interest and motivation to learn.
Using symbols from the case-ordered effects matrix (Table 4-29), Table 4-33 shows a
comparison of the intervention’s impact on participants’ situational interest and post-situational
interest. According to the table, 33% (n=4) of the students indicated a higher level of impact on
their post-situational interest than on their original situational interest. Two of these students
indicated an increase from a medium level to a high level of impact. Additional data for these
students indicate that this impact on their post situational interest may have influenced their
interest and motivation to learn. The following are student profiles, consisting of change in
behavior summaries and a brief discussion of findings regarding the impact of the intervention
on their post- situational interest.
135
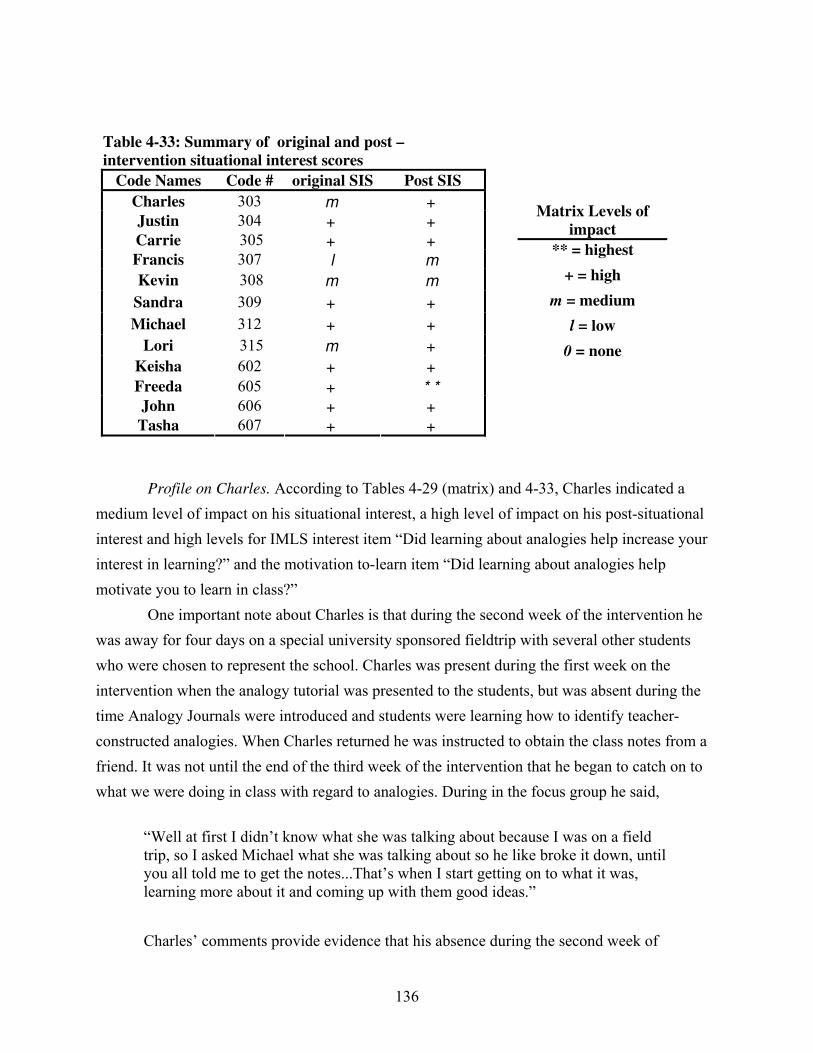
Table 4-33: Summary of original and post –
intervention situational interest scores
Code Names Code # original SIS Post SIS
Charles 303 m +
Justin 304 + +
Carrie 305 + +
Francis 307 l m
Kevin 308 m m
Sandra 309 + +
Michael 312 + +
Lori 315 m +
Keisha 602 + +
Freeda 605 + * *
John 606 + +
Tasha 607 + +
Matrix Levels of
impact
** = highest
+ = high
m = medium
l = low
0 = none
Profile on Charles. According to Tables 4-29 (matrix) and 4-33, Charles indicated a
medium level of impact on his situational interest, a high level of impact on his post-situational
interest and high levels for IMLS interest item “Did learning about analogies help increase your
interest in learning?” and the motivation to-learn item “Did learning about analogies help
motivate you to learn in class?”
One important note about Charles is that during the second week of the intervention he
was away for four days on a special university sponsored fieldtrip with several other students
who were chosen to represent the school. Charles was present during the first week on the
intervention when the analogy tutorial was presented to the students, but was absent during the
time Analogy Journals were introduced and students were learning how to identify teacher-
constructed analogies. When Charles returned he was instructed to obtain the class notes from a
friend. It was not until the end of the third week of the intervention that he began to catch on to
what we were doing in class with regard to analogies. During in the focus group he said,
“Well at first I didn’t know what she was talking about because I was on a field
trip, so I asked Michael what she was talking about so he like broke it down, until
you all told me to get the notes...That’s when I start getting on to what it was,
learning more about it and coming up with them good ideas.”
Charles’ comments provide evidence that his absence during the second week of
136
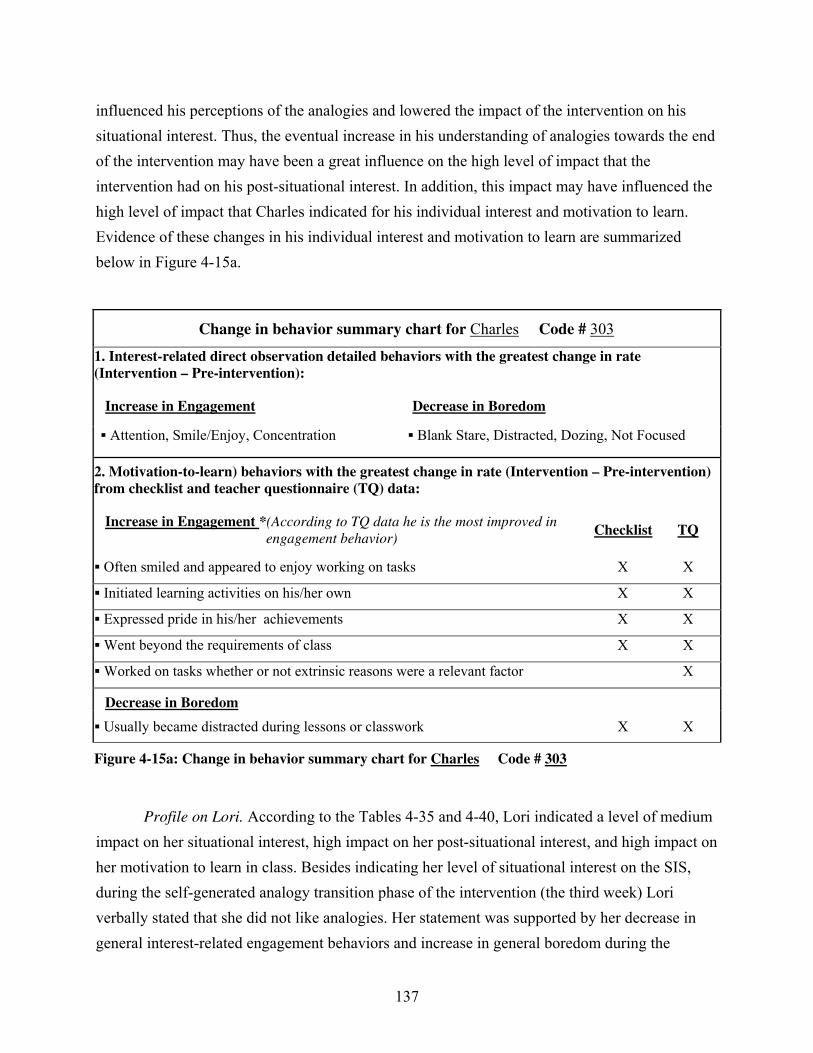
influenced his perceptions of the analogies and lowered the impact of the intervention on his
situational interest. Thus, the eventual increase in his understanding of analogies towards the end
of the intervention may have been a great influence on the high level of impact that the
intervention had on his post-situational interest. In addition, this impact may have influenced the
high level of impact that Charles indicated for his individual interest and motivation to learn.
Evidence of these changes in his individual interest and motivation to learn are summarized
below in Figure 4-15a.
Change in behavior summary chart for Charles Code # 303
1. Interest-related direct observation detailed behaviors with the greatest change in rate
(Intervention – Pre-intervention):
Increase in Engagement Decrease in Boredom
Attention, Smile/Enjoy, Concentration Blank Stare, Distracted, Dozing, Not Focused
2. Motivation-to-learn) behaviors with the greatest change in rate (Intervention – Pre-intervention)
from checklist and teacher questionnaire (TQ) data:
Increase in Engagement *(According to TQ data he is the most improved in
engagement behavior) Checklist TQ
Often smiled and appeared to enjoy working on tasks X X
Initiated learning activities on his/her own X X
Expressed pride in his/her achievements X X
Went beyond the requirements of class X X
Worked on tasks whether or not extrinsic reasons were a relevant factor X
Decrease in Boredom
Usually became distracted during lessons or classwork X X
Figure 4-15a: Change in behavior summary chart for Charles Code # 303
Profile on Lori. According to the Tables 4-35 and 4-40, Lori indicated a level of medium
impact on her situational interest, high impact on her post-situational interest, and high impact on
her motivation to learn in class. Besides indicating her level of situational interest on the SIS,
during the self-generated analogy transition phase of the intervention (the third week) Lori
verbally stated that she did not like analogies. Her statement was supported by her decrease in
general interest-related engagement behaviors and increase in general boredom during the
137
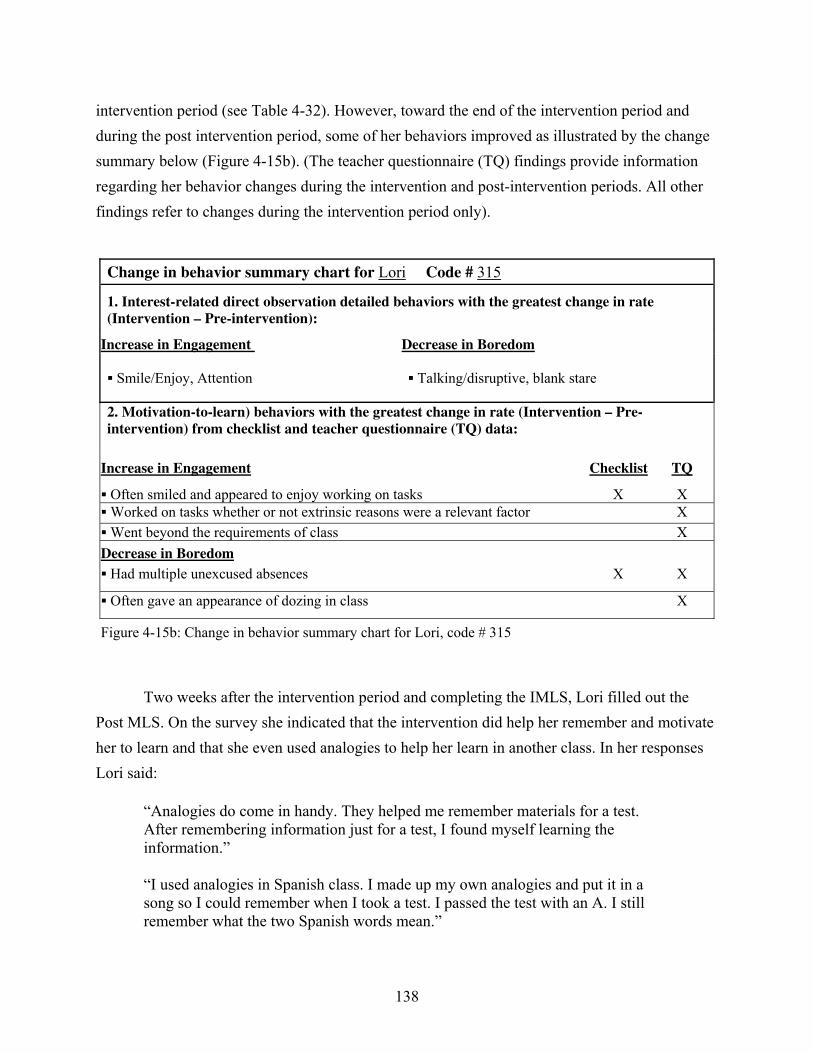
intervention period (see Table 4-32). However, toward the end of the intervention period and
during the post intervention period, some of her behaviors improved as illustrated by the change
summary below (Figure 4-15b). (The teacher questionnaire (TQ) findings provide information
regarding her behavior changes during the intervention and post-intervention periods. All other
findings refer to changes during the intervention period only).
Change in behavior summary chart for Lori Code # 315
1. Interest-related direct observation detailed behaviors with the greatest change in rate
(Intervention – Pre-intervention):
Increase in Engagement Decrease in Boredom
Smile/Enjoy, Attention Talking/disruptive, blank stare
2. Motivation-to-learn) behaviors with the greatest change in rate (Intervention – Pre-
intervention) from checklist and teacher questionnaire (TQ) data:
Increase in Engagement Checklist TQ
Often smiled and appeared to enjoy working on tasks X X
Worked on tasks whether or not extrinsic reasons were a relevant factor X
Went beyond the requirements of class X
Decrease in Boredom
Had multiple unexcused absences X X
Often gave an appearance of dozing in class X
Figure 4-15b: Change in behavior summary chart for Lori, code # 315
Two weeks after the intervention period and completing the IMLS, Lori filled out the
Post MLS. On the survey she indicated that the intervention did help her remember and motivate
her to learn and that she even used analogies to help her learn in another class. In her responses
Lori said:
“Analogies do come in handy. They helped me remember materials for a test.
After remembering information just for a test, I found myself learning the
information.”
“I used analogies in Spanish class. I made up my own analogies and put it in a
song so I could remember when I took a test. I passed the test with an A. I still
remember what the two Spanish words mean.”
138
Do the findings regarding participant’s situational interest, individual interest, and motivation
to learn confirm the theories of Hidi and Harackiewicz (2000) and Schiefele (1991)?
The findings of this study regarding situational interest, individual interest and motivation
to learn provide a strong evidence in support of Hidi and Harackiewicz’s (2000) theory that
situational interest may precede the development of long-lasting individual interest and
Schiefele’s (1991) theory that individual interest can be viewed as a pre-condition of intrinsic
motivation to learn.
Support for Hidi and Harackiewicz’s theory. Based on self-report data, most students
who indicated a high level of impact on their individual interest at the end of the intervention
also indicated a high level of impact on their situational interest during the intervention. In
addition, out of those students who indicated high levels of situational and individual interest, the
majority also indicated a high level of impact on some category of their motivation to learn. In
other words, there is evidence to suggest that for these students the intervention’s success in
promoting high situational interest led to the effective development of their individual interest
and contributed to the impact of the intervention on their motivation to learn.
Support for Schiefele’s theory. Schiefele (1991) proposed that individual interest can be
viewed as a pre-condition of intrinsic motivation and that once established may lead students to
adopt an intrinsic motivation orientation towards a specific task or learning-orientation.
According to the findings of this study, there is evidence to suggest a strong association between
individual interest and motivation to learn (a specific form of intrinsic motivation). On the
matrix, Table 4-29, ten students indicated that the intervention had a high level of impact on
some category of their individual interest. Out of these students 90% (n=9) also indicated high
levels of impact on some category of their motivation to learn. In addition, the findings of this
study also support Schiefele’s belief that increased motivation to learn will impact learning
outcomes, and more specifically impact learning processes in areas such as level of
comprehension and the use of “deep-level” learning strategies (Schiefele, 1991). According to
the matrix, Table 4-29, out of the number of students who completed the Post MLS (n=11),
100% indicated that the intervention continued to impact their thinking and motivation to learn
on their own in class and 55% indicated continued impact on their thinking and use of analogies
(which is considered a “deep-level” learning strategy) in other subject classes.
Summary
In summary, the findings of this study regarding a high level of impact on students’
139

140
situational interest, individual interest, and motivation to learn due to the intervention, provide
evidence of a strong association between the three variables confirming both Hidi and
Harackiewicz (2000) and Schiefele (1991) theories of interest and motivation to learn. In
addition, related findings regarding the impact of the intervention suggest that students’ report of
a medium level of impact on situational interest but high levels of impact on individual interest
and motivation to learn, may be an indication that the intervention’s impact on the two latter
variables could have been influenced by the presence of another factor (such as post-situational
interest) and may warrant further investigation.
Question 4: Within the at-risk group, how do the study’s findings regarding situational
interest, individual interest and motivation to learn compare between female and male
students?
This section examines data regarding the interaction of the intervention and gender on at-
risk students’ situational interest, individual interest and motivation to learn. Male and female
at-risk participant data were analyzed by examining similarities and differences in SPSS cross
tabulations and frequency data. In this study it was predicted that for each variable, data for both
groups would be similar, suggesting that the gender factor, whether or not a student was male or
female, would not have a great influence on the intervention’s level impact on participants’
situational and individual interest and motivation to learn.
Situational Interest Findings
Data regarding the intervention’s impact on students’ situational interest show that the
level of impact was similar for both males (n=5) and females (n=7). Table 4-34 shows a
comparison of whole group Situational Interest Survey (SIS) data categorized by gender.
According to the data, both male and female total group SIS scores were within the category of
high situational interest. Although the female SIS score (3.01) was slightly lower than the male
SIS score (3.21), the median and the range in scores for the female group (m= 3.25, range= 3.00)
was greater than that of the males (m=3.00, range =2.00) indicating that the majority of female
scores was higher than most of the males scores, but further apart in value. In addition, the
distribution of male and female scores, shown in Table 4–35, shows that a majority of scores are
in the category of high level of situational interest for both groups. However, the female group
also has the lowest SIS score (1.66) which resulted in a lower group SIS score.
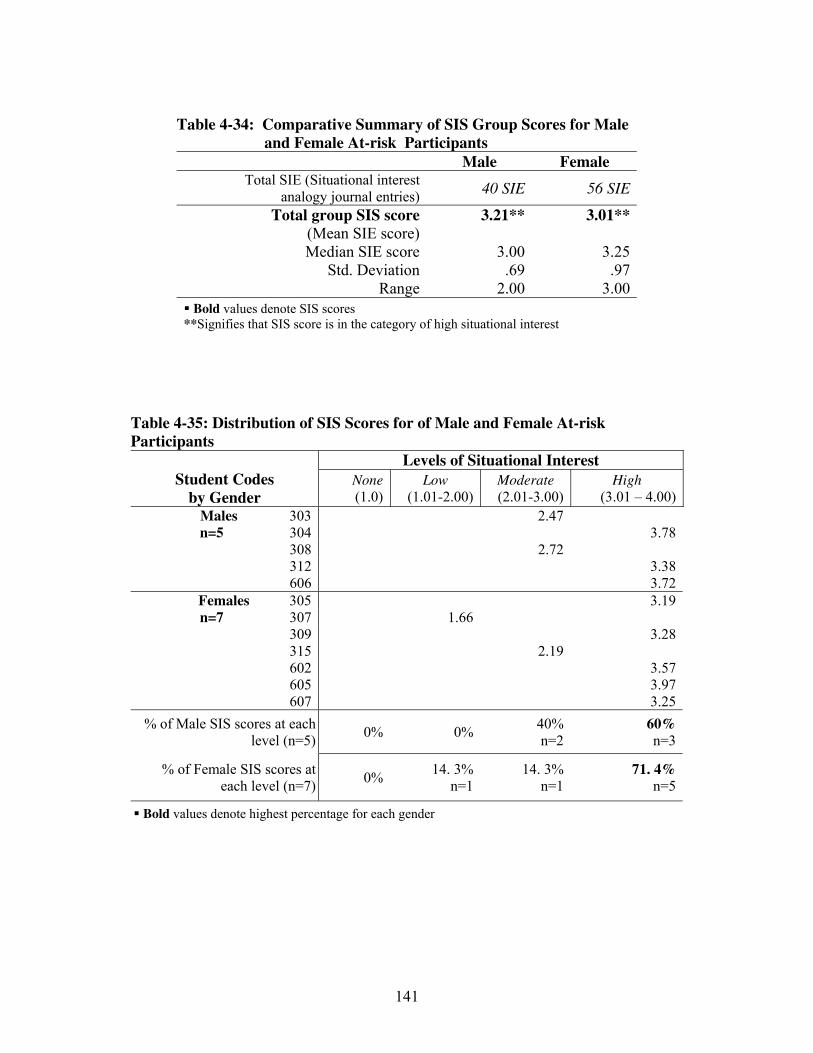
141
Table 4-34: Comparative Summary of SIS Group Scores for Male
and Female At-risk Participants
Male Female
Total SIE (Situational interest
analogy journal entries)40 SIE 56 SIE
Total group SIS score
(Mean SIE score)
3.21** 3.01**
Median SIE score 3.00 3.25
Std. Deviation .69 .97
Range 2.00 3.00
Bold values denote SIS scores
**Signifies that SIS score is in the category of high situational interest
Table 4-35: Distribution of SIS Scores for of Male and Female At-risk
Participants
Levels of Situational Interest
Student Codes
by Gender
None
(1.0)
Low
(1.01-2.00)
Moderate
(2.01-3.00)
High
(3.01 – 4.00)
Males 303 2.47
n=5 304 3.78
308 2.72
312 3.38
606 3.72
Females 305 3.19
n=7 307 1.66
309 3.28
315 2.19
602 3.57
605 3.97
607 3.25
% of Male SIS scores at each
level (n=5) 0% 0%
40%
n=2
60%
n=3
% of Female SIS scores at
each level (n=7) 0%
14. 3%
n=1
14. 3%
n=1
71. 4%
n=5
Bold values denote highest percentage for each gender
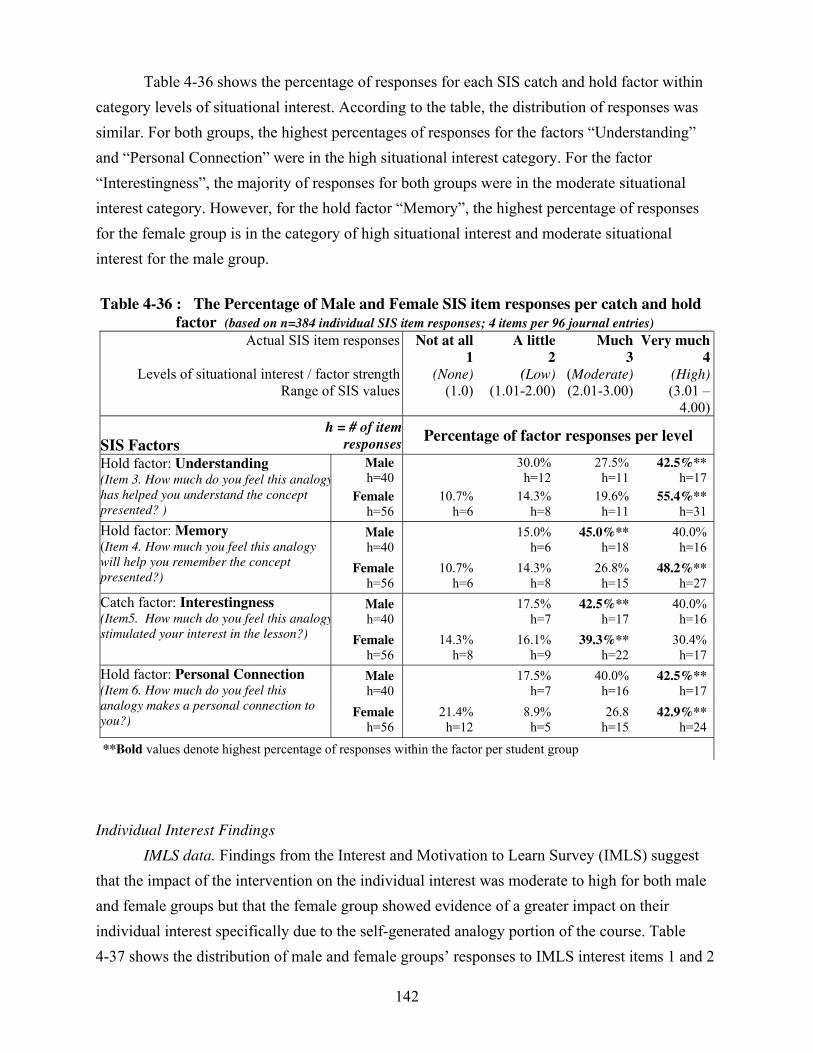
142
Table 4-36 shows the percentage of responses for each SIS catch and hold factor within
category levels of situational interest. According to the table, the distribution of responses was
similar. For both groups, the highest percentages of responses for the factors “Understanding”
and “Personal Connection” were in the high situational interest category. For the factor
“Interestingness”, the majority of responses for both groups were in the moderate situational
interest category. However, for the hold factor “Memory”, the highest percentage of responses
for the female group is in the category of high situational interest and moderate situational
interest for the male group.
Table 4-36 : The Percentage of Male and Female SIS item responses per catch and hold
factor (based on n=384 individual SIS item responses; 4 items per 96 journal entries) Actual SIS item responses
Levels of situational interest / factor strength
Range of SIS values
Not at all
1
(None)
(1.0)
A little
2
(Low)
(1.01-2.00)
Much
3
(Moderate)
(2.01-3.00)
Very much
4
(High)
(3.01 –
4.00)
SIS Factors
h = # of item
responsesPercentage of factor responses per level
Male
h=40
30.0%
h=12
27.5%
h=11
42.5%**
h=17 Hold factor: Understanding (Item 3. How much do you feel this analogy
has helped you understand the concept
presented? ) Female
h=56
10.7%
h=6
14.3%
h=8
19.6%
h=11
55.4%**
h=31
Male
h=40
15.0%
h=6
45.0%**
h=18
40.0%
h=16
Hold factor: Memory
(Item 4. How much you feel this analogy
will help you remember the concept
presented?) Female
h=56
10.7%
h=6
14.3%
h=8
26.8%
h=15
48.2%**
h=27
Male
h=40
17.5%
h=7
42.5%**
h=17
40.0%
h=16
Catch factor: Interestingness
(Item5. How much do you feel this analogy
stimulated your interest in the lesson?) Female
h=56
14.3%
h=8
16.1%
h=9
39.3%**
h=22
30.4%
h=17
Male
h=40
17.5%
h=7
40.0%
h=16
42.5%**
h=17
Hold factor: Personal Connection
(Item 6. How much do you feel this
analogy makes a personal connection to
you?) Female
h=56
21.4%
h=12
8.9%
h=5
26.8
h=15
42.9%**
h=24
**Bold values denote highest percentage of responses within the factor per student group
Individual Interest Findings
IMLS data. Findings from the Interest and Motivation to Learn Survey (IMLS) suggest
that the impact of the intervention on the individual interest was moderate to high for both male
and female groups but that the female group showed evidence of a greater impact on their
individual interest specifically due to the self-generated analogy portion of the course. Table
4-37 shows the distribution of male and female groups’ responses to IMLS interest items 1 and 2
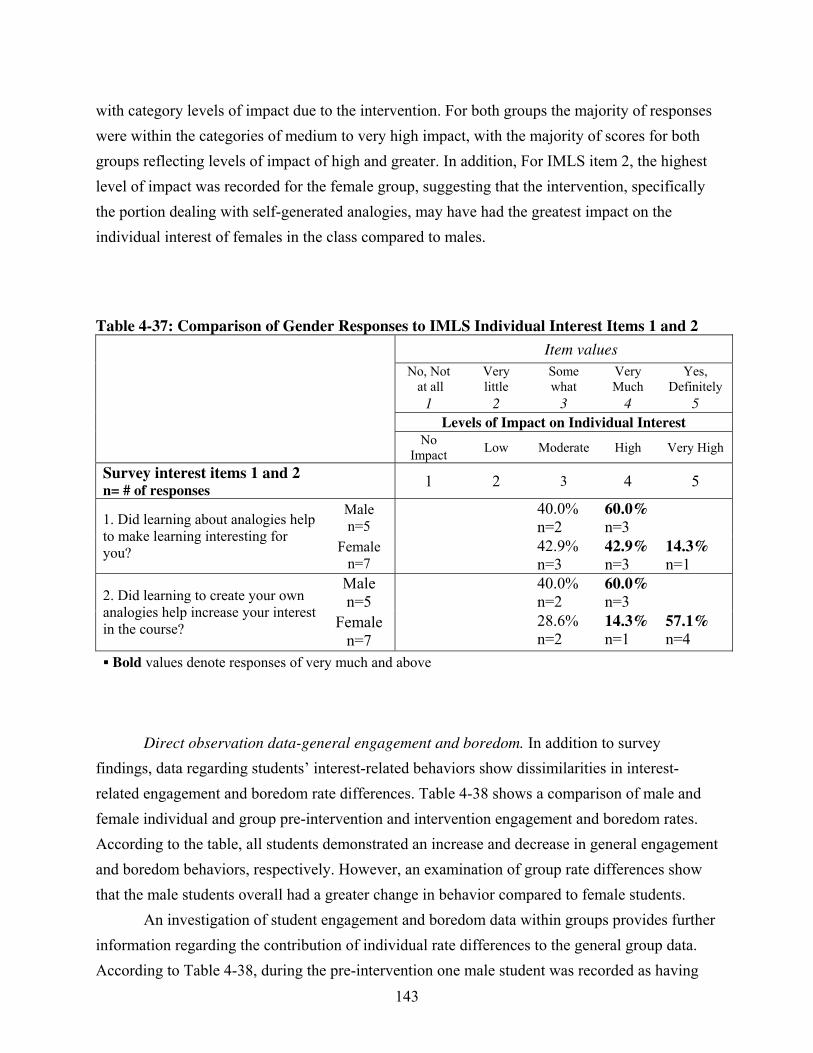
with category levels of impact due to the intervention. For both groups the majority of responses
were within the categories of medium to very high impact, with the majority of scores for both
groups reflecting levels of impact of high and greater. In addition, For IMLS item 2, the highest
level of impact was recorded for the female group, suggesting that the intervention, specifically
the portion dealing with self-generated analogies, may have had the greatest impact on the
individual interest of females in the class compared to males.
Table 4-37: Comparison of Gender Responses to IMLS Individual Interest Items 1 and 2
Item values
No, Not
at all
Very
little
Some
what
Very
Much
Yes,
Definitely
1 2 3 4 5
Levels of Impact on Individual Interest No
Impact Low Moderate High Very High
Survey interest items 1 and 2 n= # of responses
1 2 3 4 5
Male
n=5
40.0%
n=2
60.0%
n=3
1. Did learning about analogies help
to make learning interesting for
you? Female
n=7
42.9%
n=3
42.9%
n=3
14.3%
n=1
Male
n=5
40.0%
n=2
60.0%
n=3 2. Did learning to create your own
analogies help increase your interest
in the course? Female
n=7
28.6%
n=2
14.3%
n=1
57.1%
n=4
Bold values denote responses of very much and above
Direct observation data-general engagement and boredom. In addition to survey
findings, data regarding students’ interest-related behaviors show dissimilarities in interest-
related engagement and boredom rate differences. Table 4-38 shows a comparison of male and
female individual and group pre-intervention and intervention engagement and boredom rates.
According to the table, all students demonstrated an increase and decrease in general engagement
and boredom behaviors, respectively. However, an examination of group rate differences show
that the male students overall had a greater change in behavior compared to female students.
An investigation of student engagement and boredom data within groups provides further
information regarding the contribution of individual rate differences to the general group data.
According to Table 4-38, during the pre-intervention one male student was recorded as having
143
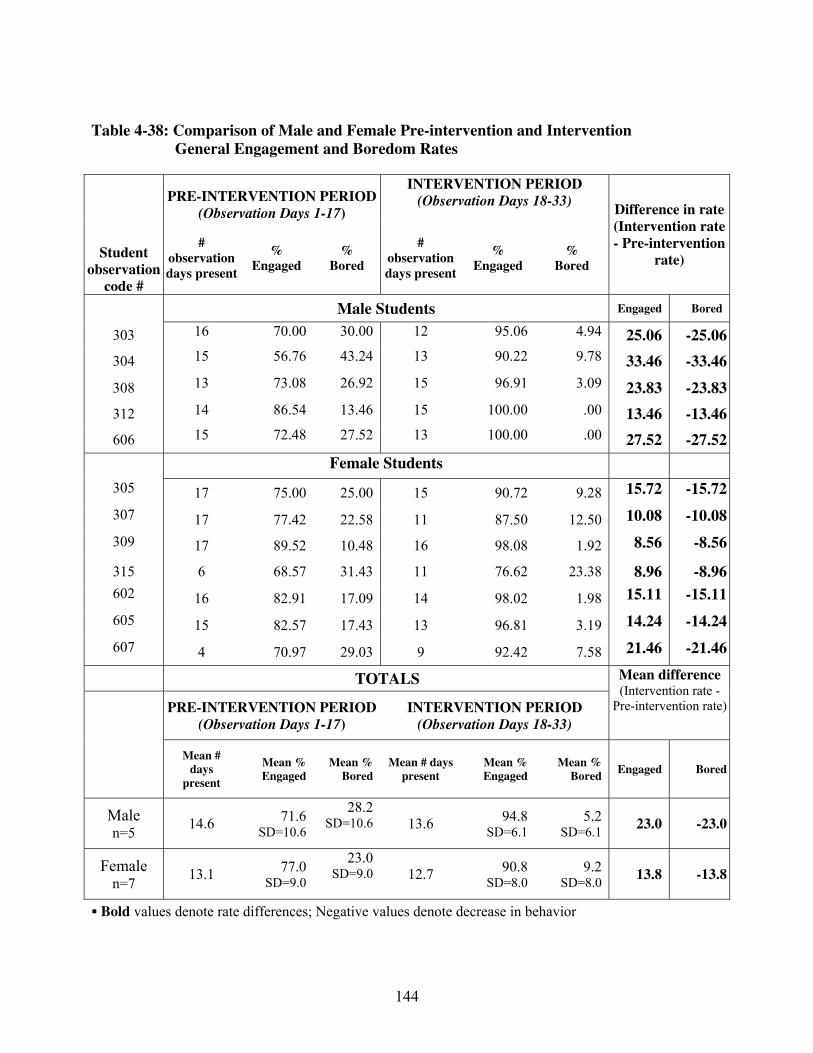
144
Table 4-38: Comparison of Male and Female Pre-intervention and Intervention
General Engagement and Boredom Rates
PRE-INTERVENTION PERIOD
(Observation Days 1-17)
INTERVENTION PERIOD
(Observation Days 18-33)
Student
observation
code #
#
observation
days present
%
Engaged
%
Bored
#
observation
days present
%
Engaged
%
Bored
Difference in rate
(Intervention rate
- Pre-intervention
rate)
Male Students Engaged Bored
303 16 70.00 30.00 12 95.06 4.94 25.06 -25.06
304 15 56.76 43.24 13 90.22 9.78 33.46 -33.46
308 13 73.08 26.92 15 96.91 3.09 23.83 -23.83
312 14 86.54 13.46 15 100.00 .00 13.46 -13.46
606 15 72.48 27.52 13 100.00 .00 27.52 -27.52
Female Students
305 17 75.00 25.00 15 90.72 9.28 15.72 -15.72
307 17 77.42 22.58 11 87.50 12.50 10.08 -10.08
309 17 89.52 10.48 16 98.08 1.92 8.56 -8.56
315 6 68.57 31.43 11 76.62 23.38 8.96 -8.96
602 16 82.91 17.09 14 98.02 1.98 15.11 -15.11
605 15 82.57 17.43 13 96.81 3.19 14.24 -14.24
607 4 70.97 29.03 9 92.42 7.58 21.46 -21.46
TOTALS
PRE-INTERVENTION PERIOD
(Observation Days 1-17) INTERVENTION PERIOD
(Observation Days 18-33)
Mean difference
(Intervention rate -
Pre-intervention rate)
Mean #
days
present
Mean %
Engaged
Mean %
Bored
Mean # days
present
Mean %
Engaged
Mean %
Bored Engaged Bored
Male n=5
14.6 71.6
SD=10.6
28.2 SD=10.6 13.6
94.8 SD=6.1
5.2 SD=6.1
23.0 -23.0
Female n=7
13.1 77.0
SD=9.0
23.0 SD=9.0 12.7
90.8 SD=8.0
9.2 SD=8.0
13.8 -13.8
Bold values denote rate differences; Negative values denote decrease in behavior
145
the lowest engagement/highest boredom rate between the two groups. This male student is also
recorded as having the greatest difference in rate between the two groups. In addition, two males
were recorded as having 100% engagement during the intervention period. The difference in
rates for these students greatly contributed to the group score. Within the female group, two
students had the lowest change in rate between the two groups. One student, #309, began the
intervention period already exhibiting the highest engagement and lowest boredom rates in the
class, and her change in behavior could not exceed eleven percentage points. The other student,
#315 began the intervention period with the lowest engagement and highest boredom behavior
rates among females during the pre-intervention period and continued to demonstrate the lowest
rate of engagement and the highest rate of boredom compared to individuals in both male and
female student groups. The rate differences for these students greatly contributed to the lower
rate difference recorded for the female group.
Direct observation data--detailed engagement and boredom. Table 4-39 shows a
comparison of at-risk male and female detailed engagement and boredom rates. According to the
table, both groups had substantial increases in engagement and decreases in boredom behaviors.
However, males had a difference in rate that was 17.8% points greater than that of the female
group. In addition, both groups demonstrated favorable behavior changes in many of the same
interest-related engagement and boredom categories. For example, for both males and females
the greatest increase in engagement was for the behavior category “Attention” (23.2%points, and
25.9%points respectively). Both male and female groups also had similarities in the engagement
categories “Concentration” and “Smiling and enjoyment.”
Regarding boredom, males exhibited a rate decrease in all behavior categories, with the
greatest rate differences occurring in “Distracted” (-19.5%points) and “Dozing” (-11.0%points).
Females exhibited a rate decrease in four out of six boredom categories. For females the
boredom behavior categories with the greatest decrease in rate were “Blank or confused stare”
(-13.7%points) and “Distracted” (-10.9%points).
Motivation to Learn Findings
IMLS findings. Findings from the (IMLS) suggest that the impact of the intervention on
the individual interest was moderate to very high for both male and female groups. Table 4-40
shows a comparison of student responses for each IMLS item 4-6 categorized by levels of impact
due to the intervention. The table shows that the majority of responses for both male and female
groups were in the moderate to very high impact categories. In addition, 54% of the female
responses and 40% of the male responses were in the categories of high to very high impact. For
one item, IMLS item#6: “Did creating your own analogies help motivate you to learn in class”,
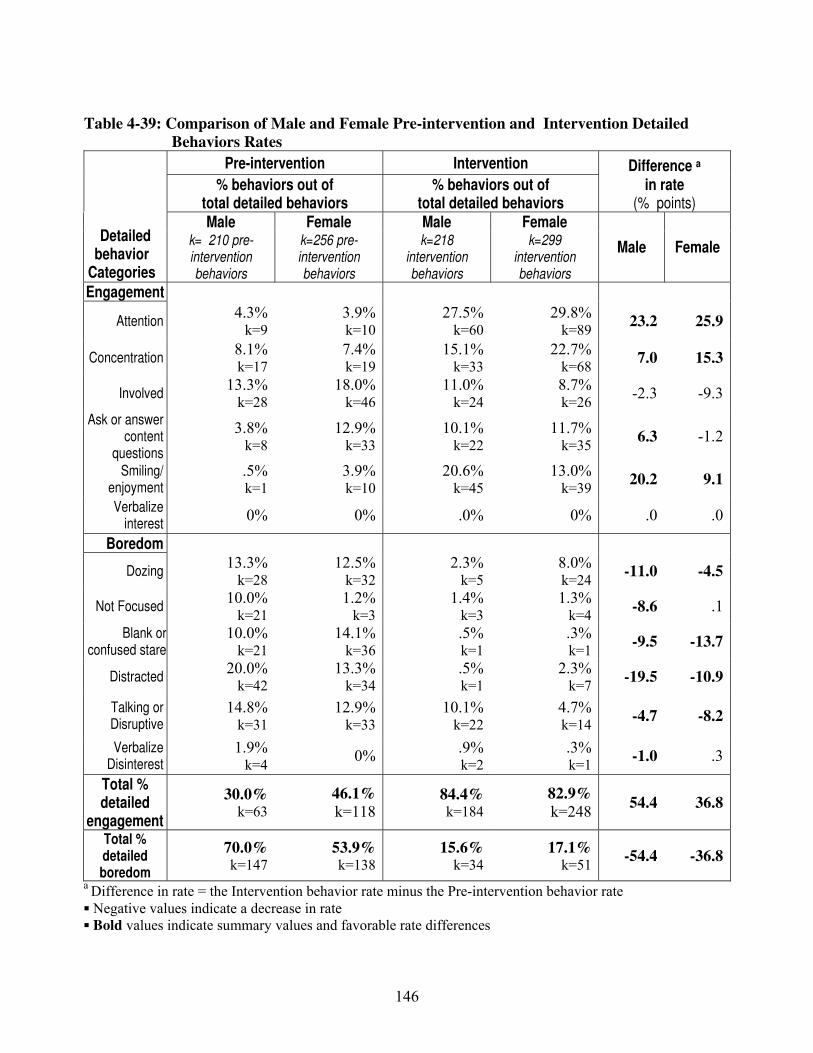
146
Table 4-39: Comparison of Male and Female Pre-intervention and Intervention Detailed
Behaviors Rates
Pre-intervention Intervention Difference a
% behaviors out of
total detailed behaviors % behaviors out of
total detailed behaviors in rate
(% points) Male Female Male Female
Detailed behavior
Categories
k= 210 pre-intervention behaviors
k=256 pre-intervention behaviors
k=218 intervention behaviors
k=299 intervention behaviors
Male Female
Engagement
Attention 4.3%
k=9
3.9%k=10
27.5%k=60
29.8% k=89
23.2 25.9
Concentration 8.1% k=17
7.4%k=19
15.1%k=33
22.7% k=68
7.0 15.3
Involved 13.3%
k=28
18.0%k=46
11.0%k=24
8.7% k=26
-2.3 -9.3
Ask or answer content
questions
3.8% k=8
12.9%k=33
10.1%k=22
11.7% k=35
6.3 -1.2
Smiling/ enjoyment
.5% k=1
3.9%k=10
20.6%k=45
13.0% k=39
20.2 9.1
Verbalize interest
0% 0% .0% 0% .0 .0
Boredom
Dozing 13.3%
k=28
12.5%k=32
2.3%k=5
8.0% k=24
-11.0 -4.5
Not Focused 10.0%
k=21
1.2%k=3
1.4%k=3
1.3% k=4
-8.6 .1
Blank orconfused stare
10.0% k=21
14.1%k=36
.5%k=1
.3% k=1
-9.5 -13.7
Distracted 20.0%
k=42
13.3%k=34
.5%k=1
2.3% k=7
-19.5 -10.9
Talking or Disruptive
14.8% k=31
12.9%k=33
10.1%k=22
4.7% k=14
-4.7 -8.2
Verbalize Disinterest
1.9% k=4
0%.9%k=2
.3% k=1
-1.0 .3
Total % detailed
engagement
30.0% k=63
46.1%
k=11884.4%k=184
82.9%
k=248 54.4 36.8
Total % detailed boredom
70.0% k=147
53.9%k=138
15.6%k=34
17.1% k=51
-54.4 -36.8
a Difference in rate = the Intervention behavior rate minus the Pre-intervention behavior rate
Negative values indicate a decrease in rate Bold values indicate summary values and favorable rate differences
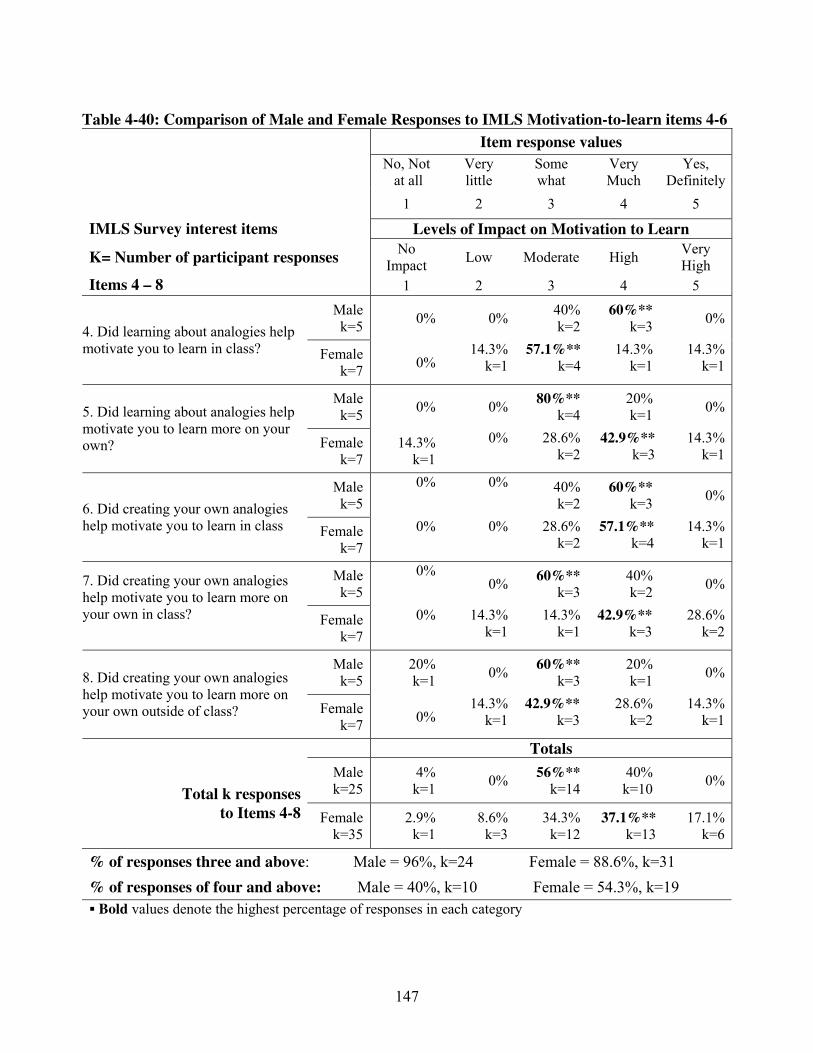
Table 4-40: Comparison of Male and Female Responses to IMLS Motivation-to-learn items 4-6
Item response values
No, Not
at all
Very
little
Some
what
Very
Much
Yes,
Definitely
1 2 3 4 5
IMLS Survey interest items Levels of Impact on Motivation to Learn
K= Number of participant responses No
Impact Low Moderate High
Very
High
Items 4 – 8 1 2 3 4 5
Male
k=50% 0%
40%
k=2
60%**
k=3 0%
4. Did learning about analogies help
motivate you to learn in class? Female
k=70%
14.3%
k=1
57.1%**
k=4
14.3%
k=1
14.3%
k=1
Male
k=50% 0%
80%**
k=4
20%
k=1 0%5. Did learning about analogies help
motivate you to learn more on your
own? Female
k=7
14.3%
k=1
0% 28.6%
k=2
42.9%**
k=3
14.3%
k=1
Male
k=5
0% 0% 40%
k=2
60%**
k=3 0%
6. Did creating your own analogies
help motivate you to learn in class Female
k=7
0% 0% 28.6%
k=2
57.1%**
k=4
14.3%
k=1
Male
k=5
0%0%
60%**
k=3
40%
k=2 0%7. Did creating your own analogies
help motivate you to learn more on
your own in class?
Female
k=7
0% 14.3%
k=1
14.3%
k=1
42.9%**
k=3
28.6%
k=2
Male
k=5
20%
k=10%
60%**
k=3
20%
k=1 0%8. Did creating your own analogies
help motivate you to learn more on
your own outside of class? Female
k=70%
14.3%
k=1
42.9%**
k=3
28.6%
k=2
14.3%
k=1
Totals
Total k responses
Male
k=25
4%
k=10%
56%**
k=14
40%
k=10 0%
to Items 4-8 Female
k=35
2.9%
k=1
8.6%
k=3
34.3%
k=12
37.1%**
k=13
17.1%
k=6
% of responses three and above: Male = 96%, k=24 Female = 88.6%, k=31
% of responses of four and above: Male = 40%, k=10 Female = 54.3%, k=19
Bold values denote the highest percentage of responses in each category
147
148
both groups had the majority of their responses in high level of impact category, indicating a
consensus between groups for this item.
In general, these findings suggest that for both male and female groups, the intervention
had an overall high to very high impact on their motivation-to-learn inside the classroom.
Specifically, data for the female group indicated that, compared to the male group, the
intervention had a higher level of impact on motivation to learn on their own in the classroom.
With regards to the motivation to learn outside the classroom, the highest percentage of
responses for both male and female groups was within the moderate level of impact category.
However, it should be noted that for the female group, an equal number of responses (k=3) was
also within the combined categories of high and very high level of impact.
Checklist and teacher questionnaire findings. Regarding changes in motivation-related
engagement and boredom behaviors, data from the checklist and teacher questionnaires show
that in general both the male and female groups experienced an increase in motivation-related
engagement and a decrease in boredom behaviors. However, according to the data, the difference
in rate for the male group is substantially greater than that of the female group. Table 4-41 shows
a summary of the percentage of checklist behaviors for male and female groups. According to
the table, the total difference in behavior rate for males (52.3%points) was approximately 30
points higher than that of females (22.1%points). This difference is notable since during the pre-
intervention period, males exhibited a much lower rate of motivation-related engagement
(17.5%) and higher rate of motivation-related boredom (82.5%) compared to the female group
(37.5% and 62.5%, respectively). Table 4-41 shows that even though the female group had
exhibited a 22% point increase in favorable motivation-to learn behaviors during the intervention
period, the male group exhibited a higher rate of engagement (69.8%) and lower rate of boredom
(30.2%) compared to the female group (59.6% and 40.4%, respectively).
Teacher questionnaire data regarding changes in motivation to learn behavior show
similar patterns in the higher rate of rate of favorable motivation-to-learn behaviors in males
compared to the female group. Table 4-42 summarizes the classroom teacher’s perception of
changes in motivation-to-learn for male and female groups. According to the table, the teacher’s
responses indicate that she perceived a greater change in motivation to learn behaviors for males
compared to females as a group. In these data the difference in engagement for the male group
was .57%points higher and the difference in boredom was .20% points lower than the female
group. Though these difference seem slight, together they are substantial considering that during
the pre-intervention period, the teacher perceived the male group as exhibiting less motivation-
related engagement and approximately the same degree of motivation-related boredom
compared to the female group (see Table 4-42).
Regarding specific behaviors, data from the motivation-to-learn checklist on Table 4-41
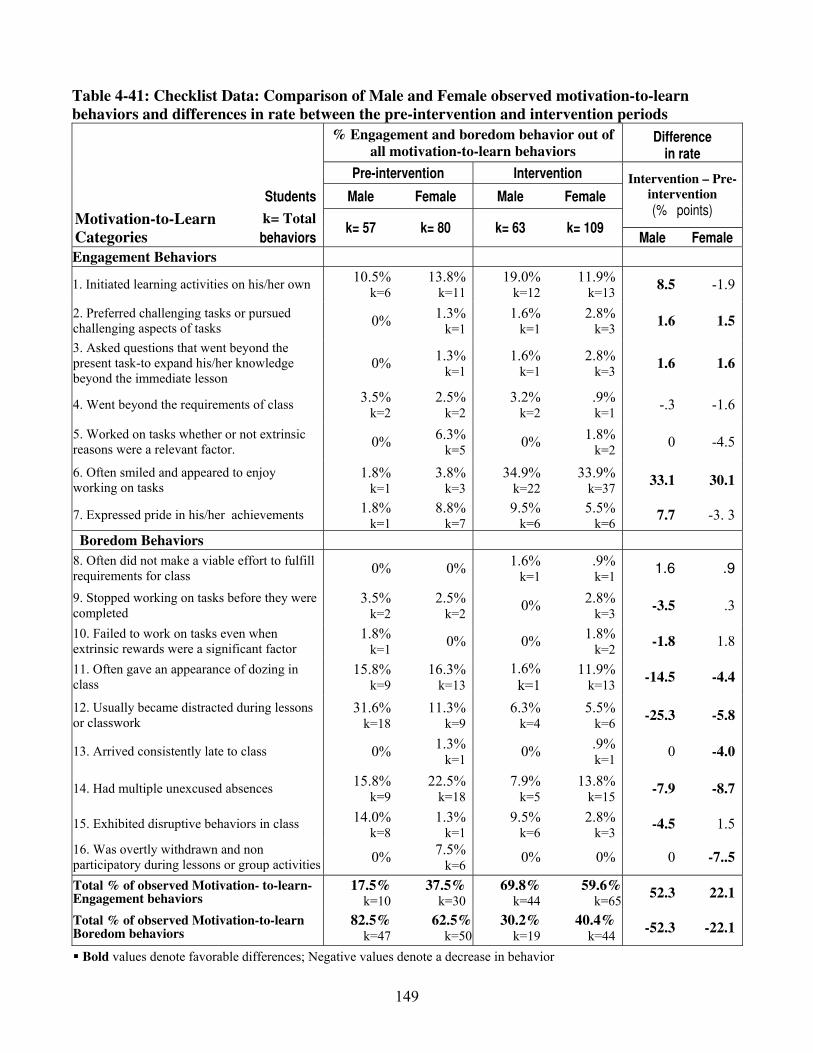
Table 4-41: Checklist Data: Comparison of Male and Female observed motivation-to-learn
behaviors and differences in rate between the pre-intervention and intervention periods
% Engagement and boredom behavior out of
all motivation-to-learn behaviors Difference
in rate
Pre-intervention Intervention
Students Male Female Male Female
k= Total
Intervention – Pre-
intervention (% points)
Motivation-to-Learn
Categories behaviors k= 57 k= 80 k= 63 k= 109
Male Female
Engagement Behaviors
1. Initiated learning activities on his/her own 10.5%
k=6
13.8% k=11
19.0% k=12
11.9% k=13
8.5 -1.9
2. Preferred challenging tasks or pursued
challenging aspects of tasks 0%
1.3% k=1
1.6% k=1
2.8% k=3
1.6 1.5
3. Asked questions that went beyond the
present task-to expand his/her knowledge
beyond the immediate lesson 0%
1.3% k=1
1.6% k=1
2.8% k=3
1.6 1.6
4. Went beyond the requirements of class 3.5%
k=2
2.5% k=2
3.2% k=2
.9% k=1
-.3 -1.6
5. Worked on tasks whether or not extrinsic
reasons were a relevant factor. 0%
6.3% k=5
0% 1.8%
k=2 0 -4.5
6. Often smiled and appeared to enjoy
working on tasks 1.8%
k=1
3.8% k=3
34.9% k=22
33.9% k=37
33.1 30.1
7. Expressed pride in his/her achievements 1.8%
k=1
8.8% k=7
9.5% k=6
5.5% k=6
7.7 -3. 3
Boredom Behaviors
8. Often did not make a viable effort to fulfill
requirements for class 0% 0%
1.6% k=1
.9% k=1
1.6 .9
9. Stopped working on tasks before they were
completed 3.5%
k=2
2.5% k=2
0% 2.8%
k=3 -3.5 .3
10. Failed to work on tasks even when
extrinsic rewards were a significant factor 1.8%
k=1 0% 0%
1.8% k=2
-1.8 1.8
11. Often gave an appearance of dozing in
class 15.8%
k=9
16.3% k=13
1.6%
k=111.9%
k=13 -14.5 -4.4
12. Usually became distracted during lessons
or classwork 31.6%
k=18
11.3% k=9
6.3% k=4
5.5% k=6
-25.3 -5.8
13. Arrived consistently late to class 0%1.3%
k=1 0%
.9% k=1
0 -4.0
14. Had multiple unexcused absences 15.8%
k=9
22.5% k=18
7.9% k=5
13.8% k=15
-7.9 -8.7
15. Exhibited disruptive behaviors in class 14.0%
k=8
1.3% k=1
9.5% k=6
2.8% k=3
-4.5 1.5
16. Was overtly withdrawn and non
participatory during lessons or group activities 0%
7.5% k=6
0% 0% 0 -7..5
Total % of observed Motivation- to-learn- Engagement behaviors
17.5%k=10
37.5%k=30
69.8%k=44
59.6% k=65
52.3 22.1
Total % of observed Motivation-to-learn Boredom behaviors
82.5%k=47
62.5%k=50
30.2%k=19
40.4% k=44
-52.3 -22.1
Bold values denote favorable differences; Negative values denote a decrease in behavior
149
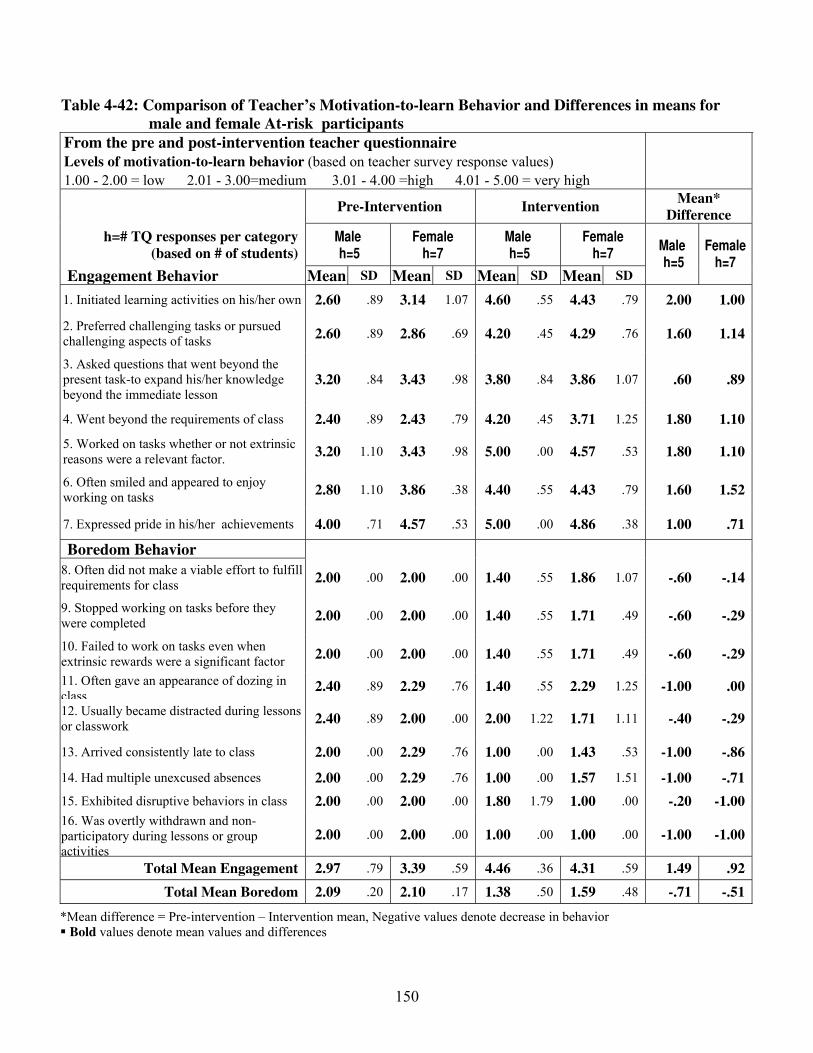
Table 4-42: Comparison of Teacher’s Motivation-to-learn Behavior and Differences in means for
male and female At-risk participants
From the pre and post-intervention teacher questionnaire
Levels of motivation-to-learn behavior (based on teacher survey response values)
1.00 - 2.00 = low 2.01 - 3.00=medium 3.01 - 4.00 =high 4.01 - 5.00 = very high
Pre-Intervention Intervention
Mean*
Difference
h=# TQ responses per category
(based on # of students)
Male h=5
Female h=7
Male h=5
Female h=7
Engagement Behavior Mean SD Mean SD Mean SD Mean SD
Male h=5
Female h=7
1. Initiated learning activities on his/her own 2.60 .89 3.14 1.07 4.60 .55 4.43 .79 2.00 1.00
2. Preferred challenging tasks or pursued
challenging aspects of tasks 2.60 .89 2.86 .69 4.20 .45 4.29 .76 1.60 1.14
3. Asked questions that went beyond the
present task-to expand his/her knowledge
beyond the immediate lesson 3.20 .84 3.43 .98 3.80 .84 3.86 1.07 .60 .89
4. Went beyond the requirements of class 2.40 .89 2.43 .79 4.20 .45 3.71 1.25 1.80 1.10
5. Worked on tasks whether or not extrinsic
reasons were a relevant factor. 3.20 1.10 3.43 .98 5.00 .00 4.57 .53 1.80 1.10
6. Often smiled and appeared to enjoy
working on tasks 2.80 1.10 3.86 .38 4.40 .55 4.43 .79 1.60 1.52
7. Expressed pride in his/her achievements 4.00 .71 4.57 .53 5.00 .00 4.86 .38 1.00 .71
Boredom Behavior
8. Often did not make a viable effort to fulfill
requirements for class 2.00 .00 2.00 .00 1.40 .55 1.86 1.07 -.60 -.14
9. Stopped working on tasks before they
were completed 2.00 .00 2.00 .00 1.40 .55 1.71 .49 -.60 -.29
10. Failed to work on tasks even when
extrinsic rewards were a significant factor 2.00 .00 2.00 .00 1.40 .55 1.71 .49 -.60 -.29
11. Often gave an appearance of dozing in
class2.40 .89 2.29 .76 1.40 .55 2.29 1.25 -1.00 .00
12. Usually became distracted during lessons
or classwork 2.40 .89 2.00 .00 2.00 1.22 1.71 1.11 -.40 -.29
13. Arrived consistently late to class 2.00 .00 2.29 .76 1.00 .00 1.43 .53 -1.00 -.86
14. Had multiple unexcused absences 2.00 .00 2.29 .76 1.00 .00 1.57 1.51 -1.00 -.71
15. Exhibited disruptive behaviors in class 2.00 .00 2.00 .00 1.80 1.79 1.00 .00 -.20 -1.00
16. Was overtly withdrawn and non-
participatory during lessons or group
activities
2.00 .00 2.00 .00 1.00 .00 1.00 .00 -1.00 -1.00
Total Mean Engagement 2.97 .79 3.39 .59 4.46 .36 4.31 .59 1.49 .92
Total Mean Boredom 2.09 .20 2.10 .17 1.38 .50 1.59 .48 -.71 -.51
*Mean difference = Pre-intervention – Intervention mean, Negative values denote decrease in behavior
Bold values denote mean values and differences
150
show that the male group demonstrated a favorable change in rate in 11 out of 16 motivation-
related behavior categories (consisting of an increase in five engagement and a decrease in six
boredom categories). The female group demonstrated favorable changes in only eight categories
(consisting of an increase in three engagement and decrease in four boredom categories). Both
groups demonstrated the greatest difference in the engagement category “Often smiled and
appeared to enjoy working on tasks” (33.1% points males and 30.1% points females). Males also
exhibited large differences in rates in the boredom categories “Usually became distracted during
lessons or classwork” (-25.3% points) and “Often gave an appearance of dozing in class”
(-14.5% points). For the female group, two other categories with favorable changes in rate were
“Had multiple unexcused absences” (-8.7%points) and “Was overtly withdrawn and non
participatory during lessons or group activities” (-7.5%points).
Data from the teacher questionnaire were consistent with the checklist findings. In
relation to specific behaviors, the male group had higher mean differences than the female group
in almost every category. For both groups, the behaviors with the highest mean difference were
all within engagement categories. For the male group, the greatest difference was in the category
“Initiated learning activities on his/her own” (2.00 points) For the female group the greatest
difference was in the category “Often smiled and appeared to enjoy working on tasks” (1.52
points).
Post-Intervention Motivation to Learn. The Post Motivation to learn Survey (Post MLS)
was used to gather data regarding students’ continued motivation to learn during a two week
period after the end of the Intervention. Table 4-43 shows a summary comparison of individual
male and female student responses to the IMLS. According to the table, there is no indication
that the intervention’s impact on students’ post-motivation to learn was different for male and
female groups. Out of all participants that completed the survey, all students, male and female,
affirmed with evidence that the intervention continued to have an impact on their motivation to
learn in class. Regarding their post-motivation to learn outside of the classroom, an equal
number of students from each group, three males and three females, affirmed with evidence that
the intervention motivated them to learn outside the class, to create new analogies and/or other
learning strategies. In addition, two males and two females said that the intervention motivated
them to learn outside of the classroom but that they hadn’t created any new analogies. Only one
student, a female, reported that the intervention didn’t motivate her outside of class.
151

Table 4-43 Comparison of Male and Female Post MLS Responses
Post Intervention Motivation to learn
Item 1: IN CLASS Item 2: OUTSIDE of CLASS
Code #
Do you think that learning about
analogies and making your own analogies
helped motivate you to learn new
information in Science class?
Has the analogy project motivated you to
create new analogies or use other
learning strategies to help you learn in
other classes or outside of school?
Males
303 * * *
304 * +
308 * * *
312 * * *
606 * +
Fem ales
305 * +
307 * +
309 * * *
315 * * *
602 n/ a n/ a
605 * * *
607 * 0
* = Said yes and presented evidence of continued used of analogies and motivation to learn in class
** = Said yes and presented evidence of continued used of analogies or other strategies outside of class
+ = Said yes, but no analogy use outside of class since the intervention
0 = Said no it has not motivated them to learn outside of class since the intervention
n/a = Was not available to take survey
152
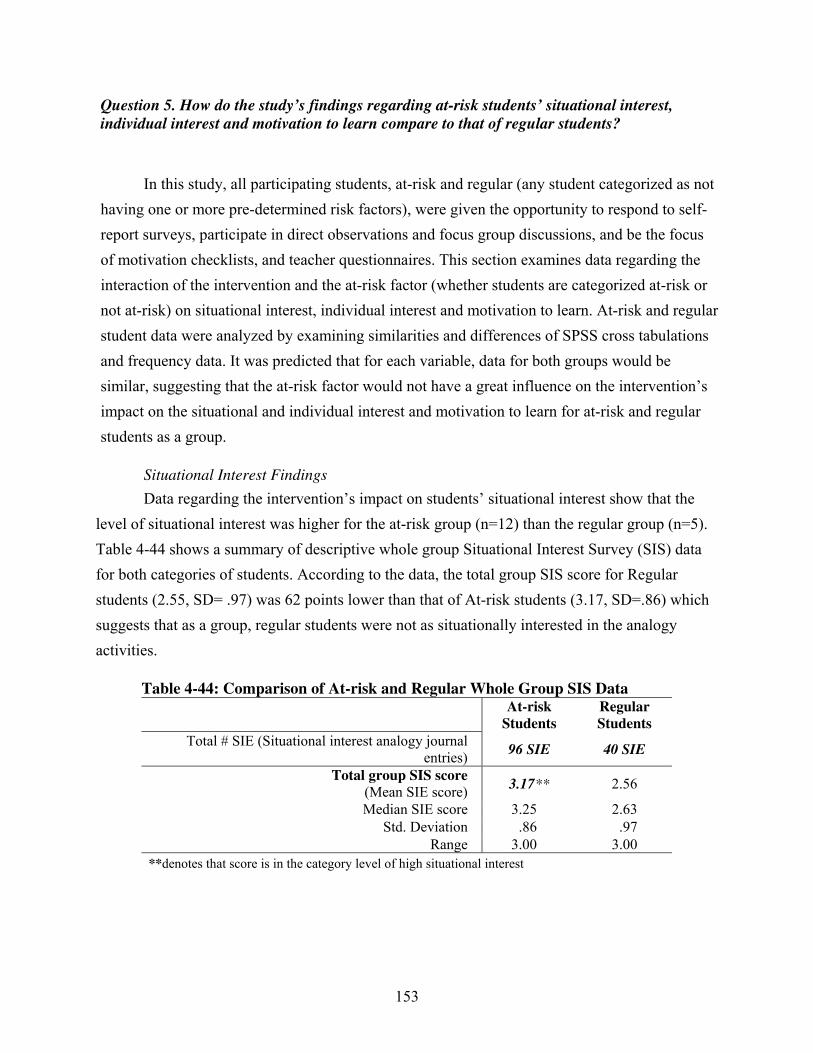
Question 5. How do the study’s findings regarding at-risk students’ situational interest,
individual interest and motivation to learn compare to that of regular students?
In this study, all participating students, at-risk and regular (any student categorized as not
having one or more pre-determined risk factors), were given the opportunity to respond to self-
report surveys, participate in direct observations and focus group discussions, and be the focus
of motivation checklists, and teacher questionnaires. This section examines data regarding the
interaction of the intervention and the at-risk factor (whether students are categorized at-risk or
not at-risk) on situational interest, individual interest and motivation to learn. At-risk and regular
student data were analyzed by examining similarities and differences of SPSS cross tabulations
and frequency data. It was predicted that for each variable, data for both groups would be
similar, suggesting that the at-risk factor would not have a great influence on the intervention’s
impact on the situational and individual interest and motivation to learn for at-risk and regular
students as a group.
Situational Interest Findings
Data regarding the intervention’s impact on students’ situational interest show that the
level of situational interest was higher for the at-risk group (n=12) than the regular group (n=5).
Table 4-44 shows a summary of descriptive whole group Situational Interest Survey (SIS) data
for both categories of students. According to the data, the total group SIS score for Regular
students (2.55, SD= .97) was 62 points lower than that of At-risk students (3.17, SD=.86) which
suggests that as a group, regular students were not as situationally interested in the analogy
activities.
Table 4-44: Comparison of At-risk and Regular Whole Group SIS Data At-risk
Students
Regular
Students
Total # SIE (Situational interest analogy journal
entries) 96 SIE 40 SIE
Total group SIS score
(Mean SIE score) 3.17** 2.56
Median SIE score 3.25 2.63
Std. Deviation .86 .97
Range 3.00 3.00
**denotes that score is in the category level of high situational interest
153
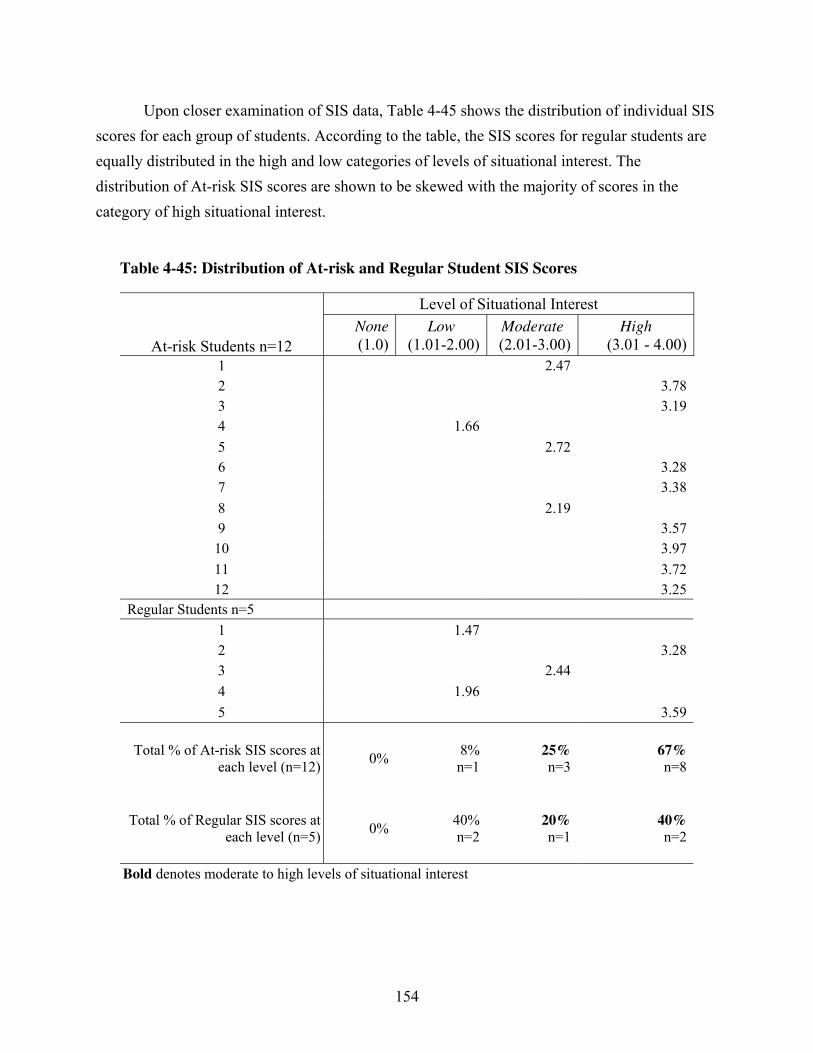
Upon closer examination of SIS data, Table 4-45 shows the distribution of individual SIS
scores for each group of students. According to the table, the SIS scores for regular students are
equally distributed in the high and low categories of levels of situational interest. The
distribution of At-risk SIS scores are shown to be skewed with the majority of scores in the
category of high situational interest.
Table 4-45: Distribution of At-risk and Regular Student SIS Scores
Level of Situational Interest
At-risk Students n=12
None
(1.0)
Low
(1.01-2.00)
Moderate
(2.01-3.00)
High
(3.01 - 4.00)
1 2.47
2 3.78
3 3.19
4 1.66
5 2.72
6 3.28
7 3.38
8 2.19
9 3.57
10 3.97
11 3.72
12 3.25
Regular Students n=5
1 1.47
2 3.28
3 2.44
4 1.96
5 3.59
Total % of At-risk SIS scores at
each level (n=12) 0%
8%
n=1
25%
n=3
67%
n=8
Total % of Regular SIS scores at
each level (n=5) 0%
40%
n=2
20%
n=1
40%
n=2
Bold denotes moderate to high levels of situational interest
154
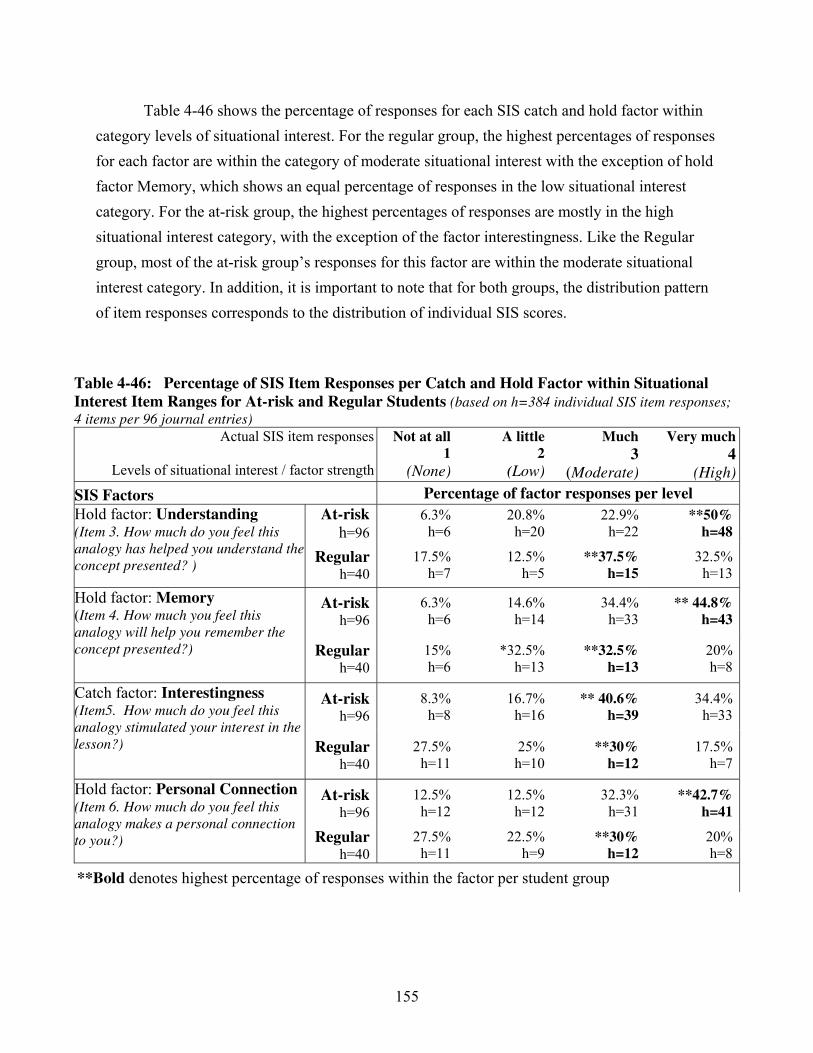
Table 4-46 shows the percentage of responses for each SIS catch and hold factor within
category levels of situational interest. For the regular group, the highest percentages of responses
for each factor are within the category of moderate situational interest with the exception of hold
factor Memory, which shows an equal percentage of responses in the low situational interest
category. For the at-risk group, the highest percentages of responses are mostly in the high
situational interest category, with the exception of the factor interestingness. Like the Regular
group, most of the at-risk group’s responses for this factor are within the moderate situational
interest category. In addition, it is important to note that for both groups, the distribution pattern
of item responses corresponds to the distribution of individual SIS scores.
Table 4-46: Percentage of SIS Item Responses per Catch and Hold Factor within Situational
Interest Item Ranges for At-risk and Regular Students (based on h=384 individual SIS item responses;
4 items per 96 journal entries) Actual SIS item responses
Levels of situational interest / factor strength
Not at all
1
(None)
A little
2
(Low)
Much 3
(Moderate)
Very much
4
(High)
SIS Factors Percentage of factor responses per level
At-risk
h=96 6.3%
h=6
20.8%
h=20
22.9%
h=22
**50%
h=48
Hold factor: Understanding (Item 3. How much do you feel this
analogy has helped you understand the
concept presented? ) Regular
h=40
17.5%
h=7
12.5%
h=5
**37.5%
h=15
32.5%
h=13
At-risk h=96
6.3%
h=6
14.6%
h=14
34.4%
h=33
** 44.8%
h=43
Hold factor: Memory (Item 4. How much you feel this
analogy will help you remember the
concept presented?) Regularh=40
15%
h=6
*32.5%
h=13
**32.5%
h=13
20%
h=8
At-risk h=96
8.3%
h=8
16.7%
h=16
** 40.6%
h=39
34.4%
h=33
Catch factor: Interestingness (Item5. How much do you feel this
analogy stimulated your interest in the
lesson?) Regularh=40
27.5%
h=11
25%
h=10
**30%
h=12
17.5%
h=7
At-risk h=96
12.5%
h=12
12.5%
h=12
32.3%
h=31
**42.7%
h=41
Hold factor: Personal Connection (Item 6. How much do you feel this
analogy makes a personal connection
to you?) Regularh=40
27.5%
h=11
22.5%
h=9
**30%
h=12
20%
h=8
**Bold denotes highest percentage of responses within the factor per student group
155

To facilitate the comparison of at-risk and regular group responses, Table 4-47
summarizes the percentage of responses for each factor within two general combined categories:
responses of three and above and responses of two and below. For the at-risk group,
approximately 75% of responses for all factors are within the category of moderate and above.
For the regular group, approximately 50% of responses are within the category moderate and
above and 50% within the category low and below for the SIS factors “Memory”,
“Interestingness”, and “Personal connection”. For the hold factor “Understanding”, 70% of the
scores were in the category of moderate and above identifying that factor as being the strongest
for the Regular group.
Table 4-47: At-risk and Regular ~ Percentage of SIS item responses per catch and
hold factor within situational interest item ranges (based on n=384 individual SIS item responses; 4 items per 96 journal entries)
Actual SIS item responses Levels of situational interest / factor strength
1 and 2 (Low and below)
3 and 4 (Moderate and above)
SIS Factors Percentage of factor responses per level
At-risk
h=96
27.0% h=26
72.9% h=70
Hold factor: Understanding (Item 3. How much do you feel this analogy
has helped you understand the concept
presented? ) Regular
h=40
30.0% h=12
70% h=28
At-risk
h=96
20.8% h=20
79.2% h=76
Hold factor: Memory
(Item 4. How much you feel this analogy
will help you remember the concept
presented?) Regular
h=40
47.5% h=19
52.5% h=21
At-risk
h=96
25.0% h=24
75% h=72
Catch factor: Interestingness
(Item5. How much do you feel this analogy
stimulated your interest in the lesson?)
Regular
h=40
52.5% h=21
47.5% h=19
At-risk
h=96
25% h=24
75% h=72
Hold factor: Personal Connection (Item 6. How much do you feel this
analogy makes a personal connection to
you?) Regular
h=40
50% h=20
50% h=20
**Bold denotes highest percentage of responses within the factor per student group
156
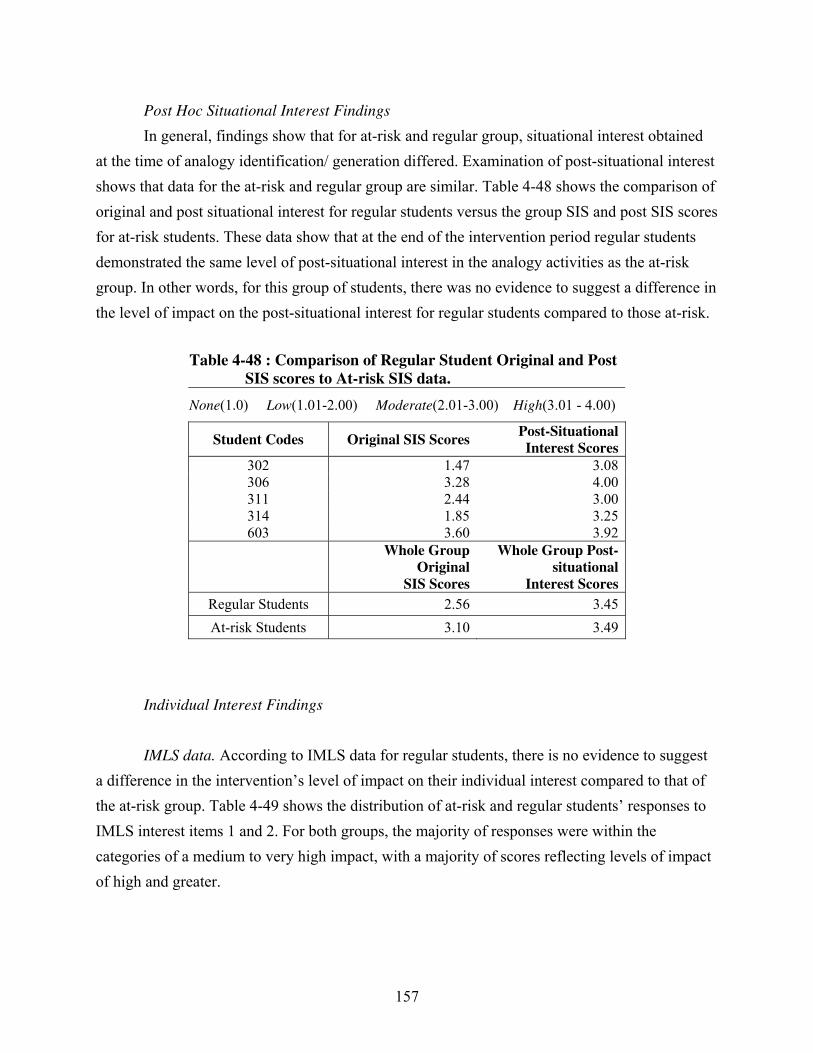
Post Hoc Situational Interest Findings
In general, findings show that for at-risk and regular group, situational interest obtained
at the time of analogy identification/ generation differed. Examination of post-situational interest
shows that data for the at-risk and regular group are similar. Table 4-48 shows the comparison of
original and post situational interest for regular students versus the group SIS and post SIS scores
for at-risk students. These data show that at the end of the intervention period regular students
demonstrated the same level of post-situational interest in the analogy activities as the at-risk
group. In other words, for this group of students, there was no evidence to suggest a difference in
the level of impact on the post-situational interest for regular students compared to those at-risk.
Table 4-48 : Comparison of Regular Student Original and Post
SIS scores to At-risk SIS data.
None(1.0) Low(1.01-2.00) Moderate(2.01-3.00) High(3.01 - 4.00)
Student Codes Original SIS ScoresPost-Situational
Interest Scores
302 1.47 3.08
306 3.28 4.00
311 2.44 3.00
314 1.85 3.25
603 3.60 3.92
Whole Group
Original
SIS Scores
Whole Group Post-
situational
Interest Scores
Regular Students 2.56 3.45
At-risk Students 3.10 3.49
Individual Interest Findings
IMLS data. According to IMLS data for regular students, there is no evidence to suggest
a difference in the intervention’s level of impact on their individual interest compared to that of
the at-risk group. Table 4-49 shows the distribution of at-risk and regular students’ responses to
IMLS interest items 1 and 2. For both groups, the majority of responses were within the
categories of a medium to very high impact, with a majority of scores reflecting levels of impact
of high and greater.
157
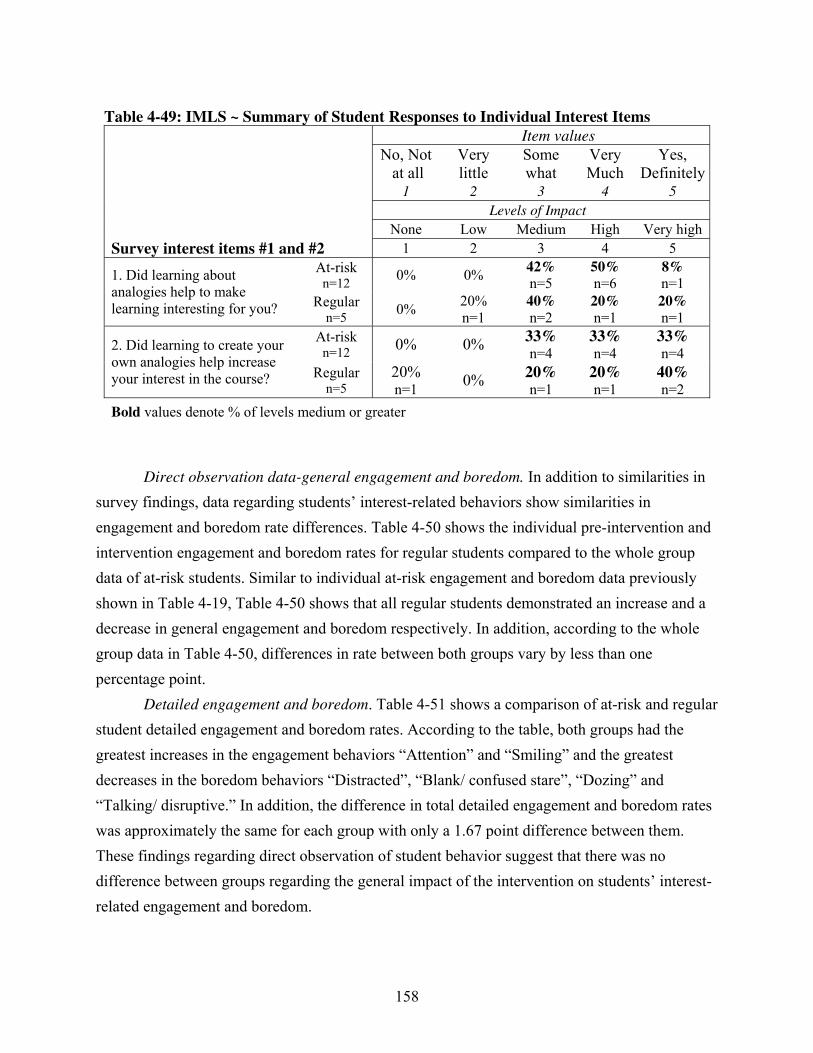
Table 4-49: IMLS ~ Summary of Student Responses to Individual Interest Items
Item values
No, Not
at all
Very
little
Some
what
Very
Much
Yes,
Definitely
1 2 3 4 5
Levels of Impact
None Low Medium High Very high
Survey interest items #1 and #2 1 2 3 4 5
At-risk n=12
0% 0% 42%
n=5
50%
n=6
8%
n=1 1. Did learning about
analogies help to make
learning interesting for you? Regular
n=5 0%
20%
n=1
40%
n=2
20%
n=1
20%
n=1
At-risk n=12
0% 0% 33% n=4
33% n=4
33% n=4
2. Did learning to create your
own analogies help increase
your interest in the course? Regular n=5
20% n=1
0% 20% n=1
20% n=1
40% n=2
Bold values denote % of levels medium or greater
Direct observation data-general engagement and boredom. In addition to similarities in
survey findings, data regarding students’ interest-related behaviors show similarities in
engagement and boredom rate differences. Table 4-50 shows the individual pre-intervention and
intervention engagement and boredom rates for regular students compared to the whole group
data of at-risk students. Similar to individual at-risk engagement and boredom data previously
shown in Table 4-19, Table 4-50 shows that all regular students demonstrated an increase and a
decrease in general engagement and boredom respectively. In addition, according to the whole
group data in Table 4-50, differences in rate between both groups vary by less than one
percentage point.
Detailed engagement and boredom. Table 4-51 shows a comparison of at-risk and regular
student detailed engagement and boredom rates. According to the table, both groups had the
greatest increases in the engagement behaviors “Attention” and “Smiling” and the greatest
decreases in the boredom behaviors “Distracted”, “Blank/ confused stare”, “Dozing” and
“Talking/ disruptive.” In addition, the difference in total detailed engagement and boredom rates
was approximately the same for each group with only a 1.67 point difference between them.
These findings regarding direct observation of student behavior suggest that there was no
difference between groups regarding the general impact of the intervention on students’ interest-
related engagement and boredom.
158
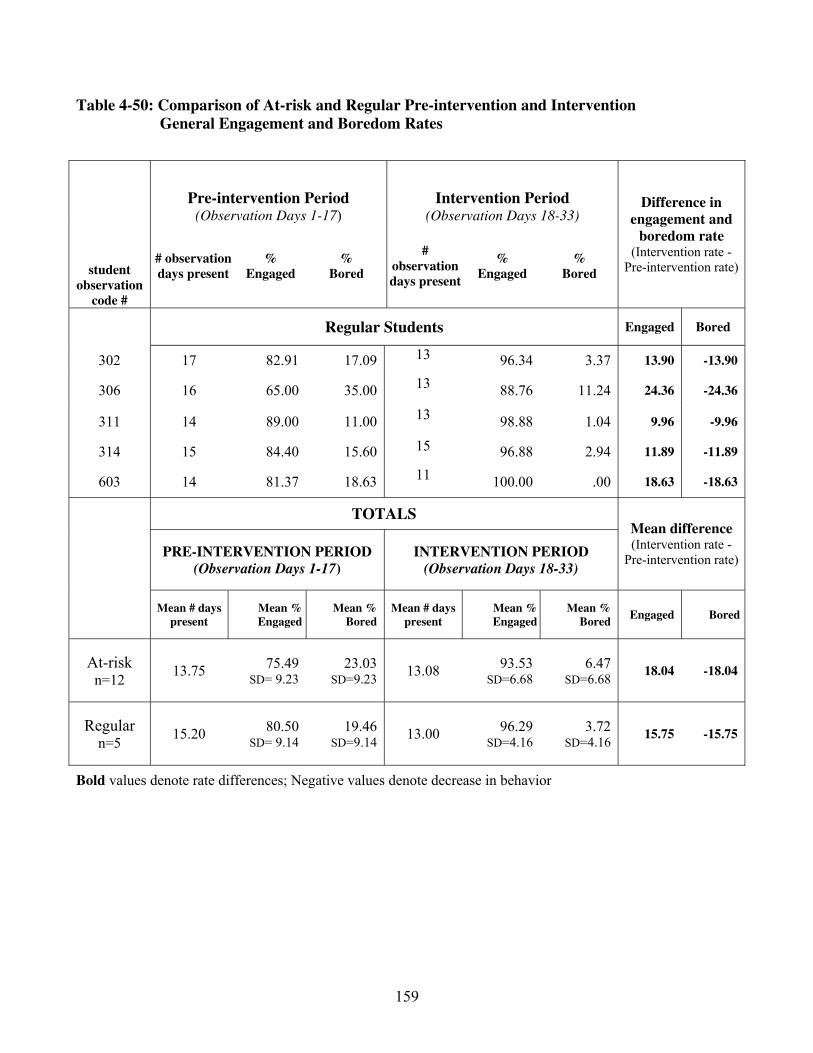
Table 4-50: Comparison of At-risk and Regular Pre-intervention and Intervention
General Engagement and Boredom Rates
Pre-intervention Period (Observation Days 1-17)
Intervention Period (Observation Days 18-33)
student
observation
code #
# observation
days present
%
Engaged
%
Bored
#
observation
days present
%
Engaged
%
Bored
Difference in
engagement and
boredom rate (Intervention rate -
Pre-intervention rate)
Regular Students Engaged Bored
302 17 82.91 17.09 13 96.34 3.37 13.90 -13.90
306 16 65.00 35.0013
88.76 11.24 24.36 -24.36
311 14 89.00 11.0013
98.88 1.04 9.96 -9.96
314 15 84.40 15.60 15 96.88 2.94 11.89 -11.89
603 14 81.37 18.6311
100.00 .00 18.63 -18.63
TOTALS
PRE-INTERVENTION PERIOD
(Observation Days 1-17)
INTERVENTION PERIOD
(Observation Days 18-33)
Mean difference
(Intervention rate -
Pre-intervention rate)
Mean # days
present
Mean %
Engaged
Mean %
Bored
Mean # days
present
Mean %
Engaged
Mean %
Bored Engaged Bored
At-risk n=12
13.75 75.49
SD= 9.23
23.03 SD=9.23
13.08 93.53
SD=6.68
6.47 SD=6.68
18.04 -18.04
Regular n=5
15.20 80.50
SD= 9.14 19.46
SD=9.14 13.00
96.29 SD=4.16
3.72 SD=4.16
15.75 -15.75
Bold values denote rate differences; Negative values denote decrease in behavior
159
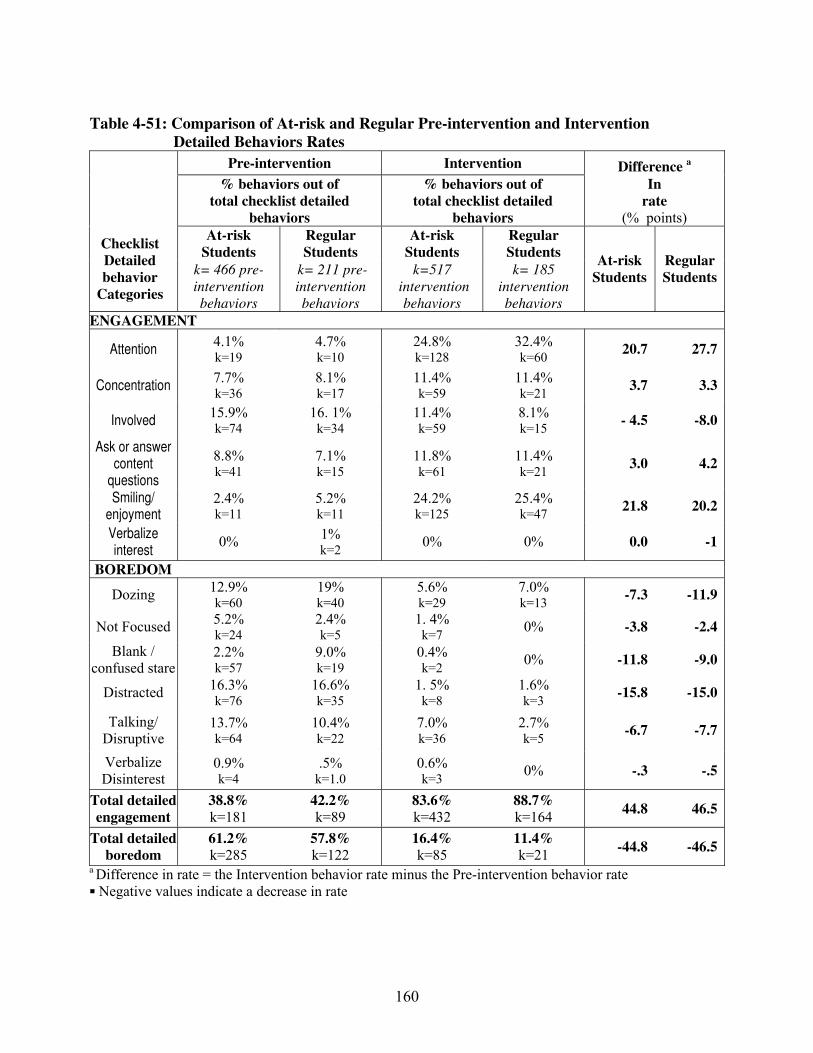
Table 4-51: Comparison of At-risk and Regular Pre-intervention and Intervention
Detailed Behaviors Rates
Pre-intervention Intervention Difference a
% behaviors out of
total checklist detailed
behaviors
% behaviors out of
total checklist detailed
behaviors
In
rate
(% points)
At-risk
Students
Regular
Students
At-risk
Students
Regular
Students Checklist
Detailed
behavior
Categories
k= 466 pre-
intervention
behaviors
k= 211 pre-
intervention
behaviors
k=517
intervention
behaviors
k= 185
intervention
behaviors
At-risk
Students
Regular
Students
ENGAGEMENT
Attention 4.1% k=19
4.7% k=10
24.8% k=128
32.4% k=60
20.7 27.7
Concentration 7.7% k=36
8.1% k=17
11.4% k=59
11.4% k=21
3.7 3.3
Involved 15.9% k=74
16. 1% k=34
11.4% k=59
8.1% k=15
- 4.5 -8.0
Ask or answer content
questions
8.8% k=41
7.1% k=15
11.8% k=61
11.4% k=21
3.0 4.2
Smiling/ enjoyment
2.4% k=11
5.2% k=11
24.2% k=125
25.4% k=47
21.8 20.2
Verbalize interest
0% 1% k=2
0% 0% 0.0 -1
BOREDOM
Dozing 12.9% k=60
19% k=40
5.6% k=29
7.0% k=13
-7.3 -11.9
Not Focused 5.2% k=24
2.4% k=5
1. 4% k=7
0% -3.8 -2.4
Blank /
confused stare 2.2% k=57
9.0% k=19
0.4% k=2
0% -11.8 -9.0
Distracted 16.3% k=76
16.6% k=35
1. 5% k=8
1.6% k=3
-15.8 -15.0
Talking/
Disruptive 13.7% k=64
10.4% k=22
7.0% k=36
2.7% k=5
-6.7 -7.7
Verbalize
Disinterest 0.9% k=4
.5% k=1.0
0.6% k=3
0% -.3 -.5
Total detailed
engagement
38.8%
k=181
42.2%
k=89
83.6%
k=432
88.7%
k=164 44.8 46.5
Total detailed
boredom
61.2%
k=285
57.8%
k=122
16.4%
k=85
11.4%
k=21 -44.8 -46.5
a Difference in rate = the Intervention behavior rate minus the Pre-intervention behavior rate
Negative values indicate a decrease in rate
160
Motivation to Learn Findings
IMLS findings. Student self-report survey data regarding the intervention’s impact on
student’s motivation to learn show that the majority of at-risk and regular students gave similar
responses to IMLS motivation-to-learn items. Table 4-52 shows the percentage of student
responses categorized by levels of impact for each motivation to learn item. According to the
table, the majority of responses for both regular and at-risk groups were in the moderate to very
high categories. For items 4, 5, and 8 both groups had the highest percentage of their responses
in the moderate level of impact category. For item 7, both groups had the highest percentage of
responses in the high level of impact category. For item 6, the student groups differed in their
responses. For this item, the majority of regular group responses were in the moderate level of
impact category while the majority of at-risk group responses were in the high level of impact
category. In general, these findings suggest that the majority of students in both groups felt the
same regarding the general level of impact of the intervention on their motivation to learn.
Checklist and teacher questionnaire findings. In accordance with findings of student
survey data, findings regarding changes in motivation-to-learn engagement and boredom
behavior are also similar. Table 4-53 show a comparison of checklist behaviors for at-risk and
regular students. According to Table 4-53 regular and at-risk groups experienced general
increases in engagement and decreases in boredom behaviors. Both groups demonstrated their
greatest increase in the engagement category “Often smiled and appeared to enjoy working on
tasks” and their greatest decrease in boredom the category “Usually became distracted during
lessons or classwork.” Regular students also showed a large decrease in the boredom category
“Often gave an appearance of dozing in class” while at-risk students showed a notable decrease
in “had multiple unexcused absences”.
Findings from teacher questionnaire data show that, responses appeared to be similar for
both groups of students across all motivation-to-learn behavior categories. Table 4-54
summarizes the classroom teacher’s perception of changes in student motivation-to-learn for at-
risk and regular groups. According to the table, the total mean difference for the groups was
similar, with a disparity of only 0.2% points for engagement and 0.1% point for boredom
between the two groups. According to the findings from the teacher questionnaire, there is
insufficient evidence to suggest that the at-risk factor (being at-risk or not at-risk) had a bearing
on the intervention’s impact on motivation-to-learn behaviors.
161
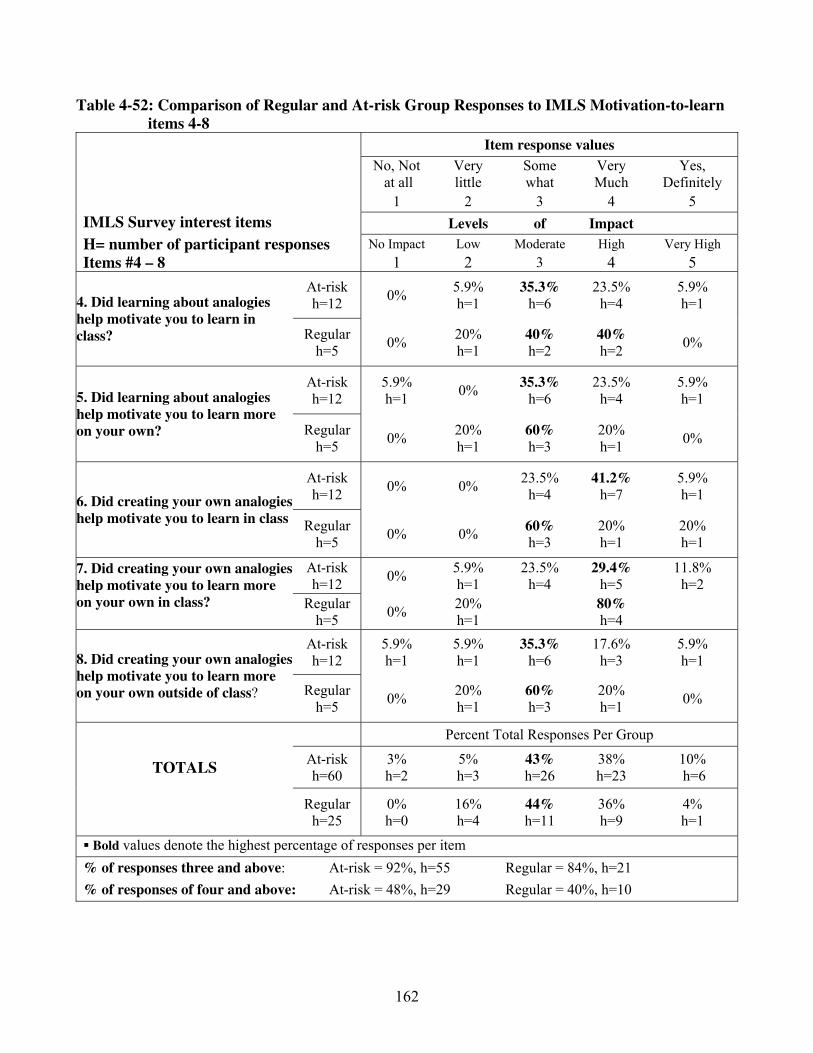
Table 4-52: Comparison of Regular and At-risk Group Responses to IMLS Motivation-to-learn
items 4-8
Item response values
No, Not
at all
Very
little
Some
what
Very
Much
Yes,
Definitely
1 2 3 4 5
IMLS Survey interest items Levels of Impact H= number of participant responses No Impact Low Moderate High Very High
Items #4 – 8 1 2 3 4 5
At-risk
h=12 0%
5.9%
h=1
35.3%
h=6
23.5%
h=4
5.9%
h=1 4. Did learning about analogies
help motivate you to learn in
class? Regular
h=5 0%
20%
h=1
40%
h=2
40%
h=2 0%
At-risk
h=12
5.9%
h=1 0%
35.3%
h=6
23.5%
h=4
5.9%
h=1 5. Did learning about analogies
help motivate you to learn more
on your own? Regular
h=5 0%
20%
h=1
60%
h=3
20%
h=1 0%
At-risk
h=12 0% 0%
23.5%
h=4
41.2%
h=7
5.9%
h=1 6. Did creating your own analogies
help motivate you to learn in class Regular
h=5 0% 0%
60%
h=3
20%
h=1
20%
h=1
At-risk
h=12 0%
5.9%
h=1
23.5%
h=4
29.4%
h=5
11.8%
h=2 7. Did creating your own analogies
help motivate you to learn more
on your own in class?
Regular
h=5 0%
20%
h=1
80%
h=4
At-risk
h=12
5.9%
h=1
5.9%
h=1
35.3%
h=6
17.6%
h=3
5.9%
h=1 8. Did creating your own analogies
help motivate you to learn more
on your own outside of class? Regular
h=5 0%
20%
h=1
60%
h=3
20%
h=1 0%
Percent Total Responses Per Group
TOTALS At-risk
h=60
3%
h=2
5%
h=3
43%
h=26
38%
h=23
10%
h=6
Regular
h=25
0%
h=0
16%
h=4
44%
h=11
36%
h=9
4%
h=1
Bold values denote the highest percentage of responses per item
% of responses three and above: At-risk = 92%, h=55 Regular = 84%, h=21
% of responses of four and above: At-risk = 48%, h=29 Regular = 40%, h=10
162

163
Table 4-53: Checklist Data: The percentage of observed motivation-to-learn behaviors and differences
in rate between the pre-intervention and intervention periods
% Engagement and boredom behavior out of
all motivation-to-learn behaviors Difference
in rate
Pre-intervention Intervention
Students At-risk Regular At-risk Regular
k= Total
Intervention –
Pre-intervention (% points)
Motivation-to-Learn
Categories behaviors k= 137 k= 48 k= 172 k= 51
At-risk Regular
Engagement Behaviors
1. Initiated learning activities on his/her own 11.8%
k=17
8.3%
k=4
14.9%
k=25
9.8%
k=5 3.1 1.5
2. Preferred challenging tasks or pursued
challenging aspects of tasks
.7%
k=1 0%
2.4%
k=4
3.9%
k=2 1.7 3.9
3. Asked questions that went beyond the
present task-to expand his/her knowledge
beyond the immediate lesson
.7%
k=1 0%
2.4%
k=4 0% 1.7 0
4. Went beyond the requirements of class 2.8%
k=4 0%
1.8%
k=3 0% -1 0
5. Worked on tasks whether or not extrinsic
reasons were a relevant factor.
3.5%
k=5 0%
1.2%
k=2 0% -2..3 0
6. Often smiled and appeared to enjoy
working on tasks
2.8%
k=4
8.3%
k=4
35.1%
k=59
45.1%
k=23 32..3 36.8
7. Expressed pride in his/her achievements 5.6%
k=8
4.2%
k=2
7.1%
k=12
5.9%
k=3 1.5 1.7
Boredom Behaviors
8. Often did not make a viable effort to fulfill
requirements for class 0% 0%
1.2%
k=2 0% 0 0
9. Stopped working on tasks before they were
completed
2.8%
k=4
2.1%
k=1
1.8%
k=3 0% -1 -2.1
10. Failed to work on tasks even when
extrinsic rewards were a significant factor
.7%
k=1 0%
1.2%
k=2
2.0%
k=1 .5 2.0
11. Often gave an appearance of dozing in
class
15..3%
k=22
27.1%
k=13
9.5%
k=16
7.8%
k=4 -5.8 -19.3
12. Usually became distracted during lessons
or classwork
18.8%
k=27
33.3%
k=16
6%
k=10
3.9%
k=2 -12.6 -29.4
13. Arrived consistently late to class .7%
k=10%
.6%
k=10% -.1 0
14. Had multiple unexcused absences 18.7%
k=27
14.6%
k=7
11..9%
k=20
19.6%
k=10 -6.8 5.0
15. Exhibited disruptive behaviors in class 6.3%
k=9
2.1%
k=1
5.4%
k=9
2.0%
k=1 -.9 -.1
16. Was overtly withdrawn and non
participatory during lessons or group activities
4.2%
k=6 0% 0% 0% -4.2 0
Total % of observed Motivation- to-learn- Engagement behaviors
29.2%
k=40
20.8%
k=10
63.4%
k=109
64.7%
k=33 34.2 43.9
Total % of observed Motivation-to-learn Boredom behaviors
70.8% k=97
79.2% k=38
36.6% k=63
35.3% k=18
-34.2 -43.9
Bold values denote summary means and differences; Negative values denote a decrease in behavior
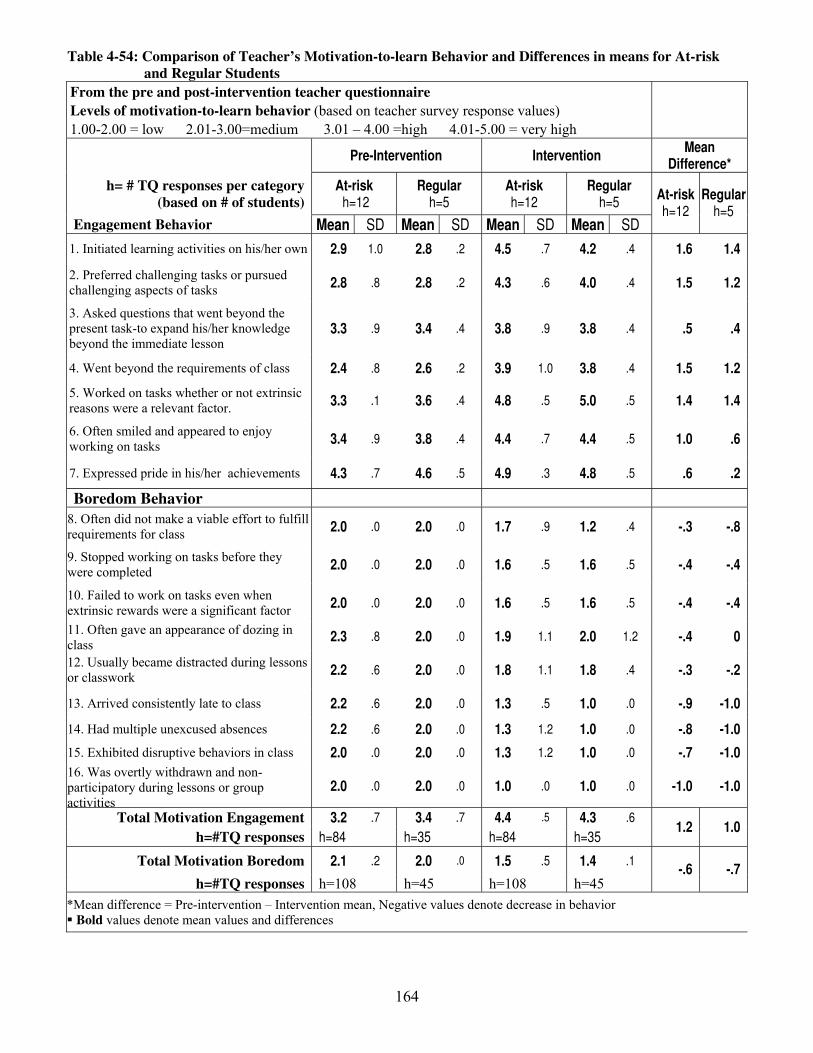
Table 4-54: Comparison of Teacher’s Motivation-to-learn Behavior and Differences in means for At-risk
and Regular Students
From the pre and post-intervention teacher questionnaire
Levels of motivation-to-learn behavior (based on teacher survey response values)
1.00-2.00 = low 2.01-3.00=medium 3.01 – 4.00 =high 4.01-5.00 = very high
Pre-Intervention Intervention
Mean Difference*
h= # TQ responses per category
(based on # of students)
At-risk h=12
Regular h=5
At-risk h=12
Regular h=5
Engagement Behavior Mean SD Mean SD Mean SD Mean SD
At-risk h=12
Regular h=5
1. Initiated learning activities on his/her own 2.9 1.0 2.8 .2 4.5 .7 4.2 .4 1.6 1.4
2. Preferred challenging tasks or pursued
challenging aspects of tasks 2.8 .8 2.8 .2 4.3 .6 4.0 .4 1.5 1.2
3. Asked questions that went beyond the
present task-to expand his/her knowledge
beyond the immediate lesson 3.3 .9 3.4 .4 3.8 .9 3.8 .4 .5 .4
4. Went beyond the requirements of class 2.4 .8 2.6 .2 3.9 1.0 3.8 .4 1.5 1.2
5. Worked on tasks whether or not extrinsic
reasons were a relevant factor. 3.3 .1 3.6 .4 4.8 .5 5.0 .5 1.4 1.4
6. Often smiled and appeared to enjoy
working on tasks 3.4 .9 3.8 .4 4.4 .7 4.4 .5 1.0 .6
7. Expressed pride in his/her achievements 4.3 .7 4.6 .5 4.9 .3 4.8 .5 .6 .2
Boredom Behavior
8. Often did not make a viable effort to fulfill
requirements for class 2.0 .0 2.0 .0 1.7 .9 1.2 .4 -.3 -.8
9. Stopped working on tasks before they
were completed 2.0 .0 2.0 .0 1.6 .5 1.6 .5 -.4 -.4
10. Failed to work on tasks even when
extrinsic rewards were a significant factor 2.0 .0 2.0 .0 1.6 .5 1.6 .5 -.4 -.4
11. Often gave an appearance of dozing in
class 2.3 .8 2.0 .0 1.9 1.1 2.0 1.2 -.4 0
12. Usually became distracted during lessons
or classwork 2.2 .6 2.0 .0 1.8 1.1 1.8 .4 -.3 -.2
13. Arrived consistently late to class 2.2 .6 2.0 .0 1.3 .5 1.0 .0 -.9 -1.0
14. Had multiple unexcused absences 2.2 .6 2.0 .0 1.3 1.2 1.0 .0 -.8 -1.0
15. Exhibited disruptive behaviors in class 2.0 .0 2.0 .0 1.3 1.2 1.0 .0 -.7 -1.0
16. Was overtly withdrawn and non-
participatory during lessons or group
activities
2.0 .0 2.0 .0 1.0 .0 1.0 .0 -1.0 -1.0
Total Motivation Engagement 3.2 .7 3.4 .7 4.4 .5 4.3 .6
h=#TQ responses h=84 h=35 h=84 h=35 1.2 1.0
Total Motivation Boredom 2.1 .2 2.0 .0 1.5 .5 1.4 .1
h=#TQ responses h=108 h=45 h=108 h=45 -.6 -.7
*Mean difference = Pre-intervention – Intervention mean, Negative values denote decrease in behavior
Bold values denote mean values and differences
164

Post-Intervention Motivation to Learn
Post MLS findings. Findings from the Post MLS show that data regarding sustained
motivation to learn in class and outside of class after the intervention was similar for both
groups. On the post motivation to learn survey, 100% of surveyed students in both the at-risk
group (n=11) and regular group (n=5) affirmed with evidence that the intervention continued to
have an impact on their motivation to learn in class. Below is a sample of survey responses from
regular students regarding this question (pseudonyms are used:
Shondra : “Yes, Most of the analogies were helpful and motivating. It did help me
remember most of the information that was given to me in science class.
The analogy with the three point contest was very helpful, because I play
basket ball. So I think about it a lot.”
Malik : Yes, It has motivated me to learn more in science class. Because when we
learn something new, I say in my head ‘That’s like...’ For example: The
Punnett Square is like a multiplication table.”
In response to the question, “Has the analogy project motivated you to create new
analogies or use other learning strategies to help you learn In other classes besides Biology or
outside of school?” 55% (n=6) of at-risk students and 40% (n=2) of regular students affirmed
with evidence that the intervention motivated them to learn outside the class, to create new
analogies and/or other learning strategies. In addition, 60% (n=3) of regular students said “no”,
the intervention has not motivated them to use analogies outside of class. However, this is
compared to 9% (n=1) of at-risk students who responded no to this question. The following are a
sample of responses regular students gave to the question above:
Sherry: “Yes, I have created some new analogies. One analogy I have made up
had related to my studies in geometry and it helped make a better grade for
me in both science and math.”
Malik: “No, biology is the only class I will use analogies in simply because this is
the only class we do them in and I’m not used to doing them in other
classes.”
Corrine : “No, I never thought about analogies outside of science class.”
165
Question 6. What are some general student attitudes and perceptions regarding teacher and
self-generated analogy use before and during the intervention period?
The intervention was designed to stimulate students’ self-generation of analogies through
the identification and modeling of teacher-constructed analogies, and the use of generative
teaching where students would be asked to generated their own analogies as a part of the set
curriculum. In addition, the classroom teacher in this study was chosen because she was
experienced in analogy construction and used it regularly in her teaching. In addition, with
regards to self-generated analogy use, the teacher reported that it was rarely used before the
intervention period.
In this section, students’ attitude regarding teacher-constructed analogy use during the
pre-intervention (which includes the previous and current semesters, up until the start of the
intervention period) compared to teacher-constructed and self-generated analogy use during the
intervention period is examined. In addition, students’ preferences regarding teacher constructed
analogies and self-generated analogies is discussed. Data was obtained from focus group data for
all participating students (both at-risk and regular) in specific response to this question.
(Pseudonyms are used to identify all focus group responses)
Focus Group findings
One major theme in the focus group discussion regarding teacher-constructed analogy
use during the pre-intervention period was that students felt the teacher analogies did not do
much in helping them learn because the students were not aware of what analogies were or that
she was using them. Some focus group students responded:
Francis: “Before when we were doing cell division I barely even knew that she
was using them.”
Kelley: “I noticed that she was using analogies from the cell stuff, because I
remember learning in the 8th
grade when our teacher was like the cell is
like a machine factory. I thought of it as an analogy and then after that she
probably kept using it in other things but I really didn’t notice.”
Charles: “I thought she was using them like regular examples not analogies...I
wasn’t looking for them, at the time.
166
However, after the start of the analogy intervention which introduced analogies through
the use of the analogy tutorial and follow-up activities, students learned to pay attention and
identify teacher-constructed analogies. Compared to the pre-intervention analogies students said
the teacher analogies used during the intervention period did help them learn more. In the focus
group Francis, Tasha and Kelley responded:
Francis: “Well it did make me think about more stuff. And it made me pay more
attention to more of the stuff Ms. Brown was saying about her
analogies...After we started going over analogies, every time she said is
like or are, it hit me that she was using an analogy.
Tasha: “They came up with some good ones [analogies], and that made me learn
about it more.”
Kelley: “Well I felt that the analogies were all good in general and they help me
learn more in class and when we were taking notes they help me. Like
sometimes her [Ms. Brown] notes was kind of vague and then it help me
like look in the book, look it up to understand it more and...read up on the
definitions.
In addition, because the teacher constructed analogies were integrated within the self-
generated analogy instruction, students learned from them and found that they helped to
increase their interest in the class and considered them helpful in the advancing of their own
self-generated analogies. In the discussion, Kelley, Charles and Malik told of their experiences
in learning with analogies:
Kelley: “The analogies were good. It made it worth learning about... because
before then I used to fall asleep a little bit in class and now the analogies
are getting me more interested in class. I’m awake all the time, listening to
the analogies that are being explained to me so I understand the lesson
more.”
Junior: “The teacher analogies help me because it gave me ideas on what I was
going to do. And I could use that a little bit and mix it in there a little bit
and get it right
Malik: “But first in the lesson I had to learn how to use them. Because I had to
learn the do’s and don’ts of the analogies...Now that I know what to do it
is fun.”
167

However, In addition to perceiving the teacher generated analogies as helpful, most
students felt that the teacher analogies were good but that their self– generated analogies were
more helpful to them in increasing their interest and motivation in the course. In the focus group,
Freeda, Malik and Kelly explain their preference for self-generated analogies:
Freeda: “I learned and understand the teacher analogies, but I understand mine the
most...Though I understand the teacher analogy, I have to learn for myself
and understand for myself. That’s why I understand mine the most.
Because I know where I’m coming from.”
Malik: “See, when the teacher’s came up with their analogies it wasn’t fun for us
because we didn’t get to come up with them. So we didn’t understand
where she was coming from. So when we did it, we knew what she was
talking about, we knew where she was coming from. So, that’s what
changed it...It was easier to do mine that hers.”
Kelley: “The analogies help me...Both of them were good, but I think my
analogies help me the most because they related more to [me]. It was what
motivated me to learn...because I am trying to learn more about the
analogies and trying to connect it to myself and make my own analogies.”
Summary of Findings
Research Question 1a - Situational Interest
♦ 92% of participants reported moderate to high situational interest with the majority of
these participants reporting high situational interest.
♦ Total group SIS score (3.10, h=96) signified that the overall level of situational
interest for the group was high.
♦ Hold factor “Understanding” was reported as the strongest factor
Research Question 1b - Individual Interest
♦ 58% (n=7) and 67% (n=8) participants gave responses values of four and above to
IMLS items #1 and #2 respectively, signifying that the majority of participants felt
the analogy intervention had a high to very high impact on their interest in the course
and learning in general.
♦ Increase and decrease in general engagement and boredom for all participants with a
majority of participants exhibiting an engagement rate of greater than 90% and
168
boredom rate less than 10% during the intervention period.
♦ Greatest increases in “Smiling and enjoyment” and “Attention.”
♦ Greatest decreases in “Distracted”, “Blank or confused stare” and Dozing.”
Research Question 2 – Motivation to Learn
♦ 92% (h=55) of all participant responses were reported values of three and above, with
53% of those responses (h=29) reported as four and above.
♦ Majority of participants felt that the analogy intervention had a high to very high
level of impact on some facet of their motivation to learn during the intervention
period.
♦ General pattern of increase and decrease in motivation-related engagement and
boredom, respectively.
♦ On Pre and Post-TQ, teacher perceived an increase in that five out of seven
engagement categories and a decrease in all nine categories of boredom.
Research Question 3 – Does a viable relationship exist between the three variables?
♦ The findings of this study provided strong evidence of a relationship between the
variables and support for Hidi and Harackiewicz’s (2000) and Schiefele’s (1991)
theories.
Research Question 4 – At-risk Male versus Female group
♦ Data for both groups were similar for situational interest and post-intervention
motivation to learn, but different for individual interest and motivation to learn
Research Question 5 – At-risk group versus Regular group
♦ Data for both groups were similar for individual interest, motivation to learn, and
post-intervention motivation to learn, but different for situational interest.
♦ Research Question 6 – Students’ perspective on analogy use
♦ All students reported that teacher analogies used during the intervention period
helped them learn more than those used by the teacher before the intervention
because they helped increase their interest in the class and in the advancing of their
self-generated analogies
♦ Most students preferred self– generated analogies more than teacher constructed
analogies because they were more helpful to them and helped to increase their
interest and motivation to learn more.
169
CHAPTER FIVE
Discussion
This chapter presents a discussion of the findings of the study, as well as conclusions,
implications and recommendations for further research. The purpose of this study was to
examine the impact of self-generated analogy instruction on the situational interest, individual
interest and motivation to learn in students who are at-risk of dropping out of high school. The
goals of this study were to better understand and confirm the dynamic relationships between
situational interest, individual interest and intrinsic motivation to learn and to confirm whether or
not self-generated analogy instruction can be an effective tool in nurturing at-risk students’
interest and motivation to learn. This study involved the introduction of an intervention, self-
generated analogy instruction, within two intact high-school biology classrooms and utilized a
mixed method research design comprised of both qualitative and quantitative techniques for
collecting data.
Based on dropout prevention research, theories of interest and motivation to learn, and
theories of generative teaching and learning, the rationale of the study makes the following
claims:
1. The problem of students leaving school before graduation is a national social and
economic crisis (Catterall, 1985) that demands immediate attention from policy-
makers/ educators and warrants further research.
2. In Rumberger’s (1987) review of literature on high school dropouts “Dislike of
school” was chosen by the largest percentage of dropouts across ethnicity and
gender; and according to a contemporary survey study, students’ “dislike of
school” often translated into feelings of boredom (Epstein, 1989; Farrell, 1990).
3. Learning environments for at-risk students who are failing have traditionally been
teacher controlled and have provided low-level, routine tasks (DiCintio & Gee,
1999; McDermott, 1997) and this type of learning situation goes against current
theory and research regarding environments that enhance students’ motivation to
learn. Restructuring of schools therefore should focus on changing a student’s
classroom experience (Dynarski & Gleason, 1999).
4. Many times, students who are labeled “at-risk of dropping out” simply
demonstrate a lack of motivation to learn in school (DiCintio & Gee, 1999). They
170
exhibit this lack of motivation in behaviors such as not doing classwork or
assignments, putting heads down on desks, attending school but “hanging around
the school” instead of going to certain classes (DiCintio & Gee, 1999; Ianni & Orr
1996). Therefore, “If students are unmotivated to learn, teachers must create the
conditions to support self-motivation” (DiCintio & Gee, 1999, p. 231).
5. Because disinterest in learning is a primary manifestation of lack of motivation to
learn (Mitchell, 1993), we may combat classroom boredom and empirically
examine students’ learning in the classroom through the investigation of the
intrinsic motivational variables, interest and motivation to learn. Through
continued stimulation of a person’s situational interest, a person’s long-term
individual interest can be developed (Hidi & Harackiewicz, 2000), which in turn
may effectively foster their motivation to learn (Schiefele, 1991).
6. Self-generated analogy instruction is a potentially effective teaching/learning tool
that can be used to continuously stimulate students’ situational interest within the
classroom (Duit, 1999; Glynn,1991), thereby developing individual interest in
learning and in the course and fostering students’ motivation to learn, while
decreasing boredom and low motivation to learn.
7. Increased student interest and motivation to learn combined with the continued
and independent use of self-generated analogies (or other self-initiated learning
strategy) as learning tool can promote sustained motivation to learn in individuals,
empowering them to become independent, self-motivated learners who are more
apt to remain in school until completion.
The discussion of findings in this section has been organized by the research questions of
the study to facilitate the readers’ understanding of the findings and their connection to the
rationale and design of the study.
Research Question 1a - Situational Interest
To what extent does the analogy intervention impact at-risk students’ situational interest in
the analogy activities?
According to interest theory, there are two distinct types of interest: (a) situational
interest, which pertains to the specific characteristics of an event or object that capture one’s
interest (Hidi, 1990) and tend to be shared among individuals (Krapp, Hidi, and Renninger,
1992); and (b) individual interest which emerges from one’s history of interaction with an object
171

or a stimulus over time (Hidi, 1990) and is always specific to individuals (Krapp, Hidi, and
Renninger, 1992).
The purpose of this question was to investigate the intervention’s effectiveness or success
in stimulating students’ situational interest. It was predicted that the impact of intervention on
student’s situational interest in the analogy activities would be moderate to high. The results of
study show that the prediction was supported. The intervention, self-generated analogy
instruction, was successful in producing a moderate to high level of situational interest in almost
all at-risk participants, with the majority of students reporting a high level of situational interest.
In written and verbal responses students cited the analogy activities as interesting because they
were fun to do, were instrumental in helping them understand and remember concepts, and were
meaningful because they helped connect the concepts they were learning to their every day life.
Findings in this study regarding catch and hold factors are consistent with Mitchell
(1993). In his research, Mitchell (1993) proposed that hold factors are those that empower
students and that catch factors stimulate or temporarily increase the activity of students. In this
study, the to SIS findings indicate that for most students, the hold factor “Understanding,” was
the strongest factor in their situational interest, with the greatest percentage of responses in the
category of high situational interest. This was validated with focus group responses regarding
student’s situational interest in the analogy activities. The major theme in students’ responses
was that the analogy activities were most interesting to them because the analogies helped
promote their understanding of the concept. In addition, the hold factors, “Memory” and
Personal Connection,” were also quite strong, with a high level of impact reported for most
student responses. Students responses regarding these factors confirm the existence of hold
factors in situational interest.
In this study, however, the catch factor “Interestingness” was determined to be the factor
with the least strength, with a medium level of impact reported for most student responses. This
may be due in part to the way teacher-constructed analogies were presented and modeled in the
lesson. It was anticipated that in the teacher’s presentation of analogies, some imagery, diagram
or hands on object would be used to heighten interest. However, in this study, this was not the
case. During the period of use of teacher-constructed analogies and student identification of
them, the analogies presented by the intern teacher and supervising teacher did not include
imagery or any visible diagram or object but were only discussed briefly in the lesson. Had
these strategies been used in presenting the teacher-constructed analogies, students’ level of
response for “interestingness” possibly would have been higher.
172

Other Possible Catch and Hold Factors
In focus group discussions regarding students’ interest in the analogy activities, there was
evidence suggesting the possible existence of three other catch or hold factors. Students
identified competition, groupwork, and viewing analogies as a puzzle or a game (learning as
play) as other factors that influenced their situational interest in the analogy activities. In
Mitchell’s (1993) investigation of a math class, he identified “groupwork”, “computers”, and
“puzzles” as catch factors specific to the academic subject of math because students in the math
class mentioned these factors as providing a change of pace and variety to their classroom. In
this study more investigation needs to be done to determine whether these function to catch or
hold students’ situational interest.
Post-intervention Situational Interest
At the end of the intervention period, evidence of the possible existence of another form
of situational interest emerged from the data. This form of situational interest was referred to as
post-intervention situational interest because it was observed at the end of the intervention
period and operationally defined as the self-reported level of perceived interestingness in the
analogy activities obtained at the end of the intervention period or thereafter. Three students in
particular, who said they did not like analogies in the beginning of the intervention period, were
recorded as having a positive shift in attitude towards analogies at the conclusion of the
intervention. Further investigation of this alternate form of situational interest is needed and in
conjunction with original situational interest may shed more light on the relationship between
repeated situational interest and the development of long-lasting individual interest.
Research Question 1b - Individual Interest
To what extent does the analogy intervention impact at-risk students’ individual interest in the
Biology course and learning in general?
It has been suggested by interest researchers that individual interest emerges from a
“repeated state of an object-specific situational interest” (Renninger, Hoffmann, & Krapp, 1998,
p.12). In this study, the goal was to use the intervention, self-generated analogy instruction, as an
instructional tool to repeatedly stimulate students situational interest over a period of five ½
weeks.
The purpose of this question was to investigate whether or not, at the end of the
intervention period, students perceived the intervention as increasing their individual interest in
173

the course and in learning in general, and whether or not these self-report data would be
confirmed by evidence of an increase and decrease in interest-related engagement and boredom,
respectively. It was predicted that individual interest on the Interest and Motivation to Learn
Survey (IMLS) would be moderate to high (depicted by a student response value of three or
above) with a majority of students reporting a high level interest (value of four or above). Also, it
was predicted that observed interest-related behavior would improve during the intervention
period as compared to that of the pre-intervention period (as indicated by an increase in interest-
related engagement and a decrease in interest-related boredom behaviors during the intervention
period).
The results show that these predictions were supported. For both items#1 and #2 on the
IMLS, individual interest was reported to be moderate to high for all students, with a majority of
students reporting levels of high to very high individual interest due to the intervention. In
written and verbal comments regarding individual interest, some students said that their interest
in the course and in learning increased because they felt that because the analogy activities
helped them understand and remember more so that they could participate in class and raise their
hands to answer questions more. In addition some students felt that the analogy activities made
the course more interesting because the activities stimulated their creative thinking in class and
gave them more confidence to share their ideas without being afraid that they were wrong. In
addition some students felt that the personal connection self-generated analogies made to their
everyday life made what they were learning in the course more meaningful and interesting to
them.
Direct Observations
In the examination of interest-related behavior, data showed an increase and decrease in
general engagement and boredom, respectively, for all participants with a majority of
participants exhibiting an engagement rate of greater than 90% and boredom rate less than 10%
during the intervention period. More specifically, in relation to detailed interest-related
behaviors, greatest increases in engagement were seen in the behaviors “Smiling and enjoyment”
and “Attention.” Greatest decreases in boredom were seen in the behaviors, “Distracted”,
“Blank or confused stare” and Dozing.”
An interesting finding with regards to engagement and boredom was that the behaviors
with the greatest increases and decreases respectively corresponded mainly with students’
outward displays of enjoyment and attention. For example, the fact that students were more
attentive to the teacher during class also meant that they were showing less signs of being
174
distracted, staring blankly into space, and falling asleep. According to interest research, outward
displays of personal enjoyment (smiling, laughing) directly correspond to Individual Interest,
however there is a question as to the function of attention in individual interest. Some theorists
believe that attention is one of the key mediating variables between interest and learning, not
causally related, but rather an “epiphenomenon that occurs simultaneously with learning” (Hidi
& Berndorff, 1998 p.83). It is a position of this paper that further research in defining processes,
such as attention, which mediate the effects of individual interest on learning, may help to
explain and provide more information regarding the dynamics between individual interest and
motivation to learn.
Research Question 2 – Motivation to Learn
To what extent does the analogy intervention impact at-risk student’s motivation to learn
inside and outside of class during and after the intervention period?
The purpose of this question was to investigate the extent to which students perceived the
intervention as motivating them to learn in class and outside of class with evidence of increased
motivation-related engagement and decreased motivation-related boredom during the
intervention period, and to investigate the extent to which students perceived the intervention as
and in sustaining their motivation to learn inside and outside of class after the intervention
period.
Interest and Motivation to Learn Survey (IMLS)
It was predicted that the level of motivation to learn on the IMLS would be moderate to
high for most of the students as depicted by self-report item values of three or above, with a
majority of these students reporting values of four and above.
Results show that these predictions were supported. On the IMLS, the level of motivation
to learn was moderate to high for most of students, with a majority of these students reporting a
levels of four or above for one or more of the five IMLS items (#4-8). This data signifies the
majority of participants felt that the analogy intervention had a high to very high level of impact
on some facet of their motivation to learn during the intervention period. In addition, IMLS
results showed that most students felt the intervention, especially the portion directly dealing
with the self-generation of analogies had a greater impact on their motivation to learn in the
classroom than outside the classroom.
175
Observation Checklist and Teacher Questionnaire Data
In correspondence with survey data, observed motivation-to-learn behaviors and the
responses given by the teacher on the pre and post-intervention teacher questionnaires were
predicted to reflect an improvement in student motivation to learn behavior during the
intervention and post-intervention periods as compared to the pre-intervention period (indicated
by an increase and decrease in motivation-to-learn engagement and boredom behaviors,
respectively). Results show that these predictions were supported. In general, both checklist and
teacher questionnaire data provided evidence of a general increase in motivation-related
engagement and a decrease in motivation-related boredom for a majority of participants during
the intervention period as compared to the pre-intervention period. In addition, the checklist data
show that the proportion of motivation-related engagement behaviors to boredom behaviors
shifted. During the pre-intervention period, observed motivation-related boredom behaviors were
recorded at a rate of more that two times that of engagement behaviors. However, during the
intervention period, the rate of boredom decrease and engagement behaviors became almost
twice that of boredom behaviors for that period. Checklist results show the behaviors with the
greatest difference in rate were in the engagement category “Often smiled and appeared to enjoy
working on tasks” and the boredom categories, “Usually became distracted during lessons or
classwork” and “Had multiple unexcused absences.”
Teacher Questionnaire Data
Based on her current and prior experience with the students in the classroom and her
knowledge of their general patterns of engagement and boredom, the teacher perceived an
increase in the level of student engagement from a level of medium engagement to high
engagement. In addition, she perceived a decrease in boredom in the classroom from a low level
of boredom to the lowest level where boredom behaviors are characterized as occurring very
little to not at all. The greatest degree of student change on the teacher questionnaires were in the
engagement categories “Often smiled and appeared to enjoy working on tasks”, “Initiated
learning activities on his/her own”, and “Expressed pride in his/her achievements.” Regarding
motivation to learn, in written and verbal responses students said, the intervention motivated
them to pay more attention to the teacher, and answer questions more in class. In addition some
students also indicated that the intervention motivated them to learn on their own in class by
asking for help when they didn’t understand, clarifying concepts by “reading up on them” in the
text book and taking additional notes when they weren’t required to do so.
176
Post-Intervention Motivation to Learn Survey (Post MLS)
Regarding the Post MLS, it was predicted that student responses would affirm the
continued impact of the analogy intervention on their motivation to learn inside and outside the
classroom after the intervention period. The results showed that these predictions were
supported. According to student responses, all students affirm that the analogy instruction they
received during the intervention period continued to impact their motivation to learn in class. In
addition most students reported the intervention motivated them to learn outside of class and/or
in other classes, with more than half of this group affirming that they have used analogies or
generated new analogies on their own to help them learn. This data regarding students’
motivation to learn during the post-intervention period was supported by informal interviews
from the classroom teacher and another subject teacher.
Post Hoc Teacher Interview- Teacher’s Perspective on Changes in Student Learning
One notable finding regarding the teachers’ perception of student learning during the
post-intervention period is that based on the activities we did with analogies, the teacher
recognized that the students were now taking charge of their own learning by asking and
answering questions on their own, and seeking information that they need on their own. She
attributes this to the student-centered learning environment that was created to foster students’
creativity and self-generation of analogies. She recognized that in order to get students learning
and thinking for themselves she had to create opportunities for them to share their ideas and
develop a sense of confidence and responsibility towards their own learning. It was interesting to
observe that while Ms. Brown engaged her students in generative learning, in consciously
creating analogies for the purpose connecting to themselves and their prior knowledge, she was
also engaged in generative teaching. In implementing generative teaching, she began to take on a
role as facilitator of her students learning by encouraging students and providing opportunities
for them to generated analogies for themselves. Ms. Brown became more aware of the impact of
the learning environment that she was fostering and appeared to enjoy sharing ideas with her
students and they appeared to enjoy sharing ideas with her and their classmates.
In designing this study, it was anticipated that some change in Mrs. Brown style of
teaching would occur. Before introduction of the study, Ms. Brown’s teaching style was mostly
teacher-centered and traditional. In preparation for the students’ self-generated analogy project,
Ms. Brown was asked to incorporate opportunities for the students to generate their own
analogies within the upcoming genetics unit and using her own style and methods of teaching.
During the process of the students’ self-generation of analogies, the environment of the
177
classroom and Ms. Brown’s style of teaching shifted a little to encourage and increase student
creativity and to promote the generative learning process. Instead of mostly lecture, seatwork
assignments and exam-related activities, lectures were shortened to give students time to
generate analogies within the lesson and share them with the class and groupwork was used at
times to enhance the brainstorming process of generating analogies. This shift towards becoming
more students-centered was anticipated by the researcher but was not discussed with the
classroom teacher. The teacher was not asked by the researcher to modify her style of teaching in
any way but eventually did so on her own.
Research Question 3 – Does a viable relationship exist between the three variables?
Based on the outcome study, to what extent can we say that situational interest, individual
interest, and motivation to learn are related. If related, do the findings regarding the
relationship of these variables confirm Hidi & Harackiewicz’s (2000) theory that individual
interest can be influenced by continued situational interest over time and Schiefele’s (1991)
theory that individual interest can be viewed as a pre-condition of intrinsic motivation?
The purpose of this question was to gather pertinent data from the study regarding
students situational interest, individual interest and motivation to learn and present the findings
in light of these two theories. If the findings support the theories then we can say that we are on
the right tract in promoting motivation to learn in students especially those who are categorized
as being at risk of dropping out. It was predicted that the findings from this study would provide
sufficient evidence to suggest a strong association between situational interest, individual
interest, and motivation to learn, and confirm Hidi & Harackiewicz’s (2000) and Schiefele’s
(1991) theories of interest and motivation to learn.
The results show that this prediction was supported. The findings of this study regarding
situational interest, individual interest and motivation to learn, provided strong evidence in
support of Hidi and Harackiewicz’s (2000) and Schiefele’s (1991) theories. In other words, there
was evidence to suggest that for these students the intervention’s success in promoting high
situational interest led to the effective development of their individual interest and contributed to
the impact of the intervention on their motivation to learn.
The findings show that most students who indicated a high level of impact on their
individual interest at the end of the intervention also indicated a high level of impact on their
situational interest during the intervention. In addition, out of the students who indicated high
levels of situational and individual interest, a majority also indicated a high level of impact on
some category of their motivation to learn. In addition, the findings of this study regarding the
178
Post MLS also support Schiefele’s belief that increased motivation to learn will impact learning
processes in areas such as level of comprehension and the use of “deep-level” learning strategies.
As mentioned previously, all participants who completed the survey indicated that the
intervention continued to impact their thinking and motivation to learn on their own in class and
a majority indicated continued impact on their thinking and self-initiated use of self-generated
analogies (a “deep-level” learning strategies) in other subject classes.
Although there is much evidence to support the theories regarding the relationship
between situational interest, individual interest and motivation to learn, the dynamics between
these three variables are not documented or understood. From this study, there is evidence to
suggest that one theory in relation to their association may stem from the mediating process of
attention on interest and learning previously discussed. In the focus group discussion regarding
motivation, students were asked to talk about how the intervention motivated them to learn in
class. A majority of the students said that the analogy activities motivated them to pay attention
to the teacher. However, with regards to observed behaviors, attention was listed and treated as
an interest-related engagement behavior rather a motivation-to-learn behavior. The question that
can then be asked is, “What in the analogy intervention stimulated students to pay attention to
the teacher?” Investigating the answer to this question may lead to new insights with regards to
the dynamic relationship between situational and individual interest and motivation to learn.
It is an interpretation of this study that the behavior “Paying attention to the teacher” may
be connected to all three variables. If a student’s situational interested is stimulated by something
that the teacher is talking about, the student will mostly likely pay attention to her because the
topic is novel and it catches his attention. Once a students’ individual interest becomes
developed for a certain topic, activity or in learning in general, they will most likely pay attention
to the teacher because they are interested knowing more. Once a student’s motivation to learn on
their own is developed then students will pay attention to the teacher because they have a desire
to learn and have developed a better sense of what they need to do in class order to be successful
in the course. In light of this interpretation, it is a position of this paper that at-risk students who
appear to lack motivation to learn in school, who give an appearance of dozing or being highly
distracted, instead, do want to learn new things in school and can become motivated to learn if
given opportunities to develop their interest in learning. In addition, just as “dozing”, “day
dreaming” or “zoning out” (not focused) are the first signs of absenting behaviors, of internally
dropping out (Farrell, 1990), behaviors such as paying attention to the teacher and making a
conscious effort to do so may be one of the first manifestations of at-risk students’ motivation to
learn in school.
179
Research Question 4 – At-risk Males versus Females
Within the at-risk group, how do the study’s findings regarding situational interest, individual
interest and motivation to learn compare between female and male students?
This question was generated to examine whether or not there was evidence of a
difference in the intervention’s impact on male and female participants as a group. It was
predicted that for each variable, data for both groups would be similar, suggesting that the
gender factor, whether or not a student was male or female, would not have a great influence on
the intervention’s level impact on participants situational and individual interest and motivation
to learn. Results show that this prediction was supported for situational interest and post-
intervention motivation to learn, but not for individual interest and motivation to learn (to be
discussed).
Situational Interest
Results show the intervention’s impact on situational interest was similar for both males
and females. According to the data, both male and female total group SIS scores were within the
category of high level of situational interest. In addition, “Understanding” and “Personal
Connection” were strong factors for both male and female groups with their highest percentages
of responses for the factors in the high level of situational interest category. Both groups also had
responses for the catch factor “Interestingness” in common, with the highest percentage of
responses in the moderate level of situational interest category. Responses for “Memory”
however, differed among groups. “Memory” proved to be a stronger hold factor for the female
group, with most responses in the category of high situational interest, compared to the male
group, whose responses were mostly in the moderate situational interest category. However the
disparity was small. Results indicated that even though males had a higher percentage of scores
in the medium impact category, a substantial amount of their responses was also in the high
impact category with there being only an 8% point difference between genders for that category.
Individual Interest
For individual interest, results showed that the prediction was not supported. According
to the data, students’ survey responses and changes in behavior rate were different for male and
female groups.
IMLS and direct observation data. Findings from the Interest and Motivation to Learn
Survey (IMLS) suggest that the impact of the intervention on the individual interest was
moderate to high for both male and female groups, but based on their responses the female group
indicated a greater impact on their individual interest specifically due to the self-generated
180
analogy portion of the course. This finding is contrary to that of Pittman (1991) were 60% of the
girls in her study preferred teacher-constructed analogies over self-generated analogies because
they did not trust their own explanations of the science concept they were learning. Also, it is
contrary to studies that show a tendency of adolescent girls to lack self-esteem and underestimate
their performance in science. The fact that the at-risk female group in this study felt that their
self-generation of analogies increased their interest in the course, suggests that the process of
generative learning may have increased their interest in science and possibly their perception of
their ability to do well in science.
With regards to direct observation data, an examination of group engagement and
boredom rate differences show that males exhibited a greater increase in favorable interest-
related behaviors compared to females students during the time of the intervention. Overall, the
results show that during the pre-intervention period most males in the class exhibited more
boredom behaviors than most females in the class. During the intervention period, all students in
the male group had substantial increases in engagement and decreases in boredom. In the female
group some students who already had high engagement/low boredom rates improve in behavior
but did not have large differences in rate and two students who said that they did not like
analogies in the beginning did not have large differences in rate. However, upon examination of
the male and female engagement and boredom rates during the intervention period we see that
male and female behavior rates are similar with a difference of 4% points.
Motivation to Learn
For motivation to learn, results show that the prediction was not supported. According to
the data, the intervention’s impact on motivation to learn was different for male and female
groups.
IMLS. On the IMLS, self-report data for both groups were similar for item #6 regarding
the impact of the self-generated analogy portion of the intervention on their motivation to learn
in the class. For this item, the majority of responses for both groups was in the high impact
category. However, male and female group data for all other IMLS items were dissimilar. For
instance, with regards to motivation to learn on their own in the classroom, student response data
indicated that the intervention had a higher level of impact on the female group than the male
group. In addition, with regards to motivation to learn outside the classroom, the female group
had the majority if their responses equally divided between the medium category and high to
very high level of impact. The male group had most of their responses for this item in the
moderate impact category. In summary, the intervention had a high level of impact on motivation
181

to learn in class for both groups. However, females demonstrated a higher level of impact than
boys for motivation to learn on their own in class and outside of class. These findings are
consistent with the females groups’ self-report of high situational and individual interest due to
the analogy activities and show that the overall impact of the intervention on these variables was
consistently greater for females than for males. Studies on the situational interest of males and
females suggest that their interest differ but that males may be more strongly influenced by
situational interest. However, the findings of this study do not support those conclusions.
Motivation –to-learn Checklist and Teacher Questionnaire. Regarding changes in
motivation-related engagement and boredom behaviors, data from the checklist and teacher
questionnaires show that in general both the male and female groups experienced an increase in
motivation-related engagement and a decrease in boredom behaviors. However, according to the
checklist data, males exhibited a greater increase in favorable behaviors during the intervention
period than the female group. In addition, data from the teacher questionnaire were consistent
with the checklist findings. According to the results, the teacher’s responses indicate that she
perceived a greater change in motivation to learn behaviors for males compared to females as a
group and in relation to specific behaviors; the male group had higher mean differences than the
female group in almost every category. It is possible that the studies showing that males are more
influenced by situational interest may prove to be an underlying explanation for this difference in
outward expression of engagement and boredom.
Post Motivation to Learn
Post MLS. Regarding post motivation, results show that the prediction was supported.
According to the Post-MLS findings, there was no indication that the intervention’s impact on
students post-motivation to learn was different for male and female groups. Out of all
participants that completed the survey, all students, male and female, affirmed with evidence
that the intervention continued to have an impact on their motivation to learn in class. Regarding
their post-motivation to learn outside of the classroom, an equal number of students from each
group, three males and three females, affirmed with evidence that the intervention motivated
them to create new analogies and/or other learning strategies outside the class.
Research Question 5 – At-risk versus regular students
How do the study’s findings regarding at-risk students’ situational interest, individual interest
and motivation to learn compare to that of regular students?
This question was generated to compare the data of regular students as a group to that of
182
the at-risk participant group and to examine whether or not there was evidence of a difference in
the intervention’s impact between the groups. It was predicted that for each variable, data for
both groups would be similar, suggesting that the at-risk factor would not have a great influence
on the intervention’s impact on the situational and individual interest and motivation to learn for
at-risk and regular students as a group.
Situational Interest
For situational interest, results show that this prediction was not supported. According to
the data, the intervention’s impact on situational interest was different for at-risk and regular
groups. Data regarding the intervention’s impact on students’ situational interest show that the
level of situational interest was higher for the at-risk group (in the category of high situational
interest) than the regular group. According to the data, the total group SIS score for regular
students was .62 points lower than that of at-risk students placing their SIS score in the category
of moderate situational interest. These data which suggests that as a group, regular students may
not have been as situationally interested in the analogy activities during the intervention.
When examined we see that most of the regular group scored moderate to high situational
interest. However two students in the regular group had low scores. These two students were
friends who sat together in class and often helped each other as a group. One of these students
was away from class during the introductory Analogy Tutorial at conducted at the start of the
intervention period and return to class after we had begun learning about analogies and may not
have understood why were doing them. Perhaps with her friend the other regular student, she did
not initially see the value in doing analogies in biology class and was not interested.
Post-Situational Interest. Examination of post-situational interest shows that like some
at-risk students, the situational interest obtained from the IMLS at the conclusion of the
intervention was higher for regular students. These data shows that at the end of the intervention
period regular students demonstrated the same level of post-situational interest in the analogy
activities as the at-risk group. With time and after using analogies as learning strategies in class,
the regular students who initially had low situational interest may have begun to see the utility in
analogies and found that they help them to learn in class.
Individual Interest.
Results show that the prediction regarding individual interest was supported.
IMLS- interest data. According to IMLS data for regular students, there is no evidence to
suggest a difference in the intervention’s level of impact on their individual interest compared to
that of the at-risk group. For both groups the majority of responses were within the categories of
183
a medium to very high impact, with a majority of scores reflecting levels of impact of high and
greater.
Direct observation. Findings regarding direct observation of student behavior suggest
that there is no difference between groups regarding the general impact of the intervention on
students’ interest-related engagement and boredom. Similar to individual at-risk engagement and
boredom data, all regular students demonstrated an increase and a decrease in general
engagement and boredom respectively, with a differences in rate between both groups varying by
less than one percentage point. In addition, both groups had the greatest increases in the
engagement behaviors “Attention” and “Smiling” and the greatest decreases in the boredom
behaviors “Distracted”, “Blank/ confused stare”, “Dozing” and “Talking/ disruptive.”
Motivation to Learn
Results show that the prediction regarding motivation to learn was supported.
IMLS-motivation data. Student self-report survey data regarding the intervention’s impact
on student’s motivation to learn show that the majority of at-risk and regular students gave
similar responses to IMLS motivation-to-learn items. According to the results, the majority of
IMLS responses for both regular and at-risk groups were in the moderate to very high
categories, and in general, the findings suggest that both groups felt the same regarding the
general level of impact of the intervention on their motivation to learn.
Checklist behaviors and teacher questionnaire data. In addition, at-risk and regular
groups experienced general increases in engagement and decreases in boredom behaviors. Both
groups demonstrated their greatest increase in the engagement category, “Often smiled and
appeared to enjoy working on tasks,” and their greatest decrease in boredom the category,
“Usually became distracted during lessons or classwork.” Findings from teacher questionnaire
data show that, the teacher’s perspective appeared to be similar for both groups of students
across all motivation-to-learn behavior categories, suggesting that the at-risk factor (being at-
risk or not at-risk) had little bearing on the intervention’s impact on motivation-to-learn
behaviors.
Post MLS findings. Findings from the Post MLS show that data regarding sustained
motivation to learn in class after the intervention was similar for both groups. On the post
motivation to learn survey, all students surveyed, both the at-risk group and regular group
affirmed with evidence that the intervention continued to have an impact on their motivation to
learn in class. In addition, two out of five regular students compared with six out of twelve
at-risk students affirmed with evidence that the intervention motivated them to learn outside the
184
class, to create new analogies and/or other learning strategies.
These findings regarding the impact of the intervention on at-risk and regular students
show that analogical instruction is effective enough to enhance the interest and motivation of
students who are at-risk of dropping out and those who have not been categorized as such. This
support the findings of Bulgren, Desher, Schumaker, and Lenz (2000) in their studies on the use
and effectiveness of analogical instruction in diverse high school content classroom. They found
that their analogical instruction was powerful enough to enhance the performance of students
who were at risk for failure as well as other students in “diverse” classes. In addition they
conclude from their findings that this instruction can produce positive results in laboratory
settings as well as in “an actual secondary class taught by a subject-area teacher under typical
school conditions” (Bulgren & Desher, et al., 2000, p.439).
Research Question 6 – Students’ perspective on analogy use.
What are some general student attitudes and preferences regarding the use of self-generated
analogies compared to the use of pre-intervention teacher-constructed analogies as
instructional tools for promoting interest and motivation to learn?
The purpose of this question was to investigate by way of focus group interviews
students’ perception of teacher constructed and self-generated analogy use before and during the
intervention, investigate whether or not students had a shift in attitude towards analogy use and
to gather data regarding their preference in using one form of analogy over another.
One major theme in the data regarding teacher-constructed analogy use during the pre-
intervention period was that students felt the teacher analogies did not do much in helping them
learn because the students were not aware of what analogies were or that she was using them.
According to student responses, because they became more informed about analogies and
because the teacher-constructed analogies were combined with the self-generated analogy
instruction, students began to pay attention and were then able to identify teacher-constructed
analogies. For this reason, students said the teacher analogies used during the intervention period
did help them learn more than those used by the teacher before the intervention. In addition,
students reported that they learned from them more than before, found that they helped to
increase their interest in the class and considered them helpful in the advancing of their own self-
generated analogies. However, although students thought of the teacher constructed analogies
used during the intervention were helpful, some students felt that their self– generated analogies
were more helpful to them and preferred their use over the teacher constructed analogies because
185

it was instrumental in increasing their interest and motivation in the course.
Limitations
Within this study, there are three possible limitations that may have had an influence on
specific outcomes of the study. These limitations are:
1. The difference in teaching styles between the intern and classroom teacher with
respect to its influence on the performance of one participant.
2. The attrition rate of the at-risk sample after the pre-intervention period
3. The difficulty in methodically observing and documenting individual interest or
interest-related engagement and boredom.
Limit 1. The difference in teaching styles between the intern and classroom teacher with
respect to its influence on the performance of one participant.
In this study, there were two teachers who participated as lead teachers at different times
during the course of the study. There was an intern teacher who, under the supervision of the
classroom teacher taught for three out of four weeks during the study’s pre-intervention period
and three weeks at the beginning of the intervention period. The classroom teacher taught all
other times. The intern teacher had a more direct style of teaching were students were taught and
given straightforward materials that they would then be expected to study and remember for an
exam. The classroom teacher used a more indirect/ inductive type of method of teaching where
she expected students to study ahead of time and come prepare to actively participate in asking
and answering questions pertaining to the lesson.
During the time of the pre-intervention period in which the intern teacher taught, many
students who had not been doing well in biology class began to get better grades on assignments
and quizzes/exams. One student who had been failing and who was observed as being very quiet
and having her head down most of the time in the beginning of the pre-intervention period began
to do better academically during this time. However, near the end of the intern-teacher’s practical
teaching internship, this student began to “cut” Biology class (unexcused absences from class,
but present on school grounds) while “hiding” and avoiding being seen by the classroom teacher.
This student was observed engaging in this type of behavior for four days until her parents were
notified and she returned to class. During that time she missed several days of analogy
instruction and because it was a policy of the school that classwork missed due to unexcused
absences could not be made up for credit, she was not able to catch up with her assignments and
186
was the only participant who handed in an incomplete analogy journal which resulted in a very
low situational interest score.
Based on observations of this student before during and after the intervention, if the
intern had not been present in class as a lead teacher that semester, the behavioral outcomes for
this student might have been different in at least two ways: 1. she probably would have been
present in class at the time of the start of the project. (She had 100% attendance in class except
for those days that she was recorded as “cutting” class) and 2. If she were present, she probably
would have completed her analogy journal (the only journal entries that were missing correspond
to the ones that we did in class during the time that she was absent).
Limit 2. Limited sample and attrition of the at-risk sample.
Two limitations of this study regarding the sample of at-risk participants were: 1) the
sample was small and specific and 2) there was a high attrition rate for at-risk after the pre-
intervention period. First, the final sample of 13 at-risk students present during the intervention
period were all African American. Though instructional and learning strategies highlighted in
this study are considered universal for all students, interpretation of the results of the study are
generalizable only to the participant sample used in the study and perhaps other samples similar
to that of the study.
Second, at the start of the pre-intervention period, the study began with 17 at-risk
participants. Because of an event that resulted in the expulsion of three female students and
because of the truancy of a male student, the at-risk sample decreased to 13 participants. In
addition, because the survey scores of an additional female student were deemed unreliable, the
sample of at-risk students decreased again to 12 participants. This attrition rate had an impact on
the analysis and reporting of smaller within-group data sets such as at-gender and the at-risk
factor. A larger number of participants within each subgroup could have changed the pattern of
results for these groups but would have strengthened the study’s findings with respect of gender
and the at-risk factor and increased its generalizability.
Limit 3. The difficulty in observing and documenting individual interest-related
engagement and boredom.
In this study, direct observation was used to collect data regarding individual interest-
related engagement and boredom rates. A pre-set list of interest-related engagement and
boredom was used to code observed behavior at six minute increments within a classroom
period. The difficulty in observing and documenting this specific form of human behavior is that
the researcher can not always determine that the behavior being exhibited is an expression of
187

interest or boredom. For example, on the pre-intervention demographic and interest survey, one
student reported that when he is interested in some thing in class he will “act wild and crazy, I
will be out my seat all day.” Usually, in this study, this type of behavior would be categorized as
boredom behavior because it is most often disruptive in class. However, being aware of this
student’s outward expression of interest, this behavior would be documented as interest-related
engagement most of the time. Regarding his feeling of being bored in school, this same student
responded that when he felt bored in school, he would “Go to sleep, mess with other people and
be bad.” For this student, boredom behaviors were clearer and simpler to identify as disinterest.
However, there were some students in the class who during the study, especially during
the pre-intervention period, that seldom looked up at the teacher, had very little facial expression,
and showed little outward emotion. After spending some time observing these students, it
became easier to identify subtle indications of interest for these students. In addition, during the
intervention period when students became more verbal and full of expression, it became easier to
document interest-related behavior. To resolve this issue, several video-taped lessons could
have been used to verify student behavior and document specific behavior tendencies related to
interest for individual students. In addition, the use of a second observer would increase the
reliability of findings related to direct observation of interest-related behaviors. Third, informal
student interviews after the intervention period would have been helpful in validating and
clarifying student behavior with regards to specific expressions of interest-related engagement
and boredom.
Conclusion
This study demonstrated that the use of self-generated analogies in instruction can be a
powerful and effective tool in promoting situational interest, individual interest and motivation to
learn in at-risk students. In addition, the findings regarding self-generated analogy instruction
support other studies on self-generated analogies such as those done by Bou Jaoude and Tamim
(2000), Cosgrove (1995), Pittman (1999) and Wong (1993a,b) and interest-related studies done
by Sansone, Wiebe and Morgan (1999) and Wolters (1998). The findings of this study show that
self-generation of analogies in learning can empower students by way of meaningful connections
and autonomy in learning and that students can successfully engage in strategies to make their
learning more interesting and eventually develop interest in activities that had been uninteresting.
In addition, this study confirms the theories of Hidi and Harackiewicz (2000) and
188
Schiefele (1991) regarding the association between the variables situational interest, individual
interest and motivation to learn. In this study, the intervention’s success in promoting high
situational interest led to the effective development of students’ individual interest and
contributed to the impact of the intervention on their motivation to learn. In other words, the
results of the study show that when the participants in the study were taught to generate
analogies, to make potentially boring tasks more interesting and meaningful, they began to
perceive themselves as participating and taking greater control of their learning during the course
of the intervention (as documented by their open survey and focus group responses) and, as a
result, their individual interest and motivation increased. This outcome of the study supports
other findings related to interest and motivation theory and dropout prevention research
including Brophy (1986), Lepper (1988), Mitchell (1993), and Nichols and Utesch (1998). In
addition, it demonstrates that targeting the situational interest of at-risk high school students,
determining what stimulates their situational interest in the classroom and then implementing it,
may prove to be a viable solution towards decreasing classroom boredom and promoting at-risk
students’ motivation to learn and stay in school until completion.
Implications for Teacher Education
A goal of this study was to bring to light the critical issue of dropouts and dropout
prevention. Most teachers within their general training to become educators receive limited
instruction regarding the development and learning of adolescents. In addition, most do not
receive any instruction regarding the nature and learning of students who may be categorized at
risk of dropping out. In light of the findings of this study, it is important to note that, while there
is a call for school reform, particularly in the way classroom teachers engage their students in
learning, there must also be a reassessment of how teachers are being trained to teach and who
they are trained to teach. In this study, two teachers served as lead teacher, an intern teacher
(pre-service) and an experienced veteran teacher. For both teachers, using self-generated
analogies as an instructional tool was a new experience. In addition, even though the more
experienced teacher readily used teacher-constructed analogies in her teaching, she had not
taught her students how to identify nor generate analogies for themselves, to enhance their
learning and increase their motivation in class.
According to the National Research Council (2004), “pre-service teacher education
programs should provide new teachers with knowledge about student-centered pedagogy that is
focused on understanding, and teach them strategies for involving students in active learning”
(p. 215). In addition they state that explicit preparation is also important to prepare new teachers
189
and veteran teachers to be effective with diverse, heterogeneous groups of high school students
(such as those who are at risk of dropping out) (National Research Council, 2004). The findings
of this present study provide further evidence regarding the successful use of self-generated
analogy instruction in stimulating at-risk students’ interest and motivation to learn. It is the
argument of this study that the training of pre-service and veteran teachers in the use of strategies
such as self-generated analogy instruction would increase the interest and motivation to learn in
most if not all their students while potentially slowing the dropout rate.
In addition, because of situational interest’s connection to motivation, Interest researchers
urge that it should play an important role in classroom learning, and that educators can find ways
to foster students’ involvement in specific content areas and increase motivation to learn by
focusing on the enhancement of situational interest in classrooms (Bergin, 1999; Hidi, 1990;
Hidi & Harackiewicz, 2000; Mitchell, 1993). Classroom structures built around teachers’ control
of knowledge – emphasizing correct answers over the generation of understanding – often
replace curiosity with compliance, undermine motivation, and impede autonomous learning
(McNeil, 1988). If students are to become self-motivated and no longer dependent on the
teacher, teachers need to be trained to identify and use tools, such as those that stimulate
situational interest, to foster this type of learning in their students.
The use of self-generated analogies instruction warrants the restructuring of classrooms
that are teacher-centered to ones that nurture students’ creativity and sense of self. Specifically in
the area of science education, Flick (1991) suggests that teachers can benefit from a better
understanding of how personal experience can be applied to instruction and that although using
specific text or teacher-based analogies is a common tool in science instruction, teachers need to
be “sensitive to spontaneous or intuitive analogies created by students” (p.217).
Recommendations for Further Research
One recommendation of this study is that further research be done in the area of
situational interest with a focus on students at risk of dropping out of high school. Mitchell
(1993) noted that even though teachers have little influence over the individual interests (or
disinterests) students bring to class they can influence the development of such interests by
creating appropriate environmental settings which foster situational interest. In addition, studies
in relation to its connection to individual interest, attention and learning may provide more
information about how to create learning environments that stimulate students’ situational
interest and develop individual interest and motivation to learn in the classroom. Furthermore,
research investigating catch and hold factors in different settings and disciplines is important to
190

situational research and may be a starting point in identifying or developing instructional or
learning strategies that increase situational interest while meeting the cognitive and affective
needs of at-risk learners.
Another recommendation for research stems from the limited sample of this study.
Although the findings of this study provide important information regarding the effectiveness of
self-generated analogy instruction in relation to at-risk students’ interest and motivation to learn,
they are generalizable to a specific group of at-risk students. Therefore it is recommended that
this study be replicated with a larger participant pool in a wider variety of class settings,
including different disciplines outside of science. Perhaps investigating the impact of self-
generated analogy instruction on the interest and motivation to learn for a diverse group of at-
risk students’, in varying school settings (i.e. alternative, traditional) would increase the
generalizability.
A final recommendation of this study is that additional research in situational interest and
individual interest should be done in combination with research dealing with at-risk and regular
students’ perceptions of ability (self-efficacy, attributions), and student achievement goal
orientations (task vs. ego). In some studies it has been shown that along with individual interest,
self-efficacy and task-orientation are among the motivational factors that may influence the self
directed use of learning strategies (Nolen, 1988; Pintrich, 1988). In addition, Schiefele (1991)
proposed that “interest is an important mental resource for learning” which may lead students to
adopt a “task- or learning-oriented motivational orientation, which in turn codetermines level of
comprehension, use of (deep-level) learning strategies, and the quality of the emotional
experience” (p.316). Further studies on the relationship between situational interest, individual
interest and motivation to learn may help to establish a needed link between motivation research
and studies on cognitive processing (Tobias 1994), thus providing more clues towards the
development of effective classroom strategies that can capture and stimulate the development of
at-risk students’ interest in the classroom while increasing and sustaining their motivation to
learn and stay in school.
191
APPENDIX A: CLEARANCE AND CONSENT
1) Florida State University: Human Subjects Research Clearance
Letter
2) Stamped Parental consent form
3) Stamped Student assent form
192

APPENDIX B: DATA COLLECTION INSTRUMENTS
1. Direct Engagement and Boredom Observation Form (DEBO FORM)
2. Motivation-to-Learn Checklist Form
3. The Pre-Intervention Demographic and Interest Survey (Pre-DIS)
4. The Pre-Intervention Teacher Questionnaire (Pre-TQ)
5. The Situational Interest Survey (SIS)
6. The Individual Interest and Motivation to Learn Survey (IMLS)
7. The Post-Intervention Motivation to Learn Survey (Post-MLS)
8. The Post-Intervention Teacher Questionnaire (Post-TQ)
197
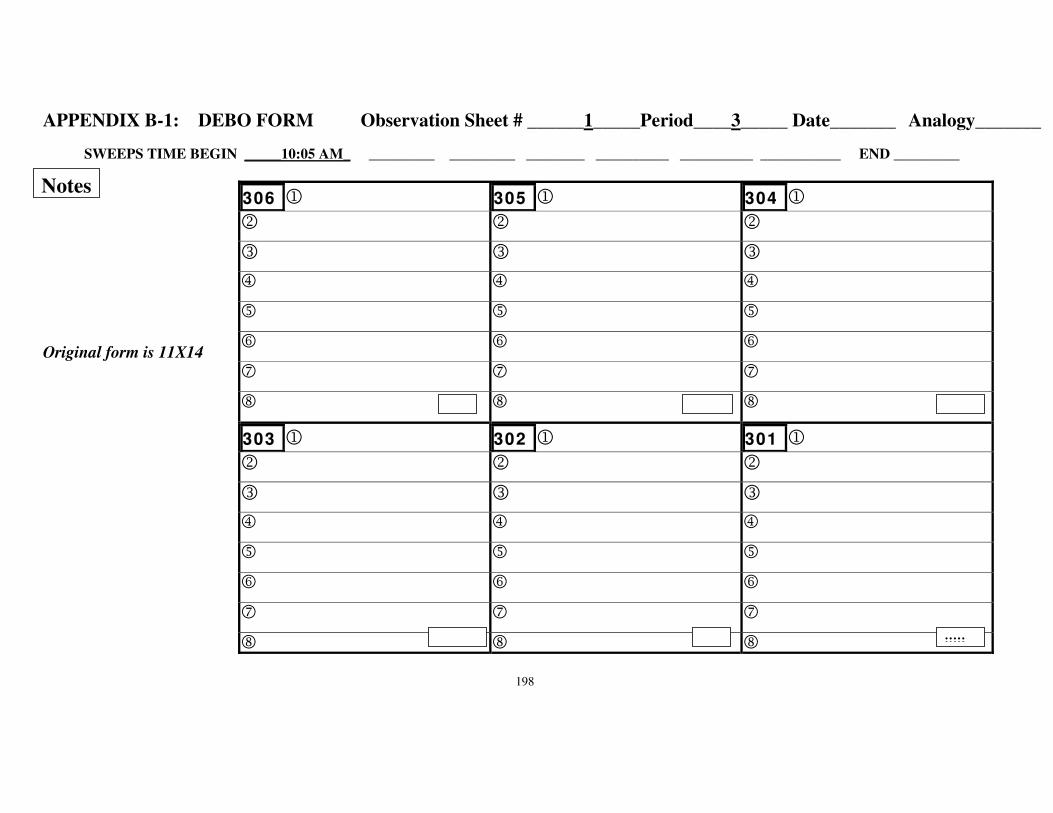
APPENDIX B-1: DEBO FORM Observation Sheet # ______1_____Period____3_____ Date_______ Analogy_______
198
SWEEPS TIME BEGIN _____10:05 AM_ _________ _________ ________ __________ __________ ___________ END _________
Original form is 11X14
306 1 305 1 304 1
2 2 2
3 3 3
4 4 4
5 5 5
6 6 6
7 7 7
8
8 8
303 1 302 1 301 1
2 2 2
3 3 3
4 4 4
5 5 5
6 6 6
7 7 7
8 8 8
Notes
;;;;;
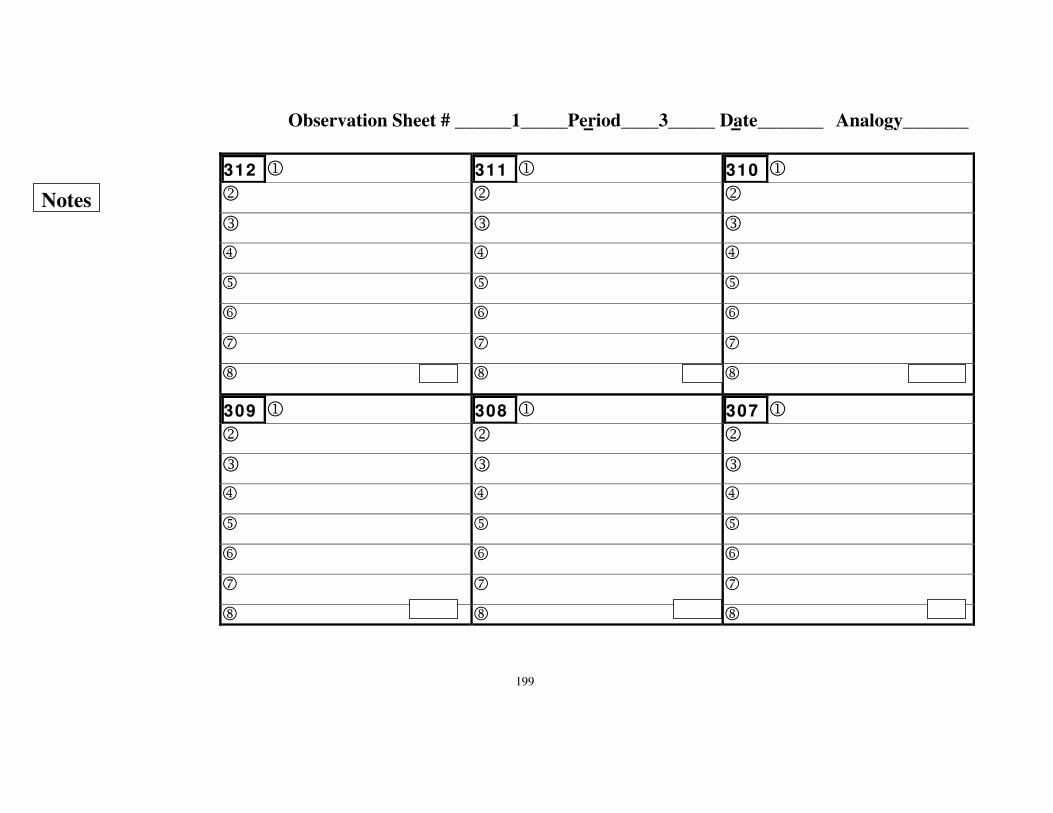
Observation Sheet # ______1_____Period____3_____ Date_______ Analogy_______
199
312 1 311 1 310 1
2 2 2
3 3 3
4 4 4
5 5 5
6 6 6
7 7 7
8
8 8
309 1 308 1 307 1
2 2 2
3 3 3
4 4 4
5 5 5
6 6 6
7 7 7
8 8 8
Notes
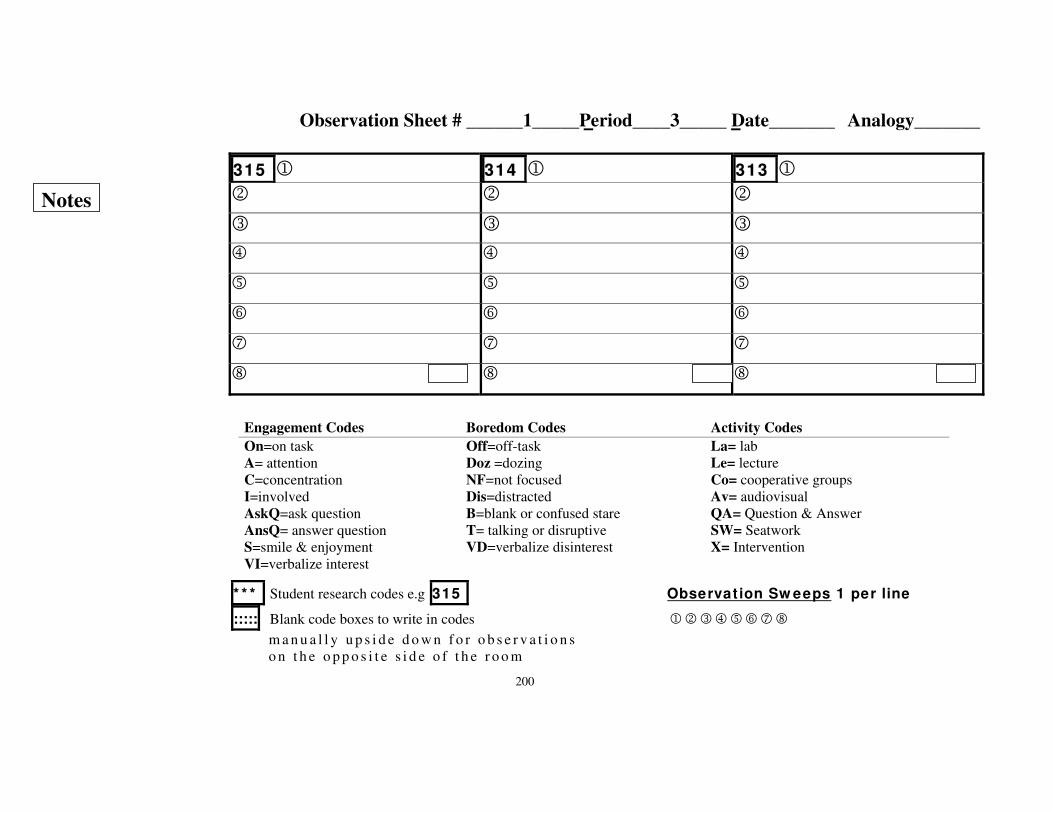
Observation Sheet # ______1_____Period____3_____ Date_______ Analogy_______
200
* * * Student research codes e.g 315 Observat ion Sw eeps 1 per line
::::: Blank code boxes to write in codes 12345678
m a n u a l l y u p s i d e d o w n f o r o b s e r v a t i o n s
o n t h e o p p o s i t e s i d e o f t h e r o o m
315 1 314 1 313 1
2 2 2
3 3 3
4 4 4
5 5 5
6 6 6
7 7 7
8
8 8
Engagement Codes Boredom Codes Activity Codes
On=on task
A= attention
C=concentration
I=involved AskQ=ask question
AnsQ= answer question
S=smile & enjoyment
VI=verbalize interest
Off=off-task
Doz =dozing
NF=not focused
Dis=distracted
B=blank or confused stare
T= talking or disruptive
VD=verbalize disinterest
La= lab
Le= lecture
Co= cooperative groups
Av= audiovisual
QA= Question & Answer
SW= Seatwork
X= Intervention
Notes
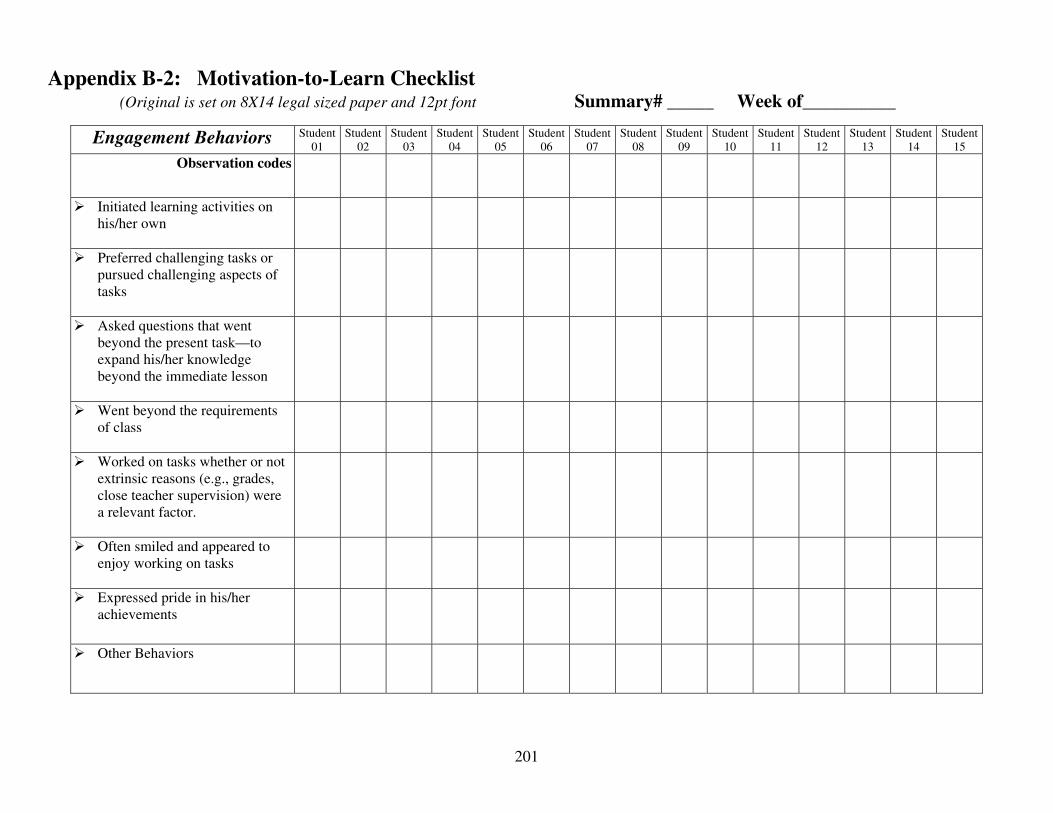
Appendix B-2: Motivation-to-Learn Checklist (Original is set on 8X14 legal sized paper and 12pt font Summary# _____ Week of__________
Engagement Behaviors Student
01
Student
02
Student
03
Student
04
Student
05
Student
06
Student
07
Student
08
Student
09
Student
10
Student
11
Student
12
Student
13
Student
14
Student
15
Observation codes
Initiated learning activities on
his/her own
Preferred challenging tasks or
pursued challenging aspects of
tasks
Asked questions that went
beyond the present task—to
expand his/her knowledge
beyond the immediate lesson
Went beyond the requirements
of class
Worked on tasks whether or not
extrinsic reasons (e.g., grades,
close teacher supervision) were
a relevant factor.
Often smiled and appeared to
enjoy working on tasks
Expressed pride in his/her
achievements
Other Behaviors
201
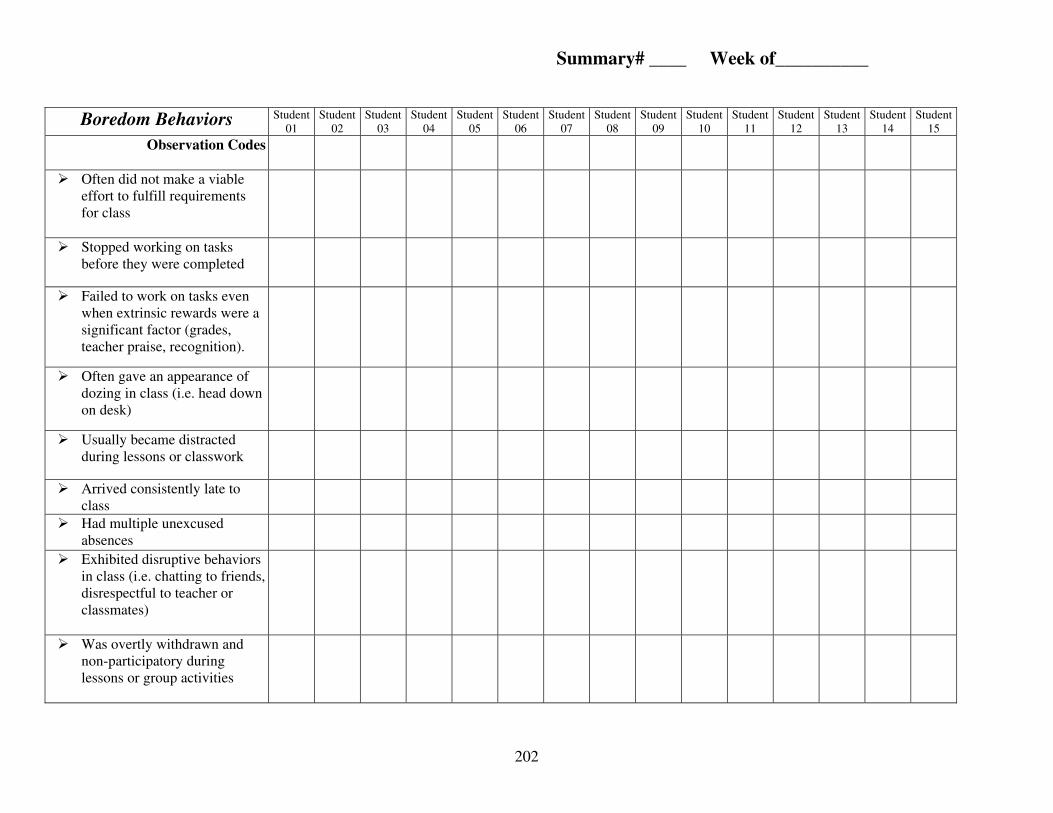
202
Boredom Behaviors Student
01
Student
02
Student
03
Student
04
Student
05
Student
06
Student
07
Student
08
Student
09
Student
10
Student
11
Student
12
Student
13
Student
14
Student
15
Observation Codes
Often did not make a viable
effort to fulfill requirements
for class
Stopped working on tasks
before they were completed
Failed to work on tasks even
when extrinsic rewards were a
significant factor (grades,
teacher praise, recognition).
Often gave an appearance of
dozing in class (i.e. head down
on desk)
Usually became distracted
during lessons or classwork
Arrived consistently late to
class
Had multiple unexcused
absences
Exhibited disruptive behaviors
in class (i.e. chatting to friends,
disrespectful to teacher or
classmates)
Was overtly withdrawn and
non-participatory during
lessons or group activities
Summary# ____ Week of__________
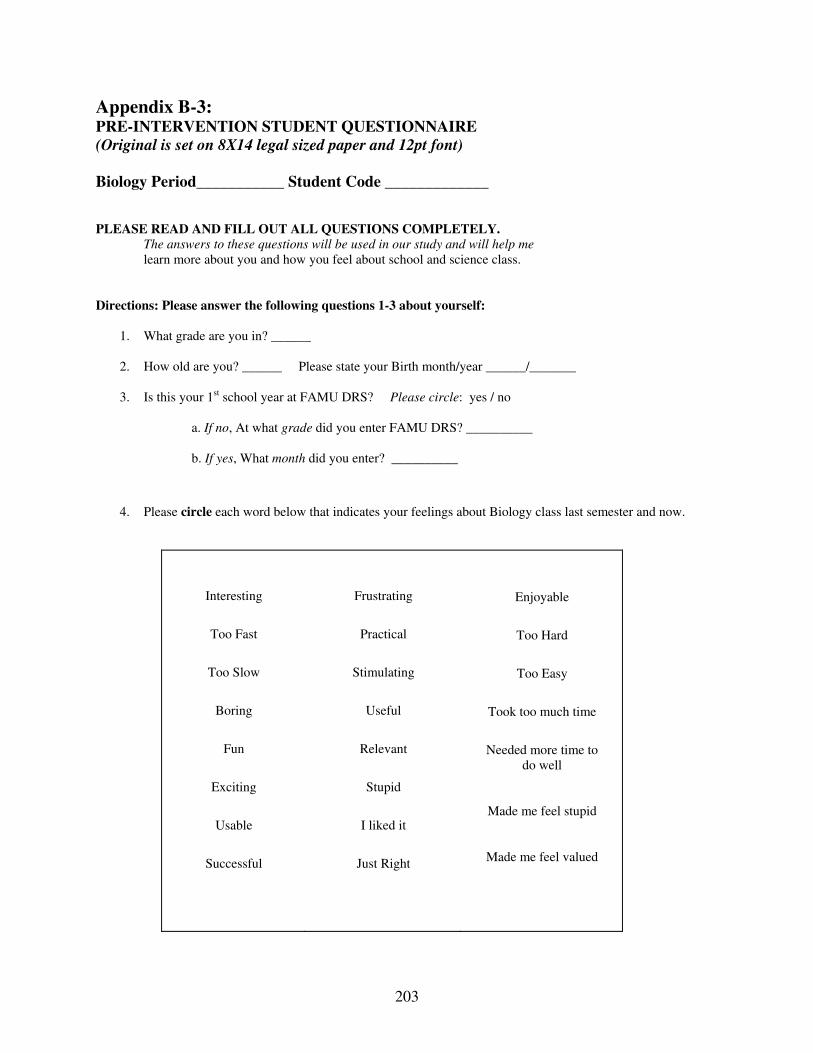
203
Appendix B-3: PRE-INTERVENTION STUDENT QUESTIONNAIRE
(Original is set on 8X14 legal sized paper and 12pt font)
Biology Period___________ Student Code _____________
PLEASE READ AND FILL OUT ALL QUESTIONS COMPLETELY. The answers to these questions will be used in our study and will help me
learn more about you and how you feel about school and science class.
Directions: Please answer the following questions 1-3 about yourself:
1. What grade are you in? ______
2. How old are you? ______ Please state your Birth month/year ______/_______
3. Is this your 1st school year at FAMU DRS? Please circle: yes / no
a. If no, At what grade did you enter FAMU DRS? __________
b. If yes, What month did you enter? __________
4. Please circle each word below that indicates your feelings about Biology class last semester and now.
Interesting
Too Fast
Too Slow
Boring
Fun
Exciting
Usable
Successful
Frustrating
Practical
Stimulating
Useful
Relevant
Stupid
I liked it
Just Right
Enjoyable
Too Hard
Too Easy
Took too much time
Needed more time to
do well
Made me feel stupid
Made me feel valued

Please complete the following :
(Circle one number for each statement)
Strongly
Agree
Agree Disagree Strongly
Disagree
8. I usually look forward to science class….. 1 2 3 4
9. I often am afraid to ask questions in science
class….. 1 2 3 4
10. It is important to know some science in order to
get a good job….. 1 2 3 4
11. Science is interesting to me….. 1 2 3 4
12. Science is boring to me… 1 2 3 4
13. I get good grades in science… 1 2 3 4
14. Science will be useful in my future…… 1 2 3 4
204
(Please complete the following questions: ) 5. Do you have a parent, Guardian, or other family member working at FAMU or FAMU DRS?
Please circle: yes / no
6. Do you participate in school sports or other after school activities?
Please circle: yes / no If Yes, what sport or activity?________________
7. Do you receive Homework help or tutoring after school?
Please circle: yes / no
If yes, circle all that apply: I receive after-school help from:
Parents Tutoring program Friends Teachers Other
(Please circle one) 15. Do you ever feel bored when you are at school?
Never…………………………………..….. 1
Once in a while………………………….. 2
About half of the time…………..……… 3
Most of the time…………………….…… 4
(Please answer questions 16 and 17 in brief sentences) 16. When you are interested in something going on in class, how do you usually react? Or how do you show it?
Describe two ways.
17. When you are bored in school, how do you usually react or how do you show you are bored?
Describe two ways.
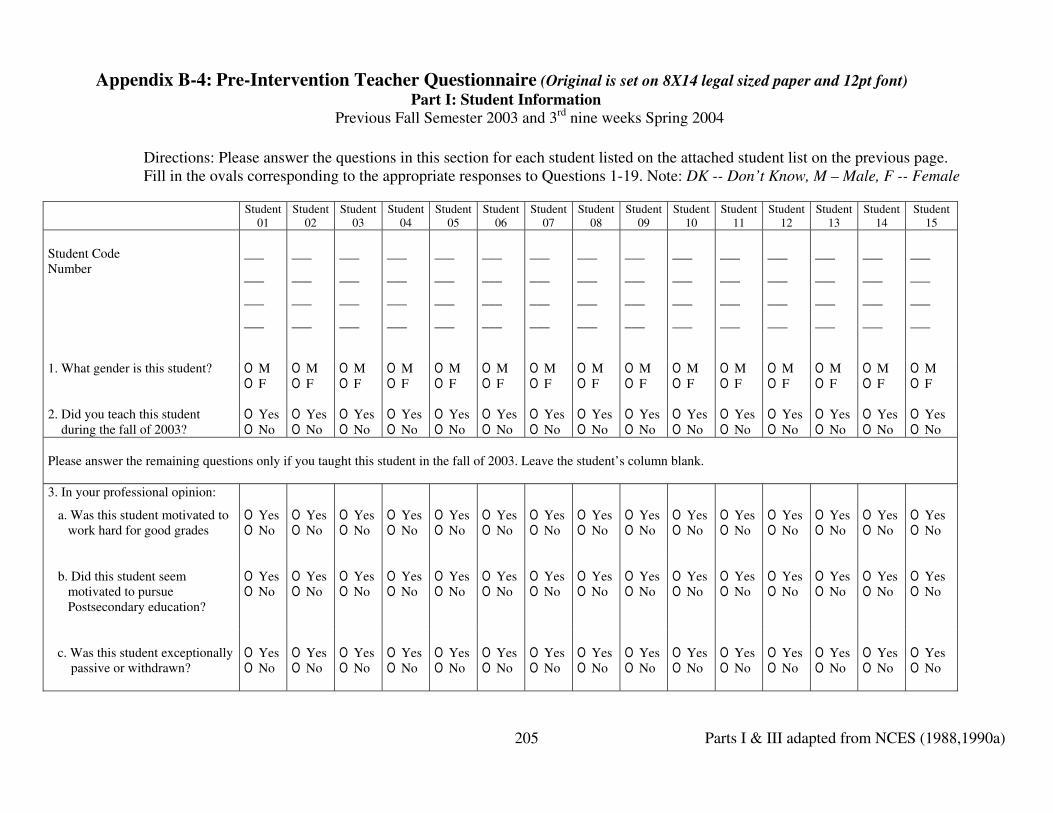
Parts I & III adapted from NCES (1988,1990a)
205
Appendix B-4: Pre-Intervention Teacher Questionnaire (Original is set on 8X14 legal sized paper and 12pt font)
Part I: Student Information
Previous Fall Semester 2003 and 3rd
nine weeks Spring 2004
Directions: Please answer the questions in this section for each student listed on the attached student list on the previous page.
Fill in the ovals corresponding to the appropriate responses to Questions 1-19. Note: DK -- Don’t Know, M – Male, F -- Female
Student Student
01
Student
02 03
Student
04
Student
05
Student
06
Student
07
Student
08
Student
09
Student
10
Student
11
Student
12
Student
13
Student
14
Student
15
Student Code
Number
___
___
___
___
___
___
___
___
___
___
___
___
___
___
___
___
___
___
___
___
___
___
___
___
___
___
___
___
___
___
___
___
___
___
___
___
___
___
___
___
___
___
___
___
___
___
___
___
___
___
___
___
___
___
___
___
___
___
___
___
1. What gender is this student? O M
O F
O M
O F
O M
O F
O M
O F
O M
O F
O M
O F
O M
O F
O M
O F
O M
O F
O M
O F
O M
O F
O M
O F
O M
O F
O M
O F
O M
O F
2. Did you teach this student
during the fall of 2003?
O Yes
O No
O Yes
O No
O Yes
O No
O Yes
O No
O Yes
O No
O Yes
O No
O Yes
O No
O Yes
O No
O Yes
O No
O Yes
O No
O Yes
O No
O Yes
O No
O Yes
O No
O Yes
O No
O Yes
O No
Please answer the remaining questions only if you taught this student in the fall of 2003. Leave the student’s column blank.
3. In your professional opinion:
a. Was this student motivated to
work hard for good grades
O Yes
O No
O Yes
O No
O Yes
O No
O Yes
O No
O Yes
O No
O Yes
O No
O Yes
O No
O Yes
O No
O Yes
O No
O Yes
O No
O Yes
O No
O Yes
O No
O Yes
O No
O Yes
O No
O Yes
O No
b. Did this student seem
motivated to pursue
Postsecondary education?
O Yes
O No
O Yes
O No
O Yes
O No
O Yes
O No
O Yes
O No
O Yes
O No
O Yes
O No
O Yes
O No
O Yes
O No
O Yes
O No
O Yes
O No
O Yes
O No
O Yes
O No
O Yes
O No
O Yes
O No
c. Was this student exceptionally
passive or withdrawn?
O Yes
O No
O Yes
O No
O Yes
O No
O Yes
O No
O Yes
O No
O Yes
O No
O Yes
O No
O Yes
O No
O Yes
O No
O Yes
O No
O Yes
O No
O Yes
O No
O Yes
O No
O Yes
O No
O Yes
O No

Parts I & III adapted from NCES (1988,1990a)
206
Student Student
01
Student
02 03
Student
04
Student
05
Student
06
Student
07
Student
08
Student
09
Student
10
Student
11
Student
12
Student
13
Student
14
Student
15
d. Would you consider this
student at-risk of dropping out of
high school?
O Yes
O No
O Yes
O No
O Yes
O No
O Yes
O No
O Yes
O No
O Yes
O No
O Yes
O No
O Yes
O No
O Yes
O No
O Yes
O No
O Yes
O No
O Yes
O No
O Yes
O No
O Yes
O No
O Yes
O No
e. Did this student consistently
perform below his/her ability
O Yes
O No
O Yes
O No
O Yes
O No
O Yes
O No
O Yes
O No
O Yes
O No
O Yes
O No
O Yes
O No
O Yes
O No
O Yes
O No
O Yes
O No
O Yes
O No
O Yes
O No
O Yes
O No
O Yes
O No
3. How often was this student
absent?
NEVER…………………………
RARELY……………………….
SOME OF THE TIME………
MOST OF THE TIME…………
ALL OF THE TIME……………
1 2 3 4 5
1 2 3 4 5
1 2 3 4 5
1 2 3 4 5
1 2 3 4 5
1 2 3 4 5
1 2 3 4 5
1 2 3 4 5
1 2 3 4 5
1 2 3 4 5
1 2 3 4 5
1 2 3 4 5
1 2 3 4 5
1 2 3 4 5
1 2 3 4 5
4. How often was this student
tardy?
NEVER…………………………..
RARELY……………………….
SOME OF THE TIME………
MOST OF THE TIME………….
ALL OF THE TIME……………
1 2 3 4 5
1 2 3 4 5
1 2 3 4 5
1 2 3 4 5
1 2 3 4 5
1 2 3 4 5
1 2 3 4 5
1 2 3 4 5
1 2 3 4 5
1 2 3 4 5
1 2 3 4 5
1 2 3 4 5
1 2 3 4 5
1 2 3 4 5
1 2 3 4 5
5. How often was this student
attentive in class?
NEVER………………..…………
RARELY…………………………
SOME OF THE TIME...…………
MOST OF THE TIME………….
ALL OF THE TIME……………
1 2 3 4 5
1 2 3 4 5
1 2 3 4 5
1 2 3 4 5
1 2 3 4 5
1 2 3 4 5
1 2 3 4 5
1 2 3 4 5
1 2 3 4 5
1 2 3 4 5
1 2 3 4 5
1 2 3 4 5
1 2 3 4 5
1 2 3 4 5
1 2 3 4 5
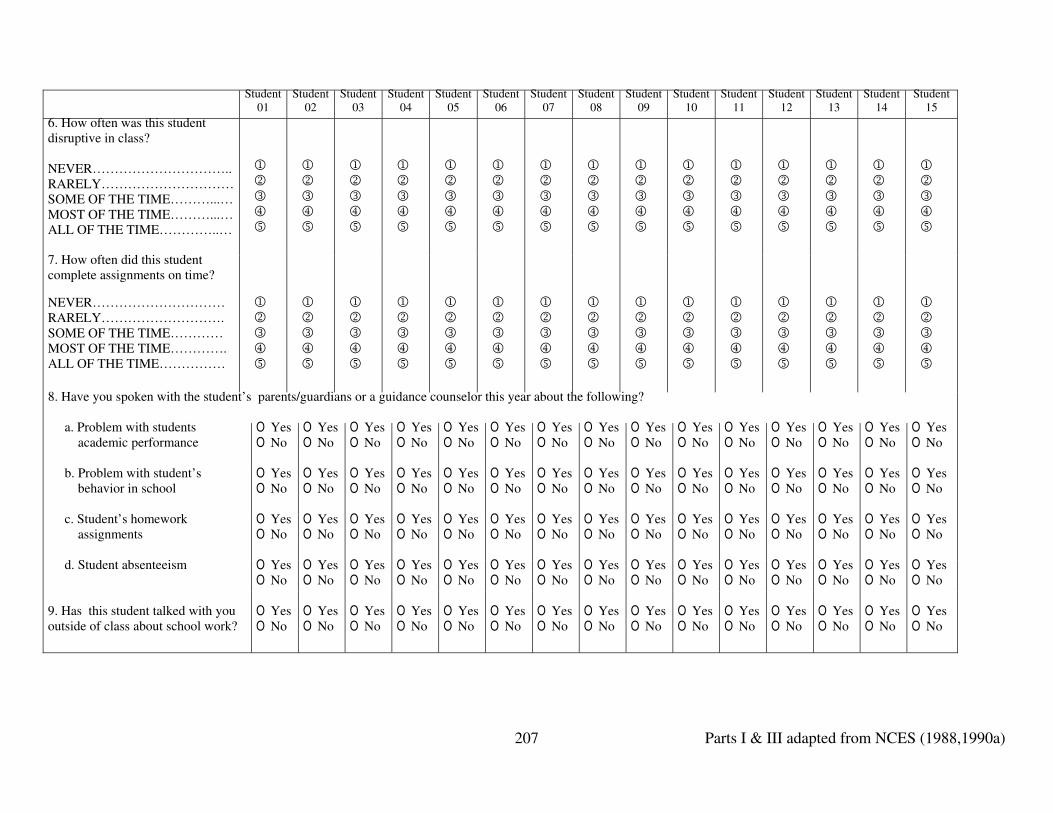
Parts I & III adapted from NCES (1988,1990a)
207
Student Student
01
Student
02 03
Student
04
Student
05
Student
06
Student
07
Student
08
Student
09
Student
10
Student
11
Student
12
Student
13
Student
14
Student
15
6. How often was this student
disruptive in class?
NEVER…………………………..
RARELY…………………………
SOME OF THE TIME………...…
MOST OF THE TIME………...…
ALL OF THE TIME…………..…
1 2 3 4 5
1 2 3 4 5
1 2 3 4 5
1 2 3 4 5
1 2 3 4 5
1 2 3 4 5
1 2 3 4 5
1 2 3 4 5
1 2 3 4 5
1 2 3 4 5
1 2 3 4 5
1 2 3 4 5
1 2 3 4 5
1 2 3 4 5
1 2 3 4 5
7. How often did this student
complete assignments on time?
NEVER…………………………
RARELY……………………….
SOME OF THE TIME…………
MOST OF THE TIME………….
ALL OF THE TIME……………
1 2 3 4 5
1 2 3 4 5
1 2 3 4 5
1 2 3 4 5
1 2 3 4 5
1 2 3 4 5
1 2 3 4 5
1 2 3 4 5
1 2 3 4 5
1 2 3 4 5
1 2 3 4 5
1 2 3 4 5
1 2 3 4 5
1 2 3 4 5
1 2 3 4 5
8. Have you spoken with the student’s parents/guardians or a guidance counselor this year about the following?
a. Problem with students
academic performance
O Yes
O No
O Yes
O No
O Yes
O No
O Yes
O No
O Yes
O No
O Yes
O No
O Yes
O No
O Yes
O No
O Yes
O No
O Yes
O No
O Yes
O No
O Yes
O No
O Yes
O No
O Yes
O No
O Yes
O No
b. Problem with student’s
behavior in school
O Yes
O No
O Yes
O No
O Yes
O No
O Yes
O No
O Yes
O No
O Yes
O No
O Yes
O No
O Yes
O No
O Yes
O No
O Yes
O No
O Yes
O No
O Yes
O No
O Yes
O No
O Yes
O No
O Yes
O No
c. Student’s homework
assignments
O Yes
O No
O Yes
O No
O Yes
O No
O Yes
O No
O Yes
O No
O Yes
O No
O Yes
O No
O Yes
O No
O Yes
O No
O Yes
O No
O Yes
O No
O Yes
O No
O Yes
O No
O Yes
O No
O Yes
O No
d. Student absenteeism O Yes
O No
O Yes
O No
O Yes
O No
O Yes
O No
O Yes
O No
O Yes
O No
O Yes
O No
O Yes
O No
O Yes
O No
O Yes
O No
O Yes
O No
O Yes
O No
O Yes
O No
O Yes
O No
O Yes
O No
9. Has this student talked with you
outside of class about school work?
O Yes
O No
O Yes
O No
O Yes
O No
O Yes
O No
O Yes
O No
O Yes
O No
O Yes
O No
O Yes
O No
O Yes
O No
O Yes
O No
O Yes
O No
O Yes
O No
O Yes
O No
O Yes
O No
O Yes
O No

208
Part II: Past Student ENGAGEMENT AND BOREDOM Behavior (Summative checklist Based on Previous Fall Semester 2003 and 3rd nine weeks Spring 2004 performance)
Please indicate for each student below whether you:
1- Strongly disagree 2-Disagree 3- Not sure 4- Agree 5- Strongly agree
Engagement Behaviors Student
01
Student
02
Student
03
Student
04
Student
05
Student
06
Student
07
Student
08
Student
09
Student
10
Student
11
Student
12
Student
13
Student
14
Student
15
Initiated learning activities on his/her
own
Preferred challenging tasks or
pursued challenging aspects of tasks
Asked questions that went beyond
the present task—to expand his/her
knowledge beyond the immediate
lesson
Went beyond the requirements of
class
Worked on tasks whether or not
extrinsic reasons (e.g., grades, close
teacher supervision) were a relevant
factor.
Often smiled and appeared to enjoy
working on tasks
Expressed pride in his/her
achievements

209
Part II: Past Student ENGAGEMENT AND BOREDOM Behavior Cont’d For Previous Fall Semester 2003 and 3rd nine weeks Spring 2004
Please indicate for each student below whether you:
1- Strongly disagree 2-Disagree 3- Not sure 4- Agree 5- Strongly agree
Boredom Behaviors Student
01
Student
02
Student
03
Student
04
Student
05
Student
06
Student
07
Student
08
Student
09
Student
10
Student
11
Student
12
Student
13
Student
14
Student
15
Often did not make a viable effort
to fulfill requirements for class
Stopped working on tasks before
they were completed
Failed to work on tasks even
when extrinsic rewards were a
significant factor (grades, teacher
praise, recognition).
Often gave an appearance of
dozing in class (i.e. head down on
desk)
Usually became distracted during
lessons or classwork
Arrived consistently late to class
Had multiple unexcused absences
Exhibited disruptive behaviors in
class (i.e. chatting to friends,
disrespectful to teacher or
classmates)
Was overtly withdrawn and non-
participatory during lessons or
group activities
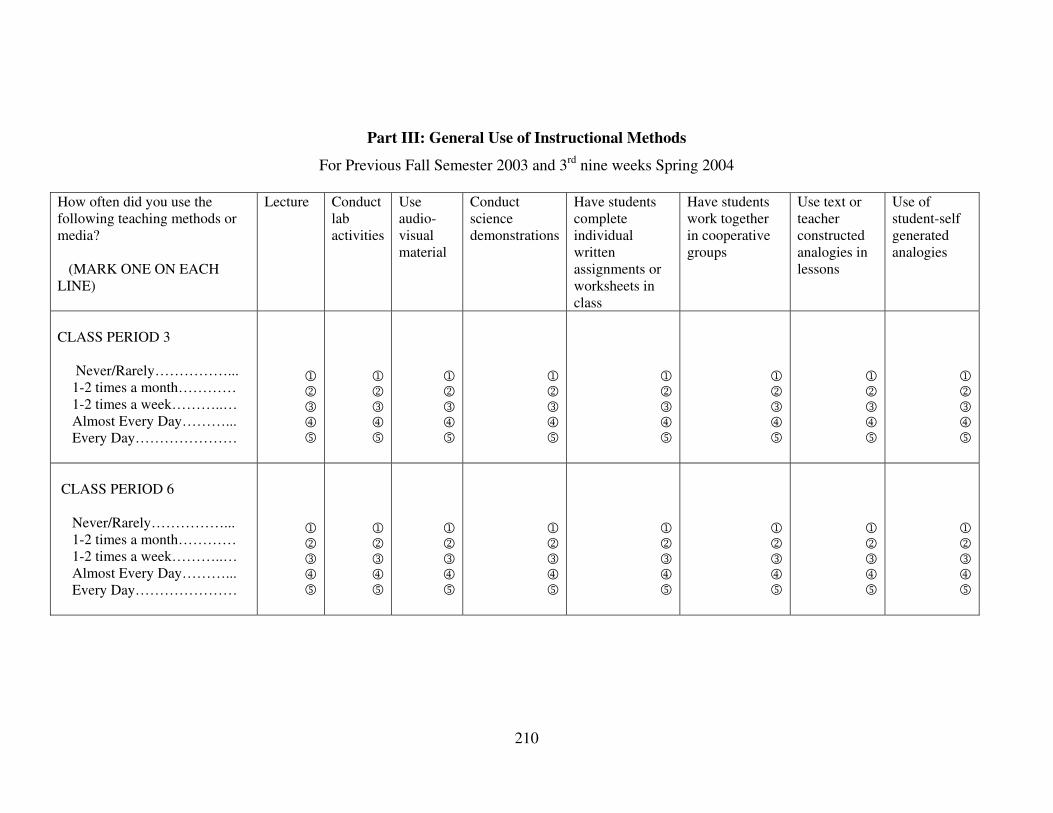
210
Part III: General Use of Instructional Methods
For Previous Fall Semester 2003 and 3rd
nine weeks Spring 2004
How often did you use the
following teaching methods or
media?
(MARK ONE ON EACH
LINE)
Lecture Conduct
lab
activities
Use
audio-
visual
material
Conduct
science
demonstrations
Have students
complete
individual
written
assignments or
worksheets in
class
Have students
work together
in cooperative
groups
Use text or
teacher
constructed
analogies in
lessons
Use of
student-self
generated
analogies
CLASS PERIOD 3
Never/Rarely……………...
1-2 times a month…………
1-2 times a week………..…
Almost Every Day………...
Every Day…………………
1 2 3 4 5
1 2 3 4 5
1 2 3 4 5
1 2 3 4 5
1 2 3 4 5
1 2 3 4 5
1 2 3 4 5
1 2 3 4 5
CLASS PERIOD 6
Never/Rarely……………...
1-2 times a month…………
1-2 times a week………..…
Almost Every Day………...
Every Day…………………
1 2 3 4 5
1 2 3 4 5
1 2 3 4 5
1 2 3 4 5
1 2 3 4 5
1 2 3 4 5
1 2 3 4 5
1 2 3 4 5
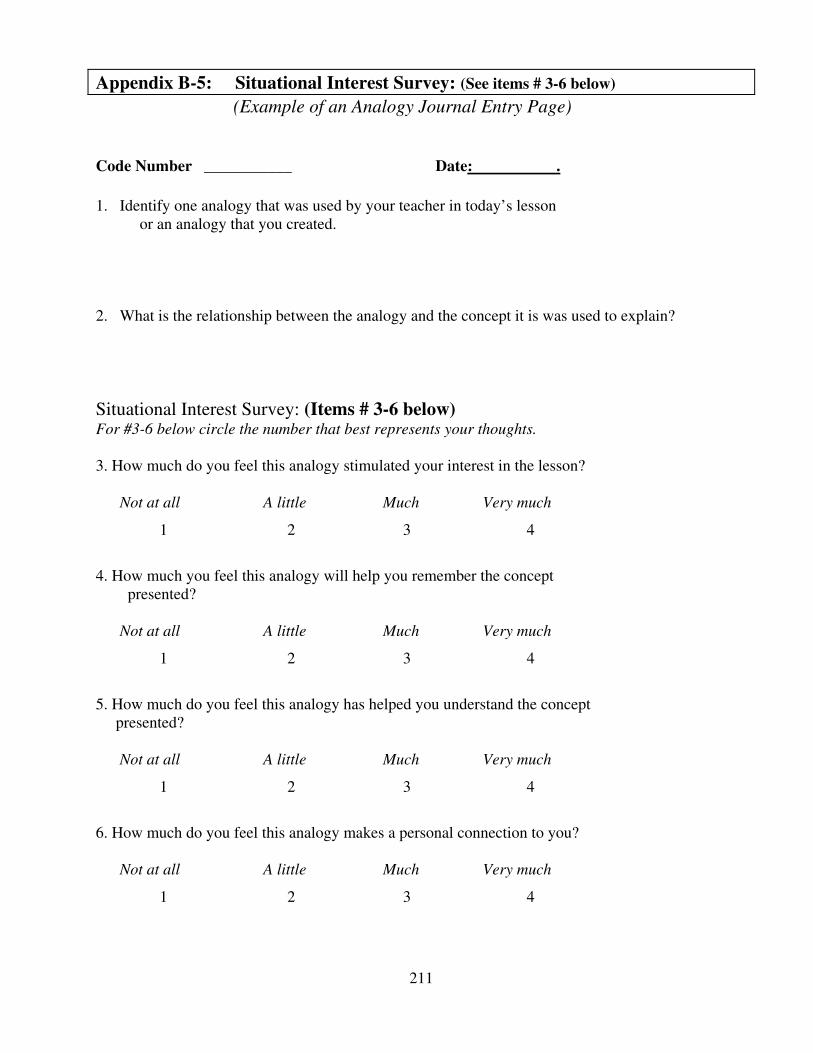
211
Appendix B-5: Situational Interest Survey: (See items # 3-6 below)
(Example of an Analogy Journal Entry Page)
Code Number ___________ Date: .
1. Identify one analogy that was used by your teacher in today’s lesson
or an analogy that you created.
2. What is the relationship between the analogy and the concept it is was used to explain?
Situational Interest Survey: (Items # 3-6 below) For #3-6 below circle the number that best represents your thoughts.
3. How much do you feel this analogy stimulated your interest in the lesson?
Not at all A little Much Very much
1 2 3 4
4. How much you feel this analogy will help you remember the concept
presented?
Not at all A little Much Very much
1 2 3 4
5. How much do you feel this analogy has helped you understand the concept
presented?
Not at all A little Much Very much
1 2 3 4
6. How much do you feel this analogy makes a personal connection to you?
Not at all A little Much Very much
1 2 3 4

212
(Original is set on 8X14 legal sized paper and 12pt font)
Appendix B-6: Interest and Motivation to Learn Questionnaire
Ms. Brown Pd. 3 Student Code #_______________
Please read and answer the following questions about analogies. These questions will help me in the analysis of our analogy study.
1. Did learning about analogies help to increase your interest in learning in biology class? No, Not at all Very little Somewhat Very Much Yes, Definitely
1 2 3 4 5
2. Did learning to create your own analogies help increase your interest in the course?
No, Not at all Very little Somewhat Very Much Yes, Definitely
1 2 3 4 5
3. Please circle each word that indicates your feelings about Biology class since the beginning of this last
nine weeks. (It began after break on Monday March 29th; we finished Meiosis and began Genetics.)
Interesting
Too fast
Too slow
Boring
Fun
Exciting
Usable
Successful
Frustrating
Practical
Stimulating
Useful
Relevant
Stupid
I liked it
Just right
Enjoyable
Too hard
Too easy
Took too much time
Needed more time to do well
Made me feel valued
Made me feel stupid
Adapted from Rogers, Ludington, and Graham (1999)
4. Did learning about analogies help motivate you to learn in class? No, Not at all Very little Somewhat Very Much Yes, Definitely
1 2 3 4 5
5. Did learning about analogies help motivate you to learn more on your own? No, Not at all Very little Somewhat Very Much Yes, Definitely
1 2 3 4 5
6. Did creating a your own analogies help motivate you to learn in class (ex. pay more attention to the teacher, able to answer questions when asked, more involved in class lessons)?
No, Not at all Very little Somewhat Very Much Yes, Definitely
1 2 3 4 5
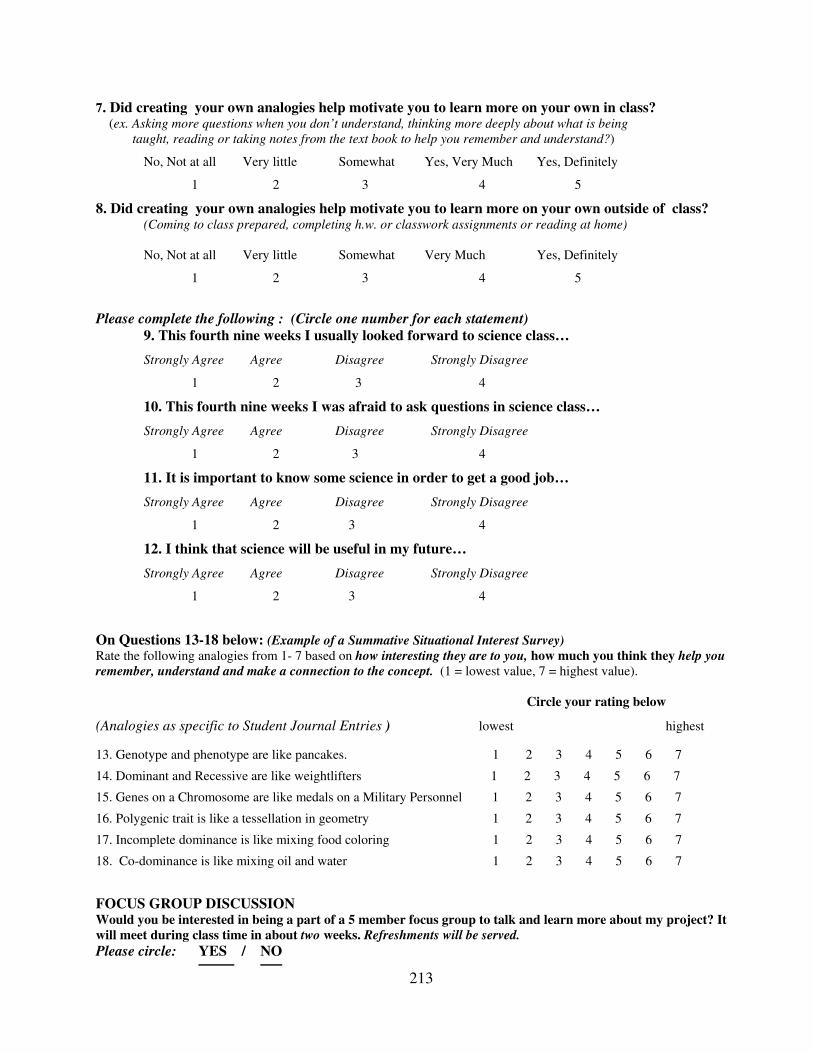
213
7. Did creating your own analogies help motivate you to learn more on your own in class? (ex. Asking more questions when you don’t understand, thinking more deeply about what is being
taught, reading or taking notes from the text book to help you remember and understand?)
No, Not at all Very little Somewhat Yes, Very Much Yes, Definitely
1 2 3 4 5
8. Did creating your own analogies help motivate you to learn more on your own outside of class? (Coming to class prepared, completing h.w. or classwork assignments or reading at home)
No, Not at all Very little Somewhat Very Much Yes, Definitely
1 2 3 4 5
Please complete the following : (Circle one number for each statement)
9. This fourth nine weeks I usually looked forward to science class…
Strongly Agree Agree Disagree Strongly Disagree
1 2 3 4
10. This fourth nine weeks I was afraid to ask questions in science class…
Strongly Agree Agree Disagree Strongly Disagree
1 2 3 4
11. It is important to know some science in order to get a good job…
Strongly Agree Agree Disagree Strongly Disagree
1 2 3 4
12. I think that science will be useful in my future…
Strongly Agree Agree Disagree Strongly Disagree
1 2 3 4
On Questions 13-18 below: (Example of a Summative Situational Interest Survey)
Rate the following analogies from 1- 7 based on how interesting they are to you, how much you think they help you
remember, understand and make a connection to the concept. (1 = lowest value, 7 = highest value).
Circle your rating below
(Analogies as specific to Student Journal Entries ) lowest highest
13. Genotype and phenotype are like pancakes. 1 2 3 4 5 6 7
14. Dominant and Recessive are like weightlifters 1 2 3 4 5 6 7
15. Genes on a Chromosome are like medals on a Military Personnel 1 2 3 4 5 6 7
16. Polygenic trait is like a tessellation in geometry 1 2 3 4 5 6 7
17. Incomplete dominance is like mixing food coloring 1 2 3 4 5 6 7
18. Co-dominance is like mixing oil and water 1 2 3 4 5 6 7
FOCUS GROUP DISCUSSION Would you be interested in being a part of a 5 member focus group to talk and learn more about my project? It
will meet during class time in about two weeks. Refreshments will be served.
Please circle: YES / NO

214
Appendix B-7: Post-Intervention Motivation to Learn Survey
Code #___________________ Period__________________
1 Now that the analogy project is complete, do you think making your own analogies helped
motivate you to learn new information in Science class? Explain your answer.
2. Has the analogy project motivated you to create new analogies or use other
learning strategies to help you learn in other classes or outside of school? Please explain or
give an example.
Thank You
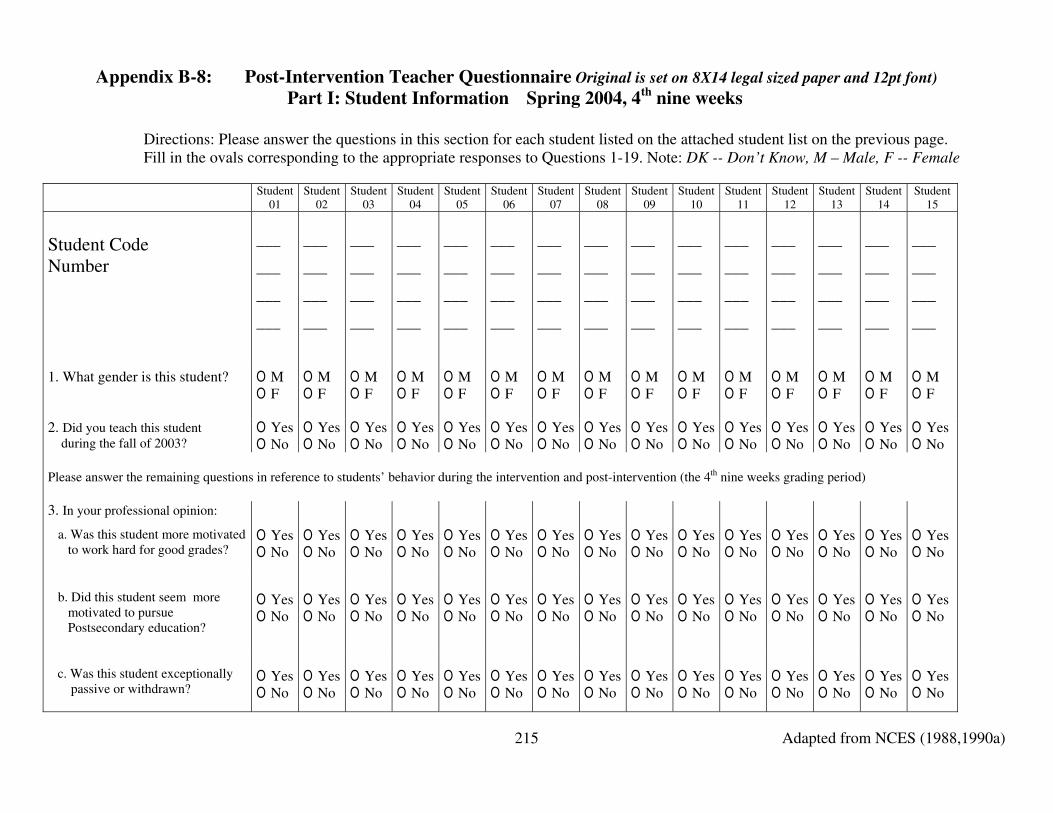
Adapted from NCES (1988,1990a)
215
Appendix B-8: Post-Intervention Teacher Questionnaire Original is set on 8X14 legal sized paper and 12pt font)
Part I: Student Information Spring 2004 , 4th
nine weeks
Directions: Please answer the questions in this section for each student listed on the attached student list on the previous page.
Fill in the ovals corresponding to the appropriate responses to Questions 1-19. Note: DK -- Don’t Know, M – Male, F -- Female
Student
01
Student
02
Student
03
Student
04
Student
05
Student
06
Student
07
Student
08
Student
09
Student
10
Student
11
Student
12
Student
13
Student
14
Student
15
Student Code
Number
___
___
___
___
___
___
___
___
___
___
___
___
___
___
___
___
___
___
___
___
___
___
___
___
___
___
___
___
___
___
___
___
___
___
___
___
___
___
___
___
___
___
___
___
___
___
___
___
___
___
___
___
___
___
___
___
___
___
___
___
1. What gender is this student? O M
O F
O M
O F
O M
O F
O M
O F
O M
O F
O M
O F
O M
O F
O M
O F
O M
O F
O M
O F
O M
O F
O M
O F
O M
O F
O M
O F
O M
O F
2. Did you teach this student
during the fall of 2003? O Yes
O No
O Yes
O No
O Yes
O No
O Yes
O No
O Yes
O No
O Yes
O No
O Yes
O No
O Yes
O No
O Yes
O No
O Yes
O No
O Yes
O No
O Yes
O No
O Yes
O No
O Yes
O No
O Yes
O No
Please answer the remaining questions in reference to students’ behavior during the intervention and post-intervention (the 4th nine weeks grading period)
3. In your professional opinion:
a. Was this student more motivated
to work hard for good grades?
O Yes
O No
O Yes
O No
O Yes
O No
O Yes
O No
O Yes
O No
O Yes
O No
O Yes
O No
O Yes
O No
O Yes
O No
O Yes
O No
O Yes
O No
O Yes
O No
O Yes
O No
O Yes
O No
O Yes
O No
b. Did this student seem more
motivated to pursue
Postsecondary education?
O Yes
O No
O Yes
O No
O Yes
O No
O Yes
O No
O Yes
O No
O Yes
O No
O Yes
O No
O Yes
O No
O Yes
O No
O Yes
O No
O Yes
O No
O Yes
O No
O Yes
O No
O Yes
O No
O Yes
O No
c. Was this student exceptionally
passive or withdrawn?
O Yes
O No
O Yes
O No
O Yes
O No
O Yes
O No
O Yes
O No
O Yes
O No
O Yes
O No
O Yes
O No
O Yes
O No
O Yes
O No
O Yes
O No
O Yes
O No
O Yes
O No
O Yes
O No
O Yes
O No
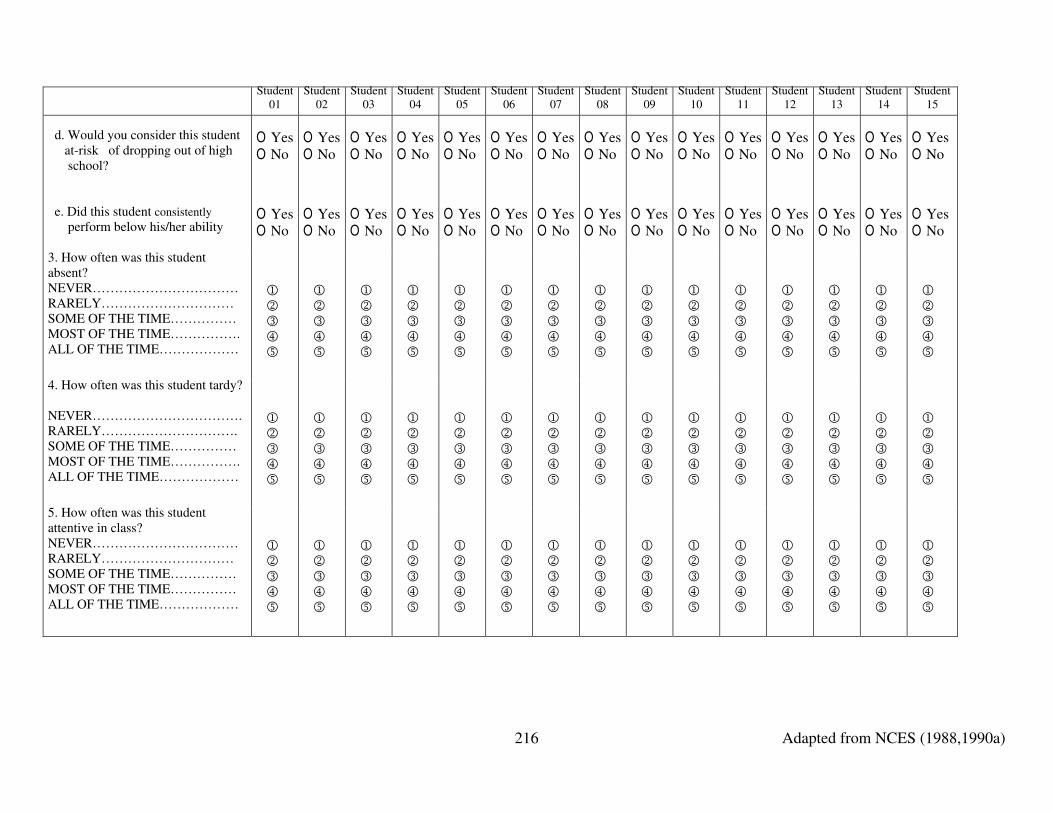
Adapted from NCES (1988,1990a)
216
Student
01
Student
02
Student
03
Student
04
Student
05
Student
06
Student
07
Student
08
Student
09
Student
10
Student
11
Student
12
Student
13
Student
14
Student
15
d. Would you consider this student
at-risk of dropping out of high
school?
O Yes
O No
O Yes
O No
O Yes
O No
O Yes
O No
O Yes
O No
O Yes
O No
O Yes
O No
O Yes
O No
O Yes
O No
O Yes
O No
O Yes
O No
O Yes
O No
O Yes
O No
O Yes
O No
O Yes
O No
e. Did this student consistently
perform below his/her ability
O Yes
O No
O Yes
O No
O Yes
O No
O Yes
O No
O Yes
O No
O Yes
O No
O Yes
O No
O Yes
O No
O Yes
O No
O Yes
O No
O Yes
O No
O Yes
O No
O Yes
O No
O Yes
O No
O Yes
O No
3. How often was this student
absent?
NEVER……………………………
RARELY…………………………
SOME OF THE TIME……………
MOST OF THE TIME…………….
ALL OF THE TIME………………
1 2 3 4 5
1 2 3 4 5
1 2 3 4 5
1 2 3 4 5
1 2 3 4 5
1 2 3 4 5
1 2 3 4 5
1 2 3 4 5
1 2 3 4 5
1 2 3 4 5
1 2 3 4 5
1 2 3 4 5
1 2 3 4 5
1 2 3 4 5
1 2 3 4 5
4. How often was this student tardy?
NEVER…………………………….
RARELY………………………….
SOME OF THE TIME……………
MOST OF THE TIME…………….
ALL OF THE TIME………………
1 2 3 4 5
1 2 3 4 5
1 2 3 4 5
1 2 3 4 5
1 2 3 4 5
1 2 3 4 5
1 2 3 4 5
1 2 3 4 5
1 2 3 4 5
1 2 3 4 5
1 2 3 4 5
1 2 3 4 5
1 2 3 4 5
1 2 3 4 5
1 2 3 4 5
5. How often was this student
attentive in class?
NEVER……………………………
RARELY…………………………
SOME OF THE TIME……………
MOST OF THE TIME……………
ALL OF THE TIME………………
1 2 3 4 5
1 2 3 4 5
1 2 3 4 5
1 2 3 4 5
1 2 3 4 5
1 2 3 4 5
1 2 3 4 5
1 2 3 4 5
1 2 3 4 5
1 2 3 4 5
1 2 3 4 5
1 2 3 4 5
1 2 3 4 5
1 2 3 4 5
1 2 3 4 5
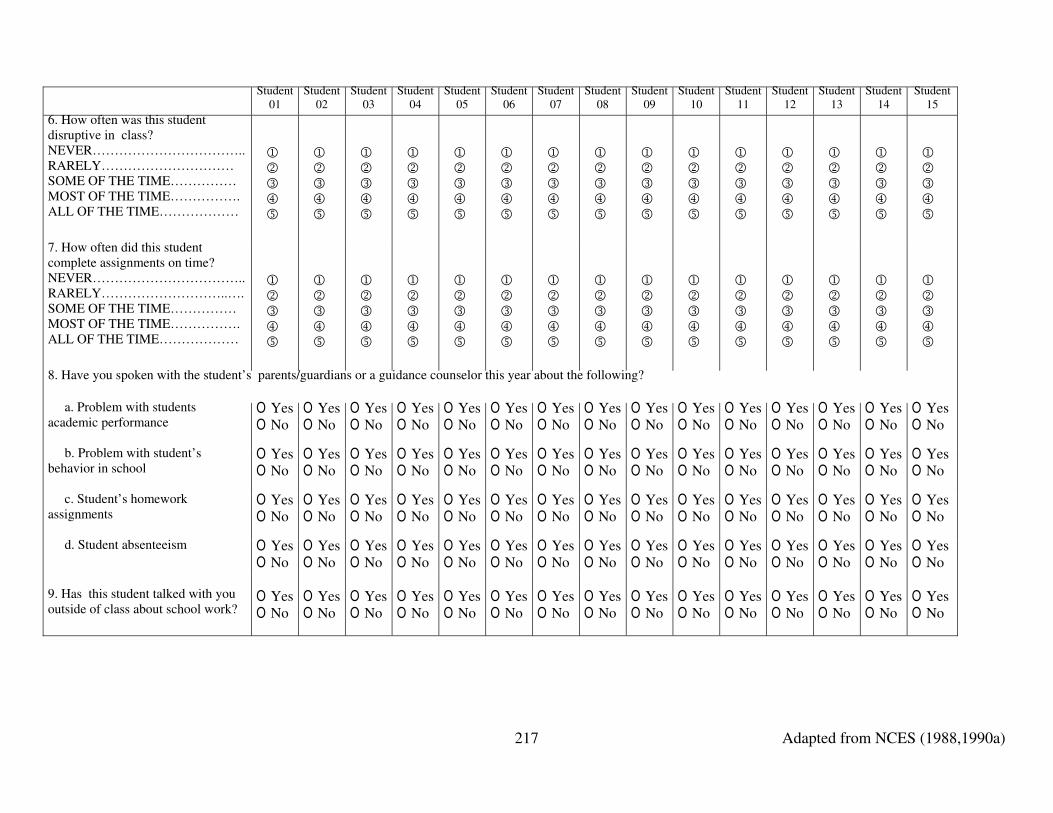
Adapted from NCES (1988,1990a)
217
Student
01
Student
02
Student
03
Student
04
Student
05
Student
06
Student
07
Student
08
Student
09
Student
10
Student
11
Student
12
Student
13
Student
14
Student
15
6. How often was this student
disruptive in class?
NEVER……………………………..
RARELY…………………………
SOME OF THE TIME……………
MOST OF THE TIME…………….
ALL OF THE TIME………………
1 2 3 4 5
1 2 3 4 5
1 2 3 4 5
1 2 3 4 5
1 2 3 4 5
1 2 3 4 5
1 2 3 4 5
1 2 3 4 5
1 2 3 4 5
1 2 3 4 5
1 2 3 4 5
1 2 3 4 5
1 2 3 4 5
1 2 3 4 5
1 2 3 4 5
7. How often did this student
complete assignments on time?
NEVER……………………………..
RARELY………………………..….
SOME OF THE TIME……………
MOST OF THE TIME…………….
ALL OF THE TIME………………
1 2 3 4 5
1 2 3 4 5
1 2 3 4 5
1 2 3 4 5
1 2 3 4 5
1 2 3 4 5
1 2 3 4 5
1 2 3 4 5
1 2 3 4 5
1 2 3 4 5
1 2 3 4 5
1 2 3 4 5
1 2 3 4 5
1 2 3 4 5
1 2 3 4 5
8. Have you spoken with the student’s parents/guardians or a guidance counselor this year about the following?
a. Problem with students
academic performance
O Yes
O No
O Yes
O No
O Yes
O No
O Yes
O No
O Yes
O No
O Yes
O No
O Yes
O No
O Yes
O No
O Yes
O No
O Yes
O No
O Yes
O No
O Yes
O No
O Yes
O No
O Yes
O No
O Yes
O No
b. Problem with student’s
behavior in school
O Yes
O No
O Yes
O No
O Yes
O No
O Yes
O No
O Yes
O No
O Yes
O No
O Yes
O No
O Yes
O No
O Yes
O No
O Yes
O No
O Yes
O No
O Yes
O No
O Yes
O No
O Yes
O No
O Yes
O No
c. Student’s homework
assignments
O Yes
O No
O Yes
O No
O Yes
O No
O Yes
O No
O Yes
O No
O Yes
O No
O Yes
O No
O Yes
O No
O Yes
O No
O Yes
O No
O Yes
O No
O Yes
O No
O Yes
O No
O Yes
O No
O Yes
O No
d. Student absenteeism O Yes
O No
O Yes
O No
O Yes
O No
O Yes
O No
O Yes
O No
O Yes
O No
O Yes
O No
O Yes
O No
O Yes
O No
O Yes
O No
O Yes
O No
O Yes
O No
O Yes
O No
O Yes
O No
O Yes
O No
9. Has this student talked with you
outside of class about school work?
O Yes
O No
O Yes
O No
O Yes
O No
O Yes
O No
O Yes
O No
O Yes
O No
O Yes
O No
O Yes
O No
O Yes
O No
O Yes
O No
O Yes
O No
O Yes
O No
O Yes
O No
O Yes
O No
O Yes
O No
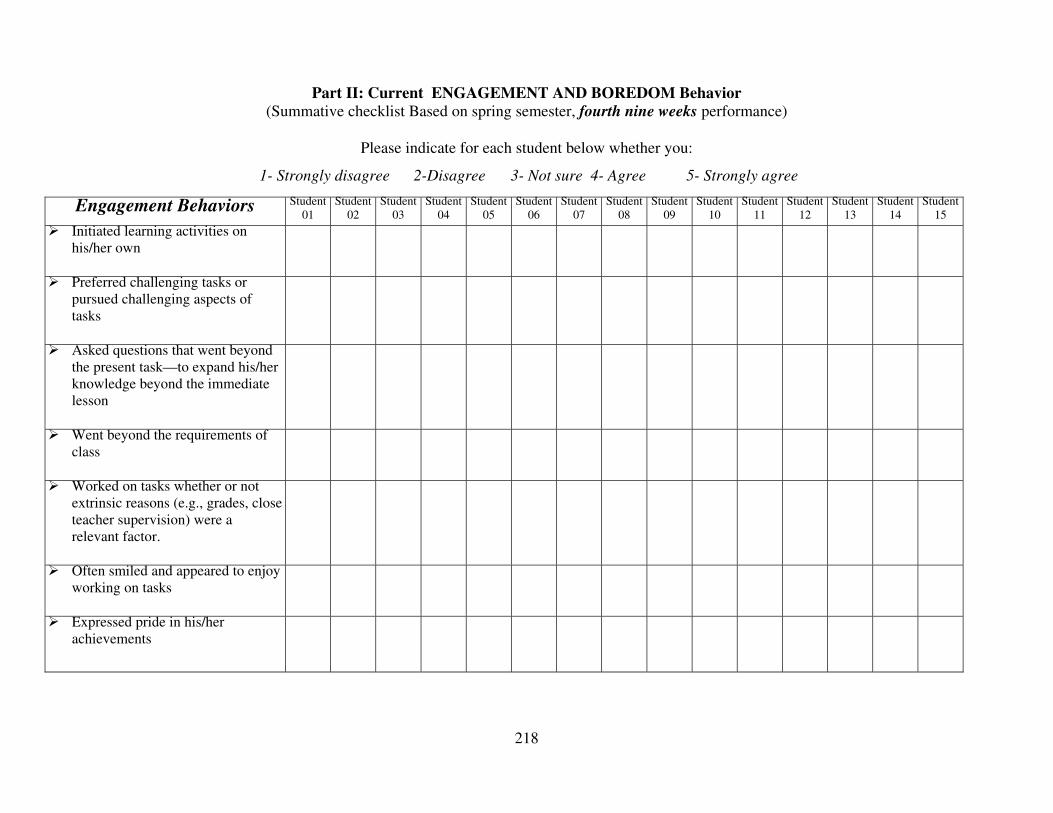
218
Part II: Current ENGAGEMENT AND BOREDOM Behavior
(Summative checklist Based on spring semester, fourth nine weeks performance)
Please indicate for each student below whether you:
1- Strongly disagree 2-Disagree 3- Not sure 4- Agree 5- Strongly agree
Engagement Behaviors Student
01
Student
02
Student
03
Student
04
Student
05
Student
06
Student
07
Student
08
Student
09
Student
10
Student
11
Student
12
Student
13
Student
14
Student
15
Initiated learning activities on
his/her own
Preferred challenging tasks or
pursued challenging aspects of
tasks
Asked questions that went beyond
the present task—to expand his/her
knowledge beyond the immediate
lesson
Went beyond the requirements of
class
Worked on tasks whether or not
extrinsic reasons (e.g., grades, close
teacher supervision) were a
relevant factor.
Often smiled and appeared to enjoy
working on tasks
Expressed pride in his/her
achievements

Part II: Current ENGAGEMENT AND BOREDOM Behavior Cont’d
Please indicate for each student below whether you:
1- Strongly disagree 2-Disagree 3- Not sure 4- Agree 5- Strongly agree
Boredom Behaviors Student
01
Student
02
Student
03
Student
04
Student
05
Student
06
Student
07
Student
08
Student
09
Student
10
Student
11
Student
12
Student
13
Student
14
Student
15
Often did not make a viable effort
to fulfill requirements for class
Stopped working on tasks before
they were completed
Failed to work on tasks even when
extrinsic rewards were a
significant factor (grades, teacher
praise, recognition).
Often gave an appearance of
dozing in class (i.e. head down on
desk)
Usually became distracted during
lessons or classwork
Arrived consistently late to class
Had multiple unexcused absences
Exhibited disruptive behaviors in
class (i.e. chatting to friends,
disrespectful to teacher or
classmates)
Was overtly withdrawn and non-
participatory during lessons or
group activities
219
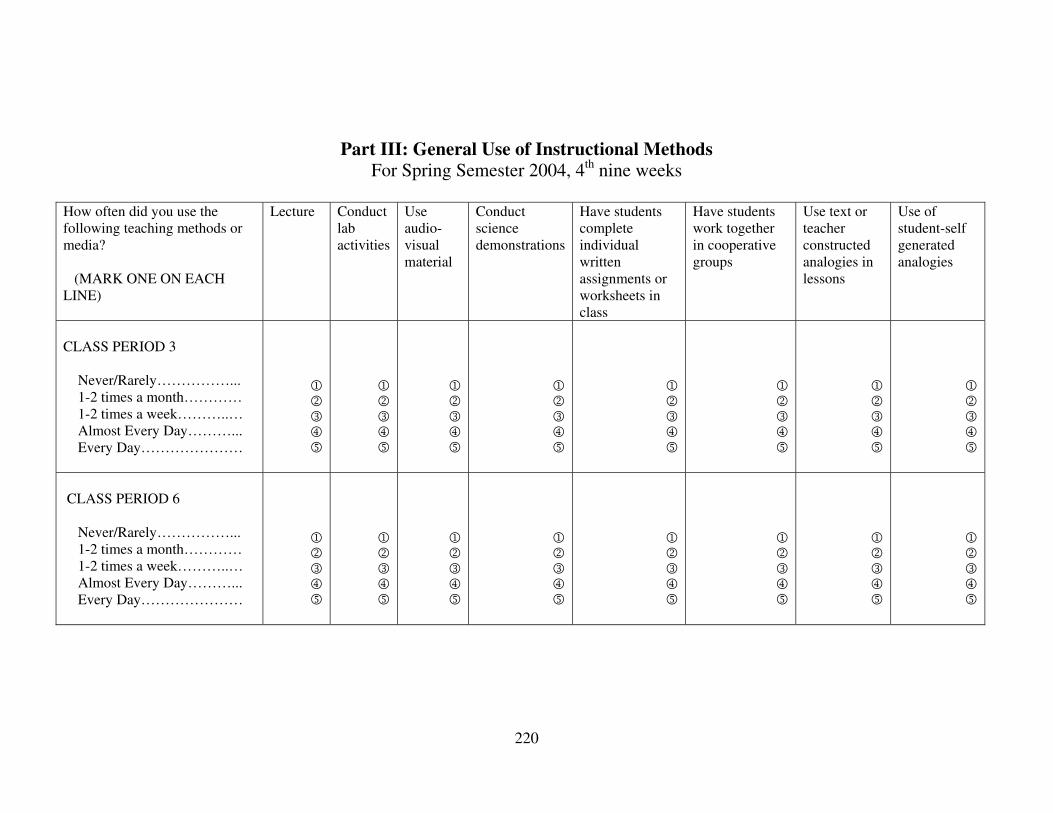
Part III: General Use of Instructional Methods
For Spring Semester 2004, 4th
nine weeks
How often did you use the
following teaching methods or
media?
(MARK ONE ON EACH
LINE)
Lecture Conduct
lab
activities
Use
audio-
visual
material
Conduct
science
demonstrations
Have students
complete
individual
written
assignments or
worksheets in
class
Have students
work together
in cooperative
groups
Use text or
teacher
constructed
analogies in
lessons
Use of
student-self
generated
analogies
CLASS PERIOD 3
Never/Rarely……………...
1-2 times a month…………
1-2 times a week………..…
Almost Every Day………...
Every Day…………………
1 2 3 4 5
1 2 3 4 5
1 2 3 4 5
1 2 3 4 5
1 2 3 4 5
1 2 3 4 5
1 2 3 4 5
1 2 3 4 5
CLASS PERIOD 6
Never/Rarely……………...
1-2 times a month…………
1-2 times a week………..…
Almost Every Day………...
Every Day…………………
1 2 3 4 5
1 2 3 4 5
1 2 3 4 5
1 2 3 4 5
1 2 3 4 5
1 2 3 4 5
1 2 3 4 5
1 2 3 4 5
220

221
APPENDIX C: SELF-GENERATED ANALOGY INTERVENTION
RELATED APPLICATIONS AND ACTIVITIES
1. Memo to Ms. Brown regarding intervention and analogy project activities
2. General outline of the Analogy tutorial
3. Analogy tutorial lesson guide and
4. Optional analogy tutorial application: Twister Candy Analogy for Meiosis
5. Tutorial follow-up activity: “You Are A Machine in a Factory” Game
6. Description of the Project: The Analogy Challenge
7. Peer evaluation forms for analogy presentations
8. Teacher Evaluation forms of student presentations
222
APPENDIX C-1: MEMO TO MS. BROWN REGARDING INTERVENTION
AND ANALOGY PROJECT ACTIVITIES
TO: MS. BROWN
FROM: MS. CLARKE
Hi Ms. Brown
This coming week we will be beginning phase 2 of the Analogy intervention.
So far Here is a Summary of what we did in PHASE ONE –
Week 1: Introduce Analogies – Analogy Tutorial + Meiosis Analogy Game
Week 2: Students learned how to identify analogies presented by the classroom teacher
Week 3: Students experimented with creating their own analogies individually and in
groups
* For Weeks 2 and 3, students entered a minimum of five journal entries - three teacher
analogies and two self-generated analogies. Journals were collected at the end of the three
week period (that was Friday 4/16).
PHASE TWO- WEEKS 4, 5, part of 6
WEEK 4 – Intro (To be presented First Day- Monday 4/19)
Discussion of Self-generated Analogies project called “The Analogy Challenge”.
Students will be given a brief Introduction to thinking about and using analogies as a learning
strategy. They will be taught that analogies are bridges or connections that can help them learn
and understand new concepts. They will be encouraged to think of Analogies as puzzles that
make learning interesting and fun. Students will be given a visual analogy bridge to help them
begin the process of creating analogies on their own.
WEEK 4 continued (Days 2-5)
Student generation of analogies. As a teaching strategy and as a part of the planned
curriculum, the classroom teacher will begin to incorporate and encourage the students’ self-
generation* of analogies. ( *Note : to the students instead of using the term “self-generated”
analogies, I will use the terms creating or making analogies, or “student-created analogies”).
For example, as a teaching strategy, the classroom teacher may highlight an important
term or concept being taught by writing it on the blackboard and after explaining it may generate
a discussion by asking the students to compare this term or concept to something they have
experienced or have knowledge about. The teacher might say, “What is this like?”, or “What
does this remind you of?”, or “How would you explain/ illustrate this to someone who doesn’t
know about genetics?”
223
Also, as a teaching strategy, the teacher may choose to highlight the concept by giving
their own teacher analogy during a lesson and then prompting students to create an analogies for
a homework or as an in class assignment. Students can be encouraged to generate more that one
analogy for a particular concept to demonstrate their understanding. Students should be told to
use the textbook, their notes, Ms. Clarke, and their teacher Ms. Brown as resources in
understanding the concept and checking the accuracy of their analogies.
Because the classroom teacher is more familiar with their students’ academic ability, the
ways in which self-generated analogies is used as a teaching strategy will ultimately be left up to
the classroom teacher. However in using the strategy, the goal is to produce a classroom
environment where students’ feel encouraged and more confident to generate analogies when
prompted by the teacher and on their own. In last years’ study, many students said that they
enjoyed self-generated analogies because it allowed them to be more involved with the lessons
and made them get more involved with their own learning.
Researchers Role: During this week (DAY 1), I will present their project and the Introduction
of self-generated analogies as a learning strategy. During DAYS 2-5, I will be systematic
conducting classroom observations but will also act in the role as a resource person for the
students.
WEEK 5 – some class time needed Wednesday and Thursday for projects
During this week of 4/26, Students continue to generate analogies for their “Analogy
Challenge” project. By this time students will have generated some analogies and what they have
done so far will be collected by Me, the researcher, at the beginning of the week on Monday and
returned Tuesday.
On Wednesday, some class time (15min?) should be allotted for students to write in
their Journal. As instructed by their project the students will choose their best three and enter
them in the Analogy Journal, one per page. Students will also begin to think about which
Analogy they will present to the class and how they are going to present this.
Some class time on Thursday (30min?) may be needed for students to write a
presentation proposal (one paragraph explaining how they will present their analogies and what
hands on item or illustration they will use). The teacher and researcher will work with individual
students to help clarify and refine their ideas.
Students’ Analogy Journals will be collected Friday
WEEK 6
On Monday 5/3 and/or Tuesday 5/4, students present their analogies and evaluate each
others analogy presentation in class.
This is the end of the students’ analogy project. Later in the week, students will be asked
to complete a brief survey for me and then are rewarded their earned prizes for their
performance on the analogy project. Later in the month I will do focus groups and a 2
question post-intervention survey.
224
Appendix C-2: General Outline of the Analogy Tutorial
Analogy Tutorial—General Outline
I. Introduction: Elicit from students the meaning of the term “Analogy” by asking
students to give examples of analogies used to describe the human brain. Student
responses may include” the brain is like a computer, “the brain is like a bowl of
noodles”, etc.
II. Identify one or two analogies that he teacher has used previously and ask students to
explain the concept that the analogy is being compared to.
III. Demonstrate to students how a relationship between analogy and concept can be
explained by identifying how they are similar and ways that they are different.
IV. Application: In groups of 3 or 4, have students practice identifying and explaining
relationships of two out of three teacher-constructed analogies that the teacher used in
previous units or use the optional Analogy Tutorial application activity given in
appendix C-2.
V. Discussion: have groups discuss the analogy they were given and explain the analogy
relationship to the class. Explain to students that they will be learning how to create
their own analogies in class.
225
Appendix C-3: Analogy Tutorial Lesson Guide
Analogy Tutorial
Introduction: Motivator—Hold a Sheep Brain up (from biology lab) in your Hand (make
sure gloves are used due to the formaldehyde preservative).
Generate a discussion of what it is:
Have some student volunteers come up to touch it or hold it and describe what it feels
like: (volunteers may say it feels soft and mushy with a hard stem).
Then have all students verbally brainstorm the answers to the question below:
Q1. What are some words or phrases that we usually use to describe the brain? i.e.
computer, noodles, hamburger meat, etc
Write student responses on the board down using this beginning statement:
(BOARD WORK) The Brain is like: 1.
2.
3.
4.
Q2.When two things that are different are compared using the word like, we often
give that comparison a special name. Can anyone think of what that special name might
be?
Yes, (these are) Analogies!
(BOARD WORK) What are Analogies?
Definition: A process of identifying similarities between two different things.
However analogies are never examples of a concept.
Discussion: i.e. The statement: “Lightning is like an electrical spark” is not an analogy
because, lightning is an electrical spark! But in describing it using an analogy we can say:
“Lightning is like a bright light turned on and off in a dark room.”
Q3. Why do you think your teacher may use Analogies to help you learn a science
concept? Wait for responses and acknowledge them.
Then use the following statement to connect the analogy tutorial to the current
biology unit:
For the next few weeks we will be learning more about Genetics and using analogies to
help us understand and retain or remember what is being taught. We will also be looking at how
your teacher uses analogies to help describe a science idea or concept that is abstract, something
you can’t see and you will get a chance to create many of your own analogies.
General Application: How can we compare a nucleus in animal cell to an animal brain?
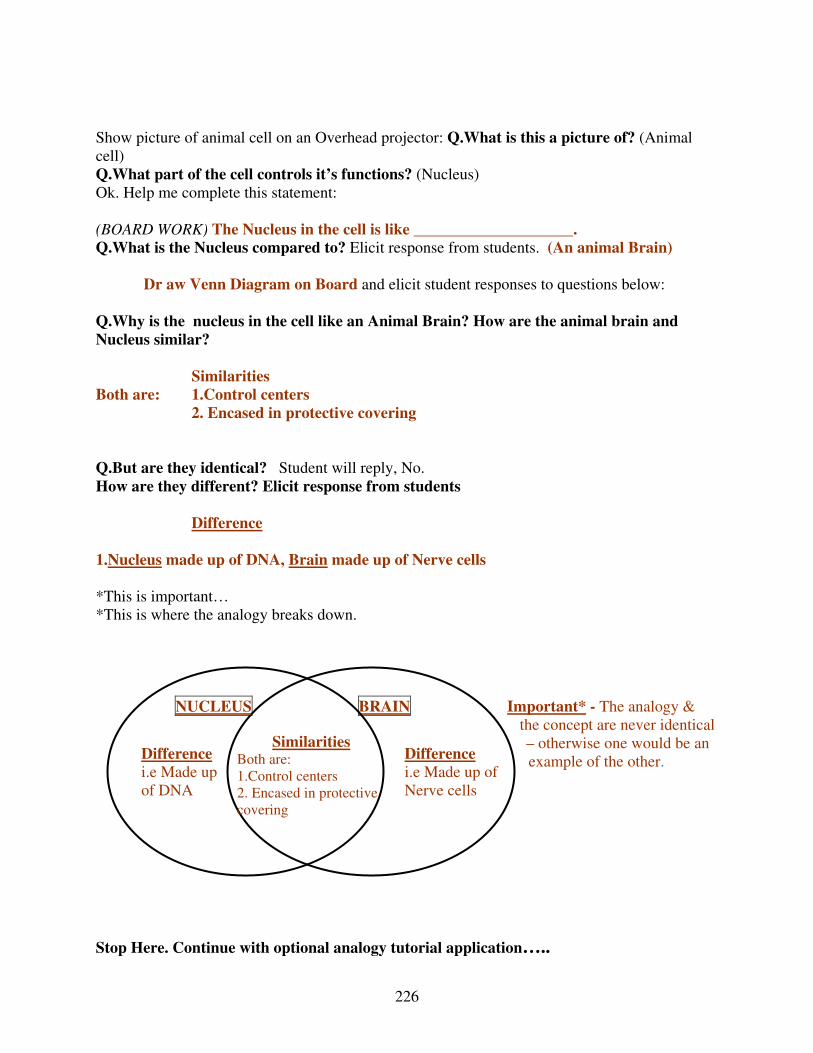
226
Show picture of animal cell on an Overhead projector: Q.What is this a picture of? (Animal
cell)
Q.What part of the cell controls it’s functions? (Nucleus)
Ok. Help me complete this statement:
(BOARD WORK) The Nucleus in the cell is like ____________________.
Q.What is the Nucleus compared to? Elicit response from students. (An animal Brain)
Dr aw Venn Diagram on Board and elicit student responses to questions below:
Q.Why is the nucleus in the cell like an Animal Brain? How are the animal brain and
Nucleus similar?
Similarities
Both are: 1.Control centers
2. Encased in protective covering
Q.But are they identical? Student will reply, No.
How are they different? Elicit response from students
Difference
1.Nucleus made up of DNA, Brain made up of Nerve cells
*This is important…
*This is where the analogy breaks down.
BRAIN NUCLEUS
Similarities Difference Difference Both are: i.e Made up
of DNA
i.e Made up of
Nerve cells1.Control centers
2. Encased in protective
covering
Important* - The analogy &
the concept are never identical
– otherwise one would be an
example of the other.
Stop Here. Continue with optional analogy tutorial application…..
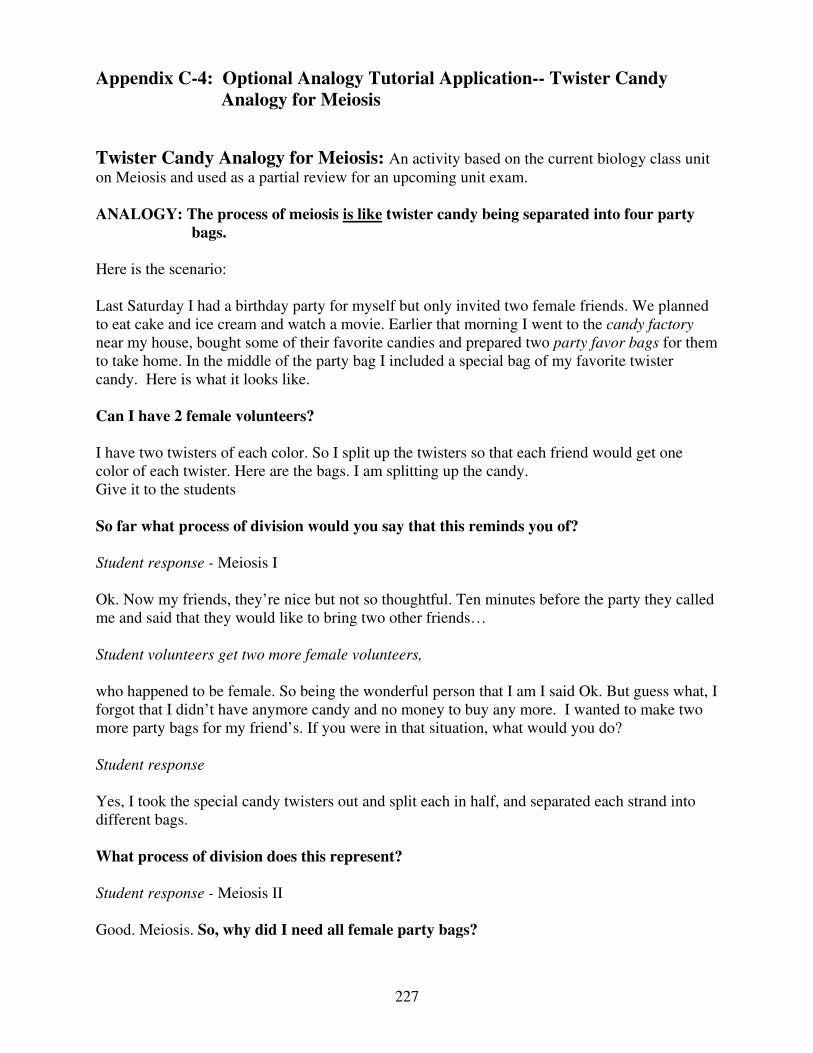
227
alogy for Meiosis
wister Candy Analogy for Meiosis: An activity based on the current biology class unit
n Meiosis and used as a partial review for an upcoming unit exam.
NALOGY: The process of meiosis is like
Appendix C-4: Optional Analogy Tutorial Application-- Twister Candy
An
To
A twister candy being separated into four party
bags.
Last Saturday I had a birthday party for myself but only invited two female friends. We planned
to eat cake and ice cream and watch a movie. Earlier that morning I went to the candy factory
near my house, bought some of their favorite candies and prepared two party favor bags for them
to take home. In the middle of the party bag I included a special bag of my favorite twister
candy. Here is what it looks like.
Can I have 2 female volunteers?
I have two twisters of each color. So I split up the twisters so that each friend would get one
color of each twister. Here are the bags. I am splitting up the candy.
Give it to the students
So far what process of division would you say that this reminds you of?
Student response - Meiosis I
Ok. Now my friends, they’re nice but not so thoughtful. Ten minutes before the party they called
me and said that they would like to bring two other friends…
Student volunteers get two more female volunteers,
who happened to be female. So being the wonderful person that I am I said Ok. But guess what, I
forgot that I didn’t have anymore candy and no money to buy any more. I wanted to make two
more party bags for my friend’s. If you were in that situation, what would you do?
Student response
Yes, I took the special candy twisters out and split each in half, and separated each strand into
different bags.
What process of division does this represent?
Student response - Meiosis II
Good. Meiosis. So, why did I need all female party bags?
Here is the scenario:
228
tudent response
t create all female party
loid (1/2 the number of chromosomes) cells: 1 egg cell and 3 other
S
Answer: Meiosis is the process of cell division in the production of sperm and egg cells
(gametes). Because the presenter (myself) was female it was importan
bags to represent a parent cell that produced four cells of the same sex. In this case the female
parent cell produced four hap
daughter cells. If the parent cell had been male, it would have produced 4 haploid sperm cells.
tudent response: Yes
Lets count the twisters in the inner bags ----- Twisters after Meiosis I =2n, Diploid,
Twisters after Meiosis II n, Haploid
Q.Is the amount of candy in the inner bags correct?
S
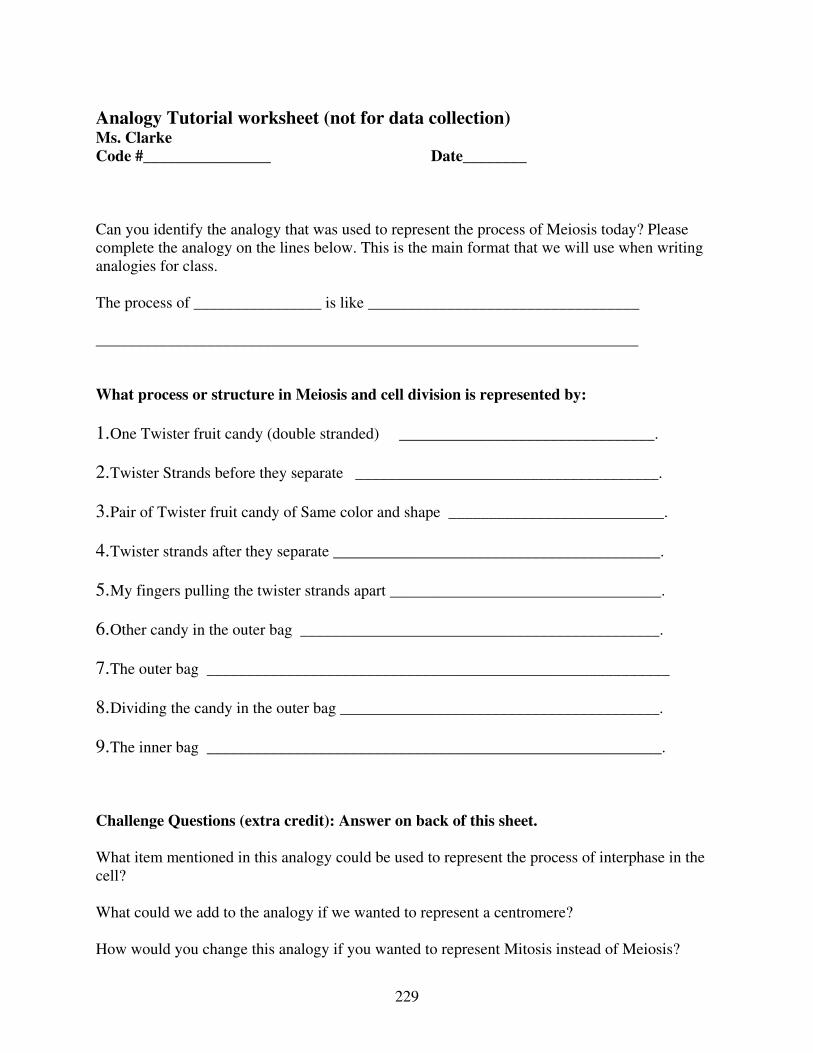
229
nalogy Tutorial worksheet (not for data collection)
cture in Meiosis and cell division is represented by:
1. One Twister fruit candy (double stranded) ________________________________.
2. Twister Strands before they separate ______________________________________.
3. Pair of Twister fruit candy of Same color and shape ___________________________.
4. Twister strands after they separate _________________________________________.
5. My fingers pulling the twister strands apart __________________________________.
6. Other candy in the outer bag _____________________________________________.
7. The outer bag __________________________________________________________
8. Dividing the candy in the outer bag ________________________________________.
9. The inner bag _________________________________________________________.
Challenge Questions (extra credit): Answer on back of this sheet.
What item mentioned in this analogy could be used to represent the process of interphase in the
cell?
What could we add to the analogy if we wanted to represent a centromere?
How would you change this analogy if you wanted to represent Mitosis instead of Meiosis?
AMs. Clarke
Code #________________ Date________
Can you identify the analogy that was used to represent the process of Meiosis today? Please
complete the analogy on the lines below. This is the main format that we will use when writing
analogies for class.
The process of ________________ is like __________________________________
___________________________________________________________________ _
What process or stru
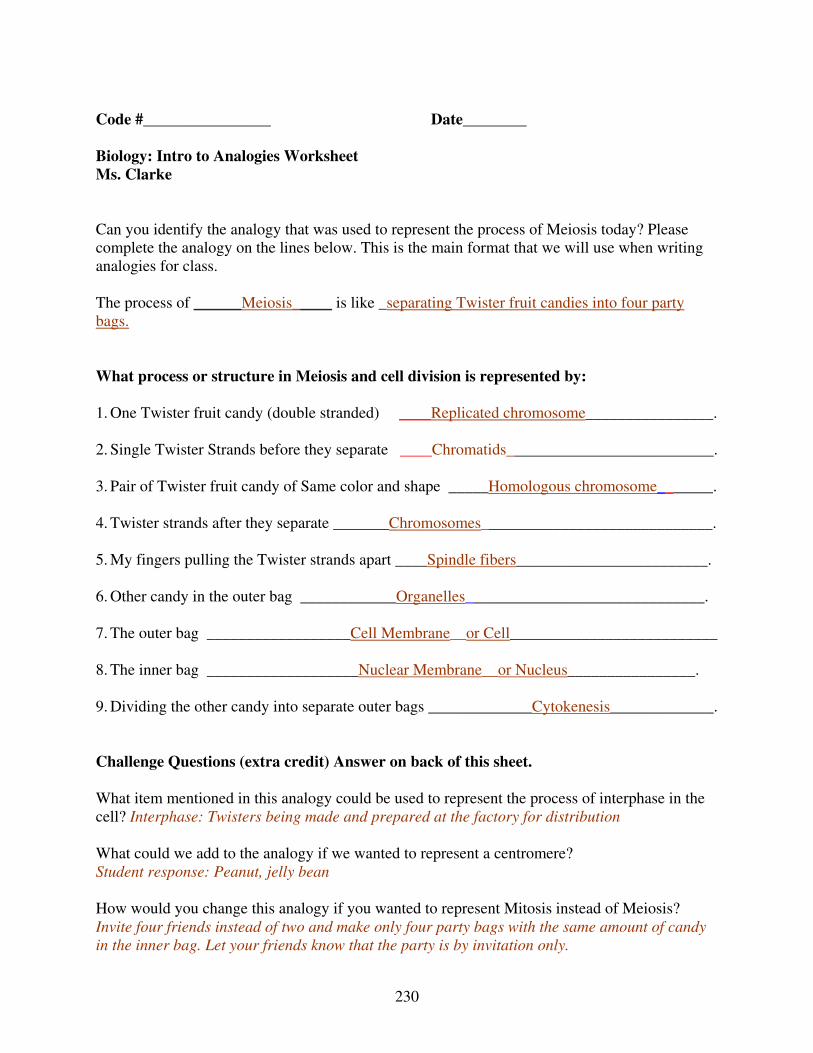
230
_
s. Clarke
Code #________________ Date_______
Biology: Intro to Analogies Worksheet
M
Can you identify the analogy that was used to represent the process of Meiosis today? Please
complete the analogy on the lines below. This is the main format that we will use when writing
analogies for class.
The process of ______Meiosis_____ is like _separating Twister fruit candies into four party
bags.
hat process or structure in Meiosis and cell division is represented by:
. One Twister fruit candy (double stranded) ____Replicated chromosome
W
1 ________________.
. Single Twister Strands before they separate ____Chromatids__________________________.
. Pair of Twister fruit candy of Same color and shape _____Homologous chromosome__
2
3 _____.
. Twister strands after they separate _______Chromosomes
4 _____________________________.
. My fingers pulling the Twister strands apart ____Spindle fibers
5 ________________________.
. Other candy in the outer bag ____________Organelles
6 ______________________________.
. The outer bag __________________Cell Membrane
7 __or Cell__________________________
. The inner bag ___________________Nuclear Membrane
8 __or Nucleus________________.
. Dividing the other candy into separate outer bags _____________Cytokenesis
9 _____________.
hallenge Questions (extra credit) Answer on back of this sheet.
ess of interphase in the
ell? Interphase: Twisters being made and prepared at the factory for distribution
could we add to the analogy if we wanted to represent a centromere?
tudent response: Peanut, jelly bean
ow would you change this analogy if you wanted to represent Mitosis instead of Meiosis?
dy
the inner bag. Let your friends know that the party is by invitation only.
C
What item mentioned in this analogy could be used to represent the proc
c
What
S
H
Invite four friends instead of two and make only four party bags with the same amount of can
in
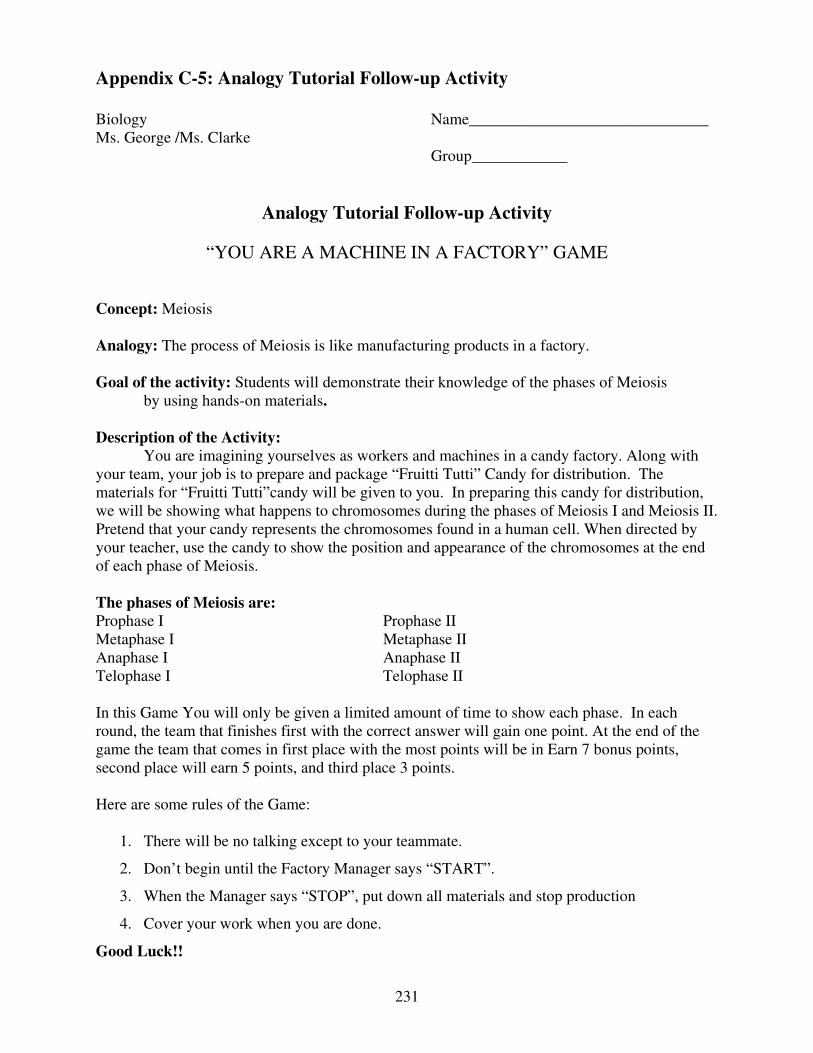
231
ppendix C-5: Analogy Tutorial Follow-up Activity
iology Name______________________________
Group____________
OU ARE A MACHINE IN A FACTORY” GAME
pt: Meiosis
n this Game You will only be given a limited amount of time to show each phase. In each
e point. At the end of the
Earn 7 bonus points,
2. Don’t begin until the Factory Manager says “START”.
Good Luck!!
A
B
Ms. George /Ms. Clarke
Analogy Tutorial Follow-up Activity
“Y
onceC
Analogy: The process of Meiosis is like manufacturing products in a factory.
Goal of the activity: Students will demonstrate their knowledge of the phases of Meiosis
by using hands-on materials.
escription of the Activity: D
You are imagining yourselves as workers and machines in a candy factory. Along with
our team, your job is to prepare and package “Fruitti Tutti” Candy for distribution. The y
materials for “Fruitti Tutti”candy will be given to you. In preparing this candy for distribution,
e will be showing what happens to chromosomes during the phases of Meiosis I and Meiosis II. w
Pretend that your candy represents the chromosomes found in a human cell. When directed by
our teacher, use the candy to show the position and appearance of the chromosomes at the end y
of each phase of Meiosis.
The phases of Meiosis are:
rophase I Prophase II P
Metaphase I Metaphase II
naphase I Anaphase II A
Telophase I Telophase II
I
round, the team that finishes first with the correct answer will gain on
ame the team that comes in first place with the most points will be ing
second place will earn 5 points, and third place 3 points.
ere are some rules of the Game: H
t to your teammate. 1. There will be no talking excep
3. When the Manager says “STOP”, put down all materials and stop production
4. Cover your work when you are done.

232
iology
Situational Interest Reflection Sheet
“YOU ARE A MACHINE IN A FACTORY” GAME
EFLECTION
r reflection
clude your responses to the following questions:
nalogy or activity to you?
3) How much do you think the analogy helped you to understand and Meiosis better?
logy will help you remember Meiosis better? Explain
n
B
Ms. George /Ms. Clarke Code #_____________________________
R
Write a one paragraph reflection about what you learned in this activity. In you
in
1) What is one thing you learned about Meiosis from doing this activity.
2) How interesting was this a
4) Do you think the ana
5) Do you think the activity help make the concept of Meiosis more real to you? Explai
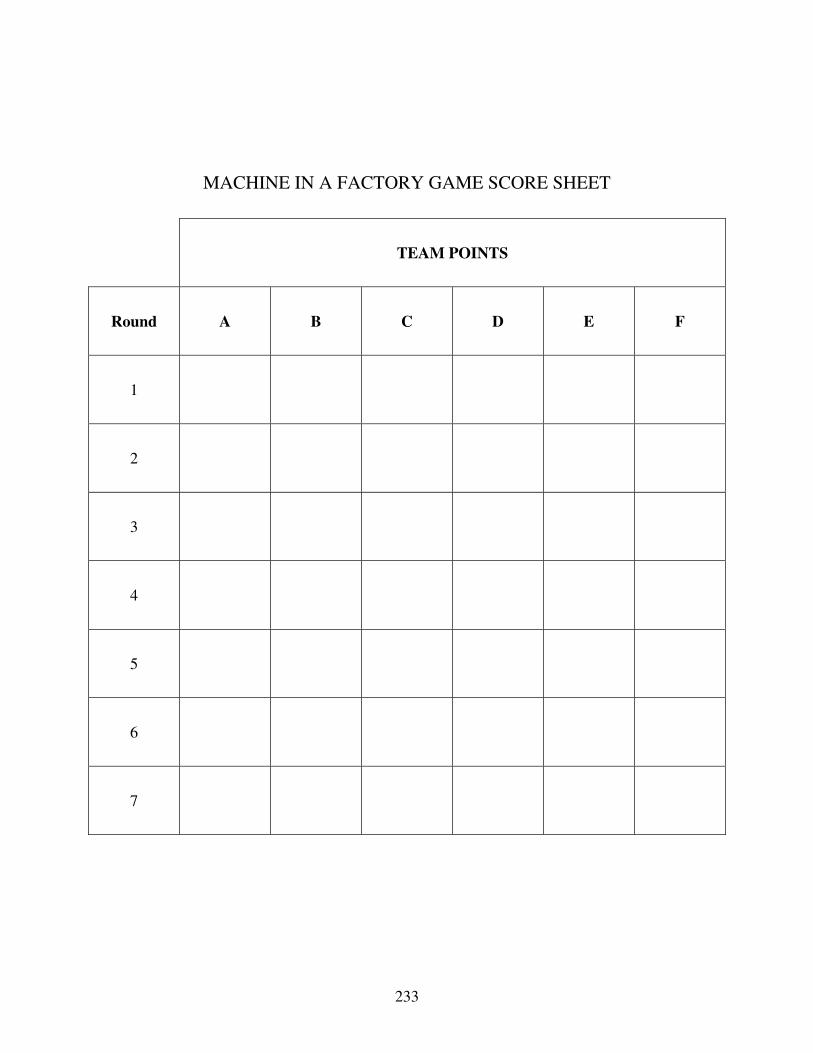
MACHI HEET
TEAM POINTS
NE IN A FACTORY GAME SCORE S
Round A B C D E F
1
2
3
4
5
6
7
233
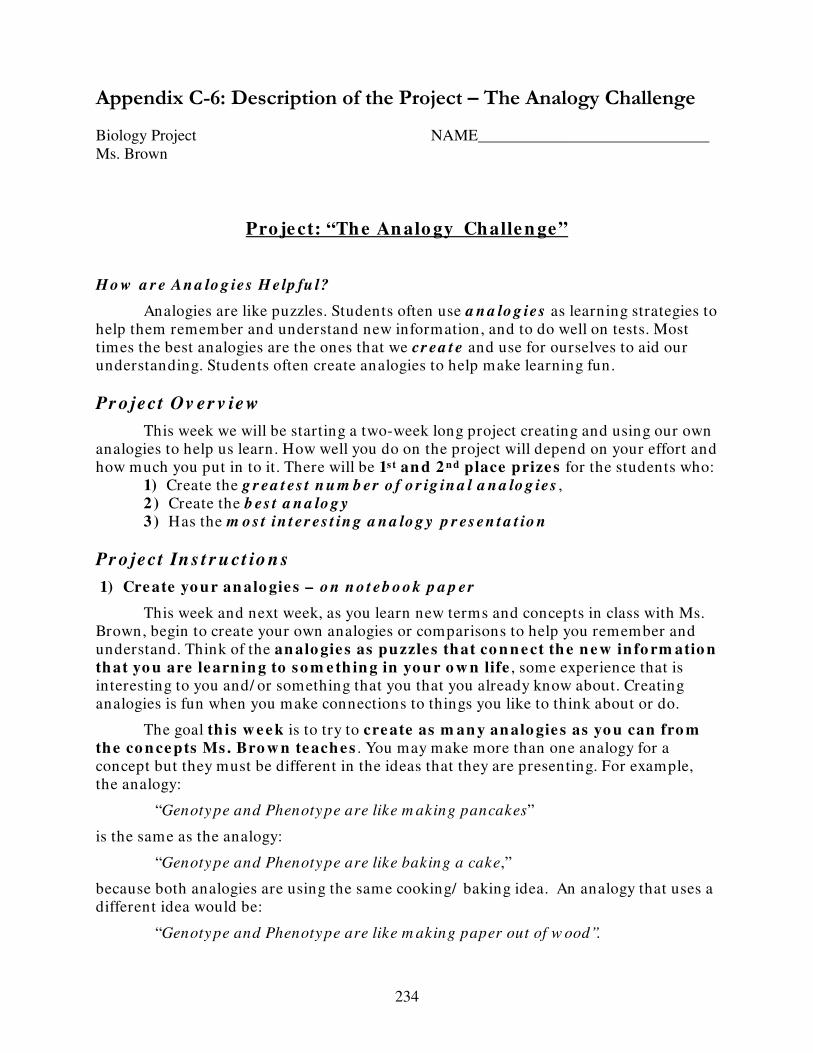
Appendix C-6: Description of the Project – The Analogy Challenge
iology Project NAME_____________________________
s. Brown
Pro je ct: “The An alo gy Ch alle n ge ”
B
M
H o w a r e An a lo g ies H elp fu l?
alogies like puzzl Students n use a n a lo g ies as learning strategies to
help them remember and understand new information, and to do well on tests. Mo
times the best analogies are the ones that we cr ea t e and use for ourselves to aid our
understanding. Students often create analogies to help make learning fun.
Pr o ject Ov er v iew
This week we will be starting a two-week long project creating and using our own
analogies to help us learn. How well you do on the project will depend on your effort and
how much you put in to it. There will be 1s t an d 2 n d place prize s for the students who:
1) Create the g r ea t es t n u m b er o f o r ig in a l a n a lo g ies ,
2) Create the b es t a n a lo g y
3 ) Has the m o s t in t er es t in g a n a lo g y p r es en t a t io n
Pr o ject In s t r u ct io n s
1) Cre ate yo ur an alo gie s – o n n o t eb o o k p a p er
This week and next week, as you learn new terms and concepts in class with Ms.
Brown, begin to create your own analogies or comparisons to help you remember and
understand. Think of the n alo gie s as puzzle s that co n n e ct th e n e w in fo rm atio n
that yo u are le arn in g to so m e th in g in yo ur o w n life , some experience that is
interesting to you and/ or something that you that you already know about. Creating
analogies is fun when you make connections to things you like to think about or do.
The goal th is w e e k is to try to cre ate as m an y an alo gie s as yo u can fro m
the co n ce pts Ms . Bro w n te ache s . You may make more than one analogy for a
concept but they must be different in the ideas that ey are pres nting. For e
the analogy:
Genotype and Phenotype are like m aking pancakes”
the same as the analogy:
“Genotype and Phenotype are like baking a cake,”
ecause both analogies are using the same cooking/ baking idea. An analogy that uses a
ifferent idea would be:
“Genotype and Phenotype are like m aking paper out of w ood”.
An are es. ofte
st
a
th e xample,
“
is
b
d
234
During the second week, choose your three best or most favorite analogies. Enter
ese analogies into you’re your My Analogy Journal. Complete one journal entry page
r each Analogy. You will get credit for all your analogies but especially those that you
choose to enter into t
3) An alo gy pre se n tatio n –
in
e will discuss presentations later next week.
a lo g y Br id g e he lp y o u b eg in cr ea t in g .
.
2 ) Cho o se yo ur thre e be s t an alo gie s – in yo ur jo urn al
th
fo
he journal.
From the three analogies that you entered into your journal, choose your favorite
to present to the class. In your presentation you must:
1) State the Genetics concept that you are illustrating,
2) State the analogy and explain its relationship to the concept. Be sure to expla
the parts it represents.
W
Re m e m be r: “Do y o u r b es t a n d y o u r b es t w ill b e r ew a r d ed !”
*************
H er e is a n u n fin is hed An
Co m ple te th is An alo gy State m e n t:
Ge n e s o n a chro m o so m e are like _ _ _ _ _ _ _ _ _ _ _ _ _ _ _ _ _ _ _ _ _ _ _ _ _ _ _ _ _ _
.
se n t th e chro m o so m e ?
.
W hy? Explain the re latio n sh ip. W hat in the an alo gy re pre se n ts the ge n e s?
W hat re pre
.
.
.
.
235

236
_____________________
s. Brown
Biology Project NAME________
M
Pro je ct: “The An alo gy Ch alle n ge ”
Du e To m o r r o w , Tu es d a y Ap r il 2 7 t h:
r lis t o f co m ple te d s e lf-create d An alo gie s o n the lin e s be lo w . If
this list and write clear
.
W rite yo u
you need more space, continue your list on the back of this sheet. On W ed n es d a y , be prepared to choose your three best analogies from
explanations for each.
1 .
.
2.
. .
3
. .
4
. .
5
. .
6
. .
7
. .
8
.
9.
10 . .
11. .
12. .

Biology Project Presentation FAMU DRS
s. Brown/ M Ms. Clarke
EN
cts combined average scores from Ms. Brown and Ms. Clarke and
re based on the criteria below:
Total 35pts 1 2 SCORES
ANALOGY PRES
TATION GRADE
Student Name:
Student’s Analogy:
Total Presentation grade refle
a
GRADING CRITERIA SCORE SCORE Average
1. Presentation includes a poster that is neatly and
colorfully designed. (5pts)
2. Definition of concept is accurate and clearly stated on
poster. (5pts)
3. Analogy is an appropriate representation of the concept and clearly stated on poster. (5pts)
4. Sections of the analogy that relate to particular sections
resentation. (5pts)
of the concept are clearly identified and stated in the p
5. Students oral explanation of the analogy is presented in
an clear auditory voice and demonstrates a good understanding of the concept. (5pts)
6. Presentation includes a visual display (diagram,
demonstration, etc.) that is a clear, accurate and creative
depiction of the student’s analogy. (5 pts)
7. Overall Presentation of the Analogy. (5pts)
TOTAL SCORE
Comments:
237
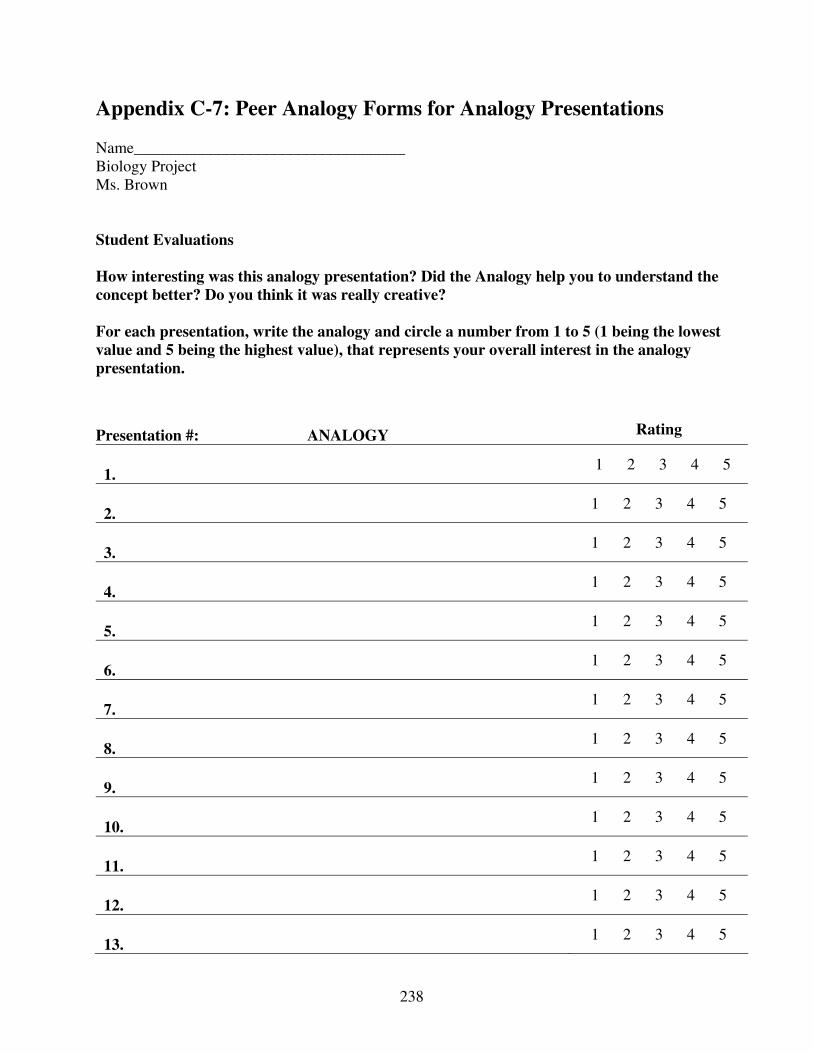
Appendix C-7: Peer Analogy Forms for Analogy Presentations
s. Brown
tudent Evaluations
his analogy presentation? Did the Analogy help you to understand the
oncept better? Do you think it was really creative?
alue), that represents your overall interest in the analogy
resentation.
Rating
1 2 3 4 5
Name__________________________________
Biology Project
M
S
How interesting was t
c
For each presentation, write the analogy and circle a number from 1 to 5 (1 being the lowest
value and 5 being the highest v
p
Presentation #: ANALOGY
1.
2. 1 2 3 4 5
3. 1 2 3 4 5
4. 1 2 3 4 5
5. 1 2 3 4 5
6. 1 2 3 4 5
7. 1 2 3 4 5
8. 1 2 3 4 5
9. 1 2 3 4 5
10. 1 2 3 4 5
11. 1 2 3 4 5
12. 1 2 3 4 5
13. 1 2 3 4 5
238

Appendix C-8: Teacher Evaluation Forms for Student Presentations
AME_________________________________________
For Your journal entries and assignments, each student was given an opportunity to redo or
vise entries as needed to improve their grade. In addition, for your project assignments and
s tim
This Final
grade reflects your effort in making final revisions to your journal entries
and should be reflective of your best work. Remember “Do Your Best and Your Best Will be
Rewarded!”
tries, Max. 7pts each
Teacher
analogy
#1
Teacher
analogy
#2
Teacher
analogy
#3
Group
analogy
#4
Group
an
#5
Biology Project Grade
/ Ms. Clarke Ms. Brown
N
FINAL ANALOGY JOURNAL AND PROJECT GRADE: This Final Biology grade
is a reflection of the work that you have submitted for:
1) Your first five journal entries
2) “The Analogy Challenge” Project assignments and
3) Analogy Presentation
re
presentation, clas e was allotted to give students an opportunity to seek and receive assistance
in understanding Biology concepts and creating your own analogies for the concepts.
and assignments
1.) Analogy Journal
En alogy Subtotal
(35pts total) _+__
Best Self-created
alogies, Max. 10pts
h
Self-
created
#1
Self-
created
#2
Self-
created
#3
EXTRA POINTS From Analog
(Total # -3 Best)
2.)
An
eac
y List Subtotal
(35pts total) + _
3.) Best Analogy Presentation Subtotal (Max. 35pts total)
+ __
TOTAL BIOLOGY PROJECT GRADE: %
239

APPENDIX D
1. Summary of student responses to Pre-DIS and IMLS Interest-related multiple
response Item: Positive and Negative words related to the course
2. Example of a general engagement/boredom observation summary sheet
3. Example of a detailed engagement/boredom summary sheet for day 1
4. Comparison of interest-related findings for focus group participants
5. Motivation-related engagement and behavior checklist categories
6. Individual motivation-to-learn engagement/boredom checklist data
7. Individual participant Pre and Post-Intervention Teacher Questionnaire
engagement data
8. Individual participant Pre and Post-Intervention Teacher Questionnaire
boredom data
240
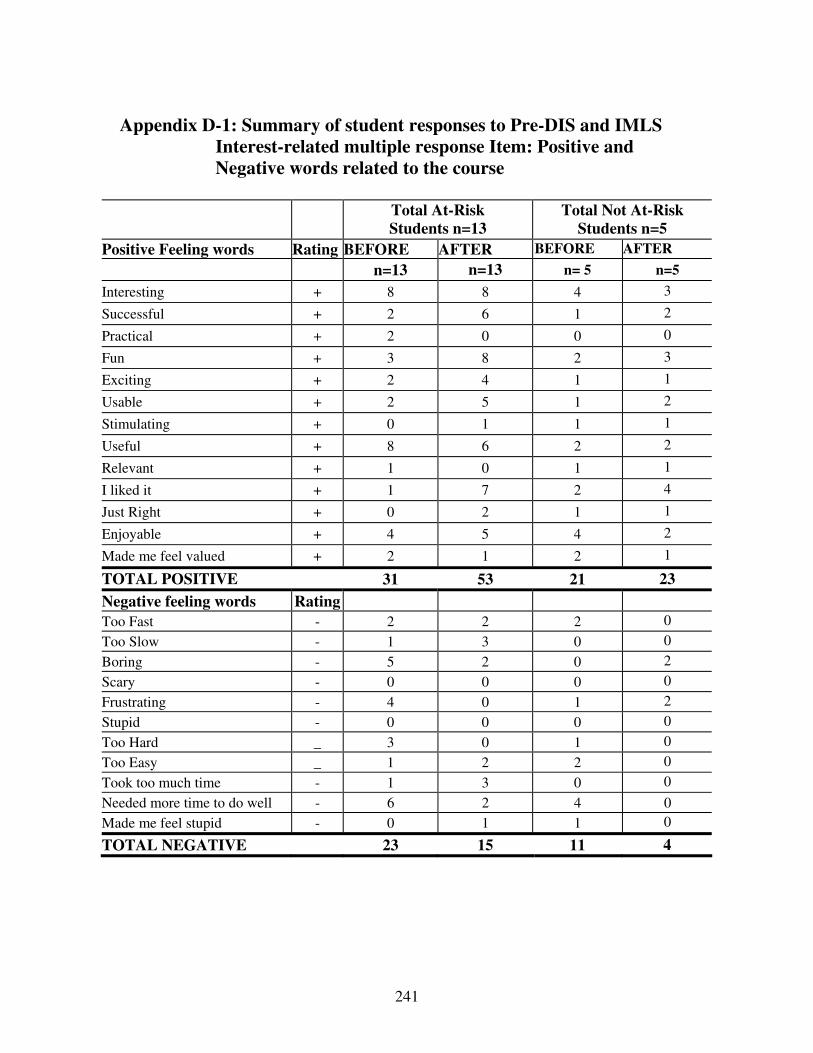
Appendix D-1: Summary of student responses to Pre-DIS and IMLS
Interest-related multiple response Item: Positive and
Negative words related to the course
Total At-Risk
Students n=13
Total Not At-Risk
Students n=5
Positive Feeling words Rating BEFORE AFTER BEFORE AFTER
n=13 n=13 n= 5 n=5
Interesting + 8 8 4 3
Successful + 2 6 1 2
Practical + 2 0 0 0
Fun + 3 8 2 3
Exciting + 2 4 1 1
Usable + 2 5 1 2
Stimulating + 0 1 1 1
Useful + 8 6 2 2
Relevant + 1 0 1 1
I liked it + 1 7 2 4
Just Right + 0 2 1 1
Enjoyable + 4 5 4 2
Made me feel valued + 2 1 2 1
TOTAL POSITIVE 31 53 21 23
Negative feeling words Rating
Too Fast - 2 2 2 0
Too Slow - 1 3 0 0
Boring - 5 2 0 2
Scary - 0 0 0 0
Frustrating - 4 0 1 2
Stupid - 0 0 0 0
Too Hard _ 3 0 1 0
Too Easy _ 1 2 2 0
Took too much time - 1 3 0 0
Needed more time to do well - 6 2 4 0
Made me feel stupid - 0 1 1 0
TOTAL NEGATIVE 23 15 11 4
241

Appendix D-2: Example of a General Engagement and Boredom Summary Sheet
Summary Record of Student Observations Period #3 class
Student observation
Code
Ob# date n= sw
3
0
2
3
0
3
3
0
4
3
0
5
3
0
6
3
0
7
3
0
8
3
0
9
3
1
0
3
1
1
3
1
2
3
1
4
3
1
5
1 2/9 13 1
2
3
4
5
6
7
8
B
E
E
E
B
E
B
E
E
E
E
E
B
E
E
E
E
E
E
E
E
E
E
E
E
E
E
E
B
E
E
E
E
E
E
E
B
E
B
B
E
B
B
E
B
B
E
B
E
B
E
E
E
E
B
B
E
E
E
E
E
B
B
E
A E
E
E
E
E
B
B
E
A B
B
E
E
E
E
E
E
E
B
E
E
E
E
E
E
2 2/11 14 1
2
3
4
5
6
E
E
E
B
B
E
E
E
E
B
B
E
E
E
B
B
B
E
E
E
B
B
B
E
E
E
B
B
B
B
E
E
B
B
B
B
E
E
E
E
B
E
E
E
E
E
E
E
E
E
B
B
B
B
E
E
E
B
E
E
E
E
E
B
B
B
E
E
E
E
E
E
A
3 2/12 15 1
2
3
4
5
6
7
8
E
E
E
E
E
E
E
B
E
E
E
E
E
E
B
B
E
E
B
B
E
B
E
E
E
E
E
E
E
E
E
E
E
E
E
E
E
E
B
B
E
E
E
E
E
E
E
E
E
E
E
E
E
B
B
B
E
E
E
E
E
E
E
E
E
E
E
E
E
E
E
E
E
E
E
E
E
E
E
E
E
E
E
E
E
E
E
E
E
E
E
E
E
E
E
E
A
4 2/16 15 1
2
3
4
5
6
7
8
E
E
E
E
E
E
E
E
E
B
B
B
B
B
B
B
E
E
B
E
E
B
B
E
E
E
E
E
E
E
E
E
E
E
E
E
E
E
B
B
E
E
E
E
E
E
E
B
E
E
E
E
E
E
B
B
E
E
E
E
E
E
B
B
B
B
B
B
E
E
B
B
E
E
E
B
E
E
E
B
E
E
E
E
E
E
B
B
E
E
E
E
E
E
B
B
A
5 2/17 12 1
2
3
4
5
6
7
E
E
E
B
E
E
E
E
E
E
E
E
B
B
B
B
B
B
B
E
E
E
E
E
E
B
B
B
B
E
E
E
E
E
E
B
E
B
E
B
E
E
LT
LT
E
E
E
B
B
E
E
E
E
E
E
E
E
E
E
E
B
E
E
E
E
E
E
E
E
E
A A A
LT
6 2/18 8 1
2
3
4
5
6
7
8
E
E
E
E
E
B
E
E
E
E
E
E
E
E
E
E
A E
B
B
E
E
B
B
B
B
B
E
E
E
E
B
E
E
E
E
E
E
E
E
E
A E
E
E
E
E
E
E
E
A E
E
E
E
E
E
E
E
E
E
E
B
B
E
E
E
A A
242
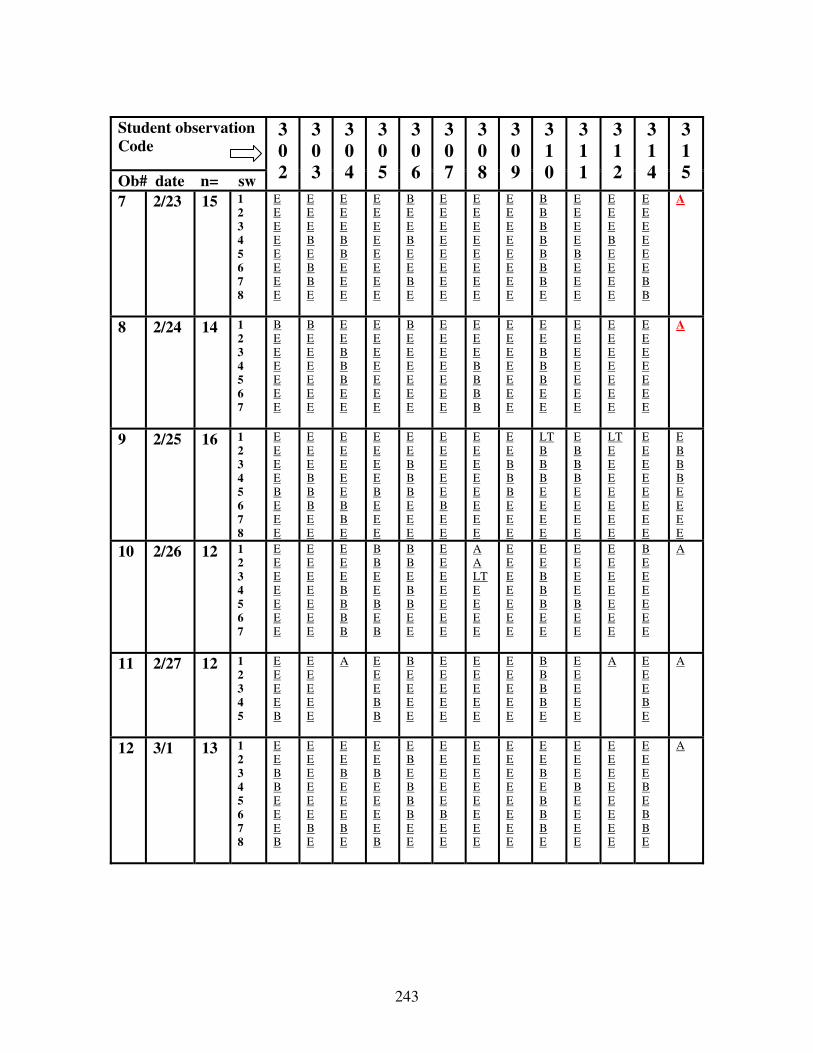
Student observation
Code
Ob# date n= sw
3
0
2
3
0
3
3
0
4
3
0
5
3
0
6
3
0
7
3
0
8
3
0
9
3
1
0
3
1
1
3
1
2
3
1
4
3
1
5
7 2/23 15 1
2
3
4
5
6
7
8
E
E
E
E
E
E
E
E
E
E
E
B
E
B
B
E
E
E
E
B
B
E
E
E
E
E
E
E
E
E
E
E
B
E
E
B
E
E
B
E
E
E
E
E
E
E
E
E
E
E
E
E
E
E
E
E
E
E
E
E
E
E
E
E
B
B
B
B
B
B
B
E
E
E
E
E
B
E
E
E
E
E
E
B
E
E
E
E
E
E
E
E
E
E
B
B
A
8 2/24 14 1
2
3
4
5
6
7
B
E
E
E
E
E
E
B
E
E
E
E
E
E
E
E
B
B
B
E
E
E
E
E
E
E
E
E
B
E
E
E
E
E
E
E
E
E
E
E
E
E
E
E
E
B
B
B
B
E
E
E
E
E
E
E
E
E
B
B
B
E
E
E
E
E
E
E
E
E
E
E
E
E
E
E
E
E
E
E
E
E
E
E
A
9 2/25 16 1
2
3
4
5
6
7
8
E
E
E
E
B
E
E
E
E
E
E
B
B
B
E
E
E
E
E
E
E
B
B
E
E
E
E
E
B
E
E
E
E
E
B
B
B
E
E
E
E
E
E
E
E
B
E
E
E
E
E
E
E
E
E
E
E
E
B
B
B
E
E
E
LT
B
B
B
E
E
E
E
E
B
B
B
E
E
E
E
LT
E
E
E
E
E
E
E
E
E
E
E
E
E
E
E
E
B
B
B
E
E
E
E
10 2/26 12 1
2
3
4
5
6
7
E
E
E
E
E
E
E
E
E
E
E
E
E
E
E
E
E
B
B
B
B
B
B
E
E
B
E
B
B
B
E
B
B
E
E
E
E
E
E
E
E
E
A
A
LT
E
E
E
E
E
E
E
E
E
E
E
E
E
B
B
B
E
E
E
E
E
E
B
E
E
E
E
E
E
E
E
E
B
E
E
E
E
E
E
A
11 2/27 12 1
2
3
4
5
E
E
E
E
B
E
E
E
E
E
A
E
E
E
B
B
B
E
E
E
E
E
E
E
E
E
E
E
E
E
E
E
E
E
E
E
B
B
B
B
E
E
E
E
E
E
A
E
E
E
B
E
A
12 3/1 13 1
2
3
4
5
6
7
8
E
E
B
B
E
E
E
B
E
E
E
E
E
E
B
E
E
E
B
E
E
E
B
E
E
E
B
E
E
E
E
B
E
B
E
B
B
B
E
E
E
E
E
E
E
B
E
E
E
E
E
E
E
E
E
E
E
E
E
E
E
E
E
E
E
E
B
E
B
B
B
E
E
E
E
B
E
E
E
E
E
E
E
E
E
E
E
E
E
E
E
B
E
B
B
E
A
243

Student observation
Code
Ob# date n= sw
3
0
2
3
0
3
3
0
4
3
0
5
3
0
6
3
0
7
3
0
8
3
0
9
3
1
0
3
1
1
3
1
2
3
1
4
3
1
5
13 3/4 14 1
2
3
4
5
6
7
8
E
B
E
E
E
E
E
E
B
B
B
B
B
E
E
E
E
E
B
B
B
E
E
E
B
B
B
B
B
B
E
E
E
E
E
E
E
B
E
E
E
E
B
B
B
E
E
E
E
E
B
B
B
E
E
E
E
E
E
E
E
E
E
E
E
E
E
E
E
E
E
E
A
E
E
E
E
E
E
E
E
E
E
E
E
E
E
E
E
E
E
E
E
E
E
E
E
14 3/5 10 1
2
3
4
5
6
7
8
E
B
B
B
B
B
E
E
B
E
E
B
B
B
E
E
B
B
B
B
B
B
B
E
E
B
E
E
B
B
E
E
B
E
B
B
E
B
E
E
E
E
B
B
B
B
E
E
A
B
E
B
B
B
B
E
E
A A B
E
B
E
B
B
E
E
E
B
B
B
B
E
E
E
A
15 3/8 13 1
2
3
4
5
6
7
8
E
E
E
E
E
E
E
E
E
E
E
B
B
B
B
E
E
B
B
B
E
E
E
E
E
E
E
E
E
E
E
E
B
B
B
B
E
E
B
E
B
E
B
B
E
B
B
E
B
E
E
E
B
B
B
E
E
E
E
E
E
E
B
E
E
E
E
B
B
B
B
E
A E
E
E
E
E
E
B
E
E
E
E
E
E
E
B
E
E
E
E
E
E
E
E
E
Subtotl sw
Tot N for all
obs Tot # sw
Sub E
Total Engagement
Behavior
Engagement Rate
Sub B
Total Boredom Behavior
Boredom Rate
LT = Out of class due to Lateness
A = Out of class due to Absence
244
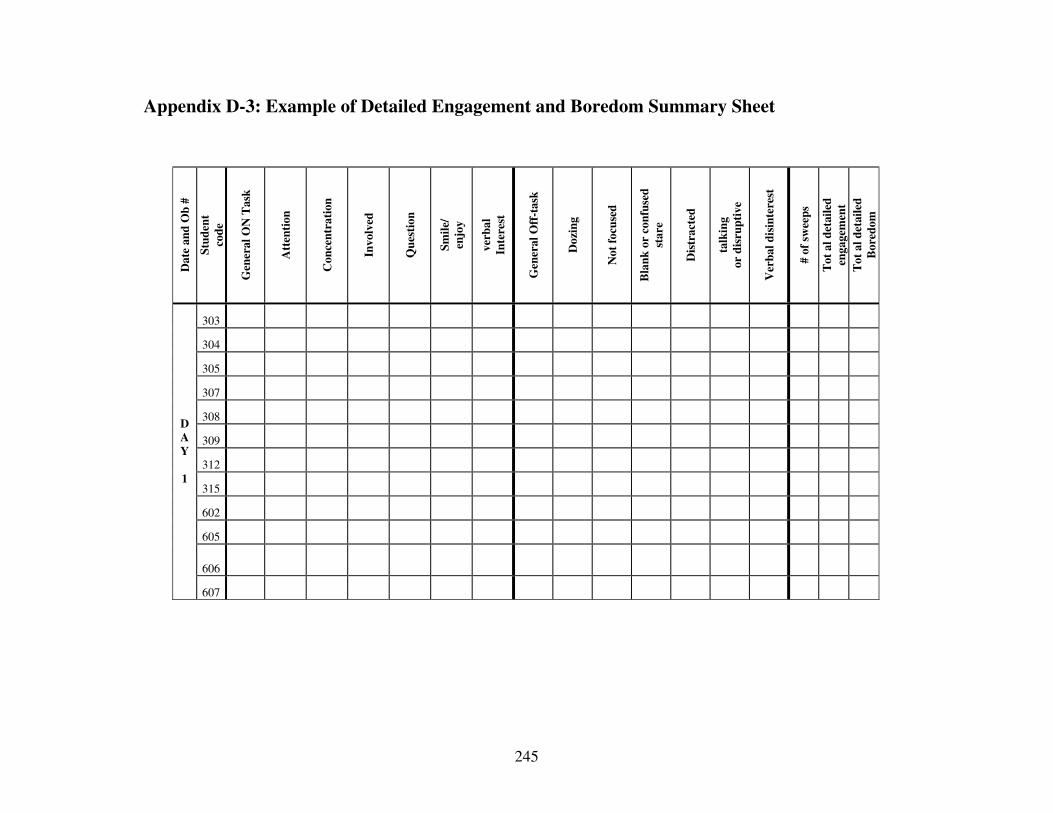
Appendix D-3: Example of Detailed Engagement and Boredom Summary Sheet
Date
an
d O
b #
Stu
den
t
cod
e
Gen
eral
ON
Ta
sk
Att
enti
on
Co
nce
ntr
ati
on
Involv
ed
Qu
esti
on
Sm
ile/
enjo
y
ver
ba
l
Inte
rest
Gen
eral
Off
-ta
sk
Dozi
ng
Not
focu
sed
Bla
nk
or
con
fuse
d
sta
re
alk
ing m
Dis
tra
cted
t
or
dis
rup
tive
Ver
ba
l d
isin
tere
st
# o
f sw
eep
s
To
t a
l d
etail
ed
eng
ag
emen
t
To
t a
l d
etail
ed
Bo
red
o
303
304
305
307
308
309
312
315
602
605
606
D
A
Y
1
607
245

Appendix D-4 : Comparison of interest-related finding of focus group participants
Carire (305) Charles (303) Sandra (309)
Pre Int Dif Pre Int Dif Pre Int Dif
k= # behaviors k= 43 k=57 k= 42 k=31 k= 46 k=56
Attention 4.7 28.1 23.4 4.8 51.6 46.9 2.2 21.4 19.3
Concentration .0 10.5 10.5 .0 12.9 12.9 6.5 14.3 7.8
Involved 16.3 10.5 -5.8 16.7 9.7 -7.0 23.9 14.3 -9.6
Questions 4.7 3.5 -1.1 2.4 3.2 .8 26.1 10.7 -15.4
Smile/enjoy .0 22.8 22.8 2.4 16.1 13.7 8.7 33.9 25.2
Verbal Intrs .0 .0 .0 .0 .0 .0 .0 .0 .0
Dozing -16.3 15.8 -.5 -19.0 3.2 -15.8 .0 .0 .0
Not focused -4.7 5.3 .6 -14.3 .0 -14.3 .0 .0 .0
Blank stare -37.2 .0 -37.2 -19.0 .0 -19.0 -4.3 .0 -4.3
Distracted -14.0 3.5 -10.4 -21.4 3.2 -18.2 -13.0 1.8 -11.3
Talking/
disruptive -2.3 .0 -2.3 .0 .0 .0 -15.2 3.6 -11.6
Verbalize
Disinterest .0 .0 .0 .0 .0 .0 .0 .0 .0
Tasha (607) Freeda (605) John (606)
Pre Int Dif Pre Int Dif Pre Int Dif
k= 8 k=28 k= 44 k=52 k= 48 k=42
Attention .0 21.4 21.4 -4.5 19.2 14.7 -8.3 19.0 10.7
Concentration .0 7.1 7.1 -18.2 9.6 -8.6 -8.3 21.4 13.1
Involved 25.0 25.0 .0 -11.4 3.8 -7.5 -16.7 11.9 -4.8
Questions .0 3.6 3.6 -15.9 34.6 18.7 -6.3 31.0 24.7
Smile/enjoy .0 32.1 32.1 -2.3 28.8 26.6 .0 14.3 14.3
Verbal Intrs .0 .0 .0 .0 .0 .0 .0 .0 .0
Dozing .0 3.6 3.6 -20.5 3.8 -16.6 -4.2 .0 -4.2
Not focused .0 .0 .0 -2.3 .0 -2.3 -12.5 2.4 -10.1
Blank stare .0 .0 .0 -13.6 .0 -13.6 -16.7 .0 -16.7
Distracted -12.5 .0 -12.5 -2.3 .0 -2.3 -20.8 .0 -20.8
Talking/
disruptive -62.5 7.1 -55.4 -9.1 .0 -9.1 -4.2 .0 -4.2
Verbalize
Disinterest .0 .0 .0 .0 .0 .0 -2.1 .0 -2.1
246
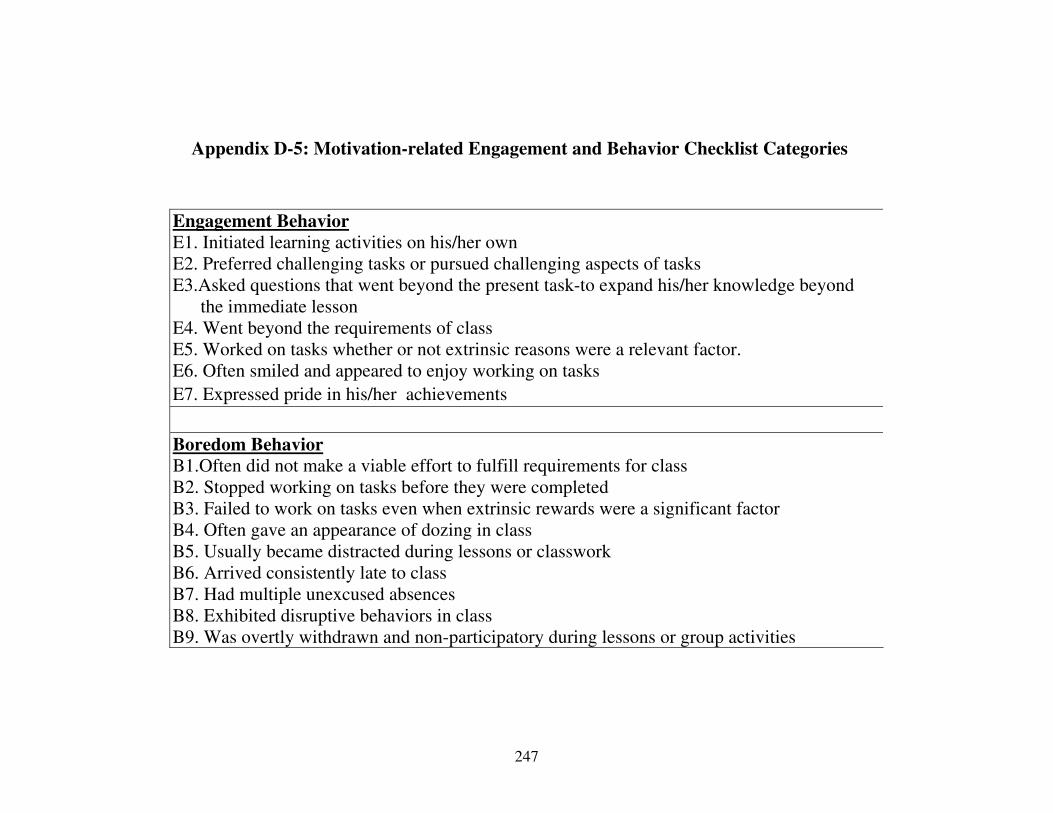
Appendix D-5: Motivation-related Engagement and Behavior Checklist Categories
Engagement Behavior
E1. Initiated learning activities on his/her own
E2. Preferred challenging tasks or pursued challenging aspects of tasks
E3.Asked questions that went beyond the present task-to expand his/her knowledge beyond
the immediate lesson
E4. Went beyond the requirements of class
E5. Worked on tasks whether or not extrinsic reasons were a relevant factor.
E6. Often smiled and appeared to enjoy working on tasks
E7. Expressed pride in his/her achievements
Boredom Behavior
B1.Often did not make a viable effort to fulfill requirements for class
B2. Stopped working on tasks before they were completed
B3. Failed to work on tasks even when extrinsic rewards were a significant factor
B4. Often gave an appearance of dozing in class
B5. Usually became distracted during lessons or classwork
B6. Arrived consistently late to class
B7. Had multiple unexcused absences
B8. Exhibited disruptive behaviors in class
B9. Was overtly withdrawn and non-participatory during lessons or group activities
247
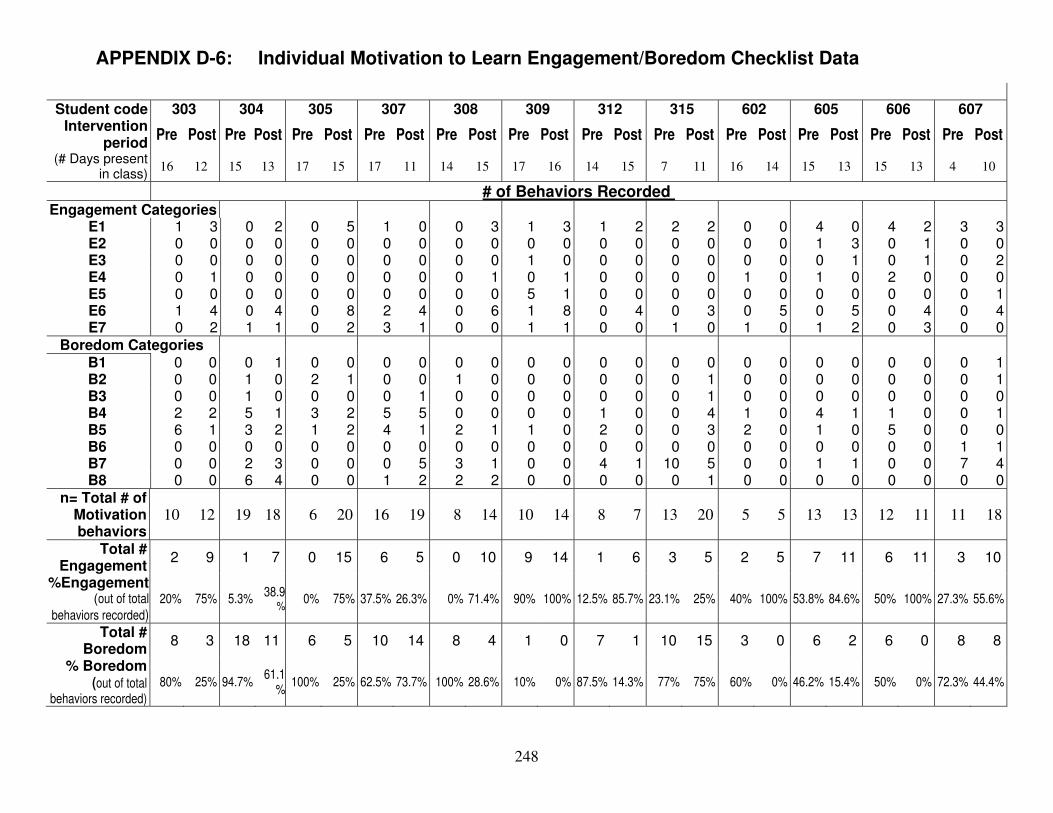
APPENDIX D-6: Individual Motivation to Learn Engagement/Boredom Checklist Data
Student code 303 304 305 307 308 309 312 315 602 605 606 607Intervention
period Pre Post Pre Post Pre Post Pre Post Pre Post Pre Post Pre Post Pre Post Pre Post Pre Post Pre Post Pre Post
(# Days present in class)
16 12 15 13 17 15 17 11 14 15 17 16 14 15 7 11 16 14 15 13 15 13 4 10
# of Behaviors Recorded Engagement Categories
E1 1 3 0 2 0 5 1 0 0 3 1 3 1 2 2 2 0 0 4 0 4 2 3 3E2 0 0 0 0 0 0 0 0 0 0 0 0 0 0 0 0 0 0 1 3 0 1 0 0E3 0 0 0 0 0 0 0 0 0 0 1 0 0 0 0 0 0 0 0 1 0 1 0 2E4 0 1 0 0 0 0 0 0 0 1 0 1 0 0 0 0 1 0 1 0 2 0 0 0E5 0 0 0 0 0 0 0 0 0 0 5 1 0 0 0 0 0 0 0 0 0 0 0 1E6 1 4 0 4 0 8 2 4 0 6 1 8 0 4 0 3 0 5 0 5 0 4 0 4E7 0 2 1 1 0 2 3 1 0 0 1 1 0 0 1 0 1 0 1 2 0 3 0 0
Boredom Categories B1 0 0 0 1 0 0 0 0 0 0 0 0 0 0 0 0 0 0 0 0 0 0 0 1B2 0 0 1 0 2 1 0 0 1 0 0 0 0 0 0 1 0 0 0 0 0 0 0 1B3 0 0 1 0 0 0 0 1 0 0 0 0 0 0 0 1 0 0 0 0 0 0 0 0B4 2 2 5 1 3 2 5 5 0 0 0 0 1 0 0 4 1 0 4 1 1 0 0 1B5 6 1 3 2 1 2 4 1 2 1 1 0 2 0 0 3 2 0 1 0 5 0 0 0B6 0 0 0 0 0 0 0 0 0 0 0 0 0 0 0 0 0 0 0 0 0 0 1 1B7 0 0 2 3 0 0 0 5 3 1 0 0 4 1 10 5 0 0 1 1 0 0 7 4B8 0 0 6 4 0 0 1 2 2 2 0 0 0 0 0 1 0 0 0 0 0 0 0 0
n= Total # of Motivation behaviors
10 12 19 18 6 20 16 19 8 14 10 14 8 7 13 20 5 5 13 13 12 11 11 18
Total # Engagement
2 9 1 7 0 15 6 5 0 10 9 14 1 6 3 5 2 5 7 11 6 11 3 10
%Engagement (out of total
behaviors recorded) 20% 75% 5.3%
38.9%
0% 75% 37.5% 26.3% 0% 71.4% 90% 100% 12.5% 85.7% 23.1% 25% 40% 100% 53.8% 84.6% 50% 100% 27.3% 55.6%
Total # Boredom
8 3 18 11 6 5 10 14 8 4 1 0 7 1 10 15 3 0 6 2 6 0 8 8
% Boredom (out of total
behaviors recorded) 80% 25% 94.7%
61.1%
100% 25% 62.5% 73.7% 100% 28.6% 10% 0% 87.5% 14.3% 77% 75% 60% 0% 46.2% 15.4% 50% 0% 72.3% 44.4%
248
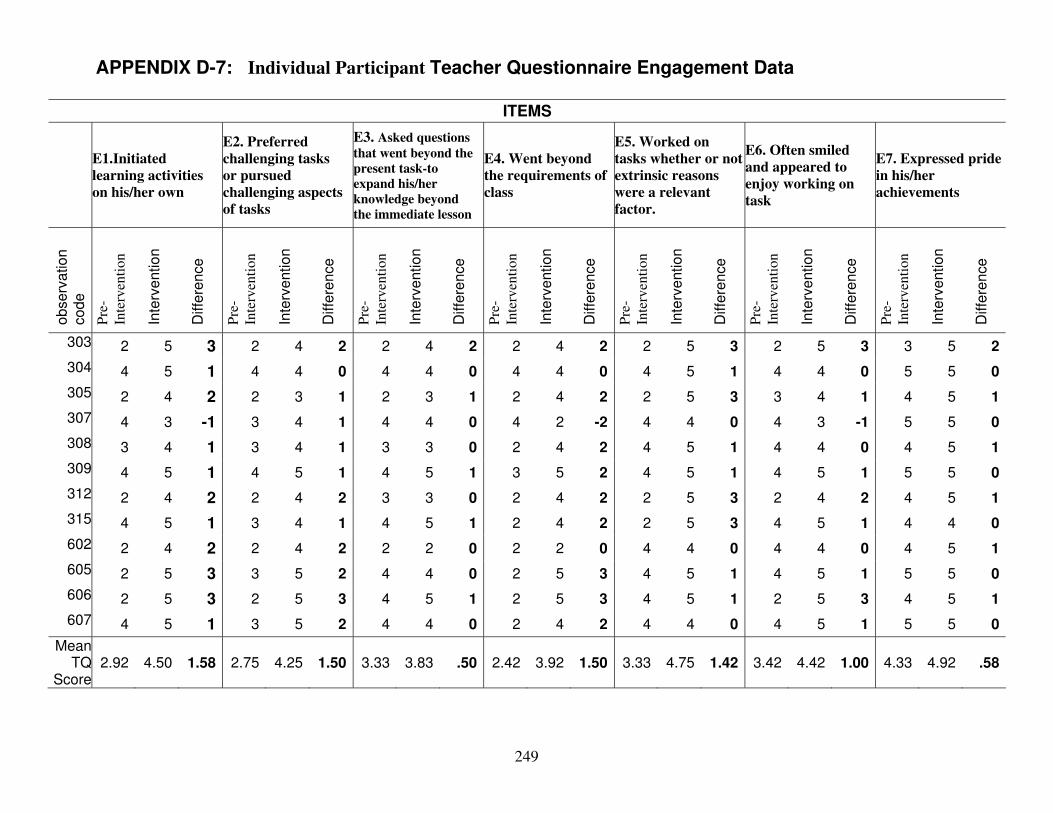
APPENDIX D-7: Individual Participant Teacher Questionnaire Engagement Data
ITEMS
E1.Initiated
learning activities
on his/her own
E2. Preferred
challenging tasks
or pursued
challenging aspects
of tasks
E3. Asked questions
that went beyond the
present task-to
expand his/her
knowledge beyond
the immediate lesson
E4. Went beyond
the requirements of
class
E5. Worked on
tasks whether or not
extrinsic reasons
were a relevant
factor.
E6. Often smiled
and appeared to
enjoy working on
task
E7. Expressed pride
in his/her
achievements
ob
se
rva
tio
n
co
de
Pre
-
Inte
rven
tio
n
Inte
rve
ntio
n
Diffe
ren
ce
Pre
-
Inte
rven
tio
n
Inte
rve
ntio
n
Diffe
ren
ce
Pre
-
Inte
rven
tio
n
Inte
rve
ntio
n
Diffe
ren
ce
Pre
-
Inte
rven
tio
n
Inte
rve
ntio
n
Diffe
ren
ce
Pre
-
Inte
rven
tio
n
Inte
rve
ntio
n
Diffe
ren
ce
Pre
-
Inte
rven
tio
n
Inte
rve
ntio
n
Diffe
ren
ce
Pre
-
Inte
rven
tio
n
Inte
rve
ntio
n
Diffe
ren
ce
303 2 5 3 2 4 2 2 4 2 2 4 2 2 5 3 2 5 3 3 5 2
304 4 5 1 4 4 0 4 4 0 4 4 0 4 5 1 4 4 0 5 5 0
305 2 4 2 2 3 1 2 3 1 2 4 2 2 5 3 3 4 1 4 5 1
307 4 4 4 4 2 4 3 5 53 -1 3 4 1 0 -2 4 4 0 -1 0
308 3 3 3 2 4 4 4 4 54 1 3 4 1 0 2 4 5 1 0 1
309 4 4 5 3 5 4 5 5 55 1 4 5 1 1 2 4 5 1 1 0
312 2 3 3 2 4 2 4 4 54 2 2 4 2 0 2 2 5 3 2 1
315 4 4 5 2 4 4 5 4 45 1 3 4 1 1 2 2 5 3 1 0
602 2 2 2 2 2 4 4 4 54 2 2 4 2 0 0 4 4 0 0 1
605 2 4 4 2 5 4 5 5 55 3 3 5 2 0 3 4 5 1 1 0
606 2 4 5 2 5 2 5 4 55 3 2 5 3 1 3 4 5 1 3 1
607 4 4 4 2 4 4 5 5 55 1 3 5 2 0 2 4 4 0 1 0
Mean TQ
Score2.92 4.50 1.58 2.75 4.25 1.50 3.33 3.83 .50 2.42 3.92 1.50 3.33 4.75 1.42 3.42 4.42 1.00 4.33 4.92 .58
249

APPENDIX D-8: PRE-TQ and POST-TQ: Individual Participant Teacher Questionnaire Boredom Data
ITEMS
B1.Often did not
make a viable
effort to fulfill
requirements for
class
B2. Stopped
working on tasks
before they were
completed
B3. Failed to
work on tasks
even when
extrinsic rewards
were a significant
factor
B4. Often gave an
appearance of
dozing in class
B5. Usually
became distracted
during lessons or
classwork
B6. Arrived
consistently late
to class
B7. Had multiple
unexcused
absences
B8. Exhibited
disruptive
behaviors in class
B9. Was overtly
withdrawn and
non-participatory
during lessons or
group activities
ob
se
rva
tio
n
co
de
Pre
-
Inte
rven
tio
n
Inte
rvention
Diffe
rence
P Inte
rven
tio
n
re-
re-
re-
re-
re-
re-
re-
re-
Inte
rvention
Diffe
rence
P Inte
rven
tio
n
Inte
rvention
Diffe
rence
P Inte
rven
tio
n
Inte
rvention
Diffe
rence
P Inte
rven
tio
n
Inte
rvention
Diffe
rence
P Inte
rven
tio
n
Inte
rvention
Diffe
rence
P Inte
rven
tio
n
Inte
rvention
Diffe
rence
P Inte
rven
tio
n
Inte
rvention
Diffe
rence
P Inte
rven
tio
n
Inte
rvention
Diffe
rence
303 0 1 -1 2 1 -1 2 1 -1 2 1 2 2 2 1 2 1 2 1 2 1-1 0 -1 -1 -1 -1
304 2 2 0 2 4 2 4 4 2 1 2 1 2 5 2 12 0 2 2 0 -2 0 -1 -1 3 -1
305 0 1 -1 2 2 2 2 2 2 1 2 1 2 1 2 12 0 2 2 0 0 0 -1 -1 -1 -1
307 2 4 2 2 2 4 2 2 2 2 2 5 2 1 2 12 0 2 2 0 2 0 0 3 -1 -1
308 0 1 -1 2 2 1 2 1 2 1 2 1 2 1 2 11 -1 2 1 -1 -1 -1 -1 -1 -1 -1
309 0 1 -1 2 2 1 2 1 2 1 2 1 2 1 2 11 -1 2 1 -1 -1 -1 -1 -1 -1 -1
312 0 1 -1 2 2 2 2 2 2 1 2 1 2 1 2 12 0 2 2 0 0 0 -1 -1 -1 -1
315 2 4 1 2 1 2 2 4 1 2 1 2 12 0 2 2 0 2 2 0 -3 -1 0 -3 -1 -1
602 2 2 2 2 4 2 1 2 1 2 1 2 12 0 2 2 0 2 2 0 0 2 -1 -1 -1 -1
605 2 2 4 2 1 4 2 2 1 2 1 2 11 -1 2 1 -1 2 1 -1 2 -1 -2 -1 -1 -1
606 2 2 1 2 1 2 1 2 1 2 1 2 12 0 2 1 -1 2 1 -1 -1 -1 -1 -1 -1 -1
607 2 2 2 2 1 2 1 2 1 2 1 2 12 0 2 2 0 2 2 0 0 -1 -1 -1 -1 -1
Mean TQScorel
2.0 1.67 -.33 2.00 1.58 -.42 2.00 1.58 -.42 2.33 1.92 -.42 2.17 1.83 -.33 2.17 1.25 -.92 2.17 1.33 -.83 2.00 1.33 -.67 2.00 1.00 -1.00
250
BIOGRAPHICAL SKETCH
Ciana Bernadine Bennett-Clarke was born in Kingston, Jamaica West Indies on February
6th
, 1966 to John J. Bennett and Hermie M. (Witter) Bennett. She is the youngest child in her
family with five older brothers. In 1968, she emigrated with her family to Brooklyn, New York
where she was raised and resided for 25 years. While Ciana was living in Brooklyn she attended
Public School 68 Ridgewood, Queens, NY, Public School 91 and Junior High School 119 in
Glendale, Queens, NY. She attended Franklin K. Lane High School in Jamaica, Queens, NY
where she obtained a H.S. Regents diploma in 1984 and won a New York State Regents
Scholarship. After graduating high school, she attended Houghton College in western upstate
New York. At the end of her junior year in Houghton, Ciana decided to pursue teaching as her
first career and applied to Pace University for acceptance in their Master of Science for Teachers
(M.S.T.) Program. After graduating from Houghton with a B.A. degree in Biology/ Minor in
Psychology in 1988, Ciana was awarded the New York State Empire Challenger Fellowship for
teachers and attended the Pace University Graduate School of Education’s M.S.T. Program in
New York, NY. While attending Pace University, Ciana was awarded a matching tuition grant
and acquired a graduate assistantship under Dr. Kathryn DeLawter, chairperson of the
department of teaching. In 1990, in her final term at Pace University, Ciana was awarded the
Pace Education Student of the Year Award, Phi Delta Kappan Educational Leadership Award,
and Bronze Medal for academic achievement.
In September 1990, Ciana began her first year of teaching as a Biology teacher at
Graphics Communication Arts High School in Midtown, Manhattan where she was inspired and
challenged by her students to experiment with current student-centered, hands-on, and various
cognitive techniques to help her students make personal/meaningful connections in science.
That school year she was nominated by the school for the Sallie Mae National First Year Teacher
Award. In September 1991, Ciana was introduced to Middle College H.S. at LaGuardia
Community College, Long Island City, NY, a progressive Public Alternative School of choice
that caters to students at-risk of dropping out. Ciana taught there for two 1/2 years and spend one
summer as a “Hands-on Science Teacher Trainer” for junior high school teachers and their
students.
In the summer 1993, Ciana left Brooklyn, New York and moved to Port Charlotte,
Florida to be closer to her family. In April 1994, she married her husband, Jerry A. Clarke, and
259

moved back to Brooklyn for four years while Jerry attended nursing school there. During this
time in New York, Ciana taught Regents Biology at a newly created alternative school, the High
School for the Integration of the Arts and Science in Long Island City, NY, for half a year
in1994 and then went on maternity leave for one year to begin her family. After maternity leave,
Ciana taught at Middle College H.S. for one semester in 1996 and then began teaching at City-
As-School High School in Greenwich Village, NY, a progressive alternative school of choice for
those interested in real-life work experiences/ academic internships rather than traditional
methods of instruction. Ciana served as a Science teacher / internship coordinator at City-as-
School for two years and was inspired to begin her doctoral studies in Educational Psychology.
In 1998 Ciana was accepted into the doctoral degree program in Educational Psychology
at Florida State University and moved to Tallahassee, FL with her husband and 2½ year old son
Jude. In 1988 she was awarded a Leslie Neilson Assistantship and a graduate assistantship. In
1989, she awarded a summer graduate research assistantship with the Florida State University
Foundations and teaching assistantship with the College of Education the following semester.
Later that year, she was awarded a graduate research assistantship with the Department of
Education at the National High Magnetic Field Laboratory at Florida State University. Ciana
worked at the Magnet Lab for one semester and then went on maternity/ family leave. While on
family leave, Ciana attended graduate school at Florida State part-time and worked as a full-time
mother and wife to care for her now three young children.
In 2003, Ciana was awarded a Delores Auzenne Fellowship for minority students and
returned to school Full-time to work on her dissertation and complete her Doctor of Philosophy
Degree. On July 29, 2005 she successfully defended her dissertation and graduated with her
PhD in Educational Psychology in Fall 2005.
Currently, Ciana resides in Tallahassee, Fl with her husband Jerry Clarke and three
children Jude 9 ½ , James 5, and Ciara 3 ½ and is working as a faculty research associate with
the Florida Center for Reading Research at Florida State University.
260