The Impact of Cultural Context on Corporate Web Sites - CORE
195
The Impact of Cultural Context on Corporate Web Sites: A New Zealand and South Korean Comparison Mun Ga Choi A thesis submitted to Auckland University of Technology in fulfilment of the requirements for the degree of Master of Philosophy (MPhil) 2008 School of Business Primary supervisor: Professor Peter Enderwick
-
Upload
khangminh22 -
Category
Documents
-
view
3 -
download
0
Transcript of The Impact of Cultural Context on Corporate Web Sites - CORE

The Impact of Cultural Context on Corporate
Web Sites: A New Zealand and South Korean
Comparison
Mun Ga Choi
A thesis submitted to Auckland University of Technology in
fulfilment of the requirements for the degree of Master of
Philosophy (MPhil)
2008
School of Business
Primary supervisor: Professor Peter Enderwick

i
Table of Contents
LIST OF FIGURES ....................................................................................... V
LIST OF TABLES ......................................................................................... V
ATTESTATION OF AUTHORSHIP .............................................................. VII
ACKNOWLEDGMENTS ........................................................................... VIII
ETHICS APPROVAL ................................................................................... IX
ABSTRACT………. .................................................................................... X
CHAPTER 1: INTRODUCTION .................................................................. .1
1.1 BACKGROUND TO THE RESEARCH ...................................................................................... 1
1.2 RESEARCH OBJECTIVE ........................................................................................................ 2
1.3 METHODOLOGY ................................................................................................................. 4
1.4 OUTLINE OF THE REPORT .................................................................................................... 5
1.5 KEY ASSUMPTIONS ............................................................................................................. 7
1.6 CONTRIBUTIONS ................................................................................................................. 7
1.7 CONCLUSION ...................................................................................................................... 9
CHAPTER 2: LITERATURE REVIEW ....................................................... 10
2.1 INTRODUCTION ................................................................................................................. 10
2.1.1 The functionalist paradigm of culture ....................................................................... 11
2.1.2 Hofstede’s dimensions of national culture................................................................. 13
2.1.3 Critiques of Hofstede’s model ................................................................................... 17
2.1.4 Hall’s cultural categories ......................................................................................... 21
2.2 CULTURE AND MARKETING COMMUNICATION .................................................................. 23
2.2.1 Cultural differences in marketing communication .................................................... 23
2.2.2 Cross-cultural content analysis of advertisements .................................................... 26
2.2.3 Value paradoxes in advertising ................................................................................. 29
2.2.4 Consumers’ perceptions toward cultural appeals in advertisements ......................... 31
2.3 CULTURE AND WEB SITES ................................................................................................. 33
2.3.1 Cultural adaptation .................................................................................................. 33
2.3.2 The effect of language............................................................................................... 37
2.3.3 Cultural manifestations ............................................................................................ 39

ii
2.3.4 Hall’s high- and low-context communication styles .................................................. 41
2.3.5 Hofstede’s cultural dimensions ................................................................................. 44
Power distance .......................................................................................................................... 45
Individualism/Collectivism ....................................................................................................... 47
Masculinity/Femininity ............................................................................................................. 49
Uncertainty Avoidance .............................................................................................................. 50
2.3.6 Web user’s perception toward a Web site .................................................................. 52
2.4 RESEARCH QUESTIONS ..................................................................................................... 54
2.5 CONCLUSION .................................................................................................................... 55
CHAPTER 3: STUDY ONE ....................................................................... 56
3.1 INTRODUCTION ................................................................................................................. 56
3.2 HYPOTHESES .................................................................................................................... 56
3.2.1 Product portrayal ..................................................................................................... 56
3.2.2 People portrayal ....................................................................................................... 57
3.2.3 Multimedia ............................................................................................................... 58
3.2.4 Web site features ....................................................................................................... 59
3.3 METHOD ........................................................................................................................... 62
3.4 UNIT OF ANALYSIS ............................................................................................................ 62
3.5 SAMPLE ............................................................................................................................ 63
3.6 RESULTS ........................................................................................................................... 65
3.6.1 Product portrayal ..................................................................................................... 66
3.6.2 People portrayal ....................................................................................................... 67
3.6.3 Multimedia ............................................................................................................... 68
3.6.4 Web site features ....................................................................................................... 68
3.7 CONCLUSION .................................................................................................................... 75
CHAPTER 4: STUDY TWO ...................................................................... 76
4.1 INTRODUCTION ................................................................................................................. 76
4.2 HYPOTHESES .................................................................................................................... 76
4.3 CREATING FOUR CULTURALLY MANIPULATED WEB SITES ................................................ 79
4.4 CONSIDERATION OF CREATING THE WEB SITES ................................................................ 83
4.5 PARTICIPANTS ................................................................................................................... 85
4.6 METHOD ........................................................................................................................... 86

iii
4.7 DATA COLLECTION ........................................................................................................... 90
4.8 PILOT TEST ....................................................................................................................... 91
4.9 RESULTS ........................................................................................................................... 93
4.9.1 Hofstede’s Values Survey Module for Young People 1997 (VSMY 97) ...................... 93
4.9.2 Demographic information of three ethnic groups ..................................................... 95
4.9.3 Ethnic group 1 – Korean university students ............................................................ 97
One-Way AVONA results.......................................................................................................... 97
Post-hoc tests ............................................................................................................................ 98
4.9.4 Ethnic group 2 – New Zealand university students ................................................. 100
One-Way AVONA results........................................................................................................ 100
4.9.5 Ethnic group 3 – Korean university students studying in New Zealand .................. 102
One-Way AVONA results........................................................................................................ 102
Post-hoc tests .......................................................................................................................... 103
4.9.6 First language ........................................................................................................ 104
4.9.7 Two-Way ANOVA .................................................................................................... 105
4.9.8 Open-ended questions............................................................................................. 109
4.10 CONCLUSIONS .............................................................................................................. 110
CHAPTER 5: DISCUSSION .................................................................... 112
5.1 INTRODUCTION ............................................................................................................... 112
5.2 THE DIFFERENCES IN CORPORATE WEB SITES ................................................................. 112
5.2.1 Different purposes for online presence ................................................................... 115
5.2.2 Different level of Internet broadband infrastructure ............................................... 117
5.2.3 Company size .......................................................................................................... 119
5.3 THE SIMILARITIES IN CORPORATE WEB SITES ................................................................. 120
5.3.1 Genre of Web site .................................................................................................... 123
5.3.2 Internet culture ....................................................................................................... 125
5.4 WEB USER’S SIMILAR PERCEPTION TOWARD CORPORATE WEB SITES ............................. 128
5.4.1 International segmentation ..................................................................................... 130
5.4.2 Change of culture ................................................................................................... 131
5.4.3 Economic development ........................................................................................... 133
5.5 FIRST LANGUAGE ........................................................................................................... 134
5.6 WEB SITE TRANSFORMATION .......................................................................................... 136

iv
5.7 CONCLUSION .................................................................................................................. 137
CHAPTER 6: CONCLUSIONS AND IMPLICATIONS.................................. 139
6.1 SUMMARY ...................................................................................................................... 139
6.2 IMPLICATIONS................................................................................................................. 140
6.2.1 Implications for the theoretical field ....................................................................... 140
6.2.2 Implication for managers ....................................................................................... 142
6.3 LIMITATIONS ................................................................................................................... 144
6.4 FINAL REFLECTIONS ....................................................................................................... 147
REFERENCES…………. ......................................................................... 148
APPENDICES…… ................................................................................... 160
Appendix 1. New Zealand and South Korean company lists .................................................... 160
Appendix 2. Use of visuals and features by New Zealand and South Korean industries ........ 168
Appendix 3. Demographic information of three ethnic groups................................................. 171
Appendix 4. Survey - English version ....................................................................................... 174
Appendix 5. Survey - Korean version ........................................................................................ 179

v
List of Figures
Figure 1: Degree of Web site adaptation a ....................................................................... 37
Figure 2: Four different Web sites ................................................................................... 81
Figure 3 : Graph of Two-Way Interactions ................................................................... 106
Figure 4 : Graph of Two-Way Interactions ................................................................... 108
Figure 5: Dial-up and broadband shares of total fixed Internet subscribers, December
2005 a............................................................................................................................. 118
List of Tables
Table 1: The ten values emphasised in Hofstede's cultural dimensions a ....................... 16
Table 2: Hofstede's index values for Korea (KOR) and New Zealand (NZL) ................ 17
Table 3 : The ten values in Hall's high- and low-context communication style a ........... 23
Table 4 : Global, adaptation, differentiation and local strategies for communication a .. 25
Table 5: Cultural categories for Hall's high- and low-context communication styles .... 44
Table 6 : Cultural categories for the power distance dimension ..................................... 46
Table 7 : Cultural categories for the individualism/collectivism dimension ................... 48
Table 8 : Cultural categories for the masculinity/femininity dimension ......................... 50
Table 9: Cultural categories for the uncertainty avoidance dimension ........................... 51
Table 10: Cultural Web site features ............................................................................... 60
Table 11 : Visuals on the corporate homepages from New Zealand and South Korea ... 65
Table 12 : Frequency of Web site features ...................................................................... 69
Table 13: ANOVA Results for cultural dimensions by country ...................................... 70
Table 14: Web features on corporate homepages by industry sectors in South Korea ... 72
Table 15: Web features on corporate homepages by industry sectors in New Zealand .. 73
Table 16: ANOVA Results for cultural dimensions in South Korea ............................... 74
Table 17: ANOVA Results for cultural dimensions in New Zealand .............................. 75
Table 18: The contents of the Web sites .......................................................................... 82
Table 19: Hofstede's index formulas ............................................................................... 89
Table 20: Results of the pilot test .................................................................................... 93

vi
Table 21 : Hofstede's original index scoresb for NZ and KOR ....................................... 94
Table 22 : Results of index scoresb gained from the participants in this research .......... 95
Table 23 : ANOVA results for Korean university students in South Korea .................... 98
Table 24 : Mean difference of attitude toward Web site ................................................. 99
Table 25 : ANOVA results for New Zealand university students in New Zealand ....... 101
Table 26: AVONA results for South Korean university students in New Zealand ....... 103
Table 27 : Mean difference of attitude toward Web sites .............................................. 103
Table 28 : Means of attitude toward Web site in three ethnic groups ........................... 105
Table 29 : Mean difference of attitude toward Web site by ethnic group ..................... 107
Table 30 : Mean difference of attitude toward Web site by Web site type .................... 107
Table 31: Mean difference of future intention toward Web site by Web site type ........ 108
Table 32: Business activities and different functions a .................................................. 116
Table 33: Transformation in Web feature adoption of corporate Web sites .................. 137
Table 34 : Korean company list .................................................................................... 160
Table 35 : New Zealand company list ........................................................................... 163
Table 36 : Use of visuals by industry sector ................................................................. 168
Table 37: Use of Web features by industry sector ......................................................... 169
Table 38 : Demographic statistics of ethnic group 1 ..................................................... 171
Table 39 : Demographic statistics of ethnic group 2 ..................................................... 172
Table 40 : Demographic statistics of ethnic group 3 ..................................................... 173

vii
Attestation of Authorship
“I hereby declare that this submission is my own work and that, to the best of my
knowledge and belief, it contains no material previously published or written by another
person (except where explicitly defined in the acknowledgements), nor material which
to a substantial degree has been submitted for the award of any other degree or diploma
of a university or other institution of higher learning.”
-----------------------------------------
Mun Ga Choi
viii
Acknowledgments
I wish to thank Professor Peter Enderwick and Professor Cristel Russell, my supervisors,
for their guidance and feedback. I would also like to give heartfelt thanks to Sabina, my
very best friend and mentor, for encouraging me through the entire journey and
reviewing the thesis.
My gratitude also goes to those who participated in the survey and especially Professor
Sung Bae Kim at Gyeongsang National University in Korea for helping to gather
invaluable responses from Korean university students.
I deeply appreciate my family for their support and patience throughout this journey,
especially my father, for his endless love and strong belief in my ability.

ix
Ethics Approval
I went through the Massey self assessment process and this research was judged to be
low risk and approved under delegated authority from the Massey University Human
Ethics Committee (please refer to the letter below).

x
Abstract
This study examines the impact of national culture on the content of corporate Web sites,
and Web users’ attitudes and intentions toward culturally congruent or incongruent Web
sites. In this work, culturally bipolar clusters based on Hofstede’s (1991) and Hall’s
(1976) cultural dimensions are conceptualised. New Zealand and Korea are chosen as
representatives of the respective bipolar clusters.
This research utilises both content analysis and experimental research to provide deep
insight into an area which has not yet been explored. Two studies are undertaken, Study
One, focusing on the content analysis, examines how the use of visual communication
and Web features differs between the two countries and between industry types. Study
Two assesses Web users’ predispositions to respond favourably or unfavourably to the
Web site. Web users’ perceptions, measured by experimental research with four
culturally manipulated Web sites, are assumed to be the most suitable concept for
studying the effectiveness of Web sites. Three ethnic groups are involved: Korean
university students, New Zealand university students, and English-Korean bilingual
university students.
The findings reveal differences in the content of corporate Web sites from the two
countries. However, these results do not support the findings of extant research. The
results show that the corporate Web sites studied can be distinguished not only by the
two national cultures, but also by other significant factors such as a company’s
characteristics, its online presence strategy, national broadband infrastructure, and
unique Internet culture. Additionally, the segment of young adults shows a convergence
of cultural value systems which can be attributed to the fact that young adults in both
countries have similar perceptions toward corporate Web sites regardless of their
nationalities. Language structure and local terminology on the Web sites, however, are
still important.
This study contributes to knowledge by providing critical insights into the effectiveness
and cultural congruence of Web sites. The results will benefit both academics and
practitioners.
Keywords: cultural adaptation, attitude, future intention, industry effects, Web site
effectiveness.

Mun Ga Choi 1
1 Chapter 1: Introduction
Chapter 1: Introduction
1.1 Background to the research
The Internet is a revolutionary invention. Enormous changes have taken place over the
past two decades in the way information is exchanged and business is conducted.
Sophisticated computer networks such as the Internet have created new environments
and many organisations are interested in an entry to the Internet or have already spent a
considerable amount of resources on a Web site‟s development. According to Neilsen
(2001, cited in Teo et al., 2003), about 90% of current commercial Web sites have low
effectiveness. Such Web sites will lead to unsatisfied users and will not become
successful in the long term. It is critically significant for Web site developers and
managers to recognise whether their Web sites communicate effectively with users and
succeed in the digital environment.
Most of the literature has focused primarily on technical and applied issues, from the
lists of dos and don‟ts for general Web site design to more specific explanations of site
security and usability. However, with respect to the global reach of Internet technology,
the cultural aspects of Web site design are considered more controversial than technical
or economical aspects. Many have speculated that its ubiquitous nature has a
homogenising effect, contributing to cultural convergence or globalisation. This
argument suggests cultures will become more similar since they must pass through a
relatively fixed pattern of technology development (Zahir, Dobing, & Hunter, 2002). A
culturally neutral environment can be used in businesses, corporations, or government
settings. By contrast, computer networks cannot or do not provide a completely
common and neutral environment for global international communication between all
cultures. In many cases, a culture which imports a new technology from another does

Mun Ga Choi 2
2 Chapter 1: Introduction
not adopt the technology unchanged, along with the technology‟s inherent ideologies
and value systems embedded in it, but instead adapts by fitting it into its own cultural
values and ways of thinking and behaving (Sugimoto & Levin, 2000).
Therefore, the Internet or its usability in a business environment could not avoid the
continuous debate of globalisation versus localisation. This debate has been studied
primarily by marketing and advertising scholars. They have emphasised that people live
with their traditional core cultures and that these cultures affect the expression of
marketing communication messages and people‟s perceptions toward those messages.
Technically speaking, given the Internet‟s capability, the target audience of a Web site
can be scattered around the world. However, the cultural acceptability of a Web site
often reduces its target audience to a much smaller group in terms of its way of life,
customs and religious beliefs (Lu & Yeung, 1998). Web sites are not free from human
values and activities, but need to reflect cultural sensibility and understanding of
targeted audiences to be effective in communicating their messages. In spite of the
extent of the Internet‟s potential in the marketing and advertising area and the
importance of cultural aspects of the Internet, little research has been conducted in this
area.
1.2 Research objective
From among the various types of marketing messages on the Internet, this study focuses
on corporate Web sites. Web sites have functions similar to advertisements, those basic
functions of informing and persuading, so they should make users aware of not only the
sites themselves but also their products or services. Main visuals on homepages and
Web features of corporate Web sites will be different in accordance with their cultural
contexts.
Mun Ga Choi 3
3 Chapter 1: Introduction
Another significant element in making Web sites effective is to realise the importance of
understanding their users. When it comes to e-commerce or electronic transactions, a
Web user who is successfully persuaded by a Web site might be related to a company‟s
financial success. Web sites are required to make their users assume potential intentions
and behaviours toward them. Therefore, they should be created to match the desired
Web user preference and response with effective Web site design. The deeper the
understanding of Web users, the more effective is the design of the site and the resulting
communication.
In this study, the Republic of Korea (South Korea) and New Zealand were selected as
the different cultural contexts. The two countries have similarities in national factors,
including economic and technology factors. The economic factors are related to the
wealth of a nation as measured by variables like GDP per capita: US$24,084 (2006) for
South Korea and US$25,874 (2006) for New Zealand (Wikipedia, 2007). The national
technology factors capture the technology infrastructure of the country which might be
measured by Internet penetration rate: 66.5% for South Korea and 74.9% for New
Zealand (Internet-World-Stats, 2007).
However, New Zealand and the Republic of Korea (South Korea) were representatives
of Hofstede‟s bipolar Anglo Cluster and Asian Cluster respectively (Hofstede, 2001).
According to Porter and Samovar‟s (1982, cited in Cho & Cheon, 2005) scale of socio-
cultural differences, Western (e.g. New Zealand) and Eastern (e.g. South Korea) cultures
reveal the maximum difference. Therefore, the cultural comparison of the two countries
provided the solid theoretical and practical foundations of this research. South Korean
university students, New Zealand university students, and South Korean international
students in New Zealand (bilinguals) were asked to participate in this study.
Mun Ga Choi 4
4 Chapter 1: Introduction
Thus, the objectives of this research are fourfold: (1) to apply the theories of culture
(e.g., Hofstede‟s and Hall‟s cultural typologies) to understanding cultural adaptation on
Web sites; (b) to examine cultural differences and similarities between the content of
existing corporate Web sites from the two countries; (c) to study differences and
similarities of Web users‟ perceptions toward culturally congruent or incongruent Web
sites by measuring their attitudes and future intentions; and (d) to assess whether Web
users‟ attitudes and their future intentions are different among the three cultural groups.
In this study, the definition of cultural congruity is derived from Luna, Peracchio and de
Juan (2002, 2003) and means the relationship between the cultural values expressed in
the Web site and those of its visitor.
1.3 Methodology
Most previous studies which are rather descriptive and prepositional in nature, point to
the general conclusion that Web site design needs to be adapted to the different cultures
of its targeted Web users. There were methodological limitations and weak validity of
findings in previous research since little of this has focused on industry effects on the
contents of Web sites and their users‟ perceptions toward culturally congruent or
incongruent Web sites. Therefore, this research adopts both descriptive and evaluative
methods: content analysis and experimental research with an online questionnaire. The
experimental research allows an opportunity for respondents to express their feelings
and has been developed as a solution to the weakness of content analysis. These
combined methods could provide deep insight into an area which has been unexplored
in previous studies.
Two studies are performed. Study One examines cultural influence on the content of
existing corporate Web sites from the two culturally different countries of New Zealand
Mun Ga Choi 5
5 Chapter 1: Introduction
and South Korea. This examines how the use of visual communication and Web features
differs between the two countries. For analysis of the content of corporate Web sites,
content analysis is adopted as an appropriate method. The first or the main graphics on
homepages of corporate Web sites are chosen as the unit of analysis for visual
communication while entire Web sites are viewed for analysis of Web features. The
corporate Web sites studied are classified by industry type.
Study Two assesses whether and how Web users‟ perceptions of Web sites differ in the
three ethnic groups and in four culturally manipulated Web sites. For the latter, four
versions of a fictitious company‟s Web sites are created, based on the cultural categories
defined in previous research, in which the contents of the text and graphics are all varied,
but under the same structure. In Study Two, an online questionnaire is used since this is
well suited for measuring the attitudes and future intentions of Web users who live in
different geographic regions. The participants are connected to the online questionnaire
via a hypertext link after viewing one of the manipulated corporate Web sites on the
Internet. The questionnaire includes three main parts: participants‟ attitudes toward the
Web sites, participants‟ values, and their demographic information.
1.4 Outline of the report
The structure of the thesis is as follows. Chapter Two explores cultural typologies,
cultural studies in marketing communication, and cultural studies in Web site design
giving clear verification of how the research questions have been developed and why
they are significant. In discussing cultural typologies, famous typologies from the etic
perspective (refer to full explanation on section 2.1.1), such as those of Hofstede and
Hall, are explored. The following section investigates accumulated knowledge on
cultural issues in traditional marketing and advertising research. In promoting people, or

Mun Ga Choi 6
6 Chapter 1: Introduction
organisations and their products, services, or ideas, communication via the Web is
generally equivalent to marketing communication media such as broadcasting and
printing. In the final section, literature about the cultural issues raised on Web site
design is reviewed, from second language effects to cultural categories and indicators
that previous scholars have used for analysing the content of Web sites.
Chapters Three and Four present hypotheses, procedures for conducting the
investigation, and the empirical results in detail, for Study One and Study Two. For
Study One, a chi-square test is utilised to examine group differences in the frequency of
particular visuals and Web features used on the homepages of corporate Web sites,
comparing the results between the two nations (New Zealand and South Korea) and the
industry types. In Study Two, One-Way ANOVA (Analysis of variance) and Two-Way
ANOVA are used to perform an analysis of the group differences in the means of
independent variables, four levels of Web sites and three levels of ethnic groups in this
study. If a statistical difference is found, a post-hoc test is applied to determine where
the group differences occur.
Chapter Five includes a discussion based on the results shown in Chapters Three and
Four and highlights new and important findings of this research. Also, by investigating
the cultural effects on this new medium, the Web site, it is considered whether the
findings of Web sites yield results consistent or inconsistent with findings in traditional
marketing media.
Chapter Six, the final chapter, draws conclusions from the discussion and ends with the
limitations and implications of this research.

Mun Ga Choi 7
7 Chapter 1: Introduction
1.5 Key assumptions
Cross-cultural research has developed with complexity. It is crucial to establish a
definition of culture and how it is understood and used in this study. This research is
based on the functionalist paradigm view in which culture is considered as a variable,
explaining stable and orderly characteristics (Martin & Nakayama, 1999). Hofstede‟s
and Hall‟s cultural studies are good examples of the functionalist paradigm and research
into it has often proven to be very useful in studying cross-cultural differences in
international marketing and advertising.
There are three solid reasons why Hofstede‟s and Hall‟s cultural models are adopted in
this research. First, in spite of the shortcomings of Hofstede‟s model, cultural
dimensions are the ones that have been most widely applied and validated by repetitive
studies in a variety of cultural contexts. Secondly, Hofstede‟s and Hall‟s studies have
been found to offer a valid basis for differences between national cultures or
geographical regions. Thirdly, their models have been used by many Human-Computer
Interaction (HCI) researchers to explain similarities and differences in the adaptation of
the Internet and design of Web sites in different cultures (Callahan, 2005a; Gould,
Zakaria, & Yusof, 2000; Marcus & Gould, 2000; Robbins & Stylianou, 2001-2002;
Singh & Baack, 2004; Singh & Matsuo, 2004; Singh, Zhao, & Hu, 2003, 2005)
1.6 Contributions
Most related previous studies have analysed the content of local Web sites of U.S.
multinational companies with cultural categories and indicators derived from Hofstede‟s
and Hall‟s typologies. However, effective Web sites should match the values of the Web
user with those of the Web site content (cultural congruity). Previous studies provided
evidence of cultural differences in Web site content, but they did not quantitatively
Mun Ga Choi 8
8 Chapter 1: Introduction
measure the effectiveness of culturally adapted Web sites. The question remains whether
people in different cultures interpret and respond to culturally adapted Web sites
differently. Therefore, this study not only takes a „researcher-driven approach‟, but also
a „respondent-driven approach‟ by measuring Web users‟ perceptions toward Web sites.
Moreover, only a small percentage of cross-cultural articles in major marketing and
business journals from 1995 to 2006 have explored South Korea and New Zealand; six
per cent for South Korea and six per cent for Australia and New Zealand (Okazaki &
Mueller, 2007).
In addition, only a few studies have researched Web sites of U.S. companies categorised
according to product category such as non-durable, durable, and services, but most were
not concerned with industry-specific effects in culturally adapted Web sites. This study
believes that industry type and its relevance to consumer (B2C) or business (B2B)
interests influences the degree of cultural adaptation for Web site design. The different
industry types to which the companies belong tend to be important in moderating
cultural differences across cultures and are considered as a control variable in this
research.
Unlike previous research which has used existing Web sites, those created for this study
provided the researcher with optimal conditions for measuring and controlling their
cultural characteristics. This prevents the possibility of „vendor familiarity‟ built by the
previous experience of a vendor and its products influencing participant perception.
Instead of assuming the participants‟ values from Hofstede‟s original cultural scores,
this research measures these values by using Hofstede‟s Value Survey Module. Previous
researchers barely measured where the respondents of their study were placed on the
cultural dimensions (Taylor, 2005), while this empirical study collects participants‟
Mun Ga Choi 9
9 Chapter 1: Introduction
scores. Prior data cannot be relied on since many people believe that at least some level
of cultural convergence is taking place and samples in this study, in particular young
university students, are different from those of Hofstede‟s original study. This empirical
process helps the researcher gain a good understanding of the cultural context of the
participants before carrying out analysis of their perceptions toward the Web sites.
1.7 Conclusion
This study derives from studies of culture typologies, information technology, and
international marketing to construct a theoretical foundation. Despite the growing
interest in Web sites, little is understood about whether cultural differences exist in the
content of corporate Web sites from different cultures and whether the cultural
adaptation of a corporate Web site is different by industry category. Even less is known
about how users from different cultures perceive culturally different sites. Cultural
preferences of Web users in text, graphics, and language, as studied in this research, are
an almost unexplored area. No longer can the issues of Web user culture, and its impact
on Web site design, remain separate from each other.

Mun Ga Choi 10
10 Chapter 2: Literature Review
Chapter 2: Literature Review
2.1 Introduction
The main focus of this thesis is the effect of culture on the design of corporate Web sites.
This chapter is divided into three areas. First of all, cultural typologies, which have
often and widely been used to understand cultural effect on international business and
marketing contexts, are introduced. To date, the majority of cross-cultural business and
marketing research has relied heavily on Hofstede‟s cultural dimensions (Okazaki &
Mueller, 2007). To a lesser extent, Hall‟s cultural model has also been employed in the
investigation of cultural research. The way to understand culture in these typologies is
different from that of anthropologists and social field scholars. This review is rooted in
the functionalist paradigm or the etic tradition of culture research.
The second section covers the literature exploring cultural issues in traditional
marketing and advertising research. The Web site became another significant tool of
marketing communication between companies and customers by sending messages to
multiple people via the Internet. It is generally equivalent to marketing communication
media such as newspapers, magazine, television or radio broadcasting. Therefore,
arguments around cultural issues in a Web site have been developed with accumulated
knowledge from these traditional international marketing channels. This knowledge
provides us a solid base from which to analyse the cultural effect on how Web sites
communicate with Web users.
The final section explores previous research studying cross-cultural differences in Web
site design or content. It is summarised briefly into four large categories: those who
emphasised the importance of local language on Web sites; those who studied Web sites

Mun Ga Choi 11
11 Chapter 2: Literature Review
with the concept of distinctive cultural features and styles; those who compared cultural
differences in the content of Web sites across different countries by adopting a
traditional advertising content analysis method, often using a framework based on the
cultural dimensions of Hall‟s and Hofstede‟s; and those, very few, who studied the
effectiveness of Web sites from a Web user‟s or a customer‟s point of view. Stemming
from the literature review, the research questions for the thesis are stated at the end of
this chapter.
2.1.1 The functionalist paradigm of culture
Culture is a very difficult term to define and has different meanings in different senses.
The famous scholar Raymond Williams described culture as “one of the two or three
most complicated words in the English language” (Williams, 1983, p.87). When we
discuss culture in a group, we question that there exist variations between individuals
and that the culture is changing. However, there must be a tendency to exhibit similar
behaviours and similar ways of thinking within the group. Researchers have been
studying how culture influences the way of doing international business and marketing,
since culture may be one of the most powerful means of explaining, predicting, and
understanding behaviours.
This research is based on the functionalist paradigm view in which culture is considered
as a variable and explains stable and orderly characteristics (Martin & Nakayama, 1999).
Culture is collectively shared by people in social groups and different groups have
different sets of values (Hermeking, 2005). Therefore, a human behaviour can be
described and predicted according to the cultural pattern in the cultural group from an
etic perspective. An etic perspective is different from an emic perspective that is culture
specific and necessary to seek out the idiosyncrasies of individual cultures (Fletcher,

Mun Ga Choi 12
12 Chapter 2: Literature Review
2006). Hofstede‟s and Hall‟s works describe and explain a very complex matter like
culture in a rather simplified and operational way. Their works are good examples of the
functionalist paradigm based on the model of Florence Kluckhohn published in the
1950s (Hermeking, 2005).
The terms emic versus etic were borrowed from anthropology by cross-cultural
psychologists, while idiographic and nomothetic are better known among sociologists
(Hofstede, 1998). Throughout the history of comparative cross-cultural research, there
has been a long dispute between those who stress the unique and those who stress the
comparable aspects (Hofstede, 1998). Researchers labelled the choice as a Malinovskian
dilemma (Hofstede, 1980, p.41). A Malinovskian dilemma is the choice between two
different styles of scientific inquiry that sociology distinguishes, idiographic and
nomothetic or between phonemic and phonetic classification in linguistics. The
idiographic and the phonemic style focus on the unique and the specific while the
nomothetic and the phonetic on the comparable and the general. Therefore, the suffixes
–emic and –etic have been promoted to independent terms for distinguishing between
the study of unique and specific wholes from the application of general classification
schemes (Hofstede, 1998).
Within the functionalist paradigm, scholars like Hofstede studied national cultures
through collected data from survey questionnaires and analysed those data by statistical
technique (Williamson, 2002). Although there exist criticisms of this functionalist or
etic approach and neither Hofstede nor Hall focused on marketing matters explicitly,
research in the functionalist paradigm has often proven to be very useful in studying
cross-cultural differences (Martin & Nakayama, 1999) and to make a valuable
contribution to international business and marketing fields (Baack & Singh, 2007).

Mun Ga Choi 13
13 Chapter 2: Literature Review
2.1.2 Hofstede’s dimensions of national culture
In the past 20 years, Hofstede‟s (Hofstede, 1980, 1996, 2001) theory of the specific
patterns in the values and beliefs that constitute national culture has gained prominence.
Before his study, the notion of culture was referred to as an additional explanation,
rather than as a main focal point of a cause and effect relation (Johnston & Johal, 1999).
The Social Science Citation Index (SSCI) proved the popularity of Hofstede‟s two
books, Culture’s Consequence and Cultures and Organisations in that they have been
cited over 3,500 times since their publication (Callahan, 2005b). Hofstede‟s typology of
culture is regarded as one of the more important and popular theories of culture types.
Hofstede (1980) defines culture as a set of shared assumptions that results in a common
frame of reference by members of a society. His definition of culture, “collective
programming of the mind which distinguishes the members of one category of people
from another,” has been cited in prominent works for last two decades (Hofstede, 2001).
He attempted to determine the main criteria empirically by which the national cultures
of 40 independent nations differed, and initially identified four bipolar dimensions of
cultural variation: power distance (from small [or low] to large [or big]), collectivism
versus individualism, masculinity versus femininity, and uncertainty avoidance (from
weak [or low] to strong [or big]); (Hofstede, 1980, 1996, 2001). Hofstede assigned each
country a score on these dimensions, the scores being calculated by the formula
developed by him, and varying between 0 and 100 to represent the relative position of a
country from his sample.
Power distance refers to the „acceptance of authority‟ differences between people
(Hofstede, 1980, 1996, 2001). It is concerned with how workers view their superiors
and the extent to which they accept that power is distributed unequally (Johnston &

Mun Ga Choi 14
14 Chapter 2: Literature Review
Johal, 1999). Large power distance cultures are status conscious and respectful of age
and seniority (Donald, Hendon, & Herbig, 1998). The employees rely on their superiors
to make decisions and they prefer a dictatorial and autocratic style of management
(Zahedi, Van Pelt, & Song, 2001). Conversely, there is an attempt to minimise
inequality and positions of status in small power distance cultures. A small power
distance society demands quite a different style of management from that required for a
large power distance society. Small power distance prefers the decision making process
to be one of consultation and tends to place more emphasis on personal competence
(Hofstede, 1980, 1996, 2001). In a country with a large power distance, it is expected
that written communications will contain references to the status and authority of
readers, professional expertise, and highly respected figures in the scientific and
educational communities. Furthermore, readers used to a large power distance would
expect communications to be one-way, detailed, exact, and followed literally.
Hofstede‟s collectivism versus individualism dimension describes the degree to which a
society emphasises either individual, or group welfare (Heydenfeldt, 2000). This
dimension is characterised by important differences in members‟ social perceptions and
social behaviour. Individualism emphasises individual rights and independence, while
collectivism emphasises group harmony, interdependence (Triandis, 1995; Tse &
Francis, 1994), and community-based social order (Hofstede, 1991). People of
collectivistic cultures perceive that the building of lasting relationships, and
engendering a sense of loyalty, are important (Triandis, 1995).
Individualism versus collectivism is perhaps the most basic dimension of cultural
variability identified in cross-cultural research (Han & Shavitt, 1994). In general, the
East is linked to the notion of collectivism and the West to individualism. Hofstede

Mun Ga Choi 15
15 Chapter 2: Literature Review
(2001) observes a strong correlation between individualism versus collectivism against
power distance that the two dimensions tend to be negatively correlated (Hofstede, 2001;
Zahedi et al., 2001). Many countries that indicate large power distance cultures score
low on the individualism index. In other words, since most extended families have
patriarchal structures with the head of the family exercising strong authority, people
who are dependent on ingroups are usually also dependent on power figures.
Uncertainty avoidance represents how uncomfortable a person feels in risky or
ambiguous situations. In strong uncertainty avoidance societies, its members are
inclined to anticipate the future, to refuse to tolerate deviant ideas or behaviour, to
adhere to rules and regulation, and to resist innovation and invention (Hofstede, 2001).
Thus, people in such cultures value advice and help from experts or organisations. On
the other hand, members of weak uncertainty avoidance are encouraged to take risks
and take each day as it comes (Johnston & Johal, 1999). In Great Britain, which has
relatively weak uncertainty avoidance, students tend to dislike structure and prefer
open-ended learning situations with vague objectives and no timetable (Zahedi et al.,
2001). This propensity is different from German society. With relatively strong
uncertainty avoidance, German society maintains a high respect for punctuality and
strict timetables. In summary, the features of strong uncertainty avoidance include
language and references that emphasise precise and detailed information and strong
adherence to established business processes and practices.
The last dimension of Hofstede‟s (1980) cultural variations is related to genders and
gender roles. Masculinity and femininity constitute cultural differences, rather than an
individual‟s biological distinction, recognising some behaviours as more suitable for
females or less suitable for males (Hofstede, 2001; Zahedi et al., 2001). However, which

Mun Ga Choi 16
16 Chapter 2: Literature Review
behaviours belong to which gender differs from one society to another (Hofstede, 1980).
Masculinity belongs to societies in which social gender roles are clearly well defined
and femininity pertains to societies in which social gender roles overlap (Hofstede,
1980). Masculine cultures typically value assertiveness, independence, task orientation,
and self-achievement while values such as caring, nurturing, concern for people, quality
of life and emotional factors are linked to femininity (Donald et al., 1998). For example,
Sweden and Norway, at the feminine extreme of the masculinity index, show that there
is no difference between the scores of men and women, and both express equally tender
and nurturing values (Hofstede, 1996). For better understanding, the ten values
emphasised in Hofstede‟s cultural dimension are summarised in Table 1.
Table 1: The ten values emphasised in Hofstede's cultural dimensions a
Dimension Ten values
High power distance inequality, status, power, wealth, paternalism, autocracy,
dominance, professionalism, expertise, dependence, vertical
interpersonal relationship
Low power distance egalitarian relationship, participation, consultation,
interdependence, horizontal interpersonal relationship,
decentralisation, flat hierarchical pyramids, majority vote, narrow
salary range, pluralist government
Individualism I, nuclear family, personal time, personal accomplishments,
individual self-interest, personal preferences, freedom, challenge,
independence, low context, guilt cultures
Collectivism we, group cohesion, extended family, harmony, filial piety, lifelong
loyalty, dependence relationship, high context, shame cultures (loss
of face), social network
High uncertainty
avoidance
theoricism, nationalism, conservatism, concern with security,
absolute truth, expertise, historical events, consensus, less risk-
taking, pessimism

Mun Ga Choi 17
17 Chapter 2: Literature Review
Low uncertainty
avoidance
empiricism, relativism, few rules, common sense, practical
thinking, more risk taking, optimism, more acceptance of dissent,
risky decision, deviance
Masculinity competitiveness, material success, winning, strength, assertiveness,
advancement, challenge, recognition, toughness, decisiveness
Femininity nurturance, quality of life, shared belief, harmony, cooperation,
support, modesty, caring, tenderness, consultation
a adapted from Hofstede (1980)
In addition, Hofstede (1980) classified countries into six clusters based on cultural
commonalities and similar histories. The Anglo cluster includes countries like New
Zealand which descended from the British Empire and speak English. On the other hand,
the Asian cluster, which shares the influence of the Chinese majority, includes South
Korea (Robbins & Stylianou, 2001-2002). Hofstede‟s (1980) analysis of four value
dimensions indicated that South Korea and New Zealand showed marked differences
from each other in their cultural values. Table 2 depicts the scores of New Zealand and
South Korea on Hofstede‟s index values. South Korea belongs to groups of large power
distance, collectivist, feminine, and strong uncertainty avoidance cultures. Conversely,
New Zealand is associated with small power distance, individualism, masculinity, and
weak uncertainty avoidance and belongs to the Anglo cluster in this study.
Table 2: Hofstede's index values for Korea (KOR) and New Zealand (NZL)
Power distance Individualism Masculinity Uncertainty Avoidance
KOR 60 18 39 85
NZL 22 79 58 49
2.1.3 Critiques of Hofstede’s model
Although Hofstede‟s model of national cultures has been used extensively in empirical
research and explanations of interaction between national culture and management,

Mun Ga Choi 18
18 Chapter 2: Literature Review
mention of Hofstede‟s work has typically been accompanied by a critique. The rigorous
debate concerning the methodological and theoretical foundations for Hofstede‟s work
has resulted in careful reviewing (Baskerville-Morley, 2005). Salient methodological
concerns include the generalisability of findings and the methods of data collection. On
theoretical grounds, Hofstede‟s model is mainly challenged on his conceptualisation of
national culture.
McSweeney (2002a) identified five important assumptions underpinning Hofstede‟s
methodology which invalidated the model. In particular, Hofstede assumed that the
micro-local data from one part (services and marketing departments) of IBM employees
were representative of a uniform national culture. IBM subsidiaries not only had
atypical characteristics by themselves, such as the technologically advanced and
unusual characteristics of their products, but also their employees were likely to diverge
from the general population, more so in some nations than in others. For example,
working for a non family owned firm or high technology business would have been
much more unusual in some countries than Britain, USA or West Germany during the
time the survey was undertaken (McSweeney, 2002a, p.101).
The second problem with which McSweeney was concerned was that what Hofstede
identified was not national culture, but an averaging of situationally specific opinions of
a single multinational company (IBM) to a narrow set of cultural dimensions
(McSweeney, 2002a). Even Hofstede himself (1980, p.313) acknowledged that there
might be other dimensions related to equally fundamental problems of mankind which
were not found. The wide range of dimensions found by Trompenaars and Hampden-
Turner (1998) were quite different from those of Hofstede and indicated that Hofstede‟s
five dimensions were not comprehensive. In short, McSweeney (2002a) pointed out that
Mun Ga Choi 19
19 Chapter 2: Literature Review
Hofstdede‟s national culture was situationally specific to a workplace. Therefore, the
venue where Hofstede‟s respondents were asked to complete his survey might have
affected his results. For example, an employee showing high power distance in the
workplace might demonstrate more or less power distance in the family.
The next criticism by McSweeney was derived from doubts about the notion of
national-cultural-causation (McSweeney, 2002a, p.109). He believed that there were
other cultural and non-cultural influences which caused social actions within a nation.
Sometimes changed social actions might have simple physical explanations and the
influence of other historical specificities might lead to these changed social actions.
National dimensions precluded consideration of interplay between macroscopic and
microscopic cultural levels and underscored non-cultural factors like certain universal
human needs, predispositions, and preferences which bound the human race together
(Jacob, 2005; McSweeney, 2002a, 2002b). Also, McSweeney (2002a) urged that the
implication of national break-up or integration should be taken into account. Nations
may fissure, combine, and expand voluntarily or forcibly. It could be a myth that when
nations split, the cultural characteristics of the former nation must also be those of each
of the several new nations.
Furthermore, in his reviewing of Hofstede‟s theoretical foundations, Baskervill (2003)
argued why the validity of Hofstede‟s dimensions of culture had not been widely used in
sociology and anthropology. In line with McSweeney, the major contention over
Hofstede‟s work is that culture does not equate with nations. Baskervill (2003) warned
that Hofstede was minimising diversity within a nation by incorporating and equalising
culture with nations in the units of analysis. This extreme universalist approach, in
which only a few barriers exist to make meaningful comparisons between a wide range

Mun Ga Choi 20
20 Chapter 2: Literature Review
of countries (Rokkan, 1996, p.18 cited in Baskerville, 2003), is plausible only if human
societies are isolated from each other. However, people live in societies with constantly
expanding networks of exchange and communication. The invalidity of the universalist
approach is also supported by Jacob (2005) who maintained the view that cultural
diversity could exist internationally or within a single country, since cultural boundaries
were construed as permeable, rather than as walls which differentiate and segregate.
On the other hand, Williamson (2002) refuted McSweeney‟s critique at Hofstede‟s
model. He claimed that since McSweeney (2002a) and Hofstede (2002) viewed national
culture from different paradigms, they therefore started from different premises and
evaluated research methods by different criteria. Hofstede‟s findings lay in the
foundation that culture was a construct and there was not a direct measure for culture.
Therefore, scores for Hofstede‟s dimensions are not absolute measures, but relative
positions by which nation can be compared. If Hofstede‟s dimensions are seen as
approximations for constructs of cultural values, the issue is not whether IBM samples
are representative of national populations, but whether differences between their
responses are representative of differences in cultural values (Williamson, 2002).
Williamson (2002) also argued that McSweeney‟s view on uniform national cultures
was inconsistent with Hofstede‟s findings, because Hofstede‟s model admitted
differences between populations and was based on the “average response” or “shared
central tendency” for each national group of respondents (Williamson, 2002, p.1378).
Regarding the validity of using IBM employees as representative of a nation,
Williamson (2002) explained that Hofstede‟s findings depended on national culture
affecting IBM employees in one country to the same extent that it affected IBM staff in
other countries. Hofstede (2002) made it clear that any set of functionally equivalent

Mun Ga Choi 21
21 Chapter 2: Literature Review
samples from national populations could supply information about national difference.
Although Asian IBM subsidiaries had more unrepresentative cultures than that of IBM‟s
home country of the USA, they selected local employees atypically attuned to US
norms and therefore, showed national differences.
To conclude, there is always the general dilemma of choosing between a simplistic
model that approximately describes or predicts phenomena across a wide range of
situations and a more precise, emic description that is needed for facilitating inquiry
into more complex dynamic interrelationships. Hofstede‟s model has the beauty of
parsimony (Williamson, 2002, p.1387). A parsimonious theory is relatively easy to
explain, communicate, and apply when academics and practitioners conduct research
and experimentation in intercultural cooperation. However, they need to remember that
Hofstede‟s critics raise useful warnings and that Hofstede‟s model does not provide a
direct measure of national culture, but rather a rough approximation of cultural variety.
This model still provides academics and practitioners with a comprehensive and robust
benchmark. Much business research uses Hofstede‟s dimensions to study culture‟s role
in a variety of business settings from behaviour styles (e.g. different negotiation styles
and consumer behaviours) to identification of different advertising appeals across
cultures. Williamson (2002) concluded that Hofstede‟s model or a similar functionalist
model of national culture (e.g. Trompenaars) opened up “a black box of cultural factors”
(p.1394); it is not recommended to just reject the model and throw away valuable
insight, without development of more satisfactory models.
2.1.4 Hall’s cultural categories
Similar to Hofstede‟s cultural variations, Hall‟s model has often been mentioned in
academic works to understand cultural variety across cultures. Hall‟s model of cultural

Mun Ga Choi 22
22 Chapter 2: Literature Review
categories focused on the interdependence of culture and communication. Since
communication is central to all marketing activities, Hall‟s model is considered very
useful for marketing matters (Hermeking, 2005). Hall (1976) expressed two important
theories about the way cultures processed time and information in his book, Beyond
culture. Our interaction is influenced by internal views of time, monochronic and
polychronic time at either end of a continuum of time orientation. Monochronics believe
that tasks can be performed during each segment and usually think in a linear fashion.
However, polychronics think about a number of things simultaneously (Dodd, 1995).
American, British, and Canadian cultures are monochronic while Latin American and
Asian cultures are polychronic (Dodd, 1995).
Also, Hall proposes the concept of high versus low context as a way of understanding
different cultural orientations. Like monochronic and polychronic time orientation, high
and low context are on either extreme of a continuum (Kim, Pan, & Park, 1998).
Context is referred to as the situation, background, or environment connected to an
event, a situation, or an individual (Wurtz, 2005). A high-context communication is
implicit, indirect, and deeply embedded in the context. The closer the relationship
between communicators, the more a high-context communication style tends to be used.
Japanese people consider a nondirective, polite communication style may be the best
way to engage in communication accommodation (Dodd, 1995). In contrast, a low-
context communication is more direct and more informative and the mass of the
information is expressed in the explicit code (Hall, 1976). In conversation, people with
a low-context communication style develop the conversation from information already
stated to information about to be given, while those with a high-context communication
style jump backward and forward and often leave out detail (Wurtz, 2005). This is also

Mun Ga Choi 23
23 Chapter 2: Literature Review
related to linear versus circular thinking by monochronic versus polychronic cultures.
However, since the low vs. high-context concept was drawn from personal observations
and interpretations, there is no clear clarification defining and measuring where a
country stands in the continuum (Kim et al., 1998). For this reason, Hall‟s model is less
operational and less favoured by marketing researchers compared to Hofstede‟s
(Hermeking, 2005). Generally speaking, China, Korea and Japan are at the high end of
the continuum and Switzerland, Germany, and Scandinavian countries like Norway and
Sweden are at the low end of the continuum (Wurtz, 2005). Table 3 describes the ten
values emphasised in Hall‟s high- and low-context communication styles.
Table 3 : The ten values in Hall's high- and low-context communication style a
Dimension Ten values
High uncertainty
avoidance
rule orientation, employment stability, detailed information,
regulations, structured environment, public discipline, social control,
high anxiety, punctuality, precision
Low uncertainty
avoidance
novelty, personal interpretation, ambiguity, low anxiety, innovation,
deviant ideas, low stress, lenient rules, open-ended learning situation,
laziness
a adapted from Hall (1976)
2.2 Culture and marketing communication
2.2.1 Cultural differences in marketing communication
Culture acts as a fundamental filter when people interpret the meanings of messages. It
impacts considerably on the encoding and decoding of messages and the cultural
differences are reflected in the content of marketing communication. In many cases,
previous research has focused on the comparison of Western cultures such as the USA
and Eastern cultures such as Japan, Korea, and China (Miracle, Chang, & Taylor, 1992;
Wang & Chan, 2001). One example that Miracle et al. (1992) indicated in their
Mun Ga Choi 24
24 Chapter 2: Literature Review
empirical study is that differences in marketing communication between South Korea
and the USA were found in accordance to their cultural orientation like high- or low-
context, direct/confrontational or indirect/harmony-seeking behaviours, and
individualistic or group-oriented behaviours. In general, indirect advertising messages
creating emotions through pictures and entertainment are more favoured in high-context
cultures, whereas direct and rational advertising messages with product information
play a more important role in low-context cultures (Hermeking, 2005).
More systematically, Van Raaij (1997) explained that cultural differences embedded in
communication might be depicted at four different levels: mission, proposition, concept,
and execution (1997). In his article, the mission was defined as the comprehensive
objective and vision of a communicator and the proposition was the more specific
theme or objective which drew the desired changes from the target groups of receivers
of the message. The proposition was translated by the creative concept into the language
and culture of the target group to help the understanding and attractiveness of the
message. In some cases, metaphors and rhetorical expressions could be used for
effective communication. The concept was executed with style, typography, and visual
presentation. Table 4 below helps understanding of the communication of different
strategies at different levels (van Raaij, 1997).

Mun Ga Choi 25
25 Chapter 2: Literature Review
Table 4 : Global, adaptation, differentiation and local strategies for communication a
Global Adaptation Differentiation Local
Mission Identical Identical Identical Identical/different
Proposition Identical Identical Identical Different
Concept Identical Identical Different Different
Execution Identical Different Different Different
a adapted from van Raaij, 1997
In a similar vein, Cho et al. (1999) demonstrated differences in values between themes
and their execution in advertising. There might exist some opportunities to standardise
the strategic levels (the upper levels), of international advertising to build on a uniform
brand image. It is known that multinationals have standardised broad-level marketing
communication strategy such as their vision of a product‟s positioning and the specific
theme of main selling point. However, considerable adaptation of executional elements
in international advertising is inevitable. It is now clear that many advertisers
standardise general strategy while modifying executions and languages as needed
(Taylor, 2005). Therefore, the current literature advances this topic by looking more
closely at the advertising elements, to what extent words (e.g. headlines) and visuals
(e.g. models, illustrations) are tailored for target culture, used at the execution level
(Nelson & Paek, 2007).
Furthermore, culture influences not only the way people interpret the meanings of
messages but also the media channel they use for spreading the messages. There are
also enormous and persistent differences in world-wide consumption of traditional
media such as newspapers and TV across different countries. The trend might be
interpreted as a result of culture-specific communication preferences like high-context
versus low-context communication preferences. Since TV is based mainly on pictures
and consumed by a collective group, it is more popular in high-context cultures. On the
Mun Ga Choi 26
26 Chapter 2: Literature Review
contrary, as print media like newspapers are more or less based on written text and
consumed by an individual at a time, it might be well used as a tool of marketing
communication in low-context cultures (Hermeking, 2005).
2.2.2 Cross-cultural content analysis of advertisements
Among diverse marketing communications, advertising is a reflection of cultural values
expressed through cultural symbols, heroes, and rituals (Hofstede, 1980). There have
been many studies pointing out the diverse advertising styles of different countries
(Albers-Miller & Gelb, 1996; Baack & Singh, 2007; Cho et al., 1999; Koudelova &
Whitelock, 2001; Lin, 2001; Mueller, 1992; Nelson & Paek, 2005; Taylor, Miracle, &
Wilson, 1997; Tse, Belk, & Zhou, 1989; Wang & Chan, 2001; Zhou & Belk, 2004; Zhou,
Zhou, & Xue, 2005). These studies have provided strong evidence of cultural effect on
advertising. Most prior research focused on print or television advertising, and content
analysis is the most common methodological approach in international marketing
research (Taylor, 2005).
Some research has provided a list of creative themes or common advertising appeals. In
developing a systematic framework, Albers-Miller and Gelb (1996) modified Pollay‟s
„42 cultural list‟ to encompass 30 different cultural values. However, this kind of
framework lost some appeal due to its lack of parsimony (Cho et al., 1999). Thus, most
made a more limited set of cultural dimensions with a large variety within these
dimensions. For example, the use of information level, emotional appeal, sexuality,
hedonism, and belonging have been compared in a cross-cultural context (Lin, 2001;
Nelson & Paek, 2005; Taylor et al., 1997; Tse et al., 1989). Also, portrayal of women,
the use of comparative advertising, and the provision of pricing information are widely
included in cross-cultural research (Karande, Almurshidee, & Al-Olayan, 2006). As

Mun Ga Choi 27
27 Chapter 2: Literature Review
such, most cross-cultural studies on advertising, whether they used a list of appeals or a
limited set of their own dimensions, have described the findings by comparative
analysis of the content of the advertising (Albers-Miller & Gelb, 1996; Koudelova &
Whitelock, 2001; Lin, 2001; Moon & Chan, 2005; Nelson & Paek, 2005; Taylor et al.,
1997; Tse et al., 1989; Wang & Chan, 2001).
In the literature, Hofstede‟s cultural dimensions (1980) and Hall‟s (1976) high- and low-
context communication typology have often provided a rationale for cross-cultural
differences in advertisements. Sometimes, only one dimension of Hofstede‟s, such as
individualism vs. collectivism, or femininity vs. masculinity, was used for exploring
cultural differences in advertising content (An & Kim, 2007; Han & Shavitt, 1994;
Wang & Chan, 2001). Also, marketing often deals with segmented clusters of many
individuals; each cluster is to be treated as a homogeneous target group and such
clusters are differentiated or positioned with respect to their typical market-related
characteristics. This way of creating cultural clusters is well matched with Hofstede‟s
and Hall‟s models (Hermeking, 2005).
The notion was supported that, in collectivistic cultures such as China and Korea,
appeals focusing on in-group benefits, concern for others, and family integrity were
more effective; whereas in an individualistic culture like the United States, appeals
focusing on individual benefits, personal success, and independence were more
effective (de Mooij, 2005; Miracle et al., 1992). Similar findings were demonstrated in a
study of Chinese and American television advertising. Chinese advertising employed
more emotional appeals, veneration for the elderly, and group consensus appeals than
US advertising (Lin, 2001).
Furthermore, Choi et al (2005) revealed that there was a strong relationship between

Mun Ga Choi 28
28 Chapter 2: Literature Review
celebrity endorsement in television advertising and Hofstede‟s cultural dimensions.
Comparing US and Korean advertisements on television, they concluded that Korean
advertising had a higher frequency of celebrity appearances than its US counterpart.
They considered the result as anticipated, since in high-context and collectivistic culture
celebrities showing the shared values of the society were considered more credible and
influential. Furthermore, Korean celebrity advertising contained less information (high-
context) and showed more collectivistic values than its US counterpart.
In the case of high-/low-context communication styles, advertising in high-context
culture is characterised as emotional, symbolic, indirect, soft-selling and less
informational while advertising in low-context culture focuses on detailed data-based
arguments, explicit expression, and direct and hard-sell messages (An, 2007). Of note,
Moriarty studied a relationship between advertising visuals and communication styles
(1987). Literal visuals are more prevalent in advertising for low-context cultures and
symbolic visuals are expected to appear more often in advertising for high-context
cultures (An, 2007).
The literal category provides direct experience of a product like factual information and
its role. It can be subcategorised into (a) identification (brand, logo, package), (b)
description (what it looks like, attributes, parts, schematics), (c) comparison (between
two competitors, before and after), and (d) demonstration (how to do, use, apply, make).
By contrast, the symbolic category presents more abstract meanings using the process of
(a) association (lifestyle, typical person, situation), (b) association using a character or
celebrity, (c) metaphor (allegorical use, unexpected substitution based on similarity of
some feature), (d) storytelling (narrative, drama, playlet), and (e) aesthetics (details
become art, pattern, abstraction); (Moriarty, 1987).

Mun Ga Choi 29
29 Chapter 2: Literature Review
In a similar vein, differences between the use of photographs and illustrations were
under academic study (An, 2007), comparing a hard-sell vs. soft-sell strategy and a low-
context vs. high-context communication style. The hard-sell approach emphasises the
direct delivery of factual information about the products or services, and photographs
are therefore more effective than illustrations. Cutler et al. (1992) found a significant
cross-cultural difference in the use of photographs and illustrations among US, UK,
French, and Korean magazine advertising; photographs were an ideal visual type for ads
in low-context nations like the U.S. and the UK whereas Korea and Frence used
illustrations more to deliver artistically decorated information.
However, Moon and Chan (2005) compared Hong Kong and Korean television
commercials with respect to Hofstede‟s two cultural dimensions, uncertainty avoidance
and masculinity/femininity, and had contrary findings to what had been discovered.
They supported masculinity/femininity variables for explaining differences in
advertising between Hong Kong (masculine society) and Korea (feminine society). In
contrast to the masculinity/femininity dimension, both Hong Kong and Korean
advertising showed no difference in values of uncertainty avoidance. Values of low
uncertainty avoidance were even more reflected in Korean television commercials.
Similarly, Paek and his colleagues (2004) revealed that both Korean and US advertising
conveyed more individualistic indicators than collectivistic indicators. It was also
supported by Cho et al. (1999) that Korean advertising did not include more
collectivistic values than US advertising and both countries reflected strong present-
time orientations.
2.2.3 Value paradoxes in advertising
The reasons for these inconsistent findings in previous research could be explained by

Mun Ga Choi 30
30 Chapter 2: Literature Review
Moon and Chan (2005). They attributed empirical evidence that was contrary to
Hofstede‟s framework to the impact of value paradoxes in advertising. Before Moon
and Chan (2005), de Mooij (2005) pointed out in her book that people who thought that
the world was becoming one global culture with similar values were just deluded by
value paradoxes. Advertising appeals or claims may represent two opposing statements
about values, which are the “desirable” and the “desired” (de Mooij, 2005, p.164). The
desirable represents the general norms of a society and the desired is linked to what
people consider important for themselves. For example, an individualist society has
individualism as its norm (the desirable), but people in that society may still desire and
portray collectivist values because they think that too much individualism creates
loneliness and social problems. Interestingly, value paradoxes were often found in those
countries that have undergone remarkable economic development (Shao, Raymond, &
Taylor, 1999; Taylor, 2005).
Osland and Bird (2000) explored cultural paradoxes further and identified six possible
explanations in their study: the tendency for observers to confuse individual with group
values, unresolved cultural issues, bipolar patterns, role differences, real versus
espoused values, and value trampling where in a specific context certain sets of values
take precedence over others (Osland & Bird, 2000, p.69). It is also supported by
Rapaille‟s recent claim (2006) about the culture code that the only effective way to
understand what people truly mean is to ignore what they say because they do not know
why they do the things they do. If people are asked direct questions, they give answers
that sound logical and are even what the questionnaire expected. These paradoxical
values are often represented in advertising and make cultures appear to be similar or to
be moving in a similar direction. In addition, research describing similar appeals in
advertising derives from those characteristics of the advertising industry showing more

Mun Ga Choi 31
31 Chapter 2: Literature Review
popular Western culture emphasising product merit and youth/modernity. These
characteristics were found even in a region like Taiwan where traditional values
mandate behaviours (Shao et al., 1999).
Another explanation of similar appeals in advertising across cultures was found in the
same product category. Lin (2001) illustrated that, in the automobile category, a similar
advertising appeal like status was employed for both Chinese and US advertising,
although automobiles were considered a necessity in the U.S. but a luxury in China.
Conversely, Nelson and Paek (2007) described automobiles as a general product, like
food, which was more culture specific and might reflect indigenous cultural rules and
practice. As such, product categories appear to be potentially important in moderating
cultural differences across cultures. According to Han and Shavitt (1994), products
could be divided into shared versus personal product categories. It is likely that personal
products, which primarily provide personal benefits and are used individually, should be
promoted emphasising individual benefits even in cultures where group benefits are
highly valued. From the perspective of a standardised/localised advertising strategy,
standardisation may be effective for products in which the audience shares universal
demands and behaviours. Examples are high-touch products such as fashion, perfume,
and jewellery and high-tech products such as computers and mobile phones (de Mooij,
2005; Nelson & Paek, 2007).
2.2.4 Consumers’ perceptions toward cultural appeals in advertisements
Much international advertising research is descriptive in nature. In reviewing the
literature, this kind of research has focused on explaining the differences in relation to
the cultural values of the society in which the advertising has appeared (Fam & Grohs,
2007). Although advertising plays a role of meaning transfer (Wang & Chan, 2001),

Mun Ga Choi 32
32 Chapter 2: Literature Review
these cross-cultural content analysis studies are somewhat limited in that they describe
existing phenomena and what advertisers say rather than testing what is effective with
consumers (Taylor, 2005). The underlying assumption in these content-analytic studies
is that what an advertisement says or what its creator intends to convey through the
advertisement is what consumers prefer (Zhou & Belk, 2004). The consumer may
interpret the advertisement in a way that is unintended by the author (Hung, Li, & Belk,
2007). Therefore, it is dangerous to think that advertiser preference of images and
appeals is taken to mean that consumers in a particular culture also like those images
and appeals, and that their values are changing accordingly. Effective advertising should
match the values of the receiver with the value in the message. Although content
analysis can be viewed as a useful basis, Moriarty and Duncan (1991) emphasised the
need for more research regarding the effectiveness of advertising and how this
effectiveness should be evaluated. Also, Fam and Grohs (2007) insisted on taking a
“respondent-driven approach” instead of a “researcher-driven approach”.
Prior empirical and theoretical research supported the proposition that different
advertisements generated differences in consumer emotional response patterns in
different countries. Investigating consumer emotional response patterns in central
European countries, Orth et al. (2007) found that even within a small geographical area,
national culture has a significant effect on different emotional response patterns.
Similarly, in a controlled experiment, Han and Shavitt (1994) found that advertisements
emphasising individual benefits were more persuasive, and those emphasising family or
ingroups were less persuasive in the U.S than they were in Korea. They used purchase
intentions, attitude toward the advertisement, and overall impression of the brand as
dependent variables. As such, there is a link between culture and attitudinal processes.
However, Fam and Grohs (Fam & Grohs, 2007) found that there was not a specific

Mun Ga Choi 33
33 Chapter 2: Literature Review
likeable executional technique that influenced a purchase in four of the five countries
and concluded that people rather shared the same values in the same cohort than
countries they live in.
Taylor (2002) claimed that to overcome the limitation of content analysis, what we need
is experimental research in which the impact of specific executional variables is isolated.
For example, Taylor, Miracle, and Wilson (1997), examining information level in
advertising, performed an experiment in which the information level was manipulated
while other variables were held constant. They found that US participants responded
less favourably to commercials with low level of information than did Korean. As such,
the methodology that allows an opportunity for respondents to express their thoughts
and feelings and measures how the respondents stand on the cultural dimensions
investigated has been developed as a solution to the weakness of content analysis, in
small number of studies.
2.3 Culture and Web sites
2.3.1 Cultural adaptation
The Internet is regarded as a global medium so that any company that produces a Web
site on the Internet automatically becomes a multinational company (Ko, Roberts, &
Cho, 2006). Web sites are globally accessible and tend to be strongly standardised.
Regardless of the preferred cultural styles in the related countries, many of the Web sites
tend to be dominated by a low-context communication style. In the old economy, Web
sites of companies involved with industrial goods and addressing business users (B2B)
were standardised. In the new digital economy, globalisation in Web site design has
become more prominent since e-commerce, primarily based on Web sites like
amazon.com, obtains popularity everywhere. Those e-commerce Web sites are mainly

Mun Ga Choi 34
34 Chapter 2: Literature Review
influenced by rational content appeals like text-heavy layout, low multimedia
presentation, large Web site volume, high interactivity, and content with intensive
navigation support (Hermeking, 2005).
Along with e-commerce Web sites, Web portals are a good example of more globally
standardised Web sites. Web portals are Internet sites intended to be the starting point
and designed to appeal to a wide audience within a country or culture, typically offering
a search engine, directories of links on a set of selected topics, news items,
advertisements and shopping, and other services such as free e-mail service and Web
pages (Zahir et al., 2002). Many portal sites are very much like the Yahoo format.
Furthermore, global brands of computer-related, digital high-tech, or high-interest goods
are generally characterised by standardisation in their design (Hermeking, 2005). These
products have uniform frames or functional features. Web sites for these products or
using these products provide a similar external appearance.
However, a well designed Web site is defined as one communicating the right
information at the right place with the right layout in the right manner and in the right
time in accordance with the culture of target Web users (Hermeking, 2005). Given the
Internet‟s communication capability, the target audience of a Web site could technically
be scattered around the world. The cultural acceptability of a Web site might reduce its
target audience to a much smaller group in terms of its way of life, habits and religious
belief (Lu & Yeung, 1998). At first, cultural adaptation of early Web sites which were
simple and text-based was simple, in that they were merely translated. However, the
development of various technologies like flash, video and sound have brought new
challenges to Web developers in their attempts to design effective Web sites for other
cultures.

Mun Ga Choi 35
35 Chapter 2: Literature Review
Day (1997) advocated that the purpose of Web application should be very clear and its
content should be based on an understanding of the target audience and how they think
and behave. A culturally congruous Web site clearly conveys the marketer‟s respect for
the Web user‟s culture. Del Galdo and Nielsen (1996) emphasised that Web sites needed
to be created in a way that their content accommodated the user‟s cultural
characteristics and mindset. In other words, a Web design has to incorporate the way
people communicate and the way business is conducted in the target society. A Web site
should illustrate a distinct consciousness regarding the cultural backgrounds of the
target audience (Yli-Jokipii, 2000). The goal of localising the interfaces of Web sites is
to provide a technically, linguistically and culturally congruous interface which
incorporates local content and functionality to fit the target users at different locals (Cyr
& Trevor-Smith, 2004). Because of complexities and difficulties in designing culturally
congruent Web sites, Web designers must study the target groups of the Web site and
design elements prevalent in those groups, and include them in the design process
(Wurtz, 2005).
Zahir et al. (2002), after studying the contents of 26 different national portals, concluded
that there was evidence of divergence, where national portals were customised to fit at
least some cultural characteristics although the national portals offered remarkably
similar directory headings and other links. Major portal providers like Yahoo often
provide a split-run portal for major countries and groups. There are also indigenous
national portals which are popular because they reflect the socio-cultural, technological
and economic characteristics of their cultures and countries both in their appearance and
in the list of services they provide. For example, an Australian portal did not include
items such as women‟s issues, religion, and personal issues that, in general, represented
ways of bringing people together. It could be explained that Australians, according to

Mun Ga Choi 36
36 Chapter 2: Literature Review
Hofstede‟s individualism-collectivism dimension, do not feel the necessity of providing
these group-oriented services on their national portal. Therefore, as Robbins and
Stylianou (2001-2002) proposed, there must be a clear definition that Web site content
should be treated separately from design. The majority of Web site content features are
found to be significantly different across various cultural groups.
There is an interesting argument that Web sites representing global brands of non-
durable, low-interest products show an even higher degree of cultural adaptation. This is
confirmed by Okazaki (2005) that non-durable product Web sites well demonstrate
this cultural adaptation. Also, Wurtz (2005) analysed the contents of McDonald‟s Web
sites in different high-context and low-context cultures and found that the Web sites for
non-durable products revealed considerable differences in aesthetics such as animation
and moving visuals, and in navigation. Furthermore, although local Web sites of global
consumer brands often showed more standardised contents, they utilised the typical
communication styles of their brands‟ country of origin (Hermeking, 2005). For
example, worldwide Web sites for a global French food brand tended to be more
dominated by French high-context style, whereas those for a global German car brand
tended to represent more German low-context style (Hermeking, 2005). The „country-
of-origin‟ effect is a complex matter in Web site design. It is not clear whether including
country of origin feelings can create an appropriate attitude or whether culture-specific
adaptations are more suitable in diminishing „not-invented-here‟ feelings.
Figure 1 below shows the degree of Web site adaptation derived from Hermeking
(2005). Web sites for industrial goods and e-commerce show the strongest
standardisation tendencies with a similar technology or usability pattern. These
tendencies are very similar to a low-context communication style since the boundaries

Mun Ga Choi 37
37 Chapter 2: Literature Review
of industrial goods and e-commerce are not limited to one ethnic group. On the contrary,
non-durable consumer products are purchased by consumers with low involvement in
buying decision; therefore, less explicit, detailed, and rational information might be
needed. Also, non-durable products like food are generally considered to be consumed
in traditional and idiosyncratic ways (Nelson & Paek, 2007).
Figure 1: Degree of Web site adaptation a
a adapted from Hermeking, 2005
2.3.2 The effect of language
Language is the first issue to be considered in the localisation process of Web sites. The
use of a Web visitor‟s native language can symbolise respect for the visitor‟s culture.
The interface and information of Web sites should be understandable and usable in the
users‟ native language, to create a bond between the Web site and visitors, regardless of
its content (Luna et al., 2002). Therefore, designers must consider the possibility that
second-language sites could result in increased challenge and difficulty for global
E-
comm
erce
Industrial
goods
Durables
Non-durables
High adaptation
High standardisation
B2C
B2C
B2B

Mun Ga Choi 38
38 Chapter 2: Literature Review
visitors.
Since the Internet‟s origin was in the USA and some of its earliest adopters were
English speaking, English language ability is related specifically to Internet adoption
(Maitland & Bauer, 2001). In 1996, 80% of Web users‟ first language was English. By
2004, less than one third of Web users worldwide spoke English as their first language
(Luna et al., 2003). However, according to Warden, Lai, and Wu (2002), Fortune 100
Web sites found that only nine percent offered Chinese, Japanese, or Korean language
as options in 2002. In reality, approximately 75% of Web users in China and Korea
prefer Web sites in their local language and choose local Web sites to make purchase
(Singh & Baack, 2004).
In a pragmatic, wide sense, culture could be considered to equate with the idea of
speaking the same language (Rey, 2001). Under this assumption, companies might be
caught in a trap: to solve cultural conflicts that occurred in one language just by offering
a language option (Luna et al., 2003) so that the rest of the web site would be consistent
with the values emphasised by that culture. However, even in English, there are often
problems of interpretation between one variety of English and another, such as
American as opposed to New Zealand English.
Simple translation from other languages is not sufficient considering that patterns of
communication behaviour are deeply rooted in language culture complexities (Ulijin &
Campbell, 2001). Different languages have different patterns of discourse (Fletcher,
2006). For example, in one language, the main point of the communication may be at
the beginning of the sentence and the qualifiers follow. In other languages like Korean,
the main point comes at the end of the sentence. In China, the parallel construction of
sentences is one of the most typical rhetorical devices adapted in written Chinese (Lee,

Mun Ga Choi 39
39 Chapter 2: Literature Review
So, & Wong, 2006). This parallel construction gives viewers an impression of formality
and respect; therefore, it is extensively employed on Web sites targeting views of the
Chinese mainland (Lee et al., 2006). Therefore, in comparison with the Web sites
written in Chinese, corporate Web sites written in English often adopt a less formal tone
and give more detailed information about corporate citizenship (Lee et al., 2006).
Another interesting cultural distinction in written documents is that Japanese readers
prefer text that is organised inductively, unlike the deductively organised text more
common in the West (Fukuoka & Spyridakis, 2000). If the translation does not include
underlying concepts, then the meaning can easily become distorted and the emphasis of
the message is diminished.
Although a large number of Web users at the international level have a working
knowledge of English, most are obviously more fluent in their native language, so
navigating through English is likely to be somewhat challenging (Luna et al., 2003).
This is especially significant for Asian Web users since more people would be willing to
use a Web site if it were designed for their language and culture (Barber & Badre, 1998).
The importance of display and processing of Web user‟s native language can never be
over-emphasised (Del Galdo & Nielsen, 1996).
2.3.3 Cultural manifestations
Different cultures look differently at the images the world offers, often preferring
images of the culturally familiar. Nowadays a Web site is not just a collection of text,
but one of images, multimedia, interactive features, animated graphics, and sounds. For
creating more efficient Web sites for other cultures, a company should consider not just
language and modification of time- and date-formats, but also design issues including
specific colour connotations, preferences in layout, animation, sounds, and other effects

Mun Ga Choi 40
40 Chapter 2: Literature Review
(Dragona & Handa, 2000; Wurtz, 2005).
According to Marcus and Gould (2000), the use of colour could be related to Hofstede‟s
uncertainty avoidance dimension. Colour could either provide redundant cues (to reduce
ambiguity for high uncertainty avoidance cultures) or be used to maximise information
without redundancy (for low uncertainty avoidance cultures). Also, colours have
different images in different ethnic groups. For example, grey is considered
„inexpensive‟ in countries like China, South Korea, and Japan, but „expensive and
high quality‟ in the U.S. (Fletcher, 2006). Colours used in a Web site for a different
ethnic group should not detract from the effectiveness of the version of the Web site.
“Cultural marker” was defined by Barber and Badre (1998, p.2) as the interface design
elements and features that are prevalent, and possibly preferred, within particular
cultural groups. The cultural markers typically comprise colour, colour combinations,
use of metaphor, language cues, currency formats, and navigation controls that match
the cultural expectations of the users for that particular domain. A problem comes from
the ignorance that often a company‟s Web site tends to be ethnocentric in nature,
exclusively expressing the cultural manifestations of the company‟s country of origin.
In many English-speaking countries, the number 13 is related to negative feelings, while
the number 4 is negative in Mandarin (Fletcher, 2006). The use of inauspicious numbers
in pricing in Web sites should be avoided.
In addition, cultural differences are described in their specific manifestations: value,
heroes, rituals, and symbols (Hofstede, 1980; Luna et al., 2002). Values rest at the heart
of most definitions of culture and have a central role among the other manifestations of
culture; however, it is considered that symbols, heroes, and rituals are manifestations
that directly express and represent a particular culture (Luna et al., 2002). First of all,

Mun Ga Choi 41
41 Chapter 2: Literature Review
symbols are words, gestures, pictures, or objects that carry a particular meaning which
is only recognised by those who share the culture (Hofstede, 1991, p.7). Thus, a
particular society‟s symbols may not exist in different cultures, or their meaning may be
different. Language is a good example of symbols. Secondly, heroes are those who have
characteristics that are highly recognised in a culture and thus serve as models for
behaviour (Hofstede, 1980). Heroes may influence Web users through their association
with patriotism. Next, rituals are collective activities, for example, ways of greeting and
paying respect to others, social and religious ceremonies (Hofstede, 1980). Culture-
specific rituals are constantly being performed by all members of a society, important
for marketing because rituals involve the consumption of goods and services (Luna et
al., 2002). Therefore, the understanding of culture-specific symbols, heroes, and rituals
is essential.
Furthermore, Barber and Badre (1998) and Sheppard and Scholtz (1999) not only
stressed the importance of using cultural markers and the relationship between culture
and usability in Web site design, but they also noted the interplay between culture and
genre. They hoped that cultural markers weighed by region, country, genre, and
language can be guidelines offering Web developers specific information about the
region and country.
2.3.4 Hall’s high- and low-context communication styles
The differences in high-context and low-context communication styles across cultures
might challenge the ways in which Web sites communicate their messages most
optimally (Wurtz, 2005). The nature of Web sites is overall more similar to print media,
which is based on written texts and more appropriate to low-context cultures, than to TV.
TV is the more appropriate medium for the transformational or entertaining
Mun Ga Choi 42
42 Chapter 2: Literature Review
communication preferred in high-context cultures (Hermeking, 2005). According to
information richness theory, communication channels have different capacities for
processing information (Ross, 2001). Impersonal written documents and numeric
documents have the least information richness since they are presented without the
sources of understanding, intentions, and feelings. Therefore, it is especially important
to study how high-context cultures communicate their messages through the Internet
which was originally developed in low-context cultures and is similar to written
documents. High-context cultures generally exhibit a higher degree of cultural
adaptation (Hermeking, 2005).
A Web site from a low-context culture provides a detailed overview with the use of
headings and subheadings, which enable users to find what they are interested in
immediately. However, most Web sites from high-context cultures depend on links and
information described by a limited amount of text, forcing users to chase the
information through exploration of the site (Wurtz, 2005). This is in line with Hall‟s
monochronic or polychronic time orientation. In monochronic cultures, time is linear
and passing and can be divided in an orderly fashion. Therefore, Web sites should be
structured in an orderly way and their text-heavy content should be sequentially
organised to reduce download or searching time (Hermeking, 2005). The tendency was
supported by a study of Yli-Jopikii (2000) showing that the Finnish and English Web
sites of a Finnish company displayed different cultural strategies. The Finnish site
contained detailed and itemised information and portrayed a rather nonsensical strategy.
The author attributed the result to Finnish culture which was characterised by a high-
context culture, where the role of shared knowledge and the information contained in
the context were quite significant. For the English-speaking audience, the company used

Mun Ga Choi 43
43 Chapter 2: Literature Review
a more persuasive strategy, with information on equity matters and company holdings.
Similarly, Okazaki and his colleague studied Japanese and American multinational
companies‟ (MNCs) Web site strategies across differing cultures (Okazaki, 2005;
Okazaki & Alonso, 2003; Okazaki & Riva, 2002). They used the traditional advertising
content technique and revealed significant differences in Japanese and American MNCs‟
Web sites across countries. For example, soft sell appeals prevailed in the Japanese Web
sites whereas hard sell appeals prevailed in the American. In line with this, Wurtz (2005)
found that Web sites from countries like Japan, China, and Korea, as representatives of
high-context cultures, were likely to use more imagery and less text than sites from
countries like Germany, Denmark, Sweden, Norway, Finland, and the USA, as
representative of low-context cultures.
Furthermore, animated illustrations on Web sites tend to be more prominent and
elaborate in high-context than in low-context cultures where the concern is more on
photographs of products, text, and subtle effects like companies‟ logos (Wurtz, 2005).
This is because realistic impressions and identification of products are more important
in low-context cultures. High-context cultures rely more on artistically decorated
features like animations and illustrations (An, 2007). The implementation of music and
sound effects is often utilised in Web sites in high-context cultures. Also, Web sites in
high-context cultures provide more occasional options for downloads of video or radio
interviews. This is in line with an empirical research that Asians, which are high-context
cultures, strongly liked sound effects while only a small number of the Australian group
did so (Evers, 2001 cited in Wurtz, 2005). Table 5 summarises cultural categories for the
high-context and low-context dimension on Web sites derived from previous literature.

Mun Ga Choi 44
44 Chapter 2: Literature Review
Table 5: Cultural categories for Hall's high- and low-context communication styles
Cultural
Dimension
Categories or Indicators Supporting
References
High context/
Low context
-Politeness (high)
-Soft sell approach (high)
-Aesthetic (high)
-Animations or illustrations (high)
-music and sound effects (high)
-Hard sell approach (low)
-Ranks or prestige of the company (low)
-Explicit comparisons (low)
-Use of superlatives (low)
-Terms and conditions of use (low)
(An, 2007; Okazaki &
Alonso, 2003; Singh &
Baack, 2004; Singh &
Matsuo, 2004; Singh et
al., 2003; Singh, Zhao
et al., 2005; Wurtz,
2005)
2.3.5 Hofstede’s cultural dimensions
The popularity of Hofstede‟s model in intercultural communication research has led a
number of researchers to use it to examine differences in Web sites designed in various
cultures (Callahan, 2005b). Zahedi et al. (2001) introduced a large theoretical study of
user satisfaction and effectiveness of various Web site designs based on cultural and
individual factors. They identified six cultural factors developed by Hofstede‟s (2001)
five dimensions of culture and Hall‟s (1976) high-context versus low-context cultural
dimensions. Unlike a theoretical study by Zahedi et al., Singh and his teams have
proved cultural adaptation on Web sites with empirical evidence in continued studies
(Singh & Baack, 2004; Singh, Furrer, & Ostinelli, 2004; Singh & Matsuo, 2004; Singh
et al., 2003; Singh, Zhao et al., 2005). From a thorough review process, they proposed
Hofstede‟s four cultural dimensions and Hall‟s two different communication styles as
most appropriate for the analysis of Web site design. They developed cultural coding
categories, which were commonly present on Web sites and analysed the contents of
Web sites from different countries or American MNCs‟ domestic and international Web
sites. In most of their studies, they emphasised the importance of a culturally unique
Mun Ga Choi 45
45 Chapter 2: Literature Review
Web style, rather than a transnational one. They also warned that even within a
geographic region (Asia), there is considerable variation in the depiction of cultural
values (Singh, Zhao et al., 2005).
Power distance
The power distance dimension is apparent in the hierarchical structure of the Web site.
High power distance is reflected in tall hierarchical Web site structures which have
many Web pages in an unstructured layout or the opening of new windows for new Web
pages. In contrast, low power distance is reflected in flat or shallow hierarchical
structures which have only a few pages in a coherent or linear layout (Wurtz, 2005).
Web sites from high power distance included organisational charts, biographical
sketches of top leaders, and a corporate message from the CEO whereas Web sites from
low power distance reflected the content of powerful people trying to look less powerful
(Robbins & Stylianou, 2001-2002). For example, Malaysian Web sites showed
prominent organisational charts that emphasised levels of the hierarchy so that people
could better understand about the basic structure and chain of command of the company
(Gould et al., 2000). Table 6 summarises cultural categories for the power distance
dimension on Web site derived from the literature.

Mun Ga Choi 46
46 Chapter 2: Literature Review
Table 6 : Cultural categories for the power distance dimension
Cultural
Dimension
Categories or Indicators Supporting
References
Power
distance
(PD)
-Prominent organisational charts (high-PD)
-Special title (e.g., Mr. or Dr.) (high-PD)
-The structure of the organisation and the structure of
information are related and should be similar (high-
PD)
-Focus on users and their needs, not on the
organisation (low-PD)
-Emphasise value rather than rely on reputation and
prestige (low-PD)
(Gould et al.,
2000; Wurtz,
2005)
-Access to information: highly (high-PD) vs. less-
highly (low-PD) structured
-Hierarchies in mental models: tall vs. shallow
-Emphasis on the social and moral order (e.g.,
nationalism or religion) and its symbols:
significant/frequent vs. minor/infrequent use
-Focus on expertise, authority, experts, certification,
official stamps, or logos: strong vs. weak
-Prominence given to leaders vs. citizens, customers,
or employees
-Importance of security and restrictions to access:
explicit, enforced, frequent restrictions on
users vs. transparent, integrated, implicit freedom to
roam
-Social roles used to organise information (e.g., a
managers‟ section obvious to all but sealed off from
non-managers): frequent vs. infrequent
(Marcus &
Gould, 2000)
-Organisational chart (high-PD)
-Bio-sketches of Top-Leaders (high-PD)
-Message from CEO (high-PD)
(Robbins &
Stylianou, 2001-
2002)

Mun Ga Choi 47
47 Chapter 2: Literature Review
-Company hierarchy information (high-PD)
-Picture of CEOs (high-PD)
-Quality information and awards (high-PD)
-Vision statement (high-PD)
-Pride of ownership appeal (high-PD)
-Proper titles (high-PD)
(Singh & Baack,
2004; Singh &
Matsuo, 2004;
Singh et al., 2003;
Singh, Zhao et al.,
2005)
Individualism/Collectivism
Among Web site features, the collectivism dimension is operationalised in terms of the
depiction of group relations, family themes, pictures of national identity and loyalty
programs (Singh, Kumar, & Baack, 2005). In collectivist cultures, there is strong
emotional attachment between individuals and organisations and society. Therefore,
people expect to find places in Web sites where they can share their concerns, views,
and emotions (Singh & Baack, 2004). In countries with high levels of individualism,
everyone is believed to have a right to privacy and individual freedom while
collectivism reflects little privacy since the groups and organisation which people
belong to interfere with private life. Therefore, the capability for individual
acknowledgement and protection of personal information are significant in individualist
countries (Robbins & Stylianou, 2001-2002). Table 7 summarises cultural categories for
the individualism/collectivism dimension on Web site derived from the literature.
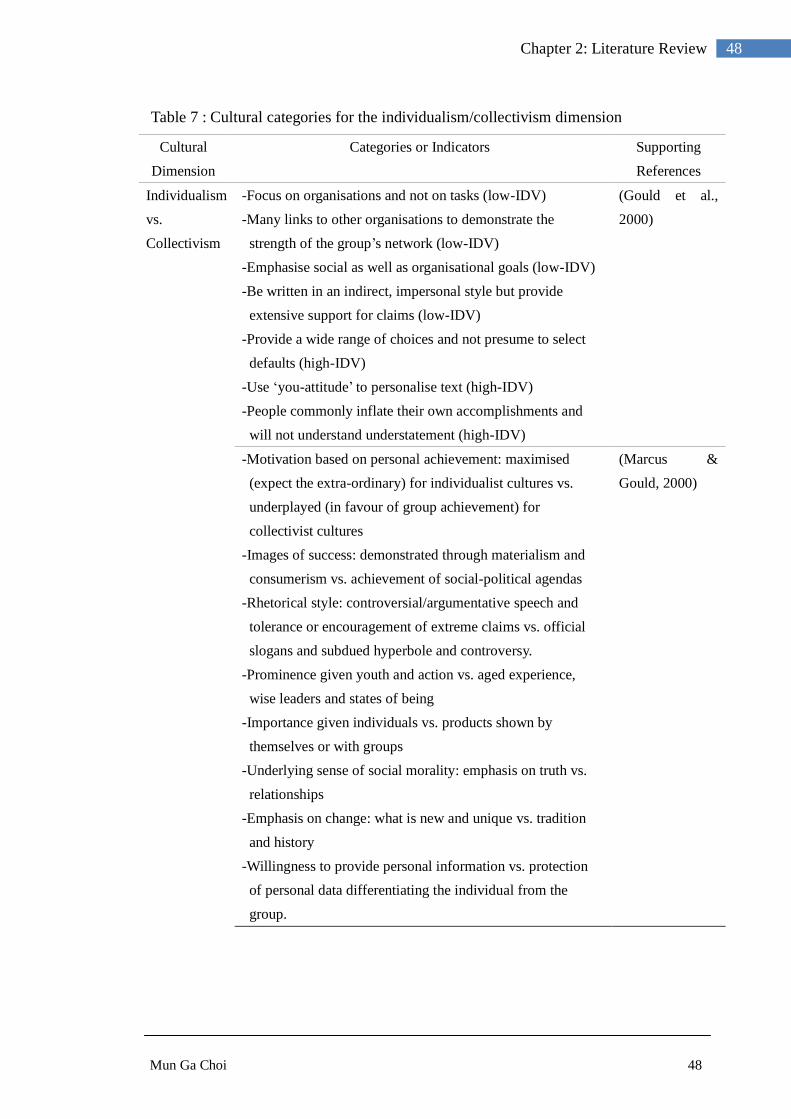
Mun Ga Choi 48
48 Chapter 2: Literature Review
Table 7 : Cultural categories for the individualism/collectivism dimension
Cultural
Dimension
Categories or Indicators Supporting
References
Individualism
vs.
Collectivism
-Focus on organisations and not on tasks (low-IDV)
-Many links to other organisations to demonstrate the
strength of the group‟s network (low-IDV)
-Emphasise social as well as organisational goals (low-IDV)
-Be written in an indirect, impersonal style but provide
extensive support for claims (low-IDV)
-Provide a wide range of choices and not presume to select
defaults (high-IDV)
-Use „you-attitude‟ to personalise text (high-IDV)
-People commonly inflate their own accomplishments and
will not understand understatement (high-IDV)
(Gould et al.,
2000)
-Motivation based on personal achievement: maximised
(expect the extra-ordinary) for individualist cultures vs.
underplayed (in favour of group achievement) for
collectivist cultures
-Images of success: demonstrated through materialism and
consumerism vs. achievement of social-political agendas
-Rhetorical style: controversial/argumentative speech and
tolerance or encouragement of extreme claims vs. official
slogans and subdued hyperbole and controversy.
-Prominence given youth and action vs. aged experience,
wise leaders and states of being
-Importance given individuals vs. products shown by
themselves or with groups
-Underlying sense of social morality: emphasis on truth vs.
relationships
-Emphasis on change: what is new and unique vs. tradition
and history
-Willingness to provide personal information vs. protection
of personal data differentiating the individual from the
group.
(Marcus &
Gould, 2000)

Mun Ga Choi 49
49 Chapter 2: Literature Review
-Use of cookies (an invasion of privacy) (low-IDV)
-Site registration requirements (low-IDV)
-Site security provisions (high-IDV)
-Privacy policy statement (high-IDV)
(Robbins &
Stylianou, 2001-
2002)
-Community relations (low-IDV)
-Clubs or chat rooms (low-IDV)
-Newsletter (low-IDV)
-Family theme (low-IDV)
-Country specific news (low-IDV)
-Symbols and pictures of national identity (low-IDV)
-Loyalty programs (low-IDV)
-Links to local websites (low-IDV)
(N. Singh &
Baack, 2004; N.
Singh &
Matsuo, 2004;
N. Singh et al.,
2003; N. Singh,
Zhao et al.,
2005)
Masculinity/Femininity
Singh et al. (2003) concluded in their findings that Fortune 500 global companies‟
Chinese Web sites depicted much lower masculine values than US domestic Web sites.
The masculine values of realism, product effectiveness, and clear gender roles were
found to differ significantly. Furthermore, high masculinity cultures focus on elements
like traditional gender/family/age distinctions, attention, work task, and mastery while
Web sites in high femininity cultures include visual aesthetics, mutual cooperation and
support rather than mastery and winning for interface design (Marcus & Gould, 2000).
In a masculine society, money and assets are considered important so that corporate
Web sites include annual reports and financial highlights (Robbins & Stylianou, 2001-
2002). Table 8 summarises cultural categories for the masculinity/femininity dimension
on Web site derived from the literature.

Mun Ga Choi 50
50 Chapter 2: Literature Review
Table 8 : Cultural categories for the masculinity/femininity dimension
Cultural
Dimension
Categories or Indicators Supporting
References
Masculinity/
Femininity
-Traditional gender/family/age distinctions (high-MAS)
-Work tasks, roles, and mastery, with quick results for
limited tasks (high-MAS)
-Navigation oriented to exploration and control (high-
MAS)
-Attention gained through games and competitions
(high- MAS)
-Graphics, sound, and animation used for utilitarian
purposes (high-MAS)
-Blurring of gender roles (low-MAS)
-Mutual cooperation, exchange, and support (rather than
mastery and winning) (low-MAS)
-Attention gained through poetry, visual aesthetics, and
appeals to unifying values (low-MAS)
(Marcus & Gould,
2000)
-Annual report (high-MAS)
-Financial highlights (high-MAS)
-Hit/Visitor counter (high-MAS)
-Indication of social responsibility (low-MAS)
-Indication of cultural sensitivity (low-MAS)
(Robbins &
Stylianou, 2001-
2002)
-Quizzes and games (high-MAS)
-Realism theme (high-MAS)
-Product effectiveness (high-MAS)
-Clear gender roles (high-MAS)
(Singh & Baack,
2004; Singh &
Matsuo, 2004;
Singh et al., 2003;
Singh, Zhao et al.,
2005)
Uncertainty Avoidance
Countries having high uncertainty avoidance characteristics exhibit nationalism and
xenophobic attitudes (Robbins & Stylianou, 2001-2002). This was reflected in the
British Airway‟s Web site from the United Kingdom (a relatively low uncertainty
avoidance country) showing a higher complexity of content and choices with popup

Mun Ga Choi 51
51 Chapter 2: Literature Review
windows (Marcus & Gould, 2000). Furthermore, Mexican Web sites of American
brands displayed traditional themes such as history, respect, and veneration of the
elderly (Singh & Baack, 2004). However, on the uncertainty avoidance dimension, no
significant differences were found between Web sites from different countries (Singh,
Kumar et al., 2005; Singh & Matsuo, 2004; Singh, Zhao et al., 2005). Table 9
summarises the cultural categories for the uncertainty avoidance dimension on Web
sites derived from Hofstede‟s cultural dimensions.
Table 9: Cultural categories for the uncertainty avoidance dimension
Cultural
dimension
Categories or indicator Supporting
references
Uncertainty
Avoidance
-Listing of job openings (low-UA)
-Description of career/jobs (low-UA)
-Job openings international in scope (low-UA)
-Cookie disclosure (low-UA)
-Organisational chart (low-UA)
(Robbins &
Stylianou, 2001-
2002)
-Customer service (high-UA)
-Secure payment (high-UA)
-Guided navigation (high-UA)
-Traditional theme (high-UA)
-Local stores (high-UA)
-Local terminology (high-UA)
-Free trials or downloads (high-UA)
-Customer testimonials (high-UA)
-Toll-free numbers (high-UA)
(Singh & Baack,
2004; Singh &
Matsuo, 2004;
Singh et al., 2003;
Singh, Zhao et al.,
2005)

Mun Ga Choi 52
52 Chapter 2: Literature Review
-Simplicity, with clear metaphors, limited choices, and
restricted amounts of data (high-UA)
-Attempts to reveal or forecast the results or implications
of actions before users act (high-UA)
-Navigation schemes intended to prevent users from
becoming lost (high-UA)
-Mental models and help systems that focus on reducing
„user errors‟ (high-UA)
-Redundant cues (colour, typography, sound, etc.) to reduce
ambiguity (high-UA)
-Complexity with maximal content and choices (low-UA)
-Acceptance (even encouragement) of wandering and risk,
with a stigma on „over-protection‟ (low-UA)
-Less control of navigation: for example, links might open
new windows leading away from the original location
(low-UA)
-Mental models and help systems might focus on
understanding underlying concepts rather than narrow
tasks (low-UA)
-Coding of colour, typography, and sound to maximise
information (multiple links without redundant cueing)
(low-UA)
(Marcus & Gould,
2000)
2.3.6 Web user’s perception toward a Web site
Although there has been a steady increase, both social and business, in seeking a better
understanding of user preferences in Web site design, little research has systematically
examined this (Cyr & Trevor-Smith, 2004). Personality might be a highly relevant
factor in determining individual preferences on Web site design. For example,
individuals with a strong need for closure prefer less interactive Web sites containing
fewer hyperlinks, while those with a lower need prefer a more interactive Web site with
more hyperlinks (Yates & Noyes, 2007).
Fang and Rau (2003) researched the effects of cultural differences of the Chinese and

Mun Ga Choi 53
53 Chapter 2: Literature Review
US people on their perceived usability and search performance of Internet portal sites.
The results of the study indicated that the Chinese users felt somewhat less satisfied
since the portal site, used in the experiment, was initially developed for the US audience.
It is clear that the site better fits the cognitive style and thought processes of US people
than those of the Chinese. Therefore, it is assumed that a Web site represents cultural
differences and its users are likely to react positively and favourably to a culturally
congruent content of text.
In a similar vein, Singh et al. (2004) have studied whether global consumers preferred
to browse and buy from standardised global Web sites or from thouse adapted to their
local cultures. They tested the effects of cultural adaptation level - local, adapted, and
standardised Web sites - with Italian, Indian, Dutch, Spanish, and Swiss consumers on
five different effectiveness variables (navigation ease, presentation of information,
attitude toward the site, purchase intention, and cultural adaptation). Some countries
like Spain and India showed a high propensity to rank local sites as more effective than
adapted and standardised Web sites. However, the results were contradicted in other
countries like Italy, the Netherlands, and Switzerland, these countries showing higher
mean values for some effectiveness variables for standardised and adapted Web sites
compared to local Web sites. Singh et al. concluded that the reasons why Spain and
India preferred local sites were because Spain scored high on Hofstede‟s uncertainty
avoidance and India scored high on Hofstede‟s power distance dimensions.
Furthermore, the importance of the congruity of a Web site with a visitor‟s culture and
the manifestations of that culture are significantly highlighted by Luna, Peracchio and
de Juan (2002, 2003). They found that attitudinal measures were influenced by the
interaction of Web site language with two types of congruity: graphic and cultural. In

Mun Ga Choi 54
54 Chapter 2: Literature Review
their context, graphic congruity meant the relationship between the graphics and the text
in a Web site. Cultural congruity referred to the relationship between the cultural values
expressed and those of the visitor.
In short, there was a very limited number of studies that measured how the degree of
cultural adaptation on the Web site affected user perception of its effectiveness. Only
research conducted by Luna et al. (2002), Luna et al. (2003), and Singh et al. (2004) are
noteworthy in this area. In addition, a work by Morel and Snelders (2006) has been
developed along the same lines, but used credibility scales for measuring cross-country
differences in Web site design. As discussed earlier, the literature emphasises evaluation
of a Web site‟s informative and technological quality, not its cultural content
characteristics, which this study pursues.
2.4 Research Questions
Based on previous research, two primary questions were developed, followed by
ancillary assumptions.
(1) Are there cultural differences and similarities in the content of corporate Web
sites from two culturally different countries?
Main visuals and Web site features in Korean company Web sites will be
different from those in New Zealand company Web sites.
(2) Are there differences and similarities in the perceptions of Web users from two
countries toward culturally congruent or incongruent Web sites?
Web users will have more favourable attitudes and future intentions
toward a culturally congruent Web site than a culturally incongruent Web

Mun Ga Choi 55
55 Chapter 2: Literature Review
site.
The following chapters will explain the research design and findings of Study One for
the first research question (Chapter 3) and Study Two for the second research question
(Chapter 4) respectively.
2.5 Conclusion
The term culture is developed in this research from the functionalist paradigm.
Hofstede‟s and Hall‟s typologies have been widely used to explain cultural phenomena
in marketing communication in spite of some critiques. The accumulated knowledge
developed in marketing communication using Hofstede‟s and Hall‟s models provides a
beneficial level of analytical flexibility for studying the cultural aspects of Web sites.
The Internet is still relatively new as a medium and cultural effects on Web sites are also
at a nascent stage. Previous studies provided a general description of phenomena in the
field, but only few studied industry-specific effects on culturally adapted Web sites.
Most of the studies focused on US companies in a specific industry without researching
industry effects. Furthermore, little research has quantitatively measured the
effectiveness of culturally adapted Web sites. The question remains whether people of
different cultures interpret and respond to culturally adapted Web sites differently.
Cultural effects on Web site design have been studied and published by only a limited
number of researchers. Therefore, this research should be developed on a more
programmatic process to fill the gap.

Mun Ga Choi 56
56 Chapter 3: Study One
Chapter 3: Study One
3.1 Introduction
Study One tested whether there were cultural differences and similarities in the content
of corporate Web sites targeting different national groups. In particular, it was expected
that main visuals and Web features on Web sites would differ between the two countries,
New Zealand and South Korea, on the opposite continuum of high-context and low-
context communication styles and Hofstede‟s four cultural dimensions. Study One
employed quantitative content analysis, an appropriate method for examining
advertising messages to provide the frequency of visual and feature presentation
(Kassarjian, 1977, cited in An, 2007). The chi-square test was utilised to examine group
differences in the frequency of particular visuals and Web features on corporate Web
sites and to compare the results between two nations. Later, the effects of different
industry types were also studied.
3.2 Hypotheses
3.2.1 Product portrayal
Among advertising components, the study of visual components captured greater
attention (Cutler et al., 1992) since visual components in advertising were more quickly
processed and more effective in drawing attention and stimulating curiosity than verbal
components (An, 2007). Also, visuals can add meaning, eliciting a positive response to
something that is basically neutral like products in advertising (An, 2007). Visuals help
to demonstrate product features and benefits, introduce a personality for a product,
relate the product to specific lifestyles, and engrave the product brand identity in the
memories of the audience (Moriarty, 1987).
Mun Ga Choi 57
57 Chapter 3: Study One
Advertising visuals are well associated with high-/low-context communication styles;
literal visuals are more prevalent in advertising for low-context cultures and symbolic
visuals are expected to appear more often for high-context cultures (An, 2007). Also,
there is a positive relationship between a hard-sell vs. a soft-sell approach and product
portrayals in advertising. In the hard-sell approach, advertisement visuals are more
likely to portray the actual products whereas direct presentation of products tends to be
avoided in the soft-sell approach (de Mooij, 2005). As discussed in the previous chapter
(see session 2.2.2), literal visuals, preferred in low-context cultures, can be expressed by
identification (brand, logo, package), description (what it looks like, attributes, parts,
schematics), comparison (between two competitors, before and after), and
demonstration of products (how to do, use, apply make); (Moriarty, 1987). This research
derived two most relevant elements to direct product portrayals from Moriarty‟s four
literal visuals of representing products: description and demonstration. Therefore, a
difference in the frequency of product portrayals on the homepages of corporate Web
sites is predicted between New Zealand and South Korea.
H1: New Zealand companies‟ home pages are more likely to use visuals of
description of products (what it looks like, attributes, parts, schematics) than
those of South Korea.
H2: New Zealand companies‟ home pages are more likely to use visuals of
demonstration of products (how to do, use, apply make) in main visuals than
those of South Korea.
3.2.2 People portrayal
The individualism vs. collectivism dimension is perhaps the broadest and most widely
used dimension of cultural variability in cross-cultural advertising research (Han &

Mun Ga Choi 58
58 Chapter 3: Study One
Shavitt, 1994). This is in line with the connectedness-separateness self-schema theory
(Wang & Chan, 2001). An individual with a separated self-schema tends to perceive
himself or herself as distinct from others whereas one with a connected self-schema
keeps close and harmonious relationships with others. In a collectivistic culture, a
greater percentage of advertisements feature celebrity models to draw consumer
attention (An, 2007). Celebrities show the shared values of a society and are considered
more credible and influential (Choi et al., 2005). This is supported by a reflection of the
symbolic visuals uppermost in high-context cultures (Moriarty, 1987). Symbolic visuals
can be expressed with meanings by association using a character or celebrity (Moriarty,
1987). Based on this discussion, a cultural difference in the utilising of collectivism vs.
individualism appeals on the homepages of corporate Web sites is expected between
New Zealand and South Korea.
H3: South Korean companies‟ home pages are more likely to use visuals of
individuals associated with others (family or group themes) than those of New
Zealand.
H4: South Korean companies‟ home pages are more likely to use visuals of celebrity
models than those of New Zealand.
3.2.3 Multimedia
There appears to be a preference for illustrations in relation to a more soft-sell and
indirect approach in high-context cultures. By contrast, low-context cultures like the
U.S. use realistic photographic visuals for the direct delivery of factual information
about the products or services advertised in relation to a hard-sell approach (An, 2007;
Cutler et al., 1992). As such, symbolic visuals emphasising strong aesthetic aspects are
expected to appear more frequently on corporate Web sites for high-context cultures.

Mun Ga Choi 59
59 Chapter 3: Study One
The following hypotheses address differences in the uses of animated illustrations and
moving visuals on the homepages of corporate Web sites between New Zealand and
South Korea.
H5: South Korean companies‟ home pages are more likely to use visuals of animated
illustrations than those of New Zealand.
H6: South Korean companies‟ homepages are more likely to use moving visuals (e.g.
flashy graphics or texts and movies) than those of New Zealand.
H7: South Korean companies‟ homepages are more likely to use music or sound
effects than those of New Zealand.
3.2.4 Web site features
Based on the cultural categories in the cross-cultural literature of Web sites, a more
comprehensive set of web features was proposed for this research to study cultural
differences. Although it is believed that prior studies have provided a good foundation
in this field, there are some cultural categories or features, such as quizzes, games and
traditional themes, which are not normally included on corporate Web sites. Instead of
just adopting these studies, those in which the most important and commonly used
features of corporate Web sites were explored and supplemented. According to Liu el al.
(1997), the main features of the homepages of Fortune companies included: product and
service, company overview, feedback, what‟s new, financial facts, customer service and
assistance, search, employment opportunities, guest book (sign-in), index/directory,
online business, links to other sites, CEO messages, and frequently asked questions
(FAQ). These features were also supported by other scholars as essential, common
features (Cheung & Huang, 2002; Heinze & Hu, 2006; Huang, Le, Li, & Gandha, 2006;

Mun Ga Choi 60
60 Chapter 3: Study One
Robbins & Stylianou, 2003).
For this thesis, after extensive review of relevant research, a set of 23 cultural Web site
features, which were related to Hofstede‟s cultural dimensions but considered as
significant features in designing corporate Web sites, were identified. Regardless of
cultural characteristics of Web site features, online sales available were further
investigated for understanding the recent traits of corporate Web sites from the two
countries. Table 10 presents cultural Web site features. The justification for including
certain Web site features under each cultural dimension was elaborated in the section
2.1.2 and 2.3.5.
Table 10: Cultural Web site features
Dimension Features Detailed information
Power
distance
-Hierarchy information Ranks of company personnel;
organisational chart
-Messages of leaders Pictures of CEO; leaders‟ information; bio-
sketches of leaders
-Vision statement
Collectivism -Community relations Community policy; social responsibility
-Newsletter Newsletters; what‟s new; Web magazines
-Links to local Web
sites
Links to other local Web sites
-Loyalty program Policies and procedures based on loyalty
-National identity Symbols and pictures of national identity
-Sharing experience Discussion groups; testimonials; case
studies; message boards
Individualism -Search engine Access to information (less highly
structured)
-Personalisation My page; individual acknowledgements;
log-on
-Good privacy
statement
Privacy policy: confidentiality
-Product uniqueness Product differentiation features; patents
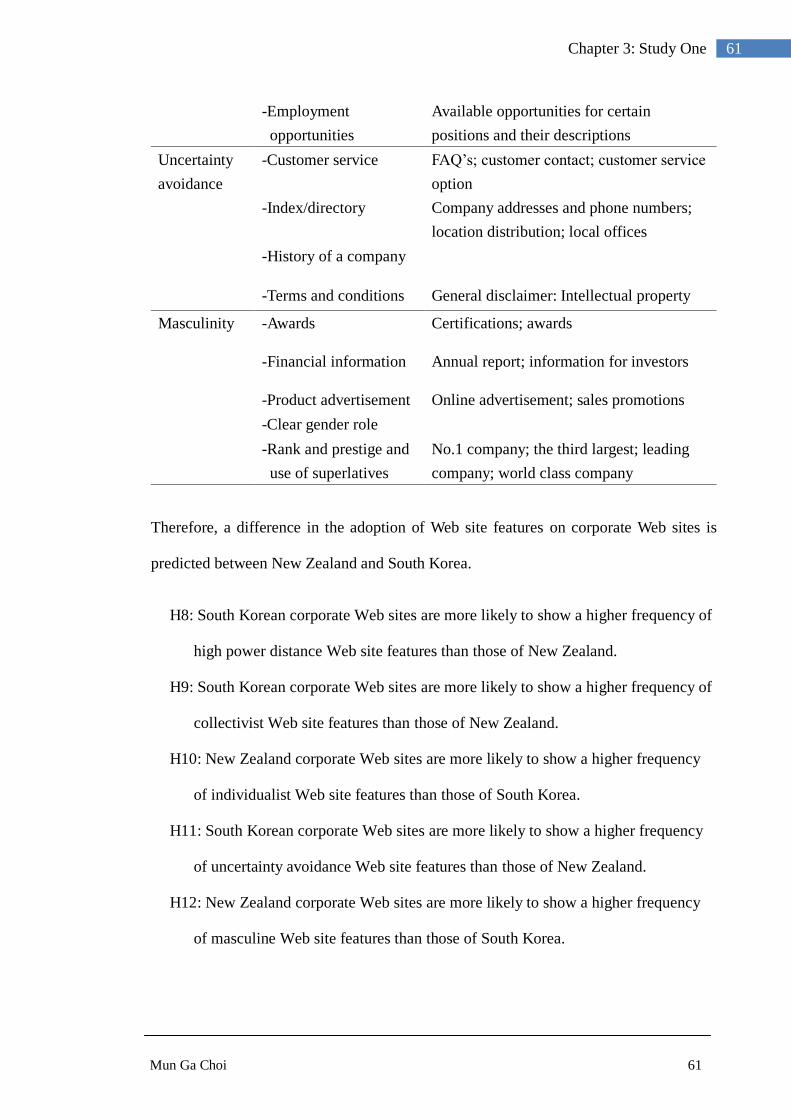
Mun Ga Choi 61
61 Chapter 3: Study One
-Employment
opportunities
Available opportunities for certain
positions and their descriptions
Uncertainty
avoidance
-Customer service FAQ‟s; customer contact; customer service
option
-Index/directory Company addresses and phone numbers;
location distribution; local offices
-History of a company
-Terms and conditions General disclaimer: Intellectual property
Masculinity -Awards Certifications; awards
-Financial information Annual report; information for investors
-Product advertisement Online advertisement; sales promotions
-Clear gender role
-Rank and prestige and
use of superlatives
No.1 company; the third largest; leading
company; world class company
Therefore, a difference in the adoption of Web site features on corporate Web sites is
predicted between New Zealand and South Korea.
H8: South Korean corporate Web sites are more likely to show a higher frequency of
high power distance Web site features than those of New Zealand.
H9: South Korean corporate Web sites are more likely to show a higher frequency of
collectivist Web site features than those of New Zealand.
H10: New Zealand corporate Web sites are more likely to show a higher frequency
of individualist Web site features than those of South Korea.
H11: South Korean corporate Web sites are more likely to show a higher frequency
of uncertainty avoidance Web site features than those of New Zealand.
H12: New Zealand corporate Web sites are more likely to show a higher frequency
of masculine Web site features than those of South Korea.

Mun Ga Choi 62
62 Chapter 3: Study One
3.3 Method
For the analysis of visual communication and Web features, content analysis was
adopted as an appropriate method. Content analysis is a well-established method
(Anderson, Dewhirst, & Ling, 2006) and has been widely used by researchers to
investigate the content of the media such as commercials or advertisements in television
or the print media. It is defined as a method of studying and analysing communication
in a systematic, objective, and quantitative manner for the purpose of measuring
variables (Kerlinger, 2000, cited in Wimmer & Dominick, 2006). In order to enhance its
unique characteristics of objectivity and systematisation, the content to be analysed and
the definition of relevant categories are selected systematically and objectively. There
must be uniformity in analysis and evaluation procedures. Additionally, the quantitative
characteristic of content analysis allows researchers to summarise results in a more
precise and succinct way. With statistical aids, the results can be interpreted and
analysed to find objective answers to research questions. Qualitative data like the
content of a large number of advertisements can be understood in some simplified
patterns and trends (Anderson et al., 2006).
Therefore, the procedure is briefly described as follows: (1) selecting an appropriate
sample from the population, (2) defining a unit of analysis, (3) developing categories of
content to be analysed, (4) coding the content according to the categories, (5)
statistically analysing the coded data, and (6) drawing conclusions.
3.4 Unit of analysis
The first part of Study One focused on visual communication. The first or the main
graphics on the homepages of corporate Web sites were chosen as the analysis unit. The
homepage of a Web site is the most important part of the Web site since it is the front
Mun Ga Choi 63
63 Chapter 3: Study One
door and essential portal to the rest of the site (Weinberg, 2000). Therefore, analysis of
the first or the main graphics on homepages is essential for ensuring visual
communication.
However, the unit of analysis for Web features was an entire Web site. These seem to
have significant functions or features beyond those of traditional advertising or
marketing. Corporate Web sites have unique characteristics which provide new contexts
to companies. Through the gateway of a homepage, Web users are able to interact with
Web sites and navigate through whole pages on a Web site. Unlike a main visual on a
homepage which has the strongest impact, diverse Web features are spread through an
entire site; therefore, an entire Web site should be analysed.
In this research, a corporate Web site is defined as one of a „bricks and mortar‟ company
that sells goods and services to consumers. Corporate Web sites were chosen for this
study over other types since companies possessed financial resources that drove the
technological development of the Web and about 88% of all registered domain names
on the Web were commercial (Ha & James, 1998). Visuals and features on corporate
Web sites were analysed to count the occurrence or non-occurrence of each of the
categories.
3.5 Sample
Sampling of content involved some consideration. There should be as little bias as
possible in the selection of content to be compared. Corporate Web sites were classified
by industry types from each country. The same number of companies from the same
industry were selected and compared across the industry between the two countries. A
systematic sampling procedure was followed to take a sample of corporate Web sites for

Mun Ga Choi 64
64 Chapter 3: Study One
each country.
Most companies were selected from the companies listed in the New Zealand Exchange
(NZX) and the Korea Exchange (KRX). The companies listed on the Exchange were
cornerstone and the best-known companies in each country. The industry types were
derived from the sectors of NZX since this had a much simpler category and a relatively
smaller number of companies. About 250 companies were listed in the New Zealand
Stock Market (NZSX), New Zealand Debt Market (NZDX), and New Zealand
Alternative Market (NZAX) as of March, 2008, compared to about 1,800 companies
listed in the Korean Stock Exchange (KSE) and KOSDAQ.
Additionally, this study referred to South Korea‟s top 1000 companies from Naver
(2007), one of the biggest Korean Internet portal sites, for the Korean sample. In the
same fashion, this study referred to New Zealand‟s top 100 companies for 2002
(WebRank, 2007) and the New Zealand Business Who‟s Who Online (NZBWW, 2008)
for the New Zealand sample. For example, as only three companies were listed under
the building materials and construction sector in the NZX, the remainder were derived
from the other two sources. Conversely, since 47 companies were listed under the
general construction sector in the KRX, those which were in higher ranks and sorted by
Capital Stocks were selected. If a Web site did not exist or was under construction at the
time of the visit, the next available site was included. A total of 120 company Web sites
was viewed from each country. The company categories included agriculture & fishing
(10), apparel and jewellery (10), building materials and construction (10), business
assistance service (10), durables (10), energy (10), finance and insurance (10), food and
beverages (10), retail sales (10), science and technology (10), telecommunication (10),
and transport (10). Numbers in parentheses indicate the number of Web sites viewed for

Mun Ga Choi 65
65 Chapter 3: Study One
each industry. The company lists, Table 34 and 35 are provided in Appendix 1. In the
analysis of Web sites, the time frame is emphasised because of possible changes in their
content necessitating rapid collection of data. The homepages of 120 companies from
each country were viewed from the 17th
of March to the 31st of March, 2008 for about
two weeks.
3.6 Results
A chi-square test was utilised to examine a statistical test of the significance of
differences between frequencies. Table 11 shows the frequency of the occurrence of
visuals on corporate homepages from South Korea and New Zealand. The cells in the
table indicate the frequency of each row and column combination. Percentages in
parentheses indicate the proportion of the total main visuals on homepages for each
country (n=120) using a particular visual function. For example, 76% of main visuals on
120 South Korean homepages (frequency=70) contained product visuals. If the chi-
square test was statistically significant at 95 percent, the hypotheses were supported,
otherwise they were rejected.
Table 11 : Visuals on the corporate homepages from New Zealand and South Korea
Nations Chi-Square
Results South Korea
(n=120)
New Zealand
(n=120) Values
H1: description of a product 70 (58.3) 76 (63.3) 2
= .630 Rejected
H2: demonstration of a
product 59 (49.2) 46 (38.3)
2 = 2.861 Rejected
H3: people associated with
others 33 (27.5) 20 (16.7)
2 = 4.092
a Supported
H4: celebrity models 16 (13.3) 1 (0.8) 2
= 14.244b Supported
H5: animated illustrations 42 (35) 5 (4.2) 2
= 36.221b Supported
H6: moving visuals 113 (94.2) 41 (34.2) 2
= 93.941b Supported
H7: music or sound effects 16 (13.3) 0 2
= 17.143b Supported
Mun Ga Choi 66
66 Chapter 3: Study One
Percentages are in parentheses.
a South Korea and New Zealand differed significantly at p <.05
b South Korea and New Zealand differed significantly at p ≤.001
3.6.1 Product portrayal
The first hypothesis was to examine the difference in the frequency of description of a
product in the main visuals on the homepages of corporate Web sites between New
Zealand and South Korea. As shown in Table 11, 70 (58.3%) South Korean corporate
homepages reflected their products in main visuals, compared to those of 76 (63.3%)
New Zealand. There was only a small difference between South Korea and New
Zealand although New Zealand did reflect a higher frequency. The group difference
between New Zealand and South Korea was not statistically significant (2
= .630).
Therefore, H1 was rejected.
The second hypothesis predicted a difference in the use of demonstration of a product
(how to do, use, apply or make) in the main visuals on the homepages between the two
national groups. The number of visuals featuring demonstration of products was
compared with the total number of visuals sampled for each group. As Table 11
illustrates, 59 visuals out of 120 (49%) from South Korea featured demonstration of
products in visuals while 46 out of 120 (38.3%) from New Zealand did so. The
difference between New Zealand and South Korea was not statistically significant (2 =
2.861). Therefore, H2 was rejected.
For use of visuals on corporate homepages by industry sectors, Table 36 (see Appendix
2) indicates the frequency of use of visuals; only two visuals, description of a product
and demonstration of a product, had a statistically significant industry difference in use
(2 = 54.911, df = 11, p <.001 for visual of description of a product;
2 = 55.314, df = 11,
p <.001 for visual of demonstration of a product). Industry sectors like agriculture and

Mun Ga Choi 67
67 Chapter 3: Study One
fishing (80%), apparel and jewellery (85%), building materials and construction (80%),
food and beverages (85%), and retail sales (80%) included visuals of description of
product on the majority of their homepages. However, service sectors like business
assistance service (35%), energy (20%), and finance and insurance (20%) reflected
visuals of description of products with far less frequency. It makes sense that service is
intangible and does not have form or shape. Similarly, many apparel and jewellery (75%)
and building materials and construction (90%) companies used visuals of demonstration
of products on their homepages whereas energy (15%) and finance and insurance (10%)
rarely featured visuals of product usages on their homepages.
3.6.2 People portrayal
The third hypothesis predicted a national difference in the use of visuals of individuals
associated with others (family or group theme) between New Zealand and South Korea.
As presented in Table 11, 33 visuals on Korean corporate homepages included family or
group themes (27.5%) whereas 20 visuals on New Zealand homepages used family or
group themes (16.7%). Chi-square statistics showed that the group difference between
New Zealand and South Korea was statistically significant (2 = 4.092, df = 1, p <.05).
Therefore, H3 was supported.
The fourth hypothesis was to examine a group difference in the frequency of visuals of
celebrity models between New Zealand and South Korea. As Table 11 shows, 16 out of
120 (13.3%) Korean corporate homepages used celebrity models for their main visuals
whereas only one New Zealand corporate homepage used a celebrity model. Although
overall frequency of celebrity models was low, the group difference was statistically
very significant (2 = 4.092, df = 1, p <.001). Therefore, H4 was strongly supported.

Mun Ga Choi 68
68 Chapter 3: Study One
3.6.3 Multimedia
The fifth hypothesis predicted that Korean companies‟ home pages would show higher
level of visuals of animated illustrations than those of New Zealand. As depicted in
Table 11, 35% of main visuals on South Korean corporate homepages (frequency = 42)
used animated illustrations, compared with only 4.2% of main visuals of New Zealand
corporate homepages (frequency = 5). Photographs were the main type of visuals used
on New Zealand corporate homepages. Consequently, animated illustrations were used
far more frequently by the corporate homepages from South Korea. The group
difference was statistically very significant (2 = 36.221, df = 1, p <.001), therefore, H5
was strongly supported.
The last comparison between South Korean and New Zealand corporate homepages
concerned moving visuals (e.g. flashy graphics or texts and movies) and music or sound
effects. Almost all the South Korean corporate homepages examined used moving
visuals (94.2%, frequency = 113) whereas only 34.2% of those of New Zealand
included moving visuals (frequency = 41). This was a large and statistically significant
group difference (2 = 93.941, df = 1, p <.001). In contrast, only a small portion of
South Korean corporate homepages used music or sound effects. However, compared to
New Zealand corporate homepages which featured none (0%), the group difference was
statistically very significant (2
= 17.143, df = 1, p <.001). Both H6 and H7 were
strongly supported.
3.6.4 Web site features
Table 12 shows the frequency of Web site features involving cultural dimensions on
corporate sites from New Zealand and South Korea, and the chi-square test results.

Mun Ga Choi 69
69 Chapter 3: Study One
Table 12 : Frequency of Web site features
Cultural
dimensions Web site features
Nations Chi-Square
South Korea
(n=120)
New Zealand
(n=120) Values
Power
distance
Hierarchy
information 57 (47.5) 67 (55.8)
2 =1.669
Messages of leaders 107 (89.2) 83 (69.2) 2 =14.552
b
Vision statement 120 (100) 110 (91.7) 2 =10.435
b
Collectivism Community relations 69 (57.5) 55 (45.8) 2 =3.270
Newsletter 118 (98.3) 101 (84.2) 2 =15.082
b
Links to local Web
sites 87 (72.5) 58 (48.3)
2 =14.653
b
Loyalty program 34 (28.3) 19 (15.8) 2 =5.448 a
National identity 5 (4.2) 8 (6.7) 2 =0.732
Sharing experience 45 (37.5) 21 (17.5) 2 =12.038
b
Individualism Search engine 46 (38.3) 61 (50.8) 2 =3.795
Personalisation 83 (69.2) 47 (39.2) 2 =21.751
b
Good privacy
statement 90 (75.0) 55 (45.8)
2 =21.343
b
Product uniqueness 116 (96.7) 78 (65.0) 2 =38.835
b
Employment
opportunities 106 (88.3) 77 (64.2)
2 =19.350
b
Uncertainty
avoidance
Customer service 112 (93.3) 91 (75.8) 2 =14.091
b
Index/directory 118 (98.3) 118 (98.3) nac
History of a
company 119 (99.2) 65 (54.2)
2 =67.919
b
Terms and
conditions 60 (50) 69 (57.5)
2 =1.358
Masculinity Awards 103 (85.8) 22 (18.3) 2 =109.540
b
Financial
information 103 (85.8) 84 (70)
2 =8.742
a
Product
advertisement 97 (80.8) 42 (35)
2 =51.713
b
Clear gender role 1 (0.8) 0 (0) nac
Rank and prestige
and use of
superlatives
116 (96.7) 115 (95.8) nac

Mun Ga Choi 70
70 Chapter 3: Study One
Online business 62 (51.7) 27 (22.5)
2 =21.877
b
Percentages are in parentheses.
a South Korea and New Zealand differed significantly at p <.05
b South Korea and New Zealand differed significantly at p ≤.001
c Statistically invalid, in 2x2 tables, any of the expected frequencies is less than 5.
In order to test hypotheses 8 to 12, the overall score for each of the five cultural
dimensions (power distance, collectivism, individualism, uncertainty avoidance, and
masculinity) was needed. This research followed a previous study for a way of
generating an aggregate variable for each dimension (Singh et al., 2003). The researcher
calculated the average presence of each of the sub-categories within each dimension,
and recorded it as an aggregated score for that cultural dimension. For example, the
aggregated score for the cultural dimension, power distance, was calculated by counting
the presence of all three sub-categories of power distance on a Web site; hierarchy
information, message of leaders, and vision statement, and then divided that number by
three.
Table 13: ANOVA Results for cultural dimensions by country
Hypothesis:
Dimension
Nations
F-Value Results South Korea New Zealand
Mean values (%)
H8: Power distance 79 72 3.745 Rejected
H9: Collectivism 50 37 32.883a Supported
H10: Individualism 74 53 36.987 a Rejected
H11:
Uncertainty
avoidance
85 71 30.510 a Supported
H12: masculinity 70 44 164.502 a Rejected
a F-value is significant at p ≤.001 level
The percentage of occurrence of aggregated power distance score on Korean corporate

Mun Ga Choi 71
71 Chapter 3: Study One
Web sites (79%) was comparatively more than on New Zealand Web sites (72%), but
the result was not statistically significant; thus hypothesis 8 was rejected. Hypotheses 9
and 11 were supported since the results showed that the overall frequency of the
occurrences of collectivism and uncertainty avoidance was relatively higher on Korean
Web sites than on New Zealand Web sites. Conversely, hypotheses 10 12 were rejected
since the results were opposite to what we proposed.
For further understanding, as shown in Table 37 (see Appendix 2), an industrial
difference was studied and 11 out 26 features indicated an industrial difference. Features
like personalisation, privacy policy, terms and conditions and online business in energy,
finance & insurance, and retail sales made the Web sites distinguishable from those of
other industrial sectors. These four features are related since online business needs a
log-on system which requires strong online safety issues like privacy policy, and terms
and conditions, to use the Web sites. The service sector was found to be advanced in its
use of online business.
In addition, the industry sectors, segmented into 12 sectors, were aggregated into three
larger sectors and analysed for each country: non-durable, durable, and service sectors.
The non-durable sector (40 companies) was composed of agriculture and fishing,
apparel and jewellery, food and beverages and retail sales. The durable sector (40
companies) included durables, building materials and construction, science and
technology, and business assistance service. Finally, the service sector (40 companies)
included energy, finance and insurance, telecommunication, and transport.
As shown in Table 14, Ten Web features had statistically significant differences between
industry sectors. The most distinguishable difference was found in loyalty program and

Mun Ga Choi 72
72 Chapter 3: Study One
financial information features.
Table 14: Web features on corporate homepages by industry sectors in South Korea
Cultural
dimensions Web site features
Industry
Chi-Square
Non-
durable
(n=40)
Durable
(n=40)
Service
(n=40)
Frequency (%)
Power
distance
Hierarchy information 27.5 60 55 2 = 9.825
b
Messages of leaders 77.5 95 95 na
Vision statement 100 100 100 na
Collectivism Community relations 45 52.5 75 2 = 7.980
b
Newsletter 97.5 100 97.5 na
Links to local Web
sites 65 65 87.5
2 = 6.771
b
Loyalty program 52.55 5 27.5 2 = 22.244
a
National identity 5 2.5 5 na
Sharing experience 52.5 15 45 2 = 13.440
a
Individualism Search engine 45 22.5 47.5 2 = 6.416
b
Personalisation 92.5 47.5 67.5 2 = 19.069
a
Good privacy
statement 87.5 55 82.5
2 = 13.067
a
Product uniqueness 100 100 90 na
Employment
opportunities 82.5 95 87.5 na
Uncertainty
avoidance
Customer service 95 87.5 97.5 na
Index/directory 97.5 97.5 100 na
History of a company 100 100 97.5 na
Terms and conditions 60 37.5 52.5 ns
Masculinity Awards 85 82.5 90 ns
Financial information 65 95 97.5 2 = 21.519
a
Product advertisement 92.5 72.5 77.5 ns
Clear gender role 2.5 0 0 na
Rank and prestige and
use of superlatives 95 100 95 na

Mun Ga Choi 73
73 Chapter 3: Study One
Online business 52.5 30 72.5
2 = 14.483
a
a industry sectors differed significantly at p ≤.001
b industry sectors differed significantly at p <.05
ns: not significant at p <.05. na: not statistically valid
New Zealand, as shown in Table 15, had industry differences in six Web features with
messages of leaders and online business features the most noticeable features.
Table 15: Web features on corporate homepages by industry sectors in New Zealand
Cultural
dimensions Web site features
Industry
Chi-Square
Non-
durable
(n=40)
Durable
(n=40)
Service
(n=40)
Frequency (%)
Power
distance
Hierarchy information 52.5 50 65 ns
Messages of leaders 50 75 82.5 2 = 10.863
b
Vision statement 80 95 100 na
Collectivism Community relations 47.5 32.5 57.5 ns
Newsletter 82.5 87.5 82.5 ns
Links to local Web
sites 47.5 55 42.5 ns
Loyalty program 27.5 5 15 2 = 7.629
b
National identity 7.5 7.5 5 na
Sharing experience 7.5 25 20 ns
Individualism Search engine 45 45 62.5 ns
Personalisation 42.5 22.5 52.5 2 = 7.834
b
Good privacy
statement 52.5 35 50 ns
Product uniqueness 57.5 72.5 65 ns
Employment
opportunities 75 60 57.5 ns
Uncertainty
avoidance
Customer service 67.5 77.5 82.5 ns
Index/directory 97.5 97.5 100 na
History of a company 60 57.5 45 ns
Terms and conditions 67.5 42.5 62.5 ns

Mun Ga Choi 74
74 Chapter 3: Study One
Masculinity Awards 20 32.5 2.5 2 = 12.134
b
Financial information 75 62.5 72.5 ns
Product advertisement 52.5 25 27.5 2 = 8.132
b
Clear gender role 0 0 0 na
Rank and prestige and
use of superlatives 90 97.5 100 ns
Online business 32.5 5 30
2 = 10.609
b
a industry sectors differed significantly at p ≤.001
b industry sectors differed significantly at p <.05
ns: not significant at p <.05. na: not statistically valid
The overall scores for each of the five cultural dimensions by the three industry groups
are presented in Table 16 for South Korea. To obtain the location of group difference, a
post hoc comparison using Turkey‟s test was performed.
Table 16: ANOVA Results for cultural dimensions in South Korea
Hypothesis:
Dimension
Industry
F-Value Post-hoc results Non-durable
(ND)
Durable
(D)
Service
(S)
Frequency (%)
Power distance 68 85 83 8.917a D>S;ND
Collectivism 53 40 56 10.816 a S;ND>D
Individualism 82 64 75 6.158b ND;S>S;D
Uncertainty
avoidance
88 81 87 2.817
Masculinity 68 70 72 0.639 a F-value is significant at p <.001 level
b F-value is significant at p <.05 level
Compared to South Korean corporate Web sites, New Zealand sites did not display
group differences in cultural dimensions, except in the power distance dimension, as
shown in Table 17.

Mun Ga Choi 75
75 Chapter 3: Study One
Table 17: ANOVA Results for cultural dimensions in New Zealand
Hypothesis:
Dimension
Industry
F-Value Post-hoc results Non-durable
(ND)
Durable
(D)
Service
(S)
Frequency (%)
Power distance 61 73 83 5.076b S;D>D;ND
Collectivism 37 35 37 0.089
Individualism 55 47 58 1.453
Uncertainty
avoidance
73 69 73 0.437
Masculinity 48 44 41 2.001 b F-value is significant at p <.05 level
3.7 Conclusion
Study One used content analysis and descriptive study for discovering whether there
were cultural differences in the use of main visuals and Web features of corporate sites
between New Zealand and South Korea. A total of 120 company Web sites were viewed
for each country. Multimedia usage like animated illustration and moving visuals on
corporate homepages had the most noticeable difference between the two countries in
the findings. Moreover, the most prominent difference of Web features between the two
was found in individualism and masculinity dimensions which were typically
considered as cultural characteristics of Web sites from Western countries. However,
high individualist and high masculine Web features were more portrayed by South
Korean corporate Web sites, along with high collectivist and high uncertainty avoidance
features. For further understanding, industrial difference was explored. Compared to
New Zealand, South Korean corporate Web sites displayed clear industrial differences
in Web features in that the sites for service and non-durable sectors included more
features of low power distance, high individualism, and high collectivism dimensions.

Mun Ga Choi 76
76 Chapter 4: Study Two
Chapter 4: Study Two
4.1 Introduction
Study Two was to examine whether there were differences and similarities in Web users‟
perceptions on culturally different Web sites and to testify whether these perceptions
were different between three cultural groups. The perceptions, considered as predictors
of effectiveness of a Web site, were measured through user attitudes and future
intentions toward them. Culturally congruent or incongruent sites were designed in
accordance with cultural categories and indicators derived from the literature. Study
Two employed an online questionnaire to ask three cultural groups - New Zealand
university students, South Korean university students, and Korean bilingual university
students - about their cultural values and their perceptions towards Web sites.
One-Way ANOVA (Analysis of variance) and Two-Way ANOVA were used to perform
an analysis of group differences in the means of independent variables, for example,
four levels of Web sites and the three levels of ethnic groups in this study. If a statistical
difference was found, a post-hoc test was applied to find where the group differences
occurred. However, the researcher did not look at the post-hoc tests if no significant
main effect of an independent variable on a dependent variable was found.
4.2 Hypotheses
Advertisers have spent a considerable amount of money to persuade consumers to
perceive their products and companies more favourably and to convert consumers into
“ideal customers” through advertising (Singh & Dalal, 1999). An ideal customer is
defined as one who not only holds a favourable attitude toward a company and its
products but also buys those products on a regular basis and spreads positive word-of-

Mun Ga Choi 77
77 Chapter 4: Study Two
mouth advertising. If Web sites are considered as another channel of advertising, it is
obvious to extend this concept of advertising to the context of Web sites. The
fundamental objective of a corporate Web presence is to establish a positive corporate
identity in cyberspace and to conduct business with customers and business partners
over the Internet. The objective depends, among other things, on whether the Web sites
create a positive impression with users after their initial interaction. When ideal Web
users hold positive, favourable beliefs and attitude toward a company‟s Web site, they
will frequently visit it and buy its products.
Luna et al. (2002) applied the evaluation scale proposed by Chen and Wells (1999) in
their study. According to Chen and Wells (1999), “attitude toward the Web site”
parallels “attitude toward the advertisement (AD)” in evaluating effectiveness. Previous
research on attitude toward the AD - a predisposition to respond in a favourable or
unfavourable manner to a particular advertising stimulus during a particular exposure
situation - were well sponsored and viewed as the best single predictor of effectiveness
(Aaker & Stayman, 1990). Therefore, in this study, attitude toward the Web site, users‟
predispositions to responding favourably or unfavourably to it, is considered to be the
most suitable concept to use in studying the effectiveness of Web sites with different
cultural content characteristics, irrespective of their informative and technological
effectiveness. Therefore, we hypothesise as follows;
H13: Web users are likely to have more favourable attitudes toward a culturally
congruent (+) Web site than a culturally incongruent (-) Web site.
As with advertisements, attitude toward a Web site depends predominantly on a user‟s
first impression of it, especially when the same technical functionality of a Web site,
advertising, is provided. Generally speaking, graphics draw more attention from Web

Mun Ga Choi 78
78 Chapter 4: Study Two
users than verbals or text. A graphic is worth a thousand words, especially since the
average visit duration of a company‟s Web site is very short at 6.8 seconds (Conger &
Mason, 1998). Theoretically, under the circumstances of this research, participants are
considered as Web surfers since they are requested to just visit a Web site. Unlike Web
searchers who are goal oriented, looking for specific information, Web surfers are likely
to visit a Web site, linger for a brief period, and leave. Since their involvement is low,
the emotional tone of the message, the use of graphics and colours, and the setting of a
Home page are more related to their perceptions of a Web site (Singh & Dalal, 1999).
Therefore, we hypothesise as follows;
H14: Web users are likely to have more favourable attitudes toward a Web site with
culturally congruent (+) graphics and culturally incongruent (-) text than one
with culturally incongruent (-) graphics and culturally congruent (-) text.
Regardless of a Web site‟s content, a strong bond can be created between users and the
site if the Web sites are designed in the users‟ native language (Luna et al., 2002).
Therefore:
H15: Web users are likely to have a more favourable attitude toward a Web site
designed in their first language.
Furthermore, although some Web sites have the objective of information dissemination
or relationship-building with partners, more and more companies exploit their Web sites
commercially. In a Web environment, satisfaction is related to “stickiness” which refers
to “the sum of all the Web site qualities that induce visitors to remain at the Web site
rather than move to another site” (Holland & Baker, 2001). The characteristics of Web
sites are crucial for users to come back to the sites in the future and to shop at these Web
Mun Ga Choi 79
79 Chapter 4: Study Two
sites. When it comes to e-commerce or electronic transactions, a Web user‟s attitude is
especially important since purchase intentions resulting from on-line visits are found to
improve as attitude toward the Web site improves (Stevenson, Bruner, & Kumar, 2000).
A Web user‟s favourable attitude toward a Web site might not be directly linked to overt
purchasing behaviour. In this study, Web users‟ future intentions are measured as the
immediate determinant of a particular behaviour. The intentions are powerful predictors
of actual purchase (Hsiao, Sun, & Morwitz, 2002). The model in this study applies to
international companies who want to enhance Web users‟ associations and future
intentions to visit the sites again and make transactions.
Therefore:
H16: Web users are likely to have more favourable future intentions toward a
culturally congruent (+) Web site than a culturally incongruent (-) Web site.
4.3 Creating four culturally manipulated Web sites
For the independent variable of cultural characteristics of Web sites, 2 (high or low
culturally congruent text) X 2 (high or low culturally congruent graphics) Web sites
were designed in English; thus four versions of virtual Web sites (Web sites of a
fictitious electronic appliance company) were prepared for different groups or
conditions of the Web sites. The text and graphics accounted for either Cluster A-
specific or Cluster B-specific. The Cluster A-specific contents of the Web site included
the values of high power distance, collectivism, femininity, and high uncertainty
avoidance. The Cluster B-specific contents of the Web site contained the values of low
power distance, individualism, masculinity, and low uncertainty avoidance.
In detail, the main graphic of the Cluster A-specific Web site included a family theme; a

Mun Ga Choi 80
80 Chapter 4: Study Two
family was having a good time outside. No direct product portrayal and information
were included in the graphic. The main tagline was simple, “The products save you time
and energy for your family.” Conversely, the main graphic of the Cluster B-specific
Web site reflected an individual; one man was cooking with joy (actually using a
product). The main tagline emphasised an individual‟s joy and excitement and the
company‟s competitiveness using the superlative, “The fastest growing home appliance
company in the world” and “The company‟s competitiveness offers you the products
that generate joy and excitement.”
There has not been clear verification or agreement between researchers on which Web
site indicators and categories are clearly associated with which Hofstede‟s dimension.
Therefore, the divisions of Cluster A and Cluster B were considered significant since all
the cultural dimensions for Cluster A or for Cluster B were statistically associated with
each other in accordance with Hofstede‟s study. For instance, Hofstede (2001) observed
a strong correlation between individualism versus collectivism against power distance.
Many countries that indicated large power distance cultures scored low on the
individualism index. The two dimensions tended to be negatively correlated (r=-.70)
(Hofstede, 2001; Zahedi et al., 2001). Also, Hofstede‟s dimensions were strongly related
to those of Hall. High individualism was very often connected to low-context
communication, whereas low individualism was very often connected to high-context
communication (Hermeking, 2005).
Although four versions of the virtual Web sites were designed by applying different
combinations of text and graphics, the structures and outlines of the Web sites were
exactly the same. The study was tested in three different cultural contexts; four Web
sites were tested by Korean university students in South Korea, New Zealand university
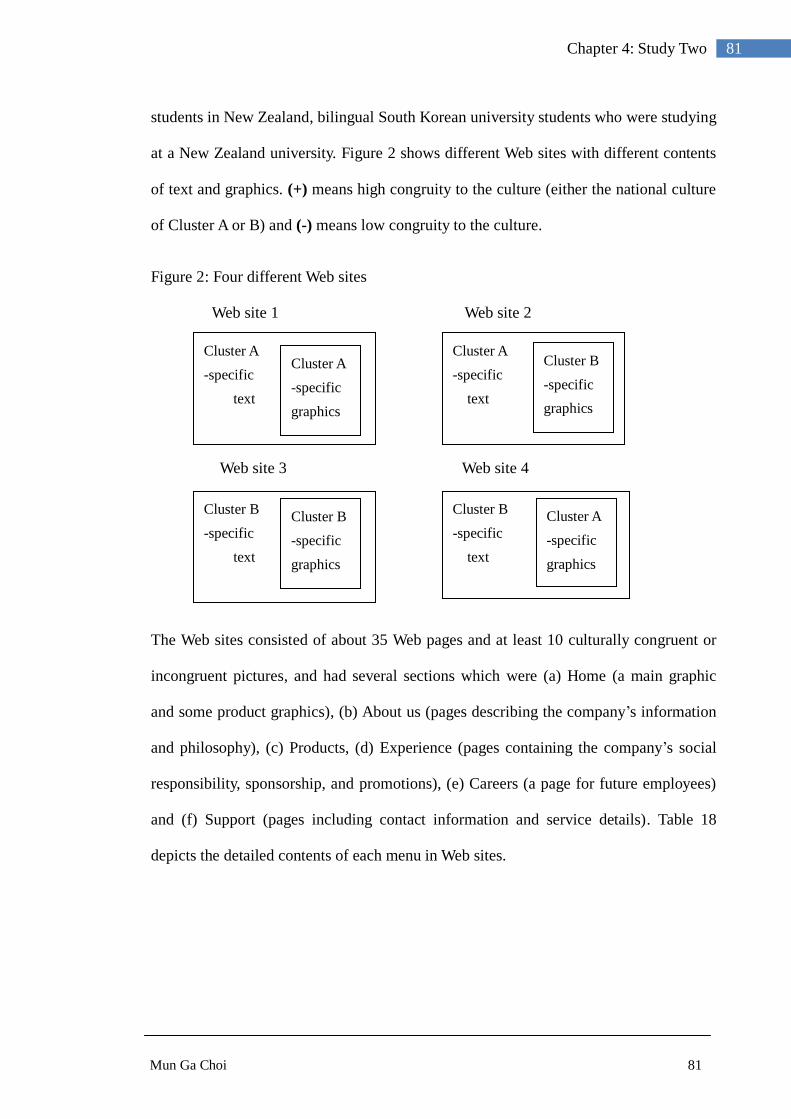
Mun Ga Choi 81
81 Chapter 4: Study Two
students in New Zealand, bilingual South Korean university students who were studying
at a New Zealand university. Figure 2 shows different Web sites with different contents
of text and graphics. (+) means high congruity to the culture (either the national culture
of Cluster A or B) and (-) means low congruity to the culture.
Figure 2: Four different Web sites
The Web sites consisted of about 35 Web pages and at least 10 culturally congruent or
incongruent pictures, and had several sections which were (a) Home (a main graphic
and some product graphics), (b) About us (pages describing the company‟s information
and philosophy), (c) Products, (d) Experience (pages containing the company‟s social
responsibility, sponsorship, and promotions), (e) Careers (a page for future employees)
and (f) Support (pages including contact information and service details). Table 18
depicts the detailed contents of each menu in Web sites.
Web site 1 Web site 2
Web site 3 Web site 4
Cluster A
-specific
text
Cluster B
-specific
graphics
Cluster A
-specific
text
Cluster A
-specific
graphics
Cluster B
-specific
text
Cluster B
-specific
graphics
Cluster B
-specific
text
Cluster A
-specific
graphics
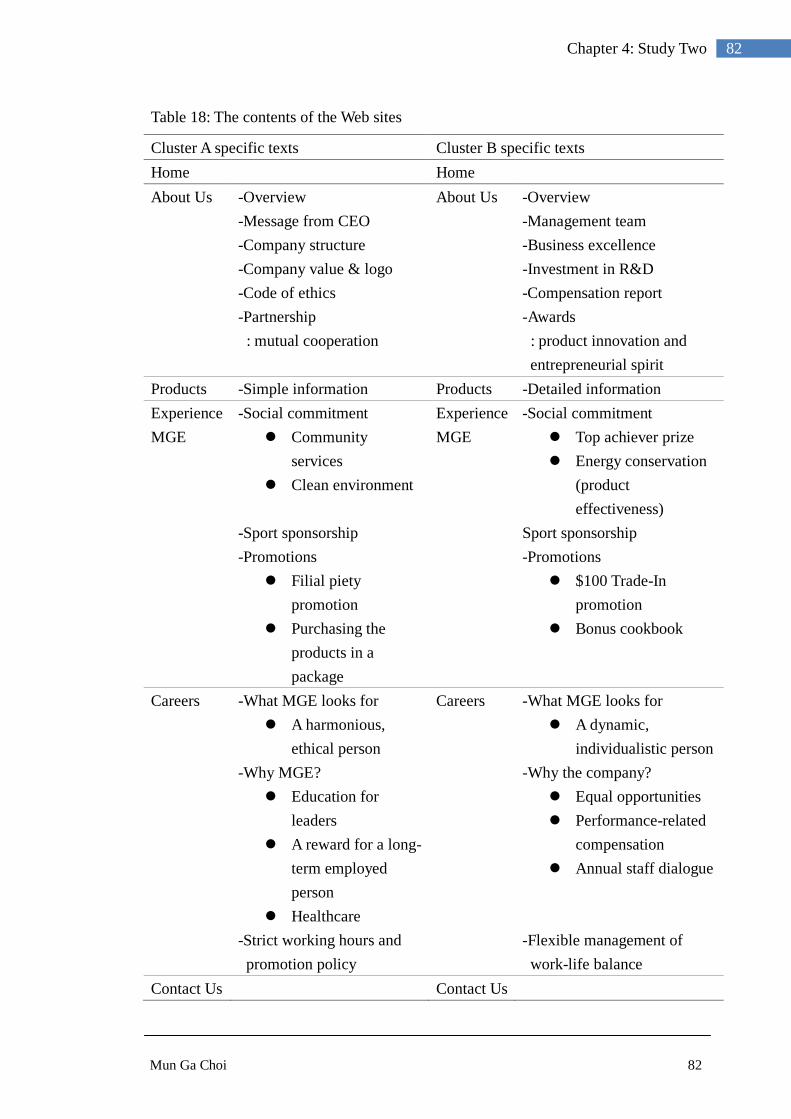
Mun Ga Choi 82
82 Chapter 4: Study Two
Table 18: The contents of the Web sites
Cluster A specific texts Cluster B specific texts
Home Home
About Us -Overview About Us -Overview
-Message from CEO -Management team
-Company structure -Business excellence
-Company value & logo -Investment in R&D
-Code of ethics -Compensation report
-Partnership
: mutual cooperation
-Awards
: product innovation and
entrepreneurial spirit
Products -Simple information Products -Detailed information
Experience
MGE
-Social commitment
Community
services
Clean environment
Experience
MGE
-Social commitment
Top achiever prize
Energy conservation
(product
effectiveness)
-Sport sponsorship Sport sponsorship
-Promotions
Filial piety
promotion
Purchasing the
products in a
package
-Promotions
$100 Trade-In
promotion
Bonus cookbook
Careers -What MGE looks for
A harmonious,
ethical person
Careers -What MGE looks for
A dynamic,
individualistic person
-Why MGE?
Education for
leaders
A reward for a long-
term employed
person
Healthcare
-Why the company?
Equal opportunities
Performance-related
compensation
Annual staff dialogue
-Strict working hours and
promotion policy
-Flexible management of
work-life balance
Contact Us Contact Us

Mun Ga Choi 83
83 Chapter 4: Study Two
4.4 Consideration of creating the Web sites
The Web sites were modelled on typical electronic appliance companies‟ Web sites.
There were three main reasons why Web sites of a fictitious electronic appliance
company were created for this study. First, according to the research by Han and Shavitt
(1994), cross-cultural differences in advertising emerging for shared products like
washer, dryer, and home furnishings, were greater than for personal products like
cosmetics and fashion apparel. Shared products were more likely to be promoted
differently in different countries while personal products offer predominantly personal
or individually experienced benefits. Secondly, Web sites for a fictitious company
prevented users from having positive or negative previous feelings for existing
companies or products. Cyr et al. (2005) identified that “vendor familiarity”, built by
experience of purchasing from a vendor, the popularity of that vendor‟s name, and the
vendor‟s reputation, was an important factor influencing their participants‟ trust in
online purchasing. These feelings of a vendor or its product could have significant
effects on attitudes toward the company‟s Web site. It is also acknowledged by Winter et
al. (2003) that they selected target Web sites of companies that were not well known
since they wanted to measure participants‟ impressions based just on their immediate
observation of the Web sites, not on their previous experience.
Thirdly, the segment of B2C retail Web sites was growing by 100 % per year in certain
areas (N. Singh, Kumar et al., 2005). B2Cs are more suitable for measuring users‟
perceptions since their Web sites usually have direct relationships with end consumers.
Unlike B2B Web sites that are more globalised, B2C sites are relatively unaffected by
globalisation due to the heterogeneity of consumers and different national regulatory
systems (Kraemer, Gibbs, & Dedrick, 2005).

Mun Ga Choi 84
84 Chapter 4: Study Two
Another consideration for creating Web sites for this research was that many recently
made Web sites were abandoned due to slow loading by the latest multimedia tools like
animation and video. Research has estimated that more than US$4 billion in revenue
had been lost due to slow downloads in US e-commerce (Weinberg, 2000). Protracted
loading time of a homepage makes Web users switch attention to competitors‟ sites and
leave if the waiting time becomes intolerable. Therefore, the Web sites for this study
were designed to be as simple as possible even for participants who connect the Internet
via modem (the maximum theoretical speed for a 33.6 Kbps modem is just 56 Kbps).
According to Statistics New Zealand, the number of broadband subscribers in New
Zealand was fast growing but still below 15% in the year ended September, 2006
(Welch, 2007). The optimum load time for one Web page is recommended to be only
one second, but Web users might tolerate load times of 15 seconds for one Web page at
maximum (Swanson, 2007). In order to load within 15 seconds over a typical modem
connection, one Web page's total size should be less than 30KB. Therefore, the size of
one Web page of the Web sites designed for this study was kept strictly below 20KB.
The four Web sites were uploaded to the server of a Web site hosting company that
provided some spaces in its server and URL addresses. The addresses the hosting
company provided helped to hide the origin of a company as the addresses of the Web
sites did not include a national tag like kr (South Korea) and nz (New Zealand) at the
end of the URL addresses. The URL address for Web site 1 was http://www.mge1.zc.bz
(Korean-specific text and graphics); Web site 2 was http://www.mge2.zc.bz (Korean
specific-text and New Zealand specific-graphics); Web site 3 was
http://www.mge3.zc.bz (New Zealand specific-text and New Zealand specific-graphics);
and Web site 4 was http://www.mge4.zc.bz (New Zealand specific-text and Korean-
specific graphics). The four Web sites were viewed on the Internet from 10th
January to
Mun Ga Choi 85
85 Chapter 4: Study Two
25th
of April, 2007.
4.5 Participants
South Korean university students, New Zealand university students, and South Korean
international students in New Zealand (bilinguals) were asked to participate in this study.
They received no remuneration. For Korean-English bilinguals, South Korean
international students who had been in New Zealand for more than two years were
asked to participate for the survey. This group was included as a reflection of
acculturation or the idea of multiculturalism. The South Korean students spoke fluent
English since New Zealand universities require a minimum overall band of 6.0 for the
International English Language Testing System (IELTS) from international students
who speak English as their second language. The IELTS describes people with an
overall band of 6.0 as being able to use and understand fairly complex English (IELTS,
2004). For this reason, a measurement of English proficiency of the bilinguals in this
study was not necessarily required.
This research followed the strategy of matched samples (Hofstede, 1991). This means
that rather than trying to draw representative samples from the populations of the
countries studied, this research decided to study well-defined and homogeneous samples
which differ in nationality but are alike in as many respects as possible (Fam & Grohs,
2007; Orth et al., 2007). This is supported by extant cross-cultural research. Cultural
groups to be compared should be made as similar as possible in their demographic
characteristics, otherwise it may difficult to conclude whether differences in the results
are due to cultural or other differences. Also, the use of a homogenous population of
subjects may be more effective in examining relationships between variables than the
use of a more heterogeneous group in experimental research (Muehling, 1987, cited in

Mun Ga Choi 86
86 Chapter 4: Study Two
Ko et al., 2006). Therefore, business students from different cultures are often used in
cross-cultural studies. For this study, there was one more reason to use students as
participants. The primary objective of this study is to understand how individuals
identify cultural aspects in the Websites and the results do not need to be grounded in
high level job-related knowledge.
4.6 Method
Experimental research is the best way to learn the opinions or attitudes of the mass of
people. However, it is conducted in realistic settings rather than in a laboratory or
screening room under artificial conditions and is not constrained by geographic
boundaries (Wimmer & Dominick, 2006). Therefore, it was well suited to Study Two in
this research that needed to measure the attitudes and future intentions of Web users
from three different ethnic groups in a realistic setting. The online questionnaire was
composed of 32 questions - 28 closed-ended and 4 open-ended questions. They were
written very simply to draw the highest response rate. The questionnaire consisted of
three main parts: participants‟ attitudes and future intentions toward the Web sites;
participants‟ values (Hofstede‟s Value Survey Module), and demographic information.
In detail, the first part of the questionnaire included eight closed-ended items and two
open-ended items for measuring participants‟ attitudes toward the Web sites and their
future intentions. The questions were derived from previous studies of Chen and Wells
(1999) and Chen, Clifford, and Wells (2002). The original instrument was proven for a
high reliability coefficient, over 0.92 in previous research (Chen & Wells, 1999). The
first work by Chen and Wells has been cited 46 times in social science journals and their
second 11 times since 2002. Among Chen and Wells‟ original six evaluative items, one
item - „compared with other Web sites, I would rate this one as (one of the worst-one of
Mun Ga Choi 87
87 Chapter 4: Study Two
the best)‟- was removed. The Web sites made by simple and plain tools only to meet the
purpose of this study cannot be compared with complex Web sites with various sound
and moving visual effects, made by professional Web developers.
Furthermore, two items measuring feeling were added to the original instrument of
Chen and Wells (1999) in order to reinforce affective components since these are a
crucial element of attitude (Teo, Oh, Liu, & Wei, 2003). The attitude toward a Web site
depends predominantly on a Web user‟s first impression of it, and overall feeling toward
the Web site. Therefore, two questions, „my first impression of this Web site is good‟
and „It is hard to put into words, but this Web site leaves me with a good feeling‟ were
added. In addition, one more item for measuring future intention of purchasing products
from the Web site - „If I needed one of these products and this Web site provided online
shopping service, I would consider buying it from this Web site‟ - was added for
reinforcing a future intention construct; thus, two items were prepared to measure Web
users‟ future intentions.
Each item used a 5-point Likert-type format anchored by „strongly disagree (1)‟ and
„strongly agree (5)‟. Two open-ended items asking what particular aspects of the Web
site the participants found most or least appealing were included for capturing further
valuable information. Open-ended questions offer respondents freedom in answering
questions and an opportunity to provide in-depth responses (Wimmer & Dominick,
2006). The two open-ended questions enabled the researcher to gather information
about the respondents‟ feelings and the motives behind their answers to the closed-
ended questions. Also, the responses might suggest possible relationships with other
responses or variables.
In the second part of the survey, in order to measure participants‟ value, they were

Mun Ga Choi 88
88 Chapter 4: Study Two
provided with Hofstede‟s Value Survey Module for Young People 1997 (VSMY 97)
questionnaire which is a revised version of the Value Survey Module 94 (VSM 94) for
young people, like students. Unlike prior studies in which researchers scarcely
measured where the actual respondents of their study fell on the cultural dimensions
(Taylor, 2005), this empirical study actually collected the scores of participants on the
cultural dimensions. Although Hofstede‟s cultural dimensions have been proved to have
validity in replicative studies, it is not useful to rely on prior data since many people
believe that at least some level of cultural convergence is taking place and samples in
this study, in particular, young university students, are different from those of the
original Hofstede study, IBM employees who were considered to be a unique cultural
segment. This process helped the researcher gain a good understanding of the context of
the participants before carrying out an analysis of their perceptions toward the Web sites.
The researcher obtained VSM 94 and VSMY 97 questionnaires by contacting Dr.
Hofstede directly via e-mail correspondences. In the process of confirming whether the
VSM 94 could be used with young students, VSMY 97 was recommended by Dr.
Hofstede. VSM 94 contains 20 questions for Hofstede‟s five cultural dimensions, plus 6
demographic questions covering gender, age, years of formal education, type of
occupation, nationality, and nationality at birth (Hofstede, 2001). Each Hofstede
dimension has four questions. However, this study included only Hofstede‟s four
cultural dimensions so that four questions for long-term orientation were excluded.
Finally, only 16 questions of the original VSMY 97 were used for measuring
participants‟ value in this study. Each item used the same format of a 5-point Likert-type
as the original module. The mean scores on four questions for each dimension were
calculated in accordance with Hofstede‟s index formulas, seen below (Hofstede, 2001,

Mun Ga Choi 89
89 Chapter 4: Study Two
p.494).
Table 19: Hofstede's index formulas
Cultural dimensions Formulas
Power distance PDI = -35m(03) + 35m(06) + 25m(14) – 20m(17) – 20
Uncertainty avoidance UAI = 25m(13) + 20m(16) – 50m(18) – 15m(19) + 120
Individualism IDV = -50m(01) + 30m(02) + 20m(04) – 25m(08) + 130
Masculinity MAS = 60m(05) – 20m(07) + 20m(15) – 70m(20) +100
In these formulas, m(question number) is the mean score for the question. For example,
m(03) is the mean score for question 3. The index normally has a value between 0 and
100, but values below 0 and above 100 are technically possible (Hofstede, 2001). One
assumption to be required to use Hofstede‟s questionnaire is that the minimum number
of respondents per country or region in comparison is 20, otherwise the influence of
single individuals becomes too strong (Hofstede, 2005).
The last part of the questionnaire, „About yourself‟, had five questions. Participants
were instructed to answer questions in regard to their demographic backgrounds such as
age, gender and the ethnic group to which they belonged. Additional two questions
captured participants‟ Internet experience like their average time spent online per day
and their skills using the Web.
The two language versions of questionnaires were prepared for New Zealand
participants (English version), South Korean university students in South Korea
(Korean version), and South Korean university students in New Zealand (English
version). The Korean version of Hofstede‟s Value Survey Module 97 (VSMY 97)
questionnaire was obtained from Hofstede, and had been translated by a team from
Seoul National University. Except for Hofstede‟s Value Survey Module, translation

Mun Ga Choi 90
90 Chapter 4: Study Two
procedures followed the standard of cross-cultural and international research. First, a
native speaker of Korean translated the invitation letter and the questionnaire into
Korean and the translation was then back-translated into English by another translator.
Finally, the translated letter and questionnaire and the English version were reviewed by
the researcher and other scholars who spoke both Korean and English to affirm the
consistency between both versions. The two sets of questionnaires (English and Korean
version) are provided in Appendix 4 and Appendix 5.
4.7 Data collection
Three groups of participants (New Zealand students, South Korean students, and
bilingual South Korean students) were organised for different samples from different
cultures in this survey. Each group has four sub-groups and each sub-group was directed
to view one of the four different Web sites. Every participant was exposed to only one
Web site because there was possibly “multiple-treatment interference” or “accumulated
learner advantage” (Faiola & Matei, 2005, Methods section, para. 6). The multiple-
treatment interference can be explained that if participants were exposed to several
similar sites, their performance could be affected by the experience gained from their
exposure to the first site. There have been some studies where participants were
assigned to view Web sites and fill in the questionnaire for every Web site they had seen.
In those cases, Web sites represented different companies, sometimes from different
countries. However, the four Web sites made for this study depicted one fictitious
company with different contents, but the same structures and outlines.
For this research, a one-page invitation letter including brief instruction and one of the
four Web sites‟ addresses was handed around to participants who were asked to type the
address (URL) into a browser, spend some time on browsing the Web site, and click the

Mun Ga Choi 91
91 Chapter 4: Study Two
survey button located on the left corner on every page on the Web site. They then were
forwarded to the online questionnaire via a hypertext link. At the head of the
questionnaire, participants were able to see the introduction including the confidentiality
of their participation and their rights as participants. Upon completion, the participants
were asked to click the submit button at the end of the questionnaire. A Web page
displaying „thank you for your participation‟ followed as a confirmation. The data of
participants‟ responses were transferred and stored in a remote server for analysis.
This method was subject to the willingness of participants to visit the Web sites and fill
in the questionnaire, in order to avoid the disadvantages caused by laboratory
experiments in which there are possible unnatural behaviours of respondents and
possible influences by peers. As in real life, the participants could browse the Web sites
as long as they wished.
4.8 Pilot test
Although the questionnaire was based on previous studies, a small-scaled pilot test was
required since the theoretical and conceptual framework of the study was elaborated by
the researcher and the questionnaire was used with different cultural groups in prior
studies. The critical purpose of the pilot test was to ensure that no ambiguities resided
within the questions and to check technical issues before a large-scaled real data
collection. In the process of completing an online questionnaire, the data of participants‟
answers should be transferred and stored in a remote server without problems. The
feedback from the pilot test was used for modifications and improvement of the method.
For the pilot test, seven Chinese and five New Zealand business students at Massey
University participated. The requesting process of the pilot test was conducted exactly
the same as that for actual data collection except for Web sites 1 and 3, the sites with the

Mun Ga Choi 92
92 Chapter 4: Study Two
most opposite conditions, which were required to be viewed by the students. After the
pilot test, no changes were made to the wording of the questions, but the 5-point Likert-
type format was considered to be a lack of variance since participants chose the two
highest positive values; therefore, it was changed to a 7-point Likert-type for detecting
more sensitive change.
As a prerequisite for the validity of a test, the reliability of a measuring instrument
should be determined. In this study, Cronbach‟s Alpha was used to examine the internal
consistency of the test. Cronbach‟s Alpha of measuring attitude toward the Web site was
0.763, which indicated high overall internal consistency among the six items
representing attitude toward a Web site, following Nunally‟s criteria of 0.7. Also,
Cronbach‟s Alpha of measuring future intention was 0.741 which indicated high internal
consistency among the two items. Furthermore, one participant gave a feedback
throughout the comment section in which “the website was clear, easy to read and
navigate and there was not an overload of information on each page. Overall, it was a
pleasant experience.” Neither technical problems nor manipulation failures occurred
during the pilot study.
Table 20 shows the results of the pilot test showing the participants‟ scores of
Hofstede‟s cultural dimensions and the average scores of participants‟ attitudes and
future intentions toward Web site 1 and Web site 3. Chinese students, compared to New
Zealand students, have less power distance and more collectivist, feminine, and
uncertainty avoidance values. However, the results did not have methodological validity
since Hofstede suggested that the minimum number of respondents per country to be
included should be 20 to avoid the influence of single individuals. In this pilot test, the
main purpose is to pre-test general correctness in the questionnaire and to prevent
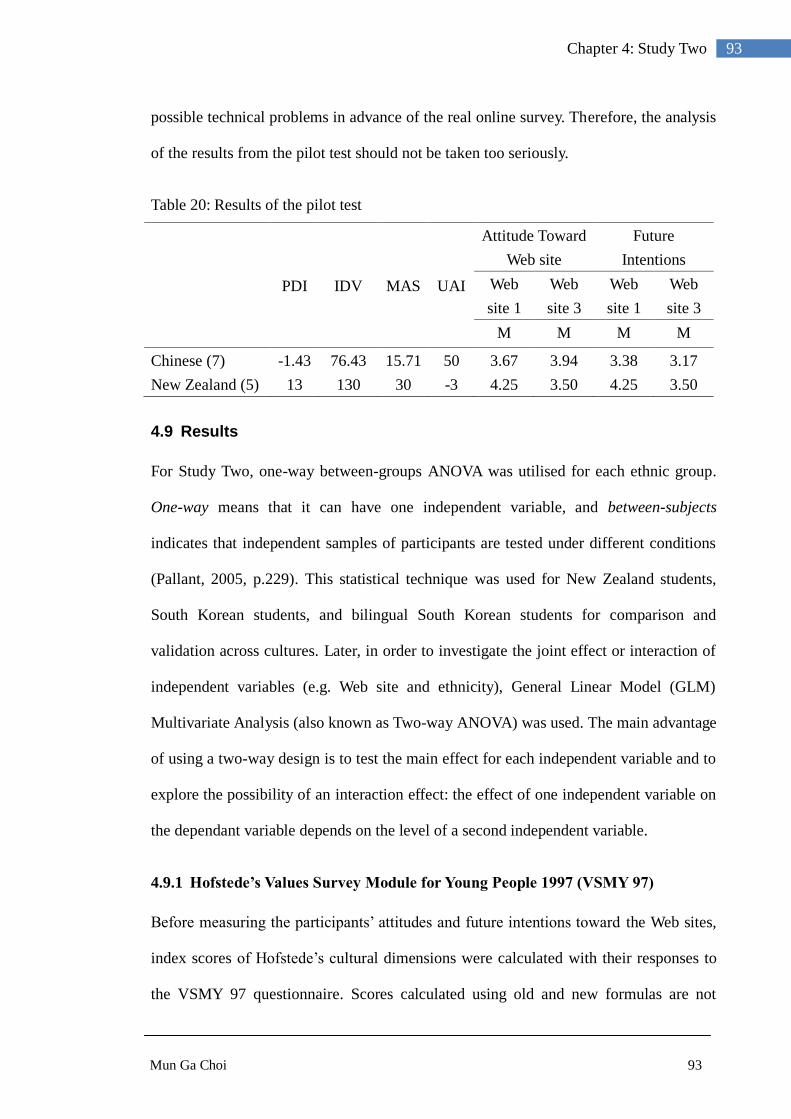
Mun Ga Choi 93
93 Chapter 4: Study Two
possible technical problems in advance of the real online survey. Therefore, the analysis
of the results from the pilot test should not be taken too seriously.
Table 20: Results of the pilot test
PDI IDV MAS UAI
Attitude Toward
Web site
Future
Intentions
Web
site 1
Web
site 3
Web
site 1
Web
site 3
M M M M
Chinese (7) -1.43 76.43 15.71 50 3.67 3.94 3.38 3.17
New Zealand (5) 13 130 30 -3 4.25 3.50 4.25 3.50
4.9 Results
For Study Two, one-way between-groups ANOVA was utilised for each ethnic group.
One-way means that it can have one independent variable, and between-subjects
indicates that independent samples of participants are tested under different conditions
(Pallant, 2005, p.229). This statistical technique was used for New Zealand students,
South Korean students, and bilingual South Korean students for comparison and
validation across cultures. Later, in order to investigate the joint effect or interaction of
independent variables (e.g. Web site and ethnicity), General Linear Model (GLM)
Multivariate Analysis (also known as Two-way ANOVA) was used. The main advantage
of using a two-way design is to test the main effect for each independent variable and to
explore the possibility of an interaction effect: the effect of one independent variable on
the dependant variable depends on the level of a second independent variable.
4.9.1 Hofstede’s Values Survey Module for Young People 1997 (VSMY 97)
Before measuring the participants‟ attitudes and future intentions toward the Web sites,
index scores of Hofstede‟s cultural dimensions were calculated with their responses to
the VSMY 97 questionnaire. Scores calculated using old and new formulas are not

Mun Ga Choi 94
94 Chapter 4: Study Two
necessarily the same; however, the old and new formulas should produce approximately
the same score difference between countries (Hofstede, 2005). Table 21 below shows
Hofstede‟s original index scores calculated by the old formula that South Korea and
New Zealand belonged to relatively opposite cultural groups based on four cultural
dimensions and the last column indicates the score difference between two countries.
The score difference on the individualism dimension is relatively large, 61, followed by
the difference of the power distance dimension of -38.
Table 21 : Hofstede's original index scoresb for NZ and KOR
Dimensiona New Zealand South Korea Score difference
Power distance (PDI) 22 60 -38
Individualism (IDV) 79 18 61
Masculinity (MAS) 58 39 19
Uncertainty avoidance (UAI) 49 85 -36
a The higher the index value the more they reflect this dimension trait.
b The index normally has a value between 0 and 100, but values below 0 and above 100 are
technically possible.
However, the index scores calculated by the responses of the participants to VSMY97
for this research showed different, unexpected results. The index scores, shown in Table
22, were calculated using the new formula, shown in Table 19 (see section 4.6). New
Zealand students were higher individualistic (99) and feminine (1) than both Korean
university students in Korea and in New Zealand while they showed higher power
distance and uncertainty avoidance values than Korean university students in South
Korea. On power distance and uncertainty avoidance dimensions, the scores of Korean
university students studying in New Zealand were closer to those of New Zealand
university students than Korean university students in South Korea. Overall, the results
indicated that Korean university students, whether they lived in South Korea or were
studying in New Zealand, were not as collectivist as the original scores showed,

Mun Ga Choi 95
95 Chapter 4: Study Two
although the scores were lower than those of New Zealand university students on
individualism dimension. The difference was a matter of degree rather than bipolar and
dichotomous as predicted. Korean university students in South Korea showed almost
opposite values to the original scores measured by Hofstede about 30 years ago.
Table 22 : Results of index scoresb gained from the participants in this research
Dimensiona
New Zealand
university students
Korean university
students in Korea
Korean university
students in New
Zealand
Power distance 0 -11 26
Individualism 99 77 85
Masculinity 1 21 19
Uncertainty
Avoidance 18 6 41
a The higher the index value the more they reflect this dimension trait.
b The index normally has a value between 0 and 100, but values below 0 and above 100 are
technically possible.
4.9.2 Demographic information of three ethnic groups
For ethnic group 1, 67 Korean university students at Gyeongsang National University in
South Korea participated in Study Two. After viewing one of the four Web sites
designed in English, they were asked to complete the Korean version of the online
questionnaire. Among 67 Korean undergraduate university students who completed the
questionnaires, 58 useful questionnaires were transferred and stored in a remote server.
As shown in Table 38 (see Appendix 3), the majority of Korean university students in
South Korea spent one to three hours on the Internet per day (46.6%) and 24.1% spent
more than four hours. Korean students considered themselves moderately skilled at
using the Internet (M=3.62).
The sample for the second ethnic group was composed of 63 New Zealand university

Mun Ga Choi 96
96 Chapter 4: Study Two
students (male = 38.1%, female = 61.9%) enrolled at Massey University, Palmerston
North. Like the first group, invitation letters were spread around the campus. The online
questionnaire was the English version and all the responses were stored in the server.
Table 39 (see Appendix 3) depicts the demographic statistics of ethnic group 2.
Compared to the Korean university students in South Korea, a higher proportion of New
Zealand university students spent one to three hours on the Internet per day (68.3%)
whereas far fewer students spent more than four hours (4.8%). New Zealand students
considered themselves moderately skilled at using the Internet (M=3.70) which was
very similar to Korean participants in South Korea (M=3.62).
Ethnic group 3 represented Korean university students who were studying in New
Zealand. The 53 Korean university students (17 male and 36 female), studying at
Massey University, completed the online survey. They viewed the English version of the
online questionnaire. The majority of this group spent one to three hours (62.3%) and
more than four hours (18.9%) respectively on the Internet a day. The participants
considered themselves moderately skilled at using the Internet (M=3.30), but the
average was lower than Korean university students in South Korea (M=3.62) and New
Zealand university students (M=3.70).
Comparing the demographic statistics of the three ethnic groups, the first group of
Korean university students in South Korea indicated a higher mean age (M=4.09),
compared to the second group (M=2.90) and the third group (M=3.51). The large
variance is explained by the different way that Koreans count people‟s ages from the
Western system. Babies are already one year old when they are born, not zero. Also,
everyone becomes one year older on the first day of a new year at the same time. With
those differences, Westerners usually age one or two year more when counted in the

Mun Ga Choi 97
97 Chapter 4: Study Two
Korean way.
Another difference was that a lower proportion of Korean university students in South
Korea spent one to three hours on the Internet per day (46.6%) than New Zealand
students (68.3%) and Korean students studying in New Zealand (62.3%). However,
there was a big difference between Korean students in Korea and New Zealand students
who spent more than four hours on the Internet a day, 24.1% and 4.8% respectively.
Korean students studying in New Zealand (18.9%) fell between the other two groups.
This indicated that Korean students were the heaviest Internet users. The participants
displayed similar mean scores for the question asking how skilful they considered
themselves at using the Internet: 3.62 for Korean university students in South Korea,
3.70 for New Zealand university students, and 3.30 for Korean students in New Zealand.
The heavier the Internet users might be, the less skilful they felt about themselves.
4.9.3 Ethnic group 1 – Korean university students
One-Way AVONA results
The items measuring attitude toward a Web site (Cronbach Alpha was 0.90, 0.87, 0.79,
0.89 for Web site 1, Web site 2, Web site 3, Web site 4 respectively) and future intention
(Cronbach Alpha was 0.93, 0.94, 0.94, 0.80 for Web site 1, 2, 3, 4 respectively) were
very reliable. In order to investigate hypotheses H13, H14 and H16, ANOVA was
conducted to explore the impact of a Web site‟s cultural aspects on levels of
favourability, measured by users‟ attitudes toward Web sites and their future intentions.
Table 23 summarises the results of ANOVA. There was a statistically significant
difference at the p<.05 level in attitude toward Web site (F(3,54) = 3.71, p<.05) and
future intention (F(3,54) = 2.96, p<.05). In spite of statistical significance, the actual

Mun Ga Choi 98
98 Chapter 4: Study Two
difference in mean scores between the Web sites was quite small.
Table 23 : ANOVA results for Korean university students in South Korea
Web site 1a
n=13
Web site 2b
n=17
Web site 3c
n=13
Web site 4d
n=15 F e
Group comparisons f
M SD M SD M SD M SD
Attitude
toward
Web site
3.88 1.01 4.64 0.73 4.79 0.56 4.11 0.96 3.71*
Web site 3 >Web site 2
> Web site 4> Web site
1
Future
intention 4.08 1.26 4.77 1.13 4.93 1.1 3.94 0.98 2.96*
Web site 3 >Web site 2
> Web site 1> Web site
4
a Web site 1= Cluster A (Korean) specific graphics & texts
b Web site 2=Cluster B (New Zealand) specific graphics & Cluster A (Korea) specific texts
c Web site 3=Cluster B (New Zealand) specific graphics & texts
d Web site 4=Cluster A (Korean) specific graphics & Cluster B (New Zealand) specific texts
e F(3, 54) = 3.71* and 2.96* are significant at p <.05 level
f Group comparisons based on the means
Post-hoc tests
Although the highly significant F-ratio (p <.05) indicated that the means of four
independent variable levels (Web site1, 2, 3, and 4) differed significantly, we wanted to
know where the difference occurred. To investigate the location of this difference, we
needed to conduct post tests. SPSS provided these post-hoc tests as part of the ANOVA
output. Post-hoc comparisons using the Turkey HSD were used for this study. As shown
in Table 24, the mean score of attitude toward Web site 1 was significantly different
from the mean score of attitude toward Web site 3 at the 0.05 level of significance.
Attitudes toward Web site 2 and Web site 4 did not differ significantly from Web site 1
and Web site 3. Any means that were underscored by the same column were not
significantly different from each other. However, although the results of ANOVA
showed that there was an overall difference in future intention toward a Web site, the

Mun Ga Choi 99
99 Chapter 4: Study Two
Turkey post-hoc test indicated that there was no specific difference of future intention
toward a Web site between the four different Web sites.
Table 24 : Mean difference of attitude toward Web site
Web site No. N Subset
1 2
1 13 3.88
4 17 4.11 4.11
2 13 4.64 4.64
3 15 4.79
Turkey‟s HSD test at = 0.05 was used
As such, ANOVA results above did not support hypotheses H13, H14, and H16 based
on the assumption that Korean university students indicated values belonging to the
Asian Cluster. However, Korean university students in South Korea showed more
favourable attitudes and future intentions toward a culturally incongruent Web site, Web
site 3, which was designed with New Zealand-specific graphics and texts. Also, they
liked Web site 2 which depicted New Zealand-specific graphics and Korean-specific
texts more than Web site 1 and 4 which both had Korean-specific graphics.
However, the results could be interpreted conversely, based on the findings of the index
scores of Hofstede‟s cultural dimensions in this research. Korean university students
unexpectedly manifested westernised cultural values similar to the New Zealand context.
Therefore, H13 was supported since the participants considered the most culturally
congruent Web site, Web site 3 (New Zealand-specific graphics and text), most
favourable and the least culturally congruent Web site, Web site 1 (Korean-specific
graphics and text), least favourable. Also, H14 was supported based on the cultural
index scores that Korean university students were affected more by graphics of Web
sites than by texts, as they perceived Web site 2 (New Zealand-specific graphics and

Mun Ga Choi 100
100 Chapter 4: Study Two
Korean-specific text) the second most favourable after Web site 1, and preferred Web
site 2 (New Zealand-specific graphics and Korean-specific text) to Web site 4 (Korean
specific-graphics and New Zealand-specific text) and Web site 1 (Korean-specific
graphics and texts). Also, H16 was supported as the results indicated a similar pattern
with the first variable of attitude toward a Web site except the order of favourability
(F(3,54) = 2.96, p<.05). The participants showed the strongest future intentions toward
Web site 3 (New Zealand-specific graphics and texts) and stronger future intentions
toward Web site 1 (Korean-specific graphics and texts) than Web site 4 (Korean-specific
graphics and New Zealand-specific graphics). However, the post-hoc test did not
support a specific difference of future intention toward a Web site between the four
different Web sites.
4.9.4 Ethnic group 2 – New Zealand university students
One-Way AVONA results
First of all, to determine the internal consistency of a measuring instrument, reliability
was measured using Cronbach‟s Alpha. Cronbach‟s Alpha of measuring attitude toward
a Web site was 0.79, 0.82, 0.80, and 0.85 for Web site 1, Web site 2, Web site 3, Web
site 4 respectively. Cronbach‟s Alpha of measuring future intention was 0.55, 0.70, 0.66,
and 0.79 for Web sites 1, 2, 3, 4 respectively. The coefficients for the dependent variable
of attitude toward a Web site were acceptable when they were above 0.7, following
Nunnally‟s criteria. It meant that the dependent variable for the four groups was
internally consistent. However, the coefficients for future intention were not consistent.
The relatively lower reliability of a future intention construct might undermine the
significance of the findings and its generalisability. However, Peter (1979, cited in Park
& Jun, 2003) argued that lower levels of reliability may be acceptable in marketing

Mun Ga Choi 101
101 Chapter 4: Study Two
research studies since Nunnally‟s guidelines are primarily concerned with the
development of finely tuned measures of individual traits to be used for decisions about
individual persons.
As illustrated in Table 25, the results of ANOVA showed that there was not a
statistically significant difference at the p<.05 level in attitude toward a Web site (F(3,59)
= 0.841, p>.05) and future intention (F(3,59) = 0.856, p>.05). There were no statistical
differences in the dependent variables so that post hoc comparisons between the four
Web sites were not necessary. Compared to the first ethnic group, the overall mean
scores of the dependant variables, attitude toward a Web site and future intention were
higher.
Table 25 : ANOVA results for New Zealand university students in New Zealand
Web site 1a
n=16
Web site 2b
n=15
Web site 3c
n=17
Web site 4d
n=15 F
Group comparisons e
M SD M SD M SD M SD
Attitude
toward
Web site
4.68 0.89 4.76 1.01 5.13 0.77 4.99 0.97 0.841
Web site 3 >Web site 4
> Web site 2> Web site
1
Future
intention 4.03 1.18 4.60 1.39 4.68 1.04 4.53 1.45 0.856
Web site 3 >Web site 2
> Web site 4> Web site
1
a Web site 1= Cluster A (Korean) specific graphics & texts
b Web site 2=Cluster B (New Zealand) specific graphics & Cluster A (Korean) specific texts
c Web site 3=Cluster B (New Zealand) specific graphics & texts
d Web site 4=Cluster A (Korean) specific graphics & Cluster B (New Zealand) specific texts
e Group comparisons based on the means
As Table 25 indicates, ANOVA results did not support H13, H14 and H16 in the
second ethnic group and the mean differences of attitudes and future intentions between
the four Web sites were not worth discussing due to the lack of statistical support.

Mun Ga Choi 102
102 Chapter 4: Study Two
However, the mean score of attitude toward Web site 3 (New Zealand-specific graphics
and texts) was the highest and the mean score of attitude toward Web site 1 (Korean-
specific graphics and texts) was the lowest. Interestingly, the New Zealand university
group was affected more by the texts of the Web site than the graphics as they perceived
Web site 4 (Korean-specific graphics and New Zealand-specific texts) the second most
favourable after Web site 3, which was opposite to our prediction. By contrast, the mean
scores of future intentions showed different results in ranking; the New Zealand
participants preferring Web site 2 (New Zealand-specific graphics and Korean-specific
texts) to Web site 4 (Korean-specific graphics and New Zealand-specific texts) after
Web site 3. However, the mean scores between Web site 2 and Web site 4 were too
small to compare.
4.9.5 Ethnic group 3 – Korean university students studying in New Zealand
One-Way AVONA results
The items measuring attitude toward a Web site (Cronbach Alpha was 0.94, 0.87, 0.87,
and 0.93 for Web site 1, Web site 2, Web site 3, Web site 4 respectively) and future
intention (Cronbach Alpha was 0.61, 0.93, 0.70, and 0.81 for Web site 1, 2, 3, 4
respectively) were very reliable. The statistical analysis of the results using ANOVA
indicated, as shown in Table 26, that the averages were significantly different in Web
users‟ attitudes toward Web sites (F(3,49) = 2.79, p=.05) but not statistically different in
their future intentions (F(3,49) = 2.64, p>.05).

Mun Ga Choi 103
103 Chapter 4: Study Two
Table 26: AVONA results for South Korean university students in New Zealand
Web site 1a
n=12
Web site 2b
n=15
Web site 3c
n=13
Web site 4d
n=13 F e
Group comparisons f
M SD M SD M SD M SD
Attitude
toward
Web site
3.86 1.42 4.82 0.96 5.05 0.89 4.38 1.12 2.79*
Web site 3 >Web site 2
> Web site 4> Web site
1
Future
intention 3.67 1.57 4.61 1.37 4.77 1.01 3.60 1.50 2.64
Web site 3 >Web site 2
> Web site 1> Web site
4
a Web site 1= Cluster A (Korean) specific graphics & texts
b Web site 2=Cluster B (New Zealand) specific graphics & Cluster A (Korea) specific texts
c Web site 3=Cluster B (New Zealand) specific graphics & texts
d Web site 4=Cluster A (Korean) specific graphics & Cluster B (New Zealand) specific texts
e F(3, 49) = 2.79* are significant at p =.05 level
f Group comparisons based on the means
Post-hoc tests
To know where the differences in the means of the groups occur, post-hoc comparisons
using the Turkey HSD were performed. As indicated in Table 27, the mean score of
attitude toward Web site 1 was significantly different from the mean score of attitude
toward Web site 3 at the 0.05 level of significance. Attitudes toward Web site 2 and Web
site 4 did not differ significantly from Web site 1 and Web site 3.
Table 27 : Mean difference of attitude toward Web sites
Web site No. N Subset
1 2
1 12 3.86
4 15 4.38 4.38
2 13 4.82 4.82
3 13 5.05
Turkey‟s HSD test at = 0.05 was used
Mun Ga Choi 104
104 Chapter 4: Study Two
The ANOVA results should be interpreted in the same way as the first ethnic group.
Based on Hofstede‟s original index scores, H13 and H14 were not supported. Similarly
to the first ethnic group, Korean university students studying in New Zealand indicated
westernised cultural values, except for the uncertainty avoidance dimension which was
still not as high as the original score. Under these findings of participants‟ cultural
values, H13 and H14 were supported. Ethnic group 3 considered Web site 3 (New
Zealand-specific graphics and text) the most favourable and Web site 1 (Korean-specific
graphics and text) the least favourable. Also, the participants were affected more by
graphics of Web sites than by text, since they perceived Web site 2 (New Zealand-
specific graphics and Korean-specific text) the second most favourable after Web site 1,
and preferred Web site 2 (New Zealand-specific graphics & Korean-specific text) to
Web site 4 (Korean-specific graphics & New Zealand-specific text). However, H16 was
not supported in this ethnic group. Although Web users showed more favourable future
intentions toward a culturally congruent Web site than a culturally incongruent Web site,
the results were not supported in a statistical term (F(3,49) = 2.64, p>.05).
4.9.6 First language
To confirm H15, whether Web users had a more favourable attitude toward a Web site
designed in their first language, the means of attitude toward Web sites were compared.
The means indicated that the participants from New Zealand assigned the highest means
of attitude toward Web sites, followed by Korean students studying in New Zealand, as
shown in Table 28. For the open-ended question asking about the least appealing aspects
of Web sites, five Korean students from ethnic group 1 actually pointed out that Web
sites designed in English were not appealing to them. Therefore, H 15 was supported.
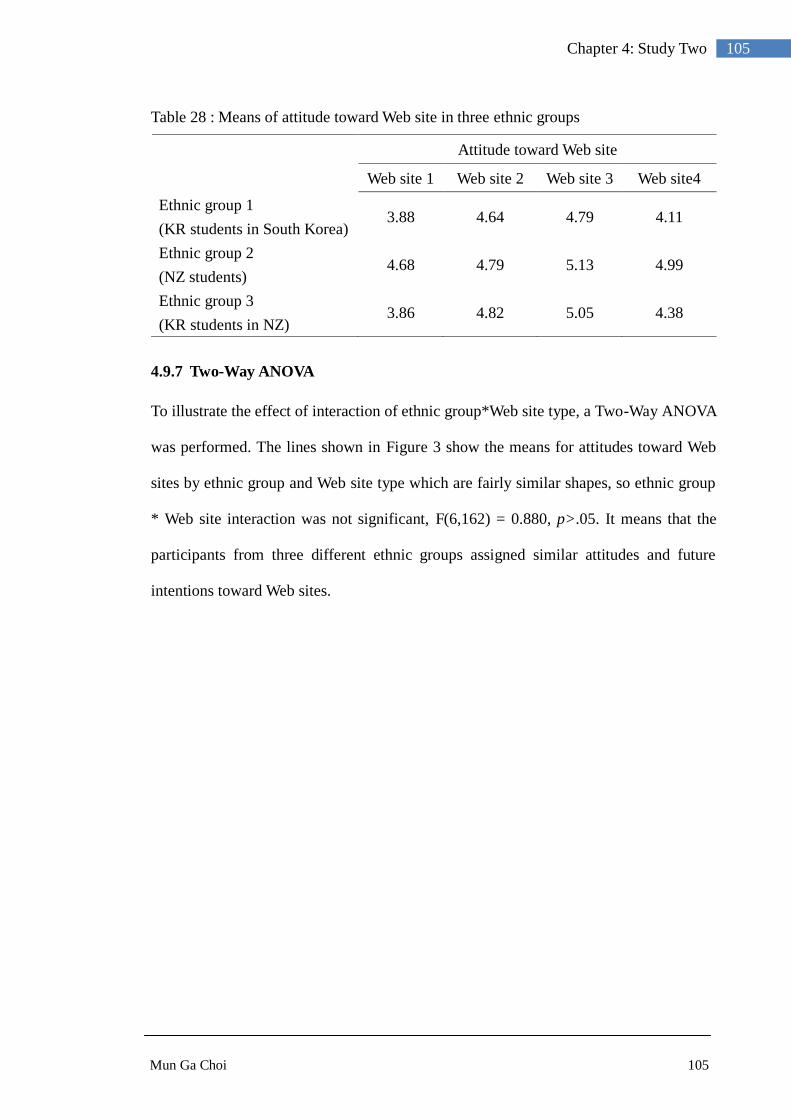
Mun Ga Choi 105
105 Chapter 4: Study Two
Table 28 : Means of attitude toward Web site in three ethnic groups
Attitude toward Web site
Web site 1 Web site 2 Web site 3 Web site4
Ethnic group 1
(KR students in South Korea) 3.88 4.64 4.79 4.11
Ethnic group 2
(NZ students) 4.68 4.79 5.13 4.99
Ethnic group 3
(KR students in NZ) 3.86 4.82 5.05 4.38
4.9.7 Two-Way ANOVA
To illustrate the effect of interaction of ethnic group*Web site type, a Two-Way ANOVA
was performed. The lines shown in Figure 3 show the means for attitudes toward Web
sites by ethnic group and Web site type which are fairly similar shapes, so ethnic group
* Web site interaction was not significant, F(6,162) = 0.880, p>.05. It means that the
participants from three different ethnic groups assigned similar attitudes and future
intentions toward Web sites.
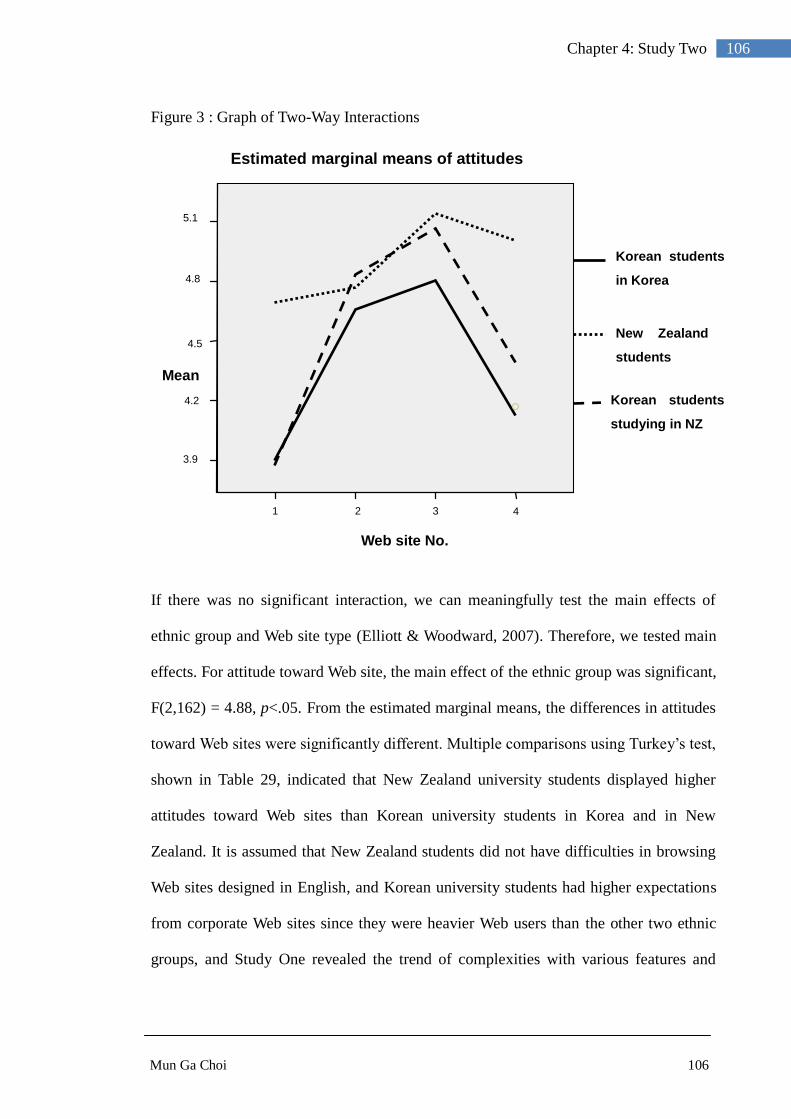
Mun Ga Choi 106
106 Chapter 4: Study Two
Figure 3 : Graph of Two-Way Interactions
If there was no significant interaction, we can meaningfully test the main effects of
ethnic group and Web site type (Elliott & Woodward, 2007). Therefore, we tested main
effects. For attitude toward Web site, the main effect of the ethnic group was significant,
F(2,162) = 4.88, p<.05. From the estimated marginal means, the differences in attitudes
toward Web sites were significantly different. Multiple comparisons using Turkey‟s test,
shown in Table 29, indicated that New Zealand university students displayed higher
attitudes toward Web sites than Korean university students in Korea and in New
Zealand. It is assumed that New Zealand students did not have difficulties in browsing
Web sites designed in English, and Korean university students had higher expectations
from corporate Web sites since they were heavier Web users than the other two ethnic
groups, and Study One revealed the trend of complexities with various features and
4 3 2 1
Web site No.
5.1
4.8
4.5
4.2
3.9
Mean
s
Estimated marginal means of attitudes
Korean students
in Korea
New Zealand
students
Korean students
studying in NZ

Mun Ga Choi 107
107 Chapter 4: Study Two
visual aids on the existing Korean corporate Web sites.
Table 29 : Mean difference of attitude toward Web site by ethnic group
Ethnic groups N Subset
1 2
Korean university students in South Korea 58 4.35
Korean university students studying New Zealand 53 4.53 4.53
New Zealand university students 63 4.89
Turkey‟s HSD test at = 0.05 was used
Furthermore, the main effect of Web site type was significant, F(3,162) = 5.53, p<.05
indicating that there was a statistically significant difference in attitude toward a Web
site by Web site type. A post-hoc analysis showed that Web site 1 (New Zealand-specific
texts and graphics) was perceived more favourably than the other three Web sites, as
shown in Table 30.
Table 30 : Mean difference of attitude toward Web site by Web site type
Web site Type N Subset
1 2
1 41 4.19
4 47 4.47 4.47
2 41 4.74
3 45 4.99
Turkey‟s HSD test at = 0.05 was used
In a similar vein, for future intentions toward Web sites, ethnic group * Web site type
interaction was not significant, F(6,162) = 0.880, p>.05. As shown in Figure 4, the lines
show all similar patterns.
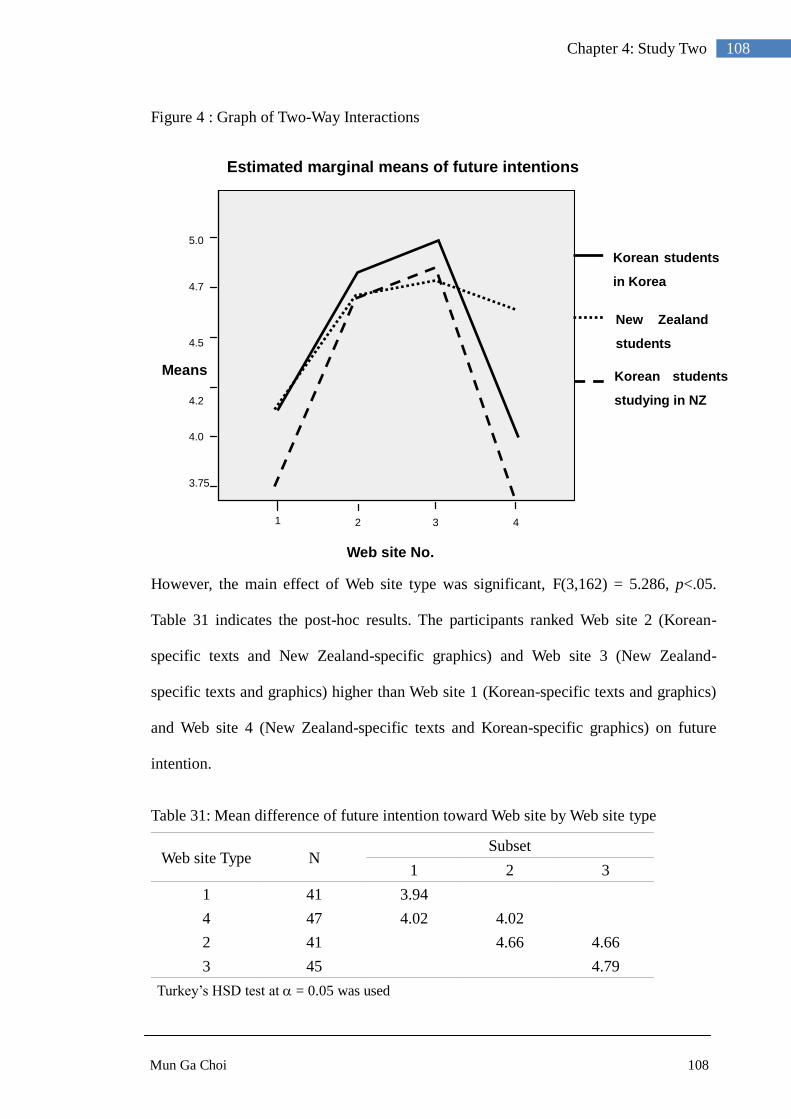
Mun Ga Choi 108
108 Chapter 4: Study Two
Figure 4 : Graph of Two-Way Interactions
However, the main effect of Web site type was significant, F(3,162) = 5.286, p<.05.
Table 31 indicates the post-hoc results. The participants ranked Web site 2 (Korean-
specific texts and New Zealand-specific graphics) and Web site 3 (New Zealand-
specific texts and graphics) higher than Web site 1 (Korean-specific texts and graphics)
and Web site 4 (New Zealand-specific texts and Korean-specific graphics) on future
intention.
Table 31: Mean difference of future intention toward Web site by Web site type
Web site Type N Subset
1 2 3
1 41 3.94
4 47 4.02 4.02
2 41 4.66 4.66
3 45 4.79
Turkey‟s HSD test at = 0.05 was used
4 3 2 1
Web site No.
5.0
4.7
4.5
4.2
4.0
3.75
Means
Estimated marginal means of future intentions
Korean students
in Korea
New Zealand
students
Korean students
studying in NZ

Mun Ga Choi 109
109 Chapter 4: Study Two
On the other hand, the main effect of ethnic groups was not significant, F(2,162) =
0.941, p>.05. Korean university students in Korea displayed the highest overall
averages in future intentions toward Web sites whereas Korean university students
studying in New Zealand showed the lowest overall averages. Future intention might be
related to uncertainty avoidance values. Korean university students in Korea showed the
lowest score on uncertainty avoidance whereas Korean university students studying in
New Zealand showed the highest scores among the three ethnic groups.
4.9.8 Open-ended questions
The responses to open-ended questions were similar between the participants who
viewed Web site 1, 2, 3, and 4 and between the different ethnic groups. Many of the
respondents considered the overall design (tidy, comfortable, and polished) as the most
appealing aspect of the Web sites they viewed. Other appealing aspects noted were
sufficient, well organised information, easy to navigate, diverse products, and no
advertising banners. On the contrary, respondents pointed out that lack of information,
lack of diversity of products, and lack of eye-catching things were the least appealing
aspects.
Other interesting comments of ethnic group 1 were as follows: five Korean respondents
commented that they could not browse competently since the Web sites were designed
in English; two Korean respondents thought the font size of text rather small; two
Korean respondents mentioned that the company lacked aggressiveness and emphasis to
inform or advertise the company itself and its products; one Korean respondent wanted
to know the prices of the products; and one Korean respondent wanted to know what the
interiors of the refrigerators and dishwashers looked like. These comments were
consistent with Hofstede‟s index scores that Korean university students reflected

Mun Ga Choi 110
110 Chapter 4: Study Two
westernised values. They expected to see a hard-sell approach and detailed information
on the corporate Web sites.
When asked about the most or the least appealing aspects of the Web site they viewed,
New Zealand university students mentioned similar points to the first group of Korean
university students in South Korea. There were also no noticeable differences in the
responses between the four different Web sites except several respondents who viewed
Web site 4 (Korean-specific graphics and New Zealand-specific texts) and
complimented the main graphic on the homepage: “I liked the picture on the homepage
of the family jumping over the railway tracks, I wasn‟t sure at first what it had to do
with the company‟s products, but I thought it was energetic and lively – image of
innovation and family.”
Ethnic group 3 (bilingual group) mentioned clean layout, pictures, and simplicity of
design as the most appealing aspects of the Web sites they viewed. However, the simple,
plain design received contradictory opinions in that some participants found these
aspects least appealing. Small font size, no service of price presentation, and no strong
brand image were also mentioned as the least appealing aspects of the Web sites. The
big difference between this group and the first was that nobody commented that English
was a barrier to browsing the Web sites.
4.10 Conclusions
Study Two was based on an evaluative method for measuring the attitudes and future
intentions of Web users with different cultural backgrounds toward culturally different
Web sites, with online questionnaires as being the way to capture Web users‟
perceptions as naturally and spontaneously as possible. Before asking Web users‟
perceptions toward the Web sites, it measured Hofstede‟s value among the participants.
Mun Ga Choi 111
111 Chapter 4: Study Two
They expressed similar westernised values regardless of their nationalities. Furthermore,
the favourability of Web sites in the three ethnic groups lay in a similar pattern in that
those with westernised values were liked more by the participants, although the students
from New Zealand indicated the highest means of perception toward the Web sites.
There was a clear difference in attitudes toward Web sites and future intentions between
the four Web site types. In short, this research came up with surprising results which
were not in line with previous research. These findings are interpreted in detail with
theoretical and empirical support in the following Discussion chapter.

Mun Ga Choi 112
112 Chapter 5: Discussion
Chapter 5: Discussion
5.1 Introduction
The purpose of this research is to investigate cultural effects on the use of main visuals
and Web features on corporate Web sites from the two nations, and to explore whether
Web users from different ethnic groups perceive culturally congruent or incongruent
Web sites differently. We found both differences and similarities in the content of
existing corporate Web sites and in Web users‟ perceptions toward Web sites between
the two countries. The empirical results found in the Results chapter not only answered
the research questions, but also highlighted new findings.
This chapter consists of four main sections. Firstly, the differences in aesthetic visuals
and diverse features of corporate Web sites between the two countries are elaborated
with key explanations. Secondly, the similarities found on corporate Web sites of a
similar industry sector are examined. Thirdly, underlying explanations of the Web users‟
similar perceptions toward culturally different Web sites are explored. Next, this chapter
examines why Web sites designed in Web users‟ first languages are significant. Finally,
a framework of Web site transformation developed in this study is introduced.
5.2 The differences in corporate Web sites
Multimedia had the most noticeable difference in visuals between the corporate
homepages of New Zealand and South Korea in the findings. The main difference lay in
the use of animated illustration and moving visuals. From 120 Korean corporate
homepages (94.2%) in Study One, 113 included moving visuals like flashes. This is
consistent with our prediction based on the literature that Web sites from a high-context
culture would emphasise the more aesthetic aspects of Web sites (Wurtz, 2005) and

Mun Ga Choi 113
113 Chapter 5: Discussion
would require many non-verbal cues for electronic communications media. This trend
might be interpreted, as Hermeking (2005) explained, that television is better liked by
high-context cultures, while print media like newspapers are preferred by low-context
cultures. Also, this might be one of the reasons why Korean university students in Study
Two displayed the lowest overall averages toward the Web sites. Attitude might be
measured by the emotional effects of Web sites‟ entertainment which is strongly related
to the aesthetic enjoyment of multimedia. The Web sites created for this research might
be perceived as rather static and simple by the young Koreans who might have very
high expectations of quality Web sites with rich multimedia and Web features.
Moreover, the most prominent difference of Web features in cultural dimensions was
found in individualism and masculinity dimensions which were typically considered as
cultural characteristics of westernised Web sites. High individualist and high masculine
Web features were more portrayed by Korean corporate Web sites, in contrast to our
prediction based on previous research. At the same time, Korean Web sites were
inclusive of high collectivist and high uncertainty avoidance features as expected.
Overall, Korean companies facilitated their Web sites more for a direct marketing tool
by advertising the companies‟ reputations and products‟ uniqueness though „awards‟,
„history of a company‟, and „product advertisement‟ features. Korean corporate Web
sites had more diverse Web features and a larger number of Web pages than New
Zealand Web sites while the general characteristics of New Zealand corporate Web sites
were static and simple.
Additionally, there were industry differences found in the use of main visuals and Web
features. Use of visuals on homepages was similar among industry sectors except the
service sector which displayed far fewer visuals of products and their demonstration. It

Mun Ga Choi 114
114 Chapter 5: Discussion
would be inappropriate to employ the graphics of products by service sectors on
corporate homepages since services generally do not have tangible shapes. For example,
one Korean gas company (Seoul City Gas) which supplies natural gas to customers, had
a main graphic of illustrated buildings and roads and tried to indicate how and where its
product was used. Furthermore, the noticeable difference in ranking between uses of
visual of products and their demonstration was food and beverages, and agriculture and
fishing. It is understood that products in the agriculture and fishing sector have many
and varied uses so that companies might be reluctant to reflect certain usages, or
consider it more important to show the actual products before their original shape or
appearance are distorted by usage.
Web features encompassing high power distance, high collectivist, and high
individualist values were found to be clearly different among three industry groups in
Korean Web sites while features of high uncertainty avoidance were included in all
three groups to a similar extent. On the other hand, New Zealand Web sites showed very
similar cultural characteristics among industry sectors except the features for high
power distance dimension.
The findings in Korean corporate Web sites were inconsistent with Figure 1 in section
2.3.1. that non-durable, low interest product Web sites tended to demonstrate higher
degrees of cultural adaptation on Web sites (Hermeking, 2005; Okazaki, 2005). The
differences might be that previous studies which asserted this propensity did not study
Web features on Web sites systematically and empirically as did this study. Also, there
might be a possibility that non-durable consumer products which were generally
consumed in their own cultural way might give researchers the impression that the Web
sites were culturally adapted. However, this research found that the non-durable sector,
Mun Ga Choi 115
115 Chapter 5: Discussion
along with the service sector, contained more Web features indicating low power
distance and high individualism dimensions which were not cultural characteristics of
Korea in Hofstede‟s original study. Furthermore, the non-durable and service sector
section displayed Web features of high collectivist dimension at the same time. Overall,
Korean corporate Web sites in the durable sector were similar to those of New Zealand
reflecting more features of high power distance and low individualist, low collectivist,
low uncertainty avoidance and low masculine dimensions.
The possible explanations as to why there were differences in corporate Web sites from
the two countries in which some were opposite to the prediction, might be that South
Korea and New Zealand are two countries divided not only by culture, but also by the
level of company adoption of online business, national broadband infrastructure, and
corporate characteristics (e.g. company size). Therefore, differences in corporate Web
sites found in our research might be based on these differences, not just on a cultural
difference. These factors have been overlooked in previous cross-cultural research, but
must be considered and explored.
5.2.1 Different purposes for online presence
The first explanation is that companies from two countries might have different
purposes for their online presence. Most of the New Zealand companies were likely to
have business purposes of general publicity by containing company background and
history, while Korean companies were more likely to adopt online business on their
Web sites (22.5% vs. 51.7%). Cheung and Huang (2002) identified the four major
business purposes for companies‟ online presence; general publicity, customer support,
online information exchange, and www sales. Different business purposes result in
different contents of Web sites. For example, a company which has a business purpose

Mun Ga Choi 116
116 Chapter 5: Discussion
of online information exchange for its corporate Web site includes a function of sharing
information and experience like a guest book or interactive inquiries. Furthermore, Liu
et al. (1997) showed that a Web site could be used to support the three different
activities: pre-sales, sales, and after-sales. Depending on the activity that a Web site
pursues, the functions or features on Web sites are different shown in Table 32 below.
Table 32: Business activities and different functions a
Business activities
Pre-sales Sales After-sales
Global connection
Products/services
Company overview
Guest book
Online business
What‟s new
Interactive feedback
Customer service
FAQ
Index/directory
Search
Financial, messages, etc.
a adapted from Liu et al, 1997.
Many of the New Zealand corporate Web sites were at the initial stages of Internet
usage while Korean corporate Web sites reflected the movement toward fully developed
online business. These different business purposes and activities identified in Table 32
support the findings in this research that Korean corporate Web sites had more features
of low power distance and high collectivist, high individualist, high uncertainty
avoidance, and high masculine dimensions. Also, these different purposes might force
Korean Web sites to include features of both high collectivist and high individualist
dimensions simultaneously. The functions of sales and after-sales activities overlap with
the features of high collectivist and high uncertainty avoidance dimensions adopted in
this research.
This corroborates the findings of differences in industry sectors. Compared to the
durable sector, Korean non-durable and service sector Web sites utilised more online
business and displayed more features of low power distance and high collectivist, high

Mun Ga Choi 117
117 Chapter 5: Discussion
individualist, and high uncertainty avoidance dimensions. Web sites for e-commerce
developed in a similar technology or usability pattern might show the strongest
standardisation tendencies. For necessary conditions of e-commerce, the standardised
usability pattern is inclusive of Web features of a low-context and westernised
communication style and Web features of high collectivist and high uncertainty
avoidance dimensions.
5.2.2 Different level of Internet broadband infrastructure
Another possible explanation for the differences in corporate Web sites from the two
countries might be due to different levels of Internet broadband infrastructure. The high
penetration of broadband is likely to account for Korea‟s high audio and video usage (H.
Lee, O'Keefe, & Yun, 2003) and online business. Although the two countries have
similar Internet penetration rates, as shown in Figure 5 below, at the end of 2005, dial-
up subscribers accounted for a very small share of fixed Internet subscriptions in Korea,
compared to New Zealand with a relatively high share of dial-up access (OECD, 2007).
South Korea was ranked first among the 30 member countries of the Organization for
Economic Cooperation and Development (OECD) in terms of broadband access
(Hwang, Jung, & Salvendy, 2006).

Mun Ga Choi 118
118 Chapter 5: Discussion
Figure 5: Dial-up and broadband shares of total fixed Internet subscribers, December
2005 a
a adapted from OECE, 2007.
South Korea had unique social environment factors driving the development of the
high-speed (broadband) Internet infrastructure. Since the 1997 Asian financial crisis, the
South Korean government has vigorously implemented economic reforms. The
information technology industry has been considered as an industry of growth which
would promote recovery of the overall economy (Choudrie & Lee, 2004). The South
Korean government invested US$5 billion in ICT infrastructure development between
1996 and 2001 for major strategic projects. For example, 144 major cities were
connected through high-speed computer networks and free training in Internet use was
provided to more than 13 million people (29% of the population) throughout the country
– students, teachers, housewives, the handicapped, military personnel, and so forth (Lee,
2003). Due to this governmental effort, the information technology industry in Korea
grew from 8.6% of GDP in 1997 to 13% in 2000, the highest proportion among OECD
countries (Choudrie & Lee, 2004; Lee et al., 2003).
0%
20%
40%
60%
80%
100%
Broadband Dial-up

Mun Ga Choi 119
119 Chapter 5: Discussion
The Korean market even migrated to a new faster service – Very High Bit Rate Digital
Subscriber Line (VDSL). VDSL is 5-10 times faster than ADSL (Choudrie & Lee,
2004). Pricing is also lower than that in many countries. For example, broadband
Internet connections were available at the flat rate of about US$25 per month for a 24
hours per day connection without a monthly usage limit (Lee et al., 2003). Therefore,
Koreans perceive broadband as a necessity since it is ubiquitous and very much a part of
their daily lives (BBC News, 2002, October 11). These unique environment factors such
as relatively low-cost and high-speed Internet connection allow Koreans to engage in
audio and video usage over three times more than US Americans (Lee et al., 2003). In
short, the usages of animation, video, or illustration on Web sites might be more
dependent on this technical issue than on the Web user‟s particular culture.
5.2.3 Company size
The difference of multimedia strategy and Web features between New Zealand and
South Korea could be explained by size and resource of companies as well as size of
markets. The number of potential customers of a company is far higher in South Korea
than in New Zealand due to population size. Organisational size or revenues and
multiple audiences are two influential factors in Web site design (Liao, To, & Shih,
2006; Lin, 2002). Larger companies have a larger scope of business, produce more
diverse products, engage in more activities, and manage more issues. The dynamic
nature of larger companies is an important internal organisational variable for Web
development and also leads to an increase in the number of Web pages and functional
features of Web sites.
In the findings, Korean Web sites contained a higher number of Web features such as
links to local Web sites, community relation, sharing experience, and product

Mun Ga Choi 120
120 Chapter 5: Discussion
advertisement. The Korean companies studied in this research were relatively large and
some companies were even affiliated companies of Chaebol, a South Korean form of
business conglomerate. They included links to their affiliated companies, TV
advertisements, or community relations in their press rooms and promoted diverse
events in which Web users could participate online or offline. Korean companies were
more active seeking to enhance public relations and to collect user responses. In the
case of New Zealand, for example, the largest company, Fonterra, used a similar number
of Web features and Web pages and included diverse information about community
relations and product advertisements.
5.3 The similarities in corporate Web sites
Along with the differences, this research found some similarities in corporate Web sites
from the two nations. Many previous advertising studies claimed that indirect
advertising messages creating emotions though pictures were more favoured in high-
context cultures while direct, rational, and hard-sell advertising messages with product
information played a more significant role in low-context cultures (An & Kim, 2007; de
Mooij, 2005; Hermeking, 2005; Miracle et al., 1992). Also, collectivistic societies
placed high importance on people and relations, whereas individualistic societies tended
to value products and consumerism. This research offered inconsistent results, but there
were also similarities. From the results of Study One, the group difference between New
Zealand and South Korea was not statistically significant in the direct portrayal of
products on the corporate homepages. There was no significant difference in the use of
visual demonstration of products (how to do, use, apply or make) on the homepages
between the two national groups. This finding is also strongly related to the findings of
Study Two. The participants, regardless of their nationalities, perceived Web site 3 (New
Zealand-specific graphics and New Zealand-specific texts) most favourably. The main
Mun Ga Choi 121
121 Chapter 5: Discussion
graphic of Web site 3 displayed „an individual using the products (e.g. oven)‟.
Moreover, the findings are in contrast to An‟s (2007) study that 10 out of 34 Korean
front pages of global brands‟ Web sites presented the direct portrayal of products and
Korean front pages were significantly different from their low-context counterparts. The
reason for this inconsistency might be that An (2007) studied Korean Web sites of the
global brands only three of which global brands were originally from South Korea.
Therefore, it is understood that global brands did not actually employ what was really
happening in the design of Korean corporate Web sites. It might be considered as a
failure of the global brands‟ adaptation of corporate Web sites and as a stereotype of
global companies toward Korean society.
It was found that advertising appeals focusing on in-group benefits, concern for others,
and family integrity were more effective in Korea (de Mooij, 2005; Miracle et al., 1992).
The finding of H3 was consistent with the literature in that 27.5% of Korean corporate
homepages reflected a family or group theme while only 16.7% of the main visuals on
New Zealand homepages used this theme. In spite of the statistical significance between
the two countries, we could not say that the theme was popular among the Korean Web
sites and was not popular among the New Zealand Web sites. The family or group
theme was not as prevalent on Korean corporate homepages as advertisements on
television and in print studied in previous research. Also, according to the responses of
open questions in Study Two, several New Zealand respondents who viewed Web site 4
(Korean-specific graphics and New Zealand-specific texts) complimented the first
graphic on the homepage (a family having a good time). New Zealand students might be
familiar with those themes due to the Maori culture which is centred on the family.
Furthermore, extant research like Choi et al. (2005) and An (2007) reported that Korean
Mun Ga Choi 122
122 Chapter 5: Discussion
commercials on television employed more celebrities due to the shared values of the
society. Only a small proportion, 13.3% of Korean corporate homepages used celebrity
models whereas only one New Zealand corporate homepage used a celebrity model.
Like the family or group theme, employing celebrity models on corporate Web sites was
not a strong trend in either country. This is in line with what An (2007) found in his
research that only a small percentage of the front pages featured celebrity models
although there was a statistically significant difference between low-context nations and
high-context nations. He claimed his results were considerably lower than those found
in earlier studies on television and magazine advertising.
Features for high power distance were included in both Korean and New Zealand
corporate Web sites to a similar extent. This may be explained by different purposes for
corporate online presence. Many New Zealand companies used their Web sites for
general publicity and they allocated most of their Web pages to company information
and company products. The three features for high power distance in this research were
strongly related to company overview information. However, the way of expressing
information on CEOs was found to be different in this research. The usual way of
including such messages on the Korean Web sites was with pictures of CEOs with their
direct messages to Web users, Netizen; the usual way on the New Zealand Web sites
was pictures of CEOs or management with their bio-sketches. In addition, in line with
music or sound effects, Web features such as local requirements of national identity and
clear gender role were found as rather obsolete. The companies were reluctant to
indicate the country of origin feelings.
Possible explanations for the similarities in corporate Web sites found in the results
from the two countries might be that there were genre-specific elements and the Internet

Mun Ga Choi 123
123 Chapter 5: Discussion
culture, regardless of the national culture in which they are created. It seems that high-
context cultures might have grown accustomed to the way in which Web sites are
designed in Western societies and have adopted many of the same functional menu
structures before exploring how communication on the Web can be reconfigured to
conform to high-context communication patterns. In particular, Korean Web sites are
more likely to be affected by the Internet culture due to higher Internet penetration rates
and broadband access.
5.3.1 Genre of Web site
As Barber and Badre (1998) and Sheppard and Scholtz (1999) explained, Web sites that
belonged to similar genres or domains were organised in a similar fashion, regardless of
the country/culture (Callahan, 2005b; Tarafdar & Zhang, 2006). All characteristics are
not equally important for all domains of Web sites. Industry types are considered a
critical external environmental variable as companies in a same industry face similar
competitiveness and threats (Liao et al., 2006). Hwang et al. (2006) found that there was
no difference in the effective design of a shopping cart among Korea, Turkey and the
U.S. and concluded that Web site usability issues in e-commerce were universal and not
a good candidate for localisation. There were industry similarities found in the uses of
main visuals on homepages and Web features in this research. Most of the companies
from the two countries primarily displayed visuals of products and how to do, apply and
make them on their corporate homepages. In particular, the corporate homepages of the
non-durable sector from both countries indicated the highest frequencies in the use of
visuals of products in main graphics. The companies producing tangible non-durable
and durable products were more likely to adopt the hard-sell approach with direct
presentation of products in their Web sites while the companies providing services were
unlikely to include visuals of products or product usages due to their intangible

Mun Ga Choi 124
124 Chapter 5: Discussion
characteristics.
Compared to the companies in the durable sector, non-durable and service sectors
engaged in more online business. This agrees with a 2007 report by National Internet
Development Agency in Korea that the most wanted items from online shopping in
Korea were non-durable products like clothing, footwear, and sporting goods (66.8%),
followed by music products (55.5%), books or magazines (41.6%); (NIDA, 2008). The
Web sites including online business provided electronic commerce features and showed
similar cultural characteristics in the findings. Features like loyalty programs,
personalisation (e.g. log-on), privacy statements, search engines, terms and conditions,
and product advertisements were found more often in non-durable and service sectors.
Online business resulted in the inclusion of features of high collectivist and high
uncertainty avoidance dimensions. Conversely, the degree of including Web features of
power distance decreases if a company‟s Web site includes online business.
The number of e-commerce Web sites has skyrocketed and continues to climb each year.
For e-commerce to work, Web site customisation and personalisation are needed. Both
companies and the Internet consumers must be willing to disclose information about
themselves. Personal information such as the customer‟s name, address, and credit card
number are necessary for almost all online commercial tractions. For trust issues,
company information such as directory and history and customer service such as
answers to FAQs and complaints increase online customer confidence in a company,
lowering the perceived risk of electronic exchange with that company and increasing the
likelihood of consumers engaging in online business. The biggest barrier to the growth
of online business is the public‟s fears about privacy and security online (Metzger,
2004). How secure they perceive their Web transactions to be and how confident they

Mun Ga Choi 125
125 Chapter 5: Discussion
are that their personal information is safe are the most important determinants of how
good an e-commerce Web site is (Park & Jun, 2003). Therefore, Web features of high
individualism and high uncertainty avoidance dimensions must be included if a
company is developing from limited usage Web sites to the direction of online business.
5.3.2 Internet culture
The Internet culture exists and might affect Web site design and perceptions of Web
users. Too many studies have focused on country-specific or technology-specific studies
of the Internet without considering the nature of the information technology under
investigation (Ford, Connelly, & Meister, 2003). With people from the same business
culture sharing similar beliefs and attitudes, regardless of their nationalities (Callahan,
2005b), the Internet could succeed in turning all cultures of the world into one
monolithic culture. Web users might possess an online culture in the Internet, regardless
of their national cultures, since the Internet is a medium of a global nature.
We should not understand Web sites in the same way as we have understood other
media. It has been developed within a short period of time and through different
development processes. The way people have perceived this unique medium is different
from that of other media. Its unique characteristics might be stronger than those of other
media developed a long time ago. The digital technologies of computerisation,
electronic communication and mass media create both mediascapes and audience on a
scale that was unimaginable in the framework of the analogue technologies of the first
and second industrial revolutions (Hand & Sandywell, 2002). Unlike other older,
analogue media which are sent to many by a few in a hierarchical and unidirectional
way within limited space, the Internet makes it possible to send information and
communication to many in a horizontal, interactive pattern across territories. With a

Mun Ga Choi 126
126 Chapter 5: Discussion
computer in most households wired up to the worldwide Web, we live in virtual
communities and create a digital culture.
The Internet culture is described as the outcome of “cultural synchronisation” as was
claimed in Hamelink‟s (1988) book. He preferred the concept of cultural
synchronisation to cultural imperialism used in the international literature since cultural
synchronisation can take place without imperialistic relations. Exogenously developed
technologies like the Internet are introduced more on the basis of the interests and need
of countries than those of the host country. The indiscriminate adoption of foreign
technology can obviously produce profound cultural effects. The Internet is the main
carrier of transnational cultural synchronisation.
Johnston and Johal (1999) mapped out the culture of the Internet in their study using
Hofstede‟s (1980) dimension of cultural variations. The Internet initially reflected a
collective nature, emphasising the notion of cooperation and sharing, since it began its
emergence with the focus on free information for all. In contrast, the Internet has more
recently experienced a culture clash, and is paving the way forward in a more
individualistic fashion. It possesses characteristics that lean towards low power distance.
No hierarchical structures or bureaucratic procedures are required to gain access to the
Internet. The whole structure is of an informal nature without emphasis on status or
acceptance of inequality. Status cues are usually less visible and there is a tendency for
perceptions about status to converge. Groups on the Internet form without the traditional
barriers to participation based on occupation, socioeconomic status, position in the
corporate or educational hierarchy, or other factors (Wallace, 1999).
Furthermore, prominent rhetorics of the Internet culture are the cosmopolitan and
globalisation paradigm. The cosmopolitan paradigm reflects the Anglo-American model

Mun Ga Choi 127
127 Chapter 5: Discussion
since the Internet originally came from the USA. Also, the widespread adoption of
information and communication technologies (ICT) has developed with globalisation.
The cosmopolitan and globalisation paradigms represent liberalisation, deregulation,
migration, and the expansion of capitalism and democracy (Kraemer et al., 2005).
Therefore, it is expected that more globally oriented Web users, due to the influence of
the Internet culture, reflect more cosmopolitan values and favour Web sites tailored to
more capitalist content.
In the findings from the open-ended questions, the participants expressed a similar
desire, regardless of their ethnic groups, to see more detailed information on the
company and products. Web users expected detailed information about the company and
its products not only in texts, but also in graphics on corporate Web sites. There are
many words to describe Internet users, such as the digital citizen, the global village
people, the net generation, and the superconnected. These names can easily give the
impression that Internet users form a cohesive ingroup. The Internet users are
“information elite”, as Hermeking (2005) defined.
This argument is consistent with a previous study revealing that Korean university
students preferred to choose Internet shopping sites that present detailed, exact
information about products (Hwang et al., 2006). Online consumers often have to base
their judgements and decisions solely on the information presented on the Web sites and
they want to be provided with even sensory and appearance information since they
cannot touch or smell the products (Liao, Proctor, & Salvendy, 2008). E-commerce Web
sites were mainly influenced by rational content appeals like text-heavy layout and large
Web site volume (Hermeking, 2005). The desire of Web users to see more detailed
information explains why Web sites characterised by a dominant low-context style were

Mun Ga Choi 128
128 Chapter 5: Discussion
prevalent even in target countries with high-context communication preferences.
Marketing research on frequent Internet users all over the world shows a continued
dominance of informational over entertainment needs. Internet users in the UK, for
example, motivated primarily by information needs, prefer informational to entertaining
TV programs. Internet users in Germany read books and daily newspapers more often
than non-users. Similarly, in the UK and in the Netherlands, the Internet as an
informative medium has been found to be more complementary to the traditional
newspaper industry than cannibalistic. Finally, even studies on the recent increase in
Internet usage in Korea revealed that Internet users watched TV less often, but spent
more hours reading books than non-users (Rhee & Kim, 2004).
5.4 Web user’s similar perception toward corporate Web sites
Four fictitious Websites providing the optimal condition and maximal difference of
cultural characteristics were designed for this study. Web site 1 and Web site 3
represented culturally opposite characteristics according to Hofstede‟s and Hall‟s
dimensions. The four Web sites were controlled to illustrate only variations of cultural
characteristics; therefore, there was much less likelihood for Web users to be distracted
from other components of a Web site. There were clear differences of Web users‟
attitudes toward Web sites and their future intentions between the four Web sites. All
three ethnic groups liked Web site 3 (New Zealand-specific texts and graphics) most and
Web site 1 (Korean-specific texts and graphics) least. Similarly, there were differences
in the participants‟ future intentions. The participants expressed the most positive future
intentions toward Web site 3 (New Zealand-specific texts and graphics) and the least
positive toward Web site 1 (Korean-specific texts and graphics). However, the
difference in the future intention variable was not statistically significant between the

Mun Ga Choi 129
129 Chapter 5: Discussion
ethnic groups.
Korean university students, whether they lived in South Korea or were studying in New
Zealand, showed almost opposite values to the original scores measured by Hofstede
about 30 years ago. This strongly supports the argument by Taylor (Taylor, 2005) on
future research direction in international advertising. He emphasised the necessity of
measuring respondents‟ cultural dimensions. Cross-cultural studies should not rely just
on the literature or contend that one country is more collectivistic than another, since
scales to measure the cultural dimensions are typically available and also many believe
that at least some level of cultural convergence is taking place (Taylor, 2005).
There were only minor differences in the cultural dimensions between the three ethnic
groups. The results were in contrast to our prediction. The culture of Korean university
students was unexpectedly like that of New Zealand on Hofstede‟s dimensions, higher
on individualism, lower on uncertainty avoidance, and lower on power distance
dimensions. The three ethnic groups displayed similar lower scores on masculine
dimension. This was a conspicuous difference from previous studies which just assumed
their participants‟ cultures according to Hofstede‟s and Hall‟s original results. There was
evidence of convergence of the participants‟ (young university students) value systems
in this research context.
Several explanations can be elaborated for the underlying reasons for the cultural
convergence of university students. One reason might be, as discussed, the influence of
the internal characteristics of the Internet such as Internet culture and genre of Web site.
Also, it can be assumed that since the Web sites were designed in English, the English
language is strongly related with the USA culture due to its origin and could convey
cosmopolitan American values which were the cultural characteristics of Web site 3.

Mun Ga Choi 130
130 Chapter 5: Discussion
However, a more significant underlying reason for this finding could be found in those
who viewed the sites in this context.
5.4.1 International segmentation
As Cleveland and Laroche (2007) claimed, market researchers and practitioners should
not utilise countries, but consider similar consumers more important than national
differences. International segmentation is considered as one of the solutions to the
standardisation versus adaptation debate in that it creates the conceptual framework for
offering products and/or marketing programs that are standardised across countries by
targeting the same consumer segment(s) in different countries (Steenkamp & Hofstede,
2002). Many companies recognise that groups of consumers in different countries often
have more in common with one another than with other consumers in the same country.
Hence, they choose to serve segments (e.g. young people, new mothers, business
travelers, and computer users) that transcend national borders (Moriarty & Duncan,
1991). International segmentation aids the firm in structuring the heterogeneity that
exists among consumers and nations and helps to identify segments that can be targeted
in an effective and efficient way.
The youth segment is a transnational market ideology created by mass culture and the
development of global marketing. Youth culture, like other manifestations of Western
modernity, is inherently modern, global, and Western at its core (Kjeldgaard &
Askegaard, 2006). Youth culture is often associated with a rebellious breaking of the
mainstream and often equally portrayed as a problem or threat to the social order. In the
market-segmentation literature, the global youth segment is constructed as sharing a
similar set of desires based on global brands and consumption practices. In this research,
Web users were demographically or culturally similar to each other and also displayed

Mun Ga Choi 131
131 Chapter 5: Discussion
similarity in their perceptions toward the Web sites. This complies with Viswanathan
and Dickson‟s (2007) definition of customer homogeneity. They insisted that customer
homogeneity should mean the homogeneity of customer response to the marketing mix.
In the case of communication technology like Web sites, who is going to use the new
technology is important. This young group should be treated with importance since the
Internet shopping user can be clearly divided according to age. The 20-29 age group
accounts for the largest portion of Korean Internet shopping users at 82.2% according to
a report of National Internet Development Agency of Korea (NADA) (NIDA, 2008).
Convergence and fragmentation driven by the globalisation of information could coexist.
The globalisation of information has not only broken down country and cultural barriers,
but contributed to the creation of new ones. Barriers which do not follow traditional
ethnic or religious affiliations could be based on sub-cultures such as techies versus
greens (Schlegelmilch & Sinkovics, 1998). Sub-groups across country boundaries might
be considered more important than cultural differences between countries.
5.4.2 Change of culture
Hofstede‟s typology of culture is one of the most widely accepted and frequently cited
in academic works. The question remains whether this typology is still valid in a time of
information revolution led by the Internet and globalisation, since the etic studies like
Hofstede‟s and Hall‟s were undertaken before the recent revolution in cross border
communication and the accelerated movement of peoples between countries. This raises
the question as to whether their cultural dimensions are as relevant in the new
millennium as when they were originally developed (Fletcher, 2006).
Traditionally culture has been viewed as localised and defined by territorial boundaries
(Craig & Douglas, 2006). One reason for culture change is global flows that are

Mun Ga Choi 132
132 Chapter 5: Discussion
transforming cultures and diluting the differences between them. Craig and Douglas
(2006) explained the five global flows identified by the sociologist Appadurai (1990,
cited in Craig & Douglas, 2006) which were mediascapes (flows of image and
communication), ethnoscapes (flows of tourists, migrants, and foreign students),
ideoscapes (flows of political ideas and ideologies), technoscapes (flows of technology),
and finanscapes (flows of capital and money). The global flows dramatically change the
character of the global landscape and dissolve the boundaries between national cultures.
It is not unusual to see young Korean people watching their favourite US TV shows
with their laptop computers in trendy coffee franchises like Starbucks, in Seoul, the
capital of Korea (DPA, 2008). Because of these global flows, individualism, autonomy,
freedom, and mobility, which are associated with core Western values and capitalism,
become the trend in contemporary societies.
The impact of these cultural influences increased significantly in the late twentieth
century and many basic cultural orientations within traditional societies are changing.
With advances in information and communication technologies, the permeability of
cultural boundary is accelerating the change of culture at much higher speed. According
to Lee and Ungson (2008), new technologies underlying the Internet-centric economy of
Korea create a new breed of customers, empower individuals, and change their patterns
of consumption. In South Korea, the Internet is seen not as the voice of authority, but as
the voice of the people challenging that authority in Korea (Coyner, 2007, para 4). The
global flow of an online game like „Starcraft‟, Korea‟s most popular online game,
provides graphic testimony of the competitive intensity displayed by younger Koreans
(Lee & Ungson, 2008).
Mun Ga Choi 133
133 Chapter 5: Discussion
5.4.3 Economic development
Along with global flows, there is another likely explanation for the phenomenon of
Westernised cultural traits in South Korean university students. The South Korean
economy has made a dramatic leap over 70 years since the country‟s liberation from
Japanese colonisation and skyrocketed 520-fold over the years (An & Kim, 2007).
South Korea has developed from a traditional agricultural society to a predominantly
urban, educated, industrial society and achieved remarkable economic growth. South
Korea‟s rapid economic development is attributed to the dynamics of industrialisation
based on effective government intervention, a highly educated workforce, and the
strategies and structures of large business groups, or chaebols (Lee & Ungson, 2008).
Hofstede (1980) speculated that individualism would increase and the power distance
norm will decrease as long as national wealth increased in the longer term. Also,
Triandis supported the view (1995) that industrialisation encourages a shift from family
values to the development of individualism due to affluence, exposure to mass media,
and modernisation. As such, economic development and cultural change seem to move
in coherent patterns (Allen et al., 2007). For example, Japanese responses indicated that
there has been a shift of values toward individualism during only a few years of
dramatic economic development (Zhang & Shavitt, 2003). Hong Kong and Japan grew
strong economically and have shifted away from „mastery‟ values since 1982 (Allen et
al., 2007). This is also in line with Hyun‟s (2001) research revealing that traditional
values like those of Confucius were not strong among young Koreans. However, the
phenomenon does not suggest that there is an abandonment of feelings of national pride
or Korean values. Nor does it imply that participants embrace only Western values and
disrespect local and traditional values.

Mun Ga Choi 134
134 Chapter 5: Discussion
Furthermore, De Mooij argued that paradoxical values were found in most cultures and
that they were frequently present in advertising. It has been suggested that this may be
particularly true in countries that have experienced rapid economic development (Taylor,
2005). South Korean economic development was praised with such accolades as „The
Miracle on the Han River‟ (the Han river flows through Seoul, the capital of South
Korea) and being one of the „Four Asian Tigers‟, along with Taiwan, Singapore, and
Hong Kong (Lee, 2003). The Korean university students in this study were born after
1980 and enjoyed fast economic development and foreign influence. Traditional Korean
society practices might not be what they want. It was found that cultural practices of „as
it is and cultural values of „as it should be‟ were negatively correlated with one another
in a recently conducted cultural study, GLOBE (an abbreviation of the Global
Leadership and Organisational Behaviour Effectiveness project). It is assumed that
young Korean adults might be ready for dynamic societal change.
5.5 First language
This research suggests to practitioners and academics that Web sites targeting other
cultures might not need dramatic cultural customisation in content and visual design but
strongly suggests that translation of the interface into a target language is an essential
step to a more positive attitude toward the Web site. Although the three groups showed
similar favourability toward the four culturally different Web sites, the degrees of this
favourability were significantly different. New Zealand university students indicated the
highest average of attitudes toward the four culturally different Web sites, followed by
Korean university students studying in New Zealand and Korean university students in
South Korea.
Korean students in Korea were familiar with complicated Web sites with animation,
Mun Ga Choi 135
135 Chapter 5: Discussion
video, or illustration. However, Web sites designed in English might be one of the
prominent underlying reasons for their less positive perceptions toward the Web sites. It
was found in the responses of five participants to the open questions that they expressed
discontent and fear, being overwhelmed by the predominance of English. These findings
were consistent with the results claimed by previous research that about 75% of Web
users in China and Korea preferred Web sites in their local languages, and chose local
sites to make purchases (Singh & Boughton, 2005). Conversely, proficiency in the
English language could be relevant to the New Zealand participants‟ more positive
responses to the Web sites.
Beyond simple translation, Web designers need to study each culture for its specific
language elements. It might be considered out-of-date that Japanese, Korean, and
Chinese read vertically. As found in the open-ended questions of the questionnaire,
Korean participants perceived the font size of the Web site designed for this research
rather small. Special attention should be paid when translating Roman-based alphabets
like English, French, and German to non-Roman-based alphabets like Chinese, Japanese,
and Korean (Singh & Baack, 2004). The Korean alphabet, known as Han-gul, uses a
pictographic font and looks large on the computer interface compared to English. For
example, a font size of 12 in English looks smaller and less legible compared to a font
size of 10 in Korean. Similarly, differing language structures mean that the size of the
text grows by about by 30% when translated into Roman-based languages (Singh &
Baack, 2004). These language elements can alter the overall layout of the text and
possibly decrease the relative impact of visual elements. Therefore, space considerations
including the text length have to be taken into account when conceiving the text.
Another emic enquiry found in this research was local terminology. The researcher often

Mun Ga Choi 136
136 Chapter 5: Discussion
found the word Sin-moon-go on Korean corporate Web sites. The word refers to a big
drum used during the Joseon Dynasty (1392-1910) and represents the system of
handling complaints against the government during that period. The word was reborn as
a channel through which people report petitions, complaints, and proposals. When
Koreans find the word Sin-moon-go under the customer service section on Web site,
they automatically know that here they can submit their complaints, petitions, and
proposals. Furthermore, unlike New Zealanders, Koreans always use titles connected
with their profession, place of work and rank when they both speak and write in Korean.
Therefore, translating a Web site into a local language by using software on the Internet
that offers automatic translation services is not sufficient. The software may be prone to
various cultural errors. Web developers could standardise a general strategy of Web site
design, but should modify execution and languages as needed (Taylor, 2005). In
particular, metaphors, rhetorical expressions, and typography should be considered
carefully for effective online communication.
5.6 Web site transformation
This research identifies the underlying patterns of differences and similarities which can
provide a platform for companies at the strategic and operational level when they create
their corporate Web sites for other cultures. For Web site interface design, the most
common approach is the standardisation-localisation process like advertising in
broadcasting or printing. Standardisation is accomplished by removing all culture-
specific content such as language and culturally meaningful icons from the Web site
interface. On the contrary, localisation enhances the Web site interface to fit the Web
users of a particular culture and to accommodate local requirements such as language,
country-related information, writing styles, and so forth. However, the complicated
findings found in this empirical study suggest that the simple standardisation-

Mun Ga Choi 137
137 Chapter 5: Discussion
localisation process introduced in the Web site localisation models is too general to
apply to corporate Web site design. The localisation process of a company‟s Web site is
strongly affected by a target country‟s broadband infrastructure, a company‟s online
presence strategy and size, its industry characteristics, and target Web users.
A new framework of Web site transformation is suggested in this research. Table 33
shows the transformation in Web feature adoption from limited usage Web sites to more
complex ones. The solid arrows lines represent the direction of transformation in
Websites.
Table 33: Transformation in Web feature adoption of corporate Web sites
Limited usage Web sites More complex Web sites
Company size Small Large
High-speed
Internet
Infrastructure
Low broadband penetration
rate
High broadband
penetration rate
Online strategy General publicity Online business
Cultural
characteristics
High power distance Low power distance
Low collectivism High collectivism
Low individualism High individualism
Low uncertainty avoidance High uncertainty
avoidance
Low masculinity High masculinity
Industry Durable Service & non-durable
In this research New Zealand Web sites Korean Web sites
5.7 Conclusion
The differences and similarities found in this study are not completely due to the fact
that South Korea and New Zealand are two countries divided by culture, but there might
be other significant factors such as a company‟s characteristics, its online presence

Mun Ga Choi 138
138 Chapter 5: Discussion
strategy, national broadband infrastructure, and unique Internet culture. Also, global
flows, accelerated by the Internet, are changing traditional cultural orientations to more
westernised values like individualism and capitalism. The young adult segment, the
participants in this research, is most shaped by the global cultural flows. Therefore,
Hofstede‟s and Hall‟s studies undertaken before the revolution of the Internet and
dramatic movement of global flows might not be enough to explain what is happening
in Web site design between the two countries and young Web users‟ perceptions toward
it.
Mun Ga Choi 139
139 Chapter 6: Conclusions and Implications
Chapter 6: Conclusions and Implications
6.1 Summary
This research studied the meaning of cultural differences in the Internet environment
where national or ethnic boundaries are blurred. Hofstede‟s and Hall‟s studies have been
employed as the theoretical foundation for studying the impact of national culture on
corporate Web site design and users‟ perceptions. The findings of two important
research questions were presented.
The first question was whether there were cultural impacts on the content of corporate
Web sites from the two different countries. The differences and similarities manifested
in the use of visuals and Web features displayed results that are inconsistent with
previous studies. The findings are explained in that corporate Web sites of South Korea
and New Zealand are divided not only by the two national cultures, but also by
differences in a company‟s adoption of online business and size, its industry
characteristics, and a country‟s broadband infrastructure.
These internal and external factors have not been explored in previous cross-cultural
studies of Web site design. If a company is small and has a business purpose of general
publicity online, its corporate Web site might be static, displaying cultural
characteristics of high power distance, low individualism, low collectivism, low
uncertainty avoidance, and low masculinity. On the other hand, if a company has
extensive resources and pursues online business on its Web site, the site might be more
complex with features of low power distance, high collectivism, high individualism,
high uncertainty avoidance, and high masculine dimensions. Compared to the durable
sector, Web sites from the non-durable and the service sector utilised more online

Mun Ga Choi 140
140 Chapter 6: Conclusions and Implications
business. Depending on their different purposes and requirements, different cultural
characteristics of Web sites were emphasised to varying extents.
In addition, a more important question was asked and answered in the current study: do
people from countries at the opposite ends of Hofstede‟s and Hall‟s cultural dimensions
prefer Web sites with culturally congruent elements to those with culturally incongruent
elements? This research question is especially important since it measures the
perceptions of Web users from different cultures rather than the Web site elements as
such. Participants from different cultures responded to the design of Web sites in similar
ways, preferring the Web site with westernised features. The underlying reasons for this
phenomenon might be the cultural convergence of the participants and, the influence of
Internet culture and genre of Web site. However, language structure and local
terminology on the Web sites were considered still important for Web site effectiveness.
In conclusion, these findings, which differed from many previous theoretical studies,
emphasised more the importance of a technically and linguistically congruent interface
which fits the target users at different locals than that of a culturally congruent graphics
and features.
6.2 Implications
The way a company presents itself on the Internet through its Web site has become a
significant topic for both academic researchers and corporate practitioners. The findings
of this research have important implications for both business management and
academia.
6.2.1 Implications for the theoretical field
The present research employed multiple methods, content analysis and experimental
research, to investigate cultural impact on Web site design. A multimethod approach is

Mun Ga Choi 141
141 Chapter 6: Conclusions and Implications
deemed highly desirable in cross-cultural research. Many of the previous studies have
concluded their findings based on a content-analysis of Web sites from different
countries and displayed cultural design guidelines. By contrast, in this research, the Web
site design guidelines were applied to manipulate the design of culturally congruent and
incongruent Web sites, which were used to measure how the degree of cultural
adaptation affected a user‟s perception of Web site effectiveness.
Additionally, a limited number of studies explored industry effects. Industry types affect
the adoption or non-adoption of e-commerce of a company. This research is considered
to be more significant since it incorporated international segmentation into
understanding users‟ perceptions. Because of the unique Internet culture driving
convergence and fragmentation, digital citizens, especially young adults, are constructed
as sharing a similar set of perceptions toward Web sites. This provides academic
researchers with evidence to support the notion that the standardisation versus
adaptation debate is not suitable in the Internet environment. Furthermore, the majority
of cross-cultural studies have been conducted mainly in Triad countries. In particular,
cross-cultural studies in Web site design have been researched with multinationals‟ Web
sites and people from Triad countries. This research undertaken in the specific contexts,
New Zealand and South Korea, therefore, adds value in that sense.
Although this study was developed on the basis of Hofstede‟s work, it is strongly
suggested that there is a need to study the culture of a target audience in depth.
Hofstede‟s model is based on research that was begun nearly 20 years ago and
developed within an organisational setting. His scales and findings have been
revalidated (Hofstede, 1991); however, there might have been some cultural
convergence or acculturation, as found in this research. Hofstede‟s work can still be
Mun Ga Choi 142
142 Chapter 6: Conclusions and Implications
used to understand general patterns of culture change for each country sample. However,
alternative approaches will become necessary as online intercultural communication is
fostered by the continued expansion and diffusion of the Internet.
6.2.2 Implication for managers
Apart from theoretical consideration, our findings provide practical implications for
international marketing managers and Web developers who may consider making or
revising their corporate Web sites for other cultures. Their Web sites must not only
provide company and product information to customers but also match the desired Web
user response with effective Web site design for which a specific set of instrumental or
technical, economic, social, aesthetic, and symbolic attributes are needed.
First of all, the findings of this research provide some understanding of the practice of
main visuals and Web features for designing more effective Web sites in various
industries. Cultural and social proximity has been created through the Internet‟s
ubiquity and ease of access. However, due to differing industrial characteristics and the
nature business, industries differ in their use of Web features and functions and some
companies might not even wish to provide comprehensive Web features. Therefore, a
full understanding of both the idiosyncrasies of the Internet and industrial differences
should be considered as a prerequisite for effective design of corporate Web sites. These
findings can be used as a guideline for companies to adopt, implement, or diffuse Web
technology. For this reason, more specifically, those who have rich industrial business
experiences or who have received formal business training would be better candidates
for Web site development projects.
Furthermore, this research suggests the need to gather data about the potential
population group (e.g. young or old) in a particular culture prior to designing a

Mun Ga Choi 143
143 Chapter 6: Conclusions and Implications
corporate Web site for that culture. If the site is targeting young, heavy Web users, a
simple underlying assumption of their national cultural values derived from previous
typologies might be a mistake. The results indicate that such barriers can perhaps be
overcome since young Web user groups have similar cultural values and might more
readily accept westernised content of a Web site.
However, when companies are introduced via a global medium, the Internet, language
barriers are still big issues in the designing Web sites. Beyond simple translation,
international marketing managers and Web developers need a full understanding of
language elements such as structure and local terminology. Therefore, it is necessary to
involve local people.
In addition, the majority of companies in New Zealand regarded the Web only as a
platform to promote their products/services or as a channel to broadcast their
news/images. It is risky for those companies to overlook the potential of the Web since
their international rivals in other countries may use these opportunities. Therefore, it is
suggested that New Zealand companies should build more Web features on their Web
sites and follow their Korean counterparts‟ developmental steps in terms of Web feature
adoption. Korea and New Zealand differed significantly on reciprocal communication
features like log-on system (e.g. personalisation feature in this research) and interactive
feedback (e.g. sharing experience in this research). When the development of a
corporate Web site moves to an advanced stage, it should provide more consumer-
advertiser interaction.
On the contrary, Korean companies should take into consideration that some countries
do not have the high-speed Internet infrastructures for viewing complex multimedia
presentations; in other words, users from those countries live in the environment where

Mun Ga Choi 144
144 Chapter 6: Conclusions and Implications
they are technologically unable to process them and might not see the necessity of them.
Given the short history of the Internet as a marketing tool for a company, there have
been very few published studies where academics and practitioners team up to conduct
studies on cultural effects on Web site design. The integrated studies will provide solid
results that are theoretically interesting and generalisable while simultaneously being
practically actionable. Additionally, to fully address the research questions there might
be a need for a large-scale study across many countries.
6.3 Limitations
This study is limited in several ways. The first limitation is that of the restricted sample.
This study considered only two different cultures. To have a better understanding of
cultural issues, research needs to cover more geographically extended areas which are
not limited to specific regions like Western and Eastern cultures. The degree of
importance assigned to designing a culturally sensitive user interface may vary from
country to country.
There are some inherent limitations to the methods (Han & Shavitt, 1994). Although
content analysis is a well-established method of studying advertising messages and
communication content, it is likely for coders to interpret explicit content rather than
meaning embedded in the content messages, in other words, a connotative level of
content is easily overlooked (Anderson et al., 2006). Secondly, content analysis inhibits
researchers from assessing the effect or signification of the content, but only measures
the frequency or repeatability of sign or element in the body of content which does not
mean that sign or element are necessarily the most significant (Wimmer & Dominick,
2006). What is practised in the content of a medium might not always be what people
think effective. Also, it does not allow for interpreting the underlying reasons why
Mun Ga Choi 145
145 Chapter 6: Conclusions and Implications
differences in the frequency of use of a technique exist (Taylor, 2002). In contrast,
experimental research limits variation to the manipulated factors so that causal
relationship can be established, but such manipulations may not resemble social
phenomena in their natural settings, and thus may be low in external validity (Han &
Shavitt, 1994).
Furthermore, the use of a single cohort limits the ability to generalise findings. This
study was conducted with university students who were educated and heavy Web users.
University students are likely to have high levels of cosmopolitanism and globalisation.
Also, the participants considered themselves experienced Internet users. Cultural
differences might play a greater role for novice than experienced users. If other cohorts
(e.g. people aged 40-50) or a wider representation of populations were examined, there
could be different findings between South Korea and New Zealand with respect to the
effects of cultural values on the adoption of e-commerce. Generally, age is negatively
correlated with computer usage. Caution therefore should be used in generalising these
results beyond this context.
Although the two nations involved in this research have similar information technology
adaptation, the infrastructure of Korean information technology has been developed
further under the government‟s strategic policy. Factors related to the infrastructure of
Web sites were not examined although they might affect attitudes and behavioural
intention differently between the two countries. Therefore, future research should
compare countries with similar levels of high-speed Internet infrastructure, but with
different cultural value orientations.
Another limitation is the use of Hofstede‟s and Hall‟s models. As Baack and Singh
(2007) pointed out, applying any one or two cultural typologies might not be a good

Mun Ga Choi 146
146 Chapter 6: Conclusions and Implications
guide to creating cultural congruent or incongruent contents of Web sites. The models
might be oriented toward western thinking, since, for example, Hofstede‟s instruments
were developed by the international team, consisting only of western researchers
(Hofstede, 1980). Future research needs to take a complex multi-facetted look at
cultural adaptation in Web sites by including more varied, additional cultural typologies.
The inevitable cultural bias of the researcher in conducting the research should, of
course, be kept in mind in cultural studies, especially in research such as this one, which
had a high level of involvement in designing Web sites. Also, the Web sites for this
research were created by the researcher whose limited technical ability resulted in some
common features of Web sites not being included. For example, features such as club or
chat rooms, FAQ‟s, and newsletters, which represent Hofstede‟s collectivism dimension,
were not part of the Korean-specific Web sites.
This study focused on the influence of cultural impact on Web users‟ perceptions toward
Web sites of an electronic company. The kind of company and its products might result
in different findings. Some marketing scholars argued that studying cross-cultural
differences for shared products like washers, dryers, and home furnishings are more
appropriate than personal products like cosmetics and fashion apparel. Other argued that
non-durable products like food, with low involvement for buying decision, have more
tendencies to be adapted culturally. Other factors such as genre and institutional
guidelines might affect Web users‟ attitude toward Web sites.
There might be cultural differences if this research had studied cultural differences in
Internet motivation and Internet usage patterns across cultures, although the participants
have similar perceptions toward Web site design. The high involvement of the Korean
population in online communities should not be ignored, for example, their involvement

Mun Ga Choi 147
147 Chapter 6: Conclusions and Implications
in online communities like „Daum‟ (www.daum.net) and „Cyworld‟
(www.cyworld.co.kr) is higher than in any other countries (Park & Jun, 2003). Web
users in Korea tend to spend more time in online communities or communication, but
less time in online shopping. For this reason, more online community sites tend to
include online shopping in their Web sites.
6.4 Final reflections
The Internet is still a relatively new medium for conducting business. Having been
widely used by companies for just over a decade, its ultimate impacts are still to be seen.
Numerous studies have been conducted on the technical aspects of the Internet and the
commercial benefits that it brings to organisations. This research attempts to broaden
the scope of cross-cultural research by expanding cross-cultural studies to the electronic
environment. Only a limited number of scholars have examined the impact of cultural
context on the design of corporate Web sites and Web users‟ perceptions, thus this study
extends the knowledge in this regard.
Although these findings should not be generalised across all countries or cultures, it is
believed that they do provide critical insights for academic researchers and practitioners
who make appealing Web sites for other countries or cultures, especially in the
examined countries. In the absence of large-scale analysis in this area, an empirical
study like this research contributes to the advance of theoretical knowledge in a cross-
cultural study and the development of practical guidelines to Web site design.

Mun Ga Choi 148
148 References
References
Aaker, D. A., & Stayman, D. M. (1990). Measuring audience perceptions of
commercials and relating them to AD impact. Journal of Advertising Research,
30(4), 7-17.
Albers-Miller, N. D., & Gelb, B. D. (1996). Business advertising appeals as a mirror of
cultural dimensions: a study of eleven countries. Journal of Advertising, 15(4),
57-70.
Allen, M. W., Ng, S. H., Ikeda, K., Jawan, J. A., Sufi, A. H., Wilson, M., et al. (2007).
Two decades of change in cultural values and economic development in eight
east asian and pacific island nations. Journal of Cross-Cultural Psychology,
38(3), 247-269.
An, D. (2007). Advertising visuals in global brands' local websites: a six-country
comparison. International Journal of Advertising,, 26(3), 303-332.
An, D., & Kim, S. (2007). Relating Hofstede's masculinity dimension to gender role
portrayals in advertising: A cross-cultural comparison of web advertisements.
International Marketing Review, 24(2), 181-207.
Anderson, S. J., Dewhirst, T., & Ling, P. M. (2006). Every document and picture tells a
story: Using internal corporate document reviews, semiotics, and content
analysis to assess tobacco advertising. Tobacco Control, 15(3), 254-261.
Baack, D. W., & Singh, N. (2007). Culture and web communications. Journal of
Business Research, 60(3), 181-188.
Barber, W., & Badre, A. (1998). Culturability: The merging of culture and usability,
from http://research.microsoft.com/users/marycz/hfweb98/barber/index.htm
Baskerville-Morley, R. F. (2005). A research note: The unfinished business of culture.
Accounting Organizations and Society, 30, 389-391.
Baskerville, R. F. (2003). Hofstede never studied culture. Accounting Organizations and
Society, 28(1), 1-14.
BBC News. (2002, October 11). Broadband lessons to be learned. Retrieved May 1,
2008, from http://news.bbc.co.uk/1/hi/technology/2319879.stm
Callahan, E. (2005a). Cultural similarities and differences in the design of university
websites. Journal of Computer-Mediated Communication, 11(1),
http://jcmc.indiana.edu/vol11/issue11/callahan.html.
Callahan, E. (2005b). Interface design and culture. Annual Review of Information
Science and Technology, 39(1), 257-310.
Chen, Q., Clifford, S. J., & Wells, W. D. (2002). Attitude toward the site II: New
information. Journal of Advertising Research, 42(2), 33-45.
Chen, Q., & Wells, W. D. (1999). Attitude toward the site. Journal of Advertising

Mun Ga Choi 149
149 References
Research, 39(5), 27-38.
Cheung, W. M., & Huang, W. (2002). An investigation of commercial usage of the
World Wide Web: A picture from Singapore. International Journal of
Information Management, 22(5), 377-388.
Cho, B., Kwon, U., Gentry, J. W., Jun, S., & Kropp, F. (1999). Cultural values reflected
in theme and execution: A comparative study of U.S. and Korean television
commercials. Journal of Advertising, 28(4), 59-73.
Cho, C. H., & Cheon, H. J. (2005). Interactivity on Japanese versus American Corporate
Websites. Journal of International Consumer Marketing, 17(4), 41-63.
Choi, S. M., Lee, W., & Kim, H. (2005). Lessons from the rich and famous: A cross-
cultural comparison of celebrity endorsement in advertising. Journal of
Advertising, 34(2), 85-98.
Choudrie, J., & Lee, H. (2004). Broadband development in South Korea: Institutional
and cultural factors. European Journal of Information Systems, 13(2), 103-114.
Cleveland, M., & Laroche, M. (2007). Acculturation to the global consumer culture:
Scale development and research paradigm. Journal of Business Research, 60(3),
249-259.
Conger, S. A., & Mason, R. O. (1998). Panning and designing effective websites.
Cambridge, MA: Course Technologies.
Coyner, T. (2007, May 3). Power of cyber marketing in Korea. The Korea Times.
Craig, C. S., & Douglas, S. P. (2006). Beyond national culture: Implications of cultural
dynamics for consumer research. International Marketing Review, 21(3), 322-
342.
Cutler, B. D., Javalgi, R. G., & Erramilli, M. K. (1992). The visual components of print
advertising: A five-country cross-cultural analysis. European Journal of
Marketing, 26(4), 7-20.
Cyr, D., Bonanni, C., Bowes, J., & Ilsever, J. (2005). Beyond trust: Web site design
preferences across cultures. Journal of Global Information Management, 13(4),
25-54.
Cyr, D., & Trevor-Smith, H. (2004). Localization of web design: An empirical
comparison of German, Japanese, and U. S. website characteristics. Journal of
the American Society for Information Science and Technology, 55(13), 1199-
1208.
Day, A. (1997). A model for monitoring web site effectiveness. Internet Research:
Electronic Networking Applications and Policy, 7(2), 109-115.
de Mooij, M. (2005). Global marketing and advertising: Understanding cultural
paradoxes. Thousand Oaks: Sage Publications, Inc.
Del Galdo, E. M., & Nielsen, J. (1996). International User Interfaces. New York: John

Mun Ga Choi 150
150 References
Wiley & Sons.
Dodd, C. H. (1995). Dynamics of Intercultural Communication. Madison, Wis: WCB
Brown & Benchmark Publishers.
Donald, H. W., Hendon, R. A., & Herbig, P. (1998). Negotiating across culture. Security
Management, 42(11), 25-29.
DPA. (2008, 17 Jan). US TV dramas become outdoor entertainment for South Korean
youth. Monsters and Critics.com.
Dragona, A., & Handa, C. (2000). Xenes glosses: Literacy and cultural implications of
the Web for Greece. In G. E. Hawisher & C. L. Selfe (Eds.), Global literacies
and the World-Wide Web (pp. 133-153). London: Routledge.
Elliott, A. C., & Woodward, W. A. (2007). Statistical analysis quick reference
guidebook: With SPSS examples. Thousand Oaks, California: Sage Publications.
Faiola, A., & Matei, S. A. (2005). Cultural cognitive style and web design: Beyond a
behavioral inquiry into computer-mediated communication. Journal of
Computer-Mediated Communication, 11(1),
http://jcmc.indiana.edu/vol11/issue11/faiola.html.
Fam, K., & Grohs, R. (2007). Cultural values and effective executional techniques in
advertising. International Marketing Review, 24(5), 519-538.
Fang, X., & Rau, P. P. (2003). Culture difference in design of portal sites. Ergonomics,
46(1-3), 242-254.
Fletcher, R. (2006). The impact of culture on web site content, design, and structure: An
international and a multicultural perspective. Journal of Communication
Management, 10(3), 259-273.
Ford, D. P., Connelly, C. E., & Meister, D. B. (2003). Information systems research and
Hofstede's culture's consequences: An uneasy and incomplete partnership. IEEE
Transactions on Engineering Management, 50(1), 8-24.
Fukuoka, W., & Spyridakis, J. H. (2000). Japanese readers' comprehension and
preferences for inductively versus deductively organized text. IEEE
Transactions on Professional Communication, 43(4), 355-367.
Gould, E. W., Zakaria, N., & Yusof, S. A. M. (2000). Applying culture to website design:
A comparison of Malaysian and US websites. Paper presented at the
Proceedings of IEEE Professional Communication Society International
Professional Communication Conference; and Proceedings of the 18th Annual
ACM International Conference on Computer Documentation: Technology &
teamwork, Cambridge, Massachusetts.
Ha, L., & James, E. L. (1998). Interactivity reexamined: A baseline analysis of early
business web sites. Journal of Broadcasting & Electronic Media, 42(Fall), 457-
474.

Mun Ga Choi 151
151 References
Hall, E. T. (1976). Beyond culture. New York: Anchor Press-Doubleday.
Hamelink, C. J. (1988). Cultural autonomy in global communications. London: The
Centre for the Study of Communication and Culture.
Han, S. P., & Shavitt, S. (1994). Persuasion and culture - Advertising appeals in
individualistic and collectivistic societies. Journal of Experimental Social
Psychology, 30(4), 326-350.
Hand, M., & Sandywell, B. (2002). E-topia as cosmopolis or citadel: On the
democratizing and de-democratizing logics of the Internet, or, toward a critique
of the new technological fetishism. Theory, Culture & Society, 19(1-2), 197-225.
Heinze, N., & Hu, Q. (2006). The evolution of corporate web presence: A longitudinal
study of large American companies. International Journal of Information
Management, 26(4), 313-325.
Hermeking, M. (2005). Culture and Internet consumption: Contributions from cross-
cultural marketing and advertising research. Journal of Computer-Mediated
Communication, 11(1), http://jcmc.indiana.edu/vol11/issue11/hermeking.html.
Heydenfeldt, J. A. (2000). The influence of individualism/ collectivism on Mexican and
US business negotiation. International Journal of Intercultural Relations, 24,
383-407.
Hofstede, G. (1980). Culture's consequences: International differences in work-related
values. Beverly Hill, CA: Sage Publications, Inc.
Hofstede, G. (1991). Cultures and organizations: Software of the mind. London:
McGraw-Hill International (UK) Limited.
Hofstede, G. (1996). Riding the waves of commerce: A test of Trompenaars' model of
national culture differences. International Journal of Intercultural Relations,
20(2), 189-198.
Hofstede, G. (1998). A case for comparing apples with oranges: International
differences in values. International Journal of Comparative Sociology, 39(1),
16-31.
Hofstede, G. (2001). Culture's consequences: Comparing values, behaviors, institutions,
and organizations across nations (2nd ed.). Thousand Oaks, California: Sage
Publications, Inc.
Hofstede, G. (2002). Dimensions do not exist: A reply to Brendan McSweeney. Human
Relations, 55(11), 1355-1361.
Hofstede, G. (2005). VSM94-Manual. Retrieved 5 May, 2005, from
http://feweb.uvt.nl/center/hofstede/~1st-VSM.html
Holland, J., & Baker, S. M. (2001). Customer participation in creating site brand loyalty.
Journal of Interactive Marketing, 15(4), 34-45.
Hsiao, C., Sun, B., & Morwitz, V. G. (2002). The role of stated intentions in new

Mun Ga Choi 152
152 References
product purchase forecasting. Econometric Models in Marketing, 16, 11-28.
Huang, W., Le, T., Li, X., & Gandha, S. (2006). Categorizing web features and
functions to evaluate commercial web sites. Industrial Management & Data
Systems, 106(3-4), 523-539.
Hung, K., Li, S. Y., & Belk, R. (2007). Global understandings: Female readers'
perceptions of the new woman in Chinese advertising. Journal of International
Business Studies, 38(6), 1034-1051.
Hwang, W., Jung, H. S., & Salvendy, G. (2006). Internationalisation of e-commerce: A
comparison of online shopping preferences among Korean, Turkish and US
population. Behaviour & Information Technology, 25(1), 3-18.
Hyun, K. (2001). Sociocultural change and traditional values: Confucian values among
Koreans and Korean Americans. International Journal of Intercultural
Relations, 25(2), 203-229.
IELTS. (2004). International English Language Testing System. Retrieved May 20,
2004, from http://www.ielts.org
Internet-World-Stats. (2007). Top 36 countries with the highest Internet penetration rate.
Retrieved 24 November, 2007, from
http://www.internetworldstats.com/top25.htm
Jacob, N. (2005). Cross-cultural investigations: Emerging concepts. Journal of
Organizational Change Management, 18(5), 514-528.
Johnston, K., & Johal, P. (1999). The internet as a virtual cultural region: Are extant
cultural classification schemes appropriate? Internet Research, 9(3), 178-186.
Karande, K., Almurshidee, K. A., & Al-Olayan, F. (2006). Advertising standardisation
in culturally similar markets. International Journal of Advertising,, 25(4), 489-
512.
Kim, D., Pan, Y., & Park, H. S. (1998). High-versus low-context culture: A comparison
of Chinese, Korean, and American cultures. Psychology & Marketing, 15(6),
507-521.
Kjeldgaard, D., & Askegaard, S. (2006). The glocalization of youth culture: The global
youth segment as structures of common difference. Journal of Consumer
Research, 33(2), 231-247.
Ko, H., Roberts, M. S., & Cho, C.-H. (2006). Cross-cultural differences in motivations
and perceived interactivity: A comparative study of American and Korean
Internet users. Journal of Current Issues & Research in Advertising, 28(2), 93-
104.
Koudelova, R., & Whitelock, J. (2001). A cross-cultural analysis of television
advertising in the UK and the Czech Republic. International Marketing Review,
18(3), 286-300.
Mun Ga Choi 153
153 References
Kraemer, K. L., Gibbs, J., & Dedrick, J. (2005). Impacts of globalization on e-
commerce use and firm performance: A cross-country investigation. The
Information Society, 21(5), 323-340.
Lee, H., O'Keefe, R. M., & Yun, K. (2003). The growth of broadband and electronic
commerce in South Korea: Contributing factors. The Information Society, 19(1),
81-93.
Lee, M. Y. P., So, D. W. C., & Wong, L. Y. F. (2006). An inter-linguistic and inter-
cultural analysis of global corporate web sites. Corporate Communications: An
International Journal, 11(3), 275-287.
Lee, S. M., & Ungson, G. R. (2008). Towards a theory of synchronous technological
assimilation: The case of Korea's Internet economy. Journal of World Business,
43(3), 274-289.
Lee, S. M. (2003). South Korea: From the land of morning calm to ICT hotbed.
Academy of Management Executive, 17(2), 7-18.
Liao, C. C., To, P. L., & Shih, M. L. (2006). Website practices: A comparison between
the top 1000 companies in the US and Taiwan. International Journal of
Information Management, 26(3), 196-211.
Liao, H., Proctor, R. W., & Salvendy, G. (2008). Content preparation for cross-cultural
e-commerce: A review and a model. Behaviour & Information Technology,
27(1), 43-61.
Lin, C. A. (2001). Cultural values reflected in Chinese and American television
advertising. Journal of Advertising, 20(4), 83-94.
Lin, C. C. (2002). Organizational size, multiple audiences, and Web site design.
Technical Communication, 49(1), 36-44.
Liu, C., Arnett, K. P., Capella, L. M., & Beatty, R. C. (1997). Web sites of the Fortune
500 companies: Facing customers through home pages. Information &
Management, 31(6), 335-345.
Lu, M., & Yeung, W. (1998). A framework for effective commercial Web application
development. Internet Research: Electronic Networking Applications and
Policy, 8(2), 166-173.
Luna, D., Peracchio, L. A., & de Juan, M. D. (2002). Cross-cultural and cognitive
aspects of web site navigation. Journal of the Academy of Marketing Science,
30(4), 397-410.
Luna, D., Peracchio, L. A., & de Juan, M. D. (2003). The impact of language and
congruity on persuasion in multicultural e-marketing. Journal of Consumer
Psychology, 13(1&2), 41-50.
Maitland, C. F., & Bauer, J. M. (2001). National level culture and global diffusion: The
case of the Internet. In C. Ess (Ed.), Culture, technology, communication:

Mun Ga Choi 154
154 References
Toward an intercultural global village (pp. 87-120). Albany: State University of
New York Press.
Marcus, A., & Gould, E. W. (2000). Crosscurrents: Cultural dimensions and global web
user-interface design. ACM Interactions, 7(4), 33-46.
Martin, J. N., & Nakayama, T. K. (1999). Thinking dialectically about culture and
communication. Communication Theory, 9(1), 1-25.
McSweeney, B. (2002a). Hofstede's model of national cultural differences and their
consequences: A triumph of faith - a failure of analysis. Human Relations, 55(1),
89-118.
McSweeney, B. (2002b). Essentials of scholarship: A reply to Geert Hofstede. Human
Relations, 55(11), 1363-1372.
Metzger, M. J. (2004). Privacy, trust, and disclosure: Exploring barriers to electronic
commerce. Journal of Computer Mediated Communication, 9(4),
http://jcmc.indiana.edu.ezproxy.aut.ac.nz/vol9/issue4/metzger.html.
Miracle, G. E., Chang, K. Y., & Taylor, C. R. (1992). Culture and advertising executives:
A comparison of selected characteristics of Korean and U.S. television
commercials. International Marketing Review, 9(4), 5-17.
Moon, Y. S., & Chan, K. (2005). Advertising appeals and cultural values in television
commercials: A comparison of Hong Kong and Korea. International Marketing
Review, 22(1), 48-66.
Morel, K. P. N., & Snelders, D. (2006). The effect of country-specific design styles of e-
commerce web sites on perceptions of credibility and appeal (pp. 1-43): Delft
University of Technology, Netherlands.
Moriarty, S. E. (1987). A content analysis of visuals used in print media advertising.
Journalism Quarterly, 64(2-3), 550-554.
Moriarty, S. E., & Duncan, T. R. (1991). Global advertising: Issues and practices.
Current Issues and Research in Advertising, 13(1-2), 313-341.
Mueller, B. (1992). Standardization vs. specialization: An examination of westernization
in Japanese advertising. Journal of Advertising Research, 32(1), 15-24.
Naver. (2007). South Korea 1000 companies. Retrieved 4 December, 2007, from
http://finance.naver.com/coinfo/1000_list.php?page=1&order_name=thousand_
rank
Nelson, M. R., & Paek, H. (2005). Cross-cultural differences in sexual advertising
content in a transnational women's magazine. Sex Roles, 53(5/6), 371-383.
Nelson, M. R., & Paek, H. J. (2007). A content analysis of advertising in a global
magazine across seven countries. International Marketing Review, 24(1), 64-86.
NIDA. (2008). Survey on the computer and Internet usage (NIDA statistics report):
Ministry of Information and Communication & National Internet Development

Mun Ga Choi 155
155 References
Agency of Korea.
NZBWW. (2008). The New Zealand Business Who's Who Online.
OECD. (2007). OECE Communications Outlook 2007.
Okazaki, S. (2005). Searching the web for global brands: How American brands
standardise their web sites in Europe. European Journal of Marketing, 39(1/2),
87-109.
Okazaki, S., & Alonso, J. (2003). Right messages for the right site: On-line creative
strategies by Japanese multinational corporations. Journal of Marketing
Communications, 9(4), 221-239.
Okazaki, S., & Mueller, B. (2007). Cross-cultural advertising research: Where we have
been and where we need to go. International Marketing Review, 24(5), 499-518.
Okazaki, S., & Riva, J. A. (2002). A content analysis of multinationals' Web
communication strategies: Cross-cultural research framework and pre-testing.
Internet Research: Electronic Networking Applications and Policy, 12(5), 380-390.
Orth, U. R., Koenig, H. F., & Firbasova, Z. (2007). Cross-national differences in
consumer response to the framing of advertising messages - An exploratory
comparison from Central Europe. European Journal of Marketing, 41(3-4),
327-348.
Osland, J. S., & Bird, A. (2000). Beyond sophisticated stereotyping: Cultural
sensemaking in context. Academy of Management Executive, 14(1), 65-79.
Paek, H. J., Nelson, M. R., & McLeod, D. M. (2004). Beyond polarized cultural values -
A new approach to the study of South Korean and US newspaper
advertisements. Advances in Consumer Research, 31(1), 495-502.
Pallant, J. (2005). SPSS Survival Manual: a step by step guide to data analysis using
SPSS (2 ed.). Crows Nest: Allen & Unwin.
Park, C., & Jun, J. (2003). A cross-cultural comparison of Internet buying behavior.
International Marketing Review, 20(5), 534-553.
Rapaille, C. (2006). The culture code. New York: Broadway Books.
Rey, L. (2001). Cultural attitudes toward technology and communication. In C. Ess
(Ed.), Culture, technology, communication: Toward an intercultural global
village (pp. 87-120). Albany: State University of New York Press.
Rhee, K. Y., & Kim, W. B. (2004). The adoption and use of the Internet in South Korea.
Journal of Computer Mediated Communication, 9(4),
http://jcmc.indiana.edu.ezproxy.aut.ac.nz/vol9/issue4/rhee.html.
Robbins, S. S., & Stylianou, A. C. (2001-2002). A study of cultural differences in global
corporate web sites. Journal of Computer Information Systems, 42(1), 3-9.
Robbins, S. S., & Stylianou, A. C. (2003). Global corporate web sites: An empirical
investigation of content and design. Information & Management, 40(3), 205-
Mun Ga Choi 156
156 References
212.
Ross, D. N. (2001). Electronic communications: Do cultural dimensions matter?
American Business Review, 19(2), 75-80.
Schlegelmilch, B. B., & Sinkovics, R. (1998). Viewpoint: Marketing in the information
age - can we plan for an unpredictable future? International Marketing Review,
15(3), 162-170.
Shao, T., Raymond, M. A., & Taylor, C. (1999). Shifting advertising appeals in Taiwan.
Journal of Advertising Research, 39(6), 61-69.
Sheppard, C., & Scholtz, J. (1999). The effects of cultural markers on web site. Paper
presented at the Proceedings of the 5th Conference on Human Factors and the
Web.
Singh, N., & Baack, D. W. (2004). Web site adaptation: A cross-cultural comparison of
U.S. and Mexican web sites. Journal of Computer-Mediated Communication,
9(4), http://jcmc.indiana.edu/vol9/issue4/singh_baack.html.
Singh, N., & Boughton, P. D. (2005). Measuring Website globalization: A cross-
sectional country and industry level analysis. Journal of Website Promotion,
1(3), 3-20.
Singh, N., Furrer, O., & Ostinelli, M. (2004). To localize or to standardize on the web:
Empirical evidence from Italy, India, Netherlands, Spain, and Switzerland. The
Multinational Business Review, 12(1), 69-87.
Singh, N., Kumar, V., & Baack, D. (2005). Adaptation of cultural content: Evidence
from B2C e-commerce firms. European Journal of Marketing, 39(1/2), 71-86.
Singh, N., & Matsuo, H. (2004). Measuring cultural adaptation on the web: A content
analytic study of U.S. and Japanese web sites. Journal of Business Research,
57(8), 864-872.
Singh, N., Zhao, H., & Hu, X. (2003). Cultural adaptation on the web: A study of
American companies' domestic and Chinese websites. Journal of Global
Information Management, 11(3), 63-80.
Singh, N., Zhao, H., & Hu, X. (2005). Analyzing the cultural content of web sites: A
cross-national comparison of China, India, Japan, and US. International
Marketing Review, 22(2), 129-146.
Singh, S. N., & Dalal, N. P. (1999). Web home pages as advertisements. Communication
of the ACM, 42(8), 91-98.
Steenkamp, J. E. M., & Hofstede, F. T. (2002). International market segmentation:
Issues and perspectives. International Journal of Research in Marketing, 19(3),
185-213.
Stevenson, J. S., Bruner, G. C., & Kumar, A. (2000). Webpage background and viewer
attitudes. Journal of Advertising Research, 40(1/2), 29-34.

Mun Ga Choi 157
157 References
Sugimoto, S., & Levin, J. A. (2000). Reading sideways, backwards, and across: Scottish
and American literacy practices and weaving the Web. In G. E. Hawisher & C.
L. Selfe (Eds.), Global literacies and the World-Wide Web (pp. 133-153).
London: Routledge.
Swanson, L. (2007). Design your web pages for fast loading. Retrieved 7 July, 2007,
from http://www.score.org/eb_5.html
Tarafdar, M., & Zhang, J. (2006). Analysis of critical website characteristics: A cross-
category study of successful web sites. Journal of Computer Information
Systems, 46(2), 14-24.
Taylor, C. R. (2002). What is wrong with international advertising research? Journal of
Advertising Research, 42(6), 48-54.
Taylor, C. R. (2005). Moving international advertising research forward. Journal of
Advertising, 34(1), 7-16.
Taylor, C. R., Miracle, G. E., & Wilson, R. D. (1997). The impact of information level
on the effectiveness of U.S. and Korean television commercials. Journal of
Advertising, 26(1), 1-18.
Teo, H. H., Oh, L.-B., Liu, C., & Wei, K.-K. (2003). An empirical study of the effects of
interactivity on web user attitude. International Journal of Human-Computer
Studies, 58(3), 281-305.
Triandis, H. C. (1995). Individualism & collectivism. Boulder: Westview Press.
Trompenaars, F., & Hampden-Turner, C. (1998). Riding the waves of culture:
Understanding diversity in global (2 ed.). New York: McGraw-Hill.
Tse, D. K., Belk, R. W., & Zhou, N. (1989). Becoming a consumer society: A
longitudinal and cross-cultural content analysis of print ads from Hong Kong,
the People's Republic of China, and Taiwan. Journal of Consumer Research,
15(March), 457-472.
Tse, D. K., & Francis, J. (1994). Cultural differences in conducting intra- and inter-
cultural negotiations: A Sino-Canadian comparison. Journal of International
Business Studies, 25(3), 537-556.
Ulijin, J. M., & Campbell, C. P. (2001). Technical innovation and global business
communication: An introduction. IEEE Transactions on Professional
Communication, 44(2), 77-82.
van Raaij, W. F. (1997). Globalisation of marketing communication? Journal of
Economic Psychology, 18(2-3), 259-270.
Viswanathan, N. K., & Dickson, P. P. (2007). The fundamentals of standardizing global
marketing strategy. International Marketing Review, 24(1), 46-63.
Wallace, P. M. (1999). The psychology of the Internet. Cambridge: Cambridge
University Press.

Mun Ga Choi 158
158 References
Wang, C. L., & Chan, A. K. K. (2001). A content analysis of connectedness vs.
separateness themes used in US and PRC print. International Marketing Review,
18(2), 145-159.
Warden, C. A., Lai, M., & Wu, W. (2002). How worldwide is marketing communication
on the World Wide Web? Journal of Advertising Research, 42(5), 72-85.
WebRank. (2007). Search Engine Compatibility and the top 100 New Zealand
Companies. Retrieved 4 December, 2007, from
http://www.webrank.biz/Top100NZ.htm
Weinberg, B. D. (2000). Don't keep your Internet customers waiting too long at the
(virtual) front door. Journal of Interactive Marketing, 14(1), 30-39.
Welch, D. (2007). Kiwis continue to embrace broadband. Retrieved 7 March 2007, from
http://www.scoop.co.nz/stories/BU0703/S00121.htm
Wikipedia. (2007). List of countries by GDP (PPP) per capita. Retrieved 24 November,
2007, from
http://en.wikipedia.org/wiki/List_of_countries_by_GDP_%28PPP%29_per_cap
ita
Williams, R. (1983). Keywords: A vocabulary of culture and society. London: Fontana.
Williamson, D. (2002). Forward from a critique of Hofstede's model of national culture.
Human Relations, 55(11), 1373-1395.
Wimmer, R. D., & Dominick, J. R. (2006). Mass media research: An introduction (8th
ed.). Belmont, CA Wadsworth.
Winter, S. J., Saunders, C., & Hart, P. (2003). Electronic window dressing: impression
management with Websites. European Journal of Information Systems, 12(4),
309-322.
Wurtz, E. (2005). A cross-cultural analysis of websites from high-context cultures and
low-context cultures. Journal of Computer-Mediated Communication, 11(1),
http://jcmc.indiana.edu/vol11/issue11/wuertz.html.
Yates, R. A., & Noyes, J. M. (2007). Web site design, self-monitoring style, and
consumer preference. Journal of Applied Social Psychology, 37(6), 1341-1362.
Yli-Jokipii, H. (2000). The local and the global: An exploration into the Finnish and
English Websites of a Finnish company. IEEE Transactions on Professional
Communication, 44(2), 104-113.
Zahedi, F. M., Van Pelt, W. V., & Song, J. (2001). A conceptual framework for
international web design. IEEE Transactions on Professional Communication,
44(2), 83-103.
Zahir, S., Dobing, B., & Hunter, M. G. (2002). Cross-cultural dimensions of Internet
portals. Internet Research: Electronic Networking Applications and Policy,
12(3), 210-220.

Mun Ga Choi 159
159 References
Zhang, J., & Shavitt, S. (2003). Cultural values in advertisements to the Chinese x-
generation. Journal of Advertising, 32(1), 23-33.
Zhou, N., & Belk, R. W. (2004). Chinese consumer readings of global and local
advertising appeals Journal of advertising, 33(3), 63-76.
Zhou, S., Zhou, P., & Xue, F. (2005). Visual differences in U.S. and Chinese television
commercials. Journal of Advertising, 34(1), 111-119.

Mun Ga Choi 160
160 Appendices
Appendices
Appendix 1. New Zealand and South Korean company lists
Table 34 : Korean company list
Industry Company Name URL
Agriculture &
Fishing (10)
Han Kook Fruits & Vegetables www.hkck.co.kr
Joong Ang Fruits & Vegetables www.ejoongang.co.kr
Lotte Milk www.lottemilk.co.kr
Nong Woo Bio www.nongwoobio.co.kr
Onnara www.onnara.com
Oyang Corporation www.oy.co.kr
Sajo Industries www.sajo.co.kr
Seoul Milk www.seoulmilk.co.kr
Shinhan F&B www.myzingo.co.kr
Silla Co. www.sla.co.kr
Apparel &
Jewellery (10)
Agabang www.agabang.com
Cambridge Members www.cambridge.co.kr
Good People www.j.co.kr
In the F www.inthef.co.kr
Jindo F & CO. www.jindofand.co.kr
Kolon Fashion www.kolonfashion.biz
LG Fashion www.lgfashion.co.kr
Shinwon www.sw.co.kr
Trybrands www.trybrands.co.kr
Woosung I & C www.woosungshirts.com
Building
materials &
Construction (10)
Byucksan Engineering &
Construction
www.becco.co.kr
Daewoo Engineering &
Construction
www.dwconst.co.kr
Daelim Industrial www.daelim.co.kr
Doosan Heavey www.doosanheavy.com
GS Engineering &
Construction
www.gsconst.co.kr
Hyundai Engineering &
Construction
www.hdec.co.kr

Mun Ga Choi 161
161 Appendices
Kumho Industrial www.kumhoenc.com
POSCO www.posco.com
Ssanyong E&C www.ssyenc.com
Sungwon Co. www.sungwon.co.kr
Business
Assistance
Service (10)
Cheil Communications www.cheil.com
Gentech Holdings www.g-entech.com
Hyosung ITX www.hyosungitx.co.kr
Korea Ratings www.korearatings.com
MPC www.mpc.co.kr
National Information & Credit
Evaluation
www.nice.co.kr
Nice e-Banking Services www.nicebanking.co.kr
SCI www.sci.co.kr
Shin Cheon Co. www.shincheon.co.kr
S1 www.s1.co.kr
Durables (10) Borneo International Furniture www.bif.co.kr
Enex www.enex.co.kr
Halla Climate Control Co. www.hcc.co.kr
Humax www.humaxdigital.com/korea/
LG Cable www.lgcable.co.kr
LG Electronics www.lge.co.kr
Samsung Electronics www.sec.co.kr
Samsung Techwin www.samsungtechwin.co.kr
Shindoricoh www.sindo.co.kr
Woongjin Coway www.coway.co.kr
Energy (10) Daegu City Gas www.Taegugas.co.kr
Daehan City Gas www.daehancitygas.com
Incheon City Gas www.icgas.co.kr
Korea Gas Corporation www.kogas.or.kr
Korea Electric Power www.kepco.co.kr
Kyungdong City Gas www.kdgas.co.kr
Pusan City Gas www.sk-
enron.com/pusan/main.jsp
Samchully www.samchully.co.kr
Seoul City Gas www.seoulgas.co.kr
Yesco www.lsyesco.com
Finance & Dongbu Insurance www.idongbu.com

Mun Ga Choi 162
162 Appendices
Insurance (10) Industrial Bank of Korea www.ibk.co.kr
Hana Financial Group www.hanafn.com
Han Kook Capital www.hkcapital.co.kr
Korea Exchange Bank www.keb.co.kr
Korea Investment Holdings www.koreaholdings.com
KTB Network www.ktb.co.kr
Samsung Card Co. www.samsungcard.co.kr
Shinhan Financial Group www.shinhangroup.com
Woori Finance Holdings www.woorifg.com
Food &
Beverages (10)
Binggae www.bing.co.kr
CJ Cheil Jedang Corp www.cj.co.kr
HITE Brewery www.hite.com
KSDB www.ksdb.co.kr
Lotte Confectionery www.lotteconf.co.kr
Nongshim www.nongshim.com
Orion Corp. www.orionworld.com
Samlip General Foods www.samlipgf.co.kr
Samyang Foods www.samyangfood.co.kr
Seoul Food Industrial www.seoul-food.co.kr
Retail Sales (10) CJHS www.cjmall.com
D & Shop www.dnshop.com
Eyesvision www.eyesshop.com
GSHS www.gseshop.co.kr
Hyundai DSF www.ehyundai.com
Kyobobook www.kyobobook.co.kr
Lotte Shopping Co. www.lotteshopping.com
Savezone I & C www.savezone.co.kr
Shinsegae Co. www.shinsegae.com
Wizwid www.wizwid.com
Science &
Technology (10)
Crystal Genomics www.crystalgenomics.com
Daeduck Electronics www.daeduckgds.com
Eco solution www.ecosol.co.kr
HumanTec www.humantec.co.kr
Hynix Semiconductor www.hynix.co.kr
Interflex Co. www.interflex.co.kr
LG Micron www.lgmicron.com
NHN www.nhncorp.com

Mun Ga Choi 163
163 Appendices
Viromed www.viromed.co.kr
Yooshin www.yooshin.co.kr
Telecommunicati
on (10)
Hanaro Telecom www.hanaro.com
Hannet www.hannet.net
KL-Net www.klnet.co.kr.
KT Corporation www.kt.com
KTF www.ktf.com
KTH http://corp.paran.com
KRT Net www.krtnet.co.kr
LG Dacom www.lgdacom.net
LG Telecom www.lgtelecom.com
SK Telecom www.sktelecom.com/main.htm
l
Transport (10) Dongbang www.dongbang.co.kr
Dongyang Express www.dyexpress.co.kr
Hanjin Logistics www.hanjin.co.kr
Hyundai Merchant Marine www.hmm21.com
Glovis www.glovis.net
KCTC www.kctc.co.kr
Korean Airlines http://kr.koreanair.com
Korea Express www.korex.co.kr
Kukbo www.kukbo.com
Sun Kwang www.sun-kwang.co.kr
Table 35 : New Zealand company list
Industry Company name URL
Agriculture &
Fishing (10)
A2 Corporation www.a2corporation.com
AFFCO Holdings Ltd www.affco.co.nz
Dairy Equity Ltd www.dairyequity.co.nz
Fonterra Co-operative Group www.fonterra.co.nz
ENZA www.enza.co.nz
Sanford www.sanford.co.nz
Satara Co-operative Group www.satara.co.nz
Seek a Kiwifruit Industries Ltd www.seeka.co.nz
Turners & Growers Ltd www.turnersandgrowers.com
ZESPRI Group www.zespri.com

Mun Ga Choi 164
164 Appendices
Apparel &
Jewellery (10)
Ambler & Co. www.ambler.co.nz
Canterbury of New Zealand www.canterburynz.com
Cavalier Corporation Ltd www.cavcorp.co.nz
Ezibuy www.ezibuy.co.nz
Hallenstein Glasson www.hallensteinglasson.co.nz
Kathmandu www.kathmandu.co.nz
Line 7 New Zealand www.line7.com
Michael Hill International www.michaelhill.co.nz
Postie Plus www.postieplus.co.nz
Pumpkin Patch www.pumpkinpatch.biz
Building
materials &
Construction (10)
AB Equipment www.abequipment.co.nz
Acorn Building Supplies www.acornbuilding.co.nz
Alliance Construction www.allianceconstruction.co.n
z
Fletcher Building www.fletcherbuilding.com
Glenn Henderson Ltd www.hendersondemolition.co.
nz
Hawkins Construction www.hawkins.co.nz
Mainzeal Property and
Construction
www.mainzeal.co.nz
Nuplex Industries Ltd www.nuplex.co.nz
Steel & Tube Holdings Ltd www.steelandtube.co.nz
Winstone Wallboards www.gib.co.nz
Business
Assistance
Service (10)
Allied Work Force Group www.labourhire.co.nz
Amtel Communications www.amtel.co.nz
BERL Business and Economic
Research
www.berl.co.nz
Brookers Ltd www.brookers.co.nz
Canary Data Solutions www.canary.co.nz
Diligent Board Member
Services, INC
www.boardbooks.com
Finzsoft Solutions www.finzsoft.com
Jade Software Corporation www.jadeworld.com
Miller Dean Chartered
Accountants and Audits
www.millerdean.co.nz
Spotless Service www.spotless.co.nz
Durables (10) Ebos Group www.ebos.co.nz

Mun Ga Choi 165
165 Appendices
Fisher & Paykel Appliances
Hldgs
www.fisherpaykel.co.nz
Fisher & Paykel Healthcare
Corporation
www.fphcare.com
Methven Ltd www.methven.biz
Mercer Stainless www.mercers.co.nz
Provenco Group Ltd www.provenco.com
Rakon Ltd www.rakon.co.nz
Ramset www.ramset.co.nz
Scott Technology Ltd www.scott.co.nz
Smartpay Ltd www.smartpay.co.nz
Energy (10) Contact Energy www.contactenergy.co.nz
Genesis Power www.genesisenergy.co.nz
Horizon Energy www.horizonenergy.net.nz
Infratil Ltd www.infratil.com
Meridian Energy www.meridianenergy.co.nz
Natural Gas Corporation of
New Zealand (Vector Energy)
www.ngc.co.nz
New Zealand Refining www.nzrc.co.nz
New Zealand Windfarms www.nzwindfarms.co.nz
SunSeeker Energy www.sunseekerenergy.co.nz
Trust Power www.trustpower.co.nz
Finance &
Insurance (10)
ANZ www.anz.co.nz
ASB Capital www.asb.co.nz
BNZ www.bnz.co.nz
Dominion Finance www.dominionfinance.co.nz
Dorchester Pacific www.dorchesterpacific.co.nz
Lombard Group www.lombardgroup.co.nz
New Zealand Finance www.nzf.co.nz
Pyne Gould Corporation www.pgc.co.nz
Tower Insurance www.towerlimited.com
Vero Insurance www.vero.co.nz
Food &
Beverages (10)
Charlie‟s Group Ltd www.charlies.co.nz
Delegats Group Ltd www.delegats.co.nz
DB Breweries www.dbbreweries.co.nz
Goodman Fielder Ltd www.goodmanfielder.com.au
Griffins Foods www.griffins.co.nz

Mun Ga Choi 166
166 Appendices
Heinz Wattie‟s Ltd www.heinz.co.nz
Just Water International Ltd www.jwi.co.nz
Lion Nathan Limited www.lion-nathan.com.au
NZ Wine Company www.nzwineco.co.nz
Oyster Bay Marlborough
Vineyards Ltd
www.obmvl.co.nz
Retail Sales (10) Boise Cascade Office Products
(NZ)
www.officemax.co.nz
Briscoe Group Ltd www.briscoegroup.co.nz
Farmlands Trading Society www.farmlands.co.nz
Foodstuffs www.foodstuffs.co.nz
Kirkcaldie & Stains www.kirkcaldies.co.nz
Life Pharmacy www.lifepharmacy.co.nz
Mitre 10 www.mitre10.co.nz
Smiths City www.smithscitygroup.co.nz
Warehouse Group www.thewarehouse.co.nz
Whitcoulls Group www.arw.co.nz/
Science &
Technology (10)
BLIS Technologies www.blis.co.nz
Botry-Zen www.botryzen.co.nz
Cadmus Technology Ltd www.cadmus.co.nz
Cavotec MSL Holdings www.cavotec.com
CER Group Ltd www.cer.co.nz
Genesis Reseach &
Development Corp
www.genesis.co.nz
ICP Biotechnology www.icpbio.com
Pacific Edge Biotechnology www.pacificedgebiotech.com
Sealegs Corporation www.sealegs.com
Windflow Technology www.windflow.co.nz
Telecommunicati
on (10)
Atg Technology Group www.atgltd.co.nz
Avotus www.avotus.com
Cabletalk Group www.cabletalk.co.nz
ihug www.ihug.co.nz
Pro-active Telecommunications www.proactivetech.co.nz
Teamtalk www.teamtalk.co.nz
Telecom Corp www.telecom.co.nz
TelstraClear www.telstraclear.co.nz
Vodafone New Zealand www.vodafone.co.nz

Mun Ga Choi 167
167 Appendices
Zintel Group www.zintel.co.nz
Transport (10) Air New Zealand www.airnewzealand.com
Crown Relocations www.crownrelo.co.nz
Eurocan Beacon International www.eurocan.co.nz
Freightways Ltd www.freightways.co.nz
InterCity www.intercity.co.nz
McCullough Ltd www.mmnz.biz/mccullough.ht
m
Mainfreight Ltd www.mainfreight.com
New Zealand Couriers Ltd www.nzcouriers.co.nz
New Zealand Post www.nzpost.co.nz
Owens Group www.owensglobal.com

168
Appendix 2. Use of visuals and features by New Zealand and South Korean industries
Table 36 : Use of visuals by industry sector
Industry a
- Frequency (%) Chi-square
I(1)
n =20
I(2)
n =20
I(3)
n =20
I(4)
n =20
I(5)
n =20
I(6)
n =20
I(7)
n =20
I(8)
n=20
I(9)
n=20
I(10)
n=20
I(11)
n=20
I(12)
n=20 Values
H1: description of a
product 80 85 80 35 75 20 20 85 80 55 60 55
2=54.911
b
H2: demonstration of a
product 15 75 90 35 55 15 10 30 40 50 45 65
2=55.314
b
H3: people associated
with others 35 35 20 20 15 25 20 20 0 30 20 25 N/A
d
H4: celebrity models 0 30 15 0 10 0 10 10 10 0 0 0 N/Ad
H5: animated
illustrations 20 15 20 10 5 40 30 25 25 20 20 5 N/A
d
H6: moving visuals 60 75 75 45 65 60 80 65 55 70 65 55 N/Ad
H7: music or sound
effects 5 20 25 0 0 5 10 5 5 0 5 0 N/A
d
a I(1): agriculture & fishing, I(2): apparel & jewellery, I(3): building materials & construction, I(4): business assistance service, I (5): durables, I(6):
energy, I(7): finance & insurance, I(8): food & beverages, I(9): retail sales, I(10): science & technology, I(11): telecommunication, and I(12): transport b Industry sector differed significantly at p <.001,
c Industry sector differed significantly at p <.05
d N/A: statistically invalid or insignificant at p <.05

169
Table 37: Use of Web features by industry sector
Industry a
- Frequency (%) Chi-square
I(1)
n =20
I(2)
n =20
I(3)
n =20
I(4)
n =20
I(5)
n =20
I(6)
n =20
I(7)
n =20
I(8)
n=20
I(9)
n=20
I(10)
n=20
I(11)
n=20
I(12)
n=20 Values
Hierarchy information 55 25 80 50 30 85 65 45 35 60 45 45 2=30.167
b
Messages of leaders 65 40 85 80 85 95 90 80 70 90 90 80 N/Ad
Vision statement 90 85 95 100 95 100 100 100 85 100 100 100 N/Ad
Community relations 30 45 60 30 45 85 65 65 45 35 60 55 2=30.167
c
Newsletter 90 80 90 95 90 100 95 95 95 100 90 75 N/Ad
Links to local Web sites 85 25 75 45 35 55 60 55 60 85 70 75 2=32.807
b
Loyalty program 0 60 5 0 15 15 25 15 85 0 30 15 N/Ad
National identity 5 0 5 5 5 5 10 15 5 5 0 5 N/Ad
Sharing experience 20 15 10 35 10 35 25 55 30 25 50 20 2=22.821
c
Search engine 40 25 40 35 35 55 65 45 70 25 60 40 N/Ad
Personalisation 65 60 30 35 60 70 60 60 85 15 55 55 2=31.754
b
Good privacy statement 55 65 30 55 55 75 70 75 85 40 65 55 2=21.935
c

170
Product uniqueness 90 80 80 85 85 95 40 85 60 95 100 75 N/Ad
Employment opportunities 70 75 85 80 80 85 60 80 90 65 85 60 N/Ad
Customer service 80 95 90 85 90 85 80 70 80 65 95 100 N/Ad
Index/directory 100 100 90 100 100 100 100 90 100 100 100 100 N/Ad
History of the company 75 70 90 75 80 65 85 90 85 70 65 70 N/Ad
Terms and conditions 50 65 20 55 55 60 70 45 95 30 60 40 2=33.438
b
Awards 40 45 60 40 55 45 50 60 65 75 45 45 N/Ad
Financial information 70 60 65 65 85 95 95 70 80 100 85 65 N/Ad
Product advertisement 45 90 50 50 45 50 40 70 85 50 75 45 2=26.857
c
Clear gender role 5 0 0 0 0 0 0 0 0 0 0 0 N/Ad
Rank and prestige and use
of superlatives 90 100 95 100 100 100 100 90 90 100 100 90 N/A
d
Online business 25 45 10 25 20 45 45 20 80 15 50 65 2=43.485
b
a I(1): agriculture & fishing, I(2): apparel & jewellery, I(3): building materials & construction, I(4): business assistance service, I (5): durables, I(6): energy, I(7):
finance & insurance, I(8): food & beverages, I(9): retail sales, I(10): science & technology, I(11): telecommunication, and I(12): transport
b Industry sector differed significantly at p <.001,
c Industry sector differed significantly at p <.05
d N/A: statistically invalid or insignificant at p <.05
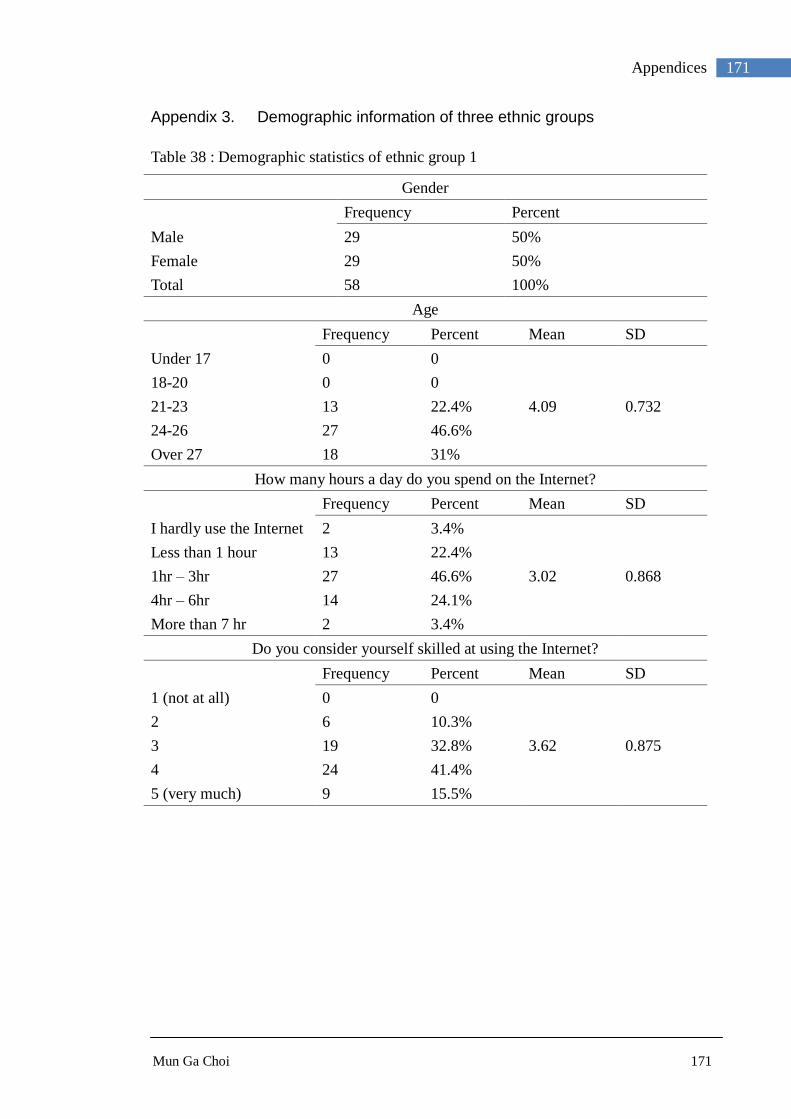
Mun Ga Choi 171
171 Appendices
Appendix 3. Demographic information of three ethnic groups
Table 38 : Demographic statistics of ethnic group 1
Gender
Frequency Percent
Male 29 50%
Female 29 50%
Total 58 100%
Age
Frequency Percent Mean SD
Under 17 0 0
4.09 0.732
18-20 0 0
21-23 13 22.4%
24-26 27 46.6%
Over 27 18 31%
How many hours a day do you spend on the Internet?
Frequency Percent Mean SD
I hardly use the Internet 2 3.4%
3.02 0.868
Less than 1 hour 13 22.4%
1hr – 3hr 27 46.6%
4hr – 6hr 14 24.1%
More than 7 hr 2 3.4%
Do you consider yourself skilled at using the Internet?
Frequency Percent Mean SD
1 (not at all) 0 0
3.62 0.875
2 6 10.3%
3 19 32.8%
4 24 41.4%
5 (very much) 9 15.5%

Mun Ga Choi 172
172 Appendices
Table 39 : Demographic statistics of ethnic group 2
Gender
Frequency Percent
Male 24 38.1%
Female 39 61.9%
Total 63 100%
Age
Frequency Percent Mean SD
Under 17 2 3.2%
2.90 1.103
18-20 26 41.3%
21-23 20 31.7%
24-26 6 9.5%
Over 27 9 14.3%
How many hours a day do you spend on the Internet?
Frequency Percent Mean SD
I hardly use the Internet 3 4.8%
2.73 0.627
Less than 1 hour 14 22.2%
1hr – 3hr 43 68.3%
4hr – 6hr 3 4.8%
More than 7 hr 0 0%
Do you consider yourself skilled at using the Internet?
Frequency Percent Mean SD
1 (not at all) 1 1.6%
3.70 0.873
2 4 6.3%
3 18 28.6%
4 30 47.6%
5 (very much) 10 15.9%

Mun Ga Choi 173
173 Appendices
Table 40 : Demographic statistics of ethnic group 3
Gender
Frequency Percent
Male 17 32.1%
Female 36 67.9%
Total 53 100%
Age
Frequency Percent Mean SD
Under 17 2 3.8%
3.51 1.219
18-20 10 18.9%
21-23 16 30.2%
24-26 9 17.0%
Over 27 16 30.2%
How many hours a day do you spend on the Internet?
Frequency Percent Mean SD
I hardly use the Internet 1 1.9
2.98 0.665
Less than 1 hour 9 17.0
1hr – 3hr 33 62.3
4hr – 6hr 10 18.9
More than 7 hr 0 0
Do you consider yourself skilled at using the Internet?
Frequency Percent Mean SD
1 (not at all) 2 3.8%
3.30 0.890
2 5 9.4%
3 25 47.2%
4 17 32.1%
5 (very much) 4 7.5%
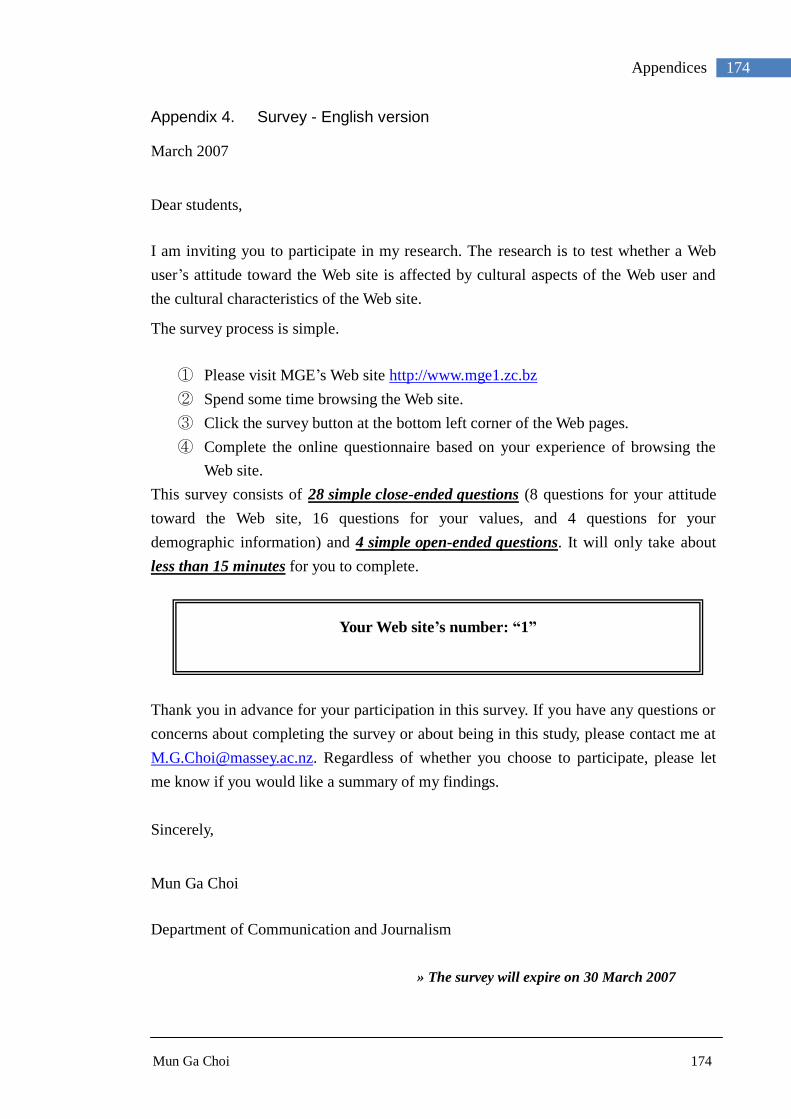
Mun Ga Choi 174
174 Appendices
Appendix 4. Survey - English version
March 2007
Dear students,
I am inviting you to participate in my research. The research is to test whether a Web
user‟s attitude toward the Web site is affected by cultural aspects of the Web user and
the cultural characteristics of the Web site.
The survey process is simple.
① Please visit MGE‟s Web site http://www.mge1.zc.bz
② Spend some time browsing the Web site.
③ Click the survey button at the bottom left corner of the Web pages.
④ Complete the online questionnaire based on your experience of browsing the
Web site.
This survey consists of 28 simple close-ended questions (8 questions for your attitude
toward the Web site, 16 questions for your values, and 4 questions for your
demographic information) and 4 simple open-ended questions. It will only take about
less than 15 minutes for you to complete.
Thank you in advance for your participation in this survey. If you have any questions or
concerns about completing the survey or about being in this study, please contact me at
[email protected]. Regardless of whether you choose to participate, please let
me know if you would like a summary of my findings.
Sincerely,
Mun Ga Choi
Department of Communication and Journalism
» The survey will expire on 30 March 2007
Your Web site’s number: “1”
(Please tick “1” for the first question asking about your Web site‟s number)
Mun Ga Choi 175
175 Appendices
Instructions:
Thank you for participating in this survey.
Please answer the following questions by ticking the appropriate button
and click the submit button after completing the questions.
Note:
This survey is confidential and taking part in this survey represents your
informed consent.
What is your Web site number? - Your Web site's number is indicated in the coverletter
○ 1 ○ 2 ○ 3 ○ 4
About the Web site
The following items assess your general favourability toward the Web site you just visited.
My first impression of this Web site is good.
○ 1 (strongly disagree) ○ 2 (moderately disagree) ○ 3 (slightly disagree) ○ 4 (neutral) ○
5 (slightly agree) ○ 6 (moderately agree) ○ 7 (strongly agree)
This Web site makes it easy for me to build a relationship with this company.
○ 1 (strongly disagree) ○ 2 (moderately disagree) ○ 3 (slightly disagree) ○ 4 (neutral) ○
5 (slightly agree) ○ 6 (moderately agree) ○ 7 (strongly agree)
I am satisfied with the service provided by this Web site.
○ 1 (strongly disagree) ○ 2 (moderately disagree) ○ 3 (slightly disagree) ○ 4 (neutral) ○
5 (slightly agree) ○ 6 (moderately agree) ○ 7 (strongly agree)
I feel comfortable in surfing this Web site.
○ 1 (strongly disagree) ○ 2 (moderately disagree) ○ 3 (slightly disagree) ○ 4 (neutral) ○
5 (slightly agree) ○ 6 (moderately agree) ○ 7 (strongly agree)
I feel surfing this Web site is a good way for me to spend my time.
○ 1 (strongly disagree) ○ 2 (moderately disagree) ○ 3 (slightly disagree) ○ 4 (neutral) ○
5 (slightly agree) ○ 6 (moderately agree) ○ 7 (strongly agree)
It is hard to put into words, but this Web site leaves me with a good feeling.
○ 1 (strongly disagree) ○ 2 (moderately disagree) ○ 3 (slightly disagree) ○ 4 (neutral) ○
5 (slightly agree) ○ 6 (moderately agree) ○ 7 (strongly agree)

Mun Ga Choi 176
176 Appendices
I would like to visit this Web site again in the future.
○ 1 (strongly disagree) ○ 2 (moderately disagree) ○ 3 (slightly disagree) ○ 4 (neutral) ○
5 (slightly agree) ○ 6 (moderately agree) ○ 7 (strongly agree)
If I needed one of these products and this Web site provided online shopping service, I would
consider buy it from this Web site.
○ 1 (strongly disagree) ○ 2 (moderately disagree) ○ 3 (slightly disagree) ○ 4 (neutral) ○
5 (slightly agree) ○ 6 (moderately agree) ○ 7 (strongly agree)
What particular aspects of the Web site did you find most appealing?
What particular aspects of the Web site did you find least appealing?
About your values
Please think of an ideal job. In choosing an ideal job, how important would it be to you to...
have sufficient time for your personal or family life.
○ 1 (of utmost importance) ○ 2 (very important) ○ 3 (of moderate importance) ○ 4 (of little
importance) ○ 5 (of very little or no importance)
have good physical working conditions (good ventilation, lighting, and adequate work space,
etc.).
○ 1 (of utmost importance) ○ 2 (very important) ○ 3 (of moderate importance) ○ 4 (of little
importance) ○ 5 (of very little or no importance)
have a good working relationship with your boss.

Mun Ga Choi 177
177 Appendices
○ 1 (of utmost importance) ○ 2 (very important) ○ 3 (of moderate importance) ○ 4 (of little
importance) ○ 5 (of very little or no importance)
have security of employment.
○ 1 (of utmost importance) ○ 2 (very important) ○ 3 (of moderate importance) ○ 4 (of little
importance) ○ 5 (of very little or no importance)
work with people who cooperate well with one another.
○ 1 (of utmost importance) ○ 2 (very important) ○ 3 (of moderate importance) ○ 4 (of little
importance) ○ 5 (of very little or no importance)
be consulted by your boss in his/her decisions.
○ 1 (of utmost importance) ○ 2 (very important) ○ 3 (of moderate importance) ○ 4 (of little
importance) ○ 5 (of very little or no importance)
have an opportunity for advancement to higher level jobs.
○ 1 (of utmost importance) ○ 2 (very important) ○ 3 (of moderate importance) ○ 4 (of little
importance) ○ 5 (of very little or no importance)
have an element of variety and adventure in the job.
○ 1 (of utmost importance) ○ 2 (very important) ○ 3 (of moderate importance) ○ 4 (of little
importance) ○ 5 (of very little or no importance)
How often do you feel nervous or tense?
○ 1 (never) ○ 2 (seldom) ○ 3 (sometimes) ○ 4 (usually) ○ 5 (always)
How often, in your experience, are young people afraid to express disagreement with their
parents?
○ 1 (very seldom) ○ 2 (seldom) ○ 3 (sometimes) ○ 4 (frequently) ○ 5 (very frequently)
Most people can be trusted.
○ 1 (strongly agree) ○ 2 (agree) ○ 3 (neutral) ○ 4 (disagree) ○ 5 (strongly disagree)
Conflicts with our opponents are best resolved by both parties compromising a bit.
○ 1 (strongly agree) ○ 2 (agree) ○ 3 (neutral) ○ 4 (disagree) ○ 5 (strongly disagree)
The main reason organisations have bosses and subordinates is so that everyone knows who
has authority over whom.
○ 1 (strongly agree) ○ 2 (agree) ○ 3 (neutral) ○ 4 (disagree) ○ 5 (strongly disagree)

Mun Ga Choi 178
178 Appendices
Competition between students usually does more harm than good.
○ 1 (strongly agree) ○ 2 (agree) ○ 3 (neutral) ○ 4 (disagree) ○ 5 (strongly disagree)
Rules in an organisation should not be broken - even if somebody thinks it is not in the
organisation's best interest.
○ 1 (strongly agree) ○ 2 (agree) ○ 3 (neutral) ○ 4 (disagree) ○ 5 (strongly disagree)
When people have failed in life, it is often their own fault.
○ 1 (strongly agree) ○ 2 (agree) ○ 3 (neutral) ○ 4 (disagree) ○ 5 (strongly disagree)
About yourself
Are you : ○ Male ○ Female
Which of the following age categories are you in?
○ under 17 ○ 18 – 20 ○ 21 - 23 ○ 24 – 26 ○ over 27
Please write the ethnic group you belong to (e.g. Chinese, Maori, or Italian).
On average, how many hours a day do you spend on the Internet?
○ I hardly use the Internet ○ less than 1 hour ○ 1hr - 3hr ○ 4hr - 6hr ○ more than 7hr
Do you consider yourself skilled at using the Internet?
○ 1 (not at all) ○ 2 ○ 3 ○ 4 ○ 5 (very much)
Are there any further comments you would like to make regarding this questionnaire?

Mun Ga Choi 179
179 Appendices
Appendix 5. Survey - Korean version
학생 여러분께,
저의 논문의 서베이 참여를 부탁드립니다. 이 연구의 주된 목적은 웹사용자의 특정
웹사이트에 대한 의견이 그 웹사이트의 문화적 특성과 웹사용자 본인의 문화적 특성
에 의해 영향을 받는지를 알아보는 것입니다.
서베이의 과정은 간단합니다.
①먼저 다음의 “MG Electronics” 회사 웹사이트에 방문해 주십시요.
http://www.mge3.zc.bz
②웹사이트를 여기저기 구경해 주십시요.
③웹페이지의 왼쪽 아래쪽에 있는 “survey” 버튼을 클릭해 주십시요.
④방금 구경한 웹사이트의 경험을 토대로 온라인 질문서를 완성해 주십시요.
이 서베이는 29 개의 간단한 객관식 질문들 (방문한 웹사이트에 대한 당신의 견해에
관한 질문 8 가지, 당신의 가치에 대한 질문 16 가지, 당신에 관한 질문 5 가지)과 3
개의 간단한 주관식 질문들로 이루어져 있습니다. 온라인 질문서를 완성하는 데 대
략 15 분 미만이 소요될 것 입니다.
만약 서베이 또는 이 논문에 대해서 질문이 있으시면 [email protected] 으로
연락 주십시요. 서베이의 참여 여부의 관계없이, 만약 이 논문의 조사결과를 알고 싶
으시면 연락 주십시요. 바쁘시더라도 많은 참여 부탁드리겠습니다.
감사합니다.
최문가드림
Department of Communication and Journalism
Massey University, New Zealand
» The survey will expire on 31 Dec 2006
당신이 방문한 웹사이트 번호: “3”
(당신의 웹사이트 번호를 묻는 질문서의 첫번째 질문에 “3”이라고 체크해
주십시요)
)

Mun Ga Choi 180
180 Appendices
설명:
이 서베이에 참여해 주셔서 감사합니다.
알맞은 버튼에 체크하므로 다음의 질문에 답해 주시고, 답변이 끝나시면 "submit button"을 눌러
주십시요.
주의:
이 서베이는 비밀이 보장되며, 이 서베이에 참여하는 것은 당신의 "설명에 근거한 자발적 동의
(informed consent)" 간주 합니다.
당신의 뭽사이트 번호는 무엇입니까? - 웹사이트 번호는 받으신 이메일이나 웹사이트 주소를
참고 하십시요.
(예를 들면, 당신이 방문한 웹사이트의 주소가 만약 www.mge1.zc.bz 라면 1 번에,
만약 www.mge4.zc.bz 라면 4 번에 체크해 주십시요.)
○ 1 ○ 2 ○ 3 ○ 4
웹사이트에 대하여
다음의 질문들은 금방 방문한 웹사이트에 대한 당신의 일반적인 호감도를 측정하는 것입니다.
이 웹사이트에 대한 나의 첫 느낌은 좋다.
○ 1 (전혀 동의하지 않음) ○ 2 (동의하지 않음) ○ 3 (약간 동의하지 않음) ○ 4 (중간) ○
5 (약간 동의함) ○ 6 (동의함) ○ 7 (매우 동의함)
이 웹사이트는 내가 이 회사와의 관계를 맺는 것을 쉽게 만든다.
○ 1 (전혀 동의하지 않음) ○ 2 (동의하지 않음) ○ 3 (약간 동의하지 않음) ○ 4 (중간) ○
5 (약간 동의함) ○ 6 (동의함) ○ 7 (매우 동의함)
나는 이 웹사이트에 의해 제공되는 서비스에 만족한다.
○ 1 (전혀 동의하지 않음) ○ 2 (동의하지 않음) ○ 3 (약간 동의하지 않음) ○ 4 (중간) ○
5 (약간 동의함) ○ 6 (동의함) ○ 7 (매우 동의함)
나는 이 웹사이트를 서핑함에 편안함을 느낀다.
○ 1 (전혀 동의하지 않음) ○ 2 (동의하지 않음) ○ 3 (약간 동의하지 않음) ○ 4 (중간) ○
5 (약간 동의함) ○ 6 (동의함) ○ 7 (매우 동의함)
나는 이 웹사이트를 서핑하는 것이 나의 시간을 보내는 좋은 방법이라고 느낀다.
○ 1 (전혀 동의하지 않음) ○ 2 (동의하지 않음) ○ 3 (약간 동의하지 않음) ○ 4 (중간) ○
5 (약간 동의함) ○ 6 (동의함) ○ 7 (매우 동의함)
말로 표현하기는 어렵지만, 이 웹사이트는 나에게 좋은 느낌을 남긴다.

Mun Ga Choi 181
181 Appendices
○ 1 (전혀 동의하지 않음) ○ 2 (동의하지 않음) ○ 3 (약간 동의하지 않음) ○ 4 (중간) ○
5 (약간 동의함) ○ 6 (동의함) ○ 7 (매우 동의함)
나는 이 웹사이트를 미래에 다시 방문하고 싶다.
○ 1 (전혀 동의하지 않음) ○ 2 (동의하지 않음) ○ 3 (약간 동의하지 않음) ○ 4 (중간) ○
5 (약간 동의함) ○ 6 (동의함) ○ 7 (매우 동의함)
만약 이 제품들중에 하나가 필요하다면, 또한 이 웹사이트가 온라인쇼핑 서비스를 제공한다면,
나는 이 웹사이트에서 제품을 구입하는 것을 생각해 보겠다.
○ 1 (전혀 동의하지 않음) ○ 2 (동의하지 않음) ○ 3 (약간 동의하지 않음) ○ 4 (중간) ○
5 (약간 동의함) ○ 6 (동의함) ○ 7 (매우 동의함)
당신은 이 웹사이트의 어떤 특정한 면이 가장 맘에 드십니까?
당신은 이 웹사이트의 어떤 특정한 면이 가장 맘에 안 드십니까?
당신의 가치관에 대하여
가장 이상적인 직업에 대해 생각해 주십시오, 생각하셨다면, 이상적인 직업을 선택하는데 있어서,
다음의 항목들이 당신에게 얼마나 중요한지 확인해 주십시오.
개인적으로 혹은 가족들과 보내는 시간이 충분히 있어야 한다.
○ 1 (최고로 중요하다) ○ 2 (매우 중요하다) ○ 3 (보통이다) ○ 4 (별로 중요하지 않다) ○
5 (거의 중요하지 않다)
물리적인 근무환경이 좋아야 한다. (좋은 환기시설과 조명시설, 충분한 업무공간 등)
○ 1 (최고로 중요하다) ○ 2 (매우 중요하다) ○ 3 (보통이다) ○ 4 (별로 중요하지 않다) ○
5 (거의 중요하지 않다)

Mun Ga Choi 182
182 Appendices
상사와 좋은 업무적 관계이어야 한다.
○ 1 (최고로 중요하다) ○ 2 (매우 중요하다) ○ 3 (보통이다) ○ 4 (별로 중요하지 않다) ○
5 (거의 중요하지 않다)
고용에 대한 안정이 있어야 한다.
○ 1 (최고로 중요하다) ○ 2 (매우 중요하다) ○ 3 (보통이다) ○ 4 (별로 중요하지 않다) ○
5 (거의 중요하지 않다)
협력을 잘하는 동료들이 있어야 한다.
○ 1 (최고로 중요하다) ○ 2 (매우 중요하다) ○ 3 (보통이다) ○ 4 (별로 중요하지 않다) ○
5 (거의 중요하지 않다)
상사의 조언을 쉽게 구할 수 있어야 한다.
○ 1 (최고로 중요하다) ○ 2 (매우 중요하다) ○ 3 (보통이다) ○ 4 (별로 중요하지 않다) ○
5 (거의 중요하지 않다)
더 높은 단계의 업무로 발전 할 수 있는 기회를 가질 수 있어야 한다.
○ 1 (최고로 중요하다) ○ 2 (매우 중요하다) ○ 3 (보통이다) ○ 4 (별로 중요하지 않다) ○
5 (거의 중요하지 않다)
업무에 있어서 다양성과 모험적인 요소가 있어야 한다.
○ 1 (최고로 중요하다) ○ 2 (매우 중요하다) ○ 3 (보통이다) ○ 4 (별로 중요하지 않다) ○
5 (거의 중요하지 않다)
얼마나 자주 긴장이나 불안감을 느끼십니까?
○ 1 (전혀 없다) ○ 2 (거의 없다) ○ 3 (가끔 그렇다) ○ 4 (대체로 그렇다) ○ 5 (항상 그렇다)
당신의 경험으로 볼때, 자녀들이 부모의 의견에 반대견해를 표시하는 것을 얼마나 자주
어려워 합니까?
○ 1 (아주 드물다) ○ 2 (드물다) ○ 3 (때때로) ○ 4 (자주) ○ 5 (매우 자주)
대부분의 사람들은 믿을만 하다.
○ 1 (매우 동의함) ○ 2 (동의함) ○ 3 (잘 모르겠다) ○ 4 (동의하지 않음) ○ 5 (매우 동의하지
않음)
상대방과의 분쟁을 가장 잘 해결하는 방법은 당사자 모두가 조금씩 양보하는 것이다.
○ 1 (매우 동의함) ○ 2 (동의함) ○ 3 (잘 모르겠다) ○ 4 (동의하지 않음) ○ 5 (매우 동의하지
않음)

Mun Ga Choi 183
183 Appendices
조직이 상사와 부하직원의 체계를 가지는 주된 이유는 모든 사람들이 누가 누구의 권한 아래
있는지 알기 위함이다.
○ 1 (매우 동의함) ○ 2 (동의함) ○ 3 (잘 모르겠다) ○ 4 (동의하지 않음) ○ 5 (매우 동의하지
않음)
학생들끼리의 경쟁은 대체로 긍정적인 면 보다는 부정적인 면이 많다.
○ 1 (매우 동의함) ○ 2 (동의함) ○ 3 (잘 모르겠다) ○ 4 (동의하지 않음) ○ 5 (매우
동의하지 않음)
조직의 규칙을 깨는 것이 조직에 최선의 이익이 되는 경우에도 조직의 규칙은 깨져서는
안된다.
○ 1 (매우 동의함) ○ 2 (동의함) ○ 3 (잘 모르겠다) ○ 4 (동의하지 않음) ○ 5 (매우 동의하지
않음)
사람들이 인생에서 실패했을 때, 그것은 그들 자신의 잘못이다.
○ 1 (매우 동의함) ○ 2 (동의함) ○ 3 (잘 모르겠다) ○ 4 (동의하지 않음) ○ 5 (매우 동의하지
않음)
대부분의 사람들은 믿을만 하다.
○ 1 (매우 동의함) ○ 2 (동의함) ○ 3 (잘 모르겠다) ○ 4 (동의하지 않음) ○ 5 (매우 동의하지
않음)
상대방과의 분쟁을 가장 잘 해결하는 방법은 당사자 모두가 조금씩 양보하는 것이다.
○ 1 (매우 동의함) ○ 2 (동의함) ○ 3 (잘 모르겠다) ○ 4 (동의하지 않음) ○ 5 (매우 동의하지
않음)
조직이 상사와 부하직원의 체계를 가지는 주된 이유는 모든 사람들이 누가 누구의 권한 아래
있는지 알기 위함이다.
○ 1 (매우 동의함) ○ 2 (동의함) ○ 3 (잘 모르겠다) ○ 4 (동의하지 않음) ○ 5 (매우 동의하지
않음)
학생들끼리의 경쟁은 대체로 긍정적인 면 보다는 부정적인 면이 많다.
○ 1 (매우 동의함) ○ 2 (동의함) ○ 3 (잘 모르겠다) ○ 4 (동의하지 않음) ○ 5 (매우 동의하지
않음)
조직의 규칙을 깨는 것이 조직에 최선의 이익이 되는 경우에도 조직의 규칙은 깨져서는
안된다.

Mun Ga Choi 184
184 Appendices
○ 1 (매우 동의함) ○ 2 (동의함) ○ 3 (잘 모르겠다) ○ 4 (동의하지 않음) ○ 5 (매우 동의하지
않음)
사람들이 인생에서 실패했을 때, 그것은 그들 자신의 잘못이다.
○ 1 (매우 동의함) ○ 2 (동의함) ○ 3 (잘 모르겠다) ○ 4 (동의하지 않음) ○ 5 (매우 동의하지
않음)
당신에 대하여
당신은 ○ 남성입니까? ○ 여성입니까?
다음중 당신이 속한 연령그룹은 어느 것입니까?
○ 1 (17 세이하) ○ 2 (18-20) ○ 3 (21-23) ○ 4 (24-26) ○ 5 (27 이상)
평균적으로, 당신은 하루의 몇시간을 인터넷을 하는 것에 보냅니까?
○ 1 (거의 사용하지 않는다) ○ 2 (한시간 이하) ○ 3 (1 시간 - 3 시간) ○ 4 (4 시간 - 6 시간)
○ 5 (7 시간 이상)
당신은 자신이 인터넷을 사용하는데 능숙하다고 생각합니까?
○ 1 (전혀 그렇지 않다) ○ 2 ○ 3 ○ 4 ○ 5 (매우 그렇다)
이 질문서에 관해서 덧붙이고 싶은 의견이 있습니까?