THE HISTORY OF BATSE - De Gruyter
10
Gamma-ray Bursts: 15 Years of GRB Afterglows A.J. Castro-Tirado, J. Gorosabel and I.H. Park (eds) EAS Publications Series, 61 (2013) 5–14 THE HISTORY OF BATSE G.J. Fishman 1 Abstract. The BATSE experiment on the Compton Gamma-ray Observatory was the first large detector system designed for the study of gamma-ray bursts. The eight large-area detectors allowed full-sky coverage and were optimized to operate in the primary energy region of emission of most GRBs. BATSE provided detailed observations of the temporal and spectral characteristics of several thousand GRBs, and it was the first experiment to provide rapid notifications of the coarse location of many them. It also provided strong evidence for the cosmological distances to GRBs through the observation of the sky distribution and intensity distribution of numerous GRBs. The large number of GRBs observed with the high- sensitivity BATSE detectors continues to provide a database of GRB spectral and temporal proper- ties in the primary energy range of GRB emission that will likely not be exceeded for at least another decade. The origin and development of the BATSE experiment, some highlights from the mission and its continuing legacy are described in this paper. 1 How BATSE began Soon after the announcement of the discovery of GRBs by the Los Alamos Group with the Vela satellites (Klebesadel et al. 1973) it was realized that balloon flight observations of them were possible by means of sufficiently large area, sensitive detectors. An extrapolation of a −3/2 power law intensity distribution of them, expected for a homogeneous, three-dimensional distribution of GRB sources to lower intensities would yield a GRB rate of several dozen per day over the full sky. Thus, a balloon-borne detector system with an effective area of ∼1m 2 had a good chance of observing ∼10 GRBs during a balloon flight of reasonable duration. Using the cosmic ray research facilities and personnel kindly made available by T. Parnell at the NASA-Marshall Space Flight Center (MSFC), I decided to begin a modest balloon flight program aimed at observing GRBs that were considerably 1 ZP12, NASA-Marshall Space Flight Center, Huntsville, AL, 35812 USA; e-mail: [email protected] c EAS, EDP Sciences 2013 DOI: 10.1051/eas/1361001
-
Upload
khangminh22 -
Category
Documents
-
view
1 -
download
0
Transcript of THE HISTORY OF BATSE - De Gruyter
Gamma-ray Bursts: 15 Years of GRB AfterglowsA.J. Castro-Tirado, J. Gorosabel and I.H. Park (eds)EAS Publications Series, 61 (2013) 5–14
THE HISTORY OF BATSE
G.J. Fishman1
Abstract. The BATSE experiment on the Compton Gamma-rayObservatory was the first large detector system designed for the studyof gamma-ray bursts. The eight large-area detectors allowed full-skycoverage and were optimized to operate in the primary energy regionof emission of most GRBs. BATSE provided detailed observations ofthe temporal and spectral characteristics of several thousand GRBs,and it was the first experiment to provide rapid notifications of thecoarse location of many them. It also provided strong evidence forthe cosmological distances to GRBs through the observation of the skydistribution and intensity distribution of numerous GRBs. The largenumber of GRBs observed with the high- sensitivity BATSE detectorscontinues to provide a database of GRB spectral and temporal proper-ties in the primary energy range of GRB emission that will likely notbe exceeded for at least another decade. The origin and developmentof the BATSE experiment, some highlights from the mission and itscontinuing legacy are described in this paper.
1 How BATSE began
Soon after the announcement of the discovery of GRBs by the Los Alamos Groupwith the Vela satellites (Klebesadel et al. 1973) it was realized that balloon flightobservations of them were possible by means of sufficiently large area, sensitivedetectors. An extrapolation of a −3/2 power law intensity distribution of them,expected for a homogeneous, three-dimensional distribution of GRB sources tolower intensities would yield a GRB rate of several dozen per day over the full sky.Thus, a balloon-borne detector system with an effective area of ∼1 m2 had a goodchance of observing ∼10 GRBs during a balloon flight of reasonable duration.
Using the cosmic ray research facilities and personnel kindly made available byT. Parnell at the NASA-Marshall Space Flight Center (MSFC), I decided to begina modest balloon flight program aimed at observing GRBs that were considerably
1 ZP12, NASA-Marshall Space Flight Center, Huntsville, AL, 35812 USA;e-mail: [email protected]
c© EAS, EDP Sciences 2013DOI: 10.1051/eas/1361001

6 Gamma-ray Bursts: 15 Years of GRB Afterglows
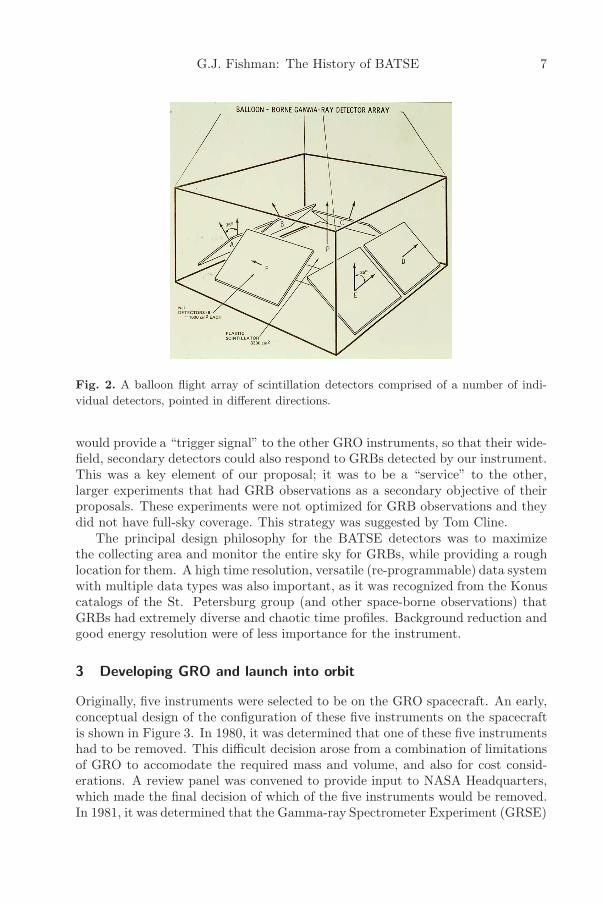
weaker that those observed by the Vela spacecraft and by other small, space-bornedetectors. Large-area crystal scintillation detectors were fabricated using cheap,scrap pieces of thallium-activated sodium iodide scintillator crystals, NaI(Tl), im-mersed in clear mineral oil (Fishman 1974; Fishman & Austin 1976), as seen inFigure 1. These hermetically-sealed detectors had a crystal thickness of ∼2 cm,with a high detection efficiency for gamma radiation up to a few hundred keV.Two balloon flights with a total duration of 28 hours were carried out in 1975 and1977 from Palestine, Texas using an array of these detectors on a balloon payloadsimilar to that shown in Figure 2. These observations resulted in an observed GRBrate that was well below that expected for a homogeneous, nearby distribution ofGRBs (Fishman et al. 1978).
Fig. 1. Left: a single large area detector tray made from NaI(Tl) scintillation crystal
pieces. Right: a group of seven NaI(Tl) detector trays developed for balloon flight ob-
servations of GRBs. Notice the variation in the amount of hydration (yellow color) of
the crystals in the different trays. This hydration was largely reversible be pumping the
interior of the trays for long periods and removing the moisture.
2 The BATSE proposal
NASA Headquarters issued an Announcement of Opportunity (AO) in 1977, so-liciting proposals for instruments for a large Gamma-Ray Observatory (GRO),originally scheduled for launch in 1985. This spacecraft was intended to be thesecond of the four “Great Observatories in Space” that NASA planned to launchwith the Space Shuttle in the 1980s (Hubble was the first of the series; Chandrawas the third; Spitzer was the forth). Initially, our balloon group in Huntsvillehad not planned to submit a proposal, but at the suggestion of Tom Cline andwith the encouragement of Tom Parnell, a proposal was submitted with myself(G. Fishman) as the Principal Investigator (P.I.). Chip Meegan and Tom Parnellwere Co-Investigators.
The objectives of the experiment were to observe the coarse sky distributionand the intensity distribution of GRBs, along with the spectral and high-time-resolution properties of a large number of them. In addition, this experiment
G.J. Fishman: The History of BATSE 7
Fig. 2. A balloon flight array of scintillation detectors comprised of a number of indi-
vidual detectors, pointed in different directions.
would provide a “trigger signal” to the other GRO instruments, so that their wide-field, secondary detectors could also respond to GRBs detected by our instrument.This was a key element of our proposal; it was to be a “service” to the other,larger experiments that had GRB observations as a secondary objective of theirproposals. These experiments were not optimized for GRB observations and theydid not have full-sky coverage. This strategy was suggested by Tom Cline.
The principal design philosophy for the BATSE detectors was to maximizethe collecting area and monitor the entire sky for GRBs, while providing a roughlocation for them. A high time resolution, versatile (re-programmable) data systemwith multiple data types was also important, as it was recognized from the Konuscatalogs of the St. Petersburg group (and other space-borne observations) thatGRBs had extremely diverse and chaotic time profiles. Background reduction andgood energy resolution were of less importance for the instrument.
3 Developing GRO and launch into orbit
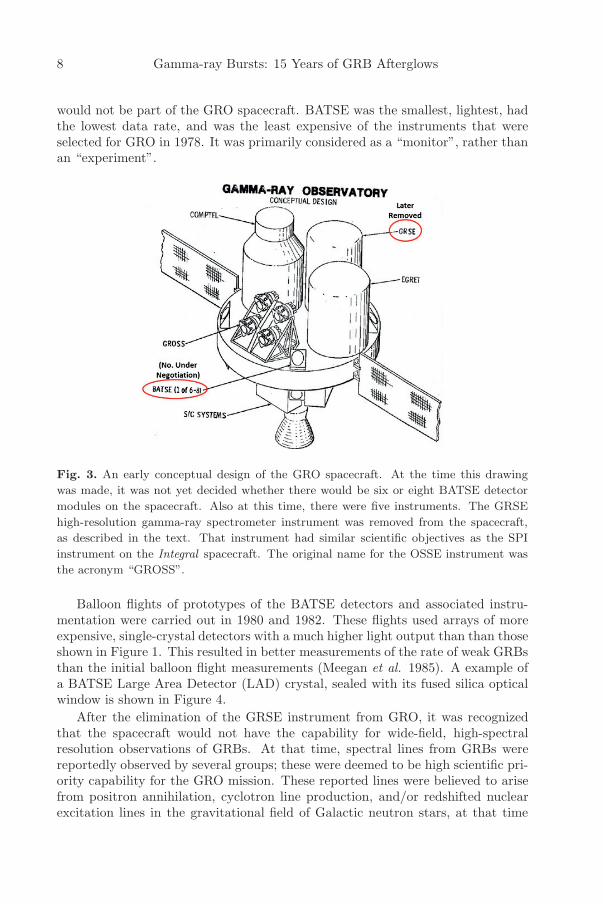
Originally, five instruments were selected to be on the GRO spacecraft. An early,conceptual design of the configuration of these five instruments on the spacecraftis shown in Figure 3. In 1980, it was determined that one of these five instrumentshad to be removed. This difficult decision arose from a combination of limitationsof GRO to accomodate the required mass and volume, and also for cost consid-erations. A review panel was convened to provide input to NASA Headquarters,which made the final decision of which of the five instruments would be removed.In 1981, it was determined that the Gamma-ray Spectrometer Experiment (GRSE)
8 Gamma-ray Bursts: 15 Years of GRB Afterglows
would not be part of the GRO spacecraft. BATSE was the smallest, lightest, hadthe lowest data rate, and was the least expensive of the instruments that wereselected for GRO in 1978. It was primarily considered as a “monitor”, rather thanan “experiment”.
Fig. 3. An early conceptual design of the GRO spacecraft. At the time this drawing
was made, it was not yet decided whether there would be six or eight BATSE detector
modules on the spacecraft. Also at this time, there were five instruments. The GRSE
high-resolution gamma-ray spectrometer instrument was removed from the spacecraft,
as described in the text. That instrument had similar scientific objectives as the SPI
instrument on the Integral spacecraft. The original name for the OSSE instrument was
the acronym “GROSS”.
Balloon flights of prototypes of the BATSE detectors and associated instru-mentation were carried out in 1980 and 1982. These flights used arrays of moreexpensive, single-crystal detectors with a much higher light output than than thoseshown in Figure 1. This resulted in better measurements of the rate of weak GRBsthan the initial balloon flight measurements (Meegan et al. 1985). A example ofa BATSE Large Area Detector (LAD) crystal, sealed with its fused silica opticalwindow is shown in Figure 4.
After the elimination of the GRSE instrument from GRO, it was recognizedthat the spacecraft would not have the capability for wide-field, high-spectralresolution observations of GRBs. At that time, spectral lines from GRBs werereportedly observed by several groups; these were deemed to be high scientific pri-ority capability for the GRO mission. These reported lines were believed to arisefrom positron annihilation, cyclotron line production, and/or redshifted nuclearexcitation lines in the gravitational field of Galactic neutron stars, at that time

G.J. Fishman: The History of BATSE 9
Fig. 4. The scintillation detector element of a Large Area Detector (LAD) for BATSE.
The design and dimensions are similar to those manufactured for medical diagnostic
purposes in devices known as Anger cameras. It consists of a circular, hermetically-
sealed disc of NaI(Tl), optically-coupled to a thick, fused silica optical window. The
crystal had a thickness of 1.27 cm and a surface area of 2025 cm2. Details of the design,
development and testing of the BATSE flight system are contained in the comprehensive
publication by Horack (1991).
presumed to be the source of GRBs. An appeal was made to NASA Headquartersby a group of GRB theorists to include a capability for these observations by aninstrument on GRO. After a study of the impact to the mission, NASA agreedto include this capability. In response, the BATSE team (with additional inves-tigators from UCSD and GSFC) submitted a proposal to include an additionaldetector in each of the eight BATSE modules, smaller than the LAD, but thickerand with better energy resolution. It would cover a broader energy range (bothhigher and lower) than the LAD. These detectors were termed the SpectroscopyDetectors (SDs). This proposal was accepted by NASA Headquarters.
Although the BATSE SDs had considerably better energy resolution than theLADs, their sensitivity was much less than that of the LADs in the energy regionfrom ∼30 keV to ∼600 keV. However, at lower and at higher energies, the SDs hadgreater sensitive area than the LADs for the following reasons: Below 30 keV, theLAD efficiency dropped sharply due to absorbing material in front of the detectorand above 600 keV, the LAD efficiency decreased due to the transparency of therelatively thin NaI detector. The final design of the GRO spacecraft, showing theplacement of the four main instruments and the eight BATSE detector modulesat the corners of the spacecraft is shown in Figure 5. The faces of the BASE LADdetectors are aligned to be parallel to the faces of a regular octahedron; the threeaxes of this octahedron are parallel to the spacecraft axes.

10 Gamma-ray Bursts: 15 Years of GRB Afterglows
Fig. 5. The final configuration of the CGRO spacecraft with eight BATSE detector
modules at the corners of the spacecraft. Each module had nearly a clear forward field-
of-view. Two of the BATSE Modules are circled in red.
The majority of the design, development and testing of the BATSE instru-mentation was performed at NASA-MSFC in the timeframe from 1982 to 1988(Fig. 6). In late 1988, the BATSE flight system was delivered to the facilitiesof the spacecraft contractor, TRW Inc., in Redondo Beach, California. BATSEunderwent two years of integration and testing with the GRO spacecraft. It wasthen shipped to the Kennedy Space Flight Center (KSC) for integration and test-ing with the Space Shuttle Atlantis. GRO was launched and deployed into aninitial orbit of ∼450 km in April 1991 (Fig. 7). When it became operational abouta month later, it was re-named the Compton Gamma-ray Observatory (CGRO),in honor of Arthur Holly Compton. He was awarded the Nobel Prize in Physicsin 1927 for discovering what became known as the Compton scattering of gammarays. The CGRO spacecraft was re-boosted twice by an on-board propulsion sys-tem, following the expected, slow decay of its orbit. It operated extremely well upduring its lifetime; it was de-orbited into the Pacific Ocean in June 2000.
4 Primary GRB results from BATSE
Before the end of its first year in orbit, the BATSE-observed isotropic sky dis-tribution, together with the intensity distribution of GRBs, showed with highsignificance that their origin was unlike that of any known Galactic distributionof objects (Meegan et al. 1992). Furthermore, they were not associated with anynearby galaxies, or clusters of galaxies. Over the next few years, as the statis-tical measurements of these distributions became more accurate, workers in the

G.J. Fishman: The History of BATSE 11
Fig. 6. A group of four BATSE detector mdules undergoing assembly and testing at the
NASA-Marshall Space Flight Center (MSFC) in Huntsville.
Fig. 7. The GRO spacecraft (later re-named the CGRO) during deployment from the
payload bay of the Space Shuttle Atlantis in April 1991.
GRB field were abandoning models of GRBs originating from Galactic neutronstars. At that time, these were thought to have been their origin. The most likelyexplanation was that the GRBs originated from cosmological distances. The fi-nal BATSE sky distribution of GRBs after nine years of observations is shown inFigure 8. The definitive recognition of the cosmological distances of GRBs had to

12 Gamma-ray Bursts: 15 Years of GRB Afterglows
wait for the BeppoSAX observations in 1997 and 1998 which provided precise andrapid GRB locations. Along with this breakthrough came rapid follow-up X-rayand optical observations of GRB afterglows and the redshift measurements of theirhost galaxies and/or that of intervening matter.
Fig. 8. The BATSE sky distribution of GRBs observed over nine years of observation by
BATSE-CGRO, plotted in Galactic coordinates. This distribution has not been corrected
for sky exposure. The color of each GRB corresponds to the indicated fluence of the burst.
There are generally accepted to be two classes of GRBs, short and long; theusual dividing line between long and short GRBs is ∼2 s, although there is signif-icant overlap between these classes. Prior to BATSE, it had been suspected thatthe shorter GRBs had harder spectra than the longer ones. BATSE data showedthe definitive separation between the short/hard and the long/soft classes withvery good statistics, as shown in Figure 9.
Data from BATSE triggered GRBs are available online (http://heasarc.gsfc.nasa.gov/); they are described by Paciesas et al. (1999). Limits togamma-ray lines from GRBs using the BATSE spectroscopy detectors were foundto be below those of line fluxes reported previously (Briggs et al. 1999). In aneffort to find additional (primarily weaker) GRBs that were not part of the stan-dard BATSE GRB catalogs, several investigators compiled catalogs of un-triggeredBATSE GRBs, using the so-called “continuous” data stream.
In 1993, a system known as BACODINE (for BATSE COordinates DIstributionNEtwork) was implemented at GSFC. This system was made possible due to thedeterioration of the CGRO tape recorders during the first year of its missionand the need for real-time data from the spacecraft caused by the resulting lackof on-board data storage. The design and implementation of BACODINE wasthe work of Scott Barthelmy and colleagues from NASA-GSFC (Barthelmy et al.1995) to take advantage of this unplanned opportunity. It used the near real-time

G.J. Fishman: The History of BATSE 13
Fig. 9. Two classes of GRBs, as observed with BATSE: Short-Hard and Long-Soft
(Kouveliotou et al. 1993). They are seen to have overlapping distributions.
BATSE data to compute a coarse GRB location when an on-board burst triggeroccurred. Automated GRB location messages were made available to users forrapid GRB follow-up observations. Even though these locations were usually ofthe order of several square degrees, they were useful for wide-field optical cameras.Several optical systems were constructed specifically for this purpose. One ofthese robotic systems was able to observe the optical emission from the intenseburst GRB 990123 while the burst was in progress (Akerlof et al. 1999). Asother spacecraft with GRB capabilities were placed into orbit, their data were alsodistributed to the GRB community over this same network. The BACODINEsystem evolved into a more general system, the GRB Coordinates Network (GCN),which distributes data from many spacecraft and ground-based observatories. Itis used today by hundreds of observers world-wide and has become an invaluableservice for the GRB community.
The large number of GRBs observed with BATSE, afforded by its sensitive areaand long duration in orbit, allowed observations of the temporal and spectral prop-erties of GRBs in more detail than those previously. Over a thousand of papershave been published describing the BATSE-observed properties of GRBs and thetheoretical implications derived from them. Observations with BATSE affordedan unsurpassed study of many of the fine points of the gamma-ray emission in theenergy region where the major fraction of energy is emitted during the promptphase. The GRBs observed with a single instrument has provided a large, homo-geneous dataset of GRBs, without the difficulties associated with cross-calibrationbetween different instruments. This capability will likely not be exceeded for manyyears. An overview of many more of the GRB and scientific results made possiblethrough BATSE observations, but not covered here, are summarized in a chapterentitled “The BATSE Era”, in a recently-published book (Fishman & Meegan2012).

14 Gamma-ray Bursts: 15 Years of GRB Afterglows
References
Akerlof, C., Balsano, R., Barthelmy, S., et al., 1999, Nature, 398, 400
Barthelmy, S.D., Butterworth, P., Cline, T.L., et al., 1995, Ap&SS, 231, 235
Briggs, M.S., Band, D.L., Preece, R.D., et al., 1999, ApL, 39, 237
Fishman, G.J., & Meegan, C.A., 2012, “The BATSE Era”, Chapter 3, in Gamma-rayBursts, ed. C. Kouveliotou, et al. (Cambridge Univ. Press)
Fishman, G.J., 1974 “Radiation Detectors Using Multiple Scintillation Crystal Pieces”,U.S. Patent #3,835, 325
Fishman, G.J., & Austin, R.W., 1976, Nucl. Inst. Meth., 140, 193
Fishman, G.J., Meegan, C.A., Watts, J.W., Jr., & Derrickson, J.H., 1978, ApJ, 223, L13
Horack, J.M., 1991, “Development of the Burst and Transient Source Experiment”,NASA Reference Publication 1268 (Washington: NASA)
Klebesadel, R.W., Strong, I.B., & Olson, R.A., 1973, ApJ, 182, L85
Kouveliotou, C., Meegan, C.A., Fishman, G.J., Bhat, N.P., et al., 1993, ApJ, 413, L101
Meegan, C.A., Fishman, G.J., & Wilson, R.B., 1985, ApJ, 291, 479
Meegan, C.A., Fishman, G.J., Wilson, R., et al., 1992, Nature, 355, 143
Paciesas, W.S., Meegan, C.A., Pendleton, G.N., et al., 1999, ApJS, 122, 465