The Hidden Hurdles of Indirect Expenses - uAspire
51
Beyond the College Bill The Hidden Hurdles of Indirect Expenses JUNE 2020
-
Upload
khangminh22 -
Category
Documents
-
view
1 -
download
0
Transcript of The Hidden Hurdles of Indirect Expenses - uAspire

Beyond the College Bill The Hidden Hurdles
of Indirect Expenses
JUNE 2 0 2 0
AuthorsAnn Coles, Laura Keane, Brendan Williams
ContributorsAli Caccavella, Jonathan Lewis
AcknowledgementsFirst we want to thank all the students we engaged via surveys and focus groups as well as the collaborating
organizations who supported student participation in our research: Amarillo Community College, Aspire Public
Schools, Bunker Hill Community College, College Bound Initiative, Mastery Charter Schools, Philadelphia
Futures, and the University of Massachusetts Boston.
We appreciate the higher education professionals who shared their experiences for the promising practices
we profiled: Jordan Herrera, Amarillo College; Paula Umana, Community College of Philadelphia; Kelly Russell,
Fresno State University; Matthew Bloom, Maricopa Community College District; Katy Abel, Massachusetts
Department of Higher Education; Nicole Hinds, Oregon State University; Marybeth McCarthy, Tacoma
Community College; Andrea Gutierrez, University of California Irvine; Tremaine Kwasikpui and Courtney
Lundgren, University of Houston Downtown; Dawn Medley, Wayne State University; and Ilia Cordero, Valencia
College. We also thank the nine financial aid administrators we interviewed to better understand the
complexity in calculating and communicating indirect expenses from the institutional perspective.
We value the engagement of industry experts who provided key feedback on our work: Chris Fernandez,
Robert Kelchen, Laura Perna, and Mamie Voight. We are grateful to Alain Poutré for conducting federal data
analyses, and John Bailey for supporting research as the uAspire Chewning Fellow in 2019.
Heartfelt thanks to uAspire colleagues: Carrie Fethe for leading editorial work and design; Sarah Crooker,
Melina Dominguez, Mya Goodman, Audrey Jerome, Joyce Kim, Simone Lawrence, Katelyn Montalvo, Aiden
Nguyen, Ramon Soto, Karen Wilber, and Emily Wolfson for your valuable assistance with organizing student
focus groups, compiling data, editing, and other essential tasks.
Finally, we want to express our gratitude to Lumina Foundation for supporting uAspire efforts on this project.
Its focus on supporting actionable research into issues of college affordability is critical to the field.
Recommended CitationColes, A., Keane, L., & Williams, B. (2020), Beyond the College Bill: The Hidden Hurdles of Indirect Expenses.
uAspire. Retrieved from: www.uaspire.org/BlankSite/media/uaspire/Beyond-the-College-Bill.pdf
About uAspireuAspire is a national nonprofit ensuring that all young people have the financial information and resources to
find an affordable path to and through college. Through student advising, counselor training, and policy and
systems change, we work to remove the financial barriers to higher education.
ContentsExecutive Summary 4
Foreword: A Student Experience 5
Introduction 6
Indirect Expenses are Hard to Find and Understand 9
Indirect Expense Estimates Don’t Add Up 15
Complexities for Financial Aid Administrators 19
Challenges for Students 23
Easing the Burden on Students 29
Policy Recommendations 33
Appendix: Promising Practices 39

Executive SummaryIndirect expenses are rarely taken into account when considering the cost of college. With the focus on
tuition and fees, students and families are often left unaware of the additional expenses they will encounter
beyond the college bill. These indirect expenses encompass school supplies, laptops, off-campus housing,
transportation, food outside of a meal plan, and more. Indirect expenses can create hardships for students,
especially those from lower income backgrounds and communities of color who face significant affordability
gaps nationwide.
Covering indirect expenses is essential for college success, yet many students do not receive and cannot
access clear information about what constitutes indirect expenses, when and how often they need to be paid,
and what resources can be used to pay for them. Using primary and secondary research along with data from
colleges and students, this study examines how indirect expense estimates are calculated and communicated
by colleges, how students struggle to understand the costs beyond tuition, and the resulting impact on
students. The study’s key findings are the following:
Indirect Expenses are Hard to Find Colleges do not communicate about indirect
expenses in a transparent, consumer-friendly way.
We were unable to locate any indirect expense
information on 39 percent of the college websites
reviewed for this study.
Estimates Don’t Add UpLarge discrepancies exist between estimates
of indirect expenses provided by different campuses
located within the same city, raising questions
about how colleges determine which expenses
to include. We found differences of over $8,000
in the estimates from colleges only miles apart.
Complexity for Financial Aid AdministratorsSetting cost of attendance, particularly indirect
expenses, is a complex process that requires
assessing many living scenarios, using multiple
data sources, and engaging many campus offices.
Institutions receive minimal guidance from
government agencies. As a result, colleges use
a wide variety of approaches which leads
to inconsistencies in their estimates.
Challenges for StudentsStudents face numerous hidden hurdles to their
college success when tripped up by unexpected
expenses. Fifty-one percent of students surveyed
paid more for indirect expenses than they anticipated.
Managing the high cost of food, course materials,
or transportation puts strain on students to meet
their basic needs. Fifty-three percent of students
shared that they changed food shopping or eating
habits when they encountered unexpected expenses.
Institutional Strategies Can Ease the BurdenSome institutions develop evidence-based strategies
to reduce the burden of indirect expenses—from
subsidizing public transportation and replacing
textbooks with Open Education Resources to
establishing on-campus food pantries and partnering
with local housing authorities to provide subsidized
apartments. Innovative stopgap supports such
as emergency aid programs and on-campus social
service centers help students navigate unexpected
financial challenges.
Supporting the millions of students across the country burdened by indirect expenses requires systems-level
solutions. Federal, state, and higher education leaders need to provide direction and resources to incentivize
broadscale changes that enable students with limited financial means to cover the true cost of college.
The report offers ten policy recommendations to achieve this goal.

B eyo n d t h e C o l l e g e B i l l - u Asp i re 5
Foreword: A Student ExperienceJamie was excited when she received her financial aid offer for North State University. College would be
expensive with tuition and fees costing nearly $10,000, but North State offered financial aid in a combination
of grants and loans that would cover most of the bill. Living at home with her mother would spare Jamie
having to pay for on-campus housing, and she’d commute with an older car from her grandparents.
Jamie’s big sister reminded her that tuition and fees weren’t the only costs at North State. She’d need
to buy books, a laptop, and school supplies, plus other costs would pop up so she would need “spending
money.” Jamie figured she’d be able to cover those costs with money saved from her summer job.
After registering for first semester classes, Jamie added up the costs of textbooks at the university bookstore:
$60 for a sociology book and $80 for a stack of English paperbacks seemed pricey, but reasonable. Math,
however, cost $90, and Spanish, a two-course sequence, came with a workbook and textbook combination that
cost $140. Physics included a $90 textbook and a $100 “access code”—no one had mentioned that she would
need access codes to complete class assignments.
Overwhelmed by her $500 shopping cart, Jamie looked for other options while waiting for her financial aid
refund check to arrive. She rented some of the books online for half the cost, but she had to purchase a new
Spanish workbook and the physics access code. And the English books she bought used online didn’t arrive
until two weeks into the course, setting her back in the class.
Arriving on campus, Jamie found that parking cost $140 a semester. After adding gas, car insurance, and
maintenance, Jamie’s low-cost commuting option turned out to be far more expensive than she had planned.
Jamie mostly prepared food at home, stretching her dollars as she contributed to her family’s weekly grocery
bill. Sometimes she also bought snacks at campus cafes to sustain her through long days with a full course
load and her work-study job. Classmates often invited her to grab a coffee or a pizza, important opportunities
to make friends and be involved on campus. These extra food costs made Jamie realize that her “no-cost” food
plan wasn’t possible.
Jamie’s work-study job covered less than half of her commuting expenses and books. Everything else came
out of her summer savings, which dwindled to almost nothing by November. In December, when her car’s fuel
pump failed, Jamie feared missing her final exams unless she came up with $400 to replace it. She scraped the
money for the repairs together with help from family and friends, but she entered the spring semester with
almost no savings and the prospect of another $500 textbook bill. Ambitious college goals like a study abroad
program or volunteer spring break now felt completely out of reach. Even navigating how to pay for her spring
semester appeared insurmountable.
AU T H O R S ’ N OT E : T H I S I S A F I C T I O N A L I Z E D ACCO U N T B AS E D O N O U R WO R K W I T H ST U D E N T S .

B eyo n d t h e C o l l e g e B i l l - u Asp i re 6
IntroductionFree college and student debt are headline issues being debated by presidential candidates as college costs
continue to rise faster than inflation.1 But what is included in college costs? Typically, students and families
might think of college costs as tuition, fees, room and board, when it incorporates many additional factors:
textbooks and course materials, transportation, food beyond the meal plan, housing for students living
off campus, and more. Non-tuition expenses make up more than half the cost of college and they increase
year over year. Average non-tuition cost increases outpaced inflation between the 2007-8 and 2015-16
academic years.2
Students and families are often unaware of these additional costs beyond their bill, which we call “indirect”
expenses, until they set foot on campus. Many students, especially those from low-income backgrounds, lack
the financial resources to cover them—even with financial aid. After all federal student loans and grants are
applied, our research has shown students still face close to a $12,000 gap on average, leaving them struggling
to make ends meet.3 Their college bill gets paid first, while money runs out to cover their indirect expenses.
A growing affordability gap is placing even our public institutions increasingly out of reach.4 Working their
way through college is not a realistic option like it was for previous generations, when costs were lower
and the Pell Grant held more purchasing power.5 In order to make up the difference, students are forced
to make difficult choices. According to our analysis of the National Postsecondary Student Aid Study data, the average full-time undergraduate can only cover 19 percent of non-tuition costs with their work-study earnings.6 Another study found that many students drop from full-time to part-time college
attendance because they needed to pay basic living costs.7 Work earnings are not enough to cover today’s
increased gap between costs and financial aid.
Indirect expenses create hardships for students, especially for those who live off campus in apartments or
with their families and commute to school—which describes the majority of today’s students. A troubling
number report they struggle to feed and house themselves. A 2018 study found that 42 percent of community
college students and 36 percent of four-year students indicated they had been food insecure in the last 30
days. In the same study, 46 percent of community college students and 36 percent of four-year students
reported experiencing housing insecurity in the last year.8 Many students also find commuting costs daunting.
A 2016 study found that full-time community college students spend an average of $1,760 on transportation,
an amount almost half of the average community college tuition nationally.9 Twenty-four percent of today’s
students are parents themselves and child care is a large expense they struggle to pay.10
While covering indirect expenses is essential to college success, students do not have clear information about
what specific indirect expenses they will incur, when these expenses need to be paid, and what resources
are available to help pay them. Students from low-income backgrounds, whose financial aid packages rarely
cover all the costs they will confront, deserve better. Transparency is one step to address student needs,
and it must be accompanied by increased investment in order to create equitable pathways to and through
higher education.

B eyo n d t h e C o l l e g e B i l l - u Asp i re 7
Purpose of this StudyWhile college costs have substantially spiked in recent years, attention has been too focused on tuition
and fees alone. Giving students a better understanding of the costs beyond the college bill they must pay,
combined with improved policies to cover those costs, will help drive degree completion with less debt and
are critical to advance higher education equity for students from low-income backgrounds and students of
color. A recent study found that given the lack of generational wealth, students of color are more likely to rely
on borrowing to cover college costs.11 Inaccurate and under-communicated costs beyond the college bill can
lead economically vulnerable students to take on even more debt and exacerbate rather than break the cycle
of poverty. We all have a stake in tackling this issue to improve student outcomes and ensure higher education
is an opportunity for all.
= +
Cost of Attendance
Cost of attendance (COA) refers to the all-in amount to cover a full year of academic study
and is formally defined by policymakers in the federal Higher Education Act. It is the total
of direct costs owed to the institution and indirect expenses which are educational-related
expenses not paid directly to the college.
*Housing and meals are direct costs only if living on campus; if living off campus or at home these costs are indirect expenses.
DIRECT COSTS
ON-CAMPUS HOUSING & MEALS*
TUITION & FEES
INDIRECT EXPENSES
BOOKS & SUPPLIES
TRANSPORTATION
PERSONAL EXPENSES
COST OF ATTENDANCE

B eyo n d t h e C o l l e g e B i l l - u Asp i re 8
This study examines how colleges calculate and communicate indirect expenses, how students struggle to
understand and afford them, and the impact on students. It seeks to better understand how students manage
indirect expenses and financial insecurity in order to look beyond challenges and identify solutions. Students
and financial aid administrators offer their own policy and systems change recommendations to help students
meet the very real costs beyond tuition. Finally, we highlight institutions that are working to reduce indirect
expenses for students and offer policy recommendations to address these challenges on a systemic level.
MethodologyThis study draws on several primary and secondary sources including qualitative and quantitative data
predominantly from five states where we advise students and train practitioners: California, Massachusetts,
New York, Pennsylvania, and Texas.
To better understand the student experience, we collected accounts from 105 students of various ages,
ethnicities, institution types, and housing scenarios via 16 focus groups. Students shared their experiences
with indirect expenses, how they deal with them, and how their colleges communicate about them. Multiple
investigators holistically reviewed focus group audio files and field notes to ensure accuracy. A survey dataset
including 154 students (focus group participants plus others) provided additional insights. The 26-question
survey focused primarily on the variation and amount of indirect expenses students experience, how well
students are prepared to meet such expenses based on communication from their colleges, and how students
manage unexpected expenses to make ends meet and progress in school.
Additionally, we conducted research on indirect expenses listed on the websites of 820 institutions, including
public four-year, private four-year, and community colleges from the five states referenced above. This data
analysis included communication of estimated indirect expense categories and costs, including terms and
descriptions. We cross-referenced this website data with 72 unique college financial aid offers (sourced
from our uAspire financial aid offer database) to assess consistency of terminology and estimates between
formats. We augmented this data with two national datasets: the Integrated Postsecondary Education Data
System (IPEDS) survey of postsecondary institutions and the National Postsecondary Student Aid Study
(NPSAS) survey of student experiences with financial aid, both conducted by the National Center for Education
Statistics (NCES).
Finally, we include two qualitative data sources to learn more from the institutional perspective. We
interviewed nine senior financial aid administrators to learn how they calculate and communicate indirect
expenses and explore opportunities to improve their practice. Additionally, we interviewed 11 higher education
professionals who implement promising practices on their campuses to reduce students’ indirect expenses.

B eyo n d t h e C o l l e g e B i l l - u Asp i re 9
Indirect Expenses are Hard to Find and UnderstandColleges communicate cost information to students and families through
many channels including their federally-required net price calculator,
institutional website, and financial aid offers. Previous studies show
that net price calculators inadequately provide students with reliable
cost information because they can be hard to find, complicated to complete,
and are often sourced with outdated cost data.12 Our own research finds
that financial aid offers and college websites also fail to give students
clear, consistent information to effectively budget for indirect expenses
and compare the full costs of different colleges.
WebsitesWe examined the websites of 820 institutions in California, Massachusetts, New York, Pennsylvania,
and Texas and found wide variation in the consistency of including indirect expenses and the transparency
of the language used (see figure 1 on next page). We could not find indirect expenses on 39 percent of the examined websites. Sixty-one percent mentioned indirect expenses though the quality of information varied
widely. Options ranged from providing a full itemized list of expense categories with estimated amounts and
clarifying explanations (23%) to a list of items and dollar amount estimates without any explanations (31%),
and others which provided missing or outdated estimates (7%).

B eyo n d t h e C o l l e g e B i l l - u Asp i re 1 0
Financial Aid OffersFinancial aid offers also fail to effectively communicate indirect expense information. Our 2018 study with
New America examined 515 financial aid offers from unique institutions and found that two-thirds included no
information about indirect expenses.13 These findings mirror the experience of uAspire advisors working with
students to calculate their college costs. In our practice, no matter the format, it is remarkably difficult to find
useful and current college cost information on which to base our student advising sessions.
Confusing TerminologyStudents in our focus groups reported that they were confused by some of the more commonly used terms for
indirect expenses. Seventy-two percent of students found “supplies” unclear as one student admitted, “I have
no idea what supplies means.” They found “board,” used by 56 percent of colleges, also lacking in meaning.
The bundling of terms, such as “books and supplies,” also created confusion for students by obscuring the
actual expenses included within the larger lump sum estimate the college provided for that category.
Figure 1. Presentation of Indirect Expenses on College Websites
39%Indirect expenses not found
23%Itemized list with amounts and explanations
7% Missing or outdated estimates
31% Itemized list with amounts

B eyo n d t h e C o l l e g e B i l l - u Asp i re 1 1
Inconsistent TerminologyThe terminology to explain and itemize indirect expenses varies considerably on college websites.
The federal government defines general categories in the Higher Education Act (HEA), however currently
the Department of Education is not allowed to set further parameters or requirements. Collectively,
the institutions we analyzed used 58 different terms to refer to the overall category of “indirect expenses”
and at least 30 different terms for each of the subcategories (see table 1).
Inconsistent terminology forces students to interpret the meaning of these terms and equate them when
comparing cost information, a challenging task for anyone unfamiliar with financial aid jargon. Within the
personal expenses category alone we found “discretionary personal expenses,” “other educational costs,”
“personal/maintenance,” “incidentals,” and “other.”
Variation of terms amongst colleges is not surprising given the absence of any formal standardization, yet
discrepancies exist even within singular state higher education systems. Across one state university system,
for example, we found eight different terms used for personal expenses. Across another state university
system, we found eight different terms for indirect expenses, seven different terms for personal expenses,
and seven different terms for housing and food.
We even found variation within an individual institution when comparing their websites to their financial
aid offers. In our sample of 72 colleges, 36 percent use different terms for books and supplies and 31 percent use different terms for personal expenses from their website to their financial aid offer.
Inconsistent ExplanationsGiven the vagueness and variation of indirect expense terminology, consumer-friendly explanations are critical
to students’ understanding of these costs. Of the 444 websites we reviewed that provided an updated itemized
list of indirect expenses, only 43 percent included explanations. In reality, the explanations colleges provide
on websites sometimes add to rather than alleviate students’ confusion.
The quality of these explanations varies widely. Many use non-specific descriptions and vague terms that
provide little to no information to guide students’ decisions. “Non-billed costs will vary based on personal
choices” and “additional costs not included in base price” are two examples of unhelpful explanations provided
by colleges on their websites.
Table 1. High Variation of Indirect Expense Terminology on College Websites
INDIRECT EXPENSES
58 Terms
BOOKS & SUPPLIES
30 Terms
TRANSPORTATION
31 Terms
PERSONAL EXPENSES
52 Terms
HOUSING & FOOD
61 Terms

B eyo n d t h e C o l l e g e B i l l - u Asp i re 1 2
Certain umbrella terms such as “personal expenses” encompass a variety of items, including cell phone,
laundry, clothing, personal hygiene, student club fees, emergency funds, entertainment, and dining out.
Without further description, students cannot determine what is or is not included. Similarly, terms for “food”
reflect different expectations: some included only “lunch at school,” others included food in a “commuter
budget allowance,” and still others listed “food” or “meal plan” with no further explanation.
When defining transportation, some colleges included “maintenance,” while others explained their estimate
“does not include such items as vehicle maintenance.” A laptop is commonly regarded as essential to undertake
college coursework. However, only four of the 444 colleges that listed indirect expenses on their website included a laptop as an expense. The lack of consistency exposes an underlying problem downstream—
indirect expense calculations rely on different definitions, making them incomparable across institutions.
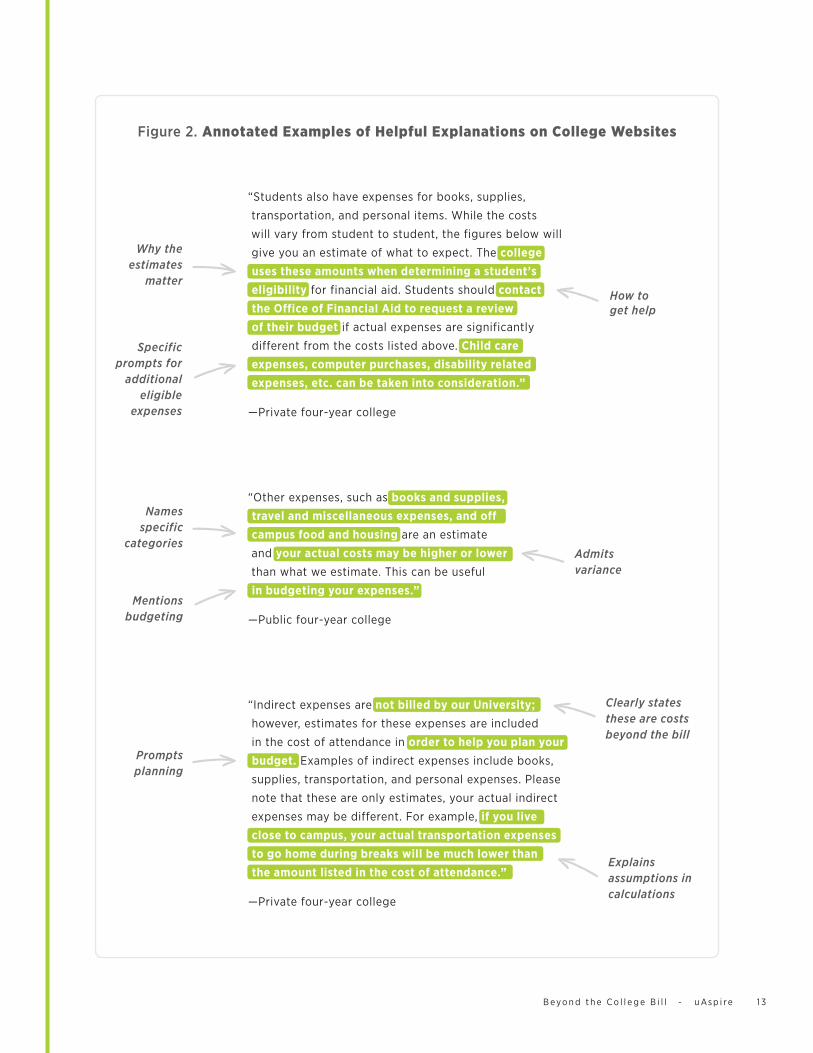
Stronger explanations use accessible language and cite concrete specifics that a student can easily understand.
Helpful explanations recognize variances and articulate assumptions, offer how to seek help, and prompt
students to plan and budget. Figure 2 showcases the best explanations we found on college websites.
Why the estimates
matter
Specific prompts for
additional eligible
expenses
How to get help
Names specific
categories
Mentions budgeting
Prompts planning
Admits variance
Clearly states these are costs beyond the bill
Explains assumptions in calculations
B eyo n d t h e C o l l e g e B i l l - u Asp i re 1 3
Figure 2. Annotated Examples of Helpful Explanations on College Websites
“Students also have expenses for books, supplies,
transportation, and personal items. While the costs
will vary from student to student, the figures below will
give you an estimate of what to expect. The college uses these amounts when determining a student’s eligibility for financial aid. Students should contact the Office of Financial Aid to request a review of their budget if actual expenses are significantly
different from the costs listed above. Child care expenses, computer purchases, disability related expenses, etc. can be taken into consideration.”
—Private four-year college
“Other expenses, such as books and supplies, travel and miscellaneous expenses, and off campus food and housing are an estimate
and your actual costs may be higher or lower than what we estimate. This can be useful
in budgeting your expenses.”
—Public four-year college
“Indirect expenses are not billed by our University; however, estimates for these expenses are included
in the cost of attendance in order to help you plan your budget. Examples of indirect expenses include books,
supplies, transportation, and personal expenses. Please
note that these are only estimates, your actual indirect
expenses may be different. For example, if you live close to campus, your actual transportation expenses to go home during breaks will be much lower than the amount listed in the cost of attendance.”
—Private four-year college

B eyo n d t h e C o l l e g e B i l l - u Asp i re 1 4
Effect on StudentsOpaque and inconsistent indirect expense information leaves students with a knowledge gap when making
college choices and budgeting for college. Students surveyed in our focus groups felt that colleges did not
consistently communicate helpful indirect expense information and shared how inadequate communication
affected their experiences.
One student expressed confusion around the ambiguity of what was covered by financial aid and
what wasn’t: “I wanted to know what I was awarded and what it goes for. Is it my classes? My books?
My computer? What is it covering? What specifically do I need to have?” Another student was
surprised by the expenses for specific classes that were never mentioned until they were already
enrolled in the class:
“What they don’t tell you is that for chemistry and bio labs, you have to pay for those things, buy your own lab coat and goggles. The school doesn’t provide that for you and those things are expensive.”
Inconsistent and opaque terminology is a troubling trend. A clear understanding of indirect expenses
is paramount for students to make informed decisions related to college choices and budgeting. Vague
and poorly communicated indirect expenses also impact student borrowing. Without a clear understanding
of what these expenses will be, students may either borrow more than they need or not borrow enough
to cover their costs.

B eyo n d t h e C o l l e g e B i l l - u Asp i re 1 5
Indirect Expense Estimates Don’t Add UpThe variation of indirect expenses from college to college is to be expected,
as they can vary based on geography, major, and a student’s personal
choices throughout the year. We also recognize that consistency of indirect
expenses from one college to the next does not necessarily denote accuracy.
Yet the wide range of indirect expense estimates, especially for colleges
in the same city, raises questions of how colleges determine what
to include. This matters because colleges may use these numbers
in determining net cost,14 a federally-defined calculation that includes
indirect expense estimates. When students compare net cost from college
to college, they likely do so unaware of the inherent inconsistency of what
is or is not included within the indirect expense estimates.
Variation of EstimatesPrevious studies by Robert Kelchen and others have documented the variance of indirect expense estimates
across colleges in the same geographic location. For example, in the 2013-14 academic year in Philadelphia,
one private college estimated it cost $14,728 for a student to live off campus versus $18,365 at another private
college just a few blocks away. Similarly, in Chicago, one private college estimated a living allowance of
$16,300, while a neighboring private institution estimated $21,240.15

B eyo n d t h e C o l l e g e B i l l - u Asp i re 1 6
With these findings in mind, we reviewed indirect expense estimates within our dataset and found similarly
large disparities between the estimated costs of housing, transportation, and food among colleges in the same
city. In Boston, New York City, and Philadelphia, colleges just a few miles apart provided indirect expense
estimates that differed by $8,000 or more, whether for on-campus, off-campus, or commuting students.
For example, commuter indirect expenses at one New York college were $18,600, while at another college less
than a half mile away they were $9,870—an $8,730 difference. In Boston, two colleges just over two miles apart
had estimates that differed by $10,836, and in Philadelphia two colleges a half mile apart had estimates
differing by $15,036 (see table 2).
Table 2. Indirect Expense Estimates Differ Between Colleges in Close Proximity*
Boston
New York City
Philadelphia
ON-CAMPUS**
Private 4-Year: $5,250
Private 4-Year: $2,700
Difference (<1 Mile): $2,550
OFF-CAMPUS
Private 4-Year: $23,858
Public 2-Year: $13,022
Difference (2 Miles): $10,836
COMMUTER/WITH FAMILY
Public 2-Year: $9,361
Private 4-Year: $6,073
Difference (3 Miles): $3,288
ON-CAMPUS**
Private 4-Year: $8,000
Private 4-Year: $2,520
Difference (3 Miles): $5,480
OFF-CAMPUS
Public 4-Year: $20,431
Private 4-Year: $15,790
Difference (<1 Mile): $4,641
COMMUTER/WITH FAMILY
Private 4-Year: $18,600
Public 4-Year: $9,870
Difference (<1/2 Mile): $8,730
ON-CAMPUS**
Private 4-Year: $6,334
Private 4-Year: $3,834
Difference (<1 Mile): $2,500
OFF-CAMPUS
Private 4-Year: $25,012
Private 4-Year: $9,976
Difference (<1/2 Mile): $15,036
COMMUTER/WITH FAMILY
Public 2-Year: $8,000
Private 4-Year: $6,573
Difference (2 Miles): $1,427
* Analysis done by uAspire using unique institutions per category
** Exclusive of on-campus housing costs

B eyo n d t h e C o l l e g e B i l l - u Asp i re 1 7
Transportation EstimatesColleges in cities with robust public transit systems
can provide an accurate baseline expectation of
transportation costs, yet we found that colleges’
estimated transportation expenses can be misaligned
with local public transit costs. In New York City,
for example, we found the local public transit cost
for nine months is $1,089, yet on their websites,
33 percent of NYC colleges provided a lower estimate
for off-campus students and 50 percent provided
a lower estimate for on-campus students.
Impact on Student Decisions The discrepancy in estimated indirect expenses,
especially for colleges in the same city, can have
a large impact on the student experience. Table 3
gives the indirect expense estimates for on-campus
students at three private four-year colleges in
Boston. The difference between the highest and
lowest estimates is $2,300. While a relatively small
amount compared to the total cost of college, it
could influence a student’s decision and lead them
to believe they are making a more affordable choice,
when they are really choosing the college that
provides more conservative estimates.
Table 3. High Variation of Indirect Expense Terms* and Calculations in Boston
College One Private 4-year
INDIRECT EXPENSES
Books & Supplies: $1,000
Incidentals: $1,950
Total: $2,950
College Two Private 4-year
INDIRECT COSTS
Books: $1,200
Transportation: $250
Misc: $2,200
Total: $3,450
College Three Private 4-year
INDIRECT COSTS
Books & Supplies: $1,500
Transportation: $1,000
Miscellaneous: $2,750
Total: $5,250
* Different terms listed represent direct quotes pulled from actual college websites

B eyo n d t h e C o l l e g e B i l l - u Asp i re 1 8
Table 4. High Variation of Indirect Expense Terms* and Calculations for Commuters in NYC
College One Private 4-year
COLLEGE LIVING EXPENSES
Books & Supplies: $2,050
Transportation: $460
Personal Expenses: $500
Food: $500
Total: $3,510
College Two Public 4-year
INDIRECT COSTS
Books & Supplies: $1,850
Transportation: $1,100
Personal: $1,500
Lunch & Maintenance: $2,250
Total: $6,700
College Three Public 4-year
RELATED COSTS
Books & Supplies: $1,364
Transportation: $1,088
Personal Expenses: $1,796
Room & Board: $4,390
Lunch: $1,232
Total: $9,870
Students and families should be able to trust that the estimated indirect expenses provided by one college
are comparable to those of another college. The wide variance between colleges just a few miles apart proves
this is not the case and adds another layer of complexity for students trying to determine the actual cost
of college and which college they can afford.
Table 4 shows the estimated indirect expenses for a student living with their family and commuting
to three four-year colleges in New York City. The difference between the highest and lowest estimate
is over $6,000 and highlights the inconsistency among colleges of what to include, in this case
the potential cost of a student living at home.
* Different terms listed represent direct quotes pulled from actual college websites

B eyo n d t h e C o l l e g e B i l l - u Asp i re 1 9
Complexities for Financial Aid AdministratorsSetting cost of attendance, particularly indirect expenses, is a complex process
that many institutions tackle with minimal guidance and varied estimation approaches.
This projection requires assessing many living scenarios, using multiple data sources,
and integrating perspectives from different departments across campus. Once calculated,
communicating indirect expense estimates in a consumer-friendly way is not a simple
task. Nine financial aid administrators from a cross section of institutions and
geographies shared thoughtful insights on how professionals weigh these issues
in their work.
Minimal Guidance for CalculationInstitutions receive minimal guidance from government or industry experts regarding how to calculate
the indirect expense estimates they include in student budgets. Federal Student Aid (FSA) suggests
institutions use periodic student surveys and other “reasonable methods you may devise which generate
average costs for various student cohorts”16 to calculate indirect expenses. It also encourages institutions
to use averages for students with the same enrollment status (e.g., full-time) rather than the actual
expenses of individual students.
The National Association of Student Financial Aid Administrators (NASFAA) recommends institutions
use the following three principles in calculating what it costs for a student:
• comprehensive: “reflect any goods and services necessary to permit a student to concentrate
on educational pursuits”
• reasonable: enables students “to maintain a moderate standard of living”
• systematic: include regular review and updating of specific items.17
Putting these principles into practice is complex due to individual student circumstances and decisions
institutions make regarding how they estimate indirect expenses.

B eyo n d t h e C o l l e g e B i l l - u Asp i re 2 0
Different Estimation Approaches Calculating indirect expenses requires drawing on several data sources and can involve substantial work
for financial aid administrators, depending on the methods institutions use. The varied approaches institutions
use explain some of the considerable differences in indirect expense estimates previously discussed. Financial
aid administrators in our interviews recognized these variances, even internally. One administrator stated,
“This leads to some students being short on funds, while others being awarded more heavily than necessary.”
The approaches colleges use to calculate indirect expenses include:
Information from studentsInstitutions use surveys, focus groups, and budget
logs to collect information about living expenses
and other costs from students on their campus. They
also consider the number of appeals for changes in
indirect expenses that they receive from students.
Several aid administrators expressed concern
about whether the information they gathered from
the students completing these tasks reflected the
amounts spent by all students at their institution.
Estimates based on mid-range pricingOne aid administrator explained this approach as
follows: “A lot of schools look at on-campus meal
plan, they take the middle-tier plan and just use
that for off-campus.” Another administrator said
she calculates off-campus food budgets by taking
the college’s most common full meal plan cost and
subtracting a small fraction. A problem with using
mid-range pricing is the tremendous variation in
costs internally. As one administrator put it, “We
were developing averages for everything and using
those averages for all students across the board.
[We] recognized even on campus there was a huge
differential in there—over $3,000 dollars.”
External dataExternal sources provide cost-of-living data from
federal, state, and regional government and non-
governmental agencies. Several administrators
identified the MIT Living Wage Calculator as a useful
source. The California Student Aid Commission
conducts the Student Expense and Resource Survey
(SEARS) to assess how much students spend on
costs beyond tuition.18 While external data sources
offer high validity, sometimes using them can
be challenging because geographical regions
set by external sources may be wide-ranging. To
compensate for this problem, one aid administrator
compared local grocery and eatery prices to data
provided by a state agency and used the larger
amount to estimate food costs.
Local research Aid administrators rely on campus bookstore staff
for the cost of books and supplies. Some institutions
interview local realtors for the average rent charged
for different types of apartments and community
action agency staff to estimate the cost of food and
heat. They also estimate the amount students need
for food based on the cost of the meal plans offered
to students living on campus.
How often institutions update their estimates of indirect expenses varies considerably. The majority of those
we interviewed update these numbers every one to two years, while others do so every three to five years.
One aid administrator couldn’t recall the last time they had updated their indirect expense estimates saying,
“We never get push-back from students or parents, so we assume our indirect expense estimates are okay.”

B eyo n d t h e C o l l e g e B i l l - u Asp i re 2 1
The decisions financial aid staff make in estimating indirect expenses often require assessing how students
should be living and what should be included. This process is not easy and can require a cross-departmental
team with different priorities and perspectives. One administrator shared,
“The hardest part is deciding when and how to make value judgements when setting indirect expenses.”
The administrator continued, “For the entirety of when we’ve been calculating, we’ve used the mean response.
Recently, questions arise whether we should make value judgements. For example, should we not use survey
data for rent when there are more than X number of roommates, or maybe we should exclude a studio
apartment on the other end of the cost spectrum?”
Pricing Pressures In an increasingly market-based environment, many colleges face pressure to compete for students based
on their cost. One administrator shared,
“There is a real tension between what we know is the real story of attending [our institution], including indirect expenses, and the tendency among the public, higher education boards, and policymakers to focus on tuition.”
This example demonstrates the pressure on public institutions to align their costs with their state’s higher
education policy agenda.
At many institutions, the financial aid office reports to the head of enrollment management, whose priority
is to meet enrollment targets. Because affordability is a major consideration for students in choosing a college
to attend, some institutions may try to keep their total cost down so they look more attractive when students
and families compare their college options. One administrator shared the assumption that decision-makers
likely aim towards “the lower end.”
Communication to Students The aid administrators we interviewed shared that they primarily communicate indirect expense information
through the financial aid offer sent to students and the institution’s website. Several mentioned their
institutions also include indirect expenses in admissions brochures and presentations for high school students
and families. They found that the most effective way is through in-person conversations. One institution even
has a one-on-one session with every accepted student to review costs.
Administrators discussed a number of problems they have communicating indirect expenses. The biggest
challenge is being able to explain a complex subject in a simple way that is easy to understand. A public
college administrator shared, “It is confusing to students because students think we are charging them to live
at home even though that is not the case. ... People expect public colleges to be inexpensive and are unhappy
when they see that a state college costs $30,000” when tuition is well below half that number.
Several administrators shared that their institutions do not list indirect expenses on their website for these
reasons. They also described families not understanding indirect expenses until they actually start paying
them. They noted this issue especially comes up when students move off campus, are not used to budgeting
for monthly expenses, and need money for rent.

B eyo n d t h e C o l l e g e B i l l - u Asp i re 2 2
Improving CommunicationAll of these problems lead administrators to look for new and better ways to communicate college costs to
students. One administrator commented, “If I could Snapchat my costs to students, they might actually read it.”
To improve their communications, some institutions are taking steps to make their communications more
accessible to students. One administrator said, “[We] take pride in constantly reviewing printed and web
materials for readability and web accessibility and making sure the materials are getting through to students.”
This college has a team of students to review documents for understanding before publishing them.
Administrators agreed that the best approach would be personalized sessions with a financial aid counselor.
However, with limited staff and technology, colleges cannot afford to develop a personalized budget for every
student or speak with students individually to make sure they understand their costs.
Financial aid administrators made the following recommendations to improve the ways institutions
communicate with students and families about indirect expenses:
Gather Student FeedbackEngage students to provide feedback on terms,
definitions, and formats the college uses in
publications and on websites. Institutions can
leverage their work-study students and/or seek
support from institutional research departments
for surveys or focus groups.
Improve PortalsAlign the content on student portals with other
financial aid communications. Use portals to share
important college cost information with a consumer
lens to teach students about what they must pay,
when, and to whom. Increased interactivity can help
students better understand what specific costs are
included in indirect expense estimates and how
to assess their own situation and estimate
their expenses.
Adapt Communications with Student Audience in MindDesign student-friendly communications that explain
the different components of indirect expenses.
Highlight how the choices students make can
increase or help control expenses.
Introduce College Cost Concepts EarlyDevelop a financial literacy curriculum and/or
workshops on college costs and financial aid that
public secondary school systems can implement
to increase understanding before college. Incorporate
workshops on college costs and financial aid into
the orientation for new students at the institution.

B eyo n d t h e C o l l e g e B i l l - u Asp i re 2 3
Challenges for StudentsThe difficulties institutions face to accurately calculate and communicate
the cost of attendance create challenges for students that can derail their
progress toward graduation. The students in our research described their
struggle to afford indirect expenses. In our survey, 51 percent of students
paid more for indirect expenses than they had anticipated. Eighty-eight
percent of students felt stress about affording indirect expenses at least
one-two times a semester with over 50 percent stressing monthly.
Without an explicit breakdown of indirect expenses, students face
significant pressure to scrape money together for items not in their
budget yet necessary for their success.
Students Experience Significant Stress Affording Indirect Expenses
50%Per Month
88%Per Semester

B eyo n d t h e C o l l e g e B i l l - u Asp i re 24
Budget Shortfalls for Books and TechnologyAs one student put it, “Books were the biggest thing that really shocked me. When I went to get books
for the first semester and they were over $100, I didn’t know what to do with myself. Where am I getting
this money from?”
Colleges typically estimate book expenses based on an average reported by the bookstore, which can
lead students to budget inaccurately for the particular courses they are taking. One student explained,
“On the financial aid worksheet, it gives you, like, rough estimates but those are never what you’re actually paying. Oh, you’re only gonna spend $200 on books! Like, one book last semester cost me $200.”
Students may also be unaware of lower-cost options, such as buying used textbooks online, as colleges do not
typically share this information. One student said, “In my first semester I figured a cost is a cost, and I spent
$800-$1000 getting books for all my classes. Now I’ve found ways to get around it, but it would be nice
to have that insider information right away.”
Faculty choices about course materials can significantly drive up students’ indirect expenses. Students noted
that instructors sometimes require students to purchase costly books they almost never use in class. Costs
climb higher when faculty choose texts that require an online access code for an additional fee. Assignments
are hidden behind a publisher’s paywall and must be accessed with the code.
One student described their experience having to unexpectedly purchase multiple access codes,
“I had already paid $250 for an access code that was supposed to cover all my biology courses, but then it turned out that the genetics course text has a different code. Student Activities gives you a free used book, but not an access code.”
Students expressed stress about purchasing access codes and other technology such as laptops and mandated
software, knowing that cutting this expense would severely limit their ability to succeed in class.
The Troubling Cost of Transportation Many students struggle with getting to campus because of the cost of parking, public transit, and car
ownership. They spoke about not being able to meet the actual costs of transportation, especially for
the reality of commuter students. A student who received outdated information from his college said,
“The parking pass was a little ridiculous. On the [college’s] website it said $300, which is a little steep but I could still do it. Then you look at the fine print and it said, ‘last updated in 2008,’ and it had doubled.”
When taking public transit, the “cost” of transportation is both money and time. Some students who attend
school in urban areas shared that they need to live farther away from campus and/or work to afford housing.
This creates a trade-off between cheaper housing and more expensive, more time-consuming transportation.
Students explained that the commuter rail transit options are faster, yet more expensive and often not
included in the transit subsidies offered by their college.

B eyo n d t h e C o l l e g e B i l l - u Asp i re 2 5
One student shared the hard reality that logistics can play with simply getting to class in an affordable
and timely way:
“ So last year, spring semester, I had a 7 a.m. class and that fit my class schedule to my work schedule. The issue is it takes me about one hour 10 minutes to get here. But the twist is that the first bus from my place is at 6:30. So if I wait for that bus I’ll be late, so I have to take an Uber to the other closest bus stop which is a ten-minute drive or about 30-minute walk.”
Many students shared that they did not budget for the higher cost of rideshare services they need to use when
public transportation is not available and that institutions rarely included such services in their estimated
budgets. Students also spoke about how unanticipated transitions such as a change in living situation
or transfer to a new college increased their transportation costs.
Timing of Financial Aid Communication and DisbursementThe timing of financial aid communications and disbursements matter. This is particularly true for students
from low-income backgrounds who depend on every cent received. Students need to know the amount of
funds available and when they will be applied.
Unclear communications about when scholarships are applied to their account can lead to students taking out
unnecessary loans. One student explained, “For my freshman year they told me I needed a certain amount of
loans and so I requested that amount of loans. Then when I got to school they said, ‘Actually, you’re fine,’ and
I didn’t need that loan money. But by then it was too late and the 14-day loan cancellation period was over.
I had to go through all the paperwork to send the loan money back. It took over a week. It created all this
anxiety, and I didn’t know if I would have what I needed for the spring semester.” Another explained,
“ The scholarship came in late, and I had a hold on my account. I couldn’t register for classes, it was a whole big deal.”
Another student observed, “We need a system that shows us where the money is coming from and when it’s
being applied. I took out a loan. It was a Parent PLUS loan—my mom did that for me. But she didn’t have to do
that if I had known about the scholarship being applied.”
The timing of financial aid refunds can also cause problems. Many students receive their refunds weeks after
the start of the semester when they were needed to pay for textbooks, school supplies, and other expenses.
The delayed disbursement of scholarship and/or refund dollars leaves students reliant on that aid at a
disadvantage to start the semester. One student described being “ … on that fine line where if I wait until I get
my refund I can buy [books] for cheap but that puts me behind in my class.”

B eyo n d t h e C o l l e g e B i l l - u Asp i re 2 6
Impact on Student EngagementBeing a fully-engaged student is not free. For students from low-income backgrounds the cost to be involved
on campus can be out of reach. Sixty-eight percent of the students we surveyed said they turned down
a school-related opportunity because of cost.
Timing of class or school events—in the evenings and on weekends—puts a price on the ability of students
living off campus to participate in the campus community. Additional expenses occur when students are
required to stay on campus and create a barrier that limits students’ ability to have the full college experience.
One student shared,
“ I don’t live the campus life or the college life that other people are living … I want to be part of things, but I have to save money for next semester.”
Costly requirements for successful completion of a course surprised and frustrated one student: “It’s especially
annoying when you have to pay for [school-related] activities. I was asked to pay for a Broadway play that was
$100 for a class that wasn’t part of my major.”
For students in programs requiring professional internships, appropriate workwear and interview clothes
represent another indirect expense they may not have anticipated. “It could be hundreds of dollars,”
said one student talking about her university’s cooperative education program.
Socializing and studying with peers contributes to students’ college success yet also comes with associated
costs. As one student put it,
“ Food is a big part of the campus social scene in general. I feel like that’s one indirect expense I knew existed, but it was much more than I anticipated.”
Her experience illustrates how a lack of resources can undermine students’ ability to develop the social
belonging critical for college success.
Concern about such expenses often leads
students to an impossible choice between
engaging more in school and working
to pay for it. A survey conducted by the
California Student Aid Commission found
that 64 percent of students listed “cost
of college” or “balancing school and work
responsibilities” as the greatest barrier to
succeeding in college.19 Likewise, in the
survey uAspire conducted, 42 percent of
students reported being significantly or
extremely concerned about their ability
to cover the indirect expenses needed to
complete their degree. These cascading
barriers can turn a single indirect expense
into a degree-delaying obstacle.
Students Concerned They Cannot Afford Indirect Expenses to Complete Degree
42%

B eyo n d t h e C o l l e g e B i l l - u Asp i re 2 7
Students shared countless scenarios where they gamble and make trade-offs pitting one indirect expense
against another. Access code versus food? Gas money versus books? This drives risky behavior. Given the lack
of transparency about indirect expenses, it is even more difficult for first-generation students to predict which
expenses to prioritize over others. First-generation students and students from low-income backgrounds not
only have less familiarity with the risks, they also lack a safety net when their bet goes awry.
Being unclear about how to cover various indirect expenses can cause students stress. One student explained,
“ We get all tuition and fees for my scholarship, but then there are outside costs and that’s what I’m confused about. There’s books obviously, then there’s food, transportation ... Me asking to be able to pay for food sounds like me being greedy, but I also do need to eat to go to college.”
Even when students receive scholarships that cover annual direct costs, they can still struggle with a lack of
funds to cover their indirect expenses.
Managing Unexpected Expenses Seventy-nine percent of students we surveyed encountered an unexpected indirect expense at least
one-two times in the last academic year, with 38 percent encountering unexpected expenses four
or more times. When asked what they do when faced with unexpected indirect expenses, over half responded
that they changed their food shopping or eating habits and/or cut back on social activities. Over 40 percent
reported that they increased their work hours and/or chose not to buy all the books required for their courses
(see figure 3). Students shared vivid examples of needing to cut back on food and other indirect expenses,
as their attention inevitably shifted from academics to empty stomachs. One student talked about strategies
to manage “going to class hungry” and “controlling my belly.” Another posed a rhetorical question: “If I had
back-to-back classes and needed lunch for the day … do I starve through classes or get something to eat?”
Figure 3. Coping Strategies Students Use When They EncounterUnexpected Expenses
CHANGED FOOD SHOPPING OR EATING HABITS 53%
CUT BACK ON SOCIAL ACTIVITIES/ENTERTAINMENT 53%
INCREASE AMOUNT OF TIME WORKING 45%
DID NOT BUY ALL REQUIRED BOOKS OR SUPPLIES 41%
STOPPED OR CUT BACK ON TRANSPORTATION 22%
USED CREDIT CARD MORE 18%

B eyo n d t h e C o l l e g e B i l l - u Asp i re 2 8
Life-Hacking and Peer NetworksAccording to a recent report by the Institute of Higher Education Policy and our research, personal networks
like friends, family, and social media help students better understand indirect expenses and devise stopgap
measures.20 As one student shared, “My brother is a college graduate, he’s been through it. He said ‘those
numbers, they’re kinda really wrong … If it says $100, you’re gonna spend $500 or more.’” Not all students,
however, have an older sibling or friends who went to college to show them the ropes.
Many students find creative ways to get around indirect expenses, but they often rely on personal networks
and the goodwill of other students. As one student described, “There’s one book on reserve and there’s 100
people taking the class, and 20 people gambling on scanning it … someone else has it and is making copies,
so you better be good friends with that person.”
During one of our focus groups, participants exchanged phone numbers and strategies to cut costs for books
and supplies. These valuable networks may take time to build, as a student described, “When you get to your
sophomore year, you have made some more connections, you get to ask people and know people who can
provide you with sources … for the little expenses you’re going to require.”
Students also rely on social media for informal knowledge about indirect expenses:
“ Going on Twitter and seeing people complain about the indirect expenses is how I learned that textbooks would be expensive and room and board was something.”
Many students employ life-hacking strategies to get by. One student said, “I can’t work on an empty stomach
and I can’t concentrate. Sometimes I need to go to the fitness center where they have $1 apples.” Over school
breaks, for instance, students who cannot afford to travel home described how they scramble to find a place
to stay or food to eat when the dorms and dining halls are closed.
Students’ ability to cover indirect expenses should not rely on the knowledge and experience of their personal
network. Though students’ creativity and resourcefulness is impressive, the severity of the cost barriers
they consistently face is shocking and unacceptable. The dire situations of Pell-eligible students, who are
disproportionately Black and Latinx, are clear indicators of an inequitable higher education system that fails
to provide students the aid they need.

B eyo n d t h e C o l l e g e B i l l - u Asp i re 2 9
Easing the Burden on StudentsSome institutions are leading the way to implement innovative programs, services,
and collaborations to address the challenges students face. uAspire conducted
interviews with eleven higher education professionals championing this work
on their campuses whom are profiled in the Appendix. This section highlights some
of those profiles and other evidence-based strategies used by institutions to effectively
reduce the costs and burden of indirect expenses.
Reducing Textbook CostsStudents in our focus groups talked about ways faculty members ease the burden of textbook costs, access
codes, and other course materials. Some described professors who seek out cheaper textbook options
and allow students to use older versions that can be purchased as less expensive used books. One student
expressed appreciation describing:
“ For my math course, my professor, instead of having us buy the access code, he used this other site called Lumen. He’d put the homework on there so we could just do it for free instead of wasting money.”
Professors also reduce or eliminate costs by using free textbooks available from OpenStax, Bookboon, and
Open Textbook Library. The most widespread and promising approach to reducing students’ textbook costs
is the Open Educational Resources (OER) movement. OERs are online educational materials that are openly
licensed and can be accessed for free. Colleges best serve students when they treat high textbook costs as an
institutional problem in need of an institutional solution.
Some colleges even launch initiatives incentivizing faculty to develop courses using OERs. The Maricopa
Community College District began the Maricopa Millions Project in 2013 with the goal of developing OER
content for courses with the highest enrollments.21 Five years later, the project saved students $11.5 million
in textbook costs.22 Achieving the Dream coordinates a collaborative OER Degree Initiative Project across
38 colleges. In a third-party evaluation, 41 percent of students reported that OER courses had a significant
impact on their ability to afford college.23

B eyo n d t h e C o l l e g e B i l l - u Asp i re 3 0
Subsidizing TransportationMany colleges collaborate with public transit agencies to offer students free or discounted ride fares. In order
to defray costs, institutions may leverage federal, state, and local funds or student fees. The National Academy
of Sciences Transit Research Board found that student transit pass programs improve college affordability
by increasing the percentage of students using public transportation and decreasing the percentage driving
to campus. At California State University, 71 percent more students used public transportation to get
to campus than before the university implemented a pass program. At Penn State University, the number
of students using public transportation increased by 160 percent and car usage decreased from 70 to 20
percent. In another survey, 15 percent of University of Wisconsin-Milwaukee students said the reduced
fare program had a significant effect on their ability to persist in college.24
Fighting Student HungerRepeatedly throughout our focus groups students spoke about forced choices between meeting their basic
needs and paying for college-related expenses. In the last decade, student food insecurity has emerged
as a pressing challenge for thousands of college students nationwide, led by research at the Hope Center
for College, Community, and Justice.
Colleges across the country are responding to student food insecurity and hunger. In some instances, colleges
partner with local food banks, such as the Houston Food Bank’s stocking of the food pantry at the University
of Houston Downtown.25 In many instances, students are leading campus efforts to reduce hunger among
their peers by referring students to community-based sources of food, helping them apply for SNAP
(Supplemental Nutrition Assistance Program) benefits, and organizing food pantries and meal swipe
programs. These initiatives are supported by student activity fees and campus-wide fundraising drives.
Meal swipe programs allow students to donate unused dollars on their meal plan to students in need. On some
campuses, food service vendors also donate meals to the program. Momentum is growing as demonstrated
by the national nonprofit Swipe Out Hunger which increased their number of campus partners by 82 percent
in 2018-2019.26 University of California Irvine’s meal swipe program decreased students skipping meals
by 62 percent, while 61 percent of those using the food pantry say it had a positive effect on their ability
to complete the previous quarter.27
An Affordable Place to LiveAccording to one financial aid administrator we interviewed,
“Housing and meal cost increases have outpaced those of tuition and fees and yet they get very little attention. Housing has become the biggest barrier for first-generation and/or low-income students.”
In a California study, students attending community college full-time and living off campus frequently voiced
frustration with not having enough financial aid to cover housing costs. One in five students indicated that
they had difficulty paying their rent or did not have the money to pay their entire utility bill. They appreciated
the aid they received, but indicated that even if they worked part-time, they would not have enough
to pay rent.28

B eyo n d t h e C o l l e g e B i l l - u Asp i re 3 1
One of the most promising solutions to students’ housing insecurity involves partnerships between colleges
and local public housing authorities. An example is the College Housing Assistance Program, a partnership
between Tacoma Community College (TCC) and the Tacoma Housing Authority (THA) to provide subsidized
housing for homeless and near-homeless students. This is supported by leveraging a combination of federal
HUD funding to cover rent subsidies and institutional funds to coordinate the program.
THA subsidizes housing for students in three ways: reserving apartments it owns near the TCC campus; paying
down rents to affordable levels in private developments near the campus; and helping students pay security
and utility deposits in the private real estate market, purchase furniture, and other housing expenses.29 The
program is highly effective: 95 percent of participating students remained enrolled in college one year later
compared with 24 percent of eligible students who were not served.30
Subsidizing Child CareAffordable and reliable child care is essential for students with children to succeed in college but the demand
for campus-based childcare is not being met. Since 2003, campus-based child care centers have decreased
significantly. Additionally, waitlists are rampant and run deep as noted by recent research citing that 95
percent of centers maintained an average waitlist of 82 children.31
Despite the discouraging data, promising campus-based child care services exist and are supported by federal,
state, and institutional funds. The federal Child Care Access Means Parents in School program (CCAMPIS)
supports campus child care centers at close to 200 institutions across the country, while the states of
Arkansas, Minnesota, and Tennessee provide assistance with child care costs for college students. Other states
support child care for Temporary Assistance for Needy Families (TANF) recipients attending college who work
a certain number of hours. Fifty-two percent of TANF recipients participating in Arkansas’ Career Pathways
initiative completed degrees or certificates, double the completion rates of TANF recipients who did not.32
Some institutions operate family resource centers, such as Los Angeles Valley College’s Family Resource
Center, that provide multiple support services for student parents including child care subsidies. Eighty
percent of Los Angeles Valley’s students who used the Family Resource Center returned for a second year
compared with 69 percent of students at the college in general.33 Similarly, student parents at Monroe
Community College in New York who used the campus child care center completed college on time
at over three times the rate of those who did not.34
On-Campus Resource Centers Offer SupportOver the past decade, a number of colleges have established on-campus social service resource centers that
offer students a range of assistance. These can include referrals to community resources, assistance with
applying for public benefit programs, budgeting assistance, legal help, and tax preparation services. Some
centers target vulnerable student groups such as recipients of TANF and Social Security Disability Insurance
(SSDI), homeless students, or those transitioning from foster care, while others are open to all students
seeking assistance.

B eyo n d t h e C o l l e g e B i l l - u Asp i re 3 2
uAspire profiled two examples of these centers at Amarillo College and Oregon State University (OSU).35 The
Amarillo center is supported by the college, while student activity fees fund the OSU center. Evidence of their
effectiveness demonstrates a compelling return on investment. Amarillo’s three-year completion and transfer
rates have increased from 19 percent in 2011, when its social services center was established, to 48 percent in
2018.36 Similarly, at OSU, 91 percent of the students who applied for food assistance and the textbook lending
program in 2017 returned to college the following year, compared with 84 percent of all students.37
Some institutions partner with community-based organizations to leverage public benefits and other resources
to help students. Single Stop, a national nonprofit, operates centers on 18 community college campuses across
the country. A national impact study found that the year-to-year college persistence of students using Single
Stop services increased 3 to 16 percent compared to similar students who did not receive services.38
Emergency Aid as Financial Safety Net Colleges also offer stopgap supports through emergency aid that helps students navigate unexpected financial
challenges at a moment-in-time. Over 500 colleges offer emergency aid for students funded primarily by
campus foundations and individual donors. According to a HOPE Lab study, the most common emergency
expenses are medical (71 percent), living/housing (67 percent), childcare (57 percent), and transportation
(52 percent).39 Aid is typically provided in the form of loans or grants up to $1,000.40 Some colleges also issue
vouchers for meals and campus bookstore purchases.
Emergency aid clearly makes a difference. Austin Community College students who received emergency aid
persisted in college at higher rates than students who did not.41 Likewise, at Florida International University,
97 percent of students who received emergency aid remained enrolled or graduated.42
Make Student Supports Apparent and AccessibleWhen offering these lifelines of support, it is crucial that institutions ensure such programs are easy for
students to find. In one focus group, a student shared information about an emergency aid program on
campus: “The college has money for students who fall short. Have any of you used that money?” Another
student replied in disbelief: “What money? I’ve never heard of that.” Many students reported being unaware
and/or unclear about how to access existing support such as free meals, discounted public transportation
passes, and emergency funds. One student observed,
“ A lot of colleges have programs, but don’t vocalize that they can help students. How could we know to reach out? Help me help myself.”
Spreading awareness about financial support services is a key start. It is also important to share information
and run programs in ways to reduce the stigmas associated with being in need. The dignity is in the details.
One student explained: “They have a collection bin of outfits downstairs but it’s hard to gather up the courage
to go into the donation bin. Is that interview outfit even gonna fit? ... It’s literally a box in the hallway, the most
traffic-heavy hallway in the school.” Institutional choices about communication methods, location, and delivery
of support services can go a long way to help students feel genuinely cared for and more likely to accept
the support being offered.

B eyo n d t h e C o l l e g e B i l l - u Asp i re 3 3
Policy Recommendations To support the success of millions of college students burdened by indirect expenses,
urgent federal, state, and system leadership is required. Policymakers must address
the root causes of college affordability struggles and mobilize broadscale changes
so students can cover the complete costs of college beyond the bill. Finally, uAspire
urges that students are prioritized as the key stakeholders and centered in all policy
changes. We offer the following policy recommendations to provide systems-level
solutions to this systems-level problem.

B eyo n d t h e C o l l e g e B i l l - u Asp i re 3 4
Increase Funding of Need-Based Aid Students pay a disproportionate share of increasing
college costs since the purchasing power of the
Pell Grant decreased from covering over three-
quarters of the cost of a four-year public degree in
the 1970s to covering less than one-third today.43
This decline means that indirect expenses go unmet.
More resources are needed to help students make
ends meet. Protecting and bolstering the public
investment in grant and work-based aid for students
can lead to increased degree completion and help
break the cycle of poverty. uAspire supports federal
and state policies to increase aid, specifically:
• restoring the purchasing power of Pell to cover
at least 50 percent of the average public school
total cost of attendance, reinstating Pell’s
automatic annual inflation index adjustment;
• returning Pell lifetime eligibility to 7.5 years
from 6 years; and
• allowing for a negative Expected Family
Contribution so that students who are below
zero can access the increased resources
they require.
Allow Need-Based Aid to Cover Indirect ExpensesAll state governments should ensure that every
aid dollar offered to Pell-eligible students can
be leveraged to cover costs beyond tuition. This
can be managed in two ways. State financial aid
policies could authorize need-based grants to cover
costs beyond tuition, up to the institution’s cost
of attendance. Alternatively, state aid programs
could distribute need-based grants as first-dollar
scholarships. First-dollar scholarships allow state
aid to be applied to the tuition bill before federal
grant aid is applied. This increases the federal grant
aid available to cover indirect expenses. Finally,
government aid programs should offer increased
funding and allow more flexible and timely delivery
of emergency aid to help students navigate financial
volatility when no safety net exists.
Require Transparency and Accessibility of Indirect Expense InformationAll institutions that receive Title IV funding should
post their current cost of attendance (COA)
including an itemized breakdown of estimated
indirect expenses on their website. Each indirect
expense item should include a brief explanation of
its basis in addition to the estimated dollar amount.
Consumer Test “Net Cost”“Net cost” is a term widely used by the federal
government, such as on the College Finance
Plan. The intent is to offer an apples-to-apples
cost comparison between institutions after
grants and scholarships are applied. Yet, with
the inconsistencies of how indirect expenses are
calculated, the reliability of “net cost” as a tool
to compare or prepare for the costs of college is
questionable. Unsurprisingly, students in uAspire
focus groups shared a lack of confidence in “net
cost” calculations. The federal government should
consumer test the term “net cost” with students.
It is important to assess whether this bundled
term, encompassing all direct costs and indirect
expenses, effectively provides students with the
clear consumer information they need.
Standardize Indirect Expense Terms and DefinitionsConduct consumer testing to inform increased
specificity of indirect expenses and their
components. Use the results to establish
standardized, student-centered indirect expense
terms and definitions. For example, the indirect
expense glossary (see table 5 on next page) was
developed by students in uAspire’s user testing
groups. To ensure transparency and consistency,
all institutions using Title IV funding should
be required to use standardized terms and
definitions on their website and all financial aid
communication where COA is communicated.

B eyo n d t h e C o l l e g e B i l l - u Asp i re 3 5
Table 5. Student-Created Indirect Expense Glossary
Textbooks, printed materials, software, access codes, clickers, and additional course requirements in syllabi
Pens, pencils, notebooks, calculators, laptop, reference guides, and other supplies to aid in studying and completing coursework
Healthcare services, fees, co-pays, over-the- counter medications, and other expenses not covered by insurance related to physical and mental wellbeing
Snacks, beverages and meals on-campus, off-campus, and at home in addition to a school meal plan
Expenses for travel to work, home, school, shopping centers, study abroad and/or school breaks including gas, car insurance, maintenance, parking, public transit, and rideshare
All costs related to the rent, mortgage, utilities, furnishing and maintenance of your residence while enrolled in school
Expenses for personal needs, extracurricular activities and employment including laundry, self-care/hygiene products, uniforms, security clearances, collegiate clubs, social activities, internet, and cell phone service
The costs of caring for dependents, including daycare, food, clothing, and support services
Clear, consistent, and timely communication of indirect expenses and their cost estimates is paramount for students to make informed decisions related to college choices and budgeting. Through user experience design sessions, students shared their perspective of indirect expenses, what categories should be called,
how they’re best defined and which key examples describe the costs included.
Required Course Materials
STUDENT TERM
Books
COMMON TERM
Educational SuppliesSupplies
Physical & Mental HealthcareHealthcare
FoodFood
Transportation CostsTransportation
HousingHousing
Personal ExpensesPersonal Expenses
Child andDependent Care
Child and Dependent Care
STUDENT DEFINITION

B eyo n d t h e C o l l e g e B i l l - u Asp i re 3 6
Improve Guidance on How to Calculate Indirect Expense EstimatesColleges acknowledge that they each have their
own practices when estimating indirect expenses.
Improving guidance on how to calculate indirect
expense estimates will increase consistency and
transparency while allowing necessary flexibility
for institutions. Some states have started providing
guidance based on state-level data, yet this mainly
impacts public colleges and universities in those
states. Increased state and federal guidance would
make estimated calculations more comparable from
one college to the next.
Direct Federal Work-Study Funding to the Neediest StudentsThirty-five percent of federal work-study (FWS) funds
go to students in the top two income quintiles, based
on an analysis by the Congressional Budget Office.44
Congress should increase FWS funding and better
direct it to low- and moderate-income students.
Congress should pass legislation that updates the
FWS formula to allocate funding to institutions based
on the percentage of Pell Grant recipients they enroll.
Simplify Student Access to Public BenefitsFederal and state means-tested benefits (e.g., TANF,
SNAP) are a potential source of aid for students
struggling to pay indirect expenses, but the process
to access benefits is overly complicated. To address
this uAspire advocates three policy changes. First,
allow interagency data-sharing to streamline benefits
application and eligibility determination. Second,
require that colleges provide students with benefit
program information, applications, and support
services. Third, adjust restrictions that block student
access to public benefit programs, such as allowing
postsecondary enrollment (half-time or more)
to qualify as work.
Incentivize Innovation to Reduce Indirect ExpensesFederal-state partnerships, such as federal matching
funds, can encourage states and institutions to
reduce indirect expenses for students and keep total
costs low. Government dollars should be leveraged to
motivate institutions, state systems, and vendors to
cut costs and employ innovative strategies to reduce
actual expenses, particularly for transportation
and required course materials. States should pass
legislation to increase, if not mandate, that public
education institutions move towards the use of OERs.
Advance Federal Data Collection on Costs Beyond TuitionThe federal government does not currently collect
sufficient survey data on postsecondary students’
indirect expenses. Given non-tuition expenses
account for the majority of college costs, more
precise information (e.g., books and educational
expenses, food access and insecurity, housing access
and insecurity) would better direct federal investment
and policy solutions. Government-sponsored research
to gather nationally representative data could include
adding questions to the National Postsecondary
Student Aid Study (NPSAS)45 and requesting the
Government Accountability Office (GAO) to conduct
research on costs beyond tuition.

B eyo n d t h e C o l l e g e B i l l - u Asp i re 3 7
Endnotes1. Ma, J., Baum, S., Pender, M., & Libassi, C. (2019), Trends in college pricing 2019. College Board.
Retrieved from: https://research.collegeboard.org/pdf/2019-trendsincp-highlights.pdf
2. Analysis of 2015-16 National Postsecondary Student Aid Study (NPSAS:16) data, conducted by uAspire.
3. Burd, S., Keane, L., Fishman, R., & Habbert, J. (2018), Decoding the cost of college: The case for transparent financial aid award letters. New America and uAspire. Retrieved from: https://www.uaspire.org/BlankSite/media/uaspire/Decoding-the-Cost-of-College.pdf
4. Anthony Jr., M., Nichols, A., Marshall Anthony Jr., & Schak, J. O. (2019), How affordable are public colleges in your state? The Education Trust. Retrieved from: http://edtrust.org/resource/affordability-gap/
5. National College Access Network. Strengthen Pell: Restore the purchasing power of the Pell grant. Retrieved from: https://collegeaccess.org/page/Pell
6. Analysis of 2015-16 National Postsecondary Student Aid Study (NPSAS:16) data, conducted by uAspire.
7. Cochrane, D., & Szabo-Kubitz, L. (2016), On the verge: Costs and tradeoffs facing community college students. The Institute for College Access and Success. Retrieved from: https://ticas.org/wp-content/uploads/legacy-files/pub_files/on_the_verge.pdf
8. Goldrick-Rab, S., Richardson, J., Schneider, J., Hernandez, A., & Cady, C. (2018), Still hungry and homeless in college. Wisconsin HOPE Lab. Retrieved from: https://hope4college.com/wp-content/uploads/2018/09/Wisconsin-HOPE-Lab-Still-Hungry-and-Homeless.pdf
9. Bray, J. (2017), Transportation costs in student living expenses. AACT Now. Retrieved from: http://perspectives.acct.org/stories/transportation-costs-in-student-living-expenses
10. Lumina Foundation. (2019), Who is today’s student?. Retrieved from: https://www.luminafoundation.org/files/resources/today-s-student.pdf
11. Kahn, S., Huelsman, M., & Mishory, J. (2019), Bridging progressive policy debates: How student debt and the racial wealth gap reinforce each other. Roosevelt Institute, The Century Foundation, & Demos. Retrieved from: https://rooseveltinstitute.org/wp-content/uploads/2019/08/RI_Student-Debt-and-RWG-201909.pdf
12. Perna, L., Wright-Kim, J., & Jiang, N. (2019), Questioning the calculations: Are colleges complying with federal and ethical mandates for providing students with estimated costs?. University of Pennsylvania Graduate School of Education and Penn AHEAD. Retrieved from: https://www.gse.upenn.edu/pdf/ahead/Questioning_the_Calculations.pdf
13. Burd, S., Keane, L., Fishman, R., & Habbert, J. (2018), Decoding the cost of college: The case for transparent financial aid award letters. New America and uAspire. Retrieved from: https://www.uaspire.org/BlankSite/media/uaspire/Decoding-the-Cost-of-College.pdf
14. In this report we are using net cost as it is defined on the Education Department’s College Financing Plan: “Cost of attendance minus total grants and scholarships.”
15. Kelchen, R., Goldrick-Rab, S., & Hosch, B. (2017), The costs of college attendance: Examining variation and consistency in institutional living cost allowances. Journal of Higher Education, 88(6). Retrieved from: https://kelchenoneducation.files.wordpress.com/2017/09/kelchen_etal_coa_prepub.pdf
16. U.S. Department of Education, Federal Student Aid. (2017), Federal student aid handbook: Volume 3–Calculating awards & packaging. Retrieved from: https://ifap.ed.gov/fsahandbook/1718FSAHbkVol3.html
17. National Association of Student Financial Aid Administrators. (2017), Self-study guide: Cost of attendance—Award year, 2017-18. Retrieved from: https://www.nasfaa.org/uploads/documents/NASFAA_Authorized_Training_COA_SSG_151D.pdf
18. California Student Aid Commission. (2019), 2018-2019 Student expenses and resources survey: Volume 4—Initial insights. Retrieved from: https://www.csac.ca.gov/sears
19. California Student Aid Commission. (2019), 2018-2019 Student expenses and resources survey: Volume 4—Initial insights. Retrieved from: https://www.csac.ca.gov/sears
20. Peters, E. E., Roberson, A. J., & Voight, M. (2019), The cost of opportunity: Student stories of college affordability. Institute of Higher Education Policy. Retrieved from: http://www.ihep.org/sites/default/files/uploads/docs/pubs/ihep_student_voices_full_report_v6_web_pages.pdf
21. uAspire interview with Matthew Bloom, Faculty-in-Residence OER Coordinator, Maricopa Community College District, on August 6, 2019. See the Appendix: Promising Practices for more information.
22. Bloom, M. (2018), Incentivizing faculty leads to over $11 million in savings. Community College Consortium for Open Educational Resources. Retrieved from: https://www.cccoer.org/casestudy/incentivizing-faculty-leads-to-over-11-million-in-savings/

B eyo n d t h e C o l l e g e B i l l - u Asp i re 3 8
23. Griffiths, R., Gardner, S., Mislevy, J. L., & Wang, S. (2018), Participant experiences and financial impacts: Findings from year 2 of Achieving the Dream’s OER degree initiative. SRI International. Retrieved from: https://www.sri.com/publication/participant-experiences-and-financial-impacts-findings-from-year-2-of-achieving-the-dreams-oer-degree-initiative/
24. Yu, J., & Beimborn, E. (2018), College student transit pass programs: A synthesis of transit practice. The National Academy of Sciences. Retrieved from: https://www.nap.edu/read/25052/chapter/1#ii
25. uAspire interview with Tremaine Kwasikpui, Director of Student Activities, and Courtney Lundgren, Director of Enrollment Communications and Client Relationship Management, University of Houston, on June 27, 2019.
26. Swipe Out Hunger. (2018), Swipe out hunger: 2017-2018 Impact report. Retrieved from: https://www.swipehunger.org/ourimpact/
27. FRESH Basic Needs Hub. (2018), FRESH Basic needs hub user survey: Preliminary report. University of California Irvine Center for Educational Partnerships; uAspire interview with Andrea Gutierrez, Director, FRESH Basic Needs Hub, Student Life and Leadership, University of California Irvine on July 30, 2019.
28. Cochrane, D., & Szabo-Kubitz, L. (2016), On the verge: Costs and tradeoffs facing community college students. The Institute for College Access and Success. Retrieved from: https://ticas.org/wp-content/uploads/legacy-files/pub_files/on_the_verge.pdf
29. uAspire interview with Marybeth McCarthy, Education Navigator, Tacoma Community College, on July 24, 2019.
30. Sackett, C., Goldrick-Rab, S., & Broton, K. (2016), Addressing housing insecurity and living costs in higher education: A guidebook for colleges and universities. U.S. Department of Housing and Urban Development, Office of Policy Development and Research. Retrieved from: https://www.huduser.gov/portal/sites/default/files/pdf/HousingInsecurityInHigherEd.pdf
31. Eckerson, E., Talbourdet, L., Cruse, L. R., Sykes, M., Noll, E., & Gault, B. (2016), Child care for parents in college: A state–by–state assessment. Institute for Women’s Policy Research. Retrieved from: https://iwpr.org/publications/child-care-for-parents-in-college-a-state-by-state-assessment/
32. College Counts, (2016), The Arkansas career pathways institute: Phase one research results. U.S. Department of Education, Office of Career, Technical & Adult Education. Retrieved from: https://lincs.ed.gov/professional-development/resource-collections/profile-979
33. Brayhill, L. (2019), Impact series: LA valley college’s family resource center boosts student parent success. ASCEND at The Aspen Institute. Retrieved from: https://ascend.aspeninstitute.org/impact-series-la-valley-colleges-family-resource-center-boosts-student-parent-success/
34. Eckerson, E., Talbourdet, L., Cruse, L. R., Sykes, M., Noll, E., & Gault, B. (2016), Child care for parents in college: A state–by–state assessment. Institute for Women’s Policy Research. Retrieved from: https://iwpr.org/publications/child-care-for-parents-in-college-a-state-by-state-assessment/
35. uAspire interview with Jordan Herrera, Director of Social Services at Amarillo Community College on July 24, 2019.
36. Mangan, K. (2016), A culture of caring: Amarillo college’s ‘no excuses’ program for low–income students has become a national model. Chronicle of Higher Education 65(30). Retrieved from: https://library.laredo.edu/eds/detail?db=edsgbc&an=edsgcl.604328429&isbn=edsgbc
37. uAspire interview with Nicole Hinds, Assistant Director, Human Services Resource, Oregon State University, on July 23, 2019.
38. Zhu, J., Harnett, S., & Scuello, M. (2018), Single stop final impact and implementation report. Metis Associates. Retrieved from: https://singlestop.org/wp-content/uploads/2019/11/Single-Stop-Final-Impact-and-Implementation-Study-final1.pdf
39. Dachelet, K. & Goldrick-Rab, S. (2015), Investing in student completion: Overcoming financial barriers to retention through small dollar grants and emergency aid programs. Wisconsin HOPE Lab. Retrieved from: https://hope4college.com/wp-content/uploads/2018/09/Investing-in-Student-Completion-WI-Hope_Lab.pdf
40. Kruger, K., Parnell, A., & Wesaw, A. (2016), Landscape analysis of emergency aid programs. National Association of Student Personnel Administrators, Student Affairs Administrators in Higher Education. Retrieved from: https://www.naspa.org/images/uploads/main/Emergency_Aid_Report.pdf
41. Austin Community College. (2017), 2017 Student success report. Retrieved from: https://www.austincc.edu/oiepub/pubs/student_success_factors_reports/Student_Success_Report_2017_FINAL.pdf
42. Reos Partners. (2019), To graduate or not to graduate? For millions of U.S. students, $1000 can make the difference. Retrieved from: https://reospartners.com/to-graduate-or-not-to-graduate/
43. Protopsaltis, S., & Parrott, S. (2017), Pell Grants–a key tool for expanding college access and economic opportunity–need strengthening, not cuts. Center on Budget and Policy Priorities. Retrieved from: https://www.cbpp.org/research/federal-budget/pell-grants-a-key-tool-for-expanding-college-access-and-economic-opportunity
44. Mok, S., & Shakin, J. (2018), Distribution of federal support for students pursing higher education in 2016. Congressional Budget Office. Retrieved from: https://www.cbo.gov/system/files/2018-06/53732-taxexpenditureshighereducation.pdf
45. To learn more about how NPSAS improvements could deepen our understanding of students’ indirect expense challenges, please see the Postsecondary Data Collaborative letter to Commissioner Woodworth of the National Center on Education Statistics, June 11, 2019. Retrieved from: http://www.ihep.org/sites/default/files/uploads/postsecdata/docs/resources/psdwg-npsas.pdf

B eyo n d t h e C o l l e g e B i l l - u Asp i re 3 9
Appendix Promising Practices: Institutions Reducing Indirect ExpensesuAspire applauds institutions who work explicitly to reduce indirect
expenses for students. In our research, we discovered innovative programs,
services, and collaborations that successfully address the burdens of indirect
expenses or demonstrate significant potential to do so. We interviewed
eleven higher education administrators affiliated with these programs
to unpack each initiative and offer insights to other practitioners. For each
profile we assess the root problem and solution; describe the program’s
structure, funding, and impact; and offer recommendations for replication
and links to learn more.

B eyo n d t h e C o l l e g e B i l l - u Asp i re 4 0
Amarillo CollegeCampus-based social services improve student outcomes
Problem Large numbers of students struggle to balance additional responsibilities as parents and employees, alongside the stress of limited financial resources to meet basic needs. A survey of barriers to college completion identified housing and food insecurity, transportation, jobs, and child care as the biggest challenges students face.
Solution An institution-wide initiative to change policies and practices and create new resources to better support the non-academic needs of students that interfere with their academic success.
Structure The vice president of academic affairs engaged departments across the college to understand why students were struggling and what changes the institution could make to improve persistence and degree completion rates. A plan was developed to shift the culture of the college to focus on students’ basic needs. All faculty and staff attended a training to understand poverty in Texas Panhandle communities and how it affected students attending Amarillo College.
College officials created the Billie Bee Flesher Advocacy and Resource Center (ARC) to bring social services together in the center of the campus. They identified and invited incoming first-year students with household incomes below $19,000 to visit the ARC before encountering an emergency. The ARC employs professional social workers to provide case management services for students and link them to support they may need to stay in college.
A food pantry at the ARC is supported by faculty, staff, and students who donate food and organize activities, such as preparing Thanksgiving bags for 500 students. Faculty and staff can contribute monthly to the food pantry and an emergency aid fund through a payroll deduction.
ARC staff host social service resource fairs on campus so students don’t have to travel to get an application. They also partner with 60 local nonprofits that help students pay utility bills or find dentists and eye doctors willing to help students for free.
Funding The ARC, which was developed with grant funds from the Bill & Melinda Gates Foundation, is funded by the college, except for the food pantry and emergency aid fund which are supported by donations from individuals and local businesses.
Impact & Benefits• Amarillo College’s three-year completion/transfer rate has increased from 19 to 48 percent since the program
began in 2011
• Students who use ARC services have a fall-to-fall persistence rate 14 percent higher than their peers who do notreceive assistance
Replication Tips• Conduct a survey of students’ needs. Trellis Foundation and HOPE Center have surveys to determine students’
basic needs that could be helpful
• Hire a professional social worker to organize and deliver the social services component of the initiative
• Tap into the resources of the college’s foundation to launch the initiative
Learn More
Amarillo College Advocacy and Resource Center

B eyo n d t h e C o l l e g e B i l l - u Asp i re 4 1
Community College of PhiladelphiaSingle Stop helps students access public benefits and budget effectively
ProblemMany students at the Community College of Philadelphia face significant financial challenges paying their living costs. Eighty-six percent of first-time, full-time students receive financial aid.
SolutionSingle Stop helps students navigate public benefit programs, secure tax credits, and access campus and community resources. Staff also provide legal advice, financial management counseling, and tax preparation.
StructureSingle Stop offers a one-stop center to assist students with determining their eligibility and applying for public benefit programs. Staff connect students to food, subsidized transportation and housing, and other essentials to help them get through college. They also help students with budgeting, including how to effectively manage their financial aid refunds and earnings to make it through a semester without exhausting available funds.
Single Stop is one part of a network of campus and community services that functions as a safety net, allowing students to stay in school and focus on their academics without the constant stress of inadequate finances for meeting basic living expenses. This program receives strong support across the campus community. For example, faculty include information about Single Stop services in first-year courses and the college’s culinary arts department offers food prepared in classes to students with vouchers issued by Single Stop.
FundingFederal government, foundations, individual donors
Impact & Benefits• Students received an average of $2,043 in cash from the combined sources to which Single Stop helped them apply
• An independent evaluator found that compared to a matched comparison group, Single Stop students weresignificantly more likely to persist in college from semester to semester, had completed more of the degree-bearing credits they attempted, and had higher grade point averages
Replication Tips• Use the resources offered by Single Stop USA to help campuses establish these services
• Help college staff understand the specific needs of students struggling to overcome poverty
• Secure strong support from top-level college administrators for integrating the program into the campus community
Learn More
Single Stop USA
Community College of Philadelphia Single Stop
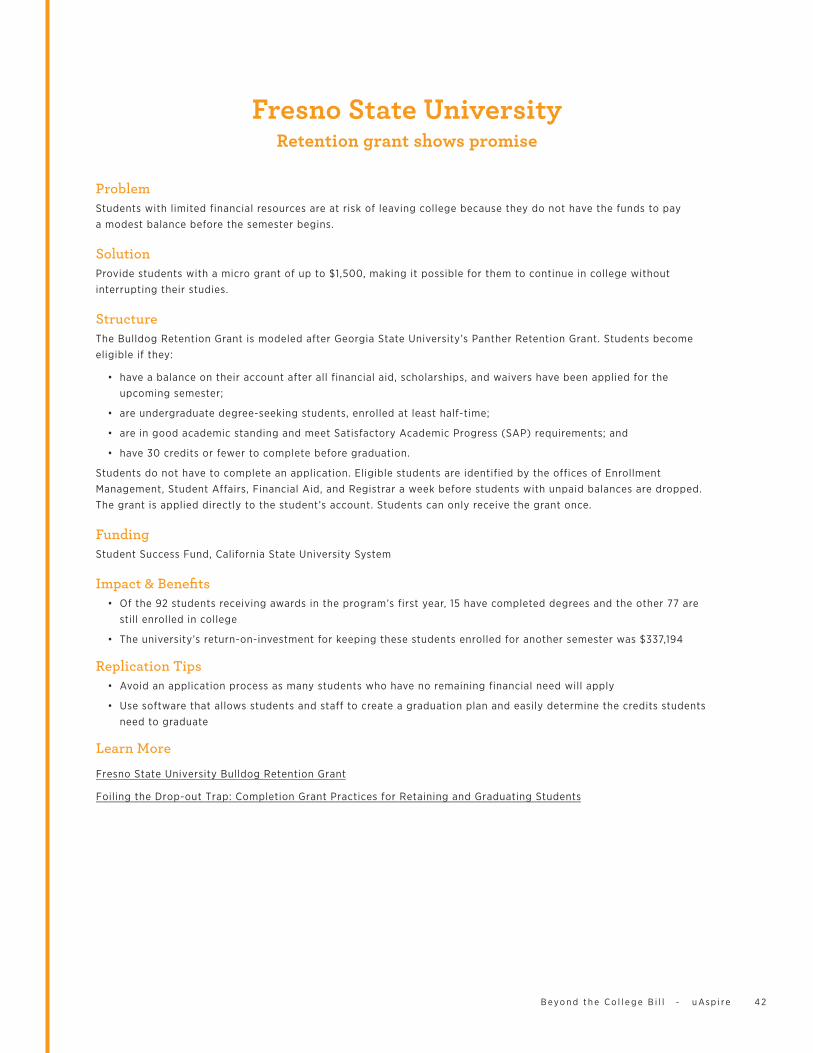
B eyo n d t h e C o l l e g e B i l l - u Asp i re 4 2
Fresno State UniversityRetention grant shows promise
ProblemStudents with limited financial resources are at risk of leaving college because they do not have the funds to pay a modest balance before the semester begins.
SolutionProvide students with a micro grant of up to $1,500, making it possible for them to continue in college without interrupting their studies.
StructureThe Bulldog Retention Grant is modeled after Georgia State University’s Panther Retention Grant. Students become eligible if they:
• have a balance on their account after all financial aid, scholarships, and waivers have been applied for theupcoming semester;
• are undergraduate degree-seeking students, enrolled at least half-time;
• are in good academic standing and meet Satisfactory Academic Progress (SAP) requirements; and
• have 30 credits or fewer to complete before graduation.
Students do not have to complete an application. Eligible students are identified by the offices of Enrollment Management, Student Affairs, Financial Aid, and Registrar a week before students with unpaid balances are dropped. The grant is applied directly to the student’s account. Students can only receive the grant once.
FundingStudent Success Fund, California State University System
Impact & Benefits• Of the 92 students receiving awards in the program’s first year, 15 have completed degrees and the other 77 are
still enrolled in college
• The university’s return-on-investment for keeping these students enrolled for another semester was $337,194
Replication Tips• Avoid an application process as many students who have no remaining financial need will apply
• Use software that allows students and staff to create a graduation plan and easily determine the credits studentsneed to graduate
Learn More
Fresno State University Bulldog Retention Grant
Foiling the Drop-out Trap: Completion Grant Practices for Retaining and Graduating Students

B eyo n d t h e C o l l e g e B i l l - u Asp i re 4 3
Maricopa Community College DistrictOERs saves students millions in textbook costs
ProblemCollege textbook prices have increased rapidly over the last 25 years—204 percent above the average rate of inflation from 1997 to 2018. At one campus in the Maricopa Community College District (MCCD), textbook costs comprise approximately a third of the total cost of an associate’s degree.
SolutionEliminate the cost barriers created by commercial textbooks and access codes by incentivizing faculty to design and offer courses using low-cost or no-cost open educational resources (OER).
StructureMaricopa Millions started as a grassroots initiative among faculty on one of the district campuses. Senior administration dedicated funding and created a district-wide committee including faculty members, IT specialists, and the director of the college’s Center for Teaching and Learning to spread OER use across all the campuses. OER development has focused on high-enrollment courses.
Faculty receive incentives, such as $2,700 and a reduced teaching load of one three-credit course, in order to complete OER design training, to develop a course using OER materials that are free or low-cost ($40 maximum), and to pilot the course.
In many cases, faculty use an OER company like Creative Commons to curate their materials and ensure that they are current. Once courses have been piloted and changes made, faculty share the content they developed with their peers through Canvas Commons, a digital repository of course materials.
Students can search the course schedule for courses using OER materials. Students pay up to $40 to access OER materials from the firm that curated them.
FundingInstitutional funds
Impact & Benefits• Saved students $11,520,000 in textbook costs over the five years since MCCD launched the initiative
• College officials plan to assess the impact of OER materials on student learning outcomes in the near future
Replication Tips• Clearly set dollar expectations for low-cost or no-cost open education resources (OER)
• Actively involve faculty in designing a plan for OER adoption
• Look at models developed by institutions participating in the Community College Consortium for OpenEducational Resources
Learn MoreMaricopa Millions

B eyo n d t h e C o l l e g e B i l l - u Asp i re 4 4
Massachusetts State Government Partnership with public colleges to use available beds
to reduce homelessness
Problem A 2017 survey found that 13 percent of Massachusetts community college students and 10 percent of four-year college students (approximately 1,800) reported being homeless during the previous year. The ability of students with severe economic hardships, particularly those transitioning from foster care, to succeed in college was compromised by their lack of housing and food.
Solution Use empty residence hall beds on public college campuses and provide meals for students through campus dining facilities.
StructureThe Massachusetts Student Housing Security Project began as a pilot in 2018. It involves eight campuses in four regions of the state, with a four-year college and a community college working together in each region. Students participating in the program are eligible for on-campus housing and meals during the academic year and the summer.
A youth services agency in each region offers students various kinds of support depending on their needs, including bedding, clothing, laptops, and case management services. Collaborating with these agencies equips campuses with source of assistance for students’ non-academic needs.
To be eligible, students 25 years and younger who are homeless must attend college full-time or aspire to do so. They are required to periodically meet with their youth service agency advisor.
FundingMassachusetts Unaccompanied Homeless Youth Commission, U.S. Department of Housing and Urban Development, Moving to Work program, and participating institutions
State government pays the housing and youth services costs, while campuses pay for the costs of meals.
Impact & Benefits Results are unavailable for this new program. Officials are currently tracking students’ GPAs, credits earned, and course withdrawals. The ultimate measure will be whether students served graduate from college and attain jobs that pay enough for them to live independently.
Replication Tips• Build connections with other state agencies serving similar populations
• Employ communication strategies to make the case that a college credential can be a way out of homelessnessand poverty
• Work with institutions whose leaders recognize what students who are homeless can achieve if they earn a degree
Learn MoreMassachusetts Department of Higher Education: Student Hunger & Homelessness

B eyo n d t h e C o l l e g e B i l l - u Asp i re 4 5
Oregon State University Student-developed resource center meets basic needs
ProblemStudents from low-income backgrounds were being priced out of a college degree by rising costs of tuition, books, and living expenses.
SolutionA campus-based center that provides various supports to meet students’ basic needs and advocates for systemic change to remove barriers that prevent students living in poverty from succeeding in college.
StructureThe Human Services Resource Center (HSRC) was started and supported by undergraduates through the student government, which at Oregon State University (OSU) has the authority to set student fees that support a variety of non-academic programs and activities. The one-stop, multi-service center is staffed by “Basic Needs Navigators” who connect students with food programs, emergency housing, and other supports. It also offers laundry, shower, and kitchen facilities, a textbook lending library, lockers, wireless access, computer workstations, and printing.
Food programs at the HSRC include a food pantry run in partnership with the local food bank, food assistance funds for income-eligible students, assistance completing SNAP applications, a garden, and a Twitter account letting students know where to find food leftover from events.
A number of campus departments support the center such as Student Affairs, the Center for Civic Engagement, the College of Public Health, and the Financial Aid Office. Faculty members are strongly encouraged to include a “basic needs statement” describing the center in their course syllabi. The center staff all organize activities to educate and advocate for addressing the root causes of poverty on campus, in the community, and with elected officials.
FundingNinety-eight percent from student fees ($11.91 per student per term), established by a vote of the OSU student government members.
Food pantry costs are covered by foundation dollars.
Federal SNAP dollars pay a portion of staff salaries.
Impact & Benefits• In 2017, 91 percent of those students who applied for food assistance and the textbook lending program returned
to college the following year compared with 84 percent of all students who attended full-time
• During the same year, the case manager helped the 360 students access $370,000 in SNAP and other mostly non-university benefits
Replication Tips• Employ a full-time person to manage the center—this work cannot be done effectively by committee or as only one
piece of someone’s job
• Dedicate time to building community relations and staying current with federal public benefits regulations andcollege policies
• Actively pursue ideas for improvements in the center’s services and operation
Learn MoreOregon State University Human Services Resource Center

B eyo n d t h e C o l l e g e B i l l - u Asp i re 4 6
Tacoma Community CollegePartnership with housing authority to reduce homelessness
and increase degree attainment
ProblemA 2016 study found that 69 percent of Tacoma Community College (TCC) students had experienced housing insecurity during the previous year and 27 percent were homeless at some point. Persisting in college is challenging without a stable place to live and most homeless students leave without a degree.
SolutionTCC partners with the Tacoma Housing Authority (THA) to provide subsidized housing for 150 homeless and near-homeless students, most of whom are parents. A subset began their studies while in prison and came to campus after their release to continue their studies.
StructureTHA subsidizes housing for students with federal funds by:
• providing students with financial assistance to secure housing in the private rental market;
• renting students the THA-owned apartments near campus; and
• paying down rents on private development apartments reserved for students to affordable levels.
Housing subsidies are available to students whose income is 30 percent or less of the median income for Tacoma residents. TCC has a $30,000 fund to help students pay security and utility deposits, purchase furniture, and cover other housing expenses. Students can receive assistance for up to three years; those who earn an associate’s degree and transfer to the University of Washington Tacoma can retain their housing assistance.
Students are required to make progress toward a degree by enrolling in 12 credits minimum each semester, maintaining a 2.0 or higher GPA, and participating in support services provided by TCC.
A full-time TCC staff member refers and supports eligible students. Work-study students and interns serve as “completion” coaches.
FundingTCC, TCC Foundation, US Housing and Urban Development (HUD) Moving to Work Program
Impact & Benefits• Sixty percent of the students participating in the pilot program had earned a degree or were still enrolled in
college after two years, compared with just 16 percent of homeless and near-homeless students who were notreceiving housing assistance
• Harvard University’s John F. Kennedy School of Government named the program one of the nation’s 25 mostinnovative governmental initiatives for the year in 2018
Replication Tips• Partner with a local housing authority; If the housing authority is not participating in the Moving to Work Program,
encourage them to apply
• Work with an institutional research office to compile data on students’ living situations and determine thepercentage experiencing housing insecurity at some point during a given year
• Secure support of top-level college leadership
Learn More
Tacoma Community College
Tacoma Housing Authority College Housing Assistance Program

B eyo n d t h e C o l l e g e B i l l - u Asp i re 47
University of Houston-DowntownPartnership with Houston Food Bank to reduce hunger through
a campus food market
ProblemEighty-six percent of entering students at University of Houston Downtown (UHD) receive financial aid and 68 percent are Pell Grant recipients. All students commute to campus. Students reported struggling to find affordable food near campus and that they did not bring lunch because there were no groceries at home. Students who are hungry have trouble focusing in classes and are at risk of dropping out.
SolutionUHD partnered with the Houston Food Bank to open a food market on campus where students can get up to 120 pounds of free groceries a month.
StructureThe Food for Change Market started in 2017 as a Food Scholarship but changed to a Food Market because scholarship implied students were getting money. In spring 2019, the program expanded to serve all UHD students, as opposed to only serving those meeting eligibility criteria. This expansion has destigmatized the provision of food for students.
UHD has an MOU and a zero-dollar contract with the Houston Food Bank. Houston Food Bank provides food, shelving, and refrigeration equipment, and delivers the food to the campus every week. UHD provides space and maintenance services. Two staff from student affairs and enrollment management oversee the market, devoting 10 to 25 percent of their time to the initiative. Work-study students handle the ordering, help with the deliveries, stock the shelves, and staff the market during open hours.
The Food Market is open four days a week, from 9 am to 6 pm. Students can get food, household cleaning supplies, and toiletries for themselves and their families. They can also designate a family member to shop for them. The market’s inventory is based on what students tell staff they need. Staff sets aside food for students with special dietary needs.
FundingHouston Food Bank, UHD
Impact & Benefits• The Food Market reduces stress that students experience because they and their families are hungry
• The market meets the Houston Food Bank’s goal to help food-insecure individuals complete education and trainingprograms that will qualify them for living wage jobs and enable their families achieve financial stability
• UHD was named Houston Food Bank’s Higher Education Partner of the Year
• A third-party evaluation is underway
Replication Tips• Vet idea/plans for the program with staff, faculty, and students; their feedback will be invaluable
• Secure support of top campus leadership
• Flexibility is important—be open to all new ideas and learning
Learn More
University of Houston Downtown Food for Change
Houston Food Bank

B eyo n d t h e C o l l e g e B i l l - u Asp i re 4 8
Valencia CollegeFinancial Learning Ambassadors teach financial literacy
to reduce cohort default rate
ProblemMany students at Valencia College reported that they did not have money for indirect expenses like child care or a bus pass and would have to borrow to pay for these expenses.
SolutionFinancial education provided by work-study students, trained as Financial Learning Ambassadors who offer classroom presentations and interactive events to promote discussion about managing personal finances.
StructureValencia College’s high loan default rate and the need to increase retention provided the impetus for starting the program, which focuses on paying for college and real-world money management.
Ambassadors give 30-minute presentations in first-year courses and staff information tables on campus during orientation, registration, and the week students receive their financial aid refunds. They host monthly themed financial literacy events (e.g., a haunted house full of identity thieves and victims in October).
Branding is important. Ambassadors wear specified color shirts with the program logo for class presentations and events to make them recognizable across the campus.
The program engages departments across the campus to support the Ambassadors and help create a culture that money management matters. Partnerships with external entities support financial learning as a campus-wide priority. Specifically, all first-year students are required to complete Grad Ready’s Paying for College module, which is part of the college’s New Experience course. In addition, a Central Florida credit union (Addition Financial) opened a student-run branch on campus and gives students $50 as an incentive to open a no-fee checking or savings account.
FundingInstitutional funds, launched with a grant from USA Funds (now Strata)
Impact & BenefitsCohort default rate decreased from 18.8 percent when the program began in 2009, to 6.8 percent in 2019.
Replication Tips• Ensure dedicated staff time to manage Ambassadors
• Incorporate program into existing activities such as orientation and college success courses
• Partner with other campus departments that can help
• Start small to learn what the program involves
Learn More
Valencia College Financial Literacy
Promoting Pathways to Financial Stability

B eyo n d t h e C o l l e g e B i l l - u Asp i re 4 9
Wayne State UniversityDebt forgiveness helps former students return
to complete their degree
ProblemSome students at Wayne State University who were close to college graduation left without completing a degree because they owed a small past-due account balance. Holds on student accounts and transcripts are barriers to students’ degree completion.
SolutionA debt forgiveness program that allows students who left college, typically when they were close to graduation, to re-enroll and complete their degree by forgiving up to $1,500 of the past-due balance owed to the university. The program also enrolls students who acquired past-due balances because they did not understand and complete the verification process.
StructureThe impetus for the Warrior Way Back program came from the university’s interest in re-enrolling students who left college without completing degrees. Officials noticed that many of these former students had a past-due balance and a cost-benefit analysis demonstrated that forgiving balances could benefit students and the university.
The university reacquires debt from collection agencies and writes it off. Transferring the debt from a collection agency to the university automatically improves the student’s credit rating. The student accounts office determines the actual amount the student owes, and where possible, waives fees and interest charges. Administrators reach out to former students through media, open houses, local churches, and social media. Once accepted to the program, the university forgives $500 of the student’s past-due balance each semester for three consecutive semesters.
Student eligibility criteria include undergraduate level, previously attended the university but had not enrolled in a class in over two years or earned a bachelor’s degree, a past-due balance of $1,500 or less,and a minimum cumulative 2.0 GPA.
Accepted students must meet the following requirements: register for at least six credits for three out of four consecutive terms, limit courses to those required for degree completion, earn a C grade or better in each course and a GPA of 2.5 or higher each term, and meet all financial aid and account balance requirements, including SAP.
FundingInstitutional funding
Impact & Benefits• Seven of the 59 student participants completed their graduation requirements in one semester
• Officials report a significant return on investment for the university, which forgave $39,000 in past-due debts for2018-2019 fall and winter terms and netted $373,000 in tuition and fees paid by students
• The program has expanded to a regional debt forgiveness program involving the Detroit Regional Chamber ofCommerce and four other higher education institutions
Replication Tips• Seek input from faculty, staff, and students across the institution in planning the program
• Employ advisors with dedicated time to help re-enrolling students develop and follow a clear path to degree completion.
Learn More Wayne State University’s Warrior Way Back Program

B eyo n d t h e C o l l e g e B i l l - u Asp i re 5 0
University of California, IrvineComprehensive services reduce student food insecurity
ProblemStudents are hungry because they lack the money to purchase food. They skip meals, lose weight, and lack the energy to focus on their studies. Seventy eight percent of students at University of California, Irvine (UCI) received free or reduced price meals before enrolling in college.
SolutionA campus food pantry, donated meal swipes, applying for SNAP, and an emergency grant program.
StructureAll food support programs are managed centrally through the FRESH Basic Needs Hub.
Students donating meal swipes provide close to one-third of the meals offered, while FRESH Hub purchases the rest at a discounted price from UCI dining services. Swipes are distributed to students who complete an application process or are identified by a campus social worker.
The food pantry secures food from two local food banks at $0.06/lb. and six grocery stores through a food “rescue” program. The pantry is organized like a grocery store with music and student workers who take a customer service approach. It runs on an honor system students swipe their IDs when they check out. Officials estimate that students visit an average of five times a year.
Emergency Crisis Response Grants are provided to students who lack the funds to access needed food, housing, medical, or mental health care. A social worker and a financial aid officer review applications weekly and award grants of up to $1,000.
FundingFifty percent of expenses are covered by fees the students voted to provide, while the remainder is provided by individual contributions and the University of California Office of the President.
Impact & Benefits• The meal swipe program has reduced food insecurity among users by more than half; the number of students
skipping meals on a regular basis has decreased by 62 percent, while 76 percent of students report having mealswipes has helped them stay in school
• Sixty-one percent of users reported that using FRESH Hub had a positive impact on their completion of theprevious academic quarter, while 54 percent indicated they had increased capacity to make education- related purchases
• Among students currently receiving SNAP, nearly all learned about them through FRESH Hub
Replication Tips • Partner with an administrator with decision-making power at the university and build trust with committed and
empathetic student leaders
• Bring a customer service approach to serving students and making them feel comfortable and safe
• Train faculty and staff how to talk with students about basic needs
Learn More
FRESH Basic Needs Hub, University of California Irvine
SwipeOut Hunger