The function of intersegmental connections in determining temporal characteristics of the spinal...
19
The function of inter segmental connections in determining temporal characteristics of the spinal cord rhythmic output Amir Ayali 1,2,* , Einat Fuchs 1,3 , Eshel Ben-Jacob 3 , and Avis Cohen 2 1 Department of Zoology, Tel-Aviv University, Tel-Aviv 69978, Israel 2 Department of Biology and Institute for System Research, University of Maryland, Collsge Park, MD 20742, USA 3 School of Physics and Astronomy, Tel-Aviv University, Tel-Aviv 69978, Israel Abstract Recent renewed interest in the study of rhythmic behaviors and pattern-generating circuits has been inspired by the currently well-established role of oscillating neuronal networks in all aspects of the function of our nervous system: from sensory integration to central processing, and of course motor control. An integrative rather than reductionist approach in the study of pattern-generating circuits is in accordance with current developments. The lamprey spinal cord, a relatively simple and much studied preparation, is a useful model for such a study. It is an example of a chain of coupled oscillatory units that is characterized by its ability to demonstrate robust coordinated rhythmic output when isolated in vitro. The preparation allows maximum control over the chemical (neuromodulators and hormones) as well as neuronal environment (sensory and descending inputs) of the single oscillatory unit - the pattern-generating circuit. The current study made use of recently developed tools for nonlinear analysis of time-series, specifically neurophysiological signals. These tools allow us to reveal and characterize biological-functional complexity and information capacity of the neuronal output recorded from the lamprey model network. We focused on the importance of different types of inputs to an oscillatory network and their effect on the network's functional output. We show that the basic circuit, when isolated from short and long-range neuronal inputs, demonstrates its full potential of information capacity: maximal variation quantities and elevated functional complexity. Morphological and functional constraints result in the network exhibiting only a limited range of the above. This constitutes an important substrate for plasticity in neuronal network function. Keywords Central pattern generator; Lamprey; Cross-correlation; Complexity Introduction Central pattern generating circuits (CPG) constitute a unique type of neuronal network characterized by the ability to generate rhythmic motor patterns in the absence of timing cues from sensory or extrinsic inputs (Marder and Bucher, 2001;Kiehn, 2006). There has been a resurgence of interest in CPG with the growing recognition that rhythmic activity patterns are * Author for correspondence: Amir Ayali: [email protected]; [email protected] Publisher's Disclaimer: This is a PDF file of an unedited manuscript that has been accepted for publication. As a service to our customers we are providing this early version of the manuscript. The manuscript will undergo copyediting, typesetting, and review of the resulting proof before it is published in its final citable form. Please note that during the production process errors may be discovered which could affect the content, and all legal disclaimers that apply to the journal pertain. NIH Public Access Author Manuscript Neuroscience. Author manuscript; available in PMC 2008 June 15. Published in final edited form as: Neuroscience. 2007 June 15; 147(1): 236–246. NIH-PA Author Manuscript NIH-PA Author Manuscript NIH-PA Author Manuscript
-
Upload
independent -
Category
Documents
-
view
2 -
download
0
Transcript of The function of intersegmental connections in determining temporal characteristics of the spinal...
The function of inter segmental connections in determiningtemporal characteristics of the spinal cord rhythmic output
Amir Ayali1,2,*, Einat Fuchs1,3, Eshel Ben-Jacob3, and Avis Cohen2
1 Department of Zoology, Tel-Aviv University, Tel-Aviv 69978, Israel
2 Department of Biology and Institute for System Research, University of Maryland, Collsge Park, MD 20742,USA
3 School of Physics and Astronomy, Tel-Aviv University, Tel-Aviv 69978, Israel
AbstractRecent renewed interest in the study of rhythmic behaviors and pattern-generating circuits has beeninspired by the currently well-established role of oscillating neuronal networks in all aspects of thefunction of our nervous system: from sensory integration to central processing, and of course motorcontrol. An integrative rather than reductionist approach in the study of pattern-generating circuitsis in accordance with current developments. The lamprey spinal cord, a relatively simple and muchstudied preparation, is a useful model for such a study. It is an example of a chain of coupledoscillatory units that is characterized by its ability to demonstrate robust coordinated rhythmic outputwhen isolated in vitro. The preparation allows maximum control over the chemical (neuromodulatorsand hormones) as well as neuronal environment (sensory and descending inputs) of the singleoscillatory unit - the pattern-generating circuit. The current study made use of recently developedtools for nonlinear analysis of time-series, specifically neurophysiological signals. These tools allowus to reveal and characterize biological-functional complexity and information capacity of theneuronal output recorded from the lamprey model network. We focused on the importance ofdifferent types of inputs to an oscillatory network and their effect on the network's functional output.We show that the basic circuit, when isolated from short and long-range neuronal inputs,demonstrates its full potential of information capacity: maximal variation quantities and elevatedfunctional complexity. Morphological and functional constraints result in the network exhibitingonly a limited range of the above. This constitutes an important substrate for plasticity in neuronalnetwork function.
KeywordsCentral pattern generator; Lamprey; Cross-correlation; Complexity
IntroductionCentral pattern generating circuits (CPG) constitute a unique type of neuronal networkcharacterized by the ability to generate rhythmic motor patterns in the absence of timing cuesfrom sensory or extrinsic inputs (Marder and Bucher, 2001;Kiehn, 2006). There has been aresurgence of interest in CPG with the growing recognition that rhythmic activity patterns are
* Author for correspondence: Amir Ayali: [email protected]; [email protected]'s Disclaimer: This is a PDF file of an unedited manuscript that has been accepted for publication. As a service to our customerswe are providing this early version of the manuscript. The manuscript will undergo copyediting, typesetting, and review of the resultingproof before it is published in its final citable form. Please note that during the production process errors may be discovered which couldaffect the content, and all legal disclaimers that apply to the journal pertain.
NIH Public AccessAuthor ManuscriptNeuroscience. Author manuscript; available in PMC 2008 June 15.
Published in final edited form as:Neuroscience. 2007 June 15; 147(1): 236–246.
NIH
-PA Author Manuscript
NIH
-PA Author Manuscript
NIH
-PA Author Manuscript
widespread in the brain and play an important role in all aspects of the function of our nervoussystem, from sensory integration to central processing and motor control (Laughlin andSejnowski, 2003;Buzsaki and Draguhn, 2004;Sejnowski and Paulsen, 2006;Kahana, 2006).Yuste et al. (2005) have recently suggested profound similarities between simple patterngenerating networks and other circuits, namely neocortical networks. These similarities reflectbasic organization or rules common to circuits that generate robust and spatially patternedrhythmic activity on different timescales.
The lamprey spinal cord, a relatively simple and much studied preparation, is a useful modelfor the study of oscillatory circuits and specifically CPG. The lamprey, a representative of agroup of early vertebrata, swims using undulatory movements of its eel-like body. Thesemovements are generated and coordinated by oscillatory neural networks repeated along theapproximately 100 spinal cord segments (Cohen and Wallen, 1980;Sigvardt, 1989;Grillner etal., 1998). The lamprey locomotor pattern is activated by descending inputs from reticulospinalneurons in the brainstem. However, in an isolated piece of spinal cord the same basic patterncan be activated by bath application of excitatory amino acids such as D-glutamate (Poon,1980;Wallen and Williams, 1984). The intact spinal cord can be isolated and kept in oxygenatedRinger solution in vitro for days and its activity can be monitored by extracellular recordingfrom spinal ventral roots (Rovainen, 1979).
Much effort has been focused on the neural circuitry of the oscillatory mechanism in lampreys(Grillner, 2003). The acquired information has been incorporated into various CPG models ofvarying complexity. However, these occasionally fail to reproduce experimental results beyondthose used during the models' development (Parker, 2006). This may at least partly be due toinadequate emphasis on the functional role of circuit interconnections and on inputs to the CPGnetwork. The anatomy of the system supports the presence of both short as well as long-distanceinter segmental connections (Rovainen, 1983;Buchanan and Kasicki, 1999, and referenceswithin). The vast majority of research into these connections was aimed at elucidating theirrole in determining and controlling the inter segmental phase lags appropriate for forwardswimming (Cohen, 1987;Williams et al., 1990;Williams, 1992;Cohen and Kiemel,1993;Miller and Sigvardt, 2000). However, the functional coupling that determines phaseappears to extend over a much more limited range than the full projection range of 30–50segments reported for some interneurons (Rovainen, 1974;Cohen, 1987;Williams et al.,1990;Williams, 1992;Cohen and Kiemel, 1993;Miller and Sigvardt, 2000). Thus, it has beensuggested that the interneurons that comprise a segmental oscillator act not only to generatethe local rhythm but also project to, and influence, rhythm generation in other nearby or distantsegments (see Hill et al., 2003, and references within). These effects can in turn take part inshaping the distinct temporal characteristics of the networks' motor output - the informationsent to and read by the muscles, resulting in the animal's behavior.
Buchanan and Cohen (Buchanan and Cohen, 1982) and others have demonstrated that lampreyslow muscle fibers respond to the precise temporal structure of the motor output (Fig. 1;Buchanan and Cohen, unpublished results). In the lack of a detailed study of the dynamicproperties of the lamprey swim muscles, we can only speculate on the behavioral significanceof the rhythmic bursts' temporal characteristics or their information capacity.
The current study was aimed at investigating fundamental principles in circuit dynamics,namely the functional role of oscillator coupling and neuronal inputs to a pattern generatingnetwork. We took advantage of the well-established lamprey model system, and recentlydeveloped analysis tools, including clustering algorithms and functional biological complexityanalysis (Hulata et al., 2004;Segev et al., 2004). We investigated temporal motifs seen in theCPG output and constructed tests to extract the maximal information on the sequence temporal
Ayali et al. Page 2
Neuroscience. Author manuscript; available in PMC 2008 June 15.
NIH
-PA Author Manuscript
NIH
-PA Author Manuscript
NIH
-PA Author Manuscript
ordering. Our results shed light on the neural mechanisms underlying behavior in this motorsystem and potentially also on oscillatory and rhythmic pattern generating systems in general.
Experimental ProceduresAnimals and in vitro preparation
Adult lampreys, Ichthyomyzon unicuspis, were obtained from a commercial supplier and keptin tanks at 5°C. Experimental animals were anesthetized by immersion in a buffered solutionof 0.18g/L MS222. After inhibition of all reflex and breathing was ensured, animals weredecapitated and transferred to a chilled surgical dish. Next, animals were eviscerated, their skinand muscle removed from around the spinal cord, and the membranes overlying the spinal cordwere removed. In all experiments 50 of the roughly 100 total spinal cord segments wereexposed, retaining the support of the notocord, which was split and pinned down.
ElectrophysiologyThe nerves that exit the spinal cord along the notochord were cleared for recording. In lamprey,the muscles and sensory nerves are separate at this point, so one can record from the musclenerve alone using a loosely fit suction electrode. D-glutamate was added to the saline bath toinduce fictive swimming motor output (Poon, 1980); Cohen and Wallen, 1980). Analog voltagewas sampled at 5 kHz using a 4-channel differential amplifier (Model 1700, A-M Systems,USA) and stored on the computer in real time using an A-D board (National Instruments) andVI-Logger software (National Instruments, USA).
Data AnalysesInitial event detection was carried out using threshold recognition (DataView; W. Heitler,Univ. St. Andrews, UK). All recorded signals were transformed into ordinary binary timesequences whose “1”s mark detected action potentials (spike sequences). Next, we evaluatedfor each such time sequence of spikes its corresponding sequence of neuronal bursting events(bursts of action potentials). The bursts' time positions and time widths were evaluated (burstsequences).
Burst classification and correlation analysisThis method followed in general that reported by Segev et al. (2004). In short, for each recordedsequence, a time window T was selected that included each of the N bursts of action potentials.This time window (constant for all bursts) was divided into time bins of 2 msec. A matrix Aof N rows (analyzed bursts) and T/2 columns (time bins) was composed. Each row representsthe activity of all the neurons firing throughout the burst. In most cases (if not stated otherwise)N = 200 randomly selected bursts were analyzed. We defined Ai,j =1 if an action potential wasfired in the i-th burst during the j-th time bin, and zero otherwise. In order to obtain a smoothrepresentation of the burst activity profile the activity vectors were then convolved with anormalized Gaussian. Next, the cross-correlation between the n-th and the m-th convolutedbursts (n,m =1,2…N) was computed using a standard algorithm under a MatLab environment(The MathWorks Inc. USA). We then found the maximum value of the cross-correlation toobtain R(n,m), the time invariant correlation between the two bursts . For visualization, a colorcode was assigned to R(n,m) according to the Jet color map, where blue represents the lowestcorrelation and dark red the highest (The MathWorks Inc. USA). In the final color cross-correlation matrices, by definition, R(n,m)= R(m,n) and R(n,n)=R(m,m)=1.
We then reordered each recorded sequence so that bursts with higher correlations were closelypositioned; namely, we applied a hierarchical clustering algorithm (dendrogram) to identifyclear groups in the matrix. Block partitioning in the matrix indicates non-random variation, i.e.
Ayali et al. Page 3
Neuroscience. Author manuscript; available in PMC 2008 June 15.
NIH
-PA Author Manuscript
NIH
-PA Author Manuscript
NIH
-PA Author Manuscript

that a recorded burst sequence is composed of subgroups of distinct bursts with mixed temporalorder of appearance. In order to determine whether bursts that belong to one group or in aspecific experimental condition differ from others, we applied a similar cross correlationprocedure to all bursts from different groups and conditions.
Representation in the time-frequency domain, best tiling and complexityNeuronal information is expected to be encoded both in activity rates and in their relativetemporal location. Signals of complex temporal nature, characterized by large local and globaltemporal variations, demonstrate large frequency variations at each temporal location whenlooking at time windows of different widths. These local variations also vary from one time toanother place to place along the sequence. Hence a proper method of characterizing andquantifying signal dynamics would be to use the sequence representation in a time-frequencyplane.
The algorithm used for analyzing signal complexity was fully described by Hulata et al.(2004). We first transformed each sequence of events into a representation in its correspondingtime-frequency domain. Utilizing the wavelet packet decomposition (MatLab, The MathWorksInc. USA), the domain was tiled (partitioned) into N rectangles, each with its own height Δfand width Δt representing the relative “energy” (qn) of the frequency range f in the time windowΔt. Each tiling (a combination of non-overlapping rectangles covering the time-frequencydomain) served to represent the recorded sequence. We used the Thiele-Villemoes algorithm(Thiele and Villemoes, 1996) to construct the best tiling: that which extracts maximalinformation about the sequence temporal ordering (the tiling that maximizes the globalinformation measure M ≡ − Σqn Log qn).
The structural complexity of a sequence is associated with the plane local (intra segment) andglobal (inter segment) variability. We began by segmenting the sequence into words andquantifying the amount of variation factor (VF) within each word l to be:
VF l = (NE(l) − NE
NE)∑n,m ∣ Rn − Rm ∣ ⋅ Θ(qn ⋅ qm)
∑n,m Θ(qn ⋅ qm)
where the sum is over all neighboring rectangles n,m. NE(l)is the number of events detectedwithin the l -th word, and N E is an average over different words of the same length as the l -th one. Θ(x) , is the heavy-tail function; Θ(0) and Θ(x≠0) = 1. The global variability was thenquantified using the variance of the variation factors between the sequence words. For asequence segmented into Nw words, we will thus define the observable structural complexity(SC) as:
SC ≡ var (VF ) ≡ 1Nw
∑l=1
Nw(V Fl − VF )2
The above was conducted for the time sequence of action potentials within bursts as well asfor the sequence of burst events.
Experimental procedures: differentially manipulating inputs to an oscillatory unitThe presentes results are based on overall 16 different preparations (animals). It was notpossible however to go through all the experimental procedures described below with eachpreparation. Thus, each experimental group (different manipulation) comprised of 4-7independent repetitions (Fig 2). The experimental bath was divided into three chambers(Rostral, Medial and Caudal; 15, 20 and 15 segments respectively; Fig 2) by carefully sealed
Ayali et al. Page 4
Neuroscience. Author manuscript; available in PMC 2008 June 15.
NIH
-PA Author Manuscript
NIH
-PA Author Manuscript
NIH
-PA Author Manuscript

Vaseline partitions. The activity of a selected range of adjacent segments within one chamberwas silenced by bathing the segments in a D-glutamate-free, low calcium solution. Thisprocedure inhibited all oscillatory activity in, and consequently all output originating from, theselected segments (in practically all cases the blocked region showed no spiking activitywhatsoever). Thus spinal cord segments in the neighboring or distal chambers were deprivedof short-range or long-range inputs respectively. Such blocking of the medial region of thespinal cord did allow long-range connections between the rostral and caudal chambers.
The above described analysis methods were used to characterize the neuronal output of thespinal chord oscillatory network, first under control conditions with all chambers in the sameD-glutamate solution. Next, activity in one or more of the chambers was blocked according toone or several of the routes in figure 2 and the same analysis was applied. Thus we conducteda comparative study of the role of the different inputs in shaping the temporal characteristicsof the motor output of spinal cord pattern generating circuits and their information capacity.
Further data for analysis were kindly supplied by Dr. Guan Li. These comprised recordingsfrom a selected range of distal segments in similar preparations as above, under controlconditions and also after long-range inputs had been differentially omitted by applying twohemisections halfway down the length of the spinal cord: first on one side, and then on theother, five segments apart (described in (Kiemel et al., 2003). Practically no long-range fiberstransverse the five segments separating the two hemisections (Rovainen, 1983,Kiemel et al.,2003).
ResultsFigure 3 shows a typical simultaneous spinal cord ventral root recording at three locationsalong the spinal cord (each at one of the three experimental chambers, left or right sides andsegment number are indicated). This figure also shows the accepted statistics used tocharacterize rhythmic patterns including cycle period, burst duration and inter-burst intervals.
The basic and most consistent result demonstrated in all the different experimental protocolsdescribed in figure 2 was that of increased variation in the temporal parameters of the rhythmwith the elimination of rhythmic inputs (short range and/or long range) to any spinal cordregion. This was clear in all preparations when comparing either burst duration, cycle period,or inter-burst intervals (n=16 different preparations, 4–7 in each experimental group). Forexample, the average cycle period calculated for the rhythmic bursting activity recorded froma distal region of the spinal cord (rostral or caudal) under control conditions (1 mM D-Glutamate) was 1.61±0.47 sec. Blocking the middle and opposite distal regions of the cord andthus practically all inputs to the recorded segments resulted in a general slowing: i.e. the cycleperiod increased to 2.66±1.46 sec (n = 7). This represents a 1.7-fold increase in cycle period,while comparing the average coefficient of variation calculated for the above two conditionsyielded a four-fold increase in variation (0.11 vs. 0.44 for the control and “all inputs blocked”conditions respectively). Similarly, the corresponding burst durations changed from 0.55±0.20sec in control to 0.83±0.50 sec in the fully blocked preparation (both short and long-rangeinputs blocked) while the average coefficient of variation was again more than tripled (from0.22 to 0.71 respectively).
Not all kinds of manipulations, however, resulted in such dramatic effects. Blocking only long-range inputs to a distal region, for example, usually resulted in no significant change in burstduration and only a minor effect on cycle period. Similarly, when monitoring the middlesegments, blocking the first neighboring (distal) region had practically no effect on burstduration and only a minor effect on cycle period. However, changes in the above statistics, orlack thereof, may not fully reflect the functional consequences of blocking inputs. Thus we
Ayali et al. Page 5
Neuroscience. Author manuscript; available in PMC 2008 June 15.
NIH
-PA Author Manuscript
NIH
-PA Author Manuscript
NIH
-PA Author Manuscript
went on to investigate changes in the information capacity of the recorded time sequences, e.g.the within-burst temporal structure, when we differentially blocked short and long range,descending or ascending inputs.
Figure 4 shows a typical example of an experiment in which the rostral segments of the spinalcord were monitored (recordings made 10 segments from the rostral end of the preparation)while eliminating first the long range, and then also the short-range inputs to the recordedregion. The dendrograms shown in figure 4A are the results of hierarchical clustering analysisbased on cross correlation of 200 randomly selected bursts out of the 1000–1500 burstsrecorded for each experimental condition. As can be seen, already after blocking activity inthe distal chamber (thus eliminating long-range inputs) the rather uniform temporal structureof the control bursts changed to reveal heterogeneity and some partitioning. This was in spiteof the fact that the frequency of the recorded rhythmic activity (Fig 4B), as well as the burstduration in this example, were practically unchanged.
The large assembled cross-correlation matrix shown in figure 4C is a combined sorted matrixof the bursts under control and under the fully-blocked conditions (based on the dendrogramsshown in 4A1 and 3). As indicated by the rather uniform shades of red, the correlation orsimilarity of the control bursts to each other is high (top right, marked 1). Blocking both typesof inputs to the recorded region resulted in a general decrease in similarity, as is evident by theappearance of bluish shades in the cross-correlation matrix (bottom left, marked 3). Theintroduced variation, which in this case was also reflected in cycle period (Fig 4B), is notrandom however, as distinct clusters or types of bursts are clearly seen. The temporal structuresof some of these bursts were somewhat similar to the control bursts (indicated by 'a' in Fig 4C).Other bursts were less similar to control (indicated by 'b'), while others still were completelynew types of bursts (indicated by 'c' and 'd' in Fig 4C). For further clarity, we show in figure 5raw data from a similar experiment. A change in the temporal pattern of activity as inputs areblocked is clear though more difficult to fully appreciate without analysis.
Monitoring activity of the caudal region of the spinal cord while successively blocking inputsresulted in a similar picture: a consistent trend of increased non-random variation, i.e.appearance of partitions in the correlation matrixes (Fig 6). The data in figure 6 were also usedto further demonstrate that new types of bursts were indeed emerging. Average burst profileswere generated from 50 control bursts and 50 bursts comprising a clear new correlation clusterafter blocking short and long-range inputs (Fig. 6B, I and II respectively as marked). Toemphasize the point, a third 50-burst average profile was constructed from a region not differentfrom control (III from Fig 6A2).
We calculated the structural complexity for the time series recorded for all experimentalconditions (sequences of 500–2000 bursts), following the different manipulations of inputs toa monitored region of spinal segments. The measure of complexity in figure 7 is shown relativeto that calculated for control in the specific experimental protocol (indicated by a dashed linein all panels). As can be seen, this kind of information capacity analysis corroborates the trendof increase in non-random variability with elimination of inputs demonstrated by our crosscorrelation analysis. Though the differences are not always significant, they are stronglysupported by the fact that they repeat in every single experiment and under all the differentmanipulations. Furthermore, when pulling data from the upper and lower panels (monitoringthe rostral or caudal regions), a two way ANOVA shows a significant effect of blocking shortrange inputs as well as short and long range inputs (for analysis of spike or burst sequences).
While blocking a region of the spinal cord distal to the recording site (more than 20 segmentsaway) eliminates long-range inputs, it may also have indirect effects via short-rangeconnections to the adjacent non-blocked middle region. To verify the distinct effects of
Ayali et al. Page 6
Neuroscience. Author manuscript; available in PMC 2008 June 15.
NIH
-PA Author Manuscript
NIH
-PA Author Manuscript
NIH
-PA Author Manuscript

blocking long-range inputs, we analyzed additional data, obtained before and after applyingtwo hemisections at the middle region of the cord (see Experimental Procedures; Kiemel etal., 2003). As can be seen in figure 8, results of the hemisection experiments confirm a cleareffect of blocking long-range inputs; a general decrease in similarity is reflected by theappearance of more greenish and bluish shades in the cross-correlation matrix. The introducedvariation is not random, as evident from the distinct clusters or types of bursts, some of whichhave little or no similarity to the control bursts. Our analysis may suggest that the rostral partof the cord is more sensitive to elimination of the long-range connections (compare Fig. 8Aand 8B), but the data are not conclusive at this stage (this point is being specifically addressedin a current follow-up study).
In order to further demonstrate the functional relevance of our findings to neural mechanismsfor animal behavior, we conducted a similar analysis as above on time series recorded fromthe lamprey spinal cord after bath application of an endogenous modulator; 5HT (n=2preparations, 2 different concentrations each). Here, instead of directly manipulating the inputsto a recorded set of spinal segments, we manipulated its neuromodulatory state which, amongother things (e.g. presynaptic inhibition of neurotransmitter release; Schwartz et al., 2005,segmental premotor interneurons; Biró et al., 2006), may affect the inter-segmentalconnections. As previously reported, 5-HT reduces the frequency of ventral root burstingduring fictive locomotion (see above references). In accordance with these reports, we foundcycle period to be increased from 0.95±0.23 sec in control conditions to 3.64±0.84 and 10.63±3.26 sec under 10−6 M and 10−5 M 5HT respectively (n=500–1000 cycles in 2 preparations).A similar effect on the duration of the burst resulted in a minor (though statistically significant)change in duty cycle (burst duration divided by cycle period): from 0.22±0.06 in control to0.25±0.12 under 10−5 M 5HT. As mentioned earlier these statistics carry no informationregarding the within-burst temporal structure Thus we further analyzed the time sequencesrecorded with and without the modulator. Figure 9A shows data similar to those seen in figure4C. Again, a large cross-correlation matrix is shown which includes sorted correlation results(based on the corresponding dendrograms). The region of the matrix showing controlconditions is again characterized by relative uniformity and high levels of correlation (shadesof red) compared to the bursts recorded in the presence of the modulator. Moreover, distincttypes of bursts can be seen in the 5HT data, some of which are somewhat similar to controlbursts (indicated by 'a' in Fig 9A ) while others are clearly new, modulator-induced types ofbursts (indicated by 'b'). Furthermore, increased non-random variability, as indicated by arelatively low correlation and somewhat clustered matrix, could already be seen followingapplication of the low dose of the modulator (Fig 9B). As in figure 6, average burst profilesare shown, each calculated for 50 bursts from the region of the cross-correlation matrixesindicated by I (control), II (10−5 M 5HT) and III (10−6 M 5HT).
DiscussionThe current results have direct implications for our understanding of the lamprey spinal cordas a model for the study of mechanisms of locomotory behavior. Oscillator coupling andintersegmental neuronal inputs have an important functional role in shaping the temporalcharacteristics of the rhythmic motor output and in stabilizing it. Thus these connections shouldbe important components of any proposed computational model of the system.
Our results show first that short-range coupling has the dominant role in stabilizing cyclefrequency and burst properties. Second, long range connections have an additive influence onburst properties, but not cycle frequency, as is evident from the appearance of hiddencorrelations in the correlation matrix (distinct and new types of bursts not seen in control)already after blocking regions of the cord separated by more than 20–30 segments from therecording site, as well as by the results of the hemisections experiments. Segev et al. (2004)
Ayali et al. Page 7
Neuroscience. Author manuscript; available in PMC 2008 June 15.
NIH
-PA Author Manuscript
NIH
-PA Author Manuscript
NIH
-PA Author Manuscript
have reported on hidden neuronal correlations in cultured neuronal networks. Using multi-electrode array technology for simultaneous recording of many neurons in vitro, these authorswere able to show that in a cultured network system the appearance of distinct burst types (orhidden correlations) was a reflection of different neuronal populations taking part in generatingthe different bursts. There is no direct way to extrapolate from the culture system to the spinalcord. Yet, in our system also, it may well be that the inputs to an oscillator unit serve to choosea subpopulation of interneurons (and follower motorneurons) to take part in generating theburst. Eliminating inputs or applying a modulator, in this respect, changes the active neuronalpopulations. Biró et al. (2006) have suggested that 5HT modulation of different types ofsegmental premotor interneuron types can partially account for the observed effects of 5-HTon the swim pattern in lamprey. In the neonatal mouse spinal cord, Zhong et al. (2006) reportthat 5HT modulates the properties of ascending commissural interneurons and propose thatthese may be component neurons in the locomotor CPG. Similarly, in the lamprey the inputinterneurons may be both modulated by 5HT and important components of the CPG.
The spinal chord is very often referred to as a homogenous chain of coupled oscillators. Towhat extent is functional rostral - caudal asymmetry imbedded in the intrinsic structure of thespinal chord, the inter- and intra-connections of the spinal cord pattern generating networks,is a question that was not yet fully addressed. The current results may offer some insights intothis question. The data presented in figure 7 suggest differences between the effects of a caudalvs. a rostral short-range blockade. When directly tested by comparing the relative change fromcontrol of the complexity value when caudal or rostral segments were blocked the result wasa consistently though non-significantly larger effect of blocking the caudal segments (p=0.1).In a future study (already underway) we intend to focus on this question as part of a largereffort to reveal endogenous functional rostral-caudal asymmetry in the lamprey spinal cord.
As mentioned, the lamprey spinal cord serves as a model for systems of coupled oscillatorsand moreover can also serve as a model for systems generating rhythmic output in general. Forcontrolling motor behavior, CPGs must act in a highly coordinated and self-regulated mode inorder to demonstrate flexible modulation without losing their essential stability (Harris-Warrick and Marder, 1991;Marder and Bucher, 2001;Nusbaum and Beenhakker, 2002). Animportant factor allowing the nervous system in general and specifically modular ensemblesof neurons such as the CPG the plasticity needed to generate continuously adjusting behavior,is that of the endogenous capacity of their singular unit to show very large variations in output.The unit may be the single neuron or a small sub-network in a simple invertebrate patterngenerating circuit, or it may be an oscillatory unit in the vertebrate spinal cord, or a complexmicrocircuit in our central nervous system.
In accordance with this hypothesis, Ayali et al. (2004) recently reported that self-assembledin-vitro networks, obtained from a relatively simple invertebrate ganglion, the locust frontalganglion, show very rich spontaneous electrical activity. By characterizing the activity of adistinct population of neurons under progressive levels of structural and functional constraints-self-formed networks of neuron clusters in-vitro, isolated ex-vivo ganglia, in-vivo task-free,and in-vivo task-forced neuronal activity in the intact animal - Ayali et al. demonstratedcommon motifs and identified trends of increasing self-regulated complexity with decreasingconstraints
This important principle is supported and may even be better demonstrated by the currentresults. The motor output of single unit oscillator in a complex system of coupled oscillators,the lamprey spinal cord, is characterized by high information capacity, i.e non-randomvariability or self regulated complexity. This endogenous high capacity is not evident howeverunder normal (control) conditions, as it is restricted by morphological and functionalconstraints. In the in vitro system these constraints are the short-range coupling and long-range
Ayali et al. Page 8
Neuroscience. Author manuscript; available in PMC 2008 June 15.
NIH
-PA Author Manuscript
NIH
-PA Author Manuscript
NIH
-PA Author Manuscript
inputs from nearby or remote oscillatory networks. The constraints are more elaborate in theintact animal, including descending and sensory inputs, and interactions with the rest of thebody and the environment. Glimpses of this vast potential can be experimentally revealed byblocking inter segmental connections or by the appropriate modulatory conditions.
The overall result of the above is the animal's ability to demonstrate stereotyped, consistent,or stable behavior that can, nonetheless, show large context-dependent variability and richbehavioral plasticity.
Acknowledgements
The authors are very grateful to Dr L. Guan, and Dr T. Kiemel for providing previous data on spinal cord hemisectionsexperiments. This work was partially supported by National Institute of Neurological Disorders and Stroke GrantNS-39909 to A. H. Cohen
Reference ListAyali A, Fuchs E, Zilberstein Y, Robinson A, Shefi O, Hulata E, Baruchi I, Ben Jacob E. Contextual
regularity and complexity of neuronal activity: From stand-alone cultures to task-performing animals.Complexity 2004;9:25–32.
Biro Z, Hill RH, Grillner S5- 5HT modulation of identified segmental premotor interneurons in thelamprey spinal cord. Journal of Neurophysiology 2006;96:931–935. [PubMed: 16707720]
Buchanan JT, Cohen AH. Activities of identified interneurons, motoneurons, and muscle fibers duringfictive swimming in the lamprey and effects of reticulospinal and dorsal cell stimulation. JNeurophysiol 1982;47:948–960. [PubMed: 7086476]
Buchanan JT, Kasicki S. Segmental distribution of common synaptic inputs to spinal motoneurons duringfictive swimming in the lamprey. Journal of Neurophysiology 1999;82:1156–1163. [PubMed:10482735]
Buzsaki G, Draguhn A. Neuronal oscillations in cortical networks. Science 2004;304:1926–1929.[PubMed: 15218136]
Cohen AH. Effects of Oscillator Frequency on Phase-Locking in the Lamprey Central Pattern Generator.Journal of Neuroscience Methods 1987;21:113–125. [PubMed: 2890796]
Cohen AH, Kiemel T. Intersegmental Coordination - Lessons from Modeling Systems of CoupledNonlinear Oscillators. American zoologist 1993;33:54–65.
Cohen AH, Wallen P. The Neuronal Correlate of Locomotion in Fish - Fictive Swimming Induced in AnInvitro Preparation of the Lamprey Spinal-Cord. Experimental Brain Research 1980;41:11–18.
Grillner S. The motor infrastructure: From ion channels to neuronal networks. Nature ReviewsNeuroscience 2003;4:573–586.
Grillner S, Ekeberg O, El Manira A, Lansner A, Parker D, Tegner J, Wallen P. Intrinsic function of aneuronal network - a vertebrate central pattern generator. Brain Research Reviews 1998;26:184–197.[PubMed: 9651523]
Harris-Warrick RM, Marder E. MODULATION OF NEURAL NETWORKS FOR BEHAVIOR. AnnualReview of Neuroscience 1991;14:39–57.
Hill AA, Masino MA, Calabrese RL. Intersegmental coordination of rhythmic motor patterns. JNeurophysiol 2003;90:531–538. [PubMed: 12904484]
Hulata E, Baruchi I, Segev R, Shapira Y, Ben Jacob E. Self-regulated complexity in cultured neuronalnetworks. Physical Review Letters 2004:92.
Kahana MJ. The cognitive correlates of human brain oscillations. J Neurosci 2006;26:1669–1672.[PubMed: 16467513]
Kiehn O. Locomotor circuits in the mammalian spinal cord. Annual Review of Neuroscience 2006;279–306:29.
Kiemel T, Gormley KM, Guan L, Williams TL, Cohen AH. Estimating the strength and direction offunctional coupling in the lamprey spinal cord. Journal of computational neuroscience 2003;15:233–245. [PubMed: 14512749]
Ayali et al. Page 9
Neuroscience. Author manuscript; available in PMC 2008 June 15.
NIH
-PA Author Manuscript
NIH
-PA Author Manuscript
NIH
-PA Author Manuscript
Laughlin SB, Sejnowski TJ. Communication in Neuronal Networks. Science 2003;301:1870–1874.[PubMed: 14512617]
Marder E, Bucher D. Central pattern generators and the control of rhythmic movements. Current Biology2001;11:R986–R996. [PubMed: 11728329]
Miller WL, Sigvardt KA. Extent and role of multisegmental coupling in the lamprey spinal locomotorpattern generator. Journal of Neurophysiology 2000;83:465–476. [PubMed: 10634888]
Nusbaum MP, Beenhakker MP. A small-systems approach to motor pattern generation. Nature2002;417:343–350. [PubMed: 12015615]
Parker D. Complexities and uncertainties of neuronal network function. Philosophical Transactions ofthe Royal Society B-Biological Sciences 2006;361:81–99.
Poon MLT. Induction of Swimming in Lamprey by L-Dopa and Amino-Acids. Journal of comparativephysiology 1980;136:337–344.
Rovainen CM. Synaptic Interactions of Identified Nerve-Cells in Spinal-Cord of Sea Lamprey. Journalof Comparative Neurology 1974;154:189–206. [PubMed: 4363563]
Rovainen CM. Neurobiology of Lampreys. Physiological reviews 1979;59:1007–1077. [PubMed:227003]
Rovainen, CM. Identified neurons in the lamprey spinal cord and their roles in fictive swimming. In:Roberts, A.; Roberts, BL., editors. Neural origin of rhythmic movements. Cambridge; CambridgeUP: 1983. p. 305-330.
Schwartz EJ, Gerachshenko T, Alford S. 5-HT prolongs ventral root bursting via presynaptic inhibitionof synaptic activity during fictive locomotion in lamprey. Journal of Neurophysiology 2005;93:980–988. [PubMed: 15456802]
Segev R, Baruchi I, Hulata E, Ben Jacob E. Hidden neuronal correlations in cultured networks. PhysicalReview Letters 2004:92.
Sejnowski TJ, Paulsen O. Network oscillations: emerging computational principles. J Neurosci2006;26:1673–1676. [PubMed: 16467514]
Sigvardt KA. Spinal Mechanisms in the Control of Lamprey Swimming. American zoologist 1989;29:19–35.
Thiele CM, Villemoes LF. A fast algorithm for adapted time-frequency tilings. Applied andComputational Harmonic Analysis 1996;3:91–99.
Wallen P, Williams TL. Fictive Locomotion in the Lamprey Spinal-Cord Invitro Compared withSwimming in the Intact and Spinal Animal. Journal of Physiology-London 1984;347:225–239.
Williams TL. Phase coupling by synaptic spread in chains of coupled neuronal oscillators. Science1992;258:662–665. [PubMed: 1411575]
Williams TL, Sigvardt KA, Kopell N, Ermentrout GB, Remler MP. Forcing of coupled nonlinearoscillators: studies of intersegmental coordination in the lamprey locomotor central pattern generator.J Neurophysiol 1990;64:862–871. [PubMed: 2230930]
Yuste R, MacLean JN, Smith J, Lansner A. The cortex as a central pattern generator. Nat Rev Neurosci2005;6:477–483. [PubMed: 15928717]
Zhong GS, Dias-Rios M, Harris-Warrick RM. Serotonin modulates the properties of ascendingcommissural interneurons in the neonatal mouse spinal cord. Journal of Neurophysiology2006;95:1545–1555. [PubMed: 16338993]
Ayali et al. Page 10
Neuroscience. Author manuscript; available in PMC 2008 June 15.
NIH
-PA Author Manuscript
NIH
-PA Author Manuscript
NIH
-PA Author Manuscript

Figure 1.Two examples of an extracellular recording from a lamprey spinal cord ventral nerve root anda simultaneous recording of slow muscle fibers junction potentials reveal the strongdependence of the muscle response on the distinct temporal pattern of the burst of activity inthe nerve.
Ayali et al. Page 11
Neuroscience. Author manuscript; available in PMC 2008 June 15.
NIH
-PA Author Manuscript
NIH
-PA Author Manuscript
NIH
-PA Author Manuscript

Figure 2.The experimental preparation was composed of 50 spinal cord segments divided into threechambers as shown (top left, number of segments indicated). Loosely fit suction electrodeswere used to record the D-glutamate-induced fictive swimming motor pattern from the ventralnerve roots in the three locations along the preparation. The different experimentalmanipulations are shown; blocking activity in selected chambers and testing for the effects ofdepriving short-range or long-range inputs to a selected range of segments whose activity wasmonitored. (1 mM D-Glutamate, or Glutamate free, low Ca2+ saline were used to induce orblock activity respectively)
Ayali et al. Page 12
Neuroscience. Author manuscript; available in PMC 2008 June 15.
NIH
-PA Author Manuscript
NIH
-PA Author Manuscript
NIH
-PA Author Manuscript

Figure 3.An example of a simultaneous recording of ventral nerve roots as shown in figure 2. A. Arobust fictive swimming motor pattern is shown with both left-right alternation and consistentphase lag from head to tail. L- Left or R- right side of the body and the position of the recordingare noted (segment number out of a total of 50, 0 being the most rostral). The segments in theisolated spinal cord preparation are numbered 1–50 from rostral to caudal. B. Commonly usedstatistical parameters are noted on a short time window shown in higher time resolution. CP,cycle period; BD, burst duration; IBI, inter-burst interval.
Ayali et al. Page 13
Neuroscience. Author manuscript; available in PMC 2008 June 15.
NIH
-PA Author Manuscript
NIH
-PA Author Manuscript
NIH
-PA Author Manuscript

Figure 4.A1-3. Three examples of the results of a hierarchical clustering algorithm (dendrogram) appliedto the outcome of the inter-burst cross-correlation analyses of 200 randomly selected burstsrecorded from a single preparation in each of the different, illustrated, experimental conditions.The dendrograms clearly demonstrate the change from the rather homogenous highlycorrelated activity in control (top, low and uniform branch length) to the more variable andpartitioned picture induced by blocking inputs. The effect is clear already after blocking long-range inputs (A2) although this can not be seen by comparing a traditional descriptive ofrhythmic activity such as cycle periods (B, numbers correspond to experimental conditions asin A). C. The reordered cross-correlation matrices based on the clustering analysis conductedfor conditions 1 and 3 (indicated) were subjected to a second round of analysis showing thecorrelation between the bursts recorded under the two conditions. As can be seen, out of theemerged subgroups or types of bursts in condition 3 some show rather high or mediumsimilarity of temporal structure to the control bursts (indicated by a and b respectively, yellowto cyan colors in the between-conditions correlation area). Other bursts seem to be completelynew types (indicated by c, dark bluish color in the cross correlation matrix).
Ayali et al. Page 14
Neuroscience. Author manuscript; available in PMC 2008 June 15.
NIH
-PA Author Manuscript
NIH
-PA Author Manuscript
NIH
-PA Author Manuscript
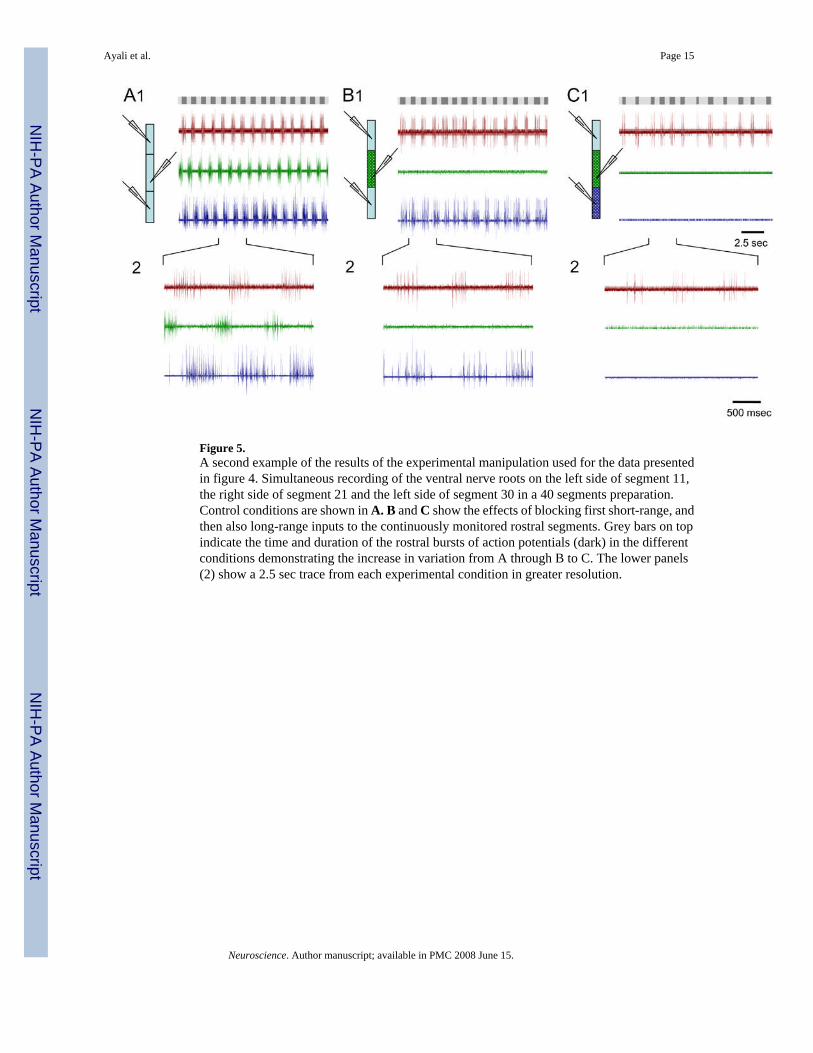
Figure 5.A second example of the results of the experimental manipulation used for the data presentedin figure 4. Simultaneous recording of the ventral nerve roots on the left side of segment 11,the right side of segment 21 and the left side of segment 30 in a 40 segments preparation.Control conditions are shown in A. B and C show the effects of blocking first short-range, andthen also long-range inputs to the continuously monitored rostral segments. Grey bars on topindicate the time and duration of the rostral bursts of action potentials (dark) in the differentconditions demonstrating the increase in variation from A through B to C. The lower panels(2) show a 2.5 sec trace from each experimental condition in greater resolution.
Ayali et al. Page 15
Neuroscience. Author manuscript; available in PMC 2008 June 15.
NIH
-PA Author Manuscript
NIH
-PA Author Manuscript
NIH
-PA Author Manuscript

Figure 6.A. Two examples of the results of blocking both short and long-range inputs to a caudal regionof spinal segments. As in figure 4C, matrices shown include the results of the inter-burstcorrelation of 200 randomly selected bursts recorded under control and under the fully blockedconditions (indicated by blue or red dashed lines respectively), as well as the cross correlationbetween the two experimental conditions. Thus, again, while control bursts are ratherhomogenous, fairly similar as well as clearly new types of bursts can be seen after manipulatingthe inputs (a, b or c respectively). B. An example of one burst as well as the average burstprofile of 50 bursts (bottom) from the areas indicated in A2: I, control bursts; II, a new type ofburst, compared to a rather similar group of bursts in III.
Ayali et al. Page 16
Neuroscience. Author manuscript; available in PMC 2008 June 15.
NIH
-PA Author Manuscript
NIH
-PA Author Manuscript
NIH
-PA Author Manuscript

Figure 7.Structural complexity (see details in Method section) computed for the sequences of spike orburst times recorded in the different experimental conditions reveals a similar trend of increasein non-random variability with elimination of inputs. A, B, C show results of analysesconducted on all recordings obtained from the rostral, middle or caudal regions of spinalsegments respectively. Data shown as change from control; statistical significance is indicated.Analysis of spike or burst sequences are shown in dark and light bars respectively.
Ayali et al. Page 17
Neuroscience. Author manuscript; available in PMC 2008 June 15.
NIH
-PA Author Manuscript
NIH
-PA Author Manuscript
NIH
-PA Author Manuscript

Figure 8.Inter-burst cross-correlation matrices similar to those shown in figures 4C and 5A. Bursts arecompared within and between control conditions and after applying two hemisections, 5segments apart, in the middle region of the spinal cord. Two examples are shown of datarecorded from rostral (A) or caudal (B) segments of the cord.
Ayali et al. Page 18
Neuroscience. Author manuscript; available in PMC 2008 June 15.
NIH
-PA Author Manuscript
NIH
-PA Author Manuscript
NIH
-PA Author Manuscript

Figure 9.The results of applying a modulator to the spinal cord are reminiscent of the results ofeliminating input to a distinct region of spinal segments. A. A correlation matrix composed forbursts recorded in control and after bath application of 10−5 M 5HT shows that the modulatorinduces the appearance of somewhat different or new types of bursts (indicated by a and brespectively). B. Variation is induced already after application of 10−6 M 5HT. C. An averageburst profile calculated for groups of 50 bursts recorded in control conditions (I) or afterapplication of the different doses of the modulators (II and III). The areas of the cross correlationmatrixes representing the bursts used for calculating the averages are indicated in A and B.
Ayali et al. Page 19
Neuroscience. Author manuscript; available in PMC 2008 June 15.
NIH
-PA Author Manuscript
NIH
-PA Author Manuscript
NIH
-PA Author Manuscript