The formation of share market prices under heterogeneous beliefs and common knowledge
22
arXiv:1105.3228v1 [physics.soc-ph] 16 May 2011 The formation of share market prices under heterogeneous beliefs and common knowledge Yuri Biondi 1* , Pierpaolo Giannoccolo 2† , Serge Galam 3‡ 1 Pˆ ole de Recherches en ´ Economie et Gestion (PREG), ´ Ecole Polytechnique and CNRS, Boulevard Victor, 32, F-75015 Paris, France 2 Department of Economics. University of Bologna, 40100 Bologna, Italy, 3 Centre de Recherche en ´ Epist´ emologie Appliqu´ ee (CREA), ´ Ecole Polytechnique and CNRS, Boulevard Victor, 32, F-75015 Paris, France May 17, 2011 Abstract Financial economic models often assume that investors know (or agree on) the fundamental value of the shares of the firm, easing the passage from the individual to the collective dimension of the financial system gen- erated by the Share Exchange over time. Our model relaxes that heroic assumption of one unique ”true value” and deals with the formation of share market prices through the dynamic formation of individual and so- cial opinions (or beliefs) based upon a fundamental signal of economic performance and position of the firm, the forecast revision by heteroge- neous individual investors, and their social mood or sentiment about the ongoing state of the market pricing process. Market clearing price for- mation is then featured by individual and group dynamics that make its collective dimension irreducible to its individual level. This dynamic holis- tic approach can be applied to better understand the market exuberance generated by the Share Exchange over time. PACS numbers: Financial markets, 89.65.Gh; Social systems, 89.65.-s; Econo- physics, 89.65.Gh Keywords: opinion dynamics, reaction-diffusion, bubble formation, market dynamics * [email protected] † [email protected] ‡ [email protected] 1
Transcript of The formation of share market prices under heterogeneous beliefs and common knowledge

arX
iv:1
105.
3228
v1 [
phys
ics.
soc-
ph]
16
May
201
1 The formation of share market prices
under
heterogeneous beliefs and common knowledge
Yuri Biondi1∗, Pierpaolo Giannoccolo2†, Serge Galam3‡
1Pole de Recherches en Economie et Gestion (PREG),
Ecole Polytechnique and CNRS,Boulevard Victor, 32, F-75015 Paris, France
2Department of Economics. University of Bologna, 40100 Bologna, Italy,3Centre de Recherche en Epistemologie Appliquee (CREA),
Ecole Polytechnique and CNRS,Boulevard Victor, 32, F-75015 Paris, France
May 17, 2011
Abstract
Financial economic models often assume that investors know (or agreeon) the fundamental value of the shares of the firm, easing the passagefrom the individual to the collective dimension of the financial system gen-erated by the Share Exchange over time. Our model relaxes that heroicassumption of one unique ”true value” and deals with the formation ofshare market prices through the dynamic formation of individual and so-cial opinions (or beliefs) based upon a fundamental signal of economicperformance and position of the firm, the forecast revision by heteroge-neous individual investors, and their social mood or sentiment about theongoing state of the market pricing process. Market clearing price for-mation is then featured by individual and group dynamics that make itscollective dimension irreducible to its individual level. This dynamic holis-tic approach can be applied to better understand the market exuberancegenerated by the Share Exchange over time.
PACS numbers: Financial markets, 89.65.Gh; Social systems, 89.65.-s; Econo-physics, 89.65.Gh
Keywords: opinion dynamics, reaction-diffusion, bubble formation, marketdynamics
∗[email protected]†[email protected]‡[email protected]
1
1 Introduction
Advances in heterogeneous agents modeling from economics [1, 2] and complexsystems dynamics in sociophysics [3, 4] call for an understanding of the workingof the financial market based upon the collective and dynamic properties of sys-tems featured by interacting parts and structures. These elements can be atomsor macromolecules in a physical context, as well as people, firms or regulatedExchanges in a socio-economic context. These approaches aim then to analyzethe properties of socio-economic systems over time by focusing on interactions,relationships and the overall architecture of them.
Drawing upon these advances, this paper integrates the phenomenon of opin-ion dynamics studied by sociophysics [5, 6] to an economic dynamic model ofmarket price formation over time through hazard and interaction [7]. The studyof opinion dynamics has been a long and intensive subject of research amongphysicists working in sociophysics [8, 9, 10, 11, 12, 13, 14]: we apply here theGalam sequential probabilistic majority model of opinion dynamics [14, 15, 16].
During the last decades, financial market analysis has assisted to the pro-liferation of financial economic models that relax received assumptions of fullknowledge, individual rationality and market efficiency. However, many mod-els remain somewhat tied to an equilibrium approach to the formation of sharemarket prices over time. This approach entails a pricing rule that satisfies all themarket orders simultaneously passed by all investors in the purpose to maximizetheir expected utilities. This approach actually implies a peculiar understand-ing of the market coordination between individual investors. This coordinationis supposed to be achieved in a solitary moment beyond time and context [17]when all investors contemplate the past, present and future of the business firmand univocally agree on its fundamental value of reference.
Once this unanimous consensus achieved, they perform market transactionsat that price, which does not change unless the fundamental value of the firmdoes change [18]. Therefore, the share market price is supposed to incorporate(all the available information on) the fundamental value of the firm at everyinstant [19, 20]. The share market price becomes a sufficient statistics of thefundamental value of the firm [21], and investors are then supposed to know (oragree with) the fundamental value of its shares, even though the current marketprice may diverge from this ”true value” in some ways over time. The under-standing and the modeling of market pricing, and the dynamics of individualand collective opinions, are then driven by this assumption of uniqueness of thevalue of the firm.
Our model relaxes this heroic assumption of the market price as the bestevidence of the ”true value,” and deals with the formation of share market priceof one firm through the dynamic formation of individual and social opinions(or beliefs) based upon a fundamental signal Ft on the economic performanceand position of the firm, the market clearing price of each share pt, and asocial mood (or sentiment) mt on the ongoing state of market pricing process.Accordingly, individual investors are assumed to form their personal opinions- which orient their financial decisions of sell or hold, and buy or wait - in a
2

fundamentally interactive context [22]. At every instant k, each investor i doesform its opinions respectively on the evolution of corporate fundamentals andthe market clearing price that is continuously changed by achieved transactionsthrough the Share Exchange.
Nothing can assure one investor about the permanent alignment between hisopinion on the evolving fundamentals, its opinion on the current market price,and the market price itself [23]; nor can he be sure that the market order -which he passes through the Share Exchange according to those opinions - maybe eventually satisfied. In this dynamic setting, the formation of share pricescritically depends on both the interactive formation of social opinions amonginvestors, and their common knowledge of corporate fundamentals over time.Every investor strives then to revise its price expectations Et(pt+1)|i accordingto the dynamics of the fundamental signal Ft and the social market sentimentmt.
2 Definition of Variables and Timing
The formation of share market price over time depends here on the dynamicformation of individual and social opinions (or beliefs) based upon a fundamen-tal signal Ft on the economic performance and position of the firm, the marketclearing price of each share pt, and a social mood (or sentiment) mj
t about themarket pricing. These three dimensions (or layers, or orders) correspond tothree different rhythms of change, that is, three different timings:
• Ft,h, the fundamental signal, has the slowest rhythm or the largest lag(duration). This means that Ft can be constant for t+ h periods; it lastsfor h periods;
• pt, the market clearing price, when exist, changes at each period t;
• mjt,k, the social mood, has the quickest rhythm or the shortest lag. At
each period t, its value is the final result of k interactions; each mood lastsindeed for 1
kperiods.
Two distinctive forces drive then the market clearing price formation troughtime. From one side, ongoing market pricing is submitted to individual guessesand intentions, hopes and fears, subsumed by the social mood m
jt,k and its
quickest interactions; from another side, it is concerned with the slowest historyof reporting and disclosure that, in principle, may be partly public, consistent,and conventionally agreed. This general system (which is no longer an equi-librium)1 consists in and depends upon the coherence and universal diffusionof relevant and reliable knowledge through a price system (providing marketinformation) and an accounting system (disclosing firm-specific, fundamentalinformation) publicly determined and announced.
In particular, the fundamental signal is assumed to be common knowledgeamong all investors:
1Our analysis distinguishes system and equilibrium as distinctive concepts.
3

• Ft is the fundamental signal about the economic performance and positiongenerated by the business firm over time; it is fundamentally related tothe firm’s share price, but agents do not know (or agree on) the workingof this relationship;
• Ft can be positive or negative and is exogenous to the model;
• Each agent applies an individual weight ϕi ∈ [0; 1] to this signal, related toits personal confidence degree on it, from ϕi = 0 (no confidence at all) toϕi = 1 (full confidence); this implies that all agents agree on the direction(sign) of the fundamental signal, but disagree on its material impact onthe share price.
• In some specifications of the model, Ft may influence the social moodm
jt,k.
The social mood (or market sentiment) captures the group interaction thatgenerates the collective opinion on the current state of market pricing:
• mjt,k ∈ [0; 1] is the mood of group j at time t, resulting from k group
interactions (steps) starting from mjt,k=0;
• At each time t, mjt,k=0 ∈ [0; 1] exists and is exogenous to the model; in fact,
mjt,k=0 may be endogenous to the model; in particular, it may depends on
F .
The market clearing price (when exists) is generated by the matchingof aggregate supply and demand, which are based upon heterogeneous priceexpectations by individual agents:
• pt is the market clearing price at time t;
• By assumption, pt ≥ 0;
• Et(pt+1)|j
i is the price expectation at time t by agent i belonging to thegroup j on the market clearing price at period t+ 1.
Individual investors have both group and individual heterogeneities re-garding the formation of their expectations, which are then based upon individ-ual and social opinions (or beliefs). In particular:
• Investors are distinguished between actual and potential shareholders. An-alytically, they belong then to two groups j = S,D, where S denotes sup-ply by potential sellers (actual shareholders), while D denotes demand bypotential buyers (potential shareholders);
• In each group j, the number of agents is normalized to one, with i ∈ [0; 1];
• In each group j, every agent i is characterized by an individual weightϕi ∈ [0; 1] that is applied to the fundamental signal Ft;
4

• In each group j, agents are further characterized by the social mood mjt,k
that constitutes the market sentiment expressed by group j at time t; itsweight results from k inter-individual interactions between t− 1 and t.
3 The formation of individual expectations
Following [24] and [25], every agent forms its price expectation according to thefollowing generic function:
Et(pt+1)|j
i = pt +mjt,k (pt − pt−1)− β
ji
(
Et−1(pt)|j
i − pt
)
+ γjϕiFt (1)
with j = S (Supply), D (Demand); i, ϕi ∈ [0, 1]; mjt,k ∈ [0, 1]; βj
i ∈ [0; 1];
γj > 0, and
εji,t ≡
(
Et−1(pt)|j
i − pt
)
.
This equation comprises forth elements. The first element is the past clearingprice pt. The second element is the market signal (or price trend) that is weightedby the social opinionm
jt,k of the group j at time t, expressing the group’s ongoing
market confidence. The third element is the individual forecasting revision thatconsists of the difference between the past price expectation and the currentrealized price. This revision is weighted by β
ji which may include both group
and individual heterogeneities. The forth element denotes the formation of anindividual opinion by investor i (belonging to the group j) based upon availablefundamental information Ft, which is common knowledge for both groups andall the individual investors, and is weighted then by the individual parameter ϕi.This structure of individual expectations follows the dual structure which theshare market process is embedded in: From the cognitive viewpoint, investorsare confronted with fundamental information from the business firm (they investin) from one side, and the market pricing from another side. From the financialviewpoint, they are confronted with dividends and earnings generated by thebusiness firm, and the capital gains and losses involved in the market trading(see [26] for further details). The firm side is subsumed here by the factor F ,while the market side is captured by the price trend t−1∆t (p).
Following the Galam’s specification of the formation of social opinions [15,16], we can define the generic function of the social mood m
jt,k as follows:
mjt,k = f
(
mjt,k=0, k
jt , Ft, Ft−1
)
where the fundamental signal F can influence kjt . For each group j = S,D,
mjt,k defines then the density at time t of individual investors who are confident
in the market signal or trend (m → 1), while 1− mjt,k defines the density at
time t of investors who distrust that market signal (m → 0). The initial valuem
jt,k=0 can be exogenous or endogenous to the model setting. In particular, it
can depend on F .
5
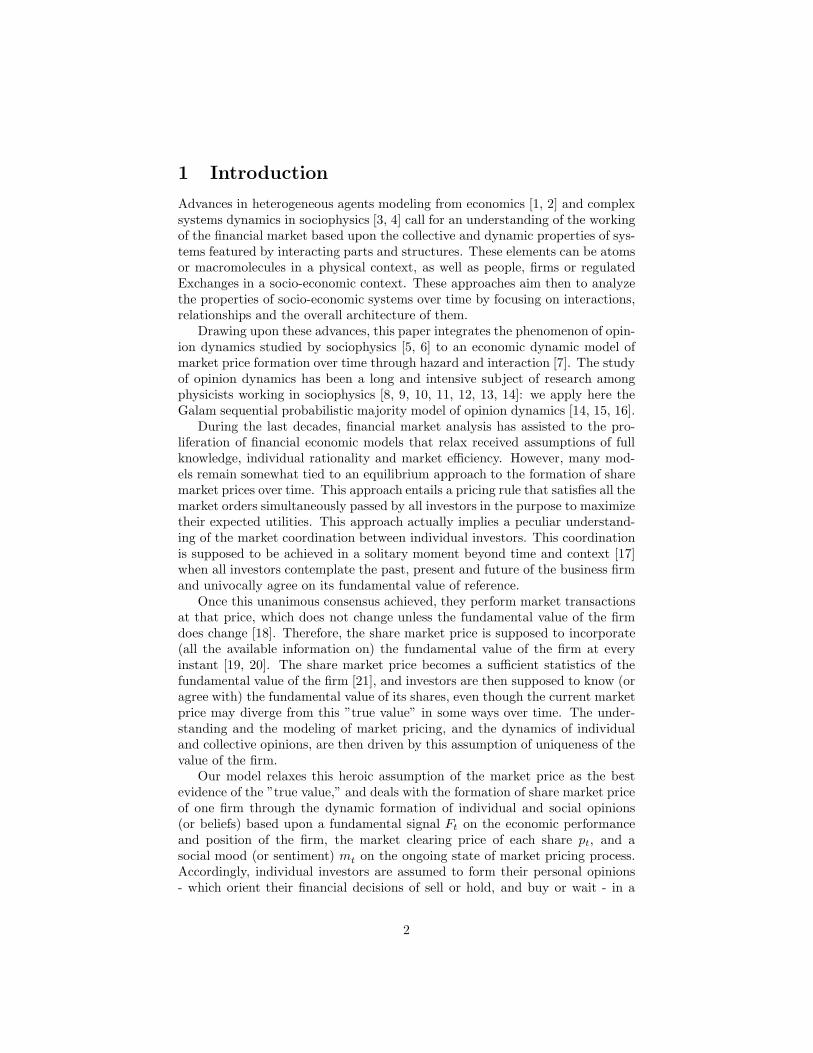
On this basis, at each time t, we assume that individual investors interactwithin each group j by subgroups of a given size for k sub-periods, in order togenerate the group opinion for time t. In particular, for groups of size 3, thedensity after k successive updates is
mjt,k = (mj
t,k−1)3 + 3(mj
t,k−1)2(1−m
jt,k−1),
where mjt,k−1 is the proportion of agents who are confident in the market
signal at a distance of (k− 1) updates from the initial time t, k = 0. For groupsof size 4, the density after n successive updates is
mjt,k = (mj
t,k−1)4 + 4(mj
t,k−1)3{1−m
jt,k−1}+ 6(1− p)(mj
t,k−1)2{1−m
jt,k−1)
2,
where mjt,k−1 is the proportion of agents who are confident in the market
signal at a distance of (k − 1) updates from the initial time t, k = 0. Thelast term includes the tie case contribution (where two ”believers” confrontedwith two ”distrusters”) weighted with the probability p. Then, the social mood(density) goes down to 0 with probability (1 − p) and up to 1 with probabilityp. For a mixture of group sizes with the probability distribution ai with theconstraint
∑L
i=1 ai = 1 - where L is the largest group size and i refers to thegroup size:
mjt,k =
L∑
i=1
ai{
i∑
j=N [ i2+1]
Cij(m
jt,k−1)
j(1−mjt,k−1)
(i−j)+
(1− p)V (i)Cii2
(mjt,k−1)
i2 (1−m
jt,k−1)
i2 }, (2)
where Cij ≡
i!(i−j)!j! , N [ i2 +1] ≡ Integer Part of ( i
2 +1), mjt,k−1 is the proportion
of agents who believe in the market signal after (k − 1) updates, and V (i) ≡N [ i2 ]−N [ i−1
2 ]. This implies V (i) = 1 for i even and V (i) = 0 for i odd. The
proportion of ”distrusters” is then 1−mjt,k.
It is worth to emphasize that the Galam model of opinion dynamics tanglesup three main mechanisms to produce a threshold opinion dynamics amongtwo competing choices within an ensemble of investors. The first mechanism isexogenous and combines all effects which act directly and individually on theagent to influence its own personal choice, here to trust or distrust the currenttrend of the market. It determines the initial share mj
t,k=0 of investors who arerespectively confident to or distrusting the market price trend. The two othermechanisms are endogenous to the ensemble of interacting investors.
One mechanism embeds a social mimetic effect using a local majority rule,i.e., agents confront their actual choice with the ones of a small group of otheragents and update their respective choices following the choice which was locally
6

majority within the group. At the collective global level, this interactive processproduces a threshold dynamics for which the tipping point is located at preciselyfifty percent: The choice which starts with an initial support of more than fiftypercent of the investors will drive the market along its direction.
The second mechanism is more subtle and depends on the occurrence of alocal doubt within a group of investors which are settling their respective opin-ions. In such a case, all the involved agents converge to just one common beliefabout the market price trend and adopt it as their own choice. Accordingly,within an ensemble of investors, with m
jt,k percent of them expecting the trend
to be positive, a local doubting group of even size may decide to either trustthe trend with a probability of p and distrust it with a probability of (1− p).
The breaking contribution of the leading common belief is to unbalancedrastically the threshold dynamics by placing the tipping point at a value whichcan be as low as 15% for the choice which goes along the common belief, andas high as 85% for the choice which contradicts the common belief [15, 16]. Forthe case of group of size four used in this work, we have respectively 23% and77% for the tipping points. This second mechanism illustrates how the commonbelief shared by some groups of investors can shape substantially the workingof the market pricing [7]over time.
4 The formation of the market clearing price
The formation of the market clearing price p∗t+1 over time depends on the aggre-gation of individual bids of demand and supply at each period t. In particular,every shareholder (j = S) i wishes to sell if p∗t+1 ≥ Et(pt+1)|
S
i , while every
potential buyer (j = D) i wishes to buy if p∗t+1 ≤ Et(pt+1)|D
i . By assuminguniform distribution of individual investors within each group j = S,D, theindividual price expectation Et(pt+1)|
j
i of investor i belonging to group j canbe rewritten as a function of expectations expressed by investors i = 0 and i = 1defined as follows:
εt|j
0 ≡(
Et−1(pt)|j
0 − pt
)
εt|j
1 ≡(
Et−1(pt)|j
1 − pt
)
.
Individual price expectation by investor i may then be described as follows:
Et(pt+1)|j
i = pt +mjt,k (pt − pt−1)−
(
βj0 (1− ϕi) ε
j0,t + β
j1ϕiε
j1,t
)
+ ϕiγjFt
Aggregated demand and supply are now defined by the focal prices of fourrepresentative agents with i = 0 and i = 1 ∀j = S,D. By defining:
7

Pjt ≡ maxarg
[
Et(pt+1)|j
i=0 ; Et(pt+1)|j
i=1
]
Pjt ≡ min arg
[
Et(pt+1)|j
i=0 ; Et(pt+1)|j
i=1
]
,
the aggregate functions of supply xSt+1 and demand xD
t+1 integrate individualbids as follows:
xSt+1 =
∫ p∗
t+1
PSt
1
PSt −PS
t
dx
xDt+1 =
∫ PDt
p∗
t+1
1
PDt −PD
t
dx
or, equivalently:
xSt+1 =
0 if p∗t+1 ≤ PSt
p∗
t+1−PSt
PSt −PS
t
if PSt < p∗t+1 < PS
t
1 if p∗t+1 ≥ PSt
(3)
xDt+1 =
1 if p∗t+1 ≤ PDt
PDt −p∗
t+1
PDt −PD
t
if PDt < p∗t+1 < PD
t
0 if p∗t+1 ≥ PDt .
(4)
The necessary condition for the existence of a market clearing price p∗t+1
(implying that both demand and supply are different from zero) is
PSt ≤ p∗t+1 ≤ PD
t
This condition implies two different scenarios:
1. if PDt ≤ PS
t , there is not matching between demand and supply; therefore,no exchange transactions occur, and the share Exchange does not fix anyupdated clearing price at period t; at the next period t + 1, investorswill then observe a special no-clearing price pNCgenerated by the market-making process according to some external rule or device;
2. if PDt > PS
t , there is matching, and the market clearing price pC is defined
as the price that makes demand equal to supply.2
On this basis, the market clearing price at period t is
p∗t+1 =
{
pNC if PDt ≤ PS
t
pC if PDt > PS
t
2The Walrasian auction is included by this scenario when the whole share offer is satisfied.
8

Let assume that the no-clearing price pNC is fixed according to the followingrule:
pNC = pt + ǫ
where ǫ is the smallest tick value available on the share Exchange. Further-more, concerning the clearing price pC , demand is equal to supply if
pC − PSt
PSt − PS
t
=PDt − pC
PDt − PD
t
, implying that
pC =PDt
(
PSt − PS
t
)
+ PSt
(
PDt − PD
t
)
(
PDt − PD
t
)
+(
PSt − PS
t
)
Therefore, the market clearing price p∗t+1 at time t is:
p∗t+1 =
pNC = pt + ǫ if PDt ≤ PS
t
pC =PD
t
(
PSt −PS
t
)
+PSt
(
PDt −PD
t
)
(
PDt −PD
t
)
+(
PSt −PS
t
) if PDt > PS
t .(5)
5 The dynamics of the market clearing price
In order to analyze the dynamics of the market clearing price (when it exists,i.e., p∗t+1 = pC) over time, let define ∀j = S,D:
Pj (n) ≡
t∑
n=1
(
−βj0
)n (
pt−n +mjt−n (pt−n − pt−n−1)− pt−n+1
)
Fj (n) ≡
t∑
n=0
[(
−βj0
)n(
γjFt−n
)
]
Lj (P (n) ,F (n)) ≡
∣
∣
∣
(
βj1 − β
j0
)
·Pj (n) + Fj (n)∣
∣
∣
∑
j=S,D
∣
∣
∣
(
βj1 − β
j0
)
·Pj (n) + Fj (n)∣
∣
∣
−1
Mj(P (n) ,F (n)) ≡(
βj1 − β
j0
)
·Pj (n) + Fj (n) .
Accordingly,
Et(pt+1)|j
i = pt +mjt,k (pt − pt−1) + β
j0 ·P
j (n) + ϕi ·Mj(·).
9

The four rapresentative agents are then described as follows:
∀j = S,D with ϕi = 0: Et(pt+1)|j
i=0 = pt +mjt,k (pt − pt−1) + β
j0 ·P
j (n)
∀j = S,D with ϕi = 1: Et(pt+1)|j
i=0 = pt +mjt,k (pt − pt−1) + β
j1 ·P
j (n) + Fj (n) .
By computation, the market clearing price function can be rewritten asfollows:
p∗t+1 = pt +∑
j=S,D
(
mjt (pt − pt−1) +Pj (·)
)
L¬j (·)
+ (6)
[
MD(·)
LS(·)
]
if Mj(·) > 0 ∀j
[
MS(·)
LD(·)
]
if Mj(·) < 0 ∀j∑
j=S,D
[
Mj(·)
L¬j(·)
]
if MD(·) > 0and MS(·) < 0
0if MD(·) < 0and MS(·) > 0
Accordingly, the pattern of market clearing price p∗t+1 is based on the his-torical price pt by adding two further elements. The first element comprises (forboth j = S and j = D) two sub-elements:
• the numerator, mjt,k (pt − pt−1) + Pj (n), is independent from signal Ft
and dependent on the price trend ∆t (p∗) weighted by the current group
mood mjt ,3 and its weighted past series Pj (n);
• the denominator, Lj (·), depends on both Fj (n) which represents theweighted fundamental signal trend series, and Pj (n) which representsthe weighted market price trend series; for each group j, this sub-elementweights the contribution of the price trend series to the formation of themarket clearing price at time t.
The second element depends on both weighted past series Fj (·) and Pj (·).In particular, if Mj(·) is positive (negative) for both groups, then this elementincreases (decreases) the market clearing price. Moreover, if Mj(·) is negativefor shareholders (j = S) while it is positive for potential investors (j = D), thenthe divergence between groups is mutually balanced on the marketplace. Onthe contrary, if Mj(·) is positive for shareholders while negative for potentialinvestors, then the divergence makes the whole element equal to zero.
3Remember that mj
t,k→ 1 implies full weight to this information in order to build indi-
vidual price expectations.The mood m can be influenced by the fundamental signal F , and is
the final result of the dynamic interaction within the group j for k steps occurring between
t− 1 and t.
10
In sum, the formation of share prices over time depends respectively on thedynamics of the fundamental signal F from one side, and the dynamics of theclearing market price p from another side. Both dynamics are shaped by theongoing evolution of individual and group opinions (and related bids) capturedby the structure of the model.
6 An illustrative analysis of a particular speci-
fication of the model
This section shall illustrate the theoretical contribution of our model by vi-sualizing some particular cases. For this purpose,let assume that β
ji = β and
γj = γ ∀j = S,D and ∀i. This specification implies that group heterogeneity iscaptured by the group mood m
jt,k and leads to the following proposition:
Proposition 1 If βji = β and γj = γ ∀j = S,D and ∀i, the group mood m
jt,k
subsumes all the group heterogeneities between demand and supply; then, there
exists only one market clearing price case instead of the four cases defined above.
In particular, the individual price expectation function becomes:
Et(pt+1)|j
i = pt +mjt,k (pt − pt−1) +
t∑
n=1
[
(−β)n(
pt−n −mjt−n (pt−n − pt−n−1)− pt−n+1
)]
+
ϕi
t∑
n=0
[(−β)n(γFt−n)]
or Et(pt+1)|j
i = pt +mjt,k (pt − pt−1) +Pj (n) + ϕiγ
jFj (n) .
Concerning the formation of the market clearing price, for βji = β ∀i, j,
Lj (·) = 2. Therefore, closer are βji ∀i, j, closer is Lj (·) to 2, implying that
the whole first element of equation 6 tends to become independent from thefundamental signal series Fj (n). Furthermore, when β
j1 , β
j0 = βj , Mj(·) =
Fj (n) ∀j: Closer are βj0 and β
j1 ∀j, closer is Mj(·) to Fj (n) that is independent
from the market price trend series Pj (n). Therefore, this specification clearlydistinguishes the dual structure of the market clearing price dynamics which isdriven by two distinct factors: the market signal or trend ∆t (p
∗) weighted bythe evolution of groups’ market sentiments, and the fundamental signal F . Themarket clearing price becomes:
p∗t+1 = pt +1
2
∑
j=S,D
(
mjt,k (pt − pt−1) +Pj (n)
)
+
[
F (n)
2
]
where
11

Pj (n) ≡
t∑
n=1
(−β)n(
pt−n +mjt−n (pt−n − pt−n−1)− pt−n+1
)
F (n) ≡
t∑
n=0
[(−β)n(γFt−n)]
Accordingly, the dynamics of the market clearing price (when it exists) isdenoted as follows:
∆t+1 (p∗) ≡ pt+1 − pt = f
(
∆t (p∗) ,mj
t,k
)
+ g (F (n))
This price pattern comprises two different elements. The first element,
f(
∆t (p∗) ,mj
t,k
)
, is a group factor that depends on the market signal ∆t (p∗)
weighted by the group moodmjt,k that is collectively assigned to the market price
trend by group j at time t. The second element, g (F (n)) = F(n)2 , depends on
the weighted trend of the fundamental signal Ft, with Fj (n) = FD (n) = FS (n)in this particular specification. Consequently, if F (n) is positive (negative), theng (F (n)) proportionally increases (decreases) the market clearing price at timet.
6.1 Illustrative case of a constant trend in the fundamen-
tal signal
Let illustrate this particular specification of the model when the fundamentalsignal experiences an alternate positive and negative trend: Ft = ±0.1 every 10periods of t. Let assume: βj
i = β = 0.5; γj = γ = 1; ǫ = 0.01; p0 = 10; F0 = 0;
mSt,k=0 = 0.6; mD
t,k=0 = 0.4; εt=0|j
i = 0.1 · (U(0; 1)−U(0; 1)), ∀j = S,D and ∀i.
The group interaction is based on groups of size 3, 4 (with pD = pS = 0.3) and4 (with pD = 0.3 and pS = 0.3). The probability p means here that, in case ofgroup inderterminacy, the group belief tends to trust the market (p → 1) or not(p → 0). We perform simulations for periods from t = 1 to t = 100, with variousk from 0 to 7. In this case, the market clearing price and the fundamental signalchange at the same rhythm t, while the market sentiment changes at its rhythmk from 0 (no steps, implying no change from the initial value) to 7 (seven stepsbetween t− 1 and t). Figures 1a,b,c illustrate the result.
The simulation shows that changes in the market sentiment exacerbates theimpact of the fundamental signal on the market clearing price over time. Theresulting market price remains under- or over-valuated the shares relative totheir fundamental price computed as follows:4
pFt = pFt−1 + Ft−1 = p0+
t−1∑
n=0
Fn.
4By definition, the first market price and the first fundamental price are equal.
12

Figure 1: Simulation for groups of size 3
Figure 2: Simulation for groups of size 4 (pD = pS = 0.3
13

Figure 3: Simulation for groups of size 4 (with pD = 0.6 and pS = 0.4)
6.2 Illustrative case of market exuberance
Under the same conditions, let assume that the fundamental signal experiencesa random pattern: Ft = U(0; 1) − U(0; 1) ∀t ≥ 1. We perform simulations forperiods from t = 1 to t = 100, with various k from 0 to 7. In this case, themarket clearing price and the fundamental signal change at the same rhythmt, while the market sentiment changes at its rhythm k from 0 (no change) to 7(seven steps between t− 1 and t). Figures 2a,b,c illustrate the result.
The simulation shows that changes in the market sentiment exacerbates themarket exuberance around the path provided by the fundamental price pFt . Thisresult is in line with theoretical and empirical analyses of market exuberancediscussed by [27] and [28] among others.
6.3 Illustrative case of market disconnection from funda-
mental price
The latter case shows a distinctive pattern where the market price disconnectsfrom the fundamental price over time. Figures 3a,b,c illustrate this result.
The simulation shows that the dynamics of the clearing price may be discon-nected by the dynamics of fundamental price pFt over time. This implies thatthe formation of a market clearing price over time is not sufficient to assure thatmarket pricing is aligned on the fundamental price that arises from fundamentalsthat are common knowledge among heterogeneous market participants.
7 Conclusive remarks
Financial economic models often assume that investors know (or agree on) thefundamental value of the firm’s shares that are traded, easing the passage from
14
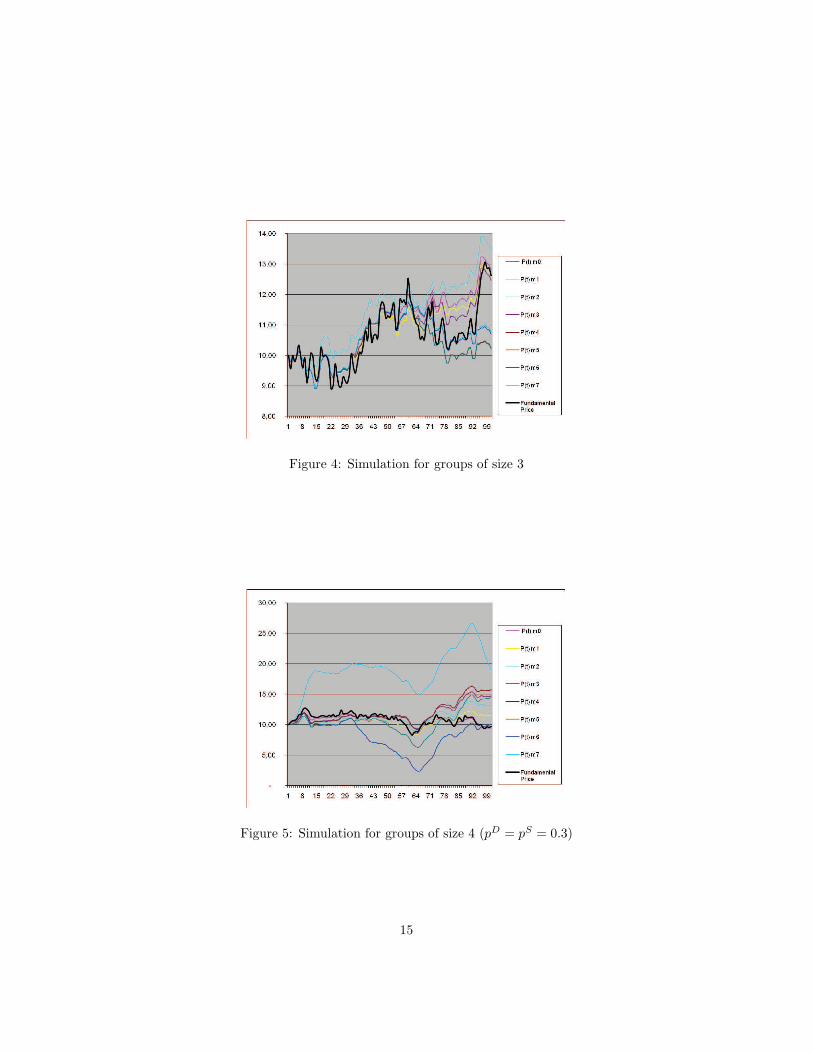
Figure 4: Simulation for groups of size 3
Figure 5: Simulation for groups of size 4 (pD = pS = 0.3)
15

Figure 6: Simulation for groups of size 4 (with pD = 0.6 and pS = 0.4)
Figure 7: Simulation for groups of size 3
16

Figure 8: Simulation for groups of size 4 (pD = pS = 0.3)
Figure 9: Simulation for groups of size 4 (with pD = 0.6 and pS = 0.4)
17

the individual to the collective dimension of the financial system generated bythe Share Exchange over time. Our model relaxes that heroic assumption of oneunique ”true value” and deals with the formation of share market prices throughthe dynamic formation of individual and social opinions (or beliefs) based upona fundamental signal of economic performance and position of the firm, theforecast revision by heterogeneous individual investors, and their social moodor sentiment about the ongoing state of the market pricing process. Marketclearing price formation is then featured by individual and group dynamics thatmake its collective dimension irreducible to its individual level.
This dynamic holistic approach provides a better understanding of the mar-ket exuberance generated by the Share Exchange over time. This exuberancedepends not only on individual biases or mistakes, but also on dynamic andcollective dimensions that arise from the interaction of individuals among themand with evolving collective structures over time. Our model captures this col-lective dimension through the evolution of available common knowledge on theeconomic performance and position of the firm (fundamental or firm-specificinformation), as well as through the evolving social mood or sentiment on thecurrent state of the market (or the industry, or the whole economy). While theformer can be related to information release by accounting reporting and dis-closure, the latter can be related to investors’ confidence and financial analysts’consensus, and their respective evolution over socio-economic time and spacewhere the financial market is embedded.
References
[1] C. H. Hommes, Heterogeneous Agent Models in Economics and Finance, InLeigh Tesfatsion and Kenneth L. Judd (ed.), Handbook of ComputationalEconomics, chapter 23, 1109-1186 (2006)
[2] M. Cristelli, L. Pietronero, A. Zaccaria, Critical Overview of Agent-basedModel for Economics, arXiv:1101.1847v1 [q-fin.TR] (2011)
[3] A. Chakraborti., I. M.Toke, M. Patriarca and F. Abergel, e-PrintarXiv:0909.1974, (2009)
[4] E. Samanidou., E. Zschischang, D. Stauffer and T. Lux., Report on Progressin Physics, 70 (2007)
[5] C. Castellano, S. Fortunato and V. Loreto, “Statistical physics of socialdynamics”, Rev. Mod. Phys. 81, 591-646 (2009)
[6] S. Galam, “Sociophysics: a review of Galam models”, Int. J. Mod. Phys.C 19, 409-440 (2008)
[7] S. Galam, “Valeurs fondamentales et croyances collectives”, in Critique de
la valeur fondamentale, Chap. 5, 99-115, Springer (Paris), C. Walter et E.Brian (Eds), (2008)
18

[8] A. C. R. Martins, C. B. Pereira and R. Vicente, “An Opinion DynamicsModel for the Diffusion of Innovations”, Physica. A 388, 3225-3232 (2009)
[9] M. Ausloos and F. Petroni , “Statistical dynamics of religions and adher-ents”, Euro. Phys. Lett. 77, 38002 (1-4), (2007)
[10] P. Contucci and S. Ghirlanda, “Modeling Society with Statistical Mechan-ics: an Application to Cultural Contact and Immigration”, Quality andQuantity 41, 569-578 (2007)
[11] J. J. Schneider and C. Hirtreiter, “The Impact of election results on themember numbers of the large parties in bavaria and germany, Int. J. Mod.Phys. C 16, 1165-1215 (2005)
[12] K. Sznajd-Weron and J. Sznajd,“Opinion evolution in closed community”,Int. J. Mod. Phys. C 11, 1157-1165 (2000)
[13] G. Deffuant, D. Neau, F. Amblard and G. Weisbuch, “Mixing beliefs amonginteracting agents”, Advances in Complex Systems 3, 87-98 (2000)
[14] S. Galam, “Collective beliefs versus individual inflexibility: The unavoid-able biases of a public debate”, Physica A, in press (2011)
[15] S. Galam, “Minority Opinion Spreading in Random Geometry”, Eur. Phys.J. B 25 Rapid Note, 403-406 (2002)
[16] S. Galam, “Heterogeneous beliefs, segregation, and extremism in the mak-ing of public opinions”, Phys. Rev. E 71, 046123 (2005)
[17] M. Shubik, “Accounting and its Relationship to General Equilibrium The-ory” , reprinted in Y. Biondi et al. eds. (1993). The Firm as an Entity:Implications for Economics, Accounting, and Law. NY and London: Rout-ledge (2007)
[18] J. Tirole, ”On the Possibility of Speculation under Rational Expectations,”Econometrica, 50, p. 1163-1181 (1982)
[19] E. F. Fama, ”Efficient capital markets: a review of theory and empiricalwork,” Journal of Finance, 25 (2), 383-417 (1970)
[20] E. F. Fama, Foundations of Finance, New York: Basic Books (1976)
[21] E. F. Fama, The Behavior of Stock Market Prices, Journal of Business, 38(1), p. 34-105 (1965)
[22] S. E. Phelps, “Recent studies of speculative markets in the controversyover rational expectations”, European University Institute, WP n. 87/267,Florence (1987)
[23] R. Frydman, ”Towards an understanding of market processes: individualexpectations, learning, and convergence to rational expectations equilib-rium,” American Economic Review, 72 (4), September, p. 652-668 (1982)
19

[24] S. Hirota and S. Sunder, “Price bubbles sans dividend anchors: Evidencefrom laboratory stock markets,” Journal of Economic Dynamics and Con-
trol, 31: 1875-1909 (2007)
[25] P. Heemeijer, C. Hommes, J. Sonnemans, and J. Tuinstra, “Price stabilityand volatility in markets with positive and negative expectations feedback:An experimental investigation,” Journal of Economic Dynamics and Con-
trol, 33, 1052–1072 (2009)
[26] Y. Biondi, and P. Giannoccolo, ”Share Price Formation, Market Exuber-ance and Accounting Design,” Banque de France Foundation Research Sem-inar, November 23, 2010. URL: http://ssrn.com/abstract=1690398 (2010)
[27] R. J. Shiller, Irrational Exuberance. Princeton, N.J.: Princeton UniversityPress (2000)
[28] S. F. LeRoy, ”Rational Exuberance,” Journal of Economic Literature, 42(3) September: 783-804 (2004)
20

Appendix
For sake of completeness, we provide here various other versions of the marketprice equation. Starting from equation 6, let define:
λt ≡
∣
∣MS∣
∣
|MS|+ |MD|= LS (P (n) ,F (n))−1
(1− λt) ≡
∣
∣MD∣
∣
|MS|+ |MD|= LD (P (n) ,F (n))−1
with Mj(·) =(
βj1 − β
j0
)
·Pj (n) + Fj (n) = −(
βj1ε
j1,t − β
j0ε
j0,t
)
+ γjFt
Or, equivalently:
λt =
∣
∣
∣
∣
∣
∣
∣
∣
∣
∣
(
βS1 − βS
0
)
t∑
n=1
[(
−βS0
)n (
pt−n +mSt−n (pt−n − pt−n−1)− pt−n+1
)]
+
t∑
n=0
[(
−βD0
)n (
γDFt−n
)]
∣
∣
∣
∣
∣
∣
∣
∣
∣
∣
∑
j=S,D
∣
∣
∣
∣
∣
∣
∣
∣
∣
∣
(
βj1 − β
j0
)
t∑
n=1
[(
−βj0
)n (
pt−n +mjt−n (pt−n − pt−n−1)− pt−n+1
)]
+
t∑
n=0
[(
−βj0
)n(
γjFt−n
)
]
∣
∣
∣
∣
∣
∣
∣
∣
∣
∣
and
(1− λt) =
∣
∣
∣
∣
∣
∣
∣
∣
∣
∣
(
βD1 − βD
0
)
t∑
n=1
[(
−βD0
)n (
pt−n +mDt−n (pt−n − pt−n−1)− pt−n+1
)]
+
t∑
n=0
[(
−βD0
)n (
γDFt−n
)]
∣
∣
∣
∣
∣
∣
∣
∣
∣
∣
∑
j=S,D
∣
∣
∣
∣
∣
∣
∣
∣
∣
∣
(
βj1 − β
j0
)
t∑
n=1
[(
−βj0
)n (
pt−n +mjt−n (pt−n − pt−n−1)− pt−n+1
)]
+
t∑
n=0
[(
−βj0
)n(
γjFt−n
)
]
∣
∣
∣
∣
∣
∣
∣
∣
∣
∣
Therefore, the market clearing equation can be rewritten as follows:
21

p∗t+1 = pt + λtmDt (pt − pt−1) + (1− λt)m
St (pt − pt−1)+
λt
(
βD0 εD0,t
)
+ (1− λt)(
βS0 ε
S0,t
)
+
λt
[(
βD1 εD1,t − βD
0 εD0,t)
+ γDt Ft
]
if Mj > 0(1− λt)
[(
βS1 ε
S1,t − βS
0 εS1,t
)
+ γSt Ft
]
if Mj < 0λt
[(
βD1 εD1,t − βD
0 εD0,t)
+ γDt Ft
]
+(1− λt)
[(
βS1 ε
S1,t − βS
0 εS1,t
)
+ γSt Ft
]
if MD > 0and MS < 0
0if MD < 0and MS > 0
Or, equivalently:
p∗t+1 = pt + λtmDt (pt − pt−1) + (1− λt)m
St (pt − pt−1)+
λt
t∑
n=1
[
(
−βD0
)n (
pt−n +mDt−n (pt−n − pt−n−1)− pt−n+1
)
]
+
(1− λt)
t∑
n=1
[
(
−βS0
)n (
pt−n +mSt−n (pt−n − pt−n−1)− pt−n+1
)
]
+
λt
[
MD(·)]
if Mj > 0 ∀j(1− λt)
[
MS(·)]
if Mj < 0 ∀j
λt
[
MD(·)]
+ (1− λt)[
MS(·)] if MD > 0
and MS < 0
0if MD < 0and MS > 0
22