The Federated States of Micronesia (FSM) attained self ...
222
1 Chapter 1. Introduction T he Federated States of Micronesia (FSM) attained self-government in 1979 when four of the seven districts comprising the Trust Territory of the Pacific Islands ratified the Constitution of the Federated States of Micronesia. Under the newly-formed federation, the former Trust Territory districts became the States of Chuuk, Kosrae, Pohnpei, and Yap. Negotiations on the terms of a Compact of Free Association between the US and the Congress of Micronesia (then representing all seven districts of the Trust Territory) began in 1967. In 1986, the Compact was finally implemented and the United Nations Trusteeship of the Pacific Islands administered by the US was formally ended. United Nations’ acknowledgment of the Compact of Free Association signaled formal international recognition of the FSM as a sovereign nation. The FSM is situated in the western Pacific Ocean, extending from 135 0 to 165 0 east longitude and 1 0 south to 14 0 north latitude. The FSM includes more than 600 small islands historically known as the Caroline Islands. The geographic dispersion of the islands has resulted in an Exclusive Economic Zone (EEZ) of approximately 1.0 million square miles, giving the FSM one of the largest tuna fisheries in the Pacific. While the FSM is comprised of numerous islands, the total land area is only about 271 square miles. The FSM population is small and dispersed. Only the state capital islands include urban areas. Statistics on population, population density, and economically active population by State in 2000 are given in Table 1. Table 1. Population, Population Density and Economically Active in FSM: 2000 Area Population Population Density Employed Chuuk State 53,595 1,094 11,979 Kosrae State 7,686 179 1,864 Pohnpei State 34,486 261 10,368 Yap State 11,241 244 4,964 FSM Total 107,008 395 29,175 Source : FSM (2000) Census of Population and Housing. Notes : (1) Population density is number of residents per square mile. (2) Employed in formal employment, self-employment and economically active in subsistence production. Section 1 New.pmd 12/12/2005, 2:11 PM 1
-
Upload
khangminh22 -
Category
Documents
-
view
0 -
download
0
Transcript of The Federated States of Micronesia (FSM) attained self ...

Chapter 1. Introduction
1
Chapter 1. Introduction
T he Federated States of Micronesia (FSM) attained self-governmentin 1979 when four of the seven districts comprising the TrustTerritory of the Pacific Islands ratified the Constitution of theFederated States of Micronesia. Under the newly-formedfederation, the former Trust Territory districts became the States
of Chuuk, Kosrae, Pohnpei, and Yap. Negotiations on the terms of a Compactof Free Association between the US and the Congress of Micronesia (thenrepresenting all seven districts of the Trust Territory) began in 1967. In 1986, theCompact was finally implemented and the United Nations Trusteeship of thePacific Islands administered by the US was formally ended. United Nations’acknowledgment of the Compact of Free Association signaled formal internationalrecognition of the FSM as a sovereign nation.
The FSM is situated in the western Pacific Ocean, extending from 1350 to1650 east longitude and 10 south to 140 north latitude. The FSM includes morethan 600 small islands historically known as the Caroline Islands. The geographicdispersion of the islands has resulted in an Exclusive Economic Zone (EEZ) ofapproximately 1.0 million square miles, giving the FSM one of the largest tunafisheries in the Pacific. While the FSM is comprised of numerous islands, thetotal land area is only about 271 square miles.
The FSM population is small and dispersed. Only the state capital islandsinclude urban areas. Statistics on population, population density, andeconomically active population by State in 2000 are given in Table 1.
Table 1. Population, Population Density andEconomically Active in FSM: 2000
Area Population Population Density Employed
Chuuk State 53,595 1,094 11,979Kosrae State 7,686 179 1,864Pohnpei State 34,486 261 10,368Yap State 11,241 244 4,964FSM Total 107,008 395 29,175
Source : FSM (2000) Census of Population and Housing.Notes : (1) Population density is number of residents per square mile.
(2) Employed in formal employment, self-employment and economically active in subsistence production.
Section 1 New.pmd 12/12/2005, 2:11 PM1

Federated States of Micronesia Towards a Self-Sustainable Economy
2
The discovery of the Caroline Islands by the West occurred in the early 1500swith first contact made by Spanish and Portuguese explorers. However, it was notuntil the early 1800s that the many island groups and distinct cultures of theCaroline Islands were in frequent contact with foreigners. These contacts weremainly with European traders interested in goods destined for the Asian markets.German traders established the copra trade in the mid-1850s and came todominate commerce through their control of this industry despite Spain’sestablished colonial control over the Caroline Islands. Spanish colonial rule from1885 to 1898 ended when they sold the Caroline Islands to Germany after theirdefeat in the hands of the Americans and the subsequent relinquishing of thePhilippines and Guam.
German colonial rule of the Caroline Islands lasted until World War I. Withthe tacit agreement of Great Britain, Japanese naval forces quickly capturedthe Northern Marianas, Marshall, and Caroline Islands in 1914. At the end ofWWI, the League of Nations mandated the Pacific Islands of Micronesia,including the Caroline Islands to Japan which remained as an occupying poweruntil the end of World War II.
Fisheries and agricultural production, including the cultivation of rice, wassubstantial and contributed to the Japanese empire and war effort in WWII. Atthe end of the war, American military forces took control of Micronesia and in1947 the United Nations established the Trust Territory of the Pacific Islands,which was placed under American administration.
The long colonial period that lasted a century under four different foreignpowers provided little opportunity for Micronesians to develop theadministrative, technical, and commercial skills needed to govern a nation inthe twentieth century. Despite American efforts in the 60s and 70s to instituteeducation, healthcare and infrastructure systems, much remained to be donein terms of building an economy that could stand on its own. With thisrecognition on the part of both Micronesian and US negotiators, economicassistance was inevitably one of the key elements of the negotiations on thepolitical relationship to be established upon termination of the Trusteeship.
The Congress of Micronesia was established in 1965 to represent thedifferent island groups comprising the Trust Territory in negotiating with theUS on the future political relationship that was to be formed. Early on, most ofthe Trust Territory Districts decided on a “freely associated” relationship withthe US. However, it took nearly 20 years for the districts comprising the FSMto negotiate the Compact of Free Association. The Compact accomplishedseveral important objectives including: (a) defining the freely associatedpolitical relationship that recognized the FSM as an independent sovereign
Section 1 New.pmd 12/12/2005, 2:11 PM2

Chapter 1. Introduction
3
nation, with national security being guaranteed by the US; (b) enabling FSMcitizens the right to reside and work in the US and its territories without anyrestrictions; and, (c) providing an economic aid package of annual grantassistance and access to a range of stipulated US Government services (e.g.,US Postal Service, weather service, Federal Deposit Insurance Corporationprogram), and federal grant programs.
The Compact economic assistance package was committed by the US fora period of 15 years, from 1987 to 2001. An additional two years economicassistance was stipulated, provided negotiations towards a new compactagreement were in progress. The overall economic assistance actually receivedby the FSM in the period 1987-2003 was about $2.1 billion in 2003 dollar terms,including grant aid from non-US multi- and bilateral donors.
As provided in the Compact, negotiations towards an amended or secondCompact agreement began in 1999. The negotiations for Compact II (as theAmended Compact will be referred to hereinafter) were focused mainly on theeconomic benefits package. The lengthy negotiations produced an agreementon Compact II in 2003. The main economic and related provisions of CompactII are summarized in Box 1.
With Compact II, the FSM, the US, and the wider donor communityanticipate progress in building the nation and reaching economic self-sufficiencythrough the adoption of more effective development policies.
The FSM has just begun the transition to the new US aid package underCompact II, and difficult medium term economic adjustments must be made.The significant decline in grant aid under Compact II, following difficulteconomic conditions in 1997-2000, requires a major policy shift on the part ofall FSM governments. This shift will require steadfast commitment to policiesand objectives that have been proposed in the past, but which have never beenfully supported.
The present economic report reviews the past performance of the economyunder Compact I, and closely examines the institutional setting and societalresponses to development driven by large-scale US grant funding. Theinstitutional environment, distinctly shaped by the different cultures comingtogether to form a federation, has in turn profoundly affected intergovernmentalrelations. All of this has an impact on efficiently and effectively managing theeconomic development of the nation.
Chapters 2-4 cover the historical experience of the FSM and the influence ofthis on contemporary society and institutional structure. These chapters alsodiscuss how this experience has impacted economic decision making on the partof government and private sector institutions. Chapters 5-7 discuss the economic
Section 1 New.pmd 12/12/2005, 2:11 PM3

Federated States of Micronesia Towards a Self-Sustainable Economy
4
performance of the FSM during the Compact I period, from 1986-2003, andaddress the substantially altered US economic aid package negotiated for theCompact II period to run from 2004 to 2023. These chapters also tackle the needfor renewed commitment to development goals and policies that have been widelydiscussed and supported by stakeholders representing all segments of FSM society.
In Chapters 8-11, the nation’s three most important productive sectors –agriculture, fisheries, and tourism – will be discussed in more detail as thesemust play a significant role in enabling the transition to sustainable long-termgrowth and development. Also covered in these chapters section are othersignificant emerging economic issues that will need further analysis and debateto be appropriately addressed by development policies and strategies. In thereport’s final chapter, findings and conclusions will be summarized along withpolicy recommendations.
Box 1. Economic Benefits of Compact II
• Annual grant assistance starting at $76.0 million in the initial 3-year period from 2004-2006, then steadily declining from 2007 to 2023 as an additional $0.8 million each yearis taken from grant and deposited in Trust Fund along with an annual deposit of $16.0million by the US.
• The Trust Fund is intended to replace annual US grant assistance beginning in 2024following the end of Compact II.
• The annual grant is to be allocated to six sectors: (1) education, (2) health, (3) privatesector development, (4) capacity building in the public sector, (5) environment, and(6) public infrastructure. Allocations are to be determined in accordance with sectordevelopment plans prepared by the FSM, consistent with annual sector grant proposalsmade by FSM, subject to policy review and discussions annually by the Joint EconomicManagement Committee (JEMCO). Voting membership of JEMCO includes threemembers from US and two members from FSM. Policy decisions are in accordancewith majority vote.
• Additional grant and program assistance is made available under Section 221 (of TitleTwo – Economic Relations). Stipulated programs include US Weather Service and PostalService, and grant assistance to education and health sectors under the SupplementalEducation Grant (SEG). In fiscal year 2005, the amount of the SEG grant was $12.2million. The SEG amount is not set and will vary from year to year. Additional USfederal grant assistance is available on a competitive basis with other US states andterritories. Available funding is ultimately dependent on US Congressionalappropriations.
Section 1 New.pmd 12/12/2005, 2:11 PM4

Executive Summary
5
Chapter 2. Economic and Social History
2.1 Economic Changes from Pre-colonial Times
During the pre-colonial era, Micronesians existed almost solely onsubsistence. The natural resources satisfied the requirements oftheir daily life, although there was also trade taking place. Theinhabitants of the low-lying coral islands traded their localvaluables with inhabitants of the high islands. The Yap Empire,
which extended from Gagil district on the Yap Islands to the Namonwito Islandswest of Chuuk Lagoon, was a trading empire.
The arrival of beachcombers, traders, whalers, and other foreigners in the1800s changed the way the Micronesians lived. The metal tools and kniveswere obviously of high value and better quality than the ones made of stoneand wood used by Micronesians. With such tools, building canoes became easierand faster.
The traders came to Micronesia in search of goods to sell in the Asian markets.They collected beche-de-mer, turtle shells, bird eggs, and seashells. They soldthese items for good prices in the Chinese market. Pohnpei was reportedlyexporting between five and six hundred pounds of turtle shells per year.
The last traders to arrive in Micronesia were the ones interested in copra.The copra trade started in the mid-1850s and brought in independent tradersand large firms from around the world. Copra trading was successful inMicronesia. For the most part, local residents could earn a sustainable cashincome from copra. Some traditional chiefs in the Marshall Islands becamewealthy enough from the copra trade to purchase their own vessels. TheMicronesians used copra income to buy imported goods. For the first time theMicronesians participated fully in the cash economy imposed on them by foreigntraders.
Even long after the foreign traders left, copra remained as the most reliablesource of income for Micronesians living in the outlying villages and islands.The industry was so prevalent, it brought about a minor relocation of population.Some individuals were taken from their homes to work on coconut plantationson other islands.
In Micronesian societies, social ranking and stratification permeate alltraditional cultures. This is true even in the sparsely-populated coral islands,although the emphasis on rank is not as intense. In highly stratified societies,such as Kosrae, Pohnpei, and Yap, rank is expressed through and consequentlycontrolled by a dualistic sociopolitical system.
Section 1 New.pmd 12/12/2005, 2:11 PM5

Federated States of Micronesia Towards a Self-Sustainable Economy
6
The social changes in Micronesia precipitated by contact with the Europeanshave had varied impacts on local communities. Two high islands - Pohnpei andYap - became the centers of the colonial administration and commercial activity.The towns that grew around these centers triggered further change. Migrationfrom the outlying areas and islands, the introduction of the cash economy, andthe establishment of private and public schools brought about social and politicaldevelopment similar to Western models. The members of these local communitieswho received Western training soon formed a new social and political elite whooften challenged traditional authorities. Traditional leadership was furtherstrained as extended family loyalties and maternal ties were weakened as wagelabor tended to favor the nuclear family and paternal ties.
2.2 Caroline Economies in Colonial Times
In the Federated States of Micronesia, colonial administration started in 1886when Spain established its headquarters in the Caroline Islands on Yap IslandsProper. The second Spanish administrative headquarters was created the followingyear on Pohnpei Island. These, however, were not the first established foreignpresence on the islands.
The German firms had dominated trading in the Marshall and the CarolineIslands for decades prior to the arrival of the Spaniards. The economy wasfueled mainly by the thriving copra trade. At the time of Spanish takeover ofthe Caroline Islands, the economy was dominated by German trading firmslike Hernsheim & Company, Jaluit Company, and the DHPG. Germanychallenged the Spanish claim to the Caroline Islands based on an absence ofexercise of Spanish control. In October of 1885, Germany annexed thearchipelago and held it for several months before turning it over to Spain asstipulated in a peace settlement arbitrated by Pope Leo XIII. The resultingsituation had the two European presences coexist on the islands. While theSpanish colonial officials controlled the government, the German trading firmsdominated the economy.
The Spanish officials faced no significant resistance to their governmentin Yap. The little resistance they encountered came primarily from the localpriests who stood to lose their traditional prestige and authority in thecommunity. But the Yapese did not rise up against the colonists in the way thatthe Pohnpeians did.
When the Spanish colonists arrived in Pohnpei in 1887, they encounteredlocal resistance almost immediately. The Spanish governor’s lack of flexibilitytowards the traditional chiefs and his lack of good judgment and contemptuous
Section 1 New.pmd 12/12/2005, 2:11 PM6

Chapter 2. Economic and Social History
7
attitude towards local cultures, coupled with the foremen’s misappropriation oflocal workers’ wages, prompted the people of Sokehs and Nett to attack theSpanish settlement in Kolonia. The rebels killed the Spanish Governor andseveral of his men.
The second war against Spanish rule broke out when the Catholic priestsand a contingency of soldiers arrogantly started laying the foundation for a newchurch next to the Protestant church at Ohwa in Madolenihmw. The localwarriors quickly killed the construction workers and the soldiers. They wouldhave killed the Catholic priests too had a local church official not given safeconduct into Kolonia.
From the outset of its rule, Spain was too occupied with the rebellions inPohnpei and never turned its attention to economic and social development.The Caroline and the Marianas Islands were the two last remaining coloniesand Spain’s national commitment to keep them was dubious at best. Spainasserted its claim to the Caroline Islands in 1885 more for national pride thaneconomic benefit.
As the succeeding colonizing power, Germany gave supervision ofMicronesia to the German Governor of New Guinea. The Germans createdfour administrative districts in the Carolines: Chuuk, Palau, Pohnpei, and Yap.Kosrae Island was incorporated into the Pohnpei district. The districtgovernment was headed by a district officer and a few staff members. To enforcetheir laws, the Germans brought in New Guinean policemen.
The Germans brought sweeping economic reforms. To assist in paying forthe colony in the Caroline Islands, the Germans levied a head tax on everyoneabove sixteen years of age. To encourage development of agriculture, theGermans introduced land title registration, particularly in Pohnpei; and toincrease copra production for export, they required Micronesians to convert alluncultivated parcels of land to coconut plantations. They made all able-bodiedmen work on public projects such as docks, roads, public buildings. They evendug a canal in Yap to shorten trips from one side of the island to the other.When mining of phosphate on Angaur in Palau began, government officers acrossMicronesia recruited laborers to work in the mine.
The Germans also introduced social reforms. Alcoholism and tobaccoproblems were rampant in the Caroline Islands before the Germans came. Theproblem existed even among boys and girls as young as nine and ten years old.The Germans solved this by banning the sale of alcohol to Micronesians.
There was also a problem of endemic warfare which the Germans stoppedby confiscating all firearms and ammunition, and prohibiting their sale toMicronesians. The violators of the bans against the sale of alcohol and firearms
Section 1 New.pmd 12/12/2005, 2:11 PM7

Federated States of Micronesia Towards a Self-Sustainable Economy
8
were deportated from the islands. Local trouble-makers were exiled to anotherpart of Micronesia.
Several severe typhoons swept through the Carolines during the Germancolonial period. These typhoons destroyed coconut trees and other crops, andforced the Germans to relocate people from the outlying low coral islands tothe high islands. The loss of coconut trees set back copra production for years.Some people from Woleai Atoll in Yap were evacuated to Saipan in the Marianas,joining their fellow islanders who settled there at the beginning of thenineteenth century. Some people from Mokil and Pingelap were relocated toSokehs in Pohnpei. A group of Mortlockese was allowed to settle in Sokehs onlands confiscated by the German authorities after the Sokehs rebellion.
The only people who actively rebelled against German rule were the peopleof Sokehs in Pohnpei. In the aftermath of the uprising, the leaders of therebellion were executed and the rest of the population was exiled to BabeldoabIsland in Palau.
The rule of Germany ended in World War I. Great Britain and Japanentered into a secret agreement dividing the German colonies in the Pacificbetween them. The colonies that lay north of the equator were to becaptured by the Japanese while the colonies south of the equator were forthe British. When the war started in 1914, Japanese naval forces quicklycaptured the Carolines, the Northern Marianas, and the Marshalls. Theconquest was bloodless. The Japanese invading force for each major islandwas then immediately transformed into an occupying power. Thecommander became the head of the district government, and a functioningadministrative apparatus was created.
Schools were established and military officers were assigned to teach.Temporary headquarters for the Provisional South Seas Defense Force was setup on Dublon Island in Chuuk Lagoon. It took the Japanese less than threemonths to firmly establish themselves in their new colony in Micronesia.
In 1919, when the victorious Allied Powers assembled in Versailles in Franceto create the League of Nations and divide the spoils of war, Japan had been infirm control of this former German colony for five years and showed no sign ofrelinquishing. In fact, the Japanese chief delegate demanded that his country“should be confirmed in its possession of Micronesia” because in their five-year occupation, the Japanese had accomplished much in terms of social,political, and economic development.
In spite of President Woodrow Wilson’s anti-colonialism posture at the peaceconference, the League of Nations awarded several mandates in the Pacific.Japan was awarded authority over Micronesia. Under the League of Nations
Section 1 New.pmd 12/12/2005, 2:11 PM8

Chapter 2. Economic and Social History
9
mandate, Japan ran the islands as an integral part of the Empire. The Micronesianswere considered subjects of the Japanese Emperor, and were under Japanese law.
The post-war occupation, however, was not the first contact between theJapanese and Micronesia. Japanese traders started to come to Chuuk Lagoonin the 1890s. They were a nuisance to the German colonial officials becausethey sold guns and alcohol, both banned items, to the Micronesians. TheJapanese were deported from Chuuk but returned with renewed determinationto continue their trading activities. Towards the end of the German occupation,the Japanese firms, such as Nan’yo Boeki Kaisha (Nambo), were competing withGerman companies for control of trade.
From the outset of Japanese colonial rule, private Japanese commercialfirms like Nambo were given government subsidies to provide crucial servicessuch as transportation linking the major islands in the new colony to each otherand to Japan.
The Japanese called the area Nan’yo cho (South Seas). From the outset oftheir colonial rule, private Japanese firms were given government subsidies toprovide services and enhance trade in Micronesia. The dominant commercialpresence was Nambo which took over the German copra trading companies.Copra was still the single most profitable trading activity. The Japanesegovernment in Micronesia also established its own firm to take control of thephosphate mines on Angaur Island in Palau.
As with every economic development endeavor in the Nan’yo cho, thegovernment approached the harnessing of fishery resources with careful researchand planning. In 1931, the Nan’yo cho government created a Marine ProductsExperimental Station in Palau to study oceanic conditions, and to perfectcatching and canning of fish and shellfish. The fishery resources were exploitedby small commercial fishing operations run mainly by Okinawan fishermen.They sold some of their catch in the local fish market and the rest was processedfor export to Japan.
Agricultural resources were also harnessed by Japan. Farmers from Okinawawere brought in and they grew vegetables, tubers, and grain. As with the fisheryproducts, the farm produce was exported to Japan.
The efficient development of marine and agriculture resources, theoperation of the phosphate mines in Angaur and Fais, and the increase in copraproduction made it possible to cut off the annual subsidy provided by theJapanese government to the Nan’yo cho in about twenty-five years making theMicronesian economy self-sufficient.
However, this success brought about a large migration of Japanese intoMicronesia, a phenomenon that had negative effects. From the beginning of the
Section 1 New.pmd 12/12/2005, 2:11 PM9

Federated States of Micronesia Towards a Self-Sustainable Economy
10
Japanese colonial administration, its social policies were unfavorable to theMicronesian population. For instance, the Nan’yo cho government established adual system of education: the shogakko and the kogakko. The shogakko were schoolsfor Japanese children; and the kogakko were public schools for Micronesianchildren. While the shogakko maintained the standards of regular Japaneseschools, the kogakko operated on a lower level. For one, they used an inferiorform of Japanese. The students in the kogakko could stay for a maximum of fiveyears. At the end of that period, the very best students were sent to attend theCarpentry School in Koror, Palau. These were the minority, however. Theeducation provided by the Japanese was clearly inadequate, but at least theyset up an education system accessible to every child.
Obviously, the Japanese did not intend to train the Micronesians to runthe Nan’yo cho government or to assume an active role in the booming economy.The Nan’yo cho government created two positions exclusively for Micronesians.The Sosoncho was a village chief ’s position and was sometimes filled bytraditional chiefs. The Sosoncho’s job was to liaise between the local populationand the Nan’yo cho government. The other position was Soncho, assistant to thevillage chief.
In terms of health services, the Japanese provided free health care accessibleto everyone who needed it. For the first time in their history, the Micronesianscould receive free medical attention in any of the public hospitals in the Nan’yocho. The closest a colonial power got to providing health care was when theGermans tried to deliver medical services in response to the typhoons thatdevastated the region during their occupation.
The Japanese attack on Pearl Harbor in Hawaii on December 7, 1941brought World War II to Micronesia. During the war, American bombersdestroyed Japanese military installations and local infrastructure. Although theAmerican forces did not invade any of the high islands, the roads, docks, andother public facilities were completely destroyed.
After the war, the Americans repatriated all foreign nationals from Micronesia.Unfortunately, they had been the backbone of the cash economy; and with themgone, the economy collapsed. With the low level of education provided to themby the Japanese, the Micronesians lacked the knowledge and the technical-know-how to even restore minimum public services such as power and water. So it wasleft to the new colonial regime to set up social services, and to create administrativestructures. Unfortunately, the United States Navy lacked trained personnel toadminister the newly-acquired territory. The initial policies of the naval Americanadministration reflected these problems. The first directives issued by AdmiralRaymond Spruance were characterized as a “policy of minimum government.” As
Section 1 New.pmd 12/12/2005, 2:11 PM10

Chapter 2. Economic and Social History
11
Admiral Dewitt Ramsey, the first deputy high commissioner, explained it: “theNavy does not govern these islands — it administers them.” This policy was alsoexplained by Admiral Louis Denfield this way: “…We see no need to interfereunduly with the happy, simple life of these new charges of the Americangovernment.”
This “policy of minimum government” set the tone for the Americanadministration for the next fifteen years. Even the establishment of theUnited Nations Trusteeship in 1947 did little to alter the naval policy inMicronesia. As pointed out by Fran Hezel, S.J., “…(the trusteeship) effecton the machinery of administration in the islands was little more than achange of name—from military government to civil administration.” Thebudget for the entire Trust Territory was a little over $7 million and it stayedat that level until the 1960s.
With a meager budget, the United States attempted to build its new colony.The American administration established elementary schools in everycommunity; and later added junior high schools in every district center. Theelementary schools were mostly housed in native thatched roof buildings. In1952, the first general high school opened in Chuuk and students from all overthe Trust Territory were brought in to attend. It would take another eightyears for each of the six districts to have its own high school.
Development of public health was also slow. Americans were finding outthat training of local health personnel was prerequisite to the delivery of adequatehealth care to the Micronesian population. For this, they relied heavily on the FijiSchool of Medicine.
Fishing and agriculture did not offer much hope for the Americanadministration to develop the Trust Territory economy. They tried to exportfish to Guam, but they stopped because of uncertainty in the industry. Theagriculture program in Pohnpei identified several promising products such asramie, cacao, pepper, and rice. However, benefits did not materialize becauseof farmers’ loss of interest in the project, largely due to damage done by pests.With the failure to develop fisheries and agriculture, copra remained the mostreliable cash crop in the Trust Territory.
Economic development was not easy with the unenthusiastic approachtaken by the American administration. Foreign investment was prohibited; andwith the constraint of a small budget, the Trust Territory administration had torely on old industries such as copra for export. Small freighters would bringcopra from other parts of the Trust Territory to the dock in Majuro fortransshipment. The Majuro dock was the only one in the entire Trust Territorycapable of handling large transoceanic vessels.
Section 1 New.pmd 12/12/2005, 2:11 PM11

Federated States of Micronesia Towards a Self-Sustainable Economy
12
Many writers have referred this period in the American administration of theTrust Territory as the period of “benign neglect.” Critics of American policystarted calling the islands the “Rust Territory.”
The second identifiable period of the American administration started inthe early 1960s. Three important events converged to focus American attentionon the Trust Territory. These were: (1) the 1961 UN Visiting Mission report;(2) the polio epidemic in the Marshall Islands; and, (3) the fact that by 1960, theTrust Territory was among the last few remaining trusteeships the United Nationshad created after WWII.
The UN Visiting Mission report was very critical of the way the UnitedStates was administering the Trust Territory. This report ended up on PresidentJohn Kennedy’s desk. In 1962, the president signed National Security ActionMemorandum No. 145 creating an inter-agency committee to oversee policydevelopment in the Trust Territory. In addition, President Kennedy authorizedan eight-member task force headed by Anthony Solomon to survey the islandsand draw up a master plan for development that would secure American goalsand interests in the area. After visiting the islands in 1963, the task forceproduced a three-volume report on how to improve the economy, raise thestandard of living, and ensure that Micronesians would choose in a plebiscite apolitical status compatible with United States security interests. Theserecommendations became the basis of the new American policy in the TrustTerritory.
In 1962, the new administration in the United States doubled the budgetfor the Trust Territory to $15 million. In 1963, the United States administrationallotted $10 million to start a crash education program that would constructmore than five hundred classrooms and bring four hundred American teachersto the elementary and secondary schools. By 1964, all districts, including Kosraeand Ulithi, had started their own high schools.
The US government was pouring money into the Trust Territory inunprecedented amounts. The budget went from a meager $7.5 million annuallyfrom 1947 to 1962, to $58 million annually from1963 to 1978. A whole array ofnew US federal education and healthcare programs were introduced.
One important initiative taken by the United States that would changethe political landscape of the Trust Territory and serve as counterweight toAmerican aims, was the creation of the Congress of Micronesia in 1965. In justtwo years after its creation, the Congress of Micronesia had served notice tothe United States that it intended to play an active role in deciding the futurepolitical status of the Trust Territory. In 1967, they requested the Americanadministration to form a task force to look into alternative political positions for
Section 1 New.pmd 12/12/2005, 2:11 PM12

Chapter 2. Economic and Social History
13
the Trust Territory. When the United States government failed to act, the Congressof Micronesia created its own Joint Committee on Future Political Status toinvestigate political alternatives to the trusteeship. After a year of visiting otherdependent territories, the Joint Committee recommended negotiations with theUnited States for free association status.
Formal negotiations with the United States started in 1969. The negotiationfor the Compact of Free Association took seventeen years to complete. Duringthose seventeen years, the Trust Territory was fragmented into four politicalentities: a commonwealth and three independent nations with Compact ofFreely Association treaties with the United States. The formal break-up of theTrust Territory came when the Marianas, Marshalls, and Palau Districts didnot ratify the draft constitution for the Federated States of Micronesia in the1979 referendum. In that year, the Chuuk, Kosrae, Pohnpei and Yap Districtsofficially formed a political union called the Federated States of Micronesia.
2.3 Self-Government and Compact I
The four districts of the Trust Territory that ratified the Constitution of theFederated States of Micronesia attained self-government in 1979. Members ofthe new National Congress were elected in March and took office in May. Aftertaking office, they elected the first president and vice president from amongthemselves.
The first task of the president and vice president was to form the executiveand judicial branches of the national government. The new administrationmodeled the bureaucratic structure of the executive branch after that of theUnited States government. The judicial branch was created when the FSMCongress confirmed Edward King as the first Chief Justice of the FSM SupremeCourt. The legislative branch inherited the administrative staff and offices ofthe interim FSM Congress.
Prior to the implementation of the Compact of Free Association in 1986,the FSM National Government was gradually building its administrative staffto a level where critics were comparing it to the Trust Territory government.To attract qualified employees to work for the new national bureaucracy, thecompensation level was set higher than the wages paid to state employees.When the Compact was implemented in 1986, there was a new flurry of hiring.The national government was also staffing federal programs. Some were hiredas permanent employees at the end of the programs. By 1987, the nationalbureaucracy had come to rival the former Trust Territory headquarters staff insize and funding.
Section 1 New.pmd 12/12/2005, 2:11 PM13

Federated States of Micronesia Towards a Self-Sustainable Economy
14
In the same year, the new FSM Administration submitted a reorganizationplan for the executive branch to the FSM Congress. The plan was rejected mainlybecause the ruling politicians felt there was nothing wrong with the currentsystem. The congress approved an emaciated version of the proposal, which atleast eliminated most of the independent agencies and folded their functionsinto existing offices of the executive branch. It is interesting to note that whenthe governments at the national and state levels were forced to reduce employmentand wages in the 1990s, no reference was made to the attempt to reorganize theexecutive branch of the national government in 1987.
Under Compact I, the national and state governments had so many workersthat they could not withstand the impact of the second step-down in funding.It was deemed politically risky to lay-off staff members and reduce wages. Sothe national and state governments initiated an early retirement program foremployees that paid two-years’ wages to those who were willing to leave theirgovernment jobs. In the national government, some employees were allowedto take the two-year salary and retire even though the jobs were not targetedfor abolition. In some states, employees who were removed under the earlyretirement program were actually hired back. Some as consultants to thegovernment, doing the same work that they did prior to retirement.
Section 1 New.pmd 12/12/2005, 2:11 PM14

Chapter 2. Economic and Social History
15
Chapter 3. Social Institutions andTheir Relevance for Economic Decisions
3.0 Introduction
T he Federated States of Micronesia is a nation with a dualisticheritage fostered by its traditional customs and beliefs and byassimilation of Western systems of economic, legal, political, andreligious models inherited from its colonial past (Box 2) andperpetuated through its continuing reliance on the US. The FSM
society that has evolved through this process is one that is multi-cultural, multi-linguistic, and fiercely ethnocentric. Ethnocentrism is present in the way FSMconducts its businesses, elects leaders, adjudicates disputes, protects humanrights, engages in politics, formulates public policies, allocates resources,prioritizes state’s interests, and maintains distinctive state identities. Theuniqueness of cultural values and beliefs, customs and traditions, and socialsystems and languages of each of the four FSM States play a decisive role inmaintaining a traditional system of decision-making, leadership and governance,conducive to FSM collective and communal traditions.
This chapter analyzes how social institutions and systems affect economicdevelopment and policymaking. Section 3.1 analyzes how cultural, religious andsocial institutions, such as the family, the church, and land tenure systemsnegatively impact private sector development. Section 3.2 proposes analternative integrated development framework that addresses basic communaleconomic and social needs specific to rural areas throughout the FSM.Alternative models of people-centered development initiatives designed,owned, and managed by communities in partnership with the private sector,the government, and the donor community are presented. Section 3.3establishes linkages between the family, the church, land tenure, and economicdevelopment. It highlights the opportunities such social institutions bring tocreating economic opportunities and an enabling environment that blendstraditional and modern systems conducive to public sector development andsustainable livelihood.
3.1 The Family, Its Structures, and Systems of Organization
The cultural and social structures of FSM society were traditionally based onextended kinship systems. Kosrae and Pohnpei are predominantly patrilinealwhile Chuuk is essentially matrilineal. Yap has both patrilineal and matrilineal
Section 1 New.pmd 12/12/2005, 2:11 PM15

Federated States of Micronesia Towards a Self-Sustainable Economy
16
Box 2. Historical Summary
Since the 16th century, the Micronesian islands have been dominated by large foreignpowers. The impact of each colonial period is summarized as follows:
I. Spanish Colonial rule Spanish Colonial rule Spanish Colonial rule Spanish Colonial rule Spanish Colonial rule was formally established in 1869 and ended with the Spanish-American War in 1899. Impact of this period included (a) organized religion,(b) introduction of European building construction, (c) trade and commerce, and(d) resultant changes to traditional cultures and traditions throughout Micronesia.
II. German AdministrationGerman AdministrationGerman AdministrationGerman AdministrationGerman Administration began in 1899 when Germany purchased the Carolineand Mariana Islands from Spain after the Spanish-American War. German rule ofthe Caroline Islands ended in 1914, at the onset of World War I. Impact of this eraincluded (a) trade and commerce, (b) economic, social and infrastructure development(roads, communication stations, hospital, churches, copra industry, etc), (c) creationof political districts, (d) introduction of the cash economy, (e) activation of patriarchalland registration, personal land rights and titling systems and, (f) levying of taxes.
III. Japanese AdministrationJapanese AdministrationJapanese AdministrationJapanese AdministrationJapanese Administration began in 1914 and ended in 1945 following the endingof WWII. Impact of the Japanese Administration includes: (a) continuation of tradeand commerce, (b) land development and commercialization, (c) economic socialinfrastructure development, (d) introduction of occupation education, (e) militarycontrol, and (f) emasculation of island-wide leadership authority and power.
IV. American AdministrationAmerican AdministrationAmerican AdministrationAmerican AdministrationAmerican Administration came into force in 1945 at the conclusion of WWII. An initialNaval Administration was put in place from 1945 to see to post-war rehabilitation efforts.This was followed by the Trust Territory of the Pacific Islands (TTPI) periodadministered by the United States. A High Commissioner was appointed by the US toadminister the TTPI as mandated by the United Nations. Rehabilitation of basicinfrastructure was undertaken to help restore peace and order and to protect thehealth and welfare of the people. Basic social services (hospitals, schools, roads, publicutilities, transportation, communication and social welfare programs) were provided toassist post WWII recovery efforts in the urban areas. To operate these services theTTPI administration introduced the US civil service system heavily staffed by seniorUS expatriates. A US Federal System of Government was also adopted. Its centralizedheadquarters was based in the Marianas and district administrations were establishedin all TTPI districts. The TTPI period covered the period from 1947 to 1979.
V. The Micronesian TMicronesian TMicronesian TMicronesian TMicronesian Transitional Governmentransitional Governmentransitional Governmentransitional Governmentransitional Government administered the islands from 1979-1986.This was a period of greater political activism on self-rule, de-colonization anddemocratization. The establishment of the Congress of Micronesia in 1965 hadprecipitated intensive political status negotiations between the US Administration,the United Nations De-colonization Committee and leaders of the Congress ofMicronesia. By 1979, UN endorsed de-colonization and independence for the TTPI.The UN urged the US and Micronesia to speed up political status negotiations thatwould eventually result in an agreed political entity for the former TTPI nations. In1985, the Compact of Free Association status with the United States was ratified byFSM and the Marshall Islands. The Marianas opted to accept Commonwealth statusand Palau deferred action on the Compact until 1994.
Section 1 New.pmd 12/12/2005, 2:11 PM16
Chapter 3. Social Institutions and Their Relevance for Economic Decisions
17
systems of association, but increasing modernization and exposure to externallifestyles have made Yap society more patrilineal. The same is happening toChuuk.
In terms of societal structure, Pohnpei retains a monarchy – although it isnow more symbolic than functional. Modern Yap society is highly stratified,with rules of engagement for and between its social hierarchy and caste system,clearly defined and strictly followed. Exposure to external influences hasmodified Yapese customs and practices, but the essential principles underlyingits unique traditional values and customs remain relevant today.
The extended family systems are being supplanted by the nuclear family incontemporary FSM society. However, the notion of extended family still has itsinfluence on social and political relations. There is still the obligation to lookafter the members of the extended family. For example, wage earners are expectedto give cash or cash-bought goods to non-wage earners in exchange for services.
Mobility, changing values and lifestyles, and the high cost of livingassociated with the cash economy have made this obligatory reciprocity difficultto maintain. The difficulty is one major contributing factor to the rapidbreakdown of traditional kinship systems.
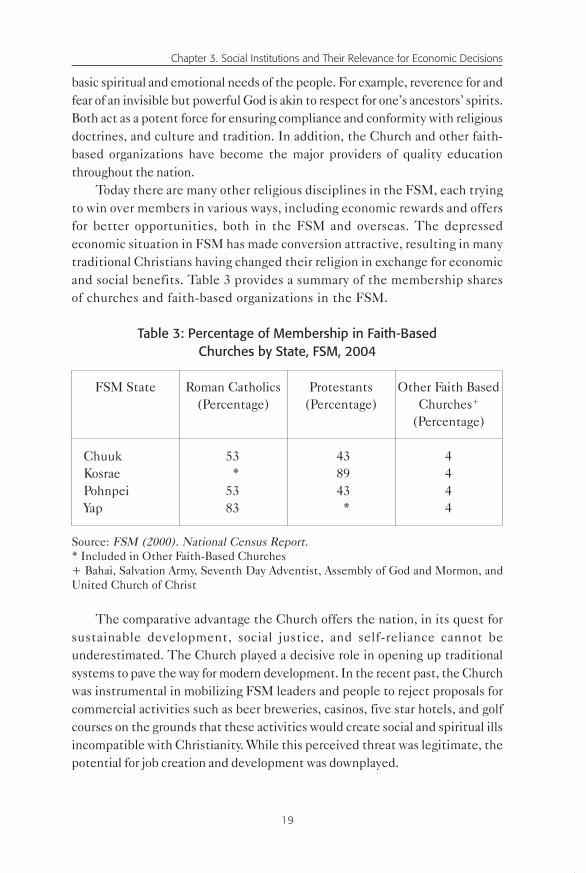
Culture also has a role in influencing the pace of development and theoutcome of economic and political decision-making. This is particularly truefor Yap, where the government and its Councils of Chiefs have forged a dynamicalliance to guide the State’s development without unduly compromisingcustoms and traditions. Pohnpei culture, to some extent, is compliant towardstraditional social duties and obligations but serves no functional role in itsmodern institutions and systems. For Chuuk and Kosrae, traditions and customsare not as prevalent as those in Pohnpei and Yap and may be exploited in supportof specific political agendas.
VI. FFFFFederated States of Micronesiaederated States of Micronesiaederated States of Micronesiaederated States of Micronesiaederated States of Micronesia (FSM)(FSM)(FSM)(FSM)(FSM) came into being in 1986 following thesigning of its Compact of Free Association with the United States. The FSM consistsof four of the former TTPI districts – Chuuk, Kosrae, Pohnpei, and Yap. The FSMseat of Government is located at Palikir in the State of Pohnpei. The FSM stategovernments are located in each of the FSM States of Chuuk (Weno), Kosrae (Tofol),Pohnpei (Kolonia), and Yap (Colonia). The FSM National Government representsthe Federation and is responsible for foreign affairs. Politically, each state governmentruns its own domestic affairs but exerts major influence on national policy anddecision-making. Each state government holds equal power in national affairs throughelectoral representation in the FSM National Congress and through specific states’rights and powers set out in the FSM Constitution.
Section 1 New.pmd 12/12/2005, 2:11 PM17

Federated States of Micronesia Towards a Self-Sustainable Economy
18
Table 2. Structures and Systems of Organizations, FSM, 2004
Clan and Kinship Systems Chuuk Kosrae Pohnpei Yap
Matrilinage – relationship is x xbased on maternal (female)line of accession
Patrilinage – relationship is x x xbased on paternal (male) lineof accession
Estate – mixed line of accession x(adoption, Estates, HouseFoundations and Communal)
Feudal – a system based on x xsocial class, status, power andcontrol
Nuclear – relationship based x x x xon a couple and their children
Source: Marksbury (1979); Perin (1996); Ritter (1978).
The political exploitation of customs and traditions allows special interestagendas to dominate public events and dictate economic decision-makingprocesses. Often, this hinders national development efforts. Discretionaryapplication of traditional culture in contemporary FSM affairs has occasionallycompromised sustainable development efforts. This is because the role oftraditional customs in mainstream development policies is not clearly defined.When customs are evoked, the application is inconsistent. There is also theexisting attitude that traditions stand in the way of progress and must be alteredor reformed.
3.2 The Church and Other Faith-Based Institutions
Christianity continues to be the most successful agent of cultural and socialchange in FSM society. It blends well with the collective, communal, andcomplementary elements of traditions and customs, and is responsive to the
Section 1 New.pmd 12/12/2005, 2:11 PM18
Chapter 3. Social Institutions and Their Relevance for Economic Decisions
19
basic spiritual and emotional needs of the people. For example, reverence for andfear of an invisible but powerful God is akin to respect for one’s ancestors’ spirits.Both act as a potent force for ensuring compliance and conformity with religiousdoctrines, and culture and tradition. In addition, the Church and other faith-based organizations have become the major providers of quality educationthroughout the nation.
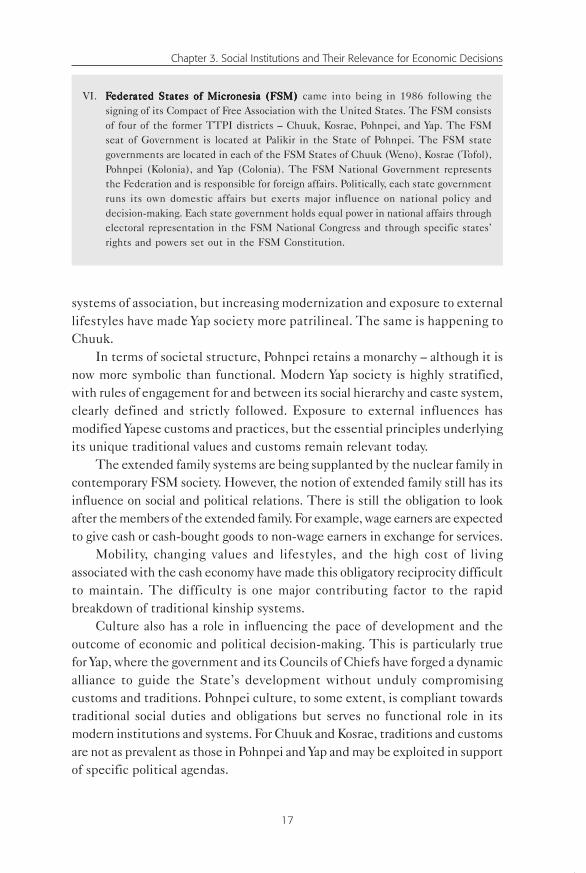
Today there are many other religious disciplines in the FSM, each tryingto win over members in various ways, including economic rewards and offersfor better opportunities, both in the FSM and overseas. The depressedeconomic situation in FSM has made conversion attractive, resulting in manytraditional Christians having changed their religion in exchange for economicand social benefits. Table 3 provides a summary of the membership sharesof churches and faith-based organizations in the FSM.
Table 3: Percentage of Membership in Faith-BasedChurches by State, FSM, 2004
FSM State Roman Catholics Protestants Other Faith Based(Percentage) (Percentage) Churches+
(Percentage)
Chuuk 53 43 4Kosrae * 89 4Pohnpei 53 43 4Yap 83 * 4
Source: FSM (2000). National Census Report.* Included in Other Faith-Based Churches+ Bahai, Salvation Army, Seventh Day Adventist, Assembly of God and Mormon, andUnited Church of Christ
The comparative advantage the Church offers the nation, in its quest forsustainable development, social justice, and self-reliance cannot beunderestimated. The Church played a decisive role in opening up traditionalsystems to pave the way for modern development. In the recent past, the Churchwas instrumental in mobilizing FSM leaders and people to reject proposals forcommercial activities such as beer breweries, casinos, five star hotels, and golfcourses on the grounds that these activities would create social and spiritual illsincompatible with Christianity. While this perceived threat was legitimate, thepotential for job creation and development was downplayed.
Section 1 New.pmd 12/12/2005, 2:11 PM19

Federated States of Micronesia Towards a Self-Sustainable Economy
20
In times of natural disasters, such as the landside in Chuuk in 2002, thechurches and other faith-based organizations provided much-neededemergency services and psychological and social support to victims andaffected communities. They also partner with the government and the FSMRed Cross Society to mobilize international humanitarian relief for victimsof natural disasters. The Churches and their emergency programs are well-positioned to provide the moral platform upon which social and politicaltransformation can be built. Many church leaders are influential community,public and/or traditional leaders.
As the FSM embarks on a fiscally tighter policy regime dictated by theprovisions of the newly amended Compact, the Church may become more usefulthan ever. As development catalysts, the Churches can partner with governmentand non-state actors to mobilize the citizenry into collective action. This can beachieved via the Churches’ public awareness and education campaigns, throughits social justice and development outreach activities, and by providingaccountable and transparent rules and guidelines for leaders’ involvement inpublic and political leadership. The Churches are best suited to instill responsibleand accountable governance and leadership ethics in their members.
Churches can also work with civil society, businesses, and the governmentto define expected roles, lines of responsibility, and partnership arrangementsthat are accountable, participatory, transparent, and protective of human rightsand the rule of law. They can do this by focusing collective efforts towardsrealizing the FSM strategic and infrastructure development plans and otherinternational development commitments. The Micronesian Seminar, a pastoraleducation and research organization, has contributed to improved awarenessand literacy on public affairs, and in speaking out on issues related todevelopment, politics and foreign relations.
3.3 Land and its Titles
In Micronesia, land is wealth, power, spirituality, identity, and the basis for lifeitself. Land is a valuable cultural asset and a priceless heritage to be passed tofuture generations.
The overall land area of the FSM is 271 square miles. Pohnpei has thelargest land area followed by Chuuk, Yap, and Kosrae. Sixty eight per cent of theland in the FSM is privately owned. Approximately 98% is privately owned inChuuk and Yap, while 64% and 36% are privately owned in Pohnpei and Kosrae,respectively. Table 4 presents selected land-related indices to show developmentpotential.
Section 1 New.pmd 12/12/2005, 2:11 PM20

Chapter 3. Social Institutions and Their Relevance for Economic Decisions
21
Land ownership and inheritance are traditionally collective. Land is ownedor inherited through the following: direct accession through matrilineal,patrilineal, extended or communal relationships or ancestry; acceptance of a“gift” or compensation for service rendered; land purchase; land lease; or squattingon unsettled lands.
Table 4: Selected Land and Land UseRelated Indicators by State, FSM, 2004
Chuuk Kosrae Pohnpei Yap FSM
Land Area (sq.m.) 49 42 133 46 271 Population 53,595 7,686 34,486 11,241 107,008Population Density
(per sq.m.) 1,094 179 261 244 395Population Growth Rate
(in % per annum) 0.1 0.9 0.4 0.1 0.3
Source: FSM (2002). Statistical Yearbook.
Traditionally, property rights and land ownership are reserved forinheritance within families or clans. They are rarely transferred outside theindigenous community. A majority of land parcels in the FSM continue to haveextended family or traditional authority over use or alienation rights. Most ofthe land in the FSM has not been surveyed, mapped, registered, or titled.These are the main reasons why land is difficult to acquire and develop. Toimprove land ownership and titling in all FSM states, land administration officeswithin formal and traditional jurisdictions have to be restructured to allow formore effective and efficient land development and management systems. Areview of the laws governing land use needs to be done and it can begin withprovisions in the FSM National and State Constitutions that forbid the sale ofland, or the indefinite use of land by non-FSM citizens (See Box 3).
Developers and landowners have different agendas on how and to whatextent land is to be utilized. Developers, on the one hand, see potential forlarge-scale commercial land development. Landowners, on the other, are largelysubsistence users, and view land as the primary source of food production andsecurity for daily survival.
In all the states of FSM, the tie between land and traditional ownershipand authority is still strong. In Yap, for example, the Councils of Chiefs havethe power to veto any decision or law that may affect customs and tradition.
Section 1 New.pmd 12/12/2005, 2:11 PM21

Federated States of Micronesia Towards a Self-Sustainable Economy
22
Box 3. Land Tenure Laws & Regulations
Constitution of the FConstitution of the FConstitution of the FConstitution of the FConstitution of the Federated States of Micronesiaederated States of Micronesiaederated States of Micronesiaederated States of Micronesiaederated States of MicronesiaArticle XIII: General ProvisionsSection 4Section 4Section 4Section 4Section 4: A non-citizen of the FSM or a corporation not wholly owned by citizens may notacquire title to land or waters in Micronesia.Section 5Section 5Section 5Section 5Section 5: A lease agreement for the use of land for an indefinite term by a non-citizen,corporation not wholly owned by citizens, or any government is prohibited. An existingagreement becomes void 5 years after the effective date of this constitution. Within thattime, a new agreement shall be concluded between the parties. When the nationalgovernment is a party, it shall initiate negotiations.
Chuuk State ConstitutionChuuk State ConstitutionChuuk State ConstitutionChuuk State ConstitutionChuuk State ConstitutionArticle XI: General ProvisionsSection 2Section 2Section 2Section 2Section 2: The power to take an interest in land may only be exercised by the State Governmentfor a specific purpose of general public interest, as prescribed by statute. Negotiations withthe owner for voluntary lease, sale or exchange shall be fully exhausted and just compensationshall be fully tendered before a taking may occur. The Legislature shall provide for access tothe courts to ensure that good faith of the negotiations, the reasonable necessity of theacquisition, and the adequacy of the compensation tendered. Upon the termination of thepublic use for which an interest in land is involuntarily acquired, the State Government shallreturn and quit claim the land to the owner or the owner’s successors.Also refer to Article IV: Traditional Rights for supplementary clauses on customary rightsand practices in text box 12 under Chuuk State Constitution
KKKKKosrae State Constitutionosrae State Constitutionosrae State Constitutionosrae State Constitutionosrae State ConstitutionArticle XI: Land and the EnvironmentSection 3Section 3Section 3Section 3Section 3: The use of real property shall, in the public interest, be regulated by law toassure public health, community well-being, the orderly and economical use of land,preservation of places of cultural or historical value and island beauty.Section 7Section 7Section 7Section 7Section 7: Only a person who is a citizen of the Federated States of Micronesia and adomiciliary of the State, or a corporation which is wholly owned by such persons, may acquiretitle to land in the State. Acquisition or utilization of interests in real property may berestricted or regulated by law.
PPPPPohnpei State Constitutionohnpei State Constitutionohnpei State Constitutionohnpei State Constitutionohnpei State ConstitutionArticle XII: LandSection 1Section 1Section 1Section 1Section 1: Limitation of Leaseholds. No lease of land, except from the Government or asprovided in Section 4 of this Article, may not exceed 25 years. The right for option to renewand other protections shall be provided by statute.Section 2Section 2Section 2Section 2Section 2: Acquisition of Permanent Interest in Real Property. The acquisition of permanentinterest in real property shall be restricted to Pohnpeian citizens who are also pwilidak ofPohnpei, as specified under Article 3 of this ConstitutionSection 3Section 3Section 3Section 3Section 3: Indefinite Land-Use Agreements. An agreement that grants the user of land theunilateral authority to continue use for an indefinite term is prohibited.Section 4Section 4Section 4Section 4Section 4: Land Legislation. The Legislature may provide, by appropriate legislationprocedures to permit leases and other uses of land in excess of limits prescribed in Section1 of this Article.Section 5Section 5Section 5Section 5Section 5: Land Sale. No land shall be sold, except as authorized by statute.
Section 1 New.pmd 12/12/2005, 2:12 PM22

Chapter 3. Social Institutions and Their Relevance for Economic Decisions
23
In the FSM, land rights and land use are based on a principle of reciprocitybetween landowners and those who have the right to use the land. The existinginformal market, however, allows transactions in which land ownership istransferred in exchange for money or power. This will become a more acceptedbusiness practice as private sector development needs for land expands, thedemand for housing increases, and requirements for local production ofconsumable goods and services grow.
The cash or money economy has changed the socio-economic reality sothat landowners are now forced by necessity to exchange their land rights forcash and other material rewards. As land becomes more acceptable as a cashcommodity, accession and inheritance rights are changing. For example, inChuuk, authority to alienate land, once vested in the matrilineal groups as acollective decision-making responsibility, has now been taken over by educated,business-minded individuals. The financial gain from the land is turning into aconstant source of family or clan conflicts, and costly legal proceedings. Thisconflict is a symptom of increasing economic hardships (underemploymentand lack of family income), increasing population, and changing economic andsocial aspirations and lifestyles.
Public lands are also the subject of legal issues. Strategically positioned piecesof land where important public infrastructure is built and maintained forgovernment operations is leased, often for huge sums of money. Unpaid land leaseshave become a major source of litigation and government expenditure.
Given these concerns and the fact that land is limited and has high socialand cultural value, legislating changes in land use or the relevant constitutionallyprotected land tenure provisions will take time. This situation raises numerousquestions about how land in FSM can be best managed. These issues havebeen addressed in various ADB-funded technical assistance projects in the FSM.So far, a few key points have been identified but no real consensus reached. Thelegal framework for secured lending needs to be clarified and updated. New land-use regimes must incorporate customary use rights, but at the same time permitmore land to serve as collateral or be available for private sector development.
YYYYYap State Constitutionap State Constitutionap State Constitutionap State Constitutionap State ConstitutionArticle XIII: Conservation and Development of ResourcesSection 2Section 2Section 2Section 2Section 2: An agreement for the use of land where a party is not a citizen of the FederatedStates of Micronesia or a corporation not wholly owned by such citizens shall not exceed aterm of fifty years. The Legislature may prescribe a lesser term.Section 3Section 3Section 3Section 3Section 3: Title to land may be acquired only in a manner consistent with traditions andcustoms.
Section 1 New.pmd 12/12/2005, 2:12 PM23

Federated States of Micronesia Towards a Self-Sustainable Economy
24
There needs to be commitment to change that simultaneously protects traditionalland use rights, while facilitating economic development.
Culturally sensitive land development policies and enabling legislation canevolve through formalizing stakeholder consultation processes such as nationaland state economic summits or the establishment of “issue-based” developmentpolicy forums (DPFs). It is also possible to create statutory policy mechanismssuch as a Native Land Trust (NLT), or an office of Micronesian Cultural Affairs.Having such systems in place can help bridge the current gaps betweengovernment, the private sector, and the people by:
• Providing a formally structured, participatory consultation process thatinvolves key representatives of all stakeholder groups in land planning,policy formulation, and decision-making.
• Making land planning, policy and decision-making processes primarilyconfined to government officials, accessible to the private sector, civilsociety, and local development partners such as training institutions,chambers of commerce, and landowners.
• Ensuring that economic policy and decision-making affecting landdevelopment be dictated by national and state development realitiesrather than driven by external development interests.
• Making available performance or results-based indicators to assistplanning, decision-making, and programming efforts.
• Conducting workshops and forums to develop consensus on how tostrengthen and improve governance, leadership, management, andtechnical capacities at all levels.
• Convening conferences or workshops on formulating a clear and unifiednational vision and to address inconsistencies between national andstate constitutional rights and provisions.
The recommended measures would address the long-standing indigenousweaknesses in managing and administering the modern democratic institutionsand systems required to successfully promote economic development.
There was virtually no real commitment to developing this capacity andthe result has been a chronic shortage of qualified professionals and techniciansin the public service and in the local labor force. This in turn has resulted in ahigh dependency on foreign advisors and contract employees. Given this reality,there is a pressing need to conduct a needs-assessment of the institutional(administrative, organizational and technical) capacity of government and publicenterprise functions and programs.
Section 1 New.pmd 12/12/2005, 2:12 PM24

Chapter 3. Social Institutions and Their Relevance for Economic Decisions
25
Box 4. S.L. No. 4L-21-96: Pohnpei Development Leasehold Act of 1996
This act is known as the “Pohnpei Development Leasehold Act of 1996”. This Actstipulated the following:
1) Each notice submitted for the recordation pursuant to Section 3 of this act shall beaccompanied by a non-refundable recordation fee of $100 and a refundable bond equalto $100 for each year of the term of the proposed lease – Section 5
2) The recordation fee so paid upon submission of a notice of intent shall be deposited intothe General Fund of the Pohnpei Treasury as the realization of general revenue. Therefundable bond shall be deposited in a special fund of the Pohnpei Treasury, and shallbe returned to the payor or his designee if the prospective development lease agreementis not executed within the time limits prescribed by Section 12 of this act or if so executedon the fifth anniversary of the execution of the development lease upon a finding by theDirector that the requisite capital improvements have been emplaced on the real propertyas prescribed by Section 13(4) of this act; provided, however, that such bonds shall beforfeited to the state if required by Section 16(2) of this act.
3) The maximum number of years for which the lease may be executed, but not in excessof 55 years -Article 13 (3).
4) A covenant stating the minimum value of improvements to the real property that isthe subject of the lease which must be emplaced upon the property by the fifthanniversary of the issuance of the lease, the value of which shall not be less than $200,000– Article 13(4)
5) A covenant stating that the lessor shall be entitled to not less than 10 per cent of thecapital gains received by the lessee or his successors in interest for an assignment,sublease or subsequent assignment or lease, of the leasehold estate or portion thereof;provided that the calculation of such capital gains shall not include investment lessdepreciation and reasonable business costs incurred by the lessee or his successors ininterest with respect to improving the leasehold estate or developing the businessactivities thereon – Article 13(6)
6) The statutory conditions prescribed by Section 13 of this act are hereby made a part byreference and operation of law of every development lease executed in the State ofPohnpei for the benefit of the lessor, notwithstanding their incorporation or non-incorporation in the written leasehold agreement. Any provision in a lease contract,agreement or subsequent agreement or contract which seeks to effectuate a waiver ofthe statutory provisions of Section 13 of this act to the detriment of the rights andprivileges of the lessor contained herein is null and void as against public policy. Violationof any condition or covenant prescribed by said sections of this act to the detriment ofthe rights and privileges of the lessor shall be deemed a material breach of the leaseagreement, which may be redressed by report to judicial action – Section 14
7) In addition to the civil sanctions as may be imposed under Section 14 of this act, anylessee who, within five years of execution of the leasehold agreement, fails to improvethe leasehold estate at a value equal to or in excess of the valuation prescribed in thedevelopment agreement shall be liable for the payment to the lessor or his successorsin interest of a civil fine of 10 per cent per year of the value of the improvements thathave not been so made to the property – Section 16(1)
8) In addition to the civil fine imposed by Subsection (1) of this section, the bond paidfor filling of a notice of intent to enter or substantially modify a development lease asprescribed by Section 5 of this act shall be forfeited to the state – Section 16(2)
Section 1 New.pmd 12/12/2005, 2:12 PM25

Federated States of Micronesia Towards a Self-Sustainable Economy
26
The current impasse between landowners and government on land tenuresystems arises because of the perception that development plans promoteonly the economic value of land as measured by market price, and not itscultural and natural resource use values. It is true that whatever naturalresources the present generation has exists because of the investments andconservative decisions made in the past. The management of resources overtime, in light of the future benefits those resources may yield, is an importantquestion of economic efficiency. There are also ethical and moral issuesinvolved as to the current generation’s responsibility to conserve resources forthe future.
Concerns regarding clear title to land, i.e., identification of all ownershipinterests in private property, underlies much of the support for land and realestate registration. However, identification is only part of the problem. Toserve as collateral with economic value, land ownership rights must betransferable. Land is inalienable to non-citizens which means securityinterests or liens cannot be enforced. In many customary settings, however,freehold titles do considerable harm to traditional practices. Modernapproaches often ignore the fact that land rights in a traditional setting havevalue over and above simply holding title.
Land reform should address the issue of how to harness the values of landwhile preserving its associated traditional values. One mechanism that providesa robust land tenure system together with economic incentives and legal securityfor lending is found in the Western ownership model. This required approachwould entail the following actions.
• Reforming land administration, management, and enforcement;• Creating a one-stop-shop for real estate property development and
investment;• Reforming and expanding EPIC (Refer to 3.1.3);• Performing an institutional audit of existing national and state
executive, legislative, and judiciary systems to identify administrativeand legal constraints and to propose development-friendlyimprovement measures and legislative acts;
• Adopting a government policy of pro-actively working with civil societyand other non-state actors; and,
• Providing for independent national and state legal and regulatory reviewsand appraisals
Section 1 New.pmd 12/12/2005, 2:12 PM26

Chapter 3. Social Institutions and Their Relevance for Economic Decisions
27
Box 5. Laws on Customs and Traditions
FSM Constitution - Article VFSM Constitution - Article VFSM Constitution - Article VFSM Constitution - Article VFSM Constitution - Article V: T: T: T: T: Traditional Rightsraditional Rightsraditional Rightsraditional Rightsraditional RightsSection 1Section 1Section 1Section 1Section 1: Nothing in this Constitution takes away a role or function of a traditionalleader as recognized by custom and tradition, or prevents a traditional leader from beingrecognized, honored, and given formal or functional roles at any level of government asmay be prescribed by this Constitution or by statue.Section 2Section 2Section 2Section 2Section 2: The traditions of the people of the FSM may be protected by statute. Ifchallenged as violative of Article IV, protection of Micronesian tradition shall be considereda compelling social purpose warranting such government action.Section 3Section 3Section 3Section 3Section 3: The Congress may establish, when needed, a Chamber of Chiefs consistingof traditional leaders from each state having such leaders, and of elected representativesfrom States having no traditional leaders. The Constitution of a state having traditionalleaders may provide for an active, functional role for them.
Chuuk State Constitution - Article IVChuuk State Constitution - Article IVChuuk State Constitution - Article IVChuuk State Constitution - Article IVChuuk State Constitution - Article IV: T: T: T: T: Traditional Rightsraditional Rightsraditional Rightsraditional Rightsraditional RightsSection 1Section 1Section 1Section 1Section 1: Existing Chuukese custom and tradition shall be respected. The Legislaturemay prescribe by statute for their protection. If challenged as violative of Article III,protection of Chuukese custom and tradition shall be considered a compelling socialpurpose warranting such government action.Section 2Section 2Section 2Section 2Section 2: Nothing in this Constitution takes away the role or function of a traditionalleader as recognized by Chuukese custom and tradition, or prevents a traditional leaderfrom being recognized, honored, and given formal or functional roles in government.Section 3Section 3Section 3Section 3Section 3: The Legislature may appropriate funds annually for a traditional leadersconferenceSection 4Section 4Section 4Section 4Section 4: Traditional rights over all reefs, tidelands, and other submerged lands,including their water columns, and successor rights thereto, are recognized. The Legislaturemay regulate their reasonable use.
Kosrae State Constitution - Article II: The Community and the IndividualKosrae State Constitution - Article II: The Community and the IndividualKosrae State Constitution - Article II: The Community and the IndividualKosrae State Constitution - Article II: The Community and the IndividualKosrae State Constitution - Article II: The Community and the IndividualSection 1Section 1Section 1Section 1Section 1: Except when a tradition protected by statute provides to the contrary.Section 2Section 2Section 2Section 2Section 2: The State Government shall protect the State’s traditions as may be requiredby the public interest.
PPPPPohnpei State Constitution - Article 5: Tohnpei State Constitution - Article 5: Tohnpei State Constitution - Article 5: Tohnpei State Constitution - Article 5: Tohnpei State Constitution - Article 5: TraditionraditionraditionraditionraditionSection 1Section 1Section 1Section 1Section 1: Customs and Traditions. This Constitution upholds, respects, and protectsthe customs and traditions of the traditional kingdom of Pohnpei.Section 2Section 2Section 2Section 2Section 2: Protection of Customs and Traditions. The Government of Pohnpei shallrespect and protect the customs and traditions of Pohnpei. Statutes may be enacted touphold customs and traditions. If such a statue is challenged as violating the rightsguaranteed by this Constitution, it shall be held upon proof of existence and regularpractice of the custom or tradition and the reasonableness of the means established forthe protection, as determined by the Pohnpei Supreme Court.Section 3Section 3Section 3Section 3Section 3: Family Obligations. (1) To strengthen and retain good family relations inPohnpei, as needed, this Constitution recognizes and protects the responsibility andauthority of parents over their children. (2) This Constitution also acknowledgesthe duties and rights of children in regards to respect and good family relations asneeded.
Section 1 New.pmd 12/12/2005, 2:12 PM27
Federated States of Micronesia Towards a Self-Sustainable Economy
28
YYYYYap State Constitution - Article III: Tap State Constitution - Article III: Tap State Constitution - Article III: Tap State Constitution - Article III: Tap State Constitution - Article III: Traditional Lraditional Lraditional Lraditional Lraditional Leaders and Teaders and Teaders and Teaders and Teaders and TraditionsraditionsraditionsraditionsraditionsSection 1Section 1Section 1Section 1Section 1: There shall be a Council of Pilung and a Council of Tamol which shall performfunctions which concern tradition and custom.Section 2Section 2Section 2Section 2Section 2: Due recognition shall be given to traditions and customs in providing a system oflaw, and nothing in this Constitution shall be construed to limit or invalidate any recognizedtradition or custom.Section 16Section 16Section 16Section 16Section 16: A certified copy of every bill which shall have passed the Legislature be presentedto the Council of Pilung and Council of Tamol for consideration. The Councils shall havethe power to disapprove a bill which concerns tradition and customs or the role or functionof a traditional leader as recognized by tradition and custom. The Councils shall be thejudge of the concernment of such a bill.Section 17Section 17Section 17Section 17Section 17: The Council of Pilung and the Council of Tamol may disapprove a bill by returningthe certified copies of the bill with their objections within thirty days after it is receivedfrom the Legislature. A disapproved bill may be amended to meet the Councils’ objectionsand, if so amended and passed, only one reading being required for such passage, it shall bepresented again to the Councils.
Innovative approaches are needed to achieve small-scale interventions whichstrengthen and support existing goals and values in a manner complimentary tosocial-cultural relationships within the community.
There is a perception that current FSM development policies and structuraladjustment programs emphasize an overly “top-down” economic developmentagenda perpetuated by the discretionary application of customary governance.This neo-traditional policy framework undermines the dynamism of a collectiveand communal lifestyle suitable to a largely subsistence economy and society.Traditional authority and governance were purposefully stripped of anyfunctional role in the modern FSM democratic government in all but one state.As a result, the role of traditional authority in public governance has taken on amore superficial ceremonial role that often is subject to financial gain or politicalmanipulation.
Customs and traditions are often invoked in times of crisis to pull thenation together, or to appeal to a collective endorsement and legitimacy forotherwise unpopular leadership actions. In the political sphere, traditionalcustoms and extended kinships hold the authority and wield the bargaininginfluence that opens doors to elected office and positions of power. Politicalaspirants actively seek endorsement from traditional authority and closelyalign themselves with these traditional processes to further their politicalaspirations. People expect elected leaders and politicians to reciprocate byhonoring obligatory “duties and rights” prescribed by traditional authority.
Section 1 New.pmd 12/12/2005, 2:12 PM28

Chapter 3. Social Institutions and Their Relevance for Economic Decisions
29
The extent of traditional authority and status is intrinsically proportional toone’s relative relationship to the land and collective extended family systems.There are two ways to be elected into leadership and power: (1) ride on the ticketof the extended family alliances and networks in one’s electoral district or inone’s municipality or state; and (2) use of current position and authority to buyvotes or provide employment opportunities. Once elected, these leaders are subjectto keeping and nurturing the electorate they represent. This is their prioritymission. Those who reciprocate and fulfill their “obligatory duties” secure forthemselves a perpetual elected position.
3.4 Community-Based Development Approaches
The search for national identity in the post-colonial era and thepreoccupation with economic development has relegated social welfare tosecondary importance in the FSM. Already, the pace of urbanization andpopulation growth is challenging the ability of customary traditions to protectpeople from hardship. Pockets of squatter dwellings and settlements arebeginning to emerge throughout the FSM. An estimated 20% of FSM citizenshave migrated overseas in search of better economic and social opportunities.
Economic and social development of heritage and natural resource-basedassets, based on traditional, indigenous cultural values and practices maybe an effective approach for rural areas and those adjacent to them whichcontain cultural and natural resources. This involves initiating a variety ofcommunity participatory activities which act as catalysts for local communityinterest groups to assess the unique characteristics and economic potentialof the elements making up their physical heritage. This assessment canprovide a basis for designing community action plans that are both profitableand sustainable. This approach would be complementary to private sectordevelopment that would be more focused on utilizing land in the urbanareas. While the private sector development approach would depend to amuch larger extent on foreign investment and the use of technological andmanagement skills prevalent in the global economy, the community-basedapproach would likely be a more effective approach for mobilizing resourcesin the non-profit sector, relying more heavily on local labor and capital. Asignificant portion of the labor could come from the underemployed in thesubsistence sector.
Three alternative models for rehabilitating and empowering localcommunities to achieve self-reliance through responsible cultural heritagepreservation are presented.
Section 1 New.pmd 12/12/2005, 2:12 PM29

Federated States of Micronesia Towards a Self-Sustainable Economy
30
The L L L L Local Effort And Pocal Effort And Pocal Effort And Pocal Effort And Pocal Effort And Preservation (LEAP) Modelreservation (LEAP) Modelreservation (LEAP) Modelreservation (LEAP) Modelreservation (LEAP) Model is a process-basedmodel premised on local communities assuming an active stewardship of theircultural heritage and being empowered to develop elements of that heritage in aresponsible, profitable and sustainable manner. LEAP views preservation as anactivity that can bring economic opportunities and serve as a tool for job creationand income generation based on traditional technologies, locally availablematerials and the human resources in the local community. This modelstimulates economic opportunities by using traditional skills and indigenousresources available in the community. Recruiting the potential of culturaltourism as a tool for the preservation and enhancement of both the physicaland intangible heritage can be combined with a specific cultural industry topromote urban regeneration and revitalization of rural and remote islandcommunities throughout the FSM.
Land development can be a catalyst for further cultural development. LEAPaims to empower inhabitants in local communities to:
• Understand and advocate the sustainable conservation of locallysignificant monuments, sites, and the material and tangible traditionsuniquely associated with local culture;
• Play a leading role in actual hands-on conservation and preservationwork, as well as in the interpretation of the heritage values which are tobe safeguarded;
• Develop the means through which they can benefit financially from theenhanced conservation of their heritage.
Such promotional efforts also restore pride in local heritage therebyattracting opportunities for income generation and job creation in eco-businesses in local communities. The aim is to restore heritage conservationfrom an elite technical specialization practiced by a handful of experts to apopular grass-roots movement. LEAP would serve as a tool for endogenous andsustainable economic and human development that is appropriate to a particularlocale.
The Enterprise FEnterprise FEnterprise FEnterprise FEnterprise Facilitation Modelacilitation Modelacilitation Modelacilitation Modelacilitation Model has as its primary focus buildingcommunities around people doing what they love and empowering localeconomic development based on the personal growth of people within thecommunities they live in.
The Enterprise Facilitation Model is a grassroots approach to localdevelopment that promotes and teaches civic leaders how to establish a programthat transforms individual passion and community activism into rewarding and
Section 1 New.pmd 12/12/2005, 2:12 PM30

Chapter 3. Social Institutions and Their Relevance for Economic Decisions
31
sustainable local enterprises. It is a client-centered, management coaching methodmade available to self-motivated individuals with a bona fide business idea. It isa low-cost, locally managed project that complements strategic infrastructuredevelopment and provides for better utilization of all business-related resourcesalready available in each community. It succeeds by introducing sound andeffective management principles to the grassroots by restoring personal motivationand talent to its central role in spurring entrepreneurship and promoting economicdevelopment.
Since 1985, Enterprise Facilitation has demonstrated that the provision ofcompetent and dedicated support to entrepreneurs is as important as thebuilding of physical infrastructure to the development of a stable and successfuleconomy. This is because true economic development is two-fold: the creationof infrastructure for development, and building the capacity of people to utilizesuch infrastructure.
Enterprise Facilitation is a social initiative that helps communities creatediversity and sustainability that is people-centered and locally owned andcontrolled. This model challenges leaders, managers, planners, and policymakersto listen, keep development simple, and do whatever it takes to make sure theentrepreneurs have a strong team in place. It forces the community to buildenterprises with ordinary people. It offers a practical tool that gives communitiesthe ability to create their own prosperous future.
The Community Economic Development Initiative (CEDI) ModelThe Community Economic Development Initiative (CEDI) ModelThe Community Economic Development Initiative (CEDI) ModelThe Community Economic Development Initiative (CEDI) ModelThe Community Economic Development Initiative (CEDI) Modelis a bottom-up approach to economic planning and development. This initiativeseeks to bring members of the community, the private sector, civil societyorganizations, and various government departments together to generate a moreinformed response to the communities’ development efforts. It focuses theattention of central and local government on the economic development needs oflocal communities, and it provides a mechanism for coordinating the delivery ofgovernment services with the private sector to remove bottlenecks. The approachuses a participatory planning process to ensure that communities identify whatthey themselves can do to achieve economic development, and what services andassistance they need from others to help them achieve their plans. The output isa community-formulated resource development action plan that is owned by abroad-based constituency of stakeholders, all of who have a vital interest in theplan’s success.
The CEDI Model is based on getting a community to work on the following:assess and prioritize its needs; identify its resources and assets; determineviable economic ideas and potentials; match community development ideaswith existing enterprise facilitation programs; develop community cooperative
Section 1 New.pmd 12/12/2005, 2:12 PM31

Federated States of Micronesia Towards a Self-Sustainable Economy
32
plans; convene financing forums between cooperative officials and investors/donors to deliberate on cooperative plans to secure financing; form communitycooperatives and revolving loan and savings funds; and establish cooperativebusiness ventures and community development corporations.
Economic development has more to do with people than with so-calledcomparative advantage. Wealth can be generated in the short term by exploitingnatural resources, but long-term prosperity can only be created collectively –exchanging ideas, and sharing technologies and resources. CEDI helpscommunities initiate and generate their own solutions to common economicproblems, build long-term community capacity, and foster the integration ofeconomic, social, environmental and cultural heritage objectives to expandlivelihood and to improve productivity.
3.5 Developing a Shared Vision
Developing a shared vision is important to building and strengthening nationalidentity. This goal entails a strategic planning framework that cuts throughinstitutional boundaries by establishing a multi-sector, multi-disciplinary,partnership-based decision-making process. This participatory developmentframework would contribute to:
• Promoting good governance and respect for the rule of law;• Improving governance as stakeholders seek to achieve consensus on
policies and practical measures that enhance the urban-rural linkagesand harness the potential of towns to productively absorb increasingurban congestion;
• Strengthening national, state, and municipal links so that all are well-informed and ready to participate in public affairs critical to theirmandates;
• Encouraging citizen participation in public affairs and thedevelopmental process;
• Promoting agreement on actions to be taken and timetables forimplementation;
• Clarifying roles and responsibility of the private, public and civil sectors(non-profit organizations);
• Strengthening the judicial sector;• Reducing government control over the economy.
Section 1 New.pmd 12/12/2005, 2:12 PM32

Chapter 3. Social Institutions and Their Relevance for Economic Decisions
33
To actively support and facilitate the community-based developmentapproach, there is a need for an agency or office of government that is mandatedto work with the non-profit sector in seeking external financing (and in the future,government funding out of domestic revenues) and in assisting in the programmingof such funding. This new agency (perhaps a Bureau of Community Developmentand Cultural Affairs) could also be responsible for ensuring national and stategovernment support to the non-profit sector towards achieving the nation’s MDGs(discussed in Section 10.2). To this end, serious consideration should be given toestablishing a Social Development Fund (SDF).
The SDF is a means to provide much-needed assistance for basic communityservices not provided under traditional national and state health and educationprograms. Some of the MDG targets that could be addressed by the SDF includehardship reduction by creating employment, and environmental sustainabilityby furthering the targets on protection of forested land and maintenance ofbiological diversity. Other programs could address public education, legal literacy,human rights education, and basic adult literacy.
Section 1 New.pmd 12/12/2005, 2:12 PM33

Federated States of Micronesia Towards a Self-Sustainable Economy
34
Chapter 4. Government Structures andImplications for Economic Development
4.1 National and State Governments’ Role in the Federal Structure
T he national constitution created three levels of government in theFederated States of Micronesia: national, state, and local. A state,however, is not required to establish a new local government if noneexisted prior to the effective date of the constitution. Under thisfederal system of government, the areas of responsibility between
the national and the state governments are separated. The constitution delegatedto the national government two types of power:
• powers expressly delegated to the national governments;• powers that are indisputably national in character as to be beyond the
powers of the states to control.
The powers granted to the state governments are:
• powers not expressly delegated to the national government;• powers not prohibited to the state.
The constitution does not grant any authority to the local governments. Thepowers granted to the state are residual, i.e., the states exercise the remainingpowers. The FSM Constitution does not seem to make any use of the doctrine ofpre-emption on the part of the national government to encroach on state power.
The powers delegated to the national government are legislative andenumerated in Article IX. Among these legislative powers are:
• to regulate banking, foreign and interstate commerce, insurance, theissuance and use of commercial paper and securities, bankruptcy andinsolvency, and patents and copyright;
• to impose taxes, duties, and tariffs based on imports;• to impose taxes on income;• to establish usury limit on major loans;• to regulate navigation and shipping except within lagoons, lakes, and
rivers;
Section 1 New.pmd 12/12/2005, 2:12 PM34
Chapter 4. Government Structures and Implications for Economic Development
35
• to regulate the ownership, exploration, and exploitation of naturalresources within the marine space of the Federated States of Micronesiabeyond 12 miles from island baselines.
In addition, the national government has the power to establish andadminister post-secondary institutions and provide legal assistance. Pursuant tothese powers, the national government established the College of Micronesia-FSM and the Public Defender’s Office, and provided funding for theMicronesian Legal Services Corporation.
Among the residual powers exercised by the state governments are to:
• establish and administer elementary and secondary schools;• establish and administer health services;• establish local government units;• borrow money on state credit;• establish and maintain public safety;• regulate intrastate commerce;• regulate navigation and shipping within lagoons and rivers;• regulate the sale and use of land;• regulate fishing within the twelve-mile territorial sea;• levy sales tax.
Despite the fact that the states control their area of jurisdiction, the FSMConstitution is the supreme law of the land and any state constitution andlaws in conflict with it are invalid to the extent of conflict. However, some ofthe states have enacted laws that may be in breach of the equal protectionclause of the national constitution. The legality of these laws has not beenchallenged in national courts so the states continue to enforce them regardlessof their discriminatory nature.
4.1.1 The National, States, and Local Governments
The national government of the FSM is one of the four successors to thegovernment of the Trust Territory of the Pacific Islands and the newest levelof government in the federation. Two states, Chuuk and Yap, inherited theirboundaries from the former administrative districts of the Trust Territory. Theother two states, Kosrae and Pohnpei, were administered as one unit under theUN Trusteeship. Prior to the referendum on the national constitution, Kosraebecame a separate and distinct state. With the exception of Chuuk, the
Section 1 New.pmd 12/12/2005, 2:12 PM35

Federated States of Micronesia Towards a Self-Sustainable Economy
36
municipalities in the other three states maintained the boundaries that existedduring pre-colonial times. In Chuuk, the Japanese consolidated the villages oneach high island into local governmental units. Consequently, the boundary ofeach municipality in Chuuk transcended the borders of the autonomous pre-colonial local villages. So with the exception of Chuuk, the municipalities in theother three states are the oldest political units in the Federated States ofMicronesia.
4.1.2 The Hot Spot: Center versus the Periphery
Despite the clear allocation of powers to each level of government, there isoften conflict between the national and state governments which usually involvepolitical power, money, and land.
One recurring issue, which started surfacing very early after the nationalgovernment was installed, is which government – state or national – has thepower to issue foreign investment permits. This power is not specifically allocatedto the national government, but it could assert jurisdiction to regulate foreignand interstate commerce. In addition, foreign investment is linked to foreignaffairs making it national in character. But in the journal of the 1975 MicronesianConstitutional Convention, the authority to regulate the issuance of foreigninvestment permits was listed as an example of a power a state may exercise.This conflict over jurisdiction prompted state and national leaders to call forleadership conferences to sort out the issue. The conferences decided on acompromise that resulted in both state and national governments having theauthority to issue foreign investment permits. This political solution did notplease the states.
In 1997, the national congress enacted a foreign investment law which setup national categories of economic sectors to be regulated by the nationalgovernment and their state counterparts. It is unlikely that the states will readilyembrace this new foreign investment law because it essentially dictates to thestates what they can and cannot do. The states will view the new foreigninvestment law as a national government attempt to further control economicdevelopment activities. This issue should be revisited by national and statesleaders to decide on where to draw the jurisdictional line between the nationaland state governments.
Another flash point has to do with the power of the national court to hearcases arising in areas of jurisdiction constitutionally delegated to the states.These cases deal with land, and foreign boats illegally fishing in the territorialsea. The national court has introduced the legal fiction of concurrent jurisdiction
Section 1 New.pmd 12/12/2005, 2:12 PM36

Chapter 4. Government Structures and Implications for Economic Development
37
to hear these cases. The state courts consider this claim as another example ofnational government’s encroachment on state jurisdiction.
An issue that has caused many political problems and dissention in thestates, mainly in Pohnpei, is land. All the states incorporate in their constitutionssome form of restriction against the sale of land. In Yap, any transaction must bein accordance with local custom and tradition. In Pohnpei, the restriction againstsale of land applies to foreigners as well as non-Pohnpeian citizens. In spite ofthis restriction, Pohnpeian landowners have found a lawful way to transfer title totheir land to FSM citizens from the other states by treating the transfers as giftsand accepting payment as a private loan. This problem exemplifies the difficultyin regulating the use of private land.
The constraint on the sale of land discourages foreign investors fromestablishing business ventures. Pohnpei, under pressure from donor agencies, hasenacted a land-use law which allows fifty-five year-leases, but it attaches somany conditions that no investor would want to obtain such a lease. The effect ofthis law is disappointing to donor agencies that have encouraged FSM governmentsto promote private sector development. The states need to enact new land-uselaws that will allow long-term leases to attract investment in the private sector.The states must do their part to demonstrate to donor agencies and countriesthat they are serious about private sector development.
There also exists a conflict about money which has to do with revenue derivedfrom two sources: tax on wages and gross business receipts, and fishing permit fees.
The national government collects wages and salaries tax, and gross receiptstax then pays each state its share of 50% as mandated by law. The dispute centersaround the share of each state. The states wanted a split of eighty-twenty: 80% ofthe taxes collected going to the state, and 20% to the national government. Eachstate government was able to collect enough signatures to force the nationalgovernment to subject the eighty-twenty formula to a nationwide referendum.The new formula failed to gain the constitutionally mandated prerequisite of atleast two thirds of the votes cast in three of the four states. After the referendum,the national congress enacted a new revenue sharing formula of seventy-thirty.The national congress also mandated that the states should use the revenuereceived under the new formula only for education and health. The states arguedthat even though they would be getting a bigger share of the revenue, the attachedcondition made the law incapable of meeting their needs. But with the defeat ofthe eighty-twenty formula at the hands of the voters, the states shied away fromrisking another showdown with the national government over revenue sharing. Sothe seventy-thirty formula remained until 2004 when the national congressamended the revenue sharing law to restore the original fifty-fifty split.
Section 1 New.pmd 12/12/2005, 2:12 PM37

Federated States of Micronesia Towards a Self-Sustainable Economy
38
A second money problem deals with the fishing permit fees. The nationalgovernment, through the National Oceanic Resources and Management Agency(NORMA), issues licenses to foreign vessels to fish within the exclusive economiczone (EEZ). When the Micronesian Constitutional Convention met in 1975, thedelegates did not foresee the revenue that would derive from issuance of permitsto foreign fishing vessels.
The proposal to allow the national government to regulate the use of living andnon-living resources in the EEZ was adopted without any attempt to require thenational government to share the revenue with the states. To the delegates, theconstitutionally mandated creation of the EEZ was a political statement intendedto strengthen the hands of the Micronesian negotiators at the Compact negotiation.
In just a few years after the national constitution took effect, the revenuederived from the issuance of fishing permits to foreign fishing boats became amajor source of funds for the national government, and the states had started toexpress interest in receiving a share of the fishing permit fees. There was noresponse from the national government so the states circulated a proposedconstitutional amendment that would declare the states as the owners of theexclusive economic zone (The National Union, 1998). The amendment wasgreatly flawed, but the states were determined to push it in a nationwidereferendum. The proposed constitutional amendment failed in the four states,but this issue continues to be a potential source of conflict in the relationshipbetween the national government and the states.
Pohnpei has been the most vocal critic of the national government. In 1991,the Pohnpei State Legislature created a special committee to look into areas ofstate concern vis-à-vis the national government. The committee reported thatPohnpei was actually worse off at the beginning of Compact I because it wasreceiving less funding than under the Trusteeship. The committee also indicatedthat with the impending step-downs and termination of Compact I, the statewould face a drastic cut in operating revenues. One way to increase revenue is toliberalize foreign investment law. The only way the state could manage this is tohave the power to make decisions without interference from national government.
The committee report also leveled the following complaints against thenational government:
• Pohnpei needs more liberalized investment policies than the FSM iswilling to provide.
• The FSM government is encroaching on the authority of the state bymaking payments to local governments and handing out Congress moneyto other institutions over the heads of state officials.
Section 1 New.pmd 12/12/2005, 2:12 PM38

Chapter 4. Government Structures and Implications for Economic Development
39
• FSM government is not compensating Pohnpei for its government servicesto non-Pohnpeian FSM citizens.
• Pohnpei is obligated to honor those FSM laws that may be against itsbest interest; e.g., open immigration policy.
• Land on Pohnpei is being lost to other FSM citizens, even though purchaseof land by non-Pohnpeians is illegal.
• The presence of the national government on Pohnpei only intensifiesnegative social change as exemplified in the increased rate in crime andfamily breakdown.
• There are too many levels of government (national, state, municipal) foreffective and decisive action.
• Pohnpei is ready for full independence, as opposed to being a part of theFSM’s Compact of Free Association with the US.
A glance at the list shows that only one has to do with the federal relationshipwith the national government. The first complaint has to do with foreigninvestment policies which the state shares with the national government. Theother complaints are misleading. An example is the accusation made against thenational government for failure to compensate the state for services (presumablyeducation, health, and utilities) provided to non-Pohnpeian FSM citizens. Infact, employees from other FSM states who reside in Pohnpei pay taxes to thePohnpei State treasury, but their children are not eligible to receive scholarshipsfrom Pohnpei. In addition, most of the national government employees fromother FSM states enroll their children in private schools and join the healthinsurance program. When they are sick they utilize the services of the variousmedical clinics in Kolonia. These employees pay their utility bills, too. Thecommittee report did not discuss the benefits Pohnpei receives from the presenceof the national government and the College of Micronesia in the state. Thecommittee also attributed the rise in crime rates and family breakdown to thepresence of non-Pohnpeian FSM citizens. This claim is potentially divisive.
The problems articulated in the report of the special committee have littleto do with the nature of the federal system of government. These tensions arepolitical. Since the inception of the Federated States of Micronesia, Pohnpeihas attempted several times to secede. This breakaway movement flares upfrom time to time, especially during economic hardship such as the Compactfunding step-downs in the 1990s.
The criticism against the national congress for directly providing funds tothe municipalities is valid, but this is not unconstitutional. The funds are usedto build secondary roads, repair municipal offices, and extend power in the villages.
Section 1 New.pmd 12/12/2005, 2:12 PM39

Federated States of Micronesia Towards a Self-Sustainable Economy
40
A possible incentive for the national government is that providing funds forinfrastructure development in the villages make the national senators moreinfluential with the local leaders and voters.
The complaint that FSM has too many levels of government is valid, but thenational government is not responsible for creating municipal governments. Thestate could choose to utilize the traditional political structure already in existence.This arrangement will actually be less expensive for the states.
Despite being home to the government for 24 years, Pohnpei is stilluncomfortable with this role. Although the discomfort of Pohnpei does very littleharm, the picture of political instability it portrays is not conducive to economicdevelopment.
The ongoing Yap State Constitutional Convention is considering a proposalthat would ask the voters, at ten-year intervals, whether the state shouldremain a part of the Federated States of Micronesia. At present Yap isconsidered as the most politically stable state in the federation. However, thefact that this proposal is being discussed in the state constitutional conventionwould mark Yap State as politically unstable and discourage potential investorsin the local economy.
The structure of the federal system of government in the Federated Statesof Micronesia is not an insurmountable barrier to a good working relationshipbetween the center and the periphery. To maintain political unity in Micronesia,a federal system is more acceptable than a unitary one. The resentment directedtowards the national government is due to the division of national resourcesand the perceived co-optation of state powers. It will take an innovativeapproach and commitment to national viability and economic self-sufficiencyon the part of the national and state leaders to reach an acceptable division ofnational resources and to solve the nuances of the federal relationship thatexist in the Federated States of Micronesia.
4.2 Role of the Legislature vis-à-vis the Executive
The FSM Congress is given the power to elect the President and Vice Presidentfrom among its four at-large members who represent the four states. These membersserve a longer term of four years. The other ten members of Congress, who representsingle-election districts, serve two-year terms. The National Congress has noterm limit.
A quick glance at the lists of powers delegated to the three branches of thenational government indicates where the power in the national government lies.The powers assigned to the National Congress fill more than four pages while the
Section 1 New.pmd 12/12/2005, 2:12 PM40

Chapter 4. Government Structures and Implications for Economic Development
41
ones entrusted to the Executive Branch fill only two. Aside from the power toelect the President and Vice President, the National Congress possesses threeother important powers:
• to impose taxes;• to appropriate public funds;• to override presidential veto.
The power to elect the President and the Vice president gives the NationalCongress undue influence over the executive branch. If the president wants torun for reelection, he must act upon requests from members of Congress.Perhaps what impacts the president’s decision the most is the knowledge thatany use of his power might alienate the people who handed him the presidency.
The power to impose taxes gives the national congress the authority to controlthe financial policy of the nation. For instance, earlier this year congress alteredthe revenue sharing formula despite strong protest from state leaders. In addition,the power to appropriate public funds enables Congress to have influence overdecisions that could result in conflicts of interest, such as projects in their electiondistricts. The president is almost powerless to guide such decisions. Since 1992,the Congress has developed a practice of overriding presidential veto ofappropriations for projects in their election districts. This year Congress overrodea presidential veto of an appropriation of $2 million for public projects in thestates, an act which put the nation in deficit.
The cornerstone of the relationship between the national congress and theexecutive branch is the doctrine of checks and balances. For this relationship towork properly, the functions of the legislative and executive branches must becomplementary.
In the FSM, the political culture is devoid of ideology; and political partiesare yet to develop. Lacking these necessary political ingredients, politics in theFSM is driven mainly by the interests of the states, as represented by the individualpoliticians.
One political phenomenon unique to the FSM government system is thecohesiveness that exists among the members of the national congress. The onlycentrifugal force is state interest. The members have an informal understandingthat each state congressional delegation has exclusive authority to determine thefunding priority for its state public projects appropriations. The direct result ofthis unity among the members is the ability of congress to override presidentialveto with ease. Political observers contend that there are too many checks and nobalance between the Congress and the President. This problem will persist untilthe political infrastructure in the system becomes fully developed.
Section 1 New.pmd 12/12/2005, 2:12 PM41

Federated States of Micronesia Towards a Self-Sustainable Economy
42
The president however is not completely powerless. He is bestowed withsuch constitutional powers as the nomination of the principal officials of thegovernment; appointment and reception of ambassadors; the conduct of foreignaffairs according to statute; and the veto of bills enacted by the congress. Thepresident derives additional power from the respect and prestige of his officeas the head of government and head of state. This accords the president thepower to persuade. This means that the president must be fully immersed inpolitics with the national congress and the state governments. The presidentialposition is key to the system, and success depends on the political skill topersuade and to build political alliances that transcend regional, ethnic, andcultural divides.
At the state level, the executive and legislative branches work relativelywell together. Yap is a model of cooperation in a government that espouses thedoctrines of separation of power. Yap practices cannot be replicated in otherstates because the Yapese have lived under a traditional political system thatpracticed a similar type of checks and balances as that built into the moderngovernment.
Three states have fulltime unicameral legislatures. Chuuk, on the otherhand, chose a bicameral legislature, with a senate and a house of representatives.The advantage of a bicameral legislature lies in the internal checks and balancesbetween the two chambers. But this system of government is expensive andChuuk can hardly afford the expense.
4.3 Economic Implications
The economic implications of the political problems come down to one thing:if people perceive the FSM to be politically unstable, nobody will make anysignificant investment in the country. The national and state governmentsneed to work out a more acceptable solution for the good of the entire FSM.
The delineation of power should be reviewed. In matters concerning economicdevelopment, the national government’s role should be to support state efforts.The states need a clearly designated area of jurisdiction with respect to foreigninvestment. The national government can step in if, for example, the foreigninvestor is involved in export from FSM – then the national government mayregulate such an activity through taxation.
The other issue has to do with the sharing of fishing permit revenues. Muchtension can be alleviated if the national government shared this income with thestates. The matter of revenue is particularly important to the states because it isat that level that the cost of education and health is shouldered.
Section 1 New.pmd 12/12/2005, 2:12 PM42

Chapter 4. Government Structures and Implications for Economic Development
43
Another fiscal measure that may be adapted to avoid conflict over domesticrevenue is the application of VAT as a substitute for business gross tax and dutieson imported goods. VAT has two major advantages. The first is that since it isspread across a broad base, it may be assessed at a lower rate. Second, since VATis not assessed against investment goods and exports, it makes the economicenvironment more conducive to the development of the private sector.
The implementation of VAT, however, must come with an amendment tothe FSM constitution granting both the national government and the states theconcurrent power to levy value-added taxes. This is necessary because as a tax ongoods and services, VAT comes within the taxation power of the state – but alsofalls under the authority of the national government as a tax on imported goods.
There are concerns over the checks and balances applicable to the nationalCongress. The recent indictments against several members of the nationalcongress for criminal conspiracy and theft of public funds are the symptoms ofa corrupt national political system. Similarly, there are concerns over theincomplete separation of powers. For example, the Chuukese national senatorshave created the Chuuk State Committee on Improvement Projects despitethe national court ruling in Udot v. FSM that national senators’ involvement inchoosing and approving projects for funding by the Committee is in violationof the separation of powers embodied in the FSM constitution and that theexistence of the Committee itself is constitutionally suspect. Protection ofpublic confidence and trust in the national government requires that thesematters be carefully examined.
Promotion of transparency in the three levels of government in theFederated States of Micronesia requires an interested public. The lack of mediato report what is happening in government is a big factor in the lack of publicinterest. One option is to encourage non-governmental organizations to reporton the happenings in government.
To reduce the cost of government, the states need to consider amendingtheir constitutions so that members of their legislatures are only paid whenthey are actually performing official work.
For the Federated States of Micronesia to effectively promote an attractivepolitical and business climate for investment and economic development,governance standards must be raised substantially, through implementation ofinitiatives to achieve transparency and accountability – and in the end, byremoving the potential for corruption.
Section 1 New.pmd 12/12/2005, 2:12 PM43

Federated States of Micronesia Towards a Self-Sustainable Economy
44
Chapter 5. Economic Development, 1987-2003
5.1 Compact I in Historical Perspective
T he relationship between the government of the FSM and the USfrom the end of World War II until 1986 was defined in accordancewith the United Nations International Trusteeship System. In thelatter years of the transition to independence, the FSM opted tocontinue its relationship with the US through a treaty of Free Association.
This relationship was formalized through the Compact of Fee Association(Compact I), which stipulated the respective governments’ rights andobligations through a 15-year period term. An important obligation of the USunder Compact I was financial aid in terms of general, special, and capitalgrants that cumulatively amounted to $1.54 billion.
During Compact I, the bulk of financial assistance was provided in theform of budgetary transfers – general and capital grants that were subject onlyto a few restrictions. Under Compact I, 40% of total grant funding (excludingspecial grants) was to be allocated to capital investment, as indicated inTable 5, but this was a cumulative requirement and did not have to be met onan annual basis.
Table 5. Compact I Grant Funding by Category and Period:Fiscal 1987 to 2003 (Millions of Current Dollars)
FY87-91 FY92-96 FY97-01 FY02-03
General Grant 36.00 30.60 24.00 30.198Capital Grant 24.00 20.40 16.00 20.132Special Grants 15.27 15.27 15.27 15.27
Source: Compact of Free Association, Articles I, II and III. November 1986; and subsidiary agreement specifying allocation of selectedSpecial Grant funding between the FSM and the Republic of the Marshall Islands (Article I, Section 216 and Article II, Section 221).
The smaller special grants were designated for specific purposes, includingcommunications, energy, medical referrals, scholarships, health and education,and support for the activities of the Civic Action Teams provided by the USmilitary. Compact I also provided for continued access to other US domesticprograms.
Section_2_New.pmd 12/12/2005, 1:36 PM44
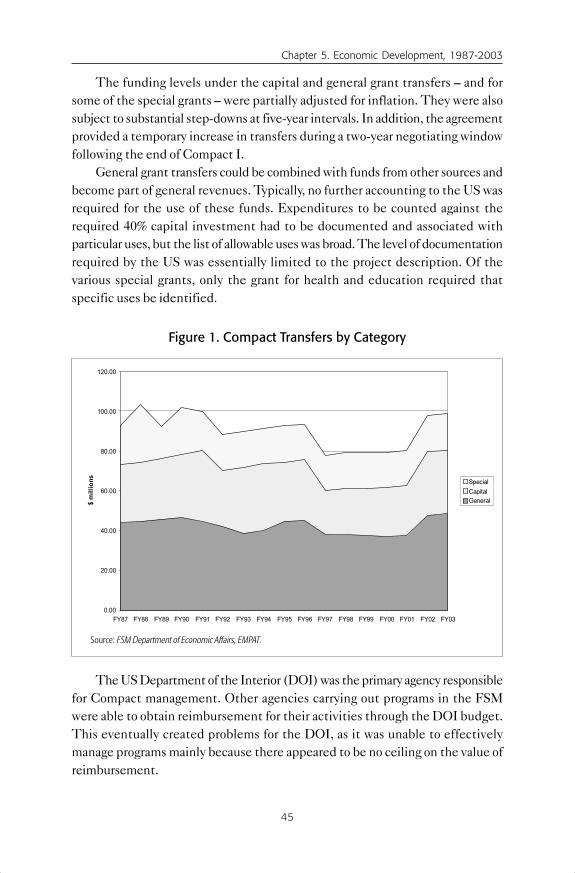
Chapter 5. Economic Development, 1987-2003
45
The funding levels under the capital and general grant transfers – and forsome of the special grants – were partially adjusted for inflation. They were alsosubject to substantial step-downs at five-year intervals. In addition, the agreementprovided a temporary increase in transfers during a two-year negotiating windowfollowing the end of Compact I.
General grant transfers could be combined with funds from other sources andbecome part of general revenues. Typically, no further accounting to the US wasrequired for the use of these funds. Expenditures to be counted against therequired 40% capital investment had to be documented and associated withparticular uses, but the list of allowable uses was broad. The level of documentationrequired by the US was essentially limited to the project description. Of thevarious special grants, only the grant for health and education required thatspecific uses be identified.
Figure 1. Compact Transfers by Category
Source: FSM Department of Economic Affairs, EMPAT.
The US Department of the Interior (DOI) was the primary agency responsiblefor Compact management. Other agencies carrying out programs in the FSMwere able to obtain reimbursement for their activities through the DOI budget.This eventually created problems for the DOI, as it was unable to effectivelymanage programs mainly because there appeared to be no ceiling on the value ofreimbursement.
0.00
20.00
40.00
60.00
80.00
100.00
120.00
FY87 FY88 FY89 FY90 FY91 FY92 FY93 FY94 FY95 FY96 FY97 FY98 FY99 FY00 FY01 FY02 FY03
$ m
illio
ns
Special Capital General
Section_2_New.pmd 12/12/2005, 1:42 PM45

Federated States of Micronesia Towards a Self-Sustainable Economy
46
Box 6. Federal US Program Assistance
US Federal program assistance was an important part of the overall Compact I aidpackage, with the health and education sectors being the primary beneficiaries. Theseprograms provided a combination of technical and grant assistance. The FSM was eligible,on a competitive basis with other US states and territories, for a wide range of programs.In addition, several projects included specific provisions for assistance to the FSM andthe other Freely Associated States.
Federal Program Assistance in Health and Education: 1996-2000(in current US $)
1996 1997 1998 1999 2000
Health 2,123,906 1,854,975 1,976,277 2,168,365 2,120,579Education 4,471,432 3,246,928 6,803,676 6,814,478 7,180,371
Source: Deloitte and Touche (1987-2001). Single Audit Report.
The table above summarizes government current expenditures for health and education,but excludes payments made directly to beneficiaries and programs implemented throughnon-governmental organizations. Nevertheless, these expenditures accounted for morethan 10% of the total value of Compact grant assistance between 1998 and 2000.
5.2 Structure and Performance of Economy
5.2.1 Economic Structure
The FSM economy in the mid-1980s leading into the initial Compact period,was dominated by a large public sector funded by US budgetary transfers. Thefunds essentially paid for all government functions, including a large public servicewage bill and external trade imbalance in favor of merchandise imports. Theeconomic structure of the nation was the product of policies that emphasized thebuilding of institutions and infrastructure patterned after those in the US. Lesspriority was placed on providing the policy climate, technical assistance, andtraining and institutional support needed to promote development of acompetitive private sector.
National, state and municipal government employment accounted foran average of 58.7% of employment from 1987-1989 (Table 6), comparedwith a 31.6% employment share for the private sector, 7.9% for the non-profitsector, and 1.9% for public sector enterprises (PSEs). In terms of GDPcontribution, the government accounted for 37.5%, compared with a 26.8%share for the private sector. PSEs and non-profit groups each contributed 2.9%of GDP. Other activities, which mainly include the household sector
Section_2_New.pmd 12/12/2005, 1:36 PM46

Chapter 5. Economic Development, 1987-2003
47
(subsistence agriculture and fisheries), contributed an average of 29.9% ofGDP from 1987-1989.
Table 6. FSM Employment and GDP by Institutional Sector:1987-89 and 2001-03 (figures in %)
Sector 1987-1989 Average 2001-2003 Average
Employment GDP Employment GDP
Private 31.6 26.8 42.6 30.8Government 58.7 37.5 42.9 27.2Public Sector
Enterprises 1.9 2.9 5.6 7.6Non-Profits 7.9 2.9 8.9 4.8Other 1/ – 29.9 29.6 Total 100.1 100.0 100.0 100.0
Source: Annex A Tables A1 to A10.1/ - Other GDP includes subsistence, home ownership, indirect taxes, less bank charges.
Meanwhile, private sector employment averaged 42.6% of totalemployment in 2001-03 - an 11percentage point gain - almost equal to thegovernment share of 42.9%. The decline in government share by15.8percentage points was offset by the rise in the PSE share. In terms of GDPcontribution, the rise in private sector share was significantly less – only a 4percentage point gain. On the part of government, its share in the GDPdeclined by 10.3%. The significantly smaller gain in GDP contribution ofthe private sector over the 17-year Compact period, compared withemployment, is largely explained by the persistently large gap in wage ratesbetween government and private sectors. It also reflects lack of improvementin productivity.
Although employment by itself is a significant structural indicator, thecomposition of employment within each sector is also important. For example, alarge share of private sector jobs in export industries is indicative of a relativelystrong economy. Relative wage levels (per employee per period) is alsoimportant. More will be said about these dimensions of economic structure inlater sections.
Section_2_New.pmd 12/12/2005, 1:36 PM47

Federated States of Micronesia Towards a Self-Sustainable Economy
48
5.2.2 Growth of GDP
Income and expenditure accounts in the FSM only present estimates ofdomestic value added using the income approach. Data on goods and servicesexpenditures (final demand) and capital investment are not available. Grossdomestic product estimates for the FSM as a whole and by State are presented inTables A5 (Appendix A). In the first year under the Compact, nominal GDP wasestimated at $113.7 million for the nation, about $1,260 per capita, which placedthe FSM among lower middle income developing countries based on World Bankcriteria. By the end of the Compact I period in FY2003, nominal GDP doubled to$229.6 million. In real terms (1998 $) GNP grew from $164.3 million (1987) to$218.9 million (2003), representing average annual growth of 1.8% over the entireCompact I period (Table 7).
Table 7. Real GDP and GDP per Capita in the FSM by State:FY1987-FY2003 (GDP in millions US$)
FSM/ FY87 FY95 Growth1/ FY99 Growth FY03 Growth GrowthState FY87-95 FY95-99 FY99-03 FY87-03
Real GDP:FSM 164.3 223.4 3.9 193.2 -3.6 218.9 3.2 1.8Chuuk 56.6 69.2 2.5 54.2 -5.9 64.7 4.5 0.8Kosrae 15.9 17.8 1.4 16.1 -2.5 18.5 3.5 1.0Pohnpei 67.6 104.3 5.6 88.1 -4.1 99.1 3.0 2.4Yap 24.1 32.2 3.7 34.6 1.8 36.8 1.6 2.7
Real GDPPer capita:FSM 1,822 2,112 1.9 1,809 -3.8 2,031 2.9 0.7Chuuk 1,249 1,296 0.5 1,013 -6.0 1,205 4.4 -0.2Kosrae 2,446 2,405 -0.2 2,118 -3.1 2,342 2.6 -0.3Pohnpei 2,372 3,086 3.3 2,561 -4.6 2,840 2.6 1.1Yap 2,459 2,875 2.0 3,089 1.8 3,257 1.3 1.8
Source: Table A1, Annex A/ Average annual growth.
In per capita terms, real growth amounted to 0.7% for the same period. Growthof GDP in the first half of the Compact I period (fiscal 1987-1995) was satisfactoryin terms of its rate, particularly in Pohnpei and Yap, but the growth was beinggenerated by large government expenditures and public sector investment. Therewas no development of competitive, private sector-led activities. The large
Section_2_New.pmd 12/12/2005, 1:36 PM48

Chapter 5. Economic Development, 1987-2003
49
government and PSE investments, mostly in commercial fisheries, weresubstantially non-performing, resulting in significant operating losses and needfor government subsidies.
The substantial step-downs in US grant assistance in 1992 and 1997, in tandemwith the large amount of non-performing government investments, resulted in asignificant decline of GDP in the 1995-1999 period. The economic contractionoccurred in all states except Yap. Individual states differed significantly (Figure 2).Among the four states, both Chuuk and Kosrae experienced a contraction in real percapita GDP, with only Pohnpei and Yap able to generate a modest positive growthrate for the entire Compact period at 1.1 and 1.8% per annum, respectively.
5.2.3 Balance of Payments
Balance-of-payments current account data are summarized in Table 8. Asnoted earlier, merchandise imports and official unilateral transfers dominate thenation’s external account. In 1994-1996, average merchandise imports amountedto $95.2 million, while merchandise exports averaged $17.9 million, a ratio of 5.3to 1.0 in favor of imports. This resulted in a large trade deficit averaging $77.million over the three-year period. In the last three years of the Compact, thecorresponding deficit in merchandise trade was $88.5 million, with the import toexport ratio averaging 3.9 to 1.0.
- 1 5 .0
- 1 0 .0
- 5 .0
0 .0
5 .0
1 0 .0
1 5 .0
2 0 .0
2 5 .0
8 8 8 9 9 0 9 1 9 2 9 3 9 4 9 5 9 6 9 7 9 8 9 9 0 0 0 1 0 2 0 3
F i s c a l Y e a r
Perc
ent F S M
C h u u kK o s r a eP o h n p e iY a p
Figure 2. Growth in FSM and State Real GDP
Section_2_New.pmd 12/12/2005, 1:47 PM49

Federated States of Micronesia Towards a Self-Sustainable Economy
50
Table 8. FSM Balance of Payments Current Account:FY1994-FY2003 (in millions US$)
Item FY94-FY96 FY97-FY00 FY01-FY03Average Average Average
Trade Balance -77.3 -78.7 -88.5Exports, fob 17.9 17.1 22.6Imports, fob -95.2 -95.8 -111.1
Services -23.1 -31.6 -29.2Receipts 17.5 16.5 18.2Payments -40.6 -48.1 -47.4
Income 22.5 19.5 10.6Receipts 34.4 28.7 16.8Payments -12.0 -9.2 -6.2
UnrequitedTransfers 98.0 89.5 109.8
Private 1.2 2.0 2.3Official 96.8 87.5 107.5
CurrentAccount Balance 20.1 -1.3 2.7
With implementation of the Public Sector Reform Program (PSRP) in 1996,the level of both imports and exports declined in nominal terms during the period1997-2000. Exports in 1997-2000 averaged $17.1 million per annum while importsaveraged $95.8 million per annum. Details of external trade are covered in Section5.2.5.
From 1994-2003, there were substantial deficits with respect to services,factor and resource payments, and other current account items. As expected,the deficits were offset by the large official transfers of Compact money.The annual deficit in services, typically in the $20-30 million range (seeTable A26), is driven by the large cost of freight, transportation, and insuranceof merchandise imports. While the tourism sector does make positivecontributions to the national account (an average of $10.6 M from 2001–2003),it is not enough to offset the costs of merchandise imports. Overall, the netincome balance has declined from over $20 million in the 1994–1996 period toan average of just over $10 million in 2001–2003. This decline is largely theresult of a drop in interest and dividend income in 200–2003.
Section_2_New.pmd 12/12/2005, 1:36 PM50

Chapter 5. Economic Development, 1987-2003
51
Between 1994 and 2003, average annual total transfers amounted to $98.2million. The lowest amount of $80 million came in 1997 and the largest transferof $122.3 million was made in 2003. Of the official transfers, $37.2 million or 30per cent came from the donor community. Without these transfers, the currentaccount was in deficit, averaging $81.12 million annually, equivalent to an averageof 39% of the GDP from 1994-2004.
5.2.4 External Debt
The external official debt of the FSM is shown in Table A27. The datareported are for the fiscal years 1990 to 2003. The nation had no external debtbefore 1990. Shortly after the commencement of Compact I, FSM governmentsbegan borrowing heavily overseas to fund investments. Much of the earlyborrowing, through utilization of Medium Term Notes bonds secured by futureCompact transfers, was used by Yap for portfolio investment ($71.0 million)and by Chuuk, Kosrae, and Pohnpei to fund fisheries investments ($42.9million). From nearly $20 million in borrowing in 1990, external debtincreased rapidly to a peak of nearly $137 million in 1993. A significant shareof this external debt represented financial assets (mainly Yap’s portfolioinvestment) held in overseas investment accounts. Taking into accountadjustments made for offsetting externally held financial assets, the externaldebt balance peaked at $78.3 million in 1993. External debt then declinedsteadily through 2003, despite the necessity to borrow in 1997-1998, whenthe country implemented a Public Sector Reform Program.
External debt, with adjustments for overseas financial assets, steadilydeclined from 41.0% of GDP in fiscal 1993 to 17.0% in 2003. In relation toexports (value of goods and services), debt service declined from 35.0% in1994 to 7.5% in 2003.
5.2.5 Exports and Imports
Commodity exports and imports for the nation and by state are presented inTables A40-A41. With respect to total commodity imports (Table A40), the totalcif (cost, insurance and freight) value of commodity imports averaged $108.3million in the three-year period 2000-2002. The largest import category was foodand beverages, accounting for 28% ($30.0 million). The next largest category wasindustrial supplies, which accounted for 18%, followed by fuels and lubricants,with a 15% share. In the food and beverage category, the largest imports were(2000-2002 average): rice ($3.8 million), poultry and meat ($3.1 million), beer
Section_2_New.pmd 12/12/2005, 1:36 PM51

Federated States of Micronesia Towards a Self-Sustainable Economy
52
($2.5 million), canned meat ($2.2 million), and canned fish ($1.7 million).Another large item, accounting for $1.6 million, was cigarettes and tobacco.
Table A42 presents figures for total FSM exports for 1992-1994 and 2000-2002. Marine exports represent the single largest category, accounting forover 90% of total exports on average in the 1992-1994 period, and 68 per centin 2000-2002. It should be noted that the value of marine exports declinedsharply from an average value of $43.6 million per annum in 1992-1994 to$16.5 million per annum in 2000-2002 – a 62% drop. The bulk of the declinecame in the offshore fish catch. Agricultural commodity exports representedless than 10% of the total in both periods. Chapters 8 and 9 contain a moredetailed discussion of agricultural and fisheries exports, respectively.
Commodity imports for 2002 by State are shown in Table A41. Thepattern of state imports generally follow the order of importance for the nation.Food was the highest import category in all states except Yap which importedmore industrial supplies. Chuuk’s food imports accounted for 38.3% of itstotal. This state, with the lowest per capita GDP, was also the leading importerof fuels and lubricants in terms of proportion to total imports (19.4%). Chuukwas also the smallest importer of capital goods (6.2% compared with 11.3%for Kosrae and 12.7% for Pohnpei). Total imports per capita amounted to$550 for Chuuk, $1,279 for Kosrae, $1,255 for Pohnpei, and $1,932 for Yap.
Commodity exports for 1992 and 2002 by state are shown in Table A43.Offshore fish (mainly tuna) was the primary export of the nation accounting for84% of total exports in 1992 and 61% in 2002. For 1992, nearly all offshore fishexports were produced by Pohnpei and Yap, each with 47% of the total. Thesecond largest commodity export for the FSM is garments, all exported from Yap.In 1992, this commodity comprised about 25% ($3.6 million) of total FSMexports. Given that Compact II removes the import preference granted to FSMimports into the US, the continued viability of this export is in question.
5.2.6 Employment, Wages and Prices
The main data source on formal employment is the FSM Social SecurityAdministration. Their reports contain quarterly and annual data on both privateand public sector workers. The data do not include information on those workingin the subsistence sector, in family-owned businesses, and the self-employed. Inthe first years of Compact I, employment growth was strong, averaging 4.0% perannum between 1987 and 1992. Figure 3 depicts employment performance forthe FSM and for each of the states. Annual employment and wage figures aredetailed in Tables A6-A15, in Appendix A.
Section_2_New.pmd 12/12/2005, 1:36 PM52
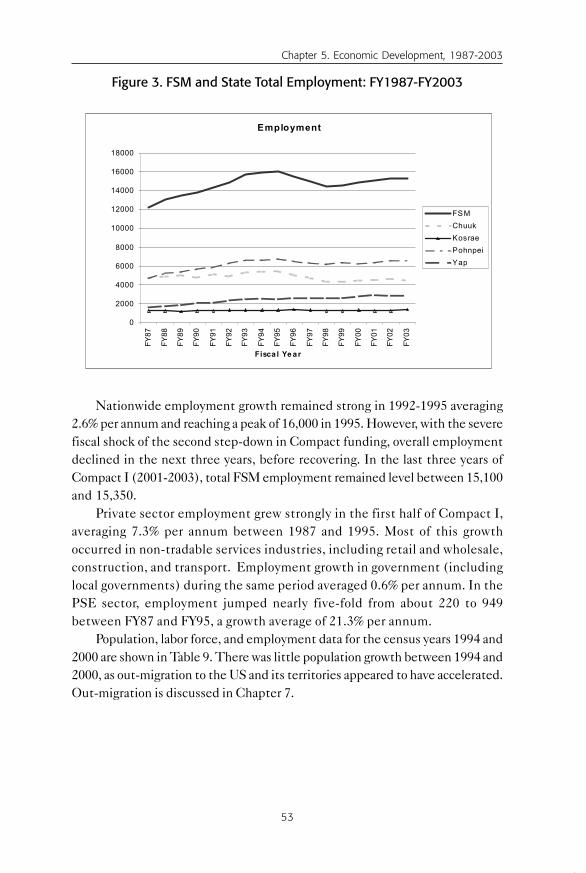
Chapter 5. Economic Development, 1987-2003
53
Figure 3. FSM and State Total Employment: FY1987-FY2003
Nationwide employment growth remained strong in 1992-1995 averaging2.6% per annum and reaching a peak of 16,000 in 1995. However, with the severefiscal shock of the second step-down in Compact funding, overall employmentdeclined in the next three years, before recovering. In the last three years ofCompact I (2001-2003), total FSM employment remained level between 15,100and 15,350.
Private sector employment grew strongly in the first half of Compact I,averaging 7.3% per annum between 1987 and 1995. Most of this growthoccurred in non-tradable services industries, including retail and wholesale,construction, and transport. Employment growth in government (includinglocal governments) during the same period averaged 0.6% per annum. In thePSE sector, employment jumped nearly five-fold from about 220 to 949between FY87 and FY95, a growth average of 21.3% per annum.
Population, labor force, and employment data for the census years 1994 and2000 are shown in Table 9. There was little population growth between 1994 and2000, as out-migration to the US and its territories appeared to have accelerated.Out-migration is discussed in Chapter 7.
Employment
0
2000
4000
6000
8000
10000
12000
14000
16000
18000FY
87
FY88
FY89
FY90
FY91
FY92
FY93
FY94
FY95
FY96
FY97
FY98
FY99
FY00
FY01
FY02
FY03
Fisca l Ye ar
Num
be
FSM Chuuk Kosrae Pohnpei Yap
Section_2_New.pmd 12/12/2005, 1:50 PM53

Federated States of Micronesia Towards a Self-Sustainable Economy
54
Table 9. Population and Labor Force by State: 1994 and 2000
Popula- Popula- Labor Formal Subsistence Un-tion tion Force Employ- Agriculture/ employed
ment Fisheries
Non- MarketedMarket
1994
Chuuk 53,319 29,068 11,140 5,373 3,119 430 2,218Kosrae 7,317 4,251 2,079 1,386 98 282 313Pohnpei 33,692 19,500 9,020 5,539 1,408 756 1,317Yap 11,178 6,754 3,733 2,083 1,249 33 368
FSM 105,506 59,573 25,972 14,381 5,874 1,501 4,216
2000
Chuuk 53,595 31,587 18,192 4,546 5,134 2,299 6,213Kosrae 7,686 4,628 2,232 1,468 198 198 368Pohnpei 34,486 20,468 11,816 5,375 3,058 1,935 1,448
Yap 11,241 7,153 5,174 2,570 2,234 160 210
FSM 107,008 63,836 37,414 13,959 10,624 4,592 8,239
Source: FSM (2002.) National Census Report. Table 9.1
Despite the lack of growth in overall employment in the last half of CompactI, there was a sizable contingent of foreign workers holding jobs in the FSM –nearly 1,700 at the end of 2003, about 11% of the total workforce (FSMImmigration records).
Government wages have been consistently higher than those in the privatesector. There is also a sizable differential in wage rates between national andstate governments. Table 10 summarizes wage rates among institutional sectorsat beginning and end of Compact I.
In the first three years of the Compact, the average private sector wage ratewas around half that of state governments and one-quarter of the nationalgovernment rate. The municipal government average wage rate was only 40%that of the state. As indicated in Table 10, the differences among levels ofgovernment narrowed substantially by the end of Compact I, although averageprivate wage relative to the state government wage remained about the same.
Section_2_New.pmd 12/12/2005, 1:50 PM54

Chapter 5. Economic Development, 1987-2003
55
Over the 14-year period between 1989 and 2003, the real wage rate in the privatesector declined by 8.0%, while that of both national and state governments alsodeclined, by 29.2% and 5.4%, respectively.
Table 10. FSM Wage Rate Comparisons Among Sectors and Over Time:1987-2003 (Mean Wage Rates in 1998 US Dollars)
Sector 1987-89 Differential 2001-03 Differential Wage RateAverage Among Average Among Increase
Sectors Sectors 1989-2003(in %)
Private 4,257 0.544 3,915 0.529 -8.0Non-Profits 4,965 0.635 7,090 0.958 42.8Public Enterprise 7,699 0.984 9,871 1.334 28.2National Govt. 15,425 1.972 10,925 1.477 -29.2State Govt. 7,821 1.000 7,398 1.000 -5.4Municipal Govt. 3,042 0.389 4,473 0.605 47.0
Source: FSM Department of Economic Affairs
Prior to 1999, the US Consumer Price Index was used as a proxy for movementsin price levels in the FSM. In 1999 an FSM CPI was established for the nationand for each state. In the case of Chuuk, however, the CPI was not fully establisheduntil the first quarter of 2001, and for the interim period 1999-2000, averageprices of index items in the other three states were combined with Chuuk pricedata (on a subset of items) to estimate the Chuuk CPI series. Annual CPI dataare presented in Tables 11 and 12 for the nation and each of the states for theperiod 2000-2004.
Table 11. Consumer Price Index by State:2000-2004(All Items 1999=100)
Period FSM Chuuk Kosrae Pohnpei Yap
2000 – Q1 100.8 100.4 101.1 101.4 100.1 - Q2 102.0 101.5 101.2 102.8 100.6 - Q3 102.5 101.4 101.4 104.5 101.4 - Q4 103.3 103.1 101.9 104.4 102.1
Section_2_New.pmd 12/12/2005, 1:50 PM55

Federated States of Micronesia Towards a Self-Sustainable Economy
56
2001 – Q1 102.8 101.7 101.8 104.4 102.5 - Q2 102.6 100.9 101.3 104.4 103.4 - Q3 102.5 102.3 100.7 102.5 103.6 - Q4 102.7 102.9 100.4 102.8 103.0
2002 – Q1 102.8 102.6 99.1 103.7 102.7 - Q2 102.7 103.4 97.3 102.6 103.4
- Q3 102.4 103.0 96.8 102.6 102.5 - Q4 102.3 103.3 96.6 102.0 102.7
2003 – Q1 102.0 102.7 96.5 102.2 102.1 - Q2 102.6 103.3 96.4 103.4 101.5 - Q3 102.7 103.5 96.7 103.1 102.0 - Q4 103.5 105.6 96.7 102.8 101.9
2004 – Q1 103.9 106.3 97.1 103.2 101.5 - Q2 — — — 104.2 —
Table 12. Annual Inflation Rate by State: FY2000-FY2004 (%)
Period FSM Chuuk Kosrae Pohnpei Yap
2000 2.0 1.4 1.2 3.6 0.72001 1.3 1.0 0.4 1.4 2.42002 -0.1 1.0 -3.0 -1.0 0.02003 -0.2 .2 -1.8 -0.2 -0.8
20041 – Q1 1.9 3.5 0.6 1.0 -0.5
1 Quarter relative to year earlier quarter
5.2.7 Money and Banking
The unit of currency in the FSM is the US dollar. In the absence of anycapacity to control the quantity of money in circulation and exchange rate againstother currencies, there is little room for monetary policy as an instrument inoverall macroeconomic management. Given the small population and economyof the FSM, together with the long-standing modern era historical trade andpolitical links to the US, the utilization of the US dollar has probably representedstability and efficiency for the financial sector. With little capacity to influencethe structure of interest rates, prevailing credit and lending rates have essentially
Section_2_New.pmd 12/12/2005, 1:50 PM56

Chapter 5. Economic Development, 1987-2003
57
reflected trends in the US economy, with appropriate adjustments for the higherdegree of risk in FSM. The risk premium is a consequence of a number of factorsincluding a relative lack of entrepreneurial, technical, and management skills torun businesses profitably, and a high cost of doing business.
The commercial banking sector currently includes only two banks – theBank of the FSM, which is domestically owned, and Bank of Guam, a branch ofthe parent corporation that is based in that US Territory. The Bank of Hawaii alsooperated in the country until December 2002, but closed its FSM operations inline with an overall corporate restructuring. Under the Compact, commercialbanks were supervised by the US Federal Deposit Insurance Corporation (FDIC)for greater assurance of a sound banking system. The nation has an FSM BankingBoard responsible for the licensing of both domestic and foreign banks. This bodytakes care of on- and off-site commercial bank supervision, consumer protection,and FDIC coordination.
Commercial bank deposit and loan statistics are compiled by the FSMBanking Board, and are presented in Table A33. Bank assets, and deposit andloan balance sheet data are given for 1993-2003. In this period there waslittle growth in total assets, essentially reflecting the difficult economicsituation coinciding with the large step-down in Compact I funding,implementation of the Public Sector Reform Program, and the period ofuncertainty associated with FSM-US negotiations to amend the Compact.While total commercial bank asset growth was marginally positive, total bankloans declined substantially from just over $50 million in the three-year period1999-2001, to an average of $31.6 million from September 2002 to September2003, a decline of 39%. Assets not going into loans were essentially investedoverseas. The low rate of growth in commercial bank deposits over the 1993-2003 period and decline in loan-to-deposit ratio in 2002 and 2003 may in partreflect the government fiscal crisis that occurred in Chuuk in 2000-2001, whengovernment failed to pay employee allotments – many tied to employee loanpayment deductions – and vendors. Given the sharp decline in bank loans in2002-2003, the banking sector has been criticized as being less competitivesince the withdrawal of the Bank of Hawaii.
The FSM development bank (FSMDB) also had to adopt a relativelyconservative approach to lending, particularly in recent years, due to concernsabout the availability of future capital transfers from the government. Access toloan or grant funds from outside sources is likely to depend largely on the bank’sfinancial performance. The FSMDB is perceived to have increasingly assumedthe normal lending functions of a commercial bank, as reflected in the morestringent criteria being applied to prospective borrowers.
Section_2_New.pmd 12/12/2005, 1:50 PM57

Federated States of Micronesia Towards a Self-Sustainable Economy
58
The development bank is able to offer more favorable terms – longer loanterms and lower interest rates – than the commercial banking sector. It allows aloan term of up to 25 years, at a fixed interest rate of 9.0%, while the commercialbanks restrict lending to a 5-year term at a variable interest rate. This allows theFSMDB to select the most viable borrowers and projects. Bank management iscurrently pursuing changes in regulations that would remove the 9.0% cap oninterest rates and allow it to charge different rates for different clients and activities.
5.2.8 Fiscal Policy and Macroeconomic Performance
In assessing fiscal and macroeconomic performance in the FSM, it is necessaryto examine the position of both national and state governments (see Tables A34-A37). The four states account for a large share (more than two-thirds) of totalincome and expenditure because they provide most of the essential servicesincluding education, health care, and utilities.
5.2.8.1 National and Consolidated Government
With the onset of Compact I in 1986, FSM governments received large UStransfers of both current and capital funding. On a consolidated basis, the FSMGovernment enjoyed a budgetary surplus between 1986 and 1990 (Figure 4). By1991, government had adjusted to the larger budgetary resources and had begunto make major capital investments, mainly in the fisheries sector. In 1991, theconsolidated budget position of government (national and state governments)slipped into a small deficit position as a result of capital expenditures (Figure 5).In the first five years of the Compact, total revenues from grants and all domesticrevenue sources amounted to 117% of GDP on average, with grants (mostly throughCompact) accounting for 75% of total revenues. The government wage bill inthis period amounted to 121% of domestically generated revenues. Tax revenuesas a percentage of GDP, the standard measure of tax effort, came to only 9.7% inthe initial five years of Compact I. Capital expenditures, which were at modestlevels in the first two years, nearly doubled in the next three and averaged $37.5million during the initial five years of the Compact.
Despite a 15.0% step-down in the basic Compact general and capital grantsat the beginning of the sixth year (FY92), governments in general were able toabsorb the external shock largely by carrying over unspent revenues, augmentedin some States by the issuance of Medium Term Note (MTN) bonds secured byfuture Compact transfers. From a healthy 12-33% of GDP in 1987 to 1990,overall budgetary balances slipped into deficit, ranging from negative 1.0 to
Section_2_New.pmd 12/12/2005, 1:50 PM58

Chapter 5. Economic Development, 1987-2003
59
-40.0
-20.0
0.0
20.0
40.0
60.0
80.0
100.0
120.0
1987 1988 1989 1990 1991 1992 1993 1994 1995 1996 1997 1998 1999 2000 2001 2002 2003
Fiscal Year
$ m
illio
ns Compact transfersFiscal balanceGovernment wage bill
-15.0
-10.0
-5.0
0.0
5.0
10.0
15.0
20.0
FY87FY88
FY89FY90
FY91FY92
FY93FY94
FY95FY96
FY97FY98
FY99FY00
FY01FY02
FY03
Fiscal Year
Mill
ions
US$
's
NationalChuukKosraePohnpeiYap
Source: FSM Department of Economic Affair. (2004). EMPAT.
Figure 5. National and States Budgetary Balance
Figure 4. Compact Transfers in Relation to Government BudgetaryBalance and Wage Bill (Consolidated FSM Governments)
Section_2_New.pmd 12/12/2005, 1:54 PM59

Federated States of Micronesia Towards a Self-Sustainable Economy
60
negative 6.0% of GDP. Subsequently, the overall balance ranged from negative1.0% to negative 4.0% from 1991 to 1996. With the larger 22% step-down inCompact basic grant transfers beginning in 1997, compounded by the earlierlarge external debt financing of non-productive fisheries investments, there wasrecognition on the part of government and donor community that the magnitudeof the required fiscal adjustment would necessitate extraordinary measures. Thenational government, with ADB support, led the way in implementing a PublicSector Reform Program (PSRP).
To weather the fiscal shock of the large step-down in Compact grantsbeginning in 1997, the PSRP targeted a 27% reduction in governmentemployment and a 35% reduction in the corresponding wage bill. The PSRPresults, while a little short of the targets, did achieve significant reductionsby 1999 – 22% and 28%, in employment and wage bill for governmentrespectfully. This coincided with the end of the Early Retirement Programwhich was funded by an ADB loan. The reductions in spending were achievedas a result of both cuts in the workweek of employees, early retirements, anda freeze on hiring. Unfortunately, by the close of the 15-year Compact I periodin 2001, the initial fiscal restraint achieved with the PSRP had beensignificantly reversed through increases in the wage bill as most governmentswent back to a full, or nearly full, work week.
5.2.9 State Governments
5.2.9.1 Chuuk
Fiscal performance in the first five years of Compact I was generallysatisfactory with respect to maintaining overall and current budgetary balance.However, Chuuk slipped into a small current budget deficit in 1991, the seeds ofwhich had been planted in 1990 when the government wage bill increased 12%over the previous year and continued to rise sharply through 1993.
With respect to the capital budget, Chuuk had a healthy surplus in the earlyyears of the Compact. Chuuk’s large capital account balances stemmed mostlyfrom a constitutional provision requiring the state to transfer to the municipalities40% of all Compact capital grants received. Since the municipalities lacked thecapacity to plan and implement capital projects, these funds were spent slowlyand large balances accumulated. Interest on the accumulated capital balancesaccrue to the state, thus contributing to the State’s capital account balance,while providing little incentive for the state to assist the municipalities inimplementing capital investment projects.
Section_2_New.pmd 12/12/2005, 1:54 PM60

Chapter 5. Economic Development, 1987-2003
61
Lack of fiscal discipline with respect to current expenditures, especially thewage bill, coupled with the step-down in Compact aid funding in 1992, produceda severe financial crisis in the mid-1990s. Reacting to the cash-flow problem, thestate ran up large arrears with suppliers and stopped paying allotments on publicemployee payrolls (money scheduled to be withheld for payment to banks thathad made employee loans).
In late 1996, Chuuk began implementing a recovery program with conditionalassistance from the national government. Recovery was greatly aided by the FSM-wide PSRP that included the Early Retirement Program, the results of whichproduced sharp cutbacks in government employment and the wage bill. Totalcurrent expenditures were reduced to 20.3% for 1997-1999. Over 90% of this cutin current spending was the result of lowering the state wage bill.
Unfortunately, the fiscal discipline applied by authorities for most of 1997-1999 was not maintained. This lack of restraint was manifest not only withrespect to its wage bill, but also because of a jump in capital improvementsspending as the state undertook a large airport renovation project and a number ofother capital projects that had been put on hold earlier. While the 1999 overallbudget deficit was primarily the result of capital spending, current expendituresalso began increasing, largely driven by increased wages (and new hiring) andother discretionary spending. The overall budget deficit during the period 1999-2001 totaled $23.6 million.
5.2.9.2 Kosrae
Kosrae, like Chuuk, is heavily dependent on government expenditures togenerate overall economic activity, income, and employment. This is a functionof a small population with limited markets and little room for economies of scalein competing with outside suppliers to provide goods and services. Althoughconsiderable improvement was made over the Compact I period in reducingdependence on government expenditures, the ratio of this spending to GDP stillaveraged 71% from 1999-2001 (compared to an average of 109% in the first threeCompact years, 1987-1989).
During the first three years of the Compact, the state maintained comfortablecurrent and capital budget surpluses. Beginning in 1991, the overall balance fellinto deficit mainly as a result of large capital investments. Capital investments,mostly in PSEs, have been large in relation to GDP, particularly in the first half ofthe Compact period (averaging 43% of GDP in the first seven years of theCompact, 1987-1993; and 23% in the last 8 years, ending in 2001). Given sucha high rate of capital investment, the relatively low growth rate of real GDP of an
Section_2_New.pmd 12/12/2005, 1:54 PM61

Federated States of Micronesia Towards a Self-Sustainable Economy
62
average of 1.5% over the 15-year Compact I period, is a reflection of the poorreturn on investment in PSEs. The large-scale capital investments made in 1991-1993, partially financed by the sale of MTNs, were mainly responsible for theState’s overall budget deficits in the same period.
Kosrae’s fiscal performance with respect to the current budget was commendable,even after the first step-down in Compact grant aid. Limiting growth in the wage billwas an important contributory factor. Even with the substantially larger secondCompact step-down in fiscal 1997, Kosrae was able to maintain fiscal balance inthe current budget, except for the initial step-down year, when it failed to actquickly enough in implementing the PSRP to further reduce payroll costs.
5.2.9.3 Pohnpei
Pohnpei is least dependent on grants to fund operations and capitalinvestment. In the first seven years of the Compact, total grants averaged only42% of state GDP, and 26% in the last eight years. Despite having the leastdependence on external aid, Pohnpei failed to restrain growth in the wage bill,which increased 49% between 1989 and 1997. Lack of discipline on the wagebill, in conjunction with the first step-down in Compact aid, resulted in a currentbudget deficit equivalent to 2% of GDP in 1992. This deficit persisted through1996, peaking at 9% of GDP in 1995. The situation was worsened by the onset ofinterest payments on MTNs issued earlier to fund large capital investments.
Pohnpei, like Chuuk and Yap, made large-scale investments in the fisheriessector early in the Compact period. The state resorted to the sale of $23.9 millionin MTN bonds between 1990 and 1993 to invest in a fish processing plant andthe Caroline Fisheries Corporation. Beginning early in the Compact period,Pohnpei invested aggressively, not only in state-owned fisheries operations but inother PSEs as well. In general, these investments were not productive andsubsequently drained the current budget in terms of interest and principalpayments against borrowing. The investments ended up requiring subsidies tomaintain operations. Between 1989 and 1993, capital budget deficits rangedfrom 3.1% to 8.5% of GDP.
By implementing the PSRP in coordination with national government, thestate substantially reduced its wage bill, achieving an estimated $4.0 million inpayroll savings as of September 2002 (IMF Staff Report, 2003:7). Fiscalperformance in terms of the current budget was strong between 1997 and 2001.
Section_2_New.pmd 12/12/2005, 1:54 PM62

Chapter 5. Economic Development, 1987-2003
63
5.2.9.4 Yap
During Compact I, Yap’s overall fiscal performance was strong. With respectto the current budget, in only one year (1993) did the state run a deficit. Early on,Yap opted to pursue a monetization scheme whereby MTNs were issued to borrowexternally, with the state using the proceeds to make overseas portfolioinvestments. The success of the scheme depended on the borrowing cost beinglower than the return on portfolio investment. Since the MTN bonds were securedwith future Compact grant receipts, Yap could expect to obtain a favorably lowborrowing rate. Thus, instead of investing heavily in PSEs that provedunproductive, Yap was able to profit from the monetization scheme by obtaininga positive return on the portfolio investment.
Even with the sharper second step-down in Compact aid in 1997, Yap wasable to avoid a current budget deficit. Much of its strong fiscal performance wasdue to restraint in the wage bill. Unique among the states, Yap exceeded itsworkforce reduction and wage bill reduction targets, maintaining a 33% cut inworkforce and 34% cut in wage bill as of September 2002 (FSM Department ofEconomic Affairs, EMPAT). Perhaps the only area in which performance laggedwas state tax revenue which declined from $1.8 million in 1996 to $0.9 millionin 2001.
5.3 Economic Adjustment and Public Sector Reform
Following the initial step-down in Compact assistance in 1992, the FSMcontinued to enjoy real growth through 1995. Faced however with the muchsharper second step-down in fiscal 1997, it was apparent that FSM would have toimplement extraordinary fiscal measures to avoid a major economic crisis.
In anticipation of the second step-down, the FSM requested assistance fromthe ADB to prepare for reduced funding. The resulting study showed that thereshould be a substantial structural change centered on the public sector.
An FSM Economic Summit was held in November 1995. This summitbecame one of three convened between November 1995 and April 2004. Theinitial 1995 summit (subsequently referred to as First Summit) brought togethera wide range of stakeholders to discuss sector development strategies and overallnational development goals and strategies. The First Summit endorsed a set ofeconomic reforms that were then presented to a Consultative Group (i.e., donorcommunity) and discussed in a series of state-level summits during 1996.
Section_2_New.pmd 12/12/2005, 1:54 PM63

Federated States of Micronesia Towards a Self-Sustainable Economy
64
In 1996, each of the five FSM governments created a task force charged withreviewing current public sector organizational structures, and developing theelements to be included in a set of policy matrices that would constitute the coreelements of a Public Sector Reform Program (PSRP) loan proposal to be submittedto the ADB. The main objectives of the PSRP were to: (a) restructure governmentoperations, thereby reducing the size and cost of the civil service; (b) transform orrestructure public enterprises to eliminate subsidies and increase operatingefficiencies); and, (c) promote private sector development.
The PSRP loan, which entailed two payment installments totaling $18million, was approved by the ADB in April 1997. The centerpiece of the PSRPinitiative was an Early Retirement Program (ERP). In advance of the PSRP,about 500 positions were eliminated throughout the five governments through acombination of attrition, hiring freezes, termination of temporary and contractualpersonnel, and the relocation of some employees to public enterprises (primarilyto the public utilities).
As part of the PSRP program, there was a streamlining of governmentoperations at the national level whereby several departments, divisions, or officeswere merged. The Office of Planning and Statistics became part of the Departmentof Economic Affairs. The Office of Administrative Services and the Budget Officewere incorporated in a newly organized Department of Finance and Administration.The Departments of Health and Education were combined in a new Departmentof Health, Education, and Social Affairs. This organizational restructuring resultedin the elimination of about 50 positions at the national level.
A number of additional positions were removed through a bargaining processbetween the different departments. Employees in positions identified as beingnon-essential were encouraged to leave the public service through departurebonuses. Finally, the individual governments also resorted to reductions in thelength of the workweek as a means of reducing wage bills.
While a significant reduction in the overall public sector wage bill was achieved,this was not matched by unit labor costs, mainly because the wage bill reductionscame through shortening the workweek. Also, the ability of some government officesto effectively carry out their functions was compromised. The targets for reductionswere not closely tied to the personnel needs of the different offices and agencies,while rules for eligibility for the ERP inadvertently encouraged the departure ofsome of the more highly skilled employees. The hope had been that reductions inthe wage bill would be implemented in a way that would lead to a reduction inpublic sector unit labor costs thereby enabling the private sector to attract skilledworkers, which in turn could be expected to make FSM exports more competitivein regional markets.
Section_2_New.pmd 12/12/2005, 1:54 PM64

Chapter 5. Economic Development, 1987-2003
65
0.0
10.0
20.0
30.0
40.0
50.0
60.0
70.0
80.0
FY87
FY88
FY89
FY90
FY91
FY92
FY93
FY94
FY95
FY96
FY97
FY98
FY99
FY00
FY01
FY02
FY03
Mill
ion
1998
$
PrivateGovernment
The reduction in the public sector wage bill had a significant impact onoverall economic growth. At the national level, real GDP growth was negative forthree consecutive years, from 1996 through 1999. Performance at the state levelvaried, with only Yap showing positive growth during this interval. Growth resumedtowards the end of the 1990s, led by the private sector.
The slowing of growth in the public sector following the initial step-downled to an actual contraction in the private sector, despite the fact that thegovernment wage bill continued to increase. This probably reflects the impact ofdelayed payments from government to private sector vendors, which was one ofthe means by which Chuuk funded its fiscal deficit. The private sector experiencednegative growth in 1994, 1996 and 1997, and grew relatively slowly in 1998 and1999, before rebounding strongly in 2000.
By 2000, it was clear that the US intended to provide continued grantassistance, although the level of future assistance was not yet known. The increasein funding during the two-year negotiating period added to the eventual adjustmentburden as some of the FSM governments used much of the step-up funding tosupport increased current expenditure. Efforts to persuade the states to save theadditional funds were only partially successful. Some of the funds were retainedto help meet the required FSM contribution to the new Compact (Compact II)trust fund, but a substantial portion went to increased government spending.
Source: FSM Department of Economic Affairs.
Figure 6. Relative Growth in Real GDP Contribution ofGovernment and Private Sectors
Section_2_New.pmd 12/12/2005, 1:57 PM65
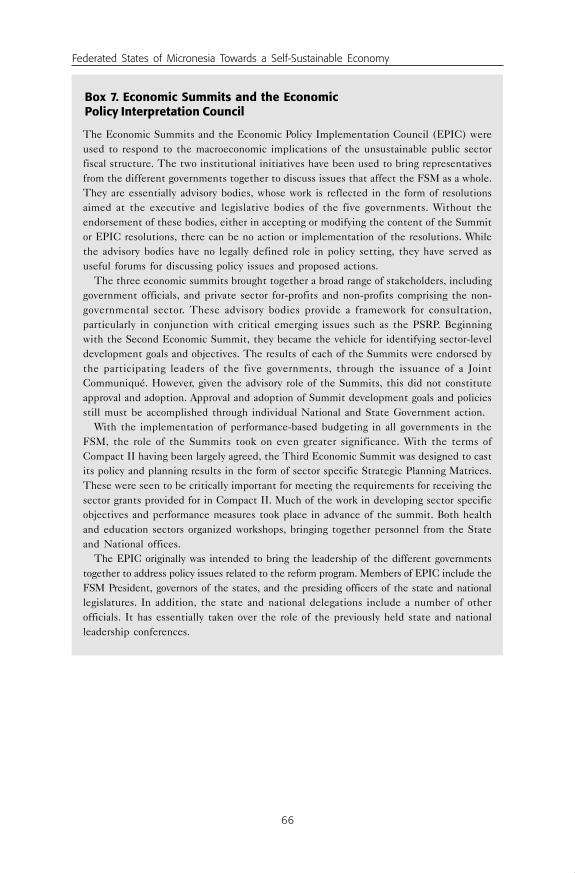
Federated States of Micronesia Towards a Self-Sustainable Economy
66
Box 7. Economic Summits and the EconomicPolicy Interpretation Council
The Economic Summits and the Economic Policy Implementation Council (EPIC) wereused to respond to the macroeconomic implications of the unsustainable public sectorfiscal structure. The two institutional initiatives have been used to bring representativesfrom the different governments together to discuss issues that affect the FSM as a whole.They are essentially advisory bodies, whose work is reflected in the form of resolutionsaimed at the executive and legislative bodies of the five governments. Without theendorsement of these bodies, either in accepting or modifying the content of the Summitor EPIC resolutions, there can be no action or implementation of the resolutions. Whilethe advisory bodies have no legally defined role in policy setting, they have served asuseful forums for discussing policy issues and proposed actions.
The three economic summits brought together a broad range of stakeholders, includinggovernment officials, and private sector for-profits and non-profits comprising the non-governmental sector. These advisory bodies provide a framework for consultation,particularly in conjunction with critical emerging issues such as the PSRP. Beginningwith the Second Economic Summit, they became the vehicle for identifying sector-leveldevelopment goals and objectives. The results of each of the Summits were endorsed bythe participating leaders of the five governments, through the issuance of a JointCommuniqué. However, given the advisory role of the Summits, this did not constituteapproval and adoption. Approval and adoption of Summit development goals and policiesstill must be accomplished through individual National and State Government action.
With the implementation of performance-based budgeting in all governments in theFSM, the role of the Summits took on even greater significance. With the terms ofCompact II having been largely agreed, the Third Economic Summit was designed to castits policy and planning results in the form of sector specific Strategic Planning Matrices.These were seen to be critically important for meeting the requirements for receiving thesector grants provided for in Compact II. Much of the work in developing sector specificobjectives and performance measures took place in advance of the summit. Both healthand education sectors organized workshops, bringing together personnel from the Stateand National offices.
The EPIC originally was intended to bring the leadership of the different governmentstogether to address policy issues related to the reform program. Members of EPIC include theFSM President, governors of the states, and the presiding officers of the state and nationallegislatures. In addition, the state and national delegations include a number of otherofficials. It has essentially taken over the role of the previously held state and nationalleadership conferences.
Section_2_New.pmd 12/12/2005, 1:57 PM66

Chapter 6. Economic Policy in Light of Amended Compact
67
Chapter 6. Economic Policy inLight of Amended Compact
6.1 Economic and Financial Provisions of Compact:Comparative Analysis
N egotiations regarding amendments to the Compact of FreeAssociation, which focused primarily on the financial provisions,were completed in May 2003. After review and approval by therespective legislatures, the amended Compact was formallyratified in June 2004. In October 2003, interim procedures were
approved for implementation in early 2004.Under the terms of Compact II, budgetary transfers are replaced by sector
grants designated for specific purposes jointly agreed upon by the FSM and USgovernments. Six sector grants are specified: (1) Health, (2) Education, (3)Infrastructure, (4) Capacity Building, (5) Private Sector Development, and (6)Environment.
In the new Compact, the real value of annual grant assistance is substantiallylower than at the end of Compact I. The assistance package includes an annualUS contribution to a jointly-managed trust fund, the earnings from which areintended to replace annual grant assistance beginning in 2023, the end of CompactII. The annual grant amount under the new agreement, before inflationaryadjustment, is $76 million for the initial years (fiscal 2004-2006, Table 13).Beginning in 2007, the annual grant amount will decline by $800,000 annually.This amount will be added to the annual trust fund contribution.
Table 13. Compact II Grant Assistance:Fiscal 2004-2023 (in Millions of US$)
Annual Trust Fund Audit Contribution TotalGrant Contribution Grant to Disaster
Fund
FY 2004-06 76.0 16.0 0.5 0.2 92.7FY 2007-23 75.2 - 62.4 16.8 - 29.6 0.5 0.2 92.7
Source: Compact of Free Association, as amended.
Section_2_New.pmd 12/12/2005, 1:57 PM67

Federated States of Micronesia Towards a Self-Sustainable Economy
68
There is still access to US program assistance under Compact II, except thatcertain education programs are replaced by an annual cash grant intended toallow the FSM to develop similar projects. The terms under which the services ofvarious US agencies are provided were renegotiated.
The new terms and conditions of Compact II include a substantial increasein US involvement in programming and monitoring the use of grant assistance.Under Compact I, US concurrence was required only for the use of the specialgrant for health and education. The allowable uses of funds designated for capitalexpenditure were subject only to a list of expenditure categories. The reportingrequirements, being limited to an annual report, were minimal.
Box 8. The Supplemental Education Grant
During the initial 17 years of the Compact relationship, US domestic programs providedsubstantial amounts of technical and financial support to the FSM, particularly in the areasof health and education. With respect to the education sector, federal programs accountedfor an average of more than 21% of total expenditure between 1996 and 2000. Thisincluded a combination of grants that were awarded on a competitive basis (competitivegrants) and amounts specifically designated for use by the FSM (formula grants).
The new Compact arrangements contain important changes in the way many services arefunded Most formula grants will be replaced by the new Supplemental Education Grant(SEG). The FSM will continue to be eligible, on a competitive basis, for a wide range of USdomestic programs. The rationale for the change, which takes effect in fiscal 2005, is toallow the FSM the flexibility to develop programs that are better adapted to its needs.
FSM FY2005 Proposal for Supplemental Education Grant
National Chuuk Kosrae Pohnpei Yap Total
Freely Associated States
Education Grant 0 794,586 796,094 777,842 611,248 2,979,770Vocational Education
Improvement Program 0 140,000 140,000 140,000 140,000 560,000Workforce Investment
Act 281,474 658,884 100,253 448,429 147,216 1,636,256Head Start Program 0 2,498,532 110,000 1,851,788 1,348,641 5,808,961
Adult EducationProgram 100,000 0 0 0 0 100,000
College Work StudyProgram 174,331 0 0 0 0 174,331
Supplemental EducationOpportunity Grant 95,937 0 0 0 0 95,937
Other 75,745 337,389 96,747 224,722 140,222 874,825Total 727,487 4,429,391 1,243,094 3,442,781 2,387,327 12,230,080
Section_2_New.pmd 12/12/2005, 1:57 PM68
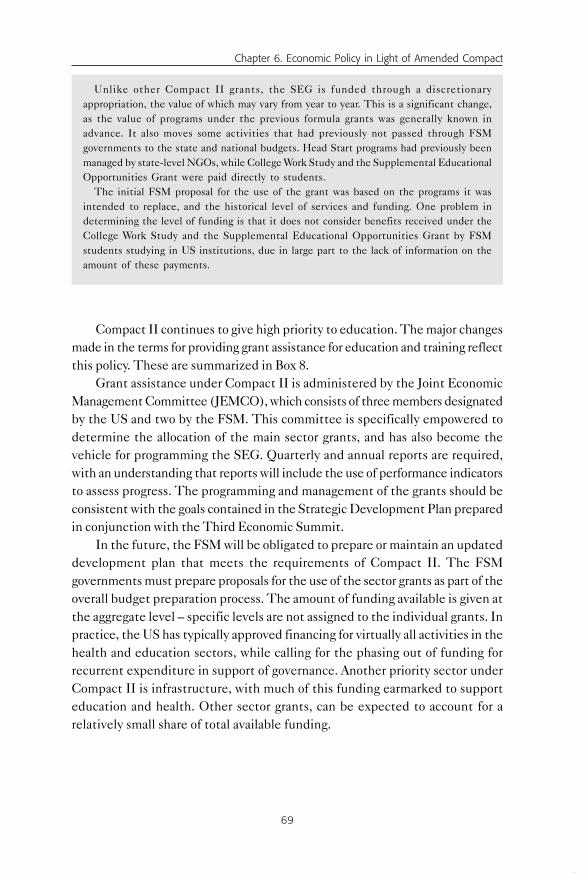
Chapter 6. Economic Policy in Light of Amended Compact
69
Compact II continues to give high priority to education. The major changesmade in the terms for providing grant assistance for education and training reflectthis policy. These are summarized in Box 8.
Grant assistance under Compact II is administered by the Joint EconomicManagement Committee (JEMCO), which consists of three members designatedby the US and two by the FSM. This committee is specifically empowered todetermine the allocation of the main sector grants, and has also become thevehicle for programming the SEG. Quarterly and annual reports are required,with an understanding that reports will include the use of performance indicatorsto assess progress. The programming and management of the grants should beconsistent with the goals contained in the Strategic Development Plan preparedin conjunction with the Third Economic Summit.
In the future, the FSM will be obligated to prepare or maintain an updateddevelopment plan that meets the requirements of Compact II. The FSMgovernments must prepare proposals for the use of the sector grants as part of theoverall budget preparation process. The amount of funding available is given atthe aggregate level – specific levels are not assigned to the individual grants. Inpractice, the US has typically approved financing for virtually all activities in thehealth and education sectors, while calling for the phasing out of funding forrecurrent expenditure in support of governance. Another priority sector underCompact II is infrastructure, with much of this funding earmarked to supporteducation and health. Other sector grants, can be expected to account for arelatively small share of total available funding.
Unlike other Compact II grants, the SEG is funded through a discretionaryappropriation, the value of which may vary from year to year. This is a significant change,as the value of programs under the previous formula grants was generally known inadvance. It also moves some activities that had previously not passed through FSMgovernments to the state and national budgets. Head Start programs had previously beenmanaged by state-level NGOs, while College Work Study and the Supplemental EducationalOpportunities Grant were paid directly to students.
The initial FSM proposal for the use of the grant was based on the programs it wasintended to replace, and the historical level of services and funding. One problem indetermining the level of funding is that it does not consider benefits received under theCollege Work Study and the Supplemental Educational Opportunities Grant by FSMstudents studying in US institutions, due in large part to the lack of information on theamount of these payments.
Section_2_New.pmd 12/12/2005, 1:57 PM69

Federated States of Micronesia Towards a Self-Sustainable Economy
70
6.2 Strategies and Policies for Achieving Sustainable Development
The FSM has committed to the improvement of public sector governance,including changes in the management of public sector enterprises. As part of theADB-supported Private Sector Development Program, the FSM will transform anumber of enterprises and activities currently owned and operated by the publicsector. This would include taking steps to privatize, or contract to the privatesector the management of enterprises or activities delivering goods and servicesto intermediate and final demand markets (including services that are paid forby government, e.g., food service in schools and hospitals). Making good on thiscommitment constitutes an important element of an overall government policytowards private sector development.
6.2.1 Strategic Development Plan
The FSM’s current strategic planning process evolved from the need for amore flexible framework to facilitate the design and implementation of the PublicSector Reform Program. The strategic planning framework will include a set oflong-term goals for each of the sectors, as well as a listing of medium-termobjectives and strategies. While the long-term goals will tend to remain the sameover time, the specific activities will be updated periodically. The ultimateobjective is to create an explicit linkage between the development planning andbudgeting processes.
The goals and objectives of the initial Strategic Planning Framework weredeveloped in the Second Economic Summit. Documents were prepared for eachof the sectors in advance of the summit, including descriptions of key issues andproposed strategies. Summit participants then worked to develop sectoral matricesthat associated broad strategic goals with more focused objectives and activities.
The provisions of Compact II require the FSM to prepare and submit adevelopment plan to the US that is strategic in nature and continuously reviewedand updated through the annual budget process. It shall identify the goals andstrategies of the Government of the Federated States of Micronesia to promoteeconomic advancement, budgetary self-reliance, and economic self-reliance, andcontain specific multi-year objectives for the sectors described in section 211(a)of the Compact, as amended.
The Third Economic Summit in March 2004 was convened primarily to preparethe sector level Strategic Development Plans (SPDs) and Strategic Planning Matrices(SPMs) that would fulfill the Compact II sector plans requirement. The agricultureand fisheries SDPs were prepared along with this report.
Section_2_New.pmd 12/12/2005, 1:57 PM70

Chapter 6. Economic Policy in Light of Amended Compact
71
The main objectives of the Summit were to: (1) build awareness of theeconomic structure of the amended Compact provisions and the likely impact onthe economy; (2) achieve consensus on an overall strategy consistent with thetheme of achieving economic growth and self-reliance; and (3) improveimplementation and monitoring of the outcome of the planning process.
The extent to which the Summit accomplished the three objectives isdebatable. Certainly, among the approximately 400 participants at the ThirdSummit, the first and second objectives were at least nominally accomplished, asindicated by the principal resolution that endorsed the high-growth strategy.
The overall Strategic Development Plan, which was completed by thebeginning of fiscal year 2004, was submitted to the FSM Congress for approval inJanuary 2005. The Third Economic Summit accomplished the task of draftingSector Planning Matrices (SPMs) for eight sectors: private sector, agriculture,fisheries, tourism, environment, health, education, and gender. However the SPMsfor agriculture and fisheries, as well as the Macroeconomic Framework of theSDP, were not finalized until January 2005.
Having completed most of the work of preparing the SPMs, the Summitwas presented with three economic scenarios that the FSM could face in thenext 20 years, the period covered by US Compact II grant assistance. Thescenarios were: (a) the “dismal” scenario; (b) the “moderate growth strategy”scenario; and, (c) the “high-growth” scenario. The last was subsequentlyrenamed the “sustained growth strategy.” Each scenario assumes the presenceof a policy environment and commitment to reform that enables economicgrowth and development. However, in the dismal scenario, problems inimplementing the infrastructure grant result in low levels of investment. It isalso assumed that the policy regime remains essentially the same. This scenariorepresents the status quo development projection – essentially nil growth ofreal GDP over the 2004-2023 period.
The “moderate” growth strategy will result in little growth of per capita realGDP over the 20-year Compact II period, averaging less than 1.0% per annum.The modest growth scenario assumes governments’ adoption of a reform agenda,but with less commitment than in the sustained growth scenario. For example,although the foreign investment climate has improved, reform efforts are weakwith respect to public sector enterprises. Agriculture sector growth is projected atonly 2.5%, but little growth occurs in the fisheries sector because important PSEreforms are not implemented. Tourism improves significantly in this scenariowith at least a five-fold increase projected in visitor arrivals from 21,000 to 110,000by 2023.
Section_2_New.pmd 12/12/2005, 1:57 PM71
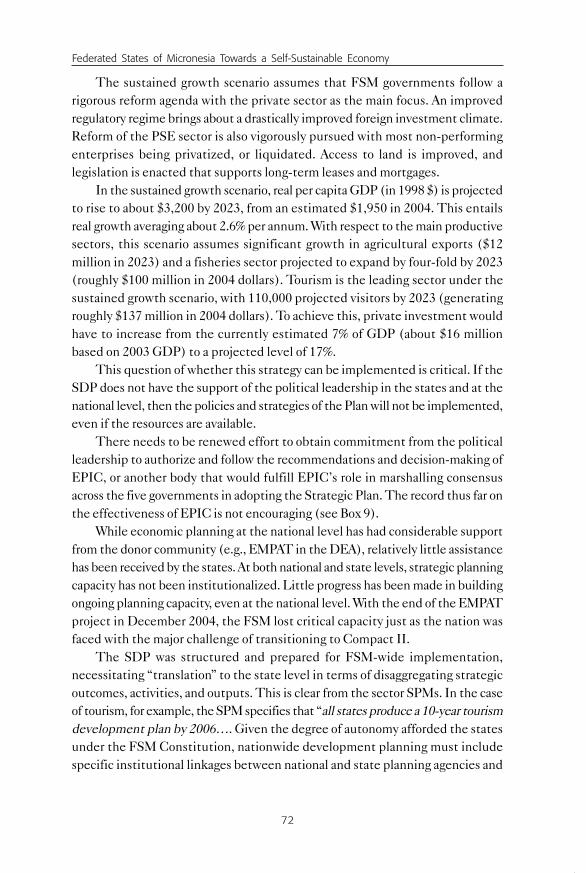
Federated States of Micronesia Towards a Self-Sustainable Economy
72
The sustained growth scenario assumes that FSM governments follow arigorous reform agenda with the private sector as the main focus. An improvedregulatory regime brings about a drastically improved foreign investment climate.Reform of the PSE sector is also vigorously pursued with most non-performingenterprises being privatized, or liquidated. Access to land is improved, andlegislation is enacted that supports long-term leases and mortgages.
In the sustained growth scenario, real per capita GDP (in 1998 $) is projectedto rise to about $3,200 by 2023, from an estimated $1,950 in 2004. This entailsreal growth averaging about 2.6% per annum. With respect to the main productivesectors, this scenario assumes significant growth in agricultural exports ($12million in 2023) and a fisheries sector projected to expand by four-fold by 2023(roughly $100 million in 2004 dollars). Tourism is the leading sector under thesustained growth scenario, with 110,000 projected visitors by 2023 (generatingroughly $137 million in 2004 dollars). To achieve this, private investment wouldhave to increase from the currently estimated 7% of GDP (about $16 millionbased on 2003 GDP) to a projected level of 17%.
This question of whether this strategy can be implemented is critical. If theSDP does not have the support of the political leadership in the states and at thenational level, then the policies and strategies of the Plan will not be implemented,even if the resources are available.
There needs to be renewed effort to obtain commitment from the politicalleadership to authorize and follow the recommendations and decision-making ofEPIC, or another body that would fulfill EPIC’s role in marshalling consensusacross the five governments in adopting the Strategic Plan. The record thus far onthe effectiveness of EPIC is not encouraging (see Box 9).
While economic planning at the national level has had considerable supportfrom the donor community (e.g., EMPAT in the DEA), relatively little assistancehas been received by the states. At both national and state levels, strategic planningcapacity has not been institutionalized. Little progress has been made in buildingongoing planning capacity, even at the national level. With the end of the EMPATproject in December 2004, the FSM lost critical capacity just as the nation wasfaced with the major challenge of transitioning to Compact II.
The SDP was structured and prepared for FSM-wide implementation,necessitating “translation” to the state level in terms of disaggregating strategicoutcomes, activities, and outputs. This is clear from the sector SPMs. In the caseof tourism, for example, the SPM specifies that “all states produce a 10-year tourismdevelopment plan by 2006…. Given the degree of autonomy afforded the statesunder the FSM Constitution, nationwide development planning must includespecific institutional linkages between national and state planning agencies and
Section_2_New.pmd 12/12/2005, 1:57 PM72

Chapter 6. Economic Policy in Light of Amended Compact
73
professional-technical capacity for strategic planning and performance budgeting.Another critical issue relates to the infrastructure development plan (IDP).
Although the SDP planning papers prepared for each sector were to explicitlyconsider infrastructure needs, the IDP was prepared separately. The strategicplanning process must integrate infrastructure investment with sectoral planning.This is currently not the case in the FSM. Under Compact II this would be theProject Management Units (PMUs). The PMU approach was first proposed inthe report by Nathan Associates, from which a large portion of the IDP wasdrawn. Discussions regarding the PMU are ongoing. Its structure is likely toinclude a central office in the national government and project managers in eachof the state governments. Part of the funding will come from the Compactinfrastructure grant since 15% of the value of each project can be added to totalproject costs to cover PMU operating expenses.
A key element of the FSM negotiating position was the role of performance-based budgeting and management in providing a link between planning andexpenditure. Progress has been made in establishing the technical components ofthe performance budgeting system and training mid-level staff in using thesoftware, but higher-level professional capacity in using the system for planning,budget preparation and performance monitoring is still lacking. Governments
Box 9. Government Endorsement of Policy-RelatedOutputs of the Summits and EPIC
In the aftermath of the first two Economic Summits, some leaders within the FSMgovernments questioned whether the summit’s policy and planning outputs trulyrepresented the development policy of the FSM. Legislators in some of the governmentsindicated that even though the executive branch had endorsed summit policies, they hadnot been approved by the legislatures. Some senators in the National Congress alsoquestioned the legitimacy of the initial Strategic Development Framework on the samebasis.
The establishment of the Economic Policy Implementation Council (EPIC), followingthe second Summit in 1999, was probably intended to address this issue. This bodyincluded the chief executives of all the governments, and the presiding officers of all ofthe legislative bodies. Nevertheless, the resolutions coming out of the EPIC meetings didnot legally bind the participants, and the record of subsequent legislative implementationof the decisions has been mixed at best.
In recent years, there has been a move towards seeking explicit legislative endorsementfor key policy documents. This was done for the Infrastructure Development Plan, andis now being done through the legislative budget process for the decisions of the US-FSMJoint Economic Management Committee.
Section_2_New.pmd 12/12/2005, 1:57 PM73

Federated States of Micronesia Towards a Self-Sustainable Economy
74
need to renew efforts to move forward with full implementation of performancebudgeting and its integration with strategic planning, in both executive andlegislative branches.
6.2.2 Reform of the PSE Sector
The top-heavy public sector structure was a carry-over from the US TrustTerritory administration. In the early years of the Compact, governmentinvolvement was deemed necessary, based on the belief that large-scaleinvestments were required to establish viable enterprises and that the local privatesector was not capable of such commitment. In early 2000, the Aries projectdetermined from interviews that the annual wage bill for formally constitutedPSEs amounted to an estimated minimum of $2.7 million per annum for the2,073 people formally employed.
A total of 26 enterprises and 25 or more commercial activities have beenidentified. These generally fall within one of four distinct categories: (1) units oractivities that carry out the functions of an enterprise or engage in commercialactivities through a government department or agency created by statute; (2)PSEs that carry out enterprise functions through an authority created by statuteand which are owned and operated by the state; (3) PSEs that carry out functionsof an enterprise through a public corporation created by specialized statutewithout share capital and that are wholly owned and operated by the state; and(4) PSEs that carry out the functions of an enterprise through a private corporationorganized under the Companies Act and whose shares are held in whole or in partby the state.
At the same time, governments gradually privatized various services that hadbeen part of government agencies under the former Trust Territory administrationand during the early years of the Compact. Beginning in the early 1990s, thepublic utility services were moved out of the public works departments andtransformed into independent corporations, albeit with continued state ownership.Electrical power generation has also followed this system but corporatization ofthe water system in Kosrae has lagged behind due to public resistance to watercharges and the existence of many small water systems. Similarly, the ports andairports in Kosrae and Pohnpei are now operated by independent authorities whichare overseen by boards composed of political appointees.
All of the economic summits resulted in policies that strongly endorsed theneed to reduce government involvement in market-oriented enterprises andactivities that could be more efficiently operated either on a strictly commercialbasis, or through some form of privatization. In some cases, the closing of operations
Section_2_New.pmd 12/12/2005, 1:57 PM74

Chapter 6. Economic Policy in Light of Amended Compact
75
was recommended. An important step in advancing overall public sector economicreform, following the First Summit, was the specific focus given to the PSEsector. An ADB project, TA No. 3201, was initiated in October 1999 to assist theFSM in formulating a comprehensive program for privatization and corporategovernance reform of public sector enterprises. The project, commonly referred toas the Aries Study, included three broad policy objectives: (1) promote moreefficient operations through corporate governance reforms and de-monopolizationand exposure to competition in order to reduce the need for State subsidies; (2)spread and encourage local ownership through disposition either in whole or inpart in order to enlarge the private sector; and, (3) obtain the best value possibletaking into account the interests of all stakeholders in the event of disposition.
The scope of work of the Aries study included taking a comprehensiveinventory of all PSEs, both national and state-owned; preparing an in-depthanalysis of ten pilot PSEs targeted for corporatization and/or privatization(including a transformation plan); and the preparation of a model Five-Year MasterPlan, and a one-year, Action Plan for a Public Sector Enterprise Unit (PSEU).The PSEU was to be instrumental in managing and coordinating implementationof the PSE program.
Upon completing the inventory, the Aries project submitted a list of proposedpilot PSEs for transformation, two in each of the five governments. In early 2001,the project submitted a preliminary master plan for the reform of all PSEs.
There is substantial financial, administrative and legal work entailed inachieving the transformations. For this reason, the follow-on work envisionedfor the Public Sector Enterprise Unit (PSEU) is critical and was addressed interms of its recommended organizational structure, including duties andresponsibilities and staffing requirements. Duties and responsibilities of thePSEU include: (a) working with outside consultants to implement approvedTransformation Plans as directed by the Public Enterprise Reform Committee(PERC); (b) coordinating with the state counterparts on the preparation ofEnterprise Transformation Plans for state enterprises; (c) providing assistance tostate counterparts and coordinating with the states and outside consultantsinvolved with the implementation of the program; (d) monitoring the performanceof the public enterprises from the latest financial statements available andprovide the PERC with reports on their performance and impact on national andstate budgets; and (e) formulating a Multi-Year Master Plan and Annual ActionPlans (for transformation of enterprises). The PERC is the high-level decision-making committee on Public Sector Reform Program chaired by the FSMPresident or Vice-President. The Committee is responsible for approval ofEnterprise Transformation Plans.
Section_2_New.pmd 12/12/2005, 1:57 PM75

Federated States of Micronesia Towards a Self-Sustainable Economy
76
Clearly, the work of the PSEU will be substantial and critical to thesuccess of the Public Enterprise Reform Program. The importance of thisreform program is underscored by the level of support provided by the ADB. Itendorsed in part the recommendation made by the Aries project to fund along-term advisor to ….. provide continuity to identify and oversee theperformance of a number of tasks in order to tackle the numerous specialtychallenges arising out of this program.
At the time of this report (March 2005), planned public sector enterprisetransformations in the four States had been adjusted to one in each state ratherthan the two originally planned. No PSE transformation has actually taken place.With respect to the PSEU, the Secretary of the DEA has assumed the positionPSEU unit head, and neither the full-time financial analyst, nor the part-timelawyer have been employed.
Although progress in privatizing, commercializing, or divesting the PSEshas been disappointing, there has been some progress in reducing the level ofoperating subsidies, as shown in Figure 7. However, there are still many PSEsthat continue to operate inefficiently and effectively preclude (because ofsubsidization) the market entry of private enterprise. Some SOEs continue tooperate at a loss by drawing down invested capital, and direct and implicitsubsidies continue to adversely impact government budgets. As indicated inFigure 7, the direct subsidies alone still account for about $4.0 million perannum (implicit subsidies are not included in the subsidies and transfersshown in Figure 7).
6.2.3 Private Sector Development
In the seventeen years of receiving large-scale economic aid under CompactI, there has been modest progress in building a larger private sector, both in termsof GDP and employment. Table 14 indicates the relative shares in GDP andemployment for the four institutional sectors in 1987 and 2003. A similar tablewas presented and discussed in Section 5.2.1.
Section_2_New.pmd 12/12/2005, 1:57 PM76

Chapter 6. Economic Policy in Light of Amended Compact
77
0
2,000,000
4,000,000
6,000,000
8,000,000
10,000,000
12,000,000
14,000,000
16,000,000
1987 1988 1989 1990 1991 1992 1993 1994 1995 1996 1997 1998 1999 2000 2001 2002 2003
Source: FSM Department of Economic Affairs .
Figure 7. Government Subsidies and Capital Transfersto Non-Financial Public Sector Enterprises
Table 14. Sector Shares of GDP and Formal Employment:FY1987 and FY2003
1987 2003
Sector GDP Employment GDP EmploymentPercent 1/ Percent Percent 1/ Percent
Private 34 29 41 42Government 57 60 40 42PSE 4 2 12 6Non-Profit 5 9 7 10Total 100 100 100 100
Source: FSM Department of Economic Affairs. 1/ - Only relevant components of GDP are included for comparisons.
Section_2_New.pmd 12/12/2005, 2:01 PM77

Federated States of Micronesia Towards a Self-Sustainable Economy
78
Throughout the Compact I period the level of private sector activity in theFSM has been driven in large part by the level of Compact transfers andgovernment expenditure. This is illustrated in Figure 8.
Given the significant decline in Compact II grant assistance and the factthat in real terms the decline will steadily continue to 2023, the FSM will haveto do more towards increasing the size of the private sector. This restructuringwill facilitate an increase in tax base and productivity and will enable a rise inshare of tradable goods output, all key elements needed to raise the standard ofliving and economic self-sufficiency. In the overall FSM development context,private sector is explicitly meant to encompass all non-governmental organizationswhether or not they are profit-oriented.
Although the size of the private sector has increased modestly, thestructure has not fundamentally changed since the mid-1990s. Expansionhas occurred almost exclusively in the non-traded goods sector of the economy,i.e. in the retail and wholesale sectors and services activities (e.g., repair andmaintenance, residential and commercial construction related mainly relatedto retail and government demand, and communications) and not to the mainproductive sectors in the FSM – agriculture, fisheries, and tourism. It is theselatter sectors that include the production of tradable goods and services that
0.00
10.00
20.00
30.00
40.00
50.00
60.00
70.00
FY87 FY88 FY89 FY90 FY91 FY92 FY93 FY94 FY95 FY96 FY97 FY98 FY99 FY00 FY01 FY02 FY03
$ m
illio
ns
Private Sector VAGovernment Wage Bill
Figure 8. Relationship Between the GovernmentWage Bill and Private Sector GDP Growth
Section_2_New.pmd 12/12/2005, 2:03 PM78

Chapter 6. Economic Policy in Light of Amended Compact
79
can compete with overseas suppliers (e.g., food commodity imports, processed/manufactured items) or in overseas markets (e.g., tourists to FSM, regionaland international fisheries and agricultural commodity exports).
The Second Economic Summit identified a number of specific factorslimiting private sector growth, including:
• Excessive government intervention in productive sectors as opposed toremoval of business constraints;
• Greater public sector employment opportunities and higher relativewages;
• Skill limitations;• Dependence on government rather than commercial financing for
development;• Evolving land tenure systems (that include constraints to economic
development, including inefficient land markets, restrictions on leases,slow titling and registration, and limitations on use of secured loans);
• Variable transparency and efficiency in the business and investmentenvironment;
• Protective attitudes towards foreign investment;• Variable infrastructure and transport limitations that undermine private
sector growth and competitiveness; and,• Transport constraints and high fuel costs (affecting international access).
The Second Summit reviewed efforts to address these limiting factors. Theinitiatives included the PSRP aimed at downsizing government and restrainingthe wage bill, creating an enabling and regulatory environment to facilitate privatesector development (revisions of codes related to foreign investment, securedtransactions and taxation), changing attitudes to foreign investment, revisingland titling procedures, and extending leasehold terms in some states.
Policy elements endorsed by the Second Summit with respect to privatesector development included:
(1) Commitment to economic reforms• Macroeconomic policy that fosters fiscal responsibility• Maintenance of financial stability• Limits on size of government and development of public
accountability• Consistency of tax regime with private sector-led development
strategy
Section_2_New.pmd 12/12/2005, 2:03 PM79

Federated States of Micronesia Towards a Self-Sustainable Economy
80
(2) Outward-looking approaches to economic development• Make tax regime consistent with outward-oriented economic strategy• Encourage investment in priority and potentially competitive export
growth industries(3) Lower costs, improve performance and develop competitive markets for
the means of production• Ensure labor is wage competitive by reducing public/private sector
wage differentials• Increase labor productivity and competitiveness• Direct human resources development investment towards skill gaps
for priority growth industries• Make land more readily available to those who need it for sound
development• Facilitate the use of land as collateral to increase availability of
development financing(4) Reorient public agencies and administration to facilitate private sector
development; decrease the cost and increase the ease of doing business;promote good governance; and, minimize government involvement incommercial and service activity• Develop a business-enabling regulatory environment that promotes
a private sector capable of generating long-term economic value• Foster a corporate climate which respects the interests of
stakeholders and society• Focus support on competitive tradable goods and services• Focus on efficient, coordinated support services providing
information, advice and training – not subsidized finance• Allow the market to determine the value and commercial viability
of state-owned productive enterprises earmarked for privatization
Now that the FSM is well into fiscal year 2005, the second year of CompactII, it is possible to briefly review the progress made in addressing the mainconstraints to private sector development that have been identified in theeconomic summits. Discussed here are: (a) commitment to economic reforms insupport of private sector development; (b) access to land; (c) labor marketinefficiencies; and (d) enabling environment.
Section_2_New.pmd 12/12/2005, 2:03 PM80

Chapter 6. Economic Policy in Light of Amended Compact
81
6.2.3.1 Commitment to Economic Reforms
Studies conducted in the Pacific Islands region and in developing countriesaround the world affirm the importance of an appropriate policy framework andpro-active commitment to working with the private sector to create a favorablebusiness and investment climate. Strength of commitment is the key to successin building a private sector that is outwardly competitive and capable of sustainedgrowth. These are elements critically needed to enable the nation to adjust to thediminishing aid provisions of Compact II.
While government commitment is important to all components of acomprehensive PSD strategy, this section focuses mainly on encouraging privateinvestment, both domestic and foreign. As noted in the Third Economic Summit:
“Experience has shown that foreign investors tend to require a significantperiod of policy reform “coherence” before they become sufficientlyconfident that improvement will be long-lasting. It may be the casethat recent policy reform stagnation (and even some back-tracking) hasmade domestic investors somewhat skeptical that FSM policy makerswill, in fact, follow a coherent economic strategy.
For the private sector to confidently invest and create new jobs,their perceptions about governance need to be effectively addressed.Through an improved public-private dialogue four positive outcomescan be achieved: (i) private sector perceptions can be comprehensivelyaddressed; (ii) misperceptions and misinformation can be corrected;(iii) information on actual improvements and policy objectives can beshared; and (iv) emerging issues can be addressed collaboratively.”
Potential investors are more likely to commit to opportunities in which the costsof doing business are reasonably predictable. Transparency of regulations, securityof transactions, and access to factors of production at reasonable cost, are factorsthat permit the investor to determine their risk-return situation. This increasesthe likelihood of achieving an acceptable return on investment.
There are weak communications, little interaction, and a significant degreeof mistrust between the government and the private sector. There has been noformal program for government to interact on a regular basis with the business(and civil society) community to discuss outstanding issues perceived to bedetrimental to operating profitable businesses. Government needs to providethis venue. Specific mechanisms need to be created for involving the businessand civil society in regularly scheduled national and state workshops or
Section_2_New.pmd 12/12/2005, 2:03 PM81

Federated States of Micronesia Towards a Self-Sustainable Economy
82
conferences organized to enable participation and input into economic planningand policy-making.
Very little foreign investment has been attracted, not only because of thehigh-risk business environment, but also because of non-transparent and essentiallynon-accommodating provisions included in the foreign investment statutes andregulations. As noted in the Third Summit, even though …. Foreign investmentlaws were reformed as part of the reform program in 1997-98 to remove overlappingjurisdiction at the national and state levels. Implementation of the reformed lawsthrough regulations reduced the intended effect and left a large degree ofbureaucratic discretion and lengthy case-by-case reviews for many applicants.
In 1999, the Foreign Investment Advisory Service (FIAS), a joint service agencyof The World Bank and the International Finance Corporation, conducted a reviewof FSM national and state foreign investment legislation. In its review, FIASnoted the practice of the national and state governments to develop lists whichcategorize sectors and give particular options to investors. The first is the red listwhich specifies sectors reserved for citizen investments. Second is the amber listin which a foreign investor must obtain a permit and fulfill the specified conditions.The third category contains sectors in need of foreign investment. In this thirdlist, investors need to secure a permit but may operate without conditions.
FIAS’s review pointed out that sectors or activities on the amber list shouldclearly specify the attached conditions (for each activity or sector) and they mustbe transparent and publicly listed. The intent of the foreign investment law shouldbe to make the issuance of a foreign investment permit (FIP) a simple registrationprocess. This enables the investor to know before applying whether or not he willqualify for the permit, and what conditions (if any) will have to be met.
6.2.3.2 Access to Land
From an economic development standpoint, difficulties in gaining access toland for business purposes translates into increased cost of doing business andhigher risk in achieving an acceptable return on investment. This is especiallytrue for foreign investors and many FSM citizens wanting to start businesses instates other than their home state. While land occasionally may be leased, eventhis is difficult given traditional values towards keeping title and use rights inthe clan (refer to Chapter 3 discussion).
Each state has jurisdiction under the FSM Constitution to legislate andregulate land transactions, and therefore each state has distinct laws governingthe sale, lease, registration and transfer of title to land. In most states, long-termleases can be obtained if an investor can find an available land parcel. However,
Section_2_New.pmd 12/12/2005, 2:03 PM82

Chapter 6. Economic Policy in Light of Amended Compact
83
in the case of Pohnpei, land lease terms are limited to 25 years, a term too shortfor most large capital investments. To mitigate this problem, legislation waspassed by Pohnpei State to allow a 55-year lease provided the lessee meets certainconditions for making capital improvements within 5 years (see Chapter 3 Box 4on Pohnpei Development Leasehold Act provisions). However, the conditionsspecified under the law apparently are perceived as excessively burdensome,discouraging the use of this lease option.
While the Deed of Trust can be used in some states in conjunction withleaseholds, it is seldom used because of unfamiliarity and because of difficultiesresulting from ownership challenges. As most privately-owned land in the FSM isstill collectively held by the clan (i.e., not formally registered in individual title),the risks involved in leasing or buying land are high because of the uncertainty ofobtaining a valid title or lease rights. Also, in the absence of price data on sale orlease transactions (in part because land is seldom leased or sold), it is difficult forinvestors or buyers to determine the value of available land.
Implementing more workable land tenure and mortgage financing laws andregulations is an important objective of the current PSD program. With appropriatecommitment on the part of FSM governments, new or amended laws andregulations making it easier for investors to obtain land (and use of land formortgage secured finance) would significantly contribute to promoting bothdomestic and foreign investment.
6.2.3.3 Labor Market Inefficiencies
Although the FSM is not affected by labor-industry discord – as there are nounions and governments, along with the COM, represent the largest employers –the large differential in salary rates between government and the private sectorconstitutes a major structural inefficiency. The ratio of average wage in Governmentto that in the private sector was nearly 2:1 at the beginning of the Compact(1987-1990) and actually increased to 2.08 to 1.0 in the 2000-2003 period. Thisdiscrepancy has acted as a major distortion in the FSM labor markets, attractingthe most skilled and educated to government jobs. This has had the effect oflowering the competitiveness of the private sector, not only because of the lowerskills and education of the remaining labor pool but because of the pressure onthe private sector to raise rates to compete with government. Excessively highwage rates is a government pay structure the FSM carried over from the TrustTerritory era, but is also a result of the large grant transfers flowing into governmenttreasuries in the initial years of Compact I. It has also profoundly affectedagricultural and near-shore fisheries production which has largely stagnated during
Section_2_New.pmd 12/12/2005, 2:03 PM83

Federated States of Micronesia Towards a Self-Sustainable Economy
84
most of the Compact I period. The PSRP in 1997, intended to reduce the wagerate differential but this was never realized.
With the grant aid step-downs of Compact I and continuing grant aid declinebuilt into Compact II, the government cannot be a future source of employmentgrowth. The right to freely immigrate into the US in conjunction with a scarcityof jobs in the domestic economy, has led to a large out-migration of youngerworkers and their families. With higher pay and job training incentives availablein Guam, the CNMI, and in the US, out-migration is likely to be a continuingreality that will have to be taken into account in strategic planning, as discussedin 7.3.
6.2.3.4 Enabling Environment
In addition to assisting the PSEU in the National DEA to work with thestates in facilitating PSE transformations, the long-term PSD advisor has beenworking with the states to implement laws and regulations on key commercialcodes that are taken for granted in most countries. These include a bankruptcylaw, secured transactions law, revisions to foreign investment laws and regulations,and legislation or regulatory changes to facilitate use of land (owned or leased) tosecure mortgage lending.
Another function of government that is critically important but is notaddressed by the PSD program is the provision of information and technicalassistance to key productive sectors such as agriculture, fisheries and tourism.In agriculture, for example, a well-qualified group of extension agents is basedat the national COM campus, but is unable to provide field visitations tofarms to assess needs and give technical advice. Also, since the closure ofmost state agriculture departments, no commodity price, supply, export andimport and other important industry statistics are made available to farmersand other sector stakeholders. For the fisheries and visitor sectors, lack ofindustry data and information is also a problem. Basic sector or industryperformance data and technical assistance is an important enabling servicethat government either provides, or contracts for, to support the sector.
Section_2_New.pmd 12/12/2005, 2:03 PM84

Chapter 6. Economic Policy in Light of Amended Compact
85
Chapter 7. Challenges to AchievingEconomic Self-Sufficiency
7.0 Introduction
T he steady decline in grant aid and conditions placed on use of fundsmakes it imperative for governments to increase tax revenues. Atthe same time, development strategies must be carefully examinedto ensure that government programs efficiently address socialneeds and encourage meaningful private sector involvement in
planning and policymaking.
7.1 Public Sector Adjustment Under Compact II
7.1.1 Development Impact of Funding Level and Terms
The impact of the steady decline in grant funding under Compact II isindicated in Table 15. Although the decline in real value of the Compact grantsis in itself a source of fiscal pressure, an even more difficult problem is theconditions attached to the use of the Compact funds. Column 5 indicates theamount of government expenditures in 2005 that are deemed “ineligible” or“non-conforming” by JEMCO for use of grant funds.
Table 15. Projected Compact Grants, Domestic Revenue andExpenditure (Millions of US Dollars at 2004 Prices)
Government 2005 2009 2005 2005 2005Compact Compact Domestic Ineligible CapacityGrants Grants Revenue Expenditure Bldg. Grant
Chuuk 29.31 27.70 5.53 8.12 3.15Kosrae 8.41 7.94 2.42 3.85 0.90Pohnpei 19.52 18.45 7.81 6.95 2.10Yap 12.18 11.51 4.38 6.20 1.31National 6.57 6.21 21.79 21.73 0.71Total 76.00 71.81 41.92 46.85 8.17
Source: FSM National Department of Economic Affairs, and TA No. 4258, November 2004.
Section_2_New.pmd 12/12/2005, 2:03 PM85

Federated States of Micronesia Towards a Self-Sustainable Economy
86
Although there is no explicit clause in the Compact agreement that prohibitsgrant funds from being used to pay for general government recurrent expenses,JEMCO has authority to stipulate how grant funds may be used and whatconditions shall apply. Of the six sector grants provided for, the Compact clearlygives highest priority to education and health care.
As discussed previously, in negotiating the terms of Compact II, the FSMsought to include government recurrent expenditures in the Public SectorCapacity Building Grant to the extent activities contributed to enhancedgovernment capacity and increased productivity. The US – which controlsdecision making with three of the five voting members – did not agree to this.However, the US did agree to a 5-year phase-in period during which capacitybuilding grant funds could be used for non-conforming (recurrent expenditure)purposes.
As indicated in Table 15, the 2005 capacity building grant of $8.17 millionrepresents just 10.8% of the total sector grants funding of $76.0 million. Thelargest sectors – those being given the highest priority by the US – are: educationat $27.1 million (35.7%), health at $17.43 million (22.9%), and infrastructure at$16.9 million (22.2%). These high priority sectors, along with capacity building,take up nearly 92% of the 2005 grant funding, leaving small amounts for privatesector development and the environment.
The data on state-generated domestic revenues clearly indicate that withoutthe capacity building grant funds (column 6), only Pohnpei and the nationalgovernment will be able to cover the cost of ineligible expenditures (column 5).The national government is in a much stronger revenue position, but for all thestates general government recurrent expenditure (on virtually all program purposes,except education and health) will fall below what is needed unless governmentrevenues can be increased significantly.
Technical assistance on improving and reforming tax systems in the FSMhas been ongoing in recent years. The latest study, ADB TA No. 4258-FSM,Compact Fiscal Adjustment and Transition, provides detailed analysis andrecommendations on both the transition associated with the phasing out of thecapacity building grants and the urgent need for governments to increase taxrevenues to accommodate the steady decline in Compact II grant funding.
Tax effort (ratio of tax revenues to GDP) in the FSM is among the lowest inthe Pacific Region at 12.3% of GDP. Of seven countries, the FSM had the lowesttax effort and it was the only country with a tax effort below 17%. Three countrieswere above 20% and three were between 17 and 20%. The latest tax studyrecommended a number of options for increasing revenues, with most optionsnecessitating substantial changes to tax administration. In options requiring
Section_2_New.pmd 12/12/2005, 2:03 PM86

Chapter 7. Challenges to Achieving Economic Self-Sufficiency
87
lesser increases in tax burden, the states would be required to cut expendituresmore deeply to accommodate the decline in Compact grant funding.
The technical assistance studies have unanimously recommendedimplementation of a value-added tax (VAT) to effectively raise revenue to meetboth medium and long term FSM needs. The VAT would replace the customsduties and state sales taxes. A major advantage of the VAT is that it will replacetwo taxes that have distorting effects on the economy. The VAT is relativelysimple to administer, entailing a single rate that would apply to a broad tax baseincluding both goods and services and private and public enterprises. The VATavoids the distortion of the sales, customs, and gross receipts tax, with theircascading effects as goods move through each level of distribution. Another majoradvantage is that the VAT provides positive incentives to export and investmentactivities, in that exported goods are exempt from this, and exporters receiverefunds for VAT taxes paid on material and service inputs used to produce exportgoods. In the case of investment, business expenditure on capital goods is exemptfrom the VAT. This tax is also consistent with the requirements of internationaland regional trade agreements (against export subsidies vis-à-vis tax system).Another big advantage of the VAT is that it would constitute an efficient means ofraising tax revenues over the long term as Compact II aid steadily declines, as thesingle rate could be increased. Other Pacific Island countries that have adoptedthe VAT include: Fiji Islands, Samoa, Vanuatu and the Cook Islands.
Effective administration of the VAT clearly calls for changes in the taxjurisdictions of the national and state governments. The recommended reformwould entail a single “FSM Unified Tax Administration” (FUTA), which wouldbe an independent agency patterned after the current FSM Social SecurityAdministration. This agency would be empowered to collect all taxes (not justthe VAT) on behalf of both national and state governments. However, eachgovernment would still maintain the authority to set the tax rates (for eachcategory of tax, e.g., VAT, personal income tax) in its own jurisdiction. A criticalissue, given the dual taxation powers of the national and state governments, isthe most appropriate way to authorize and implement a VAT. Two approaches aresuggested: (1) the national government will enact legislation for a VAT on imports,and it will be left to the States to enact associated legislation for a VAT ondomestic production; and (2) the states will endorse VAT without the nationalgovernment taking any action on the premise that even though the VAT would becollected on imports (a national tax power) it would subsequently be rebated. Inview of possible legal complications in interpreting constitutional jurisdictionon States levying VAT on imports, the first approach may be preferable but wouldbe administratively more complicated to implement.
Section_2_New.pmd 12/12/2005, 2:03 PM87

Federated States of Micronesia Towards a Self-Sustainable Economy
88
While the VAT would be the best long-term solution for the need to increasetax revenues, in the short term there will be a need for the state governments toraise existing taxes, and cut recurrent expenditures.
Chuuk Kosrae Pohnpei Yap National
FY 2004 36.00% 10.80% 24.10% 15.80% 13.30%FY 2005 38.57% 11.06% 25.69% 16.03% 8.65%
More recently, the states have pushed for a change in the distribution formula forCompact revenues, which would reduce the share going to the national government. Partiallyin response to this move, the FSM Congress withdrew the additional amount of revenuesharing from tax revenues, returning to the amounts required by the Constitution. The endresult was that the States ended up with a larger share in Compact revenues, which aresubject to significant restrictions, while losing access to domestically generated tax revenues.
The applicability of the revised distribution formula for Compact revenues has beencalled into question, effectively reopening the dialogue in that area. The FSM Congressapproved the change in the distribution formula for FY 2005, but reserved the right tomake adjustments in future years. It is clear that there will be a need for continueddialogue on issues related to revenue sharing.
Box 10. Revenue Sharing Betweemthe State and National Governments
The FSM Constitution specifies that the taxes collected by the national government – onimports, fuel, wages and salaries, and business receipts – be divided between the nationalgovernment and the states in which they are collected. The division of the Compacttransfers in Compact I was established by a memorandum of understanding worked outbetween representatives of the different governments.
The level of fisheries revenue, primarily from agreements with distant water fishingnations, increased sharply during the late 1990s. This led to an effort by the states tohave these funds be divided in the same way as the tax revenues. This attempt wasunsuccessful, as the courts ruled in favor of the national government. Nevertheless, theFSM Congress agreed to increase the states’ share in tax revenue, with the proviso thatthe additional funding be used for capital expenditure in the areas of health and education.
Compact Distribution Formulas
7.1.2 Medium Term Policy Adjustments
In view of the restrictive terms on use of funds and the steady decline overtime in grant funding, Compact II will place an increased burden on themanagement capacity of the FSM governments. Preparing the consolidated fundingproposals and keeping up with required reporting for the five governments will be
Section_2_New.pmd 12/12/2005, 2:03 PM88

Chapter 7. Challenges to Achieving Economic Self-Sufficiency
89
a significant challenge. Several proposals have been prepared for a restructuringof government services in order to better deal with these requirements, but nonehave been adopted.
In adjusting to the reduced level of annual grant funding, FSM governmentsin the short to medium term will have to increase tax revenues and raise efficiencyin the provision of services. Service cutbacks in the short-term are also probablyunavoidable.
Short-term tax revenue raising options being considered include the following:
• Import duties in the FSM are generally low by regional standards. Severaltypes of commodities enjoy a significant level of tariff protection,including bar laundry soap and fruit juices. The protected industrieshave difficulty in meeting local demand, so that there is some support forthe removal of this protection. It seems likely that the initial target forrevenue increases would be import surtaxes on tobacco and alcohol. Reducedconsumption of alcohol and tobacco as a result of increased taxes would alsobe expected to have positive economic consequences, through health andsocial impacts (i.e., lowering healthcare and social services costs).
• The use of the GRT as a substitute for a business earnings tax leads tosignificant distortions due to differences in the effective rate for differentindustries and businesses. It would be preferable to replace the currentGRT with a less distortionary alternative, such as a corporate incometax. It would appear that a revenue-neutral profit tax in the range of 20per cent could be a feasible option, since this rate would be at the lowend of the rates currently applied in other countries in the region.
• The Wages and Salaries Tax is only mildly progressive, with a significantdiscontinuity at the $5,000 level on annual income. The top rate of 10%is quite low by regional standards. A revised structure, involving additionalbrackets and higher rates, could increase collections and make the overalltax system more progressive.
Constitutional restrictions on the taxes that can be collected by the differentlevels of government complicate any attempt to increase revenues. This isparticularly true for the potential implementation of excise taxes or the VAT. Thenational government has the right to levy import and income taxes, the proceeds ofwhich are shared with the states. Income taxes include a Wages and Salaries Taxthat applies to individuals and a Gross Receipts Tax that applies to businesses.Other taxes – including sales and other consumption-based taxes – are reserved for
Section_2_New.pmd 12/12/2005, 2:03 PM89

Federated States of Micronesia Towards a Self-Sustainable Economy
90
the states. There is considerable variation in the tax effort at the state level. Overall,however, state level taxes account for only about 20% of total tax revenues.
A further complication is introduced with the continued application of therevised distribution formula of the Compact grants (Box 10). It is probable thatthere will be further dialogue between the two levels of government regarding thedistribution of Compact grants and the formula for revenue sharing. This dialoguecould be a useful opportunity for discussing other issues related to taxation, suchas the potential for coordinating efforts to improving collections.
7.2 Policies and Strategies for Achieving Sustainable Growth
In the medium term, the reduced level of Compact transfers can be expected tohave a negative impact on overall economic growth. The series of annual reductionsin grant assistance, in favor of increased contributions to the trust fund, can alsobe expected to have a similar impact.
In the short to medium term, private sector activity in the FSM is likely tocontinue to be dominated by services – including retail sales – aimed at the localmarket. Retail activities may become increasingly competitive, and someconsolidation is possible as real incomes (and consumer spending) fall in theshort term under the pressure of likely public sector expenditure cuts.
Import substitution, particularly in terms of local substitutes for importedproduce, could become more important. Imported produce is expensive and oftenof poor quality due to shipping time and costs. Falling real incomes – heavilyaffected by necessary public sector wage restraint and other recurrent expenditurecuts in conjunction with price level inflation – may make agricultural self-employment a more attractive option for those with access to land.
Distance from markets and high labor costs will continue to work against thedevelopment of export-oriented manufacturing. Changes in the world tradingsystem, including the development of regional trade agreements to which the USis a party, are also expected to reduce or eliminate former incentives in the freelyassociated countries for activities such as garment manufacturing and fishprocessing plants.
The terms of the original Compact I agreement were intended to providethe FSM with unusually favorable access to US markets. These benefits havelost value over time, as other countries also tapped into US markets throughregional trade arrangements. Broader changes in the world trading systemhave also reduced the value of the provisions in the original agreement. In thecourse of the Compact II negotiations, the FSM expressed an interest inexploring arrangements similar to those under regional trade agreements
Section_2_New.pmd 12/12/2005, 2:03 PM90

Chapter 7. Challenges to Achieving Economic Self-Sufficiency
91
between the US and other nations. In the end, however, the outcome waslimited to an updating of the original terms.
Several elements of an overall development strategy have been suggested inprevious sections. These include:
• Reform of the FSM governments tax systems. This includesimplementation of a unified tax administration system and VAT toreplace customs and sales taxes;
• Raising efficiency of public service. This involves increased HRD,comprehensive review of departmental and agency missions, functionsand job position requirements, wage rates, and performance incentives;
• Accelerated movement towards rationalization of the PSE sector. Thiswill demonstrate a firm commitment to the principal of encouragingprivate sector performance of commercial activities and non-competitionof public enterprises with private businesses in providing goods andservices;
• Pro-active policy of encouraging growth of the private sector includingnon-profit organizations. This should include policy elements focusedon gradually reducing wage rate differentials between public and privatesector employees, implementing a tax system which provides incentivesfor investment, exports and equal treatment of PSEs and privatebusinesses, and contracting out services that can be provided moreefficiently by the private sector;
• Public sector provision of critical support services. Among these areagricultural extension, industry/sector price and production statistics,credit and loan financing accessible to small and micro businesses,institutional mechanisms enabling businesses and non-profits toparticipate in planning and policymaking at national and sectorallevel, and support in working with private sector to jointly provideentrepreneurial and business skill training;
• Accelerated movement towards providing the critical elements of a PSDenabling environment. This entails transparent and efficientlyadministered foreign investment regulations, legal-regulatory regime thatenables efficient equitable access to land, secure transactions and othercommercial legislation designed to lower risk and cost of doing business,and legal/regulatory mechanisms enabling mortgage or other land-secured loan financing.
Section_2_New.pmd 12/12/2005, 2:03 PM91

Federated States of Micronesia Towards a Self-Sustainable Economy
92
Implementing some of these strategies will require specific support actionson the part of JEMCO to increase the likelihood of success, and reduce the timerequired for implementation. There needs to be explicit agreement on use ofCompact II grant funding for private sector targeted training, industry information/technical support, facilitation of the transformation of PSE activities to privatesector operations, and contracting of legal/technical expertise to assistachievement of specific elements (objectives) of private sector enablingenvironment. Together with this, it is necessary to preclude government use offunds for recurrent costs.
In conjunction with human resource development, there is a legitimate needfor project/program funding that should come via the capacity building sectorgrant. If tied to specific project designs, this would constitute a use of fundingconsistent with the goals and objectives of Compact II.
7.3 Out-Migration
Out-migration has increased significantly since 1997 and the FSM needs to take aclose look at this phenomenon in terms of its extent and likely consequences. Certainlymore information and analysis will be needed to enable the formulation of policyoptions. What is apparent is that continuing poor economic performance in terms ofjob creation and maintaining household incomes in the face of inflation will resultin continued heavy out-migration of FSM citizens.
There were over 9,100 FSM citizens living in the CNMI, Guam, and Hawaiiin 1997 according to US Bureau of the Census survey data. This number refers tothe Compact “impact” population – those who emigrated from the FSM after1986. The US Census Bureau conducted an update survey in the same areas in2003. For the “impact” population in 2003, the number of migrants includedchildren of the post-1986 emigrants under the age of 18. This latter surveyindicated an FSM migrant “impact” population of 15,514, an increase of about6,400 or 70%.
This number will be significantly higher if total migrants – including thosewho emigrated to the US mainland and children above18 – are taken into account.Estimates have been made based on adjusting the intercensal population growthrates for declining fertility rates. Data from the FSM 2000 National CensusReport indicates that the decline in fertility rates was most pronounced from1980-1990. Utilizing data on both Age Specific Fertility Rates and Crude BirthRate for relevant periods between 1980 and 2000, a low (2.12%) and a high(2.58%) adjusted population growth rate was estimated for the purpose ofprojecting total FSM population growth between 1989 and 2003. These rates are
Section_2_New.pmd 12/12/2005, 2:03 PM92

Chapter 7. Challenges to Achieving Economic Self-Sufficiency
93
of course mere approximations. Resulting projections of total FSM population(both resident in FSM and all citizens living outside the FSM) for the year 2003would be between 128,400 and 136,800. Given that the estimated 2003 residentFSM population is 107,800, this means that between 20,600 and 29,000 FSMcitizens are estimated to be living overseas – between 16 and 21% of the totalFSM population. Most of the overseas citizen population would be in the CNMI,Guam, Hawaii and US mainland.
Differences in social and economic characteristics of the Compact “impact”population and the FSM resident population are highlighted in the box below.The comparisons are based on the US Census survey data and the FSM 2000Census. Not covered in the box is the place of residence of impact area migrantsin 1993, 10 years before the survey was taken. Of the impact area population 10years of age and older in 2003 (11,292), 50.5% (5,702) had lived in the FSM in1993, and of this number, 68.6% (3,911) were from Chuuk. Of the total numberwho were resident in Chuuk State in 1993 (2,751), a majority lived in islandsoutside of Weno, the State center.
The migrant population in the US impact areas had a higher labor forceparticipation rate – 58% (of those age 16 and older) versus 44% (of those 15 andolder) for the FSM resident population. In terms of economically active people inrelation to working age, 49% of the migrant population was economically active(either in formal employment, self-employment or, in family businesses) versus37% in the FSM. In the FSM, the economically active includes those insubsistence livelihood in addition to those in formal and informal wageemployment. With respect to the number of unemployed people, 9.0% wereunemployed in the migrant population – a higher rate than the 7.1% in FSM.These are not comparable to unemployment rates reported in most industrialcountries, which are based on the number of persons in the labor force withoutany work and who are available to work and are actively looking for work.Availability of subsistence work in the FSM (but essentially not available in theUS impact areas) makes comparisons of unemployment, even in terms of workingage population, difficult between the two populations since most FSM residentscould be working in subsistence activities even if this were only part-time innature. Having said this, the formal unemployment rate for migrants in the impactareas is quite high, 15.5% in 2002. This high rate may reflect the reality thatFSM citizens are not as competitive in the labor market as FSM residents whohave been trained in the US, even in the CNMI and Guam.
Migration has been an important part of the FSM-US relationship since thebeginning of Compact I. The right to live and work in the US and its territories
Section_2_New.pmd 12/12/2005, 2:03 PM93
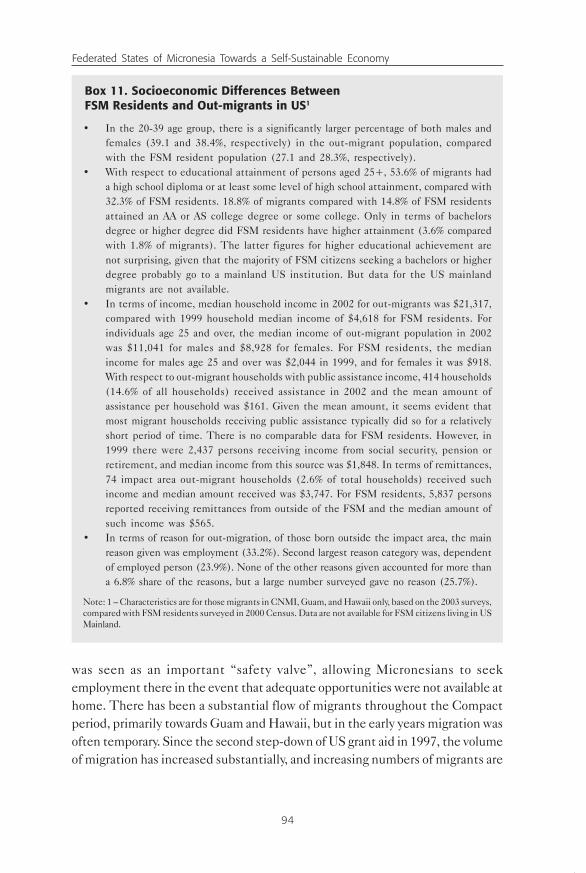
Federated States of Micronesia Towards a Self-Sustainable Economy
94
was seen as an important “safety valve”, allowing Micronesians to seekemployment there in the event that adequate opportunities were not available athome. There has been a substantial flow of migrants throughout the Compactperiod, primarily towards Guam and Hawaii, but in the early years migration wasoften temporary. Since the second step-down of US grant aid in 1997, the volumeof migration has increased substantially, and increasing numbers of migrants are
Box 11. Socioeconomic Differences BetweenFSM Residents and Out-migrants in US1
• In the 20-39 age group, there is a significantly larger percentage of both males andfemales (39.1 and 38.4%, respectively) in the out-migrant population, comparedwith the FSM resident population (27.1 and 28.3%, respectively).
• With respect to educational attainment of persons aged 25+, 53.6% of migrants hada high school diploma or at least some level of high school attainment, compared with32.3% of FSM residents. 18.8% of migrants compared with 14.8% of FSM residentsattained an AA or AS college degree or some college. Only in terms of bachelorsdegree or higher degree did FSM residents have higher attainment (3.6% comparedwith 1.8% of migrants). The latter figures for higher educational achievement arenot surprising, given that the majority of FSM citizens seeking a bachelors or higherdegree probably go to a mainland US institution. But data for the US mainlandmigrants are not available.
• In terms of income, median household income in 2002 for out-migrants was $21,317,compared with 1999 household median income of $4,618 for FSM residents. Forindividuals age 25 and over, the median income of out-migrant population in 2002was $11,041 for males and $8,928 for females. For FSM residents, the medianincome for males age 25 and over was $2,044 in 1999, and for females it was $918.With respect to out-migrant households with public assistance income, 414 households(14.6% of all households) received assistance in 2002 and the mean amount ofassistance per household was $161. Given the mean amount, it seems evident thatmost migrant households receiving public assistance typically did so for a relativelyshort period of time. There is no comparable data for FSM residents. However, in1999 there were 2,437 persons receiving income from social security, pension orretirement, and median income from this source was $1,848. In terms of remittances,74 impact area out-migrant households (2.6% of total households) received suchincome and median amount received was $3,747. For FSM residents, 5,837 personsreported receiving remittances from outside of the FSM and the median amount ofsuch income was $565.
• In terms of reason for out-migration, of those born outside the impact area, the mainreason given was employment (33.2%). Second largest reason category was, dependentof employed person (23.9%). None of the other reasons given accounted for more thana 6.8% share of the reasons, but a large number surveyed gave no reason (25.7%).
Note: 1 – Characteristics are for those migrants in CNMI, Guam, and Hawaii only, based on the 2003 surveys,compared with FSM residents surveyed in 2000 Census. Data are not available for FSM citizens living in USMainland.
Section_2_New.pmd 12/12/2005, 2:03 PM94

Chapter 7. Challenges to Achieving Economic Self-Sufficiency
95
moving beyond Guam and Hawaii to the US mainland. With larger numbers ofbetter-educated citizens moving abroad, remittances could become an increasinglyimportant source of income for the FSM economy.
Further survey and research work will be needed to determine whetherremittances are likely to become an important source of transfer income, or whetherthey will not be a factor if FSM households in the US become less involved withtheir families in the FSM.
Eventually, at least some portion of the out-migrant population will returnto the FSM. To the extent that they bring new ideas and skills, they may helpboost entrepreneurial activity in the economy. This could also help address humanresource constraints with respect to the provision of government services.
7.4 Self-Sufficiency by 2023: Attainable Goal?
The high-growth or sustained growth strategy endorsed by the Third EconomicSummit relies mainly on tourism. The tourism sector has substantial potential,but all the elements needed to stimulate significant growth will require a strongcommitment to the policies recommended by this report, the same policyrecommendations made by a host of technical assistance missions in the lastdecade. Even with the new commitment called for by the Third EconomicSummit, there will be a time-lag factor in that many policy initiatives need twoyears or more to be fully implemented (e.g., tax reform, comprehensive trainingand institutional strengthening of the public service).
Another major medium-term constraint is likely to be the adequacy ofinfrastructure investment, particularly those needed to support a major campaignto make tourism the leading economic sector. Given the realities of Compact IIconditions, there will be an inadequate level of funding for key infrastructureneeded to support rapid growth in tourism.
Another major concern is whether the general public will accept and supporta major expansion in tourism. As acknowledged in the SDP’s tourism sector plan,a major education and awareness program will have to be undertaken.
Better economic performance in the agriculture and fisheries sectors willrequire sufficient resources to implement the recommended policy initiatives.However, given the fiscal expenditures compression that must be borne by FSMgovernments in the mid-term, there will unlikely be any available resources tosupport PSD. With demonstrated commitment of FSM governments to policyreforms, adjustments in JEMCO policies on sector grant use conditions would bewarranted. This would at least partially address the economic and financial
Section_2_New.pmd 12/12/2005, 2:03 PM95

Federated States of Micronesia Towards a Self-Sustainable Economy
96
capacity constraints that will have to be overcome if sustained growth is to beachieved and progress made in becoming more self-sufficient by 2023.
The Compact II trust fund will provide a sustainable, relatively stable sourceof funding for government operations. The performance of the fund, over thetwenty years covered by the amended Compact, can be expected to have a positivelonger-term impact on investor confidence, as will any indication that the USwill continue to provide additional economic assistance beyond 2023.
There has been a succession of ADB-supported resident economic advisors,with significant continuity in terms of personnel, over a period of nearly nineyears. The primary functions of the economic advisors in the FSM remainedlargely the same. However, a gradual shift in emphasis of duties has occurred,from acting in an advisory capacity to becoming more involved in line managementresponsibilities. The EMPAT team and successor activities have essentially filledthe role of government personnel that would normally have been responsible foreconomic management. An example of one such activity has been technicalassistance provided by advisors acting in the capacity of linking the FSM and thedonor community on issues related to economic management.
Capacity building in economic planning and statistics in the nationalgovernment has been limited in both scope and effectiveness. Rather than workingwith mid-level counterparts, the focus has been on recruiting trainees whoessentially serve as junior-level members of departmental planning and statisticsdivisions. To the extent that ongoing substantive training would have been givenin conjunction with the assignment of increasing responsibilities andcommensurate wage increases, the limited capacity building would probablyhave had a more permanent beneficial impact. The experience has been thatmost of the junior citizens who received graduate level training have leftgovernment service.
Section_2_New.pmd 12/12/2005, 2:03 PM96

Executive Summary
97
I n the FSM the three main productive sectors – agriculture, fisheries, andtourism – have the largest potential for generating income and jobs. Fromthese sectors they could generate the export and import substitute incomenecessary to narrow the existing large gap in merchandise trade and in theoverall current account imbalance.
The lead-up to the Third Economic Summit included a StrategicDevelopment Plan (SDP) for the tourism sector. The tourism SDP was valuablein informing summit participants, and enabled the Third Summit TourismCommittee to produce a Tourism Strategic Planning Matrix (SPM) based ona current sector assessment. The same cannot be said for the agriculture andfisheries sectors. The Third Summit did produce SPMs for these sectors, butwithout the benefit of current SDPs.
One may question the basis for including these sector study findings andrecommendations along with other emerging economic issues. However, sectorperformance in both agriculture and fisheries in recent years has been poorrelative to the early 1990s, and many of the constraints to better performancecould be overcome. Given these circumstances, agriculture and fisheriesperformance constitute emerging issues. The tourism sector also has not performedwell, and it must do much better if sustained growth of income and employmentis to be achieved and the FSM is to make any progress in becoming more self-reliant.
The poor performance of tourism may be explained in large part by the samelack of commitment on policy reforms that has affected the performance ofagriculture. Although the FSM Strategic Development Plan that was submittedto Congress for approval in January 2005 assumes agriculture and fisheries wouldalso contribute to sustainable economic growth, the SPD clearly expects tourismto be the principal driver.
Chapter 11 covers other emerging economic issues that must be addressedby the FSM if it is to achieve its Millennium Development Goals (MDGs) by2015 and significantly raise economic self-sufficiency by the end of Compact II.These emerging economic issues include out-migration, capacity and productivityof the public sector, increased hardship, and governance standards.
Section_3_New.pmd 12/12/2005, 2:26 PM97
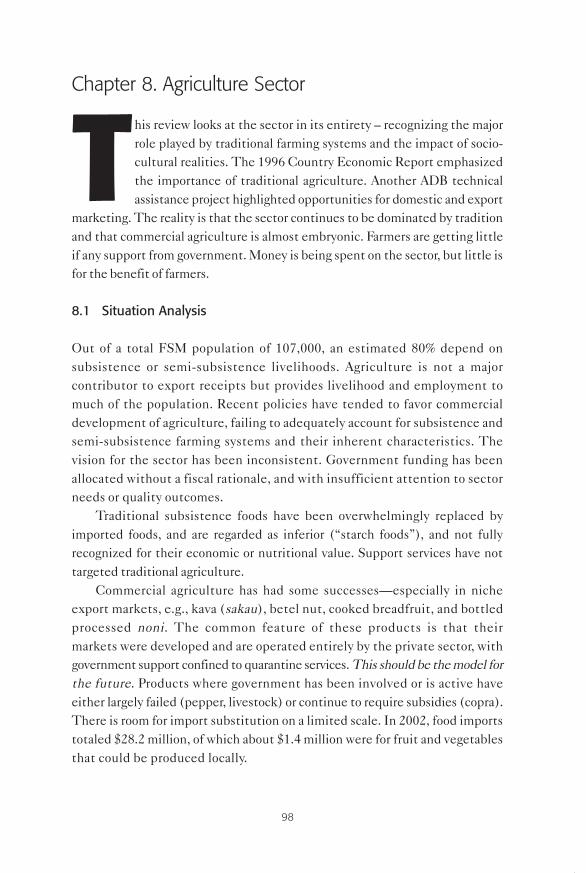
Federated States of Micronesia Towards a Self-Sustainable Economy
98
Chapter 8. Agriculture Sector
This review looks at the sector in its entirety – recognizing the majorrole played by traditional farming systems and the impact of socio-cultural realities. The 1996 Country Economic Report emphasizedthe importance of traditional agriculture. Another ADB technicalassistance project highlighted opportunities for domestic and export
marketing. The reality is that the sector continues to be dominated by traditionand that commercial agriculture is almost embryonic. Farmers are getting littleif any support from government. Money is being spent on the sector, but little isfor the benefit of farmers.
8.1 Situation Analysis
Out of a total FSM population of 107,000, an estimated 80% depend onsubsistence or semi-subsistence livelihoods. Agriculture is not a majorcontributor to export receipts but provides livelihood and employment tomuch of the population. Recent policies have tended to favor commercialdevelopment of agriculture, failing to adequately account for subsistence andsemi-subsistence farming systems and their inherent characteristics. Thevision for the sector has been inconsistent. Government funding has beenallocated without a fiscal rationale, and with insufficient attention to sectorneeds or quality outcomes.
Traditional subsistence foods have been overwhelmingly replaced byimported foods, and are regarded as inferior (“starch foods”), and not fullyrecognized for their economic or nutritional value. Support services have nottargeted traditional agriculture.
Commercial agriculture has had some successes—especially in nicheexport markets, e.g., kava (sakau), betel nut, cooked breadfruit, and bottledprocessed noni. The common feature of these products is that theirmarkets were developed and are operated entirely by the private sector, withgovernment support confined to quarantine services. This should be the model forthe future. Products where government has been involved or is active haveeither largely failed (pepper, livestock) or continue to require subsidies (copra).There is room for import substitution on a limited scale. In 2002, food importstotaled $28.2 million, of which about $1.4 million were for fruit and vegetablesthat could be produced locally.
Section_3_New.pmd 12/12/2005, 2:26 PM98

Chapter 8. Agriculture Sector
99
In summary:
• Government expenditure in the sector is largely ineffective;• Government expenditure can be better targeted at traditional crop
production;• Non-government groups can provide cost-effective support to
traditional farmers;• More people rely on subsistence agriculture for employment than
they did 10 years ago;• The integration of agriculture and culture must be recognized by
sector planners;• Traditional farmers place higher priority on social obligations than
on agriculture;• Traditional farmers prefer crops that allow flexibility to meet social/
cultural obligations;• Land resources are adequate in Kosrae, Pohnpei and Yap, Chuuk is
under pressure;• Niche markets exist for traditional crops;• Opportunities exist for local production of some imported fruit and
vegetables; and• Some local foods can address serious dietary deficiencies and disorders.
8.2 Farming Systems
Most agricultural production in the FSM is subsistence in nature, producingfood for family use, ceremonial purposes, social obligations, and incomegeneration. But most people have come to prefer the convenience of cashtransactions. The decreasing regard for local foods had made policy makersoverlook subsistence agricultural development. However, reductions toCompact funding coupled with cuts in the public sector, have forced many familiesto fall back on subsistence agriculture. The 2000 Census indicated that nearly17% of families were dependent on subsistence agriculture for their main sourceof employment, compared with 10% in the previous census.
A recent survey on Pohnpei showed the value of average agricultural productionper household at $4700 in 2003, equivalent to 74% of median household incomein 2000. However, only 25% of this came from market sales; own consumptionaccounted for about 53%, and 22% was used for ceremonial activities or to fulfillsocial obligations. Looking at it another way, after providing for household needs,only about half of the discretionary surplus is used to generate cash income.
Section_3_New.pmd 12/12/2005, 2:26 PM99

Federated States of Micronesia Towards a Self-Sustainable Economy
100
The major species of livestock are free-range chicken and pigs which arekept for home consumption. Pigs have an important ceremonial value,especially in funerals. There are few regular piggeries, and prices are highbecause of expensive imported pig feed. Poultry are run free-range, and areused for both meat and egg production. There are a few commercial layerpoultry operations, but imported feed makes production costs high. Eggimports in 2002 amounted to $444,400, suggesting additional opportunitiesfor local production, based on locally grown feeds.
There are export markets in Guam, the Marshalls, and Saipan for rootcrops, bananas, betel nut and kava, and in many countries for copra. Inaddition, there are immediate prospects for import substitution of selectedfruit and vegetables in local markets.
Agriculture exports amounted to about $1.4 million in 2002, equivalent to anaverage annual increase of 6.5% from 1999-2002. Exports of betel nut, kava, andcopra grew annually by 18%, 7%, and 5% respectively in the same period. All threecrops are grown by traditional, semi-subsistence farmers. Exports of banana, citrusfruits and root crops declined over the same period by an average of 17%. Themajority of agriculture exports are sourced from Yap - 51% and 65% of totalagriculture exports for 1999 and 2002 respectively - while Pohnpei accounted for31% and 26%, respectively. Conversely, exports from Chuuk and Kosrae are negligible.
Gross margin analysis of cabbage and cucumber shows a profitable opportunityto grow crops which are currently imported in significant quantities. Costs ofproduction are five times lower than the CIF cost of an equivalent importedproduct. Assuming a crop failure rate of one in four (e.g., caused by drought,typhoons, disease), farmers can still expect to earn about $5 per hour, about threetimes the rate for agriculture labour.
Internal marketing infrastructure is limited. Most produce is marketedthrough supermarkets, with individual growers delivering directly, butsupermarkets report that supplies of local product are limited and erratic.
The coconut tree stock is ageing and there has been limited replanting.Since 1991, copra production has exceeded 1,000 tons only once, and it hasaveraged 610 tons in the last five years. Prices are subsidized but irregular collectionand slow payment are disincentives to farmers. Subsidy allocations by the nationalgovernment have dropped by 62% from $200,000 in 2002 to $75,000 in 2005.
In September 2004, the farm-gate price of copra was reduced from 13cents/lb ($260 per ton) to 5 cents/lb ($100 per ton). Widespread oppositionultimately led to introduction of a subsidized price of 10 cents/lb ($205 perton) – still a 23% drop in price. Freight costs an additional $205 per ton,making the FOB price still higher than the world price of around $350/t.
Section_3_New.pmd 12/12/2005, 2:26 PM100

Chapter 8. Agriculture Sector
101
Availability of inputs e.g., seeds, fertilizer, chemicals, animal feeds, isvariable. The private sector provides feeds for pigs and poultry on a fairlyregular basis. However, the Department of Agriculture in some states continuesto compete with the private sector in the provision of seeds and fertilizer.While this is done with the best of intentions, it undermines the opportunitiesfor smaller private sector providers.
Box 12. Case Study: A Commercial Fruitand Vegetable Farmer – Pohnpei
Three generations make a living off 10 acres of rocky, medium fertility land. About twoacres are rock free and can be mechanically cultivated. On this land, a range of vegetablesare grown, including eggplant, cherry pepper, cucumber, runner beans, Chinese cabbages,gourds, and pumpkin. On the rocky land, they are moving to sweet taro (colocasia) for therestaurant market and betel nut for local and export markets. All soils require heavycompost, supplemented with inorganic fertilizers.
Vegetables are marketed locally to outlets with which there is an established relationship.Buyers accept everything delivered, but with a right to reject poor quality product, whichis replaced free of charge. Payments are made weekly for deliveries that week.
In addition, they raise pigs – large animals for the funeral market ($1000 per head)and smaller ones for everyday use. Annual sales are about 10 big “funeral” pigs and 40-50smaller pigs (at about $200/head). The market for funeral pigs is weakening due toweaker economic conditions.
The family regards its livestock as ready collateral for the FSM Development Bank andan important fertilizer source for vegetables. The family sees commercial agriculture asa risky business, due to the variations of climate and markets. Although droughts are aconstant worry, a loan application for irrigation development was declined ‘because of therisk”. Typhoons also cause losses. The land is government land, allocated to the wife’sfamily in 1960 under the Homestead Grant Scheme. They have been applying forindividual title ever since, and especially in last few years, but to no avail. Lack of cleartitle is also constraining their ability to access development finance.
Reliable access to inputs (especially seeds and fertilizer) is a problem. Fertilizer suppliesfrom the Department of Agriculture are currently erratic, but generally alright. But thefamily expects supplies to become more erratic as the frequency of shipping servicesdeclines.
They are the only private commercial growers in Pohnpei. Why is this? They note anumber of constraints. People do not differentiate between traditional and commercialfarming – both have low status. There is a general unwillingness to work hard on asustained basis. The farming system is too complicated – Pohnpeans lack business andfarming skills.
What can be done to develop agriculture? They say people lack initiative – life is tooeasy. Agriculture is the victim of people in government with grand visions of big internationalmarkets and large-scale livestock production and slaughter facilities. The reality is different– what is needed is a community grassroots approach, not fantasies. Lessons should belearned from previous failures – especially pepper. There should be more realisticexpectations of production potential and markets, and adequate technical backup beforeinvestment begins.
Section_3_New.pmd 12/12/2005, 2:26 PM101

Federated States of Micronesia Towards a Self-Sustainable Economy
102
8.3 Productive Resources – land, labor and capital
8.3.1 Land
Arable land in FSM is generally sufficient to support food production needs.The exception is Chuuk, where a combination of high population and limitedland means food production capacity is stretched under traditional farmingpractices. Chuuk accounts for over 50% of FSM’s population, but has only 12% ofthe arable land. Arable land per capita is 0.1 ha in Chuuk, compared to 0.95 ha,0.65 ha and 0.80 ha in Kosrae, Pohnpei and Yap, respectively.
In pre-colonial times, land tenure was the responsibility of the traditionalchiefs, then it passed to successive colonial rulers. Since the Federation in 1986,surveying of individual land plots for issuance of title has proceeded slowly.Previous studies have also highlighted this point. Land can be mobilized underprivate lease arrangements. The terms of lease of agricultural land varies: Chuuk– 99 years; Kosrae – 25 years; Pohnpei – 25 years; and Yap – 49 years. However,rental arrangements are mostly informal, with little transparency of terms.
Land degradation is a serious issue on most islands. On Pohnpei,encroachment by squatters growing kava into the upper watershed has reducedthe area of primary forest significantly – from 15,000 ha in 1975 to 5,200 ha in1995 to 4,200 ha in 2002. Siltation of the fringing reefs as a result of deforestationand subsequent erosion is causing significant damage to traditional marinefood supplies.
8.3.2 Labor
The 2000 Census shows that 52% of the labor force (37,414 out of a totalworking-age population of 63,836) were engaged in agriculture and/or fishing. Ofthese, 70% said they were engaged in subsistence activities. Eighty per cent ofthe males and 86% of the females engaged in subsistence agriculture had eitherno education or had failed to complete high school. This stark reality highlightsthe dualistic nature of FSM society – the educated participate in the cash economywhile the rest are increasingly marginalized to subsistence agriculture.
In 2000, the Census showed 17% of the working age population engaged insubsistence activities – up significantly from 10% in 1994. The rate for femalesincreased from six per cent in 1994 to 18% in 2000.
Of significance to the agriculture sector is the continuing out-migration ofyoung people, especially men. Anecdotal evidence suggests that this is a factor,
Section_3_New.pmd 12/12/2005, 2:26 PM102

Chapter 8. Agriculture Sector
103
but not yet a major concern. The youth of FSM tend to prefer the cash economyand imported food rather than agricultural work. Agriculture as a career has lowstatus as illustrated by the closure in 2002 of the Pohnpei Agriculture and TradesSchool course on vocational agriculture – one of the few remaining courses of itstype in the region. The College of Micronesia is offering a two year degree coursein agriculture but currently only 15 of 2500 total students (0.5%) are enrolled.
8.3.3 Capital
Access to affordable capital is a constraint. Loans are geared towards largercommercial operations, though FSM’s recent history is littered with such failedenterprises. Evidence suggests that commercial crop production is sufficientlyprofitable to justify a well-designed credit program at an appropriate scale.
Opportunities for capital formation from savings are constrained by socialissues and a shrinking job market. The FSM Development Bank and others arebuilding compulsory savings into their loan products. But FSMDB has had verylimited exposure to the agriculture sector over the past five years with only 0.2%of total portfolio concerned with that sector in 2002.
The budget for agriculture in 2004 and estimates for 2005 demonstrate thelack of government support. Agriculture is designated as a priority productivesector, but only 1.8% is set aside for agriculture in both 2004 and 2005 nationaland state budgets. The small budget is made worse by the fact that most of thebudget is absorbed by personnel costs (i.e., wages and benefits) of agriculture staff,leaving even less to cover the costs of providing field support to farmers.
8.4 Technical Support
The major thrust of agricultural technical backup is offered through the COMCooperative Research and Extension Service affiliated with the USDA LandGrant Program. This service has a budget of $0.75 million and total of 43 staffmembers 21 of whom are either extension agents or researchers. But as salariesaccount for over 97% of total budget, their capacity to deliver relevant servicesto rural communities is constrained. There is an opportunity to improve theproductivity of these funds. Discussions with the relevant USDA staff regardingfunding of community-oriented NGOs to deliver agriculture extension shouldbe a priority. SPC and Peoples Republic of China also have activities in FSMand there are volunteers from Peace Corp and JOCV supplementing StateAgriculture staff.
Section_3_New.pmd 12/12/2005, 2:26 PM103

Federated States of Micronesia Towards a Self-Sustainable Economy
104
8.5 Policy Issues
The agriculture sector has been typified over the last 20 years by the lack of aconsistent vision and by expensive failed government investments. Policy andinvestments are made in relative isolation, with little or no data, and withoutreference to the needs and priorities of either rural communities or the privatesector.
The problems in agriculture are, for the most part, directly attributable toleadership and governance failures. The rate of out-migration in the FSM is aclear measure of the degree of that failure. Policy advice has favored commercial,market-oriented approaches and paid too little attention to the realities – inparticular the prevalence and characteristics of traditional agriculture and thevarying needs of the different states – especially Chuuk. Future agriculture policymust reflect the needs of those who rely on the sector for food, livelihood andemployment, with investments directly benefiting them.
There are opportunities to work with village communities, and to introducesimple but improved technologies, business understanding, and market awareness.One State Director of Agriculture freely admitted that little, if anything, wasbeing done for traditional farmers. Research and development (R&D) has beenlimited and of little value to farmers.
Poor performance and fiscal constraints have created the need to developalternative strategies. A number of agencies are using a community-basedapproach, recognizing that farmers do respond to new technologies. The FAObelieves that for any positive changes to be initiated, target groups need a betterbasis for decision making. Decisions should be made based on an understandingof the real agricultural business environment (without handouts and subsidies).The Natural Resource Conservation Service (NRCS) in Pohnpei has been doingcommunity-based extension work with farmer groups organized by the villagechief. NRCS believes the key is grassroots involvement in initial planning, whenneeds are determined by the community for the type of service required. Theyalso see demonstrations as a key approach, with many opportunities to improvethe performance of traditional agriculture.
The Pohnpei Conservation Society (PCS) started as an NGO in 1997 andhas 19 staff members and a $350,000 budget now funded independently ofgovernment. The PCS works with farmers to encourage agriculture and discourageforest encroachment. It believes science can be applied to traditional farmingsystems, but must be underpinned by proper dissemination through farmer groups.It sees a current gap between R&D and farmer needs—no interaction, nodissemination, and no feedback.
Section_3_New.pmd 12/12/2005, 2:26 PM104

Chapter 8. Agriculture Sector
105
The Yap agriculture garden program aims to help people establish a foodgarden by providing funds for seeds, fertilizer, tools, fencing, and other inputs– up to about $200 per applicant. The ultimate aim is to form a cooperativeserving the successful grantees, with a market outlet based on the localsupermarket.
Rice has become the single largest imported staple, valued at nearly $4.4million (cif) in 2002. The shift away from reliance on traditional crops bringsexposure to cash shortages and shipping delays. As one villager commented “ourtraditional root crops and bananas have become ‘show foods’ at special occasions– afterwards we go home to eat rice and tinned meat”.
A 1994 blood survey in Chuuk and Pohnpei showed that more than 50% ofchildren had low levels of vitamin A, with Chuuk having the worst levels. In2000, another blood survey showed Yap and Kosrae had 38 and 63% of childrenwith low levels of vitamin A, respectively. A recent UNICEF study found that 30-50% of youth in Pohnpei state reported consuming no fruit or vegetables. VitaminA deficiency can lead to diabetes, infections, impaired vision, heart disease, cancerand anaemia. Infant mortality (aged 0-1 year) is about 50 per 1000 in FSM. In arecent dietary survey in Kosrae, not a single mother or child was meeting vitaminA dietary needs, but many were eating three times their protein needs.
Some traditional FSM foods (especially yellow flesh banana, taro andbreadfruit) are high in beta keratin (bk), the source of vitamin A. While a whiteCavendish banana has 30 micrograms of bk per 100 gm, the FSM “karat” bananahas 800 micrograms of bk. One karat banana per day would be more than sufficientto provide a child’s vitamin A needs. Conversely, rice contains no bk. Rice has tobe supplemented by healthier and more nutritious traditional local foods.
FSM agriculture must be adaptable to the demands that socio-culturalactivities place on farmers and their families - in particular the funeral culture.The main constraint to commercial agriculture is not technical, economic, or thelack of markets, but local culture, especially attitudes to agricultural work andthe costs and obligations associated with funerals. It is harder for a farmer to optfor agricultural work rather than participate in a funeral, an obligation thattypically lasts three days.
Coconut provides the only cash crop option for the 19,071 people living inthe outer islands. The crop has been heavily subsidized by Government – throughshouldering shipping costs and price support. In 2004, the total subsidy requiredwill be about $73,000 and is projected to be about $68,000 in 2005. Theselosses would be much higher if the copra price had not increased by 70% in thelast 2-3 years.
Section_3_New.pmd 12/12/2005, 2:26 PM105

Federated States of Micronesia Towards a Self-Sustainable Economy
106
While the coconut tree stock is ageing, it is still productive and younger thanin other parts of the region, e.g., Tonga or Samoa. There are prospects for extractionof oil in situ in each outer island, reducing freight costs and storage losses. There isa current capacity to produce about 100,000 gallons of oil, equal to $210,000 ofoil exports – a 33% increase on the 2004 copra export revenue, after subsidies.This should allow farmgate payments to increase and subsidy payments to beeliminated. There are still further opportunities for value adding to the coconutcrop by processing the oil into high-end consumer products.
Previous development approaches have identified market opportunities,assuming farmers would capture these opportunities. However, the cumbersomeprocesses of governments are typically too slow for niche marketing. Agriculturein the FSM will never develop on the basis of large monoculture crops. Supplycapacity is too limited and most farmers will not change their farming system.
Imports of vegetables and fruits that can be grown locally in FSM amountedto $1.4 million in 2002. It seems reasonable to assume that technically thisamount could be replaced with local production in the medium term. In addition,imports of rice and noodles amounted to $5.9 million in 2002. It is assumed that10% of this amount could be replaced with locally produced root and tree crops inthe medium term.
In this kind of flexible market, government’s role is to provide an enablingenvironment, including a consistent and appropriate policy framework, secureland tenure, public infrastructure, R&D, and effective quarantine and protectionservices. The private sector’s role is to find and fill markets with quality products,on a consistent basis and in a manner that treats farmer suppliers equitably.There has to be regular dialogue between the farmers, government, and the privatesector. Such dialogue does not occur in FSM at this time.
An important function of government is establishment of an enabling policyframework. To develop effective policy that reflects the priorities of allstakeholders, policy makers need good information on crops and livestock. Atpresent there is a complete absence of such data with the only reliable informationcoming from the quarantine service. However, because of staff constraints, theirdata is not up-to-date. The extension staff will greatly benefit from a simplefarm-monitoring program where they work with village leaders to gather area andyield data and identify a few randomly selected farmers to monitor in-depth on aregular basis. This way, the data could be constantly updated, both horizontally(general data) and vertically (in-depth data from individual farmers).
As part of an enabling environment, land tenure systems need to be assessed.The following account is considered an accurate assessment of land tenure issuesin relation to agriculture. “Land tenure arrangements vary in each state, and
Section_3_New.pmd 12/12/2005, 2:26 PM106

Chapter 8. Agriculture Sector
107
depend on the type and prevalence of traditional and customary authority, andthe degree of change to modern systems of land registration and ownership.Systems that are in the process of transition are least clear. Land is perceived asscarce and has high value (but there is no transaction price data that would atleast provide some indication of land values) but standards for land value appraisalsystems are not clear. Where survey and ownership records and values are disputed,and progress with new surveys and registration is slow, the access and security ofownership to land is a constraint to production and investment. Where customaryagreements or modern systems provide fair and undisputed access, value andownership, the constraint is diminished”.
8.6 Sector Goals & Policies
The sector goals and policies are designed to support agriculture sectordevelopment strategies that:
• Ensure that within an agreed framework, investment in the sector isconsistent, equitable, and relevant;
• Encourage dialogue between stakeholders, including national and stategovernments, private sector businesses, civil society agencies, and farmergroups;
• Focus attention on the reality that agriculture is based on traditionalfarm systems;
• Recognize that significant commercial production comes fromtraditional agriculture;
• Bring rural communities into the decision making process, encouraginggreater self reliance, responsibility and local level initiative for thedevelopment of agriculture;
• Develop both extension and research services that respond to the differentneeds of traditional and commercial farmers;
• Encourage civil society participation in extension delivery on acontractual basis;
• Recognize market opportunities in import substitution, and local andregional exports;
• Allow the private sector to devise realistic strategies for each marketsegment;
• Ensure that the private sector is fully responsible for supplies of farminputs;
• Encourage the provision of sustainable financing for commercial farming;and
• Ensure environmentally sustainable production.
Section_3_New.pmd 12/12/2005, 2:26 PM107

Federated States of Micronesia Towards a Self-Sustainable Economy
108
The mission statement for the agriculture sector is:
“““““The agriculture sectorThe agriculture sectorThe agriculture sectorThe agriculture sectorThe agriculture sector, including forestry, including forestry, including forestry, including forestry, including forestry, shall provide:, shall provide:, shall provide:, shall provide:, shall provide:(i) food security(i) food security(i) food security(i) food security(i) food security, cash income, and healthy livelihood; and,, cash income, and healthy livelihood; and,, cash income, and healthy livelihood; and,, cash income, and healthy livelihood; and,, cash income, and healthy livelihood; and,(ii) opportunities for domestic and export markets, while(ii) opportunities for domestic and export markets, while(ii) opportunities for domestic and export markets, while(ii) opportunities for domestic and export markets, while(ii) opportunities for domestic and export markets, whilepromoting environmentally sustainable production withinpromoting environmentally sustainable production withinpromoting environmentally sustainable production withinpromoting environmentally sustainable production withinpromoting environmentally sustainable production withina stable and consistent policy framework”.a stable and consistent policy framework”.a stable and consistent policy framework”.a stable and consistent policy framework”.a stable and consistent policy framework”.
The Draft Strategic Goals and Policies for the agriculture sector are:
Strategic Goal 1:Strategic Goal 1:Strategic Goal 1:Strategic Goal 1:Strategic Goal 1: A well resourced and properly focused agricultureA well resourced and properly focused agricultureA well resourced and properly focused agricultureA well resourced and properly focused agricultureA well resourced and properly focused agriculturesector consistently operating within a stable policy framework.sector consistently operating within a stable policy framework.sector consistently operating within a stable policy framework.sector consistently operating within a stable policy framework.sector consistently operating within a stable policy framework.
Supporting Policies:• Adherence to an agreed policy framework based on solid information• Allocation of an equitable Government budget share to agriculture• Equitable allocation of Government agriculture budget between staff
salary-related costs and operating expenses• Delivery of effective education to rural population• Raising the image of agriculture as a worthy and satisfying career choice
This Strategic Goal provides a consistent vision and adequate productiveinvestment that benefits farmers and their families, and not government staff.Agriculture receives inadequate funding and existing funds are largelyunproductive, i.e., expenditure is ineffective in helping traditional farmers.Compact II funding levels and restrictions on uses will result in reducedGovernment budget resources. Thus, greater efficiency and productivity ofGovernment expenditures will have to be achieved.
The agriculture sector has lacked a consistent vision. Policy advice has tendedto favor commercial, market-oriented approaches (both export and importsubstitution at various times) and has paid too little attention to the realities ofthe sector–that it is substantially based on traditional agriculture and that thestates have different needs constraints and opportunities – especially Chuuk.Future agriculture policy must reflect the expressed needs of those who rely onthe sector for food, livelihood, and employment. Future investments must directlybenefit them.
Policy and investments are made in relative isolation, with little or no data,and without reference to the needs and priorities of either rural communities orthe private sector. The norm for investment in agriculture has been single solutions
Section_3_New.pmd 12/12/2005, 2:26 PM108

Chapter 8. Agriculture Sector
109
based on large government expenditure. But most such investments have failedand have tended to either ignore or overwhelm small, traditional farmers. Themajor share of expenditure is on agriculture staff that are perceived by farmers tobe ineffectual in providing assistance because they offer little of relevance tothem or their families. Agriculture successes in recent times (in kava and betelnut production) have been achieved despite Government involvement in thesector, not because of it.
Strategic Goal 2: TStrategic Goal 2: TStrategic Goal 2: TStrategic Goal 2: TStrategic Goal 2: To increase production of traditional farmingo increase production of traditional farmingo increase production of traditional farmingo increase production of traditional farmingo increase production of traditional farmingsystems for home nutritional and traditional needs, and cashsystems for home nutritional and traditional needs, and cashsystems for home nutritional and traditional needs, and cashsystems for home nutritional and traditional needs, and cashsystems for home nutritional and traditional needs, and cashincomes.incomes.incomes.incomes.incomes.
Supporting Policies:• Improved outputs and profitability from traditional farming systems• Development of a flexible extension service specifically designed to
deliver quality services to traditional farmers• Elimination of Vitamin A deficiency among the FSM population• Development of a more focused household food security strategy for
agriculture in Chuuk• Replacement of some imported foods with local product• Adequate investment in border protection and agricultural quarantine
This Strategic Goal aims to: (i) focus specifically on the farm family; (ii)differentiate services, especially extension services, between traditional andcommercial agriculture; (iii) highlight the need to offer support services at thecommunity level where extension will be effective; (iv) employ agencies bestequipped to deliver such services – not necessarily from inside the government;and (v) ensure that closely related aspects of traditional agriculture such asquarantine and nutritional health are seen as part of the same goal.
Strategic Goal 3: Increased volumes of saleable surpluses to be placedStrategic Goal 3: Increased volumes of saleable surpluses to be placedStrategic Goal 3: Increased volumes of saleable surpluses to be placedStrategic Goal 3: Increased volumes of saleable surpluses to be placedStrategic Goal 3: Increased volumes of saleable surpluses to be placedinto local and regional markinto local and regional markinto local and regional markinto local and regional markinto local and regional markets by the private sectorets by the private sectorets by the private sectorets by the private sectorets by the private sector.....
Supporting Policies:• Establishment of regular dialogue between stakeholders (Government,
private sector and growers)• Recognition of the separate roles of stakeholders• Encouragement of niche commercial crops for import substitution and
export
Section_3_New.pmd 12/12/2005, 2:26 PM109

Federated States of Micronesia Towards a Self-Sustainable Economy
110
• Manage the coconut industry for the benefit of both producers andprocessors
• Differentiate extension services between commercial and traditionalfarmers
• Develop small-scale agriculture/food production units and industries
This Strategic Goal aims to ensure that: (i) the role of the private sector inmarket development is realized; (ii) there is recognition of the need to holddialogues between all market stakeholders; (iii) there is a focus on smallincremental gains from niche markets which will build confidence among allstakeholders, especially farmers, to whom improved status and recognition areimportant needs; (iv) the potential of selected commodities, such as coconut, forvalue adding is captured.
In any successful marketing environment, each stakeholder will recognizeits particular role. Some niche markets already exist. There are opportunities toleverage the FSM image of a clean and green environment where food can beproduced without concerns about contamination. Niche markets can also betapped for import substitution. A community of farmers could agree to produce toreplace a share of the market of some imported fruit and vegetables.
Strategic Goal 4: PStrategic Goal 4: PStrategic Goal 4: PStrategic Goal 4: PStrategic Goal 4: Promote environmentally sound and sustainableromote environmentally sound and sustainableromote environmentally sound and sustainableromote environmentally sound and sustainableromote environmentally sound and sustainableproduction.production.production.production.production.
Supporting Policies:• Establish effective mechanisms to control invasive species• Discourage slash and burn farming/deforestation
The FSM’s limited land resources and fragile ecosystems should not be leftto casual methods of environmental protection given the rapid deterioration thatcan result from inappropriate production practices. The causes and effects ofenvironmental decline are often not immediately understood by resource users.For those striving to make a living, the issue may not be a priority. As proven in anumber of programs, a community-based approach focusing on resource usersthrough education and appropriate support services can yield results. The policyis aimed at a pro-active and integrated approach to addressing environmentalsustainability.
Section_3_New.pmd 12/12/2005, 2:26 PM110

Chapter 8. Agriculture Sector
111
8.7 Agriculture Sector Growth Projections (2005 – 2023)
Growth scenarios for agriculture have been calculated, demonstrating that thesector could make significant contributions to economic growth if it were providedwith appropriate support and direction. In the average growth scenario over theperiod from 2005-2023, subsistence agriculture is expected to grow by 3.3% perannum, agriculture exports by 13.3%. Eighty two per cent of the readilyreplaceable food imports will be locally produced. The average growth scenarioassumes a population growth of 0.5%. In addition, there is an expectation that ahigher proportion of the population will go back to traditional agriculture, and ahigher productivity from traditional agriculture will result from theimplementation of the Agriculture Sector Matrix. Export receipts are expected togrow as a result of improved extension services to commercial farmers, and agreater focus on niche markets and increases in food processing. In the averagegrowth scenario, coconut crop potential is captured by moving to oil extraction.Import substitution of readily replaceable products is achieved, and there issome tourism growth — averaging 1.5% annually.
In the high growth scenario, subsistence agriculture is expected to grow by9.6% per annum, exports by 33.5%. Ninety seven per cent of the readily replaceableproducts will be locally produced. With enthusiastic and full support for thepolicies and strategies recommended, including the full collaboration ofstakeholders, this scenario is achievable.
In the low growth scenario subsistence agriculture is expected to grow by 1per cent per annum, exports by 3.6% and 59% of the readily replaceable productswould be locally produced. A continuation of current policies, resource allocationsand governance standards, will result in this rather dismal scenario.
8.8 Agriculture Infrastructure Investment Needs
An Infrastructure Development Plan (IDP) for FSM was prepared in 2002 toaddress anticipated needs for the period 2003-2017. While the IDP addresses theinfrastructure needs of the private sector in general, it makes no specific mentionof agriculture, except that for secondary rural roads. In fact there is $250 millionearmarked for investment in roads. Additional investments in agriculture thatshould be considered, in addition to that contained in the IDP, is infrastructurefor quarantine ($1,040,000), additional market infrastructure ($120,000) andcoconut oil extraction facilities in the outer islands ($180,500).
Section_3_New.pmd 12/12/2005, 2:26 PM111

Federated States of Micronesia Towards a Self-Sustainable Economy
112
Chapter 9. Fisheries Sector
T he marine resources of the Federated States of Micronesia arecontained within an Exclusive Economic Zone (EEZ) covering some900,000 square miles extending from 135° to 165° east longitudeand from 10° north to 1° south latitude in the western Pacific Ocean.Responsibility for the oversight and management of near-shore and
coastal resources to 12 miles is vested in FSM state governments with themanagement of offshore oceanic resources retained as a national governmentfunction under the National Oceanic Resources Management Agency (NORMA).
Since the 1996 FSM Economic Report there have been a number of studieson FSM fisheries. The ADB TA 2832 – Fisheries Management and DevelopmentProject alone produced 40 substantial TA reports, many of which continue toremain relevant to the FSM.
9.1 Coastal and Near-Shore Fisheries and Marine Resources
Coastal and near-shore marine and fisheries resource use in FSM comprises inshorefisheries (those taking place in mangroves, reef areas, and lagoons), near-shorefisheries for large pelagic species (including tuna), and bottom fisheries forsnappers, groupers and other demersal species. The coastal areas and lagoonshave an enormous variety of living resources including reef and deep-slope fish,mangrove crab, land crab, coconut crab, lobster, deep-water shrimp, trochus shell,clams, pearl oyster, ornamental shells, turtles, octopus and squid, sea cucumber,sponges, and corals. Reef and lagoon areas also provide a source of sand and coralrubble for construction and road building.
Subsistence fishers make the greatest use of inshore resources with much ofthe artisanal (small-scale commercial) fishing effort focused on near-shore, bottomand coastal pelagic resources.
In the main islands of each state, small-scale fishers sell catch in excess oftheir own requirements through various outlets. A few fishers and traders alsoship small quantities of fish to other parts of FSM and overseas although commercialactivity in the export of reef fish has recently been controlled in Kosrae, Yap andPohnpei due to resource depletion concerns. The greatest cash value resource istrochus (Trochus niloticus) shells, a commodity specific to Yap but which sincethe 1930s has been progressively introduced to many other locations within FSM.
Attempts to develop and structure small-scale commercial fisheries, throughprojects such as the financing (or gratis provision) of fishing craft have met withlimited success. Problems with catch distribution and marketing are perennial
Section_3_New.pmd 12/12/2005, 2:26 PM112

Chapter 9. Fisheries Sector
113
constraints. Nevertheless, a great deal of (mainly foreign) development fundinghas been directed towards the commercialization of inshore fisheries, and hasincluded regional or village fisheries centers, infrastructure projects, and theprovision of boats, motors, and other equipment.
The development and management of coastal fisheries encompasses all reefand lagoon fisheries as well as near-shore fisheries for coastal and ocean pelagicspecies, including tuna. Responsibility for marine resource fisheries developmentand management activities has been divested to separate agencies in Kosrae,Pohnpei and Yap with a single agency responsible for both management anddevelopment in Chuuk. The FSM national government, through the FisheriesSection of the Division of Sector Development within the Department ofEconomic Affairs, has the responsibility to provide support to state agenciesinvolved in coastal fisheries development and management efforts. The FisheriesSection assists the states in implementing their development and managementplans through the provision of technical support and information, facilitation ofcontacts between state agencies and external organizations, and coordination ofthe activities of FSM’s international development partners in the fisheries sector.The Fisheries Section also retains responsibility for the operation of the NationalAquaculture Center in Kosrae State.
Various other organizations, including environmental agencies, fisheries andeconomic development authorities, and non-government organizations are alsoinvolved in coastal resource management, making coordination of activities andharmonization of goals and objectives an ongoing challenge.
In the mid-1990s draft marine resources legislation was prepared for eachState to enable community or traditional participation in fisheries management,and to harmonize key provisions among states and with the national governmentfor effective management and enforcement. These respective marine resourceslaws, responding to different needs and situations in each state, were originallyinspired by the concept of a “model law”. Since then, there have been changes inpersonnel, political administrations, and priorities in the states causing unevenprogress in revising the state fisheries laws. New laws have been passed in recentyears in Yap and Kosrae but have yet to be adopted in Pohnpei and Chuuk. However,in Pohnpei, the recent adoption of a Marine Protected Areas Act has provided apartial framework for fisheries management.
9.1.1 Coastal Fisheries Landings and Economic Contribution
Dalzell et al. (1996), using information from Smith (1992), estimated coastalfisheries production and value as approximately 6,243 metric tons (mt) valued at
Section_3_New.pmd 12/12/2005, 2:26 PM113

Federated States of Micronesia Towards a Self-Sustainable Economy
114
$11,237,400 for subsistence fisheries and 637 mt valued at $1,483,544 for smallscale commercial fisheries. The Statistics Unit suggested that some 490 mt offish and shellfish worth about $1.2 million was “purchased by local fishingmarkets” in 1997.
The Household Income and Expenditure Survey reported that $18,496,000was spent by FSM households on fresh and frozen fish, the vast majority of whichcome from small-scale commercial fishing. Using average fish price informationin Statistics Unit (1999), this equates to 6,323 mt of purchased fish.
Fisheries Engineering carried out extensive fieldwork in Pohnpei andestimated the total coastal fishery production of Pohnpei Island to be about 1780mt (75% reef/inshore, 25% pelagic). Of this, 780 mt was attributed to subsistencecatch and 1000 mt to commercial effort (with the proviso that approximately28% of this was for non-sale domestic consumption).
If the catch level reported in Pohnpei (32% of FSM population) wereextrapolated to all of FSM, the coastal fisheries catch would be about 5,500metric tons. However, taking into account population increase and the likelyhigher per capita catches of the outer islands and Chuuk, a more likely catchestimate is approximately 8,000 metric tons per year. Gillett et al. estimated anannual catch of about 2,000 metric tons of tuna in small-scale coastal fisheries.
However, with known increases in fishing effort in recent years and increasingpopulations, an approximate indication of coastal fisheries production wouldpossibly be in the range of 10,000 metric tons . At $2.90 per kg for the commercialcatch and $2 per kg of value for the subsistence catch this equates to a value of$24.5 million per year.
9.1.2 Problems, Constraints, and Issues
Near-shore marine and fisheries resources have increasingly become the targetfor commercial development. New fishing methods and associated technology,and the establishment of fisheries infrastructure have made commercial activitymore prevalent and accessible, especially in proximity to urban development. Insome cases, traditional communities have become more susceptible to the use ofunsustainable fishing methods to meet needs for immediate cash income.Increasing population over the past fifty years has placed greater demands oncoastal resources for income generating activity, food, housing, and otherdevelopments. Inappropriate fishing techniques have accelerated resourcedepletion.
Recent years have seen an increasing focus on resource management andissues relating to sustainability and the need to preserve fisheries for subsistence
Section_3_New.pmd 12/12/2005, 2:26 PM114

Chapter 9. Fisheries Sector
115
and community access. This is clearly exemplified in the work of state marineresource agencies and NGO’s, and reflected in the recommendation of the 2002National Coastal Fisheries Consortium that FSM should “Take a precautionaryapproach to management of inshore resources and refrain from promoting orallowing commercial exploitation for export until it is determined to beecologically sustainable.”
Chuuk has the largest state fishery agency in FSM. It is also the state withthe most serious fishery management problems. A rapidly growing population iscreating greater pressure on resources. There is no current data on fish catches orproduction but anecdotal information suggests that large quantities of reef fishare being exported by air to Guam, and declines in abundance of some resourcesare said to have occurred. Dynamite fishing is prevalent, and dredging and sandmining for landfill and for building materials is largely uncontrolled. The dredgingproblem is exacerbated by the shortage of land on Weno, the state center, wheredevelopment is leading to extensive shoreline reclamation. The state’s numerousmunicipalities (and in some cases individual reef owners) nominally have someauthority to control access to their fishing areas but these seem to be upheld onlyin the outer island and more remote parts of Chuuk proper, and are largely ignoredclose to the population centers.
Kosrae is the state with the least complicated fisheries managementenvironment because historically its people were not into fishing. Kosrae’s fisherymanagement problems are mainly related to the smallness of the resource. Harvestsof certain key species such as trochus and crabs are, or need to be, controlled, butmost threats to coastal resources come from land-based developments that causeincreased runoff, pollution, or sedimentation. Kosrae probably has the best-developed coastal management system among the states, with environmentalreview procedures being progressively implemented for all coastal developmentprojects. Basic statistics on catches are said to be collected on a regular basis, butthese are not analyzed or published.
Pohnpei is an intermediate case in terms of resources, degree of exploitation,and the extent of fishery management problems. Some production statistics arecollected by the state fisheries agency, but these are not analyzed to show trendsor even annual production data. The general perception in Pohnpei seems to bethat resources are not yet in crisis but that the time is approaching whenmanagement action will be needed. As in other states, enforcement of Statefishery laws by State police or conservation officers is largely ineffective, whilethe absence of traditional reef/lagoon tenure systems on Pohnpei proper mayimpede the development of community-based management arrangements. Theisland has lost a large proportion of its virgin forest to the cultivation of sakau and
Section_3_New.pmd 12/12/2005, 2:26 PM115

Federated States of Micronesia Towards a Self-Sustainable Economy
116
this is thought to have caused increased runoff, sedimentation, and chronic reefdegradation.
Yap is unique in the degree to which traditional marine tenure arrangementshave been preserved. Inshore fishery management in the state is community-based because the state constitution and laws recognize that communities andtheir leaders have authority over access to, and use of coastal areas. Relative toother states, Yap has a large resource base and in most areas a small population, somanagement issues related to over-exploitation are generally not pronounced.Nevertheless some resources, especially of sessile types such as clams and beche-de-mer, or of other species close to the state center of Colonia, have been over-exploited in the past, demonstrating that the traditional system of tenure doesnot guarantee effective stewardship. For several years the state government hasbeen progressively trying to introduce a coastal area management plan to beimplemented through both Government and traditional groups.
9.1.3 Development Potential
Due to their distinct biological, physical, and economic characteristics,FSM’s four states each have different prospects for the development of coastalliving marine resources. In terms of resource endowment Chuuk and Yap and, toa lesser extent, Pohnpei, have extensive areas of reef and lagoon and thereforerelatively substantial inshore resources. Kosrae, a single high island with a shortcoastline and small fringing lagoon, is much more limited in this regard.
The commercial potential varies considerably from state to state. Localmarkets for fish could be developed further in each state, particularly in Pohnpei,which, as the seat of national government, has the most extensive cash economy.Yap formally participated in a relatively steady reef fish export trade with Guam.As a resource management measure however, this trade has recently been restricted.Pohnpei also participates in a similar trade albeit with some species controls anda higher overall cost for fish transportation. Chuuk exports of reef fish haveincreased in recent years despite lack of transport hubs. Kosrae, which is hamperedboth by high transportation costs and limited resource endowment, is effectivelyexcluded from such trade.
In all the states but Kosrae, there exist ‘outer’ islands that are either coralatolls or single coral islands. For most of the atolls, the lack of regular transportationand resource limitations preclude money-economy marketing of most coastal fisheryresources. There are also uninhabited or lightly-inhabited atolls (and islands, inthe case of Chuuk) which have commonly been seen as ‘storehouses’ of marineresources, and whose existence further complicates management in those states.
Section_3_New.pmd 12/12/2005, 2:26 PM116

Chapter 9. Fisheries Sector
117
The main role of small-scale fisheries is likely to continue to be providingsubsistence protein, contributing to dietary health, and helping maintain rurallifestyles in the face of a tendency to urban drift or emigration. Artisanal fishingmay be able to expand in some areas through local market development or bytaking advantage of export opportunities to Guam and Saipan. Where marketingproblems can be overcome, however, resource constraints are likely to quicklylimit commercial fishery expansion.
One possible area of development potential is in linking the management ofinshore resources to key activities in the tourism industry based on soundenvironmental management. A pristine marine environment is one of theunderpinning sales opportunities for tourism development. For example, if keyselected areas of coral biodiversity or fish abundance were reserved as dive sitesand marketed accordingly there could be greater overall community benefit fromincome generated by the dive industry. This has been clearly demonstrated inPalau which has an extensive Marine Protected Area (MPA) program.
Primarily due to the efforts of the Pohnpei Conservation Society, a network of11 MPAs are already in place. The development challenge is to link conservationefforts to tourism marketing and establish mechanisms to ensure direct benefitsto communities.
There may also be room to further develop coastal pelagic fisheries. Deploymentof Fish Aggregating Devices (FAD’s) in coastal areas has the potential to divertfishing effort from near-shore and reef-based fishing to targeting tuna and othercoastal pelagic species. The emphasis in this scenario will be on diverting fishingeffort from heavily-fished resources rather than increasing overall fishing effort.
Given the increasing focus on resource management and conservation, itmust be concluded that there is very little real development potential in near-shore and coastal fisheries.
9.1.4 Aquaculture
Aquaculture has been the focus of technical and development attention inFSM, as well as in some neighboring countries, for at least 20 years.
A National Aquaculture Center (NAC) was established in Kosrae in 1991 toexplore aquaculture potential and to undertake research and training. Its primarywork involved the propagation of giant clams for farming and re-seeding in otherstates. In its early days the NAC was the operational base for aquaculture extensionagents funded through the US Center for Tropical and Sub-Tropical Aquaculture(CTSA)/Land Grant Program, but these have now relocated their activities toPohnpei.
Section_3_New.pmd 12/12/2005, 2:26 PM117

Federated States of Micronesia Towards a Self-Sustainable Economy
118
Despite the activities of the Center, no private commercial culture operationsfor giant clam have commenced in FSM. There has been little reseeding activityand there appears to be little prospect of any such development in the foreseeablefuture. The operation of the NAC was reviewed in 2000 and it was concluded thatthe focus on giant clam aquaculture provided little or no economic benefit to FSM.
A number of other aquaculture initiatives have been undertaken by bothlocal and international organizations. Sponge culture started in Pohnpei about10 years ago and several pilot farms began with donor funding support. There arenow nine established farms in operation but production volumes have yet toreach the levels required to attract export markets. The culture of Eucheumaseaweed was attempted in Pohnpei during the mid-1980s, but relatively lowreturns to farmers and other problems prohibited it from developing. Black pearlculture trials began on Nukuoro atoll in Pohnpei state in 1995. Initial harvestinghas reportedly yielded good quality pearls and several other ventures are in theearly stages of development. Operations in farming milkfish, tilapia, carp, andprawns have been attempted or proposed but have not resulted in sustainedcommercial success. More recently, a Korean Joint Venture company (HansMicronesia Inc) has reportedly commenced an operation whereby fry are importedinto Chuuk for sea-cage grow-out and subsequent export. In Kosrae, a project isunderway to develop capacity for the culture of mangrove crabs.
Despite widespread investment and interest in the commercial potential ofvarious aquaculture pursuits, there has been very little commercial development.Prospects for commercial activities have probably been overstated, and it seemsunlikely that the sector will become a significant revenue earner for FSM, at leastin the near future. However, there is still potential for subsistence and artisanalaquaculture activities to be successful, both in income generation or simply forfood production.
9.1.5 Coastal and Near-shore Resources and theFSM Sustained Growth Strategy
Inshore fisheries and marine resources are seen as having a number of inherentadvantages as a source of income and employment. If incomes fall (as a result ofa decline in Compact funding) there is likely to be greater activity and supplyfrom inshore fisheries for food and cash purposes, especially from subsistence andartisanal activity.
The overriding issue in near-shore and coastal fisheries is the sustainabilityof resources. The inshore resource has, in many cases, already been depleted andthe immediate focus required is resource conservation and management .
Section_3_New.pmd 12/12/2005, 2:26 PM118

Chapter 9. Fisheries Sector
119
9.2 Oceanic Resources
The Exclusive Economic Zone (EEZ) of the Federated States of Micronesia isone of the largest declared national jurisdictions in the Western and CentralPacific Ocean (WCPO). The EEZ supports diverse tuna fishery operations whichrange from subsistence and artisanal activities to industrial scale longline, poleand line, and purse seine fishing.
The main oceanic target species are skipjack tuna (katsuwonis pelamis),yellowfin tuna (thunnus albacares) and bigeye tuna (thunnus obesus) with the vastmajority of fishing effort coming from the established distant water fishing nations(DWFN), the United States, Japan, People’s Republic of China (PRC), Republicof Korea, Taipei,China.
The extent of the tuna resource of FSM has the potential to vary greatlydepending on fishing effort, the migratory nature of the species, and the climaticevents La Niña and El Niño which affect sea temperature. During a La Niñaperiod (such as 1995), surface tuna schools are most active in the western PacificOcean in the area of the FSM EEZ. In contrast, the surface schools concentratemore to the eastern part of the central Pacific during El Niño periods, as was thecase in 1998.
Tuna catches in FSM waters increased steadily to 253,174 mt in 1995 withsubsequent significant declines through 1998. An improved catch in 1999 wasfollowed by progressive declines to the low catch of 43,690 mt in 2002. Thecatch trend improved in 2003. Reflecting the La Niña and El Niño phenomena,the catch in FSM started declining in 1996 while overall Western and CentralPacific Ocean (WCPO) catches continued to increase.
Large purse seine vessels land more than 80% of the tuna. For the period1999 – 2003, the largest catch went to Japan followed by Taipei,China, Republicof Korea, the US and FSM domestic vessels. The total catch for purse seinevessels fishing in FSM waters for the period was 562,509 mt.
Longline fishing showed a dramatic reduction in catches in the period 1999-2002 with a subsequent increase again reported in 2003. The downward trendmatches reported catch reductions in other WCPO fisheries such as Fiji Islands,Samoa and Tonga.
From total landings for the period 1999 – 2003 of 32,900 mt, the Guam-based Japanese fleet vessels reported current landings of 16,799 mt inclusive ofby-catch. The average catch per vessel in 1999 was 61.84 mt compared to 52.46mt in 2003.
In pursuit of domestic capacity development in the longline fishery in the1990s, FSM encouraged both public and private sector investment in longline
Section_3_New.pmd 12/12/2005, 2:26 PM119

Federated States of Micronesia Towards a Self-Sustainable Economy
120
vessels. Domestic vessel numbers reached 25 in 1999 with 487 mt of landedcatch. Domestic vessels numbers have declined to 18 in 2002, 21 in 2003 andonly 12 vessels reportedly operating in 2004.
The Japanese pole and line fishing fleet has operated variously in FSM withcatch highs achieved in 1991 and 1995 and a subsequent reduction in fishingfrom 2000 to 2003 where there were 6 licensed vessels and reported landings of1733 mt.
9.2.1 Oceanic Resource Management
Following a review and consultation process spanning some 10 years, theMarine Resources Act of 2002 (MRA 2002) was passed into law as Title 24 of theFSM code. The law established the National Oceanic Resource ManagementAuthority (NORMA), previously known as the Micronesian Maritime Authority(MMA) and the Micronesian Fisheries Authority (MFA), as the national agencyresponsible for the management of oceanic resources from 12 – 200 miles in theFSM economic zone. The mission of the Authority is to be an effective guardianand manager of the living and non-living marine resources in the EEZ of theFederated States of Micronesia.
The Authority is empowered to draft regulations for the management,development, and sustainable use of fisheries resources and related activities inthe EEZ, in relation to fisheries monitoring and control and to implement accessagreements and fisheries management agreements. Other regulatory powers relateto compliance with regional arrangements, the issuance of citations, andassessment of penalties. NORMA is also tasked with the regulation andmanagement of marine scientific management and training, the delineation ofboundaries in the EEZ, and the issuance of fishing licenses. The agency also hasa coordination role in the implementation of fisheries monitoring and controlactivities but active surveillance activity and the operation of patrol boats iscarried out by the Maritime Wing of the FSM National Police under theDepartment of Justice.
FSM has a history of participation in the programs of the regional fisheriesagencies such as the Oceanic Fisheries Program of the Secretariat for the PacificCommunity and the Forum Fisheries Agency (FFA). As such, FSM is a party tothe 1982 Nauru Agreement Concerning the Management of Common Interestand the 1994 Federated States of Micronesia Arrangement for Regional FisheriesAccess. Agency managers have attended all 7 sessions of the PreparatoryConference for the Establishment of the Commission for the Conservation andManagement of Highly Migratory Fish Stocks in the Western and Central Pacific.
Section_3_New.pmd 12/12/2005, 2:26 PM120
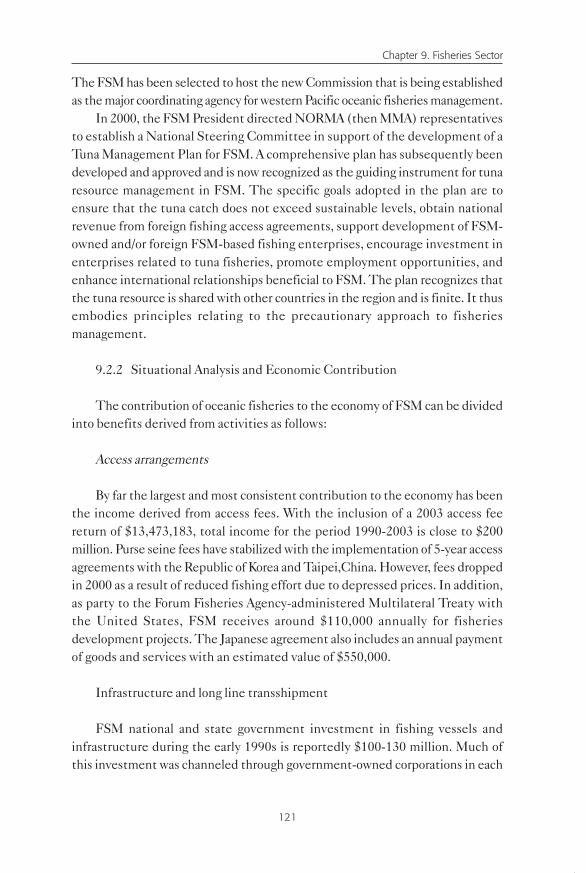
Chapter 9. Fisheries Sector
121
The FSM has been selected to host the new Commission that is being establishedas the major coordinating agency for western Pacific oceanic fisheries management.
In 2000, the FSM President directed NORMA (then MMA) representativesto establish a National Steering Committee in support of the development of aTuna Management Plan for FSM. A comprehensive plan has subsequently beendeveloped and approved and is now recognized as the guiding instrument for tunaresource management in FSM. The specific goals adopted in the plan are toensure that the tuna catch does not exceed sustainable levels, obtain nationalrevenue from foreign fishing access agreements, support development of FSM-owned and/or foreign FSM-based fishing enterprises, encourage investment inenterprises related to tuna fisheries, promote employment opportunities, andenhance international relationships beneficial to FSM. The plan recognizes thatthe tuna resource is shared with other countries in the region and is finite. It thusembodies principles relating to the precautionary approach to fisheriesmanagement.
9.2.2 Situational Analysis and Economic Contribution
The contribution of oceanic fisheries to the economy of FSM can be dividedinto benefits derived from activities as follows:
Access arrangements
By far the largest and most consistent contribution to the economy has beenthe income derived from access fees. With the inclusion of a 2003 access feereturn of $13,473,183, total income for the period 1990-2003 is close to $200million. Purse seine fees have stabilized with the implementation of 5-year accessagreements with the Republic of Korea and Taipei,China. However, fees droppedin 2000 as a result of reduced fishing effort due to depressed prices. In addition,as party to the Forum Fisheries Agency-administered Multilateral Treaty withthe United States, FSM receives around $110,000 annually for fisheriesdevelopment projects. The Japanese agreement also includes an annual paymentof goods and services with an estimated value of $550,000.
Infrastructure and long line transshipment
FSM national and state government investment in fishing vessels andinfrastructure during the early 1990s is reportedly $100-130 million. Much ofthis investment was channeled through government-owned corporations in each
Section_3_New.pmd 12/12/2005, 2:26 PM121

Federated States of Micronesia Towards a Self-Sustainable Economy
122
State with the intention that the establishment of fisheries infrastructure wouldstimulate state economies and foster further investment. The various governmententities established for fishing, vessel servicing, and transshipment haveultimately not performed well. They have accumulated high debt levels andfinancial loss and have either ceased to operate or scaled back their activities.Utilization of facilities in Yap, Chuuk, and Kosrae are reduced to the extent thatfacilities in each port are now inoperable and longline transshipments no longertake place.
For the purpose of overall operational efficiency, the longline fleets of Japan,People’s Republic of China, and Taipei,China have opted to move their operationalbase for transshipment to Guam. Operators cite airfreight issues, high costs, andpoor service as the principal reasons for the transfer.
A 1995 fisheries development study estimated the retained value of longlinetransshipment at $120,000 per annum per vessel. With only 21 Chinese vesselscontinuing to transship from Pohnpei in 2004 the overall loss to the economyfrom the departure of the foreign longline fleet could be as much as $21,000,000per year. The degraded state of the transshipment facilities represents anadditional economic loss.
Domestic operated long line and purse seine vessels
Government and domestic private sector investment in longline and purseseine vessels has proven to be high risk as seen in the significant reduction in thenumber of operational vessels in the domestic longline fleet. Since 1999, thenumber of operational vessels has decreased annually with only 18 vessels activein 2002, 21 in 2003, and only 12 vessels reported operational in 2004.
The State Governments of Pohnpei, Chuuk, and Yap have all invested in thepurchase and operation of purse seine vessels. Pohnpei has two small seinersoperated by the Caroline Fishing Corporation. Following issues relating to jointventure ownership and a period of receivership, the operational performance ofthese vessels has improved in recent times with higher international bulk tunaprices. Yap also experienced difficulties with the operational management oftheir purse seine business. However, with a vessel purchased from South Americaand tight management, Yap’s Diving Seagull company has performed well inrecent years and is reportedly debt free in 2004 and able to pay dividends to thestate. The Chuuk investment also involved complex joint venture arrangements.These ultimately led to the ownership of a single vessel, the Nien Feioch, by theChuuk Public Fisheries Corporation. This vessel sank at the wharf in Chuuk inearly 2004 and was uninsured.
Section_3_New.pmd 12/12/2005, 2:26 PM122

Chapter 9. Fisheries Sector
123
Under a foreign investment permit, Tri-Marine was established in FSM in1999 and by 2004 had 3 operational FSM registered vessels.
The purchase and on-sale or value adding of by-catch
Outside of the construction of cold stores in Kosrae and Yap, major investmentin processing and value adding capacity has been limited to the Pohnpei FisheriesCorporation (PFC) which was established as a Pohnpei State public corporationin 1993. PFC is engaged in two principal lines of business – the provision of ice,and processing and marketing of second grade tuna, marlin, and bi-catch. A reviewof PFC in 2000 revealed significant cumulative loss, cash flow difficulties, andan inability to source sufficient raw material to adequately utilize facilities.
Services provided in support of purse seine transshipment
Since 1993, there has been a regional ban on at-sea in-zone transshipmentsof purse seine catches. This was intended to facilitate monitoring of catches,increase port usage, and generate revenue. In subsequent years, a large amount oftuna has been transshipped through FSM ports with an estimated 2400 individualtransshipments for 1993-2003.
The majority of FSM transshipments in the past 2 years (130 in 2002 and100 in 2003) have been in Pohnpei. The number of transshipments in a particularport in any given year cannot be guaranteed as decisions on location are mostoften made by the company operating the carrier vessels in consultation with thepurse seine vessel owners or managers. However, other factors are also taken intoconsideration, such as the availability of licenses in the particular countryconcerned, weather conditions, and recent experiences in that port.
Purse seine transshipment does not require specific infrastructure other thangeneral wharf facilities and port services associated with standard cargo handling.It contributes to local economies through the purchase of goods, services, andlabour as well as in the collection of fees and charges. The extent of spending inany single transshipment will depend on the goods and services available. In thecurrent study, the estimated retained value from each purse seine transshipmentis $10,200 per vessel.
Employment and employment opportunities
Formal employment in tuna fisheries or related activities was estimated in2001 to total some 614 jobs comprising those on foreign vessels (150), jobs on
Section_3_New.pmd 12/12/2005, 2:26 PM123

Federated States of Micronesia Towards a Self-Sustainable Economy
124
locally based vessels (86), those in domestic tuna enterprises (178) andemployment on artisanal vessel operations (200). This estimate is at odds withthe 2000 census data that reports formal employment at 226. Possible reasons forthis discrepancy are that 200 of the reported jobs are essentially informal andmany of the 178 reported jobs in domestic tuna enterprise are likely to be casualin nature.
While the loss in formal employment in the fisheries sector (Table A6) isreflective of the general downturn in transshipment and FSM port based fishing,it must also have been seen as a serious indicator of the major problems facing thesector. Accepting the median incomes of the respective census periods, this reflectsa loss of annual wage income in the vicinity of $1.7 million.
The real contribution of oceanic fisheries to the economy of FSM in anygiven year is difficult to define. Account must be taken of fluctuations in pricesfor purse seine caught species as well as the substantial variations in pricesobtained for sashimi exports. There is also an issue in defining retained value inthe services provided to the sector and in the value of the subsistence sectorcontribution. While the data provide a reasonable estimate of the total value ofthe resource, they do not in any way take account of costs or contribute to thedetermination of profitability. In reality, further analysis would reveal a very highproduction cost in achieving the overall value. This has been exemplified in thegenerally poor performance of domestic longline vessels.
9.2.3 Problems, Constraints, and Issues
The most significant problem with oceanic fisheries in FSM is the failure tofully realize the potential benefits associated with the exploitation of availableresources.
While FSM has enjoyed a reasonably consistent return from receipt of fisheriesaccess fees, attempts to promote returns through infrastructure investment,transshipment, domestic fishing, value added processing, vessel servicing, andemployment have essentially failed to add significant value or return oninvestment.
Since 2000, Pacific Island domestic-based sashimi tuna industries haveexperienced a downturn across the region. Operators in Fiji Islands, Samoa, andTonga have had declining catch levels (despite increasing fishing effort) andincreasing competition from international suppliers to the principal market inJapan. Primarily as a result of supply and the sustained Japanese economicrecession, sashimi tuna market prices have remained flat. The Asian economiccrisis and the SARS epidemic have also impacted sashimi market prices. Coupled
Section_3_New.pmd 12/12/2005, 2:26 PM124

Chapter 9. Fisheries Sector
125
with post 9/11 security issues, increases in fuel prices and airfreight costs, therehas been an overall reduction to profit margins in sashimi tuna longlining.
The supply of tuna for canning from purse seine fishing is essentially acommodity trade and is thus subject to significant market price variations. Thevery high regional catch levels of the late 1990s saw bulk tuna prices reduced to aslittle as $350/mt in 1999 and 2000. Prices have subsequently stabilized in 2003– 04 at $ 750 - $850/mt. As a result of the volatile nature of the market, commercialpurse seine fishing is a high-risk business, especially for small operators.
The fisheries policies of FSM, as developed during the 1990s, promotedforeign access arrangements, government and private sector investment ininfrastructure and fishing vessels, the provision of transshipment services, andvalue-added processing and employment as principle development strategies.
An evolution is apparent in the national direction regarding sectoralinvestment. Fifteen years ago the general perception was that, because of theweak private sector and other factors, development opportunities relating to tunawere in government investment in infrastructure and fishing, and governmentparticipation in commercial activities. Following a generally poor performancefrom these government interventions, the direction shifted to the idea that themost favorable opportunities were for domestic private sector companies to longlinefor fresh tuna. In subsequent years, numerous failed operations of this type appearto have resulted in an additional evolution in direction. This is essentially thattuna fishing itself is too risky and that value adding ashore and servicing offishing vessels are the most important opportunities.
In considering development constraints, the 1995 study on tuna industrydevelopment noted the major issues to be:
• The limited size of the FSM labor pool in both number and range ofcurrent skills. The tuna industry specifically needs foreign skills andforeign management until Micronesians can be trained and can gainexperience in the industry. Imports of foreign labor are discouraged bybureaucratic administration and the requirement to annually renewelaborate work permits.
• All non-service FSM State and National government enterprises thathave been in operation for more than 2 years have proven unprofitable.
• For longline transshipment, the inability to extend airport runways inalmost every state without major capital cost could be a developmentlimitation in the future. Additional runway length allowing larger aircraftand improved payloads could be a key factor in achieving improvedairfreight economies of scale.
Section_3_New.pmd 12/12/2005, 2:26 PM125

Federated States of Micronesia Towards a Self-Sustainable Economy
126
• Though simple to administer and understand, Gross Receipts Tax(GRT) is a “cascading” tax and the prevailing tax regime is a disincentiveto primary industry and manufacturing investment.
• A very significant problem in the FSM is the difficulty in finding outexactly what the current law is.
• The FSM currently is a comparatively highly protected economy withhighly priced resources. The FSM economy is further protected byinvestment and recruitment approval processes that emphasize sanctionsand concessions as opposed to open, uniform treatment.
While strategies to mitigate these constraints are reflected in policydocuments, there has been limited success in addressing these issues. Theprincipal issue is generally limited accountability in policy implementation anda lack of political will. This is particularly apparent at the state level, especiallyin relation to dealing with difficult issues such as the commercialization of state-owned assets.
The development of domestic fisheries capacity throughout the Pacific regionwas reviewed in detail in 2003. The FSM component of this review reiterated theperspectives put forward in 1995, and cited the principal constraints to include:
• Reductions in air freight capacity and availability, and the economiclimitations of restricted freight volumes due to aircraft and runwaylimitations;
• Increases in the cost of air freight due to escalating fuel costs;• A poor business environment and inadequate provision of services;• Government agencies with commercial involvement in the tuna industry
detracting from the functioning of private sector tuna firms, especiallythe Economic Development Authority (EDA) in Pohnpei;
• Requirements for local vessels fishing in FSM waters to undergo customsand immigration formalities and the high cost of these services;
• High cost of operation – high prices for fuel and skilled labour; and arequirement to air- freight many parts/supplies.
Other issues raised included fee variance, higher access fees compared toPalau and the Marshall Islands, the provision of conflicting consultancy advise,the inadequacy of port infrastructure for vessel maintenance, the scarcity of skilledlabor, declining catch rates, unclear legislation, and unnecessarily high penaltiesfor regulatory transgressions.
Section_3_New.pmd 12/12/2005, 2:26 PM126

Chapter 9. Fisheries Sector
127
The demise of transshipment services from FSM ports and the associatedloss of income generating opportunities is a clear indication that FSM has failedto adequately deal with constraints and issues that have been on the table for anumber of years.
There has been a very large amount of technical assistance focused on thedevelopment of FSM’s fisheries sector with more that 20 documentedinterventions. There is a sense that outside assistance to tuna industrydevelopment is fatigued by the continued failure of FSM to address key issues.Constraints to industry development have been widely documented, especiallythose relating to the lack of progress on privatizing government fishery companiesand continued government monopolies providing essential commercial servicesto the tuna industry. While much of this failure can be attributed to a lack ofaccountability and political will, there is an additional issue relating to lines ofcommunication and the need to clearly define responsibilities in relation topolicy implementation. The formation of the FSM Offshore Fisheries Associationin 2002 has provided a clear direction for an industry voice in policy determinationand implementation. However, the same cannot be said of Government. There isa range of conflicting national and state agencies with varying responsibilities.For a potential foreign investor in fisheries, there is no clear process or specificagency to facilitate the investment process.
It is clear that further development of the sector cannot take place withoutadditional investment. State governments having previously invested large sumsin fisheries projects are reluctant to commit further investment. The domesticprivate sector has been similarly affected by poor sectoral performance. Investorconfidence will continue to be constrained by an ongoing failure to addressdevelopment issues and achieve progress with policy implementation. Perhapsthe key requirement to address the sector’s development issues is a clear politicalwill to do so.
9.3 Fisheries Sector Policy
The process of developing a fisheries policy for the FSM was initiated with thedeclaration of the FSM EEZ in 1989 and was first articulated in a 1991 study.More detailed analysis was undertaken in 1996 for the consideration of theNational Fisheries Summit of FSM in December 1996. The recommendations ofthe National Summit resulted in the presentation of a National Fisheries PolicyDocument.
Section_3_New.pmd 12/12/2005, 2:26 PM127

Federated States of Micronesia Towards a Self-Sustainable Economy
128
Key elements of this policy were the promotion of the private sector, thecreation of a favorable business environment, and privatizing government ownedfisheries enterprises. FSM ownership of fishing vessels and shore enterpriseswas proposed with the possibility of using access fees to finance enterprises andthe promotion of other possible incentives such as tax breaks and amendedinvestment rules.
A more strategic approach to human resource development was also proposed,as was a commitment to conservation and management of resources. Consolidationof responsibilities for fisheries policy development, management and enforcementunder one well-financed and autonomous body was suggested to lead the reformof laws inhibiting fisheries development (tax, duties, levies, foreign investment,fisheries and maritime laws and land tenure). The promotion of value-addedinvestment in processing, manufacturing, and marketing was also proposed, aswas more stringent control of fisheries access. A public awareness program tostimulate FSM citizens’ interest in fisheries through information programsunderpinned these key policy areas.
In the lead-up to the 1999 Second Economic Summit, these policy elementswere expanded to detail strategies, activities, and accountable agencies in twoseparate strategic policy framework documents covering oceanic and inshorefisheries. These policy frameworks and detailed activity plans were subsequentlyadopted by the Summit and can thus be accepted as the agreed National fisheriespolicy for the period 1999 – 2004.
The expected process leading up to the Third Economic Summit was thatthe 1999 framework would be tabled to both public and private sector stakeholdersfor review and comment, especially in relation to implementation progress, issues,current relevance, and changing circumstance. However, policy implementationhas not been widely reviewed, perhaps because it is also apparent that very littleprogress has been made in implementing the 1999 policy.
While the passing of the Title 24 fisheries law, the adoption of the tunamanagement plan, the consolidation of NORMA, and the re-opening of the YapFisheries Academy are positive steps, the majority of key policy directions remainas sector development issues.
Strategies to clearly promote investment and growth have not beenforthcoming and private sector investment has not been successful. Domestic-based foreign longline vessel numbers have dropped to a low of 20, SOEinfrastructure is either closed or underutilized and remains the responsibilityof Government agencies. The majority of long-line transshipment activityhas essentially transferred to Guam. Considering the time-span for policyimplementation (1999 – 2004), the lost opportunity for economic benefits
Section_3_New.pmd 12/12/2005, 2:26 PM128

Chapter 9. Fisheries Sector
129
from the successful implementation of previously recommended policyelements is substantial.
In situations where the activities associated with policy elements have beenactively facilitated (such as in the preparation of a Tuna Management Plan byNORMA), policy implementation has been successful. In many cases, the absenceof a facilitator for activities would appear to have limited activity success. Forexample, in the absence of a committed driver to campaign for a fuel subsidy,there is no incentive for Government to establish such a subsidy.
Policy elements that relate to wider fiscal management or changes inlegislation (such as taxes, labour laws, immigration laws, subsidies and duties)are much broader in application than just fisheries, and are thus more complexand challenging to achieve. Even if there is a strong driving influence from thefisheries sector, success in legislating industry-backed measures will be determinedby wider political considerations. It is apparent that one of the key factors inpolicy implementation is political will. This is most evident in the apparentfailure to produce results in relation to the performance and future direction ofcertain SOE’s. Clearly, without the support of State Governments, an activity topromote private sector or investor management or ownership of these facilitieswill not succeed.
In determining the future direction of policy, it is perhaps useful to considerthe scenario that FSM would like to achieve for fisheries in the next five-yearperiod. In a review context, it appears that there are no major differences from theoverall objectives of the past five years. However, it is important to considerpolicy direction in relation to ‘lessons learned’ from the previous period and alsoin relation to possible changes in the wider (international and regional) sectorenvironment in the coming period.
The key lessons in relation to policy implementation are:
• There need to be clear responsibilities assigned to undertake activitiesassociated with policy implementation;
• The agency or entities assigned such responsibilities should be requiredto account for progress in relation to activities undertaken;
• In situations where a particular policy requires the wider endorsementof government or legislative enactment, the implementation strategyshould include activities that take account of the need to generatepolitical will.
Taking into account the findings of the situational analysis for the sector andthe intent of the Third Economic Summit, the following policy themes areapparent:
Section_3_New.pmd 12/12/2005, 2:26 PM129

Federated States of Micronesia Towards a Self-Sustainable Economy
130
For Coastal Fisheries, increased focus on:
• resource management strategies encompassing traditional practice andprotected areas;
• ensuring resource exploitation is carefully managed and priority accessis accorded to subsistence and low level artisanal activities rather thancommercial fisheries;
• aquaculture activities at the subsistence and artisanal levels;• community participation in management.
For Oceanic Fisheries:
• a continued emphasis on improving economic benefits, utilization ofinfrastructure, and domestic commercial activity;
• in the context of the Tuna Management Plan, a more focused emphasison resource management and monitoring;
• acknowledgement of the urgent need to attract investment.
A revised fisheries policy matrix has been prepared as part of the fisheriessector strategic development plan that was drafted at the request of nationalgovernment in follow-on to the Third Economic Summit.
Section_3_New.pmd 12/12/2005, 2:26 PM130

Chapter 9. Fisheries Sector
131
Chapter 10. Tourism Sector
W hile FSM leaders in the past have recognized tourism asa productive sector with significant developmentpotential, national economic policy has not designated ita leading economic sector. In accordance with the ThirdSummit’s Select Committee endorsement of the High
Growth Strategy, tourism will be the dominant sector enabling growth anddevelopment of the economy in the 2004-2023 Compact II period. This policystance represents a major change in thinking on the role of tourism in development,as many people in the wider community in all the states have consistentlyexpressed concerns about potential negative impacts of tourism on both thesocio-cultural fabric and the natural environment of the FSM.
The following sector review represents a summary of the Tourism componentof the Strategic Development Plan prepared by the National GovernmentDepartment of Economic Affairs in conjunction with the work of the ThirdEconomic Summit.
10.1 Tourism Sector Review
10.1.1 Current Status of Industry
There were 18,500 international visitor arrivals in the FSM in 2003 (Table16), slightly less than the peak of 20,000 visitors recorded in 2000 based on timeseries compiled by the DEA. Corresponding figures for each of the states arepresented in Appendix A (Tables A29-A32). Compared with the growth of tourismarrivals in the Pacific Islands, which recorded an increase of 23% over the 1996-2003 period, the FSM has clearly under-performed.
Based on an FSM inventory of 476 hotel rooms, 42,000 visitors would berequired annually to achieve an acceptableoccupancy rate of 65%. The principalorigin markets for the FSM have traditionally been the US and Japan, with Europebecoming a significant market in recent years. Travel to FSM, however, may benegatively affected by different factors like the economic recession in Japan, theSARS (pneumonic flu) outbreak, and security concerns brought about by theWorld Trade Center attack. The overall positive trends in travel to the Pacificregion, particularly to destinations such as Palau and the Cook Islands, stronglysuggests that the FSM has not made any progress towards becoming aninternationally-recognized tourist destination. The FSM appears to be caught ina vicious cycle in which tourism under-performs because of a lack of infrastructure
Section_3_New.pmd 12/12/2005, 2:26 PM131

Federated States of Micronesia Towards a Self-Sustainable Economy
132
Tabl
e 16
. FSM
Inte
rnat
iona
l Vis
itor
Arr
ival
s by
Nat
iona
lity:
FY 1
996-
FY20
04
Nat
iona
lity
FY9
6F
Y97
FY9
8F
Y99
FY0
0F
Y01
FY0
2F
Y03
FY0
4
Asi
a2,
029
2,30
11,
830
2,06
42,
890
2,25
51,
737
1,84
22,
003
Aus
tral
ia56
145
243
856
379
154
056
663
984
0
Can
ada
187
224
169
177
188
192
223
214
195
Eur
ope
1,00
799
51,
048
1,30
21,
427
1,23
51,
343
1,66
81,
353
Japa
n5,
519
4,22
33,
429
3,39
94,
661
3,19
44,
061
3,98
43,
661
New
Zea
land
113
119
128
140
111
8716
114
317
1
Oth
er52
5290
7411
663
9185
117
Paci
fic
Isla
nds
1,60
81,
580
1,23
184
31,
249
962
1,42
31,
150
1,41
4
Phi
lippi
nes
--
--
--
943
1,03
51,
149
USA
7,08
37,
137
5,91
26,
950
8,60
56,
966
8,15
27,
736
7,10
1
Tot
al18
,159
17,0
8314
,275
15,5
1220
,038
15,4
9418
,700
18,4
9618
,004
Sour
ce: F
SM D
epar
tmen
t of
Eco
nom
ic A
ffai
rs
Section_3_New.pmd 12/12/2005, 2:26 PM132

Chapter 10. Tourism Sector
133
and poor service and promotion. This results in low profitability and little publicand private investment. Consequent low visitor satisfaction, in turn, leads tounfavorable word-of-mouth recommendations, thus perpetuating the sector’sunder-performance.
The critical issue for tourism development in the FSM is to break this cycleof poor industry performance and initiate changes that will stimulate newinvestment, growth, and development.
10.1.2 Development Potential
Despite the FSM’s distance from major tourism origin markets and theconsequent high cost and inconvenience of travel, the nation offers manyattractions for selected niche markets: a pristine marine environment, tropicalscenery and diverse plant and bird life, traditional cultures – all in sparsely-populated, clean environmental settings outside the district center urbanareas.
For the sophisticated and experienced tourism markets that are lookingfor something different, the FSM’s isolation is a potential selling point forniche markets such as eco-tourism, cultural tourism, water sports, and otherspecial interests, e.g., traditional plant medicines, bird-watching, and socialanthropology.
The main question to be addressed is: can the FSM achieve the volume andvalue of tourism that would meet its economic objectives for the sector?
The SDP tourism sector assessment notes that “the current hotel stockwould be filled to an acceptable average occupancy rate if some 46,000 visitorsstaying for five days on average came to the FSM annually. This represents ashort-term objective of increasing current visitation levels by around two and ahalf times.”
Pointing out the small size (land area and population) of the islands, theassessment notes that it is crucial that the “high end” characteristic of tourismbe a focal point. Product development should be designed to capture and retainmaximum visitor expenditures. That is, attracting the more affluent touristswho have high average daily expenditure rates, and ensuring that the localeconomies are capable of supplying a relatively large share of the goods and servicessold to visitors (i.e., strong cross-sectoral linkages) must be part of the tourismdevelopment strategies.
To realize its potential and achieve the economic benefits that have beentargeted, goals and policies are detailed in the tourism sector chapter of the SDPand in the associated Strategic Planning Matrix (SPM).
Section_3_New.pmd 12/12/2005, 2:26 PM133

Federated States of Micronesia Towards a Self-Sustainable Economy
134
Before discussing issues and problems facing tourism development in theFSM, the sector assessment summarizes the main points of a comprehensiveprogram needed to achieve the long-term development desired:
• the tourism sector will require influential “champions” at the highestlevel of government to ensure that the proposed program is pushed through;
• concerted action on all fronts;• real investment resources will be required over a sustained period that
will demand that a higher priority be given to tourism;• product development and diversification will be needed to attract visitors;• an overall plan for these actions will be required; and,• in order to gain the desired economic benefits, a special effort will be
required to develop genuine inter-sectoral linkages.
10.1.3 Constraints to Development
The goal for tourism in the FSM should be to develop “high end, low impact”tourism, meaning relatively modest numbers of visitors, each making a relativelylarge financial impact in terms of average daily expenditure. Residents in eachstate have expressed concern about tourism damaging the social and culturalenvironment, and also to the fragile natural environment. Therefore, while therewill be an inevitable impact, policymakers will need to strike a careful balancebetween sector development and sustainability, both socio-culturally andenvironmentally.
At present the nation offers a very limited range of activities and opportunitiesfor visitors, and therefore product development is a critical area that the tourismindustry will have to address. Even the most rudimentary amenities expected byinternational visitors are not available, such as sidewalks or boardwalks, trails, accessto beaches or shoreline areas, public transport such as buses, safe boat transportservices. There is a lack of information for visitors, and very few restaurants and cafes,and points of interest or assembly that appeal to most international visitors.
As mentioned earlier, the FSM is remote and does not lie on any of the majorlong-haul air routes. Inter-island air routes carry limited traffic and therefore arecostly to operate making air access both limited and expensive. Also, from thestandpoint of developing a national tourism “product,” a major obstacle is inabilityto directly access the State of Yap from any of the other three States.
Infrastructure is poor both in terms of national services such as power, safewater and health services, and in terms of the tourism sector itself as some hotelsdo not meet international standards.
Section_3_New.pmd 12/12/2005, 2:26 PM134

Chapter 10. Tourism Sector
135
Immigration procedures are unwelcoming, and airport facilities are deficient.In relation to the relatively low volumes of passenger traffic handled by the fourmain airports, the time required to pass through the airport and board departingflights is grossly excessive.
Visual and other environmental standards are poor, detracting from one of thekey motivations for foreigners to visit the FSM. In terms of overseas promotion ofthe nation as a tourism destination, there is little information made available,giving the FSM a low profile in the tourism trade and a lack of competitiveness interms of “brand recognition” compared with other Pacific island countries.
Another significant constraint to tourism development is the lack ofunanimous commitment to tourism in all states. There is a need to educate thegeneral public on the importance of tourism, and a need for FSM leadership togive their full support.
Of particular relevance to the hotel industry and to small business supportare the following points:
• Since development of hotel capacity, either new or refurbished, willlikely attract foreign investment, there is a need to make the process offoreign investment registration and approval consistent and transparent.There is also a need to ensure that any investment project is subject toappropriate national and state planning controls, especially in regard tomaking it mandatory to undertake an environmental impact assessment;
• Foreign investment will be important not only in providing sufficientfunding for development, but also with respect to two other criticalneeds: (i) design and construction skills that will have to be importedto ensure the attainment of standards appropriate to the new hotel’sgrade and corresponding quality of services, and (ii) the transfer ofprofessional hotel management and marketing skills from abroad toenable the attainment of a satisfactory level of profitability;
• Except for hotels and aviation, most private sector activity in tourismwill likely be operated by small businesses. Private sector developmentpolicies and strategies that address the needs of small business are criticalfor tourism development. Prime areas of need have been identified:business management, financing, and marketing. While the proposedFSM Visitors Authority should have a role in pinpointing andcoordinating the needs and provision of support to the small businessesin the tourism sector, the main burden for this support should be withthe small business management specialists and the banking system.With regard to financing, there is a need for a small-loans facility.
Section_3_New.pmd 12/12/2005, 2:26 PM135

Federated States of Micronesia Towards a Self-Sustainable Economy
136
10.1.4 Infrastructure Development Plan – Implications for Tourism
The FSM Infrastructure Development Plan 2003-2017 (IDP) was preparedbefore the SDP, but was intended to anticipate the long-term needs in support ofdevelopment, taking into account expected economic aid under Compact II.Considering that tourism has been recognized as one of the three main productivesectors of the FSM, the IDP specifically addressed infrastructure support for thissector. Tourists must have adequate standards of utilities, transport, and health servicesin their holiday destination. As for the current status, the IDP notes that “much ofthe basic infrastructure that should be in place to provide a foundation for growth ofthe tourism industry (and related industries) remains on the drawing boards”.
The IDP specifically noted the following areas as being important for tourismdevelopment:
Air Transport
Passenger terminals in all four States need to be expanded and improved,along with the provision of new baggage handling and security equipment. PohnpeiAirport is in urgent need of runway, taxiway, and apron pavement rehabilitationto meet safety standards. There is an issue about whether airport runways willneed to be extended. With the exception of Ulithi, the outer islands of the FSMdo not have air service that meets acceptable standards.
Road Transport
In Chuuk, Kosrae, and Pohnpei circumferential roads are incomplete andsome parts are in need of repair. These roads are important for enabling visitors toaccess scenic sites and rural nature-based attractions. Few routes have pathwaysfor pedestrians and bicyclists, and in some areas roadways may be consideredunsafe. Also, there is virtually no public transport or tour bus service available.
Sea Transport and Marine Facilities
No public maritime transport services suitable for visitors are available tothe outer islands of the FSM, and in the case of privately operated transport,government does not certify the safety of boats and vessel crews. In the lagoonislands, particularly in Chuuk, docking facilities are inadequate. Even on themain islands, there is a lack of pier facilities offering direct access to vessels, andno shops and restaurants that would attract tourists.
Section_3_New.pmd 12/12/2005, 2:26 PM136

Chapter 10. Tourism Sector
137
Power and Water
While power is generally adequate for the current level of tourism activity,expansion, particularly in rural areas, will require additional generating capacityand distribution systems. In Chuuk, the power system is inadequate, and thereare some rural areas in Kosrae and Pohnpei without power service. Sewerage systemsand treatment plants are generally inadequate and/or inoperative, resulting insurface water pollution and damage to lagoons and wetlands. Potable water is notavailable in many areas.
Heath Services
Health services are limited, and this lack of minimally acceptable healthand medical services constitutes a significant constraint to developing a largertourism sector.
10.2 Strategic Goals, Policies, and Outcomes
This summary draws from both Section 6.2, Strategic Goals, Policies andOutcomes, of the tourism chapter in the SDP, and the SPM for tourism that wasprepared in conjunction with the Third Economic Summit.
Strategic Goal 1: Making tourism the leading economicStrategic Goal 1: Making tourism the leading economicStrategic Goal 1: Making tourism the leading economicStrategic Goal 1: Making tourism the leading economicStrategic Goal 1: Making tourism the leading economicactivity in the FSMactivity in the FSMactivity in the FSMactivity in the FSMactivity in the FSM
The main outcomes targeted include: (a) increasing international tourismarrivals from the current 19,300 to 35,000 by 2008, and gross income (tourismexpenditures) to $25 million, with subsequent growth of visitor arrivals and grossincome of 5.0% and 7.0% per annum respectively; (b) average annual occupanciesof 50% by 2008 and 65% by 2010; (c) sustained total employment in tourism of1,250 by 2008, thereafter growing by 5.0% per annum; (d) By 2012, the FSMshould be positioned as a premium priced destination with average per visitor perday expenditure of $250, exclusive of airfare.
Key policy implications for policy goal include: (a) ensuring that foreigninvestment laws and practices are welcoming, transparent in their application,and respectful of FSM interests; (b) giving priority to public investment in servicesand infrastructure that benefit residents and tourism development (includingprovision of safe water in all main islands); (c) adopting planning practices thatenhance the physical environment and allow for the development of activities
Section_3_New.pmd 12/12/2005, 2:26 PM137

Federated States of Micronesia Towards a Self-Sustainable Economy
138
and points of interest for tourists, such as attractive retail centers; (d) providingincentives for raising standards and skills across the industry.
Critical issues for implementation include: (a) having each State formulateand implement a 10-year tourism development plan to be coordinated by theFSM Visitors Authority; (b) establishing the FSMVA by 2005; (c) producingupdated marketing and promotion plans coordinated by the FSMVA incollaboration with State Visitor Bureaus; and, (d) formulating and implementingtourism sector investment programs.
Strategic Goal 2: Integrate the tourism sectorStrategic Goal 2: Integrate the tourism sectorStrategic Goal 2: Integrate the tourism sectorStrategic Goal 2: Integrate the tourism sectorStrategic Goal 2: Integrate the tourism sectorinto national economic planning and developmentinto national economic planning and developmentinto national economic planning and developmentinto national economic planning and developmentinto national economic planning and development
In 2002, the FSM contracted an overseas travel research firm to prepare aNational Tourism Marketing and Promotion Action Plan (NTMPAP). Completedin April 2002, the national tourism marketing plan recommended that Congressenact legislation establishing the FSM Visitors’ Authority (FSMVA). The FSMVAis targeted to become fully operational by the second half of 2005. The tourismSPM specifically notes that the FSMVA budget should be funded out of nationalgovernment’s Private Sector Grant.
Other critical issues include: (a) insuring that national investment plansincorporate all key tourism projects by 2007; (b) producing a draft tourismsector policy paper with input from FSMVA and state VAs by first half of 2006;(c) preparing a statement of tourism sector’s key investment areas, e.g., health,sanitation, infrastructure, that would be coordinated at the national level bythe FSMVA.
Strategic Goal 3: Create an attractive and supportiveStrategic Goal 3: Create an attractive and supportiveStrategic Goal 3: Create an attractive and supportiveStrategic Goal 3: Create an attractive and supportiveStrategic Goal 3: Create an attractive and supportiveenvironment for private sector tourism industry investorsenvironment for private sector tourism industry investorsenvironment for private sector tourism industry investorsenvironment for private sector tourism industry investorsenvironment for private sector tourism industry investors
It is anticipated that most of the larger tourism businesses and investmentswill be in relation to the hotel industry, and most other tourism-relatedbusinesses will be owned and operated by small-to-medium size enterprises(SMEs), e.g., car rentals, restaurants, marine transport.
To achieve strategic goal 3 there must be at least one new tourism investmentproposal per annum in each state. In addition, the targeted new employmentmentioned earlier must be achieved. In terms of activities, each state shouldestablish a private tourism and hotel association by 2006, and the FSMVA establisha coordinating “signposting” system by 2007 to assist private sector businessesin obtaining assistance from existing institutions in and outside the FSM.
Section_3_New.pmd 12/12/2005, 2:26 PM138

Chapter 10. Tourism Sector
139
Outputs include: (a) a program of grant assistance to SMEs funded byinternational grant aid that would entail the provision of business support serviceson a fee basis; (b) FSMVA compilation of indicative investment opportunitiesguidelines starting in 2008; (c) provision of semi-annual project briefs and tourismmarket assessments to the banking and investment community in the FSM andabroad starting 2008; (d) an annual conference for all tourism stakeholders; and(e) Small Business Development Centers (SBDCs) assistance to at least 100current or potential tourism-related activities annually.
Strategic Goal 4: Invest in tourism product development toStrategic Goal 4: Invest in tourism product development toStrategic Goal 4: Invest in tourism product development toStrategic Goal 4: Invest in tourism product development toStrategic Goal 4: Invest in tourism product development todiversify and expand the range of attractions and activities fordiversify and expand the range of attractions and activities fordiversify and expand the range of attractions and activities fordiversify and expand the range of attractions and activities fordiversify and expand the range of attractions and activities forvisitorsvisitorsvisitorsvisitorsvisitors
A major constraint to tourism development in the FSM is the lack of a well-developed range of activities. Many natural scenic and historic attractions areinaccessible and poorly presented.
Outcomes that have been targeted include: (a) the compilation of acomplete inventory of land and water transport services, cultural centers, andattractions used by tourists by 2006; (b) identification of the top 3-5 touristattractions in each state to enable the main focus of product development by2006; and (c) preparation of an outline product development plan for eachstate by 2006. Principal outputs contributing to the achievement of goal 4include: (a) an outline plan for upgrading existing accommodation completedby 2007; (b) an outline plan for accommodation expansion by state and possiblelocation by 2008 in conjunction with each state’s tourism development plan;(c) an outline plan for tourism transport sector expansion by 2008 to be preparedin conjunction with each state’s tourism development plan; (d) specific plansfor infrastructure and service improvements (e.g., marinas, cruise ship and outisland facilities) to be completed by 2008; and (e) submission to UNESCOWorld Heritage Site applications (for specific identified sites) by 2008.
Strategic Goal 5: Establish the FSM’s tourism sector as having aStrategic Goal 5: Establish the FSM’s tourism sector as having aStrategic Goal 5: Establish the FSM’s tourism sector as having aStrategic Goal 5: Establish the FSM’s tourism sector as having aStrategic Goal 5: Establish the FSM’s tourism sector as having ahigh standard in dive, eco- and cultural tourism to command ahigh standard in dive, eco- and cultural tourism to command ahigh standard in dive, eco- and cultural tourism to command ahigh standard in dive, eco- and cultural tourism to command ahigh standard in dive, eco- and cultural tourism to command apremium in global tourism marketspremium in global tourism marketspremium in global tourism marketspremium in global tourism marketspremium in global tourism markets
There are two reasons why the FSM has the potential to command a premiumin global tourism markets. First, the FSM has some of the richest and mostdeeply-embedded social and cultural traditions in the Pacific. This represents aresource for international tourists interested in indigenous cultures. However,
Section_3_New.pmd 12/12/2005, 2:26 PM139

Federated States of Micronesia Towards a Self-Sustainable Economy
140
this resource is also susceptible to damage or impacts from tourism that wouldchange traditional values and lifestyles, and therefore diminish or degrade theattractiveness of the FSM’s cultures as a tourism destination. For this reason,high volume or mass tourism would not be appropriate for the FSM.
Second, the FSM offers one of the most pristine natural environmentsavailable to tourists. Given its small physical size, there is recognition that limitsmust be placed on the number of international visitors that can come to each ofthe islands in the FSM. At the same time, tourism offers economic benefits for allof the communities that would participate in attracting visitors. The FSM needshigh tourism standards to attract big-spending visitors.
Principal outcomes to achieve strategic goal 5 are: (a) hotel/resortaccommodation standards in FSM raised and graded according to acceptedinternational standards by 2007; and (b) tourism industry standards raisedsufficiently to enable charging a premium to international visitors by 2012. Mainoutputs include: (a) mandatory accommodation grading system in place by 2008;(b) all dive operations licensed by FSM government in accordance withinternational standards by 2006; (c) national boat operators’ licensing systemimplemented by 2008, and technical safety standards for tourist boats and forcrew qualifications specified for 2008 and beyond; (d) tourism service industryquality accreditation implemented from 2010; (e) tour guide certificationstandards and procedures established by 2006; and (f) proposed planning controls,capacity limits, minimum daily charges, and other acceptable measures presentedto Congress in 2012.
Strategic Goal 6: PStrategic Goal 6: PStrategic Goal 6: PStrategic Goal 6: PStrategic Goal 6: Promote interromote interromote interromote interromote inter-sectoral linkages-sectoral linkages-sectoral linkages-sectoral linkages-sectoral linkagesand maximize use of local produce and servicesand maximize use of local produce and servicesand maximize use of local produce and servicesand maximize use of local produce and servicesand maximize use of local produce and services
This goal is designed to ensure that import leakages are minimized, andvisitor spending in FSM is maximized in terms of generating value-added activityand employment in the country. Principal outcomes include: (a) hotels in theFSM to buy 100% of their fish, 50% of vegetables, and 10% of meat from withinthe FSM; and (b) ensure that every foreign visitor spends at least $50 on locally-produced artifacts, souvenirs, and handicrafts. Main outputs include: (a) demandassessments prepared by State VBs for consumption of local produce by thetourism sector; (b) tourism industry purchasing consortia and/or cooperativescreated where necessary to “regularize” demand by 2007; (c) a range of handicraftsand products available for sale to visitors in each state certified in accordancewith FSMVA standards by 2010; and (d) where appropriate, State VBs to operatetheir own shop(s) and/or cooperatives for local artisans by 2010.
Section_3_New.pmd 12/12/2005, 2:26 PM140

Chapter 10. Tourism Sector
141
Strategic Goal 7: Involve FSM residentsStrategic Goal 7: Involve FSM residentsStrategic Goal 7: Involve FSM residentsStrategic Goal 7: Involve FSM residentsStrategic Goal 7: Involve FSM residentsin tourism sector developmentin tourism sector developmentin tourism sector developmentin tourism sector developmentin tourism sector development
Given the multitude of issues, effects and risks associated with developingtourism to become the leading economic sector in the FSM, a major educationalprogram will be required to properly inform citizens and gain their support.
Principal outcomes to be targeted for this goal include: (a) achieve nationwideawareness of tourism’s importance by completing initial public awarenesscampaigns in all four State main islands by 2008; (b) raise ability of residents torespond to tourists needs; and (c) obtain acceptance of citizens to tourismdevelopment plans. Main activities to be undertaken include: (a) develop tourismawareness programs to inform FSM citizens of tourism’s benefits, opportunitiesand impacts; (b) develop programs to educate citizens on tourists’ requirements;and (c) develop public consultative mechanisms with traditional leaders, thechurch and other relevant stakeholders on tourism development strategies.
Strategic Goal 8: PStrategic Goal 8: PStrategic Goal 8: PStrategic Goal 8: PStrategic Goal 8: Promote the FSM in appropriate markromote the FSM in appropriate markromote the FSM in appropriate markromote the FSM in appropriate markromote the FSM in appropriate marketsetsetsetsetsand markand markand markand markand market segments to realize the sectoret segments to realize the sectoret segments to realize the sectoret segments to realize the sectoret segments to realize the sector ’s potential’s potential’s potential’s potential’s potential
The primary role of the FSMVA is to promote and market the FSM as aleisure destination to key international markets. These have been identifiedin the NTMPAP as North America, Japan/Northeast Asia, and Europe. In itsprimary role, the FSMVA will be responsible for a number of key tasks,including: (a) overseeing the role and performance of the regional marketingagents; (b) coordinating all national collateral and associated marketingmaterial; (c) establishing a national photo library; (d) maintaining anddeveloping the FSM website as an active tool in the country’s tourismmarketing and promotional program; and (e) monitoring the results ofmarketing initiatives and modifying subsequent programs accordingly.
Although its primary role is in marketing and promoting the whole of theFSM, the FSMVA will have a much broader role in developing the tourism sector.Main outcomes and activities to be undertaken by the FSMVA to help achievestrategic goal 8 include: (a) marketing and promotion to help achieve theobjective of increasing both visitor expenditures and visitor arrivals by 5.0% perannum from 2006 onwards; (b) raising visitor satisfaction by 5 percentage pointsper annum (based on visitor surveys) beginning in 2007 and continuing until thevisitor satisfaction rate reaches 85%; and (c) creating new business in the amountof 5% gain in verifiable sales and/or new relationship contacts with the traveltrade based on trade shows at which the FSM is represented.
Section_3_New.pmd 12/12/2005, 2:26 PM141

Federated States of Micronesia Towards a Self-Sustainable Economy
142
Principal activities of the FSMVA would include: (a) implementation of theNTMPAP to include selecting regional marketing agents that will begin arrangingFSM representation at trade shows, deal directly with regional travel agents, touroperators and other travel industry interests, and other tasks specified in theagents performance and reporting requirements; and (b) taking advantage ofinternational travelers increasing use of Internet and the potential of electronicmarketing. Outputs of the FSMVA to further this second activity would includelaunching a new fully-interactive website, and commencing an active and ongoingelectronic marketing campaign to targeted consumers (e.g., divers, eco-tourists)and a regular quarterly e-mail news bulletin service, by 2006.
Strategic Goal 9: Ensure that tourism is developedStrategic Goal 9: Ensure that tourism is developedStrategic Goal 9: Ensure that tourism is developedStrategic Goal 9: Ensure that tourism is developedStrategic Goal 9: Ensure that tourism is developedin a manner that actively contributes to environmentalin a manner that actively contributes to environmentalin a manner that actively contributes to environmentalin a manner that actively contributes to environmentalin a manner that actively contributes to environmentalconservation and cultural protectionconservation and cultural protectionconservation and cultural protectionconservation and cultural protectionconservation and cultural protection
Awareness of sound environmental practices, both in terms of residentlifestyles and business practices, leaves much to be desired with respect to solidwaste management and conservation. There is also a general lack of understandingabout what forms of tourism would best protect the environment and culturalpractices. Ensuring that the tourism industry adopts an effective environmentalprotection and conservation program will require the committed involvement ofmany different organizations and government agencies. There may also be a needfor additional legislation to ensure strict environmental impact assessment (EIA)requirements specifically for tourism developments and regulations or controlsapplicable to new hotel/resort structures. While the FSMA will have a major rolein implementing the program, other agencies will also have a major responsibilityfor the establishment and enforcement of controls.
Targeted outcomes include: (a) adoption by all existing tourism businessesof environmental sustainability and eco-friendly practices; (b) preparationby all new tourism developments of an EIA; (c) enforcement of environmentallaws and regulations within the tourism industry; (d) competition forinternationally-recognized awards for sustainable tourism commencing in2006; and (e) establishment of a World Park by 2007.
Significant activities include, for existing businesses: (a) adoption ofenvironmentally friendly practices; (b) establishment of environmental/conservation standards and provision for issuing “green” accreditation;(c) establishment of environmental monitoring systems for all tourismenterprises; and (d) maintenance and protection of cultural, historicaland natural sites. For new developments: (a) establishment of national
Section_3_New.pmd 12/12/2005, 2:26 PM142

Chapter 10. Tourism Sector
143
criteria and standards that must be addressed in preparing the EIA; and(b) establishment of a national monitoring system to ensure that no furtherdamage is done to coral reefs by tourist boats, , , , , divers, and snorkelers, and toensure protection of flora, fauna, and natural resources. For awareness: (a) regularcollection of trash, removal of old cars, beach clean-up, etc. and introduction ofother appropriate measures to enhance the environment by 2005; (b) developmentof environmental sustainability and conservation modules on all school and COMtourism courses; (c) facilitate accessibility of traditional culture (dances, villagesand footpaths, etc.) without impinging on cultural values; and (d) protection ofhistorical sites and improvement of their accessibility.
Main outputs would include: (a) a tourism environmental practices manualby 2006; (b) national “Green” awards scheme introduced by 2007 and each stateVB to ensure that 30% of establishments are on register by 2007; (c) baselineenvironmental audit of existing businesses conducted by a respectedenvironmental body (e.g., TNC) to commence immediately; (d) beautificationprograms and anti-litter laws in place and actively followed; (e) lists of culturalevents, places accessible to visitors and a guide to social and cultural sensitivitiesfor the visitor by 2005, with annual update; (f) EIAs specifically designed fortourism sector, carried out on all proposed tourism developments from 2008;(g) environmental information guide for visitors produced by FSMVA andmade available to all state VBs by 2006; (h) World Park plan developed by2007; and (i) World Park public awareness campaign launched by 2008.
Strategic Goal 10: PStrategic Goal 10: PStrategic Goal 10: PStrategic Goal 10: PStrategic Goal 10: Put in place a reliable systemut in place a reliable systemut in place a reliable systemut in place a reliable systemut in place a reliable systemof measuring tourism activity in the FSMof measuring tourism activity in the FSMof measuring tourism activity in the FSMof measuring tourism activity in the FSMof measuring tourism activity in the FSMto enable accurate monitoring of progressto enable accurate monitoring of progressto enable accurate monitoring of progressto enable accurate monitoring of progressto enable accurate monitoring of progress
Currently, statistics on international visitor arrivals, purpose of visit, lengthof stay, and other important parameters are not reliable. There are difficulties inreconciling state data (sum of four states) with national data (e.g., unduplicatedcount of visitor arrivals in FSM). It is absolutely essential that adequate, reliablestatistical data be made available on a timely basis to policymakers and planners.Given the relatively small size of the tourism sector and volume of activity,establishing an effective and efficient system should not be too difficult orexpensive.
Principal outcomes to be targeted include: (a) new immigration forms issuedand processing procedures implemented by 2006 to accurately measure arrivalsby origin, length of stay, purpose of visit, and intra-FSM travel; (b) establishmentof accurate real-time computer-based immigration system for visitors in each
Section_3_New.pmd 12/12/2005, 2:26 PM143

Federated States of Micronesia Towards a Self-Sustainable Economy
144
state by 2012; (c) availability of annual visitor and accommodation surveys by2007; and (d) regular reporting of accurate data on monthly hotel occupancyrates available throughout the FSM by 2006. Outputs include: (a) Redesignedimmigration cards for foreign visitors in all four states in 2006; (b) Monthlyvisitor arrivals analysis issued by FSMVA from 2006 (including on FSMVAwebsite), based on reports from each state, including hotel occupancy rates;(c) Periodic and regular reports issued on tourist expenditure, activities, nightsspent, length of stay, origins, purpose of visit, satisfaction and other relevantissues commencing 2007; (d) Computer network installed at all points of entryfor real-time monitoring of visitor arrivals and flows by 2012; and (e) annualreport to President and Congress on recommendations for future tourism policybased on ongoing monitoring of industry development progress.
Strategic Goal 11: PStrategic Goal 11: PStrategic Goal 11: PStrategic Goal 11: PStrategic Goal 11: Progressively develop tourismrogressively develop tourismrogressively develop tourismrogressively develop tourismrogressively develop tourismservices that are acceptable to the internationalservices that are acceptable to the internationalservices that are acceptable to the internationalservices that are acceptable to the internationalservices that are acceptable to the internationalmarket through structured training programsmarket through structured training programsmarket through structured training programsmarket through structured training programsmarket through structured training programs
The FSM must implement a comprehensive training program addressing allsegments of the tourism sector that cater to visitors, from the immigration andcustoms officers to retail sales persons to the hotel and restaurant food serviceworkers. While some establishments, notably the hotel sector, have ongoing in-house training programs, much remains to be done throughout the industry tobring service standards up to the level consistent with the premium, high percapita spending tourist destination that the nation has targeted. In addition,given that Japan is one of the prime origin markets in terms of volume of visitingtourists, Japanese-speaking guides, front-desk staff, restaurant personnel and othersmust be recruited and/or trained to become an integral part of industry staffing.
The main outcomes are: (1) basic level training programs for all keystaff who would have received appropriate certificates of competence by2008; (b) intermediate-level training completed for all selected recipients/groupsby the end of 2009; (c) advanced level training for all selected recipients/groupsby the end of 2010; (d) service quality accreditation schemes operative by 2008for all tourism sector businesses; (e) all tourism-related transport services to holdFSMVA approval licenses by 2008; (f) work place orientation course modulesand procedures to be agreed and implemented for all new industry entrants byend-2008; and (g) certified training achievements to be formally incorporatedinto positioning of FSM as a premium tourism destination by 2012.
Section_3_New.pmd 12/12/2005, 2:26 PM144
Chapter 10. Tourism Sector
145
Targeted outputs include: (a) tourism industry training operational planand budgets prepared by 2006 covering the three year period 2006-2008; (b)approval secured for Year 1 (2006) training budgets and outline budgets for Years2 and 3; (c) state visitor bureau staff training plan prepared by 2006; (d) allocateincreased resources to COM state campuses for tourism certificate trainingprograms agreed by 2006; (e) schedule of short-term vocational courses and on-the-job training for the tourism sector agreed by 2006; (f) action program designed,with input of responsible tourism authorities, to identify special industry trainingneeds; (g) training schedules for main sub-sectors completed by State VisitorBureaus and FSMVA by 2006; and (h) agreement with all State governments onenrollment of participants for training programs and/or for on-site training modules.
Section_3_New.pmd 12/12/2005, 2:26 PM145

Federated States of Micronesia Towards a Self-Sustainable Economy
146
Chapter 11. Emerging EconomicManagement and Policy Issues
T he emerging economic management and policy issues discussed inthis chapter are critical in the sense that maintaining the statusquo, rather than making a firm commitment to policy changes, islikely to result in less growth and development and increasedhardship for segments of the already struggling community. Some of
the issues covered have been apparent for some time and others have emergedmore recently as FSM governments have had to meet the more restrictiveconditions for receiving Compact II grant assistance.
11.1 Out-Migration
Although there is almost total agreement that emigration will have an economicimpact on the FSM, there is little agreement on whether the effects will benegative or positive. Most of this uncertainty comes from not having factualinformation on the number, socioeconomic characteristics, and motivations ofFSM citizens who have emigrated to the US and other countries.
Anecdotal information indicates that many, if not a majority, of the emigrantsto the US are going for the purpose of earning a four-year degree in Mainlandschools. Another significant group of emigrants are those joining the US armedservices.
To the extent that large numbers of younger residents out-migrate,population growth will decline and the demographic profile (age distribution)will change. Without appropriate demographic studies and data on the rateand characteristics of out-migration, it is difficult to predict likely impacts.One possibility would be an increase in the dependency ratio (i.e., ratio ofnumber of non-working age to number of working age population). Fewerworkers to support those that cannot work will have consequent householdhardships. Also, there would likely be more of the nation’s most intelligentand capable persons leaving, with the potential consequence of lower workforceproductivity. Given that lack of jobs and income tend to be more prevalent inrural and out-island areas, there may be much greater out-migration fromthese areas, with consequent disruption in delivery of social services as facilitiesmust be closed because of cost factors. School enrollments would also likelybe reduced, and again the pattern of reductions would very likely affect ruralareas to a higher degree.
Section_3_New.pmd 12/12/2005, 2:26 PM146

Chapter 11. Emerging Economic Management and Policy Issues
147
On the positive side, greater out-migration in the long-run could result insignificant benefits, if citizens living in the US and other countries became amajor source of remittance income to relative living in the FSM. In many SouthPacific nations such as Tonga and Samoa, overseas remittances are a major sourceof foreign exchange and household income. Another potential longer-term benefitwould be the return of citizens who have lived abroad that have acquiredoccupational and entrepreneurial skills needed in the FSM economy. A numberof Pacific countries have adopted policies to recruit or promote the return ofcitizens with critically needed skills.
11.2 Public Sector Capacity and Efficiency
There is an urgent need to strengthen economic and financial managementand planning at state and national government levels to formulate andimplement more effective SDPs, and to effectively monitor and report onachievements. While the work of the Third Economic Summit resulted in aset of sectoral Strategic Planning Matrices (SPMs) intended to provide thebasis for government budgeting of Compact and other expenditures,considerable difficulty has been encountered in obtaining the necessarylegislative endorsement.
Institutional strengthening involving both training and technical assistance,is needed to raise productivity of the public service and to enable the capacity toefficiently carry out the programmatic reporting mandated under the Compact.However, not only has Compact II funding been significantly reduced, but JEMCOhas directed that the Capacity Building sector grant may not be used forgovernment recurrent expenditures. FSM representatives appealed this decision,and the US has agreed to a five-year phase-out period during which FSMgovernments may use a declining portion of the capacity building grant for recurrentgovernment costs. As noted in Chapter 7, beginning in fiscal year 2009, anyfunding received for capacity building cannot be used to fund governmentrecurrent costs.
There is a need to undertake a review of all organizational functions andassociated personnel requirements. There must be an ongoing policy mandate togradually reduce public sector employment in conjunction with rising productivityresulting from the institutional strengthening. Other human resourcedevelopment (HRD) elements would include more rigorous applications of jobposition skill and education requirements, elimination of non-essentialgovernment functions (or contracting services to other parties), andimplementation of measures to enable a transition of job position pay rates to
Section_3_New.pmd 12/12/2005, 2:26 PM147

Federated States of Micronesia Towards a Self-Sustainable Economy
148
levels comparable to equivalent jobs in the private sector (and equivalence acrossgovernmental levels – state and national).
With well-designed institutional strengthening and associated HRDprograms, the FSM should be in a good position to request Compact II capacitybuilding sector grant funding to pay for public service training and technicalassistance.
11.3 Reducing Hardship
The FSM is a participatory country in the ADB’s regional project on NationalPoverty Reductions Strategies. As part of this project, an updated hardshipassessment was conducted in late 2003. This assessment was part of the ADB’sprogram for achieving Millennium Development Goals (MDG) which the FSMcommitted to in 2002. This commitment requires that government: (a) betterdefine and assess the concept of hardship in the FSM; (b) monitor progress towardsthe achievement of the MDGs; (c) design appropriate strategies to reducehardship; and (d) incorporate these strategies into the country’s developmentplans.
The hardship assessment conducted in the FSM utilized data from theHousehold Income and Expenditure Study (HIES) done in 1998, and the 2000Census. A Participatory Assessment of Hardship (PAH) survey was held in ninecommunities, three each in the States of Chuuk, Pohnpei, and Yap. The PAH wasundertaken to obtain a qualitative assessment of the perceptions of the communityon hardship. Groups interviewed (about 30-40 persons in each community)included traditional leaders and elders, church leaders, youth, and representativesof women’s groups.
Based on the PAH, poverty in the FSM was perceived to be hardship. Thisconcept has been defined as: “An Inadequate Level of Sustainable HumanDevelopment”, manifested by:
• A lack of access to basic services;• A lack of opportunities to participate fully in the socio-economic life of
the community; and• A lack of adequate resources (including cash) to meet the basic needs of
the household or customary obligations to the extended family, villagecommunity and/or the church”
An analysis of the HIES and Census data determined that there was a largeincidence of low income families experiencing periodic cash shortages that kept
Section_3_New.pmd 12/12/2005, 2:26 PM148

Chapter 11. Emerging Economic Management and Policy Issues
149
them from meeting all their basic needs. The hardship assessment defined food‘poverty’ lines (FPLs) and basic needs ‘poverty’ lines (BNPLs) in relation to thecost of providing an inexpensive, minimally nutritious diet for each state. TheBNPL excludes food and is calculated as a percentage of the FPL. The BNPL forPohnpei was 74.5% of the FPL (which in 1998 was calculated to be US$437 percapita per annum) and for Kosrae the BNPL was 114%. Based on the FPL andBNPL criteria, a surprisingly large proportion of households in the states hadincomes below the BNPL. In the FSM overall, 27.9% of households were belowthe BNPL, meaning that this proportion of all FSM households had insufficientincomes to meet the level of expenditures required to provide basic needs. Bystate, 32.9% of Chuuk households, 12.3% of Kosrae, 29.5% of Pohnpei, and 14.4%of Yap households fell below the BNPL (ADB TA 6047-REG: Table 8).
The HIES data in 1998 indicated substantial inequality in distribution,whether measured in terms of household expenditure or income, particularly forChuuk and Pohnpei, the states accounting for over 80% of total nationalpopulation. With respect to expenditure, in Chuuk 56.0% of all households are inthe bottom quintile and in Pohnpei 39.1% are in the lowest quintile. In contrast,in Kosrae only 0.8% and in Yap only 4.0% of households are in the bottom quintile.The results for distribution according to income are similar, with Chuuk andPohnpei having nearly the same proportions of households in the bottom quintile.
Two indices defined by the United Nations Development Programme(UNDP) are used to make cross-country comparisons of human developmentand hardship status. Based on 1999 rankings, the FSM ranked 7th among 12Pacific developing countries (ADB member countries), and 9th in terms of‘poverty.’ The human development index takes into account life expectancy,adult literacy, school enrollments, and per capita GDP. The human poverty indextakes into account underweight children under 5, people without access to safewater and health services, as well as specific measures of illiteracy and lifeexpectancy. Inadequate social services in the rural and outer islands contributessignificantly to the FSM’s low ranking on these indices.
The MDGs have been set to define quantitative targets to be achieved by2015. For example, current infant mortality rate of 40 (per 1000 live births) is tobe reduced by two thirds to below 14 by 2015. The goals for hardship, defined inthe FSM in accordance with the FPL and BNPL criteria, call for reducing hardshipby 50% by 2015.
The FSM governments in general have not addressed the hardship issue intheir strategic planning. In part, this is may be based on a gap between theperceptions of government leaders and those of the community groups assessedin the PAH work. That is, most government executives and politicians are of the
Section_3_New.pmd 12/12/2005, 2:26 PM149

Federated States of Micronesia Towards a Self-Sustainable Economy
150
view that the traditional customs and systems of social obligations provide a“safety net” that keep families from experiencing hardship. Another reason maybe that many officials do not believe the underlying data (HIES and Census) arereliable or applicable for measuring hardship.
11.4 Governance
The federal structure has come with costs as well as benefits for the nation’scitizens. As a larger nation state having territorial sovereignty over a vast expanseof ocean, the FSM has realized benefits in its international relations (e.g., fisherieslicensing agreements). However, perhaps less obvious, there have been significantcosts in terms of the multi-levels of government, particularly the state-nationalrelationships. From the beginning of the Compact of Free Association and nationalindependence, there has been the inevitable political friction between the statesand the national government as each state competed for Compact assistance andother bilateral and multilateral assistance that had to come through the nationalgovernment. With the high degree of autonomy given the states under the FSMconstitution, building cooperative and efficient working relationships at thebeginning of a new federation probably could have been expected to take sometime. However, after nearly 20 years there may be a reasonable expectation thatinter-governmental relations would be functioning much more efficiently thanthey have in the last five years.
Political in-fighting and non-productive competition has also extendedto the executive and legislative branches with detrimental results. With theoutcome of the Compact II negotiations, it was apparent that the new economicaid regime was not only less generous, but would come with many conditionsattached in terms of eligible expenditure purposes and the degree of requiredplanning, budgeting and accountability. Governments thus far have notresponded well to the new regime, as required, planning and budgeting taskshave been delayed.
With the difficult medium-term transition required of FSM governments toadjust fiscally to the lower initial grant assistance of Compact II and thecontinuing decline in grant funding over the entire assistance term, it is imperativethat governments strengthen their policy and management linkages, includingcapacity for executive and legislative branches cooperate to enact and implementpolicies and measures.
Good governance extends to many other aspects of development besides theefficient utilization of Compact and donor assistance. The four basic elements ofgood governance identified by Mellor include: (a) accountability – making public
Section_3_New.pmd 12/12/2005, 2:26 PM150

Chapter 11. Emerging Economic Management and Policy Issues
151
officials answerable for government behavior and responsible to the entity fromwhich they derive their authority. Criteria must be established to measure theperformance of officials along with oversight mechanisms to ensure that thecriteria are met; (b) participation – people (citizens) must participate in theprocess of governance, as people are the heart of development; (c) predictability– means rule of law, which refers to the existence of laws, regulations and policiesto regulate society, and their fair and consistent application; and (d) transparency– refers to the availability of information to the general public and clarity aboutgovernment rules, regulations, and decisions. Policies or decisions that are knownonly to the preparers and administrators of the information, distort the governanceprocess. Mellor notes that, while “governance means different things in differentcontexts and to different people …. for its purposes, ADB defines governance as‘the manner in which power is exercised in the management of country’s economicand social resources for development.’ Thus the concept of governance is concerneddirectly with the management of the development process, involving both thepublic and private sectors.”
Good governance is necessary in providing the requisite enabling environmentor business climate to achieve sustainable development of the private sector.Transparency and accountability are critical in establishing a favorable policyand regulatory environment for building a more diversified, competitive privatesector. Attracting foreign investment is a case in point. Not only has there beenfriction between the states and national government over jurisdiction, but therehas been no consensus regarding the steps or measures that should be implementedto attract foreign investment. Law and regulations for issuing foreign investmentpermits must be transparent to attract investors. This has been an ongoing issuefor nearly two decades, and remains unresolved.
Public confidence in the integrity of government is important for obtainingand maintaining support of policies and programs. Timely financial audits(accountability), openness (transparency) in informing or disclosing programperformance, dialogue and opportunity to contribute or comment on the makingof policies, plans and budgets, are all important elements in building publicconfidence. While the series of economic summits provided an opportunity forthe public to participate in the making of policies, there were little or no follow-on provisions to enable participants to learn what policies or actions were adopted,and what progress was made in their implementation. Also, since a large share ofthe funding and other resources required to convene the summits came fromdonors, it is questionable whether they would have been held if government hadto depend only on its own resources.
Section_3_New.pmd 12/12/2005, 2:26 PM151

Federated States of Micronesia Towards a Self-Sustainable Economy
152
Fairness in the application of laws and regulations, and due process in theadjudication of law or regulatory violations, also is very important for buildingand maintaining public confidence in government, and in promoting both politicalstability and participation in the political process (backing issues and petitioninglegislators to support specific legislative bills or proposals, for instance).Appointment or election of an independent ombudsman to handle citizencomplaints or appeals, promotes fairness and hence good governance. Loss ofconfidence in government to effectively manage the economy and to deliversatisfactory social services is almost certainly a factor contributing to the largeout-migration in the last six years.
At this juncture, it is very important for FSM governments to criticallyexamine their position on all the elements that contribute to raising the level orstandard of governance. Not only is this important from the standpoint ofpromoting public confidence and support of the citizenry, but improved governancealso can be expected to result in greater efficiency in the conduct of government.
Section_3_New.pmd 12/12/2005, 2:26 PM152

Chapter 11. Emerging Economic Management and Policy Issues
153
Chapter 12. Conclusion: Challengesto Achieving Sustainable Development
F acing a significant reduction in grant funding, and an aid managementregime under Compact II that largely stipulates the allocation offunding among relatively few priority sectors, FSM governments willhave to reach consensus on new economic development policies andstrategies. Maintaining the status quo can no longer be tolerated, if
the nation has any chance of achieving sustainable growth of employment andincome, slowing the out-migration of its more productive citizens, and avoidingsocial decline.
The Third Economic Summit held in early 2004 deliberated economicpolicies and strategies to enable the nation to transition to the reduced level ofaid under Compact II and to achieve sustainable growth and increased self-sufficiency by 2023. The recommended economic strategies and policies endorsedby this summit essentially mirrored those recommended in the 1st and 2ndSummits. The latter policies and strategies were largely not supported, and thusnot implemented. Consensus among governments was not achieved, and therewas little dialogue among and between stakeholders and government on why orhow the earlier recommended policies and strategies should or could beimplemented.
The Strategic Development Plan that resulted from the 3rd EconomicSummit provides the basis for the nation to move ahead toward reaching aconsensus on development policies and priorities. Broad based support—that ofthe general public, private sector, FSM governments, and the donor community—can be expected to generate the strength of commitment needed to completeand implement the currently proposed SDP.
Summarizing specific challenges, it is critically important that the FSM hasresident (citizen) capacity to carry out strategic planning on a continuing basis.While this capacity will in the short-term necessarily have to depend on externallysupplied expertise, more institutional strengthening will be required to ensurethe development and institutionalization of planning and policymaking capacityat both national and state levels.
Both national and state governments need to implement institutionalstrengthening and human resources development (HRD) programs to raiseproductivity of the public service. Strengthening institutional capacity,particularly in economic and financial planning and management is a high priorityin all governments. Integrating strategic planning and performance budgeting
Section_3_New.pmd 12/12/2005, 2:26 PM153

Federated States of Micronesia Towards a Self-Sustainable Economy
154
will require substantially more training, to enable efficient and effective executionof the monitoring, reporting, budget preparation, revision of strategic developmentplans and grant proposal preparation that is required to satisfy Compact IIrequirements.
Strengthening governance standards may be one of the most important tasksfor achieving sustainable development. Governance elements to be addressedwould include commitment (to stated policies), transparency, accountability,efficiency, equity (fairness), inclusiveness (promoting participation of all citizens),and predictability. Other important elements include, honesty (absence ofcorruption, ethical behavior), prudence, and cooperativeness.
Increased growth in private sector activity will create new jobs and providean expanded tax base. A number of elements contributing to an enablingenvironment must be addressed, including strengthened communicationsbetween public and private sectors, rationalization of the Public Sector Enterprisesector to remove unfair competition and pro-active initiatives to contract outactivities that can be more efficiently performed by businesses, a needs assessmentto pinpoint and address industry short- and longer-term skills training to raiseproductivity, a regulatory climate characterized by transparency and efficientcustomer-oriented responsiveness of public agency services, and legal frameworksupportive of business that includes secured transactions and bankruptcy laws.
There must be renewed commitment on the part of national and stategovernments to attracting foreign investment. Private sector development,particularly in fisheries and tourism, will require substantially greater foreigndirect investment (FDI) than what has occurred in the past, to achieve sustainablegrowth in income and employment. Particularly important elements in promotinggreater domestic investment and FDI include: (a) greatly improved public-privatesector dialogue; (b) reasonably predictable costs of doing business; and, perhapsmost importantly, (c) transparency of foreign investment regulations. Nationaland state governments need to reach consensus on a consistent, transparent set ofprocedures for issuing foreign investment permits.
Improved fiscal performance is needed to increase tax revenues to offsetdeclining Compact II resources and to provide budgetary balance that promotesoverall macroeconomic performance conducive to promoting private sector growthand investment. As recommended by several technical assistance missions, theFSM may consider implementing a value-added tax (VAT) to replace import andstate sales taxes.
The NGO sector represents large unrealized potential toward enabling thenation to achieve sustainable development and increased self-sufficiency. Whilethe NGO sector currently is heavily involved in social and economic development,
Section_3_New.pmd 12/12/2005, 2:26 PM154
Chapter 12. Conclusion: Challenges to Achieving Sustainable Development
155
the unrealized potential could be tapped by FSM governments working moredirectly with the NGO sector, particularly if this approach is facilitated bydedicated funding and an agency or bureau made responsible for coordinating allgovernment working relations with the NGO sector.
Section_3_New.pmd 12/12/2005, 2:26 PM155

Federated States of Micronesia Towards a Self-Sustainable Economy
156
Table A1FSM Gross Domestic Product: Fiscal 1987-2004
(in US $ Millions)
SectorSectorSectorSectorSector FY87FY87FY87FY87FY87 FY88FY88FY88FY88FY88 FY89FY89FY89FY89FY89 FY90FY90FY90FY90FY90 FFFFFY9Y9Y9Y9Y911111 FY92FY92FY92FY92FY92 FY93FY93FY93FY93FY93 FY94FY94FY94FY94FY94
Productive Enterprises 29.4 34.4 37.9 44.3 51.5 58.1 65.1 70.7 Private Sector 26.1 31.0 34.0 39.5 46.8 53.3 59.2 56.8 Compensation 10.5 12.6 13.4 16.3 17.7 21.9 24.4 24.4 Operating Surplus 15.6 18.4 20.6 23.1 29.0 31.3 34.9 32.3 Public Enterprises 3.3 3.4 3.9 4.8 4.7 4.8 5.9 13.9 Compensation 1.7 1.9 2.3 2.7 3.0 4.0 5.6 7.9 Operationg Surplus 1.9 2.1 2.5 3.0 3.4 4.6 3.1 10.3 Less Subsidies -0.3 -0.6 -0.9 -0.9 -1.7 -3.7 -2.8 -4.2Financial Enterprises 2.6 2.9 3.0 3.3 3.7 4.0 4.5 5.8Government 44.4 47.0 47.9 50.8 54.3 55.7 61.9 62.3 National 7.1 6.6 7.6 7.9 8.4 8.8 9.9 10.4 State 35.7 38.6 38.3 41.0 43.8 44.5 49.3 49.1 Municipal 1.6 1.9 2.0 1.9 2.1 2.4 2.6 2.8Non Profit Organizations 3.6 3.8 3.5 3.4 4.0 4.8 4.9 5.1Households 30.3 32.5 35.1 37.6 40.2 42.2 44.3 46.3 Subsistence 18.4 19.8 21.3 22.8 24.4 25.7 27.0 28.2 Home Ownership 11.9 12.7 13.8 14.7 15.8 16.5 17.3 18.1Indirect Taxes 6.9 8.6 9.0 9.7 12.1 13.0 15.2 15.4Less Bank Service Charges -3.5 -3.8 -4.0 -4.4 -4.9 -5.3 -5.9 -7.2
Nominal GDP 113.7 125.4 132.4 144.6 160.9 172.5 190.0 198.5Per capita GDP ($) 1,261 1,350 1,384 1,482 1,617 1,700 1,836 1,882
Inflation Index 69.2 72.1 75.5 79.3 83.3 85.8 88.4 90.7Population (‘000) 90.2 92.9 95.7 97.6 99.5 101.5 103.5 105.5
Real GDP (in FY98 $ millions) 164.3 173.9 175.4 182.3 193.2 201.0 214.9 218.9 2Real GDP Growth Rate (%) 2.0 5.8 0.9 3.9 6.0 4.0 6.9 1.9
-4.8 -5.9 -0.3 -3.2 8.9 0.1 0.7 3.3 -3.4
Source: FSM Department of Economic Affairs.Note: e - estimated
Appendix : Statistical Tables
Tables layout2.pmd 12/12/2005, 3:13 PM156

Appendixes
157
22222 FY93FY93FY93FY93FY93 FY94FY94FY94FY94FY94 FY95FY95FY95FY95FY95 FY96FY96FY96FY96FY96 FY97FY97FY97FY97FY97 FY98FY98FY98FY98FY98 FY99FY99FY99FY99FY99 FY00FY00FY00FY00FY00 FFFFFY0Y0Y0Y0Y011111 FY02FY02FY02FY02FY02 FY03FY03FY03FY03FY03 FY04eFY04eFY04eFY04eFY04e
65.1 70.7 74.3 68.1 64.0 72.1 66.6 79.8 79.7 79.1 82.6 79.13 59.2 56.8 58.8 56.3 51.9 53.2 55.1 63.8 63.9 61.9 64.2 64.59 24.4 24.4 23.7 23.4 22.4 23.2 25.3 27.9 29.1 29.3 30.2 32.03 34.9 32.3 35.1 32.9 29.5 30.0 29.8 35.9 34.8 32.6 34.0 32.58 5.9 13.9 15.5 11.8 12.1 18.9 11.5 16.0 15.7 17.2 18.4 14.70 5.6 7.9 10.4 11.7 11.3 13.5 13.2 13.3 12.7 11.4 11.8 11.46 3.1 10.3 9.4 5.9 5.2 10.0 3.0 8.4 8.9 10.5 11.2 8.07 -2.8 -4.2 -4.3 -5.8 -4.4 -4.6 -4.7 -5.7 -5.8 -4.7 -4.6 -4.80 4.5 5.8 5.8 5.6 5.3 5.7 5.9 7.4 7.1 6.6 4.2 3.57 61.9 62.3 66.8 67.1 62.2 53.5 53.7 56.5 58.8 61.5 63.0 60.98 9.9 10.4 11.0 11.5 13.5 12.5 11.8 11.4 11.6 12.7 12.9 12.55 49.3 49.1 53.0 52.7 45.8 38.2 38.9 41.7 43.4 44.9 46.3 44.44 2.6 2.8 2.9 2.9 2.9 2.7 2.9 3.4 3.8 3.8 3.8 4.08 4.9 5.1 5.7 6.3 6.9 7.5 8.1 8.8 9.5 11.1 11.7 12.42 44.3 46.3 47.8 49.2 50.7 51.6 52.7 54.0 54.9 54.9 54.9 55.77 27.0 28.2 29.1 29.9 30.8 31.4 32.0 32.7 33.3 33.3 33.3 33.95 17.3 18.1 18.7 19.3 19.8 20.2 20.7 21.3 21.6 21.6 21.5 21.80 15.2 15.4 14.9 14.6 14.3 16.2 17.4 21.2 20.1 17.7 18.3 17.83 -5.9 -7.2 -7.1 -7.1 -6.4 -7.1 -7.5 -8.9 -8.4 -8.0 -5.1 -4.35 190.0 198.5 208.2 203.8 197.0 199.6 196.9 218.8 221.7 222.9 229.6 225.10 1,836 1,882 1,969 1,922 1,854 1,875 1,844 2,042 2,067 2,074 2,130 2,084
8 88.4 90.7 93.2 95.8 98.4 100.0 101.9 104.0 105.3 105.2 104.9 106.55 103.5 105.5 105.8 106.0 106.3 106.5 106.8 107.0 107.3 107.5 107.8 108.0
0 214.9 218.9 223.4 212.7 200.2 199.6 193.2 210.4 210.5 211.9 218.9 211.40 6.9 1.9 2.1
3 -3.4
Tables layout2.pmd 12/12/2005, 3:13 PM157

Federated States of Micronesia Towards a Self-Sustainable Economy
158
Table A2Chuuk Gross Domestic Product: Fiscal 1987-2003
(in US $ Millions)
SectorSectorSectorSectorSector FY87FY87FY87FY87FY87 FY88FY88FY88FY88FY88 FY89FY89FY89FY89FY89 FY90FY90FY90FY90FY90 FFFFFY9Y9Y9Y9Y911111 FY92FY92FY92FY92FY92 FY93FY93FY93FY93FY93
Productive Enterprises 9.2 11.0 11.8 12.4 15.0 16.8 16.1 Private Sector 8.3 10.2 11.2 11.3 14.1 14.9 15.4 Compensation 3.1 3.2 3.6 3.7 4.1 4.6 5.2 Operationg Surplus 5.2 7.0 7.6 7.6 10.0 10.3 10.3 Public Enterprises 0.9 0.8 0.7 1.1 1.0 1.9 0.8 Compensation 0.2 0.2 0.3 0.4 0.4 0.6 0.5 Operationg Surplus 0.6 0.6 0.8 1.0 1.1 1.5 0.7 Less Subsidies 0.0 0.0 -0.4 -0.3 -0.6 -0.2 -0.4Financial Enterprises 0.8 0.9 0.9 1.0 1.1 1.2 1.2Government 15.3 17.3 16.5 18.2 19.7 20.3 22.5 National 0.3 0.3 0.3 0.3 0.3 0.3 0.4 State 14.4 16.5 15.4 17.3 18.7 19.3 21.3 Municipal 0.6 0.6 0.7 0.7 0.7 0.7 0.8Non Profit Organizations 1.1 1.0 1.0 0.9 1.2 1.5 1.5Households 11.4 12.2 13.2 14.1 15.1 15.9 16.8 Subsistance 9.0 9.6 10.3 11.1 11.9 12.5 13.2 Home Ownership 2.5 2.6 2.8 3.0 3.3 3.4 3.6Indirect Taxes 2.5 3.6 3.5 3.4 4.7 4.4 4.9Less Bank Service Charges -1.0 -1.2 -1.2 -1.3 -1.5 -1.6 -1.6 Nominal GDP 39.2 44.7 45.7 48.7 55.4 58.6 61.4 Per capita GDP ($) 865 959 958 996 1,108 1,147 1,176
Inflation Index 69.2 72.1 75.5 79.3 83.3 85.8 88.4Population (‘000) 45.3 46.6 47.7 48.9 50.0 51.1 52.2
Real GDP (in FY98 $ millions) 56.6 62.0 60.5 61.4 66.5 68.3 69.5Real GDP Growth Rate (%) -2.4 9.5 -2.4 1.5 8.3 2.7 1.8
Source: FSM Department of Economic Affairs.
Tables layout2.pmd 12/12/2005, 3:13 PM158

Appendixes
159
11111 FY92FY92FY92FY92FY92 FY93FY93FY93FY93FY93 FY94FY94FY94FY94FY94 FY95FY95FY95FY95FY95 FY96FY96FY96FY96FY96 FY97FY97FY97FY97FY97 FY98FY98FY98FY98FY98 FY99FY99FY99FY99FY99 FY00FY00FY00FY00FY00 FFFFFY0Y0Y0Y0Y011111 FY02FY02FY02FY02FY02 FY03FY03FY03FY03FY03
0 16.8 16.1 16.0 17.2 12.2 13.3 14.1 13.4 20.0 18.3 16.8 18.714.9 15.4 14.8 15.5 12.6 11.8 12.5 12.4 18.1 16.6 15.1 16.84.6 5.2 5.3 5.4 4.7 4.2 4.1 4.5 5.5 5.3 5.6 6.1
0 10.3 10.3 9.4 10.1 8.0 7.6 8.3 7.9 12.6 11.3 9.5 10.80 1.9 0.8 1.2 1.7 -0.4 1.6 1.7 1.1 2.0 1.7 1.8 1.94 0.6 0.5 0.6 0.8 1.1 1.5 1.6 1.8 2.0 2.0 1.9 1.9
1.5 0.7 1.7 1.4 1.3 1.9 1.6 1.0 2.0 1.7 1.9 1.96 -0.2 -0.4 -1.1 -0.5 -2.8 -1.9 -1.5 -1.7 -2.0 -2.0 -2.0 -2.0
1.2 1.2 1.6 1.4 1.2 0.9 0.9 1.0 1.5 1.7 1.6 1.57 20.3 22.5 21.5 23.3 22.0 18.0 13.7 15.1 17.7 19.2 19.2 20.13 0.3 0.4 0.4 0.4 0.4 0.5 0.5 0.5 0.4 0.4 0.5 0.57 19.3 21.3 20.3 22.1 21.0 17.0 12.9 14.3 17.0 18.6 18.5 19.57 0.7 0.8 0.8 0.8 0.6 0.5 0.3 0.3 0.3 0.2 0.2 0.22 1.5 1.5 1.5 1.6 1.9 2.0 2.2 2.3 2.4 2.5 3.0 3.1
15.9 16.8 17.6 18.1 18.6 19.1 19.5 19.9 20.2 20.4 20.6 20.79 12.5 13.2 13.8 14.2 14.6 15.0 15.3 15.6 15.8 16.0 16.2 16.23 3.4 3.6 3.8 3.9 4.0 4.1 4.2 4.3 4.3 4.4 4.4 4.47 4.4 4.9 4.8 4.6 3.6 3.8 4.6 4.9 7.1 6.7 5.4 6.15 -1.6 -1.6 -2.0 -1.7 -1.6 -1.2 -1.2 -1.4 -1.8 -2.1 -2.0 -1.94 58.6 61.4 61.0 64.5 57.9 55.9 53.7 55.2 67.1 66.7 64.6 68.38 1,147 1,176 1,144 1,208 1,084 1,045 1,004 1,032 1,252 1,244 1,203 1,272
3 85.8 88.4 90.7 93.2 95.8 98.4 100.0 101.9 103.4 104.4 105.4 105.60 51.1 52.2 53.3 53.4 53.4 53.5 53.5 53.5 53.6 53.6 53.7 53.7
5 68.3 69.5 67.2 69.2 60.4 56.9 53.7 54.2 64.9 63.9 61.3 64.73 2.7 1.8 -3.3 3.0 -12.7 -5.8 -5.6 0.9 19.7 -1.5 -4.1 5.5
Tables layout2.pmd 12/12/2005, 3:13 PM159

Federated States of Micronesia Towards a Self-Sustainable Economy
160
Table A3Kosrae Gross Domestic Product: Fiscal 1987-2003
(in US $ Millions)
SectorSectorSectorSectorSector FY87FY87FY87FY87FY87 FY88FY88FY88FY88FY88 FY89FY89FY89FY89FY89 FY90FY90FY90FY90FY90 FFFFFY9Y9Y9Y9Y911111 FY92FY92FY92FY92FY92 FY93FY93FY93FY93FY93
Productive Enterprises 3.0 2.4 2.4 2.8 3.3 2.9 3.8 Private Sector 3.0 2.4 2.4 2.8 3.3 2.9 3.3 Compensation 0.9 0.8 0.7 0.9 1.0 1.1 1.1 Operationg Surplus 2.2 1.6 1.7 1.9 2.4 1.8 2.2 Public Enterprises 0.0 0.0 0.0 0.0 0.0 0.0 0.5 Compensation 0.0 0.0 0.0 0.0 0.0 0.0 0.2 Operationg Surplus 0.0 0.0 0.0 0.0 0.0 0.0 0.4 Less Subsidies 0.0 0.0 0.0 0.0 0.0 0.0 -0.1Financial Enterprises 0.3 0.3 0.3 0.3 0.3 0.3 0.4Government 4.9 4.9 5.0 5.2 5.4 5.7 5.9 National 0.2 0.2 0.2 0.2 0.2 0.2 0.2 State 4.6 4.6 4.7 4.9 5.1 5.3 5.6 Municipal 0.1 0.1 0.1 0.1 0.1 0.1 0.2Non Profit Organizations 0.1 0.1 0.1 0.1 0.1 0.2 0.1Households 2.3 2.5 2.6 2.8 3.0 3.1 3.3 Subsistance 1.0 1.1 1.2 1.2 1.3 1.4 1.4 Home Ownership 1.3 1.4 1.5 1.6 1.7 1.8 1.9Indirect Taxes 0.8 0.7 0.6 0.7 0.9 0.8 0.9Less Bank Service Charges -0.4 -0.3 -0.4 -0.4 -0.4 -0.4 -0.5 Nominal GDP 11.0 10.5 10.7 11.5 12.6 12.7 14.0 Per capita GDP ($) 1,692 1,591 1,574 1,667 1,800 1,789 1,944
Inflation Index 69.2 72.1 75.5 79.3 83.3 85.8 88.4Population (‘000) 6.5 6.6 6.8 6.9 7.0 7.1 7.2
Real GDP (in FY98 $ millions) 15.9 14.6 14.2 14.5 15.1 14.8 15.8Real GDP Growth Rate (%) 2.3 -8.2 -2.7 2.1 4.1 -2.0 6.8
Source: FSM Department of Economic Affairs.
Tables layout2.pmd 12/12/2005, 3:13 PM160

Appendixes
161
11111 FY92FY92FY92FY92FY92 FY93FY93FY93FY93FY93 FY94FY94FY94FY94FY94 FY95FY95FY95FY95FY95 FY96FY96FY96FY96FY96 FY97FY97FY97FY97FY97 FY98FY98FY98FY98FY98 FY99FY99FY99FY99FY99 FY00FY00FY00FY00FY00 FFFFFY0Y0Y0Y0Y011111 FY02FY02FY02FY02FY02 FY03FY03FY03FY03FY03
2.9 3.8 6.6 5.5 5.9 4.9 5.1 5.6 6.6 8.5 7.5 6.32.9 3.3 4.2 3.8 4.6 3.7 4.0 4.4 5.4 6.6 5.8 5.31.1 1.1 1.2 1.2 1.4 1.4 1.4 1.5 2.2 2.8 2.8 2.81.8 2.2 2.9 2.6 3.2 2.4 2.6 2.9 3.2 3.9 3.0 2.60.0 0.5 2.4 1.7 1.3 1.1 1.1 1.3 1.2 1.9 1.7 1.00.0 0.2 0.9 1.3 1.1 1.0 1.4 1.4 1.3 1.1 1.1 1.00.0 0.4 2.6 1.1 0.8 0.8 0.4 0.5 0.6 2.3 1.5 0.60.0 -0.1 -1.0 -0.7 -0.6 -0.7 -0.7 -0.7 -0.8 -1.5 -0.9 -0.60.3 0.4 0.5 0.4 0.4 0.5 0.5 0.4 0.8 0.7 0.8 0.45.7 5.9 5.9 6.3 6.7 6.7 5.4 5.3 5.7 5.8 6.6 6.30.2 0.2 0.2 0.3 0.3 0.3 0.3 0.3 0.3 0.3 0.3 0.35.3 5.6 5.5 5.9 6.3 6.2 5.0 4.9 5.3 5.3 6.1 5.80.1 0.2 0.2 0.2 0.2 0.2 0.2 0.2 0.2 0.2 0.2 0.20.2 0.1 0.1 0.2 0.2 0.2 0.2 0.3 0.3 0.3 0.4 0.43.1 3.3 3.4 3.5 3.7 3.8 3.9 4.0 4.1 4.1 4.0 4.01.4 1.4 1.5 1.5 1.6 1.6 1.7 1.7 1.8 1.8 1.8 1.71.8 1.9 1.9 2.0 2.1 2.1 2.2 2.3 2.3 2.3 2.3 2.30.8 0.9 1.1 1.2 1.2 1.2 1.3 1.4 1.7 1.8 1.4 1.3
-0.4 -0.5 -0.6 -0.5 -0.5 -0.6 -0.6 -0.5 -0.9 -0.8 -0.9 -0.512.7 14.0 17.0 16.6 17.6 16.6 15.8 16.4 18.3 20.4 19.7 18.2
1,789 1,944 2,329 2,243 2,378 2,213 2,079 2,158 2,377 2,649 2,526 2,304
85.8 88.4 90.7 93.2 95.8 98.4 100.0 101.9 103.2 103.6 100.5 98.67.1 7.2 7.3 7.4 7.4 7.5 7.6 7.6 7.7 7.7 7.8 7.9
14.8 15.8 18.7 17.8 18.4 16.9 15.8 16.1 17.7 19.7 19.6 18.5-2.0 6.8 18.4 -4.8 3.4 -8.2 -6.5 1.9 9.9 11.3 -0.5 -5.6
Tables layout2.pmd 12/12/2005, 3:14 PM161

Federated States of Micronesia Towards a Self-Sustainable Economy
162
Table A4Pohnpei Gross Domestic Product: Fiscal 1987-2003
(in US $ Millions)
SectorSectorSectorSectorSector FY87FY87FY87FY87FY87 FY88FY88FY88FY88FY88 FY89FY89FY89FY89FY89 FY90FY90FY90FY90FY90 FFFFFY9Y9Y9Y9Y911111 FY92FY92FY92FY92FY92 FY93FY93FY93FY93FY93
Productive Enterprises 13.4 16.6 19.1 22.1 25.3 26.6 33.8 Private Sector 11.5 14.6 16.3 19.0 21.6 24.7 30.3 Compensation 5.0 6.7 7.0 8.7 9.3 11.5 14.0 Operationg Surplus 6.5 7.9 9.3 10.3 12.3 13.2 16.3 Public Enterprises 2.0 2.0 2.8 3.1 3.6 1.9 3.4 Compensation 1.1 1.3 1.7 1.9 2.2 2.9 4.1 Operationg Surplus 0.9 1.0 1.4 1.6 1.8 2.3 1.4 Less Subsidies 0.0 -0.3 -0.3 -0.4 -0.4 -3.3 -2.1Financial Enterprises 1.3 1.4 1.6 1.7 1.9 2.0 2.4Government 18.1 18.6 20.2 21.0 22.7 23.0 26.4 National 6.6 6.1 7.0 7.3 7.8 8.2 9.2 State 11.0 11.7 12.2 12.8 13.8 13.7 16.0 Municipal 0.6 0.8 1.0 1.0 1.1 1.2 1.3Non Profit Organizations 2.2 2.5 2.2 2.2 2.5 2.9 3.1Households 11.1 12.0 13.1 14.0 15.0 15.7 16.5 Subsistance 5.3 5.7 6.2 6.7 7.1 7.5 7.8 Home Ownership 5.8 6.3 6.8 7.3 7.8 8.2 8.6Indirect Taxes 2.4 2.9 3.5 3.5 4.2 4.8 5.9Less Bank Service Charges -1.7 -1.9 -2.1 -2.3 -2.5 -2.6 -3.2
Nominal GDP 46.8 52.1 57.5 62.2 69.1 72.4 84.9Per capita GDP ($) 1,642 1,760 1,873 1,987 2,173 2,235 2,565
Inflation Index 69.2 72.1 75.5 79.3 83.3 85.8 88.4Population (‘000) 28.5 29.6 30.7 31.3 31.8 32.4 33.1
Real GDP (in FY98 $ millions) 67.6 72.3 76.2 78.4 83.0 84.4 96.0Real GDP Growth Rate (%) 7.1 7.0 5.4 2.9 5.9 1.7 13.7
Source: FSM Department of Economic Affairs.
Tables layout2.pmd 12/12/2005, 3:14 PM162

Appendixes
163
11111 FY92FY92FY92FY92FY92 FY93FY93FY93FY93FY93 FY94FY94FY94FY94FY94 FY95FY95FY95FY95FY95 FY96FY96FY96FY96FY96 FY97FY97FY97FY97FY97 FY98FY98FY98FY98FY98 FY99FY99FY99FY99FY99 FY00FY00FY00FY00FY00 FFFFFY0Y0Y0Y0Y011111 FY02FY02FY02FY02FY02 FY03FY03FY03FY03FY03
3 26.6 33.8 36.7 40.9 38.1 33.1 35.0 31.8 37.9 35.9 40.2 40.56 24.7 30.3 27.7 30.6 29.1 26.2 25.1 25.2 27.8 27.3 28.6 28.63 11.5 14.0 13.1 12.9 12.7 11.9 11.5 12.4 12.8 13.2 13.1 13.43 13.2 16.3 14.6 17.7 16.4 14.3 13.6 12.8 15.0 14.0 15.5 15.26 1.9 3.4 9.0 10.3 9.1 6.9 9.9 6.6 10.1 8.6 11.6 11.92 2.9 4.1 5.5 7.2 8.2 7.2 7.8 7.8 7.7 6.9 6.4 6.78 2.3 1.4 5.4 5.9 2.9 1.2 4.2 0.6 5.1 3.5 6.6 6.74 -3.3 -2.1 -1.8 -2.8 -2.0 -1.5 -2.1 -1.8 -2.7 -1.8 -1.4 -1.69 2.0 2.4 3.2 3.5 3.5 3.4 3.8 3.8 4.3 3.8 3.3 1.97 23.0 26.4 27.3 29.3 30.2 29.9 27.2 26.7 26.5 26.5 28.2 29.08 8.2 9.2 9.6 10.1 10.6 12.4 11.6 10.9 10.5 10.8 11.8 11.98 13.7 16.0 16.3 17.8 18.1 15.8 14.1 14.1 14.1 13.7 14.3 14.9
1.2 1.3 1.4 1.4 1.6 1.6 1.6 1.7 1.9 2.0 2.1 2.25 2.9 3.1 3.3 3.6 3.9 4.4 4.9 5.2 5.7 6.2 7.1 7.40 15.7 16.5 17.2 17.8 18.4 18.9 19.3 19.8 20.6 20.9 20.8 20.8
7.5 7.8 8.2 8.5 8.7 9.0 9.2 9.4 9.8 10.0 9.8 9.98 8.2 8.6 9.0 9.3 9.6 9.9 10.1 10.4 10.8 11.0 10.9 10.92 4.8 5.9 5.9 6.3 6.3 6.1 6.6 7.4 8.6 7.7 7.9 7.65 -2.6 -3.2 -3.9 -4.2 -4.4 -4.0 -4.6 -4.8 -5.1 -4.5 -4.0 -2.3
72.4 84.9 89.8 97.2 96.0 91.8 92.2 89.8 98.5 96.5 103.5 104.93 2,235 2,565 2,665 2,876 2,824 2,692 2,696 2,610 2,855 2,789 2,974 3,006
3 85.8 88.4 90.7 93.2 95.8 98.4 100.0 101.9 105.7 107.1 106.1 105.98 32.4 33.1 33.7 33.8 34.0 34.1 34.2 34.4 34.5 34.6 34.8 34.9
0 84.4 96.0 99.0 104.3 100.2 93.3 92.2 88.1 93.2 90.1 97.5 99.19 1.7 13.7 3.1 5.4 -3.9 -7.2 -1.2 -4.4 5.8 -3.3 8.2 1.6
Tables layout2.pmd 12/12/2005, 3:14 PM163
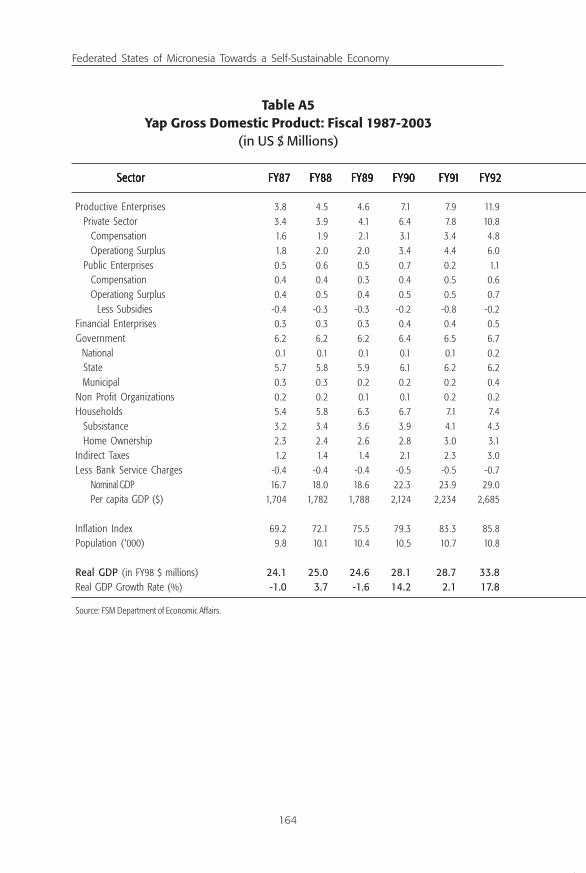
Federated States of Micronesia Towards a Self-Sustainable Economy
164
Table A5Yap Gross Domestic Product: Fiscal 1987-2003
(in US $ Millions)
SectorSectorSectorSectorSector FY87FY87FY87FY87FY87 FY88FY88FY88FY88FY88 FY89FY89FY89FY89FY89 FY90FY90FY90FY90FY90 FFFFFY9Y9Y9Y9Y911111 FY92FY92FY92FY92FY92 FY93FY93FY93FY93FY93
Productive Enterprises 3.8 4.5 4.6 7.1 7.9 11.9 11.4 Private Sector 3.4 3.9 4.1 6.4 7.8 10.8 10.2 Compensation 1.6 1.9 2.1 3.1 3.4 4.8 4.2 Operationg Surplus 1.8 2.0 2.0 3.4 4.4 6.0 6.0 Public Enterprises 0.5 0.6 0.5 0.7 0.2 1.1 1.2 Compensation 0.4 0.4 0.3 0.4 0.5 0.6 0.8 Operationg Surplus 0.4 0.5 0.4 0.5 0.5 0.7 0.7 Less Subsidies -0.4 -0.3 -0.3 -0.2 -0.8 -0.2 -0.3Financial Enterprises 0.3 0.3 0.3 0.4 0.4 0.5 0.5Government 6.2 6.2 6.2 6.4 6.5 6.7 7.0 National 0.1 0.1 0.1 0.1 0.1 0.2 0.2 State 5.7 5.8 5.9 6.1 6.2 6.2 6.5 Municipal 0.3 0.3 0.2 0.2 0.2 0.4 0.4Non Profit Organizations 0.2 0.2 0.1 0.1 0.2 0.2 0.2Households 5.4 5.8 6.3 6.7 7.1 7.4 7.8 Subsistance 3.2 3.4 3.6 3.9 4.1 4.3 4.5 Home Ownership 2.3 2.4 2.6 2.8 3.0 3.1 3.3Indirect Taxes 1.2 1.4 1.4 2.1 2.3 3.0 3.5Less Bank Service Charges -0.4 -0.4 -0.4 -0.5 -0.5 -0.7 -0.7
Nominal GDP 16.7 18.0 18.6 22.3 23.9 29.0 29.8Per capita GDP ($) 1,704 1,782 1,788 2,124 2,234 2,685 2,709
Inflation Index 69.2 72.1 75.5 79.3 83.3 85.8 88.4Population (‘000) 9.8 10.1 10.4 10.5 10.7 10.8 11.0
Real GDP (in FY98 $ millions) 24.1 25.0 24.6 28.1 28.7 33.8 33.7Real GDP Growth Rate (%) -1.0 3.7 -1.6 14.2 2.1 17.8 -0.3
Source: FSM Department of Economic Affairs.
Tables layout2.pmd 12/12/2005, 3:14 PM164

Appendixes
165
11111 FY92FY92FY92FY92FY92 FY93FY93FY93FY93FY93 FY94FY94FY94FY94FY94 FY95FY95FY95FY95FY95 FY96FY96FY96FY96FY96 FY97FY97FY97FY97FY97 FY98FY98FY98FY98FY98 FY99FY99FY99FY99FY99 FY00FY00FY00FY00FY00 FFFFFY0Y0Y0Y0Y011111 FY02FY02FY02FY02FY02 FY03FY03FY03FY03FY03
9 11.9 11.4 11.4 10.7 11.9 12.8 17.9 15.8 15.2 17.0 14.6 17.08 10.8 10.2 10.2 9.0 10.0 10.3 11.7 13.2 12.5 13.4 12.5 13.44 4.8 4.2 4.8 4.2 4.7 5.0 6.2 6.9 7.3 7.7 7.8 8.04 6.0 6.0 5.4 4.8 5.4 5.3 5.4 6.3 5.2 5.7 4.7 5.52 1.1 1.2 1.3 1.7 1.8 2.5 6.2 2.6 2.8 3.6 2.1 3.65 0.6 0.8 0.9 1.0 1.3 1.6 2.8 2.2 2.4 2.7 2.1 2.25 0.7 0.7 0.7 1.0 0.9 1.2 3.9 0.9 0.7 1.5 0.5 1.98 -0.2 -0.3 -0.3 -0.4 -0.3 -0.4 -0.4 -0.5 -0.3 -0.6 -0.5 -0.54 0.5 0.5 0.5 0.6 0.5 0.5 0.6 0.7 0.9 0.8 0.9 0.45 6.7 7.0 7.6 8.0 8.2 7.7 7.1 6.6 6.5 7.3 7.6 7.7
0.2 0.2 0.2 0.2 0.2 0.2 0.2 0.2 0.2 0.2 0.2 0.22 6.2 6.5 7.0 7.3 7.4 6.8 6.2 5.7 5.3 5.7 6.0 6.12 0.4 0.4 0.5 0.5 0.6 0.7 0.7 0.8 1.0 1.4 1.4 1.42 0.2 0.2 0.2 0.3 0.3 0.3 0.3 0.3 0.4 0.5 0.6 0.8
7.4 7.8 8.1 8.3 8.6 8.8 9.0 9.2 9.2 9.5 9.5 9.44.3 4.5 4.7 4.9 5.0 5.1 5.2 5.3 5.4 5.5 5.5 5.5
0 3.1 3.3 3.4 3.5 3.6 3.7 3.8 3.8 3.9 4.0 4.0 3.93 3.0 3.5 3.6 2.8 3.4 3.2 3.7 3.7 3.7 3.9 3.3 3.45 -0.7 -0.7 -0.7 -0.7 -0.6 -0.6 -0.7 -0.8 -1.1 -1.0 -1.1 -0.49 29.0 29.8 30.9 30.0 32.3 32.7 37.9 35.3 34.9 38.0 35.4 38.34 2,685 2,709 2,759 2,679 2,884 2,920 3,384 3,152 3,116 3,363 3,133 3,389
3 85.8 88.4 90.7 93.2 95.8 98.4 100.0 101.9 102.6 105.1 105.1 104.27 10.8 11.0 11.2 11.2 11.2 11.2 11.2 11.2 11.2 11.3 11.3 11.3
7 33.8 33.7 34.1 32.2 33.7 33.2 37.9 34.6 34.0 36.2 33.7 36.817.8 -0.3 1.2 -5.6 4.7 -1.5 14.2 -8.7 -1.7 6.5 -6.9 9.2
Tables layout2.pmd 12/12/2005, 3:14 PM165

Federated States of Micronesia Towards a Self-Sustainable Economy
166
Table A6FSM Employment by Industry: 1987-2004
IndustryIndustryIndustryIndustryIndustry FY87FY87FY87FY87FY87 FY88FY88FY88FY88FY88 FY89FY89FY89FY89FY89 FY90FY90FY90FY90FY90 FFFFFY9Y9Y9Y9Y911111 FY92FY92FY92FY92FY92 FY93FY93FY93FY93FY93 FY94FY94FY94FY94FY94
Agriculture and Forestry 11 10 10 12 16 27 49 44Fisheries 57 75 85 93 109 127 253 470Mining and Quarrying 53 44 60 60 61 54 51 48Manufacturing 117 181 365 476 486 636 671 612Utilities 2 11 10 10 13 34 126 203Construction 819 945 929 1,141 1,055 1181 1,256 1,086Wholesale & Retail; and
Repair of Vehicles,Personal & Household Goods 1,544 1,685 1,870 1,946 2,095 2,236 2,361 2,471
Hotels and Restaurants 277 320 369 401 434 497 545 584Transport, Storage and Communications 469 540 611 690 680 788 826 859Banking and Other Financial Services 137 180 201 219 235 248 261 251Real Estate and Other Business Services 225 231 230 258 257 293 311 285Public Administration and Other
Government Services 7,445 7,787 7,900 7,645 7,972 7,670 7,986 8,005Education 362 433 320 339 369 399 386 387
Health and Social Work 1 1 1 2 6 9 9 11Other Community, Social and
Personal Services 619 595 473 462 536 527 526 456Foreign Government and Private
Organizations 69 68 71 49 55 90 112 133Unclassified 1 0 0 0 0 7 1 0TTTTTotalotalotalotalotal 111112,202,202,202,202,2088888 111113,3,3,3,3,111110000066666 111113,53,53,53,53,50505050505 111113,83,83,83,83,80303030303 111114,34,34,34,34,37777799999 111114,8234,8234,8234,8234,823 111115,7305,7305,7305,7305,730 111115,95,95,95,95,90505050505 11
Source: FSM Department of Economic Affairs.Note: e - Estimated
Tables layout2.pmd 12/12/2005, 3:14 PM166

Appendixes
167
22222 FY93FY93FY93FY93FY93 FY94FY94FY94FY94FY94 FY95FY95FY95FY95FY95 FY96FY96FY96FY96FY96 FY97FY97FY97FY97FY97 FY98FY98FY98FY98FY98 FY99FY99FY99FY99FY99 FY00FY00FY00FY00FY00 FFFFFY0Y0Y0Y0Y011111 FY02FY02FY02FY02FY02 FY03FY03FY03FY03FY03 FY04eFY04eFY04eFY04eFY04e
7 49 44 41 33 38 38 33 30 25 27 26 307 253 470 632 493 420 356 304 225 222 176 187 1814 51 48 39 17 11 12 7 15 14 11 12 126 671 612 610 621 572 555 581 700 812 794 684 6254 126 203 229 293 403 415 429 429 412 411 417 423
1,256 1,086 994 877 796 879 881 935 917 788 812 776
6 2,361 2,471 2,410 2,309 2,320 2,291 2,454 2,585 2,452 2,591 2,733 2,7847 545 584 642 708 677 731 755 827 744 709 720 7078 826 859 955 857 840 798 825 870 804 761 793 8108 261 251 240 232 226 232 229 206 206 202 178 1743 311 285 303 288 291 278 301 362 410 454 423 392
0 7,986 8,005 7,845 7,619 7,145 6,410 6,299 6,353 6,706 6,894 6,635 6,4759 386 387 439 471 513 557 580 587 605 686 729 7999 9 11 15 15 12 11 14 22 31 45 53 64
7 526 456 460 482 590 711 745 545 573 611 676 722
0 112 133 148 141 137 148 152 152 169 183 177 1807 1 0 0 0 0 0 0 1 1 1 2 233333 111115,7305,7305,7305,7305,730 111115,95,95,95,95,90505050505 111116,0026,0026,0026,0026,002 111115,455,455,455,455,4566666 111114,94,94,94,94,99999911111 111114,4224,4224,4224,4224,422 111114,54,54,54,54,58888899999 111114,84,84,84,84,84444444444 111115,5,5,5,5,111110303030303 111115,3445,3445,3445,3445,344 111115,255,255,255,255,2577777 111115,5,5,5,5,111115555566666
Tables layout2.pmd 12/12/2005, 3:14 PM167

Federated States of Micronesia Towards a Self-Sustainable Economy
168
Table A7Chuuk Employment by Industry: 1987-2004
IndustryIndustryIndustryIndustryIndustry FY87FY87FY87FY87FY87 FY88FY88FY88FY88FY88 FY89FY89FY89FY89FY89 FY90FY90FY90FY90FY90 FFFFFY9Y9Y9Y9Y911111 FY92FY92FY92FY92FY92 FY93FY93FY93FY93FY93 FY94FY94FY94FY94FY94
Agriculture and Forestry 0 0 0 0 0 0 1 2Fisheries 18 23 27 20 27 18 76 100Mining and Quarrying 45 35 54 55 56 50 50 46Manufacturing 67 88 101 141 130 144 149 139Utilities 0 0 0 0 0 0 0 0Construction 134 91 120 84 57 94 88 70Wholesale and Retail; and Repair
of Vehicles, Personal andHousehold Goods 668 673 726 710 753 797 816 874
Hotels and Restaurants 94 121 159 154 168 187 217 199Transport, Storage and
Communications 226 248 223 227 230 269 302 288Banking and Other
Financial Services 37 38 43 44 42 44 42 36Real Estate and Other
Business Services 38 36 37 49 39 32 26 28Public Administration and
Other Government Services 3,118 3,336 3,303 3,019 3,339 2,943 3,276 3,308Education 95 93 102 115 124 142 132 127Health and Social Work 0 0 0 0 0 0 0 2Other Community, Social
and Personal Services 175 161 162 165 181 185 201 191Foreign Government and
Private Organizations 4 5 6 6 6 5 5 6Unclassified 0 0 0 0 0 0 0 0TTTTTotalotalotalotalotal 4,74,74,74,74,71111199999 4,9484,9484,9484,9484,948 5,0635,0635,0635,0635,063 4,7894,7894,7894,7894,789 5,5,5,5,5,111115252525252 4,94,94,94,94,91111100000 5,385,385,385,385,3811111 5,45,45,45,45,41111166666
Source: FSM Department of Economic Affairs.Note: e - Estimated
Tables layout2.pmd 12/12/2005, 3:14 PM168

Appendixes
169
22222 FY93FY93FY93FY93FY93 FY94FY94FY94FY94FY94 FY95FY95FY95FY95FY95 FY96FY96FY96FY96FY96 FY97FY97FY97FY97FY97 FY98FY98FY98FY98FY98 FY99FY99FY99FY99FY99 FY00FY00FY00FY00FY00 FFFFFY0Y0Y0Y0Y011111 FY02FY02FY02FY02FY02 FY03FY03FY03FY03FY03 FY04eFY04eFY04eFY04eFY04e
0 1 2 2 0 0 0 0 0 0 0 0 08 76 100 67 27 14 13 32 20 0 0 1 30 50 46 37 14 8 9 5 13 13 10 10 104 149 139 111 94 83 60 61 55 55 49 41 300 0 0 0 44 88 85 95 99 102 105 104 1044 88 70 70 56 44 63 63 125 74 58 64 69
7 816 874 791 680 625 597 631 704 750 825 902 9467 217 199 252 293 262 255 271 335 269 248 254 258
9 302 288 341 278 300 279 298 291 239 210 208 206
4 42 36 30 23 20 20 21 22 21 22 24 26
2 26 28 30 28 30 31 26 32 36 32 34 35
3 3,276 3,308 3,366 3,155 2,875 2,505 2,359 2,403 2,623 2,733 2,415 2,3322 132 127 149 151 143 150 143 143 140 144 140 1420 0 2 2 3 3 3 4 5 8 13 14 20
5 201 191 209 192 223 282 339 225 221 241 250 264
5 5 6 6 6 4 6 5 6 7 8 11 140 0 0 0 0 0 0 0 1 1 1 1 100000 5,385,385,385,385,3811111 5,45,45,45,45,41111166666 5,4635,4635,4635,4635,463 5,0445,0445,0445,0445,044 4,7224,7224,7224,7224,722 4,3584,3584,3584,3584,358 4,3534,3534,3534,3534,353 4,4794,4794,4794,4794,479 4,5594,5594,5594,5594,559 4,6994,6994,6994,6994,699 4,4734,4734,4734,4734,473 4,4604,4604,4604,4604,460
Tables layout2.pmd 12/12/2005, 3:14 PM169

Federated States of Micronesia Towards a Self-Sustainable Economy
170
Table A8Kosrae Employment by Industry: 1987-2004
IndustryIndustryIndustryIndustryIndustry FY87FY87FY87FY87FY87 FY88FY88FY88FY88FY88 FY89FY89FY89FY89FY89 FY90FY90FY90FY90FY90 FFFFFY9Y9Y9Y9Y911111 FY92FY92FY92FY92FY92 FY93FY93FY93FY93FY93 FY94FY94FY94FY94FY94
Agriculture and Forestry 1 1 1 3 4 1 1 1Fisheries 5 8 9 9 10 7 2 37Mining and Quarrying 0 1 1 1 0 0 0 0Manufacturing 7 14 12 17 24 38 38 30Utilities 0 0 0 0 0 0 0 7Construction 98 49 32 64 67 33 39 38Wholesale and Retail; and
Repair of Vehicles, Personal& Household Goods 112 130 146 161 172 191 189 185
Hotels and Restaurants 4 12 17 20 23 39 41 34Transport, Storage and
Communications 50 60 46 38 38 43 49 56Banking and Other
Financial Services 4 4 4 3 3 2 3 2Real Estate and Other
Business Services 20 18 15 18 15 17 23 24Public Administration and
Other GovernmentServices 915 906 877 888 888 904 881 881
Education 0 0 0 0 0 0 0 8Health and Social Work 0 0 0 0 0 0 0 0Other Community, Social
and Personal Services 19 19 18 15 19 14 26 27Foreign Government and
Private Organizations 1 1 1 1 1 1 1 1Unclassified 1 0 0 0 0 0 0 0TTTTTotalotalotalotalotal 11111,23,23,23,23,2377777 11111,223,223,223,223,223 11111,,,,,111117777799999 11111,238,238,238,238,238 11111,26,26,26,26,2644444 11111,29,29,29,29,2900000 11111,293,293,293,293,293 11111,33,33,33,33,3311111
Source: FSM Department of Economic Affairs.Note: e - Estimated
Tables layout2.pmd 12/12/2005, 3:14 PM170

Appendixes
171
22222 FY93FY93FY93FY93FY93 FY94FY94FY94FY94FY94 FY95FY95FY95FY95FY95 FY96FY96FY96FY96FY96 FY97FY97FY97FY97FY97 FY98FY98FY98FY98FY98 FY99FY99FY99FY99FY99 FY00FY00FY00FY00FY00 FFFFFY0Y0Y0Y0Y011111 FY02FY02FY02FY02FY02 FY03FY03FY03FY03FY03 FY04eFY04eFY04eFY04eFY04e
1 1 1 1 1 1 1 1 1 1 1 17 2 37 87 87 62 68 62 27 30 0 0 00 0 0 0 0 0 0 1 0 0 0 0 08 38 30 23 25 32 30 28 29 24 33 31 290 0 7 27 29 33 33 32 35 30 32 33 343 39 38 34 39 56 80 99 122 87 78 111 90
189 185 182 190 187 200 215 228 236 240 295 2749 41 34 46 55 61 52 55 44 42 47 47 48
3 49 56 30 34 33 30 34 62 51 42 41 48
2 3 2 1 0 0 0 0 0 0 0 1 3
7 23 24 44 53 49 49 48 53 43 42 40 43
4 881 881 799 824 804 701 672 680 670 695 704 6970 0 8 14 0 0 0 0 0 0 0 0 00 0 0 0 0 0 0 0 0 0 0 0 0
4 26 27 36 27 18 20 18 23 44 49 55 55
1 1 1 1 2 3 3 3 3 3 3 20 0 0 0 0 0 0 0 0 0 0 0 000000 11111,293,293,293,293,293 11111,33,33,33,33,3311111 11111,325,325,325,325,325 11111,365,365,365,365,365 11111,338,338,338,338,338 11111,26,26,26,26,2677777 11111,26,26,26,26,2688888 11111,30,30,30,30,3077777 11111,26,26,26,26,2611111 11111,262,262,262,262,262 11111,362,362,362,362,362 11111,324,324,324,324,324
Tables layout2.pmd 12/12/2005, 3:14 PM171
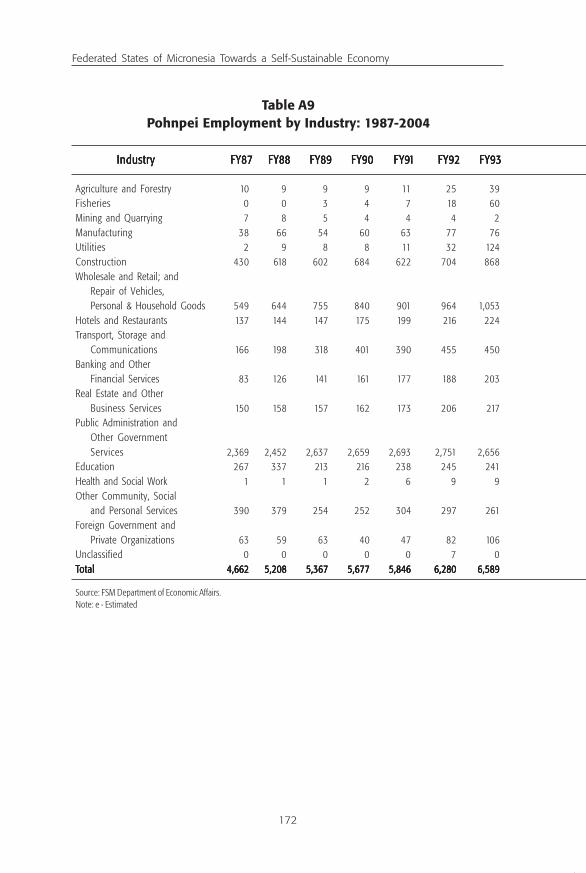
Federated States of Micronesia Towards a Self-Sustainable Economy
172
Table A9Pohnpei Employment by Industry: 1987-2004
IndustryIndustryIndustryIndustryIndustry FY87FY87FY87FY87FY87 FY88FY88FY88FY88FY88 FY89FY89FY89FY89FY89 FY90FY90FY90FY90FY90 FFFFFY9Y9Y9Y9Y911111 FY92FY92FY92FY92FY92 FY93FY93FY93FY93FY93 FY94FY94FY94FY94FY94
Agriculture and Forestry 10 9 9 9 11 25 39 32Fisheries 0 0 3 4 7 18 60 175Mining and Quarrying 7 8 5 4 4 4 2 2Manufacturing 38 66 54 60 63 77 76 76Utilities 2 9 8 8 11 32 124 194Construction 430 618 602 684 622 704 868 799Wholesale and Retail; and
Repair of Vehicles,Personal & Household Goods 549 644 755 840 901 964 1,053 1,061
Hotels and Restaurants 137 144 147 175 199 216 224 237Transport, Storage and
Communications 166 198 318 401 390 455 450 480Banking and Other
Financial Services 83 126 141 161 177 188 203 200Real Estate and Other
Business Services 150 158 157 162 173 206 217 194Public Administration and
Other GovernmentServices 2,369 2,452 2,637 2,659 2,693 2,751 2,656 2,562
Education 267 337 213 216 238 245 241 236Health and Social Work 1 1 1 2 6 9 9 10Other Community, Social
and Personal Services 390 379 254 252 304 297 261 200Foreign Government and
Private Organizations 63 59 63 40 47 82 106 126Unclassified 0 0 0 0 0 7 0 0TTTTTotalotalotalotalotal 4,6624,6624,6624,6624,662 5,2085,2085,2085,2085,208 5,3675,3675,3675,3675,367 5,6775,6775,6775,6775,677 5,8465,8465,8465,8465,846 6,2806,2806,2806,2806,280 6,5896,5896,5896,5896,589 6,5846,5846,5846,5846,584
Source: FSM Department of Economic Affairs.Note: e - Estimated
Tables layout2.pmd 12/12/2005, 3:14 PM172

Appendixes
173
22222 FY93FY93FY93FY93FY93 FY94FY94FY94FY94FY94 FY95FY95FY95FY95FY95 FY96FY96FY96FY96FY96 FY97FY97FY97FY97FY97 FY98FY98FY98FY98FY98 FY99FY99FY99FY99FY99 FY00FY00FY00FY00FY00 FFFFFY0Y0Y0Y0Y011111 FY02FY02FY02FY02FY02 FY03FY03FY03FY03FY03 FY04eFY04eFY04eFY04eFY04e
5 39 32 28 25 30 30 26 25 20 21 21 268 60 175 328 257 223 212 174 124 140 140 145 1394 2 2 2 3 3 3 2 1 1 1 2 27 76 76 77 78 71 63 52 51 44 64 45 392 124 194 200 199 199 207 205 194 186 180 181 1834 868 799 713 559 488 494 524 488 555 422 366 381
4 1,053 1,061 1,075 1,066 1,066 1,069 1,134 1,173 1,068 1,137 1,152 1,1786 224 237 228 230 218 233 206 203 221 227 230 215
5 450 480 549 513 472 455 461 475 465 467 495 501
8 203 200 198 197 195 200 196 181 185 180 153 145
6 217 194 193 171 173 154 143 160 193 238 226 228
2,656 2,562 2,545 2,515 2,430 2,226 2,372 2,363 2,433 2,486 2,508 2,4455 241 236 262 306 356 401 435 442 463 539 586 6549 9 10 13 12 9 8 10 15 20 30 37 42
7 261 200 160 193 242 292 272 209 209 234 238 255
2 106 126 141 134 131 139 143 142 160 172 164 1647 0 0 0 0 0 0 0 0 0 0 0 000000 6,5896,5896,5896,5896,589 6,5846,5846,5846,5846,584 6,76,76,76,76,71111122222 6,4586,4586,4586,4586,458 6,3066,3066,3066,3066,306 6,6,6,6,6,111118888866666 6,3556,3556,3556,3556,355 6,2466,2466,2466,2466,246 6,3636,3636,3636,3636,363 6,5386,5386,5386,5386,538 6,5496,5496,5496,5496,549 6,5976,5976,5976,5976,597
Tables layout2.pmd 12/12/2005, 3:14 PM173

Federated States of Micronesia Towards a Self-Sustainable Economy
174
Table A10Yap Employment by Industry: 1987-2004
IndustryIndustryIndustryIndustryIndustry FY87FY87FY87FY87FY87 FY88FY88FY88FY88FY88 FY89FY89FY89FY89FY89 FY90FY90FY90FY90FY90 FFFFFY9Y9Y9Y9Y911111 FY92FY92FY92FY92FY92 FY93FY93FY93FY93FY93 FY94FY94FY94FY94FY94
Agriculture and Forestry 0 0 0 0 1 2 8 9Fisheries 34 44 46 60 64 83 114 158Mining and Quarrying 0 0 0 0 0 0 0 0Manufacturing 5 13 198 259 269 378 408 367Utilities 0 2 2 2 2 2 2 2Construction 157 186 175 309 309 349 262 178Wholesale & Retail; and
Repair of Vehicles, Personal& Household Goods 215 238 243 235 269 283 304 351
Hotels and Restaurants 43 44 46 52 44 54 63 113Transport, Storage and
Communications 27 33 24 25 21 22 26 34Banking and Other
Financial Services 12 12 12 12 13 14 14 13Real Estate and Other
Business Services 17 20 22 29 30 38 45 40Public Administration and
Other GovernmentServices 1,044 1,092 1,082 1,079 1,053 1,073 1,173 1,255
Education 0 3 6 8 7 12 14 16Health and Social Work 0 0 0 0 0 0 0 0Other Community, Social
and Personal Services 36 36 39 30 31 31 38 39Foreign Government and
Private Organizations 2 3 2 2 2 2 0 0Unclassified 0 0 0 0 0 0 1 0TTTTTotalotalotalotalotal 11111,5,5,5,5,59292929292 11111,726,726,726,726,726 11111,8,8,8,8,89999977777 2,2,2,2,2,111110202020202 2,2,2,2,2,111111111155555 2,3432,3432,3432,3432,343 2,4722,4722,4722,4722,472 2,5752,5752,5752,5752,575
Source: FSM Department of Economic Affairs.Note: e - Estimated
Tables layout2.pmd 12/12/2005, 3:14 PM174

Appendixes
175
22222 FY93FY93FY93FY93FY93 FY94FY94FY94FY94FY94 FY95FY95FY95FY95FY95 FY96FY96FY96FY96FY96 FY97FY97FY97FY97FY97 FY98FY98FY98FY98FY98 FY99FY99FY99FY99FY99 FY00FY00FY00FY00FY00 FFFFFY0Y0Y0Y0Y011111 FY02FY02FY02FY02FY02 FY03FY03FY03FY03FY03 FY04eFY04eFY04eFY04eFY04e
2 8 9 9 7 7 7 6 4 4 5 4 33 114 158 151 123 122 62 36 54 52 35 41 390 0 0 0 0 0 0 0 0 0 0 0 08 408 367 398 424 386 402 440 565 689 648 567 5272 2 2 2 21 83 90 97 101 95 94 98 1029 262 178 177 224 208 242 195 201 201 230 272 236
3 304 351 362 374 441 424 474 481 398 389 385 3864 63 113 116 129 135 191 223 244 212 186 189 186
2 26 34 34 32 34 33 33 41 49 42 49 56
4 14 13 11 11 11 12 12 3 0 0 0 0
8 45 40 37 36 39 44 84 118 138 141 123 86
3 1,173 1,255 1,134 1,125 1,036 978 895 906 981 980 1,007 1,0002 14 16 14 14 14 7 2 2 2 3 3 30 0 0 0 0 0 0 0 2 2 2 2 2
38 39 55 70 107 116 116 88 98 88 134 147
2 0 0 0 0 0 0 0 0 0 0 0 00 1 0 0 0 0 0 0 0 0 0 1 133333 2,4722,4722,4722,4722,472 2,5752,5752,5752,5752,575 2,5002,5002,5002,5002,500 2,5902,5902,5902,5902,590 2,6232,6232,6232,6232,623 2,6082,6082,6082,6082,608 2,62,62,62,62,61111133333 2,82,82,82,82,81111100000 2,922,922,922,922,9211111 2,8432,8432,8432,8432,843 2,8752,8752,8752,8752,875 2,7742,7742,7742,7742,774
Tables layout2.pmd 12/12/2005, 3:14 PM175

Federated States of Micronesia Towards a Self-Sustainable Economy
176
Table A11FSM Employment by Institutional Sector: 1987-2004
FY87FY87FY87FY87FY87 FY88FY88FY88FY88FY88 FY89FY89FY89FY89FY89 FY90FY90FY90FY90FY90 FFFFFY9Y9Y9Y9Y911111 FY92FY92FY92FY92FY92 FY93FY93FY93FY93FY93 FY94FY94FY94FY94FY94
Private Sector 3,492 3,916 4,378 4,909 5,046 5,655 6,148 6,149Public Enterprise 202 250 280 291 306 351 484 719Financial Institutions 137 161 177 198 215 230 245 236National Government 515 556 591 634 651 681 722 730State Government 6,050 6,307 6,362 6,173 6,433 6,033 6,291 6,244Municipalities 775 797 823 751 778 819 851 877Non-Profits 1038 1118 894 847 951 1052 988 949Total 12,209 13,105 13,505 13,803 14,380 14,821 15,729 15,904 1
Source: FSM Department of Economic Affairs. Note: e- data are estimates.
Table A12Chuuk Employment by Institutional Sector: 1987-2004
FY87FY87FY87FY87FY87 FY88FY88FY88FY88FY88 FY89FY89FY89FY89FY89 FY90FY90FY90FY90FY90 FFFFFY9Y9Y9Y9Y911111 FY92FY92FY92FY92FY92 FY93FY93FY93FY93FY93 FY94FY94FY94FY94FY94
Private Sector 1,304 1,325 1,460 1,457 1,491 1,612 1,750 1,786Public Enterprise 10 10 13 14 14 16 15 15Financial Institutions 37 38 43 44 42 44 42 36National Government 0 0 0 0 0 1 1 0State Government 2,663 2,866 2,755 2,569 2,825 2,416 2,735 2,747Municipalities 365 373 457 397 443 421 453 457Non-Profits 339 337 333 306 337 400 383 374Total 4,718 4,949 5,061 4,787 5,152 4,910 5,379 5,415 5
Table A13Kosrae Employment by Institutional Sector: 1987-2004
FY87FY87FY87FY87FY87 FY88FY88FY88FY88FY88 FY89FY89FY89FY89FY89 FY90FY90FY90FY90FY90 FFFFFY9Y9Y9Y9Y911111 FY92FY92FY92FY92FY92 FY93FY93FY93FY93FY93 FY94FY94FY94FY94FY94
Private Sector 309 302 286 334 357 366 394 389Public Enterprise 0 0 0 0 0 0 0 41Financial Institutions 4 4 4 3 3 2 3 2National Government 2 3 3 4 5 4 4 4State Government 861 861 826 848 851 863 838 836Municipalities 52 42 48 36 32 36 39 40Non-Profits 9 10 12 12 17 18 14 19Total 1,237 1,222 1,179 1,237 1,265 1,289 1,292 1,331
Tables layout2.pmd 12/12/2005, 3:14 PM176

Appendixes
177
22222 FY93FY93FY93FY93FY93 FY94FY94FY94FY94FY94 FY95FY95FY95FY95FY95 FY96FY96FY96FY96FY96 FY97FY97FY97FY97FY97 FY98FY98FY98FY98FY98 FY99FY99FY99FY99FY99 FY00FY00FY00FY00FY00 FFFFFY0Y0Y0Y0Y011111 FY02FY02FY02FY02FY02 FY03FY03FY03FY03FY03 FY04eFY04eFY04eFY04eFY04e
5 6,148 6,149 6,141 5,770 5,567 5,551 5,832 6,366 6,281 6,250 6,379 6388484 719 949 976 1,038 1,021 965 892 867 849 847 825
0 245 236 227 220 217 224 222 200 200 195 170 162722 730 712 684 694 683 835 801 845 837 861 788
3 6,291 6,244 6,094 5,918 5,497 4,935 4,659 4,695 4,918 5,075 4,777 46979 851 877 878 824 763 619 634 678 741 787 768 7662 988 949 1002 1064 1,214 1,388 1,441 1,210 1,251 1,351 1,455 1530
15,729 15,904 16,003 15,456 14,990 14,421 14,588 14,842 15,103 15,344 15,257 15,156
4
22222 FY93FY93FY93FY93FY93 FY94FY94FY94FY94FY94 FY95FY95FY95FY95FY95 FY96FY96FY96FY96FY96 FY97FY97FY97FY97FY97 FY98FY98FY98FY98FY98 FY99FY99FY99FY99FY99 FY00FY00FY00FY00FY00 FFFFFY0Y0Y0Y0Y011111 FY02FY02FY02FY02FY02 FY03FY03FY03FY03FY03 FY04eFY04eFY04eFY04eFY04e
2 1,750 1,786 1,756 1,520 1,403 1,355 1,438 1,666 1,554 1,557 1,644 17226 15 15 14 56 101 88 95 98 98 99 96 904 42 36 30 23 20 20 21 22 21 22 22 22
1 0 0 0 0 0 0 0 0 0 0 06 2,735 2,747 2,830 2,676 2,473 2,251 2,120 2,142 2,374 2,464 2,136 2062
453 457 433 340 268 134 117 115 86 99 100 880 383 374 402 429 458 511 563 434 425 458 476 4760 5,379 5,415 5,465 5,044 4,723 4,359 4,354 4,477 4,558 4,699 4,474 4,460
4
22222 FY93FY93FY93FY93FY93 FY94FY94FY94FY94FY94 FY95FY95FY95FY95FY95 FY96FY96FY96FY96FY96 FY97FY97FY97FY97FY97 FY98FY98FY98FY98FY98 FY99FY99FY99FY99FY99 FY00FY00FY00FY00FY00 FFFFFY0Y0Y0Y0Y011111 FY02FY02FY02FY02FY02 FY03FY03FY03FY03FY03 FY04eFY04eFY04eFY04eFY04e
6 394 389 392 424 424 419 453 521 517 494 578 5440 0 41 101 107 105 137 130 94 67 70 73 712 3 2 1 0 0 0 0 0 0 0 1 34 4 4 4 5 5 5 5 6 6 6 6 63 838 836 756 783 763 659 633 639 629 651 661 6546 39 40 39 37 36 36 34 36 35 37 37 428 14 19 32 9 6 10 13 13 8 5 5 59 1,292 1,331 1,325 1,365 1,339 1,266 1,268 1,309 1,262 1,263 1,361 1,325
Tables layout2.pmd 12/12/2005, 3:14 PM177

Federated States of Micronesia Towards a Self-Sustainable Economy
178
Table A14Pohnpei Employment by Institutional Sector: 1987-2004
FY87FY87FY87FY87FY87 FY88FY88FY88FY88FY88 FY89FY89FY89FY89FY89 FY90FY90FY90FY90FY90 FFFFFY9Y9Y9Y9Y911111 FY92FY92FY92FY92FY92 FY93FY93FY93FY93FY93 FY94FY94FY94FY94FY94
Private Sector 1,436 1,768 1,929 2,212 2,258 2,562 2,879 2,835Public Enterprise 141 179 206 206 220 244 368 553Financial Institutions 83 107 118 139 157 170 186 185National Government 513 553 588 630 646 677 718 726State Government 1,559 1,557 1,736 1,718 1,739 1,763 1,639 1,516Municipalities 282 313 280 278 268 279 265 269Non-Profits 648 732 508 493 559 584 535 498Total 4,662 5,209 5,365 5,676 5,847 6,279 6,590 6,582 6
Source: FSM Department of Economic Affairs. Note: e - data are estimates.
Table 15Yap Employment by Institutional Sector: 1987-2004
FY87FY87FY87FY87FY87 FY88FY88FY88FY88FY88 FY89FY89FY89FY89FY89 FY90FY90FY90FY90FY90 FFFFFY9Y9Y9Y9Y911111 FY92FY92FY92FY92FY92 FY93FY93FY93FY93FY93 FY94FY94FY94FY94FY94
Private Sector 443 521 703 906 940 1,115 1,125 1,138Public Enterprise 51 62 60 70 71 91 102 112Financial Institutions 12 12 12 12 13 14 14 13National Government 0 0 0 0 0 0 0 0State Government 967 1,023 1045 1,038 1018 991 1,079 1,144Municipalities 77 69 37 41 35 82 94 111Non-Profits 42 39 41 36 38 50 57 57Total 1,592 1,726 1,898 2,103 2,115 2,343 2,471 2,575 2
Tables layout2.pmd 12/12/2005, 3:14 PM178

Appendixes
179
4
22222 FY93FY93FY93FY93FY93 FY94FY94FY94FY94FY94 FY95FY95FY95FY95FY95 FY96FY96FY96FY96FY96 FY97FY97FY97FY97FY97 FY98FY98FY98FY98FY98 FY99FY99FY99FY99FY99 FY00FY00FY00FY00FY00 FFFFFY0Y0Y0Y0Y011111 FY02FY02FY02FY02FY02 FY03FY03FY03FY03FY03 FY04eFY04eFY04eFY04eFY04e
2 2,879 2,835 2,844 2,591 2,442 2,423 2,496 2,528 2,518 2,545 2,543 26134 368 553 691 661 655 641 586 520 534 538 537 5180 186 185 185 186 185 192 189 176 179 174 147 1377 718 726 708 679 689 678 830 796 839 831 855 7823 1,639 1,516 1,510 1,455 1,346 1,176 1,140 1,169 1,179 1,215 1,207 12159 265 269 270 327 338 319 353 367 385 424 405 4104 535 498 506 560 649 757 761 693 728 813 855 9229 6,590 6,582 6,714 6,459 6,304 6,186 6,355 6,249 6,362 6,540 6,549 6,597
22222 FY93FY93FY93FY93FY93 FY94FY94FY94FY94FY94 FY95FY95FY95FY95FY95 FY96FY96FY96FY96FY96 FY97FY97FY97FY97FY97 FY98FY98FY98FY98FY98 FY99FY99FY99FY99FY99 FY00FY00FY00FY00FY00 FFFFFY0Y0Y0Y0Y011111 FY02FY02FY02FY02FY02 FY03FY03FY03FY03FY03 FY04eFY04eFY04eFY04eFY04e
5 1,125 1,138 1,150 1,236 1,298 1,353 1,446 1,651 1,692 1,654 1,614 1509102 112 143 151 177 155 155 179 167 141 142 146
4 14 13 11 11 11 12 12 3 0 0 0 00 0 0 0 0 0 0 0 0 0 0 0 0
1,079 1,144 999 1,004 915 849 766 746 737 745 773 7672 94 111 136 121 120 129 130 160 234 227 226 2260 57 57 62 66 101 110 104 70 91 76 120 1273 2,471 2,575 2,501 2,589 2,622 2,608 2,613 2,809 2,921 2,843 2,875 2,775
Tables layout2.pmd 12/12/2005, 3:14 PM179

Federated States of Micronesia Towards a Self-Sustainable Economy
180
Table A16FSM Nominal Wage Rates by Institutional Sector: 1987-2004
(Annual Wage Rates in US $)
FY87FY87FY87FY87FY87 FY88FY88FY88FY88FY88 FY89FY89FY89FY89FY89 FY90FY90FY90FY90FY90 FFFFFY9Y9Y9Y9Y911111 FY92FY92FY92FY92FY92 FY93FY93FY93FY93FY93 FY94FY94FY94FY94FY94
Private Sector 2,991 3,190 3,037 3,306 3,490 3,843 3,914 3,918Public Enterprise 5,593 5,222 5,865 6,470 6,989 7,941 8,099 7,935Financial Institutions 7,846 8,793 8,879 9,693 10,129 10,858 11,437 12,518National Government 11,376 11,461 10,519 11,348 11,667 12,553 13,092 13,810State Government 5,619 5,668 5,646 6,108 6,547 6,848 7,448 7,480Municipalities 2,004 2,266 2,330 2,567 2,727 2,863 3,056 3,187Non-Profits 3,440 3,408 3,920 4,114 4,232 4,532 4,962 5,393Total 4,720 4,804 4,744 5,090 5,409 5,667 6,014 6,128 6
Source: FSM Department of Economic Affairs. Note: e- data are estimates.
Table A17Chuuk Nominal Wage Rates by Institutional Sector: 1987-2004
(Annual Wage Rates in US $)
FY87FY87FY87FY87FY87 FY88FY88FY88FY88FY88 FY89FY89FY89FY89FY89 FY90FY90FY90FY90FY90 FFFFFY9Y9Y9Y9Y911111 FY92FY92FY92FY92FY92 FY93FY93FY93FY93FY93 FY94FY94FY94FY94FY94
Private Sector 2,365 2,377 2,445 2,524 2,709 2,826 2,921 2,973Public Enterprise 3671 3717 3301 3947 4445 5518 5263 5458Financial Institutions 5986 6828 8104 11033 9965 12220 11371 12274National Government - - - - - 1920 1920 –State Government 5,304 4,870 5,304 5,686 6,244 6,435 6,613 6,399Municipalities 1470 1508 1347 1590 1507 1543 1729 1714Non-Profits 2551 2227 2403 2219 2876 3080 3145 3165Total 4,000 3,782 3,950 4,206 4,619 4,604 4,786 4,686 5
Tables layout2.pmd 12/12/2005, 3:14 PM180

Appendixes
181
4
22222 FY93FY93FY93FY93FY93 FY94FY94FY94FY94FY94 FY95FY95FY95FY95FY95 FY96FY96FY96FY96FY96 FY97FY97FY97FY97FY97 FY98FY98FY98FY98FY98 FY99FY99FY99FY99FY99 FY00FY00FY00FY00FY00 FFFFFY0Y0Y0Y0Y011111 FY02FY02FY02FY02FY02 FY03FY03FY03FY03FY03 FY04eFY04eFY04eFY04eFY04e
3 3,914 3,918 3,808 3,938 3,941 3,990 4,054 4,091 4,287 4,315 4,408 4,4148,099 7,935 7,663 8,163 8,532 8,997 9,764 10,491 11,014 10,815 10,960 10,815
8 11,437 12,518 12,364 12,829 13,091 13,385 14,407 16,043 16,040 15,481 16,630 14,4933 13,092 13,810 14,682 14,711 14,651 13,768 12,896 11,785 11,892 12,304 12,100 12,7878 7,448 7,480 8,095 8,182 7,613 7,661 7,620 7,850 7,954 8,151 8,482 8,3653 3,056 3,187 3,265 3,459 3,821 4,356 4,584 4,926 5,074 4,843 4,940 5,2002 4,962 5,393 5,676 5,786 5,573 5,433 5,521 7,148 7,534 8,088 7,939 8,0037 6,014 6,128 6,361 6,552 6,360 6,365 6,402 6,528 6,756 6,881 6,981 6,932
2004
22222 FY93FY93FY93FY93FY93 FY94FY94FY94FY94FY94 FY95FY95FY95FY95FY95 FY96FY96FY96FY96FY96 FY97FY97FY97FY97FY97 FY98FY98FY98FY98FY98 FY99FY99FY99FY99FY99 FY00FY00FY00FY00FY00 FFFFFY0Y0Y0Y0Y011111 FY02FY02FY02FY02FY02 FY03FY03FY03FY03FY03 FY04eFY04eFY04eFY04eFY04e
6 2,921 2,973 3,059 3,053 2,961 3,029 3,107 3,282 3,391 3,523 3,649 35268 5263 5458 5,503 6,615 7,175 8,435 10,284 10919 10774 10153 10397 94080 11371 12274 12333 14938 13589 13235 14590 16054 16159 13462 12110 124660 1920 – – – – – – – – – – –5 6,613 6,399 7,173 7,093 6,106 6,054 5,970 6,599 7,007 6,974 7,469 72233 1729 1714 1848 1611 1818 2146 2836 2393 1890 1710 1466 17460 3145 3165 3221 3358 3,308 3,241 2,972 3,780 3,967 4,384 4,214 44974 4,786 4,686 5,162 5,219 4,712 4,745 4,688 5,123 5,518 5,564 5,669 5,467
Tables layout2.pmd 12/12/2005, 3:14 PM181

Federated States of Micronesia Towards a Self-Sustainable Economy
182
Table A18Kosrae Nominal Wage Rates by Institutional Sector: 1987-2004
(Annual Wage Rates in US $)
FY87FY87FY87FY87FY87 FY88FY88FY88FY88FY88 FY89FY89FY89FY89FY89 FY90FY90FY90FY90FY90 FFFFFY9Y9Y9Y9Y911111 FY92FY92FY92FY92FY92 FY93FY93FY93FY93FY93 FY94FY94FY94FY94FY94
Private Sector 2,753 2,475 2,282 2,615 2,622 2,815 2,735 3,088Public Enterprise – – – – – – – 4,831Financial Institutions 6,259 6,247 6,348 6,404 5,271 5,550 6,590 5,855National Government 4,660 4,128 3,914 3,438 3,162 3,416 3,285 3,167State Government 4,326 4,919 5,330 5,249 5,569 5,873 6,511 6,446Municipalities 2,473 2,944 2,231 2,830 3,464 3,823 4,100 3,977Non-Profits 5,088 4,175 3,669 3,331 2,619 2,946 2,592 2,252Total 3,868 4,244 4,446 4,446 4,634 4,899 5,235 5,270 5
Source: FSM Department of Economic Affairs.Note: e- data are estimates.
Table A19Pohnpei Nominal Wage Rates by Institutional Sector: 1987-2004
(Annual Wage Rates in US $)
FY87FY87FY87FY87FY87 FY88FY88FY88FY88FY88 FY89FY89FY89FY89FY89 FY90FY90FY90FY90FY90 FFFFFY9Y9Y9Y9Y911111 FY92FY92FY92FY92FY92 FY93FY93FY93FY93FY93 FY94FY94FY94FY94FY94
Private Sector 3,432 3,770 3,620 3,891 4,106 4,437 4,771 4,536Public Enterprise 6,301 5,791 6,822 7,721 8,256 9,711 9,255 9,005Financial Institutions 9,107 9,700 9,323 9,439 10,354 10,724 11,669 12,828National Government 11,401 11,500 10,555 11,402 11,728 12,616 13,159 13,872State Government 7,048 7,452 6,388 7,411 7,826 8,265 10,258 11,099Municipalities 1,985 2,686 3,477 3,542 4,263 4,305 4,811 5,144Non-Profits 3,884 3,947 5,062 5,269 5,216 5,756 6,566 7,502Total 5,681 5,843 5,653 6,167 6,492 6,885 7,642 7,935
Tables layout2.pmd 12/12/2005, 3:14 PM182

Appendixes
183
2004
22222 FY93FY93FY93FY93FY93 FY94FY94FY94FY94FY94 FY95FY95FY95FY95FY95 FY96FY96FY96FY96FY96 FY97FY97FY97FY97FY97 FY98FY98FY98FY98FY98 FY99FY99FY99FY99FY99 FY00FY00FY00FY00FY00 FFFFFY0Y0Y0Y0Y011111 FY02FY02FY02FY02FY02 FY03FY03FY03FY03FY03 FY04eFY04eFY04eFY04eFY04e
5 2,735 3,088 3,007 3,216 3,128 3,279 3,223 3,169 3,466 3,552 3,596 3,602– – 4,831 6,159 5,600 7,880 7,936 8,936 10,926 11,700 10,881 9,542 9,4640 6,590 5,855 4,259 – – – – – – – 1,651 2,0866 3,285 3,167 3,061 2,964 2,876 2,795 2,720 2,652 2,588 2,529 2,508 2,5083 6,511 6,446 7,236 7,317 7,431 6,715 7,248 7,474 7,669 9,004 8,456 8,3693 4,100 3,977 3,876 4,587 4,322 4,254 4,476 4,538 4,662 4,039 4,270 4,0406 2,592 2,252 3,244 3,200 2,095 2,097 1,894 1,807 2,629 3,475 4,334 5,0939 5,235 5,270 5,693 5,792 5,981 5,588 5,834 5,849 6,021 6,779 6,292 6,280
2004
22222 FY93FY93FY93FY93FY93 FY94FY94FY94FY94FY94 FY95FY95FY95FY95FY95 FY96FY96FY96FY96FY96 FY97FY97FY97FY97FY97 FY98FY98FY98FY98FY98 FY99FY99FY99FY99FY99 FY00FY00FY00FY00FY00 FFFFFY0Y0Y0Y0Y011111 FY02FY02FY02FY02FY02 FY03FY03FY03FY03FY03 FY04eFY04eFY04eFY04eFY04e
7 4,771 4,536 4,454 4,782 4,723 4,606 4,836 4,925 5,142 5,019 5,102 5,1119,255 9,005 8,548 9,460 9,679 10,099 10,785 11,995 12,574 11,866 12,122 11,947
4 11,669 12,828 12,509 12,686 13,145 13,527 14,551 16,098 16,026 15,735 17,372 15,0906 13,159 13,872 14,755 14,792 14,734 13,850 12,961 11,849 11,956 12,374 12,168 12,8675 10,258 11,099 11,151 11,526 10,902 11,767 11,270 11,081 10,888 10,974 11,540 11,4635 4,811 5,144 5,093 4,835 4,710 4,823 4,712 5,242 5,262 5,027 5,329 5,5226 6,566 7,502 8,147 8,047 7,790 7,549 8,057 9,861 10,232 10,501 10,580 10,3605 7,642 7,935 7,994 8,346 8,215 8,198 8,268 8,427 8,624 8,590 8,791 8,703
Tables layout2.pmd 12/12/2005, 3:14 PM183

Federated States of Micronesia Towards a Self-Sustainable Economy
184
Table A20Yap Nominal Wage Rates by Institutional Sector: 1987-2004
(Annual Wage Rates in US $)
FY87FY87FY87FY87FY87 FY88FY88FY88FY88FY88 FY89FY89FY89FY89FY89 FY90FY90FY90FY90FY90 FFFFFY9Y9Y9Y9Y911111 FY92FY92FY92FY92FY92 FY93FY93FY93FY93FY93 FY94FY94FY94FY94FY94
Private Sector 3,569 3,708 2,972 3,392 3,582 4,284 3,678 4,148Public Enterprise 4,018 3,808 3,157 3,333 3,595 3,628 4,338 4,091Financial Institutions 5,439 7,733 8,103 8,527 9,024 9,051 9,528 9,913National Government - - - - - - - -State Government 5,335 5,817 5,565 5,701 6,018 6,188 6,024 6,038Municipalities 4,288 4,054 5,908 5,196 5,766 4,305 4,086 4,237Non-Profits 3,421 3,311 2,138 2,250 2,526 2,425 2,693 2,660Total 4,701 4,995 4,478 4,575 4,805 5,053 4,756 4,986 4
Table A21FSM Real Wage Rates by Institutional Sector: 1987-2004
(Annual Wage Rates in 1998 US $)
FY87FY87FY87FY87FY87 FY88FY88FY88FY88FY88 FY89FY89FY89FY89FY89 FY90FY90FY90FY90FY90 FFFFFY9Y9Y9Y9Y911111 FY92FY92FY92FY92FY92 FY93FY93FY93FY93FY93 FY94FY94FY94FY94FY94
Private Sector 4,322 4,427 4,023 4,172 4,193 4,481 4,429 4,321Public Enterprise 8,081 7,246 7,770 8,163 8,395 9,259 9,165 8,750Financial Institutions 11,337 12,202 11,762 12,230 12,166 12,661 12,942 13,804National Government 16,437 15,904 13,934 14,318 14,014 14,637 14,815 15,229State Government 8,119 7,865 7,479 7,707 7,863 7,985 8,429 8,249Municipalities 2,895 3,144 3,087 3,239 3,275 3,338 3,459 3,515Non-Profits 4,971 4,730 5,193 5,064 5,083 5,284 5,615 5,947Total 6,820 6,666 6,285 6,422 6,497 6,608 6,806 6,758 6
Source: FSM Department of Economic Affairs. Note: e - data are estimates.
Tables layout2.pmd 12/12/2005, 3:14 PM184

Appendixes
185
04
22222 FY93FY93FY93FY93FY93 FY94FY94FY94FY94FY94 FY95FY95FY95FY95FY95 FY96FY96FY96FY96FY96 FY97FY97FY97FY97FY97 FY98FY98FY98FY98FY98 FY99FY99FY99FY99FY99 FY00FY00FY00FY00FY00 FFFFFY0Y0Y0Y0Y011111 FY02FY02FY02FY02FY02 FY03FY03FY03FY03FY03 FY04eFY04eFY04eFY04eFY04e
4 3,678 4,148 3,623 3,718 3,795 4,071 3,906 3,921 4,087 4,206 4,378 4,5138 4,338 4,091 4,647 4,881 5,452 5,705 6,276 5,659 5,904 7,240 7,666 8,319
9,528 9,913 10,458 10,875 11,298 11,296 11,713 12,445 - - - -- - - - - - - - - - - - -8 6,024 6,038 6,740 6,912 6,998 6,971 7,060 6,702 6,554 6,696 6,528 6,5255 4,086 4,237 3,972 4,598 5,634 5,522 5,848 6,106 5,993 5,996 5,899 6,1775 2,693 2,660 2,699 2,728 1,769 1,342 1,228 2,218 3,020 4,888 4,010 4,1483 4,756 4,986 4,954 5,071 5,064 5,101 4,995 4,861 4,933 5,170 5,222 5,388
04
22222 FY93FY93FY93FY93FY93 FY94FY94FY94FY94FY94 FY95FY95FY95FY95FY95 FY96FY96FY96FY96FY96 FY97FY97FY97FY97FY97 FY98FY98FY98FY98FY98 FY99FY99FY99FY99FY99 FY00FY00FY00FY00FY00 FFFFFY0Y0Y0Y0Y011111 FY02FY02FY02FY02FY02 FY03FY03FY03FY03FY03 FY04eFY04eFY04eFY04eFY04e
4,429 4,321 4,084 4,156 4,005 3,990 3,978 3,890 3,949 3,915 3,882 3,8239 9,165 8,750 8,219 8,518 8,672 8,997 9,580 9,976 10,147 9,811 9,654 9,367
12,942 13,804 13,262 13,387 13,305 13,385 14,136 15,256 14,777 14,044 14,647 12,5547 14,815 15,229 15,748 15,350 14,890 13,768 12,653 11,207 10,956 11,162 10,657 11,0765 8,429 8,249 8,683 8,538 7,737 7,661 7,477 7,465 7,328 7,395 7,470 7,2468 3,459 3,515 3,502 3,609 3,883 4,356 4,498 4,684 4,674 4,394 4,351 4,5044 5,615 5,947 6,088 6,037 5,663 5,433 5,417 6,798 6,941 7,337 6,992 6,9328 6,806 6,758 6,823 6,836 6,464 6,365 6,282 6,208 6,224 6,242 6,148 6,004
Tables layout2.pmd 12/12/2005, 3:14 PM185
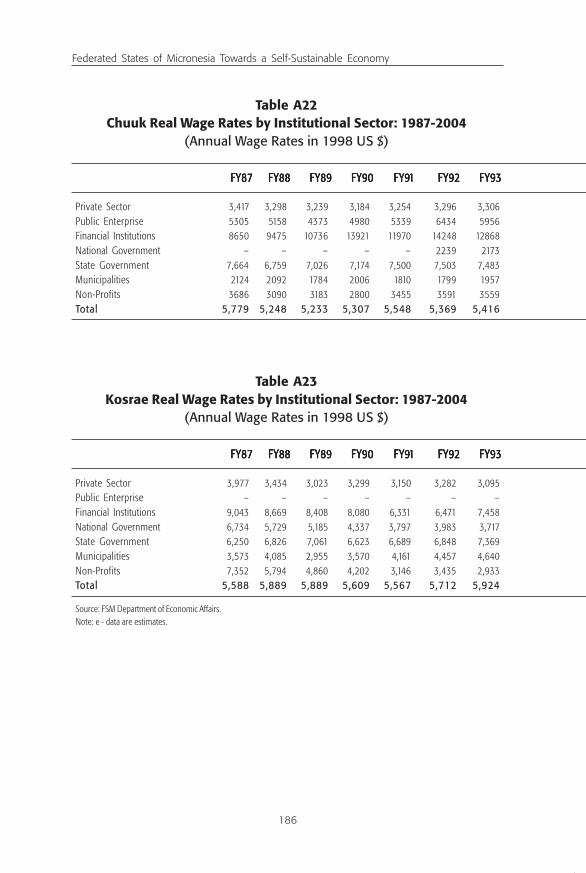
Federated States of Micronesia Towards a Self-Sustainable Economy
186
Table A22Chuuk Real Wage Rates by Institutional Sector: 1987-2004
(Annual Wage Rates in 1998 US $)
FY87FY87FY87FY87FY87 FY88FY88FY88FY88FY88 FY89FY89FY89FY89FY89 FY90FY90FY90FY90FY90 FFFFFY9Y9Y9Y9Y911111 FY92FY92FY92FY92FY92 FY93FY93FY93FY93FY93 FY94FY94FY94FY94FY94
Private Sector 3,417 3,298 3,239 3,184 3,254 3,296 3,306 3,278Public Enterprise 5305 5158 4373 4980 5339 6434 5956 6,019Financial Institutions 8650 9475 10736 13921 11970 14248 12868 13,535National Government – – – – – 2239 2173 –State Government 7,664 6,759 7,026 7,174 7,500 7,503 7,483 7,056Municipalities 2124 2092 1784 2006 1810 1799 1957 1,890Non-Profits 3686 3090 3183 2800 3455 3591 3559 3,490Total 5,779 5,248 5,233 5,307 5,548 5,369 5,416 5,167 5
Table A23Kosrae Real Wage Rates by Institutional Sector: 1987-2004
(Annual Wage Rates in 1998 US $)
FY87FY87FY87FY87FY87 FY88FY88FY88FY88FY88 FY89FY89FY89FY89FY89 FY90FY90FY90FY90FY90 FFFFFY9Y9Y9Y9Y911111 FY92FY92FY92FY92FY92 FY93FY93FY93FY93FY93 FY94FY94FY94FY94FY94
Private Sector 3,977 3,434 3,023 3,299 3,150 3,282 3,095 3,406Public Enterprise – – – – – – – 5,237Financial Institutions 9,043 8,669 8,408 8,080 6,331 6,471 7,458 6,456National Government 6,734 5,729 5,185 4,337 3,797 3,983 3,717 3,492State Government 6,250 6,826 7,061 6,623 6,689 6,848 7,369 7,108Municipalities 3,573 4,085 2,955 3,570 4,161 4,457 4,640 4,386Non-Profits 7,352 5,794 4,860 4,202 3,146 3,435 2,933 2,483Total 5,588 5,889 5,889 5,609 5,567 5,712 5,924 5,811 6
Source: FSM Department of Economic Affairs.Note: e - data are estimates.
Tables layout2.pmd 12/12/2005, 3:14 PM186

Appendixes
187
04
22222 FY93FY93FY93FY93FY93 FY94FY94FY94FY94FY94 FY95FY95FY95FY95FY95 FY96FY96FY96FY96FY96 FY97FY97FY97FY97FY97 FY98FY98FY98FY98FY98 FY99FY99FY99FY99FY99 FY00FY00FY00FY00FY00 FFFFFY0Y0Y0Y0Y011111 FY02FY02FY02FY02FY02 FY03FY03FY03FY03FY03 FY04eFY04eFY04eFY04eFY04e
6 3,306 3,278 3,281 3,185 3,009 3,029 3,049 3,121 3,124 3,196 3,214 3,0544 5956 6,019 5,903 6,902 7,292 8,435 10,091 10,383 9,926 9,211 9,158 8,1498 12868 13,535 13,228 15,587 13,811 13,235 14,316 15,266 14,887 12,213 10,666 10,7989 2173 – – – – – – – – – – –3 7,483 7,056 7,694 7,401 6,206 6,054 5,858 6,275 6,455 6,326 6,578 6,2579 1957 1,890 1,983 1,681 1,848 2,146 2,783 2,276 1,741 1,552 1,291 1,513
3559 3,490 3,455 3,503 3,362 3,241 2,916 3,594 3,654 3,977 3,712 3,8969 5,416 5,167 5,537 5,446 4,789 4,745 4,600 4,872 5,084 5,048 4,993 4,735
04
22222 FY93FY93FY93FY93FY93 FY94FY94FY94FY94FY94 FY95FY95FY95FY95FY95 FY96FY96FY96FY96FY96 FY97FY97FY97FY97FY97 FY98FY98FY98FY98FY98 FY99FY99FY99FY99FY99 FY00FY00FY00FY00FY00 FFFFFY0Y0Y0Y0Y011111 FY02FY02FY02FY02FY02 FY03FY03FY03FY03FY03 FY04eFY04eFY04eFY04eFY04e
2 3,095 3,406 3,225 3,356 3,179 3,279 3,162 3,013 3,193 3,223 3,167 3,120– – 5,237 6,606 5,843 8,009 7,936 8,768 10,390 10,779 9,871 8,404 8,198
7,458 6,456 4,568 – – – – – – – 1,454 1,8063 3,717 3,492 3,283 3,093 2,923 2,795 2,669 2,522 2,384 2,294 2,209 2,1738 7,369 7,108 7,761 7,635 7,553 6,715 7,112 7,107 7,065 8,168 7,448 7,2497 4,640 4,386 4,158 4,786 4,393 4,254 4,391 4,315 4,295 3,664 3,760 3,5005 2,933 2,483 3,479 3,339 2,129 2,097 1,859 1,719 2,422 3,153 3,818 4,4112 5,924 5,811 6,106 6,044 6,078 5,588 5,724 5,562 5,547 6,150 5,542 5,439
Tables layout2.pmd 12/12/2005, 3:14 PM187

Federated States of Micronesia Towards a Self-Sustainable Economy
188
Table A24Pohnpei Real Wage Rates by Institutional Sector: 1987-2004
(Annual Wage Rates in 1998 US $)
FY87FY87FY87FY87FY87 FY88FY88FY88FY88FY88 FY89FY89FY89FY89FY89 FY90FY90FY90FY90FY90 FFFFFY9Y9Y9Y9Y911111 FY92FY92FY92FY92FY92 FY93FY93FY93FY93FY93 FY94FY94FY94FY94FY94
Private Sector 4,959 5,231 4,796 4,909 4,932 5,174 5,399 5,002Public Enterprise 9,104 8,037 9,036 9,742 9,916 11,323 10,474 9,930Financial Institutions 13,159 13,461 12,351 11,909 12,436 12,504 13,206 14,146National Government 16,474 15,959 13,981 14,386 14,087 14,711 14,891 15,297State Government 10,184 10,341 8,462 9,351 9,400 9,636 11,609 12,239Municipalities 2,868 3,727 4,606 4,470 5,120 5,019 5,444 5,673Non-Profits 5,612 5,478 6,706 6,648 6,265 6,711 7,431 8,272Total 8,208 8,108 7,489 7,782 7,797 8,028 8,648 8,750 8
Table A25Yap Real Wage Rates by Institutional Sector: 1987-2004
(Annual Wage Rates in 1998 US $)
FY87FY87FY87FY87FY87 FY88FY88FY88FY88FY88 FY89FY89FY89FY89FY89 FY90FY90FY90FY90FY90 FFFFFY9Y9Y9Y9Y911111 FY92FY92FY92FY92FY92 FY93FY93FY93FY93FY93 FY94FY94FY94FY94FY94
Private Sector 5,158 5,145 3,936 4,280 4,302 4,995 4,162 4,574Public Enterprise 5,806 5,285 4,182 4,205 4,317 4,230 4,909 4,511Financial Institutions 7,859 10,731 10,734 10,759 10,839 10,553 10,782 10,931National Government - - - - –State Government 7,708 8,072 7,372 7,193 7,229 7,216 6,818 6,658Municipalities 6,196 5,625 7,826 6,555 6,926 5,019 4,624 4,672Non-Profits 4,942 4,595 2,832 2,839 3,034 2,828 3,048 2,934Total 6,792 6,931 5,931 5,772 5,772 5,891 5,382 5,498 5
Tables layout2.pmd 12/12/2005, 3:14 PM188

Appendixes
189
004
22222 FY93FY93FY93FY93FY93 FY94FY94FY94FY94FY94 FY95FY95FY95FY95FY95 FY96FY96FY96FY96FY96 FY97FY97FY97FY97FY97 FY98FY98FY98FY98FY98 FY99FY99FY99FY99FY99 FY00FY00FY00FY00FY00 FFFFFY0Y0Y0Y0Y011111 FY02FY02FY02FY02FY02 FY03FY03FY03FY03FY03 FY04eFY04eFY04eFY04eFY04e
4 5,399 5,002 4,778 4,989 4,800 4,606 4,745 4,683 4,737 4,553 4,494 4,4273 10,474 9,930 9,169 9,871 9,837 10,099 10,582 11,406 11,584 10,765 10,677 10,3484 13,206 14,146 13,417 13,237 13,360 13,527 14,277 15,309 14,764 14,275 15,301 13,071
14,891 15,297 15,826 15,435 14,975 13,850 12,717 11,268 11,015 11,226 10,717 11,1456 11,609 12,239 11,961 12,027 11,080 11,767 11,058 10,538 10,031 9,956 10,164 9,9299 5,444 5,673 5,463 5,045 4,787 4,823 4,623 4,985 4,848 4,560 4,694 4,783
7,431 8,272 8,738 8,396 7,917 7,549 7,905 9,378 9,426 9,526 9,319 8,9738 8,648 8,750 8,574 8,709 8,349 8,198 8,113 8,014 7,946 7,793 7,743 7,539
4
22222 FY93FY93FY93FY93FY93 FY94FY94FY94FY94FY94 FY95FY95FY95FY95FY95 FY96FY96FY96FY96FY96 FY97FY97FY97FY97FY97 FY98FY98FY98FY98FY98 FY99FY99FY99FY99FY99 FY00FY00FY00FY00FY00 FFFFFY0Y0Y0Y0Y011111 FY02FY02FY02FY02FY02 FY03FY03FY03FY03FY03 FY04eFY04eFY04eFY04eFY04e
5 4,162 4,574 3,887 3,879 3,857 4,071 3,832 3,729 3,765 3,816 3,856 3,9090 4,909 4,511 4,984 5,093 5,541 5,705 6,158 5,382 5,439 6,568 6,752 7,2063 10,782 10,931 11,218 11,347 11,482 11,296 11,493 11,834 – – – –- – – – – – – – – – – –6 6,818 6,658 7,230 7,212 7,113 6,971 6,927 6,374 6,038 6,074 5,750 5,6529 4,624 4,672 4,261 4,798 5,726 5,522 5,738 5,807 5,522 5,440 5,196 5,3508 3,048 2,934 2,895 2,847 1,798 1,342 1,205 2,109 2,782 4,435 3,532 3,592
5,382 5,498 5,313 5,291 5,146 5,101 4,901 4,623 4,545 4,691 4,600 4,667
Tables layout2.pmd 12/12/2005, 3:14 PM189
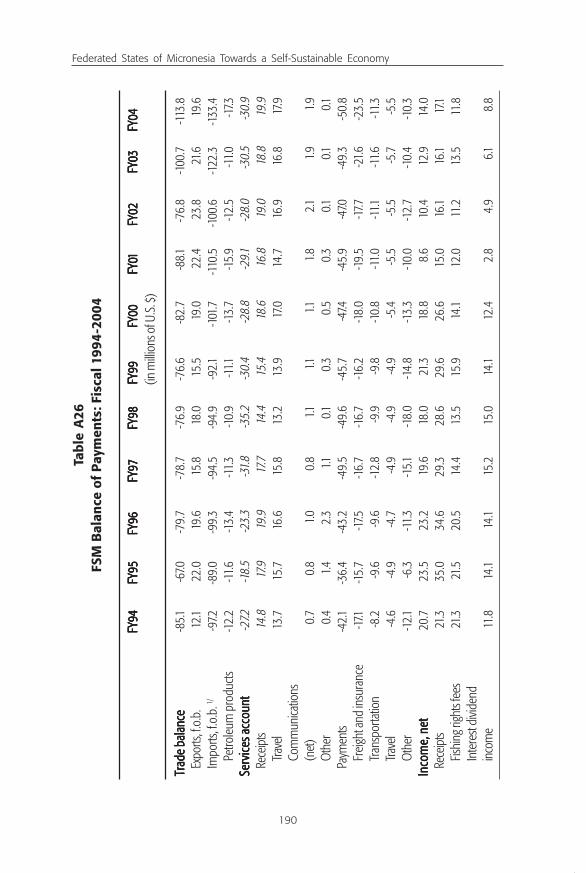
Federated States of Micronesia Towards a Self-Sustainable Economy
190
Tabl
e A
26FS
M B
alan
ce o
f Pa
ymen
ts: F
isca
l 199
4-20
04
FY94
FY94
FY94
FY94
FY94
FY95
FY95
FY95
FY95
FY95
FY96
FY96
FY96
FY96
FY96
FY97
FY97
FY97
FY97
FY97
FY98
FY98
FY98
FY98
FY98
FY99
FY99
FY99
FY99
FY99
FY00
FY00
FY00
FY00
FY00
FFFF F Y0Y0Y0Y0 Y01111 1
FY02
FY02
FY02
FY02
FY02
FY03
FY03
FY03
FY03
FY03
FY04
FY04
FY04
FY04
FY04
(in m
illion
s of U
.S. $)
TTTT T rad
e ba
lanc
era
de b
alan
cera
de b
alan
cera
de b
alan
cera
de b
alan
ce-8
5.1-6
7.0-7
9.7
-78.
7-7
6.9
-76.
6-8
2.7
-88.1
-76.
8-1
00.7
-113
.8Ex
ports
, f.o.
b.12
.122
.019
.615
.818
.015
.519
.022
.423
.821
.619
.6Im
ports
, f.o.
b. 1/
-97.2
-89.
0-9
9.3
-94.
5-9
4.9
-92.1
-101
.7-1
10.5
-100
.6-1
22.3
-133
.4Pe
trole
um p
rodu
cts-1
2.2
-11.6
-13.
4-1
1.3-1
0.9
-11.1
-13.
7-1
5.9
-12.
5-1
1.0-17
.3Se
rvic
es a
ccou
ntSe
rvic
es a
ccou
ntSe
rvic
es a
ccou
ntSe
rvic
es a
ccou
ntSe
rvic
es a
ccou
nt-2
7.2-18
.5-2
3.3
-31.8
-35.
2-3
0.4
-28.
8-2
9.1-2
8.0
-30.
5-3
0.9
Rece
ipts
14.8
17.9
19.9
17.7
14.4
15.4
18.6
16.8
19.0
18.8
19.9
Trave
l13
.715
.716
.615
.813
.213
.917
.014
.716
.916
.817
.9Co
mm
unica
tions
(net
)0.
70.
81.0
0.8
1.11.1
1.11.8
2.11.9
1.9O
ther
0.4
1.42.
31.1
0.10.
30.
50.
30.1
0.10.1
Paym
ents
-42.1
-36.
4-4
3.2
-49.
5-4
9.6
-45.
7-4
7.4-4
5.9
-47.0
-49.
3-5
0.8
Frei
ght a
nd in
sura
nce
-17.1
-15.
7-17
.5-1
6.7
-16.
7-1
6.2
-18.
0-1
9.5
-17.7
-21.6
-23.
5Tr
ansp
orta
tion
-8.2
-9.6
-9.6
-12.
8-9
.9-9
.8-1
0.8
-11.0
-11.1
-11.6
-11.3
Trave
l-4
.6-4
.9-4
.7-4
.9-4
.9-4
.9-5
.4-5
.5-5
.5-5
.7-5
.5O
ther
-12.1
-6.3
-11.3
-15.1
-18.
0-1
4.8
-13.
3-1
0.0
-12.
7-1
0.4
-10.
3In
com
e, n
etIn
com
e, n
etIn
com
e, n
etIn
com
e, n
etIn
com
e, n
et20
.723
.523
.219
.618
.021
.318
.88.
610
.412
.914
.0Re
ceip
ts21
.335
.034
.629
.328
.629
.626
.615
.016
.116
.117
.1Fis
hing
righ
ts fe
es21
.321
.520
.514
.413
.515
.914
.112
.011
.213
.511
.8In
tere
st di
viden
din
com
e11
.814
.114
.115
.215
.014
.112
.42.
84.
96.1
8.8
Tables layout2.pmd 12/12/2005, 3:14 PM190

Appendixes
191
Tabl
e A
26 (
cont
inue
d)FS
M B
alan
ce o
f Pa
ymen
ts: F
isca
l 199
4-20
04
FY94
FY94
FY94
FY94
FY94
FY95
FY95
FY95
FY95
FY95
FY96
FY96
FY96
FY96
FY96
FY97
FY97
FY97
FY97
FY97
FY98
FY98
FY98
FY98
FY98
FY99
FY99
FY99
FY99
FY99
FY00
FY00
FY00
FY00
FY00
FFFF F Y0Y0Y0Y0 Y01111 1
FY02
FY02
FY02
FY02
FY02
FY03
FY03
FY03
FY03
FY03
FY04
FY04
FY04
FY04
FY04
(in m
illion
s of U
S $)
Paym
ents
-12.
4-1
2.1-11
.4-9
.9-1
0.5
-8.7
-7.7
-6.2
-5.7
-6.8
-6.6
Inte
rest
paym
ents
-1.6
-2.0
-2.0
-1.7
-3.4
-2.5
-2.7
-2.8
-2.6
-3.7
-3.6
Divid
ends
-9.5
-8.7
-7.7
-6.7
-5.5
-4.6
-3.7
-2.0
-1.7
-1.6
-1.6
Unre
quite
dUn
requ
ited
Unre
quite
dUn
requ
ited
Unre
quite
dtra
nsfe
rstra
nsfe
rstra
nsfe
rstra
nsfe
rstra
nsfe
rs98
.097
.498
.785
.189
.190
.393
.496
.711
0.6
122.
310
6.8
Priva
te1.1
1.21.4
1.71.9
2.2
2.2
2.3
2.3
2.3
2.4
Inflo
ws3.
43.
53.
74.
04.
24.
44.
64.
74.
84.
95.
0O
utflo
ws-2
.2-2
.3-2
.3-2
.2-2
.2-2
.2-2
.5-2
.5-2
.5-2
.6-2
.6O
fficial
96.9
96.2
97.3
83.4
87.1
88.1
91.2
94.4
108.
212
0.0
104.
3Co
mpa
ct fu
nds
61.4
62.1
62.8
53.6
54.4
54.4
54.7
55.3
65.9
66.6
58.9
Oth
er35
.534
.134
.529
.832
.733
.736
.539
.142
.353
.445
.4Cu
rrent
Acc
ount
Curre
nt A
ccou
ntCu
rrent
Acc
ount
Curre
nt A
ccou
ntCu
rrent
Acc
ount
Bala
nce
Bala
nce
Bala
nce
Bala
nce
Bala
nce
6.5
35.4
18.9
-5.7
-5.1
4.7
0.7
-11.9
16.2
3.9
-23.
9Ca
pita
l and
Fin
ancia
lCa
pita
l and
Fin
ancia
lCa
pita
l and
Fin
ancia
lCa
pita
l and
Fin
ancia
lCa
pita
l and
Fin
ancia
lAc
coun
tAc
coun
tAc
coun
tAc
coun
tAc
coun
t30
.017
.613
.435
.223
.618
.313
.020
.036
.621
.45.
2CCCC C a
pita
l Tap
ital T
apita
l Tap
ital T
apita
l Tra
nsfe
rsra
nsfe
rsra
nsfe
rsra
nsfe
rsra
nsfe
rs37
.634
.535
.236
.528
.329
.029
.931
.037
.437
.55.
2Ca
pita
l Tra
nsfe
rs,O
fficial
28.8
29.4
29.8
30.2
24.0
24.5
24.5
24.6
31.8
32.2
0.0
Capi
tal T
rans
fers,
in-ki
nd8.
85.1
5.4
6.3
4.3
4.5
5.5
6.4
5.6
5.2
5.2
Tables layout2.pmd 12/12/2005, 3:14 PM191
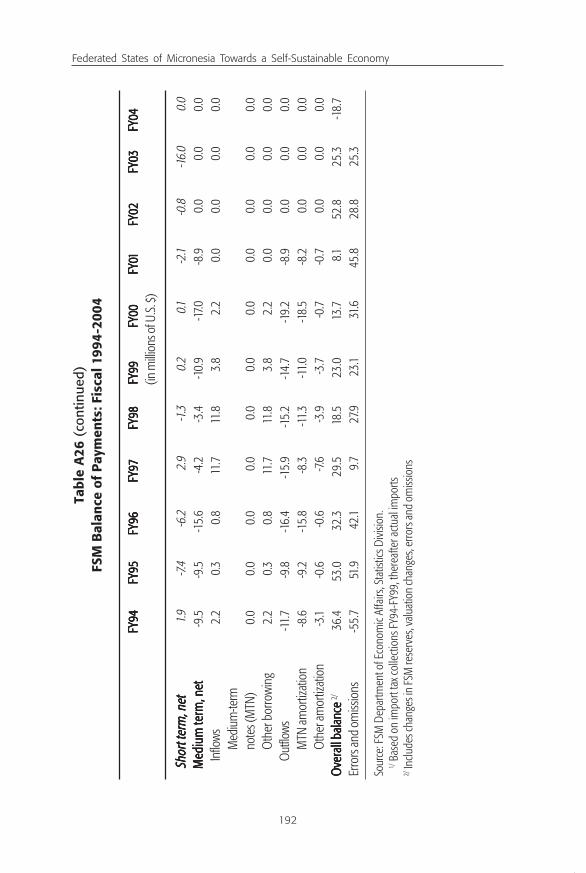
Federated States of Micronesia Towards a Self-Sustainable Economy
192
Tabl
e A
26 (
cont
inue
d)FS
M B
alan
ce o
f Pa
ymen
ts: F
isca
l 199
4-20
04
FY94
FY94
FY94
FY94
FY94
FY95
FY95
FY95
FY95
FY95
FY96
FY96
FY96
FY96
FY96
FY97
FY97
FY97
FY97
FY97
FY98
FY98
FY98
FY98
FY98
FY99
FY99
FY99
FY99
FY99
FY00
FY00
FY00
FY00
FY00
FFFF F Y0Y0Y0Y0 Y01111 1
FY02
FY02
FY02
FY02
FY02
FY03
FY03
FY03
FY03
FY03
FY04
FY04
FY04
FY04
FY04
(in m
illion
s of U
.S. $)
Shor
t ter
m, n
etSh
ort t
erm
, net
Shor
t ter
m, n
etSh
ort t
erm
, net
Shor
t ter
m, n
et1.9
-7.4
-6.2
2.9
-1.3
0.2
0.1-2
.1-0
.8-16
.00.
0M
ediu
m te
rm, n
etM
ediu
m te
rm, n
etM
ediu
m te
rm, n
etM
ediu
m te
rm, n
etM
ediu
m te
rm, n
et-9
.5-9
.5-1
5.6
-4.2
-3.4
-10.
9-17
.0-8
.90.
00.
00.
0In
flows
2.2
0.3
0.8
11.7
11.8
3.8
2.2
0.0
0.0
0.0
0.0
Med
ium
-term
note
s (M
TN)
0.0
0.0
0.0
0.0
0.0
0.0
0.0
0.0
0.0
0.0
0.0
Oth
er b
orro
wing
2.2
0.3
0.8
11.7
11.8
3.8
2.2
0.0
0.0
0.0
0.0
Out
flows
-11.7
-9.8
-16.
4-1
5.9
-15.
2-1
4.7
-19.
2-8
.90.
00.
00.
0M
TN am
ortiz
atio
n-8
.6-9
.2-1
5.8
-8.3
-11.3
-11.0
-18.
5-8
.20.
00.
00.
0O
ther
amor
tizat
ion
-3.1
-0.6
-0.6
-7.6
-3.9
-3.7
-0.7
-0.7
0.0
0.0
0.0
Ove
rall
bala
nce
Ove
rall
bala
nce
Ove
rall
bala
nce
Ove
rall
bala
nce
Ove
rall
bala
nce
2/36
.453
.032
.329
.518
.523
.013
.78.1
52.8
25.3
-18.
7Er
rors
and
omiss
ions
-55.
751
.942
.19.
727
.923
.131
.645
.828
.825
.3
Sour
ce: F
SM D
epar
tmen
t of E
cono
mic
Affa
irs, S
tatis
tics D
ivisio
n.1/ B
ased
on
impo
rt ta
x col
lect
ions
FY9
4-FY
99, t
here
afte
r act
ual im
ports
2/ In
clude
s cha
nges
in FS
M re
serv
es, v
alua
tion
chan
ges,
erro
rs an
d om
issio
ns
Tables layout2.pmd 12/12/2005, 3:14 PM192

Appendixes
193
Tabl
e A
27FS
M E
xter
nal D
ebt
(in U
S $
milli
ons)
EEEE E xxxx xte
rnal
Deb
t Tte
rnal
Deb
t Tte
rnal
Deb
t Tte
rnal
Deb
t Tte
rnal
Deb
t Tot
alot
alot
alot
alot
alFY
90FY
90FY
90FY
90FY
90FFFF F Y
9Y9Y9Y9 Y91111 1
FY92
FY92
FY92
FY92
FY92
FY93
FY93
FY93
FY93
FY93
FY94
FY94
FY94
FY94
FY94
FY95
FY95
FY95
FY95
FY95
FY96
FY96
FY96
FY96
FY96
FY97
FY97
FY97
FY97
FY97
FY98
FY98
FY98
FY98
FY98
FY99
FY99
FY99
FY99
FY99
FY00
FY00
FY00
FY00
FY00
FFFF F Y0Y0Y0Y0 Y01111 1
FY02
FY02
FY02
FY02
FY02
FY03
FY03
FY03
FY03
FY03
FY04
FY04
FY04
FY04
FY04
New
19.9
91.9
19.3
28.6
2.20.3
0.811
.711
.83.8
2.20.0
0.02.0
1.1O
utsta
ndin
g19
.911
1.712
8.714
5.613
8.812
7.411
8.411
3.710
9.698
.285
.766
.657
.859
.259
.6Am
ortiz
atio
n0.0
2.311
.79.0
11.7
9.816
.415
.915
.214
.719
.18.8
0.60.6
0.7In
tere
st0.0
2.27.7
9.19.4
8.77.7
6.75.6
4.73.8
2.11.7
1.71.7
Prin
cipal
balan
ce19
.910
9.411
7.013
6.612
7.111
7.610
2.097
.894
.483
.566
.657
.857
.258
.558
.9Ex
tern
al D
ebt a
s % o
f GD
P14
6868
7264
5650
5047
4230
2626
2526
Deb
t Ser
vice
as %
of e
xpor
ts*–
––
–79
4661
6764
6361
285.5
8.26.5
Exte
rnal
Deb
t Adj
uste
d fo
rEx
tern
al D
ebt A
djus
ted
for
Exte
rnal
Deb
t Adj
uste
d fo
rEx
tern
al D
ebt A
djus
ted
for
Exte
rnal
Deb
t Adj
uste
d fo
rO
ffset
ting
Asse
ts**
Offs
ettin
g As
sets
**O
ffset
ting
Asse
ts**
Offs
ettin
g As
sets
**O
ffset
ting
Asse
ts**
New
19.9
20.9
19.3
28.6
2.20.3
0.81.7
3.83.8
2.20.0
0.00.0
0.0O
utsta
ndin
g19
.940
.757
.781
.480
.575
.773
.966
.960
.957
.551
.045
.439
.839
.238
.5Am
ortiz
atio
n0.0
2.34.9
3.15.1
2.68.7
9.87.2
8.75.6
5.60.6
0.60.7
Inte
rest
0.01.9
2.93.7
4.44.3
3.93.5
2.82.6
2.21.8
1.61.5
1.5Pr
incip
al ba
lance
19.9
38.4
52.8
78.3
75.4
73.1
65.2
57.1
53.7
48.8
45.4
39.8
39.2
38.5
37.9
Exte
rnal
Deb
t (ad
juste
d) a
s %
of G
DP
14%
24%
31%
41%
38%
35%
32%
29%
27%
25%
21%
18%
18%
17%
17%
Deb
t Ser
vice
(adj
uste
d) a
s %
of e
xpor
ts*–
––
–35
%17
%32
%40
%31
%36
%21
%19
%5.1
%7.5
%5.9
%
Mem
oran
dum
Item
s: D
ebt t
oM
emor
andu
m It
ems:
Deb
t to
Mem
oran
dum
Item
s: D
ebt t
oM
emor
andu
m It
ems:
Deb
t to
Mem
oran
dum
Item
s: D
ebt t
oAD
B AD
B AD
B AD
B AD
B (a
ll con
cess
iona
l)–
––
––
0.31.1
12.8
24.6
28.4
30.6
30.6
30.6
32.6
33.7
GD
P (U
S $
milli
ons)
144.7
161.0
172.5
190.0
198.5
208.2
203.8
196.9
199.7
196.8
218.5
221.7
223.0
229.5
225.1
Expo
rt of
Goo
ds a
nd S
ervic
es–
––
–26
.939
.939
.533
.632
.430
.937
.639
.342
.828
.937
.0
Sour
ce: F
SM D
epar
tmen
t of F
inan
ce an
d Ad
min
istra
tion
and
EMPA
T es
timat
es.
Not
es:
*
expo
rt of
goo
ds a
nd se
rvice
s *
* Y
ap M
TN (m
ediu
m te
rm n
otes
), an
d th
ree
ADB
loan
s all h
eld/
hold
secu
red
asse
ts in
offs
hore
inve
stmen
ts eq
ual/g
reat
er th
an d
iscou
nted
valu
e of
deb
t.
Tables layout2.pmd 12/12/2005, 3:14 PM193

Federated States of Micronesia Towards a Self-Sustainable Economy
194
Tabl
e A
28FS
M I
nter
nati
onal
Vis
itor
Arr
ival
s by
Nat
iona
lity:
FY
1996
-FY
2004
Nat
iona
lity
Nat
iona
lity
Nat
iona
lity
Nat
iona
lity
Nat
iona
lity
FY96
FY96
FY96
FY96
FY96
FY97
FY97
FY97
FY97
FY97
FY98
FY98
FY98
FY98
FY98
FY99
FY99
FY99
FY99
FY99
FY00
FY00
FY00
FY00
FY00
FFFF F Y0Y0Y0Y0 Y01111 1
FY02
FY02
FY02
FY02
FY02
FY03
FY03
FY03
FY03
FY03
FY04
FY04
FY04
FY04
FY04
Asia
2,02
92,
301
1,830
2,06
42,
890
2,25
51,7
371,8
422,
003
Austr
alia
561
452
438
563
791
540
566
639
840
Cana
da18
722
416
917
718
819
222
321
419
5Eu
rope
1,007
995
1,048
1,302
1,427
1,235
1,343
1,668
1,353
Japa
n5,
519
4,22
33,
429
3,39
94,
661
3,194
4,06
13,
984
3,66
1Ne
w Ze
aland
113
119
128
140
111
8716
114
317
1O
ther
5252
9074
116
6391
8511
7Pa
cific
Islan
ds1,6
081,5
801,2
3184
31,2
4996
21,4
231,1
501,4
14Ph
ilippi
nes
––
––
––
943
1,035
1,149
USA
7,08
37,1
375,
912
6,95
08,
605
6,96
68,1
527,
736
7,101
TTTT T ota
lot
alot
alot
alot
al1111 1 8
,8,8,8, 8,1111 1 5555 5
9999 91111 1 7
,07,0
7,0
7,0
7,0 8
3838383 831111 1 4
,275
4,27
54,
275
4,27
54,
275
1111 1 5,55,5
5,5
5,5
5,5 1111 1
2222 220
,038
20,0
3820
,038
20,0
3820
,038
1111 1 5,4
95,
495,
495,
495,
494444 4
1111 1 8,78,7
8,7
8,7
8,7 0
0000000 001111 1 8
,49
8,49
8,49
8,49
8,49
6666 61111 1 8
,00
8,00
8,00
8,00
8,00
4444 4
Sour
ce:F
SM D
epar
tmen
t of
Eco
nom
ic A
ffairs
.
Tables layout2.pmd 12/12/2005, 3:14 PM194

Appendixes
195
Tabl
e A
29Ch
uuk
Inte
rnat
iona
l Vis
itor
Arr
ival
s by
Nat
iona
lity:
FY
1996
-FY
2004
Nat
iona
lity
Nat
iona
lity
Nat
iona
lity
Nat
iona
lity
Nat
iona
lity
FY96
FY96
FY96
FY96
FY96
FY97
FY97
FY97
FY97
FY97
FY98
FY98
FY98
FY98
FY98
FY99
FY99
FY99
FY99
FY99
FY00
FY00
FY00
FY00
FY00
FFFF F Y0Y0Y0Y0 Y01111 1
FY02
FY02
FY02
FY02
FY02
FY03
FY03
FY03
FY03
FY03
FY04
FY04
FY04
FY04
FY04
Asia
417
1,004
647
827
1,052
548
370
381
492
Austr
alia
163
122
6715
328
310
918
922
637
3Ca
nada
4572
5055
6262
103
8560
Euro
pe29
140
234
953
451
031
347
342
351
1Ja
pan
731
1,181
901
1,023
2,04
51,2
771,6
901,0
571,6
99Ne
w Ze
aland
2813
1939
3110
3248
57O
ther
522
3530
3920
1916
23Pa
cific
Islan
ds63
160
128
112
130
107
162
178
173
Philip
pine
s-
--
--
-29
337
448
7US
A1,7
892,
602
1,898
2,33
92,
705
1,810
2,73
52,
810
2,41
2
TTTT T ota
lot
alot
alot
alot
al3,
532
3,53
23,
532
3,53
23,
532
5,57
85,
578
5,57
85,
578
5,57
84,
094
4,09
44,
094
4,09
44,
094
5,5,5,5, 5,1111 1 1111 1
2222 26,
857
6,85
76,
857
6,85
76,
857
4,25
64,
256
4,25
64,
256
4,25
66,
066
6,06
66,
066
6,06
66,
066
5,59
85,
598
5,59
85,
598
5,59
86,
287
6,28
76,
287
6,28
76,
287
Sour
ce:
FSM
Dep
artm
ent
of E
cono
mic
Affa
irs.
Tables layout2.pmd 12/12/2005, 3:14 PM195

Federated States of Micronesia Towards a Self-Sustainable Economy
196
Tabl
e A
30K
osra
e In
tern
atio
nal V
isit
or A
rriv
als
by N
atio
nalit
y: F
Y19
96-F
Y20
04
Nat
iona
lity
Nat
iona
lity
Nat
iona
lity
Nat
iona
lity
Nat
iona
lity
FY96
FY96
FY96
FY96
FY96
FY97
FY97
FY97
FY97
FY97
FY98
FY98
FY98
FY98
FY98
FY99
FY99
FY99
FY99
FY99
FY00
FY00
FY00
FY00
FY00
FFFF F Y0Y0Y0Y0 Y01111 1
FY02
FY02
FY02
FY02
FY02
FY03
FY03
FY03
FY03
FY03
FY04
FY04
FY04
FY04
FY04
Asia
271
217
193
281
288
278
9796
103
Austr
alia
6364
6386
7195
110
6178
Cana
da36
1824
2234
2826
2524
Euro
pe15
584
7610
012
711
812
110
510
6Ja
pan
297
220
263
339
244
163
235
213
314
New
Zeala
nd9
1421
2120
1619
2322
Oth
er11
84
524
1110
814
Pacif
ic Isl
ands
377
622
559
249
616
298
375
272
466
Philip
pine
s–
––
––
–11
815
615
5US
A1,2
9399
884
11,0
392,
273
1,170
1,133
1,034
910
TTTT T ota
lot
alot
alot
alot
al2,
52,
52,
52,
52,
5 1111 12222 2
2,24
52,
245
2,24
52,
245
2,24
52,
044
2,04
42,
044
2,04
42,
044
2,2,2,2, 2,1111 1 4
2424242 423,
697
3,69
73,
697
3,69
73,
697
2,2,2,2, 2,1111 1 7777 7
7777 72,
244
2,24
42,
244
2,24
42,
244
1111 1 ,9,9,9,9 ,993939393 93
2,2,2,2, 2,1111 1 9
2929292 92
Sour
ce:
FSM
Dep
artm
ent
of E
cono
mic
Affa
irs.
Tables layout2.pmd 12/12/2005, 3:14 PM196

Appendixes
197
Tabl
e A
31Po
hnpe
i Int
erna
tion
al V
isit
or A
rriv
als
by N
atio
nalit
y: F
Y19
96-F
Y20
04
Nat
iona
lity
Nat
iona
lity
Nat
iona
lity
Nat
iona
lity
Nat
iona
lity
FY96
FY96
FY96
FY96
FY96
FY97
FY97
FY97
FY97
FY97
FY98
FY98
FY98
FY98
FY98
FY99
FY99
FY99
FY99
FY99
FY00
FY00
FY00
FY00
FY00
FFFF F Y0Y0Y0Y0 Y01111 1
FY02
FY02
FY02
FY02
FY02
FY03
FY03
FY03
FY03
FY03
FY04
FY04
FY04
FY04
FY04
Asia
1,181
663
1,008
988
1,289
1,276
1,022
1,161
1,316
Austr
alia
497
302
374
366
506
359
361
335
394
Cana
da96
4751
6071
6765
8585
Euro
pe41
729
333
428
031
733
126
954
435
4Ja
pan
3,70
12,
428
1,853
1,565
1,496
1,727
1,802
2,37
51,4
88Ne
w Ze
aland
8373
105
6858
5510
587
136
Oth
er12
2152
1637
3647
5158
Pacif
ic Isl
ands
880
489
481
363
453
375
877
622
683
Philip
pine
s–
––
––
–48
659
876
3US
A3,1
712,
218
2,184
2,26
32,
440
2,81
23,
484
3,27
92,
929
TTTT T ota
lot
alot
alot
alot
al1111 1 0
,038
0,03
80,
038
0,03
80,
038
6,53
46,
534
6,53
46,
534
6,53
46,
442
6,44
26,
442
6,44
26,
442
5,96
95,
969
5,96
95,
969
5,96
96,
667
6,66
76,
667
6,66
76,
667
7,03
87,
038
7,03
87,
038
7,03
88,
58,
58,
58,
58,
5 1111 18888 8
9,9,9,9, 9,1111 1 3333 3
7777 78,
206
8,20
68,
206
8,20
68,
206
Sour
ce:
FSM
Dep
artm
ent
of E
cono
mic
Affa
irs.
Tables layout2.pmd 12/12/2005, 3:14 PM197

Federated States of Micronesia Towards a Self-Sustainable Economy
198
Tabl
e A
32Ya
p In
tern
atio
nal V
isit
or A
rriv
als
by N
atio
nalit
y: F
Y19
96-F
Y20
04
Nat
iona
lity
Nat
iona
lity
Nat
iona
lity
Nat
iona
lity
Nat
iona
lity
FY96
FY96
FY96
FY96
FY96
FY97
FY97
FY97
FY97
FY97
FY98
FY98
FY98
FY98
FY98
FY99
FY99
FY99
FY99
FY99
FY00
FY00
FY00
FY00
FY00
FFFF F Y0Y0Y0Y0 Y01111 1
FY02
FY02
FY02
FY02
FY02
FY03
FY03
FY03
FY03
FY03
FY04
FY04
FY04
FY04
FY04
Asia
660
614
463
442
745
647
411
540
433
Austr
alia
7797
5772
7169
8814
312
6Ca
nada
8999
6882
7067
6581
77Eu
rope
423
412
428
533
665
624
589
810
566
Japa
n1,2
0899
774
583
786
769
970
774
148
3Ne
w Ze
aland
2925
2640
2218
3727
15O
ther
3324
926
4221
3319
37Pa
cific
Islan
ds29
944
822
523
519
019
515
917
519
2Ph
ilippi
nes
––
––
––
143
203
258
USA
2,111
2,37
31,9
822,1
382,
341
2,38
22,
096
2,122
2,08
0
TTTT T ota
lot
alot
alot
alot
al4,
929
4,92
94,
929
4,92
94,
929
5,08
95,
089
5,08
95,
089
5,08
94,
003
4,00
34,
003
4,00
34,
003
4,40
54,
405
4,40
54,
405
4,40
55,
05,
05,
05,
05,
0 1111 13333 3
4,72
24,
722
4,72
24,
722
4,72
24,
328
4,32
84,
328
4,32
84,
328
4,8
4,8
4,8
4,8
4,8 6666 6
1111 14,
267
4,26
74,
267
4,26
74,
267
Sour
ce:
FSM
Dep
artm
ent
of E
cono
mic
Affa
irs.
Tables layout2.pmd 12/12/2005, 3:14 PM198

Appendixes
199
Tabl
e A
33FS
M C
omm
erci
al B
anki
ng S
urve
y(in
milli
ons o
f US $
)
1111 1 9999 993939393 93
1111 1 9999 99999 9 4444 4
1111 1 9999 995959595 95
1111 1 9999 99999 9 6666 6
1111 1 9999 99999 9 7777 7
1111 1 9999 99 999 9 8888 8
1111 1 9999 99999 9 9999 9
2000
2000
2000
2000
2000
200
200
200
200
200 1111 1
2002
2002
2002
2002
2002
2003
2003
2003
2003
2003
Dec. 3
1De
c. 31
Sept.
30Se
pt. 30
Sept.
30Se
pt. 30
Sept.
30Se
pt. 30
Sept.
30Se
pt. 30
Sept.
30
TTTT T OOOO OTTTT T A
L AS
AL A
SAL
AS
AL A
SAL
AS SSSS S
EEEE E TTTT TSSSS S
129.1
126.
312
8.7
127.8
123.
813
5.8
134.
213
7.013
8.6
128.
313
7.1To
tal L
iqui
d As
sets
75.8
75.8
78.4
83.8
80.6
81.2
82.2
83.5
107.7
Cash
& D
ue fr
omLo
cal b
anks
5.4
4.14.
25.
54.
64.
24.
45.
23.1
Fore
ign
Asse
ts - D
uefro
m B
anks
Abr
oad
70.4
71.7
74.2
78.3
75.9
77.0
77.8
78.3
104.
6To
tal L
oans
58.1
57.9
51.3
49.3
42.9
48.1
50.0
52.4
52.0
39.1
24.0
Com
mer
cial L
oans
19.8
20.7
18.7
18.8
17.8
22.0
21.7
21.3
18.3
21.0
10.1
Cons
umer
Loan
s38
.437
.232
.630
.525
.126
.028
.331
.133
.818
.113
.9O
ther
Ass
ets
1.52.
72.
53.
93.
63.
44.
45.
75.
4
TTTT T OOOO OTTTT T A
L LI
ABAL
LIA
BAL
LIA
BAL
LIA
BAL
LIA
B IIII ILI
TLI
TLI
TLI
TLI
T IIII IEEEE E SSSS S
ANANANAN AND
CD
CD
CD
CD
CAPAPAPAP AP
ITITITIT ITALALALAL AL
129.1
126.
312
8.7
127.8
123.
813
5.8
134.
213
7.013
8.6
128.
313
7.1To
tal D
epos
its:
116.
711
3.6
116.
311
2.3
109.
312
0.0
119.1
120.
812
1.711
2.0
119.
8De
man
d21
.024
.823
.722
.121
.625
.923
.324
.224
.225
.528
.1Sa
vings
52.6
40.4
36.0
30.5
31.6
37.9
41.0
36.1
42.8
44.7
60.2
Time
43.1
48.3
56.6
59.7
56.1
56.3
54.7
60.5
54.5
41.7
31.4
Oth
er0.1
0.10.
20.1
0.1O
ther
Liab
ilitie
s & C
apita
l12
.512
.712
.315
.514
.515
.815
.116
.117
.016
.317
.3
cont
inue
d on
nex
t pag
e
Tables layout2.pmd 12/12/2005, 3:14 PM199
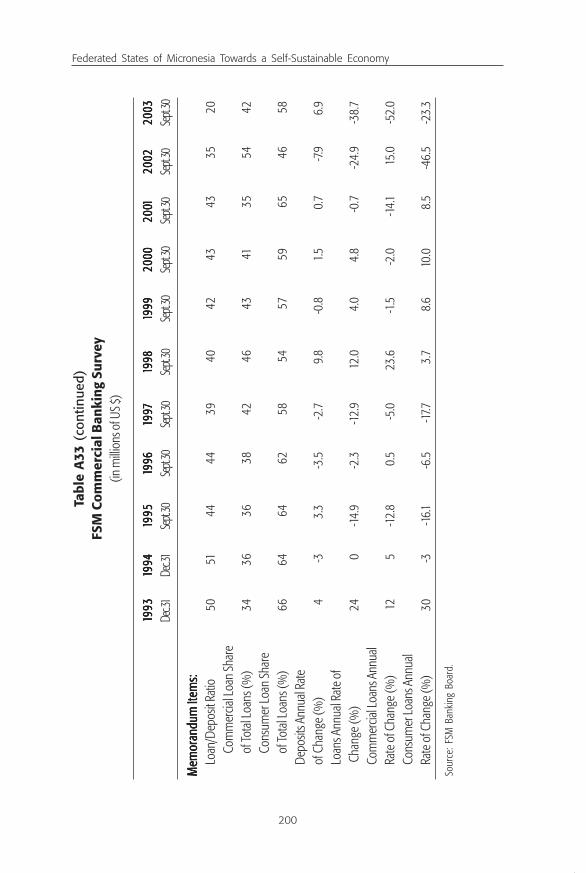
Federated States of Micronesia Towards a Self-Sustainable Economy
200
Tabl
e A
33 (
cont
inue
d)FS
M C
omm
erci
al B
anki
ng S
urve
y(in
milli
ons o
f US $
)
1111 1 9999 993939393 93
1111 1 9999 99999 9 4444 4
1111 1 9999 995959595 95
1111 1 9999 99999 9 6666 6
1111 1 9999 99999 9 7777 7
1111 1 9999 99 999 9 8888 8
1111 1 9999 99999 9 9999 9
2000
2000
2000
2000
2000
200
200
200
200
200 1111 1
2002
2002
2002
2002
2002
2003
2003
2003
2003
2003
Dec. 3
1De
c. 31
Sept.
30Se
pt. 30
Sept.
30Se
pt. 30
Sept.
30Se
pt. 30
Sept.
30Se
pt. 30
Sept.
30
Mem
oran
dum
Item
s:M
emor
andu
m It
ems:
Mem
oran
dum
Item
s:M
emor
andu
m It
ems:
Mem
oran
dum
Item
s:Lo
an/D
epos
it Rat
io50
5144
4439
4042
4343
3520
Com
mer
cial L
oan
Shar
eof
Tota
l Loa
ns (%
)34
3636
3842
4643
4135
5442
Cons
umer
Loan
Shar
eof
Tota
l Loa
ns (%
)66
6464
6258
5457
5965
4658
Depo
sits A
nnua
l Rat
eof
Cha
nge
(%)
4-3
3.3
-3.5
-2.7
9.8
-0.8
1.50.
7-7.
96.
9Lo
ans A
nnua
l Rat
e of
Cha
nge
(%)
240
-14.
9-2
.3-1
2.9
12.0
4.0
4.8
-0.7
-24.
9-3
8.7
Com
mer
cial L
oans
Ann
ual
Rate
of C
hang
e (%
)12
5-1
2.8
0.5
-5.0
23.6
-1.5
-2.0
-14.1
15.0
-52.
0Co
nsum
er Lo
ans A
nnua
lRa
te o
f Cha
nge
(%)
30-3
-16.1
-6.5
-17.7
3.7
8.6
10.0
8.5
-46.
5-2
3.3
Sour
ce: F
SM B
anki
ng B
oard
.
Tables layout2.pmd 12/12/2005, 3:14 PM200

Appendixes
201
continued on next page
Table A34FSM Consolidated Government Revenues and Expenditures
Fiscal 1987-2004(in million US $)
FY87FY87FY87FY87FY87 FY88FY88FY88FY88FY88 FY89FY89FY89FY89FY89 FY90FY90FY90FY90FY90 FFFFFY9Y9Y9Y9Y911111 FY92FY92FY92FY92FY92 FY93FY93FY93FY93FY93 FY94FY94FY94FY94FY94 FY95FY95FY95FY95FY95
TTTTTotal Reotal Reotal Reotal Reotal Revenue and Grantsvenue and Grantsvenue and Grantsvenue and Grantsvenue and Grants 1111142.342.342.342.342.3 11111666664.54.54.54.54.5 11111555559.89.89.89.89.8 11111666660.0.0.0.0.11111 11111666668.88.88.88.88.8 1111148.48.48.48.48.11111 111115555577777.0.0.0.0.0 1111162.462.462.462.462.4 11111777770.30.30.30.30.3RevenueRevenueRevenueRevenueRevenue 23.923.923.923.923.9 28.228.228.228.228.2 46.046.046.046.046.0 42.042.042.042.042.0 49.649.649.649.649.6 48.448.448.448.448.4 55.755.755.755.755.7 56.056.056.056.056.0 58.758.758.758.758.7
Tax revenue 9.7 12.3 13.3 13.6 17.0 17.7 21.5 21.2 21.1Wages and salary tax 3.3 4.0 3.9 3.8 4.5 4.6 5.4 5.7 6.2Gross revenue tax 2.6 3.2 3.7 4.2 5.2 5.7 6.2 6.0 6.1Import tax: Fuel 0.4 0.4 0.5 0.5 0.6 0.6 0.5 0.9 0.7Import tax: All others 1.4 2.0 2.1 2.0 2.3 2.6 4.6 4.3 3.8All other tax (National) 0.0 0.0 0.0 0.0 0.0 0.0 0.6 0.0 0.3State tax revenue 2.0 2.8 3.1 3.1 4.3 4.2 4.2 4.4 4.0
Nontax revenue 14.2 15.9 32.6 28.4 32.7 30.7 34.2 34.7 37.6Fishing access revenue 3.8 7.7 10.8 12.7 12.9 12.5 18.3 21.3 21.5Dividend and interest income 4.7 3.5 13.2 7.7 11.1 10.2 7.4 6.6 8.2Other nontax revenues 5.6 4.7 8.7 8.0 8.7 8.0 8.5 6.8 7.9
GrantsGrantsGrantsGrantsGrants 11111111118.48.48.48.48.4 1111136.336.336.336.336.3 11111111113.83.83.83.83.8 11111111118.8.8.8.8.11111 11111111119.29.29.29.29.2 99.799.799.799.799.7 111110000011111.3.3.3.3.3 11111000006.46.46.46.46.4 111111111111111.6.6.6.6.6Current grants 78.0 95.1 77.2 83.3 78.7 69.6 65.3 70.5 77.2
Compact General 43.9 44.6 45.7 46.8 44.5 42.2 38.9 39.7 44.7Compact Special 19.5 28.9 15.9 23.8 19.3 17.8 17.9 17.9 18.3Other: Current 14.5 21.6 15.6 12.7 15.0 9.6 8.5 12.8 14.3
Capital grants 40.4 41.2 36.6 34.8 40.4 30.1 35.9 35.9 34.3Compact CIP 29.3 29.8 30.5 31.2 35.9 28.2 33.1 33.7 29.8Other: Capital 11.2 11.4 6.2 3.6 4.5 2.0 2.9 2.2 4.6
ExpenditureExpenditureExpenditureExpenditureExpenditure -1-1-1-1-1000004.34.34.34.34.3 -1-1-1-1-125.525.525.525.525.5 - 1- 1- 1- 1- 143.043.043.043.043.0 - 1- 1- 1- 1- 143.043.043.043.043.0 -1-1-1-1-1666669.99.99.99.99.9 -1-1-1-1-1555558.48.48.48.48.4 -1-1-1-1-16666611111.2.2.2.2.2 - 1- 1- 1- 1- 163.063.063.063.063.0 - 1- 1- 1- 1- 173.473.473.473.473.4Current expenditure -84.0 -100.4 -95.8 -100.1 -117.7 -119.6 -123.6 -128.3 -142.2
Expenditure on goodsand services -82.5 -94.2 -92.6 -95.8 -112.4 -107.0 -109.8 -114.7 -130.0
Wages and salaries -42.0 -44.2 -44.8 -47.7 -50.7 -51.9 -57.9 -58.4 -62.9Travel -5.1 -4.2 -5.1 -5.7 -6.0 -6.2 -5.7 -5.8 -6.2Other -35.4 -45.8 -42.7 -42.4 -55.8 -48.9 -46.3 -50.5 -60.9
Interest payments 0.0 0.0 0.0 0.0 -1.6 -6.8 -7.3 -7.4 -6.8Subsidies -1.1 -6.2 -3.2 -4.3 -3.7 -5.1 -5.0 -4.9 -4.9Transfers -0.4 0.0 0.0 -0.1 0.0 -0.7 -1.4 -1.3 -0.6
Capital expenditureCapital expenditureCapital expenditureCapital expenditureCapital expenditure -20.3-20.3-20.3-20.3-20.3 -25.-25.-25.-25.-25.11111 -4-4-4-4-477777.2.2.2.2.2 -42.9-42.9-42.9-42.9-42.9 -52.-52.-52.-52.-52.11111 -38.8-38.8-38.8-38.8-38.8 -3-3-3-3-377777.6.6.6.6.6 -34.7-34.7-34.7-34.7-34.7 -3-3-3-3-311111.....11111Acquisition of fixed capital -2.8 -3.3 -4.4 -10.2 -14.4 -13.4 -7.7 -7.4 -8.2Multi-purposedevelopment projects -17.3 -18.9 -27.9 -19.9 -24.3 -21.8 -25.1 -19.1 -18.9Capital Transfers -0.2 -3.0 -14.9 -12.8 -13.5 -3.6 -4.8 -8.2 -4.1Net lending (domestic) 0.0 0.0 0.0 0.0 0.0 0.0 -4.5 0.0 0.0
Overall BalanceOverall BalanceOverall BalanceOverall BalanceOverall Balance 38.038.038.038.038.0 39.039.039.039.039.0 111116.86.86.86.86.8 1111177777.....11111 -1-1-1-1-1.....11111 -1-1-1-1-10.20.20.20.20.2 -8.7-8.7-8.7-8.7-8.7 -0.6-0.6-0.6-0.6-0.6 -3.-3.-3.-3.-3.11111Current Balance 17.9 23.0 27.4 25.2 10.7 -1.6 -7.0 -1.8 -6.3Capital Balance 20.2 16.0 -10.5 -8.1 -11.7 -8.7 -1.7 1.2 3.2
Memo items:Memo items:Memo items:Memo items:Memo items:Nominal GDP 114.1 126.0 132.9 145.3 162.2 173.2 190.4 199.2 208.1Grants as % of GDP 103.8 108.1 85.6 81.3 73.5 57.6 53.2 53.4 53.6Grants as % of Total Revenue 83.2 82.9 71.2 73.8 70.6 67.3 64.5 65.5 65.5Tax Revenue as % of GDP 8.5 9.8 10.0 9.4 10.5 10.2 11.3 10.7 10.1Current Expenditure as % of GDP -73.6 -79.6 -72.1 -68.9 -72.6 -69.1 -64.9 -64.4 -68.4Capital Expenditure as % of GDP -17.8 -19.9 -35.5 -29.5 -32.2 -22.4 -19.7 -17.4 -15.0Overall Balance as % of GDP 33.3 30.9 12.7 11.8 -0.7 -5.9 -4.6 -0.3 -1.5Current Balance as % of GDP 15.7 18.2 20.6 17.3 6.6 -0.9 -3.7 -0.9 -3.0
Tables layout2.pmd 12/12/2005, 3:14 PM201

Federated States of Micronesia Towards a Self-Sustainable Economy
202
Table A34 (continued)FSM Consolidated Government Revenues and Expenditures
Fiscal 1987-2004(in million US $)
FY96FY96FY96FY96FY96 FY97FY97FY97FY97FY97 FY98FY98FY98FY98FY98 FY99FY99FY99FY99FY99 FY00FY00FY00FY00FY00 FFFFFY0Y0Y0Y0Y011111 FY02eFY02eFY02eFY02eFY02e FY03eFY03eFY03eFY03eFY03e FYO4pFYO4pFYO4pFYO4pFYO4p
TTTTTotal Reotal Reotal Reotal Reotal Revenue and Grantsvenue and Grantsvenue and Grantsvenue and Grantsvenue and Grants 1111162.962.962.962.962.9 1111138.738.738.738.738.7 111115555511111.2.2.2.2.2 1111149.449.449.449.449.4 1111148.848.848.848.848.8 111114444411111.....11111 11111666660.20.20.20.20.2 111116666611111.9.9.9.9.9 111111111177777.9.9.9.9.9RevenueRevenueRevenueRevenueRevenue 54.2 48.7 55.6 53.4 52.6 45.4 46.3 45.7 43.1
Tax revenue 21.1 20.6 26.1 25.3 27.1 26.5 27.2 25.9 25.3Wages and salary tax 5.6 5.4 7.8 5.6 6.4 6.1 8.0 7.3 7Gross revenue tax 6.0 5.5 5.7 5.8 6.9 6.9 6.3 6.1 5.8Import tax: Fuel 0.9 0.7 0.8 0.8 0.7 0.9 0.9 0.7 0.7Import tax: All others 3.7 4.1 6.3 6.3 7.2 7.0 6.1 6.3 6.3All other tax (National) 0.3 0.5 0.2 0.7 0.0 0.2 0.9 0.4 0.5State tax revenue 4.6 4.3 5.4 6.0 6.4 5.5 5.1 5.1 5
Nontax revenue 33.1 28.1 29.5 28.2 24.9 19.0 19.1 19.8 17.8Fishing access revenue 20.5 14.4 13.5 16.0 14.1 11.3 10.6 13.5 11.8Dividend and interest income 8.1 8.7 8.9 7.4 5.2 2.1 2.0 1.1 1.3Other nontax revenues 4.5 5.1 7.2 4.7 5.6 5.5 6.5 5.2 4.6
GrantsGrantsGrantsGrantsGrants 11111000008.78.78.78.78.7 90.090.090.090.090.0 95.695.695.695.695.6 96.096.096.096.096.0 96.296.296.296.296.2 95.695.695.695.695.6 11111111113.93.93.93.93.9 11111111116.26.26.26.26.2 74.874.874.874.874.8Current grants 77.2 66.0 71.0 70.9 70.4 70.5 82.1 83.0 74.8
Compact General 45.3 38.0 37.9 37.5 36.9 37.4 47.7 48.3 0Compact Special 18.0 18.0 18.2 18.2 17.7 17.8 18.2 18.3 58.9Other: Current 13.9 9.9 14.9 15.2 15.8 15.2 16.1 16.4 15.9
Capital grants 31.6 24.0 24.6 25.1 25.8 25.1 31.8 33.2 0Compact CIP 30.2 22.0 23.3 23.7 24.6 25.0 31.8 32.2 0Other: Capital 1.4 2.0 1.3 1.4 1.1 0.2 0.0 1.0 0
ExpenditureExpenditureExpenditureExpenditureExpenditure -162.4 -137.9 -165.3 -165.3 -163.2 -160.6 -147.1 -150.5 -133.0Current expenditureCurrent expenditureCurrent expenditureCurrent expenditureCurrent expenditure -132.8 -124.4 -124.9 -126.6 -131.9 -129.7 -124.9 -126.4 -120.4
Expenditure on goodsand services -119.7 -113.6 -109.1 -114.3 -119.7 -122.1 -116.1 -117.8 -114.8
Wages and salaries -63.2 -58.5 -50.1 -50.2 -52.2 -54.3 -56.9 -58.4 -56.6Travel -5.1 -6.9 -6.8 -7.7 -8.4 -8.9 -8.5 -8.6 -8.5Other -51.4 -48.2 -52.2 -56.4 -59.1 -58.9 -50.6 -50.8 -49.8
Interest payments -5.7 -4.8 -3.6 -2.9 -1.9 -0.6 0.0 0.0 0.0Subsidies -6.3 -3.9 -3.4 -4.3 -5.9 -3.6 -4.2 -4.3 -1.3Transfers -1.1 -1.9 -8.8 -5.2 -4.5 -3.4 -4.7 -4.3 -4.2
Capital expenditureCapital expenditureCapital expenditureCapital expenditureCapital expenditure -29.6-29.6-29.6-29.6-29.6 -1-1-1-1-13.53.53.53.53.5 -40.4-40.4-40.4-40.4-40.4 -38.8-38.8-38.8-38.8-38.8 -3-3-3-3-311111.3.3.3.3.3 -30.9-30.9-30.9-30.9-30.9 -22.2-22.2-22.2-22.2-22.2 -24.-24.-24.-24.-24.11111 -1-1-1-1-12.62.62.62.62.6Acquisition of fixed capital -4.4 -3.3 -21.3 -14.8 -9.4 -12.1 -6.4 -6.8 -5.5Multi-purposedevelopment projects -22.2 -10.2 -16.9 -23.0 -21.5 -18.5 -15.9 -17.1 -7.1Capital Transfers -3.0 0.0 -2.2 -1.0 -0.5 -0.3 0.0 -0.3 0.0Net lending (domestic) 0.0 0.0 0.0 0.0 0.0 0.0 0.0 0.0 0.0
Overall Balance 0.4 0.8 -14.1 -15.9 -14.4 -19.6 13.1 11.4 -15.1Current Balance -1.5 -9.7 1.7 -2.3 -8.8 -13.8 3.5 2.3 -2.5Capital Balance 1.9 10.5 -15.8 -13.6 -5.6 -5.8 9.6 9.1 -12.6
Memo items:Memo items:Memo items:Memo items:Memo items:Nominal GDP 203.0 195.6 197.3 194.1 216.5 220.8 222.4 221.7 225.1Grants as % of GDP 53.6 46.0 48.4 49.4 44.4 43.3 51.2 52.4 33.2Grants as % of Total Revenue 66.8 64.9 63.2 64.2 64.6 67.8 71.1 71.8 63.5Tax Revenue as % of GDP 10.4 10.5 13.2 13.0 12.8 12.0 12.2 11.7 11.2Current Expenditure as % of GDP -65.4 -63.6 -63.3 -65.2 -60.9 -58.8 -56.2 -57.0 -53.5Capital Expenditure as % of GDP -14.6 -6.9 -20.5 -20.0 -14.5 -14.0 -10.0 -10.9 -5.6Overall Balance as % of GDP 0.2 0.4 -7.1 -8.2 -6.6 -8.9 5.9 5.2 -6.7Current Balance as % of GDP -0.7 -5.0 0.9 -1.2 -4.1 -6.3 1.6 1.1 -1.1
Source: FSM National Department of Economic Affairs, EMPAT. Figures for FY01- FY03 are estimates and FY04 is projected, as auditeddata not available.
Tables layout2.pmd 12/12/2005, 3:14 PM202

Appendixes
203
Table A35National Government Revenues and Expenditures: FY2001-2003
(in million US $)
FY87 FY88 FY89 FY90 FY91 FY92 FY93 FY94 FY95
TTTTTotal Rotal Rotal Rotal Rotal Reeeeevenue and Grantsvenue and Grantsvenue and Grantsvenue and Grantsvenue and Grants 38.338.338.338.338.3 48.248.248.248.248.2 38.38.38.38.38.11111 4444477777.6. 6. 6. 6. 6 40.340.340.340.340.3 3333377777.0.0.0.0.0 48.048.048.048.048.0 50.550.550.550.550.5 54.354.354.354.354.3Total revenue 10.0 15.5 19.1 23.7 24.3 22.3 31.7 32.8 33.8Tax revenue 3.8 4.6 5.0 5.1 6.1 6.6 8.7 8.0 8.4
Wages and salary tax 1.7 2.0 1.9 1.9 2.3 2.3 2.7 2.7 2.8Gross revenue tax 1.3 1.6 1.9 2.1 2.6 2.9 3.0 3.0 3.1Import tax: Fuel 0.1 0.1 0.1 0.1 0.1 0.1 0.1 0.2 0.2Import tax: All others 0.7 1.0 1.1 1.0 1.2 1.3 2.3 2.1 2.0All other tax (National) 0.0 0.0 0.0 0.0 0.0 0.0 0.6 0.0 0.3
Nontax revenue 6.2 10.9 14.1 18.6 18.1 15.8 23.0 24.7 25.5Fishing access revenue 3.8 7.7 10.8 12.7 12.9 12.5 18.3 21.3 21.5Dividend and interest income 1.4 1.7 2.2 2.7 3.5 1.9 2.0 2.1 2.4Other nontax revenues 0.9 1.5 1.1 3.2 1.7 1.3 2.6 1.3 1.5
GrantsGrantsGrantsGrantsGrants 28.228.228.228.228.2 32.732.732.732.732.7 111119.09.09.09.09.0 23.923.923.923.923.9 111116.6.6.6.6.11111 111114.74.74.74.74.7 111116.36.36.36.36.3 1111177777.7.7.7.7.7 20.520.520.520.520.5Grants from abroad 28.2 32.7 19.0 23.9 16.1 14.7 16.3 17.7 20.5
Current grants 20.4 24.2 12.9 21.0 9.0 12.0 6.2 8.9 14.4Compact General 6.4 6.5 6.7 6.8 3.3 6.2 0.0 2.1 6.5Compact Special 11.6 15.8 3.9 11.9 3.9 4.0 4.0 4.0 4.0Other: Current 2.4 1.8 2.4 2.3 1.8 1.9 2.3 2.8 3.9
Capital grants 7.8 8.5 6.1 2.9 7.0 2.7 10.0 8.7 6.1Compact CIP 2.7 2.8 2.9 2.9 6.8 2.6 9.0 7.1 2.8Other: Capital 5.1 5.7 3.2 0.0 0.2 0.0 1.0 1.7 3.3
TTTTTotal eotal eotal eotal eotal expenditure and net lendingxpenditure and net lendingxpenditure and net lendingxpenditure and net lendingxpenditure and net lending 25.25.25.25.25.11111 34.734.734.734.734.7 44.044.044.044.044.0 32.332.332.332.332.3 42.042.042.042.042.0 35.735.735.735.735.7 444440.0.0.0.0.11111 45.445.445.445.445.4 52.052.052.052.052.0Total expenditure 25.1 34.7 44.0 32.3 42.0 35.7 40.1 45.4 52.0Current expenditure 19.7 25.5 25.1 26.7 29.7 32.4 34.9 38.0 43.4
Expenditure on goods and services 18.6 20.0 22.8 23.3 27.7 30.8 30.1 34.7 41.2Wages and salaries 7.1 6.5 7.5 7.7 8.3 8.7 9.9 10.3 10.9Travel 2.0 1.6 2.1 1.9 2.1 2.4 2.6 2.5 2.9Other 9.5 11.8 13.2 13.7 17.2 19.6 17.7 22.0 27.5Interest payments 0.0 0.0 0.0 0.0 0.0 0.2 0.0 0.0 0.0Subsidies 0.8 5.6 2.3 3.4 2.0 1.4 3.7 2.1 1.7Transfers 0.4 0.0 0.0 0.0 0.0 0.0 1.1 1.2 0.5[Memo: incl. transfers to state 1.7 0.7 0.7 1.7 0.9 2.6 2.2 1.9 2.1governments]
Capital expenditure 5.4 9.1 19.0 5.5 12.3 3.4 5.2 7.4 8.6Acquisition of fixed capital 0.0 0.0 0.0 0.0 0.0 0.0 0.0 0.0 0.5Multi-purpose development 5.2 6.1 5.5 2.0 1.2 0.9 3.2 2.7 4.7
projectsCapital Transfers 0.2 3.0 13.5 3.5 11.0 2.5 2.0 4.7 3.4Overall Balance 13.1 13.6 -5.9 15.3 -1.7 1.3 7.8 5.0 2.3Current Balance 10.7 14.2 6.9 17.9 3.6 2.0 3.0 3.7 4.8Capital Balance 2.4 -0.6 -12.9 -2.6 -5.3 -0.7 4.8 1.3 -2.5
Memo items:Memo items:Memo items:Memo items:Memo items:Nominal GDP 114.1 126.0 132.9 145.3 162.2 173.2 190.4 199.2 208.1Grants as % of GDP 24.7 25.9 14.3 16.5 9.9 8.5 8.5 8.9 9.9Grants as % of Total Revenue 73.8 67.8 49.9 50.3 39.8 39.6 33.9 35.0 37.8Tax Revenue as % of GDP 6.9 7.5 7.7 7.2 7.8 7.8 9.0 8.3 8.2Current Expenditure as % of GDP 17.3 20.3 18.9 18.4 18.3 18.7 18.4 19.1 20.9Capital Expenditure as % of GDP 4.7 7.2 14.3 3.8 7.6 1.9 2.7 3.7 4.1Overall Balance as % of GDP 11.5 10.8 -4.5 10.6 -1.0 0.7 4.1 2.5 1.1Current Balance as % of GDP 9.4 11.3 5.2 12.3 2.2 1.1 1.6 1.8 2.3
continued on next page
Tables layout2.pmd 12/12/2005, 3:14 PM203

Federated States of Micronesia Towards a Self-Sustainable Economy
204
Table A35 (continued)National Government Revenues and Expenditures: FY2001-2003
(in million US $)
FY97FY97FY97FY97FY97 FY98FY98FY98FY98FY98 FY99FY99FY99FY99FY99 FY00FY00FY00FY00FY00 FFFFFY0Y0Y0Y0Y011111 FY02eFY02eFY02eFY02eFY02e FY03eFY03eFY03eFY03eFY03e FYO4eFYO4eFYO4eFYO4eFYO4e
TTTTTotal reotal reotal reotal reotal revenue and grantsvenue and grantsvenue and grantsvenue and grantsvenue and grants 52.352.352.352.352.3 42.042.042.042.042.0 4444477777.0. 0. 0. 0. 0 43.043.043.043.043.0 39.739.739.739.739.7 3333377777.8.8.8.8.8 4444411111.5.5.5.5.5 42.942.942.942.942.9 40.040.040.040.040.0TTTTTotal reotal reotal reotal reotal revenuevenuevenuevenuevenue 32.232.232.232.232.2 26.326.326.326.326.3 30.30.30.30.30.11111 25.225.225.225.225.2 20.920.920.920.920.9 111119.69.69.69.69.6 20.320.320.320.320.3 2222211111.5.5.5.5.5 23.723.723.723.723.7
Tax revenue 8.2 8.2 10.4 6.4 5.5 5.7 7.6 6.4 10.2Wages and salary tax 2.7 2.6 3.9 1.5 1.4 1.5 2.9 2.2 3.5Gross revenue tax 3.1 2.9 2.8 1.8 1.9 1.8 1.9 1.8 2.9Import tax: Fuel 0.2 0.1 0.2 0.2 0.1 0.2 0.1 0.1 0.1Import tax: All others 2.0 2.1 3.2 2.0 2.1 2.1 1.8 1.9 3.1All other tax (National) 0.3 0.5 0.2 0.7 0.0 0.2 0.9 0.4 0.5
Nontax revenue 24.0 18.2 19.6 18.9 15.4 13.9 12.7 15.0 13.6Fishing access revenue 20.5 14.4 13.5 16.0 14.1 11.3 10.6 13.5 11.8Dividend and interest income 2.1 1.9 2.2 1.6 0.1 0.7 0.5 0.2 0.2Other nontax revenues 1.4 1.9 4.0 1.2 1.2 1.8 1.6 1.4 1.6
GrantsGrantsGrantsGrantsGrants 28.228.228.228.228.2 111115.65.65.65.65.6 111116.96.96.96.96.9 1111177777.7.7.7.7.7 111118.88.88.88.88.8 111118.28.28.28.28.2 2222211111.2.2.2.2.2 2222211111.5.5.5.5.5 111116.26.26.26.26.2Grants from abroad 20.1 15.6 16.9 17.7 18.8 18.2 21.2 21.5 16.2
Current grants 17.2 13.3 14.6 15.5 16.5 15.9 18.2 18.4 16.2Compact General 6.6 5.2 5.4 5.4 5.4 5.5 7.0 7.0 0.0Compact Special 4.0 4.0 4.1 4.1 4.1 4.1 4.8 4.8 9.8Other: Current 6.6 4.0 5.2 6.0 7.1 6.3 6.5 6.6 6.5
Capital grants 2.8 2.3 2.3 2.3 2.3 2.3 3.0 3.0 0.0Compact CIP 2.8 2.3 2.3 2.3 2.3 2.3 3.0 3.0 0.0Other: Capital 0.0 0.0 0.0 0.0 0.0 0.0 0.0 0.0 0.0
TTTTTotal eotal eotal eotal eotal expenditure and net lendingxpenditure and net lendingxpenditure and net lendingxpenditure and net lendingxpenditure and net lending 5555511111.0.0.0.0.0 5555511111.3.3.3.3.3 55.855.855.855.855.8 52.552.552.552.552.5 5555511111.3.3.3.3.3 50.350.350.350.350.3 43.343.343.343.343.3 43.443.443.443.443.4 4444411111.7.7.7.7.7TTTTTotal eotal eotal eotal eotal expenditurexpenditurexpenditurexpenditurexpenditure 5555511111.0.0.0.0.0 5555511111.3.3.3.3.3 55.855.855.855.855.8 52.552.552.552.552.5 5555511111.3.3.3.3.3 50.350.350.350.350.3 43.343.343.343.343.3 43.443.443.443.443.4 4444411111.7.7.7.7.7
Current expenditure 43.7 50.4 48.1 47.0 47.9 47.0 40.6 40.7 39.2Expenditure on goods and 41.4 47.9 44.9 42.4 41.8 42.0 35.2 35.6 34.7
servicesWages and salaries 11.4 13.5 12.5 11.8 11.4 11.6 12.7 12.9 12.5Travel 2.6 4.3 4.2 4.7 4.9 5.2 4.4 4.5 4.4Other 27.3 30.2 28.2 26.0 25.6 25.2 18.0 18.2 17.8
Interest payments 0.0 0.0 0.0 0.0 0.0 0.0 0.0 0.0 0.0Subsidies 1.5 1.0 1.3 1.5 2.2 1.6 1.9 1.6 1.0Transfers 0.8 1.4 1.8 3.0 3.8 3.4 3.6 3.6 3.6
[Memo: incl. transfers to state 4.7 4.7 6.5 4.5 6.2 6.4 3.0 2.6 0.0governments]
Capital expenditure 7.3 0.9 7.7 5.5 3.5 3.3 2.7 2.7 2.5Acquisition of fixed capital 0.0 0.0 3.3 3.7 2.7 1.6 1.4 1.4 1.3Multi-purpose development 4.3 0.9 2.9 0.8 0.7 1.7 1.3 1.3 1.1
projectsCapital Transfers 3.0 0.0 1.5 1.0 0.0 0.0 0.0 0.0 0.0
Overall BalanceOverall BalanceOverall BalanceOverall BalanceOverall Balance 11111.3.3.3.3.3 -9.3-9.3-9.3-9.3-9.3 -8.8-8.8-8.8-8.8-8.8 -9.5-9.5-9.5-9.5-9.5 -1-1-1-1-111111.7.7.7.7.7 -1-1-1-1-12.62.62.62.62.6 -1-1-1-1-1.8.8.8.8.8 -0.5-0.5-0.5-0.5-0.5 -1-1-1-1-1.7.7.7.7.7Current Balance 5.8 -10.7 -3.4 -6.3 -10.5 -11.6 -2.1 -0.8 0.7Capital Balance -4.5 1.4 -5.4 -3.2 -1.2 -1.0 0.3 0.3 -2.5
Memo items:Memo items:Memo items:Memo items:Memo items:Nominal GDP 203.0 195.6 197.3 194.1 216.5 220.8 222.4 221.7 225.14Grants as % of GDP 9.9 8.0 8.6 9.1 8.7 8.2 9.5 9.7 7.2Grants as % of Total Revenue 38.4 37.2 36.0 41.3 47.4 48.2 51.0 50.0 40.6Tax Revenue as % of GDP 8.2 8.3 10.8 10.3 8.5 8.6 10.6 9.4 14.7Current Expenditure as % of GDP 21.5 25.8 24.4 24.2 22.1 21.3 18.3 18.4 17.4Capital Expenditure as % of GDP 3.6 0.5 3.9 2.8 1.6 1.5 1.2 1.2 1.1Overall Balance as % of GDP 0.6 -4.8 -4.5 -4.9 -5.4 -5.7 -0.8 -0.2 -0.8Current Balance as % of GDP 2.9 -5.5 -1.7 -3.2 -4.8 -5.2 -1.0 -0.4 0.3
Source: FSM National Department of Economic Affairs, EMPAT. Figures for FY02- FY03 are estimates and FY04 is projected, as auditeddata not available.
Tables layout2.pmd 12/12/2005, 3:14 PM204

Appendixes
205
Table A36Chuuk Government Revenues and Expenditures: FY2001-2004
(in million US $)
FY87FY87FY87FY87FY87 FY88FY88FY88FY88FY88 FY89FY89FY89FY89FY89 FY90FY90FY90FY90FY90 FFFFFY9Y9Y9Y9Y911111 FY92FY92FY92FY92FY92 FY93FY93FY93FY93FY93 FY94FY94FY94FY94FY94 FY95FY95FY95FY95FY95
TTTTTotal reotal reotal reotal reotal revenue and grantsvenue and grantsvenue and grantsvenue and grantsvenue and grants 4444411111.4.4.4.4.4 48.848.848.848.848.8 5555511111.....11111 45.445.445.445.445.4 55.055.055.055.055.0 42.642.642.642.642.6 4444411111.5.5.5.5.5 4444411111.8.8.8.8.8 42.842.842.842.842.8TTTTTotal reotal reotal reotal reotal revenuevenuevenuevenuevenue 3.53.53.53.53.5 4.4.4.4.4.11111 1111111111.3.3.3.3.3 6.36.36.36.36.3 111110.0.0.0.0.11111 77777.2.2.2.2.2 6.86.86.86.86.8 6.76.76.76.76.7 77777.0.0.0.0.0Tax revenue 1.7 2.8 3.1 2.8 4.1 3.7 4.1 3.9 3.6
Wages and salary tax 0.5 0.7 0.7 0.5 0.7 0.7 0.8 0.7 0.9Gross revenue tax 0.4 0.6 0.6 0.6 0.8 0.9 0.9 0.8 0.7Import tax: Fuel 0.1 0.1 0.1 0.1 0.2 0.2 0.1 0.3 0.3Import tax: All others 0.2 0.4 0.4 0.4 0.5 0.4 0.8 0.7 0.5State tax revenue 0.5 0.9 1.3 1.2 1.8 1.6 1.5 1.4 1.3
Nontax revenue 1.8 1.3 8.2 3.5 6.0 3.5 2.7 2.8 3.3Dividend and interest income 0.8 0.8 4.1 1.9 3.0 1.8 1.3 0.9 1.2Other nontax revenues 1.0 0.6 4.1 1.6 3.1 1.7 1.4 1.9 2.1
GrantsGrantsGrantsGrantsGrants 3333377777.9.9.9.9.9 44.744.744.744.744.7 39.839.839.839.839.8 39.039.039.039.039.0 44.944.944.944.944.9 35.435.435.435.435.4 34.734.734.734.734.7 35.235.235.235.235.2 35.835.835.835.835.8Grants from abroad 37.9 44.7 39.8 39.0 44.9 35.4 34.7 35.2 35.8
Current grants 24.8 33.0 27.5 26.3 31.7 23.8 25.0 23.8 24.3Compact General 16.1 16.4 16.8 17.2 17.7 15.5 17.8 16.2 16.4Compact Special 3.2 5.0 4.7 4.7 6.0 5.3 5.3 5.4 5.3Other: Current 5.5 11.5 6.0 4.4 8.0 3.0 1.8 2.2 2.6
Capital grants 13.1 11.8 12.4 12.8 13.2 11.6 9.7 11.4 11.5Compact CIP 11.2 11.4 11.7 12.0 12.3 10.8 9.0 11.3 11.4Other: Capital 1.8 0.4 0.7 0.8 0.9 0.8 0.7 0.1 0.1
Grants from national government 0.0 0.0 0.0 0.0 0.0 0.0 0.0 0.0 0.0Current 0.0 0.0 0.0 0.0 0.0 0.0 0.0 0.0 0.0
TTTTTotal eotal eotal eotal eotal expenditure and net lendingxpenditure and net lendingxpenditure and net lendingxpenditure and net lendingxpenditure and net lending 3333311111.7.7.7.7.7 39.039.039.039.039.0 40.240.240.240.240.2 39.739.739.739.739.7 54.254.254.254.254.2 45.345.345.345.345.3 48.948.948.948.948.9 4444477777.5. 5. 5. 5. 5 42.442.442.442.442.4TTTTTotal eotal eotal eotal eotal expenditurexpenditurexpenditurexpenditurexpenditure 3333311111.7.7.7.7.7 39.039.039.039.039.0 40.240.240.240.240.2 39.739.739.739.739.7 54.254.254.254.254.2 45.345.345.345.345.3 48.948.948.948.948.9 4444477777.5. 5. 5. 5. 5 42.442.442.442.442.4
Current expenditure 27.7 34.8 29.7 31.6 42.1 34.6 36.0 34.2 33.6Expenditure on goods 27.7 34.8 29.3 31.4 41.6 33.9 35.6 33.3 32.0
and servicesWages and salaries 14.4 16.2 15.2 17.0 18.2 19.1 21.0 20.1 21.9
Travel 1.1 0.9 1.0 1.8 2.1 2.0 1.5 1.3 0.8Other 12.2 17.7 13.0 12.6 21.2 12.9 13.1 11.9 9.3
Interest payments 0.0 0.0 0.0 0.0 0.0 0.0 0.0 0.6 0.7Subsidies 0.0 0.0 0.4 0.3 0.6 0.2 0.2 0.3 0.9Transfers 0.0 0.0 0.0 0.0 0.0 0.4 0.3 0.1 0.1
Capital expenditure 4.1 4.2 10.6 8.1 12.1 10.8 12.9 13.3 8.7Acquisition of fixed capital 0.0 1.2 1.6 2.3 3.4 3.4 3.6 3.2 2.2Multi-purpose development 4.1 3.0 8.9 5.8 8.7 7.4 9.3 10.1 6.6projects
Overall Balance 9.6 9.8 10.9 5.6 0.9 -2.8 -7.5 -5.7 0.4Current Balance 0.6 2.2 9.1 0.9 -0.3 -3.7 -4.2 -3.8 -2.3Capital Balance 9.0 7.6 1.8 4.7 1.2 0.9 -3.2 -1.9 2.8
Memo items:Memo items:Memo items:Memo items:Memo items:Nominal GDP 39.4 44.9 45.8 48.8 55.6 58.7 61.5 61.1 64.8Grants as % of GDP 96.2 99.5 87.0 79.9 80.9 60.3 56.5 57.5 55.3Grants as % of Total Revenue 91.6 91.6 77.9 86.1 81.7 83.2 83.7 84.1 83.7Tax Revenue as % of GDP 7.1 10.0 10.6 8.9 11.0 9.7 10.6 10.1 9.0Current Expenditure as % of GDP 70.3 77.5 64.8 64.8 75.8 59.0 58.6 56.0 51.9Capital Expenditure as % of GDP 10.3 9.3 23.1 16.5 21.7 18.4 21.0 21.7 13.5Overall Balance as % of GDP 24.4 21.8 23.8 11.5 1.6 -4.8 -12.1 -9.2 0.6Current Balance as % of GDP 1.5 4.9 19.8 1.9 -0.6 -6.2 -6.9 -6.2 -3.6
continued on next page
Tables layout2.pmd 12/12/2005, 3:14 PM205

Federated States of Micronesia Towards a Self-Sustainable Economy
206
Table A36 (continued)Chuuk Government Revenues and Expenditures: FY2001-2004
(in million US $)
FY96FY96FY96FY96FY96 FY97FY97FY97FY97FY97 FY98FY98FY98FY98FY98 FY99FY99FY99FY99FY99 FY00FY00FY00FY00FY00 FFFFFY0Y0Y0Y0Y011111 FY02eFY02eFY02eFY02eFY02e FY03eFY03eFY03eFY03eFY03e FYO4pFYO4pFYO4pFYO4pFYO4p
TTTTTotal reotal reotal reotal reotal revenue and grantsvenue and grantsvenue and grantsvenue and grantsvenue and grants 40.040.040.040.040.0 34.234.234.234.234.2 3333377777.5.5.5.5.5 39.339.339.339.339.3 42.242.242.242.242.2 38.738.738.738.738.7 44.244.244.244.244.2 45.245.245.245.245.2 25.525.525.525.525.5TTTTTotal reotal reotal reotal reotal revenuevenuevenuevenuevenue 5.3 6.0 8.0 8.6 10.1 8.3 6.7 8.5 6.5
Tax revenue 2.8 3.2 5.0 5.3 7.4 6.3 5.2 6.5 4.6Wages and salary tax 0.7 0.5 1.7 1.1 1.4 1.4 1.2 1.5 0.9Gross revenue tax 0.5 0.6 0.7 0.9 1.7 1.3 1.1 1.3 0.8Import tax: Fuel 0.1 0.1 0.2 0.1 0.3 0.3 0.2 0.2 0.2Import tax: All others 0.3 0.5 0.8 1.2 1.6 1.4 1.1 1.5 0.9State tax revenue 1.1 1.5 1.6 1.9 2.4 2.0 1.6 2.1 1.8
Nontax revenue 2.5 2.8 3.0 3.3 2.7 2.0 1.5 2.0 1.9Dividend and interestincome 1.4 1.9 2.2 2.2 1.6 0.3 0.1 0.2 0.3Other nontax revenues 1.1 0.9 0.8 1.1 1.1 1.7 1.4 1.7 1.5
GrantsGrantsGrantsGrantsGrants 34.7 28.2 29.5 30.7 32.1 30.5 37.5 36.7 19.0Grants from abroad 34.7 28.2 29.2 30.5 29.0 29.5 36.3 36.7 19.0
Current grants 23.0 19.0 19.8 21.1 19.6 19.9 24.1 24.4 19.0Compact General 16.6 13.2 13.5 13.5 13.6 13.8 17.5 17.7 0.0Compact Special 5.0 5.0 5.0 5.0 5.0 5.1 5.0 5.0 17.4Other: Current 1.3 0.8 1.3 2.6 1.0 1.1 1.6 1.6 1.6
Capital grants 11.7 9.2 9.4 9.4 9.5 9.6 12.2 12.4 0.0Compact CIP 11.6 9.2 9.4 9.4 9.5 9.6 12.2 12.4 0.0Other: Capital 0.1 0.0 0.0 0.0 0.0 0.0 0.0 0.0 0.0
Grants from national government 0.0 0.0 0.3 0.2 3.1 1.0 1.2 0.0 0.0Current 0.0 0.0 0.3 0.2 3.1 1.0 1.2 0.0 0.0
TTTTTotal eotal eotal eotal eotal expenditure and net lendingxpenditure and net lendingxpenditure and net lendingxpenditure and net lendingxpenditure and net lending 39.339.339.339.339.3 25.825.825.825.825.8 3333377777.2.2.2.2.2 50.250.250.250.250.2 48.548.548.548.548.5 45.245.245.245.245.2 40.340.340.340.340.3 42.242.242.242.242.2 36.36.36.36.36.11111TTTTTotal eotal eotal eotal eotal expenditurexpenditurexpenditurexpenditurexpenditure 39.339.339.339.339.3 25.825.825.825.825.8 3333377777.2.2.2.2.2 50.250.250.250.250.2 48.548.548.548.548.5 45.245.245.245.245.2 40.340.340.340.340.3 42.242.242.242.242.2 36.36.36.36.36.11111
Current expenditure 32.3 23.6 26.7 31.1 35.6 35.1 33.9 34.4 31.2Expenditure on goodsand services 29.1 21.4 22.5 28.2 34.0 34.1 32.7 33.2 31.2
Wages and salaries 20.9 16.9 12.8 14.0 16.8 18.4 18.4 19.3 18.1Travel 0.7 0.8 0.7 1.1 1.3 1.3 1.2 1.1 1.1Other 7.5 3.7 9.0 13.1 15.8 14.4 13.2 12.8 12.0
Interest payments 0.7 0.7 0.4 0.5 0.3 -0.1 0.0 0.0 0.0Subsidies 2.5 1.5 1.2 1.5 1.2 1.2 1.2 1.2 0.0Transfers 0.0 0.0 2.6 0.9 0.1 0.0 0.0 0.0 0.0
Capital expenditure 7.0 2.2 10.5 19.0 12.9 10.0 6.4 7.8 4.9Acquisition of fixed capital 1.7 0.2 3.7 4.2 3.3 3.3 2.2 2.6 1.7Multi-purposedevelopment projects 5.3 2.0 6.8 14.8 9.6 6.8 4.2 5.2 3.1
Overall BalanceOverall BalanceOverall BalanceOverall BalanceOverall Balance 0.70.70.70.70.7 8.48.48.48.48.4 0.30.30.30.30.3 -1-1-1-1-10.90.90.90.90.9 -6.3-6.3-6.3-6.3-6.3 -6.4-6.4-6.4-6.4-6.4 3.93.93.93.93.9 3.03.03.03.03.0 -1-1-1-1-10.60.60.60.60.6Current Balance -4.0 1.5 1.5 -1.2 -2.8 -6.0 -1.9 -1.6 -5.7Capital Balance 4.7 7.0 -1.1 -9.6 -3.5 -0.4 5.8 4.6 -4.9
Memo items:Memo items:Memo items:Memo items:Memo items:Nominal GDP 58.0 56.0 53.8 55.3 66.8 66.8 65.4 66.5 65.5Grants as % of GDP 59.8 50.3 54.8 55.6 48.1 45.6 57.4 55.2 29.0Grants as % of Total Revenue 86.7 82.3 78.6 78.2 76.1 78.7 84.9 81.2 74.6Tax Revenue as % of GDP 7.5 8.6 15.3 12.2 14.2 12.1 10.2 12.7 8.8Current Expenditure as % of GDP 55.6 42.1 49.6 56.3 53.3 52.6 51.8 51.8 47.6Capital Expenditure as % of GDP 12.1 4.0 19.6 34.5 19.4 15.0 9.8 11.8 7.4Overall Balance as % of GDP 1.2 15.1 0.6 -19.7 -9.4 -9.7 5.9 4.5 -16.1Current Balance as % of GDP -6.9 2.6 2.7 -2.2 -4.2 -9.0 -2.9 -2.3 -8.7
Source: FSM National Department of Economic Affairs, EMPAT. Figures for FY02- FY03 are estimates and FY04 is projected,as audited data not available.
Tables layout2.pmd 12/12/2005, 3:14 PM206

Appendixes
207
Table A37Kosrae Government Revenues and Expenditures: FY2001-2004
(in million US $)
FY87FY87FY87FY87FY87 FY88FY88FY88FY88FY88 FY89FY89FY89FY89FY89 FY90FY90FY90FY90FY90 FFFFFY9Y9Y9Y9Y911111 FY92FY92FY92FY92FY92 FY93FY93FY93FY93FY93 FY94FY94FY94FY94FY94 FY95FY95FY95FY95FY95
TTTTTotal reotal reotal reotal reotal revenue and grantsvenue and grantsvenue and grantsvenue and grantsvenue and grants 111115.25.25.25.25.2 111115.45.45.45.45.4 111114.24.24.24.24.2 111114.24.24.24.24.2 111113.93.93.93.93.9 111112.32.32.32.32.3 111112.72.72.72.72.7 111115.05.05.05.05.0 111115.25.25.25.25.2TTTTTotal reotal reotal reotal reotal revenuevenuevenuevenuevenue 2.2.2.2.2.11111 0.90.90.90.90.9 2.32.32.32.32.3 11111.4.4.4.4.4 11111.6.6.6.6.6 11111.9.9.9.9.9 11111.4.4.4.4.4 2.02.02.02.02.0 2.42.42.42.42.4
Tax revenue 0.5 0.6 0.6 0.6 0.8 0.7 0.8 0.9 0.9Wages and salary tax 0.2 0.2 0.2 0.2 0.2 0.2 0.2 0.2 0.3Gross revenue tax 0.1 0.1 0.2 0.2 0.2 0.2 0.2 0.3 0.2Import tax: Fuel 0.0 0.0 0.0 0.0 0.0 0.1 0.0 0.1 0.1Import tax: All others 0.1 0.1 0.1 0.1 0.1 0.1 0.2 0.2 0.2State tax revenue 0.1 0.1 0.1 0.2 0.2 0.2 0.1 0.1 0.1Nontax revenue 1.6 0.4 1.8 0.8 0.8 1.2 0.7 1.1 1.5Dividend and interest income 1.3 0.1 1.3 0.5 0.4 0.3 0.2 0.5 0.4Other nontax revenues 0.3 0.3 0.4 0.3 0.4 0.8 0.5 0.6 1.1
GrantsGrantsGrantsGrantsGrants 111113.23.23.23.23.2 111114.54.54.54.54.5 1111111111.8.8.8.8.8 111112.82.82.82.82.8 111112.32.32.32.32.3 111110.40.40.40.40.4 1111111111.3.3.3.3.3 111113.03.03.03.03.0 111112.82.82.82.82.8Grants from abroad 12.8 14.2 11.8 12.7 12.3 10.4 10.8 12.1 11.9
Current grants 6.7 7.9 7.3 8.3 7.9 6.7 7.1 8.3 7.9Compact General 4.0 4.1 4.2 4.3 4.4 3.9 3.9 4.0 4.1Compact Special 1.0 1.8 1.6 1.6 1.9 2.0 2.0 2.0 2.0Other: Current 1.7 2.0 1.5 2.4 1.5 0.9 1.2 2.3 1.8
Capital grants 6.2 6.4 4.5 4.4 4.4 3.8 3.7 3.8 4.0Compact CIP 3.5 3.6 3.7 3.7 3.9 3.4 3.4 3.5 3.6Other: Capital 2.7 2.8 0.8 0.7 0.6 0.4 0.3 0.3 0.5
Grants from national government 0.3 0.2 0.0 0.1 0.0 0.0 0.5 0.9 0.9Current 0.0 0.0 0.0 0.0 0.0 0.0 0.0 0.2 0.1Capital -0.3 -0.2 0.0 -0.1 0.0 0.0 -0.5 -0.6 -0.7
TTTTTotal eotal eotal eotal eotal expenditure and net lendingxpenditure and net lendingxpenditure and net lendingxpenditure and net lendingxpenditure and net lending 111112.72.72.72.72.7 111112.52.52.52.52.5 1111111111.7.7.7.7.7 111113.83.83.83.83.8 111114.84.84.84.84.8 111115.25.25.25.25.2 111113.63.63.63.63.6 111113.43.43.43.43.4 111113.63.63.63.63.6TTTTTotal eotal eotal eotal eotal expenditurexpenditurexpenditurexpenditurexpenditure 111112.72.72.72.72.7 111112.52.52.52.52.5 1111111111.7.7.7.7.7 111113.83.83.83.83.8 111114.84.84.84.84.8 111115.25.25.25.25.2 111113.63.63.63.63.6 111113.43.43.43.43.4 111113.63.63.63.63.6
Current expenditure 7.6 7.8 8.0 8.2 8.1 7.9 9.1 9.6 10.5Expenditure on goods and 7.6 7.8 8.0 8.2 8.1 7.6 8.8 8.7 9.9
servicesWages and salaries 4.2 4.3 4.4 4.5 4.6 4.9 5.1 5.1 5.5Travel 0.8 0.4 0.5 0.6 0.4 0.3 0.3 0.5 0.6Other 2.5 3.1 3.2 3.1 3.1 2.4 3.4 3.1 3.8
Interest payments 0.0 0.0 0.0 0.0 0.0 0.2 0.3 0.2 0.1Subsidies 0.0 0.0 0.0 0.0 0.0 0.0 0.0 0.7 0.4Transfers 0.0 0.0 0.0 0.0 0.0 0.0 0.0 0.0 0.0
Capital expenditure 5.1 4.7 3.7 5.6 6.6 7.3 4.5 3.8 3.1Acquisition of fixed capital 0.4 0.3 0.5 1.8 3.8 5.4 0.5 0.5 0.4Multi-purpose development -4.7 -4.5 -3.1 -3.8 -2.8 -1.8 -4.0 -3.1 -2.7
projects
Capital Transfers 0.0 0.0 0.0 0.0 0.0 0.0 0.0 -0.3 0.0Net lending (domestic) 0.0 0.0 0.0 0.0 0.0 0.0 0.0 0.0 0.0
Overall BalanceOverall BalanceOverall BalanceOverall BalanceOverall Balance 2.62.62.62.62.6 2.92.92.92.92.9 2.52.52.52.52.5 0.40.40.40.40.4 -0.8-0.8-0.8-0.8-0.8 -2.9-2.9-2.9-2.9-2.9 -0.9-0.9-0.9-0.9-0.9 11111.6.6.6.6.6 11111.5.5.5.5.5Current Balance 1.1 1.0 1.7 1.5 1.3 0.7 -0.6 0.9 -0.1Capital Balance 1.4 1.9 0.8 -1.1 -2.2 -3.5 -0.4 0.7 1.6Memo items:Memo items:Memo items:Memo items:Memo items:Nominal GDP 11.5 11.1 11.3 12.2 13.4 13.4 14.8 18.2 17.5Grants as % of GDP 115 131 104 105 92 78 76 71 737Grants as % of Total Revenue 87 94 83 90 88 85 89 87 84Tax Revenue as % of GDP 7.6 8.9 8.5 8.7 9.6 9.0 9.2 8.9 9.4Current Expenditure as % of GDP 65.9 70.2 70.8 67.3 60.5 58.7 61.6 52.7 59.7Capital Expenditure as % of GDP 44.2 42.9 32.3 46.1 49.4 54.3 30.7 20.9 17.9Overall Balance as % of GDP 22.3 26.2 21.9 3.6 -6.3 -21.4 -6.4 8.8 8.8Current Balance as % of GDP 9.8 9.3 14.6 12.6 10.0 4.9 -3.8 5.2 -0.5
continued on next page
Tables layout2.pmd 12/12/2005, 3:14 PM207

Federated States of Micronesia Towards a Self-Sustainable Economy
208
Table A37(continued)Kosrae Government Revenues and Expenditures: FY2001-2004
(in million US $)
FY96FY96FY96FY96FY96 FY97FY97FY97FY97FY97 FY98FY98FY98FY98FY98 FY99FY99FY99FY99FY99 FY00FY00FY00FY00FY00 FFFFFY0Y0Y0Y0Y011111 FY02eFY02eFY02eFY02eFY02e FY03eFY03eFY03eFY03eFY03e FYO4pFYO4pFYO4pFYO4pFYO4p
TTTTTotal reotal reotal reotal reotal revenue and grantsvenue and grantsvenue and grantsvenue and grantsvenue and grants 111115.25.25.25.25.2 111113.33.33.33.33.3 111112.02.02.02.02.0 111112.42.42.42.42.4 111114.34.34.34.34.3 111113.83.83.83.83.8 111114.84.84.84.84.8 111115.05.05.05.05.0 8.98.98.98.98.9
TTTTTotal reotal reotal reotal reotal revenuevenuevenuevenuevenue 11111.8.8.8.8.8 11111.5.5.5.5.5 11111.5.5.5.5.5 11111.8.8.8.8.8 3.23.23.23.23.2 11111.4.4.4.4.4 2.2.2.2.2.11111 11111.8.8.8.8.8 11111.4.4.4.4.4Tax revenue 1.0 1.0 1.0 1.4 1.6 1.9 1.5 1.5 1.1
Wages and salary tax 0.3 0.3 0.3 0.4 0.4 0.5 0.5 0.5 0.3Gross revenue tax 0.3 0.2 0.2 0.4 0.4 0.5 0.4 0.3 0.2Import tax: Fuel 0.1 0.1 0.1 0.1 0.1 0.1 0.1 0.1 0.1Import tax: All others 0.2 0.2 0.3 0.4 0.5 0.5 0.4 0.4 0.3State tax revenue 0.2 0.2 0.1 0.2 0.2 0.2 0.2 0.2 0.2
Nontax revenue 0.8 0.6 0.5 0.4 1.6 -0.4 0.6 0.4 0.3Dividend and interest income 0.3 0.3 0.3 0.3 0.8 -0.8 0.2 0.1 0.0Other nontax revenues 0.5 0.3 0.2 0.1 0.8 0.3 0.4 0.3 0.3
GrantsGrantsGrantsGrantsGrants 111113.43.43.43.43.4 1111111111.8.8.8.8.8 111110.40.40.40.40.4 111110.60.60.60.60.6 1111111111.....11111 111112.42.42.42.42.4 111112.82.82.82.82.8 111113.23.23.23.23.2 77777.5.5.5.5.5Grants from abroad 12.1 10.1 10.4 10.0 10.5 10.6 12.5 12.7 7.5
Current grants 8.2 6.7 6.9 7.0 7.6 7.7 8.7 8.6 7.5Compact General 4.1 3.3 3.4 3.4 3.4 3.4 4.4 4.4 0.0Compact Special 2.0 2.0 2.1 2.1 2.1 2.1 2.0 2.0 5.3Other: Current 2.1 1.3 1.5 1.6 2.1 2.2 2.3 2.2 2.2
Capital grants 3.9 3.4 3.6 2.9 3.0 3.0 3.8 4.1 0.0Compact CIP 3.6 2.9 2.9 2.9 3.0 3.0 3.8 3.9 0.0Other: Capital 0.2 0.5 0.6 0.0 0.0 0.0 0.0 0.2 0.0
Grants from national government 1.3 1.7 0.0 0.6 0.6 1.7 0.2 0.5 0.0Current 0.2 0.1 0.0 0.1 0.1 0.1 0.1 0.1 0.0Capital -1.2 -1.6 0.0 -0.5 -0.5 1.6 0.1 0.3 0.0
TTTTTotal eotal eotal eotal eotal expenditure and net lendingxpenditure and net lendingxpenditure and net lendingxpenditure and net lendingxpenditure and net lending 111115.35.35.35.35.3 111113.33.33.33.33.3 1111111111.3.3.3.3.3 1111111111.8.8.8.8.8 111113.43.43.43.43.4 111114.64.64.64.64.6 111114.54.54.54.54.5 111114.04.04.04.04.0 111110.50.50.50.50.5
TTTTTotal eotal eotal eotal eotal expenditurexpenditurexpenditurexpenditurexpenditure 111115.35.35.35.35.3 111113.33.33.33.33.3 1111111111.3.3.3.3.3 1111111111.8.8.8.8.8 111113.43.43.43.43.4 111114.64.64.64.64.6 111114.54.54.54.54.5 111114.04.04.04.04.0 111110.50.50.50.50.5Current expenditure 10.0 9.4 8.4 8.1 8.4 9.5 10.9 10.2 9.7
Expenditure on goods and 9.5 8.4 7.0 7.5 8.4 9.0 10.1 9.9 9.7servicesWages and salaries 5.8 5.7 4.6 4.6 4.9 5.0 5.7 5.5 5.4Travel 0.4 0.4 0.5 0.4 0.7 0.7 0.8 0.8 0.8Other 3.3 2.3 1.9 2.4 2.8 3.3 3.6 3.6 3.5
Interest payments 0.0 0.0 0.0 0.0 0.0 0.0 0.0 0.0 0.0Subsidies 0.5 1.1 0.5 0.5 0.0 0.5 0.5 0.3 0.0Transfers 0.0 0.0 0.9 0.1 0.0 0.0 0.4 0.0 0.0
Capital expenditure 5.3 3.8 2.8 3.6 5.0 5.1 3.5 3.8 0.8Acquisition of fixed capital 0.3 0.3 0.5 0.4 0.5 0.3 0.3 0.3 0.2Multi-purpose development -4.9 -3.6 -2.4 -3.2 -3.9 -4.6 -3.2 -3.2 -0.6
projectsCapital Transfers 0.0 0.0 0.0 0.0 -0.5 -0.3 0.0 -0.3 0.0
Net lending (domestic) 0.0 0.0 0.0 0.0 0.0 0.0 0.0 0.0 0.0
Overall BalanceOverall BalanceOverall BalanceOverall BalanceOverall Balance -0.-0.-0.-0.-0.11111 0.00.00.00.00.0 0.70.70.70.70.7 0.70.70.70.70.7 11111.0.0.0.0.0 -0.8-0.8-0.8-0.8-0.8 0.30.30.30.30.3 11111.0.0.0.0.0 -1-1-1-1-1.6.6.6.6.6Current Balance 0.1 -1.1 0.0 0.8 2.5 -0.3 0.0 0.4 -0.7Capital Balance -0.2 1.2 0.7 -0.2 -1.5 -0.6 0.4 0.6 -0.8
Memo items:Memo items:Memo items:Memo items:Memo items:Nominal GDP 18.4 17.0 16.4 17.1 18.5 20.7 20.0 19.0 17.8Grants as % of GDP 73 70 64 62 60 60 64 69 42Grants as % of Total Revenue 88 89 87 85 78 90 86 88 84Tax Revenue as % of GDP 9.6 10.1 11.4 11.4 11.7 12.3 10.2 10.6 8.3Current Expenditure as % of GDP 54.5 55.7 51.4 47.6 45.5 45.7 54.7 53.6 54.2Capital Expenditure as % of GDP 28.7 22.6 17.3 21.1 26.9 24.8 17.6 20.0 4.6Overall Balance as % of GDP -0.5 0.2 4.3 3.9 5.3 -4.0 1.7 5.2 -8.8Current Balance as % of GDP 0.7 -6.6 -0.1 4.9 13.5 -1.3 -0.2 2.0 -4.1
Source: FSM National Department of Economic Affairs, EMPAT. Figures for FY01- FY02 are estimates and FY03 and FY04 are projected,as audited data not available.
Tables layout2.pmd 12/12/2005, 3:14 PM208

Appendixes
209
Table A38Pohnpei Government Revenues and Expenditures: FY2001-2004
(in million US $)
FY87FY87FY87FY87FY87 FY88FY88FY88FY88FY88 FY89FY89FY89FY89FY89 FY90FY90FY90FY90FY90 FFFFFY9Y9Y9Y9Y911111 FY92FY92FY92FY92FY92 FY93FY93FY93FY93FY93 FY94FY94FY94FY94FY94 FY95FY95FY95FY95FY95
TTTTTotal reotal reotal reotal reotal revenue and grantsvenue and grantsvenue and grantsvenue and grantsvenue and grants 29.729.729.729.729.7 32.332.332.332.332.3 34.334.334.334.334.3 3333311111.3.3.3.3.3 35.235.235.235.235.2 3333311111.5.5.5.5.5 3333311111.9.9.9.9.9 33.233.233.233.233.2 34.734.734.734.734.7Total revenue 5.9 5.3 8.0 6.2 7.3 7.4 7.6 6.9 7.4
Tax revenue 2.4 2.9 3.1 3.1 3.7 4.2 5.2 5.1 5.7
Wages and salary tax 0.8 0.8 0.9 0.9 1.0 1.1 1.4 1.4 1.8Gross revenue tax 0.6 0.7 0.8 0.9 1.1 1.2 1.5 1.3 1.6Import tax: Fuel 0.1 0.1 0.2 0.2 0.2 0.2 0.1 0.2 0.1Import tax: All others 0.3 0.3 0.4 0.4 0.4 0.5 0.9 0.9 0.8State tax revenue 0.6 0.9 0.8 0.7 1.0 1.2 1.4 1.3 1.3Nontax revenue 3.5 2.4 4.9 3.1 3.6 3.2 2.4 1.8 1.8
Dividend and interest income 0.5 0.6 2.7 1.1 1.6 0.9 0.5 0.6 0.8Other nontax revenues 3.0 1.8 2.2 2.0 2.0 2.3 1.9 1.2 0.9
GrantsGrantsGrantsGrantsGrants 23.723.723.723.723.7 2727272727.0.0.0.0.0 26.326.326.326.326.3 25.25.25.25.25.11111 2727272727.8.8.8.8.8 24.24.24.24.24.11111 24.324.324.324.324.3 26.326.326.326.326.3 2727272727.2.2.2.2.2Grants from abroad 23.7 27.0 26.3 24.8 27.8 24.1 24.3 26.3 27.2
Current grants 16.0 18.1 18.4 16.8 19.1 16.8 16.5 18.8 19.1Compact General 10.3 10.5 10.8 11.0 11.4 9.9 10.2 10.4 10.5Compact Special 2.2 3.5 3.3 3.3 4.6 3.9 3.7 3.7 4.0Other: Current 3.4 4.1 4.4 2.5 3.1 3.0 2.7 4.7 4.6
Capital grants 7.7 8.9 7.9 8.0 8.8 7.2 7.8 7.5 8.1Compact CIP 7.5 7.6 7.8 7.9 8.2 7.2 7.3 7.5 7.6Other: Capital 0.3 1.3 0.1 0.1 0.6 0.1 0.5 0.1 0.5
Grants from national government 0.0 0.0 0.0 0.3 0.0 0.0 0.0 0.0 0.0Current 0.0 0.0 0.0 0.3 0.0 0.0 0.0 0.0 0.0
TTTTTotal eotal eotal eotal eotal expenditure and net lendingxpenditure and net lendingxpenditure and net lendingxpenditure and net lendingxpenditure and net lending 111119.69.69.69.69.6 24.424.424.424.424.4 3333311111.2.2.2.2.2 35.235.235.235.235.2 38.238.238.238.238.2 38.338.338.338.338.3 36.636.636.636.636.6 33.933.933.933.933.9 39.839.839.839.839.8TTTTTotal eotal eotal eotal eotal expenditurexpenditurexpenditurexpenditurexpenditure 111119.69.69.69.69.6 24.424.424.424.424.4 3333311111.2.2.2.2.2 35.235.235.235.235.2 38.238.238.238.238.2 38.338.338.338.338.3 36.636.636.636.636.6 33.933.933.933.933.9 39.839.839.839.839.8
Current expenditure 17.9 19.9 21.5 21.3 24.5 26.0 25.9 27.7 34.9Expenditure on goods and
services 17.9 19.7 21.2 20.9 22.9 21.1 23.3 24.3 31.6Wages and salaries 10.8 11.5 12.0 12.7 13.5 13.3 15.6 16.2 17.7Travel 0.4 0.6 0.9 0.8 0.8 0.7 0.7 0.9 1.0Other 6.6 7.6 8.3 7.4 8.7 7.1 7.1 7.2 13.0
Interest payments 0.0 0.0 0.0 0.0 1.3 1.6 1.5 1.7 1.6Subsidies 0.0 0.3 0.3 0.4 0.4 3.3 1.1 1.8 1.7Transfers 0.0 0.0 0.0 0.0 0.0 0.0 0.0 0.0 0.0
Capital expenditure 1.7 4.5 9.7 13.9 13.6 12.3 10.7 6.2 4.9Acquisition of fixed capital 0.6 1.1 1.1 1.3 1.1 0.6 0.6 1.1 0.6Multi-purpose development 1.1 3.5 7.3 7.0 10.2 10.7 7.2 1.8 3.6
projects
Capital Transfers 0.0 0.0 -1.4 -5.6 -2.2 -1.1 -2.8 -3.3 -0.7Overall BalanceOverall BalanceOverall BalanceOverall BalanceOverall Balance 111110.0.0.0.0.11111 77777.8.8.8.8.8 3.3.3.3.3.11111 -3.9-3.9-3.9-3.9-3.9 -3.0-3.0-3.0-3.0-3.0 -6.8-6.8-6.8-6.8-6.8 -4.7-4.7-4.7-4.7-4.7 -0.7-0.7-0.7-0.7-0.7 -5.-5.-5.-5.-5.11111Current Balance 4.1 3.5 5.0 2.0 1.9 -1.7 -1.8 -2.0 -8.3Capital Balance 6.0 4.4 -1.8 -5.9 -4.8 -5.1 -2.9 1.3 3.2
Memo items:Memo items:Memo items:Memo items:Memo items:Nominal GDP 46.5 52.0 57.1 61.9 69.0 71.9 84.1 88.8 95.5Grants as % of GDP 51.0 51.9 46.0 40.5 40.3 33.5 28.9 29.6 28.5Grants as % of Total Revenue 80.1 83.6 76.6 80.1 79.2 76.4 76.2 79.2 78.5Tax Revenue as % of GDP 8.7 9.1 9.4 8.8 9.1 9.9 10.6 9.9 10.4Current Expenditure as % of GDP 38.4 38.3 37.6 34.4 35.6 36.2 30.9 31.2 36.6Capital Expenditure as % of GDP 3.7 8.7 17.0 22.5 19.7 17.1 12.7 7.0 5.1Overall Balance as % of GDP 21.7 15.1 5.5 -6.3 -4.3 -9.5 -5.6 -0.8 -5.4Current Balance as % of GDP 8.8 6.7 8.7 3.2 2.7 -2.4 -2.2 -2.3 -8.7
continued on next page
Tables layout2.pmd 12/12/2005, 3:14 PM209

Federated States of Micronesia Towards a Self-Sustainable Economy
210
Table A38 (continued)Pohnpei Government Revenues and Expenditures: FY2001-2004
(in million US $)
FY96FY96FY96FY96FY96 FY97FY97FY97FY97FY97 FY98FY98FY98FY98FY98 FY99FY99FY99FY99FY99 FY00FY00FY00FY00FY00 FFFFFY0Y0Y0Y0Y011111 FY02eFY02eFY02eFY02eFY02e FY03eFY03eFY03eFY03eFY03e FYO4pFYO4pFYO4pFYO4pFYO4p
TTTTTotal reotal reotal reotal reotal revenue and grantsvenue and grantsvenue and grantsvenue and grantsvenue and grants 33.733.733.733.733.7 29.29.29.29.29.11111 3333311111.4.4.4.4.4 32.332.332.332.332.3 32.732.732.732.732.7 33.233.233.233.233.2 38.38.38.38.38.11111 36.536.536.536.536.5 2727272727.0.0.0.0.0Total revenue 6.4 7.1 8.1 10.3 10.4 9.9 10.8 9.2 7.5
Tax revenue 5.7 5.5 6.5 8.6 8.5 8.8 9.8 8.0 6.8Wages and salary tax 1.5 1.6 1.5 2.2 2.3 2.4 2.7 2.3 1.7Gross revenue tax 1.5 1.3 1.3 1.7 1.7 1.8 2.2 1.9 1.4Import tax: Fuel 0.4 0.3 0.2 0.3 0.2 0.3 0.3 0.2 0.2Import tax: All others 0.8 0.9 1.3 1.9 2.0 1.9 2.0 1.6 1.3State tax revenue 1.5 1.4 2.3 2.4 2.4 2.4 2.4 2.0 2.2
Nontax revenue 0.7 1.6 1.5 1.7 1.9 1.1 1.1 1.2 0.7Dividend and interest income 0.5 0.7 0.4 0.8 1.2 0.1 0.3 0.2 0.3Other nontax revenues 0.2 0.9 1.2 1.0 0.8 1.0 0.7 1.0 0.4
GrantsGrantsGrantsGrantsGrants 2727272727.2.2.2.2.2 22.022.022.022.022.0 23.323.323.323.323.3 22.022.022.022.022.0 22.222.222.222.222.2 23.423.423.423.423.4 2727272727.3.3.3.3.3 2727272727.4.4.4.4.4 111119.49.49.49.49.4Grants from abroad 25.4 20.8 22.9 21.7 21.9 22.1 26.5 26.5 19.4
Current grants 17.2 16.5 17.2 16.1 15.6 15.8 18.4 18.3 19.4Compact General 10.7 10.5 9.8 9.4 8.7 8.8 11.2 11.4 0.0Compact Special 4.0 4.0 4.1 4.1 3.8 3.8 3.7 3.7 16.2Other: Current 2.5 2.0 3.3 2.6 3.1 3.1 3.4 3.2 3.2
Capital grants 8.2 4.3 5.7 5.7 6.3 6.4 8.1 8.2 0.0Compact CIP 7.7 4.1 5.0 5.4 6.3 6.4 8.1 8.2 0.0Other: Capital 0.5 0.3 0.6 0.2 0.0 0.0 0.0 0.0 0.0
Grants from national government 1.8 1.1 0.5 0.3 0.4 1.2 0.8 0.8 0.0Current 1.8 1.1 0.5 0.3 0.4 1.2 0.8 0.8 0.0
TTTTTotal eotal eotal eotal eotal expenditure and net lendingxpenditure and net lendingxpenditure and net lendingxpenditure and net lendingxpenditure and net lending 30.230.230.230.230.2 2727272727.7.7.7.7.7 29.629.629.629.629.6 2727272727.6.6.6.6.6 29.29.29.29.29.11111 30.430.430.430.430.4 32.232.232.232.232.2 33.733.733.733.733.7 2727272727.6.6.6.6.6 T T T T Total eotal eotal eotal eotal expenditurexpenditurexpenditurexpenditurexpenditure 30.230.230.230.230.2 2727272727.7.7.7.7.7 29.629.629.629.629.6 2727272727.6.6.6.6.6 29.29.29.29.29.11111 30.430.430.430.430.4 32.232.232.232.232.2 33.733.733.733.733.7 2727272727.6.6.6.6.6 Current expenditure 27.6 24.3 24.6 23.5 24.7 23.9 24.4 25.8 24.9
Expenditure on goods andservices 25.8 22.6 22.1 22.8 22.2 23.7 24.1 24.9 24.9Wages and salaries 17.9 15.7 14.1 14.1 13.8 13.6 14.1 14.7 14.6Travel 0.5 0.6 0.6 0.6 0.6 0.7 0.8 0.8 0.8Other 7.4 6.3 7.4 8.1 7.8 9.3 9.2 9.4 9.5
Interest payments 1.2 1.0 0.6 0.4 0.2 0.1 0.0 0.0 0.0Subsidies 0.6 0.1 0.2 0.3 2.3 0.1 0.3 0.9 0.0Transfers 0.0 0.5 1.8 0.0 0.0 0.0 0.0 0.0 0.0
Capital expenditure 2.7 3.5 5.0 4.1 4.4 6.5 7.8 7.9 2.7Acquisition of fixed capital 0.5 0.6 1.2 0.7 0.9 1.6 1.0 1.0 0.7Multi-purpose development 2.2 2.9 3.8 3.4 3.5 4.9 6.8 7.0 2.0
projectsCapital Transfers 0.0 0.0 0.0 0.0 0.0 0.0 0.0 0.0 0.0
Overall BalanceOverall BalanceOverall BalanceOverall BalanceOverall Balance 3.43.43.43.43.4 11111.3.3.3.3.3 11111.8.8.8.8.8 4.74.74.74.74.7 3.63.63.63.63.6 2.82.82.82.82.8 5.95.95.95.95.9 2.82.82.82.82.8 -0.6-0.6-0.6-0.6-0.6Current Balance -2.1 0.5 1.1 3.2 1.7 3.0 5.6 2.6 2.1Capital Balance 5.5 0.9 0.7 1.6 1.8 -0.2 0.3 0.3 -2.7
Memo items:Memo items:Memo items:Memo items:Memo items:Nominal GDP 94.1 89.7 89.7 87.4 96.4 95.9 102.5 99.2 105.6Grants as % of GDP 28.9 24.5 26.0 25.2 23.1 24.4 26.6 27.6 18.4Grants as % of Total Revenue 80.8 75.5 74.3 68.1 68.0 70.3 71.6 74.9 72.0Tax Revenue as % of GDP 10.2 10.4 12.0 12.8 11.5 12.0 12.5 10.6 8.3Current Expenditure as % of GDP 29.3 27.1 27.4 26.9 25.6 24.9 23.8 26.0 23.6Capital Expenditure as % of GDP 2.8 3.9 5.6 4.7 4.6 6.8 7.6 8.0 2.6Overall Balance as % of GDP 3.6 1.5 2.0 5.4 3.7 2.9 5.8 2.8 -0.6Current Balance as % of GDP -2.2 0.5 1.3 3.6 1.8 3.1 5.5 2.6 1.9
Source: FSM National Department of Economic Affairs, EMPAT. Figures for FY01- FY02 are estimates and FY03 and FY04 areprojected, as audited data not available.
Tables layout2.pmd 12/12/2005, 3:14 PM210

Appendixes
211
Table A39Yap Government Revenues and Expenditures: FY2001-2004
(in million US $)
FY87FY87FY87FY87FY87 FY88FY88FY88FY88FY88 FY89FY89FY89FY89FY89 FY90FY90FY90FY90FY90 FFFFFY9Y9Y9Y9Y911111 FY92FY92FY92FY92FY92 FY93FY93FY93FY93FY93 FY94FY94FY94FY94FY94 FY95FY95FY95FY95FY95
TTTTTotal reotal reotal reotal reotal revenue and grantsvenue and grantsvenue and grantsvenue and grantsvenue and grants 19.5 20.4 22.8 23.3 25.3 27.4 25.1 23.8 25.4TTTTTotal reotal reotal reotal reotal revenuevenuevenuevenuevenue 2.4 2.4 5.2 4.4 6.4 9.6 8.2 7.6 8.1
Tax revenue 1.3 1.5 1.5 2.0 2.3 2.5 2.7 3.3 2.5Wages and salary tax 0.2 0.2 0.2 0.3 0.4 0.3 0.3 0.6 0.4Gross revenue tax 0.2 0.2 0.2 0.4 0.5 0.6 0.6 0.6 0.5Import tax: Fuel 0.1 0.1 0.1 0.1 0.1 0.1 0.2 0.1 0.1Import tax: All others 0.1 0.1 0.1 0.2 0.1 0.2 0.4 0.5 0.3State tax revenue 0.8 0.8 0.9 1.1 1.3 1.3 1.3 1.6 1.3
Nontax revenue 1.1 0.9 3.7 2.4 4.1 7.1 5.5 4.3 5.6Dividend and interestincome 0.6 0.3 2.9 1.4 2.7 5.3 3.5 2.5 3.4Other nontax revenues 0.5 0.5 0.8 1.0 1.4 1.8 2.0 1.8 2.2
GrantsGrantsGrantsGrantsGrants 17.1 18.0 17.6 19.0 18.9 17.8 16.9 16.2 17.3Grants from abroad 15.7 17.6 16.9 17.7 18.0 15.2 15.2 15.1 16.1
Current grants 10.1 12.0 11.1 11.0 11.0 10.4 10.4 10.7 11.5Compact General 7.0 7.1 7.3 7.5 7.7 6.8 6.9 7.1 7.2Compact Special 1.6 2.7 2.4 2.3 2.8 2.6 3.0 2.9 2.9Other: Current 1.5 2.1 1.3 1.2 0.5 1.0 0.5 0.8 1.5
Capital grants 5.6 5.6 5.8 6.7 7.0 4.8 4.7 4.4 4.6Compact CIP 4.3 4.4 4.5 4.6 4.8 4.2 4.3 4.3 4.4Other: Capital 1.3 1.2 1.3 2.1 2.2 0.7 0.5 0.1 0.2
Grants from national government 1.4 0.4 0.7 1.3 0.9 2.6 1.7 1.1 1.2Current 1.3 0.4 0.6 0.5 0.5 0.4 0.3 0.9 1.1Capital 0.1 0.0 0.1 0.8 0.4 2.2 1.5 0.1 0.1
TTTTTotal eotal eotal eotal eotal expenditure and net lendingxpenditure and net lendingxpenditure and net lendingxpenditure and net lendingxpenditure and net lending 15.2 14.8 15.8 22.0 20.8 23.8 26.3 22.8 25.5TTTTTotal eotal eotal eotal eotal expenditurexpenditurexpenditurexpenditurexpenditure 15.2 14.8 15.8 22.0 20.8 23.8 21.8 22.8 25.5
Current expenditure 11.2 12.3 11.6 12.3 13.2 18.8 17.5 18.7 19.8Expenditure on goods
and services 10.8 11.9 11.3 11.9 12.1 13.5 12.0 13.7 15.3Wages and salaries 5.6 5.6 5.7 5.8 6.0 6.0 6.3 6.7 7.0Travel 0.7 0.6 0.6 0.7 0.6 0.8 0.6 0.7 1.0Other 4.6 5.7 5.0 5.5 5.5 6.8 5.1 6.3 7.3
Interest payments 0.0 0.0 0.0 0.0 0.3 4.8 5.4 5.0 4.4 Subsidies 0.3 0.3 0.3 0.2 0.8 0.2 0.1 0.1 0.2 Transfers 0.0 0.0 0.0 0.1 0.0 0.2 0.0 0.0 0.0 Capital expenditure 4.0 2.6 4.3 9.8 7.6 5.0 4.3 4.1 5.7
Acquisition of fixed 1.8 0.7 1.1 4.9 6.1 4.0 3.0 2.6 4.4capitalMulti-purpose developmentprojects 2.2 1.8 3.1 1.2 1.3 1.1 1.3 1.4 1.3
Capital Transfers 0.0 0.0 0.0 3.7 0.2 0.0 0.0 0.0 0.0 Net lending (domestic) 0.0 0.0 0.0 0.0 0.0 0.0 -4.5 0.0 0.0Overall Balance 4.3 5.5 6.9 1.3 4.5 3.6 -1.2 1.0 -0.1Current Balance 2.6 2.5 5.4 3.6 4.6 1.6 -3.1 0.5 0.8Capital Balance 1.7 3.1 1.6 -2.3 -0.2 2.0 1.9 0.5 -1.0
Memo items:Memo items:Memo items:Memo items:Memo items:Nominal GDP 16.7 18.0 18.7 22.5 24.2 29.2 30.0 31.2 30.3Grants as % of GDP 102 100 94 84 78 61 56 52 57Grants as % of Total Revenue 88 88 77 81 75 65 67 68 68Tax Revenue as % of GDP 11 12 11 12 13 12 14 16 12Current Expenditure as % of GDP 67 68 62 55 55 64 58 60 66Capital Expenditure as % of GDP 24 14 23 43 31 17 14 13 19Overall Balance as % of GDP 25.9 30.8 37.1 6.0 18.4 12.4 -4.0 3.2 -0.4Current Balance as % of GDP 15.7 13.8 28.6 16.2 19.2 5.4 -10.3 1.5 2.8
continued on next page
Tables layout2.pmd 12/12/2005, 3:14 PM211

Federated States of Micronesia Towards a Self-Sustainable Economy
212
Table A39 (continued)Yap Government Revenues and Expenditures: FY2001-2004
(in million US $)
FY96FY96FY96FY96FY96 FY97FY97FY97FY97FY97 FY98FY98FY98FY98FY98 FY99FY99FY99FY99FY99 FY00FY00FY00FY00FY00 FFFFFY0Y0Y0Y0Y011111 FY02eFY02eFY02eFY02eFY02e FY03eFY03eFY03eFY03eFY03e FYO4eFYO4eFYO4eFYO4eFYO4e
TTTTTotal reotal reotal reotal reotal revenue and grantsvenue and grantsvenue and grantsvenue and grantsvenue and grants 26.5 24.7 29.8 26.9 26.2 24.0 24.6 24.9 16.5TTTTTotal reotal reotal reotal reotal revenuevenuevenuevenuevenue 8.4 7.7 7.9 7.5 8.0 6.3 6.4 4.7 3.9
Tax revenue 3.3 2.8 3.1 3.6 4.7 3.8 3.2 3.5 2.6Wages and salary tax 0.4 0.4 0.4 0.4 0.9 0.3 0.7 0.9 0.5Gross revenue tax 0.6 0.6 0.6 0.9 1.2 1.5 0.7 0.8 0.5Import tax: Fuel 0.1 0.1 0.1 0.0 0.0 0.1 0.1 0.1 0.1Import tax: All others 0.5 0.4 0.7 0.7 1.2 1.1 0.9 0.9 0.6State tax revenue 1.8 1.2 1.4 1.5 1.4 0.9 0.8 0.9 0.8
Nontax revenue 5.1 4.9 4.8 3.9 3.3 2.5 3.3 1.2 1.3Dividend and interestincome 3.7 3.9 3.8 2.6 1.6 1.8 0.9 0.4 0.5Other nontax revenues 1.3 1.0 1.0 1.3 1.6 0.7 2.4 0.8 0.8
GrantsGrantsGrantsGrantsGrants 118.1 17.1 21.9 19.4 18.2 17.7 18.1 20.1 12.6Grants from abroad 16.6 15.2 16.1 16.0 16.0 15.2 17.4 18.8 12.6
Current grants 11.6 10.5 12.5 11.2 11.2 11.3 12.7 13.3 12.6Compact General 7.3 5.8 5.9 5.9 5.9 6.0 7.6 7.7 0.0Compact Special 2.9 2.9 2.9 2.9 2.8 2.8 2.8 2.7 10.2Other:Current 1.4 1.8 3.7 2.4 2.5 2.5 2.3 2.8 2.5
Capital grants 5.0 4.7 3.6 4.8 4.8 3.9 4.7 5.5 0.0Compact CIP 4.5 3.5 3.6 3.6 3.6 3.7 4.7 4.8 0.0Other: Capital 0.5 1.2 0.0 1.2 1.1 0.2 0.0 0.8 0.0
Grants from national government 1.5 1.8 5.8 3.4 2.2 2.5 0.7 1.3 0.0Current 1.0 1.3 1.3 1.4 1.3 2.4 0.7 1.3 0.0Capital 0.5 0.5 4.5 2.0 0.9 0.1 0.0 0.0 0.0
TTTTTotal eotal eotal eotal eotal expenditure and net lendingxpenditure and net lendingxpenditure and net lendingxpenditure and net lendingxpenditure and net lending 26.6 19.8 31.4 23.3 20.9 20.1 16.9 17.1 17.1TTTTTotal eotal eotal eotal eotal expenditurexpenditurexpenditurexpenditurexpenditure 26.6 19.8 31.4 23.3 20.9 20.1 16.9 17.1 17.1
Current expenditure 19.3 16.7 17.2 16.8 15.3 14.2 15.0 15.3 15.4Expenditure on goods 14.0 13.4 12.7 13.3 13.3 13.4 14.0 14.3 14.4
and servicesWages and salaries 7.3 6.7 6.1 5.6 5.3 5.6 6.0 6.1 6.0Travel 0.9 0.9 0.9 0.9 0.9 1.1 1.4 1.4 1.5Other 5.8 5.7 5.7 6.8 7.1 6.7 6.6 6.8 6.9
Interest payments 3.8 3.2 2.6 2.0 1.3 0.6 0.0 0.0 0.0 Subsidies 1.2 0.1 0.2 0.5 0.2 0.2 0.3 0.3 0.3 Transfers 0.3 0.0 1.7 1.1 0.6 0.0 0.7 0.7 0.7 Capital expenditure 7.4 3.1 14.3 6.5 5.5 5.9 1.8 1.9 1.7
Acquisition of fixed capital 1.9 2.2 12.5 5.7 1.9 5.4 1.5 1.6 1.5Multi-purpose development 5.5 0.9 1.0 0.7 3.7 0.5 0.3 0.3 0.3projects
Capital Transfers 0.0 0.0 0.7 0.0 0.0 0.0 0.0 0.0 0.0 Net lending (domestic) 0.0 0.0 0.0 0.0 0.0 0.0 0.0 0.0 0.0Overall Balance -0.2 5.0 -1.6 3.6 5.3 3.9 7.7 7.7 -0.6Current Balance 1.7 2.8 4.6 3.3 5.2 5.8 4.8 4.1 1.1Capital Balance -1.8 2.2 -6.2 0.3 0.1 -1.9 2.9 3.7 -1.7
Memo items:Memo items:Memo items:Memo items:Memo items:Nominal GDP 32.5 32.9 37.4 34.4 34.8 37.4 34.6 37.0 36.2Grants as % of GDP 56 52 59 56 52 47 52 54 35Grants as % of Total Revenue 68 69 73 72 69 74 74 81 77Tax Revenue as % of GDP 15 13 13 13 18 13 12 12 9.2Current Expenditure as % of GDP 59 51 46 49 44 38 44 41 42Capital Expenditure as % of GDP 23 9.4 38.2 18.8 15.8 15.7 5.3 5.1 4.8Overall Balance as % of GDP -0.5 15.0 -4.4 10.4 15.3 10.4 22.3 20.9 -1.7Current Balance as % of GDP 5.2 8.5 12.2 9.5 14.9 15.5 14.0 11.0 3.1Source: FSM National Department of Economic Affairs, EMPAT. Figures for FY01- FY02 are estimates and FY03 and FY04 are projected,as audited data not available.
Tables layout2.pmd 12/12/2005, 3:14 PM212

Appendixes
213
Table A40FSM Imports by Product Category: 2000-2002
(CIF Value US$ Millions)
CategoryCategoryCategoryCategoryCategory 20002000200020002000 20020020020020011111 20022002200220022002
Food and Beverages 20.8 35.3 33.9 Industrial Supplies N.E.C. 19.5 20.2 20.1 Fuels and Lubricants 16.2 18.7 14.8 Capital Goods, except transport equip. 8.6 10.7 11.2 Transport Equipment, Parts & Accessories 7.1 9.8 6.5 Consumer Goods N.E.C. 9.6 14.6 14.6 All Other Goods 25.0 4.5 3.3 TTTTTotalotalotalotalotal 106.8 113.8 104.3Source: International Trade Publication. FSM Department of Economic Affairs, Division of Statistics, September 2004.
Table A41FSM Imports by State and Product Category: 2002
(CIF value US$ Millions)
CategoryCategoryCategoryCategoryCategory FSMFSMFSMFSMFSM ChuukChuukChuukChuukChuuk KosraeKosraeKosraeKosraeKosrae PohnpeiPohnpeiPohnpeiPohnpeiPohnpei YYYYYapapapapap
Food and Beverages 33.9 11.3 2.9 13.9 5.9 Industrial Supplies N.E.C. 20.1 4.8 1.8 7.4 6.0 Fuels and Lubricants 14.8 5.7 1.6 5.1 2.4 Capital Goods, except transport equip. 11.2 1.8 1.1 5.5 2.7 Transport Equipment, Parts & Accessories 6.5 1.3 0.5 3.3 1.4 Consumer Goods N.E.C. 14.6 4.3 1.2 5.8 3.3 All Other Goods 3.3 0.3 0.7 2.2 0.1 TTTTTotalotalotalotalotal 104.3 29.5 9.8 43.3 21.7
Tables layout2.pmd 12/12/2005, 3:14 PM213

Tabl
e A
42 F
SM C
omm
odit
y Ex
port
s by
Sta
te a
nd P
rodu
ct: 1
992
and
2002
FOB
val
ue in
US$
‘000
)
FSM
FSM
FSM
FSM
FSM
Chuu
kCh
uuk
Chuu
kCh
uuk
Chuu
kKo
srae
Kosr
aeKo
srae
Kosr
aeKo
srae
Pohn
pei
Pohn
pei
Pohn
pei
Pohn
pei
Pohn
pei
YYYY Y apapapap ap
Com
mod
ityCo
mm
odity
Com
mod
ityCo
mm
odity
Com
mod
ity1111 1 9999 9
92929292 9220
0220
0220
0220
0220
021111 1 9999 9
92929292 9220
0220
0220
0220
0220
021111 1 9999 9
92929292 9220
0220
0220
0220
0220
021111 1 9 999 9
92929292 9220
0220
0220
0220
0220
021111 1 9999 9
92929292 9220
0220
0220
0220
0220
02Co
pra
222
211
154
760
nil
6888
046
Bana
na27
826
148
792
622
1316
nil
Citr
us15
280
—15
250
nil
03
Kava
—24
1—
——
nil
—24
1—
—Be
tel
Nut
s94
888
0—
0ni
lni
l31
9485
7Bl
ack
Pepp
er32
—0
—0
—32
—0
—Ro
ot C
rops
114
0—
83
nil
12
—O
ther
Fam
Com
mod
ities
306
3022
30
153
674
125
TTTT T ota
l Agr
icul
ture
Eot
al A
gric
ultu
re E
otal
Agr
icul
ture
Eot
al A
gric
ultu
re E
otal
Agr
icul
ture
Exp
orxp
orxp
orxp
orxp
ortstststs ts
958
958
958
958
958
1111 1 ,42
8,4
28,4
28,4
28,4
2852
552
552
552
552
583838383 83
1111 1 30303030 30
37373737 371111 1 8888 8
9999 937
837
837
837
837
81111 1 1111 1
3333 393939393 93
1111 1M
arin
e Pr
oduc
tsM
arin
e Pr
oduc
tsM
arin
e Pr
oduc
tsM
arin
e Pr
oduc
tsM
arin
e Pr
oduc
tsO
ffsho
re F
ish19
,485
8,79
61,
071
—0
—9,
216
—9,1
98—
Reef
Fish
—11
0—
760
5—
6—
22Cr
ab/L
obst
ers
6520
639
147
08
1519
1132
Tro
chus
She
lls/M
eat
524
—52
2—
0—
0—
2—
Oth
er M
arin
e Pr
oduc
ts39
2621
230
nil
161
21
TTTT T ota
l Mar
ine
Eot
al M
arin
e E
otal
Mar
ine
Eot
al M
arin
e E
otal
Mar
ine
E xpo
rxp
orxp
orxp
orxp
ortstststs ts
20,
20,
20,
20,
20, 1111 1 1111 1
3333 39,9,9,9, 9,
1111 1 38383838 38
1111 1 ,65
3,6
53,6
53,6
53,6
5324
624
624
624
624
60000 0
1111 1 3333 39,
247
9,24
79,
247
9,24
79,
247
26262626 269,
29,
29,
29,
29,
2 1111 13333 3
55555555 55O
ther
Pro
duct
sO
ther
Pro
duct
sO
ther
Pro
duct
sO
ther
Pro
duct
sO
ther
Pro
duct
sG
arm
ents
2,04
53,
591
0—
0—
0—
2,04
53,
591
Hand
icraf
ts &
Sou
veni
rs35
1112
80
221
81
1Co
oked
Foo
d—
251
—19
8—
10—
37—
5O
ther
Pro
duct
s N
.E.C
.16
822
3—
01
165
7—
14To
tal O
ther
Exp
orts
2,24
83,
875
1520
60
1318
652
2,04
63,
611
TTTT T OOOO OTTTT T A
L E
AL E
AL E
AL E
AL E
XXXX X POPOPOPO PO
RTRTRTRT RTSSSS S
23,3
1914
,441
2,19
353
513
063
9,62
245
611
,372
4,59
7
Sou
rce:
FSM
Trad
e Bu
lletin
No.
9, D
epar
tmen
t of E
cono
mic
Affa
irs, S
tatis
tics U
nit,
Nov
embe
r 199
8.In
tern
atio
nal T
rade
Pub
licat
ion.
FSM
Dep
artm
ent o
f Eco
nom
ic Af
fairs
, Divi
sion
of S
tatis
tics,
Sept
embe
r 200
4.
Not
es:1
.”—” d
enot
es, n
ot av
aila
ble
or n
ot se
para
tely
repo
rted.
2. In
200
2, o
ffsho
re fi
sh d
ata
not a
vaila
ble
by st
ate.
3.Ha
ndicr
afts
& So
uven
irs ar
e sa
les r
epor
ted
by o
utle
ts.
Tables layout2.pmd 12/12/2005, 3:14 PM214

Table A43FSM Commodity Exports: 1992-1994 and 2000-2002
(FOB value in US$ ‘000)
CommodityCommodityCommodityCommodityCommodity 11111999999292929292 11111999999393939393 11111999999999944444 20002000200020002000 20020020020020011111 20022002200220022002
Copra 222 0 390 186 201 211Banana 278 754 456 72 33 26Citrus 15 8 9 44 23 28Kava — — — 152 160 241Betel Nuts 94 267 252 625 908 888Black Pepper 32 36 95 — — —Root Crops 11 85 91 30 17 4Other FarmCommodities 306 530 327 30 25 30
Total AgricultureExports 958 1,680 1,620 1,139 1,367 1,428
Marine ProductsMarine ProductsMarine ProductsMarine ProductsMarine ProductsOffshore Fish 19,485 25,217 73,573 12,143 12,100 8,796 Reef Fish — — — 75 101 110 Crab/Lobsters 65 75 97 172 178 206 Trochus Shells/Meat 524 3 430 — — — Other Marine Products 39 30 13 42 3 26 Total Marine
Exports 20,113 25,325 74,113 12,432 12,382 9,138Other ProductsOther ProductsOther ProductsOther ProductsOther ProductsGarments 2,045 2,055 2,161 3,010 4,391 3,591 Handicrafts &
Souvenirs 35 85 240 9 11 11 Cooked Food — — — 191 232 251 Other Products
N.E.C. 168 24 39 6 17 22Total Other
Exports 2,248 2,164 2,440 3,216 4,651 3,875TTTTTotalotalotalotalotalExportsExportsExportsExportsExports 23,319 29,169 78,173 16,787 18,400 14,441
Source: FSM Trade Bulletin No.9, Department of Economic Affairs, Statistics Unit, November 1998.Notes: Handicrafts & Souvenirs are sales reported by outlets. “—” denotes, not available or not
Tables layout2.pmd 12/12/2005, 3:14 PM215

Tables layout2.pmd 12/12/2005, 3:14 PM216

Appendix 6. Tourism Strategic Planning Matrix
217
Bibliography
Abbott, D. 2004. Hardship and poverty discussion paper. Presented to NationalWorkshop: National Poverty Reduction Strategies for PDMCs.
Anon. 1997. The fisheries policy of the Federated States of Micronesia:Recommendations of the National Fisheries Summit.
Aries Group Ltd. 2000. PSE reform strategy for the FSM: Draft.
Aries Group Ltd. 2000. PSE reform strategy for the FSM: Final report.
Aries Group Ltd. 2000. Privatization of public enterprises and corporategovernance reforms: Draft final report.
Asian Development Bank. 1995. Strengthening agriculture support services.
Asian Development Bank. 1996. Pohnpei watershed management andenvironment.
Asian Development Bank. 1997. Federated States of Micronesia 1996 economicreport. Pacific Studies Series.
Asian Development Bank. 2003. Millennium development goals in the Pacificrelevance and progress.
Asian Development Bank. 2003. Private sector development program.
Asian Development Bank. 2004. Compact final adjustment and transition.
Bliss, D.T. 1995. Land use planning in Micronesia. Saipan: CNMI.
Burslem, W. 1999. Federated States of Micronesia national fisheries corporationreview.
Caldwell, R.G. 1999. Land leasing in the FSM: A report on long-term land leasingand leasehold mortgaging.
Castro, F. 1989. Pohnpei land tenure and registration. Pohnpei Land Commission.
Compact of Free Association. Article I, Section 216.
Compact of Free Association. Article II, Section 221.
Conservation Society of Pohnpei. 2003. Annual review.
Corsi, A. 2004. An exploratory study of food and nutritional beliefs and practicesin Pohnpei, Federated States of Micronesia. University of Colorado: Athesis submitted to the Department of International Health, RollinsSchool of Public Health, Emory University.
fsm bib.pmd 12/12/2005, 3:15 PM217

Federated States of Micronesia Towards a Self-Sustainable Economy
218
Dalzell, P., Adams, T., & Polunin, N. 1996. Coastal Fisheries in the Pacific Islands.Oceanography and marine biology, 34, 395-531.
Darroch, M. 1998. Improved economic use of land. FSM: Pohnpei.
Darroch, M. 1988. Land consultancy and valuation: Government leased land.FSM: Chuuk State.
Deloitte and Touche. 1987-2001. Single audit reports.
Englberger, L. 2003. A community and laboratory-based assessment of naturalfood sources of vitamin A in the Federated States of Micronesia. TheUniversity of Queensland, Doctorate Dissertation.
Federated States of Micronesia. FSM Code: Yap State Constitution. FSM:Pohnpei.
Federated States of Micronesia. FSM Code: Pohnpei State Constitution. FSM:Pohnpei.
Federated States of Micronesia. FSM Code: Kosrae State Constitution, FSMCode. FSM: Pohnpei.
Federated States of Micronesia. FSM Code: Chuuk State Constitution.
Federated States of Micronesia. FSM Code: Constitution of the Federated Statesof Micronesia.
Federated States of Micronesia. 1996. Pohnpei Land Leasehold Act of 1996.FSM: Pohnpei State.
Federated States of Micronesia. 1999. Second economic summit: Public sectormanagement paper.
Federated States of Micronesia. 2002. Pohnpei State Census Report 2002. FSMDivision of Statistics.
Federated States of Micronesia. 2002. Kosrae State Census Report 2002. FSM:Division of Statistics.
Federated States of Micronesia. 2002. Yap State Census Report 2002. FSM:Division of Statistics.
Federated States of Micronesia. 2002. National Census Report.
Federated States of Micronesia. 2002. Statistical yearbook.
Federated States of Micronesia. 2003. Annual reports 1999.
Federated States of Micronesia. 2004. Press release. FSM: Office of the President.
Federated States of Micronesia. 2005. SDP Tourism SPM: Strategic Goal 1.
fsm bib.pmd 12/12/2005, 3:15 PM218

Bibliography
219
Federated States of Micronesia Department of Economic Affairs 1999. StatisticsReview. FSM: Statistics Unit.
Federated States of Micronesia Department of Economic Affairs. 2002. ChuukState Census Report 2002. FSM: Division of Statistics.
Federated States of Micronesia Department of Economic Affairs. 2002. The FSM2000 Census of Population and Housing. FSM: Division of Statistics.
Federated States of Micronesia Department of Economic Affairs 2002.International trade publication.
Federated States of Micronesia Department of Economic Affairs. 2004. EMPATReports.
Federated States of Micronesia Department of Economic Affairs. 2004. Financialestimates FY04, FY05.
Federated States of Micronesia National Government. 1987-1993. Capitalimprovement projects financed by Compact of Free Association, Stateof Chuuk.
Federated States of Micronesia National Government. 1995. First FSM EconomicSummit. FSM: Palikir, Pohnpei.
Federated States of Micronesia National Government. 1999. Second FSMEconomic Summit. FSM: Palikir, Pohnpei.
Federated States of Micronesia National Government. 2004. Third FSMEconomic Summit. FSM: Palikir, Pohnpei.
Federated States of Micronesia National Union. 1980. The second nationalleadership conference. FSM Pohnpei: Public Information Office, Officeof the President.
Federated States of Micronesia Public Auditor. 1987-1993. Audit report number102-95, Capital Improvement Projects. FSM: Chuuk: Compact of FreeAssociation.
Federated States of Micronesia Public Information Office. 2004. FSM congressoverride presidential veto. FSM: Palikir, Pohnpei.
Fischer, J.L. Contemporary Pohnpei land tenure, Part II.
Fisheries Engineering Company 1995. Report on in-shore fisheries resources andenvironment in Pohnpei State.
Gillet, R. 2003. Domestic tuna industry development in the Pacific Islands: Thecurrent situation and considerations for future development assistance.
fsm bib.pmd 12/12/2005, 3:15 PM219

Federated States of Micronesia Towards a Self-Sustainable Economy
220
Gillet, R., & Lightfoot, C. 2001. The contribution of fisheries to Pacific Islandeconomics.
Hezel, F. 1983. First taint of civilization: A history of the Caroline and MarshallIslands in pre-colonial days 1521 – 1885. Pacific Islands MonographSeries No. 1. Honolulu: University of Hawaii Press.
Hezel, F. 1995. Strangers in their own land: A century of colonial rule in theCaroline and Marshall Islands. Pacific Islands Monograph Series no.13.Honolulu: University of Hawaii Press.
Hezel, F. 2002. Is it time for a change in direction? FSM: Pohnpei, A MicronesianSeminar Publication
Hezel, F. 2002. Land: Public use and regulation. FSM: Pohnpei, A MicronesianSeminar Publication.
Holden, P., Malcom B., & Sarah H. 2004. Swimming against the tide? Anassessment of the private sector in the Pacific. Asian Development Bank:Pacific Study Series.
International Monetary Fund. 2005. Federated States of Micronesia CountryReport No. 05/103.
International Monetary Fund. 2003. Staff report for the 2002 article IVconsultation.
King, J. 1987-1992. JK report: Economic development and politics in Micronesia.
Leibowitz, A.H. 1989. Defining status: A comprehensive analysis of United Statesterritorial relations. USA, Boston: Martinus Nijhoff Publishers.
Lingenfelter, S.G. 1975. Yap: Political leadership and culture change in an islandsociety. Honolulu: University Press of Hawaii.
Lucas, K., Tiller, S., & Swan, J. 1996. The national fisheries policy study.
Marksbury, R.A. 1979. Land tenure and modernization in the Yap Islands. USA:Ann Arbor, Michigan.
Meller, N. 1969. The congress of Micronesia. Honolulu: University of HawaiiPress.
Meller, N. 1985. Constitutionalism in Micronesia. La’ie, Hawaii: Brigham YoungUniversity Institute for Polynesian Studies.
Meller, N. 2004. Governance in the Pacific: Focus for Action 2005-2009.
fsm bib.pmd 12/12/2005, 3:15 PM220

Bibliography
221
Miles, E, 1991. A fisheries policy for the Federated States of Micronesia.
Myers, S. 1998. Democracy is a discussion II: The challenges and promise ofa new democratic era. USA: U.S. Information Agency and ConnecticutCollege.
Nathan Associates Inc. 2002. Infrastructure development plan: Final report.
National Oceanic Resource Management Authority. 2000. Annual Reports.
National Oceanic Resource Management Authority. 2001. Annual Reports.
National Oceanic Resource Management Authority. 2002. Annual Reports.
Peattie, M.R. 1988. Nan’yo: The rise and fall of the Japanese in Micronesia,1885-1945. Pacific Islands Monograph Series No.4. Honolulu: TheUniversity of Hawaii Press.
Perin, D. 1996. Economic use of land in the FSM.
Pragma Corporation. 1992. Agriculture sector development project.
Preston, G. 2001. Future operations of the national aquaculture center.
Preston, G. 2001. Proceedings of the coastal fisheries consortium.
Phillips, B. 1992. Kosrae Island resource management program (KIRMP)implementation strategy. FSM, Kosrae State: Office of Planning andStatistics.
Ritter, P.L. 1978. The population of Kosrae: Population and social organizationon a Micronesian high island. USA, Michigan: University MicrofilmsInternational.
Sehpin, M. November 27, 2003. 3 FSM Congressmen Face Criminal Charges.The Kaselehlie Press, 4, l.
Sirolli, E. 1999. Ripples from the Zambezi: Passion, entrepreneurship, and the re-birth of local economies.
Smith, A. 1992. Federated States of Micronesia marine resource profiles (FFAreport No.92/17).
Sturton. 2004. Compact Fiscal Adjustment and Transition.
Ting Hong Group. 1996. Review and future prospects of the Ting Hong operationsin the Federated States of Micronesia.
Trust Territory of the Pacific Islands Office of the High Commissioner. 1979.Kosrae land use guide. Saipan, CNMI: Office of Planning and Statistics.
fsm bib.pmd 12/12/2005, 3:15 PM221

Federated States of Micronesia Towards a Self-Sustainable Economy
222
UNICEF Pacific Office. 2001. The state of health behavior and lifestyle of Pacificyouth. FSM: Pohnpei.
United States Department of the Interior. 2003. The status of Micronesianmigrants in 1998. Retrieved from www.pacificweb.org
United States Department of the Interior. 2003. 2003 Micronesian migrantstables. Retrieved from www.pacificweb.org
United States Information Agency. 1998. Economic perspectives.
United States Information Agency. 1991. What is democracy?
UNESCO. 2000. World culture report 2000: Cultural diversity, conflict andpluralism.
United States Naval Institute. 1972. National security and internationaltrusteeship in the Pacific (Eds). Maryland, Annapolis: Naval InstitutePress.
United States Government General Accounting Office. 2000. Foreign relations:Better accountability over US assistance to Micronesia and the MarshallIslands.
USDA Soil Conversation Service. 1983. Soil Survey of Micronesia – Chuuk, Kosrae,Pohnpei, Yap 1983.
United States Government General Accounting Office. 2000. US funds to twoMicronesia nations had little impact on economic development andaccountability over the funds was limited.
World Bank. 2000. Cities, seas, and storms: Managing change in Pacific Islandeconomies. Managing Pacific Towns, Volume II.
World Bank. 2000. Regional Economic Development Initiative (REDI) Approach.Managing Pacific towns, Volume II.
World Bank. Retrieved 14 July 2005. World Development Indicators. www.worldbank.org/data
Zuniga-Carmine, M.L. 2004. Federated States of Micronesia participatory povertyassessment: A draft final report. Asian Development Bank.
fsm bib.pmd 12/12/2005, 3:15 PM222