The Expression of Emotions through Full-body Movement
202
The Expression of Emotions through Full-body Movement: Features and Asymmetry Dissertation zur Erlangung des Grades eines Doktors der Naturwissenschaften der Fakultät für Biologie und der Medizinischen Fakultät der Eberhard-Karls-Universität Tübingen vorgelegt von Claire Louise Roether aus Frankfurt am Main im Mai 2010
-
Upload
khangminh22 -
Category
Documents
-
view
4 -
download
0
Transcript of The Expression of Emotions through Full-body Movement

The Expression of Emotions through Full-bodyMovement: Features and Asymmetry
Dissertation
zur Erlangung des Grades eines Doktors
der Naturwissenschaften
der Fakultät für Biologie und
der Medizinischen Fakultät
der Eberhard-Karls-Universität Tübingen
vorgelegt von
Claire Louise Roether
aus Frankfurt am Main
im Mai 2010

Tag der mündlichen Prüfung: 22.02.2011
Dekan der Fakultät für Biologie: Prof. Dr. H. A. Mallot
Dekan der Medizinischen Fakultät: Prof. Dr. I. B. Autenrieth
1. Berichterstatter: Prof. Dr. M. A. Giese
2. Berichterstatter: Prof. Dr. H. H. Bülthoff
3. Berichterstatter: Prof. Dr. I. M. Thornton
Prüfungskommission: Prof. Dr. H. H. Bülthoff
Prof. Dr. M. A. Giese
Prof. Dr. C. Schwarz
Prof. Dr. I. M. Thornton
Prof. Dr. D. Wildgruber

Meinen Eltern


DanksagungAn dieser Stelle möchte ich meinem Betreuer Prof. Dr. Martin Giese danken, der mich auf dem Weg von den experimentellen Ideen zur erfolgreichen Publikation kontinuierlich unterstützt hat. Seine Arbeitsgruppe, zuletzt unter dem Namen Computational Sensomo-torics war maßgeblich am Erfolg meiner Arbeit beteiligt. Von Herzen danke ich meinem Kollegen Dr. Lars Omlor. Seine hervorragende Arbeit und seine Bereitschaft, ungezählte Stunden gemeinsam den Feinheiten unserer Animationen zu widmen, sind unvergessen. Dr. Winfried Ilg danke ich neben der Konstanz und Erfahrung in der alltäglichen Arbeit für seine umsichtige Führung des Bewegungslabors. Nach meinem Umzug hat Andrea Christensen, unterstützt von Jannike Scharm, mit Einsatz und Sorgfalt experimentelle Fäden zu Ende gesponnen, wofür ich den beiden herzlich danke. Ich danke Prof. Dr. Tal-ma Hendler, Prof. Dr. Konrad Schindler und Prof. Dr. Beatrice de Gelder aus dem EU-Projekt COBOL für wichtige Diskussionen. Für die administrative Unterstützung danke ich Dagmar Heller-Schmerold und Susanne Smidt. Meinen Eltern danke ich für die Zu-versicht, die sie mir die Jahre über vermittelt haben, auch wenn mein Vater die fertige Arbeit nun nicht mehr lesen kann. Denis, danke, dass du für mich da bist.
Diese Arbeit wurde finanziell unterstützt durch - Volkswagenstiftung- Deutsche Forschungsgemeinschaft (SFB 550, Forschergruppe Perceptual Gra-
phics)- Human Frontier Science Program - Europäische Union (FP6-Projekt COBOL)- Hermann und Lilly-Schilling-Stiftung - Fortune-Programm.
Zusätzlich wurde die Arbeitsgruppe viele Jahre durch die AG Bülthoff, Max-Planck-Institut für biologische Kybernetik, Tübingen unterstützt.


7
Contents Contents ............................................................................................................................ 7 Summary......................................................................................................................... 11 Chapter 1 Introduction.................................................................................................... 13
1.1 Facial emotion expression and its perception....................................................... 14 1.1.1 Functions of emotional expression................................................................ 14 1.1.2 Universality of emotional facial expressions................................................. 16 1.1.3 Models of the relationship between different affects .................................... 19
1.2 Specific problems in research on facial emotion expression................................ 23 1.2.1 Expressive features and feature integration................................................... 23 1.2.2 Asymmetry of facial emotion expression...................................................... 25
1.3 Non-facial emotion expression............................................................................. 26 1.3.1 Emotionally expressive speech...................................................................... 27 1.3.2 Emotionally expressive touch........................................................................ 28
1.4 Emotionally expressive body movement.............................................................. 28 1.4.1 Types of emotionally expressive body movements....................................... 28 1.4.2 Body-movement features for socially relevant information.......................... 30
1.5 Aim of thesis and experimental questions............................................................ 34 1.5.1 Features for the perception of emotion from gait (Chapter 3)....................... 35 1.5.2 Feature integration in emotion perception (Chapter 4) ................................. 36 1.5.3 Asymmetry of bodily emotion expression (Chapter 5) ................................. 37
Chapter 2 General Methods............................................................................................ 39 2.1 Movement recording............................................................................................. 39
2.1.1 Actors ............................................................................................................ 39 2.1.2 Ethics approval .............................................................................................. 39 2.1.3 Mood induction ............................................................................................. 40 2.1.4 Recording procedure ..................................................................................... 41 2.1.5 Motion capture and data pre-processing........................................................ 42
2.2 Computation of joint angles ................................................................................. 43 2.2.1 Construction of coordinate systems............................................................... 44 2.2.2 Computation of rotation matrices .................................................................. 45 2.2.3 Joint-angle extraction .................................................................................... 45
2.3 Animation ............................................................................................................. 46 2.3.1 Point-light walker .......................................................................................... 46 2.3.2 Avatar model ................................................................................................. 48 2.3.3 Reconstruction of position data ..................................................................... 49
2.4 Perception experiments......................................................................................... 51 2.4.1 Intensity rating............................................................................................... 51 2.4.2 Classification: forced-choice ......................................................................... 52 2.4.3 Detection / yes-no.......................................................................................... 53 2.4.4 General setup and procedure ......................................................................... 54
Chapter 3 Features for the perception of emotion from gait .......................................... 55 3.1 Introduction .......................................................................................................... 55
3.1.1 Features involved in facial emotion expression ............................................ 55

8
3.1.2 Features supporting the perception of bodily emotion expressions .............. 56 3.1.3 The current study........................................................................................... 57
3.2 Experiment 1: Movement analysis ....................................................................... 58 3.2.1 Methods ......................................................................................................... 58 3.2.2 Results ........................................................................................................... 66 3.2.3 Discussion...................................................................................................... 72
3.3 Experiment 2: Critical features for emotion perception ....................................... 72 3.3.1 Methods ......................................................................................................... 73 3.3.2 Results ........................................................................................................... 73 3.3.3 Discussion...................................................................................................... 81
3.4 Experiment 3: Adaptation of emotion perception ................................................ 82 3.4.1 Methods ......................................................................................................... 82 3.4.2 Results ........................................................................................................... 84 3.4.3 Discussion...................................................................................................... 85
3.5 General Discussion ............................................................................................... 86 3.5.1 Influence of gait speed................................................................................... 87 3.5.2 Role of posture and movement features for emotion perception................... 88 3.5.3 Implications for the relationship between different affects ........................... 90 3.5.4 Outlook and limitations ................................................................................. 91 3.5.5 Outlook to Chapters 4 and 5.......................................................................... 93
3.6 Appendix: Details of mathematical operations .................................................... 94 3.6.1 Computation of blind source separation........................................................ 94 3.6.2 Generalized cross-validation ......................................................................... 95 3.6.3 Performance of novel blind source separation algorithm.............................. 96
Chapter 4 Feature integration in emotion perception ..................................................... 97 4.1 Introduction .......................................................................................................... 97
4.1.1 Modelling feature integration in visual perception: Types of models........... 98 4.1.2 Application of feature integration to object recognition ............................... 99 4.1.3 Application to the visual perception of socially relevant stimuli ................ 101
4.2 The current study ................................................................................................ 102 4.2.1 Description of features................................................................................. 102 4.2.2 Methods ....................................................................................................... 104
4.3 Model and results: Expressiveness ratings ......................................................... 108 4.3.1 Cue-fusion model ........................................................................................ 108 4.3.2 Experimental results: Expressiveness ratings.............................................. 109
4.4 Model and results: Yes-no/detection data .......................................................... 112 4.4.1 Cue-fusion model ........................................................................................ 112 4.4.2 Experimental results .................................................................................... 114
4.5 Discussion........................................................................................................... 119 4.5.1 Effect of features’ congruence with motor behaviour ................................. 119 4.5.2 Influence of different body parts for emotion perception............................ 120 4.5.3 Relationship between results for ratings and for detection.......................... 121 4.5.4 Outlook and limitations ............................................................................... 122
4.6 Appendix: Cue-fusion models ............................................................................ 123 4.6.1 Goodness-of-fit test for the rating data........................................................ 123 4.6.2. Model of the perception process................................................................. 124

9
4.6.3. Model of the perceptual decision: emotional vs. neutral............................ 125 4.6.4 Parameter fitting .......................................................................................... 128
Chapter 5 Asymmetry of bodily emotion expression................................................... 131 5.1 Hemispheric asymmetry for emotion ................................................................. 131
5.1.1 Historical background ................................................................................. 131 5.1.2 Findings with patients.................................................................................. 132 5.1.3 Emotion-related asymmetries in healthy subjects ....................................... 134 5.1.4 Asymmetries of facial emotion expression ................................................. 138 5.1.5 The current study: Asymmetry of bodily emotion expression .................... 142
5.2 Methods and results: Asymmetry in production................................................. 144 5.2.1 Methods: Movement asymmetries............................................................... 144 5.2.2 Results: Movement asymmetries................................................................. 145
5.3 Methods and results: Asymmetry in expression intensity .................................. 152 5.3.1 Asymmetry in expression intensity: Methods ............................................. 152 5.3.2 Asymmetry in expression intensity: Results ............................................... 154
5.4 Discussion........................................................................................................... 156 5.4.1 Main findings............................................................................................... 156 5.4.2 Implications ................................................................................................. 158 5.4.3 Shortcomings and outlook........................................................................... 158 5.4.4 Advantages of brain asymmetry and its population-level alignment .......... 160
Chapter 6 Overview and conclusions ........................................................................... 163 6.1 Key findings ....................................................................................................... 163
6.1.1 Critical features for the perception of emotion from gait ............................ 163 6.1.2 Integration of features in the perception of emotion from gait.................... 168 6.1.3 Asymmetry of emotional body expression.................................................. 170
6.2 Implications ........................................................................................................ 173 6.2.1 Overarching topics of Chapters 3 to 5 ......................................................... 173 6.2.2 Visual perception of other types of socially relevant information .............. 174
6.3 Suggestions for future work ............................................................................... 175 References .................................................................................................................... 178Erklärungen .................................................................................................................. 201Darstellung des Eigenanteils bei Gemeinschaftsarbeiten............................................. 202 Curriculum Vitae for Claire L. Roether........................................................................ 203 Publications .................................................................................................................. 205

10

11
SummaryEmotions accompany all that we think and do. They are one of the prime motivators of behaviour, and they specifically serve to coordinate behaviours of different individuals acting within a social context. For these reasons, communication about emotional states has been receiving substantial attention in terms of experimental research. It has been established that humans can perceive different emotional states with remarkable ease and cross-cultural stability, and many of the relevant stimulus characteristics have been identified. Recently, efforts have been extended to investigating the expression of emo-tions through other effectors, especially body movement and body posture, the topic of this dissertation.
Following a general introduction in Chapter 1 and a description of general meth-ods in Chapter 2, in Chapter 3 I describe the most comprehensive quantitative descrip-tion to date of the expression of affect in human full-body movement. Based on motion-capture data, we identified specific patterns of movement and posture changes in differ-ent joints of the body associated with the expression of different affects in human gait. This was made possible by our application of a novel algorithm for blind source separa-tion that provided and more compact and meaningful parameterisation of the emotion-ally expressive movements than e.g. principal component analysis. Emotion-related changes especially affected movement size and speed, head inclination and elbow flex-ion. We also studied in detail the role played by different movement and posture changes for the perception of emotional body expression, applying sparse feature learn-ing for automatic extraction of the key relationships between features and the emotion perception. We found that head inclination was a dominant feature for perceiving ex-pressions of sadness. Additional dominant features for both classification and intensity ratings were average joint (especially elbow) flexion and the size and speed of move-ments. The quantitative approach also allowed us to answer a number of specific ques-tions concerning the emotional body expressions. The first of these concerned the cues discriminating between different affects sharing a similar level of movement activation (i.e., the size and speed of movement). Our analysis uncovered average joint flexion as the discriminating cue used by human observers; this cue appears to code hostile rela-tionships. Besides, we have answered the question of which movement parameters dif-ferentiate between emotionally expressive gait and emotionally neutral gait matched to it in terms of gait velocity. We found that emotion expression effects kinematic changes that go beyond those effected by changes in movement speed alone: angry and happy gait were expressed in larger movements than speed-matched (i.e. fast or very fast) neu-tral gait, while fearful and sad gait used smaller movements than speed-matched (i.e. slow or very slow) neutral gait. Last, not least, the findings reported in Chapter 3 dem-onstrate that the movement parameters we extracted can be employed in terms of a ‘generative grammar’ of emotionally expressive gait: artificial emotional gaits gener-ated by adding the largest average posture and movement changes to neutral gait in-duced adaptation effects not significantly different from those of the original emotional gait. Our representation of affect-specific changes can thus be used to generate emo-tionally expressive gaits by adding specified movement and posture changes.
While individual expressive features were studied in Chapter 3, in Chapter 4 we conducted a cue-fusion experiment which showed that observers integrate the individual expressive features over the spatial extent of the human body in near-optimal fashion. Using component-wise motion morphing between neutral and emotional prototypic

12
movements, we generated continua of emotionally expressive gait. Emotional expres-sion was either restricted to a spatial component of the stimulus (component stimuli) or extended to the entire figure (full-body stimulus), and subjects were asked to detect the presence of emotional expression as well as rating the intensity of emotional expression. Using Bayesian modelling to predict the response to the full-body stimulus from the responses to the component stimuli, we found that integration was very close to optimal. However, we falsified our hypothesis that integration be closer to optimal if the design of the components followed features present in our movement analysis (upper body half compared with lower body half) than if the components specifically violated them (crossed component comprising one arm and one leg from opposite sides of the body).
In Chapter 5 I describe the first demonstration of a lateral asymmetry in human emotional full-body movement and of an emotional expressiveness advantage of left-sided body movement, using an emotional chimeric walker we developed. These find-ings match a host of published findings of an emotional-expressiveness advantage of the left side of the face, but going considerably beyond these to show that lateral asymme-tries of emotional expression exist independently of the specific effector. We compared the amplitude and energy of limb movements on the left and right side of the body, find-ing left-sided body movements higher on both parameters for both right- and left-handed actors. Additionally, emotionally expressive gait was more asymmetric than neutral gait. To study the perceptual effects of this movement asymmetry independently of potential anatomical asymmetries, we designed an emotional chimeric walker: a bi-laterally symmetric puppet with the movement on one side of the body exchanged by that of the other, corrected for phase differences, with a dynamic stimulus that moved in a very natural-looking way. We found that the movements of left-left chimeras were rated as more expressive than those of right-right chimeras, entailing that the movement of the left side of the body is more emotionally expressive than that of the right, for bothleft- and right-handers. Since the asymmetry of both the production and the perception of movements went in the same direction, we can conclude that perceiver bias did not play a crucial role and that the physical parameters we considered captured movement characteristics highly relevant for emotion perception. Our findings considerably strengthen the existence of left-right asymmetries of emotion expression. Since the asymmetry is independent of the specific expressive effector, we can conclude that left-right asymmetry of emotion perception is not simply due to asymmetries in the produc-tion and perception of emotionally neutral face movements. Given the more complete crossing of motor efferences to distal body musculature than to the expressive facial musculature, our findings provide considerable new support to a dominant role for the right hemisphere in the control of emotional expression. The slight indication we found of a hemifield bias, by comparing the expressiveness of original and mirror-reversed animations, was in line with findings for facial emotion expressions and appears worthy of further investigation.
Future work on emotional body expression should investigate the individual ex-pressive features in more detail, especially with stimuli containing only few expressive features, investigated using the cue-fusion approach, for instance when combining pos-ture and movement features or facial and bodily expression. Eye-movement recordings and experiments using the ‘bubbles’ technique or classification images will help clarify the perceptual strategies observers employ when viewing bodily emotion expressions. A multimodal approach including fMRI and neuropsychological studies will be instructive for discovering the neural basis of emotional body expressions and their perception.

13
Chapter 1 Introduction
‘For what purpose, Mr. Scott? What is it in you humans that re-quires an overwhelming display of emotion in a situation such as this?’
Mr. Spock in Star Trek, That Which Survives, Episode 3.17
Emotions accompany all that we think and do. But what are they for? They have been conceptualised as the prime motivator for human behaviour (Izard, 1977; Rolls, 2007). They likely serve a special role in behaviours occurring within a social context. Much of human behaviour occurs within a social context, requiring coordination between differ-ent individuals. Successful coordination requires, among other things, us knowing how others feel about the things we do. It is therefore not surprising that, while in the pres-ence of others, we nonverbally express emotions almost continuously, and that humans are highly skilled readers of others’ emotional expressions. Interestingly, knowing what others feel, although essential in ancient times (Schmidt & Cohn, 2001), even carries fitness advantages in the modern age: adeptness at reading facial expressions is corre-lated with success in situations of negotiation (Elfenbein, Foo, White, Tan, & Aik, 2007). The importance of emotional expression to human social interactions, and the window that expressions of emotion open into our complex internal world, are reflected in the immense research effort addressing the topic. Most of this research has tradition-ally been focused on facial expressions of emotion, but recently, there has been growing interest in other expressive channels, mainly through the human voice and through body movement and posture. Within this dissertation, I will describe several experiments aimed at answering some central questions regarding the expression of emotions in a human full-body movement, gait, and of its perception by human observers.
What do I mean by the term emotion? The answer to this question seems clear to most of us until asked to define it (Fehr & Russell, 1984). Since the definition in part depends on the outcomes of their work, most researchers, rather than provide a strict definition of emotion, settle on a satisfactory working definition, at least initially (Oatley & Jenkins, 1996; Öhman & Birbaumer, 1993). Many agree that the set of com-ponents that any description of emotion has to cover include (Loewenstein & Lerner, 2003): (1) the experience or conscious sensation of feeling, (2) the associated processes or changes in the brain and nervous system, and (3) a visible expression of emotion, particularly in the face. A focus on the differences between affects, and especially be-tween the external expressions of these, considerably reduces concern about such con-ceptual issues. What remains necessary is to consider the differences between emotionand related terms. Of these, affect is usually treated as synonymous with emotion, if perhaps slightly more general in meaning. Moods are differentiated from emotions in terms of lower intensity and higher duration, as well as by a less stringent association with an external object or event, although the two terms are usually considered as both lying on a continuum of emotional processes (Ewert, 1983; Morris, 1989; Scherer,

14
Johnstone, & Klasmeyer, 2003; Schmidt-Atzert, 1996; Ulich, 1995). Feelings, although essentially isomorphic with emotions, should be considered as the more psychological term, whilst emotion more strongly focuses on the underlying physiological processes, and has been claimed to correspond more strongly to a hard-wired response (Bischof, 1989).
1.1 Facial emotion expression and its perception
1.1.1 Functions of emotional expression Human beings are social animals. Many of the problems we encounter, such as the rais-ing of children or the distribution of resources, are mastered within social relationships (Baumeister & Leary, 1995; Fiske, 1992) and hence require high levels of interindi-vidual coordination. To this end, emotions represent perhaps the most powerful mecha-nism regulating our social behaviour, benefiting especially the formation of complex social interactions (Keltner & Haidt, 1999; Keltner & Kring, 1998) and allowing hu-mans to enter the long-term cooperative relationships indispensable for reproduction and survival (de Waal, 1996; Eibl-Eibesfeldt, 1989; Sober & Wilson, 1998). Positive emotions promote affiliation and cooperation: feelings of romantic love promote long-term commitment between sexual partners, while feelings of gratitude and trust mark valuable partners for social and commercial interactions; in the long term, amusement is associated with more satisfying interpersonal relationships (Keltner & Bonanno, 1997). Negative feelings and emotions, on the other hand, serve to protect individuals from exploitative relationships, and they can be associated with behaviours aimed at punish-ing transgressors of cooperative bonds: we feel angry with and might punish people who interfere with our goals; transgressions of intimate relationships can evoke the feel-ing of jealousy, its intensity correlating with the duration of the relationship (Buss, Lar-sen, Westen, & Semmelroth, 1992). The relevance of this affect for behaviour is dem-onstrated by its ability to even drive the betrayed spouse to murder, as alluded to by the term crime of passion (Daly & Wilson, 1988).
Given this strong influence of emotions on the regulation of social interactions, it is only fitting that, when in the presence of others, humans display nonverbal expres-sions of emotion almost continuously. The best-understood emotional signalling chan-nel is facial expression, humans being able to express and recognise at least six different emotional states (anger, happiness, sadness, fear, surprise and disgust) with remarkable cross-cultural stability (Ekman & Friesen, 1971; Ekman, Sorenson, & Friesen, 1969; Izard, 1977). Less intensely investigated but nevertheless effective modes of nonver-bally communicating emotions include affect-related modulations in speech (Scherer, 1986), touch (Eibl-Eibesfeldt, 1989), and of body movement and posture (Dittrich, Tro-scianko, Lea, & Morgan, 1996; Walk & Homan, 1984). All these nonverbal expressions of emotion are capable of influencing human behaviour, as evidenced e.g. by the finding that smiles guide us in whom we choose to cooperate with (Schmidt & Cohn, 2001).
Empirical evidence supports at least three important functions that (facial) emo-tion expression serves in shaping social interactions. Emotion displays have informativefunction, providing the observer with a rich source of information about the surrounding social world. They indicate the sender’s emotions, intentions, and relationship with the target (Ekman, 1992; Fridlund, Kenworthy, & Jaffey, 1992), and they allow individuals to coordinate their responses to outside opportunities or threats (Klinnert, Emde, Butterfield, & Campos, 1986; Scorce, Emde, Campos, & Klinnert, 1985). As an exam-

15
ple of this function, parents’ vocal and facial displays of positive affect or of fear influ-ence whether an infant will walk across a visual cliff (Scorce et al., 1985). The elicita-tion of complementary or matching emotions from relationship partners is the evocative function played by emotion expression (Eibl-Eibesfeldt, 1989; Keltner & Kring, 1998).
Figure 1.1. Facial expressions of emotion. From left to right, top to bottom, panels show pictures recognised as expressions of happiness, surprise, fear, anger, disgust, sad-ness.
As examples of this function, presenting pictures of anger expressions can evoke fear in observers (Dimberg & Öhman, 1996), a response that can influence behaviour by enhancing fear conditioning (Esteves, Dimberg, & Öhman, 1994; Öhman & Dimberg, 1978). Evoking emotions can also directly benefit social relationships, as in the case of distress displays that arouse compassion or sympathy in observers (Eisenberg et al., 1989; Eisenberg & Strayer, 1989), even in children as young as eight months (Zahn-Waxler, Radke-Yarrow, Wagner, & Chapman, 1992). The incentive function of emo-tional expression lies in providing incentives for others’ desired (social) behaviour, laughter and displays of positive emotions serving to reward both child (Rothbart, 1973; Tronick, 1989) and adult behaviour (Owren & Bachorowski, 2001).
Humans have a rich repertoire of emotional expression, paired with highly de-veloped skills at reading them. The importance of emotional communication for social coordination, and the window it provides into the complex hidden emotional worlds of human beings, make the expression of emotions an extremely rich and appealing field for experimental research.

16
1.1.2 Universality of emotional facial expressions
1.1.2.1 Evidence supporting universal expressions Claiming that emotion expression is beneficial for individuals’ functioning within social relationships implies that the expression of emotions was shaped by evolution (Eibl-Eibesfeldt, 1989; Plutchik, 1962; Tomkins, 1962, 1963). This claim would be supported by finding a continuity between primate and human expressions. And indeed, chimpan-zee facial expressions can be accurately judged by human subjects (Foley, 1938). Be-sides, there appear to be important similarities in the facial configurations associated with emotional expression in the two species (Chevalier-Skolnikoff, 1973; Redican, 1982).
Figure 1.2. Continuity between facial expressions of humans and other primates. Top row: human equivalents to other primates’ facial expressions, together with the Facial Action Units activated to produce them (Ekman & Friesen, 1978). Important continuities exist between e.g. the primate play face (bottom row, middle) and the human smile. Picture from (Parr & Waller, 2006).
The evolutionary development of emotional expression immediately implies that human individuals from diverse cultural backgrounds should use the same expressions (encod-ing hypothesis), and that any expression should be recognised at a similar level across different cultures (decoding hypothesis) (Ekman & Friesen, 1971; Ekman et al., 1969; Izard, 1971; Tomkins, 1962, 1963). More circumstantial evidence suggests that e.g. a brief raising of the eyebrows, which humans exhibit when flirting with or greeting someone, might represent such a universal facial expression (Eibl-Eibesfeldt, 1970). Systematic studies on universal facial emotion expressions were based on subjects’ la-belling large numbers of photographs of facial emotion expressions, demonstrating that individuals from very different cultures generally agree in how they label photographs depicting anger, disgust, fear, happiness, sadness and surprise (Ekman, 1984, 1992; Elf-enbein & Ambady, 2002, 2003; Izard, 1971, 1994), these six affects often being consid-

17
ered as basic emotions (Ekman, 1992). Besides, it has been shown that visual isolation does not drastically alter expression: blind children express emotion much in the same way as seeing children do, although the intensity of blind children’s expressions de-creases with age (Dumas, 1932; Eibl-Eibesfeldt, 1970; Fulcher, 1942; Thompson, 1941). Furthermore, members of the (up to then) largely isolated South Fore culture in Papua New Guinea were found to both encode and decode expressions similarly to Westerners (Ekman et al., 1969).
1.1.2.2 Problems and criticisms One major set of problems for the concept of universal expressions of emotion stems from the experimental methodology employed in the relevant studies. Proponents of the so-called forced-choice critique argue that the high rates of response agreement arise from forced-choice labelling with a small number of different labels provided as re-sponse alternatives. However, a number of studies designed to make guessing strategies less likely for the subjects show this influence to be relatively slight: recognition per-formance was not greatly changed when subjects were allowed to label the pictures us-ing their own words, and subjects both within and across cultures even used labels simi-lar to those supplied in forced-choice studies (Haidt & Keltner, 1999; Carroll E. Izard, 1994; Rosenberg & Ekman, 1995; Russell, Suzuki, & Ishida, 1993). Further, allowing subjects to use the response choice ‘none of the above’ or the inclusion of additional response options (Frank & Stennett, 2001) did not reduce labelling agreement.
Happiness Surprise Sadness Fear Disgust Anger Japanesea 87.0 87.0 74.0 71.0 82.0 63.0 Japaneseb 93.8 79.2 66.8 58.2 55.8 56.8 Japanesee 90.0 94.0 87.0 65.0 60.0 67.0 Americana 97.0 91.0 73.0 88.0 82.0 69.0 Americanb 96.8 90.5 74.0 76.0 83.2 89.2 Americanc 96.7 85.9 72.6 69.8 71.7 64.6 American d 100.0 92.5 87.5 67.5 92.5 90.0 Adult Foref 92.0 68.0 79.0 80.0 81.0 84.0 Child Foref 92.0 98.0 91.0 93.0 85.0 90.0 Median Westerng 96.4 87.5 80.5 77.5 82.6 81.2 Median Non-Westerng 89.2 79.2 76.0 65.0 65.0 63.0
Table 1.1. Cultural gradients in recognition of facial emotional expressions. Top table: recognition differences between US college students and the Fore of New Guinea (Ekman & Friesen, 1972). Bottom: differences between Western and non-Western cul-tures, and stability of measurements across different studies performed in the same country. (a) NJap = 29, NAmer = 99 (Ekman et al., 1969); (b) NJap = 60, NAmer = 89 (Izard, 1971); (c) N = 53 (Boucher & Carlson, 1980); (d) N = 40, (McAndrew, 1986); (e) N = 98, (Ekman et al., 1987); (f) NAdlt = 189, NChld = 130 (Ekman & Friesen, 1971); (g) (Russell, 1994). N: number of participants.

18
Perhaps a more serious problem with the concept of universal expressions of emotion is formulated in the gradient critique (Russell, 1994), describing a cross-cultural gradient of accuracy in the recognition rates of different emotions. The recogni-tion rates of fear, surprise and disgust expressions are less stable across cultures than are those for happiness, sadness and anger expressions. Table 1.1 shows (mean) percent-ages of correct recognition for the expression of different emotions in different cultures. Recognition rates can vary drastically both across cultures and across different studies performed within the same culture (references in table legend). In particular, the Japa-nese tend to label fear expressions as surprise (Russell, Suzuki, & Ishida, 1993).
The forced-choice critique also pertains to the relationship between emotional expression and the emotional state a person is experiencing. If we find that observers consistently label the stimuli shown in experiments on emotional expression, is it then justified to refer to these images as emotional expressions? The answer has to be no. As implied by the criticism of forced-choice experiments on emotional expression, the ex-ternal validity of the suggested expressions has to be verified in a separate step. After all, a cartoon smiley face consisting of no more than a pair of dots and an upward-curved line all surrounded by a circle, represents a stimulus that will be reliably labelled as expressing happiness.
The problem of the external validity of stimuli used in experiments on emotional expression can be addressed by taking care to produce stimulus materials that are as close as possible to spontaneous expressions of emotion. The studies mentioned above, allowing subjects to use their own emotion labels, already show that this problem may not actually be as grave as theoretical considerations suggest. Besides, researchers have attempted to verify the external validity of facial emotion expressions in separate ex-periments, mostly by investigating the relationship between external expression and underlying emotional state. Some studies show that at least the intensity of both may not necessarily be correlated: for instance, in one study participants’ self-reports of happi-ness were more strongly correlated with the participant’s belief about the sociality of the situation than with outward smiling behaviour (Fridlund, 1990; Fridlund, Kenworthy, & Jaffey, 1992). Generally speaking, though, the validity of facial expressions of emotion has been established by studies supporting facial emotion expressions as veridical sig-nals of affective states: a meta-review of eleven studies backs a small but significant relationship between facial expressions and other markers of emotion (Matsumoto, 1987), the intensity of the disgust or joy experience during the viewing of evocative films being correlated with the intensity of disgust expressions and smiles, respectively (Ekman, Friesen, & Ancoli, 1980). Besides, certain emotion elicitors have been found to evoke emotional expressions in a prototypical manner. Thus, Duchenne smiles are asso-ciated with the viewing of positive film clips or with the approach of intimate others (Keltner & Ekman, 1996), failure provokes shame-related gaze aversion and downward-directed head movements (Keltner & Harker, 1998), and bereaved participants mainly exhibit sadness displays when talking about their deceased partner (Bonanno & Kaltmann, 1999).
More drastic examples of cultural differences in emotion have been described: men of the Gururumba people in New Guinea experience an emotion they describe as being a wild pig, characterised by an urge to race around, harry and attack others (Evans, 2003). Such eccentricities provide a certain challenge to the concept of univer-sal emotion expressions (Klineberg, 1940), more tending to support a constructivist view. The consensus opinion about cultural differences in emotional expression appears

19
to be that although certain differences can be identified, the majority of these do not pose a serious threat to the concept of universal expressions of emotion (Gordon, 1989). Instead, many of these are secondary to cultural differences in the interpretation of emo-tions, strikingly reflected in cultures where laughter is pervasive at funerals (Bonanno & Kaltmann, 1999), or by the observation that the Arctic Utku apparently never express anger in the face (Briggs, 1972). Other differences can be culturally acquired, as de-scribed above for the Gururumba affect of being a wild pig. Known cultural differences include display rules (Ekman et al., 1969), affecting the type and nature of expressions habitually displayed by members of different cultures. This effect was famously demon-strated by videotaping Japanese and American college students while they watched an unpleasant film (Ekman, 1973). Although both groups showed nearly identical facial expressions when watching such films individually and with no one else present, the Japanese students were more likely than the Americans to mask their negative emo-tional expressions with a smile when an authority figure was present. Ritualised and emblematic or iconic displays of emotion also differ between cultures, as e.g. shown in the tongue bite expression of embarrassment, commonly used and reliably recognised in Southeast Asia only (Haidt & Keltner, 1999).
Social context shapes facial emotion expression. In particular, expressions ap-pear to be more intense, or mark emotion more reliably, when individuals are among familiar others as opposed to strangers. For example, it is easier to judge the emotions (Wagner & Smith, 1991) or content (Buck, Losow, Murphy, & Costanzo, 1992) of stimuli from observing the expressive behaviour of women exposed to evocative stimuli in the presence of friends than of women who saw the evocative stimuli in the presence of strangers. In another study, the presence of a friend enhanced the expressive behav-iour of female participants as they viewed films of slapstick comedy (Hess, Banse, & Kappas, 1995). During teasing interactions, social status can affect emotional expres-sion, low-status members being more likely to display embarrassment and fear, whereas high-status members are more likely to display anger and contempt (Keltner, Young, Heerey, Oemig, & Monarch, 1998).
Concepts of emotional expression in modern research allow us to deal with such cultural and contextual influences, thus leaving intact the concept of our possessing ba-sic associations between emotional states and external expressions that are more or less preserved across different cultures. Learned components such as iconic emotion dis-plays are not considered a serious threat to the concept of basic, evolutionarily shaped expressions of emotion. Social or contextual influences demonstrate that there is no simple one-to-one relationship between affect states and external expressions. Instead, it is necessary to consider the influence of e.g. social context on the appraisal of the emo-tion-eliciting events (Scherer, 1993). Since social context influences the appraisal proc-ess, one and the same event can elicit different emotional responses in people, or at least affect the intensity of the emotional response, implying that the affect-expression rela-tionship is not threatened by finding a contextual influence on emotional expression.
1.1.3 Models of the relationship between different affects Should the different emotions be thought of as discrete states, or as related states that differ from each other along underlying dimensions such as valence, activity, and ap-proach-withdrawal (Ekman, Friesen, & Ellsworth, 1982; Lang, 1995; Russell, 1997; Schlosberg, 1954b)? The discrete stance focuses on the different adaptive functions of and the appropriate responses associated with each emotion; it is more common for

20
those who consider emotional responses evoked by external stimuli and related physio-logical changes. Dimensional approaches are more commonly adopted by researchers who consider emotions as being socially learned and who study semantic relationships between the emotions (Russell, 1977, 1980; Schlosberg, 1952, 1954a). A typical exam-ple of such a dimensional emotion model is shown in Figure 1.3, where emotion terms are placed according to their being considered as high or low in arousal and pleas-ure/displeasure. Overall, although it can be beneficial to consider commonalities in ba-sic underlying characteristics such as arousal or valence, recent experimental evidence seems to be more in favour of the existence of discrete emotion categories.
Figure 1.3. Example dimension model of emotion. In this model, emotions are de-scribed according to two basic underlying dimensions: arousal or attention (horizontal) and agreeableness or valence (vertical) (e.g. Schlosberg, 1952).
Discrete emotion categories are supported by perceptual studies analogous to the investigations of the categorical perception of e.g. colour or sound. For these stimulus modalities, within-category distinctions are more difficult to make than between-category distinctions, even when involving the same physical distance (Etcoff & Magee, 1992). The transition between two categories is associated with a sharp drop in the probability of the original response, and a sharp increase in the probability of the alter-native response, termed a categorical boundary effect. For facial emotion expressions, researchers have demonstrated similar findings for continua of facial expressions (Calder, Young, Perrett, Etcoff, & Rowland, 1996; Etcoff & Magee, 1992; A. W. Young et al., 1997), generated by morphing between prototypical expressions (Section 4.2.1). The categorical boundary effect is perhaps most prominently illustrated by the example of perceiving spoken phonemes, e.g. for distinguishing between the voiced and unvoiced versions of a consonant, based on the time delay between the beginning of the sound and when the vocal cords start to vibrate (voiced: small delay, unvoiced: larger delay). With sounds, it is possible to create stimuli along the physical continuum be-tween the two extreme voice onset times (VOTs). Perceivers usually report hearing only

21
one or the other sound, rather than e.g. something in between; a sharp change in re-sponse behaviour thus occurs at some intermediate delay (Figure 1.4).
Figure 1.4. Schematic diagram of the categorical perception of voice onset time (VOT). With increasing VOT, the perception of a given speech sound sharply changes from /da/ to /ta/.
Neuropsychological studies provide at least partial support for the discrete view, stating that distinct brain regions are associated with particular affects. Other findings are more in line with the dimensional view. For example, a dimensional view is supported by findings on a hemispheric asymmetry for emotion. Inactivating one cerebral hemisphere by intracarotid injection of sodium amytal has opposite effects on mood depending on which hemisphere is injected: left inactivation causes negative affective reactions (Goldstein, 1939), while right-sided infusions produce euphoric behaviour (Rossi & Rosadini, 1967; Terzian, 1964), suggesting valence-dependent global differences in networks involved in the production of emotions depending on valence. An association between emotions of negative valence and the right hemisphere is also supported by right-hemisphere-damaged patients’ impairments at identifying negative emotional ex-pressions (Borod, Andelman, Obler, Tweedy, & Welkowitz, 1992; Borod, Koff, Lorch, & Nicholas, 1986), although others have found right-hemisphere damage to impair the perception of all emotions more than left-hemisphere damage does, regardless of va-lence (A. W. Young, Newcombe, de Haan, Small, & Hay, 1993). A more thorough re-view of the evidence on emotion-related hemispheric asymmetries is provided in Sec-tion 5.1. Additionally, there are brain regions suggested to be involved in generalised processing of emotional faces: the orbitofrontal cortex, supported by human lesion stud-ies (Hornak, Rolls, & Wade, 1996), and Brodmann area (BA) 47, which PET shows to be activated when presented with emotional compared to neutral faces (Sprengelmeyer, Rausch, Eysel, & Przuntek, 1998). Generally speaking, imaging studies show consider-able overlap between the brain regions activated associated with different emotions (Costafreda, Brammer, David, & Fu, 2008; Hennenlotter & Schroeder, 2006; Phan, Wager, Taylor, & Liberzon, 2002; Wager, Phan, Liberzon, & Taylor, 2003). One of the most widely agreed-on associations between an emotion and a brain region is between

22
fear and the amygdala. But more recent studies have shown the amygdala to be involved in negative or withdrawal-related emotions besides fear (Phan, Wager, Taylor, & Liber-zon, 2002), it being activated in response to e.g. happy faces (Breiter et al., 1996), and to both appetitive and aversive stimuli (Garavan, Pendergrass, Ross, Stein, & Risinger, 2001; Hamann, Ely, Grafton, & Kilts, 1999; Hamann, Ely, Hoffman, & Kilts, 2002; Hamann & Mao, 2002; Liberzon, Phan, Decker, & Taylor, 2003). Meta-reviews also show that brain activation suggested to be emotion-specific may simply be associated with cognitive processes concurrent with an emotion. For instance, emotional induction by visual stimuli activated occipital cortex and amygdala, while induction by emotional recall or imagery further recruited the anterior cingulate and insula, as did emotional tasks with cognitive demand (Phan et al., 2002).
There are a number of neuropsychological findings supporting emotion-specific neural networks. Thus, the perception of facial expressions of different emotions elicits some emotion-specific activity, e.g. perceiving fearful facial expressions activates re-gions in the left amygdala (Breiter et al., 1996; Phillips et al., 1998), even when they are masked by an immediately ensuing neutral expression (Whalen et al., 1998). The per-ception of sad faces activates the left amygdala and right temporal lobe, whereas the perception of angry faces activates the right orbitofrontal cortex and cingulate cortex (Blair, Morris, Frith, Perrett, & Dolan, 1999; Sprengelmeyer et al., 1998). The percep-tion of disgust expressions activates the basal ganglia, anterior insula, and frontal lobes (Phillips et al., 1998; Sprengelmeyer et al., 1998). Besides, the imaging evidence, dis-ease and lesion studies also support associations between brain regions and different emotions. Specifically, bilateral lesions to the amygdala impair the ability to recognise fearful facial expressions and vocalisations but not the ability to recognise facial expres-sions of sadness, disgust or happiness (Adolphs, Russell, & Tranel, 1999; Adolphs, Tra-nel, Damasio, & Damasio, 1994; Calder et al., 1996; Sprengelmeyer et al., 1999). Be-sides, Huntington’s disease patients were specifically impaired at recognising disgust expressions (J. M. Gray, Young, Barker, Curtis, & Gibson, 1997; Sprengelmeyer et al., 1996), supporting a role for the basal ganglia in the perception of disgust. Associations between brain regions and emotions are not limited to the perception of emotional ex-pressions: for example, laughter can be evoked by microstimulating the anterior part of the human supplementary motor area (Fried, Wilson, MacDonald, & Behnke, 1998).
The autonomic nervous system’s activity associated with different emotion states also has potential implications for the discrete-dimensional distinction between emotional states. Finding different such activity patterns to be associated with different emotions would support the existence of distinct emotion categories. Conversely, di-mensional accounts of emotion would be supported if autonomic physiology were found to reflect the underlying dimensions of e.g. valence and arousal (Levenson, 1992). Stud-ies show that at least the hypothesised arousal dimension is not clearly reflected in the psychophysiological processes involved in emotions: expressions of anger, fear and sadness all produced greater heart-rate deceleration than disgust, and expressions of anger produced greater finger temperature than fear expressions (Ekman, Levenson, & Friesen, 1983; Levenson, 1992). On the other hand, some expressions appear to be spe-cific to an emotion, e.g. blushing is only observed during embarrassment (Shearn, Bergman, Hill, Abel, & Hinds, 1990).
A last type of finding supporting distinct emotions is the observation that facial expressions evoke fairly specific responses in observers: while facial expressions of anger evoke fear-related facial and autonomic responses (Esteves et al., 1994), distress

23
expressions tend to induce feelings of sympathy (Eisenberg et al. 1989) and expressions of embarrassment and shame evoke amusement and sympathy (Keltner, Young & Buswell 1997).
1.2 Specific problems in research on facial emotion expression
1.2.1 Expressive features and feature integration
1.2.1.1 Role of features for the perception of facial emotion expressions But what are the relevant visual features supporting the recognition of the different emotions from facial expressions? Most research aimed at this question has focused on the relationship between the characteristics of static images of facial emotion expres-sions and the responses to these images by human observers. In general, although there are findings that for some aspects of the perception of emotional expression the face is treated as an unparsed perceptual whole (White, 2000), with large performance decre-ments for inverted stimuli (Valentine & Bruce, 1988), there are good reasons for pursu-ing an explicitly feature-based approach. For instance, in a study restricting the facial display to either the lower or the upper half, it was shown that the emotions differ in which face regions are especially important for expressing them (Bassili, 1978). More specifically, by testing responses to stimuli restricted to small regions of the face, it has been shown that the eye region is very important for perceiving anger and fear, whereas for the expression of happiness, the mouth is very informative (Gosselin & Schyns, 2001; Schyns, Petro, & Smith, 2007). Examples of highly influential features associated with different expressions include the raising or lowering of the corners of the mouth, correlated with the expression of positive or negative valence, and raising or puckering of the eyebrows, correlated with expressing surprise and fear or with anger and distress, respectively (Ekman & Friesen, 1978; Ellison & Massaro, 1997). Elaborate systems have been developed that describe the relationship between physical aspects of the fa-cial expression and the perception of emotions. Prominent models are based on the anatomy of the expressive facial musculature (Ekman & Friesen, 1978; Izard, 1977); the most well-known is the Facial Action Coding System (FACS), describing the produc-tion of distinct emotional expressions based on patterns of muscle contraction (Ekman & Friesen, 1978).
More recently, unsupervised-learning techniques such as principal component analysis (PCA) or independent component analysis (ICA) have been applied to face images, mostly in the context of face recognition (Bartlett, Movellan, & Sejnowski, 2002; Hancock, Burton, & Bruce, 1996), but also to emotional facial expressions (Calder, Burton, Miller, Young, & Akamatsu, 2001). PCA develops a representation of face images as linear combinations of basis images extracted from the intensity correla-tions between pairs of pixels (Turk & Pentland, 1991). Usually applied to images of complete faces, PCA-based approaches are not ideally suited for identifying individual features carrying emotional expression and altogether, unsupervised learning methods are not normally used to identify individual expressive features (Schwaninger, Wall-raven, Cunningham, & Chiller-Glaus, 2006). However, feature-based strategies fare better in this respect (Black & Yacoob, 1997; Terzopoulos & Waters, 1993), and it is interesting to note that separate PCAs applied to the eye and mouth region of the face can actually perform better than whole-face PCA (Padgett & Cottrell, 1995). While much work shows that unsupervised learning is accepted as a technique for studying

24
face perception, its use is limited when trying to uncover individual meaningful features in faces and facial expressions of emotion.
Although many important insights have been derived from research with static face images, it should not be forgotten that dynamic cues also play an important role in the recognition of facial expressions. For instance, superior recognition performance is achieved for dynamic compared with static expressions (Ambadar, Schooler, & Cohn, 2005), as well as for expressions unfolding at the appropriate speed (Kamachi et al., 2001), and participants appear to be most sensitive to the temporal characteristics of the early stages of an expression (Edwards, 1998). The timecourse of an expression has even been shown to differentiate between deceptive smiles and spontaneous, sincere smiles (Ekman & Friesen, 1982; Ekman, Hager, & Friesen, 1981a). In fact, separate encoding processes for static and dynamic cues are supported by a double dissociation for the recognition of facial emotion expressions from static and dynamic stimuli (Humphreys, Donnelly, & Riddoch, 1993).
1.2.1.2 Feature integration in visual perception As described in the preceding section, there is a long list of potential cues available for perceiving facial expressions. Combined with the unreliability involved in any visual estimate of a cue, one might ask how different individual cues to emotion are combined by perceivers. The question of cue integration has traditionally been addressed in the domain of depth perception, where multiple visual cues, with their visual estimates sub-ject to error, are available to observers judging the three-dimensional layout of the envi-ronment. The models assign weights to individual cues, describing their relative contri-bution to the sensory estimate (Bruno & Cutting, 1988; H. H. Bülthoff & Mallot, 1988; Clark & Yuille, 1990; Landy, Maloney, Johnston, & Young, 1995; M. J. Young, Landy, & Maloney, 1993). Studies on cue integration usually involve varying the availability of the different cues and testing how the perceptual estimates of the individual cues relate to the case when all cues are available at the same time. A typical finding of such stud-ies is that observers integrate information over cues, shown e.g. by increasingly con-vincing depth percepts with increasing numbers of depth cues (Bruno & Cutting, 1988; H. H. Bülthoff & Mallot, 1988), although one cue can also override the other (Rogers & Collett, 1989; Turner, Braunstein, & Andersen, 1997).
The cue-integration approach is applicable to a wide range of perceptual ques-tions besides depth perception, and even to object and scene perception, which can all be formulated as problems in which information is integrated over many sources. For example, understanding the combination of colour and luminance information for bor-der detection has been formulated in terms of a cue-integration problem (Frome, Buck, & Boynton, 1981). On a different level, object perception represents an interesting case of the integration of information for visual perception. In many theories of object recog-nition, it is suggested that we extract invariant spatial features from the input images, e.g. to overcome irrelevant appearance changes brought about by lighting or viewpoint changes (Biederman, 1987). If we could treat individual spatial features that an object constitutes as separate sources of information, then object perception could be treated as a problem of cue combination. Analogously, the cue-fusion approach might then also be applicable to the integration of information about emotional expression over different facial features, similar to studies of the integration of information in other perceptual contexts.

25
1.2.2 Asymmetry of facial emotion expression One question about facial expressions of emotion that has received substantial research effort over the last few decades is that of an asymmetry in emotional expressiveness between the left and right side of the face, or hemiface. The phenomenon received per-haps its first quantitative description for the example of anger expressions, where the upper lip is drawn further to one side of the face than to the other (Borod & Caron, 1980; Darwin, 1872). Starting in the late 1970s, then, a number of studies appeared that showed the left side of the face to be more active and more intense than the right during emotional expression (Campbell, 1978; Chaurasia & Goswami, 1975; Sackeim, Gur, & Saucy, 1978; Strauss & Kaplan, 1980). This general conclusion was also supported by a meta-analysis covering 49 experiments (Borod, Haywood, & Koff, 1997). The studies were based on the so-called composite technique, chimeric facial expressions being generated by replacing one half of a picture of a facial expression by the mirror image of the other half. With this method, it is possible to create complete pictures of expres-sions as left-left or right-right chimeras, containing only those parts of the expression normally appearing on the (anatomically) left or right hemiface (Figure 1.5).
Besides their obvious neuropsychological implications, studies on differences in the emotional expression on the left and right hemiface can also inform us about the expressive cues in the pictures if the asymmetry in the physical cues were correlated with the expressiveness asymmetry. Unfortunately, the three-dimensionality of the face and the complexity of the transformations it undergoes during movements make it diffi-cult to measure physical characteristics of facial expressions. Such measurements have been attempted using three-dimensional face scanners, with more movement actually found for the left hemiface (Nicholls, Ellis, Clement, & Yoshino, 2004), but with incon-sistent relationships between hemifacial movement asymmetry and expressiveness asymmetry.
Figure 1.5. Asymmetry of facial emotion expression. Middle panel shows original anger expression. Side panels show chimeric pictures, generated by replacing one vertical hemiface with the other’s mirror image. Left panel: right-right chimera; right panel: left-left chimera. Figure from Sackeim & Gur 1978.
It seems altogether safe to assume greater emotional expressiveness for the left hemiface compared to the right. A dominant role for the right hemisphere in the control of emotional expression is often inferred from these findings, fitting the traditional idea that the right hemisphere is dominant in the regulation of our vegetative and instinctual functions, as opposed to the capabilities of the intelligent, linguistic left hemisphere

26
(Luys, 1881). Unfortunately, although the principle of muscle innervation from the con-tralateral hemisphere is usually assumed, only the lower part of the face receives pre-dominantly crossed efferences, while upper face regions are bilaterally innervated (Kuypers, 1958; Kuypers, Fleming, & Farinholt, 1960; Lawrence & Kuypers, 1968; Rinn, 1984). However, support for an overall right-hemisphere dominance for emo-tional expression is provided by findings in patients with unilateral brain lesions: pa-tients with right-hemisphere brain lesions have been shown to be more impaired at the production of prosody (E. D. Ross & Mesulam, 1979) as well as of facial and gestural emotion expressions (Borod et al., 1986; Buck & Duffy, 1980) than patients with le-sions restricted to the left hemisphere. Similar findings have been reported for the per-ception of prosody (Heilman, Scholes, & Watson, 1975), for the recognition and dis-crimination of emotional compared with non-emotional words (Borod et al., 1998; Tucker, Watson, & Heilman, 1977), and for the recognition of facial expressions of emotion (Borod et al., 1998; Mandal, Asthana, & Tandon, 1993; Weddell, 1994).
There are a number of other problems that complicate the inference from a left-hemifacial expressiveness advantage to a right-hemisphere dominance for the control of emotional expression. For example, morphological asymmetries in the resting face could also be influencing emotional expressiveness, the influence of facial movement and facial anatomy not usually separated in studies on facial emotion expression. In the right-handed population, the two sides of the face differ in area (compare width of left-most and right-most panel of Figure 1.5), potentially ‘diluting’ the expressiveness of the available emotion cues, although this effect is not assumed to explain the lateral expres-siveness differences (Jaeger, Borod, & Peselow, 1984; Nicholls et al., 2004; Sackeim & Gur, 1980). Perhaps more seriously, the left side of the face was perceived as more emotionally expressive even when neutral or resting in a number of studies (Borod, Kent, Koff, Martin, & Alpert, 1988; Campbell, 1978; Kowner, 1995; Mandal & Singh, 1990; Moreno, Borod, Welkowitz, & Alpert, 1990; Sackeim et al., 1978; Schwartz, Ahern, & Brown, 1979). Although no consistent correlations between morphological asymmetries in the resting face and facial asymmetry during emotional expression were found in early studies (Borod et al., 1988; Moreno et al., 1990), a more modern study applying image-based approaches to digitised sequences of posed facial expressions led the authors to conclude that structural asymmetry in the resting face accounted for 54 to 66 % of the variance in the asymmetry at the peak of joy, anger and disgust expressions (Schmidt, Liu, & Cohn, 2006).
Facial asymmetries during non-emotional unilateral movement provide another possible source of objection to inferences about hemispheric dominance for emotion expression. At least lower regions of the face appear to be more mobile on the left side than on the right in normal right-handed adults, e.g. for closing one eye or pulling the mouth out to the side (Borod & Koff, 1983; Campbell, 1982; Chaurasia & Goswami, 1975; Ekman, Hager, & Friesen, 1981b; Koff, Borod, & White, 1981; Moscovitch & Olds, 1982). In one study, however, hemifacial differences in non-emotional mobility were not significantly correlated with asymmetries in expression intensity during emo-tional facial expression (Borod & Koff, 1983).
1.3 Non-facial emotion expression Fitting both the complexity of emotions in general and the diversity of emotional effects on the body, the expression of emotion is not restricted to the face. Emotions are also prominently expressed in prosodic aspects of speech, in touch and in the movement and

27
posture of the body. While extremely interesting topics of investigation in themselves, and while required for a complete understanding of emotional expression and commu-nication, the expression of emotions by these channels also provides useful testing grounds for hypotheses derived from work on facial emotion expression. Thus, other modalities of emotional expression can serve as a control condition for whether previ-ous findings on emotional expression were peculiar to the face, or whether they apply to the expression of emotions generally, regardless of the effector.
1.3.1 Emotionally expressive speech During speech, the human voice can express the speaker’s emotional state through variation in stress, intonation, loudness, pitch, juncture, and rate of speech. Speaker arousal is very robustly expressed and perceived in prosody (Murray & Arnott, 1993; Scherer, 1979, 1986). A meta-review covering around 60 experimental studies has shown that listeners can judge the five states anger, fear, happiness, sadness and tender-ness with an accuracy of over 70 % (Juslin & Laukka, 2003), rates roughly comparable to the accuracy of the recognition of facial emotion expression. The study also showed that recognition was best if speaker and listener had a shared cultural background.
There are consistent relationships between physical changes and the perception of emotional expression, e.g. anger being associated with increases in tempo and loud-ness (Scherer, Johnstone, & Klasmeyer, 2003). Besides, for speech, the links between direct physiological changes and emotional expression are quite well understood. Thus, high sympathetic arousal (e.g. while angry) is associated with higher mean fundamental frequency (Fo), greater Fo variabiliy and a greater intensity and faster rate of speech (Frick, 1985; Murray & Arnott, 1993; Pittam & Scherer, 1993). Anxiety, on the other hand, causes the muscles around the lungs to contract, restricting the amount of air flow through the larynx, leading to more quiet utterances; tenser vocal chords might also lead to decreases in pitch variability (Scherer, 1986). Thus, there is a relatively good under-standing of the direct physiological changes leading to the prosodic effects, and the relevant changes include many of which are well understood in their connection with activation of the sympathetic or parasympathetic nervous system. In terms of pitch, Forange and a rising or falling Fo trend across the utterance have especially high discrimi-native power, but sociocultural and psychological factors such as the speaker’s and lis-tener’s context also influence the decoding of the prosodic signal. Even animals use vocal utterances that differ depending on context: vervet monkeys have been shown to utter different types of alarm calls depending on the type of the approaching predator, and different calls elicit the appropriate escape action (Cheney & Seyfarth, 1990).
As deaf individuals’ counterpart to vocal prosody, a form of visual affective prosody has been described in sign language. Emotion-specific sign modifications when producing sentences with different emotional meaning have been reported to show high across-signer consistency (Reilly, McIntire, & Seago, 1992). For sentences of neutral content, the authors reported that the most consistent differences occurred between sad-ness and anger expressions, both in the shape of the movement path and in sign dura-tion, sad utterances taking longer than neutral ones, while angry utterances were faster. Interestingly, in many ways, the modifications of visual affective prosody have direct parallels in vocal prosody, e.g. in the tempo with which utterances unfold. When con-sidering the perception of visual affective prosody, observers can reliably categorise the different affects, although confusions mainly occur between different emotions sharing a similar intensity or arousal, anger expressions being confused with happiness or sur-

28
prise expressions, but not with expressions of sadness (Hietanen, Leppanen, & Lehto-nen, 2004; Reilly et al., 1992). Affective prosody in sign languages is related to the findings on the expression of emotions in human body movement that I start discussing in Section 1.4.
1.3.2 Emotionally expressive touch Distinct emotional states can also be inferred from feeling a person’s touch (Hertenstein, Keltner, Apps, Bulleit, & Jaskolka, 2006), participants correctly identify-ing more than 50 % of instances of being touched for communicating fear and anger, when they had 13 response alternatives. Touching provides a very direct way of emo-tional interaction, which is especially important for adults interacting with infants (Gray, Watt, & Blass, 2000), or during flirting (Eibl-Eibesfeldt, 1989; Henley, 1973; Hertenstein et al., 2006). Touching is presumed to be an evolutionarily old means of establishing cooperative behaviours, particularly within populations of nonhuman pri-mates. Primates gather for grooming, a behaviour hypothesised to help maintain affec-tionate social relationships (de Waal, 1989; Dunbar, 1996), since it induces conspecifics to cooperate (de Waal, 1996; Willis & Hamm, 1980).
The expression of affects by sign language and by touch have in common the fact that they both use body parts as effectors. Emotional expression modulates move-ments in many different ways, especially in terms of their size and speed as well as of temporal frequency and of subtler differences in movement path, and these characteris-tics bear a consistent relationship with the attribution of emotions by human observers. Since such a wide range of body movements can be emotionally expressive, it is not surprising that the expression of emotions in a wider range of body movements has been receiving substantial research interest in the past few years. I cover some of the most important findings of this research in the following section.
1.4 Emotionally expressive body movement
1.4.1 Types of emotionally expressive body movements Research effort on the topic of emotional expression has mostly been focused on facial expression. Nevertheless, the fact that body movement is specifically and recognisably affected by emotion has been known for a long time. Over the past two decades, re-search on emotional body expressions has received continuously increasing attention. Some of the findings made in this context came up through their connection with the facial expression of emotions. Thus, head and eye movements can occur during facial emotion expressions, as part of a multi-component display and probably coordinated with facial movements (Ekman, 1979; Niemitz, Loi, & Landerer, 2000). Head position also significantly affects the perception of facial expression, head-position changes be-ing perceived as facial-expression changes, even in the absence of facial-muscle activity (Lyons et al., 2000). A multi-channel emotion display is also used in sign languages, meaning being conveyed in parallel by the hands, face, gaze and torso; it has been dem-onstrated that changes in body position can mark information about both discourse and syntax (Engberg-Pedersen, 1993; Loew, Kegl, & Poizner, 1997).Although they usually co-occur with facial expressions of emotion, body movements have been and should be considered as a separate expressive channel capable of signal-ling emotions. Interestingly, although bodily emotion expression is strongly represented in Darwin’s early account of emotional expression (Darwin, 1872), it has taken another

29
100 years for research on the topic really to gain momentum. In the past two decades, a sizeable number of studies have covered the association between body movements and the attribution of emotional states (Atkinson, Dittrich, Gemmell, & Young, 2004; At-kinson, Tunstall, & Dittrich, 2007; Boone & Cunningham, 1998; Clarke, Bradshaw, Field, Hampson, & Rose, 2005; de Gelder, 2006; de Gelder & Hadjikhani, 2006; de Meijer, 1989, 1991; Ekman, 1965; Ekman & Friesen, 1967; Grezes, Pichon, & de Gelder, 2007; Hietanen et al., 2004; Montepare, Goldstein, & Clausen, 1987; Monte-pare, Koff, Zaitchik, & Albert, 1999; Pollick, Lestou, Ryu, & Cho, 2002; Pollick, Pater-son, Bruderlin, & Sanford, 2001; Sogon & Masutani, 1989; Walk & Homan, 1984; Wallbott, 1998; Wallbott & Scherer, 1986). These studies are usually based on re-cordings of emotionally expressive body movements by video or motion capture, often evoked by actors imagining affect-inducing scenarios; the recorded movements can be highly expressive, as demonstrated by the finding that human observers can classify them with accuracies significantly above chance level. In the 1960s, pessimism about the specificity of bodily emotion expression still prevailed, authors suggesting that since confusions between the expressions of different affects are most frequent for emotions sharing a similar level of movement activation (Ekman, 1965), body movement was only sufficient for perceiving a person’s general level of agitation, the perception of valence at least requiring cues about head inclination (Ekman & Friesen, 1967). How-ever, the studies performed in the meantime demonstrate that human observers attribute emotions to bodily expressions much more consistently than would be expected if they only judged the amount of movement activity.
When studying the expression of emotions through body movements, it is essen-tial first to differentiate types of body movement that transport emotional messages (Ekman, 1969; Ekman & Friesen, 1972; Friesen, Ekman, & Wallbott, 1979). Here, I briefly review existing classifications before stating and explaining my choice of movement type for the work described in the following chapters. The most thoroughly described class of communicative body movements are (mostly manual) gestures. They usually accompany verbal communication, and the sender’s emotional state can be in-ferred from some of these gestures. One typology of expressive gestures (Ekman, 1969) lists at least four different important types besides actual affect displays. Illustratorsaccompany speech, mostly in terms of arm actions, but they can also be executed as torso movements, rigid head movements or facial actions. They are employed to illus-trate the verbal message, and they can be e.g. ideographs, pictographs or deictic move-ments. Regulators are different nonverbal behaviours used to coordinate the conversa-tional flow, i.e. the sequence of contributions by the different conversation partners. These include looking and pointing, or the orientation of the body towards or away from people as a signal to start or stop speaking. Self-adaptors are somewhat closer to emo-tion, since the term refers to nervous behaviours performed without obvious intention and usually involving self-touching. Scratching oneself (a manipulator) is an example of such a gesture. Emblems are gestures that directly translate into words, e.g. the thumbs-up sign or the eye wink. They are typically used to replace speech when e.g. noise is making verbal communication difficult, and they are often strongly culture-dependent.
Style variations of one and the same movement can be sufficient to support the percept of emotional states (Hietanen et al., 2004; Montepare et al., 1987; Pollick et al., 2001). This class of movements allows us to study the expression of different emotions in a single type of movement, effected by differences in the emotional style with which

30
a movement is executed. Studying the bodily expression of emotion thus differs in kind from studying facial emotion expressions, since facial expressions of different affects can involve quite different types of movement. So rather than consider, for instance, jumping up and down with delight versus angrily shaking one’s fist, which might be the proper equivalent of studying smiles versus frowns, we compare e.g. the gait of a person just after hearing that they scored highly on a test with their gait pattern just after hear-ing that they failed the test. Limiting expression to a given type of movement might limit the recorded movements’ expressiveness and our ability to generalise from our data. But this procedure also minimises variance and the risk of studying culturally shaped gestures, making the data well amenable to statistical analysis. Besides, by studying emotional style variations, we can try to find commonalities in emotion-related style changes across movements, thus enabling us to find basic movement properties that serve to express emotions.
1.4.2 Body-movement features for socially relevant information Most behavioural studies of bodily emotion expression have been aimed at studying the relationship between movement features and emotion attribution. While some have fo-cused on the actual movements and movement characteristics people adopt when ex-pressing different emotions (Wallbott, 1998), the majority of researchers have aimed to elucidate the recognisability of bodily expressions of emotion and the range of affects that can actually be expressed in body movement, as well as the relationship between movement and posture characteristics and emotion perception. Similar questions have also been addressed regarding other types of socially relevant information that observers can judge from body movement alone, such as a person’s age, gender or identity. Since the role of individual features for the perception of bodily emotion expression is one of the major questions I address, I review some of the research that investigates features supporting the perception of other types of socially relevant information in Sections 1.4.2.1 to 1.4.2.3. In Section 1.4.2.4 I then directly address emotionally expressive body-movement features.
1.4.2.1 Body-movement features revealing socially relevant informa-tionBody movements can reveal many types of socially relevant information besides affec-tive states, that is useful for human beings to perceive in the individuals surrounding them. Thus, even from point-light displays, in which the body is represented by dots that move as if placed on a person’s joints (Johansson, 1973), human observers can rec-ognise the moving person’s gender (Cutting & Kozlowski, 1977) or identity (Troje, Westhoff, & Lavrov, 2005). They can also distinguish between different types of loco-motion (Todd, 1983) or between different types of action such as hammering, bouncing or boxing (Dittrich, 1993), and their sensitivity to subtle differences in movement style is demonstrated by the ability to infer the weight of a box being lifted from movement kinematics (Bingham, 1987), or judge the elasticity of a surface from the movement of a person walking on it (Stoffregen & Flynn, 1994).
What characteristics, somewhat akin to universals in facial emotion expression, support the recognition of these movement aspects? Different types of experimental manipulation have been devised to address this question. One of the major findings of such studies has been that biological-motion perception is not dependent on the exact low-level motion properties present in the normal display. This inference is indicated by

31
finding perception to be vulnerable to stimulus inversion, similar to face perception (Bertenthal & Pinto, 1994; Pavlova & Sokolov, 2000; Shiffrar, Lichtey, & Heptulla Chatterjee, 1997). Besides, the perception of point-light body movements was not criti-cally disturbed by changes in e.g. dot contrast or spatial frequency (Ahlstrom et al. 1997) or in the temporal delay between the frames (Thornton, Pinto, & Shiffrar, 1998), by depth scrambling (I. Bülthoff, Bülthoff, & Sinha, 1998) or by off-joint dot positions (Dittrich, 1993). A point-light walker is also notoriously difficult to mask (Bertenthal & Pinto, 1994; Cutting, Moore, & Morrison, 1988; Pinto & Shiffrar, 1999; Thornton et al., 1998). Yet while it is obvious that motion cues are important for recognising human actions in point-light displays, and although the point-light display strongly limits the availability of form cues, an influence of stimulus form has also been demonstrated by employing a point-light walker whose dots jumped to different positions along the limbs throughout the movement. This manipulation arguably disrupts the tracking of coherent motion more strongly than the perception of body shape, yet the perception of walking direction from this stimulus was left reasonably intact (Beintema & Lappe, 2002). An interaction between form and motion cues for the perception of human movements is now widely accepted, and it has been formally described in a computational model (Giese & Poggio, 2003).
1.4.2.2 Estimating object mass from point-light displays of lifting mo-tionAs specific example of investigating the exact nature of cues supporting the perception of point-light body movements, I now consider movement characteristics observers use for judging the mass of a box from seeing a person lift it. It has been demonstrated that observers can quite reliably judge the mass of a box from a point-light display of a per-son lifting it (Runeson & Frykholm, 1981). The authors suggested that the potential cues used by observers include leaning to preserve balance, and differences in the shape of the object’s movement trajectory between boxes of different mass. They also found indications of a role for movement speed for mass judgements when asking actors to deceive the observers about the actual mass they were lifting. Although the observers noticed that the lifters were attempting to deceive them, there was nevertheless a corre-lation between the velocity of the lifting motion and judged object weight (Runeson & Frykholm, 1983).
In a more controlled study, Bingham studied the perception of lifted mass from observing one-arm curls (Bingham, 1987). The lifters leaned against a wall whilst lift-ing to exclude leaning cues, leaving the arm and object trajectory as available cues. With two lifters and five different masses, they recorded position data from which they computed movement velocity and acceleration. The most prominent movement change they observed was a drop in peak velocity for heavier weights during the stage where the forearm is approximately orthogonal to the upper arm. Both peak and average flex-ion velocity and the duration of the flexion movement were also affected by mass, while movement amplitude remained approximately constant. A strong positive correlation was observed between movement duration and perceivers’ judgements of the amount of effort expended by the lifters, and a strong negative correlation was obtained between judged effort and peak and average velocity. Bingham’s work entails that perceivers appeared to be using the strongest movement cues available to them, and that kinematic cues can provide information about human interaction with objects in the environment. Whether observers were judging the kinematic cues directly or whether they used them

32
as cues for inferring the underlying dynamics (Runeson & Frykholm, 1983) remains an open question. Interestingly, the findings showed that humans can judge mass reasona-bly accurately even from static pictures of lifting actions (Valenti & Costall, 1997), es-pecially during slow and controlled parts of the action, such as walking and placing the object on the table, but not during the lifting itself. This observation warrants the caveat that although movement differences may be correlated with perceptual results, static shape information also provided important cues for perceivers’ judgements.
1.4.2.3 Perception of walker gender Another series of studies investigating body-movement features influencing observers’ judgements was designed to assess the cues observers use to determine walker gender. Although some of these studies were performed years before the box-lifting work de-scribed above, the experimental manipulations involved in some of these studies were more sophisticated than merely correlating perception and measures of the movement features. Stimulus design employed in the studies went beyond the recording of specific types of movement, instead testing how directly manipulating the hypothesised stimulus characteristics influences perception. The relevance of movement cues for perceiving walker gender was demonstrated by finding that discrimination was above chance only for dynamic point-light walkers, not for static displays (Cutting & Kozlowski, 1977). To identify the relevant movement differences, the authors attempted to study the effect of arm swing and gait velocity, since the females in their sample exhibited higher values for these parameters. However, when the stimuli for this study were generated by re-cording actors actually asked to change these aspects in their gait gender judgements were not strongly correlated with either arm swing or gait velocity. Another stimulus manipulation employed in the study was to limit the display to subsets of the available dots, in an attempt to pinpoint those movement aspects most influential for gender judgements. It was found that upper-body displays were more identifiable than lower-body displays, arm swing was especially helpful, but including the legs also added to the information. Even ankle movement appeared to influence gender judgements, while hip movement played a more minor role than expected. Another study demonstrated a role of shape cues for gender discrimination: comparing gender-discrimination abilities between normal and upside-down displays, since the latter display type tended to be misclassified consistently (Barclay, Cutting, & Kozlowski, 1978). Although the male walkers in the study had wider shoulders than the females, while the females tended to have wider hips, these structural differences were not responsible for the experimental effect since they were not correlated with identifiability. Both structual and movement differences thus appear to influence the judgement of walker gender.
Two further studies addressed as specific candidate feature for the perception of walker gender the centre of moment between the hips, describing the relative movement between shoulders and hips, and related to relative torso torsion (Cutting, 1978; Cutting, Proffitt, & Kozlowski, 1978). The measure is defined as the ratio between shoulder movement and the sum of hip and shoulder movement (Figure 1.6), and it tends to be higher for males (average 0.53) than for females (average 0.49). It is positively corre-lated with the frequency of stimuli being judged as depicting a male walker. Further-more, when systematically manipulated in a synthetic walker, a strong positive linear relationship can be found between centre of moment and the proportion of ‘male’ judgements. Mather and Murdoch (Mather & Murdoch, 1994) conducted a study point-ing to the amount of lateral sway as a strong feature supporting gender judgements, and

33
as overriding the structural cue given by the relative width of hips and shoulders. Vary-ing both cues in a factorial design, they found that the movement cues strongly domi-nated gender judgements for stimuli in profile view. They additionally found that lateral body sway was higher for males than for females, while hip lateral sway was higher for females than for males. Their conclusion that movement cues dominate judgements of walker gender was further supported by the finding that those aspects of the gait cycle associated with the highest discrimination accuracy were those with the largest move-ments.
Figure 1.6. Centre of moment in males’ and females’ gait. The centre of moment be-tween the movement of hips (bottom pairs of dots) and shoulders (top pairs of dots) has been suggested as a biomechanical marker used by observers to distinguish be-tween male and female walkers. Figure adapted from Cutting & Kozlowski, 1978.
Is walker gender some kind of a basic property that we perceive in visual stim-uli, comparable e.g. to the direction of visual motion? If that were so, we might assume that human observers possess specialised feature detectors for this stimulus property, corresponding to the model view consistent with perceptual adaptation effects: presenta-tion of a stimulus at one end of a perceptual dimension leads to reduced sensitivity for stimulus properties occurring at this end, and thus to a shift in perceptual sensitivity towards the opposite end. Such adaptation effects have recently been described for gen-der as a high-level stimulus property, and in particular for the perception of walker gen-der (Jordan, Fallah, & Stoner, 2006; Troje, Sadr, Geyer, & Nakayama, 2006).
1.4.2.4 Features supporting the perception of bodily emotion expres-sionsEmotionally expressive body movement and body posture are readily recognised by human observers (Atkinson et al., 2004; Atkinson et al., 2007; de Gelder, 2006; Dittrich et al., 1996; Pollick et al., 2001; Wallbott, 1998; Wallbott & Scherer, 1986). One of the most obvious questions with regard to the perception of emotional body expressions concerns the relationship between characteristics of the movements and emotion judge-ments. In other words, which of the myriad emotion-related movement changes actually drive the perception of emotion? Studies investigating this relationship have been done involving subjects’ ratings of movement characteristics, finding e.g. that such holistic

34
aspects as the openness of body posture or the overall amount of movement activity are consistently related with judged warmth, or with the intensity of the anger expression, respectively (Wallbott, 1985). Others have attempted to investigate the influence of physical measures of movement characteristics, finding e.g. strong positive correlations between the judged intensity of anger expressions and movement velocity or accelera-tion (Pollick et al., 2001; Sawada, Suda, & Ishii, 2003), in fact consistent with the re-sults of subjective rating studies. In terms of body posture, systematic variation of joint angles has revealed e.g. correlations between the amount of head inclination or elbow flexion and perceived intensity of sadness or anger expression, respectively (Coulson, 2004). A more thorough account of previous findings on features driving the perception of emotional body expression is provided in Section 3.1.
One of the biggest difficulties for investigating how we perceive emotions ex-pressed in human body movements is similar to one known from the literature on facial emotion expression: emotional expressions involve large and complex dynamic visual stimuli. It is difficult to quantify the changes that movements undergo during emotional expression, especially in terms of movement kinematics – body posture is relatively accessible in terms of joint angles). While it is possible to consider basic parameters such as movement velocity and amplitude as potential cues to affect, and such studies have been done in the past, it seems altogether more convincing to apply unsupervised-learning methods such as ICA or PCA (Section 1.2.1) to the movement data, which pro-vide highly compact models of the variance in movement trajectories. While previous studies have investigated and identified certain emotion-specific movement and posture features and their relationship with the perception of emotional body expressions, they have usually only done so for a limited number of degrees of freedom, especially the arm joints (Pollick et al., 2001; Sawada, Suda, & Ishii, 2003). A more comprehensive study of these features would allow us to understand more of the many features that accompany the expression of emotions through body movement. Besides, objective measures of emotion-specific movement changes allow an assessment independent of attentional or other subjective influences on the discovered features. In terms of meth-ods for perceptual experiments, studies can be designed exploiting either the natural variation available in large samples, or by designing synthetic stimuli that vary along a chosen stimulus dimension. In this way, feature-perception relationships can be studied in much detail, including the question of how different features are integrated during the perception of emotional body expressions.
1.5 Aim of thesis and experimental questions The expression and perception of emotions by human beings represent important means of inter-individual communication, and understanding them tells us much about how human behaviour is coordinated. The majority of research on emotional expression has focused on facial expression. Extending research to the expression of emotions through body movement represents an important step towards obtaining a more complete picture of how emotions are communicated. As another emotionally expressive channel in the visual domain besides facial expression, it allows us to test whether hypotheses derived from research on facial expressions also apply to the expression through other effectors. In terms of the temporal unfolding of expressions, emotional body movements also re-semble emotional prosody, as reflected in the term ‘body language’. Emotional body expressions combine body actions and emotions, two topics highly relevant in the cur-rently fashionable interest in mirror neurones, the candidate neural substrate for the per-

35
ception of socially meaningful body actions (Iacoboni et al., 1999). Within the wider field of research on the perception of human body movements, emotional movement style provides an interesting testing ground because very subtle style differences carry important semantic information, allowing us to study the perception of subtle features of human movement. A better understanding of these style differences might also bear implications for movement representations ideally suited for the design of avatars used in man-machine interactions, or for the reliable detection of deviant behaviours.
I will now briefly describe the main questions addressed in the following chap-ters. Chapters 3 to 5 describe different experiments aimed at uncovering different as-pects of bodily emotion expression. The majority of experimental methods are covered in Chapter 2, while more specific methods will be covered in the chapter to which they are most relevant.
1.5.1 Features for the perception of emotion from gait (Chapter 3) The experiments described in Chapter 3 were aimed at identifying postural and kine-matic features important for the perception of emotion expressed in human gait. While a number of such features and their relationship have been described in the published lit-erature, these accounts are usually based on studying subjective ratings of movement features or a limited number of quantitatively described features, e.g. limiting the de-scription to the movement and acceleration of the arm only. We attempted to gain a thorough quantitative description of movement and posture features present during emotionally expressive gait. To this end, we applied a novel blind source separation algorithm (Omlor & Giese, 2007a, 2007b) to the trajectories of emotional gait to extract informative features from the movement data. Besides, the movement data of emotion-ally expressive gait were compared with those of neutral gait as baseline, both at cus-tomary walking speed and matched in speed to emotional gait. In this way we could test not only what sets apart emotionally expressive gait from neutral gait. Since emotional expression strongly influences the speed with which movements are executed, we also identified which of the features of emotional gait are truly emotion-specific, rather than appearing as by-products of the speed changes. As our second step we analysed the role of the emotion-related gait features for the perception of emotional expression. For this purpose, we conducted a perception experiment during which human observers had to classify and rate the emotional expressiveness of computer-generated characters ani-mated with the recorded trajectories of emotional gaits. The perceptual judgments were then subjected to sparse feature learning with the Lasso method (Fu, 1998; Tibshirani, 1996) in order to identify the most important posture and dynamic1 features that influ-enced the perceptual judgments. Since we found that individual emotionally expressive features can be extracted, and since there was a high degree of overlap between the in-formative features extracted from the motor behaviour and the features determining perceptual judgments, in a third experiment we exploited high-level aftereffects to test whether the extracted feature set is critical for the perception of the individual emotions. This experiment went beyond using the variance present in the dataset, actually testing whether adding individual posture and movement features to neutral gait was sufficient
1 The use of the term ‘dynamic’, when referring to movements of the human body, is used throughout this dissertation as synonymous with ‘moving’ or ‘movement-related’, unless specified otherwise. Although inaccurate in biomechanical terms, this use of the term is common in visual neuroscience, where any stimulus containing movement is often described as ‘dynamic’. The biomechanically correct term ‘kine-matic’ is used synonymously here.

36
for generating movements perceived as emotionally expressive. For face perception, adaptation with face stimuli with a particular identity can bias the perception of subse-quent faces in specific directions (Leopold, O'Toole, Vetter, & Blanz, 2001; Webster, Kaping, Mizokami, & Duhamel, 2004). These aftereffects for faces are not simply a consequence of previously known low-level adaptation processes, e.g. for orientation or local contrast (Xu, Dayan, Lipkin, & Qian, 2008). Instead, they appear to result, at least partially, from adaptive changes in higher-level face-selective representations. More recently, similar aftereffects have also been reported for the perception of biological motion (Jordan et al., 2006; Troje et al., 2006): adaptation with a male walker, for in-stance, biases the perception of a subsequent gender-neutral walker towards the opposite gender (female). We exploited such high-level aftereffects as a tool for testing whether the extracted emotion-specific features capture a significant amount of the perceptually relevant emotion-specific information. To this end, we used as adapting stimuli artificial emotional walkers containing only the postulated critical features as adaptors and com-pared the size of the resulting adaptation effects with the ones induced by natural emo-tional walking patterns. Comparable sizes of the induced aftereffects suggest that the extracted feature set comprises the major part of the perceptually relevant emotion-specific information. Besides, this experiment shows that the emotion-specific move-ment and posture features we extracted can be used in the sense of a generative gram-mar for emotionally expressive body movements, describing how a neutral movement needs to be changed in order to be made to appear emotionally expressive.
1.5.2 Feature integration in emotion perception (Chapter 4) Given the large number of different features involved in bodily emotion expression, it seems only natural to ask how observers integrate over the different emotion-related movement features available to them. We therefore treated the perception of emotion-ally expressive gait as a visual perceptual problem requiring the integration over multi-ple cues. Inspired by the idea that object recognition involves decomposition of visual stimuli into constituent parts (Biederman, 1987; Ullman, Vidal-Naquet, & Sali, 2002), we defined spatial components of the human figure as individual features for emotion perception. The integration of emotional information was then tested in a rating and detection experiment. To investigate whether observers integrated the information over components in a statistically optimal way, we applied Bayesian modelling to both the rating and detection data, an approach used for a good number of studies perceptual problems mainly over the last two decades. Within visual perception, studies have been aimed at modelling the integration of, for instance, different visual cues to depth (H. H. Bülthoff & Mallot, 1988; B. J. Rogers & Collett, 1989). However, statistically optimal integration has also been demonstrated across sensory modalities, e.g. for visual and haptic estimates of size (Ernst & Banks, 2002). Besides, principles of Bayesian reason-ing have also been applied to object and scene perception (Kersten, Mamassian, & Yuille, 2004; Kersten & Yuille, 2003). We specifically investigated the hypothesis that integration is closer to optimal if the components are defined such that they correspond to features naturally occurring during motor behaviour than if they violate such natu-rally occurring features. This reasoning matches the hypothesis that the perception of body movements utilises information about the normal control of body movements (Prinz, 1997; Schütz-Bosbach & Prinz, 2007; Viviani & Stucchi, 1992). The features for our experiments were defined according to the results presented in Chapter 3: since we had found highly similar changes on both sides of the body during emotionally expres-

37
sive gait, our congruent feature set included the pairs of limbs on either the upper or the lower half of the body. The incongruent feature set consisted of the combination of one arm and one leg on each body side. In order to test integration, we used motion morph-ing applied to the different components of the body individually, in order to generate stimuli along the continuum between neutral and emotional gait. Our study showed that integration of emotional information was indeed very close to being statistically opti-mal, but the degree of deviation for the model prediction was greater for the motor-incongruent feature set than for the motor-congruent feature set, possibly due to the dis-tribution of visual attention. However, our study also showed that observers integrate emotion-related information over the spatial extent of the stimulus; Bayesian modelling can thus very successfully be applied to the modelling of the perception of emotional body expressions.
1.5.3 Asymmetry of bodily emotion expression (Chapter 5) In Chapter 5 I investigate a left-right asymmetry of emotional body expression that was present in the analyses described in Chapter 3 and that resonates with a sizeable litera-ture on an asymmetry between the left and right side of the face for emotion expression. In those studies, an expressiveness advantage for the left hemiface is indicated by higher expressiveness ratings for left-left compared to right-right chimeras of facial expres-sions – stimuli in which one hemiface is replaced with the mirror image of the other (Sackeim et al., 1978). The finding that the left side of the face should be more emo-tionally expressive than the right has intrigued researchers for it can be taken to imply a right-hemisphere dominance in the control of emotional expression that resonates nicely with the right-hemisphere hypothesis of emotion (E. D. Ross, 1985; Silberman & Wein-gartner, 1986). However, important confounds have been put forward against this infer-ence. Thus, major parts of the face are actually bilaterally innervated (Rinn, 1984). The right hemisphere of the brain is thought to be dominant for the control of even non-emotional facial movements, and the left hemiface is more mobile for non-emotional facial movements also (Chaurasia & Goswami, 1975). Besides, anatomical differences have been described that might influence hemifacial expressiveness in ways unrelated to emotion (Schwartz, Ahern, & Brown, 1979).
Studying an asymmetry of emotional body expressions represents an ideal test-ing ground for investigating the role of the mentioned confounds for effecting a left-right expressiveness asymmetry. For instance, the crossing of efferences to distal body musculature is a well-accepted principle (Lawrence & Kuypers, 1968). We can compare the asymmetry of emotionally expressive gait with that of neutral gait in order to rule out non-emotional movement effects causing asymmetry. And since we use dynamic stimuli, where we can separate movement from anatomy, we can actually design a stimulus that is bilaterally symmetric to rule out any anatomical influences on asymme-try. To investigate the asymmetry of bodily emotion expression, we compared move-ment amplitude and energy on the two sides of the body. The expressiveness asymmetry between left- and right-sided body movement was studied with the aid of a novel stimu-lus type we developed: the emotional chimeric walker. This stimulus moves on both sides of the body as either the left or the right side normally does, effected by replacing the body-movement trajectories on one side with those of the other. We show that dur-ing emotional expression, the left side of the body moves with higher amplitude and energy than the right. The asymmetry is not reversed in direction for left-handed indi-viduals, and it is stronger than the asymmetry of neutral gait. Our findings also indicate

38
that the movements of the left side of the body are perceived as more emotionally ex-pressive than those of the right side. Altogether then, we show that lateral asymmetries in the intensity of emotional expression are a phenomenon that pertains to emotional expression in general, regardless of the actual bodily (or facial) effector. Only by inves-tigating the asymmetry of emotional expression for body movement as another effector can many of the confounds present in studies on the asymmetry of facial emotion ex-pression finally be ruled out.

39
Chapter 2 General Methods
“I inadvertently made a woman angry (…) by looking directly at her in a public situation, and (…) I also frightened some chil-dren.”
PAUL EKMAN (1934 - ) in Dalgleish and Power (1999), ch. 16, p. 307
This chapter covers methodological aspects applicable to the experimental work de-scribed in the following chapters. The description includes movement recording, stimu-lus design as well as design and setup of psychophysical experiments. Methods of nar-rower scope are covered in the methods sections of the relevant chapters.
2.1 Movement recording
2.1.1 Actors Altogether 25 individuals were recorded, thirteen of which were right-handed with be-tween six months’ and two years’ acting experience performing in lay theatre groups (four male, eight female, mean age 27 years 3 months), twelve were left-handers (six male, eight female, mean age 25 years 8 months). Criterion for inclusion in the handed-ness groups was a laterality quotient above 0.5 for right-handers and below -0.5 for left-handers on the Edinburgh Handedness Inventory (Oldfield, 1971). The foot used to kick a ball served as indicator of footedness. All right-handers were right-footed, whereas of the left-handed sample eight were left-footed, four were right-footed. All recorded indi-viduals were Caucasian and students at the University of Tübingen.
The individuals in the left-handed sample had no specific acting experience, while the right-handers all had experience performing in lay theatre groups; none had received any formal acting training. Although the group with lay-acting experience re-ported less inhibition during the recording of emotional movements than did the nov-ices, we combined their data for analysis since there were no statistically significant differences in recognisability between the movements executed by the two groups. Since we usually did not differentiate between the two groups, we refer to both as ‘ac-tors’ for the sake of brevity.
2.1.2 Ethics approval All recordings and psychophysical experiments were performed with informed consent of the participants. All experimental procedures had been approved by the responsible local ethics board of the University of Tübingen (Germany).

40
2.1.3 Mood induction
2.1.3.1 Effectiveness of different mood-induction procedures For anyone attempting to study the perception of emotional expression, the recording of valid and reliable expressions clearly represents one of the key experimental-design issues. This is important, for neuropsychological evidence supports a double dissocia-tion between the neural basis of spontaneously occurring and deliberate facial expres-sions of emotion (Rinn, 1984), as well as by the observation that the magnitude of the left-right asymmetry of facial emotion expression can be affected by whether one is considering spontaneous or deliberate expressions (Ekman, Hager, & Friesen, 1981). The most important techniques for mood induction include
- Imagination: Subjects are instructed to imagine situations from their own lives that had evoked the desired mood, to imagine the situation in a vivid manner and to try to re-experience the affective reactions (Brewer & Doughtie, 1980; Schwarz & Clore, 1983)
- Velten: Subjects are presented self-evaluation statements (e.g. ‘I’ve doubted that I’m a worthwhile person’) or statements about somatic states, and asked to try to feel the relevant mood (Velten, 1968)
- Facial expression: Subjects are asked to contract or relax specific facial muscles, resulting in their adopting an emotional facial expression, a procedure that can effect mood changes, in accordance with the facial-feedback hypothesis (Leventhal & Mace, 1970)
- Film/story/music: Subjects’ imagination is stimulated by presenting a narrative, in terms of a story or a film, and the subjects are often additionally asked to get involved in the suggested feelings (Gross & Levenson, 1995); as a variant of this procedure, music can be employed to effect mood changes (Sutherland, New-man, & Rachman, 1982)
- Combinations of the above methods.
The effectiveness of different commonly used mood-induction techniques at inducing positive and negative mood states has been compared in a meta-analysis considering 250 experimental effects taken from 111 studies (Westermann, Spies, Stahl, & Hesse, 1996). All the above methods yielded medium to large effect sizes on self-reported mood, especially when only considering whether positive or negative affect were relia-bly induced, rather than differentiating their effectiveness at inducing individual affects. The induction of negative moods is generally more effective than that of positive moods, and the most powerful induction technique is the film/story procedure, espe-cially if it includes instructing the subject that a change in affect state is attempted by the manipulation; the Velten technique, which is the most frequently employed tech-nique, is only slightly less effective. Of two techniques not requiring specialised equip-ment to administer, the imagination procedure is effective at producing both positive and negative moods, while the facial expression technique is less effective overall, but exceptional in inducing positive moods more reliably than negative ones. Combining several techniques can lead to very powerful induction results, especially for negative moods.
Instructing subjects that a mood change is attempted generally leads to more pronounced mood changes than when mood induction is performed without such an

41
explicit instruction. However, instructing subjects to change their mood maximises the possibility of subjects simply reporting the desired mood change in order to please the experimenter. Such demand effects seriously undermine the validity of mood-induction procedures, thus posing a serious threat to investigations of emotion expression. Al-though it would be possible to estimate the influence of demand effects by telling sub-jects that the mood-induction procedure will have the opposite of the expected effect (Polivy & Doyle, 1980), the meta-analysis mentioned above (Westermann et al., 1996) already includes some persuasive arguments against the self-reported mood changes being entirely brought about by demand effects: there is little evidence that subjects doin fact attempt to guess and confirm the experimenter’s hypothesis (Berkowitz & Troc-coli, 1986; Cook & Campbell, 1979). Besides, mood induction usually also elevates the reported intensity of affects additional to the target emotion (C. Atkinson & Polivy, 1976; Strickland, Hale, & Anderson, 1975), the negative emotions depression, anxiety and hostility being especially prone to covarying (Polivy, 1981). Finally, demand ef-fects appear to be most threatening when considering rating scales as indicators of sub-jects’ affect state (Clark 1983). Yet even behavioural effects of mood induction have been reported, Velten-method-induced affect states impacting psychomotor speed (Larsen & Sinnett, 1991).
2.1.3.2 Method employed in our experiments To conclude from the preceding section, the imagination technique represents a quick and simple method for mood induction that can be performed without any special equipment. It enables us to induce reliable mood changes, especially if subjects are in-structed that the experimenter is aiming at an affective change in the subject, and if combined with e.g. facial expressions of emotion. Therefore, we instructed our actors to recall a past situation associated with the relevant affect; in addition, we asked the ac-tors to express the relevant emotion by gestures, vocalisation and facial expression throughout the induction phase. The actors were to perform this induction procedure until they started to experience the relevant mood state, which they indicated by walking to a particular point in the recording area. Then the recording for the affect was started without further intervention by the experimenter, the actor executing specific types of actions (usually walking). For fear, we only considered expressions associated with movements slower than normal gait in our analysis; if an actor first spontaneously chose fast movements, we further instructed him or her to induce a fearful mood associated with slow movements, which were then recorded.
2.1.4 Recording procedure The recording area was approximately five metres in length, allowing the recording of around six complete step cycles. Walking in a straight line was recorded, each condition repeated three times. The actors were instructed to avoid the use of gestures that would interrupt their rhythmic walking pattern. First, emotionally neutral gaits were recorded to serve as baseline, the actors walking at their customary walking speed. Then four emotionally expressive gaits were recorded. Emotionally expressive gait (anger, fear, happiness and sadness, in an order counterbalanced across actors) was recorded after-wards, following the mood-induction procedure described in Section 2.1.3.2. For a sub-set of actors, the recordings of emotionally expressive gait were preceded by recordings of neutral gait at four different velocities: two higher speeds and two lower speeds than their usual walking speed. Actors were instructed to walk slightly faster/slower than

42
normal, or very fast/slow. Eleven actors participated in these recordings, all of them left-handed. Each emotionally expressive trial was matched on a trial-by-trial basis to that emotionally neutral trial with the most similar velocity. Such a match was possible for a good number of trials (anger: 24; fear: 18, happiness: 30, sadness: 20, all used in Chapter 3), resulting in an overall velocity difference below 15 %.
2.1.5 Motion capture and data pre-processing Motion capture was performed using an eight-camera Vicon 612 system (Vicon, Ox-ford, UK). The system had a sampling frequency of 120 Hz and could determine the three-dimensional positions of reflective markers (2.5 cm diameter) with a spatial error below 1.5 mm. The markers were attached to skin or tight clothing with double-sided adhesive tape, according to the 41 positions of Vicon’s PlugInGait marker set, as shown in Figure 2.1. The four head markers were attached to a sweatband which was worn around the head. The two markers for each wrist which were kept at a distance of 12 cm by being attached to each end of a solid bar fastened to a sweatband that was worn in a position such that the bar lay above the wrist centre.
Figure 2.1 PlugInGait marker set. Grey spheres indicate location of motion-capture markers relative to the skeleton, figure shown both facing to (figure on the left) and away from (figure on the right) the reader. Illustration: Vicon manual.
Commercial Vicon software was used to reconstruct and label the markers and to inter-polate short missing parts in the trajectories. It was also used to derive estimates for the positions of the hip, knee and ankle joint centres, using the anatomical measures of the actors shown as blue spheres in Figure 2.2. The movement trajectories were further

43
processed using MATLAB 7.0 (The MathWorks, Natick, USA): we first estimated the positions of the shoulder, elbow and wrist centres, again represented by blue spheres in Figure 2.2. They were estimated as displacements from the actual marker position, from measures of the width of the joints, taken for each participant. We estimated the posi-tion of the wrist joint centre by computing a vector orthogonal to the forearm and wrist markers, and going along this vector at the centre between both wrist markers by half the height of the actor’s wrist. Elbow joint centre was in the same direction, by half the maximum elbow width. The position of the shoulder centre was estimated by a vector that pointed along an axis parallel to the thorax, as defined by the mean position of the four midline thorax markers.
Differences between start and end points of the trajectories were corrected by spline interpolation between the five first and last frames of each trajectory, and trajec-tories were additionally smoothed by fitting with a third-order Fourier series.
Figure 2.2. Position of motion-capture markers and of joint centres. Captured figure is shown facing approximately 15 degrees away from the observer, to the left. Grey cir-cles show positions of motion-capture markers, connecting lines added for easier inter-pretation. Left-hand figure: markers for the motion-capture markers, position on body as shown in Figure 2.1. Markers that appear on both sides of the body only labelled on one side (e.g. only marker for left forehead labelled (LFHD); RFHD marker is the corre-sponding front-head marker on the right, not labelled). Right-hand figure: blue circles represent estimated positions of joint centres, blue lines added for easier interpretation. Labels for base of neck (nb) and base of thorax (tb), and for the left-sided joint centres of the shoulder (lsc), elbow (lec), wrist (lwc), hip (lhc), knee (lkc) and ankle (lac).
2.2 Computation of joint angles We computed joint angles from the position data for two main reasons: the joint-angle trajectories were used for quantitative movement analysis, for the unsupervised learning used in Chapter 3 and for quantifying asymmetries between the left and right side of the

44
body (Section 5.2). We also used joint-angle trajectories to animate the avatar model for different psychophysical experiments. Thus, avatars were generated from joint-angle trajectories to produce the artificial emotional gaits used to assess the effect of average posture and movement changes on emotion perception (Section 3.4). They were also used to generate emotional chimeric walkers, designed to investigate a left-right expres-siveness asymmetry (Section 5.3).
2.2.1 Construction of coordinate systems For the computation of joint angles, we first approximated the marker positions with a hierarchical kinematic body model (skeleton) with 17 joints (head, neck, spine, and right and left clavicle, shoulder, elbow, wrist, hip, knee and ankle). A three-dimensional coordinate system was then attached to each rigid segment of the body. For each of these systems, two vectors were first determined based on actual or computed motion-capture markers, such that they were approximately orthogonal to one another. Figure 2.3 shows examples for the knee and ankle joints. For the knee joint, axis a2 was given by the vector from knee centre to knee marker, while a3 was given by the vector from knee centre to hip centre. The orientation of the third axis (a1) was computed such that it was orthogonal to both of the first two axes. All coordinate systems were oriented such that one axis was approximately parallel to the direction of walking, one parallel to the interauricular axis, and one to the longitudinal body axis (in the norm pose; axis orienta-tion can change during locomotion).
B
Aa1
a3
a2
b1
b3
b2
Rotation matrix R
B
Aa1
a3
a2
Aa1
a3
a2
b1
b3
b2
Rotation matrix R
Figure 2.3. Example coordinate systems attached to joint centres in lower body. Grey circles represent motion-capture markers, red circles estimated joint-centre positions. Black and red connecting lines drawn for easier interpretation. Coordinate systems Aand B are attached to the left knee centre and to the left ankle centre, respectively. First, two axes of each coordinate system defined by marker positions, third (i.e., a1and b1) computed as orthogonal to the remaining two axes in the system (i.e. a1 or-thogonal to both a2 and a3; b1 orthogonal to both b2 and b3). Joint angles determined by the rotation matrix R, which rotates A into B. Angles ψ, ϑ and ϕ (not marked) represent rotations around the a3, a2 and a1 axis, respectively.

45
2.2.2 Computation of rotation matrices The joint angles were then determined by the rotation between two neighbouring coor-dinate systems along the kinematic chain, e.g. from hip to knee and from shoulder to elbow, etc., the pelvis serving as the first link in the chain. The relevant rotation matrix, e.g. for the rotation of A into B, would be given by 1−⋅= ABR if both coordinate sys-tems were perfectly orthogonal, as shown in Figure 2.3. Since the coordinate systems were based on the positions of markers placed on anatomical landmarks, the coordinate systems were not exactly orthogonal. Therefore, we applied singular-value decomposi-tion (SVD) in order to find the optimal rotation matrix in the least-square sense to re-place R (Schönemann, 1966). The general problem of finding a rotation matrix R such that BAR =⋅ for two arbitrary matrices A and B can be formulated as a minimisation problem (where the subscript F denotes the Frobenius norm):
,min)3(,
FORR
ARB ⋅−∈
The problem can be solved by SVD, amounting to a Procrustes fit for the rotation (Schönemann, 1966).
2.2.3 Joint-angle extraction The Euler angles describing the configurations of the joints can then be extracted by equating R with the matrix given by the Euler-angle parameterisation:
.coscoscossinsinsincossinsincossincossincoscoscossinsinsinsincoscossinsin
sinsincoscoscos
−++−
−=
ψϑϕψϕϑψϕψϕϑψψϑϕψϕϑψϕψϕϑψ
ϑϕϑϕϑR (2.1)
The angles , and , specifying rotations around axis a3, a2 and a1, respectively, can then be extracted e.g. according to the following relationships:
( ) .arctan,arcsin,arctan11
1213
33
23 =−==RRR
RR ϕϑψ
Due to the ambiguities inherent in the periodicity of the trigonometric functions used to extract the angles from the rotation matrices, the extracted angle trajectories can jump by multiples of 2π. All angle trajectories were inspected for such jumps, and any occur-rences were removed by unwrapping, i.e. by adding multiples of 2π such that the trajec-tories were continuous. Additionally, the so-called gimbal lock problem can occur with Euler angles: if the axes of the first and third rotation align, the rotation angles about these axes cannot be uniquely determined (Watt & Watt, 1992). This problem can be overcome by parameterising rotations in quaternion notation. However, we did not en-counter any instances of gimbal lock in our data.
With the joint-angle representation, the configuration of each joint at any point in time is represented in terms of a set of three Euler angles. These angles describe the amount of rotation about the three main axes we fitted to each joint; for locomotion these axes are approximately parallel to a Cartesian coordinate system aligned with the direction of walking and with the vertical. As indicated in Figure 2.5A, the abduction angle corresponded roughly to a rotation about the axis parallel to the direction of walk-ing, the rotation angle to a rotation about axes parallel to the longitudinal body axis, and

46
the flexion angle described a rotation around a horizontal axis parallel to the line con-necting two corresponding pelvis or shoulder markers on the left and right side of the body.
2.3 Animation We produced two main types of animation to serve as stimuli for our perceptual ex-periments: point-light walkers, where dots represented the movement of the joints (Fig-ure 2.4), and 3-D avatars representing a full human figure (Figure 2.5A). The point-light walker animation is described in Section 2.3.1 and was used – combined with motion morphing – for the experiments described in Chapter 4. In Chapters 3 and 5 we em-ployed an avatar, generated by plotting three-dimensional shapes into the positions of the motion-capture markers or of virtual markers derived from them by applying a skeleton model. These animations could either be based directly on the motion-capture data we recorded; in most of the experiments described in Chapter 3 we used this tech-nique to study the role of posture and movement features for emotion perception; the relevant animation methods are described in Section 2.3.2. However, one of the major advantages of creating avatar stimuli from motion-capture data lies in the possibility of manipulating the movements in specific ways in order to investigate the effects of indi-vidual manipulations on affect perception. Although it is possible to directly interfere with position data, as we did when motion morphing between neutral and emotional movements in Chapter 4, the more drastic movement manipulations we performed for the animations we used in the experiments of Chapters 3 and 5 required movement data to be represented in terms of joint angles. Since position data can be reconstructed from joint-angle data in the way I describe in Section 2.3.3, the reconstructed movements look highly natural even after the joint angles have been interfered with. Thus, in Chap-ter 5, we describe a chimeric emotional walker as a completely novel type of stimulus, where the limb movements between the left and right side of the body are exchanged. It would be difficult to conceive of a way of generating such chimeric walkers from video or position data. In Chapter 3 we designed another novel type of animation exhibiting artificial emotional gait. It was generated by superimposing the two largest posture and movement features for happy or sad gait to neutral gait. We used this stimulus in an adaptation experiment testing whether our movement analysis had extracted features critical for perceiving emotions expressed in gait. The generation of this stimulus type is described in Chapter 3.
For all purposes we generated animations of one typical step cycle, presented in a loop until the subject responded. In cases where repeated presentation resulted in pe-culiar-looking movements e.g. of the head or of the vertical body axis, we replaced the trajectories by those of another step cycle from the same recording trial.
2.3.1 Point-light walker The point-light walker animations were used in the experiments on feature integration, described in Chapter 4. The walker consisted of 13 dots, corresponding roughly to the head, the shoulder, elbow, wrist, hip, knee and ankle joint centres on both sides of the body. The position of these dots was determined by averaging between the positions of different motion-capture markers, as listed in Table 2.1 and as depicted in Figure 2.4. Translation was removed from the trajectories by subtracting the centre of gravity of all points for each frame, resulting in a natural-looking movement as if the walker were placed on a treadmill. To obtain a 2-D representation, we treated the horizontal axis

47
perpendicular to the direction of walking as the normal vector and then projected all positions onto the corresponding orthogonal plane.
Figure 2.4. Position of dots for point-light walker. Grey spheres indicate positions of motion-capture markers, black lines connecting markers drawn in for easier interpreta-tion. Black circles represent approximate location of dots for the point-light walker. Dots were placed either directly in the positions of motion-capture markers (shoulders, knees), or in positions determined by averaging over several markers, as described in Table 2.1.
For use as stimuli in our perceptual experiments (Chapter 4), the point-light walkers were animated on-line by drawing black dots in the positions determined as just de-scribed (Figure 2.4).
Body position Marker(s) Body position Marker(s)
Head LFHD, RFHD, LBHD, RBHD Left hip LASI, LPSI
Left shoulder LSHO Right hip RASI, RPSI Right shoulder RSHO Left knee LKNE Left elbow LELB Right knee RKNE Right elbow RELB Left foot LANK, LHEE, LTOE Left hand LWRA, LWRB, LFIN Right foot RANK, RHEE, RTOE Right hand RWRA, RWRB, RFIN
Table 2.1. Relationship between motion-capture markers and dots for point-light walker. The PLW consisted of 13 dots with body positions roughly corresponding to the anatomical sites listed in the central column. Their positions were derived by averaging between the positions of those motion-capture markers listed in the rightmost column.

48
2.3.2 Avatar model For the experiments described in Chapters 3 and 5, the stimuli were presented using a custom-built volumetric puppet model (Figure 2.5A) that was rendered in MATLAB.
Figure 2.5. Avatar model: coordinate systems and skeleton model. (A) In the experi-ments described in Chapters 3 and 5, volumetric puppet models like the one shown were used as stimuli. They were generated by plotting 3-D shapes into the positions of motion-capture markers. Further details in text. The joint angles describe rotation around the three axes defining the flexion angle (red, marked flex), abduction (blue, marked abd) and the rotation angle (green, marked rot). (B) Avatar model in standard posture used for computing anatomy. All joints at zero rotation (i.e., ψ, , = 0). Fur-ther details in text.
2.3.2.1 Construction from geometric shapes The avatar was generated by plotting geometric shapes into the marker positions re-corded by motion capture. The diameter of these shapes was fixed for one actor of me-dium height, and scaled by body height for the other actors. As shown in Figure 2.5A, most limbs were represented by ellipsoids spanning the distance between the joint cen-tres at each end (upper and lower arm, thigh, shank); the head also consisted of an ellip-soid, positioned relative to the head markers. Spheres were added at the shoulder, el-bow, wrist, hip, knee and ankle joints. Cylinders represented the neck and waist. Several body parts were constructed by a combination of shapes that were then covered by a convex hull: the shoulder region was modelled by an ellipsoid parallel to the clavicles and two ellipsoids each orthogonal to the first, positioned at their proximal ends; for the hip, a central sphere was combined with two lateral ellipsoids that each pointed slightly outward to the hip joint centre on their side of the body. Hands and feet were modelled by an ellipsoid pointing in the direction of the finger marker or of the toes, respectively.

49
2.3.2.2 Whole-body translation and vertical hip movement In order for the character to appear as though walking on the same spot (as if on a treadmill), we removed translation by subtracting the average of the four hip markers (LASI, RASI, LPSI, RPSI; Figure 2.1). This step was not necessary for the animations generated from position data reconstructed from the joint-angle trajectories (Chapter 5) since when reconstructing 3-D positions from joint angles the hip centre was already at the zero position.
When animating these two types of data with removed whole-body translation, the resulting animation would show no vertical translation of the hip, yielding unnatu-ral-looking movements with the hip fixated in space and the feet losing ground contact. Therefore, we added a synthetic vertical hip translation, generated by determining the distance between the pelvis centre and the lowest marker point, corresponding to the figure’s foot touching the ground. The vertical component of this difference trajectory was fitted with a third-order Fourier series and added to the position of the pelvis centre, resulting in a natural-looking movement.
2.3.3 Reconstruction of position data For the perception experiments described in Chapter 5 and the adaptation experiment described in Section 3.4 we used avatars animated with movements that we had ma-nipulated in order to test the perceptual effects of movement characteristics. In Chapter 5, we thus generated left-left or right-right chimeric walkers by exchanging the limb movements on one side of the body with those of the other side of the body; in Chapter 3 we designed adapting stimuli by superimposing the largest posture and movement changes for happy or sad gait to neutral gait. In these cases it was necessary to animate the puppet model by reconstructing the actual 3-D positions of the puppet’s polygons from the relevant manipulated Euler-angle trajectories. Since the reconstructed data corresponded very closely to those originally recorded, they could be used to animate the avatar in exactly the same way as described in Section 2.3.2. Roughly, the positions were reconstructed by assuming a base (lying in the pelvis centre), and then progressing along the kinematic chain according to the distances between markers and with the an-gles specified by the Euler-angle trajectories. In the following, I first describe the nature of the skeleton model and the kinematic chain we used, followed by the operations in-volved in reconstructing the actual marker positions.
2.3.3.1 Skeleton model The starting point for reconstructing position data from joint-angle trajectories was a skeleton model for each actor, assuming the rigid segments shown in Figure 2.7 (black labels). This skeleton was described in terms of the positions of all markers in a stan-dard posture, where all joints had zero rotation (i.e., ψ, , = 0). This position was de-rived by rotating each joint into a position such that its rotation with respect to the joint immediately preceding it in the kinematic chain was described by the identity matrix (Figure 2.5B). In order to estimate this standard posture as stably as possible, we com-puted the required marker positions for each frame and averaged the results over the entire gait cycle. All marker positions were then expressed relative to the centre of rota-tion (red spheres in Figure 2.7) of the segment they belonged to. For modelling the en-tire spine including the head, we assumed two joints: one at the base of the thorax (tb in Figure 2.7), around which the thorax up to the shoulder joints could rotate freely, and one for the head and neck, situated at the base of the neck (nb in Figure 2.7), about

50
which the head and neck could rotate. The extremities were modelled by assuming three rigid segments per arm and leg, i.e., upper arm (LUA/RUA), lower arm (LLA/RLA) and hand (LHa/RHa), or thigh (LTi/RTi), shank (LSh/RSh) and foot (LFo/RFo), respec-tively, for both sides of the body. The segments are represented in Figure 2.7, with the marker positions (grey circles) and estimated joint-centre positions (blue circles) as above. The red circle in each segment indicates the positions of the centre of rotation for this segment.
Figure 2.7. Hierarchy for reconstructing position data from joint-angle representation. Grey and blue spheres as before, figure cut into the segments we assumed for the skeleton; red spheres serve as centres of rotation, and red arrows indicate progression of kinematic chain. Markers of each segment reconstructed dependent on the centre of rotation in their segment. For the head and all limb segments, to ease interpretation of the segments, their markers are drawn twice. The positions of these markers were re-constructed once only (the second time they are drawn in less saturated colour). Simi-larly, for the positions of the joint centres, the blue markers were reconstructed and drawn in red to indicate that these are corresponding markers. Further details in text. Labels for segments: head (He), thorax (To), left upper arm (LUA), left lower arm (LLA), left hand (LHa), pelvis (Pe), left thigh (LTi), left shank (LSh), left foot (LFo). Labels for centres of rotation: base of neck (nb), base of thorax (tb), and for the joint centres of the right shoulder (rsc), right elbow (rec), right wrist (rwc), pelvis (pc), right hip (rhc), right knee (rkc) and right ankle (rac). All segments and marker positions for paired body parts were assumed and drawn for both body sides; right-sided body segments (right upper arm, right lower arm, right hand, right thigh, right shank, right foot) and left-sided joint-centre positions (left shoulder, left elbow, left wrist, left hip, left knee and left ankle) were not labelled here in order to avoid crowding.

51
2.3.3.2 Reconstruction of position data Generally speaking, the 3-D positions of the markers were determined from the joint-angle trajectories by multiplying the relative position vector between two markers with the appropriate rotation matrix, determined from Equation 2.1, and adding the already reconstructed position of this segment’s centre of rotation.
The pelvis centre was treated as the origin of the figure. From this point we re-constructed the positions of the four pelvis markers (LASI, RASI, LPSI, RPSI), of the thorax base (tb) and of both hip-joint centres (lhc and rhc), by multiplying their relative position vectors with the rotation matrix for the pelvis. The positions of the markers in each segment were then reconstructed relative to that segment’s centre of rotation. The principle of reconstruction can be illustrated e.g. for the position of the right knee centre (rkc). To reconstruct this marker’s position, we first multiplied its relative position vec-tor (rkcrhc, i.e., relative to rhc) with two rotation matrices: first, with Rrkc_rhc, describing the rotation of rkc relative to rhc and afterwards with Rrhc_pc, describing the rotation of rhc relative to pc. Finally, the position of this marker was shifted to the correct absolute position in space by adding the absolute position vector for rhc (the position of rhc was already expressed in absolute coordinates), i.e. the position of the centre of rotation of the right thigh segment. The entire operation can be formally described as:
.__ rhcrkcRRrkc rhcrhcrkcpcrhc +⋅⋅= (2.2)
The procedure described by Equation 2.2 was also applied for reconstructing the posi-tions of markers belonging to segments removed from the centre of the kinematic chain (i.e., pc) if the first rotation matrix in the equation already incorporates all preceding rotations. Formally, thus, to reconstruct e.g. the position of the right ankle centre, rac,the formula would be
,__ rkcRRrac rkcracrhcrkc +⋅= where .___ rhcrkcpcrhcrhcrkc RRR ⋅= (2.3)
2.4 Perception experiments The animations generated as described in Section 2.3 were used as stimuli in psycho-physical experiments aimed at investigating the perception of bodily emotion expres-sion. Depending on the experimental question being asked, different psychophysical methods will be applicable. We used three main types of techniques, in different chap-ters: a classification and discrimination task was used in Chapter 3, and in Chapter 4 we employed a yes-no (detection) task; ratings of the intensity of emotional expression were used in all three chapters describing experiments (3, 4 and 5).
2.4.1 Intensity rating One of the simplest questions any psychophysicist could ask concerns the relationship between actual physical stimulus magnitude and perceived magnitude. For example, we might be interested in the relationship between physical light intensity and the bright-ness percept of human observers, or in the sensation of warmth brought about by differ-ent temperatures. Establishing this relationship is the purpose of conducting magnitude-estimation experiments (Haber & Hershenson, 1980). Indirect scaling, based only on subjects’ comparison between pairs of stimuli, is often used in such experiments, and it has led to the development of Stevens’ power law (Stevens, 1957), stating that per-

52
ceived magnitude P is related to stimulus intensity S, raised to the power n, scaled by a constant K, i.e. .nKSP =
Direct scaling involves subjects assigning numerical values to stimuli of varying intensity. In one variant of this technique, magnitude estimation (Stevens, 1961, 1962), subjects are first presented a standard stimulus and a numerical value corresponding to its magnitude. They then estimate the values associated with subsequent stimuli. A similar technique involves subjects being asked to judge the magnitude of their sensa-tion on a numerical scale (e.g. from 1 to 10), with verbal anchors describing the mean-ing of the different values (Allard, 2001). Such techniques have been shown to provide reliable estimates of perceived stimulus magnitude: for instance, the reported length of a line is proportional to its actual length (Allard, 2001). We performed direct-scaling tasks in which we asked subjects to rate their perception of the intensity of emotional expression. In Chapters 3 and 4, we used this type of task to investigate whether body movement and posture of emotionally expressive gait are related to perceived intensity of emotional expression in a graded manner, either exploiting inter-subject movement variability (Chapter 3) or synthetically generating continua of style variation by motion morphing (Chapter 4; morphing algorithm described in Section 4.2.1). In Chapter 5, we again asked subjects to scale their perceived intensity of emotional expression to test whether the movement of one side of the body is more emotionally expressive than that of the other side of the body.
2.4.2 Classification: forced-choice In classification tasks, subjects assign verbal labels to stimuli, usually chosen from a list of labels provided by the experimenter. The task is in some ways similar to scaling, the difference being that rather than attribute a certain perceived magnitude to a stimulus, they now attribute a verbal label. Forced-choice classification is frequently used in re-search on emotional expression, to test in how far subjects consistently label a given stimulus as expressing a particular affect. The most pressing problem with applying forced-choice classification tasks in emotion-perception research lies in the dissociation between reliability and validity. Even if we find that subjects classify a certain stimulus with high consistency, we cannot necessarily conclude that this stimulus represents a valid emotional expression. In fact, human observers have even been shown to attribute reliable emotion labels to basic 2-D geometric shapes such as triangles (Pavlova, Soko-lov, & Sokolov, 2005)! Besides, the labels that the experimenter provides might influ-ence subjects’ categorisation ability, consistency obviously being the higher, the fewer categories available. The potential pitfalls inherent in forced-choice classification have been discussed at length in the context of research on the facial expression of emotion, and most experimental findings of studies using these tasks have actually been shown to be robust to changes in experimental design (see Section 1.1.2.2). Still, it is not strictly warranted to describe the recorded movements I use for stimuli as emotional body ex-pressions. Instead, where I use this expression it should be considered a short, elegant way of saying something like ‘body movements differing in ways such that observers reliably attribute a given affect label to them’. This is the case even though we took the utmost care during our recordings to encourage the actors to enter the relevant mood state and to be as uninhibited as possible in their spontaneous expression of emotion. The issue will remain unresolved until closer links between bodily movements and in-ternal affective states have been demonstrated, as has been done for facial expressions of emotion. For instance, the intensity of the disgust or joy experience during the view-

53
ing of evocative films, has been shown to be correlated with the intensity of facial ex-pressions of disgust and smiles, respectively (Ekman et al., 1980).
The results of classification tasks are usually represented in terms of a confusion matrix. Such a matrix can already provide some insight into what might be relevant stimulus qualities for emotion classification, based on which emotions tend to be con-fused with one another. Therefore, we used this method in Chapter 3 to assess the fea-tures relevant to subjects’ attribution of emotion to body movements. We also looked at the confusion matrix for an adaptation experiment, designed to compare the effective-ness of our largest emotion-related posture and movement changes and of the original emotional stimuli on influencing the discrimination between happy and sad expressions.
2.4.3 Detection / yes-no Psychophysics can also be used to determine the intensity of the stimulus required to be detected, i.e., to determine a detection threshold for the stimulus. The classical form of detection or yes-no task used requires subjects to detect brief flashes of light in a dark room, and to answer ‘yes’ or ‘no’ depending on whether they detected the stimulus. The external stimulus is thought to be represented in the human information-processing sys-tem by a signal with a given strength, and both external noise (e.g. fluctuations in the visual stimulus) and internal noise (e.g. in the nervous system) influence the exact level of this internal representation. The internal representation is usually expressed in terms of a probability density function (PDF), showing the likelihood with which a stimulus of given strength is represented by a certain level of internal representation. An internal representation is also formed on signal-absent trials, which can also be represented by a PDF. The PDF usually assumed for both types of trial follows a Gaussian distribution, as shown in Figure 2.8. The subject’s strategy is formulated as choosing a criterion level. The stimulus is detected if the level is above this criterion; it is not detected if the level is below criterion. Obviously, increasing the intensity of the stimulus causes the PDF representing signal-present trials to be shifted further to the right on the x axis, making it easier to detect the signal because there is less overlap between the PDF’s representing signal-present and signal-absent trials.
Figure 2.8. Probability density function resulting from a detection task. Probability of detection dependent on stimulus intensity, which increases along the abscissa.

54
We applied a yes-no task to the case of detecting emotional expression in gait, treating baseline neutral gait as signal-absent trials and emotional gait as signal-present trials. When a subject recognises the emotional expression, they answer e.g. ‘angry’, corresponding to the ‘yes’ response in the classical yes-no situation, and when they do not detect it, they respond ‘neutral’, corresponding to ‘no’ in classical yes-no. We could apply this sort of task because we created a continuum of stimulus intensities by motion morphing (see Section 4.2.2) between neutral and emotional gait.
2.4.4 General setup and procedure Testing took place in a small, dimly-lit room. Stimuli were displayed and participants’ responses were recorded using the Psychophysics Toolbox (Brainard, 1997) on a PowerBook G4 (60 Hz frame rate; 1280 × 854 pixel resolution), viewed from a distance of 50 cm. The stimuli subtended approximately 4 × 8.6 degrees of visual angle, and they were presented on a uniform grey background. The participants of the perception ex-periments were students at the University of Tübingen. They all had normal or cor-rected-to-normal vision. Participants were tested individually and were paid for their participation.
For emotion-classification tasks, there were four response keys, one for each emotion. For a given experiment, the full set of response keys was kept constant throughout the experiment, but the assignment of responses to keys was counterbal-anced across participants. For the rating tasks, participants were instructed to rate the intensity of emotional expression of each stimulus on a seven-point scale (ranging from ‘not expressing the emotion’ to ‘expressing the emotion very strongly’), responding by pressing number keys 1 to 5 or 1 to 7.

55
Chapter 3 Features for the perception of emotion from gait
The love of the body of man or woman balks account, the body itself balks account, That of the male is perfect, and that of the female is perfect.
The expression of the face balks account, But the expression of a well-made man appears not only in his face, It is in his limbs and joints also, it is curiously in the joints of his hips and wrists,It is in his walk, the carriage of his neck, the flex of his waist and knees, dress does not hide him, The strong sweet quality he has strikes through the cotton and broadcloth,To see him pass conveys as much as the best poem, perhaps more, You linger to see his back, and the back of his neck and shoulder-side.
WALT WHITMAN (1819-1892), I Sing the Body Electric
3.1 Introduction Emotional expression plays a central role in the regulation of human social interactions. Reliable judgements about other people’s feelings therefore represent a highly important skill in our everday lives. It has been shown, for example, that smiles guide us in whom we choose to cooperate with (Schmidt & Cohn, 2001), and emotion-recognition aptitude predicts success in negotiation situations (Elfenbein et al., 2007). One of the most im-portant emotional signalling channels is facial expression: humans are able to recognise at least six different emotional states (anger, happiness, sadness, fear, surprise and dis-gust) from facial expression, and with remarkable cross-cultural stability (Ekman & Friesen, 1971; Ekman et al., 1969; Izard, 1977).
3.1.1 Features involved in facial emotion expression But which are the relevant visual features supporting the recognition of the different emotions? By restricting the stimulus images to parts of the face it has been shown that the emotions differ in which face regions are most important for recognition (Bassili, 1979a), the eye region being very important for perceiving anger and fear, whereas the mouth is very informative for the expression of happiness (Gosselin & Schyns, 2001; Schyns, Petro, & Smith, 2007). Studies show that raising or lowering of the eyebrows or of the corners of the mouth represent examples of important features of facial emotion expression (Ekman & Friesen, 1978; Ellison & Massaro, 1997). The components of the different emotional expressions were formulated most prominently in the facial action coding system that describes the production of distinct emotional expressions based on

56
local components originally derived from patterns of muscle contraction (Ekman & Friesen, 1978). More recently, unsupervised-learning techniques, such as principal component analysis (PCA) or independent component analysis (ICA), have been ap-plied to determine components of facial expressions for dimension reduction and in or-der to identify features that are critical for the recognition of faces (Bartlett, Movellan, & Sejnowski, 2002; Hancock, Burton, & Bruce, 1996; Turk & Pentland, 1991; Valen-tin, Abdi, Edelman, & O'Toole, 1997) and of facial emotion expression (Calder et al., 2001). Last, not least, it has also been shown that dynamic cues contribute to the recog-nition of facial expressions (Bassili, 1978; O'Toole, Roark, & Abdi, 2002). For exam-ple, recognition performance is influenced by the speed at which an expression unfolds (Kamachi et al., 2001).
3.1.2 Features supporting the perception of bodily emotion expres-sionsWhile most research on the expression of emotions has focused on the human face as signalling channel, recently there has been rising interest in studying emotionally ex-pressive body movement and body posture. Human observers readily recognise emo-tions expressed in body movement (A. P. Atkinson, Dittrich, Gemmell, & Young, 2004; A. P. Atkinson, Tunstall, & Dittrich, 2007; de Gelder, 2006; Dittrich, Troscianko, Lea, & Morgan, 1996; Pollick, Paterson, Bruderlin, & Sanford, 2001; Wallbott, 1998; Wall-bott & Scherer, 1986). To identify relevant physical stimulus attributes that support these perceptual capabilities, researchers have attempted to correlate observers’ classifi-cation performance or expressiveness ratings of videotaped expressive movements that excluded culture-dependent emblems (Ekman, 1969) with emotion-specific movement characteristics, extracted either from movement trajectories or from observers’ ratings of predefined kinematic features. These previous studies provide some insight into the influence of different physical characteristics of body movements on the perception of emotions. First, studies employing static pictures show emotion recognition to be influ-enced by body posture. A systematic analysis of this effect was performed in experi-ments requiring observers to classify emotions from static images of puppets whose joint angles covered a range of possible values (Coulson, 2004). Examples of important posture features include head inclination, which is typical for sadness, or elbow flexion, which observers associate with the expression of anger. Second, the perception of emo-tions from body expressions is influenced by movement kinematics. Typically, velocity, acceleration and jerk have been considered as interesting parameters, and all three have been shown to affect emotional classifications of expressive movements, as well as ac-counting for a substantial part of the variance in the classification of expressive arm movements (Pollick et al., 2001; Sawada, Suda, & Ishii, 2003). However, since the speed with which a movement is executed has such a profound effect on the perception of emotional style and since the posture and kinematics of movements are affected by velocity (Donker, Beek, Wagenaar, & Mulder, 2001; Kirtley, 2006), it seems crucial to evaluate emotional body expressions against a baseline of neutral body movements with speeds that are comparable to those of emotionally expressive movements.
An important difficulty for uncovering relationships between physical aspects of body movement and emotional style is the fact that the moving human body represents a complex, high-dimensional dynamic visual stimulus. While some studies have inves-tigated heuristically chosen pre-selected potentially interesting features, others have tried to make this high dimensionality more tractable by application of data-reduction

57
methods. As for images of faces, PCA has been applied to learn lower-dimensional rep-resentations of human movements (Santello, Flanders, & Soechting, 2002; Troje, 2002; Yacoob & Black, 1999). Other studies have exploited motion morphing in order to de-fine low-dimensional parameterisations of motion styles (Giese & Lappe, 2002; Van-geneugden, Pollick, & Vogels, 2009). Studies in motor control have applied ICA, factor analysis, and Non-negative Matrix Factorization (NMF) for the analysis of body move-ments (Ivanenko, Cappellini, Dominici, Poppele, & Lacquaniti, 2005; Ivanenko, Pop-pele, & Lacquaniti, 2004; Santello & Soechting, 1997; Tresch, Cheung, & d'Avella, 2006). Our own group has developed a novel blind source separation algorithm that approximates trajectories by linear mixtures of source signals with variable delays, also known as ‘anechoic mixture’ in acoustics (Bofill, 2003; Torkkola, 1996). The advantage of this model is that it typically results in more compact representations of movement trajectories, requiring fewer source terms or ‘parameters’ than PCA and ICA for a given level of accuracy (Omlor & Giese, 2007a, 2007b). It seems plausible that such highly compact models, by minimising redundancies in the parameterisation of body move-ments, are particularly suited for the identification of movement features carrying in-formation about emotional style.
An interesting question in this context is whether it is possible to identify spa-tially localised features that carry information about emotion. The extraction of informa-tive spatially localised features has been successfully demonstrated for static pictures of faces (Gosselin & Schyns, 2001). Besides, it has been shown that applying PCA sepa-rately to different local face regions (e.g. centered on the eye and the mouth) improves classification performance, presumably because the individual extracted features are more informative (Padgett & Cottrell, 1995). Previous studies suggest an influence of heuristically chosen local features, such as head inclination or arm swing, on the percep-tion of emotion from gait (Montepare, Goldstein, & Clausen, 1987). The problem with such approaches is that, in principle, a very large number of such local features can be defined, raising the question whether it is possible to extract limited sets of highly in-formative features in a more systematic way.
The existence of such informative, spatially local features is consistent with the hypothesis that the processing of biological motion, and potentially also of body shape, is based on ‘holistic’ templates (Bertenthal & Pinto, 1994; Dittrich, 1993). ‘Holistic processing’ refers to the observation that the perception of biological-motion stimuli is strongly degraded if only parts of the stimulus are presented (Mather, Radford, & West, 1992; Pinto & Shiffrar, 1999). Similar findings are also well-established for face stimuli (Carey & Diamond, 1994; Tanaka & Farah, 1993). While the spatial integration of fea-tures might well be based on holistic mechanisms, the integrated local information could still be defined in terms of a limited number of highly informative local features.
3.1.3 The current study The goal of the current study was to identify postural and kinematic features that are important for the perception of emotion expressed in human gait. To accomplish this goal, we conducted three experiments:
Experiment 1: Applying machine learning methods, we extracted informative features from the joint-angle trajectories of emotional gaits that were recorded by mo-tion capture from participants that expressed different emotions during walking.
Experiment 2: In a second step, we analysed how the features we had extracted from the motor behaviour are related to features that determine the perception of emo-

58
tional gaits. For this purpose, we conducted a perception experiment during which hu-man observers classified and rated the emotional expressiveness of computer-generated characters animated with the recorded trajectories of emotional gaits. The perceptual judgments were then subjected to statistical analysis in order to identify the most impor-tant posture and dynamic features that influenced the perceptual judgments.
Experiment 3: Since we found a high degree of overlap between the informative features extracted from the motor behaviour and the features determining perceptual judgments, in a third experiment we exploited high-level aftereffects to test whether the extracted feature set corresponded to critical features driving the perception of the indi-vidual emotions.
High-level aftereffects were first described in the context of face perception. Adaptation with face stimuli with a particular identity can bias the perception of subse-quent faces towards identities that correspond to points on the opposite side of the aver-age face in face space (Leopold et al., 2001; Webster et al., 2004) and control experi-ments show that these aftereffects for faces are not simply a consequence of previously known low-level adaptation processes, e.g. for orientation or local contrast (Xu et al., 2008). Instead, at least partially, these aftereffects seem to result from adaptive changes in higher-level face-selective representations. More recently, similar aftereffects have also been reported for the perception of biological motion (Jordan et al., 2006; Troje et al., 2006): adaptation with a male walker, for instance, biases the perception of a subse-quent gender-neutral walker towards the opposite gender (female). In the third part of our study, we exploited such high-level aftereffects as a tool for testing whether the ex-tracted emotion-specific features capture a significant amount of the perceptually rele-vant emotion-specific information. To this end, we used as adapting stimuli artificial emotional walkers containing only the postulated critical features as adaptors and com-pared the size of the resulting adaptation effects with the ones induced by natural emo-tional walking patterns. Comparable sizes of the induced aftereffects suggest that the extracted feature set comprises the major part of the perceptually relevant emotion-specific information.
3.2 Experiment 1: Movement analysis
3.2.1 Methods Details of the methods employed in the current chapter are described in Chapter 2. The statistical analysis of movement trajectories and the perceptual experiments described in Chapter 3 is based on the neutral and emotionally expressive gaits of the 25 individuals motion-captured as described in Section 2.1, the neutral gaits of a subset of actors both at customary walking speeds as well as at two higher and lower speeds. The work de-scribed here is based on individual step cycles cut from the movement trajectories, ex-pressed either in terms of 3-D position data or in terms of joint angles computed from the position data.
3.2.1.1 Computation of simple body-posture and kinematic parametersSince it has been shown that emotionally expressive gaits vary in postural and kinematic characteristics (A. P. Atkinson et al., 2007; Wallbott, 1998) as well as in gait velocity (Montepare et al., 1987), for the purpose of the statistical analysis of physical move-ment parameters we computed simple postural and kinematic parameters characterising the movements. To determine which features are most important for expressing the dif-

59
ferent affects, we extracted the following physical movement features. Gait velocity was computed as the ratio of travelled distance and duration. As measure of body posture extracted from the joint-angle trajectories, we considered mean flexion, averaged over the entire step cycle. As shown in Figure 2.5A, the flexion angles corresponded to rota-tions about the main joint axes. For straight walking the resulting rotation axes were approximately orthogonal to the walking direction. We considered the angles of eleven major joints (head, spine, pelvis and left and right shoulder, elbow, hip and knee joints).
Further informative parameters were uncovered by blind source separation, as described in the following section. This was applied to the flexion-angle trajectories independent of differences in posture and velocity. For this purpose, the mean flexion angles were subtracted.
3.2.1.2 Blind source separation The joint-angle trajectories of emotionally expressive gait define complex spatio-temporal patterns, and myriad possible features could be analysed in order to investigate how these trajectories change with emotion. A more systematic approach of dealing with this high dimensionality is to apply unsupervised learning in order to obtain a pa-rameterised generative model for the measured joint angle trajectories. The variations in the model parameters can then be analysed in order to characterise the emotion-specific spatio-temporal changes. A description in terms of maximally informative features is obtained if the generative model is highly compact and contains only a minimum set of estimated parameters. In the following we present a blind source-separation method that results in such compact generative models.
One of the central concepts in motor-control research are ‘synergies’, referring to the idea that the control of complex movement behaviour is accomplished by the co-ordinated control of a number of degrees of freedom (Bernstein, 1967). Given the large number of degrees of freedom the body possesses, basing the control of movements on simpler movement primitives considerably reduces the complexity of the control prob-lem. Different concepts have been suggested to describe these building blocks from which movements are constructed, including movement primitives usually extracted from movement trajectories by unsupervised learning (Arbib, 1981; Flash & Hochner, 2005) or basis vector fields (d'Avella & Bizzi, 2005; Poggio & Bizzi, 2004).
Within this context, dimension-reduction techniques have been applied to movement data in order to extract basic components from motor behaviour by unsuper-vised learning. For modelling gait, PCA has been applied (Ivanenko et al., 2004; Santello & Soechting, 1997; Troje, 2002), and so have been factor analysis (Davis & Vaughan, 1993; Merkle, Layne, Bloomberg, & Zhang, 1998; Olree & Vaughan, 1995), Fourier analysis (Unuma, Anjyo, & Takeuchi, 1995), or standard ICA (Ivanenko et al., 2005; Tresch et al., 2006). Both ICA and PCA accomplish dimension reduction by ap-proximating the data with superpositions of a small number of basis components or source functions. Often a limited number of components is sufficient to explain a large fraction of the variance in the data. In other studies, such techniques were applied to electromyographic (EMG) data recorded from moving organisms (d'Avella & Bizzi, 2005), in order to extract movement components from patterns of muscle activation. However, the application of dimension reduction has not been limited to the problem of trying to understand how movements are controlled, but they have also been applied in the context of computer graphics and computer vision, e.g. for the purpose of efficient synthesis and tracking of full-body components from motion-capture data (Safonova,

60
Hodgins, & Pollard, 2004; Yacoob & Black, 1999). In such approaches, sufficient ap-proximation accuracy for the treatment of complex body movements can be achieved when a relatively high number of basis components is included in the models (e.g. > 8 principal components). However, when using dimension-reduction techniques for studying movement, the distribution of the variance over a large number of parameters complicates the interpretation of the individual parameters.
Similar to the aforementioned studies, we modelled the joint-angle trajectories of emotional gaits by applying a blind source separation algorithm that learns independent components linearly combined with joint-specific time delays (Omlor & Giese, 2007b). The algorithm we used in our study is based on ICA, which approximates sets of time signals by the weighted linear superposition of source signals that are (approximately) statistically independent. This linear superposition is usually computed separately for each point in time t, resulting in an instantaneous mixture model of the form
),()(1
tstxn
jjiji
=
= α (3.1)
where the joint-angle trajectories xi(t) are approximated by linear superpositions of the source signals or basis components sj, weighted by the mixing weights ij. The same mixing model also underlies PCA, with the difference that the source signals are or-thogonal rather than statistically independent (Cichocki & Amari, 2002; Jolliffe, 2002).
It turned out that the complexity of the model could be considerably reduced by taking into account phase relationships between individual body segments. Highly regu-lar phase relationships characterise many stable motor coordination patterns between different limbs; in gait, for example, there is an anti-phase relationship between ho-mologous joints on opposite sides, e.g. right and left leg (Golubitsky, Stewart, Buono, & Collins, 1999).
Figure 3.1. Similarity of components extracted for two joints. The first three source functions extracted from the shoulder (left panel) and elbow (centre panel) trajectories in arm movements by applying the novel algorithm for blind source separation; right panel demonstrates similarity in the shape of the components for different joints after appropriate phase shifting.
It has been shown that exploiting these relationships can lead to highly compact move-ment representations for gait data expressed in terms of joint angles (Omlor & Giese, 2007a, 2007b): if the analysis is applied to the angle trajectories of individual joints, then a very small number of source terms (independent components) is sufficient to accomplish very accurate approximations (e.g. explaining > 96 % of the variance with only three components). Besides, the source components that are extracted for different joints tend to be extremely similar in shape and mainly differ in terms of phase shifts.

61
This is shown in Figure 3.1 for the first three ICA components extracted from the shoulder and elbow trajectories of a set of arm movements, consisting of right-handed throwing, golf swing and tennis swing, indicating that the model’s applicability is not limited to gait data.
After appropriate phase shifting, the components extracted from the elbow and shoulder joint are almost identical, as reflected in high maximum cross-correlations be-tween the source components for different types of movements when cross-correlations are computed for all possible phase shifts (Table 3.1).
Walking Arm movements JointShoulder Elbow Wrist Shoulder Elbow Wrist
Shoulder 1.00 0.83 0.88 1.00 0.93 0.85 Elbow 0.83 1.00 0.80 0.93 1.00 0.83 Wrist 0.88 0.80 1.00 0.85 0.83 1.00
Table 3.1. Correlation of components across joints, for gait (left) and different arm movements (throwing, golf swing, tennis swing).
We therefore concluded that the instantaneous mixture model (Equation 3.1) may not be the optimal model to use for gait data since it fails to model phase differences between different limbs in an explicit manner. Instead, an anechoic mixing model can exploit regularities in the data better by explicitly modelling these phase delays. Classically, this type of statistical model has been employed in acoustics (Bofill, 2003; Torkkola, 1996). By introducing delays in the mixing model, anechoic mixing can model the vary-ing travelling times between sound sources and microphones at different positions in space. Mathematically, an anechoic mixing model is characterised by the equation
( ) ( ),1=
−=n
jijjiji tstx τα (3.2)
where the constants ij describe joint-specific time delays between source signals and joint angles.
The introduction of such time delays has previously been shown to be beneficial for the modelling of electromyographically recorded patterns of muscle activation dur-ing coordinated leg movements (d'Avella & Bizzi, 2005). Previous work from our group shows that for different types of body movements the model described by Equation 3.2 results in more compact representations of sets of trajectories than the model defined by Equation 3.1. This result implies that models of this form provide significantly more accurate approximations of the trajectory data, for a given number of estimated parame-ters. For gait data, at the same level of approximation accuracy PCA requires more than twice the number of source terms than the proposed novel model (Omlor & Giese, 2007b). The novel algorithm thus provides a compact representation of body move-ments that reduces redundancies in their parameterisation. Due to their ability to ac-count for variability in data with a small number of model parameters, it seems a plau-sible hypothesis that such compact models are advantageous for the analysis of informa-tive features. In contrast, redundant models with large numbers of parameters typically result in ambiguities where multiple parameter combinations result in equally good ap-

62
proximations of the data. Such ambiguities both complicate the interpretation of the parameters and result in higher variance of the estimated parameters, both factors ob-scuring the identification of important features. We later show (Figure 3.4 and Section 3.6.3) that this hypothesis was confirmed in the analysis of our gait data, the anechoic mixture model indeed resulting in more interpretable parameter estimates than other, related methods.
The original version of the blind source separation algorithm described above (Omlor & Giese, 2007a, 2007b) estimates one mixing weight ij and one time delay ijper joint and source. This approach already resulted in the extraction of well-interpretable emotion-specific features from the movement trajectories. However, com-paring across emotions, we noticed that the time delays estimated for a given joint were often largely independent of the emotion. This made it possible to further reduce the number of parameters in the model by constraining the delays for each individual joint to be equal for all different emotions (i.e., ij = kj if i, k specify the same joint, but dif-ferent emotions). Mathematically, this constraint can be easily embedded in the original blind source separation algorithm (see Section 3.6.1 for details). The constraint im-proved the robustness of the results and the interpretability of the parameters. With the additional constraint the explained variance for a model with three sources was 92 % (opposed to 99 % without this additional constraint). The final model applied to each trial contained three source functions, 51 time delays ij that were equal for all emotions, and 51 mixing weights (one per joint and source, estimated separately for the different emotions).
3.2.1.3 Sparse regression Facial and body expressions can be characterised by a large number of potentially rele-vant features. Even the application of unsupervised learning techniques, such as the one discussed in the last section, results in models with relatively many parameters. To ob-tain clearer insights into which features are critical for the expression of emotion in gait, we need to identify the most informative features, i.e. those that capture the most impor-tant emotion-specific variations in the data. The automatic extraction of such features is possible e.g. by applying sparse regression. We used it for two purposes: to extract emo-tion-specific postural and dynamic features from gait trajectories and to identify features that are critical for the perception of emotions from gait, as discussed in Experiment 2.
To introduce sparse regression, I first consider linear regression. Linear regres-sion normally models a dependent variable Y (e.g. a rating of emotional expressiveness) as a linear function of the predictors X (representing, for instance, different relevant postural or kinematic features), where the elements of the vector β are the estimated regression coefficients and is a noise vector:
.εβ += XY (3.3)
The regression coefficients can be estimated, for instance, by minimising the least-squares error:
,minargˆ 2
2ββ
βXY −= (3.4)
where the l2-norm of a vector u is defined as

63
.1
22
=
=n
kkuu (3.5)
Yet for problems with many predictor variables typically a large number of these contribute to the solution, resulting in many small non-zero coefficients k and unstable estimates of the individual parameters’ values. Such regression models are usually diffi-cult to interpret. Ideally, one would try to explain the data variance with a minimum number of free model parameters, corresponding to a solution where many of the re-gression parameters k are zero. Such a sparse solution, which automatically selects the most important features, can be computed by forcing small terms to adopt the value zero, leaving only those predictors in the model that carry the highest proportion of the variance. It is well-known that regression models can be sparsified by including an ad-ditional regularising term such as an l1-norm regulariser into the cost function (Equation 3.4). The corresponding error function is given by
,minargˆ1
2
2βλββ
β+−= XY (3.6)
where the parameter λ 0 controls the degree of sparseness. In statistics, this method is known as the ‘Lasso Method’ (Meinshausen, Rocha, & Yu, 2007; Tibshirani, 1996), where the l1-norm is defined as
.1
1=
=n
kkuu (3.7)
The corresponding (convex) minimisation problem has only a single solution, which can be determined by quadratic programming (Nocedal & Wright, 2006). The parameter specifies the degree to which small weights are penalised, determining the sparseness
of the solution. For = 0, the algorithm coincides with normal least-squares regression. With increasing values of , less important contributions to the solution are progres-sively forced to zero, resulting in models with fewer and fewer active variables (Tibshirani, 1996).
The mode of operation of sparse regression can be demonstrated with a toy ex-ample where e.g. body-posture angles serve as predictors in a linear regression model of observers’ ratings of emotional expressiveness (the dependent variables). Assume that these parameters are given as a matrix X (e.g. representing shoulder, elbow, hip and knee angle), each row corresponding to a different joint angle, while the mean ratings of emotional expressiveness are considered as dependent variable and given by the vector Y (Equation 3.8). Changes in the predictor variables influence the dependent variable Yin a characteristic manner: for example, anger trials might be rated as more expressive the higher an actor’s elbow flexion, or sad walks might be rated as more expressive the higher an actor’s head inclination. Standard linear regression models assume linear rela-tionships between predictors and dependent variable, the relationship specified by the regression parameters i estimated for each predictor i (a vector whose length corre-sponds to the number of predictors). While the data specify the vector Y and the matrix X, the values of the regression parameters need to be estimated as described above.

64
.
47.062.025.019.0
,
11.073.004.029.014.019.019.113.018.217.019.167.159.033.015.143.0
4
3
2
1
=
−−−
−−−−
==
Y
xxxx
X
(3.8)
The solutions of the optimisation problem (Equation 3.6) for three different sparseness levels (i.e., three different levels of the sparseness parameter ) are shown in Figure 3.2A. The case = 0 corresponds to the standard least-squares solution, and in this case all posture angles contribute substantially to the model (all i highly different from zero). For medium levels of sparseness ( = 0.31) only two angles (2 and 3) have non-zero contributions. This finding implies that the two other angles are less essential for explaining the variance in the data. For even higher sparseness ( = 0.43) only a sin-gle posture angle (angle 2) remains active in the reduced model, so this angle is most essential for explaining the relationship between posture and perceived expressiveness of anger.
Another way of illustrating these results is shown in Figure 3.2C. In this plot, colour indicates the values of the estimated regression weights k for a continuum of values of the parameter and the different posture angles (1 to 4). The lengths of the coloured bars in this plot can be interpreted as a measure of the ‘importance’ of the in-dividual joints (features), the longest bar corresponding to joint 2, whose regression coefficient is non-zero even for very high values of the sparseness parameter. We used this form of data representation in Figures 3.6 and 3.7, depicting the relationship be-tween postural or kinematic parameters and the ratings of emotional expressiveness.
By adjusting sparseness we can influence the number of active parameters in the regression solution. But which is the optimal level of sparseness for a given regression problem? In some sense this value would depend on a tradeoff between the number of active features and prediction error. The number of active features decreases with in-creasing sparseness, and we intend to keep this number small, while prediction error increases with increasing sparseness (see Figure 3.2B), and we intend to keep the error small also. Of the different statistical techniques available for computing this tradeoff, in our analysis we applied generalized cross-validation (GCV) (Fu, 1998; Tibshirani, 1996), which minimises a combined error measure that depends on the approximation error and on an estimate of the effective number of model parameters. Details of this technique are provided in Section 3.6.2. In the following, the parameter opt signifies the optimal value of the sparseness parameter, determined by minimum GCV (its value represented by black horizontal lines in Figures 3.6 and 3.7).
We also applied sparse regression for automatically selecting the most informa-tive trajectory features for emotional walking compared with neutral walking. For this purpose, essentially we computed sparse regression between the measured posture or movement data and the mean vector of posture or movement data, individually for the different joints and for the four tested emotions. This technique identifies the most con-sistent changes present in the movements of actors expressing a given affect.

65
Figure 3.2. Illustration of sparse regression. (A) Solutions for a toy example for different values of the sparseness parameter . At = 0, as shown in the leftmost graph, the regression solution equals that of the standard least-squares solution; in this case, all features contribute to the model, as indicated by nonzero coefficients i. At increasingly higher sparseness (higher values of ) more and more regression coefficients i be-come zero, leading to models with fewer predictors. (B) Prediction error of the regres-sion model increases with increasing sparseness. The discontinuities in the curve cor-respond to the values of the sparseness parameter for which an additional predictor first becomes active. (C) Solutions of the same regression problem for a continuum of values of the sparseness parameter . Colours correspond to the values of the regres-sion coefficients i (red indicating positive and blue negative values) for the different predictors (posture angles 1 to 4). The height of the four bars is a measure for the im-portance of the predictors. The example solutions in Figure 3.2A correspond to hori-zontal cross-sections of this figure for the indicated values of .
To perform this analysis, we defined vectors aj and a0 as specifying the movement and posture features for emotion j and for neutral gait, respectively; the emotion-specific feature changes were thus given by Yj = aj – a0. In this model, j signified the vector of the corresponding regression coefficients (Equation 3.4), characterising the importance of the individual features for the changes of emotion j compared to neutral walking.

66
Thus, we can define the trivial regression problem Yj = Xj j + j, where the non-square matrix Xj contains only ‘one’ entries, so the estimated βj without regularisation terms correspond to the joint-specific means across trials of the Yj term’s individual entries. Concatenating the βj, εj, Xj, and Yj in matrices, i.e., B = [β1, …, β4]T, X = [X1, …, X4]T,Y = [Y1, …, Y4]T, and E = [ε1, …, ε4]T, one can approximate the emotion-specific changes of all features across emotions by the regression problem Y = XB + E. For this matrix regression problem we can define an error function equivalent to the one in Equation 3.6 simply by replacing the vector norms by matrix norms. In this case the norm ||U||2 indicates the (matrix) Frobenius norm, and ||U||1 refers to the sum of the ab-solute values of all matrix elements. Non-zero sparsified regression coefficients in the matrix B specify those features that are important for approximating the emotion-specific changes compared to neutral walking, for a given joint and emotion. Again the optimal sparsification parameter λopt can be determined by GCV. The results of this analysis for posture (Figure 3.3A) and movement features (Figure 3.4A) were effective at identifying the most consistent affect-related gait characteristics.
3.2.2 Results In the following, I present the results of the statistical analysis of movement trajectories, aimed at extracting critical posture and movement features characterising emotionally expressive gaits. In addition, by comparing the emotional gaits with neutral gaits matched to them in walking speed, I describe postural and kinematic changes in emo-tional gaits not explained by changes in gait velocity. There were characteristic differ-ences in body movement and body posture between the gaits expressing different emo-tions. Movies of example gaits (Roether, Omlor, Christensen, & Giese, 2009) are pro-vided on the enclosed CD (Movie 3.1: left – fear; right – sad; Movie 3.2: left – angry, right – neutral speed match; Movie 3.3: left – happy, right – neutral speed match).
3.2.2.1 Posture features The postural effects of emotional expression were analysed by comparing the respective average posture angles for the emotional and the neutral gaits on an actor-by-actor basis. The results of this analysis are shown in Figure 3.3. Figure 3.3A shows the weights jfrom the sparse regression analysis as colour-coded plot. Since the weights for the right and left body side were usually very similar we collapsed the results over both sides of the body for each individual joint. Since sparse regression was applied here for the fea-tures of emotional gait relative to the features of neutral gait, the weight changes can be interpreted as directly corresponding to sparsified changes in mean joint flexion. There was a clear pattern of emotion-specific posture changes (defined by the average joint angles) relative to neutral walking, the most prominent findings being the strongly re-duced head angle (corresponding to increased head inclination) for sad walking, and increases in elbow flexion for fearful and angry walking.
To further validate the obtained results and for easier comparison with findings reported in the literature on emotional body expressions, Figure 3.3A also contains a summary of the results from related previous studies (Coulson, 2004; de Meijer, 1989, 1991; Montepare, Koff, Zaitchik, & Albert, 1999; Schouwstra & Hoogstraten, 1995; Sogon & Masutani, 1989; Wallbott, 1998). The results are summarised by signs, ‘+’ signs indicating cases in which increased emotional expressiveness was associated with increased flexion or greater perceived movement in the corresponding joints, while ‘–’ signs indicate reductions in the perceived joint flexion associated with increased expres-

67
siveness. We found good correspondence between the features automatically extracted by our algorithm and those derived from published psychophysical experiments, espe-cially for our most prominent features. However, some features with small regression weights were not consistent with published findings: for example, in previous studies changes of spine and shoulder angles were not detected as significant features for hap-piness and fear expressions, and neither was a decrease in elbow angle described as a feature for expressing sadness. In total, 67 % of the detected features coincided with those extracted from psychophysical data in these previous studies. Our sparse regres-sion analysis missed 21 % of the features described as significant in the previous psy-chophysical literature.
Figure 3.3. Emotion-specific posture effects. (A) Regression weights from the sparse regression analysis for the posture changes for emotional relative to neutral gait for six different joints (averaging the data for corresponding bilateral joints), for head (He), spine (Sp), shoulder (Sh), elbow (El), hip (Hi) and knee (Kn) joints. Colour code as in flanking colourbar. Signs (+ and -) indicate critical posture features reported in previous psychophysics experiments on the perception of emotional body expressions. (B) Mean ± s.e.m. posture change (in rad), for emotional relative to neutral gait for six dif-ferent joints (averaging the values for bilateral joints). Emotions colour-coded (red: an-ger, yellow: fear, green: happiness, blue: sadness). For head and spine, negative val-ues indicate increased inclination; upper-arm retraction is indicated by negative shoul-der flexion. For elbow, hip and knee positive values indicate increased flexion. Aster-isks mark significant posture changes (p < 0.05).
One might ask if the same results could not have been obtained by a more classi-cal analysis, without sparsification. Emotion-specific movement effects can also be sta-tistically analysed using a multivariate GLM to assess the effect of the factor Emotion (four levels: anger, fear, happiness and sadness) on the movement of the ten joints (head, spine, and left and right shoulder, elbow, hip and knee). With this type of analy-sis, we obtained significant differences between the emotions on all entered joints (F3, 296 ranging from 13.7 to 64.2, all p < 0.001), and significant differences between neutral and emotional gait for several joints were uncovered by a t-test (t74 > 2.95, un-corrected p < 0.006). The means and standard errors underlying this analysis are pre-sented in a conventional bar diagram in Figure 3.3B. A post-hoc Scheffé test revealed significant similarities between the different emotions. The most prominent posture fea-tures in this analysis coincided with the ones extracted by sparse regression. In total, ten features were significantly different from neutral walking, out of which 90 % matched
68
features derived from psychophysical data. The GLM analysis missed 29 % of the fea-tures found in previous psychophysical studies.
Summarising, with two different types of analysis of the average joint angles we found a clear pattern of emotion-specific posture changes, which strongly overlaps with features that published psychophysical studies have been shown to be critical for the perception of emotion from gait: sadness vs. happiness expressions contrasted in terms of head inclination; spine inclination was observed for all negative affects, while elbow flexion was especially pronounced for expressions of anger and fear, and not so strongly for happiness expressions. Arm and leg joints were most strongly flexed during fear expressions, evident also in our finding that significant mean upper-arm retraction and knee flexion were only observed for fear expressions.
3.2.2.2 Movement features The effects of emotional expression on movement were characterised by the linear mix-ing weights extracted using the blind source separation algorithm described in Methods (in order to validate application of the novel blind source separation algorithm we ap-plied, we show in Section 3.6.3 how the results of this algorithm compare with those of applying PCA). The trajectories were approximated by three source signals. Feature extraction was based on the differences of the mixing weights that result from applying this blind source separation algorithm between emotional and neutral walking, on an actor-by-actor basis. Since the third fitted source function only accounted for a very small amount of variance, we restricted the feature analysis to the weight differences for the two sources that explained the greatest part of the trajectory variance. The analysed weight differences coincided directly with amplitude changes in the movement of the corresponding joints (Omlor & Giese, 2007a, 2007b), as corroborated by a substantial correlation (r = 0.86; p < 0.001) between weight differences and joint-angle amplitudes computed over the entire dataset.
Figure 3.4A shows the results for the sparsified mixing weights for the first source s1, which explained the largest amount of variance in the trajectories in terms of a colour-coded plot. This plot immediately reveals that the emotions happiness and an-ger were associated with increased joint amplitudes (indicated in red), while sadness and fear rather tended to be associated with a reduction in joint-angle amplitudes (indi-cated in blue) compared to normal walking: our results therefore appeared to be consis-tent with the intuition that more energetic emotions were characterised by ‘larger movements’, while ‘smaller movements’ were typical for sadness and fear. For expres-sions of fear we also observed reduced linear weights for knee movement, likely caused by a slinking gait adopted by the actors when expressing this emotion. We also com-pared our findings with motion features found to be important for the perception of emotion from gait in previous psychophysical experiments (de Meijer, 1989; Montepare et al., 1987; Wallbott, 1998). In these studies, the authors investigated correlations be-tween observed kinematic features with perceived emotional expressiveness, as indi-cated by the signs in Figure 3.4A. Almost always positive correlations (‘+’ signs) and negative correlations (‘-’ signs) coincide with the sign of the emotion-specific weight change relative to neutral walking we observed. The only exception to this rule was the reduction in hip- and knee- angle movement for fearful walking that was not observed in published psychophysical studies. Interestingly, in a previous perception experiment with stimuli generated from movement trajectories taken from the same database, we had already found that leg-movement kinematics strongly influence the perception of

69
fear expressed in gait (Roether, Omlor, & Giese, 2009), implying a one-to-one corre-spondence between the features we extracted automatically and the features determined in perception studies.
Figure 3.4. Emotion-specific dynamic features. (A) Regression coefficients from sparse regression based on the weight differences between emotional and neutral walking for the first source function (s1) which explained the maximum of the variance (see Meth-ods). The signs indicate corresponding features derived from psychophysical experi-ments (see text) for left (L) or right (R) side of body. Joint abbreviations as in Figure 3.3A. (B) Mean ± s.e.m. of differences in mixing weights between emotional and neu-tral gait extracted by the novel algorithm, for s1. Emotions are colour-coded, and aster-isks mark significant weight changes (p < 0.05). (C) Features extracted by PCA and plotted in the same way as in (A); most weight changes do not match results from psy-chophysics.
As further validation step, we ran a multivariate GLM analysis with the factor Emotion (four levels: anger, fear, happiness and sadness) on the weights for the first two source functions, s1 and s2, for the paired shoulder, elbow, hip and knee joints as dependent variables. The means and standard errors for the weight differences of the first source compared to normal walking are shown as conventional bar plots in Figure 3.4B. We found emotion-specific effects in all joints and for both source functions (all F3, 296 > 6.35, p < 0.001; for s1 only: all F3, 296 > 16.98, p < 0.001) except for the left and right knee on s1 (F3, 296 < 2.5, p > 0.063). Homogeneous subsets determined post hoc using the Scheffé test revealed obvious commonalities according to emotion activation:

70
especially for the arm joints similar weight changes relative to neutral occurred during expressions of anger and happiness on the one hand, and of sadness and fear on the other (see also Figure 3.4A). Using conventional tests to compare the weight changes for the first source against neutral walking, we identified 14 significant features, all of which had also been reported in previous perception studies. In addition, the GLM analysis detected significant changes in the knee movement of anger and sadness ex-pressions not described in previous studies.
We also extracted informative features for the second source function, s2, that explains the second largest amount of variance in the data. In this analysis step, the co-efficients from the sparse regression were increased for the movement of the left shoul-der and elbow joint during expressions of anger and happiness, and decreased for knee movement during expressions of fear and sadness (data not shown). Since this source oscillates with double the frequency of gait, and since the corresponding weights can be considered as a measure of the high-frequency components in the joint-angle trajecto-ries, these results were again consistent with the intuition of larger, and potentially less smooth movements during happy and angry walks, and with a reduction of amplitude in fearful and angry gait.
3.2.2.3 Influence of average gait velocityUp to this point my analysis has compared emotional gaits to neutral gaits without ex-plicitly taking into account velocity differences. Yet it is known that walking speed var-ies substantially with emotion (Montepare et al. 1987), and the gaits in our study cov-ered a speed range from 0.5 to more than 2 m/s. Since biomechanical parameters are strongly affected by walking speed (Kirtley, 2006), it is possible that the observed pos-tural and kinematic characteristics were simply an indirect consequence of these changes in gait speed. Alternatively, there may also be additional emotion-specific fea-tures that cannot be explained by variations in average speed alone. To test this question we compared the emotional gaits with neutral gaits whose speeds were matched, for each actor and on a trial-by-trial basis, to the speed of the emotional gaits (with overall velocity difference 15 %). An example of angry and happy gait and of their neutral speed matches have been published (Roether, Omlor, Christensen et al., 2009) and are provided on the enclosed CD (Movies 3.2 and 3.3: left – angry or happy gait, right – velocity-matched neutral gait).
Figure 3.5 shows the differences between emotional and velocity-matched neu-tral gaits in the mixing weights of the blind source separation algorithm, for the first and second source function (s1 and s2) separately for the four emotions and for the individ-ual joints. Weights were increased for the activated affects anger and happiness, espe-cially for the shoulder and elbow joints, and weights were decreased for expressions of sadness and fear. The results were thus very similar to those for the comparison against neutral gaits not matched with respect to speed (Figure 3.4). To test for significant ef-fects of emotional expression on movement dynamics, we conducted a one-way multi-variate GLM (Bortz, 1993) with the factor Trial (two levels: emotional gait; speed-matched neutral gait) for each of the four emotions. All eight tested features (four joints times two sources, taking the average weight between the joints on the left and right side of the body) served as dependent variables in this analysis. Overall, we found sig-nificant differences for all emotional gaits compared to speed-matched neutral gait (F1, 60 > 6.5, p < 0.05), as marked in Figure 3.5, confirming the existence of emotion-specific dynamic features that are independent of changes in overall gait speed. Essen-

71
tially we found that when expressing activated affects (anger and happiness), actors adopted arm movements that were more energetic than expected from their gait veloc-ity; expressing deactivated affects (fear and sadness) was associated with smaller movements than expected from gait speed. Actors thus appeared to exaggerate or cari-cature the velocity-related movement changes when they were expressing affects during walking. Although the findings of this analysis were generally very similar for both ac-tivated affects and for both deactivated affects we tested, interestingly, the size differ-ence in shoulder movement relative to neutral gait were larger for happy than for angry gait. In this analysis, the deactivated affects differed from the activated affects in com-prising significant (if small) changes in leg movement.
Figure 3.5. Emotion-specific kinematic effects beyond the effects of gait velocity. Mean ± s.e.m. difference in linear weights for the first (four darker grey bars) and sec-ond (lighter grey bars) source function. Joint abbreviations as in Figure 3.3, asterisks mark significant differences between emotional and speed-matched neutral walking (*p < 0.05, **p < 0.01). (A) Anger, (B) Fear, (C) Happiness, (D) Fear.
A similar analysis was conducted for the average posture angles. Again, we found overall significant differences between emotional gait and speed-matched neutral gaits for all emotions (F1, 60 > 5.4, p < 0.05). Since posture is not generally strongly af-fected by gait speed, the results of this analysis were comparable to those shown in Fig-

72
ure 3.3B. As for the comparison with neutral walks not speed-matched to emotional gaits, significantly increased head inclination was observed during expression of sad-ness, and angry and fearful gaits were characterised by increased elbow flexion. For fear, in addition, upper-arm retraction and knee flexion were increased, consistent with widespread postural tension.
3.2.3 Discussion Summarising our detailed analysis of posture and kinematic features derived from the joint angle trajectories, we found pronounced emotion-specific changes in body posture and movement kinematics. During the expression of activated affects such as anger and happiness, movements are faster than normal, and larger than even speed-matched neu-tral movements; the deactivated affects fear and sadness are associated with small, slow movements, smaller than even speed-matched neutral gait. In the set of affects we tested, limb flexion and head inclination are the most prominent body-posture factors that differentiate between pairs of affects sharing a similar speed.
By comparison with published studies, we found that the features that are critical for the accurate approximation of the motor behaviour closely match features that in previous studies have been shown to be important for perceiving emotional body ex-pressions. Another important observation in our analysis is that for the automatic extrac-tion of meaningful features it was critical to approximate the trajectories with a highly compact model that minimises the number of redundant parameters.
Our findings imply that the visual perception of emotionally expressive body movements efficiently extracts the features that best characterise the emotion-specific movement changes. Opposed to many previous studies on the perception of emotions in gait, Experiment 1 provided us with an exact characterisation of the emotion-specific physical changes. This made it possible to study in detail how individual postural and kinematic features influence the perception of emotional gait. In Experiment 2 (Section 3.3) I describe how individual posture and movement characteristics related to emotion perception (both classification and intensity ratings). In Section 3.4, then, I describe an adaptation experiment designed to investigate whether the largest feature changes we observed have a dominant effect on the perception of emotional body expressions.
3.3 Experiment 2: Critical features for emotion perception The statistical analysis of the movement trajectories recorded in Experiment 1 revealed the existence of emotion-specific postural and kinematic features in gait. Comparison with published studies suggested that the features which were critical for an accurate reconstruction of the joint angles and their trajectories corresponded to features that published studies have shown observers to base their emotion judgements on. However, most of the studies I cite were based on other types of movements than gait, and the physical changes in the emotional expressions were usually not quantified objectively, so we aimed at establishing the relationship between the movement features extracted in Experiment 1 and emotion perception.
We thus investigated the role that the postural and kinematic features we had ex-tracted play for emotion perception, by conducting a two-part perception experiment consisting of classification and emotional-expressiveness ratings. For the classification part we analysed the patterns of confusions between the different emotions as well as the influence of gait velocity on classification. Besides, by applying discriminant analy-sis, we tried to determine movement and posture features that are diagnostic for the

73
classification of different emotions. In the rating experiment participants judged the perceived emotional expressiveness of the trajectories. Applying sparse regression analysis, we identified the postural and kinematic features that were critical for deter-mining emotional expressiveness.
3.3.1 Methods Details of stimuli, apparatus and setup are described in Chapter 2. As stimuli, we used all animations of emotionally expressive gait (i.e. altogether 300, with 75 per affect) and 88 neutral speed matches (less than 15 % speed difference). All animations were pre-sented facing to the observer’s left, turned 20 degrees from the frontal view, since this view maximised the visibility of expressive cues. On each trial one stimulus was pre-sented, moving continuously until the participant responded by pressing a key on the computer’s keyboard.
3.3.1.1 Participants Twenty-one participants were tested in Experiment 2 (9 male, 12 female, mean age 23 years 4 months, their ages ranging from 19 years 6 months to 27 years 10 months). They were all students at the University of Tübingen, had normal or corrected-to-normal vision and were tested individually and paid for their participation.
3.3.1.2 Experimental paradigm The experiment consisted of two blocks: a classification task followed by a rating task. In both blocks, a total of 388 animations were shown. This set included the animations generated from each of the three repetitions of the four emotions, executed by 25 actors (N = 300). The remaining 88 animations constituted the two neutral walks best match-ing the gait velocity of the emotional walks, for eleven left-handed actors. Inter-stimulus intervals randomly varied between 500 and 800 ms. For the classification task, the animations were presented in random order. Participants were instructed to classify each as expressing anger, happiness, sadness or fear by a key press. The set of four re-sponse keys was kept constant throughout, but the assignment of responses to keys was counterbalanced. For the emotional-expressiveness ratings, the stimuli were presented in four emotion blocks, each containing all 75 animations per emotion and the 22 best velocity-matched neutral walks presented in random order. Order of emotions was counterbalanced across participants. The name of the target emotion was displayed on the screen at the beginning of each block. Participants were instructed to rate the inten-sity of emotional expression of each stimulus on a five-point scale (from ‘not expressing the emotion’ to ‘expressing the emotion very strongly’), responding by pressing the number keys 1 to 5. Each block was completed within less than 35 minutes. To avoid fatigue, participants took a short break after seeing the first 194 trials within a block, and a break between blocks, if desired. All procedures of the psychophysical experi-ments had been approved by the ethics board of the University of Tübingen.
3.3.2 Results Our analysis of the classification results includes three parts: first, we investigated the probability of confusions between different emotional gaits, demonstrating the recog-nisability of the emotional expressions in the database and revealing typical confusions between different emotional gait patters. Second, we tested how observers classified neutral gaits whose speed was matched to that of emotional gaits. While gait speed is
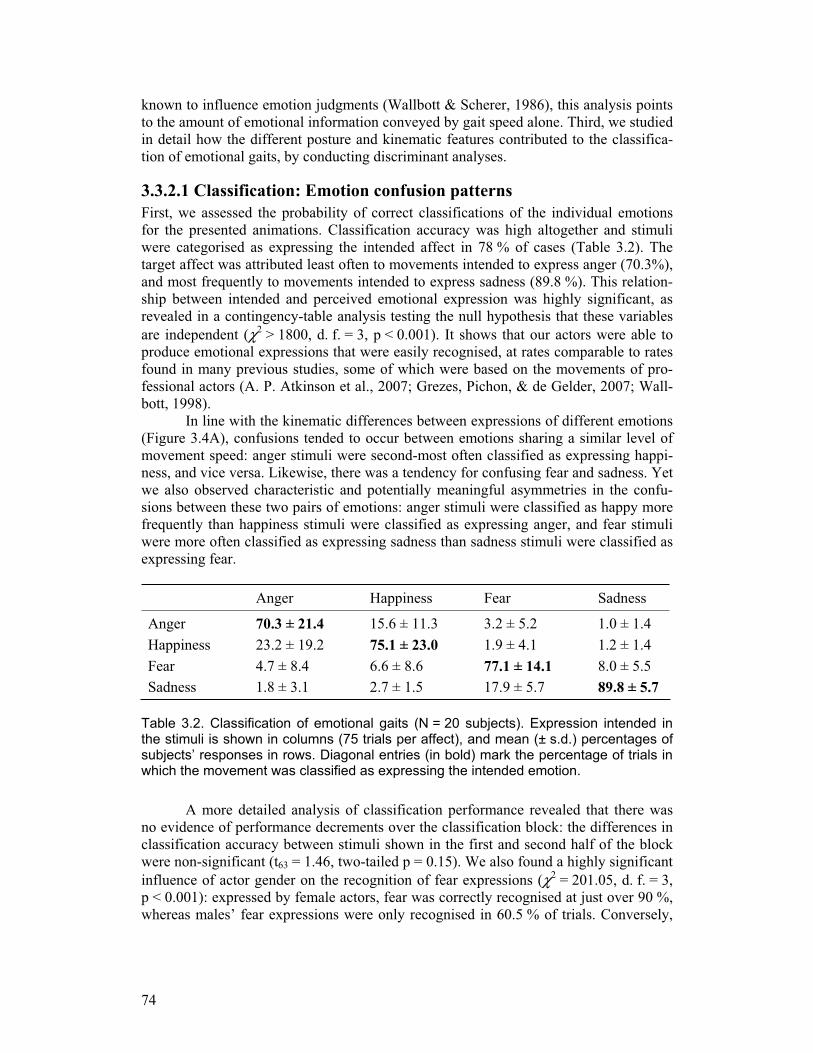
74
known to influence emotion judgments (Wallbott & Scherer, 1986), this analysis points to the amount of emotional information conveyed by gait speed alone. Third, we studied in detail how the different posture and kinematic features contributed to the classifica-tion of emotional gaits, by conducting discriminant analyses.
3.3.2.1 Classification: Emotion confusion patterns First, we assessed the probability of correct classifications of the individual emotions for the presented animations. Classification accuracy was high altogether and stimuli were categorised as expressing the intended affect in 78 % of cases (Table 3.2). The target affect was attributed least often to movements intended to express anger (70.3%), and most frequently to movements intended to express sadness (89.8 %). This relation-ship between intended and perceived emotional expression was highly significant, as revealed in a contingency-table analysis testing the null hypothesis that these variables are independent (χ2 > 1800, d. f. = 3, p < 0.001). It shows that our actors were able to produce emotional expressions that were easily recognised, at rates comparable to rates found in many previous studies, some of which were based on the movements of pro-fessional actors (A. P. Atkinson et al., 2007; Grezes, Pichon, & de Gelder, 2007; Wall-bott, 1998).
In line with the kinematic differences between expressions of different emotions (Figure 3.4A), confusions tended to occur between emotions sharing a similar level of movement speed: anger stimuli were second-most often classified as expressing happi-ness, and vice versa. Likewise, there was a tendency for confusing fear and sadness. Yet we also observed characteristic and potentially meaningful asymmetries in the confu-sions between these two pairs of emotions: anger stimuli were classified as happy more frequently than happiness stimuli were classified as expressing anger, and fear stimuli were more often classified as expressing sadness than sadness stimuli were classified as expressing fear.
Anger Happiness Fear Sadness
Anger 70.3 ± 21.4 15.6 ± 11.3 3.2 ± 5.2 1.0 ± 1.4 Happiness 23.2 ± 19.2 75.1 ± 23.0 1.9 ± 4.1 1.2 ± 1.4 Fear 4.7 ± 8.4 6.6 ± 8.6 77.1 ± 14.1 8.0 ± 5.5 Sadness 1.8 ± 3.1 2.7 ± 1.5 17.9 ± 5.7 89.8 ± 5.7
Table 3.2. Classification of emotional gaits (N = 20 subjects). Expression intended in the stimuli is shown in columns (75 trials per affect), and mean (± s.d.) percentages of subjects’ responses in rows. Diagonal entries (in bold) mark the percentage of trials in which the movement was classified as expressing the intended emotion.
A more detailed analysis of classification performance revealed that there was no evidence of performance decrements over the classification block: the differences in classification accuracy between stimuli shown in the first and second half of the block were non-significant (t63 = 1.46, two-tailed p = 0.15). We also found a highly significant influence of actor gender on the recognition of fear expressions (χ2 = 201.05, d. f. = 3, p < 0.001): expressed by female actors, fear was correctly recognised at just over 90 %, whereas males’ fear expressions were only recognised in 60.5 % of trials. Conversely,
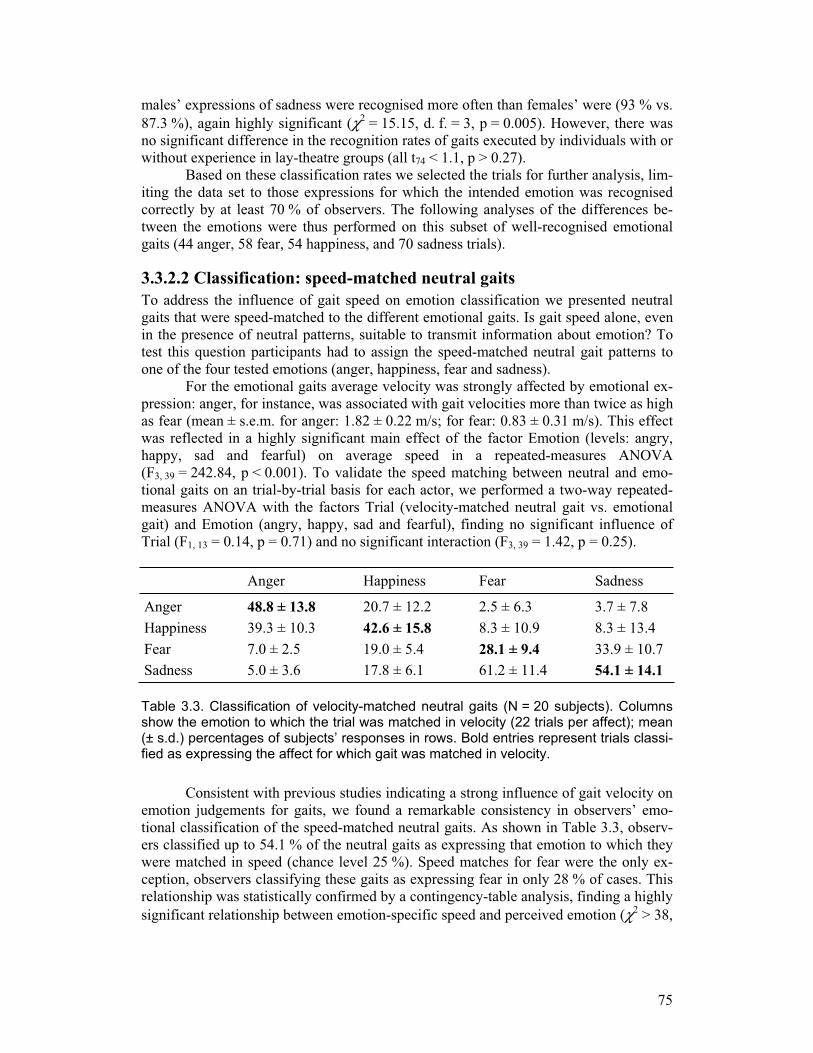
75
males’ expressions of sadness were recognised more often than females’ were (93 % vs. 87.3 %), again highly significant (χ2 = 15.15, d. f. = 3, p = 0.005). However, there was no significant difference in the recognition rates of gaits executed by individuals with or without experience in lay-theatre groups (all t74 < 1.1, p > 0.27).
Based on these classification rates we selected the trials for further analysis, lim-iting the data set to those expressions for which the intended emotion was recognised correctly by at least 70 % of observers. The following analyses of the differences be-tween the emotions were thus performed on this subset of well-recognised emotional gaits (44 anger, 58 fear, 54 happiness, and 70 sadness trials).
3.3.2.2 Classification: speed-matched neutral gaitsTo address the influence of gait speed on emotion classification we presented neutral gaits that were speed-matched to the different emotional gaits. Is gait speed alone, even in the presence of neutral patterns, suitable to transmit information about emotion? To test this question participants had to assign the speed-matched neutral gait patterns to one of the four tested emotions (anger, happiness, fear and sadness).
For the emotional gaits average velocity was strongly affected by emotional ex-pression: anger, for instance, was associated with gait velocities more than twice as high as fear (mean ± s.e.m. for anger: 1.82 ± 0.22 m/s; for fear: 0.83 ± 0.31 m/s). This effect was reflected in a highly significant main effect of the factor Emotion (levels: angry, happy, sad and fearful) on average speed in a repeated-measures ANOVA (F3, 39 = 242.84, p < 0.001). To validate the speed matching between neutral and emo-tional gaits on an trial-by-trial basis for each actor, we performed a two-way repeated-measures ANOVA with the factors Trial (velocity-matched neutral gait vs. emotional gait) and Emotion (angry, happy, sad and fearful), finding no significant influence of Trial (F1, 13 = 0.14, p = 0.71) and no significant interaction (F3, 39 = 1.42, p = 0.25).
Anger Happiness Fear Sadness
Anger 48.8 ± 13.8 20.7 ± 12.2 2.5 ± 6.3 3.7 ± 7.8 Happiness 39.3 ± 10.3 42.6 ± 15.8 8.3 ± 10.9 8.3 ± 13.4 Fear 7.0 ± 2.5 19.0 ± 5.4 28.1 ± 9.4 33.9 ± 10.7 Sadness 5.0 ± 3.6 17.8 ± 6.1 61.2 ± 11.4 54.1 ± 14.1
Table 3.3. Classification of velocity-matched neutral gaits (N = 20 subjects). Columns show the emotion to which the trial was matched in velocity (22 trials per affect); mean (± s.d.) percentages of subjects’ responses in rows. Bold entries represent trials classi-fied as expressing the affect for which gait was matched in velocity.
Consistent with previous studies indicating a strong influence of gait velocity on emotion judgements for gaits, we found a remarkable consistency in observers’ emo-tional classification of the speed-matched neutral gaits. As shown in Table 3.3, observ-ers classified up to 54.1 % of the neutral gaits as expressing that emotion to which they were matched in speed (chance level 25 %). Speed matches for fear were the only ex-ception, observers classifying these gaits as expressing fear in only 28 % of cases. This relationship was statistically confirmed by a contingency-table analysis, finding a highly significant relationship between emotion-specific speed and perceived emotion (χ2 > 38,

76
d. f. = 3, p < 0.001). As obtained for the emotionally expressive gaits, we found high confusion probabilities between emotions typically associated with high gait speeds (anger and happiness), and between those associated with low speeds (sadness and fear). Interestingly, in over 60 % of cases sadness was attributed to neutral gaits at the veloc-ity of fearful walking. Since the gait velocities observed for fearful and sad walking largely overlap, this finding points to an influence of factors other than gait velocity as critical for the perception of fear from bodily expressions (e.g. posture).
Summarising, the comparison between Table 3.3 and Table 3.2 shows that de-spite the fact that participants were able to classify emotions from speed-matched neu-tral gaits with remarkable consistency, the correct classification rates were substantially higher for the emotionally expressive gaits. Consistent with the results of analysing emotion-specific features in the movement trajectories, this finding indicates that while speed had a strong influence on emotion classification, emotional gait patterns con-veyed substantial additional information that is independent of movement speed. This interpretation was also confirmed by comparing the emotional-expressiveness ratings (see below): real emotional gaits were rated as significantly more expressive than speed-matched neutral gaits (confirmed by a repeated-measures ANOVA on the mean expres-siveness ratings; F1, 17 = 88.1, p < 0.001).
What about the classification of neutral gait at normal walking speed? If observ-ers could distinguish between neutral gait and emotionally expressive gait, then this would underscore the specificity of the emotional expressions. To test this, we ran a control experiment in which we repeated the classification task exactly as above, but now including neutral as both stimulus and response category (neutral gaits at normal speed), with five observers (three female and two male, mean age 26 years 3 months). The results of this experiment are shown in Table 3.4: as for four-choice classification, observers gave highly consistent responses for all five stimulus types (neutral, happy, sad, angry and fearful). The modal response was always the emotion that the actor was attempting to express. For fear and sadness, classification performance was hardly af-fected by including the neutral condition; there were only very few confusions between neutral and these two affects. However, there was a tendency for angry and happy gaits to be confused with neutral, and vice versa, especially for happy gait, where the second most frequent classification was in fact ‘neutral’. Neutral gait itself was classified as neutral in more than 70 % of trials, demonstrating that there are specifically emotional aspects in emotionally expressive gait that differ from neutral.
Anger Happiness Neutral Fear Sadness
Anger 76.0 ± 2.8 14.9 ± 4.2 8.5 ± 2.4 1.9 ± 1.8 0.5 ± 0.7 Happiness 15.5 ± 3.2 65.1 ± 6.5 12.3 ± 3.5 2.9 ± 3.8 1.9 ± 1.8 Neutral 5.3 ± 4.9 18.4 ± 6.2 71.5 ± 3.1 5.1 ± 3.5 3.5 ± 2.2 Fear 1.6 ± 1.7 1.1 ± 0.6 4.0 ± 1.9 80.0 ± 10.0 2.1 ± 0.7 Sadness 1.6 ± 1.5 0.5 ± 0.7 3.7 ± 2.9 10.1 ± 5.4 92.0 ± 3.1
Table 3.4 Classification of emotional gait including neutral (N = 5 subjects). Columns show stimulus affect (75 trials per affect); mean (± s.d.) percentages of subjects’ re-sponses in rows. Diagonal entries (in bold) mark the percentage of trials in which the movement was classified as expressing the intended emotion.

77
3.3.2.3 Classification: Influence of movement and posture features To investigate the relationship between the features identified by the analysis in Ex-periment 1 and the perceptual classification results in Experiment 2, we performed two discriminant analyses, separately for the posture and movement features. For body pos-ture, the discriminant analysis determined one strong discriminant function (eigenvalue 1.37), which loaded highly on head inclination (0.56), and which separated sadness ex-pressions from those of the other affects, most strongly happiness. The second discrimi-nant function loaded moderately highly on limb flexion. It provided a coarse separation of anger and fear expressions from expressions of happiness and sadness. However, since the eigenvalues for the second and third discriminant functions were rather small (0.51 and 0.18, respectively), we decided to refrain from further analysing them.
The discriminant analysis for the dynamic features was based on the weights of the source functions of the trajectory models defined by Equation 3.2. Since the third source function explained only approximately 5 % of the variance in the data, we re-stricted our feature analysis to the first two sources. Again, we restricted the discrimi-nant analysis to the left side of the body, which the work described in Chapter 5 shows to be more emotionally expressive than the right (Roether, Omlor, & Giese, 2008) and included average gait velocity as an additional predictor. Our analysis revealed only one strong discriminant function which explained 90.0 % of the variance (eigenvalue 4.11). It loaded highly on gait velocity and was strongly correlated with the weights of the first source for the shoulder and elbow joint. It separated the emotions according to gait ve-locity, the highest values associated with angry walking, followed by happy walking (mean ± s.d. gait velocity 1.82 ± 0.22 m/s for anger; 1.31 ± 0.36 m/s for happiness). Negative values were obtained for fearful and sad gaits (fear: 0.83 ± 0.31 m/s; sadness: 0.68 ± 0.21 m/s). The other two discriminant functions accounted only for a small amount of variance and were therefore not considered for further analysis.
In summary, the discriminant analysis confirmed the strong influence of gait ve-locity, arm swing, elbow flexion and head inclination on emotion classification ob-served in the analysis of the motor patterns in Experiment 1. The following analysis of the rating data will provide more information about the features that are critical for per-ception.
3.3.2.4 Expressiveness ratings: Influence of posture features In the following, I describe the relationship between posture features and observers’ ratings of perceived intensity of emotional expression. In order to identify the posture features that were most strongly predictive of emotional expressiveness, we applied a linear regression model according to Equation 3.3. In this model the dependent variable Y represents the expressiveness ratings, and the predictors X are given by the posture features (average joint angles over one gait cycle). In order to determine the relative importance of the different features for predicting expressiveness, we estimated the re-gression coefficients by sparse regression, minimising the error function defined by Equation 3.6 for different values of the sparseness parameter λ, where the case λ = 0 corresponds to a standard linear regression without sparsification. With increasing val-ues of the sparseness parameter the resulting model contains fewer and fewer active features, i.e. features for which the corresponding regression weight k is different from zero. Such regression models reduce complexity at the cost of less accurate approxima-tion of the data, and only the most important features will still be active for large values of the sparseness parameter. Thus, sparse regression provides an elegant way of defin-

78
ing a rank ordering for the importance of the different features. Bilateral features were very similar on the left and the right body side, as indicated by high correlation coeffi-cients (smallest r > 0.52, p < 0.001). During stimulus presentation the avatar’s (ana-tomically) left side was always shown facing the observer, making the left side of the body more visible than the right. In addition, we have previously demonstrated an emo-tional-expressiveness advantage for the movement of the left side of the body (Roether et al., 2008). For these reasons, for bilateral features, we constrained the feature analysis to the left joints.
Figure 3.6. Relationship between posture features and perceived intensity of emotional expression. Weights j of the posture features derived by sparse regression, where emotional-expression intensity was predicted by a sparsified linear combination of the posture angles. Weights are colour-coded and plotted as a function of the sparseness parameter . Increasing values of this parameter along the vertical axis indicate in-creasingly sparse models, which are based on fewer and fewer features. Black hori-zontal lines mark optimal value of the sparseness parameter opt estimated by GCV (see Section 3.5.2). Mean joint flexion served as measure of posture; joint abbrevia-tions as in Figure 3.3A. (A) Anger, (B) Fear, (C) Happiness, (D) Sadness.
Figure 3.6 shows the regression weights of the different posture features for dif-ferent levels of sparsification. Red and blue indicate positive and negative values of the coefficients k respectively. As expected, without sparsification (sparseness parameter λ = 0) the models typically contain all features with often small non-zero weights, which makes interpretation of the importance of such features rather difficult. Increas-

79
ing the sparseness parameter λ resulted in models with fewer and fewer active features (non-zero regression coefficients), providing a ranking of models with different num-bers of features. With respect to body posture, we found good agreement between the prominent features directly extracted from the motor behaviour (Experiment 1) and those features most strongly related to ratings of emotional expressiveness: for sad walking the most important feature was increased head inclination (indicated by a nega-tive regression weight in the chosen parameterisation, see Figure 3.6D). The most im-portant predictor for the expressiveness ratings for angry and fearful walking (Fig-ure 3.6A and Figure 3.6B) was the elbow-flexion angle, corresponding to the important role of this feature in the analysis described in Experiment 1. For happy walking the most important features predicting the perceived emotional expressiveness were an in-creased elbow angle and a decreased shoulder angle (Figure 3.6C). The former feature corresponds to one of the less prominent features in the analysis of the motor patterns, while no change of the shoulder angle was observed in this analysis.
In summary, the posture features that most prominently influenced the percep-tual expressiveness ratings matched those that were directly extracted from the trajecto-ries in Experiment 1. Mismatches only occurred for those features Experiment 1 had extracted as less prominent.
3.3.2.5 Expressiveness ratings: Influence of dynamic features Since movement speed proved to be an important cue for emotion classification (Table 3.2 and Table 3.3), we also correlated the ratings of emotional expressiveness with gait velocity. Expressions of both anger (r41 = 0.76, p < 0.001) and happiness (r41 = 0.36, p = 0.002) were rated as more intense the higher the gait velocity. For expressions of fear and sadness, gait velocity was inversely related to expressiveness ratings, signifi-cant for sadness only (r67 = -0.59, p < 0.001). An exception to this general rule was ob-tained for fear, for which a non-significant correlation between gait velocity and expres-siveness was obtained (r52 = -0.19, p = 0.19). This finding fitted the hypothesis of a dominant role of postural cues for fear perception and parallelled the strong influence of speed on emotion classification in the discriminant analysis.
The analysis of the relationship between dynamic features and perceived expres-siveness followed exactly the same procedures as the analysis of important posture cues discussed in the last section. Sparse regression was applied to predict the emotional ex-pressiveness ratings from the linear weights of the first and second source of the model as defined by Equation 3.2. Again the analysis was restricted to the left side of the body for bilateral joints.
Consistent with the features derived from the trajectory analysis (Figure 3.4A), high expressiveness of anger and happiness expressions was mostly associated with increases of the linear weights, and with weight decreases for gaits expressing sadness or fear (Figure 3.7). For anger, the features with the most prominent relationship be-tween expressiveness ratings were the weights for the shoulder and hip joint on the first source, matching the prominent features extracted from the motor patterns in Experi-ment 1. Additional important features for expressiveness were the weights of the elbow and knee joint on the second source. The expressiveness of happy gaits was most strongly influenced by the elbow joint on both source functions, but also by the shoulder joint on the first source, and by both leg joints on the second, again matching the results of the analysis of the motor patterns. Deviating from these results, the weight of the knee joint on the first source was negatively related to expressiveness. Again consistent

80
Figure 3.7. Relationship between dynamic features and perceived intensity of emo-tional expression. Weights j of the dynamic features derived by sparse regression, where emotional-expression intensity was predicted from the dynamic features (weights for the first and second source function). Four emotions (anger, fear, happi-ness and sadness) shown in rows, as marked. Joint abbreviations as in Figure 3.3A. (A) Weights for first source function, (B) weight for second source function. Conven-tions as in Figure 3.6.

81
with the feature analysis in Experiment 1, the expressiveness of angry and happy walks was positively influenced by the weights of elbow and shoulder (first and second source). Besides, we found that hip movement on the first source only affected the per-ception of angry gait, not of happy gait. In addition, for the expressiveness ratings there was a negative influence of the weight of the knee angle (first source) that had no equivalent in Experiment 1. As for the analysis of the motor patterns, the expressiveness of both fearful and sad gaits was strongly negatively related to the shoulder-movement amplitudes, accompanied by an influence of leg-movement amplitude particularly for fearful gaits. For sadness and fear the weight of the knee movement on the second source function was the dominant factor influencing expressiveness, indicating that the expressiveness of sad or fearful gaits was increased when some higher-frequency com-ponents in the knee were reduced (since the second source function oscillates with dou-ble gait frequency).
To summarise, gait speed and the size of movements were strongly correlated with expressiveness ratings. Both angry and happy gait was rated as more expressive when larger, faster movements had been adopted by an actor; fearful and sad gaits were judged as more expressive the smaller and slower an actor’s movement. These relation-ships exhibited emotion-specific patterns in terms of which joints were important for driving expressiveness ratings.
3.3.3 Discussion The results of Experiment 2 confirm our initial hypothesis about the features critical for perceiving emotions from gait: they closely mirror the features that the results of Ex-periment 1 had shown to be critical for accurately approximating the movements’ trajec-tories. Thus, we found that individual emotion-specific features were strongly related to observers’ affect judgements, both for classifying the movements and for rating the in-tensity of their emotional expression. Both postural and dynamic information played a role in shaping observers’ expressiveness ratings. One particularly influential posture feature is head inclination, which turned out to be the single most important feature both in a discriminant analysis on the classification of emotional expressions, and in the sparse regression between expressiveness judgements and body-posture features. Simi-larly, elbow flexion dominated the perception of the emotional intensity of anger and fear expressions, surpassing this feature’s discriminative power for emotion classifica-tion. In terms of movement kinematics, increases and decreases in the size and speed of movements were among the most important features driving the perception of emotional gaits, strongly related to both emotion classification and emotional-intensity judgments.
While in Experiments 1 and 2 we studied in detail the relationship between natu-rally occurring variance in movement features and expressiveness ratings, the crucial test remains of investigating the effect on perception of manipulating stimulus features. Such a study would represent a causal test of the importance of the extracted features for emotion perception. It would involve manipulating the intensity with which a candi-date feature is present in the moving figure, rather than using the natural variation pre-sent in the recorded dataset, and testing the consequences of this manipulation for emo-tion perception. This approach was taken in Experiment 3.

82
3.4 Experiment 3: Adaptation of emotion perception In Experiment 1 we applied a statistical analysis to extract a minimum set of maximally informative features from the trajectories of emotionally expressive gait; Experiment 2 demonstrated that this distinct set of postural and kinematic cues was highly informative about the expression of emotions in human gait. In Experiment 3 we went one step fur-ther towards testing whether the extracted set of emotion-specific features captures the crucial aspects of the emotion-specific movement information, namely, by comparing the effects on emotion perception of natural emotional gait patterns with those of stimuli containing those features showing the largest emotion-specific changes. This experi-ment was possible because the model given by Equation 3.2 is generative and thus al-lowed us to synthesise gait patterns that include only those features exhibiting the larg-est emotion-related changes in Experiment 1.
To measure the emotion-specific perceptual effects induced by these stimuli we exploited a paradigm based on high-level aftereffects in motion recognition. High-level aftereffects were first described for the perception of static face pictures (Leopold et al., 2001; Webster et al., 2004), but they have recently been reported to apply to the percep-tion of point-light biological motion stimuli too (Jordan et al., 2006; Troje et al., 2006): extended observation of a male gait pattern results in a bias for judging a gender-neutral motion morph between male and female gait as female, while adaptation with a female gait pattern results in the opposite bias, i.e., a tendency to judge the neutral pattern as male. Such high-level aftereffects might also arise for emotional gait stimuli, providing a tool for comparing emotion-specific perceptual effects induced by emotional gait stimuli that contain different types of features.
In Experiment 3 we compared the adaptation effect induced by emotional gait patterns with adaptation following presentation of artificial emotional walkers only ex-hibiting the largest critical features extracted in Experiment 1 (Figure 3.3 and Figure 3.4). In order to limit the duration of the experiment, we constrained our analysis to the emotions happy and sad, as examples of a positive emotion associated with high activa-tion, and an example of a negative emotion associated with low activation. By compar-ing the sizes of the induced aftereffects on the classification of motion morphs between happy and sad walking, we were able to investigate if the extracted feature set ade-quately captures the critical information for driving the perception of emotional style. The reasoning behind this experiment is that an artificial walker that presents an effi-cient set of emotion-specific features should result in high-level aftereffects comparable in size to those induced by adaptation with a real emotional walker stimulus.
3.4.1 Methods In the adaptation experiment we compared the influence of different types of happy or sad adapting stimuli on the discrimination between stimuli falling along a continuum between sad and happy gait. The adaptor presented preceding the test stimulus could be either a natural sad or happy walk, or an artificial stimulus exhibiting only several criti-cal features for these emotions. The test stimuli were generated by morphing between a natural happy and a natural sad walk, providing different intermediate levels of emo-tional style between these two emotions. In order to rule out simple low-level motion aftereffects as a major source of the observed adaptation, all presented gait patterns were resampled so as to guarantee that the average gait velocity was 1.35 m/s (the aver-age of this actor’s velocity for sad and happy gait). We verified that the average speed of the other markers did not significantly differ between the different gait styles. This

83
procedure ensured that the motion energy spectrum of the different adaptors was very similar.
3.4.1.1 Natural and artificial adaptor stimuli All stimuli in Experiment 3 were derived from one example each of sad, happy and neu-tral gait executed by the same individual. The selected emotional gaits had been cor-rectly classified by more than 85 % of the observers in Experiment 2, and they had re-ceived expressiveness ratings in the highest quartile. As natural adaptors we used the happy and sad walk (one cycle) of this actor. In order to minimise the influence of low-level motion adaptation we rendered all stimuli (adaptation and test stimuli) to have the same gait-cycle duration as the neutral prototype.
The artificial adaptors were based on the neutral gait of the same person. To this pattern we added the two largest postural and kinematic changes for sad and happy walking extracted in Experiment 1. For generating the artificial sad-gait stimulus, we approximated the trajectories of neutral walking by Equation 2, and then modified the weights by adding the population average of the weight difference between sad and neu-tral walking for the shoulder and the elbow joints. These two joints had shown the maximum differences between sad and neutral walking (shoulder joints: −0.67, elbow joints: −0.79; corresponding left and right joints were treated as symmetric). Likewise, for the joints with the largest posture changes between sad and neutral walking, we added the population average of the differences between the posture angles between sad and neutral walking (−18.9 deg for the head, and −16.6 deg for the elbow joints). Corre-spondingly, the artificial happy gait was generated by adding the weight changes be-tween happy and neutral walking to the weights of the shoulder and elbow (shoulder: +0.42 and elbow +0.61), the two joints showing the largest emotion-specific change relative to neutral walking. In this case, elbow and head showed the largest changes of the posture angles compared to neutral walking, and we added 2.5 deg to the elbow flexion angle and 6.3 deg to head inclination. The artificial happy and sad adaptor stim-uli are provided as Movies 3.4 and 3.5 on the enclosed CD.
3.4.1.2 Test stimuli: happy-sad morphs The test stimuli were motion morphs between the selected sad and happy gait described in the last section. By morphing we created a continuum of expressions between happy and sad walking. Morphing was based on spatio-temporal morphable models (Giese & Poggio, 2000), a method which generates morphs by linearly combining prototypical movements exploiting a spatio-temporal correspondence algorithm. The method has previously been shown to produce morphs with high degrees of realism for rather dis-similar movements (Giese & Lappe, 2002) and even for complex movements such as martial-arts techniques (Mezger, Ilg, & Giese, 2005). The method is described in detail in Section 4.2.2.1. For generating the stimuli we used only the two emotional gaits as prototypes. In the different test conditions the weight of the sad prototype was set to the values 0.2, 0.3, 0.38, 0.42, 0.46, 0.5, 0.54, 0.58, 0.62, 0.7, and 0.8; in a pilot experiment, these values had been determined as optimal for sampling the relevant region of the response curves. The weights of the happy prototype were chosen such that the sum of the morphing weights was always equal to one.

84
3.4.1.3 Participants In Experiment 3, eight participants were tested individually, five of which were female, and three male (mean age 22 years 11 months, ages ranging from 20 years 8 months to 27 years 11 months). They all completed each of the five blocks within approximately 12 to 15 minutes, and they were allowed to take up to five minutes’ break between every two blocks. They had normal (or corrected-to-normal) vision, were students at the University of Tübingen, and were paid for their participation.
3.4.1.4 Task and procedure Experiment 3 was based on stimulus discrimination. On individual trials, the test stimu-lus was presented, which participants had to classify as ‘sad’ or ‘happy’ by pressing one of two keys. Except during the no-adaptation block, each presentation of the test stimu-lus was preceded by presentation of one of four adapting stimuli per block (Natural Happy, Artificial Happy, Natural Sad, or Artificial Sad) for 8 s, followed immediately by a noise mask presented for 260 ms. The mask comprised 49 darker grey dots on a uniform grey background, moving along a planar projection of the trajectories of human arm movements. Each dot moved about a randomly chosen position, and with random phase. Fully extended, the mask had an approximate size of 5 × 9.5 degrees of visual angle. Following the mask, the test stimulus was presented for a maximum of 2 s, fol-lowed by a grey screen with a response prompt; the subject’s response interrupted stimulus presentation.
The experiment constituted altogether five blocks, each consisting of 55 trials in random order, corresponding to five presentations of each test stimulus. The no-adaptation block was always the first, followed by four blocks in random order, includ-ing two artificial adaptors (happy or sad) and two natural-adaptor (happy or sad) blocks.
3.4.2 Results Figure 3.8 shows the response curves (proportions of ‘sad’ responses as a function of the morphing weight of the sad prototype in the test stimulus) for the five different ad-aptation conditions. All curves could be closely fitted by sigmoidals separately for the individual subjects. Based on these curves we determined the ‘ambiguity points’ (AP), i.e. the morph levels at which subjects gave sad and happy responses equally often (Jordan et al., 2006). These values formed the basis of our statistical analysis.
The different adaptation conditions clearly influenced the measured psychomet-ric functions. First, evidently, the curves obtained for the ‘happy’ and ‘sad’ adaptors were shifted in opposite directions away from the baseline curve (black) obtained for the no-adaptation blocks; the statistical significance of this effect was confirmed by separate repeated-measures ANOVAs for both the happy (F2, 14 = 5.64, p = 0.016) and the sad adaptor (F2, 14 = 12.60, p = 0.009) with the three-level factor Adaptor (levels: no-adaptor, artificial-adaptor and natural-adaptor). Crucially, the shifts induced by both artificial adaptors were significantly different from baseline: presenting the artificial sad adaptor shifted the AP to the right (mean ± s.e.m 0.62 ± 0.043 compared to 0.57 ± 0.040 for no adaptation; t7 = −2.28, p = 0.029), while presenting the artificial happy adaptor shifted it to the left (0.48 ± 0.041, t7 = 2.95, one-tailed p = 0.011).
The shift associated with presentation of the natural adaptor was larger for both emotions compared with the influence of the artificial adaptor (happy: 0.42 ± 0.023, sad: 0.65 ± 0.029), but neither of these differences reached statistical significance, as reflected in the non-significant effect of adaptor naturalness in a repeated-measures

85
ANOVA on all APs to stimuli preceded by an adaptor (F1, 7 = 0.063, p = 0.45). There was thus no significant difference between the high-level aftereffects induced by natural and artificial adapting stimuli.
Figure 3.8. Adaptation of emotion perception. High-level aftereffects induced by artifi-cial emotion stimuli, containing only the two largest critical posture and kinematic fea-tures, in comparison with aftereffects following presentation of natural emotionally ex-pressive gait. Mean proportions of ‘sad’ responses are shown as a function of the linear weight of the sad prototype in the test stimulus. Responses for the condition without presentation of adaptors shown in black. Green (blue): responses following presenta-tion of happy (sad) adaptor; solid lines and filled circles represent results for adaptation with the artificial adaptors, while dashed lines and open circles represent responses for natural adaptors.
3.4.3 Discussion Using test stimuli generated by motion morphing, Experiment 3 compared the high-level aftereffects induced by natural emotional (sad and happy) walks with those in-duced by the presentation of artificial stimuli that contained only the most prominent posture and dynamic features extracted by the analysis of the motor patterns of emo-tionally expressive gait in Experiment 1. First and foremost, our results demonstrate emotion-specific high-level aftereffects in the perception of emotions expressed in hu-man full-body movement. More specifically, they show that the dominant features ex-

86
tracted by analysing motor behaviour (Experiment 1) had a powerful effect on perceiv-ers’ sensitivity to emotional expression, shifting it in the same direction as the presenta-tion of natural adaptors. The extent of these shifts was not significantly smaller than the size of those induced by the natural adaptors. Therefore, our findings imply that the ex-tracted feature sets are complete in the sense of capturing the crucial aspects for deter-mining observers’ perception of emotional body expressions.
3.5 General Discussion We investigated the influence of posture and dynamic cues for the expression and rec-ognition of emotions in gait. Our study combined an analysis of motor behaviour, based on the angle trajectories of the major joints, with an analysis of the perception of emo-tions from gaits, including discriminative judgments between different emotions and ratings of the intensity of emotional expression. Beyond classical statistical techniques, our analysis exploited advanced methods from machine learning in order to derive an easily interpretable parameterisation of dynamic trajectory features, and to select sets of highly informative features. In addition, we studied the influence of average gait veloc-ity on the emotional expressiveness of gaits, by comparing the trajectories and percep-tual judgements of emotional gaits with the ones of speed-matched neutral walking. This analysis confirmed the strong influence of movement speed on the perception of emotions from body movements, and also provides evidence of additional, emotion-specific posture and dynamic features that cannot be explained by variations in gait speed alone. Altogether, we found a well-defined set of movement and posture features that were critical both for expressing and perceiving emotions expressed in walking. In addition, exploiting high-level motion aftereffects, we showed that artificial stimuli con-taining only these critical features produce similar emotion-specific aftereffects as natu-ral emotionally expressive gaits, which confirms the high perceptual relevance of the feature set we extracted.
The majority of recorded movements were categorised as expressing the emo-tion that the actor was intending to express. This finding indicates the high validity of the recorded expressions. Expressions of anger were recognised at the lowest rate (around 70 %), while the highest recognition rate was achieved for sadness expressions (around 90 %). These rates are comparable to those reported in studies based on expres-sions executed by professional actors (e.g. Grèzes et al., 2007), invalidating the possible criticism that the emotional expressions of non-professional actors might not be suffi-ciently expressive or convincing.
Interestingly, the recognisability of emotions was critically dependent on actor gender: gaits intended to express fear were recognised at a 30 % (!) higher rate if the actor was female than if the actor was male. We assume that this effect arose at the en-coding stage, since the female actors showed stronger fear-related modifications of their body postures than did the male actors. In other studies considering the gender of the encoder similar effects have been observed for aggression, which is attributed more readily to male actors than to female actors (de Meijer, 1991; Pollick, Lestou, Ryu, & Cho, 2002). This effect might be related to stereotypes about (Henley & Harmon, 1985; Spiegel & Machotka, 1974) or actual (Brescoll & Uhlmann, 2008) gender differences in the frequency of aggressive behaviours. Alternatively, females’ body movements might be less compatible with anger-related movement qualities such as force (Pollick et al., 2001; Wallbott, 1998). For facial expressions females are generally more expressive than males, across emotions (Zuckerman, Lipets, Koivumaki, & Rosenthal, 1975). Our

87
present finding of a female advantage for fear expression could also be related to social context: the presence of the female experimenter might have differentially influenced male and female participants. However, effects of social context have only rarely been demonstrated for emotionally expressive behaviour in adults (Fridlund, 1990; Fridlund et al., 1992). While the present study does not provide a conclusive answer about the causes of this gender difference, the sheer size of the effect makes it appear worthy of further investigation.
3.5.1 Influence of gait speed Movement speed had a strong influence on the perception and expression of emotions in gait. First, in the classification experiment confusions preferentially occurred between emotions that shared a similar level of movement activation: angry gaits tended to be confused with happy gaits, and sad gaits with fearful ones. This pattern of confusions matched the results of our discriminant analysis, which revealed a strong influence of gait speed on the classification results. It is also consistent with the classical hypothesis that the general level of movement activity represents an important variable for the per-ception of emotions from movements (Ekman, 1965; Montepare et al., 1987; Pollick et al., 2001; Sawada et al., 2003; Wallbott, 1998). The importance of gait speed for emo-tion classification is also supported by our results on the classification of speed-matched neutral gaits: they were usually classified as expressing the affect associated with a similar average gait speed. Compared to facial expressions of emotion, bodily expres-sions therefore seem to bear a stronger relationship between visual cues and the dimen-sion of emotional activation or arousal (Osgood, 1966; Schlosberg, 1954; Wundt, 2004), some of these cues (e.g. retraction as a cue for fear) potentially even revealing underly-ing ‘action tendencies’ (Frijda, 1988). In this respect, emotional body expressions more closely resemble the expression of emotions in vocal prosody than in the face: in pros-ody, anger and happiness are associated with intensity increases relative to neutral speech. Opposed to facial expressions of emotion (Scherer et al., 2003), our results re-vealed a stronger tendency for confusing affects associated with similar activation for emotional body expressions.
Beyond the influence of gait speed, our study provides strong evidence for addi-tional emotion-specific dynamic and postural features. There was substantially less variance in emotion classification for emotional gaits than for speed-matched neutral gaits. In addition, we observed characteristic asymmetries in the attribution of emotion to the speed-matched neutral gaits: neutral gaits velocity-matched to angry gaits were more often classified as expressing happiness (nearly 40 %) than neutral gaits speed-matched to happiness were classified as angry (20 %). This asymmetry was observed even though the velocity of angry gaits (1.80 + 0.25 m/s) substantially exceeded the speed of happy gaits (1.41 + 0.19 m/s). Likewise, nearly 60 % of the slow neutral gaits were classified as expressing sadness rather than fear, an asymmetry that was observed despite the fact that head inclination provides an additional diagnostic cue for the ex-pression of sadness (Wallbott, 1998) – head inclination was never observed for slow neutral walking. Such asymmetries in the confusion patterns suggest that neutral gait lacks emotion-specific postural and/or dynamic features, especially for limb flexion, which appears to be a necessary prerequisite for the attribution of anger and fear. Inter-estingly, previous studies have also indicated a stronger influence of postural cues com-pared to dynamic cues for expressing fear (A. P. Atkinson et al., 2007; Dittrich et al.,

88
1996) and anger (Aronoff, Woike, & Hyman, 1992) than for expressing sadness or hap-piness.
Previous studies have demonstrated an effect of velocity on different movement parameters, even in neutral gait: arm-swing amplitude, for instance, increases with walking speed (Donker et al., 2001; Donker, Mulder, Nienhuis, & Duysens, 2002), and so does the duration of knee flexion during the stance phase (Kirtley, 2006). In order to characterise emotion-specific posture and movement features that go beyond those in-duced by gait speed, we compared the values of posture and movement parameters for emotionally expressive gaits with the same parameters extracted from speed-matched neutral gait. This quantitative analysis demonstrates that for affects associated with high gait velocities, there was even higher movement activity (indicated by the mixing weights in particular for the arm joints) compared to speed-matched neutral gait. Like-wise, for affects associated with low gait velocities, the weights of several source func-tions were decreased relative to velocity-matched neutral gaits, indicating lower move-ment activity than for speed-matched neutral gaits. In summary, these observations en-tail that the emotion-specific movement effects in some sense ‘exaggerate’ the effects induced by emotion-specific speed changes. In contrast with the dynamic features, body posture was hardly affected by gait velocity, and the same posture features were identi-fied for emotions associated with slow speed as for emotions with high speed. Emotion-specific body posture thus appears to be modulated largely independently of gait veloc-ity.
3.5.2 Role of posture and movement features for emotion perception The mathematical parameterisation we developed allowed us to separate posture and dynamic features of emotional gaits. For all tested emotions we found a significant in-fluence of both types of features. For example, as previously discussed, gait speed and other dynamic features strongly influenced the perception of emotion. At the same time, limb flexion represented an important feature for the perception of anger and fear, while the perception of sadness was dominantly influenced by head inclination. In general, critical features extracted from the rating and from the classification experiments were in good agreement with one another. Besides, we found substantial concordance be-tween the prominent movement and posture features extracted by analysing the move-ment trajectories and those features identified in the perception experiments. The third experiment further confirmed this concordance by revealing that the critical features extracted from motor behaviour induced strong aftereffects in the perception of emo-tional gaits. These results imply that the perceptual system efficiently extracts the domi-nant trajectory features from body-motion stimuli. The implication is consistent with other experiments demonstrating that the visual perception of body motion and the un-derlying neural representations are ‘veridical’ in the sense that they reflect the metrics of physical differences between joint-motion trajectories (Giese & Lappe, 2002; Giese, Thornton, & Edelman, 2008; Vangeneugden, Pollick, & Vogels, 2008).
Our findings are in line with previous experiments where observed kinematic features were correlated with perceived emotional expressiveness (Coulson, 2004; de Meijer, 1989, 1991; Montepare et al., 1999; Schouwstra & Hoogstraten, 1995; Sogon & Masutani, 1989; Wallbott, 1998). The finding that posture cues are especially important for the recognition of anger is consistent with the observation that the presence of angu-lar arrangements between body segments influences observers’ attribution of anger to body poses (Aronoff et al., 1992). Vertical body extension appears to encode valence

89
(de Meijer, 1989). A greater reliance on posture cues for the perception of anger and fear as compared to expressions of sadness or happiness fits the observation that full-light presentation improves the recognition of anger and fear expressions more than of happiness and sadness expressions, compared with the recognition of the same stimuli under point-light conditions (A. P. Atkinson et al., 2004). The similarities between the emotionally expressive posture and movement features of our study with those reported in the published literature strongly points to the existence of universals of bodily emo-tion expression.
Our study does reveal a number of features that have not been reported in the published literature, for instance, the widespread posture changes observed during fear expressions, and the leg-movement changes especially during expressions of anger and fear. Another surprising finding was the observation of lateral asymmetries, studied more systematically in a recent study using the same set of trajectories, see Chapter 5, and showing that the left body side is more emotionally expressive than the right (Roether et al., 2008). Together, these observations demonstrate that systematic ap-proaches for an automatic identification of relevant features have the advantage of pro-viding a more complete picture of the posture and dynamic features within the given parameterisation. Previous approaches, based e.g. on sets of pre-selected heuristically defined features and on subjective ratings are prone to missing important information, especially if features are not obvious or intuitive so that observers do not expect promi-nent emotion-specific changes to occur.
Choosing a joint-angle representation of body-movement data also offers ways of testing causal relationships between features and emotion perception. Studying the feature-perception relationship with the statistical techniques of correlation and regres-sion, making use of the variance across actors, is a powerful way of addressing the per-ception of emotional body expressions. But manipulating emotionally neutral move-ments by superimposing on them individual features extracted by analysing emotionally expressive movements and testing the consequences for perception allows us more di-rect experimental tests of the relationship between features and emotion perception. Essentially, we designed emotional gaits by adding individual emotion-specific move-ment and posture features to the trajectories of neutral gait, testing whether only includ-ing the largest and most consistent features would be sufficient for inducing an emotion percept. In fact, not only were our artificially emotional stimuli effective at inducing high-level aftereffects in the perception of bodily emotion expression, shifting the dis-crimination performance in directions consistent with high-level adaptation of emotion perception. The role of the movement features we extracted was indeed such that the adaptation effect they induced did not significantly differ in size from the adaptation effect induced by natural emotional gait. These results certainly validate the characteris-tics we extracted by movement analysis as key features for the perception of emotion from gait. Furthermore, it shows that individual movement features can be used in the sense of a ‘generative grammar’ of emotional gait. We thus provide a description of relevant changes which, when applied to neutral body movements, will generate emo-tional expressive gait. Unlike modulating the emotional expressiveness of gait by morphing between neutral and affective prototypical movements, in this case the rele-vant posture and kinematic parameters were described in an abstract, inter-individual sense. This type of description raises the possibility of even transferring the relevant changes to different movements or skeletons, with wide applicability e.g. in the field of computer animation.

90
3.5.3 Implications for the relationship between different affects Expressions of both fear and anger were characterised by increased limb flexion (in particular elbow and hip joints) compared to the emotions happiness and sadness. Emo-tions related to danger thus seemed to be associated with increased postural tension. Increased muscle tension has been reported during the experience of angry and fearful states: experience of anger is associated with feelings of tension and bodily strength (Bartlett & Izard, 1972), and the intensity of the subjective experience of fear correlates with the degree of contraction of different facial muscles (Izard, 1977). Besides, muscle contraction and body rigidity represent prominent characteristics of the subjective ex-perience of hypnosis-induced fear (Bull, 1951). Such increases in muscle tension seem appropriate in the light that anger and fear represent states related to the organism’s preparation for attack or flight actions. The posture adopted by an individual might thus be part of a preparatory response of the organism, potentially associated with an activa-tion of the sympathetic nervous system (Gellhorn, 1964). We have to leave to specula-tion whether the importance of posture cues for the perception of fear and anger expres-sions has evolutionary origins (A. P. Atkinson et al., 2007), e.g. being advantageous for a fast processing of emotions that are relevant in dangerous situations (‘alarm hypothe-sis’) (Walk & Homan, 1984), or whether they simply represent the cues we most readily observe or processe with the greatest ease.
The postural similarities discussed in the above paragraph contrast the similari-ties in movement between the affects: happiness and anger are similar in terms of movement (both are fast and large), and so are fear and sadness (both are small and slow). The observers’ particularly strong reliance on limb posture for the perception of anger and fear suggests that the analysis of posture cues helps disambiguate emotions that are associated with similar dynamic cues or, more generally, movement activation. So it seems conceivable that observers, faced with a movement expressing one of the four tested affects, perform the following two steps when deciding which emotion is being expressed by a moving body: the speed and amplitude and movements determine whether an activated or a deactivated affect is expressed; posture cues, especially ex-tremity flexion, then determine whether the activated affect is anger or happiness, or whether the deactivated affect is fear or sadness (both times in order of decreasing joint flexion). Fitting with this model, we found that confusions between affects mostly oc-curred with the other affect sharing a similar movement speed and amplitude (i.e. anger mostly confused with happiness, and vice versa; sadness mostly confused with fear, and vice versa). Besides, when we presented neutral gait speed-matched to emotional gait, we found that subjects attributed sadness to neutral gaits speed-matched to fear expres-sions – presumably because the relevant posture features were missing, even though the telltale head inclination was not present in these stimuli. I would like to suggest that if we wish to treat emotions in terms of a model of two underlying dimensions, then for bodily emotion expression, the relevant dimensions should be activation-deactivation and a hostility or fight-or-flight dimension. The latter would be associated with more or less tendency for hostile interaction, and expressed in terms of more or less tense mus-cles and flexed extremities. Vertical body extension represents an additional informative posture cue for this discrimination: head inclination differentiates especially between fear and sadness, and experiments could and should be performed to test which of the cues is more important for observers.
Compared with facial emotion expression, where there is a tendency for confu-sions according to valence, the perception of bodily emotion expression reveals a high

91
probability of confusion according to activation level. Our finding that postural tension in the limbs could serve as a cue for discriminating affects sharing a similar activation level contrasts previous accounts which have assumed that (for non-facial expressions) posture might carry information about gross affect state, while body movement reveals information about the nature of the emotion (Ekman & Friesen, 1967).
3.5.4 Outlook and limitations The methodology we developed for assessing critical features in motion stimuli can be applied to a broad field of studies on body movement, far beyond the domain of emo-tional body expressions. In terms of applications for the statistical methods we propose, sparse regression could also be applied to extract features influencing observers’ ratings for completely different types of stimuli. The method we applied for the parameterisa-tion of dynamic features of body-movement trajectories carries the advantage, com-pared e.g. to methods such as Fourier series, of not being restricted to periodic move-ments. It has been successfully applied for the modelling of highly complex non-periodic movements, including even martial-arts techniques (Mukovskiy, Park, Omlor, Slotine, & Giese, 2008). Our methodology could also profitably be applied for other purposes within the domain of body motion, including the study of the attractiveness of body movements, or of communicative body expressions. Besides body movement, the same method can also be applied to the study of dynamic facial expressions (O'Toole et al., 2002).
Beyond the transfer of methodology, several future studies are motivated by limitations of the present study. Firstly, we only tested a small class of movements: gait expressing four emotions. The investigation of more general principles of emotional body expressions, allowing the establishment of potential ‘universals’ of dynamic body expressions, similar to the previous work with facial expression of emotion (Ekman, 1992), critically requires the study of much broader movement classes, including in par-ticular non-periodic movements, communicative gestures and goal-directed actions (Grezes et al., 2007), as well as the study of a larger number of expressions. Differences across cultures and over varying contexts, specifically including spontaneous emotional expressions recorded in naturalistic scenarios would be informative (Kleinsmith, De Silva, & Bianchi-Berthouze, 2006). Likewise, the adaptation experiment reported in Section 3.4 had to be limited to two emotions. In the context of an extended experimen-tal study, the same approach could easily be applied for a detailed comparison of many different emotion pairs, and by including different sets of informative features for each emotion.
A second line of possible further work concerns the question whether the rela-tionship between the movements we studied and emotional body expressions is actually bidirectional. Although all actors underwent mood induction prior to recording, and although observers could usually recognise the intended affect, neither of these results unequivocally proves that these movements represent universally valid bodily expres-sions of emotion. A first indication of the specificity of the expressions is provided by our finding that emotion classification was not strongly affected by including neutral as a stimulus and response category. The vast majority of neutral gaits were classified as neutral, which shows that there are characteristic differences between neutral body movements and emotionally expressive body movements that observers can use to dis-tinguish between them. This is an important result in the light of the finding that ob-servers in a forced-choice situation attribute emotional states with above-chance consis-

92
tency even to simple, static geometric shapes (Pavlova et al., 2005). A conclusive an-swer to the question of the relationship between expressive body movements and emo-tions would require monitoring the emotional experience of the actors more closely, perhaps by parallel assessment of psychophysiological measures (Cacioppo, Berntson, Larsen, Poehlmann, & Ito, 2000). In the absence of such data, one might also consider subjective mood ratings as a possible method for the assessment of the affective changes that were experienced by the actors. We chose not to collect such subjective ratings for fear that this additional introspective step disturb the immediacy of the ac-tor’s emotional experience. Besides, subjective reports of mood states are subject to strong demand effects, actors being inclined to exaggerate their experienced mood change, presumably in order to conform with the experimenter’s intentions (Westermann et al., 1996).
Third, the nature of the stimulus material is a key issue in any study of emotional expression, since it strongly influences the scope and validity of the conclusions to be drawn from the study. In order to record expressions as close as possible to spontaneous expressions of emotion, we chose not to record the movements of professional actors. Although skilled at producing highly expressive body movements, professionally trained actors potentially use overlearned, stereotypical ways of emotional expression they know to evoke the intended reactions in observers. Individuals from the general population, without any acting experience, would represent the other extreme. One half of our dataset was recorded with such novices, the other half was performed by univer-sity students who had at most two years’ experience with acting in lay theatre groups, but who had received no formal acting training. Although the latter group reported less inhibition during the recording of emotional movements than did the novices, we com-bined their data for analysis throughout this study since there were no statistically sig-nificant differences in recognisability between the movements executed by the two groups. However, it remains an interesting question for future research which are the possible differences between emotional expressions recorded with naïve and profes-sionally trained actors.
Fourth, the majority of our analyses were based on correlations between ob-served natural differences between trajectories and emotion perception. An exception was Experiment 3 with which we studied the causal relationship between selected emo-tion-specific features and the induced emotion-specific adaptation effects. The method-ology we developed, which at the same time provides a generative model for emotional body expressions, opens up a whole range of possibilities for detailed studies investigat-ing causal relationships between movement features and perceptual judgments. Such studies could investigate the relationship between parametric variations of individual features and their perceptual effects. Finding out how such features are integrated seems an especially interesting question, and ideal-observer models exploiting Bayesian ap-proaches for cue fusion (Ernst & Banks, 2002; Knill & Richards, 2008; Maloney, 2002) provide a powerful approach for such questions (Roether, Omlor, & Giese, 2009).
Finally, a potential limitation of our study lies in our features’ being defined on the basis of the three-dimensional joint trajectories. One might validly object that fea-tures relevant for visual perception be defined in the domain of two-dimensional images and that they are not necessarily related to the structure of the joint trajectories, at least not in a simple way. It thus seems interesting to compare the results from our or related studies (Pollick et al., 2001; Sawada et al., 2003) with future studies that try to extract informative features directly from image sequences, e.g. by extending techniques such

93
as classification images (Eckstein & Ahumada, 2002) or ‘bubbles’ (Gosselin & Schyns, 2001) to space-time (Lu & Liu, 2006; Thurman, Giese, & Grossman, 2010; Thurman & Grossman, 2008).
3.5.5 Outlook to Chapters 4 and 5 The work described in Chapters 4 and 5 is directly motivated from findings described in the current chapter, as follows. Our finding of a large number of different expressive features for each of the tested emotions motivates the work I describe in Chapter 4, where we specifically investigate the integration of information over different spatial components of the stimulus. This work is in analogy with Bayesian cue-fusion models (Ernst & Banks, 2002; Knill & Richards, 2008; Maloney, 2002) designed to study the integration of different informative cues in comparison with ideal-observer models (Roether, Omlor, & Giese, 2009). In the cue-fusion experiments we also centrally use the hypothesis that integration ought to be closer to optimal if the components match those extracted from an analysis of motor behaviour than when they conflict the com-ponents extracted from motor behaviour. Such a finding would be consistent with the hypothesis that the perception of body movements is based on an internal simulation of the underlying motor behaviour (Gallese, 2006; Wolpert, Doya, & Kawato, 2003). We derived components congruents with motor behaviour from the analysis reported in Sec-tion 3.3.1, namely, that the movement changes due to emotional expression affect paired joints in similar ways on both sides of the body. In the cue-fusion experiments we vary the emotion content of body parts separately, by motion morphing, and study the perceptual integration over these spatial components.
The work reported in Chapter 5 is based on one specific observation: a move-ment asymmetry between the left and right side of the body during emotional expres-sion (Section 3.3.1.3 and Figure 3.4). This finding resonates with a sizeable literature on asymmetries in the expressiveness (Borod et al., 1997; Sackeim et al., 1978), and possi-bly also of physical asymmetries (Nicholls et al., 2004) of the left and right side of the face during emotional expression. Studies investigating this effect are usually based on chimeric facial expressions, which are generated by cutting a picture of an expression along the vertical midline, and replacing one hemiface with the mirror image of the other to create a full face containing only information normally appearing on the left (left-left chimera) or on the right (right-right chimera) hemiface. Findings of facial-expression asymmetry are intriguing to neuroscientists since they match hypotheses about hemispheric dominance for the control of emotional expression (Adolphs, Jansari, & Tranel, 2001; Davidson, 1992; Heberlein, Adolphs, Tranel, & Damasio, 2004). How-ever, some major confounds complicate the inference from facial-expression asymmetry to a dominant role of the right hemisphere in the control of emotional expression: for instance, incomplete crossing of the efferences to the expressive facial musculature (Rinn, 1984) or hemispheric differences in the control of even non-emotional move-ments (Chaurasia & Goswami, 1975; Moscovitch & Olds, 1982). If we could identify similar left-right asymmetries in bodily emotion expression, then the dominant role of the right hemisphere in the control of emotional expression would be considerably strengthened, independent of the specific effector.

94
3.6 Appendix: Details of mathematical operations
3.6.1 Computation of blind source separation As described above, we modeled the trajectories by applying a blind source separation algorithm that learns independent components that are linearly combined with joint-specific time delays (Omlor & Giese, 2007a, 2007b). The joint-angle trajectories xi(t)were thus approximated by linear superpositions of the statistically independent source signals (basis functions) sj(t), weighted by the mixing weights ij (Equation 3.2). The model incorporates phase differences between different degrees of freedom by allowing for time delays ij between source signals and angle trajectories:
).()(1
ij
n
jjiji tstx τα −=
= (3.2)
Exploiting the framework of time-frequency analysis (Wigner-Ville transform) and critically the fact that the sources are mutually uncorrelated, this relationship can be transformed into the following identities for the Fourier transforms of the trajectories and the source signals (Omlor & Giese, 2007a):
( ) ( ) ,222 ωαω jj
iji FsFx = (3.A1)
( ) ( )( ) ( ) ( )( ) .argarg 222 +∂∂=
∂∂
ijjjj
ijii FsFsFxFx τωω
ωαωω
ω (3.A2)
These two equations can be solved by consecutively iterating the following two steps until convergence is achieved:
1) Solving Equation 3.A1, by applying source separation methods with additional positivity constraint, such as non-negative PCA (Oja & Plumbley, 2003), posi-tive ICA (Hojen-Sorensen, Winther, & Hansen, 2002) or non-negative matrix factorisation (NMF) (D. D. Lee & Seung, 1999). This is justified by the fact that the only difference between Equation 3.A1 and the standard instantaneous mix-ing model of standard PCA or ICA is the fact that all variables are non-negative.
2) Solving Equation 3.A2 numerically, given the results of the preceding step. The solution provides the unknown delays τij and the phases of the Fourier trans-forms of the source signals arg(Fsj). To separate these two variables, we esti-mate τij in a separate step which is then iterated with the solution of Equation 3.A2.
This separate step for delay estimation exploits the phase information in the Fourier domain. The Fourier transform of a delayed signal simply corresponds to the original Fourier transform multiplied by a complex exponential that depends on the time shift. Assuming the signal x2(t) is a scaled and time-shifted copy of the signal x1(t), such that x2(t) = αx1(t-τ), the following relationship in the Fourier domain holds (z specifying the complex conjugate of z):
( ) ( ) ( ) .22121
τωπωαωω ieFxFxFx =⋅ (3.A3)

95
Equation 3.A3 implies that ( ) ( )( ) πωτωω 2arg 21 =⋅ FxFx , which has to hold for all fre-quencies. The delay can thus be estimated by linear regression, concatenating the equa-tions for a set of different frequencies, τ specifying the slope of the regression line. Equation 3.A3 shows how the complex phase of the cross-spectrum is connected with the unknown delay τij.
If the two signals x1 and x2 are influenced by Gaussian additive noise, it can be shown that the delay can be estimated by linear regression using the equation
( ) ( )( ) ( ),2arg 21 ωεπωτωω +=⋅ FxFx (3.A4)
where ε (ω) is a composite noise term. Under appropriate assumptions, the estimated slope 2πτ of this regression line is the best unbiased linear estimator (Chan, Hattin, & Plant, 1978).
Since the time delays for the individual joints varied only weakly between the different emotions (Omlor & Giese, 2007b), we constrained all delays belonging to the same joint across all emotions to the same value (i.e., τij = τkj if i, k specify the same joint and source, but different emotions). This constraint resulted in a higher interpret-ability of the mixing weights. Assuming we want to estimate a common delay from the time shifts between a reference signal x0(t) and the signals xl(t), 1 l L, we can con-catenate all regression equations belonging to the same joint into the vector relationship
( ) ( )( )( ) ( ),2arg 101 ωεπωτωω +⋅=⋅= ≤≤ uFxFxc Ll (3.A5)
where the vector c contains the values of the cross spectrum for the different signals, and where u is a one-element vector. Concatenating these equations over different val-ues of the frequency ω results in a regression problem from which the joint delay can be estimated in the same way as from Equation 3.A4.
3.6.2 Generalized cross-validation The sparseness parameter λ in Equation 3.6 is a free parameter of our analysis method. Large values of this parameter result in highly compact models with few features, but limited approximation quality, while small values lead to better fitting models with more features. It is only natural to ask if there is an optimal value for the choice of this parameter, which results in an optimal trade-off between prediction error and model complexity.
In statistics, several methods for optimal sparsification have been developed. One of them (Tibshirani, 1996) is based on minimising the generalized cross-validation (GCV) error of the sparsified model. It can be shown that the GCV error is given by
( )( )
,1
2
2
2
−
−=
npn
XYGCV
λλ (3.A6)
where p(λ) signifies the number of active parameters of the model and n is the number of variables (dimensionality of β). The number of active parameters is given by the rela-tionship
( ) ( )( ) 011 nXWXXXtracep TT −+= −−λλ (3.A7)

96
with W-1 the generalised inverse of the matrix W = diag(2| j|) and n0 signifying the number of zero entries in the vector of regression coefficients (i.e. j = 0). This number is determined by solving the constrained regression problem described in Equation 3.6 for all values of the sparseness parameter . An optimal estimate for the sparseness pa-rameter opt can thus be determined by solving the minimisation problem
( ).minarg λλλ
GCVopt = (3.A8)
3.6.3 Performance of novel blind source separation algorithm One might object that the results reported in the current chapter were critically depend-ent on the chosen unsupervised-learning method, or that we should have used simpler, classical algorithms such as PCA or Fourier analysis for trajectory representation. To counter such objections, we validated the performance of the novel algorithm by re-analysing the data in exactly the same way as before, now using a different type of tra-jectory model, but matching the number of estimated parameters. Thus, we compared the novel algorithm with standard PCA and ICA, and Fourier PCA, a technique that combines PCA on the postures frame-by-frame with modelling of the weights of the eigenvectors by truncated Fourier series (Troje, 2002). The results obtained by applying sparse regression to PCA components are shown in Figure 3.4C. The features extracted with this technique did not match well with the psychophysical results from the previ-ous literature: a number of relevant features were not detected, while in other cases the signs of the weight changes did not match the signs of perceived joint-amplitude changes (‘+’ and ‘−’ signs). This finding was in stark contrast with those obtained using the new algorithm (reaching a perfect match (100 %) with previous results from percep-tion studies in the sense that all features we found reported were also detected by our algorithm; see above). PCA and Fourier-PCA resulted in only 25 % and 15 % matching features, respectively.
The above comparison strongly supports the hypothesis that highly compact tra-jectory models that avoid redundant terms are advantageous for identifying informative features since they avoid distributing the variance over a large number of parameters. This finding reflects a fundamental principle of statistical learning theory: the stability of statistical inference (in our case about informative features) increases when the ca-pacity (complexity) of the underlying model is restricted or minimised (Vapnik, 1999).
97
Chapter 4 Feature integration in emotion perception
Every resultant is either a sum or a difference of the co-operant forces; their sum, when their directions are the same – their dif-ference, when their directions are contrary. Further, every resul-tant is clearly traceable in its components, because these are homogeneous and commensurable. It is otherwise with emer-gents, when, instead of adding measurable motion to measurable motion, or things of one kind to other individuals of their kind, there is a co-operation of things of unlike kinds. The emergent is unlike its components insofar as these are incommensurable, and it cannot be reduced to their sum or their difference.
GEORGE HENRY LEWES. (1817 - 1878) Problems of Life and Mind (First Series),
vol. 2, p. 412.
Emotions represent infinitely complex states affecting us in many ways, and on many levels, both mentally and physically. A frightening stimulus or situation that you sud-denly encounter will very likely change your conscious feeling state and evoke in you an impulse for behaviours to fight or escape from said stimulus or situation. You might experience changes in blood pressure and heart rate, your skin might flush and your muscles become tense. Your movements may become fast and jerky (if you experience panic) or small and tentative (if feeling apprehensive), and there may be characteristic changes to your voice. Many of these changes are likely cues used by an observer trying to judge your emotional state. But how does an observer integrate over the many differ-ent emotion cues available? The integration of emotion-related information over the extent of the human body is addressed in the current chapter. It follows naturally from the question of which features or characteristics are used for perceiving emotionally expressive body movements, which was addressed in Chapter 3, in which I presented work describing features observers use when perceiving emotions expressed in human body movement. In Chapter 4 I specifically address the question of how observers who have multiple cues available to judge emotional expressions integrate over these differ-ent cues.
4.1 Introduction Many types of perceptual judgements are based on the integration of information from diverse sources. In the visual domain, typical examples include the perception of depth or of illumination (Blake, Bülthoff, & Sheinberg, 1993; Nawrot & Blake, 1993; B. J. Rogers & Collett, 1989; Tittle, Todd, Perotti, & Norman, 1995; Turner, Braunstein, & Andersen, 1997), or the integration of information from different sensory channels, e.g. haptic and visual cues to size (Ernst & Banks, 2002). Research aimed at modelling the integration of different sources of information as weighted averages or by Bayesian

98
modelling is long-standing. The usual finding of such studies is that humans integrate different types of information in a statistically optimal way. The visual perception and recognition of objects, something that we do both continuously and effortlessly, can also be construed as a perceptual problem based on multiple informative cues. This ap-proach is evident when considering hierarchical models of object recognition, where the extraction of individual meaningful features from input stimuli is posited as a mecha-nism serving to achieve object constancy despite identity-irrelevant appearance changes. Thus, object and scene perception have been formulated in terms of a Bayesian frame-work (Kersten et al., 2004; Kersten & Yuille, 2003).
For the purpose of studying the integration of information for the perception of emotional body expressions, i.e. to assess how we integrate emotion-specific movement aspects over different parts of the body, we defined different spatial components of the moving body as features; the components were defined according to results presented in Chapter 3. We used motion morphing between prototypical neutral and emotional movements to vary the information that each of these cues individually contributed about emotional expression, and investigated how human observers integrate the emo-tional information over spatial features in the stimulus, describing a model for percep-tual integration.
4.1.1 Modelling feature integration in visual perception: Types of modelsThe multitude of potential cues available supporting face perception, combined with the unreliability involved in any visual estimate of a cue, raises the question of how differ-ent individual cues are combined by observers during their perceptual judgements. One domain in which the question of cue integration has traditionally been addressed is depth perception, where multiple visual cues, with their visual estimates subject to error, are available to observers judging the three-dimensional layout of the environment. Three main classes of models have been proposed to describe the interaction of different visual cues for depth perception: weak-fusion, strong-fusion and modified weak-fusion models (Bruno & Cutting, 1988; H. H. Bülthoff & Mallot, 1988; Clark & Yuille, 1990; Landy & Kojima, 2001; Landy et al., 1995). The models differ in the way that weights are assigned to different cues, and in the rules governing cue interaction. Weak-fusion models assume a linear combination of cues, or weighted averages. Separate estimates of the weights are derived from independent data sources, and linearly averaged for the composite estimate. In contrast, in strong-fusion models, there are no restrictions as to how the different sources of information can be combined. Last, modified weak-fusion models combine properties of these two approaches: assuming weak fusion, such mod-els take into account additional properties of the stimulus input such as viewing condi-tions, cue availability or cue reliability. The modular properties of weak fusion are thus combined with constrained nonlinear interactions, as in strong-fusion models.
For dealing with separate sources of information, the sensory estimate of each of which is associated with noise, what is the optimal rule for cue combination? In this case, optimality is defined as an estimator that fulfils the properties of being unbiased and of having minimum variance. Let’s assume that the observer has unbiased estimates S1 and S2 of two separate cues, and that the errors in these estimates are uncorrelated and have variances σ1
2 and σ22. It can be shown that linear combination of both will
yield the minimum-variance unbiased estimate as a weighted average satisfying (Cochran, 1937)

99
,2211 SwSwS += where21
11 rr
rw+
= and .21
22 rr
rw+
=
The reliabilities of the two cues, r1 and r2, correspond to the reciprocal of the respective variance parameter (e.g. r1 = σ1
-2). No other non-linear combination rule yields a lower-variance estimate if the errors associated with the individual estimators are Gaussian.
Cue-fusion models have been applied for modelling psychophysical data in a number of fields, most notably depth perception (Blake et al., 1993; Nawrot & Blake, 1993; B. J. Rogers & Collett, 1989; Tittle et al., 1995; Turner et al., 1997). The general rationale underlying the studies involves varying the availability of the different cues, and testing how the perceptual estimates of the individual cues relate to the case when all cues are available at the same time. While increasing amounts of depth percept with increasing numbers of depth cues point to integration of information, many of these studies also point to little interaction between individual cues, thus supporting weak-fusion models (Bruno & Cutting, 1988; H. H. Bülthoff & Mallot, 1988; Dosher, Sper-ling, & Wurst, 1986). The results of scaling tasks support the use of approximately line-arly additive procedures by observers, but under conditions of cue conflict, one cue can override the other, as has been shown by the strong preference for binocular disparity over motion parallax for both shape judgement (B. J. Rogers & Collett, 1989) and sur-face detection (Turner et al., 1997).
More recent studies have addressed the influence of cue reliability on integra-tion, assessing whether cue combination for appearance judgements or discrimination performance is statistically optimal (Alais & Burr, 2004; Ernst & Banks, 2002; Gep-shtein & Banks, 2003; Knill, 2003; Landy & Kojima, 2001). Varying the reliabilities of the individual cues and determining the variances for estimates of individual cues when only one cue was informative, they could predict statistically optimal estimates for stimuli with both cues present. The combined estimates are usually found to be very close to statistical optimality. Such reports even exist for integration across different sensory modalities, e.g. for size discrimination through both visual and haptic explora-tion (Ernst & Banks, 2002). The variance parameters of the cumulative Gaussians fitted to the two psychometric functions under the single-cue conditions were treated as esti-mates of the variances of the underlying visual and haptic estimators. From these, size-discrimination performance in the two-cue conditions could be successfully predicted.
4.1.2 Application of feature integration to object recognition It has been shown in the last few years that, besides the well-known applications in the domain of depth perception, Bayesian modelling can inform our understanding of object and scene perception, since both tasks can be treated as problems in which information is integrated over many sources.
Humans recognise objects with remarkable ease and precision, despite the fact that perception operates on the basis of impoverished retinal images of the outside world, and despite changes in the visual appearance of objects due to changes in illumi-nation, viewpoint etc. Much work has dealt with the nature of the representation and processing underlying object perception. One popular class of models of human visual object recognition follows a structural-description approach. Such models claim that object-centered three-dimensional representations are reconstructed from local features in a hierarchical process, followed by identification of their qualitative spatial relation-ships (Marr, 1982; Marr & Nishihara, 1978). Since these reconstructions are not af-

100
fected by changes in viewpoint etc., this process achieves the generalisation and invari-ance required for stable object representations. One of the most prominent structural-description models was put forward in the late 1980s by Irving Biederman (Biederman, 1987). According to his model, scenes and objects are decomposed into their underlying building blocks where the contours show abrupt changes, e.g. of curvature; as building blocks, the model describes a set of 36 three-dimensional ‘geons’ (geometric icons).Properties such as symmetry, curvature or parallelism (which remain constant across viewpoint changes) as well as the geons’ regular shape (which entails good recognis-ability even under partial occlusion) make the geons discriminable even under different viewing conditions. Support for Biederman’s theory is provided by the finding that ob-ject recognition is more strongly impaired by occluding parts that cannot be easily in-terpolated, e.g. edges, than by occluding parts that e.g. follow a straight line.
The dubious robustness and biological validity of the structural-description ap-proach, combined with little success of machine-vision implementations (Nalwa, 1993) were only some of the reasons prompting the development of viewpoint-specific models of human object perception. In contrast to structural-description models, proponents of the image-based approach to human object recognition argue that objects are encoded in terms of the visual information from the vantage point of the observer. By applying ap-propriate generalisation or normalisation strategies such as mental rotation (Tarr & Pinker, 1989) or view interpolation (Poggio & Edelman, 1990), the views are compared with a limited set of stored object views. The results of many psychophysical studies are in line with image-based models: subjects trained to recognise a limited set of view-points of novel objects reveal viewpoint-dependent generalisation patterns (H. H. Bült-hoff & Edelman, 1992; Tarr, 1995), even given highly dissimilar objects (Hayward & Tarr, 1997). Besides, single-cell recordings in monkey inferior temporal cortex have revealed view-tuned neurones preferentially active for trained object views (Logothetis, Pauls, & Poggio, 1995). However, it has been criticised that the relevant experiments are often performed with a narrow stimulus class (H. H. Bülthoff & Edelman, 1992; Tarr, 1995) and that for many image-based models it is not clear how class-level recog-nition can be performed on their basis.
Experimental results do not yield a clear pattern of results in favour of either viewpoint invariance or dependence, but rather – depending on e.g. stimulus class and experimental task – a spectrum ranging from almost complete invariance (Biederman & Gerhardstein, 1993; Tarr, Williams, Hayward, & Gauthier, 1998) to extreme viewpoint dependence (H. H. Bülthoff & Edelman, 1992; Tarr, 1995). A viable model of human object recognition thus likely encompasses elements of both approaches (Jolicoeur, 1990). One of the core building blocks of object-recognition theories is the idea that recognition is based on the extraction of specific features, where the nature of features varies between different types of recognition models. The detection of spatial features is another area to which the cue-combination approach has been successfully applied. Fea-tures such as borders, crucial for many theories of object recognition, can be defined in different ways, e.g. in terms of luminance, colour or texture differences, all of which could be treated as individual cues over which the visual system integrates. With this approach it has been found, for instance, that colour and luminance information appear to make independent contributions to border visibility – since their combined influence can satisfactorily be modelled via probability summation (Frome et al., 1981). Appro-priately, Bayesian modelling has been applied e.g. to the problem of combining differ-ent information sources for object and scene recognition as a way of accounting for the

101
remarkable efficiency with which human observers solve these tasks. It has been shown that object perception, dealing as it does with immensely complex and ambiguous visual images, can seriously profit from incorporating e.g. prior knowledge about objects or about the probability of observing a given object (Kersten et al., 2004; Kersten & Yuille, 2003). We reasoned that the cue-fusion methodology could be employed for modelling how human observers integrate information over individual spatial features during the visual perception of emotional body expressions.
4.1.3 Application to the visual perception of socially relevant stimuli In Chapters 1 and 3 I already introduced published findings relevant to our understand-ing of the role played by individual features in the perception of socially relevant infor-mation. For instance, much effort has gone into studying the expression of emotions in face and body, as well as for the recognition of e.g. gender from emotionally neutral body movements. So which expressive features have been identified, and what kinds of experiments have been performed in order to extract them? Certain spatially restricted features have been shown to support the recognition of facial emotion expressions (Gosselin & Schyns, 2001), such as the raising of the corners of the mouth as a feature for happiness expressions, or wrinkling of the nose as a feature for expressing disgust (Ekman & Friesen, 1978). Modern work on perceiving faces (Bartlett et al., 2002; Han-cock et al., 1996; Valentin et al., 1997) or on the perception of facial emotion expres-sions (Bartlett et al., 2002; Calder et al., 2001) has been strongly based on the applica-tion of unsupervised-learning techniques such as PCA or ICA, providing compact rep-resentations of the input images, while not specifically extracting meaningful features. In terms of body movements, individual stimulus features allow users to infer different types of information, such as the centre of moment in the hip supporting the percept of walker gender (Cutting, 1978; Cutting, Proffitt, & Kozlowski, 1978), while movement kinematics can be used by observers to judge the weight of a box being lifted (Bingham, 1987). Similarly, those who have considered emotional body expressions have right from the start been trying to identify the perceptually relevant stimulus features. The question of which movement characteristics observers base their emotion judgements on thus falls into a long-standing tradition of researchers investigating the relationship between movement features and emotion perception.
In the work described in Chapter 3, we found by analysing movement trajecto-ries that consistent patterns of movement changes can be identified for the expression of different emotions. For example, we found that – matching published reports – the am-plitude of arm swing was strongly increased during the expression of both happiness and anger, while it was reduced during the expression of fear and sadness (Figure 3.4). We further observed that the movements on the left and right side of the body were usu-ally changed in a very similar way, as reflected in the similar average mixing weights for pairs of joints on the left and right side of the body. Besides, we saw that the changes in the upper and lower extremities were relatively independent of each other, especially in the case of happy gait, where arm-movement amplitude is increased rela-tive to neutral gait, while leg movement is not strongly affected. By then considering the relationship between movement characteristics and observers’ emotion perception we could establish a remarkably strong relationship between individual movement and posture features on the one hand and perception (i.e. expressiveness ratings and classifi-cation data) on the other hand, this correspondence reflecting the close link between physical movement features and visual perception.

102
Individual stimulus features can be treated as sources of information. This is im-plied e.g. by the finding that for the perception of facial emotion expressions, in studies where only parts of point-light expressions were shown to observers, certain face areas were more important for recognising a certain expression than others (Bassili, 1978, 1979b). For static pictures of facial emotion expressions, the ‘bubbles’ technique re-stricts the visible part of the stimulus to large numbers of small, randomly sampled patches, allowing conclusions about which parts of the face are especially important for perceiving a given expression (Gosselin & Schyns, 2001; Schyns et al., 2007). Such studies demonstrate that there are emotion-specific patterns of informative face parts, e.g. the corners of the mouth are key for expressing happiness, while observers pay spe-cial attention to the inner corners of the eyebrows during the perception of anger expres-sions. In fact, the bubbles technique has been adapted to point-light walker perception. Temporal bubbles have revealed key events in the gait cycle for perception by human observers (Thurman et al., 2010; Thurman & Grossman, 2008). Given the multitude of expressive cues within a single example of emotionally expressive gait, in this chapter I describe a study investigating how emotion perception integrates over individual ex-pressive features.
4.2 The current study The cue-fusion approach to sensory perception thus appears to be powerfully applicable to many kinds of problems where different sources of sensory information are com-bined. We applied it to the problem of perceiving emotions expressed in human body movement, for a number of reasons. First, a multitude of different expressive cues are available in facial expressions of emotion (Section 1.2.1.1), and previous studies have indicated that human observers integrate the available information over different parts of the face (Bassili, 1978, 1979b). Besides, the cue-fusion approach has been success-fully applied to many different types of perceptual problems, especially in the visual domain. In particular, the applicability of cue-fusion models to the integration of avail-able information and previous knowledge pertinent to object and scene perception (Kersten, Mamassian, & Yuille, 2004; Kersten & Yuille, 2003) indicates that our under-standing of the use of the many different cues to emotion expression could be consid-erably enhanced by formulating it as a cue-fusion problem. In this section I cover how we described and defined the features we considered in the integration study, and since we changed the information about emotion in different parts of the body separately, I also describe here the way in which we applied motion morphing separately to different parts of the body.
4.2.1 Description of features For studying how information is integrated across different spatial components we chose two different ways of dividing the human figure into spatial components. The first division (‘Upper-lower’) was defined by the feature combinations found in the analysis of the motor patterns, which showed that the movement changes in pairs of joints on the left and right side of the body are very similar (Figure 3.4). Comparing the changes relative to neutral walking, arms and legs emerged as separate spatial compo-nents that show emotion-specific changes, especially for happy gait, for which only arm movement exhibited strong emotion-specific amplitude increases, while leg movement was not strongly affected by expressing this affect. Additionally, experiments involving the combination of locomotor actions with other actions have pointed to a relative inde-

103
pendence of the control of upper- and lower-body movement (Ivanenko et al., 2005). The walker was thus separated in the upper and lower half at the level of the pelvis (up-per: head, arms and spine; lower: hips and legs, as shown in Figure 4.1).
Figure 4.1. Sets of spatial components used in the perception experiment. Red lines indicate the two components that specified different amounts of emotion-specific infor-mation. Grey lines denote parts of the figure moving as in neutral walking. (Lines con-necting the point-light walker’s dots were not shown in the experiment.) Top row: Up-per-lower components that are consistent with the features extracted from motor be-haviour. Bottom row: Right-left components consisting of an opposite arm and leg of the walker, violating the right-left symmetry observed in the motor behaviour. The emo-tional style of the head movement is modulated together with the component containing the left arm and the right leg.
Since the design of spatial features was thus inspired by analysis of motor be-haviour, we additionally addressed the question whether such features are particularly efficiently integrated in perception. This prediction was motivated by the popular hy-pothesis that the perception of motor acts, and potentially also of emotions, be based on an internal simulation of the underlying motor behaviour (Wolpert, Doya, & Kawato, 2003). Recognition should thus be most accurate and sensitive if the structure of exter-nal stimuli matches the structure of such internal models as closely as possible. We therefore designed a second type of division (‘Right-left’) explicitly such that it violated the right-left symmetry observed in the analysis of the motor trajectories (Figure 4.1). In this case, the components were defined by one arm and one leg from opposite sides of the body (the head was part of the component containing left arm and right leg). If con-gruence with motor behaviour crucially affects perception, then integration over the motor-congruent features ought to be closer to optimal than integration over the features incongruent with motor behaviour. The chosen spatial components always comprised at least one or more complete limbs of the point-light walker. This ensured a minimum violation of kinematic constraints, confirmed by our informal observation during de-briefing that none of the observers reported the observation of strange-looking kine-matic features or irregularities that would make it difficult to ‘imitate’ the observed movement.

104
For comparison with the ideal-observer models we generated three different stimulus classes by variation of the morphing weights, for each of the two types of divi-sion (Figure 4.1). For the first two classes information about emotion was present only in one of the spatial components (weight combinations with m1 ≥ 0, m2 = 0 or m1 = 0, m2 ≥ 0, where m1 and m2 refer to the contribution of the emotional prototype in the movement of the first and second component of the stimulus, respectively). I refer to these types of stimulus as ‘first-component’ or ‘second-component’, respectively. In particular, these two components for the ‘Upper-lower’ division are referred to as ‘up-per-body’ and ‘lower-body’, whereas the terms ‘left-right’ and ‘right-left’ denote the two component conditions of the ‘Right-left’ component set. The two component condi-tions were used to determine the free parameters of the ideal-observer model. The third condition, which I refer to as ‘full-body’, specified information about emotional style simultaneously for both spatial components (m1 = m2 ≥ 0). The ratings of emotional expressiveness in this condition were predicted from the ideal-observer model and com-pared to the ratings measured with the full-body stimuli. Deviations of a subject’s re-sponses from the predicted statistically optimal ratings were indicative of suboptimal integration of the information provided by the two spatial components.
4.2.2 Methods
4.2.2.1 Motion morphing Different prototypical facial expressions can be grossly different from each other, mak-ing it difficult to study the influence of small image differences on perception. This problem can be overcome by image morphing, allowing researchers to blend between different prototypical images, e.g. a neutral and a happy expression. By specifying the contribution of each prototype to the resulting image, it is possible to create stimuli that differ from each other in very subtle ways, spanning the entire continuum between the prototypes at each end. These latter two characteristics make morphed face images ideal for creating stimuli used in psychophysical experiments. In face-perception research, morphed face images have been used e.g. for investigating the neural representation of faces in monkey inferior temporal cortex (Leopold, Bondar, & Giese, 2006). For facial emotion expression, morphing has been employed particularly to address the question of whether categorical or dimensional accounts better explain the recognition of facial emotion expression (Calder, Young, Perrett, Etcoff, & Rowland, 1996; Etcoff & Magee, 1992; A. W. Young et al., 1997), and to detect subtle perceptual deficits in patient popu-lations (Suzuki, Hoshino, Shigemasu, & Kawamura, 2006).
In a similar way it is also possible to use motion morphing to morph between different movements that differ in style, as is useful for generating stimuli used in psy-chophysical experiments investigating the perception of movement style (Giese & Lappe, 2002; Jordan, Fallah, & Stoner, 2006; Troje, 2002). With such techniques it is possible to blend or interpolate between e.g. a prototypical sad movement and a proto-typical neutral movement (Bruderlin & Williams, 1995; Wiley & Hahn, 1997), in order to create displays that vary in the intensity of expression of sadness. The technique we employed is based on a spatio-temporal morphable model (Giese & Poggio, 2000) that generates new trajectories from different prototypical trajectories by linearly combining them in space-time. We also applied this method in order to generate the continuous change between sad and happy gaits in the discrimination task described in Chapter 3,

105
where we describe high-level aftereffects for the perception of bodily emotion expres-sion.
The operation of the spatio-temporal morphable model is most easily understood by focusing on a single pair of trajectories (Figure 4.2). Imagine, for instance, that one of these trajectories represent the movement of the left knee in neutral walking and that the other trajectory represent the movement of the left knee in sad walking. Each of these trajectories can be thought of as corresponding to a single moving dot in a point-light dsplay. With both trajectories the same length, one could of course create an inter-polated curve by simple spatial interpolation, i.e. by choosing all points lying the same proportion of the distance away from the reference trajectory. A simple example would be all points lying halfway between both curves. The problem with this approach is that style differences between movements can affect both the amplitude and the acceleration of a movement. If, for example, an angry movement has higher amplitude and higher acceleration than a neutral movement (Pollick et al., 2001), then corresponding points (e.g. the point of maximum extension) may be reached earlier in time on the angry movement’s trajectory than on the neutral movement’s trajectory. The morphing algo-rithm we employed accounts for such temporal shifts between movements of different style by establishing spatio-temporal correspondence between movements: the trajecto-ries x1(t) and x2(t), two time-dependent vectors taken from two different movements differing in style, differ from each other by spatial shifts xi(t) and temporal shifts (t), so one can be transformed into the other by
( ) ( )( ) ( ).12 tttxtx ξτ ++= (4.1)
The relevant values for the temporal and spatial shifts are computed by minimising the weighted l2 norm of the temporal and spatial deviations whilst fulfilling the requirement that the resulting novel time axis be monotonically increasing (Giese & Poggio, 2000). With e.g. x1(t) serving as the reference trajectory, it is possible to generate a trajectory that interpolates between the two by choosing a linear weight m for both the spatial and the temporal shifts. The new trajectory is then created as a linear combination of the two original trajectories. Formally, the morphs can be characterised by the equation
( ) kemot,neutralnew 1 xxx ⋅+⋅−= mm (4.2)
where m represents a morphing parameter that determines the information about the emotion contained in the morph. The variables xneutral and xemot,k signify the trajectories of the neutral walk and of the walk with emotion k from the same actor. The multiplica-tion signs indicate linear combination in space-time, rather than the simple linear com-bination of the trajectory values time-point by time-point (Giese & Poggio, 2000). Ap-plying these transformations to the trajectories describing the movements of all degrees of freedom of the body, new full-body movements can be generated that lie on a contin-uum between neutral and emotionally expressive walking. Examples of sad gait at morphing weights 0.2, 0.7 and 1.2 are provided on the enclosed CD (Movies 4.1 to 4.3).
It has previously been shown that this morphing mechanism results in smooth interpolations that lead to the production of natural-looking morphs for different loco-motion patterns (Giese & Lappe, 2002; Giese & Poggio, 2003) and even for very com-plex movements such as karate techniques (Mezger, Ilg, & Giese, 2005). Motion morphing has been used to generate stimuli for many psychophysical experiments ad-dressing the perception of movement style (Giese & Lappe, 2002; Jastorff, Kourtzi, & Giese, 2006; Jordan et al., 2006; Troje, 2002). Studies have shown that the metric of the

106
morphing-parameter space for locomotion patterns closely matches the perceptual met-ric reconstructed by applying multi-dimensional scaling to human similarity judgements (Giese & Poggio, 2003), indicating that the interpolated trajectories also interpolate with respect to their perceived movement style. In fact, a recent study has shown that the visual perception of body motion closely reflects the physical similarities between joint trajectories (Giese et al., 2008).
Figure 4.2. Spatio-temporal correspondence. A pair of sample trajectories taken from the same movement executed in an emotionally neutral (x1(t), blue) and in an angry (x2(t), red) fashion. The angry movement has higher amplitude and higher acceleration than the neutral movement, so without establishing temporal correspondence the blend would not occur between corresponding points on the two curves. Instead, spatial shifts ξ(t) and temporal shifts (t) map between corresponding points on the two trajectories, to generate the interpolated curve (See text for further details).
4.2.2.2 Motion morphing for individual components Deviating from the usual applications of motion morphing, we morphed different spatial components, defined by groups of dots of a point-light figure, separately. This made it possible to specify, for example, strong emotion-specific information for the arm movement, but (low or) no emotion-specific information for the movement of the legs. All morphs were generated by linearly combining the trajectories of a prototypical emo-tional walk (angry, fearful, sad) with the trajectory of an emotionally neutral walk from the same actor.
In order to vary the information content of different spatial components of point-light patterns separately, we applied the same algorithm to the trajectories of subgroups of dots. The parameters m1 and m2 referring to the morphing parameters of two different spatial components, each of them defined by a number of dots of the point-light stimu-lus, one can formally describe the resulting morph by the equations:
( )( ) (2)
kemot,2(2)neutral2
(2)new
(1)kemot,1
(1)neutral1
(1)new
1
1
xxx
xxx
⋅+⋅−=
⋅+⋅−=
mm
mm (4.3)
The variables (i)newx signify the generated trajectories of the dots that belong to spatial
component (i). Likewise, (i)neutralx and (i)
kemot,x signify the trajectories of the corresponding

107
prototypes. By varying the morphing parameters m1 and m2, the information content in the two spatial components can be changed gradually. This change can be applied to both components together and at the same level, i.e. m1 = m2. For this type of stimulus the choice m1 = m2 = 1 defines a morph with full information content in both compo-nents, i.e., corresponding to the emotional prototype, while m1 = m2 = 0 specifies a neu-tral walk. Stimuli with information content only in the first component would corre-spond to parameter combinations with m1 > 0 and m2 = 0, while e.g. the combination m1 = 0 and m2 = 1 defines a stimulus with no content about emotion in the first compo-nent, but full information in the second. The actual morphing parameters used in the different experimental conditions are given in Table 4.1. Full-body, upper-body and lower-body angry gait are provided on the enclosed CD (Movies 4.4 to 4.6).
4.2.2.3 Other experimental details General information about actors, motion capturing, processing of motion-capture data and details of the perception experiment are provided in Chapter 2. The prototype tra-jectories for morphing were selected from the database (details described in Section 2.1), the prototypes selected from the gaits of one individual. We selected one step cycle each from a typical trial of neutral, angry, fearful and sad gait. The actor was a male aged 31 years and 2 months, and he had had several years’ acting experience in a lay theatre group. A pilot experiment with 15 observers showed that the selected emotion prototypes were recognized at a minimum of 80 % correct. The morph weights were adjusted for the individual emotions in order to achieve an optimal sampling of the re-sponse curves, and they are listed in Table 4.1. All stimuli were shown at the walking speed of the neutral prototype used in the experiment. The two sets of components were tested in separate experiments with non-overlapping participants. The participants were students at the University of Tübingen, and they all had normal or corrected-to-normal vision. They were tested individually and paid for their participation. For the Upper-lower components eleven participants (6 male, 5 female, mean age 23.6 years) and for the Right-left components 13 participants (5 male, 8 female, mean age 22.9 years) were included in the analysis.
Each of the two experiments consisted of three blocks, one for each of the three emotions anger, sadness and fear. Order of emotions was counterbalanced across par-ticipants. In each block a total of 330 stimuli was shown, in random order: neutral walk-ing was shown 90 times, and each of the morphed stimuli was repeated ten times. On each trial one stimulus was shown, and the participant performed two tasks: first, for the yes-no task the participant responded whether he/she perceived the movement as neutral (emotion absent) or e.g. angry (emotion present); immediately afterwards, for the rating task a response prompt appeared on the screen after which the participant rated the in-tensity of expression of the target emotion in the stimulus (e.g. ‘how angry?’) on a seven-point scale (ranging from ‘not expressing the emotion’ to ‘expressing the emotion very strongly’), responding by pressing the number keys 1 to 7. When a response key was pressed, a grey screen was shown for an inter-stimulus interval of 500 ms, followed by presentation of the next stimulus. The grey screen was also shown if the subject had not responded after 2.5 consecutively presented step cycles.
Stimuli were presented as point-light walkers consisting of 13 dots, as shown in Figure 2.4. The positions of these dots were computed from the morphed 3-D trajecto-ries by parallel projection, as described in Section 2.3.1. We chose a profile view, the figure always facing to the observer’s left. The walkers were moving as if on a tread-

108
mill, simulated by fixing the centre of gravity of the figures to a constant point in space. The point-light stimuli consisted of black dots (diameter 0.47 deg of visual angle) on a uniform grey background. At their point of maximum extension, the overall figures sub-tended approximately 4 by 8.6 degrees of visual angle.
Upper-lower Right-left Full-body
Component 1 Component 2 Component 1 and 2
All affects All affects Anger, Fear Sadness All affects
0.05 0.05 0.1 0.1 0.05
0.10 0.10 0.2 0.2 0.10
0.15 0.15 0.3 0.3 0.15
0.20 0.20 0.4 0.5 0.20
0.25 0.25 0.5 0.6 0.25
0.30 0.30 0.6 0.8 0.30
0.50 0.50 0.8 1.0 0.50
0.80 0.80 1.0 1.3 0.80
Table 4.1. Morphing weights of the emotional prototypes for the different types of spa-tial components and different emotions. For the second component of the Upper-lower division different weights had to be chosen for sadness than for the other two emotions to ensure an optimal sampling of the rating function, because the recognisability of sadness from the leg movements was smaller than for the other two emotions.
4.3 Model and results: Expressiveness ratings
4.3.1 Cue-fusion model Many perceptual tasks require the integration of multiple sensory cues for making a perceptual decisions. Such cues might arise from the same sensory modality, as in depth perception that integrates diverse cues such as shape and texture, motion, retinal dispar-ity, or from different sensory modalities, as for the integration of haptic and visual esti-mates of e.g. object size. The sensory estimate obtained in presence of multiple cues can often be well approximated by a linear combination of the estimates provided by the individual cues (Alais & Burr, 2004; Knill, 2007; Landy & Kojima, 2001; Landy et al., 1995). Assuming Normal distributions and independence for the individual cues, one can derive the statistically optimal estimator (by maximum likelihood estimation) re-sulting in a linear combination where the cues are weighted by their relative reliabilities (Alais & Burr, 2004; Ernst & Banks, 2002; Hillis, Watt, Landy, & Banks, 2004; Knill, 2003).
We applied the theoretical framework of such cue-integration models to the in-tegration of different spatial cues for the perception of emotional body expressions. To this end, we assumed that, as for the perception of objects that likely integrates informa-

109
tion from different spatial parts or features (Harel, Ullman, Epshtein, & Bentin, 2007; Logothetis, Pauls, & Poggio, 1995), the recognition of emotions from body movements might integrate different spatio-temporal components. Since it was difficult to obtain reliable ratings of emotional expressiveness from stimuli containing only one spatial component (especially for stimuli with emotional information restricted to lower-extremity movement) we did not attempt to estimate the reliability of the individual cue estimates directly. Instead we chose an approach where we directly fitted the model parameters based on the ratings of the Component stimuli, for which the emotion-specific information was restricted to one of the spatial components. We then used this model to predict the ratings of the subjects for the full-body stimuli, where emotional style information was present in both spatial components (Section 4.2). The model pa-rameters were estimated by linear regression.
Details of the linear-regression model are provided in Section 4.6.1. The infor-mation content of individual spatial components was varied by motion morphing, as described in Section 4.1. The morph parameters m1 and m2 thus defined the true emo-tional information content in the spatial components of the stimulus. Subjects rated the emotional expressiveness of each stimulus, defining the perceptual rating. With the as-sumption that the emotional expressiveness ratings obtained from the individual cues are linearly related to the morph parameters mi, and that they are normally distributed, one can derive the model prediction for the rating. Thus, with the perceived emotional expressiveness a linear function of the morph parameters in the individual spatial com-ponents, and assuming that the ratings obtained for a fixed value of the morph parame-ter mi are normally distributed, the parameters of the model can then be estimated by linear regression. The prediction quality or goodness-of-fit of the model was assessed by applying an F test to compare the model prediction with the direct fit to the data. The test compares the difference between the fits of the prediction from the Component stimuli and the fit for the Full-body stimuli. Details of the goodness-of-fit test are pro-vided in Section 4.6.1.
4.3.2 Experimental results: Expressiveness ratings
4.3.2.1 Model goodness-of-fit The results of the expressiveness rating experiments, averaged across subjects, are shown in Figures 4.3 and 4.4. As expected, the rated emotional intensity of the stimuli generally increased with increasing morphing level. This finding implies that the morphing technique was effective in gradually varying the information about emotion contained in the stimuli. In addition, the ratings varied almost linearly with the morph parameters, supporting the adequateness of the linearity assumption that was central for deriving the cue-fusion model in the preceding section.
On a descriptive level, the results for the integration of emotional information over the spatial features can be summed up as follows: for all emotions and for both sets of components, the regression line for the full-body condition always had the steepest slope, indicating that for a given morphing weight the full-body morph received on av-erage higher expressiveness ratings than either of the component conditions. Therefore, our findings were consistent with the assumption that the emotional information avail-able in the visual stimulus was integrated across its spatial extent, or across the different spatial components.

110
The cue-fusion model described in Section 4.3.1 allowed us to test the nature of the integration of information in a formal way, essentially by attempting to predict the results for the full-body stimuli from the integrated results of the component stimuli.
Figure 4.3. Cue-integration results for expressiveness ratings: Upper-lower compo-nents. Upper-lower components corresponded to components extracted from motor behaviour; Upper-body: head and upper extremities; Lower-body: lower extremities. The contribution of the emotional prototype in the stimulus was varied by motion morphing, separately in the different components; remainder of figure was shown mov-ing as in neutral gait. Mean intensity ratings are shown as a function of the morph pa-rameters m1 and/or m2 (linear weight). The first column shows the ratings measured with the full-body stimuli (solid lines) and the prediction from the Upper-body and Lower-body conditions (dashed line). The other two columns show the ratings for the component conditions, central column: Upper-body, right-hand column: Lower-body. Standard errors were not plotted because they were very small (< 0.15). Top row shows results for fearful gait; middle row: angry gait; bottom row: sad gait.
If the ratings for the full-body stimuli coincided with the model predictions from the component stimuli, then this finding would point to optimal integration. As the left-most column of Figure 4.3 and of Figure 4.4 shows, the predictions derived from the model (dashed lines) were generally very close to the real data, but often slightly steeper, which indicates a close-to-optimal but slightly suboptimal integration of the information provided by the individual spatial components. The predictions for the Right-left stimuli were closer to the experimental data than for the Upper-lower compo-nents, which indicates that, opposed to the hypothesis that spatial components that match the ones extracted from motor behaviour are more efficiently processed, we found a more efficient integration of the more figure-spanning components that in-cluded opposite arms and legs.
These results were confirmed by a statistical analysis of the goodness-of-fit of the predictions obtained from the first- and second-component conditions in comparison

111
with the results for the full-body stimuli. Table 4.2 provides a summary of the signifi-cant F values from the model comparison (Section 4.6.1).
Affect Upper-lower Right-left
Angry 67.7 % 38.5 %
Fearful 67.7 % 38.5 %
Sad 18.2 % 38.5 %
Table 4.2. Percentage of subjects with significant deviations (F test) between the rat-ings obtained for the full-body stimuli and the model prediction derived from the first- and second-component condition for the Upper-lower and Right-left component set. In all cases of significant deviation the prediction by the ideal-observer model overesti-mated the results obtained with the full-body stimuli.
Significant F values indicate that the model prediction deviated significantly from a regression model estimated directly from the Test data (i.e., those measured with the Full-body stimuli). The F values ranged from 0.02 to 66.5. The table shows that for more than half of the subjects the ideal-observer model significantly overestimated the emotional-expressiveness rating significantly for the Upper-lower components, while this happened only for about one third of the subjects for the Right-left components.
Figure 4.4. Cue-integration results for expressiveness ratings: Right-left components. Conventions as in Figure 4.3. Right-left components were designed to contrast with features extracted from motor behaviour. Component “left-right”: motion morphing be-tween neutral and emotional prototype for left arm, right leg and head (centre column). Component “right-left”: morphing for right arm, left leg (rightmost column).

112
4.3.2.2 Role of different body parts for expressiveness perception What do the results of our experiments reveal about the emotional expressiveness of different body parts/regions? Mainly the Upper-lower set is relevant in this respect, and can potentially inform us on the differential importance of upper- and lower-body movement for affect perception. Similar slopes for the expressiveness ratings of both components would indicate that both halves contribute approximately equal amounts of information about emotion, while a slope imbalance would indicate e.g. that upper-body movement contributed more to the emotional expression of the entire body than lower-body movement. We found that the slope for the first component, corresponding to up-per-body (i.e. mainly arm) movement, was always significantly higher than that ob-tained with the second (all t > 6.53, d.f. 9, p < 0.001), except for the expression of fear (t8 = 0.96, p = 0.18). Thus, there appeared to be a general importance of the movement of the upper half of the body for perceiving emotional body expressions. However, in-terestingly, the expressiveness of lower-body movement appeared to differ between affects. The gradient of importance was such that for fear leg-movement expressiveness was highest, while for sadness it was lowest at a given morphing level; leg-movement expressiveness for anger expressions fell somewhere in between. A one-way ANOVA on the slopes of the regression lines fitted for the expressiveness ratings of the lower-body component, followed by multiple comparisons, showed that indeed, for a given morphing weight, fearful leg movement was rated as more expressive than either sad or angry leg movement, and angry leg movement was rated as more expressive than sad leg movement (F2, 26 = 14.8, p < 0.001).
With the data pooled over the two different component sets, we tested whether there were differences between the emotions in overall expressiveness. To answer this, we only considered the expressiveness ratings given to full-body stimuli at the maxi-mum morph level. Anger expressions were rated as more expressive than both fearful (t229 > 5, p < 0.001) and sad (t259 > 5, p < 0.001) gait; fear expressions were rated as significantly less expressive than expressions of sadness (t239 = 2.36, p < 0.001). A slightly surprising finding emerged when we compared the expressiveness ratings for the maximum morph level of the full-body stimuli for the two component sets. For sad-ness, the maximum expressiveness rating for the Full-body stimulus of the Upper-lower component set was rated as significantly more expressive than that of the Right-left component set (t259 = 2.18, p = 0.03), but not for fear (t239 = 1.29, p = 0.2) or anger ex-pressions (t229 = 0.11, p = 0.91). This effect might stem from the emotion-related infor-mation being more concentrated in upper-body movement relative to lower-extremity movement for sadness compared to either fear or anger expressions, perhaps due to some kind of holistic perception. The higher expressiveness of isolated sad upper-body movement compared to fear or anger expressions is demonstrated in the higher slope of the regression line of the expressiveness ratings for upper-body stimuli, and lower slopes for lower-body stimuli, for sadness than for the other two affects.
4.4 Model and results: Yes-no/detection data
4.4.1 Cue-fusion model For modelling the yes-no data we assume that the stimulus, represented by the morph weights with which the emotional prototype contributes to the movement of the indi-vidual components, s1 and s2, is represented in the observer’s processing system by the randomly distributed internal variables x = [x1, x2] (see Figure 4.5). The stimulus is

113
characterised by the weight of the emotional prototype in the two components, which we refer to as s1 and s2, respectively. For each stimulus, the observer has to decide whether it is neutral, corresponding to s = 0, or emotionally expressive, corresponding to s = 1, and accordingly classify the trial as ‘emotion absent’, or ‘emotion present’, respectively. We refer to the two corresponding perceptual hypotheses as H0 and H1,and assume that the observer makes an optimal decision based on the available data x.We aim to study the relationship between, ultimately, the stimulus and the perceiver’s decision about the presence of emotional expression.
x1
x2
1
1‚emotionabsent‘
‚emotionpresent‘
decision line
w1
w2
x1
x2
x1
x2
1
1‚emotionabsent‘
‚emotionpresent‘
decision linex1
x2
1
1‚emotionabsent‘
‚emotionpresent‘
decision line
w1
w2
x1
x2
w1
w2
x1
x2
Figure 4.5. Model for the yes-no decision. Each stimulus, characterised by the vector sof linear weights of the emotional prototype in the two components, is represented in the observer’s processing system by a vector x of the perceptual variables correspond-ing to the two components of the stimulus. The observer decides that ‘emotion present’ when x falls to the right of the decision line (orange-shaded region), or ‘emotion absent’ if it falls to the line’s left (area shaded in grey). Model details in text.
Assuming that the observer behaves optimally given the available perceptual data x, the decision can be expressed as a likelihood ratio: the observer should decide for H1 if the value of x is more likely to result from an emotionally expressive stimulus than from a neutral stimulus. Since the two hypotheses are characterised by the true style vectors s = 1 for H1 (emotional) and s = 0 for H0 (neutral), a simple decision rule is given by the likelihood-ratio test, where the observer decides for H1 if
.)0|()1|(
)()(
)(|
|
|
|
0
1 qff
ff
rH
Hq >==
xx
xx
xsx
sx
x
x (4.4)
In Equation 4.4, the positive parameter q defines the decision threshold and rq(x) refers to the region in the x1, x2 plane where the observer will decide for H1 (corresponding to stimulus representations falling in the orange-shaded region in Figure 4.5); func-tions
1Hxf and0Hxf describe the values of x corresponding to the decision for H1 or H2,
respectively.

114
Since the experiment investigated the probability of deciding for H1 (and against H0) as a function of the true emotional style s of the stimulus, the probability of the ob-server deciding for H1 can be computed from:
,d)|()|for HDecide( |1 =qR
fP xsxs sx with { }.)(:)( qrR qq >= xxx (4.5)
From this relationship it is possible to compute the probability of the decision for H1, as a function of s and of the corresponding variances σ1, and σ2, associated with the per-ception of each component. It is given by
+−
+−++
+Φ−=
+−
+−
+Φ−=
+
+−Φ−=
−−
−−
222
212
112
2211
222
212
221
21
222
212
112
2211
2
22
21
21
22
21
22
221
1
1
)(21ln1
1
1)|forDecide(
ssq
ssc
sscHP
σσσσ
σσσσσσ
σσσσ
σσσσ
σσσσ
σσσσ
σσ
σσs
(4.6)
with 22
21
22
212
σσσσσ+
= , and where Φ is the Gaussian error function. Further details of the
relevant mathematical derivations and of fitting the model parameters are provided in Sections 4.6.2 to 4.6.4.
4.4.2 Experimental results
4.4.2.1 General findings The results of the yes-no (or emotion detection) task are shown in Figure 4.6, for the Upper-lower component set, and Figure 4.7, for the Right-left component set, in the same layout as the rating data were presented in Figures 4.3 and 4.4. Similar to the re-sults of the rating study (Section 4.3), we found close-to-optimal integration of informa-tion about bodily emotion expression when the observer’s task was to detect the pres-ence of emotionally expressive movement. The increase of emotion detection rates with the morphing weight of the emotional prototype in the stimulus followed a sigmoidal shape, typical of visual detection. Altogether, this experiment once more demonstrated the validity of using motion morphing to study the perception of emotional body ex-pression, and of applying the cue-fusion approach to the question of how human ob-servers integrate emotional movement characteristics over the spatial extent of the mov-ing human body.

115
Figure 4.6. Cue-integration results for yes-no/emotion detection: Upper-lower compo-nent set. Components (and stimuli) as in Figure 4.3. Mean proportions of ‘emotion pre-sent’ responses are shown as a function of the morph parameters m1 and/or m2 (linear weight). The first column shows the rates measured with the full-body stimuli (solid lines) and the prediction from the upper-body and lower-body conditions (dashed line). The other two columns show the rates for the component conditions (centre: upper-body; rightmost: lower-body). Standard errors were not plotted because they were very small (< 0.05). Top row shows results for fearful gait; middle row: angry gait; bottom row: sad gait.
Generally speaking, we found that observers were more likely to detect the pres-ence of the emotion the higher the linear weight of the emotional prototype in the stimu-lus, and thus, the closer the movement pattern of the stimulus was to the movement pat-tern of an actor’s emotionally expressive gait. This finding was true for both full-body and component stimuli. It implies that for detecting the presence of emotional expres-sion (i.e., deciding whether a given movement is neutral or emotionally expressive), motion morphing between neutral and emotionally expressive gait was a valid approach for varying the intensity of emotional expression of a body-movement pattern. For each emotion, a sharper increase in emotion-detection rate with the linear weight of the emo-tional prototype in the stimulus was obtained for the Full-body condition than for the component conditions. Since the rise was not as steep for the component conditions as for the Full-body condition, these basic findings imply that when seeing the full-body

116
stimulus, observers integrated emotional information across its spatial extent. All these findings were closely in line with the results obtained for the emotional-expressivenessratings (Section 4.3).
Figure 4.7. Cue-integration results for yes-no/emotion detection: Right-left component set. Components (and stimuli) as in Figure 4.4. The first column shows the rates measured with the full-body stimuli (solid lines) and the prediction from the first- and second-component conditions (dashed line). The other two columns show the rates for the component conditions (centre: left-right, rightmost: right-left). Standard errors were not plotted because they were very small (< 0.05). Top row shows results for fearful gait; middle row: angry gait; bottom row: sad gait.
4.4.2.2 Model goodness-of-fit As described above for the ratings of emotional expressiveness, we modelled how ob-servers integrated the emotion-related information over the spatial components of the stimulus when detecting the presence of emotional expression. The validity of the inte-gration of information would be reflected in non-significant deviations between the re-sults of the detection task for the Full-body stimuli and the results predicted from inte-grating the results of the two component conditions. Indeed, we did generally find close correspondence or close-to-optimal integration of emotion-related information between the detection data measured for the full-body condition and the predicted detection data measured with the component stimuli. To test the goodness of the fit between the full-

117
body data and the detection data predicted from the results for the component conditions in a formal way, we compared the fitted with the predicted curve parameters. To this end, we conducted a three-factor multivariate ANOVA with factors Type of component (two levels: Upper-lower, Right-left), Prediction (two levels: measured, predicted) and Affect (three levels: angry, fearful, sad). There was a significant effect of emotion only, for both parameters (“offset”: F1, 112 = 5.19, p = 0.007; “slope”: F1, 112 = 12.40, p < 0.001), reflecting the somewhat steeper rise of detection rate with morphing weight for sadness compared to the other affects. None of the other main effects or interactions reached significance (all F1, 112 or F2, 112 < 1.14, p > 0.29), except for a marginally sig-nificant three-way interaction for “slope” (F1, 112 = 3.03, p = 0.052). Altogether, then, there did not seem to be any major differences between measured and predicted curve parameters for a given affect, entailing that our model was well able to account for the integration of emotion-related information over the spatial extent of the stimulus.
The results described in the above paragraph already point to possible differ-ences in information integration between the Upper-lower and the Right-left component set. This effect relates to the hypothesis we introduced about the perception of features depending on whether they are congruent with features naturally occurring in motor behaviour. We had reasoned that, since the Upper-lower component set was congruent with divisions apparent in motor behaviour, the perception and integration of informa-tion might be different compared to the stimuli of the Right-left component set, which were designed to be incongruent with naturally occurring movement features. To test this hypothesis, we compared the goodness of fit between measured and predicted curve parameters between the Upper-lower and the Right-left component sets. Thus, we con-ducted three two-factor multivariate ANOVAs with the factors and levels as above, but now testing for the three affects separately. We found that for the detection of anger expressions, the prediction for the Upper-lower component set overshot the data meas-ured with the full-body stimuli more strongly than was the case for the Right-left com-ponent set (F1, 38 = 6.43, p = 0.016); this effect did not reach significance for either fear (F1, 46 = 10.10, p = 0.2) or sadness expressions (F1, 40 = 0.093, p = 0.76), although there was a significant interaction with Prediction (F1, 46 = 4.33, p = 0.04), reflecting the find-ing that an overshooting prediction was found for the Upper-lower condition, compared with the undershoot in the prediction for the Right-left condition. Thus, since there was a tendency for greater deviation from the prediction for the Upper-lower compared with the Right-left component set, our results were contrary to our hypothesis that compo-nents consistent with human motor behaviour (i.e. the Upper-lower set, consistent with the statistical analysis of the movement trajectories reported in Chapter 3) be integrated more optimally than those designed to be inconsistent with human motor behaviour (i.e. the Right-left set).
4.4.2.3 Influence of different body parts for emotion detection Similar to the results for the rating task, the results of the detection experiment also demonstrate some points about which body parts were more informative than others for observers trying to detect the presence of emotional expression. Especially the results for the Upper-lower component set showed that the upper and lower half of the body differed in their importance for perceiving emotions expressed in human body move-ment. The detection of sadness, for instance, was almost exclusively related to charac-teristics of upper-body movement. This was reflected in the finding that ‘sadness’ re-sponses to Lower-body stimuli were extremely rare even at the highest morphing

118
weight for the sad prototype in the stimulus (Figure 4.7). In contrast, the detection of both fear and anger rose with increasing morphing weights of the corresponding proto-types in the stimulus, even when applied only to the lower body half.
To test these effects in a formal way, we considered differences in detection threshold, i.e. the linear weight at which the emotional expression is detected in 50 % of trials. For the Upper-lower component set, the emotion-detection threshold was gener-ally lower for the upper-body stimuli compared to the lower-body stimuli (F1, 7 = 17.94, p = 0.004). However, emotion interacted significantly with this factor (F2, 14 = 6.06, p = 0.013), due to the heterogeneity across affects in the detection threshold for the lower-body stimuli: post-hoc comparisons showed that fear was the only affect for which there was no significant difference in detection thresholds between upper- and lower body stimuli. Since for sadness expressions the presence of emotion was detected at much lower thresholds from upper-body compared to lower-body stimuli, we ran a two-way ANOVA (factors: Component – full vs. upper; Affect – anger, fear, sadness) to test whether detection threshold in fact differed between full-body and upper-body stimuli. Only a trend towards significance was obtained for the main effect of compo-nent (F1, 7 = 4.20, p = 0.08).
The above results indicate pronounced differences in the threshold of anger and sadness detection between upper- and lower-body stimuli. Given the design of the Up-per-lower stimuli, however, this does not necessarily entail differences in the role of upper- and lower-body movement for emotion detection, since the change in emotional expression of the upper-body stimuli affected both head and body movement. In con-trast, the results for the Right-left stimuli might allow us to differentiate between the influence of the head and of the rest of the upper body on emotion detection, since for the component stimuli here the emotional expression in the body always affected ex-tremity movement on one body side, with additional changes in head movement only for the component in which left arm and right leg movement was affected, but not for the component in which right arm and left leg were changed. In fact we found that the emotion-detection thresholds were lower for those stimuli of the Right-left component set in which emotion-related variation excluded the head, i.e. the left-right (including head) component compared to the right-left (excluding head) component (F1, 8 = 5.34, p < 0.001) with neither main effect of affect nor affect-by-component interaction reach-ing significance (both F2, 16 < 2.26, p > 0.14). Thus, it seems that unless we assume strong lateral asymmetries in the emotional expressiveness of extremity movement, then we can conclude that the head plays a dominant role for the detection of emotional body expression.
4.4.2.4 Comparison with findings of the rating study The findings we reported for the detection task were almost overwhelmingly concordant with those of the rating task: leaving aside the difference in the shape of the measured curves – approximately linear for the ratings, but sigmoidal for the detection task – we found that both expressiveness rating and detection rose with the linear weight of the emotional prototype in the stimulus; observers integrated the emotional information over the spatial extent of the stimulus and in ways that the different models we applied to the data could well account for. Fear, anger and sadness expressions exhibited, in this order, increasing importance of upper-body and decreasing influence of lower-body movement on emotion perception. Within the upper body, head movement seemed to play a major role for emotion perception: the predicted ratings and detection rates were

119
slightly closer to the measured full-body data for the Right-left component set than for the Upper-lower set. The one major difference between the rating and detection results was found in the direction of the integration error relative to the results of the full-body condition: while for the ratings, the average prediction always overshot the full-body data, this was only the case for the Upper-lower detection data. The predicted detection data for the Right-left component set, at least for fear and anger expressions, were be-low the detection data measured with the full-body stimulus.
4.5 DiscussionWhen human observers perceive emotionally expressive full-body movement, they in-tegrate the emotional information distributed over the stimulus in close-to-optimal fash-ion. We demonstrated this by predicting with Bayesian modelling the rating and detec-tion data of human full-body stimuli from the results of perceptual experiments with stimuli in which the emotional information was restricted to local features. The fits we obtained between the results measured with the full-body stimuli and with their predic-tions were generally very close to each other. This finding entails that we could treat the visual perception of emotional body movements as the perception of other multi-cue visual displays where several sources of information are perceived and the observer makes a perceptual decision based on their individual influence. This finding is note-worthy because the moving human body presents the visual system with processing requirements very different from the fields that our approach was inspired from – the cue-combination approach originally applied for modelling depth perception, and the decomposition of visual stimuli in constituent components that is common in theories of object recognition.
Our study demonstrates that it is possible to restrict the perceptually meaningful aspects of body movement to spatial features in the stimulus without destroying the overall impression of such a seemingly subtle stimulus quality as the expression of af-fect. Dividing up the emotion-related information and only displaying parts of it in a given stimulus leads to reported percepts corresponding in some way to the intensity of the information present in the stimulus. Since the results for both emotional expressive-ness and emotion detectability can be predicted almost perfectly from the rating and detection data of the component stimuli, it seems as though the emotional information was preserved almost perfectly in the component stimuli. The one small blemish to these conclusions might be the relatively low stability of perceivers’ responses to stim-uli in which only leg movement was varied in emotional expression. To mention just one other general finding of importance, we can safely conclude that motion morphing can be profitably applied for studying emotional body expressions. Both expressiveness ratings and detection rates continuously increased with increasing linear weight of the emotional prototype in the stimulus, and there were no reports of unnatural-looking movements at intermediate morphing levels.
4.5.1 Effect of features’ congruence with motor behaviour Besides observing generally good fits between the data measured with the full-body stimuli and the predictions from the data measured with the component stimuli, the de-sign of the above experiments allows testing a difference hypothesis between the two types of component stimuli: specifically, the question whether components in the visual stimulus that match the ones extracted from motor behaviour (as described in Chapter 3) are integrated with different efficiency than components that are inconsistent with the

120
structure of motor behaviour. Given the hypothesis that the recognition of body move-ments is based on an internal representation reflecting the fine structure of motor behav-iour (Prinz, 1997; Wolpert et al., 2003) and studies consistent with this hypothesis (Schütz-Bosbach & Prinz, 2007), one would expect a more efficient integration of the information from components that match the intrinsic structure of such potential internal models. Thus, closer fits would be expected for the components congruent with motor behaviour (i.e., the upper-lower component set) than for those incongruent with motor behaviour (i.e., the Right-left component set). Interestingly, though, the reverse appears to be true for our stimuli, closer fits being obtained for the spatial components incon-gruent with the components extracted from motor behaviour (Right-left) than for the congruent stimuli (Upper-lower).
What differences between the two types of component stimuli might underlie the differences in the integration results obtained with them? Since it is well established that the perception of biological motion is strongly influenced by attention (Cavanagh, Labi-anca, & Thornton, 2001; Thornton, Rensink, & Shiffrar, 2002), attentional effects might be responsible. Thus, while the Right-left components are more spatially extended, po-tentially requiring a broader distribution of attention, the Upper-lower components con-centrate the informative stimulus aspects in either half of the stimulus. This distribution of emotional information might lead to specific types of scanning paths for the lower-body stimuli: it could be that observers usually make their emotion judgments based mostly on the emotional expression of the upper body half; if the arm movement is not informative, then they are induced to consider leg movement more strongly than they would normally do. For the full-body stimuli, which have fully expressive movement in the entire body, observers might fail to consider the full emotional expression of the leg movement, which in a sense is not necessary for their perceptual decision, since upper-body movement is already sufficient for their decision. Lower-body stimuli, where up-per-body movement is uninformative, might induce observers to consider lower-body movement more strongly than they normally would for full-body stimuli, and hence, we get an overshooting prediction when we predict the full-body results from the combined upper- and lower-body results. This hypothesis fits with our finding overshooting pre-dictions for those affects with leg movements judged emotionally expressive (i.e., anger and fear vs. sadness). It also fits with the finding that the overshooting predictions were more pronounced for the Upper-lower component set than for the Right-left component set. This finding would be predicted since for both the left-right and for the right-left component stimulus, there is always at least one emotionally expressive arm in the stimulus. Support for this hypothesis could be obtained by eye-movement recordings showing differences in the scanning paths between the stimulus types.
4.5.2 Influence of different body parts for emotion perception As shown in Chapter 3, characteristic movement features can be extracted from bodily emotion expressions by applying unsupervised learning. The experiments I report in Chapter 4 also bear some implications for the influence of different body parts for affect perception, and we need to consider whether these resonate with the findings reported in Chapter 3. Especially the results of the upper-lower component set are informative in this respect, and provide an important complement to the findings reported in Chapter 3: rather than applying correlation and regression to uncover the relationship between stimulus features and perception, the upper-lower stimuli of Chapter 4 were manipu-lated so as to contain only some of the potentially informative stimulus parts. Thus, they

121
allow us to draw more direct conclusions about the role of individual stimulus features for emotion perception.
Considering only the Upper-lower component set, it seems that for all emotions the movement of the upper body has a stronger influence on emotion recognition and expressiveness perception than lower-body movement has, a finding corroborating our analyses of Chapter 3 (Figure 3.7) and consistent with published studies (Wallbott, 1998). Matching our finding that fear expression has pronounced effects on leg move-ment (Figure 3.3 and Figure 3.4), and that leg movement plays an important role in fear perception (Figure 3.5 and 3.6), we find here that fear expressions of the legs are recog-nised more easily and rated as more expressive than the leg movements of other affects. In contrast, the perception of sadness is strongly dominated by upper-body movement, consistent with the dominance of head inclination (Figure 3.5) and the reduced ampli-tude of arm movement (Figure 3.6) for sadness perception in Chapter 3. For the Right-left component set, the tendency towards higher expressiveness at a given morphing level for that component containing the left arm than for the component containing the right arm (Figure 4.3) may be influenced by the fact that the position of the head was only varied with the former of the components in the Right-left set. It is possible, al-though we did not test it further in this context, that this result is also influenced by ac-tual differences in emotional expressiveness between the movements of the left and right side of the body, which we have demonstrated in the experiments described in Chapter 5 (Roether et al., 2008). But the main effect is likely due to the dominance of head inclination as an upper-body cue for emotion perception.
In the context of the role of individual body regions for emotion perception, it is also necessary to consider the suggested holistic perception of biological motion (Bertenthal & Pinto, 1994; Dittrich, 1993). Thus, it has been suggested that the percep-tion of biological motion and possibly of body shape is based on ‘holistic’ templates. Such hypotheses are based on studies showing that the perception of biological-motion stimuli is strongly degraded if the stimulus display is restricted to parts of the body (Mather et al., 1992; Pinto & Shiffrar, 1999), with similar findings also reported for face perception (Carey & Diamond, 1994; Tanaka & Farah, 1993). We would like to argue that our findings for the role of different informative spatial features for emotion per-ception is consistent with the idea of holistic processing. At least it seems safe to say that while the integration of information over the spatial extent of the stimulus may well be based on holistic mechanisms, we can still define the local information that observers integrate in terms of a limited number of highly informative local features.
4.5.3 Relationship between results for ratings and for detection For the observer, deciding whether a stimulus is emotionally expressive is a different task from rating the intensity with which the stimulus is expressing the emotion. Never-theless, a few important commonalities exist between the two tasks: both expressiveness ratings and detection rate increase with the linear weight of the emotional prototype in the stimulus, and thus, with the similarity between the stimulus and emotional gait. Be-sides, very good fits could be obtained between the full-body results and their prediction from integrating the results measured with the component stimuli. Similar general pat-terns of results can also be observed across experimental tasks: for instance, upper-body stimuli were generally rated as more expressive than lower-body stimuli, and lower-body movement for fear reached, for a given morphing level, both higher expressive-ness ratings and detection rates than it did for sadness or anger. It is interesting that all

122
these similarities exist despite a major difference in the shape of the response curves for the two tasks: the expressiveness ratings increase approximately linearly with morphing weight, while the increase in detection rate follows a sigmoidal curve. Finally, the one major difference between the results of the two tasks was the tendency for rating data of overshooting predictions for both the Right-left and the Upper-lower component sets, while the only strong overshooting prediction was obtained for fear under the Upper-lower condition; for the Right-left component set average overshoots were not ob-served. At this point we have to leave open to speculation whether this difference has implications for the differential validity of the two types of tasks as tests of emotion perception.
4.5.4 Outlook and limitations A number of interesting experimental ideas are generated by the above findings. For instance, eye-movement recordings could be used to study possible attention effects of the stimulus manipulations used. As described above, it would be interesting to test whether observers spend more time viewing the more informative parts of the stimulus, if they usually start scanning at the upper body, and if they tend to focus on the expres-sive arm and leg in the Right-left component stimuli.
Variations of the cue-fusion approach for bodily emotion expression could also be highly informative. For example, varying the reliability of individual cues (Ernst & Banks, 2002) would allow us to test whether the results we found would also adapt to the varying reliabilities. Different feature sets could be designed, or stimuli with space-time bubbles that restrict visibility to small parts of the stimulus (Gosselin & Schyns, 2001; Thurman et al., 2010; Thurman & Grossman, 2008) in order to test more specific hypotheses regarding the role of individual features for the perception of emotional body movements, for instance, the role of individual changes to head movement and posture could be considered. Given that, as we show in Chapter 3, the posture and kinematics of the movements are varied relatively independently of each other, a cue-combination study for such different types of movement effect could also be very inter-esting, especially in terms of dominance of posture over kinematic cues that some of the findings of Chapter 3 appear to suggest. By designing cue-conflict stimuli, e.g. where different spatial features express different affects, it would be possible to test the alarm hypothesis, stating that we are more likely to detect e.g. fear than e.g. happiness since the former represents a relevant danger signal, that has been put forward for the percep-tion of bodily emotion expression (Walk & Homan, 1984). Similarly, facial and bodily expressions could be combined in order to study the hierarchy of importance of the dif-ferent signalling channels. Besides, the experimental and statistical methods we employ are of general applicability and thus could be used to investigate e.g. other problems in emotional-expression research such as the question of how observers integrate over fa-cial expressions and rigid head movements.
Similar to the experiments reported in Chapters 3 and 5, the above study was limited by the range of affects and movement types considered. Potential studies could also be done for morphed facial emotion expressions with parts of the expression frozen (Nusseck, Cunningham, Wallraven, & Bülthoff, 2008). Interestingly, in contrast to the experiments reported in the other two chapters, in this chapter only three negative emo-tions were tested. Happy gait was tested in a small pilot experiment but it turned out that there was too strong a bias for reporting happy gait even when the neutral prototype was shown for applying our models to the data. This finding, though not formally reported

123
here, is probably related to our finding regarding the confusion between neutral and other emotional gaits shown in Table 3.4: in a classification experiment with neutral, angry, happy, sad and fearful gait we observed that the modal confusion for happy gait was with neutral, and vice versa. Although it seems fair to say that neutral and happy body movements are physically closer to each other than neutral movements are to movements expressing anger, fear or sadness, the finding that human observers have a tendency to perceive neutral body movements as expressing happiness does throw a pleasant light on affect perception.
4.6 Appendix: Cue-fusion models
4.6.1 Goodness-of-fit test for the rating data We investigated how human observers integrate information about the intensity of emo-tional expression across individual features of the stimulus. To test whether integration is statistically optimal, we compared the expressiveness rating of emotional gait in the full body (i.e. the ratings for the Full-body stimuli, which I refer to as ‘Test data’) with the intensity ratings predicted from statistically integrating the ratings given to stimuli with individual expressive features (i.e. the ratings for the Component stimuli, which I refer to as ‘Training data’). In the following, I first describe the linear-regression model I use for the rating data (Section 4.6.1.1). The actual test of the goodness of fit between the ratings of the Test data and the ratings predicted from the Training data is described in Section 4.6.1.2.
4.6.1.1 Linear-regression model To test the integration of emotional information across spatial features in the stimulus, we directly fitted the model parameters to the ratings for the Component stimuli (Test data). From these, we predicted the ratings for the Full-body stimuli and compared these with the ratings actually given to the Full-body stimuli (Training data).
Data were given as triples of the two morph levels m1l and m2
l and the rating re-sponse yl for each trial l, and all data fitting was performed within-subject. The data for the first- and second-component conditions, i.e. where the emotion content was only varied in one of the spatial components, were used to determine the parameters of the model (Test data). The full linear-model fit of the rating data is given by
.22110 mwmwwy ++= (4.A1)
If the ratings of the training data are given by the vector TNyy ],...,[ 1=y and if the vec-tors m1 and m2 represent the morph levels for the two component conditions, the weight parameters can be estimated by normal least-squares minimisation of the residual
( ) ( )( ) 22
22110 Mwy −=++−=l
lllF mwmwwywR (4.A2)
with Twww ],,[ 210=w and ].,,[ 21 mm1M = The result of this minimisation is given
through multiplication with the pseudo inverse of M: ( ) yMMMw TT 1ˆ −= . Assuming that the rating data is given by the predictions of the model plus Gaussian noise el that is normally distributed with mean zero and variance 2, and independent over the trials l,the ratings can be represented by

124
.22110ll emwmwwy +++= (4.A3)
It can be shown that the estimator for w is bias-free, with an expected value of w and the covariance matrix ( ) ( ) .ˆCov 21σ−= MMw T Since the data are normally distributed, the estimator is also asymptotically normally distributed. With N representing the num-ber of data points, the unknown variance 2 can then be estimated from the data as
( ) .3ˆˆ 2
−=
NRF wσ (4.A4)
4.6.1.2 Testing the goodness-of-fit To test the goodness-of-fit between the measured and the predicted ratings, the model parameters wi were determined from the Training data (i.e., those for the Component stimuli). In order to determine if these provide a good description for the Test data (Full-body stimuli), we consider the following auxiliary model (concerning the Test data):
( ) ( ) ( ) .22110ll emwmwwy ++++++= γβα (4.A5)
By construction, the new parameters , and now determine the deviation between the model parameters for the Test and Training data. If both models (or parameters sets) coincide, then = = = 0. This situation corresponds to the null hypothesis. The re-sidual concerning the Test data is defined by:
[ ]( )( ) ( ) ( )( )( ) .
,,2
2,21,10 +++++−=
=
l
lTr
lTr
l mwmwwy
RR
γβαγβα
(4.A6)
To test for the equality between measured and predicted data, we perform an overall test of the hypothesis set H0: = = = 0 H1: or or 0. The test statistic for this comparison is an F statistic given by
( )413
−−=
NQQF (4.A7)
with three degrees of freedom in the numerator and (N – 4) degrees of freedom in the denominator and the correlation coefficient between the rating data y and their estimate
β̂ˆ Xy = (Fahrmeir, Hamerle, & Tutz, 1996):
( ) ( )( ) ( ){ } .
ˆˆ
ˆˆ2122 −−
−−=
yyyy
yyyyQ
nn
nn (4.A8)
4.6.2. Model of the perception process Sections 4.6.2 to 4.6.4 cover the integration model for the emotion-detection data. We assume that the stimulus consists of two components, or parts (e.g. upper and lower body), both of which carry information about emotional style. The veridical styles of the two parts are defined by the variables s1 and s2, defining the vector s = [s1, s2]’ and

125
given by the morphing parameters of the two parts. We assume in the following that si = 0 corresponds to neutral gait and that si = 1 corresponds to the natural expression level of the emotional style. The style information present in the stimulus induces in the observer’s processing system a perceptual impression of an emotional style defined by two variables x1 and x2 that characterise the perceived style of the two body parts. These variables define the vector x = [x1, x2]’, which is a random variable (RV) whose distri-bution depends on the true style s. For simplicity, we assume in the following that this distribution is Gaussian, implying that it can be characterised by the density function
,)|( )()')(2/1(1|
1 sxKsxsx sx −−− −
= eNf (4.A9)
where N1 is an appropriate normalisation constant and K represents the covariance ma-trix of the distribution. While the distribution of the RV x depends on the true emotional style of the stimulus, the actual perceived expression varies randomly and can deviate from the true style vector s.
4.6.3. Model of the perceptual decision: emotional vs. neutral The observer’s processing system has to solve the following inference problem: given the percept x, decide whether the stimulus was emotional (H1) or neutral (H0). We will assume that the observer behaves as an ideal Bayesian observer, utilising an appropriate decision rule given the perceptual state x. Since the two hypotheses are characterised by the true style vectors s = 1 for H1 (emotional) and s = 0 for H0 (neutral), a simple deci-sion rule is given by the likelihood ratio test:
Decide for H1 if ,)|()|(
)()(
)(|
|
|
|
0
1 qff
ff
rH
Hq >==
0x1x
xx
xsx
sx
x
x (4.4)
where the positive parameter q defines the decision threshold. In the experiment the probability of deciding for H1 and against H0 is measured as a function of the true emo-tional style, given by the vector s. According to the previous decision rule this probabil-ity rule can be computed from:
,d)|()|for HDecide( |1 =qR
fP xsxs sx with { }.)(:)( qrR qq >= xxx (4.5)
In the following sections, we show that this integral can be computed analytically for different forms of the covariance matrix K, first, for the case of equal variances for all components, K = I/σ2 (Section 4.6.3.1), and second, for the case where the variances σ1
and σ2 are unequal (Section 4.6.3.2).
4.6.3.1 Case of equal variances for all components This section describes the case of equal variances for all components: .2σI=K For the case σ1 = σ2, the density function of the perceptual state is given by:
,)|(2
2||
21
1|
sx
sx sx−−
= σeNf (4.A10)
which implies the following condition for the likelihood ratio:

126
( ) ( ) .ln1'12
1)(ln 2
22
2, qrq >−=−−−= x1x1xxσσσ (4.A11)
The points in x space that fulfil this condition form a half-space that can be mathemati-cally described by { }qxxRq ln1:)( 2
21 σ+>+= xx . The integral in Equation 4.5 can thus be explicitly computed.
We introduce the coordinate transform y = Ax with the symmetric orthogonal matrix
,11
11−
=A (4.A12)
implying y1 = x1 + x2 and y2 = x1 – x2. The transformation matrix A fulfils the two rela-tionships A-1 = (1/2) A and A2 = 2 I and |A| = –2. With the abbreviation qc ln1 2σ+=the integral in Equation 4.5 can be written as
( )
( ) ( )
( )
.d)(
d)(d)(
dd2
d2
d2
d||
1d)|for HDecide(
2)(
12
3
)(1
421
)((4
1
2
1
)(2(4
1
2
)(2(4
12
||1
}:{
|||'||)2/1(2
11
}:{
|)2/1(|2
11
}:{
||2
1
1}:{
||2
1
11
21
21
21
2
212
2112
211212212
2222
2
1
222
1
22
1
212
11
22
∞
+−
−
∞
+−
−∞ +−−
∞ +−−∞
∞−
−−−−
>
+−−
>
−−
>
−−
>+
−−
=
==
=
==
==−
σ
σσ
σσσ
σσ
σσ
ssc
y
ssc
y
c
ssy
c
ssyyssyy
cycy
cycxx
yeN
yeNyeN
yeyeeN
eNeN
eNeNP
s
ss
yy
yA
xs
s
y
sAysy
y
sAy
y
syA
x
sx
(4.A13)
In the above transformations the expressions Ni(s) signify normalisation constants that depend on the style vector s. We introduce the cumulative standardised Normal distribu-tion:
.d21)( 2
2
yezz y
∞−
−=Φ
π (4.A14)
From the limit q → 0, with 1)|for HDecide( 1 →sP and taking into account ,1)( =∞Φ
it follows that the normalisation constant takes on the value π2
1)(3 =sN . Thus, the
probability of the subject deciding for H1 can finally be expressed as
.2
)(ln112
)(1)|for HDecide( 212
211
+−+Φ−=+−Φ−=σ
σσ
ssqsscP s (4.A15)

127
4.6.3.2 Case of unequal variances This section describes the case of unequal variances for all components:
.0
02
2
21=
−
−
σσ
K For the case σ1 σ2, the density function of the perceptual state is given
by
)()'(21
1
)()'(21
1| )|(sxsxsxKsx
sx sx−−−−−−
== eNeNf (4.A16)
with =2
1
00
σσ
. The coordinate transformation Z = Σ−1 X defines a new RV that is
characterised by the density function:
.)|(21
21
22
21
1|
sz
sz sz−−−
= eNfσσ
(4.A17)
For the likelihood ratio according to Equation 4.4 in this case we obtain
,ln21
21)(ln 1
, qrq >−=−= − K11'z1'K11'Kx1'x (4.A18)
defining the region )(zqR in z space for which the perceptual state would result in a decision for H1 against H0. With this result it is possible to compute the probability of deciding that the emotional expression is present given the perceptual state s:
+>
−−
−
−
=K11'z1'z
szzs
21ln:
21
22
21
11
1
21
d)|forDecide(q
eNHPσσ
(4.A19)
We introduce the orthogonal transformation matrix
−= −−
−−
11
12
12
11
σσσσ
B (4.A20)
that fulfils ( ) 122
21
1 −−−− += σσBB and ( )IB 22
21
2 −− += σσ . Furthermore, its determinant is given by the expression ( )2
22
1|| −− +−= σσB . By introducing the new variable w = Bz
the decision region )(zqR is transformed into the region +> K11'w21ln: 1 qw . Using
the equation ,21ln K11'+= qc the last integral can be transformed into:

128
( ){ }
( )
( ) ( )
( )∞
+
+−
−∞
+−
+−
∞+
+−
−∞
∞−
+
−−−
>
+−−
+>
−−
−−
−−
−−−−
−−
−
−−
==
=
=
=
22
21
22
221
1
21
22
221
1
22
21
21
22
21
122
221
121
22
21
22121
22
1
22
21
12
1
211
12
412
3
12
2
22
2
2
:
2'2||
2
21ln:
21
22
21
11
)()(
)(
d)(
d||
)|forDecide(
σσ
σσσσ
σσ
σσσσ
σσσσ
σσ
σσ
ssc
w
ssc
w
c
wsswwssw
cw
qw
dweNdweN
dwedweN
eN
eNHP
ss
s
ws
wB
s
w
Bwsw
K11'w
swB
(4.A21)
Again, the terms Ni(s) signify normalisation constants that depend on the style vector s.
The relationship ∞−→c
lim P(Decide for H1 | s) = 1 implies that ,21)(4 π
=sN allowing us
to derive the final probability of the subject’s decision for H1 given s:
.)(21ln1
1
1)|forDecide(
222
212
112
2211
222
212
221
21
222
212
112
2211
222
21
21
22
21
22
221
1
1
+−
+−++
+Φ−=
+−
+−
+Φ−=
+
+−Φ−=
−−
−−
ssq
ssc
sscHP
σσσσ
σσσσσσ
σσσσ
σσσσ
σσσσ
σσσσ
σσ
σσs
(4.A22)
For the special case of equal variances, ,21 σσσ == Equation 4.A22 yields Equation 4.A15, which was derived in Section 4.6.3.1.
4.6.4 Parameter fitting We assume that the probability of a decision for H1 given the stimulus parameters was measured in the experiments. The probabilities )|forDecide( 1 nn HPP s= were meas-ured for given values of the parameter vector sn, forming a dataset { } Nnnn P ≤≤1),(s with Ndata points. The parameters can be estimated exploiting the fact that the arguments of the function )(xΦ in Equation 4.A15 and Equation 4.A22 are linear in the vector ele-ments s1 and s2. Therefore, they can be estimated by fitting to the data a linear regres-sion model of the form
.)1( 221101 sasaaPn ++≈−Φ− (4.A23)
The parameters of the statistical models can be computed from the estimated regression coefficients. The estimation of the parameters of Equation 4.A15 is straightforward and

129
thus not further discussed here. In order to estimate the parameters σ1, σ2, and q in
Equation 4.A22 we start from the relationships 21
2221 σσ=aa and 2
221
211
σσ +=aa .
Since22
211
21
σσσσ
+=a and
22
212
12
σσσσ
+=a , it follows that
.)(
1,)(
1
212
22
211
21 aaaaaa +
=+
= σσ (4.A24)
The last unknown parameter follows the relationship
+++
= −− )(21ln 2
22
122
21
210 σσ
σσσσ qa , which can be solved for q taking into account
Equation 4.A24:
.2)(
)( 21021
+−+
=aa
aaaeq (4.A25)

130

131
Chapter 5 Asymmetry of bodily emotion expression
The great pleasure and feeling in my right brain is more than my left brain can find the words to tell you.
ROGER SPERRY (1913 – 1994)
In Chapter 3 I described some movement asymmetries between the left and right side of the body (Figure 3.4). We chose to investigate this matter further, since it resonates with a sizeable literature on asymmetries between the left and right side of the face for emo-tional expression. At this point I first review some of the relevant literature, covering a range of modalities and methodologies, including findings with brain-lesioned patients and from psychopathologies as well as with healthy individuals, I also consider brain-imaging and peripheral psychophysiological studies, visual (and other) perception and, most importantly, the production of facial expressions of emotion.
5.1 Hemispheric asymmetry for emotion Functional or behavioural laterality allows us to draw inferences about structural and/or functional asymmetries between the two cerebral hemispheres, one of the reasons why such asymmetries intrigues neuroscientists and the general public alike. There are many well-known instances of behavioural laterality in humans, perhaps the most well-known example being handedness, i.e., a right-hand advantage in manual dexterity for the great majority of people. Similarly, it has been suggested that the right hemisphere plays an important role in the control of emotion. What are the historical roots and what is the state of scientific evidence regarding this hypothesis?
5.1.1 Historical background For a long time, neuroscientists have formally been interested in findings supporting functional asymmetries between the two cerebral hemispheres, though sometimes more for political than inherently scientific interest. The development of this interest can be traced back to that of another neuroscientific issue of long-standing concern: localisa-tion of function. Shaped by Gall, the idea of the brain serving as the organ of the mind and representing a composite of parts (Spurzheim, 1908) gained momentum in the 1860s when Paul Broca presented his patient Tan who, having sustained a lesion in the third frontal convolution of the left hemisphere, had lost his speech without concomitant paralysis of the tongue or lips (Broca, 1861). The brain being composed of different functional units, as suggested by these findings, was an idea at odds with the concept of the unity of the soul (Flourens, 1847). Therefore, evidence supporting localisationalism directly undermined the claims to transcendent authority of the conservative Catholic Church in its then-current alliance with the monarchy (Jacyna, 1981). To students living in the Third Republic the doctrine of localisation of function served as a symbol of lib-eral politics and free thought – one of their main reasons for seizing upon it.

132
Owing to Broca’s work, the left hemisphere was firmly established as the seat of language functions, paving the way for the concept of lateralisation of function in gen-eral. In particular, language serving as a predominant trait of civilised life, the manually dextrous left hemisphere became associated with our intelligent, educated, ‘human’ side. To complement these functions, the right hemisphere was thought to dominate in terms of sensibility, emotion, and activities related to primitive, vegetative, instinctual life (Luys, 1881). Support for such claims came from personality differences observed between patients with left and right hemiplegia, the former tending to be emotionally volatile, while the latter tended to become apathetic, researchers concluding that an emotion-inhibiting centre had been destroyed in patients with right-hemisphere lesions.
Largely forgotten during the first half of the 20th century, laterality research was revived in the 1960s by work conducted with split-brain patients, i.e. patients who have their corpus callosum severed to limit the distribution of epileptic brain activity (Gazzaniga, Bogen, & Sperry, 1965). Such patients provide a valuable source of infor-mation about the functioning of the isolated hemispheres when they take part in experi-ments with lateralised stimulus presentation. With stimuli presented e.g. to one ear, one hand or one visual hemifield, the transfer of information to the other hemisphere is strictly limited due to the interruption of interhemispheric fibres. At that time, once more, hemispheric asymmetry inspired politically liberal researchers, especially by the idea of the two hemispheres seating logical versus intuitive consciousness. The popular-ity of dichotomising the human brain as possessing one hemisphere specialised for ana-lytical thinking, and another hemisphere more inclinced to intuitive thinking as well as the intertwinement of adhering to cerebral asymmetry and liberal political convictions both underscore the importance of a critical stance towards the evidence supporting emotion-related cerebral asymmetries.
5.1.2 Findings with patients
5.1.2.1 Emotional changes following left- or right-hemisphere damage The hypothesis that the two cerebral hemispheres play different roles in emotion has intrigued neuroscientists until the present day. Much insight into hemispheric asymme-try for emotion has been gained from emotional changes observed in patients with dam-age limited to either the left or the right cerebral hemisphere. In a famous study involv-ing 150 patients with unilateral brain lesions, it was shown that left-hemisphere damage causes emotional changes that can in some sense be characterised as opposite to those effected by right-hemisphere damage: while the so-called catastrophic or dysphoric re-action, characterised by the negative feelings of desperation, hopelessness and anger, was observed in 62 % of left-hemisphere-damaged patients, this reaction was restricted to only about 10 % of patients suffering right-hemisphere damage. In contrast, right-hemisphere damage often causes an indifferent-euphoric reaction, characterised by emo-tional equanimity, elevated mood, and downplaying of symptoms (observed in 38 % of patients with right-hemisphere damage, but in only 11 % of left-hemisphere-lesioned patients) (Mattay et al., 1996). Similar results have been reported following intracarotid injection of sodium amytal (WADA test), which essentially inactivates one hemisphere and is thus used to verify language laterality prior to brain surgery: dysphoric reactions, often accompanied by crying, occur much more frequently than indifferent-euphoric reactions following left-hemisphere injections (Christianson, Saisa, Garvill, & Silfven-ius, 1993; G. P. Lee, Loring, Meader, & Brooks, 1990). Right-hemisphere injections, on

133
the other hand, more frequently cause the indifference-euphoria reaction, which can have the intensity of a manic reaction, the patient appearing careless, smiling, laughing and expressing considerable well-being in both face and speech (G. P. Lee et al., 1990).
Consistent with the above findings, unilateral brain lesions of the left or right hemisphere have been found to be associated with opposite effects on the frequency of pathological laughter and crying, i.e. spontaneous, uncontrollable emotional behaviours, not connected with external events (Gainotti, 1972). Pathological laughter is three times as frequent following right-hemisphere damage than following left-hemisphere damage, while pathological crying is twice as frequent following left-hemisphere lesions than following right-hemisphere lesions. Unilateral lesions to the left hemisphere thus appear to be associated with the experience of negative emotions. Yet bouts of laughter occur-ring during epileptic fits have been reported to be twice as frequent in patients with a left-hemisphere focus than in patients with a right-hemisphere focus. This finding could be reconciled with the above lesion evidence by arguing that a tendency towards epilep-tic activity is associated with an overexcitability of brain tissue. Altogether, thus, the lesion studies seem to support an affect-related asymmetry depending on the valence of the affect, whether directly or indirectly, through release from inhibition.
5.1.2.2 Insight from psychopathologies Altogether, if we assume that unilateral lesions have a more or less direct impact on the experience of certain feelings, the lesion evidence seems to support an association be-tween positive emotions and the left hemisphere, as well as between negative emotions and the right as certainly the most parsimonious hypothesis to derive from the lesion evidence. It is also consistent with findings on the association between the two hemi-spheres and psychopathologies, as shown in a study measuring post-stimulatory audi-tory adaptation (PAA) and after-image thresholds (AIT) following unilateral presenta-tion of auditory or visual cues as measures of the intensity of activation of the cerebral hemispheres (Egorov, Nikolaenko, & Sechenov, 1996). Depressed patients had higher PAA on the right ear and lower AIT in the right visual field, indicating higher activation in the right hemisphere; in contrast, in manic patients PAA was higher and AIT lower on the left side, entailing higher activation of the left hemisphere. Both patient groups showed the corresponding lateralised deficits in space perception, as shown in a task requiring the patients to draw on an irregular grid. Depressed patients also performed better on the grid task in their left visual hemifields, while manic patients performed poorly in their left visual hemifields.
5.1.2.3 Perception and expression of emotions Besides effecting mood changes in the manner described above, unilateral brain lesions can also differentially impact the perception or expression of emotions. The right hemi-sphere appears to play an important role in the processing of emotional information since right-hemisphere-damaged patients have more difficulty identifying emotional facial expressions or grasping the emotional meaning of prosodic aspects of speech than patients with left-hemisphere damage do (Heilman et al., 1975), especially if the lesion includes frontal cortex (E. D. Ross & Mesulam, 1979). In fact, even global aphasics with extensive left-hemisphere damage can sometimes perfectly identify facial emotion expressions by pointing (Borod et al., 1998; Mandal, Asthana, & Tandon, 1993; Mandal & Singh, 1990; Weddell, 1994). Similarly, right-hemisphere damage impairs the recog-nition and discrimination of emotional words more than it impairs patients’ performance

134
on the same tests with non-emotional words (Tucker, Watson, & Heilman, 1977); this dissociation was not found for left-hemisphere-damaged patients or in healthy controls (Borod et al., 1998). Thus, the right hemisphere appears to dominate when perceivingemotions, both positive and negative.
Concerning expressive capacities, the right hemisphere seems dominant for the production of both positive and negative emotions expressed in prosody (E. D. Ross & Mesulam, 1979). Patients with right-hemisphere damage also produce less recognisable facial expressions (Borod, Koff, Lorch, & Nicholas, 1986) or facial and gestural emo-tional expressions in response to viewing slides with affective content (Buck & Duffy, 1980) than did healthy controls or patients with left-hemisphere damage.
5.1.3 Emotion-related asymmetries in healthy subjects Since the 1970s, many studies have addressed emotional asymmetries between the two cerebral hemispheres of healthy participants. Such studies have been performed using various brain-imaging techniques, electroencephalography, lateralised presentation of visual or auditory affective materials. Others have focused on expressiveness differ-ences between the left and right side of the face.
5.1.3.1 Imaging evidence Modern brain-imaging methods such as positron-emission tomography (PET) or func-tional magnetic resonance imaging (fMRI) have been employed to measure asymmetric brain activity in emotion-related tasks. A large meta-review on the topic analysed 65 studies, specifically addressing the question whether any consistent lateralised effects could be identified (Wager, Phan, Liberzon, & Taylor, 2003). Focusing on the percep-tion and experience of emotion, there were some lateralised effects in terms of the den-sity of activation foci for different regions, but the majority of these were greater in the left hemisphere than in the right. Rather than supporting a general dominance of one or the other hemisphere for emotion, the findings of this study pointed to a small degree of lateralisation, in a direction depending on the brain structure and on the quality of the emotion. Consistent with the approach-withdrawal hypothesis of emotion (Davidson, Ekman, Saron, Senulis, & Friesen, 1990) and in contrast to the right-hemisphere hy-pothesis of emotion (E. D. Ross, 1985; Silberman & Weingartner, 1986), there was a tendency towards an association between approach emotions (e.g. happiness) and the left hemisphere and withdrawal emotions (e.g. fear) and the right. In summary, thus, imaging findings suggest that when the entire brain is considered, a simple left-right distinction for emotion-related dominance represents an overly simplistic model.
For certain aspects of emotion-related processes lateralised findings have been reported. In fear-conditioning studies, right-lateralised activation was stronger during presentation of a negative conditioned stimulus than during the original presentation of the unconditioned stimulus in orbitofrontal (OFC), dorsolateral prefrontal (DLPFC), and inferior and superior frontal cortex (Hugdahl et al., 1995) as well as in the pulvinar, OFC, superior frontal gyrus and anterolateral thalamus (Morris, Friston, & Dolan, 1997). Punishment, associated with negative feelings in the participants, induced e.g. by losing in a game (Zalla et al., 2000), was associated with stronger activation in the right amygdala as well as in right PFC (BA9), putamen and globus pallidum. Conversely, it seems as if regions in the left hemisphere tend to be activated during rewarding situa-tions, e.g. in experiments involving monetary reinforcement, eliciting activation in the left hemisphere’s lateral prefrontal cortex (BA10/44), OFC (BA47), thalamus and mid-

135
brain (Thut et al., 1997). Similarly, winning in a game was associated with stronger left- than right-hemisphere activation in amygdala, inferior frontal gyrus, hippocampus and orbitofrontal cortex (Zalla et al., 2000).
Regarding the response to externally elicited affect, a number of studies have been performed based on the presentation of affective pictures. One such study reported, for arousal-matched pictures, greater left-hemispheric activity for positive than negative pictures in middle frontal (BA6/8) and middle/superior temporal (BA21/38) structures. Negative pictures evoked greater right-hemispheric activation in inferior frontal PFC (Canli, Desmond, Zhao, Glover, & Gabrieli, 1998) than positive pictures, a finding con-sistent with the valence hypothesis of emotion, stating that the direction of cerebral asymmetry depends on the valence of the emotion (Davidson, 1994; Fox, 1991; Heller, 1993). Similarly it has been reported that aversive pictures specifically activated right parietal regions and right BA18, whereas pleasant pictures were associated with larger activation in the left fusiform gyrus; however, in this study pleasant pictures were also associated with greater activation in the right lingual gyrus (Lang et al., 1998). Aversive pictures have even been shown to elicit selective single-unit responses in a patient’s right ventral PFC (Kawasaki et al., 2001). Increasingly dissonant musical stimuli, asso-ciated with higher unpleasantness ratings, were positively correlated with blood flow in various regions of the right hemisphere, including the parahippocampal gyrus (BA28/36) and the right precuneus (BA7).
Although certain brain regions appear to show lateralisation of activation, in line with the approach-withdrawal hypothesis, it seems as though a simple left-right dichot-omy does not adequately reflect the evidence. Do such findings necessarily contradict a functional hemispheric asymmetry related to emotion? I think not, and for a number of reasons. First, emotions are complex neural states involving many different areas of the brain, depending on the exact aspect of emotion we focus on and different experiments designed to look for cerebral hemispheric asymmetry employ heterogeneous method-ologies. Therefore, the exact psychological and neurophysiological processes induced in the different experiments will be heterogeneous and will require thorough investigation. Second, a bias against asymmetric findings is probably also introduced by studies not specifically designed to test asymmetry. Third, there is at least one field in cognitive neuroscience in which a strong hemispheric asymmetry is clearly supported by other evidence, but for which only scant imaging evidence exists: the functional hemispheric asymmetry for language has been extensively studied using both imaging and more tra-ditional neuropsychological approaches, especially lesion studies. From clinical neuro-logical data it is estimated that the production of speech is limited to the left hemisphere in 95 % or so of right-handers (Segalowitz & Bryden, 1983), corroborated in studies on split-brain patients (Gazzaniga, 1985). Some imaging studies also support a left-hemisphere dominance for language: for instance, left-sided activation in dorsal and inferior lateral frontal cortex has been reported following auditory presentation of se-mantic tasks (Binder, 1997; Binder et al., 1997) and during phonetic discrimination tasks in the Broca area (Buchanan et al., 2000; Jancke, Specht, Shah, & Hugdahl, 2003). Right-sided activation has been more often reported in association with more emotion-related aspects of speech processing, prosodic discrimination increasing activation in right inferior frontal gyrus (Buchanan et al., 2000; Jancke, Shah, Posse, Grosse-Ryuken, & Muller-Gartner, 1998). Yet some authors argue that on the whole, PET and fMRI studies do not show clear evidence of lateralised activation in response to language tasks: while left-sided structures are slightly more activated than right-sided ones in

136
response to the visual presentation of letters or words, there are also bilateral activation increases in inferior-posterior-temporal areas (Jancke et al., 2003; Vigneau et al., 2006). Besides, while the Broca and Wernicke areas respond to visually presented sentences, so do, more weakly, the homologous areas of the right hemisphere (Just, Carpenter, Keller, Eddy, & Thulborn, 1996), and auditory presentation of phonemes or words for identification or semantic tasks evokes bilateral increases of activation in primary and secondary auditory areas, only sometimes left-dominant (Zatorre, Evans, Meyer, & Gjedde, 1992). Thus, the comparison with language shows that inconsistencies between lesion and imaging data on functional asymmetries are not uncommon; further studies are required to investigate the relationship between behavioural asymmetry and its neu-ral correlates as well as their representation in brain-imaging data.
5.1.3.2 Physiological measures More direct physiological measures have also been used to investigate emotional cere-bral asymmetries. Indeed, electroencephalographic (EEG) recordings taken over the left or right hemisphere show individual differences in frontal electrophysiological asymme-tries to influence mood dispositions and the reactivity to emotion-inducing stimuli (Davidson, 1992): higher left prefrontal resting activity was correlated with the intensity of positive reactions to a positively valenced film clip, while the intensity of negative reactions to a negative clip were correlated with higher right prefrontal resting activity (Pickens, Field, & Nawrocki, 2001). Similar findings have been reported for general mood disposition (Hagemann et al., 1999). Davidson has interpreted the EEG findings as pointing to the general importance of frontal areas for emotional expression, the left hemisphere for positive, approach emotions, the right hemisphere more involved in negative, withdrawal emotions (Davidson, Schwartz, Saron, Bennett, & Goleman, 1979). Such findings point to the necessity of differentiating between expression and perception of emotions when investigating asymmetry (Borod et al., 1997; Davidson et al., 1990); Davidson suggests that posterior areas of the brain are more involved in emo-tion perception, with the right hemisphere dominant for all emotions.
5.1.3.3 Recognition of emotional expressions Emotion-related asymmetries have also been reported for sensory perception, so the established neurophysiological asymmetries are seemingly complemented by functional perceptual asymmetries. For auditory perception, an asymmetry has been demonstrated by the left-ear (and thus right-hemisphere) advantage for the recognition of prosody, i.e. emotional speech intonation (Borod et al., 1998), as well as for processing affect words spoken in an emotionally neutral manner (Sim & Martinez, 2005).
Regarding visual perception, in studies aimed at cerebral hemispheric asymme-tries, pictures of facial emotion expressions are presented such that there is a difference in the emotional content appearing between the left and right visual hemifield. The rea-soning behind this type of study is that a visual stimulus presented to the observer’s left is first processed mostly in the right hemisphere, and vice versa. If stimulus presentation on one side leads to superior recognition compared to presentation on the other, then this effect can be interpreted as an indication of a processing advantage of one hemi-sphere. Such studies usually show a “hemispace bias” for the left visual hemifield, con-sistent with a processing advantage for the right hemisphere: observers tend to focus on the left side of space in judgements of affect, as shown using schematic (Carlson & Har-ris, 1985) and photographic (Heller & Levy, 1981; Jaeger, Borod, & Peselow, 1987;

137
Levy, Heller, Banich, & Burton, 1983; Moreno, Borod, Welkowitz, & Alpert, 1990) facial stimuli presented centrally; the faces were chimeras, one half of the face showing a neutral expression, the other an emotional expression, and observers were asked to focus on the centre of the stimulus. The effect can also be demonstrated using intact pictures shown at both normal and mirror orientations, to control for naturally occurring differences in the intensity of emotional expression between the two hemifaces (Borod, St Clair, Koff, & Alpert, 1990; Sackeim & Grega, 1987). Besides, the hemispace bias can be demonstrated with stimuli presented in either the left or the right visual hemi-field, or with two different stimuli appearing side by side, one in each hemifield; the stimulus appearing to the observer’s left is judged as more emotional (Levine & Levy, 1986), and it elicits a greater autonomic response in the observer (Spence, Shapiro, & Zaidel, 1996). These findings entail that for studying asymmetries in the intensity of facial emotion expression, the stimuli should always be presented at both original and mirror-reversed orientations. They also imply that, if the left side of the face is more emotionally expressive than the right, and if we fixate centrally on a person facing us, then the asymmetries are suboptimally arranged: the information from the less expres-sive side of the face is fed preferentially to that cerebral hemisphere which is less tuned to picking up emotional information (Sackeim et al., 1978).
What about possible non-emotional differences between the two hemispheres that could be causing the above effects? Such findings would counter inferences about emotion-related symmetries from the described results. The left and right hemisphere of the human brain do differ in their information-processing capabilities and propensities, perhaps most remarkably demonstrated in work with split-brain patients (Gazzaniga, 1985; Sperry, 1969). For example, the right hemisphere has been found to be superior for manipulo- and visuospatial processing. The concern that these processing differ-rences are the main reason for the observed visual-hemifield bias for emotion perception can be countered by findings that show the right-hemisphere advantage in the process-ing of emotional expressions to be over and above any right-hemisphere superiority for any general visual processing advantages (Bradshaw, Nettleton, Nathan, & Wilson, 1983; Bryden, Ley, & Sugarman, 1982).
Two further, potentially relevant asymmetries should be mentioned. There ap-pears to be a difference in global versus local processing style between the hemispheres, with visual-hemifield specialisation for attention to holistic form over detailed shape analysis (Fink et al., 1997). Besides, it has been suggested that the two hemispheres may be differentially efficient at processing visual stimuli of different spatial-frequency ranges (‘spatial-frequency hypothesis’): for many tasks that use visual stimuli, reducing perceptual quality by utilising masking stimuli, blurring, and so forth more strongly interferes with performance when stimuli are projected to the left than when they are projected to the right hemisphere. Thus, the left and right hemispheres are thought, at some level, to be biased towards efficient use of higher and lower visual spatial fre-quencies, respectively. But a meta-review showed that the effect of these two perceptual asymmetries plays at most a minor role in causing visual perceptual differences for emotional faces (Hellige, 1993).
The right hemisphere has also been shown to be preferentially involved in the processing of non-emotional face stimuli (de Schonen & Mathivet, 1989; Haxby, Hoff-man, & Gobbini, 2000; Pegna, Khateb, Michel, & Landis, 2000; Rossion, Joyce, Cottrel, & Tarr, 2003; Rossion, Schiltz, & Crommelinck, 2003), and right unilateral lesions in ventral occipitotemporal cortex can be sufficient to cause prosopagnosia (De

138
Renzi, 1986a; Landis, Cummings, Christen, Bogen, & Imhof, 1986); during emotion-perception tasks, a region in the lateral fusiform gyrus is activated, usually bilaterally, but more consistently in the right hemisphere (Haxby et al., 1999; Ishai, Ungerleider, Martin, Schouten, & Haxby, 1999; Kanwisher, McDermott, & Chun, 1997; McCarthy, 1997; Sergent, Ohta, & MacDonald, 1992). The hemispace bias for the perception of emotional faces may be at least partially due to this right-hemisphere preference for face perception.
5.1.4 Asymmetries of facial emotion expression
5.1.4.1 Findings supporting expressiveness asymmetry Many studies about emotion-related behavioural asymmetry have been performed with healthy subjects. Among such studies, many have been aimed at differences in emo-tional expressiveness between the left and right hemiface. One of the first facial-expression asymmetries that was both scientifically and quantitatively described was a unilateral angry sneer occurring more often to one side than the other (Darwin, 1872). More systematic studies of emotional facial asymmetry began in the 1970s. As derived from the emotional processing literature then available, the right hemisphere was hy-pothesised to mediate the facial expression of emotion (Gainotti, 1972; Heilman et al., 1975). Rather than right-handers being left-faced and vice versa, it was predicted that facial expression would be left-sided in right-handers, but not necessarily predictable in left-handers.
The most important technique for studying asymmetry of facial emotion expres-sion is the composite-photo technique, developed early in the last century (Hallervorden, 1902). The composites, often termed ‘chimeric’ face pictures, are pro-duced by exchanging one hemiface in a picture by the mirror image of the other hemi-face. In this way, complete, mirror-symmetric face stimuli can be generated that only contain the expression normally appearing on either the left or the right hemiface. As a result, small differences in expressiveness between the two hemifaces are amplified. In the late 1970s a number of studies appeared that showed the left side of the face to be more active and more expressive than the right during emotional expression (Campbell, 1978; Chaurasia & Goswami, 1975; Moscovitch & Olds, 1982; Sackeim et al., 1978; Strauss & Kaplan, 1980). A meta-analysis of 49 experiments in which human observers rated the intensity of emotional expression of chimeric pictures of facial expressions, besides supporting the general expressiveness advantage of the left hemiface, also showed that the left hemiface was judged by observers as moving more extensively than the right (Borod et al., 1997).
Since the lower portion of the face is predominantly innervated by the contralat-eral hemisphere (Rinn, 1984), the finding of greater left-hemiface than right-hemiface activity can be interpreted as reflecting right cerebral dominance for facial emotion ex-pression. This finding is consistent with the right-hemisphere hypothesis of emotion (Borod, Koff, & Caron, 1983), and with data from right-hemisphere lesions (Buck & Duffy, 1980) as well as with descriptions of epilepsy patients during the WADA Test, who are impaired at expressing primary emotions (e.g. happiness) after inactivation of the right hemisphere (E. D. Ross, Homan, & Buck, 1994). Yet these inferences are slightly complicated by the additional finding that the direction of asymmetry can be dependent on the quality of the emotion, particularly on its valence: for negative emo-tions, expressions were left-sided both when the whole face was studied and when the

139
stimulus only showed the lower face, and for spontaneous as well as voluntary expres-sions.
The picture is slightly less consistent for positive emotions, i.e. smiling. As the meta-analysis described above showed, significant left-sided positive expressions were only obtained for posed expressions of the whole face, yet there was no strong overall trend for right-facedness of positive expressions. These findings are difficult to recon-cile with an overall dominance of the right hemisphere for emotional expression. But perhaps there are additional explanations for the asymmetry differences for happiness expressions compared to expressions of other affects? For instance, it has been sug-gested that facial expressions of positive emotions may be less asymmetric than expres-sions of negative emotions because positive emotions tend to be more communicative and linguistic in nature than negative ones (Borod, Koff, & Buck, 1986). This idea is consistent with the finding that inactivation of the left hemisphere during the WADA test impaired the expression of more social emotions (e.g. affection) more strongly than did inactivation of the right hemisphere (E. D. Ross et al., 1994). Yet if this difference had an effect, one would expect a difference in expression asymmetry depending on whether people were being watched or videotaped during the recording (Buck, 1984; Hager & Ekman, 1985), and no significant effect of this manipulation for either direc-tion or presence of asymmetries has been described (Borod et al., 1997). Proponents of the view that the quality of an emotion affects lateralisation actually claim that the left hemisphere mediates positive emotions and that the right hemisphere mediates negative emotions (Hellige, 1983). This hypothesis is more consistent with the emotional changes resulting from unilateral brain lesions, as reviewed above. Yet the data from facial expressions of emotion, although emotional valence does seem to affect asymme-try (Karch & Grant, 1978; Kowner, 1995; Stringer & May, 1980), do not allow a clear association between the left hemiface and negative emotions, and between positive emotions and the right hemiface. Similarly, it has been suggested that the right hemi-sphere may be dominant for emotions associated with behavioural withdrawal, the right hemisphere with approach emotions (Davidson, 1992, 1994; Fox, 1991; Kinsbourne, 1982; Kinsbourne & Bemporad, 1984), but again, the meta-analysis by Joan Borod and colleagues shows that facial emotion expression does not provide evidence in support of this claim: the only tested emotion that would shift category from negative to approach would be anger, which was more strongly expressed on the left than on the right hemi-face (Borod et al., 1997).
5.1.4.2 Physical left-right asymmetries of facial emotion expression In some studies, there have been attempts at measuring physical differences between the expression on the two sides of the face. Such physical asymmetries would support the existence of actual expressiveness asymmetries rather than being due to some effect caused by asymmetries in perception. Besides, if a physical asymmetry were correlated with the asymmetry in expressiveness, then these measurements might provide some insight into which are the actual features determining intensity of emotional expression. Unfortunately, it is not easy to measure physical characteristics of facial expressions since the face is three-dimensional, since it undergoes complex transformations (e.g. skin can stretch) during movements and since much of the skin is of the same colour, making it difficult for image processing to establish corresponding points between a face displaying different emotional expressions. One study on the physical asymmetry of facial emotion expression was reported by Nicholls et al., who measured the distance

140
between 3-D scans of the facial surface of neutral and emotional (happy, sad) expres-sions (Nicholls et al., 2004). After controlling for hemifacial area differences, they found a greater summed distance for the left than for the right hemiface, consistent with greater expressiveness of the left side of the face. However, in their study the expres-siveness asymmetry was not consistent across emotions, making it impossible to draw conclusions about the relationship between the amount of movement on the hemiface and observers’ perception of expressiveness.
Only a relatively small number of studies have addressed the question of how asymmetries in facial emotion expression depend on handedness. Where left-handers were considered, the authors usually expected the direction of asymmetry to be re-versed. In fact, the usual findings of such studies were of no significant overall differ-ences in the direction of facial asymmetry between right-handed and left-handed posers (Borod & Caron, 1980; Campbell, 1978; Heller & Levy, 1981; Lynn & Lynn, 1938, 1943; Wylie & Goodale, 1988). However, the effect appears to be less pronounced and slightly more heterogeneous in left-handers compared to right-handers (Chaurasia & Goswami, 1975; Moscovitch & Olds, 1982). Interestingly, based on dichotic-listeningstudies it has actually been suggested that emotional laterality be more strongly corre-lated with a person’s footedness than with their handedness (Elias, Bryden, & Bulman-Fleming, 1998) and right-footedness is more common in left-handers than left-footedness is in right-handers (Chapman, Chapman, & Allen, 1987).
5.1.4.3 Effect of expression elicitation condition There has been a long-standing discussion about the effect of expression-elicitationcondition on asymmetry of facial emotion expression. In particular, there have been attempts to study whether asymmetry is influenced by whether the expression was de-liberately posed (e.g. in response to verbal command) or spontaneous, i.e. arising as part of an instinctual reaction to an appropriately evocative emotional stimulus such as a joke (Myers, 1976). This question has arisen from the intriguing behavioural dissocia-tion between deliberate and involuntary expressions reported in the neurological litera-ture, voluntary facial behaviour believed to be contralaterally innervated, while the con-trol of spontaneous emotional expressions is believed to be bilateral (Rinn, 1984).
Voluntary facial expression is presumably controlled by cortical structures through the monosynaptic connections within the pyramidal system. For the muscles in the upper portion of the face (forehead, upper eyelid), there is strong evidence of sub-stantial bilateral projections from the precentral gyrus of the motor cortex. For the mus-cles of the lower portion of the face (lower eyelid, nose, cheeks, lips, neck), there is good evidence of contralateral projections (DeJong, 1979). Some anatomists maintain that control of the lower face is strictly contralateral (Diamond & Frew, 1979). How-ever, others suggest it is only predominantly contralateral (DeJong, 1979; Kuypers, 1958), consistent with clinical observations that some unilateral lesions of the motor face region do not produce weakness or paralysis in the contralateral hemiface (Geschwind, 1979; van Gelder & Borod, 1990) and suggesting the existence of some additional ipsilateral innervation.
The neuroanatomy of spontaneous emotional expression is considerably more complex, with innervation from bilateral subcortical structures, relayed through the multisynaptic extrapyramidal system. Many believe that control depends on the thala-mus or the globus pallidus, both of which innervate the face bilaterally (DeJong, 1979; Diamond & Frew, 1979). But it has also been suggested that the cortex is involved in
141
spontaneous facial emotion expressions (Damasio & Maurer, 1978). Some have sug-gested purely unilateral cortical control of spontaneous facial emotion expressions (Dyken & Miller, 1980). There is not even universal agreement on whether the path-ways for spontaneous expression are crossed or uncrossed and how they distribute to the portions of the facial nucleus that innervate the upper and lower face (Borod & Koff, 1983, 1991; van Gelder & Borod, 1990).
Given that the evidence points to more strongly lateralised control of spontane-ous than deliberate facial expressions, one would expect expressions to be more asym-metrical when posed than when spontaneous. Yet in fact, several studies in which facial asymmetry during posed and spontaneous facial expression was examined in normal (Borod, Koff, & White, 1983; Dopson, Beckwith, Tucker, & Bullard-Bates, 1984; Hager & Ekman, 1985) or brain-damaged (Borod et al., 1997; Borod & Koff, 1991) individuals found no differences in direction or degree of facial asymmetry between the two conditions.
5.1.4.4 Hemifacial asymmetries not related to emotion On the whole, hemifacial asymmetries in emotional expressiveness have been reported, with an expressiveness advantage for the left hemiface. Given the generally contralat-eral innervation of the muscles in our bodies, a dominant role for the right hemisphere in the control of emotional expression is often inferred from these findings, but this in-ference is not without problems. For instance, if there were facial asymmetries during non-emotional unilateral movement, then it would be impossible to decide to what ex-tent the observed asymmetries were due to emotional or facial-movement asymmetry. This issue was studied for examples such as closing one eye or pulling the mouth out to the side, and it was found that the lower part of the face appears to be more mobile on the left side than on the right in normal right-handed adults (Borod & Koff, 1983; Campbell, 1982; Chaurasia & Goswami, 1975; Ekman et al., 1981; Koff, Borod, & White, 1981), while the upper part shows no consistent asymmetries (Alford & Alford, 1981; Borod & Koff, 1983; Chaurasia & Goswami, 1975; Koff et al., 1981; Moscovitch & Olds, 1982). Yet the threat of such findings to the inference on hemispheric asymme-try in the control of emotional expression is reduced by the finding that hemifacial dif-ferences in non-emotional mobility were not significantly correlated with asymmetries in expression intensity during posed and/or spontaneous emotional facial expression (Borod, Koff, & White, 1983).
Another potential problem for conclusions about hemispheric dominance for controlling facial expression stems from the possibility of morphological asymmetries in the resting face influencing emotional expressiveness. In the right-handed population, the two sides of the face differ in area, potentially ‘diluting’ the expressiveness of the available expressive cues. This difference does not appear to play a big role, however, since hemiface width was found not to be significantly correlated with measures of hemifacial expressiveness asymmetry during posed or spontaneous emotional facial expression (Jaeger, Borod, & Peselow, 1984; Sackeim & Gur, 1980). Besides, there appears to be more movement on the left side of the face even after controlling for hemifacial differences in area (Nicholls et al., 2004).
In a number of studies, the left side of the face was perceived as more emotion-ally expressive than the right even when neutral or resting (Borod, Kent, Koff, Martin, & Alpert, 1988; Campbell, 1978; Kowner, 1995; Mandal & Singh, 1990; Moreno et al., 1990; Sackeim et al., 1978; Schwartz et al., 1979). Early studies on this effect found no

142
consistent correlations between morphological asymmetries in the resting face and fa-cial asymmetry during posed emotional expression (Borod et al., 1988; Moreno et al., 1990). Yet a more modern study applying image-based approaches to digitised se-quences of posed facial expressions from 55 individuals yielded a different conclusion, namely, that structural asymmetry in the resting face accounted for 54 to 66 % of vari-ance in the asymmetry at the peak of joy, anger and disgust expressions (Schmidt et al., 2006). The authors also considered movement asymmetry, which they defined as the ratio of summed movement on the left and on the right. Overall sidedness of movement asymmetry was only found for expressions of happiness, with significantly more movement on the left hemiface. For expressions of disgust, movement asymmetry was actually negatively related to the amount of asymmetry at the peak of the expression.
5.1.5 The current study: Asymmetry of bodily emotion expression As the above review of relevant literature shows, there is a strong indication of asym-metries between the left and right side of the face during emotional expression. More-over, the emotional expression of the left hemiface is generally perceived as more in-tense than the expression of the right hemiface. These findings might be taken to imply the attractive and somewhat cosy inference of a right-hemisphere dominance for emo-tional expression or for emotion in general. However, a number of serious objections have been raised against this inference. Investigating bodily emotion expressions as an expressive channel where certain complicating variables do not hold will certainly be instructive for resolving open questions. For instance, given findings pointing towards a laterally asymmetry for the control of even non-emotional facial movements (Moscovitch & Olds, 1982), a demonstration of asymmetry for bodily emotion expres-sion would provide considerable support for an association between the asymmetry and emotion. Yet there are more reasons besides the mentioned confounds why the right-hemisphere dominance for emotional expression and the asymmetry of emotional ex-pression remain issues that deserve a fresh look. First of all, the wealth of data available on the topic certainly underscore the considerable interest invested in studying emotion-related asymmetry. As is often the case, the large number of published studies with their variable results perhaps, rather than clarify, actually clouds the field. However, the number of findings impossible to reconcile with any simple model of dominance of one brain region over the other has not deterred proponents of models of hemispheric domi-nance for affect(s). It seems rather as if the multitude of different findings has made simple left-right dichotomies all the more attractive for seemingly bringing order to chaos. What is more, a look at the genesis of the current hypotheses of emotion-related hemispheric cerebral dominance demonstrates a strong influence of a liberal weltan-schauung on adhering to cerebral asymmetry. I am convinced that studying emotional body expressions can provide a fresh look at the field of asymmetries of emotional ex-pression. By studying the asymmetry of emotionally expressive body movements, we can directly counter confounders in the literature on facial-expression asymmetry such as idiosyncracies in the neural control of facial movements. We can test whether asym-metries in emotionally expressive movements exist over and above asymmetries in emotionally neutral movements and, as I describe below, we can conduct psychophysi-cal experiments on left-right expressiveness asymmetry with dynamic chimeric stimuli that move in an extremely natural-looking way.
How, then, did we go about obtaining said fresh look? The first and perhaps most important step we took was to create a completely novel type of stimulus with

143
bilaterally symmetric anatomy and movements. Simply put, we designed emotional chimeric walkers, a term coined in a study on the perception of direction of walking of a point-light walker (Thornton, Vuong, & Bülthoff, 2003). We generated these walkers by replacing the movements on the left side of the body by those normally executed by the right side (for the right-right chimera), or vice versa for the left-left chimera. Develop-ing this novel type of stimulus was only possible because our stimuli were produced by animating an avatar with the joint-angle trajectories derived from our motion-capture data. Since this design principle separates movement from anatomy, it allowed us to interfere quite gravely with the movements of our stimuli while still yielding avatars executing extremely natural-looking movements. The one major problem we had to overcome with this stimulus design was to control for the fact that during human gait, the two sides of the body move in opposite direction at all times. Therefore, when you replace the movement on one side with that of the other, the resulting animation will not correspond to a normal gait pattern, but instead resemble a hop, the two-legged forward motion with in-phase movements of corresponding limbs on the two sides of the body. To achieve the anti-phase relationship between the movements of pairs of joints in two-legged gait (Golubitsky et al., 1999), we phase-shifted each trajectory by half a step cycle before using it to replace the movement trajectory of the corresponding joint on the other side of the body.
With this approach we could directly address key issues raised regarding studies on hemifacial asymmetries in emotion expression. First of all, by studying the percep-tion of dynamic stimuli, we could investigate problems due to studies on emotional-facial-expression asymmetry being executed on static photographs of faces. For in-stance, at least some of the measured expressiveness asymmetries cannot be separated from structural asymmetries between the left and right hemiface (Borod et al., 1988; Campbell, 1978; Davidson et al., 1979; Kowner, 1995; Mandal & Singh, 1990; Moreno et al., 1990; Sackeim et al., 1978; Schmidt et al., 2006), while our walker stimuli allow us to separate movement asymmetries from anatomical asymmetries and even to create avatars with perfect bilateral symmetry (see Figure 5.4 and Section 5.3.1.1). Besides, the cyclic presentation of dynamic stimuli avoids a problem noted in face studies: that temporal differences in the unfolding of the expression on the two hemifaces could be causing a bias in the expressiveness of one or the other type of chimera (Ekman, 1980). Our chimeric walkers also looked very natural, in contrast to many face chimeras: those often have imperfections near the face’s vertical midline, especially where the 3-D alignment of the two sides of the face is not exact and if the camera’s objective is not exactly aligned with the face’s frontal plane. In faces, too, the physical asymmetries between the expression on the two sides are not easily measurable, since skin can de-form and since the movements of the face are small and follow complex 3-D patterns. Body movements are easier to work with in this respect since the limbs can be treated as rigid and the movements are larger, dwarfing possible effects of non-rigid movement. Especially using the joint-angle representation, we could measure physical asymmetries between the movements on the two sides of the body extremely precisely. By including left-handed actors in the population, we could also assess the influence of handedness on the direction of a possible lateral asymmetry, presenting stimuli facing either way and exchanging the movements on both sides (i.e. a stimulus whose left side is animated by the movements of the right side, and whose right side is animated by the movements of the left side) to control for perceiver biases.

144
Perhaps more importantly, studying asymmetry of bodily emotion expression can serve to strengthen the association between behavioural asymmetry and inferences about hemispheric dominance for the control of emotional expression. This is because while substantial portions of the expressive facial musculature are bilaterally innervated (Rinn, 1984), there is strong general agreement that the limb musculature is controlled by the contralateral hemisphere. Besides, it has been suggested that the right hemisphere may be dominant for controlling even non-emotional facial movements (Chaurasia & Goswami, 1975), which further complicates the association between the observed hemi-facial expressiveness asymmetries and a hemispheric asymmetry for emotional expres-sion. The study of emotionally expressive body movements provides a unique test of this controversy since it is possible to conduct a body movement both in emotionally neutral and in emotionally expressive fashion, whereas in most studies on facial emo-tion expression the movements for the different affects have much less of a common basis. We could thus directly compare the amount of asymmetry between neutral and emotionally expressive body movements. If we could also demonstrate perceiver biases for the perception of emotional body expressions, then this would imply that perceiver bias for facial expressions of emotion is not exclusively due to a right-hemisphere dominance for face perception (De Renzi, 1986b; De Renzi, Perani, Carlesimo, Silveri, & Fazio, 1994), but also that asymmetries in perception and production coincide, con-siderably strengthening the point for a general emotion-related left-right asymmetry. Thus, there is no doubt that if we were to demonstrate an emotional-expressiveness ad-vantage for the movements of the left side of the body relative to the right, then a num-ber of concerns about studies on the asymmetry of facial emotion expression would be falsified. What is more, such a finding would imply that asymmetry of emotional ex-pression is a much more general phenomenon than has previously been assumed.
First indications that cognitive factors and indeed emotional state can affect body movements in an asymmetric way are already provided in some previous studies. A right-sided preference for speech-accompanying arm and hand gestures in right-handers has been demonstrated (Kimura, 1973). This finding supports a general influ-ence of cognitive tasks on the lateralisation of behaviour, the asymmetry in this case arguably related to hemispheric asymmetry in the involvement in speech production. Affect displays appear to shift asymmetry to the left side of the body: the right-hand advantage for speech-accompanying gestures is reduced during the display of facial emotion expressions (Moscovitch & Olds, 1982). Further, for dogs, an asymmetry in the amplitude of tail wagging to the left and right is influenced by affect (Quaranta, Sinis-calchi, & Vallortigara, 2007), dogs wagging further to the right when faced with their owners (a liked stimulus), and further to the left when faced with a more negative stimulus (a strange dog), findings consistent with the valence hypothesis of emotion (Davidson, 1992; Davidson et al., 1990).
5.2 Methods and results: Asymmetry in production
5.2.1 Methods: Movement asymmetries We investigated motor asymmetries in emotionally expressive walking and tested whether such asymmetries lead to differences in the perceived emotional expressiveness of the movements of the left and the right body side. Twelve right-handed lay actors were recorded, using a VICON motion capture system, performing neutral walking and emotionally expressive walking (anger, happiness, sadness, fear). Prior to recording, the

145
actors’ involvement in each affect was maximised by combining free facial and bodily expression of the emotion with a validated mood-induction paradigm based on imagin-ing emotionally charged past life events (Westermann et al., 1996). Gaits expressing different emotions differed along many postural and kinematic dimensions, and they were recognised with high accuracy (≥88 %) by 15 observers. Further details about the mood-induction procedure, recording and data processing are described in Chapter 2.
Quantification of asymmetry in the recorded trajectories was performed for the flexion angles of the shoulder, elbow, hip and knee joints. The movement of each joint was characterised by three Euler angles; their labelling is illustrated in Figure 2.1. For the shoulder and hip joints the flexion angle corresponded to rotation around the axis connecting the joint centres of the shoulders or the hips (Figure 2.5A). For the elbow and knee joints the flexion angle was defined in the direction of the natural flexion of the joint. Asymmetries in the remaining two Euler angles per joint (abduction and rota-tion) were not further analysed since these angles had very low amplitudes and tended to be quite variable. If x(t) denotes joint angle as a function of time, two measures were applied to characterise lateral asymmetry:
(a) joint-angle amplitudes (difference between maximum and minimum ampli-tude), defined as ( )( ) ( )( )txtx
ttminmax − , of the angles x(t), and
(b) a measure for ‘movement energy’, akin to the temporal integral over kinetic energy, defined as dttxE = )(2 .
The latter measure was chosen because it depends on the shape of the entire trajectory and because it is not affected by mean differences between angles of opposite joints. Besides, motion energy has previously been employed in studies investigating socially meaningful nonverbal, non-facial communication (Grammer, Honda, Juette, & Schmitt, 1999). In physics, a temporal integral over energy defines the measure of action, which represents an important measure in the motor-control literature. However, we refer to the measure described under (b) as energy throughout this chapter.
Since the expression of emotions affects step amplitude (Montepare et al., 1987) the same measures were also investigated after normalisation by step amplitude, de-scribed in Section 5.2.2.5.
5.2.2 Results: Movement asymmetries Motor asymmetries were quantified by comparing the maximum joint-angle amplitudes and movement energies of corresponding joints on the two sides of the body. All sig-nificance levels p = 0.05 (uncorrected) in the following.
5.2.2.1 Quantification of movement asymmetries: Amplitude Movement amplitude exhibited a pronounced lateral asymmetry, the movements of the left body side significantly exceeding those of the right (Figure 5.1A). To investigate amplitude asymmetry, we performed a repeated-measures ANOVA with the three fac-tors Emotion (angry, happy, sad or fearful), Joint (shoulder, elbow, hip or knee) and Hemibody (left or right). There was a highly significant main effect of Hemibody (F1, 35 = 29.65, p < 0.001). In addition, the main effects of Emotion (F3, 105 = 163.16, p < 0.001) and Joint (F3, 105 = 72.09, p < 0.001) were significant. These effects reflected amplitude differences between the individual joints and between the individual emo-tions: higher movement amplitudes were observed for the leg joints than for the arm

146
joints, and for the expression of anger and happiness than for sadness or fear. Emotion significantly interacted with Joint (F9, 315 = 30.01, p < 0.001) as well as with Hemibody (F3, 105 = 6.56, p < 0.001). Joint and Hemibody did not interact significantly (F3, 105 = 2.15, p = 0.010), nor was there a significant three-way interaction (F9, 315 = 1.19, p = 0.030).
We analysed asymmetries in amplitude in more detail by performing post-hoc tests for effects involving the factor Hemibody. For this analysis we performed paired t-tests with Bonferroni correction for multiple comparisons (critical p = 0.0125, one-tailed since left-hemibody movement was hypothesised to be larger than right-hemibody movement; most results were not affected by whether one- or two-tailed tests were used.) For this analysis the data were collapsed across joints as justified by the lack of a significant three-way interaction and the non-significant interaction between the factors Hemibody and Joint. Consistent with the positive mean differences in Figure 5.1A, we found significant left-right asymmetries for anger (t143 = 3.92, p < 0.001), happiness (t143 = 4.36, p < 0.001) and sadness (t143 = 3.16, p = 0.001). For fear, the ef-fect was in the same direction but failed to reach significance (t143 = 1.58, p = 0.059).
Figure 5.1. Movement asymmetry of bodily emotion expression (colours denote differ-ent emotions). Analysis of motor patterns: (a) Mean amplitude difference (+/- s.e.m.) between corresponding joints on the left and right side of the body. (b) Left-right differ-ence for the energy measure plotted in the same way. Asterisks indicate significant asymmetry between left and right side of body for this joint (p < 0.05).
We also tested whether the emotions differed in magnitude of asymmetry. Anger and happiness showed comparable levels of asymmetry (t35 = -0.32, p = 0.75; two-tailed like all following p values in this paragraph, critical value of p = 0.0083 after Bonferroni correction), and they both showed significantly higher asymmetry than both sadness and fear (for anger: t35 = 2.10, p = 0.043 and t35 = 3.17, p = 0.003, respectively; for happi-ness: t35 = 3.44, p = 0.002 and t35 = 3.65, p = 0.001, respectively). Amplitude asymme-tries for sadness and fear did not significantly differ from each other (t35 = 0.83, p = 0.41). Since it is well-known that expression of happiness and anger results in higher-amplitude movements than expression of fear and sadness does (Montepare et al. 1987), it is important to test whether normalisation of the asymmetry measures by movement amplitude changes the major results (Section 5.2.2.6).

147
5.2.2.2 Quantification of movement asymmetries: Energy For movement energy, too, a left-right asymmetry was observed, the movements of the left body side again exceeding those of the right. The same statistical analysis was ap-plied as for the amplitudes. The three-way ANOVA revealed a significant main effect for the factor Hemibody (F1, 35 = 25.44, p < 0.001), and significant main effects for the factors Emotion (F3, 105 = 93.59, p < 0.001) and Joint (F3, 105 = 110.08, p < 0.001). As for amplitude, these effects were caused by higher-energy movements in expressions of anger and happiness than in expressions of fear and sadness. The highest movement energy was obtained for the knee joint, whereas the shoulder joint exhibited the lowest-energy movements. Emotion significantly interacted with Joint (F9, 315 = 8.11, p < 0.001), presumably because energy in the elbow joint was more elevated for anger and happiness compared with the other emotions. Both the Emotion-Hemibody interac-tion (F3, 105 = 15.12, p < 0.001) and the Joint-Hemibody interaction (F3, 105 = 3.22, p = 0.026) were significant, but there was no significant three-way interaction (F9, 315 = 0.49, p = 0.88).
As for the analysis of movement amplitudes, since we were mainly interested in asymmetries between left- and right-sided body movement, post-hoc investigations for Energy were focused on effects involving the factor Hemibody. We tested whether sig-nificant left-right asymmetry was obtained for the individual emotions (Figure 5.1B), again with paired one-tailed t-tests verifying the directed hypothesis of more energetic left-hemibody movements (critical p = 0.0125 after Bonferroni correction). Anger (t143 = 4.88, p < 0.001) and happiness (t143 = 5.17, p < 0.001) were significantly asym-metric and for sadness there was a trend towards a significant asymmetry (t143 = 2.12, p = 0.036); for fear, no significant asymmetry was observed (t143 = 0.49, p = 0.31).
Anger and happiness thus showed more pronounced levels of asymmetry than the other emotions, but the effect was not reversed in direction for any of the emotions. Accordingly, and in line with the results for amplitude, anger and happiness did not sig-nificantly differ from each other in asymmetry (t143 = 0.29, p = 0.78, two-tailed like all the following tests in this paragraph, and with Bonferroni-corrected critical p = 0.0083), and neither did fear and sadness (t143 = -1.50, p = 0.14). Both anger (t143 = 4.29, p < 0.001) and happiness (t143 = 4.68, p < 0.001) were significantly more asymmetric than fear, and the same was true of sadness (for anger: t143 = 3.49, p = 0.001; for happi-ness: t143 = 4.10, p < 0.001). But since anger and happiness were characterised by faster movements containing more energy than sadness or fear, we also verified that the basic results remained valid for measures normalised in terms of absolute movement energy (see below).
5.2.2.3 Comparison with neutral gait To test whether the observed asymmetry was emotion-specific we compared the asym-metry measures for emotional and neutral gaits of the same actors. Emotional walking was significantly more asymmetric than neutral walking, for anger and happiness on both asymmetry measures (t143 > 2.69, p < 0.004) and for sadness (t143 = 3.01, p = 0.002) and fear (t143 = 3.17, p = 0.002) on the energy measure only.
5.2.2.4 Asymmetry of body posture The analysis of fear expressions did not reveal significant movement asymmetries, as measured by differences in joint-angle amplitude or energy, when data were collapsed across joints. Inspired by work showing that body expressions of fear are dominantly

148
characterised by postural cues (A. P. Atkinson et al., 2007), which was consistent with the findings I reported in Chapter 3, we analysed possible asymmetries in average body posture, defined by the average joint angles over one complete gait cycle. Particularly strong asymmetries were found for trunk orientation and tilt (characterising the rotation of a coordinate system defined by the chest and spine markers relative to the hip along the longitudinal axis and laterally). Compared to emotionally neutral gait, both trunk rotation (t32 = 2.89, p = 0.003) and tilt (t32 = 2.63, p = 0.005, one-tailed) showed a sig-nificant lateral asymmetry during fear expressions. Data from one subject had to be re-moved from this analysis since for this person the trunk-orientation angles could not be robustly estimated from the motion-capture data.
5.2.2.5 Quantification of movement asymmetries: left-handers To rule out the possibility that the observed asymmetry was a consequence of handed-ness, we tested twelve left-handed subjects using exactly the same experimental proce-dure as described in the rest of the chapter. The experimental procedures and the statis-tical analysis of the data of the left-handers were identical to those of the right-handers. Results are shown in Figure 5.2A and 5.2B in the same format as in Figure 5.1A and 5.1B for the right-handed sample. The direction of asymmetry for the left-handers matched that found for the right-handers, with generally higher movement amplitude and movement energy on the left side of the body during emotionally expressive walk-ing.
Figure 5.2. Asymmetry of bodily emotion expression, left-handers. (A) Mean amplitude difference (+/– s.e.m.) between corresponding joints on the left and right side of the body. (B) Left-right difference for the energy measure plotted in the same way. Aster-isks mark joints for which significant asymmetries were obtained for at least one affect.
This result was confirmed by a three-way ANOVA for movement amplitude, with the same factors as above (Table 5.1). The effect of the factor Hemibody was highly sig-nificant for both amplitude (F1, 35 = 32.80, p < 0.001) and energy (F1, 35 = 44.11, p < 0.001), but it was qualified by interactions with both Emotion and Joint that showed at least a trend towards significance, and by significant three-way interactions. The lat-ter two interactions were specific to the left-handed sample, and they were presumably due to a more pronounced asymmetry in the elbow and knee joints than in the shoulder and hip joints, especially for energy.

149
Amplitude Energy Effect d.f.F p F P
Hemibody 1, 35 32.87 < 0.001 44.11 < 0.001 Emotion 3, 105 223.20 < 0.001 161.19 < 0.001 Joint 3, 105 137.79 < 0.001 255.83 < 0.001 Hemibody × Emotion 3, 105 2.68 0.051 2.34 0.078 Hemibody × Joint 3, 105 3.83 < 0.001 5.89 < 0.001 Emotion × Joint 9, 315 42.07 < 0.001 17.85 < 0.001 Hemibody × Emotion × Joint 9, 315 3.01 0.002 2.56 0.002
Table 5.1. Motor asymmetries in the left-handed sample. Results of two three-way re-peated-measures ANOVAs with factors Hemibody (left, right), Emotion (angry, happy, sad, fearful) and Joint (shoulder, elbow, hip, knee); significant p values in bold.
With the data pooled across emotions, the left-right asymmetry was significant on both measures for all joints except the hip, for the amplitude measure only (Table 5.2). No further post-hoc testing was performed on the left-handers’ data since they had been included mainly to verify whether they would show the same direction of asymmetry as the right-handers. Our findings matched those of studies showing that emotions are expressed more intensely on the left hemiface even for left-handed individuals (Borod & Caron, 1980).
Amplitude Energy Joint
t144 p t144 P
Shoulder 4.39 < 0.001 4.71 < 0.001Elbow 6.56 < 0.001 7.84 < 0.001Hip 1.38 0.084 2.24 0.012Knee 5.64 < 0.001 5.76 < 0.001
Table 5.2. Movement asymmetry in the left-handed sample: effect of joint. Table shows results of one-tailed one-sample t-tests on amplitude and energy, for the different joints, with data pooled across emotions. Critical p = 0.0125 after Bonferroni correction, significant p values in bold type.
One might ask whether the left-handed actors’ footedness rather than their handedness correlated with the direction of movement asymmetry, since lateralisation of emotion has been shown to correlate more strongly with footedness than with handedness in left-handers (Elias et al., 1998). In accordance with the literature (Chapman et al., 1987), there was an indication of right-footedness in one third of our left-handed participants. Within the resulting relatively small sample, we failed to find an indication of substan-tial differences between left- and right-footed individuals with respect to the direction of asymmetry (data not shown).

150
5.2.2.6 Quantification of normalised movement asymmetries As discussed in Sections 5.2.2.1 and 5.2.2.2, we could ask of the above data whether there was stronger asymmetry in the movements expressing one emotion than another. But since our own (Chapter 3) and others’ data have shown that the expression of e.g. sadness is generally characterised by slower, smaller-amplitude movements with lower movement energy than the expression of happiness and anger (A. P. Atkinson et al., 2004; Montepare et al., 1987), it is informative to analyse movement asymmetries after eliminating the absolute amplitude and energy differences. We achieved normalisation by applying a Laterality Index (LI) that has been employed in studies on facial-expression asymmetry (Indersmitten & Gur, 2003). It was defined as
( ) ,5.0
LIRL
RL+
−= (5.1)
where L represents the value of a parameter (amplitude or energy of the relevant joint) for the left side, and R indicates the parameter value for the right side. This index fulfils the inequality -2 ≤ LI ≤ 2 and is zero in absence of a lateral asymmetry.
Figure 5.3. Normalised asymmetry (LI) in the arm joints (right handers). Mean laterality index (+ s.e.m) for amplitude (bars marked ‘A’) and energy (bars marked ‘E’) of the shoulder and elbow joint. Colours denote different emotions; asterisks indicate signifi-cant asymmetries.
As indicated by mostly positive LI values, there was overall asymmetry for the emo-tions, the left hemibody moving with higher amplitude and energy than the right, espe-cially for the upper extremities (Figure 5.3). In fact, both the shoulder and the elbow joints showed significant asymmetry for both amplitude and energy for nearly all emo-tions, with few exceptions for amplitude (fear for both joints, happiness for the shoulder and anger for the elbow; see Table 5.3).
The LI values were analysed further by two-way repeated-measures ANOVAs with the factors Emotion (angry, happy, sad, fearful) and Joint (shoulder, elbow, hip, knee). A significant main effect of Emotion was obtained, at least for the energy meas-ure (Table 5.3), indicating that the emotions still differed to some extent in degree of

151
asymmetry once absolute amplitude and energy differences had been accounted for. This result was complicated by significant Joint-by-Emotion interactions on both meas-ures, caused by more pronounced arm-movement asymmetry for sadness than for the other emotions. In fact, for amplitude, there was at least a trend towards stronger asym-metry for expressions of sadness than of happiness (t143 = 2.490, p = 0.014 two-tailed; Bonferroni-corrected critical p = 0.017), as well as of anger (t143 = 2.31, two-tailed p = 0.022) and fear (t155 = 3.11, p = 0.002). Compared with the results for the raw left-right differences, the level of asymmetry between the emotions was thus changed by normalisation: anger and happiness, both in general associated with relatively high lev-els of movement amplitude and energy (A. P. Atkinson et al., 2004; Montepare et al., 1987), were actually less asymmetric than sadness, which was characterised by small and slow movements.
Amplitude Energy Effect (d.f.)
F p F p
Emotion (3, 114) 0.88 0.045 3.30 0.023Joint (3, 114) 4.67 0.004 9.20 < 0.001 Emotion × Joint (9, 342) 2.07 0.032 1.94 0.046
Emotion Amplitude Energy
t38 p t38 p
Angry 2.41 0.011 2.94 0.003Happy 1.80 0.041 2.48 0.005Sad 3.37 0.001 4.54 < 0.001 Fearful 0.20 0.42 1.18 0.130
Table 5.3. Normalised movement asymmetry. Top rows show results of two-way re-peated-measures ANOVA. Bottom rows: one-tailed, one-sample t-tests on LI for the different emotions, with data pooled across joints; Bonferroni-corrected critical p = 0.0125 (one-tailed). Left: amplitude; right: energy. Significant p values in bold type.
We also investigated whether there was asymmetry in a given joint for a given expression at all, as indicated by laterality indices that differed significantly from zero (Table 5.3 and Figure 5.3). This test was restricted to the LI derived from the energy and amplitude of the shoulder and elbow joint, since their movements were far more asymmetric than those of the leg joints. For all emotions, significant asymmetry was obtained in amplitude and energy of the elbow joint. For the shoulder joint, there was an emotion-specific effect: consistent with the lack of asymmetry in the non-normalised values of amplitude and energy for fear reported in Sections 5.2.2.1 and 5.2.2.2, fear was the only emotion for which the shoulder LI was not significantly different from zero.

152
5.3 Methods and results: Asymmetry in expression intensity Did the motor asymmetries we observed also affect perceived emotional expressive-ness? To answer this question, we tested how subjects perceive emotional ‘chimeric walkers’ (Thornton et al., 2003). These stimuli were created by using the joint-angle trajectories of real human walkers to animate completely symmetric puppets, avoiding a possible confounding influence of anatomical asymmetries. The joint-angle trajectories of one body half were replaced by those of the other side, phase-shifted by half a gait cycle. The movements of the resulting right-right or left-left chimeric walkers were thus completely symmetric. The emotional expressiveness of the right-right and left-left chimeric walkers was rated by 21 observers, each walker presented once facing 35 deg to the left and once 35 deg to the right of the viewing direction in order to control for view-dependence effects.
5.3.1 Asymmetry in expression intensity: Methods
5.3.1.1 Symmetrisation of anatomy and animation
Figure 5.4. Symmetry planes fitted to the upper and lower half of the body. Corre-sponding distances dleft and dright were averaged to make the body geometry laterally perfectly symmetric.
The puppet model was animated by specifying the joint-angle trajectories derived from one typical step cycle. Since the movement had to be repeated periodically during the experiment, we first generated one animation per actor and emotion and then excluded trials for which continuous presentation resulted in unusual head or trunk movements. Animations of such trials were replaced by animations of another gait cycle from the same trial. Some trials also had to be rejected because the construction of the corre-sponding chimera (see below) resulted in self-collisions, i.e., limbs penetrating another body part. For quantitative modelling of each actor’s anatomy, we followed the proce-dure described in Section 2.3.3.1.

153
To obtain perfect lateral symmetry between the pairs of corresponding markers on both sides of the body, the distance between the markers and sagittally oriented symmetry planes were determined (Figure 5.4). Since the trunk can be rotated relative to the pelvis, two symmetry planes were defined, one for the upper and one for the lower body. Their normal vectors were defined by the axes connecting the two shoulder joint centres and the hip joint centres, respectively. Then the distances of the markers were replaced by the average distance of the right and the left marker from the plane. The puppet model was animated by reconstructing the actual 3-D positions of the pup-pet’s polygons from the Euler-angle trajectories specifying the movement, as described in Section 2.3.3.2. Finally, the entire puppet was rotated about its vertical body axis in order to ensure that the average direction of the axis between the two shoulder joint cen-tres lay within the frontal plane. Examples of left-left (Movie 5.1) and right-right (Movie 5.2) chimeric happy gait are provided on the enclosed CD.
5.3.1.2 Construction of chimeric walker trajectories The movements of the right-right and left-left chimeras were created by exchanging the flexion angles of the shoulder, elbow, hip and knee joint on one side of the body by phase-shifted versions of those appearing in the corresponding joint on the other side. Additionally exchanging abduction and rotation angles had no noticeable effects on the animations. To correct for the anti-phase relationship characterising the movement of the two body sides in walking, the replacing trajectories were shifted by half a step cy-cle. With xR(t) and xL(t) representing the original trajectories of a corresponding pair of joints on the right and left side of the body, respectively, and T signifying gait-cycle duration, the following three types of trajectories were created: (1) original, where tra-jectories xR(t) and xL(t) animated the right and left side of the body, respectively; (2) right-right chimera, with the movement of the right side xR(t) retained and the move-ment of the left side replaced by xR(t + T / 2); (3) left-left chimera, with the movement of the left side xL(t) retained and the movement of the right side replaced by xL(t – T / 2). The movements in the chimeric conditions were thus characterised by complete bilateral symmetry of the flexion angles.
5.3.1.3 Details of the perception experiment The participants of the perception experiment were students at the University of Tübin-gen (11 male, 14 female, mean age 23 years 4 months). They all had normal or cor-rected-to-normal vision. Participants were tested individually and paid for their partici-pation. The experiment consisted of two blocks: classification and rating. In both blocks, a total of 288 animations were shown, generated from twelve actors expressing four emotions, with three types of trajectories (left-left chimera, right-right chimera, and original). Animations were presented at two viewing directions, 35 degrees to the left or to the right of the frontal plane. The animations had a mean (± s.d.) duration of 1.12 ± 0.13 s (angry), 1.29 ± 0.12 s (happy), 2.10 ± 0.50 s (sad) and 1.61 ± 0.61 s (fearful). On each trial one stimulus was presented, moving continuously until the participant responded by pressing a key on the computer’s keyboard. Inter-stimulus intervals ran-domly varied between 500 and 800 ms. For classification, the animations were pre-sented in random order. Participants were instructed to classify them as angry, happy, sad or fearful. For rating, the stimuli were presented in four emotion blocks, each con-taining all 72 animations per emotion (twelve actors, three movement conditions, two orientations) presented in random order. Order of emotions was counterbalanced across

154
participants. The name of the target affect was displayed on the screen at the beginning of each block. Participants were instructed to rate the intensity of emotional expression of each stimulus on a seven-point scale (ranging from ‘not expressing the emotion’ to ‘expressing the emotion very strongly’), responding by pressing number keys 1 to 7.
5.3.2 Asymmetry in expression intensity: Results As Figure 5.5 shows, the left-left chimeras were more emotionally expressive than the right-right chimeras for anger, happiness, and sadness (Wilcoxon Z503 > -3.28, one-tailed p < 0.001), but not for fear (Z503 = -0.90, p = 0.37).
Figure 5.5. Asymmetry of intensity of emotional expression. Mean difference of ex-pressiveness ratings between left-left and right-right chimeras. Asterisks indicate sig-nificant asymmetries (p < 0.05).
5.3.2.1 Effect of stimulus orientation For faces, the side to which a stimulus is facing or the visual hemifield in which it ap-pears impacts the perceived intensity of emotional expression (Nicholls et al., 2004). A somewhat related bias has been reported for biological-motion perception: a chimeric
Figure 5.6. Effect of stimulus orientation on expression intensity. Mean difference (± s.e.m.) in rating of expression intensity between pairs of stimuli only differing in ori-entation. Positive values indicate greater expressiveness of stimuli facing to the ob-server’s left. Asterisks mark significant orientation effects.

155
walker containing dots moving as in rightward walking and dots moving as in leftward walking was, when presented in a mask, preferentially perceived as rightward walking (Thornton et al., 2003). Except for expressions of anger, our stimuli were rated as slightly more expressive when facing to the left than when facing to the right. Accord-ingly, the expressiveness difference between left-left and right-right chimeras was greater for stimuli oriented to the left (Figure 5.6), significant on Wilcoxon matched-pairs tests for expressions of sadness and fear (both Z251 -2.52, p 0.006).
5.3.2.2 Naturalness rating Chimeric pictures employed in studies on facial-expression asymmetry often contain artifacts such as a visible line or other structural abnormalities on or close to the vertical midline. Ratings of emotional expressiveness obtained for stimuli that look unnatural might be problematic (Ekman, 1980). We therefore verified whether the movements of our chimeric walkers were perceived as natural. The chimeric walkers were perceived as looking as natural as those animated with the original movement trajectories by four subjects (Friedman 2 < 4.73, p > 0.094 for all emotions, Bonferroni-corrected critical p = 0.017). Our symmetrisation method thus produced natural-looking movements.
5.3.2.3 Visual-hemifield bias As described above (Section 5.1.3.3), human observers have a visual-hemifield bias for perceiving emotional expressions: facial emotion expressions have been shown to be processed more efficiently if they appear in the left visual hemifield. Observers tend to focus more strongly on the left side of space when judging affect. This effect has been demonstrated both for neutral-emotional chimeric faces (Carlson & Harris, 1985; Heller & Levy, 1981; Jaeger et al., 1987; Levy et al., 1983; Moreno et al., 1990) and with two different stimuli appearing side by side, one in each hemifield (Levine & Levy, 1986; Spence et al., 1996). It has also been shown for intact pictures shown at both normal and mirror orientations, exploiting naturally occurring hemifacial asymmetries in emotional-expression intensity (Borod et al., 1990; Sackeim & Grega, 1987), Such studies imply that human observers make inefficient use of the facial emotion expression of the per-son facing them since they fail to focus more on that side of the face carrying a more intense expression (Sackeim et al., 1978). Studies on the asymmetry of facial emotion expression thus usually show all face stimuli at both their normal and mirror orienta-tions.
We tested whether a similar effect might be found for our walker stimuli. If the observer fixates centrally on the stimulus, then the movement of the walker’s (anatomi-cally) left side of the body is mainly restricted to the observer’s right visual hemifield, and vice versa. To investigate whether observers are more influenced by the movements appearing to their left, we repeated the above experiment, including an extra stimulus type: the mirror stimulus, with the movements switched between the left and right side. We performed this experiment exactly as described above, with 15 participants. Our hypothesis was that, as for faces, the normal assignment of movements to the two sides of the body would be suboptimal for emotion perception. Given that left-sided body movement is more expressive than right-sided body movement, the mirror stimuli should thus be perceived as more expressive than the animations with the original movement assignment. As shown in Figure 5.7, there was indeed a small expressiveness advantage for the mirror stimuli over those with the original distribution of movements, which was significant for fearful gait only (paired t = 1.78, p = 0.04; all other t < 0.9,

156
p > 0.2), but which went in the right direction for gaits expressing anger and sadness. Thus, as for faces, it seems as if observers do not make use of the expressiveness advan-tage of the left hemibody by focusing on the (anatomically) left side of the body more, i.e., by paying more attention to that part of the stimulus appearing to the observer’s right.
Angry Happy Sad Fearful
*E
xpre
ssiv
enes
sdi
ffere
nce
0.2
-0.1
0.1
0.3
0.4
-0.2
0
Angry Happy Sad FearfulAngry Happy Sad FearfulAngry Happy Sad Fearful
*E
xpre
ssiv
enes
sdi
ffere
nce
0.2
-0.1
0.1
0.3
0.4
-0.2
0
Exp
ress
iven
ess
diffe
renc
e
0.2
-0.1
0.1
0.3
0.4
-0.2
0
0.2
-0.1
0.1
0.3
0.4
-0.2
0
Figure 5.7. Expressiveness difference between mirror and normal walker. Bars indi-cate mean (± s.e.m.) difference in expressiveness rating between the normal and mir-ror arrangement, limited to stimuli facing to the observer’s left. Positive values indicate higher expressiveness of the mirror arrangement, significant for fear (p < 0.05).
5.4 Discussion
5.4.1 Main findings Our experiments provide the first demonstration of pronounced lateral asymmetries in human emotional full-body movement, on two physical movement characteristics: am-plitude and energy. These motor asymmetries influence the perceived expressiveness of emotional gait. In particular, we show, by creating chimeric walker stimuli, whose body movements are generated either from left-sided or from right-sided movement trajecto-ries, that human observers perceive the movements of the left side of the body as more emotionally expressive than those of the right side. These findings point to a functional asymmetry between the two cerebral hemispheres in the control of emotional expres-sion, consistent with the right-hemisphere hypothesis of emotion (Adolphs et al., 2001). Besides the isolated finding that emotion-related asymmetry exists in body movement, our findings actually considerably extend findings obtained on the asymmetry of facial emotion expression: given both the robust asymmetry between the two sides of the body during bodily emotion expression and the strongly established principle of musculature being controlled by the contralateral cerebral hemisphere, our findings can be taken as strong support for a functional cerebral asymmetry related to emotional expression. Since many arguments have been put forward against facial-expression asymmetry hav-

157
ing to do with emotion, our findings on the asymmetry of bodily emotion expression considerably strengthen the conclusion of a lateral asymmetry in the control of emo-tional expression. We show that the asymmetry of emotionally expressive body move-ments is greater than the asymmetry in neutral movements. We also show that left-handed individuals exhibit movement asymmetries comparable to those of right-handers, as for faces (Borod & Caron, 1980), which implies that the observed asymme-try did not simply result from functional differences between the dominant and non-dominant arm in locomotion.
The physical left-right asymmetry in emotional gait was weakest for fear; fearful gait was also the only case for which we found no expressiveness asymmetry between the movements of the left and right side of the body. We did, however, find a postural asymmetry in fearful gait, in that the trunk was rotated and tilted to the left relative to neutral gait. Fear was also characterised by stronger posture changes relative to neutral gait than any of the other emotions we tested (Chapter 3), and it has previously been shown that body posture rather than movement is used as a dominant cue for the detec-tion of fear by human observers (A. P. Atkinson et al., 2004; A. P. Atkinson et al., 2007). Therefore, we would like to suggest that our failure to find an expressiveness asymmetry in fearful gait, rather than being to do e.g. with the approach-withdrawal quality of fear, is due to movement differences between the emotions.
We showed reliable left-right asymmetries in emotional gait for two physical measures: maximum movement amplitude and movement energy. Since the direction of the physical asymmetry matched the direction of the expressiveness asymmetry, we can conclude that the physical measures we chose did capture movement qualities that play an important role in the perception of emotion from bodily expressions. This conclusion also matches the findings we report in Chapter 3 as well as previous reports on emo-tional body expressions, amplitude being one of the consistently reported influences on the perception of emotional body expressions (Montepare et al., 1987; Pollick et al., 2001; Wallbott, 1998).
Our observations on effects of stimulus orientation and visual-hemifield bias fit with findings on lateral asymmetries in the perception of emotional expression, the left visual hemifield being superior for affect judgments. Similar to facial emotion expres-sions (Nicholls et al., 2004), our walker stimuli tended to be rated as more expressive when facing to the observer’s left than when facing to the observer’s right; besides, stimuli were rated as slightly more expressive if each side of the body was animated with the trajectory from the opposite side (mirror stimuli) when compared to the origi-nal animations. This result implies that, as for faces (Sackeim et al., 1978), the more expressive parts of the body appear more prominently in that visual hemifield less tuned at picking up emotional information. Our findings show that for our emotional body expressions the usual concern about asymmetry differences between perception and production of emotions do not seem to hold (Borod et al., 1997; Davidson et al., 1990), and that the perceiver bias observed in studies on the asymmetry of facial expressions of emotion are not exclusively due to a right-hemisphere processing advantage for faces (De Renzi, 1986b; De Renzi et al., 1994).
Asymmetries in gait are a surprising finding overall. Although it has been shown that captive chimpanzees show a side preference in descending gait (Hopkins, 2008), gait represents a rhythmic movement pattern that is most stable and efficient if the movements on both sides of the body are equal in size (Manning & Pickup, 1998; Mar-tin & Lopez, 2001). Furthermore, there is ample evidence that there is a sexual-selection

158
pressure towards symmetry in anatomy and movement (Brown et al., 2005; Brown et al., 2008; Miller, 1998), symmetry apparently serving as a trait that signals the overall performance of a potential sexual mate (Grammer & Thornhill, 1994; Scheib, Gang-estad, & Thornhill, 1999).
5.4.2 Implications Our findings considerably extend previous reports of emotional-expression asymmetry. First of all, we show that asymmetries in emotional expression are not restricted to the face, but that they can be found in human full-body movement. These findings consid-erably strengthen the association between the right hemisphere and the control of emo-tional expression, because the efferences to limb musculature (especially to the distal aspects) are believed to be more exclusively and completely contralateral than those to the expressive facial musculature (Kuypers, 1958; Rinn, 1984). The asymmetries we found were present in three emotions, and at least for posture in the case of fear expres-sions, implying these effects are general in nature.
We also controlled for several potential confounds present in many studies on the facial expression of emotion. Working with dynamic stimuli rules out a simple tim-ing bias that can be introduced when working with photographs, if the onset of the ex-pression on the two hemifaces differs. Another important problem with asymmetries in facial expression lies in structural asymmetries between the two sides of the face, e.g. differences in area (Sackeim & Gur, 1980), or in the judged intensity of emotional ex-pression of the neutral or resting face (Borod et al., 1988). In some studies, structural asymmetries have even been found to be the dominant factor in expressiveness asym-metries (Schmidt et al., 2006). Our chimeric walker stimuli were completely bilaterally symmetric both anatomically and in movement, thus excluding the possibility of this confound. They were also perceived as no less natural than the original animations, very much unlike chimeras of facial expressions (Ekman, 1980), which often have clearly visible irregularities near the vertical midline, or where stimuli can have two nose tips (Indersmitten & Gur, 2003).
Another point which sets apart the current study from previous work on facial emotion expression lies in our considering physical measures of asymmetry, which is done only in a minority of studies on facial-expression asymmetry (Nicholls et al., 2004; Schmidt et al., 2006). The advantage of combining measures of physical and ex-pressiveness asymmetry is that if both measures show asymmetries matching in direc-tion, then the measures used to quantify physical asymmetry in the first place can pro-vide a useful pointer to perceptually meaningful stimulus attributes. This point is cor-roborated by the findings we report in Chapter 3, showing in a systematic way that movement amplitude and movement energy represent important parameters influencing observers’ perception of the intensity of emotional expression. Of course it is also pos-sible that more intricate measures reflect the relevant stimulus attributes more clearly, which would be entailed by finding that expressiveness asymmetries would still be found if we corrected e.g. simple left-right amplitude differences in our chimeric walk-ers.
5.4.3 Shortcomings and outlook While the current study’s findings resonate with a sizeable literature on asymmetries in emotional expression, reduced expressiveness of emotional face movements and speech prosody being reported to follow right-hemispheric lesions (Buck & Duffy, 1980;

159
Heilman et al., 1975), future imaging (Grezes et al., 2007) and lesion studies will be required to elucidate further the cortical substrates that cause the observed asymmetry. Besides, it would be interesting to use e.g. dichotic-listening tasks (or brain imaging) to assess the emotional lateralisation especially of left-handed individuals and then to cor-relate these findings with asymmetries in the expressiveness of both facial and bodily emotional movements. A wider range of movements ought to be tested, and it might be interesting to extend the set of emotions to see if the asymmetries also hold for other movements and affects. Besides, we could perform formal tests of potential differences in asymmetry between evoked and voluntary emotional expressions, since different neu-ral structures seem to underlie the production of spontaneous and voluntary expressions in the face (Rinn, 1984; R. T. Ross & Mathiesen, 1998). While we took the utmost care to record the most spontaneous expressions possible, it might be worth experimenting with different mood-induction procedures (e.g. using videos), or to compare the avail-able expressions with ones recorded when specifically instructing actors to act, while trying not to experience a mood change. It would be interesting to combine such com-parisons with objective measures of physiological arousal to validate the induced moods (Cacioppo et al., 2000).
Emotional expression is only one of a long list of social or communicative be-haviours in humans and in fact, lateral asymmetries have been demonstrated for a range of such behaviours. For instance, about 80 % of right-handed mothers and fathers cradle their babies on the left (de Chateau, 1987; Sieratzki & Woll, 1996), and so do the major-ity of left-handed mothers (Salk 1973). Further, couples preferentially turn their heads to the right for kissing (Gunturkun, 2003). It is still an open question whether these asymmetries are secondary to known asymmetries in emotional expression or in visual-hemifield advantages for the perception of emotional signals. For instance, besides the visual-hemifield bias for emotional expression (e.g. Heller & Levy 1981), described in Section 5.1.3.3, the left ear has been shown to be superior at recognising affective as-pects of language (Bryden et al., 1982), especially infant expressions of distress (Best, Womer, & Queen, 1994), and the left side of the body is more sensitive to the emotional impact of touch (Sieratzki & Woll, 2004). In this context, it would be interesting to test whether the asymmetries we found are also present in other communicative body ac-tions, e.g. in acting even in non-emotional contexts, or in other social or communicative behaviours such as waving to someone you know, or in stroking someone.
Given the well-known visual-hemifield bias for affect judgements (Heller & Levy, 1981), and given our results with the mirror stimuli, it would be interesting to investigate the hemifield effect for our stimuli more stringently. This would be possible by presenting the original and mirror animations for a shorter time, and by exerting con-trol over observers’ fixation patterns. Alternatively, it might be possible to present only parts of the stimulus, e.g. by masking one side of the body with visual noise. The results of such tests could be revealing because a stronger observer reliance on the left visual hemifield would indicate that observers fail to take into account emotional-expressiveness asymmetries by focusing on more expressive stimulus parts when judg-ing affect expressions.
For further investigating the physical movement asymmetries in emotional body expressions, we could also develop more sophisticated physical measures of movement asymmetry, amplitude and energy only representing relatively basic measures. Such measures might help resolve one of the major remaining ambiguities in our data: we found the slightly surprising result that for all emotions, larger and higher-energy

160
movements were rated as more expressive by observers than smaller, lower-energy ones. This positive correlation between expressiveness and the size and energy of movements seems obvious for happiness and anger, demonstrated in earlier studies (Montepare et al., 1987; Pollick et al., 2001; Wallbott, 1998) and in the findings we re-port in Chapter 3. On the other hand, for our data, as well as in said previous studies, perceived emotional expressiveness is negatively correlated with movement amplitude and energy when expressions of sadness are considered.
5.4.4 Advantages of brain asymmetry and its population-level align-mentAny discussion of behavioural left-right asymmetries and asymmetries in brain function immediately raises the question of why brains should be asymmetrically organised at all. Brain asymmetry has a number of advantages: it avoids the duplication of functions that a completely symmetrical distribution would necessarily entail, thus potentially ‘saving resources’. It seems as if specialisation of function of the individual hemi-spheres may be especially pronounced in species with larger brains, since it has been shown that the relative size of the corpus callosum decreases with increasing brain size, especially for primates (Rilling & Insel, 1999). Intra-hemispheric communication may become more important than inter-hemispheric communication as the brain grows, pos-sibly to avoid the increasing duration and reduced reliability inherent in the transfer of information across the hemispheres, and reflected in the scarcity of cortical neurones actually connected with the other hemispheres, which for humans has been estimated to apply to only 1 % of all cortical cells when very thin fibres are disregarded (Pakkenberg & Gundersen, 1997). It has indeed been shown that hemispheric specialisation can im-prove performance, for instance in the visual system of birds. The avian visual system is genetically determined to be lateralised, but dependent on light as an epigenetic factor that induces a torsion of the bird embryo’s head, subsequently inducing higher levels of activity in the right eye. By affecting the level of lateralisation of the chick visual sys-tem through manipulating light exposure during maturation, it has been shown that more strongly lateralised chicks outperform less lateralised chicks at grain-grit dis-crimination (Gunturkun, 2003) and at detecting the presence of a predator (L. J. Rogers, 1996). Another advantage of hemispheric asymmetry might be that in situations where – theoretically – the processing of the individual hemispheres leads to conflicting action plans, having a ‘dominant’ hemisphere will be advantageous since only one action can be taken at a time. An example of such an arrangement may be provided by toads’ pref-erence to react with predatory tongue strikes to stimuli in their right visual hemifield (i.e., the response appropriate for moving prey) while stimuli in their left visual hemi-field evoke agnostic tongue striking, as if responding in a hostile manner to conspecifics (Vallortigara, Rogers, Bisazza, Lippolis, & Robins, 1998). Seen in this light, hemi-spheric asymmetries appear especially appropriate for emotion, given that the strong motivational power of emotions bears evolutionary advantages in dangerous situations where fear and flight responses are appropriate.
Traditionally, it has been less difficult to find plausible reasons for brain asym-metry in general than it has been to explain the advantage of aligning the direction of asymmetry at the population level. After all, not only do most human beings have a pre-ferred hand for performing fine motor tasks, but intriguingly, the right hand is the pre-ferred hand for around 90 % of us. Similarly, language has been estimated to be domi-nantly controlled in the left hemisphere in about the same proportion of humans (Binder

161
et al., 1996; Broca, 1861; Knecht et al., 2000). An evolutionary explanation has been put forward for another population-wide alignment of asymmetry, namely, animals’ turning preferences. Social species of fish tend preferably to turn to one side, whereas non-social fish species do not appear to show such a side preference (Facchin, Bisazza, & Vallortigara, 1999), a population asymmetry which may assist schooling behaviour. While predators might exploit this bias – which they seem to do, as evidenced e.g. by toads preferably responding to prey animals appearing in their right visual hemifield (Vallortigara et al., 1998), the advantage of shoaling for the individual may outweigh its disadvantages, and it might even be possible to predict an evolutionarily stable propor-tion (Smith & Price, 1973) of dissenters. The two hemispheres might additionally differ e.g. in susceptibility to diseases, another reason why population alignment of asymme-tries might be advantageous. It has been shown, for example, that meningitis often more strongly afflicts the right hemisphere than the left (Bol, Scheirs, & Spanjaard, 1997).

162

163
Chapter 6 Overview and conclusions
Action does not come to a stop in its structures, it remains in ac-tion. In other words, there is more in bodies, things and events than is contained in their structures or material forms. All things overflow their own structural limits. The inner Action tran-scends the outer structures, and there is thus a trend in things beyond themselves.
JAN CHRISTIAN SMUTS (1870-1950)Holism and Evolution, 12, 1926.
6.1 Key findings
6.1.1 Critical features for the perception of emotion from gait Both static and dynamic cues have been identified that human observers use when judg-ing facial and bodily emotion expression. However, little of the published work on emo-tional body expression has physically quantified candidate features. Quantification of features is necessary to investigate features free from subjective influences such as the observer’s visual attention or hypotheses about the features involved in expressing a given affect. We aimed at identifying expressive stimulus features in emotionally ex-pressive body movements, making use of a rigorous quantification of the available fea-tures using unsupervised-learning techniques. We addressed three main questions re-garding the bodily expression of emotions: identifying characteristic movement and posture features of emotionally expressive gait, investigating the role of these features for the perception of bodily emotion expression and, employing a high-level adaptation paradigm combined with motion morphing, verifying whether our largest and most con-sistent expressive features were effective at driving the emotion percept. To answer these questions, we considered average joint-flexion angles as measure of body posture. The representation of movements for our analysis was extracted by applying a novel blind-source-separation algorithm to our data (Omlor & Giese, 2007a, 2007b). Since all movements could in this way be represented extremely efficiently by joint- and affect-specific linear mixtures of only three source functions, the multi-dimensional problem of dealing with human body movements was made tractable by being broken down to the linear problem of comparing the mixing weights. Gait velocity was considered as another feature.
We identified emotion-specific features in terms of both body posture and body movement. Most consistently, actors inclined their heads when expressing sadness, but held it more erectly than normal while expressing happiness or fear. Since happiness was additionally associated with an usually erect spine, vertical body extent served as a cue for positive affectivity. The other main affect-specific feature was joint flexion, es-pecially of the elbow joint. Expressions of anger and fear were associated with pro-

164
nounced elbow flexion, while elbow flexion was reduced for happy and minimal during sad gait. Fearful walking was additionally associated with flexion of the hip and knee joints, indicating widespread postural tension for expressing this affect – a finding not described in the published literature. Together, these findings entail a tension or joint-flexion feature for the expression of anger and fear that sets these affects apart from sadness and joy. The size and speed of movements, as well as gait velocity, coded the activation of affects: the activated affects anger and happiness were expressed using large, fast movements, while during sad and fearful gait the actors adopted a slow gait with small movements. The posture differences (average joint flexion) could serve as cues for differentiating between happy and angry gait on the one hand and between sad and fearful gait on the other, i.e. between the pairs of affects sharing a similar level of movement activation. Joint flexion could thus serve as a cue for the hostility present during fear and anger, as the factor that sets these two affects apart from sadness and joy.
Our analysis of the movements also revealed findings of wider-reaching signifi-cance. Thus, we found that the novel blind source separation algorithm we applied to our data led to more efficient representations of the movements than PCA, making the algorithm a prime candidate for representations of a wide range of body movements and for many different purposes. For a given level of approximation accuracy, PCA requires more than twice the number of source terms compared to the novel algorithm. More importantly, though, the novel algorithm automatically extracted movement changes that were both very intuitive and closely in line with published findings on important emotion-specific movement features, whereas a match with published findings was ob-tained for only a small subset of the features extracted using PCA. The novel algorithm thus provides an efficient representation of and widely applicable analysis tool for in-vestigating human body movement.
One specific question addressed in our movement analysis concerns the long-standing issue of what differentiates between emotionally expressive movements and merely very fast or slow movements. This question arises because the movements ex-pressing different affects vary greatly in speed, and speed has strong biomechanical influences on our movements, especially in terms of a direct correlation between movement size and speed (Kirtley, 2006). It can only be satisfactorily answered by thorough quantitative analysis. It should be noted that movement speed (or in our case gait velocity) represents an important feature of emotional expression, since emotionally expressive movements probably differ greatly in speed from our everyday, emotionally neutral movements. But besides, we found that there are characteristic differences be-tween emotionally expressive gait and speed-matched neutral gait. We found that the arm movements during expressions of the activated affects anger and joy were faster and larger than those found during speed-matched neutral gait. In contrast, there were reductions in the speed and size of arm and leg movements during sad and fearful gait that went beyond the changes caused by reduced gait speed alone. It thus seems as if actors caricature the effects of the speed-associated movement changes when expressing emotions in their body movement, making them even larger or even smaller than al-ready expected from the changes in velocity.
Having identified the posture and movement features characterising expressions of the different affects, in the next step we investigated their role for observers’ percep-tual judgements. Contrasting inferences from early research that bodily emotion expres-sion reveals only the general level of movement activation, or that at best head inclina-

165
tion provides some cues as to valence (Ekman, 1965; Ekman & Friesen, 1967), we found classification rates between 70 and 90 % in a four-choice experiment, and be-tween 65 and 92 % when ‘neutral’ was included as a fifth affect category. In terms of body posture, the strongest discriminating features were limb flexion and head inclina-tion, while discriminative movement cues were gait velocity and speed-associated movement changes. Classification of sadness expressions was the most consistent, while anger and happiness expressions yielded the highest confusion rates. Confusions between the different affects mostly occurred according to movement activation, anger expressions tending to be labelled as expressing happiness and vice versa, while the same pattern was found for fear and sadness. However, although movement speed thus appears to represent an important cue for emotion judgements, observers use additional emotion cues present in the movement patterns: the classification judgements for neutral gaits speed-matched to emotionally expressive gait were much less consistent than those for emotionally expressive gait. In particular, the classification experiment already pointed to the possibility that posture cues play a special role for the perception of fear. We found that the neutral speed matches for fearful gait, although on average slower than those for sad gait, were most often classified as expressing sadness rather than fear. Therefore, it seems as if additional posture cues, not present in the neutral speed matches, are necessary for perceivers to assign fear to a movement. This result is all the more noteworthy when we compare it to the findings for the expression and perception of sadness: in our dataset, the expressions of sadness were all associated with head in-clination as a distinctive posture feature. Consistent with this, head inclination turned out to be the major feature driving the perception of sadness from body movements. However, when faced with very slow, but emotionally neutral gait, observers still clas-sified this as expressing sadness (rather than fear) even though the feature of head incli-nation was missing in the stimulus. Thus, it seems as if further posture changes in the stimulus are mandatory for the attribution of fear to a slow body movement. On the other hand, head inclination – when present – is a very important cue to sadness, but not a mandatory one. Another peculiar observation regarding fear expressions that will be left uncommented here was a 30 % difference in recognition rate between the fear ex-pressions of female and male actors.
Are emotions more or less accurately conveyed through body movements than through facial expressions of emotion? Since we only tested four affects, while in most studies on facial emotion expression six are tested (disgust and surprise are part of the dataset), the exact figures are difficult to compare. The accuracy with which the move-ments in our database were categorised ranged between 70 % and > 98 %. For facial expressions of emotion, recognition accuracies have been found to range between 80 and 100 % (Scherer et al., 2003), but for six affects, so facial emotion expression seems to be slightly more recognisable than bodily expression. The confusion patterns also differ for the two expressive channels, recognition being close to 100 % for happiness, while it is around 80 % for the other affects (Scherer et al., 2003). This is in contrast to our finding that sadness was the easiest to recognise from locomotion (the pattern may be different for other types of movement and especially for less constrained move-ments). Another interesting comparison concerns the ease with which prosodic emo-tional expressions are recognised. The affective signal conveyed by speech shares with emotionally expressive body movement the fact that investigations stress the temporal dimension of the signal. Both body-movement and vocal expressions of affect share a strong influence of emotion activation, resulting in both a physical similarity and a ten-

166
dency for subjects confusing between anger and joy expressions. Compared with affec-tive prosody, bodily emotion expression appears to be more easily recognised: a study with the four affects we tested, and neutral, found recognition rates between 57 and 77 % (Scherer et al., 2003), compared to our range from 65 to 92 % for the correspond-ing set of affects.
What are the key movement and posture features driving observers’ judgements of the intensity of emotional expression for emotional gait? To select only the most im-portant features, we applied sparse linear regression, which limits the number of active features in the regression solution by essentially punishing small regression weights (the ‘lasso’ method) (Tibshirani, 1996). The level of optimum sparseness was determined by generalized cross-validation, which optimises the trade-off between the number of ac-tive features and approximation error (Fu, 1998). The analysis showed that there are emotion-specific patterns of posture and movement features related to judgements of emotional-expression intensity. In terms of posture, we found that for judging the ex-pressiveness of sad gait, head and spine inclination were the dominant cues. For both anger and fear expressions, limb (especially elbow) flexion was a dominant cue. Judge-ments of the intensity of joy expressions were only weakly related to body posture, with upper-arm retraction and elbow flexion the more important posture features. In terms of movement, generally speaking, size and speed were positively correlated with expres-siveness judgements for angry and happy gait, while they were inversely correlated for sadness and fear expressions. For angry gait, the size of upper-arm and thigh swing was dominant, while for happy gait lower-arm movement was a more important expressive-ness cue; as an exception to the rule, smaller stepping movements of the shank were actually associated with higher happiness ratings. Expressiveness judgements for sad and fearful gait were strongly influenced by the size and speed of upper-arm swing; for fear, leg movements had a strong influence on expressiveness ratings. Altogether, our analysis revealed that in principle, the largest and most consistent posture and move-ment features present during emotional gait also represented the dominant cues driving judgements of emotional-expression intensity.
We found that e.g. leg movement and leg posture is much more important for the perception of fear from body movements than for the perception of sadness; on the other hand, head and spine inclination were rather more informative regarding sadness than fear. The flexion and movement of the elbow joint was a key feature for the perception of emotionally expressive body movement. For facial emotion expression, too, it has been shown that different parts of the face are important for perceiving facial expres-sions of different emotions. Such studies involve e.g. restricting the stimulus display to face regions (Bassili, 1978, 1979b) or the ‘freezing’ of individual facial features (Nusseck et al., 2008). It has in fact been suggested that two facial action units are suffi-cient for recognising facial expressions (Wiggers, 1982). Extensive studies based on the random sampling over restricted parts, or ‘bubbles’ of the face, have shown in much detail which specific features are most important for recognising a particular expression, e.g. the corners of the mouth for perceiving joy etc. (Gosselin & Schyns, 2001; Schyns et al., 2007). Undoubtedly, unsupervised learning of facial expressions of emotion, po-tentially using the blind source separation algorithm we employed, will be informative in this respect. Since many of the features we extracted by analysing the trajectories of emotionally expressive gait matched findings described in the published literature, it is likely that some of these features will one day be regarded as ‘universals’ of bodily emotion expression. Further studies based on the movements of individuals from di-

167
verse cultural backgrounds and different types of movements, validation with observers from different cultural backgrounds and investigation of the relationship between exter-nally observable features and actual mood state will be necessary.
What do the findings reported in Chapter 3 reveal about possible similarities be-tween different affects? We found that for the four affects we tested, movement activa-tion (i.e., the speed and size of movements) represented a major discriminating cue, confusions between affects occurring mostly between pairs of affects with similar acti-vation level. Within these pairs, posture cues were used for finer discrimination – head and spine inclination coding valence, limb flexion (i.e. postural tension) correlating with the expression of emotions associated with hostile relationships. Our results resemble those of facial-expression studies showing that discrimination performance is strongly influenced by superficial visual resemblance between expressions (Susskind, Littlewort, Bartlett, Movellan, & Anderson, 2007). Thus, for facial expressions, there is a strong tendency to confuse expressions of negative affects with each other (mostly anger, fear, sadness), while happiness expressions are more likely confused with disgust or surprise (Susskind et al., 2007). Altogether, it seems as if bodily expressions more directly code the motivational tendencies correlated with an affect (Frijda, 1988) – fight, flight of anger and fear expressions versus the openness of joy expressions and the lethargy of sadness – than facial expressions do. In this respect, bodily emotion expression resem-bles prosody more closely than it matches facial emotion expression (Scherer et al., 2003). In fact, the ‘dimensions’ of activation and valence in the circumplex model of emotion (Schlosberg, 1952, 1954b) are usually inferred more from emotional semantics, rather than from the actual facial expressions. Bodily emotion expressions reveal moti-vational tendencies coded in emotional expression and suggest that, besides emotional valence and activation, the hostility of interpersonal relationships represents an impor-tant aspect to consider when judging emotional expression.
A qualitative step further in the analysis of (the perception of) emotional body expressions lies in testing causal relationships between features and emotion perception, since all the above findings on the feature-perception relationship were based, essen-tially, on the statistical techniques of correlation and regression. Thus, we decided to test whether the largest or most consistent movement and posture changes we extracted were effective at determining the affect percept. We tested whether we could design emotional gaits by adding individual emotion-specific movement and posture features to the trajectories of neutral gait. We thus generated artificial happy and sad walker stimuli by adding to neutral gait the two largest average posture and movement changes, in terms of average joint flexion and the linear mixing weights, that we had extracted in our movement analysis. This stimulus design represents another demonstration of the immense possibilities and flexibility for designing body-movement stimuli when work-ing with joint-angle data. To test the ability of the artificial emotional gaits at driving an emotion percept, we studied the high-level adaptation effect exerted by these stimuli on happiness-sadness discrimination for stimuli on a morphed continuum between happy and sad gait. Strikingly, both the happy and sad artificial adapting stimuli shifted the discrimination performance in directions consistent with high-level adaptation of emo-tion perception. In fact, since the induced adaptation effect did not significantly differ in size from the adaptation effect induced by natural happy and sad gait, we can safely conclude that our movement analysis extracted key features for the perception of emo-tion from gait. Besides, the movement and posture features extracted in our analysis can be used in the sense of a ‘generative grammar’ of emotional gait: emotionally expres-

168
sive gait patterns can be generated by superimposing neutral gait with individual ex-pressive features.
Last, not least, the findings stated in Chapter 3 stimulated research questions fur-ther investigated in Chapters 4 and 5. The question of how the perception of emotional expressiveness integrates information over individual spatio-temporal features, and the description of such features that were either congruent or incongruent with features ex-tracted directly from motor behaviour, is addressed in Chapter 4. In Chapter 5 I de-scribed experiments investigating a left-right asymmetry in emotional body expression (see the following section), which became apparent in the description of affect-related kinematics, and which resonates with an impressively sized literature on emotion-related functional hemispheric differences and emotional-expressiveness asymmetries between the left and right hemiface (see also Section 6.1.3).
6.1.2 Integration of features in the perception of emotion from gait Over the last two decades, the cue-fusion approach has been successfully applied to a large number of perceptual tasks requiring the integration of sensory information, show-ing that integration could be modelled using Bayesian reasoning (Blake et al., 1993; Knill, 2007; Landy & Kojima, 2001). The plethora of features present during the per-ception of bodily emotion expressions led us to apply the cue-fusion approach. Similar to considering the role of features for object recognition, we reasoned that the percep-tion of emotional body expressions is based on the integration of expressive features over the spatial extent of the body. To investigate the spatial integration of information during the visual perception of emotional body expressions, we modelled observers’ expressiveness ratings and emotion detection for emotionally expressive gait, either for the original movements or when the emotion-related movement characteristics were restricted to the body parts belonging to spatial features of the stimulus. Observers judged the expressions of stimuli sampled from the morphed continuum between neutral and emotionally expressive (angry, fearful or sad) gait. The hypothesis addressed in our experiments was that perceptual integration be closer to optimal if the set of spatial fea-tures were consistent with the analysis of movements presented in Chapter 3 than if the spatial features we designed violated the natural features present in affective gait – ac-cording to the common coding hypothesis for the visual perception of body movements (Schütz-Bosbach & Prinz, 2007; Viviani & Stucchi, 1992).
To investigate these questions with point-light animations of emotional gait, we extended motion morphing for application restricted to individual spatial features of the human body, the remainder of the figure moving as in neutral gait. This approach yielded point-light animations with highly realistic-looking movements, which in itself is not a trivial finding. Two feature sets were tested: the first, designed to be congruent with motor behaviour, was characterised by a horizontal division just above the top of the pelvis (the ‘Upper-lower’ set); in the second, incongruent or ‘Left-right’ set, the upper and lower extremity of contralateral sides of the body were morphed together. Congruence and incongruence with motor behaviour was determined according to the results described in Chapter 3 and according to reports for the combination of locomo-tion with other voluntary movements (Ivanenko et al., 2005).
We found that with increasing linear weights of the emotional prototype in the morphed stimuli, both the ratings of emotional expressiveness and the probability of emotion detection increased. This finding demonstrates the validity of applying motion morphing to generate movements along a continuum of emotional-expression intensity.

169
Since the highest emotional-expressiveness rating and emotion detection rate were achieved for the full-body morph rather than for the component stimuli, we inferred that observers indeed integrated emotion-related information over the spatial extent of the stimulus. Modelling the integration of information with a Bayesian model showed that this integration was very close to being statistically optimal, with a slight tendency for overshooting predictions, for both the expressiveness ratings and for emotion detection. Contrary to our hypothesis, the integration actually deviated from the full-body results more strongly for stimuli designed to be congruent with motor behaviour (the upper-lower feature set) than for stimuli incongruent with motor behaviour (the left-right set). This finding is interesting and should be investigated in future studies. It might be re-lated to attention normally being focused on the upper body half during the perception of emotional expression. Thus, when faced with a stimulus in which only lower-body (or leg) movement is emotionally expressive, observers might be induced to attend to leg movement. Integrating over observers’ responses to the upper- and lower-body stimuli then yields overshooting predictions due to more attention being paid to the leg movement of lower-body stimuli than to the (equally expressive!) leg movement of full-body stimuli. Consistent with this hypothesis, the highest overshoots in the integration results were obtained for the perception of fearful gait, which was the emotion charac-terised by the most informative leg movements. Eye-movement recordings during per-formance of the tasks would be informative in this respect. Besides, it would be interest-ing to test how the different features should be weighted to obtain even better integra-tion results.
Since the emotional expression in the component stimuli was restricted to indi-vidual body parts, the findings of this study complement those reported in Chapter 3 on the differential role of body parts for emotion expression. For instance, while varying the contribution of the emotional prototype to leg movement hardly influenced expres-siveness ratings for sad gait, the same variation strongly correlated with the ratings for fear expressions. These findings matched the differential importance of leg movement and head inclination for the perception of fear and sadness reported in Chapter 3. Find-ing that the rating and emotion-detection rate at a given morph level were always higher for upper-body morphs compared to lower-body morphs is consistent with the finding of Chapter 3 of a special role of upper-body movement for the perception of emotional body expressions. In particular, the comparison between the results for the left-right and right-left component sets shows that head inclination was an important cue used by ob-servers. This is indicated by our finding that of the left-right component set, those com-ponent stimuli for which variation of head movement was included, were rated as more expressive and emotion was detected more easily than if head movement was not var-ied.
As for wider-ranging conclusions from the study reported in Chapter 4, we have found that the cue-fusion approach can be profitably employed for studying the percep-tion of emotional body expressions, a field not usually considered in the context of per-ceptual modelling. The facial expression of emotions, where feature-based approaches have been used (Bassili, 1979b), could undoubtedly be studied using similar models. Further studies on emotional body expression using related experimental paradigms could be performed with different spatial features, and especially with more than one feature being changed at a time, and at different intensity, making possible the investi-gation of interactions between different features. We could also study whether similar results to those of Chapter 4 would be obtained when working with 3-D animations

170
rather than with the more crude point-light animations. Cue integration could be ex-tended to include e.g. prosodic information, or the integration of facial and bodily ex-pressions etc. While the remainder of the experimental studies were performed with a set of four affects, for the experiments of Chapter 4 only data for three negative affects were reported. Interestingly, a pilot study with a few subjects for happy gait resulted in such a pronounced bias for reporting neutral gait as ‘happy’ that the results were not comparable with those for the other tested affects. In fact, this finding points to a pecu-liarity of the discrimination of emotionally neutral and happy body movements that would be worthy of further investigation. Besides, it is important to remember that ho-listic perceptual strategies exist that are not satisfactorily studied with a feature-based approach. There is much evidence supporting the concept that faces presented upright are not processed based on their individual features. Rather, as shown amongst other things by disproportionate performance decrements for inverted faces, we perceive faces based on configural aspects (Maurer, Grand, & Mondloch, 2002; Yin, 1969; A. W. Young, Hellawell, & Hay, 1987). Similarly, holistic processing strategies have been described for the perception of the human body (Pavlova & Sokolov, 2000; Reed, Stone, Grubb, & McGoldrick, 2006; Thompson, Clarke, Stewart, & Puce, 2005). Our findings have to be considered in the context of what is known of the holistic processing of the human body and its movement.
6.1.3 Asymmetry of emotional body expression A sizeable literature has been amassed on the finding that the left side of the face is more emotionally expressive than the right. Thus, with chimeric pictures of facial emo-tion expressions, where one hemiface is replaced by the mirror image of the other, the general finding is that the emotional expression of the left hemiface is perceived to be of higher intensity, i.e. to be more emotionally expressive, than the emotional expression of the right (Borod et al., 1997). The most prominent other example of laterality in hu-man behaviour is handedness: the majority of us prefer using the right hand for per-forming fine motor tasks. As it is assumed that functional and structural differences be-tween the two cerebral hemispheres correlate with handedness, it has similarly been suggested that the left-hemiface expressiveness advantage points to a greater right-hemisphere involvement in the control of emotional expressions. The inherent attrac-tions of this inference abound. It fits the right-hemisphere hypothesis of emotion, the right hemisphere being conceptualised as playing a dominant role for the control of emotion in general, as evidenced e.g. by advantages in dichotic-listening tasks for emo-tional words or by neuropsychological findings with unilaterally brain-lesioned patients (Borod, Koff, Lorch et al., 1986). In a wider context, the concept of having one rational hemisphere and one concerned with our animal instincts is certainly intriguing, and so is that of having a simple right-left dichotomy of specialisation of brain function. There-fore, the evidence pertaining to a lateral asymmetry of facial emotion expression in par-ticular, and any inferences about a functional asymmetry between the two cerebral hemispheres for the control of emotional expression must be reviewed with a critical eye.
Many serious confounds have been brought forward that complicate the infer-ence from the facial-expressiveness asymmetry to an asymmetry in the functional in-volvement between the two cerebral hemispheres. Some findings open the possibility that the expressiveness asymmetries are brought about by effects not specific to emo-tion, since the right hemisphere has been suggested to be dominant for the perception

171
even of non-emotional facial movements (de Schonen & Mathivet, 1989; Haxby et al., 2000; Pegna et al., 2000; Rossion, Joyce et al., 2003; Rossion, Schiltz et al., 2003) and since asymmetries for non-emotional facial movements have been reported (Chaurasia & Goswami, 1975). Interestingly, the Ekman photographs of facial expressions were, except for the smiles, taken of actors activating facial action units rather than of actual emotional expressions (Ekman & Friesen, 1978). Anatomical differences of the resting face are further reasons for suggesting causes for expressiveness asymmetry not con-nected to emotion: the resting face looks happier on its left than on its right (Campbell, 1978; Mandal & Singh, 1990) and the right hemiface is bigger in area than the left, thus possibly diluting the expressive cues on the right hemiface (Sackeim & Gur, 1980). In-terestingly, also, so far no clear connection between physical asymmetries between the expression on the two hemifaces and emotional-expressiveness asymmetry has been established. Last, not least, the incomplete crossing of the efferences to the expressive facial musculature (Rinn, 1984) represents a most serious objection against inferring a right-hemisphere dominance for the control of emotional expression from the emo-tional-expressiveness asymmetry.
For all these reasons, studying asymmetry in emotional expression in effectors other than the face would bring considerable light to the discussion of hemispheric dif-ferences in the control of emotional expression. Studying the expression of emotions through body movement offered exactly this. We studied asymmetry both in terms of production, i.e. measuring asymmetries between the movement of the two sides of the body, and in terms of perception, by asking observers to judge the intensity of emotion expression for left- and right-sided body movements. Thus, in terms of production, we measured lateral asymmetries in the amplitude and ‘energy’ of the movements. We found limb movements to be both larger and more energetic on the left side of the body compared to the right, across emotions. To then study whether there were asymmetries in emotional expressiveness of the movements of the left and right side of the body, we generated chimeric emotional walkers akin to the facial-expression chimeras (Sackeim et al., 1978). Making maximal use of the opportunities for stimulus manipulation of-fered by reconstructing movements specified in terms of joint angles rather than posi-tion data, we developed the chimeric emotional walker as a completely novel stimulus type. These walkers had symmetric movements, the left-left chimeras animated on both sides of the body with those movements normally appearing on the left side of the body, and the right-right chimeras were animated only with those movements normally ap-pearing on the right. This was accomplished by replacing the (flexion) movement trajec-tories on one side of the body with those of the other. But since the limbs on the two sides of the body move in opposite directions during gait (Golubitsky et al., 1999), the trajectories first had to be shifted by half a step cycle, somewhat similarly to one hemi-face of a chimeric facial expression being a mirrored version of its usual appearance. The puppets animated in this way had a laterally symmetric anatomy, and their inte-rauricular line was aligned with the picture plane before being turned to the chosen viewing angle.
For two viewing directions, observers judged the intensity of emotional expres-sion of these chimeric walkers for all affects. The left-left chimeras were perceived as more emotionally expressive than the right, for all affects, and for both right- and left-handers. Asymmetry for emotional gait was greater than for neutral gait, and it was more pronounced for arm movement than for leg movement. While the movement asymmetry was less strong for fearful gait compared to the other affects, fearful gait

172
was associated with postural asymmetry, matching the findings reported in Chapter 3 of a special role of posture for the expression and perception of fear in gait. The chimeric walkers were rated as no less natural than the original animations. We thus found a lat-eral asymmetry for bodily emotion expression, demonstrating that a left-sided expres-siveness advantage represents a much more general phenomenon than previously as-sumed. But our findings reached even further, actually answering many of the questions that have remained open when only facial emotion expression was considered. Thus, our study was unique in finding movement and emotional-expressiveness asymmetry go in the same direction, across affects. Therefore, our measures of movement amplitude and energy, as well as the posture parameters for fear can be considered as important features for the perception of emotional expression.
A number of our findings underscore the conclusion that the asymmetries we identified were actually specific to emotional expression. Our avatar stimuli controlled for any possible anatomical asymmetries that might have induced expression asymme-try, they looked and moved very natural and since they were dynamic stimuli, timing asymmetries in the onset of the expression between the left and right side could not have confounded our findings. Working with movements recorded after mood induction implies that the dataset was closer to studying asymmetry of emotional expression than at least studies using Ekman pictures, generated by asking actors to activate facial action units, to study facial-expression asymmetry. Together with our finding asymmetry to be more pronounced during emotionally expressive than during neutral gait, we conclude that our findings of a lateral asymmetry of emotional gait were due to emotional expres-sion. These findings can be taken to imply a dominant role for the right hemisphere in the control of bodily emotion expression, given the known contralateral control of distal body musculature. Compared with facial expression, where the right hemisphere is thought to play an important role in the control of even non-emotional facial movements (Chaurasia & Goswami, 1975), and where the expressive facial musculature is to a large part under bilateral control (Kuypers, 1958; Lawrence & Kuypers, 1968), our study thus provides important data supporting a dominant role for the right hemisphere in the con-trol of emotional expression. Similarly, while a lateral asymmetry and hemispheric dominance for non-emotional facial movements has been suggested (Silberman & Weingartner, 1986), in our study the asymmetry of emotionally expressive movements significantly exceeded any asymmetries of the same movements executed in an emo-tionally neutral fashion. Besides, we took the utmost care to control for potential ana-tomical asymmetries that might have an effect on emotional expressiveness – thus showing that the asymmetry of bodily emotion expression is independent of anatomical asymmetries, unlike facial emotion expression, where anatomical differences of the rest-ing face might influence expressiveness asymmetry (Campbell, 1978; Mandal & Singh, 1990; Sackeim & Gur, 1980). Our study thus answers a number of serious confounds of facial-expression asymmetry. It considerably strengthens the suggestion of a dominant role for the right hemisphere in the control of emotional expression, in a way that has not been possible by limiting investigations to facial emotion expression. Besides, our study shows, for the first time, that lateral asymmetries of human emotional expression are independent of the specific effector.
The most important open question in the findings of Chapter 5, to my eyes, con-cerns the direction of movement and expression asymmetry of sad and fearful gait. As reported in Chapter 3, and matching the published literature, it is customary to find negative correlations between movement amplitude and rated expressiveness for bodily

173
expressions of deactivated affects such as sadness and subdued fear (Montepare et al., 1987; Pollick et al., 2001; Wallbott, 1998). It seems contradictory that we found left-sided body movements for sad and fearful gait to be both larger and rated as more emo-tionally expressive than right-sided body movements. Since movement amplitude and expressiveness for these affects are negatively correlated, one might have expected an expressiveness advantage for the smaller (i.e., right-sided) body movements. One, wor-rying, possible explanation for this finding would be that the ratings of expression in-tensity were unspecific to emotional expression, i.e. judgements simply being driven by movement amplitude and energy. This hypothesis could be tested by reversing the rat-ing scale such that the smallest value corresponded to the highest emotional expressive-ness. However, there were some findings actually supporting emotion-specific reasons for this somewhat peculiar finding. First, though not reported, the left-left chimeras were also classified correctly more frequently than were the right-right chimeras, and significantly so for the expression of sadness (data not reported). Secondly, since we did not observe any strong correlations between the degree of movement asymmetry on a trial and its rated expressiveness asymmetry, it is possible that subtle differences in kind of body movement were responsible for left-sided body movements being rated as more expressive. For instance, during sad gait, arm swing tends to have twice the frequency of leg movement.
Besides the question discussed in the preceding paragraph, interesting further work could focus on a more thorough investigation of a possible expressiveness asym-metry of mirror-reversed emotional walkers compared to walkers shown at normal ori-entation. With the movements of the left and right side of the body exchanged, and e.g. shorter presentation time it would be possible to investigate further any visual-hemifield biases for the perception of emotional body expression. More detailed studies ought also to be aimed at more in-depth study of emotional-expression asymmetries in left-handed individuals (Elias et al., 1998), particularly dependent on other measures of emotion-specific asymmetries, as determined e.g. by the perception of dichotically presented emotional words (Sim & Martinez, 2005). For both right- and left-handers, it should be controlled whether an asymmetry is also found for other, but non-emotional, expressive behaviours such as e.g. playing an elephant. The asymmetric expressive cues could be studied further by testing whether an asymmetry would still be found once especially the amplitude of movements were normalised. Possible evolutionary advantages of the population alignment of emotional behaviours should be investigated further.
6.2 Implications
6.2.1 Overarching topics of Chapters 3 to 5 As the overview of the previous chapters’ main findings in Section 6.1 shows, the ex-periments reported here differed greatly in methodology as well as in the specific ex-perimental questions addressed in them. Nevertheless, there are common threads con-necting the different experiments.
The findings of Chapter 4 support those in Chapter 3 in terms of demonstrating the differential importance of body parts for the expression of different affects. Thus, the findings of Chapter 3 point to a more dominant role for upper- than lower-body movement for emotion perception, and to a special role for head inclination. Besides, the results presented in both chapters allow the conclusion that leg movement contains more important cues for the expression of fear than of the other affects. The point-light

174
stimuli used in Chapter 4 provide much fewer visual details than the avatars used in Chapter 3. They are nevertheless very interesting because in these stimuli, the visibility of individual features is manipulated, allowing us to infer causal relationships between features and perception than when simply working with the original animations, as we also saw in the experiment where adding a subset of the average movement and posture changes for an affect induced high-level aftereffects for emotion perception. Another important consequence of Chapters 3 and 4 lies in their demonstrating that important methodologies of visual psychophysics can be applied to the perception of emotional body expressions. These include the cue-fusion approach involving Bayesian modelling, for both emotion detection and ratings of the intensity of emotional expression. It would now be possible to perform much more detailed studies of the links between individual expressive features and emotion perception, and of the interaction between features. Since we have extracted a large number of features, we have shown that observers inte-grate optimally over individual features and since the superposition of individual fea-tures makes neutral gait patterns appear emotionally expressive.
In Chapter 5 I investigated the left-right asymmetry of emotional expression. This asymmetry was present in the movement analysis of Chapter 3. I chose to investi-gate it further mainly because it resonates with the much discussed lateral asymmetry of facial emotion expression and of emotion in general. As I discuss below, studying the asymmetry of bodily emotion expression directly answered many open questions re-maining from studies on asymmetric facial emotion expressions, and it provides the unique opportunity of demonstrating that lateral asymmetries in emotion expression represent a much more general phenomenon than could previously be shown. Chapters 3 and 5 also share in common that they serve to validate our methodological approach, performing detailed physical quantification of posture and movement features. Without detailed quantification of movement and posture features of bodily emotion expression, the asymmetry may well have gone undetected. Similarly, the high level of control over stimulus design possible through physical quantification was necessary for the design of the adaptation experiment in Chapter 3 as well as for the design of the chimeric emo-tional walkers used in Chapter 5.
6.2.2 Visual perception of other types of socially relevant informa-tionWithin a wider context, it is interesting mainly to consider how our findings relate to the expression of emotions through other channels, but also to the perception of other types of socially relevant information conveyed through body movement. Studying how we perceive emotions expressed through body movement represents a unique opportunity for ‘control’ experiments with another effector. By far the most thoroughly investigated emotionally expressive channel is facial emotion expression, and implications of our findings for research on facial emotion expression have been considered in Section 6.1.
Yet emotions are not the only type of socially relevant information conveyed through body movement. In fact, human observers are able to infer even from point-light renderings of body motion the type of action, the actor’s gender and even identity, as well as e.g. the weight of a lifted object (Barclay et al., 1978; Bingham, 1987; Pol-lick, Kay, Heim, & Stringer, 2005; Troje et al., 2006; Troje et al., 2005). The physical features supporting the recognition of these aspects have been investigated. In particu-lar, kinematic cues have been found to be of major importance for the perception of different aspects of biological movements. Thus, movement velocity was strongly cor-

175
related with the judged weight of a lifted object weight (Runeson & Frykholm, 1981, 1983). Duration as well as peak and average flexion velocity were strongly correlated with the judged effort of one-arm curls (Bingham, 1987). Together, these findings show that similar cues influence the perception of movements where subjects interact with objects in the environment as are important for perceiving emotionally expressive gait. The influence of static shape for weight judgements was implied by the finding that object mass can also be judged reasonably accurately even from static pictures of lifting actions, especially during slow and controlled phases of the movement (Valenti & Costall, 1997).
Our findings in many ways also match those for the perception of walker gender. First of all, there were differences between body regions in terms of their importance for gender recognition. By limiting the visibility of movement of different body regions, it was found that upper-body movement influenced gender judgements more strongly than did lower-body movement, and arm swing was especially helpful (Cutting & Kozlowski, 1977). The same study showed that, since static point-light renderings were not sufficient for gender recognition (Cutting & Kozlowski, 1977), gender recognition matched emotion perception in being influenced by dynamic visual cues. However, since upside-down displays were consistently misclassified in terms of walker gender, shape cues did appear to play a role for gender perception (Barclay et al., 1978). As we found for the perception of bodily emotion expression, not all available stimulus differ-ences actually have a strong influence on perceivers’ judgements. Thus, although males’ and females’ gait differed in terms of both arm swing and gait velocity, these cues did not play a crucial role for gender judgements. Neither did available structure cues – on average, male walkers had wider shoulders, females had wider hips – strongly correlate with gender identification. Similar to the studies on high-level aftereffects on the per-ception of walker gender (Jordan et al., 2006; Troje et al., 2006), we found that adapta-tion with the most consistent emotion cues in body movement and posture leads to high-level aftereffects on the perception of bodily emotion expressions.
Applying the type of movement representation we employed, mainly in terms of the novel blind source separation algorithm (Omlor & Giese, 2007a, 2007b), would be instrumental for identifying relevant movement aspects supporting e.g. actor gender or identity. Indications of the applicability of the algorithm to these questions are provided by our finding the algorithm capable of representing style differences in throwing, golf swing and tennis swing.
6.3 Suggestions for future work Having gone from beginning to end, is this the point to stop? Or is this not the end, not even the beginning of the end, but, perhaps, the end of the beginning? Besides specific suggestions for experiments directly following up questions raised by the studies de-scribed in Chapters 3 to 5, I would like to mention just a few more general questions about the perception of emotional body expressions.
In Chapter 3 we identified a host of features that are correlated with the percep-tion of emotions from body movement. Since the data from the described experiments were analysed using correlative measures, it would be informative to study the role of these candidate features more directly. Eye-movement recordings could be used to infer relevant stimulus parts from participants’ fixation patterns. Besides, psychophysical methods such as the ‘bubbles’ method (Gosselin & Schyns, 2001; Schyns, Petro, & Smith, 2007; Thurman et al., 2010; Thurman & Grossman, 2008) or classification im-
176
ages (Eckstein & Ahumada, 2002) could profitably be applied. As the adaptation ex-periment in Chapter 3 shows, our methods for animating avatar stimuli enable us go the crucial step further, enabling us to generate stimuli in which individual expressive fea-tures are manipulated individually. Therefore, we could test, for example, the integra-tion of posture and movement features in the perception of bodily emotion expression. The high level of control we have over stimulus makeup also opens exciting opportuni-ties for studying the neural representation of the perception of bodily emotion expres-sion by brain imaging. In particular, we could compare the representation of bodily and facial emotion expression. Regions involved in processing facial expressions, if con-cerned with the processing of emotions, regardless of the specific effector, should also be involved in the processing of bodily expressions. Previous studies have shown that the processing of emotional bodies requires many areas associated with the processing of facial emotion expressions, especially the amygdala (Grezes et al., 2007; Hadjikhani & de Gelder, 2003), but also areas explicitly thought to be involved in the processing of faces, such as the fusiform face area (Kanwisher, McDermott, & Chun, 1997; Kan-wisher & Yovel, 2006). Besides a comparison of the neural representation of the emo-tional expression of different effectors, brain-imaging studies on emotional body ex-pressions are interesting in the context of a possible role of mirror neurones. These neu-rones, originally described in area F5 of the macaque brain (Rizzolatti, Fadiga, Gallese, & Fogassi, 1996), have been shown to fire both when a monkey performs a certain ac-tion and when it sees the same action performed by another individual. Mirror neurones have received an almost hysterical welcome in cognitive neuroscience. It has been sug-gested that the human brain contains an analogous system (Iacoboni et al., 1999), treated as a candidate for the neural substrate of mind reading (Gallese, 2006) and sug-gested to play a key role in social understanding (Gallese, 2006; Gallese, Keysers, & Rizzolatti, 2004) including emotion (Warren et al., 2006), implying a role for them in the processing of emotions expressed through human body movement.
Regarding the set of movements we investigated, it would obviously be desir-able to extend this in terms of the set of affects (e.g. panic, surprise), of the range of tested movements, and of the contexts and settings in which movements were recorded, in particular more naturalistic settings for mood induction. Combined with cross-cultural work, such studies may reveal something like ‘universals’ of bodily emotion expression, akin to what has been described for facial emotion expressions (Ekman & Friesen, 1978). The external validity of the expressive features we extracted would be considerably strengthened if mood induction were accompanied by measures of emo-tional involvement, especially scales for self-reported mood state and psychophysi-ological measures such as heartrate or the galvanic skin response (Cacioppo et al., 2000).
Of the four affects we investigated, happiness was the only positive one. Asked by an animator of cartoon films to list movement features that make a character convey a specific emotional expression through its body movements, I would be most chal-lenged to list features for happiness. Gait looks sad if the movements are small and slow, with lax limbs and an inclined head and spine posture; anger expressions involve angularity in limb posture, a slight forward lean and very large and fast movements; and expressions convey fear if they are small and slow, with flexion in the arms and legs, raised shoulders and a slightly stooped spine. For happiness expressions, the cues were seemingly less clear-cut. We identified only relatively weak limb-posture cues, the head is held only slightly more erectly than usual and arm movement is increased in ampli-

177
tude, while movement speed is approximately that of emotionally neutral gait. These considerations match our finding that neutral gait was most often confused with happy gait. Besides, in the cue-fusion experiments (see Chapter 4), where participants were first asked to classify as a movement as neutral or expressing a given emotion, high rates of ‘happy’ responses even for the neutral prototype in pilot runs led us to decide only to run the experiments including only the three negative affects.
The scope of the work described here could considerably be extended in count-less other ways. For example, there could be studies assessing the perception of emo-tions from body movements in patient populations known to have problems with per-ceiving facial emotion expressions, such as autistic individuals, psychopaths or schizo-phrenic patients. In terms of the production of bodily expressions of emotion, it would be interesting to consider whether it is possible to find patients with circumscribed brain lesions, either through accidents or through neurological disorders, who are selectively impaired at expressing emotions in face and/or body. In that way, we could identify brain regions required for the production of emotional body expressions. The described paucity of both facial and bodily expressions of emotion in Parkinson disease (Jacobs, Shuren, Bowers, & Heilman, 1995), which mainly affects the functioning of the basal ganglia, provides a first pointer to such a patient group. Besides patient studies, elec-tromyographic measures of the muscle activity during emotionally expressive body movements would be interesting. For example, the suggested increase in postural ten-sion during expressions of anger and fear might be measurable in such studies. By studying the interaction of muscle activity and limb trajectories it would be possible to gain a better understanding of how emotionally expressive body movements are con-trolled, perhaps giving us a better idea whether the concept of movement synergies (Bernstein, 1967) can usefully be applied in this context. Last, not least, the algorithm applied to our movement data (Omlor & Giese, 2007a, 2007b) can be applied to many other types of movement data.
In parallel with the recent upsurge of studies on emotion, fuelled mostly by the development of brain-imaging methods and a postmodern realisation that cognitive neu-roscience need necessarily be complemented by the investigation of our affective selves, research on the expression of emotions through body movements has gained fantastic momentum over the past two decades. The application of brain imaging is certainly key to achieving a better understanding of both the perception and production of emotional body expressions, but necessarily complemented by powerful perceptual and behav-ioural studies as well as by neuropsychology, since converging evidence will allow us one day to understand a good deal about how affective processes are reflected in our minds and bodies.

178
ReferencesAdolphs, R., Jansari, A., & Tranel, D. (2001). Hemispheric perception of emotional valence
from facial expressions. Neuropsychology, 15(4), 516-524. Alais, D., & Burr, D. (2004). The ventriloquist effect results from near-optimal bimodal integra-
tion. Current Biology, 14(3), 257-262. Alford, R., & Alford, K. F. (1981). Sex differences in asymmetry in the facial expression of
emotion. Neuropsychologia, 19(4), 605-608. Allard, F. (2001). Information processing in human perceptual motor performance. University
of Waterloo, Waterloo. Ambadar, Z., Schooler, J. W., & Cohn, J. F. (2005). Deciphering the enigmatic face: the impor-
tance of facial dynamics in interpreting subtle facial expressions. Psychological Science, 16(5), 403-410.
Arbib, M. A. (1981). Perceptual structures and distributed motor control. In V. B. Brooks (Ed.), Handbook of Physiology, Section 2: The Nervous System, Vol. II, Motor Control, Part 1(pp. 1449-1480): American Physiological Society.
Aronoff, J., Woike, B. A., & Hyman, L. M. (1992). Which are the stimuli in facial displays of anger and happiness? Configurational bases of emotion recognition. Journal of Personality and Social Psychology, 62, 1050 – 1066.
Atkinson, A. P., Dittrich, W. H., Gemmell, A. J., & Young, A. W. (2004). Emotion perception from dynamic and static body expressions in point-light and full-light displays. Perception, 33(6), 717-746.
Atkinson, A. P., Tunstall, M. L., & Dittrich, W. H. (2007). Evidence for distinct contributions of form and motion information to the recognition of emotions from body gestures. Cognition,104(1), 59-72.
Atkinson, C., & Polivy, J. (1976). Effects of delay, attack, and retaliation on state depression and hostility. Journal of Abnormal Psychology, 85(6), 570-576.
Barclay, C. D., Cutting, J. E., & Kozlowski, L. T. (1978). Temporal and spatial factors in gait perception that influence gender recognition. Perception and Psychophysics, 23(2), 145-152.
Bartlett, M. S., Movellan, J. R., & Sejnowski, T. J. (2002). Face recognition by independent component analysis. IEEE Transactions on Neural Networks, 13(6), 1450-1464.
Bassili, J. N. (1978). Facial motion in the perception of faces and of emotional expression. Journal of Experimental Psychology: Human Perception and Performance, 4(3), 373-379.
Bassili, J. N. (1979a). Emotion recognition: the role of facial motion and the relative importance of upper and lower areas of the face. Journal of Personality and Social Psychology, 37, 2049-2059.
Bassili, J. N. (1979b). Emotion recognition: the role of facial movement and the relative impor-tance of upper and lower areas of the face. Journal of Personality and Social Psychology, 37(11), 2049-2058.
Baumeister, R. F., & Leary, M. R. (1995). The need to belong: Desire for interpersonal attach-ments as a fundamental human motivation. Psychological Bulletin, 117, 497-529.
Beintema, J. A., & Lappe, M. (2002). Perception of biological motion without local image mo-tion. Proceedings of the National Academy of Sciences of the United States of America, 99(8), 5661-5663.
Berkowitz, L., & Troccoli, B. T. (1986). An examination of the assumptions in the demand characteristics thesis: With special reference to the Velten Mood Induction Procedure. Mo-tivation and Emotion, 10, 337-349.

179
Bernstein, N. A. (1967). The coordination and regulation of movements: Oxford,New York: Pergamon Press.
Bertenthal, B. I., & Pinto, J. (1994). Global processing of biological motions. PsychologicalScience, 5, 221-225.
Best, C. T., Womer, J. S., & Queen, H. F. (1994). Hemispheric asymmetries in adults' percep-tion of infant emotional expressions. Journal of Experimental Psychology: Human Percep-tion and Performance, 20(4), 751-765.
Biederman, I. (1987). Recognition-by-components: a theory of human image understanding. Psychological Review, 94(2), 115-147.
Biederman, I., & Gerhardstein, P. C. (1993). Recognizing depth-rotated objects: Evidence for three-dimensional viewpoint invariance. Journal of Experimental Psychology: Human Per-ception and Performance, 19, 1162-1182.
Binder, J. R. (1997). Functional magnetic resonance imaging. Language mapping. Neurosur-gery Clinics of North America, 8(3), 383-392.
Binder, J. R., Frost, J. A., Hammeke, T. A., Cox, R. W., Rao, S. M., & Prieto, T. (1997). Human brain language areas identified by functional magnetic resonance imaging. Journal of Neu-roscience, 17(1), 353-362.
Binder, J. R., Swanson, S. J., Hammeke, T. A., Morris, G. L., Mueller, W. M., Fischer, M., et al. (1996). Determination of language dominance using functional MRI: a comparison with the Wada test. Neurology, 46(4), 978-984.
Bingham, G. P. (1987). Kinematic form and scaling: further investigations on the visual percep-tion of lifted weight. Journal of Experimental Psychology: Human Perception and Per-formance, 13(2), 155-177.
Bischof, N. (1989). Emotionale Verwirrungen. Oder: Von den Schwierigkeiten im Umgang mit der Biologie. Psychologische Rundschau, 40, 188-205.
Black, M. J., & Yacoob, Y. (1997). Recognizing facial expressions in image sequences using local parameterized models of image motion. International Journal of Computer Vision, 25(1), 23-48.
Blair, R. J. R., Morris, J. S., Frith, C. D., Perrett, D. I., & Dolan, R. J. (1999). Dissociable neural responses to facial expressions of sadness and anger. Brain, 122(5), 883-893.
Blake, A., Bülthoff, H. H., & Sheinberg, D. (1993). Shape from texture: ideal observers and human psychophysics. Vision Research, 33(12), 1723-1737.
Bofill, P. (2003). Underdetermined blind separation of delayed sound sources in the frequency domain. Neurocomputing, 55(3), 627-641.
Bol, P., Scheirs, J., & Spanjaard, L. (1997). Meningitis and the evolution of dominance of righthandedness. Cortex, 33(4), 723-732.
Bonanno, G., & Kaltmann, S. (1999). Toward an integrative perspective on bereavement. Psy-chological Bulletin, 125, 760–776.
Borod, J. C., & Caron, H. (1980). Facedness and emotion related to lateral dominance, sex, and expression type. Neuropsychologia, 18, 237-242.
Borod, J. C., Cicero, B. A., Obler, L. K., Welkowitz, J., Erhan, H. M., Santschi, C., et al. (1998). Right hemisphere emotional perception: evidence across multiple channels. Neuro-psychology, 12(3), 446-458.
Borod, J. C., Haywood, C. S., & Koff, E. (1997). Neuropsychological aspects of facial asymme-try during emotional expression: a review of the normal adult literature. Neuropsychology Review, 7(1), 41-60.
Borod, J. C., Kent, J., Koff, E., Martin, C., & Alpert, M. (1988). Facial asymmetry while posing positive and negative emotions: support for the right hemisphere hypothesis. Neuropsy-chologia, 26(5), 759-764.

180
Borod, J. C., & Koff, E. (1983). Hemiface mobility and facial expression asymmetry. Cortex, 19(3), 327-332.
Borod, J. C., & Koff, E. (1991). Asymmetries in affective facial expression: Anatomy and be-havior. British Journal of Social Psychology, 30, 113–124.
Borod, J. C., Koff, E., & Buck, R. (1986). The neurophysiology of facial expression. In P. Blanck, R. Buck & R. Rosenthal (Eds.), Nonverbal Communication in the Clinical Context). University Park, PA: University of Pennsylvania Press.
Borod, J. C., Koff, E., & Caron, H. (1983). Right hemispheric specialization for the expression and appreciation of emotion: A focus on the face. In E. Perecman (Ed.), Cognitive process-ing in the right hemisphere). New York: Academic Press.
Borod, J. C., Koff, E., Lorch, P. M., & Nicholas, M. (1986). The expression and perception of facial emotion in brain-damaged patients. Neuropsychologia, 24(2), 169-180.
Borod, J. C., Koff, E., & White, B. (1983). Facial asymmetry in posed and spontaneous expres-sions of emotion. Brain Cogn, 2(2), 165-175.
Borod, J. C., St Clair, J., Koff, E., & Alpert, M. (1990). Perceiver and poser asymmetries in processing facial emotion. Brain Cogn, 13(2), 167-177.
Bortz, J. (1993). Statistik für Sozialwissenschaftler (6 ed.). Heidelberg: Springer-Verlag. Boucher, J. D., & Carlson, G. E. (1980). Recognition of facial expression in three cultures.
Journal of Cross-Cultural Psychology, 11, 263-280. Bradshaw, J. L., Nettleton, N. C., Nathan, G., & Wilson, L. (1983). Head and body space to left
and right, front and rear--II. Visuotactual and kinesthetic studies and left-side underestima-tion. Neuropsychologia, 21(5), 475-486.
Brainard, D. H. (1997). The Psychophysics Toolbox. Spatial Vision, 10(4), 433-436. Breiter, H. C., Etcoff, N. L., Whalen, P. J., Kennedy, W. A., Rauch, S. L., Buckner, R. L., et al.
(1996). Response and habituation of the human amygdala during visual processing of facial expression. Neuron, 17(5), 875-887.
Brescoll, V. L., & Uhlmann, E. L. (2008). Can an angry woman get ahead? Status conferral, gender, and expression of emotion in the workplace. Psychological Science, 19(3), 268-275.
Brewer, D., & Doughtie, E. B. (1980). Induction of mood and mood shift. Journal of Clinical Psychology, 36(1), 215-226.
Briggs, J. L. (1972). Never in Anger: Portrait of an Eskimo Family. Harvard: Harvard Univer-sity Press.
Broca, P. P. (1861). Perte de la parole, ramollissement chronique et destruction partielle du lobe antérieur gauche du cerveau [Loss of speech, chronic softening and partial destruction of the anterior left lobe of the brain]. Bulletin de la Société Anthropologique, 2(235-238).
Brown, W. M., Cronk, L., Grochow, K., Jacobson, A., Liu, C. K., Popovic, Z., et al. (2005). Dance reveals symmetry especially in young men. Nature, 438(7071), 1148-1150.
Brown, W. M., Price, M. E., Kang, J., Pound, N., Zhao, Y., & Yu, H. (2008). Fluctuating asymmetry and preferences for sex-typical bodily characteristics. Proceedings of the Na-tional Academy of Sciences of the United States of America, 105(35), 12938-12943.
Bruderlin, A., & Williams, L. (1995). Motion signal processing. Paper presented at the SIG-GRAPH 1995, Los Angeles.
Bruno, N., & Cutting, J. E. (1988). Minimodularity and the perception of layout. Journal of Experimental Psychology: General, 117(2), 161-170.
Bryden, M. P., Ley, R. G., & Sugarman, J. H. (1982). A left-ear advantage for identifying the emotional quality of tonal sequences. Neuropsychologia, 20(1), 83-87.
Buchanan, T. W., Lutz, K., Mirzazade, S., Specht, K., Shah, N. J., Zilles, K., et al. (2000). Rec-ognition of emotional prosody and verbal components of spoken language: an fMRI study. Brain Res Cogn Brain Res, 9(3), 227-238.

181
Buck, R. (1984). The physiological bases of nonverbal communication. In W. Waid (Ed.), So-ciophysiology). New York: Springer.
Buck, R., & Duffy, R. J. (1980). Nonverbal communication of affect in brain-damaged patients. Cortex, 16(3), 351-362.
Buck, R., Losow, J. I., Murphy, M. M., & Costanzo, P. (1992). Social faciliation and inhibition of emotional expression and communication Journal of Personality and Social Psychology, 63, 962-968.
Bülthoff, H. H., & Edelman, S. (1992). Psychophysical support for a two-dimensional view interpolation theory of object recognition. Proceedings of the National Academy of Sciences USA, 89, 60-64.
Bülthoff, H. H., & Mallot, H. A. (1988). Integration of depth modules: stereo and shading. Journal of the Optical Society of America. A, Optical and Image Science, 5(10), 1749-1758.
Bülthoff, I., Bülthoff, H. H., & Sinha, P. (1998). Top-down influences on stereoscopic depth-perception. Nature Neuroscience, 1(3), 254-257.
Bull, N. (1951). The attitude theory of emotion (Vol. 81). New York: Johnson Reprint Corp. Buss, D. M., Larsen, R. J., Westen, D., & Semmelroth, J. (1992). Sex differences in jealousy:
evolution, physiology, and psychology. Psychological Science, 3(4), 251-255. Cacioppo, J. T., Berntson, G. G., Larsen, J. T., Poehlmann, K. M., & Ito, T. A. (2000). The psy-
chophysiology of emotion. In R. Lewis & J. M. Haviland-Jones (Eds.), The handbook of emotion (pp. 173-191). New York: Guilford Press.
Calder, A. J., Burton, A. M., Miller, P., Young, A. W., & Akamatsu, S. (2001). A principal component analysis of facial expressions. Vision Research, 41(9), 1179-1208.
Calder, A. J., Young, A. W., Perrett, D. I., Etcoff, N. L., & Rowland, D. (1996). Categorical perception of morphed facial expressions. Visual Cognition, 3(81-117).
Campbell, R. (1978). Asymmetries in interpreting and expressing a posed facial expression. Cortex, 14, 327-342.
Campbell, R. (1982). The lateralization of emotion: a critical review. International Journal of Psychology, 17, 211-229.
Canli, T., Desmond, J. E., Zhao, Z., Glover, G., & Gabrieli, J. D. (1998). Hemispheric asymme-try for emotional stimuli detected with fMRI. Neuroreport, 9(14), 3233-3239.
Carey, S., & Diamond, R. (1994). Are faces perceived as configurations more by adults than by children? Visual Cognition, 1, 253-274.
Carlson, D. F., & Harris, L. J. (1985). Adults' perception of affect in free viewing of asymmetri-cal faces: Sex and handedness effects, International Conference on the Meaning of Faces, Meetings of the British Psychological Association (Welsh Branch)). Dyffryn House, Cardiff, Wales
Cavanagh, P., Labianca, A. T., & Thornton, I. M. (2001). Attention-based visual rou-tines:sprites. Cognition, 80(1-2), 47–60.
Chan, Y. T., Hattin, R. V., & Plant, J. B. (1978). The least squares estimation of time delay and its use in signal detection. IEEE Transactions on Acoustics, Speech, and Signal Processing, 26(3), 217-222.
Chapman, J. P., Chapman, L. J., & Allen, J. J. (1987). The measurement of foot preference. Neuropsychologia, 25(3), 579-584.
Chaurasia, B. D., & Goswami, H. K. (1975). Functional asymmetry in the face. Acta Anatomica (Basel), 91(1), 154-160.
Cheney, D. L., & Seyfarth, R. M. (1990). How Monkeys See the World. Chicago: University of Chicago Press.
Chevalier-Skolnikoff, S. (1973). Facial expression of emotion in nonhuman primates. In P. Ek-man (Ed.), Darwin and facial expression: A century of research in review (pp. 11-90). New York: Academic Press.

182
Christianson, S. A., Saisa, J., Garvill, J., & Silfvenius, H. (1993). Hemisphere inactivation and mood-state changes. Brain Cogn, 23(2), 127-144.
Cichocki, A., & Amari, S.-I. (2002). Adaptive blind signal and image processing: learning al-gorithms and applications. Chichester, UK: John Wiley & Sons.
Clark, J. J., & Yuille, A. L. (1990). Data fusion for sensory information processing systems.Boston: Kluwer.
Cochran, W. G. (1937). Problems arising in the analysis of a series of similar experiments. Journal of the Royal Statistical Society 4 Supplement, 102–118.
Cook, T. D., & Campbell, D. T. (1979). Quasi-experimentation: Design and analysis for field settings. Chicago, Illinois: Rand McNally.
Coulson, M. (2004). Attributing emotion to static body postures: recognition accuracy, confu-sions, and viewpoint dependence. Journal of Nonverbal Behavior, 28(2), 117-139.
Cutting, J. E. (1978). Generation of synthetic male and female walkers through manipulation of a biomechanical invariant. Perception, 7(4), 393-405.
Cutting, J. E., & Kozlowski, L. T. (1977). Recognizing friends by their walk: gait perception without familiarity cues. Bulletin of the Psychonomic Society, 9, 353-356.
Cutting, J. E., Proffitt, D. R., & Kozlowski, L. T. (1978). A biomechanical invariant for gait perception. Journal of Experimental Psychology: Human Perception and Performance, 4(3), 357-372.
d'Avella, A., & Bizzi, E. (2005). Shared and specific muscle synergies in natural motor behav-iors. Proceedings of the National Academy of Sciences of the United States of America, 102(8), 3076-3081.
Daly, M., & Wilson, M. (1988). Homicide. New York: Aldine. Damasio, A., & Maurer, R. (1978). A neurological model for childhood autism. Archives of
Neurology, 35, 777-786. Darwin, C. R. (1872). The expression of the emotions in man and animals. London, UK: John
Murray. Davidson, R. J. (1992). Emotion and affective style: hemispheric substrates. Psychological Sci-
ence, 3, 39–43. Davidson, R. J. (1994). Asymmetric brain function, affective style and psychopathology: The
role of early experience and plasticity. Development and Psychopathology, 6, 741-758. Davidson, R. J., Ekman, P., Saron, C. D., Senulis, J. A., & Friesen, W. V. (1990). Approach-
withdrawal and cerebral asymmetry: emotional expression and brain physiology. I. Journal of Personality and Social Psychology, 58(2), 330-341.
Davidson, R. J., Schwartz, G. E., Saron, C., Bennett, J., & Goleman, D. J. (1979). Frontal versus parietal EEG asymmetry during positive and negative affect. Psychophysiology, 16, 202-203.
de Chateau, P. (1987). Left-side preference in holding and carrying newborn infants. Acta Psy-chiatrica Scandinavica, 75, 283–286.
de Gelder, B. (2006). Towards the neurobiology of emotional body language. Nature reviews. Neuroscience, 7(3), 242-249.
de Meijer, M. (1989). The contribution of general features of body movement to the attribution of emotions. Journal of Nonverbal Behavior, 13(4), 247-268.
de Meijer, M. (1991). The attribution of aggression and grief to body movements: The effect of sex-stereotypes. European Journal of Social Psychology, 21(3), 249-259.
De Renzi, E. (1986a). Current issues in prosopagnosia. In H. D. Ellis, M. A. Jeeves, F. New-combe & A. W. Young (Eds.), Aspects of face processing (pp. 243-252). Dordrecht, The Netherlands: Martinus Nijhoff.

183
De Renzi, E. (1986b). Prosopagnosia in two patients with CT scan evidence of damage confined to the right hemisphere. Neuropsychologia, 24(3), 385-389.
De Renzi, E., Perani, D., Carlesimo, G. A., Silveri, M. C., & Fazio, F. (1994). Prosopagnosia can be associated with damage confined to the right hemisphere--an MRI and PET study and a review of the literature. Neuropsychologia, 32(8), 893–902.
de Schonen, S., & Mathivet, H. (1989). First come, first served: a scenario about the develop-ment of hemispheric specialisation of face recognition during early infancy. European Bul-letin of Cognitive Psychology, 9, 3–44.
de Waal, F. B. M. (1989). Peacemaking among primates. Cambridge, MA: Harvard University Press. de Waal, F. B. M. (1996). Good natured. Cambridge, MA: Harvard University Press. DeJong, R. N. (1979). The neurologic examination (4 ed.). New York: Harper & Row. Diamond, C., & Frew, I. (1979). The facial nerve. Oxford, UK: Oxford University Press. Dimberg, U., & Öhman, A. (1996). Behold the wrath: Psychophysiological responses to facial
stimuli. Motivation and Emotion(20), 149-182. Dittrich, W. H. (1993). Action categories and the perception of biological motion. Perception,
22(1), 15-22. Dittrich, W. H., Troscianko, T., Lea, S. E., & Morgan, D. (1996). Perception of emotion from
dynamic point-light displays represented in dance. Perception, 25(6), 727-738. Donker, S. F., Beek, P. J., Wagenaar, R. C., & Mulder, T. (2001). Coordination between arm
and leg movements during locomotion. Journal of Motor Behavior, 33(1), 86-102. Donker, S. F., Mulder, T., Nienhuis, B., & Duysens, J. (2002). Adaptations in arm movements
for added mass to wrist or ankle during walking. Experimental Brain Research, 146(1), 26-31.
Dopson, W. G., Beckwith, B. E., Tucker, D. M., & Bullard-Bates, P. C. (1984). Asymmetry of facial expression in spontaneous emotion. Cortex, 20(2), 243-251.
Dosher, B. A., Sperling, G., & Wurst, S. (1986). Tradeoffs between stereopsis and proximity luminance covariance as determinants of perceived 3D structure. Vision Research, 26, 973-990.
Dunbar, R. I. M. (1996). Grooming, gossip, and the evolution of language. Cambridge, MA: Harvard University Press.
Dyken, P. R., & Miller, M. D. (1980). Facial features of neurologic syndromes. St. Louis, Mis-souri: C. V. Mosby Company.
Eckstein, M. P., & Ahumada, A. J., Jr. (2002). Classification images: a tool to analyze visual strategies. Journal of Vision, 2(1), 1x.
Edwards, K. (1998). The face of time: temporal cues in facial expressions of emotion. Psycho-logical Science, 9, 270-276.
Egorov, A. Y., Nikolaenko, N. N., & Sechenov, I. M. (1996). Affective disorders are accompa-nied by ceebral asymmetry changes. European Neuropsychopharmacology, 6(Supplement 1), S1/13-S11/13(11).
Eibl-Eibesfeldt, I. (1970). Ethology, Biology of Behavior. New York: Holt, Rinehart and Winston.
Eibl-Eibesfeldt, I. (1989). Human Ethology. New York: Aldine de Gruyter Press. Eisenberg, N., Fabes, R. A., Miller, P. A., Fultz, J., Shell, R., Mathy, R. M., et al. (1989). Rela-
tion of sympathy and personal distress to prosocial behavior: A multimethod study. Journal of Personality and Social Psychology, 57(1), 55-66.
Eisenberg, N., & Strayer, J. (1989). Critical studies in the study of empathy. In N. Eisenberg & J. Strayer (Eds.), Empathy and its development (pp. 3-13). New York: Cambridge Univer-sity Press.

184
Ekman, P. (1965). Differential communication of affect by head and body cues. Journal of Per-sonality and Social Psychology, 2(5), 726-735.
Ekman, P. (1969). The repertoire of nonverbal behavior: categories, origins, usage and coding. Semiotica, 1, 49-98.
Ekman, P. (1973). Cross-cultural studies of facial expression. In P. Ekman (Ed.), Darwin and Facial Expression: A Century of Research in Review (pp. 169-222). New York: Academic Press.
Ekman, P. (1979). About brows: Emotional and conversational signals. In M. von Cranach, K. L. Foppa, W. & D. Ploog (Eds.), Human ethology (pp. 169-248). Cambridge: Cambridge University Press.
Ekman, P. (1980). Asymmetry in facial expression. Science, 209(4458), 833-834. Ekman, P. (1984). Expression and the nature of emotion. In K. Scherer & P. Ekman (Eds.), Ap-
proaches to emotion (pp. 319-343). Hillsdale, N.J.: Lawrence Erlbaum. Ekman, P. (1992). Are there basic emotions? Psychological Review, 99(3), 550-553. Ekman, P., & Friesen, W. V. (1967). Head and body cues in the judgment of emotion: a refor-
mulation. Perceptual and Motor Skills, 24(3), 711-724. Ekman, P., & Friesen, W. V. (1971). Constants across cultures in the face and emotion. Journal
of Personality and Social Psychology, 17(2), 124-129. Ekman, P., & Friesen, W. V. (1972). Hand Movements. Journal of Communication, 22(4), 353-
374.Ekman, P., & Friesen, W. V. (1978). Facial Action Coding System. Palo Alto: Consulting Psy-
chologists Press. Ekman, P., Friesen, W. V., & Ancoli, S. (1980). Facial signs of emotional experience Journal of
Personality and Social Psychology, 39(6), 1125-1134. Ekman, P., Friesen, W. V., O'Sullivan, M., Chan, A., Diacoyanni-Tarlatzis, I., Heider, K., et al.
(1987). Universal and cultural differences in the judgments of facial expressions of emotion. Journal of Personality and Social Psychology, 53(702-717).
Ekman, P., Hager, J. C., & Friesen, W. V. (1981). The symmetry of emotional and deliberate facial actions. Psychophysiology, 18(2), 101-106.
Ekman, P., Levenson, R. W., & Friesen, W. V. (1983). Autonomic nervous system activity dis-tinguishes emotions. Science, 221, 1208-1210.
Ekman, P., Sorenson, E. R., & Friesen, W. V. (1969). Pan-cultural elements in facial displays of emotion. Science, 164(875), 86-88.
Elfenbein, H. A., & Ambady, N. (2002). On the universality and cultural specificity of emotion recognition: A meta-analysis. Psychological Bulletin, 128, 203-235.
Elfenbein, H. A., & Ambady, N. (2003). Universals and cultural differences in recognizing emotions. Current Directions in Psychological Science, 12, 159-164.
Elfenbein, H. A., Foo, M. D., White, J. B., Tan, H. H., & Aik, V. C. (2007). Reading your coun-terpart: the benefit of emotion recognition accuracy for effectiveness in negotiation. Journalof Nonverbal Behavior, 31(4), 205-223.
Elias, L. J., Bryden, M. P., & Bulman-Fleming, M. B. (1998). Footedness is a better predictor than is handedness of emotional lateralization. Neuropsychologia, 36(1), 37-43.
Ellison, J. W., & Massaro, D. W. (1997). Featural evaluation, integration, and judgment of fa-cial affect. Journal of Experimental Psychology: Human Perception and Performance, 23(1), 213-226.
Engberg-Pedersen, E. (1993). Space in Danish Sign Language: the semantics and morphosyntax of the use of space in a visual language. Hamburg: Signum Press.
Ernst, M. O., & Banks, M. S. (2002). Humans integrate visual and haptic information in a statis-tically optimal fashion. Nature, 415(6870), 429-433.

185
Esteves, F., Dimberg, U., & Öhman, A. (1994). Automatically elicited fear: conditioned skin conductance responses to masked facial expressions. Cognition and Emotion, 8(5), 393-413.
Etcoff, N. L., & Magee, J. J. (1992). Categorical perception of facial expressions. Cognition, 44(3), 227-240.
Evans, D. (2003). Emotion: A very short introduction. Oxford, UK: Oxford University Press. Facchin, L., Bisazza, A., & Vallortigara, G. (1999). What causes lateralization of detour behav-
ior in fish? Evidence for asymmetries in eye use. Behavioural Brain Research, 103(2), 229-234.
Fahrmeir, L., Hamerle, A., & Tutz, G. (1996). Multivariate statistische Verfahren. Berlin, New York: de Gruyter.
Fehr, B., & Russell, J. A. (1984). Concept of emotion viewed from a prototype perspective. Journal of Experimental Psychology: General, 113(3), 464-486.
Fink, G. R., Hlligan, P. W., Marshall, J. C., Frith, C. D., Frackowiak, R. S., & Dolan, R. J. (1997). Neural mechanisms involved in the processing of global and local aspects of hierar-chically organized visual stimuli. Brain, 120(10), 1779-1791.
Fiske, A. P. (1992). The four elementary forms of sociality: framework for a unified theory of social relations. Psychological Review, 99, 689-723.
Flash, T., & Hochner, B. (2005). Motor primitives in vertebrates and invertebrates. Current Opinion in Neurobiology, 15(6), 660-666.
Flourens, P. (1847). Fontenelle, ou, De la philosophie moderne relativement aux sciences phy-siques. Paris: Paulin.
Foley, J. P. J. (1938). Judgments of facial expression of emotion in the chimpanzee. Journal of Social Psychology, 6, 31-54.
Fox, N. A. (1991). If it's not left, it's right: Electroencephalogram asymmetry and the develop-ment of emotion. American Psychologist, 46, 863-872.
Frank, M. G., & Stennett, J. (2001). The forced-choice paradigm and the perception of facial expression of emotion. Journal of Personality and Social Psychology, 80, 75-85.
Fridlund, A. J. (1990). Sociality of solitary smiling: potentiation by an implicit audience. Jour-nal of Personality and Social Psychology, 60, 229-240.
Fridlund, A. J., Kenworthy, K. G., & Jaffey, A. K. (1992). Audience effets in affective imagery: Replication and extension to dysphoric memory. Journal of Nonverbal Behavior, 16, 191-212.
Fried, I., Wilson, C. L., MacDonald, K. A., & Behnke, E. J. (1998). Electric current stimulates laughter. Nature, 391(6668), 650.
Frijda, N. H. (1988). The laws of emotion. American Psychologist, 43(5), 349-358. Frome, F. S., Buck, S. L., & Boynton, R. M. (1981). Visibility of borders: separate and com-
bined effects of color differences, luminance contrast, and luminance level. Journal of the Optical Society of America, 71, 145-150.
Fu, W. J. (1998). Penalized regressions: the bridge versus the lasso. Journal of Computational and Graphical Statistics, 7(3), 397-416.
Gainotti, G. (1972). Emotional behavior and hemispheric side of the lesion. Cortex, 4, 41-55. Gallese, V. (2006). Intentional attunement: a neurophysiological perspective on social cognition
and its disruption in autism. Brain Res, 1079(1), 15-24. Gazzaniga, M. S. (1985). Some contributions of split-brain studies to the study of human cogni-
tion. In A. G. Reeves (Ed.), Epilepsy and the Corpus Callosum (pp. 341-348). New York: Plenum Press.
Gazzaniga, M. S., Bogen, J. E., & Sperry, R. W. (1965). Observations on visual perception after disconnexion of the cerebral hemispheres in man. Brain, 88(2), 221-236.

186
Gellhorn, E. (1964). Motion and Emotion: the Role of Proprioception in the Physiology and Pathology of the Emotions. Psychological Review, 71, 457-472.
Gepshtein, S., & Banks, M. S. (2003). Viewing geometry determines how vision and touch combine in size perception. Current Biology, 13(6), 483-488.
Geschwind, N. (1979). Anatomical and functional specialization of the cerebral hemispheres in the human. Bulletin et Memoires de l'Académie Royale de Médecine de Belgique, 134(6), 286-297.
Giese, M. A., & Lappe, M. (2002). Measurement of generalization fields for the recognition of biological motion. Vision Research, 42(15), 1847-1858.
Giese, M. A., & Poggio, T. (2000). Morphable models for the analysis and synthesis of complex motion patterns. International Journal of Computer Vision, 38(1), 59-73.
Giese, M. A., & Poggio, T. (2003). Neural mechanisms for the recognition of biological move-ments. Nature reviews. Neuroscience, 4(3), 179-192.
Giese, M. A., Thornton, I. M., & Edelman, S. (2008). Metrics of the perception of body move-ment. Journal of Vision, 8(9), 1-18.
Goldstein, K. (1939). The Organism. New York: American Books. Golubitsky, M., Stewart, I., Buono, P. L., & Collins, J. J. (1999). Symmetry in locomotor cen-
tral pattern generators and animal gaits. Nature, 401(6754), 693-695. Gordon, S. L. (1989). The socialization of children's emotions: Emotional culture, competence,
and exposure. In C. Saarni & P. L. Harris (Eds.), Children's understanding of emotion).New York: Cambridge University Press.
Gosselin, F., & Schyns, P. G. (2001). Bubbles: a technique to reveal the use of information in recognition tasks. Vision Research, 41(17), 2261-2271.
Grammer, K., Honda, M., Juette, A., & Schmitt, A. (1999). Fuzziness of nonverbal courtship communication unblurred by motion energy detection. Journal of Personality and Social Psychology, 77(3), 487-508.
Grammer, K., & Thornhill, R. (1994). Human (Homo sapiens) facial attractiveness and sexual selection: the role of symmetry and averageness. Journal of Comparative Psychology, 108(3), 233-242.
Gray, L., Watt, L., & Blass, E. (2000). Skin-to-skin contact is analgesic in healthy newborns. Pediatrics, 105(1), 38–46.
Grezes, J., Pichon, S., & de Gelder, B. (2007). Perceiving fear in dynamic body expressions. NeuroImage, 35(2), 959-967.
Gross, J. J., & Levenson, R. W. (1995). Emotion elicitation using films. Cognition and Emotion, 9 (1), 87-108.
Gunturkun, O. (2003). Human behaviour: Adult persistence of head-turning asymmetry. Nature, 421(6924), 711.
Haber, R. N., & Hershenson, M. (1980). The psychology of visual perception. New York: Holt, Rinehart and Winston.
Hagemann, D., Naumann, E., Lürken, A., Becker, G., Maier, S., & Bartussek, D. (1999). EEG asymmetry, dispositional mood and personality. Personality and Individual Differences, 27,541-568.
Hager, J. C., & Ekman, P. (1985). The asymmetry of facial actions is inconsistent with models of hemispheric specialization. Psychophysiology, 22(3), 307-318.
Haidt, J., & Keltner, D. (1999). Culture and facial expression: Open-ended methods find more expressions and a gradient of recognition. Cognition and Emotion, 13, 225-266.
Hallervorden, J. (1902). Eine neue Methode experimenteller Physiognomik [A new method of experimental physiognomy]. Psychiatrisch-neurologische Wochenschrift, 4, 309-311.

187
Hancock, P. J., Burton, A. M., & Bruce, V. (1996). Face processing: human perception and principal components analysis. Memory and Cognition, 24(1), 21-40.
Haxby, J. V., Hoffman, E. A., & Gobbini, M. I. (2000). The distributed human neural system for face perception. Trends in Cognitive Sciences, 4(6), 223-233.
Haxby, J. V., Ungerleider, L. G., Clark, V. P., Schouten, J. L., Hoffman, E. A., & Martin, A. (1999). The effect of face inversion on activity in human neural systems for face and object perception. Neuron, 22, 189-199.
Hayward, W. G., & Tarr, M. J. (1997). Testing conditions for viewpoint invariance in object recognition. Journal of Experimental Psychology: Human Perception and Performance, 23(5), 1511-1521.
Heberlein, A. S., Adolphs, R., Tranel, D., & Damasio, H. (2004). Cortical regions for judgments of emotions and personality traits from point-light walkers. Journal of Cognitive Neurosci-ence, 16(7), 1143-1158.
Heilman, K. M., Scholes, R., & Watson, R. T. (1975). Auditory affective agnosia. Disturbed comprehension of affective speech. Journal of Neurology, Neurosurgery, and Psychiatry, 38, 69-72.
Heller, W. (1993). Neuropsychological mechanisms of individual differences in emotion, per-sonality, and arousal. Neuropsychology, 7, 476-489.
Heller, W., & Levy, J. (1981). Perception and expression of emotion in right- handers and left-handers. Neuropsychologia, 19(2), 263–272.
Hellige, J. B. (1983). Brain asymmetry. What's right and what's left. Cambridge, Massachusetts: Harvard University Press.
Hellige, J. B. (1993). Hemispheric asymmetry. Cambridge, MA.: Harvard University Press. Henley, N. M. (1973). Status and sex: Some touching observations. Bulletin of the Psy-
chonomic Society, 2, 91-93. Henley, N. M., & Harmon, S. (1985). Power, dominance, and nonverbal behavior. In S. L. Elly-
son & J. F. Dovidio (Eds.)). New York: Springer. Hertenstein, M. J., Keltner, D., Apps, B., Bulleit, B. A., & Jaskolka, A. R. (2006). Touch com-
municates distinct emotions. Emotion, 6(3), 528–533. Hess, U., Banse, R., & Kappas, A. (1995). The intensity of facial expression is determined by
underlying affective state and social situation. Journal of Personality and Social Psychol-ogy, 69, 280-288.
Hojen-Sorensen, P. A. d. F. R., Winther, O., & Hansen, L. K. (2002). Mean-Field Approaches to Independent Component Analysis. Neural Computation, 14(4), 889-918.
Hopkins, W. D. (2008). Brief communication: Locomotor limb preferences in captive chimpan-zees (Pan troglodytes): implications for morphological asymmetries in limb bones. Ameri-can Journal of Physical Anthropology, 137(1), 113-118.
Hornak, J., Rolls, E. T., & Wade, D. (1996). Face and voice expression identification in patients with emotional and behavioural changes following ventral frontal lobe damage. Neuropsy-chologia, 34(4), 247-261.
Hugdahl, K., Berardi, A., Thompson, W. L., Kosslyn, S. M., Macy, R., Baker, D. P., et al. (1995). Brain mechanisms in human classical conditioning: a PET blood flow study. Neu-roreport, 6(13), 1723-1728.
Humphreys, G. W., Donnelly, N., & Riddoch, M. J. (1993). Expression is computed separately from facial identity, and it is computed separately for moving and static faces: neuropsy-chological evidence. Neuropsychologia, 31(2), 173-181.
Iacoboni, M., Woods, R. P., Brass, M., Bekkering, H., Mazziotta, J. C., & Rizzolatti, G. (1999). Cortical mechanisms of human imitation. Science, 286(5449), 2526-2528.

188
Indersmitten, T., & Gur, R. C. (2003). Emotion processing in chimeric faces: hemispheric asymmetries in expression and recognition of emotions. Journal of Neuroscience, 23(9), 3820-3825.
Ishai, A., Ungerleider, L. G., Martin, A., Schouten, J. L., & Haxby, J. V. (1999). Distributed representation of objects in the human ventral visual pathway. Proceedings of the National Academy of Sciences USA, 96, 9379-9384.
Ivanenko, Y. P., Cappellini, G., Dominici, N., Poppele, R. E., & Lacquaniti, F. (2005). Coordi-nation of locomotion with voluntary movements in humans. Journal of Neuroscience, 25(31), 7238-7253.
Ivanenko, Y. P., Poppele, R. E., & Lacquaniti, F. (2004). Five basic muscle activation patterns account for muscle activity during human locomotion. Journal of Physiology, 556(Pt 1), 267-282.
Izard, C. E. (1971). The face of emotion. New York: Appleton-Century-Crofts. Izard, C. E. (1977). Human Emotions. New York: Plenum Press. Izard, C. E. (1994). Innate and universal facial expressions: Evidence from developmental and
cross-cultural research. Psychological Bulletin, 115, 288-299. Jacobs, D. H., Shuren, J., Bowers, D., & Heilman, K. M. (1995). Emotional facial imagery,
perception, and expression in Parkinson's disease. Neurology, 45, 1696-1702. Jacyna, L. S. (1981). The physiology of mind in Victorian Britain. British Journal for the His-
tory of Science, 14(2), 109-132. Jaeger, J., Borod, J. C., & Peselow, E. (1984). Facial expression of positive and negative emo-
tions at rest: Size, area, and emotional expression. Cortex, 20, 165-178. Jaeger, J., Borod, J. C., & Peselow, E. (1987). Depressed patients have atypical hemispace bi-
ases in the perception of emotional chimeric faces. Journal of Abnormal Psychology, 96(4), 321-324.
Jancke, L., Shah, N. J., Posse, S., Grosse-Ryuken, M., & Muller-Gartner, H. W. (1998). Inten-sity coding of auditory stimuli: an fMRI study. Neuropsychologia, 36(9), 875-883.
Jancke, L., Specht, K., Shah, J. N., & Hugdahl, K. (2003). Focused attention in a simple di-chotic listening task: an fMRI experiment. Brain Res Cogn Brain Res, 16(2), 257-266.
Jastorff, J., Kourtzi, Z., & Giese, M. A. (2006). Learning to discriminate complex movements: biological versus artificial trajectories. Journal of Vision, 6(8), 791-804.
Johansson, G. (1973). Visual perception of biological motion and a model for its analysis. Per-ception and Psychophysics, 14, 201 – 211.
Jolicoeur, P. (1990). Identification of disoriented objects: A dual-systems theory. Mind and Language, 5(4), 387-410.
Jolliffe, I. T. (2002). Principal Component Analysis (2 ed.). New York: Springer. Jordan, H., Fallah, M., & Stoner, G. R. (2006). Adaptation of gender derived from biological
motion. Nature Neuroscience, 9(6), 738-739. Juslin, P. N., & Laukka, P. (2003). Emotional expression in speech and music: evidence of
cross-modal similarities. Annals of the New York Academy of Sciences, 1000, 279-282. Just, M. A., Carpenter, P. A., Keller, T. A., Eddy, W. F., & Thulborn, K. R. (1996). Brain acti-
vation modulated by sentence comprehension. Science, 274(5284), 114-116. Kamachi, M., Bruce, V., Mukaida, S., Gyoba, J., Yoshikawa, S., & Akamatsu, S. (2001). Dy-
namic properties influence the perception of facial expressions. Perception, 30(7), 875-887. Kanwisher, N., McDermott, J., & Chun, M. M. (1997). The fusiform face area: a module in
human extrastriate cortex specialized for face perception. Journal of Neuroscience, 17(11),4302-4311.
Karch, G. R., & Grant, C. W. (1978). Asymmetry in perception of the sides of the human face. Perceptual and Motor Skills, 47(3 Pt 1), 727-734.

189
Kawasaki, H., Kaufman, O., Damasio, H., Damasio, A. R., Granner, M., Bakken, H., et al. (2001). Single-neuron responses to emotional visual stimuli recorded in human ventral pre-frontal cortex. Nature Neuroscience, 4(1), 15-16.
Keltner, D., & Bonanno, G. A. (1997). A study of laughter and dissociation: distinct correlates of laughter and smiling during bereavement. Journal of Personality and Social Psychology, 73(4), 687-702.
Keltner, D., & Ekman, P. (1996). Affective intensity and emotional responses. Cognition and Emotion, 10, 323-328.
Keltner, D., & Haidt, J. (1999). Social functions of emotions at four levels of analysis. Cogni-tion and Emotion, 13(5), 505-521.
Keltner, D., & Harker, L. (1998). The forms and functions of the nonverbal signal of shame. In P. Gilbert & B. Andrews (Eds.), Shame. Interpersonal behavior, psychopathology, and cul-ture (pp. 78-98). New York: Oxford University Press.
Keltner, D., & Kring, A. M. (1998). Emotion, social function, and psychopathology. Review of General Psychology, 2(3), 320-342.
Keltner, D., Young, R. C., Heerey, E. A., Oemig, C., & Monarch, N. D. (1998). Teasing in hier-archical and intimate relations. Journal of Personality and Social Psychology, 75(5), 1231-1247.
Kersten, D., Mamassian, P., & Yuille, A. (2004). Object perception as Bayesian inference. An-nual Review of Psychology, 55, 271-304.
Kersten, D., & Yuille, A. (2003). Bayesian models of object perception. Current Opinion in Neurobiology, 13(2), 150-158.
Kimura, D. (1973). Manual activity during speaking. I. Right-handers. Neuropsychologia, 11(1), 45-50.
Kinsbourne, M. (1982). Hemispheric specialization and the growth of human understanding. American Psychologist, 37(4), 411-420.
Kinsbourne, M., & Bemporad, B. (1984). Lateralization of emotion: A model and the evidence. In N. A. Fox & R. J. Davidson (Eds.), The psychobiology of affective development (pp. 259-291). Hillsdale, NJ: Lawrence Earlbaum Associates.
Kirtley, C. (2006). Clinical gait analysis (1 ed.). Oxford: Churchill Livingstone. Kleinsmith, A., De Silva, R., & Bianchi-Berthouze, N. (2006). Cross-cultural differences in
recognizing affect from body posture. Interacting with Computers, 18(6), 1371-1389. Klineberg, O. (1940). Social Psychology. New York: Holt. Klinnert, M. D., Emde, R. N., Butterfield, P., & Campos, J. J. (1986). Social referencing: the
infant's use of emotional signals from a friendly adult with mother present. DevelopmentalPsychology, 22, 427–432.
Knecht, S., Deppe, M., Dräger, B., Bobe, L., Lohmann, H., Ringelstein, E.-B., et al. (2000). Language lateralization in healthy right-handers. Brain, 123(1), 74-81.
Knill, D. C. (2003). Mixture models and the probabilistic structure of depth cues. Vision Re-search, 43(7), 831-854.
Knill, D. C. (2007). Robust cue integration: a Bayesian model and evidence from cue-conflict studies with stereoscopic and figure cues to slant. Journal of Vision, 7(7), 1-24.
Knill, D. C., & Richards, W. (2008). Perception as Bayesian Inference (1 ed.). Cambridge: Cambridge University Press.
Koff, E., Borod, J. C., & White, B. (1981). Asymmetries for hemiface size and mobility. Neu-ropsychologia, 19, 825-830.
Kowner, R. (1995). Laterality in facial expression and its effect on attributions of emotion and personality: A reconsideration. Neuropsychologia, 33, 539-559.

190
Kuypers, H. G. (1958). Corticobulbar connections to the pons and lower brain stem in man. An anatomical study. Brain, 81, 364-388.
Landis, T., Cummings, J. L., Christen, L., Bogen, J. E., & Imhof, H.-G. (1986). Are unilateral right posterior cerebral lesions sufficient to cause prosopagnosia? Clinical and radiological findings in six additional patients. Cortex, 22(2), 243-252.
Landy, M. S., & Kojima, H. (2001). Ideal cue combination for localizing texture-defined edges. Journal of the Optical Society of America. A, Optical and Image Science, 18(9), 2307-2320.
Landy, M. S., Maloney, L. T., Johnston, E. B., & Young, M. J. (1995). Measurement and mod-eling of depth cue combination: in defense of weak fusion. Vision Research, 35(3), 389-412.
Lang, P. J., Bradley, M. M., Fitzsimmons, J. R., Cuthbert, B. N., Scott, J. D., Moulder, B., et al. (1998). Emotional arousal and activation of the visual cortex: An fMRI analysis. Psycho-physiology, 35, 199-210.
Larsen, R. J., & Sinnett, L. (1991). Meta-analysis of manipulation validity: Factors affecting the Velten mood induction procedure. Personality and Social Psychology Bulletin, 17(3), 323-334.
Lawrence, D. G., & Kuypers, H. G. (1968). The functional organization of the motor system in the monkey. II. The effects of lesions of the descending brain-stem pathways. Brain, 91(1),15-36.
Lee, D. D., & Seung, H. S. (1999). Learning the parts of objects by non-negative matrix factori-zation. Nature, 401(6755), 788-791.
Lee, G. P., Loring, D. W., Meader, K. J., & Brooks, B. B. (1990). Hemispheric specialization for emotional expression: a reexamination of results from intracarotid administration of so-dium amobarbital. Brain Cogn, 12(2), 267-280.
Leopold, D. A., Bondar, I. V., & Giese, M. A. (2006). Norm-based face encoding by single neurons in the monkey inferotemporal cortex. Nature, 442(7102), 572-575.
Leopold, D. A., O'Toole, A. J., Vetter, T., & Blanz, V. (2001). Prototype-referenced shape en-coding revealed by high-level aftereffects. Nature Neuroscience, 4(1), 89-94.
Levenson, R. W. (1992). Autonomic nervous system differences among emotions. Psychologi-cal Science, 3(1), 23-27.
Leventhal, H., & Mace, W. (1970). The effect of laughter on evaluation of a slapstick movie. Journal of Personality, 38, 16-30.
Levine, S. C., & Levy, J. (1986). Perceptual asymmetry for chimeric faces across the life span. Brain Cogn, 5(3), 291-306.
Levy, J., Heller, W., Banich, M. T., & Burton, L. A. (1983). Asymmetry of perception in free viewing of chimeric faces. Brain and Cognition, 2(4), 404-419.
Loew, R., Kegl, J., & Poizner, H. (1997). Fractionation of the components of role play in a right-hemispheric lesioned signer. Aphasiology, 11(3), 263-281.
Loewenstein, G., & Lerner, J. S. (2003). The role of affect in decision making. In R. J. David-son (Ed.), Handbook of affective sciences (pp. 619-642). Oxford: Oxford University Press.
Logothetis, N. K., Pauls, J., & Poggio, T. (1995). Shape representation in the inferior temporal cortex of monkeys. Current Biology, 5(5), 552-563.
Lu, H., & Liu, Z. (2006). Computing dynamic classification images from correlation maps. Journal of Vision, 6(4), 475-483.
Luys, J. B. (1881). Recherches nouvelles sur les hémiplégies émotives. Encéphale, 1, 378-398. Lynn, J. G., & Lynn, D. R. (1938). Face-hand laterality in relation to personality. Journal of
Abnormal and Social Psychology, 33, 291-322. Lynn, J. G., & Lynn, D. R. (1943). Smile and hand dominance in relation to basic modes of
adaptation. Journal of Abnormal and Social Psychology, 38, 250-276.

191
Lyons, M. J., Campbell, R., Plante, A., Coleman, M., Kamachi, M., & Akamatsu, S. (2000). The Noh mask effect: vertical viewpoint dependence
of facial expression perception. Proceedings of the Royal Society of London, Series B, 267, 2239–2245.
Maloney, L. T. (2002). Illuminant estimation as cue combination. Journal of Vision, 2(6), 493-504.
Mandal, M. K., Asthana, H. S., & Tandon, S. C. (1993). Judgement of facial expression of emo-tion in unilateral brain-damaged patients. Archives of Clinical Neuropsychology, 8, 171-183.
Mandal, M. K., & Singh, S. K. (1990). Lateral asymmetry in identification and expression of facial emotions. Cognition and Emotion, 4, 61-70.
Manning, J. T., & Pickup, L. J. (1998). Symmetry and performance in middle distance runners. International Journal of Sports Medicine, 19(3), 205-209.
Marr, D. (1982). Vision. A Computational Investigation into the Human Representation and Processing of Visual Information. New York: W. H. Freeman & Co. Ltd.
Marr, D., & Nishihara, H. K. (1978). Representation and recognition of the spatial organization of three dimensional structure. Proceedings of the Royal Society of London: Series B, 200,269-294.
Martin, J., & Lopez, P. (2001). Hindlimb asymmetry reduces escape performance in the lizard Psammodromus algirus. Physiological and Biochemical Zoology, 74(5), 619-624.
Mather, G., & Murdoch, L. (1994). Gender discrimination in biological motion displays based on dynamic cues. Proceedings of the Royal Society of London, Series B, 258, 273-279.
Mather, G., Radford, K., & West, S. (1992). Low-level visual processing of biological motion. Proceedings of the Royal Society B: Biological Sciences, 249(1325), 149-155.
Matsumoto, D. (1987). The role of facial response in the experience of emotion: more methodo-logical problems and a meta-analysis. Journal of Personality and Social Psychology, 52(4), 769-774.
Mattay, V., Santha, A., Van Horn, J., Sexton, R., Frank, J., & Weinberger, D. (1996). Motor function and hemispheric asymmetry: a whole brain echo planar fMRI study. NeuroImage,3(Supplement), S398.
Maurer, D., Grand, R. L., & Mondloch, C. J. (2002). The many faces of configural processing. Trends in Cognitive Sciences, 6(6), 255-260.
McAndrew, F. T. (1986). A cross-cultural study of recognition thresholds for facial expression of emotion. Journal of Cross-Cultural Psychology, 17, 211-224.
McCarthy, G. (1997). Physiological studies of face processing in humans. In M. S. Gazzaniga (Ed.), The new cognitive neurosciences (pp. 393-409). Cambridge, MA.: MIT Press.
Meinshausen, N., Rocha, G., & Yu, B. (2007). A tale of three cousins: Lasso, L2boosting and Dantzig. Annals of Statistics, 35(6), 2373-2384.
Mezger, J., Ilg, W., & Giese, M. A. (2005). Trajectory synthesis by hierarchical spatio-temporal correspondence: comparison of different methods. Paper presented at the ACM SIGGRAPH Symposium on Applied Perception in Graphics and Visualization, A Coruna, Spain.
Miller, G. F. (1998). How mate choice shaped human nature: a review of sexual selection and human evolution. In C. Crawford & D. L. Krebs (Eds.), Handbook of Evolutionary Psy-chology: Ideas, Issues and Applications (pp. 87-129). New Jersey: Lawrence Erlbaum As-sociates.
Montepare, J. M., Goldstein, S. B., & Clausen, A. (1987). The identification of emotions from gait information. Journal of Nonverbal Behavior, 11(1), 33-42.

192
Montepare, J. M., Koff, E., Zaitchik, D., & Albert, M. (1999). The use of body movements and gestures as cues to emotions in younger and older adults. Journal of Nonverbal Behavior, 23(2), 133-152.
Moreno, C. R., Borod, J. C., Welkowitz, J., & Alpert, M. (1990). Lateralization for the expres-sion and perception of facial emotion as a function of age. Neuropsychologia, 28(2), 199-209.
Morris, J. S., Friston, K. J., & Dolan, R. J. (1997). Neural responses to salient visual stimuli. Proceedings of the Royal Society B: Biological Sciences, 264(1382), 769-775.
Moscovitch, M., & Olds, J. (1982). Asymmetries in spontaneous facial expressions and their possible relation to hemispheric specialization. Neuropsychologia, 20, 71-81.
Mukovskiy, A., Park, A., Omlor, L., Slotine, J. J., & Giese, M. A. (2008). Selforganization of character behavior by mixing of learned movement primitives). Konstanz, Germany: The 13th International Fall Workshop of Vision, Modeling, and Visualization (VMV) 2008.
Myers, R. E. (1976). Comparative neurology of vocalization and speech: proof of a dichotomy. Annals of the New York Academy of Sciences, 280, 745-760.
Nalwa, V. S. (1993). A guided tour of computer vision. Reading, MA.: Addison-Wesley. Nawrot, M., & Blake, R. (1993). On the perceptual identity of dynamic stereopsis and kinetic
depth. Vision Research, 33(11), 1561-1571. Nicholls, M. E., Ellis, B. E., Clement, J. G., & Yoshino, M. (2004). Detecting hemifacial
asymmetries in emotional expression with three-dimensional computerized image analysis. Proceedings of the Royal Society B: Biological Sciences, 271(1540), 663-668.
Niemitz, C., Loi, M., & Landerer, S. (2000). Investigations on human laughter and its implica-tions for the evolution of hominid visual communication. Homo, 51, 1–18.
Nocedal, J., & Wright, S. (2006). Numerical Optimization (2 ed.). Berlin: Springer. Nusseck, M., Cunningham, D. W., Wallraven, C., & Bülthoff, H. H. (2008). The contribution of
different facial regions to the recognition of conversational expressions. Journal of Vision, 8(8), 1 1-23.
O'Toole, A. J., Roark, D. A., & Abdi, H. (2002). Recognizing moving faces: a psychological and neural synthesis. Trends in Cognitive Sciences, 6(6), 261-266.
Oatley, K., & Jenkins, J. M. (1996). Understanding emotions. Cambridge, MA: Blackwell. Öhman, A., & Birbaumer, N. I. E., (pp. 3-17). : Publishers. (1993). Psychophysiological and
cognitive-clinical perspectives on emotion: Introduction and overview. In N. Birbaumer & A. Öhman (Eds.), The structure of emotion (pp. 3-17). Seattle: Hogrefe & Huber.
Öhman, A., & Dimberg, U. (1978). Facial expressions as conditioned stimuli for electrodermal responses: A case of "preparedness"? Journal of Personality and Social Psychology, 34, 1211-1218.
Oja, E., & Plumbley, M. (2003). Blind separation of positive sources using non-negative PCA.Paper presented at the 4th International Symposium on Independent Component Analyis and Blind Signal Separation (ICA), Nara, Japan.
Oldfield, R. C. (1971). The assessment and analysis of handedness: the Edinburgh inventory. Neuropsychologia, 9(1), 97-113.
Omlor, L., & Giese, M. A. (2007a). Blind source separation for over-determined delayed mix-tures. In B. Schölkopf, J. Platt & T. Hoffman (Eds.), Advances in Neural Information Proc-essing Systems (pp. 1049-1056). Cambridge, MA: MIT Press.
Omlor, L., & Giese, M. A. (2007b). Extraction of spatio-temporal primitives of emotional body expressions. Neurocomputing, 70(10-12), 1938-1942.
Osgood, C. E. (1966). Dimensionality of the semantic space for communication via facial ex-pressions. Scandinavian Journal of Psychology, 7, 1–30.
Owren, M. J., & Bachorowski, J.-A. (2001). The evolution of emotional experience: A "selfish-gene" account of smiling and laughter in early hominids and humans. In G. A. Bonanno

193
(Ed.), Emotions: Current issues and future directions (pp. 152-191). New York: Guilford Press.
Padgett, C., & Cottrell, G. (1995). Identifying emotion in static face images. Paper presented at the 2nd Joint Symposium on Neural Computation, La Jolla, CA, University of California, San Diego.
Pakkenberg, B., & Gundersen, H. J. G. (1997). Neocortical neuron number in humans: effect of sex and age. Journal of Comparative Neurology, 384, 312-320.
Parr, L. A., & Waller, B. M. (2006). Understanding chimpanzee facial expression: insights into the evolution of communication. Social Cognitive and Affective Neuroscience, 1(3), 221-228.
Pavlova, M., & Sokolov, A. (2000). Orientation specificity in biological motion perception. Perception and Psychophysics, 62(5), 889-899.
Pavlova, M., Sokolov, A., & Sokolov, A. (2005). Perceived dynamics of static images enables emotional attribution. Perception, 34(9), 1107-1116.
Pegna, A. J., Khateb, A., Michel, C. M., & Landis, T. (2000). Visual recognition of faces, ob-jects, and words using degraded stimuli: where and when it occurs. Human Brain Mapping, 22, 300-311.
Phan, K. L., Wager, T., Taylor, S. F., & Liberzon, I. (2002). Functional neuroanatomy of emo-tion: a meta-analysis of emotion activation studies in PET and fMRI. NeuroImage, 16(2), 331-348.
Pickens, J., Field, T., & Nawrocki, T. (2001). Frontal EEG asymmetry in response to emotional vignettes in preschool age children. International Journal of Behavioral Development, 25, 105-112.
Pinto, J., & Shiffrar, M. (1999). Subconfigurations of the human form in the perception of bio-logical motion displays. Acta Psychologica (Amsterdam), 102(2-3), 293-318.
Poggio, T., & Bizzi, E. (2004). Generalization in vision and motor control. Nature, 431(7010), 768-774.
Poggio, T., & Edelman, S. (1990). A network that learns to recognize three-dimensional objects. Nature, 343(263-266).
Polivy, J. (1981). On the induction of emotion in the laboratory: discrete moods or multiple affect states? Journal of Personality and Social Psychology, 41(4), 803-817.
Polivy, J., & Doyle, C. (1980). Laboratory induction of mood states through the reading of self-referent mood statements: affective changes or demand characteristics? Journal of Abnor-mal Psychology, 89(2), 286-290.
Pollick, F. E., Kay, J. W., Heim, K., & Stringer, R. (2005). Gender recognition from point-light walkers. Journal of Experimental Psychology: Human Perception and Performance, 31(6), 1247-1265.
Pollick, F. E., Lestou, V., Ryu, J., & Cho, S. B. (2002). Estimating the efficiency of recognizing gender and affect from biological motion. Vision Research, 42(20), 2345-2355.
Pollick, F. E., Paterson, H. M., Bruderlin, A., & Sanford, A. J. (2001). Perceiving affect from arm movement. Cognition, 82(2), B51-61.
Quaranta, A., Siniscalchi, M., & Vallortigara, G. (2007). Asymmetric tail-wagging responses by dogs to different emotive stimuli. Current Biology, 17(6), R199-201.
Redican, W. K. (1982). An evolutionary perspective on human facial displays. In P. Ekman (Ed.), Emotion in the Human Face (pp. 212-280). Cambridge: Cambridge University Press.
Reed, C. L., Stone, V. E., Grubb, J. D., & McGoldrick, J. E. (2006). Turning configural process-ing upside down: part and whole body postures. Journal of Experimental Psychology: Hu-man Perception and Performance, 32(1), 73-87.
Reilly, J. S., McIntire, M. L., & Seago, H. (1992). Affective prosody in American Sign Lan-guage. Sign language studies, 75, 113-128.

194
Rilling, J. K., & Insel, T. R. (1999). The primate neocortex in comparative perspective using magnetic resonance imaging Journal of Human Evolution, 37(2), 191-223.
Rinn, W. E. (1984). The neuropsychology of facial expression: a review of the neurological and psychological mechanisms for producing facial expressions. Psychological Bulletin, 95, 52-77.
Rizzolatti, G., Fadiga, L., Gallese, V., & Fogassi, L. (1996). Premotor cortex and the recogni-tion of motor actions. Brain Res Cogn Brain Res, 3(2), 131-141.
Roether, C. L., Omlor, L., Christensen, A., & Giese, M. A. (2009). Critical features for the per-ception of emotion from gait. Journal of Vision, 9(6:15), 1-32.
Roether, C. L., Omlor, L., & Giese, M. A. (2008). Lateral asymmetry of bodily emotion expres-sion. Current Biology, 18(8), R329-330.
Roether, C. L., Omlor, L., & Giese, M. A. (2009). Features in the recognition of emotions from dynamic bodily expression. In U. Ilg & G. Masson (Eds.), Dynamics of Visual Motion Processing: Neuronal, Behavioral and Computational Approaches). Berlin, Heidelberg: Springer.
Rogers, B. J., & Collett, T. S. (1989). The appearance of surfaces specified by motion parallax and binocular disparity. The Quarterly Journal of Experimental Psychology. A, Human Ex-perimental Psychology, 41(4), 697-717.
Rogers, L. J. (1996). Behavioral, structural and neurochemical asymmetries in the avian brain: A model system for studying visual development and processing. Neuroscience and Biobe-havioral Reviews, 20, 487-503.
Rolls, E. T. (2007). Emotion explained. Oxford: Oxford University Press. Ross, E. D. (1985). Modulation of affect and nonverbal communication by the right hemisphere.
In M. M. Mesulam (Ed.), Principles of behavioral neurology (pp. 239–258). Philadelphia: F.A. Davis.
Ross, E. D., Homan, R., & Buck, R. (1994). Differential hemispheric lateralization of primary and social emotions. Neuropsychiatry, Neuropsychology, and Behavioral Neurology, 7(1), 1-19.
Ross, E. D., & Mesulam, M. M. (1979). Dominant language functions of the right hemisphere? Prosody and emotional gesturing. Archives of Neurology, 36(3), 144-148.
Ross, R. T., & Mathiesen, R. (1998). Images in clinical medicine. Volitional and emotional supranuclear facial weakness. New England Journal of Medicine, 338, 1515.
Rossi, G. F., & Rosadini, G. (1967). Experimental analysis of cerebral dominance in man. In C. H. Millikan & F. L. Darley (Eds.), Brain mechanisms underlying speech and language).New York: Grune and Stratton.
Rossion, B., Joyce, C. A., Cottrel, G. W., & Tarr, M. J. (2003). Early lateralization and orienta-tion tuning for face, word, and object processing in the visual cortex. NeuroImage, 20(3), 1609-1624.
Rossion, B., Schiltz, C., & Crommelinck, M. (2003). The functionally defined right occipital and fusiform "face areas" discriminate novel from visually familiar faces. NeuroImage, 19(3), 877-883.
Rothbart, M. K. (1973). Laughter in young children. Psychological Bulletin, 80, 247-256. Runeson, S., & Frykholm, G. (1981). Visual perception of lifted weight. Journal of Experimen-
tal Psychology: Human Perception and Performance, 7(4), 733-740. Runeson, S., & Frykholm, G. (1983). Kinematic specification of dynamics as an informational
basis for person-and-action perception: expectation, gender recognition, and deceptive in-tention. Journal of Experimental Psychology: General, 112(4), 585-615.
Russell, J. A. (1994). Is there universal recognition of emotion from facial expression? A review of the cross-cultural studies. Psychological Bulletin, 115(1), 102-141.

195
Russell, J. A., Suzuki, N., & Ishida, N. (1993). Canadian, Greek, and Japanese freely produced emotion labels for facial expressions. Motivation and Emotion, 17, 337-351.
Sackeim, H. A., & Grega, D. M. (1987). Perceiver bias in the processing of deliberately asym-metric emotional expressions. Brain Cogn, 6(4), 464-473.
Sackeim, H. A., & Gur, R. C. (1980). Asymmetry in facial expression. Science, 209(4458), 834-836.
Sackeim, H. A., Gur, R. C., & Saucy, M. C. (1978). Emotions are expressed more intensely on the left side of the face. Science, 202(4366), 434-436.
Safonova, A., Hodgins, J., K., & Pollard, N., S. . (2004). Synthesizing physically realistic hu-man motion in low-dimensional, behavior-specific spaces, ACM SIGGRAPH 2004 Papers).Los Angeles, California: ACM Press.
Santello, M., Flanders, M., & Soechting, J. F. (2002). Patterns of hand motion during grasping and the influence of sensory guidance. Journal of Neuroscience, 22(4), 1426-1435.
Santello, M., & Soechting, J. F. (1997). Matching object size by controlling finger span and hand shape. Somatosensory & Motor Research, 14(3), 203-212.
Sawada, M., Suda, K., & Ishii, M. (2003). Expression of emotions in dance: relation between arm movement characteristics and emotion. Perceptual and Motor Skills, 97(3 Pt 1), 697-708.
Scheib, J. E., Gangestad, S. W., & Thornhill, R. (1999). Facial attractiveness, symmetry and cues of good genes. Proceedings of the Royal Society B: Biological Sciences, 266(1431), 1913-1917.
Scherer, K. R. (1986). Vocal affect expression: a review and a model for future research. Psy-chological Bulletin, 99(2), 143-165.
Scherer, K. R. (1993). Studying the emotion-antecedent appraisal process: an expert system approach. Cognition and Emotion, 7, 325-355.
Scherer, K. R., Johnstone, T., & Klasmeyer, G. (2003). Vocal Expression of Emotion. In R. J. Davidson (Ed.), Handbook of affective sciences (pp. 433-456). Oxford: Oxford University Press.
Schlosberg, H. (1954). Three dimensions of emotion. Psychol Rev, 61(2), 81-88. Schmidt, K. L., & Cohn, J. F. (2001). Human facial expressions as adaptations: evolutionary
questions in facial expression research. Yearbook of Physical Anthropology, 44, 3–24. Schmidt, K. L., Liu, Y., & Cohn, J. F. (2006). The role of structural facial asymmetry in asym-
metry of peak facial expressions. Laterality, 11(6), 540-561. Schönemann, P. H. (1966). A generalized solution of the orthogonal procrustes problem. Psy-
chometrika, 31, 1-10. Schouwstra, S. J., & Hoogstraten, J. (1995). Head position and spinal position as determinants
of perceived emotional state. Perceptual and Motor Skills, 81(2), 673-674. Schütz-Bosbach, S., & Prinz, W. (2007). Perceptual resonance: action-induced modulation of
perception. Trends in Cognitive Sciences, 11(8), 349-355. Schwaninger, A., Wallraven, C., Cunningham, D. W., & Chiller-Glaus, S. (2006). Processing of
identity and emotion in faces: A psychophysical, physiological and computational perspec-tive. Progress in Brain Research, 156, 321-343.
Schwartz, G. E., Ahern, G. L., & Brown, S. (1979). Lateralized facial muscle response to posi-tive and negative emotional stimuli. Psychophysiology, 16, 561-571.
Schwarz, N., & Clore, G. L. (1983). Mood, misattribution, and judgements of well-being: in-formative and directive functions of affective states. Journal of Personality and Social Psy-chology, 45, 513-523.
Schyns, P. G., Petro, L. S., & Smith, M. L. (2007). Dynamics of visual information integration in the brain for categorizing facial expressions. Current Biology, 17(18), 1580-1585.

196
Scorce, J. F., Emde, R. N., Campos, J., & Klinnert, M. D. (1985). Maternal emotional signaling: Its effect on the visual cliff behavior of 1-year-olds. Developmental Psychology, 21, 195–200.
Segalowitz, S. J., & Bryden, M. P. (1983). Individual differences in hemispheric representation of language. In S. J. Segalowitz (Ed.), Language functions and brain organization (pp. 341-372). New York: Academic Press.
Sergent, J., Ohta, S., & MacDonald, B. (1992). Functional neuroanatomy of face and object processing. A positron emission tomography study. Brain, 115, 15-36.
Shearn, D., Bergman, E., Hill, K., Abel, A., & Hinds, L. (1990). Facial coloration and tempera-ture responses in blushing. Psychophysiology, 27(6), 687-693.
Sieratzki, J. S., & Woll, B. (1996). Why do mothers cradle babies on their left? Lancet, 347, 1746-1748.
Sieratzki, J. S., & Woll, B. (2004). The impact of maternal deafness on cradling laterality with deaf and hearing infants. Journal of deaf studies and deaf education, 9(4), 387-394.
Silberman, E. K., & Weingartner, H. (1986). Hemispheric lateralization of functions related to emotion. Brain and Cognition, 5, 322-353.
Sim, T. C., & Martinez, C. (2005). Emotion words are remembered better in the left ear. Later-ality, 10(2), 149-159.
Smith, J. M., & Price, G. (1973). The logic of animal conflict. Nature, 246, 15-18. Sober, E., & Wilson, D. S. (1998). Unto others: The evolution and psychology of unselfish be-
havior. Cambridge, Mass.: Harvard University Press. Sogon, S., & Masutani, M. (1989). Identification of emotion from body movements: A cross-
cultural study of Americans and Japanese. Psychological Reports, 65(1), 35-46. Spence, S., Shapiro, D., & Zaidel, E. (1996). The role of the right hemisphere in the physiologi-
cal and cognitive components of emotional processing. Psychophysiology, 33(2), 112-122. Sperry, R. W. (1969). A modified concept of consciousness. Psychological Review, 76(6), 532-
536.Spiegel, J., & Machotka, P. (1974). Messages of the body (1 ed.). New York: Free Press. Sprengelmeyer, R., Rausch, M., Eysel, U. T., & Przuntek, H. (1998). Neural structures associ-
ated with recognition of facial expressions of basic emotions. Proceedings of the Royal So-ciety of London, Series B, 265(1409), 1927-1931.
Spurzheim, J. K. (1908). Phrenology: Or the doctrine of the mental phenomena. New York: J.B. Lippincott Co.
Stevens, S. S. (1957). On the psychophysical law. Psychological Review, 64(3), 153–181. Stevens, S. S. (1961). To honor Fechner and repeal his law. Science, 13, 80-86. Stevens, S. S. (1962). The surprising simplicity of sensory metrics. American Psychologist, 17,
29-39.Stoffregen, T. A., & Flynn, S. B. (1994). Visual perception of support surface deformability
from human body kinematics. Ecological Psychology, 6, 33-64. Strauss, E., & Kaplan, E. (1980). Lateralized asymmetries in self-perception. Cortex, 16, 289-
293.Strickland, B. R., Hale, W. D., & Anderson, L. K. (1975). Effect of induced mood states on
activity and self-reported affect. Journal of Consulting and Clinical Psychology, 43, 587. Stringer, P., & May, P. (1980). Attributional asymmetries in the perception of moving, static,
chimeric, and hemisected faces. Journal of Nonverbal Behavior, 5, 238-252. Susskind, J. M., Littlewort, G., Bartlett, M. S., Movellan, J., & Anderson, A. K. (2007). Human
and computer recognition of facial expressions of emotion. Neuropsychologia, 45(1), 152-162.

197
Sutherland, G., Newman, B., & Rachman, S. (1982). Experimental investigations of the rela-tions between mood and intrusive unwanted cognitions. British Journal of Medical Psy-chology, 55(Pt 2), 127-138.
Suzuki, A., Hoshino, T., Shigemasu, K., & Kawamura, M. (2006). Disgust-specific impairment of facial expression recognition in Parkinson's disease. Brain, 129(3), 707-717.
Tanaka, J. W., & Farah, M. J. (1993). Parts and wholes in face recognition. The Quarterly Jour-nal of Experimental Psychology. A, Human Experimental Psychology, 46(2), 225-245.
Tarr, M. J. (1995). Rotating objects to recognize them: A case study of the role of viewpoint dependency in the recognition of three-dimensional objects. Psychonomic Bulletin and Re-view, 2(1), 55-82.
Tarr, M. J., & Pinker, S. (1989). Mental rotation and orientation dependence in shape recogni-tion. Cognitive Psychology, 21(28), 233-282.
Tarr, M. J., Williams, P., Hayward, W. G., & Gauthier, I. (1998). Three-dimensional object recognition is viewpoint dependent. Nature Neuroscience, 1(4), 275-277.
Terzian, T. (1964). Behavioral and EEG effects of intracarotid sodium amytal injections. ActaNeurochirurgica, 12, 230-240.
Terzopoulos, D., & Waters, K. (1993). Analysis and synthesis of facial image sequences using physical and anatomical models. IEEE Transactions in Pattern Analysis and Machine Intel-ligence, 15, 569-579.
Thompson, J. C., Clarke, M., Stewart, T., & Puce, A. (2005). Configural processing of biologi-cal motion in human superior temporal sulcus. Journal of Neuroscience, 25(39), 9059-9066.
Thornton, I. M., Pinto, J., & Shiffrar, M. (1998). The visual perception of human locomotion. Cognitive Neuropsychology 15, 535-552.
Thornton, I. M., Rensink, R. A., & Shiffrar, M. (2002). Active versus passive processing of biological motion. Perception, 31, 837-853.
Thornton, I. M., Vuong, Q. C., & Bülthoff, H. H. (2003). A chimeric point-light walker. Per-ception, 32(3), 377-383.
Thurman, S. M., Giese, M. A., & Grossman, E. D. (2010). Perceptual and computational analy-sis of critical features for biological motion. Journal of Vision, 10(12), 15.
Thurman, S. M., & Grossman, E. D. (2008). Temporal "Bubbles" reveal key features for point-light biological motion perception. Journal of Vision, 8(3), 28 21-11.
Thut, G., Schultz, W., Roelcke, U., Nienhusmeier, M., Missimer, J., Maguire, R. P., et al. (1997). Activation of the human brain by monetary reward. Neuroreport, 8(5), 1225-1228.
Tibshirani, R. (1996). Regression shrinkage and selection via the lasso. Journal of the Royal Statistical Society: Series B, 58(1), 267-288.
Tittle, J. S., Todd, J. T., Perotti, V. J., & Norman, J. F. (1995). Systematic distortion of per-ceived three-dimensional structure from motion and binocular stereopsis. Journal of Ex-perimental Psychology: Human Perception and Performance, 21(3), 663-667.
Todd, J. T. (1983). Perception of gait. Journal of Experimental Psychology: Human Perception and Performance, 9(1), 31-42.
Tomkins, S. S. (1962). Affect, imagery, consciousness: Vol. 1. The positive affects. New York: Springer.
Tomkins, S. S. (1963). Affect, imagery, consciousness: Vol. 2. The negative affects. New York: Springer.
Torkkola, K. (1996). Blind separation of convolved sources based on information maximization.Paper presented at the IEEE Workshop on Neural Networks for Signal Processing, Kyoto, Japan.
Tresch, M. C., Cheung, V. C., & d'Avella, A. (2006). Matrix factorization algorithms for the identification of muscle synergies: evaluation on simulated and experimental data sets. Journal of Neurophysiology, 95(4), 2199-2212.

198
Troje, N. F. (2002). Decomposing biological motion: a framework for analysis and synthesis of human gait patterns. Journal of Vision, 2(5), 371-387.
Troje, N. F., Sadr, J., Geyer, H., & Nakayama, K. (2006). Adaptation aftereffects in the percep-tion of gender from biological motion. Journal of Vision, 6(8), 850-857.
Troje, N. F., Westhoff, C., & Lavrov, M. (2005). Person identification from biological motion: effects of structural and kinematic cues. Perception and Psychophysics, 67(4), 667-675.
Tronick, E. Z. (1989). Emotions and emotional communication in infants. American Psycholo-gist, 44, 112-119.
Tucker, D. M., Watson, R. T., & Heilman, K. M. (1977). Discrimination and evocation of affec-tively intoned speech in patients with right parietal disease. Neurology, 27(10), 947-950.
Turk, M., & Pentland, A. (1991). Eigenfaces for recognition. Journal of Cognitive Neurosci-ence, 3, 71-86.
Turner, J., Braunstein, M. L., & Andersen, G. J. (1997). Relationship between binocular dispar-ity and motion parallax in surface detection. Perception and Psychophysics, 59(3), 370-380.
Ullman, S., Vidal-Naquet, M., & Sali, E. (2002). Visual features of intermediate complexity and their use in classification. Nature Neuroscience, 5(7), 682-687.
Unuma, M., Anjyo, K., & Takeuchi, R. (1995). Fourier principles for emotion-based human figure animation. Paper presented at the Proceedings of the 22nd annual conference on Computer graphics and interactive techniques.
Valenti, S. S., & Costall, A. (1997). Visual perception of lifted weight from kinematic and static (photographic) displays. Journal of Experimental Psychology: Human Perception and Per-formance, 23(1), 181-198.
Valentin, D., Abdi, H., Edelman, B., & O'Toole, A. J. (1997). Principal Component and Neural Network Analyses of Face Images: What Can Be Generalized in Gender Classification? Journal of Mathematical Psychology, 41(4), 398-413.
Valentine, T., & Bruce, V. (1988). Mental rotation of faces. Memory and Cognition, 16(6), 556-566.
Vallortigara, G., Rogers, L. J., Bisazza, A., Lippolis, G., & Robins, A. (1998). Complementary right and left hemifield use for predatory and agonistic behaviour in toads. Neuroreport, 9(14), 3341-3344.
van Gelder, R. S., & Borod, J. C. (1990). Neurobiological and cultural aspects of facial asym-metry. Journal of Communication Disorders, 23(4-5), 273-286.
Vangeneugden, J., Pollick, F., & Vogels, R. (2008). Functional Differentiation of Macaque Vis-ual Temporal Cortical Neurons Using a Parametric Action Space. Cereb Cortex.
Vangeneugden, J., Pollick, F., & Vogels, R. (2009). Functional differentiation of macaque vis-ual temporal cortical neurons using a parametric action space. Cerebral Cortex, 19(3), 593-611.
Vapnik, V. N. (1999). An overview of statistical learning theory. IEEE Transactions on Neural Networks, 10(5), 988-999.
Velten, E. (1968). A laborartory tak for induction of mood states. Behavior Research & Ther-apy, 6, 473-482.
Vigneau, M., Beaucousin, V., Herve, P. Y., Duffau, H., Crivello, F., Houde, O., et al. (2006). Meta-analyzing left hemisphere language areas: phonology, semantics, and sentence proc-essing. NeuroImage, 30(4), 1414-1432.
Viviani, P., & Stucchi, N. (1992). Biological movements look uniform: evidence of motor-perceptual interactions. Journal of Experimental Psychology: Human Perception and Per-formance, 18(3), 603-623.
Wager, T. D., Phan, K. L., Liberzon, I., & Taylor, S. F. (2003). Valence, gender, and lateraliza-tion of functional brain anatomy in emotion: a meta-analysis of findings from neuroimag-ing. NeuroImage, 19(3), 513-531.

199
Wagner, H. L., & Smith, J. (1991). Facial expression in the presence of friends and strangers. Journal of Nonverbal Behavior, 15(4), 201-214.
Walk, R. D., & Homan, C. P. (1984). Emotion and dance in dynamic light displays. Bulletin of the Psychonomic Society, 22(5), 437-440.
Wallbott, H. G. (1985). Hand movement quality: a neglected aspect of nonverbal behavior in clinical judgment and person perception. Journal of Clinical Psychology, 41(3), 345-359.
Wallbott, H. G. (1998). Bodily expression of emotion. European Journal of Social Psychology, 28(6), 879-896.
Wallbott, H. G., & Scherer, K. R. (1986). Cues and channels in emotion recognition. Journal of Personality and Social Psychology, 51(4), 690-699.
Warren, J. E., Sauter, D. A., Eisner, F., Wiland, J., Dresner, M. A., Wise, R. J., et al. (2006). Positive emotions preferentially engage an auditory-motor "mirror" system. Journal of Neu-roscience, 26(50), 13067-13075.
Watt, A., & Watt, M. (1992). Advanced animation and rendering techniques: Theory and prac-tice. New York: Addison Wesley, ACM Press.
Webster, M. A., Kaping, D., Mizokami, Y., & Duhamel, P. (2004). Adaptation to natural facial categories. Nature, 428(6982), 557-561.
Weddell, R. A. (1994). Effects of subcortical lesion site on human emotional behavior. Brain and Cognition, 25(2), 161-193.
Westermann, R., Spies, K., Stahl, G., & Hesse, F. W. (1996). Relative effectiveness and validity of mood induction procedures: A meta-analysis. European Journal of Social Psychology, 26(4), 557-580.
Whalen, P. J., Rauch, S. L., Etcoff, N. L., McInerney, S. C., Lee, M. B., & Jenike, M. A. (1998). Masked presentations of emotional facial expressions modulate amygdala activity without explicit knowledge. Journal of Neuroscience, 18(1), 411-418.
White, M. (2000). Parts and wholes in expression recognition. Cognition and Emotion, 14(1), 39-60.
Wiggers, M. (1982). Judgments of facial expressions of emotion predicted from facial behavior. Journal of Nonverbal Behavior, 7(2), 101-116.
Wiley, D., & Hahn, J. (1997). Interpolation synthesis of articulated figure motion. IEEE Trans-actions on Computer Graphics and Applications, 11, 39-45.
Willis, F. N., & Hamm, H. K. (1980). The use of interpersonal touch in securing compliance. Journal of Nonverbal Behavior, 5, 49–55.
Wolpert, D. M., Doya, K., & Kawato, M. (2003). A unifying computational framework for mo-tor control and social interaction. Philosophical Transactions of the Royal Society of Lon-don. Series B: Biological Sciences, 358(1431), 593-602.
Wundt, W. (2004). Grundriss der Psychologie (1 ed.). Saarbrücken: Vdm Verlag Dr. Müller. Wylie, D. R., & Goodale, M. A. (1988). Left sided oral asymmetries in spontaneous but not
posed smiles. Neuropsychologia, 26, 823-832. Xu, H., Dayan, P., Lipkin, R. M., & Qian, N. (2008). Adaptation across the cortical hierarchy:
low-level curve adaptation affects high-level facial-expression judgments. Journal of Neu-roscience, 28(13), 3374-3383.
Yacoob, Y., & Black, M. J. (1999). Parameterized Modeling and Recognition of Activities. Computer Vision and Image Understanding, 73(2), 232-247(216).
Yin, R. K. (1969). Looking at upside-down faces. Journal of Experimental Psychology: Human Perception and Performance, 81, 141-145.
Young, A. W., Hellawell, D., & Hay, D. C. (1987). Configurational information in face percep-tion. Perception, 16, 747–759.

200
Young, A. W., Newcombe, F., de Haan, E. H., Small, M., & Hay, D. C. (1993). Face perception after brain injury. Selective impairments affecting identity and expression. Brain, 116 ( Pt 4), 941-959.
Young, A. W., Rowland, D., Calder, A. J., Etcoff, N. L., Seth, A., & Perrett, D. I. (1997). Facial expression megamix: tests of dimensional and category accounts of emotion recognition. Cognition, 63(3), 271-313.
Young, M. J., Landy, M. S., & Maloney, L. T. (1993). A perturbation analysis of depth percep-tion from combinations of texture and motion cues. Vision Research, 33, 2685-2696.
Zahn-Waxler, C., Radke-Yarrow, M., Wagner, E., & Chapman, M. (1992). Development of concern for others. Developmental Psychology, 28, 126-136.
Zalla, T., Koechlin, E., Pietrini, P., Basso, G., Aquino, P., Sirigu, A., et al. (2000). Differential amygdala responses to winning and losing: a functional magnetic resonance imaging study in humans. European Journal of Neuroscience, 12(5), 1764-1770.
Zatorre, R. J., Evans, A. C., Meyer, E., & Gjedde, A. (1992). Lateralization of phonetic and pitch discrimination in speech processing. Science, 256(5058), 846-849.
Zuckerman, M., Lipets, M. S., Koivumaki, J. H., & Rosenthal, R. (1975). Encoding and decod-ing nonverbal cues of emotion. Journal of Personality and Social Psychology, 32(6), 1068-1076.

201
Erklärungen
Ich erkläre hiermit,
1. dass ich bisher keine Promotions- oder entsprechende Prüfungsverfahren ab-gebrochen oder abgeschlossen habe.
2. dass die vorgelegte Dissertation noch nie ganz oder teilweise als Dissertation oder sonstige Prüfungsarbeit eingereicht worden ist und bereits teilweise an den nachfolgend angegebenen Stellen veröffentlicht wurde:
a. Roether, C. L., Omlor, L., Christensen, A., & Giese, M. A. (2009) Criti-cal features for the perception of emotion from gait. Journal of Vision9(6), 1-32.
b. Roether, C. L., Omlor, L., & Giese, M. A. (2008) Lateral asymmetry of bodily emotion expression. Current Biology 18(8), R329-330.
c. Roether, C. L., Omlor, L., & Giese, M. A. (2009) Features in the rec-ognition of emotions from dynamic bodily expressions. In U. Ilg & G. Masson (Eds.), Dynamics of Visual Motion Processing: Neuronal, Be-havioral and Computational Approaches. Berlin, Heidelberg: Springer.
3. dass ich die zur Promotion eingereichte Arbeit mit dem Titel: „The Expression of Emotions through Full-body Movement: Features and Asymmetry“ selbstständig verfasst, nur die angegebenen Quellen und Hilfsmittel benutzt und wörtlich oder inhaltlich übernommene Stellen als solche gekennzeichnet habe. Ich versichere an Eides statt, dass diese Angaben wahr sind und dass ich nichts verschwiegen habe. Mir ist bekannt, dass die falsche Abgabe einer Versicherung an Eides statt mit Freiheitsstrafe bis zu drei Jahren oder mit Geldstrafe bestraft wird.
4. dass ich bisher weder strafrechtlich verurteilt, noch Disziplinarmaßnahmen und anhängigen Straf- und Disziplinarverfahren unterzogen worden bin.
Berlin, ………………. ……………………………………………. (Unterschrift)

202
Darstellung des Eigenanteils bei Gemeinschaftsarbei-ten
Die drei dieser Dissertation zu Grunde liegenden Publikationen habe ich unter Betreuung von Prof. Dr. Martin Giese erarbeitet.
• Die in allen Arbeiten verwendeten Motion-Capture-Daten habe ich aufge-nommen und nachbearbeitet. Die Gelenkswinkel berechnete Dr. Lars Omlor.
• Für die in Kapitel 3 (Abschnitte 3.2 bis 3.4) beschriebene Studie habe ich grundsätzlich durchgeführt: Design und Planung der Experimente, Anima-tion der Stimuli, Durchführung der Experimente sowie statistische Analyse und Interpretation der Daten. Dr. Lars Omlor hat den Algorithmus zur blinden Quellenseparation der Bewegungsdaten (Abschnitt 3.2) entwickelt und angewendet. Mit ihm gemeinsam habe ich die 3-D-Avatare sowie das Regressionsmodell und dessen schriftliche Darstellung erarbeitet (Ab-schnitt 3.2). Andrea Christensen generierte die Animationen für das Adaptationsexperiment in Abschnitt 3.4 gemeinsam mit Dr. Lars Omlor und erhob die experimentellen Daten in Verbindung mit Jannike Scharm. Die statistische Auswertung und Interpretation dieser Daten sowie deren schriftliche Darstellung wurden von mir mit Andrea Christensen gemein-schaftlich erarbeitet.
• Design und Planung der Experimente, Animation der Stimuli, Erhebung, statistische Analyse und Interpretation der Daten der in Kapitel 4 be-schriebenen Studie habe ich durchgeführt. Das Integrationsmodell der Expressivitätsdaten in Abschnitt 4.6.1 habe ich gemeinsam mit Prof. Dr. Martin Giese und Dr. Lars Omlor entwickelt. Die mathematischen Modelle zur Bearbeitung der Detektionsdaten und ihre schriftliche Darstellung (Ab-schnitte 4.6.2 bis 4.6.4) wurden durch Prof. Dr. Martin Giese erarbeitet.
• Design und Planung der Experimente, Animation der Stimuli, Erhebung, statistische Analyse und Interpretation der Bewegungs- und Wahrneh-mungsdaten der in Kapitel 4 beschriebenen Studie habe ich durchgeführt. Die emotionale Chimäre (Abschnitt 5.3.1) wurde von Dr. Lars Omlor und mir gemeinsam entwickelt.