The experimental and theoretical QM/MM study of interaction of chloridazon herbicide with ds-DNA
9
Spectrochimica Acta Part A 79 (2011) 1004–1012 Contents lists available at ScienceDirect Spectrochimica Acta Part A: Molecular and Biomolecular Spectroscopy jou rn al hom epa ge: www.elsevier.com/locate/saa The experimental and theoretical QM/MM study of interaction of chloridazon herbicide with ds-DNA F. Ahmadi a,∗ , N. Jamali a , S. Jahangard-Yekta a , B. Jafari a , S. Nouri b , F. Najafi c , M. Rahimi-Nasrabadi d a Department of Medicinal Chemistry, Faculty of Pharmacy, Kermanshah University of Medical Sciences, Kermanshah, Islamic Republic of Iran b Chemical Bistoon Complex of Kermanshah, Bistoon, Kermanshah, Islamic Republic of Iran c Kermanshah Health Research Center (KHRC), Kermanshah University of Medical Sciences, Kermanshah, Islamic Republic of Iran d Department of Chemistry, Imam Hossein University, Tehran, Islamic Republic of Iran a r t i c l e i n f o Article history: Received 20 December 2010 Received in revised form 20 March 2011 Accepted 10 April 2011 Keywords: Chloridazon herbicide DNA interaction Intercalation bonding Ab initio calculations ONIMO a b s t r a c t We report a multispectroscopic, voltammetric and theoretical hybrid of QM/MM study of the interac- tion between double-stranded DNA containing both adenine–thymine and guanine–cytosine alternating sequences and chloridazon (CHL) herbicide. The electrochemical behavior of CHL was studied by cyclic voltammetry on HMDE, and the interaction of ds-DNA with CHL was investigated by both cathodic dif- ferential pulse voltammetry (CDPV) at a hanging mercury drop electrode (HMDE) and anodic differential pulse voltammetry (ADPV) at a glassy carbon electrode (GCE). The constant bonding of CHL–DNA com- plex that was obtained by UV/vis, CDPV and ADPV was 2.1 × 10 4 , 5.1 × 10 4 and 2.6 × 10 4 , respectively. The competition fluorescence studies revealed that the CHL quenches the fluorescence of DNA–ethidium bromide complex significantly and the apparent Stern–Volmer quenching constant has been estimated to be 1.71 × 10 4 . Thermal denaturation study of DNA with CHL revealed the T m of 8.0 ± 0.2 ◦ C. Thermo- dynamic parameters, i.e., enthalpy (H), entropy (S ◦ ), and Gibbs free energy (G) were 98.45 kJ mol −1 , 406.3 J mol −1 and −22.627 kJ mol −1 , respectively. The ONIOM, based on the hybridization of QM/MM (DFT, 6.31++G(d,p)/UFF) methodology, was also performed using Gaussian 2003 package. The results revealed that the interaction is base sequence dependent, and the CHL has more interaction with ds-DNA via the GC base sequence. The results revealed that CHL may have an interaction with ds-DNA via the intercalation mode. © 2011 Elsevier B.V. All rights reserved. 1. Introduction Today we know very well that DNA plays a key role in cell proliferation, synthesis of proteins and transcription of genetic information in living cells. However, when the poison and muta- genic compounds interact with DNA, it may induce damaging and oxidative stress on DNA structure and, therefore, cause several dis- eases such as Parkinson’s disease, prostatitis, breast and childhood cancers [1–3]. In this context the pesticides, due to the intensive application in cultured lands and therefore widespread pollution of water and food, should be considered as genotoxic and carcino- genic compounds [4,5]. It is completely clear that some pesticides interact with DNA in many different ways such as intercalation, covalent and/or non-covalent groove bindings [6,7]. Therefore, the change of thermodynamic stability and functional properties of DNA is a result of chemical change; adduct formation and/or mutation of DNA [8]. So, the understanding in vitro effects of ∗ Corresponding author. Tel.: +98 831 4276485; fax: +98 831 4276493. E-mail address: [email protected] (F. Ahmadi). complex formations on structural and mechanical properties of DNA is an important step to elucidate a model of DNA–pesticides binding to provide valuable information about the genotoxicity and carcinogenic properties of pesticides. In principle, there are several techniques for monitoring in vitro reversible binding of pesticides to the double-helical DNA such as spectroscopy, voltam- metry and molecular mechanic calculations (Molecular Modeling) [9,10]. In fact, molecular mechanic force fields [11,12], based on quantum mechanics, have been used to determine structural and energetic properties of isolated molecules and can be used to examine molecule–molecule and molecule–biomolecule interac- tions. The critical point of DFT, HF or ab initio calculations for large biomolecules is accessed to obtain accurate and reliable results. In this way, the computational chemistry techniques, especially the hybrid methods (ONIOM) based on combination of several theoreti- cal approaches, have been developed by Morokuma and co-workers [13–16] for large biomolecule systems. ONIOM is a powerful and systematic method that divides the system into onion-like lay- ers. The chemically important region is treated with accurate high level quantum mechanics (QM) method and the rest of the lay- ers are treated with computationally less intensive lower level 1386-1425/$ – see front matter © 2011 Elsevier B.V. All rights reserved. doi:10.1016/j.saa.2011.04.012
-
Upload
independent -
Category
Documents
-
view
0 -
download
0
Transcript of The experimental and theoretical QM/MM study of interaction of chloridazon herbicide with ds-DNA
Th
Fa
b
c
d
a
ARRA
KCDIAO
1
pigoecaogictom
1d
Spectrochimica Acta Part A 79 (2011) 1004– 1012
Contents lists available at ScienceDirect
Spectrochimica Acta Part A: Molecular andBiomolecular Spectroscopy
jou rn al hom epa ge: www.elsev ier .com/ locate /saa
he experimental and theoretical QM/MM study of interaction of chloridazonerbicide with ds-DNA
. Ahmadia,∗, N. Jamali a, S. Jahangard-Yektaa, B. Jafari a, S. Nourib, F. Najafic, M. Rahimi-Nasrabadid
Department of Medicinal Chemistry, Faculty of Pharmacy, Kermanshah University of Medical Sciences, Kermanshah, Islamic Republic of IranChemical Bistoon Complex of Kermanshah, Bistoon, Kermanshah, Islamic Republic of IranKermanshah Health Research Center (KHRC), Kermanshah University of Medical Sciences, Kermanshah, Islamic Republic of IranDepartment of Chemistry, Imam Hossein University, Tehran, Islamic Republic of Iran
r t i c l e i n f o
rticle history:eceived 20 December 2010eceived in revised form 20 March 2011ccepted 10 April 2011
eywords:hloridazon herbicideNA interaction
ntercalation bondingb initio calculationsNIMO
a b s t r a c t
We report a multispectroscopic, voltammetric and theoretical hybrid of QM/MM study of the interac-tion between double-stranded DNA containing both adenine–thymine and guanine–cytosine alternatingsequences and chloridazon (CHL) herbicide. The electrochemical behavior of CHL was studied by cyclicvoltammetry on HMDE, and the interaction of ds-DNA with CHL was investigated by both cathodic dif-ferential pulse voltammetry (CDPV) at a hanging mercury drop electrode (HMDE) and anodic differentialpulse voltammetry (ADPV) at a glassy carbon electrode (GCE). The constant bonding of CHL–DNA com-plex that was obtained by UV/vis, CDPV and ADPV was 2.1 × 10⁴, 5.1 × 10⁴ and 2.6 × 10⁴, respectively.The competition fluorescence studies revealed that the CHL quenches the fluorescence of DNA–ethidiumbromide complex significantly and the apparent Stern–Volmer quenching constant has been estimatedto be 1.71 × 10⁴. Thermal denaturation study of DNA with CHL revealed the �Tm of 8.0 ± 0.2 ◦C. Thermo-
◦ −1
dynamic parameters, i.e., enthalpy (�H), entropy (�S ), and Gibbs free energy (�G) were 98.45 kJ mol ,406.3 J mol−1 and −22.627 kJ mol−1, respectively. The ONIOM, based on the hybridization of QM/MM (DFT,6.31++G(d,p)/UFF) methodology, was also performed using Gaussian 2003 package. The results revealedthat the interaction is base sequence dependent, and the CHL has more interaction with ds-DNA via the GCbase sequence. The results revealed that CHL may have an interaction with ds-DNA via the intercalationmode.. Introduction
Today we know very well that DNA plays a key role in cellroliferation, synthesis of proteins and transcription of genetic
nformation in living cells. However, when the poison and muta-enic compounds interact with DNA, it may induce damaging andxidative stress on DNA structure and, therefore, cause several dis-ases such as Parkinson’s disease, prostatitis, breast and childhoodancers [1–3]. In this context the pesticides, due to the intensivepplication in cultured lands and therefore widespread pollutionf water and food, should be considered as genotoxic and carcino-enic compounds [4,5]. It is completely clear that some pesticidesnteract with DNA in many different ways such as intercalation,ovalent and/or non-covalent groove bindings [6,7]. Therefore,
he change of thermodynamic stability and functional propertiesf DNA is a result of chemical change; adduct formation and/orutation of DNA [8]. So, the understanding in vitro effects of∗ Corresponding author. Tel.: +98 831 4276485; fax: +98 831 4276493.E-mail address: [email protected] (F. Ahmadi).
386-1425/$ – see front matter © 2011 Elsevier B.V. All rights reserved.oi:10.1016/j.saa.2011.04.012
© 2011 Elsevier B.V. All rights reserved.
complex formations on structural and mechanical properties ofDNA is an important step to elucidate a model of DNA–pesticidesbinding to provide valuable information about the genotoxicityand carcinogenic properties of pesticides. In principle, there areseveral techniques for monitoring in vitro reversible binding ofpesticides to the double-helical DNA such as spectroscopy, voltam-metry and molecular mechanic calculations (Molecular Modeling)[9,10]. In fact, molecular mechanic force fields [11,12], based onquantum mechanics, have been used to determine structural andenergetic properties of isolated molecules and can be used toexamine molecule–molecule and molecule–biomolecule interac-tions. The critical point of DFT, HF or ab initio calculations for largebiomolecules is accessed to obtain accurate and reliable results. Inthis way, the computational chemistry techniques, especially thehybrid methods (ONIOM) based on combination of several theoreti-cal approaches, have been developed by Morokuma and co-workers[13–16] for large biomolecule systems. ONIOM is a powerful and
systematic method that divides the system into onion-like lay-ers. The chemically important region is treated with accurate highlevel quantum mechanics (QM) method and the rest of the lay-ers are treated with computationally less intensive lower level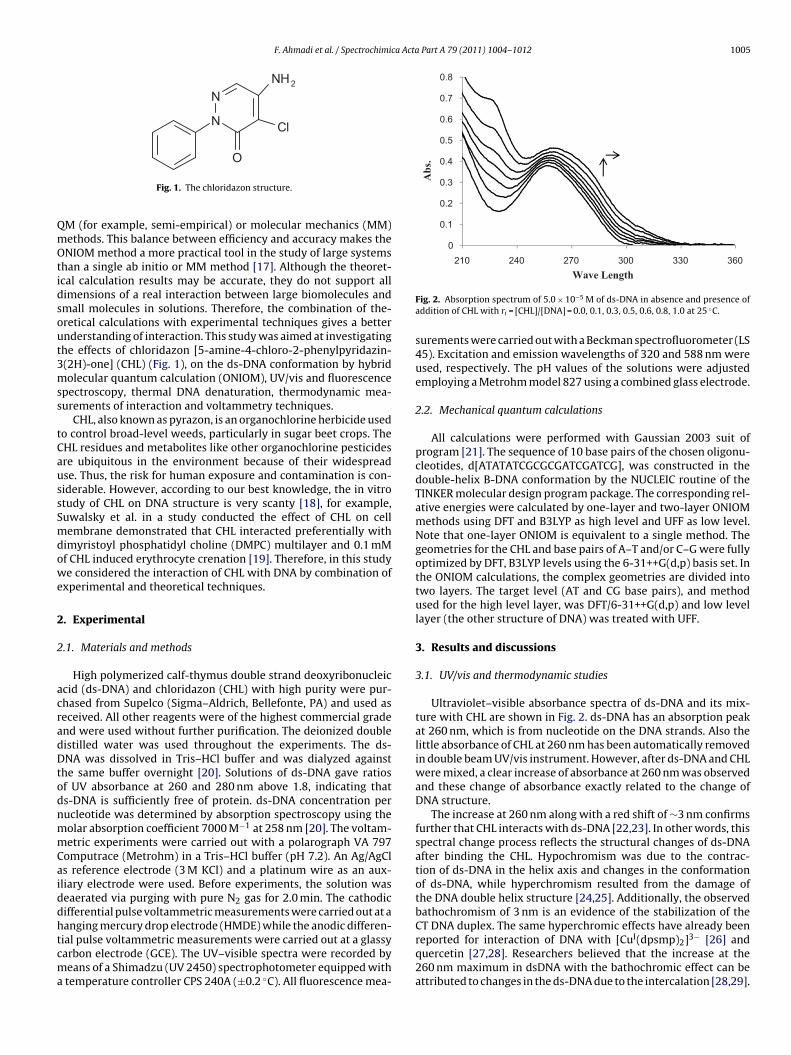
F. Ahmadi et al. / Spectrochimica Acta Part A 79 (2011) 1004– 1012 1005
N
O
N Cl
NH2
QmOtidsout3mss
tCaussSmdowe
2
2
acradDtodnmmCaiddhtcma
0
0.1
0.2
0.3
0.4
0.5
0.6
0.7
0.8
210 240 27 0 300 33 0 360
Abs
.
Wave Length
I 3−
Fig. 1. The chloridazon structure.
M (for example, semi-empirical) or molecular mechanics (MM)ethods. This balance between efficiency and accuracy makes theNIOM method a more practical tool in the study of large systems
han a single ab initio or MM method [17]. Although the theoret-cal calculation results may be accurate, they do not support allimensions of a real interaction between large biomolecules andmall molecules in solutions. Therefore, the combination of the-retical calculations with experimental techniques gives a betternderstanding of interaction. This study was aimed at investigatinghe effects of chloridazon [5-amine-4-chloro-2-phenylpyridazin-(2H)-one] (CHL) (Fig. 1), on the ds-DNA conformation by hybridolecular quantum calculation (ONIOM), UV/vis and fluorescence
pectroscopy, thermal DNA denaturation, thermodynamic mea-urements of interaction and voltammetry techniques.
CHL, also known as pyrazon, is an organochlorine herbicide usedo control broad-level weeds, particularly in sugar beet crops. TheHL residues and metabolites like other organochlorine pesticidesre ubiquitous in the environment because of their widespreadse. Thus, the risk for human exposure and contamination is con-iderable. However, according to our best knowledge, the in vitrotudy of CHL on DNA structure is very scanty [18], for example,uwalsky et al. in a study conducted the effect of CHL on cellembrane demonstrated that CHL interacted preferentially with
imyristoyl phosphatidyl choline (DMPC) multilayer and 0.1 mMf CHL induced erythrocyte crenation [19]. Therefore, in this studye considered the interaction of CHL with DNA by combination of
xperimental and theoretical techniques.
. Experimental
.1. Materials and methods
High polymerized calf-thymus double strand deoxyribonucleiccid (ds-DNA) and chloridazon (CHL) with high purity were pur-hased from Supelco (Sigma–Aldrich, Bellefonte, PA) and used aseceived. All other reagents were of the highest commercial gradend were used without further purification. The deionized doubleistilled water was used throughout the experiments. The ds-NA was dissolved in Tris–HCl buffer and was dialyzed against
he same buffer overnight [20]. Solutions of ds-DNA gave ratiosf UV absorbance at 260 and 280 nm above 1.8, indicating thats-DNA is sufficiently free of protein. ds-DNA concentration perucleotide was determined by absorption spectroscopy using theolar absorption coefficient 7000 M−1 at 258 nm [20]. The voltam-etric experiments were carried out with a polarograph VA 797
omputrace (Metrohm) in a Tris–HCl buffer (pH 7.2). An Ag/AgCls reference electrode (3 M KCl) and a platinum wire as an aux-liary electrode were used. Before experiments, the solution waseaerated via purging with pure N2 gas for 2.0 min. The cathodicifferential pulse voltammetric measurements were carried out at aanging mercury drop electrode (HMDE) while the anodic differen-
ial pulse voltammetric measurements were carried out at a glassyarbon electrode (GCE). The UV–visible spectra were recorded byeans of a Shimadzu (UV 2450) spectrophotometer equipped withtemperature controller CPS 240A (±0.2 ◦C). All fluorescence mea-
Fig. 2. Absorption spectrum of 5.0 × 10⁻⁵ M of ds-DNA in absence and presence ofaddition of CHL with ri = [CHL]/[DNA] = 0.0, 0.1, 0.3, 0.5, 0.6, 0.8, 1.0 at 25 ◦C.
surements were carried out with a Beckman spectrofluorometer (LS45). Excitation and emission wavelengths of 320 and 588 nm wereused, respectively. The pH values of the solutions were adjustedemploying a Metrohm model 827 using a combined glass electrode.
2.2. Mechanical quantum calculations
All calculations were performed with Gaussian 2003 suit ofprogram [21]. The sequence of 10 base pairs of the chosen oligonu-cleotides, d[ATATATCGCGCGATCGATCG], was constructed in thedouble-helix B-DNA conformation by the NUCLEIC routine of theTINKER molecular design program package. The corresponding rel-ative energies were calculated by one-layer and two-layer ONIOMmethods using DFT and B3LYP as high level and UFF as low level.Note that one-layer ONIOM is equivalent to a single method. Thegeometries for the CHL and base pairs of A–T and/or C–G were fullyoptimized by DFT, B3LYP levels using the 6-31++G(d,p) basis set. Inthe ONIOM calculations, the complex geometries are divided intotwo layers. The target level (AT and CG base pairs), and methodused for the high level layer, was DFT/6-31++G(d,p) and low levellayer (the other structure of DNA) was treated with UFF.
3. Results and discussions
3.1. UV/vis and thermodynamic studies
Ultraviolet–visible absorbance spectra of ds-DNA and its mix-ture with CHL are shown in Fig. 2. ds-DNA has an absorption peakat 260 nm, which is from nucleotide on the DNA strands. Also thelittle absorbance of CHL at 260 nm has been automatically removedin double beam UV/vis instrument. However, after ds-DNA and CHLwere mixed, a clear increase of absorbance at 260 nm was observedand these change of absorbance exactly related to the change ofDNA structure.
The increase at 260 nm along with a red shift of ∼3 nm confirmsfurther that CHL interacts with ds-DNA [22,23]. In other words, thisspectral change process reflects the structural changes of ds-DNAafter binding the CHL. Hypochromism was due to the contrac-tion of ds-DNA in the helix axis and changes in the conformationof ds-DNA, while hyperchromism resulted from the damage ofthe DNA double helix structure [24,25]. Additionally, the observedbathochromism of 3 nm is an evidence of the stabilization of theCT DNA duplex. The same hyperchromic effects have already been
reported for interaction of DNA with [Cu (dpsmp)2] [26] andquercetin [27,28]. Researchers believed that the increase at the260 nm maximum in dsDNA with the bathochromic effect can beattributed to changes in the ds-DNA due to the intercalation [28,29].
1006 F. Ahmadi et al. / Spectrochimica Acta Part A 79 (2011) 1004– 1012
0
20
40
60
80
100
120
0 0.3 0.6 0.9 1.2 1.5 1.8 2.1
1/(A
-A
0)
1/[CHL]
288 K
293 K
298 K
310 K
283 K
Fig. 3. Plot of 1/(A − A0) vs. 1/[CHL] for CHL and ds-DNA complex in different temper-a((
TumDCt
D
K
Fr
wAalirf2ntiie22ftw
tmmtHiccrwf
y = 5.09x + 21.22R² = 0.996
2.5
3
3.5
4
4.5
5
3.22 3.26 3.3 3.34 3.38 3.42 3.46 3.5 3.54
log
K
tures (283, 288, 293, 298 and 310 K), where A0 is the initial absorbance of ds-DNA260 nm) and A is the recorded absorbance (260 nm) at different CHL concentrations0.0–5 × 10⁻⁵ M) with constant ds-DNA concentration of 5.0 × 10⁻⁵ M at pH 7.2.
he calculation of bonding constant of CHL–DNA was carried outsing UV/vis spectroscopy as follows: the absorbance measure-ent was performed at pH 7.2 by keeping the concentration ofNA constant (5.0 × 10⁻⁵ M), while varying the concentration ofHL (1–4 × 10⁻⁵ M). To calculate the CHL–DNA bonding constant,he data are treated according to the following equations:
NA + CHL ↔ DNA–CHL complex (I)
= [DNA − CHL complex][DNA]uncomplexed[CHL]uncomplexed
(II)
or weak binding affinities, the data were treated using linear recip-ocal plots based on Eq. (III) [10,30]:
1A − A0
= 1A∞ − A0
+ 1K(A∞ − A0)
· 1[CHL]
(III)
here A0 is the absorbance of DNA at 260 nm in the absence of CHL,∞ is the final absorbance of the CHL–DNA, and A is the recordedbsorbance at different CHL concentrations and after 5 min equi-ibration. The double reciprocal plot of 1/(A − A0) versus 1/[CHL]s linear and the bonding constant (K) can be calculated from theatio of the intercept to the slope [10,30]. The bonding constantsor CHL–DNA complex were measured in different temperatures of83, 288, 293, 298 and 310 K (Fig. 3). The obtained Kb values areot very lower than those observed for typical classical intercala-or, EB–DNA, 1.4 × 10⁶ in 40 mM NaCl–25 mM Tris–HCl [31,32]. Thisndicates that DNA-bonding has an affinity less than the classicalntercalator of EB [20]. In previous works the Kb of DNA with sev-ral pesticides at 25 ◦C such as: clodinafop-propargyl (5.6 × 10³) [8],-imidazolidinethione (1.4 × 10³) [10], diazinon (1.6 × 10⁴) [33],,4-D (3.5 × 10³ and 5.0 × 10³) [34], aminocarb (7.2 × 10³) [35] andenitrithion (1.9 × 10⁴) [36] have been reported. As it is observedhese carcinogenic compounds have a significance effect on DNAith an affinity bonding in the range of 3.5 × 10³ to 1.6 × 10⁴.
As the interaction of CHL with DNA leads to changes in thehermodynamic stability and structural properties of DNA, the ther-
odynamic parameters of interaction, i.e., �H, �S and �G wereeasured as another strong evidence to elicit the mode of interac-
ion. The thermodynamic parameters were calculated using van’toff equation by plotting log Kb versus 1000/T. The negative slope
n the van’t Hoff plot (Fig. 4) indicates that the complexation pro-ess is endothermic. The �H, �S and �G values of the CHL–DNA
omplex were 98.45 kJ mol−1, 406.3 J mol−1 and −22.627 kJ mol−1,espectively. From the thermodynamic data, it is quite clear thathile complex formation is entropy favored, it is also enthalpy dis-avored. This large positive �S◦, is due to the release of the CHL
1000/T
Fig. 4. van’t Hoff plot for CHL–DNA complex.
water shell in the reaction CHL(aq) → CHL → DNA [36]. We believedthe binding thermodynamics reflects a subtle balance between thehydrogen, van der Waals or multipole bonds and entropic effects.The change in entropy is governed by release of water from DNAas well as CHL. For the transfer of small molecules from polar tononpolar environments, hydrophobic interactions give �H > 0 and�S > 0 accompanied by a negative �G [36].
3.2. Thermal denaturation studies
Thermal denaturation studies of ds-DNA are an important toolto study the interaction of small molecules with nucleic acids. It isknown that the interaction of added molecules with double helix,increases the Tm, the temperature at which half of the double helixdenatures into single strand DNA. For instance, classical interca-lators were found to increase the Tm of DNA to about 7–12 ◦C. Tm
measurements were carried out with CT-DNA (5.0 × 10⁻⁵ M) in theabsence and presence of 5.0 × 10⁻⁵ M of CHL. The absorbance ofDNA at 260 nm was recorded in the temperature range of 25–90 ◦Cand Tm was calculated by plotting temperature versus relativeabsorbance (A/A0). Under our experimental condition, addition of1:1 of CHL to DNA showed �Tm of 8.0 ± 0.2 ◦C, when compared tothe native DNA. Since the CHL contains an aromatic ring, this resultsindicative of an intercalative bonding mode.
3.3. Competitive fluorescence studies
It is well known that the classical intercalator of ethidiumbromide (EB) displays a dramatic enhancement of DNA fluores-cence efficiency when intercalated into DNA. Therefore, the popularstrategy for monitoring DNA interaction with target molecules byfluorescence spectroscopy is based on the quenching of EB flu-orescence via a competition for binding sites in DNA. However,when one compound (in this work CHL) can compete with EB onits binding sites in DNA and remove it to outside, it would pro-vide a quenched EB fluorescence intensity because of increasedquenching rate constant. Fig. 5a shows the fluorescence emissionspectrum of EB with DNA and the effect of the addition of CHLto EB–DNA complex. As it is observed, by addition of the CHL asignificant quenching of EB–DNA fluorescence occurred. Ling et al.in a study conducted on the interaction of pazofloxacin with DNAby competitive fluorescence believed that, the compound interactswith DNA by intercalation if the emission intensity of the DNA–EBsystem decreases more than 50% and if the ratio of the concentra-tion of drug to DNA is less than 100 [37]. The same conclusion was
reported before by Liao et al. [38]. The intensity of DNA–EB systemdecreased only by 76.6%, as CHL was added to the system and didnot decrease any more. This phenomenon indicates that CHL bindsto DNA via intercalation mode.
F. Ahmadi et al. / Spectrochimica Acta Part A 79 (2011) 1004– 1012 1007
(a)
0
100
200
300
400
500
600
700
800
570 575 58 0 585 59 0 595 60 0 605 610
Int.
Wavelength (nm)
y = 0.171x + 0.817R² = 0.995
0
0.5
1
1.5
2
2.5
3
3.5
4
4.5
50 10 15 20 25
F 0/F
[CHL] 105 M
(b)
Fefl
a
waflqa(
3
eca[oowoaot[
H
-50
-40
-30
-20
-10
0-1.65-1.6-1.55-1.5-1.45-1.4-1.35-1.3
i (nA
)
E (V)
Fig. 6. Cyclic voltammogram of CHL (1 × 10⁻⁵ M) in the absence of ds-DNA in 0.01 MTris–HCl buffer pH 7.2, scan rate 50 mV s−1.
(a) -60
-55
-50
-45
-40
-35
-3098765432 10
i pc(n
A)
1/2
-55
-50
-45
-40
-35
-30200 40 60 80 100
i pc(n
A)
(b)
ig. 5. (a) Emission spectra of ethidium bromide bound to DNA and quenching ofthidium bromide-bound DNA by CHL; (b) Stern–Volmer plot of the quenching ofuorescence of DNA–EB with CHL in Tris–HCl buffer (pH 7.3).
In fluorescence quenching experiments, the data were plottedccording to the Stern–Volmer equation (IV).
F0
F= 1 + Ksv[CHL] (IV)
here F0 and F are the fluorescence intensities of DNA–EB in thebsence and presence of CHL, respectively. Ksv is the Stern–Volmeruorescence quenching constant, and [CHL] is the concentration ofuencher. The Stern–Volmer quenching constant Ksv was obtaineds 1.71 × 10⁴ by the slope of the regression curve in the linear rangeFig. 5b).
.4. The electrochemical behaviors of CHL
Today we know that the voltammetric methods enable us tostimate and predict the conformational changes of DNA by pesti-ides. This information is valuable for evaluation of carcinogenicnd mutagenic effects of pesticides or other molecules on DNA10,33,34,36]. The electrochemical behavior of CHL at the surfacef HMDE was studied. A typical cyclic voltammogram of 5 × 10⁻⁵ Mf CHL in 0.1 M Tris–HCl buffer (pH 7.2) is shown in Fig. 6. In for-ard sweep potentials (−1.3 to −1.6 V with scan rate of 50 mV s−1),
ne irreversible cathodic peak in potential of −1.54 V was obtained,nd in backward sweep potentials (−1.6 to −1.3 V) no peak wasbserved. The cathodic peak at −1.54 V corresponds to the reduc-
ion of the –C O group in pyridazinone ring of CHL to –CHOH group39].The dependence of the cathodic peak current of CHL at theMDE to the scan rate (�), in the absence of DNA, was exam-
Fig. 7. Relationship between ipc and (a) �1/2, (b) �, for 5 × 10⁻⁵ M CHL in 0.01 MTris–HCl (pH 7.2) solution.
ined. Under selected experimental conditions, by increasing thescan rate, the cathodic peak currents (ipc) of CHL in absence ofDNA considerably increased. The negative shift of peak potential(Epc) with increasing scan rate � demonstrated an irreversible elec-trode process for CHL [40]. The plots of ipc versus �1/2 and � forCHL are shown in Fig. 7a and b, respectively. As it is observed,the cathodic peak current (ipc) of CHL varies linearly with squareroot of the scan rate, �1/2, rather than with �, with a linearequation of: i (nA) = 21.50 + 3.23 �(mV s−1)1/2 and regression coef-
pcficient R = 0.997.The results indicated that the mass transport of CHL to the HMDE
surface is a diffusion controlled process [40]. To measure the sym-
1008 F. Ahmadi et al. / Spectrochimica Acta Part A 79 (2011) 1004– 1012
-40
-35
-30
-25
-20
-15
-10
-5
0-1.65-1.6-1.55-1.5-1.45-1.4-1.35
i (nA
)
E (V)
(a)
500
550
600
650
700
750
800
850
1.11 1. 2 1.3 1. 4 1.5
i (nA
)
E (V)
(b)
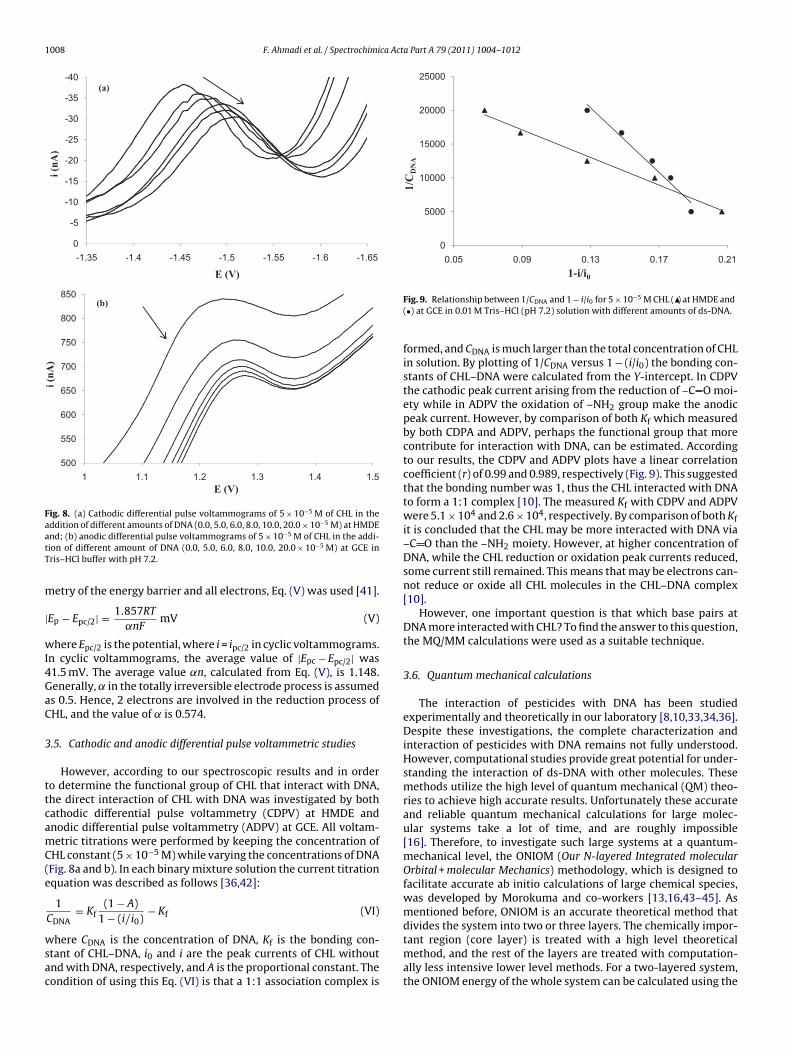
Fig. 8. (a) Cathodic differential pulse voltammograms of 5 × 10⁻⁵ M of CHL in theaddition of different amounts of DNA (0.0, 5.0, 6.0, 8.0, 10.0, 20.0 × 10⁻⁵ M) at HMDEatT
m
|
wI4GaC
3
ttcamC(e
wsac
0
5000
10000
15000
20000
25000
0.05 0.09 0.13 0.17 0.21
1/C
DN
A
1-i/i0
nd; (b) anodic differential pulse voltammograms of 5 × 10⁻⁵ M of CHL in the addi-ion of different amount of DNA (0.0, 5.0, 6.0, 8.0, 10.0, 20.0 × 10⁻⁵ M) at GCE inris–HCl buffer with pH 7.2.
etry of the energy barrier and all electrons, Eq. (V) was used [41].
Ep − Epc/2| = 1.857RT
˛nFmV (V)
here Epc/2 is the potential, where i = ipc/2 in cyclic voltammograms.n cyclic voltammograms, the average value of |Epc − Epc/2| was1.5 mV. The average value ˛n, calculated from Eq. (V), is 1.148.enerally, in the totally irreversible electrode process is assumeds 0.5. Hence, 2 electrons are involved in the reduction process ofHL, and the value of is 0.574.
.5. Cathodic and anodic differential pulse voltammetric studies
However, according to our spectroscopic results and in ordero determine the functional group of CHL that interact with DNA,he direct interaction of CHL with DNA was investigated by bothathodic differential pulse voltammetry (CDPV) at HMDE andnodic differential pulse voltammetry (ADPV) at GCE. All voltam-etric titrations were performed by keeping the concentration of
HL constant (5 × 10⁻⁵ M) while varying the concentrations of DNAFig. 8a and b). In each binary mixture solution the current titrationquation was described as follows [36,42]:
1CDNA
= Kf(1 − A)
1 − (i/i0)− Kf (VI)
here CDNA is the concentration of DNA, Kf is the bonding con-tant of CHL–DNA, i0 and i are the peak currents of CHL withoutnd with DNA, respectively, and A is the proportional constant. Theondition of using this Eq. (VI) is that a 1:1 association complex is
Fig. 9. Relationship between 1/CDNA and 1 − i/i0 for 5 × 10⁻⁵ M CHL (N) at HMDE and(•) at GCE in 0.01 M Tris–HCl (pH 7.2) solution with different amounts of ds-DNA.
formed, and CDNA is much larger than the total concentration of CHLin solution. By plotting of 1/CDNA versus 1 − (i/i0) the bonding con-stants of CHL–DNA were calculated from the Y-intercept. In CDPVthe cathodic peak current arising from the reduction of –C O moi-ety while in ADPV the oxidation of –NH2 group make the anodicpeak current. However, by comparison of both Kf which measuredby both CDPA and ADPV, perhaps the functional group that morecontribute for interaction with DNA, can be estimated. Accordingto our results, the CDPV and ADPV plots have a linear correlationcoefficient (r) of 0.99 and 0.989, respectively (Fig. 9). This suggestedthat the bonding number was 1, thus the CHL interacted with DNAto form a 1:1 complex [10]. The measured Kf with CDPV and ADPVwere 5.1 × 10⁴ and 2.6 × 10⁴, respectively. By comparison of both Kfit is concluded that the CHL may be more interacted with DNA via–C O than the –NH2 moiety. However, at higher concentration ofDNA, while the CHL reduction or oxidation peak currents reduced,some current still remained. This means that may be electrons can-not reduce or oxide all CHL molecules in the CHL–DNA complex[10].
However, one important question is that which base pairs atDNA more interacted with CHL? To find the answer to this question,the MQ/MM calculations were used as a suitable technique.
3.6. Quantum mechanical calculations
The interaction of pesticides with DNA has been studiedexperimentally and theoretically in our laboratory [8,10,33,34,36].Despite these investigations, the complete characterization andinteraction of pesticides with DNA remains not fully understood.However, computational studies provide great potential for under-standing the interaction of ds-DNA with other molecules. Thesemethods utilize the high level of quantum mechanical (QM) theo-ries to achieve high accurate results. Unfortunately these accurateand reliable quantum mechanical calculations for large molec-ular systems take a lot of time, and are roughly impossible[16]. Therefore, to investigate such large systems at a quantum-mechanical level, the ONIOM (Our N-layered Integrated molecularOrbital + molecular Mechanics) methodology, which is designed tofacilitate accurate ab initio calculations of large chemical species,was developed by Morokuma and co-workers [13,16,43–45]. Asmentioned before, ONIOM is an accurate theoretical method thatdivides the system into two or three layers. The chemically impor-tant region (core layer) is treated with a high level theoretical
method, and the rest of the layers are treated with computation-ally less intensive lower level methods. For a two-layered system,the ONIOM energy of the whole system can be calculated using the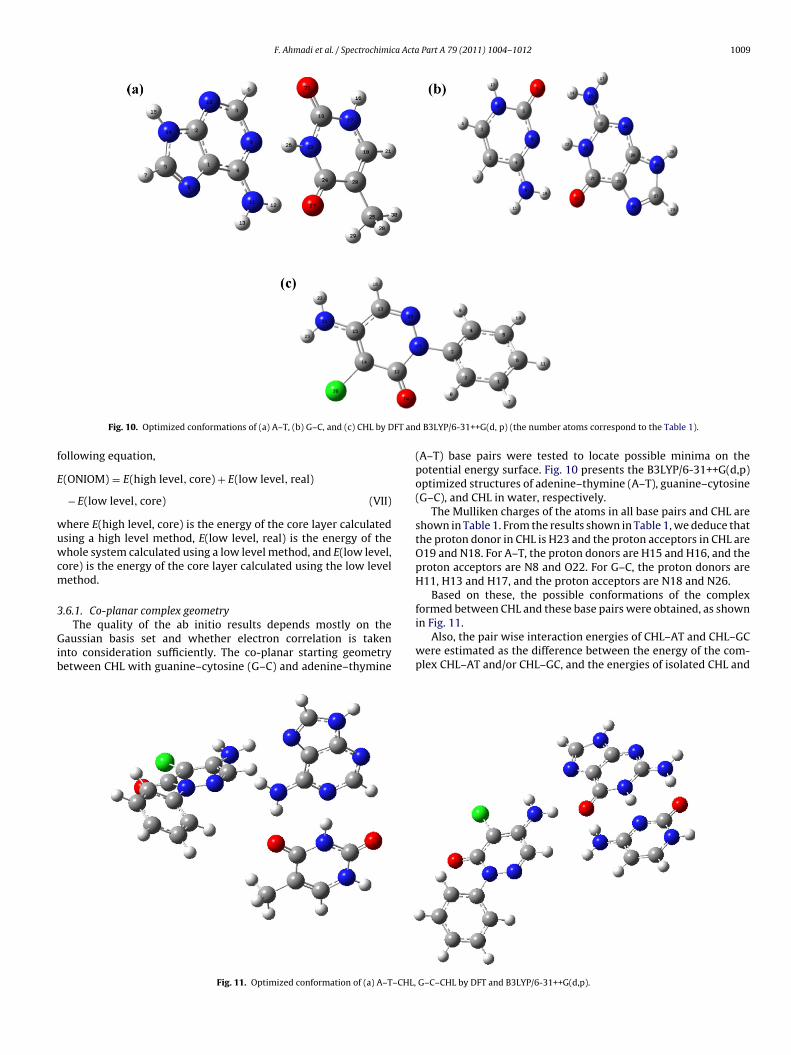
F. Ahmadi et al. / Spectrochimica Acta Part A 79 (2011) 1004– 1012 1009
FT an
f
E
wuwcm
3
Gib
Fig. 10. Optimized conformations of (a) A–T, (b) G–C, and (c) CHL by D
ollowing equation,
(ONIOM) = E(high level, core) + E(low level, real)
− E(low level, core) (VII)
here E(high level, core) is the energy of the core layer calculatedsing a high level method, E(low level, real) is the energy of thehole system calculated using a low level method, and E(low level,
ore) is the energy of the core layer calculated using the low levelethod.
.6.1. Co-planar complex geometry
The quality of the ab initio results depends mostly on theaussian basis set and whether electron correlation is takennto consideration sufficiently. The co-planar starting geometryetween CHL with guanine–cytosine (G–C) and adenine–thymine
Fig. 11. Optimized conformation of (a) A–T–CHL,
d B3LYP/6-31++G(d, p) (the number atoms correspond to the Table 1).
(A–T) base pairs were tested to locate possible minima on thepotential energy surface. Fig. 10 presents the B3LYP/6-31++G(d,p)optimized structures of adenine–thymine (A–T), guanine–cytosine(G–C), and CHL in water, respectively.
The Mulliken charges of the atoms in all base pairs and CHL areshown in Table 1. From the results shown in Table 1, we deduce thatthe proton donor in CHL is H23 and the proton acceptors in CHL areO19 and N18. For A–T, the proton donors are H15 and H16, and theproton acceptors are N8 and O22. For G–C, the proton donors areH11, H13 and H17, and the proton acceptors are N18 and N26.
Based on these, the possible conformations of the complexformed between CHL and these base pairs were obtained, as shown
in Fig. 11.Also, the pair wise interaction energies of CHL–AT and CHL–GCwere estimated as the difference between the energy of the com-plex CHL–AT and/or CHL–GC, and the energies of isolated CHL and
G–C–CHL by DFT and B3LYP/6-31++G(d,p).

1010 F. Ahmadi et al. / Spectrochimica Acta Part A 79 (2011) 1004– 1012
Table 1Mulliken charges of the atoms in AT, GC and CHL.
Adenine–thymine Guanine–cytosine CHL
No. Atom Atomic charge No. Atom Atomic charge No. Atom Atomic charge
1 C 0.018 1 C 0.532 1 C −0.3322 C −0.022 2 C −0.106 2 C −0.2583 C 0.271 3 C 0.087 3 C −1.0234 C 0.422 4 C 0.274 4 C 0.6855 C 0.283 5 N −0.480 5 C −0.3026 H 0.153 6 H 0.157 6 C 0.0137 H 0.144 7 H 0.137 7 H 0.1308 N −0.390 8 O −0.582 8 H 0.1489 N −0.426 9 N −0.561 9 H 0.134
10 N −0.333 10 H 0.333 10 H 0.12711 N −0.658 11 H 0.309 11 H 0.12512 H 0.396 12 N −0.396 12 C −0.60013 H 0.320 13 H 0.324 13 C −0.07314 N −0.423 14 H 0.380 14 C 0.65915 H 0.305 15 N −0.590 15 C 0.11816 H 0.323 16 C 0.600 16 H 0.13717 N −0.428 17 H 0.310 17 N 0.10118 C −0.553 18 N −0.525 18 N −0.11019 C 0.692 19 N −0.543 19 O −0.49020 C 1.144 20 C −0.009 20 Cl 0.13021 H 0.150 21 C 0.486 21 N −0.59422 N −0.609 22 H 0.322 22 H 0.30223 O −0.509 23 C 0.164 23 H 0.31024 C 0.011 24 N −0.409 24 – –25 C −0.634 25 O −0.558 25 – –26 H 0.409 26 N −0.364 26 – –27 O −0.554 27 C 0.279 27 – –28 H 0.175 28 H 0.296 28 – –29 H 0.175 29 H 0.136 29 – –
– 30 – –
A
�
�
tC�w
3C
iieihat3aaDl
1
2
Table 2Relevant structural parameters, distances (A) calculated for the intercalation siteobtained by full geometry optimization with the QM/MM method, and experimentaldata from X-ray crystallography for native B-form oligonucleotides.
BP distance (A)a P-P distance (A)
DNA–AT 3.70 19.26DNA–GC 3.37 19.05DNA–AT–CHL 5.54 17.9DNA–GC–CHL 5.14 16.2
30 H 0.138 30 –
T and/or GC were estimated as follows:
ECHL–AT = ECHL–AT − ECHL − EAT
ECHL–GC = ECHL–GC − ECHL − EGC
The conformation optimization described above was appliedo these complexes, giving the �E of −34.77 kJ mol−1 forHL–AT and −49.05 kJ mol−1 for CHL–GC. As it is observed, theECHL–GC > �ECHL–AT indicates that CHL interacts most stronglyith GC and most weakly with AT.
.6.2. Hybrid (ONIOM) method applied to study interaction ofHL with ds-DNA
In order to achieve more accurate and real theoretical results,t is necessary to figure out which atoms or part(s) of the CHL cannteract with complete and large ds-DNA molecule. To our knowl-dge this is the first application of ONIOM method to study ofnteraction of CHL herbicide with ds-DNA. In ONIOM, in order toave a more economical calculation, we should select as manytoms as possible for low level of theory. In this study, we usedhe UFF as a mechanical molecular, and DFT as high level with 6-1++G(d,p) basis set; while none of the other methods converged inn optimization calculation of the molecule. To apply the ONIOMnd represent which atoms can participate in the interaction ofNA and CHL, molecules have been divided up into two arbitrary
ayers of atoms as follows:
. High layer (core layer): containing all atoms of CHL, and targetbase pairs such as AT and/or GC.
. Low layer: containing all dioxyriboze sugars, phosphate back-bone and other rest base pairs.
B-DNA 3.4 17.5
a Average stacking distances.
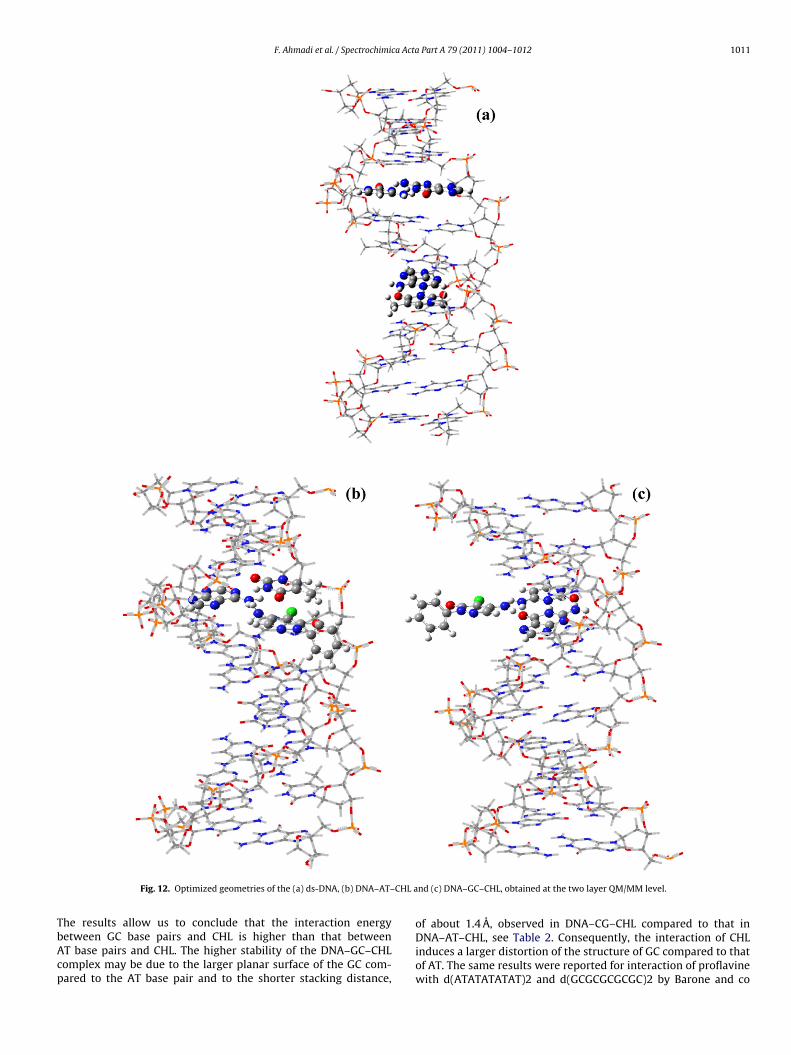
Fig. 12a–c represents the geometry-optimized structure of DNAand its complex base pairs of AT and/or GC, with CHL, respectively(Table 2).
However, this result allows us to correctly describe the AT andGC H-bonding and p–p stacking interactions of the DNA and CHL.It is attributable to the use of the UFF force field in the MM low-level layer that describes the whole DNA structure in which thehigh QM layer is embedded. Noteworthy, the same conclusioncan be drawn for the DNA–CHL complexes. The optimized struc-tures of the DNA–CHL complexes are shown in Fig. 12b and c. Theresults revealed that the CHL induces a considerable change in DNAconformation. This result confirms that CHL causes a larger axialelongation in GC base pairs than in AT. The calculated distancebetween the two phosphate groups in the interaction region, thatis supposed to increase as the base pairs separate [46] in the mod-els considered, is reduced from 19.26 to 17.9 for AT base pairs andfrom 19.05 to 16.2 for GC base pairs. In order to compare the relativestability of the two complexes, we have evaluated the interaction
energy, �E, without correction of the basis set superposition error[47] by a general equation (VII).The interaction energy, �E between DNA–GC–CHL andDNA–AT–CHL was −29.6 kJ mol−1 and −25.4 kJ mol−1, respectively.
F. Ahmadi et al. / Spectrochimica Acta Part A 79 (2011) 1004– 1012 1011
CHL a
TbAcp
Fig. 12. Optimized geometries of the (a) ds-DNA, (b) DNA–AT–
he results allow us to conclude that the interaction energy
etween GC base pairs and CHL is higher than that betweenT base pairs and CHL. The higher stability of the DNA–GC–CHLomplex may be due to the larger planar surface of the GC com-ared to the AT base pair and to the shorter stacking distance,nd (c) DNA–GC–CHL, obtained at the two layer QM/MM level.
of about 1.4 A, observed in DNA–CG–CHL compared to that in
DNA–AT–CHL, see Table 2. Consequently, the interaction of CHLinduces a larger distortion of the structure of GC compared to thatof AT. The same results were reported for interaction of proflavinewith d(ATATATATAT)2 and d(GCGCGCGCGC)2 by Barone and co
1 ca Act
wgl
4
itdppcthesnbDbcCDmeqAaD
A
tat
R
[
[
[
[
[
[
[[[
[
[
[
[[[[
[[
[[
[[[[
[[
[[[[[[
[[[[[
012 F. Ahmadi et al. / Spectrochimi
orkers [48]. We believe CHL interacts with ds-DNA via majorroove, because the affinity for interaction with AT base pairs isess than that of GC [49,50].
. Conclusions
From a short report in literature [18], the chloridazon maynteract with DNA via intercalation mode, therefore, in this work,he interaction of CHL with DNA by UV/vis, fluorescence, thermalenaturation, cyclic voltammetry, cathodic and anodic differentialulse voltammetry, one and two layer ONIOM methods was com-letely studied. The binding of CHL to DNA resulted in a series ofhanges in the electrochemical behavior and spectrum characteris-ics. Upon binding to DNA, the adsorption spectra of DNA showed ayperchromic effect with a bathochromic shift and the fluorescencemission of DNA–EB was efficiently quenched. These investigationshowed that CDPV and ADPV coupled with spectroscopy tech-iques could provide a convenient way to characterize both theinding mode and the interaction mechanism of CHL binding toNA. From the CDPV and ADPV and spectroscopic results, it coulde affirmed that the interaction of CHL with DNA through inter-alative mode, and furthermore, a portion of the chromophore ofHL (i.e., –C O moiety) was more involved in the intercalation intoNA base pairs. In addition in order to clear which base pairs haveore tendency to interaction with CHL the, we present a coher-
nt set of theoretical investigations using the ab initio mechanicaluantum, to calculate the interaction energies between CHL andT or CG base pairs. The results revealed this interaction appearss base sequence dependent and showed CHL more interact withNA via the GC base sequence.
cknowledgements
The Chemical Bistoon Complex of Kermanshah has supportedhis work. We would also like to thank Vice Chancellor for Researchnd Technology of Kermanshah University of Medical Sciences forhe financial support.
eferences
[1] M. Landau-Ossondo, N. Rabia, J. Jos-Pelage, L.M. Marquet, Y. Isidore, C. Saint-Aimé, M. Martin, P.D. Irigaray, Biomed. Pharmacol. 63 (2009) 383–395.
[2] M. Nasterlack, Int. J. Hyg. Environ. Health 210 (2007) 645–657.[3] D.G. Le Couteur, A.J. McLean, M.C. Taylor, B.L. Woodham, P.G. Board, Biomed.
Pharmacol. 53 (1999) 122–130.[4] M. Börzsönyi, A. Pintér, A. Surján, G. Török, Cancer Lett. 5 (1978) 107–113.[5] D.A. Eastmond, S. Balakrishnan Hayes, Handbook of Pesticide Toxicology, third
ed., 2010.[6] M. Wink, Chem. Biol. 64 (2007) 1–47.[7] Q. Saquib, A.A. Al-Khedhairy, S.A. Alarifi, S. Dutta, S. Dasgupta, J. Musarrat, Int.
J. Biol. Macromol. 47 (2010) 68–75.[8] S. Kashanian, S. Askari, F. Ahmadi, K. Omidfar, S. Ghobadi, F. Abasi Tarighat, DNA
Cell Biol. 27 (2008) 581–586.[9] M. Stoytcheva, in: F. Ahmadi (Ed.), Pesticides The Impacts of Pesticides Expo-
sure, first ed., 2011, Chapter 18, pp. 385–422.10] F. Ahmadi, A.A. Alizade, F. Bakhshandeh-Saraskanrood, B. Jafari, M. Khodada-
dian, Food Chem. Toxicol. 48 (2010) 29–36.
[
[[[
a Part A 79 (2011) 1004– 1012
11] S.S. Braga, I.S. Goncalves, M. Pillinger, P. Ribeiro-Claro, J. Teixeira-Dias, J.Organomet. Chem. 632 (2001) 11–16.
12] G. Barone, C. Saturnino, G. De Martino, D. Duca, G. La Manna, J. Mol. Struct. 572(2001) 113–119.
13] M.J. Svensson, S. Humbel, R.D.J. Froese, T. Matsubara, S. Sieber, K. Morokuma, J.Phys. Chem. 100 (1996) 19357–19363.
14] R.D.J. Froese, K. Morokuma, in: P.v.R. Schleyer, N.L. Allinger, P.A. Kollman, T.Clark, H.F. Scheafer, J. Gasteiger, P.R. Schreiner (Eds.), Encyclopedia of Compu-tational Chemistry, Vol. 2, Wiley, Chichester, 1998, pp. 1244–1257.
15] K. Morokuma, D.G. Musaev, T. Verena, H. Basch, M. Torrent, D.V. Khoroshun,IBM J. Res. Dev. 45 (2001) 367–375.
16] K. Morokuma, Korean Chem. Soc. 24 (2003) 797–801.17] M. Kuno, S. Hannongbua, K. Morokuma, Chem. Phys. Lett. 380 (2003) 456–463.18] K.M. Mehd, K. Soheila, R. Hamideh, P. Hossein, New Biotechnol. 25S (2009)
S366.19] M. Suwalsky, M. Benites, F. Villena, B. Norris, L. Quevedo, Compar. Biochem.
Physiol. C 120 (1998) 29–35.20] S. Kashanian, M.B. Gholivand, F. Ahmadi, A. Taravati, A. Hosseinzadeh Colagar,
Spectrochim. Acta A 67 (2007) 472–478.21] M.J. Frisch, G.W. Trucks, H.B. Schlegel, G.E. Scuseria, M.A. Robb, J.R. Cheeseman,
J.A. Montgomery Jr., K.N. Vreven, J.C. Kudin, J.M. Burant, S.S. Millam, J. Iyengar,V. Tomasi, B. Barone, M. Mennucci, G. Cossi, N. Scalmani, G.A. Rega, H. Petersson,M. Nakatsuji, M. Hada, M. Ehara, K. Toyota, R. Fukuda, J. Hasegawa, M. Ishida, T.Nakajima, Y. Honda, O. Kitao, H. Nakai, M. Klene, X. Li, J.E. Knox, H.P. Hratchian,J.B. Cross, C. Adamo, J. Jaramillo, R. Gomperts, R.E. Stratmann, O. Yazyev, A.J.Austin, R. Cammi, C. Pomelli, J.W. Ochterski, P.Y. Ayala, K. Morokuma, G.A.Voth, P. Salvador, J.J. Dannenberg, V.G. Zakrzewski, S. Dapprich, A.D. Daniels,M.C. Strain, O. Farkas, D.K. Malick, A.D. Rabuck, K. Raghavachari, J.B. Foresman,J.V. Ortiz, Q. Cui, A.G. Baboul, S. Clifford, J. Cioslowski, B.B. Stefanov, G. Liu, A.Liashenko, P. Piskorz, I. Komaromi, R.L. Martin, D.J. Fox, T. Keith, M.A. Al-Laham,C.Y. Peng, A. Nanayakkara, M. Challacombe, P.M.W. Gill, B. Johnson, W. Chen,M.W. Wong, C. Gonzalez, J.A. Pople, Gaussian 03, Revision A.1, Gaussian, Inc.,Pittsburgh, PA, 2003.
22] Z.C. Yong, X.X. Li, Y. Pin, Biochemistry 72 (2007) 37–43.23] C.Y. Zhou, J. Zhao, Y.B. Wu, C.X. Yin, P. Yang, J. Inorg. Biochem. 101 (2007) 10–18.24] Q.S. Li, P. Yang, H.F. Wang, M.L. Guo, J. Inorg. Biochem. 64 (1996) 181–195.25] S. Shi, J. Liu, J. Li, K.C. Zheng, M. Huang, J. Inorg. Biochem. 100 (2006) 385–
395.26] S. Mahadevan, M. Palaniandavar, Inorg. Chem. 37 (1998) 693–700.27] A. Rahman, S. Shahabuddin, S.M. Hadi, J.H. Parish, Carcinogenesis 11 (1990)
2001–2003.28] A.M. Oliveira, Bioelectrochemistry 64 (2004) 133–141.29] A. Plaper, M. Golob, I. Hafner, M. Oblak, T. Solmajer, R. Jerala, Biochem. Biophys.
Res. Commun. 306 (2003) 530–536.30] J.J. Stephanos, J. Inorg. Biochem. 62 (1996) 155–169.31] M.J. Waring, J. Mol. Biol. 13 (1965) 269–275.32] J.B. Lepecq, C. Paoletti, J. Mol. Biol. 27 (1967) 87–91.33] S. Kashanian, M.B. Gholivand, F. Ahmadi, H. Ravan, DNA Cell Biol. 27 (2008)
325–332.34] F. Ahmadi, F. Bakhshandeh, DNA Cell Biol. 28 (2009) 527–533.35] G. Zhang, X. Hu, N. Zhao, W. Li, L. He, Pestic. Biochem. Physiol. 98 (2010)
206–211.36] F. Ahmadi, B. Jafari, Electroanalysis 23 (2011) 675–682.37] X. Ling, W. Zhong, Q. Huang, K. Ni, J. Photochem. Photobiol. B 93 (2003) 172–178.38] J.P. Liao, G.D. Liu, S.S. Huang, J. Instrum. Anal. 20 (2001) 5–10.39] M.B. Gholivand, F. Ahmadi, Anal. Lett. 41 (2008) 3324–3341.40] S. Wang, T. Peng, C.F. Yang, Biophys. Chem. 104 (2003) 239–248.41] A.J. Bard, L.R. Faulkner, Electrochemical Methods Fundamentals and Applica-
tions, John Wiley & Sons Inc., New York, 1980.42] G.C. Zhao, J.J. Zhu, J.J. Zhang, H.Y. Chen, Anal. Chim. Acta 394 (1999) 337–344.43] S. Humbel, S. Sieber, K. Morokuma, J. Chem. Phys. 161 (1996) 959–965.44] F. Maseras, Organomet. Chem. 4 (1999) 165–170.45] T. Vreven, K. Morokuma, J. Comput. Chem. 16 (2000) 1419–1432.46] J.B. Chaires, Biopolymers 44 (1998) 201–215.
47] C.J. Cramer, Essentials of Computational Chemistry, second ed., Wiley, NewYork, 2004, Chapter 6, pp. 195–196.48] R. Ruiz, B. García, G. Ruisi, A. Silvestri, G. Barone, J. Mol. Struct. 915 (2009) 86–92.49] S.M. Nelson, L.R. Ferguson, W.A. Denny, Mutat. Res. 623 (2007) 24–40.50] X. Cai, Gray Jr., J. Von Hoff, Cancer Treat. Rev. 35 (2009) 437–450.


![ksx ds funsZ'ku ds vUrxZr LukrdksŸkj] bfrgkl foHkkx dk ikB;Øe ...](https://static.fdokumen.com/doc/165x107/631bc8b3c2fddc481907b1c2/ksx-ds-funszku-ds-vurxzr-lukrdksykj-bfrgkl-fohkkx-dk-ikboe-.jpg)