The Everyone City: How ICT-Based Participation Shapes Urban Form
24
Chapter 17 The Everyone City: How ICT-Based Participation Shapes Urban Form Sara Levy, Karel Martens and Rob van der Heijden Abstract Citizen participation is a cornerstone of urban planning. One common criticism is that the process can be cumbersome and slow. However, in the face of recent advances in information and communication technologies (ICT), those problems can be easily overcome, making it possible to extend public participation to a wider sphere of urban planning matters. But what do we know of how ICT- based public participation affects urban form? What does a city shaped by social networks and other ICT-tools look like? We develop an agent-based model of urban growth to improve our understanding of these issues. Our model consists of a spatially disaggregated, micro-economic-based, real estate market model coupled with an ICT-based planning process. In the model, public participation is based on social network af filiation and preferences over the height of buildings. 1 Introduction 1.1 ICT, Citizen Participation and Urban Planning That citizens should participate in the creation and management of their own cities is a much revered idea, but one that has been proven dif ficult to implement in practice. The most common criticisms are that participation processes can be cumbersome, slow, frustrating and fail to give a real voice to the citizens, especially the underprivileged classes and minorities. Urban planners continually struggle to S. Levy (&) K. Martens R. van der Heijden Institute for Management Research, Radboud University Nijmegen, P.O. Box 9108, 6500 HK Nijmegen, The Netherlands e-mail: [email protected] K. Martens e-mail: [email protected] R. van der Heijden e-mail: [email protected] © Springer International Publishing Switzerland 2015 S. Geertman et al. (eds.), Planning Support Systems and Smart Cities, Lecture Notes in Geoinformation and Cartography, DOI 10.1007/978-3-319-18368-8_17 313
-
Upload
csregistry -
Category
Documents
-
view
3 -
download
0
Transcript of The Everyone City: How ICT-Based Participation Shapes Urban Form

Chapter 17The Everyone City: How ICT-BasedParticipation Shapes Urban Form
Sara Levy, Karel Martens and Rob van der Heijden
Abstract Citizen participation is a cornerstone of urban planning. One commoncriticism is that the process can be cumbersome and slow. However, in the face ofrecent advances in information and communication technologies (ICT), thoseproblems can be easily overcome, making it possible to extend public participationto a wider sphere of urban planning matters. But what do we know of how ICT-based public participation affects urban form? What does a city shaped by socialnetworks and other ICT-tools look like? We develop an agent-based model of urbangrowth to improve our understanding of these issues. Our model consists of aspatially disaggregated, micro-economic-based, real estate market model coupledwith an ICT-based planning process. In the model, public participation is based onsocial network affiliation and preferences over the height of buildings.
1 Introduction
1.1 ICT, Citizen Participation and Urban Planning
That citizens should participate in the creation and management of their own citiesis a much revered idea, but one that has been proven difficult to implement inpractice. The most common criticisms are that participation processes can becumbersome, slow, frustrating and fail to give a real voice to the citizens, especiallythe underprivileged classes and minorities. Urban planners continually struggle to
S. Levy (&) � K. Martens � R. van der HeijdenInstitute for Management Research, Radboud University Nijmegen,P.O. Box 9108, 6500 HK Nijmegen, The Netherlandse-mail: [email protected]
K. Martense-mail: [email protected]
R. van der Heijdene-mail: [email protected]
© Springer International Publishing Switzerland 2015S. Geertman et al. (eds.), Planning Support Systems and Smart Cities,Lecture Notes in Geoinformation and Cartography,DOI 10.1007/978-3-319-18368-8_17
313

enhance the participation process, to maximize and diversify stakeholder input inthe design of solutions for urban problems (Brabham 2009).
Many authors have welcomed the recent advances in information and commu-nication technologies (ICT), which, by making transactions of information muchfaster, cheaper and easier, promise to help overcome some of the problems withcitizen participation in urban planning. To some extent this is already happening.Mobile apps and webpages are being used to help citizens navigate zoning andurban plan information (Desouza and Bhagwatwar 2012); blogs and social net-works are being successfully used as platforms for expressing opinions aboutplanned developments, and for gathering support for those opinions (Evans-Cowleyand Hollander 2010); and online petitions against new developments are now acommon presence on the web.
While new methods and arenas for citizen participation keep emerging, it is stilltoo soon to know for sure what final forms ICT-based participation will take.Formal public participation is usually reserved for large or complex developments,especially those expected to have wide environmental, social or economic impli-cations. However, nowadays, citizens are no longer dependent on the official arenasfor providing feedback over planning matters. They can express their views about awider sphere of urban planning matters. Opinions expressed through unofficialchannels do not have to be considered by planners. However, if support spreads, itmight become hard to ignore them and, as a minimum, they are likely to delayapproval processes.
Not a lot is known about how public participation affects urban form. But thequestion takes on new and greater relevance if ICT-based participation fulfils itspromise and is able to successfully involve a significant number of citizens incommenting on a wider number of projects. While technology may seem todemocratize access to information, it may also introduce undesirable side effects inthe outcomes. For example, blogs and social networks may give full-blown visi-bility to some opinions, even if they do not represent the norm. In addition, ICTtools are not neutral in terms of whom they empower, since the wealthy haveprivileged access to technology. Furthermore, social networks tend to be composedof similar individuals (except for a few well connected individuals that tend to havevery diverse networks), and therefore something that spreads through a socialnetwork does not necessarily reach a diverse pool of people.
1.2 Urban Density, Planning Process and Externalities
The urban environment is characterized by a number of dimensions, of which theheight of buildings and the amount of green areas are two of the most visible andcontroversial. On the one hand, the high densities achieved by tall buildings areimportant for the reduction of negative environmental externalities of humanoccupation. On the other hand, green and open areas lower residential densities, but
314 S. Levy et al.

they are important for keeping citizens happy and healthy. These are matters thatpeople care deeply about but have little control over.
Urban economics’ models tend to assume that demand for housing is seamlesslytranslated into supply of housing, and therefore, to treat urban form as a directproduct of households’ preferences. But decisions over building height and amountof open areas are ultimately taken by developers, in dialogue with architects andengineers, in the creative process, and then with planners, in the approval process.Glaeser and Gyourko (2002) argue that, more than a housing affordability crisis, itis the difficulty in obtaining permits for new buildings, compounded with strictzoning laws, that has affected the supply of new housing in some cities. Schaefferand Hopkins (1987) describe how projects can be transformed in the process ofobtaining approval from the planning authorities. According to the authors, if theproject stays within the current constraints set by zoning regulations and buildingcodes, the approval should be obtained easily. If not, a negotiation process mayensue, regarding zoning changes and other regulations, or the rights and obligationsattached to the land. It is in this process of negotiation that the final shape of theproject is determined.
These insights suggest that the relationship between households’ preferences andurban form is not as simple as supply and demand. Approval time, for example, isan important variable. Long permit approval times affect developers’ decisionsbecause they imply a delay to realize profits, during which the money invested inthe project is unproductive. Furthermore, the final form of the development (thedensity or building height) is affected by negotiation during the permit applicationperiod.
On the demand side, things are equally complicated. Households may preferlow-density neighbourhoods, even if higher densities would be more beneficial interms of environmental impact and economic efficiency. Cinyabuguma andMcConnell (2013, p. 332) frame this problem as an externality of urban growth:“growth often creates benefits for an entire urban area, but the costs of that growthare born primarily by residents of the neighborhoods where new developmentoccurs. An externality problem arises because existing residents perceive the localcosts associated with admitting new residents, but not the full benefits which accrueto the city as a whole”. The same argument can be made for compact (tall)developments. While it allows increasing urban densities and thereby limitingsprawl and its associated environmental costs, the costs of compact developmentare born by the residents in the neighbourhoods where it occurs. The result is thatexisting residents have an incentive to block new residents to their neighbourhoods,resulting in cities that are less dense than is optimal, or too spread out(Cinyabuguma and McConnell 2013).
The full-blown impact of this effect, however, depends on the ability ofincumbent residents to effectively halt or transform planned developments. In mostcases, their ability is small because most developments do not require an officialpublic hearing. But the last decades have delivered the tools to boost the visibilityof any one opinion, by spreading it cheaply and quickly to virtually everyone.
17 The Everyone City: How ICT-Based Participation Shapes Urban Form 315

What happens to urban form when citizens are able to influence the approval orrejection of residential projects? How does such a city compare to one wherecitizens only get to shape it as consumers? These are relevant questions if urbanplanning is serious about the goal of expanding public participation.
1.3 Agent-Based Models of Urban Growth and UrbanPlanning
Despite being a relatively recent methodology, agent-based models (ABMs) alreadyhave a long tradition of modelling urban growth, land-use change and land and realestate markets. Most ABMs of land use are based on von Thünen’s (1826) agri-cultural land rent theory, and its application to urban land markets by Alonso(1964). Alonso’s monocentric city model has since been refined by several authors(such as Muth and Mills), and remains a staple of urban economics. Its basicpremises are that employment is located in the central business district (CBD), andhouseholds face a trade-off between housing lot consumption and the costs ofcommuting to the CBD. The Alonso-Muth-Mills models have also been extensivelycriticized on the grounds of their simplistic assumptions, especially: the adoption ofthe utility maximizing framework and the assumption of perfect rationality; thereliance on commuting costs as the only determinant of urban spatial structure; theneglect of the impact of hedonic value of housing characteristics and neighbour-hood characteristics on residential choice; the neglect of various forms of exter-nalities; the assumption of monocentricity; the static nature of the models; and theassumption that location is continuously variable (for a summary, see Briassoulis,undated). Many subsequent models have addressed these limitations. Here, wereport only on ABMs.
One important line of ABMs focuses on modelling land markets and land-usechange, with an emphasis on the externalities of land-use decisions. Parker andMeretsky (2004), Brown et al. (2004, 2008), Caruso et al. (2007, 2009) and Zellneret al. (2010) explore how both negative externalities of urban land use and positiveexternalities of agriculture or green land cover affect other agents’ location andland-use decisions. Caruso et al. (2007, 2009) present, in great detail, a frameworkfor modelling households residential location decisions subject to two neighbour-hood externalities: local residential density and open space. We adapt this frame-work in our model, but add accessibility as a further location criterion, and adapt theshape of the utility functions to reflect a more complex attitude of householdstowards open space and residential density (building height, in the case of ourmodel).
Iovanna and Vance (2013) and Filatova et al. (2009) model the bilateral inter-actions between buyers (urban dwellers) and sellers (farmers) of land. Iovanna andVance (2013) introduce landscape heterogeneity in terms of different agriculturalproductivities, and focus on predicting the place of future conversion of land to
316 S. Levy et al.

urban uses in real landscapes, while Filatova et al. (2009) use an abstract landscapeto explore how differences in sellers’ and buyers’ market power affect urban form.Sun et al. (2014) extend the Filatova et al. (2009) model to show how the level ofdetail of market representation affects the outcomes of the model. Following theseauthors’ recommendations, our model includes representation of essential marketfeatures such as budget constraints and competitive bidding to ensure a morerealistic representation of the real estate market. CHALMS (Magliocca et al. 2011)is a comprehensive ABM of both land and real estate markets. It includes devel-opers that face the decision of where to develop and at what density. However, inCHALMS, developers and households choice set is composed of fixed combina-tions of house size and lot size that are prevalent in exurban developments. Noneighbourhood attributes are considered in the residential choice. Our model, on theother hand, focuses on how households’ choices (both as consumers and as citizens)shape and are shaped by the neighbouring environment. Therefore, the focus is onthe most relevant aspects of a residential location: building height, the amount ofgreen space and accessibility.
Another line of research focuses on modelling real estate markets. Devisch et al.(2009) and Ettema (2011) use ABMs to model housing markets as the outcome ofhouseholds’ relocation decisions and bargaining processes with sellers. Thesemodels emphasize the decision process as one that incorporates learning fromprevious market interactions, the effects of uncertainty inherent in decisions aboutthe future, and life cycle effects, leading to changed preferences over time.
Only a handful of ABMs explicitly include planning agents (Monticino et al.2007; Li and Liu 2007, 2008; Zellner et al. 2009; Robinson and Brown 2009;Ligmann-Zielinska and Jankowski 2010), and of these, in only a few is the focus onapproving new developments. These models include some ad hoc features of theplanning process and of land markets, but no solid micro-economic foundation. InLi and Liu (2007), government agents decide whether to approve applications forland development, based on a number of factors, including existing land use,existing land-use plans, and the number of times the location has been targeted fordevelopment by developers or residents. In Monticino et al. (2007), governmentagents can approve, modify or reject a development proposal. The decision is basedon the government agent type, proposal type, and environmental information pro-vided by the natural system model. In addition, homeowner agents can decidewhether to protest the proposed development or not. The protest decision is basedon the homeowner agent type, the development proposal, and the type of residentialdevelopment in which the homeowner agent resides and the weights of the gov-ernment agent’s decision to approve the project. Our model is thus far, to the best ofour knowledge, the only ABM to represent the interaction between citizen partic-ipation and the real-estate market.
17 The Everyone City: How ICT-Based Participation Shapes Urban Form 317

2 Model Description
2.1 Purpose of the Model
This chapter presents an ABM of a real estate market coupled with a participatoryplanning process, developed to explore the impact of broad ICT-based citizenparticipation on urban form. The model represents a growing urban area, wheredevelopers search for developable land, households search for houses, and a plannerhandles permit requests. The model extends existing microeconomic models, suchas Czamanski and Roth (2011), which provides a solid foundation for addressingthe developer’s decision of where and how tall a building to build, while at thesame time establishing a link with both institutional variables and consumerdemand for residential locations. The model used a very simple stylized landscapebut can easily be improved to make use of spatial data from real cities.
2.2 Agents
The ABM comprises a landscape consisting of cells, three ‘human’ agent types—households, developers and planners—and three instrumental agents—alternatives,projects and buildings.
2.3 Process and Scheduling
There are four main processes (A, B, C, D) that occur sequentially in every step ofthe model.
A. Developers: Surveying and SelectingA number of developers operate in the city. Their goal is to build houses and sellthem at the highest profit, and their program is to: (i) find potential locations; (ii)assess the potential revenue from each alternative location and building height; (iii)select a project and submit it for approval; (iv) build; and (v) sell the houses to thehighest bidders.
A.1. Finding potential locations: Developers search for developable land, probinga high (though limited) number of randomly chosen locations, from which theyselect the three most promising for further evaluation. Different locations havedifferent values of ‘Accessibility’ and ‘OpenSpace’ (undeveloped cells aroundthem).
318 S. Levy et al.

A.2. Estimating revenue for different locations and development types: Foreach of the three selected locations, developers estimate the potential revenue andcosts for each possible building height (1–10). The potential profit from eachalternative depends on the cost of land, construction costs, the duration of theapproval process, and the estimated demand for each location and height. Theyselect the option with highest potential profit, purchase the land, and submit it forapproval to the planning authorities.
B. Permitting and Participation ProcessIn the baseline scenario, the approval process consists only of an interval of timebetween selection of an alternative and its construction where no action is taken. Inthe participation scenarios, on the other hand, during this time the planner has toinform citizens of the projects submitted for approval. After he/she informs thepublic, the following processes can take place:
1. Households: platform creation and support.2. Planner: gauging strength of public opposition to a project.3. All agent types: search for consensus solutions.
These processes are detailed in the Design Concepts section below.
C. ConstructionThe construction process consists of transforming the selected and approveddevelopments into buildings, whose houses are put on the market with an ask priceset by the developer.
D. Bidding and TradingHouseholds from the ‘rest-of-the-world’ migrate into the city at a fixed rate insearch of a place to live. Households search for available residential locationswithin their housing budget. They select the option with the highest utility, based ontheir preferences for three aspects of a location: Accessibility, OpenSpace andHeight of buildings. Households place a bid on the selected house that equals theirwillingness-to-pay (wtp) for the house. Households’ wtp is calculated based onhousing budget, estimated commuting costs and utility. For each building, devel-opers sell the houses to the highest bidders.
D.1. Market adjustmentsThe bidding and trade process is repeated 20 times or until there are no moreavailable houses or no more households searching for a house. Unsuccessfulhouseholds will be able to search and bid again in the next step. Developers whohaven’t been able to sell at least half of the houses they built are not allowed toengage in new projects. Every four steps of the model, the amount of unsatisfieddemand is queried, and more developers can be created in response to high levels ofunsatisfied demand.
17 The Everyone City: How ICT-Based Participation Shapes Urban Form 319

2.4 Design Concepts
2.4.1 Households’ Residential Location Choice
The theoretical framework for the households’ residential location choice is utilitytheory. Households calculate the utility of available residential locations based ontheir preferences regarding the type of neighbourhood environment they would liketo live in. Note that households consider only attributes of the location (neigh-bourhood), and not the actual estate. This corresponds to assuming that, for eachlocation, there is a wide enough array of housing options so that the choice of ahouse can be nested within the choice of location, but considered independentfrom it.
Household utility for a particular location depends on three neighbourhoodattributes. These are: Accessibility (A), representing the proximity to employment,services and shops in the CBD; OpenSpace (O), representing the amount ofundeveloped land in the building’s immediate surroundings; and Height (H), rep-resenting the height of the surrounding buildings.
Households use a (de)compositional approach (Louviere and Timmermans1990), in that they evaluate residential opportunities by first valuing the attributelevels and then combining these attribute level values into a value (utility, U) for theentire bundle according to some simple algebraic rule—in this case, a Cobb-Douglas utility function:
U ¼ AaObHc ð1Þ
Households are heterogeneous in what concerns their preference profile for thelocation’s attributes. Some households attribute more importance to accessibilitywhile others find that the presence of nature or height of development weighs morein their decision. The households’ preference profile is the vector of weights [α, β,γ]. These weights reflect the strength of households’ preferences concerning,respectively, Accessibility, OpenSpace and Height attributes. The preferences of thehouseholds for each factor are assumed to be independent of each other and ofincome.
Accessibility of a location to the CBD (Aij) is computed using a negativeexponential formula, which is one of the standard forms of measuring accessibility:
Aij ¼ c � exp �h� distanceCBDij� � ð2Þ
for which ij is the cell for which accessibility is being computed; c is a constant; θ isa distance decay parameter and distanceCBDij is the topographical distance of thecell to the CBD. For chosen parameters, Eq. (2) renders values that normalize to a100–0 scale (Fig. 1).
320 S. Levy et al.

The amount of OpenSpace (O) is calculated based on the number of undevel-oped cells in the 8-cell neighbourhood of the building. Like other authors [see, forexample, Caruso et al. (2007)], we assume O to take a negative exponential form.However, we do not assume that individuals’ utility always increases withOpenSpace (more Accessibility is always better, but more OpenSpace is not alwaysbetter). We assume that each individual n has an ideal value of OpenSpace(openspace*n) that gives them maximum utility, and they evaluate each location inrelation to the ideal value using:
Onij ¼ c � exp �g� openspace�n - openspaceij�� ��� �
ð3Þ
Figure 2 shows the values taken by Onij, for chosen parameters, as calculated byEq. (3).
Building Height (H) refers to the height of the tallest building present in the8-cell neighbourhood of each location. We assume that individuals have a certainheight they tolerate, below which they are indifferent and above which their utilitydecreases quickly with increases in height. Overmax represents how many floorsthe height is above the maximum tolerated height, hn*. Figure 3 shows the valuestaken by Hnij, for chosen parameters, as calculated by Eq. (4):
Hnij ¼ exp �j�overmaxnij� �
overmaxaij= 0 if h� h�a¼ h� h�a if h [ h�a
� ð4Þ
Fig. 1 Normalized accessibility values versus distance to the CBD for different values of theexponent θ
17 The Everyone City: How ICT-Based Participation Shapes Urban Form 321

When selecting a house, households choose, out of the available housingopportunities, the one that maximizes their utility U and is affordable given theirbudget, net of transport costs. The exponents θ, η and κ are chosen after a sensitivityanalysis. Alpha, beta and gamma are random parameters controlling for taste
Fig. 2 Normalized OpenSpace values versus number of undeveloped cells in the locationimmediate neighbourhood, for different values of the exponent η, and for a household with idealopenspace* = 4
Fig. 3 Normalized height values versus building height, for different values of the exponent η,and for a household with maximum tolerated height, h* = 4
322 S. Levy et al.

heterogeneity and are taken out of a normal distribution, with mean chosen by theuser. Ideal OpenSpace (openspace*) and maximum tolerated height (h*) are alsotaken out of a normal distribution, with means and standard deviation chosen by theuser.
2.4.2 Developers’ Decision Making
Micro-economic foundations We adapt the model of developer decision-makingdeveloped by Czamanski and Roth (2011) and Czamanski and Broitman (2012).This model was chosen because it presents a sound micro-economic foundation forthe developers’ simultaneous choice of location and building height, and its links toinstitutional variables such as the duration of the development process. InCzamanski and Roth’s model, developers search for developable land whilesimultaneously deciding on the type of development density to build (buildingheight). Each developer chooses the location and height of development thatmaximizes the future value of their cash-flow (Czamanski and Roth 2011).Equation (5) assumes the developer has two costs: the initial investment (I), whichis essentially the cost of purchasing the land, and ‘overnight costs’ (c) that representall the other multi-period costs, such as building costs. Because the investment onland has to be made in a time well before the realization of income from the project,it is penalized by interest rate r for the number of years that separate investmentfrom revenue realization. This time is the Characteristic time τ, and includes con-struction time plus approval time. Approval time varies according to location andheight:
maxx;h
FV t ¼ sð Þ ¼ �Ix� 1þ rð Þs�Cd hð Þ þ P A;G;Hð Þ�h ð5Þ
Developers’ heterogeneity and rationality Developers are rational profit-maxi-mizers, but their rationality is bounded due to limited access to information aboutconsumers’ preferences and the duration of the planning process, and because thecosts of searching for information are high. In our model, this translates in a numberof ways. Developers do not evaluate all possible locations for building, but ratherprobe a limited (though high) number of randomly chosen locations, from whichthey select the three most promising for further evaluation. Also, developers’estimates of consumer preferences are based on random samples of households andnot on their future buyers. Developers are heterogeneous in regard to their tech-nology, meaning the overnight costs are developer specific. The cost function for abuilding of height h is:
Cd hð Þ ¼ cted þ sloped � h ð6Þ
where cted and sloped for each developer d are taken from a normal distribution,and h is the height of the building.
17 The Everyone City: How ICT-Based Participation Shapes Urban Form 323

Two-step decision-making Developers follow a two-step protocol that allowsthem to consider a broad range of locations and alternative developments. First,they carry out a preliminary estimation of demand for a high number of possibledevelopment locations. This first estimate only considers the characteristics of thelocation in terms of Accessibility and OpenSpace. The first estimate allowsdevelopers to narrow down location choices for their developments. Once choice isnarrowed down to three locations, they carry out a second estimation exercise,which also takes into account all possible building heights (1–10) in each of thethree selected locations.
Land market We do not explicitly model a land market. Usually, the price of ahousing good unit is set in relation to a reservation bid rent, set to be equal to theprice of undeveloped land, which is assumed to be at least no less than the averageprice of agricultural land. As the argument goes, the plots that are not converted tourban use only provide the agricultural rent to the landowners, or at least, averageagricultural land price serves as the opportunity costs for conversion into urban land(Filatova et al. 2011). But as these authors point out, in the real world, agriculturalproductivity, cost of production and prices for agricultural goods, affecting the pricefor agricultural land are heterogeneous (Filatova et al. 2011), and thus do notprovide a solid base for price formation. In our model, land is homogenous exceptfor distance to the CBD. Developers’ bids for land are directly proportional to itsaccessibility, and always above agricultural productivity (farmers always sell).
Duration of development process The duration of the development processdepends on the duration of the permitting process, which is endogenous to theparticipation process.
Estimating demand/sale price of real estate We assume that the developer is ableto access stated preference data about residents’ preferences directly, and estimatethe wtp of households for the concrete alternatives being considered using Eq. (7),adapted from Filatova et al. (2009), where U is the household’s Utility, Yhousing isthe budget for housing, Ccomm are commuting costs, and b is a proxy for theaffordability of all other goods to reflect their relative influence on the WTP forhousing (Filatova et al. 2009):
WTP ¼ Yhousing � Ccomm� ��U2
b2 þ U2� � ð7Þ
For each alternative, the developer can use stated preference data for a number ofrandom households. The developer can then consider the top 20 wtp (average of the20 highest values of wtp), commit to the alternative that maximizes the future valueestimated with Eq. (5), and turn the alternative into a project that is submitted forapproval. The wtp estimated will serve as ask price when the house enters themarket.
324 S. Levy et al.

2.4.3 Participation Process
Social network formation On arrival, each household starts to form its socialnetwork. It adds the first n agents at random, or based on (budget) similarity if theparameter ‘status homophily’ is on. Agents then add any other agent that hasbefriended them. Social networks are of varied length.
Platform creation and support When developers submit a project for approval,planners inform the public of the characteristics of the new project submitted.Households examine the impact of the project on their utility. If any householdsuffers a big enough loss of utility, it can create a platform (website, blog, etc.) toexpress its disapproval and gather support from other households. The opinionsexpressed in the platform travel through the social network via the platform-own-er’s personal network, and the networks of any supporters. The degree of supportfor the opinion of others depends on many factors. According to research onhomophily reported by McPherson et al. (2001) both status and value similaritybetween two people tends to increase the likelihood of issue-related interpersonalcommunication, and in turn, leads them to have more influence over one another. Inthe case of this model, since status similarity may already determine the compo-sition of agents’ networks, support from each member of the platform-owner’ssocial network depends on:
• the degree of value similarity (s) between the two households, as expressed bydifferences in preferences for building height;
• the difference between the height of the proposed new development and theheight tolerance of the household (t); and
• a random variable (ξ).
These values are transformed into a probability of support, which is thentranslated into support if it is higher than 0.5.
Psupport ¼ 11þ e�stn ð8Þ
Gauging public opposition Planners have access to the platform and continuouslygauge public opposition for a project, only approving projects for which oppositionis down to acceptable levels.
Search for consensus When the planner becomes aware of public opposition tothe project, he/she can facilitate a negotiation process between citizens and thedeveloper about the height of the development. In the negotiation, the first proposalon the negotiation table is the original project. If there is minimal public opposition,it can be approved. But if public opposition is high, the developer re-examines theprofit estimates while lowering the building height by one floor. If this is still aprofitable project, the developer introduces this project alteration. If not, the projectis withdrawn. The negotiation progresses in this manner from one round to the next.
17 The Everyone City: How ICT-Based Participation Shapes Urban Form 325

It ends when public opposition reaches a minimum, or when the developer with-draws the project. Only one negotiation round takes place per time step. Therefore,the negotiation process can span through several time steps, as many as necessaryuntil the loop reaches an exit condition. The longer the negotiation takes, the greaterthe difference between the original and the consensus solution. This process doesnot only affect the duration of the development process, but also transforms theproject.
Duration of permitting process The duration of development process dependsessentially on the duration of the permitting process, which is constant for thebaseline scenario and depends on the number of negotiation rounds in the search forconsensus in the participation scenario.
2.5 Implementation
The model is implemented in Netlogo v5.0.4. (Wilensky 1999).
2.6 Limitations
Our modelling approach presents a few limitations. With respect to the households’residential location choice, several factors are not accounted for, such as thelocation of employment, school quality, taxation, and others. With respect to thereal estate model, several processes are not accounted for, such as the heterogeneityof housing products, cycles of decay and gentrification, and the cyclical nature ofreal estate markets (Wheaton and Simonton 2007). In what concerns the partici-pation process, citizens only oppose protests. If a project actually improves theirutility, they remain passive. Also, their only two possible motivations are utility andhomophily. We do not include other motivations, such as caring for the environ-ment, caring for other parts of the city that are not their own neighbourhood. Inaddition, negotiations are complex processes that usually involve multiple dimen-sions of a project. In our model, the only dimension open to negotiation is height.
3 Results
The model was run on a 41 × 41 gridded landscape, with the CBD in the middle atcoordinates (0, 0). Incoming households at each step of the model are characterizedby a set of preferences and a budget for housing (which also serves as a proxy forwealth). Preferences are drawn randomly from a normal distribution with variablemean and variance, and budget is drawn from a normal distribution with average$200,000 and standard deviation $40,000.
326 S. Levy et al.

The model was run 10 times for each group of settings. The statistics presentedbelow are averages of the 10 runs, and the snapshots are of one typical run, atstep 150.
3.1 Baseline Scenario
In the baseline scenario, only market processes are at work; there is no participation.The results are consistent with urban economic theory: urban density tends todecrease from the centre to the periphery, along with land prices. In the model,arriving households are assigned a set of preferences that are drawn from normaldistributions, defined by a mean and a variance. Figure 4 shows the model’s state attime step 150 for different runs of the model, that differ in the mean of the randomdistribution from which the households’ preferences for OpenSpace and Height aredrawn. For populations with high average ideal OpenSpace, the urban core issurrounded by a mixed use (urban-rural) fringe, confirming previous results byCaruso et al. (2007). For populations with low average ideal open space, the mixedused fringe is less noticeable or disappears completely. For populations with a highaverage tolerance for building height, a lot of buildings with heights 10 and 9 floorsare built, reflecting not only household preferences, but also the developers’ scaleeconomies in building high-rise buildings. The model runs in Fig. 4 were conductedwith very low variance (homogeneous preferences).
3.2 Participation
3.2.1 Urban Form in Participated Scenarios
Participation has an impact on urban form, as can be seen in Figs. 5 and 7. As seenin Fig. 6, participation it tends to lead to a greater stock of low-rise buildings, asrenegotiation of heights pushes the height of some buildings down. For homoge-nous populations, participation tends to lead to more construction activity and lowerunsatisfied demand than any of the market scenarios, and thus a considerably largercity. Note that this model does not produce a measure of sprawl, since householdsthat cannot find a place in the model might still contribute to sprawl outside thebounds of model.
3.2.2 Agent Heterogeneity
Population taste heterogeneity, as controlled by the standard deviation (sd) of thenormal distribution of values of height tolerance (h*) and ideal open space(openspace*) also has noticeable effects on the landscape, as seen in Figs. 8 and 9.
17 The Everyone City: How ICT-Based Participation Shapes Urban Form 327

Fig. 5 Urban form in the market scenario (a) and participated scenario (b), for a population withopenspace = 4 (0.5) and h* = 5 (0.5). Colours have the same meaning as above, with the additionof red, marking buildings that have undergone negotiation
Fig. 4 Urban form for different populations in the market scenario. Different households’preferences in terms of average (and standard deviation, in parenthesis) ideal open space,openspace*, and height tolerance, h*, lead to different urban forms. Green is undeveloped land,lighter shades of brown are lower rise buildings, and darker shade browns are taller buildings(black is height 10). a openspace* = 2 (0.5); h* = 2 (0.5), b openspace* = 7 (0.5); h* = 2 (0.5),c openspace* = 2 (0.5); h* = 7 (0.5), d openspace* = 7 (0.5); h* = 7 (0.5)
328 S. Levy et al.

Fig. 6 Number of buildings per height
Fig. 7 Distribution of building density (average number of buildings per cell) in space. Eachcategory represents a concentric ring of cells at equal intervals away from the centre cell
17 The Everyone City: How ICT-Based Participation Shapes Urban Form 329

In the market scenario, when there are populations with heterogeneous taste withrespect to building height, this will lead to a larger amount of tall buildings thanwhen there are more homogenous populations with the same average heighttolerance.
For heterogeneous populations, participation results in lower supply of buildingsbut perhaps a more adequate supply, since unsatisfied demand is lower than themarket scenario.
Fig. 8 Urban form, market scenario, for populations with different degrees of heterogeneity.Households’ preferences are expressed in terms of average (and standard deviation, in parenthesis)ideal open space (openspace*) and height tolerance (h*). Colours as above. a openspace* = 4(.05); h* = 5 (0.5), b openspace* = 4 (0.5); h* = 5 (2)
Fig. 9 Urban form, participated scenario, for populations with different degrees of heterogeneity.Households’ preferences are expressed in terms of average (and standard deviation, in parenthesis)ideal open space (openspace*) and height tolerance (h*). Colours as above. a openspace* = 4(0.5); h* = 5 (0.5), b openspace* = 4 (0.5); h* = 5 (2)
330 S. Levy et al.

3.2.3 Participation and Planner’s Sensitivity
Participation is initiated from the bottom-up, when a household that opposes aplanned development creates a platform to gather the support of others. If there issubstantial opposition, the project is re-negotiated. The negotiation involves analteration of the number of floors for the building proposed, and it can end inagreement (a low-rise building is built) or the developer might have to abandon theproject (no building is built).
To evaluate the extent of the participation process, we report the number ofprojects that are negotiated, both successfully and unsuccessfully, out of all projectsproposed by the developers. The number of projects that invoke the public’sreaction is a significant proportion of the total number of projects proposed by thedeveloper—from around 13 % to just under 25 %. Out of these projects, about halfare successfully renegotiated, meaning that each project is ultimately approvedalthough with substantial alterations (different height than that originally proposed)and built. These numbers vary according to the type of population present and thesensitivity of the planner to the protests. The number of total projects negotiated ishigher in more diverse populations, but diversity does not seem to affect thechances of a successful negotiation. The planner’s sensitivity threshold is thepercentage of the population that needs to be protesting on social media in order forthe planner not to approve the project. For homogeneous populations, the moresensitive planner, the higher the number of projects negotiated. However, forheterogeneous populations, less sensitive planners can lead to more project nego-tiation (Fig. 10).
The total number of projects that are presented by the developer to the planner isconsiderably higher in the scenarios in which the public was allowed to participatethan in the market scenario. This is due to the fact that in the former scenario manyprojects are abandoned (Fig. 11).
3.2.4 Utility and Distribution of Utility
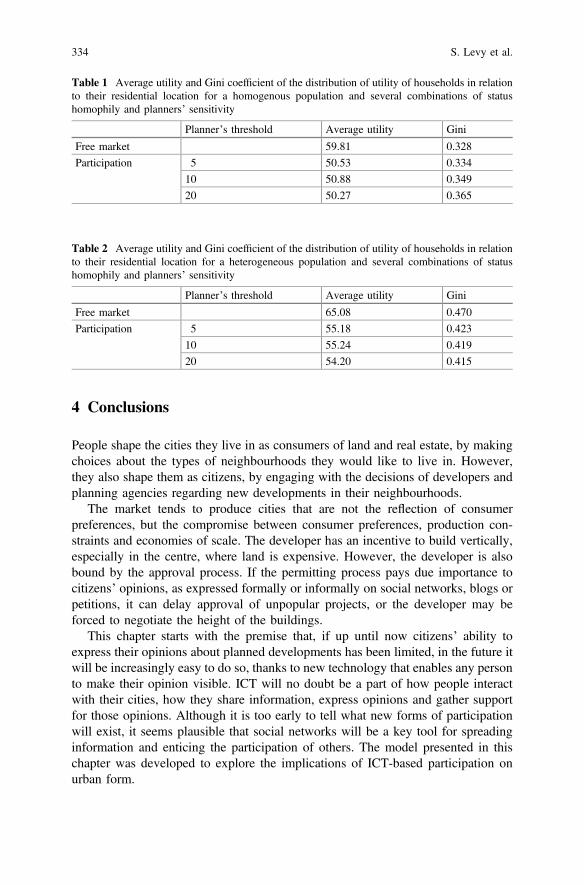
Finally, we evaluate the utility of households in relation to their residential location.In the case of a homogenous population, the free market seems to lead to a betterdistribution of utility as shown by the lower Gini coefficient in Table 1. However, inthe case of a heterogeneous population, participation leads to slightly higheraverage utility of households and a slightly more equal distribution, as measured bythe lower Gini coefficient in Table 2.
17 The Everyone City: How ICT-Based Participation Shapes Urban Form 331

Fig. 10 Percentage of all projects that undergo a participation process (whole bar), and of those,how many are successfully renegotiated and how many are abandoned, for different levels ofplanner sensitivity (from 5: very sensitive to 20: relatively insensitive); a homogenous population;b heterogeneous population
332 S. Levy et al.

Fig. 11 Total number of projects per run, for different levels of planner’s sensitivity threshold.a homogenous population; b heterogeneous population
17 The Everyone City: How ICT-Based Participation Shapes Urban Form 333
4 Conclusions
People shape the cities they live in as consumers of land and real estate, by makingchoices about the types of neighbourhoods they would like to live in. However,they also shape them as citizens, by engaging with the decisions of developers andplanning agencies regarding new developments in their neighbourhoods.
The market tends to produce cities that are not the reflection of consumerpreferences, but the compromise between consumer preferences, production con-straints and economies of scale. The developer has an incentive to build vertically,especially in the centre, where land is expensive. However, the developer is alsobound by the approval process. If the permitting process pays due importance tocitizens’ opinions, as expressed formally or informally on social networks, blogs orpetitions, it can delay approval of unpopular projects, or the developer may beforced to negotiate the height of the buildings.
This chapter starts with the premise that, if up until now citizens’ ability toexpress their opinions about planned developments has been limited, in the future itwill be increasingly easy to do so, thanks to new technology that enables any personto make their opinion visible. ICT will no doubt be a part of how people interactwith their cities, how they share information, express opinions and gather supportfor those opinions. Although it is too early to tell what new forms of participationwill exist, it seems plausible that social networks will be a key tool for spreadinginformation and enticing the participation of others. The model presented in thischapter was developed to explore the implications of ICT-based participation onurban form.
Table 2 Average utility and Gini coefficient of the distribution of utility of households in relationto their residential location for a heterogeneous population and several combinations of statushomophily and planners’ sensitivity
Planner’s threshold Average utility Gini
Free market 65.08 0.470
Participation 5 55.18 0.423
10 55.24 0.419
20 54.20 0.415
Table 1 Average utility and Gini coefficient of the distribution of utility of households in relationto their residential location for a homogenous population and several combinations of statushomophily and planners’ sensitivity
Planner’s threshold Average utility Gini
Free market 59.81 0.328
Participation 5 50.53 0.334
10 50.88 0.349
20 50.27 0.365
334 S. Levy et al.

The results generated by the model suggest that the impact of citizen partici-pation on urban form can be sizeable. Depending on the preferences of the popu-lation, and how homogenous those preferences are, participation will tend to bringheights down and increase the number of buildings. In general, participation seemsto work towards pushing developers choices in the direction of consumer prefer-ences. However, this might not be true if the incoming population becomes verydifferent from the established population, as could be the case with migration wavesor tipping points for taste shifts.
References
Alonso, W. (1964). Location and land use. Toward a general theory of land rent. Cambridge:Harvard University Press.
Brabham, D. C. (2009). Crowdsourcing the public participation process for planning projects.Planning Theory, 8(3), 242–262.
Briassoulis, H. (n.d.). Analysis of land use change: Theoretical and modeling approaches. Theweb book of regional science. http://www.rri.wvu.edu/Webbook/Briassoulis/contents.htm.Accessed January 22, 2015.
Brown, D. G., Page, S. E., Riolo, R., et al. (2004). Agent-based and analytical modeling toevaluate the effectiveness of greenbelts. Environmental Modelling and Software, 19(12),1097–1109.
Brown, D. G., Robinson, D. T., An, L., et al. (2008). Exurbia from the bottom-up: Confrontingempirical challenges to characterizing a complex system. Geoforum, 39(2), 805–818.
Caruso, G., Peeters, D., Cavailhès, J., et al. (2007). Spatial configurations in a periurban city.A cellular automata-based microeconomic model. Regional Science and Urban Economics,37(5), 542–567.
Caruso, G., Peeters, D., Cavailhès, J., et al. (2009). Space—time patterns of urban sprawl, a 1Dcellular automata and microeconomic approach. Environment and Planning B: Planning andDesign, 36(6), 968–988.
Cinyabuguma, M., & McConnell, V. (2013). Urban growth externalities and neighborhoodincentives: Another cause of Urban Sprawl? Journal of Regional Science, 53(2), 332–348.
Czamanski, D., & Broitman, D. (2012). Developers’ choices under varying characteristic time andcompetition among municipalities. The Annals of Regional Science, 49(3), 733–743.
Czamanski, D., & Roth, R. (2011). Characteristic time, developers’ behavior and leapfroggingdynamics of high-rise buildings. The Annals of Regional Science, 46(1), 101–118.
Desouza, K. C., & Bhagwatwar, A. (2012). Citizen apps to solve complex urban problems.Journal of Urban Technology, 19(3), 107–136.
Devisch, O. T. J., Timmermans, H. J. P., Arentze, T. A., et al. (2009). An agent-based model ofresidential choice dynamics in nonstationary housing markets. Environment and PlanningA, 41(8), 1997–2013.
Ettema, D. (2011). A multi-agent model of urban processes: Modelling relocation processes andprice setting in housing markets. Computers, Environment and Urban Systems, 35(1), 1–11.
Evans-Cowley, J., & Hollander, J. (2010). The new generation of public participation: Internet-based participation tools. Planning Practice and Research, 25(3), 397–408.
Filatova, T., Parker, D., & Van der Veen, A. (2009). Agent-based urban land markets: Agent’spricing behavior, land prices and urban land use change. Journal of Artificial Societies andSocial Simulation, 12(13). http://jasss.soc.surrey.ac.uk/12/1/3.html. Accessed October 29,2013.
17 The Everyone City: How ICT-Based Participation Shapes Urban Form 335

Filatova, T., Voinov, A., van der Veen, A. (2011). Land market mechanisms for preservation ofspace for coastal ecosystems: An agent-based analysis. Environmental Modelling andSoftware, 26(2), 179–190.
Glaeser, E.L., & Gyourko, J. (2002). The impact of zoning on housing affordability. Workingpaper National Bureau of Economic Research. http://www.nber.org/papers/w8835. AccessedJanuary 21, 2015.
Iovanna, R., & Vance, C. (2013). Land conversion and market equilibrium: Insights from asimulated landscape. The Annals of Regional Science, 50(1), 169–184.
Li, X., & Liu, X. (2007). Defining agents’ behaviors to simulate complex residential developmentusing multicriteria evaluation. Journal of Environmental Management, 85(4), 1063–1075.
Li, X., & Liu, X. (2008). Embedding sustainable development strategies in agent-based models foruse as a planning tool. International Journal of Geographical Information Science, 22(1), 21–45.
Ligmann-Zielinska, A., & Jankowski, P. (2010). Exploring normative scenarios of land usedevelopment decisions with an agent-based simulation laboratory. Computers, Environmentand Urban Systems, 34(5), 409–423.
Louviere, J., & Timmermans, H. (1990). Hierarchical information integration applied to residentialchoice behavior. Geographical Analysis, 22(2), 127–144.
Magliocca, N., Safirova, E., McConnell, V., et al. (2011). An economic agent-based model ofcoupled housing and land markets (CHALMS). Computers, Environment and Urban Systems,35(3), 183–191.
McPherson, M., Smith-Lovin, L., & Cook, J. M. (2001). Birds of a feather: Homophily in socialnetworks. Annual Review of Sociology, 27(1), 415–444.
Monticino, M., Acevedo, M., Callicott, B., et al. (2007). Coupled human and natural systems: Amulti-agent-based approach. Environmental Modelling and Software the Implications ofComplexity for Integrated Resources the Second Biannual Meeting of the InternationalEnvironmental Modelling and Software Society: Complexity and Integrated ResourcesManagement, 22(5), 656–663.
Parker, D., & Meretsky, V. (2004). Measuring pattern outcomes in an agent-based model of edge-effect externalities using spatial metrics. Agriculture, Ecosystems and Environment, 101(2–3),233–250.
Robinson, D. T., & Brown, D. G. (2009). Evaluating the effects of land-use development policieson ex-urban forest cover: An integrated agent-based GIS approach. International Journal ofGeographical Information Science, 23(9), 1211–1232.
Schaeffer, P., & Hopkins, L. (1987). Behavior of land developers: planning and the economics ofinformation. Environment and Planning A, 19(9), 1221–1232.
Sun, S., Parker, D. C., Huang, Q., et al. (2014). Market impacts on land-use change: An agent-based experiment. Annals of the Association of American Geographers, 104(3), 460–484.
Von Thünen, J.R. (1826). The isolated state. English edition 1966, Oxford: Pergamon.Wheaton, W. C., & Simonton, W. E. (2007). The secular and cyclic behavior of ‘true’ construction
costs. The Journal of Real Estate Research, 29(1), 1.Wilensky, U. (1999). NetLogo: Center for connected learning and computer-based modeling.
Evanston, IL: Northwestern University.Zellner, M., Page, S., Rand, W., et al. (2009). The emergence of zoning policy games in exurban
jurisdictions: Informing collective action theory. Land Use Policy, 26(2), 356–367.Zellner, M., Riolo, R., Rand, W., et al. (2010). The problem with zoning: Nonlinear effects of
interactions between location preferences and externalities on land use and utility. Environmentand Planning B: Planning and Design, 37(3), 408–428.
336 S. Levy et al.