The effects of taxonomic standardization on sampling-standardized estimates of historical diversity
6
The effects of taxonomic standardization on sampling-standardized estimates of historical diversity Peter J. Wagner 1, * , Martin Aberhan 2 , Austin Hendy 3 and Wolfgang Kiessling 2 1 Field Museum of Natural History, 1400 South Lake Shore Drive, Chicago, IL 60615, USA 2 Invalidenstraße 43, Museum fu ¨r Naturkunde, Humboldt University, 10115 Berlin, Germany 3 Department of Geology, University of Cincinnati, 500 Geology/Physics Building, Cincinnati, OH 45221, USA Occurrence-based databases such as the Palaeobiology database (PBDB) provide means of accommo- dating the heterogeneities of the fossil record when evaluating historical diversity patterns. Although palaeontologists have given ample attention to the effects of taxonomic practice on diversity patterns derived from synoptic databases (those using first and last appearances of taxa), workers have not examined the effects of taxonomic error on occurrence-based diversity studies. Here, we contrast diversity patterns and diversity dynamics between raw data and taxonomically vetted data in the PBDB to evaluate the effects of taxonomic errors. We examine three groups: Palaeozoic gastropods, Jurassic bivalves and Cenozoic bivalves. We contrast genus-level diversity patterns based on: (i) all occurrences assigned to a genus (i.e. both species records and records identifying only the genus), (ii) only occurrences for which a species is identified, and (iii) only occurrences for which a species is identified, but after vetting the genus to which the species is assigned. Extensive generic reassignments elevate origination and extinction rates within Palaeozoic gastropods and origination rates within Cenozoic bivalves. However, vetting increases generic richness markedly only for Cenozoic bivalves, and even then the increase is less than 10%. Moreover, the patterns of standing generic richness are highly similar under all three data treatments. Unless our results are unusual, taxonomic standardization can elevate diversity dynamics in some cases, but it will not greatly change inferred richness over time. Keywords: global biodiversity; taxonomy; sampling-standardization; gastropods; bivalves 1. INTRODUCTION Many studies examine how flawed taxonomy might compromise perceived historical biodiversity patterns using both empirical (Smith & Patterson 1988; Wagner 1995; Adrain & Westrop 2000; Ausich & Peters 2005) and simulation approaches (e.g. Sepkoski & Kendrick 1993; Robeck et al. 2000). These studies focus on synoptic databases of first and last appearances (e.g. Sepkoski 1982, 2002). Recently, workers have begun to re-evaluate historical biodiversity patterns using occurrence-based databases that attempt to record all finds for fossil taxa. Such databases allow sampling standardization over time and/or space in ways that are not feasible for synoptic databases (e.g. Miller & Foote 1996; Alroy 1996; Alroy et al. 2001). However, occurrence-based databases frequently rely on published fossil lists that are many years old. These lists often have outdated generic taxonomy, owing to either subsequent generic revision or inexpert systematic knowl- edge by the lists’ compilers (Smith 2003; Forey et al. 2004). The same species might be assigned to different genera on different lists, which introduces source of possible taxo- nomic error not present in synoptic studies. We assess the effects of taxonomic standardization on analyses of marine invertebrate data from the Paleobiology Database (PBDB; http://paleodb.org; see Alroy et al. 2001). The PBDB is particularly interesting because: (i) it is by far the most comprehensive palaeontological database available to the community with over 600 000 generic occurrences, (ii) the vast majority of its occur- rences use generic assignments from the original litera- ture, (iii) it includes many faunal lists over 20 years old and many identifications by non-specialists, (iv) although it uses taxonomy tables to dynamically update generic assignments, those tables have information for only a small proportion of species with occurrence records, (v) it assigns a large percentage of occurrences to a small percentage of genera, which is consistent with many assignments to ‘wastebasket’ taxa (Plotnick & Wagner 2006), and (vi) initial analyses of this database suggest historical diversity patterns very different from those suggested by synoptic databases, with the PBDB implying fairly constant generic richness over time (Alroy et al. 2001) and synoptic data implying a twofold increase in generic richness in the Cenozoic (Sepkoski 1997). Since synoptic ranges typically come from taxonomic specialists (Sepkoski 2002), outdated generic taxonomy might be Proc. R. Soc. B (2007) 274, 439–444 doi:10.1098/rspb.2006.3742 Published online 14 November 2006 Electronic supplementary material is available at http://dx.doi.org/10. 1098/rspb.2006.3742 or via http://www.journals.royalsoc.ac.uk. * Author for correspondence ([email protected]). Received 21 August 2006 Accepted 21 September 2006 439 This journal is q 2006 The Royal Society
-
Upload
mfn-berlin -
Category
Documents
-
view
5 -
download
0
Transcript of The effects of taxonomic standardization on sampling-standardized estimates of historical diversity

Proc. R. Soc. B (2007) 274, 439–444
doi:10.1098/rspb.2006.3742
The effects of taxonomic standardizationon sampling-standardized estimates
of historical diversityPeter J. Wagner1,*, Martin Aberhan2, Austin Hendy3
and Wolfgang Kiessling2
1Field Museum of Natural History, 1400 South Lake Shore Drive, Chicago, IL 60615, USA2Invalidenstraße 43, Museum fur Naturkunde, Humboldt University, 10115 Berlin, Germany
3Department of Geology, University of Cincinnati, 500 Geology/Physics Building, Cincinnati, OH 45221, USA
Published online 14 November 2006
Electron1098/rsp
*Autho
ReceivedAccepted
Occurrence-based databases such as the Palaeobiology database (PBDB) provide means of accommo-
dating the heterogeneities of the fossil record when evaluating historical diversity patterns. Although
palaeontologists have given ample attention to the effects of taxonomic practice on diversity patterns
derived from synoptic databases (those using first and last appearances of taxa), workers have not
examined the effects of taxonomic error on occurrence-based diversity studies. Here, we contrast diversity
patterns and diversity dynamics between raw data and taxonomically vetted data in the PBDB to evaluate
the effects of taxonomic errors. We examine three groups: Palaeozoic gastropods, Jurassic bivalves and
Cenozoic bivalves. We contrast genus-level diversity patterns based on: (i) all occurrences assigned to a
genus (i.e. both species records and records identifying only the genus), (ii) only occurrences for which a
species is identified, and (iii) only occurrences for which a species is identified, but after vetting the genus
to which the species is assigned.
Extensive generic reassignments elevate origination and extinction rates within Palaeozoic gastropods
and origination rates within Cenozoic bivalves. However, vetting increases generic richness markedly only
for Cenozoic bivalves, and even then the increase is less than 10%. Moreover, the patterns of standing
generic richness are highly similar under all three data treatments. Unless our results are unusual,
taxonomic standardization can elevate diversity dynamics in some cases, but it will not greatly change
inferred richness over time.
Keywords: global biodiversity; taxonomy; sampling-standardization; gastropods; bivalves
1. INTRODUCTION
Many studies examine how flawed taxonomy might
compromise perceived historical biodiversity patterns
using both empirical (Smith & Patterson 1988; Wagner
1995; Adrain & Westrop 2000; Ausich & Peters 2005) and
simulation approaches (e.g. Sepkoski & Kendrick 1993;
Robeck et al. 2000). These studies focus on synoptic
databases of first and last appearances (e.g. Sepkoski 1982,
2002). Recently, workers have begun to re-evaluate
historical biodiversity patterns using occurrence-based
databases that attempt to record all finds for fossil taxa.
Such databases allow sampling standardization over time
and/or space in ways that are not feasible for synoptic
databases (e.g. Miller & Foote 1996; Alroy 1996; Alroy et al.
2001). However, occurrence-based databases frequently
rely on published fossil lists that are many years old. These
lists often have outdated generic taxonomy, owing to either
subsequent generic revision or inexpert systematic knowl-
edge by the lists’ compilers (Smith 2003; Forey et al. 2004).
The same species might be assigned to different genera on
ic supplementary material is available at http://dx.doi.org/10.b.2006.3742 or via http://www.journals.royalsoc.ac.uk.
r for correspondence ([email protected]).
21 August 200621 September 2006
439
different lists, which introduces source of possible taxo-
nomic error not present in synoptic studies.
We assess the effects of taxonomic standardization on
analyses of marine invertebrate data from the Paleobiology
Database (PBDB; http://paleodb.org; see Alroy et al.
2001). The PBDB is particularly interesting because:
(i) it is by far the most comprehensive palaeontological
database available to the community with over 600 000
generic occurrences, (ii) the vast majority of its occur-
rences use generic assignments from the original litera-
ture, (iii) it includes many faunal lists over 20 years old and
many identifications by non-specialists, (iv) although it
uses taxonomy tables to dynamically update generic
assignments, those tables have information for only a
small proportion of species with occurrence records, (v) it
assigns a large percentage of occurrences to a small
percentage of genera, which is consistent with many
assignments to ‘wastebasket’ taxa (Plotnick & Wagner
2006), and (vi) initial analyses of this database suggest
historical diversity patterns very different from those
suggested by synoptic databases, with the PBDB implying
fairly constant generic richness over time (Alroy et al.
2001) and synoptic data implying a twofold increase in
generic richness in the Cenozoic (Sepkoski 1997). Since
synoptic ranges typically come from taxonomic specialists
(Sepkoski 2002), outdated generic taxonomy might be
This journal is q 2006 The Royal Society
440 P. J. Wagner et al. Effects of taxonomy on perceived diversity
partly responsible for the different historical patterns
implied by synoptic databases and the PBDB. We use
Middle Ordovician–Middle Carboniferous gastropods,
Jurassic bivalves and Cenozoic bivalves to assess whether
and (if so) how taxonomic revision alters sampling-
standardized diversity patterns and to find possible general
effects of taxonomic standardization.
2. MATERIAL AND METHODSSince most analyses of historical diversity focus on numbers of
genera and subgenera through time, we focus on the
generic/subgeneric assignments of species. (Following studies
such asSepkoski (1997), we treat generaand subgeneraasbeing
of equal rank). We impose some species-level synonymizations,
which occasionally reduce two or more generic occurrences to
one generic occurrence when a species is listed twice under two
names on the same list. In part, we preview what the PBDB will
show in the future, at least for the records used here. Since the
PBDB reflects especially the easily obtained published litera-
ture, we also evaluate literal readings of the prominent marine
macroinvertebrate palaeontology literature.
We examine Ordovician–Carboniferous gastropods, Jurassic
bivalves and Cenozoic bivalves owing to the authors’ familiarity
with these taxa. We have prior reason to think that the
taxonomic quality of PBDB data varies among these taxa.
Less than 20% of Palaeozoic gastropod and Cenozoic bivalve
records were published after 1994 (see Fig. S1 of the electronic
supplementary material), and there has been substantial
taxonomic revision for both groups in that time. In contrast,
54% of Jurassic bivalve records are from post-1994 papers and
39% reflect the work of two current researchers (F. Fursich &
M. Aberhan), whose taxonomic expertise we followed in
the revisions.
(a) Taxonomic assignment and reassignment
True ‘taxonomic standardization’ is impossible because there
are no universally accepted criteria for delimiting genera. Here,
we assign species to ‘correct’ generabased on recently published
opinions and also based on our own expertise and opinions
(see Appendix of the electronic supplementary material). Like
the taxonomic opinions of any worker, our assignments are also
imperfect. However, they impose uniform and current
standards on data compiled over several decades and almost
certainly improve many obvious imperfections.
We distinguish between two types of occurrences: species
records, where a species is identified (e.g. Bellerophon leda), and
genus-only records (e.g. Bellerophon sp.). All records include both
types. Species records account for 4974 of 7659 Palaeozoic
gastropod records, 10 814 of 13 813 Jurassic bivalve records
and 9996 of 13 060 Cenozoic bivalve records. Most analyses
of PBDB data (e.g. Alroy et al. 2001) use all records.
However, taxonomy tables modify the genus assignment only
of species records unless an entire genus is synonymized with
another. Therefore, we contrast three different treatments of
the data: (i) all records, (ii) unvetted species records, which
use the generic assignment as entered into the PBDB, and
(iii) vetted species records, which use the generic assignment
considered to be ‘correct’ by one of us (e.g. Retispira for
B. leda). In some cases, we acknowledge that a genus
assignment is actually indeterminate for a species, or we
separate species into informal ‘new’ genera.
Our standardization applies only to generic assignments
and species synonymies, and thus assumes that initial species
Proc. R. Soc. B (2007)
identifications are correct. Examining the effects of specimen
reidentifications on similar subsets of data is beyond the scope
of this study, and a separate study assessing the effects of
specimen reidentifications should be conducted.
(b) Contrasting historical diversity patterns
We assess the effects of taxonomic vetting on sampling-
standardized diversity patterns by subsampling fossil occur-
rences (Zrecords). Subsampling of occurrences rather than
localities can misrepresent relative diversity among intervals if
alpha diversity changes markedly among these intervals (Bush
et al. 2004). Also, restricting subsampling to occurrences of a
particular taxonomic group will dampen changes in richness
because occurrences are units of richness at each locality and
different numbers of localities must be sampled to obtain the
same number of occurrences if the diversity of a taxon relative
to other taxa changes markedly (Miller et al. 1998). However,
our purpose is not to produce definitive statements about
diversity patterns within these taxa. Instead, we want to assess
how taxonomy affects the implications of the PBDB (and
literal readings of the literature) given the methods used in
PBDB data.
We use the average number of genera and subgenera
subsampled in each interval (sampled-in-bin or SIB) to
estimate relative generic richness from interval to interval.
However, estimates of origination and extinction rates require
stratigraphic ranges within the subsampled data. Therefore,
every replication standardizes sampling in each interval and
then reconstructs stratigraphic ranges for each genus. We
then estimate origination rate as the average number of
genera first appearing divided by the average number of
genera surviving from the prior interval. We estimate
extinction rate as the average number of genera last appearing
divided by the number of genera extant in the interval. To
ameliorate ‘monographic’ effects (Raup & Boyajian 1988), we
exclude taxa known from only a single interval from both rate
metrics (Foote 2000). This precludes origination and
extinction rates for the first and last intervals.
For Palaeozoic gastropods, we use temporal bins of ca
10 million years each (see Fig. S2A of the electronic
supplementary material). For Jurassic and Cenozoic bivalves,
we use a finer scale (stages; see Fig. S2B–C of the electronic
supplementary material) because the power of our tests
increases with the number of time-intervals and the data are
rich enough to permit this. For the sake of larger subsample
sizes, we lump the Devonian 4 and Devonian 5 bins (Frasnian
and Famennian) for Palaeozoic gastropods and the Aalenian
and Bajocian stages for Jurassic bivalves.
We use Spearman’s rank correlation among first
differences (changes in diversity from one interval to the
next, e.g. Gould & Calloway 1980) to assess whether
taxonomy affects the shape of historical diversity patterns.
We then use the same test to examine correlations in the
origination and extinction rates among the data treatments.
A second issue is whether vetting alters the scale of the
diversity patterns. This is particularly important if we are to
assess whether taxonomic vetting could account for the
differences between synoptic and sampling-standardized
depictions of Cenozoic diversity relative to pre-Cenozoic
diversity. We use t-tests to assess whether subsampled generic
richness and subsampled rates differ significantly among
different data treatments. We do not use a non-parametric
analogue of the t-test because the scales of the differences are
important, not just the rank orders of the differences.
L L L EM M
Pal. Eoc. Olig. Mio.
L
Pl–Pl
E32
64
128
64
128
256
Ord. Sil. Dev. Carb.2 23 4 5 1 2 31 4–5 1 2 3 Aa–Bj
raw
gen
eric
ric
hnes
s
vetted speciesunvetted species
Palaeozoic gastropods
Ht Sn ToPl BaCa Ox Ki Ti
Jurassic
Jurassic bivalves Cenozoic bivalves
all
16
32
64
128
256
E E
(a) (b) (c)
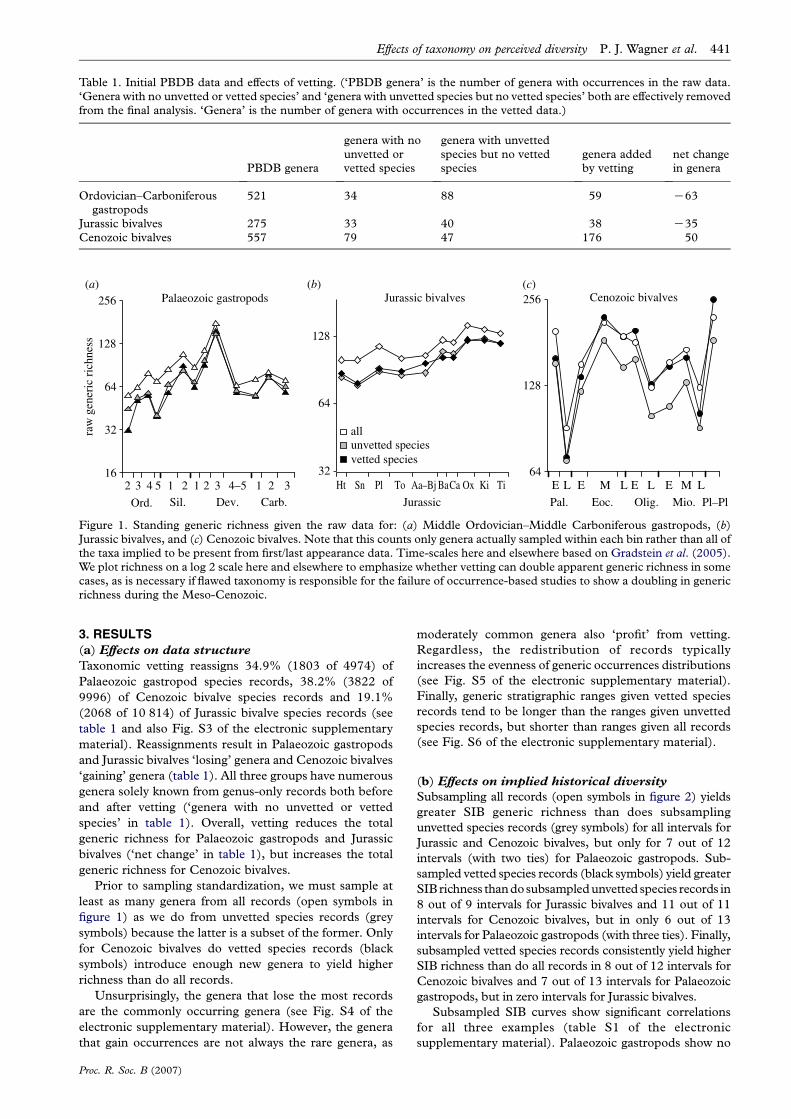
Figure 1. Standing generic richness given the raw data for: (a) Middle Ordovician–Middle Carboniferous gastropods, (b)Jurassic bivalves, and (c) Cenozoic bivalves. Note that this counts only genera actually sampled within each bin rather than all ofthe taxa implied to be present from first/last appearance data. Time-scales here and elsewhere based on Gradstein et al. (2005).We plot richness on a log 2 scale here and elsewhere to emphasize whether vetting can double apparent generic richness in somecases, as is necessary if flawed taxonomy is responsible for the failure of occurrence-based studies to show a doubling in genericrichness during the Meso-Cenozoic.
Table 1. Initial PBDB data and effects of vetting. (‘PBDB genera’ is the number of genera with occurrences in the raw data.‘Genera with no unvetted or vetted species’ and ‘genera with unvetted species but no vetted species’ both are effectively removedfrom the final analysis. ‘Genera’ is the number of genera with occurrences in the vetted data.)
PBDB genera
genera with nounvetted orvetted species
genera with unvettedspecies but no vettedspecies
genera addedby vetting
net changein genera
Ordovician–Carboniferousgastropods
521 34 88 59 K63
Jurassic bivalves 275 33 40 38 K35Cenozoic bivalves 557 79 47 176 50
Effects of taxonomy on perceived diversity P. J. Wagner et al. 441
3. RESULTS
(a) Effects on data structure
Taxonomic vetting reassigns 34.9% (1803 of 4974) of
Palaeozoic gastropod species records, 38.2% (3822 of
9996) of Cenozoic bivalve species records and 19.1%
(2068 of 10 814) of Jurassic bivalve species records (see
table 1 and also Fig. S3 of the electronic supplementary
material). Reassignments result in Palaeozoic gastropods
and Jurassic bivalves ‘losing’ genera and Cenozoic bivalves
‘gaining’ genera (table 1). All three groups have numerous
genera solely known from genus-only records both before
and after vetting (‘genera with no unvetted or vetted
species’ in table 1). Overall, vetting reduces the total
generic richness for Palaeozoic gastropods and Jurassic
bivalves (‘net change’ in table 1), but increases the total
generic richness for Cenozoic bivalves.
Prior to sampling standardization, we must sample at
least as many genera from all records (open symbols in
figure 1) as we do from unvetted species records (grey
symbols) because the latter is a subset of the former. Only
for Cenozoic bivalves do vetted species records (black
symbols) introduce enough new genera to yield higher
richness than do all records.
Unsurprisingly, the genera that lose the most records
are the commonly occurring genera (see Fig. S4 of the
electronic supplementary material). However, the genera
that gain occurrences are not always the rare genera, as
Proc. R. Soc. B (2007)
moderately common genera also ‘profit’ from vetting.
Regardless, the redistribution of records typically
increases the evenness of generic occurrences distributions
(see Fig. S5 of the electronic supplementary material).
Finally, generic stratigraphic ranges given vetted species
records tend to be longer than the ranges given unvetted
species records, but shorter than ranges given all records
(see Fig. S6 of the electronic supplementary material).
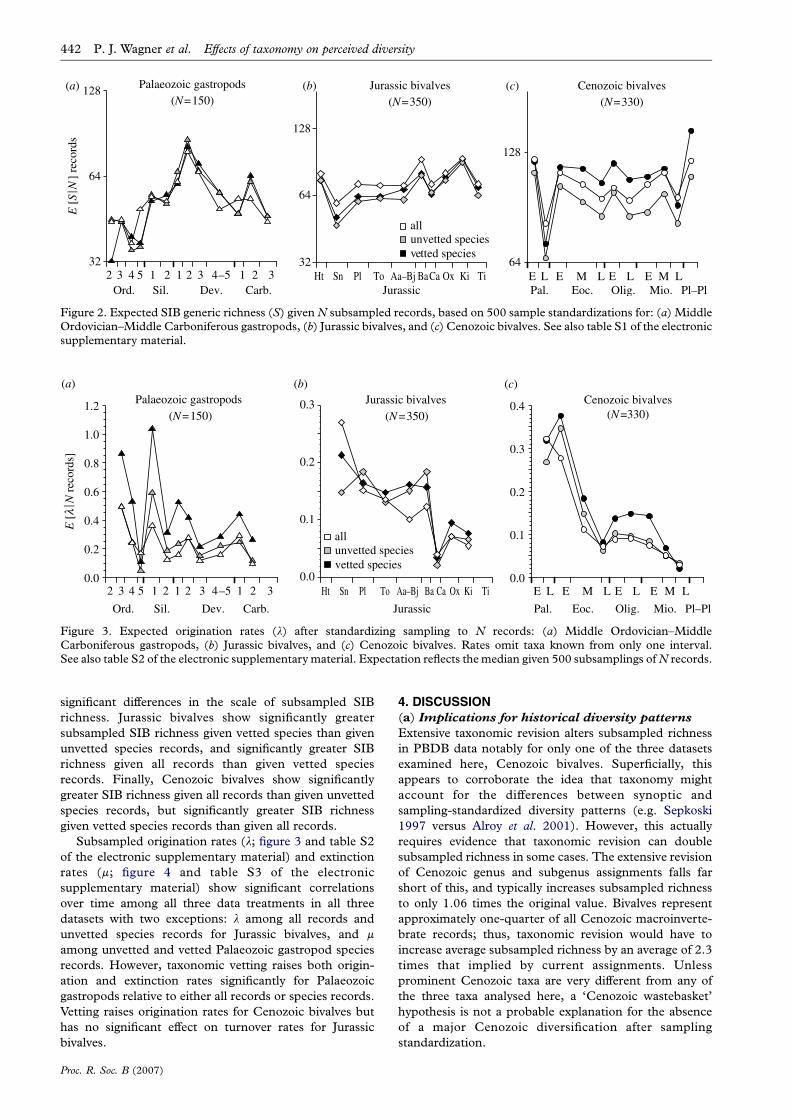
(b) Effects on implied historical diversity
Subsampling all records (open symbols in figure 2) yields
greater SIB generic richness than does subsampling
unvetted species records (grey symbols) for all intervals for
Jurassic and Cenozoic bivalves, but only for 7 out of 12
intervals (with two ties) for Palaeozoic gastropods. Sub-
sampled vetted species records (black symbols) yield greater
SIBrichness thandosubsampledunvetted species records in
8 out of 9 intervals for Jurassic bivalves and 11 out of 11
intervals for Cenozoic bivalves, but in only 6 out of 13
intervals for Palaeozoic gastropods (with three ties). Finally,
subsampled vetted species records consistently yield higher
SIB richness than do all records in 8 out of 12 intervals for
Cenozoic bivalves and 7 out of 13 intervals for Palaeozoic
gastropods, but in zero intervals for Jurassic bivalves.
Subsampled SIB curves show significant correlations
for all three examples (table S1 of the electronic
supplementary material). Palaeozoic gastropods show no
64
128
32
64
128
32
64
128
E [
SN
] re
cord
s
vetted speciesunvetted species
Palaeozoic gastropods(N=150)
Jurassic bivalves(N=350)
Cenozoic bivalves(N=330)
all
L L L EM MPal. Eoc. Olig. Mio.
LPl–Pl
EOrd. Sil. Dev. Carb.
2 23 4 5 1 2 31 4–5 1 2 3 Aa–BjHt Sn ToPl BaCa Ox Ki TiJurassic
E E
(a) (b) (c)
Figure 2. Expected SIB generic richness (S) given N subsampled records, based on 500 sample standardizations for: (a) MiddleOrdovician–Middle Carboniferous gastropods, (b) Jurassic bivalves, and (c) Cenozoic bivalves. See also table S1 of the electronicsupplementary material.
0.0
0.2
0.4
0.6
0.8
1.0
1.2
0.0
0.1
0.2
0.3
0.4
E [
lN
rec
ords
]
vetted speciesunvetted species
Palaeozoic gastropods(N=150)
Jurassic bivalves(N=350)
Cenozoic bivalves(N=330)
all
0.0
0.1
0.2
0.3
Ord. Sil. Dev. Carb.
2 23 4 5 1 2 31 4–5 1 2 3 Aa–BjHt Sn ToPl Ba Ca Ox Ki Ti
Jurassic
L L L EM M
Pal. Eoc. Olig. Mio.
L
Pl–Pl
E E E
(a) (b) (c)
Figure 3. Expected origination rates (l) after standardizing sampling to N records: (a) Middle Ordovician–MiddleCarboniferous gastropods, (b) Jurassic bivalves, and (c) Cenozoic bivalves. Rates omit taxa known from only one interval.See also table S2 of the electronic supplementary material. Expectation reflects the median given 500 subsamplings of N records.
442 P. J. Wagner et al. Effects of taxonomy on perceived diversity
significant differences in the scale of subsampled SIB
richness. Jurassic bivalves show significantly greater
subsampled SIB richness given vetted species than given
unvetted species records, and significantly greater SIB
richness given all records than given vetted species
records. Finally, Cenozoic bivalves show significantly
greater SIB richness given all records than given unvetted
species records, but significantly greater SIB richness
given vetted species records than given all records.
Subsampled origination rates (l; figure 3 and table S2
of the electronic supplementary material) and extinction
rates (m; figure 4 and table S3 of the electronic
supplementary material) show significant correlations
over time among all three data treatments in all three
datasets with two exceptions: l among all records and
unvetted species records for Jurassic bivalves, and m
among unvetted and vetted Palaeozoic gastropod species
records. However, taxonomic vetting raises both origin-
ation and extinction rates significantly for Palaeozoic
gastropods relative to either all records or species records.
Vetting raises origination rates for Cenozoic bivalves but
has no significant effect on turnover rates for Jurassic
bivalves.
Proc. R. Soc. B (2007)
4. DISCUSSION(a) Implications for historical diversity patterns
Extensive taxonomic revision alters subsampled richness
in PBDB data notably for only one of the three datasets
examined here, Cenozoic bivalves. Superficially, this
appears to corroborate the idea that taxonomy might
account for the differences between synoptic and
sampling-standardized diversity patterns (e.g. Sepkoski
1997 versus Alroy et al. 2001). However, this actually
requires evidence that taxonomic revision can double
subsampled richness in some cases. The extensive revision
of Cenozoic genus and subgenus assignments falls far
short of this, and typically increases subsampled richness
to only 1.06 times the original value. Bivalves represent
approximately one-quarter of all Cenozoic macroinverte-
brate records; thus, taxonomic revision would have to
increase average subsampled richness by an average of 2.3
times that implied by current assignments. Unless
prominent Cenozoic taxa are very different from any of
the three taxa analysed here, a ‘Cenozoic wastebasket’
hypothesis is not a probable explanation for the absence
of a major Cenozoic diversification after sampling
standardization.

0.0
0.1
0.2
0.3
0.4
vetted speciesunvetted speciesall
0.0
0.1
0.2
0.3
0.4
0.0
0.1
0.2
0.3
Ord. Sil. Dev. Carb.
2 23 4 5 1 2 31 4–5 1 2 3 Aa–BjHt Sn ToPl Ba Ca Ox Ki Ti
Jurassic
L L L EM M
Pal. Eoc. Olig. Mio.
L
Pl–Pl
E E E
Palaeozoic gastropods(N=150)
Jurassic bivalves(N=350)
Cenozoic bivalves(N =330)
(a) (b) (c)E
[m
N r
ecor
ds]
Figure 4. Extinction rates (m) after sampling standardization to N records: (a) Middle Ordovician–Middle Carboniferousgastropods, (b) Jurassic bivalves, and (c) Cenozoic bivalves. Rates omit taxa known from only one interval. See also table S3 ofthe electronic supplementary material. Expectation reflects the median given 500 subsampling runs.
Effects of taxonomy on perceived diversity P. J. Wagner et al. 443
Although taxonomic standardization does not affect
apparent turnover rates for Jurassic bivalves, it does affect
turnover rates for both Palaeozoic gastropods and Cenozoic
bivalves. For Palaeozoic gastropods, the difference reflects
the redefinition of polyphyletic taxa, which both shortens
apparent ranges and adds originations and extinctions
(see also Nutzel 2005). Vetted rates now emphasize events
such as the end-Ordovician mass extinction that are obvious
in unvetted data for other taxa ( J. Alroy 2005, personal
communication). For Cenozoic bivalves, where only
origination rates change appreciably, the change reflects
the introduction of enough ‘new’ taxa (especially subgenera
for Neogene species) to elevate net richness. This necessi-
tates elevated origination rates without requiring elevated
extinction rates.
Forey et al. (2004) predict that taxonomic standard-
ization typically will decrease turnover rates. In particular,
they expect many paraphyletic taxa to have apparent
extinctions that coincide with the origination of descen-
dants, and that standardization will eliminate these extinc-
tions and originations. However, our results lead to two
different predictions. We expect vetting tohave little effect on
estimated turnover rates for taxa such as Jurassic bivalves
(i.e. those with 80% or more records assigned to the correct
genus). We further expect vetting to elevate estimated
turnover rates for taxa such as Palaeozoic gastropods and
Cenozoic bivalves (i.e. those with 25% or more records
assigned to an inappropriate genus). In part, this reflects
breaking down polyphyletic wastebaskets; however, it also
reflects breaking down many long-lived, species-rich
paraphyletic taxa that coexist with numerous ‘descendant’
genera. Here, standardizing paraphyletic taxa add rather
than eliminate originations and extinctions.
(b) The nature of speciose genera
Vetting greatly reduces both the number of highly speciose
genera and the richness of these genera (see Appendix and
Fig. S7 of the electronic supplementary material). Never-
theless, all three datasets retain a similar rank order of
species-rich genera after vetting, and familiar names such
as Bellerophon, Plagiostoma and Anadara remain speciose
after vetting. Since character change is probabilistic, it is
unavoidable that parts of a phylogeny will conserve
Proc. R. Soc. B (2007)
characters reliably diagnosing genera simply by chance
(Plotnick & Wagner 2006). Preliminary phylogenetic
analyses of the highly speciose genera Bellerophon and
Murchisonia by one of us (P.J.W.) show that phylogenetic
structure is fairly weak within these genera relative to
contemporaneous clades with comparable numbers of
species. Sophisticated phylogenetic methods might tease
out phylogenetic signal among these species, but any new
genera stemming from such analyses will not be easy for
non-experts to identify. We expect similar results in any
future phylogenetic analyses that include species-rich,
long-lived bivalve genera such as Anadara, Chlamys,
Nuculana, Ostrea or Tellina.
Systematic revisions also can alter the numbers of
species and records within genera by synonymizing
species. For example, Johnson’s (1984) revision of
European Jurassic pectinid bivalves markedly reduced
the species richness of genera such as Camptonectes,
Chlamys, Entolium and Eopecten through synonymization
rather than reassignment. Anderson’s (1996) extensive
revision of Cenozoic corbulids greatly reduced the species
richness of Corbula in the same way. A comparable revision
is not available for other species-rich groups such as
Jurassic limids and some anomalodesmatans. As a result,
Jurassic genera such as Plagiostoma, Pholadomya and
Pleuromya, and Cenozoic genera such as Anadara,
Barbatia and Crassatella retain high species numbers
after vetting. Although we are confident that our generic
assignments are appropriate, we expect richness within
these genera to drop with future species-level revisions
that lump species that we have kept separate.
(c) Generic diversity: whether to use species
records or all genus records
Unless one synonymizes a genus, taxonomy tables can alter
generic assignments only for species records. This alone is a
reason to infer generic richness patterns from species records
rather than from all genus records. Palaeozoic gastropods
also suggest that using all generic records instead of only
species records can dampen turnover rates. For example, the
end-Ordovician and Late Devonian mass extinctions are not
obvious when using all genus records. However, both are
observable when generic diversity is derived from species
444 P. J. Wagner et al. Effects of taxonomy on perceived diversity
records even prior to taxonomic vetting. This strongly
implies that specimens assigned only (and incorrectly) to a
genus distort the subsampled ranges of genera. Obviously,
assessing the generality of this pattern requires studies of
additional taxonomically neglected clades. Moreover,
restricting generic diversity patterns to species records is
seemingly unnecessary for well-studied groups such as
Jurassic bivalves. Nevertheless, palaeontologists might be
erring on the side of caution to use only records that identify
species, if they are interested in turnover rates instead of
standing richness. This might be especially desirable for
analyses at fine temporal and/or geographical scales.
5. CONCLUSIONSExtensive vetting of generic assignments elevates apparent
turnover rates for Palaeozoic gastropods and elevates
origination rates for Cenozoic bivalves, but it has little effect
on turnover rates for Jurassic bivalves. This supports the idea
that extensive vetting will elevate apparent turnover rates
(especially among taxonomically neglected groups) rather
than dampen them. However, extensive vetting of generic
assignments has little effect on sampling-standardized
patterns of standing generic richness for Palaeozoic
gastropods, Jurassic bivalves and Cenozoic bivalves. Even
though vetting does elevate subsampled generic richness
among Cenozoic bivalves, it does not come close to
reconciling synoptic and sampling-standardized results.
Unless these results are anomalous, differences between
synoptic results and sampling-standardized results probably
are owing to other causes such as variable sampling intensity
over time and the Pull of the Recent (Raup 1979).
NSF grants EAR-990328 and EAR-0207874 funded P.J.W.’scontributions. A.J.W.H. acknowledges funding support fromthe NASA Exobiology grant NAG5-13426 to ArnoldI. Miller. W.K. was supported by the Volkswagen-Stiftung.This work was conducted as part of the Marine InvertebrateWorking Group of the Paleobiology Database, supported bythe National Center for Ecological Analysis and Synthesis,and NSF grant DEB-0083983 to C. Marshall, J. Alroy &A. Miller. This is PBDB publication no. 50.
REFERENCESAdrain, J. M. & Westrop, S. R. 2000 An empirical assessment
of taxic paleobiology. Science 289, 110–112. (doi:10.1126/
science.289.5476.110)Alroy, J. 1996 Constant extinction, constrained diversifica-
tion, and uncoordinated stasis in North American
mammals. Palaeogeogr. Palaeoclimatol. Palaeoecol. 127,
285–311. (doi:10.1016/S0031-0182(96)00100-9)Alroy, J. et al. 2001 Effects of sampling standardization on
estimates of Phanerozoic marine diversity. Proc. Natl Acad.Sci. USA 98, 6261–6266. (doi:10.1073/pnas.111144698)
Anderson, L. C. 1996 Neogene paleontology in the northern
Dominican Republic 16. The family Corbulidae (Mol-lusca: Bivalvia). Bull. Am. Paleontol. 110, 5–34.
Proc. R. Soc. B (2007)
Ausich, W. I. & Peters, S. E. 2005 A revised macroevolu-tionary history for Ordovician–Early Silurian crinoids.Paleobiology 31, 538–551. (doi:10.1666/0094-8373(2005)031[0538:ARMHFO]2.0.CO;2)
Bush, A. M., Markey, M. J. & Marshall, C. R. 2004 Removingbias from diversity curves: the effects of spatially organizedbiodiversity on sampling-standardization. Paleobiology30, 666–686. (doi:10.1666/0094-8373(2004)030!0666:RBFDCTO2.0.CO;2)
Foote, M. 2006 Origination and extinction components oftaxonomic diversity: general problems. In Deep time—Paleobiology’s perspective (ed. D. H. Erwin & S. L. Wing)Paleobiology memoir 26, 74–102.
Forey, P. L., Fortey, R. A., Kenrick, P. & Smith, A. B. 2004Taxonomy and fossils: a critical appraisal. Phil. Trans. R.Soc. B 359, 639–653. (doi:10.1098/rstb.2003.1453)
Gould, S. J. & Calloway, C. B. 1980 Clams and brachio-pods—ships that pass in the night. Paleobiology 6,383–396.
Gradstein, F., Ogg, J. & Smith, A. 2005 A geological timescale20054. Cambridge, UK: Cambridge University Press.
Johnson, A. L. A. 1984 The palaeobiology of the bivalvefamilies Pectinidae and Propeamussiidae in the Jurassic ofEurope. Zitteliana 11, 1–235.
Miller, A. I. & Foote, M. 1996 Calibrating the Ordovicianradiation of marine life: implications for Phanerozoicdiversity trends. Paleobiology 22, 304–309.
Miller, A. I., Holland, S. M., Droser, M. L. & Patzkowsky,M. E. 1998 Dynamics of the Ordovician radiation: acomment. Paleobiology 24, 524–528.
Nutzel A. 2005 Recovery of gastropods in the Early Triassic.In The biotic recovery from the end-Permian mass extinctionComptes Rendus Palevol 4, 501–515.
Plotnick, R. E. & Wagner, P. J. 2006 Round up the usualsuspects: common genera in the fossil record and thenature of wastebasket taxa. Paleobiology 32, 126–146.
Raup, D. M. 1979 Biases in the fossil record of species andgenera. Bull. Carnegie Mus. Nat. Hist. 13, 85–91.
Raup, D. M. & Boyajian, G. E. 1988 Patterns of genericextinction in the fossil record. Paleobiology 14, 109–125.
Robeck, H. E., Maley, C. C. & Donoghue, M. J. 2000Taxonomy and temporal diversity patterns. Paleobiology26, 171–187. (doi:10.1666/0094-8373(2000)026!0171:TATDPO2.0.CO;2)
Sepkoski Jr, J. J. 1982 A compendium of fossil marinefamilies. Milwaukee Publ. Mus. Contrib. Biol. Geol. 51, 139.
Sepkoski Jr, J. J. 1997 Biodiversity: past, present and future.J. Paleontol. 71, 533–539.
Sepkoski Jr, J. J. 2002 A compendium of fossil marine animalgenera. Bull. Am. Paleontol. 363, 1–563.
Sepkoski Jr, J. J. & Kendrick, D. C. 1993 Numericalexperiments with model monophyletic and paraphyletictaxa. Paleobiology 19, 168–184.
Smith, A. B. 2003 Getting the measure of diversity.Paleobiology 29, 34–36. (doi:10.1666/0094-8373(2003)029!0034:GTMODO2.0.CO;2)
Smith, A. B. & Patterson, C. 1988 The influence oftaxonomic method on the perception of patterns ofevolution. Evol. Biol. 23, 127–216.
Wagner, P. J. 1995 Diversification among early Paleozoicgastropods—contrasting taxonomic and phylogeneticdescriptions. Paleobiology 21, 410–439.