The Effects of Maternal Binge Drinking During Pregnancy on Neural Correlates of Response Inhibition...
24
The effects of maternal binge drinking during pregnancy on neural correlates of response inhibition and memory in childhood Matthew J. Burden, Ph.D. 1 , Alissa Westerlund, B.A. 2 , Gina Muckle, Ph.D. 3 , Neil Dodge 1 , Eric Dewailly, M.D., Ph.D. 3 , Charles A. Nelson, Ph.D. 2 , Sandra W. Jacobson, Ph.D. 1 , and Joseph L. Jacobson, Ph.D. 1 1 Department of Psychiatry and Behavioral Neurosciences, Wayne State University School of Medicine 2 Children’s Hospital Boston, Harvard Medical School 3 Laval University Abstract Background—Although an extensive literature has documented a broad range of cognitive performance deficits in children with prenatal alcohol exposure, little is known about how the neurophysiological processes underlying these deficits may be affected. Event-related potentials (ERPs), which reflect task-specific changes in brain electrical activity, provide a method for examining multiple constituents of cognitive processing at the neural level. Methods—We recorded ERPs in 217 children from Inuit communities in Arctic Quebec (M age = 11.3 yr) during two different tasks—Go/No-go response inhibition and continuous recognition memory. Children were classified as either alcohol-exposed (ALC) or controls (CON) depending on whether the mother reported binge drinking during pregnancy. Results—Both groups performed comparably in terms of accuracy and reaction time on the tasks, and both tasks elicited the expected effects on ERPs when responses were compared across conditions. However, the ALC group showed slower P2 latencies on Go/No-go, suggesting an altered neurophysiological response associated with initial visual processing of the stimuli. On the memory task, the ALC group showed reduced FN400 amplitude to new items, known as the familiarity effect, and reduced amplitude for the late positive component, possibly reflecting impairment in memory retrieval. Conclusions—These findings show that, even in tasks in which alcohol-exposed children exhibit behavioral performance that is comparable to controls, fetal alcohol exposure is associated with altered neurophysiological processing of response inhibition and recognition memory. The data suggest that fetal alcohol exposure is associated with reduced efficiency in the initial extracting of the meaning of a stimulus, reduced allocation of attention to the task, and poorer conscious, explicit recognition memory processing. Keywords Prenatal alcohol exposure; fetal alcohol spectrum disorders; event-related potentials; response inhibition; recognition memory Correspondence: Joseph L. Jacobson, Ph.D., Department of Psychiatry and Behavioral Neurosciences, Wayne State University School of Medicine, 2751 E. Jefferson, Suite 460, Detroit, MI, 48207; tel: 313-993-5454; fax: 313-993-3427; [email protected]. NIH Public Access Author Manuscript Alcohol Clin Exp Res. Author manuscript; available in PMC 2012 August 13. Published in final edited form as: Alcohol Clin Exp Res. 2011 January ; 35(1): 69–82. doi:10.1111/j.1530-0277.2010.01323.x. NIH-PA Author Manuscript NIH-PA Author Manuscript NIH-PA Author Manuscript
Transcript of The Effects of Maternal Binge Drinking During Pregnancy on Neural Correlates of Response Inhibition...

The effects of maternal binge drinking during pregnancy onneural correlates of response inhibition and memory inchildhood
Matthew J. Burden, Ph.D.1, Alissa Westerlund, B.A.2, Gina Muckle, Ph.D.3, Neil Dodge1,Eric Dewailly, M.D., Ph.D.3, Charles A. Nelson, Ph.D.2, Sandra W. Jacobson, Ph.D.1, andJoseph L. Jacobson, Ph.D.11Department of Psychiatry and Behavioral Neurosciences, Wayne State University School ofMedicine2Children’s Hospital Boston, Harvard Medical School3Laval University
AbstractBackground—Although an extensive literature has documented a broad range of cognitiveperformance deficits in children with prenatal alcohol exposure, little is known about how theneurophysiological processes underlying these deficits may be affected. Event-related potentials(ERPs), which reflect task-specific changes in brain electrical activity, provide a method forexamining multiple constituents of cognitive processing at the neural level.
Methods—We recorded ERPs in 217 children from Inuit communities in Arctic Quebec (M age= 11.3 yr) during two different tasks—Go/No-go response inhibition and continuous recognitionmemory. Children were classified as either alcohol-exposed (ALC) or controls (CON) dependingon whether the mother reported binge drinking during pregnancy.
Results—Both groups performed comparably in terms of accuracy and reaction time on thetasks, and both tasks elicited the expected effects on ERPs when responses were compared acrossconditions. However, the ALC group showed slower P2 latencies on Go/No-go, suggesting analtered neurophysiological response associated with initial visual processing of the stimuli. On thememory task, the ALC group showed reduced FN400 amplitude to new items, known as thefamiliarity effect, and reduced amplitude for the late positive component, possibly reflectingimpairment in memory retrieval.
Conclusions—These findings show that, even in tasks in which alcohol-exposed childrenexhibit behavioral performance that is comparable to controls, fetal alcohol exposure is associatedwith altered neurophysiological processing of response inhibition and recognition memory. Thedata suggest that fetal alcohol exposure is associated with reduced efficiency in the initialextracting of the meaning of a stimulus, reduced allocation of attention to the task, and poorerconscious, explicit recognition memory processing.
KeywordsPrenatal alcohol exposure; fetal alcohol spectrum disorders; event-related potentials; responseinhibition; recognition memory
Correspondence: Joseph L. Jacobson, Ph.D., Department of Psychiatry and Behavioral Neurosciences, Wayne State University Schoolof Medicine, 2751 E. Jefferson, Suite 460, Detroit, MI, 48207; tel: 313-993-5454; fax: 313-993-3427; [email protected].
NIH Public AccessAuthor ManuscriptAlcohol Clin Exp Res. Author manuscript; available in PMC 2012 August 13.
Published in final edited form as:Alcohol Clin Exp Res. 2011 January ; 35(1): 69–82. doi:10.1111/j.1530-0277.2010.01323.x.
NIH
-PA Author Manuscript
NIH
-PA Author Manuscript
NIH
-PA Author Manuscript

INTRODUCTIONFetal alcohol syndrome (FAS) was first described in the United States by Jones and Smith(1973), who identified a distinctive set of facial anomalies in children whose mothers drankheavily during pregnancy, accompanied by prenatal and/or postnatal growth retardation andcognitive/behavioral problems. The term fetal alcohol spectrum disorder (FASD) referscollectively to the effects seen on the continuum of prenatal alcohol exposure, with anincidence of nearly 1 in 100 live births affected (Sampson et al., 1997). In addition to theglobal impact on intellectual function typically documented in cases of FAS, children withprenatal alcohol exposure show particular difficulties with short-term memory (Burden etal., 2005b; Streissguth et al., 1994), arithmetic (Burden et al., 2005a; Goldschmidt et al.,1996; Howell et al., 2006; Jacobson et al., 1998; Meintjes et al., 2007; Streissguth et al.,1994), and information processing speed (Burden et al., 2005a ; Jacobson et al., 1993, 1994;Kable and Coles, 2004).
Although detailed prospective reports of prenatal alcohol exposure obtained duringpregnancy have been shown to provide the most sensitive indicators of exposure (Jacobsonet al., 2002), recent evidence suggests that dichotomous measures derived from retrospectivereports may also provide a valid indicator of prenatal exposure (Chiodo et al., 2009),particularly when very heavy or binge drinking is involved. Several studies have shown thatbinge drinking during pregnancy has particularly detrimental effects on the developing fetus(Jacobson et al., 2008; Streissguth et al., 1994). Experimental animal studies have reportedthat ingestion of a given dose of alcohol over a short period of time generates a greater peakblood alcohol concentration and greater neuronal (Bonthius and West, 1990) and behavioralimpairment (Goodlett et al., 1987) than when the same or even a larger dose is ingestedgradually over several days. Analyses of data from our Detroit longitudinal study indicatethat functionally significant deficits are seen primarily in infants born to mothers whoaverage at least 5 drinks/occasion during pregnancy (Jacobson et al., 1998). Similarly,Streissguth et al. (1989, 1994) found that number of drinks/occasion provided the mostsensitive predictor of attention and memory deficits in exposed children at 7- and 14-yearsof age. Thus, data from previous studies suggest that a retrospective dichotomous measureof binge drinking during pregnancy can provide a particularly useful measure of prenatalalcohol exposure.
Numerous studies have documented a broad range of cognitive performance deficits inchildren with prenatal alcohol exposure using traditional cognitive and neuropsychologicalassessments. A few recent studies have used structural and functional magnetic resonanceimaging (MRI) to identify impairment in brain structures and regions that may be involvedin these alcohol-related deficits in cognitive function (e.g., Archibald et al., 2001; Fryer etal., 2007; Meintjes et al., 2007; Sowell et al., 2001). One methodology for examining theneural correlates underlying observed cognitive deficits that is particularly under-represented in the FASD literature is event-related potentials (ERPs). ERPs, which arederived from an electroencephalogram (EEG) recording, reflect task-specific changes inbrain electrical activity (i.e., activity associated with stimulus or response onset). By contrastto the superior spatial resolution of MRI, ERPs provide a millisecond precision with whichmultiple constituent processes underlying cognitive function can be identified, essentiallycapturing the neural signature associated with a given process as it reaches the scalprecording electrodes.
In the alcohol literature, ERP studies have been conducted primarily on adults with chronicalcoholism (e.g., Begleiter et al., 1984; 1987). One consistent finding has involved areduction in the P3 component on the auditory oddball paradigm, which has been found inchronic, abstinent alcoholics (e.g., Cohen et al., 1995). This finding has also been replicated
Burden et al. Page 2
Alcohol Clin Exp Res. Author manuscript; available in PMC 2012 August 13.
NIH
-PA Author Manuscript
NIH
-PA Author Manuscript
NIH
-PA Author Manuscript

in both younger and older children at risk for developing alcoholism (Begleiter et al., 1984;1987; Porjesz and Begleiter, 1990), suggesting that a reduced P3 may be a useful biomarkerfor susceptibility to alcoholism. Because these studies were concerned with understandingpossible genetic contributions to the P3 in the context of a family history of alcoholism,children whose mothers drank during pregnancy were excluded, precluding informationregarding the impact of prenatal alcohol exposure. In one study designed to address thequestion of prenatal alcohol exposure (Kaneko et al., 1996), a reduced P3 in an auditoryoddball paradigm was also found to be characteristic of children with FAS. This reductionwas not seen in a comparison group with Down syndrome, suggesting that ERP could haveutility for differential diagnosis.
Regardless of specific task requirements, ERPs often elicit a P2-N2-P3 complex, a series ofvoltage fluctuations (positive-negative-positive) that follow the onset of the stimulus, witheach component reflecting different processes associated with task demands (e.g., Kalayamet al., 1998). In visual tasks, P2, a positive voltage deflection over frontal-central scalp thatoccurs ~200 ms after stimulus onset, is thought to play a role in visual selection,comparison, analysis, and integration (Barcelo et al., 1997). P2 is generally considered to bean obligatory component that primarily reflects perceptual processes related to stimulusidentification (Kranczioch et al., 2003), but it may reflect both exogenous (i.e., stimulus-related) and endogenous (e.g., attentional) processes (Fabiani et al., 2000). We have recentlyreported ERP data from a visual Go/No-go task, indicating that slower P2 latency ischaracteristic of children with FAS or partial FAS (PFAS). These data suggest that childrenwith fetal alcohol exposure may be slower in the initial analysis of stimulus meaningnecessary to determine whether to execute or inhibit a response (Burden et al., 2009).
By contrast, the subsequent frontally-oriented negative deflection, N2, is generallyassociated with cognitive control, including the focusing of attention and suppression ofcompeting information from distracter stimuli (Luck and Hillyard, 1994). There is debate inthe literature as to whether N2 in a response inhibition paradigm reflects the activeinhibition of a response (Falkenstein et al., 1999; Jodo and Kayama, 1992), other processesrelated to stimulus evaluation and decision-making (Nakata et al., 2005; Nieuwenhuis et al.,2003), or both. FN400 is an N2-like component elicited in visual memory paradigms, whichalso appears to play a general role in cognitive control/decision-making (Rugg and Curran,2007). The FN400 is a negative deflection seen when contrasting responses to new vs. olditems and is thought to reflect the process of familiarity, which varies on a continuum ofsignal strength in determining whether or not an item is recognized.
The P3, which has a number of different names depending on its scalp orientation, peaklatency, and relation to task demands (e.g., P3a, P3b, P300, P450), is generally thought toserve as an index of the processing demands placed on the participant, thereby reflecting therelative amount of attention allocated to the task (Donchin et al., 1986). The positive-deflecting P3 typically occurs 300-600 ms after stimulus presentation and is often maximalat the parietal scalp region. In response inhibition tasks, amplitude differences in P3 alsoappear to reflect inhibitory control (e.g., Bokura et al., 2001; Burden et al., 2010; Davis etal., 2003; Eimer, 1993). In memory tasks, the P3-like component tends to occur somewhatlater in relation to stimulus onset, and, due to its purported functional role in the memoryretrieval process and distinct morphology, is typically referred to as the late positivecomponent (LPC). Consistent with the general notion of P3, the larger LPC amplitude seenfor old items vs. new, unfamiliar ones suggests that increased activation of this componentreveals recognition memory (Rugg and Curran, 2007). By contrast to the FN400 familiarityeffect, the LPC old-new effect is believed to be associated with the conscious and explicitrecollection aspect of memory (Rugg and Curran, 2007).
Burden et al. Page 3
Alcohol Clin Exp Res. Author manuscript; available in PMC 2012 August 13.
NIH
-PA Author Manuscript
NIH
-PA Author Manuscript
NIH
-PA Author Manuscript
We have previously used an ERP Go/No-go task to examine response inhibition in twosamples of individuals with prenatal alcohol exposure. The first sample consisted of 7heavily exposed 11-year-old children from Cape Town, South Africa, with FAS or PFASand 6 age-matched non-exposed controls; the second, 31 young adults from Detroit,Michigan, who were prenatally exposed to alcohol at moderately-to-heavy levels and 47whose mothers abstained or drank only minimally during pregnancy. In the heavily exposedCape Town cohort, the children with FAS or PFAS showed a slower latency to P2,suggesting less efficient processing of visual information, and smaller P2 and N2amplitudes, the former suggesting less efficient perceptual discrimination, the latter a lesswell-defined, coherent strategy in decision and execution of response inhibition (see Burdenet al., 2009). Both groups showed the expected larger P3 amplitude during responseinhibition (the “No-go” condition), but the FAS/PFAS group also showed a more prolongedlate positive slow wave, suggesting increased cognitive effort. By contrast, the exposed andcontrol groups did not differ on the ERP wave forms in the Detroit cohort (Burden et al.,2010), either because the participants were less heavily exposed and/or because they wereolder.
In this study, we examine behavioral performance and ERPs in a sample of 11-year-old Inuitchildren from Arctic Quebec whose mothers engaged in binge drinking during pregnancy(ALC) compared with controls whose mothers did not (CON). The exposure levels werehigher than in the Detroit study but lower than in Cape Town. A broad range of potentialconfounding influences were considered, including socioenvironmental variables and otherpre- and postnatal exposures (e.g., cigarette smoking, illicit drugs, environmentalneurotoxicants). Two different cognitive tasks—Go/No-go and a Continuous RecognitionMemory Task (CRT)—were administered. Both of these tasks were expected to elicit a P2-N2-P3 complex, but we adopted the terms FN400 and LPC for the memory task to beconsistent with existing conventions in the literature (Rugg and Curran, 2007). Based onprevious studies of visual Go/No-go using the same paradigm (Burden et al., 2009; Davis etal., 2003), we expected a larger P3 amplitude to No-go vs. Go in both groups. In addition tothese stimulus-locked averages based on trials with correct responses, whose timing is basedon latency from onset of stimulus presentation, error processing can be studied byexamining ERP responses measured immediately following incorrect button presses (seeGehring et al., 1993). The timing for error processing ERPs is response locked; that is, it isdetermined by latency from onset of the incorrect button press. In the Go/No-go task, weexpected to see error-related negativity (ERN) and positivity (Pe) waveforms, which havebeen shown to be associated with error detection and awareness, respectively, in both groups(Falkenstein et al., 1999; Overbeek et al., 2005).
Based on our findings on the Go/No-go task in children with FAS and PFAS in SouthAfrica, (Burden et al., 2009), we expected to see reduced P2 latency, reduced P2 and N2amplitudes, and a more prolonged positive slow wave in the alcohol-exposed Inuit childrenin this study compared with controls. Given the evidence of memory and attention deficits inneuropsychological assessments of children with FASD, we expected the alcohol-exposedchildren to exhibit a smaller LPC or P3 amplitude than controls on the CRT task, reflectingpoorer recognition memory.
METHODSParticipants
Two hundred seventeen Inuit children from Northern Quebec (116 girls; M age = 11.3 years,SD = 0.6, range = 9.8 to 12.9 years) participated as part of a larger study on the effects ofprenatal exposure to environmental contaminants (Jacobson et al., 2008; Muckle 2001a,2001b). The children were recruited from among those whose families had participated in
Burden et al. Page 4
Alcohol Clin Exp Res. Author manuscript; available in PMC 2012 August 13.
NIH
-PA Author Manuscript
NIH
-PA Author Manuscript
NIH
-PA Author Manuscript

the Arctic Monitoring Assessment Program, a public health surveillance program in whichumbilical cord blood samples collected between 1994 and 2002 were analyzed forenvironmental contaminants (Muckle et al., 1998). Cord blood samples were obtained fromall women who delivered their infants at one of the two hospitals located in Inuit villages inNorthern Quebec. The children from 70.0% of the families invited to participate in thisstudy were examined at school age; 1.0% had died, 13.5% refused, 5.5% had moved awayfrom the region, and 10.0% could not be located. Data were collected in the three largestvillages in the region (Puvirnituq, Inukjuak, and Kuujjuaq), and children from smaller, moreremote villages traveled with their caregiver by plane to the nearest large village for testing.
Of the 217 children who participated, 5 (2%) declined the ERP capping procedure and werenot tested. Of the 212 children tested, 134 (63%) provided a sufficient number of trials afterartifact rejection/correction for ERP analyses related to correct (>= 10) and incorrect (>= 8)trials on the Go/No-go task (further details provided in Data Analysis below). For the CRTtask, 143 (67%) children had acceptable ERP data relating to correct responses.1 Thepercentage of children providing usable ERP data on these tasks compares favorably withother ERP studies performed at this age (e.g., Coch et al., 2002; Czernochowski et al., 2005;Hepworth et al., 2001). Among the children with acceptable ERP data, maternal reports ofdrinking during pregnancy were available for all but 32 (23 who were adopted and 9 whowere accompanied to the 11-year assessment by the father, grandparent, or other relative).Among the 134 children with acceptable Go/No-go data, 27 were missing maternal alcoholreports, for a total of 107. Among the 143 with acceptable CRT data, 29 were missing, for atotal of 114. Sample characteristics are described for the 139 children whose prenatalalcohol exposure was documented and provided usable data on one or both of the tasks.1
Each mother was interviewed at the 11-year assessment regarding her alcohol consumptionduring pregnancy, using a timeline follow-back approach to determine incidence andamount of drinking on a day-by-day basis during a typical week (Jacobson et al., 2002;Sokol et al., 1985). Volume was recorded for each type of beverage consumed andconverted to oz of absolute alcohol (AA), using multipliers developed by Bowman et al.(1975). Based on these data, we computed a summary measure of average oz AA per dayacross pregnancy. Average alcohol consumed per occasion was measured by dividing totalAA by number of drinking days during the pregnancy. Among the 139 children whose datawere analyzed in this study, 59 (42.4%) of the mothers reported drinking on at least oneoccasion during pregnancy and, among these, 38 (64.4%) reported one or more incidents ofbinge drinking (≥4 drinks per occasion). Given that the pattern of drinking in thiscommunity primarily involves binge drinking, we compared children born to binge drinkers(referred to as the alcohol-exposed or “ALC” group) with those whose mothers did notbinge during pregnancy (the control group, referred to as “CON”). Eighty (79.2%) of themothers in the control group abstained from drinking alcohol during pregnancy, and theother 21 drank only minimally. Median exposure for the children born to light drinkers was2.4 drinks consumed on a median of 3 occasions during pregnancy. By contrast, medianexposure for those born to binge drinkers was 7.6 drinks on a median of 24 occasions.
1The 139 children with acceptable ERP data whose prenatal alcohol exposure was documented did not differ from the 39 childrenwith exposure data whose ERP data were not acceptable in terms of prenatal alcohol exposure, gender, age at assessment, village ofresidence (local vs. remote), SES, maternal age at delivery, maternal intellectual competence (Peabody Picture Vocabulary Test;Raven Progressive Matrices), or prenatal or current DHA (all p’s > .20). The principal differences were higher IQ scores for thosewith acceptable data (M = 93.3 vs. 84.7, t = 3.66, p < .001) and higher years of maternal education (M = 8.9 vs. 8.1, t = 1.98, p < .05).The children with acceptable data also had lower levels of prenatal exposure to PCBs (t = 2.41, p < .05), mercury (t = 2.48, p < .05),and lead (t = 2.78, p < .01) and lower levels of current maternal smoking (t = 2.32, p < .05).
Burden et al. Page 5
Alcohol Clin Exp Res. Author manuscript; available in PMC 2012 August 13.
NIH
-PA Author Manuscript
NIH
-PA Author Manuscript
NIH
-PA Author Manuscript

ERP TasksGo/No-go—The Go/No-go task used in this study was based on a functional MRIparadigm used by Casey et al. (1997) to assess response inhibition, which was subsequentlyadapted for ERP by Davis et al. (2003). Children were instructed to press a button to allindividually-presented letters (the “Go” trials) except the target “X” (the “No-go” trials).Stimulus presentation proceeded at a set rate, with the stimulus on screen for 500ms, off for1100ms, and an average random intertrial interval (ITI) of 200ms (range: 100-300 ms).Children were presented with 220 total consecutive trials. The first block consisted of 40 Gotrials, which served to prime Go responses within the second 180-trial block. This secondblock, referred to as the response inhibition condition (Casey et al., 1997; Davis et al. 2003),consisted of 126 Go trials (70%) randomly intermixed with 54 No-go trials (30%).2 Datafrom the initial block of 40 Go trials were not analyzed. All responses occurring between100 and 1600 ms post-stimulus onset were considered valid.
CRT—For the CRT task, the child pressed either a “New” or “Old” response buttondepending on whether s/he remembered seeing the picture in a previous trial. Stimuli, whichconsisted of both abstract (unnamable) and concrete (namable) objects, were on for 500 ms,off for 3000 ms, with an average random ITI of 200ms (range: 100-300 ms), and presentedin continuous fashion over 3 blocks of 89 trials. The analyses focused on the 120 stimuli thatwere presented twice within each block at lags of 2, 5, or 10 intervening items, equallycounterbalanced across blocks. “New” items were counted as those that were seen for thefirst time; “Old” items, the second time. The additional 27 filler items (e.g., presented onlyone time or at a different lag) were not analyzed. All responses occurring between 100 and2000 ms post-stimulus onset were considered valid.
Task ProcedureEach child was seated 57cm from a 17-inch LCD flat panel monitor on which the stimuliwere displayed, centered on screen within a 7-cm2 space. A short practice round wasadministered prior to each task to ensure that the child understood the instructions, repeatedif necessary. The child was instructed to respond as quickly and accurately as possible andto sit still and not make any sounds during testing. The entire Go/No-go task, includinginstructions and practice, took approximately 10 minutes to complete; the entire CRT task,25 minutes.
Electroencephalogram (EEG) Collection and ERP DerivationEEGs were recorded from 26 scalp electrodes mounted in a close-fitting cap (Electro-CapInternational) using an array based on the 10-20 system (Jasper, 1958). The electrodescomprised anterior-frontal (AF3, AF4, AF7, AF8, F7, F8) frontal (F3, Fz, F4), fronto-central(FC1, FCz, FC2), central (C3, Cz, C4), temporal (T3, T4, T5, T6), parietal (P3, Pz, P4),parieto-occipital (POz), and occipital (O1, Oz, O2) scalp sites plus the left and rightmastoids (M1, M2), earlobes (A1, A2), nose, and a ground electrode. Cz was the referencelead during acquisition. Electrooculogram (EOG) was recorded from bipolar miniatureelectrodes placed vertically above and below the right eye for the purpose of artifactdetection. Impedance for all scalp and EOG electrodes was kept below 10 kOhm. EEG andEOG were acquired using a Grass Neurodata Acquisition System and amplified using Model
2Of the 212 children tested, the first 38 were presented with only 150 total trials, but the ratio of Go to No-go trials was the same: 40Block 1 Go (100%), 77 Block 2 Go (70%), and 33 Block 2 No-go (30%). The task was extended to 220 trials to allow additionalopportunities for errors, thus increasing the number of children who made enough errors to enable us to analyze ERPs in relation toincorrect as well as correct responses. Alcohol exposure was distributed similarly in the 38 children who completed the shorter and the174 who completed the longer version of the task, χ2 (1) = 1.37, p > .15, and the two groups did not differ on any of the ERP latencyand amplitude measures presented in Table 2 (all p’s > .15).
Burden et al. Page 6
Alcohol Clin Exp Res. Author manuscript; available in PMC 2012 August 13.
NIH
-PA Author Manuscript
NIH
-PA Author Manuscript
NIH
-PA Author Manuscript

15A54 quad AC amplifiers with a gain of 50,000 for scalp leads and 5,000 for EOG. Thebandpass filter was 0.1-30 Hz, and a 60-Hz notch filter was engaged. Data were sampledevery 5 ms (200 Hz).
ERP data were digitized online and then edited by computer algorithm. Prior to averaging,trials with excessive artifact (i.e., EEG > ±125 mV) were rejected. Data were then re-referenced to linked earlobes, and EOG-related artifact was corrected (Gratton et al., 1983).There was a baseline recording period of 100 ms prior to stimulus onset, and individualtrials were baseline corrected and subsequently averaged for each participant within eachcondition. Based on visual inspection of individual and averaged waveforms, individualcross-averages were accepted or rejected on the basis of excessive ear (linked earlobes), eye(vertical EOG), or suspected movement artifact that appeared to bias the waveform. Aminimum of 10 usable ERP trials across conditions was imposed for analyses relating tocorrect responses in both tasks; a minimum of 8 usable ERP trials was required for inclusionin the error-related analyses on Go/No-go. All criteria were imposed blind with respect toalcohol group status.
Automatic detection was used to identify peak amplitude or area (μV) and latency to peak(ms) associated with the stimulus-locked P2-N2-P3 complex elicited by both tasks at central(C3, Cz, C4), frontal (F3, Fz, F4), and parietal (P3, Pz, P4) scalp electrodes, respectively.Component windows for peak and latency detection were specified as follows: for Go/No-go, P2 (200 to 400 ms), N2 (325 to 500 ms); for CRT, P2 (250 to 400 ms), N2 (or FN400;300 to 500 ms). Area measures (i.e., average μV within the specified window) were used forGo/No-go P3 (400 to 700 ms) and CRT P3 (or LPC; 500 to 800 ms). For error-relatedanalyses on Go/No-go, response-locked averages were used to compare peak ERN(incorrect No-go, 0 to 125 ms) at frontal leads (F3, Fz, F4) and Pe (incorrect No-go, 100 to500 ms) at central leads (C3, Cz, C4). Stimulus-locked components were segmented 100 msbefore and 1,000 ms after the onset of the stimulus; response-locked components weresegmented 300 ms before and 500 ms after button press. Peak amplitude measures representmean activity surrounding the peak (+/- 5 ms) within the component’s specified timewindow.
Data AnalysisFor Go/No-go, accuracy (% correct) and reaction time (RT) were computed for the Go andNo-go conditions; ERP analyses focused on these two conditions as well as on a comparisonof incorrect No-go vs. correct Go. For CRT, correct Old (old item, response = “old”) andfalse alarms (FA; new item, response = “old”) were used to compute d-prime(discrimination) and C (bias) for behavioral performance measures. D-prime measuresnumber of correct button presses, adjusted for false alarms, to correct for any tendency topress the same button regardless of whether the stimulus being displayed is old or new. Biasmeasures the tendency to press the same button repeatedly without regard to the stimulusdisplayed. RT was also measured in both conditions. ERPs were examined for correct Oldand correct New (new item, response = “new”). Preliminary analyses showed that theabstract-concrete and three lag conditions all produced very similar Old-New effects. TheOld and New items were, therefore, collapsed across item type and lag in the data analysis.
All statistical analyses were conducted using SPSS 9.0. Mixed design repeated measuresanalysis of variance (ANOVA) was used to assess behavioral task performance for correctresponses (%) and mean reaction time (RT) in separate 2 (group: ALC, CON) × 2(condition) analyses, with group as the between-subjects factor and condition as the within-subjects factor. The repeated factor was used to evaluate overall condition effects on thetask; planned group comparisons were made separately for individual conditions. For ERPs,mixed design repeated measures analysis of variance (ANOVA) was used to assess peak or
Burden et al. Page 7
Alcohol Clin Exp Res. Author manuscript; available in PMC 2012 August 13.
NIH
-PA Author Manuscript
NIH
-PA Author Manuscript
NIH
-PA Author Manuscript

average amplitude (μV) and latency to peak (ms) of each component of interest, with groupas the between-subjects factor and electrode region and condition as within-subjects factors.The electrode region in the analysis was either frontal (F3, Fz, F4), central (C3, Cz, C4), orparietal (P3, Pz, P4), depending on where the response involving the component in questionappeared maximal. All F- and p-values are Greenhouse-Geisser adjusted to correct for lackof homogeneity in the variances among multiple scalp recording sites, as is commonlyapplied in ERP studies assessing component differences at multiple leads. Although multipleinteractions often emerge when analyzing multiple electrodes that differ across conditions,these interactions can be ambiguous and are not readily interpretable (see Luck, 2005;McCarthy and Wood, 1985); therefore, even though the full model was retained in theANOVA model from which results are reported, we only present relevant within-subjectseffects for the sake of parsimony. For all analyses, partial η2 was used as the measure ofeffect size.
To account for possible confounding influences, outcomes that were identified as beingsensitive to prenatal alcohol exposure group were also tested in relation to 22 controlvariables. Twelve child control variables were assessed: gender; age at assessment; IQassessed on the Wechsler Intelligence Scales for Children, 4th edition (WISC-IV), adaptedfor Inuit culture3; village of residence (local, i.e., where testing took place, vs. remote, i.e.,flown in by airplane); and pre- and postnatal exposure to three environmental contaminants(polychlorinated biphenyls (PCBs), mercury (Hg), and lead (Pb) and an omega-3 fatty acid(docosahexaenoic acid (DHA) prevalent in the Inuit diet that has been shown to beimportant for cognitive development (Colombo et al., 2004; Jacobson et al., 2008; O’Connoret al., 2001). The contaminant and DHA exposures were assessed in umbilical cord and 10-year blood samples obtained from the children. Eleven maternal control variables wereassessed: age at delivery, marital status, socioeconomic status (SES; Hollingshead, 1975),years of education, verbal competence (Peabody Picture Vocabulary Tests score), nonverbalintellectual competence (Raven Progressive Matrices), prenatal and current use of cigarettesand marijuana, and current binge drinking (present/absent) (see Table 1). For each outcomemeasure on which the exposure groups differed, the mixed-design repeated measuresANOVA was re-run as an analysis of covariance (ANCOVA) that adjusted statistically forall control variables that differed even marginally (at p < .10) between the groups. Given thepotential for multicollinearity between prenatal alcohol exposure and current maternaldrinking, current drinking was not treated as a routine control variable. Because currentdrinking was not related to any of the ERP outcomes associated with binge exposure duringpregnancy (all p’s >.10), it was not considered a potential confounder of any of the observedeffects.
RESULTSBackground Characteristics
Table 1 provides information on the demographic characteristics for the 139 children whoseprenatal alcohol exposure was documented and provided usable ERP data on the Go/No-goand/or CRT tasks. Although the two groups were generally similar in terms of childcharacteristics, the CON group showed higher values than the ALC group on prenatalexposure to both PCBs, F(1,132) = 7.57, p < .01, ηp
2 = .05, and Hg, F(1,135) = 10.24, p < .01, ηp
2 = .07; the higher PCB level in the CON group was also seen at the 11-yearassessment, F(1,134) = 6.27, p < .05, ηp
2 = .05. Regarding maternal characteristics, mothers
3Seven WISC-IV subtests were administered to assess Perceptual Reasoning, Working Memory, and Processing Speed. Because theWISC-IV Verbal Comprehension subtests were not appropriate for Inuit culture, verbal comprehension was assessed using the BostonNaming Test and Delis-Kaplan Verbal Fluency Test, which were adapted by substituting culturally-relevant vocabulary wherenecessary.
Burden et al. Page 8
Alcohol Clin Exp Res. Author manuscript; available in PMC 2012 August 13.
NIH
-PA Author Manuscript
NIH
-PA Author Manuscript
NIH
-PA Author Manuscript

in the ALC group were, on average, 4 years younger at delivery than those in the CONgroup, F(1,137) = 14.52, p < .001, ηp
2 = .10. The analyses in Table 1 were also run breakingdown maternal drinking during pregnancy into three groups: abstainers, light drinkers, andbinge drinkers. The only group differences were those that had already been seen in the two-group comparison shown in Table 1. In post hoc analyses comparing abstainers vs. lightdrinkers on those measures, no differences were seen between the abstainer and light drinkergroups (all p’s > .10).
Although no data regarding changes in pattern of drinking across pregnancy are available forthis sample, in a sample of binge drinkers from another cohort from this population(Jacobson et al., 2008), frequency of binge drinking declined from a median of 4.7 binges/month prior to pregnancy recognition to 1.3 and 1.2 binges/month during the first andsecond trimesters, respectively. Binge drinking declined further to a median of 0.6/monthduring the third trimester, increasing to 1.2/month at the end of the first postpartum year. Bythe 11-year assessment in the present sample, current maternal binge drinking in the CONgroup had increased to become as prevalent as in the ALC group during pregnancy (i.e., ~2binges/month), while frequency of binge drinking in the ALC group had increased to morethan twice that in the CON group at 11 years, F(1,137) = 19.20, p < .001, ηp
2 = .12 (seeTable 1).
Go/No-goBehavioral performance—There were significant main effects of condition for bothaccuracy and RT but no alcohol exposure group differences for the Go/No-go behavioralperformance measures. Overall, children were less accurate at correctly inhibiting No-go (M= 65.2%) compared to correctly pressing the button to Go (M = 92.6%), F(1,105) = 516.12,p < .0001, ηp
2 = .83, and failures to inhibit to the No-go stimulus (false alarms) were faster(M = 393 ms) than correct presses to Go (M = 462 ms), F(1,105) = 173.93, p < .0001, ηp
2
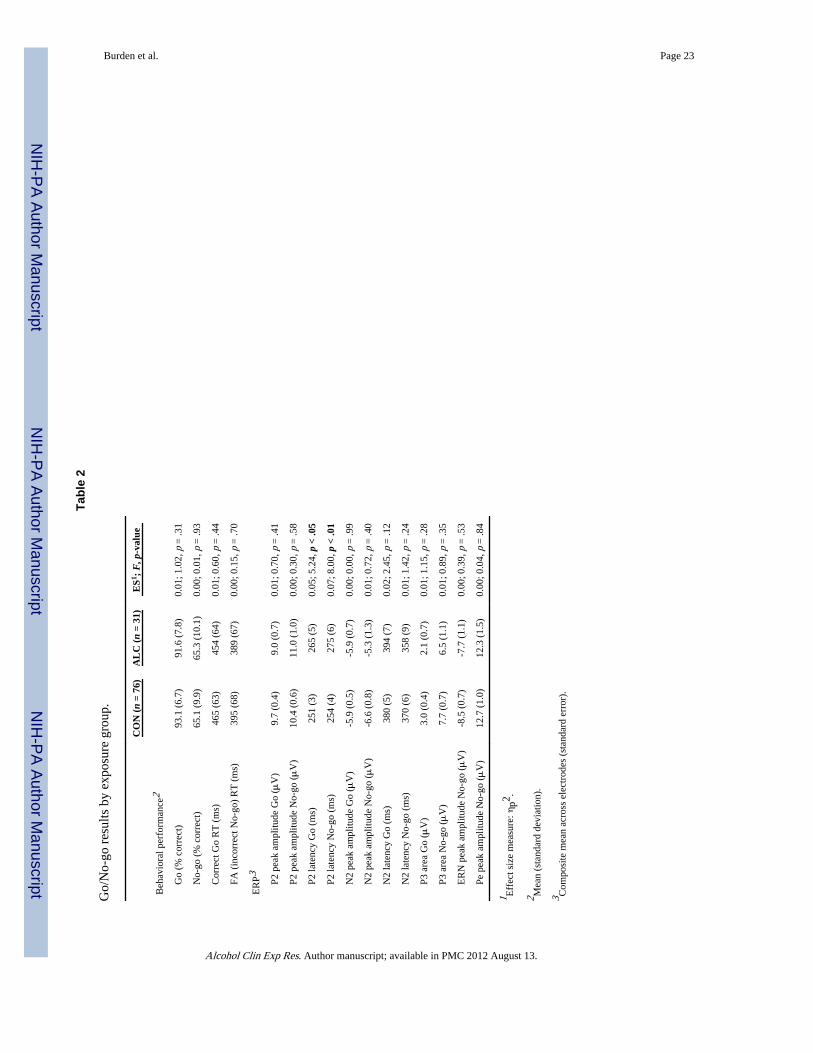
= .62. Means (SDs) for each group and the group difference statistics are presented in Table2.
ERP findings—Figure 1 shows the ERP waveforms for correct Go and No-go responsesby group. P2 peak amplitude (μV) at the central leads (C3, Cz, C4) was larger for No-go (M= 10.7) vs. Go (M = 9.5), F(1,105) = 6.90, p < .01, ηp
2 = .06. There was also an overalleffect on P2 latency (ms), with Go (M = 258) faster than No-go (M = 265), F(1,105) = 4.46,p < .05, ηp
2 = .04. The groups differed in P2 latency averaged across condition, with theALC group (M = 270) showing a slower P2 than CON (M = 253), F(1,105) = 8.42, p < .01,ηp
2 = .07. ANOVAs conducted separately for the two conditions showed that this alcoholeffect was present for both Go and No-go (see Table 2). There were no effects on N2amplitude. N2 latency (ms) for No-go (M = 364) was faster than Go (M = 387), F(1,105) =11.96, p < .001, ηp
2 = .10, and there was a group × condition interaction, F(1,105) = 4.00, p< .05, ηp
2 = .04, which was due to a larger Go vs. No-go difference in N2 latency for ALC(M difference = 36 ms) vs. CON (M difference = 10 ms) (see Table 2). For P3 area (μV),the expected condition difference was present, with No-go (M = 7.1) larger than Go (M =2.5), F(1,105) = 58.67, p < .0001, ηp
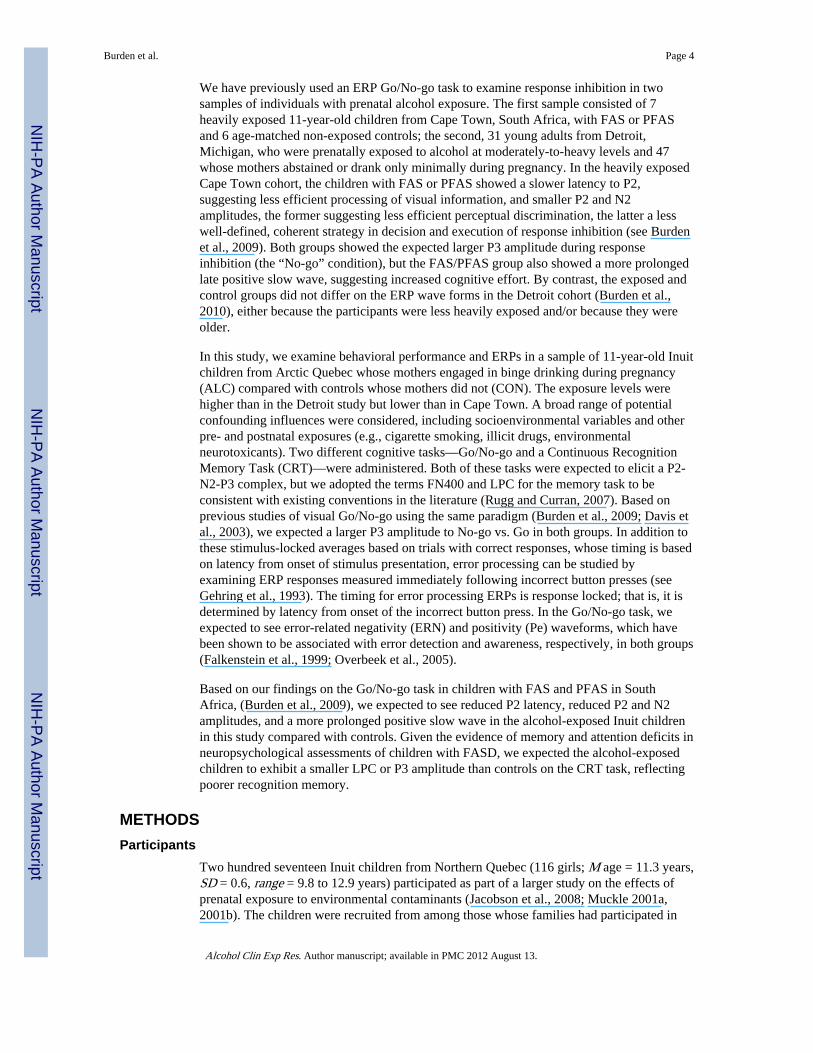
2 = .36. There were no group differences at the parietalleads (see Table 2). There were also no group effects for ERN or Pe amplitudes (Table 2)—both groups showed large, robust error-related responses (see Figure 2).
As seen in Table 1, the ALC and CON groups differed on four potential confoundingvariables unrelated to alcohol use—prenatal PCBs, prenatal Hg, 11-yr PCBs, and maternalage. After controlling for these potential confounders simultaneously in ANCOVAs, theslower P2 latency seen the ALC group continued to be significant in both conditions: Go,F(1,96) = 5.76, p < .05, ηp
2 = .06; No-go, F(1,96) = 6.63, p < .05, ηp2 = .07.
Burden et al. Page 9
Alcohol Clin Exp Res. Author manuscript; available in PMC 2012 August 13.
NIH
-PA Author Manuscript
NIH
-PA Author Manuscript
NIH
-PA Author Manuscript
Although the groups did not differ in No-go P3 amplitude at the parietal leads where theERP response appeared maximal, we conducted an exploratory post hoc analysis based onvisual inspection of electrodes Cz and C4, a region in which the ALC group appeared toshow a diminished No-go response (see Figure 1). After controlling for the four potentialconfounders on which the ALC and CON groups differed, the adjusted mean No-go P3 (μV)was significantly smaller in this right-central region for the ALC (M = 5.1) vs. CON group(M = 7.8), F(1,96) = 4.23, p < .05, ηp
2 = .04.
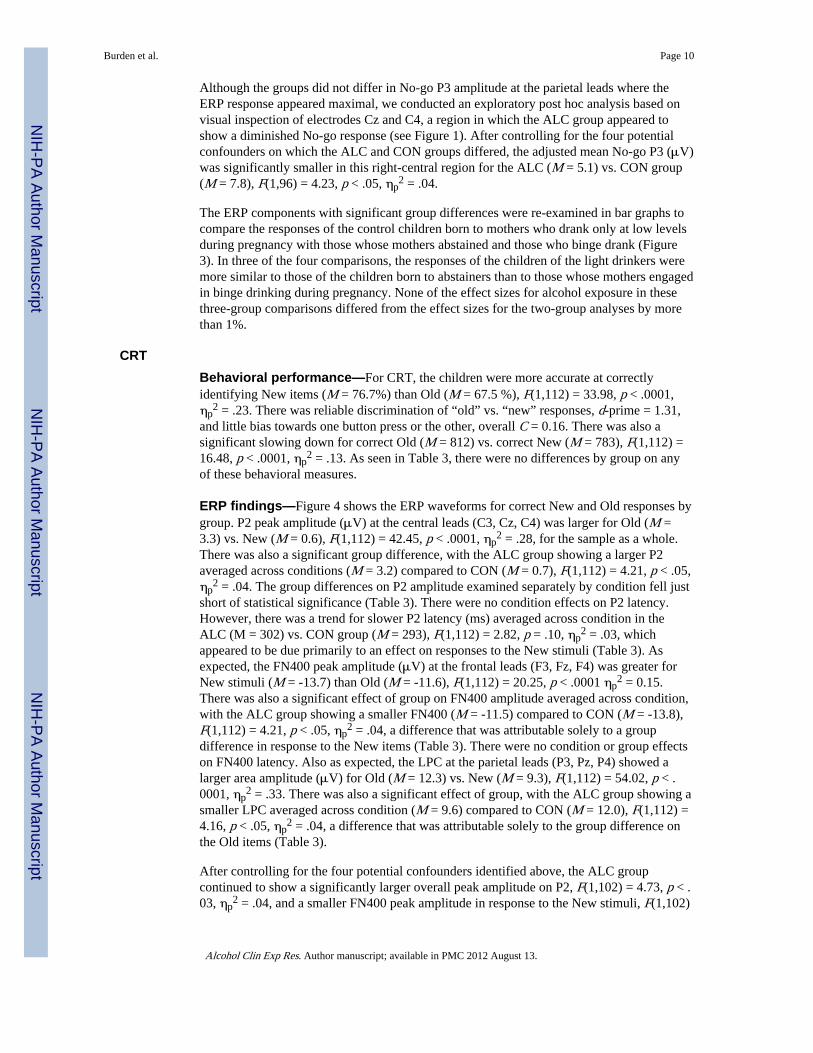
The ERP components with significant group differences were re-examined in bar graphs tocompare the responses of the control children born to mothers who drank only at low levelsduring pregnancy with those whose mothers abstained and those who binge drank (Figure3). In three of the four comparisons, the responses of the children of the light drinkers weremore similar to those of the children born to abstainers than to those whose mothers engagedin binge drinking during pregnancy. None of the effect sizes for alcohol exposure in thesethree-group comparisons differed from the effect sizes for the two-group analyses by morethan 1%.
CRTBehavioral performance—For CRT, the children were more accurate at correctlyidentifying New items (M = 76.7%) than Old (M = 67.5 %), F(1,112) = 33.98, p < .0001,ηp
2 = .23. There was reliable discrimination of “old” vs. “new” responses, d-prime = 1.31,and little bias towards one button press or the other, overall C = 0.16. There was also asignificant slowing down for correct Old (M = 812) vs. correct New (M = 783), F(1,112) =16.48, p < .0001, ηp
2 = .13. As seen in Table 3, there were no differences by group on anyof these behavioral measures.
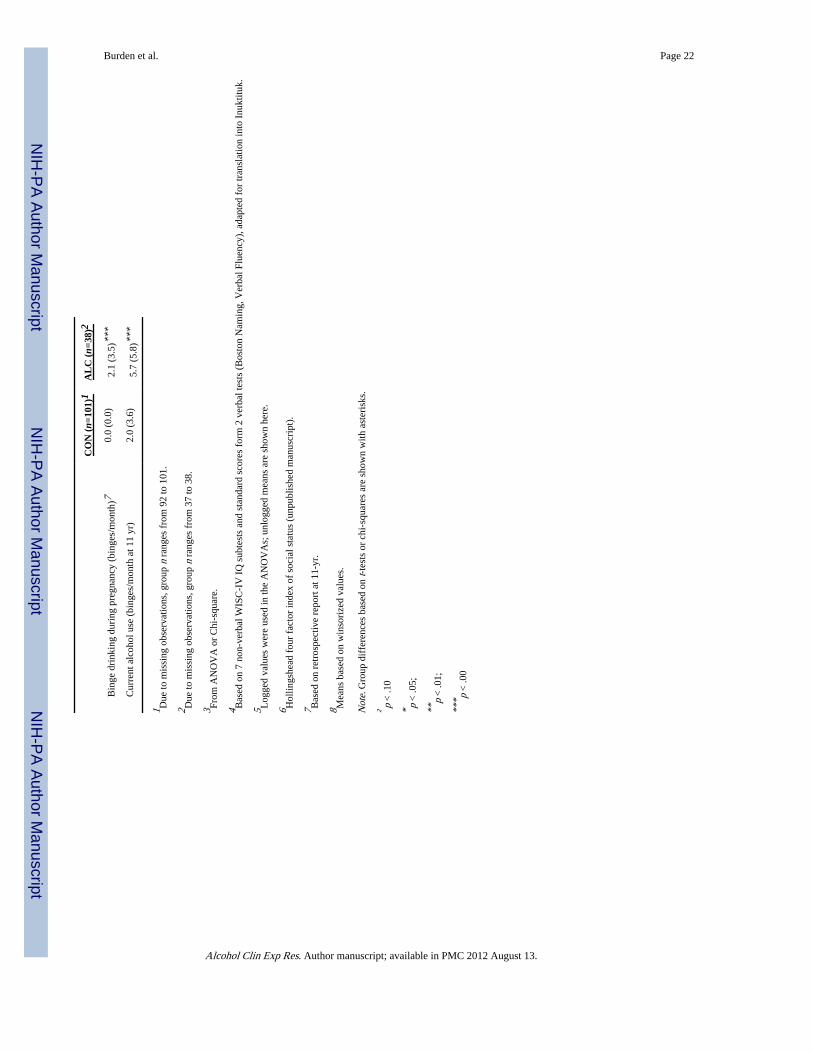
ERP findings—Figure 4 shows the ERP waveforms for correct New and Old responses bygroup. P2 peak amplitude (μV) at the central leads (C3, Cz, C4) was larger for Old (M =3.3) vs. New (M = 0.6), F(1,112) = 42.45, p < .0001, ηp
2 = .28, for the sample as a whole.There was also a significant group difference, with the ALC group showing a larger P2averaged across conditions (M = 3.2) compared to CON (M = 0.7), F(1,112) = 4.21, p < .05,ηp
2 = .04. The group differences on P2 amplitude examined separately by condition fell justshort of statistical significance (Table 3). There were no condition effects on P2 latency.However, there was a trend for slower P2 latency (ms) averaged across condition in theALC (M = 302) vs. CON group (M = 293), F(1,112) = 2.82, p = .10, ηp
2 = .03, whichappeared to be due primarily to an effect on responses to the New stimuli (Table 3). Asexpected, the FN400 peak amplitude (μV) at the frontal leads (F3, Fz, F4) was greater forNew stimuli (M = -13.7) than Old (M = -11.6), F(1,112) = 20.25, p < .0001 ηp
2 = 0.15.There was also a significant effect of group on FN400 amplitude averaged across condition,with the ALC group showing a smaller FN400 (M = -11.5) compared to CON (M = -13.8),F(1,112) = 4.21, p < .05, ηp
2 = .04, a difference that was attributable solely to a groupdifference in response to the New items (Table 3). There were no condition or group effectson FN400 latency. Also as expected, the LPC at the parietal leads (P3, Pz, P4) showed alarger area amplitude (μV) for Old (M = 12.3) vs. New (M = 9.3), F(1,112) = 54.02, p < .0001, ηp
2 = .33. There was also a significant effect of group, with the ALC group showing asmaller LPC averaged across condition (M = 9.6) compared to CON (M = 12.0), F(1,112) =4.16, p < .05, ηp
2 = .04, a difference that was attributable solely to the group difference onthe Old items (Table 3).
After controlling for the four potential confounders identified above, the ALC groupcontinued to show a significantly larger overall peak amplitude on P2, F(1,102) = 4.73, p < .03, ηp
2 = .04, and a smaller FN400 peak amplitude in response to the New stimuli, F(1,102)
Burden et al. Page 10
Alcohol Clin Exp Res. Author manuscript; available in PMC 2012 August 13.
NIH
-PA Author Manuscript
NIH
-PA Author Manuscript
NIH
-PA Author Manuscript

= 6.17, p < .05, ηp2 = 0.06. For the LPC Old area measure, the effect of a reduced amplitude
in the ALC group fell just short of statistical significance after controlling for these potentialconfounders, F(1,102), = 3.86, p = .052, ηp
2 = .04.
The ERP components with significant group differences on CRT were re-examined in bargraphs to compare the responses of the control children born to mothers who drank only atlow levels during pregnancy with those whose mothers abstained and those who binge drank(Figure 3). In four of the five comparisons, the responses of the children of the light drinkerswere clearly more similar to those of the children born to abstainers than to the children bornto mothers who binge drank. None of the effect sizes for alcohol exposure in these three-group comparisons differed from the effect sizes for the two-group analyses by more than1%.
DISCUSSIONIn this study, ERPs were measured on two different neurocognitive tasks in children whosemothers reported binge drinking during pregnancy and age-matched controls. In the Go/No-go response inhibition task, all children were more accurate in responding to the Go stimulithan in inhibiting their response to the No-go “X” stimulus, and reaction time was faster onthe No-go trials in which the child failed to inhibit than on the correct Go button presses.These types of errors have been attributed to impulsive responding (Coles et al., 2001) andare likely the result of failing to extract of all the information necessary from a givenstimulus prior to responding (cf. Gratton et al., 1988). Similar to previous ERP findings onthis task (Burden et al., 2009; Davis et al., 2003), a large P3 effect was seen, with No-goamplitude larger than Go, presumably due to the increased attentional engagement requiredto actively inhibit a response (e.g., Bokura et al., 2001; Eimer, 1993). On the CRT task, thebehavioral performance measures indicated reliable memory performance in both groups(i.e., more correct hits than false alarms) and, as expected, the children took more time tocorrectly identify old vs. new stimuli. The two expected ERP effects were also seen on thistask—a larger FN400 to new vs. old items, suggesting the presence of familiarity; and alarger LPC amplitude to old vs. new items, which likely reflects the recollection of thespecific item (Rugg and Curran, 2007).
The alcohol-exposed and control groups did not differ behaviorally on reaction time oraccuracy on either test. The absence of behavioral differences is consistent with the findingsin the more heavily exposed Cape Town cohort, where neural processing differences werefound on the ERP measures even though behavioral performance was not impaired on thisrelatively simple response inhibition task (Burden et al., 2009). As in Cape Town,differences between the alcohol-exposed and control children were seen on several ERPmeasures. For Go/No-go, a slower P2 latency was seen in the alcohol-exposed children atcentral scalp for both the Go and No-go conditions. P2, which is thought to be involved inthe initial visual processing of a stimulus (e.g., Barcelo et al., 1997), may be an index of theefficiency with which the meaning of the stimulus is extracted. Although the task used in theCape Town study was slower paced, the stimulus-locked P2 emerging with the visualpresentation of the Go and No-go stimuli was also maximal over central scalp, and the FAS/PFAS group showed the same slower P2 latency (Burden et al., 2009). This finding is alsoconsistent with behavioral measures from several studies indicating slower informationprocessing speed in infants and children with fetal alcohol exposure (e.g., Burden et al.,2005a; Jacobson et al., 1993, 1994; Kable and Coles, 2004; Streissguth et al., 1994). Thereplication and extension of this P2 latency effect from the Cape Town study in a faster-paced but highly similar response inhibition paradigm with children exposed to alcohol atlower levels suggests that slower P2 latency may warrant consideration as a potentiallyuseful biomarker across a range of fetal alcohol exposure.
Burden et al. Page 11
Alcohol Clin Exp Res. Author manuscript; available in PMC 2012 August 13.
NIH
-PA Author Manuscript
NIH
-PA Author Manuscript
NIH
-PA Author Manuscript

By contrast to the P2 latency effect, the relation of fetal alcohol exposure to reduced P2 andN2 amplitude found on the Go/No-go task in the Cape Town cohort (Burden et al., 2009)were not seen in the less heavily exposed Inuit children. As in both the Cape Town andDetroit cohorts, the exposed and control groups did not differ in No-go P3 amplitudemeasured at the parietal leads on this task which, as expected, was where the ERP responsewas maximal, although there was evidence of a diminished P3 response in the No-gocondition at central leads, suggesting that the alcohol-exposed children were not processingthe inhibition stimulus as fully or efficiently as controls. In the error-related analyses, bothgroups produced a similar ERN and Pe, indicating no difference in error monitoring or errorawareness.
On the CRT task, the alcohol-exposed children exhibited increased P2 amplitude andreduced amplitude for both FN400 and LPC. As noted above, the FN400 on the CRT isconsidered equivalent to the N2 and the LPC to the P3. The larger P2 amplitude in thealcohol-exposed group suggests that these children need to exert greater cognitive effort instimulus identification (Kranczioch et al., 2003), which is particularly challenging in thistask, in which both concrete (namable) objects and abstract figures are displayed. Thereduced FN400 amplitude suggests poorer selective attention in the context of stimulusevaluation and decision making (Luck and Hillyard, 1999; Rugg and Curran, 2003).
In addition to these earlier components, which are involved primarily in selective attentionand perceptual processing, the alcohol-exposed children showed reduced LPC (or P3)amplitudes on the CRT task, indicating alterations in neural processing of relatively latercognitive processing, particularly memory retrieval. Although lower P3 amplitudes havebeen found in adults with alcoholism (Begleiter et al., 1984; 1987; Cohen et al., 1995; 1997;Porjesz and Begleiter, 1990) and children with FAS (Kaneko et al., 1995) on the auditoryoddball paradigm, to our knowledge, our finding is the first to demonstrate reduced P3amplitudes in association with binge drinking during pregnancy in children who do not meetdiagnostic criteria for FAS. Although it is unclear what mechanism might be responsible forthis finding, future studies using larger and denser ERP arrays may be able to use sourcelocalization to more precisely pinpoint specifically affected brain regions. At this point, wecan conservatively suggest that the reduced FN400 and LPC amplitudes in the alcohol-exposed group represent a reduction in synchronous neuronal firing during processing atthese key cognitive stages.
One limitation of this study is that prenatal alcohol exposure was assessed by retrospectivematernal report rather than from information obtained contemporaneously during pregnancy.Although a continuous measure based on quantity of alcohol ingested would have enabledus to examine dose-response and threshold, whether the mother engaged in binge drinkingduring pregnancy can presumably be recalled more reliably than how much she drank peroccasion when assessed 11 years after delivery. One notable strength of this study is that theERP data go beyond standard neuropsychological tests to identify specific stages ofinformation processing that are adversely affected by prenatal alcohol exposure. Thus, thesedata extend findings linking fetal alcohol exposure to poorer response inhibition to suggestthat one important component of information processing that impairs response inhibitionperformance relates to reduced efficiency in extracting information from visual stimuli. Onthe other hand, contrary to what might have been expected, prenatal alcohol exposure didnot predict poorer error monitoring or awareness in this study. Similarly, building uponreports linking fetal alcohol exposure to poorer declarative memory, these ERP findingsidentify greater cognitive effort in stimulus recognition and reduced neural activation duringmemory retrieval as two key elements of recognition memory processing that appear to betargeted by prenatal alcohol.
Burden et al. Page 12
Alcohol Clin Exp Res. Author manuscript; available in PMC 2012 August 13.
NIH
-PA Author Manuscript
NIH
-PA Author Manuscript
NIH
-PA Author Manuscript

In conclusion, these findings suggest that fetal alcohol exposure is associated with alteredneurophysiological processing in tasks involving both response inhibition and recognitionmemory even when behavioral performance is unaffected. The consideration of potentialconfounding by a broad range of control variables in the analyses performed in this study,including smoking and marijuana use during pregnancy, current maternal alcohol use, SES,and prenatal exposure to environmental contaminants, provides evidence that these effectsare specifically attributable to prenatal alcohol exposure. Our data suggest that increased P2latency and the reduced amplitudes associated with the later cognitive components areindicative of alterations in fundamental neural processes that may mediate the well-documented effects of fetal alcohol exposure on cognitive function.
AcknowledgmentsWe thank Renee Sun, Line Roy, Brenda Tuttle, Alacie Puv, and Dave Saint-Amour for their contributions inmeeting the challenges involved in collecting these data in Arctic Quebec; Jocelyne Gagnon and Neil Dodge fortheir contributions in assembling the data set; and the Inuit community and families for their willingness toparticipate. Research support: grants from the NIH/National Institute of Environmental Health Sciences (R01-ES007902); Northern Contaminants Program, Indian and Northern Affairs, Canada; NIH/National Institute onAlcohol Abuse and Alcoholism National Research Service Award (F32-AA14730); and the Joseph Young, Sr.,Fund from the State of Michigan.
ReferencesBarcelo F, Sanz M, Molina V, Rubia FJ. The Wisconsin Card Sorting Test and the assessment of
frontal function: a validation study with event-related potentials. Neuropsychologia. 1997; 35:399–408. [PubMed: 9106269]
Begleiter H, Porjesz B, Bihari B, Kissin B. Event-related brain potentials in boys at risk foralcoholism. Science. 1984; 225:1493–1496. [PubMed: 6474187]
Begleiter H, Porjesz B, Rawlings R, Eckardt M. Auditory recovery function and P3 in boys at high riskfor alcoholism. Alcohol. 1987; 4:314–321.
Bokura H, Yamaguchi S, Kobayashi S. Electrophysiological correlates for response inhibition in a go/nogo task. Neurophysiol Clin. 2001; 112:2224–2232.
Bonthius DJ, West JR. Alcohol-induced neuronal loss in developing rats: Increased brain damage withbinge exposure. Alcohol Clin Exp Res. 1990; 14:107–118. [PubMed: 1689970]
Bowman RS, Stein LI, Newton JR. Measurement and interpretation of drinking behavior. Q J StudAlcohol. 1975; 36:1154–1172.
Burden MJ, Andrew C, Saint-Amour D, Meintjes EM, Molteno CD, Hoyme HE, Robinson LK,Khaole N, Nelson CA, Jacobson SW, Jacobson JL. The effects of fetal alcohol syndrome onresponse execution and inhibition: An event-related potential study. Alcohol Clin Exp Res. 2009;33:1994–2004. [PubMed: 19719791]
Burden MJ, Jacobson JL, Westerlund AJ, Lundahl LH, Morrison MA, Dodge NC, Klorman R, NelsonCA, Avison MJ, Jacobson SW. An event-related potential study of response inhibition in ADHDwith and without prenatal alcohol exposure. Alcohol Clin Exp Res. 2010; 34:617–627. [PubMed:20102568]
Burden MJ, Jacobson SW, Jacobson JL. The relation of prenatal alcohol exposure to cognitiveprocessing speed and efficiency in childhood. Alcohol Clin Exp Res. 2005a; 29:1473–1483.[PubMed: 16131856]
Burden MJ, Jacobson SW, Sokol RJ, Jacobson JL. Effects of prenatal alcohol exposure on workingmemory and attentional measures at 7.5 years of age. Alcohol Clin Exp Res. 2005b; 29:443–452.[PubMed: 15770121]
Casey BJ, Trainor RJ, Orendi JL, Schubert AB, Nystrom LE, Giedd JN, Castellanos FX, Haxny JV,Noll D, Cohen JD, Rapoport JL. A developmental functional MRI study of prefrontal activationduring performance on a go-no-go task. J Cogn Neurosci. 1997; 9:835–847.
Burden et al. Page 13
Alcohol Clin Exp Res. Author manuscript; available in PMC 2012 August 13.
NIH
-PA Author Manuscript
NIH
-PA Author Manuscript
NIH
-PA Author Manuscript

Chiodo LM, Janisse J, Delaney-Black V, Sokol RJ, Hannigan JH. A metric of maternal prenatal riskdrinking predicts neurobehavioral outcomes in preschool children. Alcohol Clin Exp Res. 2009;33:634–644. [PubMed: 19183137]
Coch D, Maron L, Wolf M, Holcomb PJ. Word and picture processing in children: An event-relatedpotential study. Dev Neuropsychol. 2002; 22:373–406. [PubMed: 12405510]
Cohen H, Porjesz B, Begleiter H, Wang W. Neuroelectric correlates of response production andinhibition in individuals at risk to develop alcoholism. Biol Psychiatry. 1997; 42:57–67. [PubMed:9193742]
Cohen HL, Wang W, Porjesz B, Begleiter. Auditory P300 in young alcoholics: Regional responsecharacteristics. Alcohol Clin Exp Res. 1995; 19:469–475. [PubMed: 7625584]
Coles MGH, Scheffers MK, Holroyd CB. Why is there an ERN/Ne on correct trials? responserepresentations, stimulus-related components, and the theory of error-processing. Biol Psychol.2001; 56:173–189. [PubMed: 11399349]
Colombo J, Kannass KN, Shaddy DJ, Kundurthi S, Maikranz JM, Anderson CJ, et al. Maternal DHAand the development of attention in infancy and toddlerhood. Child Dev. 2004; 75:1254–1267.[PubMed: 15260876]
Czernochowski D, Mecklinger A, Johansson M, Brinkmann M. Age-related differences in familiarityand recollection: ERP evidence from a recognition memory study in children and young adults.Cogn Affect Behav Neurosci. 2005; 5:417–433. [PubMed: 16541812]
Davis EP, Bruce J, Snyder K, Nelson CA. The X-trials: neural correlates of an inhibitory control taskin children and adults. J Cogn Neurosci. 2003; 15:432–443. [PubMed: 12729494]
Donchin, E.; Karis, D.; Bashore, TR.; Coles, MGH.; Gratton, G. Cognitive psychophysiology andhuman information processing, in Psychophysiology: Systems, Processes and Applications. Coles,MGH.; Donchin, E.; Porges, SW., editors. Guilford, New York: 1986. p. 244-267.
Eimer M. Effects of attention and stimulus probability on ERPs in a go/nogo task. Biol Psychol. 1993;35:123–138. [PubMed: 8507742]
Fabiani, M.; Gratton, G.; Coles, MGH. Event-related brain potentials: methods, theory, andapplications, in Handbook of Psychophysiology. 2. Cacioppo, JT.; Tassinary, LG.; Berntson, GG.,editors. Cambridge University Press; Cambridge, England: 2000. p. 53-84.
Falkenstein M, Hoormann J, Hohnsbein J. ERP components in go/nogo tasks and their relation toinhibition. Acta Psychologica. 1999; 101:267–291. [PubMed: 10344188]
Gehring WJ, Goss B, Coles MGH, Meyer DE, Donchin E. A neural system for error detection andcompensation. Psychol Sci. 1993; 4:385–390.
Goldschmidt L, Richardson GA, Stoffer DS, Geva D, Day NL. Prenatal alcohol exposure andacademic achievement at age six: a nonlinear fit. Alcohol Clin Exp Res. 1996; 20:763–770.[PubMed: 8800397]
Goodlett CR, Kelly SJ, West JR. Early postnatal alcohol exposure that produces high blood alcohollevels impairs development of spatial navigation learning. Psychobiology. 1987; 15:64–74.
Gratton G, Coles MGH, Donchin E. A new method for the off-line removal of ocular artifact.Electroencephalogr Clin Neurophysiol. 1983; 55:468–484. [PubMed: 6187540]
Gratton G, Coles MG, Sirevaag EJ, Eriksen CW, Donchin E. Pre- and poststimulus activation ofresponse channels: a psychophysiological analysis. J Exp Psychol Hum Percept Perform. 1988;14:331–344. [PubMed: 2971764]
Hepworth SL, Rovet JF, Taylor MJ. Neurophysiological correlates of verbal and nonverbal short-termmemory in children: repetition of words and faces. Psychophysiol. 2001; 38:594–600.
Hollingshead, AB. Four factor index of social status. Yale University; 1975. Unpublished manuscript
Howell KK, Lynch ME, Platzman KA, Smith GH, Coles CD. Prenatal alcohol exposure and ability,academic achievement, and school functioning in adolescence: a longitudinal follow-up. J PediatrPsychol. 2006; 31:116–126. [PubMed: 15829611]
Jacobson JL, Jacobson SW, Sokol RJ, Ager JW. Relation of maternal age and pattern of pregnancydrinking to functionally significant cognitive deficit in infancy. Alcohol Clin Exp Res. 1998;22:345–351. [PubMed: 9581639]
Burden et al. Page 14
Alcohol Clin Exp Res. Author manuscript; available in PMC 2012 August 13.
NIH
-PA Author Manuscript
NIH
-PA Author Manuscript
NIH
-PA Author Manuscript

Jacobson JL, Jacobson SW, Muckle G, Kaplan-Estrin M, Ayotte P, Dewailly E. Beneficial effects of apolyunsaturated fatty acid on infant development: Evidence from the Inuit of Arctic Quebec. JPediatr. 2008; 152:356–364. [PubMed: 18280840]
Jacobson SW, Jacobson JL, Sokol RJ, Chiodo LM. Preliminary evidence of primary socioemotionaldeficits in 7-year-olds prenatally exposed to alcohol. Alcohol Clin Exp Res. 1998; 22:61A.
Jacobson SW, Chiodo LM, Jacobson JL, Sokol RJ. Validity of maternal report of alcohol, cocaine, andsmoking during pregnancy in relation to infant neurobehavioral outcome. Pediatrics. 2002;109:815–825. [PubMed: 11986441]
Jacobson SW, Jacobson JL, Sokol RJ. Effects of fetal alcohol exposure on infant reaction time.Alcohol Clin Exp Res. 1994; 18:1125–1132. [PubMed: 7847594]
Jacobson SW, Jacobson JL, Sokol RJ, Martier SS, Ager JW. Prenatal alcohol exposure and infantinformation processing ability. Child Dev. 1993; 64:1706–1721. [PubMed: 8112114]
Jasper HH. The ten-twenty electrode system of the International Federation. Electroencephalogr ClinNeurophysiol. 1958; 10:371–375.
Jodo E, Kayama Y. Relation of a negative ERP component to response inhibition in a go/nogo task.Electroencephalogr Clin Neurophysiol. 1992; 28:477–482. [PubMed: 1375556]
Jones KL, Smith DW. Recognition of the fetal alcohol syndrome in early infancy. Lancet. 1973;2:999–1001. [PubMed: 4127281]
Kable JA, Coles CD. The impact of prenatal alcohol exposure on neurophysiological encoding ofenvironmental events at six months. Alcohol Clin Exp Res. 2004; 28:489–496. [PubMed:15084907]
Kalayam B, Alexopoulos GS, Kindermann S, Kakuma T, Brown GG, Young RC. P300 latency ingeriatric depression. Am J Psychiatry. 1998; 155:425–427. [PubMed: 9501758]
Kaneko WM, Ehlers CL, Philips EL, Riley EP. Auditory event-related potentials in fetal alcoholsyndrome and Down’s syndrome children. Alcohol Clin Exp Res. 1996; 20:35–42. [PubMed:8651459]
Kranczioch C, Debener S, Engel AK. Event-related potential correlates of the attentional blinkphenomenon. Cogn Brain Res. 2003; 17:177–187.
Luck, S. An Introduction to the Event-Related Potential Technique. MIT Press; Cambridge, MA: 2005.
Luck SJ, Hillyard SA. Electrophysiological correlates of feature analysis during visual search.Psychophysiol. 1994; 31:291–308.
McCarthy G, Wood CC. Scalp distributions of event-related potentials: an ambiguity associated withanalysis of variance models. Electroencephalogr Clin Neurophysiol. 1985; 62:203–208. [PubMed:2581760]
Meintjes, EM.; Jacobson, SW.; Jacobson, JL.; Gatenby, JC.; Molteno, CD.; Warton, C.; Cannistraci,C.; Dehaene, S.; Gore, JC. fMRI study of number processing in children with fetal alcoholspectrum disorder (FASD) Organization for Human Brain Mapping. Chicago, IL: Jun. 2007
Muckle G, Ayotte P, Dewailly E, Jacobson SW, Jacobson JL. Determinants of polychlorinatedbiphenyls and methylmercury exposure in Inuit women of child-bearing age. Env Health Perspect.2001a; 109:957–963. [PubMed: 11673127]
Muckle G, Ayotte P, Dewailly E, Jacobson SW, Jacobson JL. Prenatal exposure of the NorthernQuebec Inuit infants to environmental contaminants. Env Health Perspect. 2001b; 109:1291–1299.[PubMed: 11748038]
Muckle G, Dewailly E, Ayotte P. Prenatal exposure of Canadian children to polychlorinated biphenylsand mercury. Can J Public Health. 1998; 89:S20–25. [PubMed: 9654788]
Nakata H, Inui K, Wasaka T, Tamura Y, Kida T, Kakigi R. Effects of ISI and stimulus probability onevent-related go/nogo potentials after somatosensory stimulation. Exp Brain Res. 2005; 162:293–299. [PubMed: 15599719]
Nieuwenhuis S, Yeung N, van den Wildenberg W, Ridderinkhof KR. Electrophysiological correlatesof anterior cingulate function in a go/no-go task: effects of response conflict and trial typefrequency. Cogn Affect Behav Neurosci. 2003; 3:17–26. [PubMed: 12822595]
O’Conner DL, Hall R, Adamkins D, Auestad N, Castillo M, Connor WE, et al. Growth anddevelopment in preterm infants fed long-chain polyunsaturated fatty acids: a prospective,randomized controlled trail. Pediatrics. 2001; 108:359–371. [PubMed: 11483801]
Burden et al. Page 15
Alcohol Clin Exp Res. Author manuscript; available in PMC 2012 August 13.
NIH
-PA Author Manuscript
NIH
-PA Author Manuscript
NIH
-PA Author Manuscript

Overbeek TJM, Nieuwenhuis S, Ridderinkhof RK. Dissociable components of error processing. JPsychophysiol. 2005; 19:319–329.
Porjesz B, Begleiter H. Event-related potentials in individuals at risk for alcoholism. Alcohol. 1990;7:465–469. [PubMed: 2222850]
Rugg MD, Curran T. Event-related potentials and recognition memory. Trends Cogn Sci. 2007;11:251–257. [PubMed: 17481940]
Sampson PD, Streissguth AP, Bookstein FL, Little RE, Clarren SK, Dehaene P, Hanson JW, GrahamJM. Incidence of fetal alcohol syndrome and prevalence of alcohol-related neurodevelopmentaldisorder. Teratology. 1997; 56:317–326. [PubMed: 9451756]
Sokol, R.; Martier, S.; Ernhart, C. Identification of alcohol abuse in the prenatal clinic, in NIAAAResearch Monograph 17: Early Identification of Alcohol Abuse. Chang, NC.; Chao, HM., editors.DHHS Publication, U.S. Department of Health and Human Resources; Washington, DC: 1985. p.85-128.
Sowell ER, Mattson SN, Thompson PM, Jernigan TL, Riley EP, Toga AW. Mapping callosalmorphology and cognitive correlates: Effects of heavy prenatal alcohol exposure. Neurology.2001; 57:235–244. [PubMed: 11468307]
Streissguth AP, Bookstein FL, Sampson PD, Barr HM. Neurobehavioral effects of prenatal alcohol:Part III. PLS analyses of neuropsychologic tests. Neurotoxicol Teratol. 1989; 11:493–507.[PubMed: 2593988]
Streissguth AP, Sampson PD, Carmichael Olson H, Bookstein FL, Barr HM, Scott M, Feldman J,Mirsky AF. Maternal drinking during pregnancy: attention and short-term memory in 14-year-oldoffspring—a longitudinal prospective study. Alcohol Clin Exp Res. 1994; 18:202–218. [PubMed:8198221]
Burden et al. Page 16
Alcohol Clin Exp Res. Author manuscript; available in PMC 2012 August 13.
NIH
-PA Author Manuscript
NIH
-PA Author Manuscript
NIH
-PA Author Manuscript

Fig. 1.Go/No-go stimulus-locked grand means for correct Go (gray) and No-go (black) for CON(thin) and ALC (bold) groups; y-axis, μV (positive up); x-axis (ms). Arrows illustrateexample components at midline electrodes.
Burden et al. Page 17
Alcohol Clin Exp Res. Author manuscript; available in PMC 2012 August 13.
NIH
-PA Author Manuscript
NIH
-PA Author Manuscript
NIH
-PA Author Manuscript

Fig. 2.Go/No-go response-locked grand means for correct Go (gray) and incorrect No-go (black)for CON (thin) and ALC (bold) groups; y-axis, μV (positive up); x-axis (ms). Arrowsillustrate example components at midline electrodes.
Burden et al. Page 18
Alcohol Clin Exp Res. Author manuscript; available in PMC 2012 August 13.
NIH
-PA Author Manuscript
NIH
-PA Author Manuscript
NIH
-PA Author Manuscript

Fig. 3.Comparison of ERP responses among children born to mothers who abstained, drank at lowlevels, or binge drank during pregnancy for the nine ERP components found to relate tobinge drinking in Tables 2 and 3.
Burden et al. Page 19
Alcohol Clin Exp Res. Author manuscript; available in PMC 2012 August 13.
NIH
-PA Author Manuscript
NIH
-PA Author Manuscript
NIH
-PA Author Manuscript

Fig. 4.CRT stimulus-locked grand means for correct New (gray) and Old (black) for CON (thin)and ALC (bold) groups; y-axis, μV (positive up); x-axis (ms). Arrows illustrate examplecomponents at midline electrodes.
Burden et al. Page 20
Alcohol Clin Exp Res. Author manuscript; available in PMC 2012 August 13.
NIH
-PA Author Manuscript
NIH
-PA Author Manuscript
NIH
-PA Author Manuscript

NIH
-PA Author Manuscript
NIH
-PA Author Manuscript
NIH
-PA Author Manuscript
Burden et al. Page 21
Tabl
e 1
Dem
ogra
phic
and
exp
osur
e ch
arac
teri
stic
s. M
eans
(SD
) or
n (
%).
CO
N (
n=10
1)1
AL
C (
n=38
)2
Chi
ld c
hara
cter
istic
s
G
ende
r (n
umbe
r of
mal
es, %
)45
(45
)14
(37
)
A
ge a
t tes
t (yr
)11
.3 (
0.6)
11.3
(0.
6)
E
stim
ated
IQ
492
.6 (
12.7
)95
.3 (
12.0
)
V
illag
e of
res
iden
ce (
num
ber
not l
ocal
; arr
ived
by
plan
e)45
(45
)16
(42
)
Pr
enat
al P
CB
s (μ
g/kg
)513
0.5
(105
.0)
81.9
(41
.8)*
*
Pr
enat
al H
g (n
mol
/L)5
110.
9 (9
2.6)
63.9
(97
.9)*
*
Pr
enat
al D
HA
(%
fat
ty a
cid
plas
ma
phos
phol
ipid
s)3.
6 (1
.3)
3.5
(1.3
)
Pr
enat
al P
b (μ
g/dL
)4.
5 (3
.0)
4.0
(2.7
)
11
-yr
PCB
s (μ
g/kg
)588
.9 (
79.7
)56
.9 (
61.2
)*
11
-yr
Hg
(nm
ol/L
)524
.2 (
26.8
)17
.3 (
16.6
)
11
-yr
DH
A (
% f
atty
aci
d pl
asm
a ph
osph
olip
ids)
2.4
(1.0
)2.
4 (0
.8)
11
-yr
Pb (μ
g/dL
)2.
5 (2
.2)
2.6
(2.5
)
Mat
erna
l cha
ract
eris
tics
B
iolo
gica
l mot
her’
s ag
e at
del
iver
y (y
r)25
.2 (
6.1)
21.2
(3.
4)**
*
M
arita
l sta
tus
at 1
1-yr
(nu
mbe
r m
arri
ed)
47 (
47)
15 (
40)
So
cioe
cono
mic
sta
tus
(SE
S)6
28.4
(12
.2)
31.1
(12
.0)
H
ighe
st g
rade
atta
ined
8.8
(2.2
)8.
9 (2
.3)
Pe
abod
y Pi
ctur
e V
ocab
ular
y T
est
87.3
(37
.4)
97.4
(24
.6)
R
aven
Pro
gres
sive
Mat
rice
s36
.2 (
10.5
)36
.9 (
8.1)
C
igar
ette
s/da
y du
ring
pre
gnan
cy7,
87.
0 (6
.3)
6.9
(5.3
)
M
ariju
ana
use
(day
s/m
onth
) du
ring
pre
gnan
cy7
1.4
(5.2
)2.
7 (7
.5)
C
urre
nt s
mok
ing
(cig
aret
tes/
day)
88.
7 (7
.4)
6.9
(5.1
)
C
urre
nt m
ariju
ana
use
(day
s/m
onth
)5.
8 (1
0.5)
8.5
(11.
7)
A
lcoh
ol u
se a
vera
ged
acro
ss p
regn
ancy
(A
A/d
ay)5
,70.
0 (0
.0)
0.3
(0.6
)***
A
lcoh
ol u
se p
er o
ccas
ion
duri
ng p
regn
ancy
(A
A/d
ay)5
,70.
3 (0
.6)
4.3
(1.7
)***
Alcohol Clin Exp Res. Author manuscript; available in PMC 2012 August 13.
NIH
-PA Author Manuscript
NIH
-PA Author Manuscript
NIH
-PA Author Manuscript
Burden et al. Page 22
CO
N (
n=10
1)1
AL
C (
n=38
)2
B
inge
dri
nkin
g du
ring
pre
gnan
cy (
bing
es/m
onth
)70.
0 (0
.0)
2.1
(3.5
)***
C
urre
nt a
lcoh
ol u
se (
bing
es/m
onth
at 1
1 yr
)2.
0 (3
.6)
5.7
(5.8
)***
1 Due
to m
issi
ng o
bser
vatio
ns, g
roup
n r
ange
s fr
om 9
2 to
101
.
2 Due
to m
issi
ng o
bser
vatio
ns, g
roup
n r
ange
s fr
om 3
7 to
38.
3 From
AN
OV
A o
r C
hi-s
quar
e.
4 Bas
ed o
n 7
non-
verb
al W
ISC
-IV
IQ
sub
test
s an
d st
anda
rd s
core
s fo
rm 2
ver
bal t
ests
(B
osto
n N
amin
g, V
erba
l Flu
ency
), a
dapt
ed f
or tr
ansl
atio
n in
to I
nukt
ituk.
5 Log
ged
valu
es w
ere
used
in th
e A
NO
VA
s; u
nlog
ged
mea
ns a
re s
how
n he
re.
6 Hol
lings
head
fou
r fa
ctor
inde
x of
soc
ial s
tatu
s (u
npub
lishe
d m
anus
crip
t).
7 Bas
ed o
n re
tros
pect
ive
repo
rt a
t 11-
yr.
8 Mea
ns b
ased
on
win
sori
zed
valu
es.
Not
e. G
roup
dif
fere
nces
bas
ed o
n t-
test
s or
chi
-squ
ares
are
sho
wn
with
ast
eris
ks.
† p <
.10
* p <
.05;
**p
< .0
1;
*** p
< .0
0
Alcohol Clin Exp Res. Author manuscript; available in PMC 2012 August 13.
NIH
-PA Author Manuscript
NIH
-PA Author Manuscript
NIH
-PA Author Manuscript
Burden et al. Page 23
Tabl
e 2
Go/
No-
go r
esul
ts b
y ex
posu
re g
roup
.
CO
N (
n =
76)
AL
C (
n =
31)
ES1 ;
F, p
-val
ue
Beh
avio
ral p
erfo
rman
ce2
G
o (%
cor
rect
)93
.1 (
6.7)
91.6
(7.
8)0.
01; 1
.02,
p =
.31
N
o-go
(%
cor
rect
)65
.1 (
9.9)
65.3
(10
.1)
0.00
; 0.0
1, p
= .9
3
C
orre
ct G
o R
T (
ms)
465
(63)
454
(64)
0.01
; 0.6
0, p
= .4
4
FA
(in
corr
ect N
o-go
) R
T (
ms)
395
(68)
389
(67)
0.00
; 0.1
5, p
= .7
0
ER
P3
P2
pea
k am
plitu
de G
o (μ
V)
9.7
(0.4
)9.
0 (0
.7)
0.01
; 0.7
0, p
= .4
1
P2
pea
k am
plitu
de N
o-go
(μ
V)
10.4
(0.
6)11
.0 (
1.0)
0.00
; 0.3
0, p
= .5
8
P2
late
ncy
Go
(ms)
251
(3)
265
(5)
0.05
; 5.2
4, p
< .0
5
P2
late
ncy
No-
go (
ms)
254
(4)
275
(6)
0.07
; 8.0
0, p
< .0
1
N
2 pe
ak a
mpl
itude
Go
(μV
)-5
.9 (
0.5)
-5.9
(0.
7)0.
00; 0
.00,
p =
.99
N
2 pe
ak a
mpl
itude
No-
go (μ
V)
-6.6
(0.
8)-5
.3 (
1.3)
0.01
; 0.7
2, p
= .4
0
N
2 la
tenc
y G
o (m
s)38
0 (5
)39
4 (7
)0.
02; 2
.45,
p =
.12
N
2 la
tenc
y N
o-go
(m
s)37
0 (6
)35
8 (9
)0.
01; 1
.42,
p =
.24
P3
are
a G
o (μ
V)
3.0
(0.4
)2.
1 (0
.7)
0.01
; 1.1
5, p
= .2
8
P3
are
a N
o-go
(μ
V)
7.7
(0.7
)6.
5 (1
.1)
0.01
; 0.8
9, p
= .3
5
E
RN
pea
k am
plitu
de N
o-go
(μ
V)
-8.5
(0.
7)-7
.7 (
1.1)
0.00
; 0.3
9, p
= .5
3
Pe
pea
k am
plitu
de N
o-go
(μ
V)
12.7
(1.
0)12
.3 (
1.5)
0.00
; 0.0
4, p
= .8
4
1 Eff
ect s
ize
mea
sure
: ηp2 .
2 Mea
n (s
tand
ard
devi
atio
n).
3 Com
posi
te m
ean
acro
ss e
lect
rode
s (s
tand
ard
erro
r).
Alcohol Clin Exp Res. Author manuscript; available in PMC 2012 August 13.

NIH
-PA Author Manuscript
NIH
-PA Author Manuscript
NIH
-PA Author Manuscript
Burden et al. Page 24
Tabl
e 3
CR
T r
esul
ts b
y ex
posu
re g
roup
. CO
N (
n =
82)
AL
C (
n =
32)
ES1 ;
F, p
-val
ue
Beh
avio
ral p
erfo
rman
ce2
N
ew (
% c
orre
ct)
77.3
(14
.9)
75.3
(13
.6)
0.00
; 0.4
5, p
= .5
1
O
ld (
% c
orre
ct)
68.0
(17
.4)
66.2
(16
.3)
0.00
; 0.2
5, p
= .6
2
d-
prim
e (d
iscr
imin
atio
n)1.
36 (
0.93
)1.
20 (
0.87
)0.
01; 0
.69,
p =
.41
C
(bi
as)
0.16
(0.
25)
0.14
(0.
16)
0.00
; 0.2
5, p
= .6
2
C
orre
ct N
ew R
T (
ms)
797
(182
)74
8 (1
94)
0.01
; 1.6
3, p
= .2
0
C
orre
ct O
ld R
T (
ms)
827
(190
)77
2 (1
95)
0.02
; 1.9
5, p
= .1
7
ER
P3
P2
pea
k am
plitu
de N
ew (μ
V)
-0.6
(0.
6)1.
8 (1
.0)
0.03
; 3.8
1, p
= .0
53
P2
pea
k am
plitu
de O
ld (μ
V)
2.1
(0.7
)4.
5 (1
.1)
0.03
; 3.6
5, p
= .0
58
P2
late
ncy
New
(m
s)29
1 (3
)30
3 (5
)0.
03; 3
.49,
p =
.064
P2
late
ncy
Old
(m
s)29
4 (3
)30
1 (5
)0.
01; 1
.25,
p =
.27
FN
400
peak
am
plitu
de N
ew (μ
V)
-15.
3 (0
.6)
-12.
2 (1
.0)
0.06
; 6.9
4, p
< .0
1
FN
400
peak
am
plitu
de O
ld (μ
V)
-12.
3 (0
.7)
-10.
9 (1
.1)
0.01
; 1.2
7, p
= .2
6
FN
400
late
ncy
New
(m
s)40
5 (5
)40
4 (7
)0.
00; 0
.02,
p =
.89
FN
400
late
ncy
Old
(m
s)41
0 (4
)40
4 (7
)0.
01; 0
.56,
p =
.46
L
PC a
rea
New
(μ
V)
10.2
(0.
6)8.
3 (1
.0)
0.02
; 2.5
4, p
= .1
1
L
PC a
rea
Old
(μ
V)
13.7
(0.
7)10
.9 (
1.1)
0.04
; 5.0
5, p
< .0
5
1 Eff
ect s
ize
mea
sure
: ηp2 .
2 Mea
n (s
tand
ard
devi
atio
n).
3 Com
posi
te m
ean
acro
ss e
lect
rode
s (s
tand
ard
erro
r)
Alcohol Clin Exp Res. Author manuscript; available in PMC 2012 August 13.