the effectiveness of using picture series
129
THE EFFECTIVENESS OF USING PICTURE SERIES IN TEACHING SPEAKING OF THE TENTH GRADE STUDENTS OF SMA N 1 KARANGKOBAR BANJARNEGARA IN THE ACADEMIC YEAR 2013/2014 A THESIS Submitted in Partial Fulfillment of the Requirements to Acquire Sarjana Pendidikan Degree in English Education Program of Teacher Training and Education Faculty Muhammadiyah University of Purworejo Haryanti Devi Saputri 102120016 ENGLISH EDUCATION PROGRAM TEACHER TRAINING AND EDUCATION FACULTY MUHAMMADIYAH UNIVERSITY OF PURWOREJO 2014
-
Upload
khangminh22 -
Category
Documents
-
view
1 -
download
0
Transcript of the effectiveness of using picture series
THE EFFECTIVENESS OF USING PICTURE SERIES IN TEACHING SPEAKING OF THE TENTH GRADE
STUDENTS OF SMA N 1 KARANGKOBAR BANJARNEGARA IN THE ACADEMIC YEAR
2013/2014
A THESIS
Submitted in Partial Fulfillment of the Requirements
to Acquire Sarjana Pendidikan Degree in English Education Program
of Teacher Training and Education Faculty
Muhammadiyah University of Purworejo
Haryanti Devi Saputri
102120016
ENGLISH EDUCATION PROGRAM TEACHER TRAINING AND EDUCATION FACULTY MUHAMMADIYAH UNIVERSITY OF PURWOREJO
2014
ii
iii
iv
v
MOTTOS
Working without praying will be nothing. Praying without working are
empty dreams. Believe that God will always open the blessing door.
The succes is our right. Therefore,you must get the success with your
capability.
More haste less time, less time more haste.
Do your best, at any moment that you have.

vi
DEDICATION
In the name of Allah the Beneficent and the Merciful, the final project is dedicated
to:
My beloved parents who always love me, support me, pray for me and
become teachers, friend, and counsellor in my life. Thank you for the
valuable efforts and contributions in making my education success. I love
you.
My beloved grandmother who always gives me attention, support, and
pray.
My brother, my sister in law, and my little niece (Afifah Zarla and Afifah
Uswatun Nadiroh), thanks for making my life more colorful.
My beloved family, thank you very much for praying and understanding
during my study. I love you all.
Someone who always has time for me and support for me (Sarif Maulana).
Because of you, my world is really beautiful. Thank for all sweet
moments.
All of my friends in boarding house (Asri, Tyas, Winda, Dewi, Triwil,and
Hera, thanks for incredible and unforgetable moment that we have passed
together and make my life meaningful. I love you all.
All of my friends in A class. thanks for every moment that we have done.
All lecturers and the administration staff of English Department for the
guidance and help all this time.
vii
ACKNOWLEDGEMENT
Alhamdulillah, Praise and Thank to Allah SWT, The Most Gracious and the Most
Merciful, who has given me blessing and guidance so that I can accomplish the
writing of this thesis. In the occasion, I would like to express my deepest gratitude
and appreciation to the following:
1. Drs. H. Supriyono, as the Rector of Muhammadiyah University of Purworejo.
2. Drs. H. Hatono, M. M., as the Dean of Teacher Training and Education
Faculty of Muhammadiyah University of Purworejo.
3. Semi Sukarni, M.Pd., as the Head of English Language Education
Department of Muhammadiyah University of Purworejo.
4. Juita Triana, M.Pd., as my consultant who has given guidence, suggestion,
correction, advices, encouragement, and time for begining up to the
completion of this thesis writing.
5. All lecturers of English Department who enrich the writer’s knowledge
personality and gudance during the completion of this thesis.
6. Drs. A. Junaidi. A, M.M., as the Headmaster of State Senior High School 1
Karangkobar Banjarnegara who has given permission to conduct this
research.
7. Maliana Budiani, S.Pd, as English teacher at class X who helped the writer
conducting the research.
8. Students of class X of SMA N 1 Karangkobar Banjarnegara.
viii
9. All the staff of Muhammadiyah University of Purworejo library and all the
staff of administration for helps, and services that make this thesis finish.
10. My beloved parents who always pray for me, support me, and finance my
education.
Finally , the writer would like to extend great thanks to all of the people that
cannot be mentioned one by one who support me in finishing this thesis. the
writer realizes that this thesis is still far from being perfect; therefore, the writer
will happily accept constructive criticism in order to make it better. The writer
hopes that this thesis would be beneficial to everyone. Amin.
Purworejo, July 2nd, 2014
The Writer,
Haryanti Devi Saputri
ix
ABSTRACT
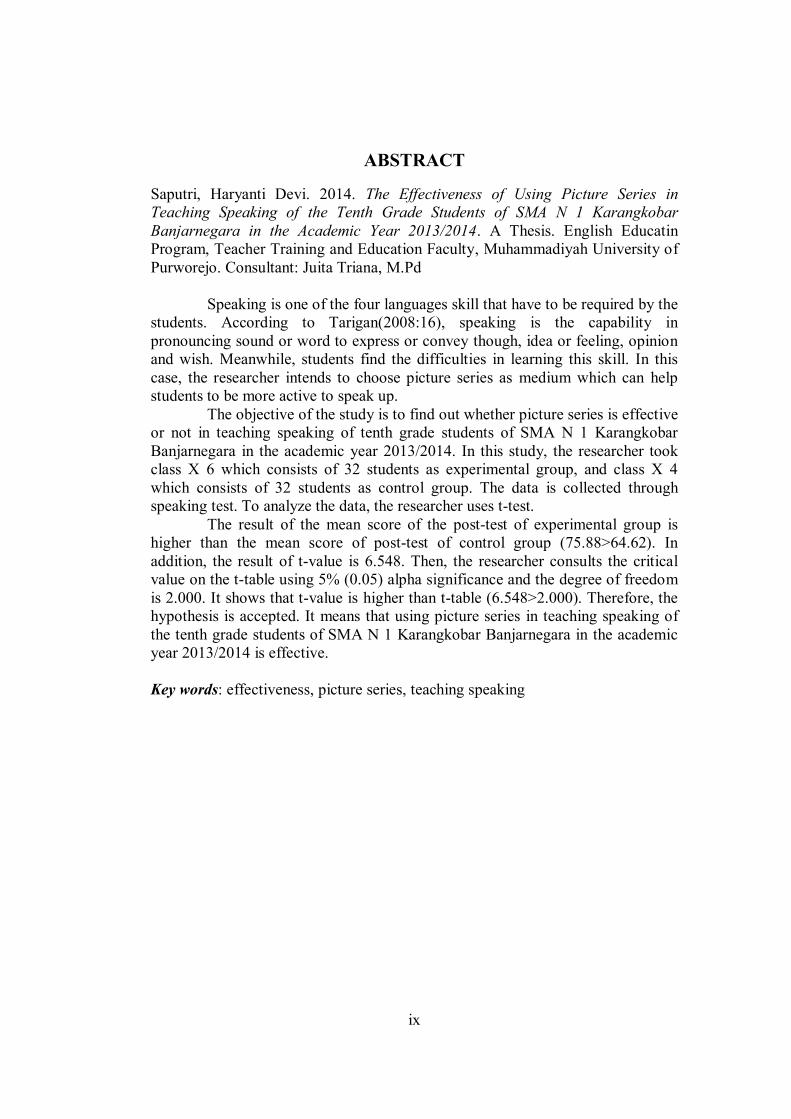
Saputri, Haryanti Devi. 2014. The Effectiveness of Using Picture Series in Teaching Speaking of the Tenth Grade Students of SMA N 1 Karangkobar Banjarnegara in the Academic Year 2013/2014. A Thesis. English Educatin Program, Teacher Training and Education Faculty, Muhammadiyah University of Purworejo. Consultant: Juita Triana, M.Pd
Speaking is one of the four languages skill that have to be required by the students. According to Tarigan(2008:16), speaking is the capability in pronouncing sound or word to express or convey though, idea or feeling, opinion and wish. Meanwhile, students find the difficulties in learning this skill. In this case, the researcher intends to choose picture series as medium which can help students to be more active to speak up.
The objective of the study is to find out whether picture series is effective or not in teaching speaking of tenth grade students of SMA N 1 Karangkobar Banjarnegara in the academic year 2013/2014. In this study, the researcher took class X 6 which consists of 32 students as experimental group, and class X 4 which consists of 32 students as control group. The data is collected through speaking test. To analyze the data, the researcher uses t-test.
The result of the mean score of the post-test of experimental group is higher than the mean score of post-test of control group (75.88>64.62). In addition, the result of t-value is 6.548. Then, the researcher consults the critical value on the t-table using 5% (0.05) alpha significance and the degree of freedom is 2.000. It shows that t-value is higher than t-table (6.548>2.000). Therefore, the hypothesis is accepted. It means that using picture series in teaching speaking of the tenth grade students of SMA N 1 Karangkobar Banjarnegara in the academic year 2013/2014 is effective. Key words: effectiveness, picture series, teaching speaking
x
TABLE OF CONTENTS
Title ................................................................................................................ i
Aproval Sheet ................................................................................................. ii
Ratification Sheet............................................................................................ iii
Statement ........................................................................................................ iv
Mottos ............................................................................................................ v
Dedications ..................................................................................................... vi
Acknowledgement .......................................................................................... vii
Abstract ......................................................................................................... ix
Table of Contents ............................................................................................ x
List of Tables .................................................................................................. xii
List of Charts .................................................................................................. xii
List of Appendices .......................................................................................... xiv
CHAPTHER I INTRODUCTION
A. Background of the Study ................................................... 1
B. Identification of the Problem ............................................. 7
C. Limitation of the Problem .................................................. 8
D. Problem Statement ............................................................ 8
E. Objective of the Study ....................................................... 8
F. Significance of the Study ................................................... 9
G. The Definition of Key Term .............................................. 10
H. The Organisation of the Thesis .......................................... 11
CHAPTER II REVIEW OF RELATED LITERATURE A. Previous Studies ................................................................ 12
B. Theoretical Review............................................................ 13
1. Teaching and Learning Proccesss .................................. 13
a. Definition of teaching ............................................... 13
b. Definition of learning ................................................ 14
c. Teaching and learning process ................................... 15
2. Speaking ....................................................................... 18
a. Definition of speaking .............................................. 17
xi
b. Types of Speaking Performance ................................ 17
c. Function of Speaking ................................................ 19
d. Speaking Asessment ................................................. 21
3. Media ............................................................................ 22
a. Definition of media ................................................... 22
b. Function of Media in Teaching and Learning Process 24
c. Picture Series ........................................................... 26
d. The Use of Picture Series in Teaching Speaking........ 28
4. Conceptual Framework .................................................. 29
C. Hypotesis .......................................................................... 30
CHAPTER III RESEARCH METHODS A. Research Design ................................................................ 31
B. Variables of the Research .................................................. 32
C. Place and Time of Research ............................................... 33
D. Population and Sample ...................................................... 33
E. Sampling Technique .......................................................... 34
F. Research instrument ........................................................... 36
G. Technique of Collecting Data ............................................ 37
H. Technique of Data Analysis .............................................. 38
1. Descriptive Analysis ...................................................... 38
2. Inferential Analysis ....................................................... 38
3. Test of Hypothesis ......................................................... 39
CHAPTER IV RESEARCH FINDING AND DISCUSSION
A. Descriptive Analysis ......................................................... 41
B. Inferential Analysis ........................................................... 50
C. Discussion and Result of the Research ............................... 58
CHAPTER V CONSLUSION AND SUGGESTIONS
A. Conclusion ........................................................................ 61
B. Suggestions ....................................................................... 62
REFERENCES ............................................................................................. 69
APPENDICES .............................................................................................. 71
xii
LIST OF TABLES
Table 1. The Criterions of Scoring the Spoken Test............................................21
Table 2. Classification of Students’ Speaking Skill ............................................41
Table.3. The Result of Speaking Test of Experimental Group ............................42
Table.4. The Result of Speaking Test of Control Group .....................................43
Table.5. The Result of Speaking Post Test at Experimental Group and Control
Group .....................................................................................................44
Table.6. Degree Mastery of Post-Test of Experiment Group...............................46
Table.7. Degree Mastery of Post-Test of Control Group .....................................47
Table.8. Score of Speaking Skill of the Experiment Group and Control Group ...47
Table.9. The Result of Computation Done By SPSS 17.00 .................................54

xiii
LIST OF CHARTS
Chart 1. The Chart of Frequency Range and Precentage Range of Speaking Skill
Result of Experimental Group ..............................................................48
Chart 2. The Chart of Frequency Range and Precentage Range of Speaking Skill
of Control Group ..................................................................................49
Chart 3. The Chart of Frequency Range and Precentage Range of Speaking Skill
Result of Experiment Group and Control Group ...................................50
xiv
LIST OF APPENDICES
Appendix 1. Information Letter from Muhammadiyah University of Purworejo
Appendix.2. Information Letter from SMA N 1 Karangkobar Banjarnegara
Appendix.3. Syllabus
Appendix.4. Lesson Plan
Appendix.5. List of Sudents of Experimental Group and Control Group
Appendix.6. Instrument of Pre-test and Post-test (Experimental Group and
Control Group)
Appendix 7. Picture Series about Activities as Medium in Teaching Speaking
Appendix.8. Data Computation
Appendix.9. Descriptive and Inferential Analysis (Experimental Group and
Control Group)
Appendix.10. Table of F-statistic P=0.05
Appendix.11. Table of Chi Quadrate
Appendix.12. T-table
Appendix.13. The Activities of Experimental Group and Control Group
Appendix.14. Thesis Consultation
1
CHAPTER I INTRODUCTION
This research is aimed at studying the effectiveness of using picture series as
a teaching media to improve students’ speaking skill. This chapter is devided into
eight parts. They are background of the study, identification of the problem,
limitation of the problem, problem statement, the objective of the study,
significance of the study, the definition of key term, and the organization of the
study .
A. Background of the Study
Language has an important rule for human life. The people all over the
world speak the language when they meet one another. The world without
language likes silent world. People’s need of the language is not separated
from main functions of the language, namely language to communication, to
express thoughts and feelings, and to understand what is expressed by others.
All countries in the world have set the language as one of the compulsory
subjects studied at school. One of the languages that has been the most
important language in international communication is English.
English is used by people in all over the world for communication. Many
things are written in English such as magazine, newspaper, scientific books
and products that often used by people. In our country, a lot of people are
interested in learning English. Consequently, in education, English has been
chosen as one of the subjects that should be mastered by the students of
elementary school, junior high school, senior high school, and even university
2
level. Besides, students have to be able to master the four skills in learning
language. Those four skills that have to be required by the language learners
are listening, speaking, reading, and writing.
Learning English is quite difficult because there are so many differences
between Indonesian and English culture. One of them is difficulty in
pronouncing speech sound in English. And for beginner, English likes strange
language. However, when we want to learn English, we have to know how to
speak first instead of how to read and write. Speaking is a second language
activity that people do in life after listening. To be able to speak in a language
properly, the speaker must master the pronounciation, structure and
vocabulary that is concerned. Speaking is important for them to practice their
capability and their understanding, how to send idea, and how to spell word
well. In this case the students’ motivation and interest are very needed to
make the process of their understanding more easily.
But, in fact, speaking is more complicated than it seems at first and
involves more just receiving and pronouncing some words. It happens
because it also employs the process of thinking of ideas and the ability to
transfer the ideas to the listeners. Therefore, it is not surprising when the
students find it hard in learning this skill. Because of the influence of the
students’ first language, students tend to feel frightened to speak up in
English and be actively involved in class. They are afraid of making mistakes
on their speaking, for examples are their grammar is bad and their vocabulary
is not enough. Moreover, they are not confident with themselves when they
3
make mistakes. It is because their classmates will laugh at and make fun of
him/her. That condition certainly also make students feel boring. That
classroom atmosphere is not encouraging. They have low motivation to study.
Students will not focus with the material, and they just join the class without
pay attention or cheat with their friends. Sometimes, when students work in
pair or group, they just end up chatting in their own language. Besides, when
all students speak together, it gets too noisy and uncontrollable so that the
teacher loses control of the class.
Therefore, to make the students have strong interest in teaching and
learning process especially in learning speaking, the teacher should take
interactive techniques to present material interestingly and effectively instead
of only using textbook to help students learn more easily and build up
students’ interest and enthusiasm. Actually textbook is not the main thing in
teaching, but it just assit students’ need to master English. The teacher should
avoid teaching their students in a passive ways, e.g the students only sit and
listen to the teacher and doing the teacher’s instruction. They are rarely given
opportunity to be active in teaching learning process. In fact, students are not
easy to speak English fluently if they only study at school generally. But, if
the school has certain rule and has good condition of school environment, so
the students can speak English as well.
Teaching and learning process will be successful if they are supported by
some factors such as the method that is used in teaching English,
completeness of teaching facilitation, interesting media, and condition of
4
school environment. It is also expected to be able to give a good contribution
for the school in improving the teaching and learning process as well as the
teaching and learning quality. According to Nunan (1996: 119), learning
appear to be maximized when classroom tasks are clearly linked to the
student need and broader curricular objectives that are conveyed to the
students in ways that are meaningful to them. If an English class is conducted
in interesting and varied ways, students will feel that their study is
meaningful and useful so that they can be expected to have high motivation to
study English. Without motivation, the students do not have efforts to do
something to improve their ability. Then, the teachers have to create many
ways to explain the subject so that it can be understood by the students.
Teachers, moreover, have to make students relaxed and feel that they are part
of the class. Because the professional teacher must have the competence to
teach students as well as can produce graduates who master the competencies
that learned at each level of education. The teacher is central to environment.
How teachers see themselves, how learners see themselves, and how they see
each other is central to developing relationships. Hence, it is suggested that
teachers vary their activities and use media in teaching. Appropriate materials
and media are able to help students learn more easily and build up students’
interest so that it can create a lively classroom.
Media are things that is offered by many experts as a tool to improve the
interest and motivations of the study. One of the important efforts that can be
done to raise the spirit of learning is designing learning in a pleasant

5
atmosphere. Fun learning would have different results with the learning
undertaken with full compulsion, depression, and threatened. Joyful learning
will be able to bring changes to the self-learner. That’s why, the ability to use
media as teaching technique is one of competences that every teacher must
have. At last the teacher hopes that media as a method can motivate the
students to speak English to communicate their need especially in the
classroom and in their daily need in general.
Picture is one medium which is suggested for helping the success of
teaching-learning process. Pictures give visual stimuli to help them transfer
their idea more easily and build up their interest. To reveal the learners’
ability to speak in a language, picture can be good stimulative conversation.
Stimuli in the form of picture is very good to be used by children of primary
school or foreign language learner in early stage. However, picture can also
be used to stimulative by learners that has high skill in languange depending
on picture itself how it is used. By seeing the clear pictures, the students will
understand more about the topic being taught. Actually, there are two kinds of
pictures; they are single picture (situational picture) and picture series (picture
sequence). Single picture is picture that has a one – word name and less
related between each other. Picture series is a set of pictures that have a
connected to each other because a set of picture series consists of more than
five picture that explain something.
In speaking, picture series is an important medium that is very useful.
Teacher can apply picture series. It is interesting for the students, and they
6
have something to look at while teaching and learning process. Besides,
picture series can assist the students because the picture series can guide them
to speak.
Additionally, in learning speaking, students can start to learn English
begin with their activities. Activities are something that is certainly done by
people. So, they will be easy to absorb and remember it. In this case, the
researcher considers to use pictures series about set of activities that most
people do as medium in teaching speaking. Students can tell about their
activities by using picture series to guide them in speaking. So, picture series
can help students to learn speaking and activate everyone in the class to speak
up.
For conducting the study, the researcher uses some previous studies as
inspiration and consideration. There some studies about using picture series
as medium in teaching and learning process which have been conducted. The
first study is “The Effectiveness of Using Sequence Pictures in Teaching
Writing of Procedure Text to the Seventh Grade Students of SMP N 1
Kajoran in the Academic Year of 2012/2013” written by Pratiwi (2013). The
second study is “The Effectiveness of Using Picture Series to Improve
Students Writing Ability in Recount Text At The Eight Grade Students of
SMPN 33 Purworejo in The Academic Year of 2011/2012” written by Hestri
(2012). The differences between this study and previous studies is on the
object of study. Pratiwi’s and Hestri’s thesis are about teaching writing.
Meanwhile, this study analyzes teaching speaking. The similarity of Pratiwi’s
7
and Hestri’s thesis with this research is using sequence picture or picture
series.
B. Identification of the Problem
Based on the background above, the researcher finds that students don’t
feel confident to speak up in English and be actively involved in class. They
are also not accustomed with English. They are afraid of making mistakes on
their speaking. Besides, teacher usually use a book and modul as the media to
teach. It is not effective to improve the students’ speaking skill. The teacher
should use interactive media to get students’ interest in this subject.
Using “picture series” is chosen by the researcher because the researcher
considers that “picture series” could be one of the best teaching media which
can help students to be more active in the class to speak up.
C. Limitation of the Problem
The researcher wants to limit those problems in order to focus on the
subject of the research. The research is conducted to tenth grade students of
SMA N 1 Karangkobar Banjarnegara in the academic year 2013/2014. The
researcher focuses on the effectiveness of using picture series as medium to in
teaching speaking. In this case, the researcher uses picture series about
activities that most people do. It will make students easily to speak because
they tell about something that is familiar with it.
8
D. Problem Statement
In reference to the background of the study previously stated, this study
attempts to answer this question: Is “picture series” an effective medium in
teaching speaking of tenth grade students of SMA N 1 Karangkobar
Banjarnegara in the academic year 2013/2014?
E. Objective of the Study
In relation to the research problem above, the objective of this study is to
find out whether picture series is effective or not in teaching speaking of tenth
grade students of SMA N 1 Karangkobar Banjarnegara in the academic year
2013/2014?
F. Significance of the Study
This research is hoped that can be useful for the English teacher, the
students, and the other researcher.
1. For the teachers
This study is expected that give more the information for English
teacher about the use of picture series as medium in teaching speaking.
Furthermore, it can help them vary their teaching technique using “picture
series” in order to activate their speaking class. Besides, it is also
expected that after applying this medium in teaching, teacher can create a
fun and interesting speaking class. By having a fun and interactive
teaching, the students will be able to gain their speaking skills and to
become active and responsive.
9
2. For the students
For the students, “picture series” as medium in teaching is expected
to be able to attract students to be more active in their speaking class.
They will be easy to understand through this medium. Additionally, they
will courage and confidence in using English. So, they can improve their
speaking skill.
3. For other researcher
The result of this research is expected that can be useful to give
references to the next related researches.
G. The Definition of Key Term
To clarify the content of the thesis, the writer presents some key term as
follows:
1. Effectiveness
According to Hornby (1995:375), effectiveness is a strong or pleasing
impression of something, it can be said that as mutual of something or
material applied.
2. Picture Series
Picture series in this research means that the medium that is used to teach
speaking. According to Nurgiyantoro (2010:204), Picture series is a set of
pictures that have conected to each other because a set of picture series
consist of more than five picture that explain something.
10
3. Teaching
According to Brown (2007:8), teaching is guiding and facilitating
learning, enabling the learner to learn, setting the conditions for learning.
4. Speaking
Speaking is the capability in pronouncing sound or word to express or
convey though, idea or feeling, opinion and wish (Tarigan, 2008:16).
H. The Organisation of the Thesis
This thesis has five chapter. With the purpose of facilitating the readers
to understand the study, this research is organized as follows:
CHAPTER I : INTRODUCTION. This chapter explains about
background of the study, identification of the problem,
reason for choosing the topic, limitation of the problem,
problem statement, objective of the study, significance
of the study, the definition of key terms, and the
organization of the thesis.
CHAPTER II : REVIEW OF RELATED LITERATURE. This chapter
explains about previous studies, theoretical review, and
hypothesis. The related theories are concept of teaching
and learning process, speaking, and media.
CHAPTER III : RESEARCH METHODS. The researcher explain about
reseach design, variable of the research, time and place
of the research, population and sample, sampling

11
technique, research instrument, technique of collecting
data, technique of data analysis.
CHAPTER IV : RESEARCH FINDING AND DISCUSSION. This
chapter deals with research findings and discussions that
concern with the results of the study.
CHAPTER V : CONCLUSION AND SUGGESTION. The researcher
presents conclusion and suggestion.
12
CHAPTER II REVIEW OF RELATED LITERATURE
In this chapter, the researcher presents the theories that underlie the
research related to the case that the researcher want to analyze. This chapter
covers the previous studies, theoretical review, and hypothesis.
A. Previous Studies
This research employs some previous studies to make easy in finishing
this study and to avoid repeating the same study.
The first study is “The Effectiveness of Using Sequence Pictures in
Teaching Writing of Procedure Text to the Seventh Grade of SMP N 1
Kajoran in the Academic Year of 2012/2013” written by Pratiwi (2013). This
study is experimental research. The researcher uses t-test. After collecting the
data and analyzing them, the researcher present the result of the research. The
result of the mean score post test of experimental group is higher than the
mean score of post test of control group (74.06 > 68.56). In addition, the
result of t-value is 2.42. Then, the researcher consult the critical value on the
t-table using 5% (0.05) alpha level significance and the degree of freedom is
2.000. It shows that t-value was higher than t-table (2.42>2.000). The result
showed that using sequence pictures in writing of procedure text to the
seventh grade of SMP N 1 Kajoran in the Academic Year of 2012/2013 is
effective.
The second study is “The Effectiveness of Using Picture Series to
Improve Students Writing Ability in Recount Text at the Eight – Grade
13
Students of SMP N 33 Purworejo in the Academic Year of 2011/2012 written
by Hestri (2012). The objective of the study is to find out whether of using
picture series as media to improve students’ writing ability in recount text is
effective or not at the eight grade students of SMP N 33 Purworejo. The
researcher used a test as to get a data. The sample of this thesis is two classes
which are devided into control group and experimental group. After getting
enough data the researcher counted the data using t-test formula. Based on the
result, it was found that using picture series were effective to improve
students’ writing competence. It is proved by the result of statistical
calculation of the t-test 2.35 which is higher than t-table, 2.00. thus t-test was
higher than t-table (2.35>2.00).
B. Theoretical Review
1. Teaching and Learning Process
a. Definition of teaching
Teaching is the most important process to reach the objective of
the education. According to Brown (2007:8), teaching is guiding and
facilitating learning, enabling the learner to learn, setting the
conditions for learning. Hornby (2000:1386) also states that teaching
is to help somebody to learn something by giving information about it.
While, Nunan (1996: 137) also defines teaching as an exciting
and uncertain profession because the personal chemsitry between
teacher – student and student – student means that no two classes will
ever be exactly the same. Besides, Djamarah and Zain (2010:39) state
14
teaching is process to arrange, organize environment around the
students so it can motivate learners to study.
From that explanation, the researcher can conclude that teaching
is a process transfer information or knowledge between teacher and
student in the classroom in door or out door, the act of guiding
someone in the study of something.
b. Definition of learning
Learning is acquiring or getting of knowledge of a subject or a
skill by study, experience, or instruction. According to Djamarah and
Zain (2010:10), learning is a change of behavior due to experience
and training. Naim (2009:179) also says that learning is change. If
there is no time to change, it means that there is no true learning.
While Spears in Suryabrata (2014:231) defines that learning is to
observe, to read, to imitate, to try something themselves, to listen, to
follow direction.
Brown stated (2007:8) learning is human activity which is done
since they were doing until they die. He proposes a composite of the
definition of learning as follows:
1. Learning is retention of information or skill.
2. Retention implies storage systems, memory, cognitive,
organization
3. Learning involves active, conscious focus on and acting upon
events outside or inside the organism.
15
4. Learning is relatively permanent, but subject to forgetting.
5. Learning involves some form of practice, perhaps reinforced
practice.
6. Learning is a change behavior.
Based on the definition above, it can be concluded that learning is
a process of activity which is done by people to get change of
experience in interaction in environment or to get knowledge by
study.
c. Teaching and learning process
Teaching – learning process is designed to follow the educative
principle. Teaching and learning has a close relationship each other, if
there is a learners process, there must be a teaching process. Teaching
and learning activities is a condition that is created designedly.
Learning process happens because there is an interaction of an
individual to the social environment. The responsibility of learning
depends on the students, and the teacher only has responsibility to
create good situation to build students’ motivation. Djamarah and
Zain (2010:33) states that in teaching and learning, there are two
things that will determine the success, namely setting the learning
process, and teaching itself. And both have the same dependence on
one another.
According to Suardi as qouted in Djamarah and Zain (2010:39-
41), the characteristics of teaching learning process are:
16
1. Teaching learning process has a goal that is to form the student in
certain development.
2. There is a planned procedure that is designed to achieve intended
goal. In order to achieve the goal optimally, so interaction needs a
procedure.
3. Teaching and learning activities are characterized by processing a
particular material. In this case, material is designed to achieve the
goal.
4. Students’ activity. There is no advantage in teaching and learning
process if the students are passive. Because the students who learn
so they must do it.
5. In teaching learning activities, teacher is as mentor. Teacher should
give motivation to their students for making favorable interaction.
6. In teaching and learning process needs discipline.
7. There is limited time. Each goal will be given a certain time, when
the goal must be achieved.
8. Evaluation. Evaluation should be conducted to know the
achievement of the goal.
2. Speaking
a. Definition of Speaking
Speaking is an articulation of sound to express thought. Speaking
is the verbal use of language to communicate with others. According
to Harmer (2001:269), speaking as the ability to speak fuently

17
presupposes not only knowledge of language feature, but also the
ability to process information and language. Tarigan (2008:16) says
that speaking is the capability in pronouncing sound or word to
express or convey though, idea or feeling, opinion and wish.
The main purpose of speaking is to send the message for the other
one or to be able to communicate about something in language and
understood by someone who becomes a listener. We generally use
speaking as a means of communication in daily interaction. Thus,
speaking is considered to be inseparable to something that we call as
communication. Communication is the way individual can show the
feelings, tell the thought, ask questions, ask for help, argue, persuade,
explain, and give order each other.
b. Types of Speaking Performance
According to Brown (2004:141), there are 5 basic types of
speaking. They are as follows:
1. Imitative
At one of continuum of types of speaking performance is the
ability to simply parrot back (imitate) a word or phrase or possibly a
sentence. While this is a purely phonetic level of oral production, a
number prosodic, lexical, and grammatical properties may be
included in the criterion performance.
2. Intensive
18
A second type of speaking frequently employed in a assessment
contexts is the production of short stretches of oral language designed
to demonstrate competence in a narrow band of grammatical, phrasal,
lexical or phonological relationship (such as prosodic elements –
intonation, stress, rhythm, juncture). The speaker must be aware of
semantic properties in order to able to respond but interaction with an
interlocutor or test administrator is minimal at best. Example of
intensive assesment task include directed response tasks, reading
aloud, sentence and dialogue completion; limited pictured – cued
tasks including simple sequences; and translation up to the simple
sentence level.
3. Responsive
Responsive assessment task include interaction and test
comprehension but at the somewhat limited level of very short
conversation, standard greetings and small talk, simple requests and
comments and the like. The stimulus is almost always a spoken
prompt (in order to preserve authenticity), with perhaps only one or
two follow-up questions or retorts.
4. Interactive
In difference between responsive and interactive speaking is
in the length and complexity of the interaction, which sometimes
includes multiple exchanges and/or multiple participants.
Interaction can take the two forms of transactional language,
which has the purpose of exchanging specific information, or
19
interpersonal exchanges, which have the purpose of maintaining
social relationships. Interactive assesment task include interview,
role play, discussions and conversation, game.
5. Extensive
Extensive oral production tasks include speeches, oral
presentations, picture–cued story-telling, and retelling a story
news events, during which the opportunity for oral interaction
from listeners is either highly limited (perhaps to nonverbal
responses) or ruled out altogether.
c. Function of Speaking
Tarigan (2008:16) defines that speaking has three functions. They
are to inform, to entertain, and to persuade. While, Brown and Yule in
Richards (2008:21) says that talk is as interaction, transaction,
performance. Each of these speech activities is quite distinct in terms
of form and function and require different teaching approaches. The
following are the explanation of talk as interaction, talk as
transactional and talk as performance:
1. Talk as interaction
This refers to what they normally means by “conversation”
and describe interaction which serves a primarily social function.
When people meet, they exchange greetings, engage in small talk ,
and chit chat, recount recent experiences, and so on because they
wish to be friendly and to establish a comfortable zone of present
20
themselves to each other than on the message. Such exchanges
may be either casual or more formal depending on the
circumstance and their nature. According to the explanation
above, talk interaction has some function. The function can be
applied for the student to retell their recent activities.
2. Talk as transactional
This type of talk refers to situtations where the focus is on
what is said or done. The message and making oneself understood
clearly and accurately is the central focus, rather than the
participants and how they interact socially with each other.
3. Talk as performance
The third type of talk that can usefully be distinguished has
been called talk as performance. This refers to public talk, that is,
talk that transmits information before an audience, such as
classroom presentations, public announcements, and speeches.
Talk as performance tends to be in the form of monolog rather
than dialog, often follows a recognizable format (e.g., a speech of
welcome), and is closer to written language than conversational
language. Similarly, it is often evaluated according to its
effectiveness or impact on the listener, something that is unlikely
to happen with talk as interaction or transaction.
21
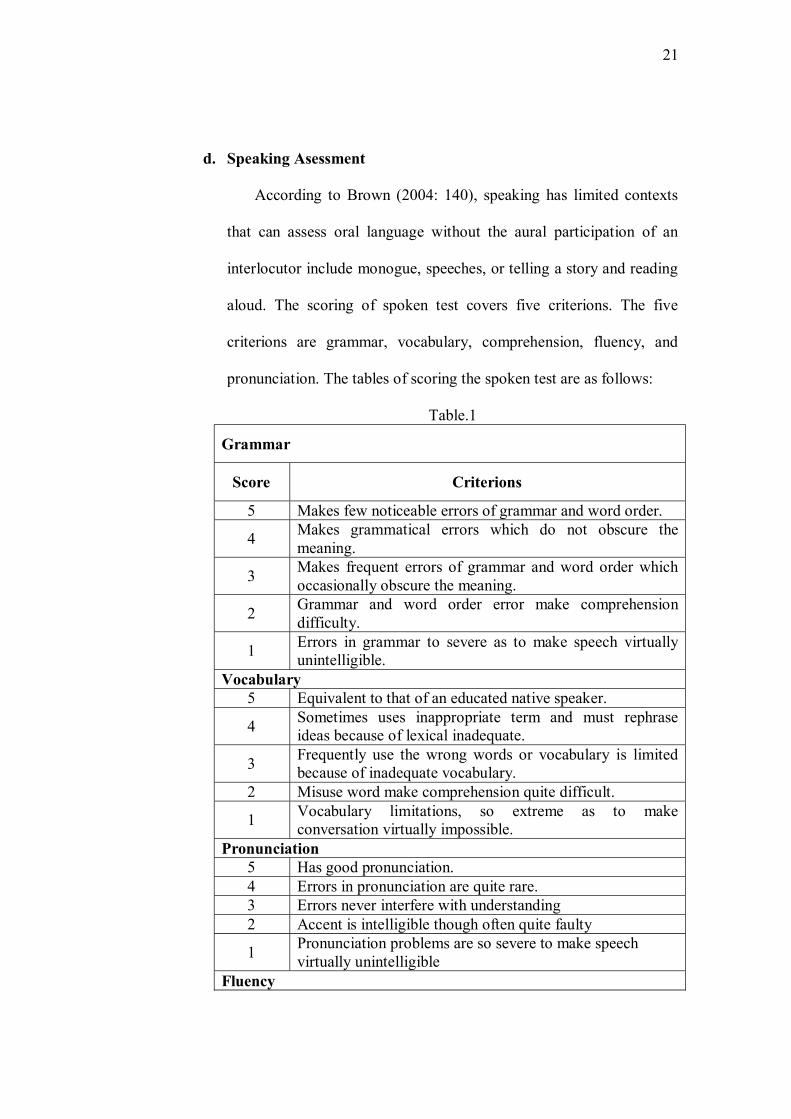
d. Speaking Asessment
According to Brown (2004: 140), speaking has limited contexts
that can assess oral language without the aural participation of an
interlocutor include monogue, speeches, or telling a story and reading
aloud. The scoring of spoken test covers five criterions. The five
criterions are grammar, vocabulary, comprehension, fluency, and
pronunciation. The tables of scoring the spoken test are as follows:
Table.1
Grammar
Score Criterions
5 Makes few noticeable errors of grammar and word order.
4 Makes grammatical errors which do not obscure the meaning.
3 Makes frequent errors of grammar and word order which occasionally obscure the meaning.
2 Grammar and word order error make comprehension difficulty.
1 Errors in grammar to severe as to make speech virtually unintelligible.
Vocabulary 5 Equivalent to that of an educated native speaker.
4 Sometimes uses inappropriate term and must rephrase ideas because of lexical inadequate.
3 Frequently use the wrong words or vocabulary is limited because of inadequate vocabulary.
2 Misuse word make comprehension quite difficult.
1 Vocabulary limitations, so extreme as to make conversation virtually impossible.
Pronunciation 5 Has good pronunciation. 4 Errors in pronunciation are quite rare. 3 Errors never interfere with understanding 2 Accent is intelligible though often quite faulty
1 Pronunciation problems are so severe to make speech virtually unintelligible
Fluency

22
5 Has fluency in the language as a native speaker
4 Speed of speech seems to be slightly affected by language problems.
3 Speed and fluency are rather strongly affected by language problems.
2 Usually hesitant, often forced into silence by language limitation.
1 Speech is halting and fragmentary, so it make conversation virtually impossible.
Comprehension 5 Appears to understand everything without difficulty.
4 Understand nearly everything at normal speed, although occasional repetitions may be necessary.
3 Understand most of what is said at slower than normal speed with repetitions.
2 Frequent do repetitions and has great difficulty following what is said.
1 Can’t be said to understand ever simple conversational English.
(Brown, 2004: 172-174)
The scale of 0 up to 100 will be used to make the scoring easier.
Here, the maximum rate a student will get 25. So, the obtained rate is
multipled by 4.
3. Media
a. Definition of media
Media derived from the word “media” which comes from Latin
and is the plural of “medium” which means intermediary or
introductory. According to Hornby (2000:830), media are the main
ways that large numbers of people receive information and
entertainment, that is television, radio, and the newspaper etc. So,
media are distributor of information and message. Media have
function as way to achieve the goal of learning process. Media that the
23
teachers used is actually to give motivating for students so that they
can enjoy in learning English. Based on the belief that teaching and
learning process using media will enhance students’ learning activities
in a long time. Djamarah and Zain (2010: 121 - 122) defines that
teaching learning activities using media will produce a good process
and output than does not use media.
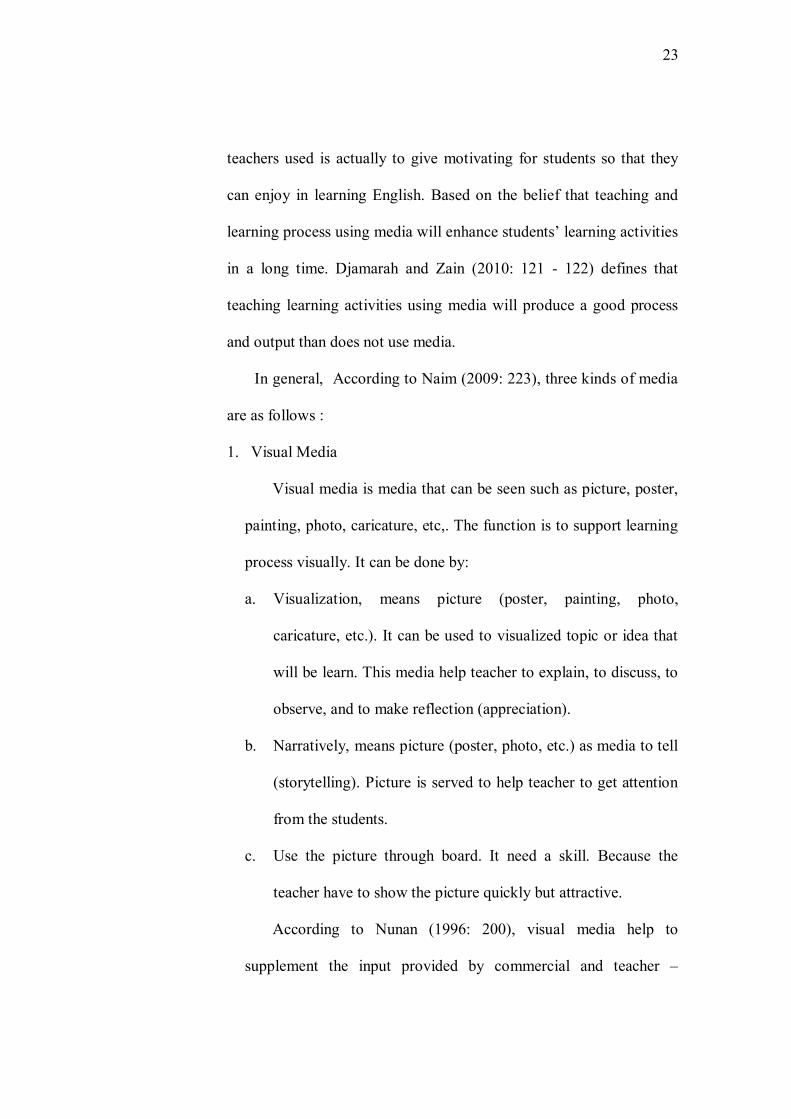
In general, According to Naim (2009: 223), three kinds of media
are as follows :
1. Visual Media
Visual media is media that can be seen such as picture, poster,
painting, photo, caricature, etc,. The function is to support learning
process visually. It can be done by:
a. Visualization, means picture (poster, painting, photo,
caricature, etc.). It can be used to visualized topic or idea that
will be learn. This media help teacher to explain, to discuss, to
observe, and to make reflection (appreciation).
b. Narratively, means picture (poster, photo, etc.) as media to tell
(storytelling). Picture is served to help teacher to get attention
from the students.
c. Use the picture through board. It need a skill. Because the
teacher have to show the picture quickly but attractive.
According to Nunan (1996: 200), visual media help to
supplement the input provided by commercial and teacher –
24
produced material, they can help to stimulate motivation and
interest, and they can help to show learners how language is used in
genuine contexts of use. In short, they can help to bring the
language classroom to life.
2. Audio media
Audio media are media thay can be listened to such as song
from cassete, CD.
3. Audio visual media
The media that involve the sense of sight and hearing are
named as audio visual media. These media are not only through
film but it can be computer such as powerpoint and flashcard.
b. Function of Media in Teaching and Learning Process
Media have function as way to achieve the goal of learning
process. Because of lack of clarity of the material presented can be
assisted by media as an intermediary. The complexity of the material
to be presented to the student can be simplified with media. Media
that the teachers used is actually to give motivating for students so
that they can enjoy in learning English. So, the researcher can
conclude that teaching and learning process using media will enhance
students’ learning activities in a long time.
Sudjana in Djamarah and Zain (2010:134) formulates the function
of media into six categories, they are:
25
1. The use of media in teaching learning process is not an additional
function. It has own function as instrument to create the
effectiveness of learning condition.
2. The use of media in teaching learning is a part of whole interaction
of teaching situation. It means that media are one of element that
should be developed.
3. It is used appropriate with the goal of the lesson content. This
function implies that the use of media should look at the goal and
materials lesson.
4. The use of media is not as entertainment or to complement the
learning process to attract the students.
5. The use of media in teaching learning is more to accelerate the
teaching learning process and assist student in accepting the
explanation.
6. The use of media in teaching learning is to improve the teaching
learning quality. By using media, students’ can memorize what
they achieve in long time. The writer concludes that using media in
teaching learning process help teacher to convey the subject.
Meanwhile, Wright (2004:2 - 4) mentions some consideration in
selecting media. First, it should be easy to prepare. If it is difficult to
prepare, the teacher should not do it. If it takes a lot of time and the
teacher can use it many times with different classes, it is worth the
effort. Second, it should be easy to organize in the classroom. The

26
teachers have to decide whether the effort of organizing a complicated
activity is worthwhile. They has to consider that many activities
require organizational time and energy. Third, it should be interesting
to the students and the teachers. If the teacher’s activity does not make
the students interested, then they will have question whether it is
worth doing. Fourth, the language and the way the teacher wants the
students to use media will be authentic to the activity. The students
will get more if the language that they use is vital to the situation.
Fifth, the activity must give rise to a sufficient amount of language in
order to justify its conclusion in the language lesson. If it does not, the
teacher should not do it. In choosing and using kinds of media, a
teacher should also consider the importance of the media in attaining
the objectives of the work, the availability of the media as compared
with other media, and the effectiveness of the media as compared to
the other media. It means that in using the media, the teacher must be
sure that the media used are really important, good, and suitable for
the class condition and material given.
c. Picture Series
Picture Series is sequence picture of a single subject. Its function
is to tell a story or sequence of events. Pictures series is an effective
medium that is used in teaching and learning process. According to
Brown (2004:180), picture series as a stimulus for a longer story or
description. The use of picture can give a great help to a teacher in a
27
class. Picture is very simple because it can be drawn, printed, or
photograpical processed in any size, and color and also it can be
correlated with a lesson and real life. Wright (2004:136) states that
pictures have been used for centuries to help students understand
various aspect of foreign language.
Picture series have an important role in teaching learning process
in order to make the students still focus and understand the material
easily. Picture is one of the medium in teaching learning process to
support the presentation of the material by emphasizing the students’
visual sense. Nunan (1996:200) defines that picture and sequence
picture (picture series) are excellent for encouraging the production of
oral.
However, picture gives advantages and disadvantages in teaching
and learning process for both teacher and students. The advantages of
using picture as a medium in teaching learning process are as follows:
1. Can stimulate and motivate students to become more observant and
express themselves
2. Is inexpensive, many even be free, and fairly easy to locate
3. Is up-to-date and can bring reality into the classroom
4. Can be used to introduce, supplement, or summarize at unit
5. Enriches reading and can help clarify misunderstanding
Meanwhile, the disadvantages of using picture are as follows:
1. Cannot depict motion as film does
28
2. If not unique, can seem uninteresting to pupils
3. Depicting a specific purpose might be difficult to locate
(http://www.shvoong..com/writing-and-speaking/branded-
content/2103882-advantages-disadvantages-using-picture-media/).
Based on the explanation above, it can be concluded that the
teacher should notice the advantages and disadvantages using picture
as medium in teaching and learning process. So that they are able to
reach the target of learning.
d. The Use of Picture Series in Teaching Speaking
In teaching learning proces, teachers have to select materials with
clear objectives, the students’ level and interest in mind, and get to
know it well before using it. And teacher must have a method to take
the students active in speaking class. Nurgiyantoro (2012:402) defines
that to reveal the learners speak in a language, visual media can be
simulative good conversation. It makes something clearer. It is also
can be used to create situation for speaking classes more clearly.
As the researcher knows that students don’t feel confident to
speak up in English and be actively involved in class. They are also
not accustomed with English. They are afraid of making mistakes on
their speaking.
The researcher uses picture series about activities that most people
do. Picture series involves students to retell their last activities that
they have done. Because it is one of the ways to explain a real
29
situation. That is also can make the students interest to learn the
material. Students will easy to speak because they tell about
something that is familiar with it. Through telling their activities, the
students can improve their pronunciation in speaking and enrich the
vocabulary. The students can perform how to communicate to each
other by the aid of this medium. The students have more courageous
to speak.
Therefore, the researcher chooses picture series as medium.
Pictures are more understandable than words. The responses to
pictures are often considerably faster than words. By using pictures in
teaching speaking, it is expected that it can give better result and can
improve students speaking skill.
4. Conceptual Framework
This study has been mentioned before that speaking is considered as
difficult skill to be mastered by the students. In speaking, the students
have to practice their capability and their understanding, how to send idea,
and how to spell word well. However, it becomes a complicated process
to the students because they have limited vocabularies and grammar
knowledge.
Teaching and learning process cannot be separated from the use of
media because media are considered as tool to improve the interest and
motivation of the study. Using media as teaching technique in one of the
competences that every teacher must have. One of the media that can be
30
used in the teaching and learning process is picture series. Picture can
help students to understand more about the material being taught. Picture
series is interesting for students, and they have something to look at while
teaching and learning process. These advantages can be maximally used
in teaching and learning of speaking to improve the students’ speaking
skill.
The researcher uses picture series about activities that most people do
in their daily life. It will help students to understand the material and can
be active in the class to speak up. Students can tell about their activities
by using picture series to guide them in speaking.
C. Hypotesis
Hypothesis is a tentative statement about the outcome of a research.
There are two hypotheses as follows:
1. Ho: the use of picture series in teaching speaking of the tenth grade
students of SMA N 1 Karangkobar Banjarnegara in the academic year
2013/2014 is not effective.
2. Ha: the use of picture series in teaching speaking of the tenth grade
students of SMA N 1 Karangkobar Banjarnegara in the academic year
2013/2014 is effective.

31
CHAPTER III RESEARCH METHODS
In this chapter, the researcher will explain the research method. Research can
be defined as an effort to find, to develop and to test the truth of knowledge and
the effort done by using scientific method. According to Sugiyono (2012:3),
research method is scientific way to get the data with certain use and purpose.
This chapter presents research design, variable of the research, place and time
of the research, population and sample, sampling technique, research instrument,
technique of collecting data, and technique of data analysis.
A. Research Design
Before doing the research, the researcher arranged a research design.
Basicaly, there are two kinds of the research, they are qualitative research and
quantitative research. In this research, the researcher uses quantitative
research. According to Arikunto (2013:30), quantitative research is devided
into two parts. They are experimental and non – experimental. This study is
experimental design because the researcher needs some information to find
out the result of the effectiveness of using picture series in teaching speaking
and to compare the result of the pre-test and the post-test of the tenth grade
students of SMA N 1 Karangkobar Banjarnegara in academic year
2013/2014.
There are two class groups that are chosen. They are experimental group
and control group. Then they are given pretest – posttest to know the

32
condition whether there is a difference between experimental group and
control group.
The sketch of this design can be seen as follow:
E
K
O1 X O2
O3 O4
Explanation:
R : Experimental and control class that are chosen randomly
O1 & O3 : Pre-test of experimental and control class
O2 & O4 : Post-test of experimental and control class
X : Treatment (Teaching speaking by using picture series)
B. Variables of the Research
According to Arikunto (2013:161), variables are the object of a research,
or the things that become points of attention of a research. There are two
variables of this research, they are:
1. Independent Variable
Nunan (1992:25) defines that independent variable is the variable that
experimenter expects to influence the other. Arikunto (2013:162) states
that the independent variable is the causal variable or free variable. In this
research, the independent variable is picture series that symbolized with
“X”.
R
33
2. Dependent Variable
According to Nunan (1992: 26), dependent variable is the variable
which the researcher observes and measures to determine the effect of the
independent variable. The dependent variable in this study is teaching
speaking. The dependent variable is symbolized with “Y”.
C. Place and Time of Research
1. The Place of the Research
In conducting the research, the researcher has set of the place of the
respondent to do the test. This research was conducted in SMA N 1
Karangkobar Banjarnegara in the academic year 2013/2014.
2. The Time of the Research
This research is divided into three sections. The first was pre-test, the
second was giving treatment for experimental group and giving
explanation of the material to the control group conventionally, and the
last was post test. The time of the research was on May 9th to May 11th,
2014.
D. Population and Sample
1. Population
According to Nunan (1992:231), population is all cases, situation, or
individuals who share one or more characteristics. Furthermore, Sugiyono
(2012:117) states population is a generalization region consisting of
34
objects / subjects that have certain qualities and characteristics that are
applied by researchers to learn and then drawn the conclusions.
The population of this research is the students of the tenth grade of
SMA N 1 Karangkobar Banjarnegara in the academic year of 2013/2014.
The number of the students is 251 students which are divided into 8
classes.
2. Sample
In a research, all members of population should be researched. But it
is possible to research a part of them as the sample. The sample however
must be really representative to all population. In brief, Nunan (1992:232)
states that sample is subset of individuals or cases within population.
While, according to Arikunto (2013:174), sample is a part of
representative of population of the research. In this research, the
researcher took two classes as the sample. One class would be treated as
experimental group and other as control group. Sample in this research is
class X4 as control class which consist of 32 students, X6 as experimental
class which consists of 32 students.
E. Sampling Technique
Arikunto (2013: 177-185) explains that to draw a sample accurately
requires many sampling techniques, which can be chosen in the research such
as:
35
1. Random Sampling
The researcher shuffles the subject of population so all subjects have
a change to be chosen.
2. Stratified Sampling
The researcher assumed that the population is divided into
stratification, the sample drawn from each stratification.
3. Area Sampling
It is sampling by drawing sample of every area in the population.
4. Purposive Sampling
The drawing of sampling is based on specific purpose by considering
the time consumed and other factors.
5. Propositional Sampling
This sample is to complete the area of probability sampling because
sometimes each area has different numbers, the drawing sample in
proportional sampling. It is proportioned to the numbers areas.
6. Quota Sampling
This sampling is based on the quota the researcher needs. The
samples have drawn random at area and stratification.
7. Cluster Sampling
The drawing of sample is based on cluster.
8. Double Sample
36
Double sample is two samples that is taken at the same time. The number
of first sample is bigger than the second sample. The second sample is to
check the completeness the number on the first sample.
Based on the kinds of sampling technique above, the researcher used
random sampling in taking the sample. The researcher could not hold a longer
time to do the research in the school. So, the researcher choose the subject of
population randomly. The researcher thinks that all subject have same a
change to be chosen to do this research.
F. Research instrument
To carry out the research, there are some ways of collecting the data.
Before collecting the data, the researcher made in an instrument first. The
instrument of the research is a tool or facility that is used by researcher for
collecting data in order to get better result. Arikunto (2013:192) states that
instrument is the tools used by the researcher when conducting a research
method. Some kinds of instrument are test, questionnaires, interview,
observation, rating scale, and documentation.
In this research, the research chose test as an instrument. According to
Arikunto (2013:193), test is a series of questions or exercises and other tools
used to measure skill, knowledge intelligence, ability or talent possessed by
individuals or groups. Test is any series of questions or of exercises or other
means to measure the skill, knowledge, intelligence, capacity or attitude of an
individual. This study is aimed at knowing the students achievement in
speaking, where students speak based on picture series.
37
The research used spoken test. The pre-test was given before the
treatment, and posttest was given after the treatment. The researcher assessed
the pronunciation, grammar, vocabulary, fluency, and comprehension.
G. Technique of Collecting Data
In this research, the researcher takes the tenth grade students of SMA N 1
Karangkobar Banjarnegara which is consist of 251 students, but the writer
just takes 32 students in experimental class and 32 students in control class as
the sample. The researcher conducted achievement test which have purpose to
measure students achievement after studying a material or lesson. There are
pre test and post test.
1. Pre test
Pre test was given before the students were given treatment. It was
given to the experimental class and control class. It was used to know the
speaking skill of the students before they get the treatment. It gave the
students to know their speaking skill before treatment.
2. Treatment
After the pre test was given, the treatment started. The students were
treated by using picture series about set of activities that most people do.
Treatments had been done in once time.
3. Post test
Post-test was given to the experiment class and control class. It was
given in order to know students’ achievement after they were taught
pictures (experimental class) and without pictures (control class). The
38
researcher used post test to know to what is the result of teaching
speaking by using picture series about activities.
H. Technique of Data Analysis
1. Descriptive Analysis
The descriptive analysis is used to describe the variable of this
research that is the effectiveness of using picture series in teaching
speaking of the tenth grade students of SMA N 1 Karangkobar
Banjarnegara. The descriptive analysis would be used in this research
were mean, mode, median, standard deviation, the lowest score, and the
highest score. After getting the result of each test, the next is putting the
data into t–test formula.
2. Inferential Analysis
In this analysis, the researcher analyzes the data to the hypothesis.
This analysis is done to find out the effectiveness of using picture series
to improve students’ speaking skill.
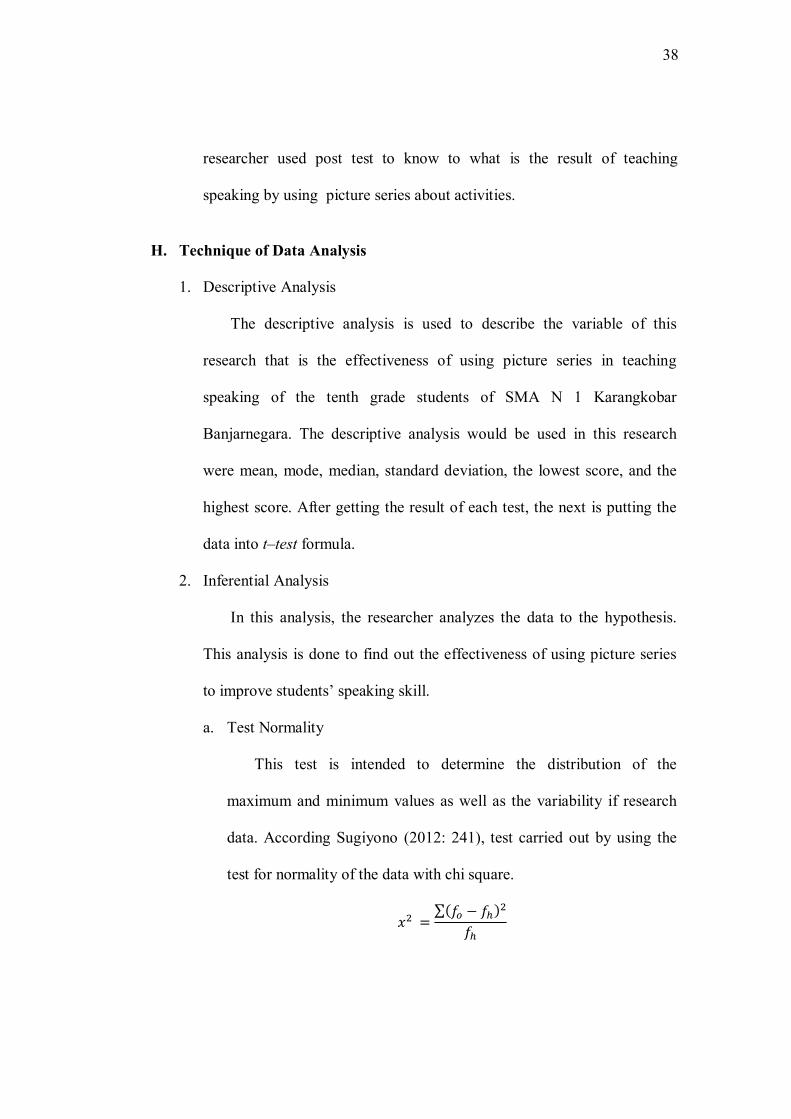
a. Test Normality
This test is intended to determine the distribution of the
maximum and minimum values as well as the variability if research
data. According Sugiyono (2012: 241), test carried out by using the
test for normality of the data with chi square.
�� �∑��� � ����
��
39
In which
�� = the chi square value
�� = the observed frequency �� = the expected frequency df = degree of freedom (the total class interval -1)
with this technique, the criteria for normal data if the subsidized price
of �� calculated is less than price of �� tables. The researcher analyses
the normality test using SPSS 17.00 with the Kolmogorov Sminov.
Testing criteria are as follows:
If probability value >0.05, so the data sitribution is normal.
If the probability value < 0.05, so the data distribution is not normal.
b. Test of Homogenity of Variance
The test determines whether the research is uniformly drawn from
the same population, given the research data drawn from separate
groups from one population.
According to Sugiyono (2012:275), to the test homogenity of
variance, the researcher use F test.
� ���� ������� ����������� ������ ��������
If the price Fvalues < Ftable it stated that variance of two group are homogeneus.
3. Test of Hypothesis
This test is used to know whether it is effective of teaching speaking
using picture series of the tenth grade students of SMA N 1 Karangkobar
Banjarnegara in the academic year 2013/2014. To decide which
40
hypothesis that will be accepted or rejected, the t-test formula is used to
compare two samples.
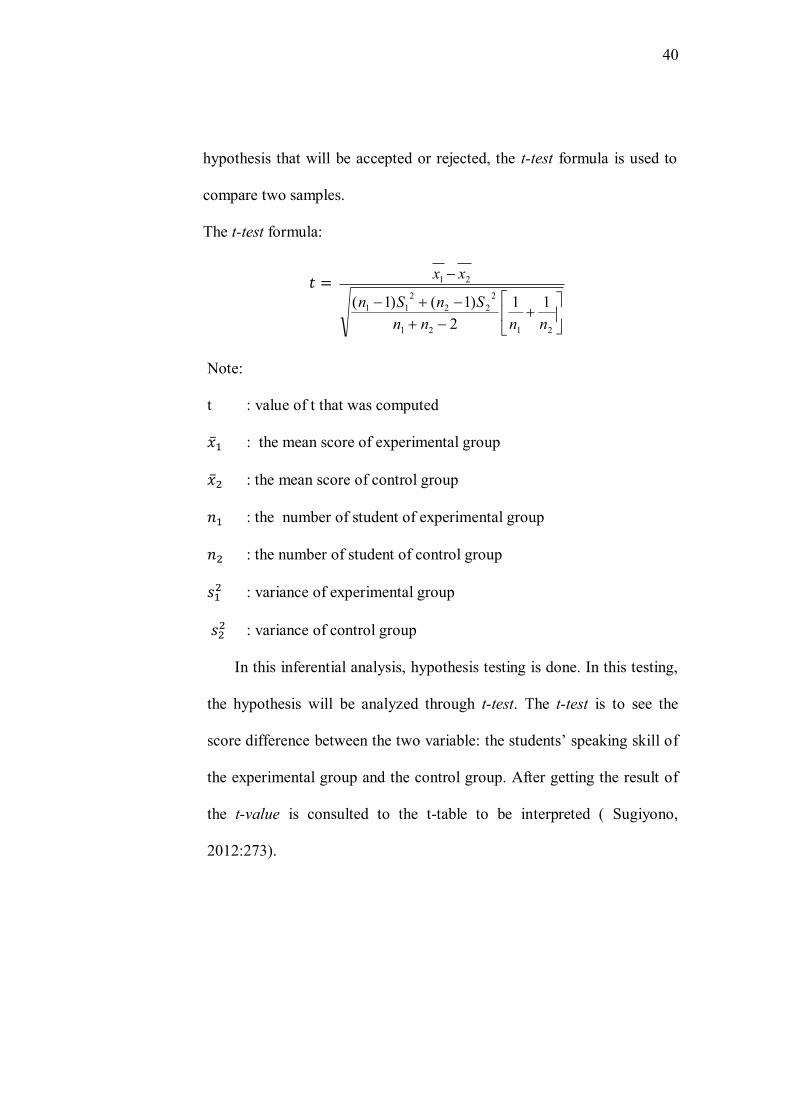
The t-test formula:
� �
2121
222
211
21
112
)1()1(nnnn
SnSn
xx
Note:
t : value of t that was computed
�̅� : the mean score of experimental group
�̅� : the mean score of control group
�� : the number of student of experimental group
�� : the number of student of control group
��� : variance of experimental group
��� : variance of control group
In this inferential analysis, hypothesis testing is done. In this testing,
the hypothesis will be analyzed through t-test. The t-test is to see the
score difference between the two variable: the students’ speaking skill of
the experimental group and the control group. After getting the result of
the t-value is consulted to the t-table to be interpreted ( Sugiyono,
2012:273).
41
CHAPTER IV RESEARCH FINDING AND DISCUSSION
A. Descriptive Analysis
To find out the effectiveness of using pictures series in teaching speaking
skill of the tenth grade students of SMA N 1 Karangkobar Banjarnegara in
the academic year 2013/2014, the writer does an analysis of quantitative data.
In conducting the research, the writer took two classes. They are 64 students.
The experimental group are 32 students (X6), and the control group are 32
students (X4), too. After conducting the research, the writer get the data of
research finding that is obtained by using the test of experimental class and
control class after conducting different treatment of learning process in both
classes. The writer collects data concerning the result by using the test. To
compare the result of speaking test, it is based on criteria of scoring. They are
as follows:
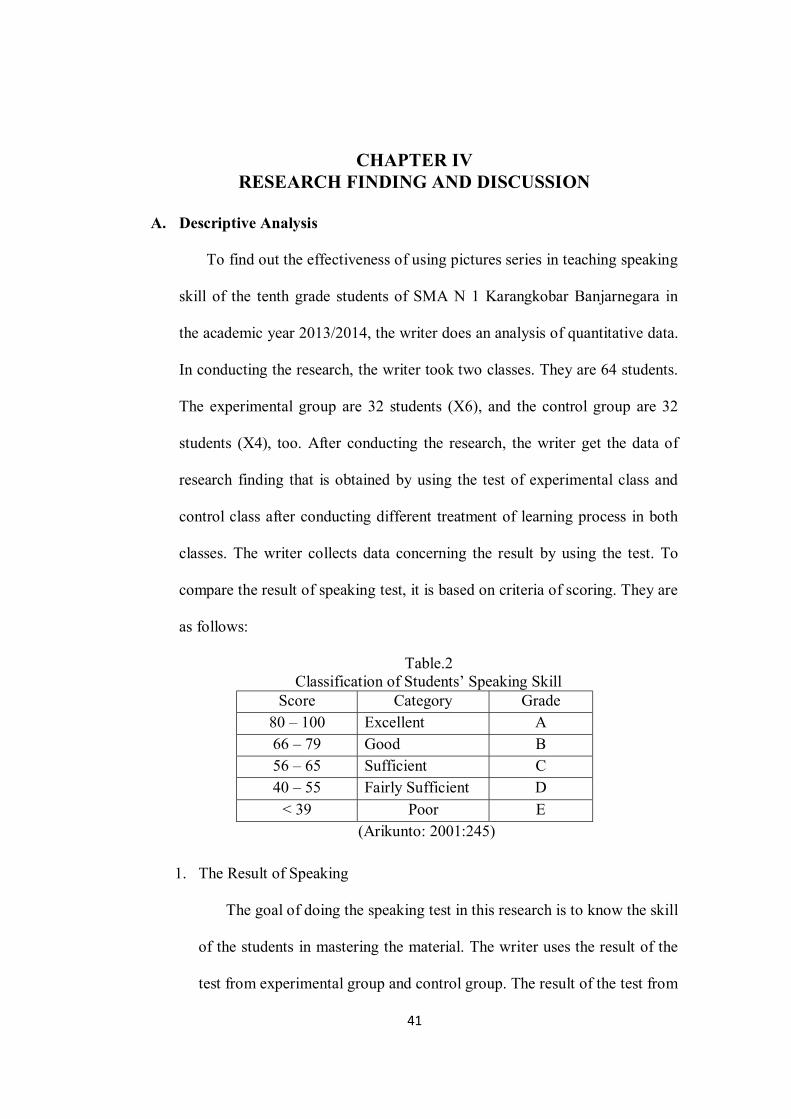
Table.2 Classification of Students’ Speaking Skill
Score Category Grade 80 – 100 Excellent A 66 – 79 Good B 56 – 65 Sufficient C 40 – 55 Fairly Sufficient D
< 39 Poor E (Arikunto: 2001:245)
1. The Result of Speaking
The goal of doing the speaking test in this research is to know the skill
of the students in mastering the material. The writer uses the result of the
test from experimental group and control group. The result of the test from
42
two variable can be shown in the following table:experimental group and
control group. The result of the test from two variable can be shown in the
following table:
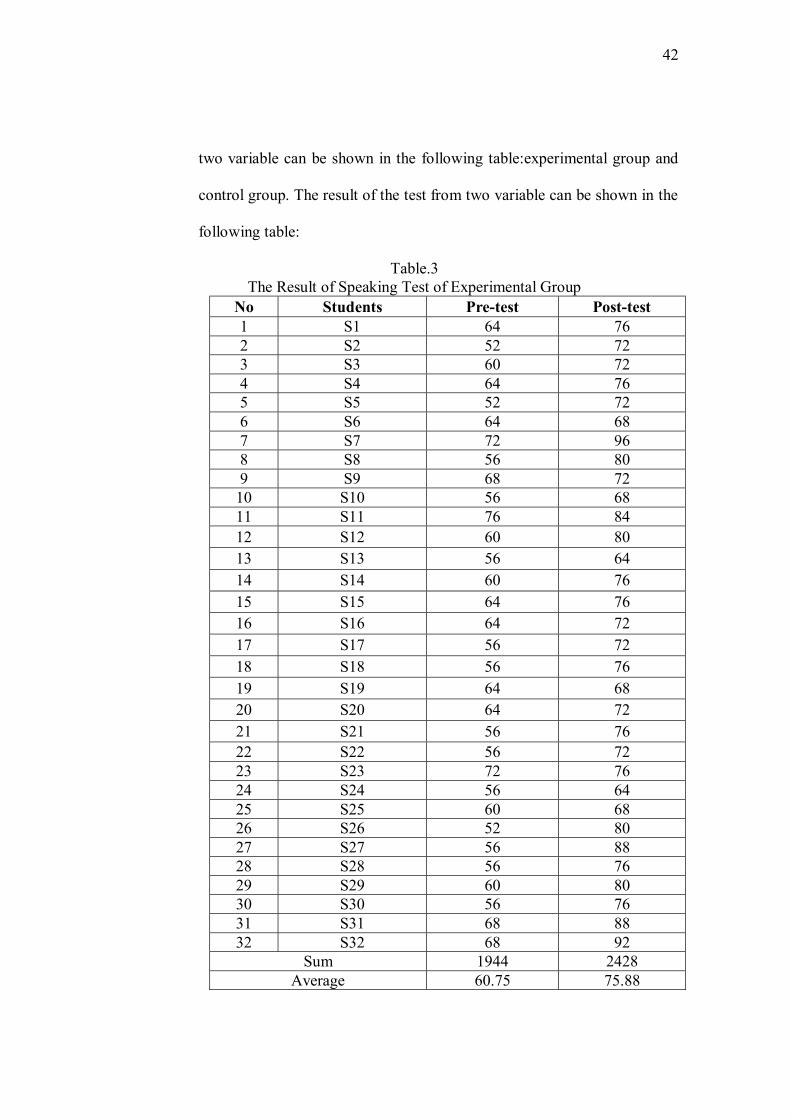
Table.3 The Result of Speaking Test of Experimental Group
No Students Pre-test Post-test 1 S1 64 76 2 S2 52 72 3 S3 60 72 4 S4 64 76 5 S5 52 72 6 S6 64 68 7 S7 72 96 8 S8 56 80 9 S9 68 72
10 S10 56 68 11 S11 76 84 12 S12 60 80 13 S13 56 64 14 S14 60 76 15 S15 64 76 16 S16 64 72 17 S17 56 72 18 S18 56 76 19 S19 64 68 20 S20 64 72 21 S21 56 76 22 S22 56 72 23 S23 72 76 24 S24 56 64 25 S25 60 68 26 S26 52 80 27 S27 56 88 28 S28 56 76 29 S29 60 80 30 S30 56 76 31 S31 68 88 32 S32 68 92
Sum 1944 2428 Average 60.75 75.88
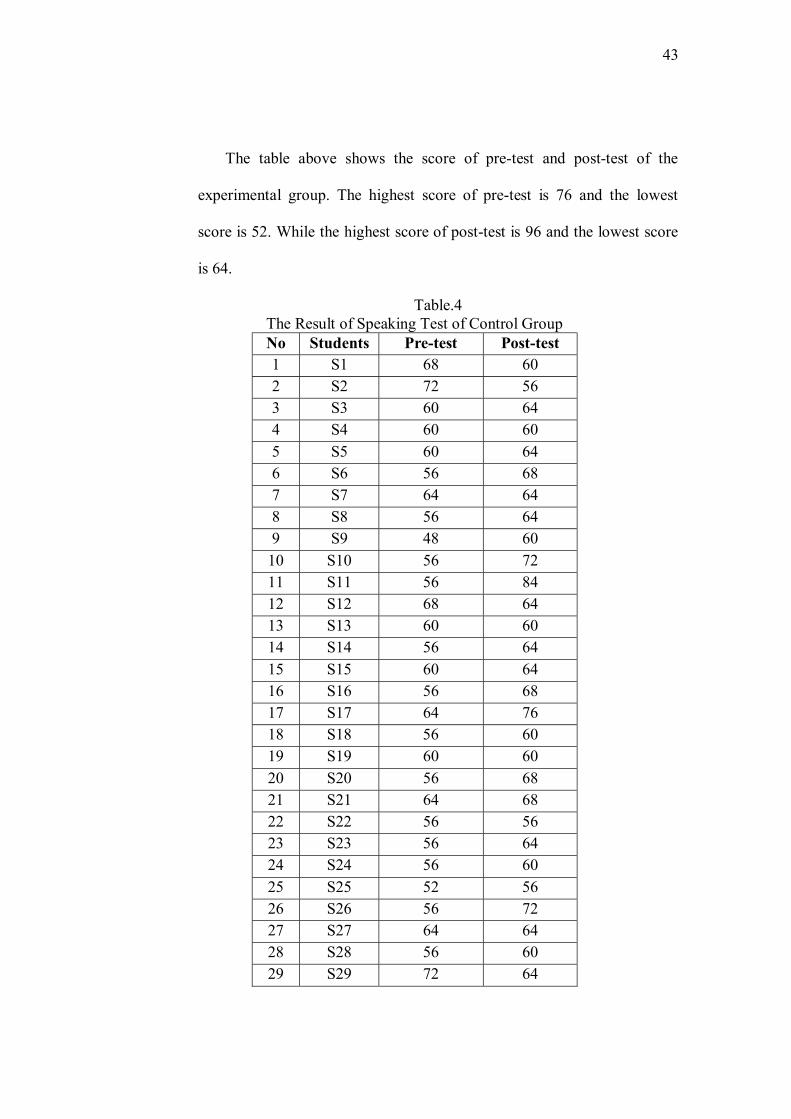
43
The table above shows the score of pre-test and post-test of the
experimental group. The highest score of pre-test is 76 and the lowest
score is 52. While the highest score of post-test is 96 and the lowest score
is 64.
Table.4 The Result of Speaking Test of Control Group No Students Pre-test Post-test 1 S1 68 60 2 S2 72 56 3 S3 60 64 4 S4 60 60 5 S5 60 64 6 S6 56 68 7 S7 64 64 8 S8 56 64 9 S9 48 60
10 S10 56 72 11 S11 56 84 12 S12 68 64 13 S13 60 60 14 S14 56 64 15 S15 60 64 16 S16 56 68 17 S17 64 76 18 S18 56 60 19 S19 60 60 20 S20 56 68 21 S21 64 68 22 S22 56 56 23 S23 56 64 24 S24 56 60 25 S25 52 56 26 S26 56 72 27 S27 64 64 28 S28 56 60 29 S29 72 64
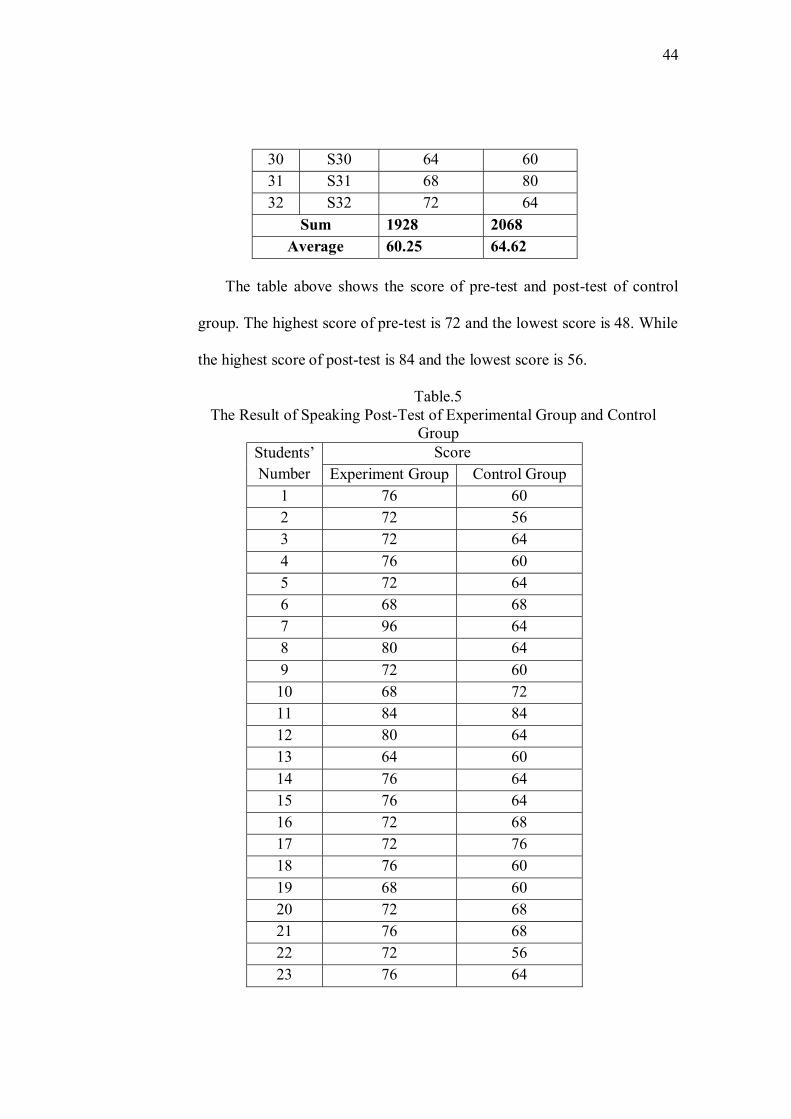
44
30 S30 64 60 31 S31 68 80 32 S32 72 64
Sum 1928 2068 Average 60.25 64.62
The table above shows the score of pre-test and post-test of control
group. The highest score of pre-test is 72 and the lowest score is 48. While
the highest score of post-test is 84 and the lowest score is 56.
Table.5 The Result of Speaking Post-Test of Experimental Group and Control
Group Students’ Number
Score Experiment Group Control Group
1 76 60 2 72 56 3 72 64 4 76 60 5 72 64 6 68 68 7 96 64 8 80 64 9 72 60
10 68 72 11 84 84 12 80 64 13 64 60 14 76 64 15 76 64 16 72 68 17 72 76 18 76 60 19 68 60 20 72 68 21 76 68 22 72 56 23 76 64
45
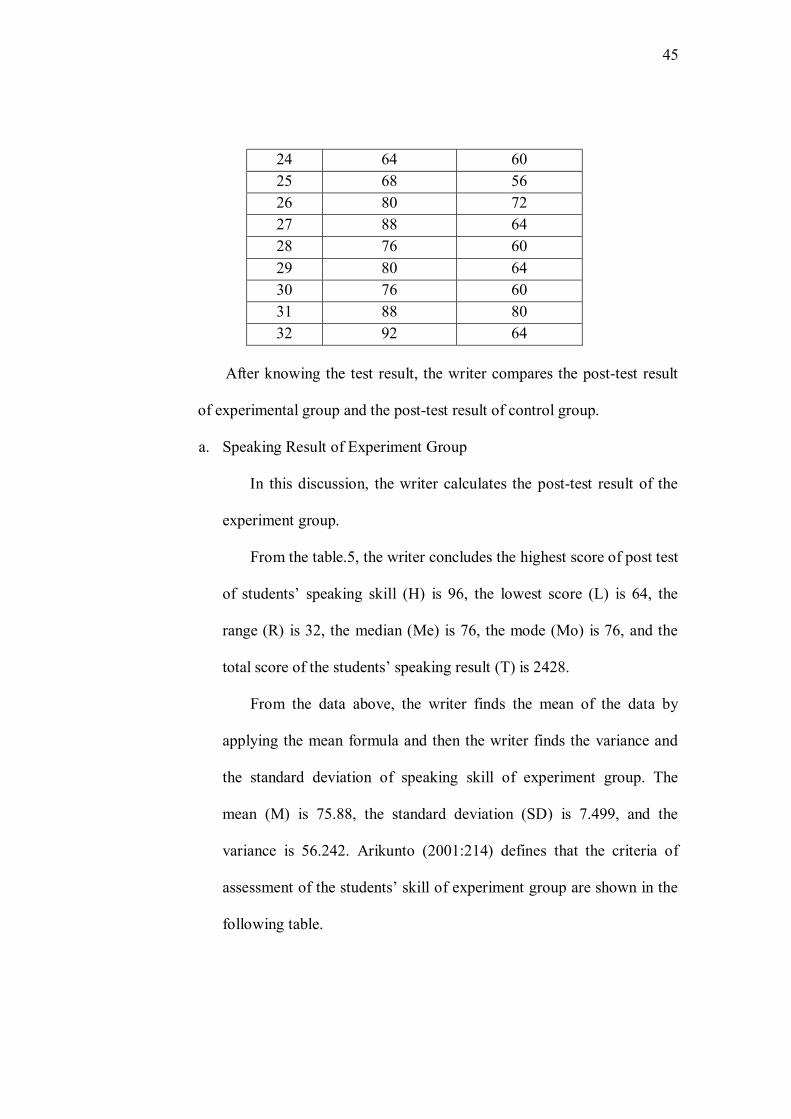
24 64 60 25 68 56 26 80 72 27 88 64 28 76 60 29 80 64 30 76 60 31 88 80 32 92 64
After knowing the test result, the writer compares the post-test result
of experimental group and the post-test result of control group.
a. Speaking Result of Experiment Group
In this discussion, the writer calculates the post-test result of the
experiment group.
From the table.5, the writer concludes the highest score of post test
of students’ speaking skill (H) is 96, the lowest score (L) is 64, the
range (R) is 32, the median (Me) is 76, the mode (Mo) is 76, and the
total score of the students’ speaking result (T) is 2428.
From the data above, the writer finds the mean of the data by
applying the mean formula and then the writer finds the variance and
the standard deviation of speaking skill of experiment group. The
mean (M) is 75.88, the standard deviation (SD) is 7.499, and the
variance is 56.242. Arikunto (2001:214) defines that the criteria of
assessment of the students’ skill of experiment group are shown in the
following table.

46
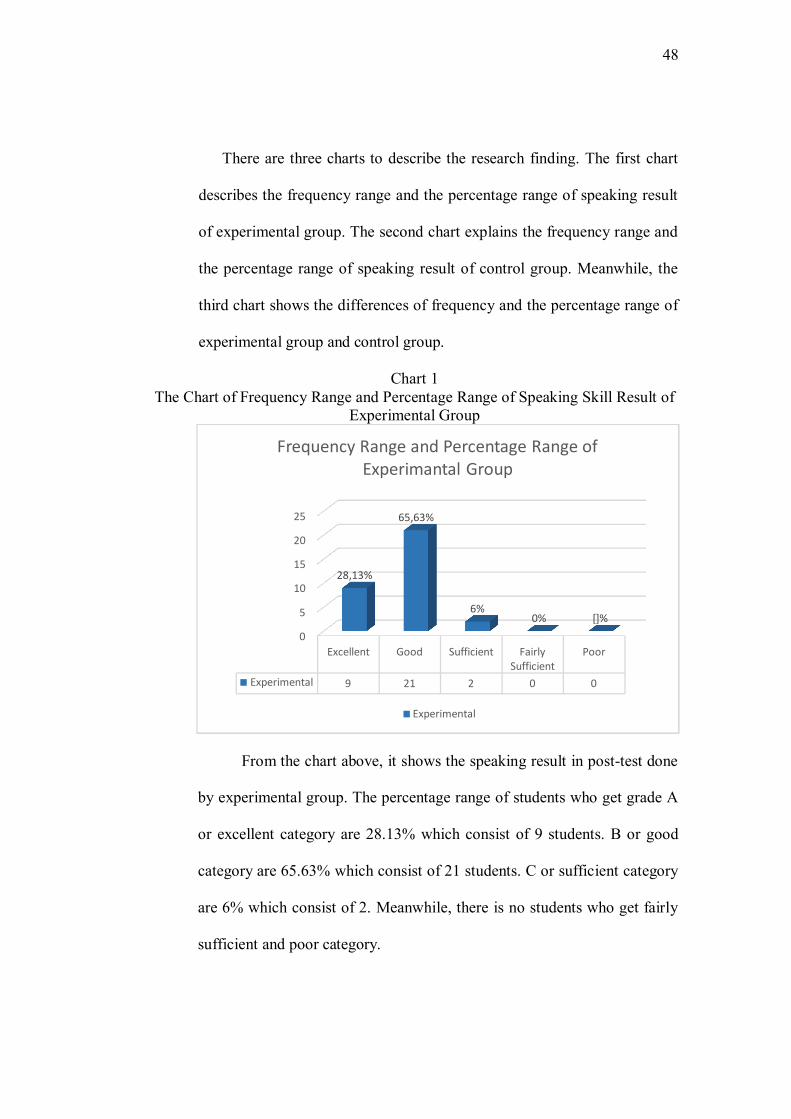
Table.6 Degree Mastery of Post-Test of Experiment Group Interval Interpretation Frequency Percentage 80-100 Excellent 9 28.13% 66-79 Good 21 65.63% 56-65 Sufficient 2 6% 40-55 Fairly sufficient - - <39 Poor - -
32 100% Based on the table above, it can be seen that there are 9 students
(28.13%) belong to excellent category, 21 students (65.63%) belong to
good category, and 2 students (6%) belong to sufficient category.
b. Speaking Result of Control Group
In this discussion, the writer calculates the post-test result of the
control group.
From the table.5, the writer concludes the highest score of post test
of students’ speaking skill (H) is 84, the lowest score (L) is 56, the
range (R) is 28, the median (Me) is 64, the mode (Mo) is 64, and the
total score of the result student’s speaking skill (T) is 2068.
From the data above, the writer finds the mean of the data by
applying the mean formula and then the writer finds the variance and
the standard devitiation of speaking skill of control group. The mean
(M) is 64.62 , the standard deviation (SD) is 6.514, and the variance is
42.435.
47
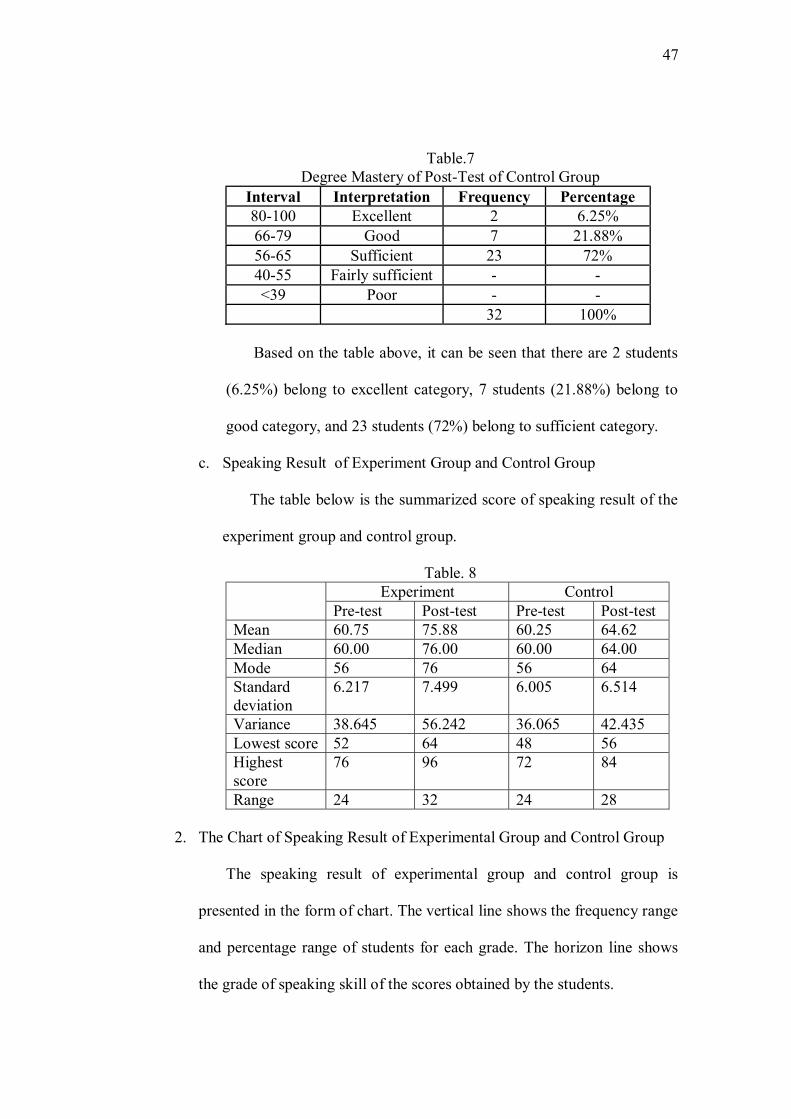
Table.7 Degree Mastery of Post-Test of Control Group
Interval Interpretation Frequency Percentage 80-100 Excellent 2 6.25% 66-79 Good 7 21.88% 56-65 Sufficient 23 72% 40-55 Fairly sufficient - - <39 Poor - -
32 100% Based on the table above, it can be seen that there are 2 students
(6.25%) belong to excellent category, 7 students (21.88%) belong to
good category, and 23 students (72%) belong to sufficient category.
c. Speaking Result of Experiment Group and Control Group
The table below is the summarized score of speaking result of the
experiment group and control group.
Table. 8 Experiment Control
Pre-test Post-test Pre-test Post-test Mean 60.75 75.88 60.25 64.62 Median 60.00 76.00 60.00 64.00 Mode 56 76 56 64 Standard deviation
6.217 7.499 6.005 6.514
Variance 38.645 56.242 36.065 42.435 Lowest score 52 64 48 56 Highest score
76 96 72 84
Range 24 32 24 28
2. The Chart of Speaking Result of Experimental Group and Control Group
The speaking result of experimental group and control group is
presented in the form of chart. The vertical line shows the frequency range
and percentage range of students for each grade. The horizon line shows
the grade of speaking skill of the scores obtained by the students.
48
There are three charts to describe the research finding. The first chart
describes the frequency range and the percentage range of speaking result
of experimental group. The second chart explains the frequency range and
the percentage range of speaking result of control group. Meanwhile, the
third chart shows the differences of frequency and the percentage range of
experimental group and control group.
Chart 1 The Chart of Frequency Range and Percentage Range of Speaking Skill Result of
Experimental Group
From the chart above, it shows the speaking result in post-test done
by experimental group. The percentage range of students who get grade A
or excellent category are 28.13% which consist of 9 students. B or good
category are 65.63% which consist of 21 students. C or sufficient category
are 6% which consist of 2. Meanwhile, there is no students who get fairly
sufficient and poor category.
0
5
10
15
20
25
Excellent Good Sufficient Fairly Sufficient
Poor
Experimental 9 21 2 0 0
28,13%
65,63%
6%0% []%
Frequency Range and Percentage Range of Experimantal Group
Experimental
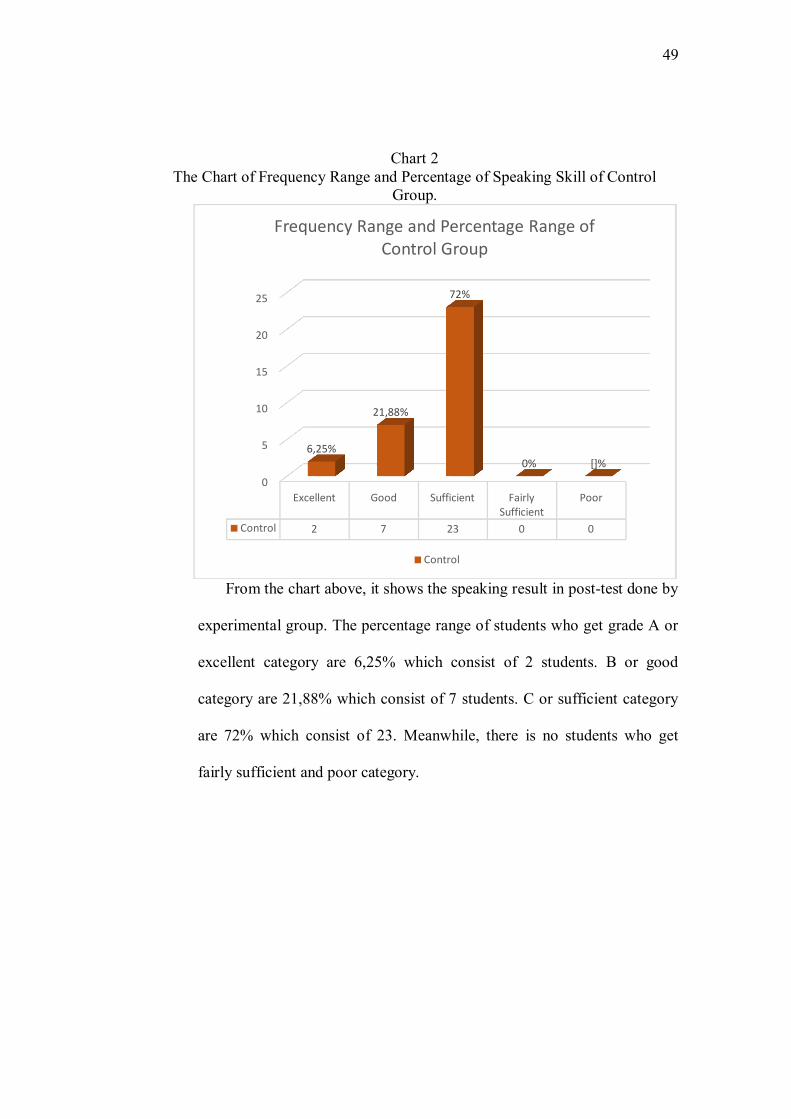
49
Chart 2 The Chart of Frequency Range and Percentage of Speaking Skill of Control
Group.
From the chart above, it shows the speaking result in post-test done by
experimental group. The percentage range of students who get grade A or
excellent category are 6,25% which consist of 2 students. B or good
category are 21,88% which consist of 7 students. C or sufficient category
are 72% which consist of 23. Meanwhile, there is no students who get
fairly sufficient and poor category.
0
5
10
15
20
25
Excellent Good Sufficient Fairly Sufficient
Poor
Control 2 7 23 0 0
6,25%
21,88%
72%
0% []%
Frequency Range and Percentage Range of Control Group
Control

50
Chart 3 The Chart of Frequency Range and Percentage Range of Speaking Skill Result of
Experiment Group and Control Group
This chart shows the speaking of experimental group and control
group. There are 28,13% or 9 students of experiment group and 6,25% or 2
students of control group who belong to excellent category. Good category
is reached by 21 students or 65,63% of exeperiment group and 7 students
or 21,88% of control group. Meanwhile, there are 6% or 2 students of
experiment group and 72% or 23 students of control group who belong to
sufficient. There is no student of experiment group and control group who
belong to fairly sufficient and poor category.
B. Inferential analysis
1. The Means Scores of Experimental Group and Control Group
0
5
10
15
20
25
Excellent Good Sufficient Fairly Sufficient
Poor
Experimental 9 21 2 0 0
Control 2 7 23 0 0
28,13%
65,63%
6%0% []%
6,25%
21,88%
72%
0% 05
Frequency Range and Percentage Range of Experimental Group and Control Group
Experimental Control
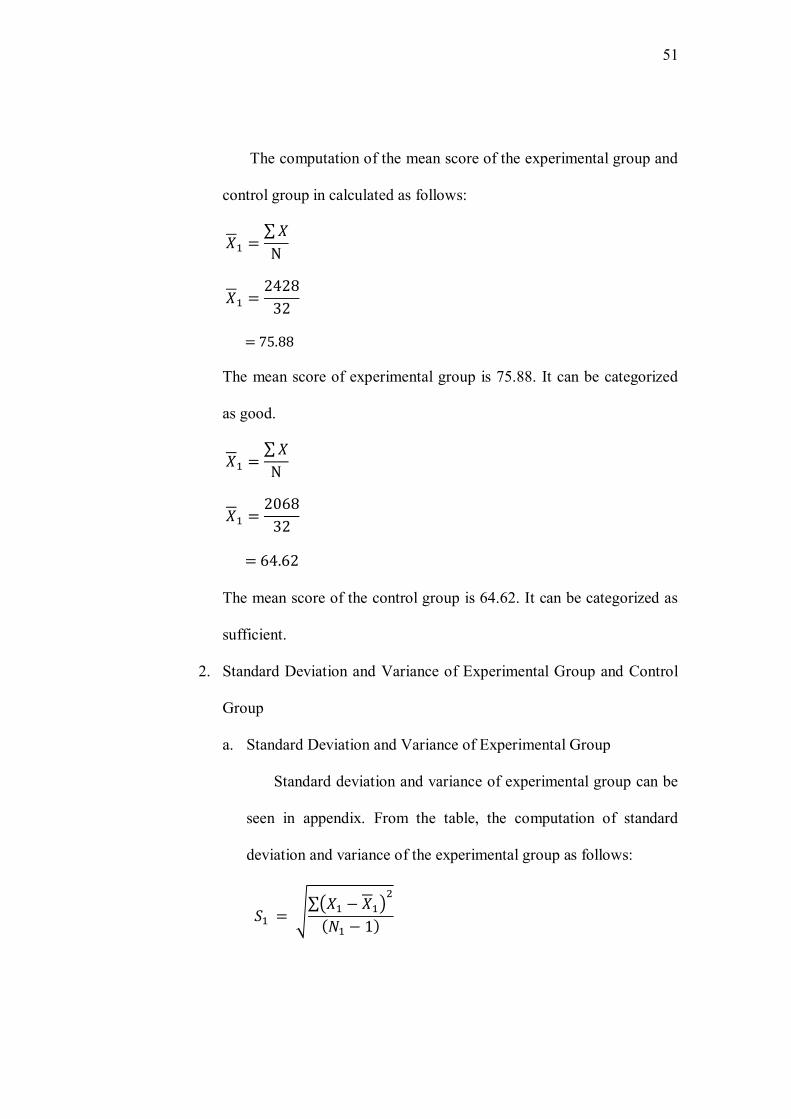
51
The computation of the mean score of the experimental group and
control group in calculated as follows:
�� �∑ �Ν
�� �2428
32
� 75.88
The mean score of experimental group is 75.88. It can be categorized
as good.
�� �∑ �Ν
�� �2068
32
� 64.62
The mean score of the control group is 64.62. It can be categorized as
sufficient.
2. Standard Deviation and Variance of Experimental Group and Control
Group
a. Standard Deviation and Variance of Experimental Group
Standard deviation and variance of experimental group can be
seen in appendix. From the table, the computation of standard
deviation and variance of the experimental group as follows:
�� � �∑��� � ����
��� � 1�
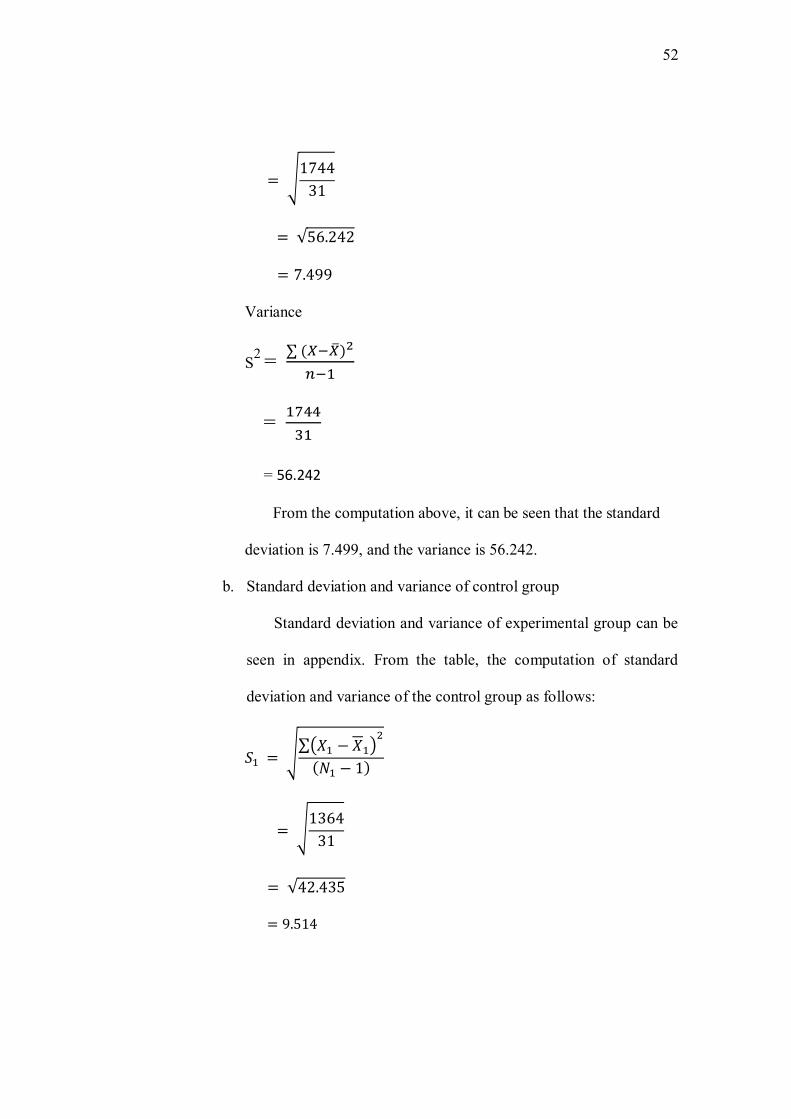
52
� �174431
� √56.242
� 7.499
Variance
S2 = ∑ �������
���
= ������
= 56.242
From the computation above, it can be seen that the standard
deviation is 7.499, and the variance is 56.242.
b. Standard deviation and variance of control group
Standard deviation and variance of experimental group can be
seen in appendix. From the table, the computation of standard
deviation and variance of the control group as follows:
�� � �∑��� � ����
��� � 1�
� �136431
� √42.435
� 9.514
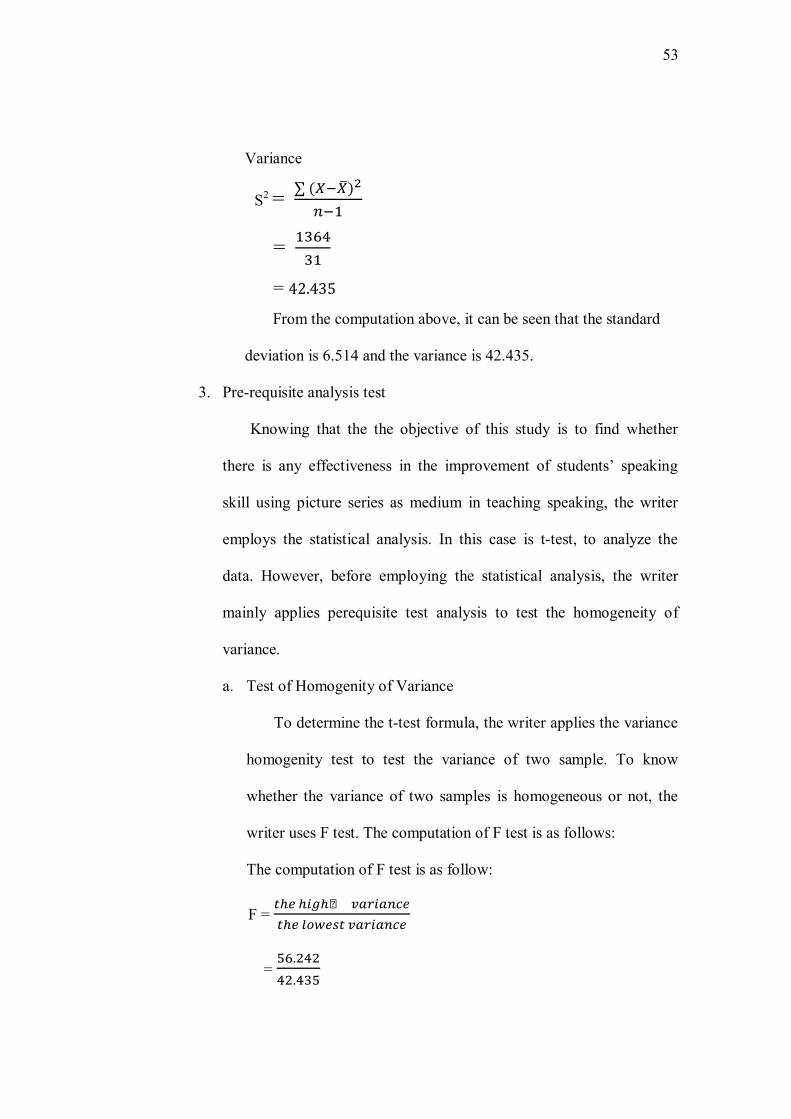
53
Variance
S2 = ∑ �������
���
= ������
= 42.435
From the computation above, it can be seen that the standard
deviation is 6.514 and the variance is 42.435.
3. Pre-requisite analysis test
Knowing that the the objective of this study is to find whether
there is any effectiveness in the improvement of students’ speaking
skill using picture series as medium in teaching speaking, the writer
employs the statistical analysis. In this case is t-test, to analyze the
data. However, before employing the statistical analysis, the writer
mainly applies perequisite test analysis to test the homogeneity of
variance.
a. Test of Homogenity of Variance
To determine the t-test formula, the writer applies the variance
homogenity test to test the variance of two sample. To know
whether the variance of two samples is homogeneous or not, the
writer uses F test. The computation of F test is as follows:
The computation of F test is as follow:
F = ��� ����� ����������� ������ ��������
= ��.�����.���
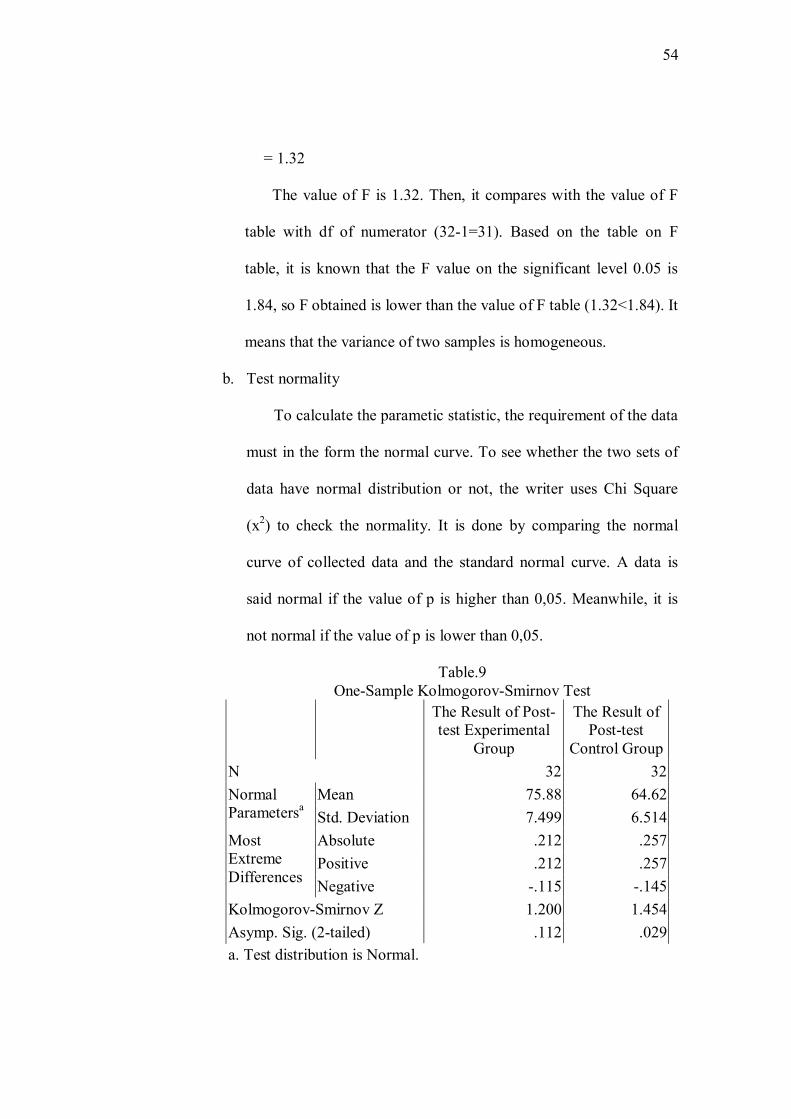
54
= 1.32
The value of F is 1.32. Then, it compares with the value of F
table with df of numerator (32-1=31). Based on the table on F
table, it is known that the F value on the significant level 0.05 is
1.84, so F obtained is lower than the value of F table (1.32<1.84). It
means that the variance of two samples is homogeneous.
b. Test normality
To calculate the parametic statistic, the requirement of the data
must in the form the normal curve. To see whether the two sets of
data have normal distribution or not, the writer uses Chi Square
(x2) to check the normality. It is done by comparing the normal
curve of collected data and the standard normal curve. A data is
said normal if the value of p is higher than 0,05. Meanwhile, it is
not normal if the value of p is lower than 0,05.
Table.9 One-Sample Kolmogorov-Smirnov Test
The Result of Post-test Experimental
Group
The Result of Post-test
Control Group N 32 32 Normal Parametersa
Mean 75.88 64.62 Std. Deviation 7.499 6.514
Most Extreme Differences
Absolute .212 .257 Positive .212 .257 Negative -.115 -.145
Kolmogorov-Smirnov Z 1.200 1.454 Asymp. Sig. (2-tailed) .112 .029 a. Test distribution is Normal.

55
Based on the table of computation above, it shows that both
pre-test and post-test are higher than 0.05. They are 0. 112 and
0.029. It means that the data is normal.
c. T-test finding
The computation of the mean score experimental group and
the control group are 75.88 and 64.62. If the two means is
compared, it is clear that the mean of experimental group is higher
than the mean of control group. The differences between the two
means is 11.46. It indicates that treatment is effective. To make the
analysis more reliable, the writer analyzes it by using t-test polled
variance formula.
The computation of t-test is as follow:
� ���� � ���
���� � 1���� � ��� � 1���
�
�� � �� � 2 � 1��
� 1��
�
�75.88 � 64.62
��31�56.242 � �31�42.43532 � 32 � 2 � 1
32 � 132�
�11.46
�1743.502 � 1315.48562 �0.0625�
�11.46
�3058.98762 �0.0625�
�11.46
√49.3385 � 0.0625

56
�11.46
√3.083
�11.461.75
� 6.548
The result of t-test was 6.548.
d. Test of Hypothesis
There are three points involved in testing hypotesis. There are
level significance, null hypothesis, and test of experimental
significance.
1. Level of significance
In testing hypothesis, the writer uses the level of
significance to minimize the false conclusion of the research.
This is applied to reject the hypothesis in order to gain the
objective conclusion. Generally, the level uses in any research
is the 5% or 1% level. By using the level of significance of the
5% level, it means the falseness of conclusion is 5% or 1%. By
using the level of significance of the 5% level, it means that the
falseness of conclusion is 5% and the truth of conclusion is
95%.
2. Null hypothesis
In testing hypothesis, the writer commonly faces with the
null hypothesis. By using the null hypothesis, the hypothesis
statement will be easier to be proved. The hypothesis of this
57
research says “ the use of picture series is effective in teaching
speaking of the tenth grade students of SMA N 1 Karangkobar
Banjarnegara in the academic year 2013/2014”.
To prove whether the hypothesis is rejected or accepted,
the writer changes the research hypothesis into null hypothesis.
Therefore, the null hypothesis says “The use of picture series is
not effective in teaching speaking of the tenth grade students
of SMA N 1 Karangkobar in the academic year 2013/2014.
3. Test of Experimental significance
The previous analysis shows that the result of computation
of the t-value is 6.548. Then, the t-value is consulted to the t-
table at 0.05 significance levels. With degree of fredom (df) 62,
the result of computation of t-value is 6.548. Based on the
value in the table is 2.000, the computation shows that t- value
was higher than t-table that is 6.548>2.000.
Therefore, the null hypothesis is rejected and the research
of hypothesis is accepted. In other words, the use of picture
series is effective in teaching speaking of the tenth grade
students of SMA N 1 Karangkobar Banjarnegara in the
academic year 2013/2014.
58
C. Discussion and Result of the Research
In this section, the writer describes the interpretation of researh result
about descriptive analysis and inferential analysis. The following are the
details:
1. Descriptive Analysis Interpretation
After describing the analysis in the previous study, the writer
discusses more about the interpretation of speaking skill result of
experimental group and speaking result of control group.
a. The Speaking Result of Experimental Group
The higher score of the students of experimental group of the
tenth grade students of SMA N 1 Karangkobar is 96 and the lowest
score is 64. The mean of experimental group is 75.88, the standard
deviation is 7.499, and the variance is 56.242. The mean is
included in the interval of 66 to 79. It means that the students of
experimental group includes good category on speaking. From 32
samples, the writer takes scores; there are 9 students (28.13%) who
are excellent on speaking, 21 students (65.63%) are good on
speaking. Meanwhile, there are only 2 students (6%) belong to
sufficient category.
b. The Speaking Result of Control Group.
The higher score of the students of control group of the tenth
grade students of SMA N 1 Karangkobar is 84 and the lowest score
is 56. The mean of control group is 64.62, the standard deviation is
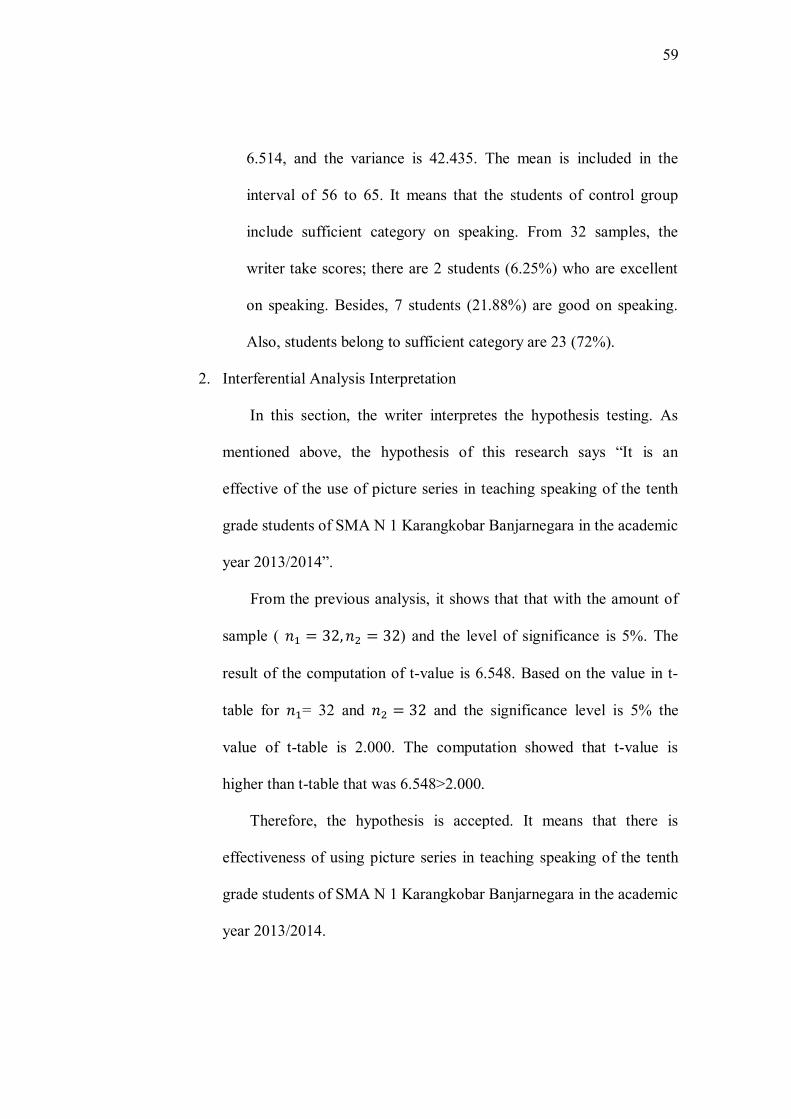
59
6.514, and the variance is 42.435. The mean is included in the
interval of 56 to 65. It means that the students of control group
include sufficient category on speaking. From 32 samples, the
writer take scores; there are 2 students (6.25%) who are excellent
on speaking. Besides, 7 students (21.88%) are good on speaking.
Also, students belong to sufficient category are 23 (72%).
2. Interferential Analysis Interpretation
In this section, the writer interpretes the hypothesis testing. As
mentioned above, the hypothesis of this research says “It is an
effective of the use of picture series in teaching speaking of the tenth
grade students of SMA N 1 Karangkobar Banjarnegara in the academic
year 2013/2014”.
From the previous analysis, it shows that that with the amount of
sample ( �� � 32,�� � 32) and the level of significance is 5%. The
result of the computation of t-value is 6.548. Based on the value in t-
table for ��= 32 and �� � 32 and the significance level is 5% the
value of t-table is 2.000. The computation showed that t-value is
higher than t-table that was 6.548>2.000.
Therefore, the hypothesis is accepted. It means that there is
effectiveness of using picture series in teaching speaking of the tenth
grade students of SMA N 1 Karangkobar Banjarnegara in the academic
year 2013/2014.
60
After computing t-test polled variance and after knowing that the
hypothesis is accepted, the theory meet the fact in the case. Then, from
the computation exist in the previous section, the writer concludes that
the use of picture series is effective in teaching speaking of the tenth
grade students of SMA N 1 Karangkobar Banjarnegara in the academic
year 2013/2014.
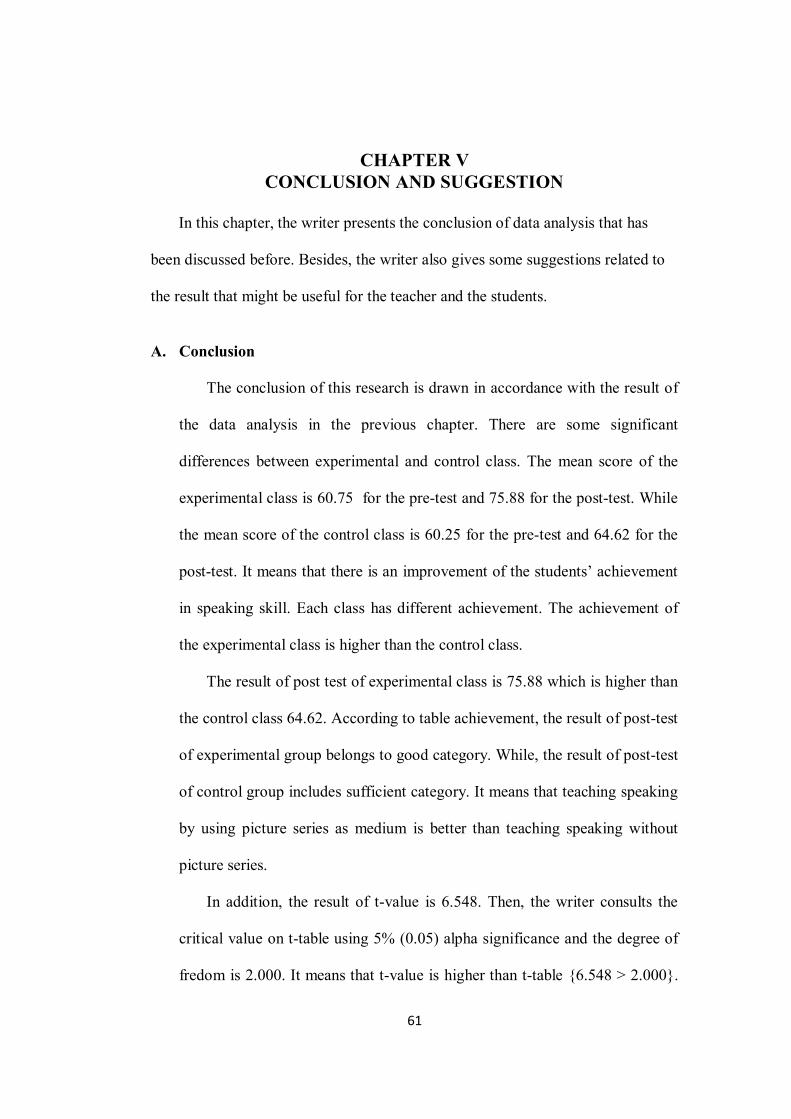
61
CHAPTER V CONCLUSION AND SUGGESTION
In this chapter, the writer presents the conclusion of data analysis that has
been discussed before. Besides, the writer also gives some suggestions related to
the result that might be useful for the teacher and the students.
A. Conclusion
The conclusion of this research is drawn in accordance with the result of
the data analysis in the previous chapter. There are some significant
differences between experimental and control class. The mean score of the
experimental class is 60.75 for the pre-test and 75.88 for the post-test. While
the mean score of the control class is 60.25 for the pre-test and 64.62 for the
post-test. It means that there is an improvement of the students’ achievement
in speaking skill. Each class has different achievement. The achievement of
the experimental class is higher than the control class.
The result of post test of experimental class is 75.88 which is higher than
the control class 64.62. According to table achievement, the result of post-test
of experimental group belongs to good category. While, the result of post-test
of control group includes sufficient category. It means that teaching speaking
by using picture series as medium is better than teaching speaking without
picture series.
In addition, the result of t-value is 6.548. Then, the writer consults the
critical value on t-table using 5% (0.05) alpha significance and the degree of
fredom is 2.000. It means that t-value is higher than t-table {6.548 > 2.000}.

62
It means that Ha is accepted while Ho is rejected. It can be concluded that
there is a significant difference in the students’ speaking result of the tenth
grade students of SMA N 1 Karangkobar Banjarnegara in the academic year
2013/ 2014 between those who have been taught speaking by using picture
series and those who have been taught by using a conventional learning or
lecturing only.
From the explanation above, it can be concluded that the use of picture
series is effective to teaching speaking of the tenth grade students of SMA N
1 Karangkobar Banjarnegara in the academic year 2013/2014.
B. Suggestion
Based on the conclusion of this study, the writer has some suggestions
for English teacher, students and next researcher as follows:
1. For the English Teacher
a. Picture series may become alternative media in teaching speaking.
Using pictures about activities that most people do to teach speaking
is a good innovation. Students can tell about their activities by using
picture series to guide them in speaking. It can also stimulate the
students’ interest in materials. By using picture series, the students can
learn and active in the class to speak up. For the teacher it is better to
use picture series in teaching speaking.
b. The teacher should have the competence of using media as teaching
technique. It can be expected that media as a method can motivate the
students to sepak English to communicate their need especially in the
63
classroom and in their daily need in general. In addition, the teacher
should match the picture with the suitable material for students, so that
the goal of the study can be fulfilled.
2. For the Students
a. The students should pay attention to the teacher when he or she gives
the English lesson.
b. The students should have high motivation to practice what they
learned from their teacher everytime and everywhere.
c. The students encourage themselves to learn English especially
speaking.
3. For next researcher
They can make this study as their reference to conduct other
researcher on the same field. They are also expected to be able to cover
the limitation about this. Besides, they can conduct a research with the
same media but in different skill. The writer hopes that the next
researchers can contribute better improvement in doing research by using
picture series as medium in teaching learning English process.
69
REFERENCES
Arikunto, Suharsimi. 2013. Prosedur Penelitian Suatu Pendekatan Praktik. Jakarta: Rineka Cipta.
Brown, H. Douglas. 2004. Language Assesment: Principles and Classroom
Practice. New York. Longman. ________________. 2007. Principle of Language Learning and Teaching 5th
Edition. New York: Longman. Djamarah, Syaiful Bahri and Zain. 2010. Strategi Belajar Mengajar. Jakarta:
Rineka Cipta Harmer, Jeremy. 2001. The Practice of English Language Teaching. Cambridg:
Longman. Hornby, A. S. 1995. Oxford Advanced Learner’s Dictionary of Current English.
Newyork : Oxford University Press ___________. 2000. Oxford Advanced Learner’s Dictionary of Current English
6th edition. Oxford: Oxford University Press. Naim, Ngainun. 2009. Menjadi Guru Inspiratif: Memberdayakan dan Mengubah
Jalan Hidup Siswa. Yogyakarta: Pustaka Pelajar. Nunan, David. 1992. Research Methods in Language Learning. New York:
Cambridge University Press. ____________. 1996. The Self-directed Teacher Managing the learning process.
New York: Cambridge University Press. Nurgiyantoro, Burhan. 2010. Penilaian Pembelajaran Bahasa Berbasis
Kompetensi. Yogyakarta: BPFE-Yogyakarta. Richards, C. Jack. 2008. Teaching Listening and Speaking: From Theory to
Practice. Cambridge: Cambridge University Press. Sugiyono. 2012. Metode Penelitian Pendidikan. Bandung: Alfabeta. Suryabrata, sumadi. 2014. Psikologi Pendidikan. Jakarta: Raja Grafindo Persada Tarigan, Henry Guntur. 2008. Berbicara: Sebagai suatu ketrampilan berbahasa.
Bandung: Angkasa Bandung.

70
Wright, Andrew. 2004. Pictures for Language Learning. New York : Cambridge University Press
http://www.shvoong.com/writing-and-speaking/branded-content/2103882-
advantages-disadvantages-using-picture-media/. Accessed on March 16th, 2014 at 3.48 p.m

71

72
Appendix 1. Information Letter from
Muhammadiyah University of
Purworejo

73
74
75
76
Appendix.2. Information Letter from
SMA N 1 Karangkobar Banjarnegara
77
78
Appendix.3. Syllabus
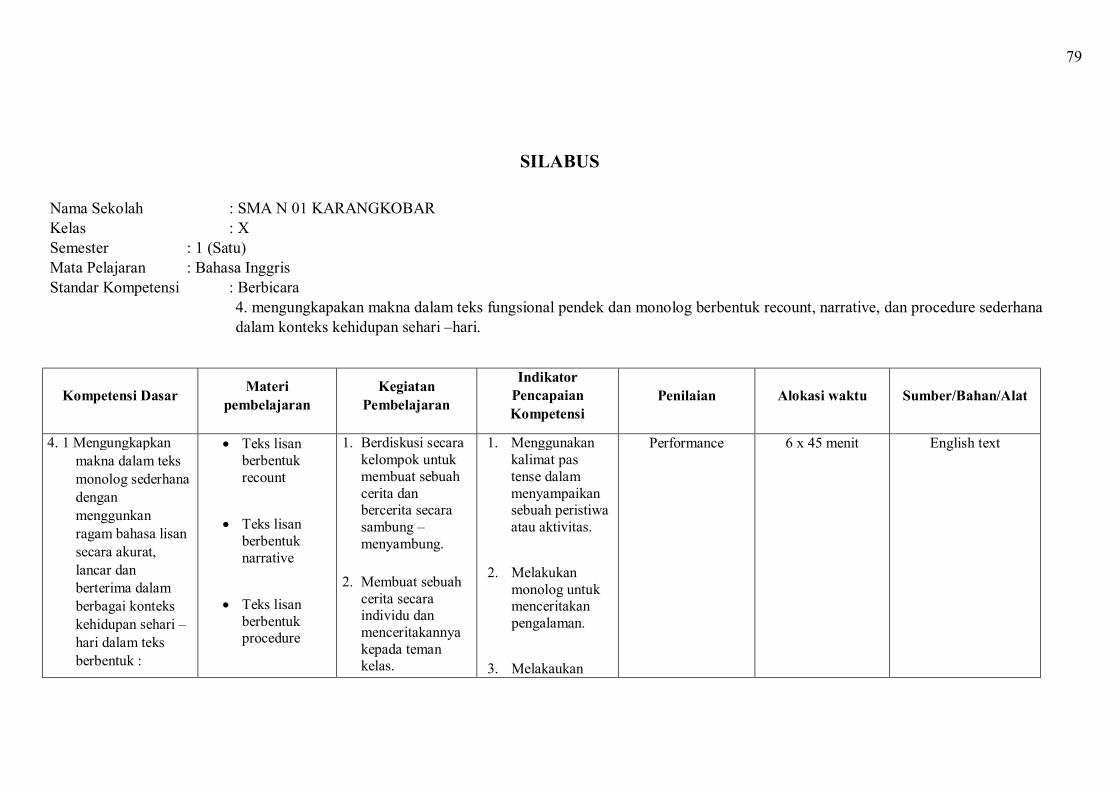
79
SILABUS
Nama Sekolah : SMA N 01 KARANGKOBAR Kelas : X Semester : 1 (Satu) Mata Pelajaran : Bahasa Inggris Standar Kompetensi : Berbicara
4. mengungkapakan makna dalam teks fungsional pendek dan monolog berbentuk recount, narrative, dan procedure sederhana dalam konteks kehidupan sehari –hari.
Kompetensi Dasar Materi pembelajaran
Kegiatan Pembelajaran
Indikator Pencapaian Kompetensi
Penilaian Alokasi waktu Sumber/Bahan/Alat
4. 1 Mengungkapkan makna dalam teks monolog sederhana dengan menggunkan ragam bahasa lisan secara akurat, lancar dan berterima dalam berbagai konteks kehidupan sehari –hari dalam teks berbentuk :
Teks lisan berbentuk recount
Teks lisan berbentuk narrative
Teks lisan berbentuk procedure
1. Berdiskusi secara kelompok untuk membuat sebuah cerita dan bercerita secara sambung – menyambung.
2. Membuat sebuah cerita secara individu dan menceritakannya kepada teman kelas.
1. Menggunakan kalimat pas tense dalam menyampaikan sebuah peristiwa atau aktivitas.
2. Melakukan monolog untuk menceritakan pengalaman.
3. Melakaukan
Performance 6 x 45 menit English text

80
recount, narrative, dan procedure.
monolog untuk menyampaikan sebuah procedure
4. Mendongeng
Mengetahui :
Kepala SMA N 1 Karangkobar
Guru Mata Pelajaran
Malina Budiani, S.Pd
NIP. 19780604 200701 2 007
81
Appendix.4. Lesson Plan
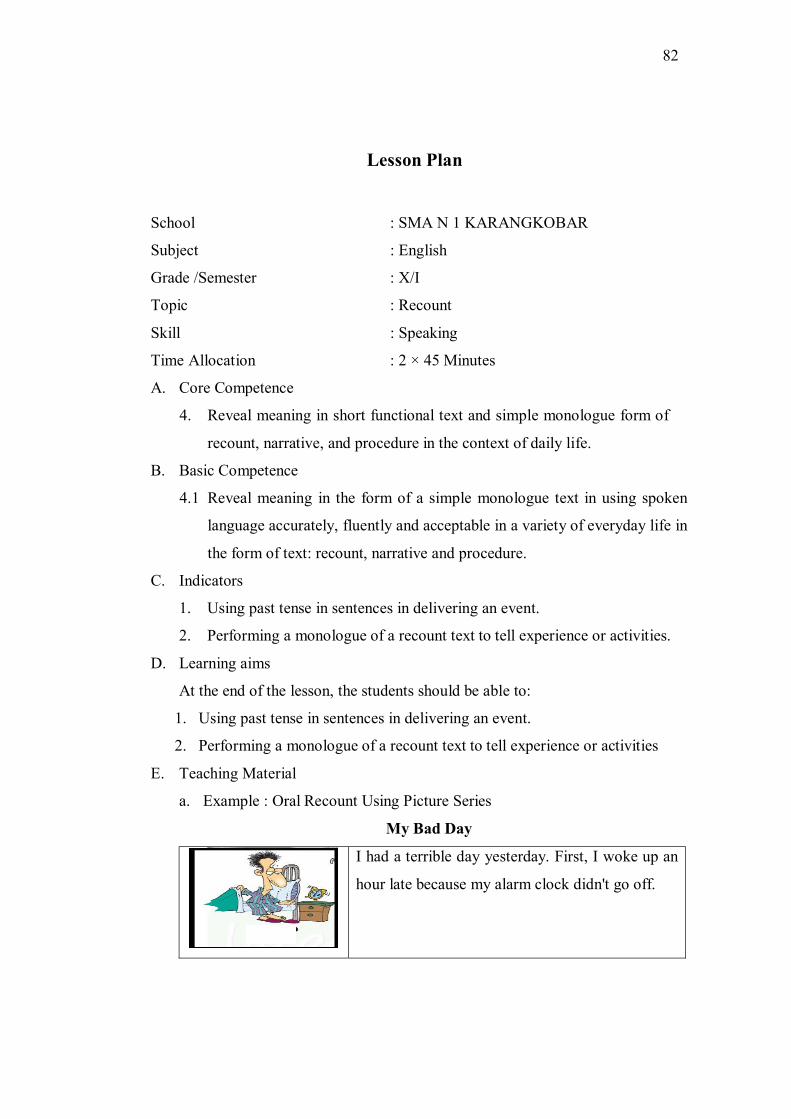
82
Lesson Plan
School : SMA N 1 KARANGKOBAR
Subject : English
Grade /Semester : X/I
Topic : Recount
Skill : Speaking
Time Allocation : 2 × 45 Minutes
A. Core Competence
4. Reveal meaning in short functional text and simple monologue form of
recount, narrative, and procedure in the context of daily life.
B. Basic Competence
4.1 Reveal meaning in the form of a simple monologue text in using spoken
language accurately, fluently and acceptable in a variety of everyday life in
the form of text: recount, narrative and procedure.
C. Indicators
1. Using past tense in sentences in delivering an event.
2. Performing a monologue of a recount text to tell experience or activities.
D. Learning aims
At the end of the lesson, the students should be able to:
1. Using past tense in sentences in delivering an event.
2. Performing a monologue of a recount text to tell experience or activities
E. Teaching Material
a. Example : Oral Recount Using Picture Series
My Bad Day
I had a terrible day yesterday. First, I woke up an
hour late because my alarm clock didn't go off.
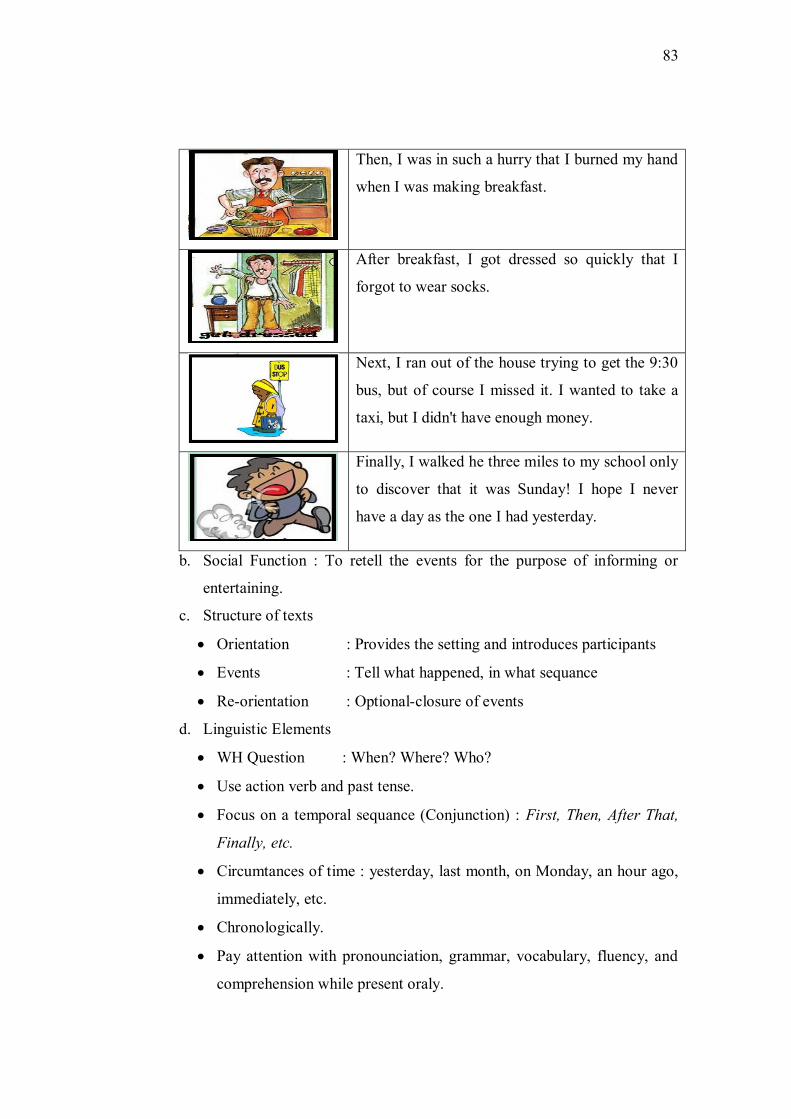
83
Then, I was in such a hurry that I burned my hand
when I was making breakfast.
After breakfast, I got dressed so quickly that I
forgot to wear socks.
Next, I ran out of the house trying to get the 9:30
bus, but of course I missed it. I wanted to take a
taxi, but I didn't have enough money.
Finally, I walked he three miles to my school only
to discover that it was Sunday! I hope I never
have a day as the one I had yesterday.
b. Social Function : To retell the events for the purpose of informing or
entertaining.
c. Structure of texts
Orientation : Provides the setting and introduces participants
Events : Tell what happened, in what sequance
Re-orientation : Optional-closure of events
d. Linguistic Elements
WH Question : When? Where? Who?
Use action verb and past tense.
Focus on a temporal sequance (Conjunction) : First, Then, After That,
Finally, etc.
Circumtances of time : yesterday, last month, on Monday, an hour ago,
immediately, etc.
Chronologically.
Pay attention with pronounciation, grammar, vocabulary, fluency, and
comprehension while present oraly.
84
F. Teaching Method
Teaching Method : Three - phase technique
G. Media
Media : Picture series about activities (in attached 1)
H. Sources of Material
www.englishindo.com, accessed on April 21st, 2014 at 14.11 p.m
Doddy,Achmad,dkk. 2008. Developing English Competencies for Grade X
Senior High School (SMA/MA). Jakarta: Pusat Perbukuan Departemen
Pendidikan Nasional
I. Learning Activities
a. First Activities
Apperception
One of the students lead the prayer to begin the lesson.
The teacher greets and checks attendance of the students.
The teacher asks questions related to the material that will be studied.
Motivation
The teacher explain the importance of the material to be learned
following competencies that must be dominated student.
The teacher motivates students to take an active during the learning.
b. Core Activities
Exploration
Students read examples of recount text in the textbook. (Students do
this process that prepared by the teacher).
The teacher gives explanation and examples to the students about an
activities / experiences through picture series.
The teacher provides students assignment to speak about their
activities / experience based on picture series.
The teacher involves the students actively in all learning activities.
Elaboration

85
Students identify the activities / experiences that they would choose to
be presented based on picture series that had been prepared by the
teacher.
The teacher provide opportunities to the students to think their
activities / experiences based on picture series.
Students present and tell the story orally based on the picture series in
front of the class.
Confirmation
The teacher gives positive feedback and reinforcement about the
students’ performance of the presentation.
Students listen to theacher’ assesment of their performance.
The teacher provides opportunities for students to give feedback or
question.
c. Closing Activities
The teacher asks the student's difficulties in understanding the subject
matter.
Teacher and students conclude the learning.
Teacher closes the lesson with a prayer.
J. Assesment
a. Technique : Spoken test
b. Instrument : Subject : English Grade : X Time allocation : 2 x 45 minutes ___________________________________ Name : Student Number :
Instruction : a. Please, retell your last activities orally! b. Open your dictionary if needed. c. Use action verbs and past tense to tell your activities.
86
c. Rubric Assesment
Scoring of spoken test (In attached 1)
The five criterions are
Grammar
Vocabulary
Comprehension
Fluency
Pronunciation
Karangkobar, May 6th, 2014
Approved by,
Subject teacher
MALINA BUDIANI, S.Pd NIP. 19780604 200701 2 007
The researcher
HARYANTI DEVI SAPUTRI NIM. 102120016

87
Lesson Plan
School : SMA N 1 KARANGKOBAR Subject : English Grade /Semester : X/I Topic : Recount Skill : Speaking Time Allocation : 2 × 45 Minutes A. Core Competence
4. Reveal meaning in short functional text and simple monologue form of recount, narrative, and procedure in the context of daily life.
B. Basic Competence 4.1 Reveal meaning in the form of a simple monologue text in using spoken
language accurately, fluently and acceptable in a variety of everyday life in the form of text: recount, narrative and procedure.
C. Indicators 1. Using past tense in sentences in delvering an event. 2. Performing a monologue of a recount text to tell experience or activities.
D. Learning aims At the end of the lesson, the students should be able to:
3. Using past tense in sentences in delivering an event. 4. Performing a monologue of a recount text to tell experience or activities.
E. Teaching Material
a. Example : Oral Recount My Bad Day
I had a terrible day yesterday. First, I woke up an hour late because my alarm clock didn't go off. Then, I was in such a hurry that I burned my hand when I was making breakfast. After breakfast, I got dressed so quickly that I forgot to wear socks.
Next, I ran out of the house trying to get the 9:30 bus, but of course I missed it. I wanted to take a taxi, but I didn't have enough money.
Finally, I walked he three miles to my school only to discover that it was Sunday! I hope I never have a day as the one I had yesterday.
b. Social Function : To retell the events for the purpose of informing or entertaining.
c. Structure of texts Orientation : Provides the setting and introduces participants Events : Tell what happened, in what sequance
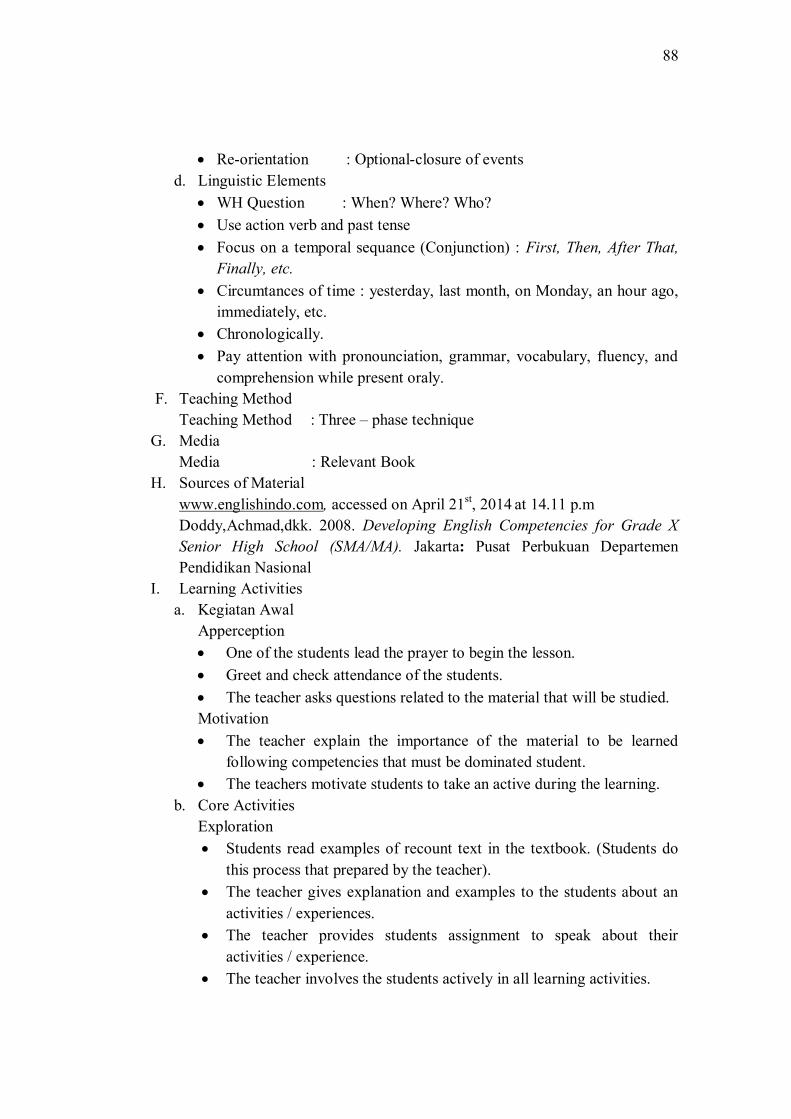
88
Re-orientation : Optional-closure of events d. Linguistic Elements
WH Question : When? Where? Who? Use action verb and past tense Focus on a temporal sequance (Conjunction) : First, Then, After That,
Finally, etc. Circumtances of time : yesterday, last month, on Monday, an hour ago,
immediately, etc. Chronologically. Pay attention with pronounciation, grammar, vocabulary, fluency, and
comprehension while present oraly. F. Teaching Method
Teaching Method : Three – phase technique G. Media
Media : Relevant Book H. Sources of Material
www.englishindo.com, accessed on April 21st, 2014 at 14.11 p.m Doddy,Achmad,dkk. 2008. Developing English Competencies for Grade X Senior High School (SMA/MA). Jakarta: Pusat Perbukuan Departemen Pendidikan Nasional
I. Learning Activities a. Kegiatan Awal
Apperception One of the students lead the prayer to begin the lesson. Greet and check attendance of the students. The teacher asks questions related to the material that will be studied. Motivation The teacher explain the importance of the material to be learned
following competencies that must be dominated student. The teachers motivate students to take an active during the learning.
b. Core Activities Exploration Students read examples of recount text in the textbook. (Students do
this process that prepared by the teacher). The teacher gives explanation and examples to the students about an
activities / experiences. The teacher provides students assignment to speak about their
activities / experience. The teacher involves the students actively in all learning activities.

89
Elaboration Students identify the activities / experiences that they would choose to
be presented. The teacher provide opportunities to the students to think their
activities / experiences. Students come to the front of class to present and share the story
orally. Confirmation The teacher gives positive feedback and reinforcement about the
students’ performance of the presentation. Students listen to theacher’ assesment of their performance. The teacher provides opportunities for students to give feedback or
question. c. Closing Activities
The teacher asks the student's difficulties in understanding the subject matter.
Teacher and students conclude the learning. Teacher closes the lesson with a prayer.
J. Assesment c. Technique : Spoken test d. Instrument :
Subject : English Grade : X Time allocation : 2 x 45 minutes ____________________________ Name : Student Number
:
Instruction : d. Please, retell your last activities orally! e. Open your dictionary if needed. f. Use action verbs and past tense to tell your
activities.
c. Rubric Assesment Scoring of spoken test (In Attached 1)
The five criterions are Pronunciation

90
Grammar Vocabulary Fluency Comprehension
Karangkobar, May 6th, 2014 Approved by,
Subject teacher
MALINA BUDIANI, S.Pd NIP. 19780604 200701 2 007
The researcher
HARYANTI DEVI SAPUTRI NIM. 102120016

91
Appendix.5. List of Sudents of
Experimental Group and Control
Group
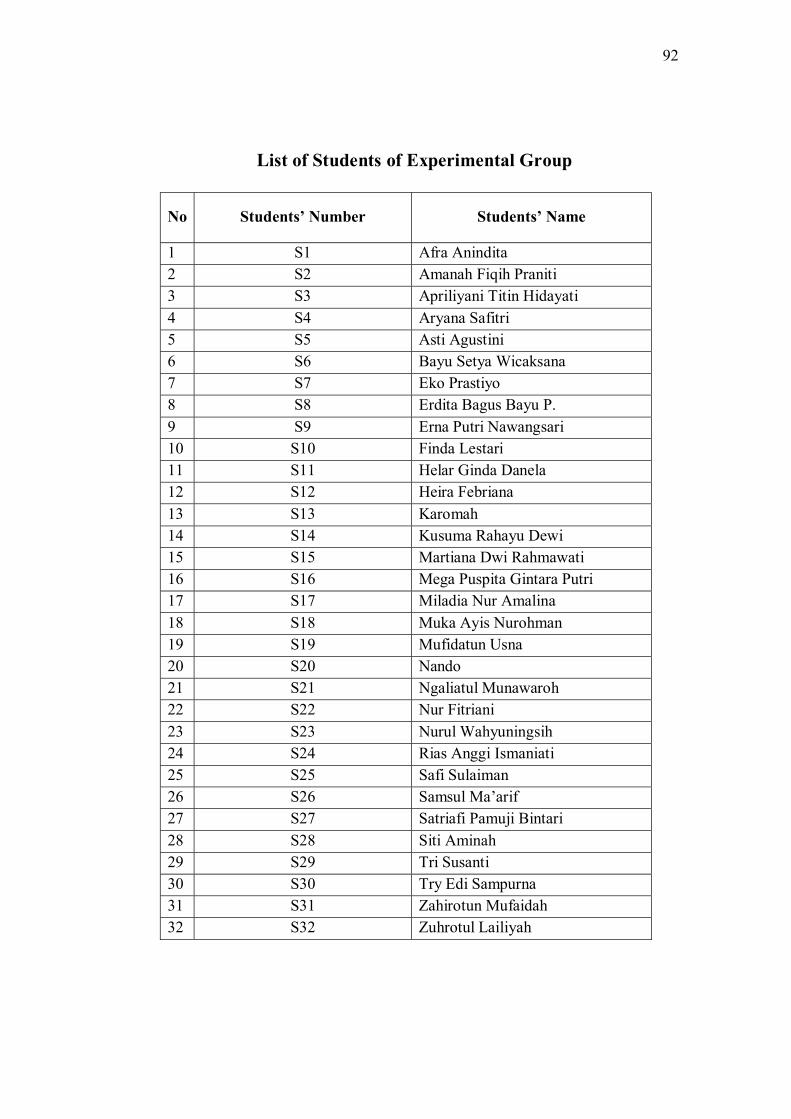
92
List of Students of Experimental Group
No Students’ Number Students’ Name
1 S1 Afra Anindita 2 S2 Amanah Fiqih Praniti 3 S3 Apriliyani Titin Hidayati 4 S4 Aryana Safitri 5 S5 Asti Agustini 6 S6 Bayu Setya Wicaksana 7 S7 Eko Prastiyo 8 S8 Erdita Bagus Bayu P. 9 S9 Erna Putri Nawangsari 10 S10 Finda Lestari 11 S11 Helar Ginda Danela 12 S12 Heira Febriana 13 S13 Karomah 14 S14 Kusuma Rahayu Dewi 15 S15 Martiana Dwi Rahmawati 16 S16 Mega Puspita Gintara Putri 17 S17 Miladia Nur Amalina 18 S18 Muka Ayis Nurohman 19 S19 Mufidatun Usna 20 S20 Nando 21 S21 Ngaliatul Munawaroh 22 S22 Nur Fitriani 23 S23 Nurul Wahyuningsih 24 S24 Rias Anggi Ismaniati 25 S25 Safi Sulaiman 26 S26 Samsul Ma’arif 27 S27 Satriafi Pamuji Bintari 28 S28 Siti Aminah 29 S29 Tri Susanti 30 S30 Try Edi Sampurna 31 S31 Zahirotun Mufaidah 32 S32 Zuhrotul Lailiyah

93
List of Student of Control Group
No Students’ Number
Respondent’s Name 1 S1 Afifah Uswatun Khasanah 2 S2 Alfyatun 3 S3 Andaru Andiwigna G 4 S4 Anggitio Sefani 5 S5 Aning Kurniyati 6 S6 Astuti Indriyani 7 S7 Doni Setyawan 8 S8 Emi Setyowati 9 S9 Fatimah Azzahra 10 S10 Fitriani 11 S11 Galu Abitia Santi 12 S12 Geger Fitrianto Aji 13 S13 Ghalang Tribuana 14 S14 Hendra Irmansah 15 S15 Lilik Setyowati 16 S16 Linda Nurhayati 17 S17 Miftahudin 18 S18 Muhammad Wisnu 19 S19 Mukhamad Hasbie Faiz A 20 S20 Nurul Hidayah 21 S21 Puspita Ratnasari 22 S22 Qoonita Rosyidah Purnama 23 S23 Rahajeng Prastiwigari 24 S24 Rachmi Puspaseruni 25 S25 Ribut Abdul Kholik 26 S26 Rilita Rindani 27 S27 Rina Listiana 28 S28 Sigit Saputra 29 S29 Titin Alfiatun 30 S30 Wiwit Eka Diana Saputri 31 S31 Yuni Astuti 32 S32 Yuli Vitrianti
94
Appendix.6. Instrument of Pre-test and
Post-test
(Experimental Group and Control Group)
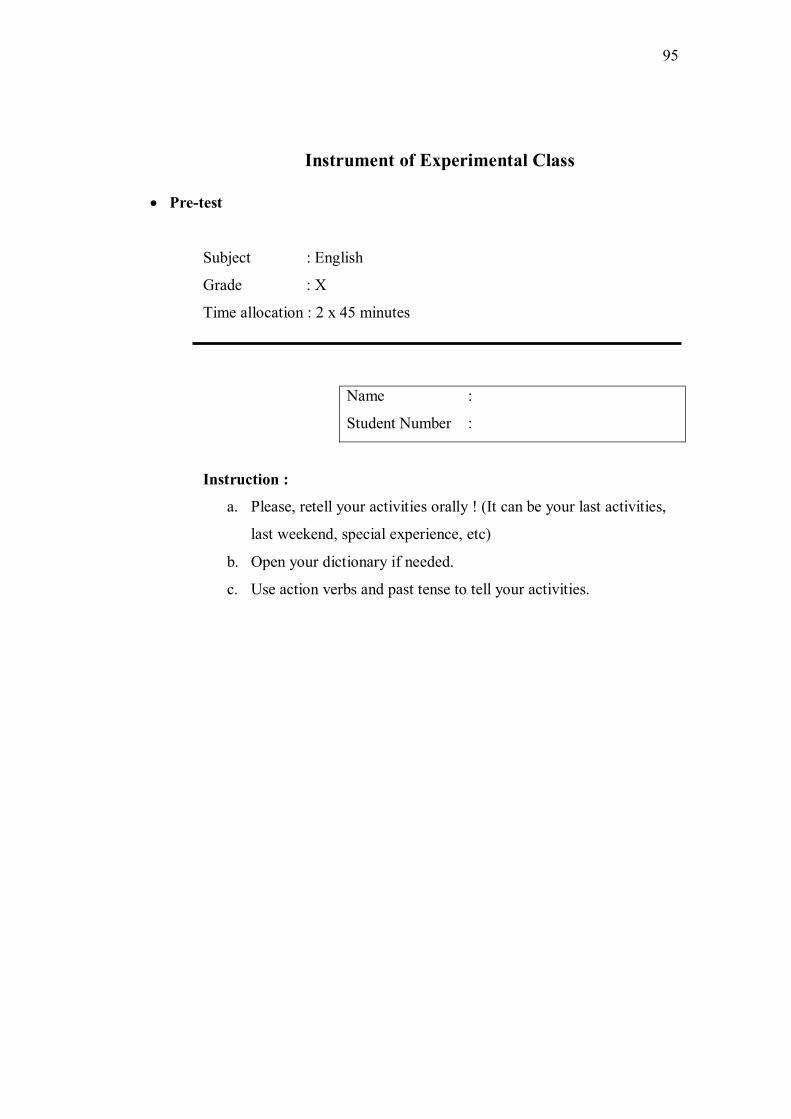
95
Instrument of Experimental Class
Pre-test
Subject : English
Grade : X
Time allocation : 2 x 45 minutes
Name :
Student Number :
Instruction :
a. Please, retell your activities orally ! (It can be your last activities,
last weekend, special experience, etc)
b. Open your dictionary if needed.
c. Use action verbs and past tense to tell your activities.
96
Post-test
Subject : English
Grade : X
Time allocation : 2 x 45 minutes
Name :
Student Number :
Instruction :
a. Please, retell your last activities orally !
b. Open your dictionary if needed.
c. Use action verbs and past tense to tell your activities.
97
Instrument of Control Class
Pre-test
Subject : English
Grade : X
Time Allocation : 2 x 45 minutes
Name :
Student Number :
Instruction :
a. Please, retell your activities orally ! (It can be your last activities, last
weekend, special experience, etc)
b. Open your dictionary if needed.
c. Use action verbs and past tense.
98
Post-test
Subject : English
Grade : X
Time Allocation : 2 x 45 minutes
Name :
Student Number :
Instruction :
a. Please, retell your last activities orally!
b. Open your dictionary if needed.
c. Use action verbs and past tense.
99
Appendix 7. Picture Series about
Activities as Medium in Teaching
Speaking
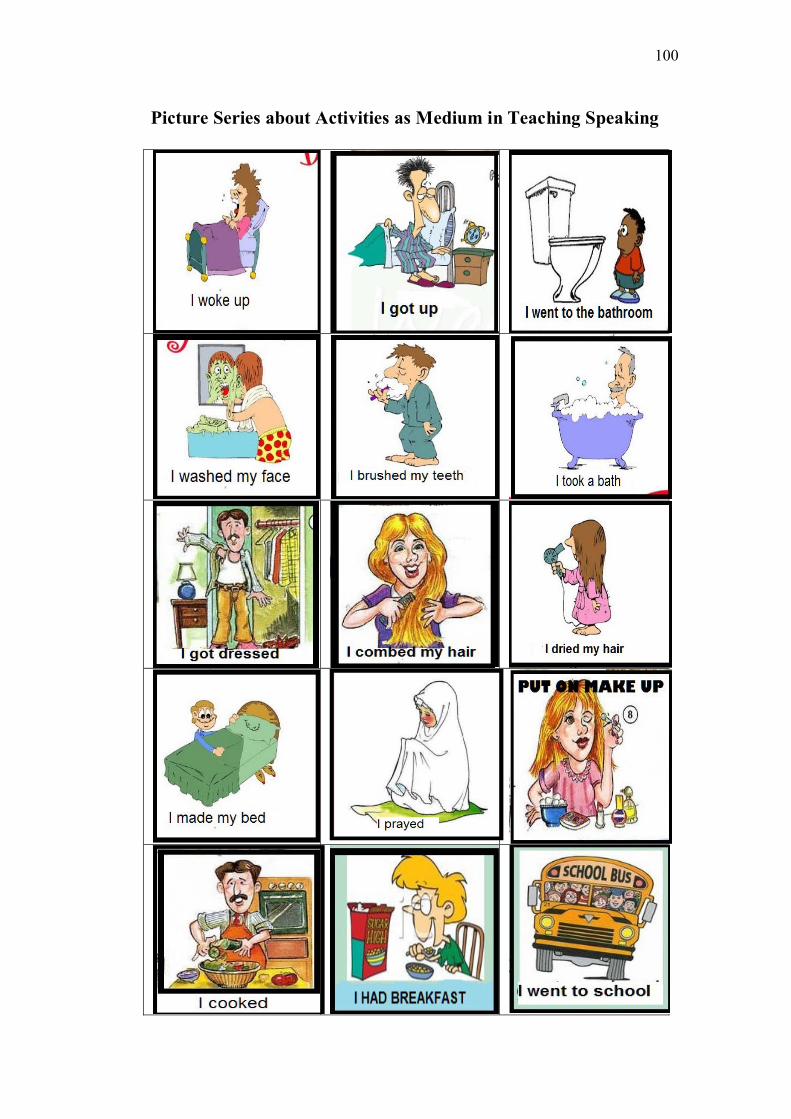
100
Picture Series about Activities as Medium in Teaching Speaking
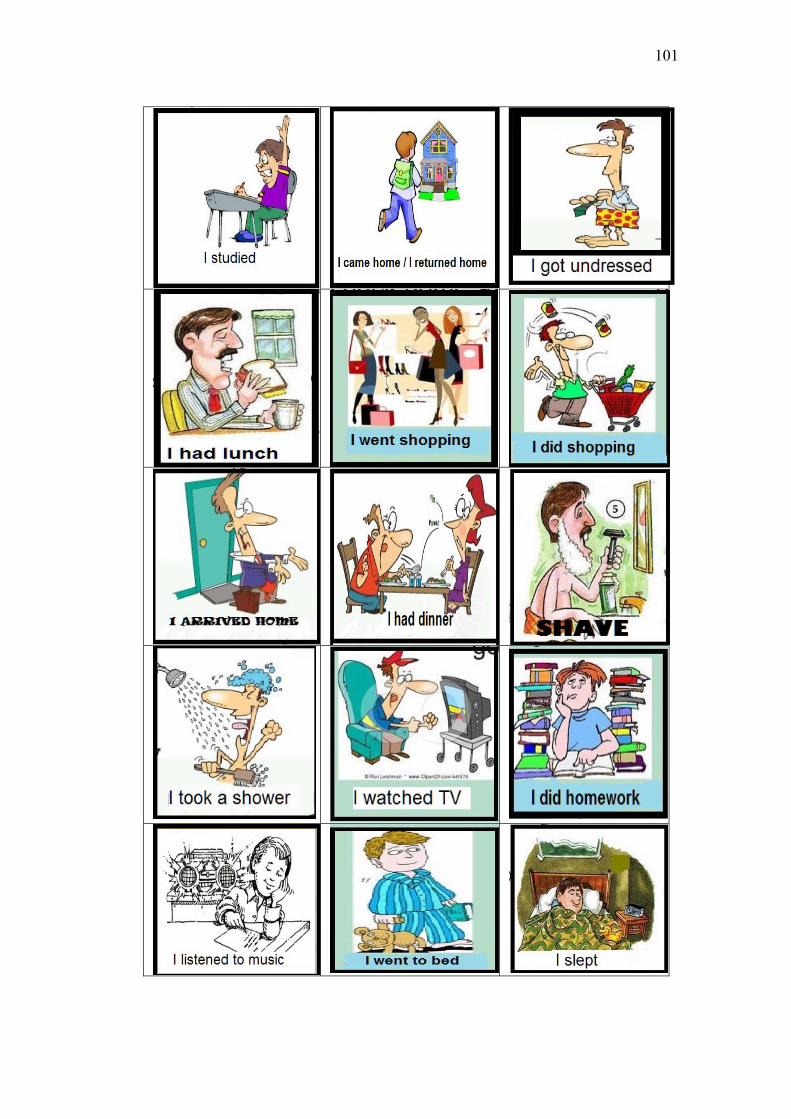
101

102
Appendix.8. Data Computation
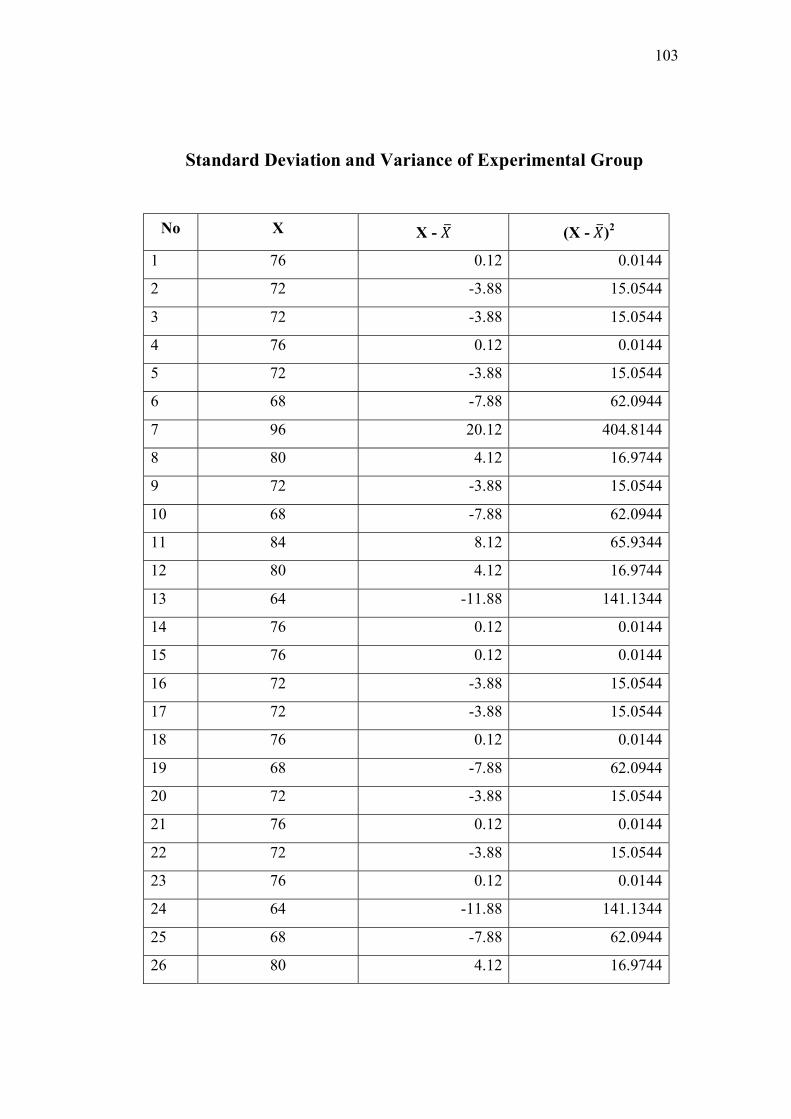
103
Standard Deviation and Variance of Experimental Group
No X X - �� (X - ��)2
1 76 0.12 0.0144
2 72 -3.88 15.0544
3 72 -3.88 15.0544
4 76 0.12 0.0144
5 72 -3.88 15.0544
6 68 -7.88 62.0944
7 96 20.12 404.8144
8 80 4.12 16.9744
9 72 -3.88 15.0544
10 68 -7.88 62.0944
11 84 8.12 65.9344
12 80 4.12 16.9744
13 64 -11.88 141.1344
14 76 0.12 0.0144
15 76 0.12 0.0144
16 72 -3.88 15.0544
17 72 -3.88 15.0544
18 76 0.12 0.0144
19 68 -7.88 62.0944
20 72 -3.88 15.0544
21 76 0.12 0.0144
22 72 -3.88 15.0544
23 76 0.12 0.0144
24 64 -11.88 141.1344
25 68 -7.88 62.0944
26 80 4.12 16.9744

104
27 88 12.12 146.8944
28 76 0.12 0.0144
29 80 4.12 16.9744
30 76 0.12 0.0144
31 88 12.12 146.8944
32 92 16.12 259.8544
Total 1,744
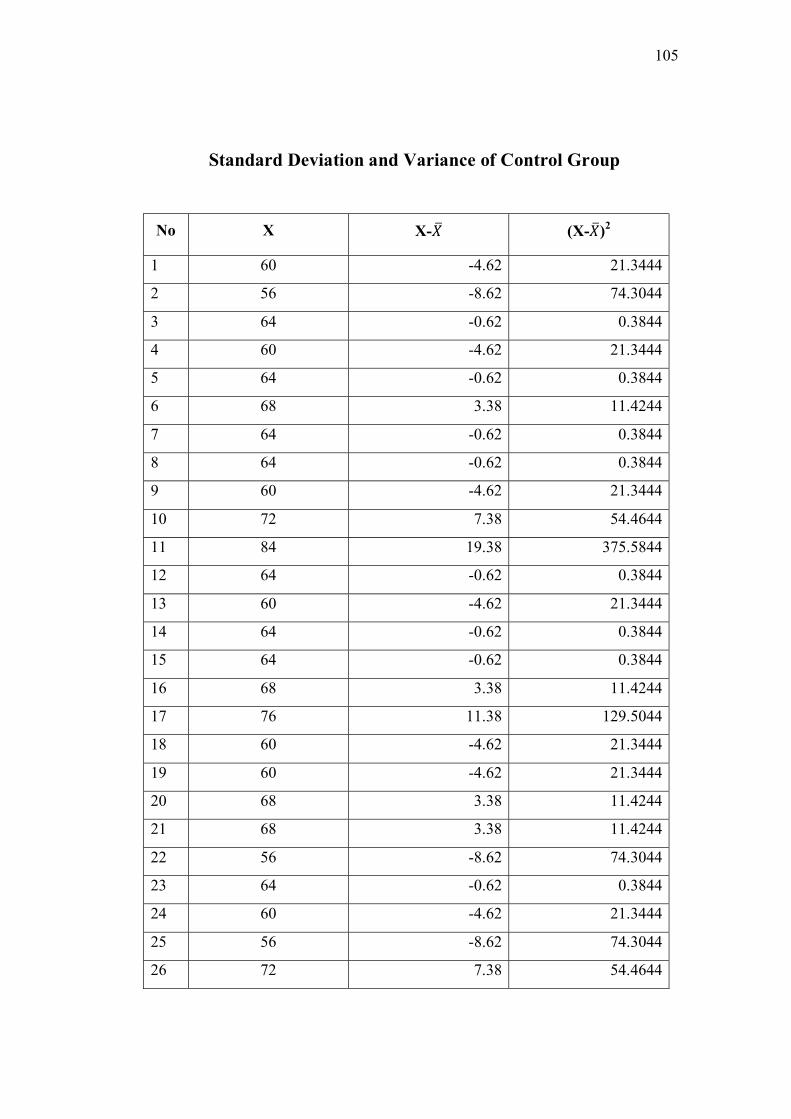
105
Standard Deviation and Variance of Control Group
No X X-�� (X-��)2
1 60 -4.62 21.3444
2 56 -8.62 74.3044
3 64 -0.62 0.3844
4 60 -4.62 21.3444
5 64 -0.62 0.3844
6 68 3.38 11.4244
7 64 -0.62 0.3844
8 64 -0.62 0.3844
9 60 -4.62 21.3444
10 72 7.38 54.4644
11 84 19.38 375.5844
12 64 -0.62 0.3844
13 60 -4.62 21.3444
14 64 -0.62 0.3844
15 64 -0.62 0.3844
16 68 3.38 11.4244
17 76 11.38 129.5044
18 60 -4.62 21.3444
19 60 -4.62 21.3444
20 68 3.38 11.4244
21 68 3.38 11.4244
22 56 -8.62 74.3044
23 64 -0.62 0.3844
24 60 -4.62 21.3444
25 56 -8.62 74.3044
26 72 7.38 54.4644

106
27 64 -0.62 0.3844
28 60 -4.62 21.3444
29 64 -0.62 0.3844
30 60 -4.62 21.3444
31 80 15.38 236.5444
32 64 -0.62 0.3844
Total 1,316
107
Appendix.9. Descriptive and Inferential
Analysis
(Experimental and Control Group)
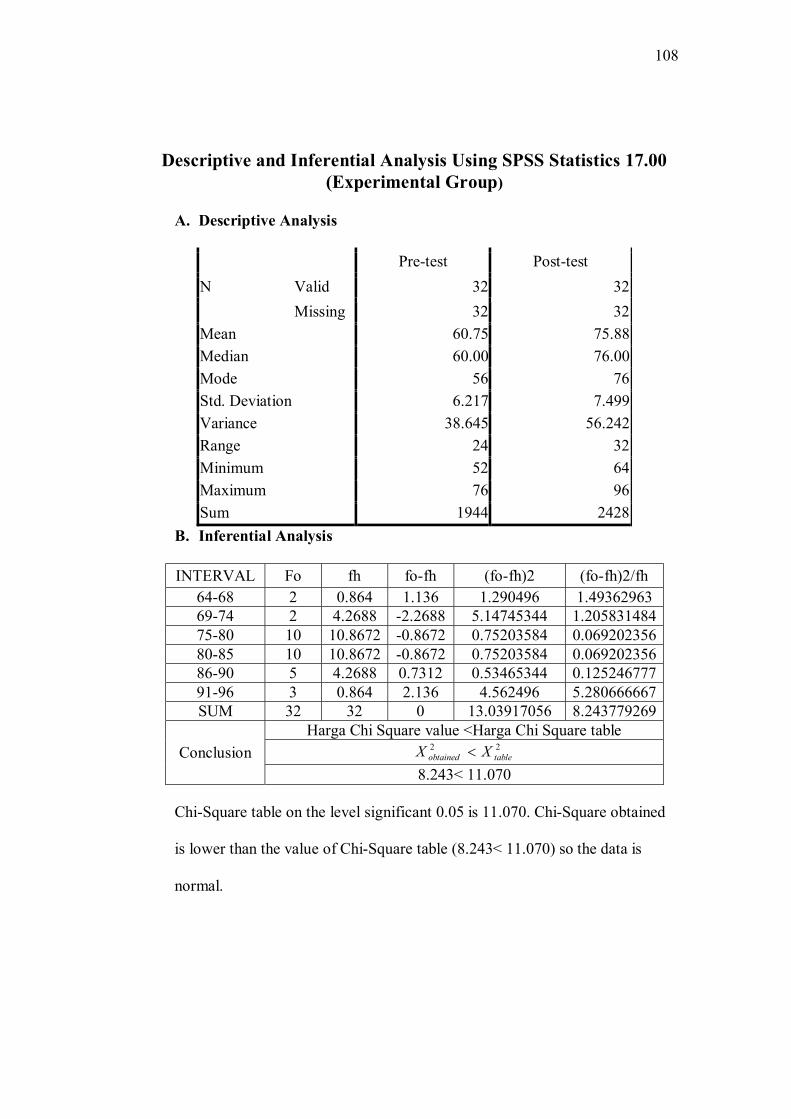
108
Descriptive and Inferential Analysis Using SPSS Statistics 17.00 (Experimental Group)
A. Descriptive Analysis
Pre-test Post-test N Valid 32 32
Missing 32 32 Mean 60.75 75.88 Median 60.00 76.00 Mode 56 76 Std. Deviation 6.217 7.499 Variance 38.645 56.242 Range 24 32 Minimum 52 64 Maximum 76 96 Sum 1944 2428
B. Inferential Analysis
INTERVAL Fo fh fo-fh (fo-fh)2 (fo-fh)2/fh 64-68 2 0.864 1.136 1.290496 1.49362963 69-74 2 4.2688 -2.2688 5.14745344 1.205831484 75-80 10 10.8672 -0.8672 0.75203584 0.069202356 80-85 10 10.8672 -0.8672 0.75203584 0.069202356 86-90 5 4.2688 0.7312 0.53465344 0.125246777 91-96 3 0.864 2.136 4.562496 5.280666667 SUM 32 32 0 13.03917056 8.243779269
Conclusion Harga Chi Square value <Harga Chi Square table
22tableobtained XX
8.243< 11.070
Chi-Square table on the level significant 0.05 is 11.070. Chi-Square obtained
is lower than the value of Chi-Square table (8.243< 11.070) so the data is
normal.
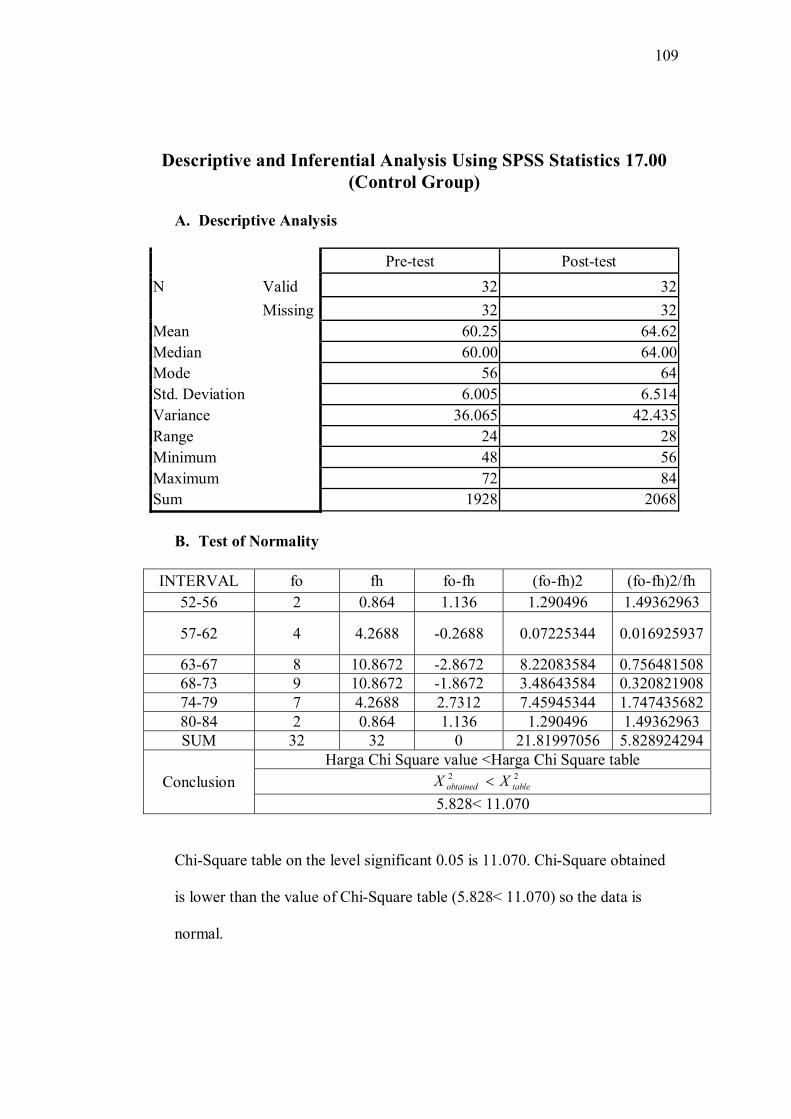
109
Descriptive and Inferential Analysis Using SPSS Statistics 17.00 (Control Group)
A. Descriptive Analysis
Pre-test Post-test N Valid 32 32
Missing 32 32 Mean 60.25 64.62 Median 60.00 64.00 Mode 56 64 Std. Deviation 6.005 6.514 Variance 36.065 42.435 Range 24 28 Minimum 48 56 Maximum 72 84 Sum 1928 2068
B. Test of Normality
INTERVAL fo fh fo-fh (fo-fh)2 (fo-fh)2/fh 52-56 2 0.864 1.136 1.290496 1.49362963
57-62 4 4.2688 -0.2688 0.07225344 0.016925937
63-67 8 10.8672 -2.8672 8.22083584 0.756481508 68-73 9 10.8672 -1.8672 3.48643584 0.320821908 74-79 7 4.2688 2.7312 7.45945344 1.747435682 80-84 2 0.864 1.136 1.290496 1.49362963 SUM 32 32 0 21.81997056 5.828924294
Conclusion Harga Chi Square value <Harga Chi Square table
22tableobtained XX
5.828< 11.070
Chi-Square table on the level significant 0.05 is 11.070. Chi-Square obtained
is lower than the value of Chi-Square table (5.828< 11.070) so the data is
normal.
110
Appendix.10. Table of F-statistic P=0.05

111
1. Table of F-statistics P=0.05
df2\df1 1 2 3 4 5 6 7 8 9 10 11 12 13 14 15 16 17 18 19 20 22 24 26 28 30
3 10.13 9.55 9.28 9.12 9.01 8.94 8.89 8.85 8.81 8.79 8.76 8.74 8.73 8.71 8.70 8.69 8.68 8.67 8.67 8.66 8.65 8.64 8.63 8.62 8.62
4 7.71 6.94 6.59 6.39 6.26 6.16 6.09 6.04 6.00 5.96 5.94 5.91 5.89 5.87 5.86 5.84 5.83 5.82 5.81 5.80 5.79 5.77 5.76 5.75 5.75
5 6.61 5.79 5.41 5.19 5.05 4.95 4.88 4.82 4.77 4.74 4.70 4.68 4.66 4.64 4.62 4.60 4.59 4.58 4.57 4.56 4.54 4.53 4.52 4.50 4.50
6 5.99 5.14 4.76 4.53 4.39 4.28 4.21 4.15 4.10 4.06 4.03 4.00 3.98 3.96 3.94 3.92 3.91 3.90 3.88 3.87 3.86 3.84 3.83 3.82 3.81
7 5.59 4.74 4.35 4.12 3.97 3.87 3.79 3.73 3.68 3.64 3.60 3.57 3.55 3.53 3.51 3.49 3.48 3.47 3.46 3.44 3.43 3.41 3.40 3.39 3.38
8 5.32 4.46 4.07 3.84 3.69 3.58 3.50 3.44 3.39 3.35 3.31 3.28 3.26 3.24 3.22 3.20 3.19 3.17 3.16 3.15 3.13 3.12 3.10 3.09 3.08
9 5.12 4.26 3.86 3.63 3.48 3.37 3.29 3.23 3.18 3.14 3.10 3.07 3.05 3.03 3.01 2.99 2.97 2.96 2.95 2.94 2.92 2.90 2.89 2.87 2.86
10 4.96 4.10 3.71 3.48 3.33 3.22 3.14 3.07 3.02 2.98 2.94 2.91 2.89 2.86 2.85 2.83 2.81 2.80 2.79 2.77 2.75 2.74 2.72 2.71 2.70
11 4.84 3.98 3.59 3.36 3.20 3.09 3.01 2.95 2.90 2.85 2.82 2.79 2.76 2.74 2.72 2.70 2.69 2.67 2.66 2.65 2.63 2.61 2.59 2.58 2.57
12 4.75 3.89 3.49 3.26 3.11 3.00 2.91 2.85 2.80 2.75 2.72 2.69 2.66 2.64 2.62 2.60 2.58 2.57 2.56 2.54 2.52 2.51 2.49 2.48 2.47
13 4.67 3.81 3.41 3.18 3.03 2.92 2.83 2.77 2.71 2.67 2.63 2.60 2.58 2.55 2.53 2.51 2.50 2.48 2.47 2.46 2.44 2.42 2.41 2.39 2.38
14 4.60 3.74 3.34 3.11 2.96 2.85 2.76 2.70 2.65 2.60 2.57 2.53 2.51 2.48 2.46 2.44 2.43 2.41 2.40 2.39 2.37 2.35 2.33 2.32 2.31
15 4.54 3.68 3.29 3.06 2.90 2.79 2.71 2.64 2.59 2.54 2.51 2.48 2.45 2.42 2.40 2.38 2.37 2.35 2.34 2.33 2.31 2.29 2.27 2.26 2.25
16 4.49 3.63 3.24 3.01 2.85 2.74 2.66 2.59 2.54 2.49 2.46 2.42 2.40 2.37 2.35 2.33 2.32 2.30 2.29 2.28 2.25 2.24 2.22 2.21 2.19

112
17 4.45 3.59 3.20 2.96 2.81 2.70 2.61 2.55 2.49 2.45 2.41 2.38 2.35 2.33 2.31 2.29 2.27 2.26 2.24 2.23 2.21 2.19 2.17 2.16 2.15
18 4.41 3.55 3.16 2.93 2.77 2.66 2.58 2.51 2.46 2.41 2.37 2.34 2.31 2.29 2.27 2.25 2.23 2.22 2.20 2.19 2.17 2.15 2.13 2.12 2.11
19 4.38 3.52 3.13 2.90 2.74 2.63 2.54 2.48 2.42 2.38 2.34 2.31 2.28 2.26 2.23 2.21 2.20 2.18 2.17 2.16 2.13 2.11 2.10 2.08 2.07
20 4.35 3.49 3.10 2.87 2.71 2.60 2.51 2.45 2.39 2.35 2.31 2.28 2.25 2.23 2.20 2.18 2.17 2.15 2.14 2.12 2.10 2.08 2.07 2.05 2.04
22 4.30 3.44 3.05 2.82 2.66 2.55 2.46 2.40 2.34 2.30 2.26 2.23 2.20 2.17 2.15 2.13 2.11 2.10 2.08 2.07 2.05 2.03 2.01 2.00 1.98
24 4.26 3.40 3.01 2.78 2.62 2.51 2.42 2.36 2.30 2.25 2.22 2.18 2.15 2.13 2.11 2.09 2.07 2.05 2.04 2.03 2.00 1.98 1.97 1.95 1.94
26 4.23 3.37 2.98 2.74 2.59 2.47 2.39 2.32 2.27 2.22 2.18 2.15 2.12 2.09 2.07 2.05 2.03 2.02 2.00 1.99 1.97 1.95 1.93 1.91 1.90
28 4.20 3.34 2.95 2.71 2.56 2.45 2.36 2.29 2.24 2.19 2.15 2.12 2.09 2.06 2.04 2.02 2.00 1.99 1.97 1.96 1.93 1.91 1.90 1.88 1.87
30 4.17 3.32 2.92 2.69 2.53 2.42 2.33 2.27 2.21 2.16 2.13 2.09 2.06 2.04 2.01 1.99 1.98 1.96 1.95 1.93 1.91 1.89 1.87 1.85 1.84
35 4.12 3.27 2.87 2.64 2.49 2.37 2.29 2.22 2.16 2.11 2.08 2.04 2.01 1.99 1.96 1.94 1.92 1.91 1.89 1.88 1.85 1.83 1.82 1.80 1.79

113
Appendix.11. Table of Chi Quadrate
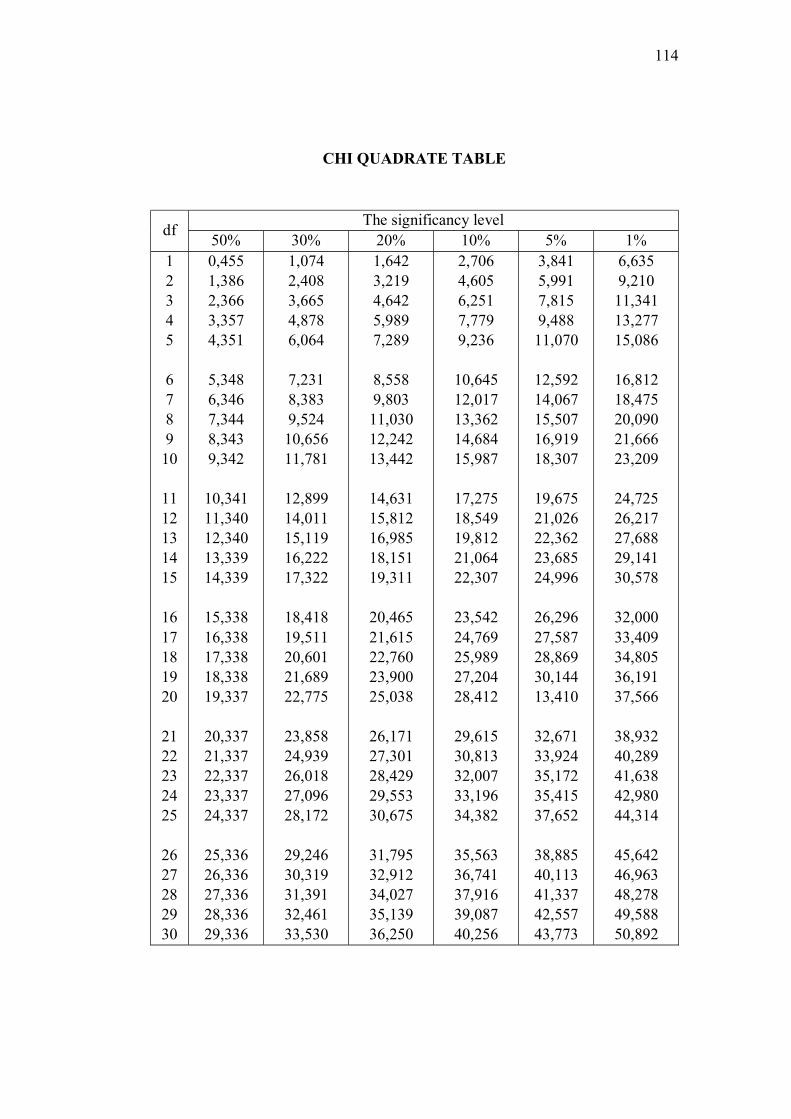
114
CHI QUADRATE TABLE
df The significancy level 50% 30% 20% 10% 5% 1%
1 2 3 4 5 6 7 8 9
10
11 12 13 14 15
16 17 18 19 20
21 22 23 24 25
26 27 28 29 30
0,455 1,386 2,366 3,357 4,351
5,348 6,346 7,344 8,343 9,342
10,341 11,340 12,340 13,339 14,339
15,338 16,338 17,338 18,338 19,337
20,337 21,337 22,337 23,337 24,337
25,336 26,336 27,336 28,336 29,336
1,074 2,408 3,665 4,878 6,064
7,231 8,383 9,524 10,656 11,781
12,899 14,011 15,119 16,222 17,322
18,418 19,511 20,601 21,689 22,775
23,858 24,939 26,018 27,096 28,172
29,246 30,319 31,391 32,461 33,530
1,642 3,219 4,642 5,989 7,289
8,558 9,803 11,030 12,242 13,442
14,631 15,812 16,985 18,151 19,311
20,465 21,615 22,760 23,900 25,038
26,171 27,301 28,429 29,553 30,675
31,795 32,912 34,027 35,139 36,250
2,706 4,605 6,251 7,779 9,236
10,645 12,017 13,362 14,684 15,987
17,275 18,549 19,812 21,064 22,307
23,542 24,769 25,989 27,204 28,412
29,615 30,813 32,007 33,196 34,382
35,563 36,741 37,916 39,087 40,256
3,841 5,991 7,815 9,488 11,070
12,592 14,067 15,507 16,919 18,307
19,675 21,026 22,362 23,685 24,996
26,296 27,587 28,869 30,144 13,410
32,671 33,924 35,172 35,415 37,652
38,885 40,113 41,337 42,557 43,773
6,635 9,210 11,341 13,277 15,086
16,812 18,475 20,090 21,666 23,209
24,725 26,217 27,688 29,141 30,578
32,000 33,409 34,805 36,191 37,566
38,932 40,289 41,638 42,980 44,314
45,642 46,963 48,278 49,588 50,892

115
Appendix.12. T-table
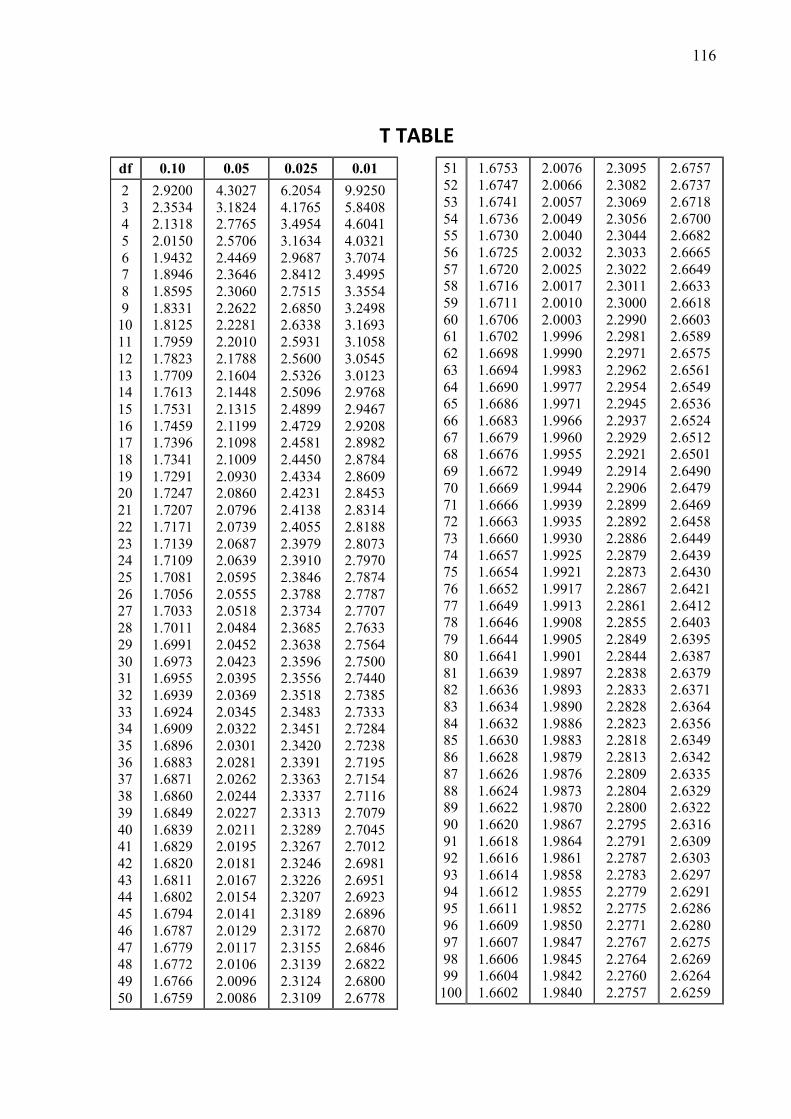
116
T TABLE df 0.10 0.05 0.025 0.01
2 3 4 5 6 7 8 9
10 11 12 13 14 15 16 17 18 19 20 21 22 23 24 25 26 27 28 29 30 31 32 33 34 35 36 37 38 39 40 41 42 43 44 45 46 47 48 49 50
2.9200 2.3534 2.1318 2.0150 1.9432 1.8946 1.8595 1.8331 1.8125 1.7959 1.7823 1.7709 1.7613 1.7531 1.7459 1.7396 1.7341 1.7291 1.7247 1.7207 1.7171 1.7139 1.7109 1.7081 1.7056 1.7033 1.7011 1.6991 1.6973 1.6955 1.6939 1.6924 1.6909 1.6896 1.6883 1.6871 1.6860 1.6849 1.6839 1.6829 1.6820 1.6811 1.6802 1.6794 1.6787 1.6779 1.6772 1.6766 1.6759
4.3027 3.1824 2.7765 2.5706 2.4469 2.3646 2.3060 2.2622 2.2281 2.2010 2.1788 2.1604 2.1448 2.1315 2.1199 2.1098 2.1009 2.0930 2.0860 2.0796 2.0739 2.0687 2.0639 2.0595 2.0555 2.0518 2.0484 2.0452 2.0423 2.0395 2.0369 2.0345 2.0322 2.0301 2.0281 2.0262 2.0244 2.0227 2.0211 2.0195 2.0181 2.0167 2.0154 2.0141 2.0129 2.0117 2.0106 2.0096 2.0086
6.2054 4.1765 3.4954 3.1634 2.9687 2.8412 2.7515 2.6850 2.6338 2.5931 2.5600 2.5326 2.5096 2.4899 2.4729 2.4581 2.4450 2.4334 2.4231 2.4138 2.4055 2.3979 2.3910 2.3846 2.3788 2.3734 2.3685 2.3638 2.3596 2.3556 2.3518 2.3483 2.3451 2.3420 2.3391 2.3363 2.3337 2.3313 2.3289 2.3267 2.3246 2.3226 2.3207 2.3189 2.3172 2.3155 2.3139 2.3124 2.3109
9.9250 5.8408 4.6041 4.0321 3.7074 3.4995 3.3554 3.2498 3.1693 3.1058 3.0545 3.0123 2.9768 2.9467 2.9208 2.8982 2.8784 2.8609 2.8453 2.8314 2.8188 2.8073 2.7970 2.7874 2.7787 2.7707 2.7633 2.7564 2.7500 2.7440 2.7385 2.7333 2.7284 2.7238 2.7195 2.7154 2.7116 2.7079 2.7045 2.7012 2.6981 2.6951 2.6923 2.6896 2.6870 2.6846 2.6822 2.6800 2.6778
51 52 53 54 55 56 57 58 59 60 61 62 63 64 65 66 67 68 69 70 71 72 73 74 75 76 77 78 79 80 81 82 83 84 85 86 87 88 89 90 91 92 93 94 95 96 97 98 99 100
1.6753 1.6747 1.6741 1.6736 1.6730 1.6725 1.6720 1.6716 1.6711 1.6706 1.6702 1.6698 1.6694 1.6690 1.6686 1.6683 1.6679 1.6676 1.6672 1.6669 1.6666 1.6663 1.6660 1.6657 1.6654 1.6652 1.6649 1.6646 1.6644 1.6641 1.6639 1.6636 1.6634 1.6632 1.6630 1.6628 1.6626 1.6624 1.6622 1.6620 1.6618 1.6616 1.6614 1.6612 1.6611 1.6609 1.6607 1.6606 1.6604 1.6602
2.0076 2.0066 2.0057 2.0049 2.0040 2.0032 2.0025 2.0017 2.0010 2.0003 1.9996 1.9990 1.9983 1.9977 1.9971 1.9966 1.9960 1.9955 1.9949 1.9944 1.9939 1.9935 1.9930 1.9925 1.9921 1.9917 1.9913 1.9908 1.9905 1.9901 1.9897 1.9893 1.9890 1.9886 1.9883 1.9879 1.9876 1.9873 1.9870 1.9867 1.9864 1.9861 1.9858 1.9855 1.9852 1.9850 1.9847 1.9845 1.9842 1.9840
2.3095 2.3082 2.3069 2.3056 2.3044 2.3033 2.3022 2.3011 2.3000 2.2990 2.2981 2.2971 2.2962 2.2954 2.2945 2.2937 2.2929 2.2921 2.2914 2.2906 2.2899 2.2892 2.2886 2.2879 2.2873 2.2867 2.2861 2.2855 2.2849 2.2844 2.2838 2.2833 2.2828 2.2823 2.2818 2.2813 2.2809 2.2804 2.2800 2.2795 2.2791 2.2787 2.2783 2.2779 2.2775 2.2771 2.2767 2.2764 2.2760 2.2757
2.6757 2.6737 2.6718 2.6700 2.6682 2.6665 2.6649 2.6633 2.6618 2.6603 2.6589 2.6575 2.6561 2.6549 2.6536 2.6524 2.6512 2.6501 2.6490 2.6479 2.6469 2.6458 2.6449 2.6439 2.6430 2.6421 2.6412 2.6403 2.6395 2.6387 2.6379 2.6371 2.6364 2.6356 2.6349 2.6342 2.6335 2.6329 2.6322 2.6316 2.6309 2.6303 2.6297 2.6291 2.6286 2.6280 2.6275 2.6269 2.6264 2.6259

117
Appendix.13. The Activities of Experimental
and Control Group
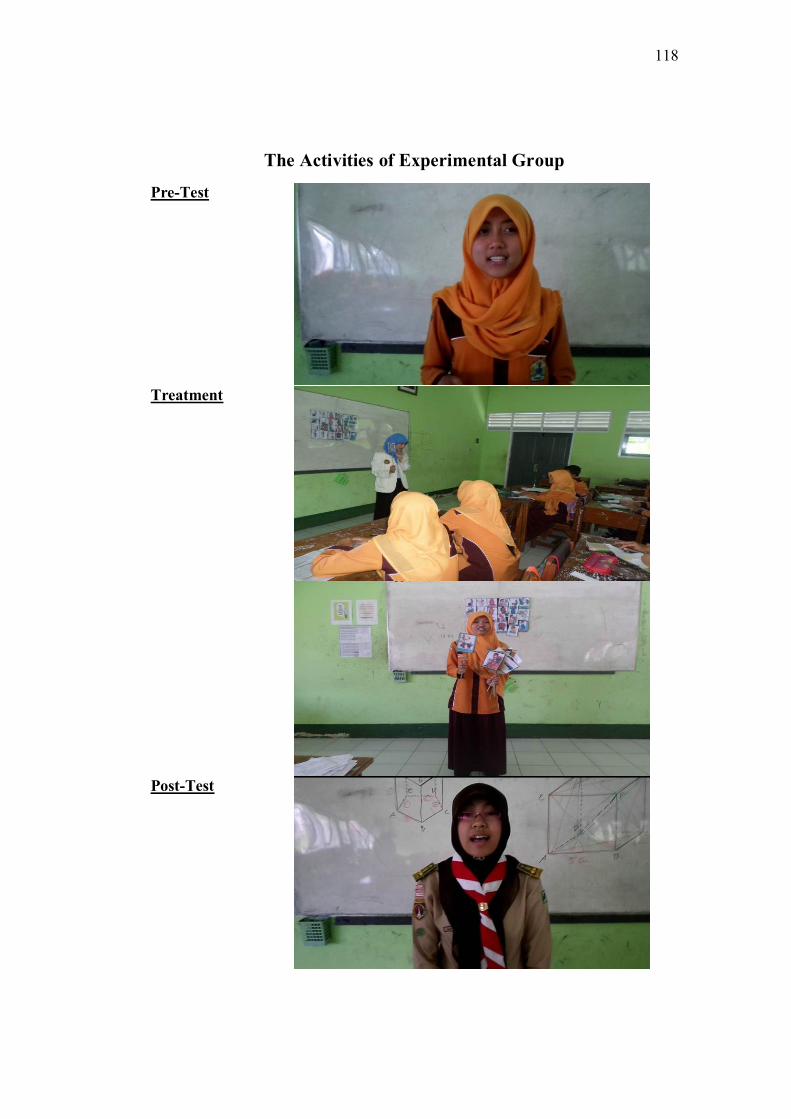
118
The Activities of Experimental Group
Pre-Test
Treatment
Post-Test

119
The Activities of Control Group
Pre-Test
Giving explanation of the material conventionally
Post-Test
120
Appendix.15. Thesis Consultation