Customer Satisfaction of Ayurvedic Hair Oils with Special ...
Upload
khangminh22Category
view
4download
0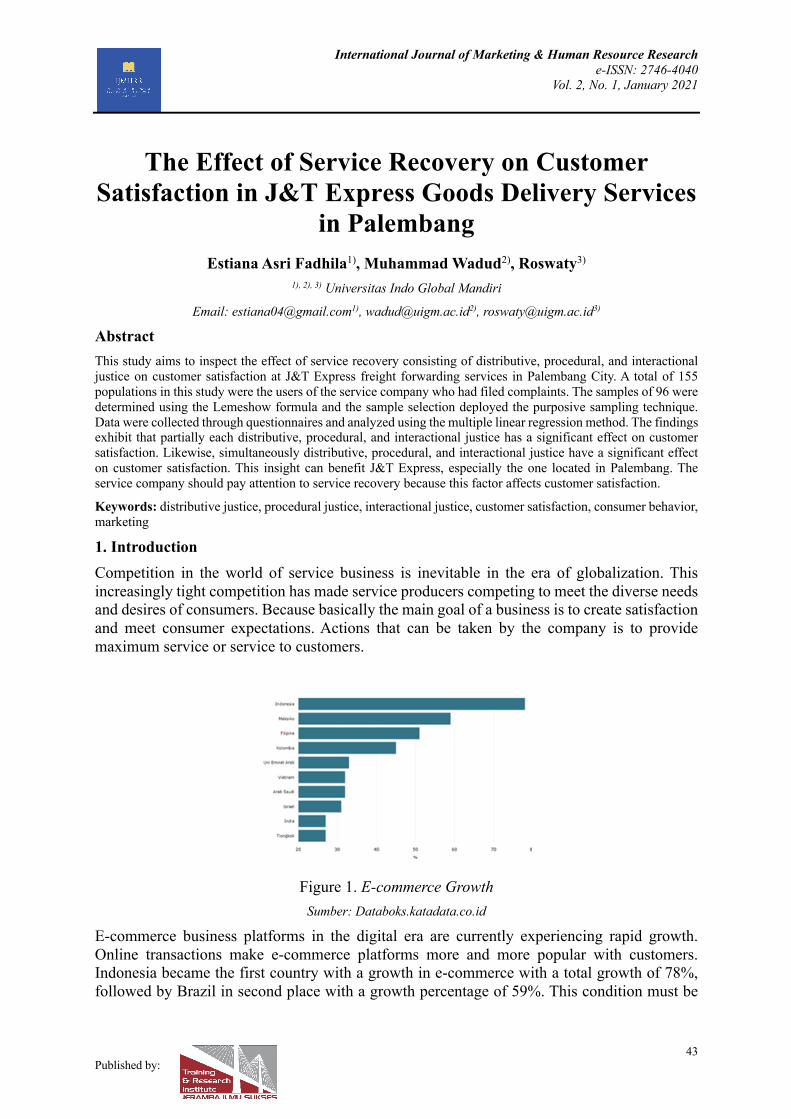
International Journal of Marketing & Human Resource Research e-ISSN: 2746-4040
Vol. 2, No. 1, January 2021
43 Published by:
The Effect of Service Recovery on Customer Satisfaction in J&T Express Goods Delivery Services
in Palembang Estiana Asri Fadhila1), Muhammad Wadud2), Roswaty3)
1), 2), 3) Universitas Indo Global Mandiri
Email: [email protected]), [email protected]), [email protected])
Abstract This study aims to inspect the effect of service recovery consisting of distributive, procedural, and interactional justice on customer satisfaction at J&T Express freight forwarding services in Palembang City. A total of 155 populations in this study were the users of the service company who had filed complaints. The samples of 96 were determined using the Lemeshow formula and the sample selection deployed the purposive sampling technique. Data were collected through questionnaires and analyzed using the multiple linear regression method. The findings exhibit that partially each distributive, procedural, and interactional justice has a significant effect on customer satisfaction. Likewise, simultaneously distributive, procedural, and interactional justice have a significant effect on customer satisfaction. This insight can benefit J&T Express, especially the one located in Palembang. The service company should pay attention to service recovery because this factor affects customer satisfaction.
Keywords: distributive justice, procedural justice, interactional justice, customer satisfaction, consumer behavior, marketing
1. Introduction Competition in the world of service business is inevitable in the era of globalization. This increasingly tight competition has made service producers competing to meet the diverse needs and desires of consumers. Because basically the main goal of a business is to create satisfaction and meet consumer expectations. Actions that can be taken by the company is to provide maximum service or service to customers.
Figure 1. E-commerce Growth
Sumber: Databoks.katadata.co.id
E-commerce business platforms in the digital era are currently experiencing rapid growth. Online transactions make e-commerce platforms more and more popular with customers. Indonesia became the first country with a growth in e-commerce with a total growth of 78%, followed by Brazil in second place with a growth percentage of 59%. This condition must be
International Journal of Marketing & Human Resource Research e-ISSN: 2746-4040
Vol. 2, No. 1, January 2021
44 Published by:
utilized properly, especially by Micro, Small and Medium Enterprises actors. During the Covid-19 Pandemic during 2020, it forced people to reduce direct interaction, including shopping. Plus, several shopping centers that had to be closed due to the corona outbreak. This is what makes the e-commerce business platform the prima donna for consumers during 2020. Online sales surged during the pandemic based on the “Big Data Overview of the Impact of Covid-19” published by the Central Statistics Agency. E-commerce sales increase when entering March 2020. The e-commerce business platform also requires courier services to deliver products sold to consumers, especially products that must be sent across city, provincial, and even state boundaries. Therefore, along with a sharp spike in e-commerce sales, this was followed by a high demand for freight forwarding services. Goods delivery service companies in Indonesia are increasingly mushrooming due to the great opportunities. In Indonesia, there are currently many companies that provide delivery services. These companies are competing to be the best by offering a variety of services so that they can calm the hearts of consumers. Various shipping service companies currently dominating the freight forwarding market include JNE, J&T, SiCepat, Pos Indonesia, DHL, TiKi, Wahana, Pahala Express, and others. In the services performed, of course the freight forwarder cannot be separated from problems during the service process. The higher the complexity of service delivery, the higher the risk of service failure or what is also known as a service falure. Therefore, companies need to design the right strategy in order to meet customer expectations and reduce service failures. Then J&T Express needs to make a good service recovery so that it can handle complaints or complaints from customers. This is done as an effort to improve service quality so that customers feel satisfied. It is important for companies to provide or facilitate consumers who experience failure in service by using service recovery so that no consumers are disappointed and can also maintain the survival of the company itself. J&T Express also needs to monitor or implement service recovery to find out how thoroughly a service failure problem can be handled so that it can create customer satisfaction. Customer trust can be increased again after service recovery efforts with the right procedures. Based on the above background, the researcher is interested in conducting research with the title "The Effect of Service Recovery on Customer Satisfaction at J&T Express Freight Forwarding in Palembang City". Based on the background described above the research questions for this study are: (RQ1) How is the influence of Distributive Justice Partially on Customer Satisfaction at J&T Express Freight Forwarding in Palembang City? (RQ2) How is the Partial Influence of Procedural Justice on Customer Satisfaction at J&T Express Freight Services in Palembang City? (RQ3) How is the influence of Interactional Justice Partially on Customer Satisfaction at J&T Express Freight Forwarding in Palembang City? (RQ4) How is the influence of Distributive Justice, Procedural Justice, and Interactional Justice Simultaneously on Customer Satisfaction at J&T Express Freight Forwarding in Palembang City?
2. Literature Review 2.1 Service Recovery Quoted from Tjiptono (2014: 481), service recovery is a satisfactory problem solving performed by service providers in handling customer bad complaints, and delivering services back to

International Journal of Marketing & Human Resource Research e-ISSN: 2746-4040
Vol. 2, No. 1, January 2021
45 Published by:
consumers on a second chance. Basically, service recovery provides a second chance for companies to fix errors that occur due to unfulfilled customer expectations. According to Tax, Brown, & Chandrashekaran (2013), service recovery itself has three dimensions, namely as follows:
1. Distributive Justice Tax et al., (2013) revealed that distributive justice refers to the calculation of costs incurred by consumers and benefits received by consumers. Distributive justice can be measured using three indicators, namely: a. Equity b. Equality c. Need
2. Procedural Justice Tax et al., (2013) say that procedural justice emphasizes the value of justice inherent during the complaint submission process. Customers will be willing to go through the complaint handling process if the procedures provided by the company are easy and fast. Procedural justice can be measured using four indicators: a. Handling problems with proper procedures b. Good policy in handling complaints c. Complaints are handled flexibly d. Speed in handling complaints
3. Interactional Justice Interactional justice is the value of justice received by customers due to the interaction process that occurs between customers and employees while following complaint handling procedures (Tax et al., 2013). Interactional justice according to Tax et al., (2013), can be measured by five indicators: a. Explanation/Causal Account (explanation), namely the provision of reasons why a
failure occurred in service b. Honesty, namely the truth of information submitted to customers c. Politeness, namely the polite attitude shown by employees d. Effort is an attitude of seriousness in handling complaints e. Empathy is showing a sense of care and attention to a complaint.
2.2 Customer Satisfaction According to Gaspersz (2005) in Ganita (2019) customer satisfaction is a condition where through the products consumed, consumers can fulfill their needs, wants and expectations. In general, satisfaction can be defined as a condition in which consumers feel happy or disappointed based on a comparison between product performance and expectations (Yanti, Karim, & Wadud, 2018; Wadud, 2018; Hildayanti & Marnisah, 2018; Nugraha & Sumadi, 2020; Pribadi, 2020; Siswanto, Adhila, & Purwoko, 2020; Afrilliana, 2020; Aditia, Wadud, & DP, 2020; Oktareza, Halin, & Handayani, 2020; Amha, 2020). Lupiyoadi (2001) in Jatra (2015) states that there are five important factors to determine the level of customer satisfaction:
1. Product Quality
International Journal of Marketing & Human Resource Research e-ISSN: 2746-4040
Vol. 2, No. 1, January 2021
46 Published by:
Product quality is an important factor in the service sector. Consumers will feel happy if the results of their evaluation after using the product show that the product is of good quality. Products offered to consumers can be in the form of goods or services.
2. Quality of Service In the service industry, customers will feel satisfied if the service they receive is in accordance with their expectations or expectations.
3. Emotional Customers feel proud and have the confidence that other people will feel amazed at them when using goods or services with certain brands. Satisfaction with emotional factors is not caused by the quality of a product, but comes from social values that can make customers satisfied with certain brands.
4. Price Products with the same quality but at a lower price will provide more value to consumers. Therefore, the price level will greatly affect the level of consumer satisfaction with a product.
5. Costs Customers who do not need to spend outside of the main cost or do not need to waste time getting a product or service will tend to be satisfied with the product.
2.3 Previous Research In a study conducted by (Khoiriyatun, 2016) the title "The Effect of Service Recovery on Customer Satisfaction (Studies on Customers of Hotel Ibis Yogyakarta)", shows that distributional justice, procedural justice, and interactional justice have a significant effect on customer satisfaction. Research conducted by (Sastranegara, 2016) with the title 'The Effect of Service Recovery on Passenger Satisfaction at Husein Sastranegara Airport', the results of this study indicate that Service Recovery affects passenger satisfaction both simultaneously and partially. Research conducted by (Ganita, 2019) entitled "The Effect of Service Recovery on Customer Loyalty with Satisfaction as a Mediation Variable", shows that Service Recovery has a positive effect on customer loyalty. Research conducted by (Service et al., 2017) entitled 'The Effect of Service Recovery on Customer Loyalty at PT BPRS Safir Bengkulu', the results in this study indicate that service recovery has a significant effect on customer loyalty of PT BPRS Safir Bengkulu. In a study conducted by (Rohmat Khoiri, 2017) entitled "The Effect of Service Recovery on Customer Satisfaction (Study at PT. Tiki Jalur Nugraha Eka Kurir (JNE) in Purworejo) ', shows that there is a positive and significant influence between Service Customer Satisfaction Recovery. 2.4 Research Hypothesis From the formulation of the problem and the framework, the following hypothesis can be formulated:
H1 = It is suspected that there is a partial influence between the variable distributive justice on customer satisfaction. H2 = It is suspected that there is a partial influence between procedural justice variables on customer satisfaction.
International Journal of Marketing & Human Resource Research e-ISSN: 2746-4040
Vol. 2, No. 1, January 2021
47 Published by:
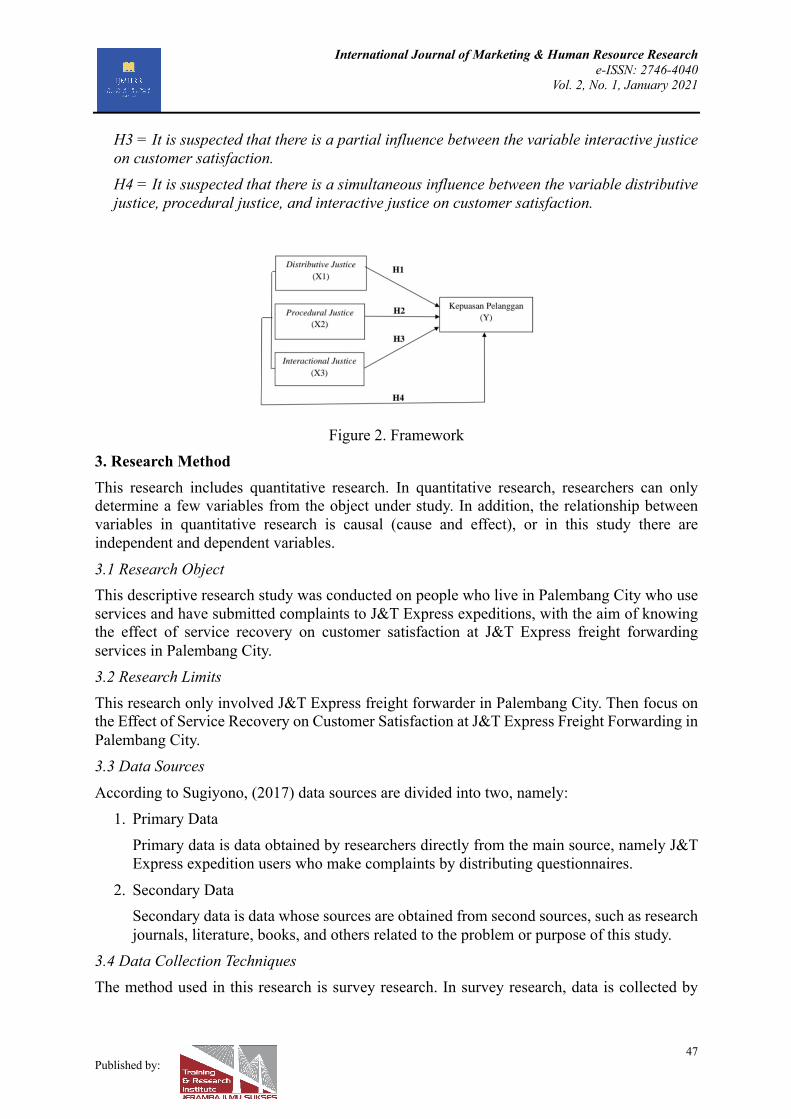
H3 = It is suspected that there is a partial influence between the variable interactive justice on customer satisfaction. H4 = It is suspected that there is a simultaneous influence between the variable distributive justice, procedural justice, and interactive justice on customer satisfaction.
Figure 2. Framework
3. Research Method This research includes quantitative research. In quantitative research, researchers can only determine a few variables from the object under study. In addition, the relationship between variables in quantitative research is causal (cause and effect), or in this study there are independent and dependent variables.
3.1 Research Object This descriptive research study was conducted on people who live in Palembang City who use services and have submitted complaints to J&T Express expeditions, with the aim of knowing the effect of service recovery on customer satisfaction at J&T Express freight forwarding services in Palembang City. 3.2 Research Limits This research only involved J&T Express freight forwarder in Palembang City. Then focus on the Effect of Service Recovery on Customer Satisfaction at J&T Express Freight Forwarding in Palembang City. 3.3 Data Sources
According to Sugiyono, (2017) data sources are divided into two, namely: 1. Primary Data
Primary data is data obtained by researchers directly from the main source, namely J&T Express expedition users who make complaints by distributing questionnaires.
2. Secondary Data Secondary data is data whose sources are obtained from second sources, such as research journals, literature, books, and others related to the problem or purpose of this study.
3.4 Data Collection Techniques The method used in this research is survey research. In survey research, data is collected by
International Journal of Marketing & Human Resource Research e-ISSN: 2746-4040
Vol. 2, No. 1, January 2021
48 Published by:
distributing questionnaires, conducting interviews, tests and others. The data collection technique taken by the researcher was through a questionnaire.
3.5 Population and Sample The population in this study were the people of Palembang City who used and complained to J&T Express expedition services, totaling 155 people including customers who had complained to J&T Express expedition services. The sampling technique used in this study is non-probability sampling. In this technique each member of the population does not have the same opportunity to be selected as a sample. The non-probability sampling technique used was purposive sampling. In purposive sampling, the sample is determined with certain considerations (Sugiyono, 2017). The criteria that researchers consider in selecting samples are as follows: customers who are domiciled in the city of Palembang; customers who use J&T expedition services at least 2 times; customers who have complained. To find out the number of samples, the author uses the Lemeshow formula in (Ridwan & Akdon, 2010).
n=𝐙𝐚𝟐𝐗𝐏𝐗𝐐𝐋𝟐
Where:
n = minimum number of samples required Zα = standard value of distribution of value α = 5% = 1.96
P = prevalence of outcome, because data has not been obtained, 50% is used Q = 1-P
L = accuracy level of 10%
Based on the formula, then, n = (),+,)"./,0./,0(/,))"
= 96,04
From the above calculations, the minimum number of samples needed in this study is 96 respondents.
3.6 Analysis Techniques 3.6.1 Validity Test The validity test is used to measure whether a questionnaire is valid or not. The questionnaire is said to be valid if the questions on the questionnaire are able to reveal something that will be measured by the questionnaire (Sunyoto, 2016). 3.6.2 Reliability Test According to Ghozali (2011) in Rohmat Khoiri (2017), whether a questionnaire is reliable or not can be seen from the consistency of respondents' answers to a question from time to time. Reliability measurement is done by looking at Cronbach's Alpha, where if the Cronbach's Alpha value is>0.6 then the data analysis technique is said to be reliable.
3.6.3 Normality Test The normality test aims to determine the results of the data distribution in the variables that will
International Journal of Marketing & Human Resource Research e-ISSN: 2746-4040
Vol. 2, No. 1, January 2021
49 Published by:
be used in the study. Data normality can be analyzed using Dependent Histogram and Normal P-Plot Graph using SPSS for windows.
3.6.4 Multiple Linear Regression Analysis The analytical tool used in this research is multiple linear regression analysis. This analysis is useful for determining the effect of independent or independent variables on the dependent or dependent variable. In this study, multiple linear regression analysis was used to determine whether or not the influence of the independent variables, namely distributive justice, procedural justice, and interactional justice on the dependent variable, namely customer satisfaction, was used. Data analysis was performed using a computer through the SPSS 26 program. The multiple linear regression equation is as follows:
Y = a + b1X1 + b2X2 + b3X3 + e Where:
Y = Customer Satisfaction a = constant value
b1 = regression coefficient of variable X1 b2 = regression coefficient of variable X2
b3 = regression coefficient of variable X3 X1 = Distributive Justice
X2 = Procedural Justice X3 = Interactional Justice
e = error term (confounding variable) 3.6.5 Partial Test (t test) To determine the effect of variables partially or individually between X1 on Y, X2 on Y and X3 on Y, according to (Sujarweni, 2015: 113), decision making uses two ways. The first method is if pvalue>0.05 then H0 is accepted and if pvalue<0.05 then H0 is rejected. The second method is if tvalue<ttable then H0 is accepted and if tvalue>ttable then H0 is rejected.
3.6.6 Simultaneous Test (Test F) The F test is carried out to see simultaneously or together how the influence of variable X on variable Y. The F test formula according to (Sunyoto, 2016: 188) is as follows:
Where:
R²: The coefficient of determination n: Number of Samples
k: Total Number of Variables

International Journal of Marketing & Human Resource Research e-ISSN: 2746-4040
Vol. 2, No. 1, January 2021
50 Published by:
4. Findings and Discussions 4.1 Research Results
4.1.1 Validity Test Based on the results of the validity test, it shows that the value of r-count per statement item is positive and is more than the r-table, which is 0.200, so it can be concluded that all question items in the questionnaire are proven valid.
4.1.2 Reliability Test Cronbach's Alpha value of all variables is greater than 0.6, so it can be concluded that the indicators or questionnaires used variables of Distributive Justice, Procedural Justice, and Interactional Justice on Customer Satisfaction are all said to be reliable and can be trusted as a variable measuring tool. 4.1.3 Normality Test
Figure 3. Dependent Histogram
Based on Figure 3, the normal plot of the graph presented above can be concluded that the histogram graph provides a normal distribution pattern.
Figure 4. Normal P-P Plott of Regression Standardized Residual Graph
Based on Figure 4, the P-P Plot graph also shows a conclusion, from the display above, it can be seen that there is data that spreads out slightly from the diagonal line, so that it can still be
International Journal of Marketing & Human Resource Research e-ISSN: 2746-4040
Vol. 2, No. 1, January 2021
51 Published by:
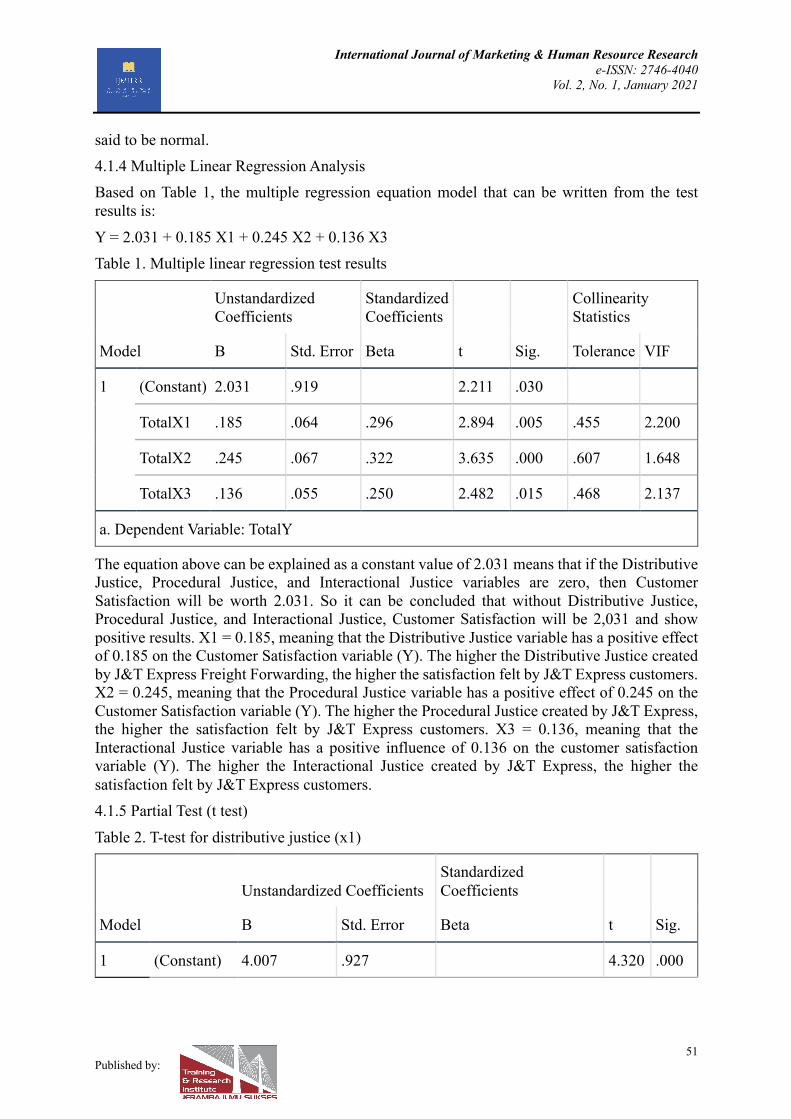
said to be normal. 4.1.4 Multiple Linear Regression Analysis Based on Table 1, the multiple regression equation model that can be written from the test results is:
Y = 2.031 + 0.185 X1 + 0.245 X2 + 0.136 X3 Table 1. Multiple linear regression test results
Model
Unstandardized Coefficients
Standardized Coefficients
t Sig.
Collinearity Statistics
B Std. Error Beta Tolerance VIF
1 (Constant) 2.031 .919 2.211 .030
TotalX1 .185 .064 .296 2.894 .005 .455 2.200
TotalX2 .245 .067 .322 3.635 .000 .607 1.648
TotalX3 .136 .055 .250 2.482 .015 .468 2.137
a. Dependent Variable: TotalY
The equation above can be explained as a constant value of 2.031 means that if the Distributive Justice, Procedural Justice, and Interactional Justice variables are zero, then Customer Satisfaction will be worth 2.031. So it can be concluded that without Distributive Justice, Procedural Justice, and Interactional Justice, Customer Satisfaction will be 2,031 and show positive results. X1 = 0.185, meaning that the Distributive Justice variable has a positive effect of 0.185 on the Customer Satisfaction variable (Y). The higher the Distributive Justice created by J&T Express Freight Forwarding, the higher the satisfaction felt by J&T Express customers. X2 = 0.245, meaning that the Procedural Justice variable has a positive effect of 0.245 on the Customer Satisfaction variable (Y). The higher the Procedural Justice created by J&T Express, the higher the satisfaction felt by J&T Express customers. X3 = 0.136, meaning that the Interactional Justice variable has a positive influence of 0.136 on the customer satisfaction variable (Y). The higher the Interactional Justice created by J&T Express, the higher the satisfaction felt by J&T Express customers. 4.1.5 Partial Test (t test)
Table 2. T-test for distributive justice (x1)
Model
Unstandardized Coefficients Standardized Coefficients
t Sig. B Std. Error Beta
1 (Constant) 4.007 .927 4.320 .000
International Journal of Marketing & Human Resource Research e-ISSN: 2746-4040
Vol. 2, No. 1, January 2021
52 Published by:
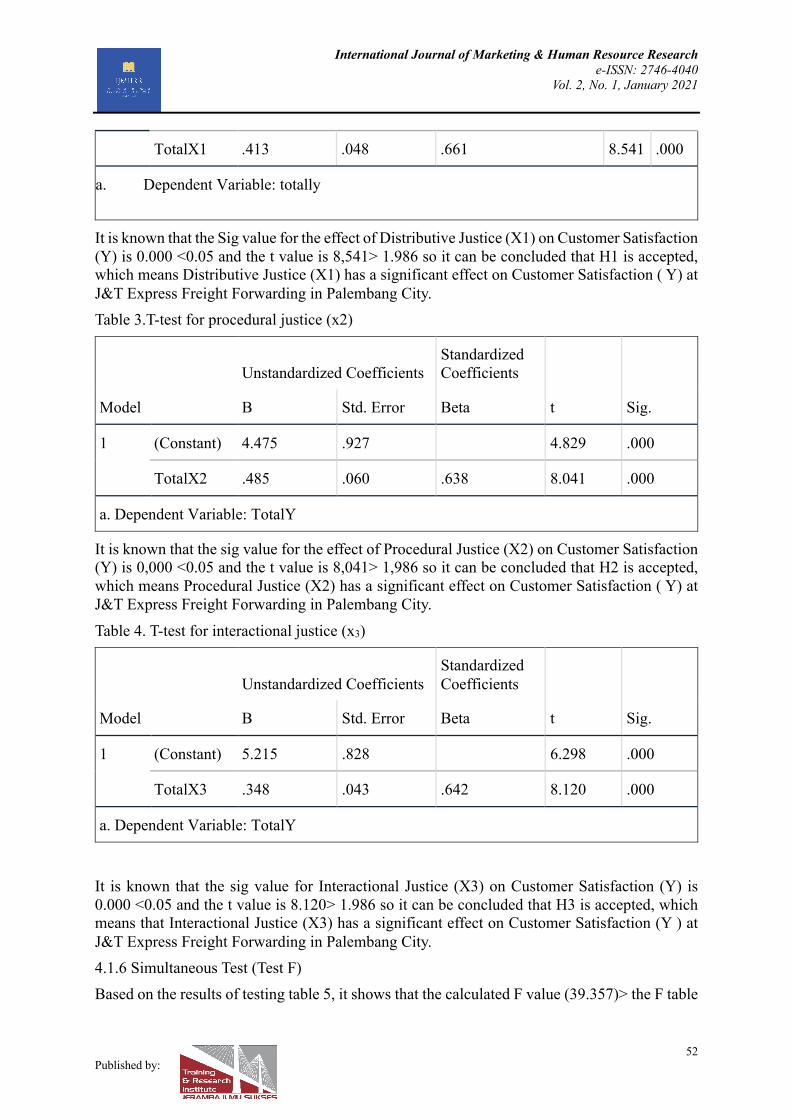
TotalX1 .413 .048 .661 8.541 .000
a. Dependent Variable: totally
It is known that the Sig value for the effect of Distributive Justice (X1) on Customer Satisfaction (Y) is 0.000 <0.05 and the t value is 8,541> 1.986 so it can be concluded that H1 is accepted, which means Distributive Justice (X1) has a significant effect on Customer Satisfaction ( Y) at J&T Express Freight Forwarding in Palembang City. Table 3.T-test for procedural justice (x2)
Model
Unstandardized Coefficients Standardized Coefficients
t Sig. B Std. Error Beta
1 (Constant) 4.475 .927 4.829 .000
TotalX2 .485 .060 .638 8.041 .000
a. Dependent Variable: TotalY
It is known that the sig value for the effect of Procedural Justice (X2) on Customer Satisfaction (Y) is 0,000 <0.05 and the t value is 8,041> 1,986 so it can be concluded that H2 is accepted, which means Procedural Justice (X2) has a significant effect on Customer Satisfaction ( Y) at J&T Express Freight Forwarding in Palembang City.
Table 4. T-test for interactional justice (x3)
Model
Unstandardized Coefficients Standardized Coefficients
t Sig. B Std. Error Beta
1 (Constant) 5.215 .828 6.298 .000
TotalX3 .348 .043 .642 8.120 .000
a. Dependent Variable: TotalY
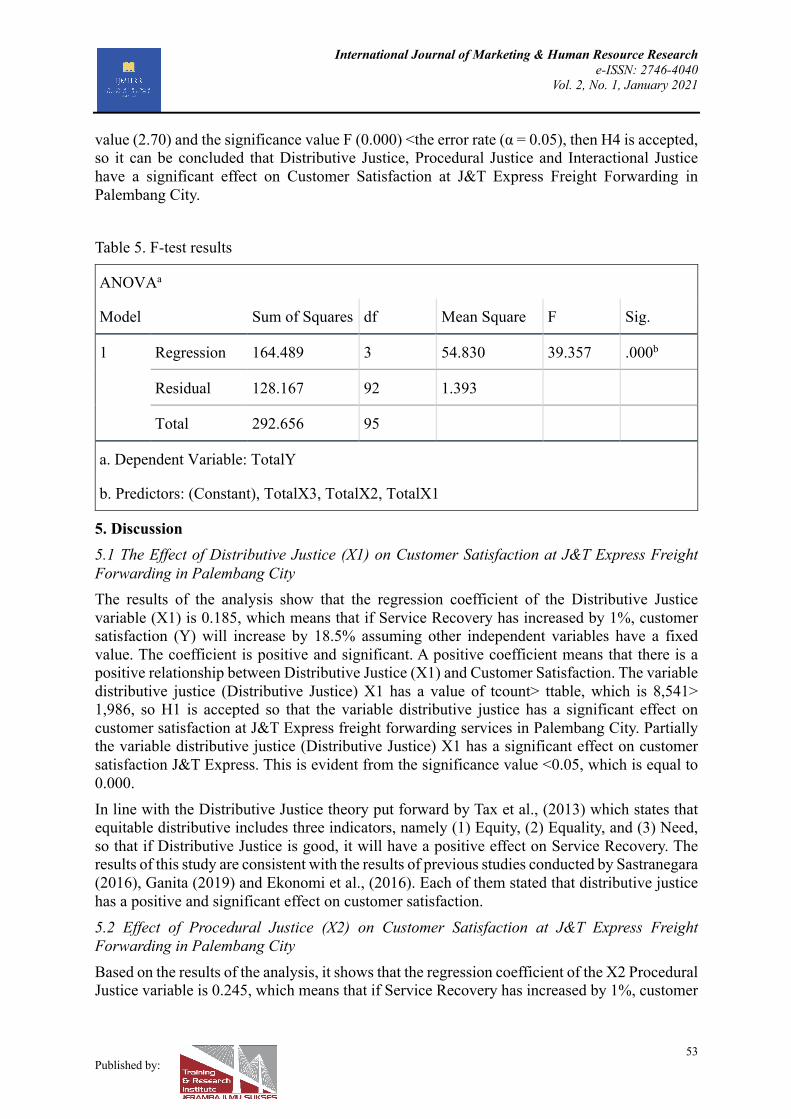
It is known that the sig value for Interactional Justice (X3) on Customer Satisfaction (Y) is 0.000 <0.05 and the t value is 8.120> 1.986 so it can be concluded that H3 is accepted, which means that Interactional Justice (X3) has a significant effect on Customer Satisfaction (Y ) at J&T Express Freight Forwarding in Palembang City. 4.1.6 Simultaneous Test (Test F) Based on the results of testing table 5, it shows that the calculated F value (39.357)> the F table
International Journal of Marketing & Human Resource Research e-ISSN: 2746-4040
Vol. 2, No. 1, January 2021
53 Published by:
value (2.70) and the significance value F (0.000) <the error rate (α = 0.05), then H4 is accepted, so it can be concluded that Distributive Justice, Procedural Justice and Interactional Justice have a significant effect on Customer Satisfaction at J&T Express Freight Forwarding in Palembang City.
Table 5. F-test results
ANOVAa
Model Sum of Squares df Mean Square F Sig.
1 Regression 164.489 3 54.830 39.357 .000b
Residual 128.167 92 1.393
Total 292.656 95
a. Dependent Variable: TotalY
b. Predictors: (Constant), TotalX3, TotalX2, TotalX1
5. Discussion 5.1 The Effect of Distributive Justice (X1) on Customer Satisfaction at J&T Express Freight Forwarding in Palembang City The results of the analysis show that the regression coefficient of the Distributive Justice variable (X1) is 0.185, which means that if Service Recovery has increased by 1%, customer satisfaction (Y) will increase by 18.5% assuming other independent variables have a fixed value. The coefficient is positive and significant. A positive coefficient means that there is a positive relationship between Distributive Justice (X1) and Customer Satisfaction. The variable distributive justice (Distributive Justice) X1 has a value of tcount> ttable, which is 8,541> 1,986, so H1 is accepted so that the variable distributive justice has a significant effect on customer satisfaction at J&T Express freight forwarding services in Palembang City. Partially the variable distributive justice (Distributive Justice) X1 has a significant effect on customer satisfaction J&T Express. This is evident from the significance value <0.05, which is equal to 0.000. In line with the Distributive Justice theory put forward by Tax et al., (2013) which states that equitable distributive includes three indicators, namely (1) Equity, (2) Equality, and (3) Need, so that if Distributive Justice is good, it will have a positive effect on Service Recovery. The results of this study are consistent with the results of previous studies conducted by Sastranegara (2016), Ganita (2019) and Ekonomi et al., (2016). Each of them stated that distributive justice has a positive and significant effect on customer satisfaction. 5.2 Effect of Procedural Justice (X2) on Customer Satisfaction at J&T Express Freight Forwarding in Palembang City Based on the results of the analysis, it shows that the regression coefficient of the X2 Procedural Justice variable is 0.245, which means that if Service Recovery has increased by 1%, customer
International Journal of Marketing & Human Resource Research e-ISSN: 2746-4040
Vol. 2, No. 1, January 2021
54 Published by:
satisfaction (Y) will increase by 24.5% assuming other independent variables have a fixed value. The coefficient is positive and significant. Variable Procedural Justice (X2) has a value of tcount> ttable which is equal to 8,041> 1,986, so H2 is accepted so that the variable Procedural Justice (X2) has a significant effect on customer satisfaction on J&T Express freight forwarding services in Palembang City. Partially the Procedural Justice (X2) variable has a significant effect on customer satisfaction of J&T Express. This is evident from the significance value <0.05, which is equal to 0.000. In line with the Procedural Justice theory put forward by Tax et al., (2013) which states that fair procedures include four indicators, namely (1) Handling problems with proper procedures, (2) Good policies in handling complaints, (3) Complaints are handled flexibly, and (4) Speed in handling complaints, so that if Procedural Justice is good it will have a positive effect on Service Recovery. The results of this study are consistent with the results of previous studies conducted by Management et al., (2017), Khoiriyatun (2016), and Rohmat Khoiri (2017). Each of them stated that procedural fairness has a positive and significant effect on customer satisfaction. 5.3 The Influence of Interactional Justice (X3) on Customer Satisfaction at J&T Express Freight Forwarding in Palembang City Based on the results of the analysis, it shows that the regression coefficient of the Interactional Justice (X3) variable is 0.136, which means that if Service Recovery has increased by 1%, customer satisfaction (Y) will increase by 13.6% assuming other independent variables have a fixed value. The coefficient is positive and significant. A positive coefficient means that there is a positive relationship between Interactional Justice (X3) and Customer Satisfaction. The variable interactional justice (Interactional Justice) X3 has a value of tcount> t table, which is 8.120> 1.986, so H3 is accepted so that the variable interactional justice has a significant effect on customer satisfaction on J&T Express freight forwarding services in Palembang City. Partially, the variable interactional justice (Interactional Justice) X3 has a significant effect on customer satisfaction of J&T Express. This is evident from the significance value <0.05, which is equal to 0.000. In line with the theory of Interactional Justice proposed by Tax et al., (2013) which states that fair interaction includes five indicators, namely (1) Explanation, (2) Honesty or Honesty, (3) Politeness or Courtesy, (4) ) Effort or effort, and (5) Empathy or Empathy, so that if Interactional Justice is good it will have a positive effect on Service Recovery. The results of this study are consistent with the results of previous studies conducted by Khoiriyatun (2016), Ganita (2019) and Rohmat Khoiri (2017). Each of them stated that interactional justice has a positive and significant effect on customer satisfaction. 5.4 The Influence of Distributive Justice (X1), Procedural Justice (X2), and Interactional Justice (X3) on Customer Satisfaction (Y) on J&T Express Freight Forwarding in Palembang City Based on the results of the Simultaneous Test analysis (Test F) has a value of Fcount> Ftable which is equal to 39,357> 2.70 with a significance value of F (0.000) <(0.05), then H4 is accepted so that it can be concluded that Distributive Justice (X1), Procedural Justice (X2) , and Interactional Justice (X3) has a significant effect on Customer Satisfaction at J&T Express Freight Forwarding in Palembang City. The results of this study are in line with the Service Recovery theory put forward by Tjiptono (2014: 481) which states that Service Recovery is a satisfactory problem solving performed by

International Journal of Marketing & Human Resource Research e-ISSN: 2746-4040
Vol. 2, No. 1, January 2021
55 Published by:
service providers in handling customer bad complaints, and delivering services back to consumers on a second chance. In accordance with the results of the Coefficient of Determination (R2), it shows that 0.562 means that the variation that occurs in variable Y (Customer Satisfaction) is 56.2% determined by independent variables, namely Distributive Justice (X1), Procedural Justice (X2), and Interactional Justice. (X3). The remaining 43.8% is determined by variables or other factors that are not included in this study and are not included in this regression model. This means that the fourth hypothesis of the study can be accepted. This is supported by the results of previous research conducted by Ganita (2019), Khoiriyatun (2016), and Rohmat Khoiri (2017). Stating that Service Recovery which consists of three dimensions, namely Distributive Justice (X1), Procedural Justice (X2), and Interactional Justice (X3) has a positive and significant effect on Customer Satisfaction (Y). 6. Conclusion This study suggests J&T Express to maintain the Service Recovery that is already in the system implemented by J&T Express because the Service Recovery implemented by J&T Express has been considered good by customers who complain. From the results of the Multiple Linear Regression Analysis, it can be seen that the Interactional Justice (X3) variable is the aspect of justice that has the lowest effect on customer satisfaction, so J&T Express must pay attention to aspects of Interactional Justice in order to be better, especially in terms of employees providing a better explanation. be logical about the problems experienced by customers, provide information about the causes of problems honestly to customers, be polite to customers and be able to solve problems experienced by customers so that later these improvements will add value to customer satisfaction. For further researchers, it is hoped that they can conduct deeper and broader research regarding Service Recovery on Customer Satisfaction with a larger sample, by adding different analysis methods and adding other variables that are not in this study. References Aditia, A. R. R., Wadud, M., & DP, M. K. (2020). Pengaruh Kualitas Produk terhadap Kepuasan Konsumen Sepeda Motor NMAX pada PT Yamaha A. Rivai Palembang. Jurnal Nasional Manajemen Pemasaran & SDM, 1(01), 23-37. https://doi.org/10.47747/jnmpsdm.v1i01.4 Afrilliana, N. (2020). Pengaruh Kualitas Pelayanan terhadap Kepuasan Pelanggan Grab di Kota Palembang. Jurnal Nasional Manajemen Pemasaran & SDM, 1(2), 46-55. https://doi.org/10.47747/jnmpsdm.v1i2.119 Alzoubi, H., Alshurideh, M., Kurdi, B. Al, & Inairat, M. (2020). Do perceived service value, quality, price fairness and service recovery shape customer satisfaction and delight? A practical study in the service telecommunication context. Uncertain Supply Chain Management, 8(3), 579–588. https://doi.org/10.5267/j.uscm.2020.2.005. Amha, G. G. (2020). Determinants of Customer Satisfaction and Customer Loyalty in Amhara Credit and Saving Institute (ACSI): The Case of Waghimera Zone Sekota Town. International Journal of Marketing & Human Resource Research, 1(01), 34-51. Retrieved from https://journal.jis-institute.org/index.php/ijmhrr/article/view/70 Choerunnisa, S. P., Rachma, N., & Hatneny, A. I. (2017). Pengaruh Pemulihan Layanan Terhadap Loyalitas Pelanggan JNE Express dengan Kepuasan Pelanggan Sebagai Variabel Intervening. 95–112.
International Journal of Marketing & Human Resource Research e-ISSN: 2746-4040
Vol. 2, No. 1, January 2021
56 Published by:
Ekonomika, F., Bisnis, D. A. N., & Diponegoro, U. (2016). Loyalitas Konsumen Melalui Kepuasan Konsumen. Ferdinand, A. (2019). Metode Penelitian Manajemen (Edisi Keli). Semarang: Badan Penerbit Universitas Diponegoro. Ganita, F. (2019). Pengaruh Service Recovery Terhadap Loyalitas Pelanggan Dengan Kepuasan Sebagai Variabel Mediasi. Jurnal Ilmu Manajemen, 7(1), 172–179. Ghozali, I. (2011). Aplikasi Analisis Multivariate Dengan Program SPSS. Semarang: Badan Penerbit Universitas Diponegoro. Ghozali, I. (2014). Ekonometrika Teori, Konsep dan Aplikasi dengan Program IBM SPSS 22 (Edisi Pert). Semarang: Badan Penerbit Universitas Diponegoro. Hildayanti, S. K., Marnisah, L., & Dinata, E. S. (2018). Pengaruh Nilai, Kualitas Pelayanan dan Komitmen Organisasi Terhadap Kepuasan Pelanggan Pada PT. Asuransi Kresna Mitra Tbk Cabang Palembang. Jurnal Ilmiah Ekonomi Global Masa Kini, 9(1), 61-70. Jatra, I. M. (2015). Pelanggan Restoran Baruna Sanur Fakultas Ekonomi dan Bisnis Universitas Udayana, Bali, Indonesia dalam bidang kuliner (Gonius, 2013). Sehingga menjadikan bisnis restoran. 4(7), 1984–2000. Khoiriyatun. (2016). Pengaruh Service Recovery Terhadap Kepuasan Pelanggan (Studi pada Pelanggan Hotel Ibis Yogyakarta). 1–14. Khoiri Rohmat. (2017). Pengaruh Service Recovery Terhadap Kepuasan Pelanggan (Studi pada Pelanggan PT. Tiki Jalur Nugraha Ekakurir (JNE) di Purworejo).
Kotler, P., & Amstrong, G. (2012). Principles of Marketing (14th ed.). Pearson Education. Kompasiana. Perkembangan J&T Express dan Keistimewaan di Era 4.0.24 Desember 2019.https://www.kompasiana.com/anggi02853/5e01d8f6d541df72b1031762/perkembangan-j-t-express-dan-keistimewaan-di-era-4-0?page=all. Diakses pada 12 November 2020. Kuncoro, Mudrajat, 2003. Metode Riset Untuk Bisnis & Ekonomi, Bagaimana Meneliti Dan Menulis Tesis. Jakarta: Erlangga. Laksono, F. A., Wijoyo, S. H., & Perdanakusuma, A. R. (2020). Pengaruh Kualitas Layanan Terhadap Kepuasan Pelanggan dan Loyalitas Pengguna MyTelkomsel Dengan Menggunakan Model E-Service Quality dan E-Recovery Service Quality (Studi Kasus: Pengguna Aplikasi MyTelkomsel Malang). 4(2), 541–549. Manajemen, P. S., Ekonomi, F., & Purworejo, U. M. (2017). Pengaruh Service Recovery Terhadap Kepuasan. Nugraha, M., & Sumadi, S. (2020). Pengaruh Kualitas Pelayanan dan Persepsi Harga terhadap Kepuasan Pasien di Rumah Sakit Type C Kabupaten Kebumen. Jurnal Ilmiah Ekonomi Global Masa Kini, 11(2), 97-102. Ogechi, C. (2015). Evaluation of Service Recovery Strategies in Some Hotels in Lagos Metropolis, Lagos, Nigeria, V1(2), 57-63. Oktareza, M. E. T., Halin, H., & Handayani, S. (2020). The Effect of Service on Customer Satisfaction at PT Pandu Siwi Sentosa. International Journal of Community Service &
International Journal of Marketing & Human Resource Research e-ISSN: 2746-4040
Vol. 2, No. 1, January 2021
57 Published by:
Engagement, 1(01), 19-26. Retrieved from https://journal.jis-institute.org/index.php/ijcse/article/view/74 Pribadi, G. (2020). Service Quality Sebagai Pengukuran Kepuasan Siswa dan Orang Tua/Wali Murid SMP Muhammadiyah 1 Gombong. Jurnal Ilmiah Ekonomi Global Masa Kini, 11(1), 22-28. Ridwan, & Akdon. (2010). Rumus dan Data dalam Analisis Statistika. Bandung: Alfabeta. Rudyanto, 2010. Pengaruh Pemulihan Layanan dan Keadilan Distributif terhadap Loyalitas Pelanggan. Jurnal Ilmiah Hospitaliti 1, (1). Sastranegara, D. H. (2016). Pengaruh Service Recovery Terhadap Kepuasan Penumpang Dibandara Husein Sastranegara.1, 1005–1012. Service, P., Terhadap, R., Nasabah, L., Bprs, P. T., Bengkulu, S., & Sari, L. N. (2017). Fakultas Ekonomi dan Bisnis Islam Institut Agama Islam Negeri (IAIN) Bengkulu. Siswanto, H., Adhilla, F., & Purwoko, P. (2020). Analisis Pengaruh Kualitas Produk dan Kualitas Layanan terhadap Kepuasan Pelanggan Pasar Bisnis (Studi pada CV Kreasindo Mitra Pratama). Jurnal Ilmiah Ekonomi Global Masa Kini, 11(2), 92-96. Sugiyono, P. D. (2017). Metode Penelitian: Kuantitatif, Kualitatif, dan R&D (26th ed.). Penerbit Alfabeta Bandung. Sujarweni, W. (2015). Metodologi Penelitian Bisnis & Ekonomi. Yogyakarta: Pustaka Baru Press. Sunyoto, D. (2016). Metodologi Penelitian Akuntansi. Bandung: PT. Refika Aditama. Tedy. Pengiriman J&T yang kacau dan Paket Saya Hilang, 11 Oktober 2020, https://mediakonsumen.com/tag/jt-express, diakses pada 12 November 2020.
Tjiptono, F. (2014). Pemasaran Jasa: Prinsip, Penerapan, dan Penelitian. CV Andi Offset. Wadud, M. (2018). BAURAN PEMASARAN JASA (3 Ps: PEOPLE, PROCESS & PHYSICAL EVIDENCE) BAGI KEPUASAN PELANGGAN. Jurnal Ilmiah Ekonomi Global Masa Kini, 8(1), 21-29. Yanti, F., Karim, A., & Wadud, M. (2018). Pengaruh Kualitas Pelayanan Terhadap Kepuasan Konsumen Pada Studio Ribka Foto Cabang Sekip Di Palembang. Jurnal Ilmiah Ekonomi Global Masa Kini, 8(2), 47-52. Yulianto, E., & Mawardi, M. K. (2015). (Survey Pada Pelanggan Fedex Express Surabaya). 25(2), 1–7.
Copyright © 2022 FDOKUMEN