
The Effect of Seniority and Security Covenants on Bond Price Reactions to Credit News
43
The Effect of Seniority and Security Covenants on Bond Price Reactions to Credit News David D. Cho, Hwagyun Kim, and Jungsoon Shin * This Version: September 19, 2011 Abstract This paper examines the daily abnormal returns of corporate bonds with different priorities following Moody's announcements. We show that bond returns react significantly positive (negative) following upgrade (downgrade) Watchlist events but not necessarily following rating change events. Because Watchlist news precede rating changes, this suggests that the Watchlist contains less contaminated information, leading to the stronger short-run price effects. Additionally, we find that subordinated bond prices react more than secured bonds to Watchlist news. However, this finding does not hold when we compare investment and non- investment grade bonds. Cross-sectional regression results confirm this after controlling for issue- and issuer-specific characteristics. The results imply that restrictive bond covenants affect corporate bond risk premia associated with unexpected credit news, which we provide a theoretical explanation. Keywords: Corporate bonds, Seniority/Security, TRACE, Watchlist, Credit News, Credit Risk JEL code: G24, G14 * Hwagyun Kim: Mays Business School, Texas A&M University, 4218 TAMU, College Station, TX 77843 (e-mail: [email protected]); David Cho: Huizenga School of Business and Entrepreneurship, Nova Southeastern University, 3301 College Ave. Ft. Lauderdale, FL 33314 (e-mail: [email protected]); Jungsoon Shin: School of Business, Ehwa Womens University, 11-1 Daehyun-Dong 120-750, Seoul, South Korea. We are grateful for helpful comments by Audra Boone, Shane Johnson, Kenneth Kim, Myron Kwast, David Lando, Jorg Rocholl, Til Schuermann, Kostas Tsatsaronis, Tao Wu and the participants at the Conference on the Interaction of Market and Credit Risk held by the Bundesbank and the BIS. Usual disclaimer applies.
-
Upload
independent -
Category
Documents
-
view
1 -
download
0
Transcript of The Effect of Seniority and Security Covenants on Bond Price Reactions to Credit News
The Effect of Seniority and Security Covenants on Bond Price Reactions to Credit News
David D. Cho, Hwagyun Kim, and Jungsoon Shin*
This Version: September 19, 2011
Abstract
This paper examines the daily abnormal returns of corporate bonds with different priorities
following Moody's announcements. We show that bond returns react significantly positive
(negative) following upgrade (downgrade) Watchlist events but not necessarily following
rating change events. Because Watchlist news precede rating changes, this suggests that the
Watchlist contains less contaminated information, leading to the stronger short-run price
effects. Additionally, we find that subordinated bond prices react more than secured bonds to
Watchlist news. However, this finding does not hold when we compare investment and non-
investment grade bonds. Cross-sectional regression results confirm this after controlling for
issue- and issuer-specific characteristics. The results imply that restrictive bond covenants
affect corporate bond risk premia associated with unexpected credit news, which we provide
a theoretical explanation.
Keywords: Corporate bonds, Seniority/Security, TRACE, Watchlist, Credit News, Credit Risk
JEL code: G24, G14
* Hwagyun Kim: Mays Business School, Texas A&M University, 4218 TAMU, College Station, TX 77843 (e-mail:
[email protected]); David Cho: Huizenga School of Business and Entrepreneurship, Nova Southeastern
University, 3301 College Ave. Ft. Lauderdale, FL 33314 (e-mail: [email protected]); Jungsoon Shin: School of
Business, Ehwa Womens University, 11-1 Daehyun-Dong 120-750, Seoul, South Korea.
We are grateful for helpful comments by Audra Boone, Shane Johnson, Kenneth Kim, Myron Kwast, David Lando,
Jorg Rocholl, Til Schuermann, Kostas Tsatsaronis, Tao Wu and the participants at the Conference on the Interaction
of Market and Credit Risk held by the Bundesbank and the BIS. Usual disclaimer applies.

1
I. Introduction
A. Theoretical Motivation
According to Duffie and Singleton (2003), ―the possibility that major rating agencies will
change the credit rating of a bond issue is an important source of credit risk.‖ Defining market
risk as the risk of unexpected price changes, credit rating changes and related events can have
immediate impacts on bond prices, were those not fully anticipated. Two research questions arise
from this observation.
First, are the changes in actual credit rating good measures of unexpected credit news on
corporate debts? Intuitively, if a rating change and its direction were expected, investors have
already reacted to earlier news, which implies credit rating may be insufficient in measuring
credit news. Second, how does credit news affect prices of corporate bonds with various
characteristics, provided that credit news is properly measured? Put slightly differently, which
aspects of corporate debt matter in explaining the relationship between bond prices and credit
news? Naturally, characteristics related to credit risks will matter in this regard. It is noteworthy
that priority structure in case of bankruptcy is important in pricing equity and debt following
Merton (1974), and Black and Cox (1976) apply this to the valuation of corporate debts. Thus,
the priority structure of corporate bonds is fundamentally linked to credit risk, which can affect
corporate bond prices. In addition, it is well known that rating agencies and analysts consider
collaterals and restrictive covenants of issuers, which are the main ingredients of the priority
structure of corporate debts.
Motivated by these, we investigate the short-run performance of corporate bonds with
different characteristics, especially priorities of debt covenants, when news is announced
regarding credit rating changes. To this end, we extend the theory of debt valuation by Merton
(1974), Black and Cox (1976) and others, and show that the priority structure of debt covenants
2
affects bond prices in that senior/secured debt react less compared to junior/unsecured debt under
mild conditions. In addition, we theoretically illustrate that a noisy, yet informative signal on
credit rating reduces the volatility of actual credit rating changes, which can reduce price
variations of corporate bonds under some conditions. To verify if these theoretical results are
consistent with data, an empirical investigation should follow, which we describe in the below.
B. Empirical Strategy for Investigating Credit News
Our empirical analysis uses corporate debt transactions data from the Trade Reporting
and Compliance Engine (TRACE) together with bond rating agency announcements measured
by Watchlist announcements as well as the actual rating changes. Using TRACE data allows us
to identify the announcement effect on abnormal bond price reactions while maintaining short
event windows due to the high number of data points around the credit news event. Specifically,
We use 10-day window cumulative abnormal returns (CARs) surrounding the dates of Moody‘s
Watchlist and credit rating changes to find significantly abnormal bond returns around Watchlist
news but not necessarily for the rating change events.
Previous literatures on price reactions to credit rating changes have mainly focused on
long-term effect and reported significant results in cases of downgrade news. The use of long
horizon window is motivated partly by the need to address market efficiency issues. For instance,
in their seminal paper, Pinches and Singleton (1978) used data from 180 rating changes from
Moody‘s and S&P and found negative reactions occur after downgrades. Goh and Ederington
(1993) also researched the stock price reactions to the Moody's news release and found
significantly negative reactions to the downgrades and no significant abnormal reactions to
upgrades. Hand, Holthausen, and Leftwich (1992) used both stock and bond markets with the
event widow of 11 days before to 60 days after an event using Moody's and S&P data of 1,100
rating changes and information from 256 Watchlist events. They reported significantly negative
3
abnormal returns of both stock and bond returns for downgrades and no significant reactions for
upgrades.1 Hite and Warga (1997) studied the bond price responses before and after rating
changes news. They found significantly negative returns during 6 months before downgrades,
especially when the rating moves from investment grade to non-investment grade. More recently,
Dichev and Piotroski (2001) examined long-run stock returns around bond rating changes.
Finding no abnormal returns following upgrades but significant abnormal returns following
downgrades, they argued that long-run underperformance of stock returns results from an
underreaction to downgrade news.
In contrast, we examine the short-term, abnormal price reactions of corporate bonds.
Delayed price reactions over longer period time might represent the effects not directly from
rating agency announcement news but from other new pieces of information partially predicted
by credit agencies‘ announcements. Thus, our study is useful, not only because it isolates short-
term investors‘ behavior around credit rating news but also because our results shed light on the
long-term effects found in previous literature. One caveat using a short event window would be
the possibility of not capturing the preannouncement effect of rating agencies‘ announcements as
reported by prior works (e.g., Hite and Warga, 1997; Holthausen and Leftwich, 1986). We
explicitly tackle this issue by merging TRACE data with Moody‘s Watchlist events and rating
changes; we compare the short-term effects of two related announcements regarding credit rating
changes. In particular, Watchlist events (sometimes called rating reviews) are the statements
made by a full rating committee before the actual rating changes. The rating agencies tend to
make subsequent rating changes in the same direction as the Watchlist events for stability
purposes. In other words, their rating system management practices attempt to limit rating
1 Hand et al. (1992) reported some symmetry in the case of bond price reactions and Watchlist events only when
they filter data with the expectation model they proposed.

4
reversals. Therefore, Watchlist news often contains more information content than rating change
news regarding the direction of rating changes. In addition, rating agencies are less likely to
announce Watchlists unless actual rating changes are likely in the near future.2 That is, putting
Watchlist sends a strong signal to the market that the actual rating changes are imminent. Thus,
the nature of this credit rating procedure suggests that Watchlist announcements are more likely
to be unexpected and, hence, have less preannouncement effect and produce more pronounced
effects than actual rating changes. By examining 10-day event windows of both Watchlist events
and rating changes, we show that Watchlist events do, indeed, have considerably smaller
preannouncement effects than the rating change events.
C. Credit News and Cross Section of Bond Returns
We further analyze short-term bond price reactions by comparing the abnormal returns of
different types of bonds. Specifically, we focus on the priority structure of corporate bonds. We
show that the average CAR of subordinated bonds is 1.12% greater than that of secured bonds in
upgrade events. For downgrade events, the subordinated bond prices decline 1.37% more than
the secured bonds. However, this finding does not always hold when comparing between
investment and non-investment grade bonds, suggesting seniority/security matters. The
information contained in the seniority/security of a bond issue may possibly already be captured
by the current credit rating or other factors. To verify this, we run cross-sectional regressions of
CARs onto seniority/security status by controlling issue- and issuer-specific factors. Based on
these regressions, we argue that our results are not driven by time to maturity, coupon rate,
2 To better capture this announcement effect related to Credit Watch additions or bond rating changes, one can filter
out bonds of interest with expected effects. For instance, Hand et. al. (1992) collected a set of unexpected samples
by removing the data that show the expected directions of rating agencies in comparison with their model based on
prior bond prices. This procedure also handles possible endogeneity issues between bond prices and Watchlist events
or rating changes. This adjustment is in fact critical and, interestingly enough, ‗amplifying‘ the announcement effect.
In our case, this procedure is not needed to obtain a similar result. We suspect that this is due to the larger sample
size and the shorter event horizon. Applying the same method to our case is likely to strengthen the announcement
effect quantitatively. Thus, our results can be understood as conservative estimates of the announcement effect.

5
modified duration, issuer factors, and, most notably, credit rating. In other words, the seniority
and security covenants have an impact on corporate bond returns, which is not captured by the
current credit rating or other factors. In addition, the bond price effects associated with
seniority/security exist for both upgrade and downgrade announcements even after controlling
for a long list of other variables. Most existing studies have examined asymmetric responses of
bond returns of investment and non-investment grades when credit ratings change. This method
is intuitive because non-investment grade implies relative proximity to the default event, thereby
more sensitive price reactions. However, the credit rating is an endogenous variable that varies
over time and business conditions. Conversely, the seniority/security status is not altered by
rating changes or credit news. This exogeneity of the seniority/security information as compared
with credit rating helps us to identify better the responses of corporate bond returns on credit
news.
D. Literature Review
Security/seniority structure has been an important issue in the debt financing literature.
Stulz and Johnson (1985) argued that financing new projects with senior debts can limit wealth
transfers from stockholders to the existing bondholders. Smith and Warner (1979) suggested that
inclusion of security provisions mitigates asset substitution problem. Barclay and Smith (1995)
analyzed priority structure and showed variations in the use of claims of different priorities.
Black and Cox (1976) derived bond prices with the seniority and security covenants, and Roberts
and Viscione (1984) reported some empirical support on this view by observing the number of
months for which senior/secured bonds carry lower bond yields compared with subordinated
bonds.3 This previous literature has attempted to analyze the effects of adding subordinated or
3 Related, there is also a line of literature on the use of subordinated debts in the banking industry.
Numerous academic as well as nonacademic researchers have suggested that banking supervisors should make
6
unsecured debts to the existing priority structure of a corporate debt issuer. Despite this extensive
line of literature on subordinated debts in debt financing and capital structure, there exist few
studies analyzing the price reactions of bonds with different security/seniority. In fact, this is the
first study analyzing the variations in bond prices with different seniority and security when
credit news is announced. In fact, we indeed show that seniority/security matters on unexpected
credit news measured by Watchlist events. Interestingly, a popular characteristic to categorize
bonds, bond credit rating, plays little part in this regard.
The paper proceeds as follows. Section II provides a theoretical explanation to motive our
empirical study. Section III describes the data and displays summary statistics. Section IV
presents the main empirical findings are presented, followed by a discussion. Section V discusses
the cross sectional regression results, and Section VI concludes.
II. Corporate Debt Value and Credit News
A. Corporate Debt Valuation under Seniority and Security Covenants
This section presents a theoretical model of corporate debt valuation with a priority rules
in the event of default. The main point is to illustrate how alternative liability structures lead to
different degrees of bond price fluctuations. We adopt a structural approach to risky debt
valuation that goes back to Merton (1974), applying the Black-Scholes-Merton model with the
insight that equity is like a call option. Black and Cox (1976), Leland (1994), Longstaff and
Schwartz (1995) and numerous authors develop models with a first-passage default. Specifically
we use the model of Longstaff and Schwartz (1995) to incorporate bond covenants related to
extensive use of ―market discipline‖ in addendum to traditional regulatory methods. Among potential market
discipline mechanisms, much attention has been paid to subordinated debt requirement. Flannery and Sorescu (1996)
studied subordinated debt yields to show that bank specific risks are correctly priced so that market discipline could
operate to reduce banks‘ exposure to risk due to excessive risk taking. Goyal (2005) argued that restrictive
covenants on debts could be an important channel for monitoring market.

7
priority or security.
Let V denote the total value of the assets of a firm with the Geometric Ito process
( )
where r is the instantaneous risk-free rate, σ, σr, κ, θ are constant, and and
are standard
Brownian motions under a risk neutral measure with the instantaneous correlation of
(
) . We assume that V is the sum of equity (E) and corporate debt (D). The
value of debt is then further divided into those of secured or senior debt (Ds) and subordinated or
junior debt (DJ). Suppose that default occurs when V reaches a lower boundary Vb, for the first
time (say τ), which is assumed to be a constant fraction ( ) of the present value of the
face value of debt (F),
( )
where q(r,t,T) is the time-t price of the zero coupon bond with the remaining maturity (T-t). The
formula of q(r,t,T) is known to be an exponentially affine function of the interest rate as4
( ) ( ) ( )
The assumption of being a constant is mostly for convenience, and it may vary over time
depending on a variety of factors, such as firm size, the relationships among managers,
shareholders, and bondholders, and institutional details on bankruptcy. Since our focus is on the
effect of debt priority structure on bond prices, we abstract from this issue. For those interested,
we refer to Anderson and Sundaresan (1996) and Leland (1994).
As with Black and Cox (1976) or Longstaff and Schwartz (1995), our setup implies that
default declaration applies to all debts involved. Then, the value of a senior debt at time t can be 4 The price of the zero coupon bond is exactly that of Vasicek model. For derivation, see Cochrane (2000) or Duffie
and Singleton (2003).

8
written as
0 ∫ ( )
1 0 ∫
( )
1
where T is the maturity of the debt, is the face value of the senior/secured debt,
* ( ) + * ( )
+ and 1(.) is an indicator function assigning one
only when the condition inside the bracket holds. stands for the fraction after netting out
possible costs and factors related to bankruptcy procedure. Similarly we can write down the
value of a junior debt as
0 ∫ ( )
1 0 ∫
( )
1
where is the face value of the junior/subordinated debt, and the value available to
junior bond holders when bankruptcy occurs is expressed as
* ( )
+ * ( ) +
* ( ) + * ( ) +
Intuitively, the first terms in and
represent the value of debts when the firm is solvent,
and the second terms are those under financial distress. The first terms, using Girsanov
transformation and Ito‘s lemma, can be computed as
0 ∫
( )1
( ) ,
where for i=S, J,
,
4
( )
√ ( )5 .
/ 4
( )
√ ( )5,
( ) ( ) ,
( ) ∫ ( ( ) ( ))

9
Φ is the cumulative distribution function of normal distribution. As is well known, is
the survival probability up to time t and one can clearly see that this gets close to zero when the
value V converges to the lower boundary of . On the contrary, when the value V deviates
farther above from , is approaching 1. Clearly, what makes distinct the two kinds of the
debt contracts lies in the second terms reflecting priority rules. In the below, we compare the
second terms. For this purpose and tractability, we assume This assumption states that
the fraction ( ) of debt value to disappear for the secured debt is smaller than the fraction
( ) to be wasted to declare bankruptcy. This is to assure that bankruptcy is sufficiently
costly.
Then, for the senior/secure debt, we can compute as
( ) , ( )
-.
For the junior/subordinated debt, the debt value is
( ) 6
4 8 ( )
95
7
Note that ( ) . 2 ( )
3/ holds under the assumption of .
That is, if credit news affects the risk-neutral survival probability , bond prices will react to the
news. Moreover, junior/subordinated debt prices will react more to the news than those of
senior/secure debts (
).
Now, we provide a rough intuition on the above result by the following analogous delta
analysis. We assume that default decision occurs only at the last period ( ). Instead of
comparing junior/subordinated debts (SUB) with senior/secured debts (SEC), consider first
comparing equity with secured debt. As mentioned earlier, equity can be considered as a call
option on the firm value with the outstanding debt as the strike price. Instead of comparing SUB

10
vs. SEC, consider comparing equity with secured debt. Equity can be considered as a call option
on the firm value with the outstanding debt as the strike price. Delta, which measures the price
sensitivity to underlying firm value, of the equity is larger than that of the debt, if the call option
is in the money. In other words, if the firm value is greater than the outstanding debt, the equity
price will react more than the debt price, when the firm value changes. Considering SUB is
senior to equity but junior to SEC, SUB price reaction will lie between the equity and SEC. As
equity reacts more than SEC, SUB will have more price reaction than SEC, when the firm value
changes.
Finally, two remarks are in order. First, admittedly, this setup abstracts from important
sources of time-variability of capital structure, and bankruptcy rule. However, a clean testable
implication of this model is that seniority/security of corporate bonds have different effects on
bond prices on credit news. Second, although it appears to be somewhat obvious that
subordinated debts are riskier and hence involve higher price fluctuations on credit news, the
theory shows that it is not unambiguous. Therefore, this issue is ultimately an empirical concern,
which is subject to a further scrutiny.
B. Credit News and Price Impact
Before we begin our empirical study, we recall a key question of this study: Suppose that
empirical researchers identify rating changes as a major source of credit news. Then, they must
check whether an announcement of credit rating is sufficiently unexpected to satisfy the
condition that it contains new information. Are the changes in actual credit rating good measures
of unexpected credit news on corporate debts? Intuitively, if credit news is already fully
incorporated into the risk-neutral probability of default, its impact on bond prices is going to be
zero.

11
As discussed in the introduction, credit watch events precede actual credit rating changes.
Suppose that Watchlists operate as a signal for an actual rating change, and the actual rating
change is perfectly correlated with changes in firm value. In particular, for a positive (negative)
rating change, Watchlists can be either ‗UP‘ with probability P (Q) or ‗DOWN‘ with 1-P (1-Q),
where P>Q. That is, if Watchlist Up is observed, it can result from an event of a positive rating
change (+) or a negative rating change (-), and the directions of Watchlists are positively
correlated with actual rating decisions. How probable is that a positive rating change follows
after ‗UP‘ signal? Using the Bayes rule,
( | ) ( | ) ( )
( | ) ( ) ( | ) ( )
.
This is higher than 0.5 which is the probability of positive rating change (+) with no prior signal
(i.e., Prob(+)). Therefore, as long as Watchlists are positively correlated with the actual rating
changes (P>Q in this case), one can infer that actual rating changes are going to be more
predictable, hence price reactions associated with actual rating changes can be smaller than those
with watchlists. This intuition can be further developed in a dynamic framework as follows.
Suppose that investors observe the past announcements ( ) of rating agencies on the mean firm
value (μ) but do not know the true value due to the existence of noise ( )
For simplicity, assume that the prior distribution of follows a normal distribution with the
mean and the standard deviation √ . Now if agents make use of credit announcements to
compute a sequence of updated posteriors for , the Kalman filtering formula states that the
conditional posterior distribution for on follows a normal distribution with
( | )

12
( | )
Integrating out gives the expectation of the posterior distribution on ( ) as
( )
where ( ). Thus, the expected value at time t is the weighted average of
the prior and the true value, and a more weight will be given to the true value when more time is
allowed, and the posterior variance becomes smaller as well. That is, earlier announcements will
involve uncertainty on the value of firms, which can lead to bigger fluctuations of bond prices.
Therefore, investigating different types of credit news, especially, Watchlist events, is
relevant in evaluating bond price reactions to information on the financial stability of corporate
bonds. Of course, following the same logic, it is possible that even Watchlists may be
contaminated by previous credit news releases. Now we tackle these issues empirically.
III. Data and Descriptive Statistics
A. Data and Measurement of Abnormal Bond Returns
Credit ratings and Watchlist data come from Moody‘s Default Risk Service Database.
This database provides data on rating reviews and actions at the issuer and issue levels. It also
provides access to credit histories for over 10,000 issuers and more than 200,000 individual debt
securities, which includes information such as debt class, size, maturity, and coupon rate of each
rated debt issue. In addition to the ratings history, the database reports Watchlist events, which
can be understood as an interim review by credit rating agencies toward future rating changes.
On September 30 1991, Moody‘s began assigning one of the following three categories to the
issues under review: upgrade, downgrade, and uncertain. Watchlists are usually followed by
official credit rating changes, which imply actual rating changes are more or less expected for the
13
bonds with precedent Watchlist information. Hence, compared with the official rating change,
Watchlist events are believed to contain more unexpected information. As a result, we expect a
large price movement around Watchlist events.
To obtain bond returns, we acquire corporate bond transaction data from TRACE‘s
comprehensive database. The TRACE system began on July 1, 2002 to provide immediate
corporate bond prices for all bonds traded in the over-the-counter market. This comprehensive,
high-frequency data set system was developed to facilitate and improve transparency of the
corporate bond market participants and provides an unmatched opportunity for bond transaction
related studies.
From the daily close prices in TRACE, we first calculate daily raw returns of bond issues
in Moody‘s Watchlist database between July 1, 2002 and May 4, 2006. We only consider U.S.
corporate bonds and exclude debts issued by the financial sector (SIC = 6x) as financial industry
firms such as banks have different capital structures from other industries, as previously
mentioned. The final merged database includes 2,853 individual Watchlist events during the
sample period.
To calculate the abnormal bond returns, we adjust for the Citigroup bond index return.
We use Citigroup US Broad Investment Grade Bond Index for investment grade issues (Baa3 or
higher) and Citigroup High Yield Market Index for non-investment grade issues. The Citigroup
Index has subcategories such as AA, A, BBB, BB, B, CCC and four different maturities: 1–3, 3–
7, 7–10, and 10+ years. For each bond issue, we first find the Citigroup bond index with
equivalent credit rating and maturity and then subtract the bond index daily return from the bond
raw return to obtain the abnormal returns.
Moody‘s classifies the seniority/security of a bond into five categories: junior,

14
subordinated, senior subordinated, senior unsecured, and senior secured. If we use Moody‘s
classification, only 30 issues (roughly 1% of sample) are subordinated bond, which makes our
analysis ineffective. Instead, we use Moody‘s debt type description to identify seniority/security
further. We classify all the issues into three categories: subordinated (SUB), regular (REG), and
secured (SEC) bonds. If Moody‘s debt description includes a phrase equivalent to ―subordinated,‖
we classified it as SUB. For the remaining issues, the bond is classified as SEC, if a phrase
similar to ―secured‖ or ―senior‖ appears.5 The remainders are classified as REG. For example,
according to our classification, ―Notes‖ are REG bonds, but ―Senior Notes‖ are SEC bonds.6
After applying this algorithm to 2,853 bonds, we identify 180 SUB, 1,284 SEC and 1,389 REG
bonds. Roughly 6% of our bond sample is SUB, which, although still far fewer than SEC or REG,
is six times the number of bonds in Moody's SUB classification.
B. Descriptive Statistics and Empirical Motivation
Table 1 reports the summary statistics of Watchlist events. During the sample period, 759
upgrade and 2,025 downgrade events occurred. The number of investment grade bonds of
upgrade events is 394 (52.7%) and of downgrade events is 1,522 (76.2%). Even though there are
more investment grade bonds than non-investment grades in our data, the percentage of
investment grade bonds is significantly smaller than other studies. For example, the percentage
of investment grade in Schultz‘s (2001) sample is 90.9%. One reason for our higher percentage
of non-investment grades is because Schultz, as well as Hong and Warga (2000) and
Chakravarty and Sarkar (1999), used the Capital Access database, which contains transaction
information by institutions such as insurance companies, mutual funds, and public pension funds.
5 Senior subordinated bonds will be classified as SUB because these bonds are senior among the subordinated
bonds. 6 Nevertheless, REG doesn‘t necessary mean they are between SUB and SEC. Often Moody‘s fails to find the
correct description of a bond and lists it as ―Notes.‖

15
Many institutions are required to invest only in investment grade bonds, and, hence, their
samples have higher percentages of investment grade bonds than the bond universe. By contrast,
the TRACE database contains all corporate bond transactions, which, we believe, represents a
more accurate view of the corporate bond market. We scale the credit ratings from 1 to 19 (1 = C;
10 = Baa3; 19 = Aaa). The average credit rating of upgrade issues is 8.76, which lies between
Ba1 and Ba2. On the other hand, the average rating of downgrade issues is 11.29, which is an
investment grade.
[Insert Table 1 about here]
The percentage of SUB or unsecured bonds is small but similar between upgrade and
downgrade bonds. SUB accounts for 7.5% of the upgrade and 5.9% of downgrade. On the other
hand, SEC accounts for 51.8% of the upgrade and 41.3% of downgrade. The average time to
maturity of upgrade (downgrade) bonds is 10.23 (11.18) years. Panel B of Table 1 compares the
bond issuer characteristics between upgrade and downgrade. We obtain issuer information from
COMPUSTAT.7 The average market capitalization, Tobin's Q, leverage ratio, and return on
assets (ROA) are comparable between upgrade and downgrade bonds. Downgrade bonds have
slightly higher market capitalization and leverage ratio, but upgrade bonds have slightly higher
Tobin's Q and ROA. Panel C shows the results of abnormal bond returns in three categories. The
first two represent the proxies for liquidity. Calculating the number of observed daily returns for
an 81-trading-day window, we find that downgrade bonds are traded, on average, 41.1 days and
upgrade bonds are traded, on average, 29.9 days out of 81-trading-day window around the event
7 Note that bonds can be issued by a subsidiary rather than the parent company. Because we collect the issuer
information, not the parent company information, many values are missing for the issuer information.

16
date. In addition, from the average number of transactions per day, downgrade bonds are traded,
on average, 8.8 times per trading day compared with 3.6 times for upgrade bonds, showing that
the downgrade bonds are traded more often (i.e., are more liquid) than upgrade bonds. Finally,
the average 1-day abnormal return on the Watchlist event is –0.696% for downgrade bonds and
0.370% for upgrade bonds. These returns are significantly different from zero return. In addition,
the mean returns are statistically different between downgrade and upgrade.8 On the day of
credit news with unexpected information, average bond prices react significantly for both good
and bad news. In sum, the bond issue and issuer characteristics are similar between upgrade and
downgrade bonds, but the market responds asymmetrically. Downgrade bonds are traded more
frequently, and also the 1-day price reaction is larger in absolute value.
[Insert Table 2 about here]
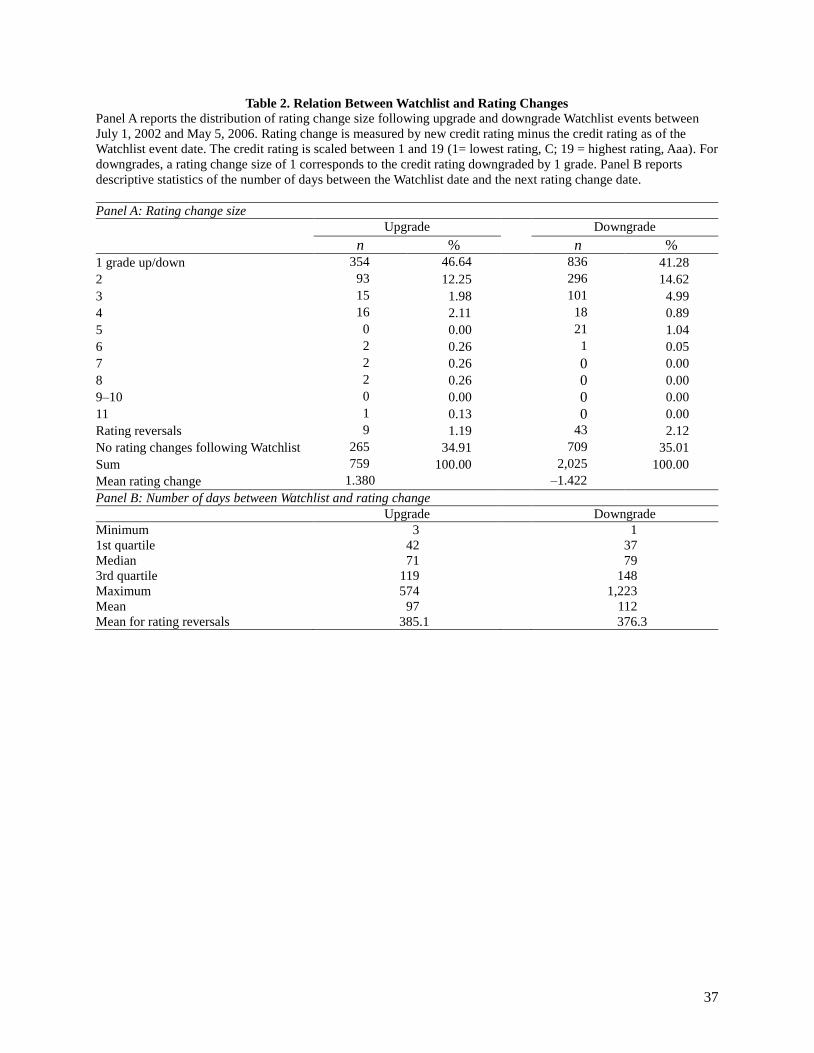
Because Watchlist events are designed to provide signals on the next rating events, it is
logical to probe characteristics of rating changes following Watchlist events. Panel A of Table 2
reports distribution of rating changes following Watchlist events, and the Panel B displays the
number of days between Watchlist events and ensuing rating changes. The results show that
during the sample period (July 1, 2002–May 5, 2006), 65% of the Watchlist events are followed
by rating changes. Clearly, not all Watchlist events are followed by official rating changes,
which is partially a result of the small sample period window. For example, because rating
changes lag Watchlist events by several months, Watchlist events issued in 2006 may not have
8 For rating change events, the mean 1-day abnormal return for upgrade rating change is 0.118% and that for
downgrade rating change is -0.570%. The upgrade mean return is not statistically different from zero but the
downgrade mean return is significant. The difference in means around rating change is also significant but not as big
as the case for Watchlist.

17
corresponding rating change observations until 2007. For the Watchlist events that are followed
by rating changes, more than 97% of the subsequent rating changes are consistent with the
direction indicated by Watchlist. However, on rare occasions rating changes reversed the
Watchlist. Nonetheless, note that these sign reversals occurred, on average, more than 370 days
from both the upgrade and DNG Watchlist events.
[Insert Figure 1 about here]
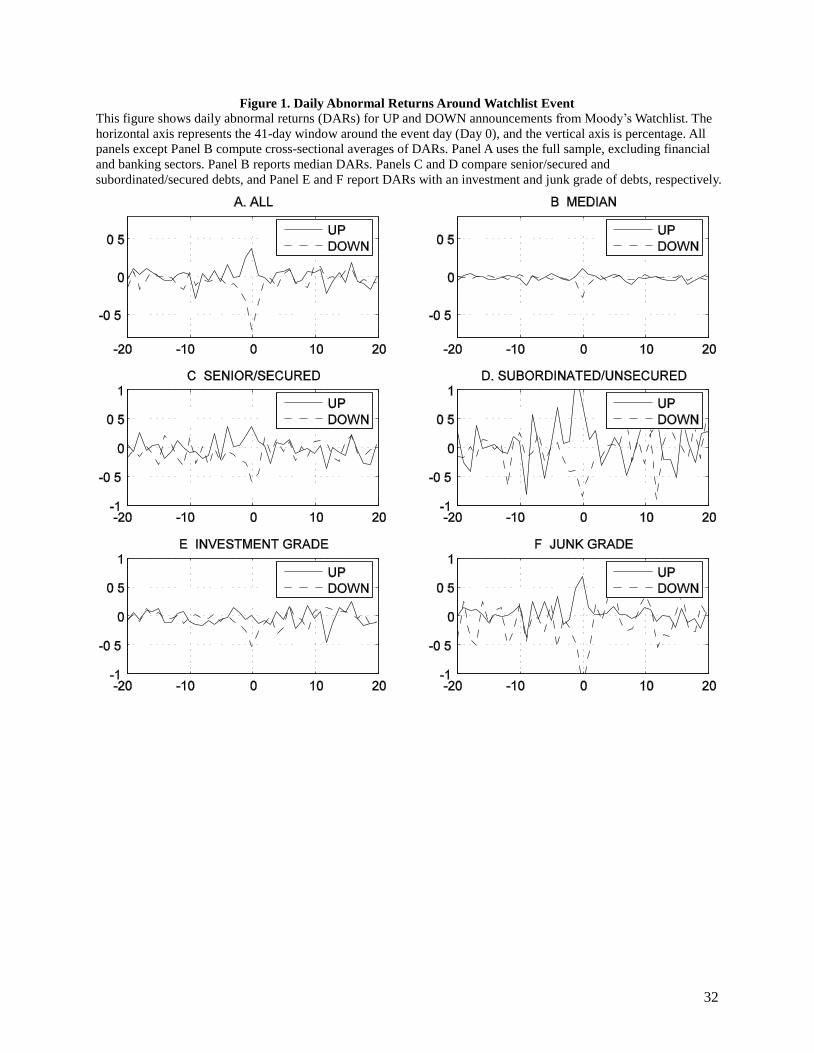
Panels A and B of Figure 1 plot average and median daily abnormal returns (DARs),
respectively, for upgrade and downgrade events around the Watchlist event days (–20 to 20; Day
0 = event date). As conjectured, the bond returns are positive around the upgrade events and
negative around the downgrade events. On the event day, we find more pronounced movement in
case of downgrade, which is consistent with the corporate debt literature, although median DAR
shows rather symmetric reactions.
Panels A and B of Figure 2 report average and median DARs, respectively, around the
rating change event window. In contrast to the Figure 1, Figure 2 shows that DARs react to
credit rating mostly in downgrade events; upgrade events responses are very modest, although
some post-event effects appear to be present.
[Insert Figure 2 about here]
Figures 1 and 2 also display DAR around the event windows when the sample is split into
SEC and SUB debts (Panels C and D, respectively) and investment and junk bonds (Panels E and

18
F, respectively).
We expect SUB debts should react more to the credit news events than SEC debts as
shown in the previous section. Panels C and D of Figure 1 clearly suggest that SUB debts,
compared with SEC debts, respond more to Watchlist events. Panel D shows that upgrade news
leads to even more price reactions in case of subordinate debts. On the other hand, these patterns
are not observed for DARs around the rating changes events as shown in Figure 2, Panels C and
D. When upgrade rating change news is announced, the average DAR of the SUB debts,
unexpectedly, declines. Reactions to downgrade rating change show expected negative signs for
both the SEC and SUB debts. Note, however, that the average DAR for the SEC debts responds
more. Panels E and F of Figure 2 report similar findings. When credit news is measured by the
Watchlist event, DAR reactions prevail clearly in both upgrade and downgrade news, whereas
the results with rating changes event are, at best, mixed. This finding raises two questions. First,
does a Watchlist event measure unexpected credit quality change better than the Moody‘s rating
announcement? Second, is whether security/seniority status a subset of credit rating information?
The latter issue is discussed in the next section, and we address the former question with Figures
3 and 4.
[Insert Figure 3 and 4 about here]
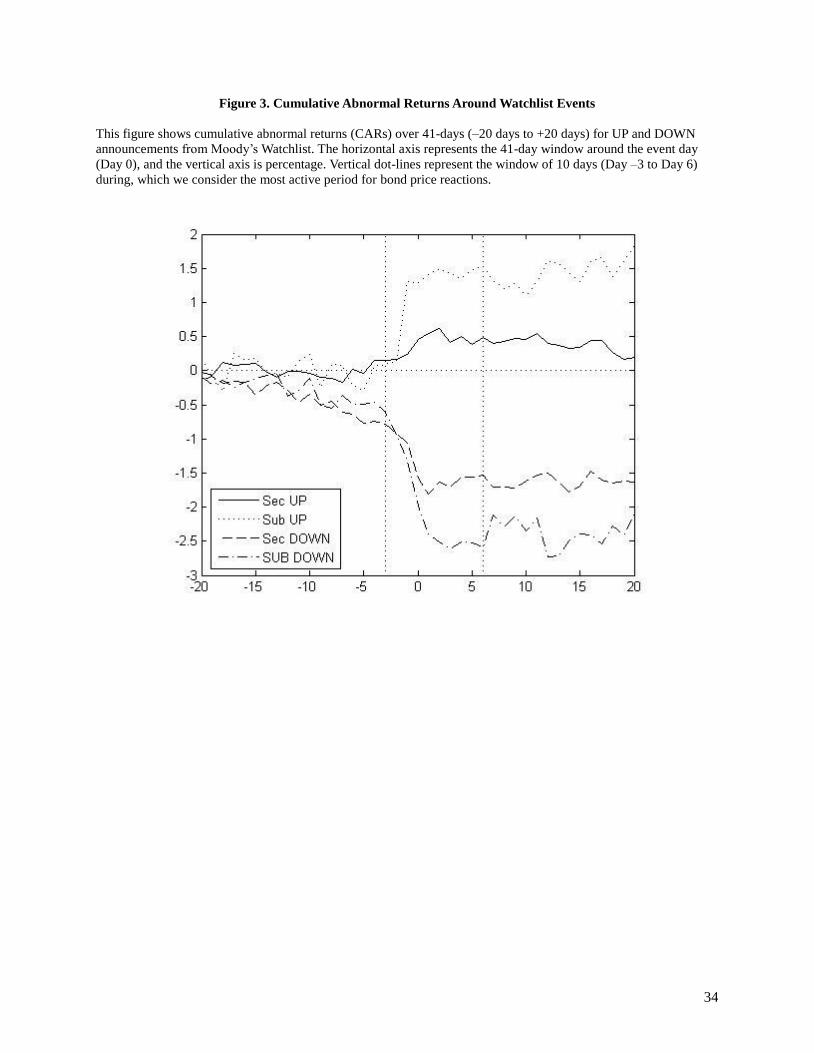
If bond market participants expect credit news, they must respond before the news is
announced. Figure 3 plots CARs in percentages, ranging from –20 days to +20 days surrounding
the Watchlist event day (Day 0). Although not tabulated here, the figure clearly shows that the
CARs start moving sharply around the Watchlist event day. Moreover, it shows that SUB
19
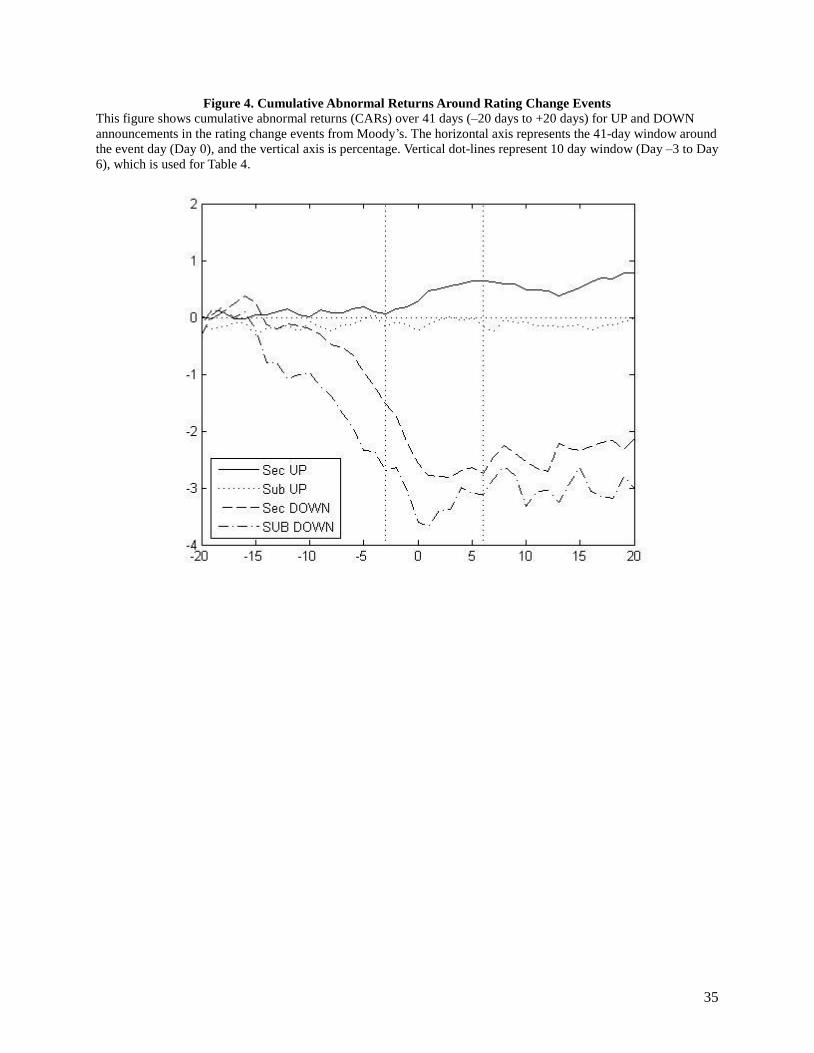
reactions are stronger than SEC both for upgrade and downgrade. Figure 4 plots CARs around
credit rating change events. First, it shows bond prices do not necessarily react to the upgrade
news. This result is consistent with the prior empirical studies. Some practitioners even claim
that Moody‘s doesn‘t provide new information because the market doesn‘t react to the Moody‘s
ratings announcement. Second, the returns are negative around downgrade news as expected.
However, a closer look at the figure shows that the negative returns initiate about two weeks
prior to the announcements. This is partly due to the fact that downgrade ratings usually follow
firm events such as low earnings announcement. In fact, CARs following the downgrade news
show upward trend, which suggests the rating change announcements reveal almost no new
information. This finding suggests that, based on abnormal returns, Watchlist events are a better
measure of unexpected credit news than rating changes events.
IV. Univariate Tests of Bond Market Reactions to Credit News
In this section, we empirically investigate whether SUB bonds respond more to the
credit news than SEC bonds. Specifically, we test whether the bond prices move differently
between SUB and SEC bonds around the Watchlist events. If Watchlist events are unexpected,
we anticipate that the market will reflect this new information quickly to the bond prices—
provided that the market functions efficiently. Suppose Moody‘s suggests a possibility of an
upgrade in the near future. Because SUB bonds are more susceptible to the default risk, we
expect this indication of rating change is better news for the SUB bonds than the SEC bonds. In
other words, we expect the delta of SUB to be higher than that of SEC. Hence, the abnormal
returns around the Watchlist event day should be higher for SUB bonds for good news and lower
for a bad news than SEC bond returns.

20
Even though TRACE provides transaction data, illiquidity is still a concern for the
corporate debt market. The average number of daily returns available in our sample is 39.95 out
of a 81-trading-day window. Infrequently traded bonds tend to be noisy and, therefore, we
remove bonds with less than 20 observations within the 81-trading-day window. In addition,
rather than analyzing the 1-day return on the event day, we use a 10-day window from –3 to +6
to calculate the CARs.9
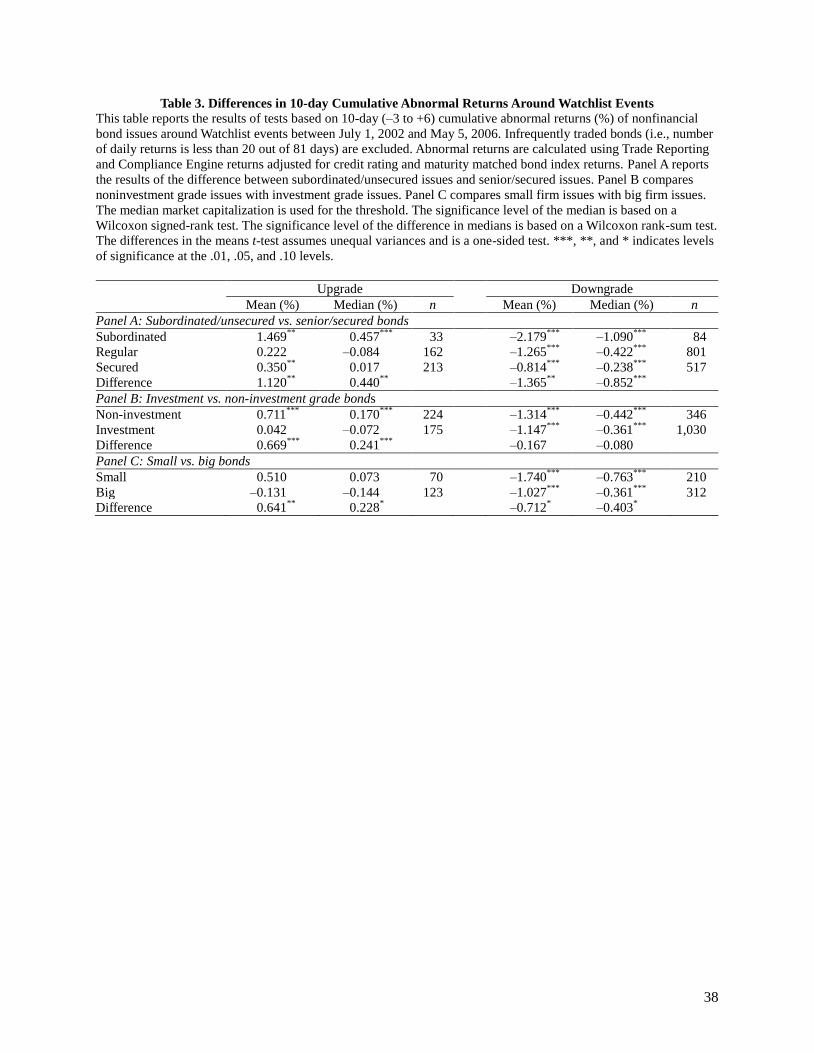
Table 3, Panel A, reports the mean and median of 10-day CARs and the difference
between SUB and SEC for upgrade and downgrade Watchlists. The mean CARs are 1.469% for
SUB, 0.222% for REG, and 0.350% for SEC, of which SUB and SEC are statistically significant.
Furthermore, the difference between SUB and SEC is 1.120%, which is also significant. In other
words, in the event of an upgrade Watchlist event, SUB bond prices not only move upward but
also increases 1.120% higher than SEC bonds increase to the same upgrade news. We find the
same results for median CARs.
[Insert Table 3 about here]
We also find similar results in the downgrade Watchlist events. First, the cumulative
abnormal bond returns are expected to be negative around downgrade news. The 10-day mean
CARs are –2.179% for SUB, –1.265% for REG, and –0.814% for SEC. All three are significant
at the 1% level. The bigger effect of bad news on the bond prices as contrast to the good news is
consistent with the prior empirical studies.10
This asymmetric effect between downgrade and
upgrade is partly due to the number of transactions. As Table 1 shows, bonds are traded more
9 Figures 1 and 3 suggest most of the price change around Watchlist events occurs between Day –3 to +6 and,
therefore, is our choice for CAR window. We also tried many other CAR windows and found the results are robust. 10
The differences between upgrade and downgrade CARs are all significant at the 1% level. The results are
available upon request.

21
frequently during downgrade events. The average number of available daily returns of
downgrade bonds within the 81-trading-day window is 41 days compared with 30 days for
upgrade bonds. If trading occurs within the day, the average number of transactions per day for
downgrade bonds is 8.80, compared with 3.64 for upgrade bonds. This finding makes a
convincing argument that market participants respond more often to the bad news than to good
news; thus, bad news causes a bigger price effect than good news. More importantly, we should
expect the bad news to impact SUB bond prices more than SEC bond prices. To that end, we test
whether the SUB CAR is smaller (i.e., larger in absolute value) than the SEC CAR. We find that
the difference in CAR between SUB and SEC is –1.365%, which is significant. Thus, similar to
the upgrade case, SUB prices react more than SEC during downgrade events. Median statistics
also show same results. The median CARs are –1.090%, –0.422%, and –0.238% for SUB, REG,
and SEC, respectively and the difference in medians between SUB and SEC is significant. To
summarize, for both good news and bad news, our empirical study shows that market responds to
the credit risk news more for the SUB bonds than for the SEC bonds.
Table 4, Panel A, is a replication of Table 3, Panel A, but the credit news is defined as the
rating change events rather than Watchlist events.11
We find mixed results around rating change
events. First, in contrast to the Watchlist case, the mean and the median CAR of SUB are not
significant. Second, the difference between SUB and SEC is insignificant, which is different
from Watchlist case. We argue that the insignificant result of rating announcement is attributed
to the timing issue. As illustrated in Figure 4, negative price reaction to downgrade news starts to
occur 20 days prior to the news date and the majority of effects arise before our 10 day window.
11
Note that we measure abnormal price reactions around the rating change events for Table 4. Although one might
be tempted to run a regression of abnormal returns around the rating changes onto dummy variables for Watchlists
and rating changes, this procedure is statistically misleading due to multicollinearity, which makes impossible
assessment of individual contribution. Furthermore, this departs from our theme of studying short-run effects of
bond prices around credit news.

22
In short, due to the expected nature of rating change news, it is harder to find pure price reaction
around event dates.
[Insert Table 4 about here]
Panel B of Table 3 displays the CARs with bond rating (investment vs. non-investment),
which has often been employed in the previous studies. Non-investment grade bonds are
typically expected to react to the credit news more than investment grade bonds. Table 3, Panel
B, however, shows mixed results. First, for upgrade Watchlist events, the mean (median) CAR of
non-investment grade bonds during an upgrade Watchlist event is 0.711% (0.170%). However,
both the mean and median of the investment grade CAR are not significant. One possible
explanation to this result is investment grade bonds have very low default rate and hence any
upgrade news has little effect to the bond value. The difference in means (median) between
investment and non-investment is 0.669% (0.241%). This finding implies non-investment grade
bonds react more than investment grade to upgrade events.
Second, for downgrade Watchlist events, both investment and non-investment grade
bonds have negative CARs. The mean (median) CAR of non-investment grade and investment
grade bonds are –1.314% (–0.442%) and –1.147% (–0.361%), respectively. One would expect
that because credit rating measures the credit risk of a bond, lower rated bonds should have
bigger price effects than higher rated bonds. However, the differences in means and medians
between the two types are not statistically significant. These mixed results imply that credit
ratings do not have a consistent effect on how bonds react to the credit news. A possible
explanation for the investment grade‘s large negative price reaction is some of these investment
grade bonds fell into non-investment grade bonds. Many institutional investors who are required

23
to hold investment grade bonds must sell these bonds, which triggers negative returns. In our
sample, there are 470 Baa (the lowest investment grade) bonds with downgrade Watchlist, which
are on the verge of becoming non-investment grade. The mean CAR of these bonds is -1.7162%.
If we exclude Baa bonds from the analysis, the mean CAR of the rest investment grade bonds
becomes -0.6693%, which is statistically different from non-investment grade bonds.
Next we compare the characteristics between SUB and SEC bonds to further understand
why SUB reacts more to credit news. Table 5 reports the issue and issuer characteristics of SUB
and SEC. Most characteristics are similar between SUB and SEC, which makes our previous
analysis meaningful. The percentages of upgrade events for SUB and SEC are 28.2% and 29.2%,
respectively. Even though the number of observations are fewer for SUB (n = 117) than SEC (n
= 730), the proportions of upgrade and downgrade events are similar for both SUB and SEC. For
both type of bonds, downgrade events outnumber upgrade events by a ratio of 2 to 1 in our
sample.12
[Table 5 about here]
Panel A of Table 5 provides details regarding the number and percentage of Watchlist
upgrade and downgrade events for both SUB and SEC bonds, and Panel B compares the bond
issue characteristics of SUB and SEC bonds. On average, SUB bonds are non-investment grade
bonds, and SEC bonds are investment grade. Specifically, the average rating of SUB is below B2
grade, and that of SEC is Baa3. Some may argue SUB must have lower credit ratings than SEC
by design, but this is not always the case. For example, commercial banks, which are excluded
12
This asymmetric behavior is well documented by Blume, Lim, and MacKinlay (1998). They argued that the
higher number of downgrade events in recent years is partly due to the more stringent standards used by credit rating
agencies in assigning ratings.

24
from this study, have high credit ratings but tend to issue SUB bonds. To be precise, the average
credit rating of banks is A2. Due to their high credit ratings, banks may elect to issue SUB bonds
instead of SEC bonds. We find 70% of the debts issued by banks are SUB bonds with investment
grade in our sample before removing the financial industry. Surprisingly, if we include SUB
bonds issued by banks in our data, the average credit rating of the SUB group becomes higher
than that of the SEC group. Table 3, Panel B shows that non-investment grade bond prices react
more than investment grade bonds around Watchlist events. However, the difference in CARs
between these two types is smaller than SUB versus SEC. Moreover, the difference is not
statistically significant for downgrade events. Nevertheless, the difference between SUB and
SEC can partially be explained by the credit rating difference. To examine whether seniority has
any marginal effect, we run a cross-sectional regression of CARs on seniority controlled for
credit ratings in the next section.
The average time to maturity of SUB on the Watchlist event date is 7.71 years versus
9.48 years for SEC. In addition, the average coupon rate for SUB is 8.14% and 6.81% for SEC.
The lower time to maturity and the higher coupon rates imply SUB has, on average, smaller
modified duration than SEC, which suggests smaller interest rate risk for SUB. In other words,
for the same yield change, the price should fluctuate less for SUB than SEC. Instead, we find
SUB prices change more than SEC following the credit news events. This finding suggests our
results are not driven by interest rate risks and, therefore, adds further support to our findings.
Note that the average number of available daily returns and the number of transaction per day are
similar between SUB and SEC. This similarity rules out the possibility that the different number
of transactions or liquidity is causing bigger effect for SUB.
The average market capitalization of SUB issuers is $4,513.72 million (M) compared
25
with $14,066.81M for SEC.13
To determine whether a size effect exists between the SUB and
SEC bond market, we test how size influences bond prices‘ reaction to credit news in Table 3,
Panel C. The relative difference between bonds issued by small firm and large firms is 0.641 for
upgrade and –0.712 for downgrade. We find that bonds issued by smaller firms react more to
credit news, but the results are only statistically significant for upgrade bonds. Because the
average firm size for SUB is much smaller than SEC, our SEC results may be partly due to the
size effect. Finally, other company characteristics, such as Tobin‘s Q, leverage ratio and ROA,
are similar between SUB and SEC.
V. Cross Sectional Regression Results
Table 6 reports the cross sectional regression results of 10-day CARs on seniority factor and
control variables. Panel A (Panel B) reports the regression results for upgrade (downgrade) news.
For each type of news, we estimate five regression models. Specifically, Model 1 uses the
seniority factors, SUB and SEC. In Model 2 to 5, we control for issue/issuer factors: In Model 2,
we add bond issue factors such as time to maturity, number of transactions, and coupon rate;
Model 3 adds a dummy variable for investment grade to Model 2 to control for credit ratings;
Model 4 adds control variables for issuer factors such as market capitalization, Tobin's Q,
leverage ratio, and ROA.
[Insert Table 6 about here]
Upgrade event results are reported in Panel A of Table 6. Consistent with the mean test
13
If we include the financial sector, then the average market capitalization of SUB issuers becomes $22,132M—
roughly twice the size of SEC issuers.

26
results in Table 3, SUB in Model 1 is statistically significant at the 5% level. Our results use
White's standard errors to adjust heteroskedasticity. The coefficient of SUB dummy variable is
1.247, which means the SUB bond 10-day CAR is 1.247% higher than SEC/REG bonds around
upgrade events. The coefficient of SEC is positive but insignificant, implying there is no
different price reaction between SEC bonds and REG bonds. Next, when we control for bond
issue characteristics such as time to maturity, number of transaction, and coupon rate in Model 2,
the coefficient of SUB becomes 1.394, larger than in Model 1. This finding implies the effect of
SUB becomes stronger after controlling for issue characteristics. In Table 5, we find that SUB
tends to have lower ratings than SEC. To test whether the strong effect of SUB on price is due to
lower credit ratings, we add an investment grade dummy to the regression in Model 3. After
controlling for the credit ratings, the coefficient of SUB remains significant at 1.121. Although
the previous SUB effect is partly due to the credit ratings, the marginal effect of SUB on CARs
still exists. Finally, Model 4, which controls for all issue and issuer characteristics, shows that
even though the SUB is only significant at the 20% level, the coefficient is 1.416, which is
bigger than in Model 1. This result implies that other factors such as credit ratings and firm size
are not driving our main results found in Table 3.
Panel B of Table 6 reports the regression results for the downgrade events. We
hypothesize that SUB has smaller (i.e., more negative) 10-day CARs than SEC and, thus, test
whether this result is robust after controlling for issue and issuer characteristics. First, the SUB
coefficient in Model 1 is –0.913, implying that 10-day the CAR decreases 0.913% more for SUB
than REG or SEC bonds in the event of downgrade Watchlist events. The SEC coefficient is
0.452%.Contrary to the upgrade Watchlists, secured bonds have a different reaction from regular
bonds in the downgrade events. We argue this is due to the nature of secured bonds. Since

27
secured bonds are mostly guaranteed in the event of default, the effect of bad news on the
secured bond is expected to be small compared to regular bonds. After controlling for the issue
characteristics in Model 2, the SUB coefficient remains almost identical to Model 1. This
suggests the difference in mean test result in Table 3 is not caused by issue characteristics such
as time to maturity, number of transactions, and coupon rate. In Model 3, which adds an
investment grade dummy variable, surprisingly, the coefficient of SUB not only becomes –1.337%
and bigger, but it also becomes more significant after controlling for credit ratings. This suggests
our results for SUB vs SEC is not caused by the investment grade versus non-investment grade
effect.
One would expect investment grade bonds react less to bad news than non-investment
grade bonds. However, the coefficient of investment grade dummy in Model 3 is –0.559, which
implies investment grade bonds decreases 0.559% more than non-investment grade bonds. In
addition, if we include issuer factors in Model 4, this coefficient becomes –1.470, which implies
this adverse effect of investment grade bonds becomes stronger. Note that our investment
dummy variable measures whether bond issues belong to an investment grade at the time of
Watchlist events, which implies that the set of investment grade bonds will include the bond
issues that are currently at the lower end of investment grade but become more likely to be non-
investment grade after the downgrade signal from the Watchlist events. Hite and Warga (1997)
reported significantly negative bond price reactions in the preannouncement as well as
announcement months when the credit rating falls from an investment grade to a non-investment
grade. Therefore, our regression result is a product of tension between two groups of the
investment grade bonds and suggests that the effect from the bonds that could fall below
investment grade dominates the effect from those remaining in investment grade. This is

28
consistent with the results of Baa bonds in the previous section, where we found the CAR of Baa
(lowest investment grade) bonds is –1.7162%, more negative than that of non-investment grade
bonds.
We test whether the difference in mean the CARs of SUB and SEC bonds is caused by
other factors by running several models of cross sectional regression. The results indicate that
even if we control for issue or issuer characteristics, the SUB bonds react more than SEC bonds
to Moody's Watchlist news. More important, the coefficient of SUB generally increases in
absolute value by controlling more factors. This result further confirms that the effect of
seniority on price reaction to credit news is not driven by other factors.
VI. Conclusion
This paper analyzes the effects of credit news events (Watchtlist and rating change) on
the prices of corporate debt issues with different characteristics such as priority structures and
credit ratings. One of the advantages of using the priority structure such as seniority is that this is
an exogenous fixed factor as opposed to the endogenous credit ratings, which may vary over
time and business conditions. Previous literature (e.g. Hand et. al., 1992; Hite and Warga, 1997)
has shown mixed results or weak effects of credit ratings on bond and stock prices. Rather than
focusing on the credit ratings, we investigate the effect of seniority/security, which is an
exogenous factor determining the credit ratings, on price reactions to credit news. Subordinated
bonds are expected to react more to the credit news because these are more susceptible to the
default risk than secured bonds according to a simple model built in this paper.
We identify the credit news using Moody's Watchlist and rating change announcements.
Simply speaking, Watchlist can be perceived as an early indicator of future rating changes. As a

29
result, Watchlist can contain more unexpected information than credit news and, therefore, the
market may react more strongly to Watchlist events as they are less contaminated than rating
change events. Thus, Watchlist captures an important dimension of credit risk and our paper
shows that it matters using cumulative abnormal bond returns. To measure market reaction to the
credit news, researchers prefer analyzing high frequency bond price data. Although previous
studies on similar topics have used monthly bond data, we calculate daily abnormal returns for
corporate debts using the transaction data from the recently accessible TRACE database.
Using Moody‘s Watchlist announcements in conjunction with TRACE and
COMPUSTAT data, we find that subordinated bonds have bigger responses to default-related
news in comparison with secured bonds. Our results are statistically significant and robust to
other factors such as time to maturity, coupon rate, credit ratings, and market capitalization.
Previous studies on priority structure of corporate debts have suggested that firms issue debts
with different level of seniority and security for various strategic reasons (e.g. Stulz and Johnson,
1985; Barclay and Smith, 1995). Our findings, therefore, imply that a firm‘s debt financing
decisions—especially regarding seniority/security structure—can affect bond prices in a short-
horizon, particularly when the news is credit related. It would be interesting to study the effects
of other aspects of corporate financing decision as well as the priority on bond prices in an
integrated framework. We leave these tasks to future works.

30
References
Anderson, R.W., Sundaresan, S., 1996. Design and Valuation of Debt Contracts. Review of
Financial Studies 9, 37-68.
Barclay, M.J., Smith, C.W., Jr., 1995. The priority structure of corporate liabilities. Journal of
Finance 50, 899–917.
Black, F., Cox, J.C., 1976. Valuating corporate securities: Some effects of bond indenture
provisions. Journal of Finance 31, 351–368.
Blume, M.E., Lim, F., MacKinlay, A.C., 1998. The declining credit quality of U.S. corporate
debt: Myth or reality? Journal of Finance 53, 1389–1413.
Chakravarty, R., Sarkar, A., 1999. Liquidity in U.S. fixed income markets: Comparative
evidence from transactions in corporate, government and municipal bond markets. Staff
report no. 73. Federal Reserve Bank of New York. Available at
http://www.newyorkfed.org/research/staff_reports/sr73.pdf.
Cochrane, John, 2001, Asset Pricing. Princeton University Press.
Dichev, I.D., Piotroski, J.D. 2001, The long-run stock returns following bond ratings changes.
Journal of Finance 41, 173–203.
Duffie, D., Singleton, K.J., 2003, Credit Risk, Princeton University Press.
Flannery, J.M., Sorescu, S.M., 1996. Evidence of bank market discipline in subordinated
debenture yields: 1983–1991, Journal of Finance 51, 1347–1377.
Goh, J.C., Ederington, L., 1993. Is a bond rating downgrade good news, bad news, or no news to
stockholders? Journal of Finance 48, 2001–2008.
Goyal, V., 2005. Market discipline of bank risk: Evidence from subordinated debt contracts.
Journal of Financial Intermediation 14, 318–350.
Hamilton, D.T., Cantor, R., 2004. Rating transitions and defaults conditional on Watchlist,
outlook and rating history. Moody‘s Investors Service-Special Comment, February.
31
Hand, J.R.M., Holthausen, R.W., Leftwich, R.W., 1992. The effect of bond rating agency
announcements on bond and stock prices. Journal of Finance 47, 733–752.
Hite, G., Warga, A., 1997. The effect of bond-rating changes on bond price performance.
Financial Analysts Journal 53, 35–51.
Holthausen, R.W., Leftwich, R.W., 1986. The effect of bond rating changes on common stock
prices. Journal of Financial Economics 17, 57–89.
Hong, G., Warga, A. 2000. An empirical study of bond market transactions. Financial Analysts
Journal 56, 32–46.
Leland, E., Hayne, 1994. Corporate Debt Value, Bond Covenants, and Optimal Capital Structure.
Journal of Finance 49, 1213-1252
Longstaff, F., Schwartz, E., 1995. A Simple Approach to Valuing Risky Fixed and Floating Rate
Debt 50, 789-819.
Pinches, G., Singleton, J., 1978. The adjustment of stock prices to bond rating changes. Journal
of Finance 33, 29–44.
Roberts, G., Viscione, J.A., 1984. The impact of seniority and security covenants on bond yields:
A note, Journal of Finance 39, 1597–1602.
Schultz, P., 2001. Corporate bond trading costs: A peek behind the curtain. Journal of Finance 56,
677–698.
Smith, C.W., Jr., Warner, J.B., 1979. On financial contracting: An analysis of bond covenants.
Journal of Financial Economics 7, 117–161.
Stulz, R.M., Johnson, H., 1985. An analysis of secured debt. Journal of Financial Economics 14,
501–521.
32
Figure 1. Daily Abnormal Returns Around Watchlist Event
This figure shows daily abnormal returns (DARs) for UP and DOWN announcements from Moody‘s Watchlist. The
horizontal axis represents the 41-day window around the event day (Day 0), and the vertical axis is percentage. All
panels except Panel B compute cross-sectional averages of DARs. Panel A uses the full sample, excluding financial
and banking sectors. Panel B reports median DARs. Panels C and D compare senior/secured and
subordinated/secured debts, and Panel E and F report DARs with an investment and junk grade of debts, respectively.

33
Figure 2. Daily Abnormal Returns Around Rating Change Event
This figure shows daily abnormal returns (DARs) for UP and DOWN announcements in the rating changes from the
Moody‘s. The horizontal axis represents the 41-day window around the event day (Day 0), and the vertical axis is
percentage. All panels expect Panel B compute cross-sectional average of DARs. Panel A uses the full sample,
excluding financial and banking sectors. Panel B reports median DARs. Panels C and D compare senior/secured and
subordinated/secured debts, and Panel E and F show DARs with an investment and junk grade of debts, respectively.
34
Figure 3. Cumulative Abnormal Returns Around Watchlist Events
This figure shows cumulative abnormal returns (CARs) over 41-days (–20 days to +20 days) for UP and DOWN
announcements from Moody‘s Watchlist. The horizontal axis represents the 41-day window around the event day
(Day 0), and the vertical axis is percentage. Vertical dot-lines represent the window of 10 days (Day –3 to Day 6)
during, which we consider the most active period for bond price reactions.
35
Figure 4. Cumulative Abnormal Returns Around Rating Change Events
This figure shows cumulative abnormal returns (CARs) over 41 days (–20 days to +20 days) for UP and DOWN
announcements in the rating change events from Moody‘s. The horizontal axis represents the 41-day window around
the event day (Day 0), and the vertical axis is percentage. Vertical dot-lines represent 10 day window (Day –3 to Day
6), which is used for Table 4.

36
Table 1. Mean Statistics of Watchlist Events
The table compares the mean statistics among upgrade, downgrade and uncertain Watchlist events between July 1,
2002 and May 5, 2006. The sample period is determined by the intersection of Moody‘s database and the Trade
Reporting and Compliance Engine (TRACE) data. The financial industry is excluded. Bond issue data are from
Moody‘s Default Risk Service Database. The credit rating is converted to numeric scales (19 = highest Moody‘s
grade, Aaa; 10 = lowest investment grade, Baa3; 1 = lowest Moody grade, C). Bond issuer data are from
COMPUSTAT, and the bond return data are from TRACE. Number of observed daily return is measured by how
many days (between –40 to +40 trading days around the Watchlist event) the TRACE has transaction data for each
issue (max = 81). The average number of transactions per day measures how many transactions, on average, were
recorded in TRACE within a trading day, if transaction occurred. DAR is the daily abnormal bond return on the
event day. Abnormal return is calculated by subtracting the rating and maturity matched Citigroup bond index
returns from the bond returns. *** indicate levels of significance at the .01 level.
Upgrade Downgrade Uncertain
(n = 759) (n = 2,025) (n = 69)
Panel A: Bond issue characteristics
Number of investment/non-investment grades/not graded 394/354/11 1,522/475/28 53/16/0
Credit rating 8.755 11.292 10.029
Subordinated/unsecured bonds
n 57 119 4
% 7.5 5.9 5.8
Senior/secured bonds
n 393 837 54
% 51.8 41.3 78.3
Time to maturity (in years) 10.227 11.182 11.066
Panel B: Bond issuer characteristics
Market capitalization (in $MM) 14,611.456 17,665.615 4,069.837
Tobin's Q 1.662 1.470 1.543
Leverage ratio 0.321 0.362 0.204
Return on assets 0.139 0.103 0.117
Panel C: Bond return
Number of observed daily returns (max = 81) 29.943 41.139 31.261
Average number of transactions per day 3.635 8.802 3.870
Mean DAR on the Watchlist event day (%) 0.370*** –0.696*** 0.144
DAR difference between upgrade and downgrade 1.066***
Mean DAR on the Rating change event day (%) 0.118 –0.570***
DAR difference between upgrade and downgrade 0.688***
37
Table 2. Relation Between Watchlist and Rating Changes
Panel A reports the distribution of rating change size following upgrade and downgrade Watchlist events between
July 1, 2002 and May 5, 2006. Rating change is measured by new credit rating minus the credit rating as of the
Watchlist event date. The credit rating is scaled between 1 and 19 (1= lowest rating, C; 19 = highest rating, Aaa). For
downgrades, a rating change size of 1 corresponds to the credit rating downgraded by 1 grade. Panel B reports
descriptive statistics of the number of days between the Watchlist date and the next rating change date.
Panel A: Rating change size
Upgrade Downgrade
n % n %
1 grade up/down 354 46.64 836 41.28
2 93 12.25 296 14.62
3 15 1.98 101 4.99
4 16 2.11 18 0.89
5 0 0.00 21 1.04
6 2 0.26 1 0.05
7 2 0.26 0 0.00
8 2 0.26 0 0.00
9–10 0 0.00 0 0.00
11 1 0.13 0 0.00
Rating reversals 9 1.19 43 2.12
No rating changes following Watchlist 265 34.91 709 35.01
Sum 759 100.00 2,025 100.00
Mean rating change 1.380 –1.422 Panel B: Number of days between Watchlist and rating change
Upgrade Downgrade
Minimum 3 1
1st quartile 42 37
Median 71 79
3rd quartile 119 148
Maximum 574 1,223
Mean 97 112
Mean for rating reversals 385.1 376.3
38
Table 3. Differences in 10-day Cumulative Abnormal Returns Around Watchlist Events
This table reports the results of tests based on 10-day (–3 to +6) cumulative abnormal returns (%) of nonfinancial
bond issues around Watchlist events between July 1, 2002 and May 5, 2006. Infrequently traded bonds (i.e., number
of daily returns is less than 20 out of 81 days) are excluded. Abnormal returns are calculated using Trade Reporting
and Compliance Engine returns adjusted for credit rating and maturity matched bond index returns. Panel A reports
the results of the difference between subordinated/unsecured issues and senior/secured issues. Panel B compares
noninvestment grade issues with investment grade issues. Panel C compares small firm issues with big firm issues.
The median market capitalization is used for the threshold. The significance level of the median is based on a
Wilcoxon signed-rank test. The significance level of the difference in medians is based on a Wilcoxon rank-sum test.
The differences in the means t-test assumes unequal variances and is a one-sided test. ***, **, and * indicates levels
of significance at the .01, .05, and .10 levels.
Upgrade Downgrade
Mean (%) Median (%) n Mean (%) Median (%) n
Panel A: Subordinated/unsecured vs. senior/secured bonds
Subordinated 1.469**
0.457***
33 –2.179***
–1.090***
84
Regular 0.222 –0.084 162 –1.265***
–0.422***
801
Secured 0.350**
0.017 213 –0.814***
–0.238***
517
Difference 1.120**
0.440**
–1.365**
–0.852***
Panel B: Investment vs. non-investment grade bonds
Non-investment 0.711***
0.170***
224 –1.314***
–0.442***
346
Investment 0.042 –0.072 175 –1.147***
–0.361***
1,030
Difference 0.669***
0.241***
–0.167 –0.080
Panel C: Small vs. big bonds
Small 0.510 0.073 70 –1.740***
–0.763***
210
Big –0.131 –0.144 123 –1.027***
–0.361***
312
Difference 0.641**
0.228* –0.712
* –0.403
*

39
Table 4. Differences in 10-day Cumulative Abnormal Returns Around Rating Change Events
This table shows the results of tests are based on 10-day (–3 to +6) cumulative abnormal returns (%) of nonfinancial
bond issues around Moody‘s rating change events between July 1, 2002 and May 5, 2006. Infrequently traded bonds
(number of daily returns is less than 20 out of 81 days) are excluded. Abnormal returns are calculated using Trade
Reporting and Compliance Engine returns adjusted for credit rating and maturity matched bond index returns. Panel
A reports the difference between subordinated/unsecured issues and senior/secured issues. Panel B compares non-
investment grade issues with investment grade issues. Panel C compares small firm issues with big firm issues. The
median market capitalization is used for the threshold. The significance level of the median is based on a Wilcoxon
signed-rank test. The significance level of the difference in medians is based on a Wilcoxon rank-sum test. The
differences in means t-test assumes unequal variances and is a one-sided test. ***, **, and * indicate significance at
the .01, .05, and .10 levels.
Upgrade Downgrade
Mean (%) Median (%) n Mean (%) Median (%) n
Panel A: Subordinated/unsecured vs. senior/secured bonds
Subordinated –0.207 0.071 143 –0.878 –0.385 121
Regular 0.342**
0.008* 360 –0.808
*** –0.815
*** 910
Secured 0.565***
0.267***
382 –1.575***
–0.771***
564
Difference –0.771 –0.196**
0.696 0.386
Panel B: Investment vs. non–investment grade bonds
Non-investment 0.478***
0.306***
402 –1.347***
–0.699***
512
Investment 0.242**
0.037 483 –0.960***
–0.803***
1,083
Difference 0.236* 0.269 –0.387
* 0.189
Panel C: Small vs. big bonds
Small 0.157 0.092 194 –1.256**
–0.620***
345
Big 0.516***
0.234***
232 –1.314***
–1.114***
440
Difference –0.359 –0.142 0.058 0.494**

40
Table 5. Mean Statistics of Subordinated/Unsecured Bonds and Senior/Secured Bonds
This table compares the average characteristics of subordinated/unsecured bonds and senior/secured bonds used in
Table 2. Panel A reports the number and percentage of Watchlist upgrades and downgrades for both
subordinated/unsecured bonds and senior/secured bonds. Panel B reports the bond issue characteristics from
Moody‘s Default Risk Service Database. Credit rating is converted into a scale from 1 to 19 (1 = lowest rating, C; 19
= highest rating, Aaa). Panel C reports the bond issuer characteristics from COMPUSTAT.
Subordinated Secured
Panel A. Watchlist events up/downgrade number and percentages
Observations 117 730
Upgrade Watchlist events
n 33 213
% 28.2 29.2
Downgrade Watchlist events
n 84 517
% 71.8 70.8
Panel B: Bond issue characteristics
Credit rating scale 4.836 9.958
Time to maturity (years) 7.711 9.483
Coupon rate (%) 8.139 6.811
Number of daily returns (max = 81) 45.222 48.747
Average number of transactions per day 5.241 6.542
Panel C: Bond issuer characteristics
Market capitalization (in $MM) 4,513.72 14,066.81
Tobin's Q 1.455 1.528
Leverage ratio 0.442 0.350
Return on assets 0.126 0.113

41
Table 6. Cross Sectional Regressions of 10-Day Cumulative Abnormal Returns
Panel A reports the regression results for Moody‘s Watchlist upgrade events, and Panel B reports the downgrade
events between July 1, 2002 and May 5, 2006. Financial industry issues and infrequently traded bonds (number of
daily returns is less than 20 out of 81 days) are excluded. Y variable is the 10-day cumulative abnormal bond returns
around the Moody‘s Watchlist events. Citigroup bond index after matching the credit rating and maturity is
subtracted from the bond returns to calculate the abnormal returns. SUB is a dummy variable for
subordinated/unsecured bonds. SEC is a dummy for senior/secured bonds. TTM is time to maturity. #TRANS is the
number of average transactions per day. LN(MKTCAP is the natural logarithm of the firm‘s market equity. INV is a
dummy variable for investment grade. Heteroskedastic-adjusted White standard errors are in parentheses. **, *, and
† indicate significance at the .05, .10, and .20 levels.
(1) (2) (3) (4)
Panel A:Upgrade
Constant 0.222
(0.188)
0.154
(0.500)
0.764
(0.604)
0.761
(1.244)
SUB 1.247
**
(0.636)
1.394**
(0.664)
1.121*
(0.662)
1.416†
(0.985)
SEC 0.127
(0.246)
0.144
(0.238)
0.048
(0.245)
0.156
(0.336)
TTM 0.027†
(0.018)
0.028†
(0.017)
0.020
(0.024)
#TRANS 0.046
**
(0.024)
0.043*
(0.023)
0.082**
(0.035)
Coupon rate –0.061
(0.073)
–0.101†
(0.078)
–0.022
(0.107)
INV –0.596
**
(0.257)
–0.150
(0.310)
LN(MKTCAP) –0.080
(0.071)
Tobin‘s Q –0.221
(0.369)
Leverage –0.216
(1.060)
Return on assets –0.145
(3.329)
Observations 408 402 402 244
R2 0.017 0.038 0.049 0.081
Adj. R2 0.012 0.026 0.035 0.042
(Table 6 continues)
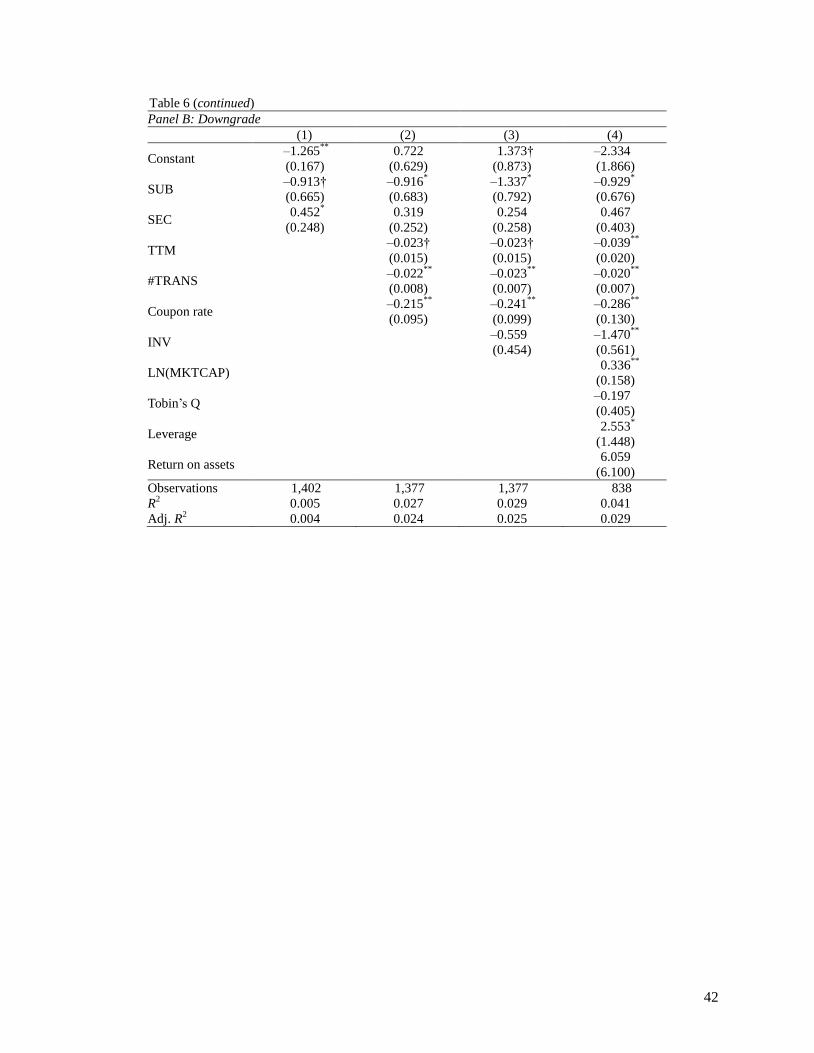
42
Table 6 (continued)
Panel B: Downgrade
(1) (2) (3) (4)
Constant –1.265
**
(0.167)
0.722
(0.629)
1.373†
(0.873)
–2.334
(1.866)
SUB –0.913†
(0.665)
–0.916*
(0.683)
–1.337*
(0.792)
–0.929*
(0.676)
SEC 0.452
*
(0.248)
0.319
(0.252)
0.254
(0.258)
0.467
(0.403)
TTM –0.023†
(0.015)
–0.023†
(0.015)
–0.039**
(0.020)
#TRANS –0.022
**
(0.008)
–0.023**
(0.007)
–0.020**
(0.007)
Coupon rate –0.215
**
(0.095)
–0.241**
(0.099)
–0.286**
(0.130)
INV –0.559
(0.454)
–1.470**
(0.561)
LN(MKTCAP) 0.336
**
(0.158)
Tobin‘s Q –0.197
(0.405)
Leverage 2.553
*
(1.448)
Return on assets 6.059
(6.100)
Observations 1,402 1,377 1,377 838
R2 0.005 0.027 0.029 0.041
Adj. R2 0.004 0.024 0.025 0.029