The effect of moral waivers on the success of Navy recruits
76
Calhoun: The NPS Institutional Archive Theses and Dissertations Thesis Collection 2007-09 The effect of moral waivers on the success of Navy recruits Huth, Richard A. Monterey, California. Naval Postgraduate School http://hdl.handle.net/10945/3287 brought to you by CORE View metadata, citation and similar papers at core.ac.uk provided by Calhoun, Institutional Archive of the Naval Postgraduate School
-
Upload
khangminh22 -
Category
Documents
-
view
0 -
download
0
Transcript of The effect of moral waivers on the success of Navy recruits

Calhoun: The NPS Institutional Archive
Theses and Dissertations Thesis Collection
2007-09
The effect of moral waivers on the success of Navy recruits
Huth, Richard A.
Monterey, California. Naval Postgraduate School
http://hdl.handle.net/10945/3287
brought to you by COREView metadata, citation and similar papers at core.ac.uk
provided by Calhoun, Institutional Archive of the Naval Postgraduate School

NAVAL
POSTGRADUATE SCHOOL
MONTEREY, CALIFORNIA
THESIS
Approved for public release; distribution is unlimited.
THE EFFECT OF MORAL WAIVERS ON THE SUCCESS OF NAVY RECRUITS
by
Richard A. Huth
September 2007
Thesis Advisor: Samuel E. Buttrey Second Reader: David L. Schiffman

THIS PAGE INTENTIONALLY LEFT BLANK

i
REPORT DOCUMENTATION PAGE Form Approved OMB No. 0704-0188 Public reporting burden for this collection of information is estimated to average 1 hour per response, including the time for reviewing instruction, searching existing data sources, gathering and maintaining the data needed, and completing and reviewing the collection of information. Send comments regarding this burden estimate or any other aspect of this collection of information, including suggestions for reducing this burden, to Washington headquarters Services, Directorate for Information Operations and Reports, 1215 Jefferson Davis Highway, Suite 1204, Arlington, VA 22202-4302, and to the Office of Management and Budget, Paperwork Reduction Project (0704-0188) Washington DC 20503. 1. AGENCY USE ONLY (Leave blank)
2. REPORT DATE September 2007
3. REPORT TYPE AND DATES COVERED Master’s Thesis
4. TITLE AND SUBTITLE The Effect of Moral Waivers on the Success of Navy Recruits 6. AUTHOR(S) Richard A. Huth
5. FUNDING NUMBERS
7. PERFORMING ORGANIZATION NAME(S) AND ADDRESS(ES) Naval Postgraduate School Monterey, CA 93943-5000
8. PERFORMING ORGANIZATION REPORT NUMBER
9. SPONSORING /MONITORING AGENCY NAME(S) AND ADDRESS(ES) Commander, Navy Recruiting Command 5722 Integrity Drive, Bldg 784, Millington, TN 38054
10. SPONSORING/MONITORING AGENCY REPORT NUMBER
11. SUPPLEMENTARY NOTES The views expressed in this thesis are those of the author and do not reflect the official policy or position of the Department of Defense or the U.S. Government. 12a. DISTRIBUTION / AVAILABILITY STATEMENT Approved for public release; distribution is unlimited.
12b. DISTRIBUTION CODE A
13. ABSTRACT (maximum 200 words) This study examines the Navy’s enlisted screening process and identifies success predictors through the analysis of moral waiver and attrition data for a two-year cohort (Calendar Years 2003 and 2004) compiled from three sources: (1) Personnel Recruiting for Immediate and Delayed Enlistments (PRIDE), (2) Military Entrance Processing Command (MEPCOM) Integrated Reporting System (MIRS), and (3) Navy Recruiting District (NRD) Nashville, Tennessee. Data comparisons were performed to measure the quality of existing waiver data. Historical success rates were then compared against moral waiver status, and logistic regression models were constructed to predict (1) the long-term success of applicants from the beginning of the Delayed Entry Program (DEP) through first term and (2) the success of sailors from the time they enter active duty. The data comparisons showed that MIRS recorded more waivers than PRIDE and that Nashville recorded more waivers than either MIRS or PRIDE. Results also showed that those with moral waivers were actually more successful at completing DEP than those who enlisted without moral waivers. However, it was shown that those who required moral waivers were not as successful in the long term and were significantly more likely to be moral-related losses from active duty than those without moral waivers. Regression analysis showed that moral waivers are negative predictors of long-term success.
15. NUMBER OF PAGES
75
14. SUBJECT TERMS moral waivers, civil waivers, attrition, success, recruiting, waiver codes, Delayed Entry Program (DEP)
16. PRICE CODE
17. SECURITY CLASSIFICATION OF REPORT
Unclassified
18. SECURITY CLASSIFICATION OF THIS PAGE
Unclassified
19. SECURITY CLASSIFICATION OF ABSTRACT
Unclassified
20. LIMITATION OF ABSTRACT
UU NSN 7540-01-280-5500 Standard Form 298 (Rev. 2-89) Prescribed by ANSI Std. 239-18

ii
THIS PAGE INTENTIONALLY LEFT BLANK
iii
Approved for public release; distribution is unlimited.
THE EFFECT OF MORAL WAIVERS ON THE SUCCESS OF NAVY RECRUITS
Richard A. Huth
Lieutenant, United States Navy B.S., Vanderbilt University, 1998
Submitted in partial fulfillment of the requirements for the degree of
MASTER OF SCIENCE IN OPERATIONS RESEARCH
from the
NAVAL POSTGRADUATE SCHOOL September 2007
Author: Richard A. Huth
Approved by: Samuel E. Buttrey Thesis Advisor
David L. Schiffman Second Reader
James N. Eagle Chairman, Department of Operations Research

iv
THIS PAGE INTENTIONALLY LEFT BLANK

v
ABSTRACT
This study examines the Navy’s enlisted screening process and identifies
success predictors through the analysis of moral waiver and attrition data for a
two-year cohort (Calendar Years 2003 and 2004) compiled from three sources:
(1) Personnel Recruiting for Immediate and Delayed Enlistments (PRIDE), (2)
Military Entrance Processing Command (MEPCOM) Integrated Reporting
System (MIRS), and (3) Navy Recruiting District (NRD) Nashville, Tennessee.
Data comparisons were performed to measure the quality of existing waiver data.
Historical success rates were then compared against moral waiver status, and
logistic regression models were constructed to predict (1) the long-term success
of applicants from the beginning of the Delayed Entry Program (DEP) through
first term and (2) the success of sailors from the time they enter active duty. The
data comparisons showed that MIRS recorded more waivers than PRIDE and
that Nashville recorded more waivers than either MIRS or PRIDE. Results also
showed that those with moral waivers were actually more successful at
completing DEP than those who enlisted without moral waivers. However, it was
shown that those who required moral waivers were not as successful in the long
term and were significantly more likely to be moral-related losses from active
duty than those without moral waivers. Regression analysis showed that moral
waivers are negative predictors of long-term success.

vi
THIS PAGE INTENTIONALLY LEFT BLANK

vii
TABLE OF CONTENTS
I. INTRODUCTION............................................................................................. 1 A. BACKGROUND ................................................................................... 1 B. OBJECTIVE ......................................................................................... 1 C. SCREENING PROCESS...................................................................... 2 D. ORGANIZATION.................................................................................. 5
II. LITERATURE REVIEW .................................................................................. 7 A. HALL (1999) ........................................................................................ 7 B. GOVERNMENT ACCOUNTING OFFICE (GAO) (1999)...................... 8 C. PUTKA, NOBLE, BECKER, AND RAMSBERGER (2004).................. 9 D. NOBLE (2005) ..................................................................................... 9 E. BACZKOWSKI (2006) ....................................................................... 10
III. DATA AND METHODOLOGY...................................................................... 11 A. DATA SOURCES............................................................................... 11
1. Commander, Navy Recruiting Command (CNRC) .............. 11 2. Defense Manpower Data Center (DMDC)............................. 11 3. Navy Recruiting District (NRD) Nashville ............................ 12
B. DATA ERRORS ................................................................................. 13 1. Commander, Navy Recruiting Command (CNRC) .............. 13 2. Defense Manpower Data Center (DMDC)............................. 14 3. Navy Recruiting District (NRD) Nashville ............................ 14 4. All Sources............................................................................. 15
C. VARIABLE DEFINITIONS ................................................................. 16 D. METHODOLOGY............................................................................... 17
IV. DATA COMPARISONS ................................................................................ 19 A. WAIVER RECORDING ACCURACY................................................. 19
1. Navy Delayed Entry Program (DEP)..................................... 19 2. Navy Accessions ................................................................... 20 3. Navy Recruiting District (NRD) Nashville Delayed Entry
Program (DEP) ....................................................................... 21 4. Navy Recruiting District (NRD) Nashville Accessions ....... 23
B. MORAL-RELATED LOSSES FROM ACTIVE DUTY ........................ 23 1. Navy Accessions ................................................................... 23 2. Navy Recruiting District (NRD) Nashville Accessions ....... 24
C. SUMMARY......................................................................................... 26 V. SUCCESS OF NAVY APPLICANTS ............................................................ 27
A. SUCCESS HISTORIES OF APPLICANTS WITH OR WITHOUT MORAL WAIVERS............................................................................. 27
B. DATA CONVERSIONS...................................................................... 28 C. LOGISTIC REGRESSION MODELS ................................................. 31
1. Predicting Success from DEP Entry through First Term ... 31

viii
a. Descriptive Statistics.................................................. 31 b. Model............................................................................ 32
2. Predicting Success of Sailors from the Time of Active Duty Accession through First Term..................................... 33 a. Descriptive Statistics.................................................. 33 b. Model............................................................................ 35 c. Summary...................................................................... 36
VI. CONCLUSIONS AND RECOMMENDATIONS............................................. 39 APPENDIX A. CIVIL CHARTS [AFTER, CNRC, 2002] .................................. 41 APPENDIX B. WAIVER CODES [AFTER, CNRC, 2002] ............................... 45 APPENDIX C. DATA DESCRIPTIONS........................................................... 47 APPENDIX D. MORAL-RELATED ATTRITION ANALYSIS .......................... 51 LIST OF REFERENCES.......................................................................................... 53 INITIAL DISTRIBUTION LIST ................................................................................. 55

ix
LIST OF FIGURES
Figure 1. Portion of Waiver Log [After, NRD Nashville] ..................................... 13

x
THIS PAGE INTENTIONALLY LEFT BLANK

xi
LIST OF TABLES
Table 1. Portion of Interservice Separation Code (ISC) List Associated With Poor Performance (See Appendix B for Complete Table) [After, DMDC].................................................................................................. 2
Table 2. Waiver Policy for Civil Offenses [After, CNRC, 2002]........................... 3 Table 3. Eligibility Determination Policy for Alcohol/Drug Abusers [After,
CNRC, 2002] ........................................................................................ 4 Table 4. Portion of Waiver Code Table [After, CNRC, 2002]............................ 11 Table 5. Example of PRIDE Waiver Data......................................................... 16 Table 6. Example of MIRS Waiver Data........................................................... 16 Table 7. Waiver Summary for Applicants Entering Navy-Wide DEP ................ 20 Table 8. Waiver Summary for Navy-Wide Accessions ..................................... 21 Table 9. Waiver Summary for 2,819 Applicants Entering NRD Nashville DEP. 22 Table 10. Waiver Summary for 2,185 NRD Nashville Accessions...................... 23 Table 11. Navy-Wide Moral Losses With and Without a Moral Waiver as
Reported by Different Data Sources................................................... 24 Table 12. NRD Nashville Moral Losses With and Without a Civil Waiver as
Reported by Different Data Sources................................................... 25 Table 13. NRD Nashville Moral Losses With and Without an Alcohol Abuse
Waiver as Reported by Different Data Sources.................................. 25 Table 14. Success of the 99,375 Navy-Wide Applicants by Moral Waiver
Status Who Entered DEP ................................................................... 27 Table 15. Success of the 76,897 Navy-Wide Enlistees by Moral Waiver
Status Who Had Finished DEP and Entered Active Duty Service ...... 28 Table 16. List of Variables Used in Logistic Regression..................................... 28 Table 17. Logistic Regression Variable Descriptions ......................................... 29 Table 18. Descriptive Statistics of Age, AFQT, and Bonus Amount for Those
Who Entered DEP .............................................................................. 31 Table 19. Descriptive Statistics of Regressor Variables for Those Who
Entered DEP ...................................................................................... 32 Table 20. Regressor Coefficients Used for Predicting Success of Applicants
from the Time of DEP Entry................................................................ 33 Table 21. Descriptive Statistics of Age, Armed Forces Qualification Test
(AFQT), and Bonus Amount for Those Who Entered Active Duty ...... 34 Table 22. Descriptive Statistics of Regressor Variables for Those Who
Entered Active Duty............................................................................ 35 Table 23. Regressor Coefficients Used for Predicting Success of Applicants
from the Time of Accession to Active Duty ......................................... 36

xii
THIS PAGE INTENTIONALLY LEFT BLANK

xiii
LIST OF ACRONYMS
2YO Two Year Obligor General Details
5YO Five Year Obligor
AEF Advanced Electronics Field
AFQT Armed Forces Qualification Test
ATF Advanced Technical Field
AWOL Absence Without Leave
BEERS Basic Enlistments Eligibility Requirements
BTW Behind-the-Wheel
CNRC Commander, Navy Recruiting Command
CO Commanding Officer
CSM Compensatory Screening Model
CY Calendar Year
DEP Delayed Entry Program
DMDC Defense Manpower Data Center
DoD Department of Defense
EPSQ Electronic Personnel Security Questionnaire
FY Fiscal Year
GAO Government Accounting Office
GTEP GENDET Targeted Enlistment Program
HP3 High Performance Predictor Profile
ISC Interservice Separation Code
JOBS Job Oriented Basic Skills
MEPCOM Military Entrance Processing Command
MEPS Military Entrance Processing Station
MIRS MEPCOM Integrated Reporting System
NCSA National Call to Service
NF Nuclear Field
NIDT Non-Instrumented Drug Test

xiv
NPS Naval Postgraduate School
NPSB Non-Prior Service Basic
NRD Navy Recruiting District
OR Operations Research
PRIDE Personnel Recruiting for Immediate and Delayed
Enlistments
RTC Recruit Training Command
SEAL Special operations
SECNAV Secretary of the Navy
SF Subfarer
SG School Guarantee
SSN Social Security Number
TAR Non-Prior Service Basic and Training and Administration of
the Reserve
TEP TAR Enlistment Program
UIC Unit Identification Code

xv
ACKNOWLEDGMENTS
The author would like to acknowledge the sponsorship and guidance
provided by Navy Recruiting Command. Mr. John Noble, Head of Research, was
instrumental in making an experience tour possible.

xvi
THIS PAGE INTENTIONALLY LEFT BLANK

xvii
EXECUTIVE SUMMARY
The objective of this study was to investigate the relationship between
moral waivers and long-term success of Navy applicants. The issue of waivers
continues to be high-profile, as Navy leaders seek to minimize disciplinary
problems in the fleet that may be linked to pre-enlistment behavior of sailors. In
order to support analysis, Navy Recruiting Command provided waiver and
demographic information from its databases for a two-year cohort (Calendar
Years 2003 and 2004), and Defense Manpower Data Center provided loss dates
and codes as well as its waiver records up to May 2007. The resulting dataset
contained 99,375 records. Finally, in order to provide a third data source for
comparison, Navy Recruiting District Nashville provided its internal waiver
logbook, which was transcribed and merged with the other two sources.
Extensive data comparisons were conducted in order to measure the
quality of the waiver data. To alleviate data entry bias, the concept of “highest”
waiver was established so that each applicant was counted throughout the study
only for his or her highest-level civil waiver. Additionally, if an applicant had one
civil, alcohol abuse, or drug-related waiver from any one of the three sources,
then a flag was set to indicate that the applicant had received a moral waiver.
The data comparisons showed that MIRS recorded more waivers than PRIDE
and that Nashville recorded more waivers than either MIRS or PRIDE.
Surprisingly, it was found that those with moral waivers were actually more
successful at completing DEP than those who enlisted without moral waivers. It
was shown, however, that those who required moral waivers were not as
successful in the long term, and population proportion tests showed that those
with moral waivers were significantly more likely to be moral-related “losses” from
active duty than those without moral waivers.
Long-term success was defined in this study as those who completed
DEP and continued on active duty until May 2007 (completed contracts and
officer programs accounted for). To test the actual significance of moral waivers

xviii
in predicting long-term success, two logistic regression models were created.
The first predicts success of applicants from DEP entry through first term. The
second model looked only at the subset of those who survived DEP, so it
predicts the long-term success of sailors from the time they begin active duty.
Both models’ logit coefficients showed that moral waivers are negative predictors
of success. Among those who finish DEP and enter active duty, sailors with
moral waivers have predicted odds of long-term success that are 32 percent
lower than the corresponding odds of those without.
The strongest predictors of success included high school diploma, Test
Score Category I, male, prior service, advanced paygrade (above E-1), not
having a moral waiver, as well as Hispanic and Asian Pacific Islander or Native
American. In the presence of all other variables, marital status was found to be
insignificant in both models, while age and mission day were found to be
significant only to the DEP model. Overall, the accession model performs better
than the DEP model, and, in general, predicting long-term success from the
beginning of DEP through first term is much more difficult than predicting
success only from the beginning of active duty.

1
I. INTRODUCTION
A. BACKGROUND
Navy Recruiting Command is located in Millington, Tennessee. Its current
mission is to manage the recruitment of men and women for enlisted and officer
programs in the regular and reserve components of the United States Navy.
With an annual accession goal of more than 40,000 enlisted sailors,
Commander, Navy Recruiting Command (CNRC) employs more than
6,800 military, civilian, and contractor personnel (CNRC, 2007). The enormous
amount of time and cost associated with the recruiting mission makes it
paramount that CNRC (1) understand recruit characteristics that can be used to
predict success and (2) operate a reliable screening system.
The existing screening process gained new importance in early 2005, after
Commander, Naval Surface Forces, expressed concern over enlistment waivers
that were being approved to assist applicants who would otherwise not make it
through the screening process (Noble, 2005, p. 2). CNRC analysts responded
by analyzing historical data from the Personnel Recruiting for Immediate and
Delayed Enlistments (PRIDE) system (the Navy’s accession management
system) and found “no evidence recruits with moral waivers [are] causing a
disproportionate number of disciplinary problems in the fleet” (Noble, 2005, p. 9).
It recommended additional research, including a first term attrition study as well
as the tracking of moral waivers, with an emphasis to “capture more detail in
PRIDE” (Noble, 2005, p. 13).
B. OBJECTIVE
In accordance with the recommendations above, this study attempted to
identify success predictors and evaluate the Navy’s enlistment screening system
through the analysis of attrition and moral waiver data. Attrition reasons related
to poor performance are presented in Table 1. Since the moral waiver detail
captured by PRIDE was highlighted as a particular concern, the study first

2
conducted a series of comparisons to other waiver tracking sources in order to
measure the quality of PRIDE waiver data.
Code Definition 060 Character or behavior disorder 064 Alcoholism 065 Discreditable incidents, civilian or military 067 Drugs 071 Civil court conviction 072 Security 073 Court-martial 074 Fraudulent entry 075 Absence without leave (AWOL) or desertion 076 Homosexuality 077 Sexual perversion 078 Good of the service (discharge in lieu of court-martial) 080 Misconduct, reason unknown 081 Unfitness, reason unknown 083 Pattern of minor disciplinary infractions 084 Commission of a serious offense 085 Failure to meet minimum qualifications for retention 086 Unsatisfactory performance (former Expeditious Discharge Program) 087 Entry level performance and conduct (former Trainee Discharge Program)
Table 1. Portion of Interservice Separation Code (ISC) List Associated With Poor Performance (See Appendix B for Complete Table) [After, DMDC]
The study used data from enlistments of regular component enlisted
personnel during Calendar Years (CYs) 2003 and 2004, a period of tremendous
success for Navy recruiting. In fact, CNRC was awarded the Meritorious Unit
Commendation for the period October 1, 2003 through September 30, 2004 for
“outstanding leadership, aggressive team spirit, and commitment to mission
accomplishment” (CNRC, 2007). The time window for the study was chosen so
that the two-year cohort could be tracked through both the Delayed Entry
Program (DEP) and a significant length of active duty service.
C. SCREENING PROCESS
Upon processing for enlistment at a Military Entrance Processing Station
(MEPS), an applicant is sworn into the inactive reserve, otherwise known as the

3
Delayed Entry Program (DEP). The applicant is then reserved an occupational
specialty rating as well as a date to “ship” to Recruit Training Command (RTC).
If an applicant does not initially meet the moral qualification for enlistment due to
civil charges or a history of drug or alcohol abuse, a “moral waiver” may be
considered. The screening process attempts to use moral waivers to ensure
high moral character, which protects unit morale and prevents disciplinary
problems that divert resources from the performance of military missions. The
types of civil charges that may be waived are outlined in a series of charts
labeled “A” through “D” (see Appendix A of this study).
The Navy’s recruiting manual explains that waivers are to be
recommended for only two reasons: (1) highly favorable traits or mitigating
circumstances exist which outweigh the reason for disqualification, or (2) the
enlistment is clearly in the best interests of the Navy. The waiver policies and
authority levels in place at the beginning of CY 2003 are listed in Tables 2 and 3.
Offense Number of Offenses Waiver Authority Minor Traffic Violations (Chart “A”) Six or more violations CO, NRD
Three through five violations CO, NRD Minor Non-Traffic/Minor Misdemeanors (Chart “B”) Six or more violations CNRC
Up to three violations CO, NRD Non-Minor Misdemeanor (Chart “C”) Four or more violations CNRC Felonies (Chart “D”) One or more violations CNRC
Table 2. Waiver Policy for Civil Offenses [After, CNRC, 2002]

4
Alcohol/Drug Abuse Eligibility Determination AuthorityExperimental/casual use of marijuana Eligible (no waiver required); however,
shipping of recruit must not occur until 45 days have passed since last use.
Two Behind-the-Wheel (BTW) offenses. CNRC Prior psychological or physical dependence upon any drug or alcohol. CNRC
Abuse of stimulant or depressant drugs, narcotics, hallucinogenic or psychedelic drugs (other than experimental/casual use of marijuana).
CO, NRD; mandatory minimum waiting period of one year since last use or conviction. No waiver authorized (if under one year).
Any drug abuse while in DEP. (Positive Non-Instrumented Drug Test (NIDT) results while in DEP count as drug abuse in DEP.)
CO, NRD
Two or more alcohol related offenses. CO, NRD Tested positive at MEPS more than six months (marijuana) or one year (cocaine) ago.
CO, NRD Second positive test – CNRC
Drug trafficking/supplying. Not eligible. No waivers authorized. LSD use within two years of enlistment. Not eligible.
Table 3. Eligibility Determination Policy for Alcohol/Drug Abusers [After, CNRC, 2002]
The complete waiver process is executed as follows:
• The Waiver Briefing Sheet, NAVCRUIT 1133/39, is prepared by
Navy liaison processors at MEPS, signed by the Commanding
Officer (CO) or other waiver authority at one of the 31 Navy
Recruiting Districts (NRDs), and retained as a permanent part of an
applicant’s service record.
• Up to six waiver processing codes are derived from a waiver code
table (see Appendix B of this study). The codes, which consist of
three letters to document the type of waiver and authority level
required, are then recorded by Navy liaison processors into the
appropriate sections of the DD Form 1966, Record of Military
Processing – Armed Forces of the United States.
• The Navy’s Classifier, or job placement specialist, enters the waiver
codes from the DD Form 1966 into PRIDE.

5
• Navy liaison processors relinquish control of the service record to
Military Entrance Processing Command (MEPCOM).
• Data from the DD Form 1966 is transcribed by data entry personnel
into yet another computer system—the MEPCOM Integrated
Reporting System (MIRS).
The post-enlistment verification processes for electronic and hardcopy
records are different. Hardcopy service records undergo quality assurance
checks. After the records have been reviewed at MEPS, the records accompany
the enlistees to RTC, where officials review them for required legal documents.
Any errors or omitted documents found in the hardcopy records are reported to
CNRC to help determine the eligibility of the 31 districts for annual recruiting
excellence awards. Unfortunately, there is no post-enlistment check of PRIDE
waiver entries. It is clear that waivers were completed; in part, this study
investigated how accurately these waivers were recorded in PRIDE.
D. ORGANIZATION
Chapter II is a literature review, and Chapter III reviews data and
methodology. Chapter IV presents data analysis of waiver reporting accuracy as
well as moral-related losses from active duty. Chapter V discusses the histories
of success for those with and without moral waivers and shows the results of
logistic regression models developed to predict success. Finally, Chapter VI
provides conclusions and recommendations.

6
THIS PAGE INTENTIONALLY LEFT BLANK

7
II. LITERATURE REVIEW
A. HALL (1999)
The topic of moral waivers was visited once before by the Operations
Research (OR) Department at the Naval Postgraduate School (NPS). Hall’s
thesis used logistic regression and classification trees in his thesis to analyze the
effect of moral waivers on attrition occurring within the first two years of enlisted
service. CNRC provided the demographic and attrition data from PRIDE and
TrainTrack (a database no longer in service) for the Fiscal Year (FY) 1995 and
1996 cohort of Navy accessions. The author used available waiver codes, which
at the time could not distinguish general enlistment waivers from program
waivers (more stringent requirements for certain high-security jobs). Therefore,
the dataset was reduced from 86,815 to 56,510 to account for possible bias from
program waivers. Hall concluded that those with moral waivers are more likely to
have “unsuitability” attrition than those without moral waivers. Prediction models
suggested that those entering the Navy with moral waivers and less than a high
school diploma perform most poorly. The author did not recommended policy
changes due to the challenging recruiting environment existing at the time of his
research. However, it was recommended that “a similar study to this one be
conducted once data is available that does not include program waivers in the
moral waiver data” (p. 65).
Major recruiting policy and procedural changes have occurred since Hall
completed his research:
• Program waivers now have specific codes to distinguish them from
enlistment eligibility waivers.
• Waiver codes were modified to allow for identification of multiple
waivers.
• Attrition codes were modified.

8
• High Performance Predictor Profile (HP3) screening replaced
Compensatory Screening Model (CSM) policy for determining
eligibility for those applicants without a high school diploma.
• The Navy cancelled the “Sunset Rule,” which could override the
requirement for a waiver if three years had elapsed since
certain offenses.
• The Chart system, a naming convention, was created to more
easily categorize the levels of civil waivers.
Since Hall discussed related research completed prior to his thesis, it will be left
to the reader to review that discussion. This study, in essence a follow-up to
Hall’s thesis, will review four other works related to the topic of this study that
have been published since 1999.
B. GOVERNMENT ACCOUNTING OFFICE (GAO) (1999)
GAO provided an analysis of moral waiver data from FYs 1990 through
1997, in support of its assessment of Department of Defense (DoD) policies for
screening criminal histories and granting moral waivers. Defense Manpower
Data Center (DMDC) data was used despite a detailed explanation about how
“the services and the Military Entrance Processing Command apply moral waiver
codes inconsistently” (p. 26). The report showed that across all services, the
overall percentage of moral waivers completed went down year-to-year during
the entire period. Interestingly, the percentage of non-minor misdemeanors rose
during the same period from 33 percent to 58 percent. GAO broke down the
first-term separation reasons for nearly 600,000 individuals, and it was found that
19.5 percent of accessions who had a moral waiver left the service “for generally
the same reasons and at similar rates . . . [as those] who enlisted without moral
waivers” (p. 29). GAO recommended the use of the Electronic Personnel
Security Questionnaire (EPSQ) as well as the Integrated Automated Fingerprint
Identification System in order to improve background checks and therefore
reduce the number of sailors entering with “undesirable backgrounds.”

9
C. PUTKA, NOBLE, BECKER, AND RAMSBERGER (2004)
This report to the Directorate of Accession Policy examined moral
character screening policies used to allow waivers for applicants who have
records of criminal behavior and/or drug and alcohol abuse. DMDC provided
accession and loss data up to June 2003 for those who entered service from
June to September 2001. EPSQs collected from various sources provided
criminal background information on the accession cohort. Hierarchical logistic
regression and point-biserial correlation analysis methods were used, and results
showed that those with moral waivers were not related to non-moral attrition, but
instead were significantly tied to moral losses and disciplinary problems while on
active duty. Recommendations included:
• Adoption of a “standard law violation classification framework” and
clarifications in recruiting manuals to reduce subjectivity and assist
processors across the services in recording identical waiver codes
for the same types of offenses.
• Addition of more detailed instructions concerning multiple waiver
requirements so that processors become better trained to use more
than one waiver entry field when applicable.
• Use of EPSQ data for waiver consideration.
• Requirements for moral waiver applicants to meet higher
standards.
D. NOBLE (2005)
Noble, head of research at CNRC, looked at accessions from FY 2000 to
FY 2004 to assess the validity of concerns expressed by Commander, Naval
Surface Force, that enlistment waivers cause a “disproportionate amount of
disciplinary problems” (p. 2). The author found that newer, tougher rules had
reduced the percentage of total waivers from FY 2000 to FY 2004 by 6 percent.
The percentage of moral waivers granted during the same period went down by
2.5 percent. It was suggested by Noble that the “target market is more likely to

10
need a waiver” (p. 12) and that elimination of waivers in Navy recruiting would
cost between $58M (moral only) and $100M (all waivers). Noble recommended
further research to look at (1) first-term attrition, (2) first-term disciplinary
problems, and (3) tracking of moral waivers, with an emphasis to “capture more
detail in PRIDE” (p. 13).
E. BACZKOWSKI (2006)
Baczkowski examined the effect of DEP entry date on attrition from
the Marine Corps Recruit Depot. The author used regression analysis in his
thesis to examine entry (1) on the last day of the month, (2) in the last week of
the month, and (3) during the last ten days of the month. Demographic and
attrition data was collected from the Total Force Data Warehouse in November
2005 for a 19-month cohort that entered active duty between October 2003 and
April 2005. Results of all three regression models showed that the day a recruit
enters DEP is not a significant factor in predicting boot camp attrition. These
findings countered previous research that had identified higher DEP attrition by
those entering during the final week. The author recommended a cost analysis
to “determine the feasibility of adding additional recruiters to manage the [DEP]
program, allowing the ‘street recruiters’ to focus on obtaining new contracts” (p.
50). A second recommendation backed an idea for a pilot program in which
higher-risk applicants would be observed after shipping earlier than other
enlistees to see whether or not attrition rates change.

11
III. DATA AND METHODOLOGY
A. DATA SOURCES
1. Commander, Navy Recruiting Command (CNRC)
CNRC provided all PRIDE records for applicants who entered DEP for a
three-year period, during FYs 2003-2005. In order to attain the desired dataset,
any records outside of CYs 2003 and 2004 were eliminated. It was found that
3,836 Social Security Numbers (SSNs) were duplicated. These records were
sorted by SSN and DEP entry date, and only the latest instance of DEP entry
was retained. The resulting dataset contained 99,375 applicants. Each record
contained the six waiver code fields from the DD Form 1966, as well as personal
characteristics such as gender, date of birth, aptitude test scores, education, and
race. For the purposes of this study, only moral-related waiver codes starting
with a first character of D or F, as presented in Table 4, were considered. See
Appendix B of this study for the complete waiver code table.
First Character – Type of Enlistment/Program Waiver
Second Character — Sub-Type for the Enlistment/Program Waiver
Basic Enlistment Eligibility Requirements (BEERS) Law Violations D
Minor Traffic Offense Serious Traffic Offense Minor Non-Traffic/Minor Misdemeanor Serious Non-Traffic/Major Misdemeanor Felony (Adult) Felony (Juvenile/Youthful Offender)
A B C D E F
BEERS Drug Involvement (Not Law Violation) F
Alcohol Abuse Marijuana Usage Other Drug Usage Drug/Alcohol Test Positive
A B C D
Table 4. Portion of Waiver Code Table [After, CNRC, 2002]
2. Defense Manpower Data Center (DMDC)
DMDC provided loss dates and codes as well as MIRS waiver records for
these 99,375 enlistees up to May 2007. Assuming that applicants entering prior

12
to the last day of CY 2004 could remain in DEP for a maximum of 365 days, all
enlistees in the study must have either undergone attrition or entered active duty
by January 1, 2005. Therefore, all sailors were tracked for a minimum of
17 months of active service. Those who entered in January 2003 (the beginning
of the study period) were tracked for 53 months of active duty service.
3. Navy Recruiting District (NRD) Nashville
NRD Nashville contributed a third source of waiver information by
providing applicable portions of its hardcopy and electronic waiver logs, which
were updated daily by the waivers clerk or other cross-trained members of the
enlisted programs office at district headquarters. The district started recording
waiver data in fall 2002, in an effort to capture more detail than PRIDE—details
that could help the district’s leaders better analyze their internal waiver process.
Figure 1 shows a portion of one page of the waiver logbook (date, name, and
SSN omitted). There were more than 500 log entries identified and transcribed
onto a spreadsheet for analysis. To confirm the soundness of the waiver process
in NRD Nashville during CYs 2003 and 2004, it is important to note that the
command received zero discrepancies in the waivers category during a biennial
inspection by CNRC in June 2004.

13
Figure 1. Portion of Waiver Log [After, NRD Nashville]
B. DATA ERRORS
1. Commander, Navy Recruiting Command (CNRC)
In the PRIDE dataset, there were eight waiver entries with invalid codes
that started with a D or F. Once these invalid codes were eliminated, only three
of the eight applicants still had at least one valid moral waiver code remaining.
Also, it was found that some of the deleted duplicates had contained waiver
codes that were not identified in the retained record for that SSN. A count found
85 individuals, many with waiver codes from a previous DEP entry prior to
CYs 2003 and 2004, who did not have a moral waiver code retained in the final
data set. These individuals accounted for 0.09 percent of the dataset. The next
section discusses PRIDE duplicate entries and their impact on analysis in
more detail.

14
2. Defense Manpower Data Center (DMDC)
Several entries were found to contain a loss date and loss code, but no
information for the last Unit Identification Code (UIC) assigned. It was confirmed,
however, that any record matching this combination indicated that the enlistee
left active duty service within his or her first few weeks at RTC.
3. Navy Recruiting District (NRD) Nashville
Of the three drug waiver sub-types (marijuana usage, other drug usage,
and drug or alcohol test positive), it was the test positive sub-type that provided
difficulties in transcription. For example, there are nearly 50 instances in the
logbook of DEP discharge waivers due to a positive drug test. However, there
are more than 100 other entries that simply show “DEP discharge.” Since these
waivers may or may not have been a result of positive drug tests, it was deemed
that there was inadequate specificity to merit the inclusion of drug-related
waivers. In general, however, all civil and alcohol abuse waivers were
easily transcribed.
In addition to the drug waiver issue, there was one entry that did not
match by SSN to the PRIDE dataset, and this record was deleted. Fifty-nine
waivers were entered only in the electronic log, and 47 of these applicants
entered DEP. Twenty-four applicants who were approved for a waiver did not
enter DEP (refused to enlist or were disapproved by higher authority). Three
applicants were approved prior to December 31, 2004, but did not enter the DEP
until CY 2005; these were removed from the dataset. Eleven applicants who
were listed in the log had already enlisted prior to January 1, 2003 and had
simply required additional waivers for offenses committed while in DEP; these,
too, were removed from the dataset. Twenty-four applicants had more than one
entry due to a mistake or a multiple waiver requirement; these entries were
combined into one entry during transcription. Thirty-two logbook entries did not
have any indication of a waiver decision; 26 of these applicants entered DEP and
were therefore assumed to have had their waivers approved. Twenty-three

15
approved waivers read only “Physical Violence Interview,” so it is assumed that
these waivers should be classified as Chart C offenses (for assault).
4. All Sources
Waiver data entry bias exists for several reasons, including different
interpretations of coding instructions (GAO, 1999, p. 26 and Putka et al., 2004,
pp. 117-118). Another problem is the multilevel approach to entering data within
each MEPS. One processor prepares the initial waiver briefing sheet. The same
or another processor may or may not later transcribe the waiver description on
the waiver briefing sheet into applicable codes and handwrite them on a
DD Form 1966. The classifier then may or may not enter any codes from the
form into PRIDE. It is probable that after the Navy office turns over the service
record, MEPCOM Integrated Reporting System (MIRS) waiver fields become
more populated than PRIDE waiver fields since MEPCOM data entry personnel
have only one task, which is the entry of all data (not just waiver codes) directly
from the DD Form 1966 into MIRS.
To better explain the differences that can appear between PRIDE and
MIRS data entry, the actual records for two applicants are shown in Tables 5 and
6. Standard operating procedures directed that “YYY” be entered in the first field
if no waiver was required. If no second or third waivers were required, then the
two additional fields were to be left blank. As a reminder, Table 4 provides a
legend for waiver codes used in this example, and it is the second character that
determines which civil “chart” is applicable. There were five initial record entries
provided by PRIDE, and after duplicates were deleted, only Record 3 for
Applicant A and Record 2 for Applicant B were retained. For applicant A, three
waiver codes were deleted (Charts A, B, and C). For applicant B, two waiver
codes (Charts A and B) were retained, but the most serious civil waiver code of
the three (Chart C) was deleted.

16
Before Waiver 1 Waiver 2 Waiver 3 Applicant A Record 3 YYY Applicant A Record 2 DDE Applicant A Record 1 DAE DCE Applicant B Record 2 DAE DCE Applicant B Record 1 DDE
After Waiver 1 Waiver 2 Waiver 3 Applicant A Record 3 YYY Applicant B Record 2 DAE DCE
Table 5. Example of PRIDE Waiver Data
Only one record per applicant was provided by MIRS. For Applicant A,
none of the three civil waiver codes shown in the PRIDE entries were recorded,
but a medical waiver is recorded. Applicant B’s record from MIRS does show the
two civil waiver codes that were also in PRIDE, but the MIRS record also
includes a failed drug test waiver code that did not appear in PRIDE. Obviously,
waiver studies using the same group of applicants could possibly produce
different results depending on the data source used.
DMDC Record Waiver 1 Waiver 2 Waiver 3 Applicant A HCB Applicant B DCE DAE FDE
Table 6. Example of MIRS Waiver Data
C. VARIABLE DEFINITIONS
The independent variables used in this study include demographic, loss,
and waiver data elements. Tables showing the fields provided by CNRC, DMDC,
and NRD Nashville are listed in Appendix C. This study used the concept of
“highest civil waiver” to account for data entry and duplicate record bias. After
the types of civil waivers for a single individual were determined, only the highest
civil waiver type received a flag. In the end, a series of flags were created to
answer five basic questions about that single individual:
• What was the highest civil waiver recorded?
• Did the applicant require a civil waiver in order to enlist?

17
• Did the applicant require a drug-related waiver in order to enlist?
• Did the applicant require an alcohol abuse waiver in order to enlist?
• Did the applicant require a moral waiver in order to enlist?
Example 1: DBE, DCE, and DDE are recorded by CNRC. Interpretation: One Chart B and two Chart C waivers.
Variables: C.AFlag: 0 C.CivilFlag: 1
C.BFlag: 1 C.DrugFlag: 0
C.CFlag: 1 C.AlcFlag: 0
C.DFlag: 0 C.MoralFlag: 1
C.HighCivil: 3 (for Chart C)
Example 2: DAE and FAE are recorded by DMDC. Interpretation: One Chart A and one alcohol abuse waiver.
Variables: D.AFlag: 1 D.CivilFlag: 1
D.BFlag: 0 D.DrugFlag: 0
D.CFlag: 0 D.AlcFlag: 1
D.DFlag: 0 D.MoralFlag: 1
D.HighCivil: 1 (for Chart A)
Example 3: FAE and FBE are recorded by CNRC. Interpretation: One alcohol abuse waiver and one drug-related waiver.
Variables: C.AFlag: 0 C.CivilFlag: 0
C.BFlag: 0 C.DrugFlag: 1
C.CFlag: 0 C.AlcFlag: 1
C.DFlag: 0 C.MoralFlag: 1
C.HighCivil: 0 (no civil)
D. METHODOLOGY
The data mining software Clementine 11.1 was used for all aspects of this
study. For data comparisons, the actual number of waivers recorded by the
three individual data sources is listed along with the best available “truth,” a union
of the data provided by PRIDE, MIRS, and NRD Nashville. In other words, if at

18
least one of those three sources showed a specific waiver for an applicant, then
the “TRUTH” flag was set in that waiver category for that particular applicant.
For the purposes of this study, a successful recruit was defined as one
who entered DEP, got sworn into active duty, and served without receiving an
ISC. In order to investigate the characteristics of success, a flag called
“SUCCESS” was derived to serve as a dependent variable for use in logistic
regression. Note that an enlistee was considered a success if he or she received
an ISC due to completion of enlistment contract, reenlistment, or selection to an
officer program.
Large-sample population proportion tests were used to determine whether
or not there was a difference between the proportions of recorded data as well as
between the proportions of successful applicants. The null hypothesis was that
there is no difference, and an alpha of 0.01 was applied.

19
IV. DATA COMPARISONS
A. WAIVER RECORDING ACCURACY
Analysis on PRIDE and MIRS accuracy was performed separately for
four groups:
• Navy-wide applicants who joined DEP
• Navy-wide accessions to active duty
• NRD Nashville applicants who joined DEP
• NRD Nashville accessions to active duty
For each of these four groups, all available data was compared to the union of
the two data sources, called the TRUTH.
1. Navy Delayed Entry Program (DEP)
Table 7 shows that for the 99,375 applicants who entered DEP, PRIDE
reported 9,452 individuals (9.5 percent) who required at least one moral
enlistment waiver. This compared to 11,271 for MIRS (11.3 percent) and 14,012
for the TRUTH (14.1 percent). Note that PRIDE reflected only two-thirds
of the TRUTH.

20
PRIDE MIRS
Waiver Type Number Percent
of DatasetPercent
of TRUTH Number Percent
of Dataset Percent
of TRUTH Chart A 306 0.3% 70.8% 322 0.3% 74.5% Chart B 1,685 1.7% 71.0% 1,754 1.8% 73.9% Chart C 6,204 6.2% 66.1% 7,587 7.6% 80.8% Chart D 89 0.1% 41.2% 198 0.2% 91.7% Total Civil * 8,284 8.3% 67.9% 9,861 9.9% 80.8% Alcohol Abuse 490 0.5% 71.6% 488 0.5% 71.3% Drug-Related 1,179 1.2% 59.7% 1,506 1.5% 76.3% Moral** 9,452 9.5% 67.5% 11,271 11.3% 80.4%
TRUTH ***
Waiver Type Number Percent
of Dataset Chart A 432 0.4% Chart B 2,374 2.4% Chart C 9,390 9.4% Chart D 216 0.2% Total Civil * 12,203 12.3% Alcohol Abuse 684 0.7% Drug-Related 1,974 2.0% Moral ** 14,012 14.1%
* Only the “highest” civil waiver per applicant is counted, so A-D sum to total civil. ** Not the sum of total civil, alcohol, and drug waivers. An applicant can count once for each of those categories, but only once in the moral category. *** Reflects the union of information received by all data sources.
Table 7. Waiver Summary for Applicants Entering Navy-Wide DEP
2. Navy Accessions
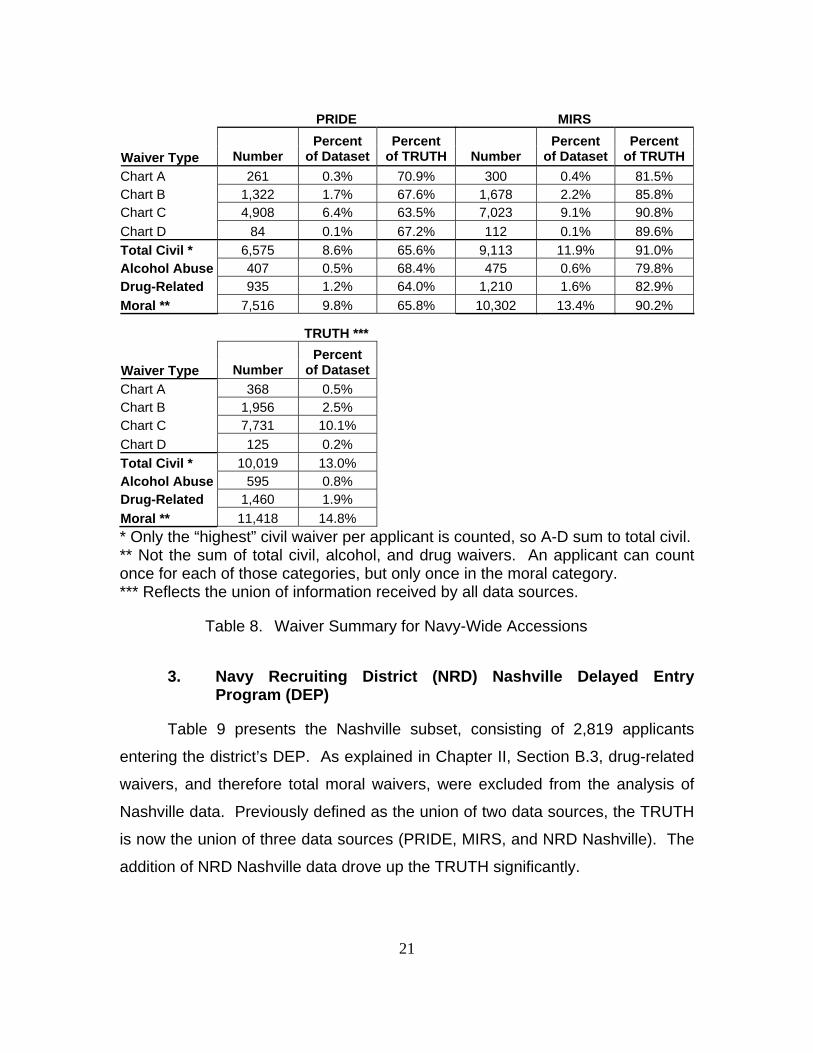
Table 8 shows that for the 76,897 enlistees who entered active duty,
PRIDE reported that 7,516 individuals (9.8 percent) required at least one moral
enlistment waiver, compared to 10,302 for MIRS (13.4 percent) and 11,418 for
the TRUTH (14.8 percent).
21
PRIDE MIRS Waiver Type Number
Percent of Dataset
Percent of TRUTH Number
Percent of Dataset
Percent of TRUTH
Chart A 261 0.3% 70.9% 300 0.4% 81.5% Chart B 1,322 1.7% 67.6% 1,678 2.2% 85.8% Chart C 4,908 6.4% 63.5% 7,023 9.1% 90.8% Chart D 84 0.1% 67.2% 112 0.1% 89.6% Total Civil * 6,575 8.6% 65.6% 9,113 11.9% 91.0% Alcohol Abuse 407 0.5% 68.4% 475 0.6% 79.8% Drug-Related 935 1.2% 64.0% 1,210 1.6% 82.9% Moral ** 7,516 9.8% 65.8% 10,302 13.4% 90.2%
TRUTH *** Waiver Type Number
Percent of Dataset
Chart A 368 0.5% Chart B 1,956 2.5% Chart C 7,731 10.1% Chart D 125 0.2% Total Civil * 10,019 13.0% Alcohol Abuse 595 0.8% Drug-Related 1,460 1.9% Moral ** 11,418 14.8% * Only the “highest” civil waiver per applicant is counted, so A-D sum to total civil. ** Not the sum of total civil, alcohol, and drug waivers. An applicant can count once for each of those categories, but only once in the moral category. *** Reflects the union of information received by all data sources.
Table 8. Waiver Summary for Navy-Wide Accessions
3. Navy Recruiting District (NRD) Nashville Delayed Entry Program (DEP)
Table 9 presents the Nashville subset, consisting of 2,819 applicants
entering the district’s DEP. As explained in Chapter II, Section B.3, drug-related
waivers, and therefore total moral waivers, were excluded from the analysis of
Nashville data. Previously defined as the union of two data sources, the TRUTH
is now the union of three data sources (PRIDE, MIRS, and NRD Nashville). The
addition of NRD Nashville data drove up the TRUTH significantly.

22
PRIDE MIRS
Waiver Type Number Percent
of Dataset Percent
of TRUTH NumberPercent
of Dataset Percent
of TRUTH Chart A 8 0.3% 36.4% 4 0.1% 18.2% Chart B 64 2.3% 68.8% 72 2.6% 77.4% Chart C 219 7.8% 43.0% 262 9.3% 51.5% Chart D 2 0.1% 40.0% 5 0.2% 100.0% Total Civil * 293 10.4% 53.2% 343 12.2% 62.3% Alcohol Abuse 12 0.4% 19.4% 17 0.6% 27.4%
Nashville TRUTH **
Waiver Type Number Percent
of Dataset Percent
of TRUTH NumberPercent
of Dataset Chart A 16 0.6% 72.7% 22 0.8% Chart B 10 0.4% 10.8% 93 3.3% Chart C 460 16.3% 90.4% 509 18.1% Chart D 2 0.1% 40.0% 5 0.2% Total Civil * 488 17.3% 88.6% 551 19.5% Alcohol Abuse 55 2.0% 88.7% 62 2.2% * Only the “highest” civil waiver per applicant is counted, so A-D sum to total civil. ** Reflects the union of information received by all data sources.
Table 9. Waiver Summary for 2,819 Applicants Entering NRD Nashville DEP
Civil waivers were compared first. It is shown that PRIDE reported that
293 individuals (10.4 percent) required at least one civil enlistment waiver,
compared to 343 for MIRS (12.2 percent), 488 for Nashville (17.3 percent), and
551 for the TRUTH (19.5 percent). Note that PRIDE and MIRS each provided
only about half of the TRUTH in the Chart C category, which comprised
74.9 percent of the “highest” civil waivers completed Navy-wide during the period
of this study.
Alcohol abuse waivers are also compared in Table 9. It is clear that the
differences are quite large in this category, in which Nashville provided more than
four times as many waivers as PRIDE and three times as many waivers as
MIRS. These large differences may be due to the way in which waiver briefing
sheet summaries are transcribed into codes. By reviewing Figure 1 in
Chapter III, it is observed in the first and fifth entries (just as seen on waiver
briefing sheets) that alcohol abuse interviews are sometimes “buried” behind the
civil charges that necessitated the alcohol abuse interviews in the first place.

23
4. Navy Recruiting District (NRD) Nashville Accessions
Table 10 shows that for the 2,185 enlistees entering active duty from
Nashville, PRIDE reported that 238 individuals (10.9 percent) required at least
one civil enlistment waiver, compared to 321 for MIRS (14.7 percent), 390 for
Nashville (17.8 percent), and 441 for the TRUTH (20.2 percent).
PRIDE MIRS
Waiver Type Number Percent
of Dataset Percent
of TRUTH Number Percent
of Dataset Percent
of TRUTH Chart A 5 0.2% 33.3% 4 0.2% 26.7% Chart B 54 2.5% 66.7% 71 3.2% 87.7% Chart C 177 8.1% 43.6% 244 11.2% 60.1% Chart D 2 0.1% 100.0% 2 0.1% 100.0% Total Civil * 238 10.9% 54.0% 321 14.7% 72.8% Alcohol Abuse 10 0.5% 18.5% 16 0.7% 29.6%
Nashville TRUTH **
Waiver Type Number Percent
of Dataset Percent
of TRUTH NumberPercent
of Dataset Chart A 11 0.5% 73.3% 15 0.7% Chart B 8 0.4% 9.9% 81 3.7% Chart C 369 16.9% 90.9% 406 18.6% Chart D 2 0.1% 100.0% 2 0.1% Total Civil * 390 17.8% 88.4% 441 20.2% Alcohol Abuse 47 2.2% 87.0% 54 2.5%
* Only the “highest” civil waiver per applicant is counted, so A-D sum to total civil. ** Reflects the union of information received by all data sources.
Table 10. Waiver Summary for 2,185 NRD Nashville Accessions
B. MORAL-RELATED LOSSES FROM ACTIVE DUTY
1. Navy Accessions
There were a total of 12,772 active duty personnel throughout the Navy
who left the service due to poor performance. These “moral losses” made up
16.6 percent of the total of 76,897 enlistees across the nation that entered active
duty during this time. This section reviews the analysis of those moral losses
who were granted moral waivers. Table 11 presents a breakdown of how each

24
data source reported the moral waiver status of those who were moral losses.
PRIDE reported that 7,516 of its accessions had received a moral waiver, and a
total of 1,774 of these (23.6 percent) left the service as a moral loss. MIRS
(24.5 percent) and the TRUTH (24.1 percent) show similar proportions. Also,
note that PRIDE (15.9 percent), MIRS (15.4 percent), and the TRUTH
(15.3 percent) all present similar moral loss proportions for those who had not
required a moral waiver upon enlistment. When tested, all three sources showed
that those who required a moral waiver were significantly more likely to be moral
losses (all three at p = 0.00000).
PRIDE MIRS TRUTH
Moral
WaiverNo
Moral Waiver
Moral Waiver
No Moral
Waiver Moral
Waiver No
Moral Waiver
Number of Moral Losses 1,774 10,998 2,529 10,243 2,751 10,021Number of Accessions 7,516 69,381 10,302 66,595 11,418 65,479% of Moral Losses 23.6% 15.9% 24.5% 15.4% 24.1% 15.3%
Table 11. Navy-Wide Moral Losses With and Without a Moral Waiver as Reported by Different Data Sources
2. Navy Recruiting District (NRD) Nashville Accessions
There were a total of 431 active duty personnel who entered active duty
from NRD Nashville, but left the service due to poor performance. These “moral
losses” made up 19.7 percent of the total 2,185 enlistees who entered active duty
during the period of this study. This section reviews the analysis of Nashville
moral losses who had been granted civil or alcohol abuse waivers.
Table 12 presents a breakdown of how each data source reported the civil
waiver status of those who were moral losses. PRIDE reported that 238 of its
accessions had received a civil waiver, and a total of 65 of these (27.3 percent)
left the service as a moral loss. MIRS (26.2 percent), Nashville (25.6 percent),
and the TRUTH (25.6 percent) reported similar proportions. PRIDE
(p = 0.00183), MIRS (p = 0.00169), Nashville (p = 0.00120), and the TRUTH
25
(p = 0.00049) all show that those who were moral losses were significantly more
likely to have received a civil waiver upon enlistment.
PRIDE MIRS Nashville TRUTH
Civil
Waiver No
Civil Waiver
Civil Waiver
No Civil
WaiverCivil
WaiverNo
Civil Waiver
Civil Waiver
No Civil
WaiverNumber of Moral Losses
65 366 84 347 100 331 113 318
Number of Accessions 238 1,947 321 1,864 390 1,795 441 1,744
% of Moral Losses 27.3% 18.8% 26.2% 18.6% 25.6% 18.4% 25.6% 18.2%
Table 12. NRD Nashville Moral Losses With and Without a Civil Waiver as Reported by Different Data Sources
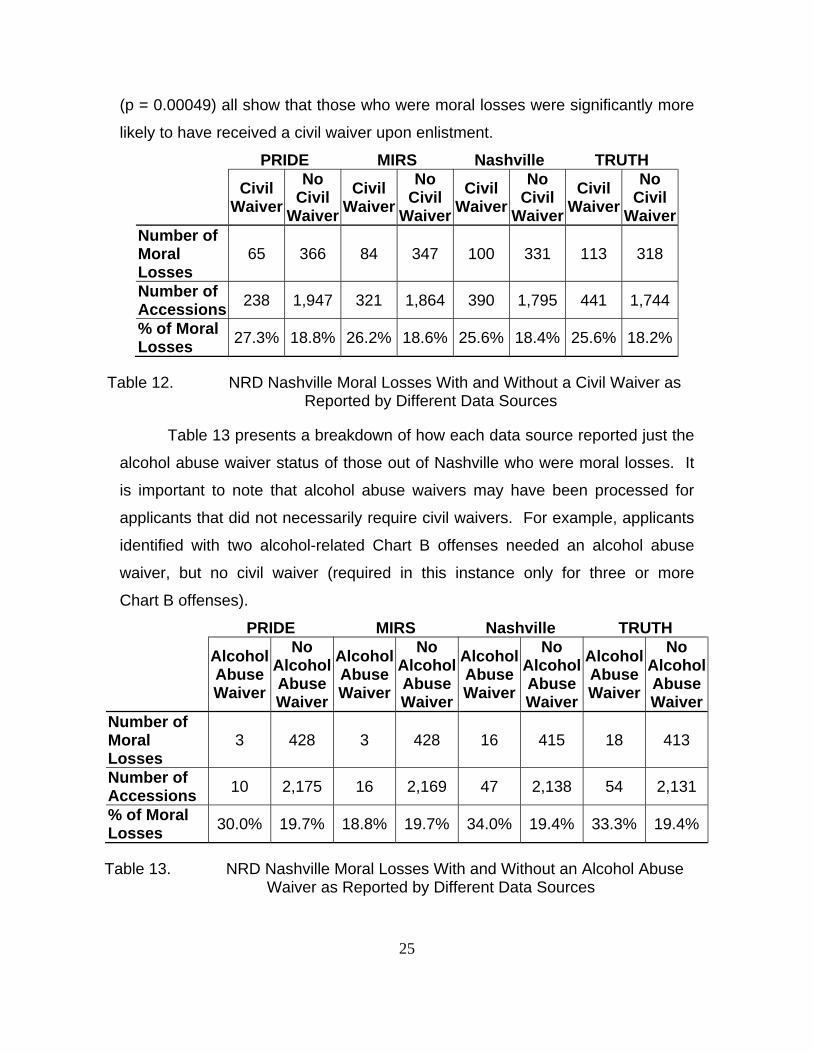
Table 13 presents a breakdown of how each data source reported just the
alcohol abuse waiver status of those out of Nashville who were moral losses. It
is important to note that alcohol abuse waivers may have been processed for
applicants that did not necessarily require civil waivers. For example, applicants
identified with two alcohol-related Chart B offenses needed an alcohol abuse
waiver, but no civil waiver (required in this instance only for three or more
Chart B offenses).
PRIDE MIRS Nashville TRUTH
Alcohol Abuse Waiver
No Alcohol Abuse Waiver
Alcohol Abuse Waiver
No Alcohol Abuse Waiver
Alcohol Abuse Waiver
No Alcohol Abuse Waiver
Alcohol Abuse Waiver
No Alcohol Abuse Waiver
Number of Moral Losses
3 428 3 428 16 415 18 413
Number of Accessions 10 2,175 16 2,169 47 2,138 54 2,131
% of Moral Losses 30.0% 19.7% 18.8% 19.7% 34.0% 19.4% 33.3% 19.4%
Table 13. NRD Nashville Moral Losses With and Without an Alcohol Abuse Waiver as Reported by Different Data Sources

26
PRIDE reported that ten accessions from NRD Nashville received an
alcohol abuse waiver, and a total of three of these (30.0 percent) left the service
as a moral loss. MIRS (18.8 percent) reported a lower proportion, while
Nashville (34.0 percent) and the TRUTH (33.3 percent) reported higher
proportions. In this category, PRIDE (p = 0.413134), MIRS (p = 0.921602),
Nashville (p = 0.0126458), and the TRUTH (p = 0.01094) all showed that, based
on this subset, those with alcohol abuse waivers were no more likely than those
without them to end up as a moral loss.
C. SUMMARY
Section A of this chapter looked at the accuracy of waiver data sources.
In general, MIRS recorded more waivers than PRIDE, and Nashville recorded
more waivers than both MIRS and PRIDE. Note that the proportion of those
entering active duty with moral waivers was higher than the proportion of those
entering DEP with such waivers. Upon further investigation, it was found that
only 11.6 percent of DEP losses had been granted moral waivers, while 14.8
percent of those who finished DEP had been approved for a moral waiver. In
other words, those with moral waivers did better in successfully completing DEP.
Similar findings were made for civil waivers out of NRD Nashville, where
17.5 percent of DEP losses had a waiver compared to 20.1 percent for those
who successfully completed DEP.
Section B of this chapter analyzed active duty attrition data in order to
investigate whether or not those granted moral waivers were more likely to leave
the service due to moral-related reasons. When population proportion tests were
performed, all data sources showed that those who required a moral waiver were
significantly more likely to be moral losses than those who did not receive a
moral waiver.

27
V. SUCCESS OF NAVY APPLICANTS
For the purposes of this study, an applicant was considered successful if
he or she completed DEP, entered into active duty, and served through
May 2007. An enlistee was also considered successful if he or she completed
their first term or was accepted into an officer program. Section A of this chapter
compares actual success rates by moral waiver status. Section B summarizes
data conversions that were made in order to create appropriate logistic
regression variables. Section C presents the results of two logistic regression
models. The first model predicts the long-term success of applicants from the
beginning of DEP through first term, while the second model predicts the success
of sailors once they have entered active duty.
A. SUCCESS HISTORIES OF APPLICANTS WITH OR WITHOUT MORAL WAIVERS
An applicant was considered to have received a moral waiver if either data
source, PRIDE or MIRS, recorded a civil, alcohol abuse, or drug-related waiver
for that individual. Table 14 shows the long-term success rates, broken down by
moral waiver status, of all 99,375 Navy-wide applicants from the beginning of
DEP through first term. Based on this data set, moral waivers lowered the
probability of success.
Number That
Entered DEP
Success Rate
No Moral Waiver 85,363 57.4% Moral Waiver * 14,012 54.4% *Used TRUTH data.
Table 14. Success of the 99,375 Navy-Wide Applicants by Moral Waiver Status Who Entered DEP
Table 15 presents the success rates for the subset of 76,897 Navy-wide
accessions. These sailors had all completed DEP, so this success rate was

28
measured from the beginning of active duty through first term. It was found that
of these accessions, those with moral waivers again succeeded less often. Note
that the success gap widened between those measured from the beginning of
DEP through first term and those measured only from point of accession.
Number of Accessions
Success Rate
No Moral Waiver 65,479 74.6% Moral Waiver * 11,418 66.7% *Used TRUTH data.
Table 15. Success of the 76,897 Navy-Wide Enlistees by Moral Waiver Status Who Had Finished DEP and Entered Active Duty Service
B. DATA CONVERSIONS
The logistic regression models presented later in Section C target the
binomially distributed dependent variable SUCCESS. Before logistic regression
could be attempted, several data fields had to be modified. Table 16 presents
the final list of regressors, all of which were tested in the models through
stepwise analysis prior to any elimination. Data descriptions for the variables
and their respective levels (if not easily apparent) are shown in Table 17.
VARIABLE TYPE LEVELS AGE Set 5 PROG Set 13 AFQT Set 5 REGION Set 4 RACE Set 5 EDUC Set 4 BONUS Set 5 MARITAL Set 3 MALE Flag 2 MISSION_DAY Flag 2 MORAL_TRUE Flag 2 PAYGRADE Flag 2 PRIOR Flag 2 SUCCESS Flag 2
Table 16. List of Variables Used in Logistic Regression

29
Variable Description PROG 2YO Two Year Obligor General Details (GENDET) SG School Guarantee SF Subfarer 5YO Five Year Obligor GTEP GENDET Targeted Enlistment Program NF Nuclear Field AEF Advanced Electronics Field NCSA National Call to Service
TEP Training and Administration of the Reserve (TAR) Enlistment Program
ATF Advanced Technical Field JOBS Job Oriented Basic Skills NPSB Non-Prior Service Basic SEAL Sea, Air, Land (special operations) EDUC D High school diploma graduate G GED or equivalency N Non-graduate MARITAL M Married S Single D Divorced RACE W White B Black H Hispanic A Asian Pacific Islander or Native American O Other AFQT I 93-99 II 65-92 IIIA 50-64 IIIB 31-49 IVA 21-30 MALE 1 if male, 0 otherwise MORAL_TRUE 1 if a moral waiver was recorded by PRIDE or MIRS, 0 otherwise PAYGRADE 1 if entered DEP at paygrade greater than E-1, 0 otherwise MISSION_DAY 1 if entered on last day of month, 0 otherwise PRIOR 1 if entered with any prior enlisted service time, 0 otherwise
Table 17. Logistic Regression Variable Descriptions
Age was determined by using the “date-years-difference” function in
Clementine 11.1 to compare date of birth and date of DEP entry, and 73 records
were removed from the dataset to account for non-prior service applicants who

30
were either too young or too old to meet basic enlistment eligibility criteria. The
results were then broken into a five-level set called AGE for those 17-21, 22-25,
26-29, 30-34, and greater than 34.
The variable EDUC was derived into a three-level set. It was necessary to
modify the status of 8,418 records that still showed a last-recorded status of “P”
for high school senior to either “N” for non-graduate or “D” for diploma graduate.
These individuals left DEP prior to accession for various reasons, including
officer programs (106), declination of enlistment (4,602), medical issues (1,059),
and failure to graduate high school (1,397). Those who left DEP due to
academic ineligibility were modified to the “N” category for non-graduate. The
remaining 7,021 were modified to “D” for diploma graduate.
RACE was derived by reducing 30 Department of Defense race codes into
a five-level set. Twenty-five codes that represent mixed races were combined
into a category for other (“O”). Also, ethnicities of Hispanic, Puerto Rican,
Mexican, Cuban, and Latin American Hispanic were programmed to override any
race codes to create a new race category for Hispanic (“H”). The largest change
as a result of this modification was the reduction in the White classification from
63.0 percent to 51.2 percent. Finally, three race codes were combined for the
category of Asian Pacific Islander or Native American (“A”).
REGION was derived by dividing the 31 Navy Recruiting Districts into a
four-level set with NORTH, SOUTH, CENTRAL, and WEST. Armed Forces
Qualification Test (AFQT) scores were grouped according to the test score
categories used by the military to determine mental eligibility. The scores
required a five-level set for 21-30 (IVA), 31-49 (IIIB), 50-64 (IIIA), 65-92 (II), and
93-99 (I). A three-level set called MARITAL was derived from six unique
identifiers. In order to create the set, three records for common law and two
records for legal separation were changed to married (“M”), and three records for
annulled were changed to single (“S”). BONUS was derived into a five-level set
based on natural breaking points in the range of bonus amounts awarded (there
were no bonuses given in the range between $12,000 and $40,000). Finally, in

31
an attempt to identify whether or not the end of month “crunch” impacts success,
MISSION_DAY (last processing day of the month) was derived by identifying the
applicants who entered DEP on any one of the 24 mission days encompassed by
this study.
C. LOGISTIC REGRESSION MODELS
1. Predicting Success from DEP Entry through First Term
a. Descriptive Statistics
The descriptive statistics for age, AFQT, and bonus amount (prior
to binning) are shown in Table 18. The average applicant who entered DEP was
20 years old with an AFQT score of 62 and bonus amount of $5,927.
STATISTIC Mean Min Max Std Dev Median Mode
AGE 20 17 42 3 19 18 AFQT 62 29 99 18 60 35 BONUS ($) 5,927 0 50,000 12,088 3,000 0
Table 18. Descriptive Statistics of Age, AFQT, and Bonus Amount for Those Who Entered DEP
Table 19 presents a more detailed list of the descriptive statistics
for all levels of the regressor variables. The nine subcategories whose members
had success rates of two-thirds or greater are highlighted in bold print. Those
older than 34 (82.7 percent) were the most successful age group. Other top
independent success traits included married (63.7 percent), prior service
(80.6 percent), Test Score Category I (66.7 percent), and $10,000 or more in
bonus amount (at least 60.4 percent). NF, TEP, NPSB, and SEAL programs all
had success rates greater than 70 percent. The race of Asian Pacific Islander or
Native American was the most successful in its category (60.1 percent).
Although some enlistees entered the DEP with education waivers as
non-graduates and succeeded, the overall success rate for non-graduates (“N”)

32
is shown to be 25.4 percent, which reflects the fact that all seniors who joined
DEP, but failed to graduate were contained in this category.
VARIABLE Percent of Sample
Success Rate * VARIABLE Percent
of Sample Success
Rate * PROG RACE SG 37.5% 55.8% W 51.2% 56.3% SF 23.3% 53.3% B 17.5% 54.2% 5YO 16.1% 56.4% H 17.4% 59.3% GTEP 7.0% 54.2% A 11.1% 61.0% NF 5.0% 70.9% O 2.9% 55.8% AEF 3.5% 60.4% AFQT NCSA 2.8% 65.0% I 6.3% 66.7% TEP 1.8% 74.1% II 36.6% 59.9% ATF 1.4% 64.4% IIIA 27.3% 54.2% JOBS 1.1% 56.0% IIIB 29.8% 53.8% NPSB 0.4% 81.9% IVA 0.0% 0.0% SEAL 0.2% 72.1% BONUS 2YO 0.1% 63.0% 0 37.4% 54.6% EDUC 1-5K 35.2% 55.9% D 93.8% 58.4% 6-8K 15.8% 60.2% G 3.1% 46.3% 10-12K 4.7% 67.9% N 3.1% 25.4% 40-50K 6.9% 60.4% REGION AGE WEST 28.3% 60.1% 17-21 81.6% 56.6% SOUTH 26.4% 54.2% 22-25 12.6% 58.4% NORTH 22.7% 56.6% 26-29 3.8% 58.7% CENTRAL 22.6% 56.6% 30-34 1.9% 59.0% MARITAL >34 0.1% 82.7% M 1.4% 63.7% MALE 82.9% 58.9% S 98.4% 56.9% MORAL_TRUE 14.1% 52.7% D 0.2% 54.5% MISSION_DAY 12.8% 52.0% PAYGRADE 6.3% 70.1% PRIOR 0.8% 80.6% * Percentages of success above 66.7% are in bold.
Table 19. Descriptive Statistics of Regressor Variables for Those Who Entered DEP
b. Model
Backward stepwise regression was used to create the best model
for use in predicting success of applicants from the beginning of DEP through
first term. The process began with all terms in the model, from which
insignificant variables were iteratively eliminated. MARITAL was the only
regressor removed, and the remaining 12 predictors were retained since each
was shown to provide important information in the presence of all others. The
33
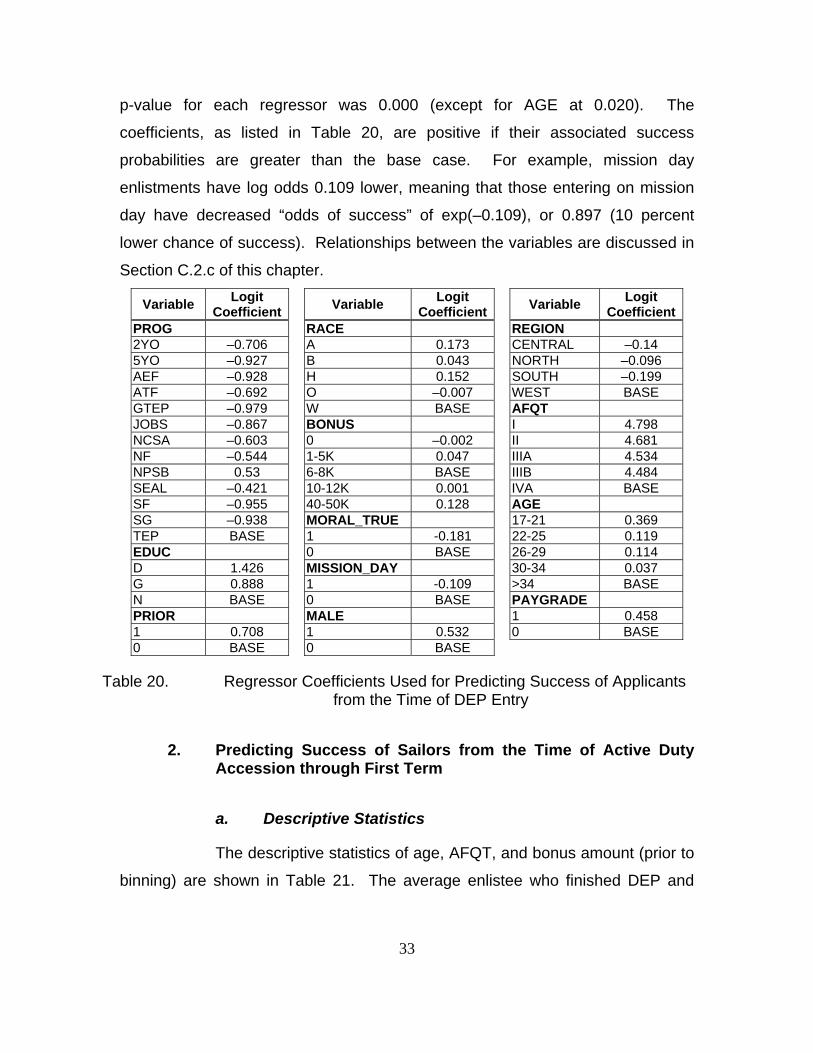
p-value for each regressor was 0.000 (except for AGE at 0.020). The
coefficients, as listed in Table 20, are positive if their associated success
probabilities are greater than the base case. For example, mission day
enlistments have log odds 0.109 lower, meaning that those entering on mission
day have decreased “odds of success” of exp(–0.109), or 0.897 (10 percent
lower chance of success). Relationships between the variables are discussed in
Section C.2.c of this chapter.
Variable Logit Coefficient Variable Logit
Coefficient Variable Logit Coefficient
PROG RACE REGION 2YO –0.706 A 0.173 CENTRAL –0.14 5YO –0.927 B 0.043 NORTH –0.096 AEF –0.928 H 0.152 SOUTH –0.199 ATF –0.692 O –0.007 WEST BASE GTEP –0.979 W BASE AFQT JOBS –0.867 BONUS I 4.798 NCSA –0.603 0 –0.002 II 4.681 NF –0.544 1-5K 0.047 IIIA 4.534 NPSB 0.53 6-8K BASE IIIB 4.484 SEAL –0.421 10-12K 0.001 IVA BASE SF –0.955 40-50K 0.128 AGE SG –0.938 MORAL_TRUE 17-21 0.369 TEP BASE 1 -0.181 22-25 0.119 EDUC 0 BASE 26-29 0.114 D 1.426 MISSION_DAY 30-34 0.037 G 0.888 1 -0.109 >34 BASE N BASE 0 BASE PAYGRADE PRIOR MALE 1 0.458 1 0.708 1 0.532 0 BASE 0 BASE 0 BASE
Table 20. Regressor Coefficients Used for Predicting Success of Applicants from the Time of DEP Entry
2. Predicting Success of Sailors from the Time of Active Duty Accession through First Term
a. Descriptive Statistics
The descriptive statistics of age, AFQT, and bonus amount (prior to
binning) are shown in Table 21. The average enlistee who finished DEP and

34
entered active duty was 20 years old, with an AFQT score of 62 and bonus
amount of $5,922 (nearly identical to the values for the average applicant
entering DEP).
STATISTIC Mean Min Max Std Dev Median Mode
AGE 20 17 42 3 19 18 AFQT 62 31 99 18 61 35 BONUS ($) 5,922 0 50,000 11,891 3,000 0
Table 21. Descriptive Statistics of Age, Armed Forces Qualification Test (AFQT), and Bonus Amount for Those Who Entered Active Duty
Table 22 presents a more detailed list of the descriptive statistics for all
levels of the regressor variables. The 11 subcategories that experienced
success at a rate of 80 percent or greater are highlighted in bold print. Those
older than 34 (86.1 percent) were the most successful age group. Other top
independent success traits included married (74.9 percent), prior service
(83.9 percent), Test Score Category I (81.2 percent), and $10,000 or more in
enlistment bonus amount (at least 80.3 percent). Nuclear Field (NF), Advanced
Technical Field (ATF), Two Year Obligor General Details (2YO), and Sea, Air,
Land (SEAL) programs all had success rates greater than 80 percent, while Non-
Prior Service Basic and Training and Administration of the Reserve (TAR)
Enlistment Program (TEP) each had a 99 percent success rate. The race of
Asian Pacific Islander or Native American was the most successful in its category
(61.0 percent).

35
VARIABLE Percent of Sample
Success Rate * VARIABLE Percent
of Sample Success
Rate * PROG RACE SG 35.7% 75.7% W 51.2% 56.3% SF 24.3% 65.7% B 17.6% 54.2% 5YO 15.4% 76.1% H 17.2% 59.3% GTEP 7.8% 62.1% A 11.2% 61.0% NF 5.5% 81.5% O 2.8% 55.8% AEF 3.5% 77.6% AFQT NCSA 2.9% 79.8% I 6.5% 81.2% TEP 1.7% 99.0% II 37.0% 76.5% ATF 1.4% 82.2% IIIA 26.7% 71.7% JOBS 1.1% 78.0% IIIB 29.9% 69.4% NPSB 0.4% 99.0% IVA 0.0% 0.0% SEAL 0.2% 83.8% BONUS 2YO 0.1% 85.0% 0 35.6% 74.0% EDUC 1-5K 36.6% 69.4% D 95.3% 74.0% 6-8K 16.1% 76.0% G 3.0% 61.4% 10-12K 5.1% 80.6% N 1.7% 61.4% 40-50K 6.7% 80.3% REGION AGE WEST 28.4% 77.2% 17-21 81.3% 73.2% SOUTH 25.9% 71.4% 22-25 12.8% 73.9% NORTH 22.6% 73.2% 26-29 3.9% 74.3% CENTRAL 23.2% 71.2% 30-34 1.9% 74.3% MARITAL >34 0.1% 86.1% M 1.6% 74.9% MALE 84.9% 74.1% S 98.3% 73.4% MORAL_TRUE 14.9% 66.7% D 0.2% 69.4% MISSION_DAY 12.0% 73.2% PAYGRADE 7.2% 79.1% PRIOR 0.9% 83.9% * Percentages of success above 80.0% are in bold.
Table 22. Descriptive Statistics of Regressor Variables for Those Who Entered Active Duty
b. Model
Backward stepwise regression was used to create the best model
for use in predicting the long-term success of sailors once they enter active duty.
The process began with all terms in the model, from which insignificant variables
were iteratively eliminated. AGE, MISSION_DAY, and MARITAL were removed,
and the remaining ten predictors were retained since they were shown to provide
important information in the presence of all others. The p-value for each
remaining regressor was 0.000 (except for PRIOR at 0.001). The coefficients, as

36
listed in Table 23, are positive if their associated success probabilities are greater
than the base case. Relationships between the variables are discussed in
Section C.2.c of this chapter.
Variable Logit Coefficient Variable Logit
Coefficient Variable Logit Coefficient
PROG RACE AFQT 2YO –3.095 A 0.226 I 0.414 5YO –3.567 B 0.018 II 0.214 AEF –3.566 H 0.277 IIIA 0.041 ATF –3.294 O –0.012 IIIB BASE GTEP –4.139 W BASE MALE JOBS –3.481 PAYGRADE 1 0.294 NCSA –3.238 1 0.192 0 BASE NF –3.389 0 BASE REGION NPSB –0.006 PRIOR CENTRAL –0.235 SEAL –3.128 1 0.366 NORTH –0.135 SF –3.965 0 BASE SOUTH –0.211 SG –3.559 BONUS WEST BASE TEP BASE 0 0.216 MORAL_TRUE EDUC 1-5K 0.113 1 -0.39 D 0.699 6-8K BASE 0 BASE G 0.058 10-12K 0.066 N BASE 40-50K 0.362
Table 23. Regressor Coefficients Used for Predicting Success of Applicants from the Time of Accession to Active Duty
c. Summary
Higher test scores and a diploma are significant positive predictors
of success. The logit coefficients for BONUS, however, are less than intuitive. In
the DEP model, having a bonus under $12,000 is just slightly more positive in
predicting success than not having any bonus at all. In the accession model,
surprisingly, no bonus was actually a more positive predictor of success than any
bonus up to $12,000. In both models, the $40,000 to $50,000 bonus range was
the superior positive predictor of success. It is logical to conclude that a lot of
extremely motivated, high quality recruits do not qualify for a bonus and that in
the presence of all other variables, bonus amount is not always a reliable
predictor of success.

37
In the DEP and accession models, the traits of male, prior service,
advanced pay grade (above E-1), and not having a moral waiver were all shown
to be significant positive predictors of success. The race categories of Hispanic
and Asian Pacific Islander or Native American were also significant positive
predictors of success in both models. On the other hand, mission day enlistment
was a significant predictor only in the DEP model. The accession model showed
that once sailors enter service, the mission day factor is no longer important in
predicting success.
Interestingly, the logit coefficients in the DEP model for all AFQT
levels are extremely large, due to the fact that the base is Test Score Category
IV, in which there was only one member (not a success). The logit coefficients in
the Accession model for NPSB and TEP were also extremely large. They were
very positive predictors of success, as one might have expected based on actual
success rates (as shown in Table 22). This is not particularly surprising,
however, as these individuals in most cases “go back home” to affiliate with local
reserve activities after completion of initial accession and skills training.
Overall, the purpose of using logistic regression is to predict
success. When applied to the applicants from CYs 2003 and 2004, the
accession model (73.4 percent) performed better than the DEP model
(57.0 percent). The predictions made by these models, however, were on par
with their respective naïve models, which would predict success for all parties
based simply on percentages (greater than 50 percent) found in Tables 14 and
15. In general, predicting long-term success from the beginning of DEP through
first term is much more difficult than predicting success only from the beginning
of active duty.

38
THIS PAGE INTENTIONALLY LEFT BLANK

39
VI. CONCLUSIONS AND RECOMMENDATIONS
Data comparisons showed that those who enlisted with moral waivers did
better than those without moral waivers in completing DEP. This may be due to
(1) recruiters spending extra time to mentor, (2) less options prior to accession
and/or (3) an emotional incentive to “toe the line” for their recruiters, who “went to
bat” for them in the waiver process. Although interesting, the cost of a DEP loss
is assumed to be trivial compared to that of attrition from active duty, so it is
success from the point of accession that should concern Navy leaders.
This study confirmed that a significant relationship exists between moral
waivers and the odds of long-term success in the Navy; moral waivers are
negative predictors. Further, results showed that these individuals with moral
waivers are significantly tied to moral-related, post-accession attrition. Navy
leaders must continuously weigh the cost of screening out more moral waivers
against the real possibility of missing accession mission. The best
recommendation is to screen out those with moral waivers based on
characteristics shown by this study to be significant in predicting success (AFQT
and education are the most practical).

40
THIS PAGE INTENTIONALLY LEFT BLANK
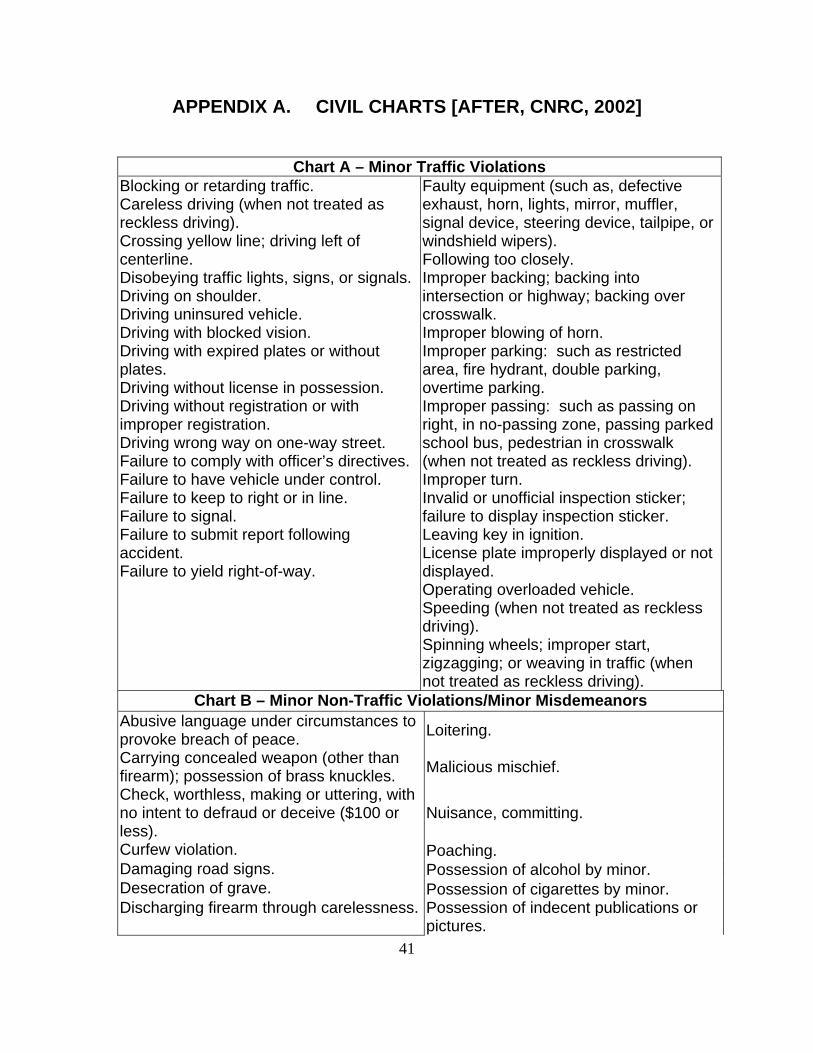
41
APPENDIX A. CIVIL CHARTS [AFTER, CNRC, 2002]
Chart A – Minor Traffic Violations Blocking or retarding traffic. Careless driving (when not treated as reckless driving). Crossing yellow line; driving left of centerline. Disobeying traffic lights, signs, or signals. Driving on shoulder. Driving uninsured vehicle. Driving with blocked vision. Driving with expired plates or without plates. Driving without license in possession. Driving without registration or with improper registration. Driving wrong way on one-way street. Failure to comply with officer’s directives. Failure to have vehicle under control. Failure to keep to right or in line. Failure to signal. Failure to submit report following accident. Failure to yield right-of-way.
Faulty equipment (such as, defective exhaust, horn, lights, mirror, muffler, signal device, steering device, tailpipe, or windshield wipers). Following too closely. Improper backing; backing into intersection or highway; backing over crosswalk. Improper blowing of horn. Improper parking: such as restricted area, fire hydrant, double parking, overtime parking. Improper passing: such as passing on right, in no-passing zone, passing parked school bus, pedestrian in crosswalk (when not treated as reckless driving). Improper turn. Invalid or unofficial inspection sticker; failure to display inspection sticker. Leaving key in ignition. License plate improperly displayed or not displayed. Operating overloaded vehicle. Speeding (when not treated as reckless driving). Spinning wheels; improper start, zigzagging; or weaving in traffic (when not treated as reckless driving).
Chart B – Minor Non-Traffic Violations/Minor Misdemeanors Abusive language under circumstances to provoke breach of peace. Loitering.
Carrying concealed weapon (other than firearm); possession of brass knuckles. Malicious mischief.
Check, worthless, making or uttering, with no intent to defraud or deceive ($100 or less).
Nuisance, committing.
Curfew violation. Poaching. Damaging road signs. Possession of alcohol by minor. Desecration of grave. Possession of cigarettes by minor. Discharging firearm through carelessness. Possession of indecent publications or
pictures.

42
Disobeying summons. Probation Violation. Disorderly conduct; creating disturbance; boisterous conduct. Public urination.
Disturbing peace. Purchase, possession, or consumption of alcoholic beverages by minor.
Driving without a license or with suspended or revoked license.
Racing, dragging, contest for speed (when not treated as reckless driving).
Drinking in public. Removing property under lien. Drunk in public; drunk and disorderly. Removing property from public grounds. Dumping refuse near highway. Robbing orchard. Failure to appear. Trespass to property. Fair/toll evasion. Unlawful assembly. Illegal betting or gambling; operating illegal handbook, raffle, lottery, punch board; matching cockfight. Use of false ID to buy alcohol. Juvenile non-criminal misconduct; beyond parental control; incorrigible; runaway; truant; or wayward. Using or wearing unlawful emblem. Liquor: unlawful manufacture, sale, possession, or consumption in public place. Vagrancy.
Littering. Vandalism: injuring or defacing public property or property of another; shooting out streetlights.
Violation of fireworks laws. Violation of fish and game laws.
Chart C – Non-Minor Misdemeanors Accessory before or after the fact of a misdemeanor. Negligent homicide.
Assault/Assault and battery. Prostitution. Behind the wheel (regardless of blood alcohol content level).
Petty larceny (value $500 or less), such as, stealing hubcaps, shoplifting.
Bigamy. Possession and/or use of marijuana/controlled substance.
Breaking and entering. Possession of drug paraphernalia. Check, worthless, making or uttering, with intent to defraud or deceive ($500 or less). Probation violation.
Child neglect. Providing false information to police/authorities.
Conspiring to commit misdemeanor. Reckless driving. Contributing to delinquency of minor. Resisting arrest. Criminal mischief. Sex crime related charges. Criminal trespass. Shooting. Cruelty to animals. Slander. Driving while drugged or intoxicated. Stolen property, knowingly receiving

43
(value $500 or less). Failure to stop and render aid after accident. Suffrage rights, interference with.
False Imprisonment. Unlawful carrying of firearms; carrying concealed firearm.
Harassment. Unlawful entry.
Indecent exposure. Unlawful use of long-distance telephone lines.
Indecent, insulting, or obscene language communicated directly or by telephone.
Use of telephone to abuse, annoy, harass, threaten, or torment another.
Juvenile Delinquency involving criminal misconduct. Using boat without owner’s consent.
Leaving scene of accident (hit and run). Willfully discharging firearm so as to endanger life; shooting in public place.
Looting. Wrongful use of chemical substances. Motor vehicles: Wrongful appropriation of motor vehicle; joyriding; driving motor vehicle without owner’s consent.
Chart D – Felonies Accessory before or after the fact of a felony.
Indecent acts or liberties with child under 16.
Adultery. Indecent assault. Aggravated assault; assault with dangerous weapon; assault, intentionally inflicting great bodily harm; assault with intent to commit felony.
Kidnapping; abduction.
Arson. Mail matters: abstracting, destroying, obstructing, opening, secreting, stealing, or taking.
Attempt to commit a felony. Mails, depositing obscene or indecent matter in.
Bomb threat. Maiming; disfiguring. Breaking and entering with intent to commit a felony. Manslaughter.
Bribery. Murder. Burglary. Pandering. Carnal knowledge of female under 16. Perjury; subordination of perjury.
Cattle rustling. Possession and/or use of marijuana/controlled substance.
Car jacking.
Public record: altering, concealing, destroying, mutilating, obliterating, or removing.
Check, worthless, making or uttering, with intent to defraud or deceive (over $500).
Rape.
Child abuse. Riot.

44
Concealing knowledge of a felony. Robbery. Conspiring to commit a felony. Sedition; solicitation to commit sedition. Criminal libel. Selling or leasing weapons to minors. Extortion. Sodomy. Forgery; knowingly uttering or passing forged instrument.
Stalking.
Graft. Stolen property, knowingly receiving (value over $500).
Grand larceny; embezzlement (value over $500).
Housebreaking.

45
APPENDIX B. WAIVER CODES [AFTER, CNRC, 2002]
1st digit – Type of Enlistment/Program Waiver
2nd digit – Sub-Type for the Enlistment/Program Waiver
Basic Enlistment Eligibility Requirements (BEERS) Age
A Not Applicable Y
BEERS Dependency B Military Spouse Number of Dependents Not Applicable
ABY
BEERS Mental Qualifications C Not Applicable YBEERS Law Violations
D
Minor Traffic Offense Serious Traffic Offense Minor Non-Traffic/Minor Misdemeanor Serious Non-Traffic/Major Misdemeanor Felony (Adult) Felony (Juvenile/Youthful Offender)
ABCDEF
Previous Military Separation – (Not DEP)
E
Reenlistment Eligibility Pay Grade Lost Time Existed prior – physical disability Skill Requirement Not Applicable
ABCDEY
BEERS Drug Involvement (Not Law Violation) F
Alcohol Abuse Marijuana Usage Other Drug Usage Drug/Alcohol Test Positive
ABCD
Reserved – Future Use G Medical/Physical Disqualification
HHeight; Weight Waiver condition assigned ICD9 code
ABC
Sole Survivor Member J Not Applicable YMinimum Education Requirements K Not Applicable YAlien L Not Applicable YSecurity Risk M Not Applicable YConscientious Objector N Not Applicable YReserved in MIRS for Army P Not Applicable YReserved in MIRS for Air Force Q Not Applicable YNavy Admin (Reserved - future use) R Not Applicable YReserved in MIRS for Marines X Not Applicable YNo Waiver Required Y Not Applicable Y3rd digit – Level of Waiver Authority Navy Department (Secretary of the Navy, etc.) A Commander, Navy Recruiting Command B Commanding Officer, Navy Recruiting Region D Commander, Navy Recruiting District E Not Applicable or NONE Y

46
THIS PAGE INTENTIONALLY LEFT BLANK

47
APPENDIX C. DATA DESCRIPTIONS
Interservice Separation Codes [From DMDC]
Code Definition 000 Unknown or not applicable 001 Expiration of term of service 002 Early release, insufficient retainability 003 Early release, to attend school 005 Early release, in the national interest 008 Early release, other, including RIF, VSI, and SSB 010 Condition existing prior to service 011 Disability, severance pay 012 Permanent disability retirement 013 Temporary disability retirement 014 Disability, no condition existing prior to service, no severance pay 016 Unqualified for active duty, other 017 Failure to meet weight or body fat standards 022 Dependency or hardship 030 Death, battle casualty 031 Death, non-battle, disease 032 Death, non-battle, other 033 Death, cause not specified 040 Officer commissioning program 042 Military service academy 050 Retirement, 20 to 30 years of service 060 Character or behavior disorder 064 Alcoholism 065 Discreditable incidents, civilian or military 067 Drugs 071 Civil court conviction 072 Security 073 Court-martial 074 Fraudulent entry 075 AWOL or desertion 076 Homosexuality 077 Sexual perversion 078 Good of the service (discharge in lieu of court-martial) 080 Misconduct, reason unknown 081 Unfitness, reason unknown 083 Pattern of minor disciplinary infractions 084 Commission of a serious offense 085 Failure to meet minimum qualifications for retention

48
086 Unsatisfactory performance (former Expeditious Discharge Program) 087 Entry level perform and conduct (former Trainee Discharge Program) 090 Secretarial authority 091 Erroneous enlistment or induction 092 Sole surviving family member 094 Pregnancy 095 Minority (underage) 096 Conscientious objector 097 Parenthood 098 Breach of contract 099 Other
DMDC Independent Variables
D.DisDate DEP discharge date D.DisCode Reason for DEP discharge D.DepWvr1 1st enlistment waiver required before DEP entry D.DepWvr2 2nd enlistment waiver required before DEP entry D.DepWvr3 3rd enlistment waiver required before DEP entry D.AccWvr1 1st enlistment waiver required during DEP D.AccWvr2 2nd enlistment waiver required during DEP D.AccWvr3 3rd enlistment waiver required during DEP D.Srvc Military service and component D.Uic Unit identification code D.FileDate Month of loss D.LossDate Date that service member left active duty service D.IscCode Reason for loss
NRD Nashville Independent Variables
N.NumA Number of Chart A offenses N.A Civil waiver required due to Chart A offense(s) N.NumB Number of Chart A offenses N.B Civil waiver required due to Chart B offense(s) N.NumC Number of Chart A offenses N.C Civil waiver required due to Chart C offense(s) N.NumD Number of Chart A offenses N.D Civil waiver required due to Chart D offense(s) N.Alc Waiver for history of alcohol abuse N.Comp Log entry was contained in computer log only N.UnkCiv Log did not specify specific offenses requiring waiver N.Hp3 Waiver for non-graduate status N.Prog Waiver required for specific rating requested N.DepDis Waiver for number of dependents

49
N.Depend Waiver for charges of physical violence N.PhysViol Waiver for drug test failure N.PosDat Waiver for exceeding debt matrix N.Debt Waiver for charges of domestic violence
CNRC Independent Variables
C.term Length of contract C.prog Type of enlistment program C.rate Job field C.sex Gender C.prior Prior enlisted experience C.cived Years of education C.edcert High school education status C.afqt Armed Forces Qualification Test composite score C.cancode Cancellation code – assigned to attrites C.race Race C.ethnic Ethnicity C.paygrd Paygrade C.advpay Advance pay flag C.nrd NRD used C.marital Marital status C.csmflag HP3 waiver flag C.civcode Education level C.zipcode Zip code C.bonus Bonus flag C.bonamt Bonus amount C.nidt Non-Instrumented Drug Test flag C.birthst Birth state C.depstat DEP status flag – ACCESSED or ATTRITED C.fy Fiscal year C.depw1 1st DEP waiver C.depw2 2nd DEP waiver C.depw3 3rd DEP waiver C.accw1 1st Accession waiver C.accw2 2nd Accession waiver C.accw3 3rd Accession waiver C.enldate Date entered active duty C.resdate Date entered DEP C.dobdate Date of birth C.srcdate Source date – indicates month of accession
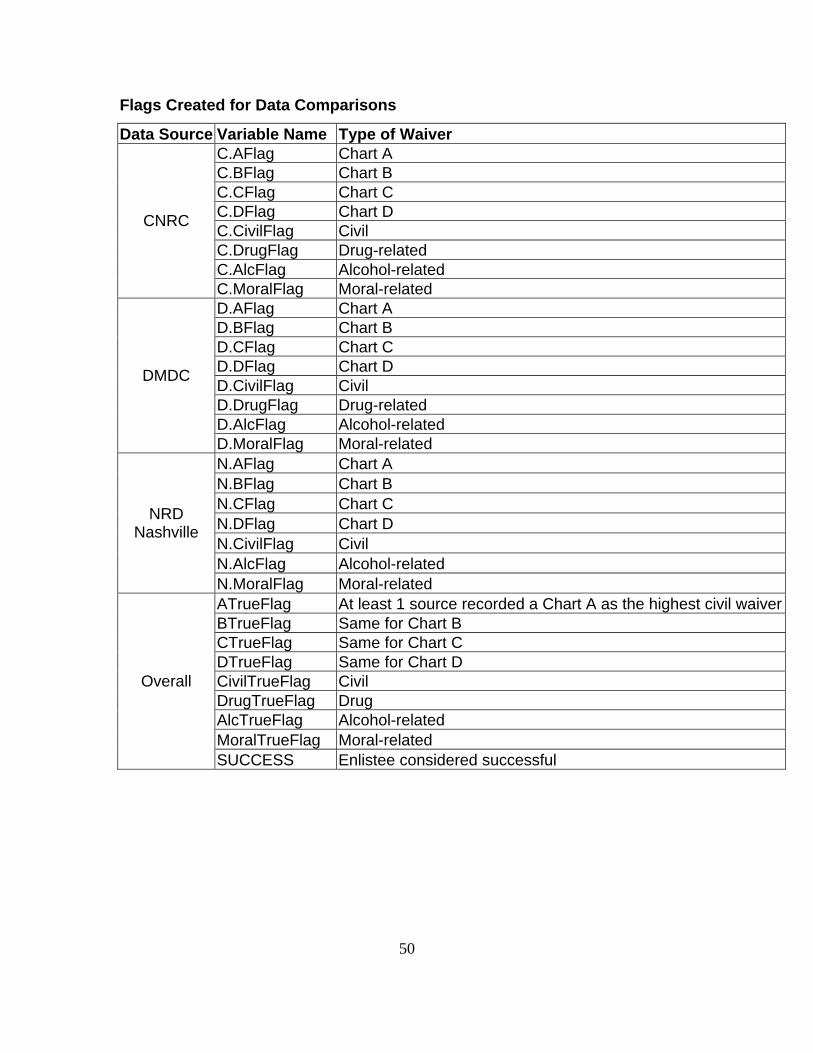
50
Flags Created for Data Comparisons
Data Source Variable Name Type of Waiver C.AFlag Chart A C.BFlag Chart B C.CFlag Chart C C.DFlag Chart D C.CivilFlag Civil C.DrugFlag Drug-related C.AlcFlag Alcohol-related
CNRC
C.MoralFlag Moral-related D.AFlag Chart A D.BFlag Chart B D.CFlag Chart C D.DFlag Chart D D.CivilFlag Civil D.DrugFlag Drug-related D.AlcFlag Alcohol-related
DMDC
D.MoralFlag Moral-related N.AFlag Chart A N.BFlag Chart B N.CFlag Chart C N.DFlag Chart D N.CivilFlag Civil N.AlcFlag Alcohol-related
NRD Nashville
N.MoralFlag Moral-related ATrueFlag At least 1 source recorded a Chart A as the highest civil waiverBTrueFlag Same for Chart B CTrueFlag Same for Chart C DTrueFlag Same for Chart D CivilTrueFlag Civil DrugTrueFlag Drug AlcTrueFlag Alcohol-related MoralTrueFlag Moral-related
Overall
SUCCESS Enlistee considered successful

51
APPENDIX D. MORAL-RELATED ATTRITION ANALYSIS
Moral Losses by ISC for Navy-Wide Accessions With Moral Waivers (Codes With Less Than Ten Losses Not Shown)
ISC Total Moral
Losses Moral Losses with
Moral Waivers % in ISC
% of TRUTH
PRIDE 60 1667 146 8.8% 63.2% 64 505 106 21.0% 68.4% 65 1436 176 12.3% 61.3% 67 2864 549 19.2% 65.0% 71 78 16 20.5% 69.6% 73 130 13 10.0% 46.4% 74 2852 402 14.1% 66.8% 75 224 24 10.7% 60.0% 76 246 18 7.3% 60.0% 78 593 72 12.1% 62.6% 84 1746 222 12.7% 64.7% 87 288 19 6.6% 63.3% Total 12772 1774 13.9% 64.5%
MIRS 60 1667 201 12.1% 87.0% 64 505 145 28.7% 93.5% 65 1436 266 18.5% 92.7% 67 2864 784 27.4% 92.9% 71 78 21 26.9% 91.3% 73 130 26 20.0% 92.9% 74 2852 547 19.2% 90.9% 75 224 40 17.9% 100.0% 76 246 28 11.4% 93.3% 78 593 108 18.2% 93.9% 84 1746 314 18.0% 91.5% 87 288 26 9.0% 86.7% Total 12772 2529 19.8% 91.9%
TRUTH 60 1667 231 13.9% 100.0% 64 505 155 30.7% 100.0% 65 1436 287 20.0% 100.0% 67 2864 844 29.5% 100.0% 71 78 23 29.5% 100.0% 73 130 28 21.5% 100.0% 74 2852 602 21.1% 100.0% 75 224 40 17.9% 100.0% 76 246 30 12.2% 100.0% 78 593 115 19.4% 100.0% 84 1746 343 19.6% 100.0% 87 288 30 10.4% 100.0% Total 12772 2751 21.5% 100.0%

52
Moral Losses by ISC for NRD Nashville Accessions With Civil Waivers (Codes With Less Than Five Losses Not Shown)
ISC Total Moral
Losses Moral Losses with
Moral Waivers % in ISC
% of TRUTH
PRIDE 60 59 4 6.8% 57.1% 64 20 5 25.0% 71.4% 65 31 3 9.7% 42.9% 67 95 17 17.9% 63.0% 74 107 21 19.6% 58.3% 78 29 4 13.8% 66.7% 84 57 6 10.5% 37.5% Total 431 65 15.1% 57.5%
MIRS 60 59 5 8.5% 71.4% 64 20 5 25.0% 71.4% 65 31 4 12.9% 57.1% 67 95 23 24.2% 85.2% 74 107 26 24.3% 72.2% 78 29 4 13.8% 66.7% 84 57 12 21.1% 75.0% Total 431 84 19.5% 74.3%
Nashville 60 59 6 10.2% 85.7% 64 20 7 35.0% 100.0% 65 31 7 22.6% 100.0% 67 95 25 26.3% 92.6% 74 107 30 28.0% 83.3% 78 29 6 20.7% 100.0% 84 57 14 24.6% 87.5% Total 431 100 23.2% 88.5%
TRUTH 60 59 7 11.9% 100.0% 64 20 7 35.0% 100.0% 65 31 7 22.6% 100.0% 67 95 27 28.4% 100.0% 74 107 36 33.6% 100.0% 78 29 6 20.7% 100.0% 84 57 16 28.1% 100.0% Total 431 113 26.2% 100.0%

53
LIST OF REFERENCES
Baczkowski, R.E., “The Effects of End-of-month Recruiting on Marine Corps Recruit Repot Attrition,” Master’s Thesis, Naval Postgraduate School, Monterey, California, March 2006.
Commander, Navy Recruiting Command, Navy Recruiting Command History,
7 August 2007 <http://www.cnrc.navy.mil/history.htm>. Commander, Navy Recruiting Command, Navy Recruiting Manual-Enlisted,
COMNAVCRUITCOMINST 1130.8F with Change 14, Millington, Tennessee, 15 August 2002.
Defense Manpower Data Center, Active Duty 700 byte Edit File Data Dictionary. Hall, L.D., “Analyzing Success of Navy Enlistees with Moral Waivers,”
Master’s Thesis, Naval Postgraduate School, Monterey, California, September 1999.
Montgomery, D.C., Peck, E.A., and Vining, G.G., Introduction to Linear
Regression Analysis, 3rd Ed., John Wiley & Sons, Inc., 2003. Navy Recruiting District Nashville, Waiver Log, 2002. Noble, J.L., “Navy Recruits with Moral Waivers,” Accessions Research
Conference, Navy Support Training Center, Great Lakes, Illinois, August 2005.
Putka, D.J., Noble, C.L., Becker, D.E., and Ramsberger, P.F., “Evaluating Moral
Character Waiver Policy Against Servicemember Attrition and In-Service Deviance Through the First 18 Months of Service,” Human Resources Research Organization, Alexandria, Virginia, January 2004.
United States General Accounting Office, “Military Recruiting: New Initiatives
Could Improve Criminal History Screening,” GAO/NSIAD-99-53, Washington, D.C., February 1999.

54
THIS PAGE INTENTIONALLY LEFT BLANK

55
INITIAL DISTRIBUTION LIST
1. Defense Technical Information Center Ft. Belvoir, Virginia
2. Dudley Knox Library Naval Postgraduate School Monterey, California
3. Professor Samuel E. Buttrey Naval Postgraduate School Monterey, California
4. CDR David L. Schiffman Naval Postgraduate School Monterey, California
5. Mr. John Noble Navy Recruiting Command Millington, Tennessee
6. CDR Voresa E. Booker Navy Recruiting District Nashville Nashville, Tennessee
7. Al Clark Navy Recruiting District Nashville Nashville, Tennessee
8. LT Don Britton Naval Postgraduate School Monterey, California
9. Richard Moreno Defense Manpower Data Center Seaside, California
10. LT Richard Huth Atoka, Tennessee