The effect of different open plan and enclosed classroom ...
12
The effect of different open plan and enclosed classroom acoustic conditions on speech perception in Kindergarten children a) Kiri T. Mealings b) and Katherine Demuth Department of Linguistics, ARC Centre for Cognition and its Disorders, Level 3 Australian Hearing Hub, 16 University Avenue, Macquarie University, Sydney, New South Wales 2109, Australia J € org M. Buchholz c) and Harvey Dillon National Acoustics Laboratories, Australian Hearing Hub, 16 University Avenue, Macquarie University, Sydney, New South Wales 2109, Australia (Received 12 February 2015; revised 7 September 2015; accepted 11 September 2015; published online 27 October 2015) Open plan classrooms, where several classes are in the same room, have recently re-emerged in Australian primary schools. This paper explores how the acoustics of four Kindergarten classrooms [an enclosed classroom (25 children), double classroom (44 children), fully open plan triple class- room (91 children), and a semi-open plan K–6 “21st century learning space” (205 children)] affect speech perception. Twenty-two to 23 5–6-year-old children in each classroom participated in an online four-picture choice speech perception test while adjacent classes engaged in quiet versus noisy activities. The noise levels recorded during the test were higher the larger the classroom, except in the noisy condition for the K–6 classroom, possibly due to acoustic treatments. Linear mixed effects models revealed children’s performance accuracy and speed decreased as noise level increased. Additionally, children’s speech perception abilities decreased the further away they were seated from the loudspeaker in noise levels above 50 dBA. These results suggest that fully open plan classrooms are not appropriate learning environments for critical listening activities with young children due to their high intrusive noise levels which negatively affect speech perception. If open plan classrooms are desired, they need to be acoustically designed to be appropriate for criti- cal listening activities. V C 2015 Acoustical Society of America. [http://dx.doi.org/10.1121/1.4931903] [MAS] Pages: 2458–2469 I. INTRODUCTION Ensuring young children can adequately perceive speech in the classroom is essential for their learning. In Australia, Kindergarten is children’s first experience of for- mal primary school education. In this grade children are introduced to the basic concepts of literacy and numeracy. As children are estimated to spend 45%–60% of their time at school listening, it is vital that they can hear and comprehend their teacher’s and classmate’s speech amongst the other dis- tracting noises heard in the classroom (Rosenberg et al., 1999). The main noise source present in the classroom is the noise generated by other children (Shield and Dockrell, 2004). High noise levels not only adversely affect children’s speech perception (Crandell and Smaldino, 2000; Finitzo- Hieber and Tillman, 1978), but also their reading and lan- guage comprehension (Klatte et al., 2010; Maxwell and Evans, 2000; Ronsse and Wang, 2013), cognition, concentra- tion, and their psychoeducational and psychosocial achieve- ment (American Speech-Language-Hearing Association, 2005; Crandell and Smaldino, 2000; Shield et al., 2010). Furthermore, continuous noise exposure places additional demands on children’s listening effort which reduces the resources available for linguistic and cognitive processing (Anderson, 2001). As a result, children can “tune out” from the auditory overload (Anderson, 2001; Maxwell and Evans, 2000). Classes with young children tend to have the highest noise levels (Jamieson et al., 2004; MacKenzie and Airey, 1999; Picard and Bradley, 2001; Wr oblewski et al., 2012). Young children are also more affected by noise compared to older children and adults (Johnson, 2000; Leibold and Buss, 2013; Nishi et al., 2010; Nittrouer and Boothroyd, 1990). This is because children’s auditory systems are neurologically immature so they cannot discriminate speech or use linguistic knowledge or experience to fill in missing information as adults can (Boothroyd, 1997; Nelson and Soli, 2000; Wilson, 2002). More specifically, children’s consonant perception in noise does not become adult-like until the late teenage years (Johnson, 2000). Similarly, it has been shown that sentence recall performance is significantly reduced in young children compared to adults, in particular, when the target sentences are presented in a spatially separated speech background (Cameron and Dillon, 2007). Children with hearing impair- ment and/or those who have English as a second language (ESL) are even more adversely affected by poor classroom acoustics (MacKenzie and Airey, 1999; Nelson and Soli, a) Portions of this study were presented at the 15th Speech Science and Technology Conference, Christchurch, New Zealand, December 2–5, 2014, and the Acoustical Society of America Conference, Pittsburgh, PA, May 18–22, 2015. b) Electronic mail: [email protected] c) Also at: the Department of Linguistics, Macquarie University, Sydney, New South Wales 2109, Australia. 2458 J. Acoust. Soc. Am. 138 (4), October 2015 0001-4966/2015/138(4)/2458/12/$30.00 V C 2015 Acoustical Society of America Redistribution subject to ASA license or copyright; see http://acousticalsociety.org/content/terms. Download to IP: 137.111.13.204 On: Tue, 17 Nov 2015 21:49:32
-
Upload
khangminh22 -
Category
Documents
-
view
0 -
download
0
Transcript of The effect of different open plan and enclosed classroom ...

The effect of different open plan and enclosed classroom acousticconditions on speech perception in Kindergarten childrena)
Kiri T. Mealingsb) and Katherine DemuthDepartment of Linguistics, ARC Centre for Cognition and its Disorders, Level 3 Australian Hearing Hub,16 University Avenue, Macquarie University, Sydney, New South Wales 2109, Australia
J€org M. Buchholzc) and Harvey DillonNational Acoustics Laboratories, Australian Hearing Hub, 16 University Avenue, Macquarie University,Sydney, New South Wales 2109, Australia
(Received 12 February 2015; revised 7 September 2015; accepted 11 September 2015; publishedonline 27 October 2015)
Open plan classrooms, where several classes are in the same room, have recently re-emerged in
Australian primary schools. This paper explores how the acoustics of four Kindergarten classrooms
[an enclosed classroom (25 children), double classroom (44 children), fully open plan triple class-
room (91 children), and a semi-open plan K–6 “21st century learning space” (205 children)] affect
speech perception. Twenty-two to 23 5–6-year-old children in each classroom participated in an
online four-picture choice speech perception test while adjacent classes engaged in quiet versus
noisy activities. The noise levels recorded during the test were higher the larger the classroom,
except in the noisy condition for the K–6 classroom, possibly due to acoustic treatments. Linear
mixed effects models revealed children’s performance accuracy and speed decreased as noise level
increased. Additionally, children’s speech perception abilities decreased the further away they were
seated from the loudspeaker in noise levels above 50 dBA. These results suggest that fully open
plan classrooms are not appropriate learning environments for critical listening activities with
young children due to their high intrusive noise levels which negatively affect speech perception. If
open plan classrooms are desired, they need to be acoustically designed to be appropriate for criti-
cal listening activities. VC 2015 Acoustical Society of America.
[http://dx.doi.org/10.1121/1.4931903]
[MAS] Pages: 2458–2469
I. INTRODUCTION
Ensuring young children can adequately perceive
speech in the classroom is essential for their learning. In
Australia, Kindergarten is children’s first experience of for-
mal primary school education. In this grade children are
introduced to the basic concepts of literacy and numeracy.
As children are estimated to spend 45%–60% of their time at
school listening, it is vital that they can hear and comprehend
their teacher’s and classmate’s speech amongst the other dis-
tracting noises heard in the classroom (Rosenberg et al.,1999). The main noise source present in the classroom is the
noise generated by other children (Shield and Dockrell,
2004). High noise levels not only adversely affect children’s
speech perception (Crandell and Smaldino, 2000; Finitzo-
Hieber and Tillman, 1978), but also their reading and lan-
guage comprehension (Klatte et al., 2010; Maxwell and
Evans, 2000; Ronsse and Wang, 2013), cognition, concentra-
tion, and their psychoeducational and psychosocial achieve-
ment (American Speech-Language-Hearing Association,
2005; Crandell and Smaldino, 2000; Shield et al., 2010).
Furthermore, continuous noise exposure places additional
demands on children’s listening effort which reduces the
resources available for linguistic and cognitive processing
(Anderson, 2001). As a result, children can “tune out” from
the auditory overload (Anderson, 2001; Maxwell and Evans,
2000).
Classes with young children tend to have the highest
noise levels (Jamieson et al., 2004; MacKenzie and Airey,
1999; Picard and Bradley, 2001; Wr�oblewski et al., 2012).
Young children are also more affected by noise compared to
older children and adults (Johnson, 2000; Leibold and Buss,
2013; Nishi et al., 2010; Nittrouer and Boothroyd, 1990). This
is because children’s auditory systems are neurologically
immature so they cannot discriminate speech or use linguistic
knowledge or experience to fill in missing information as
adults can (Boothroyd, 1997; Nelson and Soli, 2000; Wilson,
2002). More specifically, children’s consonant perception in
noise does not become adult-like until the late teenage years
(Johnson, 2000). Similarly, it has been shown that sentence
recall performance is significantly reduced in young children
compared to adults, in particular, when the target sentences
are presented in a spatially separated speech background
(Cameron and Dillon, 2007). Children with hearing impair-
ment and/or those who have English as a second language
(ESL) are even more adversely affected by poor classroom
acoustics (MacKenzie and Airey, 1999; Nelson and Soli,
a)Portions of this study were presented at the 15th Speech Science and
Technology Conference, Christchurch, New Zealand, December 2–5,
2014, and the Acoustical Society of America Conference, Pittsburgh, PA,
May 18–22, 2015.b)Electronic mail: [email protected])Also at: the Department of Linguistics, Macquarie University, Sydney,
New South Wales 2109, Australia.
2458 J. Acoust. Soc. Am. 138 (4), October 2015 0001-4966/2015/138(4)/2458/12/$30.00 VC 2015 Acoustical Society of America
Redistribution subject to ASA license or copyright; see http://acousticalsociety.org/content/terms. Download to IP: 137.111.13.204 On: Tue, 17 Nov 2015 21:49:32

2000; Shield et al., 2010) and these children are now often
integrated into mainstream classes rather than being in
smaller, specialized schools (Konza, 2008). High noise levels
also increase annoyance and stress levels for the teachers
(Kristiansen et al., 2011).
In the 1970s there was a trend of converting enclosed
classrooms into open plan classrooms, where multiple class
bases share the same area. These spaces were thought to cre-
ate a more secure feeling for the child as they are perceived
as more “home-like” and less authoritarian (Maclure, 1984).
They also allowed for a range of activities to be carried out,
facilitating group work and social development (Brogden,
1983). Additionally, they promoted the sharing of skills,
ideas, and experiences amongst teachers, and allowed for
team-teaching which is thought to facilitate a more coopera-
tive and supportive atmosphere (Brogden, 1983; Hickey and
Forbes, 2011). However, these classrooms resulted in high
noise levels due to large numbers of children sharing the
same area and being engaged in a range of activities, so they
were soon abandoned (see Shield et al., 2010, for a review).
Now, the American National Standards Institute (2002)
strongly discourages the use of open plan classrooms as the
high levels of background noise negatively impact children’s
learning processes. Additionally, studies have shown that
smaller class sizes are linked to higher student achievement,
and the lower exposure to noise provides a better environ-
ment for both students and teachers (Glass and Smith, 1979;
Pelegr�ın-Garc�ıa et al., 2014).
Despite these previous findings, new-style open plan
classrooms have recently been emerging in Australia and
other countries such as New Zealand, the United States, the
United Kingdom, Japan, Norway, Sweden, Portugal, and
Denmark, renamed as “21st century learning spaces” which
center around group work. These can have up to 200 chil-
dren sharing the same area (Stevenson, 2011). It is important
to note, however, that while these open plan classrooms are
primarily designed for group activities, Kindergarten teach-
ers in these classrooms can still spend up to 40% of the time
teaching in a traditional didactic-style method (Mealings
et al., 2015a), so it is vital that children are able to hear the
new concepts that are being taught. Therefore, these new-
style open plan classrooms need to be assessed to see if they
are an improvement on the open plan classrooms from the
1970s. As several schools in Australia are currently convert-
ing to these layouts, it is timely to conduct some of the first
Australian research in these classrooms to assess how the
acoustic parameters of these classrooms directly affect child-
ren’s speech perception accuracy and speed.
Although there is evidence from Europe and the United
Kingdom that high noise levels were a common problem in
open plan schools, to our knowledge there have been no
speech perception studies conducted live in open plan class-
rooms to directly assess how real-life noise and the class-
room’s design affects how well the children can hear their
teacher. Most previous research focuses on measuring the
acoustic parameters [e.g., noise levels, SNRs, speech trans-
mission index (STI) scores, and reverberation times] of open
plan classrooms and comparing these to acoustic standards/
recommendations, rather than directly investigating how
these acoustics affect children’s ability to hear the words
their teacher is saying. While many studies have investigated
speech intelligibility in traditional classrooms (e.g., Astolfi
et al., 2012; Finitzo-Hieber and Tillman, 1978; Jamieson
et al., 2004; Johnson, 2000; Klatte et al., 2010; Neuman
et al., 2010; Vickers et al., 2013; Wr�oblewski et al., 2012),
they usually do so using a virtual environment and/or head-
phones. Such studies are not representative of natural listen-
ing environments, which contain a binaural advantage [see
Bradley and Sato (2008)]. Other studies have used simulated
classroom noise/multitalker babble which is not representa-
tive of the children’s/teacher’s voices and movement, furni-
ture noise, air-conditioning unit noise and other equipment
noises that are present in the classroom (Jamieson et al.,2004). Both Astolfi et al. (2012) and Bradley and Sato
(2008) raise the need for speech perception studies to be con-
ducted in live classrooms.
The goal of the present study, therefore, was to investi-
gate the practical implications of the classroom acoustics
measured by Mealings et al. (2015a) on the children’s ability
to hear and understand their teacher. This was achieved via a
word discrimination test conducted live in the real classroom
environments using the Mealings, Demuth, Dillon, and
Buchholz Classroom Speech Perception Test (MDDB CSPT)
(Mealings et al., 2015b), which was especially designed for
live open plan classroom speech perception studies. In this
test, personal response systems (PRSs) were used to simulta-
neously test all children live in the classroom. This method
not only records accuracy, but also response times, which is
an important variable for understanding children’s ability to
process information in noise that many intelligibility tests do
not capture. Such a method of testing is expected to provide
strong ecological validity, generalizing into real-world learn-
ing/speech perception. [More information on the use of PRSs
live in the classroom can be found in Mealings et al. (2015b),
and Vickers et al. (2013).] Using this type of live test will
give a better indication of how well children can hear their
teacher in different types of open plan classrooms.
Therefore, the aim of this study was to compare child-
ren’s speech perception abilities in different open plan and
enclosed classrooms when the other class bases were
engaged in quiet versus noisy activities. In light of previous
findings by Astolfi et al. (2012) and Bradley and Sato
(2008), it was hypothesized that the children’s speech per-
ception accuracy would be poorer for lower SNR/STI values.
In our study, this was determined by two factors: (i) an
increase in the noise level from the adjacent class(es) (which
we predicted would largely be related to the number of chil-
dren in the classroom area) and (ii) an increases in the dis-tance the child was seated from the loudspeaker (which
simulated the teacher’s voice). In addition to measures of
speech perception accuracy, we also investigated a new pa-
rameter—the children’s response times. This gives extra
insight into children’s ability to process information in the
classroom. It was hypothesized that the children’s response
times would be slower in noisier conditions due to increased
cognitive load. Finally, it was also hypothesized that the
design of the classroom might be a factor affecting child-
ren’s speech perception (not just the number of children in
J. Acoust. Soc. Am. 138 (4), October 2015 Mealings et al. 2459
Redistribution subject to ASA license or copyright; see http://acousticalsociety.org/content/terms. Download to IP: 137.111.13.204 On: Tue, 17 Nov 2015 21:49:32

the classroom area). Therefore, we predicted that the chil-
dren in the purpose-built, “21st century” semi-open plan
K–6 classroom would perform better than those in the
untreated, fully open plan triple classroom despite the K–6
classroom having over twice the number of children.
II. METHOD
A. Schools involved
The study took place in Sydney, Australia in the second
half of the school year. The same schools that were involved
in the classroom acoustic measures study by Mealings et al.(2015a) were involved in this study. As described in
Mealings et al. (2015a), a wide range of potential primary
schools were examined before the final classrooms were
selected. As the number of children in the open plan class-
rooms we examined ranged between 40 and 200 children
(divided into class bases of 20–30 children), we chose three
open plan classrooms across the 40–200 child range as well
as one enclosed classroom with 25 children. A subset of
Kindergarten children (i.e., 5–6-year-olds in their first year
of primary school) in each classroom participated in the
speech perception test. When selecting the schools, effort
was made to choose those with similar scores on The Index
of Community Socio-Educational Advantage (ICSEA) scale
which represents a school’s level of educational advantage
based on family backgrounds. ICSEA scores range from 500
ot 1300 (M¼ 1000; SD¼ 100) where higher scores represent
more advantaged schools. [More information about the
ICSEA can be found at My School (2013).] We used the
school’s ICSEA scores calculated for 2013 when the studies
were conducted. Below are the descriptions of each of the
classrooms involved in the study as found in Mealings et al.(2015a). Further details on the participating classrooms are
shown in Table I. More details on the room acoustics can
also be found in Mealings et al. (2015a).
1. Enclosed classroom: 25 children
This classroom consisted of 25 Kindergarten children in
a classroom with three solid brick walls, a closed floor-to-
ceiling 4 cm thick concertina (i.e., operable) wall with pin
boards, and a shared storeroom with the adjacent
Kindergarten class. The class area was carpeted with loop
pile carpet and windows were located on both side walls
(Fig. 1). The ceiling was rough concrete textured. No acous-
tic treatment was evident. A survey of 50 primary schools in
the region found that 60% of Kindergarten classrooms have
a concertina wall between them and an additional 10% have
a shared storeroom or door with another class. Only 30% of
schools had fully enclosed classrooms with four solid walls.
Therefore this classroom with its concertina wall and shared
storeroom was more typical of those enclosed classrooms
found in the Sydney region, and hence was chosen for the
study. The average unoccupied reverberation time (T30) of
this classroom was 0.50 s,1 which is within the recommended
time of 0.4–0.5 s (Australia/New Zealand Standard, 2000).
2. Double classroom: 44 children
This space originally consisted of two separate class-
rooms with plasterboard walls, but the wall between had
TABLE I. Details of the participating classrooms (from Mealings et al., 2015a).
Enclosed classroom Double classroom Triple classroom K–6 classroom
Total number of children in area 25 44 91 205
School’s ICSEA 1141 1133 1035 1090
Classroom type Enclosed classroom with
shared concertina wall
Fully open double
classroom
Linear, fully open plan
classroom
Semi-open plan classroom
Class grades in area Kindergarten Kindergarten Kindergarten Kindergarten to year 6
(5–6-year-olds) (5–6-year-olds) (5–6-year-olds) (5–12-year-olds)
Number of class bases in area 1 2 3 5–7 (depending on activity)
Number of children in each class base 25 21–23 30–31 30–50
Room dimensions (m) 8� 9 15� 9 37� 11 27� 32
Total floor area (m2) 72 135 407 864
Space per child (m2) 2.9 3.1 4.5 4.2
Distance between edge of class bases (m) N/A 2 6 7
Ceiling height (m) 3.0 2.8–4.2 3.3 3.2–6.0
Total room volume (m3) 216 470 1340 3900
FIG. 1. Floor plan of the enclosed classroom with 25 children.
2460 J. Acoust. Soc. Am. 138 (4), October 2015 Mealings et al.
Redistribution subject to ASA license or copyright; see http://acousticalsociety.org/content/terms. Download to IP: 137.111.13.204 On: Tue, 17 Nov 2015 21:49:32

been removed at the start of the year to make it an open dou-
ble classroom for the 44 Kindergarten children. The ceiling
was made of plasterboard and was triangular in shape, and
the top half of the wall still remained in this area between
the two classrooms where the original wall had been. The
class area was carpeted with loop pile carpet but the utility
area was a hard surface. Windows were located on two walls
and pin boards covered the other two walls (Fig. 2). No other
acoustic treatment was evident. The average unoccupied
reverberation time (T30) of this classroom was 0.60 s, which
is above the recommended time of 0.4–0.5 s (Australia/New
Zealand Standard, 2000).
3. Triple classroom: 91 children
This open plan classroom consisted of 91 Kindergarten
children grouped linearly into three classes (K1, K2, K3),
with no barriers between them. This classroom represented a
mid-range number of children and class bases for an open
plan space. The Year 1 and 2 classes were located off an ad-
jacent corridor but had no doors/walls separating the spaces,
hence noise from these classes could also be heard.
Originally the space had consisted of separate enclosed
classrooms with 30 children in each, but these walls had
recently been removed to make the area fully open plan. The
walls were plasterboard and the class area was carpeted with
loop pile carpet, but the corridor floor was a hard surface.
The ceiling was acoustically tiled. Windows were located on
both the front and back walls and pin boards were on the
other two walls (Fig. 3). No other acoustic treatment was
evident. The average unoccupied reverberation time (T30)
of this classroom was 0.70 s, which is above the recom-
mended time of 0.4–0.5 s (Australia/New Zealand Standard,
2000).
4. K–6 classroom: 205 children
This classroom contained the entire primary school (205
children) in the one area representing one of the biggest types
of open plan classrooms found in Sydney. It had been
purpose-built to be a “21st century learning” open plan
school. The children were separated into class stages with
Kindergarten, Year 1, and Year 2 in a semi-open plan layout
with dividers between them and only one open wall. Years
3/4 and 5/6 were in the fully open plan area. The
Kindergarten class was located in the corner in the acousti-
cally most sheltered location, particularly for their whole class
teaching area where the children were grouped together on
the floor to listen to their teacher (see Fig. 4). The ceiling
height in this area was the lowest of the room measuring
3.2 m. The entire area was carpeted with loop pile carpet, and
3 cm thick pin boards along the walls and soft furnishings pro-
vided some acoustic absorption. The ceiling was acoustically
tiled. Windows were located on the external wall. The average
unoccupied reverberation time (T30) of this classroom was
0.58 s, which is above the recommended time of 0.4–0.5 s
(Australia/New Zealand Standard, 2000), but lower than the
reverberation times of the double and triple classrooms.
B. Participants
Twenty-four Kindergarten children from each school
were randomly selected to participate in the classroom
FIG. 2. Floor plan of the double classroom with 44 children.
FIG. 3. Floor plan of the triple classroom with 91 children.
FIG. 4. Floor plan of the K–6 classroom with 205 children.
J. Acoust. Soc. Am. 138 (4), October 2015 Mealings et al. 2461
Redistribution subject to ASA license or copyright; see http://acousticalsociety.org/content/terms. Download to IP: 137.111.13.204 On: Tue, 17 Nov 2015 21:49:32

speech perception test. No children were reported by their
parents to have otitis media, or intellectual or behavioural
disabilities in the enclosed, triple, and K–6 classrooms. One
child in the double classroom was reported to have a sensory
processing disorder, but as their performance did not deviate
from their peers, they were included in the analysis. For both
the double and K–6 classrooms, one child was absent on the
day of testing so only 23 children were included in the study.
For the triple classroom, two children who participated in
the study were excluded as they did not finish the test. For
the enclosed classroom, one child only scored 8% in the
quiet condition so was excluded from the analysis as they
failed to demonstrate an ability to understand and complete
the test. Table II shows the demographics of the participating
children. The remaining Kindergarten children in each of the
classrooms made up the class(es) to provide the intrusive
noise.
C. Stimuli
The MDDB CSPT word lists were used for the study
(Mealings et al., 2015b). This test was chosen as it was
developed especially to be conducted live in real classroom
environments, efficiently testing a whole class of children
simultaneously through the use of PRSs. Additionally, this
test was developed in Australia, so the words are appropriate
for an Australian context and the stimuli are presented in an
Australian accent. This test is based on the Chear Auditory
Perception Test (Marriage and Moore, 2003). The test con-
sists of 6 lists of 4 minimally contrastive monosyllabic
words, with Lists O1, O2, and O3 having onset consonant
contrasts and Lists C1, C2, and C3 having coda consonant
contrasts (Table III). Phonemically, the types of contrasts are
balanced between list pairs with Lists O1 and C1 contrasting
voiceless stops and fricatives, Lists O2 and C2 contrasting
voiced stops and nasals, and Lists O3 and C3 contrasting
voiceless stops, fricatives, affricates, and clusters. Each
word is pictorially represented and appears in one of six
five-syllable carrier sentences (one sentence for each list,
e.g., Sally likes the…).
The test uses audio recordings of the 24 sentences by an
adult Australian-English female speaker using teacher-like
speech. These recordings were made in an anechoic chamber
using a DPA headset microphone and the intensities were
normalized so that each sentence had the same average root
mean square value. [For more information on how the test
was developed, see Mealings et al. (2015b).]
D. Listening conditions
The aim of the experiment was to assess how intrusive
classroom noise impacts children’s listening abilities. There
were two listening conditions; one when the other classes
were engaged in quiet activities (e.g., whole class teaching
or quiet individual work) and the other when they were
engaged in noisy activities (e.g., group work with move-
ment). The study was run in the afternoon after the lunch
break and the teachers of the other classes were instructed to
choose typical quiet and noisy activities for their classes to
engage in. To counterbalance possible learning effects, the
participants were split into two groups. Group 1 completed
the experiment in quiet then in noise, whereas group 2 com-
pleted it in noise and then in quiet. The noise from each ac-
tivity was recorded using an omnidirectional condenser
microphone (calibrated in diffuse speech-shaped noise using
a BandK 2250 sound level meter) connected to a USB sound
card and Toshiba Satellite U940 Ultrabook running
Audacity software. This allowed us to calculate the average
noise levels for each activity offline. These noise files were
then segmented and the speech signal of the stimuli and any
other artefacts were removed from the final noise file so the
average noise levels for each activity could be calculated.
E. Procedure
Participants were each assigned a seating position in one
of six rows of four children in front of a Smart Board with
males/females and ESL children evenly distributed front to
back. The distance of the children from the loudspeaker
ranged from 1 to 3 m. The visual stimuli were projected onto
a Smart Board via a Toshiba Tecra Notebook and the audio
was played through a Genelec 8020B (active studio monitor)
loudspeaker positioned at the front of the classroom under
the center of the Smart Board. The audio volume was
TABLE II. Demographic information for participating children.
Classroom
Number of children
in area
Number
of participants
Number of
males/females
Age range and
mean
Number who
have ESL
Number who have
attended preschool
Enclosed 25 23 13M; 10F 5;3–6;7 12 23
M¼ 6;0
Double 44 23 12M; 11F 5;7–6;9 0 20
M¼ 6;3
Triple 91 22 9M; 13F 5;5–6;6 11 19
M¼ 5;9 (þ 4 multilingual)
K–6 205 23 12M; 11F 5;0–6;5 4 21
M¼ 5;10 (þ6 multilingual)
TABLE III. MDDB CSPT word lists.
List O1 List O2 List O3 List C1 List C2 List C3
_Art _Eat Talk K_ Bee_ Beat
Tart Beat Fork Cape Bead Bees
Cart Meat Chalk Cake Beam Beach
Heart Neat Stalk Case Bean Beast
2462 J. Acoust. Soc. Am. 138 (4), October 2015 Mealings et al.
Redistribution subject to ASA license or copyright; see http://acousticalsociety.org/content/terms. Download to IP: 137.111.13.204 On: Tue, 17 Nov 2015 21:49:32

adjusted so that the average sound level presentation was 60
dBA at 2 m [which represents a teacher’s average speech
level (Sato and Bradley, 2008)] as measured by a calibrated
Dick Smith Electronics Q1362 sound level meter. The test
began with all participants completing a familiarization
phase of the target words, pictures, and their PRS. When the
children were ready the testing phase began. The children
saw the four pictures of a particular list appear on the screen,
accompanied by the audio sentence that contained one of the
words of that list. They were instructed to select the picture
they heard via the colour-coded buttons on their PRS. The
List order was pseudo-randomised (e.g., 1, 4, 6, 3, 5, 2) and
the lists were rotated through four times. Pseudo-
randomisation was used rather than having all four words of
a list presented consecutively to make it harder for children
to use a process of elimination. This procedure was repeated
for all 24 stimuli (pseudo-randomized) in both conditions. A
maximum of 15 s (from the start of each stimulus display)
was allowed for the children to record their response. Group
1 completed the test in the quiet condition first while Group
2 left the testing area. Groups 1 and 2 then completed the
testing phase in the noisy condition together (to ensure the
noise level was the same for both groups tested) before
Group 1 left Group 2 to do the test in the quiet condition.
Having two Groups complete the test in different orders
helps minimise learning effects. The responses were then
collated and analyzed for both performance accuracy and
speed using the TurningPoint software.
III. RESULTS
A. Noise levels
The noise levels were recorded during the test in each
classroom as described in Sec. II D. Figure 5 shows a com-
parison of the levels recorded for each school while the other
classes were engaged in quiet versus noisy activities. It is
recommended that classroom noise levels should be kept
below 50 dBA (Berg et al., 1996). This was only achieved
for the two smaller classrooms in the quiet condition.
(Unfortunately the open-door shared store room in the
enclosed classroom allowed additional noise transmission
between classrooms, resulting in above recommended noise
levels during its noisiest periods.) The noise levels generally
increased as class size increased, however, the noise levels
in the K–6 classroom did not reach the high level of noise
that the triple classroom did during the noisy condition.
Notice also that the noise levels were consistent for the K–6
classroom across conditions. As with the other schools, we
asked the surrounding classes at this school to engage in
quiet activities and then noisy activities so we could measure
the difference between the two conditions. However, due to
the large number of class bases in the area, it was not possi-
ble to coordinate this across the whole classroom. Hence the
recorded noise levels were the same for both conditions in
the speech perception test demonstrating that the noise levels
in this classroom stay fairly constant in contrast to the chang-
ing noise levels in the other three classrooms.
B. Overall speech perception scores
1. Linear mixed effects model results
A linear mixed effects analysis was conducted using IBM
SPSS Statistics software (version 21) to assess what factors
may contribute to the children’s speech perception scores.
The fixed factors of classroom type (which included factors
such as room volume, design, number of children, reverbera-
tion time, ICSEA, etc.), noise level, test order (i.e., quiet/noise
condition order), gender, ESL, time in preschool (using the
square root of total hours), and distance from the loudspeaker
(using log base 2) were entered into the model with partici-
pant as the random factor. This model was used to predict the
change in score relative to that in the enclosed classroom. As
predicted, noise level and distance from the loudspeaker were
significant factors in the model [F(1,87)¼ 70.92, p< 0.0005;
F(1,79166)¼ 30.47, p< 0.0005, respectively]. As shown in
Table IV, if all other predictor variables were held constant,
every increase in noise by 10 dBA resulted in scores being
14.3% lower, which was approximately the difference in noise
levels between the quiet and noisy condition in the class-
rooms. Similarly, if all other predictor variables were held
constant, scores were estimated to decrease by 12.8% for each
doubling of distance the child was seated away from the loud-
speaker (i.e., 1, 2, 4 m, etc.). Further analysis of these two fac-
tors for each classroom can be found below. Interestingly,
classroom type was also a significant factor [F(3,99)¼ 5.24,
p¼ 0.002]. The scores of the K–6 classroom were estimated
FIG. 5. Average recorded noise levels for each classroom while adjacent
classes were engaged in quiet activities and noisy activities.
TABLE IV. Estimates of fixed effects for speech perception scores.
Parameter Estimate SE df t p
Intercept 163.58 10.46 146 15.64 0.000a
K–6 classroom 8.17 3.65 113 2.24 0.027a
Triple classroom �1.25 3.72 127 �0.34 0.737
Double classroom �4.80 3.54 79 �1.36 0.179
Enclosed classroom 0.00 0.00
Noise level �1.43 0.17 87 �8.42 0.000a
Distance �12.81 2.32 79 �5.52 0.000a
Test order �3.94 2.27 79 �1.73 0.088
Gender �0.10 2.30 79 �0.04 0.967
ESL �1.66 2.84 79 �0.59 0.560
Preschool 0.03 0.05 79 0.69 0.495
ap< 0.05.
J. Acoust. Soc. Am. 138 (4), October 2015 Mealings et al. 2463
Redistribution subject to ASA license or copyright; see http://acousticalsociety.org/content/terms. Download to IP: 137.111.13.204 On: Tue, 17 Nov 2015 21:49:32

to be 8.2% higher than the enclosed classroom, 13.0% higher
than the double classroom, and 9.4% higher than the triple
classroom, when all other predictor variables, including noise
level, were held constant. Test order, gender, and time in pre-
school were not significant factors in the model
[F(1,79)¼ 2.99, p¼ 0.088; F(1,79)¼ 0.00, p¼ 0.967;
F(1,79)¼ 0.47, p¼ 0.495, respectively]. Additionally, ESL
was not a significant factor in the model [F(1,79)¼ 0.34,
p¼ 0.560] despite previous research suggesting these children
are more affected by noise (Nelson and Soli, 2000). [Note,
however, that Astolfi et al. (2012) who conducted a similar
speech perception study in Italy also did not find a significant
difference between children who had Italian as their first lan-
guage with those who did not.]
2. Speech perception scores by classroom type
Figure 6 shows the children’s average percentage of cor-
rect responses by classroom type for both the quiet and noisy
conditions. Paired t-tests were conducted to compare the
children’s performance for each classroom in the two condi-
tions. Performance was significantly better while adjacent
classes were engaged in quiet compared to noisy activities for
the enclosed classroom [t(22)¼ 5.34, p< 0.0005, d¼ 1.31],
the double classroom [t(22)¼ 5.16, p< 0.0005, d¼ 1.26], and
the triple classroom [t(21)¼ 7.70, p< 0.0005, d¼ 1.43] as
expected following the trend of the noise levels shown in Fig.
5. Note, however, that there was no difference in performance
for the K–6 classroom between the two conditions. As men-
tioned previously, there was no difference in noise levels for
the two conditions in this classroom as quiet versus noisy
activities were unable to be coordinated across classes
because of its size. Noise levels therefore tended to stay at a
consistent level (and reliability of the test is shown by the
children having similar group mean scores both times they
participated in the test). As the K–6 classroom does not have
the two noise conditions like the other classrooms, we report
the average results from the two conditions to compare with
the other classrooms for the remaining analyses, as shown by
the different shading in Figs. 6 and 7, and 9.
A significant difference in speech perception scores was
found between classrooms in the quiet condition as deter-
mined by one-way analysis of variance (ANOVA)
[F(3,87)¼ 6.48, p¼ 0.001, g2¼ 0.18] with a Tukey post hoctest revealing significantly better performance by children in
the enclosed classroom compared to the triple and K–6 class-
room (penclosed vs triple¼ 0.004, penclosed vs K–6¼ 0.003). A sec-
ond one-way ANOVA also revealed a statistically significant
difference between classrooms in the noisy condition [F(3,87)
¼ 8.76, p< 0.0005, g2¼ 0.23] with a Tukey post hoc test
revealing significantly poorer performance by children in the
triple classroom (which had the highest noise levels) compared
to the other classrooms (penclosed vs triple¼ 0.001, pdouble vs triple
¼ 0.009, pK–6 vs triple< 0.0005; see Fig. 6).
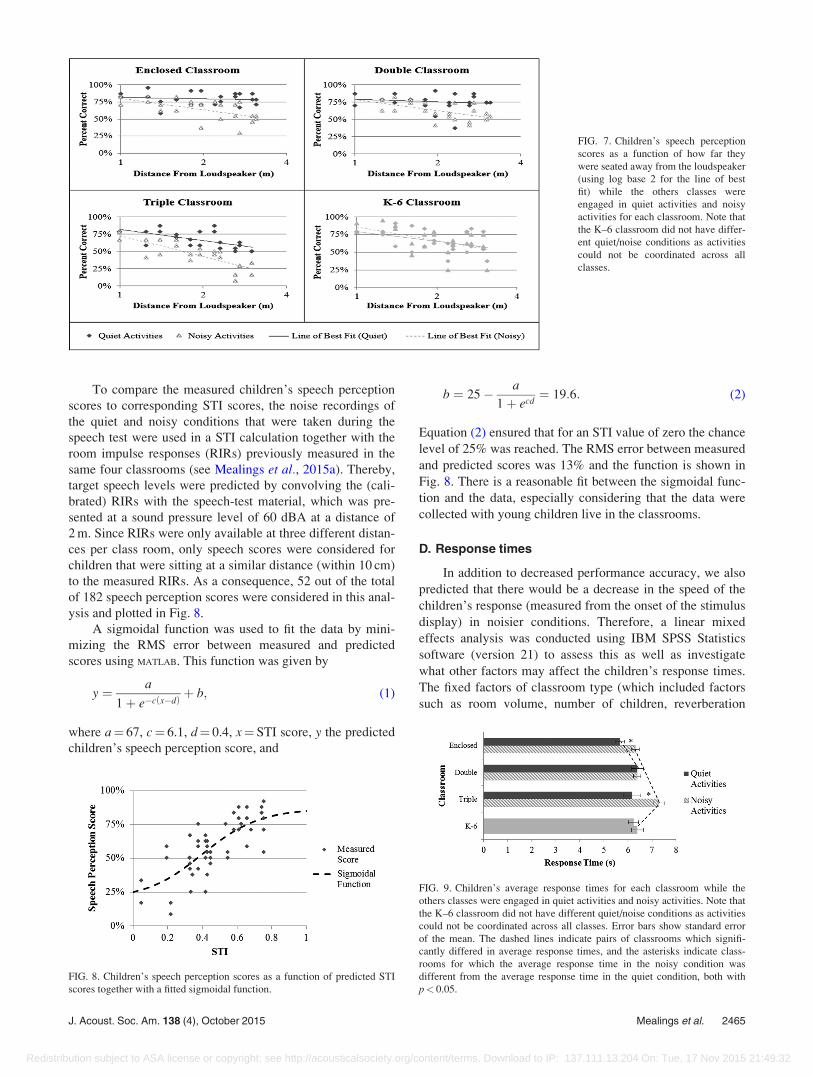
C. Performance by seating position for eachclassroom
Figure 7 shows the children’s speech perception scores as
a function of how far they were seated away from the loud-
speaker simulating the teacher’s voice. A correlation analysis
was conducted for each classroom to assess how the child-
ren’s scores changed for each doubling of distance the chil-
dren were seated away from the loudspeaker (i.e., the change
from 1 m to 2 m to 4 m, etc.). For the enclosed and double
classrooms, no correlation between children’s performance
and seating distance was found for the quiet condition, with
children performing consistently well front to back (which
were also the conditions that reported noise levels within the
50 dBA recommended limit). For the noisy condition, how-
ever, both classrooms reported a moderate negative correla-
tion (renclosed¼�0.59, R2enclosed¼ 0.35, penclosed¼ 0.003;
rdouble¼�0.54, R2double¼ 0.29, pdouble¼ 0.012). (Note that
we excluded two outliers in the noise condition for the double
classroom for this analysis as the unusually low scores clearly
did not fit the linear trend when plotted, i.e., it is likely that
these two children did not attend to the whole test.) On aver-
age, scores at the front were 80% compared to 53% at the
back for the enclosed classroom and 79% at the front com-
pared to 52% at the back for the double classroom. For the tri-
ple classroom, a moderate negative correlation was found
between children’s performance and seating distance in the
quiet condition (r¼�0.63, R2¼ 0.40, p¼ 0.002). On average,
scores at the front were 82% compared to 56% at the back.
When the other classes changed to noisy activities, this rela-
tionship increased to a strong negative correlation (r¼�0.80,
R2¼ 0.65, p< 0.0005). In this condition, children’s scores
decreased by 30% per doubling of distance from the loud-
speaker, with average scores at the front being 72% compared
to only 25% at the back. Overall (as there was no difference
in noise levels for the two conditions) the K–6 classroom
reported a weak-to-moderate negative correlation (r¼�0.49,
R2¼ 0.24, p¼ 0.001). On average, scores at the front were
83% compared to 55% at the back. These results show the
detrimental effect of reduced SNRs on speech perception as a
result of being seated further away from the teacher, espe-
cially in high noise levels.
FIG. 6. Children’s average percentage of correct responses for each class-
room while adjacent classes were engaged in quiet activities and noisy activ-
ities. Note that the K–6 classroom did not have different quiet/noise
conditions as activities could not be coordinated across all classes. Error
bars show standard error of the mean. The dashed lines indicate pairs of
classrooms which significantly differed in average scores, and the asterisks
indicate classrooms for which the average score in the noisy condition was
different from the average score in the quiet condition, both with p< 0.05.
2464 J. Acoust. Soc. Am. 138 (4), October 2015 Mealings et al.
Redistribution subject to ASA license or copyright; see http://acousticalsociety.org/content/terms. Download to IP: 137.111.13.204 On: Tue, 17 Nov 2015 21:49:32
To compare the measured children’s speech perception
scores to corresponding STI scores, the noise recordings of
the quiet and noisy conditions that were taken during the
speech test were used in a STI calculation together with the
room impulse responses (RIRs) previously measured in the
same four classrooms (see Mealings et al., 2015a). Thereby,
target speech levels were predicted by convolving the (cali-
brated) RIRs with the speech-test material, which was pre-
sented at a sound pressure level of 60 dBA at a distance of
2 m. Since RIRs were only available at three different distan-
ces per class room, only speech scores were considered for
children that were sitting at a similar distance (within 10 cm)
to the measured RIRs. As a consequence, 52 out of the total
of 182 speech perception scores were considered in this anal-
ysis and plotted in Fig. 8.
A sigmoidal function was used to fit the data by mini-
mizing the RMS error between measured and predicted
scores using MATLAB. This function was given by
y ¼ a
1þ e�c x�dð Þ þ b; (1)
where a¼ 67, c¼ 6.1, d¼ 0.4, x¼ STI score, y the predicted
children’s speech perception score, and
b ¼ 25� a
1þ ecd¼ 19:6: (2)
Equation (2) ensured that for an STI value of zero the chance
level of 25% was reached. The RMS error between measured
and predicted scores was 13% and the function is shown in
Fig. 8. There is a reasonable fit between the sigmoidal func-
tion and the data, especially considering that the data were
collected with young children live in the classrooms.
D. Response times
In addition to decreased performance accuracy, we also
predicted that there would be a decrease in the speed of the
children’s response (measured from the onset of the stimulus
display) in noisier conditions. Therefore, a linear mixed
effects analysis was conducted using IBM SPSS Statistics
software (version 21) to assess this as well as investigate
what other factors may affect the children’s response times.
The fixed factors of classroom type (which included factors
such as room volume, number of children, reverberation
FIG. 7. Children’s speech perception
scores as a function of how far they
were seated away from the loudspeaker
(using log base 2 for the line of best
fit) while the others classes were
engaged in quiet activities and noisy
activities for each classroom. Note that
the K–6 classroom did not have differ-
ent quiet/noise conditions as activities
could not be coordinated across all
classes.
FIG. 8. Children’s speech perception scores as a function of predicted STI
scores together with a fitted sigmoidal function.
FIG. 9. Children’s average response times for each classroom while the
others classes were engaged in quiet activities and noisy activities. Note that
the K–6 classroom did not have different quiet/noise conditions as activities
could not be coordinated across all classes. Error bars show standard error
of the mean. The dashed lines indicate pairs of classrooms which signifi-
cantly differed in average response times, and the asterisks indicate class-
rooms for which the average response time in the noisy condition was
different from the average response time in the quiet condition, both with
p< 0.05.
J. Acoust. Soc. Am. 138 (4), October 2015 Mealings et al. 2465
Redistribution subject to ASA license or copyright; see http://acousticalsociety.org/content/terms. Download to IP: 137.111.13.204 On: Tue, 17 Nov 2015 21:49:32

time, ICSEA, etc.), noise level, test order (i.e., quiet/noise
condition order), gender, ESL, time in preschool (using the
square root of total hours), and distance from the loud-
speaker (using log base 2) were entered into the model, with
participant as the random factor. This model was used to pre-
dict the change in response time relative to that in the
enclosed classroom. As predicted, noise level was a signifi-
cant factor in the model [F(1,87)¼ 70.92, p¼ 0.003]. As
shown in Table V, if all other predictor variables were held
constant, every increase in noise by 10 dBA resulted in
response times being 364 ms longer. Distance was also a sig-
nificant factor in the model [F(1,79)¼ 18.62, p< 0.0005]. If
all other predictor variables were held constant, response
times were estimated to increase by 844 ms for each dou-
bling of distance the child was seated away from the loud-
speaker (i.e., 1 m, 2 m, 4 m, etc.). Classroom type, test order,
gender, ESL, and time in preschool were not significant fac-
tors in the model [F(3,94)¼ 1.84, p¼ 0.048; F(1,79)¼ 0.01,
p¼ 0.925; F(1,79)¼ 0.97, p¼ 0.328; F(1,79)¼ 1.03,
p¼ 0.314; F(1,79)¼ 2.31, p¼ 0.133, respectively].
Figure 9 presents children’s average response times for
each classroom while adjacent classes were engaged in quiet
activities and noisy activities. Note in particular the slow
response times by the children in the triple classroom in the
noisy condition.
IV. DISCUSSION
Open plan style classrooms have recently been re-
emerging as “21st century learning spaces.” The main issue
with open plan classrooms is the intrusive noise coming
from the other classes sharing the space. This is particularly
problematic when one class is trying to engage in critical lis-
tening activities; while the teacher can tell their own class to
be quiet, they have no control over the noise levels of the
other classes. As school is a vital time for children to learn
new concepts and words, they need to be able to hear clearly
what their teacher is saying. Therefore, the aim of this study
was to assess and compare Kindergarten children’s speech
perception accuracy and speed live in different types of
open plan and enclosed classrooms when the other class
bases were engaged in quiet versus noisy activities.
Measurements of the noise levels during the test
revealed acceptable listening conditions only in the enclosed
and double classrooms while the other classes were engaged
in quiet activities (although it is likely that they would have
remained acceptable in the enclosed classroom during noisy
activities if the shared store room door was closed). The
noise levels in the triple classroom, however, were problem-
atic especially when the other classes were engaged in noisy
activities. The noise levels were also high in the K–6 class-
room, but did not reach the high levels found in the triple
classroom despite the K–6 classroom having over twice the
number of children.
The speech perception test revealed, as expected, that
higher noise levels significantly decrease children’s speech
perception accuracy and speed of response. The children’s
speech perception accuracy and speed also decreased the
further away the child was seated from the loudspeaker (sim-
ulating the teacher’s voice), but only when the noise level
was over the recommended 50 dBA (Berg et al., 1996). In
quiet conditions, the children in the two smaller classrooms
performed consistently well front to back. However, in the
larger classrooms, the children seated at the back were at a
disadvantage as the noise levels during the “quiet” condition
were still high. Most concerning, however, was the triple
classroom which had particularly high noise levels when the
other classes were engaged in noisy activities. This resulted
in very poor speech perception scores for the children seated
at the back. The distance effect in the K–6 classroom, how-
ever, was less severe and more similar to the smaller class-
rooms during the noisy condition.
It was also found that the K–6 classroom had consistent
intrusive noise levels throughout the day, rather than the
changing quiet and noisy periods that the other three class-
rooms had depending on what activities the adjacent classes
were engaged in. Interestingly, the children in this classroom
also had significantly better speech perception scores overall
compared to the children in the other three classrooms, if
noise levels were to be held constant across all the classrooms.
It is unlikely that socio-economic status contributed to this
difference in performance as this school had the second lowest
ICSEA of the schools tested. It is possible that the children in
this classroom have learned to work in the consistent noise
levels and are less distracted both auditorily and visually
because it is consistent rather than dynamic or impulsive. This
possible explanation needs to be considered with caution,
however, as mixed results have been found regarding the age
at which children are able to habituate to noise (e.g.,
Anderson, 2001; Barnett et al., 1982; Maxwell and Evans,
2000; Shield et al., 2010). This issue therefore needs further
investigation.
The most likely explanation for these better scores is
that the design of the K–6 classroom aided the children’s
speech perception—this classroom was newly purpose-built
as a “21st century open plan learning space.” The
Kindergarten class was located in the corner with a semi-
open plan style (i.e., only one open wall), so the extra bar-
riers may have helped remove some of the visual distraction
as well as providing some acoustic shielding. It was also
equipped with pin boards and other furnishings for
TABLE V. Estimates of fixed effects for response times.
Parameter Estimate SE df t p
Intercept 2.94 0.78 160 3.78 0.000a
K–6 classroom 0.12 0.30 103 0.41 0.682
Triple classroom 0.44 0.30 114 1.48 0.143
Double classroom 0.58 0.30 79 1.93 0.057
Enclosed classroom 0.00 0.00
Noise level 0.04 0.01 87 3.06 0.003a
Distance 0.84 0.20 79 4.32 0.000a
Test order 0.02 0.19 79 0.10 0.925
Gender �0.19 0.19 79 �0.98 0.328
ESL 0.24 0.24 79 1.01 0.314
Preschool 0.01 0.00 79 1.512 0.133
ap< 0.05.
2466 J. Acoust. Soc. Am. 138 (4), October 2015 Mealings et al.
Redistribution subject to ASA license or copyright; see http://acousticalsociety.org/content/terms. Download to IP: 137.111.13.204 On: Tue, 17 Nov 2015 21:49:32

absorption which helped reduce reverberation and hence the
effect of noise as the two combine synergistically to mask
speech (Crandell and Smaldino, 2000; Klatte et al., 2010).
This contrasts with the double and triple classrooms where
they had just knocked down the original wall/s between the
existing classrooms and no proper acoustic modifications
were put in place to help reduce reverberation and noise.
The K–6 classroom also had the greatest spatial separation
between classes. This means that the speech coming from
the children in other classes was likely to be less intelligible/
distracting.
These results suggest that the new architectural style of
the “21 century learning spaces” are an improvement on the
open plan classrooms that simply add classrooms together
by removing walls. This is shown by the higher scores and
quicker response times by the children in the K–6 classroom
compared to those in the triple classroom, despite it having
over twice the number of children. However, this classroom
still needs to reduce noise levels to be within the recom-
mended 50 dBA maximum to eliminate the distance effect,
and add acoustic absorption to bring the reverberation time
within 0.4–0.5 s (Australia/New Zealand Standard, 2000). It
is also important to note that although classroom type was a
significant factor in the speech perception scores linear
mixed effects model (with the children in the K–6 classroom
having better performance than children in the other class-
rooms if noise was held constant), noise was also a signifi-
cant factor. Additionally, the children in the K–6 classroom
still had lower scores than the children in the enclosed class-
room during the quiet condition. Therefore, the children in
the K–6 classroom would still perform better in a quieter
environment even though they still performed fairly well in
this noisy open plan setting.
These results suggest that if open plan classrooms are
desired, they should be acoustically built as flexible learning
spaces. That is, they should have operable walls that can stay
open for group work and other activities that benefit from an
open plan space, but can be closed for critical listening activ-
ities. This will create an acceptable environment like the
enclosed classrooms tested, and we expect it will still be ac-
ceptable even if the other classes are engaged in noisy activ-
ities provided there are no other sound transmission channels
like the open-door shared store room.
The results of this study clearly demonstrate the benefit
of having acoustic barriers (i.e., enclosed walls) between
classes to minimize the transmission of intrusive noise from
adjacent classes and enhance speech perception. This is
especially important for younger children as their auditory
systems are neurologically immature and world knowledge
and experience cannot as effectively be used to fill in the
missing pieces with top-down information (Boothroyd,
1997; Wilson, 2002). The results of the study generally sup-
port those found by Pelegr�ın-Garc�ıa et al. (2014) who con-
clude that “no acceptable acoustic conditions can be
achieved for more than approximately 40 students without
exposing the teacher to talk uncomfortably or the students to
experience noticeably degraded speech intelligibility.” This
is shown by the poor speech perception accuracy and speed
by the children in the triple classroom, even when the other
classes were engaged in only quiet activities. However, num-
ber of children is not the only factor that needs to be consid-
ered when designing classrooms. Although the noise levels
in the K–6 “21st century learning space” with 205 children
were still too high, they were not as high as those in the tri-
ple classroom, and the children’s performance on the speech
perception test was actually better. This suggests that
purpose-built semi-open plan classrooms may be able to pro-
vide tolerable listening environments for more than 40 chil-
dren if they are appropriately designed (which future
research needs to determine). Is it important to note, how-
ever, that they will still compromise acoustic privacy com-
pared to an enclosed classroom and children may still find it
hard to concentrate in these environments.
Overall, the results suggest that when there is noise
coming from other classes in open plan classrooms, the chil-
dren engaged in active listening are likely to misunderstand
their teacher. Even if they initially hear their teacher, the
presence of noise results in slower processing of the sen-
tence, which means they are more likely to miss the follow-
ing information while they try to understand and integrate
what has previously been said. The distance effect further
emphasizes the importance of controlling noise levels and
gathering children close to the teacher during critical listen-
ing tasks. One limitation of this study it that it used a loud-
speaker with constant gain, whereas talkers tend to increase
their speech level as function of the distance to the listener
and the effect of the room (Pelegr�ın-Garc�ıa et al., 2011). The
advantage of this is an increased SNR (hence increased
speech intelligibility), however, it is likely to result in the
teacher speaking above a comfortable level which may con-
tribute to vocal health problems (Gotaas and Starr, 1993;
Smith et al., 1997). Using sound field amplification systems
in classrooms are one way of decreasing the distance effect
without requiring teachers to speak louder. Note, however,
that amplification systems are not appropriate for open plan
classrooms because of their disturbance to other classes.
This further suggests the shortcomings of this type of learn-
ing space as it is in these classrooms that speech perception
is even more affected by the child’s distance from the
teacher because of the high intrusive noise levels.
Minimizing noise levels in the classroom is not only im-
portant for typically developing children, but is essential for
children with special educational needs such as those with
attention deficits, hearing impairment, language delays, audi-
tory processing disorders and ESL (Anderson, 2001). These
children are increasingly being integrated into mainstream
schools (Konza, 2008). For example, it is estimated that 83%
of children with hearing impairment are now in a regular
classroom (Punch and Hyde, 2010). These children are even
more affected by poor acoustics, so it is vitally important to
ensure the listening environment for these children is good
(Crandell and Smaldino, 2000; MacKenzie and Airey,
1999). Future research is needed to investigate how the
acoustics of open plan classes may affect these populations.
This will assist people in making informed decisions when
choosing the most appropriate schools for these children to
attend. The results of our study suggest that favourable lis-
tening conditions for young typically developing children
J. Acoust. Soc. Am. 138 (4), October 2015 Mealings et al. 2467
Redistribution subject to ASA license or copyright; see http://acousticalsociety.org/content/terms. Download to IP: 137.111.13.204 On: Tue, 17 Nov 2015 21:49:32

are unlikely to be achieved in fully open plan classrooms, so
we would expect that they are even more problematic for
children with special educational needs. Minimizing noise
levels is also important for the teachers as high noise levels
raises blood pressure, increases stress levels, causes head-
aches, results in fatigue, increases annoyance, and puts them
at high risk of vocal abuse and pathological voice conditions
from the need to constantly raise their voice above a com-
fortable level to be heard (Airey et al., 1998; Anderson,
2001; Evans and Lepore, 1993; Gotaas and Starr, 1993;
Kristiansen et al., 2011; Le~ao et al., 2015; Shield et al.,2010; Smith et al., 1997). As this study only involved four
classrooms, it is important that future research is conducted
in a wide range of open plan and enclosed schools. This will
help provide a better understanding of what noise levels,
reverberation times, and classroom sizes/designs are needed
to provide adequate speech perception in the classroom for
all children at their different ages. Acoustic modelling can
then be used for designing new classrooms or determining
the treatment needed for existing classrooms so they achieve
these acceptable conditions. Once this research has been
conducted it may be beneficial for Australia and other coun-
tries to implement recommendations or restrictions for class-
room acoustic conditions and classroom design so speech
perception is not compromised in the educational setting.
V. CONCLUSIONS
The results of this study revealed acceptable listening
conditions for the enclosed and double classrooms, but only
when the adjacent class was engaged in quiet activities. For
the two larger open plan classrooms, the noise levels were
excessive irrespective of the activity of the other classes.
Higher noise levels resulted in decreased speech perception
accuracy and speed, especially for the children seated
towards the back of the class when the noise level was over
the recommended 50 dBA limit (Berg et al., 1996).
Interestingly, however, the noise levels and children’s
speech perception scores were better in the K–6 “21st cen-
tury learning space” compared to those in the untreated con-
verted triple classroom, despite it having over twice the
number of children. This demonstrates that the new-style
open plan classrooms are an improvement on the open plan
classrooms that simply add rooms together by removing
walls. However, it is important to note that the statistical
model still suggested children would perform better in a qui-
eter environment.
Overall, the findings of this study provide further evi-
dence for the importance of having optimal listening condi-
tions in Kindergarten classrooms to enhance children’s
access to new concepts. The results suggest that classrooms
that are unable to control the ingress of noise from nearby
classes do not provide appropriate learning environments for
critical listening activities with young children due to the
adverse effects of this noise on children’s speech perception.
ACKNOWLEDGMENTS
We thank all the schools involved in the study for their
participation. We also thank Hui Chen, Amy German, Mark
Seeto, Tobias Weller, Nan Xu, and the Child Language Lab
at Macquarie University for their helpful assistance and
feedback. This research was supported, in part, by funding
from Macquarie University, and Grants Nos. ARC
CE110001021 and ARC FL130100014.
1Note a Tannoy V8 loudspeaker was used for measuring the room impulse
responses which were used to calculate the T30s for the classrooms (see
Mealings et al., 2015a). Hence, the directivity of this loudspeaker may
have resulted in a slight underestimation of the T30 when compared to
measurements with an omni-directional sound source which most stand-
ards are based on. However, the directivity of the applied loudspeaker bet-
ter resembled the directivity of a teacher’s voice and thus, provided more
realistic predictions of the STI which is why it was used.
Airey, S. L., MacKenzie, D. J., and Craik, R. J. (1998). “Can you hear me at
the back? Effective communication in classrooms,” in Proceedings of the7th International Conference on Noise as a Public Health Problem: NoiseEffects ’98, Sydney, edited by N. Carter and R. F. Job, pp. 195–199.
American National Standards Institute (2002). Acoustical PerformanceCriterea, Design Requirements, and Guidelines for Schools (S12.60-2002)(ANSI, Melville, NY).
American Speech-Language-Hearing Association (2005). Acoustics inEducational Settings, technical report.
Anderson, K. (2001). “Kids in noisy classrooms: What does the research
really say?,” J. Ed. Audiol. 9, 21–33.
Astolfi, A., Bottalico, P., and Barbato, G. (2012). “Subjective and objective
speech intelligibility investigations in primary school classrooms,”
J. Acoust. Soc. Am. 131(1), 247–257.
Australia/New Zealand Standard. (2000). AS/NZS2107:2000, Acoustics—
Recommended Design Sound Levels and Reverberation Times for
Building Interiors.
Barnett, D. L., Nichols, C., and Gould, G. (1982). “The effects of open-
space versus traditional, self-contained classrooms on the auditory selec-
tive attending skills of elementary school children,” Lang. Speech Hear.
Serv. Schools 13, 138–143.
Berg, F., Blair, J., and Benson, P. (1996). “Classroom acoustics: The prob-
lem, impact, and solution,” Lang. Speech Hear. Serv. Schools 27, 16–20.
Boothroyd, A. (1997). “Auditory development of the hearing child,” Scand.
Audiol. 26(Suppl. 46), 9–16.
Bradley, J. S., and Sato, H. (2008). “The intelligibility of speech in elemen-
tary school classrooms,” J. Acoust. Soc. Am. 123(4), 2078–2086.
Brogden, M. (1983). “Open plan primary schools: Rhetoric and reality,”
School Organ.: Form. School Organ. 3(1), 27–41.
Cameron, S., and Dillon, H. (2007). “Development of the Listening in
Spatialized Noise-Sentences Test (LISN-S),” Ear Hear. 28(2), 196–211.
Crandell, C. C., and Smaldino, J. J. (2000). “Classroom acoustics for chil-
dren with normal hearing and with hearing impairment,” Lang. Speech
Hear. Serv. Schools 31, 362–370.
Evans, G. W., and Lepore, S. J. (1993). “Non-auditory effects of noise on
children: A critical review,” Child. Environ. 10(1), 42–72.
Finitzo-Hieber, T., and Tillman, T. W. (1978). “Room acoustics effects on
monosyllabic word discrimination ability for normal and hearing-impaired
children,” J. Speech Hear. Res. 21(3), 440–458.
Glass, G. V., and Smith, M. L. (1979). “Meta-analysis of research on class
size and achievement,” Ed. Eval. Policy Anal. 1(1), 2–16.
Gotaas, C., and Starr, C. D. (1993). “Vocal fatigue among teachers,” Folia
Phoniatrica 45(3), 120–129.
Hickey, C., and Forbes, D. (2011). “Open space learning: Meeting modern
needs or repeating past mistakes?,” Ind. Educat. 41(2), 10–13.
Jamieson, D., Kranjc, G., Yu, K., and Hodgetts, W. (2004). “Speech intelli-
gibility of young school-aged children in the presence of real-life class-
room noise,” J. Am. Acad. Audiol. 15, 508–517.
Johnson, C. (2000). “Children’s phoneme identification in reverberation and
noise,” J. Speech Lang. Hear. Res. 43, 144–157.
Klatte, M., Lachmann, T., and Meis, M. (2010). “Effects of noise and rever-
beration on speech perception and listening comprehension of children
and adults in a classroom-like setting,” Noise Health 12(49), 270–282.
Konza, D. (2008). “Inclusion of students with disabilities in new times:
Responding to the challenge,” in Learning and the Learner: ExploringLearning for New Times, edited by P. Kell, W. Vialle, D. Konza, and G.
Vogl (University of Wollongong, Wollongong), pp. 39–64.
2468 J. Acoust. Soc. Am. 138 (4), October 2015 Mealings et al.
Redistribution subject to ASA license or copyright; see http://acousticalsociety.org/content/terms. Download to IP: 137.111.13.204 On: Tue, 17 Nov 2015 21:49:32

Kristiansen, J., Lund, S. P., Nielsen, P. M., Persson, R., and Shibuya, H.
(2011). “Determinants of noise annoyance in teachers from schools with dif-
ferent classroom reverberation times,” J. Environ. Psychol. 31, 383–392.
Le~ao, S. H. S., Oates, J. M., Purdy, S. C., Scott, D., and Morton, R. P.
(2015). “Voice problems in New Zealand teachers: A national survey,”
J. Voice 29, 645.e1–645.e13.
Leibold, L. J., and Buss, E. (2013). “Children’s identification of consonants
in a speech-shaped noise or a two-talker masker,” J. Speech Lang. Hear.
Res. 56, 1144–1155.
MacKenzie, D. J., and Airey, S. (1999). Classroom Acoustics: A ResearchProject (Summary Report) (Heriot-Watt University, Edinburgh).
Maclure, S. (1984). Educational Development and School Building: Aspectsof Public Policy 1945-73 (Longman Group Ltd., Essex).
Marriage, J., and Moore, B. (2003). “New speech tests reveal benefit of
wide-dynamic-range, fast-acting compression for consonant discrimina-
tion in children with moderate-to-profound hearing loss,” Int. J. Audiol.
42, 418–425.
Maxwell, L. E., and Evans, G. W. (2000). “The effects of noise on pre-
school children’s pre-reading skills,” J. Environ. Psychol. 20(1),
91–97.
Mealings, K. T., Buchholz, J. M., Demuth, K., and Dillon, H. (2015a).
“Investigating the acoustics of a sample of open plan and enclosed
Kindergarten classrooms in Australia,” Appl. Acoust. 100, 95–105.
Mealings, K. T., Demuth, K., Buchholz, J. M., and Dillon, H. (2015b). “The
development of the Mealings, Demuth, Dillon, and Buchholz Classroom
Speech Perception Test,” J. Speech Lang. Hear. Res. 58, 1350–1362.
My School (2013). http://www.myschool.edu.au/ (Last viewed September 8,
2014).
Nelson, P. B., and Soli, S. (2000). “Acoustical barriers to learning: Children
at risk in every classroom,” Lang. Speech Hear. Serv. Schools 31,
356–361.
Neuman, A. C., Wroblewski, M., Hajicek, J., and Rubinstein, A. (2010).
“Combined effects of noise and reverberation on speech recognition per-
formance of normal-hearing children and adults,” Ear Hear. 31(3),
336–344.
Nishi, K., Lewis, D. E., Hoover, B. M., Choi, S., and Stelmachowicz, P. G.
(2010). “Children’s recognition of American English consonants in noise,”
J. Acoust. Soc. Am. 127(5), 3177–3188.
Nittrouer, S., and Boothroyd, A. (1990). “Context effects in phoneme and
word recognition by young children and older adults,” J. Acoust. Soc. Am.
87(6), 2705–2715.
Pelegr�ın-Garc�ıa, D., Brunskog, J., and Rasmussen, B. (2014). “Speaker-ori-
entated classroom acoustics design guidelines in the context of current
regulations in European countries,” Acta Acust. Acust. 100, 1073–1089.
Pelegr�ın-Garc�ıa, D., Smits, B., Brunskog, J., and Jeong, C.-H. (2011).
“Vocal effort with changing talker-to-listener distance in different acoustic
environments,” J. Acoust. Soc. Am. 129(4), 1981–1990.
Picard, M., and Bradley, J. S. (2001). “Revisiting speech interference in
classrooms,” Audiology 40(5), 221–244.
Punch, R., and Hyde, M. (2010). “Children with cochlear implants in
Australia: Educational settings, supports, and outcomes,” J. Deaf Stud.
Deaf Educat. 15(4), 405–421.
Ronsse, L. M., and Wang, L. M. (2013). “Relationships between unoccupied
classroom acoustical conditions and elementary student achievement
measured in eastern Nebraska,” J. Acoust. Soc. Am. 133(3), 1480–1495.
Rosenberg, G., Blake-Rahter, P., Heavner, J., Allen, L., Redmond, B.,
Phillips, J., and Stigers, K. (1999). “Improving classroom acoustics (ICA):
A three year FM sound- field classroom amplification study,” J. Educat.
Audiol. 7, 8–28.
Sato, H., and Bradley, J. S. (2008). “Evaluation of acoustical conditions for
speech communication in working elementary school classrooms,”
J. Acoust. Soc. Am. 123(4), 2064–2077.
Shield, B. M., and Dockrell, J. E. (2004). “External and internal noise sur-
veys of London primary schools,” J. Acoust. Soc. Am. 115(2), 730–738.
Shield, B. M., Greenland, E. E., and Dockrell, J. E. (2010). “Noise in open plan
classrooms in primary schools: A review,” Noise Health 12(49), 225–234.
Smith, E., Gray, S. D., Dove, H., Kirchner, L., and Heras, H. (1997).
“Frequency and effects of teachers’ voice problems,” J. Voice 11(1), 81–87.
Stevenson, A. (2011). “All in Together—197 Students in One Room,”
June 6, http://www.smh.com.au/national/education/all-in-together-197-
students-in-one-room-20110605-1fnji.html (Last viewed May 21, 2013).
Vickers, D. A., Backus, B. C., Macdonald, N. K., Rostamzadeh, N. K.,
Mason, N. K., Pandya, R., Marriage, J. E., and Mahon, M. H. (2013).
“Using personal response systems to assess speech perception within the
classroom: An approach to determine the efficacy of sound field amplifica-
tion in primary school classrooms,” Ear Hear. 34(4), 491–502.
Wilson, O. (2002). Classroom Acoustics: A New Zealand Perspective (The
Oticon Foundation in New Zealand, Wellington).
Wr�oblewski, M., Lewis, D. E., Valente, D. L., and Stelmachowicz, P. G.
(2012). “Effects of reverberation on speech recognition in stationary and
modulated noise by school-aged children and young adults,” Ear Hear.
33(6), 731–744.
J. Acoust. Soc. Am. 138 (4), October 2015 Mealings et al. 2469
Redistribution subject to ASA license or copyright; see http://acousticalsociety.org/content/terms. Download to IP: 137.111.13.204 On: Tue, 17 Nov 2015 21:49:32