GCARD Regional Review for Latin America and Caribbean Key issues document
Inter-American Development Bank
Banco Interamericano de Desarrollo (BID) Research Department
Departamento de Investigación Working Paper #600
The Educational Gender Gap in Latin America and the Caribbean
by
Suzanne Duryea*
Sebastian Galiani** Hugo Ñopo*
Claudia Piras*
*Inter-American Development Bank ** Washington University, St. Louis.
April 2007

2
Cataloging-in-Publication data provided by the Inter-American Development Bank Felipe Herrera Library The educational gender gap in Latin America and the Caribbean / by Suzanne Duryea … [et al.].
p. cm. (Research Department Working paper series ; 600) Includes bibliographical references.
1. School enrollment—Latin America. 2. School enrollment—Caribbean Area. 3. Educational equalization—Latin America. 4. Educational equalization—Caribbean Area. I. Duryea, Suzanne. II. Inter-American Development Bank. Research Dept. III. Series.
LC142 .E282 2007 371.219 E282----dc-22 ©2007 Inter-American Development Bank 1300 New York Avenue, N.W. Washington, DC 20577 The views and interpretations in this document are those of the authors and should not be attributed to the Inter-American Development Bank, or to any individual acting on its behalf. This paper may be freely reproduced provided credit is given to the Research Department, Inter-American Development Bank. The Research Department (RES) produces a quarterly newsletter, IDEA (Ideas for Development in the Americas), as well as working papers and books on diverse economic issues. To obtain a complete list of RES publications, and read or download them please visit our web site at: http://www.iadb.org/res.

3
Abstract*
This paper analyzes the evolution of gender differences in schooling attendance and attainment in Latin America and the Caribbean, for both adults who left the educational system and children in school. For individuals 21 years old and above the paper uses a cohort analysis of school attainment. The results indicate that the schooling gap has closed for the cohort born at the end of the 1960s. Since then, the gap has reversed such that within the cohort born in 1980, females have, on average, ¼ of a schooling year more than males. During the four decades of birth cohorts of our analysis (1940-1980) the gender gap in attainment has moved in favor of females at a pace of 0.27 years of schooling per decade. A decomposition exercise suggests that the changes in the schooling gap are mainly explained by the educational attainment of females at the higher levels, rather than improvements in the early years of education. An analysis of attendance and attainment among girls and boys between 6 and 18, for Bolivia, Guatemala, Mexico and Peru (the countries that have not closed the gap in adult schooling attainment) reveals noticeable gender differences, favoring boys, only among older children of the lowest income quintiles and indigenous ethnicity.
Keywords: Educational Gender Gap, School Attainment, School attendance, Marital Status, Latin America
*The superb research assistance of Georgina Pizzolitto is especially acknowledged.

4
1. Introduction Education is fundamental to prospects for economic and social development and the end of
world poverty, and nations with higher average schooling for their populations have been more
successful in their development paths. Nonetheless, as important as the overall level of education
in a country is its distribution among its citizens. A significant dimension in the distribution of
education is that of gender, and worldwide data show that in most countries, females attain lower
levels of schooling than males. In fact, the gender gap in education is higher in developing
countries than in developed countries.
Strengthening girls’ education opportunities is a strategic priority. The econometric
evidence suggests that societies have to pay a price for gender inequality in terms of slower
growth and reduced income (Dollar and Gatti, 1999). Besides generating private returns from
labor market participation, women's education has strong social externalities. There is a large
literature showing that higher levels of education of women contribute to reducing fertility
(Schultz, 1973; Cochrane, 1979), which in turn decreases infant mortality and increases life
expectancy (Behrman and Deolalikar, 1988). There is also ample evidence of the
intergenerational effects of the education of mothers on the education, health and wellbeing of
their children (Behrman, 1997; King et al., 1986; Schultz, 1988; Strauss and Thomas, 1995;
Behrman, Duryea and Székely, 1999). In addition, there is empirical evidence for asserting that
adding to a mother’s schooling will have a larger beneficial effect on a child’s health, schooling,
and adult productivity than would adding to a father’s schooling by the same amount (Schultz,
1993; King and Hill, 1993). Studies on rates of return have also documented the economic
benefits of investing in females’ education (Psacharopoulos, 1994; Psacharopoulos and
Tzannatos, 1992).
Despite the mounting empirical evidence demonstrating the social benefits of promoting
equal educational achievements for men and women, in many developing countries investments
in the education of girls continues to lag behind that of boys. In Paul Schultz’s words, “the
objective of increasing educational opportunities for women is probably as old as the gender gap
in schooling.” The international community has made sustained efforts to increase girls’
education in developing countries, most recently including it as the third goal of the Millennium
Development Goals and as Objective 5 in the Dakar Framework for Action. UNESCO data show
that girls’ enrolment improved in all regions during the 1990s. Out of 153 countries for which
5
disaggregated data are available, 86 countries have achieved gender parity. However, only 18 of
the remaining 67 have a good chance of attaining the goal by 2015. This means that globally,
more than one in five girls of primary school age are not in school, compared to about one in six
boys. Oceania, Western Asia and Southern Asia and Sub-Saharan Africa are the regions where
the gender gap is most pronounced.
Latin America and the Caribbean (henceforth LAC) have largely succeeded in improving
the education of girls and women. In contrast to the situation of Africa, Asia and the Middle
East, gender parity in education, and its corresponding Millennium Development Goal, have
been achieved in LAC. Furthermore, in most of the countries of the region there is a reverse
gender gap in education. Women are nowadays achieving higher average years of schooling than
their male counterparts, with important exceptions in the case of indigenous communities of
Guatemala and Bolivia, where girls receive slightly less schooling than boys. These surprising
outcomes seem to contradict the standard assumption that parents favor investing in boys’
education.
Advances in the education of women undoubtedly represent one of the biggest success
stories in the region. However, little is known about this important and unprecedented
accomplishment in the developing world. In fact, most studies that have looked at a variety of
educational outcomes in LAC have not gone beyond addressing the absence of a gender gap in
the region. While Knodel and Jones (1996) stress the rapid closure of the gender gap in most of
the world, suggesting that the strong emphasis on eliminating gender inequality in schooling is
no longer needed, they do not specifically address the situation in LAC. Behrman, Duryea and
Székely (1999) were the first to analyze schooling progress in LAC using household surveys.
The authors highlight, as a striking feature, that for two-thirds of the 18 LAC countries
considered the average years of schooling for females is higher than for males for the cohorts
born in 1970.
One of the few efforts to look at gender differences in education in LAC is Parker and
Pederzini (2000), who examine the determinants of the level of education of girls and boys in
Mexico and the factors that may explain gender differences. In a recent paper commissioned by
the IDB using household surveys, Marshall (2005) found that enrollment rates of 6- to 11-year-
olds were lower among girls than boys in only four of 22 countries considered. The picture
changes slightly for older age groups, but in the majority of the countries enrollment rates favor

6
girls. Turning to other performance and efficiency indicators, Marshall reports lower repetition
and drop-out among girls, as well as higher promotion rates, and in most countries girls have
better grade-for-age outcomes than boys
This paper analyzes the evolution of the gender gap in the average years of education in
LAC countries for the cohorts born between 1940 and 1980. Using household surveys we
produce an exhaustive descriptive cross-country analysis of the changes in the distribution of
education by gender, by cohorts and country. This paper’s attempts to answer the following
questions: Are there current gender differences in attendance and attainment among 6-20 year-
olds by income quintile and by ethnic characteristics? When did the gender gap in schooling
close in LAC? Was it a uniform process across the region or some countries closed the gender
gap earlier than others? Is the reversal of the gender gap in LAC uniformly distributed by
education levels or is it mostly explained by changes among the more educated? Finally, the
paper presents some preliminary results from the effects of the gender gap on the marriage
market in LAC.
In spite of the importance of understanding causes and effect, determining what policies
may have led to gender parity in the region lies beyond the scope of this paper. It is also
important to bear in mind that gender equality in education is certainly not confined to
attainment, the measure considered here.
The paper is organized as follows. After this introduction, in Section 2 we describe the
data used for the empirical analysis, the RES Harmonized Household Surveys. In Section 3 we
turn to the core of the paper and present gender differences in attainment by birth cohort,
analyzing the evolution of the gender gap by country over time. This section ends with a
decomposition of the evolution of the schooling gap by level of schooling attainment. Section 4
presents a descriptive analysis of current trends in schooling attendance and attainment of 6- to
18-year-olds by gender and income quintile for the countries in which the gender gap in
schooling has not yet closed. Section 5 concludes.

7
2. Data All the statistics and estimations presented in this study come from Household Surveys of 17
Latin American countries as shown in Table 1.
Table 1. Household Surveys
Country Survey YearArgentina Encuesta Permanente de Hogares (EPH) 2002Bolivia Encuesta de Hogares 2002Brasil Pesquisa Nacional por Amostra de Domicilios (PNAD) 2003Chile Encuesta de Caracterización Socioeconómica Nacional (CASEN) 2003Colombia Encuesta Continua de Hogares 2003Costa Rica Encuesta de Hogares de Propósitos Múltiples (EHPM) 2004El Salvador Encuesta de Hogares de Propósitos Múltiples (EHPM) 2002Guatemala Encuesta Nacional sobre Empleo e Ingresos 2002Honduras Encuesta Permanente de Hogares de Propósitos Múltiples 2003Jamaica Survey of Living Conditions 2002México Encuesta Nacional de Ingreso y Gastos de los Hogares (ENIGH) 2002Nicaragua Encuesta Nacional de Hogares sobre Medición del Nivel de Vida 2001Panamá Encuesta de Hogares 2003Paraguay Encuesta Permanente de Hogares 2003Perú Encuesta Nacional de Hogares sobre Medición de Niveles de Vida 2003Uruguay Encuesta Continua de Hogares 2003Venezuela Encuesta de Hogares por Muestreo 2004
These surveys have been processed and harmonized by the Research Department of the
Inter-American Development Bank to facilitate cross-country comparisons. The process of
harmonization involved a careful treatment of different variables of the surveys, especially
among those referred to income. As household surveys vary in their coverage of sources of
income, we have attempted to construct a consistent definition of household income which
includes monetary income from labor and non-labor sources supplied by household members.1
Then we constructed income quintiles from the distribution of per-capita household income
specific to individual countries in which the total household income was divided by the number
of household members.
For the purposes of this paper, it should be noted that a harmonization process was
undertaken to standardize the variables measuring levels and years of schooling. The need for
1 An alternative approach would be to create a measure of income that emphasizes consistency within a county across time. This is the approach taken in the Sociometro web tool (www.iadb.org/sociometro), which has a strong inter-temporal focus. Since we are using one recent survey per country we have elected to harmonize income so that it is consistent across countries.

8
such harmonization is reflected in in Appendix Table A.1, which shows a variety of ways in
which countries classify levels and years of schooling. In Appendix Table A.2 we provide
information on the classification of the schooling systems and the specific wording of the
questions asked in reference to school attendance.
As usual, each observation in each household survey has an associated expansion factor
that reflects the particularities of the sampling methods involved. The expansion factor can be
interpreted as the number of individuals that each particular observation represents, and hence,
the sum of the expansion factors in any given survey approximates the population size of the
country. In this way, pooling the observations contained in the 17 surveys, each weighted by its
expansion factor, we are able to construct a sample that represents 90 percent of the population
of Latin America and the Caribbean.
3. Gender Differences in Adult Attainment by Birth Cohort This section analyzes gender differences in school attainment, measured by years successfully
completed, for adults 21 years and older in the region. This section analyses gender differences
in school attainment for adults (21 years and older) in the region. The measure we use is the
number of approved years in the schooling system. We recognize that the range for such
numbers may differ across countries simply as a result of the differences in the corresponding
schooling systems. Nonetheless, by concentrating the analysis on the gender gap, such
differences in the schooling systems have no impact on the analysis.
To provide a perspective on the way in which the gender schooling gap has been
changing during the last decades, the analysis is done with a cohort approach. We analyze the
changes in the gender schooling gap from the oldest to the youngest birth cohort in our sample,
exploring the composition of such changes as well.
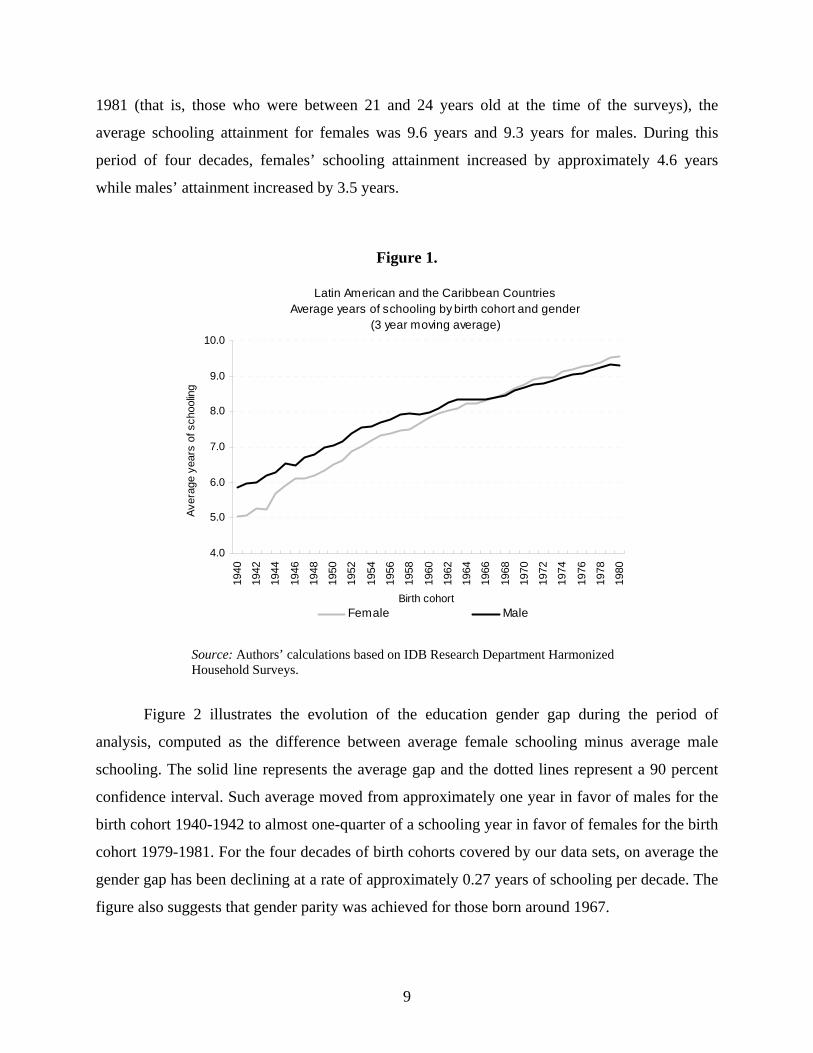
3.1 Evolution of the Gender Education Gap Figure 1 shows the evolution of the average number of years of schooling completed by females
and males by birth year. The data reported in the figure, as well as in the rest of the section, is
computed with three-year moving averages. According to the data, females born between 1940
and 1942 attained, on average, 5 years of schooling while their male counterparts attained 5.8.
The gender education gap was 0.8 years for that birth cohort. For those born between 1979 and
9
1981 (that is, those who were between 21 and 24 years old at the time of the surveys), the
average schooling attainment for females was 9.6 years and 9.3 years for males. During this
period of four decades, females’ schooling attainment increased by approximately 4.6 years
while males’ attainment increased by 3.5 years.
Figure 1.
Latin American and the Caribbean CountriesAverage years of schooling by birth cohort and gender
(3 year moving average)
4.0
5.0
6.0
7.0
8.0
9.0
10.0
1940
1942
1944
1946
1948
1950
1952
1954
1956
1958
1960
1962
1964
1966
1968
1970
1972
1974
1976
1978
1980
Birth cohort
Aver
age
year
s of
sch
oolin
g
Female Male
Source: Authors’ calculations based on IDB Research Department Harmonized Household Surveys.
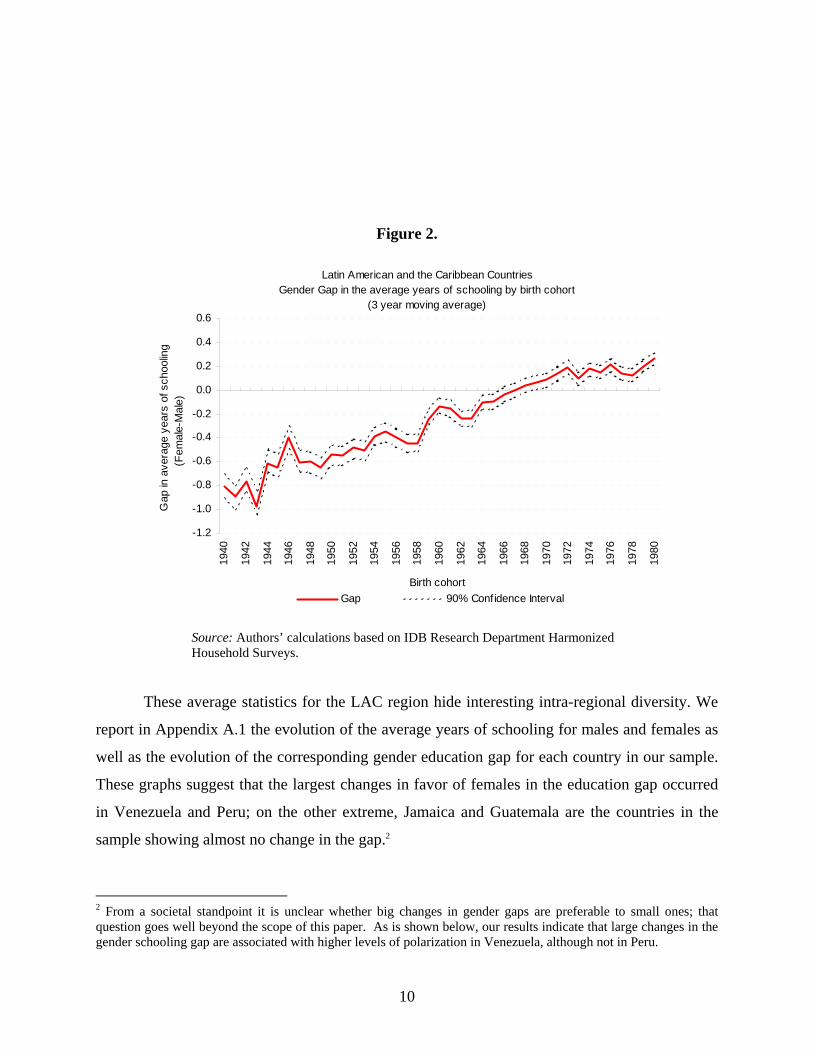
Figure 2 illustrates the evolution of the education gender gap during the period of
analysis, computed as the difference between average female schooling minus average male
schooling. The solid line represents the average gap and the dotted lines represent a 90 percent
confidence interval. Such average moved from approximately one year in favor of males for the
birth cohort 1940-1942 to almost one-quarter of a schooling year in favor of females for the birth
cohort 1979-1981. For the four decades of birth cohorts covered by our data sets, on average the
gender gap has been declining at a rate of approximately 0.27 years of schooling per decade. The
figure also suggests that gender parity was achieved for those born around 1967.
10
Figure 2.
Latin American and the Caribbean CountriesGender Gap in the average years of schooling by birth cohort
(3 year moving average)
-1.2
-1.0
-0.8
-0.6
-0.4
-0.2
0.0
0.2
0.4
0.6
1940
1942
1944
1946
1948
1950
1952
1954
1956
1958
1960
1962
1964
1966
1968
1970
1972
1974
1976
1978
1980
Birth cohort
Gap
in a
vera
ge y
ears
of s
choo
ling
(F
emal
e-M
ale)
Gap 90% Confidence Interval
Source: Authors’ calculations based on IDB Research Department Harmonized Household Surveys.
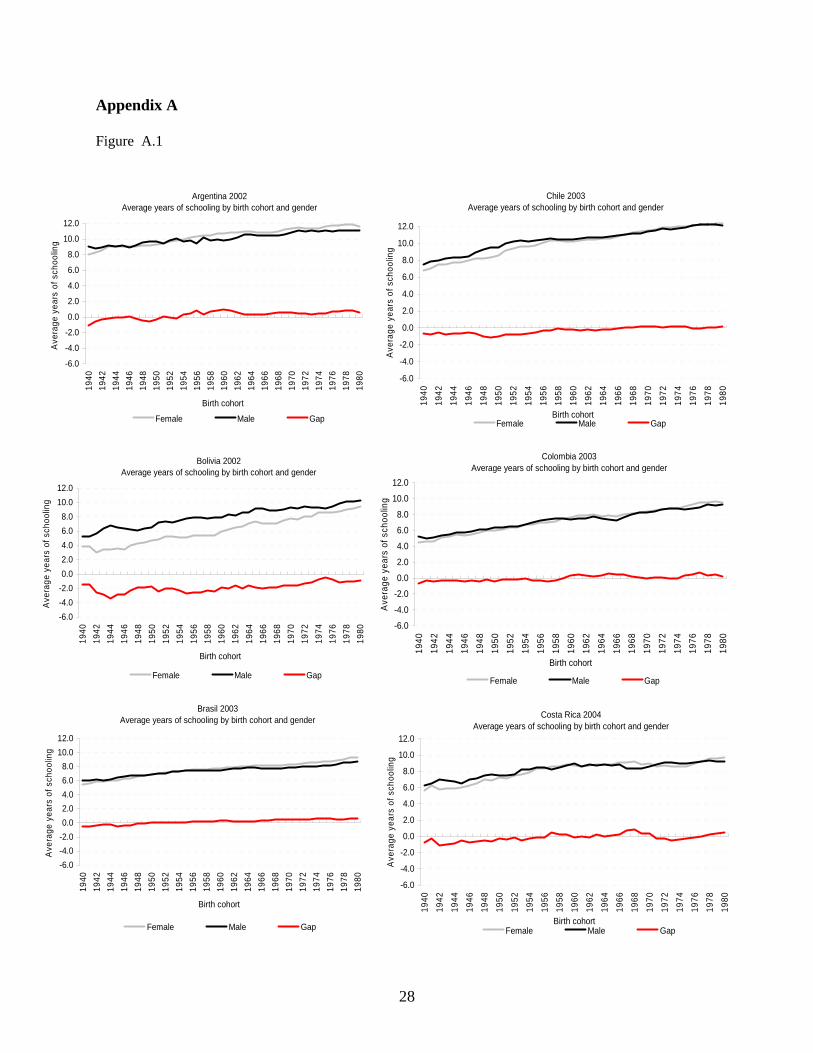
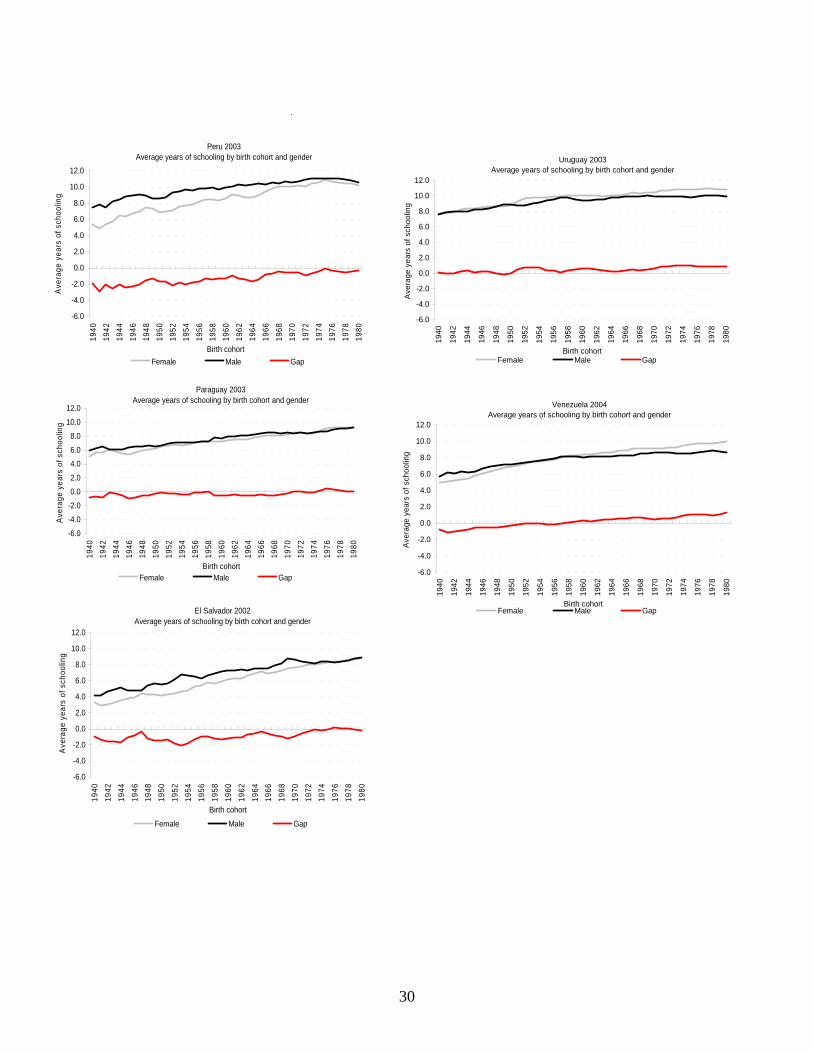
These average statistics for the LAC region hide interesting intra-regional diversity. We
report in Appendix A.1 the evolution of the average years of schooling for males and females as
well as the evolution of the corresponding gender education gap for each country in our sample.
These graphs suggest that the largest changes in favor of females in the education gap occurred
in Venezuela and Peru; on the other extreme, Jamaica and Guatemala are the countries in the
sample showing almost no change in the gap.2
2 From a societal standpoint it is unclear whether big changes in gender gaps are preferable to small ones; that question goes well beyond the scope of this paper. As is shown below, our results indicate that large changes in the gender schooling gap are associated with higher levels of polarization in Venezuela, although not in Peru.
11
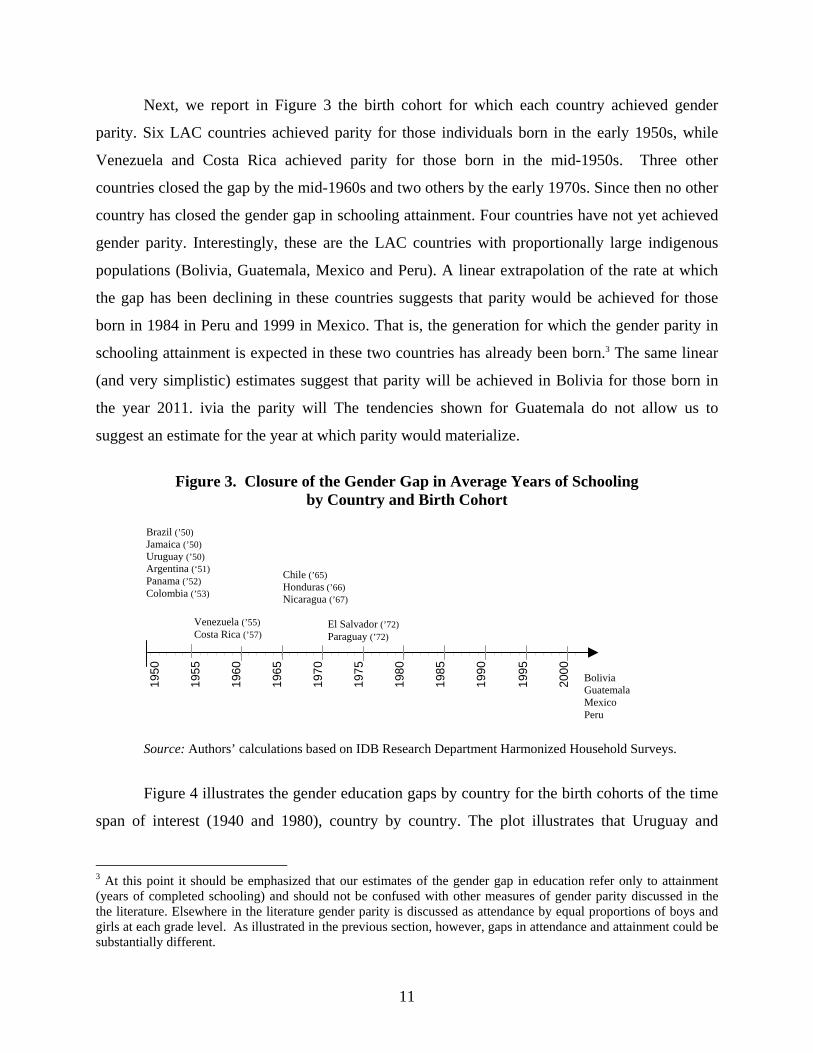
Next, we report in Figure 3 the birth cohort for which each country achieved gender
parity. Six LAC countries achieved parity for those individuals born in the early 1950s, while
Venezuela and Costa Rica achieved parity for those born in the mid-1950s. Three other
countries closed the gap by the mid-1960s and two others by the early 1970s. Since then no other
country has closed the gender gap in schooling attainment. Four countries have not yet achieved
gender parity. Interestingly, these are the LAC countries with proportionally large indigenous
populations (Bolivia, Guatemala, Mexico and Peru). A linear extrapolation of the rate at which
the gap has been declining in these countries suggests that parity would be achieved for those
born in 1984 in Peru and 1999 in Mexico. That is, the generation for which the gender parity in
schooling attainment is expected in these two countries has already been born.3 The same linear
(and very simplistic) estimates suggest that parity will be achieved in Bolivia for those born in
the year 2011. ivia the parity will The tendencies shown for Guatemala do not allow us to
suggest an estimate for the year at which parity would materialize.
Figure 3. Closure of the Gender Gap in Average Years of Schooling
by Country and Birth Cohort
Source: Authors’ calculations based on IDB Research Department Harmonized Household Surveys.
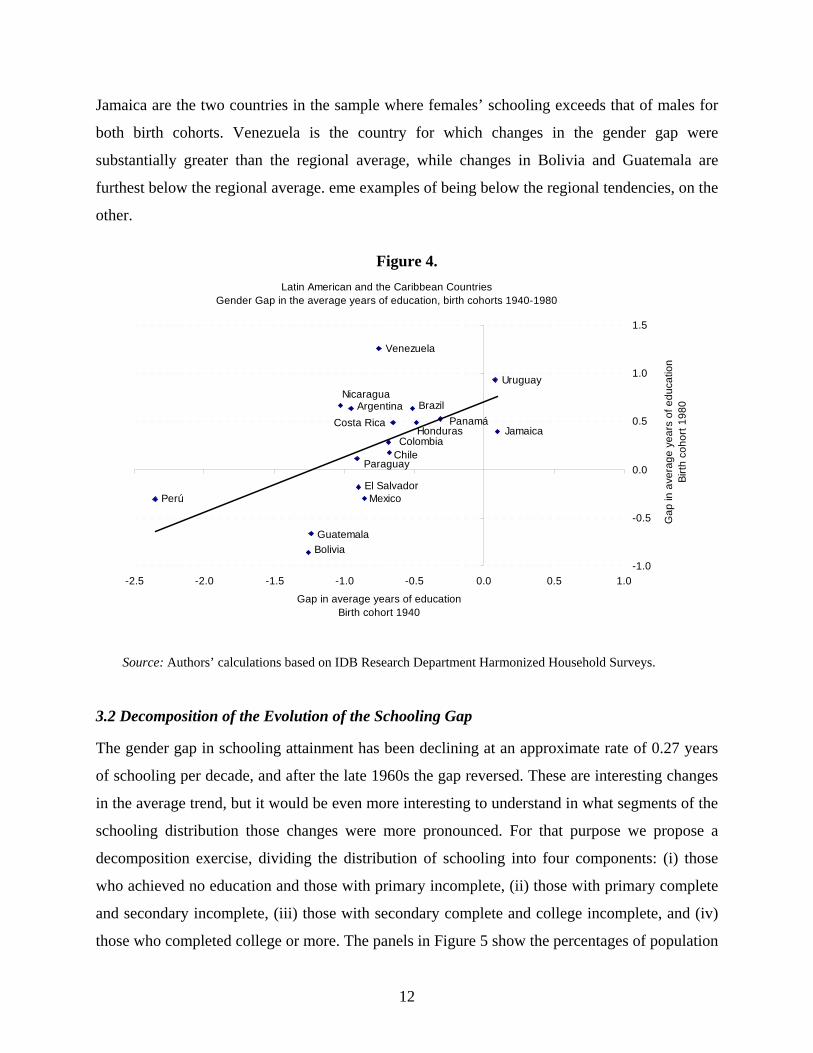
Figure 4 illustrates the gender education gaps by country for the birth cohorts of the time
span of interest (1940 and 1980), country by country. The plot illustrates that Uruguay and
3 At this point it should be emphasized that our estimates of the gender gap in education refer only to attainment (years of completed schooling) and should not be confused with other measures of gender parity discussed in the the literature. Elsewhere in the literature gender parity is discussed as attendance by equal proportions of boys and girls at each grade level. As illustrated in the previous section, however, gaps in attendance and attainment could be substantially different.
0
0.5
1
1950
1955
1960
1965
1970
1975
1980
1985
1990
1995
2000
Brazil (’50) Jamaica (’50) Uruguay (’50) Argentina (‘51) Panama (’52) Colombia (’53)
Venezuela (’55) Costa Rica (’57)
Chile (’65) Honduras (’66) Nicaragua (’67)
El Salvador (’72) Paraguay (’72)
Bolivia Guatemala Mexico Peru
12
Jamaica are the two countries in the sample where females’ schooling exceeds that of males for
both birth cohorts. Venezuela is the country for which changes in the gender gap were
substantially greater than the regional average, while changes in Bolivia and Guatemala are
furthest below the regional average. eme examples of being below the regional tendencies, on the
other.
Figure 4.
Latin American and the Caribbean Countries Gender Gap in the average years of education, birth cohorts 1940-1980
Panamá
Perú
JamaicaHondurasCosta Rica
Paraguay
Mexico
Chile
Brazil
UruguayNicaragua
Argentina
Bolivia
Colombia
Guatemala
Venezuela
El Salvador
-1.0
-0.5
0.0
0.5
1.0
1.5
-2.5 -2.0 -1.5 -1.0 -0.5 0.0 0.5 1.0
Gap in average years of educationBirth cohort 1940
Gap
in a
vera
ge y
ears
of e
duca
tion
Birth
coh
ort 1
980
Source: Authors’ calculations based on IDB Research Department Harmonized Household Surveys. 3.2 Decomposition of the Evolution of the Schooling Gap The gender gap in schooling attainment has been declining at an approximate rate of 0.27 years
of schooling per decade, and after the late 1960s the gap reversed. These are interesting changes
in the average trend, but it would be even more interesting to understand in what segments of the
schooling distribution those changes were more pronounced. For that purpose we propose a
decomposition exercise, dividing the distribution of schooling into four components: (i) those
who achieved no education and those with primary incomplete, (ii) those with primary complete
and secondary incomplete, (iii) those with secondary complete and college incomplete, and (iv)
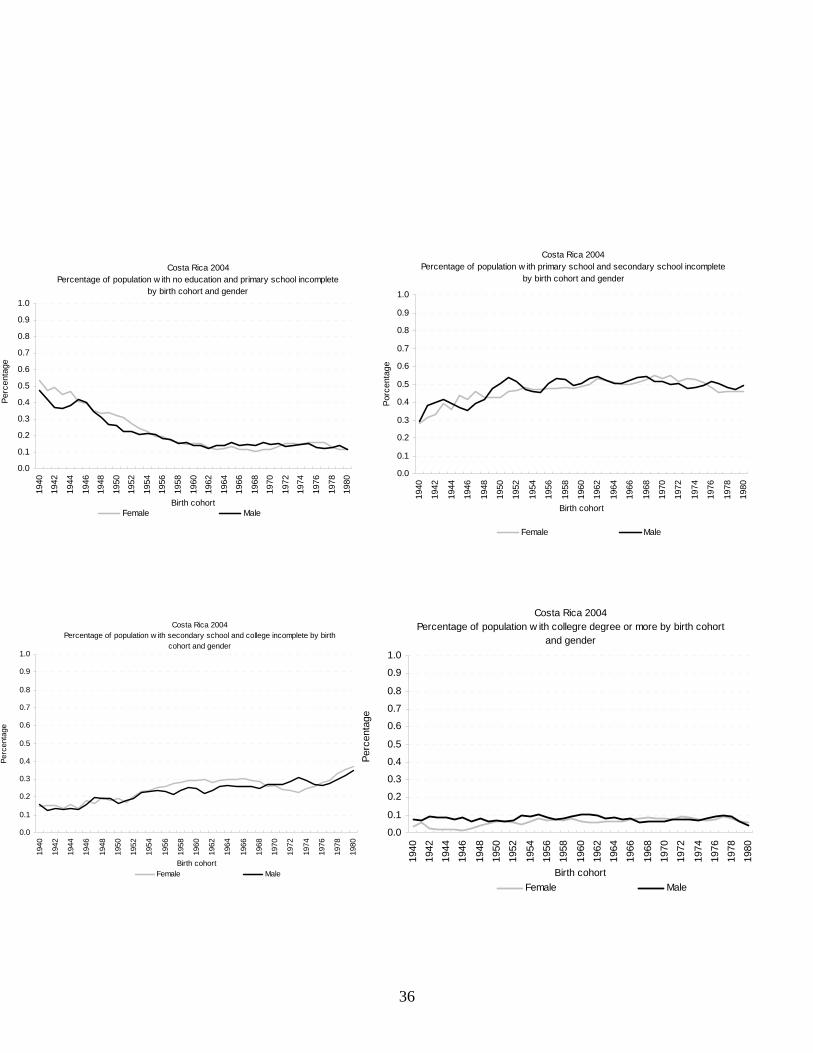
those who completed college or more. The panels in Figure 5 show the percentages of population
13
by birth cohort and gender in Latin American and the Caribbean for the four attainment groups
defined above.4
Females’ overall advancement in education is reflected in the panels. The proportion of
females with no schooling or primary incomplete declined notably and at a faster rate than that of
males. The fraction with secondary complete and college incomplete increased slightly faster for
females than for males. At the upper extreme of the distribution there are three periods with
interesting differences. The first period, comprising the birth cohorts between 1940 and 1960,
shows a growing college graduation rates for females; this was followed by a second period
characterized by a relative stagnation between 1960 and 1975. A third and final period, the third
period, starting around 1975, is marked by a decrease in college graduation rates (for both
females and males). Nonetheless, there are good reasons to attribute such a decline to the fact
that younger individuals in these cohorts could still be in the educational system.
4 For the reader interested in exploring the cross-country differences for the panel of graphs shown in Figure 3, we report in Appendix A.2 a country-by-country replica of these calculations.

14
Figure 5. Levels of Educational Attainment by Birth Cohort and Gender
Source: Authors’ calculations based on IDB Research Department Harmonized Household Surveys.
Motivated by the changes shown above, we now introduce a decomposition of the
changes in the gender difference in the average years of schooling between the oldest and the
youngest cohort in our sample. The point of departure for this calculation is point for that would
be to express the expected value of the number of years of schooling for females and males in a
single cohort as:
[ ] [ ] ( ) [ ] ( ) [ ] ( ) [ ] ( )44332211 *|*|*|*| LPLSELPLSELPLSELPLSESE FFFFFFFFF +++=
Latin American and the Caribbean CountriesPercentage of population w ith no education and primary school
incomplete by birth cohort and gender
0.0
0.1
0.2
0.3
0.4
0.5
0.6
1940
1942
1944
1946
1948
1950
1952
1954
1956
1958
1960
1962
1964
1966
1968
1970
1972
1974
1976
1978
1980
Birth cohort
Perc
enta
ge
Female Male
Latin American and the Caribbean CountriesPercentage of population w ith primary school and secondary school
incomplete by birth cohort and gender
0.0
0.1
0.2
0.3
0.4
0.5
0.6
1940
1942
1944
1946
1948
1950
1952
1954
1956
1958
1960
1962
1964
1966
1968
1970
1972
1974
1976
1978
1980
Birth cohort
Perc
enta
ge
Female Male
Latin American and the Caribbean CountriesPercentage of population w ith secondary school and college
incomplete by birth cohort and gender
0.0
0.1
0.2
0.3
0.4
0.5
0.6
1940
1942
1944
1946
1948
1950
1952
1954
1956
1958
1960
1962
1964
1966
1968
1970
1972
1974
1976
1978
1980
Birth cohort
Perc
enta
ge
Female Male
Latin American and the Caribbean CountriesPercentage of population w ith collegre degree or more by birth cohort
and gender
0.0
0.1
0.2
0.3
0.4
0.5
0.6
1940
1942
1944
1946
1948
1950
1952
1954
1956
1958
1960
1962
1964
1966
1968
1970
1972
1974
1976
1978
1980
Birth cohort
Perc
enta
ge
Female Male

15
[ ] [ ] ( ) [ ] ( ) [ ] ( ) [ ] ( )44332211 *|*|*|*| LPLSELPLSELPLSELPLSESE MMMMMMMMM +++=
where S represents the number of years of schooling (SF for females and SM for males); L1, ..., L4
represent the four levels of attainment depicted above (L1 for no education and primary
incomplete, L2 for primary complete and secondary incomplete, L3 for secondary complete and
college incomplete and L4 for college degree or more); E stands for expected value and P for
probability (as for the variable S, we distinguish the probabilities by gender: PF for females from
PM for males). In this way, the gender education gap in any given cohort can be expressed as the
sum of four differences:
[ ] [ ] [ ] ( ) [ ] ( )[ ]∑=
−=−4
1*|*|
ii
Mi
Mi
Fi
FMF LPLSELPLSESESE (1)
Each element of this sum can be interpreted as the particular contribution of each
educational level to the aggregate gender gap. We compare the gender schooling gap prevailing
in the 1940 birth cohort (that is, according to our three-year moving average, the cohort
comprising persons born between 1939 and 1941) with the gender schooling gap in the 1980
cohort (comprising persons born between 1979 and 1981). Formally, using the operator Δ to
denote the changes from the oldest cohort to the youngest, we have:
[ ] [ ]( ) [ ] ( ) [ ] ( )[ ]∑=
−Δ=−Δ4
1*|*|
ii
Mi
Mi
Fi
FMF LPLSELPLSESESE (2)
For the LAC region, the gender education gap in the 1940 cohort is –0.81 (the negative
sign denotes that it favors males) and an application of the decomposition approach delivers
figures of –0.029, -0.053, -0.166 and –0.560 as the components for the corresponding four
attainment levels. On the other hand, the gender education gap in the 1980 cohort is 0.27,
favoring females in this case, and is decomposed as –0.012, -0.390, 0.514 and 0.159 (see Figure
6). As a result, the change in the education gap between these two extreme (oldest and youngest)
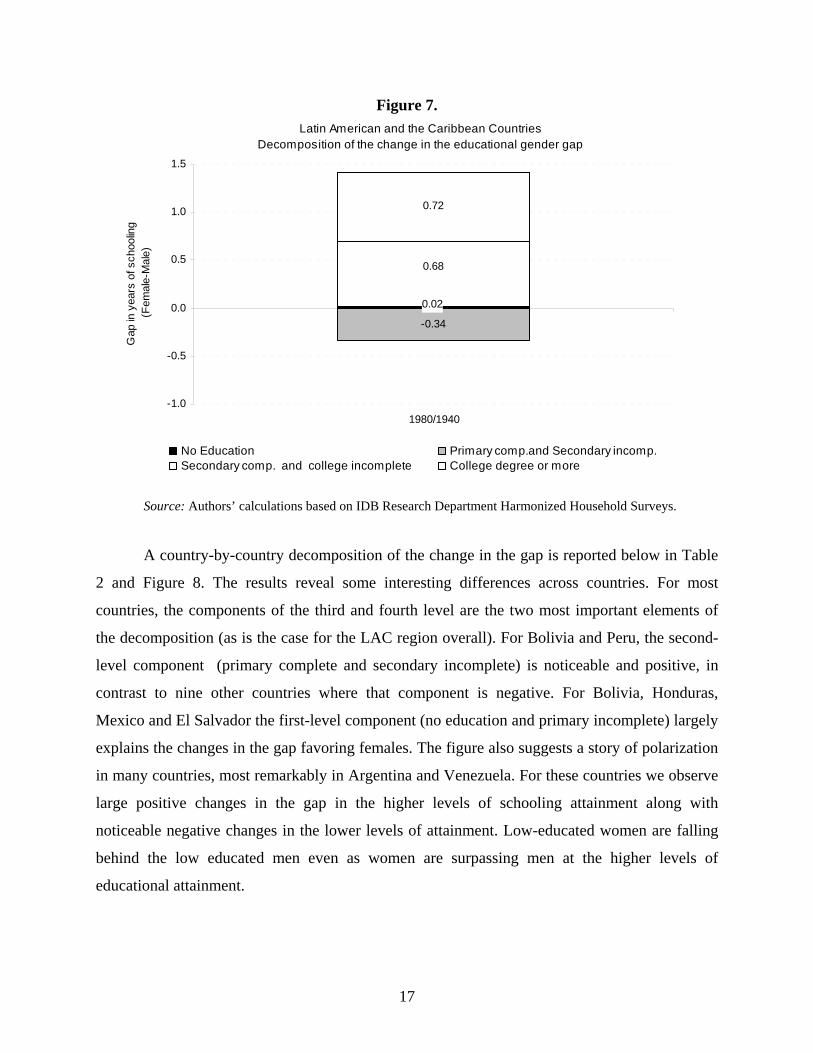
cohorts, which is 0.27-(-0.81)=1.08, is decomposed as 0.017, -0.337, 0.679 and 0.719 (see Figure
7). These are the four elements of the sum expressed in equation (2). The decomposition of the

16
difference of education gender gaps suggests that most of the changes in the gender gap are
explained by those that happened among the most educated.
Figure 6.
Latin American and the Caribbean Countries Decomposition of the educational gender gap by educational level
-0.01-0.03
-0.39-0.05
0.51
-0.17
0.16
-0.56
-1.0
-0.5
0.0
0.5
1.0
1.5
1940 1980Birth cohort
Gap
in y
ears
of s
choo
ling
(Fem
ale-
Mal
e)
No Education Primary comp.and Secondary incomp.Secondary comp. and college incomplete College degree or more
Source: Authors’ calculations based on IDB Research Department Harmonized Household Surveys.
17
Figure 7. Latin American and the Caribbean Countries
Decomposition of the change in the educational gender gap
-0.34
0.72
0.02
0.68
-1.0
-0.5
0.0
0.5
1.0
1.5
1980/1940
Gap
in y
ears
of s
choo
ling
(Fem
ale-
Mal
e)
No Education Primary comp.and Secondary incomp.Secondary comp. and college incomplete College degree or more
Source: Authors’ calculations based on IDB Research Department Harmonized Household Surveys.
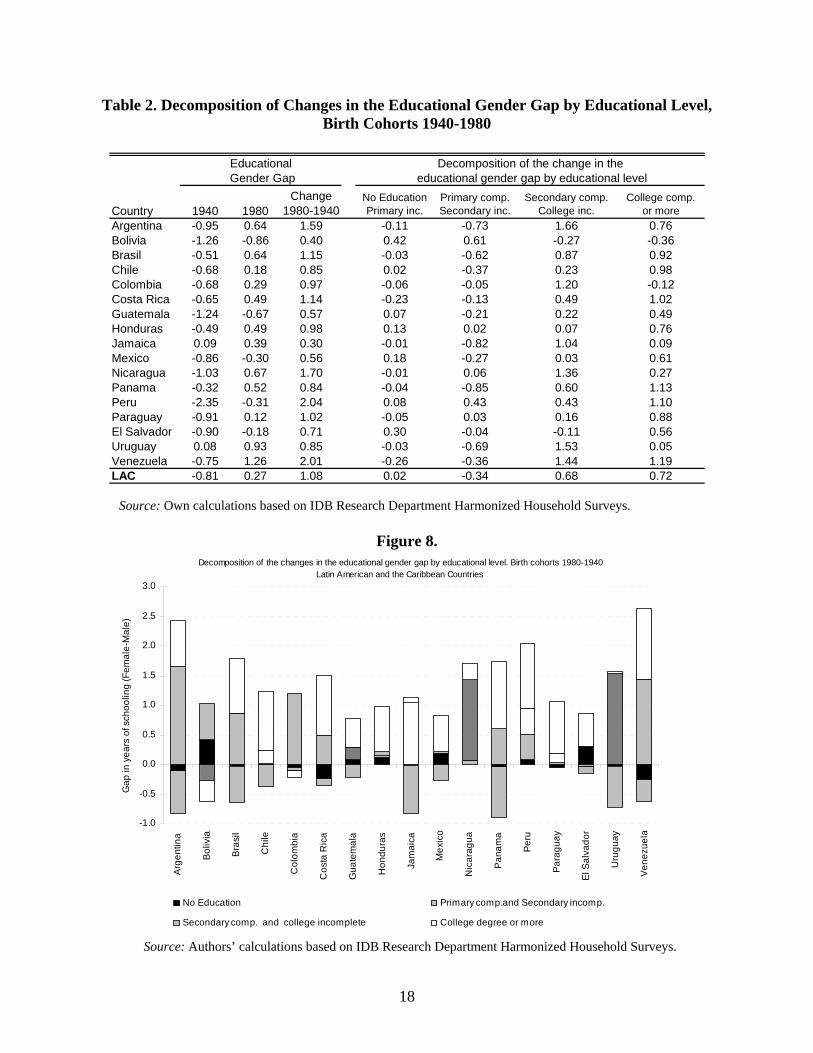
A country-by-country decomposition of the change in the gap is reported below in Table
2 and Figure 8. The results reveal some interesting differences across countries. For most
countries, the components of the third and fourth level are the two most important elements of
the decomposition (as is the case for the LAC region overall). For Bolivia and Peru, the second-
level component (primary complete and secondary incomplete) is noticeable and positive, in
contrast to nine other countries where that component is negative. For Bolivia, Honduras,
Mexico and El Salvador the first-level component (no education and primary incomplete) largely
explains the changes in the gap favoring females. The figure also suggests a story of polarization
in many countries, most remarkably in Argentina and Venezuela. For these countries we observe
large positive changes in the gap in the higher levels of schooling attainment along with
noticeable negative changes in the lower levels of attainment. Low-educated women are falling
behind the low educated men even as women are surpassing men at the higher levels of
educational attainment.
18
Table 2. Decomposition of Changes in the Educational Gender Gap by Educational Level, Birth Cohorts 1940-1980
Country 1940 1980Change
1980-1940No Education Primary inc.
Primary comp.Secondary inc.
Secondary comp.College inc.
College comp.or more
Argentina -0.95 0.64 1.59 -0.11 -0.73 1.66 0.76Bolivia -1.26 -0.86 0.40 0.42 0.61 -0.27 -0.36Brasil -0.51 0.64 1.15 -0.03 -0.62 0.87 0.92Chile -0.68 0.18 0.85 0.02 -0.37 0.23 0.98Colombia -0.68 0.29 0.97 -0.06 -0.05 1.20 -0.12Costa Rica -0.65 0.49 1.14 -0.23 -0.13 0.49 1.02Guatemala -1.24 -0.67 0.57 0.07 -0.21 0.22 0.49Honduras -0.49 0.49 0.98 0.13 0.02 0.07 0.76Jamaica 0.09 0.39 0.30 -0.01 -0.82 1.04 0.09Mexico -0.86 -0.30 0.56 0.18 -0.27 0.03 0.61Nicaragua -1.03 0.67 1.70 -0.01 0.06 1.36 0.27Panama -0.32 0.52 0.84 -0.04 -0.85 0.60 1.13Peru -2.35 -0.31 2.04 0.08 0.43 0.43 1.10Paraguay -0.91 0.12 1.02 -0.05 0.03 0.16 0.88El Salvador -0.90 -0.18 0.71 0.30 -0.04 -0.11 0.56Uruguay 0.08 0.93 0.85 -0.03 -0.69 1.53 0.05Venezuela -0.75 1.26 2.01 -0.26 -0.36 1.44 1.19LAC -0.81 0.27 1.08 0.02 -0.34 0.68 0.72
Decomposition of the change in the educational gender gap by educational level
Educational Gender Gap
Source: Own calculations based on IDB Research Department Harmonized Household Surveys.
Figure 8. Decomposition of the changes in the educational gender gap by educational level. Birth cohorts 1980-1940
Latin American and the Caribbean Countries
-1.0
-0.5
0.0
0.5
1.0
1.5
2.0
2.5
3.0
Arge
ntin
a
Boliv
ia
Bras
il
Chi
le
Col
ombi
a
Cos
ta R
ica
Gua
tem
ala
Hon
dura
s
Jam
aica
Mex
ico
Nic
arag
ua
Pan
ama
Peru
Para
guay
El S
alva
dor
Uru
guay
Ven
ezue
la
Gap
in y
ears
of s
choo
ling
(Fem
ale-
Mal
e)
No Education Primary comp.and Secondary incomp.
Secondary comp. and college incomplete College degree or more Source: Authors’ calculations based on IDB Research Department Harmonized Household Surveys.
19
Returning to equation (1) we can explore further the way in which the changes average
differences in years of schooling happened for the birth cohorts under analysis. After adding and
subtracting the element [ ] ( )iF
iM LPLSE *| in the right-hand side of equation (1), it can also be
expressed as:
[ ] [ ] [ ] [ ][ ] ( ) [ ] ( ) ( )[ ][ ]∑=
−+−=−4
1*|*||
ii
Mi
Fi
Mi
Fi
Mi
FMF LPLPLSELPLSELSESESE
or equivalently:
[ ] [ ] [ ] [ ][ ] ( ) [ ] ( ) ( )[ ]∑∑==
−+−=−4
1
4
1*|*||
ii
Mi
Fi
M
ii
Fi
Mi
FMF LPLPLSELPLSELSESESE (3)
which can be interpreted as the sum of four elements that account for gender differences in the
expected number of years of schooling within each attainment level (weighted by the probability
distribution of females across levels) and the sum of other four elements that account for gender
differences in the probabilities of being within each attainment level (weighted by the expected
numbers of years of schooling of males for each level). As we did with equation (2) we can
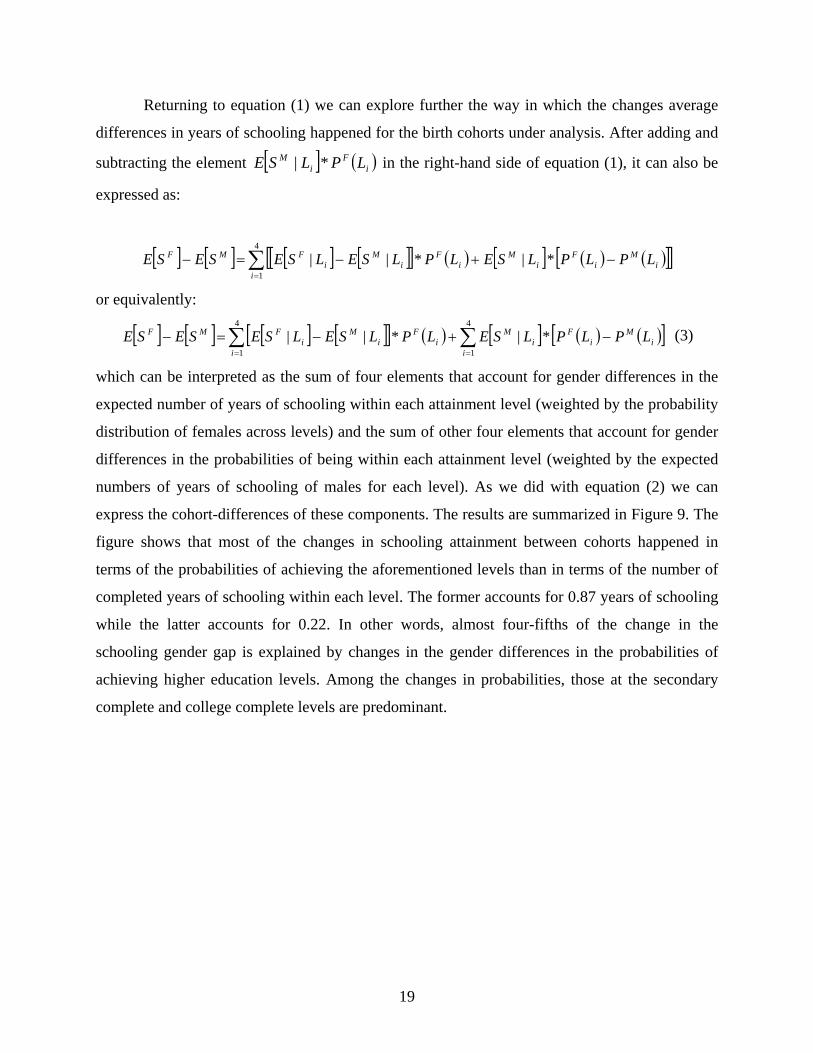
express the cohort-differences of these components. The results are summarized in Figure 9. The
figure shows that most of the changes in schooling attainment between cohorts happened in
terms of the probabilities of achieving the aforementioned levels than in terms of the number of
completed years of schooling within each level. The former accounts for 0.87 years of schooling
while the latter accounts for 0.22. In other words, almost four-fifths of the change in the
schooling gender gap is explained by changes in the gender differences in the probabilities of
achieving higher education levels. Among the changes in probabilities, those at the secondary
complete and college complete levels are predominant.
20
Figure 9.
Latin American and the Caribbean Countries Decomposition of the change in the educational gender gap by component and
educational level
0.09-0.07
0.07
-0.40
0.040.64 0.02
0.70
-1.0
-0.5
0.0
0.5
1.0
1.5
Probability Cond. ExpectationsComponent
Gap
in y
ears
of s
choo
ling
(Fem
ale-
Mal
e)
No Education Primary comp.and Secondary incomp.Secondary comp. and college incomplete College degree or more
Source: Own calculations based on IDB Research Department Harmonized Household Surveys.
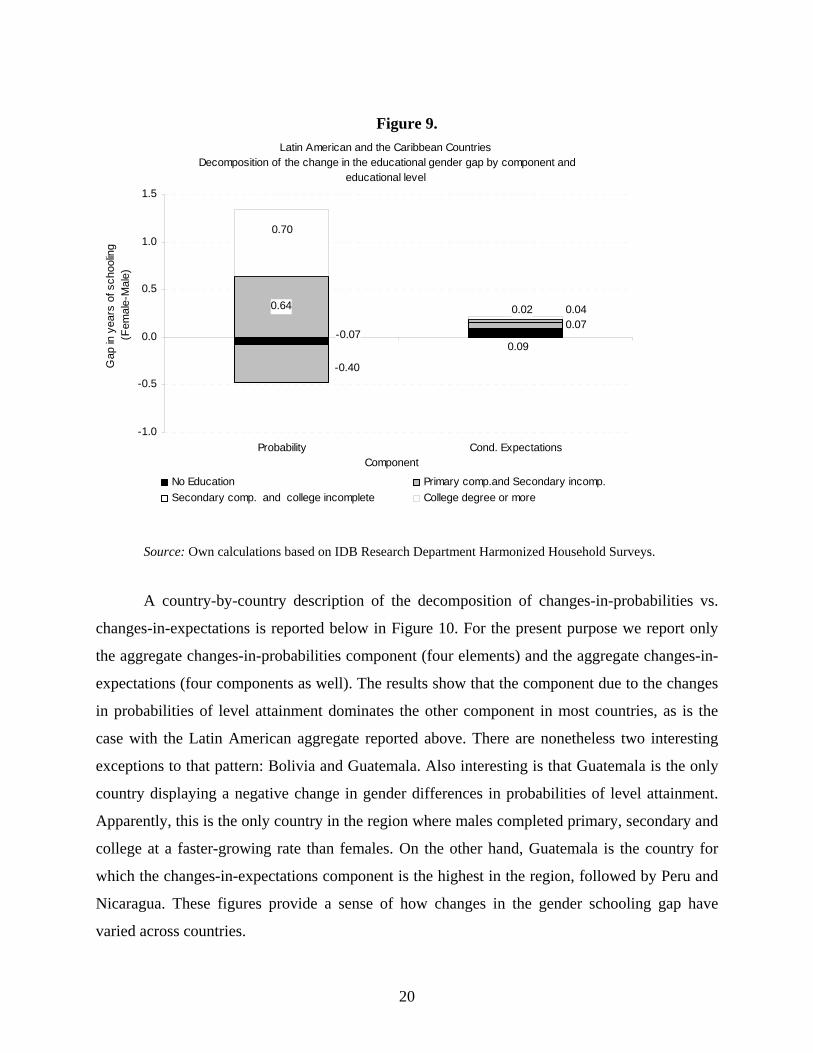
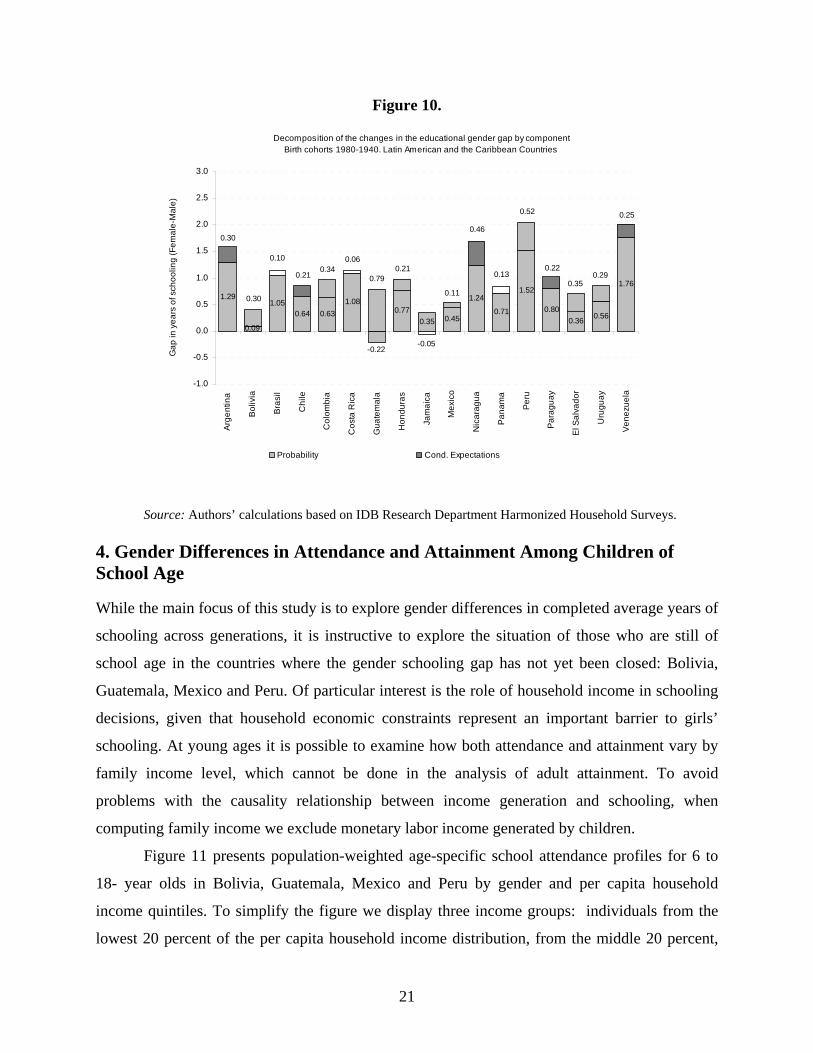
A country-by-country description of the decomposition of changes-in-probabilities vs.
changes-in-expectations is reported below in Figure 10. For the present purpose we report only
the aggregate changes-in-probabilities component (four elements) and the aggregate changes-in-
expectations (four components as well). The results show that the component due to the changes
in probabilities of level attainment dominates the other component in most countries, as is the
case with the Latin American aggregate reported above. There are nonetheless two interesting
exceptions to that pattern: Bolivia and Guatemala. Also interesting is that Guatemala is the only
country displaying a negative change in gender differences in probabilities of level attainment.
Apparently, this is the only country in the region where males completed primary, secondary and
college at a faster-growing rate than females. On the other hand, Guatemala is the country for
which the changes-in-expectations component is the highest in the region, followed by Peru and
Nicaragua. These figures provide a sense of how changes in the gender schooling gap have
varied across countries.
21
Figure 10.
Decomposition of the changes in the educational gender gap by component Birth cohorts 1980-1940. Latin American and the Caribbean Countries
1.291.05
0.64 0.631.08
0.770.35 0.45
1.24
0.71
1.52
0.800.36 0.56
1.76
0.09
-0.22
0.30
0.30
0.10
0.210.34
0.06
0.790.21
0.46
0.52 0.25
0.290.35
0.220.13
0.11
-0.05
-1.0
-0.5
0.0
0.5
1.0
1.5
2.0
2.5
3.0
Arge
ntin
a
Bol
ivia
Bras
il
Chi
le
Col
ombi
a
Cos
ta R
ica
Gua
tem
ala
Hon
dura
s
Jam
aica
Mex
ico
Nic
arag
ua
Pan
ama
Peru
Para
guay
El S
alva
dor
Uru
guay
Vene
zuel
a
Gap
in y
ears
of s
choo
ling
(Fem
ale-
Mal
e)
Probability Cond. Expectations
Source: Authors’ calculations based on IDB Research Department Harmonized Household Surveys. 4. Gender Differences in Attendance and Attainment Among Children of School Age While the main focus of this study is to explore gender differences in completed average years of
schooling across generations, it is instructive to explore the situation of those who are still of
school age in the countries where the gender schooling gap has not yet been closed: Bolivia,
Guatemala, Mexico and Peru. Of particular interest is the role of household income in schooling
decisions, given that household economic constraints represent an important barrier to girls’
schooling. At young ages it is possible to examine how both attendance and attainment vary by
family income level, which cannot be done in the analysis of adult attainment. To avoid
problems with the causality relationship between income generation and schooling, when
computing family income we exclude monetary labor income generated by children.
Figure 11 presents population-weighted age-specific school attendance profiles for 6 to
18- year olds in Bolivia, Guatemala, Mexico and Peru by gender and per capita household
income quintiles. To simplify the figure we display three income groups: individuals from the
lowest 20 percent of the per capita household income distribution, from the middle 20 percent,

22
and from the highest 20 percent. The estimates for attendance rates for children ages 8-11 in the
region are above 95 percent, leaving little room for variation across gender or income group.
According to this profile, significant differences in attendance by gender are not found before
age 12. At older ages there is a slight tendency for boys from the lowest income quintile to have
higher attendance rates than girls from the same income group, while the opposite happens at the
highest income quintile.
Figure 11.
Bolivia, Guatemala, Mexico and PeruSchool Attendance by Gender and Per Capita Household Income Quintile
0.0
0.1
0.2
0.3
0.4
0.5
0.6
0.7
0.8
0.9
1.0
6 7 8 9 10 11 12 13 14 15 16 17 18
Age
Shar
e At
tend
ing
Scho
ol
Male, low est quintile Female, low est quintile Male, middle quintile
Female, middle quintile Male, highest quintile Female, highest quintile
Source: Authors’ calculations based on IDB Research Department Harmonized Household Surveys.
We now turn to the (censored) profiles of school attainment, defined as the number of
years completed in the schooling system.5 The results suggest no gender differences in
attainment for the middle and highest income quintiles but offer slight evidence of a gender gap
in favor of males in the lowest quintile (see Figure 12). In any case, the most striking differences
5 This measure of attainment should not be confused with a measurement of number of years spent in the schooling system. In that sense, the measure we use is “net of repetition.”

23
in school attendance and attainment observed in Figure 11 and Figure 12 occurred across income
groups rather than gender.
Figure 12.
Bolivia, Guatemala, Mexico and PeruMean School Attainment by Gender and Per Capita Household Income Quintile
0.0
1.0
2.0
3.0
4.0
5.0
6.0
7.0
8.0
9.0
10.0
11.0
12.0
6 7 8 9 10 11 12 13 14 15 16 17 18
Age
Mea
n Ye
ars
of C
ompl
eted
Sch
oolin
g
Male, low est quintile Female, low est quintile Male, middle quintileFemale, middle quintile Male, highest quintile Female, highest quintile
Source: Authors’ calculations based on IDB Research Department Harmonized Household Surveys.
Finally, we explore the relationship between ethnicity and schooling outcomes among a
smaller set of countries. Bolivia, Guatemala and Peru include questions in their household
surveys which permit the construction of a proxy for indigenous ethnicity. In Bolivia and Peru
the indigenous classification is based on a question about an individual’s “mother tongue,” while
in Guatemala the survey inquires about self-identification with indigenous peoples.6
Figure B.1 in the Appendix shows how attendance profiles vary by gender and ethnicity
in these three countries, and Figure B.2 presents age-specific schooling attainment by gender and
ethnicity. As shown in Figure A.1, attendance rates in Figure A.1 for Peru are above 90 percent 6 In Bolivia the question is “¿Cuál es el idioma o lengua en el que aprendió a hablar en su niñez?” In Peru the question is “¿Cuál es la lengua materna que habla?” and in Guatemala the question is “¿Se considera usted perteneciente a alguno de los siguientes pueblos indígenas del país?”.

24
from age 6 to 13 for all groups. There is quite a bit of noise, however, in the data for ages 14-18,
with an unclear pattern in attendance rates for indigenous males and females. At ages 19 and 20
it becomes clear, though, that indigenous males and females attend school at much lower rates
than their non-indigenous peers. While non-indigenous females display similar schooling
attainment to their male peers, as shown in Figure B.2, indigenous females lag behind their male
peers by approximately two full years of schooling.
The situation is less encouraging in Bolivia and Guatemala, where the indigenous display
clear lags in school attendance both at early ages and in later teen years. At age 6 indigenous
girls and boys in Bolivia are 12-15 percentage points less likely to attend school than non-
indigenous children. Although boys and girls have similar profiles from ages 7-13, attendance
rates for indigenous girls start to depart at age 9, with a faster decline after age 13. The
attendance profile for indigenous girls is dominated by that of indigenous males, who attend
school at much lower rates than non-indigenous males and females. Patterns in Guatemala are
not as clear, with noisier data reflecting a much smaller sample. Nonetheless, indigenous girls
do not attend school at the same rates as their non-indigenous peers.
Profiles of school attainment in Bolivia and Guatemala are similar to the patterns
observed in Peru. Non-indigenous males and females have similar outcomes, followed by
indigenous males and lastly by indigenous females. The differences are greatest after ages 13-
15. Although there are some common features in the patterns of schooling attainment by gender
and ethnicity among the three countries, there is a striking difference in the levels of attainment.
At age 15 indigenous girls in Peru have achieved 7.1 years of schooling and girls in Bolivia have
achieved 6.1 years; in Guatemala, however, indigenous girls of the same age have completed 4.6
years of schooling.
5.Conclusions In this paper we have explored several gender differences in education, splitting the analysis into
two age groups. On the one hand, among the younger group we were able to perform an analysis
by household per-capita income quintile. We found the most noticeable gender differences in
attendance among those in the lowest income quintile. Interestingly these differences are such
that boys attend schools at a higher proportion than females, but they nonetheless display lower
attainment (number of approved years). This apparently puzzling result is consistent with a story

25
of higher repetition rates among boys than among girls. We also explore the relationship
between ethnicity and schooling outcomes in Bolivia, Guatemala and Peru. In these three
countries, non-indigenous males and females have similar educational outcomes. However,
indigenous teenaged girls lag behind the attainment of their male indigenous peers.
On the other hand, for the older group of individuals (born between 1940 and 1980) we
performed a cohort analysis. We found that the gender schooling gap has changed at a fast pace
during the last four decades. For the oldest cohort in our data the gender gap in schooling
attainment was almost 0.8 years, favoring males. For the youngest cohort the gap changed to a
state in favor of females by almost one fourth of a schooling year. During this period the gender
gap in attainment changed at a pace of 0.27 years of schooling per decade, favoring females.
One of the plausible implications of these changes in the gender education gap has to do
with changes in marriage markets. It has been already extensively documented that individuals
are delaying marriage decisions across the world, and Latin Americans are no exception. It
would be important to understand to what extent this is the result of changes in females’ females’
schooling compared to that of males and to what extent there are other forces driving these
trends.
26
References Behrman, J., and A. Deolalikar. 1988. “Health and Nutrition.” In: H. Chenery and T.N.
Srinivasan, editors. Handbook of Development Economics. Volume 1. Amsterdam, The
Netherlands: North Holland.
Behrman, R., S. Duryea and M. Székely. 1999 “Schooling Investments and Macroeconomic
Conditions: A Micro-Macro Investigation for Latin America and the Caribbean.”
Research Department Working Paper 407. Washington, DC, United States: Inter-
American Development Bank.
Cochrane, S. 1979. Fertility and Education: What Do We Really Know? Baltimore, United
States: Johns Hopkins University Press.
Dollar, D., and R. Gatti. 1999. “Gender Inequality, Income, and Growth: Are Good Times Good
for Women?” Gender and Development Working Paper Series 1. Washington, DC,
United States: World Bank. http://www.worldbank.org/gender/prr
Duryea, S., and C. Pagés. 2003 “Human Capital Policies: What They Can and Cannot do for
Productivity and Poverty Reduction in Latin America.” In: A. Margheritis, editor. Latin
American Democracies in the New Global Economy. Miami, United States: North-South
Center Press.
King, E.M., and M.A. Hill, editors. 1993. Women’s Education in Developing Countries.
Washington, United States: World Bank.
King, E.M. et al. 1986. Change in the Status of Women Across Generations in Asia. Santa
Monica, United States: Rand Corporation.
Knodel, J., and G. Jones. 1996. “Does Promoting Girls’ Schooling Miss the Mark?” Population
and Development Review 22: 683-702.
Marshall, J., and V. Calderón. 2005. “Social Exclusion in Education in Latin America and the
Caribbean.” Discussion Draft. Washington DC: Inter-American Development Bank
Parker, S., and C. Pederzini. 2000. “Gender Differences in Education in Mexico.” World Bank
Departmental Working Paper 21023. Washington, DC, United States: World Bank.
Psacharopoulos, G. 1994. “Returns to Investment in Education: A Global Update.” World
Development 22(9): 1325-1343.
Psacharopoulos, G., and Z. Tzannatos. 1992. “Latin American Women’s Earnings and
Participation in the Labor Force.” Policy Research Working Paper 856, The World Bank.
27
Schultz, T.P. 1973. “A Preliminary Survey of Economic Analysis of Fertility.” American
Economic Review 63(2): 77-78.
----. 1988. “Educational Investment and Returns.” In: H. Chenery and T.N. Srinivasan, editors.
Handbook of Development Economics. Volume 1. Amsterdam, The Netherlands: North
Holland.
----. 1993. “Economics of Women’s Education.” In: J.K. Conway and S.C. Bourque, editors. The
Politics of Women's Education. Ann Arbor, United States: University of Michigan Press.
----. “Why Governments Should Invest More to Educate Girls.” Economic Growth Center
Discussion Paper 836. New Haven, United States: Yale University, Economic Growth
Center. Available at SSRN: http://ssrn.com/abstract=286592.
Strauss, J., and D. Thomas. 1995. “Human Resources: Empirical Modeling of Household and
Family Decisions.” In: J. Behrman and T.N. Srinivasan, editors. Handbook of
Development Economics. Volume 3A. Amsterdam, The Netherlands: Elsevier.
Turner, S., and W. Bowen. 1999. “Choice of Major: The Changing (Unchanging) Gender Gap.”
Industrial and Labor Relations Review 52(2): 289-313.
United Nations. 2006. The Millennium Development Goals Report. New York, United States:
United Nations.
28
Appendix A Figure A.1
Argentina 2002Average years of schooling by birth cohort and gender
-6.0
-4.0
-2.0
0.0
2.0
4.0
6.0
8.0
10.0
12.0
1940
1942
1944
1946
1948
1950
1952
1954
1956
1958
1960
1962
1964
1966
1968
1970
1972
1974
1976
1978
1980
Birth cohort
Aver
age
year
s of
sch
oolin
g
Female Male Gap
Bolivia 2002Average years of schooling by birth cohort and gender
-6.0-4.0-2.00.02.04.06.08.0
10.012.0
1940
1942
1944
1946
1948
1950
1952
1954
1956
1958
1960
1962
1964
1966
1968
1970
1972
1974
1976
1978
1980
Birth cohort
Aver
age
year
s of
sch
oolin
g
Female Male Gap
Brasil 2003Average years of schooling by birth cohort and gender
-6.0-4.0-2.00.02.04.06.08.0
10.012.0
1940
1942
1944
1946
1948
1950
1952
1954
1956
1958
1960
1962
1964
1966
1968
1970
1972
1974
1976
1978
1980
Birth cohort
Ave
rage
yea
rs o
f sch
oolin
g
Female Male Gap
Chile 2003Average years of schooling by birth cohort and gender
-6.0
-4.0
-2.0
0.0
2.0
4.0
6.0
8.0
10.0
12.0
1940
1942
1944
1946
1948
1950
1952
1954
1956
1958
1960
1962
1964
1966
1968
1970
1972
1974
1976
1978
1980
Birth cohort
Ave
rage
yea
rs o
f sch
oolin
g
Female Male Gap
Colombia 2003Average years of schooling by birth cohort and gender
-6.0
-4.0
-2.0
0.0
2.0
4.0
6.0
8.0
10.0
12.0
1940
1942
1944
1946
1948
1950
1952
1954
1956
1958
1960
1962
1964
1966
1968
1970
1972
1974
1976
1978
1980
Birth cohort
Ave
rage
yea
rs o
f sch
oolin
g
Female Male Gap
Costa Rica 2004Average years of schooling by birth cohort and gender
-6.0
-4.0
-2.0
0.0
2.0
4.0
6.0
8.0
10.0
12.0
1940
1942
1944
1946
1948
1950
1952
1954
1956
1958
1960
1962
1964
1966
1968
1970
1972
1974
1976
1978
1980
Birth cohort
Ave
rage
yea
rs o
f sch
oolin
g
Female Male Gap

29
Guatemala 2002Average years of schooling by birth cohort and gender
-6.0-4.0-2.00.02.04.06.08.0
10.012.0
1940
1942
1944
1946
1948
1950
1952
1954
1956
1958
1960
1962
1964
1966
1968
1970
1972
1974
1976
1978
1980
Birth cohort
Ave
rage
yea
rs o
f sch
oolin
g
Female Male Gap
Honduras 2003Average years of schooling by birth cohort and gender
-6.0-4.0-2.00.02.04.06.08.0
10.012.0
1940
1942
1944
1946
1948
1950
1952
1954
1956
1958
1960
1962
1964
1966
1968
1970
1972
1974
1976
1978
1980
Birth cohort
Ave
rage
yea
rs o
f sch
oolin
g
Female Male Gap
Jamaica 2002Average years of schooling by birth cohort and gender
-6.0-4.0-2.00.0
2.0
4.06.0
8.010.012.0
1940
1942
1944
1946
1948
1950
1952
1954
1956
1958
1960
1962
1964
1966
1968
1970
1972
1974
1976
1978
1980
Birth cohort
Ave
rage
yea
rs o
f sch
oolin
g
Female Male Gap
Nicaragua 2001Average years of schooling by birth cohort and gender
-6.0-4.0-2.00.02.04.06.08.0
10.012.0
1940
1942
1944
1946
1948
1950
1952
1954
1956
1958
1960
1962
1964
1966
1968
1970
1972
1974
1976
1978
1980
Birth cohort
Ave
rage
yea
rs o
f sch
oolin
g
Female Male Gap
Panama 2003Average years of schooling by birth cohort and gender
-6.0
-4.0
-2.0
0.0
2.0
4.0
6.0
8.0
10.0
12.0
1940
1942
1944
1946
1948
1950
1952
1954
1956
1958
1960
1962
1964
1966
1968
1970
1972
1974
1976
1978
1980
Birth cohort
Ave
rage
yea
rs o
f sch
oolin
g
Female Male Gap
Mexico 2002Average years of schooling by birth cohort and gender
-6.0
-4.0
-2.0
0.0
2.0
4.0
6.0
8.0
10.0
12.0
1940
1942
1944
1946
1948
1950
1952
1954
1956
1958
1960
1962
1964
1966
1968
1970
1972
1974
1976
1978
1980
Birth cohort
Aver
age
year
s of
sch
oolin
g
Female Male Gap
30
Female Male Gap
Peru 2003Average years of schooling by birth cohort and gender
-6.0
-4.0
-2.0
0.0
2.0
4.0
6.0
8.0
10.0
12.0
1940
1942
1944
1946
1948
1950
1952
1954
1956
1958
1960
1962
1964
1966
1968
1970
1972
1974
1976
1978
1980
Birth cohort
Ave
rage
yea
rs o
f sch
oolin
g
Female Male Gap
Paraguay 2003Average years of schooling by birth cohort and gender
-6.0
-4.0
-2.0
0.0
2.0
4.0
6.0
8.0
10.0
12.0
1940
1942
1944
1946
1948
1950
1952
1954
1956
1958
1960
1962
1964
1966
1968
1970
1972
1974
1976
1978
1980
Birth cohort
Ave
rage
yea
rs o
f sch
oolin
g
Female Male Gap
El Salvador 2002Average years of schooling by birth cohort and gender
-6.0
-4.0
-2.0
0.0
2.0
4.0
6.0
8.0
10.0
12.0
1940
1942
1944
1946
1948
1950
1952
1954
1956
1958
1960
1962
1964
1966
1968
1970
1972
1974
1976
1978
1980
Birth cohort
Ave
rage
yea
rs o
f sch
oolin
g
Female Male Gap
Uruguay 2003Average years of schooling by birth cohort and gender
-6.0
-4.0
-2.0
0.0
2.0
4.0
6.0
8.0
10.0
12.0
1940
1942
1944
1946
1948
1950
1952
1954
1956
1958
1960
1962
1964
1966
1968
1970
1972
1974
1976
1978
1980
Birth cohort
Ave
rage
yea
rs o
f sch
oolin
g
Female Male Gap
Venezuela 2004Average years of schooling by birth cohort and gender
-6.0
-4.0
-2.0
0.0
2.0
4.0
6.0
8.0
10.0
12.0
1940
1942
1944
1946
1948
1950
1952
1954
1956
1958
1960
1962
1964
1966
1968
1970
1972
1974
1976
1978
1980
Birth cohort
Ave
rage
yea
rs o
f sch
oolin
g
Female Male Gap

Figure A.2
Argentina 2002Percentage of population w ith no education and primary school
incomplete by birth cohort and gender
0.0
0.1
0.2
0.3
0.4
0.50.6
0.7
0.8
0.9
1.0
1940
1942
1944
1946
1948
1950
1952
1954
1956
1958
1960
1962
1964
1966
1968
1970
1972
1974
1976
1978
1980
Birth cohort
Perc
enta
ge
Female Male
Argentina 2002Percentage of population w ith primary school and secondary school incomplete
by birth cohort and gender
0.0
0.1
0.2
0.3
0.4
0.5
0.6
0.7
0.8
0.9
1.0
1940
1942
1944
1946
1948
1950
1952
1954
1956
1958
1960
1962
1964
1966
1968
1970
1972
1974
1976
1978
1980
Birth cohort
Perc
enta
ge
Female Male
Argentina 2002Percentage of population w ith secondary school and college incomplete by
birth cohort and gender
0.0
0.1
0.2
0.3
0.4
0.5
0.6
0.7
0.8
0.9
1.0
1940
1942
1944
1946
1948
1950
1952
1954
1956
1958
1960
1962
1964
1966
1968
1970
1972
1974
1976
1978
1980
Birth cohort
Perc
enta
ge
Female Male
Argentina 2002Percentage of population w ith collegre degree or more by birth
cohort and gender
0.0
0.1
0.2
0.3
0.4
0.5
0.6
0.7
0.8
0.9
1.0
1940
1942
1944
1946
1948
1950
1952
1954
1956
1958
1960
1962
1964
1966
1968
1970
1972
1974
1976
1978
1980
Birth cohort
Perc
enta
ge
Female Male

32
Bolivia 2002Percentage of population w ith no education and primary school
incomplete by birth cohort and gender
0.0
0.1
0.2
0.3
0.4
0.5
0.6
0.7
0.8
0.9
1.0
1940
1942
1944
1946
1948
1950
1952
1954
1956
1958
1960
1962
1964
1966
1968
1970
1972
1974
1976
1978
1980
Birth cohort
Perc
enta
ge
Female Male
Bolivia 2002Percentage of population w ith primary school and secondary school incomplete
by birth cohort and gender
0.0
0.1
0.2
0.3
0.4
0.5
0.6
0.7
0.8
0.9
1.0
1940
1942
1944
1946
1948
1950
1952
1954
1956
1958
1960
1962
1964
1966
1968
1970
1972
1974
1976
1978
1980
Birth cohort
Perc
enta
ge
Female Male
Bolivia 2002Percentage of population w ith secondary school and college incomplete by
birth cohort and gender
0.0
0.1
0.2
0.3
0.4
0.5
0.6
0.7
0.8
0.9
1.0
1940
1942
1944
1946
1948
1950
1952
1954
1956
1958
1960
1962
1964
1966
1968
1970
1972
1974
1976
1978
1980
Birth cohort
Perc
enta
ge
Female Male
Bolivia 2002Percentage of population w ith collegre degree or more by birth
cohort and gender
0.0
0.10.2
0.30.4
0.5
0.60.7
0.80.9
1.0
1940
1942
1944
1946
1948
1950
1952
1954
1956
1958
1960
1962
1964
1966
1968
1970
1972
1974
1976
1978
1980
Birth cohort
Porc
enta
ge
Female Male

33
Brazil 2003Percentage of population w ith collegre degree or more by birth
cohort and gender
0.00.10.2
0.30.40.50.60.7
0.80.91.0
1940
1942
1944
1946
1948
1950
1952
1954
1956
1958
1960
1962
1964
1966
1968
1970
1972
1974
1976
1978
1980
Birth cohort
Perc
enta
ge
Female Male
Brazil 2003Percentage of population w ith primary school and secondary school incomplete
by birth cohort and gender
0.0
0.1
0.2
0.3
0.4
0.5
0.6
0.7
0.8
0.9
1.0
1940
1942
1944
1946
1948
1950
1952
1954
1956
1958
1960
1962
1964
1966
1968
1970
1972
1974
1976
1978
1980
Birth cohort
Perc
enta
ge
Female Male
Brazil 2003Percentage of population w ith secondary school and college incomplete by
birth cohort and gender
0.0
0.1
0.2
0.3
0.4
0.5
0.6
0.7
0.8
0.9
1.0
1940
1942
1944
1946
1948
1950
1952
1954
1956
1958
1960
1962
1964
1966
1968
1970
1972
1974
1976
1978
1980
Birth cohort
Perc
enta
ge
Female Male
Brazil 2003Percentage of population w ith no education and primary school incomplete
by birth cohort and gender
0.00.10.20.30.40.50.60.70.80.91.0
1940
1942
1944
1946
1948
1950
1952
1954
1956
1958
1960
1962
1964
1966
1968
1970
1972
1974
1976
1978
1980
Birth cohort
Perc
enta
ge
Female Male

34
Chile 2003Percentage of population w ith no education and primary school
incomplete by birth cohort and gender
0.00.10.2
0.30.40.50.60.7
0.80.91.0
1940
1942
1944
1946
1948
1950
1952
1954
1956
1958
1960
1962
1964
1966
1968
1970
1972
1974
1976
1978
1980
Birth cohort
Perc
enta
ge
Female Male
Chile 2003Percentage of population w ith primary school and secondary school incomplete
by birth cohort and gender
0.0
0.1
0.2
0.3
0.4
0.5
0.6
0.7
0.8
0.9
1.0
1940
1942
1944
1946
1948
1950
1952
1954
1956
1958
1960
1962
1964
1966
1968
1970
1972
1974
1976
1978
1980
Birth cohort
Perc
enta
ge
Female Male
Chile 2003Percentage of population w ith secondary school and college incomplete by
birth cohort and gender
0.0
0.1
0.2
0.3
0.4
0.5
0.6
0.7
0.8
0.9
1.0
1940
1942
1944
1946
1948
1950
1952
1954
1956
1958
1960
1962
1964
1966
1968
1970
1972
1974
1976
1978
1980
Birth cohort
Perc
enta
ge
Female Male
Chile 2003Percentage of population w ith collegre degree or more by birth
cohort and gender
0.0
0.1
0.2
0.3
0.4
0.5
0.6
0.7
0.8
0.9
1.0
1940
1942
1944
1946
1948
1950
1952
1954
1956
1958
1960
1962
1964
1966
1968
1970
1972
1974
1976
1978
1980
Birth cohort
Perc
enta
ge
Female Male

35
Colombia 2003Percentage of population w ith no education and primary school incomplete
by birth cohort and gender
0.0
0.1
0.2
0.3
0.4
0.5
0.6
0.7
0.8
0.9
1.0
1940
1942
1944
1946
1948
1950
1952
1954
1956
1958
1960
1962
1964
1966
1968
1970
1972
1974
1976
1978
1980
Birth cohort
Perc
enta
ge
Female Male
Colombia 2003Percentage of population w ith primary school and secondary school incomplete
by birth cohort and gender
0.0
0.1
0.2
0.3
0.4
0.5
0.6
0.7
0.8
0.9
1.0
1940
1942
1944
1946
1948
1950
1952
1954
1956
1958
1960
1962
1964
1966
1968
1970
1972
1974
1976
1978
1980
Birth cohort
Porc
enta
ge
Female Male
Colombia 2003Percentage of population w ith secondary school and college incomplete by
birth cohort and gender
0.0
0.1
0.2
0.3
0.4
0.5
0.6
0.7
0.8
0.9
1.0
1940
1942
1944
1946
1948
1950
1952
1954
1956
1958
1960
1962
1964
1966
1968
1970
1972
1974
1976
1978
1980
Birth cohort
Perc
enta
ge
Female Male
Colombia 2003Percentage of population w ith collegre degree or more by birth
cohort and gender
0.00.10.2
0.30.40.50.60.7
0.80.91.0
1940
1942
1944
1946
1948
1950
1952
1954
1956
1958
1960
1962
1964
1966
1968
1970
1972
1974
1976
1978
1980
Birth cohort
Perc
enta
ge
Female Male
36
Costa Rica 2004Percentage of population w ith no education and primary school incomplete
by birth cohort and gender
0.0
0.1
0.2
0.3
0.4
0.5
0.6
0.7
0.8
0.9
1.0
1940
1942
1944
1946
1948
1950
1952
1954
1956
1958
1960
1962
1964
1966
1968
1970
1972
1974
1976
1978
1980
Birth cohort
Perc
enta
ge
Female Male
Costa Rica 2004Percentage of population w ith secondary school and college incomplete by birth
cohort and gender
0.0
0.1
0.2
0.3
0.4
0.5
0.6
0.7
0.8
0.9
1.0
1940
1942
1944
1946
1948
1950
1952
1954
1956
1958
1960
1962
1964
1966
1968
1970
1972
1974
1976
1978
1980
Birth cohort
Perc
enta
ge
Female Male
Costa Rica 2004Percentage of population w ith primary school and secondary school incomplete
by birth cohort and gender
0.0
0.1
0.2
0.3
0.4
0.5
0.6
0.7
0.8
0.9
1.0
1940
1942
1944
1946
1948
1950
1952
1954
1956
1958
1960
1962
1964
1966
1968
1970
1972
1974
1976
1978
1980
Birth cohort
Porc
enta
ge
Female Male
Costa Rica 2004Percentage of population w ith collegre degree or more by birth cohort
and gender
0.0
0.1
0.2
0.3
0.4
0.5
0.6
0.7
0.8
0.9
1.0
1940
1942
1944
1946
1948
1950
1952
1954
1956
1958
1960
1962
1964
1966
1968
1970
1972
1974
1976
1978
1980
Birth cohort
Perc
enta
ge
Female Male

37
Guatemala 2002Percentage of population w ith no education and primary school incomplete
by birth cohort and gender
0.0
0.1
0.2
0.3
0.4
0.5
0.6
0.7
0.8
0.9
1.0
1940
1942
1944
1946
1948
1950
1952
1954
1956
1958
1960
1962
1964
1966
1968
1970
1972
1974
1976
1978
1980
Birth cohort
Perc
enta
ge
Female Male
Guatemala 2002Percentage of population w ith primary school and secondary school incomplete
by birth cohort and gender
0.0
0.1
0.2
0.3
0.4
0.5
0.6
0.7
0.8
0.9
1.0
1940
1942
1944
1946
1948
1950
1952
1954
1956
1958
1960
1962
1964
1966
1968
1970
1972
1974
1976
1978
1980
Birth cohort
Perc
enta
ge
Female Male
Guatemala 2002Percentage of population w ith secondary school and college incomplete by
birth cohort and gender
0.0
0.1
0.2
0.3
0.4
0.5
0.6
0.7
0.8
0.9
1.0
1940
1942
1944
1946
1948
1950
1952
1954
1956
1958
1960
1962
1964
1966
1968
1970
1972
1974
1976
1978
1980
Birth cohort
Perc
enta
ge
Female Male
Guatemala 2002Percentage of population w ith collegre degree or more by birth
cohort and gender
0.0
0.1
0.2
0.3
0.4
0.5
0.6
0.7
0.8
0.9
1.0
1940
1942
1944
1946
1948
1950
1952
1954
1956
1958
1960
1962
1964
1966
1968
1970
1972
1974
1976
1978
1980
Birth cohort
Perc
enta
ge
Female Male

38
Honduras 2002Percentage of population w ith no education and primary school incomplete
by birth cohort and gender
0.0
0.1
0.2
0.3
0.4
0.5
0.6
0.7
0.8
0.9
1.0
1940
1942
1944
1946
1948
1950
1952
1954
1956
1958
1960
1962
1964
1966
1968
1970
1972
1974
1976
1978
1980
Birth cohort
Perc
enta
ge
Female Male
Honduras 2002Percentage of population w ith primary school and secondary school incomplete
by birth cohort and gender
0.0
0.1
0.2
0.3
0.4
0.5
0.6
0.7
0.8
0.9
1.0
1940
1942
1944
1946
1948
1950
1952
1954
1956
1958
1960
1962
1964
1966
1968
1970
1972
1974
1976
1978
1980
Birth cohort
Perc
enta
ge
Female Male
Honduras 2002Percentage of population w ith secondary school and college incomplete by
birth cohort and gender
0.0
0.1
0.2
0.3
0.4
0.5
0.6
0.7
0.8
0.9
1.0
1940
1942
1944
1946
1948
1950
1952
1954
1956
1958
1960
1962
1964
1966
1968
1970
1972
1974
1976
1978
1980
Birth cohort
Perc
enta
ge
Female Male
Honduras 2003Percentage of population w ith collegre degree or more by birth cohort and
gender
0.00.10.20.30.40.50.60.70.80.91.0
1940
1942
1944
1946
1948
1950
1952
1954
1956
1958
1960
1962
1964
1966
1968
1970
1972
1974
1976
1978
1980
Birth cohort
Perc
enta
ge
Female Male
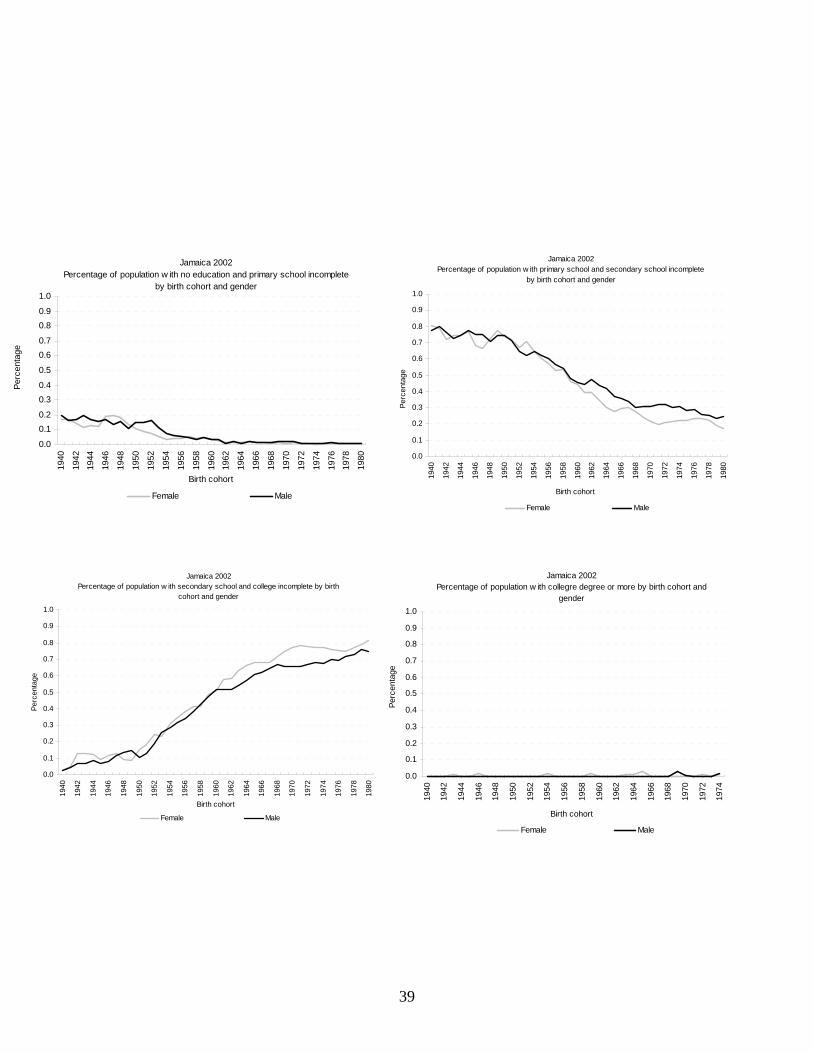
39
Jamaica 2002Percentage of population w ith no education and primary school incomplete
by birth cohort and gender
0.0
0.10.2
0.30.4
0.5
0.60.7
0.80.9
1.0
1940
1942
1944
1946
1948
1950
1952
1954
1956
1958
1960
1962
1964
1966
1968
1970
1972
1974
1976
1978
1980
Birth cohort
Perc
enta
ge
Female Male
Jamaica 2002Percentage of population w ith primary school and secondary school incomplete
by birth cohort and gender
0.0
0.1
0.2
0.3
0.4
0.5
0.6
0.7
0.8
0.9
1.0
1940
1942
1944
1946
1948
1950
1952
1954
1956
1958
1960
1962
1964
1966
1968
1970
1972
1974
1976
1978
1980
Birth cohort
Perc
enta
ge
Female Male
Jamaica 2002Percentage of population w ith secondary school and college incomplete by birth
cohort and gender
0.0
0.1
0.2
0.3
0.4
0.5
0.6
0.7
0.8
0.9
1.0
1940
1942
1944
1946
1948
1950
1952
1954
1956
1958
1960
1962
1964
1966
1968
1970
1972
1974
1976
1978
1980
Birth cohort
Perc
enta
ge
Female Male
Jamaica 2002Percentage of population w ith collegre degree or more by birth cohort and
gender
0.0
0.1
0.2
0.3
0.4
0.5
0.6
0.7
0.8
0.9
1.0
1940
1942
1944
1946
1948
1950
1952
1954
1956
1958
1960
1962
1964
1966
1968
1970
1972
1974
Birth cohort
Perc
enta
ge
Female Male

40
Mexico 2002Percentage of population w ith no education and primary school incomplete
by birth cohort and gender
0.0
0.1
0.2
0.3
0.4
0.5
0.6
0.7
0.8
0.9
1.0
1940
1942
1944
1946
1948
1950
1952
1954
1956
1958
1960
1962
1964
1966
1968
1970
1972
1974
1976
1978
1980
Birth cohort
Perc
enta
ge
Female Male
Mexico 2002Percentage of population w ith primary school and secondary school incomplete
by birth cohort and gender
0.0
0.1
0.2
0.3
0.4
0.5
0.6
0.7
0.8
0.9
1.0
1940
1942
1944
1946
1948
1950
1952
1954
1956
1958
1960
1962
1964
1966
1968
1970
1972
1974
1976
1978
1980
Birth cohort
Perc
enta
ge
Female Male
Mexico 2002Percentage of population w ith secondary school and college incomplete by birth
cohort and gender
0.0
0.1
0.2
0.3
0.4
0.5
0.6
0.7
0.8
0.9
1.0
1940
1942
1944
1946
1948
1950
1952
1954
1956
1958
1960
1962
1964
1966
1968
1970
1972
1974
1976
1978
1980
Birth cohort
Perc
enta
ge
Female Male
Mexico 2002Percentage of population w ith collegre degree or more by birth cohort and
gender
0.0
0.1
0.2
0.3
0.4
0.5
0.6
0.7
0.8
0.9
1.0
1940
1942
1944
1946
1948
1950
1952
1954
1956
1958
1960
1962
1964
1966
1968
1970
1972
1974
1976
1978
1980
Birth cohort
Perc
enta
ge
Female Male

41
Nicaragua 2001Percentage of population w ith no education and primary school incomplete
by birth cohort and gender
0.0
0.1
0.2
0.3
0.4
0.5
0.6
0.7
0.8
0.9
1.0
1940
1942
1944
1946
1948
1950
1952
1954
1956
1958
1960
1962
1964
1966
1968
1970
1972
1974
1976
1978
1980
Birth cohort
Perc
enta
ge
Female Male
Nicaragua 2001Percentage of population w ith primary school and secondary school incomplete
by birth cohort and gender
0.0
0.1
0.2
0.3
0.4
0.5
0.6
0.7
0.8
0.9
1.0
1940
1942
1944
1946
1948
1950
1952
1954
1956
1958
1960
1962
1964
1966
1968
1970
1972
1974
1976
1978
1980
Birth cohort
Perc
enta
ge
Female Male
Nicaragua 2001Percentage of population w ith secondary school and college incomplete by birth
cohort and gender
0.0
0.1
0.2
0.3
0.4
0.5
0.6
0.7
0.8
0.9
1.0
1940
1942
1944
1946
1948
1950
1952
1954
1956
1958
1960
1962
1964
1966
1968
1970
1972
1974
1976
1978
1980
Birth cohort
Perc
enta
ge
Female Male
Nicaragua 2001Percentage of population w ith collegre degree or more by birth cohort
and gender
0.0
0.1
0.2
0.3
0.4
0.5
0.6
0.7
0.8
0.9
1.0
1940
1942
1944
1946
1948
1950
1952
1954
1956
1958
1960
1962
1964
1966
1968
1970
1972
1974
1976
1978
1980
Birth cohort
Perc
enta
ge
Female Male

42
Panama 2003Percentage of population w ith no education and primary school incomplete
by birth cohort and gender
0.00.10.20.30.40.50.60.70.80.91.0
1940
1942
1944
1946
1948
1950
1952
1954
1956
1958
1960
1962
1964
1966
1968
1970
1972
1974
1976
1978
1980
Birth cohort
Perc
enta
ge
Female Male
Panama 2003Percentage of population w ith primary school and secondary school incomplete
by birth cohort and gender
0.0
0.1
0.2
0.3
0.4
0.5
0.6
0.7
0.8
0.9
1.0
1940
1942
1944
1946
1948
1950
1952
1954
1956
1958
1960
1962
1964
1966
1968
1970
1972
1974
1976
1978
1980
Birth cohort
Perc
enta
ge
Female Male
Panama 2003Percentage of population w ith secondary school and college incomplete by birth
cohort and gender
0.0
0.1
0.2
0.3
0.4
0.5
0.6
0.7
0.8
0.9
1.0
1940
1942
1944
1946
1948
1950
1952
1954
1956
1958
1960
1962
1964
1966
1968
1970
1972
1974
1976
1978
1980
Birth cohort
Perc
enta
ge
Female Male
Panama 2003Percentage of population w ith collegre degree or more by birth cohort and gender
0.0
0.1
0.2
0.3
0.4
0.5
0.6
0.7
0.8
0.9
1.0
1940
1942
1944
1946
1948
1950
1952
1954
1956
1958
1960
1962
1964
1966
1968
1970
1972
1974
1976
1978
1980
Birth cohort
Perc
enta
ge
Female Male

43
Peru 2003Percentage of population w ith no education and primary school incomplete
by birth cohort and gender
0.0
0.1
0.2
0.3
0.4
0.5
0.6
0.7
0.8
0.9
1.0
1940
1942
1944
1946
1948
1950
1952
1954
1956
1958
1960
1962
1964
1966
1968
1970
1972
1974
1976
1978
1980
Birth cohort
Perc
enta
ge
Female Male
Peru 2003Percentage of population w ith primary school and secondary school incomplete
by birth cohort and gender
0.0
0.1
0.2
0.3
0.4
0.5
0.6
0.7
0.8
0.9
1.0
1940
1942
1944
1946
1948
1950
1952
1954
1956
1958
1960
1962
1964
1966
1968
1970
1972
1974
1976
1978
1980
Birth cohort
Perc
enta
ge
Female Male
Peru 2003Percentage of population w ith secondary school and college incomplete by birth
cohort and gender
0.0
0.1
0.2
0.3
0.4
0.5
0.6
0.7
0.8
0.9
1.0
1940
1942
1944
1946
1948
1950
1952
1954
1956
1958
1960
1962
1964
1966
1968
1970
1972
1974
1976
1978
1980
Birth cohort
Perc
enta
ge
Female Male
Peru 2003Percentage of population w ith collegre degree or more by birth cohort and gender
0.0
0.1
0.2
0.3
0.4
0.5
0.6
0.7
0.8
0.9
1.0
1940
1942
1944
1946
1948
1950
1952
1954
1956
1958
1960
1962
1964
1966
1968
1970
1972
1974
1976
1978
1980
Birth cohort
Perc
enta
ge
Female Male

44
Paraguay 2003Percentage of population w ith no education and primary school incomplete
by birth cohort and gender
0.0
0.1
0.2
0.3
0.4
0.5
0.6
0.7
0.8
0.9
1.0
1940
1942
1944
1946
1948
1950
1952
1954
1956
1958
1960
1962
1964
1966
1968
1970
1972
1974
1976
1978
1980
Birth cohort
Perc
enta
ge
Female Male
Paraguay 2003Percentage of population w ith primary school and secondary school incomplete
by birth cohort and gender
0.0
0.1
0.2
0.3
0.4
0.5
0.6
0.7
0.8
0.9
1.0
1940
1942
1944
1946
1948
1950
1952
1954
1956
1958
1960
1962
1964
1966
1968
1970
1972
1974
1976
1978
1980
Birth cohort
Perc
enta
ge
Female Male
Paraguay 2003Percentage of population w ith secondary school and college incomplete by birth
cohort and gender
0.0
0.1
0.2
0.3
0.4
0.5
0.6
0.7
0.8
0.9
1.0
1940
1942
1944
1946
1948
1950
1952
1954
1956
1958
1960
1962
1964
1966
1968
1970
1972
1974
1976
1978
1980
Birth cohort
Perc
enta
ge
Female Male
Paraguay 2003Percentage of population w ith collegre degree or more by birth cohort and
gender
0.0
0.1
0.2
0.3
0.4
0.5
0.6
0.7
0.8
0.9
1.0
1940
1942
1944
1946
1948
1950
1952
1954
1956
1958
1960
1962
1964
1966
1968
1970
1972
1974
1976
1978
1980
Birth cohort
Perc
enta
ge
Female Male
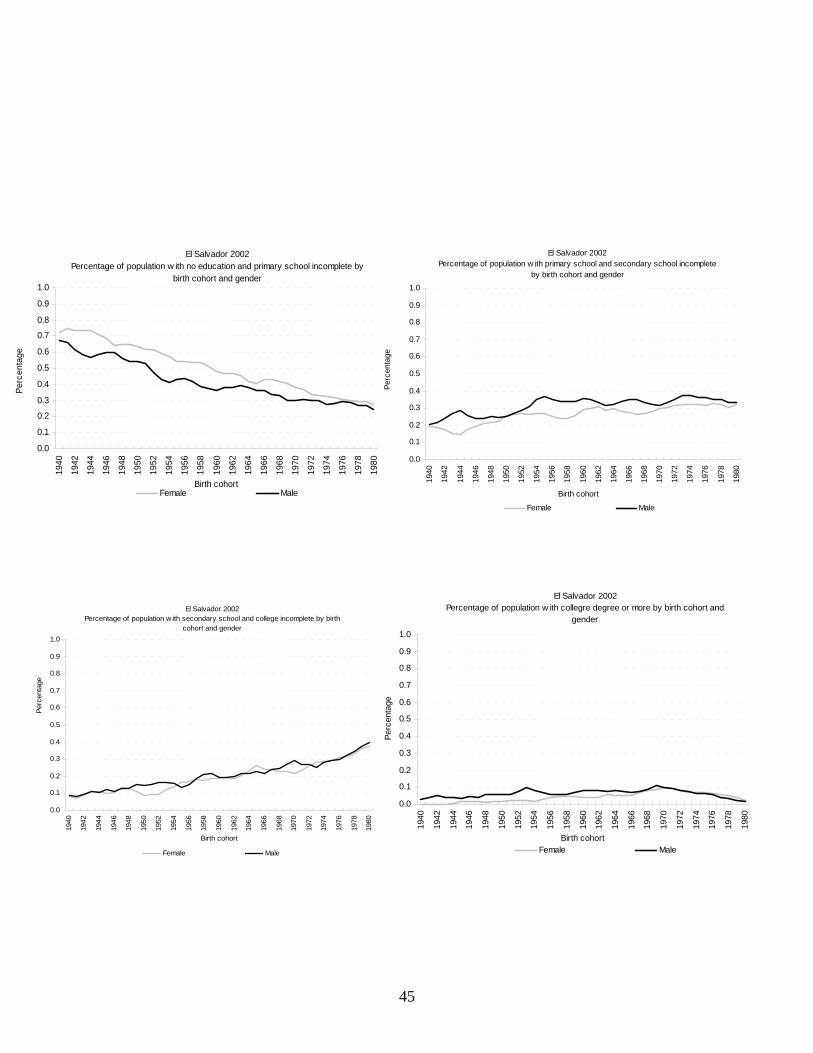
45
El Salvador 2002Percentage of population w ith no education and primary school incomplete by
birth cohort and gender
0.0
0.1
0.2
0.3
0.4
0.5
0.6
0.7
0.8
0.9
1.0
1940
1942
1944
1946
1948
1950
1952
1954
1956
1958
1960
1962
1964
1966
1968
1970
1972
1974
1976
1978
1980
Birth cohort
Perc
enta
ge
Female Male
El Salvador 2002Percentage of population w ith primary school and secondary school incomplete
by birth cohort and gender
0.0
0.1
0.2
0.3
0.4
0.5
0.6
0.7
0.8
0.9
1.0
1940
1942
1944
1946
1948
1950
1952
1954
1956
1958
1960
1962
1964
1966
1968
1970
1972
1974
1976
1978
1980
Birth cohort
Perc
enta
ge
Female Male
El Salvador 2002Percentage of population w ith secondary school and college incomplete by birth
cohort and gender
0.0
0.1
0.2
0.3
0.4
0.5
0.6
0.7
0.8
0.9
1.0
1940
1942
1944
1946
1948
1950
1952
1954
1956
1958
1960
1962
1964
1966
1968
1970
1972
1974
1976
1978
1980
Birth cohort
Perc
enta
ge
Female Male
El Salvador 2002Percentage of population w ith collegre degree or more by birth cohort and
gender
0.0
0.1
0.2
0.3
0.4
0.5
0.6
0.7
0.8
0.9
1.0
1940
1942
1944
1946
1948
1950
1952
1954
1956
1958
1960
1962
1964
1966
1968
1970
1972
1974
1976
1978
1980
Birth cohort
Perc
enta
ge
Female Male
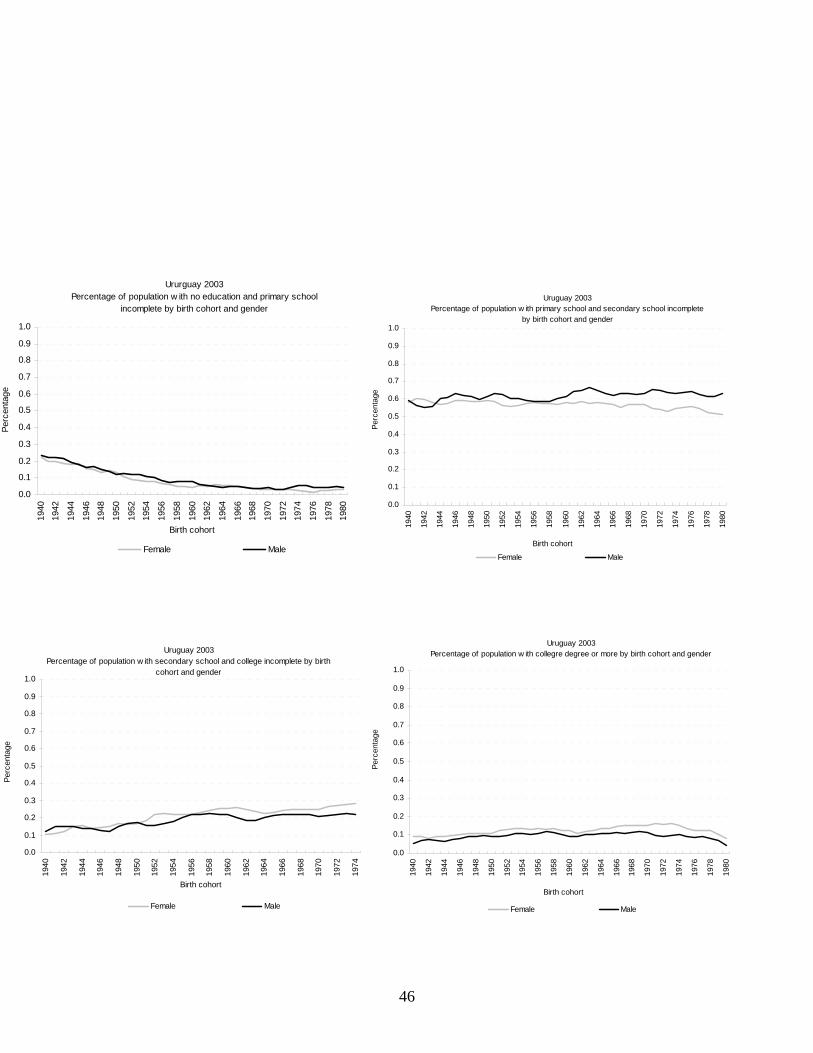
46
Ururguay 2003Percentage of population w ith no education and primary school
incomplete by birth cohort and gender
0.0
0.1
0.2
0.3
0.4
0.5
0.6
0.7
0.8
0.9
1.0
1940
1942
1944
1946
1948
1950
1952
1954
1956
1958
1960
1962
1964
1966
1968
1970
1972
1974
1976
1978
1980
Birth cohort
Perc
enta
ge
Female Male
Uruguay 2003Percentage of population w ith primary school and secondary school incomplete
by birth cohort and gender
0.0
0.1
0.2
0.3
0.4
0.5
0.6
0.7
0.8
0.9
1.0
1940
1942
1944
1946
1948
1950
1952
1954
1956
1958
1960
1962
1964
1966
1968
1970
1972
1974
1976
1978
1980
Birth cohort
Perc
enta
ge
Female Male
Uruguay 2003Percentage of population w ith secondary school and college incomplete by birth
cohort and gender
0.0
0.1
0.2
0.3
0.4
0.5
0.6
0.7
0.8
0.9
1.0
1940
1942
1944
1946
1948
1950
1952
1954
1956
1958
1960
1962
1964
1966
1968
1970
1972
1974
Birth cohort
Perc
enta
ge
Female Male
Uruguay 2003Percentage of population w ith collegre degree or more by birth cohort and gender
0.0
0.1
0.2
0.3
0.4
0.5
0.6
0.7
0.8
0.9
1.0
1940
1942
1944
1946
1948
1950
1952
1954
1956
1958
1960
1962
1964
1966
1968
1970
1972
1974
1976
1978
1980
Birth cohort
Perc
enta
ge
Female Male
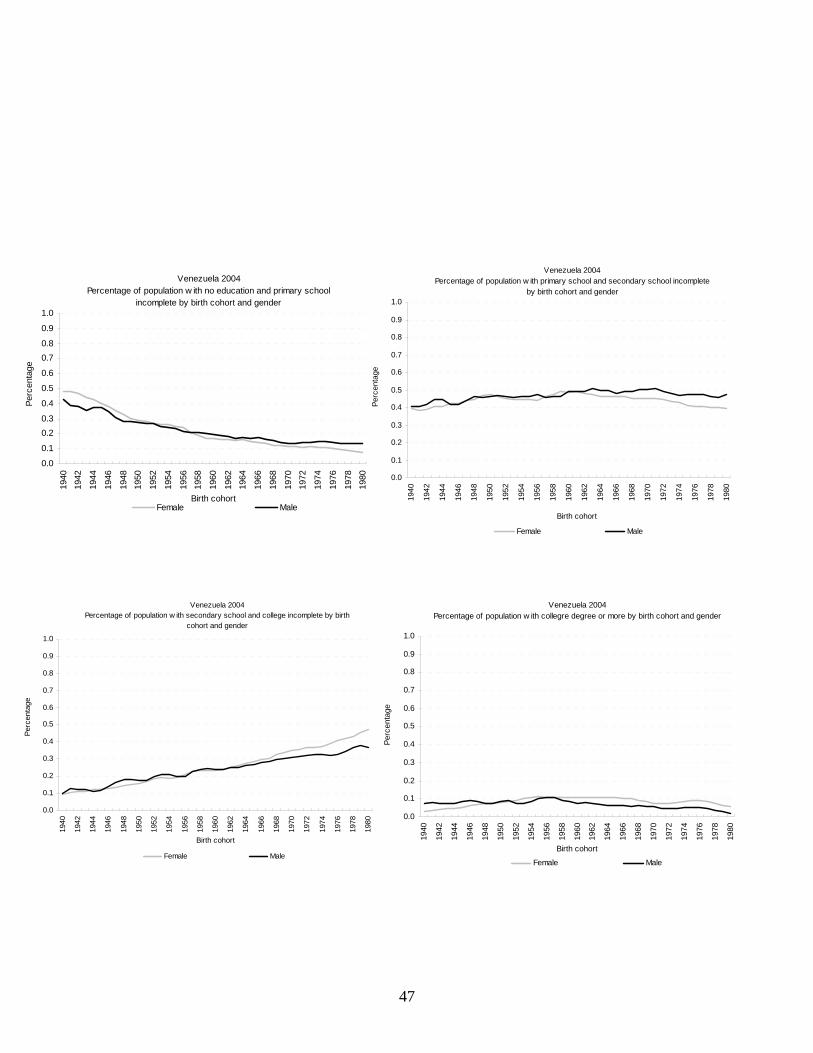
47
Venezuela 2004Percentage of population w ith no education and primary school
incomplete by birth cohort and gender
0.0
0.1
0.20.3
0.4
0.5
0.6
0.70.8
0.9
1.0
1940
1942
1944
1946
1948
1950
1952
1954
1956
1958
1960
1962
1964
1966
1968
1970
1972
1974
1976
1978
1980
Birth cohort
Perc
enta
ge
Female Male
Venezuela 2004Percentage of population w ith primary school and secondary school incomplete
by birth cohort and gender
0.0
0.1
0.2
0.3
0.4
0.5
0.6
0.7
0.8
0.9
1.0
1940
1942
1944
1946
1948
1950
1952
1954
1956
1958
1960
1962
1964
1966
1968
1970
1972
1974
1976
1978
1980
Birth cohort
Perc
enta
ge
Female Male
Venezuela 2004Percentage of population w ith secondary school and college incomplete by birth
cohort and gender
0.0
0.1
0.2
0.3
0.4
0.5
0.6
0.7
0.8
0.9
1.0
1940
1942
1944
1946
1948
1950
1952
1954
1956
1958
1960
1962
1964
1966
1968
1970
1972
1974
1976
1978
1980
Birth cohort
Perc
enta
ge
Female Male
Venezuela 2004Percentage of population w ith collegre degree or more by birth cohort and gender
0.0
0.1
0.2
0.3
0.4
0.5
0.6
0.7
0.8
0.9
1.0
1940
1942
1944
1946
1948
1950
1952
1954
1956
1958
1960
1962
1964
1966
1968
1970
1972
1974
1976
1978
1980
Birth cohort
Perc
enta
ge
Female Male
48
Appendix B B.1 Classification of Schooling by Country We use the reported level and highest grade completed within each level to create the measure of
completed years of schooling. Only grades which were successfully completed are included in
this measure. Individuals are also classified according to seven mutually exclusive levels of
schooling, each with a corresponding dummy variable, classified as follows:
No Education: Individuals who have completed 0 years of primary school.
Includes individuals who may have attended first grade but never passed.
Primary incomplete: Individuals who have at least one year of completed
schooling but did not complete the primary level
Primary complete: Individuals who have completed the last year of primary
education
Secondary incomplete: Individuals who have completed at least one year of
secondary education but did not complete the last year of secondary education
Secondary complete: Individuals who have completed the last year of
secondary education
University incomplete: Individuals who have completed at least one year of
post-secondary education but have not completed 4 or 5 years of post-
secondary education. Includes individuals who have completed degree
courses of 2-3 years.
University complete: Individuals who completed at least 4 or 5 years of post-
secondary education depending on the country.
Many countries have introduced educational reforms in recent years regarding the
definition of the number of years comprising primary education. We do not necessarily use the
most current classification system of schooling as reported by UNESCO but in most cases prefer
more traditional schooling classifications. As this paper examines temporal evolution in
schooling outcomes starting with cohorts born in the 1940s, we start with classifications that are
a better match with the decisions faced by these cohorts and thus can better measure changes
over time, especially at low levels of schooling.

49
As opposed to the information provided by the surveys for primary and secondary
schools, tthe information provided with respect to tertiary education is usually insufficient to
specify degree completion. In the interest of comparing similar post-secondary outcomes over
time we have defined university complete as the successful completion of 4 or 5 years of tertiary
schooling, depending on heaping observed in the data. The duration of the levels of schooling for
each country can be seen in the table below.
Table B.1. Duration of Levels of Schooling
Country Primary Secondary TertiaryArgentina 7 5 5Bolivia 5 7 4Brazil 4 7 4Chile 8 4 5Colombia 5 6 5Costa Rica 6 5 5Dominican Republic 8 4 4 or 5Ecuador 6 6 4 or 5El Salvador 6 6 4 or 5Guatemala 6 6 5Honduras 6 6 5Mexico 6 6 5Nicaragua 6 5 5Panama 6 6 5Peru 6 5 5Paraguay 6 6 5Uruguay 6 6 4Venezuela 6 5 5

50
Table B.2. Specific Questions on School Attendance in Latin American and the Caribbean
Household Surveys Country Question
Argentina Asiste o asistio a la escuela?
BoliviaDurante este año, ¿Se inscribió o matriculó en algún curso o grado de educación escolar o superior?
Brazil …..Frecuenta escola ou creche?
Chile¿Asiste actualmente a algún establecimiento educacional, jardin infantil, sala cuna u otro programa preescolar no convencional?
Colombia Actualmente….estudia? (asiste actaulmente a colegio, universidad o escuela)
Costa Rica ¿Asiste a...… ...preparatoria? ...escuela? ...colegio? ...parauniversitaria? ...universidad? ...enseñanza especial? ...educación abierta (para presentar exámenes ante el MEP)?
...No asiste
Guatemala ¿Asiste actualmente al ciclo escolar del 2002?
Honduras Asiste actualmente a algun centro educativo?
Jamaica What type of school is … attending this academic year?
Mexico Asistencia a un centro educativo formal/Asistencia a un centro educativo tecnicoActualmente va a la... preprimaria… primaria… secundaria… preparatoria… profesional o postgrado
Nicaragua Se matriculo en el presente ano escolar en el sistema educativo formal?
Panama ¿Asiste a la escuela actualmente?
Peru Asiste … a algun centro educativo o estudia algo actualmente?
Paraguay ¿Asiste ... Actualmente a una institución de enseñanza formal?
El Salvador Estudia Actualmente o asiste a un centro maternal?
Uruguay Asistencia a establecimento de enseñanza
Venezuela Asistencia a un centro de educación
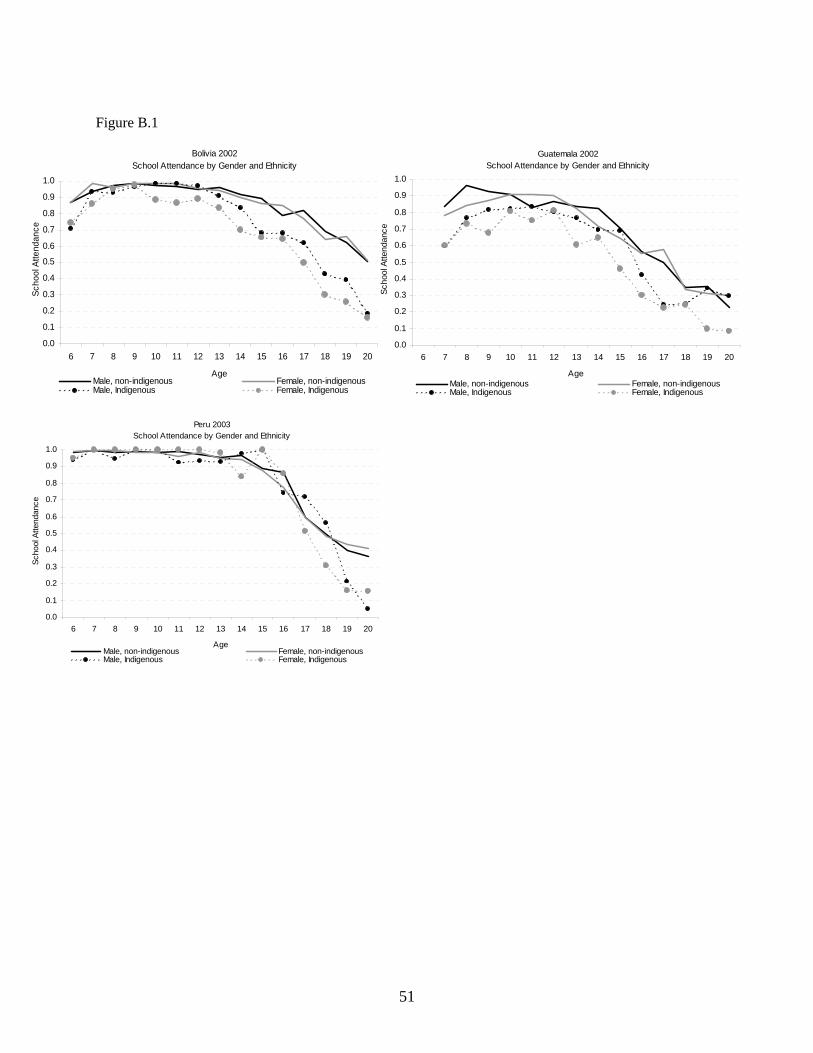
51
Figure B.1
Peru 2003School Attendance by Gender and Ethnicity
0.0
0.1
0.2
0.3
0.4
0.5
0.6
0.7
0.8
0.9
1.0
6 7 8 9 10 11 12 13 14 15 16 17 18 19 20
Age
Scho
ol A
ttend
ance
Male, non-indigenous Female, non-indigenousMale, Indigenous Female, Indigenous
Bolivia 2002School Attendance by Gender and Ethnicity
0.0
0.1
0.2
0.3
0.4
0.5
0.6
0.7
0.8
0.9
1.0
6 7 8 9 10 11 12 13 14 15 16 17 18 19 20
Age
Scho
ol A
ttend
ance
Male, non-indigenous Female, non-indigenousMale, Indigenous Female, Indigenous
Guatemala 2002School Attendance by Gender and Ethnicity
0.0
0.1
0.2
0.3
0.4
0.5
0.6
0.7
0.8
0.9
1.0
6 7 8 9 10 11 12 13 14 15 16 17 18 19 20
Age Sc
hool
Atte
ndan
ceMale, non-indigenous Female, non-indigenousMale, Indigenous Female, Indigenous
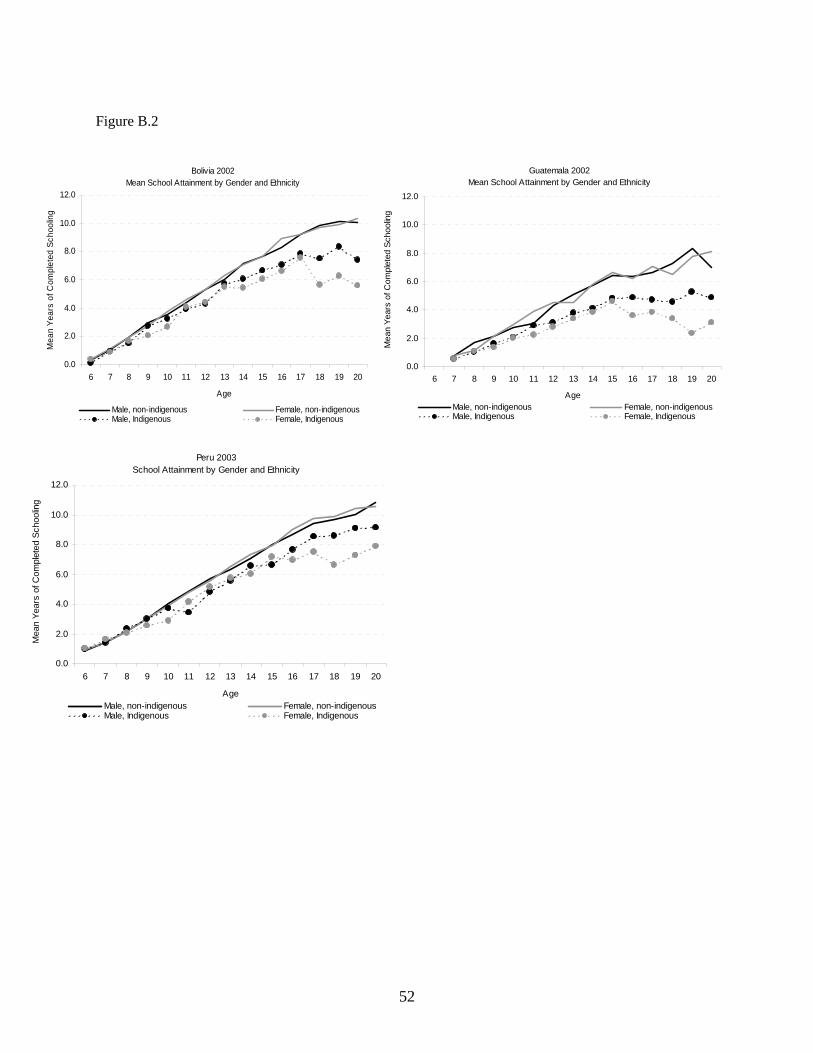
52
Figure B.2
Bolivia 2002Mean School Attainment by Gender and Ethnicity
0.0
2.0
4.0
6.0
8.0
10.0
12.0
6 7 8 9 10 11 12 13 14 15 16 17 18 19 20
Age
Mea
n Ye
ars
of C
ompl
eted
Sch
oolin
g
Male, non-indigenous Female, non-indigenousMale, Indigenous Female, Indigenous
Guatemala 2002Mean School Attainment by Gender and Ethnicity
0.0
2.0
4.0
6.0
8.0
10.0
12.0
6 7 8 9 10 11 12 13 14 15 16 17 18 19 20
AgeM
ean
Year
s of
Com
plet
ed S
choo
ling
Male, non-indigenous Female, non-indigenousMale, Indigenous Female, Indigenous
Peru 2003School Attainment by Gender and Ethnicity
0.0
2.0
4.0
6.0
8.0
10.0
12.0
6 7 8 9 10 11 12 13 14 15 16 17 18 19 20
Age
Mea
n Ye
ars
of C
ompl
eted
Sch
oolin
g
Male, non-indigenous Female, non-indigenousMale, Indigenous Female, Indigenous
Copyright © 2022 FDOKUMEN