THE ECONOMIC DEVELOPMENT OF THE GREEK OLIVE ...
662
THE ECONOMIC DEVELOPMENT OF THE GREEK OLIVE-OIL INDUSTRY WITH SPECIAL REFERENCE TO MESSENIA PROVINCE A thesis submitted to the University of Salford for the degree of Doctor of Philosophy by Anna Giannopoulou Department of Economics University of Salford June, 1990
-
Upload
khangminh22 -
Category
Documents
-
view
0 -
download
0
Transcript of THE ECONOMIC DEVELOPMENT OF THE GREEK OLIVE ...

THE ECONOMIC DEVELOPMENT OF THE GREEK
OLIVE-OIL INDUSTRY WITH SPECIAL REFERENCE
TO MESSENIA PROVINCE
A thesis submitted to the University of Salfordfor the degree of Doctor of Philosophy
by
Anna Giannopoulou
Department of EconomicsUniversity of Salford June, 1990

This thesis is dedicated to Dimitris
Kotaheas, my uncle, whose moral and
financial support made this study
possible.
II

ABSTRACT
This study examines the economic development of the Greek Olive
Industry. Its focal point is the impact of recent socio-economic
processes on the structure and organisation of the industry. In the
first part, which is concerned with the rural sector, it is argued that
olive cultivation and its development through time, has been
constrained by a number of social, structural and institutional factors
which are identified and their influence is then discussed. It is
contended that recent changes due to the imposition of the EEC regime
have brought about socio-economic processes which have considerably
affected the mode of organisation of the rural sector in particular and
the whole industry in general.
In the second part of this study, which is concerned with the urban
sector, it is argued that during the last decade, rapid change has
transformed the outlook of the second-stage processing of the industry.
This change has affected the structure in two ways. First, there has
been a large increase inkhe number of small packing units which operate
in domestic market niches and compete for a share in the export trade.
Secondly, there has been a concentration of output and economic power
in the hands of three leading packers, two multinational subsidiaries,
and the cooperative enterprise Eleour7_giki. The financial base of this
industrial change, though, is somewhat artificial. In particular,
expansion in production and the modernisation process which has been
taking place recently, are largely based on the CAP support system to
the second-stage processing and packing, and also to large amounts of
earnings which every year go through tax evasion.

Abstract
List of Tables
List of Figures
Glossary
Acknowledgements
INTRODUCTION
PART ONE
Page
III
I v
XVII
X X
X X V
17
TABLE OF CONTENTS
CHAPTER ONE
OLIVE-OIL AND OLIVE CULTIVATIONIN THE ECONOMY OF RURAL GREECE
THE CULTIVATION OF THE OLIVETREE: ENVIRONMENTAL CONDITIONSAND EVOLVING TECHNIQUES OFPRODUCTION
Introduction
1.1 Physiological Characteristics and HistoricalDevelopment
1.2 The Influence of Environmental Factors
1.2.1 Climate and Temperature
1.2.2 Rainfall
1.2.3 Soil
1.3 Methods of Cultivation and the Pattern ofProduction
1.3.1 Soil Cultivation and Weeding
1.3.2 Fertilisation
1.3.3 Irrigation
1.3.4 Alternating Production Pattern
1.4 The Application of New Techniques
1.4.1 Choice of Environment
1.4.2 Land Preparation
17
21
28
28
30
31
32
32
34
37
40
42
44
45

Conclusions
Tables - References
CHAPTER TWO OLIVE CULTIVATION AND CHANGESIN THE AGRARIAN STRUCTURE
72
74
91
1.4.3 Training of the Trees 45
1.4.4 The Layout of the Olive Groves 46
1.5 The Stages of Olive Production 48
1.5.1 Pruning 48
1.5.2 Ripening of the Olive 51
1.5.3 Harvesting 52
1.6 The Input Costs of the Major Factors of 59Production
1.7 The Trend of Production, 1950-1988: World and
65Greek National Production of Olives and Olive-Oil
Introduction 91
2.1 Greek Olive Growing and the Evolving Agrarian 94Structure
2.1.1 Production Relations in Greek
94Villages, c.1827-1871
2.1.2 The 1871 Land Reform and its
97Consequences
2.1.3 The 1922 Land Reform 99
2.2 Merchant Capital and the Cooperative Movement 107
2.3 The Role of the State 113
2.3.1 Inter-War Policy113
2.3.2 Post-War Policy 117
2.3.3 Policy under the EEC Regime 124
2.4 Changes in the Production Structure in theOlive Sector Since the 1960's 131

Conclusions '140
Tables - References 143
CHAPTER THREE DETERMINANT FACTORS IN THESUPPLY OF OLIVE-OIL: A CASE 164
STUDY OF TWO VILLAGES INMESSENIA PROVINCE
164Introduction
3.1 Estimation of an Olive-Oil Function • 166
3.2 An Estimation of the Greek Olive-OilSupply Function 1950-1988 175
3.2.1 The Data 175
3.2.2 Specification of the Model andof the Variables Used
176
3.2.3 The Results 178
3.3 The Province of Messenia 182
3.3.1 The Village of Avia 187
3.3.1a Demography and Land Tenure 189
3.3.1b Mechanisation and the Labour193
Process196
3.3.1c Marketing199
3.3.2 The Village of Coryfasi
2013.3.2a Demography
• 3.3.2b Olive Growing and Land Tenure 202
3.3.2c The Household and the Labour 205Process in Olive Growing
3.3.2d Marketing 206
3.3.3 Comparisons- between the Two 210Villages
Conclusions 214
Tables - Figures - References 216

275
281
282
297
297
299
CHAPTER FOUR THE DEVELOPMENT OF OIL-MILLING 234
Introduction 234
4.1 Extraction of Olive-Oil from the Olive Fruit
236
4.2 Growth and Concentration of the Milling Sector 240
4.3 Employment in Oil-Milling 247
4.4 Technological Progress
254
4.4.1 The Problem in Perspective 254
4.4.2 Suppliers of Technology to the 256Oil-Milling Sector
4.4.3 Types of Technological 262
Processes Used in Milling
. 267
4.5 Cooperatives versus the Private Sector in Oil-Milling
4.6 State Policy and the Oil-Milling Sector
Conclusions
Tables - Figures - References
PART TWO THE DEVELOPMENT OF URBANPROCESSING IN THE OLIVEINDUSTRY
CHAPTER FIVE THE CAP REGIME AND SECOND STAGEPROCESSING OF OLIVE-OIL
Introduction
5.1 A General Overview of the EEC Food and DrinkIndustries
5.1.1 The Multinational Presence 308
5.2 The C.A.P. and Second Stage Processing 319
5.3 Structural Similarities and Differences between 327Olive Producing Member States
5.4 Cross Section Price Comparisons between Italy, 337Spain and Greece.
Conclusions 340
Tables - Figures - References 342
VII

CHAPTER SIX
STRUCTURAL CONSEQUENCES OF
364INDUSTRIAL CHANGE IN THE SECONDSTAGE PROCESSING OF OLIVE-OIL
Introduction 364
6.1 The Development of the Second Stage Processingand Packing Sub-Sector 367
6.1.1 The Packers 368
6.1.2 Refineries and Olive Residue 374
Plants
3846.1.3 Table Olive Processing Units
6.2 Structural and Organisational Features of the 390Groups of Second Stage Processing Units
6.2.1 The Cooperative Organisation 392
6.2.2 Eleourgiki 396
6.3 Seed-Oils Processing Units 403
Conclusions 410
Tables - Figures - References 412
CHAPTER SEVEN AN INVESTIGATION INTO THEFINANCIAL PERFORMANCE OF A
443SAMPLE OF COOPERATIVE ANDPRIVATE PACKERS OF OLIVE-OIL
Introduction 443
7.1 The Packers of Messenia Province 445
7.1.1 Definitions 445
7.1.2 Description of the Sample 447
7.1.3 Technology Used and Buildings 476
7.2 Access to Markets 480
7.3 The Financial Situation of the Small Firms 483
Conclusions 486
Tables - References 488

CHAPTER EIGHT CHANNELS OF DISTRIBUTION AND
504MARKETING OF OLIVE-OIL
Introduction 504
8.1 Domestic Marketing of Olive-Oil
509
8.2 Changes in the Patterns of Consumer Demand and
516Expenditure
8.2.1 Pre-War Consumption and Trade 516
8.2.2 Post-War Olive-Oil ConsumerDemand and Expenditure 518
8.2.3 The Table Olive Market
521
8.2.4 The Olive Residue Oil and Seed
525Oils Markets
8.3 An Estimation of the Greek Olive-Oil Demand 532Function, 1958-1988.
5328.3.1 The Data
8.3.2 Specification of the Model and 534of the Variables Used.
8.3.3 The Results 536
8.4 Marketing Strategies 533
8.5 National, EEC and International Marketing of 544Olive Products and Seed-Oils.
8.5.1 Olive-Oil
544
8.5.2 Table Olives and Olive Residue
551Oil
8.5.3 Oil Seed-Oils
558
Conclusions
563
Tables - References 566
CONCLUSION593
Appendixes to Chapter Three 600
Appendix to Chapter Six 610
Bibliography 612
IX

LIST OF TABLES
Table
Thermic Criteria of the Olive Tree.
Results of the Study of Untilled Soil, Tilledand Weeding of Dry Olive Groves.
Average Olive Production, 1978-1985 (inkgr/tree).
Average Olive Production, 1978-1985 (inkgr/ha).
Urbanization in Greece and the Province ofMessenia (in percentages).
Seasonal Distribution of Labour Days, 1975-1976.
Production Cost of Olive-Oil, 1975-1976.
Production Cost of Olive-Oil, 1984.
Production of Olive-Oil by Country, 1950-88.
World Production of Edible-Oils.
Area and Number of Olive Trees for Olive-OilProduction in Greece.
Varieties of Olive Trees Cultivated in Greece.
Olive-Oil Production by Country, 1968-1981.
Edible Olive Production in Greece, 1960-1988.
Area and Trees for Edible Olive Production.
Annual Compound Rates of Growth of Olive-OilProduction.
Olive-Oil and Edible Olive Production andExports between 1920-1937.
Percentage Contribution of Olive-Oil Productionby Administrative Area: 1920, 1937.
Total Number of Olive Trees in Production, theArea of Wild-Olive Trees in Acres and theNumber of Wild Olive Trees per Acre, 1939.
Number of Olive Growing Families, Number of
•
Page
1.1
1.2
1.3
1.4
1.5
1.6
1.7
1.8
1.9
1.10
1.11
1.12
1.13
1.14
1.15
1.16
2.1
2.2
2.3
2.4
28
79
4 7
47
60
61
80
82
83
85
86
8 7
88
90
A9
71
15 0
103
15 1
153
X

109
115
155
156
120
157
159
160
126
129
161
162
136
139
167
222
Rural Families and the Populatfon of Greece byProvince in 1939.
2.5 The Composition of Agricultural Cooperatives in1931.
2.6 Composition of Tax Duties on 1 kgr of Olive-Oil when it was Traded Within Greece, (Lesbos,1930).
2.7 Olive-Oil Production in Lesbos: the Compositionof Producer Expenditure per Stremma, 1930.
2.8 Fertilizer subsidies in Greece, 1956-1975.
2.9 Cost of Olive Spraying in Greece.
2.10 Credit Provision to Agriculture and the OtherSectors of the Economy, 1948-1983.
2.11 Quantities of Olive-Oil Collected by the State,and the Storage Cost Between 1957/58 - 1976/77.
2.12 Common Prices Fixed at the Beginning of theMarket Year for Semi-Fine Olive-Oil 3° underthe EEC's CAP and World Prices, 1966/67 to1977/78.
2.13
The EEC Price Mechanism for the Olive-OilMarket, Marketing Year 1978/79.
2.14
Olive-Oil Market Mechanism-Common Prices, 1970-1984.
2.15
EEC Price Support System on Olive-Oil, 1980/81- 1986/87.
2:16
The Size Distribution of Holdings in the OliveSector, 1961-1984.
2.17 Percentage Reductions of Production Aid toCover the Cost of the Olive CultivationRegister.
2.18
Income of Olive Growers after the Action ofEleourigiki, 1981/82 - 1987/88.
3.1
Estimates of Price Elasticity of the GreekOlive-Oil Supply Function, 1950-1975.
3.2 Number of Trees and Annual Olive-Oil Productionon National, Administrative and ProvincialLevels, 1963-1984.
XI

227
212
3.3 Number of Newly Planted Olive Trees, 1972-1987. 173
3.4 (a) Data Used for the Estimation of the Greek 223Olive-Oil Supply Function, 1950-1988.
3.4 (b) Results of the Greek Olive-Oil Supply Function 2241950-1988.
3.5 Sub-Regional Distribution of Olive-Oil 13Production in Messenia, 1988.
3.6 Land-holding in Avia in the 1980's Compared 226'With Messania and with the National Average.
3.7 Land Distribution and Olive-Oil Produced in 2031900 in Avia Village.
3.8 Land-holding in Coryfasi in the 1980's Comparedwith Messenia and with the National Average.
3.9 Number of Olive Growers and their GeneralSources of Income in Avia and Coryfasi.
4.1 Geographical Distribution of Oil-Mills, 1931. 290
4.2 Oil-Mills: Number of Establishments and Numberof Persons Engaged by Branch in 1951.
4.3 Types of Power Used in Oil-Milling. 292
4.4 Regional Distribution of Oil-Mills, 1988. 293
4.5 Number of Oil-Mills, Employment and Horse- 251Power, 1978-1984.
4.6 Production of an Oil-Mill in Coryfasi, 1930, 2561970 and 1988.
4.7 Production of 78 Oil-Mills of Messenia 265Province.
4.8 Production of the "Olive Cooperative ofCoryfasi" during 1983/84 - 1987/88.
4.9 Medium-Term Loans by the ABC, 1980-1985.
5.1 Employment in the EEC's Food and DrinkIndustries (EEC-9).
5.2 The Top 10 EEC Manufacturing Industries in1977, (in terms of gross output and gross valueadded).
21)1
271
278
349
300
XII

419
420
422
376
423
378
424
381
425
5.3
Main Indicators, Vegetable and Animal Oils andFats.
5.4
Overall Results of the European Oils Industryin 1986.
5.5
Olive-Oils and Edible Olive Residue Oils, 1986-1987.
5.6
Budgetary Expenditure on Olive-Oil, 1979 to1984.
5.7
Market Shares of Leading Brands of Olive-Oil,1979.
5.8
Market Share of the Leading Brands of Seed andVegetable Oils, 1979.
5.9 Relative Producer Price Indicies for Olive-Oil:Index Price = 100, the EEC Intervention Pricefor Courante 1984/85.
5.10 Comparison of Average Producer Prices during1984/85 in Italy, Greece and Spain.
6.1 Packing Enterprises by Region 1970, 1978 and1983.
6.2 Imports of Olive-Oil Processing Equipment.
6.3 Survey Results of Packing Units in 1988.
6.4 The Ten Largest Packers of Olive-Oil, 1981/2,1982/3 and 1984/5.
6.5 Regional Distribution of Refineries 1970, 1978.
6:6 Number of Olive Residue Plants, Employment andCapacity.
6.7 Regional Distribution of Olive Residue Plants,1988.
6.8
Distribution of Olive Residue Plants Accordingto Capacity.
6.9 Consolidated Balance-Sheets of a RepresentativeSample of Firms in the Olive-Residue Sub-Sector, 1983-1985.
6.10 Sample Accounting Ratios.
6.11 Accounting Ratios of the Sample, the Food
304
305
307
350
329
332
351
352
418
X II I

Industry and the Total Industry, during 1983-1985.
6.12 Consolidated Balance-Sheets of the Sample ofOlive Residue Plants between 1986-1988.
6.13 Sample Accounting Ratios, 1986-1988. 383
6.14 Number of Table Olive Processing Units, 385Employment and Capacity.
6.15 Table Olive Processing Units According to 385Employment Size, 1984.
6.16 Regional Distribution of Olive Processing Units 427in 1984.
6.17 Production of Olives 1981/1982. 387
6.18 Consolidated Balance Sheets of the Sample ofTable Olive Processing Units.
6.19 (a) Accounting Ratios of Table Olive ProcessingUnits.
6.19 (b) Accounting Ratios of the Sample, the FoodIndustry and the Total Industry, between 1983-1985.
6.20 The Sample Firms.
6.21 (a) Capital Sources of ABC, 1980-1984. 430
6.21 (b) Distribution of ABC's Capital, 1980-84. 430
6.22 Cooperative Debts to the ABC, April 1989. 431
6. '23 Members of Eleourgiki by Administrative Area. 393
6.24 Volume and Value of Sales by Eleourgiki, 1981- 3991988.
4016.25 Eleourgiki's Exports Sales Volume.
6.26 Eleourgiki's Expenditure on Olive-Oil and 432Soaps, 1986.
6.27 Number of Seed-Oils Units, Employment and 403Capacity.
426
428
429
429
388
6.28 Regional Distribution of Seed-Oil Units in 4331985.

502
466
474
475
6.29 Output and Production Techniques of Seed-Oils 434
Units, 1985.
6.30 Capacity Utilization of Seed-Oils Units, 4351983/84.
6.31 Consolidated Balance Sheets of the Sample of 436Seed-Oil Firms, 1983-1986.
6.32 Accounting Ratios of the Sample of Seed-Oils 408Firms.
7.1 Sample Enterprises. 448
7.2 Sales Value of "Kefalea Bros". 450
7.3 Production Structure, Sales and Sales Value of 497"Kefalea Bros", 1980-1987.
7.4 Profit-Loss Account of Kefalea Bros. 498
7.5 Kefalea Bros. Accounting Ratios. 455
7.6 Export and Total Sales Value of Eleourgia 457Messenias during 1985-1989.
7.7 Profit-Loss Account of Eleourgia Messenias 499during 1986-1988.
7.8 Eleourgia Messenias Accounting Ratios. 459
7.9 Sales Value of •Andreas Yefteas during 1984-1988.
7.10 Profit and Loss Account of Andreas Yefteas S.A. 501
7..11 Andreas Yefteas S.A. Accounting Ratios between 4631985/1988.
7.12 Total and Export Sales Value of Plemmenou Bros, 464during 1985/86 - 1987/88.
Profit and Loss Account of Plemmenou Bros.
Plemmenou Bros, Accounting Ratios between 1986-1988.
7.15 Olive-Oil Production at the First StageProcessing at Gargalianoi.
7.16 Production at the Second Stage Processing andMarketing, Gargalianoi, 1981-1986.
500
7.13
7.14
X V

7.17 Equipment and Buildings Used by 12 Second-StageProcessing Units in the Olive Industry ofMessenia Province.
8.1 Eleourgiki's Expenditure on Advertising, 1981- 5121984.
8.2 Exports of Greek Olive-Oil by Country of 571Destination, 1932-1939.
8.3 Olive-Oil Consumption Patterns, 1981/82. 572
8.4 Consumption of Olives, 1981-1986. 573
8.5 World Trade Balance in Table Olives; Average of 5741981/82 - 1984/85.
8.6 (a) Index of Wholesale Olives' Prices, 1968-1983. 575
8.6 (b) Comparison of the Producer Cost and Wholesale 575Price Index.
8.7 Intervention Prices to Olive Producers, 1978/79 576- 1986/87.
8.8 EEC Prices for Olive Residue Oil 1982/83- 5771987/88.
8.9 Olive Residue Oil Collected by YDAGEP during 5281981-84.
8.10 Per Capita Consumption of Oils and Fats in 530Greece, 1988.
8.11 Retail Prices of Oils in Greek Super-Markets, 5311984-1985.
8.12 Data Used in Estimating the Greek Olive-Oil 578Demand Function, 1958-1988.
8.13 Results of the Greek Olive-Oil Demand Function, 5791958-1988.
8.14 Percentage of Total Sales Exported by the 5 3 9Sample Firms, 1985-1988.
5C0
8.15 Export Markets for Greek Olive-Oil, 1968-1982.
8.16 Percentage of Sample Firms' Exports to Italy, 5411985-1989.
8.17 Production, Consumption, Imports and Exports of 581Olive-Oil, 1968/69 - 1983/84.
479
IC I

8.18
Exports of Olive-Oil, 1975-1986. 582
8.19
Negative Monetary Compensation Amounts on 5/46Olive-Oil Exports.
8.20 The 1988 Consumption of Olive-Oil per Capita in 547the EEC.
8.21 World and EEC Consumption of Olive-Oil 1975/76
583- 1984/85.
8.22 Imports and Exports of Olive-Oil in the EEC-10, 5481983-1985.
8.23 Trade Balance of Olive-Oil in the EEC, Average 549of 1975/76 - 1984/85.
8.24 Greek Exports of Table Olives Over 1981-1986. 551
8.25 F.O.B. Prices of Olives 584
8.26 National Subsidies on Olive Exports. 585
8.27 Annual Consumption of Table Olives per Capita. 553
8.28 Consumption of Table Olives in the EEC-10 and 586EEC-12, 1981/82 - 1984/85.
8.29 Negative MCAs on Olive Residue Oil from 5557/9/1987.
8.30
Exports of Olive Residue Oil duririg 1976-1986. 555
8.31
Exports of Refined and Unrefined Olive Residue- 556Oil.
8.32 Trade Balance of Olive Residue Oil in EEC-10, 5571983-1985.
587
8.33 Imports of Oil-Seeds, 1982-1986.
8.34 Suppliers of Greek Oil-Seed Imports during 5591982-1986.
8.35
Imports of Oil Seed Oils, 1982-1986. 588
8.36
Origin of Oil Seed Oils Imports during 1982- 5601986.
8.37 Importers of Greek Oil Seeds and Oil Seed Oils'
589Exports, 1982-1986.
8.38 Exports of Oil Seed Oils, 1982-1986. 590
XVII

8.39
8.40
Figure
3.1
3.2
3.3
3.4
3.5
4.1
4.2
4.3
5.1
5.2
5.3
5.4
5.5
5.6
5.7
5.8
5.9
5.10
5.11
Analysis of Oils Consumption in the EEC. 591
Trade Balance of Oils in the EEC, 1983-1985. 5(12
LIST OF FIGURES
Olive-Oil Production in Greece, Peloponnesos 228and Messenia.
Greek Olive-Oil Production, Yt Plotted for 229
1950-1988.
The Logarithm of the Greek Olive-Oil 230
Production, LYt Plotted for 1950-1988.
Real Olive-Oil Producer Price, Pt , Plotted 231
for 1950-1988.
The Logarithm of the Real Olive-Oil Producer 232Price, LPt , Plotted for 1950-1988.
The Process of a Classical Oil-Mill. 294
The Process of a Centrifugal Oil-Mill. 295
The Process of a Mixed Oil-Mill. 296
Average Major Countries per Product Line 302for EEC-based Companies
Minerva Sales Volume, 1981-1987. 353
Profitability Comparison : Elais and Minerva 354
Commercialization Networks and Estimated 355Product Flows for Spanish Olive-Oil.
Average Producer Prices, 1984-1985 : Extra. 356
Average Producer Prices, 1984-1985: Fine 357
Average Producer Prices, 1984-1985: Lampante 358
Average Producer Prices, 1984-1985: Courante 359
Average Producer Prices, 1984-1985: Refined 360
Average Producer Prices, 1984-1985: Olive 361Residue Oil.
Average Producer Prices, 1984-1985, 362Refined Residue Oil.
XVIII

5.12 Comparison of Lampante and Refined Olive-Oil
363during 1984/85 in Italy, Greece, Spain.
4376.1 A Schematic Presentation of Refining andPacking based on 1988 throughput Data.
6.2 The Packing Process of Edible Olive-Oilin Eleourgiki, 1988.
6.3 1982-1983 Share of the Olive-Oil Market
6.4 1985 Share of the Greek Olive-Oil Market
6.5 The Structure of the Olive CooperativeMovement.
6.6 Sales Volume of Eleourgiki: 1978-1988.
438
439
440
441
442
XIX

GLOSSARY
A.B.G. Agricultural Bank of Greece
Acidity The content of olive-oil in oleic acid per 100 gr.
Alki Olive-oil brand sold by Eleourgiki. This refers tochemically processed olive-oil whose acidity doesnot exceed 1.50.
Alt is Olive-oil brand sold by Elais. This refers tochemically processed olive-oil whose acidity doesnot exceed 1.50.
Atrazine Chemical used during olive tree weeding. This actsat root level and on the seeds during growth.
Azapa Olive tree variety grown in Chile, well known forits full bearing capacity.
Blanquetta Portuguese olive variety used for the production ofolive-oil.
Coroneiki Greek olive variety, mainly grown in Peloponnesosand used for the production of olive-oil.
Conservolia Greek olive variety used for the production ofedible olives.
Coupee Chemically processed olive-oil whose acquiredacidity does not exceed 1.50.
Chiflik Large land holders who bought the land from theTurkish as they left Greece in 1929.
Consumption Aid A fixed amount determined annually by the EEC andpaid to the packing units with respect to olive-oilwhen packaged in containers suitable for the retailtrade.
Courante Olive-oil with 1.5 0 - 3•30 oleic acid content per100 gr. suitable for human consumption.
C.C.U.M. Central Cooperative Union of Messenia.
C.A.P. Common Agricultural Policy
Decanter Container within which the olive-oil is extractedfrom the olive paste through centrifugalseparation.
Decati
Tax system under which the State received one-tenth.of the cultivators output in kind. It wasabolished in the early 1930s.
XX

Dacus
E.O.M.E.H.
E.C.U.
E.T.U.C.
E.A.G.G.F.
Extra Virgin
Parasite, which attacks the leaves of the olivetree and destroys the fruit.
National Organisation of Small and MediumEnterprises.
European Currency Unit.
European Trade Unions Confederation.
European Agricultural Guidance and Guarantee Fund.
Olive-oil with 0-1° oleic acid content per 100gr,immediately suitable for human consumption.
E.E.C. European Economic Community.
Fraises Piece of Equipment Used in Ploughing.
F.D.I.C. Food and Drink Industries Council.
Fine Olive-oil with 1-1.5° oleic acid content per 100gr,immediately suitable for human consumption.
F.A.O. Food and Agriculture Organisation.
F.E.K. Official Government Newspaper.
Galega Vulgar
Portuguese olive variety mainly used for theproduction of olive-oil.
G.A.T.T. General Agreement on Tariffs and Trade.
Gramoxone Chemical used during olive-tree weeding. It actson the green parts of the tree and takes effectafter 1-2 days.
Guardia di Finanza Italian agency acting on behalf of the Ministry ofIndustry.
Green drachma The common price system in the context of theC.A.P. required a set of internal exchange rates toconvert national currencies to a commondenominator. These were "Green Currencies" oragricultural money, and examples are the greendrachma and the green pound.
Holiblanco Spanish olive variety used both for production ofedible olives and olive-oil.
I.H.P.O.C. Institute of Hypotropical Plants and OliveCultivation.

I.O.O.C.
Kalamon
Liotrivi
Lamnante
Megaritiki
Mastoidis
M.A.P.A.
M.C.A.
Intervention Price This is the price at which olive-oil is bought bythe intervention agencies. It is equal to theProduction Target Price less the Production Aidpaid to the producers plus an allowance whichcovers market fluctuations and the cost oftransporting olive-oil from producing to consumingareas.
International Olive-Oil Council.
Edible olive variety grown in Calamata, in theprovince of Messenia.
Courante olive-oil brand sold by Eleourgiki.
Olive-oil unsuitable for immediate consumption with3.30 - 120 oleic acid content per 100 gr.
Greek olive variety used both for production ofedible olives and olive-oil.
Greek olive variety used for production of olive-oil and mainly grown in Crete.
Spanish Ministry of Agriculture, Fisheries andNutrition.
Monetary Compensation Amounts. A system introducedby the Community in order to offset the differencebetween the green rate and the real exchange rate.
Mouzarilla Spanish olive variety used for production of edibleolives.
N.S.S.G. National Statistical Service of Greece.
National Lands Lands which passed onto the hands of the newlycreated Greek State after the 1821-1829 War ofIndependence against the Turks.
Nomos Administrative division correeponding to an Englishprovince.
Olea Chrysophylla Olive tree variety grown in tropical Africa. It isclaimed that many modern tree varieties originatedfrom it.
Olea Europaea Olive tree variety grown in Europe and especiallyin the Mediterranean region.
Ordinary Virgin The new name given to Courante olive-oil sinceNovember 1st 1987.
XXII
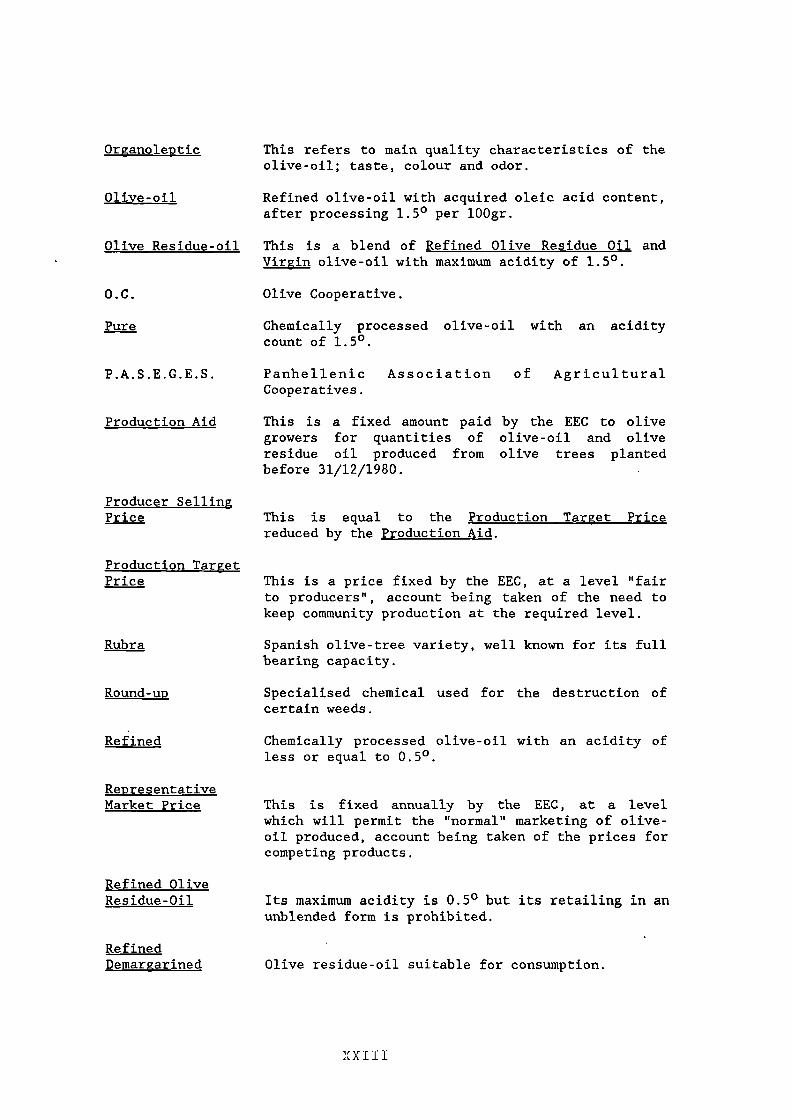
Organoleptic This refers to main quality characteristics of theolive-oil; taste, colour and odor.
Olive-oil Refined olive-oil with acquired oleic acid content,after processing 1.5° per 100gr.
Olive Residue-oil This is a blend of Refined Olive Residue Oil andVirgin olive-oil with maximum acidity of 1.5°.
O.C. Olive Cooperative.
Pure Chemically processed olive-oil with an aciditycount of 1.50.
P.A.S.E.G.E.S. Panhellenic Association of AgriculturalCooperatives.
Production Aid This is a fixed amount paid by the EEC to olivegrowers for quantities of olive-oil and oliveresidue oil produced from olive trees plantedbefore 31/12/1980.
Producer SellingPrice This is equal to the Production Target Price
reduced by the Production Aid.
Production TargetPrice This is a price fixed by the EEC, at a level "fair
to producers", account being taken of the need tokeep community production at the required level.
Rubra Spanish olive-tree variety, well known for its fullbearing capacity.
Round-up Specialised chemical used for the destruction ofcertain weeds.
Refined Chemically processed olive-oil with an acidity ofless or equal to 0.50.
Representative Market Price This is fixed annually by the EEC, at a level
which will permit the "normal" marketing of olive-oil produced, account being taken of the prices forcompeting products.
Refined OliveResidue-Oil
RefinedDemargarined
Its maximum acidity is 0.5° but its retailing in anunblended form is prohibited.
Olive residue-oil suitable for consumption.
XXIII
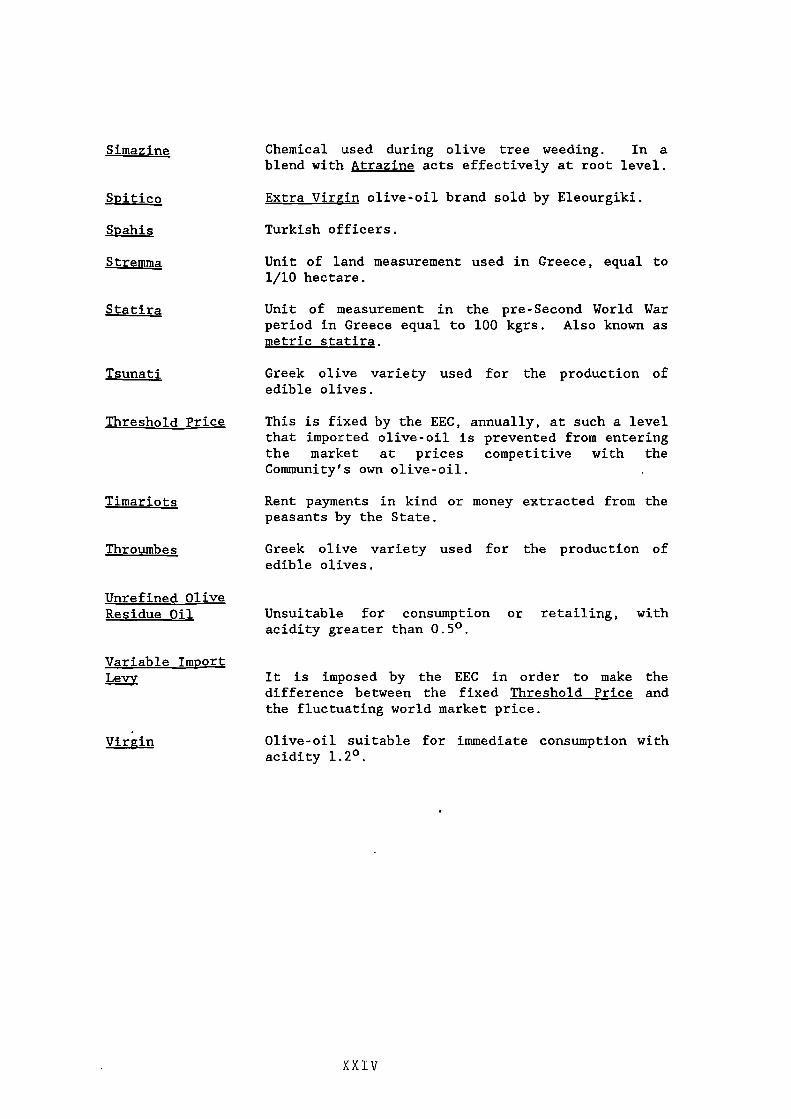
Simazine Chemical used during olive tree weeding. In ablend with Atrazine acts effectively at root level.
Spitico Extra Virgin olive-oil brand sold by Eleourgiki.
Spahis Turkish officers.
Stremma Unit of land measurement used in Greece, equal to1/10 hectare.
Statira Unit of measurement in the pre-Second World Warperiod in Greece equal to 100 kgrs. Also known asmetric statira.
Tsunati Greek olive variety used for the production ofedible olives.
Threshold Price
Timariots
Throumbes
Unrefined OliveResidue Oil
Variable Import
L.tYY
This is fixed by the EEC, annually, at such a levelthat imported olive-oil is prevented from enteringthe market at prices competitive with theCommunity's own olive-oil.
Rent payments in kind or money extracted from thepeasants by the State.
Greek olive variety used for the production ofedible olives.
Unsuitable for consumption or retailing, withacidity greater than 0.5°.
It is imposed by the EEC in order to make thedifference between the fixed Threshold Price andthe fluctuating world market price.
Virgin Olive-oil suitable for immediate consumption withacidity 1.2°.
X XIV

ACKNOWLEDGEMENTS
I would like to thank Dr. C. Simmons, my supervisor, for his useful
suggestions, critical comments, and valuable help throughout my
studentship at Salford University.
I am thankful to Mr. V. Yannopoulos of the Trade Institute of
Messenia, Mr. Tsarbopoulos of the Agricultural Institute of Messenia,
Mr. N. Eftaxopoulos of Eleourgia Messenias and Mr. P. Katsikeas, Head
of the Export and Finance Department of the Ionian Bank who granted me
access to some of the Bank's records, concerning the operations of
major processors of Messenia province.
I owe my indebtedness to Mr. V. Evagellou of the A.B.G, Mr. V.
Zambounis of Eleourgiki, Mr. Y. Xiloyianni of PASEGES, Mr. Y Cotsis of
the Ministry of Commerce, Mr. L. Melas of Elais, Mr Vasilopoulo of
Minerva and all the processors and millers of Messenia province for
their help during my research. I am also grateful to all the farmers
of • the villages Coryfasi, Avia and Tseria for their important
contribution through their personal experiences and their warmth and
help throughout my visit to the above mentioned villages. I would also
like to thank Mrs Kathy Mitchell for typing this thesis efficiently.
Finally, I must mention that the constant encouragement and support
of my parents and my brother Niko have been of immense value to me
during my studies in the U.K.
XXV

INTRODUCTION
Within the last decade the Greek economy has been engaged in a
process of economic integration in the European Community and, as a
result, most sectors of the domestic economy have been affected in some
way. In the context of the changes arising from accession the olive
industry has been experiencing a process of "modernisation" within the
ambit of rural industrialization. In an unusually short and
accelerated time frame the traditional structures of the industry have
been subject to profound change. More specifically, accession had two
initial consequences for the Greek food industry in general and the
olive industry in particular. The first was a significant transfer of
resources through Community funds from the CAP budget to the olive
industry - especially transfers arising from price intervention which
were channelled into consumption rather than productive investment.
The second was transnational acquisitions which form part of the
current restructuring of the Europe-wide food industry. Taken
together this net inflow of funds and the process of structural
transformation have altered the nature and prospects of this long
established industry.
The cultivation of the olive and the production of olive-oil is one
of the oldest of the organised agro-processing activities associated
with the Greek people, countryside and culture. This ancient lineage
signifies the strength of traditional economic ties and of deeply
embedded social forms in the evolving structure and subsequent
development of the olive industry. It is the long history of olive
1

cultivation spanning many centuries which has made it an important part
of Greece's national heritage, and has an obvious reflection in the
farmers' special attachment to the crop and the important place of the
olive press in village life. To this day around 350,000 farms (over
one third of the total number) include olive growing as an integral
part of their agricultural operations. Olive cultivation absorbs about
40 million labour days a year, equivalent to some 22% of the total
labour force in the agricultural sector. Furthermore, about 65% of the
labour required for cultivation is needed during the months between
October - January, which allows for a more evenly balanced distribution
of labour time in the rural sector as a whole. (1) This is because the
greater part of the demand for agricultural labour occurs between the
Spring and Summer seasons. Currently, olive production contributes 13-
14% of gross agricultural product and 1.5% of G.D.P (1982-1986).
Also, its share in total agricultural exports was about 6-7% over 1980-
1986.(2)
The main objective of this thesis is to study the economic
development of the Greek olive oil industry in the light of the recent
changes which have been taking place. I shall attempt to identify the
major elements prompting the current process of transformation which
is threatening to turn the Greek olive sector into just another
industry and into an integral part of the wider European food industry.
Such a trend was originally postulated in the works on rural
industrialization and can be traced back to the late 19th and early
20th century contributions of Kautsky) Lenin, and Chayanov. (3 ) Although
my analysis acknowledges the prescient value of the early theoretical
2

debate, and its continuation right up till today, I do not propose to
address directly these issues. Indeed they are only considered in so
far as they help yield a better understanding of the processes observed
in the contemporary Greek case.
The field research for this study was undertaken periodically
between 1987 and the Summer of 1989. A substantial proportion of the
material used was obtained from primary sources and include the records
of a number of second stage processing units in Messenia province; the
records of the two multinational subsidiaries (Elais and Minerva), and
those of the dominant cooperative enterprise (Eleourgiki); the records
of a number of cooperative oil-mills in Messenia; relevant regional
archives in the Town Hall at Pylos and Calamata; the records of the
Institute of Trade and Commerce including that of the Customs House
also in Messenia; and a variety of company reports obtained through
ICAP (a market research company). A great deal of information was also
obtained through personal interviews, particularly those conducted with
farmers (the fieldwork questionnaire appears in the appendix to Chapter
Three), and with officials from the banks, relevant trade organisations
and civil servants in the respective Ministries of Commerce, Economics
and Agriculture.
This thesis is divided in two interrelated parts. The first is
concerned with the rural areas and the second with the urban sector of
the industry. I argue that the core of the modernisation process which
has been occurring originated in the urban-based processing sector
which, by responding to external incentives, has brought about

important socio-economic change in agriculture. In the 1980's
production of olives per unit of land has doubled and, in some cases
tripled, because of the application of certain scientific and
technological advances. Partly as a result of this both olive-oil
production, and the primary transformation of the agricultural
product, experienced significant productivity gains. This development
of the forces of production went hand-in-hand with a decisive change in
the mode of organisation. The cooperative movement was strengthened and
this enabled the small family unit to survive. In this respect
development cannot be seen to have taken place along the unilinear
principles as advanced by the classical Marxist writers because,
although there was conflict and struggle between the private and the
cooperative sectors, this did not lead to either the emergence of an
agrarian bourgeoisie or a proletarianised rural wage labour force.(4)
This is not to deny the process of rural differentiation which followed
the land reforms of the late 19th and the early 20th century. But the
contradictory path of differentiation as experienced in the olive
sector is closely related to some of the underlying contradictions
under way in society at large. In particular, the special features and
peculiarities of the Greek economy as a whole, where the pace of
industrial development itself has been comparatively slow and halting
over the course of this century and certainly has not proceeded in the
same way as other West European States, limits the scope for production
along the lines of the classical Marxists' perception of the
development of capitalism in agriculture (at least as interpreted by
Lenin and his followers). On the other hand a number of modern
researchers have argued that agriculture in many of the developed
4

economies has undergone a process of profound structural change in the
post-War period, sometimes even referred to as a second agricultural
revolution. (5) It has been suggested that this is characterised by
"the progressive extension of technological, organizational and
economic rationality into the arena of farm operations, linking them
even more closely to the other sectors of the economy both materially
and in ethos". (6) Farms have become larger, more capital-intensive and
certainly far more specialised in production; and farmers have
increasingly followed the precepts of rationalisation apparent in other
industries. (7)
The structure and organisation of production in Greek agriculture
though has been shaped by a number of socio-economic and political
developments quite different from those which have been operative in
the core Western European countries. In accounting for anatexplaining
these developments, the role of the State must figure prominently. In
the post-War period a wide range of support policies was provided by
the Greek State to the agricultural sector. The reasons for this are
connected with the rising demand coming from the urban population; and
the rural exodus of younger members of the labour force in the 1960's
as a result of relatively low levels of agricultural incomes, and the
increased employment opportunities in the western economies. So
improvements did occur .but only in the limiting context of the
maintenance of the small scale mode of organisation which, coupled with
an on-going process of plot fragmentation, constituted a constraint
upon the further development of agriculture.
5

In recent years different aspects of the EEC regime have induced
some restructuring in the Greek countryside. In the case of the olive-
oil, agricultural production has undoubtedly been subject to
modernising influences, but the chief dynamic behind the forces of
change has been primarily exogenous. More specifically, as merchants
invested in processing in order to upgrade their function and hence
take full advantage of new opportunities provided by accession, fresh
demands were placed upon the rural sector. These amounted to specific
requirements for better quality olive-oil which, in turn, had important
logistical implications for the acquisition of supply of olive-oil in
bulk. This had two connected but quite distinct results for the rural
areas. First it stimulated a technological transformation in the first
stage processing of olive-oil (at the mill) which went along with some
restructuring of olive farms into larger units at a national level.
Secondly, it affected the mode of organisation of agriculture in
general and the whole olive-oil industry in particular. Olive
cooperatives were established in most olive producing areas of the
country. Despite these forces the small scale mode of family
enterprise managed to survive.
Such an outcome was debated intensively earlier this century with
regard to the Russian and later Soviet experience, and it may be
instructive to rehearse some of the relevant points of argument.
Chayanov in discussing this line of development in 1925, wrote:

"The dynamic processes of agricultural proletarianization and
concentration of production leading to large-scale agricultural
production units based on hired labour, are developing throughout
the world, and in the U.S.S.R [before collectivisation], at a rate
much slower than was expected at the end of the 19th
century.. .Nevertheless, it is clear to everyone working in th field
of agriculture that literally before our eyes the world's
agriculture, ours included, is being more and more drawn into the
general circulation of the world economy, and the centres of
capitalism are more and more subordinating it to their
leadership". (8)
Chayanov thus accepted that some differentiation of the peasantry was
taking place - but he interpreted it in demographic rather than class
.—.terms as Lenin had earlier tried to do. Furthermore, once
agriculture has been drawn into commodity production, Chayanov
continues, it tends to become subordinate to the interests of a
combined merchant - usurer's capital. The next step is that capitalism
begins to impinge upon the organisation of production. New higher
yielding seeds and modern inorganic fertilizers make an entry and
indeed the capitalist mode itself begins to penetrate production. This
does not become immediately manifest on the farms but rather in the
primary processing of agricultural raw materials. Such a development
is a critical component of the unfolding process of change. Chayanov
therefore claims that "despite the evident, scattered and independent
nature of the small commodity producers, agriculture converts into an
economic system concentrated in a series of the largest undertakings
7

and, through them, entering the sphere controlled by the most advanced
forms of finance capitalism". (9) Then he goes on to specify the form
of capitalist penetration as vertical concentration. At this point the
concept of cooperatives becomes crucial to his theory. When private
entrepreneurial capital is weak, the vertical concentration can take on
a cooperative appearance. So cooperatives represent "a deep process of
vertical concentration in agriculture". The essence of his work - and
of the important neo-populist tradition which follows - is the emphasis
upon the viability of peasant agriculture, and its ability to survive
and pro .sTer under difficult and hostile circumstances through
conservation of the peasant institutional framework based upon family
labour and retention of the small holding. This vision of the future
therefore went neither along "pure" capitalist nor upon "pure"
socialist lines of development.
In the case of the Greek olive sector ) producers have organised
themselves into cooperatives in order to compete more effectively
against private capital, and to market their produce on the best
possible terms. Furthermore, because the political environment was
more favourable to them in the 1980s that at any other period it even
became possible for the producers' cooperative organisation to impose
its own rules upon the olive-oil trade - and hence safeguard the level
of farm gate prices (which, as we shall see were set above costs).
Partly as a result of this, industrial capital as represented by the
multinational subsidiaries and the larger domestic processor-packers,
has attempted to substitute away from olives to seed-oils.
8

It also appears that the motive force which is transforming the
rural sector of the 0 1 1w industry does not originate from within
agriculture itself - but rather stems from the urban processing sub-
sector. It is interesting to note that this type of development was
first identified in Kautsky's seminal work The Agrarian Question and,
indeed, is its main argument. (10) For Kautsky agro-industrial capital
in either private or cooperative form would prove to be the motor-force
behind the specific structural development of western agriculture in
the 20th century. But the exact mechanism by which this would occur is
never clearly spelt out and remains only implicit. As rents fall and
profits decline an advantage is created for the "middle" peasantry and
results in a flow of capital out of agriculture into agro-industry.
Kautsky specifically mentions dairies, breweries and sugar refineries
which become important investment avenues for the landlords and the
more capitalist oriented of the tenants. In this way, capital takes
hold of certain production processes previously located on the farms,
and moves them into industrial enterprises thus completely transforming
them and creating a situation of disarticulation. It is therefore in
agro-industry that the capitalist mode makes a first decisive
appearance.
An important and relatively recent contribution to the rural
industrialization debate with respect to the food system is provided by
the synthesising study of David Goodman et.al . (11) This lends some
modern support to the hypothesis originally posited by Kautsky and
takes it a stage further by relating it to agro-business and the
modernisation processes currently under way in all of the advanced
9

economies. They begin by arguing that industrial capital has not been
able easily to transform the agro-food system(covering agricultural
production through to final food consumption), into a unified whole.
Instead individual fractions of capital have intervened at different
points in the chain, giving rise to specific - and sometimes competing
- strategies of accumulation and growth. The development of
agriculture has therefore been characterized by the industrial
appropriation of discrete activities, and capitalist production is
increasingly located in towns rather than the countryside. The
modernisation processes found in the agriculture of all developed
economies have been well documented by researchers and agricultural
economists.( 12) It is shown further that these processes can in turn
lead to the industrialization of agriculture, where the emphasis
switches from conditions within the sector to the external relations
with the other sectors of the economy. This state of affairs has been
described as a move from agriculture to agrobusiness, where farming is
increasingly organised along scientific lines and run according to
modern principles and practices of business.
At the heart of this concept is the relationship between
agricultural production and two sets of activities - those which are
"upstream" or the agricultural supply industries (including chemicals,
feedstuffs and machine engineering), and those which are "downstream"
especially food processing. In reality, agrobusiness is the
incorporation of agriculture into sectors which deal with both the
provision of farm inputs and the processing and marketing of final
agricultural produce. This is reflected in the high level of
10

concentration in both the organisation of supply and in food
processing. A number of researchers have examined rural processes and
their articulation with urban based industry in order to obtain insight
into the wider debate concerning the capitalist development of
agriculture. My purpose is to place the case of the olive-oil industry
into this body of literature, and this may help to fill a gap in view
of the limited range of works on this industry.
In the first part of this study, which is concerned with the rural
sector, I argue that olive growing and its development through time,
has been constrained by natural conditions and a number of social,
structural and institutional factors. These were traced back to the
early 19th century and in particular to the 1827 War of Independence
against the Turks. In Chapter One it is contended that natural
conditions has been a constraint to the development of olive
cultivation. However, other factors contributing to this state of
affairs have been identified as the slow pace of development in the
application of the evolving techniques; labour shortages in the rural
sector; and also the fact that considerations of economic efficiency
must be placed into a wide social context encompassing the olive
growers' decision making horizons. In Chapter Two I try to show that
merchant capital became a constraint to the further expansion of the
sector through the system of debt bondage with respect to the
cultivators. Furthermore, the development of the olive cooperative
movement which reflected the struggle of the growers for greater
control over their own production, received little or no support from
the State. In such conditions the small scale organisation of olive
11

farming became the means by which the industry was articulated with the
needs of the rising urban population. It is further argued that until
the early 1950s the main policy of the State towards olive growing was
centered on how to extract part of the cultivators' income through
taxing the marketed produce. This action posed a further constraint
upon the expansion of olive-oil production since the small cultivators
were left with little surplus to reinvest in improving their working
conditions and methods of production. Finally, it is argued that the
small size of the agricultural holdings, coupled with the process of
plot fragmentation, held back development. It appears that the small
olive growers operating in such an environment could not behave as
profit maximizers. All of these constraints, together with the
continuing influence of the natural conditions, have acted as a brake
upon accumulation.
As a matter of fact, it will be shown that there have been periods
when the olive grower could hardly reproduce his own and family's
material existence. But if he has not been a profit maximizer how does
the olive grower behave? There have been many valuable contributions
to the theory of peasant decision-making. One of these, contributed by
M. Lipton argues that peasant farmers are so subject to conditions of
risk and uncertainty that they can best be seen as "optimizers" who
seek to strike a balance between the objective of maximising profits or
yields, and that of keeping the risk of failure to a minimum.(-3)
Another study of peasant decision-making use of game theory is that
contributed by Gould. He related actual cropping patterns of Ghanaian
peasant farmers to the "minimax" solution predicted by the theory-
1 2

that is, the solution which permits the highest possible level of
output to be achieved while keeping the risks of failure to a
minimum.( 14) In my research however, I have not sought to formulate a
decision-making model of the Greek olive growers. Rather my purpose
has been to identify those factors which have prevented the grower from
exercising control over the means of production and hence enjoying the
full rewards from his work and then discuss the affect of these factors
on the development of the sector. This objective is further realised
through my fieldwork in the villages of Avia and Coryfasi, presented in
Chapter Three. I argue that recent changes as a result of the
imposition of the EEC regime have brought about socio-economic
processes which have affected considerably the mode of organisation of
the rural sector in particular, and the whole industry in general. In
this context, through the case studies of the two villages I seek to
demonstrate the possible lines of development currently under way in
the Greek olive growing. Further, it is stressed that the developments
identified in our discussion of the experience of Avia and Coryfasi
should not be seen as isolated phenomena, but as a microcosm of wider
trends affecting the whole olive industry. However, the process of
large scale operation, the strong presence of the cooperative
organisation and the adoption of modern techniques in olive-oil
production become clearer in the oil-milling part of the industry-
which has been revolutionized. This part of the industry is discussed
in Chapter Four.
In the second part of this study, which is concerned with the urban
sector, I argue that during the last decade rapid change has
13

transformed the outlook of the second stage processing of the industry.
This has affected structure in two ways. First, there has been a large
increase in the number of small packing units which operate in domestic
market niches and compete for a share of the export trade. Secondly,
there has been a concentration of output and economic power into the
hands of three leading packers, two multinational subsidiaries and the
cooperative enterprise Eleourgiki. In Chapter Five I have attempted to
identify the main features of the environment within which the Greek
second stage processing of olive-oil has operated since 1981. The
discussion of the EEC price policy and that of restructuring
constitutes the main external forces behind recent developments in
this part of the Greek olive industry. Although the research focus is
primarily on developments affecting the Greek second stage processing
of olive-oil, attempts are made to compare the Greek experience with
_that of a number of other countries. More specifically, in Chapter Six
it is contended that the core of recent structural changes lies in the
packing and branding sub-sector which is now firmly articulated within
the CAP system. The refineries, table olive processing units and olive
residue plants have reacted only slowly and modestly to new external
incentives. Furthermore, I argue that structural change has
strengthened the position of cooperatives in this part of the industry.
This took place partly as a consequence of the favourable political
environment created by the PASOC Administration of 1981-1989, and
resulted in a shift of the locus of power within the industry towards
cooperative control via Eleourgiki. This meant support for the olive-
oil producer prices, but, by the same token, it also meant higher
input costs for the second stage processors. This has led the major
1L+

packers to gradually diversify production away from olive-oil and
towards seed-oils. Such action forced Eleourgiki to resort to a
similar strategy, which has began to undermine the base of the olive
industry and so affect deleteriously the interests of the olive
farmers. In order to gain further insight into the financial
performance of the second stage processors in the context of the
incentives provided by the CAP, a sample of firms was selected for
scrutiny. The results which are discussed in Chapter Seven, suggest
that the financial base of this is somewhat artificial. In particular,
expansion in production and the modernization process which has been
taking place recently, are largely based on the CAP support system to
the second stage processing and packing, and also to considerable sums
of earnings which every year go through tax evasion. However, the
conditions in the external market and the input price of olive-oil in
the domestic market appear to be the two decisive factors determining
the future of the olive industry packers. This state of affairs
suggests the need for a nationally based campaign to market and promote
Creek sales of branded virgin olive-oil abroad. The changes in the
marketing and distribution channels of olive-oil, as well as the
changing patterns of consumer expenditure, are discussed in Chapter
Eight.
15

References
1. A.B.G, Department of Vegetable Production, 1988.
2. N.S.S.G, Agricultural Production and Exports-Imports, 1987.
3. See V.I Lenin (1899), "The Development of Capitalism in Russia" inCollected Works, Vol.3 (London, 1960) and A.V. Chanyanov, TheTheory of Peasant Economy, (Homewood, 111, 1966) and J. Banaji, "ASummary of Kautsky's The Agrarian Question", Economy and Society,5,1, p.2-49, 1976, and K. Kautsky (1899) "The Agrarian Question" inP. Goode (ed.) Selected Political Writings, (London, 1983).
4. See V.I. Lenin, ibid and K. Marx (1865), Capital, Vol.1, (New York,1967).
5. See I. Wallace and W. Smith, "Agribusiness in North America", andI. Bowler "Some Consequences of the Industrialization ofAgriculture in the European Community" in M. J. Healey and B. W.Ilbery (eds) The Industrialization of the Countryside (Norwich,1985).
6. See I. Wallace, "Towards a Geography of Agribusiness", Unpublishedpaper, 1984, p.6. in ibid.
7. See H. Newby and P. Utting, "Agribusiness in the United Kingdom-social and political implications". Paper presented to the annualconference of the British Sociological Association, UniversityCollege, Aberystwyth, 1981.
8. See A. Chayanov, 1966, op.cit p.257, and G. Kitching, Developmentand Underdevelopment in Historical Perspective : Populism. Nationalism and Industrialization, (London, 1989).
9. See A. Chayanov, 1966, op.cit, p.262.
10. See J. Banaji, 1976, op.cit and K. Tribe and A. Houssain, Marxismand the Agrarian Question, Vo1.1: German Social Democracy and thePeasantry 1890-1907, (London, 1981).
11. See D. Goodman, B. Sorj and J. Wilkinson, From Farming toBiotechnology : A Theory of Agro-Industrial Development, (U.K,1987).
16

12. See D. K Britton and B. E. Hill, Size and Efficiency in Farming,(Farnborough, 1975) and B.E. Hill and K.A Ingersent, Economic Analysis of Agriculture, (London, 1977). For an insight intodevelopments int he U.S.A. agriculture, see E.G. Smith, Annals ofthe Association of American Geographers, 70, p.528-541, 1980 and H.Newby, preen and Pleasant Land? Social change in Rural England,(London, 1979).
13. See M. Lipton, "The Theory of the Optimising Peasant" Journal ofDevelopment Studies, 4,3 p.327-51, 1968.
14. See P. Gould, "Man Against his Environment : A Game TheoreticApproach", Annals of the Association of American Geographers, 53,p.290-7, 1963.

PART ONE
OLIVE-OIL AND OLIVE CULTIVATION
IN THE ECONOMY OF RURAL GREECE

CHAPTER ONE
THE CULTIVATION OF THE OLIVE TREE: ENVIRONMENTAL CONDITIONS AND EVOLVING
TECHNIQUES OF PRODUCTION
Introduction
The main objective of this chapter is to throw some light on two
basic factors which have influenced the specific development of olive
growing around the Mediterranean basin. One is the long historical
tradition of olive cultivation among Mediterranean peoples and their
cultures. The other is the natural conditions, embodying environment
and the physiology of the tree, which provides the Mediterranean region
with an ideal terrain for olive cultivation to flourish. The
historical tradition, affords an insight into the olive growers'
decision making process by means of incorporating the relevant
socio-economic and cultural dimensions which have shaped the olive
production process. Embedded, somewhere within this tradition is an
in-built set of natural conditions subject to which the cultivator has
had to operate through many centuries of active engagement in olive
growing.
Section One concentrates on identifying several aspects of the
physiology of the olive tree and how this has affected its historical
development. It is argued that while the economic and cultural
significance of olive cultivation to the ancient civilizations was of
considerable importance - although it is obviously difficult to be
17

precise because of the lack of surveiving data - the specific type of
socio-economic development in these regions constrained and even
blocked the expansion of olive growing. Thus it appears, for example,
that the nature of the Pax Romana in the Mediterranean basin shaped the
development of olive cultivation in the colonies by subordinating it
to domestic and foreign merchant capital.
Section Two focuses on the influence of environmental factors in
determining the tree's geographic extension or rather its
concentration. It is affirmed that the particular conditions suitable
for growth are ideally found in the Mediterranean region. The unique
adaptability of the tree though, makes it a suitable cultivation even
for areas with poor soils where no alternative crops exist and, partly
as a consequence, farming has tended to be a small-sized family-based
activity. It appears that environmental factors also directly impinge
upon the ability of the olive tree to bear fruit. Furthermore, optimal
combination of the natural factors is one of the necessary conditions
in order for the olive tree to bear fruit at anywhere approaching full
bearing capacity.
The methods of cultivation are the means by which the typical
olive grower attempts to influence the physiology of the tree within a
given environment so as to achieve the desired level of production.
These methods and the ways in which they have been applied are
discussed in Section Three. I argue that the alternate bearing cycle
of the olive tree, a result of both physiological conditions and
cultivation methods, poses a structural constraint upon the process of
18

olive growing. As a consequence the incomes of olive growers
fluctuate considerably from year to year.
In order to obtain a greater degree of uniformity of production
and also achieve maximum field bearing performance from the trees both
quantity and quality wise, certain new and more cost effective
techniques of cultivation are being advocated by the olive research
institutes. The application of these techniques and the specific ways
in which they can influence olive-oil production are examined in
Section Four. It is argued that this "new style" of cultivation could
revolutionize olive growing in terms of yields obtained and cost
reduction (during the production process) as shown by the Italian
case. In Greece, partial adaptation of the "new style" has taken place
with regard to enhancing productivity gains through the practice of
dense planting.
The specific way in which cultivation methods, the physiology of
the tree, and the introduction of new techniques combine together
defi-gp the stages of olive production. Section Five discusses the
operations involved in each successive stage and shows how these are
-affected by socio-economic considerations and by the attitude of the
farmers. More specifically, the harvesting operation alone accounts
for 60-80% of the total olive production cost. This fact combined with
a shortage of available labour in the olive growing regions, has
resulted in greater attempts to mechanise harvesting. It is shown that
even though such mechanisation is widespread in Italy and steadily
19

increasing in Spain, Greece has not gone down this route to any
significant extent.
The reasons for the rather modest rate of introduction of new
techniques are examined in the Sixth Section of this Chapter. The
recruitment of labour in Greece during the olive harvesting season has
become progressively more difficult since the early 1950's as more
people have left the rural sector in order to obtain urban based jobs.
This out-migration together with rising wages is one of the reasons why
mechanisation of harvesting is sometimes considered to be beneficial.
On the other hand, considerations of strict economic efficiency do not
seem to have been at the top of the list of priorities of the majority
of olive growers. They still engage in traditional cultivation often
under quite adverse conditions and through this channel they
relate to a changing social and political framework. In fact between
1976-1984 any reasonable explanation of trends in olive-oil production
cannot be easily attributed to either the movement of producer prices
or to cost reductions.
The historical development of olive growing and the attachment of
farmers to it as a way of life, are clearly important factors in
determining recent behaviour. Within this context the trend of world
and Greek olive-oil production is examined in Section Seven. It is
shown that between 1950-1980, although production worldwide has
increased significantly, the rate of growth was faster for countries
outside the Mediterranean basin. Moreover, between 1976-1988, there
has been a declining trend in the annual compound rate of growth, and
20

in the case of Spain and some non-EEC Mediterranean countries, the rate
of change of olive-oil production has become negative.
1.1 Physiological Characteristics and Historical Development
To this day there is no certainty in the literature about the
precise origins of the olive tree. Some writers believe that the olive
tree as known today originated from the "Oleaster" wild tree found in
North Africa, Portugal, southern France and Italy. Others support the
view that the tree originated from the Olea Chrysophylla which used to
cover large areas of tropical Africa including Kenya and Uganda.(-)
The Olea breed includes 35 types of widely known olive trees. The
total number of varieties cultivated is estimated at 650, but only 60
are used exclusively for the production of edible olives. The rest
are cultivated for olive oil production. - The height of the tree
varies from 3-4 up to 20 metres. The dimensions of the tree depend on
factors such as the type of soil in which it is planted, the climate,
its positioning and pruning behaviour. At the initial stages of its
development the olive fruit is of pale green colour. Later on during
maturity it becomes dark brown and even black. Its shape differs
according to the variety: so it can be round, nearly spherical or
cylindrical. The main substances contained in the olive fruit are:
water 50%, olive-oil 22%, glucose 19%, cellulose 5.8% and proteins 2%.
This is the average chemical structure of the olive fruit. When it is
large and contains a smaller than the average percentage of olive oil,
the fruit is used for the production of edible olives. (2) There are
times though when the same variety can be used both for production of
21

edible olives and olive-oil. Such varieties are called Megaritiki and
Holiblanco. The main characteristic of the olive tree is its long and
productive life span. It is worth noting that in Calamata, a city in
the south Peloponnesos in Greece, an olive tree of about 800 years old
still stands. Its height is 8 m, and the diameter of its shape is 9 m.
It is apparently the only tree saved after fire was set to an olive
grove by the Turkish Army sometime between 1821-1829. Since then it
has been kept as a monument to nature.
Olive trees were first cultivated as early as 6,000 B.0 in
northern Africa, particularly Egypt and Ethiopia. From there, the
olive tree and the knowledge of olive oil production was carried to
central and western Mediterranean countries by Phoenician traders.(3)
There are a great many references to olive oil in the legends and the
literature of ancient cultures - such as those of Egypt, Athens and
Rome; it is also widely mentioned in the Bible and in the Koran. More
specifically, the olive tree was known to the Jews long before 1500
B.C. For them, it seems to have been a symbol of peace and happiness.
In 1984, the Israel Oil Industry Museum was founded in which the
ancient oil industry is displayed. Two of the exhibitions reported
depict the importance of the industry during the Iron Age: the first is
an industrial village for oil and wine manufacture, portrayed by
findings, photographs and plans. The site was apparently built during
the time of the Kingdom of Israel (9th Century B.C). Its estimated
output averaged 14,000 litres of oil a year, most of which was marketed
and not self-consumed by growers. The second exhibition is Tel Micine.
This is the biblical Philistine city of Ekron, where 100 olive press
22

complexes were discovered on the surface of the mount. This
"industrial town" is said to have produced 500,000 litres of olive oil
a year, an industrial capacity with no precedent in the ancient world.
The industry of Tel Maine is presented by selective tools of
production, storage vessels, photographs and plans.(4)
Ancient mythology suggests that the olive tree was brought to
Greece by Egyptians after an initiative by the Athenian King,
Kecropa. (5) Herodotus states that Eboea, in Central Greece, was full
of olive trees during a period where olive cultivation was still
unknown to Iran and Babylonia. Furthermore, in the Ionian Islands,
olive cultivation has been known since the Homeric era. According to
Herodotus, Athens was the centre of olive cultivation. In the 4th and
5th centuries B.C., large areas were under olive cultivation and apart
from being a food product, olive oil was also used for medicinal
purposes. (6) The Athenians have exported olives and olive-oil
throughout their history. This is proved by the Hadrianic Law of circa
125 A.D. reserving one third of the local production for public use.
This Law reminds us of the fact that Greek (and Roman) cities were also
large consumers of olive-oil. The first information on the marketing
of the product is mentioned in 2,500 B.0 on the Market Code of that
era. (7) Archaeologists claim that the prosperity of the Minoic Kingdom
was very closely connected to the marketing of olive-oil. In theCi-vn en vidA Aine. t-C non c trq)
palace of ancient Festos, parts of a device used as an oil millhare
saved to this very day. To support the belief that olive-oil was an
important determinant of economic welfare in the ancient Mediterranean
Evans informs us: "When for an unknown reason, in ancient Crete, trade

in olive-oil declined, Cretans lost their prosperity and many of them
emigrated. Some settled in parts of central Greece and others in the
coastal areas of Asia Minor".(8)
That is how the knowledge of olive oil production was carried to
these regions according to Evans at least. Plutarch also considers
olive oil to be a symbol of wealth. When describing the triumphs of
Caesar, he tells us that this emperor conquered a territory for Rome
during his African campaigns of such vastness, that three million
litres of olive-oil per year could be produced. (9) The extension of
olive cultivation is connected in north Africa with the period under
Roman domination. The ruins of oil-mills and traces of irrigational
operations illustrate the fact that from Tunis to Rabat and right up to
the present borders of the south Algerian desert, olives were
cultivated.
Two different views have been expressed in the literature about
the significance of olive cultivation for those territories under the
Romans. ( -° ) The first claims that Roman rule purposely promoted olive
cultivation to ensure that Rome was supplied and, more particularly,
to settle the populations and so more effectively keep them under
imperial control. The second view states that olive cultivation's
extension was merely a consequence of Pax Romana which provided farmers
with the certainty that the benefit of their efforts would be
protected. Even though both views seem reasonable it seems to me that
the first holds more weight in explaining why olive-oil came to be
regarded as a non-profitable investment in Italy. Italy, like all
24

other Mediterranean countries, was a large consumer of olive-oil.
Nevertheless, olives appear to have offered a smaller gross return - as
well as taking longer to mature than vines. Even though they were
much less labour intensive and the wide planting distance between the
trees made it especially easy to combine olives with cereals, olives do
not seem to have been very highly regarded as a "capitalist" investment
in Italy. (11) Actually, Cato places them fourth in his list of nine
types of cultivation in order of profitability. Columella shows little
interest in olive growing and Pliny the Elder says that it could be
difficult to make a profit from olives. (12) It seems to me though that
these views are too narrow in scope to explain the economic
significance of olive growing. This is because they do not take into
account Italy's position as an imperialist power. As such, the Romans
controlled most Mediterranean countries where olive growing was
flourishing. They were apparently provided therefore with adequate
supplies at relatively cheap prices for home consumption. Also,
domestic merchant capital found it more profitable to trade in olive-
oil produced in the colonies as this seems to have left them with
higher profit margins. The evidence presented by the historians has to
be seen within this context and does not contradict statements, during
the same time period, concerning the high value of olive-oil in the
colonial producer states. However, as merchant capital got
progressively more involved in olive-oil trading from the periphery of
the empire towards the centre, the development of olive growing in the
whole Mediterranean basin was oriented towards serving the needs of the
Romans through subordination to the dominant merchant capital.
Evidence from the province of Messenia, which was still under Venetian
25

control in the 17 and 18th centuries A.D., shows the effect of the
subordination of olive growing regions to merchant capital both
01)domestic and foreign. More specifically, Zaccaria Bembo informs us
that in the province of Messenia in 1711-1712, 7,000 barrels of olive-
oil were produced. Out of that quantity, 5,000 barrels would be sent
to the Metropolis, Venice, from where they would be re-exported, used
for home consumption and deployed in the Venetian soap and wool
industry. Apparently only 600 barrels would be left for domestic
consumption in the province or less than 1/10 of production. As Bembo
puts it, olive-oil was "the only substance poor growers had available
to improve the taste of their bread with". We are also informed.by
Bembo's reference how important the ship "Marciliana" was in the
Venetian olive-oil trade in the Adriatic, Ionian and Aegean Seas. It
was especially designed for trading in olive-oil. Moreover, merchant
names and quantities allocated to each show concentration of the trade
in the hands of a few Italian merchants.
Olive-oil, as M Finley puts it, "has been an essential clue to the
Mediterranean peoples' life-style". ( -4) Apart from food it was also
used as part of pharmaceutical supplies, as a remedy for certain skin
diseases and the production of liniments. Outside the Mediterranean
basin, olive cultivation was made known by Spanish and Portuguese
explorers, and coming down the centuries, between 1850-1900 several
olive varieties had been imported into California form the
Mediterranean countries. In Australia, the first olives were planted
in 1805 by Italian emigrants but despite much effort, olive
cultivation did not expand in this continent - which still relies on
26

imports to satisfy its needs. Nowadays, the Mediterranean countries
account for no less than 98% of the olive cultivated area
worldwide. (15)
We may conclude that the particular historical development of
olive cultivation in the Mediterranean region shaped production
relations and social organisation of the olive production process. At
the same time this development was itself shaped by the natural
conditions of the production process which necessitated the
concentration of olive production in the Mediterranean basin in the
first place. By "natural conditions" I refer to environmental factors
as well as the physiological characteristics of the tree: these will
now be discussed.
27

1.2 The Influence of Environmental Factors
1.2.1 Climate and Temperature
Seasonal temperatures influence decisively the geographical
extension of olive cultivation. The olive tree adapts best to a
temperate climate. It should not have to put up with sharp and lasting
cold periods lower than 5°C in winter, while late spring frosts are
considered to be detrimental. The lowest temperature at which the
olive tree can survive unharmed is -3°C, but only if it is exposed for
a short period of time. On the other hand, it can more readily undergo
quite high temperatures.( 16) Table 1.1 presents the thermic criteria
of the olive tree.
Table 1.1: Thermic Criteria of the Olive Tree
Stages of Growing Temperature
Lethargic period (Danger of Frost) -10°C up to -12°C
Interruption of lethargic period(Danger of Frost) - 5°C up to - 7°C
Interruption of growing - 9°C up to 10°C
Growing of the Flowers 14°C up to 15°C
Flowering 18°C up to 19°C
Fruit bearing 21°C up to 22°C
Interruption of growing 35°C up to 38°C
Danger of burns >40°C
Source: Derived from G Balatsouras, The Olive Tree, (Athens, 1986)
28

The subject of minimum winter temperatures and optimum exposure of
the olive tree has been a matter for investigation in recent years.
Hartmann and Porligis (17 ) showed that for the olive tree to bear fruit,
it is necessary to be exposed to low temperatures during winter. They
proved, by experimenting on olive trees at Homestead in Florida and
Brownsville in Texas, that the tree has to be subject to temperatures
below 7.2°C for a period close to 1,200 hours in order to bear fruit at
full capacity. In Greece temperatures below 7.2°C rarely last for
long periods of time. Estimates in the main olive producing centres
showed that the amount of hours during which the olive trees are
exposed to temperatures lower than 7.2°C is only a small fraction of
that required. (18) This fact has been partly blamed for the irregular
and poor fruit bearing of olive groves in Greece. On the other hand,
it has been shown by Dante Marsico, who experimented on olive trees
grown in the valley Azapa of the Tarapaca county in Chile, that the
Azapa variety produces at full capacity even though it is exposed at a
minimum temperature of 15.6°C. (19) Similar observations apply to other
olive varieties like Rubra and the Greek Coroneiki (mainly grown in
Peldponnesos).
We can therefore say that the olive tree has a unique ability to
adapt to a variety of environmental conditions and hence to
insufficient winter temperatures. Furthermore, because of this
ability, there is a large number of olive tree varieties and this
distinguishes Olea Europaea from any other type of tree cultivation.
2 9

1.2.2 Rainfall
Olive cultivation does not require . unduly large quantities of
water-which is why the olive tree can be grown in areas where no other
cultivation can flourish. In the northern hemisphere, where the
average amount of rainfall is 300-630 mm per annum, the olive tree
flourishes in non-irrigated areas. The smaller the amount of rainfall
the larger the distance that each olive tree needs to be planted from
the next. Generally, if the amount of rainfall is below 500 mm, the
olive tree needs two or three times watering during August-September
so that fruit bearing will be regular. In the southern hemisphere, on
the other hand, the amount of rainfall should range between 620-680 mm
for the olive tree to be cultivated in non-irrigated areas. (20)
Otherwise, the olive groves should be regularly watered, depending on
specific seasonal needs. Irrigated olive groves count for less than
10% in Spain and until recently, were nearly non-existent in Greece,
apart from those exclusively cultivated for the production of edible
olives. Only in Argentina do irrigated olive groves count for a large
proportion (80%) of the total.
Apart from the amount of rainfall, relative humidity can also
influence the ability of the olive tree to bear fruit, but to a lesser
degree. Relative humidity should not reach 80% during the year because
in combination with high temperatures, it can weaken the tree's
resistance to disease.( 21) Both these factors rainfall and humidity-
by influencing the tree's ability to bear fruit, impinge directly upon
olive growing as a source of income for the cultivators.
30

1.2.3 Soil
The olive tree grows best in light - but deep-soils, and does not
do well on poorly drained, heavy and impermeable ones. Nevertheless,
it may be grown successfully on many types of soil even the most arid,
stony and infertile. Soil nutrients have an important function in
regulating the olive tree's fruit bearing cycle. Thus soils where
olive cultivation takes place are usually poor in organic matter, ie.
1.6 to 1.8% in terms of total weight. Insufficient organic matter is
one of the reasons for the irregularity of the tree's fruit bearing
cycle. The best soils for olive cultivation are the calcareous-
followed by the piritaceous and the stony, but the olive tree with its
large number of varieties can adapt and flourish in a variety of
chemical soil compositions. (22)
The geographical extension of olive cultivation is closely related
to local environmental conditions. This is because environmental
factors influence the physiology of the tree and through this affect
its ability to bear fruit. The Mediterranean climate has been proved
ideal for olive growing as it is characterised by small amounts of
rainfall (200-800 mm per annum), mild winters with average temperature
of the coldest month 4.4°-10°C, and warm, dry summers full of sunshine.
The altitude at which olives can be grown varies with the latitude and
local climate conditions. It ranges from 300-400 m above sea level in
the north to 1,000-1,200 m in favourable sections of the south.(23)
These characteristics result in a concentration of olive growing to the
Mediterranean basin where olive trees are usually found either in
31

groves or in scatters. On the other hand, the adaptability of the tree
implies that it can be grown in unfavorable, dry, hill areas with poor
soils, where no alternative crops exist and farming is a small sized,
family activity. It is precisely this ability of the tree which
underlies its economic and social importance to the less advantageously
placed farmers living in deprived regions.
1.3 Methods of Cultivation and the Pattern of Production
1.3.1 Soil Cultivation and Weeding
The purpose of soil cultivation is to make the entry of rain water
into the lower layers of the soil easier. In this way the roots of
the olive trees develop better. The first ploughing of the land takes
place in Autumn in order to increase soil absorption before winter
rainfall.
Weeding, on the other hand, aims at limiting as far as possible
any ' losses in soil moistness. Currently the most commonly used
chemicals by olive growers for weeding are:
(a) The blend Atrazine and Simazine. This acts at root level and on
the seeds as they grow. It needs 20-30 days to take effect and
that is why it must be applied a month before the rainfall period
ends (i.e the beginning of February).
32

(b) Gramoxone. This acts on the green parts of the tree and takes
effect after 1-2 days. The weeds though are certain to reappear.
(c) E214111(1112 . This is a more specialised chemical used for the
destruction of certain weeds and only after they have completed
their development (during Summer). It is used as a spray at a
dosage rate of 10-15 Kgr/hectare.
The effectiveness of chemicals used in weed destruction depends
upon the type of weed, the stage of development, the type of
chemical used, the time of application, the dosage and the mode of
application as well as climatic conditions and soil.(24)
There has been a case against soil cultivation on the grounds that
it can harm the roots of the trees nearer to the surface and hence
decrease their ability to absorb nutritious soil substances. On the
other hand, if only weeding is undertaken the olive tree could gain
maximum advantage of the productive capacity of soil's outer layer and
moistness, which would be otherwise consumed by the weeds. (25) To test
these claims in the 1970's several studies were conducted in Greece.
At the Institute of Hypotropical Plants and Olive Cultivation (IHPOC)
based in Chania, Crete, experiments on different olive tree varieties
were performed. The purpose was to study the impact of separate soil
interventions on the olive tree's productive capacity. The results of
two of the studies, on the Coroneiki and Mastoidis varieties, are
presented in Table 1.2. Under "type of soil intervention", tilled
soil, untilled soil and different chemicals used for weeding are
33

listed. For each of those interventions the length of the tree's
annual of fruit growth has been recorded. Next, the content of the
olive fruit in olive oil was measured, and total olive production and
total olive oil production was also recorded. The results show that
untilled soils produce less but the content of olives in olive oil is
highest. This is apparently due to the limited ability of the tree to
absorb water as the soil has not been tilled. Therefore, the size of
the fruit is smaller as it contains less water in it. Similar
behaviour is observed when olive trees are grown in mountainous areas
where location makes tillage impossible. The results obtained by the
IHPOC signify that rational use of chemicals used for weeding, in an
optimum combination with soil tillage can considerably improve the
performance of the tree. (26)
1.3.2 Fertilization
Fertilization is the most important and productive of cultivation
activities. Suitable fertilizers can even double olive production. To
determine the need for fertilization and the right choice of chemicals
is a complicated issue and requires careful consideration. For
instance, soil, climate, disease and the type of chemicals used for
weeding must be taken into account. Scientists claim that it is
essential to control olive nutrition by fertilization since the
imbalance which causes alternate bearing appears to be largely due to
competition for nutrients - which fertilization appears to be capable
of reducing. (27)
34

A crop's nutrient requirements are determined by the amount of
mineral elements leaving the soil during growth and fructification-
while at the same time not overlooking any losses due to intensified
cultivation (by tilling, irrigation, pruning, etc). The intake of an
olive grove may be estimated and, together with soil analysis, the
amount of mineral fertilizer required may be deduced. So, according to
' Zacchrewicz (28) , one hectare with 200 olives annually withdraws 28.6
units of Nitrogen (Kg.N); 10.1 units of Phosphorus (Kg. P20 5 ); and 35.5
units of Potassium (Kg. 1(20). In a bibliographical review on the
subject, certain withdrawal figures were quoted for different regions.
It then became clear that not all the authors are in full agreement on
the amount of withdrawals by an olive grove, particularly as concerns
Nitrogen input. It has been demonstrated that the Nitrogen and
Potassium content of the reproductive organs of the olive tree
(reproductive buds, inflorescence stems, flowers, fruits) increases
from February through to September. Furthermore, if we consider the
overall content (in grams) of the various reproducing organs,
substantial amounts of Nitrogen and Potassium are observed after a good
harvest. Calcium, on the other hand, varies inversely with Potassium
and the overall content of calcium in the reproductive organs is found
to be four times less than that of Potassium. (29) Large-scale olive
production is therefore responsible for the withdrawal of appreciable
amounts of Potassium, Nitrogen and to a lesser extent, Calcium by the
olive tree.
The purpose of these observations is not to calculate
fertilization; rather they have been conducted as part of a far more
35

embracing work on the olive's fertilization and nutrition requirements.
Studies by the IHPOC, in Crete, on the olive varieties of Coroneiki and
Mastoidis resulted in the following observations. (30 The Nitrogen
withdrawal differs depending on the quantity supplied. The same occurs
with Potassium, which is found at very low levels in the tree when not
supplied. On the other hand, Phosphorus is found at high levels in the
olive tree independently on the quantity supplied. It was also
observed that large dosages of Nitrogen without any Potassium and
Phosphorus reduced olive production. The main objective of this
experimental work has been to rationalise olive fertilization which has
for long been applied haphazardly by olive growers. Moreover, studies
of fertilization aim to define the optimum amount of fertilizer
required, its nutritional effects on the tree and possible consequences
for its alternate bearing cycle. All of this, in the last analysis,
has a bearing on the economics of cultivation.
The great majority of authors are in agreement that nitric and
ammoniacal nitrogen fertilizers should be recommended in the Spring
(2/3 of the amount) and the rest in Autumn - except in regions where
the cold weather could destroy the Autumn shoots. Also the amount to
be supplied should be determined by experimentation covering each olive
growing area. With regard to alternate bearing the authors deduce that
Nitrogen content is of importance and also that the Potassium Calcium-
Magnesium balance (in which Potassium no doubt plays a crucial part),
has a bearing. Finally, comparisons of "on" and "off" years show that
fertilization has to be annually adjusted. (31) This work underlines
the increasingly scientific nature of the evolving production process
36

in recent years. Many small farmers even with an efficient Extension
Service, may not be very well informed about these Research and
Development initiatives and, even if they are, often experience
difficulty in putting them into operation on their plots.
1.3.3 Irrigation
Experts throughout the world tend to agree that olive production
may be increased and regulated through "proper" irrigation.(32)
However, most disagree on the dosage and irrigation schedules in order
to obtain optimal production performance. It has been shown that
cultivars will react differently to a given irrigation schedule. High
water doses can overly increase tree development and its alternate
bearing cycle could become accentuated. In the case of olive varieties
which, although ripe, remain strongly adhered to the tree, irrigation
dosage should aim to increase technical efficiency in order to make the
use of harvesting machinery more effective. In the opposite case,
where fruit drops with relative ease, irrigation can be combined with
the use of nets for harvesting. The cost effectiveness of irrigation
schedules also varies according to the planting density of existing
olive groves. In addition, considerable investment must be made to
mobilize water resources within the plots, with regard to those already
under pressure as well as natural flows.(33)
In the past fourteen years, research into comparative analyses of
several different irrigation systems i.e. surface, sprinkling, micro-
irrigation has been undertaken by eleven different nations: Algeria,
37

Cyprus, Spain, France, Greece, Israel, Italy, Portugal, Tunisia, Turkey
and Yugoslavia. Also, the Rural Engineering Research Centre in Tunisia
is a vital promoter of testing of briny water for irrigation. One of
the main factors which justifies coordinated effort among researchers
in different nations is the diversity of weather conditions. For
instance, in the case of Central Tunisia, average rainfall is a mere
150 mm in contrast with Yugoslavia where average annual rainfall is
1,300 mm near to the Adriatic sea. On the other hand, in the .
Mediterranean there is an estimated average of 122 days where there is
practically no rainfall. Also, in Argentina and China (which has as
many as 10 million trees) the amount of rainfall obviously differs
greatly from that in the Mediterranean countries. (34) Therefore, in
order to identify appropriate irrigation schedules, in depth
examination and research into local weather conditions is required.
Research in Greece by the IHPOC, focused on several comparative trials
on groves with the olive varieties, Coroneiki and Mastoidis, at
different planting densities. It was found that both clearly
benefitted through irrigation. The increase in olive oil production
per tree was larger in the Mastoidis variety than Coroneiki. In
addition, this increase in production was attained through different
mechanisms in each variety. For instance, with the Coroneiki, an
increase in the number of olive fruits per tree was observed while,
with the Mastoidis, the increase in olive oil production came mainly
from the larger size of the olive fruit. Also, precise biological
observations showed that the effect of . irrigation on the alternate
bearing cycle of Mastoidis was more beneficial than of Coroneiki.
38

In Cyprus differing water dosages were tested with cultivars
planted with Greek olive varieties such as Kalamon, Coroneiki and
Conservolia Despite mediocre water quality (soluble salts and calcium
carbonate), irrigation proved successful with both micro - • and mini-
sprinklers.( 35 ) Beneficial effects of irrigation on olive oil
production were also obtained in Portugal. Local varieties were used
in the research such as Galega Vulgar and Balanquetta. (36) At present
• only 5-6% of all existing olive groves are under permanent irrigation
and this mostly in the area of table olives, where greater fruit size
is a priority. Irrigated table olive plots at a relatively larger
scale are found in the region of Seville in Spain; the region of Sig
in Algeria; the irrigated zones of Morocco; the region of Beit Shean in
Israel; and in California, Argentina and France, occupying more than
ten thousand hectares in all. Further, because of the improved
technology in irrigation systems, traditional plantations in Crete, as
well as more modern plots in Spain have turned to irrigation for the
production of oil olives as well.(37)
The research undertaken by the eleven different countries
throughout the Mediterranean Basin has shown that by the very nature of
the tree, clear benefits can be derived from correctly utilizing the
water resources within the environment, particularly ground water
tables and high pressure areas. It also appears that the olive tree
adapts to very low water doses, localized dosages and low stress
conditions - such as those found when using micro-irrigation (drip
irrigation). According to several technical experts, research on
irrigation will continue to progress in th future towards a situation
39

where water balances can be properly regulated, even in difficult
topographical areas and arid zones. (38) If this does turn out to be
the case, then olive growing can well assume a new significance as a
source of income for the small farmers in those areas such as the
Peloponnesos.
1.3.4 Alternating Production Pattern
The outstanding trait of olive cultivation is that production is
irregular at the regional, grove and tree levels. Poor and rich
production years follow each other for a given tree, without it being
possible to pinpoint the precise reason for this behaviour (which also
affects many other fruit varieties like apple-trees, pear trees and
orange trees). Technicians agree that we cannot speak of a single
cause underlying such alternation. The phenomenon seems to be due to a
complex interaction on tree biology of external factors (soil,
climatic, cultivation operations) and internal factors (physiology).
The importance of biological factors has been confirmed by observing
that the rate of alternation was, if no climatic hazards intervene,
specific to the cultivar (biennial or multiannual).(39)
Generally, it is well accepted that in the olive's alternating
production pattern three main factors are at work. (40) Firstly, the
tree's state of nutrition and hormone level which can be replaced each
year. Secondly, the wrong way of pruning the tree (or lack of pruning
altogether) which results in insufficient airing of the tree and the
development of parasitic organisms. The third factor has to do with
40

the Calcium content of the tree during a rich production year: this
apparently causes a premature decrepitude which negatively influences
production. Improvements in the alternating production pattern can be
achieved by suitable fertilization and pruning of the olive trees. On
the other hand, olive research institutes throughout the world
continue their efforts to identify new genetic varieties which do not
posses the trait of irregular production.(41) In 1972, the Perugian
Olive Growing Study Centre discovered a cultivar, which was not
possible to identify with any of the existing varieties and has
therefore called "I-77". The most interesting feature of the "1-77"
cultivar is its moderate vigour, as a result of which it hardly
develops any sterile branches (suckers), not even during the first
years of growth. Moreover, it starts to bear fruit very early on; in
fact the first fruit is seen as early as the second year of being
planted out. It is also reported that the -tree's productivity is
fairly high and regular when it is farmed intensively, especially under
irrigation. Because of this characteristic, the "1-77" cultivar needs
very little pruning, especially when it is trained to a single trunk as
is the case of the monoconical shape. As for the oil which this
variety produces, preliminary trials at the Milan Experimental Fats and
Oils Station revealed an excellent quality, very fruity-tasting and
slightly bitter oil. This cultivar has been grown experimentally in
orchards in Umbria, Tuscany and Latium, under varying environmental and
farming conditions. But the period of experimentation will not be over
for a few years yet. Only field trials in several different olive
growing areas will show what real agronomic possibilities this cultivar
has to offer and whether it can be used on a large-scale.(42)
41

We may conclude with the observation that the alternate bearing
cycle of the olive tree imposes a structural constraint on the olive
growing production process. The farmer, unable to remove this
constraint in order to obtain a unified production process, has had to
suffer great fluctuations in his income. As a result, in an attempt
to adapt to this specific condition, farmers grew other crops parallel
to olive cultivation and also engage in part-time employment. It is in
this way that the natural conditions directly impinge upon economic
processes.
1.4 The Application of New Techniques
The first country to implement "modern" farming techniques and to
mechanise harvesting was Italy. (43) Greece and Spain followed but
many of the techniques are still at the experimental stage. Intensive
cultivation of olive growing involves applying all the technical
breakthroughs made in variety selection, plant training and
mechanization in order to achieve maximum performance from the species,
both qUantity and quality wise, in addition to cutting cultivation
costs. The fundamental concept on which intensive olive cultivation is
based is integral mechanisation. This is the tendency to use
machinery for all cultivational operations, including pruning and
harvesting. (44) Such principles have been used at the Perugia Olive
Growing Study Centre in Italy in order to develop a model of intensive
olive growing. This Perugia model has been extensively applied in
several Italian regions - above all in central Italy. It has been
reported that the new groves designed in this manner have produced
42

remarkable results. (45) More specifically, the trees start to bear
fruit early (at 3-4 years old) reaching full, constant production after
7 or 8 years, and the overall productive period of the groves lasts
some 40-45 years. In traditional olive growing, the trees start to
bear fruit at 7-8 years of age reaching full but not constant
production only after 8 or 9 years. Nevertheless, their overall
productive period could exceed 100 years. There are still olive
growing regions in Greece, like Mani (in Peloponnesos) and Crete, where
trees have been planted since Venetian times. Their average
production of olive oil is estimated at 700-800 Kgr per hectare. On
the other hand, the figures estimated for average conditions,
concerning the "new style" of olive growing, in central Italy put
yield, when at its height, at around 40-50 quintals per hectare in dry
cultivated groves and 55-65 quintals in irrigated groves. These
figures are more than 50% higher than yields in traditional
cultivation. It has also been reported that the high degree of
mechanisation in intensive olive growing saves on labour.( 46) Labour
hours required fall from 400 hours per hectare calculated for
traditional olive farming, to 160-180 hours per hectare. This "new
style" of olive growing has taken place in Tuscany, Latium and Umbria.
It was set in motion using in part funds granted by the government (Act
198/1985) and in part by the European Community (EEC Regulation
1654/1986) which was made available after the frosts of 1985. It has
been estimated that 2,500 hectares of new olive groves were planted in
Tuscany between early 1985 and late 1987. Under this EEC Regulation,
the producers' associations together put forward eight collective
projects for the two provinces of Perugia and Terni which, in total,
43

envisaged replanting approximately 1,000 hectares by May 1988. In
southern Italy, major olive producing areas such as Calabria, Campania
and Sardinia have drawn up their own programmes but, as yet, they have
not been able to implement them because of a shortage of funds.(47)
So the restructuring of Italian olive growing is definitely under
way. In Spain and Greece however, progress is being made at a slower
rate and only concerns a few thousand hectares planted with the "new
style" of olive cultivation. The most important of the determining
factors in setting up this "new style" of olive cultivation are
discussed next. (48)
1.4.1 Choice of Environment
The new groves should be planted in areas where the natural
fertility of the soil, the position in which the olive groves face,
and their altitude and climatic conditions combine to obtain maximum
productive performance. The amount of rainfall should be satisfactory
or, if not, suitable provision for irrigation needs to be made.
Temperature is not supposed to fall below -5°C so that areas with a
risk of frost damage have to be avoided. Also, the groves should
permit the use of machinery and have a slope of no more than 15-
l8%.()
44

1.4.2 Land Preparation
Land preparation involves uprooting the old olive trees, levelling
and draining the land as far as necessary, and exposing the subsoil
with a plough. This contributes to the better development of the
tree's rooting system. At the same time fertilizers need be added to
improve the soil's fertility, while the physical condition of the soil
needs to be renewed through a 50-60 cm deep layer. After this the new
olives can be planted. In deciding on a choice of particular olive
variety to be planted several factors have to be taken into account:
its adaptation to the local soil conditions; its productivity; its
power to resist disease; the size of the olive fruit; and the marketed
price the farmers expect to receive. New olives can be planted before
winter, usually November, as in most places in southern Greece there
are no frosty winters. They could be also planted in the Spring. (50)
1.4.3 Training of the Trees
It is suggested that the "monoconical" shape should be used because
it offers the possibility of speeding up tree growth and the onset of
fruit production. It also considerably cuts pruning costs, in addition
to which it is fully suited to mechanical harvesting. (51) Mechanical
harvesting can be applied to the olive groves provided the trees are of
the "right type" i.e., where the machinery proves effective it has been
estimated that harvesting costs can be cut by as much as 25-30% of the
value of the harvested product. The best system of harvesting at
present employs multidirectional shakers which are fitted on to
45

ordinary, medium-sized tractors: the shaker grip is clamped on to the
base of the trunk and shakes the olives off into nets laid out under
the tree canopy. Harvest yields depend on the cultivar, the size and
structure of the tree, and the time of year: under optimum conditions,
yields of above 85% may be obtained with much saving on time and
labour. (52)
1.4.4 The Lay-Out of the Olive Groves
Increasing grove density is recommended for improvements to be
achieved. A 7 x 7 m spacing in the southern areas and a 6 x 5 m
spacing in the central and northern areas has been widely
suggested.(53) During the last 17 years ten million olive trees were
planted in Crete covering an area of thirty-three thousand hectares
under the "dense and bushy" system. Another few thousand of lectares
have been also planted in Peloponnesos and other olive producing areas
of the country. The Coroneiki variety is considered the best for
dense planting. (54)
At the Institute of Hypotropical Plants and Olive Cultivation, in
Crete, experiments have taken place which examined olive production
per tree, olive oil content per tree and the mean olive fruit weight.
The grove settings for the experiments were 6x6, 6x3, 6x4, 4x4 and
5x5 m. The mean olive production per tree and per year fluctuated
considerably between the different settings for seven observation
years. The 6x6 m setting occupied the first position for seven
consecutive years. The 4x4 m and the 6x3 m setting occupied the last
46

positions, the rest were in between. The following Table 1.3 presents
the results.
Table 1.3: Average Olive Production 1978-1985 (in kgr/Tree)
Settings Production
6x6 27.76x3 15.96x4 18.54x4 15.35x5 22.3
Source: I.H.P.O.C, 1985
We can deduce that the larger the area available for each tree the
larger the olive production per tree. This has important agrarian
implications.
The second part of the experiment concerned olive production per
hectare. During the first few observation years the denser settings of
4x4 in and 6x3 in showed the highest land productivity (Kgr/ha). But
over the last years though, the settings 6x6 in and 5x5 in overtook them.
Table 1.4 presents the results.
Table 1.4: Average Olive Production, 1978-1985 in kgr/Ha
Settings (in) Production
6x6 7,7726x3 8,8216x4 7,4544x4 9,3155x5 8,677.9
Source: I.H.P.O.C, 1985
47

The setting 6x6 m and 5x5 m showed an increasing production trend
but the settings 6x4, 6x3 and 4x4 showed a decreasing trend.
In the third part of the experiment, olive-oil production was
estimated, based on the olive-oil content of the fruit during
harvesting and the olive production per tree. Comparisons were made
for the years 1984-1985 when the trees had completed their development.
The settings 6x6 m and 5x5 m gave both years a larger production.
This can apparently be explained by the regular and continuous
development of the olive trees in distant settings during the whole
experimental period. In close settings however, many problems were
created such as adverse airing and lighting conditions which resulted
in tree diseases and therefore reductions in production. Also, the
closer settings made the use of machinery for cultivation very
difficult. Currently, the recommended settings for new plants in
Greece are 6x6, 6x8 and 8x8 m, which means 150-270 olive trees per
hectare.
1.5 The Stages of Olive Production
1.5.1 Pruning
This operation has been practiced through the centuries but in
very different ways according to the respective region and the
particular olive variety. (55) As there are many different shapes and
types of training, the pruning technique should be performed by well
informed labour, with experience and willing to devote special care and
48

attention. This is because suitable pruning can strengthen the tree
and positively affect its biology (alternate bearing). Similarly, a
badly performed pruning can harm the olive tree and reduce its
production drastically. Experts suggest that pruning should be studied
in conjunction with fertilization and irrigation techniques, which also
have a bearing on tree biology. (56)The aim is to induce steady
production. There are two types of pruning currently practiced
worldwide. One type is called "Formation Pruning" which gradually,
through time came to include a great number of shapes. After trunk
formation, in traditional areas the tree was left without care, so
explaining the large sizes incompatible with up-to-date olive
cultivation, such as those to be found in older groves. Once
cultivation had been intensified many other shapes gradually appeared,
which may be classified into two groups. The first includes "trained"
shapes, where the tree has to take on the shape considered most
effective for fruiting. The most widely known example is certainly
the "palm-pattern" proposed by Breviglieri on the basis of the shape
commonly used for apple and pear trees. However, this shape requires
much upkeep. The second group includes "Free shapes" which make more
use of the tree's natural stance, either upright or drooping, and
therefore require less care. They often lead to earlier fruiting. The
standard example is the "bushy vase" shape. It has been shown in the
U.S.A. that if trees are not pruned at all during the first few years
very early fruiting results.(57)
Recent research on mechanical harvesting shows that the shape of
the trees will have to be adapted to the application of harvesting
49

machines. The work done by various experts illustrates that a single
1-meter trunk is required with a small number of scaffolds, which
should only have a few branches to ensure effective conveyance of
vibrations. (58) Formation pruning is therefore a method by which the
producer seeks to impart a shape suited to cultivational conditions.
It can also be said that the large number of shapes included in
Formation pruning correspond to stages of the crop's socio-economic
development.
The other type of pruning is Fruit-Production-pruning. This
method essentialqmore effectively redistributes nutrients and allows
the light to reach the fruit bearing twigs. It therefore enables the
most effective possible productionunit to be shaped by directly
changing the physiology of the tree. It is at this level that the
grower may most directly influence the "reproduction balance" required
if production is to remain steady. Most experts agree that if Fruit-
Production pruning were to be applied every year, the effect of
alternate bearing on the tree's production would be reduced.(59)
However, due to pruning's bearing on production costs (it stands second
to harvesting) it has been claimed that "in the near future, pruning
will lose its ranking as an essential operation".
As far as the degree of pruning is concerned, light annual pruning
is recommended in such a manner as to bolster the remaining twigs'
means of nutrition and help them to grow while retaining a volume in
line with modern methods of cultivation. Excessive farmer pruning
helps to maintain the degree of alternate fruit bearing of the tree.
50
In most of the olive growing areas pruning is undertaken in winter when
the tree's growth slows down. This is because due to the rise in the
Nitrogen content, winter pruning facilitates the twigs' growth in the
Spring. (60)
Olive growers have used pruning methods throughout the centuries
which, although rough, may have been very effective for their
varieties. It seems to me that the variety's stance as well as
traditional pruning methods needs to be taken into account in any
serious effort towards evolving a technically optimum pruning method.
1.5.2 Ripening of the Olive
The olive fruit slowly increases in size until the stage where its
kernel is hardened. Then the fruit's weight increases at a faster
rate than its size. At the beginning of Autumn the vigorous green
colour of the olive starts to shine and it appears to acquire a winey
colour with dark spots on the top. Slowly, the outer skin of the olive
acquires a darker permanent colour according to the variety - and then
turns softer. Ripening starts the moment that dark spots appear on the
fruit's outer skin and lasts until the final colour of the olive has
appeared. (61) In most varieties colour change does not appear
simultaneously in all fruits. It appears in stages and the ripening
time differs according to variety. Other factors influencing the
length of the ripening period are the climate and the soil (depending
on how infertile it is). In warm soils with sufficient quantities of
Calcium and Phosphorous, fertilizers can also speed up ripening and so

increase the content of the fruit in olive-oil. On the other hand,
Nitrogen fertilizers increase production but retard the ripening of the
fruits. Also, the density of the olive production on the tree is an
important factor for the length of the ripening period. The lesser the
olive production the shorter the ripening period required as well as
the larger the size of the olive fruit. The hours of sunshire also
speeds up the ripening of the olive fruit. The total content of the
fruit in olive - oil increases over the ripening period and reaches
maximum when ripening is completed. (62) The "organoleptic" properties
of the olive fruit are negatively affected if harvesting is delayed.
The most aromatic olive-oil is produced at the start of ripening
independently of the green colour of the fruit. Farmers believe that
harvesting should take place just before ripening is fully achieved, so
that a better quality of olive-oil can be obtained. (63)
1.5.3 Harvesting
It is well accepted that to a large extent harvesting is the
operation which mostly affects the olive tree's biology. Moreover,
harvesting alone make up for 60-80% of the total olive production cost
which, together with rapidly increasing labour costs, results in
steadily increasing production expenses. (64) The situation becomes
even more complicated if one considers that currently there is a
shortage of available labour in the olive growing regions. For several
years now many thousands of tonnes of olives had been left to rot,
since it has not been economically feasible to harvest them. Therefore
attempts to mechanise harvesting have been made in order to cut costs,
52

provide better working conditions for the operators and also to better
protect the quality of the product. The methods currently used for
olive harvesting are: cudgelling, ground and net harvesting, hand
picking, mechanical harvesting and harvesting through the use of
chemicals.
Cudgelling (65) is applied in many olive growing regions throughout
Greece. It involves beating the tree branches with a sturdy stick
until the fruit falls on the ground. Experts now claim that this
method should be abandoned altogether or at least limited to a minimum
because it is harmful to the tree. The branches quite often break and
this contributes to the alternate bearing of the tree. Moreover, the
branches may be wounded and this causes a break down of the tree's
resistance to disease - especially tree tuberculosis. During this
method of harvesting many leaves are destroyed and the olive fruit
damaged. If, in addition, the olive fruits are left for a few days
before being carried to the oil-mill, the olive-oil received will be of
poor quality. Cudgelling is mostly used to harvest the olive variety
Coroneiki in Peloponnesos and Crete. Farmers are advised to apply the
method starting from the inner end of the branches and then follow the
direction of the radius of the olive tree's circle. This way the
least damage is done to the tree.
Ground and Net harvesting (66) is a method used where olive trees
are very tall. When the tree is left free to develop in a densely
planted grove then it reaches up to 20 m in height - which makes
harvesting impossible by any known method. Then the olives are left to
53

fall themselves off the tree and are picked up off the ground. This
method is not as expensive for the producer but it is harmful to the
product. Large losses in production usually occur because of
rainfall, the wind and the birds. Furthermore, "Dacos" attacks the
olive fruits and the quality of the produced olive-oil worsens. Also
alternate bearing is reinforced by the long stay of the fruit on the
tree. Nowadays, harvesting of the variety Mastoidis, which grows very
tall if left alone, is by nets. This method has considerably reduced
labour costs and therefore increased the olive growers' income (67) . As
the use of nets prevents contact with the ground, damage is limited and
therefore the quality of the olive-oil produced is improved. Net
harvesting has contributed to a reduction in harvesting cost by 25% of
the product's gross value. This together with the improved edible
olive-oil quality, has made possible the extension of the Mastoidis
variety's life. Otherwise its cultivation would have been abandoned.
However, olives should not be left in the nets for a period further
than fifteen days as this could lead to a deterioration in the quality
of the final produce (as shown by acquired high acidity).
Harvesting by hand picking (68) is a method practiced on trees with
relatively small branches. The olives are picked by the worker one
by one from the branches of the tree. Quite often, the olives picked
this way are placed in a basket hanging on the labourer's neck. This
is mostly done with table olives where the appearance of the fruit is
an important factor in order to obtain better selling prices. Hand
picking in which no machinery is used, gives a yield of roughly 10 kg
per hour per worker. Hand held mechanical tools though (leaf removers
54

and tongs) can contribute to a 20% increase of produce. These
instruments are shaped like combs and when used manually, draw off the
fruit by traction. Portable vibrating hooks and shaker combs, provide
double the output of manual work. These are placed on the tips of
poles of varying lengths and are compressor driven. As they shake the
branches, ripe fruit is loosened. The comb works as a rake as well as
a vibrator and causes all the fruits to fall. The hooks on the other
hand, leave a fair amount of fruit still on the tree. These are low
cost tools which can be best employed in small groves whose structure
does not permit the use of large machinery, or on a very sloped
terrain. The most appropriate tree shape for these tools is the bushy
or wide base olive tree. Their disadvantage is that they are quite
difficult to handle. At present, only mechanical tools are widely
used throughout Greece, even on the mountainous olive regions in the
province of Messenia in Peloponnesos.(69)
Mechanical harvesting by vibrators enable up to twenty times
improvement over manual harvesting produce.( 70) These machines
transmit a series of vibrations to the plant to separate the fruit from
its stalk. Both branch and trunk vibrators are sold. The branch
vibrators require low power output (30-45 k.w), while trunk vibrators
require high power in order to transmit multidirectional vibrations at
high frequency. Moreover, tests carried out in Italian olive growing
regions with diverse vibrator models and varied numbers of nets, have
demonstrated that "net equipment" requires 20-60% more labour time than
"vibrating equipment". It was also shown that efficiency gains of 3-4
trees per hour, on average, can occur by limiting supplementary
55

operations while fewer workers are needed.( 71) So, it is suggested
that modern mechanical olive receiving devices should be used instead
of nets, for supplementary operations. A number of different models
have been tested in Italy including mechanical sheet harvesters,
pneumatic nets and spool nets. In tests conducted in Apulia, this sort
of equipment doubled the output of mechanical harvesting machinery:
going from 3-4 trees/hour per worker using the vibrator and
conventional nets, to 6-7 trees/hour per worker with the vibrator-
mechanical net system. In Greece, this method of harvesting is not
used because tests have shown that during vibration the fruit is
damaged and also most of the Greek groves are not suitable for the
application of mechanical harvesting. (72)
With regard to table olives, mechanical harvesting seems to have
proved more troublesome, even on well adapted trees. (73) This is
partly due to the resistance to detachment of the fruit, making for
longer vibrating periods with mediocre results. Also, one must not
overlook the possibility of damaging the fruit (cuts, bruises) during
vibration, and so reducing its final value.
In many olive growing regions in the south of Italy, in Spain and
very few regions in Greece limited to the Islands (Corfu, Crete,
Lesbos), a great deal of ground harvesting is done (ie. the fruit is
picked up after it has fallen to the ground) (74) The soil under the
tree crown must be properly prepared, weeded and leveled. Since olives
ripen gradually, a certain period of time will elapse from the moment
the first olives fall to the end of the fruit dropping period.
56

Prolonged contact with the soil will give the extracted oil an
unpleasant taste. Therefore, it is apparent that oil obtained in this
manner will have to be refined in order to become edible. Apart from
qualitative considerations, the cost of harvesting must be added given
that traditionally this is a labour intensive task. Because of this
ground harvesting machines have been introduced and used widely in
Italy and rather less so in Spain. These machines come into different
types. (75) For instance they could be Sweepers, devices with rollers
that sweep the fallen olives toward the base of the machine. The
ground must be prepared, levelled and flattened before they are used.
Another type is Vacuums, which use an air current to vacuum up the
olives which are piled into rows. Also Ventilators are quite common
and use a jet of tangential air to push the fruit towards the receiving
device. Again the soil must be prepared before hand. Finally, Sieves
are used, which comprise of sieves mounted on vibrating platforms which
separate off all impurities (soils, stones and leaves). It has been
shown that Sweepers produce about 100 kg/hour, per worker, while Sieves
provide about half that amount.
The introduction of mechanical harvesting first of all implies new
intensive plantations. If the vibrators, for instance, are to be used
to their fullest effect, both the machine and the tree must be
mutually adapted. This implies using growing techniques and pruning
systems which provide farmers with well structured, good sized trees,
whose make-up of branches, fruit and leaves is properly balanced for
mechanical harvesting and which allows for efficient transmission of
vibrations to all branchwork. Tree productivity seems to be another
57

fundamental element. It has been shown that mechanical harvesting does
not become profitable unless tree output exceeds 30 kg/tree. (76) In
Greece, the average productivity is 10.7 kg/tree. There are regions
though, in Crete and Lesbos under intensive cultivation, where such
levels of productivity have been measured at 92 kg/tree. (77) Moreover,
gradual ripening makes it difficult to dictate the exact moment for
vibration and a second operation may be needed. But repeated
applications seem uneconomic since each later operation will achieve
lower amount of fruit yield. Another factor which can make mechanical
harvesting difficult is a sloped terrain. Slopes should not exceed 15-
16% for rubber tire vehicles or 17-18% for machines with articulated
wheels. Above this percentage, harvesting become troublesome and even
impossible.
The other method of harvesting is through the use of chemicals.(78)
The I.H.P.O.0 in Crete has been experimenting with two chemical
substances which, if sprayed on the olive tree, causes the fruit to
fall. These substances are called Ethrel and Alsol. It was found that
with the Mastoidis variety 83% of the olives fall after the chemical
application. On the other hand, with the Coroneiki variety, the
chemicals had a negative effect on the alternate bearing of the tree.
They caused its leaves to fall (about 40% of them) and only 60% of the
olive fruits fell to the ground. Therefore, experiments of Coroneiki
are inconclusive while on Mastoidis they have been quite successful,
especially in large production years. The cost of the chemicals
though, and their application on the tree by spraying is considerable.
58

For this reason they have not been so far used by growers on the
Mastoidis variety.
1.6 The Input Costs of the Major Factors of Production
The importance of employment in olive growing lies in the seasonal
distribution of labour. (79) Labour is required mainly through the
winter when there are not many other opportunities of work available in
the rural sector. As was stated earlier in this Chapter, the
recruitment of labour during olive harvesting has become increasingly
difficult over 1951-1981 as more and more people have left the
countryside to try to obtain permanent jobs in the urban centres.
Table 1.5 presents the percentage distribution population into urban,
semi-urban and rural, at national and provincial levels. The province
chosen is Messenia, one of the largest olive producing regions of
Greece. We may observe that the rural population declined by 17.4%
while, in the province of Messenia it declined by 10%, from 66% in 1951
to 56% in 1981. On the other hand, the urban population increased by
10% in the province and by 21.3% in the country as a whole.
59

Table 1.5: Urbanization in Greece and the Province of Messenia (inpercentages)
Year Area Urban2 Population Semi-Urban3 Population Rural4 Population
1951 N1
1961 N
1971 N
1981 N
36.8 15.5 47.7
17.0 17.0 66.0
43.2 13.0 43.8
19.0 16.0 65.0
53.2 11.7 35.1
23.0 17.0 60.0
58.1 11.6 30.3
27.0 17.0 56.0
Notes: 1. "N", National level; "P", Provincial level (Messenia)2. Urban population refers to geographical areas with 10,000
people or over.3. Semi-Urban population refers to areas with 2,000-9,999 people4. Rural population refers to areas with less than 2,000 people
Source: N.S.S.G, Population Censuses, 1951, 1961, 1971, 1981.
With special reference to the province of Messenia, which is
primarily an olive producing region, there was no data available on the
employment situation in olive growing as a direct and separate
agricultural activity. Nevertheless, two facts can be deduced from the
statistics. First, the absolute number of people between 1951-1981
declined from 227.9 thousand to 159.8 thousand. So there was a
reduction of 29.8%. Secondly, the labour force in the province (i.e.
people between the ages of 15-64) was reduced from 62% in 1951, to 57%
in 1981. At the same time the percentage contribution of young children
(up to 14 years of age) fell from 30% in 1951, to 22% in 1981, while
that of older people over 65 years increased from 8% in 1951, to 20% in
1981. (80) If we therefore combine this information with that of Table
1.5, we can well imaging that other things being equal a shortage of
labour in the olive harvesting seasons in Messenia presented the
60
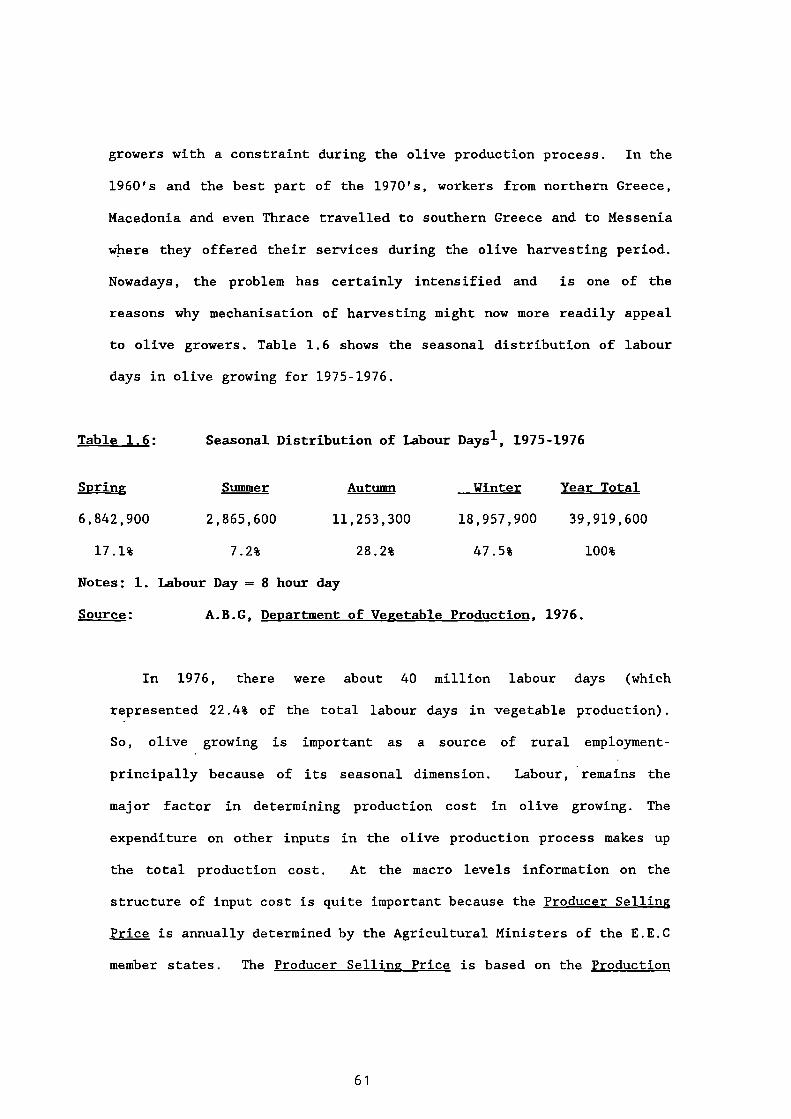
growers with a constraint during the olive production process. In the
1960's and the best part of the 1970's, workers from northern Greece,
Macedonia and even Thrace travelled to southern Greece and to Messenia
where they offered their services during the olive harvesting period.
Nowadays, the problem has certainly intensified and is one of the
reasons why mechanisation of harvesting might now more readily appeal
to olive growers. Table 1.6 shows the seasonal distribution of labour
days in olive growing for 1975-1976.
Table 1.6: Seasonal Distribution of Labour Days l , 1975-1976
5RELBZ Summer Autumn Winter Year Total
6,842,900 2,865,600 11,253,300 18,957,900 39,919,600
17.1% 7.2% 28.2% 47.5% 100%
Notes: 1. Labour Day — 8 hour day
Source: A.B.G, Department of Vegetable Production, 1976.
In 1976, there were about 40 million labour days (which
represented 22.4% of the total labour days in vegetable production).
So, olive growing is important as a source of rural employment-
principally because of its seasonal dimension. Labour, * remains the
major factor in determining production cost in olive growing. The
expenditure on other inputs in the olive production process makes up
the total production cost. At the macro levels information on the
structure of input cost is quite important because the Producer Selling
Price is annually determined by the Agricultural Ministers of the E.E.0
member states. The Producer Selling Price is based on the Production
61

Target Price which is "fixed at a level fair to producers, account
being taken for the need to keep community production at the required
level". (81)
In the normal course of things technological improvements are
introduced in order to obtain an optimum output stream at minimum
cost. We should however note that production decisions in olive
growing are mostly made by small-scale present producers whose goals
cannot be easily defined or tied down precisely. They still engage in
traditional patterns of cultivation - often under adverse conditions,
and their survival is largely dependent on how they manage to influence
the behaviour of interests groups and lobbies within the political
framework. (82) Farm gate efficiency criteria seldom seem to figure
first in their order of priorities. Of course, under the EEC regime,
where modern intensive cultivation is the rule, the empirical habits of
the olive growers finely developed over the centuries can come into
conflict with forces of change stemming from outside. In order to
adapt to changing economic and institutional conditions, the olive
growers have organised themselves into producer cooperatives. This
social organisation of production however is, largely concerned with
the marketing of the produce and hence is still only at the level of
exchange. Small scale production was retained, and rising costs
accommodated. At the micro level, farm production costs clearly
differ enormously since they, depend on the size of the cultivated
plot, the amount of fertilizers and pesticides used, the age and
variety of the olive trees, their shape and the combination of labour
62

and capital during the production process especially with respect to
pruning and harvesting.
The results of a national survey conducted during 1975-1976 on the
production cost of olive-oil in some of the main olive producing
regions of Greece, are presented in Table 1.7. This survey was
conducted by the provincial branches of the Agricultural Bank of Greece
on behalf of the Ministry of Agriculture. In each province a
"representative" (83) sample of farms was selected, and on the basis of
a questionnaire, information was obtained about different farm
operations and production expenditure. This information was then
supplemented and checked with the Banks' figures about each farm. The
minimum sample size used was fifty farms. Each branch constructed a
weighted average from sample information which was then taken as the
representative production cost structure at a provincial level. The
monetary values were expressed in current (drachma) prices. The
production cost of olive-oil per Kgr. was found by estimating total
expenditure and interest payments (per stremma) of olive-oil
production, reduced by the value of the corresponding olive-residue and
divided by the total quantity of olive-oil produced. From Table 1.7,
it is also possible to (tentatively) compare costs between
"traditional" and "intensive" cultivations, in the province of Hania,
Crete. We may observe that production cost per Kgr. in intensive olive
cultivation is lower (44.3 dr/kgr) compared with traditional
cultivation which ranged between 50.6 and 88 dr per Kgr. of olive-oil.
Corfu showed the largest olive-oil production per stremma and also the
highest capital cost. As a result Corfu's total expenditure was one of
63

the highest, but the production cost per Kgr. of olive-oil was the
lowest among the traditional cultivations due to the relatively large
production per hectare. On the other hand, Lesbos had the highest
production cost per Kgr of olive-oil due mainly to relatively low
levels of productivity (calculated as the amount of olive-oil per
stremma) and higher rates of expenditure. The provinces of Lakonia and
Elia showed low production figures per stremma which, combined with low
overall expenditure, resulted in a relatively average production cost
per Kgr. of olive-oil. The comparison between traditional and intensive
cultivation in Hania favours the latter. Not only is production per
stremma 50% larger but also the production cost per Kgr of olive-oil
is lower by 23.2%. It is worth noting that the labour required for
olive harvesting formed between 65 and 82% of the total amount of
labour required during the production process. Because of that, there
seems to be some prima facie case for mechanisation of harvesting.
This can be argued on two grounds. Firstly agricultural wage increases
make labour the highest input cost, and secondly as non-farm employment
is created the opportunity cost of rural labour increases and therefore
its supply price is bid up.
Some nine years later, in 1984, the Ministry of Agriculture
recorded production cost figures for olive-oil in traditional and
intensive cultivations. These are presented in Table 1.8. The survey
was undertaken by local branches of the Agricultural Bank of Greece but
this time at the country level. The same procedure was employed but the
samples were more "representative" as the regions taking part in the
survey were considerably smaller. Disaggregation offers greater insight
64

combined with larger precision of the estimates. We observe that among
the traditional cultivators Lesbos had the lowest production cost per
Kgr of olive-oil. The intensive cultivation in Heracleon of Crete had
production costs some 15% lower than that of Lesbos. Overall, the
proportionate expenditure on labour and fertilizers came to 51.5% of
the total production cost. Interest on capital plus interest on
deferred payments made up a huge 43.8% of the total cost. If one is to
compare (84) production costs between 1976 and 1984 for the regions of
Lesbos, Hania and Heracleon, it is apparent that in Lesbos between
1976-1984 there had been a cost reduction of 24.6% per Kgr of olive-
oil produced under conditions of traditional cultivation. In
Heracleon the cost reduction was 10% per Kgr, while in Chania there had
been a cost increase of 31% per Kgr between 1976-1984. During the same
period the producer price was reduced by 5% in real terms while
production of olive-oil increased by 25% in each of these regions.
This further suggests that the increase in the production of olive-oil
cannot be explained satisfactorily by the change in production cost in
each of these regions, or by the real producer price which was actually
reduced when deflated by the Retail Price Index (1974=100).
1.7 The Trend of Production. 1950-1988: World and GreekNational Production of Olives and Olive-Oil
According to the 1.0.0.0 the total number of olive trees worldwide
is about 750 million, and together they cover an area of some 9 million
hectares. As already mentioned the Aediterranean basin has no less
than 98% of the existing olive trees and produces 95% of world olive-
oil production. The main producer countries according to their
65

regional contribution are: Spain, Italy, Greece, Portugal, Tunisia,
Algeria and Morocco. Spain produces nearly one-third of the
Mediterranean's production.
Table 1.9 presents olive-oil production by country, and world
total between 1950-1988. We may observe that over 1950-1970 the
average annual world production was 1,265,428 tons. The lowest
production 638,000 tons was recorded in 1950. Between 1970-1988 the
average annual world production increased to 1,659,000 tons, a rise of
31%. The highest production was recorded in 1980, and was 2,223,000
tons. European production of olive-oil during the same period
increased by 26% and mainly concerned increases in the production of
the Mediterranean countries. On the other hand, the increase of olive-
oil production in other continents like Africa, America and Asia was
much larger than the European one. Some of the reasons for this
expansion are firstly, the more intensive cultivation of the olive-
tree worldwide, (through denser plantings, and the increasing
proportion of irrigated groves) which improved output per hectare.
Secondly, the effective fight against olive-tree diseases and better
information about all stages of the production process. Thirdly, a
noted expansion of the areas of olive cultivation throughout the
world. (85) Needless to say that these new area started from a very
low base and so naturally would register faster growth rates.
The production of olive-oil and other edible oils is shown in
Table 1.10 for the period 1983-1986. We observe that the world
production of olive-oil is much less than that of most known vegetable
66

oils. Therefore there seems scope for expansion providing that proper
information about the biological superiority of olive-oil is put
effectively across in a marketing sense. Production of olives is
about 8-9 million tons annually. Out of that quantity, 400-700
thousand tons are used in the production of edible olives, the
remainder is used for olive-oil production. The largest producer
of edible olives in the world is Spain followed by Greece and then
Italy.
Olive cultivation in Greece covers an area of 0.78 million
hectares. According to the Ministry of Agriculture the number of olive
trees is estimated at 126,000,000. The vast majority of them (some
103,000,000) are cultivated for olive-oil production, while 23,000,000
are cultivated for edible olives only, (Table 1.11). The area of
olive trees destined for olive oil production covers 0.65 million
hectares; the groves cover 0.53 million hectares and a further 0.12
million hectares are planted with scattered olive trees. By my
calculations therefore, Greece currently accounts for about 8% of the
world area covered with olive trees but nearly 16% of the total number
of trees. From Table 1.11, it may be seen that Peloponnesos and West
Sterea cover about 40% of the cultivated area and 39.5% of the number
of trees destined for olive oil production. Crete covers 26.7% of the
total area and has 26% of the olive trees, while Atica and the Islands
account for 24% and 26% respectively. We deduce . that these three
regions account for about 90% of area and number of olive trees
cultivated for olive-oil production. The introduction of new
techniques have improved output per hectare (as previously
67

mentioned). In Greece, while traditional cultivation produces 2,500-
3,000 kgr of olives per hectare, under the "new style" of olive
growing, production has increased to 7,000-9,000 kgr per hectare which
corresponds to 1,500-1,800kgr of olive-oil per hectare.(86)
The content of the olive-fruit in olive-oil depends on the tree-
variety. Table 1.12 shows the different varieties, their content in
olive-oil terms and the regions where each variety is cultivated.
Coroneiki is the most commonly found variety. The tree reaches a
height of between 8-15 metres, and the colour of its fruit is almost
black. The content of Coroneiki's fruit in olive-oil can reach a
maximum of 27%, and the size of the fruit is the smallest among the
Greek varieties. That makes harvesting difficult and costly. Another
common variety of olive tree found in Greece is Mastoidis (or Tsunati).
Its height ranges between 15-20 metres and the content of its olive
fruit in oil is 24-25%.(87)
Table 1.13 presents production of olive-oil in Greece, E.E.0 and
the World total between 1968-1981. The figures on production are taken
from different sources, the F.A.0 Production Yearbooks in the first
case, (1.13(a)) and the I.O.O.0 in the second (1.13(b)). All these
figures are expressed in thousands of tonnes. We may observe that there
is a discrepancy between the time series data supplied by these two
sources. The overall diversity in the recorded production figures for
Greece is of the order of 24.5% which is a considerable amount of
olive-oil to be missed out in the calculations of the International
Olive Oil Council. Moreover, production figures supplied by the Greek
68

Ministry of Agriculture during the same time period show a 10% higher
production than that recorded by the I.O.O.C, yet a 14.6% lower
production than that recorded by the F.A.O. It is difficult to explain
the obvious and significant differences between the above estimates but
it seems most likely that different ways of estimation have been used
by the scientific personnel of each organisation.(88)
Table 1.14 presents edible olive production in Greece between 1960-
1988 in Greece. The Calamon variety occupies the greatest area under
cultivation as far as the production of edible olives is concerned.
The varieties Conservolia and Spanish Mauzarilla are cultivated to a
lesser extent. The cultivation for edible olive production can be
found in all the regions of Greece. Table 1.15 shows the development of
edible olive production for selected years between 1970-1985 as well as
the number of trees. We may observe that between 1970-1980 there has
been a large change in the number of olive trees as well as the area
under cultivation (about 71.3%). Between 1980-1982 the increase
Table 1.15: Area and Trees for Edible Olive Production(In Stremma)1
Years Areal Number of Trees
1970 728,215 12,197,5971980 1,247,750 20,899,812
1982 1,347,055 22,566,700
1983 1,357,800 22,726,800
1984 1,376,140 23,051,400
1985 1,373,800 23,095,100
Notes: 1. One Stremma — 1/10 Hectares
Source: Ministry of Agriculture, Department of Forestry,
1988
69

in the number of trees and area was nearly 8%. But between 1982-1985
there has only been a small change in the number of olive trees
cultivated (+2.3% in 1985 compared with 1982), while in the area under
cultivation there has also been a 2% increase in 1985 on 1982. We can
also deduce from the data in Table 1.15 that the expansion in edible
olive cultivation has not been combined with denser plantings since the
average density remains at 16-17 trees per stremma. In the total
edible olive production of Greece, Macedonia contributes 12.2%, Thrace
2%, the Aegean Islands 0.4%, Sterea 41.8%, Peloponnesos 9%, Eptanesos
0.2%, Epirus 4.3% Thessalia 27.1% and Crete 3%. Most edible olives
therefore are produced in Thessalia and Sterea, (central Greece) and
Macedonia, (north Greece). While most olives for olive-oil production
are grown in south Greece, Peloponnesos and the Islands.
We can conclude that the historical concentration of olive-oil
production in the Mediterranean region continued between 1950-1988.
However, even though there has been a significant increase in olive-oil
production the underlying trend is decreasing. The annual compound
rates of growth have been calculated and are presented in Table 1.16.
70

Table 1.16- Annual Compound Rates of Crowthl of Olive-Oil Production(In percentages)
YearsWorld
Greece Italy Spain EEC-12 Mediterranean2
1950-1974 6.2 3.4 2.6 3.3 3.1 3.41976-1988 0.9 2.8 -0.15 1.1 -0.8 0.4
1950-1988 5 2.1 1.8 2.2 2.4 2.3
Notes: 1. Compound Rate of Growth — Antilog Log Y/A - 1
Y — Final Production ValueA — Initial Production Valuen — Number of Years
2. Mediterranean Countries apart from E.E.0 member States.
Source: Derived from Table 1.9
Since 1976 olive-oil production is increasing at a very slow rate
while for Spain and other Mediterranean countries the rate of annual
change is negative. Overall, between 1950-1988, annual growth has been
lower in the E.E.C. countries than in the world as a whole - apart from
Greece. It is against these global trends in production that we go on
to consider the structure of the national industry in Greece.
71

Conclusions
The production of olive-oil in the Mediterranean region is a
combination of two very important aspects of evolving cultivation. Its
long historical tradition has meant that olive growing has established
deep social and cultural roots in the area, and the second influence
has been the play of natural conditions of production which comprise
specific environmental factors as well as the physiological
characteristics of the trees themselves. As a result world production
remains concentrated in the Mediterranean basin. In this Chapter I
have argued that although olive-oil production has increased steadily
throughout the post-Second World War period, the rate of annual growth
has considerably slowed since the 1970's. This trend has occurred
despite the parallel evolution of techniques which aimed at
restructuring olive cultivation in order to increase output and reduce
costs, such as denser planting, improved methods of irrigation and a
greater use of mechanical machinery for harvesting. In the Greek case,
behind the sluggish annual rate of growth between 1976-1980 lies the
fact that the "traditional" aspect of olive cultivation remains strong.
The factors contributing to the existence of this state of affairs have
been identified as the slow pace of development in the application of
the evolving techniques; labour shortages in the rural sector; and also
the fact that considerations of economic efficiency must be placed into
a wide social context encompassing the olive growers' decision making
horizons. In Chapter Two it will be contended that the majority of the
olive farms are rather small in comparison with E.E.C-standards, and
the effect of a number of socio-economic and political developments has
72

delayed the restructuring of olive production at the farm-gate level.
Of course, one of the determining factors underlying the production
trends which have been identified is the market demand for the product.
This issue has become quite complex since Greece entered the Common
Market in 1981. This is because on the one hand the market for olive-
oil has expanded, while on the other it is subjected to supply quotas
and competition from an increasing and free market for its substitutes.
These issues are discussed in Chapter Eight.
73

References
1. See R. Standish, The First of Trees. The Story of the Olive(London, 1960).
2. See G Balatsouras, The Olive Tree, (Athens, 1986)+
3. Ibid
4. See D. Eitam, "Israel's Oil Industry Museum", Olivae, IVth Year,No.19, 1988.
5. See A. Kiritsakis, The Olive-Oil (Thessaloniki, 1988)+
6. See Herodotus, "Travels": in Ancient Greek Writers, (Athens,1976).+
7. Se M.J. Finley, The Ancient Economy, (London, 1973).
8. See A. Kiritsakis, 1988, op.cit.
9. See Plutarch, "Caesar": in Ancient Greek Writers, (Athens, 1976).+
10. See M. Lenoir and A. Akerraz, "Olive Cultivation in AncientMorocco", Olivae, No.3 1984.
11. See R. Duncan-Jones, The Economy of the Roman Empire: QuantitativeStudies, (Cambridge, 1974).
12. Ibid.
13. See Zaccaria Bembo's report, June 1712, : in N. Karabela,Messeniaka Grammata, (Calamata, 1981). A translation appears in anAppendix to Chapter Three.
14. See M. J. Finley, 1973, op.cit
15. See A. Kiritsakis, 1988, op.cit
16. See G. Balatsouras, 1986, op.cit
17. See H. T. Hartmann and J. Porlingis, "Effect of Different Amountsof Winter Chilling Fruitfulness of several olive varieties", Bot.Gazette, 119:102, 1957.
18. Ibid.
19. Derived from G. Balatsouras, 1986, op.cit, p.36.
20. See E. Sfakiotakis, Lessons in Olive Cultivation, (Thessaloniki,1987)+
74

21. Ibid.
22. See G. Balatsouras, 1986, op.cit
23. Ibid.
24. Information was obtained from scientific personnel in the OliveLaboratory of the Highest Agricultural School of Athens.
25. The Institute of Hypotropical Plants and Olive Cultivation,I.H.P.O.C, Reporting Experimental Work on Soil Cultivation andWeeding, (Crete, 1980).
26. Ibid. In both studies the olive trees were eight years old.
27. See M. Foli, "The Olive's Alternating Production Pattern", Olivae,IIIrd Year, No.10, 1986.
28. Quoted by M. Poll, 1986, Ibid.
29. See C. Bould, "Comparative Role of Soil and Leaf Analysis in CropNutrition Control" : in C. R. Coll, Controle de la NutritionMinerale et de la Fertilization des Cultures Mediterraneennes,(Montpellier, 1964).
30. The results of these experiments were obtained from the Ministryof Agriculture, Department of Forestry, 1988.
31. See M. Poli, 1986, op.cit.
32. See J. Le Bourdelles, "Activities of the Sub-Network on water Usein Olive Cultivation Results Obtained New Prospects forResearch(1)", Olivae, IInd year, No.6, 1985.
33. See N. G. Michelakis, "Olive Tree Behaviour under variousIrrigation Conditions", Unpublished Ph.D Thesis, Submitted to theHighest Agricultural School of Athens, 1986.+
34. See J. Le Bourdelles, 1985, op.cit.
35. Ibid.
36. Ibid.
37. See N. G. Michelakis, 1986, op.cit.
38. See M. Poli, "The Olive's Alternating Production Pattern", Olivae,IIIrd year, No. 12, 1986.
39. Ibid.
40. See E. Sfakiotakis, 1987, op.cit
75

the Harvest", Olivae , IIIrd Year,
41. See "Perugia CNR Olive Growing Study Centre", Olivae, IIIrd Year,No.11, 1986.
42. Ibid.
43. See G Giametta, "Mechanization ofNo.13, 1986.
44. See G Fontanazza, "The Intensive System", Olivae, Vth Year, No.22,1988.
45, See G. Giametta, 1986, op.cit.
46. See G. C. Martin, "Olive Harvest in California, United States ofAmerica", Olivae, IIIrd Year, No.11, 1986.
47. See G Fontanazza, "New-Style Olive Cultivation is no longer aMirage", Olivae, Vth year, No.22, 1988.
48. Ibid.
49. See G Fontanazza, "The Intensive System", Olivae, Vth Year No.22,
1988.
50. Ibid.
51. See M. Poli, 1986, op.cit.
52. See G. Giametta, 1986, op.cit.
53. See G. Fontanazza, "The Intensive System", Olivae, Vth Year, No.22, 1988.
54. I,H.P.O.C, Institute of Hypotropical Plants and Olive Cultivation,"Experimental Work on Olive Groves Lay-Out", Information receivedthrough personal contact, 1988.
55. See M. Poli, "The Olive's Alternating Production Pattern", Olivae,IIIrd year, no.12, 1986.
56. Ibid.
57. See M. Poli, 1986, op.cit.
58. See G. C. Martin, 1986, op.cit.
59. See M. Poli, 1986, op.cit.
60. See C. Bould, 1964, op.cit.
61. See G Balatsouras, 1986, op.cit.
62. See A. Kiritsakis, 1988, op.cit.
76

63. Information received through personal contact with oliver growersin the province of Messenia, Summer 1988.
64. See G. Giametta, 1986, op.cit.
65. See N. Lihnos, The Olive Tree and its Cultivation, (Athens, 1949).
66. See A Kiritsakis, The Olive-Oil, (Thessaloniki, 1988).
67. I H.P 0 C, Information received by personal contact, 1988.
68. See G. Giametta, "Mechanization of the Harvest", Orvae, IIIrdYear, No.13, 1986.
69. Information received from Eleourgiki, Department of PrimaryProduction, 1988.
70. See G. Giametta, 1986, op.cit,.
71. Ibid.
72. Information received from the Olive Research Institute ofMessenia, Summer 1988.
73. See G. Giametta, "Mechanical Harvesting of Olives in Algeria",Olivae, IInd Year, o.9, 1985.
74. See A. Kiritsakis, 1988, op.cit.
75. See G. Giametta, "Mechanization of the Harvest", Olivae, IIIrdYear, No.13, 1986.
76. Ibid.
77. Ministry of Agriculture, Department of Forestry, informationreceived by personal contact, 1988.
78. See G. C. Martin, 1986, op.cit.
79. Agricultural Bank of Greece, Department of Vegetable Production,1976.
80. Derived from N.S.S.G, Population Censuses, 1951, 1981.
81. See Official Journal of the European Communities, No. C134/5.These are prices set by the E.E.0 in the context of the CommonOrganisation of the Market for Oils and Fats. The system isdiscussed in Chapter Two.
82. See M. Tsinisizels, Groups and Agriculture in the EuropeanCommunity, (London, 1990) and T. Shanin (ed), Peasants and PeasantSocieties : Selected Readings, (Harmondsworth, 1971).
77

83. "Representative" is the term actually used by the provincialbranches of the Agricultural Bank of Greece. Some of the criteriaused in the selection of the sample were: farm size, cooperativemembership, and the amount of indebtedness to the Bank. Its notclear to me that the sample is unambiguously representative - butdespite this uncertainty, the data is obviously very useful.
84. To make the comparison the costs were deflated by the Retail PriceIndex, with a value 1974-100, for the respective years 1976, 1984.The Index was derived from the N.S.S.G, Department of Prices.
85. Derived from Olivae, I.O.O.C, various issues.
86. Information received from Eleourgiki, Department of PrimaryProduction, 1988.
87. See G. Balatsouras, 1986, on.cit.
88. For instance, the figures supplied by the I.O.O.0 were earlyestimates as it is not the practice of the latter to publishrevised figures when they became available. On the other hand theF.A.0 figures it is possible to include annual stocks as they arepublished towards the end of the marketing year.
78

Table 1.2: Results of the Study on Untilled Soil, Tilled and Weedingof Dry Olive Groves
I. Study of the Coroneiki Variety (average figures per tree, 1964-1971)
Type of Soil Intervention Annual Fruit Content in Olive Olive-OilGrowth (cm) Olive-Oil Production Production
(%) (kg) (kg)
Tilled 5.9 24.6 26.8 5.9
Untilled 7.4 23.7 30.4 6.6
Weeding (Z1)* 7.4 24.8 31.7 7.4
Weeding (Z2)* 7.2 22.9 33.7 7.2
Weeding (Z3)* 7.2 23.2 34.0 7.3
Study of the Mastoidis Variety (average figures per tree, 1964-1971)
Type of Soil Intervention Annual Fruit Content in Olive Olive-OilGrowth (cm) Olive -011 Production Production
(%) (kg) (kg)
Tilled 5.51 31.5 66.2 21.0
Untilled 6.12 30.7 70.7 21.8
Weeding (Z1)* 6.64 29.4 73.3 23.0
Weeding (Z2)* 6.90 30.4 74.0 21.5
Weeding (Z3)* 6.72 30.4 62.0 17.7
Notes: *Zl refers to the blend of Atrazine and Sima7ine
Z2 refers to Gramoxone and Z3 to Roundup.
Source: I.H.P.O.C, Crete, 1973.
79

ON•zr
•
cIP
6V
PHEd
8
•
Lfl
LnC.co
LC)
re)
lf)• 411
Lf1 00• CO
L.0 r•••• N
rs-
Lt1
r—
CO• 4‘)
1/40 1/40.
In 1111-1
re)
ret44.
(11 COre)
re)
ret
r-
co
NLn
COCO Ln
•4-1 Ln
LC,
1-1
111r-1 C)1-1Qr
V:)
rs-1--1NH
LC)
%.0 0ct.NH
CCre) 0CO 1-4
NCLC1 001 r-I
CO 01-4 01.0 v-1re)
LC1 0I-1 0
e-1•
re)
n-1
0 6ci cr
Lnrs•
rl•;1.
r-•;r
(-4
r-40N
CO rsre) fel411
rsre) re)
r-4
N Lf)Crt •:14Ln
0
14--10
0 mN
%.01-4
•zr N•cr r-1rs
0HNH
LOrel 1-11-1
Ln c\IN
411(11 r-I
0
4-)
NNH
NW 4f) re)01
•41. LI1 re) •ZI• 1/4/0re)
C11 r-1 L..0 •:1" r- m U1 •Cr01 m •zr re) •Cr CO V' co •;14 01 •zr
CO 01 CY \ LC)
4-4 rs.411re) t-1
111LO
4-1 H
80

1/1
szt.
%JD
01
gE.C•1(NC
111 1-1 C:)••
‘.0
g--4
0
•–n
C11 .1.0CV
1/40
I—I CVCO "zr
0
0
•4-)
0C•1
riCO
DC01 CVrn
4-)
z>a)
a, Cr COn.0
DCri
• • •ZI• N
2s.aE-1
Lf1 Cfl1.11
CV
C•1
CI COC•I
Cr) 0
81

•c 'o c-o o
ca•
CU
•
COOCL• • E
TC CO C-
N
cr.C' 03
^
.-
0 0'
U-'7•1
0C T-
co 07
CC
N-
T
co
t•-• 0
03
0
CO
0CO
0.-.-
C-
C
asN
so
C'.'Cr.
Z0 cc
Ca4.1
et =CC E.,
Ca1-1
66 SGCC 0
0 E.ct 3E CC a aC z
X CCCC 43Is3
43 43
—CC.)E. 43 V)
E. 2CCet 6-1
— --
Ca
0I..
CaCCLU
Ca
43 CC 0 Le,
CC c.x
LU C 0ul0. U
0 zrax a's
CO 17C
be veN 0 be
0 N- Ca, a)
0.oxN N- •
N N
0, a,
r." ...7.:.- •
c‘,N
7 L7
•••• 0.0 Q.
—Cca
l•••-:•••co
C-CO CO03 CD .-3 •21
4-3 0. co 0'X C
E-. 43 0
tn
0
(1)
Cs0 0 C
U'C-
43 6)
Zt"
C-0•-•.0 tis
03C-
70.0CO 0)
•-•CO >
0
cc a)en E
c-
C
0
0 . 0c0 a 3ee 0
C U-% CO sO
Z U,CL) La3 w 0IS4.3 0
.0
> CC L Let O. O. 17
CO0 0
C')).) a) 0 0•-•1
BCa so
L3
zE
CO Cs co00 40
—
43"z E.
01-i
Ca
-3
V) X0 a C/3 ZC CC
Ca
6 .11
C.7 043 C.)CC
—
—Ca
^ co cc
E.. Cal
CO 41V) 2
E-•Ca.3
Z Z(-n et 2 N
CC•-• •-•
82
N.sO c0
CO6-
0
0
CO
C
r's
r*"

2
cn
el 4 VD rq r4 U1 CD CT UD 00 In rl kJ, N. Ul C4 00 01 03 As C4 4 C4 00 00 014 1-4 Ui cy un N. CO VD Ch 02 CV un CD 4 N. 01 CO un r, VD 4 un 4 4 WI 44
r-I 1-1 1-1
03 r4 vD N. VD 01 u1 N. CD 4 U, CD CO CA ON N 01 N. N. ,4 00 CD CD 01 CO Ch01 U1 CD 1-1 CD r4 01 CV N. r4 00 VI A, 00 r4 CD N. VD VD VD VO C4 VO CV r4 CAq0 cA rn 1-4 CO 04 rsj rq 4 ul CD CC. Ch CV 01 u1 ul el 4 VD Ul VD 4 N. Ul
rA r4 r4 rA 1.4 r4 rA r4 rA r4 r4 rA r4 r4 ri rA rA r4 r4 r4 r4 r4 1-4
tin el CO CM01 00 Ul 04 N 40 VD 4 VI VD Cm N. Ul ul '.0 00 N. r4 Ul Ul 01 • • • .rA 01 01 r4 01 eV CD CD Ch C4 A% 01 ./ GO 01 ul ul CA 01 04 VD r, r4 N. 1-4 1-4 r, cocq 4 CV 401 C4 04 4 C4 01 01 4 el ul el 4 In ul 4 ul 4 VD N. CA CO CD C4 01
In un 4 1/40 en N.
CD N. un CA Ch OD 0 Ul N. N. 01 CV 04 04 03 03 Ch C4 CD In r4 CA 03 c0 Ul CA r,cm N. 0 co In 03 CD .1 CD CO Ch 4 r-I 4444 03 r4 As 40 01 N. cm ON rq In.
rn N. CD 02 VD CA CD OD CD cm rq op VD VD 00 r4 CV r4 1-4 CIA r4 CV CD 01 04r4 r4 1-1 r-I rv r4 r4 r4 r4 rA ,4 rA r4 r4 r4 r4 r4
(V 4 01 VI-. • •
r4 1 S NO• 4 r4 4 CV icnr4 01 1-4 r4 1-4 r4 01 01 01 01 u1 01 r4 r4
4r
4 CO un up 03 N. N. N. in VD C) Ch C) 141 r4 444 C4 VD 1/40 C4 01 01 00 00 CO CVs-I 1-1 1-1 ,4 CV CV CV CV 01 CV CV u1
CO•
C) CV CV VD N. r4 N. CO CD CV 00 CV CO N. 4 N. in C) r4 VD 4 CA 00 00 r4 04r4 C4 r4 r4 C.4 r4 01 01 r4 01 04 CV CV r4 4 4-4 r, U1 0.1 CV 01 01 cq 04 44 In
02 r4 un c>• • • •
03 VD VD 4 C4 03 .43 CA Ch CD 4 CT N. As r- co un cq N. Ul 01 Ul 04 CD N. mD r4 r4rA C4 C4 C4 01 r4 C4 1-4 r4 C4 1-4 1-4 r4 r4 r4 1-4 r4 C4 ,4 r4 CV C.4 CV r4 r4 CV
cg C)
VD 00 CV CD in 01 cm VD CV 01 03 CV 4GO C) C4 03 01 03 CD N. V) r4 N. CD 01 Ch4 Ul 4 cm vp rq 0 un In un 04 01 u1 CD CD V) 0.4 VI VD C4 Ch V3 V3 4 1-4 vD Ch 01
r-I s-i r4 r-I r-I r-I t-I
C4 C4 04. . .
C4 ,4 04 ,4 CV C4 rV 4 r4 C4 r4 4 r1 . 1.11 C4 C4 1-4 CV 01 CD r4 r4 01 01
In
cq cm u, 4 In rA CD rn C vD CA C) vD CV C4 CD ul CD a% 4 OD r4 MD In CD CD 1-4 VDu, 01 vD 4 03 4 Ch 4 cm u> VD C4 UI CD C4 '.0 ul GO u1 ul 1-4 U1 N. un rn cm CD OD
r4 r4 r4 r4 r4 C4
CV U1 CV CD l0 kJ) CV VD 4 VD CD In U1 VD en 4 CA CV rl 40 r4 rA CO 0 ul 04CA vD 4 03 c4 GO 01 44 GO U1 GO 01 GO ,4 CV mD VD Ch CA 01 GO Ch 00 N. cm 4r4 VD 01 rl rl r4 4 01 01 44 In rn sc. 1.4 01 4 04 4 01 4 01 44 01 4 01 4
CV C) 03 un 4 N. In 03 r4 CD N. 4 cm r4 rV 1--1 CD .1 CO OD CD 03 Ul 000CD r4 44 VD N. N. rq 1-4 40 00 CD 03 N. CA v, ul 4 CA GO 04 C4 N. Ch ,4 in N. Ch CD u1 ul
▪ r4 r4 rV r4 ,4 rA C4 C4 r4 1-4 C4 C4 1-V C4 C4 rA r4 N C.4
U1 01 03 CT• • • •
U1 CD VD r4 CO Ul r4 8-4 C4 CV 1-4 r4 r4 v4 on 04 4 r-I 01 rV C4 r4 1-4 rV r4• r4
03 00 CA rV Ch Ch CA Ul CV U1 Ul CT U1 44 Ul N. 4 CA eV 400CD Ul CD CD Un N.C) CV CV C) CV CD CM CD Ch N. In 4 03 01 ul ul Cm 04 C4 VD I,- N. Ch CO CD C4 01CV 4 04 4 01 04 r4 4 04 01 01 4 01 ul 01 4 01 u1 4 ul 4 No 01 ul 4 vD on r-
CD eV csi rn 4 u1 VD N. 03 Ch C) r4 04 01 4 Ul VD N. 03 CA C) ,4 C4 01 4 u1 vaUI un Ui Ui tfl tri UI U") Ul U1 1/40 1/40 *JD 1/40 1/40 1/40 1/40 1/40 VO ‘C, N. N. N. N. N. P1/4. IssCh Ch Ch CA Ch Ch CA Ch CA Ch CM Ch CA Ch CA Ch Ch Ch CM Ch CA CT Ch Ch Ch Ch Ch Ch• 1-4 1-4 rV rV ,4 r-I rA r4 r4 r4 r4 r-I r-I rA r4
83

4 I • Ul
0 el VD v-I ev• 0 CO CO 0 1/413 1/40
1/40 4 CO In 0 Ul In el es m cov-1
co 01 co oo 4 In 0 ,--1 In in Inen en oa m 4 ea cn m m 4 el
1/40 el a% I-I CO CV CT 1/40 In o coCV I-I 1-i 1-1 r..1 11 v-1 v-1 1-1
0% 4 In 0 CO CV Cn el 0 1/40 1-1ON ON V) 4 cn cc, 0 c-i 40 1.-.
I-I c-i 1-4 1-1 1-4 e4 1-1
CV in rn Is. *0 CV 4 cn 4 .--I cq
1-1 0 CV 1`, In 0 CV CO 0 ON Inoa co 4 0 CO 1,- CV 01 Is- ON %0v-I CV I-1 1-1 I-1 1-1 v-1
0 el es 1.--1 1/40 CO rn ON 4 cs1 n-1-1 co as co CV 1/41:7 1/40 CV el CO coIn 4 4 CV I,. CV ev• 4 In e-• el
In N- C' In v-1 0 ev• CV V) CV CVel 1/40 el el ON CV In 4 44 CV
CV CO 1/40 0 "-I crs 00 r-• m o1/40 cs4 cn Da r.... in 1/40 v-i 1/40 e. ONCV CS1 an CV an CV an an CV CV CV
1-1 CV CV CV 1 1-I CV .-I v-1 CV CJ
0 OelONC•14let v-1 0 1/40 e-IIs, CV Cs1 es• CV 1/40 Cel en r- In 0l'sv %0 CV 111 .-1 in ON CO e-- I-I V)v-I vi CV r-i CV 1-1 evl v-1 v-I CV .-1
Cll 1-4 4 CV 0 co NI NJ co N. 0'00' 0 %0 In v-I In ev• ev• 0 1/40
el CV 1/40 1-I 1/40 C., an 4 CV CO v-1v-1 v-.1 ,1 fi 1-1 v-I v-I v-I 1-1 v-I n-1
CV 0 el .--4 co 1/40 es CV In In V31-1 0 I-1 es In CV In co co r-I 1`,el e'l 1/40 1-1 V3 CV In 4 csa co ,-1c-i c-i c-i c-i .--1 e.1 ll e-I e-1 1-1 v-1
1/413 v-I 0 1/40 CV 0000 CO 03Crn I an1 1/40 1/40 1`.• Is. Ol an o 1/404 in vs. in 4 V) rn 1/40 4 1-n 4
>1/4
wU CO CO 0 eV CV el 4 Ill sD 1'v CO= S4 es Isv• CO CO CO CO CO CO CO CO COZ 0 ON ON 42% ON ON ON ON ON ON ON ON0 a) .-I a-I 1-1 c-1 I-I •-1 I-I 1-1 ,-.1 1-1 a-
La >-n
81414

Table 1.10: World Production of Edible-Oils (Quantities in 1,000Tonnes)
Oils 1982/83 1983/84 1984/85 1985/86
Olive 2160 1444 1580 1480
Soya 13616 13160 13330 13640
Palm 6006 5585 7040 8290
Sunflower 5809 5699 6080 6380
Rapeseed 5365 5104 5630 6250
Cotton 3346 3364 3870 3430
Groundnut 3173 3324 3100 3150
Sufflower 2669 2483 2690 3330
Palm-kernel 731 769 950 1130
Linseed 689 697 690 660
Marine 1300 1196 1280 1330
Source: flu. S. Department of Agriculture. Foreign AgriculturalService oilseeds and products (FOP 6-86)" : in A.Kiritsakis, The Olive Oil, (Thessaloniki, 1988),
85

• •
NON CV 1/40 al4 4 in inCV 0 0
1/40
Cfl CV 01 enst CV 0 i-iLel en CV 1-..1
CO In N.D
1-1 1-1 1••1
NO 4 I's CV
c•4 0 CO rn
1/40 N. ON CV• - ... ..
en 1/40 1-1 CO
e-i in en r•-•
4 co en 4
. . .. Tn
03 4 m ,-)
WW
5-1 4-)03 a) 4-) 4-)
•0
4cr%CV
CV
aoC*1CO
r--CV1--I
1--1CT01
0 c.) CV 1/404 0 cn a) In
44 V00 0 0 In 0
0 ,-; in ON14 a) 01 0 CO 1-4
4-)0 CV 01 CV 1•4
19 al 14 en n-•.i 0 csic.) 4-) l•-n I—I
Z (1)
1-) cd 4 CVcncl)
1-1 CV 41-1
T•
0 a) 14a) 14A 1-I Cl)
U1 en00)
0 ON CO 0
10 1/40 v--I 0 in4-3 en in CV r-I
.Tn CO 0 Tn
0 cD In 0 CV TnCV CV 1-n 4
$4I-I in
0COm
CV
u)0en '0W 4-1 0 W0 W of 1:10 a) of 00 3 a) CCgm. 54 u ,-.4 a) ,—Io 1:1 0 .,.4 {fl 4-) cd
1--i 0 4) 4-) P•I di 4-10 cri 0 4-> W 0
134 4 U H
C71 C'l 0 ONCs] 1/40 4 N InCrl 0 m 4N cn co ..i.0.1 CNI in aD VDCV st in a)
CV0
r-i CT CV %.o 44 cr% cq 1-1 In es.
Isn
•
.--1 ND al
co 0 0 in CO CT InCO
-
1/40 en 1/40 N CV 1/40
4 In in1/40
031/40
ON 0CV
00
4 4 0 m0 en
a) %xi co coof co 0 cvQ) .1-1 4
r—I
.4 0 03 i-i
0 k-1 010 )4
0 4-) 00) 4-)3-1 . Q 0 010 $4 a) of 0)-4 ed
C.) W C, 0 .1-.1r1 Cl) al ,C 0 ,—i
c.) 0Z r La li
(IiCl)
0ofCl)
4-1 .1-1 4-) 11 4-) c.) 14 0
$O11)Cl) 00 cd
En (clcl) Z
•-iP.
a)4
44 43 3 14 H
86

Table 1.12 Varieties of Olive Trees Cultivated in Greece
Variety
Average Content in Regions of CultivationOlive-Oil, (%)
Coroneiki
22 Peloponnesos, Crete,W.Sterea, Ionion
Mastoidis 25 Crete, Lakonia
Valanolia 26 Chios, Lesbos
Adramitini 23 Lesbos, Andros
Lianolia 19.5 Ionian Islands, WestEpirus
Thrubolia 23 Crete, Aegean Islands,Attica, Eboea
Megaritiki 19 East Sterea, North-Peloponnesos
Aguromanako 23 Argolida, Korinth,Spetses, Arkadia
Cothreiki 25 Fthiotis, Fokida,Ermioni, Poros
Source: A.B.G, Department of Vegetable Production, 1988
87

Table 1.13(a): Olive-Oil Production by Country, 1968-1981 (in1,000 Tonnes): FAO Data
YEAR GREECE ITALY FRANCE SPAIN PORTUGAL EEC-9 EEC-10 EEC-12 WORLD
1968 228 429 1.6 492 53.2 430.6 658.6 1203.8 1585.3
1969 233 520.7 3.8 393 72.5 524.5 699.5 1165 1376.9
1970 181 463.7 0.5 480 67.3 464.2 672.2 1219.5 1604.6
1971 194 670 3.4 330 42.0 673.4 891.4 1263.4 1662.8
1972 222 370 1.1 491 54.0 371.1 660.1 1205.1 1611.4
1973 260 595 2.3 481 42.3 597.3 832.3 1355.6 1688.6
1974 222 475 2 364 53 477 695 1112 1543
1975 294 695 2 509 54 697 927 1490 1928
1976 256 440 2 437 45 442 701 1183 1624
1977 259 739 2 386 33 741 1050 1469 1845
1978 268 454 2 548 47 456 719 1314 1796
1979 233 511 2 483 67 513 741 1291 1620
1980 368 • 730 2 497 39 732 1068 1604 2223
1981 277 566 2 281 33 568 848 1162 1579
Source: F.A.0, Production Yearbooks, various issues.
88

Table 1.13(b): Olive-Oil Production by Country, 1968-1981 (in 1000tonnes): I.O.O.0 Data
YEAR GREECE ITALY FRANCE SPAIN PORTUGAL EEC-9 EEC-10 EEC-12 WORLD
1968 150 384.6 2 480 52.9 386.6 536.6 1069.5 1390
1969 140 473.4 3.5 369 72 476.9 616.9 1057.9 1268.4
1970 170 419.9 0.5 479.2 66.9 420.4 590.4 1136.5 1424.1
1971 160 618.1 3 340.3 41.7 621.1 781.1 1163.1 1551.0
1972 190 339.6 1.1 439.7 53.5 340.7 530.7 1023.9 1400.3
1973 170 450 2.5 446.7 42 452.5 622.5 1111.2 1405.5
1974 190 432.7 1.6 308.1 47.8 434.3 624.3 980.2 1393.4
1975 220 430 1.5 471.6 49.1 431.5 651.5 1172.2 1588.5
1976 200 280 2 422.5 35.5 282 482 940 1345.4
1977 220 500 2 361.4 29.6 502 722 1132.2 1397.8
1978 235 350 1.7 499.9 39.9 351.7 586.7 1127.4 1510
1979 203 450 1.5 432.8 56.9 451.5 645.5 1144.2 1410.1
1980 330 500 2 446 32 502 832 1310.0 1767.9
1981 . 230 606.5 1.4 297.3 22.9 607.9 837.9 1158.1 1419.4
Source: I.O.O.C, Olivae, Various Issues
89

Table 1.14: Edible Olive Production in Greece, 1960-1988(Quantities in tonnes)
Years Quantity Years Quantity
1960
1961
1962
1963
1964
1965
1966
1967
1968
1969
1970
1971
1972
1973
1974 '
25,000
75,000
15,000
45,000
25,000
35,000
45,000
40,000
38,000
40,000
40,000
70,000
50,000
56,000
64,000
1975
1976
1977
1978
1979
1980
1981
1982
1983
1984
1985
1986
1987
1988
76,000
55,000
65,000
86,000
35,000
80,000
76,000
97,000
70,000
95,000
80,000
70,000
85,000
100,000
Source: A.B.G, Department of Vegetable Production, 1988
CHAPTER TWO
OLIVE CULTIVATION AND CHANGES IN THE AGRARIAN STRUCTURE
Introduction
This chapter has two inter-connected objectives. The first is to
examine the specific form of organisation and structure of olive
production in contemporary Greece. The second is to identify and
discuss those factors which have played an important part in creating
this state of affairs within the rural setting. It is argued that the
organisation of production in the rural sector in general and olive
growing in particular has been shaped decisively by a number of socio-
economic and political developments. These have been traced back to
the 1827 War of Independence against the Turks, and revolve around the
role of the State.
Section One focuses on the Land Reforms which established the
pattern of small scale size holding in agriculture. It is argued that
despite the low level of the forces of production and the lack of State
support towards the olive growers, the post-independence period
witnessed a spectacular increase in the number of newly planted trees
and a significant rise in olive-oil production. The reasons for this
expansion are associated with the break up of the big landowners'
property, the distribution of National Lands by the State, and also by
the further commercialisation of agriculture. Unfortunately no
continuous data for olive-oil production exists covering the long
91

formative period 1827-1914. There are only sporadic reports which, at
times, are contradictory. Nevertheless, a generally rising trend can
be observed during that period.
Section Two concentrates on the role played by the merchants in
the olive growing regions. It is argued that merchant capital became a
constraint upon the further expansion of the sector through the system
of debt bondage with respect to the cultivators. Furthermore, the
development of the olive cooperative movement - which reflected the
struggle of the growers for greater control over their own production,
received little or no support from the State at that juncture. In
such conditions, the small scale organisation of production became the
means by which the olive sector was articulated with the needs of the
rising urban population. Apparently, the majority of cultivators were
only able to retain earnings just sufficient to reproduce their labour
supply and their means of production. One of the main underlying
conditions which produced such a state of affairs was the action
undertaken by the State.
Section Three examines the role of the State during the inter-war
period. In the first part, it is shown that until the early 1950's the
main policy of the State towards olive growing was associated with how
to extract part of the cultivators' income by heavily taxing the
marketed produce. This action posed a further constraint upon the
expansion of olive-oil production since the small cultivators were left
with little surplus to reinvest in improving their working conditions
and methods of production. In the second part, it is argued that the
92

post Second World War period witnessed a change of direction in that
the State came to provide a wide range of support policies to the olive
sector. The reasons for this change are connected with the rising
demand coming from the urban population, and the rural exodus of
younger members of the labour force in the 1960's. Many people
migrated as a result of rather poor levels of agricultural income on
the one hand, and rising opportunities elsewhere on the other. As a
consequence some improvements occurred and olive production per hectare
began to rise even in the context of the small scale organisation of
production. In the third part of this Section, it is shown that under
the E.E.0 regime an entirely new dimension has been added to
agricultural policy. The E.E.0 price support mechanism is discussed
and its effect upon the olive growers' incomes is traced.
Section Four focuses on changes in the olive production structure
since the 1960's. It is argued that the small size of agricultural
landholding, coupled with the process of plot fragmentation, has
constituted a constraint upon the development of the sector. The E.E.0
regime has induced some restructuring of olive growing in the direction
of a more cost effective mode of organisation; but the relatively slow
pace of change is due, amongst other factors, to the limitations
inherent in the small scale organisational form which continues to
characterise olive production.
93

2.1 Greek Olive Growing and the Evolving Agrarian Structure
2.1.1 Production Relations in Greek Villages. c.1827-1871
Before Greece was declared an independent State in 1830, all land
was under the control of Turkish feudal landlords. They had no clear
ownership rights over the land but, in exchange for military and
administrative services to the empire, were entitled to part of the
produce. The cultivators worked the land under a rather heavy tax
burden - the duties amounted to some one-third to half of the
output. ( - ) Their lives and that of their families was closely bound up
with the often arbitrary fiscal demands of the Turkish officers, the
apat-Iis.. It seems that what little produce they were left with after
the various exactions was just about sufficient to support a meagre
existence. (2) This system of landholding prevailed in the whole
country apart from the mountainous areas where free small land
ownership was dominant. Quite often the only cultivation in such
regions was the olive tree. For some four centuries olive cultivation
was one of the few sources of income which sustained these rural
dwellers and the only effective means by which they retained their
freedom.
During the 1821-1829 uprising against the Turks it seems that a
substantial number of olive groves were set on fire in many areas
throughout the country. (3) After independence the cultivators had the
huge task of replanting such lost tree capacity. Not only did they
replace the trees but they also brought new land under olive
94

cultivation. (4) All this took place on the strong assumption that the
newly created Greek State would distribute the land to the cultivators.
The total cultivated land size in 1829 was 2,162,777.5 ha. Out of
this 551,975.4 ha belonged to the Chiflik holders and 1,610,802 ha made
up the National Lands. (5) This was land possessed by the State which
then slowly but surely passed into the hands of the big landowners.
The reason for this transfer was that contrary to its pledges the
State, did not implement land distribution in favour of the landless
cultivators who had fought for Greek independence. Instead the
Donation Law of 1835 simply gave them the right to purchase small
plots of land against annual payments spread over a thirty-six year
period. (6) But in most cases small farmers could not meet these
payments to the State plus other liabilities. The chief reason was
that production had been severely limited as a result of the
destructive war (of independence) and, further, the farmers did not
receive State support during their first years as independent
producers.( 7) Moreover, as we have shown in Chapter One, in olive
growing the newly planted trees need a seven year period before they
start to produce and they usually reach full productive capacity only
in the fourteenth or fifteenth year of their life. Therefore, many
cultivators were forced to sell their plots and work for the Chiflik
holders under sharecropping agreements. (8) No less than nine-tenths of
all cultivators were landless. Frederick Teers estimated that in 1835
only 20,000 rural families out of the existing total of 120,000 were
property owners. He then proposed a destributional schema for the
National Lands and calculated that a donation of three hectares to each
landless cultivator was possible. (9) It seems that the cultivator's
95

material existence was highly dependent upon the particular local
landowner.
In such circumstances the rural economy continued to suffer a deep
depression. For decades after independence production remained
stagnant, and most of it was handled by merchant-usurers who came to
dominate the cultivators through a system proximating to what we now
call debt bondage. (10) Despite this state of affairs in rural Greece,
olive-oil production showed some sign of improvement within the period
under examination. In the international meeting on agricultural
production in Paris in 1855, it was reported that the number of
productive olive trees in Greece was around 3 million, and most of them
were of a relatively young age. (11) However, in a report by the
Minister on Economic Affairs in 1857, the total number of olive trees
(i.e productive and unproductive) was registered as 7.4 million. (12)
In 1864 olive-oil production was recorded at 7,434.8 tonnes and the
land under olive cultivation at 37,000 hectares. (13) This production
corresponds to about 5.7 million trees which suggests that 2.7 million
trees were planted just before 1857 or in the period 1850-1857.(14)
Despite the generally poorly developed level of the forces of
production, the domination of villages by merchant-usurers, and the
lack of State support towards the olive growers, the post-independence
period witnessed a spectacular increase in the number of newly planted
olive trees and a continuous rise in olive-oil production. Restoration
of the country's independence ultimately meant the creation of an
96

environment more conducive to the restoration of olive-oil production
by the cultivators.
2.1.2 The 1871 Land Reform and its Consequences
Increasing agrarian pressure which the cultivators endured in the
rural areas resulted in several revolts directed against the large
landowners.( 15 ) On each occasion the State and the Chiflik holders
promised land reform and the former passed various law decrees through
Parliament. But in the literature there is general agreement that
little fundamental change was effected. The main reason seems to have
been that the struggle by the cultivators was not sustained and had a
rather unorganized character. Partly arising from this rural
discontent and partly because of growing commercialisation of
production and development of the domestic market, the first real
concession was made. The government passed a law on 25th March 1871
which was actually implemented. By that law, 265,000 ha were
distributed out of the National Lands and the property of closed-down
monasteries; this was released for the sum of 590 dr per hectare in
annual installments. ( - 6) But most cultivators did not possess
sufficient financial resources to pay off the debt to the State so the
size of the plots they bought was rarely more than one hectare-while
other even poorer cultivators were unable to purchase any land at
all. (17)The 1871 distribution established the future pattern of
small-scale land ownership. The majority of the cultivators who
emerged from this reform were unable to produce for the market in any
significant way. It seems that they could only produce sufficient
97

quantities of bread and olive-oil necessary to meet family
consumption. (18)
After the reform production relations within the villages do not
appear to have undergone much change. Nevertheless 1871 can be regarded
as being an important landmark for the penetration of capitalist
relations of production in the rural sector. In Peloponnesos, where
the reform was concentrated, the first signs of commercialised
production started to appear from that time. The main products of the
region were olives and raisins. Slowly, a process of social
differentiation in the village communities began to take place.(19)
During the decade 1871-1880 olive production tripled throughout
the country and the olive cultivated land expanded to approximately
100,000 ha. The reason behind this expansion was that once they had
produced enough to satisfy their own consumption and that of their
families, the new small landowners tried increasingly to meet market
demand for olive-oil. This largely came from the growing urban centres
of the country and abroad. In 1914, 20,700.4 tonnes were exported,
valued at 20,215.272 dr (at 1914 prices) .(20) At this time the
techniques used in olive-oil production were still traditional. More
specifically, horse power was used for olive crushing and very few oil-
mills were mechanised in the rural sector. Increasing mechanisation
only began to occur in the second decade of the twentieth century. (21)
In 1917, the newly established Ministry of Agriculture sent
several trained agronomists out to rural areas in an effort to educate
98

the cultivators and the oil-millers about improving the quality of
their produce. But, as might be expected, the process of change was
slow and sometimes painful. (22) By 1920, 20,753.7 tonnes of edible
olives were produced, 142,500 tonnes of olive-oil and 302,146.6 tonnes
of olive residue.(23)
Despite the limited nature of the 1871 land reform commercialised
production developed and olive-oil production expanded at quite a fast
rate. By the early 1920's other processing units - apart from oil-
mills - appeared in the rural sector such as olive residue plants, and
certain tobacco and cotton seed processing units.( 24) The social
division of labour increased in the village setting, and the
discontent of the landless cultivators became organised and persistent:
they demanded a solution to the problem of greatly unequal
landownership. This was especially manifest in Thessaly - which was
acquired in 1881. (25) In Magnesia (province) an important edible olive
producing centre, conditions appear to have been worse than elsewhere
in the country. The reason was that the Chiflik owners had the legal
right to expel the olive growers from the land which they cultivated
under sharecropping agreements (until the early 1920's) - at the
termination of such agreements.( 26) This state of affairs prevailed in
the countryside when Greece entered the First World War.
2.1.3 The 1922 Land Reform
Greece's entry into the First World War and the defeat in Asia
Minor which followed had a number of destructive consequences for the
99

national economy and especially for the rural sector. For five years
continuous army mobilization left the countryside bereft of young men.
In the villages, elderly men and women and small children were left
with inadequate means to cope. (27) Throughout the War production
remained at a low level and several hundred farms were requisitioned by
the State. In these conditions many cultivators resorted to borrowing
in order to keep their households going. As a consequence they ended
up with considerable debts to usurers and also to the banks.(28)
Upon their return to the villages after the First World War, the
cultivators naturally found that many of their properties had been run
down. They apparently needed to work very hard in order to restore
their capacity. In addition to the veteran returnees no less than
1,200,000 refugees from Asia Minor appeared in 1922 as a consequence of
the War and most of them settled in rural areas. (29) The farmers and
the refugees united in demanding a redistribution of land. One of the
ways in which they organised themselves was through cooperatives. The
cooperative idea was thought of as a means by which cultivators could
obtain the necessary facilities for the production process, and also a
means through which they could collectively fight for a redistribution
of land. Under this pressure, the 1922 land reform emerged. (30) By
1937 it was complete and it has left its mark upon the structure of
landholding to this day. Some 82,917.2 ha owned by Chiflik holders
were redistributed to around 130,000 farmers. In total, 181,292.6
hectares were given to 303,127 landless and small land holders.(31)
100

The majority of Greek economic historians consider the 1922 land
redistribution as the effective end of feudalism. From this date
labour services were commuted into cash rents throughout the
country. (32) The compensation which the new cultivating farmers paid
out to the landlords extended over a period of thirty years and was
made in annual instalments. It was only with the hyperinflation of
1945 that the cultivators finally managed to clear off their debts once
and for all.(33)
Statistics from the Ministry of Agriculture show that the value of
olive production in 1929 represented 14.5% of total agricultural
production - thus coming in third place after cereals with 32.4%, and
crops like tobacco and cotton seeds with 22%. In the 1929 Census the
size of the cultivated olive land was put at 150,740 ha representing
1.2% of the total land size (13,019,940 ha)-and 2.5% of the productive
land (6,002,489 ha). (34) If we take into account the total amount of
cultivated land at that time, some 1,721,854 ha, olive cultivation
occupied second place amongst all other crops with 8.8%. Cereal
cultivation was first with 60.8% and the third place was taken by
vineyards with 8%, and tobacco followed with 5•9%• (35) Furthermore,
the 1929 Agricultural Census informs us that apart from the olive trees
cultivated in the aforementioned area there was also a large number of
isolated and scattered olive trees estimated at 11,125,143. Taking
the average density of olive trees to be 120 per hectare, it follows
that 11,125,143 isolated olive trees occupied 92,700 hectares in
1929. (36) Therefore, the total land size covered by olive trees was
101

about 243,500 ha. Based on the same average density I estimate the
total number of trees to be approximately 29,000,000.
In 1937, when the land reform was completed, the value of olive
production had increased to 18.6% of the total agricultural
production. (37) Olive cultivation therefore showed a greater
expansion compared to other crops. The reasons for this expansion were
that first, domestic consumption increased from 60-65,000 tonnes in
1920's to 70,000 tonnes in 1937 - mainly due to the population
growth. (38) Secondly, the annual rate of export growth between 1920-
1937 was 3.6%. Table 2.1 presents olive-oil production and exports (as
well as edible olive production and exports) between 1920-1937. I
estimate that the annual rate of growth for olive-oil production was
4.7%, while for edible olive production the figure was 5.4%.
Furthermore, to see where and by how much the land reform 1922-1937
affected olive-oil production in the country, the percentage
contribution of olive-oil production over the different administrative
areas is presented in Table 2.2, before and after the land reform.
102

Table 2 2 Percentage Contribution of Olive-Oil Production byAdministrative Area: 1920. 1937
Areas 1920 1937 % change1920-1937
Macedonia 1.13 1.2 + 0.07Epirus 1.09 19.8 +18.71Aegean Islands 28.27 62.9 +34.63Crete 32.65 54.4 +21.75Thessalia 1.87 13.4 +11.53Ionian Islands 3.79 52.9 +49.11Keclades 1.78 25.6 +23.82Sterea-Eboea 8.14 20.3 +12.16Peloponnesos 21.23 19.7 - 1.53Thrace 0.1 + 0.10
Total 100 100
1920,1937Source: N.S.S.G Agricultural Production Yearbooks,
We can see that in Peloponnesos, the only area where small land
ownership was established after the 1871 reform, the percentage
contribution of olive-oil production was actually reduced. In all other
areas though, where the 1922 land reform established small landholding,
we observe a spectacular increase in the contribution to total olive-
oil production. The only exception is Macedonia which, to this day,
remains an unimportant olive producing region. However, this
impressive increase in olive-oil production after the reform does not
necessarily imply that the small farmers were technically superior to
the large estates. Rather it was due to the abolition of certain
"peculiarities" inherent in the pre-existing system of cultivation.
More specifically, the cultivators working on Chiflik properties had
little incentive to improve land or labour productivity levels since
103

they were required to give a third to half of their produce to the
landlords. Also, the Chiflik holders had rented out some of their
cultivable land as pasture.( 39 ) Once these factors were removed as a
result of the reform, the olive growing sector was in a better position
to move forward.
In the Agricultural Census of 1939 (and so two years after the
completion of the land reform) the total size of cultivated land stood
at 3,333,161.6 ha. Of this 304,979 ha were covered by olive groves
(i.e 9.1% of the total). The total number of olive trees was now
estimated at 49,487,125. (4° ) However, the Ministry of Agriculture's
Department of Planning estimated that the total number of olive trees
in 1939 was approximately 64 million, and covered an area of 500,000
ha. Of these 10 million produced only edible olives. (41) Reports from
other sources on olive production tended to agree with the latter
figures. (42) Table 2.3 shows the total number of olive trees in
production and estimates of the number of wild olive trees in 1939
throughout Greece. The figures were collected by village and by county
in a survey undertaken by. the Ministry of Agriculture which lasted over
a number of years. The survey was conducted with the cooperation of the
local authorities in each area, with certain public services and with
the help of trained agronomists so that it should be reliable. We
observe that about 85% of the total number of olive trees could be
found in Peloponnesos, Crete, Sterea, the Aegean and Ionian Islands.
The main olive producing centres of Peloponnesos were the provinces of
Messenia, Lakonia and Korinthos. In Thessaly, they were the province
of Magnesia, and in Macedonia the provinces of Halkidiki and Thasos.
104

In the Aegean Islands, Lesbos was the most important olive producing
centre and in the Ionian Islands, Kerkera (Corfu). Moreover, it
appears from Table. 2.3 that in 1939 about 15% of the total number of
olive trees were wild trees growing in isolated and remote areas
without any proper system of cultivation care for the most part. As a
result, they yielded only a fraction of their potential productive
capacity.
As far as the social structure is concerned Table 2.4 shows that in
1939 339,618 rural families were engaged in olive cultivation. This
suggests that approximately one and a half million people were engaged
in olive growing. This activity therefore provided a source of income
for 72% of the families in rural Greece. If we take into account the
area covered by olive trees, it turns out that the structure of small
land ownership meant an "average" olive farm size of 1.5 ha per family.
Apart from this small size we must also note that many of these plots
were dispersed and fragmented. (43 ) Wage labour existed on a seasonal
basis (two or three months a year) usually from November to January.
Although there are few official statistics on the numbers employed,
olive growing is widely considered to have been a family-engaging
activity. (44) The average number of olive trees owned by each
cultivator can therefore be estimated at approximately 150-250. The
highest average ranged from 200 (in Crete, Lesbos, Samos, Andros and
Tenos in the Aegean Islands, Halkidiki in Macedonia and Preveza in
Epirus) to 1,700 (in Crete, and Kerkera in the Ionian Islands). The
lowest number of trees could be found on the Keklades Islands,
especially in Seros (5-20 trees at most) and Kea (15-60 trees at most).
1 rl

Lesbos shows the highest average olive growing landholding, approaching
4,000 trees. In Lesbos one could come across a few olive plots with
8,000 or 12,000 trees owned by a single farmer. On the other hand, in
Kerkera and Ahaia one could exceptionally come across 13,000 and even
15,000 olive trees belonging to a single landlord. On a smaller scale,
the largest number of olive trees owned by a single landlord which
could be found in the province of Fthiotis in central Greece was 9,000.
In Hania (Crete) and Evros (Thrace) 7,000 trees and in the Islands of
Thasos and Paxi, 5,000 trees. In the rest of the country the number
ranged from 500 in the province of Arta (Epirus) to 4,000 in Eboea. In
Sterea the number of olive trees owned by one cultivator ranged from
20-3,000. (45) It therefore appears that although small landholding
became dominant in the olive growing sector, some Chiflik holdings
scattered throughout the country remained even after the 1922-1937 land
reform. This suggests that although the general aims of the State to
increase production and accommodate the thousands of landless
cultivators through the land reform were accomplished, the programme
did not include an equitable distribution regime. So, given the
further commercialisation of agriculture which took place over time,
there was an intensification of an already well established trend of
social differentiation in the olive growing villages, and this led to
further inequalities being generated. Various influences were at work
including differential income and price elasticities of demand for the
product during the process of development and also differential access
to credit and other services. (46) Despite these shortcomings the
break-up of the Chiflik property structure as a result of the reform,
gave a major albeit indirect-boost to the development of rural
106

capitalism. This occurred principally because agriculture operated as
a complement to the urban sector. More specifically, it ensured, in
the time honoured way, the supply of foodstuffs so contributing to the
cheaper reproduction of the urban based labour force. Furthermore, the
agricultural sector operated as a labour reservoir, and this served to
reduce pressure on urban wage rates.
2.2 Merchant Capital and the Cooperative Movement
' After the 1922 land reform and as the olive-oil trade increased,
two conflicting groups emerged from the process of social
differentiation in Greek villages: these were the olive producers who
strove to sustain a certain standard of consumption, and the oil-
millers who came from the ranks of the better-off cultivators. (47) The
majority of farmers controlled their own means of production but were
often compelled to borrow working capital at times of crop failure.(48)
The lenders were usually olive-oil wholesalers, who themselves
originated from the rural sector. The wholesalers' strategy was to
store olive-oil with a view to creating excess demand which would force
prices upward. They were then in a stronger position to earn "super-
normal" profits. As late as 1950 a number of wholesalers managed to
buy up olive-oil from the producers at 5-8 dr per kg which they then
put into storage. Only when the price increased to 20-22 dr per kgr
did they release it onto the market. (49) By and large it seems that
profits made by wholesalers were reinvested in trade or the tertiary
sector - and mainly away from olive cultivation. (50) After harvest
olive growers would take the crop to the private oil-mills. There, if
107

the oil-miller had a monopoly in the village - which seems often to
have been the case-commission rights would be levied. These amounted
to around 12% of the produce. (51) Furthermore, it was often alleged
that in the weighing of the produce oil-millers were grossly
fraudulent. Literally following the oil-miller, creditors would wait
for the farmer "around the corner" to receive the produce in return for
past credit provision and debt repayment. (52) The credit relation was
a way of appropriating surplus and of transferring control over the
means of production i.e., if the farmers were unable to repay their
debts the wholesalers took control of their property. (53)
With the Law Decree 602/1914 by which the formation of
cooperatives in the olive sector was permitted, the olive producers
started to look for a way out of this situation. The cultivators
organised themselves into cooperatives in order to obtain easier credit
terms from the State and also, tools and fertilizers required during
the olive production process. The State seems to have supported the
cooperative movement and the National Bank of Greece as the leader of
banking capital, expressed interest in investing in the rural
sector. (54) For this reason it encouraged the establishment of credit
cooperatives. The composition of agricultural cooperatives in 1931
according to their main function is presented in Table 2.5.
108

83.6
1.1
7.4
4.7
3.2
100
Actually inOperation
2,800
36
245
158
108
3,347
76.12
100
3.02
7.20
5.81
7.85
ExistingNumber
4,482
178
424
342
462
5,888
Categories
Credit
SupplyingInputs
SellingOutputs
Production
Other
Total
Table 2.5: The Composition of Agricultural Cooperatives in 1931
Source: P S Avdelidis, The Agricultural Cooperative Movement in Greece,(Athens, 1986) p.61
We observe that credit cooperatives were the dominant form of
agricultural cooperatives - a characteristic of many L.D.C's today.
Other categories cover only a small fraction of the total. Moreover,
production cooperatives which are potentially useful in serving the
needs of such small-scale producers, accounted for only 4.7% of the
cooperatives operating in that year. Out of the 342 existing production
cooperatives 75 were olive cooperatives, 137 were wine cooperatives, 57
were dairy product cooperatives and the rest were engaged in fruit and
rice activities.
109

The fact that credit cooperatives were the majority is explained
by the dependence on foreign capital and the specific form which
domestic capital took. The National Bank was responsible for credit
policies for the rural sector until 1930, and was mainly interested in
lending for short periods of time (where profits were highest).(55)
This is why it encouraged the establishment of credit cooperatives
where the common responsibility of all members guaranteed the repayment
of the loan. (58) Basically the same policy was carried through after
1930 from the A.B.G - which took over the function of financing the
rural sector from the National Bank. (57) So instead of becoming a
partner with the farmers as was hoped, the Bank became just another
source of creditor for the rural producers. Even though cooperatives
and their members increased in number, the majority of farmers remained
outside. In 1933 only 28% of rural households were members of
operating cooperatives and by 1939 this had increased marginally to
around 30%.(58)
Looking briefly at the economic activities of the cooperatives
from 1923 to 1939 we may observe that even though most of them were
mainly credit bodies, they also expanded their activities to cover
supply, production and selling. This happened after 1923 as the
membership started to increase. More specifically, in 1924 the "United
Cooperatives of Corfu" began selling the olive-oil produced by its
membership. In Corfu and Lakonia (Peloponnesos) nine mechanised
cooperative oil-mills operated.( 59) In the 1930's the "Union of
Cooperatives of Lesbos", which owned a number of oil-mills, commenced
selling large quantities of olive-oil to the members of the Drama
110
Cooperative (Macedonia). This inter-cooperative exchange helped Lesbos
defend itself against the embargo which the oil-traders tried to impose
on its oil-mills. The reason for the embargo was that the Lesbos
growers asked a higher selling price for the olive-oil produced than
was then on offer. (60)
In 1929 there were 47 cooperative oil-mills while by 1939 the
number had increased to 132. Some cooperatives expanded their
activities by the purchase of land. The cooperative "Nea Agialos" in
Thessaly, for instance, bought a farm of 900 ha in 1928 and transformed
it into a new olive grove. (61) However, the activities of the
agricultural cooperatives during the inter-War period were restricted,
and the role of the movement in the rural economy in general and the
olive sector in particular was still very modest. The reasons for this
are not hard to find. The movement faced strong opposition from a
number of different sources. First merchant capital - which was
directly affected of course - resented the expansion of cooperative
economic activity. Secondly, the National Bank appeared to have simply
used the cooperatives in order to facilitate its own credit lines, and
therefore did not allow them wider action. After 1930 the policy of
the Agricultural Bank was similar and the State itself created a number
of quite serious restrictions upon the cooperatives. (62) Later, after
1936, the movement was dealt a severe blow as a result of the arrival
of the dictatorship of G. Metaxas (1936-1940). The only input which
the State did make was via the creation of rural agricultural centres
which employed trained agronomists specialised in combating olive tree
disease.( 63 ) The reason for this action by the State was that, Dacus,
111
one of the most destructive olive tree diseases, was deemed responsible
for damaging a large proportion of olive production (up to as much as
50%) during the inter-War and in the early post-War periods. (64) In
general the State was not at that time prepared to actively defend the
interests of the olive growers vis-a-vis the creditors and wholesalers:
the political economy of Greece was still dominated by these powerful
lobbies.
It was not until 1949 that substantial moves were made towards
creating a stronger cooperative organisation among the olive producers.
Representatives of olive cooperative unions from all over Greece met
and discussed the difficulties which olive growers faced. A decision
was taken to establish an over-arching cooperative aimed at serving
olive growers in many important respects. (65) The Central Union of
Olive Growers was thus established in 1949 and called Eleourgiki. At
the start, Eleourgiki was responsible fighting olive disease, and it
managed to produce some excellent results. Following this success it
began competing with creditors and wholesalers in the olive growing
eentres for purchasing olive-oil output. The wholesalers fought back
in any way which they could such as by offering price concessions to
the olive growers, and by threatening to and then establishing certain
counter organisations. (66) In fact between the early 1950's and the
late 1970's, there has been a continuous struggle for hegemony; and
although the power of the wholesalers was seriously undermined by
cooperative action, nonetheless they managed to retain control of key
aspects of the industry in most of the important olive producing
centres.( 67 ) In 1952-53 the State requested Eleourgiki to gather
112

40,000 tonnes of olive-oil on its behalf. Later on, its activities
were further expanded by the acquisition of three refineries in Crete,
Lesbos and Corfu. In the early 1980's a large refinery and packing
unit was established by Eleourgiki in Elefsina, on the outskirts of
Athens. Apart from expanding production the purpose of this action was
to ease the flow of exports. (68) We may conclude that up until the
1970's the struggle for control of the olive industry between the olive
producers and merchant capital has been protracted and fierce. The
crucial factor was the policy of the State which I will now go on to
consider.
2.3 The Role of the State
2.3.1 Inter-War Policy
Once it had completed the distribution of the National Lands the
State left the small cultivators very much to themselves. It did
little to assist them in terms of educational access, the provision of
credit, or provide help with the distribution of fertilizers; certainly
it did little to help improve the methods of work and the mode of
organisation. (69) Indeed, it continued to implement taxation policy
which probably slowed down the process of economic development for the
olive sector in general and the small growers in particular. More
specifically, and going back in time, the newly created Greek State
left the Turkish tax system basically intact. (70) The State continued
to receive one-tenth of the output in kind (i.e. in olives) from the
cultivators. Later on, the tax was received in olive-oil. Under this
113

fiscal regime even the expenditure of cultivator, in extracting olive-
oil from the olives was taxed.( 71 ) For this reason the tax rate was
reduced from 10% to 7% of total output and this arrangement lasted
until the early 1930's. (72) This tax system, dekati, was gradually
replaced by a Land Tax. This was first introduced in the Ionian
Islands, then in Sterea, Crete and the Keklades. The Land tax was paid
at the Custom Houses when olive-oil was exported or traded within the
country. It was set by decisions in State Council and amounted to 12%
of the producer price-which was readjusted every three months. (73) It
appears that under this regime self-consumption and olive-oil sold
within the olive producing region were exempt.
Both these systems seem to have been weighed against olive
cultivators and appear to have had a serious disincentive effect upon
the improvement of the olive production process. This was because it
may have siphoned off income which might otherwise have been reinvested
in the improvement and expansion of olive-oil production. Moreover,
under dekati not only gross income was taxed but even the smallest
amount produced for the cultivator's self-consumption. Under the Land
Tax, on the other hand, gross output was taxed heavily. Although it
was implemented only on agricultural production there were great
inequalities in the tax burden within the sector. In particular the
Land Tax amounted to around 23% of total gross income in olive
production while according to the Law it should not have exceeded 3% of
the gross income of agricultural crops as a whole. (74) Table 2.6
presents the composition of tax duties upon a kgr of olive-oil in 1930
in Lesbos when oil was traded within Greece.
114

Total 2.736 dr
Land Tax on the Producer Price, 12dr x 12% 1.440Compulsory Loans, 40% of Land Tax 0.576Local Council Duty, 20% of Land Tax 0.288Agricultural Bank, 1% of 12dr 0.120Road Construction Works, 3% of Land Tax 0.043Agricultural Chamber of Commerce 1% of
Land Tax 0.014Harbour Works, 17% of Land Tax 0.240Refugee Duty, 7% of Land Tax 0.100Harbour Machinery Duty, 0.3% of Land Tax 0.005
Duties Amounts- dr)(in
Table 2.6: Composition of Tax Duties on 1 kgr of Olive-Oil when itwas traded within Greece. (Lesbos. 1930)
Notes: 1 Current 1930 prices
Source:
Derived from: The Greek Agricultural Company,Agricultural Bulletin, No. 1930, Vol.23, Part 228.
In 1930 on the prevailing producer price of olive-oil 12 dr per
kgr, the Land Tax rate was as high as 22.8% of it. (75) However, the
Land Tax for olive-oil destined for export was 2.886 in the same year
(the compulsory loan was charged at 48% and there was also an
additional charge of 10% of Land Tax to support orphanages). (76) These
tax amounts only refer to Lesbos. In other areas additional (but
admittedly quite small) charges could be levied which would inflate the
final tax bill due from the producers. Under this tax regime Lihnos
estimated (for 1930) the average production cost and revenue from one
stremma of olive cultivation in Lesbos. Table 2.7 presents a break-
down of the composition of expenditure by producers per stremma. The
total cost to the cultivator was calculated at 3,410 dr in current 1930
115

prices. Even if the expenditure upon fertilizers is not taken into
account(77) , (which amounted to 580 dr every second year), we may
deduce the following. One stremma of olive trees with an average
production over two years of 500 kgr of olives, (which yielded
approximately 108 kgr of olive-oil), cost the producer 3,410 dr. At the
prevailing selling price of 12 dr/kgr, the revenue per stremma was only
1,296 dr. As Lihnos puts it "the tragic picture of an olive grower
appears who produces at 31.6 dr/kgr and sells at 12 dr/kgr". (78) If
these estimates are to be taken at face value then clearly, in this
particular place and at that particular time there were few positive
market incentives for the growers.
The State usually allowed producer prices to be determined by the
market and in effect, these fluctuated in accordance with the rhythm of
olive-oil supply. It would only intervene (i.e. set a floor price) in
extreme circumstances in order to try to protect producer incomes.(79)
It was widely acknowledged that the wholesalers bought olive-oil from
the producers at the lowest possible price which, under the prevailing
tai system, was considerably facilitated. This was because the tax
was imposed only on the marketed product. This tax was extended to the
whole of Greece from 1 September, 1936 with the passage of Law Decree
29/1936 (supplemented by Law 209/1936). The tax rate was set at 12.6%
of the producer price which, in that year ranged between 24-30
dr/kgr.(80)
116

It appears that the only way olive growers could continue to
produce within such a context of unfavourable conditions was through
putting in many hours of hard labour contributed by family members
themselves. The fact that the majority remained owners does not of
course say very much in the way of mitigation.
2.3.2 Post-War Policy
In the Post-War period the State came to recognise - belatedly-
the fact that income disparity between agriculture and the rest of the
economy was widening. Income per person actively engaged in
agriculture was $471 in 1961 and $832 in 1971. This compared with
$1,262 and $2,760, in all other sectors taken together in the same
years. (81) As a result, during the 1960's there was a rural exodus of
younger members of the labour force to the urban centres of the country
and abroad. The State recognised the need to increase olive-oil
production in order to meet the rising urban population's demand since,
during these decades, olive-oil accounted for 80% of the total
consumption(82) of oils and fats.
Post-War policy had two principal objectives. One was to increase
productivity (production/stremma) mainly through encouraging a greater
use of purchased inputs which the State offered to subsidise-
including fertilizers, chemicals for insect and disease control,
machinery and equipment for cultivation and harvesting, new plantings
and the offer of various types of loans. The other objective was to try
and protect producer incomes by interventionist policies including
117

fixing minimum prices, and through stock maintenance. The purpose was
to encourage olive growers continue to produce in rural areas. It
appears that the State provided a wide range of support services for
the olive producers and to agriculture in general since most of the
aforementioned measures covered the whole primary sector.
The most useful production subsidies directed towards transforming
the organisation of olive production were those for new olive planting,
and for the purchase of suitable machinery for olive cultivation. (83)
Between 1960 to 1973 a subsidy was paid to the farmers for new planting
of olive trees under the so called "dense and bushy" system. (84) This
covered the purchase price of the olive trees and the cost of deep
ploughing prior to actual planting. It was usually paid out as a fixed
amount per hectare. A similar subsidy was granted to the olive growers
up until 1973 for renewing old groves, either by replacing the older
trees altogether, or by cutting off their trunks very close to the
ground. (85) This subsidy resulted in hundreds of hectares being
planted under the "dense and bushy" system - especially in Crete. In
these areas production per stremma was nearly doubled. In 1960 a
subsidy for the purchase of machinery and other means of production
used in olive cultivation was introduced. During the first years of
its operation and for some items of machinery, the subsidy amounted to
around 70% of the purchase price; later on this was reduced to between
25 and 50% of the equipment's purchase value. By 1974, when this
subsidy was abolished, many growers had incorporated some sort of
mechanical equipment into the different stages of olive production. (86)
This equipment included plastic combs for harvesting, mechanical chain
118

saws, plastic nets and other less widely diffused types of machinery.
All the subsidies were paid directly to the farmers by the regional
offices of the Ministry of Agriculture once the formal claim forms and
the relevant invoices had been submitted. (87)
Another form of production subsidy was that given for the purchase
of fertilizer. Although this measure took effect from 1953 in the
olive sector, it was not until 1956 that the subsidy was generalised to
include all agricultural crops. (88)Table 2.8 presents fertilizer
subsides in Greece between 1956-1975. We observe that the price paid
by the producers remained roughly constant while the percentage
contribution of the State subsidy increased steadily. Fertilizer
subsidy was reduced after Greece's accession into the EEC and
eventually stopped in the mid-1980s. The quantity of chemical
fertilizers used in agriculture has increased from 40.3 kgr per hectare
in 1961, to as much as 165.7 kgr per hectare in 1982. (89) Another
chemical subsidy of great importance to olive growing was that given
for spraying olive trees against Dacus. Usually this operation has
been carried out on a national scale and farmers were paid a small
handsome contribution towards meeting the total cost. Table 2.9 shows
the cost of spraying against Dacus and the relative contributions by
farmers and the State.
119

Production Year Total Cost Farmers Share Subsidy Subsidy as
a % of
Total Cost
Table 2,9: Cost of Olive Spraying in Greece (in 1.000 U.S Dollars)
1973-1974 6,436.6 1,262.0 5,174.6 80
1974-1975 6,511.6 1,288.9 5,222.7 80
1975-1976 7,201.0 1,651.2 5,549.8 77
1976-1977 9,462.3 1,397.0 8,065.3 85
Source: M. Xekalakis, "Implications for the Greek Olkve-Oil
Market of Adopting the C.A.P of the European Economic
Community". Unpublished Ph.D Thesis, Reading, 1979.
M. Xekalakis regards this subsidy as a transfer equivalent to a
higher guaranteed price of some 32 U.S. dollars per tonne of olive-oil
produced between 1973-1976.
Although these subsidies undoubtedly helped the producers between
1950-1974 they do not appear to have been radical enough to rationalise
production and place it firmly on capitalist lines. They were not
designed to take account of plot fragmentation or to induce the greater
use of machinery through a thorough going system of extension, training
and research. Rather the subsidies probably set out to increase
production and safeguard producers' income at a level sufficient to
enable small cultivators to reproduce themselves. When signs of
surplus production in the 1970's appeared though in the domestic and
the European markets the State abolished subsidies on new planting and
120

mechanical equipment, so its most ambitious policies were ended in the
mid-1970's. (90) In 1977 the average income of a person actively
engaged in agriculture was 1,487 U.S dollars while in other sectors it
was double at 2,865 U.S. dollars. (91) It appears that the disparity
between incomes has narrowed down when compared with 1961 and 1971 but
this was largely due to the deregulation of market prices after the
collapse of the Junta in 1974.
The provision of credit to agriculture was undertaken solely by
the Agricultural Bank of Greece (A.B.G). Table 2.10 shows the
provision of credit to agriculture (and, for comparison all other
sectors of the economy) between 1948-1983. We may observe that in 1948
loans to agriculture made up 41% of total credit provision. By 1965
this percentage had been reduced to 25.6%, and in 1983 amounted to a
mere 12.6% of total A.B.G credit provision: If one also looks at the
type of credit provided it appears that short-term credit exceeded by
far medium and long-term credit. This is because agricultural supplies
- which mainly refer to fertilizers and chemicals marketed by the Bank,
were provided to the farmers under the short-term scheme. "Short-term"
is usually taken to be a 12 month period and the credit obtained is
used for working capital. In olive growing working capital refers
mainly to harvesting and pruning, but also includes expenditure on
fertilizers and storage. On the other hand, medium term credit (up to
5 years) and long term credit (up to 20 years) are used for the
purchase of capital equipment such as tractors, plastic nets and
mechanical cultivators. It could also be used for land reclamation,
renewal of old trees and small irrigation projects. From 1981 the
121

interest at which the farmers borrow from the A.B.G is, on average, 3
to 4 percentage points below that offered from the commercial
banks. (92) So, we can deduce that provision of credit to agriculture
over the thirty-year period ending in 1983 has declined dramatically in
relation to other sectors. Furthermore, it mainly concerned working
capital or short-term credit rather than overhead investment - a point
which seems to reveal the inherent weakness of the small scale mode of
organisation and has implications for the expansion potential along
genuine modern capitalist lines.
The other arm of State policy in the Post-War period was directly
related to the aim of preserving a certain minimum level of income for
farmers and took the form of supporting producer prices. From 1962
until Greece's accession into the European Community the State fixed a
minimum guaranteed price for olive-oil of between00 - 100 acidity.
The difference in price between the various levels of acidity - which
determines the ultimate quality of the produce, ranged over 13% to 20%
of the final price. (93) Even though this minimum price increased
through the years it has never been significantly greater than the free
market price as determined by the interaction of supply and demand. (94)
It has therefore had little effect on producers.
Perhaps the most effective of the State's policies with respect to
the olive sector has been its market stabilization programme. At the
national level this programme has been carried out by Eleourgiki, while
on a regional level the various Unions of Agricultural Cooperatives
have been given the responsibility. (95)At the beginning of a
122

marketing period the Ministries of Agriculture and Commerce decided on
the maximum amount of olive-oil which could be bought by the
intervention agencies at the minimum guaranteed price. So, if there
were surplus quantities of olive-oil (i.e quantities left unsold by the
end of the stated marketing period) the State would buy; while if there
was a shortage, and market prices exceeded certain defined levels, the
State would sell from its accumulated intervention stocks. Olive-oil
producers or the cooperatives could offer to the intervention agencies
any quantity which they produced. Also private or cooperative oil-mills
could sell to the State the amount of olive-oil which they had received
as commission rights for crushing the olives - usually between 8-10% of
the total output. The closing date of intervention buying was
determined by the Ministries of Agriculture and Commerce. The cost of
collecting and storing the olive-oil was born by the State's
budget. (96) Table 2.11 shows the cost of collection and storage of
olive-oil over the period 1957/58-1976/77. We may observe that this
cost fluctuated between 1-8.5% of the value of the product. If we add
to that the interest on the funds used to pay for the olive-oil, the
total cost in any one year might well have exceeded 15% of the value of
purchased olive-oil. The Ministry of Commerce determined the selling
price of this olive-oil and the A.B.G took care of all the financial
transactions involved in the purchase of the produce by the
intervention agencies. The A.B.G received 1% of the total value of the
olive-oil purchased by intervention as their service commission.
According to the Ministry of Agriculture, an annual stock of about 30-
35 thousand tonnes of olive-oil was necessary to cover variations in
production caused by natural conditions. After 1981 the cost of
'123

intervention storage of olive-oil has been born by the European
Community's budget.
2.3.3 Policy under the E.E.0 Regime
Greece's accession into the E.E.0 obviously added a whole new
supra-national dimension to agricultural policy. This is because
since 1981 all the major policies and support systems for agriculture
are decided by the Ministers of Agriculture of the member-States at
their annual meetings in Brussels. All decisions are taken in the
context of that part of the C.A.P (Common Agricultural Policy) which
has been especially developed for the olive-oil sector. (97) So even
though the Greek State takes part in the decision-making process, in
the final analysis its role is to implement strategy and policies which
have been decided on the basis of European-wide considerations such as
the Community's perceived need for olive-oil - which has led to
directives for a supply quota; and the idea that olive-oil should be a
cheap input to the European food industry, which is dominated by
multinational concerns. It has been claimed that in the context of the
European Social Charter even if the sector were to be drastically
contracted growers would be guaranteed jobs elsewhere or granted
compensation. (98) My purpose here however is to consider how State
policy has been re-shaped by virtue of being within the C.A.P
framework.
The evolution of the C.A.P with respect to the olive sector may be
divided into two periods. The first is between the establishment of
124

the Basic Regulation 136/66 in September 1966, and the Council
Regulation 1562/1978 which amended the Basic Regulation and put forward%.9 lune )
a new common organisation. The second period is betweenle.78
and the mid 1980's since the enlargement of the Community when
the Greek, Spanish and Portuguese accessions created a new situation.
During the first period 1966-1978, France and Italy were the only olive
producing members of the Community so the C.A.P was strongly influenced
by their individual policies. The Basic Regulation No. 136/1966 adopted
three categories of policy measures: free trade within the Community, a
set of common prices and a variable import levy to protect domestic
production from non-EEC countries. (99) As long as the world market
prices were low enough the EEC's C.A.P operated smoothly and the Market
Target Price, was close to actual market prices. However, as
Production Aid was a fixed subsidy related to the Market Target Price.
andnot a variable deficiency payment, the world price boom of 1972-
1974 caused serious problems. The actual market prices, in response to
the impulsion of world market prices, rose significantly above the
Market Target Price. (see Table 2.12). As a consequence producers not
only received the very high market prices but the fixed PrAtAction Aid
as well. Furthermore, high retail prices of olive-oil, combined with
the availability of much cheaper vegetable oils, caused a sharp decline
in demand for olive-oil. After 1975/76 large quantities accumulated as
intervention stocks as a result of the fall off in demand. (100 ) The
136/66 regime faced two other problems. Delays in the payment of -
Production Aid to the producers, and certain administrative
difficulties (involving distribution and monitoring of the aid) which
emerged in Italy. In addition, Greece applied for accession to the
125

Production Target Priceless Production Aidequals Producer Selling Price(Intervention Priceless Consumption Aidequals Representative Market Price
(Threshold Priceless Variable Import Levyequals Work Market Price
— 2,315.6— 521.2— 1,794.4— 1,706.3)— 334.2— 1,460.2— 1,444.0)
310-555• 905.2-1150
E.E.C. These considerations ultimately led to the amendment of
Regulation 136/1966.
The new system of common prices under Council Regulation 1562/1978
was designed with two main objectives in mind: first to stimulate the
falling demand by introducing Consumption Aid, and secondly, to
restrict the expanding supply. In the Greek case production aid would
only be paid for olive-oil coming from trees planted before 1981.
Table 2.13 presents the price mechanism under Regulation 1562/1978.
Table 2.13: The E.E.0 Price Mechanism for the Olive-Oil Market. Marketing Year 1978/79. (ECU/tonne)
Souree: Situation of Agricultural Markets Report, 1979.
This Regulation provided the following support prices and aid:
a) The Production Target Price - This is a price fixed "at a level
which is fair to producers, account being taken of the need to keep
Community production at the required level. n(101)
126

b) The Intervention Price This is the price at which olive-oil is
bought by the intervention agencies. It is equal to the production
target price, less the production aid paid to the producers, plus
an allowance which covers market fluctuations and the cost of
transporting olive-oil from producing to consuming areas.
c) The Representative Market Price - is fixed at a level which will
permit the "normal" marketing of olive-oil produced, account being
taken of the prices for competing products and of their probable
trend during the marketing year.
d) The Threshold Price is fixed at a level a little less than the
Representative Market Price. So imported olive-oil is prevented
from entering the market at prices competitive with the community's
own olive-oil.
e) The Production Aid is fixed as a first stage adjustment when
deriving the Producer Selling Price. This aid is paid for
'quantities of olive-oil and olive residue oil produced from olive
trees planted before 31 October 1978 (in the case of Italy and
France), and before 31 December 1980 (in the case of Greece).
Production Aid is granted to olive growers belonging to producer
groups in respect of the volume of their actual production. The
unorganized growers receive the Production Aid as a flat rate with
respect to the potential yield of the trees they cultivate.
127

f) The Producer Selling Price is equal to the Production Target Price
reduced by the Production Aid. This price is considered as the
determinant of long run olive oil supply.
g) The Consumption Aid is paid when the Production Target Price, less
the Production Aid, exceeds the Representative Market Price (which
is usually the case in fact). The aid is equal to the excess, and
so aims at ensuring disposal of supplies on the Community market
irrespective of the price paid to the producer and of the prices of
competing products. The aid is paid to the packing units with
respect to olive-oil when packaged in containers suitable for the
retail trade and placed on the market in the Community.
h) A Variable Import Levy is imposed to make the difference between
the fixed Threshold Price and the fluctuating World Market Price.
In practice though, concessions are made to a number of
Mediterranean countries where these levies are reduced (e.g.
Morocco and Tunisia).
Table 2.14 shows olive-oil support prices between 1978/79-
1983/84.
'128

Table 2.14: Olive Oil Market Mechanism - Common Prices. 1979-1984(in ECU/tonne)
1978/79 1979/80 1980/81 1981/82 1982/83 1983/84
Production TargetPrice 2,315.6 2,350.4 2,479.7 2,727.7 3,027.7 3,194.2
Production Aid 521.2 529.0 558.1 600.0 666.0 702.6
Producer SellingPrice 1,794.4 1,821.4 1,921.6 2,127.7 2,361.7 2,491.6
Intervention Price 1,706.3 1,731.9 1,801,2 1,963.0 2,179.3 2,299.2
Consumption Aid 334.2 351.4 471.6 677.7 766.7 522.4
Representative
Market Price 1,460.2 1,470.0 1,450.0 1,450.0 1,595.0 1,968.7
Source: Official Journal of the European Communities. No C134/48Vol 28. 3.6.1985
From January to July of each marketing year the Community
determines small monthly increases of the Representative Market Price,
the Intervention Price and the Threshold Price. This scheme represents
a form of compensation paid to the olive producer to cover storage cost
and the interest on the funds that would have been received if the
olive oil had been sold. (102) The application of Regulation 1562/1978
has faced a number of problems. Some of them I will be taking up in
the next section where structural policy in the context of the C.A.P
will be considered. Here I propose to examine the effect of the price
support policy on the income of Greek olive growers.
129

The decisions taken in February 1988 - which were reached only
after a long series of negotiations in the EC-Summit and Council mark
the beginning of a new phase in the C.A.P. (103) For the first time
definite budget ceilings for agricultural expenditure, and rules for
automatic price reductions have been agreed upon for a medium term
period. By this agreement the Council has limited its scope for action
on price policy in the coming years. The decisions imply that the
prices for non-quota commodities will have to be significantly reduced
year-by-year in ECU terms. Table 2.15 shows the EEC price support
system for olive-oil with regard to the Greek case.
Looking at the Intervention Price we can see that after 1984 there
has been a reduction in ECU terms and this is continuous to 1988. In
1989/90 the Intervention Price as well as the Production Aid returned
to their 1986/87 levels. From the last two lines of Table 2.15 it
appears that between 1981/82 and 1986/87 the Green drachma was
depreciated by as much as 89%. It continued to depreciate until 1990:
and the exchange rate since 1.11.1989 has been 1 ECU — 190.998 dr. (104)
It seems therefore that the State allowed a continuous depreciation in
order to counter-balance the downward trend in the Intervention Price.
Obviously this action cannot be sustained indefinitely. Furthermore,
the percentage increase in prices after 1983/84 (expressed in drachma)
shows a levelling off, and in 1986/87 was even lower than its 1981
level. In 1987/88 and 1988/89 the increase in prices was 15% and 16.8%
respectively. This increase in prices which has occurred as a result
of the Green drachma's depreciation means that the farmers have
already lost part of their income as they subsequently have to pay
130

higher prices for all imported inputs (such as fertilizers, pesticides,
fuel etc). Since the State has cut subsidies to these inputs the
farmers have now to incur the whole cost, and this is not balanced by
the Green drachma's depreciation. If we look at the olive grower's
income now, which includes production aid, it appears that after
1984/85 the percentage increase does not even cover the annual rate of
inflation and it gets close to the 1981 level when the olive sector was
first incorporated in the C.A.P. This is an important result and
obviously has serious implications for the future.
We may conclude that if the olive growers' income was dependent on
the EEC price support policy - which came to replace the price
intervention system of the Greek State in 1981, they would have been
considerably worse off despite the continuous depreciations of the
Green drachma. This consequence of the C.A.P has been resisted by the
action of the olive cooperative movement which kept the selling
producer price of olive-oil in the domestic market, at a level which
allowed olive producers' annual income increase to exceed the annual
inflation rate. This issue will be discussed further in the next
section.
2.4 Changes in the Production Structure in the Olive Sectorsince the 1960's
The small size of agricultural landholding in Greece, combined with
the high incidence of plot fragmentation constitutes a major
constraint upon the development of the sector.( 105 ) This is because
this system seems to preclude an efficient use of capital, irrigation
111

and technological innovation. In addressing this weakness after 1953
the Ministry of Agriculture has implemented a special programme of
land consolidation. More than 600,000 hectares have currently been
rearranged; but because of the inheritance laws dating back to
Byzantine times and still in force, re-fragmentation of the farms has
taken place because no special countervailing measures were taken. (106)
Table 2.16 presents the size distribution of holdings in the olive
sector for selected years between 1961-1984. We observe that 88.7% of
the total number of holdings in 1961 occupied had less than 3 ha of
land, and 54.9% occupied less than 1 ha each. The percentage of olive
growers owning more than 5 ha holdings was only 3.65%. This signifies
the already well established fact that olive growing has been very much
a family activity with no substantial wage labour requirements.(-°7)
Until the late 1970's there was no apparent change in the above
structure. We can also observe from Table 2.16 that it was only in the
six year period between the two agricultural censuses of 1977/78 and
1984 that some restructuring has been taking place in olive growing.
Despite this, the larger part of olive groves (61.2%) remains up to 3
ha, and the bulk of production has originated from the small and
medium-size holdings. The number of rural households engaged in olive
production, based on the 1984 Census, was approximately 350,000, or
around 50% of the country's total rural households. Olive cultivation
takes place throughout Greece, but the largest percentage of olive
growers can be found in Peloponnesos 23.61%, Crete 21.71%, Thessaly
19.83% and the Islands with 18.48% (see Map I) .(108)
132

The total number of olive trees in 1962 was 83,204 thousand, in
1974 107,734 thousand, and in 1980 118,832 thousand. We observe an
increase of 29.5% and 10.3% respectively. Today it is around 123
million olive trees out of which 20 million are grown exclusively for
edible olive production. (109 ) The percentage of isolated olive trees
was reduced, while that of trees in olive groves increased throughout
this period. This signals a trend towards a greater degree of
concentration in the pattern of cultivation.
Of special importance is the distribution of olive groves in the
plains, and the mountainous and semi-mountainous areas. In 1968 olive
groves in flat areas occupied 195.43 thousand ha; in 1974 220 thousand
ha; and in 1980 260.3 thousand ha. (110) The respective percentage
increases were 12.6% and 18.2%. The increase over the period 1968-1974
was less than the increase in the total olive cultivated area-
including mountainous and semi-mountainous areas - which was 13.6%.
But the increase between 1974-1980 was 6% higher than the increase in
the total area. This shows that recently, ie., after 1974, there has
been a concentration of olive cultivation in flat areas where soil
conditions and productivity are comparatively better than elsewhere.
In mountainous areas the land size occupied by olive groves increased
from 137.42 thousand ha in 1968, to 160.6 thousand ha in 1980, an
increase of 17% which is less than the total increase in the olive
11cultivated area of 27.15% between 1968-1980. ( 1 )This can be
explained by the fact that because mountainous areas are infertile
cultivation is being diverted towards more suitable soils. In the
semi-mountainous areas the land size of olive groves increased from
133

163,42 thousand ha in 1968, to 210.1 thousand ha in 1980 i.e , 28.6%
which was higher than the total area increase of 27.l5%.(112) This
kind of development occurred because these soils have a very low
opportunity cost compared with the plains since no other type of
cultivation is suitable. Also, according to N.S.S.G statistics, in
1980 50% of olive productioncame from flat areas, 19.8% from
mountainous and 29.2% from semi-mountainous areas. It appears
therefore that production per hectare in flat areas is the highest of
these three general categories.
Under EEC policy the need for restructuring the farming units by
increasing land size and mechanising cultivation suggests that in the
near future small producers, including olive growers, may be found to
drop out the arena of marketed production. The reason is simply that
the small and fragmented farms are not as viable as the more developed
parts of the sector. In the context of this so called process of
"modernization" of olive growing, a number of specialist research
stations have been financed by the EEC and by national funds. The
research undertaken which is largely focused upon improving olive
growing techniques and in enchancing the introduction of those modern
requirements (such as skilled labour, specialist machinery and chemical
inputs) in order to achieve greater yields per hectare. Indeed, in
some cases new methods have tripled production per hectare (i.e, 7-9
tonnes of olives per hectare or 1,300-1,500 kg of o1ive-oil).( 113 )
They have also helped to improve the quality of olive-oil produced, so
that about 65% of the total production is now Extra Virgin. (114) This
means that the growers incomes have improved given the higher selling
134

price of these more up-market qualities. The mechanical equipment used
and the special care with cultivation required for "modernization" make
the advice given to the cultivators more relevant to that small and
wealthy minority of the rural population which has sufficient funds to
invest in improving their techniques of production. So, when
agricultural experts complain about farmers' ignorance and resistance
to change, they create a sense of confusion between class position and
personal characteristics. The State and the E.E.0 have specific
requirements for production processes which are dependent upon
mechanical, chemical and biological inputs whose technology is
ultimately controlled by foreign capital and aim at producing a stream
of final produce whose price will be such, that it could be easily
absorbed into the industrial food processing chain.
In the context of its restructuring policy, the E.E.0 has
classified the olive tree as a "maintained crop". According to
Regulation 1562/1978, only olive-oil produced in areas planted before a
certain date is eligible for Production Aid. This is where the
Regulation has faced a number of problems. (115 ) This constraint is
effective only if the number of trees has been accurately compiled.
Despite the Commission's suggestions and the percentage of Production
Aid which has been deduced in order to finance olive trees registering,
this task has not yet been accomplished due to administrative
difficulties and high costs. Table 2.17 presents the percentage
reductions of Production Aid set aside to cover the costs of compiling
the olive cultivation register.
135
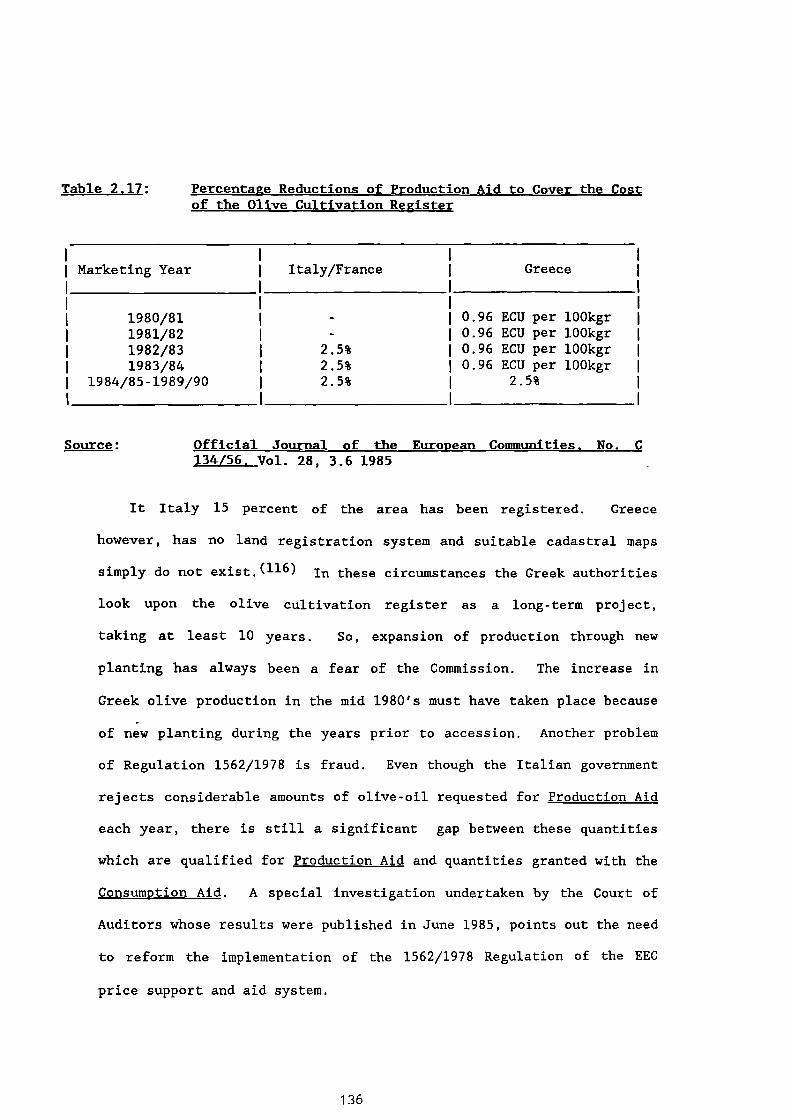
Italy/France
2.5%2.5%2.5%
Greece
0.96 ECU per 100kgr0.96 ECU per 100kgr0.96 ECU per 100kgr0.96 ECU per 100kgr
2.5%
Marketing Year
1980/811981/821982/831983/84
1984/85-1989/90
Table 2.17: Percentage Reductions of Production Aid to Cover the Costof the Olive Cultivation Register
Source: Official Journal of the European Communities. No. C134/56. Vol. 28, 3.6 1985
It Italy 15 percent of the area has been registered. Greece
however, has no land registration system and suitable cadastral maps
simply do not exist. (116) In these circumstances the Greek authorities
look upon the olive cultivation register as a long-term project,
taking at least 10 years. So, expansion of production through new
planting has always been a fear of the Commission. The increase in
Greek olive production in the mid 1980's must have taken place because
of new planting during the years prior to accession. Another problem
of Regulation 1562/1978 is fraud. Even though the Italian government
rejects considerable amounts of olive-oil requested for Production Aid
each year, there is still a significant gap between these quantities
which are qualified for Production Aid and quantities granted with the
Consumption Aid. A special investigation undertaken by the Court of
Auditors whose results were published in June 1985, points out the need
to reform the implementation of the 1562/1978 Regulation of the EEC
price support and aid system.
136

Parallel with those directives limiting olive-oil production, the
E.E.C. has encouraged the expansion of seed oils cultivation in the
olive producing member-states. In the Greek case, since 13.1.1988 free
marketing and production of seed-oils has been allowed in the olive
producing regions of the country. (117) Competition with these products
- whose average price is currently approximately 1/3 of olive-oil-
means that demand patterns are now greatly influenced at local as well
as at the national level. In the primary sector, there is an
increasing amount of land under seed-oil cultivation - mainly in
Macedonia and Thrace but also in areas like Messenia, Heracleon and
Lesbos. In 1982 sunflower was cultivated on an area of 4,800 ha; in
1986 it increased to 79,000 ha. and is still rising. (118) Elais, the
subsidiary of Unilever, has itself become involved in a project of land
diversification in favour of seed-oil cultivation. It rendered
financial help and its expertise to large producers.( 119 ) The reason
is that Elais needs seed-oils as a raw material in order to facilitate
the expansion of its own oil-seed oils production effort. Cotton
cultivation has been also expanded from 138,600 ha. in 1982 to 229,600
ha. in 1986, and is also still rising. (120) The significance of these
processes under the E.E.0 direction reflects the parallel attempt to
contract olive production. This has been clearly shown in the context
of Regulation 1096/1988 which encourage the farmers in general and
olive producers in particular, to opt out. More specifically,
cultivators aged between 55-56 years are encouraged to cease farming
activities against a monthly compensatory amount of 30,000 dr (£113)
paid for a maximum period of ten years (and not above the 70th year of
the cultivator's life). The agent for implementing Regulation
137
R1096/1988 in Greece is the A.B.G under the National egulation
296911/6031/5.4.1989. It is estimated that up to now 66,000
cultivators have opted out of the marketed production arena. (121)
The domestic response of olive growers to both arms of EEC policy,
the structural and the price support mechanism, came through the
development of the olive cooperative movement. Producers organised
themselves into cooperatives in order to obtain prices which would
cover costs and leave them with an average profit so that by
reinvesting, they could improve production conditions and so better
support family income. Producers also aimed to improve the quality of
their produce and reduce their cost of production. The vast majority
of olive growers are members of Eleourgiki. Table 2.18 shows the
effect on olive producers income by Eleourgiki's action between 1981/82
- 1987/88 as a price setter in the domestic market. The olive-oil
prices presented refer to Extra Virgin quality. We observe that the
activities of Eleourgiki such as price setting and market intervention
have managed to earn the olive growers a much higher level of income
than that allowed under the E.E.0 regime.
138

Table 2.18: Income of Olive Growers after the Action of Eleourgiki. 1981/82-1987/88. (in dr/Kgr. current prices)
Year EEC-Price Increasebetween Years
Eleourgiki -Price
Increase abovethat of theEEC-Price
1981/82 136.70 11% 153.70 +12.5%
1982/83 174.95 28% 181.00 + 5.5%
1983/84 224.76 28% 236.20 + 5.0%
1984/85 275.51 23% 314.50 +14.2%
1985/86 323.27 17.34% 382.61 +18.4%
1986/87 355.25 9.9% 416.78 +17.6%
1987/88 408.53 15% 450.20 +10.2%
Source: Eleourgiki. No. 18, June 1989
More specifically during the seven year period 1982/88 the olive
growers were granted an average increase of 11.7% above the E.E.0 price
support and aid system. Since 1981 the State has subsidised the
internal structural development of olive cooperatives and credit has
been provided through the A.B.G at interest rates of between 14-17%
p.a.(122) Olive market intervention by Eleourgiki in order to
guarantee higher producer incomes and storage of the olive-oil until
suitable markets were found, resulted in the creation of huge debts by
Eleourgiki to the A.B.G. Furthermore, the modernization process left
most cooperatives, especially those involved in olive processing, with
debts (also to the A.B.G) .(123) The main reason for this state of
affairs at least according to the A.B.G., appears to be problems with
the quality of cooperative management and high interest on deferred

payments. (124) Because 1989 was an election year, the State has
recently written down a large part of the olive cooperatives' debt to
the A.B.G. It was hoped that this measure would boost and restore
confidence in the cooperative organisation in the olive growing areas.
We can conclude that the E.E.0 regime has induced restructing of
olive growing-the oldest rural activity in Greece. The relatively slow
pace of change has been due to the constraint posed by the small scale
organisation of production, which does not seem to allow a more cost
effective transformation of the sector to take place.
Conclusions
Chapter Two has focused on the basic features of the organisation
and structure of olive production since the establishment of the Greek
State. I have attempted to identify those factors responsible for the
specific form of evolution taken in the agrarian structure. It has
been argued that the organisation of olive production has been shaped
by a number of socio-economic and political developments which have
delayed restructuring at the farm-gate level. In such development an
important role was played by factors within the rural setting as well
as outside it. More specifically, from the social differentiation
process at work within the olive growing areas, the merchants and a
group of oil-millers emerged. The development of oil-milling and its
contribution to rural industry is taken up in Chapter Four. In this
Chapter, the impact of merchant capital on the organisation and
structure of farming has been discussed. The struggle between
140

cultivators and merchants for control over production, with the
domination of the latter for decades in the olive growing areas, posed
a serious constraint upon the modernisation and expansion of the olive
production processes.
The further development of merchant capital and its connections
with the rise of urban processing of olive-oil is dealt with in the
Second Part of this Thesis. Outside the rural setting, it has been
shown that the action undertaken by the State has decisively influenced
organisation and change in olive growing. The impact of these
endogenous and exogenous forces on the organisation and structure of
farming, together with the natural conditions impinge directly upon the
cultivators' decision-making process. As a result, an important
traditional element in their decision horizon has been retained, since
on the small size farms - which still form the majority in olive
farming - there has been little real scope for the application of new
and evolving techniques or a more efficient use of capital. This
constraint has also been reflected in the fact that annual rate of•
growth of olive production between 1974-1988 was only 0.6% compared
with 6% between 1950-1974, which points to the limitations for
improvements in the absence of significant restructuring. This is not
to say that profit maximising decisions are not present implicitly in
the minds of olive growers, but these are certainly combined with a
whole range of social circumstances, technical research effort and
political developments which can accelerate or hold back improvements
in the production processes. In Chapter Three it will be contended
that any attempt to explain the cultivators' decision making process
141

by modelling production trends alone conceals rather than reveals
important structural and social factors at work within the olive
growing village setting. In support of this argument, case studies of
two villages in the prominent olive growing province of Messenia are
presented.
142

References
1. See P. S Avdelidis, The Agricultural Cooperative Movementin Greece, (Athens, 1986) pp.16-17.+
2. The surplus exacted from the peasants by the State was bymeans of taxation and the timariots (rent payments in kindor money). See L. S. Stavrianos, The Balkans since 1453,(New York, 1958) p.122fn. See also P. S. Avdelidis, 1986,Ibid, p.13.
3. See N. Lihnos, The Olive Tree and its Cultivation, (Athens,1949) p.44.+
4. Ibid, p.44
5. See P. S. Avdelidis, 1986, op.cit, p.16.
6. See N. Mouzelis, Modern Greece Facets of Underdevelopment,(London, 1978), p.14.
7. See S. Spiliotopoulou, History of the National Bank,(Athens, 1949) p.17.+
8. See A Sideris, The Agricultural Policy of Greece. 1833- 1933, (Athens, 1934).+
9. Frederick Teers was a Bavarian historian who in 1835 wrotea book entitled About the Contemporary Situation in Greece and Means for its Regeneration quoted by P. S. Avdelidis,1986, op.cit, p.16.
10. See A. Sideris, 1934, op.cit, p.91-92.
11. See N. Lihnos, 1949, op.cit, p.45.
12. Ibid, p.45
13. Ibid, p.45
14. I have deduced this from the fact that the olive treeneeded a period of seven years before it entered the fruitbearing stage.
15. See P. S. Avdelidis, 1986, on.cit, p.18.
16. Ibid, p.19
17. Ibid.
18. See J. Kordatos, Pages from the Agrarian Movement ofGreece, (Athens, 1964).+

19. Peloponnesos at that time formed the largest part of thenewly created Greek State. For more details about thecommercialisation of agriculture in Peloponnesos see D.Daniilidis, Modern Greek Society and Economy, (Athens,1934) and also N. Mouzelis, 1978, op.cit, p.19-20.
20. N.S.S.G, Economiki Epetirida, 1914.
21 See J. Kordatos, 1964, op.cit.
22. See N. E. Anagnostopoulos, The Land Reform of 1922 inGreece, (Athens, 1929).+
23. N.S.S.G, Economiki Epetirida, 1920.
24. See P. S. Avdelidis, 1986, op.cit, p.20.
25. See N. Mouzelis, 1978, op.cit, p.19.
26. Ibid, p.19.
27. See J. Kordatos, History of Modern Greece, 5 Vols. (Athens,1958). Also see N. Psiroukis, The Asia Minor Catastrophe,(Athens, 1974).+
28. According to J. Kordatos, processes of economicconcentration due to extensive usurious practices weretaking place in Greece after the 1922 Land Reform. See J.Kordatos, Pages from the Agrarian Movement of Greece. (Athens, 1964) p.143.
29. A. Pallis has calculated that the total number of refugeeswho entered Greece after 1922 (including the Greek refugeesfrom Russia and Bulgaria) was more than 1.5 million. See"Les effets de la querre sur la population de la Grece", inA Andreadis (ed), Les effets economiques et sociaux de lazuerre en Grece, (Paris, 1928).
30. See P. S. Avdelidis, The Agricultural Cooperative Movementin Greece, (Athens, 1986) p.57.
31. See A. Klemi, The Agricultural Economy of Greece. (Athens,1960).+
32. See J. Kordatos, History of Modern Greece, 5 Vols. (Athens,1958); also his Introduction to the History of GreekCapitalism (Athens, 1930). Also N. Psiroukis, The AsiaMinor Catastrophe, (Athens, 1974) and J. Zevgos, ShortStudy of Modern Greek History, (Athens, 1945).+
33. See J. Kordatos, 1964, op.cit.
34. N.S.S.G, Agricultural Census, 1929.
144

35. Ibid
36. The assumption 120 trees per hectare appears to be a goodapproximation to reality. See N. Lihnos, The Olive Tree and its Cultivation, (Athens, 1949).
37. N.S.S.G, Economiki Epetirida, 1937
38. N.S.S.G, Economiki Epetirida, 1937, 1938.
39. See P. S. Avdelidis, 1986, op.cit. p.58.
40. N.S.S.G, Agricultural Census, 1939.
41. See N. Lihnos, 1949, op.cit p.50
42. Ibid
43. This can be easily deduced if the total area is divided bythe number of olive growing families as per Table 2.4.
44. See A.B.G, Structural and Economic Indicators on FamilyFarms (Athens, 1973).+
45. See N Lihnos, 1949, op.cit, p.51
46. See N. Mouzelis, 1978, op.cit.
47. See N. Karabelas, Messeniaka Grammata, (Calamata, 1981).Also see Chapter Five of this study.
48. See D. Pournaras, History of the Agrarian Case, (Athens,1960) p.118, 133.+
49. Quoted in: Structural Changes in the Greek Rural Sector,The Centre of Marxist Research, (Athens, 1982).
50. Interview with E. Evagellou, Head of Agro-IndustryDepartment, A.B.G 1988.
51. See N. Lihnos in the Agricultural Bulletin of the GreekAgricultural Company, 1930, Vol. 23, Issue 228.+
52. Ibid.
53. See J. Kordatos, 1964, op.cit, p.143.
54. See S. Spiliotopoulou, 1949, op.cit.
55. Ibid.
145

56. The National Bank of Greece gave loans to the agriculturalsector in 1924 and 1926. Out of the total amount lent,7.45% (in 1924) and 2.28% (in 1926) went to olive growing.See the Agricultural Bulletin, Vol.23, issue 228, 1930,published by the Greek Agricultural Company.
57. In 1930 the A.B.G. gave loans of 814,473,419.90dr (incurrent 1930 prices) to 173,465 farmers who were members ofcooperatives and 73,689 independent farmers. Olive-growingreceived only 26,742,130.75 dr. while tobacco, wheat andvines received amounts six times higher. This shows therather negative attitude of the State towards olivecultivation in the inter-War period, Ibid,.
58. See P. S. Avdelidis, 1986, op.cit, p.63
59. See N. Lihnos, 1949, op.cit
60. See P.S. Avdelidis, 1986, op.cit, p.65.
61. Ibid.
62. In 1930 with Law 4640 no member of a cooperative wasallowed to undertake any political activity such ascandidacy for member of Parliament or as a Mayor. Alsowith Law 5289 in 1931 the economic activities ofcooperatives were limited and put under control. A numberof other Laws were passed between 1930-1932 which similarlyrestricted the development of cooperatives such as 5277,5420. See P.S. Avdelidis, 1986, op.cit for further details.
63. See N. Lihnos, 1949, op.cit.
64. Ibid.
65. It would guarantee to buy any unsold quantities of olive-oil from the producers through their local cooperatives.It would attempt to obtain the best terms of credit forolive producers which it could manage to secure. It wouldalso become involved in supplying the cultivators withfertilizers and other necessary inputs during theproduction process. Personal Interview with Mr. Petraki,Department of Primary Production, Eleourgiki, 1987.
66. Ibid.
67. Personal Interview with Y. Xiloyiannis, PASEGES 1988 andPersonal Interview with G. Bazyioti, Ministry ofAgriculture 1989. In the provinces of Messenia andLaconia, in Crete and other olive producing islands, olivemerchants have dominated olive growing regions for decadesand the majority of them appear to have invested theirpersonal fortunes in the tertiary sector particularly
146

tourism. In Chapter Three I present specific evidence ofthe leakage effect drawn from Messenia Province.
68. Information obtained from A. Kiriakoulako, Department ofSupplies, Eleourgiki, 1988.
69. See N. Mouzelis, 1978, op.cit. p.23
70. See P. S. Avdelidis, 1986 op.cit, p.17
71. See N. Lihnos in the Agricultural Bulletin of the GreekAgricultural Compny, 1930, Vol.23, issue 228.
72. ibid
73. N.S.S.G, Economiki Epetirida, 1931.
74. See N. Lihnos, 1930, op.cit.
75. N.S.S.G, Economiki Epetirida, 1931.
76. See N. Lihnos, 1930, op.cit.
77. Cultivators could not afford to use fertilizers every year,even if it was really necessary for their particularcircumstances, ibid,.
78. Ibid.
79. N.S.S.G, Economiki Epetirida, 1931.
80. N.S.S.G, Economiki Epetirida, 1937.
81. N.S.S.G, Income and Employment Indicators of Greece, 1971.
82. , Between 1950-1975, the A.B.G, Department of VegetableProduction, estimated that olive-oil covered about 80% ofthe total oils and fats consumption in Greece.
83. Ministry of Agriculture and Eleourgiki: Informationobtained from the Departments of Primary Production, 1988.
84. Ibid.
85. Ibid.
86. Eleourgiki estimates, Department of Primary Production,1988.
87. Ministry of Agriculture (YDAGEP), Oral Evidence, 1988.
88. Ibid.
89. A.B.G, Department of Planning and Statistics, 1983.
147

90. During this period of Post-War Policy the annual growthrate of olive-oil production (estimated in Chapter One) was6.2% which is about two percentage points above the Inter-War rate.
91. N.S.S.G, Income and Employment Indicators of Greece, 1981.
•92. Information received during discussion with E. Evagellou,Head of the Department of Agro-Industry of the A.B.G,Summer, 1988.
93. The difference in price between the various levels ofolive-oil acidity since Greece's accession into the E.E.0exceeds 25%. Ministry of Commerce, Price Series, 1987.
94. Ibid
95. Personal information received from YDAGEP, 1989.
96. Ibid
97. See Regulation No. 136/66/EEC, establishing a Common MarketOrganisation in Oils and Fats dated 22/9/1966.
98. See Eleourgiki, No. 16, December, 1988.
99. See Regulation No. 1562/78/EEC. Amending Regulation No. 136/66/EEC on the establishment of a Common Organisation ofthe market in Oils and Fats dated 29/6/1978.
100. Ibid.
101. Ibid.
102. See A Kiritsakis, The Olive-Oil, (Thessaloniki, 1988)p.278.+
103. See Monica Hartmann, W. Henrichsmeyer and P.M Schmitz,"Political Economy of the C.A.P. in the European Community"in Congress Proceedings, 9th World Congress, InternationalEconomic Association, Athens, 1989.
104. See Eleourgiki, No. 18, June 1989.
105. According to the N.S.S.G, each rural household owns onaverage 6 plots of cultivated land. In 1980 the average EECfarm-size (inclusive of Greece) was 18 ha. while in Greeceit was only approximately 4 ha. Without Greece it is 25ha. Eurostat, 1980, Yearbook of Agricultural Statistics,Statistical Office of the European Communities, Brussels.
106. See Th. Tsoumas and D. Tasioulas, The State of Ownership•and Uses of Agricultural Land in Greece, (Athens 1986).+
148

107. The importance of labour employed in olive-cultivation, (asmentioned in Chapter One), lies in its seasonaldistribution. During the winter months whene demand forlabour is low, olive-growing offers the possibility foremployment in the rural areas.
108. N.S.S.G, Agricultural Production Yearbook, 1988.
109. Ibid.
110. N.S.S.G, Agricultural Production Yearbooks, 1969, 1979,1981.
111. Ibid.
112. Ibid.
113. See Eleourgiki, No. 18, June 1989.
114. Ibid.
115. For further details on this issue see Official Journal ofthe European Communities, C.134, Volume 28, 3 June, 1985.
116. Ibid.
117. Ministry of Agriculture, Department of Information, June,1988.
118. Information received from the Cotton Organisation, Athens,1988.
119. Interview with L. Melas, General Director of Elais, March,1988.
120. Cotton Organisation, Athens, 1988.
121. See Economicos Tahidromos, 15 March 1990, p.21.
122. E.O.M.E.H, "Incentives to Small-Scale Industry andCooperatives", Internal Publication, 1985.
123. E. Evagellou, Department of Agro-Industry, the A.B.G, 1988.
124. Ibid.
149

Table 2.1 Olive-Oil and Edible Olive Production and Exportsbetween 1920-1937 (in tonnes)
Production Exports
Years Olive-Oil Edible Olives Olive-Oil Edible Olives
Average 1920-25 81,412 27,545 10,901 13,063
Average 1926-31 85,734 28,396 11,714 11,291
1932 134,320 36,092 23,198 14,374
1933 105,355 24,486 6,870 13,804
1934 122,579 35,834 11,148 15,185
1935 88,186 33,357 8,029 15,195
1936 72,570 13,388 6,730 12,805
1937 187,471 70,797 20,526 14,347
Source: N.S.S.G, Economiki Epeterida, 1938
150

Table 2.3: Total Number of Olive Trees in Production the Area ofWild-Olive Trees in Acres and the Number of Wild OliveTrees per Acre, 1939
GeographicalAreas
Provinces Olive Treesin
Production
Area ofWild Olivesin Acres
No of WildOlive treesper acre
Kerkera 3,247,000 3,153,9 12 - 40Paxi 156,100
Ionian Islands Lefkas 1,009,400Kefalonia 628,246 6,969,8 4 - 40Zakenthos 1,000.000Total 6.040.746 10.123.7 16 - 81
Samos 1,892,500 3,363,8 40 - 202Aegean Islands Ikaria 245,000 3,830,9 24 - 162
Hios 1,354,100 2,879,4 20 - 121Lesbos 7.990,193 8.414,5 20 - 121Total 11.481.793 18.488.5 105 - 607
Naxos 184,150 3,707,5 20 - 809Andros 223,200
Keklades Anafi 56,730 988,5 202Islands Melos 103,000 lowest
Kea 6,950Seros 2,645Tenos 106.500Total 683.175 4.696 20 - 1011
Rethymno 2,668,220 1,730,1 8 - 20Hania 3,531,818 2,115,9 4 - 20
Crete Heraklio 4,800.141Lasethi 2.554,400 5.437,5 4 - 243Total 13.554.579 9.284.5 16 - 283
Thessaly Larissa 4.551,924 7,350,7 40 - 202Total 4.551.924 7.350.7 40 - 202
Ebros 324,500 1,631,2 32 - 101Rodopi 151,200 37,123 8
Thrace Kaballa 923.000 5.526,4 42 - 162Total 1.398,700 44 280 7 81 - 271
Arta 150,000 28,545,2 24 - 81Epirus Preveza 1,250,493 151,3 607
Yannina 10,532 4,127,5 8 - 81Thesprotia 612.210Total 2.023.705 32.824.3 32 - 769
15 1

Euboea 2,667,595 28,372,5 61 - 121Sterea Atolia 719,520 19,127,5 32 - 81
Attica 1,847,015 18,969,3 8 - 81Fthiotida 1 882.850 25.914.5 81 - 121Total 7.116.980 92.383.8 182 - 405
Ahaia 682,245 16,145 20 - 162Peloponnese Lakonia 4,170,810
Arkadia 1,279,230 9,181,9 20 - 121Elia 968,089Messenia 4,456,864 3,601 61 - 162Korinthos 2.394.660 36.039.5 61 - 121Total 13 921.898 64.967.6 162 - 566
Halkidiki 492,250 68,919,9 101 - 243Macedonia Agio-Oros 180,750
Salonica 45.180Total 718.180 68.919.9 101 - 243
TOTAL 61,491,688 353,320
Source:
N.S.S.G, Agricultural Census, 1939
152
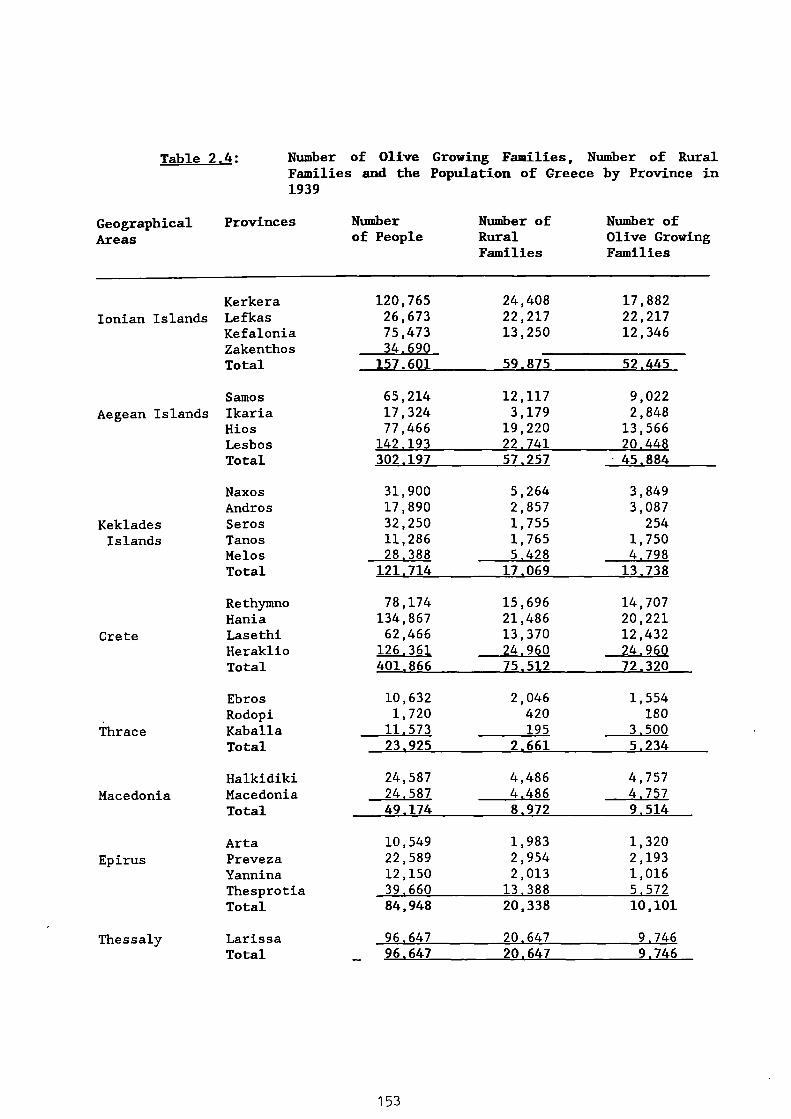
GeographicalAreas
Table 2.4: Number of Olive Growing Families, Number of RuralFamilies and the Population of Greece by Province in1939
Ionian Islands
Aegean Islands
KekladesIslands
Crete
Thrace
Macedonia
Epirus
Thessaly
Provinces Numberof People
Number ofRuralFamilies
Number ofOlive GrowingFamilies
Kerkera 120,765 24,408 17,882Lefkas 26,673 22,217 22,217Kefalonia 75,473 13,250 12,346Zakenthos 34.690Total 157.601 59.875 52.445
Samos 65,214 12,117 9,022Ikaria 17,324 3,179 2,848Hios 77,466 19,220 13,566Lesbos 142.193 22.741 20.448Total 302.197 57.257 45.884
Naxos 31,900 5,264 3,849Andros 17,890 2,857 3,087Seros 32,250 1,755 254Tanos 11,286 1,765 1,750Melos 28.388 5,428 4.798Total 121.714 17.069 13.738
Rethymno 78,174 15,696 14,707Hania 134,867 21,486 20,221Lasethi 62,466 13,370 12,432Heraklio 126.361 24,960 24.960Total 401.866 75.512 72,320
Ebros 10,632 2,046 1,554Rodopi 1,720 420 180Kaballa 11.573 195 3.500
Total 23,925 2.661 5.234
Halkidiki 24,587 4,486 4,757Macedonia 24.587 4.486 4.757
Total 49.174 8.972 9.514
Arta 10,549 1,983 1,320Preveza 22,589 2,954 2,193Yannina 12,150 2,013 1,016Thesprotia 39,660 13,388 5.572Total 84,948 20,338 10,101
Larissa 96.647 20.647 9,746Total 96,647 20.647 9.746
153

Korinthos 117,829 22,089 14,771Peloponnese Messenia 162,387 68,493 33,684
Elia 143,560 19,897 15,112Arkadia 48,630 9,598 5,701
Lakonia 13,279 2,869 2,824
Ahaia 176.478 18 022 15.129
Total 662.163 140.968 87.221
Euboea 74,898 18,226 14,149Sterea Atolia 138,352 24,079 8,825
Attica 109,207 17,044 14,646
Fthiotida 78.505 11.974 10.552Total 400.962 71.363 38.172
TOTAL 2,276,610 470,176 339,6181
Notes: 1. 339.618 families 1,500,000 people
Source: N.S.S.G, Agricultural Census, 1939
154

Table 2.7: Olive-Oil Production in Lesbos : the Composition ofProducer Expenditure per Stremma. 1930
(Average two-year olive production incurrent prices)
Cultivation Cost : First Year of Cultivation
3 units of Daily Wages for Pruning, 80 dr a day - 240 dr4 units of Daily Wages for Digging, 45 dr a day - 180 dr1 units of Daily Wage for Land Levelling, 45 dr a day - 45 dr1 unit of Daily Wage for Construction Work 50 dr a day - 50 dr
Total - 515 dr
Cultivation Cost : Second Year of Cultivation
4 units of Daily Wages for Digging, 45 dr a day - 180 dr1 unit of Daily Wage for Land Levelling, 45 dr a day - 45 dr1 unit of Daily Wage for Construction Work 50 dr a day - 50 dr
Total 275 dr
Harvesting of 500 kgrs of Olives
2 units of Daily Wages for Ground Cleaning 45 dr a day - 90 dr12 units of Daily Wages for Olive Picking 30 dr a day - 360 dr3 units of Daily Wages for Harvesting, 70 dr a day - 210 dr5 units of Transfer of Olives to the Mill 30 dr each - 150 dr
20 Baskets for Carrying the Olives - 20 dr
Total 830 dr
Production of Olive-Oil at the Mill
. Processing of 500 kgrs of Olives - 150 drFarm - Tax for Services of the Local Police - 40 dr
Total 190 dr
Cost of Land - 8.000 dr. at 10% for two years - 1.600 dr
Total Production cost of Olive-Oil - 3.410 dr.
Source: N. Lihnos in the Agricultural Bulletin, the CreekAgricultural Company, Vol. 28, 1930.
155

Table 2 8 : Fertilizer Subsidies in Greece, 1956 - 1975(in dr/tonne, current prices)
Nitrate of Ammonium Phosphate 16% Sulphate of Potash
Year Cost FarmersPrice
Subsidy Cost FarmersPrice
Subsidy Cost FarmersPrice
Subsidy
1956 3,305 2,797 15 1,117 1,130 2062 1,876 9
1960 2,440 2,600 961 892 7 2053 1,700 17
1965 2,500 2,100 16 1,236 900 3.5 2054 1,700 17
1970 2,214 2,100 5 1,257 900 28 2236 1,700 24
1973 2,461 2,100 15 1,336 900 33 2618 1,700 35
1975 4,654 2,800 40 3,576 1,300 63 5579 2,400 57
Source Derived from A.B.G. The Role of State Intervention inFruit Production, (under the authorship of N. Baltas,1977).
156

Table 2.10
Credit Provision to Agriculture and the Other Sectorsof the Economy, 1948-1983.
(In million dr, current prices)AGRICULTURE
Years Short-TermCredit
AgriculturalSupplies
Medium and LongTerm Credit
Total The OtherSectors
1948 582 111 70 763 1,852
1949 897 196 133 1,266 3,066
1950 1,095 208 155 1,458 4,569
1951 1,638 221 279 2,138 6,304
1952 1,864 277 352 2,493 6,367
1953 1,699 381 361 2,441 7,961
1954 2,155 650 377 3,182 10,172
1955 2,600 695 435 3,730 11,139
1956 3,219 560 583 4,362 13,908
1957 3,701 761 845 5,307 17,453
1958 4,309 681 1,307 6,297 20,530
1959 4,370 965 1,937 7,272 22,727
1960 4,577 741 2,515 7,833 26,133
1961 5,042 588 3,062 8,692 28,990
1962 5,027 702 3,168 8,897 33,414
1963 6,009 666 3,420 10,095 39,762
1964 6,238 976 4,144 11,358 45,416
1965 6,636 1,399 4,702 12,737 49,776
1966 6,537 2,247 5,030 13,814 56,643
1967 7,203 2,017 6,028 15,248 67,492
1968 7,113 1,480 4,896 13,489 76,039
continued /
157

continued /2.10
AGRICULTURE
Years Short-TermCredit
AgriculturalSupplies
Medium and LongTerm Credit
Total The OtherSectors
1969 7,258 1,538 6,229 15,025 92,424
1970 8,444 1,170 8,130 17,744 113,325
1971 9,795 1,247 10,380 21,422 138,503
1972 11,539 1,269 13,576 26,384 171,657
1973 14,870 1,092 17,755 33,717 202,600
1974 20,381 3,321 20,821 44,523 243,230
1975 23,748 6,945 24,568 55,261 302,823
1976 29,408 8,550 28,579 66,537 379,336
1977 38,949 14,101 37,110 90,160 475,824
1978 49,034 12,737 48,424 110,195 585,048
1979 52,347 13,259 60,194 125,800 691,777
1980 62,531 14,129 65,209 141,869 828,071
1981. 73,284 14,317 74,081 161,682 1,040,114
1982 86,883 17,794 94,873 199,552 1,277,908
1983 118,264 22,272 99,319 239,855 1,902,020
Source : The National Bank of Greece, Monthly StatisticalBulletin, various years.
158

Table 2.11 Quantities of Olive-Oil Collected by the State and theStoragel Cost between 1957/58 - 1976/77
(in current prices, thousand dr. andtonnes).
Years Quantity Storage Cost Intervention Cost ofPrice Storage asdr/kgr a Proportion
of Total Salesvalue
1957/58 6,471 8,992.4 16.3 8.51958/591959/60 974 16.81960/61 - 17.11961/62 33,125 17.11962/63 124 17.11963/64 44,019 52,787.7 19.2 6.21964/65 6,902 9,410.8 19.7 1.11965/66 33,301 34,698.9 20.6 5.11966/67 34,183 42,834.2 22 6.41967/88 41,983 48,055.0 22.5 5.11968/69 6,238 - 22.5 -1969/70 507 293.8 22.5 2.61970/71 13,384 - 26.71971/72 14,204 21,218.4 36.6 4.11972/73 33,450 77,260.8 41.6 5.51973/74 1,574 4,488.2 51 5.61974/75 9.860 27,481.2 53 5.21975/76 56,474 201,194.5 57 6.21976/77 58,421 145,091.6 65.5 3.8
Notes: 1. Including commissions for Eleourgiki and the A.B.C.transport, and maintaining the oil-banks.
Source: Data obtained from the Ministry of Agriculture andthe A.B.G.
159

Table 2.12: Common Prices Fixed at the Beginning of the MarketYear for Semi-Fine Olive-Oil 3° under the EEC's CAPand World Prices, 1966/67 to 1977/78, Prices in ECU/tonne
ProductionYear
ProducerTargetPrice
MarketTargetPrice
ProductionAid
ThresholdPrice
InterventionPrice
WorldPrice
1966/67 1,150 800 350 798 730 65467/68 1,125 802.5 3p 792 730 69868/69 1,152 721 431 707 648 66669/70 1,152 721 431 707 648 71970/71 1,152 721 431 707 648 74371/72 1,187 756 431 742 683 77572/73 1,247 796 451 782 723 997.673/74 1,371 950 421.7 930 877 1425.274/75 1,440 1,018 421.7 998.6 946 1278.875/76 1,850 1,499.6 350.4 1469.6 1427 895.776/7777/78
1,8501,877.8
1,448.91,419.1
401.1458.7
1418.91389.1
1376.41346.1
n.a.n.a.1
Notes:
1. Not available
Source M.Rekalakis, "Implications for the Greek Olive-Oil Market of Adoptingthe Common Agricultural Policy of the European Economic Community",Unpublished Ph.D Thesis, University of Reading, Reading, 1979.
160

Table 2.15: EEC Price Support System on Olive Oil, 1980/81-1986/87(in ECU/100kgr dr/100kgr)
1980/81 1981/82 1982/83 1983/84 1984/85 1985/86 1986/87
Intervention Price(1)
Greek EEC Ecu 170.8 186.97 217.93 229.92 227.62 227.62 216.24
Acidity 3° dr 10,494.88 12,126.81 14,503.8 17,760,88 20,606 23,296 25.229
Production aid (2) Ecu 11,16 12 25.65 40.50 55.04 69.56 70.951985/86 equalizationof Greek & EEC-9 dr 666.45 737.34 1,707.0 3,130.09 4,983 7,119 8,278
Producer's income Ecu 181.96 198,97 243.58 270.44 282.66 297.18 287.19
(1) + (2) dr 11,161.33 12,864.15 16,210.8 20,890.97 25,589 30,415 33,507
Consumption aid ECU/100kgr 13.55 29.33 36.98 43.39 53.04 84.94
Acidity 3o dr/100kgr 832,59 1,951.99 2,856.63 3,928 5,426 9,910
% change inproducers' income 15.25 26 28.8 22.4 18.8 10.16
% change inintervention pricein ECU
16.17 30.96 11.99 -2.3 0 -11.38
% change inintervention pricein drachmas
15.5 19.6 22.4 16 13 8.2
Inflationl 24.9 21 20.5 18.5 25 25
Exchange rateECU - dr 61.4445 66.5526 77.2479 90.5281 102.3 116,0
% Depreciationof "Green" dr 2.9 8.3 16.1 17.2 13.0 13.4
Notes: 1. The figures for inflation should be taken with cautionSource . Extracted from figures supplied by Ministry of Agriculture, Eleourgiki and
Commission (86)
161

Table 2.16 : The Size Distribution of Holdings in the Olive Sector,
Size
1961
1961-1984. (in
No.of Farms
hectares)
_1
54.9
33.8
7.6
3.2
0.42
0.03
1971
1977
No. of Farms
0.1-0.9
1-2.9
3-4.9
5-9.9
10-19.9
>20
310,982
.191,696
43,002
18,138
2,412
195
- 275,030 54.2
172,944 34.1
38,783 7.6
17,256 3.4
2,651 0.5
253 0.04
Size
566,425 100 506.917 ' 100
- 78
%
56.6.
32.2
7.1
3.3
0.63
0.08
1984
No.of Farms No. of Farms
0.1-0.9
1-2.9
3-4.9
5-9.9
10-19.9
>20
268,570
152,570
33,680
15,850
2,990
- 370
• 94,440 22.70
160,360 38.52
78,040 18.75
62,980 15.13
17,260 4.15
3,120 0.75
Source:
474.030 100 416.200 100
Derived from the National Statistical Service,Agricultural Censuses of 1975, 1984.
162

MAP I
N

CHAPTER THREE
DETERMINANT FACTORS IN THE SUPPLY OF OLIVE-OIL : A CASE STUDY OFTWO VILLAGES IN MESSENIA PROVINCE
Introduction
I have argued that the natural conditions of olive growing
(discussed in Chapter One) combined with the weight of tradition
reflected in the social organization of production (discussed in
Chapter Two), have directly impinged upon the olive growers' decision
making process. In this chapter it is contended that the supply of
olive-oil is determined not only by conventional economic variables in
association with natural conditions, but is also greatly influenced by
a complex amalgam of past and present social and institutional factors
related to the character of the rural sector in general, and to olive
cultivation in particular. In order to obtain some direct "grass-
roots" insight into the cultivators' behaviour and their decision
making process, the largest part of this Chapter concentrates on the
experience of two olive producing villages situated in Messenia
province.
Section One attempts to identify the major determinants of olive-
oil production by modelling the supply function. The difficulties in
quantifying and specifying the most important supply factors in order
to capture the correct data-generating process are discussed. It is
shown that the diversity of published estimates relating to the
164

response of olive-oil production to price changes is mainly due to data
discrepancies - an issue briefly alluded to in Chapter One.
In Section Two an estimation of the Greek olive-oil supply
function is undertaken. It is established that producer price is not
the most important determinant of production; rather the capital stock
as represented by the number of trees planted is found to be decisive.
In this respect I contend that modelling the supply function may be
seen as being a first step towards explaining the cultivators' decision
making process. This is because any formulation which does not manage
to include social processes and institutional change tends to conceal
rather more than it reveals about key aspects of producers' behaviour.
I proceed therefore in Section Three to discuss the experience of
two selected olive producing villages, Avia and Coryfasi. The
discussion of current events is based on purposive sampling undertaken
in each village between July and October, 1988. Examination of the
evolution of social organization of olive growing at the local level
permits us to draw some instructive inferences about the nature of the
problems experienced by olive growers in the past and how these may
have influenced their decision-making process. In this respect I try
to draw out the major contrasts between the two. I n A v i a
restructuring has been very slow, and relatively small farmers - who
are market oriented - combine to produce their output streams through
the medium of the cooperatives; while Coryfasi presents an instance of
the case where intensive competition between the private and
cooperative sectors has produced larger scale farms, an enhanced level
165

of cooperative organization, and the continuation of a strongly
entrenched role for merchant capital. The reason behind these
developments are then explored.
3.1 Estimation of an Olive-Oil Supply Function
The main purpose of estimating the supply response of olive
growers to changes in circumstances through time is to explain the
behaviour of producers within the context of the specific socio-
economic environment in which they operate. This is done by
quantifying the main factors which determine the supply of the product
and by specifying a functional form. Estimating a supply function has
always been a particularly difficult research area, especially for
agricultural products where considerable time lags in production need
to be specifically taken into account. The difficulty arises because
existing models provide very little information about what type of lag
model to introduce. Because standard theory offers little assistance
the issue is usually resolved through statistical means.
Estimating the response of olive-oil production to price changes
has been the main focus of research interest.( 1 ) The importance of
supply elasticity relative to price has been connected with attempts to
assess the effects of the CAP on the income of farmers and the supply
of olive-oil on to the market. (2)
Two studies of Greek olive-oil production have used aggregate time
series as a method of analysing supply. The variables used to explain
the supply response were quite similar but the results obtained
166

Price Elasticity
Best Estimation
0.7 to 1.8
0.7 to 1.4
0.1 TO 1.3
0.6 to 0.7
Medium toLong-Run
Short-Run
differed significantly. (3) In Table 3.1 the price elasticity
coefficients as estimated by M.Xekalakis for the period from 1950 up to
Greece's accession to EEC, are presented. In the other study, carried
out by D. Miliakos and published by the ABC, the short-run price
elasticity of supply was found to be as low as between 0.38 to 0.43 for
the period 1957-1975.
Table 3.1: Estimates of Price Elasticity of the Greek Olive-Oil Supply Function, 1950-1975
Source: M. Xekalakis, Unpublished Ph.D Thesis, 1979
Before proceeding to formulate any model of olive-oil production my
first concern was to try and explain why there was so much diversity
between the two published estimates. The literature offers a number
of potential explanations for the main differences. After lengthy
consideration I chose to examine the following possibilities:
choice of data series;
(ii) other data transformations;
(iii) functional forms;
(iv) lag structures;
(v) estimation methods;
(vi) diagnostic statistics.(4)
167

When attempting to standardise the models on a common basis for
(i) to (iii) above it was found that the major differences between them
did not persist. More specifically, equation (1) is similar to that
estimated by D. Miliakos (1980). The data period was 1950-1988.
LYt — -12.43 + 0.47LPt + 0.03U + 1.6LXt(1)(-2.37) (1.35)
(0.34) (3.66)
R2 — 0.59, D.W — 2.79, F — 17.049
All the variables were used in their logarithmic form LPt is the
annual producer price of olive-oil, LKt shows the number of olive-trees
between 1950-1988, and U is used in order to take account of the
biennial nature of the crop. (5) Estimation by 0.L.S gave the results
presented in equation (1). The D.W. statistic shows the presence of
serial correlation and LP t , as well as U, are found to be insignificant
as shown by the t-statistics presented in parentheses.
Next,
estimated.
LYt
three versions of M. Xekalakis's (1979) model were
The results are presented in equations (2), (3) and (4).
- 5.18 + 0.36LPt+ 0.03U + 0.67LKt + 0.59LFt(-0.56) (0.96) (0.95) (0.32) (0.64)
LYt
R2 — 0.60,
- 5.4 + 0.33LPt +
D.W — 3,
0.16U +
F — 12.99 (2)
0.72LKt _4 + 0.53LFt(-0.82) (1.02) (1.9) (0.91) (1.07)
andR2 — 0.65, D.W — 3.2, F — 13.79 (3)
LYt - 5.2 + 0.33LPt + 0.71LKt 4 + 0.53LFt(-0.76) (0.99) (1.03) (0.86)
R2 — 0.60, D.W — 3.3, F — 15.88 (4)
168

The variable LFt added to the supply function was used by M
Xekalakis to show past production capacity and is calculated by a four-
year moving average of Yt (annual olive-oil production). Also, LKt_4
is the four year lagged value of LK t (the number of olive trees).
Equation (2) shows collinearity problems between LFt and L1 t _4 - which
has rendered the constant term insignificant. In equation (4) the U
variable was dropped but the results did not change as collinearity
problems persisted. Overall though, between the four equations the
estimates for price elasticity of olive-oil supply are quite similar.
I concluded therefore, that the main factor responsible for the
diversity of their estimates was the choice of data series. On the one
hand, D Miliakos (1980) used olive-oil supply figures (production +
stock) provided by the Ministry of Agriculture as the endogenous
variable. On the other, M Xekalakis used production figures estimated
by the F.A.O. The discrepancies in the time series data for olive-oil
production data, published by different sources have already been
mentioned in Chapter One. A simple comparison of the data series on
production raises serious questions about the reliability of any
estimates received. (6) This is because econometric modelling has been
defined as an attempt to match the hypothetical data generation process
postulated by economic theory with the main properties of the observed
data. (7)
I then developed an econometric relationship of aggregate olive-
oil supply response to certain quantifiable variables. The problem was
to identify and quantify the most important supply factors. These
included economic, institutional and technological influences as well
169

as natural conditions. In analysing the olive growers pattern of
behaviour I thought it best to assume that individual motivation is not
strictly "economic" in the sense of profit maximization. In reality
olive growing is a way of life governed by the existence of a complex
webb of social relations between farmers, the land, the olive produce
and the immediate environment.
In modelling the supply function the volume of output is not the
only relevant dependent variable; the quality of this output is also
important. Quality is usually reflected in the selling price of the
produce. (8) The analysis has been based on aggregate time series data
for the whole country during the period 1950-1988. This is clearly a
disadvantage since there are geographical areas where any change in the
capacity of the olive industry is limited by land or other
environmental factors, and there are other areas where this change can
take place as a result of variations in factors determining the
relative size of the industry within the agricultural sector. Regional
output, at administrative and provincial levels, responds differently
to changes in factor and product prices - but as there is lack of
sufficient continuous disaggregated data it can only be depicted for a
relatively short-time period. Specifically, with respect to olive-oil
output in Peloponnesos and Messenia, continuous data was only available
between 1963-1984. A comparison between national, administrative and
provincial levels of olive-oil production is made in Figure 3.1. Table
3.2 presents the number of trees and annual olive-oil production at
national, administrative and provincial levels during 1963-1984. We
may observe from Figure 3.1 that the pattern of output irregularity
170

between the three levels does not occur at the same frequency. This
means that local, provincial or even administrative output fluctuations
are not captured in the national figures - which points to the
importance of using disaggregated data, not least for policy making
purposes.
When considering the short-term supply of olive-oil as compared to
other agricultural crops, I adopted the following reasoning. The
olive grower remains in production so long as his revenue exceeds the
variable costs - of which labour forms the major part. The farmer
calculates the value of the time spent by himself and his family not
only in terms of the level of prevailing agricultural wages , but also
in terms of his opportunity cost (i.e. the existing alternative choices
for employment). Evidence from different olive producing regions of
the country confirms that this is a - reasonable assumption.(9)
Specifically, on some Greek islands (e.g. Keklades and Lesbos) farmers
can easily withdraw their labour and seek out employment opportunities
in the expanding tourist industry or even as sailors. At the same
time, growers who live in remote and disadvantaged areas, still
continue in olive-oil production as it is their only source of cash
Income. In this case, migration is the only real alternative. It
appears therefore that the short-term supply function is not simply
inelastic. It is more inelastic with respect to falling than to rising
prices of olive-oil. Even though prices may be falling, the olive tree
will continue to yield some fruit and the olive grower will presumably
wish to continue to collect it.
171

Other variable inputs in the short-run include fertilizers,
pesticides and insecticides. As labour cost is the largest single
component of total production cost and migration has resulted in
increased wages, it is rather improbable that high olive-oil prices can
stimulate intensive harvesting and consequently increase the amount of
olive-oil supplied.(-° ) What tends to happen when there is a shortage
of labour or when labour costs are "too" high, is that the cultivator
assisted by his family will collect the produce himself. This will
involve a longer time period which directly affects the quality of the
produce (i.e. the olive-oil produced will be of an inferior quality).
Given the usual seven year period which intervenes between planting the
olive trees and the start of their fruit-bearing age, time is a very
important variable between the potential output over the long-run, and
the actual output in the short-run. The actual output is dependent on
a mix of factors some under the farmer's control such as the variable
inputs, and some factors beyond the farmer's control like weather and
crop disease. The short-run is here taken to be a period of between
one to seven years. On the other hand, potential output is dependent
on ,factors such as the number of trees planted, the state of
technology, structural conditions and institutional changes.
The number of trees is a major factor behind long-run output and is
related to the relative profitability of the olive tree compared with
other crops (especially fruits and seed-oils). Although such
alternatives might be more profitable than olive trees the
Osycological attachment of the olive growers to olive cultivation
means that the number of olive trees is unlikely to be reduced (they
172

1972 1,522,355 1980 563,3171973 1,187,036 1981 565,0001974 1,285,000 1982 335,0001975 1,311,060 1983 550,0001976 1,092,160 1984 360,0001977 718,000 1985 410,0001978 591,450 1986 600,0001979 675,500 1987 200,000
Year Number Year Number
will not grub them out). What will be affected is future planting.
During the 1950's - after the Second World War and the Civil War, a
considerable number of trees were planted.(- 1) These trees came into
production during the 1960's and this explains the fact that the
greater rate of increase in olive-oil production occurred then.(12)
Table 3.3 presents the number of newly planted trees in Greece between
1972-1987.
Table 3.3 Number of Newly Planted Olive Trees, 1972-1987
Source: Ministry of Agriculture and N.S.S.C, 1988
We can observe from Table 3.3 that the number of newly planted
trees has been in decline since 1976. Furthermore, during the 1980's
decade fires in the summer months have destroyed hundreds of hectares
planted with olive-trees. (13) These trees have not been replanted as
yet, so in future the annual rate of change of olive-oil production
will actually be negative, which coincidently complies with EEC
directives concerning the restriction of olive-oil production in the
member-States. (14) On the other hand, the productivity of the olive
trees as measured by yield per tree is another important long-run
variable. Yields are directly related to the alternate bearing cycle
of the olive-tree and, as explained in Chapter One, are dependent upon
certain environmental and soil conditions. These conditions can, of
course, be influenced by the utilization of fertilizers, irrigation
projects, the deployment of new olive-tree varieties and pruning which
extends the productive life of the crop.
Another important long-run variable is technology which basically
encompasses the mechanization of harvesting and pruning in order to
reduce labour requirements (and therefore costs) during the production
process. Technology also refers to insect control and new methods of
olive-oil extraction from the olive fruit. The new techniques
introduced in olive growing aim to increase the quantities of olive-oil
produced and so improve quality. If replanting of olive groves was
allowed on a nationwide basis then, given the new techniques, larger
size and more productive (i.e more irrigated) groves would be favoured.
In fact I consider the size of olive farms to be a long-run structural
factor which is affected by policy measures such as the availability of
non-farm employment, the possibility of acquiring loans, and the
provision of information (technical or economic) through the olive
research institutes and the media. After trying to take these factors
into account I undertook an estimation of the Greek olive-oil supply
function for the period 1950-88.
174

3.2 An Estimation of the Greek Olive-Oil Supply Function, 1950- 1988
3.2.1 The Data
Yt denotes the annual production of olive-oil over 1950-1988. The
series has been extracted from the F.A.0 data using various years of
publication to ensure smoothing and continuity. Figure 3.2 shows the
time series of Yt for the period 1950-1988. We may observe a strong
trend line from the data and marked irregularity in the production of
olive-oil. This, of course, is only to be expected given the
alternating production pattern of the crop as well as weather
vicissitude and other natural conditions which influence agricultural
production. A similar picture emerges when, in Figure 3.3 the
logarithmic form of Y t is graphed against time. Figures 3.4 and 3.5
graph the average annual real price of olive-oil and the graph of the
logarithm. As expected the two equivalent graphs present us with
similar patterns.
Next, in order to find the annual growth of olive-oil production
for the period an 0.L.S estimation was performed. The first estimation
gave:
Yt — 96.4 + 5.5 TIME
(5)(6.3) (8.3)
R2 — 0.65, D.W. — 2.84
175

Re-estimation by the Cochrane-Orcutt procedure to take care of first
order auto correlation produced the following:(15)
Yt — 100.7 + 5.3 TIME (6)(10.57) (12.9)
D.W. — 1.7
The compound rate of growth of olive-oil production during the
same time period was calculated at 50 16) So olive-oil production
increased on average by approximately 5,300 tonnes a year. Table
3.4(a) presents the data used in estimating the Greek olive-oil supply
function, 1950-1988.
3.2.2 Specification of the Model and of the Variables Used
All variables were used in their logarithmic form. It is assumed
that olive-oil production in year t, is a function of producer price,
LPt capital stock, LKt , and production of the previous year LYt_i. In
detail the variables used were:
LYtf (C, LKt , , LPt , LPt_i, LYt_i, U, TIME)
(a) Production of olive-Oil, LY t , on an annual year-by-year basis for
1950-1988 was given in thousands of tons. The data source was the
F.A.O. As actual production was used, an extra explanatory
variable was added to the model, LYt_i, to allow for annual
fluctuations. (17)
176

(b) Producer price for olive-oil, LP t , during 1950-1988. We had a
choice between two price series here. We could have used the
average weighted price received by the farmer during the marketing
year and estimated by the Ministry of Agriculture. In this
estimation, the producer prices prevailing in the main producing
centres of Greece were taken into account. Also, the quantities of
olive-oil produced in each area were used as weights. ( - 8) On the
other hand, we could have used the intervention price of olive-oil
as fixed by the Government each year - just before the beginning of
the production period - for a certain quality of olive-oil. This
institutional price is the minimum price the farmer can obtain for
his product.
After reflection I decided to use the average weighted price as
estimated by the Ministry of Agriculture for 1950-1980. (19) After
then, the price fixed by the Government and Eleourgiki has been
used; this exceeds the intervention price set by the EEC and
theoretically, is the minimum price received by the farmer for the
•sale of the product. (20) Furthermore, the relative producer price
has been used i.e. the producer price deflated by the Retail Price
Index, with a base of 1974 — 100. The price of the previous period
LPt_i was also deployed as an explanatory variable in the sense
that the cultivator would probably take extra care implying that
more time and effort is devoted to the crop for this year's
production if the price of the previous year was considered
favourable.
177

(c) Capital stock, LK t_l. For the capital stock the number of olive
trees recorded by the NSSG for olive-oil production is used.
Several lagged forms of LKt are used given the gestation period of
the olive tree. From the time of planting until the yield, there
is usually a period of 7 years. Of course, recently - but not to a
great extent - this period has been reduced to 4 or even 3
years. (21) So various lagged values, LK t_3, LKt_4 and LKt .7 have
been used.
(d) A constant term, C, has been used, since part of the production is
self-consumed (by the producers themselves).(22)
(e) The variable LYt_i was used to take care of the biennial bearing
cycle of the olive-tree which is, of course, related to its
physiology. Also, a dummy variable Ur, was used for the same
purpose taking the values 1 for the "bad" years and 0 for "good"
years. U proved insignificant however and was soon dropped.
(f) TIME was used to take account of technological improvements
(described in Chapter One).
3.2.3 The Results
The estimation of the model was by the Ordinary Least Square
(0.L.S) method. In Table 3.4(b) the results are presented. The first
equation, where all variables are present, gave a set of badly
determined estimates which indicated the presence of collinearity.
178

This problem can be solved by reducing the dimensionality of the
parameter space. Even though it is not always valid to assume that a
group of badly determined estimates indicates the present of
collinearity (rather than an omitted variable bias), here this is
indeed the case. (23) The second equation, where TIME is dropped
exhibits a large change in the constant term (self consumption) and an
increase in the t-statistic; this suggests that there was a severe
collinearity problem between TIME and other trend variables such as
LKt _i. The coefficients of the other parameters remained
insignificant apart form LYt_i, while the coefficient of LK t had the
wrong sign. Next, various forms were tried in order to establish the
lag structure of the model. Equation seven gave a reasonable fit (ie.
R2 — 0.72), but the price coefficients were still insignificant
indicating some collinearity among them.
We can also observe from Table 3.4(b) that different lags of LKt
were introduced and, as a result, the sample size was contracted by up
to seven observations. Equations twelve and fourteen seem to perform
best.; the fit of equation fourteen is a little better (R 2 — 0.688) of
the two. Also, the F-test of equation fourteen is F(3,28) — 20.6
compared with 19.6 in equation twelve. So, the following equation was
selected for describing the best data-generation process.
LYt — -18.6 + 0.55LPt + 2.41Kt_7 -0.53LYt_1(-4.4) (1.9) (6.0) ( - 3.5)
D.W — 1.65, F(3,28) — 20.6, R2 — 0.688 (7)
179

As a lagged dependent variable is present, the Durbin-Watson test
is not valid for detecting the presence of first-order autocorrelation.
The Durbin's h-test was calculated instead.
h = \I(1-n) v(al)/A-
where p is the least squares estimate of p based on the 0.L.S residuals
from the fitted regression, and
etet_iP t — 2
e2t_it — 2
V(al) is the estimated variance of the 0.L.S estimate of al, which, in
this case, is -0.53. The value of h is found to be 2.56. If we use a
1% test against the one-sided alternative of positive autocorrelation,
the acceptance region for the null hypothesis is h<1.96. So, in our
case, the hypothesis of no autocorrelation has to be rejected. Next,
equation (7) is re-estimated by the Cochrane Orcutt iterative technique
for 1st order serial correlation. Thus, the final form of equation (7)
is given below:
LYt — -23.76 + 0.69LPt + 3.0LKt _7 - 0.73LYt_i(-4.9) (2.16) (6.8) (-6.47)
D.W = 1.99, F(3,27) — 26.25, R 2 = 0.688
(2W) ----
The short-run elasticity of olive-oil supply was found to range
between 0.36 - 0.69. This means that a 10% increase in producer price2
will cause, on average, a 5% increase in olive-oil supply. Therefore
180

. the short-run price elasticity of supply turns out to be - as expected
- inelastic.
The long-run price elasticity of olive-oil supply on the other
hand, ranged between 0.24 - 0.39. A 10% increase in producer price
will cause a long-run increase, ceteris paribus, of 2.4-3.9% of olive-
oil output. So, while in the short-run output is more sensitive to
factors beyond the farmer's control (such as crop disease or natural
destruction) than price change, in the long-run the supply of olive-oil
is highly price inelastic. Furthermore, according to the results which
' I have obtained, the most decisive factor in determining olive-oil
output turns out to be the number of trees. What equation (8) shows is
that a 10% increase in the number of trees seven years ago will cause a
30% increase in olive-oil output. This is precisely the reason why the
task of olive-tree registration has been undertaken in the context of
the C.A.P, so as to control better the expansion of olive-oil
production. (24)
It therefore seems that the natural conditions and the historical
development of olive cultivation have decisively shaped the
organization of olive production in relation to the socio-economic
environment in which the production process takes place, and seem the
most effective constraints. But on the other hand, if restructuring
results in the domination of large scale, more cost-conscious
cultivation patterns, and olive growing ceases to be a monoculture in
several remote rural areas, then farmers will turn to the cultivation
of more profitable crops in the absence of any future EEC price support
181

mechanism and under constant demand conditions. As a result, olive
growing will be limited to the larger plantations under permanent
irrigation schemes and deploying a more mechanized mode of operation.
We may conclude that this modelling exercise shows that the
producer price is not a major determinant of olive-oil supply. It is
the capital stock in the shape of the number of trees which is the
more decisive influence. In this respect the supply function may be
considered to be a first step on the road towards explaining the
decision making process of cultivators. Clearly their behaviour is not
determined solely by purely economic variables but is also greatly
affected by past and present social and institutional factors.
Furthermore, these factors tend to be concealed in that they will not
readily show up in the standard forms of expression. After taking this
into account I decided to investigate how such factors have interacted
over time through a case study of two olive producing villages situated
in a major agricultural province of Greece, that of Messenia.
3.3 The Province of Messenia
Peloponnesos is a large administrative unit which contributes
around a quarter of the country's total olive-oil production. In 1987-
1988 olive-oil production touched 67,800 tonnes which is some 28% of
the national total. Cooperatives accounted for 40,800 tonnes, (or
61%), indicating that the movement is strongly represented.
Peloponnesos is divided into seven provinces. The province of Messenia
is the most important as far as the volume and sales value of olive-oil
182

production are concerned.( 25 ) In 1988 production was estimated at
25,000 tonnes. The sub-regional distribution of production is
presented in Table 3.5.
Table 3.5 Sub-Regional Distribution of Olive-Oil Productionin Messenia, 1988 (in tonnes)
Counties Amount
Trifylia 11,000 44
Calamata 4,500 18
Pylia 2,500 10
Messeni 7,000 28
Provincial Total 25,000 100
Source: Agricultural Institute of the Province of Messenia, 1988
Messenia is one of the oldest olive growing regions in the
country. The olive-tree and its cultivation have been the main source
of income for its inhabitants for many centuries. A report by Zaccaria
Bembo, the local governor of Messenia in 1712, gives some interesting
information of olive-oil production and marketing in a period when the
province was occupied by Venice. His report illustrates aspects of the
agricultural policy and trade between the Venitians and their Greek
colonies. (26)
Between 1204-1797 A.D. the Venitians occupied various parts of
Greece and gave special attention to olive growing and to vines. The
olive-oil produced in the Greek colonies formed an important element of
183

trade, manufacturing and consumption in the life of metropolitan
Venice. The province of Messenia had been a Venetian colony between
1206-1500 A.D. When the Venetians occupied Peloponnesos for the second
time, 1685-1688, by defeating the Turks, they replanted olive trees
throughout Messenia, in 1693. (27) Towards the end of their- thirty
year occupation, in 1712, the local and provincial governors estimated
the average annual olive-oil production of the province according to
the orders received from the centre. The reports can be found in the
collection "Proveditori Sopra Olii" in the Archives of the Venetian
State.(28)
In his report, Bembo, estimated olive-oil production for 1711-
1712 at 7,000 barrels. (29) It is not clear how he arrived at this
number as he does not state the exact amount for 1712 or 1713. It
appears however, that he expected a larger production for 1713. So, he
added the two years together and divided by two. That was a common
estimation method, also used by Vicenso Palta, the Governor of the
province of Lakonia. Palta wrote: "300 barrels were produced in 1711-
171Z and 5,800 in 1712-1713, so the average production is 3,050 barrels
of olive-oil". (30) Apart from production figures Bembo reminds us of
the monopoly position and colonial behaviour of the Venetian State
towards their Messenian province. Out of the 7,000 barrels produced,
5,000 were destined for export to the metropolis: there olive-oil was
used for re-export, consumption and certain industrial uses (in the
soap and wool industries). The Messenian farmers were able to keep
only 600 barrels for self-consumption, that is less than 1/10 of the
produce. The report also mentions that between 1693-1697, the olive
1814

trees suffered frost damage which continued to affect production two
decades later. Bembo was, of course, aware of the biennial nature of
the crop. Evidence on how strongly this phenomenon could affect
production is supplied in the production figures given by Palta for
1711-1712 and 1712-1713. There is also reference to the importance of
the merchant ship "Marciliana" for the Venetian trade in the Adriatica,
Ionion and Aegean Seas. That ship specialised in the olive-oil trade.
Names like "Cottoni", "Foresti" and "Giatro", show that Greek merchants
also took part in the trade of olive-oil between Messenia and Venice.
Indeed, Greek merchants gradually came to play a very important role,
especially in the sea and over-land trade. For instance, by the end of
the eighteenth century, Greek merchants were the important middle-men
in the exports of oil, corn and other agricultural produce, while they
had virtually monopolised the illegal wheat trade of the western part
of the Ottoman Empire. (31) Bembo also mentioned an increase in price
between October 1711 and June 1712 from 5 reels to 6.1/2 reels. He
points out that in 1712, the amount exported to the metropolis would
exceed 5,000 barrels because of the price increase. He expected people
would buy olive-oil from the surrounding areas and sell it to the
merchant ships bound for Venice. There was only a cash payment,
incurred for storage payable prior to the olive-oil being boarded and
an export tariff of 4% on the current price of the produce. The
significance of this report lies in the fact that the natural
constraints and historical conditions (merchant capital domination)
referred to, have been factors directly impinging on the economic
development of olive growing to this day.
185

In 1821 the War of Independence against the Turks started from the
province of Messenia. It lasted for six years, during which most of
the agricultural production was apparently destroyed. (32) After the
War, Peloponnesos was the only area of the newly created State where
small landholdings prevailed from relatively early on. (33) This
happened as most of the territory after the Turkish had left was
declared "National Land" and was cultivated by the peasants. The low
level of productive forces, the lack of State support and the dominance
of merchant capital in the rural regions constrained the development of
olive growing in the province. (34) Despite these unfavourable
circumstances, Messenia retained its position as one of the major olive
producing regions of the country. (35) In recent years, it comes third
in importance in olive-oil production at the national level behind
Lesbos with 10.9 million olive trees, and Crete with 8.7 million
trees. In Messenia 10.1% of the country's olive groves and 8% of the
total number of olive trees are located. Olive groves make up 97.8% of
all rural farm cultivation and the number of olive trees accounts for
83.4% of the total number of fruit trees. In 1982, employment in fruit
tree cultivation in the province stood at 35,316. This labour was
distributed in the different zonal regions as follows:(36)
The Plains
18,963 or 53.7%;
Semi - mountainous areas
10,686 or 30.3%;
Mountainous areas
5,667 or 16%.
According to the 1981/82 Census the total amount of labour in
agriculture was 47,600 people. They were distributed as follows:
186

Urban areas 1,720 or 3.6%;
Semi-urban areas 5,280 or 11%%;
Rural areas 40,660 or 85.4%.
The total active population engaged in agriculture in the province is
55.6% which is well above the country average of 26%. (37) These
figures clearly show the dependence of the area on the rural sector.
Production of olive-oil in Messenia can be seen in Table 3.2. It ranged
from 24,612.6 tonnes in 1963 to 31,035.2 tonnes in 1984. The highest
and lowest limits were achieved in the crop years 1983 (47,026.6
tonnes) and 1969 (19,236.6 tonnes) respectively. These fluctuations in
production reflect the biennial cycle of the crop and also natural
destruction (by fires or by frost). Furthermore, variations in olive-
oil production occur at totally different frequencies between local,
provincial and national levels. In this respect, the study of a
particular locality combines unique features with more general socio-
economic conditions prevailing through time.
3.3.1 The Village of Avia
Avia can be described as lying in a geographically transitional
zone between the plains of Messenia and the mountains. Its most
important agricultural characteristic is its total lack of irrigation
capacity - thus making olive cultivation a monocultural atity. The
village itself is located some 30 km southwest of Calamata, the capital
of the province. Administratively it is one of sixty villages
belonging to the county of Calamata. The average production of olive-
187

oil in the county totals some 4,500 tonnes. (38) The village is sited
along the coast and during the summer season becomes something of a
tourist resort (See Map II). Tourism started to flourish in the area
from the mid-1970's and concerns Greek as well as foreign visitors.
Some of the village's five hundred inhabitants therefore engage in
seasonal jobs generated by tourism. In these cases, agriculture is
only a supplementary source of income.(39)
Two hundred and four households engage in olive cultivation. They
are all members of the village cooperative which exclusively serves
members olive growers and operates an oil-mill and a packing unit for
the produce. The cooperative is also responsible for marketing and
distributing the olive-oil of family-managed olive farms.(40)
The main distinctive feature of this village lies in the fact that
the "old" and the "new" combine together in a complex way. On the one
hand, we can observe traditional olive growing activity which not only
survives but has been strengthened through the cooperation of the
olive growers in the village. On the other hand there is a limited-
but nevertheless dynamic - expansion of tourism which has began to
transform the village's outlook and has created a class of local
businessmen quite separate from the farmers; it is they who form a
growing part of demand for locally produced and packaged olive-oil in
order to satisfy the consumption requirement of their customers.
188

3.3.1a Demography and Land Tenure
In the 1963 Census four hundred and thirty-six people were counted
as inhabitants of the village. By 1974 the population had been
reduced to 324. However, migration from Avia was not simply a
phenomenon of the 1960's alone. Already at the beginning of the
twentieth century many villagers had moved away - mainly to the United
States. It has not been possible to establish the exact numbers of
emigrants as records are not kept at the Kinotita. (41) After 1915 the
Greek towns were the main attraction, more especially (and to an
increasing degree) Athens itself. The difference in average living
conditions between Athens and Avia was obviously very considerable.
Until the early 1970's, the village was not connected up to
electricity, waterworks or even a radio wavelength. (42) The migrants
appear usually to have attained relatively good jobs in Athens. They
became policemen, merchants or found work in offices. Most could
afford to spend a few weeks of their holiday in their former home at
Avia. This success has sometimes been portrayed as forming a
distinctive trait of the "typical" Greek farmer. Above all they are
characterised as being "survivors". However, the rather frequent
occurence of job opportunities for villagers in the urban centres can
be explained through their involvement with patronage politics.(43)
Indeed, from very early on, a belief was implanted within the village
community - by political figures trying to win votes - that the
securing of a political "protector" was a necessity for survival and
advancement. To this day there exist deep political divisions within
189

villagers originating from as far back as the Second World War and the
subsequent Civil War of 1948.
Until the mid 1970's the oldest of the farmers estimated that about
one-third of the total acreage suitable for cultivation had been
abandoned. This can be explained by looking at the farming unit in
relation to the available labour force. Most agricultural units in the
village were originally based on two corner-stones: olive growing and
fishing. When the market economy began to penetrate from around the
beginning of this century, the poorest of the cultivators reacted by
migration: the younger generation especially moved away as working
conditions in the village were hard and offered few prospects of a
better life. (44) As the migration process persisted its consequences
began to be felt. The older generation passed the land to their heirs
- many of whom lived away, either in Athens or abroad, and they had
little interest in continuing to cultivate. Land was neglected and left
to fallow - which was virtually costless given the absence of a land
tax. Further, the process of the concentration of land into large
holdings was slow. The migrants were not able to easily sell off
their holdings because in the village itself there were few young
families prepared to take on extra land; for the rest most of the
farmers could not afford to increase their acreage given their limited
ability to accumulate funds in a rural environment dominated by
merchant capital, and with regard to the heavy handed role of the State
at the time.(45)
19 0

The size of the holding was primarily determined by the amount of
labour available. There was also the possibility that the owner of the
land did not wish to sell because he hoped to return to the village at
some point later on in life. Things were obviously different for those
owners who had not moved away and were in direct touch with the local
economy. They leased out their land to the few families who had access
to wage labour. (46)
After 1974 the population trend has been reversed. The fall of the
Colonels' junta and the rejuvenation of democracy in Greece
contributed to the repatriation of many migrants. Also, older people
from the urban centres started to return. One of the main reasons
which contributed to this process was that since the end of the 1970's
financial support was given to the farmers by the State - in the shape
of releasing credit on favourable terms. By the summer of 1988 the
population of Avia had reached five hundred. (47) Out of those farmer
sampled, 15 (36%) had a history of migration - either abroad or in
Athens. Production of olive-oil increased from 120 in 1973 to 420
tonnes in 1988. The number of olive trees, both old and newly
planted, was counted at 52,694.(48)
In my sample survey, 42 farmers were drawn from the Cooperative
list of 204. Criteria for representativeness of the sample were based
on land size of the olive farms, and on methods and techniques of
production i.e. to what extent the cultivators had adopted or
experimented with new techniques of pruning and harvesting. -Another
criterion for selecting this sample was whether olive growing provided
191

the main source of income for the cultivators. My choice of these
criteria was influenced by the belief that they underlie important
socio-economic processes which have brought about the current state of
affairs.
As far as the fragmentation of the land is concerned Avia proved to
be no exception to the national situation. (49 ) Sixteen of the holdings
consist of seven separate strips of land - most of which are less than
one acre each and situated at quite some distance from each other. A
simple comparison of land structure between the sample survey,
provincial figures and national averages is presented in Table 3.6. We
can observe that there has been some concentration of land such that
the percentage of landholdings of more than six hectares is higher than
the corresponding figure for either the province or the national
average. A similar result is obtained for the category of landholdings
between 3-6 hectares. Also, the small landholdings i.e., those below
2.9 hectares, lie considerably below that of the province and the
national average. The main difference between the three levels though
is that in Avia the middle range land-size is predominant as shown up
in the sample. As already mentioned the sample was chosen in order to
portray the land structure of the village's olive farms, so in that
respect it is representative. However, we can also observe that the
middle range size of holding is quite close to the lower range at the
provincial level. Given that these figures are derived from a 1982
survey, it seems to me that under the restructuring which has taken
place in recent years, 1982-1989 - and in the context of the EEC

directive about early retirement - the middle range of olive farms will
by now have become predominant at the provincial level.(50)
3.3.1b Mechanization and the Labour Process
The lack of irrigation in the village permits only dry groves to be
cultivated and this means lower production per hectare compared with
areas under irrigation. (51) Out of the nine olive producing groups of
Kinotites in the province the M. Mandinies Kinotita (to which Avia
belongs), produces 18 kgr of olives per tree and comes third in order
of productivity with a group of Kinotites from Trifilia County first
(at 35 kgr of olives per tree) and a group of Kinotites from Pylia
County second (at 26kgr of olves per tree). The two counties with
higher olive production per tree are generally under irrigation.(52)
Despite this, the natural fertility of Avia's- soil, the altitude and
the favourable climatic conditions (very low risk of a frost damage)
combine to obtain a good performance from the trees. The extraction
ratio is one kgr of olive-oil from every five kgrs of olives, which is
above, the national average and the best of the province of Messenia.
On a national scale, only the province of Lesbos with an extraction
ratio one kgr of olive-oil from every 3.6 kgr of olives, and Crete with
1:4 or 1:3.6 olive-oil extraction ratios, exceed Avia's level of
productivity. (53) The setting of the olive groves in the village is
on average 8x8m or 8x9 m spacing and the slope of the soil (at 15-16%,
on average) permits the use of machinery at the different stages of
production.
193

In the years prior to the Second World War, the basic all-purpose
tool in olive growing was the short-handled hoe used to weed the
fields. In addition, a digging stick was used for planting new trees.
Since the 1960's, a small plastic rake could be used for harvesting,
but for the most part, harvesting has continued to be done by hand.
Transport to the mill was either by donkey for small amounts and short
distances, or by horse for large amounts and longer distances.(54)
Although first introduced in the 1930's, tractors did not become
widespread in Messenia until after the Second World War, and they did
not dominate field preparation in Avia until the late 1960's .(55) In
July 1988, there were one hundred tractors with an average capacity of
65 hp. The equipment accompanying the tractors is fairly standard.
The tractors are rubber-wheeled with hydraulic lifts, and ploughing is
done with an adjustable chisel plough. A four-wheeled wagon can be
added to transport fertilizers and pesticides to the fields. Most
farmers own their own tractors; in the sample survey 33 did so.
Others, with smaller holdings rent them from the olive-oil cooperative
for only a modest rental payment.(56)
Greek agriculture nowadays relies on chemical fertilizers such as
Nitrogenous, Potassium and Phosphorate: in 1983 2,033.2 thousand tonnes
were used. Until the 1960's home-produced animal manure was used for
this purpose. (57) In Avia, 90% of the 42 farmers surveyed said they
used chemical fertilizers for their olive growing. They interchange
between NH4 fertilizer in one year and Potassium or Phosphorate in the
next - on the advice of the Olive Research Institute of the province.
194
On average, and for an optimum crop, 10 kgr per tree is needed and
these products are generally applied by hand. (58)
Two of the largest olive growers in the sample have experimented
with mechanized harvesting. They used small mechanical devices called
portable vibrating hooks, which can produce double the output of
manual work. As these devices shake the branches of the tree the ripe
olives fall and are caught by ground nets. The farmers said that the
results were not satisfactory at that stage because the hooks leave a
fair number of olives still on the tree. Also, since the olives hit
the ground nets and remain there until picked, the quality can
deteriorate (through a lack of humidity) and, as a consequence the
acidity of olive-oil increases. This method of mechanizing the harvest
is used to some extent in Crete because the most appropriate tree shape
for such tools is the bushy type, which is often found on this island.
These tools are usually applied in large fields as their use saves on
labour. They are also designed and produced in Greece.(59)
As mentioned, not all households derive their main source of income
from olive growing. In the 1988 sample, 26 (i.e. 62%) had olive
growing as their main income source; 5 (i.e. 12%) were engaged in
government jobs; and 9 (i.e. 22%) were involved with crafts and trade.
Furthermore, 16 out of the 26 olive growers who had farming as their
main profession relied on a State pension or on daily wage labour
outside agriculture to supplement their income (such as: waiters,
builders, fishermen and taxi-owners).
195
In a sample of 42 farmers, 38 mostly used hired labour - which, in
turn formed the largest part of the cost of olive production. In my
sample, labour costs constituted 55-57% of total production cost per
stremma of olive cultivation. Seventy percent of that was accounted
for by harvest labour. This is because most labour time is spent on
harvesting since it is an activity still done by hand. Harvesting by
hand is necessary in this area given the type of olive trees (non-
irrigated) - which means that the olive fruit must be handled with
special care in order to preserve quality. Expenditure on fertilizers
formed about 15% of total production cost, while machinery consumed 9%
of total cost. In 1988 the commission right of the oil-cooperative for
processing the olives, was set at 10%, and this naturally must be added
on to the production cost of olive-oil per stremma. Gross profit
margins presented by the farmers, 8-14%, were small but this is
consonant with the lack of irrigation in the area so that olive growing
provides the only source of agricultural income for the villagers.
3.3.1c Marketing
The origins of the village oil-cooperative, called the "Olive-oil
Cooperative of Avia", dates back to 1926, when 12 individuals decided
to establish and operate an oil-mill. Within three years the
cooperative had grown to 20 working members and, as a consequence, the
private oil-mill which existed in the village had been forced to close
down. During this early period olive-oil production in the village
barely reached 23 tonnes. (60 ) With the development of improved methods
of extraction and processing production steadily increased and quality
19 6

improved. In 1958 the oil-cooperative even managed to win a gold
medal in a national competition for olive-oil quality; and indeed it is
worth noting that for this competition samples were taken from all over
the country. (61)
The members of the oil-cooperative manage their own farm affairs,
but they jointly own the assets of the enterprise. To the outside
world the cooperative is an independent legal entity managed through
the standard principles of membership control. Each member has a right
to vote and all fundamental questions of management are decided upon at
meetings of the members. The "executives", who are olive growers
themselves, are entrusted by the members to act on their behalf for a
number of years and are fully responsible to the membership. (62) The
distinctive feature of membership control is that decisions made by a
collective body must be executed under the control of a single person
who is responsible for running the day-to-day affairs of the
cooperative. The management of the cooperative's routine daily
operations is entrusted to its president who is chosen for a 5 year
term by secret ballot at a members meeting. Presidential tasks include
directing and administering the cooperative's production activity and
maintaining all the financial records. The president deals on a daily
basis with all the problems of production covering questions of loans,
contracts and development plans. He also represents the cooperative in
meetings with the State and with other outside authorities as and when
needed. (63)
197

In 1983 the oil-cooperative commenced an upgrading and
modernization programme by obtaining a part grant, part loan of 28
million dr (£103,700 at prevailing exchange rates), from the E.A.G.G.F
via the Agricultural Bank of Greece. Fifty percent of this amount was
given in the form of . a subsidy under the terms of the C.A.P regulation
concerning Greece's incorporation into the EEC. The remaining sum is
to be paid back at a fixed rate of 14.5% p.a. Given the biennial
nature of the crop, olive-oil production every second year has not been
sufficient to cover the annual interest payments of the cooperative.
In fact, interest on deferred payments rose to 22% by the A.B.G.
Because of this, the commission right for olive-oil extraction which
the cooperative charged its members since 1988 was 10% compared to 7-8%
- which is the normal current charge in other oil-cooperatives. In
the oil-mill eight people are employed for three months each year.
Part of the loan was spent on building oil-banks with a total capacity
of 320-350 tonnes. The members deposit their produce in the mill until
a suitable buyer can be found - usually through the good offices of -
the cooperative. (64)
Production of olive-oil in 1988 in Avia was 420 tonnes, but in 1987
it was less than half this amount due to the alternate bearing cycle of
the olive tree. In 1988 15.5% of the amount produced went into direct
consumption by the farmers themselves. To be able to operate its
packaging unit and receive Consumption Aid from the EEC - which was 104 .
dr/kgr in 1988 - the oil-cooperative has to package at least 60 tonnes
of its produce in plastic bottles of 1 lt and 5 lt capacity.
198

Other channels of distribution include the "Second-Order
Cooperative" situated at Calamata, which bought 126 tonnes in 1988
with the intention of exporting it to Italy. Another 230 tonnes were
sold by auction to merchants - who act as mediators on behalf of the
packers located mainly in the province. The olive residue which is
left during the extraction process, some 970 tonnes, was sold to a
private refinery at 4.01 dr/kgr - which was the State intervention
price in 1988. The olive-oil was sold unpackaged at 340 dr/kgr, and in
plastic bottles the price received was 362.5 dr/lt or 1,500 dr/51t.(65)
4
We may conclude that Avia Village presents a case of development of
Greek olive growing where relatively small market-oriented farmers
produce through cooperation. Restructuring is taking place only very
slowly due to entrenched socio-economic and cultural factors which
impinge upon the decision making process of the farmers. This suggests
that Avia Village represents with some accuracy the state of affairs in
an important part of the olive growing sector on a national level.
,3.3.2 The Village of Coryfasi
Coryfasi is rather atypical of Messenian villages in that it is
relatively large and has many powerful landowners. However many of the
village's agricultural problems may resonably be thought as being
representative of Greece as a whole. It shares with other olive
growing villages a familiar pattern of basic household structures;
problems of adaptation relating to the introduction of mechanization;
of trying to cope with the effects of changing government policy; and
199

possesses an important range of alternatives for the agricultural
labour force. The feature which makes Coryfasi a representative case
of olive cultivation in the province and the country is the big private
element involved in olive production particularly and agricultural
production in general.
Coryfasi is located on the Messenian plain some 70 km from the
urban centre of Pylos - which in fact is the capital of Pylia County
(See Map II). The County is divided administratively into 63 villages
and in 1988 its total olive-oil production was 2,500 tonnes. The
village is built on a hill, 70 in above sea level, and its population in
1988 was around 860 people.(66)
Coryfasi grows currants, vines and certain vegetables especially
tomatoes and potatoes, but its main source of income is derived from
olive growing. The area under olive cultivation is 550 ha, and the
particular variety of the tree cultivated, Coroneiki, means that
virtually all production is geared towards oil extraction. There is a
,further 3 hectares under olive cultivation where only edible olives are
produced. In the context of the five year EEC plan for 1985-1990, in
the last three years Coryfasians have ceased to cultivate currants on
50 hectares - in return for which the villagers received 40 million dr.
compensation. The reason for this action has been the substantial
reduction in the amount of Greek currants imported by Britain-as
Cyprus, Morroco and Turkey have invaded the market and are able to
supply a similar quality at lower prices. (67) In the whole county 420
hectares previously under currant cultivation have been diverted to
200

vegetables or have simply been left fallow. These events, together
with the appearance of 3 hectares under oil-seed cultivation in another
village of the county, Pisaskion, have begun to exert an ecological
and even a political impact.
3.3.2a Demography
In 1940 1008 people were counted as inhabitants of Coryfasi.(68)
By the time of the 1963 Population Census however, this had declined to
560 people and was clearly linked to out-migration by males. After
1974 this demographic . trend was reversed and population has started to
rise again. Today the figure is 860 people. (69) Although the
direction of causality cannot be easily determined from these numbers,
the reversal of the declining population trend coincided with a marked
increase in the productive forces of the village. Specifically, by the
late 1960's, nearly every family owned a tractor. Five private oil-
mills operated in the village and greater competition may have spurred
an improvement in the quality of the produce. Larger amounts of
•fertilizers and more appropriate methods of pruning and cropping were
used which also helped to increase production. There was also the
opening of a new road so that travel in and out was made far easier
than before. As a result farmers could themselves sell their products
in the nearby urban centres of Pylos and Calamata. These changes
increased the demand for labour in the village and cut back the out-
migration of men to the urban centres. But we must note that a number
of very poor families continued to migrate. Education also
contributed to the migration process. (70)In Coryfasi 6% of the
201

households sampled had a history of migration abroad or to the urban
centres of Greece. If this is extended to the population as a whole,
it suggests that there were 50-55 Coryfasians working abroad or in
urban centres of the country during the summer of 1988.
3.3.2b Olive Growing and Land Tenure
In 1900 the land cultivated by olives occupied 150 hectares and the
number of olive trees was counted at 30,000. Average production
amounted to 72 tonnes of olive-oil. Proper outside marketing of the
produce began around 1880 when the mill operating in the village
started to employ horse power for the extraction of oil. In this way,
larger quantities of olives could be processed and the small amount
retained after self-consumption by the villagers, was also traded. In
1900, 90 ha out of the 150 ha belonged to four large landowners. More
specifically, in 1900 olive groves occupied 150 hectares in the village
corresponding to 30,000 olive trees with average annual production of
60 tonnes of olive-oil. Table 3.7 presents land distribution and the
.olive-oil produced by the four richest olive producers in the village.
202

Farmers Area (ha) Olive-Trees Output (Kgr) dr/Kgr Revenue
Kalogeropoulos 50 6,500 19,500 0.75 14,625Dimitris
Panagis 30 3,900 11,700 0.75 8,775Elias
Vourlas 7 910 2,730 0.75 2,047Nikos
Kagelarios 3 390 1,170 0.75 877.5Dimitris
Table 3.7: Land Distribution and Olive-Oil Produced in 1900;in Avia Village
Source: Records kept at the Town Hall of Pylos, 1988
The average holding for the remainding 97 families of the village
was 1.6 ha with 195 olive-trees and 600 kgr average olive-oil
production. Their total revenues, about 450 dr, were a little more
than half of Dimitris Kagelarios's gross revenues and he was the
smallest landowner of the four. (71) The land owned by the big
landlords was later passed on through inheritance to their sons and
daughters; these transfers caused some degree of fragmentation and re-
division of the larger plots into smaller units.(72)
Between 1900 and 1970 olive cultivation was expanded to 380 ha
planted with 85,000 productive olive trees. Production increased to
200 tonnes. (73)Today olive-oil production in the village is 830
tonnes and occupies 550 ha. As may be observed from Table 3.8,
Coryfasi has more large-holders and fewer small-holders than either the
national average or the province of Messenia (on the results of the
203

1982 suvrey). This can be explained by looking at the process of
social differentiation in the village when the market economy began to
penetrate.
Coryfasi was - and still remains - one of the richest villages in
Pylia County. The natural fertility of its soil, combined with
irrigation, has greatly contributed towards the development of the
productive forces in the village. As the market economy started to
penetrate in the late 19th century, a significant degree property
inequality inherited from the Ottoman era was already present. Four
households (as mentioned) owned more than 50% of the land and the rest
was divided among 97 families. (74) This was the starting point of a
whole process of development of social-economic relations amongst the
farmers. It appears that the smaller farmers could barely cover their
maintenance even in the best years of production. In the majority of
cases these farmers could not make ends meet without resorting to loans
and seeking other types of employment. Every crop failure, as well as
the implications arising from the alternate bearing of the olive tree,
would hit the smaller farmers hard and, as commercialisation of
production progressed, a large proportion were apparently unable to
cope with the conditions created in the village; they therefore
resorted to out-migration. Most of the migrants sold their land if-
they had not already lost it to the merchant of the village who, in
turn, sold it to the richer farmers. An ex-magistrate who was based in
the area in the 1930's, informed me that at least 3 cases a month were
taken to him by the merchant of the village who thus became responsible
for creating a situation of landlessness. Such people had little
204

alternative than to migrate to the urban centres. (75) In this way the
process of differentiation was further enchanced and a greater degree
of concentration of production was achieved.
3.3.2c The Household and the Labour Process in Olive Growing
The household is a central institution in understanding the labour
process of a Greek village. Usually the household is the organiser of
labour among its own members. It also hires-in workers when needed
and in turn often seeks off-farm or other farm employment to
supplement the direct income gained from agriculture. Not all
households are entirely dependent upon agriculture. In my sample 17%
derived their income from crafts or trade, 70% from olive growing and
13% from currant cultivation and vines. Some people combine
agriculture with other jobs, so the phenomenon of the worker-farmer is
not unusual. (76) Women work in the olive farm alongside the men-
just as they usually do throughout rural Greece. Olives are harvested
from November to February and this is the season when most hired labour
is required.
Ploughing and pruning take place later on in the year. The head of
the household plays a key managerial role. He is responsible for
purchasing the inputs - usually through the local cooperative,
arranging for the hiring-in of labour and for the machinery used. The
majority of households own a tractor for ploughing. Depending on the
size of the crop and household labour force the household itself may
supply labour for many of these tasks. Since only one-third or so of
205

the households have more than two adult people available for
agricultural labour, every household hires in labour once in a while,
and some rely on
In a sample of 30 farmers, 22 (73%) used hired labour, while 8
(27%) used mostly or exclusively family labour. It became evident
that when the farmers prepare crop budgets they automatically include
the cost of labour even if they really use unpaid family labour. (78)
It is hard therefore to judge just how "profitable" olive growing
really is. Most figures supplied by farmers show very small profit
margins. Overall, about 40-50% of the cost of olive growing (expressed
in terms of money) goes to labour, 17% to fertilizers and other
material inputs, 10% to machinery use and 25% to fund interest on
loans, and tax.
Income depends chiefly on yields, which are highly variable
because of the biennial nature of the crop, and also on the realised
market price. Net income from a hectare was about 270 thousand dr. (in
1988 prices). With workers earning 4,800 dr for a day's work they are
certainly better off than small farmers. (79) Because of the labour
costs involved farmers nowadays do not perceive olive cultivation as
being a very profitable pursuit.
3.3.2d Marketing
Coryfasian farmers grow olives for both direct consumption as well
as for sale. Both the cooperative network and private merchants are
206

important for marketing. In the village there are four private oil-
mills and one cooperative. The private mills produced 480 tonnes out
of a total of 830 in 1988. The rest, some 350 tonnes, was produced by
the oil cooperative. The private mills are owned by wealthy olive
farmers while the cooperative started operating the oil-mill in 1984
with 68 small-farmer members. (80) Today it has 130 members and it
processes olives for non-members as well. Farmers on the whole prefer,
to take their produce to the cooperative because of the lower
commission right they pay, (7%), compared with that charged by the
private mills, (10%).(81)
In 1988 795 tonnes were marketed. Home consumption was 35 tonnes or
4% of the total, while approximately 64 tonnes of olive-oil were sold
to friends and relatives of the farmers predominantly living in nearby
urban centres. This amount then escaped the market route and so didn't
enjoy Consumption Aid. Out of the remainder, 160 tonnes or 19% was
marketed through the second-order cooperative based in the capital of
the province, Calamata. The other 635 tonnes or 76% was sold to the
private sector. Most of it was marketed through the local
merchant. (82)
The village merchant has operated in this area since the 1950's.
Before him, his father established the business in the 1920's. He
accumulated capital by buying olive-oil from the village and the
surrounding areas in order to be able to resell it later at a higher
price. As farmers became dependent on him for loans for production and
consumption, • a tie or bond was formed and the merchant secured a
207

regular supply of olive-oil. Similar evidence has been found in Asia
and Latin America. (83) The village merchant gained the upper-hand in
the process of exchange of olive-oil for money in terms of the prices
paid to the farmers. That was because small cultivators could find no
other ready source to supply cash fertilizers, and tools. So the
farmers had very little bargaining power in this exchange process.
They were compelled to sell their produce soon after the harvest to the
merchant - when prices were generally at their lowest level. In this
manner they had little access to free markets and could not accumulate
much cash even though the commercialisation of agriculture was well
under way by this time. In many cases indebted farmers lost their
property to the merchant, but instead of a proletarianization process
taking place, the farmers preferred to migrate abroad, or go off to
the urban centres especially to Athens.(84)
Today, even though cooperative organisation in the village is
growing, most of the olive-oil production is still being marketed
through the private wholesaler. Part of the reason is the close
relationship which has been built up with some of the farmers over the
years, and partly because of the involvement of the Agricultural Bank
of Greece in any transaction which takes place through the cooperative
network. The cooperatives pay the farmer by cheque which can only be
encashed at the local branch of the A.B.G. The Bank calculates the
farmer's indebtedness for inputs and services and deducts that from the
value of the olive-oil. (85) So, transacting through the cooperative
sector adds to the cost of the indebted farmer. In my sample, 8
farmers or 27% had a short or mid-term loan with the A.B.G. This is
208

one very good reason why farmers prefer the merchant who pays them
promptly.
In an interview with the wholesaler it was established that he
usually buys on account of a packer or a multinational (either Elais or
Minerva). He is given a certain price range at which he can buy plus a
2-3% commission. The Agricultural Institutes' Officials situated in
the province, suspect that it is a common practice among the merchants
and the packers to state higher amounts of olive-oil purchased on the
relevant documents than what they actually buy up. In this way, when
the documents are submitted to the Agricultural Institute, the packers
are paid higher Consumption Aid which they share with the merchants.
This particular merchant however, (P. Tsaglis), has never been subject
to check so no direct evidence can be found to substantiate these
alleged malpractices. (86)
The oil-mills, the cooperative or the private owner, on the other
hand, are expected to submit service receipts to the Agricultural
Institute for each farmer. These state the exact amount of olive-oil
produced so that the farmer can, in turn, claim Production Aid from the
EEC through the Ministry of Agriculture (Y.D.A.G.E.P). In 1988
Production Aid amounted to 1/4 of the product's market value. The
olive residue, which is retained by the oil-miller, is sold to the two
refineries based in the province,(87)

In 1988, the refineries throughout Greece formed a cartel and fixed
the price at half of what they paid in 1987. The reason for this was
that the EEC imposed export quotas which created surpluses in the
domestic market as most refiners found it unprofitable to export at a
higher cost. (88) So the oil-millers were faced with a reduction in
their revenues which they tried to pass on to the farmers by increasing
commission rights as far as possible. This issue will be discussed
further in Chapters Four and Seven of this Study.
3.3.3 Comparisons between the Two Villages
Olive growing plays a central role in each of the two villages.
It is the single-most important cultivation in terms of area planted
and value of sales.
Within each village the larger farmers tend to own a higher
proportion of the better-quality land. For example, 55% of the land
owned by the small farmers in Avia is not of the best quality as far as
the natural fertility of the soil is concerned, and nor is the slope
suitable for mechanization to be effectively applied; the corresponding
figure for the larger farmers is only 25%. Likewise, in Coryfasi, 70%
of the land of the large farmers is irrigated - which is of course the
best quality land, whereas only 30% of the land of the small farmers is
irrigated, and this naturally means lower production per hectare.
Seven out of the fourteen larger farmers in Coryfasi have replanted
their groves at distances of 6 x 8 which, in itself, allows for
greater production per hectare of land. Only three out of the sixteen
210

smaller ones have been able to replant their groves at closer spacings
than 8 x 9 m or 8 x 8 m - the norm for the area. In Avia only three
out of the eleven have replanted their olive groves while none of the
smaller farmers in the sample survey have managed to do this.
Traditional techniques of olive cultivation are broadly similar
across the two villages. The only difference lies in harvesting where
in Avia they pick the olives by hand because the groves are dry-
cultivated and therefore more sensitive to handling, while in Coryfasi
they beat the branches with wooden sticks so that the olives fall on to
ground nets. This method (cudgelling) makes harvesting faster. Olive
growing has witnessed the introduction of new techniques in harvesting,
pruning, irrigation and the application of appropriate fertilizers.
But such equipment is relatively expensive and since the State has cut
subsidies on purchased inputs, farmers now have to incur the full cost.
Therefore only the richest olive growers are able to follow the
technical advice given to them by the Research Institute. There are
in fact only two olive growers in Avia and six in Coryfasi which apply
some , of the new techniques.
Table 3.9 shows the number of olive growers in my sample, and their
different sources of income in each village.
211

Table 3 9: Number of Olive Growers and their General Sources ofIncome in Avia and Coryfasi
Main Income SourceDerived from OliveGrowing
Olive Growerswho EarnSupplementaryIncome
Main Income Derivedfrom Non-FarmEmployment
NumberNumberNumber
Avia 16 61 26 62 14 34
Coryfasi 12 57 21 70 5 17
Notes: The sample in Avia Village consisted of 42 farmers whilein Coryfasi Village, 30 farmers were considered.
Source: Sample Survey, Summer 1988.
Unfortunately the figures presented cannot be compared with similar
ones at the provincial and the national levels since no such surveys
have been undertaken by the Official Services. Neither can I claim
that they are fully representative of the two villages as a whole.
Nevertheless, they confirm what is already known: a still substantial
percentage of non-farmers (respectively 34 and 17 in the sample survey)
derive income from agriculture and income from olive growing in
particular. What this means is that during the development process
non-farm employment opportunities have risen which has resulted in
olive growing assuming the role of a supplementary income activity. It
seems to me that this state of affairs poses a constraint upon the
restructing of olive cultivation as those producers' decision making
process only partially reflects the importance of economic variables
(such as cost and prices) in the determination of their livelihood. We
212

can also observe from Table 3.9 that in both villages the number of
olive growers who need to supplement their income by either off-farm or
some other agricultural activity is relatively high, (62% and 70%
respectively). This means that as olive growing, by its nature, is an
activity which occupies the producers only a few months of each year,
other activities can be also undertaken. On the other hand, this
phenomenon impinges indirectly upon the profitability of the crop.
As far as marketing of the produce is concerned the cooperative
form of organisation has surely deeper roots in Avia, where it recently
started operating a packing unit as well as its oil-mill. But even
though productive forces have developed, managerial skills seem to
have lagged behind and in the summer of 1988, the cooperative was, in
considerable debt to the A.B.G. However, in Coryfasi there is
intensive competition between the cooperative (which is steadily
gaining ground), and private capital as represented by the merchants
who have dominated the marketing of the produce in the area from the
beginning of this century. The cooperatives in both villages are
mainly interested in marketing olive-oil and do not undertake the
introducion of new methods of olive-growing through team cultivation
which could, lower production costs. This is because even though the
farmers realize that improved marketing would yield higher revenue, the
majority have yet to be convinced that team cultivation - which mainly
refers to mechanisation of harvesting and pruning - will retain the
quality of the produce. Therefore, although they admit that the
current level of labour costs result in smaller gross profit margins
than might otherwise be the case, and agree that there is a need for

greater mechanisation, an active new agent is required - say the Olive
Research Institute, to take up the implementation of more cost
effective methods of production through the cooperative. This attitude
of the olive growers can be partly explained by the fact that even
though they expect a reasonable gross profit margin to be made from
olive cultivation, they do not seek profit-maximization.
The two village cases presented here indicate two of the
alternative lines of development in Greek olive growing. On the one
hand, development can be attained through accumulation by larger
farmers who are seeking to mechanize production (thus reducing their
dependence on wage labour) while sustaining - as far as possible-
quality the high of the produce. On the other hand, capitalist
development can be attained by small market-oriented farmers through
cooperation.
Conclusions
•In this Chapter it has been argued that in the Post-War period
price has not been the most important determinant of olive producers
behaviour as a result of the influence of certain social, structural
and institutional factors. It appears that recent tendencies which aim
to transform olive growing in the direction of a more dynamic form of
cultivation are bound to have a marked influence on the producers.
This happens as cultivators will be increasingly impelled to adopt new
and more cost effective methods involving mechanization in order to
better market their produce in a free trade environment. Furthermore,
214
the absence of any national or CAP price support scheme will intensify
competition and force many small growers to produce for self-
consumption. One of the main reasons for this transformation is that
olive-oil is used as an input by the Community's food processing
industry. It is therefore important to keep its price as low as
possible in order to satisfy the requirements of this industry.
Furthermore, as will be contended in Chapter Seven, input cost is a
determining factor for the survival of the processing part of the Greek
olive industry.
The developments identified in our discussion of the experience of
Avia and Coryfasi should not be seen as isolated phenomena, but rather
as a microcosm of wider trends affecting the whole olive industry.
However, the process of larger scale operation, the stronger presence
of the cooperative organisation, and the adoption of modern techniques
in olive-oil production, become clearer in the oil-milling part of the
industry. Indeed as will be shown in Chapter Four the rurally based
oil-milling has been revolutionized and has managed to double the
output of olive-oil per hour of machine time.
219

are attached to olive-oil according to its, the percentage of3° of acidity thebe refined before
8. Different pricesacidity level ie.olive-oil. W tothat it needs toconsumption.
fatty acids per 100 gr ofolive-oil is edible, aboveit is suitable for human
REFERENCES
1. See, for example D Miliakos, The Olive Cultivation in Greece, EEC (Italy) and other countries on the Verge of Accession to the EEC,(Athens, 1980), and N. Leventi and M Sakelli, "Size, Fragmentationand Effectivity of Agricultural Plots", in Studies for the Agricultural Economy, No.6 (Athens, 1978).+
2. See M. Xekalakis, "Implications for the Greek Olive-Oil Market ofadopting the C.A.P of European Economic Community", UnpublishedPh.D Thesis, University of Reading, 1979.
3. Cf D. Miliakos, 1980, op.cit and M Xekalakis, ibid.
4. See J. E. Davidson et al, "Econometric Modelling of the AggregateTime Series Relationship between Consumers' Expenditure and Incomein the United Kingdom", The Economic Journal, 88, 1978, pp.661-692.
5. The Pt series is obtained from the Ministry of Agriculture andEleourgiki, the Kt series is obtained from the N.S.S.G, and the Ytseries from the F.A.O. The variable U is given the value 1 for"bad" production years and 0 for "good" production years.
6. Se Chapter One, Section 1.7 and Figure 1.13(a) and 1.13(b).
7. See J.E. Davidson, et al, 1978, op.cit
9. Information obtained from E. Evagellou, Head of Department,Agricultural Bank of Greece, Department of Agro-Industry, Athens,1988.
10. See Chapter One, Section 1.6 and Tables 1.7 and 1.8, where it isshown that labour cost is the highest input cost in olivecultivation.
11. N.S.S.G, Agricultural Production, 1950-1963, See also Table3,4(a).
12. Ibid.
13. Information obtained from Ministry of Agriculture, Department ofForestry, 1988.
14. See "Restoring Equibilbrium on the Agricultural Markets", GreenEurope, Commission of the European Communities, 1/88 p.10.

15. See D. Cochrane and G. Orcutt, "Application of Least SquaresRegression to Relationships containing Autocorrelation ErrorTerms", Journal of the American Statistical Association, Vol. 44,1949.
16. The compound rate of growth was estimated by:
Y — A ertor loge Y — log A + rt
where r is the compound rate, t is the number of years over whichit is calculated, Y is the final year's value and A is the initialyear's value.
17. These fluctuations reflect the biennial nature of the crop andLYt _i was introduced in order to capture this.
18. Ministry of Agriculture, Department of Prices, 1988.
19. The average weighted price was closer to the market price whichthe farmers theoretically received for the sale of their produce.The intervention price was set for most of the Post-War period,below market price so the farmers would not sell to interventionunless they had to. So, their supply decision was not made on thebasis of this price.
20. See Chapter Two, Section 2.3.
21. See G. Giametta, "Mechanization of the Harvest" Olivae, IIIrdYear, No. 13, 1986. Also see Chapter One, Section 1.4.
22. Self-consumed olive-oil is estimated at about 65,000 tonnesannually according to the Ministry of Agriculture which in 1988,(and according to the same source), represented 24% of olive-oilproduction.
23. When further variables were added to the model, like lagged valuesof Pt or kt the collinearity problems persisted. See J.E.Davidson et al op.cit, for a detailed treatment of the problem.
24. See Commission Regulation"Ammending Regulation (EEC)for the Drawing up of aMember States ProducingEuropean Communities, No. L
(EEC) No. 586/88 of 2 March 1988,No. 2276/79 Laying Down Detailed RulesRegister of Olive Cultivation in theOlive-Oil", Official Journal of the.57/18, 3.3.1988.
25. N.S.S.G, Agricultural Production, Various Issues.
26. See Zaccaria Bembo's report, June 1912, in the Appendix to thisChapter.
27. Ibid.
217

28. See P. Topping, "The Production of Olive-Oil in the VenitianMessenia" in: N. Karabela, Messeniaka Grammata, (Calamata, 1981)pp33-35.+
29. One barrel of olive-oil is equal to 64.38 lt.
30. See P Topping, in N Karabela, 1981, op.cit. p.34.
31. See N. Mouzelis, Modern Greece : Facets of Underdevelopment,(London 1978) pp.9-10.
32. See N. Lihnos, The Olive Tree and its Cultivation+ (Athens, 1949).
33. See N. Mouzelis, 1978, op.cit. p.19.
34. This issue has been discussed in Chapter Two.
35. N.S.S.G, Agricultural Production, Various issues.
36. Derived from an I.C.A.P study on the province of Messenia in 1980.
37. N.S.S.C, Agriculture and Employment, 1987,.
38. Information received from the Agricultural Institute of theProvince of Messenia, situated in Calamata, 1988.
39. Information obtained through discussion with the President of thevillage, Summer 1988.
40. Ibid.
41. Kinotita is the Greek word corresponding to an English parish.
42. Information obtained through discussion with the President of theKinotita.
43. See N. Mouzelis, 1978, op.cit p.99. See also T. Shanin., (ed),Peasants and Peasant Society, (Harmondsworth, 1971).
44. Information obtained during fieldwork, 1988.
45. See Chapter 2, Section 2.3, on this point.
46. Information obtained through discussion with older farmers of AviaVillage, Summer 1988.
47. Information obtained from records kept at the Kinotita, 1988.
48. Information obtained from the Agricultural Institute in Calamata,1988.
49. See N. Leventi and M Sakelli, 1978, oD.cit. It is also estimatedby the N.S.S.G that each farmer owns on average 6 plots ofagricultural land.
218

50. As mentioned in Chapter Two, until early 1990, about 66,000farmers have taken early retirement, and a large percentage of them(well above 60%) are olive growers, Ministry of Agriculture,Department of Information, 1990.
51. See Chapter One, Section 1.3.
52. Information obtained from the Agricultural Institute of Messenia,1988.
53. See Commission Regulation (EEC) No. 2304/88 of 26 July 1988,"Fixing the Yields of Olives and Olive-Oil in France and Greecefor 1987/88 Marketing Year", in Official Journal of EuropeanCommunities, No. L201/46, 27.7.1988.
54. Information obtained during fieldwork discussions, Summer 1988.
55. Information obtained from the Agricultural Institute of Messenia,1988.
56. Information obtained from the President of the Oil-Cooperative ofAvia, 1988.
57. Information obtained from the Agricultural Institute of Messenia,1988.
58. Ibid.
59. Information obtained from the Ministry of Agriculture andEleourgiki which has recently (1988) established a manufacturingfirm in Heracleo, Crete, in order to supply olive growers withthese and other devices for olive cultivation as well as equipmentused in oil-milling. Eleourgiki : Department of Primary Productionand Investment, 1989.
60. Information obtained from the President of the Village. Recordsfor the exact production figures for the beginning of the centuryare not kept any longer.
61. Ibid.
62. Constitution of the "Olive-Oil cooperative of Avia", Avia, 1988.+
63. Ibid.
64. Information obtained from the President of the "Olive-OilCooperative of Avia", 1988.
65. From Records kept at the "Olive-Oil Cooperative of Avia", 1988.
66. Information obtained from the Agricultural Institute of Pylos,1988.
219

67. Information obtained from the village Kinotita and theAgricultural Institute of Pylos, Summer, 1988.
68. Information obtained from records kept at the Town Hall of Pylos,Summer, 1988.
69. Town Hall of Pylos and Kinotita of Coryfasi, 1988.
70. Young people left the village to study in the urban centres andthey did not return to the village as they settled in the cities(mainly Athens).
71. Table 3.7 was constructed from information obtained throughRecords kept at the Town Hall of Pylos. This is because Coryfasi,the largest village in the area, during 1900-1940 had been giventhe status of a "town" at the beginning of the century, so recordswere kept. Of course these Records are not continuous even thoughthey are very detailed.
72. Information obtained through discussion with the President of theVillage Coryfasi, 1988.
73. Information obtained from records kept at the Kinotita of theVillage and Town Hall of Pylos, 1988.
74. Ibid.
75. The cases taken to the magistrate could involve minor debtstotalling a few kgrs of olive-oil or a few hundred drs. Despitethis modest sum merchants would press as hard as possible to obtainthe loan back. So, quite often the farmers had to seel theirproperty in order to repay only a very small amount of debt.
76. For a discussion of this phenomenon see S. V. Frauendorfer "Part-Time Farming : A Review of World Literature", World AgriculturalEconomics and Rural Sociology Abstracts, Vol 8, Part I, 1966.
77. Information obtained from the Kinotita of Coryfasi Village, 1988.
78. Farmers calculate their own labour using the agricultural wagerate they would earn if they worked elsewhere during this period(i.e. the opportunity cost).
79. These figures are calculated on the 1988 value of olive-oilproduction and wages (in current prices).
80. Information obtained from the "Olive-Oil Cooperative of Coryfasi",Records, 1988.
220

81. Even though the commission right of the cooperative is lower thanthat of the private ones, not all olive-growers extract theirolive-oil there. The reason for this is that the members of thecooperative are served first and there are also capacity -limitations as to how many more olives could be processed by the.cooperative oil-mill.
82. Information obtained from the "Olive-Oil Cooperative of Coryfasi",Records, 1988.
83. See M. J. Rao "Interest rates in backward agriculture", Cambridge . Journal of Economics 1980, Vol. 7, 159-167.
84. Information obtained through discussion with the President of the"Olive-Oil Cooperative of Coryfasi", 1988, and also from Recordskept at the Kinotita and Town Hall of Pylos, 1988.
85. Information obtained thrOugh discussion with the local manager,Agricultural Bank of Greece, Calamata Branch, 1988.
86. Information obtained from the President of the "Olive-OilCooperative of Coryfasi", 1988.
87. Ibid.
88. Information obtained from C. Linardakis, the largest olive residuerefiner in the province, situated in Calamata, 1988.

Table 3.2: Number of Trees and Annual Olive-Oil Production on National,Administrative and Provincial Levels, 1963-1984.
Number of Trees (in thousand)
Greece' Peloponnesos Messenia
Amount of Olive-Oil2
Greece Peloponnesos Messenia
1963 74,500 25,081.2 7,005.9 69,000 66,927.5 24,612.61964 74,548 25,829.6 7,250.2 251,000 58,986.8 22,163.71965 75,378 26,633.6 7,581.1 141,000 60,204.8 19,255.21966 75,511 27,313.6 7,785.6 191,000 85,081.8 27,812.81967 76,287 27,880.0 8,119.2 180,000 61,746.6 21,564.21968 77,400 29,772.3 9,593.0 224,000 71,194.7 24,912.31969 79,119 29,101.5 8,697.0 228.000 43,071.7 19,236.61970 80,225 29,531.8 8,613.2 178,000 80,233.8 23,827.61971 81,024 30,314.3 8,961.7 190,000 59,565.0 24,781.41972 82,574 31,348.9 9,393.4 218,000 88,619.0 29,776.01973 83,545 31,439.6 9,311.6 255,000 77,990.2 28,843.21974 85,311 32,160.0 9,346.7 218,000 94,852.4 31,781.81975 86,159 32,419.6 9,602.0 288,000 92,377.2 38,495.01976 88,700 32,983.5 9,350.6 251,000 96,126.4 36,864.01977 91,300 33,468.0 10,264.3 254,000 97,917.4 32,944.81978 92,000 34,102.3 10,228.4 263,000 82,312.0 28,863.61979 92,700 34,833.2 10,402.1 228,000 98,841.0 34,819.81980 95,300 35,875.7 10,591.2 361,000 103,775.8 32,892.61981 95,865 36,859.5 11,160.2 272,000 120,753.4 43,530.81982 96,200 36,824.7 11,098.6 351,000 98,809.6 30,728.81983 96,750 37,549.8 11,286.4 317,000 121,117.0 47,026.61984 97,110 39,848.7 11,321.3 233,000 77,975.8 31,035.2
Notes: 1. The number of trees for Greece, refer to trees only for olive-oil production while for Peloponnesos and Messenia the totalnumber of olive-trees is given.
2. The amount of olive-oil produced on national level isexpressed in th.tons and is extracted from F.A.0 data series.Production of Peloponnesos and Messenia is expressed inth.tonnes and is extracted from N.S.S.G. data series.
Sources: N.S.S.G, Agricultural Production, 1963-1984 and F.A.0
222

Table 3.4(a) Data used for the estimation of the Greek Olive Oilsupply function (1950-1988)
Yt(in thousand Pt(dr) Rt(dr) Kt(th.trees)tons)
1950 42 7.4 30.9 581001951 160 7.9 33.4 590001952 78 8.7 36.8 595001953 175 9.6 38.4 586551954 124 10.8 44.0 595061955 117 13.9 46.9 63753
1956 163 17.4 48.4 64123
1957 183 15.2 49.5 64493
1958 111 13.6 50.4 66492
1959 101 13.8 51.4 68141
1960 180 14.3 51.7 69183
1961 89 14.9 52.7 71032
1962 257 19.1 52.5 73063
1963 69 19.2 54.0 74500
1964 251 19.5 54.5 74548
1965 141 20.1 56.2 75378
1966 191 20.9 59.0 75511
1967 180 21.4 60.0 76287
1968 224 24.7 60.2 77400
1969 228 25.3 61.7 79119
1970 178 28.5 63.5 80225
1971 190 27.0 65.4 81024
1972 218 29.7 68.2 82574
1973 255 37.6 78.8 83545
1974 218 47.8 100.0 85311
1975 288 54.7 113.4 86159
1976 251 56.0 128.5 88700
1977 254 61.9 144.1 91300
1978 263 73.4 162.2 92000
1979 228 81.9 193.0 92700
1980 361 97.8 241.0 95300
1981 272 112.1 300.0 958651982 351 130.8 362.9 962001983 317 165.4 437.3 967501984 233 215.1 517.8 971101985 290 264.3 617.7 975201986 247. 310.0 759.8 981201987 273 303.7 884.4 983201988 290 310.0 1003.8 103000
Notes: Yt - annual production of Olive-OilPt - annual average weighted price of olive-oilRt - Retail price index in constant 1974 prices, which has
been used as the deflator for P.Sources: Yt series from F.A.0
Pt series from the Ministry of Agriculture and ELEOURGIKIRt series from the Ministry of AgricultureKt series from the National Statistical Service

Table 3.4(b): Results of the Greek Olive-Oil Supply Function 1950-1988
Dependent Variable: LYt
Lkt LKt_i LPt LPt..1 LYt..1 U TIME R2
1. 20.6 -2.9 1.7 0.6 0.02 -0.51 0.06 0.05 0.75(0.84)* (-0.99) (0.6) (1.28) (0.04) (-4.08) (0.76) (1.64)
2. -19.3 -1.3 3.74 0.39 0.009 -0.5 0.06 0.73(-4.05) (-0.46) (1.33) (0.86) (0.02) (-3.81) (0.78)
3. 12.3 -0.4 0.49 0.1 -0.5 0.06 0.04 0.74(0.53) (-0.19) (1.09) (0.2) (-4.19) (0.81) (1.4)
4. 12.2 -2.1 1.69 0.53 -0.53 0.07 0.04 0.74(0.5) (-0.72) (0.56) (1.65) (-4.2) (0.99) (1.34)
5. -19.4 2.45 0.36 0.05 -0.49 0.06 0.73(-4.14) (5.84) (0.81) (0.01) (-3.96) (0.81)
6. -19.4 -0.95 3.41 0.37 -0.5 0.07 0.72(-4.09) (-0.34) (1.23) (1.23) (-4.03) (0.95)
7. -19.8 2.49 0.42 -0.03 -0.49 0.72(-4.27) (5.99) (0.97) (-0.05) (-4.0)
The numbers in parentheses are t -statistics
224

Table 3.4(b): Results of the Greek Olive Oil Supply Function 1951-1988(continued)
Dependent variable: LYt
LPt LPt_l Lkt_i LKt_3 LKt_4 LKt_ 7 LYt_l R2
8. -19.8 0.42 -0.03 2.5 -0.49 0.72(-4.3) 1 (0.96) (-0.05) (5.9) (-4.0)
9. -19.7 0.4 2.48 -0.5 0.72(-4.68) (1.57) (6.39) (-4.2)
10. -17.9 0.44 2.34 -0.5 0.68(-4.31) (1.67) (5.9) (-3.6)
11. -17.4 0.48 2.28 -0.46 0.69(-4.31) (1.8) (5.92) (-3.24)
12. -17.8 0.44 2.35 -0.55 0.67(-4.0) (1.47) (5.7) (-3.71)
13. -17.2 0.48 2.29 -0.51 0.69(-4.0) (1.64) (5.8) (-3.46)
14. -18.6 0.55 2.43 -0.53 0.68(-4.4) (1.93) (6.0) (-3.56)
15. .-18.6 0.57 2.46 -0.58 0.68(-4.3) (1.75) (6.0) (-3.7)
'The numbers in parentheses are t-statistics.
225

Table 3.6: Landholding in Avia in the 1980's compared with Messeniaand with the national average
Number of Holders in each category
Holding Size Sample (1988) Messenia(1982) Greece (1984)(ha) No. No. % No. %
<2.9 9 21.6 18000 45 254,800 61
3 - 6 22 52.3 16000 40 81,360 20
>6 11 26.1 6000 15 80,040 19
Sources:
Messenia: Statistical Office 1982 Survey
National: Ministry of Agriculture, 1984
Sample: Field work in the Summer of 1988
226

Table 3.8-
Landholding in Coryfasi in the 1980's compared withMessenia and with the national average
Number of Holders in each Category
Co-op Members Sample Messenia Greece(1988) (1988) (1982) (1984)
Holding Size(ha) No. No. % No. % No. %
<2.9 26 20 6 20 18000 45 254,800 61
3 - 6 43 33 10 33 16000 40 81,360 20
>6 61 47 14 47 6000 15 80,040 19
Sources:
Coryfasi: Cooperative list of landholders (1988)
Messenia: Statistical Office, 1982 survey
National: Ministry of Agriculture, 1984
Sample: Field work in the Summer of 1988
227

<I 0E •
0
0.42
Peloponnesos
r, v5 r. cs r' r's r .4 I:7 ,S P. CS CN r',1 PN r, P. P. r. P. P. r. r. c: 0: C0 C.: C3
0" e, CN CN CN CN C' C, EN CN CN CN 0.• CN CN C\ CNVS r r, vn, rn r' TS Ti r' T, r' r, T. r, r' V.
3
X
M:
E 40 1-+
0 X 4C
44ri
hl 344
4444
4
4
4
4
4
3444
4
4
4
3
4414
228

0 in 1r rs PI .4 r4 0 r. r, c) 1r c: c: c: c: cc .. 1r In 07 N. c: c)
qc N s: C7 s. C7 CN Cis cr CS CC CS C: In In v: rs s, cs cs
I: .- .4 .4.4 .4 44 4' .4 CC Cl rs 44 Cl C4 44 44 Cq C4 CI CI Ci C4 Ci . C: h: C4 PI Ci CA C4 Ci CI
CI 2:I
C X‹r
SC
tl
•-•. ••-•
coop
••••••
ON.— PI
s , C: cr 4: rs Cs. 0 r, rt %r yl st vs CN 44 C4 M^ AC in 1.% CC 0 .4 ei V 0 v:47 Lti Ul U1.0 4: 42 4: sC 40 sc rs rs 14. P. P. P. rs rs C: C: 0: tC C: 0:ON ON ON ON C4 C4 C4 C4 C4 ON CS CN C4 C4 C4 04 C4 0. Cs CN Cs C404 C4 CN C4 ON CS CN CS CN ON CS CN ON ON C4
g;C)
4-)V
0
S.
• n•-1
0
CD
7.
4-4;—;
0
a)a)
229

Ft
4-)
—a
4-)(.)
0).
a)a)s.
4-)
a
cjb0
(1)
X P-43P-CrI
2' P-I
am r4 ar. oft r4 sr•
a)
bL)
P. .4 CP co p. un CP in rq .r 03 un 43 43 un ca r4 co. cp qp un pl un un ca cp ch c3 st co ch p. co43 r. r.4 rn .r un r4 (0 4J cD r- ru cp 47 rn r- cD r4 ce NT RI rn 00 co r- tJ CD 141 qr co▪ Un C7 mi el CP cp r4 co ul 03 (4 p4 P4 CP .4 P- r4 .r r4 un r4 Ch co tin c3 a0 w4 CP on Q' Q'rn r- ul 42 r4 WS CP CP CD r4 CP COsr PI ru 1 u1 Cp r4 'Si CO 4. co .4 62 42 (Si en Fs (Si CO C, up un In up CD CI 42▪ CD en CO P. CD r4 p. 42 r4 u1 P4 Ul r4 .4 4 4r .4 r4 06 Ul PI .0 in U1 UN or 00 '0 03 P- 43 UN 43 47••• • • • ell•orpo•solle• •os• os• • • •••• • • gpo011e
Vn Un ml 4 4r ul IA 4 4 ul 4 ul 4 ul uN Ul U1 U1 WN U1 un U1 WI un Un WI an an a.% UN an an U1 UN W1 41CO :
CO '
C) r4 C4 01 4. Un 43 P. CO CP C) r4 pl 4P Ul 43 P. 03 EN C3 ekl on 4r Ul 43 r- 03 0 C3 r4 NI 01 Un 43 r- 03It 1.11 U1 In ur. In U.) un un Un '0.00.0.0.0.0.0.0.04) 43 43 4) 4) 43 .0 43 P. r- r- N N P.- NN P.- Is 07 CC ae a, .0.0.0.003 Ca 0-1
C. CP CN CP CP 0' 0' CP CA 0, 0' ce ce ce CP CA CP 0'0'G'CP CP CP CP EN CP CP O'0 CP cN EN CP CP CP ch CN
230

• .40 41 C) Ps %I. co c) r4 'GO 41 Tr IN 0 ill C4 Tr CO 'GO NO CD NC CI 41 wi N Pl CZ c) rqTr 0 Cr Ci Tr rl vs 0 CG NO C., CO 10 C: NO C4 NC re, CD C7 C5 Jr r4 Ci rl CC 41 41 M so Tr ci Tr M Tr COD. .42 so CD 41 NO Cs Ps CS CO NO C4 PI Ill r. r. Tr NO CD CD CO C4 47 07-C4 45 Os C4 4r 41 PI C) CC! 47 FN. CC rl 57PI rI pl 41 Tr Cs 41 CD NO NC Ps a. vC 41 4, 41 41 41 r4 Tr PI Ps Ps M ti C4 0 C4 C) ts NO Ps .4 Ci CD Tr C)N C4 04 C4 CV Ci PI PI C4 CI C4 C4 CO PI 14c? rel 11 PI cr Tr Tr Tr Tr Tr Tr Tr Tr c- Tr cp Tr PI po p9 Tr Tr Tr pl
O 00000000000000000000000000000000000000
0 e4 pri Tr 41 NO ts CD Cs c) .4 c4 ri Tr 41 so ps cs 0 ..., C4 PI Tr 41 vO Ps GO CN 0 r4 cy /I Tr 111 r,41 41 41 41 Ul 41 41 41 41 41 NO NC NC NC. NO NO NO NG NO NO Ps Ps Ps Ps Ps Ps Ps Ps Ps rs OC CG CC C.' C7 CGCS CS CS CS CS CS CN CS CN CS ON CS CS CS ON CS CS CS CS CS CS CS CS CS CS CS CS Cft OS ON 0*. ON CS CS CS CS ON Cs CS

c..
C.4
X
c. r' 0 ;5 cs 0. C: Fi c F. ;I F. E: c: N3 Pi CsC) ON C' CC gr gr c, gr c:Cr, r. NO gr rl CD Cs gr Si gr rs C) CD 1-1 gr rl Cs C2 Os CD gr CA r. r4 er C) c4 CO 33 NO 02 gr
gr gr cc C: cl cc 0 cc ,c M re; es CS CD CC M M CI M gr c, 41 C) cc r4 gr c, 43 IN•zr• M gr C.1 0 .-+ Mr/ tri 00 00 0 0 MCC CICO 1\1n 1", as co N 0 cnc3 co COON
se s•s .11 • ••• st s y e•ssa•s• • • • • • • • • •
I 0 C) 0 C) C) C) C) 0 C) C) C) C) C) r4 C: C) 0 0 r. vn
!!!!!IIIIIIIIIIIIII!IIIIIIIIIIIIIiIi!
a)
.H
0
a.,
0
a)
0
a)
a).04-4
C6-4
0
E
Ci
.04-)
b130
—3
C10
Cm,
r: 1.1 gr 47 NC P. CC Cs C) — M gr 41, NC PN CI. Cs CA r, gr 0 NC rs CC Cs C) M gr 4C c:41 41! 0 47 r r 41 r NC NC -0 sc sl ........ NC NC IN IN IN is f's rs. r. cs cs :s cs cs cs cs cs cs CS CS CS CS CS 's 's Cs Cs Cs Cs CS Cs ON CS CS Cs CS 5. .5 5: Er.
232

ARKADHIA
MESSINIA••• 1....e% %•Kiparossla ...... .
..n 11 .
•• i ‘....°
T R I F VI IA Meligala ..-".. I..
.- $- e%Fillatra n .° I
• 0..- .• t". ''''''''' n
•
Gargalianoi .... CALAMATAI
:'''''' .....Messini2:
1• I
-.. Kalamai %..--/LAKONIA
•1
Coryfasi s
• sAvis _ t,PYLIA
Pilos •
MESSINIAKOS
KOLPOS
25
• , .
233
ILIA
'
. •. ..... •
MAP II

CHAPTER FOUR
THE DEVELOPMENT OF OIL MILLING
Introduction
The production of olive-oil can be divided into two basic•
categories: oils which are edible immediately after pressing, and oils
which must be refined. The industry is likewise split into two
corresponding groups of firms: those who are primarily involved in
pressing and those who are refiners and packers. The sub-sector
concerned with pressing is highly fragmented and is mostly located in
the olive growing areas themselves, whereas refining and packing is
concentrated and controlled by a limited number of large urban-based
firms.
The purpose of this Chapter is to study the changing structure of
the rural processing units and at the same time explore the dynamics
and the forces behind the changes manifest in the olive producing areas
of Greece. The particular focus will be upon the province of Messenia.
It is argued that the growth of oil-milling has been accompanied by a
reduction in the number of mills brought about by technical
improvements in the methods of production. Furthermore, the recent
trend of rapid technological modernization of the mills is combined
with the development of an alternative mode of organization in the
rural areas - that of cooperatives.
234

Section One discusses the extraction of olive-oil from the olive
fruit. It is shown that through time the basic stages of olive-oil
extraction have remained the same while the technical processes
involved in them have altered dramatically. This has happened in order
to facilitate production, increase productivity (in terms of achieving
greater output per hour) and improve the quality of the produce.
In Section Two the expansion and concentration of oil-milling from
the beginning of the century is discussed, and a case study
illustrating the rise and initial stages of development of the sector
is presented. It is argued that structural change has been brought
about by technical improvements and has been combined with the
evolution of the cooperative form of organization.
In Section Three it is shown that oil-milling cannot be viewed as
a main source of alternative employment in the development of the rural
areas. Furthermore, recent technological modernization in the mills
has not only further reduced the amount of labour required but, at the
same time, has limited its use to secondary tasks within the mill-
such as carrying the produce and supervising the operation of the
machinery.
Section Four focuses on the technological progress of oil-
milling. New production processes are identified and the issue of
imported technology, costs, and the links between domestic and foreign
suppliers are discussed. It is shown that the ratio of modern to
"classical" or traditional types of oil-mills has been steadily on the
235

rise since the early 1980's, and has been accompanied by greater
cooperative ownership. The pace of change, particularly in Messenia
province, has been rapid.
Section Five examines the role of cooperative organization within
the village environment. The contribution of the olive cooperatives
towards improving the relations between producers and merchants as well
as the changing power structure in the olive producing areas is then
highlighted.
Finally, Section Six discusses State policy with respect to oil-
milling. It is argued that since Greece's accession into the EEC the
role of the State in oil-milling has been twofold. First, under the
aegis of the CAP, it has provided financial support to the sector and
this, in turn, has enabled technological modernization to take place at
a faster rate than it would probably otherwise have done. Second, the
strengthening and development of the cooperative movement has been one
of the main policy objectives of the State. Finally, in the context of
the CAP the State has also been responsible for the implementation of
the Production Aid scheme.
4.1 Extraction of Olive-Oil from the Olive Fruit
Whatever the precise method of extraction which is chosen, the
main stages involved are quite similar. These are the pressing of the
olive fruit and the pressing of the olive paste. The rest of the
236

extraction process differs depending on the type of technology used in
the oil-mill. (1)
The pressing of the paste is considered to be important to the
whole process of the olive-oil extraction. The way in which it is
performed, as well as the type of technology used, strongly influence
the amount and quality of the olive-oil received. (2) The various steps
involved in the extraction process start with the delivery of the olive
fruit to the mill. Olives are carried and placed in large sacks, in
most cases provided by the oil-mill, weighed, and then placed in a
queue for the extraction process to commence. Then, the olives are
placed in a large container from which they are led through a ribbon to
the machine where the olive leaves are removed. This is a necessary
step because the presence of leaves during the extraction process
adversely influences the taste of the produce (the greater the amount
of leaves the bitterer becomes the final output), and it also affects
the quality by increasing the quantity of chlorophyll contained in the
olive-oil. (3) Washing follows next and this directly affects the
quality of olive-oil because it clears off any substances carried with
the fruit, such as dust and soil residue. Washing takes place in a
separate container. At an experimental stage, washing powder has been
used in the temperature range of 300 - 40°C for the washing of the
olive fruit.(4)
After washing, the olives are carried through another ribbon to
the olive mill or braker. The crushing of the olives represents the
key step in the extraction of olive-oil. In the "classical" type of
237

establishment which typically operated until 1975, crushing took place
in brakers which consisted of 1-3 huge cylinder or conic stone rollers,
made of granite, rotating around a wooden or metallic axis on a stable
basis. The olive fruit was fed underneath the stone rollers by means
of a wooden or metallic attachment. The speed of rotation was very
slow, so that the olive paste could be formed. In the modern type of
mill whether "centrifugal", "mixed" or "improved classical" types,
metal crushers are used, consisting of reversely rotated disks. They
are quite small in size and operate with many rotations per minute.
These crushers have rapidly gained ground in oil-milling technology
because of their small size, greater productivity and lower cost. One
disadvantage though of the metallic crushers is that whilst rotating
they tend to fill the olive paste with metal traces coming off their
surface. (5)
The next stage in the olive-oil extraction process is the pressing
of the olive paste. This is the most important stage in the process of
oil extraction with any type of technology used, classical or modern.
Pressing takes place in a special container whose capacity depends on
the type of technology used. Usually, the side walls of the container
are made of two layers so that warm water runs between them for the
heating of the paste. The temperature should be no higher than 25°C.
The mixing of the paste is done by a rotated spiral which has a few
small wings and which moves very slowly. The mean velocity is 18-20
rotations per minute. The pressing of the olive batch is completed in
twenty to thirty minutes. Throughout the extraction process, contact
of the paste with atmospheric air needs to be avoided as far as
238

possible. If not, rancidity might be caused in the olive-oil. The
perpendicularly positioned pressing containers seem to perform much
better at this task than the horizontally positioned ones.(6)
The final phase is the separation of the olive-oil from the paste.
For that purpose, pressing has been practiced since the very start of
olive growing. In the very old mills the crushing of the olives as
well as pressing for the extraction of olive-oil was performed by the
same worker or by horses attached to suitably manufactured devices.(7)
The introduction of hydraulic presses in the 1930's, revolutionized the
operation of old oil-mills and are used to this day in the improved
classical oil-mill type. After pressing, the paste is spread onto
loosely woven hemp mats which are stacked, interspersed with metal
disks, in a hydraulic press. The mats only once undergo hundreds of
tonnes of pressure to extract the liquid contained in the paste which
includes the fruit's own water. The oil part of this liquid is allowed
to surface thus separating itself from the water.
Apart from pressing, another way to separate olive-oil from the
paste is by centrifugal separation, which constitutes a relatively
modern method. This is based on the difference in the specific gravity
between the substances of the olive paste i.e. olive-oil, water and
solids. The paste goes through centrifugal separation in a Decanter
after it is mixed with sufficient water. (8) Another method of
separation is by contiguity. The container inside which contiguity is
applied for the extraction of olive-oil is called a "Sinolea". This
consists of some 6,000 metallic discs made of a special metallic
239

amalgam which processes a high degree of olive-oil contiguity.(9)
Because of this, when the paste comes into contact with the discs,
large quantities of olive-oil are retained and collected in a special
container. Vegetable liquids and the part of the olive-oil which was
not kept by the discs remains with the paste. The resulting quantity
of olive-oil is separated in a centrifuge Decanter.
Finally, olive-oil goes through cleaning inside a filtering piece
of equipment and then it is stored in large containers or oil-tanks,
ready for marketing or household consumption. Among the factors which
influence the final cleaning of the produced olive-oil we can mention
two of the most important: specific gravity (the greater the
difference in the specific gravity between the substances of the liquid
the easier their separation), and temperature (the higher the
temperature the easier the separation).(10)
It appears therefore that through time even though the basic
stages of olive-oil extraction have remained the same, the technical
processes involved have changed. The implications of this change for
the oil-milling sector will be discussed in Section 4.4.3 below.
4.3 Growth and Concentration of the Milling Sector
In the 1931 Industrial Census the number of oil-mills in Greece
amounted at 9,200. Only 642 or 6.9% operated with some form of
mechanical power, the rest operated with horse power. (11) From Table
4.1 we can see that the Provinces of Lesbos and Messenia accounted for
240

some 34% of the mechanized oil-mills of the country. The same Census
counts the number of cooperative oil-mills at 112 - obviously an
insignificant number compared with that of the private sector. No
further breakdown of information is given concerning the number of
mechanized cooperative oil-mills. (12)
By 1939 the number of oil-mills had expanded to 9,536 and the
mechanized units were counted at 1,986. The geographical location and
concentration trends did not significantly change after 1931. During
the same period 1931-1939 production of olive-oil increased from 94,770
tonnes in 1931 to 102,805 tonnes in 1939. Exports increased from 7,342
tonnes to 28,949 tonnes respectively. It therefore appears that higher
export demand intensified production and contributed to the expansion
of the industry. (13)
The 1951 Industrial Census shows a reduction in the number of oil-
mills to 8,743. Production though remained at an average of 100,000
tonnes which indicates that production per establishment had increased.
Indeed, by 1951, 2,472 mills operated with mechanical power which
contributed to the increased capacity of the mills. The labour force
employed as a whole, in the milling sub-sector was 26,228 people.(14)
Table 4.2 shows part of the oil-mill workers (divided into male and
female) throughout Greece. It can be seen that over 90% of the oil-
mills were concentrated in the villages of the country - which further
confirms the rural nature of this activity.
241

In 1951, the food industry employed 10% or 45,000 persons in the
industrial labour force. Oil-milling employed 58% of that amount i.e.
26,228 people which was 5.8% of the total industrial labour force.(15)
This implies that oil-milling constituted the largest source of
employment within the Food Industry in the early post Second-World War
period. The numerical contraction of the mills continued in the
sixties. By 1970 there had been a further decrease of 39% - to 5,305
mills. Production of olive-oil though increased from 100,000 tonnes,
on average in 1951, to 155,600 tonnes in 1970. So, even though 3,438
oil-mills closed down over the twenty year period 1951-1970, capacity
increased - due primarily to technical improvements in production
methods. (16)
Technical progress in olive oil extraction included quality
improvements as well as larger quantities per hour. By increasing the
number of washing machines, separators and special containers for the
removal of oil leaves during the production process, the olive-oil
which was produced acquired a better taste, brighter colour and lighter
odor .which, all together, comprised its essential "organoleptic"
characteristics and constitutes its quality criteria. (17) On the other
hand, the introduction and operation of hydraulic presses working with
the use of electrical power contributed, to larger output per hour
being achieved. In 1975, 3,515 oil-mills were counted in Greece which
meant a reduction of 33.7% since 1970. Table 4.3 shows that 86% of
them operated with electrical power, 13.5% with mechanical and now only
0.5% with horse power. This trend can be explained by the
electrification of all parts of the country which assisted in the
242

easier and faster adaptation of the new production methods. The number
of washing machines in the oil-mills rose to 1,488. The containers for
olive leaf removal were counted at 1,714 and the separators at 4,702 of
which 1,171 were automatic.(18)
Since 1975, a new and revolutionary technology has been applied to
the extraction process in the oil-milling industry throughout the
world. After a long period of research Italian manufacturers
introduced horizontal centrifugal systems called Decanters. (19) These
substituted for the hydraulic presses and contributed to producing
larger amounts of olive-oil from the same quantities of olives
processed - and at only a fraction of the time previously needed.
Initially the Greek oil-millers imported the new technology from Italy.
Since 1975 a few Greek manufacturers have set up domestic lines of
production; but a large percentage of this equipment is still
imported. (20)
By March 1988, the number of oil-mills in the country incurred a
furthei. reduction of 15% to stand at 2,979. (21) Table 4.4 shows the
regional distribution and capacity of cooperative and private oil-
mills. We observe that cooperative mills now make up 17.2% of the
total number, and 26.2% of total capacity (expressed in kgr per hour).
The private mills make up 82.8% of the total number of mills and 73.8%
of total capacity. Also, 44.6% of the units are found in Peloponnesos
and represent 39.7% of total capacity. In Crete, 16% of the units are
found representing 25% of total capacity, while in Epirus and Kerkera
there are 11.6% of the units which make up 6.5% of total capacity. By
243

1988 30% of the oil-mills (i.e. 299 cooperative and 589 private)
operated the new Decanter technology. The investment cost involved in
the installation of Decanters was about 25 million dr (in 1988 current
prices). Up to 70% of this was covered through loans issued by the
commercial banks to the private sector. For the cooperatives up to
75% of the expenditure was subsidised by the Law Decree 355/77
concerning technological modernization.( 22 ) The number of cooperative
mills increased from 464 in 1975 to 513 in 1988 which represents a rise
of 9.5%.
In addition to the capacity expansion of the sector (i.e fewer
units with larger production) during 1931-1988, one point which
attracts the attention of a researcher is the regional concentration of
the mills. More specifically, in the pre-Second World War period,
there was a high concentration of mills in the provinces of Lesbos and
Messenia. In 1931, Lesbos accounted for 22.6% of the total number of
mills, 22.5% of the number of mechanized mills, 26% of the total
mechanical power (H.P) and 18% of the labour force employed in the
sector.. The corresponding figures for Messenia were 11.7%, 11%, 9.4%
and 8.8%. The reason for this geographical concentration during the
early stages of oil-milling development, was that both provinces had a
long tradition as olive producing and exporting regions. (23) This
implied that social differentiation between the producers had been
taking place for a long time previously - perhaps even over centuries.
From this situation the oil-millers and the merchants who specialised
in the olive-oil trade emerged from very early on.
244

It appears that the State took little interest in the industrial
development of the rural areas where the mills were established, so
there was no public assistance for capital formation. (24) The
necessary capital and entrepreneurs were found in the rural areas
themselves. The richest of the olive producers set-up oil-mills which
at the initial stages of technical progress, required only horse power
(literally). Therefore the most well-off families of the villages,
those who owned at least one horse and could also afford to employ wage
labour, started to produce oil.
When mechanical power was introduced, commercial capital became
involved in terms of lending the millers part of the capital which they
required. Mouzelis, for one, contends that commercial capital
preferred to remain in the sphere of exchange. (25) The initial
concentration of mills on Lesbos and Messenia meant that those two
regions, especially the former, were the largest production and trading
centres for olive-oil in the country. Some of the biggest olive
merchants operated from there and sold the locally produced olive-oil
to the'urban centres of Greece or abroad. (26)
In Messenia, the village of Coryfasi was one of the first which
developed the oil-milling sector in the province. (27)Until 1880,
olive-oil extraction in the village was performed by a hand-mill
situated in the garden of a producer's house. That producer, apart
from being an olive-grower, was a "Bavarian Officer" in the Royal Army
and one of the wealthiest farmers. (28) He was called Kagelarios
Dimitris and set-up the first oil-mill that we know about in Coryfasi.
245

Olives were pressed by the rotation of two stones with the help of
workers. Then the olive paste was put onto a woven material where, by
hand pressure, the liquid was separated from the paste and collected
into a large container. Olive-oil would surface after a few hours and
was collected by means of large spoons. Olive-oil extracted in this
way was used only for home consumption.
Between 1880-1900 the stones for the olive pressing were rotated
by horse power and, in that way, larger quantities of olive-oil were
produced which covered home consumption and left some produce over
which could be marketed. (29)
Over the years spanning 1890-1925 the extraction of olive-oil
became more systematic. Presses were used, attached to a main axis
which was then rotated by four or more workers. In 1925 four oil-mills
with horse power operated in Coryfasi. One belonged to the priest of
the village, Pavlos Pavlopoulos. The second was owned by Lambros
Katsoulas, who inherited Kagelarios's property through his mother. The
third. was owned by Athanasios Milonas, who inherited part of
Kalogeropoulos's land the wealthiest farmer of Coryfasi, and the fourth
by Athanasios Kokevis, inhabitant of a nearby town who was an oil-
trader. (30) So it appears that at least in this village anyway oil-
millers as a group emerged from the richest olive growers of Coryfasi.
The rise of the oil-milling sector in the village was accompanied by
improvements in the means of communications. The first motorised
vehicle appeared at Coryfasi in 1926. During 1930-1934 four vans were
in circulation and, by 1958, 7 vans, 7 private cars, 8 tractors and 42
246

fraises were found in the village.( 31) By 1970, production of olive-
oil rose to 200 tonnes but he number of oil-mills remained the
same. (32) Instead capacity increased due to technological change.
Three out of the four oil-mills operated with electrical power, and
each had two presses. The remaining mill operated with mechanical
power and was owned by the olive-cooperative. (33) Other villages of
the province such as Tseria and Avia in Calamata County, have
experienced similar lines of development of their oil milling. (34)
It appears that the growth of oil milling was accompanied by a
certain degree of concentration brought about by technological change
so that an increase in capacity meant a reduction in the number of
mills. However, the nature of olive growing, its mode of economic
organization and its geographical distribution was still that of a
large number of relatively small units dispersed over the rural areas.
It is worth noting that this phenomenon is shared by the experience of
other major olive producing countries such as Italy and Spain.(35)
Oil-milling may naturally be viewed as an activity forming an important
part of rural industry. In this respect its role as a source of
employment for the rural labour force needs to be considered.
4.3 Employment in Oil-Milling
In the context of the debate about the ability of small-scale
rural industry to absorb "surplus" labour from the rural areas, the
proponents of the labour absorption theory argue that small units
located in rural areas not very far from villages can solve part of the
247

problem of chronic underemployment or hidden unemployment in
agriculture. (36) Small units using simple indigenous methods are
necessarily more labour- intensive than the alternative. Also, using
machinery very intensively - (rather than investing heavily in more
machinery) which is kept running year round, these small units can vary
their operations depending on the annual agricultural cycle. In the
slack season, over the winter, between the Autumn harvest and the
Spring pruning, small rural units can absorb labour. Equally - during
the busy agricultural season when there is a great demand for pruning,
harvesting and weeding, the small units can release labour for
agricultural work. This alteration of work intensity is facilitated by
the proximity of the units to villages so that workers do not have to
leave their homes in order to find employment.
Oil-milling though constitutes a case where labour is engaged
simultaneously with the olive harvesting period and the total amount of
labour employed is not heavy in an absolute sense. More specifically,
before the recent technological modernization of the oil-mills, not
more than 4-5 workers were employed in each mill unit. (37) Most of
them were recruited from the small farmers and agricultural labourers
of the villages. The socio-economic gap between the employers and the
workers meant that oil-millers often lent money to them. (38) It
appears that this was one way of keeping the cost lower than what it
would otherwise have been and thereby assisted capital accumulation.
Oil-milling at the initial stages developed by maintaining a constant
supply of unorganized and low paid labour. (39) On the other hand, it
also retarded the growth of the organised and skilled labour found in
248

the rural areas because of its seasonal nature and the modest number of
workers required, (i.e. a few workers for only two to four months a
year).
The issue of identifying the line of development followed by the
oil-milling sector is both conceptually and empirically difficult.
This is because for the most part oil-millers engage in the production
process themselves. The difficulty arises because they are not wage
workers or just self-employed but pursue their business using family
labour, as well as employing two or three wage workers. This seems to
be why this issue is rarely substantiated in the literature. (40) In
the early 20th century the number of staff within the mills ranged from
3 to 5 workers. One of them would be the "leader" worker, more
experienced and specialised than the rest who sometimes undertook the
recruitment and supervision of the others. He was often called the
"Captain. (41) In 1929, an oil-mill operating by horse power would
"officially" keep as. its commission right 7% of the quantity
produced. (42) In the village of Tseria, in Calamata County, two
private oil-mills operated in 1930. Each of them employed three
workers and daily production amounted to approximately 500 kgr of
olive-oil. This amount corresponds to the processing of 3 tonnes of
olives a day. (43) The workers were paid in kind, so out of the 35 kgr
of olive-oil kept as a commission right by the miller, 1 kgr and 800
grs were paid out as daily wages. Of course, if we take into
consideration the evidence provided by personal and particular
observation the commission right could be as high as 1504 4) This is
because during the weighing of the produce, and from the extraction
249

process itself, a quantity of olive-oil would be allegedly kept by the
millers - which could be up to 8% more than the official rate.
The mill-workers had to put in up to 16 hours a day, in damp and
dark rooms with little time for food and rest. In many cases, these
conditions led to a deterioration in the workers' health due to
exhaustion and sickness. This was one of the reasons for the scarcity
of oil-mill workers which occurred simultaneously with unemployment
during winter periods. (45) By 1940 wages of the mill-workers had
doubled in real terms due to scarcity of labour and in the context of
general industrial legislation on wages. (46) Faced with increased wage
bills, the oil-millers who were unable to substitute technology for
labour - and that way increase output per hour and so retain their rate
of profit, had to increase the commission rights. Because of this many
mills, including one of the private mills in Tseria village, became
uncompetitive and eventually closed down. It appears that this sort of
trend was one of the main reasons for the reduction in the number of
mills from 9,200 in 1931 to 8,743 in 1951.
Between 1951-1975 the number of workers in the oil-mill was still
further reduced with the installation of new technology. This mainly
consisted of the use of hydraulic presses with electrical power.(47)
Wages in 1970 for an oil-mill worker would be 185 dr per day or 7.5 kgr
of olive-oil per 8 hour day. The price of olive-oil in the same year
ranged between 25 - 30 dr per kgr. Compared with the minimum
industrial wage in urban areas the oil-mill workers received earned
around 40% more. (48) This was an indication of the need of the rural
250

oil-milling to attract and keep. By 1970 the commission right of the
mills was 10% of the produce. Average daily production in an oil-mill
with two hydraulic presses and three workers was 1,500 kgr of olive-oil
a day. (49) Working conditions were much better by this time. Workers
were able to labour for fewer hours and if they agreed to work
overtime, they now received payment for it. In 1978, average annual
employment in oil-milling was 7,583 while in 1984 employment was
reduced to 5,615 "seasonally employed workers". (50) Table 4.5 shows
the number of mills, employment and horse power as between 1978-1984.
Table 4.5: Number of Oil-Mills. Employnent and Horse-Power between1978-1984.
ProductiveTotalNumber
UnitsUnits withPower Known
AuxiliaryUnits
Total in1984
Total for1978
Units
Employment
Horse Power
3,069
5,326
3,010
5,281
178,032
76
289
3,145
5,615
3,676
7,583
155,390
Source: N.S.S.C, National Surveys 1978 and 1984.
We may observe from Table 4.5 that between 1978-1984 there was a
reduction of 14.5% in the number of units, 26% in employment and an
increase of 14.6% in capacity.
By 1988 an oil-mill which substituted Decanters for the hydraulic
presses produced 5,000 kgr of olive-oil daily, while commission rights
251
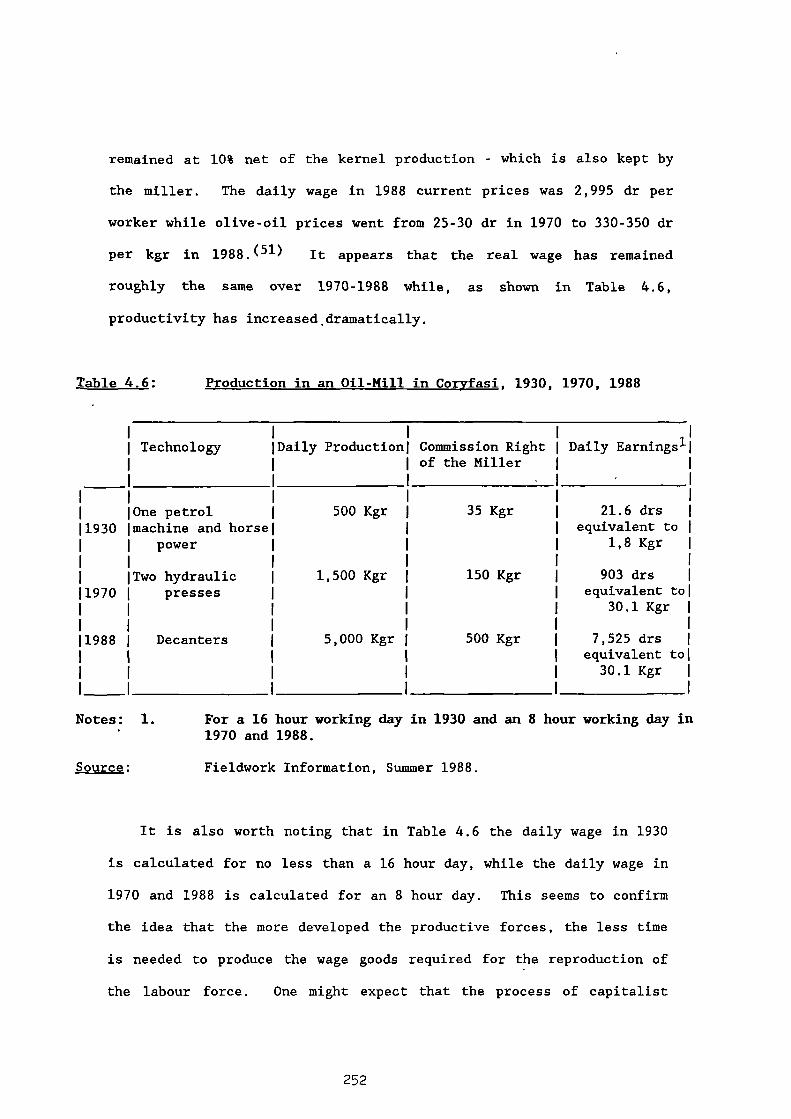
Technology Daily Production Commission Rightof the Miller
Daily Earningsl
One petrol 500 Kgr 35 Kgr 21.6 drs1930 machine and horse
powerequivalent to
1,8 Kgr
Two hydraulic 1,500 Kgr 150 Kgr 903 drs1970 presses equivalent to
30.1 Kgr
1988 Decanters 5,000 Kgr 500 Kgr 7,525 drsequivalent to
30.1 Kgr
remained at 10% net of the kernel production - which is also kept by
the miller. The daily wage in 1988 current prices was 2,995 dr per
worker while olive-oil prices went from 25-30 dr in 1970 to 330-350 dr
per kgr in 1988. (51) It appears that the real wage has remained
roughly the same over 1970-1988 while, as shown in Table 4.6,
productivity has increased dramatically.
Table 4.6: Production in an Oil-Mill in Coryfasi, 1930, 1970, 1988
Notes: 1. For a 16 hour working day in 1930 and an 8 hour working day in1970 and 1988.
Source: Fieldwork Information, Summer 1988.
It is also worth noting that in Table 4.6 the daily wage in 1930
is calculated for no less than a 16 hour day, while the daily wage in
1970 and 1988 is calculated for an 8 hour day. This seems to confirm
the idea that the more developed the productive forces, the less time
is needed to produce the wage goods required for the reproduction of
the labour force. One might expect that the process of capitalist
252
accumulation in the mill would be associated positively with higher
rates of output and a high . profit rate. (52) But for the calculation of
the rate of profit we need to estimate the depreciation of fixed
capital, plus the interest rate on it because the investment for most
of the technology installed after 1981 was financed partly by a bank
loan and partly by a grant. (53) In order to make sense of the
accumulation process of the oil-milling sector at national level we
would need to know the value added and capital depreciation.(54)
However, the available data does not measure up to these demands and
for the oil-milling sector in particular, the statistics required are
not available from the official services. Oil-milling and its
activities as a sub-sector are hidden under the general heading of the
"Food Industry". (55) However, concerning the employment position in
oil-milling, according to the information provided by the A.B.G in 1988
it was estimated that 12,855 workers were employed. Out of these,
10,455 workers were employed in the 2,091 units of "classical" mill
type, and 2,400 workers in the 888 units of "centrifugal" mill type
which operated 1,200 Decanters (56 ) (2 workers per 1 Decanter). It
should also be pointed out that in a "classical" mill type, typically
5-6 workers are employed while in a centrifugal mill type only 2-3 find
employment. (57)
We may conclude that in the early stages of development - the
extent to which labour was employed has been modest even in the
agregate. With the technological modernization of the mills, the
labour required has been further reduced and in keeping with the
253

predictions stemming from the de-skilling debate, its use has been
limited to secondary tasks.(58)
4.4 Technological Progress -
4.4.1 The Problem in Perspective .
A major question in local development is cert 'ainly the choice of
technologies that will allow an efficient use of available local
resources. According to Morawetz there are three possibilities: to
import the technology from abroad through the normal mechanisms of
international transfer, generate it locally, or adapt the technology
available in another area to suit local needs. (59) The recent
literature on the choice of technology in industry provides some
interesting comparisons of alternative production techniques.(60)
These comparisons show enormous differences in initial investment per
unit of output or per worker. However, the impact which the chosen
technologies have had upon the development of small scale producers has
not, as yet, been studied very systematically.
In the search for "appropriate" technologies for development,
China's small-scale Chemical Fertilizer Plants present an interesting
case. (61) In many ways, these plants seem to be the perfect embodiment
of "appropriate" technology. They employ an adapted version of a coal-
based process which was commonly used during the 1940's and 1950's
while the equipment is of domestic manufacture. Since they are able to
make use of relatively abundant coal resources for feed-stock and fuel,
254

the plants can be scattered in locations near the resources and the
markets. The dispersed location pattern helps to reduce the burden on
the inadequate transportation system in China and also helps to promote
a more regionally dispersed pattern of growth, stimulated by the
production of fertilizers themselves, as well as by the forward and
backward linkages they generate. In addition the factor proportions
embodied in the small-scale technology extend beyond coal-mining and
other activities stimulated by fertilizer production. The Chinese
small-scale fertilizer plants are products of the Maoist programme to
build "producer goods" industries in rural areas using "intermediate"
technologies and local materials. They are part of the autarkic
development strategy born out of necessity that placed a high priority
on dispersing industrial activities and building more economically
self-sufficient regions. Even given the problems caused by over
expansion of the programme during the Maoist period, on balance the
development of small Fertilizer Plants has been widely considered a
success of technological adaptation which allowed the early
introduction of the seed-fertilizer revolution into Chinese agriculture
in the 1960's and early 1970's.(62)
In contrast oil-milling - even though its "modernization" took
place in the context of the rural industrialization policy of the PASOC
Administration - presents us with a case where technology is largely
imported. In addition, know-how and technical support is provided by
foreign representatives. Attempts to produce domestically the
equipment used in the mills and so generate forward and backward
linkages have been few. But even in those few instances where this has
255

happened, the machinery, parts and design were all imported. (63) This
strongly suggests that the potential for small producers to flourish
depends largely on the development of the industrial structure in
general. Furthermore, one is led to the much thornier question of how
and at what cost, a given country can achieve its own indigenous
technological capacity. Some researchers plead for dissociation of the
developing countries from the international economy. (64) But against
this view is the relative success of some of the newly industrializing
countries (such as South Korea, Taiwan, Singapore, Hong-Kong and more
recently, Thailand, Indonesia and Malaysia) in reducing the problems of
underemployment through a process of rapid industrialization
characterised by their integration into the world economy.(65)
However, it is suggested - plausibly in my view - that their ability
to maintain this success may well turn out to be crucially dependent on
the extent to which they pursue their export strategies in conjunction
with a long-term policy which emphasizes the development of national
technological capacity. (66)
4.4.2 Suppliers of Technology to the Oil-Milling Sector
The oil-milling sector of Greece presents a clear case of
"modernization" through imported technological inputs. The main
supplier country is Italy. Even the few domestic producing companies
have to import the machinery and parts in order to follow the existing
design patterns of the Italian companies and so produce the correct
equipment. (67)
256

One of the domestic producers of modern oil-milling technology is
Eleourgiki - the apex cooperative organization of olive producers which
has been heavily subsidised by the State. Since nearly a thousand
mills have already (by 1990) installed the new technology at an average
cost of 20-25 million dr. (in 1988 prices), the potential demand for a
greater degree of indigenous production capacity seems apparent
(especially if my informants verdict that similar equipment
domestically produced could be 5-6 million dr cheaper per installation
is correct). (68) Eleourgiki in fact commenced production in 1987 and
built a factory in Crete. Currently it appears able to supply oil-
mills of Heracleo and Hania Provinces with machinery at a lower cost
than the imported capital goods. An Italian company, Rapanelli, has
also undertaken some common production contracts with Eleourgiki.(69)
One of these involved the production of "Sinolea", a modern "mixed"
olive-oil extraction system. (70)
Another Greek manufacturer was the Brothers Theohari, who
established a firm at the beginning of the 1980's in Peloponnesos.
Even though they were well accepted by the market because of the high
quality of their equipment and the relatively low price compared with
the imports, the firm recently has had to close down. The reason seems
to have been personal rather than to do with the objective economic
forces in that after the sudden death of the owner no willing successor
within the family was found, and since as it was a relatively small
family firm it decided to simply go out of business.(71)
257

A third Greek manufacturer, Cheruvim, is also a family firm
currently based in Athens and employing 30-40 workers. They import
their raw material requirements (i.e. the metallic parts of the
equipment) from abroad and they assemble them together according to
Italian design. Annual production of the company in 1988/89 was, about
fifty olive-oil extraction systems, 10-20 of which were sold in
Messenia Province. The ex-factory price of a whole system is around 20
million dr which makes it approximately 5 million dr. cheaper than a
similar system obtainable from a foreign company. At the present time
there are not more than four domestic manufacturers of olive-oil
extraction systems. The majority of systems are still imported from
Italy and to a lesser extent, from Germany and the U.K. In 1986 the
value of oil presses imported into Greece was 108,418 thousand drs.
Eighty-nine per cent of this (or 96,788 th.drs) was paid for machinery
imports from Italy. In 1987 the value of the oil presses imported into
Greece was 216,849 thousand drs. Seventy-six per cent of this
(164,361 thousand drs) was paid for Italian imports.(72)
Some of the well-known Italian manufacturing companies include
Alfa-Laval, Pieralisi and Rapanelli. They supply the Greek market SL,df,7
through their representatives (domestic commercial firms) who earn an
agency commission of up to 3% of the sale price of each system they
manage to sell. (73) One such firm is based and operates in Calamata in
Messenia province. The owner was a representative of Alfa Laval up to
1986. He first came into contact with Italian manufacturers, Pirelli,
in 1965. After 1975 he surveyed the market for olive-oil extraction
systems and started selling them on behalf of Alfa-Laval. Two years

40
ago he fell out with this company and now represents the Greek
manufacturers Cheruvim. He annually sells between 2-5 extraction
systems not only in Messenia but also to the islands of Zakenthos and
Kerkera. (74) These systems, as I have already mentioned, are very
similar to the Italian design but, of course, there are some variations
because of the patent and trademark restrictions deployed by the parent
company. When closely questioned some of the millers in the province
who use this equipment claimed that they did suffer from certain
technical faults and deficiencies which do not seem to be experienced
by those firms using the Italian constructions.(75)
Another import agency firm in Messenia which was visited
represents the German company Ga-Ha-De and supplies around 200-300 oil-
mills in Messenia, Zakenthos and Macedonia. Forty to fifty percent of
this firm's sales consist of domestically manufactured products,
especially the washing machines and pressers which are made in Greece.
To make the home produced equipment the firm contracts out the task by
calling on the services of 40-50 self-employed craftsmen when an order
is received. (76)
The phenomenon of subcontracting in general, is now of course well
substantiated in the literature. With reference to the developing
countries and, more specifically in Lima, Peru, it was observed that
self-employed manufacturers found it increasingly difficult to survive
as independent producers and became out-workers or subcontractors.(77)
Subcontracting has been commonly found in the footwear and clothing
industries, although it has also been identified in such unexpected
259

branches of production as the manufacture of refrigerators, transport
vehicles and stationery products. (78) Out-workers may be subcontracted
by commercial or industrial firms. The existence of this modern form
of putting-out system leads to a chain of subcontracting between out-
workers. For example, one tailor was able to run a small workshop with
eight wage labourers on the basis of outwork contracts obtained from
merchant capitalists. Another example was a cobbler who was making
shoes for a small workshop which was itself subcontracted to the
multinational firm, Bata. (79) Marx analyzed the role of the putting-
out system in the industrialization of Britain and Western Europe and
saw it very much as a transitory period towards the direct
subordination of labour in capitalist production.( 80 ) Lenin shared the
same view. He examined the question in great detail because in the
1890's there was an extensive discussion in Russia about whether and
how the small producers should be supported. (81) Lenin's main point
was that large parts of what are called "handicraft industries" are
extensions or departments of capitalist manufacture. His critique of a
contemporary census of small-scale producers is that despite the
information the census provided, it obscured the essential fact that
small-scale industry performs nothing but detailed operations for the
large-scale capitalist manufacturers or produces complete products for
merchant capital. Lenin attacked those theorists who devised policies
in support of small-scale producers. In his view, such measures would
firstly benefit mainly the "parent" firm; secondly help to preserve
conditions of work and remuneration far worse than those of the workers
directly employed by the capitalist firms themselves; and thirdly, only
retard the development of industry and fully-fledged capitalism. He
260

wrote "The Narodniks continue to cling to their intention of retarding
contemporary economic development of preventing the progress of
capitalism and of supporting small production, which is being bled
white in the struggle against large-scale production". (82) One of the
most important points in Lenin's work in his illustration that an
analysis of small-scale producers cannot be divorced from a general
understanding of the industrial structure in which they operate.
Today, with technological progress, conditions for small-scale
production and for subcontracting are being continuously created.(83)
The latest example is the introduction of micro-electronics in many
branches of manufacturing. Partly as a consequence of this the optimal
scale of output may be lowered; it is claimed that the increased
possibilities of small-scale production has led to an increase in
subcontracting. (84) In Japanese manufacturing there is an acknowledged
and highly efficient use of small enterprises in a wide range of modern
industries through subcontracting. In Japan small enterprises and
indusrial subcontracting have undoubtedly played an important role in
the economy's rapid industrialization. (85)
In the Greek experience, subcontracting is quite common among the
small-scale firms in various industries and sectors of the economy. (86)
In the olive industry as far as oil milling is concerned, the Messenian
firm of V. Vassiliou, is the only form of subcontracting which I have
managed to find. To the best of my knowledge similar cases have not
yet been reported. This firm has been working with subcontracting
since it was established twenty years ago. It supplied oil-millers and
261

other small units with the necessary mechanical equipment. Currently
the annual turnover of the firm does not exceed 10 million drs. In
this respect it is a small business. It appears therefore that the
supply of modern technology used in the mills is mostly dependent on
imports from the more industrially developed economies such as Italy
and Germany. One of the most noteworthy attempts has been that of
Eleourgiki, but the fact remains that the industrial structure of
Greece is such that a large percentage of this equipment still has to
be imported.
4.4.3 Types of Technological Processes Used in Milling
All olive-oil extraction systems which have been used to date are
generally classified as systems which produce olive kernels containing
either a low percentage of moisture (25-30%), or systems which produce
olive kernels containing a high percentage of moisture (>450. (87) The
first category includes the "classical" type of oil-mill with hydraulic
presses, (see Figure 4.1) while the second includes: the centrifugal
type oil-mills (as supplied by Alfa-Laval, Pieralisi, Hiller, Theohari,
Zambeou); and the mixed type (as supplied by Eleourgiki, Rapanelli).
The process of a centrifugal oil-mill as a method of production and
liquid separator was taken up on an experimental basis by researchers
at the beginning of this century. (88) First, Boulier in 1903 succeeded
in separating olive-oil from the olive-paste inside a centrifuge. Many
others followed his work and in 1955 the first complete system of
olive-oil extraction was successfully manufactured. (89) In 1965 the
Italian company Alfa-Laval introduced the "Centrioline" to the market,
262
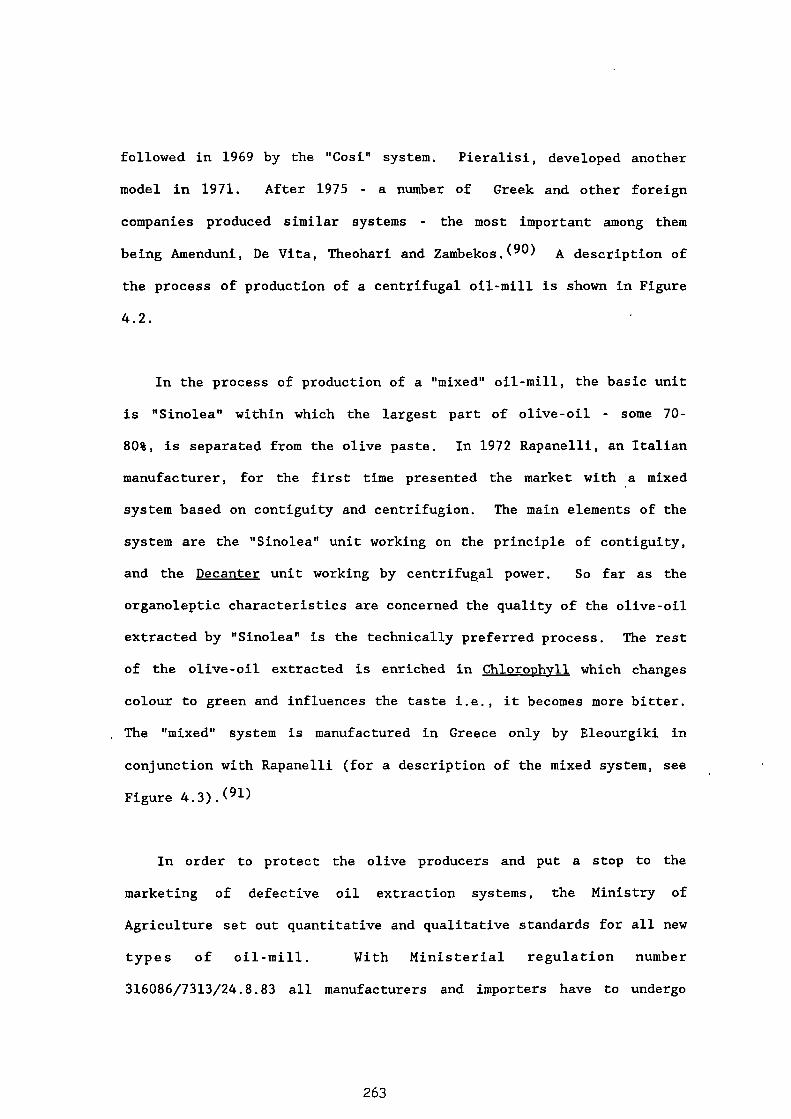
followed in 1969 by the "Cosi" system. Pieralisi, developed another
model in 1971. After 1975 - a number of Greek and other foreign
companies produced similar systems - the most important among them
being Amenduni, De Vita, Theohari and Zambekos. (90) A description of
the process of production of a centrifugal oil-mill is shown in Figure
4.2.
In the process of production of a "mixed" oil-mill, the basic unit
is "Sinolea" within which the largest part of olive-oil - some 70-
80%, is separated from the olive paste. In 1972 Rapanelli, an Italian
manufacturer, for the first time presented the market with . a mixed
system based on contiguity and centrifugion. The main elements of the
system are the "Sinolea" unit working on the principle of contiguity,
and the Decanter unit working by centrifugal power. So far as the
organoleptic characteristics are concerned the quality of the olive-oil
extracted by "Sinolea" is the technically preferred process. The rest
of the olive-oil extracted is enriched in Chlorophyll which changes
colour to green and influences the taste i.e., it becomes more bitter.
, The "mixed" system is manufactured in Greece only by Eleourgiki in
conjunction with Rapanelli (for a description of the mixed system, see
Figure 4•3)•(91)
In order to protect the olive producers and put a stop to the
marketing of defective oil extraction systems, the Ministry of
Agriculture set out quantitative and qualitative standards for all new
types of oil-mill. With Ministerial regulation number
316086/7313/24.8.83 all manufacturers and importers have to undergo
263

quality checks on their equipment before they are able to market them.
Quality checks are undertaken by the Olive Institute of Hania in Crete,
the Agricultural Institute of Mytiline in Lesbos, the Olive Institute
of Kerkera, and the Institute of Agricultural Mechanization. (92)
The replacement of the classical oil production process by the
modern one, either centrifugal or mixed, is now taking place
rapidly. (93) The main reasons for this may be identified as follows. .
First, the olive-oil produced is of a superior quality and therefore
commands a higher price in the market. Also, for up to 70% of the
systems value, the oil-miller can obtain a loan from the commercial
banks at a lower interest rate than the market one. But the main
advantage, according to the millers with whom I discussed this matter
with, is the reduction in the number of workers required during the
peak season. The size of the productive labour force today in the
modernized mills (as mentioned) ranges between two to three workers per
mill. Automation of the production process has been mainly responsible
for labour shedding. Now the oil-miller controls the production
process directly while at the same time has reduced his labour costs.
In the last decade or, more precisely, between 1975-1988, 888 oil-mills
have introduced and now operate the new processes of olive-oil
extraction. In 1986, 29% of the oil-mills in the Messenia Province
used the Decanters, the rest still operated with the classical
process. ( 94) In 1988, according to the Agricultural Institute of the
Province, 350 oil-mills were in operation. Sixty-one percent (or 213
oil-mills) operated with Decanters. It therefore appears that within a
span of only two years the number of modernised oil-mills in the

province doubled. In my sample, there are 78 oil-mills from the three
counties of the province and one cooperative oil-mill from the fourth
county. (95 ) Table 4.7 shows the olive-oil and olive residue quantities
produced in these mills according to the extraction system which they
used.
Table 4.7: Production of 78 Oil-Mills of Messenia Province (inTonnes)
PyliaCentrifugal
CountyClassical
MesseniCentrifugal
CountyClassical
Number of Mills 22 4 19 5
Olives processed 25,778.2 1,862.8 6,835.9 891.3
Olive-Oil Produced 4,114.0 307.0 1,268.7 218.2
Olive-Residue 10,709.5 642.5 3,211.1 423.9Produced
CalamataCentrifugal
CountyClassical
ExtractionCounties
RatiosCentrifugal Classical
Number
Olives
Olive-Oil
OliveResidue
14
13,522.1
2,462.7
5,665.0
13
5,112.3
911.6
1,972.9
Pylia
Messini
Calamata
1:6
1:5.4
1:5.5
1:6
1:4
1:5.6
Source: Provincial Agricultural Institute, Records, Summer, 1988..
The 78 mills in the sample accounted for 37% of the olive-oil
produced in Messenia in 1988 or some 25,000 tonnes. Out of the sample

7,843.5 tonnes came from the centrifugal units, and 1,436.8 from the
classical. In Calamata county 14 centrifugal mills and 13 classical
mills were selected in terms of the highest quantities of olive-oil
produced. It appears that even though the extraction ratios were
roughly the same the centrifugal mills processed more than double the
quantity of olives processed by the classical mills. (96) The
extraction ratios from Table 4.7 show that one kgr of olive-oil was
produced from 5.5 kgr of olives with the new process, and 5.6 kgr of
olives with the classical process. The olive residue produced by
centrifugal mills contains 10-18% more water than the one produced by
the classical mills and this implies that it could be sold cheaper in
the market. In fact the price difference is usually 1-2 dr/kgr.(97)
In Messini county, the extraction ratio is 1:5.4 in the centrifugal
mills, and 1:4 in the classical, which is higher than the average
ratios of the other two counties. The reason for this is because
Messini produces better quality olives - the soil and irrigation
techniques contributing to a greater amount of olive-oil contained in
the fruit. (98) Finally, in Pylia county, extraction ratios are 1:6 for
all mill types.
Extraction ratios for olive-residue are roughly the same in all
three counties, one kgr of olive-oil produces two kgr of olive residue.
In the three counties during 1988 207 mills operated out of which 113
were centrifugal and 94 classical. (99) It appears that 48.6% of the
centrifugal mills of the three counties account for 7,844.5 tonnes of
olive-oil or 31% of the provincial production. It seems that the new
process is dominant throughout the province of Messenia and this
266

dominance has come about within a period of only three years viz 1986-
1988. If modernization continues at the same rate, then a further
reduction in the number of mills seems inevitable and the classical
mill type will become a feature of the past. The main incentive for
this rapid "modernization" has undoubtedly been the financial support
provided by the C.A.P. This support was directed towards the
cooperative as well as the private oil-mills. However, the cooperative
sector enjoyed certain concessions in order to enhance and make its
role as a form of economic organization in oil-milling more
prominent. (100) As already indicated, the expansion of the cooperative
sector an important policy objective of the Greek government in the
1980's.
4.5 Cooperatives Versus the Private Sector in Oil-Milling
At the national level 513 oil-mills (17.2% of the total) are owned
cooperatively. According to the 1988 Industrial Census, the capacity
of the cooperatives (in terms of tonnes per hour) forms 26% of the
total, and 39% of the modernised oil-mills i.e. those equipped with
the new Decanter technology.(-01 ) In 1975, the cooperative mills
comprised only 13% of the total. The overall percentages might not
look impressive but they should be seen in the context of the overall
development of the cooperative movement. It was only since the early
1980's that the cooperative oil-mill gained the support and favour of
the State as a mode of organization. In particular olive growing
regions the presence of cooperatives is much stronger than the national
average and in some cases is even dominant. (102) For example, in
267

Heracleo Province in Crete, even though the number of cooperative oil-
mills is smaller than the private sector, capacity is 223,400 tonnes
per hour compared with 234,500 of the private. That was in 1986. By
1989, according to Eleourgiki, the cooperatives have gained even
further ground against the private mills. This is because
technological modernization in the private mills is lagging behind that
of the cooperatives. More specifically, in 1986 cooperative mills were
equipped with 137 Decanters while the private sector only had. (103)
This discrepancy continued and even grew by 1989. 103 In Lesbos 60% of
production comes from the cooperative sector again because of
technological superiority since there are only 53 cooperative units
compared with 149 private ones. In Messenia in the summer of 1988,
producers' cooperatives formed 70 (or 20%) of the existing number of
oil-mills, and 60 of these (or 86%) mills were modernized.
In Coryfasi village, by 1970 there were two cooperatives. One was
called the "Agricultural Cooperative, Nestor" and the other the "Olive
Cooperative of Coryfasi". The former was established back in 1914 and
is considered the first cooperative organization in Messenia and one
of the first in the whole of Greece. (1°) It started with a membership
of only 8 and until 1923 it still numbered only some 180 members. It
was mainly a credit cooperative and, even though it operated for 56
years, rather surprisingly did not manage to extend into any productive
activities such as supplying the producers with inputs, or building up
any storage facilities for the output to be kept until sa1e.(106)
According to older members oral testimony in 1988 the management was
incapable of running the mill for the benefit of the cultivators. The
(104)
2.68

second cooperative was established on the 14.4.1934 by 44 olive
producers. They bought an oil-mill 300 m outside the village for a sum
of 220,000 dr. (in current prices), out of which 160,000 dr. was
borrowed from the Agricultural Bank. The remaining sum was paid out
of members' own contributions. Upon purchase, the oil-mill contained
one hydraulic press, a petrol engine, a water pump and some auxiliary
equipment. Apart from the petrol engine which was replaced much
earlier (in 1948), by another 20 -25 H.P Hereford type, this mix of
machinery operated until 1962. (107 ) In 1962 the executive committee of
the mill began the process of modernization by acquiring a new petrol
engine of 30 - 40 H.P, two hydraulic presses, two separators and other
ancillary equipment. Total investment amounted came to approximately
700,000 dr which was borrowed from the Agricultural Bank. Until 1970
the cooperative earned just enough to pay interest on its long-term
loan. Total revenue remained modest over the 36 year life-span. (108)
One of the main reasons for the failure of the cooperative to prosper
was the stiff competition which it faced from the private sector. As
discussed earlier in this thesis the oil-millers and the merchant had a
long history in the village community. (109) They had established
strong links with many producers in the shape of a borrower-lender
relationship; also the family bonds existing amongst many villagers and
the millers retarded the development of the cooperative movement.
Until the late 1970's the private oil-mills were clearly dominant in
the process of olive-oil extraction in Coryfasi.
By the early 1980's, because of the incentives given to the
cooperatives as a favoured mode of organization by PASOC, the olive
269

cooperative of Coryfasi was revitalised. The executive commitee
decided to buy a 460 m2 area on the outskirts of the village near the
Keparisia-Pylos motorway. The oil-mill itself occupied 74 m 2 and was
built in 1983. The modernization process of the oil-mill took ten
months and was completed by September 1983. The new means of
production installed allowed for a capacity of 3,800 kgrs of olives to
be processed per hour in two centrifugal units. (110) The Executive of
the cooperative consisted of young farmers who believed that the new
unit would bring about an improvement in the quality and mode of
trading of their olive-oil. As a result they hoped that their incomes
would rise and this was expected to play a major role in stemming out-
migration from the area.
The total cost of modernization came to 43,702 thousand dr. The
financing was undertaken in the context of the EEC Law Decree 355/1977
concerning modernization of manufacturing units in the rural sector
(Act 13, Paragraph 5). (111) The capital was derived from the following
sources:
a) Total Subventions 30,971,250 dr.
Greek State 25% — 10,323,750 dr.
EAGGF 50% — 20,647,500 dr
b) Loans 10,323,750 dr.
c) Members contribution 2,407,000 dr.
270

The loan, obtained from the Agricultural Bank of Pylos, streched over a
10 year period at an interest rate of 14.5%. The members contribution
amounted to 2.4 million dr and was largely used for land purchase. The
amount of olives received by the cooperative for olive-oil extraction
and the final quantity of olive-oil produced between 1983/84-1987/88 is
presented in Table 4.8.
Table 4.8: Production of the *Olive Cooperative of Corvfasi" during1983/84-1987/88. (In tonnes and th.dr.)
1983-84 1984-85 1985-86 1986-87 1987-88
Olives 780 1,320 1,860 1,680 2,100
Olive-Oil 130 220 310 280 350
Sales Value 1,791.1 3,168 5,952 6,720 8,697.5
Olive-Residue 310.7 528 740.9 980
Sales Value 932.1 1,584 2,222.7 4,900
Source: Olive Cooperative of Coryfasi, Records, Summer 1988.
We may observe from Table 4.8 that production of the mill has been
increasing with the exception of 1986/87 when the output of the
village was generally lower due to adverse weather conditions.(112)
The commission right for the first three years was set at 8% which was
2% lower than that of the private sector. In 1988 the mill operated
with a 7% commission right so in this way it gained more customers.
The total mount of olive residue produced is kept by the mill and is
usually sold by auction to the refiners of the province. In 1988 it
was sold at 5 dr/kgr to a nearby refinery. (113)
27 1

Since 1981 the market price of olive-oil has been influenced by
cooperative action (through Eleourgiki), and ranges at a higher level
than the EEC intervention price. So in most cases the farmers prefer
to trade their product instead of selling it through EEC intervention.
If, at the end of the marketing year, there are unsold quantities of
olive-oil the "Olive Cooperative of Coryfasi" can always sell it off to
the "Second Order Olive Cooperative of Calamata" also at a higher price
than the EEC intervention price. (114) It would therefore appear that
the cooperative mode of organization has secured for the farmers the
best possible price.
However the modernization of the unit did not, of course, increase
the number of workers in each mill. On the contrary, the new
automatic systems did not require any labour input apart form some
secondary work involving the transfer of olives from the point of
production to the mill, and the feeding of the olives into the
machines. On the other hand, seasonal and unskilled labour could be
easily found in the village, which signifies the fact that the olive
cooperative was not in a position to offer an alternative source of
employment. Also this particular cooperative's location is such that
it guarantees easy transport for the workers, the olives, and the final
quantities of olive-oil, since the mill is situated very close to the
motorway.
While the production and membership of the cooperative increased,
the four private mills which operate in the village lost revenue and
272

customers at a rapid rate. Two of them have been modernized since the
beginning of the 1980s.( 115 ) The other two are of the classical type.
In 1988 production of one of the centrifugal private mills was 150
tonnes of olive-oil, and this suggests that the mill operates at below
capacity. The other mill produced 130 tonnes. The two classical
mills between them produced 200 tonnes of olive-oil. The capacity of
the private mills by far exceeds the need for domestic production and
this results in under employment of the technical equipment and a
greater degree of competition than would otherwise be so. Most
producers leave their olive-oil at the oil-bank of the mills until a
suitable buyer can be found. In 1988, 635 tonnes of olive-oil were
sold to the private sector at 330-350 dr/kgr the actual price, of
course, being dependent upon the quality.( 116 ) In that particular year
(1988), the entire amount was sold to the local merchant who acted as a
representative of the urban packers. There are years when the amount
of olive-oil produced is sold by auction to the highest bidder. So,
merchants from all over the province come and bid if there is increased
demand from the packers whom they represent. One hundred and sixty
tonnes were sold to the "Second - Order Cooperative" based at the
capital of the province, Calamata. The main reason that the packers
and the higher-order cooperative buy the olive-oil in this way is to
meet export demand. Export markets are the most profitable outlets for
the packers and refiners of the olive industry. This issue will be
discussed in Chapter Seven.
The merchants are given a certain price range by the packers at
which they can buy olive-oil from the producers. The standard
27 3

commission right of the merchants is 2-3%. Merchants try to increase
their percentage by making a common agreement with the packer and state
a higher amount of olive-oil purchased in each customer receipt. When
the receipt is submitted to the Provincial Agricultural Institute, the
company will be paid a higher amount of Consumption Aid which it will
then share with the wholesaler or merchant. Even though the
Agricultural Institute is aware of these schemes, the checking and
inspection of agents, packers, and merchants is rarely done in a
thorough way. Thus the merchant based at Coryfasi has never been
checked by the authorities.(117)
The practice of merchants buying at pre-market prices from the
producers which took place a few years ago has been seriously
undermined by the action of the cooperative. There are still some
cases though where the producers lose income. This can happen either
because they owe the wholesaler sums of money or because he has
arranged, before the annual announcement of the intervention price by
Eleourgiki, to buy their product at a pre-market price. Nowadays the
olive-cooperative attempts to deal with most of these cases so that the
merchant finds himself isolated.
The olive residue produced by the millers, private or cooperative,
is sold to the two refineries based in the province. In 1988 all
refineries of the country formed a cartel and fixed the price at half
of the previous year. The reason for this action was an EEC imposed
export quota which created surpluses as it made it unprofitable for the
refiners to export. (118) So, the oil-millers incurred a reduction in
274

their revenue which the private sector mills tried to pass on to the
producers by slightly increasing their commission rights by 0.5% - to
10.5%. As the olive cooperative retained its right at 7%, the private
sector suffered a sharp reduction. The oil-millers are expected to
present the Provincial Agricultural Institute with service receipts
for each customer which states the exact amount of olive-oil produced
so that the farmer can claim the Production Aid. This is paid by the
EEC through the Ministry of Agriculture (YDAGEP), and for 1988 it was
94 dr/kgr. Cases have been found of agreement between the private oil-
millers and the farmers to state a higher amount produced than the
actual and so share the additional Production Aid. The provincial
authorities estimate roughly a 5% default in the annual official figure
of production. (119)
4.6 State Policy and the Oil-Milling Sector
Soon after its first electoral victory in 1981, the PASOC
government identified itself with the cooperative movement by becoming
financially involved. At the root of this policy was the idea that
olive cooperatives should be organised on the basis of the village
community as the primary unit of production, and that they would be
responsible vehicles for regenerating rural development. ( -20 ) However,
since Greece joined the European Community, the catching-up process
with the more economically advanced countries of Europe required rapid
structural administrative and technological change. The Prime
Minister, Mr Papandreou, repeatedly proclaimed that Greece had chosen
the path of socialism with the twin objectives of accelerated economic
275

advancement and social justice. (121)
The cooperative way of
development was thought to avoid the evil of inequalities of income
distribution that result from the capitalist mode of development. But
apart from giving financial help the State did not put much effort or
resources into arranging for expert advice, auditing precedures or
providing relevant management courses for either the newly created
olive cooperatives or the ones already established. The various
Agricultural Institutes located in the provinces were certainly very
understaffed and did not possess the kind of adequate expertise
necessary to tender appropriate advice. Also the Agricultural Bank, as
the most directly responsible arm of State policy, failed to give
regular expert advice and consultation to the olive cooperatives to
help them prosper in the competitive world still dominated by the
private sector. The reason for this was that the Bank could not spare
sufficient resources to create on a national basis the appropriate
internal organization which would have been able to cope with the
expansion of the cooperative sector units. (122)
The Agricultural Bank and the commercial banks are the main
agencies for supplying credit to the oil-milling sub-sector. By
Regulation Number 164/4/18.7.1977 the Agricultural Bank was instructed
to become involved in the financing of small rural processing
units.
purposes then it is expected to be repaid in fifteen years in annual
instalments starting, at the very latest, eighteen months after actual
errection. If on the other hand, the loan concerns technological
modernization, it should be repaid within 8 years following the first
(123) If the loan requested is required for construction
276

annual instalment - and starting eighteen months after the actual
installation of the equipment on the premises. Interest on these loans
is currently at 16%. To be considered a loan application should be
made by an individual farmer, a team of farmers, or a cooperative.
Some oil-millers, especially when they apply to modernize their mills,
are unable to contribute the 30% of the total expenditure required by
the Bank. So they claim that they have to resort to other financial
sources which offer much harder terms. The interest on loans from the
Agricultural Bank has an additional charge of 1.25% which is called the
Agricultural Insurance Contribution. (124) This seems to create a
feeling of resentment and discontent among the oil-millers who would
otherwise like to borrow from the Bank. But instead they apply to the
commercial banks. The contribution of the ABC to medium-term loans is
fifty percent while another fifty percent is contributed by EAGGF.
Only investments whose value ranges between 40,000 and 5 million ECU
are considered. The loan covers (at its maximum) 70% of the total
expenditure of the applicant. In the case of cooperatives it covers up
to 800125)
The State plays the role of a guarantor when the loan is acquired
through the commercial banks. The current (1989) interest rate for
"modernization" type loans is 17%. Article 16 of Regulation 795/85
provides financial help for any technological modernization undertaken
in mountainous or semi-mountainous rural areas. The aid is up to 4
million dr. per unit. (126) Table 4.9 shows the medium-term loans given
by the ABG for building and technological modernization of rural
277

processing units including oil-mills throughout Greece over the period
1980-1985.
Table 4.9: Medium-Term Loans by the ABC. 1980-1985 (In constantprices, million dr's)1
1980 1981 1982 1983 1984 1985
85.90 70.26 - 52.35 93.09 140.38 169.50
Notes 1. The Retail Price Index has been used as a deflator.
Source: Agricultural Bank of Greece, Loans Department, 1988
The amounts are expressed in real prices, but even so there has been an
upward trend since 1983, and by 1985 loans were double the amount given
in 1980.
One controversial area where the State is involved - through the
Ministry of Agriculture - is the implementation of the Production Aid
scheme, in the context of the CAP. This issue concerns the management
of the scheme at central and local administrative levels. Management
is assigned to a service of the Ministry of Agriculture which acts as
an intervention agency (YDAGEP). It has at its disposal, for control
and advisory services in the field, staff attached to the local offices
of the Ministry in each province (nomos) headed by an agronomist. (127)
Any verification carried out on individual applications for aid are
effected by these staff members. Controls at the central level are
being confined to verifying completeness of supporting documentation,
and to checks upon the numerical accuracy of applications and summary
278

schedules. The supporting documentation consists of a crop
declaration/application for aid and a miller's certificate. The
applications of associated producers are grouped together by the
producer organizations who submit a single application for all their
members to the local YDAGEP office after verification has been carried
out. Non-associated producers submit their applications directly to
the local YDAGEP offices. (128)
In 1984/85 the Court of the European Community decided to carry
out an audit covering the implementation of production aid schemes in
the member countries. (129 ) The audit findings were as follows. There
was little evidence that producer organizations were properly inspected
by the Greek authorities. The authorities appeared to have granted
recognition on the basis of formal criteria as regards size and other
requirements without seeking any real evidence as to the fulfillment of
their essential requirements. This involved verifying the production of
their members, and of distributing the aid received. In general the
Court observed during the auditing that there was no system for tracing
cases,where, for one reason or another (e.g death), the aid was not
collected by the producer. The central authorities had not laid down
any formal payment procedures to be followed by the producer
organizations. Furthermore, the Commission had not been informed by
the Greek authorities as to which producer groups were recognised for
the purpose of the aid. Again there was little evidence that the
requisite controls on oil-mills had been carried out although the mills
which were visited maintained stock records which met with YDAGEP
instructions. Neither did the Greek "system", provide for checks
279

reconciling the capacity of mills with the millers' certificates issued
by them. Checks to detect duplicate applications for aid are also not
provided for in Greece.(130)
In responding to the auditing report the Greek authorities stated
that the results of their controls were' deemed to be fully
satisfactory and no signs of fraud were detected. They attribute
these results to the traditional honesty of Greek farmers.( 131) The
reader can draw his/her own conclusions from this disclaimer. It is
worth noting however, that the same audit found a 15% irregularity in
the Italian system of Production Aid. Although irregularities have
been reported in such strong terms by the EEC Court itself, it appears
that no decisive action has yet been taken to prevent them. In the
Greek case plans were made for the establishment of a local and
provincial EEC inspectorate but until the summer 1988 these had not
come into effect. (132) On the other hand, Italy has been a member for
a longer period of time and the problem there, according to EEC Court
auditing reports, is more significant. All these indications imply
that this issue is not just one of financial probity but it also has a
strong political dimension. It appears that EEC inspectorates cannot
impose such a close and regular control on the internal olive
industries of the member-States. This is because, even if closer
monitoring was to be conceivable, its implementation could cause
severe adverse internal reaction in the member countries concerned.
280
Conclusions
In this Chapter it has been shown that there is a positive
relationship between technological change and the structure of the oil-
milling sub-sector. It has been contended that the material interest
of the producers in the rural areas, whether private or cooperative, is
the prime motive force which drives modernization forward. Of course
the process of change which is currently under way did not just happen
overnight in the rural areas. The EEC and the adaptation of the
National Agricultural Policy to the CAP prepared the ground. Pricing
regulations and incentives for the development of olive cooperatives in
the context of the CAP shaped the environment within which the changes
took place. Nor did the technology for the modernization of the oil-
milling sector originate in rural areas. Technology has been mainly
imported from large EEC industrial countries like Italy and Germany.
Research Institutes at the provincial and higher levels helped in the
diffusion of the new equipment in rural oil-milling, and continue to
check quality standards of foreign and domestic manufacturers. On the
other _hand, the rise of cooperative organization means that nowadays
the olive producers even though have not established direct contact
with the packers or refiners of the urban centres, can deal with them
under improved conditions. The rural oil-milling sector is the link
connecting the rural producers and the urban packers and refiners. Its
essential role is to help bridge the gap in both economic and social
terms between olive producing and urban areas where the other integral
part of the olive industry is based. In Part Two the urban processing
of olive-oil is addressed.
281

REFERENCES
1. See A. Kiritsakis, The Olive-Oil, (Thessaloniki, 1988)
2. See A. J. Mendoza, "Milling-Malaxation", in J. M Moreno-Martinez (ed), Olive-Oil Technology, FAO, (Rome, 1975).
3. Chlorophyll is the green colouring matter in the leaves ofplants. The presence of this substance influences thetaste and quality of the olive-oil, ibid,.
4. See J. M. Martinez, "Preliminary Operations" in J. M.Moreno-Martinez (eds), Olive-Oil Technology, FAO, (Rome,1975).
5. A Kiritsakis, 1988, op.cit, p.91.
6. ibid.
7. See G. Frezzoti and M.. Manni, "Olive-Oil Processing inRural Mills", Agricultural Development Paper No. 58, FAO,(Rome 1956).
8. See A. J. Mendoza, 1975, op.cat.
9. Contiguity refers to the chemical property of olive-oil bywhich when oil paste comes into contact with specialmetallic discs, large amounts of olive-oil are kept.
10. See A. J. Mendoza, 1975, op.cit.
11. N.S.S.G, Industrial Census, 1931. By "horse power" I meanthat mills were literally operated by the use of horses.Mechanical power existed in the form of petrol machines forthe pressing of the olives.
12. ibid.,
13. See Chapter Two, Section 2.13.
14. N.S.S.G, Industrial Census, 1951.
15. ibid.,
16. See D. Miliakos, Olive Cultivation in Greece. EEC (Italy) and other Countries in Anticipation of Membership, A.B.G(Athens, 1980) p.22.+
_282

Facets of
17. A.B.G, Department of Vegetable Production, 1989, theinformation was derived from reports on the improvement ofthe organoleptic characteristics of olive-oil during the1970s.
18. A.B.G, Department of Agro-Industry, 1975 Survey.
19. A Decanter is a centrifuge system within which the olive-oil is separated from the olive paste in three stages. SeeA Kiritsakis, 1988, op.cit. p.103.
20. Information received from Mr E. Evagellou, Head of theDepartment, of Agro-Industry, A.B.G, 1989.
21. Ministry of Agriculture, Department of Information, 1988.
22. Ministry of Agriculture, Department of Information, 1988.
23. See N. Karabelas, Messeniaka Grammata, (Calamata, 1981)+and N.S.S.G, Agricultural Production, various issues since1914.
24. See D. Psychogios, The Extraction of Surplus fromAgriculture, (Athens, 1984).+
25. See N. Mouzelis, Modern GreeceUnderdevelopment, (London, 1978) p.25.
26. The names of a few well known merchants who operated in theprovinces of Lesbos and Messenia in the early twentiethcentury were referred to in my discussions with Y.Xiloyianni (PASEGES) and G. Bazyioti (Ministry ofAgriculture), 1988.
27. Pylos, Town Hall, Records, 1988.
28. ibid,. A Bavarian Officer was a member of the Royal Armyof Greece as the King was originally from Bavaria (inGermany).
29. Pylos, Town Hall and Kinotita of Coryfasi, Records, 1988.
30. ibid.,
31. Kinotita of Coryfasi, Records, 1988.
32. ibid.,
33. ibid.,
34. As it was not possible to find any Records in the Kinotites of Avia and Tseria, which were visited during 1988, theirindividual cases could not be included here.
283
35. Thus today the number of mills in Italy is about 9,000according to the Official Journal of the EuropeanCommunities, C134, Vol.28, 3.6.1989.
36. See A. Booth and R. M. Sundrum, Labour Absorption inAgriculture, Theoretical Analysis and Empirical Investigations, (Oxford, 1985).
37. A.B.G, Department of Agro-Industry, information receivedfrom a 1950s survey by the Bank obtained in 1989.
38. Information obtained during fieldwork in the villages ofMessenia Province : Coryfasi, Avia and Tseria, 1988.
39. Even though there is no specific published reference onthis point, it seems to be very probable in anunderdeveloped rural economy in the early 20th century.
40. See H. Schmitz, "Growth Constraints on Small-ScaleManufacturing in Developing Countries". World DevelopmentVol. 10, No.6 (1982).
41. Information provided by an elderly oil-miller, AndreasPsareas, in the village of Tseria active over 1925-1953,Summer 1988.
42. The commission right of the mills was officially set, eachyear, by the Ministry of Agriculture. In reality, it waswell above this rate depending mainly on the millersintegrity. ibid.,
43. The two mills were owned by A. Psareas and K. Petroutseas(ex-president of the village and among the five wealthiestfarmers, even though Tseria is a mountainous village andpeople apart from olive-growing engage in sheep rearing).All information cited on oil-milling in Tseria, wasprovided by these two elderly ex-millers, during thefieldwork visit in the Summer of 1988.
44. See N. Lihnos, The Olive Tree and its Cultivation, (Athens,1949).+ Also older producers' personal accounts.
45. Another reason was that during the 1920's and 1930's therewas a strong trend of migration from the rural areas ofGreece to the U.S.A.
46. N.S.S.G, Employment Bulletin, 1951.
47. See Table 4.3, A.B.G, 1975 Survey.
48. N.S.S.G, Employment Bulletin, 1970.
49. A.B.G, Department of Agro-Industry, Records, 1989.
284

50. N.S.S.G, National Survey, 1978 and 1984.
51. Ministry of Trade and Commerce, Olive-Oil Prices, Records,1988.
52. See H. Schmitz, Accumulation and Employment in Small-ScaleManufacturing : Case Studies from Brazil, (London, 1982).
53. Ministry of Agriculture, Department of Information, 1988.
54. See H. Schmitz, 1982, op.cit,.
55. Under the "Food Industry" heading of the OfficialStatistics of the N.S.S.G are simply "food, drink andtobacco". There is no systematic or detailed treatment ofany of these industries until after the 1960's.
56. Decanter, see A. Kiritsakis, 1988, op.cit,. p.103.
57. Ministry of Agriculture, YDAGEP Survey, March 1988.
58. See H. Braverman, Labour and Monopoly Capital, (New York,1974).
59. See D. Morawetz, "Employment Implications ofIndustrialization in Developing Countries : A Survey",Economic Journal, Vol.84, September, p.491-542, 1974.
60. See for example I. Benson and J. Lloyd, New Technology andIndustrial Change, (London, 1983) and Al. Rainnie, "SmallFirms Big Problems : the Political Economy of SmallBusinesses". Capital and Class, No.25, 1985.
61. American Rural Industry Delegation. Rural Small-ScaleIndustry in the People's Republic of China, (California,1977).
62. ibid,.
63. In the case of the enterprise Eleourgiki, the Cheruvim andTheohari companies, the design and machinery parts wereimported. This information was provided by the companiesduring my visits in 1988 and 1989.
64. See A. G. Frank, Reflections on the World Economic Crisis,(London, 1981) and S. Amin, Imperialism and UnequalDevelopment, (London, 1977).
65. OECD, The Newly Industrialising Countries, Challenge andOpportunity of OECD in&_stries, (1988) and L. Franco"Adjusting to Export Thrusts of Newly IndustrialisingCountries : An advanced Country perspective". The EconomicJournal, 91, June 1981, p.486-566.
285

66. ibid,.
67. Information provided by Eleourgiki. I am particularlygrateful to Mr Petrakis who as chief engineer waspersonally involved in the establishment of theEleourgiki's manufacturing firm in Heracleo, Crete. March,1988.
68. ibid,.
69. Price estimates were obtained in 1988 from Eleourgiki andthe company, Cheruvim, which also has a base in Athens.
70. For a description of the different olive-oil extractionsystems see Section 4.4.3 and A. Kiritsakis, 1988, op.cit.
71. Information provided to me personally through a businessassociate, V. Vasiliou, of the "Brothers Theohari" inCalamata, 1988.
72. N.S.S.G, External Trade 1986, 1987, code number 84594800.
73. Information obtained from E. Kallas, ex-CommercialRepresentative of Alfa-Laval who, currently acts forCheruvim, in Messenia, 1988.
74. ibid,.
75. Unpublished Report of a limited number of mills (aboutfifty) undertaken by the Agricultural Institute of Messeniain 1987. The complaints were reported to the OliveInstitute of Hania for further investigation.
76. Information obtained from V. Vasiliou, domestic businessmanand owner of the firm, Summer 1988.
77. See P. Sonza and E. Tokman, "The Informal Urban Sector inLatin America", International Labour Review, Vol. 114,No.3, 1976.
78. See A Vazquez-Barquero, "Small-Scale Industry in RuralAreas : The Spanish Experience since the beginning of thecentury" and G. Fua, "Small-Scale Industry in Rural AreasThe Italian Experience, in : K. J. Arrow (eds), The Balancebetween Industry and Agriculture in Economic Development,Vol.1, 1988.
79. See R. Bromley and E Gerry (eds). Small-Scale Manufacturingand Repairs in Dakar : A Survey of Market Relations withinthe Urban Economy, (London 1979).
80. See K. Marx, Capital, Vol. I, (london 1970), originallypublished in 1867.
286

81. See V. I. Lenin, "The Development of Capitalism in Russia",in Collected Works, Vol. 3 (London, 1960), originallypublished in 1899.
82. ibid,.
83. See K. J. Arrow (eds). The Balance between Industry andAgriculture in Economic Development, Vol. 1, 1988.
84. Cf. Special Issue in "Third World Industrialization in the1980's: Open Economies in a Closing World" in the Journalof Development Studies, 21(1), 1984, and C. Perez,"Microelectronics, Long Waves; and World Structural Change:New Perspectives for Developing Countries", WorldDevelopment, 13 (3), 1985.
85. L. Klein and K. Ohkawa, Economic growth : The JapaneseExperience since the Meiji Era, (Homewood, 1968) esp.Chapters 1,3 and 4; and S. Watanable, "Enterpreneuship inSmall Enterprises in Japanese Manufacturing". InternationalLabour Review, Vol. 102, No.6, 1970; and K. Ohkawa and G.Ranis (eds) Japan and the Developing Countries : AComparative Analysis, (Oxford, 1985).
86. EOMEH, Six Studies on Topics of Small and MediumEnterprises, (Athens, 1985); and EOMEH, Greek Organizationof Small and Medium Enterprises, Congress 13-15 June,(Athens, 1983).
87. See A. Kiritsakis, 1988, on.cit, p.111.
88. ibid,.
89. ibid,.
90. ibid,.
91. Information provided by Eleourgiki, Department of Planningand Investment, 1988.
92. Information provided by Mrs G Bazyioti of the Ministry ofAgriculture, Department of Forestry, 1988.
93. Information provided by the Ministry of Agriculture(YDAGEP); see also section 4.2.
94. Information provided by the Agricultural Institute ofMessenia, Summer 1988.
95. Records provided by M. Tsarbopoulos, Head of the Olive-Department of the Agricultural Institute of Messenia,Summer 1988.
96. ibid,.
287

97. Agricultural Institute of Messenia, Price Records and Oil-Mills' receipts, ibid,.
98. Information suppliedMessenia, Summer 1988.
by the Olive-Oil Institute of
99. ibid,.
100. See M Nikolinakou et.al , Strategy of Development of theCooperative movement in Agriculture, (Athens, 1986).+
101. Ministry of Agriculture, YDAGEP Survey, March 1988.
102. N.S.S.G and YDAGEP Surveys 1986 and 1988.
103. Information provided by A. Kiriakoulakos, Department ofSupplies, Eleourgiki, 1989.
104. Records provided by M. Tsarbopoulos, Head of Olive-Department of the Agricultural Institute of Messenia,Summer 1988.
105. Records kept at the Kinotita of Coryfasi, 1988.
106. It is a custom - at least in Messenia Province - for theolive producers to leave their produce at the oil-milluntil a suitable buyer is found. For this service thecustomers are not charged either by the private or thecooperative mills.
107. Information obtained from Mr G. Frago the President of theOlive Cooperative of Coryfasi, Summer 1988.
108. ibid,.
109. See Chapter Three.
110. Information obtained from Records of the Olive Cooperativeof Coryfasi, 1988.
ibid,.
112. Information obtained from Mr G. Frago the President of theOlive Cooperative, Summer 1988.
113. ibid,.
114. For a discussion of the role of Eleourgiki in the marketof olive-oil, see Chapter Two, Section 2.3.3.
115. Information obtained from Mr G. Frago, the President of theOlive Cooperative of Coryfasi, 1988.
288

116. This price range of 330-350 drs corresponds to thedifferent grades of olive-oil which is determined by thedegree of acidity. Above 3.3° acidity the olive-oil needsto be refined before it is suitable for human consumption.
117. This was confirmed by both the merchant himself and theAgricultural Institute of the Province.
118. This issue will be discussed in detail in Chapter Six.
119. Estimates of M. Tsarbopoulos, Head of the Olive Department,Agricultural Institute of Messenia, 1988.
120. PASOC Sectoral Development Plan, 1983-1987, Centre ofScientific Research (KEPE).
121. Y. Pottakis, Minister of Agriculture in the PASOCgovernment interview with Eleourgiki, No .9 August-September 1986, p.26.
122. Information received through discussion with E . EvagellpuHead of Agro-Industry Department, 1988.
123. ibid.
124. This aims at covering the administrative costs of the Bankand to provide an insurance against possible default by theborrower.
125. Ministry of Agriculture, Department of Information, 1988.
126. ibid.
127. Ministry of Agriculture, Department of Information, 1988.
128. ibid.
129. See Official Journal of the European Communities, C134,Vol.28, 3 June 1985.
130. ibid.
131. Ministry of Agriculture, Mr. E. Papamarkaki, Department ofProcessing and Trade, 1988.
132. Ministry of Agriculture, Department of Information, 1988.
289

Table 4.1: Geographical Distribution of Oil-Mills. 1931
Province Total Number No's UsingMechanicalPower
Total Capacityin H.P.
Etolia 156 11 144
Argolida 443 31 408
Arkadia 213 15 160
Attica 388 27 465
Ahaia 646 45 554
Eboea 372 26 456
Zakenthos 301 21 295
Eperos 214 15 227
Thessalia 314 22 362
Kerkera 72 5 79
Kefalenia 345 340
Krete 802 56 1194
Keclades 14 1
Lakonia 644 45 779
Lesbos 2082 145 2725
Macedonia 186 13 370
Messenia 1020 71 1000
Samos 202 14 176
Fthiotis 286 20 266
Hios 500 35 541
Total 9200 642(6.97%) 10.541
Source: N.S.S.G, Industrial Census, 1931.

Table 4.2: Oil-Mills: Number of Establishments and Number of Persons Engaged by Branch in 1951
City Wise Total
No, of Establishments No. of persons employed
Total Replied Male Female Total Over 15 Total Over 15
202(2.3%) 96 384 382 35 34
Total of Greece - Towns
No. of Establishments No. of persons employed
Total Replied Male Female Total Over 15 Total Over 15
722(8.2%) 265 945 933 31 24
Total of Greece - Villages
No. of Establishments No. of persons employed
Total Replied Male Female Total Over 15 Total Over 15
7819(89.4%) 1825
5281 5233 236 210
Source: Derived from N.S.S.G, Industrial Census, April 1951.
291

Table 4.3: Types of Power Used in Oil-Milling
OperationProvinces By electrical By mechanical By horse
Power Power Power
Alexandroupolis 4Kabala 17 1Thessaloniki 25 9Larisa 39 16Lamia 41 2Agrinio 83 24 1Attica 74 33 2Halkida 135 9Patra 264 22Pyrgos 189 10Tripolis 35 2Calamata 356 16Lesbos 139 24Hania 259 70Heracleo 368 10Korinthos 162 6Rodos 44 6Kerkera 217 130Pereas 84 48- 13Levadia 74 5Nafplio 140 12Preveza 108 18Sparti 161 8
Total 3018 481 16
Source: Agricultural Bank of Greece, 1975 Survey
29 2

Table 4.4: Regional Distribution of Oil-Mills. 1988.
Administrative Provinces CooperativeAreas Mills
PrivateMills
Total Capacity(kgr/hour)
Total Cooperative PrivateNumber
East Macedoniaand Thrace
Evrou, Kavalas,Dramas, Serron
10 9 19 19,900 11,100
Central & WestMacedonia
Halkidikis,Kilkis,Thessalonikis
5 35 40 7,700 31,800
Epirus -Kerkera Preveza, Arta,Kerkera,Thesprotia,Lefkada
32 314 346 34,000 171,600
Thessalia Larisa, Magnesia 10 50 60 22,500 65,300
West & CentralSterea
Fthiotida, Eboea,Viotia, Fokida
45 300 345 60,300 338,650
East Sterea andAegean Islands
Attica, Keklades,Lesbos,Hios,Samos
73 285 358 130,600 217,600
Peloponnesos
Crete
Messenia, Lakonia,Elia, Korinthia,
Hania, Heracleo,Rethimno, Lasithi
156
182
1174
299
1330
481
247,850
307,200
1014,600
495,550
Total 513 2,466 2,979 833,050 2,346,200
Source:
ABC and Ministry of Agriculture (YDACEP), 1988 Survey
293

Figure 4.1: The Process of a Classical Oil Mill.
Delivery of the Fruit
I
I
/ \'Removal of the Leaves'
\ /
1
1
1/ \
1 Washing 1
\ /
\I
I
Discarding of Leaves
/ \SCrushing-Pressingl
\ /
1
1
1
/ \'Olive-Paste Pressing 1
\ /
/ \1 Pressure by Hydraulic Presses 1
\ /
I I
I I
kiallicia. Solid
(Including Olive kernel
Olive Oil) I
I
I I
/ \ I
!Centrifugal Separators Concentration
\ / into Container
I I
I I
Olive Oil By-products
Source:A.Kiritsakis,The Olive Oil,(Thessaloniki,1988)p.112

Figure 4.2: The Process of a Centrifugal Oil Mill
Delivery of Fruits
/ \'Removal of Leaves \
1 I •\ /
Discarding ofWashing Leaves
Crushing
/ \101ive-paste Pressing'\ /
1Addition of Water
1
Centrifugal Separation
Olive Kernel Olive-Oil Liquids
Collection Olive Oil 'Centrifugal'into
Containers 'Separation
/ \I Centrifugal II Separator\ /
1 1Olive-Oil Other Liquids Other L auids
1Discarding Discarding
Source: A.Kiritsakis, The Olive Oil, (Thessaloniki 1988),p.113
295

Figure 4.3: The Process of a Mixed Oil Mill
Delivery of FruitsI / \I Washing I
\ /I
/ \1 Crushing 1\ /
I / \ 1 Sinolea I 1
\ /1
Oilve Oil Olive Paste
1 Poor in WaterI / \ / \1 Centrifugal Separator 1
\ /I I
Plive Oil Other Liquids
/ \1 Centrifugal Separator 1\ /
1Olive Oil
Other Liquids
Source:A.Kiritsakis,The Olive Olive, (Thessaloniki 1988)
p.113.
\
/
Olive Oil
1 Addition of Water 1\
I / \1 Pressing 1\ /
I / \1 Decanter I\ /
ILiquids
I/ \1 Centrifugal Separation 1\ /
1 \ Other Liquids
90F,

PART TWO
THE DEVELOPMENT OF URBAN PROCESSING
IN THE OLIVE INDUSTRY

CHAPTER FIVE
THE CAP REGIME AND SECOND STAGE PROCESSING OF OLIVE-OIL
Introduction
Chapter Five investigates the process of production
diversification within the EEC oils and fats industry, focusing upon
the case of Greek olives. My other - and related - concern is to
examine the CAP price support mechanism as applied to second stage
processing in the olive producing member States. I argue that
restructuring in the EEC oils and fats industry has meant growing
concentration of economic power in the hands of multinational
corporations. Furthermore, this concentration has tended to be
combined with a movement away from olive-oil to oil-seeds. On the
other hand, the CAP price support scheme has been designed to
maintain current levels of olive-oil consumption in the Community.
Its effectiveness differs depending on the structural characteristics
of the member State responsible for the production.
Section One shows that the EEC oils and fats industry is facing
difficulties arising from certain domestic production deficiencies.
Yet the EEC-wide olive-oil industry - its main competitor - is in a
surplus position. In fact the oils and fats sector is facing the
prospect of production substitution away from olive-oil towards oil-
seeds oils as well as going through a phase of capital restructuring.
The Greek case suggests that this process is now well under way
297

through the medium of the multi-nationals which operate in the olive
industry of the country.
Section Two examines the Common Agricultural Policy's (CAP) price
support scheme especially designed for the second stage processing of
the food industry. The administrative application of the scheme is
discussed with reference to Italy and Greece in an attempt to
highlight key operational weaknesses. I argue that by shaping the
trade environment in which they operate the CAP price support scheme
plays a decisive influence upon the firms engaged in second stage
processing.
Section Three considers the production structure of second stage
processing in Italy and Spain - Greece's main olive producing
competitors. It is contended that the structural organisation of
production impinges directly upon the present and future of the
respective olive industries in terms of competitiveness. In both
countries there is a strong multinational presence, while
, cooperative ownership is modest currently accounting for only some
10-11% of output. However, in the Spanish processing industry 37% of
the refineries are also olive-oil extractors. This implies
relatively lower costs of production due primarily to advantages
arising out of vertical integration. Italy, on the other hand,
retains the traditional production characteristic whereby first stage
processing (oil-mills) is located in rural areas but the second stage
(refiners, packers) is situated in urban centres.
298

In Section Four a cross-sectional study has been undertaken in
order to reveal some of the most important features of industrial
olive-oil production in Italy, Spain and Greece. An attempt is made
to shed light on the implications of the EEC price policy for the
domestic markets of these countries. It is argued that structural
characteristics are such that they tend to reduce the cost of
production and therefore affect competitiveness amongst the three
member States.
5.1 A General Overview of the EEC Food and Drink Industries
In terms of macro-economic aggregates, the food and drink
industries in the EEC form a major part of the European economy:
employing over two million people (Table 5.1), they account for 16.1%
of the EEC's gross output, and 9.1% of the EEC's gross value added in
manufacturing. The details of the breakdown are contained in Table
5.2 below.
299

Table 5.2: The Top 10 EEC Manufacturing Industries in 1977, (interms of gross output and gross value added)
% of all Manufacturingl
Industry2 Gross Output Gross ValueAdded
Food and Drink Processing3 16.1 9.1Chemicals 11.7 10.4Mechanical Engineering 9.1 11.1Electrical Engineering 8.9 11.4Motor Vehicles 8.8 9.4Metal Refining and Processing 7.8 6.0Misc. Metal Products 6.9 8.4
Paper, Printing & Publishing 5.1 5.9Textiles 4.3 4.4Bricks, Glass, Pottery etc. 3.6 4.6
Notes:
1. All Manufacturing : NACE Orders 2-42. EEC definitions of Industry3. Food and Drink Processing : NACE Orders 41-42
less 429 (tobacco).
Source: FDIC Bulletin No.23, March 1983, p.35.
In the mid-1980's (1986 to be precise) the food and drink industry
in the Community employed some 2.5 million people and had an estimated
, turnover of about 365 billion ECU. (1) Today the European food and
drink industry is made up of a mixture of sectors and firms with very
different structural and operational characteristics. This variety is
due to the diversity of market demand, market size and the technologies
and traditions specific to each sector and each country. According to
a recent report on the EEC food and drink industry, three factors have
brought about major structural changes. These are: the growing
interpenetration of the economies of Members States; slow growth rates
300

- or even decline in certain branches of production; and growing
competition at international and Community levels.(2)
One important factor is the tendency towards increased
concentration. In most member state, and in most branches of the food
and drink industry, there are fewer firms and the average size of these
firms has increased. As a result, the degree of industrial
concentration has grown continuously. However, as we would expect,
there are major differences in concentration levels among the various
European countries. The U.K food and drink industry is the most
concentrated in Europe. (3) The structures of the food and drink
industry in north European countries are very different from those
straddling the Mediterranean, notably Italy, Greece, Spain and
Portugal, where most firms are small, independent and oriented towards
a single product. Furthermore, concentration levels are much higher
within national markets than in the Community as a whole, due to
remaining trade obstacles within the E.E.C.(4)
Widening our perspective to the world food industry, the last ten
years has been a remarkable period. (5) From 1976 to 1986, over a
hundred major mergers of $50 million or more took place in the food
industry. Moreover, the pace of merger activity seems to be
quickening. From 1984 to 1986, nine acquisitions of over $1 billion
occurred. Global food corporations are being formed through the
acquisition of ever larger companies. In these days of debt financing,
nearly any large food company could become the target of a takeover
bid. U.S companies, by and large, have led this trend towards
301

2-3 oountrt24.0%
Ct oountryao%
Total — 46 Comoanies3-4 oar/ries
17.0%
)4 oaxitries9.0%
consolidation, and they continue to dominate the world food industry.
Over thirty U.S food companies have annual sales of $1 billion or more.
With the exception of Unilever and Nestle, the world's top ten food
groups are all U.S-based firms.(6)
By way of contrast to the U.S experience, European companies
operating in the Common Market do not seem to generally pursue an EEC-
wide strategy. Out of a sample of 46 major EEC-based food companies,
half have a presence in only two or less countries. (Figure 5.1)-.
Figures 5.1:
Notes:
1.Spain,
Source:
Average Major Countries per Product Line for EEC-
basedl Companies
1-2 countries44.0%
Major EEC countries are France, Germany, Italy,U.K; EEC-based companies are defined as those whoseheadquarters are in the EEC.
Derived from The "Cost of Non-Europe" in theFoodstuffs Industry. Vol. 12, Part A. Commission ofthe European Communities, Brussels, 1988, p.41
-Only about one in ten companies follow an EEC-wide strategy with a
presence in the five largest EEC countries. EEC food companies by and
large have remained nationally focused which means that as a result few

major EEC companies enjoy high brand strength and wide geographic
coverage. (7) Instead many companies operate in one or a small number
of countries, with both strong and weak brand positions. It is mainly
historical reasons that account for this state of affairs. Differences
in taste, culture and language as well as the national
characteristics of the retail trade - have all contributed explicitly
to the national focus, and thus to the relative fragmentation of the
EEC food industry. But other factors, such as trade barriers and
government "protection" of domestic companies from foreign competition
and control, have also played a part. Of course with the creation of a
single market in 1992, all of these elements should decrease in
importance. (8)
It therefore appears likely that "1992" will trigger off a major
consolidation and restructuring of the food industry in the EEC similar
to that already experienced in the U.S.A. However, while
consolidation and restructuring is certain to take place in the EEC
food industry as a whole, the oils and fats industry is faced with the
prospect of continuing with a highly diverse internal production
structure but now accompanied by capital restructuring. More
specifically, the EEC oils and fats industry in 1989 crushed some 23
million tonnes of oil-seeds (excluding olives), yielding an output of
6,250,000 tonnes of crude oils and fats and 16,500,000 tonnes of
protein meal. (9) Depending upon the type of raw material used, the
value added ranges from 25 to 75 ECU/1000kg of seeds. (10) However only
about half of the seeds used are supplied from internal EEC
agricultural sources, while the other half is imported from outside
303

especially the USA, Brazil and Argentina. In addition to oil-seed
crushing, the oils and fats industry each year also processes some 6.5
million tonnes of crude oils and fats of vegetable and marine origin
(again excluding olive-oil) .(11) Table 5.3 pinpoints some of the main
indicators of the vegetable and animal oils and fats industry over the
period 1980-1985.
Table 5.3: Main Indicators, Vegetable and Animal Oils and Fats'(in Million ECU)
1980 1981 1982 1983 1984 1985
Apparent Consumption 11886 13171 14230 15017 16676 16635
Total Production 9398 10187 10792 11172 12508 13166
Employment 49689 47501 46259 44733 43958 42955
Notes: 1. EC-10 Excluding Spain and Greece
Source: Panorama of EC Industry, Commission of the EuropeanCommunities, 1989, p.17-8.
, We can observe that the value of consumption consistently exceeds
that of total production in the EEC, while employment has been
declining continuously. Even though the industry is highly
competitive and is probably reasonably efficient in terms of
transforming the supply of raw material inputs into a regular flow of
outputs, and also in the final disposal of the processed products, it
faces major difficulties. These are mainly due to the problem of
obtaining a satisfactory supply of raw materials, both quantity-wise
and at prices which are compatible with the final prices of the
304

resulting processed products - the latter being imported and sold on
the domestic market at price levels determined by world market
conditions. (12) Table 5.4 presents an outline of the European Oils
Industry as in 1986.
Table 5.4: Overall Results of the European Oils Industry in 1986. (1000 tonnes)
IndustrialProductionof Oils andFats
ImportsExtra-EEC
ExportsExtra-EEC
ApparentConsumption
Fluid Oils 5987 437 2036 4388
Lauric Oils 102 803 28 887
Linseed Oil 138 8 40 106
Castor Oil 23 72 4 91
Palm Oil N/A 915 14 901
Total 6250 2235 2122 6363
Protein Meal 16316 17963 2410 31872
Fish Oil 132 559 28 633
Fish Meal 450 923 284 1089
Source: FEDIOL, in Panorama of EC Industry, 1989 p.17-10.
It appears from Table 5.4 that in most cases the consumption of
oils and fats within the EEC exceeds the total industrial production.
As mentioned EEC oilseed production represents only 50% of the volume
of seeds processed within the Community. As a result the EEC oilseed
305

dr
,
industry must turn to external markets for its supplies, either to
industrialised nations for soyabeans, sunflower-seeds, linseeds and
occasionally rape seeds, or to developing countries in the tropics for
groundnuts, copra, palm and palm kernel. In addition to its domestic
oil and fat production, the industry also uses imported crude oils and
fats, mainly palm oil, 'coconut oil and fish oil. ( - 3) It therefore
appears that deficiencies in the domestic (EEC) production of oils and
fats lie behind the difficulties which face this industry.
By way of contrast to this EEC-wide situation in oils and fats the
olive-oil industry of the Community, which is essentially concentrated
in the three Mediterranean countries of Italy, Spain and Greece, and
to a much lesser extent Portugal and France, runs a surplus. That is
the total annual supply exceeds domestic consumption in the EEC
countries. Table 5.5 presents the olive oils and edible olive residue
oils results for 1986-1987.
306

Table 5,: Olive Oils and Edible Olive Residue Oils. 1986-1987(in thousand tonnes)
Virgin and RefinedOlive-Oil
Edible OliveResidue Oil
Total
Stocks 1.11.86 577 89 666
Production 1190 96 1286
Imports' 20 0 20
Total Supply 1787 185 1972
Consumption 1326 100 1426
Exports' 92 54 146
Stocks 31/10/87 369 31 400
Notes: Extra-EEC Imports and Exports
Source: FEDOLIVE, in Panorama of EC Industry, 1989, p.17-12.
We can observe that in the year 1986-1987, total supply of olive-
oil exceeded total demand (i.e. consumption plus exports) by no less
than 369,000 tonnes. Over 80% of the olive-oil produced is consumed in
the producing countries themselves. (14) Spanish consumers are
accustomed to blends of refined and virgin oil. The Greeks and the
French consume mainly virgin olive oil. Italian consumers are divided
almost equally between virgin oils and oils blended either with refined
olive oil or olive residue oil.(15)
Because of this state of affairs within the two competing oil-
seeds and olive-oil sectors of the EEC oils and fats industry, one
might logically expect to witness an attempt to diversify production in

the olive producing States. Of course, any such attempt involves
restructuring and has to face up to the problems of managing
considerable social change. However, given the traditional nature of
olive growing in the Mediterranean countries expressed in the strong
attachment of the olive growers to the crop, one would also expect this
process of restructing to be slow and rather painful. We may now pose
the question of the agency which is most likely to be in the vanguard
of this movement - the relevant multinationals.
5.1.1 The Multinational Presence
In historical perspective one of the most significant factors in
the rise of multinational enterprise has been the process of
concentration. (16) Economic historians have assessed the changes in
economy and society during the late nineteenth century as a shift from
a one nation to a multi-nation industrial system. They have discussed
the rise of managerial capitalism, the advent of organised capitalism
and the rise of the corporate economy. (17) Historically, the motive of
capitalist enterprise to invest in foreign companies can be traced
directly (or indirectly) to the consolidation of acquired markets, to
the defence of already existing market positions, and to the
penetration and opening up of new profitable markets. Among the most
important considerations substantiated in the literature we may cite:
the control and exploitation of sources of raw material; the strategy
of domination of the entire world market or part of it for a certain
product or range of products; participation in another country's
industrial production in order to evade tariffs which would be imposed
308

if the goods were imported - but also, of course to take advantage of
privileges and preferences extended to industrial enterprise in host
countries; to shift production to low-wage areas of world in the desire
to achieve cost reductions; and to obtain a foothold in one country by
participating in its economic life for further expansion into other
countries.( 18) It appears that multinational presence itself
signifies a realization of economic aspirations within a politically
suitable environment.
In the 1960's the less developed countries of the Third World, in
an attempt to increase their national sovereignty over investment
controlled outside their territory, exerted pressure in the United
Nations Organization in favour of the implementation of a code of
conduct designed to regulate relations between multinational companies
and host governments. ( - 9) Their efforts led to the establishment of
the United Nations Centre on Transnational Corporations in 1973. The
aim of this institution was to assist "in the devising of a national
and (international policy towards multinational companies". 20) It was
felt that in this way their "influence on domestic political processes
in decision-making" would be minimised and their activities would be
channelled more positively and effectively "to establish a New
International Order". (21) Therefore, since the 1960's a new approach
has been gaining ground which does not ask whether concentration is an
inducement or an obstacle to economic development; the main issue is
the misuse of economic power by the MNC's. This is because the process
of concentration of economic power, extending from cartelization to
mergers which has been taking place since the turn of the century, has
309

proved to be very strong. (22) The present advanced stage of
multinational business structures is the outcome of a century of
intensive change in capitalist economies and, as argued by Heininger,
this has to be set against the background of scientific and
technological developments which made possible mass production,
distribution, employment and consumption on a global scale.(23)
In the world food and drink industry the presence of
multinationals is very obvious and prominent. In the OECD countries
the U.S.A. has been the largest exporter and importer of food
stuffs. (24)That country plays a decisive role in international
investment in the food and drink industry. American multinationals
cover 40% of F.D.I (Foreign Direct Investment) in food processing.
Britain follows with 30%, Switzerland 15% and the rest of the OECD
States follow with 150 25) The large U.S. -based companies and the
other OECD countries increased their investment in third world
countries to take advantage of the lower labour and raw material costs.
Thus the main American multinationals engaged in food processing
activities (such as General Foods, and Campbell Soup) have many
subsidiaries in Central and Latin America countries. Among the largest
multinational investors are Nestle of Switzerland which currently earns
no less than 98% of its revenues from its activities abroad, and the
Anglo-Dutch conglomerate Unilever, which earns 75% of its revenues from
activities abroad. (26)
EEC strategy towards multinational company issues is typified by a
series of specific legally binding supplementary measures to the
310

national laws of the twelve member countries. The European Commission
adopted its programme on multinationals back in November 1973. (27) The
need for European public control of multinational companies was
reinforced by the perception that the nation State itself is an
inadequate framework for responding to their impact. The background to
European Community efforts to develop a coherent policy designed to
deal with multinational companies was conditioned by a variety of
factors. Among these the economic importance of Europe as both home
and host region to multinational companies was clearly prominent. (28)
The Community's consumer market of approximately 320 million (after the
Spanish and Portuguese entry into the EEC) provides obvious attractions
to non-European enterprise as well as home-grown businesses. The
importance of control measures for MNC's worked out in Europe is that
they have a direct impact on a large section of international companies
at the headquarters or subsidiary level. Seventy of the world's 200
largest MNC's (by turnover) were shown to have their headquarters in
the EEC, while the majority of the non-EEC companies have subsidiaries
in one or more Common Market countries.(29)
A second factor which conditions EEC policy towards multinational
companies is institutional. More specifically, it is the fact that the
EEC presents an attempt to both devise a transnational market framework
for MNCs and, at the same time, a legal framework for their behaviour
within this framework. (30) Breaking down national trade barriers - be
they tariffs, discriminatory product specifications or national
procurement rules - has always been a key EEC priority and reflects the
wider aim of building a multinational market for trade and enterprise
311

from scratch. However, an interventionist vocation in the EEC's major
policy proposing institution, the European Commission, does exist. In
the period 1958-70 this took the form of dismantling obstacles to
market freedom. (31) But by 1970, when the EEC had completed the
elimination of internal trade barriers while fixing a common outer
economic frontier, circumstances and objectives began to change. A
comprehensive programme was drawn up for the transition from Common
Market to Community, involving in particular interventionist social and
regionai policies. ( 3 2) Before this programme was drafted at the Paris
European summit in late 1972 two events influenced the climate of
future EEC policy making. The first was the Arab-Israeli conflict of
October 1973, which created a more defensive, protective and
interventionist climate for EEC policy. The second was that in January
of the same year, the EEC was enlarged to include Britain and this
ensured a slow-down in the movement towards greater political
integration. But by the end of the 1970's European integration had,
from a business standpoint, become equatable less with transnational
market freedoms as with a framework for imposing new transnational
business "responsibilities". (33)
The third factor is political i.e. the gradual politicisation of
the MNC issue by groups operating at a European level especially trade
unions and "socialist" political parties. (34) The multinational issue
also reflects the almost inevitable politicisation of business
decision-making in an economy where a company's relations with
government can be as important as its normal relations with the
traditional market place. Companies themselves, have stepped up their
312

"governmental" departments. In Brussels, company lobbying of the EEC
headquarters reflects the admission by the business world itself that
the conduct of international business is now part and parcel of
politics. Representatives of American companies such as IBM, United
Brands and Ford compete with European rivals like Siemens, Unilever and
Fiat for the ear of the Eurocrat in Brussels. (35 ) Another major force
behind the political activation of the MNCs issue (and not just in
Europe), is the activities of the trade union movement based in the
Common Market countries. The collective strength of national unions is
brought to bear on the EEC via the European Trade Union Confederation
which, like the Common Market, has its headquarters in Brussels. Almost
from the moment of its inception (in 1973), the ETUC has been the
strongest non-governmental supporter of EEC measures designed to curb
international business.( 6) Paralleling the emergence in the mid-
1970's of the ETUC as a major EEC lobby, and the embryonic interest
shown by the European outposts of national political parties, the
business world itself has responded in kind. By the end of the 1970's,
a host of international companies were following the lead of firms like
IBM, Ford, Union Carbide and CPC in setting up high-level "watchdog"
offices in Brussels to monitor Community policy making. Also the
diplomatic presence of "the permanent representative of FIAT to the
European Communities" captures well the growing convergence of public
policy and economic practice in the mind of the business community. (37)
Finally, there is the "national factor" to be considered. This
reflects the attitudes of different governments within individual EEC
member States to business regulation.( 38) The issue is in fact multi-
313

faceted, breaking down into areas like worker participation, job
protection, MNCs employee information - items which are also key policy
focuses in other arenas such as the United Nations and the OECD.(39)
EEC governments, whose say is final on policy formulated by the
European Commission, differ quite markedly in their assessment of the
role of government in the market place. The U.K's current attitude,
for example, clearly reflects its heavy economic stake in overseas
private investment. Along with West Germany, it is a supporter
(together with the USA) of a voluntarist approach to international
regulation. The Italian government also shows great reluctance to
subscribe to arrangements which could injure its chances of increasing
national economic activity via the attraction of international
business. Industry representatives often play key roles in negotiating
MNC - related legislation being prepared by the EEC. (40) In Greece,
the evidence in the 1970's suggests a liberal attitude towards foreign
investment. (41) The presence of multinationals is evident in most
sectors of industry but the "socialist" government in the 1980's
evinced a desire for greater national control within the context of the
European framework for national control of MNCs. (42) Actually, since
1985, the Greek government has violated the EEC treaty, Article 7, and
taxed multinational profits - as reported by the German company Verband
Deutscher Machinenund Anlagenbau (VDMA) to the European Commission. (43)
By the early 1980's there were 260 manufacturing subsidiaries of
foreign-owned MNCs in Greece. The most important subsidiaries included:
in vehicle assembly (Biamax and Steyer), petrochemicals (Ethyl Hellas),
machinery workshops (Kouppas), tyres (Goodyear) and Vegetable fats
(Elais of Unilever) .(44)
21 LI

In the Greek olive industry there are two subsidiaries of
multinational organisations, Minerva of Patterson-Zohonis, and Elais of
Unilever. Unilever is among the 40 largest companies in the world.
The basic products of the company include soap, non-soapy detergents
(NSDs), margarine, cooking fats and oils, frozen and canned foods and
also products such as cattle feed and paperboard. (45) In such an
industry there is little scope for moving components round the world in
search of cheap labour. Moreover, freight on raw materials such as
vegetable oil, animal fats and chemicals to the Lever soap works in
Britain or the Van Den Bergh or Jurgens margarine factories in Holland
is so small in relation to the value of the product that there was no
advantage in manufacturing these products in the tropical countries
from which they came in order to distribute the product throughout the
world. (46) So, the nature of Unilever ensured that it had no incentive
to establish export-oriented subsidiaries round the world as it was
clearly preferable for it to manufacture in its home factories. The
only reason for setting up Unilever subsidiaries - and certainly this
is the case as far as the Greek olive industry is concerned - was the
production and processing of goods for local consumption.
The same line of reasoning holds for the Patterson-Zohonis
subsidiary, Minerva. Minerva was first established in 1906. (47) It
was a family business known by the name of its owner A. Sahpalos.
Until 1965, its activities focused on packaging and distributing
domestically produced olive-oil. After 1965 the company expanded its
internal organisation and included olive residue oil and oil-seed oils
production. In 1971, the company entered margarine and cooking fats

production for the first time. For the production of margarine, corn
seed was imported - mainly from the U.S.A. Minerva became one of the
most profitable - as well as the best known businesses in the olive
industry. (48) In the late 1970's its owner died and the members of the
board of directors decided to sell the company off to the British
multinational Patterson - Zohonis which is based in Manchester. Since
1977, Minerva is 100% controlled by the English multinational as a
subsidiary.
Elais, on the other hand, started out quite differently. It was
established in 1920 by six Greek chemists - not as a wholesaling
distributor company like Minerva - but as a refinery of olive-oil while
at the same time, running an oil-seed oil production plant. (49) In
1947 the company sold branded olive-oil for the first time. Between
1950-1960, production of animal fats and margarine was undertaken by
Elais. In 1962, when Greece signed an agreement with the Treaty of
Rome Unilever became a shareholder in Elais. In 1976, the management
of the company was totally left to Unilever and since 1985, Elais is a
full subsidiary (of Unilever). The two companies, Elais and Minerva
are in competition with each other and their presence in the Greek
olive industry seems decisive. This is because the two multinationals
have a strong tradition of oil-seeds oils, margarine and soap
production, all substitutes or by-products of olive-oil, and they
entered the Greek olive industry in an organised attempt to expand
their markets for these products and so increase their profitability.
Figure 5.2 shows Minerva's sales volume over 1981-1987.( 50) Olive-oil
production increased in 1982 and then, until 1985 there has been a

continuous fall in production accompanied by an increase in oil-seed
oils, olive residue oil and margarine production. From 1985 onwards we
observe a rise in olive-oil production followed by a further increase
in the quantities of its substitutes. Therefore, a diversification of
Minerva's production started in 1981, the year of Greece's accession
into the EEC, when production of oil-seed oils was half of olive-oil.
Since then production of oil-seed oils has more than doubled.
In Elais the same picture appears to hold. There has been a
reduction in olive-oil production between 1982-1985, from 13,000 tonnes
to 10,000 tonnes. (51) By 1988 olive-oil production reached 15,000
tonnes but at the same time, oil-seed oils production rose by far more.
Elais's total annual average production is 55,000 tonnes. Out of this,
30,000 - 35,000 tonnes is oil-seed oils production, 15,000 tonnes is
olive-oil production and up to 5,000 tonnes is soap, margarine and
butter production. (52)Furthermore, what is really indicative of
Elais's line of direction within the olive industry is its involvement
in the early 1980's in a project of land diversification towards oil-
'seed cultivation. This project concerned several thousand hectares of
sunflower-seeds cultivation in northern Greece. Elais rendered
financial help and expertise to certain large producers.( 53) This,
together with other similar projects, resulted in a large increase in
the area under sunflower-seed cultivation: between 1982-1986 it rose
nationally from 4,800 ha to 79,100 ha. (54) This represents a
spectacular rise under any circumstances, and given the traditional
preference for olive-oil among Greek consumers this trend is little
sort of being remarkable.

Figure 5.3 presents a comparison of "profitability" between Elais
and Minerva. "Profitability" has been chosen as an index on the
traditional assumption that the goal of a business is profit
maximization. In this case it is defined as pre-tax profit in
proportion to the magnitude of the company's operations.( 55) We may
observe from this proximate measure of performance that during the
years of intense diversification 1980-1987, profitability has increased
for both. Elais remains the largest and the most profitable of the
two. However, even though they have diversified their production the
two companies managed to maintain their important position in the
olive industry as far as olive-oil production is concerned. It seems
to me, that it is partly due to the reputation they gained in the
olive oil market that they have been able to impose such a rapid
Increase in oil-seed oils supply upon Greek consumers. This issue will
be discussed more thoroughly in Chapter Eight.
EEC rules on competition apply to all industrial sectors governed
by the EEC Treaty, as do the attempts to harmonize national laws and
regulations which could potentially hinder the free movement of goods
between the member States and the attainment of a Common Market. (56)
The operations of the EEC have implications for the business activities
af firms operating in the food sector as for all other European
companies. However, in the case of the former (the food companies),
the operation of the CAP has a major influence upon raw material prices
and also upon the terms and conditions under which processed food
products can be traded across existing national borders.
318

5.2 The C.A.P and Second Stage Processing
The C.A.P has been the subject of much comment and study, but it is
only in recent years that the EEC's own institutions have paid
attention to the impact of the C.A.P on food companies. Reflecting
this, most published studies of the C.A.P have all but ignored the food
industries - although that is now beginning to change. (57) There are
two areas of policy under the C.A.P : price support and structural
adjustment, but it is the former which is more important. This is so
with respect to expenditure and also because price support schemes
govern EEC policy in many different sectors and policy areas. These
areas include : the balance between advantaged and disadvantaged member
States; the EEC's international relations with developed and developing
countries; the viability of the farm sector; and, not least, the food
industries and their consumers.(58)
Concerning second stage processing in the food industries it
appears that on the one hand, price support under the C.A.P involves
, raw materials prices set at relatively high levels (vis-a-vis
international prices). As a result, food companies try to pass on to
their consumers raw material increases through retail prices in order
to maintain acceptable profit margins. On the other hand, the food
companies must be convinced of the desirability of willingly operating
the various C.A.P support mechanisms.
The firms which voluntarily operate the C.A.P are the ones engaged
in first stage processing. That is the processing of agricultural raw
319

materials into products which are themselves eligible for C.A.P support
such as olive-oil, white sugar, butter and so on. (59) The interests of
the farmer and the first stage processor, would seem to be interlinked,
and one might reasonably expect that both would wish to see the
maintenance of a high level of activity in the locally based farming
enterprises. However, any contraction in the farm sector and hence the
level of raw material produced, would affect adversely the business
interests of the first stage processor. On the other hand, the second
stage processing firms are reluctant operators of the C.A.P. This is
because these firms obtain their raw materials from rural areas, (as is
the case for olive-oil) and consequently find that the C.A.P, in
determining the conditions under which products may be bought or
imported, limits their freedom of manoeuvre. Graham referred to the
contraction imposed upon the U.K cane sugar refiners during the 1970's,
which stemmed in part from the exclusion of Australian raws from the
EEC; (60) Locke pointed to the difficulties meat processors face in
obtaining beef of suitable manufacturing quality; (61) and Rees
discussed the change in practice in the U.K milling industry brought
about by the EEC-induced price differential between EEC and third
country wheats. (62) Whether first or second stage processors would
wish to see a lowering of C.A.P support measures and the liberalising
of trade is another issue. Particularly if they believe that high
retail prices affect adversely EEC sales or profitability, or if they
find difficulty in recouping their extra raw material costs in the form
of export refunds on their sales to third countries.
320

In the olive industry, part of the Community's aid scheme paid to
the packers in order to keep their retail price at a level which would
sustain consumption, is the Consumption Aid. The Consumption Aid for
olive-oil has its origins in a decline in consumption which began in
the mid-1970's. Its aim was to maintain the level of consumption
without resorting to a substantial increase in the rate of Production
The aid first came into operation on 1 April 1979. It is
calculated as the difference between the production Target Price
•reduced by the Production Aid, and the Representative Market Price. To
ensure maximum impact on actual market prices, the aid is paid to the
packaging units. (63) Of the estimated total of 1,250,000 tonnes of
olive-oil consumed annually in the Community (chiefly concentrated, in
Italy, Greece and Spain and, to a lesser extent, in France and
Portugal) less than half qualifies for Consumption Aid. While a steady
increase in the oil benefitting from the aid has been registered since
1979, a large percentage of consumption does not qualify for benefit
despite the fact that, in Italy and Greece, the aid amounts to
approximately 25% of the retail price.(64)
The explanation usually offered for this is firstly the traditional
preference of many consumers in Italy and Greece for purchasing the
oil direct from the producer or the mill, and secondly, the significant
amount retained and consumed by producers themselves. Table 5.6
summarises the evolution of expenditure on the olive oil market from
1979. The administrative procedure for the implementation of the aid
is outlined in a General Council Regulation supplemented by
implementing the relevant regulations of the Commission. (65) The main
321

features are that the packaging units must be approved by the national
authorities, and possess a minimum capacity of 6 tonnes per day. They
should also be operational for at least 150 days each year and package
at least 60 tonnes during that period. The oil must be packaged in
containers of 5 lt or 1 lt. The containers must be sealed and have the
identification number of the packaging unit printed thereon. They must
also clearly state that the oil benefitted from Consumption Aid. Such
containers cannot be subsequently re-used.
Member State have instituted a system of supervision in order to
ensure that the olive-oil qualifies for the aid. (66) Where recognised
trade organisations are used to carry out checks the member States
define the manner of their involvement. Their function is to verify,
on the actual premises of the approved packaging units indicated to
them by the member States, that stock records are kept in the
prescribed manner and that the data given in these stock records are
precise. However, these checks do not relieve the authorities of the
member States from undertaking a systematic inspection of the stock
records of the approved packaging units (67)
In Italy the overall responsibility for the administration and
control of the aid lies with A.I.M.A.(68) The Italian authorities have
entrusted the management of the scheme to four organisations which,
between them, represent almost all the packing units in Italy. Two
together represent some 95% (in terms of capacity) of the packaging
units. One of the small organisations also acts on behalf of oil

producers and is, in fact, the largest of the four organisations
recognised for the pur: .ose of the Production Aid scheme. There is
competition for membership among the four recognised organisations.
The tasks assigned to them are contained in an agreement drawn up
between them and A.I.M.A. The main tasks include the verification of
the quantity of oil packaged and put on the market and qualifying for
aid; the presentation of a summary application for all the firms which
they represent together with the receipt of the amount of the aid; the
distribution of the aid (net of retention) to the units entitled to it;
and the carrying out of controls in the packaging units as provided for
by ministerial decrees. Requests for recognition by packaging units
are investigated on the spot by the Guardia di Finanza (acting on
behalf of the Ministry of Industry). (69) In 1982, 503 units were
recognised and in 17 cases recognition was withdrawn. According to
information supplied by the Italian authorities, during the course of
1982 visits were made to almost all the firms, during which some 3,000
monthly applications for aid, out of a total of 3,700 were verified.
By the end of 1983, a total of 38 administrative sanctions had been
imposed for irregularities in the keeping of stock records and 8 for
excessive applications for aid. Sums wrongly claimed amounting to
74,000 ECU (127 cases) were in the course of recovery.( 70) In four
cases, recognition was withdrawn for periods varying from 3 to 12
months as a result of unjustified applications, and 33 proceedings had
been instituted in the courts, of which about half emanated from
controls performed independently by the Guardia di Finanza and other
State agencies. Despite these findings not a single case of fraud or
even of irregularity pertaining to Consumption Aid has been notified to
323

the Commission under Regulation (EEC) No. 283/72.(7 1) In view of the
data supplied to the Court of Auditors by the Itali an authorities
relating to the results of its inspection activities, this is
surprising - to say the very least. It appears that the Community
chooses not to take an active role in ensuring the enforcement of this
regulation. It seems to me that this issue can be more appropriately
looked at from a political perspective. Considerations should take
into account the power structure of the Italian olive industry within
the national polity and its domination by interests of criminal
organisation including the notorious MAFIA.
In the Greek case, Consumption Aid was introduced under the
provisions of the Act of Accession, from 1 November 1981. As in the
case of Production Aid the rate of Consumption Aid was gradually
aligned to the Community rate as follows:(72)
1980/81 and 1981/82 one fifth of the full rate.
1982/83 approximately 38% of thefull rate.
1983/84 approximately 58% of thefull rate.
From 1 November 1985 the full rate was applied. The Greek intervention
agency (YDAGEP) has overall responsibility for the administration and
control of the aid. Two trade organisations, namely SEVITEL and
ESVITEL, have been recognised but firms not represented by them may
also apply directly for the aid to YDAGEP. (73) In 1989 there were 160
firms who were members of the two trade organisations - approximately
80 firms in each. Verification of the applications is carried out by

YDAGEP officials and by regional inspectors of the Ministry of
Agriculture. In all approximately 60 officials are involved although
their duties are not confined to control of the Consumption Aid. The
Greek authorities indicated that control visits are undertaken on a
monthly basis in the case of the large packaging firms, but much less
frequently in the case of smaller firms.(74) It was stated that the
verification work centres essentially on a reconciliation of physical
stocks with the stock records. Controls on packaging material and the
taking of samples for analysis are also carried out. However, no
evidence for extensive control was found on the supporting vouchers
examined by the Court of Auditors in l985.(75)
As EEC agricultural output has continued to expand, with very much
slower increases in consumption, the level of self-sufficiency has
increased. This has involved a reduction in imports and an expansion
of exports of C.A.P goods. (76) Hidden within these global changes,
national self-sufficiency rates and import-export balances may well
have developed according to different patterns partly because of
different price levels supported by the MCA System and the payment of
State aids. (77) To what extent these changes are simply due to a
supply response as a result of EEC and national policies for
agriculture, or to unforseen implications deriving from the operation
of the C.A.P for the food industries, or as a consequence of the
relative, efficiency of the national food industries, is an empirical
question which has yet to be investigated. There can be no doubt
however that the C.A.P is an important influence in the shaping of
national supply responses.
325

Rees, for example, has pointed out the increasing dependence of the
U.K grain market on exports. He refers to the "fortuitous combination
of MCAS, market prices and export refunds" and the availability of
export credits, that condition the activities of business oriented
firms. (78) Some C.A.P policy changes may be country specific; others
will affect industries right across the Community - as for example the
suspension of the advance payment of export refunds in late 1983 due to
the financial (budgetary) crisis faced by the Community. A similar
case would occur if the EEC were forced by GATT to reduce the payment
of export refunds on processed food products. Export dependence bears
direct effects on the businesses operating in the olive market. Export
refunds and MCAs are features of the olive export market and changes in
their magnitude have adversely influenced olive-oil exports of member
States. The effect on the exports of the Greek second stage processors
will be discussed in Chapters Seven and Eight of this Study.
Further problems with the C.A.P arise when its support mechanisms
embrace only a section of the market - being commodity specific the
market regimes tend to cut across market segments and hence lead to
distortions. For example, the butter and margarine prices are
influenced in quite different fashions by C.A.P. Similarly, seed-oils
and olive-oil prices are influenced in such a way that certain seed-
oils are priced only as little as one third of the olive-oil prices.
In addition, a managed market is, by its nature, subject to
administered change which may be difficult to foresee, and therefore
difficult to guard against. Changes in the direction of policy,
326

basically undertaken at the behest of the Council, may involve the
level of price support. Changes in detail, often with major
implications for the firms concerned, are more likely to be the result
of the Commission's action - for example the level of export refunds.
All firms operating in the food industries obviously need to watch for
changes in policy, levels of refunds, MCA, etc; and this may well mean
that small firms are unable to engage in intra-Community, let alone
extra-Community trade because of the burden it would impose on scarce
managerial and information - gathering resources.
It appears therefore that the C.A.P price support scheme directed
towards the second stage processing, can have a decisive influence upon
the firms involved by shaping the trade environment. As will become
evident in Chapter Seven, the firms operating in the second stage
processing of the Greek olive industry rely for their survival on the
C.A.P price support scheme. However, parallel to the price support
scheme operations, there is the structural arm of EEC policy which, in
the context of CAP, is directed towards the improvement of marketing
and. processing facilities of second stage processors in the olive
producing member States.
5.3 Structural Similarities and Differences between OliveProducing Member States
The structural arm of the C.A.P was developed in the late 1960's in
the context of the Mansholt Plan. (79) Its aims were to reduce pressure
by promoting the improvement of agricultural structures, and by the
modernisation of farms. Also there was EEC Regulation 355/77 which
327

aimed at improving marketing and processing facilities. The structural
policy was therefore directed at individual farming units to speed up
modernisation and efficiency and so enable the market support system to
be geared towards the more viable units. Indirectly the increased
efficiency and size of farms was expected to lead to the olive industry
acquiring better quality supplies at a lower unit price than might
otherwise have been the case.
In the second stage processing of olive-oil aid was given through
E.A.G.G.F for the technological modernisation of the units. This was
aimed at improving performance and transforming the old structures to
new more competitive ones in anticipation of the 1992 economic union of
the member States. The three largest producer countries of the
Community, Italy, Spain and Greece have quite different production
structures at the second stage processing and, this fact, in the
context of the C.A.P, has several important consequences for the
present (and future) of the individual olive industries in terms of
their competitiveness.
In the case of Italy oil is currently refined and blended in some
74 units, 35 of which are located in the south, 16 in the centre and 23
in the north. (80) However, the production capacity of the 23 northern
units is nearly 60% of the total as against 20% each in the south and
the centre. Olive residue oil is produced in 141 units, 106 of which
are located in the south, 25 in the centre and 10 in the north. In
considering the market shares of the different brands, only about 35%
of total olive-oil consumption is branded and sold through retail
328

Virgin Oil Other Olive-Oil
Manufacturer Brand % Share Manufacturer Brand % Share
Carapelli Carapelli 7 Alivar Bertolli 20
Erba Sagra 4 Sasso Sasso 12
Alivar Bertolli 3 Costa Dante 10
Costa Dante 2 Others 58
Others 84
outlets. The market shares that follow refer solely to branded
products.
Table 5.7: Market Shares of Leading Brands of Olive-Oil. 1979 (% ofX21012)
Source: Special Report No.2. "Edible Oils in Italy'. Marketing inEurope, 224, July, 1981.
We observe that even the leading brands of olive oil do not occupy
large market shares as far as virgin oil is concerned. On the other
hand, we can observe a considerable degree of concentration in the
market for refined or lampante olive-oil so that the three leading
brands have 42% of the market.
More recent information puts the total number of first and second
stage processing units in Italy at 2,200, of which only 475 are
recognised for Consumption Aid. (81) This number though is continuously
changing as more and more units are added. In 1980, there were 398
329

cooperative units in the industry which processed 10% of the total
Italian production and accounted for 163,763 members. The production
structure in the Italian second stage processing has not changed
significantly since 1979. It is dominated by large company groups
which run huge organisations at the national level. The largest group
is Alivar which has some State involvement. (82) The largest private
company group is Costa with smaller and medium size companies
following. So, the production structure in the olive industry of Italy
can be broken down into three parts.
The first consists of the large companies such as Alivar, Costa,
Gruppo Oleario and Carapelli with branches at the national level
selling highly priced branded oil, and spending large sums of money on
advertising. The second part consists of medium sized companies which
specialise by region, do not produce branded oils and their prices are
generally lower. The third part includes small companies restricted to
local consumption with the lowest prices; they base their sales on
oils coming from specific regions of the country. (83) The large
companies are mainly involved in the refining of the olive oil and the
largest four account for no less than 50% of the market share. But as
far as the production of Extra Virgin oils is concerned the market
share of the largest four is only 14-16% and therefore there is plenty
of scope for smaller companies. (84)
In the competitor industry of seed and vegetable oils, production
is much more concentrated as these are now produced upon an almost
exclusively industrial basis. (85)The Italian seed oils industry
330

consists of 94 oil extracting companies with a total average production
capacity of 780,000 tonnes. The capacity of the 51 companies involved
in refining is 760,000 tonnes. However, both industrial sectors are
reported to be working at well below capacity : 58% and 63%
respectively. The seed and vegetable oil industry is concentrated in
the north, with 86% of the pressing units and 55% of the refineries
located there. The market leader for seed and vegetable oils is Chiari
e Forti, Star ranks second and Unilit is third. (86) However the
positions of the major suppliers vary considerably in different
sectors. Thus, for sunflower oil, Chiari e Forti's Guore brand leads
with a share of over 50% of the sales volume; Van den Bergh (Unilit)
has a 15% market share with the Maya brand, and De Rica has a 6-8%
share with Maiss,. The market leader for peanut oil is Costa's Oio
brand with a 40% share. Table 5.8 shows the market shares of leading
brands which, although they might vary from year to year, generally
have held their position to date.
331

Brand
Topazio, Guore
Olita, Desy
Gradina, Maya, Sol
Oio, Sico
Maiss, Mare
% Share
20 - 22
14 - 16
12 - 14
7
5
36 - 42
Manufacturer
Chiari e Forti
Star
Unilit
Costa
De Rica
Others
Table 5.8: Market Share of the Leading Brands of Seed and VegetableOils. 1979 (per cent of volume)
Source: Special Report No.2 "Edible Oils in Italy". Marketing inEurope, 224, July, 1981.
Looking at the ownership of the largest companies in the Italian
oil seed sector it appears that at least one of them is a subsidiary of
a multinational. Unilever owns Unilit in Italy just as it owns Elais
in Greece. Unilit is located in Milan and is 100% owned by the
Unilever group.( 87) It was set up in 1979 through the merger of Van
den Bergh and Lever Gibbs, founded in 1928 and 1965 respectively. The
company has now four divisions : Lever manufactures detergents; Van den
Bergh's division produces food products; Eliba Gibbs produces
toiletries; and Atkinson is involved in perfumes and toiletries. In
addition to the plant in Milan (which employs 3,500 people), the group
has three other plants with a total workforce of nearly 2,000 people.
The Van den Bergh division is located in Crema and operates a plant of
48,000 square metres with 637 employees. It manufactures the Maya, Sol
and Gradina brands of seed and vegetable oil; margarine, for which it

is the market leader with the Gradina, Maya and Roma brands; cheese,
with the brand Milkana; and Calve mayonnaise which is estimated to
command a 50% share of the market (88) . So, while in Italy, Unilever
flourishes in the seed-oils sector, in Greece it retains a leading
position in the olive industry while, at the same time, spending huge
amounts on advertising and is consciously preparing the market for an
increased off take of oil-seed oils production.
The other largest competitor member State is Spain. The production
structure of its industry may be gleaAed from Figure 5.4•(89)
According to M.A.P.A, the number of refineries in Spain is currently
around the 150 mark. From information collected by the National Oil
Refiners' Association 37% are also extractors and 32% are also packers.
The highest density of refineries occurs in Andalusia. Both private
and national capital are present to a significant degree in the sector,
although companies funded by foreign capital are particularly
noticeable in production in the seed-oils sector. (90) As regards
company size, there seems to be a current surplus of installed refining
capacity and little uniformity in the technological level of the
refineries. Small and medium sized companies with reportedly obsolete
installations and inadequate technology appear to coexist alongside
companies using the latest technology and whose capacities make them
the major producers in the sector. Oil is supplied for refining by the
companies, either from their own extractors or by firm acquisition from
other extractors. So, 16.5% of this oil is self-supplied and 83.5% is
purchased from third parties. (91) The production policy followed by
refining companies focuses on the diversification of the range of
333

products treated so as to avoid stationary periods in production. Some
plants, however, do specialise in refining a single type of oil be it
olive, sunflower or fish oil and animal fat for manufacture or
margarine. Once refined oils have been obtained, the usual practice is
to channel them to the refineries' own packing units : or they are sold
for cash payments, being transported by the buyer or other packers.
Sometimes too they are sold off to manufacturers of preserves and other
allied branches of the food industry. (92)
Packers focus their activities on a variety of edible vegetable
oils. The processes carried out in the packing plants include mixing
of virgin oils with refined oils to obtain pure olive oils; filtration
of virgin oils; and packing oils according to standards laid down in
the relevant Technical Health Regulations. Data from the National
Association of Food Packers for 1986 gives the number of packers as
approximately 200. Since the 1968 Census gave a number of 600, it
appears there has been a clear drop in the number of units.(93)
According to M.A.P.A, 41.2% of the packers are located in Andalusia,
13.6% in Catalonia and 12.9% each in Valencia and Castile-La Mancha.
The private sector controls 53.6% of the packing plants, another 35.7%
is controlled by corporations and 10.7% by cooperatives. The share of
the market controlled by companies with foreign-held interests is
significant, amounting to 340 94) Packing plants are supplied by
refineries and extractors, the latter furnishing virgin olive oil.
When not supplied by their own plants, packers buy from others, in
which case an agent commonly intervenes, receiving a commission of
around 3%. Packers sell mainly on the domestic market, the most

important sales to foreign countries being those of olive-oil. Among
the companies that concentrate upon the domestic market, a distinction
can be made between those marketing their products at a nationwide
level and those whose market is restricted to a single region or
district.
The competitive sector of vegetable oil extractors consists of
units who engage in the crushing and extraction of vegetable oils other
than oliva-oil. (95) They are mainly involved in treating soya oils
and, to a lesser extent, olive residue, grape pip and maize oils. On
receiving the seeds, these are subjected to a drying process and then
cleaning, after which a dehusking process may or may not take place
according to the case in question. The resulting mass is heated,
pressed and loaded into the extractor, from which the oil is obtained.
To estimate the number of companies operating in this sector of the
processing industry, it is necessary to consider those whose "main"
activity is the extraction of a particular type of vegetable oil. The
sector is made up of seven companies extracting oil from soya, having
a total of 10 extraction plants between them. In all cases they are
located in ports. The companies that extract sunflower oil number 30,
among them are the seven soya oil extractor companies. Eighteen of
them (60 percent) are situated in Andalusia.(96)
M.A.P.A's Census includes a total of 136 companies extracting
olive residue oil, 98 of which are in Andalusia. In the 1984/85 crop
year, seven companies concentrated on oil extraction from safflower
seeds and four companies were active in crushing and extraction of

rapeseed oil. Capital is mostly in private hands. There are only two
companies in this sector where public capital has been invested - a
soya extractor and a sunflower extractor. Contrary to the position in
the milling sub-sector, there has been significant investment of
foreign capital in extraction. The commercial company predominates
(while in oil mills is the cooperative sector which is hegemonic), with
the exception of residue oil, where the holders of extraction companies
comprises both cooperative companies and individual employers.(97)
There are variations in extraction and crushing capacity among the
units. Soya extractors have the greatest capacity, followed by
sunflower. The companies themselves also show a considerable degree of
variation in technological level. Those involved in soya extraction-
who also work in sunflower extraction - possess advanced facilities.
Well behind these are the firms extracting olive residue, sunflower and
cotton oils. The latter therefore, will have to undertake the
necessary investment or many of them will disappear in the medium term.
As far as supply arrangements are concerned, they vary according to
seed type. (98) Soya extractors therefore, are supplied by imports of
soya bean, and soya cake that has not been defatted. To obtain olive,
grape pip and residue oils, the relevant by-products are purchased
(olive residue and grape pips) from oil mills and wine making cellars.
Cotton is acquired from cotton mills and other seeds (sunflower,
safflower, rapeseed), are supplied by farmers or their cooperatives.
In this sub-sector seed purchases are made directly by extractors and
not through brokers.
336

It appears, that in both countries there is a strong multinational
presence in their respective olive industries while cooperative
ownership is modest 10-11%. Also their oil-seeds industries are highly
concentrated, and largely controlled by foreign interests. The main
difference in their production structure is that in the Spanish second
stage processing 37% of the refineries are also olive-oil extractors.
This implies a relatively lower production cost due to the advantages
available through vertical integration. Italy, on the other hand,
appears to retain the traditional division between first stage
processing (oil-mills) located in rural areas and second stage
(refiners, packers) situated in urban centres. The structure and
organisation of the second stage processing of olive-oil in Greece will
be examined in Chapters Six and Seven.
5.4 Cross Section Price Comparisons between Italy. Spain andGreece
Given the production structures of the three largest producer
countries in he EEC, a cross-sectional study was undertaken in an
attempt to shed some light on the important features of each country's
industrial production of olive-oil. The aim was to identify the
implications of the EEC price policy for the domestic markets of the
three countries Detailed olive-oil price data was used for the years
1984/1985.( 99) Table 5.9(a) presents relative prices among the
different quality categories of olive-oil in Italy, Greece and Spain.
It is apparent that Italy shows the largest discrepancy for Lampante
(i.e. 90%) and Extra (i.e. 156%) from the intervention price of

Courante. Greece shows a medium discrepancy (Lampante 94% and Extra
129%). Spain has essentially the same prices for all categories of
olive-oil. All prices in Table 5.9 are expressed in ECU and divided by
the intervention price of Courante (i.e. 232 ECU for 1984/85). The
purpose of these comparisons is to reveal the price spread in the
domestic olive-oil market of Greece, Spain and Italy having taken out
the influence of currency fluctuations. Another important feature of
Table 5.9(a) is the price of Refined Olive Oil. In Italy it is at the
same level as Courante. In Greece the price is close to that of Extra,
while in Spain it is even more expensive than Extra. If the price of
the Refined olive-oil is compared to the raw material (Lampante) we can
observe that in Italy and Spain Refined is 14% and 11% respectively
more expensive than Lampante. However, in Greece it is 33% more
expensive. This fact is further supported if we compare the price of
Refined olive residue oil and unrefined olive residue oil. In Italy
and Greece the Refined is 44% and 33% respectively more expensive than
the unrefined while in Greece it is 87% more expensive. It therefore
seems clear that the costs of refining in Greece are the highest among
the competitor producer countries.
Table 5.9(b) shows price deviations for different olive-oil
categories from their corresponding prices in Italy. Prices are
expressed in ECU/100 kgr. Italy has the highest prices for Extra,
Fine and Olive Residue Oil. Greece, on the other hand, has the highest
prices for Courante, Lampante and especially Refined. Spanish prices
are especially low for the Extra and Fine category, indeed they are
less than half of the Italian. If we then express the above prices in
338

drs, (see the parentheses in Table 5.9(b)) we observe that Italy has
higher prices than Greece in all categories of the Unrefined oils.
Greece, however, has higher prices for the Refined Olive-oil and Olive
Residue Oil.
Figures 5.5-5.11 show a comparison of average producer prices in
1984/85 for different categories of olive-oil in the three member
States. They were derived from Table 5.10 and support the proposition
that production costs in the refining part of the Greek olive industry
are the highest of the three. This state of affairs should not be seen
as a isolated phenomenon within the Greek industrial structure. It is
rather indicative of the generally lower level of development of
productive forces compared with that of a more industrially advanced
country such as Italy.
Unlike the situation in Greece and in Italy, Spanish olives are
usually cultivated in vast areas : they are harvested in bulk and
crushed in large scale oil mills which usually belong to cooperatives.
The ail obtained is usually processed there. This way of bulk
production and processing keeps costs below the levels of Greece and
Italy. Hence the observation that Extra and Fine olive-oil is cheaper
in Spain than the other member States.(100) In Italy and Greece the
situation is very different in that olives are primarily cultivated in
regions where no other crops are possible and where the disappearance
of olive cultivation would mean not only social but also ecological
deterioration.

A final observation which we may derive from Figure 5.12 is that in
Italy and Spain the Price of Refined follows the price of Lampante-
while this is not the case in Greece. There has been a continuous
increase in the price of Refined Olive-oil in Greece. This suggests
that its competitiveness in a free trade environment, within the
European Community will be seriously impaired.
Conclusions
In this Chapter I have attempted to identify the main features of
the environment within which the Greek second stage processing of
olive-oil has operated since 1981. The discussion of EEC price policy
and that of restructuring may help us to understand the external forces
behind recent developments in this part of the Greek olive industry.
It is true that most of the second stage processing, involving the
production and processing of olive-residue oil, and refined olive-oil
as well as branding and packing of virgin oils - has been placed under
the CAP, in terms of both, its price support scheme and the structural
arm of the policy. Nevertheless, it is the structure and organisation
of packers which have been most affected - to the extent that the
entire operation and outlook of the sector has been transformed. It
has been argued that Refined olive-oil in Greece has a higher
production cost compared with other countries, while Extra is cheaper
than Italy's but more expensive than Spain's. This reflects different
modes of organisation of production and different industrial structures
amongst the major producer States. It also directly impinges upon the
question of competitiveness if national production levels are to be

maintained - given the free trade regulations between EEC member
States. In the following two Chapters (Six and Seven) the organisation,
structure and financial performance of the Greek second stage
processing sub-sector are investigated.

REFERENCES
1. See "Food and Drink" in Panorama of EC Industry, Chapter17, p.17-1. Commission of the European Community, 1989.
2. Ibid., p.17-2.
3. According to a report on the U.K food industry it has beenshown that "in the top 100 grocery markets,.., the two mainmanufacturers in some 70 of these markets have more thanhalf the market between them. In just over 60 of thesemarkets, one manufacturer alone holds a share of over 40%".D. Churchill, "Britain's Retailing Industry : The Battle ofthe Margins". Financial Times, March 27, 1984.
4. See Panorama of EC Industry, 1989, op.cit, p.17-3.
5. See "Research on the Cost of non-Europe", Basic Findings,Vol.12 Part A, in: The "Cost of non-Europe" in theFoodstuffs Industry, Commission of the EuropeanCommunities, 1988 p.38.
6. Ibid., p.39.
7. Ibid., p.42.
8. See "Commission's Programme for 1990. Address by JacquesDelors, President of the Commission, to the EuropeanParliament and his reply to the debate". Strasbourg, 17January and 13 Febraury 1990. Bulletin of the EuropeanCommunities, Commission of the European Communities,Supplement, 1/90 p.18,19.
9. See "Vegetable and Animal Oils and Fats" in Panorama of ECIndustry, Commission of the European Communities, 1989,p.17-8.
10. Ibid.,
11. Ibid.,
12, See Panorama of EC Industry, 1989, op.cit, p.17-10.
13. Ibid.,
14. See A. Kiritsakis, The Olive Oil (Thessaloniki, 1988) p.275and Olivae, various issues, I.O.O.C, 1975-1985.
15. See Enimerotico Deltio, SEVITEL, August 1987.
16. See Leslie Hannah, The Rise of the Corporate Economy,(London, 1976).

17. See A. Teichova, "Multinationals in Perspective" inMultinational Enterprises in Historical Perspective, editedby A. Teichova, Levy-Leboyer and E. Nussbaum, (Cambridge,1986).
18. Ibid.,
19. Transnational corporations in World Development : A re-examination, U.N Economic and Social Council, Commission onTransnational Corporations (New York, 1978).
20. Ibid., and Transnational Corporations in World Development,Third Survey. United Nations Centre on TransnationalCorporations, 1985.
21. See Horst Heininger, "Transnational Corporations and theStruggle for the Establishment of a New InternationalEconomic Order", edited by A. Teichova, Levy-Leboyer and E.Nussbaum, Multinational Enterprises in HistoricalPerspective, (Cambridge, 1986).
22. See Verena Schroter, "Participation in Market Controlthrough Foreign Investment : IC Furbemindustrie AG in theUnited States : 1920 - 1938" in : Multinational Enterprises in Historical Perspective, (Cambridge, 1986).
23. See H. Heininger, 1986, op.cit.
24. OECD, Industrial Policies, "Development and Outlook in OECDCountries", (Paris 1986).
25. See Economicos Tahidromos,+ 23 March, 1989 p.62.
26. Ibid.,
27. Transnational Corporations : Views and Proposals of Stateson a Code of Conduct, U.N, 30 December 1976 (E/C. 10/19)and Survey of Multinational Enterprises, EuropeanCommission, July, 1976.
28. See "A Community Strategy to Develop Europe's Industry",Commission of the European Communities, Brussels, 23October 1981.
29. Ibid., and "Multinational Undertakings and the Community",Commission Communication to the Council of 8 November 1973,COM 1973.
30. "Transnational Corporations : Views and Proposals of Stateson a Code of Conduct", U.N, 30 December, 1976 (E/C. 10/19),and "A Community Strategy to Develop Europe's Industry".Commission of the European Communities, Brussels, 23October, 1981.
343

31. See Bulletin of the European Communities, 1969, Commissionof the European Communities, 1969.
32. Ibid., 1972.
33. . Ibid., 1983.
34. See " A Community Strategy to develop Europe's Industry",Commission of the European Communities, Brussels, 23October, 1981.
35. See H. Heininger, 1986, op.cit,.
36. Ibid,
37. See "A Community Strategy to develop Europe's Industry",Commission of the European Communities, Brussels, 23October, 1981.
38. Davignon interview from "Multinational Service" inMultinational and Political Control, edited by J. Robinson,1983.
39. See OECD, Industial Policies, "Development and Outlook inOECD countries", Paris, 1986.
40. Ibid.,
41. See Evgenia Docopoulou, "Technology Transfer to the EECPeriphery" in : Industrial Change in Advanced Economies,edited by F.E. Ian Hamilton, 1987.
42. Ibid.,
43. Economicos Tahidromos, 23 March 1989, p.62.
44. See E. Docopoulou, 1987, OP.Cit.,
45. See D. Fieldhouse, Unilever Overseas, (London, 1978).
46. Ibid.,
47. Evidence obtained through interview, with Mr. VasilopoulosHead of the Supplies Department of Minerva, Minerva, March,1988.
48. Information obtained by the Ministry of Commerce.Interview with Mr. Y. Kotsis, 1989. Also from Eleourgilki,Interview with A. Kiriakoulakos, Department of Supplies,1988.
49. Evidence obtained through interview with L. Melas, GeneralDirector Elais, March, 1988.
344

50. Minerva, Department of Prices and Output, ConfidentialRecords, March 1988.
51. Ministry of Agriculture (YDAGEP). "Packers and Amounts ofolive-oil, 1982-1985, which have been granted theConsumption Aid", 1989.
52. Elais, Department of Supplies, Interview with Mr.Daskalakis, March, 1988.
53. Evidence obtained through interview with L. Melas, theGeneral Director of Elais, March 1988 and A.Kiriakoulakos, Department of Supplies, Eleourgiki, 1989.
54. Cotton Organisation, "Production of oil-seeds and oil-seedoils during 1982-1986", Athens, 1988.
55. Derived from Published Balance Sheets of the Companies,Elai's and Minerva, 1980-1987. There are variousdefinitions of profitability which can be derived frombalance sheet information. For a review see J. D. Blake,The Concise Guide to Interpreting Accounts. (London, 1989)p.23-30.
56. Bulletin of the European Communities, Commission of theEuropean Communities, 1989.
57. See J. A. Burns, "The U.K Food Chain with ParticularReference to the Inter-Relations between Manufacturers andDistributors". Journal of Agricultural Economics, XXXIV(3)p.361-378, 1983.
58. See J. A. Burns, J. P. McInerney and S. Swinbank (ed).Economics and Policy in the Food Industry : A Summary ofthemes, (London, 1983).
59. Ibid.,
60. See J. W. L. Graham, "Sugar and Sweeteners" in The EEC andthe Food Industries, edited by A. Swinbank and J. Burns,(London, 1984).
61. See A. Locke "Meet processing in the EEC" in : Ibid.
62. See F. T. Rees, "The EEC and the UK;'s Cereals ProcessingIndustry" in : ibid.
63. Regulation (EEC) No. 3089/78, 0.J. L 369, 29/12/1978 p.12.
64. ibid
65. Regulation (EEC) No. 3172/80, O.J. L331, 9/12/1980, p.27.
345

66. See "Special Report of the Court of Auditors" 0.J, C134,Vol. 28, 3 June 1985, paragraphs 5.1-5.12.
67. Ibid.,
68. Italian State Intervention Agency acting under the generalauthority of the Ministry of Agriculture and Forestry.
69. "Special Report of the Court of Auditors" O. J. C134,Vol.28, 3 June 1985, paragraphs 5.13-5.24.
70. ibid.,
71. Regulation (EEC) No. 283/72, 0.J. L520, 3/10/1972, p.26.
72. Ministry of Agriculture (YDAGEP). Information onConsumption Aid rates granted to Greece by the EEC until1985.
73. Until 1986 there was only one trade organisation of Greekpackers, SEVITEL. In that year half of the packersrepresented by Bro Kefalea Company - one of the largestpackers based in Messenia - broke away mainly because theyresented administrative charges by SEVITEL. They formed anew recognised trade organisation called ESVITEL.
74. Ministry of Agriculture (YDAGEP), Interview with E.Bazyioti, March, 1988.
75. "Special Report of the Court of Auditors", 1985, op.cit.
76. See I. Bowler "Some consequences of the Industrializationof Agriculture in the European Community" in: TheIndustrialization of the Countryside, edited by M. J.Healey and B, W. /lbery, (Norwich, 1985).
77. The system of MCAs (Monetary Compensation Amounts) wasintroduced by the Community in the 1970's in order tooffset the difference between the "green rate" and the realexchange rate. See G. N. Minshull, The New Europe : AnEconomic Geography of the EEC, (Kent, 1985) p.123.
78. See F. T. Rees, "The EEC and the U.K's Cereals ProcessingIndustry", in : The EEC and the Food Industries, edited byA. Swinbank and J. Burns, 1984.
79. The Mansholt plan, published in 1969 by the thenCommissioner for agriculture was the first attempt to solvethe problems of fragmentation, small and unviable farms,high-cost production and commodity surpluses. See G. N.Minshull, 1985, op.cit, p.122.
80. Special Report No. 2. "Edible Oils in Italy". Marketing inEurope, 224, July, 1981.
346

81. "Special Report of the Court of Auditors", 1985, op.cit.
G. N. Protonotarios. "Survey of the Italian Olive-OilMarket". Commercial Advisor's Office, the Greek Embassy inRome, January 1985.
83. ibid.,
84. Special Report No. 2 "Edible Oils in Italy". Marketing inEurope, 224, July, 1981.
85. ibid., and Dr. M. Guida, "Fats and Oils in Italy" Speechgiven in the Annual Conference of the IFMA-IMACE. Rome,May, 1984.
86. Marketing in Europe, 1981, op.cit.
87. ibid.,
88. ibid.,
89. J. L. Gonzalez-Burgaleta, "Commercialization of Fats andOils in Spain", Olivae, V Year, No. 21, I.O.O.C, 1986.
90. ibid.,
91. ibid.,
92. The exact amount sold to manufacturers of preservatives hasnot been possible to obtain in the Spanish case, but inGreece it does not exceed 3% of total olive-oil productionin any year.
93. The 1968 Agricultural Census is compiled by M.A.P.A, theSpanish Ministry of Agriculture, Fisheries and Nutrition.Olivae, V.-Year, I.O.O.C, 1986.
94. This percentage is the highest among the olive industriesof the EEC olive producing countries.
95. Special Report No. 2 "Edible Oils in Italy". Marketing inEurope, 224, July, 1981.
96. ibid.,
97. ibid.,
98. ibid.,
99. SEVITEL, Enimerotico Deltio,+ various issues, 1986, 1987and Eleourgiki,+ No.3, 1985.
347

100. This feature of the Spanish olive-oil production, putsSpain in a better competitive position from either Greeceor Italy in a free trade environment.
348

Table 5.1: Employment in the EEC's Food and Drink Industries (EEC 9)
Numbers Employed1 (1,000), 1978
By Industry By Country
Milk ProcessingMeat ProcessingBreweriesBakeries2
257.2314.5197.2405.7
Fruit and Vegetable 149.7 Belgium 79Processing
Cocoa, Chocolateand Confectionery
211.2 Denmark 67
Sugar 63.9 West Germany 510Oils and Fats, Margarine 49.1 France 410Beverages (other thanwine) 77.9 Ireland 55Winemaking 97.1 Italy 237Tobacco 115.3 Luxembourg 2Feedingstuffs 88.4 Netherlands 132Various 3 173 U.K 709
Total 2,201 Total 2,201
Notes: 1. Persons working for firms with 20 or more staff.
2. Including the processing of grain and themanufacture of past products.
3. Starch products, coffee, tea, spices, preservedfish and seafood products.
Source: Commission, 1983, pp.30,32
349

Table 5.6: Budgetary Expenditure on Olive Oil. 1979 to 1984
(In ECU)
Title 1979 1980 1981 1982 1983 1984
(a) Export Refunds 2,9 8,8 9.7 24.0(b) Production Aid 237.9 274.3 254.9 393.8 513.0
357.8(b) Consumption Aid(d) Deductions for
52.3 105.7 152.41 221.61 250.01
Specific Consumption n. a. -3.6 -3.4Measures(e) Net Aid (b)to(d)(f) Specific
357.8 286.6 376.6 407.3 615.4 763.0
Production n.a. n. a. n.a. 2.6 13.8 11.0Measures (olivecultivationregister etc)(g) SpecificConsumption Measures(information)(h) Cost of Publicand Intervention
n. a.
22.6
0.2
20.5
0.3
51.0
2.8
56.3
0.2
12.2
6.0
37.0
Storage(i) ProductionRefunds for Olive 7.8 10.6 11.9 15.3 23.9 22.0Oil Used in theManufacture ofPreserved Fish andVegetables
(j) Total 388.2 317.9 442.7 493.1 675.3 863.0
Notes:
Source:
1. From 1982are shown
lOfficial Journa
onwards, the figures for consumption aidnet of deductions.
of the European Communities, C134, Volume28, 3 June 1985.

TABLE 5.9
(a) RELATIVE PRODUCER PRICE INDICES FOR OLIVE OIL: INDEX PRICE— 100, THE EEC INTERVENTION PRICE FOR COURANTE 1984/85
ITALY GREECE SPAIN
Extra 156 129 59Fine 126 113 59Courante 103 106 58Lampante 90 94 56Refined 103 125 62Index — 100 price LAMPANTE 114 133 111Olive Residue Oil 49 44 36Refined Olive 71 82 47Residue OilIndex — 100 price UNREFINED 144 187 131
(b) RELATIVE PRICES OF OLIVE OIL : INDEX — 100, THECORRESPONDING PRICE IN ITALY FOR 1984/5; PRICES AREEXPRESSED IN ECU/100 Kgr.
ITALY GREECE SPAIN
Extra 100 83(76)1 38(38)Fine 100 90(82) 47(46)Courante 100 104(94) 56(61)Lampante 100 105(95) 62(61)Refined 100 122(111) 60(60)Olive Residue Oil 100 90(83) 73(74)Refined Olive 100 116(105) 66(66)Residue Oil
Notes: 1. Prices expressed in drachma/kgr.
Source: Table 5.10.

Courante Olive-Oil Lampante OliveOil
Refined Olive-Oil Olive ResidueOil
TABLE 5.10
COMPARISON OF AVERAGE PRODUCER PRICES 1 DURING 1984/85 INITALY. GREECE AND SPAIN
Extra Olive-Oil Fine Olive-Oil
Italy 363 293
Greece 301.5 264
Spain 137 137
Italy 238.9 210
Greece 247.4 219.8
Spain 134 130
Italy 239.5 114.8
Greece 291.6 102.9
Spain 144 84
Refined Olive Residue Oil
Italy 165.8
Greece 192.2
Spain 110.2
Notes:
1. Prices are expressed in ECU/100 kgr.
Source: Eleourgiki, Office on EEC Relations, Summer 1988.
352

0 CO CD d" CV..-
a
353
.nr Adoom;
•
eiwillerad CO••• •
Ir .4
wr
ar A ••raura
unon!mA_F•••6-;c•••••••

'c'otiC)
coco
1(2
I
o 0 o 0 0 0 oo
10
o
10
0
U)co
CM
cm T• 1-

4%
Figure 5.4: Commercialisation Networks and Estimated Product
Flows for Spanish Olive Oil.
IProducer/1'Farmer I
140.0% 60.0%1
I Industrial I 'Cooperative'
I Oil Mills 1 [Oil Mills 1
61.0%
24.0%1
!Packers I
58.7%
'Refiners 1
39.5%
IFORPPA I
'Food'Wholesalers I
120.0%
11.7%
25.0%/
'Retailers'
5.0%
\I49%
15.5%
1.5% \ \ II /---/
/ \ 11% / \ / \
'Food I I I I I
'Industries 1 'Consumers' 1 Export I
\ / \ / \ /
Source: Commercialisation of fats and oils. Collection of
studies. Study and Trade Modernisation Office, OLIVAE-
V YEAR -No. 21, 100C,1986.
\ - 14%
355

356
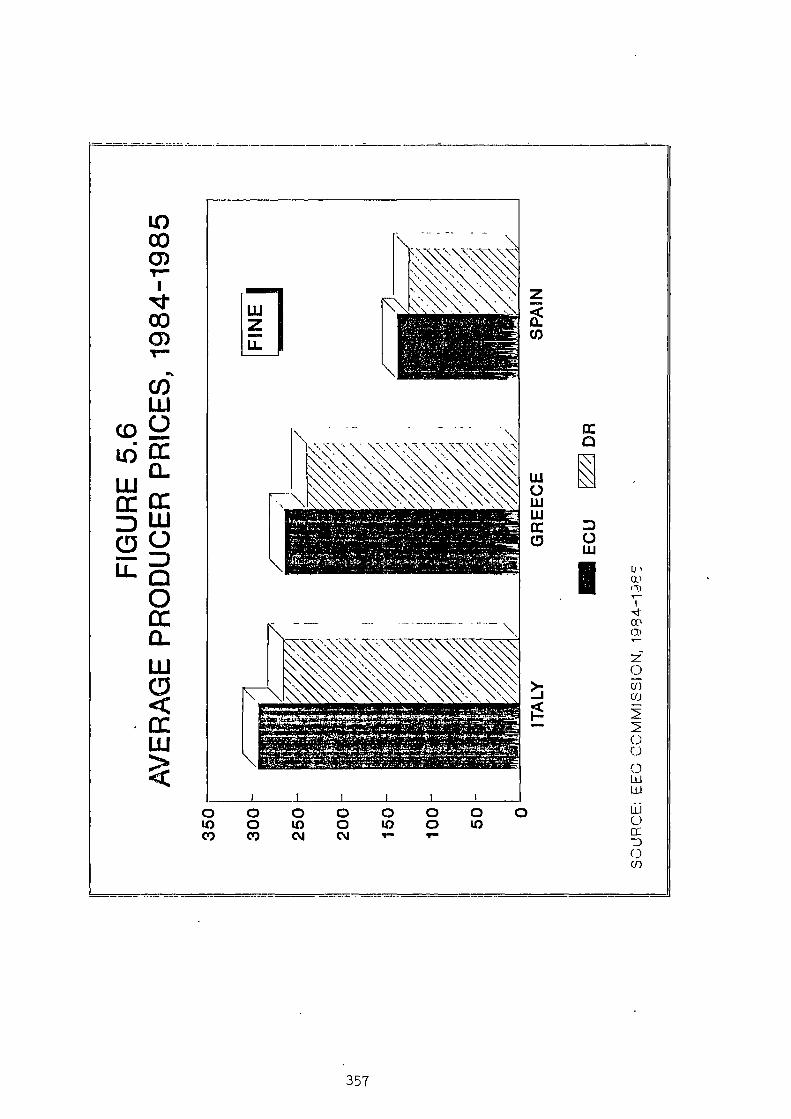
co
cca
357

358
toa 00
0

0• 10
0 000 1.0
C\I
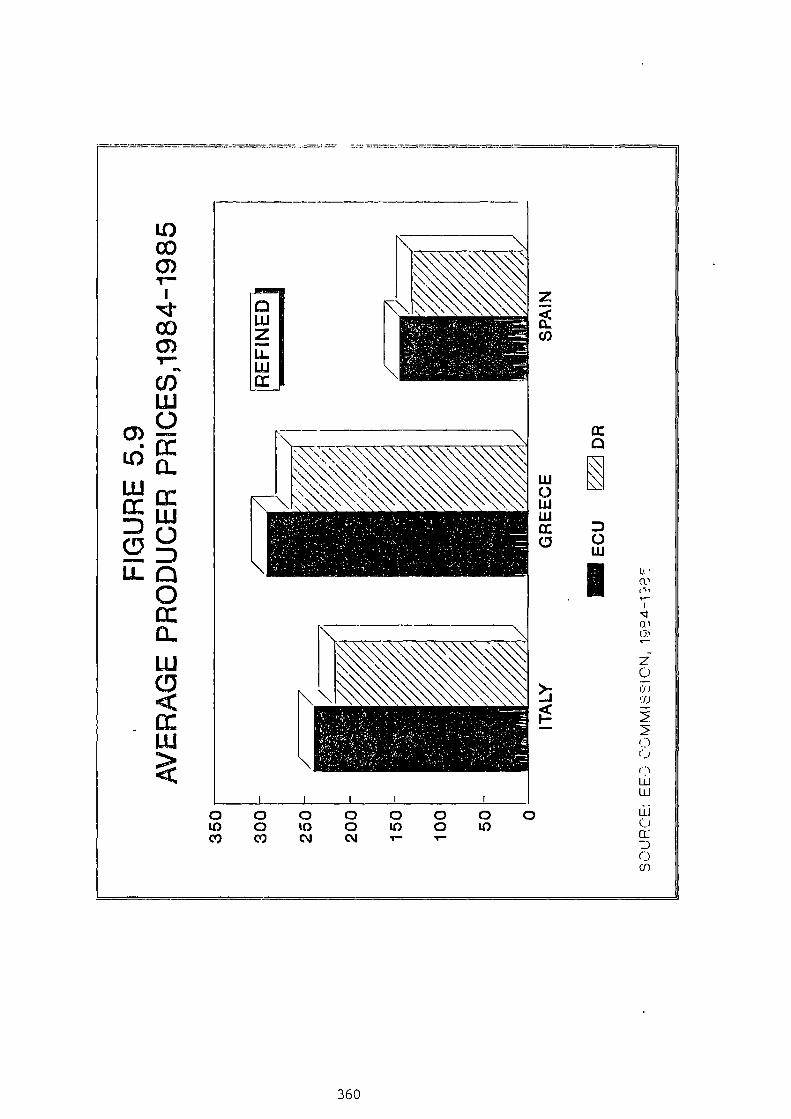
cc
Lu
360

361
cc
cc0
i 1
0 0 0 0CO CD v. N
0 00

"1 h

ECU/100 kg
350
300
250
200
150
ITALY
350
300
250
REFINED
LAMPANTE 50
Nov Dec Jan Feb Mar Apr May Jun Jul Aug Sep Oct1984 1985
GREECE
"*". - --K- -- ---X- - -X REFINED
LAMPANTE 50
200
150
6n•••
1-
Nov Dec Jan Feb Mar Apr May Jun Jul Aug Sep Oct1984 1985
350
300
SPAIN250
200
REFINED150 —LAMPANTE 3°
100
Nov Dec Jan Feb Mar Apr May Jun Jul Aug Sep Oct1984 1985
Figure 5.12
COMPARISON OF LAMPANTE AND REFINED OLIVE OIL DURING 1984/85 INITALY, GREECE, SPAIN
Prices are expressed in ECU/100 kg
363

CHAPTER SIX
STRUCTURAL CONSEQUENCES OF INDUSTRIAL CHANGEIN THE SECOND STAGE PROCESSING OF OLIVE-OIL
Introduction
The discussion in Chapter Five revolving around existing
conditions in the EEC oils and fats industry has enabled us to identify
those key factors which, in combination, have the potential to effect a
major transformation to the structure of the Greek olive industry.
Here I seek to analyse the nature of change which has taken place in
the second stage processing of olive-oil since Greece's admittance to
the European Community. In particular, I seek to show that accession
has prompted a split in second stage processing so that two
interconnected-but nevertheless distinct - parts have emerged. On the
one hand we can observe a mushrooming number of small units in the
packing and refining of olive-oil nationwide. On the other, there has
been a process of concentration in the production of branded olive-
in the hands of very few packers led by two subsidiaries of
multinational companies, together with the cooperative enterprise
Eleourgiki.
Section One focuses on developments in the second stage processing
and packing of olive-oil. It is contended that the core of recent
structural change lies in the packing and banding sub-sector which is
now firmly articulated within the CAP system. The refineries, table
olive processing units and olive residue plants have reacted only

slowly and modestly to new external incentives. In the First Part it is
argued that there has been a large increase in the number of packing
units over a ten year period. More specifically, in order for the
units to be approved by Common Market standards and receive Consumption
the EEC regime triggered off certain technical improvements to be
made in the processing of olive-oil and investment in new buildings.
This suggests that many more units were captured in the Official
statistics because they were internally upgraded rather than because
they had been newly established. In the Second Part I seek to show
that refineries and olive residue plants experienced a relatively small
expansion in number and capacity compared with the packers.
Furthermore, based on the balance sheets of a sample of olive residue
units I have tried to conduct a simple analysis of financial
performance of those firms. This reveals the weakness of the sub-
sector and I suggest that it is bound to have a deleterious effect upon
competitiveness. In the Third Part of Section One, the changes in the
table olive processing units are examined. Even though this is the
only part of the industry not directly incorporated within the CAP
price support scheme, it is nevertheless possible to observe some
structural change and modernisation that is under way. But even so
there are grounds for questioning the long-term viability of these
units.
Section Two concentrates on key organisational features of the
second stage processing. I try to argue that structural change has
strengthened the position of cooperatives in this part of the industry.
This took place partly as a consequence of the favourable political
365

environment created by the PASOC Administration of 1981-1989, which
resulted in a shift of :the locus of power within the industry towards
cooperative control via Eleourgiki. In Part One the pyramidical
structure of the cooperative movement is discussed. The role of the ABG
and PASEGES in recent years is highlighted since they are certainly the
main agents of the cooperative mode of organisation in general and of
the olive industry in particular. Part Two focuses directly upon
Eleourgiki itself. It is contended that from the early 1980's the
enterprise has been transformed out of all recognition. Formerly an
intervention agency responsible for collecting olive-oil on behalf of
the State, it became a powerful commercial organisation capable of
influencing the trading rules of the olive industry. Furthermore, it
has entered the seed-oils production arena in order to try and improve
its financial position and also in an attempt to compete with Elais and
Minerva.
Section Three examines the structure of the seed-oils processing
units. This is conducted in the light of the discussion in Chapter
Five which argued that the leading packers of the olive industry now
act as agents for the development of seed-oils (in Greece). I try to
show that between 1978-1984 there was a dramatic increase in the
capacity - but not in the number - of the relevant units. This implies
that the sub-sector underwent a process of technical modernisation in
order to be able to process a greater supply of agricultural inputs.
On the basis of the financial performance of a selected sample of firms
an optimistic picture emerges especially in •the period 1986-1988.
However, it appears that future development will largely depend upon
366

their ability to supply the major industrial units of the olive
industry with cheap inputs.
At this introductory stage I should like to point out a major
problem which I encountered in my research relating to the financial
position of the units in the second stage processing. In addition to
all the usual problems of interpreting such types of data I was unable
to locate several (presumably published) balance sheets as well as the
supplementary financial information lying behind the final statements.
Partly because of this, in all cases I have had to break down the
selected samples of processing units into two periods, and obviously
this has considerably constrained the analysis. It has also meant that
I have not been able to properly address the question of the longer-
term and change to the underlying trend. In an attempt to delve
further into the financial performance of the second stage processing
firms I collected data from a number of packing units based in Messenia
province and this information will be discussed in Chapter Seven.
The Development of the Second Stage Processing and PackingSub-sector
"Second Stage" processing includes:
1. the filtering and packing of edible olive-oil;
2. the refining of olive-oil with high acidity counts;
3. the extraction of olive residue oil; and
4. the processing and packing of the olives(l)
367

Figure 6.1 schematically shows the amount of olives and olive-oil
which went through such second stage processing in 1988. We observe
that most of the olive oil production (around 80%) is edible virgin
olive-oil. This suggests that filtering and packing is the most
important throughput second stage activity. All four production
processes depicted in Figure 6.1 might well be taking place in the same
refinery. In fact however, because of the small and fragmented
character of the industry in the Greek case different units for each
process has been the usual rule. (2) Since 1975, vertical integration
of some second stage processing activities is not an uncommon
phenomenon. Furthermore, even though the majority of units remain
small and specialised, the greater part of output comes from the big
vertically integrated firms notably Elais, Minerva and Eleourgiki.(3)
Officially, firms are classified according to the process which
accounts for the highest share of their output. (4)
6.1.1 The Packers
In the past the packing of olive-oil was undertaken by wholesalers
who were mainly based in the major olive centres of the country.(5)
The main purpose of packing was to facilitate the marketing and the
distribution of the produce. The most commonly used containers for
olive-oil packing have been iron barrels of 190 kgr, tin-plated
containers with a capacity of 1-17 lt and plastic bottles of 1 106)
Prior to 1970 there are no official statistics on the number of
wholesaling units, and those that were registered in that year (1970)
were only thirty. (7) But this is certainly an understatement since my
elAR

own rough estimate shows that the number must have been much higher
than that. Based on production figures of olive-oil in Peloponnesos
and statistics derived from the Institute of Industry and Commerce
situated in Calamata, it is evident that in 1970, 3,658 tonnes of
olive-oil priced at $5,527.416, and 2,121 tonnes of olives priced at
$3,001,645 were exported from Messenia province alone. (8) Even if we
make the assumption that half of the aforementioned amounts were
produced and packaged at other centres in Peloponnesos, the remaining
amounts imply an operation of at least 30-40 packing units in Messenia
alone. The most likely explanation for the under-reporting of the
number of wholesalers or packers is their effort to avoid taxation
imposed by the State. So, many did not possess the "proper buildings"
where packing was supposed to take place and therefore they managed to
escape the official censuses and hence the tax levies. Furthermore,
the majority of the wholesalers seem to have only packaged rather small
quantities of olive-oil - rarely in excess of 10-40 tonnes each
year. (9)
• The national statistics gathered by the Ministry of Agriculture and
PASEGES reveal (see Table 6.1) that in 1978 there were 35 packers
officially registered.( 10) These were mostly family businesses, seldom
employing more than 10 people even during the peak season. Thirteen of
them, or 37%, were owned by the cooperative sector which was relatively
more developed on the island of Crete. As far as the regional
distribution is concerned we can see from Table 6.1 that in 1970, 63%
of the packing units were located in Attica and the Islands. The same
percentage figure for regional concentration holds in 1978. Between
369

1978 and 1983 a massive increase in the number of packing units appears
in the official statistics. (11) Ninety-six units in total operated in
1983 with a further six under construction. What these figures
apparently show is that in the period of "anticipation" just prior to
Greece's accession to the EEC and again in the early years of
membership, a major increase in the number of units took place. This
increase can be explained as a consequence of the specific industrial
change generated by the CAP in the second stage processing of olive-
oil. More specifically, the EEC factor triggered off technical
improvements in the processing of olive-oil, as well as investment in
new buildings in order for the units to be officially "approved" by
Common Market standards and so receive the Consumption Aid.(-2) It
therefore appears that many more units were captured by the Official
statistics in 1983 - but not because they were newly established
entries, rather because they were internally upgraded.
The technical improvements in the methods of olive-oil processing
were based on the use of equipment imported mainly from EEC member
countries. Table 6.2 presents the value of such equipment by country
of origin and for the years 1983, 1984 and 1986-1988.(13)

Table 6.2: Imports of Olive-Oil Processing Eauipment(in 1,000 drs)
Countryof Origin
1983 1984 1986 1987 1988
Germany 2,980 3.03 114,089 41.12 27,125 16.99 9,765 3.58Italy 94,827 96.41 69,804 99.87 91,900 33.12 122,848 76.96 224,811 82.63Britain 29,100 10.49 1,597 0.58France 302 0.10 18,813 3.24Denmark 14,887 5.36 4,510 2.82Japan 14,857 5.35Other 549 0.56 90 0.13 12,294 4.43 5,129 3.21 17,078 6.27
Total 98,356 100 69,894 100 277,429 100 159,612 100 272,064 100
Source: N.S.S.C, External Trade, 1983, 1984, 1986, 1987, 1988 CodeNumbers : 84595201, 84595200, 84792090
The dominant supplier country throughout this period was Italy but
in 1986 Germany shot to prominance because of a special consignment in
that year. One of the aims of introducing this new technology
(operated by the Greek packers) was to improve the quality of the
olive-oil. Up to the mid-1970's packing operations were primarily
conducted in a manual way, which adversely affected the quality of the
final produce. (14) Since then, the newly built units and the older
ones which had modernized used continuous automated mechanical
apparatus which protects the oil and prevents it from coming into
contact with various unwanted influences from the air and the light and
so guarantees the purity of the final quality. (15) The minimum
technical requirements in terms of processing equipment used in a
modernized packing unit, as outlined by the Ministry of Agriculture,
are presented in an Appendix to this Chapter. The average cost of the
equipment for a unit with an annual capacity of 1,500 - 2,000 tonnes of
"171

olive-oil, was estimated by the Ministry to be, in 1987 prices, some 25
million drs. Total investment cost for the establishment of a new
packing unit using the same technical equipment was 43 million dr.(16)
Up to 40% of this cost is subsidised by the State and the
E.A.G.G.F.(17)
Figure 6.2 depicts the packing process of edible olive-oil in
Eleourgiki - one of the largest packing units of the olive industry.
Edible olive-oil is further classified into Extra, Fine and Semi-Fine
varieties, each corresponding to a different grading dependent upon the
degree of acidity of the olive-oil. (18) As can be seen from Figure
6.2, part of the olive-oil goes through a process of filtering and
polishing before it is packaged as Extra Virgin. Another part,
containing Extra, Fine and Semi-Fine may be mixed with refined olive-
oil produced in the refinery (of Eleourgiki). After polishing and
packing the whole process results in branding prior to being sold. (19)
The creation of new units and the modernization of the older ones
has led to a reduction in the degree of regional concentration of
packers in Attica. In 1978, 63% of the packers were situated in
Attica, while in Peloponnesos - one of the largest olive producing
areas - only 14% of the packing units operated. In 1983, 52% of the
packers operated in Attica and 24.5% in Peloponnesos. It therefore
appears that other olive producing regions, apart from the capital and
the islands, responded to incentives for modernization and
intensification. This happened as domestic oil-traders, based in the
olive producing regions, entered the processing of olive-oil in
372

response to the subsidies on investment and the Consumption Aid placed
upon production. (20)
In March 1988 the most recent survey was conducted by the Ministry
of Agriculture (YDAGEP) on the structure of the packing units.(21)
Table 6.3 shows that the sector has witnessed a further increase in
numbers, and the figure stood at 158. The pattern of regional
distribution reveals that Attica and the islands had just under half
(47.5%) of the packing units. Second is Peloponnesos with 28.5%, then
north Greece with 15%, Crete 5% and central Greece and Epirus with 4%.
The contribution of the cooperative sector fell from 37% in 1978 to 13%
in 1988. This obviously means that the private sector grew at a much
faster rate than the cooperatives as far as numbers are concerned. In
terms of capacity though the cooperative sector retained and even
managed to increase its percentage share of the total output (Table
6.4). More specifically, in 1981/82 25% of the total packaged olive-
oil was produced by the cooperative sector. In 1982/83, 30% was
produced and distributed by cooperatives while in 1984/85 the figure
amounted to 43022)
Further, in the early part of 1988 the State decided to establish
45 more cooperative packing units - most of them to be located in the
olive producing areas of the country. By the summer of that year
E.A.G.G.F had approved the establishment of 16 new units in accordance
with EEC Regulation 355/1977. (23) In the context of Law 1262/82
concerning the modernization of the olive industry, and within the
remit of the sectoral plan for 1987-1992, the State announced an
373

expenditure of 11.5 billion dr. Part of this allocation 1.6 billion
dr, will be spent on olive packing units, while a further sum of 3.5
billion dr will be spent on the construction of a sunflower oil plant
to be located in Thrace (north Greece).
According to the Official Statistics then, a rapid increase in the
number of small packing units took place within the ten year period
1978-1988. More specifically, the number of packers rose from 35 (in
1978) to 158 (in 1988) which is an astonishing growth of over 450%.(25)
However, alongside this expansion in numbers went the concentration of
output (and so of economic power) in the hands of three leading
packers, Elais, Minerva and Eleourgiki. Over fifty percent of the
branded olive-oil production is now attributable to these three
companies alone. (26) In 1982/83 they accounted for 55% of the total
branded olive-oil production, while in 1985 the figure was 49%•(27)
This happened as the number of smaller businesses increased and the
production of the second stage processing and packing units rose from
58,093 tonnes in 1982 to 78,407 tonnes in 1984 i.e. by 35%. Figures
6.3 and 6.4 show graphically the five largest companies share of the
olive market in 1982/1983 and 1985.
6.1.2 Refineries and Olive Residue Plants
Some of the packers, and certainly the largest, combine packing
with the refining of olive-oil. By the summer of 1988 the number of
refineries in Greece had stabilised at 59 units with a potential total
capacity of 964 tonnes/24 hours.( 28 ) The regional distribution at the
(24)
'"7

beginning and at the end of the 1970s decade.is presented in Table 6.5.
Forty-one percent are located in Attica and the islands, while Crete
and west-central Macedonia follow with 19% and 13.5% respectively. The
reason for this pattern of distribution is that the olive-oil produced
in Attica and some of the islands possess a higher degree of acidity
(>3.3°) than is suitable for human consumption. (29) Therefore refining
the produce is necessary before it can be released onto the market.
The refining process consists of three distinct stages during which
both mechanical and chemical means are applied to the high acidity
produce. The first stage involves neutralization of the acidity (which
obviously adversely affects the taste of the oil). The second stage
involves discolourization through which the olive-oil sheds any dark
and undesirable colours that might have been acquired during the
extraction process in the mill. The final stage involves
deodorization so that the produce is cleansed from any undesirable
odors. At the end of the process the olive-oil is now suitable for
human consumption either in its processed form or in a mixture with
virgin olive-oil. It is also worth pointing out at this stage that in
addition to refining olive-oil, both olive residue oil and oil-seed
oils may be refined in the same plant. (30)
It has been estimated that the mean annual employment in the
refineries in 1988 was 767 people since they operate at full capacity
for only 3-4 months a year. (31) In the Department concerned with the
modernization of the olive industry and within the framework of the
1988 Five-Year sectoral plan, I found that there were no plans for any
addition to the existing number of refineries : so the number will

remain at 59• (32) The average investment cost for a refinery is
roughly of the order of 500-600 million dr (at 1988 prices) and usually
the refineries are built together with olive residue plants. (33) Table
6.6 presents the number of olive residue plants, employment and
capacity in H.P, according to the Official Statistics compiled by the
National Statistical Service during the 1984 industry survey.
Table 6.6: Number of Olive Residue Plants. Employment and Capacity(H.P/h)
Number Employment H.P/h
Productive Plants 39 629 11,490
Auxiliary Plants 12 35
Total (1984) 51 664 11,490
Total (1978) 48 847 10,149
Source: N.S.S.G, Industrial Census 1984 and 1978.
We may observe that out of the 51 olive residue plants operating in
1984, 12 operated as auxiliaries. The average annual employment in
1984 was 664 people. Total potential capacity was estimated at 11,490
H.P/h. Comparing 1984 with 1978 it is apparent that the number of
plants has increased by 6.3% and their capacity by 13.2%. Employment
on the other hand, was reduced by 21.6%. Olive residue plants
constitute 1.5% of the Vegetable and Animal Fats Industry of Greece and
only 0.2% of the Food Industry. (34) According to recent information
obtained in the summer 1988 from the Ministry of Agriculture, there are
50 olive residue plants currently operating. Eight are cooperatively
376

owned with total potential capacity of processing 1,300 tonnes of olive
residue per 24 hours. Their effective annual operational time is 3-4
months, and is therefore similar to that of the oil-mills. During
periods of excess production, their operational time is extended as the
quantity of olive residue taken to the plants cannot be absorbed
despite their being in continuous operation. Instead the olive residue
is kept in store until it can be processed. When production of olive
residue is low at the mill then the extraction plants operate only one
or two shifts daily. (35) Productive capacity of the olive residue
plants (see Table 6.7) currently amounts to 7,710 tonnes/24h. Given
this capacity, the annual operating period of about 90 days and the
available quantity of olive residue to be processed, we can deduce
that the utilization of potential productive capacity for 1985/86 was
75%. It therefore appears, that existing capacity not only covers
production needs but as it is not fully deployed it results in higher
production costs than necessary and is therefore a somewhat inefficient
mode of operation. The regional distribution of olive residue plants
is also shown in Table 6.7. Thirty-four percent are situated in
Peloponnesos, and account for 37.6% of the total productive capacity
while in Crete there is 26% of the plants representing 31.1% of the
total capacity. Those two regions are the main producer areas of olive
residue in Greece.
As far as mechanical equipment and building structures are
concerned, many of the plants are of small capacity and employ old
technical equipment which does not appear to meet the current
legislation on safety and technical efficiency standards. (36) Table

Capacity (tonnes/24h)
Up to 50
51 - 100
101 - 200
201 - 300
>301
Number of Units
7
15
17
10
1
Percentage %
14
30
34
20
2
6.8 shows the plants' distribution according to potential processing
power of olive residue in tonnes per 24 hours.
Table 6.8: Distribution of Olive Residue Plants According to Capacity(tonnes/24 hours).
Source: Agricultural Bank of Greece, Department of Agro-Industry,1988.
The equipment used in all olive residue plants throughout Greece
operates discontinuously in successive pressing stages. This contrasts
with practices in other countries like Spain and Italy where the
equipment which is used is of continuous operation. (37) One
explanation behind this difference is that the most technically
efficient use of such equipment would require productive plant capacity
greater than 400 tonnes/24h (i.e considerably in excess of the Greek
average). Furthermore, there is a high financial cost involved in its
acquisition (and operation). In Greece, there is only one plant which
currently has a capacity of greater than 400 tonnes/24h. An important
additional advantage of the modern equipment is its ability with the
addition of one more attachment to process oil seeds such as
sunflower.( 38) According to the sectoral plan for 1983-1987, published
378

by the Ministry of Agriculture, three more olive residue plants owned
cooperatively are currently under construction in Heracleon, Crete,
financed and constructed by Eleourgiki; on the island of Lefkada; and
in Rhodes constructed by the Union of Olive cooperatives of that
island. There are also three private olive residue plants under
construction in Etoliko (central Greece), Molae (of Lakonia) and
Heracleon (Crete). (39)
In order to observe the basic economic parameters of the olive
residue subsector a sample of six firms were chosen, and their
consolidated balance sheets re-constituted for three years, 1983, 1984
and 1985.(4) The businesses included in the sample are:
1. Anatoli Avea, based in Hania, Crete and employing between
86-100 people;
2. Eleourgia Pyrgou S.A, based in Elia in Peloponnesos and
employing between 27-50 people;
3. Eleourgia Magnesias S.A, based in Volos and employing
between 6-25 people;
4. Eleourgia Argonafplias - Bro. Koufaki, based in Argos,
employing between 5 - 30 people;
5. Zaharioudakis S. A, based in Viotia and employing between
10 - 25 people; and finally

6. Hatzelis K - Eleourgia Spartis, based in Sparti and
employing 14 people.
The performance of the businesses was tracked over 1986, 1987 and
1988 but, unfortunately I could not obtain sufficient information to
construct uniform consolidated balance sheets for the whole period
1983-1988. The main reason for this was the fact that one of the
sample firms, Zaharioudakis S. A., closed down in 1986. Further
Eleourgia Pyrgou S.A, has not published any balance sheet for 1988.
After 1985 a uniform sample could only contain four businesses. In the
choice of the sample the main criterion was that the firms should
produce only unrefined and refined olive residue oil. We should also
add that Eleourgia of Greece, could not be included in the final
sample since, being the largest firm in the subsector, it could well
have distorted the value of the indicators. In Tables 6.9 and 6.10 the
consolidated balance sheets over 1983-1985 of the firms are presented
as well as some performance ratios calculated on the basis of the
information available. (41)
First we may observe that the value of the businesses' total assets
account has increased by no less than a third (37.5%) during 1983-1985
380

Liquidity Ratio'Gearing Ratio2
(Capital based)Fixed Assets Ratio3Performance Ratio4
1983 1984 1985
1.07:1 1.12:1 1.09:1
78.1% 76.9% 85.3%
24.3% 23.7% 17.9%
5.9% 5.4% 4.3%
Table 6.10: Sample Accounting Ratios
Notes:
1. Current Assets/Current Liabilities2. Borrowings/Total Assets3. Net Value of Fixed Assets/Total Assets4. Net Pre-Tax Profits/Total Capital
Source: Table 6.9
The greater part of this increase concerns current assets or
working capital since the net value of fixed assets has remained nearly
constant (in fact it has registered a small increase of only 1.5%).
This shows that there has been little internal expansion and
modernization in the sample firms. During 1983-1985 it appears that
liquidity and profitability of the sample companies have declined. The
decline in liquidity seems to be largely due to relaxation in working
capital control, and has resulted - especially for 1984/1985 - in a
worrying reliance on extended trade credit. Nevertheless, the sample's
liquidity ratio moved on a relatively higher level than the
corresponding one for the food industry and "total" industry, (refer to
Table 6.11). The decline in profitability has been caused by all
types of cost increasing at a faster pace than sales revenue. The
gearing ratio has ranged over quite high levels in 1983 and 1984, and
in 1985 there was a further increase to 85.3%. This is mainly
attributable to a rise in short-term loans. The degree of gearing
381

reflects the impact of borrowing upon the level of pre-tax profits. It
indicates that the effects of gearing on fluctuations in profit, and
more specifically on the performance ratio, are increasing.
Furthermore, we can observe that the degree of gearing for the sample
businesses moved at a higher level than that of the food industry or
the total industry. The performance ratio was found positive but with
a downward trend. On the other hand, the performance ratio (42) as
measured by own capital return compared favourably with the same ratio
for the food industry and total industry (refer further to Table 6.11).
It therefore appears, that net pre-tax profits of the sample firms
were positive during 1983 - 1985 but this is so, only if we do not
include Eleourgia of Greece S.A, in the sample which suffered
significant losses. However, the gearing ratio was very high in 1985
and borrowed capital mainly concerned short-term loans. This signifies
a high level of risk arising from the sample businesses' gearing
position. The fixed assets ratio remained low throughout the period
under examination, which indicates that the nature of the production
process did not involve the introduction of any complex technical
equipment.
Between 1986-1988, only four of the firms were included in the
sample, as mentioned above. The value of the businesses total assets
account increased by 83%, and the greater part of this increase
concerned working capital (see Tables 6.12 and 6.13). The value of
fixed assets also increased by 45% within this period which means that
there has been some activity in terms of internal expansion and

modernization. The fixed assets ratio shown in Table 6.13 ranged from
15-17% during 1986-1988 and this implies that the sample units are
capital-intensive with respect to working operations. It is worth
pointing out that this feature characterises commercial rather than
industrial units.
Table 6.13: Sample Accounting Ratios. 1986-1988
1986 1987 1988
Liquidity Ratio 0.6:1% 1.2:1 1.1:1
Gearing Ratio 70.4% 82.7% 91.5%(Capital Based)
Fixed Assets Ratio 16% 17% 15 %
Performance Ratio 6% 0.3% -5.7%
Source: Table 6.12
We observe that the liquidity ratio has increased between 1986-1988
and stood at 1.1:1 in 1988 which means that the companies can finance
their current liabilities from current assets so they do not run an
immediate risk of running down their fund of operational finances.
However, the extremely hip gearing ratio has affected the net pre-tax
profits of the businesses, which in 1988 were therefore negative. The
decline in profitability arises from sales cost and administrative
expenses increasing much faster than sales themselves. On the other
hand, the sample businesses' reliance on trade credit as a source of
finance appears dangerously high, and it will probably be necessary for
them to seek alternative sources of finance in the immediate future.
383

Even though the businesses included in the sample are of different
size and are located in different regions these factors do not appear
to significantly affect their trading patterns' , and so the accounting
ratios may be used as a basis for judging performance. (43) We may now
conclude that the picture presented by these indicators is one of
greatly fluctuating profits accompanied by very high gearing ratios.
This implies that in the olive residue subsector the relatively small
increase in the number of units, and capacity expansion which has
occurred between 1978-1988, is based on a rather weak financial
position. One might therefore expect that its competitiveness would
be seriously impaired in the freer trade environment of the Single
Market (1992).
6.1.3 Table Olive Processing Units
According to the N,S.S.G Industry Survey of 1984, 175 units were
involved in the processing of table olives. Of those 150 operated with
"known" capacity and 16 operate as auxiliary plants. () As shown in
Table '6.14, between 1978-1984 the number of units increased by 42 or
31.6%; their capacity as measured in H.P/24h increased by 30.5%; and
the average annual employment by 53.2%.
384

Table 6.14: Number of Table Olive Processing Units. Employment andCapacity in H.P/24h
ProductiveNumber of
UnitsCapacity Auxiliary Total Total
Units Units 1984 1978
Units 159 150 16 175 133
Employment 1,568 1,544 47 1,615 859
Capacity 3,946 3,946 3,946 1,203
Source: N.S.S.G, Industrial Census 1984 and 1978.
We may observe that the increase in the number of units has been
combined with a much larger increase in the number of people employed
in them. Table 6.15 shows the number of processing units, employment
and capacity in H.P/24h for 1984 according to employment size.
Table 6.15: Table Olive Processing Units According to Employment Size. 1984
Size Number of Units Total Employment Capacity(HP/2yh)
0-1 35 38 1552 29 62 160
3-4 38 137 4665-9 31 218 772
10-19 21 302 35320-29 12 289 50330-49 7 . 273 524>50 2 296 1,013
Source. N.S.S.G, Industry Survey 1984.

We observe that 76% of the total number of units are small
businesses employing 1-9 people, while 23% of the units employ 10-49
people. Only two units (less than 1%) employ more than 50 people each.
If we combine this information with the increase in employment between
1978-1984, it appears that the newly established processing units were
of medium size (i.e. employing 10-49 people). On the other hand,
according to figures published by the Agricultural Bank of Greece
relating to 1984, there were only 63 processing units of table olives
with total capacity equal to their oil-bank capacity i.e. 75,900
tonnes. Of these, 21 units were owned cooperatively with a capacity of
34,700 tonnes, and 42 units were privately owned with a capacity of
41,200 tonnes. The considerable difference between the sources on the
number of units is due mainly to the fact that the N.S.S.G has included
small local processing units which are operated and owned by the
producers themselves. (45)
The regional distribution of the 63 processing units is given in
Table 6.16. Many units (36.5% of the total) are located in central
Greece mainly in the provinces of Magnesia and Fthiotida. These units
account for 48.4% of the total capacity (in tonnes). Another 28.8% are
situated in Peloponnesos and west Sterea and account for 23.6% of total
capacity. The regional distribution of processing units seems to
closely mirror the regional production of olives.
386

Table 6.17: Production of Olives 1981/1982 (In tonnes).
Region Production Percentage %
East Macedonia and Thrace 2,535 3.19
West and Central Macedonia 3,361 4.23
Epirus 9,540 12
Central Greece 24,622 31
Peloponnesos andWest Sterea 27,775 35
Attica-Sterea-Islands 10,600 13.3
Crete 1,000 1.25
Total 79,433 100
Source: Agricultural Bank of Greece, Department of VegetableProduction, 1984.
Recent information from Eleourgiki for the Summer 1988, puts the
number of table olive processing units at 66. Of these 24 are
cooperatively owned and 42 private, accounting for a capacity of 47,000
and 41,200 tonnes respectively.(46) Tables 6.18 and 6.19 present
consolidated accounts of a sample of eight table olive processing units
for the period 1983-1987, as well as some ratios calculated on the
basis of the available data. (47) For 1988 my sample was reduced to six
units because the other two had failed to publish balance sheets in
that year. All units of the sample are mainly engaged in the
•
processing of table olives, i.e., olives in olive-oil, in vinegar,
salted, stuffed, and inside tin-plapted containers. The selection was

also based on the regional distribution of the units. Details on the
firms are presented in Table 6.20.
Table 6.20: The Sample Firms
Name Region Employment Year ofEstablishment
Agrevi S.A Fthiotis,Central Greece
2-8 1977
Inteal Ltd. Faliro, Attica 5-100 1933, Ltd 1976Xenia Fine Pallini, Attica 30 1966
Foods S.ASiouras S.A Volos, Sterea 28 1925, S.A 1978Sapounas & Co S.A Volos, Sterea 10 1924, S.A 1971Livio S.A Thessaloniki,
Macedonia 10 1967, S.A 1977Toulpak S.A Agrinio, Epirus 50 1978Petropouli Bro.SA Kavala,
Macedonia 10-100 1980
Source: I.C.A.P
An analysis of the figures presented in Table 6.18 reveals that the
value of the sample's total assets' account in 1984 increased by 13.4%
(compared with 1983) and continued to rise in 1985 (by 15.8% compared
with 1984). In 1986 there was a further increase of 5.6% but in 1987
there was a 1.6% reduction on 1986, which was followed by an even
further reduction of about 1% in 1988. The increase in this account
between 1983-1986 was mainly due to the growth of working capital since
the net value of fixed assets was reduced by 8.4% in 1985 compared with
1984. This signals a lack of investment in the sample firms. Between
1986-1988 there was a reduction in the working capital, hence the
reduction in the total assets account. Within the same period we can

also observe a large increase in fixed assets. But a word of caution
is appropriate here: +he monetary unit in which the accounts are
expressed represents a different measure of value in successive yearsviot
(i.e. the accounts arehexpressed in current cost accounting terms).
For example, an increase in the monetary amount of fixed assets may be
shown although the real value of the assets may have remained constant.
Table 6.19(a) presents the accounting ratios of the sample firms.
We observe that the liquidity ratio moved slightly above the unit (i.e.
>1) in 1983, but through time it shows an upward trend which reflects a
safer financial position for the sample. Furthermore, the liquidity
ratio moves in consonance with the corresponding ratios of the food and
total industries, (see Table 6.19(b)). The gearing ratio moved at
quite high levels, and followed an upward trend with the exception of
1987 where it fell back to 52.3%. Nevertheless the sample's degree of
gearing remained at lower levels compared with those of the food
industry and total industry. The fixed assets ratio shows a downward
trend: and from a level of 41.4% in 1983 it was reduced to 29.1% in
1985, 23% in 1986 and 22% in 1987. But in 1988 the ratio rose to 37%.
This type of movement obviously shows that the nature of the sample
businesses is primarily commercial. The performance ratio is positive
throughout the period 1983-1987, but with significant variations from
year-to-year. During 1986-1987, for example, there was a dramatic drop
in value from 4% to 0.02%. Furthermore, for the sample of the six
firms in 1988 the ratio assumed a negative value. In the period 1983-
1985, the performance ratio of the sample as measured by own capital
389

return moved at higher levels than that of the food industry and the
total industry, with the exception of 1985.
The retention of a large amount of stock - nearly 60% of working
capital in the sample businesses - is the main feature of the table
olive processing units since the annual closing date of accounts
coincides with the harvesting of the raw material. We can also observe
from Table 6.18 that the contribution of the sample businesses' own
capital to the total is quite high which is encouraging in terms of the
sample units being in a reasonably safe financial position. The table
olive processing units constitute the only subsector of the olive
industry which until recently (1988) was under a National support
scheme instead of being incorporated into the CAP. (48) It is a
relatively labour-intensive subsector (as indicated in Table 6.15), and
according to Eleourgiki and the A.B.G the number of processing units
now ranges between 63-66. We can conclude that even though some of
the main accounting ratios of the sample are not discouraging (i.e. the
liquidity and gearing ratios) performance has deteriorated through
time indicating that cost increases have not only diminished the
possibility of their earning profits, but they have now exhausted
reserves so that there were losses in 1988.
6.2 Structural and Organisational Features of the Groups ofSecond Stage Processing Units
Second stage processing is divided structurally into two main
parts. The first is characterised by a host of small firms, both
private and cooperative, who compete with each other for a share of
39 0

domestic and export markets. The second sees a struggle between
leading private and cooperative packers who, between them, determine
the trading rules for the industry. At the top end of the spectrum lie
enterprises such as Elais, Minerva and Eleourgiki, who incorporate
within their internal organisation all activities and the whole range
of the different production processes in this second stage processing
of olive oil. At the lower end, there are smaller independent firms
specializing in one or other of the main production processes i.e.
table olives, olive residue oil or simply just the packing of olive-
oil. (49)
It appears that this latter part of the olive industry has
undergone profound change in a relatively short period, which spans the
years of Greece's accession to the European Community. On the one
hand, these changes concern an expansion in the number of units
engaged in processing, and an increase in capacity through
modernization and the installation of technical equipment. On the
other hand, they concern a greater concentration of output and economic
power into the hands of three leading packers, Elais, Minerva and
Eleourgiki. It is important to point out that the bulk of this change
has taken place in the packing and branding of olive-oil i.e. the sub-
sector directly articulated into the CAP. For their part the
refineries, the table olive processing units and the olive residue
firms have not reacted as strongly to the new external influences.
It seems clear that the current trend of expansion in the number of
small units can be explained as a temporary phenomenon arising from the
391

financial incentives in the CAP. This is because even those parts of
the olive industry which are not greatly affected by the CAP regime in
terms of price support schemes - like the table olive processing units
- have certainly undergone some structural change and capacity increase
though modernization. Nevertheless this restructuring was not based on
small, economically efficient units which responded to an expansion in
the domestic and export demand. It reflected rather the rise of more
obviously commercial oriented enterprises, in an increasingly
competitive environment, with greatly fluctuating profits and high
gearing ratios. The question of competition between the second stage
processing units will be taken up in Chapter Seven after the discussion
of my fieldwork findings in Messenia Province.
Apart from these responses the mode of organisation in the second
stage processing underwent change. More specifically we can witness
the strengthening of the cooperative form of enterprise within the
favourable political environment created by the PASOC Administration
over 1981-1989. This in turn meant a shift of power within the
industry towards Eleourgiki.
6.2.1 The Cooperative Organisation
The cooperative organisation of the olive sector follows a
pyramidical structure (see Figure 6.5). We may observe that the olive
cooperatives are organised and operate at three different levels.(50)
At the bottom of the pyramid lie the first-order cooperatives which
constitute the base for the operation of the whole system. They
392

represent the interests of some 2,098 olive cooperatives and first-
stage processing units (i.e. oil-mills). In theory they are associated
with 347,438 olive growers - or over 90% of the total number of olive
growers in Greece. (51) These first-order cooperatives join together in
a broader geographical setting to make up a second tier of olive
cooperatives - known as the Unions of Olive Cooperatives. There are 57
such Olive Unions involved with second-stage processing.( 52) At this
level, the table olive processing units, the olive residue plants, the
refineries and the packers are connected together through the marketing
channels - though they may retain their independence as self-managed
units. The Unions then, join together to make up the third-order
Central Union of Olive Growers, Eleourgiki.
At the apex of the cooperative pyramid is the Panhellenic
Association of Agricultural Cooperatives, PASEGES - the head of the
agricultural cooperative movement. It was first established in 1935 in
Athens. According to its Manifesto, and within the context of Law
Decree 921/1979, it represents all the various agricultural
cooperatives operating at the different levels in national and
international meetings. (53) It is a full member of the appropriate
international and European organisations and, according to Law Decree
1541/1985, PASEGES has a number of definite responsibilities. It does
not take any direct part in the production, distribution or trade in
agricultural goods. It acts as an advisor to the Central Cooperative
Unions, the second-order cooperative unions and also to the first-order
cooperatives. It monitors and supports their activities in several
different ways. It takes part in the bargaining procedures concerning
393

labour contracts as far as those working in agricultural cooperatives
or similar organisations are concerned. It has the power to formally
suggest new measures for the restructuring of agricultural production,
and for the establishment and modernisation of existing processing
units. (54) In theory PASEGES is supposed to actively encourage the
growth of the idea of cooperation and to serve the interests of those
farmers who are already paid-up members of the cooperative societies.
However, in the past there have been occassions when it has only acted
as an agent of the different State administrations - and has in fact
been in conflict with the interests of the farmers.(55)
In principle the monitoring and administrative control of the
cooperative movement lies within the remit of the Ministry of
Agriculture. In practical terms the A.B.G has been assigned the
responsibility for all State issues concerning cooperatives since 1929
(the date of its establishment). In the context of implementing
agricultural policy, the presence of the ABC is required at all
management meetings of the first-order, second-order and Central
Unions in which the ABC has an involvement. (56) The ABC is responsible
for those decisions relating to regulation, the issue of manifestos,
and the establishment - or liquidation - of cooperative organisations.
It operates a large network of branches - currently 294 - throughout
the country. It also maintains a staff of 32 inspectors for overseeing
the cooperative offices and a further 32 inspectors who have the
responsibility for technical offices. (57) Its sources of capital
(Table 6.21(a)) and its distribution to the rural sector (Table
6.21(b)) are presented for the period 1980-1984. In addition to these
39 4

features the ABC's involvement in 54 agribusinesses shows that it has
assumed the role of a moving power as far as the development of the
cooperative organisation in Greece is concerned. (58) Apart from
financing cooperatives the ABC is also involved in other related
activities such as financing agricultural exports and imports, and
assisting with foreign currency and farming insurance schemes through
the various cooperatives.
From the early 1980's the ABC, in the context of the Law Decree
1541/1985 which sought to develop and modernise agricultural
cooperatives, lent large sums of money to cooperatives at all the
different levels. However, because of the structural and operational
weaknesses of the movement, and the relatively high interest that had
to be levied on these loans, the outcome has been disappointing in that
-most of the cooperatives have not been able to meet the interest
payments.
Additional interest on the deferred payments has exacerbated the
probleth and now the outstanding debt to the ABC is very
considerable. (59 ) Table 6.22 presents some recent figures of the level
of indebtness with respect to the ABC. We may observe that Eleourgiki
is the third largest indebtor to the ABG (after KYDEP and SECOVE S.A).
The recent Regulation 29/3/1989 on the settlement of cooperatives'
- debts attempted to get to grips with this difficult issue. In the
context of the Regulation, a number of special studies on the viability
of the indebted cooperatives were undertaken in order to better
determine their future level of operation and their possible
395

modernisation. Also the publication of cooperatives' annual balance
sheets became compulsory. The investigation was to be undertaken by a
special inspectorate who would decide the re-scheduling arrangements
for the debts outstanding until the beginning of 1989. The units
judged viable would be assisted in their modernisation including the
improvement to internal organisation, management structures, and their
financial planning. The rest would have to close down. By the end of
1989 cooperative debts were indeed settled. For its part PAGEGES has
arranged special courses on cooperative education, including
management, information technology, marketing of agricultural goods and
credit relations. (61)
As shown by the pyramidical structure of olive cooperative
organisation (Table 6.5), the third-order Central Union or the main
representative of the movement is Eleourgiki, the largest union in the
country in terms of membership. Because this is such an important
organisation I propose to discuss it separately.
6.2.2 ' Eleourgiki
Administratively Eleourgiki seems to be divided into the following
categories: ten central and four peripheral departments; two production
units - located on the outskirts of Athens; and two wholesaling units,
one in Thessaloniki and one in Heracleon. (62) Table 6.23 shows the
members of Eleourgiki by administrative area.
396

Table 6.23: Members of Eleourgiki by Administrative Area
Areas Unions of OliveCooperatives
First-OrderOliveCooperatives
Olive GrowerMembership
%
Sterea -Thessalia 13 704 96,696 27.8
Peloponnesos 14 774 80,134 23.1
Crete 16 668 78,135 22.5
Epirus-IonianIslands 7 443 47,305 13.6
Other 7 319 45,168 13.0
Total 57 2,908 347,438 100
Source: Eleourgiki, No.1, 1985, p.9.
We may observe that Peloponnesos has the secondlargest number of
members with 80,134 olive growers. Sterea-Thessalia has the largest
membership but they are mainly table olive producers from Central
Greece. The Internal organisation of Eleourgiki's production consists
of the following units:
(i) Installations for olive-oil processing with a refinery;
currently the daily potential capacity is 570 tonnes;
(ii) Two olive residue oil production units with potential
processing capacity of up to 400 tonnes of olive residue
(daily);
-“:17

(iii) One unit processing high acidity olive residue oil with a
daily potential production of 10 tonnes;
(iv) One unit concerned with cooking fats and margarine with a
potential daily production of 60 tonnes;
(v) Fourteen processing and packaging units of olives with a
potential daily production of 7-8 tonnes in small
containers, and 200-500 tonnes in larger containers;
(vi) Two soap production units with an annual capacity of 5,000
tonnes;
(vii) Oil-banks and storage space with a total potential capacity
of 233,00 tonnes of olive-oil and olives. (63) Apart from
the table olive processing plant all the production units
are concentrated in the same location, i.e., Elefsina, on
the outskirts of Athens. The former (the processing of the
table olives) takes place in another plant owned by
Eleourgiki, also on the outskirts of Athens. Eleourgiki
possesses 35.7% of the total oil-bank capacity of the
country. All of its oil-banks are situated in Attica. The
process of oil-bank construction between 1981-1984 was as
follows: 23,000 tonnes additional oil-bank capacity in
1981, 25,000 tonnes in 1982; 35,000 tonnes in 1983 and
47,000 tonnes in 1984. Today it has the capacity to store
almost a quarter of a million tonnes (233,000) of olives

and olive-oil. The amount Eleourgiki spent on construction
projects (including oil-banks) over 1981-1984 was in
ascending order: 26,567, 46,960, 96,777 and 83,829
thousand drs. (64)By Greek standards this was a
considerable investment programme
Until 1980 Eleourgiki acted as an intervention agency. It collected
olive-oil quantities on behalf of the Ministry of Agricu1ture.(65)
From 1981 to 1985 Eleourgiki collected on behalf of the EEC. In 1981
however it entered the olive-oil market and since then its sales volume
has been increasing year-by-year. Figure 6.6 presents Eleourgiki's
sales between 1978-1988. It has now become the single largest olive-
oil packer in Greece. Table 6.24 shows sales volumes and values of
olive-oil sold by Eleourgiki in the domestic market between 1981-1988.
Table 6.24: Volume and Value of Sales by Eleourgiki. 1981-1988.
Year Quantity(In tonnes)
% AnnualChange
Value(In million
dr)
% AnnualChange
1981 4,406 560.51982 5,113 +16 743.9 + 331983 10,128 +98 1,927.9 +1591984 13,752 +36 3,226.7 + 671985 19,000 +38 5,510.5 + 701986 26,500 +77 8,951.3 + 901987 23,000 -13 7,015.0 - 221988 25,000 +9 8,328.7 + 19
Source: Eleourgiki, Department of Domestic Trade, 1988
399

We can readily observe the substantial increase in sales volume.
In 1987, there was a d_op of 13% - which was not compensated for the
next year's increase of 9%. This fall was because 1987 proved to be a
difficult year for the olive-oil trade. The main reason was the
imposition of Negative Monetary Compensation Amounts (NMCA) on exports
by the EEC. (66) Then Eleourgiki also reduced its domestic sales in
1987 because, for the first time, it began cooking fats and margarine
production in an attempt to compete with Elais and Minerva and so
improve its financial position. In that year (1987) Eleourgiki sold
1,000 tonnes of cooking fats which represented 15% of the domestic
market, while in 1988 it sold 1,500 tonnes. It also sold 500 tonnes of
margarine in 1987, which represented 9% of the market; and in the
following year Eleourgiki sold 1,800 tonnes of margarine thereby
increasing its market share to 16%. Eleourgiki also sold 700 tonnes of
soap in 1988. The inputs for the production of cooking fats and
margarine are imported - especially from Malaysia. (67) It appears
therefore that a process of diversification has taken place even in the
Central Union of Olive Growers to include margarine and cooking fats
destined for the domestic market. In this sense since 1987 competition
has been intensified with Eleourgiki, Elais and Minerva as the leading
packers. Table 6.25 presents Eleourgiki's export sales volume between
1978-1988.
400

Table 6.25: Eleourgiki's Exports Sales Volume (In tonnes)
VirginOlive-Oil
Courante Refined Total
1978 145 406 1,004.7 1,556.41979 625 0.4 4,107.6 4,733.01980 642 8.2 650.21981 3 3.01982 5 5.01983 23,2151 23,215.01984 22,3012 2,004.0 24,305.01985 N. A3 N.A N.A 16,829.41986 800 400 11,000 12,200.01987 N.A N.A N.A 17,000.01988 15,000 10,000 25,000.0
Notes:
1. Extra : 9,176, Semi-Fine: 4,941, Fine: 1,065,Lampante: 8,033.
2. Extra: 3,266, Semi-Fine: 2,633, Fine: 1,737,Lampante: 8,033
3. Not Available
Source: Eleourgiki, Department of Marketing, 1988.
We may observe that taking an overall perspective, Eleourgiki's
exports have been increasing, especially after 1986. Since 1983 the
largest part of its exports has been virgin olive-oil. Looking at
unpublished receipts and expenditure accounts for the company for 1986
and 1988 the following points can be made. In the former year (1986),
total receipts of the enterprise amounted to 14,957 million dr. and
total expenditure was 14,118.3 million dr. The largest part of this
expenditure, some 77.94%, was made up of raw materials especially
material inputs for the production process - mainly olive-oil supplies.
Sixty percent of Eleourgiki's receipts comes from its domestic sales of
olive-oil. In 1988, receipts reached 20 billion dr. Table 6.26 shows
401

the structure of the company's expenses for 1986 on olive-oil and
soaps. (68) Each year Eleourgiki decides how much olive oil it will
require and plans its purchases according to both quality and quantity
variables. Then it sets in motion the agents of its buying system as
far as the main olive-oil producing centres are concerned. This
"system" consists of deploying the resources of the second-order unions
of olive cooperatives. In places without such unions Eleourgiki hires
private representatives to make the purchases according to orders
received from the central purchasing services department. (69)
Buying olive-oil is another arena where Eleourgiki competes with
Elais and Minerva as well as the smaller units of the private sector.
Acting as a price setter at the beginning of each crop year it
determines the rules by which transactions are to be made in the olive
market. In 1988, Elais, Minerva and Eleourgiki formed a (perfectly
legal) cartel on the import price of olive-oil supplies, but this only
seems to have held for a few months. The reaction of the olive growers
through their cooperatives forced Eleourgiki into revising the
decision and to increase the level of olive-oil prices. Usually, the
market price does not fall below the "set price" fixed by
Eleourgiki. (70) In case there are any olive-oil quantities unsold at
the end of the marketing year, Eleourgiki guarantees to buy its
members' own production at that price.
402

6.3 Seed-Oils Processing Units
During this period of structural change which is underway in the
olive industry, a potentially close competitor, oil-seeds, began to
develop strongly in the domestic market. As mentioned already (Chapter
Five), the connection between the two industries lies in the fact that
leading industrial olive-oil producers began to act as agents for the
seed-oils industry in Greece. It therefore seems apposite to present a
brief overview of the production structure of the seed-oils processing
units.
In Table 6.27 the number of productive units, employment and
capacity according to the industrial censuses of 1978 and 1984 compiled
by the N.S.S.G is presented. We may observe that in 1984, there were
40 productive seed-oils units in operation throughoutGreece. Ten
operated as auxiliaries to the sub-sector.
Table 6.27: Number of Seed-Oils Units. Employment and Capacity (H.P/h)
Oil-SeedProductiveUnits
EmploymentA.A.E1
Capacity(H.P/h)
Total Number 30 654Number with knownCapacity 27 643 26,736
Auxiliary Units 10 67Total 1984 40 720 26,736Total 1978 34 365 9,982
Notes: 1. Average Annual Employment
Source: N.S.S.G, Industrial Censuses 1978, 1984.
403

The average annual employment in all the units amounted to 720
people. Of those 654 were employed in the 30 productive units and 67
in the ten auxiliary plants. The total capacity of the 27 productive
units with known data was 26,736 H.P/h. A comparison between the
figures for 1978 and 1984 shows that the number of units increased by
17.6%, and the number of persons employed increased by no less than
97.3%. Capacity on the other hand, showed the most dramatic rate of
increase at 167.8%. In a wider context the seed-oils processing units
accounted for 1.2% of the vegetable and fats industry, 0.2% of the food
industry and 90.03% of total industry in 1984.
The regional distribution in 1985 by province and administrative
area, as well as capacity (in tonnes/24h) is presented in Table 6.28.
The data suggests that Sterea and Eboea possess an average of 68% of
the total capacity of oil-seed units, while they produce only 23.1% of
total cotton seed production and no sunflower seed. In Thessaly there
is 10% of the total capacity yet the region produces 47,.7% of cotton
seed production and 1% of total sunflower seed. Thrace on the other
hand accounts for 1.2% of total capacity while it produces 78.5% of the
total sunflower seed production. It therefore appears that there is
regional concentration of seed-oils processing units in Sterea where
the smallest quantities for processing are being produced. From this
point of view we may say that the regional distribution of plants does
not appear to be very "rational". (71) This happened because north
Greece as a production region of seed-oils developed much later that
Sterea. Especially sunflower production in north Greece (Thrace and
404

Macedonia) increased dramatically only very recently as already
mentioned in (Chapter Five).
By the end of the Second World War the level of development of the
productive forces in the domestic seed-oils units was not advanced in
terms of technical equipment and the prevailing techniques of oil-seed
oils extraction. Production was through the use of hydraulic presses,
and the refining of the produce was accomplished in separate units
using only very basic plant and machinery. (72) The result was poor
quality produce which enjoyed only very limited demand in the domestic
market. In the 1960s, however, with the general development of the
productive forces in the economy as a whole, the older seed-oils units
began using more modern technical equipment and the newer ones were
built and operated with "screwed" presses in place of the hydraulic
varieties. (73)The advantage of the new presses was considerably
larger production per hour. In 1974, for the first time, the method of
"pressing out" was introduced into the process of production. As a
result, the oil-seed oil obtained was ready for immediate consumption
and free from any undesirable odors. The first company to adopt this
method was Mili Soyas.(74)
Table 6.29 shows the state of affairs in the seed-oils units as far
as technical equipment, production and processing techniques are
concerned. Out of the 26 units included in Table 6.29, nine do not go
any further than the neutralization stage in downstream processing.
The reason for this lies with the small size of the units and their use
of the older vintages of technical equipment (i.e. the extraction
405

method, their small absolute capacity, and the discontinuous
neutralization method). An exception is Soya Hellas, which specializes
in the processing of soya oil and uses the "pressing out" method to
complete the first stage of its production. (75) Out of the remaining
17 units which, after neutralization of the produce continues with
refinement, five operate old and new methods of production viz the
"extraction" and "pressing out" methods for all varieties of seed-oils.
Three out of the five units are owned cooperatively and were
established only recently (1980, 1983, 1984). The Agroinvest S.A. was
the largest in the country, with a capacity 1,000 tonnes/24h, and
capable of processing any oil-seed variety. It started operating in
1983 but closed down by 1987 because of severe financial difficulties.
These related to the firms' inability to find the required quantities
of raw material,inadequacies in product distribution, and high
interest charges of $70-75 million. (76) Based on figures published by
the Cotton Organisation, the estimate for oil-seed production processed
in 1983-1984 was 494,332 tonnes. (77) Table 6.30 presents the
quantities of seeds processed by the units and also the percentage of
the potential capacity used by each productive unit. We can deduce
that capacity utilization per seed-oil unit ranged from 10.34%
(Diaulias AEBE) to 95.24% (Union of Agricultural Cooperatives of
Thessaloniki), while the average capacity utilization was 41.94%-
assuming, as I think is reasonable an average operating period of
approx. 300 days/year.
A sample of five businesses was chosen for analysis and a statement
of their consolidated accounts was constructed for 1983, 1984 and
406

1985. (78) Unfortunately only the accounts of three of these companies
were available for the years following i.e., 1986, 1987 and 1988: the
other two firms did not publish their balance sheets for these three
trading years. The firms are:
a) Sporeleougia Thrakis S.A. based in Alexandroupolis and
employing between 10-30 persons;
b) Mili Soyas S.A., based in Korinthos and employing 85
people;
c) Soya Hellas S.A., in Eboea, employing 65 people;
d) Eleourgia of North Greece S.A, in Emathia, employing
between 150-170 people;
e) Oliva S.A, in Moshato of Attica, employing between 6-22
people.
In the sample selection only those units which engage primarily in oil-
seed oils production were taken into account. I also decided against
including Agroinvest S.A, because being the largest in the sector its
presence may have distorted the value of the derived accounting ratios.
In Tables 6.31 and 6.32 the consolidated accounts of the sample are
presented as well as the relevant ratios calculated on the basis of the
balance sheets.
407

Table 6.32: Accounting Ratios of the Sample of Oil-Seed Firms
1983 1984 1985 19861 19871 19881
Liquidity Ratio 1.16:1 1.09:1 1.09:1 1.45:1 1.23:1 1.40:1
Gearing Ratio 75.9% 78.5% 78.3% 62.7% 67.7% 53.5%
Fixed Assets Ratio 32.3% 24.9% 21.8% 9.9% 26.9% 33.4%
Performance Ratio 5% 5.5% 4.2% -3.2% 4.6% 5.4%
Notes: 1. The sample for these years only comprises of three units.
Source: Table 6.31
The nominal value of total assets of the sample increased by 60.7%
between 1983-1985. This was mainly in the form of additions to working
capital while the net value of fixed capital remained at its 1983
level. So, the ratio of fixed assets was quite low in 1985 (i.e. 21.8%)
while 68.3% of working capital was kept in the form of stocks. The
liquidity ratio varied little registering a small decline in the last
two years 1984 and 1985. This suggests that the sample firms could pay
their way in the short-run. However, the gearing ratio between 1983-
1985 moved at high levels, and 76-78% of total assets consisted of
borrowings. Furthermore, the sample firms' degree of gearing, which
was 3.6:1 in 1985, exceeded that of a sample of 2030 industrial units
which, in 1985, was 2.78:1. Excluded from this large sample, which was
surveyed by the Administration of Small-Medium Businesses Organisation
(EOMEH), are the "problematic" companies, (79) and the 100 largest
industrial units of Greece (in terms of the value of their working
capital). This implies that the gearing ratios were not distorted
408

because of different trading patterns or of "overborrowing" as is
certainly the case of the "problematic" companies. The performance
ratio of the five sample businesses was positive throughout the three
year period, but in 1985 it was reduced in relation to the two previous
years.
Looking at the sample of the three units over 1986-1988 we may
observe that the value of their total assets more than doubled, and
this increase was mainly due to the rise in fixed capital by some 611%.
It therefore appears that a significant pattern of long-term investment
was undertaken by the sample units during this period. To further
support this observation, we may note that the ratio of fixed assets
increased from 9.8% in 1986 to over a third (33.4%) in 1988. The
liquidity ratio moved comfortably above unity (between 1.2 and 1.45)
while the gearing ratio improved from 62.7% in 1986 to 53.5% in 1988.
All this may have been reflected in the performance ratio which
recovered dramatically from a negative performance in 1986 (-3.2%) to
a healthy 5.4% in 1988. If we compare the performance of the three
units over 1986-1988 with that of the sample of five units in the
preceeding three years we may observe a considerable improvement in the
liquidity and gearing ratios - which are, of course, important
indicators of a healthier financial position. (80)
The connection between the seed-oils units and the olive refiners
is straightforward: the former can act as a supplier to the latter.
Large industrial units in the olive refining sub-sector use oil-seed
oils as raw material for the production of cooking fats and margarine.

So companies such as Elais, Minerva and Eleourgiki can buy inputs from
seed-oils units or import directly from Malaysia even if they do not
produce sufficient quantities of sunflower oil or corn-oil themselves
to cover domestic demand and their needs. A certain quantity of oil-
seed oils is annually used by these units for margarine production
depending of course on prevailing market conditions. All this suggests
that the future development of seed-oils processing units is tied up-
at least in part - with their role as suppliers to the major packers
involved in the olive industry. In this way seed-oils will be branded
and then sold to urban consumers. These points will be taken up later
in Chapter Eight.
Conclusions
This Chapter has examined the nature of change in the second stage
processing of olive-oil. I have tried to argue that the expansion in
the number of small units is probably a temporary phenomenon brought
about by financial incentives given through the CAP regime. The case
of olive residue plants and of the table olive processing units
suggests that the financial basis of their expansion has been rather
weak.
As far as organisational changes are concerned, recent developments
have strengthened the cooperative mode of organisation in the industry
as a conscious endogenous response to the entry and dominant position
occupied by the multinational subsidiaries, Elais and Minerva. As a
result, the presence of Eleourgiki supported olive-oil producer prices,
but by the same token it meant higher input cost for the second-stage

processors. This state of affairs has led the, major packers to
gradually diversify production away from olive-oil and towards seed-
oils. This forced Eleourgiki to resort to a similar strategy, and this
has began to undermine the base of the olive industry and so affect
deleteriously the interest of the olive farmers.
In order to gain further insight into the financial performance of
the second stage processors in the context of the incentives provided
by the CAP a sample of firms has been selected for further
investigation. Only after this evidence has been presented and
discussed can we hope to derive any firm conclusions concerning the
nature of recent developments in this second stage part of the olive
industry. This is attempted in Chapter Seven.
411

References
1. All the activities which I have included under the second stageprocessing of olive-oil take place in urban centres but they areusually located close by the rural olive producing areas. The onlyexception to this is the processing and packing practiced by theproducers themselves in certain regions. this exception concernsonly small quantities of olives and very often these small ruralunits are not even included in the official statistics. Ministryof Agriculture, Department of Information, 1989 and A.B.G,Department of Agro-Industry, 1988.
2. See G. Kutsumaris, The Structure of the Greek industry, (Athens,1963) and D. Katohianou, Sectoral-Regional Analysis of GreekManufacturing, (Athens, 1984).
3. In 1988 Elais, Minerva and Eleourgiki accounted for 52% of totalbranded olive-oil output. Concentration of output into their handshas been a phenomenon of the early 1980s and still continuesdespite the considerable expansion in the number of smaller unitsin second stage processing. Information on output was receivedfrom the Ministry of Agriculture (YDAGEP), 1989.
4. This classification is found in the N.S.S.G industrial censuses of1978, 1984 and also in statistics provided by the Agricultural Bankof Greece.
5. See N. Lihnos, The Olive Tree and its cultivation, (Athens, 1949)p.35.
6. Information obtained from Eleourgiki, Department of Marketing,March 1988.
7. N.S.S.G, Industrial Census, 1970.
8. Information obtained from the Institute of Industry and Commerceof Messenia Province : Unpublished Export Records, 1970 (consultedin the Summer of 1988.
9. P.A.S.E.G.E.S, The Greek Agriculture : Processing and Marketing ofolive-oil, (Athens, 1978). The attempts by wholesalers to escapeofficial censuses and tax levies was mentioned during my extendeddiscussion with Mr Y. Xiloyiannis (PASEGES, 1988) and Mr V.Yiannopoulos, Director of the Institute of Industry and Commerceof Messenia province. Furthermore, during my fieldwork visit tothe table olive processing unit "Bro. Vraka" in Calamata, in theSummer of 1988, I personally observed the extent of thesepractices which still exist.
10. Ministry of Agriculture and P.A.S.E.G.E.S. Survey, 1970. See alsoTable 6.1.

11. ibid., 1983.
12. According to these standards the minimum output requirement for aunit to be eligible to receive the consumption aid was 60 tonnesper annum, packaged in containers of 51t or lit. The technicalrequirements are set out in: "Study for the Establishment -Modernisation of Packing Olive-Oil Units", Ministry of Agriculture,Department of Agro-Industry and Supplies, (Athens, January 1987).
13. This equipment includes (a) systems especially designed for thefiltering and polishing of olive-oil; (b) systems for processing ofoils and production of margarine. This information was obtainedfrom the Ministry of Economic Affairs, Department of Tax andDuties, 1989.
14. See A. Kiritsakis, The Olive-Oil, (Thessaloniki, 1988) and M.Guida, "Fats and Oils in Italy", Speech given in the AnnualConference of the IFMA-IMACE-Rome, May 1984.
15. See A Kiritsakis, 1988, ibid., p.69.
16. See "Study for the Establishment - Modernisation of Packing Olive-Oil Units", Ministry of Agriculture, Department of Agro-Industryand Supplies, (Athens, January, 1987).
17. ibid., The CAP is administered by the European AgriculturalGuidance and Guarantee Fund (EAGGF). Its two major functions are:the guidance and improvement of farm production, and the guaranteeor protection of farmers income. See G. N. Minshull, The NewEurope : An Economic Geography of the EEC, (London, 1985). p.119.
18. Extra Olive-Oil is denoted when the percentage content of theproduce in oleic acids is less than one. Fine Olive-Oil is denotedwhen the percentage content is less than 1.5, and Semi-Fine isdenoted when the percentage content is less than 3.3. Ministry ofCommerce, Price Records, 1989.
19. Information on the packing process of edible olive-oil inEleourgiki was obtained during my visit to the production unit inElefsina. The Chemical Engineer Mr P. Skiadas, was kind enough toinstruct me in this matter.
20. Information derived from records on units registered to receiveconsumption aid in Messenia Province. Institute of Industry andCommerce, Messenia, Summer 1988.
21. Ministry of Agriculture (YDAGEP), Industrial Survey completed inMarch 1988.
22. ibid., Records on Packers' applications for consumption aid, 1983,1985.
23. Ministry of Agriculture, 1987-1992 Sectoral Plan for the OliveIndustry, 1988.
413

24. ibid.,
25. See Tables 6.1 and 6.3.
26. Ministry of Agriculture (YDAGEP). Records on consumption aidapplications, 1988.
27. ibid., 1982/1983, 1985.
28. Ministry of Agriculture, Sectoral Plan for the Olive Industry. 1987-1992, 1988.
29. See A. Kiritsakis, 1988, op.cit, p.98.
30. ibid.,
31. Agricultural Bank of Greece, Department of Agro-Industry,information provided by V. Evagellou, 1989.
32. Sectoral Plan of the Olive Industry, 1987-1992, op.cit.,
33. ibid.,
34. N.S.S.G, Industrial Census, 1984.
35. See Y. Xiloyiannis, Annual Report on the Development of the Olive-Oil Sector, (Athens, 1982).
36. A.B.G, Department of Agro-Industries, 1988 Survey. Unpublishedinformation proved by V. Evagellou, 1989.
37. A. Kiritsakis, 1988, o p .cit., p.121.
38. ibid.,
39. Sectoral Plan of the Olive Industry. 1987-1992 op.ci .,
40. The selection of the sample was determined after extensivediscussion with Commercial Bank personnel (the Commercial Bank ofGreece finances most of these units) and also after consultation oflists which referred to enterprises' number of employees andregional distribution. Furthermore, I took advice from severalfinancial analysts employed by I.C.A.P. Concerning therepresentativeness of the sample, it is true that I would haveliked to have had more years and a larger number of firms but whatthe financial indicators of this sample and the others that followsuggest seems to be in broad consonance with the generallyunderstood picture within the industry. As far as the credibilityof the financial data used is concerned, irregularities cannot bedetected unless one delves further into accounting practices andmethods which are firmly entrenched into the Greek economy'sfinancial structure. For further information on consolidatedbalance sheets and general terminology and techniques used byEnglish standard see S. A. Greenman, Accounting in Modern Form,

(London, 1966) and R. H. Parker, Understanding Company Financial Statements (Britain, 1982). The balance sheets and additionalinformation on the sample units were obtained from the I.C.A.P.
. D. Blake, The1989). In thefrom discussionand Management,
41. I have made use of the techniques presented in JConcise Guide to Interpreting Accounts, (London,interpretation of the ratios I have also benefittedwith Mr. K. Sugden of the Department of BusinessUniversity of Salford.
42. The performance ratio can also be defined as: Net Pre-TaxProfits/Own Capital. This ratio is used quite often in the Greekaccounting system.
43. See J. D. Blake, 1989, on.cit.,
44. N. S. S. G, Industrial Census, 1984 and 1978.
45. Information obtained from the N.S.S.G, through discussion with G.Katsaros, member of the team responsible for the compilation of thestatistics.
46. Eleourgiki, Department of Information, Summer 1988.
47. The balance sheets and additional information on the sample unitswas obtained from the private statistical organisation I C.A.P,based in Athens and the Official Government Newspaper, variousissues.
48. By article 70 of the Treaty of Rome, on Greece's accession thecountry was allowed to keep national measures for table olivesuntil 31 December 1985. On the 20th December 1985 the Councildecided to continue with national measures until 31st December1987. Since then, all subsidies have been gradually reduced untilthey are to be totally abolished in 1990.
49. Ministry of Agriculture (YDAGEP) 1988 survey of the processingunits in the olive industry, completed March 1988.
50. See M. Nikolinakou et.al , Strategy for the Development of theCooperative Sector in Agriculture, (Athens, 1986).
51. Eleourgiki, Department of Information, 1989.
52. ibid.,
53. PASEGES, Manifesto of its Establishment, 1935 and Interviews withrepresentatives, 1988.
54. ibid.,
55. See P. Avdelidis, The Agricultural Cooperative Movement in Greece,(Athens, 1986).
415

56. See M. Nikolinakou et.al , 1986, op.cit.,
57. ibid.,
58. On the role of the A.B.G. as a promoter of the cooperative movementI have benefitted from extensive discussion with V. Evagellou, Headof Agro-Industry Department, A.B.G, in 1988 and 1989.
59. ibid.,
60. Economicos Tahidromos, 24 June 1989.
61. Information obtained through discussion with Y. Xiloyiannis,PASEGES, 1988.
62. Eleourgiki, Department of Information, March 1988.
63. ibid.,
64. Eleourgiki, Department of Planning, 1988.
65. Eleourgiki, Department of Domestic Trade, 1988.
66. The Negative Compensation Amounts were imposed in 1987 because ofthe situation of surplus in the olive market. For each kg ofolive-oil exported to a Community country the exporter had to payan amount of up to 25% of the selling price (the actual sumdepending on the type and quality of the produce).
67. Eleourgiki, Department of Supplies, information received from A.Kiriakoulakos, Head of the Department, March 1988.
68. Eleourgiki, Department of Planning, Confidential, 1989.
69. Eleourgiki, Department of Supplies, discussion with A.Kiriakoulakos, March 1988.
70. ibid.,
71. In the sense that increased transport costs have to be incurredwhen the produce is taken to the plants for oil extraction.
72. A.B.G, "Report on Technical Development of Seed-Oils ProcessingUnits", (Athens, 1983).
73. ibid.,
74. ibid.,
75. Cotton Organisation, "Production Techniques in Seed-Oils ProcessingUnits", (Athens, 1985).
76. ibid., and information received from I.C.A.P., 1988.
416

77. Cotton Organisation, "Production of Seed-Oils 1982-1985", (Athens,1985).
78. The sample was selected in terms of representatives according tosize of employment of the firms and the level of modern productionequipment used. Information on this was provided by the CottonOrganisation and the Commercial Bank of Greece ( vir A. Katsikas,1988 was especially helpful). The balance sheets and additionalfinancial information were provided by the I.C.A.P.
79. This heading ("Problematic") includes those firms under Statemanagement since they have incurred huge losses. The losses of,just eleven amounted to 223.9 billion dr. in 1988. Economicos Tahidromos, 15 June 1989.
80. See L.E Rockley, The Meaning of Balance Sheets and Company Reports,(Essex, 1983) and J. D. Blake, 1989, 0p.cit,.
41 7

Table 6.1(a):Packing Enterprises by Region,1970,1978 and 1983
1970 1978
REGIONS CO-OPS. PRIVATE TOTAL CO-OPS. PRIVATE TOTAL
East Macedonia
and ThraceWest Central
Macedonia -
Epirus 1 1 1 1
Central Greece - -
Peloponnesos 2 2 4 3 2 5
Attica and Islands 2 17 19 3 19 22
Crete 5 1 6 6 1 7
Total - 10 20 30 13 23 351
Notes: 1. Annual Potential capacity 78,000 tonnes
6.1(b).Packers in Operation and Packing Units in The Process of
Construction by Law 355/75 in 1983
IN OPERATION UNDER CONSTRUCTION4
REGIONS
NUMBERS CAPACITY 2CAPACITY TOTAL
East Macedonia
and Thrace 2 250 250
West and Central
Macedonia 15 4,000 4,000
Epirus
Central Greece 1 500 - 500
Peloponnesos 23 22,100 2,750 3 24,850
Attica and Islands 50 80,650 6,900 4 87,550
Crete 5 3,500 3,500
Total .96 111,000 9,650 120,650
Notes: 2. Tonnes/year
3. Olive Co-operative of Gargalianoi 650 tonnes/
yearOlive Co-operatives of Lakonia- 1,100 tonnes/year
Olive co-operatives of Trihonida 1,000 tonnes/yerar
4. Cefallonia ltd. 200 tonnes/year, olive co-operatives
Zakenthos 2,500 tonnes/year, Olive Co-operative of
Lefkada 4,200 tonnes/year.
Source:Ministry of Agriculture and PASEGES,1978 and 1983 Surveys
418

Table 6.3:Survey Results of Packing Units in 1988
REGIONS CO-OPERATIVES PRIVATE TOTAL
East Macedonia and Thrace 1 3 4
West and Central Macedonia 3 17 20
Epirus 1 1
Central Greece 5 5
Peloponnesos 8 37 45
Attica and Islands 5 70 75
Crete 4 4 8
Total 21 137 158
Source: Ministry of Agriculture and Paseges, 1988 Survey
419

Table 6.4: The Ten Largest Packers of Olive Oil,1981/2,1982/3
and 1984/5
1981-1982
PACKERS % CONTRIBUTED QUANTITY1
'Elais 28 10,500
Minerva 17 6,537
Eleurgiki 8 2,995
Katsakoulis 6 2,169
O.C. Lesvou 5 2,034
0.C. Pezon 4 1,502
O.C. Laconias 4 1,338
Abea Hanion 2 824
O.C. Coumvariou 2 814
O.C. Messenias 2 726
Total
78 29,439
1982-1983
PACKERS
% CONTRIBUTED QUANTITY
Etats 22 12,997
Eleourgiki 14 8,341
Minerva 14 7,982
0.C. Lesvou 8 4,380
Katsakoulis 4 2,318
Bro. Arhondaki 3 2,013
0.C. Pezon 3 1,947
0.C. Loconias 3 1,544
Motakis 2 1,120
D.C. Colimvariou 2 1,101
Total 85 43,743
420

Table 6.4: Continued/
1984-1985
PACKERS % CONTRIBUTED QUANTITY
Eleourgiki 29.3 22,969
Elais 13 10,216
Minerva 6.6 5,154
Bro. Arhondaki 5 3,990
D.C. Lesvou 5 3,821
D.C. Eracliou 3 2,448
D.C. Pezon 2.6 2,068
Bro. Kefalea 2.4 1,855
D.C. Lahonias 2.2 1,728
D.C. Colimvariou 2 1,662
Total
71.1 55,698
Notes 1. Quantity in tonnes
Source: YDAGEP, Ministry of Agriculture, Greece,1988

Table 6.5: Regional Distribution of Refineries 1970-1978
1970 1978
REGIONS NO.OF PLANTS TONNES/YEAR NO.OF PLANTS TONNES/YEAR
East
Mecadoniaand
Thrace 4 25 4 30
West and
CentralMecadonia 8 80 8 96
Epirus 2 18 2 18
Central
Greece 6 56 5 56
Peloponnesos 2 30 4 68
Attica
and Islands 23 540 24 564
Crete 10 120 11 132
Total
55 869 59 9,641
Notes 1. The capacity of 964 tonnes or 300,00 tonnes p.a is thepotential capacity.Actual capacity does not exceed
50,00 tonnes p.a and this is the maximum amount the oil
banks available in the refineries can hold.
Source: Ministry of Agriculture, 1988.

Table 6.7: Regional Distribution of Olive ResiduePlants, 1988.
REGIONS CO-OP. PRIVATE TOTAL TONNES/24H
Peloponnesos 1 16 17 2,900Central Greeceand Eboea - 7 7 1,000
Thessalyand Epirus - - - -Ionian islands 1 2 3 400Thrace - 1 1 60Crete 3 10 13 2,400Aegean islands 2 4 6 650Dodekanisos 1 - 1 100
Total 8 42 50 7,710
Source: Ministry of Agriculture, 1988
423

Table 6.9: Consolidated Balance-Sheets of a Representa-tive Sample of Firms in the Olive ResidueSub-Sector, 1983-1985 (million dr.)
1983 1984 1985
Current Account
FixedFixed Assets 421.3
448.6 477.3Net Value ofFixed Assets 192.3
193.8 195.3
LicruidLiquid Assets 185.6 179.3 292.0Reserves 413.0 444.7 591.7Total LiquidAssets 598.6 624.0 883.7Total Assets 791.0 817.9 1,88.1
Liabilities
Own CapitalBorrowings Short-TermLiabilitiesLong-TermLiabilities
Total BorrowingsTotal Liabilities
Results
Gross. ProfitsNet Profits
173.0
559.2
58.8
618.0791.0
181.947.3
188.5 159.9
558.9 812.1
70.5 166.1
629.4 928.2817.9 1,088.1
159.0 202.5
44.6 46.4
Source: Companies' Balance Sheets, ICAP and OfficialGovernment Newspapers,1983,1984,1985.
424

Table 6.11: Accounting Ratios of the Sample, the Food Industry andthe Total Industry, during 1983-1985.
Liquidity Ratio Degree of Gearingl Performance Ratio2
1983 1984 1985 1983 1984 1985 1983 1984 1985
Sample
FoodIndustry
TotalIndustry
1.07:1
1.05:1
1.11:1
1.12:1
1.05:1
1.12:1
1.09:1
1.06:1
1,10:1
3.57:1
2.81:1
2.35:1
3.34:1
3.16:1
2.50:1
5.80:1
3.89:1
2.78:1
27.34%
3.20%
5.20 %
23.66%
5.40%
7.30%
29.02%
16.40%
12.80%
Notes: 1. Borrowings/Own Capital
2. Net Pre-Tax Profits/Own Capital
Source: National Statistical Service of Greece, Industrial Census, 1985
425

Table 6.12: Consolidated Balance Sheets of the Sample of Olive ResiduePlants between 1986-1988
(In million drs)
1986 1987 1988
Current Account
Fixed Assets157.0 241.8 257.3Fixed Assets
Net Value ofFixed Assets 157.0 241.8 257.3
Current Assets
CashStockCurrent Assets 363.2 927.8 1,379.0Total Assets 960.0 1,408.0 1,758.7
Liabilities
Own Capital 219.7 343.7 527.1
Borrowings
CurrentLiabilities 598.7 791.6 1,229.6Long-TermLiabilities 77.3 372.5 380.0
Total Borrowings 676 1,164.1 1,609.6Total liabilities 960.0 1,408.0 1,758.7
RESULTS
Gross ProfitNet Pre-Tax 54.3 I 4.7 I -123.7Profits
Source: Companies' Balance Sheets, I.C.A.P and Official GovernmentNewspaper, 1986, 1987, 1988.
426

I Regions Private Cooperative Total
Table 6.16: Regional Distribution of Olive Processing Units in 1984
Units Capacity(tonnes)
Units Capacity(tonnes)
Units Capacity(tonnes)
East Macedoniaand Thrace
1 300 1 500 2 800
West-Central 2 1000 2 2500 4 3000
Macedonia
Epirus 1 500 4 3200 5 3700
Central Greece 17 19500 6 17200 23 36700
Peloponnesos andWest Sterea 13 9600 5 8300 18 17900
Attica, Stereaand Islands 8 10300 3 3000 11 13300
Crete
Total 42 41200 21 [ 34700 63 75900
Source: Agricultural Bank of Greece, 1988
427
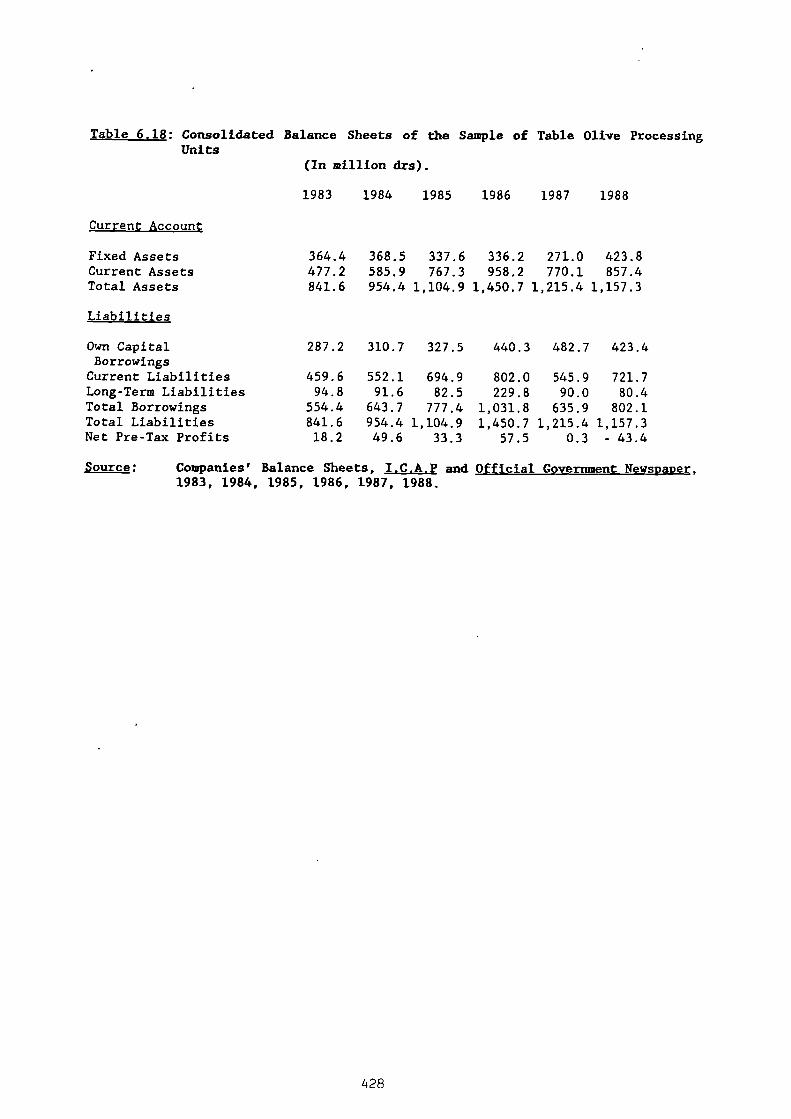
Table 6.18: Consolidated Balance Sheets of the Sample of Table Olive ProcessingUnits
(In million drs).
1983 1984 1985 1986 1987 1988
Current Account
Fixed Assets 364.4 368.5 337.6 336.2 271.0 423.8Current Assets 477.2 585.9 767.3 958.2 770.1 857.4Total Assets 841.6 954.4 1,104.9 1,450.7 1,215.4 1,157.3
Liabilities
Own Capital 287.2 310.7 327.5 440.3 482.7 423.4Borrowings
Current Liabilities 459.6 552.1 694.9 802.0 545.9 721.7Long-Term Liabilities 94.8 91.6 82.5 229.8 90.0 80.4Total Borrowings 554.4 643.7 777.4 1,031.8 635.9 802.1Total Liabilities 841.6 954.4 1,104.9 1,450.7 1,215.4 1,157.3Net Pre-Tax Profits 18.2 49.6 33.3 57.5 0.3 - 43.4
Source: Companies' Balance Sheets, I.C.A.P and Official Government Newspaper,1983, 1984, 1985, 1986, 1987, 1988.
428

Table 6.19(a): Accounting Ratios of the Sample of Table Olive ProcessingUnits.
1983 1984 1985 1986 1987 1988
Liquidity Ratio 1.04:1 1.06:1 1.10:1 1.19:1 1.14:1 1.19:1
Gearing Ratio 65.8% 67.4% 70.3% 71.1% 52.3% 69.3%
Fixed Assets Ratio 41.4% 37% 29.1% 23% 22% 37%
Performance Ratio 2.2% 5.2% 3% 4% 0.02% -3.7%
Source: Table 6.18
Table 6.19(b):
Accounting Ratios of the Sample. the Food Industry and theTotal Industry. between 1983-1985
Liquidity Ratio Degree of Gearingl Performance Ratio2
1983 1984 1985 1983 1984 1985 1983 1984 1985
Sample 1.04:1 1.06:1 1.10:1 1.93:1 2.07:1 2.37:1 6.3% 16% 10.2%
FoodIndustry 1.05:1 1.05:1 1.06:1 2.81:1 3.16:1 3.89:1 3.2% 5.4% 16.4%
TotalIndustry 1.11:1 1.12:1 1.10:1 2.35:1 2.50:1 2.78:1 5.2% 7.3% 12.8%
Notes:
1. Borrowings/Own Capital2. Net Pre-Tax Profits/Own Capital
Source: N.S.S.G, Industrial Census, 1985
470

Table 6 21(a): Capital Sources of ABC, 1980-1984
(In million dr)1
1980 1981 1982 1983 1984
A. Bank of Greece 63,341 117,660 141,268 211,479 233,563
B. Sources from Abroad 1,151 1,090 1,441 1,753 3,089
C. Agricultural Bank of Greece 22,516 45,030 79,555 67,706 145,809Operations
Total 87,008 163,780 222,264 280,938 387,461
Table 6.21(b): Distribution of ABC's Capital, 1980-84
(In million dr)1
BASIC CATEGORIES 1980 1981 1982 1983 1984
Cultivation 37,584 44,187.1 46,649 59,612.6 79,740.8Security Loans 303.7 429.4 520.5 931.2 1,442.8Cooperatives & Others 35,259.8 77,257.3 113,911.5 162,120.1 211,304.3Middle-Term 84,530.9 100,795.9 109,828.2 130,090.8 203,842.4Arranged 14,327.4 14,009.9 27,655.5 30,016.3 24,162.0Public Tobacco 17,607.8 27,826.2 30,894.0 31,053.8 3,462.9Public Supplies 694.3 3,845.9 1,726.4 465.1 335.6Ministry of Agriculture, 9,517.3 28,054.3 13,466.7 3,494.8
Intervention AgencySpecial Financial Aids 13,639.8Storage ABG. 388.7 493.4 643.4 758.3 868.8
TOTAL 190,606.6 292,002.2 359,883.8 428,514.9 528.654.4
Notes: 1. All sums expressed in current prices
otL_T.S_ft A.B.G. Department of Agro-Industries, 1984.
1+30

Table 6.22: COOPERATIVE DEBTS OF THE ABC, April 1989
(In million dr)
KYDEP (Cotton) 16,850Eleourgiki 4,950S.O. Union Patras 3,350S.O. Union Lagada 500S. 0. Union Livadias 360Ptinotr. Coop. Halkidas 500Ptinotr. Coop. Thessalonikis 240Ptinotr. Coop. Kinourias 120PTinotr. Coop. Artas 120Vine Cooperative "Marko" 500S.O. Union Serron 250S.O. Union Pierias 250S.O. Union Piliou & N. Sporadon 240Cooperative of Halkida 180Union of Forest Coop. Thessalias 240S.O. Union Alexandroupolis 120S.O. Union Poligirou 120S.O. Union Rethimnis 120Coop. Pezon 430Coop. Aharnon 240Vine Cooperative of Nemea 120S. O. Union of Dodekanisos 240S. O. Union Kobotiou "Proodos" 120Secove S.A. 6,430Speka S. A. 2,480Spe S.A. 1,240Aevek S.A. 500Coop. Industries of Thessalia 860Kair S.A. 240Sevath S.A. 360Elvik S.A. 360Sepek S.A. 120Sekap S.A. 730Rodopi S.A. 860Synergal Ltd 2,480Sergal S.A. 370Elvigal 740Agrex S.A. 1,100Kinopraxia "Asti" 370Agrobusiness Coop. Xiniadas 1,250Agrobusiness Coop. Arkalohoriou 1,250
Total 51,900
Source: Economicos Tahydromos, 6 April 1989.
431

Table 6.26: Eleourgiki's Expenditure on Olive Oil and Soaps, 1986
Expenditure Items Value in DR.
Inputs 10,949,276,000 77.94
Purchases 589,536,000 4.11
Auxiliaries 32,207,000 0.22
Fuels-Fertilisers 83,749,000 0.58
Containers 888,320,000 6.18
Labour 568,366,000 3.96
General Expenses 37,800,000 0.26
Interest 642,239,000 4.47
Paying Off Debts 28,331,000 0.20
Distribution Expenses 100,000,000 0.70
Special Compensation 198,464,000 1.38
Total 14,118,288,000 100
Source: Eleourgiki, Department of Planning, Confidential
432

Table 6.28: Regional Distribution of Seed-Oils Units in1985
Regions Cooperative Private Total Capacityl
Attica &Corinthia - 8 8 1,022
Viotia - 5 5 435Eboea - 1 1 350Fthiotis - 2 2 700-
1,045Total ofSterea &Eboea - 16 16 762,100-
855,0002Karditsa 1 - 1 80Larisa 1 1 2 340Total ofThessaly 2 1 3 420Emathia - 1 1 250Thessaloniki 1 3 4 485Serres 1 - 1 50Pella 1 - 1 40Total ofMacedonia 3 4 7 247,5002Evros - 2 2 50Total ofThrace - 2 2 15,0002Total ofGreece 5 23 28 3,802-
4,147
Notes: 1. Tonnes/24h2. Tonnes/year
Source: Cotton Organisation, 1988.
433

Table 6.29:Output and Production Techniques of Seed Oils
Units, 1985
NAMES
OF
FIRMS
PRODUCTION CAPA- REFINING METHOD ESTABLISH-
METHOD* CITY** MENT AND
CONT. DISCONT. MODERNI-
SATION
YEAR
Stauraetos & Co. No 60 No - 1967, 1974
Manos-Eleourgiki S.A. No
Skandalis & Co. S.A. No
150
20
No
No
Yes
No
1964, 1970
Oliva No 60 No No 1930,
1980
1955,
Sarelakos No 100 No Yes 1963,
1978
1975,
Mili Soyas Yes 600 Yes No 1974
Kafandaris-Papakostas No 70 No Yes 1965, 1969
Griva Bro. & Co. S.A. No
K.B. Markou Abee No
Dakar Abee No
20
100
120
- - 1952,
1975,
1977
1955
1976
Soya Hellas S.A. Yes 350 - 1979
Agroinvest S.A. Yes 1,000 Yes No 1983
Bro. Vlitsou Abee No 45 - 1971
Co-Op Karditsas No 80 Yes 1967
Co-Op Thessalias
"Kentauros" Yes 220 Yes 1984
Bro. Magrizou S.A. No 120 No Yes 1962, 1978
Eleourgia of N.
Greece S.A. Yes 250 1983
Eleourgia of
Salonica S.A. Yes 130 No Yes 1962
Seed-Oils of
Salonica S.A. No
Bro. Karagior g a Abee No
105
130
Yes
Yes
1963,
1975
1969
Union of Co-Ops
Salonica Yes 120 Yes - . 1980
Co-Ops, of Serres . No 50 No Yes 1973
Co-Ops of Giannitson No 40 No Yes 1979
Egnatia No
Kouroudis No
135
15
No
No
Yes
Yes
1959,
1967,
1964
1961,
1972
Eleourgia Daulias-
Sporelea Abee No 125 1982
Notes: * "pressing out"
** Tonnes/24h
Source: Cotton Organisation, 1985

Total Quantity Potential % ofProcessed Capacity Capacity
NAMES Tonnes/Year Utilization(300 Days)
Manos S.A. 9828 45,000 21.84Eleourgia Falirou 1656 4,200 39.43Oliva S.A. 6245 18,000 34.69Stauraetos 5371 18,000 29.84Skanddis & Co. 1041 6,000 17.35Sarelakos 7265 30,000 24.22Mili Soyas 121000 180,000 67.22Daker ABEE 27523 36,000 76.45Markou AEBE 9864 30,000 32.88Diaulias AEBE 3878 37,500 10.34Griva BRO 4329 6,000 72.15Vlitsou BRO 5332 13,500 39.50Kafandaris-Papakostas 12846 21,000 61.17Agroinvest 76636 300,000 25.54Soya Hellas 90000 105,000 85.71Union of Coop's Darditsas 16247 24,000 67.70Ser. & SP. Koroni 8654Magrizos S.A. 6029 36,000 16.75Eleourgia of Salonika S.A 14048 39,000 36.02Oil-Seeds of Salonika S.A 5121 31,000 . 16.52Karageorgou BRO 6515 39,000 16.71Eleourgia of N.Greece 10580 75,000 14.11Union of Coops of Salonica 34288 36,000 95.24Union of Coops Serron 3690 15,000 24.60Union of Coops Giannitson 4011 12,000 33.43Sporeleourgia Thrace 2130 10,500 20.28Kouroudis D. 205 4,500 4.56
TOTAL 494,332 1,244,700
Table 6.30: Capacity Utilization of Seed-Oil Units 1983/84
(Oil-Seeds in Tonnes)
Source: Cotton Organisation, 1985.

Table 6.31: Consolidated Balance Sheets of the Sample of Seed-Oils Firms, 1983-1986
1983 1984
(In million drs)
1985 19861 1987 1 19881
Current Account
Fixed Assets 1301.0 1318.8 1400.7 159.0 915.5 1131.8Current Assets 2702.5 3982.6 5033.8 1409.6 2400.8 2070.8Total Assets 4003.5 5301.4 6434.5 1611.0 3402.5 3385.8
Liabilities
Own Capital 964.2 1136.6 1393.2 581.6 1048.2 1444.7Current Liabilities 2323.3 3658.9 4608.7 968.9 1940.0 1473.9Long-Term Liabilities 716.0 505.9 432.6 41.4 366.2 337.6Total Borrowings 3039.3 4164.8 5041.3 1010.3 2306.2 1811.5Total Liabilities 4003.5 5301.4 6434.5 1611.0 3402.5 3385.8Net Pre-Tax Profits 201.3 294.3 272.2 -52.4 156.3 184.4
Notes: 1. The sample includes only three units.
Source: Companies' Balance Sheets, I.C.A.P and Official Government Newspaper,1983, 1984, 1985, 1986, 1987 and 1988.
436

270 400
216or80%
54or20%
Figure 6.1: A Schematic Presentation of Refining andPacking based on 1988 Throughput Data
(in '000 Tonnes)
1 TOTAL OLIVE PRODUCTION = 1,165
11,080 1 85 (4)\/ \ /
10IL MILLS !TABLE OLIVES 1 PROCESSING 1 /\ /75 1UNITS
10 SELF CONSUMPTION
\/
1VIRGIN
OLIVEOILVE OIL 1 1RESIDUE
/\
(3) / \/ \/ \
IEDIBLEHLAMPANTI 1EXTRACTION I SPENT RESIDUEOIL OIL PLANT --(OIL CAKE ETC.)
\ /\ / \ /I OIL FOR INDUS-
OLIVE \ - - - -TRIAL USESRESIDUE
24 OIL(2)/ \'REFINERY 1\ /
41 1 9 USED IN CANNING INDUSTRY\----\ (1) 1 \
/ \
1
BLENDINGAND/OR 90 HUMAN CONSUMPTION PACKAGEDPACKAGING / 110 HUMAN CONSUMPTION UNPACKAGED
1 65 SELF-CONSUMPTION
Source: Derived from N.S.S.G. and EleourgikiStatistics, 1988

Sold Unpacked
Waste
Sold Unpacked
Figure 6.2: The Packing Process of Edible Olive Oil in Eleourgiki
C.1988.
'Edible I'Olive Oil'
'Oil-Bank I
'Filtering'
'Extra (0-1 )
Filtering 'Fine (1-2)
/Courante (2-3.3 )
I Filtering
Extra
Fine + Refined
Courante
Polishing
I Nixing IExtra
PackingPolishing
I Packing IEXTRA VIRGIN
Source: Eleourgiki's Production Engineer, Summer, 1988
I 10

1439

440
mown._••••••1111...M••••1111•••111...•••••••••111111_,s.•••••••••111111111•111._••••••••••••••lIl111311••••••••••••110••••••n•••••••11. A
n•••••••••••••91,0 •11111••••111•••111111111A
ummun•••••••ir,Vismossim••••19/•Iii•ms•No••••00••••••••••••sti•4m•mismane•ron Alumumm•Nofr
11111•11•111•111111111•••••••n111• • •••4
W11111111•1111/M711••••••111 k
0
c\I
4-c6

<
<
Figure 6.5: The Structure of the Olive Cooperative Movement
PASEGESi
I
Third-Order Central
Unions:
Eleourgiki
I
57 Second-Order Olive
Unions
I
2,098 First-Order Olive
Cooperatives
I347,438 Associated Olive Growers
Source: A B G, Department of Cooperatives, 1988.
441

442

CHAPTER SEVEN
AN INVESTIGATION INTO THE FINANCIAL PERFORMANCEOF A SAMPLE OF COOPERATIVE AND PRIVATE PACKERS OF OLIVE-OIL
Introduction
In Chapter Six I attempted to show that the expansion of production
and the process of modernization which has taken place in the second
stage processing and packing units is based on a rather weak and
unstable financial structure. An analysis of the balance sheets of a
representative sample of firms from the processors of table olives and
olive residue plants seemed to confirm this picture - though the amount
of information available did not allow for an in-depth examination of
the financial operations of the firms. My objective here is to throw
some light on the financial performance of a sample of cooperative and
private packers located in Messenia province. In particular I seek to
examine the question already implicit in Chapter Six, that is, how do
these firms actually manage to survive? I argue that a large part of
the 'answer is connected with the CAP price support system. It is
further contended that another important factor explaining the survival
of the smaller (and indeed some of the bigger) units is the widespread
practice of tax evasion. The most recent - and still unpublished study
- of this phenomenon estimated that in 1988 Greece's black economy
amounted to almost fully one-third (31.6%) of the official GDP. (1) As
very little of such earnings appears to be reinvested in the
enterprises themselves most, - if not all - of the units in the olive
443

industry remain commercially viable enterprises; and this is partly
captured in their fixed assets ratio.
In Section One the sample of packers operating in Messenia province
is discussed. It is argued that their financial performance as shown
by their unpublished balance sheets and Profit and Loss accounts
strongly suggests an artificial financial base - one highly dependent
upon EEC subsidies. Furthermore, it is pointed out that tax evasion is
commonplace business practice. Part One deals with definitions. I try
to show that there cannot be a generally accepted definition of a
small-scale firm. It seems more useful to define "small size" in
relation to the specific socio-economic conditions prevailing in each
country. Next, a working definition is adopted for the sample firms
under investigation. In Part Two the sample units are described
individually. It is argued that the majority of these firms are
dependent on exports and therefore conditions in those markets
directly influence their sales and hence their turnover. It is also
shown that the cooperative units of the sample are not as active in the
marketing arena - especially in export markets - as the private ones
which have experience and have long-established commercial contacts.
Part Three shows that there has been a dramatic increase in the level
of technological modernisation in the packers of Messenia province.
Over 75% of the sample firms use modern equipment for the processing
and packaging of olive-oil, and this directly affects the quality of
the produce.
444

Section Two argues that the evolution of the market structure in
the second stage processing and packing of olive-oil lends some support
to the theoretical findings of the contestable market hypothesis.
Nevertheless, it is pointed out that the reliability of the results
obtained in the course of empirical research into industrial
organisation depends critically on the quality of the data employed.
It seems clear that successfully capturing recent developments in the
subsector is more than usually dependent upon the extent which valid
information can be extracted from the data available.
Section Three discusses the financial situation of the small firms
with special reference to the olive processing units. It is contended
that the cost of borrowing funds, together with the inflexibility of
the Greek financial structure, poses a considerable constraint upon
their operations. In trying to find less costly ways of financing
their activities the private firms resort to a number of legal and
illegal practices which avoid the tight mechanisms of the Greek
financial system.
,7.1
The Packers of Messenia Province
7.1.1 Definitions
Definitions of "small firms" vary a great deal; most of the
literature on developing countries deals with enterprises of between
one and ten workers, but in a few cases it includes enterprises of a
larger size. The terminology also varies as between the informal
445

sector, the urban traditional sector, the unprotected sector, petty
commodity production and even non-capitalist production. But, by and
large, the same core group of enterprises (at least when considering
manufacturing) is included. (2) As far as the definition of small size
in developed countries is concerned, a small firm is defined broadly as
one with no more than 200 employees. This, of course, cannot be
regarded as anything more than a rigid definition. The Bolton
Committee, which investigated small firms at the beginning of the
1970's, found it impossible to adequately define a small firm in terms
of employment, assets, turnover or indeed any other quantitative
measure. The Committee focused on three main characteristics. (3) First
a small firm had a relatively small share of the market. It was unable
to significantly influence prices in the market through its own actions
and it could not influence its external environment in a manner which
would assist the company's competitive position. Secondly small firms
were "managed in a personalised way", with at most a few specialised
management functions, or tiers of management. Decision making was
controlled by the owners of the business who exercised the principal
management functions. Finally, small firms were independent. The owner
manager had effective control of the business and were not subject to
the controls applied within larger organisations, though they might be
limited in their actions by obligations to financial institutions.
Perhaps there cannot be a generally accepted definition because
small size really needs to be considered in relation to the specific
socio-economic conditions prevailing in each country. In the olive
sector of the sample area under examination there are two refineries
446

which deal exclusively in processing olive residue and market in olive
residue oil. All the other units deal mainly with filtering, blending
and packaging olive-oil which they market under different brand names.
In this sense I would define these units as small size as no actual
chemical processing takes place which would transform the nature of the
product. On the other hand, the largest of these units, as far as
employment and turnover are concerned, depend primarily on exports.
Export markets are often unstable, so a small business is often quite
unable to influence outcomes acting on its own indeed it is
invariably subjected to the market and not the other way around. Also
lack of flexibility (partly due to an inability to diversify
production) may be added to the features of small size firms in the
sector under consideration.
7.1.2 Description of the Sample
Small businesses, especially in a predominantly rural area like
Messenia, have several distinguishing features. This is because of the
special type of forward and backward linkages governed 'by their
geographical location. In many cases they have established personal
long-term relationships with the larger local olive producers as well
as with the cooperatives. On the other hand, most of these businesses
rely on exports as Messenia has an important port (Calamata) which
makes her a natural centre for olive-oil shipments abroad. Very few
firms out of the thirty or so that operate in the province are limited
to producing for purely national consumption. The sample surveyed
consists of eight businesses mainly involved in olive-oil and olive
447

production, two businesses which produce olive-residue oil, and two
cooperatives, one of the second-order called the "Central Union of
Cooperatives of Messenia Province", and the other is the first-order
Olive Cooperative of Gargalianoi.( 4) A list of the sample businesses
with names, employment and year of establishment is given in Table 7.1.
All the units included in the sample - apart from the cooperatives-
are family businesses.
Table 7.1: Sample Enterprises
NAMECurrentEmployment Year of Establishment
1. Linardakis 65 19102. Vraka Bros. 10 19283. Kalogeropoulos & Sons S.A1 100 19484. Plemmenou Bros. 14 19525. Malamas Stathis 5 19586. C.C.U.M. 130 19737. Kefalea Bros. 534 19758. Koutelas 20 19769. Eleourgia Calamatas 10 198210. Olive Cooperative of
Gargalianoi 25 198411. Eleourgia Messenias S.A 20 198612: Yefteas Andreas S.A. 365 1986
Note:
1. S.A (Society Anonymous) is equivalent to a PLC
Source: Fieldwork Interviews, Summer 1988.
Not surprisingly it turns out that most of the sample packers
descend from families of olive merchants. Some of these families
started in the olive business in the early 20th century; they used to
buy olive-oil and olives in the weekly market held every Saturday in
Calamata. (5) The merchants would make their profit from the difference
448

between the price they paid to the olive growers and the price they
sold to consumers in the non-olive growing areas of the country.
Exports were undertaken only by the richest of the merchants who could
afford the greater risks. This is because in the pre-war period and
even down to the early 1950's, payment was made to the merchant
sometimes after the merchandise had been received. Since export
involved shipment of the olive-oil abroad long before payment could be
claimed mutual trust between the trading parties was crucial.
Nevertheless, the risk for the olive merchant was considerable as in
many cases he relied solely on the importers' honesty. (6)
The firm Kefalea Bros, in the sample, is the largest of Messenia
province and in recent years has been one of the ten largest in the
olive industry. The owner is the president of ESVITEL, one of the two
trade organisations which represent the packers' interests. (7) The
other trade organisation, is SEVITEL, whose members are the
multinational subsidiaries and half of the industry's packers. ESVITEL
was created in 1986 after an argument over management issues between
the members of SEVITEL, whose current president is L. Melas, the
managing director of Elais. These organisations act as sources of
information to the packers about governmental and EEC decisions
concerning the olive-oil market. SEVITEL publishes a monthly
information bulletin which is sent to its members' second stage
processing units. For the services provided to the packers by their
trade organisations there is a contribution 1.4% of the Consumption Aid
per kilogram of olive-oil received. The level of this contribution is
set by the EEC itself and in October 1986 it was reduced from 1.9% to
449
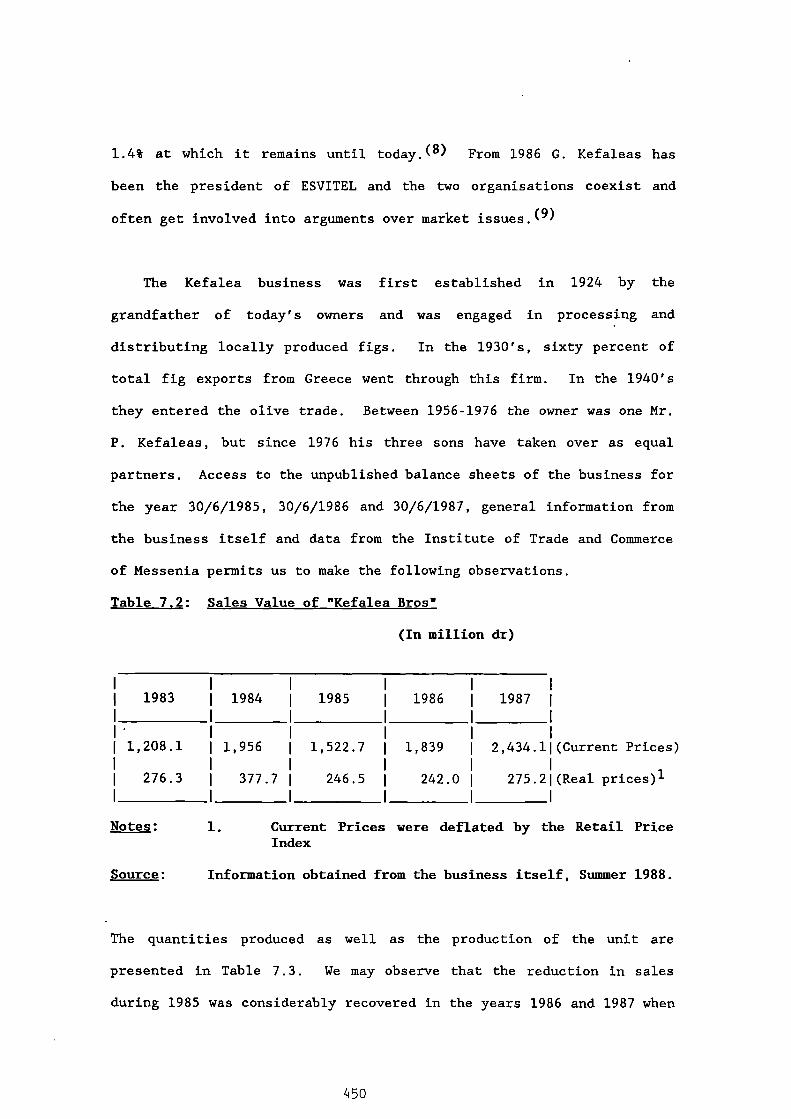
1.4% at which it remains until today. (8) From 1986 G. Kefaleas has
been the president of ESVITEL and the two organisations coexist and
often get involved into arguments over market issues.(9)
The Kefalea business was first established in 1924 by the
grandfather of today's owners and was engaged in processing and
distributing locally produced figs. In the 1930's, sixty percent of
total fig exports from Greece went through this firm. In the 1940's
they entered the olive trade. Between 1956-1976 the owner was one Mr.
P. Kefaleas, but since 1976 his three sons have taken over as equal
partners. Access to the unpublished balance sheets of the business for
the year 30/6/1985, 30/6/1986 and 30/6/1987, general information from
the business itself and data from the Institute of Trade and Commerce
of Messenia permits us to make the following observations.
Table 7,2: Sales Value of "Kefalea Bros"
(In million dr)
1983 1984 1985 1986 1987
1,208.1 1,956 1,522.7 1,839 2,434.1 (Current Prices)
276.3 377.7 246.5 242.0 275.2 (Real prices)1
Notes: 1.
Source:
Current Prices were deflated by the Retail PriceIndex
Information obtained from the business itself, Summer 1988.
The quantities produced as well as the production of the unit are
presented in Table 7.3. We may observe that the reduction in sales
during 1985 was considerably recovered in the years 1986 and 1987 when
450

the sales value increased (in current prices) by 20.7% and 32.3%
respectively. However if one looks at the sales value in real prices,
(see Table 7.2), it appears that after the 1985 fall they recovered in
1987 but, even then, the level was lower than that of 1983. As shown
in Table 7.3 production during 1981-1987 has fluctuated considerably.
In particular, for the three years 1985-1987, the trend of sales of the
firm's main export products moved as follows. First let me take
olive-oil. This contributed 68% of turnover during 1985-1987 while its
contribution in the previous four year period, 1981-1984, was 75%. It
must be pointed out that "Kefalea Bros" is mainly an exporter. Its
sales and production structure therefore fluctuates, depending on
conditions in the export markets. On the other hand such sales
fluctuations reflect the nature of the firm as a relatively large
commercial enterprise which has the ability to diversify depending on
market conditions. In 1986, the volume of the firms' sales fell by 11%
due to the introduction of certain national measures which limited
exports of unpackaged olive-oil. When in 1987 these measures were
partially lifted, the volume of olive-oil sales increased
.substantially. (10) The lowest level of olive-oil sales was attained in
1985, but since then the product has been the main contributor to the
increase in the firms' turnover - particularly so in 1987.
At this point it seems to me that I should report a major
irregularity in the sales figures of olive-oil as presented in the
firms' records and shown in Table 7.3. The sales figures for olive-oil
shown in the firms' official records deviate from the export sales
figures kept by the Custom House of Messenia. More specifically, in
451

1980 the firm admitted sales of 1,102 tonnes of olive-oil valued at
125.5 million dr. ( -- )The Customs House figures show exports by
Kefalea Bros. of 1,685 tonnes of olive-oil. This suggests that in
1980, 66.4 million dr. was not included i.e. accounted for in the
company's turnover figures. In 1986, the firm's records showed a sales
volume of 5,297 tonnes of olive oil. The Custom's House records
showed that in 1986 11,000 tonnes of olive-oil were exported by Kefalea
Bros. This means that 1,794 million dr was not included in the firm's
turnover in 1986. These findings which puzzled me at the time,
obviously meant tax evasion on the grand scale. Upon further probing
some part of the increased amount of exports shown by the Custom House
records can be explained. That is, Kefalea Bros., being one of the
largest exporters of olive-oil in the country, has established strong
commercial contacts with export markets. Smaller companies therefore
find it advantageous to export through them and use the name in return
for a commission of 2-3% of the sales value. The amounts so received
are stated - according to the firm - in the Profit and Loss accounts
under the item 'Various Receipts" (see Table. 7.4). Nevertheless, it
is my belief that a substantial part of the increased amount of exports
shown by the Customs House records is made by the company itself. I
have deduced this from the following pointers. First, since over 80% of
the quantity of olive-oil exported in 1986 was unpackaged, the company
had nothing to gain by declaring it (as Consumption Aid is only
received on the packaged produce). On the contrary, it would greatly
serve its interests if it did not include it in its annual turnover
(for tax purposes). Secondly, the Agricultural Institute of Messenia
informed me that 5,297 tonnes of olive-oil as stated in the company's
452

records for 1986 was indeed the minimum handled that year by Kefalea
Bros. This is because nearly 5,000 tonnes was purchased by the firm
from the domestic production of Messenia province alone. Then,
depending upon its needs, another 40 or 50% of the- firm's sales are
usually supplied from other olive producing areas of the country. (12)
Thirdly, in the year of my visit, 1988, the company was subjected to
tax inspection. After checking through the firm's accounts the
inspectorate must have detected serious tax evasion practices and
Kefalea Bros. was fined 12 million dr.(13)
As far as olives are concerned this product's contribution to the
company's turnover rose from 3.5% in 1983-1984 to 9.3% in 1986-1987.
Quantities as well as the sales value of the olives have been following
an upward trend - especially during the last two years, 1986-1987, as
shown in Table 7.3.
Thirdly let me consider dried figs. This commodity follows olive-
oil in importance in the company's production. During 1984 and 1985
,their sales volume and contribution to the turnover was 25% and 27.2%
respectively. During 1986 though its sales value remained constant (in
current 1986 prices) while its contribution to the firm's turnover was
reduced to 20.7%. As has already been established the company started
out in 1924 as a fig processor and distributor. It was only during the
Second World War, when trade in olive-oil assumed great value, that the
firm diversified into the olive industry. Furthermore, when it was
re-organised in 1975 figs remained its main output. Olive-oil became
dominant in the firm's production structure only after 1980 and in
453

particular after 1981 - which is the year of Greece's accession into
the EEC and also the year that Consumption Aid started to be paid for
this product to packers.
Table 7.4 presents the Profit and Loss account of the company
during 1/7/1984 - 30/6/1987. We can see that cost of sales throughout
the period under investigation exceeded the company's turnover.(14)
This suggests that gross profit cannot cover the operating expenses of
the firm. The negative gross profit (loss) of the firm and its
operating expenses are essentially covered by the Consumption Aid paid
on its sales of packaged olive-oil and the positive Monetary
Compensation Amounts (MCA's) which the company received on its
exports. (15) Pre-tax profits of Kefalea Bros. were 10.2 million dr,
19.9 million dr and 39.3 million dr for 1985, 1986 and 1987
respectively. Even though they are positive and increasing, they are
mostly created by the item "various receipts" of the company. These
chiefly consist of property incomes from the firm's real estate
holdings and the commission from the company's role as a mediator
.between smaller domestic firms and export markets.
A planned investment programme for new buildings and modernisation
started in 1985 based on the development Law 1962/1985. With the F.E.K
137/26.7.1985 an amount of 185 million dr was approved as a loan and
28% of it or 51.8 million dr. was given as a subsidy. The company
itself contributed towards the investment cost to the tune of 37.5% or
69 million dr. The rest, about 64 million dr. was obtained as a middle
term loan from the Commercial Bank of Greece. The investment project

1985 1986 1987
Liquidity Ratio l1.05 0.99 1.01
Gearing Ratio 290.7% 97% 94%
Performance Ratio
a) Profit Margin32.6% 2.6% 2.1%
b) Own Capital4 Return 31% 69% 69%
was completed by October 1988. Table 7.5 presents some accounting
ratios derived from the company's annual financial statements.
Table 7.5: Kefalea Bros. Accounting Ratios
Notes:
1. Current Assets/Current Liabilities2. Borrowings/Total Assets3. Net Pre-Tax Profit & Interest/Turnover4. Net Pre-Tax Profit/Own Capital
Source: Table 7.4 and Unpublished Company Balance Sheets, 1985,1986, 1987.
We observe that the liquidity ratio moved a little above the unit
for 1985 and 1987 while for 1986 was just below it. This, combined
with a very high gearing ratio throughout the period under examination,
gives a rather worrying picture of the company's financial position.
In addition the performance ratios as measured by own capital return
and the profit margin, seem uncomfortably low. It therefore appears,
by looking at the financial statements of one of the largest packing
units in the sector - and certainly the largest of Messenia Province-
that its operation is almost solely based on EEC subsidies (the
Consumption Aid and the positive Compensation Amounts on exports). In

particular, 64-68% of the subsidies cover the losses (negative gross
profits) of the firm during 1985-1987 (see Table 7.4), and the
remainder is used to finance part of the operating expenses of the
company. This heavy dependence upon EEC subsidies obviously casts a
deep shadow over the prospect of increasing profitability in the
future. The imposition of the negative Compensation Amounts on the
other hand, has had a deleterious effect upon the company's financial
accounts for as long as it lasted, 1987-1989.
Eleourgia Messenias is another important firm in the second stage
processing and packing of the province. It was first established in
1975 under the name, "Anthanasiou Panagulea Sons", and dealt in
wholesaling and distribution of olive-oil. In 1982 it started
exporting for the first time to Italy and France. In that year there
was a surplus of about 70,000 tonnes of olive-oil in Greece and the
markets of Italy and France imported some 300,000 tonnes. Because of
these favourable conditions in 1982 the firm packaged and exported 350
tonnes of olive-oil in tin plated containers of 16 kgr. each. In 1983,
the company's total sales were 400 tonnes of olive-oil and in 1984
2,500 tonnes of olive-oil. In 1986, the company was re-constituted by
the name it is known today. In 1985, 2,000 tonnes of olive-oil were
sold and in 1986 production reached 3,500 tonnes. It appears that by
1986 the firm's output followed an upward trend with impressive
increases in sales volume recorded for 1984 and 1986. In 1987 and
1988, production fell drastically because of the negative Compensation
amounts imposed by the EEC on exports. After January 1988, when seed-
oils production and distribution were allowed in the olive producing
456

areas of Greece, Eleourgia Messenias imports and distributes oil seed-
oils in Messenia. The bulk of its imports comes from Italy. Most of
the company's exports of olive-oil are directed to Italy and the U.S.A.
The main customers of the firm include: Fotis & Son Imports
(California, U.S.A); P. Passo & Figl. I Spa (Italy); and Oleifici
Mediteranei Spa (Genova, Italy). 0-6) Table 7.6 shows the export value
and total sales value of the firm during 1985-5/1989 in current prices.
Table 7.6: Export and Total Sales Value of Eleourgia Messenias during1985-5/1989. (In million dr, current prices)
1985 1986 1987 1988 5/1989
1 Export Value 241.8 790.2 336.9 144.6 1,057.4
1 Total Sales Value 790.2 761 444 1,345.9
Source: Confidential Company Records
We can observe that there has been a drastic reduction in the
company's total sales value in 1988. In fact it was reduced by 67% in
the domestic market and by 33% in the export market. This fall was due
to the negative Monetary Compensation Amounts on exports as well as low
price levels and import demand from Italy. During the first five
months of 1989 though, total sales value made a huge recovery and
reached three times their . 1988 level. Sales value in the export
markets were 1,057.4 million dr, while in the domestic market sales
value was 288 million dr by 31/5/1989. For the whole of 1989, the
company expected sales to increase even further provided that export
demand remained "high", and despite the retainment of the negative
457
Monetary Compensation Amounts on exports which were 43 dr/kgr on the
unpackaged olive-oil and 31 dr/kgr on the packaged olive-oil.(17)
Table 7.7 presents the company's Profit and Loss accounts during
1986-1988. We observe that in 1987 the cost of sales exceeded turnover
by about 9%. This led to a negative gross profit ( loss) which, after
the addition of the company's operating expenses, amounted to 23.4% of
the firm's turnover. The huge subsidy received through Consumption Aid
and the positive Compensation Amounts on exports (167,871 th.dr or 22%
of the turnover), was not sufficient to cover the deficit and the firm
ended up with losses (negative net pre-tax profit). After two years of
negative net pre-tax profits, 1986 and 1987, the firm presented a small
but positive net pre-tax profit in 1988 (2,453 th.dr or 0.6% of the
turnover). Furthermore, the reduction in the cost of sales, in 1988,
if it were not taken up by sales expenses would contribute a
considerable increase in the company's profits. For 1989, the firm's
owner and the bank which finances it, expected pre-tax profits to
rise. (18) To this effect an encouraging sign is the increase in the
company's own capital as a proportion of the total between 1986-1989.
Nevertheless, it still remains low relative to the total capital
engaged in the firm's activities (about 5% in 1988).
Table 7.8 presents some accounting ratios derived from the firm's
annual financial statements. It appears that the liquidity ratio has
fluctuated considerably during 1986-1988. It ended up quite low in
1988, just below the unit, which shows that the company can barely meet
its current liabilities.
45 8

Table 7.8: Eleourgia Messenias Accounting Ratios
1986 1987 1988
Liquidity Ratio 0.95 1.42 0.99
Gearing Ratio 104% 70% 95%
Performance Ratio
a) Profit Margin 0 7.1% 7.6%
b) Own Capital Return Negative Negative 8%
Source: Table 7.7 and Unpublished Company Balance Sheets, 1986,1987, 1988.
Furthermore, we observe that the gearing ratio shows an increase in
1988 (compared with 1987), and this is because the rise in the firm's
total assets account in 1988 was based on borrowed capital. These
borrowings mainly concerned short-term loans. The profit margin and
own capital return as measures of the firm's performance ratio showed
some improvement in 1988. Nevertheless, the financial position of
Eleourgia Messenias as presented by its accounting ratios is
unfavourable. Moreover, it is once more clearly shown that the net
pre-tax profit of this company in 1988 is created by the EEC subsidies,
while in previous years net pre-tax profits were negative. It seems to
me that the Profit and Loss account of this firm which is typical of
many firms operating in this sector, could have been caused by a number
of different reasons. First, after extensive discussions with Mr Elias
Panaguleas it is not entirely clear that the firm operates as a profit
459

maximizing organisation. Mr Panaguleas said he was willing to take
many risks (by incurring high borrowing) and was prepared to accept a
low return on investment in order to secure the future of the
enterprise. (19) An additional constraint to those firms operating in
this sector, including Eleourgia Messenias, is the instability which
characterises market conditions. In particular, the olive is a crop
whose fruit bearing capacity is influenced by a number of unpredictable
as well as inherent factors already discussed in Chapter One. This
suggests that a firm engaged in this sector cannot easily plan far
ahead. A third factor was that information about stocks in both the
world and domestic markets is essential for intelligent decision
making. But this was costly and time-consuming.
In addition to the reasons given by the firm itself I had
extensive talks with the Ionian Bank's accountant responsible for the
finance of this company Mr P. Katsikeas. The outcome was that it
became easier to understand the actual position when due regard was
made for the reliability of the figures presented in the Profit and
Loss accounts.(20) First the turnover could be deflated. For
instance, if transactions took place through payments in cash and not
through the bank - as is quite often the case with these firms, certain
receipts are not declared. Then, under the bland term "expenses on
sales" and "financial expenditure" sums of money may be hidden which do
not appear in the net pre-tax profits of the company. Although these
irregularities would be revealed under close scrutiny this is something
that the Bank does not undertake. It "prefers" to allow the company a
certain degree of flexibility as long as it keeps up with repayments on
460
its loans. The Bank and the owner of Eleourgia Messenias expected the
firm . 13 achieve 1 billion dr. turnover in 1989.
Another well known firm in the olive industry of Messenia province
in Adreas Yefteas S.A. It was re-constituted in 1986 as a
continuation of the company Adreas Yefteas & Son first established in
1975. Its main activities include packaging, exporting and wholesaling
of olive-oil, olives and dried figs. It is mainly an export-oriented
company. The company's sales value during 1984-1988 in the domestic
market as well as the sales value of its exports, are presented in
Table 7.9. The main destinations were Italy, U.S.A. and West
Europe. (21) We observe that after a substantial increase in 1986 the
sales value of the company was drastically reduced in 1987 due mainly
to the low level of olive-oil export demand. This came about because
of an EEC surplus which meant reduced import demand from Italy and
hence reduced market prices. However, in 1987 the company undertook a
modernisation project which was partly financed by the Ionian Bank of
Greece, and partly subsidised by the EEC. The cost had reached 131.9
million dr by 30/11/1988. The loan approved by the Ionian Bank was
117.930 thousand dr. The total revised cost of the modernisation plans
according to the P.3476/11.8.1988 report of the Ionian Bank and
investors information, was estimated at 343.6 million dr.(22)
461

Buildings:
Special Buildings:
Other Equipment:
Surrounding Projects:
Mechanical Equipment:
182
15
12
9
95.5
million dr.
it it
it Ii
ii it
Relocation of Machinery: 10.6 It
Transport Equipment and Special Vans:
Other:
11.5
8 if it
Total 343.590.000 dr
The outline programme was as follows:
In view of the considerable expansion and modernisation plans
undertaken by Andreas Yefteas S.A, it seems that the firm expects to
increase its production and sales to domestic as well as export
markets. On the other hand, the rise in its expenditure will place an
additional burden on an already weak capital structure based mainly on
EEC subsidies. More specifically, Table 7.10 presents the company's
Profit and Loss accounts, between 1/1/1985 - 30/6/1988. A similar
picture to the one of the previous firms emerges. Negative gross
profits and operating expenses are just covered by Consumption Aid and
positive Monerary Compensatory Amounts on exports leaving very small
net pre-tax profits (only 0.4% of the turnover in 1985, and 0.6% of the
turnover in 1986). During the period 1/1/1987 - 30/6/1988 the company
suffered losses due to the reduction in its turnover and to the
increase in its operational costs as a percentage of its sales,
462

compared with that of 1986 (see Table 7.10). The firm's own capital
contribution is increasing but it is still proportionately low with
respect to the total capital engaged in it. In particular, in 1985 the
firm's own capital contribution to the total was negative (-0.7%); in
1986 it was 16.3 thousand dr or 4.7% of the total and in 1988 it was
25.8 thousand dr. or 8.6% of the total. Out of the amount shown in
1988 14.2 thousand dr or 55% was the State subsidy towards the cost of
the investment plans concerning the firm's modernisation. Table 7.11
presents some accounting ratios derived from the firm's balance sheets
during 1985-1988.
Table 7.11: Andreas Yefteas S.A Accounting Ratios between 1985/1988
1/1-31/12/85 1/1-31/1286 1/1/87-30/6/88
Liquidity Ratio 0.93 0.96 0.83
Gearing Ratio 100.7% 95.5% 92%
Performance Ratio
a) Profit Margin 4.2% 4.6% 3.2%
b) Own Capital Return Not Defined 28% Negative
Source: Table 7.10 and Unpublished Company Balance Sheets, 1985,1986, 1988.
We may observe that during the eighteen months period extending
from 1/1/1987 to 30/6/1988, all the accounting ratios of the company
have deteriorated considerably compared with 1986. Even though the
firm is one of the largest packers and exporters in the province of
/ en

Messenia, its sales have been reduced during this last period because
of the adverse conditions which dominated the olive market in the
EEC. (23) It therefore appears, that the combination of factors such as,
the large investment cost undertaken by the company, its weak capital
structure and instability in the export markets, might prove critical
for its survival.
Plemmenou Bros., another firm which operates in the pruvince,
engages in packaging, wholesaling and exporting of olive-oil. It was
re-constituted in 1952 as a continuation of the family business first
established in 1912. (24) Total sales value according to unpublished
company records for 1985/86 - 1987/88 and export values are presented
in Table 7.12. We may observe that the firm's domestic sales value
forms only a small percentage of the total. Most of its turnover is
generated from overseas sales.
Table 7.12: Total and Export Sales Value of Plemmenou Bros,during 1985/86 1987/88
(In current prices, million dr.)
1985/1986 1986/1987 1987/1988
I Total Sales Value 453.0 485.5 192.6
1 Export Sales Value 340.6 411.4 113.3
Source: Unpublished Company Records, 1985-1988.
The firm exports chiefly to Italy, England and Cyprus. As shown in
Table 7.12, after a small increase during 1/7/1986 - 30/6/1987, sales
464

value dropped substantially during 1/7/1987 - 30/6/1988, mainly due to
the imposition of the negative Monetary Compensation Amounts (MCAs) on
exports, surplus in the EEC countries, and the consequent low prices
and import demand from Italy. However, for 1989, more favourable sales
prospects were forecast as the negative MCAs have been further reduced
since November 1989 and the demand from Italy has increased. (25) Table
7.13 presents the firm's Profit and Loss accounts between 1/7/1985-
30/6/1988. It is worth noting that the Consumption Aid and export
subsidies on olive-oil covers the firm's negative gross profits and its
operating expenses leaving a small net pre-tax profit for 1986 and
1987. We can also observe that the amount of subsidy has been steadily
decreasing over 1986-1988, and this has resulted in a negative net pre-
tax profit in 1988. The reason for this is that total sales have been
reduced, and also the amount of packaged olive-oil sold to export
markets suffered a decrease in favour of unpackaged. However,
according to EEC regulations, unpackaged olive-oil does not receive any
Consumption Aid hence the reduction in subsidies paid to the company.
The firm's own capital contribution to the total is the highest among
all the firms included in the sample. More specifically, in 1986 the
company's own capital was 17.7 thousand dr. or 8.3% of the total. In
1987 thought it increased to 23.2 thousand dr. or 38.3% of the total
and in 1988 it amounted to 24 thousand dr. or 38.7% of the total. This
suggests that the company's capital structure is more encouraging than
the others in terms of being in a safer financial position. Table 7.14
shows some accounting ratios of Plemmenou Bros., between 1986-1988.
465

Table 7.14: Plemmenou Bros. Accounting Ratios between 1986-1988
1986 1987 1988
Liquidity Ratio 1.05 1.27 1.87
Gearing Ratio 92.3% 72.3% 72%
Performance Ratio
a) Profit Margin 3.3% 3.6% 0.5%
b) Own Capital Return 31.7% 14% Negative
Source: Table 7.13 and Unpublished Company Balance Sheets, 1986,1987, 1988.
We may observe that the liquidity ratio goes well above the unit which
means that the firm can comfortably meet its current liabilities. Part
of the reason for the improvement in this ratio was that short term
loans were substituted by long-term loans acquired from the Commercial
Bank of Greece. (26) We can also observe a distinct improvement in the
gearing ratio which is due to the rise in the firm's own capital
contribution to the total. The performance ratio however, deteriorated
in 1988 because of the adverse conditions in the export markets for
olive-oil. Overall, we can conclude that the net pre-tax profits of
the firm are very low compared to the level of sales. Further the
dependence of the company upon EEC subsidies such as Consumption Aid
and positive Compensation Amounts on exports, is very clear.
466

The next company in the sample in Vraka Bros, established in 1928
and mainly involved in olive processing and packaging. They chiefly
export to the U.S.A., Canada and Australia.( 27) These countries have
large Greek immigrant communities and this firm established contacts
with wholesalers and retailers amongst them from the 1950's. Their
product has acquired a "quality name" in these markets so they can
afford to be more expensive than their competitors. Over the decade
1960-1970 production did not exceed 250 tonnes of olives and 150 tonnes
of olive-oil. In the late 1970's and 1980's production was restricted
to olives and was about 200 tonnes a year. (28) During my visit to this
firm in the summer of 1988, it became apparent that the building where
the processing of olives takes place was in disrepair. It consisted of
two ground floor rooms not larger than 50m 2 in total, where all the
processing, packaging and administrative work was done. It was
difficult to believe that this firm had a reputation among the olive
traders. of the province as one of the most profitable smaller
enterprises. However, it was possible to identify two reasons for this
state of affairs. One was that the owners were coming close to
retirement age and after the earthquake in Calamata in 1986, they did
not consider any repairs worthwhile since they intended to leave the
sector in the near future. The other reason concerns tax evasion. No
tax-inspector would surely believe that in such a run-down building a
profitable enterprise could be run. In this respect Vraka Bros's.
behaviour resembles that of older olive wholesalers who operated in the
province in the pre and post Second World War period. (29)
467
The next company in the sample is Stathis Malamas. This is a small
family owned enterprise. The proprietor started as an olive
wholesaler in 1953. In 1973 he entered olive processing and olive-oil
filtering and blending, but it was only in 1986/87 that the firm
started to produce packaged olive-oil according to EEC regulations and
so receive the Consumption Aid. Annual average production ranges
between 80-90 tonnes of olive-oil, and 10-15 tonnes of olives. This
enterprise currently operates quite successfully given that its net
pre-tax profit in 1987 was 3 million dr. The firm relies on domestic
sales, it mainly supplies retailers of north Greece and consumer
cooperatives. (30)
Another relatively small company is Eleourgia Calamatas,
established in 1982 with annual olive-oil production not exceeding 180
tonnes. All production is packaged according to EEC regulations so
that Consumption Aid can be claimed. About 150 tonnes of olive-oil are
packaged annually in 5 lt containers, the rest in containers of 1 lt.
In 1988 the firm exported 2.5 tonnes of olive-oil to Sweden. The rest
of its production was sold to the urban centres of the country. (31) It
appears, given the large building and the modern equipment used by the
firm for olive-oil processing, that there is an intention to expand
production further provided that favourable olive market conditions
will permit it.
The last in the sample of private packers dealing with olive-oil
and olives is Kalogeropoulos & Sons. This is one of the largest
exporters in the province and has been in the export trade for a very

long time - since 1890 in fact. But it is only after 1948 that it
became involved in olive-oil wholesaling. It was the first company
which exported branded olive-oil from the province (in 1949). The
brand was called Diana. In 1980 the firm's olive-oil sales reached 500
tonnes. In 1987/88 it sold 3,000 tonnes of unpackaged olive-oil. The
main importer countries that the company deals with are the U.S.A,
Canada and Australia. (32) It therefore appears that Kalogeropoulos &
Sons is a firm whose sales have steadily risen through time despite
adverse market conditions. This suggests that it will be able to
retain its position in the olive sector of the province as one of the
most important exporting units.
The next company in the sample is the olive residue processing
plant Linardakis also known as Georgiki Viomihania S.A. It was
established in 1890. Since 1910 it processes olive residue in order to
obtain olive residue oil. It also produces wine, surgical spirits and
recently, (after January 1988), oil seed-oils. (33) Well informed
people in the province, claim that Linardakis produces oil seed-oils on
behalf of Italian firms and there is some sort of subcontracting
agreement among them.(34)
However, when I interviewed Mr K.
Linardakis, he did not confirm this directly (which is not really
surprising in view of the sensitivity of the issue). Seventy percent
of the firm's annual production is made up of olive residue oil. The
average production is 2,600 tonnes per annum.In 1987, the company built
a new refinery at a cost estimated at 300 million dr. Forty-three
percent of this is subsidised by the State and the E.A.G.G.F. Since
1987 the firm produces olive residue oil and sells it packaged and
469

unpackaged (i.e. in container sizes which do not follow EEC
regulations). Most of its production is exported to Italy but in 1988
80% was sold in the domestic market. The reason was the negative
Monetary Compensation Amounts (MCAs) on exports which were 87 dr/kgr on
the exports of unpackaged olive residue oil, and 32 dr/kgr on the
exports of packaged. This made exports unprofitable. The company's
turnover in 1987 was 1 billion and 400 million dr. The total sales
value of olive residue oil was 459 million dr. It therefore appears
that its contribution to the firm's turnover was only 33% for 1987.
However, before the imposition of the negative MCAs the contribution of
olive residue oil sales value to the firm's total sales value was over
80%. Nevertheless, Georgiki Viomihania is the largest olive residue
processing unit in the province and the whole administrative area of
Peloponnesos.(35)
The other olive residue processing unit in the sample, Koutelas, is
much smaller and produces on average only some 500 tonnes of olive
residue oil annually. It was established in 1976 and recently due to
the negative MCAs went through a difficult period where it was unable
to pay any suppliers or meet any interest payments due to the Bank. (36)
Even though during the 1989 period the market for olive residue oil was
more favourable than the previous one, Koutela's future seems doubtful
- at least according to the Commercial Bank's report, Calamata Branch.
This is because the unit is totally dependent on the export market.
With the imposition of the negative MCAs on exports its weak financial
structure was not able to survive even temporary pressure. This case
47 0

highlights the effect that volatile export markets can have on small
units with high gearing ratios.
The first of the cooperatives included in the sample is the second-
order Central Cooperative Union of Messenia, (C.C.U.M).(37) Its
establishment in 1973 was fully financed by the State. It entered
production in 1974/75 with 100 tonnes of olives and 500 tonnes of
olive-oil. Until 1980/81 the C.C.U.M owned three oil-mills in the
province of Messenia. It processed, packaged and distributed all the
olive-oil produced by them. Since 1982 though, only one of the oil-
mills is still in operation. In 1987/88 the C.C.U.M sold 3,500 tonnes
of olive-oil, almost half of that amount (i.e. 1,500 tonnes) in the
domestic market in containers of 5 lt and 1 lt. The rest was exported
to Italy in an unpackaged form. Apart from olive-oil the C.C.U.M
processes and distributes olives. In 1987/88 it sold 200 tonnes in
containers of 1 it or 540 grs. In 1986/87 it sold 3,878 tonnes of
olive-oil, 1,355 in the domestic market and 2,653 was exported to
Italy. (38) Even though the number of cooperative oil-mills in the
province is about 40, only 15 of them are members of the C.C.U.M. This
suggests that the majority of the cooperative mills are small
independent enterprises which usually sell their output to the highest
bidder - whether private packer or cooperative. In recent years the
C.C.U.M changed its name to Union of Agricultural Cooperatives
(U.A.C). Until 1981 the U.A.0 seems to have made profits, but since
1983 this has been reversed. Two reasons for this were readily
identified by the president of the U.A.0 in 1988. The first was the
unexpectedly high prices which the U.A.0 paid to the supplier
47 1

cooperatives for olive-oil. The second reason was the additional cost
incurred by the U.A.0 because of the large amounts of olive-oil kept
in oil-banks until a suitable buyer could be found. This happened as
the export markets where the largest proportion of the U.A.C's sales is
directed, are usually "covered" by sales from the private sector. As a
result, for each day that the U.A.0 maintains olive-oil in store, it
suffers interest losses.( 39) It therefore appears that in recent years
the role of the U.A.0 has been rather to support the cooperative
movement of the province (i.e. the olive producers) by offering
relatively high olive-oil prices to the local olive cooperatives plus
6% commission on top of the price to its member cooperatives. On the
other hand, in the context of its social policy objectives, the U.A.0
employees 130 people in its offices and the processing unit. Out of
this number only six have had any experience in the olive industry, and
their educational level is well below '0' level equivalent standards.
But the marketing of the produce is a difficult task given the
competition from private packers. Nevertheless, the U.A.0 does not
employ any marketing manager who could study market trends and
efficiently manage the sales in both the domestic and export markets.
It was evident to me that poor internal organisation and low level
managerial skills are major problems in the U.A.C. As a member of
Eleourgiki, it buys and sells olive-oil to it and it is fully financed
by the A.B.G, which bore the burden of the U.A.C's losses until 1989
when cooperative debts were settled. However, the U.A.C's relationship
with Eleourgiki, even though it is one of its 57 members, does not
always seem to offer many benefits to it. (40) For instance, in 1987
the U.A.0 needed to buy 600 tonnes of olive-oil from Eleourgiki in
472

order to export to Italy. The price of olive-oil was then 340 dr/kgr
but the U.A.0 had to pay Eleourgiki 410 dr/kgr. This can be explained
by the fact that Eleourgiki suffered large debts during that period so
it could not afford to be lenient even towards its own members.
The other unit in the sample is the Olive Cooperative of
Gargalianoi, a first-order olive cooperative. It is based in Trifilia
County and processes about one-third of the county's 11,000 tonnes of
annual olive-oil production. It represents the first - and so far only
- attempt by the cooperative movement to create an agrobusiness
organisation based upon cooperative principles in the county. (41). Its
main functions include: pressing its members' olive production (it
registers 870 olive growers as members); storage of olive-oil;
branding; and marketing oil in the domestic market and abroad. It
employees 25 people - 16 seasonal and 9 permanent workers but only one
of them is a specialised accountant. The machinery of the cooperative
includes an oil-mill with 4 Decanter units by "Alfa Laval" with an
installed capacity 8,000 kgr of olives per hour; two oil banks by
"Buttler" with a potential capacity 80 tonnes of olive-oil each, and
four "Vitou" oil-banks with a potential capacity 23 tonnes each. The
Decanters in the oil-mill were installed in 1983 according to the EEC
regulation 355/1977. The investment cost was estimated to be
approximately 45 million dr, of which 65% was subsidised. The
remainder was approved as a loan from the Agricultural Bank of Greece
at an interest rate of 13% per annum. (42) Table 7.15 shows the
cooperative's olive-oil production before and after the installation of
the new equipment i.e., over 1981-1986.
473

Table 7.15: Olive-Oil Production at the First Stage Processing atCargalianoi
(in tonnes)
1981 1982 I 1984 1985 1986
Olives Processed 1,972 2,979 5,634 4,830 6,156Olive-Oil Produced
Extra Virgin, 0-lo 328.6 496.5 1,600 1,790 2,230
Value- (In dr.) 308,800,000 345,470,000 430,390,000
Notes: 1. In current prices
Source: Cooperatives' Sales Records, 1988.
It appears that after 1984, olive-oil production rose dramatically.
In particular, between 1984-1986, it nearly doubled. Furthermore
compared with 1982 and 1981 we observe _that there have been very
substantial productivity improvements. For instance, in 1982 the
extraction ratio was 6 kgr of olives for every kgr of olive-oil
produced. In 1984, 1 kgr of olive-oil was produced from only 3.5 kgr
of olives. In 1985 and 1986 the extraction ratio improved even further
at 1:2.7.
In 1984 the cooperative installed facilities for second stage
processing and packaging of the olive-oil which they produced. The
investment cost was estimated at 59,984 thousand dr. Sixty seven
percent of this was subsidised, with the remaining amount borrowed from
the ABC at 15.5% interest per annum. The investment plan consisted of
the following programme. There was one unit for filtering and
474

packaging of olive-oil in containers of 1/2, 1, 2 and 5 lt with a
potential capacity of 2,500-3,000 lt/hour and at a total cost
32,688,000 dr. There were ten oil-banks with a potential capacity of
2,000 tonnes of olive-oil which cost 27,296,000 dr. With the
completion of the investment plan, total expenditure had reached 70
million dr. (43) Table 7.16 presents production and sales of the
cooperative at the second stage processing before and after the
installation of the equipment.
Table 7.16: Production at the Second Stage Processing and Marketing,1981-1986
(in tonnes)Garalianoi,
1981 1982 1984 1985 1986
Sales of Olive-Oil 1,600 1,790 2,230PackagedSales Valuel (In th.dr) 336,000,000 375,900 468,300Sales of Unpackaged 328.6 496.5 939 805 1026Olive-OilSales Value (In th.dr) 37,810 62,457 181,227 155,365 198,018Sales of Olive Residue 791 1,263 2,254 1,932 2,415Sales Value (In th.dr) 1,054 2,136 6,762 5,796 7,245
Notes: 1. In current prices
Source: Cooperative's Sales Records, 1988
In 1984, 141 tonnes of unpackaged olive-oil was sold to Italy. In
1986, 210 tonnes and in 1988, 92 tonnes of olive-oil was sold to Italy.
Despite the increase in sales, and even though net pre-tax profits
from the first-stage processing stood at 10 million dr and 11 million
dr for 1987 and 1988 respectively, the overall net pre-tax profits of
the enterprise (including second-stage processing) were negative in
475

1987 and 1988. That is because of the large pay offs the cooperative
had to make to the ABC to service its loans. Any late payments carry
the substantial surcharge of 24.5%. It therefore appears that although
the establishment and modernisation of the cooperative has been an
important step in the autonomous development of the county's olive
industry - and taken without the involvement of any olive merchants or
private sector packers, it has not been a noted success in terms of
business organisation. But this verdict may be too harsh and premature
since it has only been modernised four years ago and so it is rather
soon to judge. Nevertheless the signs so far are not especially
encouraging. The board of directors consists of seven members - all of
them olive growers. The president cannot make any decision concerning
marketing and sales without consulting all of them. The process of
decision making is therefore exceedingly slow. Further none of the
members have any formal managerial skills and nor do they possess much
experience in formal business procedures. () All these factors
contribute adversely to the cooperative's competitiveness in relation
to the private sector in the province. To date it has not managed to
establish firm contacts in the export markets, so they are forced to
sell most of their annual production through the U.A.0 or to the
domestic market.
7.1.3 Technology Used and Buildings
As mentioned in Chapter Six most of the equipment used in the
second stage processing olive-oil is currently imported. (45) The major
elements are, filters made of carbon-steel and assembled with
476

polyproline plates with monoblock movable chassis suitable for
"brightening up" the olive-oil. Various models are available and their
performance ranges from 1,000 it/hour, up to 5,000 it/hour. Then there
are the washers which can be either automatic or semi-automatic units,
with continuous movement. They may be matched up to different shapes
of containers, and the washing cycle can be adapted to different
requirements. The containers, in the automatic unit are hooked by an
automatic hooker and, one-by-one, are turned upside down in order to
allow a washing needle to enter the container itself and so properly
wash. After washing, the containers are turned again neck up and
pushed to the discharging section. The actual washing fluid can be
recovered and recycled. All parts touched by the fluids are built with
stainless steel and teflon. Each automatic unit needs one operator and
maximum production is 10,000 containers per hour. With the semi-
automatic unit the containers have to be placed in by hand and taken
out at the end of the process - again by hand. Maximum production per
hour is 2;000 containers. The fillers are next. Their main components
are
(a) a bench unit, completely covered in stainless steel;
(b) a "star" shaped bottle holder with an intermittent movement
which drags the bottles from the loading section to the
filling and sealing sections;
477

(c) a filling unit composed of 2 (up to 6), syringes, built
with stainless steel, teflon and glass;
(d) a cap-supplying unit, formed by one or more vibrating cap
holders also in stainless steel;
(e) a sealing unit with several heads, a flanging threader,
flanging, screwer and presser.
The bottle loader and the discharger are built following customer's
requirements and according to the kind of bottles, phials or containers
that need to be filled. Depending on the model the maximum production
per hour ranges from 6,000 to 8,000 bottles. This equipment is used by
all the packing units which conform to EEC specifications.
Table 7.17 shows the equipment available to the sample firms,
together with an indication of whether their modernisation plans
include new buildings for the processing activities. Installation of
this equipment is an important indicator of the level of modernisation
in Messenia and also tells us something about the quality standard of
the resulting processed and packaged olives, olive-oil and olive
residue oil.
478

Table 7.17: Equipment and Buildings Used by 12 Second-Stage ProcessingUnits in the Olive Industry of Messenia Province
Number of Firms
Equipment in Use and InstalledAfter 1983 - EEC Approved 9 75
Equipment in Use InstalledAfter 1975 - EEC Approved 2 16.6
Equipment Installed before 1975Inferior to EEC Standards 1 8
Modern Buildings, After 1980 5 41.6
Old Buildings, Prior to 1970 7 58
Source: Fieldwork Interviews, Summer 1988.
We may observe that in my sample of 12 firms (out of the 30 which
operate in the province), 75% (including the two cooperatives), use
modern equipment. This suggests that they have taken advantage of the
1262/1982 Development Law for technological modernisation of
manufacturing units. As far as investment in buildings is concerned
though, only 41.6% of the firms surveyed have invested in new buildings
which shows plans for expanding production in view of the 1992 plans
for unification of the European Market. (46) The units which have
invested in new buildings are Kefalea Bros, Eleourgia Messenias S.A,
Yefteas Andreas S.A, Linardakis and the Olive Cooperative of
Gargalianoi. It therefore appears that the overwhelming majority of
the firms in the sample (over 90%) use modern equipment for olive-oil
processing and packaging. Seventy five percent have taken advantage of
Law 1262/1982. This suggests that the quality of the produced packaged
olive-oil has improved since 1983 - at least in Messenia.

7.2 Access to Markets
The road to expansion for the small producers is thought to be
blocked by the controls which large firms exercise over products,
markets, raw materials and credit. Certainly the total market share
of the small firms shows no clear signs of growing. The principal
reason for this constraint seems to be associated with the role of
small firms in a process of economic growth characterised by a growing
concentration of markets. (47) In highly concentrated oligopolistic
markets small firms cannot go on increasing the volume of their
business indefinitely and, in the long-run, despite registering some
small temporary gains, they tend to lose market share. (48) In the
domestic market for olive-oil, five firms including the two
multinational subsidiaries and Eleourgiki currently account for over
78% of branded olive-oil production. The rest of the market is left to
153 small units who operate in niches throughout the country.
Nevertheless, there seems to be some room for expansion since
wholesaling outside EEC specifications is being gradually reduced and,
as a result, the olive merchants (wholesalers) are driven out or
limited to their traditional role as mediators between the farmers and
the packers. This issue will be discussed further in Chapter Eight.
Although EEC specifications constitute barriers to entry into the
second stage processing of olive-oil the cost burden for the
installation of modern equipment and new buildings is partly borne by
an EEC and national subsidy. So, in the absence of substantial
barriers to entry, one would expect the correlation between

profitability and market concentration to be weak, an observation which
lends some support to the contestable market hypothesis. (49) In
particular, we have seen (Chapter Five) that Elais's and Minerva's
profitability - which is always difficult to measure precisely - has
increased since the early 1980s - but this was combined with the
gradual diversification of those companies' production from olive-oil
towards seed-oils. (50) On the other hand Eleourgiki, which
administratively sets olive-oil input prices, made losses (revenues
did not even cover production cost). So, concentration in the olive
industry does not mean higher profits if one did not take into account
the EEC subsidies paid to the packers. Also, this evolution of market
structure towards greater concentration, was not driven by
technological efficiency of the larger companies (in terms of producing
cheaper and better olive-oil quality to the consumers). (51) It was
rather their ability to create a desire for their products on national
level through extensive marketing; this included heavy advertising and
fancy packaging which gives the product a better appearance.
' The dismal record of performance shown in the sample of both new
entrants as well as older firms further supports this proposition. (52)
It therefore appears that the main attraction for entry was the
expected profits to be made from subsidies. But even then, as shown by
the Profit and Loss accounts of the sample firms, the net pre-tax
profits just exceeded their accounting costs. This suggests that these
firms operated with prices set below their average costs (P<AC). After
the EEC subsidy had been received though their price tended to be
equated to their average cost (P=AC) which again approximates to the
481

predictions of contestable marketNtheory. (53) On the other hand, as we
have already tried to point out, Profit and Loss accounts may well hide
much data. It is possible to conceal a great deal about the operation
of firms. As Schmalensee put it "...the main lesson which seems to
emerge from recent developments in empirical research in industrial
organisation is that the quality of the results obtained depends
critically on the quality of the data employed. Economists unlike
historians or anthropologists are formally trained only in the analysis
of data sets, not in their construction... Thus progress in
industrial organisation may depend critically on the extent to which
the construction of informative data sets is supported by government
agencies and other sources of research financing". (54) This general
comment seems to be very apt for this particular sub-sector.
As far as the export markets are concerned, the smaller units not
only compete with each other but also with Eleourgiki - while the two
MNC subsidiaries are mainly concerned with the domestic market. The
largest importer of Greek olive-oil is Italy, and certainly the vast
majority of the firms in my sample depend on exports to that
country. (55) But the Italian packers and wholesalers mainly require
unpackaged olive-oil, which does not, of course, receive Consumption
Aid through the EEC. The reason for this is that the Italians can then
repackage the olive-oil and so obtain the Consumption Aid themselves.
In an attempt to put an end to this practice which was very harmful to
the olive industry of Greece, in 1987 the State did not permit any
exports to Italy. The hope was that this would force the Italians to
reconsider. (56) This action created surpluses and affected adversely
482

both the smaller firms and Eleourgiki, so the State had to lift the
restriction after a few months. (57) Given the dependence of the small
producers on the Italian market, they are directly affected by the
action of Eleourgiki which is the largest exporter. For example, in
1988 Eleougiki sold 74,000 tonnes of olive-oil (which was kept in
storage for many months), to the France Oil Company. But this action
meant that exports of the small olive businesses were blocked for a
period of up to 6 months as Italy was able to buy Greek olive-oil from
France Oil as well as other buyers of Greek olive-oil. (58)It
therefore appears that if Eleourgiki decides to exercise her
monopolistic power in the export market, the smaller producers are
bound to suffer.
Recently (in 1989) the State created a Department of Export Trade
in the Ministry of Commerce in an attempt to start an organised
campaign which would boost Greek exports abroad. (59) In this context
small olive-oil packers could hope to better develop their export
markets in West Europe and America.
7.3 The Financial Situation of the Small Firms
The cooperative sector is financed by the ABC alone. The private
firms however, finance their transactions through the commercial banks
which compete with each other for the packers' custom. (60) In Messenia
one of the main banks financing the second stage processing and packing
units is the Ionian Bank of Greece through its local branch. Until
1983 interest on short-term loans through commercial banks was 10.5%,
483

in 1984 it increased to 18.5% for all manufacturing units except the
companies exporting who brought into the country foreign currency.
These could borrow at 12.5%. In 1988 the rate of interest on firms'
short term loans was raised again to 25%. The amount that each packer
can be given as a loan rarely exceeds 150 million dr. (61) Usually the
amount lent to an export unit of the olive industry includes input
expenses, processing and packaging costs, and the charge for the
product's shipment abroad. The terms of sale for the olive-oil and
olives varies from firm to firm. Generally 50-100% of the sales value
is paid by an irrevocable letter of credit. For some of the firms up
to 50% is received after a period of two to three months. (62) The
process of obtaining a loan from the .bank is slow and awkward. New
businessmen are not easily trusted and have to provide the bank with
certain guarantees. The value of such guarantees determines the level
of the loan that a firm can obtain. (63)
Because of the high interest rate charged, the Greek packers-
especially the smaller ones - find themselves at a disadvantage having
to•compete with their counterparts in Europe. In particular, Italian
interest rates currently do not exceed 6-7% which compares very
unfavourably with the 25% rate that the Greek packers are charged even
after allowing for differences in the rate of inflation. This affects
the operating expenses of the second stage processing units by
increasing their financial liabilities via the interest paid on the
loan. (64) Because of this state of affairs, the units interested in
export seek ways of financing their activities which will reduce the
level of their costs. For example, they sell foreign currency to the
484
bank in return for a three to four months loan in Greek currency, that
is in three months from the day of the loan the packer has to pay the
bank in U.S dollars or any other agreed currency. So, in three months
the packer hands over to the bank an amount of olive-oil exports equal
to the value of what is outstanding. In this way the cost of borrowing
funds in about 3% lower for the businessman which, for a large firm
like Kefalea Bros, represents over 10-15 million dr. difference.(65)
Another more difficult means is to obtain a loan from a foreign bank.
But because of State restrictions on borrowing funds from abroad, once
their application for a loan has been accepted by a foreign bank, some
packers hire a foreign representative to deposit the amount at a Greek
bank in his name. So the firm has to pay the interest on the European
currency i.e. 8%, plus 7% for the drachma depreciation plus a further
3% for other expenses. In this way the firm can save up to 7% of the
cost of borrowing. (66)
Since the early 1980s even though there has been an increase in the
volume of funds and in the range of financial packages available to
small firms in the context of the development Law Decree 1262/1982,
there are still serious obstacles to financing. (67) Of course, the
restrictions to borrowing funds from abroad will be gradually abolished
in view of the creation of the single market in 1992, and then the
Greek firms - at least the ones which are then financially strong-
will be able to obtain loans at a much lower cost in order to finance
their operational expenses. (68)
485

Conclusions
It has been shown that the financial weaknesses of the packers as
evinced in the Profit and Loss accounts makes their operation and very
existence dependent on EEC subsidies. In most cases sales costs exceed
sales turnover and, if it were not for the Consumption Aid and the
positive Monetary Compensation Amounts on exports, mak of those
companies would have to close down. In particular, it was shown that
various EEC directives such as the negative Monetary Compensation
Amounts (MCAs) on exports caused drastic cuts in the packers' sales
abroad and endangered further their already uncertain financial
position. This further supports the view that the EEC factor is
critical for their survival.
In the second stage processing and packing of olive-oil there
exists an eel-shaped oligopoly. The multinational subsidiaries and a
few more larger packers on the one side compete with the cooperative
sector (as represented by Eleourgiki) whose development and operations
have been supported by the government and financed-until recently-
through the ABC. The rest of the packing firms are small units who
strive to survive in the highly competitive environment created at home
and abroad. In the domestic markets small firms operate in the space
left by their large competitors. In the export markets the conflict
between the private and the cooperative sector intensifies. As
technological modernisation of the second stage units was not followed
by a State effort to promote Greek branded olive-oil sales in the
markets of Europe and America, the packers remain dependent upon the
486

Italian import market. This will be further substantiated in Chapter
Eight. Furthermore, it will be shown that the existence of these
firms depends largely on increasing their volume of sales abroad since
the domestic market has already started to erode as a result of the
entry of oil seed-oils even in traditionally olive producing areas
including Messenia. So the conditions in the external market and the
cost of sales (especially the input price of olive-oil) in the domestic
market appear to be the two decisive factors determining the future of
the olive industry packers. Unless a nationally based campaign on
marketing and promoting Greek branded sales abroad is undertaken soon,
the smaller packers will not be able to withstand competition from the
major European olive producing countries such as Spain and Italy after
1992. A possible alternative would be that the domestically produced
olive-oil will be sent to be branded in Italy so that the few
unofficial subcontracting agreements that already exist in some olive
producing regions of the country, might become a common feature after
the establishment of the single market.
487

References
1. -This refers to a recent study on the Greek economy by a team ofecononomists headed by Prof. A Aggelopoulos. This was undertakenupon the instruction of the temporary coalition administration ofX. Zolotas, Nov. 1989 - April 1990. The results were known inMarch 1990 though they still remain unpublished as G. Houpis statesin the Economist, 12-18 May 1990. p.6.
2. See C. Gerry, "Small Scale Manufacturing and Repairs in Dakar: a• survey of market relations within the urban economy", in R. Bromley
and C. Gerry (eds) (London, 1979) and Souza & Tokman, "The InformalUrban Sector in Latin America". International Labour Review, Vol.114, No.3, 1976 and H. Schmitz, Accumulation and Employment inSmall Scale Manufacturing: Case Studies from Brazil, (London,1982).
3. See the Report of the Bolton Committee of Inquiry on Small Firms,21 Sept. 1971. It ws presented to Parliament by the Secretary ofState for Trade and Industry, Nov 1971 (London, 1972).
4. The selection of the sample was determined by the followingcriteria. Firstly in terms of size, the largest packers operatingin the province were chosen as far as sales volume, turnover andemployment are concerned. Also three of the small size packerswere included in terms of sales volume (Eleourgia Calamatas, VrakaBros. and Stathis Malamas). The two olive residue plants werechosen as they are the only ones operating in the provincecurrently engaging in this function. Finally two cooperatives wereincluded because they represent special cases, one (the oliveCooperative of Gargalianoi) is the very first attempt at verticalintegration in the olive industry of the province. • The otherenterprise was chosen because, as a second - order cooperative, itcould provide some insight into the links of the cooperative chainin the olive industry.. Secondly the sample was chosen by function(i.e. olive-oil, olives and olive residue oil). Thirdly, thesample was chosen in terms of the owners' past experience in theolive industry. In particular I tried to include olive merchantswho, in response to certain external incentives (connected with theEEC regime) decided to upgrade their function and enter processingand packing under EEC specifications. in these respects purposivesampling was undertaken, and I am grateful to Mr V Yannopoulos,Head of the Institute of Trade ind Commerce of the province whogave me much advice on procedure. Even though the study isregionally based, given the position of at least one of them in thecountry's olive industry (Kefalea Bros. is among the ten largestpackers) the experience of these firms, reflects trends affectingthe whole olive industry.
488

5. Interviews with members of the sample firms conducted during thesummer of 1988.
6. Trade in this period was very much a matter of "oral contracts" asthe older businessmen whom I spoke to called them, and on mutualtrust between mediators. The export trade was therefore risky andthere were many cases of firms which went into liquidation becauseof the difficulties of such a manner of dealing.
7. Information obtained during the course of an interview with Mr G.Kefaleas during fieldwork visit, Summer 1988.
8. EEC Regulation No. 3193/1986, COM. According to article 11paragraph 5 of the Regulation 136/66/EEC the contribution paid totrade organisations out of the consumption aid is 1.4%. It was1.9% but since 14 October 1986 0.4% is retained by the EEC in orderto finance an advertising campaign for olive-oil. See L133,Commission, 21/5/1986 p.8.
9. The two multinational subsidiaries and about half of the packersremained in SEVITEL. The other half led by Kefaleas Bros,established ESVITEL. One of the policy issues over which the twoorganisations came into disagreement was the free entry of oilseed-oils into the olive producing regions. ESVITEL supported theview that if this were allowed to happen the future of the oliveindustry would be endangered. Recently though Kefalea Bros. andother members of ESVITEL have started to trade in oil seed-oilsthemselves.
10. During the implementation of these measures there were a series ofscandals perpetrated by the officials and which was repeatedly
.reported in the media. In particular, in order to be able toexport unpackaged olive-oil each packer had to have a licenceauthorised by the Ministry of Trade and Commerce. According to themeasures only a limited number of licenses were available (eachlicense allowed the export of approx. 60 tonnes of olive-oil).The packers though managed to bribe officials and obtain as manylicenses as they wanted.
11. The whole amount sold in 1980 by the firm refers to exports. Onlyin 1986 did Kefalea Bros, sell to urban retailers 295 tonnes ofolive-oil valued at 83.8 million dr. (wholesale prices). KefaleaBros. Confidential Records on Sales, 1988.
12. Cooperative and private mills from Lesbos, Crete and Zakenthos areamong the main suppliers to Kefalea Bros. Since 1988, the firm hasstarted to trade in oil seed-oils which it imports from Italy and
489

sells (wholesale) in the domestic market. The quantities thoughare still very small. Information obtained from Mr V. Yannopoulos,Head of the Institute of Trade and Commerce of Messenia.
13. The exact amount of the fine was disclosed to me by Mr C. Kefaleasbut only in order to make a point against the heavy tax burdenlevied on his firm by the PASOC Administration. It was later,during discussions with Mr P Katsikeas, Head of the Export Units'Financing Department of the Ionian Bank, (Calamata Branch), thatthe fats about tax inspection of the firm became known.
14. The level of the negative gross profits ranged between 16-19% ofthe firm's turnover during the period under examination. This istruly astonishing for a company with a sales volume as large asKefalea Bros.
15. Positive Monetary Compensation Amounts (MCAs) on exports were paidto Greek exports of olive-oil by the EEC until 1987 because of thedifference between the "green rate" and the real exchange rate.Exports of olive-oil were lower in price as they were paid for in acurrency which was higher in value than the real drachma. Also,the V.A.T. (about 6% of the sales value) is returned to the packerson exports while another 3% of the sales value is not taxable.
16. Information obtained in the course of interviews with E.Panagouleas and N. Eftaxopoulos, owner and managing directorrespectively, of the company Eleourgia Messenias, during fieldworkvisit, Summer 1988.
17. The negative MCAs on exports were implemented by the EEC in orderto stop speculation because of currency deviations between the
'green and current exchange rates. Speculation based on thesedifferences, costs considerable amounts of the EAGGF. Theirimplementation also aimed to reduce the competitiveness of Greekoils (because of their low price) in the international market.Eleourgiki, No. 8, 1988.
18. Eleourgia Messenias is a relatively new company in its presentform, and was established in 1986. According to the Ionian Bank,Calamata branch, which finances it, this is an importantcontributing factor to the poor initial performance of the unit.Within favorable market conditions, the firm was expected to turnin a healthy profit.
19. In order to obtain loans from the bank and finance the firm'soperating expenses, the bank had secured by mortgage all of Mr. E.Panagoulea's personal property.

20. I am also indebted to Mr K. Sugden, Department of Business andManagement, University of Salford, whose useful comments helped meto elaborate further on the reliability of the Profit and Lossaccounts of the sample firms.
21. Information obtained during discussion with Mr. A. Yefteas at hisoffices in Calamata, Summer 1988.
22. In the confidential report of the Ionian Bank, Central branch inAthens, No. P.3476/11.8.1988 which became available to me in June1989, it was suggested that the bank should not approve any furtherloans to this firm. This means that the modernisation plans willbe endangered unless other sources can be quickly found.
23. I refer here to the low import demand from Italy and the negativeMCAS on exports which affected sales of the export packing unitsduring this period.
24. Information obtained through an interview with Mr Plemmeno duringthe fieldwork visit in the Summer of 1988.
25. Indeed in 1989 the company doubled its sales value and increasedits net pre-tax profit by 2% with respect to its turnover. Thisshows how swiftly external market conditions can affect theperformance of an export-oriented packing unit of the oliveindustry. Ionian Bank of Greece, Central branch report, June 1989.
26. In order for these long-term loans to be obtained the CommercialBank (Calamata Branch) had secured-by mortgage all the personalproperty and assets of the firm's owners. This information was
,obtained from the Commercial Bank of Greece, Calamata Branch,Summer 1988.
27. Interview with Vraka Bros at their premises in Calamata, Summer1988.
28. Table olives receive only a national subsidy and this is graduallygoing to be phased out by the end of 1990. Because Vraka Bros.have established a good name in a few distinctive export markets,produce only in order to satisfy that demand - and at a price wellabove their cost.
29. See Chapter Three for a discussion of the behaviour patterns of theolder olive merchants in Messenia.
49 1

30. Interview with Stathis Malamas at his firm, in Calamata, MesseniaProvince, Summer 1988.
31. Interview with Mr. Pagakis, the owner of Eleourgia Calamatas at hispremises located on the outskirts of the town, Summer 1988.
32. Information received in the course of discussion with Mrs EKalogeropoulou, managing director and equal partner of the company.This firm has a good reputation (among the packers) in the provincefor its open dealing with customers. In the past it has repeatedlyrefused to sell to the Italians because the deals offered involvedsome "not straight forward" business practices. One of thereasons that the firm can behave this way is because of the"quality name" it has established in export markets (of the U.S.A,Canada and Australia) so it is not dependent on the Italian marketlike the majority of the other packers.
33. Interview with Mr C. Linardakis, owner of the firm, at his factoryin Calamata, Summer 1988.
34. The new refinery which Linardakis built in Trifilia County wasequipped and designed according to Italian specifications, andunder the supervision of Italian chemists who were employed by Mr CLinardakis in order to see the whole project through. So, thereseems little doubt about the close contacts that the firm sustainswith Italy and its Italian counterparts. The information aboutsubcontracting agreements was given to me by Eleourgia Messenias(N. Eftaxopoulos) and the Ionian Bank ( P. Katsikeas), in Summer1988.
35. Information received by the Institute of Industry and Commerce of' Messenia Province, Summer 1988.
36. Interview with Mr Koutelas at his factory in Zevgolatio Messenias.During the course of the interview we were interrupted by an angrysupplier (oil-miller) who demanded payment there and then. Alsoduring my visit to several mills, there were many complaints aboutdelayed payments by this firm.
37. Discussion with Mr. Drakos, the President of the C.C.U.M now calledUnion of Agricultural Cooperatives (U.A.C), 1988.
38. Confidential Sales Records of the U.A.0 which became available tome during my visit to their processing unit in Thouria, outsideCalamata, in August 1988.
492

39. It is not only the interest foregone on the sales value of olive-oil which is lost but also the fact that the quality of the productdeteriorates the longer it is kept (in excess of 3-4 months) andthis means a lower selling price.
40. This is because (and as already has been mentioned in Chapter Six)Eleourgiki had large quantities of unsold olive-oil which added tothe huge burden of liabilities that the enterprise was faced with.
41. I visited the Olive Cooperative in the winter of 1988 and thenagain in Summer 1988. I had the opportunity of holding extensivediscussions with the president and members of the unit, and wasgranted permission to visit the processing plant.
42. Cooperative's Confidential Records, Gargalianoi 1988.
43. ibid.,
44. This is now recognised by the cooperative members themselves andespecially the president who feels very constrained because of theslow, ponderous and inflexible decision making process. Recentlyhowever (in 1989) the cooperative has employed - following aunanimous decision - a marketing manager in order to help expandsales. This is clearly a welcome development.
45. Information on the processing equipment used by the packers wasobtained from the sample units which also provided me with aprospectus containing the exact mechanical specifications of themachinery. They are mostly of Italian or British manufacture andare imported through commercial representative firms based in
46. In the hope that free trade throughout the Community, together withan advertising campaign for the benefits of olive-oil consumptionwill mean an expansion of olive-oil demand from the Europeanmarkets the packers prepare to meet it.
47. See P Aydalot, "The Role of Small and Medium sized Enterprises inRegional Development : Conclusions Drawn from Recent Surveys" in M.Giaoutzi, P Nukamp and D.J. Storey (eds) Small and Medium SizeEnterprises and Regional Development (London, 1988).
493

48. See D. J. Storey, "The Problems Facing New Firms". Journal ofManagement Studies, 22(3), 327-45, 1985, and F. J. Bade, "TheEconomic Importance of Small and Medium Sized Firms in the FederalRepublic of Germany" in: D. Keeble and E. We yer (eds), New Firms and Regional Development in Europe, (London, 1986) pp. 256-74.
49. See W. Baumol, J. Panzar and R. Willig, "On the Theory of Perfectly- Contestable Markets", in J. Stiglitz and F. Mathewson (eds) NewDevelopments in the Analysis of Market Structure, (Cambridge, 1986)and J. Bain Barriers to New Competition, (Cambridge, 1956).
50. See Chapter Five.
51. For example, Harold Demsetz (1982) attributes informational andreputational advantages of early entrants as part of the costs of sp,/,doing business and not barriers to poly": But Farrell (1986) argues >sthat such factors can work decidedly against new entrants. See H.Demsetz "Industry Structure, Market Rivalry and Public Policy",Journal of Law and Economics, 27, 91-113, 1982, and J. Farrell,"Moral Hazard as an Entry Barrier" Rand Journal of Economics, 17,440-9, 1986.
52. ibid,.
53. See W. Baumol, J. Panzar and R. Willig; Contestable Markets and theTheory of Industry Structure, (New York, 1982).
54. See R. Schmalensee, "The New Industrial Organisation and theEconomic Analysis of Modern Markets" in W. Hildenbrand (eds)Advances in Economic Theory, 253-85, (Cambridge, 1982).
55. The dependency ratio of the sample firms on the Italian market aswell as their marketing strategies will be discussed in ChapterEight.
56. Apart from this prohibitive action the PASOC Administration sentsenior officials from the Ministry of Trade and Commerce to discussthe matter with their Italian counterparts. The discussions werenever in fact covered since the Greek representatives wereliterally ordered by representatives of the Italian tradeorganisation to turn back. This information was provided to me byMr. V. Yannopoulos who was one of the Ministry's officials whovisited Italy in 1987. Currently he heads the Institute of Tradeand Commerce in Messenia.
494

57. Thousands of surplus tonnes and continuous protests by thepackers' trade organisations ESVITEL and SEVITEL, made the Statereverse its decision in 1987.
58. Usually Eleourgiki controls about 1/3 of the export market butthere are cases when through its cooperative action collects largequantities of olive-oil in order to maintain high producer pricesin the domestic market. Then it finds itself in a position whereits action can considerably affect the exports of the small firmsof the olive industry.
59. In the Autumn of 1989 this Department started to operate in theMinistry of Trade and Commerce in order to promote a nationalexport strategy and organise Greek olive-oil exports.
60. They compete not so much on interest rates (which can of coursedepend on the individual case for upto 1-2% difference) but on fastservices and the minimum period which the firms have to start torepay their loans.
61. This information was provided to me by Mr. P. Katsikeas of theIonian Bank of Greece, and S. Vavaroutsos, of the Commercial Bankof Greece. They both pointed out that the amount can varydepending on the creditworthiness of the packer.
62. This is an important indicator showing how fast a firm's workingcapital is recycled and therefore whether or not a firm is in areasonably safe position as far as meeting its current liabilitiesis concerned.
63. As already mentioned, most of the businessmen in my sample and.certainly the larger packers have their personal property mortgagedto the bank.
64. As shown by the Profit and Loss accounts of the sample firms,financial expenditure constitutes the largest cost component ofoperational expenses.
65. This way of reducing the cost of borrowing funds is practiced bythe largest packers such as Kefalea Bros, Kalogeropoulos & Sons andPlemmenou Bros.
66. This information was provided by Mr. N. Eftaxopoulos, managingdirector of Eleourgia Messenias and was confirmed by Mr. V.Yannopoulos and Mr P. Katsikeas with whom I held extensivediscussions on this matter.
495

67. These include the general inflexibility of the Greek financialstructure which makes it very difficult for a new firm to set upbusiness if satisfactory guarantees are not provided to the banks.Furthermore, the bureaucratic delays act as impediments to small,innovative enterpreneurs.
68. See G. Zavvou, "The EEC policy on Banking in view of 1992" inEconomicos Tahidromos, 11 January 1990.

NJ
ON I-. 0La •..I N3lo 0 ,0
I-..C.I-.,0 I-. N30 o. 1-n ,.. 0
U. Cs NI
Na NJ 0,I-. sO •
NJ
Ln u, co• 0 co
P. 4.4
N3
N.)i•-n
1.4
NJ ha La VI
I-I.a V UI U,
NJ
0
NJ
03 tr. ...I
OP
dr
zoc,
0rr
0ftCD
11
ca
CD
de
II
[11
0
eDcr. n.1
CI ND0
I-,ha
CDz
03 dr r
N.1
1,3 N3
la la 0CO CO ha NJ
H haI-, VI ha NJN3 N.1 sa ..n
VI VI VI
P0 NJt.n
I-,00
•
LrLn la P0 .C•La Co O. Ln
UI
I-.I-. 02 La▪ VI
N3 La La
I-,I-, VI VI CO
N3N3
dr
C
▪
On1 VI 0
0 40 La co La• Lc:. 0N3
0,VD
▪
CO ra 0, 0La CO V,
oo
Laco
tit NJ U, NJ
00 a,La NJ N3
0,NJ
4•• r Laco 0 nI
CO *CIC. 42 F. I-.
Lti0
tit La so Ln
La ir Ln
N3
00
dr
•C•
NJ 0 La 1,30,
ND nJ V
VI 0,
3 I NJ
P.4 0 NJ 0,P. La 0, LI,
NJ0,CO
VI V Ca
dr
La
CD

Table 7.4: Profit-Loss Account of Kefalea Bros.
(In thousands dr.)
1/7/84-30/6/85 1/7/86-30/6/8611/7/86-30/6/87
Total Sales Turnover 1,522,702 1,839,055 2,434,073
Minus: Cost of Sales (1,776,799) (2,187,688) (2,864,751)Remainder (254,097) (348,633) (430,678)
Minus: Depreciation (2,613) (3,380) (3,244)Gross Profit (251,484) (352,013) (433,922)Consumption Aidand PMCAs
385,062 514,826 677,581
Minus: AdministrativeExpenses 20,398 24,713 53,143
Expenses on Sales 110,015 131,761 175,184FinancialExpenditure 40,082 42,053 24,426
Depreciation(furniture etc) 1,361 1,183 1,659
Other Expenses 3,826 2,943 1,714Profit (42,104) (39,840) (12,467)Various Receipts 52,276 59,765 51,767Pre-Tax Profit 10,172 19,925 39,330Dividents 5,607 15,858 11,192
Notes:
Figures in brackets indicate losses
Source:
Company's Confidential Records, Summer 1988.
49 8

Table 7.7: Profit-Loss Accounts of Eleourgia Messenias, during 1986-1988
(In thousand dr.)
1986 1987 1988
Total Sales Turnover 790,193 790,972 443,943Cost of Sales 730,655 830,070 405,367Remainder 59,538 (69,098) 38,576Depreciation 0 (213) (643)Gross Profit 59,538 (69,311) 37,933Administrative Expenses 6,113 13,989 13,958Expenses on Sales (112,733 17,851 41,188Financial Expenditure 77,869 35,987Depreciation (Furniture
etc) 147 363 1,570Other Expenses 2,736 515 0Profit (62,191) (179,899) (54,770)Various Receipts 44,077 167,871 57,223(Consumption Aid and PMCAs)Net Pre-Tax Profit (18,114) (12,028) 2,453Dividends 0 0 0
Source: Company's Confidential Records, 1988

0
0(D.• •
0
Ul(,-)
tsilN)
LAJ-A -I.
.., ......
ON (...) —.I UT _-.‘ ....4. . 1‘..) ......
NJ CO Lk) ----- CO0 Ul Ul OD -C
_t 0 -C.
op
CO Lk)
IND COUi 0 UlLk) 1/40 (,) 03
I\ OD
--4 —.4 -A .......
ON CA) N.) ...„. .-A
0 r‘) CO -A ,.....
.. .. .. IND OD_.a 0 0 —00 U1 -C.- co—4 %..0 CO ON
-C. -Cl- C.)-'.0n.0 LA) Ul -.A .....
LA) 0 -Cl- ON ...... -A
Ui . *a . -A s...„
zrz CrN kil —v IN) CO—4 CT —a ".... —4co __. —4 OD
--I
La) —.—%
0 NJ co0 ',......... _..,
ON l'U (....) ON ".-.. ... '-. CO
.asit -Cl- Os --4 CO —4—.3 CO 03 —4Ul OD —4
1\0 0
%-0 \0 0' —
NJ IN) 1/4.0 OD\ Ul OD 03
CO
ON ON CA)
%.0 CO 0 01 \ CO
\
0 03 0 co1/4.0 CO --3
U.) FN.1 _‘ CO
ON (...)
-s4 -A —4 0 --s--4..
0...,N.) —1 --4
CO ON 0 -A ......
NJ —a --3 "*.... 03-C-- --4 03 --4
---3
LA)
VD Ca) Ui 0Uico.asz
n.)--a
—.a 0Lk/ CO
GD OD COCO
• 0C
500

Table 7.10: Profit and Loss Accounts of Andreas Yefteas S.A.(in thousand dr)
1/1/-31/12/85 1/1/-31/12/86 1/1/87-30/6/88
Sales Turnover
Minus: Cost of Sales
385,531
406,517(20,986)
760,107
758,0112,096
692,903
712,084(19,181)Remainder
Minus: Depreciation 2,018 2,203 4,501Gross Profit (23,004) (107) (23,682)Consumption Aidand PMCAs
• 126,046 137,097 156,322
Minus: AdministrativeExpenses 5,918 9,298 27,884
Expenses on Sales 74,805 98,329 115,861FinancialExpenditure 20,231 36,722 63,764
Depreciation(furniture etc) 341 1,135 957
Other Expenses 395 293 -Profit 1,352 - (8,787) (75,826)Various Receipts 13,362 39,339Pre-Tax Profit 1,352 4,575 (36,487)Dividends
Source: Company's Confidential Records, 1988
501

Table 7.13: Profit and Loss Accounts of Plemmenou Bros.(In thousand dr.)
1986 1987 1988
Total Sales Turnover 453,039 485,482 192,602
Minus: Cost of Sales 514,875 514,275 239,349
Remainder (63,836) (28,793) (46,747)
Minus: Paying Offs 1,291 975 994
GROSS PROFIT (63,127) (29,768) (47,741)
Consumption Aidand PMCAs
108,172 93,246 67,239
Minus: AdministrativeExpenses 10,429 14,391 7,588
Expenses on Sales 12,319 24,659 11,122
FinancialExpenditure 13,206 17,874 2,756
Paying Offs(furniture etc) 85 300 120
Other Expenses 3,406 3,009Profit 5,600 3,245 (2,088)
Various Receipts 650
Pre-Tax Profit 5,600 3,245 (1,438)
Dividends 5,600 2,595
Source: Company's Confidential Records, 1988
502

CHAPTER EIGHT
CHANNELS OF DISTRIBUTION AND MARKETING OF OLIVE OIL
503

CHAPTER EIGHT
CHANNELS OF DISTRIBUTION AND MARKETING OF OLIVE-OIL
Introduction
Changes in channels of distribution in the olive industry both
reflect and in turn help promote change of internal structure over
time. By the beginning of this century two basic channels had been
established. One was from the producers to consumers via the retailing
chain. This was commonly found in olive growing areas located close by
urban centres. Producers would go to the town market - if they could
afford the transport cost - and there retailers would buy up the olive-
oil. The second more usual channel, involved the sale of olive-oil to
wholesalers or merchants and so from them to retailers and consumers.
From the late 1970's, however, with the rise of second stage
processing, the normal channels of distribution goes from producers to
middlemen who work on behalf of processors, then to the retailers and
consumers in the domestic market; or to processors, retailers and
consumers in the export markets. Such a channel yields a wider
distribution of the product at reduced cost. Various considerations-
sometimes conflicting - play an important role in the selection of
distribution channel as modern marketing has begun to influence i.e
stimulate, the demand for the product.
The most effective promotional method is through advertising and
brand differentiation. The two MNCs subsidiaries now spend
considerable sums on advertising campaigns through the media
504

(television, radio and the magazines). In recent years even Eleourgiki
has also increased its expenditure on advertising. However,
advertising campaigns undertaken by the private sector in the olive
industry not only focus upon the promotion of olive-oil sales but also
the promotion of seed-oils as well. Price has become another key
element in the marketing of olive-oil and obviously influences demand.
The full adoption of the Community's CAP has resulted in higher
consumer prices of olive-oil and the free entrance of competing seed-
oils; indeed each of the new Mediterranean member countries have been
forced to dismantle any restrictive measures remaining. Demand has
also been faltering in the Mediterranean countries and Greece seems to
be in the most vulnerable position at present because she still has the
highest per capita consumption and, until recently, had the most
protectionist olive-oil regime.
In this Chapter, I hope to show that from the late 1970's and more
specifically, with the rise of the second stage processing and packing
of olive-oil, rapid change has taken place in the distribution channels
and consumer expenditure patterns with respect to olive-oil. At the
same time the promotion of seed-oils by domestic producers and through
imports has resulted in a marked increase in consumption and a
decreasing trend in the demand for olive-oil. The main reasons behind
these developments are effective advertising and lower prices for seed-
oils. On the other hand, it is argued that Greek exports of olive-oil
improved considerably since accession into the European Community, even
though in 1987 and 1988 they suffered a set back because of the
implementation of the negative MCAs. However, during this period,
505

Greece was further subordinated to the Italian market without being
able to influence Italy's dominance in the Western European markets.
In Section One the domestic marketing arrangements for olive-oil
are discussed. It is argued that the entry of the packers into
distribution has been occasioned by two forces: the weight of
increasing productive volume, and the desire to exert control over the
market. Consumer demand stimulated by brand identification through
adverti ,-ing is perhaps the strongest weapon in the hands of a packer
seeking to establish control of his outlets. However consumer
information about the different categories of olive-oil and the
different brands has been neglected by the appropriate authorities.
In Section Two it will be contended that in addition to the usual
factors which determine demand the prevailing social habits and style
of living play an important part in consumption decisions. It is
likely that urbanisation, the general process of modernisation, and the
pressures of everyday life have important implications for the
industry. At base they seem more responsible for the falling demand
than the rising price trend of olive-oil. In order to put this into
long-term perspective Part One attempts to establish the pre-war
importance of consumption and trade in olive products. Part Two deals
with post-war developments in demand and consumer expenditure. As the
home village increasingly becomes remote memory for migrants, links
with rural origins appear to be alternating and many "traditional
habits" are dying out. Thus olive-oil consumption is now coming to
depend upon how frequently home cooking is undertaken and the extent of
506

"take away" foods and self-service. Whereas many housewives may well
continue to appreciate the value of olive-oil - despite its price, the
restaurant owner or proprietor of the fast food outlet naturally is
only interested in economising an expensive oil and, where possible,
substituting away. Part Three examines the domestic table olive
market. It is shown that two features have become dominant after
accession. First there has been a gradual reduction in the national
support scheme and export subsidies. Secondly, there is the
uncertainty this action has caused which has been further reinforced by
constant domestic level of demand. Finally, Part Four focuses on the
markets for olive residue and seed-oils which are generally classified
as substitutes for olive-oil. It is argued that even though domestic
consumption of olive residue oil has increased in recent years, most of
its production is still absorbed in export markets. However, domestic
consumption of seeds-oil has nearly doubled in the last ten years. The
reasons for this state of affairs are highlighted.
In Section Three I report the results of my empirical investigation
of the Greek demand function for olive-oil between 1958-1988. I try to
argue that olive-oil still has a unique hold for Greek consumers and
this affects the nature of demand.
In Section Four, the marketing strategies of a sample of surveyed
firms in Messenia are examined. I argue that demand in the Italian
market is crucial.
507

Finally, Section Five focuses on the marketing of olive products
and seed-oils. It is contended that since Greece's accession the
export of olive products have improved. The main reason has been the
growth in demand from Italy - the main importing country for all
products of the Greek olive industry. However Greece also experienced
a large increase in the import and domestic consumption of seed oils.
This state of affairs is bound to have a deleterious effect on the
future of the olive products, and this is already apparent in the
negative annual growth of olive-oil consumption in Greece. Part One
deals with olive-oil. It is argued that after the Spanish and
Portuguese accession, the EEC by implementing negative MCAs on olive-
oil exports, attempted to deal with any surplus quantities within its
market. However, it appears that the only way surpluses can be
balanced is by an increase in olive-oil consumption in the north
European countries as well as an increase of EEC exports to third
countries. Part Two discusses the marketing of table olives and olive
residue oil. It is contended that the observed increase in the demand
for table olives was chiefly caused by effective worldwide marketing,
general improvements in the standard of living and the "dual" use of
the product as a dietary complement and as a luxury. On the other
hand, the rising importance of olive residue oil as a consumption good,
due to the lifting of all restrictions on its availability, makes it
another substitute for olive-oil consumption. Part Three examines the
trade in seed-oils since 1981.
508

8.1 Domestic Marketing
Distribution is, of course, the link between production and
consumption so that changes in its pattern and disposition must be set
against the background of the national economy. This is because as the
channels of distribution change, they not only reflect group conflict
between distributors but also the impact of the deeper forces within
the economy. (1) Distribution and wholesaling in the olive industry
have had to conform to the changing patterns of society. Naturally, in
the past better quality control on olive-oil and emerging new centres
of demand especially in urban areas have altered consumer behaviour but
have had little impression upon the mode of distribution. Wholesalers
continued to dominate the industry right up until the early 1970s. The
reasons for this have been identified in Chapters Two and Three and
basically are connected with the low level of development of the
cooperative movement and the inactivity of the State with respect to
helping improve the method and standard of distribution. Why then
should the current forces acting upon the distributors produce any
different results? Part of the answer has to lie with the greater
knowledge of marketing now available to the trade. However, there can
be little doubt that it has been Greece's accession to the EEC which
has made the real difference. As we have already seen earlier (Chapter
Six), entry to the EEC promoted a growth in the number of processing
units. The owners of these units mainly originated from the ranks of
olive merchants and wholesalers plus a sprinkling who diversified into
the trade from other activities. Those wholesalers who did not seem
inclined to take the risk of upgrading their function and penetrate the
509

processing part of the industry were marginalised, experienced a
, decline and were forced to limit their activities to mediation between
the olive growers and the processor - packers.
The private packers on the one hand and the cooperatives on the
other, competed in the domestic and export markets, and were now able
to find outlets themselves to match their expanded production capacity.
This impetus was reinforced by the knowledge that distributors,
wholesalers and retailers alike had no exclusive interest in any one
packer's product. The resulting changes in distributive methods aimed
at direct dealing with the consumers and to retain control of the
product as far down the distributive chain as possible. (2) The
increase in the size and cost of the packaging units dictated a smooth
and continuous process of marketing. Fluctuating and inconsistent
demand seemed quite incompatible with an efficient and low cost mode of
production and, as both cooperative and private firms grew in scale and
concentration their movement into distribution became necessary.(3)
This growth in scale, alongside the successful application of
concentration techniques by the large packers in the industry, produced
a new awareness of their strength and ability to control the market.
The shorter the supply line the closer the processor-packer was to his
market and the greater the control of both product and market. For
firms such as Elais, Minerva and Eleourgiki this seemed a natural step.
These two forces i.e, the weight of increasing productive volume and
the desire to control the market, have prompted the entry of the
processors into distribution, an expansion which signifies vertical
organisation.
(1 n

In 1981/82 out of a total consumption of 190,000 tonnes of olive-
oil, 24.2% was packaged. By 1987/1988, 90,000 tonnes of olive-oil was
packaged out of the 200,000 tonnes consumed i.e. 45• 4) It therefore
appears that within a period of only six years the amount of olive-oil
which is sold packaged according to EEC specifications has doubled.
One-third is now distributed through the cooperatives (5) , and the rest
through the private units. There is also a decreasing amount of
unpackaged olive-oil distributed by small wholesalers. This is now
probably less than 1006)
We may now pose the question why the wholesalers have been unable
to prevent the packers and the cooperatives from competing in their own
territory, and why have they accepted the condition of controlled
activity and dependence? Perhaps the main reason is the processors'
role in olive-oil packaging, advertising and branding. Consumer
demand, responding to guaranteed quality and stimulated by brand
identification, is the strongest weapon in the hands of a packer
seeking to establish control of his outlets. Though this falls short
of ownership and contractual obligation, it nevertheless confers a
greater degree of power than other conceivable methods. (7) Branding
seems effective in proportion to the amount of promotion it is
accorded, and is therefore dependent upon the weight of advertising
undertaken. The main purpose of advertising in this sector is to
create goodwill (which is demonstrated by the willingness to buy a new
commodity or brand, or by a repeat purchase of a previous one). What
seems important here is that the good will so created is attached more
to the advertisers than to the distributors when these two functions
511

Media
T.VRadioMagazinesNewspapers
-TotalSum
Year
1981
1982
1983
1984
186.8
29.2
285
987
2,717
654
1,005 13,104
19,298
186.8
29.2
17,110
20,939
are distinct. Product diffentiation by branding creates demand power
and it is therefore no accident that the increasing .similarity between
products should have been offset by the creation of brand
distinction. (8) Where no real product difference exists the greater
then is the need to influence the consumer by the brand name.
Eleourgiki, currently the largest packer of olive-oil in Greece, sells
three brands in the domestic market. More specifically, out of the
25,000 tonnes it sold in 1988, 12,000 tonnes were Spitiko, 5,000 tonnes
were Alki and 8,000 tonnes were Liotrivi olive-oil. The whole amount
was marketed in containers of 1 lt and 5 lt, and bottles of 1 •lt
according to EEC specifications.
Eleourgiki equally promotes all three of its brands. (9) Table 8.1
shows Eleourgiki's expenditure on advertising during 1981-1984, by
different media.
Table 8. 1: Eleourgiki's Expenditure on Advertising, 1981-1984(In thousandl dr.)
Notes: 1. In current prices
Source: Eleourgiki, Department of Marketing, 1988
512

We may observe that since 1983, the year when Eleourgiki moved
decisively away from being just an intervention agency on behalf of the
State, and entered the domestic and foreign markets, expenditure on
advertising increased dramatically. As advertising is one of the
arenas where Eleourgiki competes in the domestic market with Elais and
Minerva, expenditure on advertising followed an increasing trend after
1984. With regard to Elais, out of the 15,000 tonnes of olive-oil
which is sold in 1988, 60% was Altis. This brand is the main
competitor of Liotrivi. (10) On average, Eleourgiki occupies 28% of the
olive-oil market, Elais 15% and Minerva 10%.(11)
Another important factor in the marketing of olive-oil and
especially virgin olive-oil, is whether the packing units have in their
possession oil-banks where the product can be collected and kept for a
specific time period. The general procedure is to retain the olive-oil
in such banks for 3-4 months, so that maturity, clarity and homo-
geneity can be obtained before it is packaged and sold. This
guarantees high quality olive-oil. (12) The total capacity of oil banks
owned publicly and cooperatively, on a national level was 173,930
tonnes in 1980. The cooperatives owned oil-banks with a capacity of
127,230 tonnes, and the State owned the rest with a total capacity of
46,700 tonnes. ( -3) For the private oil-banks no aggregate data was
available. Since 1981 though, Eleourgiki alone has spent 254,133
thousand dr. on oil-bank construction. Today, Eleourgiki's total oil-
bank capacity is 233,000 tonnes. Therefore, it can be deduced that
since 1981 (14) the country's total oil-bank capacity has more than
doubled. If we take into account the fact that modernisation plans of
513

the private as well as the cooperative sector included oil-bank
construction together with their new buildings, this confirms such a
trend.
The factor of quality in the marketing of olive-oil and olives has
occupied the attention of State policy since at least the Second World
War. The main reason for State intervention to protect the purity of
olive-oils was the disparity in the price of olive-oil, oil seed-oils
and edible olive residue oil. (15) This allowed potential adulterators
(olive-oil wholesalers and retailers) to make windfall gains. The
blending of olive-oil with oil seed-oils or olive residue oil is
considered as adulteration and is punishable under Law Decree 136/1946
of the "Market Code". Market inspectorates made sporadic quality
checks and some protective consumer measures have been applied over the
years. The most important and the one implemented before January 1988,
was that the import and trade of oil seed-oils was not allowed in the
main olive producing centres of Greece such as Hania, Heracleo,
Lasethi, Rethymno, Lesbos, Kerkera, Messenia, Lakonia, Lefkada,
Zakenthos, Kefallonia and Preveza. After that date though, the
restriction was lifted in the context of EEC regulations. The measures
also specify that during the process of selling, the wholesalers and
packers have to hand over to the retailers sealed samples of the olive-
oil they intend to sell to them. Further, when olive-oil is exported,
all transactions include a quality certificate stamped by the National
Institute of Chemistry. (16)
514

According to the EEC regulation 1915/1987 the placing of olive-oil
into quality categories has changed and is now as follows: the Extra
olive-oil (0-10), was called by the new regulation Extra Virgin. That
previously known as Fine olive-oil (1-1.5°), was called Virgin olive-
oil and includes oils with acidity of 1-2°. The term Fine could only
be used at the production and wholesaling levels; retailing had to
comply with the new regulation. Courante or Semi-Fine olive-oil was
redefined to include oils with 2-3.3° oleic acid content per 100 gr,
and the new name given to it was Ordinary Virgin. Even though this is
considered edible its retailing was prohibited except when blended with
Extra or unless it has been processed in a refinery. Lampante olive-
oil remained inedible and now includes oils with an acidity count of
3.3 0 - 12°. Refined olive-oil was redefined to chemically processed
oil with an acidity of less or equal to 0.5°; and as it is not suitable
for immediate consumption, retailing is prohibited. Pure olive-oil was
now called Olive-Oil while the use of the previous term Coupee could be
extended until 31/12/1989 exclusively for exports to third countries.
The acidity of Olive-Oil may not exceed 1.5°.
With regard to olive residue oil we now have two categories, the
first is called Unrefined olive residue oil and the second Refined with
a maximum acidity of 0.5°, but its retailing in an unblended form is
prohibited. Finally, the term Blend of Refined Olive Residue Oil and
Virgin Olive-Oil was substituted by the term Olive Residue Oil with a
maximum acidity of 1.5 0 . Summarising we note that since November 1st,
1987 a new terminology has been applied on marketed categories to the
EEC market, export to third markets and , from 1/1/1990, is applied to

the domestic market. Retailing of olive-oil is limited to the
categories Extra Virgin (0-1°), Virgin (1-2°), Olive-Oil (0-1.5°) and
Olive Residue Oil (0-1.5 0 ).(17) The issue which arises is how well
consumers are informed about these marketing categories, and what they
really mean. Through advertising and branding information about the
quality of the olive-oil (concerning acidity levels, and the
distinction between extra virgin and refined) does not appear to come
across. Furthermore, the State and especially the Ministry of Trade
and Commerce, has not taken any initiative in order to remedy the
situation. It therefore seems that even though rapid change has
occurred in the domestic marketing and distribution of olive-oil, the
flow of relevant information has not kept up with the pace of change
and, as a result, consumer preferences for the different brands and
categories are formed through the advertising campaigns of the firms.
8.2 Changes in the Patterns of Consumer Demand and Expenditure
8.2.1 Pre-War Consumption and Trade
Prior to the Second World War around 90% of olive-oil production,
and around 55% of table olive production, was consumed domestically.
According to the official estimates the average per capita consumption
of olive-oil in 1939 was 10.5 kgr. (18) However since total consumption
amounted to approximately 90,000 tonnes a more realistic figure of
consumption per head would be 12.8 kgr of olive-oil. (19) During the
pre-war period exports varied in accordance with the fluctuations in
international trade. Table 8.2 shows that during the 1930s the lowest
516

quantity of olive-oil was exported in 1937 and the highest in 1932.
Generally speaking oliv o -oil exports were used for blending with other
oils. Some good quality olive-oil was also exported, and naturally
this was suitable for immediate consumption. Even then Italy was the
largest importer of Greek olive-oil, and there were years when that
country absorbed up to 75% of the total Greek export. More normally,
the average amount of exports to Italy over 1932-1939 comprised 36.5%
of the total. The U.S.A., Britain and Egypt (together with the other
minor markets) followed. According to the official sources 50% of
exports originated from Crete, Lesbos and Kerkera. Messenia province
exported only small quantities and other areas even more modest
amounts. (20) Olive-oil exports were traded in barrels. As Greece was
a net exporter, imports were negligible. However, during these pre-war
years the processing of olive residue for export developed
considerably. In years where the domestically produced olive residue
was not sufficient, olive residue was imported from Turkey and Albania.
It was processed in Greece and then re-exported within a nine month
period from the day of arrival. Although there are statistics on olive
residue imports there are none for olive residue oil exports for the
period 1929-1938. In order to estimate such exports I therefore
assumed that 100 kgr of olive residue contained around 10 kgr of olive
residue oil. In this way I deduced that in 1927 4,869 tonnes of
imported olive residue after crushing produced 486.8 tonnes of olive
residue oil. In that year since olive residue oil exports were 1,217
tonnes the difference represented net national exports. (21) Finally in
the pre-war period Greece occupied second place (after Spain) in the
export of edible olives. In the last decade before the War these
517

exports accounted for 45% of total average production, while before
this period they amounted to approximately 30% of the total. (22)
In the early post-War period per capita consumption of olive-oil
reached an annual of 15.5 kgr which means that 107,000 tonnes of olive-
oil were consumed domestically. Furthermore up to the early 1950's, no
olive-oil exports were allowed. This was due to the high domestic
demand for the product caused by the absence of foodstuffs as a result
of the destructive effects of the Second World War. During the War
years, olive-oil was used as a means of exchange, and one could
literally buy a piece of land in an urban area for a 16 kgr tin
container.( 23) In 1947 the export of 5,000 tonnes of olive-oil to the
U.S.A. was allowed in return for importing the same amount of oil seed-
oils.(24)
8.2.2 Post-War Olive-Oil Consumer Demand and Expenditure
The pattern of consumer demand and expenditure has changed
consistently - if slowly - throughout the post-War years. At first the
distributive channels responded even more slowly but nonetheless a
gradual adjustment to the new demands came about. In the economy at
large new goods and new methods of retailing began to evolve, while
some of older traditional methods of retailing faded away. The Second
World War was an incubation period for the shift changes in the pattern
of consumer spending and demand that were to emerge after the rationing
and shortages of the immediate post-War period ended. Urban population
rose at an unprecedented rate after 1948. Of course for many years,
518

people in the urban centres kept their contacts with the rural sector,
and the old methods of retailing through relatives and friends
persisted. (25) As the new generations grew up though, preferences
tastes and modes of shopping changed. The increase in real incomes has
been a fundamental cause of the changes, but it is also pertinent to
enquire how far secondary influences (i.e. those apart from income)
such as the changing conception of class and social status, and the
widespread diffusion of education have been responsible for altering
the patten of consumer expenditure. Greek olive consumers now appear
to react to advertising in the predicted manner and to respond to image
created characteristics of the product. This seems to presage a new
attitude and there is certainly the means now available to follow it
through in the market place. For example in 1988, Minerva sold 1 lt
bottles of corn oil at 214 dr, Elais's price for exactly the same
product was 200 dr and all the rest of the firms sold at 185 dr.
Despite the price difference Minerva's brand remains in first place and
it has even managed to increase its market share.(26)
' Olive-oil consumption per capita in the domestic market in 1988 was
about 20 kgr and total average consumption (of annually consumed olive-
oil) amounted to 200,000 tonnes. This quantity is consumed as follows:
65,000 tonnes takes the form of self-consumption in the olive producing
regions, and the balance of 135,000 tonnes is consumed in the urban
areas. The consumption in the olive producing areas is 100% Virgin
Olive-oil while consumption in the urban centres is 70% Courante and
30% Virgin Refined olive-oil is seldom used for home-hold
consumption.( 27) Naturally consumption per capita is much higher than
519

the average in the olive producing regions and much lower in the areas
with low production such as Macedonia, Thrace and Thessaly. (28)
In the urban areas there is increasing consumption of olive-oil
substitutes such as sunflower oil, soya oil and cottonseed oil which,
since January 1988, are also being consumed in the olive regions. In
addition to the promotion and advertising campaigns launched by large
firms like Elais and Minerva, the lower price of these products
relative to that of olive-oil has been an important factor in
explaining this trend. The price ratio is currently of the order of
about 2:1 and in some instances can even assume values of 3:1 - a very
worrying trend for the future prospects of maintaining olive-oil
demand. (29) Table 8.3 presents patterns of olive-oil consumption by
region in 1981/82. We may observe that out of the total consumption
(190,000 tonnes) 24.2% was sold packaged, 44.2% unpackaged and 31.6%
was self consumed. It is clear that the heaviest consumption per
household is found in Peloponnesos and the Islands, and the least in
the greater Athens area. By 1984/85 out of the total domestic
consumption of 200,000 tonnes, 78,299 tonnes or 39% was sold packaged,
30% unpackaged and 30% was self-consumed. Three years later 1987/88,
out of 200,000 tonnes domestically consumed 45% was sold packaged, 25%
unpackaged and 30% was self-consumed. (30) So in less than a decade a
combination of a rise in disposable income and the effect of
advertising has indeed changed the pattern of expenditure on olive-oil
and just about doubled the quantity of packaged olive-oil, while total
consumption demand remained little changed.
520

8.2.3 The Table Olive Market
Table olives are distinguished by variety, category, type and size.
Each variety has its own shape and taste and the best known varieties
are: Conservolia, Halkidikis, Megaritiki, Kalamon, Throubolia and
Kolovi. The category makes a lot of difference to the processing of
the olive because each has its own maturity period, organoleptic
characteristics and chemical composition. The three principal
categories are green blonde and black. (31) According to the way they
are processed table olives are distinguished by type and to each of
these types a different commercial value is attached. For example,
after special processing from the green we get the Spanish type.
Another method of processing yields the Sikelian type, the stuffed type
and many other local variations. From black olives we get the natural
salt type, the dry type and locals. Ordering the table olives
according to size is one of the most important tasks of processing
because it makes the produce more obviously presentable. Moreover
size, variety, category and quality are the main determinants of the
selling price. Quality is a function of taste, odour, colour, shape
and any alternations which the product might have suffered during
processing and preservation. Following these criteria table olives are
distinguished into two main qualities: first and the second order.(32)
Annual per capita consumption of table olives in Greece is
estimated at 3 kgr and this seems to have remained rather constant over
the last few years. (33) Some varieties are only exported, but domestic
consumption is primarily covered by varieties such as Throubolia-
521

exclusively absorbed by the domestic market, Megaritiki, Kolovi and
others which meet special consumption needs and represent particular
olive growing regions. On average 10,000 - 12,000 tonnes of table
olives are self-consumed and processed in small containers in
households every year (including producer and non-producer families).
A further 10,000 - 25,000 tonnes a year (depending on the level of
production) is processed in containers owned by the olive producersthemselves or by small olive merchants. The remaining amount is
processed in the private and cooperative processing units. Average
annual production of table olives between 1980/81-1986/87 was 84,000
tonnes out of which about 47,000 tonnes were exported. Each year the
domestic market absorbs some 29,000 tonnes of table olives, average
(1980/81 - 1986/87), with an average annual stock of about 36,000
tonnes. (34)
Table 8.4 shows annual consumption in Greece between 1981-1986.
The overall trend is downward, especially after 1984. Cooperatives
process about 40% of the total, but with an increasing tendency and now
amounts to around 50%. They market 25% of the produce themselves while
a further 15% is sold through the olive merchants. Clearly marketing
is still an area where cooperatives lag behind the private sector and
the main reason for this is the lack of experienced marketing personnel
in the cooperative sector. Before Greece's accession into the EEC the
State had established a national table olive market organisation.(35)
Its aims were to support the income of table olive producers through
stabilization of market demand for processed and unprocessed olives in
the domestic (and export) market. It also set out to keep the final
522

processed produce at a reasonable price and high quality. The national
measures were decided at the beginning of each crop year by the
Commission of Prices and Incomes. The type and intensity of these
measures differed from year to year according to the quantity produced,
the level of stocks and to international conditions. The main features
of this national intervention system were: a guaranteed "lowest price"
for unsold annual production; a production subsidy to the olive
growers; and a subsidy to the olive producers and cooperatives for the
purchase of storage and processing facilities. An export subsidy for
all exported olives quite independent of the country of destination was
also granted. In the year of Greece's accession to the EEC, export
subsidies ranged between 23-38% on top of the F.O.B value of the
produce. By this policy the State aimed at improving the quality of
table olives while maintaining the income of producers and the
processors-exporters. (36)
By article 70 of the Rome Treaty on Greece's accession the country
was allowed to keep national measures for table olives until 31
DeCember 1985. Also, Article 42b of EEC Regulation 136/1966 concerning
Common Market Organisation of fats and oils (which was modified to
include table olive), stated that the Council would adopt special
measures for table olives, the latest until 31st December 1985. But
after taking into account the Commission's proposal that it was not
necessary to introduce a scheme of Common Market organisation for table
olives the Council, decided on the 20th December 1985 that the Greek
State could extend their national measures until 31st December
1987. (37) This proposal was in recognition of the fact that the table
523

olive sector was still in need of a national support scheme. Despite
the fact that the two-year extension and the uncertainty about the
future constituted obstacles to the development of the sector, the
problem appeared with grater intensity after the 1st of January 1987.
Then the Greek government were forced to reduce the percentage of
export subsidies on the produce by 55% (when exported to EEC counties)
and by 40% when exported to third countries. These reductions will
continue (until the subsidies are abolished later in 1990) on
transactions with EEC countries and (by 1992) on transactions with
third countries. (38) One would expect that by 31st December 1987 the
EEC would have adopted some Common Market scheme for table olives.
Instead, uncertainty and the reduced export subsidy have become major
features in the domestic table olive market after accession.
The problems created in the domestic market become clearer if we
take into account the following factors. Over the seven year period
1980-1986, as mentioned Greece produced on average 84,000 tonnes and
consumed 29,000 tonnes of olives. Average exports were 47,000 tonnes
and the stock at the end of each period reached 36,000 tonnes of table
olives. Domestic consumption and exports during the period between the
end of an olive year and the beginning of the marketing of the newly
produced table olives seldom exceed 16,000 tonnes. (39) It therefore
appears that there is a stock of 20,000 tonnes or 24% of the total
production. While this is happening in the domestic market the EEC
market of table olives has annual stocks of the order of 98,000 tonnes
(table 8.5), which presents the Community with a problem as EEC
produces 45% of the world production, consumes 34% of world consumption
524

and accounts for 78% of the world trade in table olives. Table 8.6
shows the index of wholesale prices of table olives between 1968-1983 .
and the index of producers' costs over 1978-1983 against the wholesale
prices over the same period. We may observe that while the wholesale
price index nearly doubled, producers costs nearly tripled. The
figures in Table 8.7 present prices paid to the producers of table
olives in dr/kgr for 200 olives/kgr during 1978/79 - 1986/87. Over the
period 1987/88 no minimum price was set. Prices were determined by the
free market through the interaction of supply and demand. For 1985/86,.
those producers who kept storage facilities for processing received
increased prices for the black table olives and Kalamon by 4 dr/kgr in
the beginning of the year, and 1 dr/kgr on top for each additional
month. Cooperatives on the other hand, received a subsidy of 5.5
dr/kgr for the green and blonde types, while for the black Kalamon and
Throumbes, they received 6.5 dr/kgr. Also, for 1986/87 the marginal
increase to producers with storage facilities was set at 5 dr for
January and 1 dr for each additional month. (40) It therefore appears
that if the national support scheme ceases to operate and no other
provision is made in the context of an EEC common market organisation
for table olives, Greek producers will face grave problems.
8.2.4 The Olive Residue Oil and Seed-Oils Markets
The olive residue oil market forms the final part of consumption
and expenditure of the industry. According to acidity, olive residue
oils are distinguished into three categories. First there is low-
grade, with acidity up to 15% in free oleic acids. Secondly there is
525

the midgrade, with acidity greater than 33% in free oleic acids. After
refining these two are made suitable for human consumption while the
third, the highgrade, are only used in the production of green
soap. (41)
Edible olive residue oil is available for consumption in two types:
Refined and Refined Demargarined olive residue oil. A small
percentage of the refined produce is used as raw material for margarine
and cooking fat. The two types of olive residue oil are marketed in 1
lt plastic bottles and 5 it metallic containers. A minimum price for
the marketed olive residue is set each year by the local provincial
administration. To determine this price, the content of olive residue
in oil is taken into account as well as the cost of extraction of olive
residue during the previous year. Another consideration is the price
of olive residue in previous years. (42) The processing units in most
cases buy the olive residue at a higher price than the one set by the
authorities. This happens because of competitive action between the
different plants - especially when export demand for the produced olive
residue oil is buoyant. - The price of olive residue varies from region
to region and is also dependent on the methods of production. For
example, the cost of the olive residue which is produced by classical
type presses at oil-mills is higher than that produced by modern
Ciiritrifugal type of equipment. The reason is that in the former case
the olive residue holds less water and therefore more olive residue oil
can be extracted out of a given amount.

The main factor which influences the price of olive residue oil is
its acidity. To support the price of olive residue oil and create a
public regulatory stock so that there are few price fluctuations in the
domestic market, the State has intervened.( 43) Until 1980 national
intervention prices were determined by the Ministry of Agriculture
(YDAGEP). After 1981 the product is under the Common Market
Organisation for Oils and Fats. Intervention prices are therefore set
by the EEC and Table 8.8 shows EEC prices and subsidies over the period
1982/83 - 1987/88. Production aid is 8% on top of the production aid
paid for olive-oil. This is because the olive residue contains olive
oil estimated at 8% of the total content of olives in olive-oil. The
production aid is paid to the producer together with that for olive-
oil. Consumption aid on the other hand is paid to the refiner-packer.
It is only received for the blend of refined olive residue oil and
virgin olive-oil. Until 1986/87 it was only paid on quantities
exported but, since 1987/88, it is paid on domestically consumed
amounts as well. Furthermore, since 1981, unrefined olive residue oil
with acidity levels up to 15% in free oleic acids is collected by
YDAGEP on behalf of the EEC. () According to their content in free
oleic acids, olive residue oils are now placed into three categories
Category A, which contains oils with up to 5% oleic acids; Category B,
contains oils with 5.1-8% oleic acids; and Category C which contains
oils with 8.1-15% oleic acids. Table 8.9 presents the amounts
collected by YDAGEP during 1981-1984.
527

Table 8.9: Olive Residue Oil Collected by YDACEP during 1981-84
(In tonnes)
Year Category A Category B Category C
•
Total
1980/81 831 3,622 4,453
1981/82 735 4,165 4,900
1982/83 404 998 1,402
1983/84 48 353 401
Source: Ministry of Agriculture, (YDACEP)
Since 1984/85 there has not been any olive residue oil collection
by YDAGEP because of the export activity which earned the producers
higher prices. According to the International Olive Oil Council
domestic consumption of olive residue oil between 1975/76 - 1982/83 did
not exceed on average the 16,000 tonnes. Even though in recent years
it has ranged above this average, it is still below 20,000 tonnes a
year. This seems to be due to a lack of effective advertising by the
refiners since the product is edible. (45) But if olive residue oil is
not considered by Greek consumers as a serious substitute for olive-
oil, oil seed-oils definitely are.
The consumption of oil seed-oil has increased considerably over
the last few years as an edible product as well as an input to
margarine production. At present, the needs of the domestic market
are estimated at about 90,000 tonnes but on a rising trend towards the
528

120,000 tonnes mark. Between 1977-1980, average domestic consumption
was 48,000 tonnes. (46) An important factor here was the improvement in
the quality of edible oil seed-oils and for more effective advertising
(mainly by Elais and Minerva) emphasising its role in a healthy diet
this succeeded in convincing consumers that oil seed oils were equally
as good as olive oil - yet could be obtained for a much lower price.
This is because the input price of seed-oils is much lower than that of
olive-oil on account of a lower production cost. (47)Thus the
diversification by the larger packers from olive-oil to oil seed-oils
has proceeded apace. On the other hand, as Greece is the third major
world producer of olive-oil, the product was under the national
protection scheme long before the country's accession into the EEC.
This scheme meant that production and trade of oil seed-oils in olive
growing regions was strictly prohibited. This delayed the development
of the seed-oils industry and, as a result, the preferences of Greek
consumers were shaped by the availability of olive-oil - especially
virgin olive-oil. However the major competitors of Greece inside
Europe - Italy and Spain, have developed their own seed-oils industries
to ' a point where the annual consumption of oil seed-oil is now very
close to that of olive-oil. More specifically, in Italy average
consumption per capita of oil seed-oils over 1977-1980 was estimated at
12.6 kgr, and olive-oil consumption at only 8.8 kgr. In Spain, oil
seed-oils consumption is 10 kgr and that of olive-oil is just above it
at 10.1 kgr. (48) It therefore appears that in both countries consumer
preferences have been shaped so as to accommodate the supply of both
types of oil. Furthermore, the largest part of olive-oil presently
consumed in Italy and Spain is a blend of refined and extra virgin, and

this makes for a different pattern of consumption than that prevailing
in Greece. There per capita consumption of oil seed-oils was only 5.2
kgr in 1988, compared with nearly 20 kgr of olive-oil. Since April
1986, the restriction on oil seed-oils imports have been gradually
lifted as the adjustment period has ended. From January 1988 oil seed-
oils have been freely imported and cultivated in the olive producing
regions. (49) Per capita consumption of oil seed-oils in Greece
compared with that of olive-oil and other oils and fats is presented in
Table 8.10.
Table 8.10: Per Capita Consumption of Oils and Fats in Greece, 1988 (inkgs)
Per Capita Consumption
Olive-Oil & Olive ResidueOil 20.8 73.4
Oil Seed -Oils 5.2 18.2
Butter-Lard 0.6 2.3
Margarine and OtherAnimal Fats 1.7 6.1
Total Consumption ofOils and Fats 28.3 100
Source: Eleourgiki, Department of Marketing, 1988.
We may observe that only 26.6% of the diet of the Greek consumer is
made up of oils and fats other than olive-oil and olive residue oil.
But ten years ago consumption of other oils and fats was below 10%, so
the figure of 26% indicates a rapidly growing consumption demand.
Total
530

Quite clearly the retail price of oil seed-oils in comparison with
that of olive-oil is an important factor. Table 8.11 presents retail
prices in the super markets, of the main oils and fats products
consumed in the country.
Table 8.11: Retial Prices of Oils in Greek Supermarkets, 1984-1985(dr/lt)
Nov' 84 Feb' 85 Change % Apr' 85 Change %
Sunflower Oil 178.8 185 3.5 189 1.9Cotton Oil 173.8 196 12.8 194 1 .1,Corn Oil 204.5 211 13.2 245 16.1Olive Residue Oil
(refined)186.4 234
Olive-Oil, Virgin 245.5 320 30.3 326 1.9Olive-Oil, Coupee 239.6 275 14.8 302 9.8
RelationshipSunflower/Virgin 1:1.37 1:1.73 1:1.73Olive-Oil
Source: Eleaourgiki, Department of Marketing, 1988.
The prices shown are representative of the retail prices in the
super-markets and are expressed in dr/kgr (they are an average of
several different brands). The inclusion of olive-oil retail prices
(virgin and coupee) as well as of olive residue oil makes a comparison
possible. We can observe that in the period November 1984 to February
1985 the price of virgin olive oil increased 30.3% while the price of
its substitutes, especially sunflower oil, increased by only 3.5%. So
the price relationship changed from 1:1.37 to 1:1.73; within a period
of three months. (50) It appears that the domestic market for olive-oil
531

has been eroded by imports and domestic production of cheaper seed-
oils. Greek consumers have responded to the change in relative prices
and there has been a steady increase in the consumption of seed-oils.
On the other hand, the annual rate of change of domestic olive-oil
consumption over the last eight years 1981-1988 is -0.3%: this of
course, is a very worrying trend for the olive-oil producers. In order
to quantify the main variables which affect olive-oil consumption a
time-series estimation of the Greek olive-oil demand function is
undertaken next.
8.3 An Estimation of the Greek Olive-Oil Demand Function. 1958- 1988
8.3.1 The Data
Ct denotes the annual consumption of olive-oil over 1958-88. The
series has been extracted from data provided by the N.S.S.G and the
Ministry of Agriculture. Yt denotes personal disposable income over
1958-1988. The series has been extracted from the National Accounts,
1958-1975. Since personal disposable income is not calculated by the
N.S.S.G after 1975 I have extracted the data from 0.E.C.D sources. In
order to find the annual growth of olive-oil consumption for the
period, an 0.L.S estimation was performed. The first estimation gave:
Ct — 124.6 2.8 TIME(27.8) (11.7)
R2 — 0.82, D.W. — 0.88
532

Re-estimation by the Cochrane-Orcutt procedure to take care of 1st
order auto-correlation produced the following:
Ct — 122.4 + 2.9 TIME(15.9) (7.0)
D.W — 2.3
The compound rate of growth of olive-oil consumption during the same
time period was calculated at 2%. So olive-oil consumption increased
on average by approximately 2,900 tonnes a year. However the annual
compound rate of growth of olive-oil consumption during 1981-1988 was
calculated at -0.3%. Next, in order to find the marginal propensity to
consume an 0.L.S estimation was performed.
Ct — 157.8 + 0.01Yt(29.6) (3.9)
R2 = 0.33 D.W — 0.3
Re-estimation by the Cochrane-Orcutt procedure produced the following:
Ct — 151.2 + 0.007Yt
(7.2) (1.18)D.W = 2.6
It appears that the marginal propensity to consume olive-oil out of
personal disposable income is statistically insignificant and indicates
that a 10% rise in income would cause a 0.07% rise in the consumption
of olive-oil. Table 8.12 presents the data used in estimating the
Greek olive-oil consumption function for the entire period 1958-1988.
533

8.3.2 Specification of the Model and of the Variables Used
All variables were used in their logarithmic form. It is assumed
that olive-oil consumption in year t, is a function of the retail
price of olive-oil, LPt , personal disposable income LYt , the retail
price of the substitute seed-oils, LPS t , population, Nt , and
consumption of the previous year LC t ..1. In detail the variables used
were the following:
LCtf (C, LPt , LYt , LPSt , LCt _i, Nt,TIME)
(a) Consumption of Olive-Oil, LC t , on an annual year-by-year basis for
1958-1988 was given in thousands of tonnes. The data source was
the N.S.S.G and the Ministry of Agriculture. An extra explanatory
variable was added to the model, LC t _ i , to allow for consumer
preferences.
(b) Retial price of olive-oil, LP t , during 1958-1988. The data source
was the N.S.S..G, Statistikes Epetirides (various years). The
'price series used was the average retail price of olive-oil
(acidity 3 0 ), prevailing in the main urban centres of the country
i.e. Athena, Pireas, Thessaloniki, Heracleo and Hania. The price
series was used with a base of 1970=100. The real olive-oil price
was used after being deflated by the Retail Price Index (with a
base of 1970 = 100).

(c) Personal disposable income, LYt , during 1958-1988. The data source
was the National Accounts, N.S.S.G, (various issues). As already
mentioned, since 1975 the N.S.S.G has not estimated annual personal
disposable income figures so they were extracted from 0.E.C.D,
Economic Indicators (various years). The series was used at
current market prices and also with a base year of 1970-100. Per
capita personal disposable income was also used.
(d) Retail price of substitute seed-oils during 1958-1988. The data
series was extracted from the N.S.S.G, Monthly Statistical Bulletin
(various years). This is an average weighted price of sunflower-
oil, corn-oil and cotton-oil. The price series was used with a
base year 1970=100. The real seed-oils price was also used, and
the price series was deflated by the Retail Price Index with a base
of 1970-100.
(e) Population, Nt , during 1958-1988 was extracted from the National
Accounts, various years. Given that olive-oil is an important
'dietary product in Greece it was felt that this should be included.
(0 A constant term, C, was used, since an important part of totalolive-oil consumption is self-consumed (i.e. by the producers
themselves).
(g) TIME was used to take account of social habits, preferences and the
increase in population.
535

8.3.3 The Results
The estimation of the model was by the Ordinary Least Squares
(0.L.S) method. The results are presented in Table 8.13. The first
equation, where all variables are present, showed consumption of the
previous period, LCt_i, to be statistically insignificant. This
suggests that there may be collinearity between this variable and
income, given that both increased over the period.
In the second equation, the LC t_i was dropped and the statistical
significance of all variables increased. Income LY t nearly became
statistically significant. In the third equation the real price of
olive-oil and seed-oils was used but the results were unsatisfactory.
This may be because in the deflator - (the Retail Price Index), the
price of other goods are included which do not influence the decision
of the olive-oil consumer. After all the Greek public traditionally
purchases this product in large quantities. It appears that the
following equation performed best:
LCt — 4.86 -0.10LYt - 0.5LPt +0.44PSt +0.04TIME(11.8) (-1.9) (-3.3) (2.4) (8.5)
R2 — 0.91, D.W = 2.10
We observe that all variables are statistically significant apart from
income which also has a negative sign. This suggests that a 10%
increase in personal disposable income will, ceteris paribus, cause a
1% reduction in the consumption of olive-oil. This may be explained by
the fact that higher incomes which go together with urbanisation and
536

"modernisation" are factors which take the consumer away from their
traditional dietary product of olive-oil. The price coefficient shows
that a 10% increase in the price of olive-oil ceteris paribus, cause a
5% reduction in consumption. Also the price coefficient of seed-oils
shows that a 10% increase in price will cause a 4.4% increase in the
consumption of olive-oil. This cross elasticity of demand shows the
substitution possibility between seed-oils and olive-oil. Overall it
appears that olive-oil remains a highly valued product to the typical
Greek consumer since the income elasticity of demand is much lower than
its price elasticity. (51) Next, per capita consumption and personal
disposable income were used. Here tourist consumption is taken into
account as countries like Greece, Italy and Spain attract many tourists
every year. The following equation performed best:
L (C) t — -4.5 -0.11L (Y) t -0.45LPt + 0.37LPS t + 0.04TIMENt (-7.9) (-2.2) Nt (-3.0) (2.0) (7.7)
R2 — 0.82, D.W — 2.2
We observe that there is a good fit of the regression with R 2 = 0.82,
but this is not as high as in the total consumption formulation. The
value of the coefficients has not changed, but income has become
statistically significant while keeping its negative sign. We may
conclude that this modelling exercise shows that the usual economic
variables do not seem to be the major determinants of olive-oil
consumption. However, a combination of high consumer prices,
relatively lower seed-oils prices and higher incomes, has led to a
negative annual compound rate of growth (-0.3%) in the consumption of
olive-oil since 1981. This suggests that a national campaign is
537

required in order to inform the consumers in the urban centres about
the properties of healthy unprocessed foods in their diet including
olive-oil.
8.4 Marketing Strategies
The approach to marketing of the sample of firms surveyed in he
province of Messenia may be discussed at two levels : the market
level, i.e. the use of agents in foreign markets, and at the customer
level, i.e. the management of actual customer relationships.
Generally, the policy of the firms in relation to their international
operations is designed in a stepwise manner where only a limited number
of alternatives are analysed and where the experience and the results
of earlier activities continuously affect policy. One very important
•constraint upon the firms is the nature of the product they deal in.
They cannot easily plan in advance and their policy cannot be designed
on a once-and-for-all basis because there are often unexpected
fluctuations in production which influence the export price. In my
experience the longest time these firms can effectively plan ahead is
three to four months.
A specific relationship between the firm and the market can be seen
as an exchange process whereby the firm faces several different problem
situations, carries through certain activities, monitors reactions in
several ways from customers, distributors and competitors, adapts its
activities and then reacts again. (53) During this process of
"muddling through" the firm's approach towards the market develops. As
538

Sample Firms 1985/86 1986/87 1987/88 1988/89
Eleourgia Messenias 100 -44 32.5 78.6Plemmenou Bros. 75 84.7 58.9 N.A1Kefalea Bros. 100 100 96.3 N.AYefteas Andreas 91.1 95.7 87.1 N.AEleourgiki 46 45 50 N.AKalogeropoulos & Sons 92 90 85 N.AVraka Bros. 95 90 100 N.AEleourgia Kalamatas - 5 N.AGeorgiki Viomihania 100 100 20 N.AKoutelas 85 90 N.AC.C.U.M 20 60 N.AOlive Cooperative 20 14 10 N.AGargalianoi
far as the international market is concerned there are many different
kinds.of subprocesses, which are all interrelated. Changes in one may
well cause change in all the others. Four of these processes as
substantiated in the literature were used with reference to the sample
of firms surveyed. (54)
The first process is the perception of the export market for olive
oil and olives. This perception is partly based, on earlier experience
and upon the knowledge of the existing social environment. Table 8.14
presents the percentage of total sales exported by the sample firms.
Table 8.14: Percentage of Total Sales Exported by the Sample Firms1985-1988.
Notes: N A — Not available
Source: Company Confidential Records and Interviews, 1988.
We may observe that a majority of firms in the sample are export
oriented and their export share can comprise between 80-100% of their
total sales. Italy is (and has for a long time been) a very important
539

area for Greek olive exports (see Table 8.15). In recent years Italy
has imported 80-90% of Greek olive exports (by value). In 1983 the
exact figure was 81.2%, in 1984 88.5%, in 1985 88.1% and in 1986 94%.
All the other markets except France and Cyprus (which have absorbed up
to 7% of the total export value) have been - and still remain
marginal. So, the frame within which the Greek firms operate is a
virtual monopsony. Therefore, if we assume the perceived importance of
different markets is related to the sales volume of the companies, it
is the Italian market and the domestic market which have the highest
priorities.. Then follows, France, Cyprus, U.S.A, Canada, Britain and
lastly Africa. If we allow this information to be complemented by the
comments given during my interviews, this ranking also appears to be
consistent. (55) Italy is given the highest priority. This can be
explained by the fact that perceptions are influenced not only by
experience by also by expectations. There is however, a clear
variation among the different firms. The reason is that the perceived
market potential of individuals firms is not only dependent on the size
of the total market, but also on the competitive situation and on the
structure and characteristics of the purchasing side.
The second process is supplier-customer relationships. The
interaction between sellers and customers in export markets develops
into relationships over time. Generally one could characterise such
relationships in quantitative and qualitative ways. The quantitative
dimension applies to the volume dependence between the two sides, while
the qualitative dimension concerns the function that each party accords
the other. The quantitative dimension can be detected by seeing how
540

customers use a certain supplier as a main source and in this way some
of the customers evolve into comprising the seller's main outlet. Let
us first look at it from the selling firm's point of view by
determining the importance of individual export markets. For our
sample we have tried to discover the relative importance of customer
relationships by calculating the share of sales accounted for by the
buyers. The figures are presented in Table 8.16.
Table 8.16: Percentage of Sample Firms' Exports to Italy, 1985-1989.
Sample Firms 1985/86 1986/87 1987/88 1988/89
Eleourgia Messenias 100 100 100 100Plemmenou Bros. 73 66 80Kefalea Bros. 50 70 65Yefteas Andreas 70 85 69Eleourgiki 10 30 57.2Kalogeropoulos & Sons 28 -50 60Vraka Bros. None None NoneEleourgia Kalamatas NoneGeorgiki Viomihania 100 100 100Koutelas 100 100C.C.U.M 100 100Olive Cooperative 100 100 100Gargalianoi
Source: Confidential Company Records and Interviews, 1988.
We observe that for those olive firms which are mainly exporters
beyond 94 doubt the largest market is Italy. If the relationship nowis looked at from the buying firms' point of view, on a national level
we can deduce from Table 8.17 that Italy has never imported more than
30% of her imports from Greece. So, it seems reasonable to assume that
in Italy there are many examples where the Greek olive firms and

especially the sample ones, are not more than marginal suppliers.(56)
Therefore the trade between Greece and Italy has something of an in-
built inequality of exchange process. In this type of dependency the
buyer has a very large need in relation to the supplier's capacity,
since it takes the greater part of the supplier's sales yet still
purchase its main volume from elsewhere.
The qualitative dimension in this relationship relates to the
function the partners play in each others business. This can be seen
from two points of view: the customer's and the supplier's
perspectives. Italy as the key customer for Greek olive-oil can
dictate to Greek suppliers. For example, it prefers to import
unpackage virgin olive-oil because then it can blend it with its own
production, package it and receive the consumption aid offered by the
EEC. Even when it imports packaged olive-oil its acts as a price
setter since it will usually buy at cost price (plus some mark up plus
of course transport expenses). As entrepreneurs in the sample firms
indicated representatives of the Italian firms visit frequently the
areas where Greek firms operate in order to personally estimate the
cost price and, on this basis make an offer to the suppliers. In other
words it is the (largest) customers who choose the rules of the
exchange. Buyers also take advantage of their strong bilateral
position through a variety of other means. But this can also work to
the benefit of the sellers too. Thus there are indications that
sellers try to gain ideas of how to improve their own production and
distribution. For example modern equipment used in the 'second stage
processing of olive-oil to be found in the sample firms actually
542

originated (i.e was imported) from Italy. Also the way Italian firms
operate has given their Greek suppliers several ideas about how to
improve their international marketing performance.
The third process is that of channel organisation. This is the
attempt of firms acting either alone or together with some external
unit, to facilitate the interaction process in several possible
directions. As the Italian market is generally considered to be an
unsafe place for independent business dealings, the firms - even the
larger ones like Eleourgiki and Kefalea Bros. - do not wish to commit
resources to set up their own sales organisations. (57) So the firms
trade either directly with the customer or they use an agent. The
agent may be particularly strong in a certain region or have an
extensive distribution network covering the target customers.
Regardless of whether a firm has some form of representation in the
foreign market or not (via an agent or an office), it seems important
for the firm itself to possess knowledge and experience of the market
in order to derive maximum benefit in its dealings.
The fourth process concerns the Greek olive firms' experience and
knowledge of export markets. This is a factor which should improve
through time and as a result of natural and continuous exposure to the
market in question. It seems reasonable to suppose that a firm's
behaviour in a market is very dependent upon the knowledge and
experience it has managed to accumulate.
543

We may conclude with the observation that the Greek olive export
firms, at least those in Messenia, are highly dependent on the demand
from the Italian market. This suggests that the buyer - supplier
relationship is an unequal one. The Greek supplier finds himself
subordinate to Italian needs. The obvious way to remedy this situation
is diversification through a campaign to promote olive-oil to the rich
markets of Western Europe, U.S.A and Canada. But this itself raises
many issues and questions which I will now try to address.
8.5 National. EEC and International Marketing of Olive Productsand Seed-Oils
8.5.1 Olive-Oil
Until the accession to the EEC, Greece's exports of olive-oil
ranged from 8,000 - 12,000 tonnes a year except for 1978 and 1979 when
they increased significantly (to reach 52,000 and 23,000 tonnes
respectively). Another exception was 1977 when exports touched their
lowest level of the decade. Table 8.18 presents Greek exports during
the'period 1975-1986. We may observe that since 1981, exports of olive
oil display a marked improvement compared with that of previous years.
Record levels were achieved in 1983 and 1984 when 147,500 and 108,500
tonnes were exported. This unprecedented increase was due to the
increased demand from Italy where bad weather conditions destroyed
olive production. (58)
Apart from Italy other markets in order of significance include,
France, the Soviet Union, Cyprus, U.S.A, Canada and Egypt. In 1985
544

certain national measures were implemented aimed at encouraging the
export of packaged olive-oil so that the EEC consumption aid could be
received by the packers. (59) But in fact these measures affected
exports in a negative way since the largest part of export demand is
unpackaged olive-oil from Italy. In 1986 when restrictions on exports
were lifted, we observe an increase to 66,730 tonnes of packaged and
unpackaged olive-oil i.e. an increase of 24.4% compared with the
previous year. In 1987, exports did not rise since bad weather
conditions destroyed a large part of the crop (about 27%), as well as
part of the olive trees. (60) As a result, domestic olive-oil stocks
had to absorb a substantial proportion of production instead of
exports. For the first time since Greece's accession to the EEC, as of
the 1/7/1987 negative Monetary Compensation Amounts (MCAs) were
Imposed by the Community which acted as a subsidy on the import of
olive-oil into Greece and as a flat tax rate on exports.(61)
The negative MCAs are calculated by multiplying the product of the
intervention price (expressed in ECU) and the green rate of exchange of
the national currency, by the percentage difference between the green
rate of exchange (of the drachma) and the flexible exchange rate
between the drachma and the ECU. According to tax classification and
type of packaging the negative MCAs in the olive oil market in the last
week of June 1987 are summarised in Table 8.19.
545

Tax Classification Unpackagedl Olive-Oilor in Packaging over5 it
Packaged Olive-Oil inContainers up to 5 it
Table 8.19: Negative Monetary Compensation Amounts on Olive-Oil Exports(in dr/kgr)
1507 Al a2 -99.40 -60.36
1507 AIb2 -94.19 -55.14
1507 AIIa3 -97.96 -58.91
1507 AIIb3 -47.52 - 8.47
Notes: 1. The amounts presented are not constant but changeaccording to the difference between the green andflexible rate of exchange between the dr and ECUduring the period of export or import of olive-oil.
2. Refers to virgin olive-oil
3. Refers to refined olive-oil
Source: Ministry of Trade and Commerce, 1988.
The negative MCAs are implemented on exports in intra-Community as
well as inter-Community trade. But let us examine what the situation
is as far as consumption of olive-oil is concerned in the EEC
countries. First of all and not surprisingly the chief consumer
countries are the olive oil producers themselves. Tables 8.20 presents
consumption per capita in 1988 in the EEC. It is apparent that EEC-
north countries have a negligible consumption per capita.
54.6

Countries
Italy
EEC -North'
Greece
EEC-10
Spain
Portugal
EEC-12
Per Capita Consumption
8.8
0.1
20.0
2.6
10.0
4.8
3.5
Table 8.20: The Consumption of Olive-Oil per Capita in the EEC 1988
Note:
(In kgs)
1. EEC of eight apart from Greece and Italy.
Source: Eleourgiki, Department of Marketing, 1988
According to the available information, per capita consumption of those
countries in oils and fats is 26.2 kgr. Within this figure the
contribution of olive-oil is 0.1 kgr; oil seed-oils 12.7 kgr, butter
6.3 kgr; while margarine and other animal fats contribute 7.1 kgr. In
Italy per capita consumption of oils and fats consists of 12.6 kgr oil
seed-oils, 1.7 kgr butter, 2.2 kgr margarine and 8.8 kgr olive-oil, a
total of 25.3 kgr. In Spain, the total per capita consumption in oils
and fats is 21.6 kgr, oil seed-oils 10.1 Kgr, butter 0.3 kgr, margarine
1.2 kgr and olive oil 10 kgr. Greece, on the other hand, has the
highest level of per capita consumption in olive-oil at 20.0 kgr, then
5.2 kgr in oil seed-oils, 0.6 kgr in butter and 1.7 kgr in margarine
and other animal fats thus yielding a total of 27.5 kgr.(62)
547

Table 8.21 shows consumption of olive-oil in the EEC and other
countries for the period 1975/76 to 1984/85 according to information
proved by the I00C. We may observe a small but steady increase in
consumption for all countries. The EEC-10 group consumed 932.3
thousand tonnes in 1984/85 which, compared with their 1975/76 level of
consumption, shows a 56.1% change over a period of only ten years.
Over the last three years however, (i.e. 1987 - 1989), consumption has
tended to stabilise at 930 thousand tonnes a year. (63) It is also
apparent that Spain has increased its consumption from 278.2 thousand -
tonnes in 1975/76 to 365 thousand tonnes in 1981/82 and 1982/83 even
though this was followed by a small reduction in 1984 and 1985. World
consumption also rose to 1,710.1 thousand tonnes in 1984/85 compared
with 1,280 thousand tonnes in 1975/76 i.e. an increase of 33.6% over
the decade.
A significant reduction however, can be observed in Turkey's
consumption, since from 100 thousand tonnes in 1978/79, the amount fell
to 60 thousand tonnes in 1984/85 following a decreasing trend in the
years in between. (64) Table 8.22 presents intra-EEC trade as well as
trade between EEC and non-member countries.
Table 8.22: Imports and Exports of Olive-Oil in the EEC-10, 1983-85(In tonnes and '000 ECU)
Years Intra EEC Trade Imports of EEC-10 Exports of EEC-10Quantity Value Quantity Value Quantity Value
1983 128,241 282,480 82,673 118,616 45,502 87,3391984 115,281 242,905 52,353 73,075 47,980 101,1371985 57,751 135,275 294.,754 294,754 70,620 137,340
Source: Eurostat, Imports-Exports, 1983, 1984, 1985
548

Out of the three olive producer countries in the EEC-12, Greece and
Spain are the net exporters and therefore the main suppliers to the
other member States and especially to Italy (which is the main importer
and consumer member State) France and Portugal. We can see from Table
8.22 that in 1985 trade suffered a significant reduction compared with
that of 1983 and this was because Greece limited its exports of olive-
oil that year. The EEC has been the largest importer of olive-oil in
the World. After Greece's accession though imports were reduced by
half. After the accession of Spain and Portugal imports were further
limited to quantities coming in from Tunisia - largely thanks to the
special measures taken by the EEC-Council to perpetuate exports of that
country to the Community. (65) On the other hand, the export by the EEC
to third counties is increasing continuously. Before 1981, the average
exports were about 17,000 tonnes. After Greece's accession EEC exports
increased to 45,500 tonnes in 1983, 48,000 tonnes in 1984 and 70,600 in
1985. At present EEC-12 exports exceed 130,000 tonnes. Table 8.23
presents the trade balance of olive-oil in the European Community.
Table: 8.23 Trade Balance of Olive-Oil in the EEC, Average of 1975/76-1984/85. (In thousand tonnes)
EEC-10 Spain and Portugal EEC-12
Production 711 492 1203Imports 137 3 140Quantity Availablel 848 495 1343Consumption 780 370 1150Exports 79 78 157Demand2 859 448 1307Production - Demand -148 + 44 - 104Change in Stocks3 - 11 + 47 + 36
Notes: 1. Quantity Available — Production + Imports2. Consumption + Exports3. Change in Stock — Available - Demand
Source: Eleourgiki, Department of Marketing, 1988
549

We can see that demand for olive-oil in the EEC-10 was in excess of
production during this period. The difference was covered by imports
from Tunisia, Morocco and one or two other counties. In the EEC-12
however, during the same period we observe that supply exceeded demand
(i.e. there was a positive change in stock levels). All this
represented the situation until 31/12/1985. After the accession of
Spain and Portugal the positive picture tends to change significantly
for the following reasons. First, it is reasonable to assume that
Spanish production will increase since producer prices will rise by 70%
in the adjustment period until they are set equal to the EEC level.
Also, on the demand side, we will see important changes. It seems
likely that the Spanish consumer will probably start to desert olive-
oil and consume more oil seed-oils instead since the price of olive oil
will inevitably increase despite the consumption aid, and therefore the
price relationship will further encourage Spanish consumption of oil
seed-oils which is already considerable. Another factor contributing
to this increase will be the abolition of the national protection
scheme for olive oil. Similar changes tend to appear in the Greek
market for olive-oil. The only ways such forces can be neutralised is
through structural increase in the consumption of olive-oil by the
north European countries, or an increase in EEC exports to third
countries. Both measures do not at present look promising.
550

8.5.2 Table Olives and Olive Residue Oil
Over the period 1981-1986 (and in previous years too) Greece did
not import olives of any type or category. Exports account for more
than half (52%) of the total production Main countries which import
Greek table olives are Italy, Rumania, Boulgaria, U.S.A, Yugoslavia,
Lybia, Saudi Arabia, Canada and Egypt. Table 8.24 presents table olive
exports during 1981-1986.
Table 8.24: Greek Exports of Table Olives over 1981-1986.(Quantity in tonnes, Value in '000 dr, current prices)
Year Quantity Value
1981 35,414 2,427,2071982 39,826 3,272,6121983 39,782 3,803,8101984 37,738 4,269,8341985 48,465 6,747,7561986 59,615 9,561,157
Average of 6 - years 43,473
Source: N.S.S.G, Exports - Imports, 1981-1986.
We observe that there has been an increase in the volume of exports for
the last two reported years 1985 and 1986, while the average of the 6-
year period is 43,473 tonnes. In 1985 exports increase by 28.4%
compared with the previous year, while in 1986 they further increased
by 23% compared with 1985. Table 8.25 shows the prices F.O.B for the
three main types of table olives. All categories and types of green
table olives, the black Conservolia type and the black Kalamon type
are in demand. Also, the black Kalamon olives are sold at premium
551

prices because • they are considered as the luxury type. To encourage
exports, subsidies on top of the F.0.13 price are given. Table 8.26
presents the national subsidies valid until 31/12/1986 and those
applied since 1/1/1987 according to the type of the olive and the size
of packaging. Apart from these subsidies until 31/12/1986 exporters of
table olives received 5.5% return on the stamp duty and another 3% when
the foreign currency was received. Since 1/1/1987, the respective
amounts became 1.52% on the stamp duty and 3% with the arrival of the
foreign currency. In 1988, the return on the stamp duty was set at
1,216 dr while the subsidy for importing foreign currency in the
country was abolished. (65) All this happens in the context of the
gradual abolition of the national price support scheme due to be
completed in 1990.
World consumption of table olives between 1981/82-1984/85 was
730,000 tonnes,. The EEC-10 consumed 21.4% of this but since the
accession of Spain and Portugal, the EEC-12 consumes about 33.5% of the
total world consumption of table olives. The U.S.A. consumes 15.7%,
Turkey 15.1%, Roumania 2.2% and Algeria 0.7% of the total amount
consumed worldwide. (66) Table 8.27 presents annual consumption per
capita of table olives in the most important consumer markets.
552

Table 8.27: Annual Consumption of Table Olives Per Capita (in Kgs)
Countries Consumption Countries Consumption
Italy 1.7 Argentina 0.5France 0.4 Roumania 0.3Greece 3.0 Boulgaria 1.1West Germany 0.07 Turkey 3.4Spain 1.2 Morocco 0.7Portugal 1.9 Syria 4.0U.S.A 0.4 Egypt 0.2Canada 0.4 Lebanon 4.0Brazil 0.2
Source: A.B.G, Department of Vegetable Production, 1986.
Consumption obviously does not coincide with incomes per head in the
particular country. It depends more upon custom, since in some
countries it is consumed as a basic dietary complement (Mediterranean
countries, Arabia, Middle East) while in others, it is used as a
starter (U.S.A. France, Canada, Germany). In a few countries it is not
consumed at all (China, India, Japan). Table 8.28 shows consumption
for the EEC-10 and EEC-12 over the period 1981/82 - 1984/85.
Consumption in the EEC has remained almost constant since the changes
in the years between are rather negligible. Italy, the largest
consumer of table olives in Europe, makes up 37.3% of the total EEC-12
consumption (average 1981/82 - 1984/85) while it produces 18.3% of the
total EEC-12 production. France also consumes 11.1% of the total while
producing 0.5% of total production. Finally, Greece consumes 10.7% of
EEC-12 consumption and produces 24.4% of the total EEC-12 production.
On the other hand, the EEC-10 imports of table olives over the period
1981/82 - 1984/85 were 68.3 thousand tonnes, and exports were 55.6
553

thousand tonnes (see Table 8.5). Main importer countries of the
European Community members are France (50% of total imports), Italy,
Germany, Great Britain and Belgium. Imports for the EEC-12 were 68.3
thousand tonnes while exports were 158.9 thousand tonnes. The major
exporter countries are Spain and Greece. They sell to the U.S.A,
Brazil, Canada, Bulgaria and Rumania. The small rise in the last few
years-of total world consumption resulted in an increase in exports
from the EEC-12. It appears that population increases, improvements in
the standard of living and effective marketing of table olives as well
as the dual use of the product as a basic dietary complement or a
luxury, are the factors contributing to the observed changes in demand.
The other important product of the olive industry is olive residue
oil which, unlike table olives, is under the Common Organisation of the
EEC market for oils and fats. According to the Council of Agricultural
Ministers' decision of 1/7/1987, negative MCAs had to be imposed on the
export of olive residue oil from 7/9/1987. (67) The system of negative
MCA operates exactly the same way as for the olive-oil. Table 8.29
presents negative MCAs based on the currency exchange rate of the last
week of June and according to tax classification and packing size.
554

Tax Classification Description NMCAs
1.1npackaged
NMCAs Packaged
Table 8.29: Negative MCAs on Olive Residue Oil from 7/9/1987(In dr/kgr)
1507 AIc Pure Olive Residue -39.60 -0.55Oil
1507 aIIb Blend of OliveResidue - Oil and -47.52 -8.47Virgin Olive-Oil
Source: Ministry of Agriculture, YDAGEP, 1988
The amounts shown are not constant but vary according to the currency
exchange rate at the date of import or export of the product.
Concerning imports from third countries into the EEC, the amounts paid
are the same as those in the case of packaged olive residue oil
Independently of the import packaging (i.e. less or over 5 lt). Table
8.30 presents exports of olive residue oil during 1976-1986.
* Table 8.30: Exports of Olive Residue Oil during 1976-1986
Year Quantity Value Year Quantity Value
1976 4,635 0.15 1981 4,751 196.311977 1,586 36.97 1982 7,861 406.471978 2,779 56.75 1983 26,152 1,857.371979 4,272 102.80 1984 26,771 2,285.341980 1,645 44.61 1985 16,457 1,675.39
1986 47,389 6,331.35
Notes: In Current Prices
Source: N.S.S.G, Exports-Imports, 1976-1986
555

We may observe that until 1982 exports moved at modest levels,
averaging over the 7-year period only 3,900 tonnes. Since 1982
however, exports have showed a marked improvement and reached 47,400
tonnes in 1986, which is record high for Greek exports in that
particular product. In 1985 exports fell compared with the two
previous years, but this was the only year of exception. The largest
part of Greek exports was absorbed by EEC member States (about 80%
mainly by Italy). Other important markets for Greek exports outside
the EEC are the Arabic counties which absorbed the total volume of
exports in 1978 and 1980, and the COMECON countries - with Yugoslavia
figuring to a smaller extent. (68)
The largest part of exported olive residue oil concerns unrefined
(rather than refined) oil. During the period 1981-1986 the ratio
between exports of refined and unrefined can be deduced from Table
8.31. Until 1986, imports were non-existent and domestic consumption
was covered exclusively by domestic production 1981-86.
Table 8.31: Exports of Refined and Unrefined Olive Residue Oil(In tonnes)
Years Unrefined Refined Total
1981 2,966 62.4 1,785 37.6 4,7511982 4,533 57.7 3,328 42.3 7,8611983 17,605 67.3 8,547 32.7 26,1521984 22,547 84.2 4,224 15.8 26,7711985 15,856 96.3 601 3.7 16,4571986 43,338 91.4 4,051 8.6 47,389
Source:
N.S.S.G, Exports - Imports, 1981-1986.

Italy is the largest EEC market. The main supplier to both Italy
and the other EEC member countries is Greece. But as Italy demands
unrefined olive residue oil, it deprives the sector of a significant
amount of value added which could be gained with the refining. Imports
from third countries have increased in 1985 compared with 1983 by as
much as 88.8%. Main supplier countries were Spain and Tunisia. (69)
Table 8.32 presents the trade balance of olive residue oil in the EEC-
10 over 1983-85.
Table 8.32: Trade Balance of Olive Residue Oil in EEC-10, 1983-1985(In tonnes & million drl)
Years Intra EEC Trade Imports of EEC-10 Exports of EEC-10Quantity Value Quantity Value Quantity Value
1983 31,138 35,613 3,201 8,211 9,593 7,9791984 26,854 30,100 5,914 4,007 28,524 22,1091985 26,152 31,110 6,045 5,261 12,291 13,041
Notes:
1. In Current Prices
Source: Eurostat, Imports-Exports 1983, 1984, 1985
We can see that exports to third countries increased in 1984 by 197.3%
compared with 1983, a reduction followed in 1985, but generally exports
remained at levels higher than those of 1983. After accession of Spain
and Portugal the EEC-12 cover about 95% of total world olive residue
oil production (i.e. about 100,000 tonnes), and consume around 85% of
world consumption. Italy is the largest producer with an annual average
production of 40,000 tonnes. It consumes well in excess of that amount
mainly as a blend of refined olive residue oil and virgin olive-oil.
Standing second in both production and consumption is Spain. Its
557

annual average production is 35,000 tonnes and she consumes on average
28,000 tonnes p.a. Greece follows as a producer country. (70) Until
1987, the blend of olive residue oil and virgin olive oil was not
available in the Greek domestic market in order to protect olive-oil
consumption. From the Spring of 1987 though all restrictions were
lifted. (71) It therefore appears that olive residue oil might well
become another substitute for olive-oil. Until today the product has
been virtually ignored by the Greek consumers.
8.5.3 Oil Seed-Oils
Finally, the trade in the oil seed-oils sector will be considered
as any change occurring in this area is likely to influence the future
pattern of consumption for olive oil. At present the domestic
production of oil-seeds is insufficient to cover the needs for
processing and production of oil seed-oils. In 1983/84, it was
estimated that out of the total quantity of oil-seeds processed in
Greek units, 38.9% was domestically produced and 61.1% imported.(72)
'Table 8.33 shows imports of soya-seed, cotton-seed, sunflower, sesame
and linen-seed between 1982-1986. In Greece soya is not produced,
therefore all quantity required for processing is imported. The
Ministry of Commerce, in order to protect the consumer from
adulteration, made the addition of sesame oil by 2.5-5% in all oil
seed-oils compulsory. Therefore, pure sesame oil is not available but
only as a small percentage in all seed oils marketed. In this manner
the State control agencies can easily detect any adulterations.(73)
558

Countries 1982 1983 1984 1985 1986
EEC-12 88.0 40.4 49.2 95.3 5,128.8
Third Countries 137,541 193,085 66,971 179,692 191,874
Total 137,629 193,125 67,020 179,787 197,003
According to information presented in Table 8.34, in 1986 Greece
imported from EEC countries only 2.6% of its needs.
Table 8.34: Suppliers of Greek Oil Seed Imports during 1982-1986
Source:
Derived from N.S.S.G Statistics, 1982-1986
We may observe that he main bulk of Greece's imports made up of soya
seed imports from the U.S.A and rather smaller amounts from other
countries such as Honduras and Lebanon. Also, linen seed is not
processed for linen seed oil but for industrial usage or as an animal
feed. Imports of oil seed-oils in Greece over 1982-1986 are presented
in Table 8.35. Since April 1986 imports of oil seed oils are not
restricted as in previous years, so the most important measure for the
protection of olive-oil has been abolished. Therefore, as Table 8.35
suggests the import of oil seed oils was negligible until 1984. In
1985 though imports doubled compared with 1984 and in 1986 tripled
compared with 1985. The largest increase is observed in corn seed oil
and sunflower oil. Imports mainly include unrefined products which are
then processed, refined and packaged in the Greek manufacturing plants.
Table 8.36 shows that the largest volume of oil seed oils imports comes
from EEC member States - in contrast with oil seed imports. This is
559
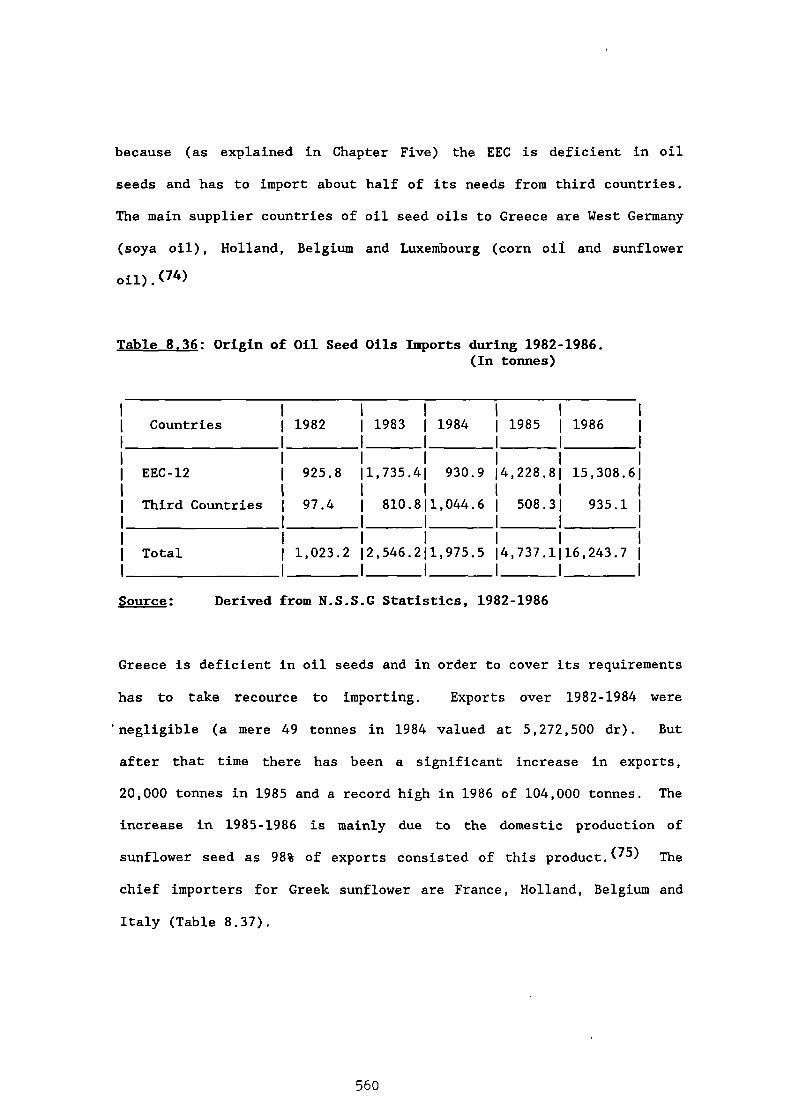
because (as explained in Chapter Five) the EEC is deficient in oil
seeds and has to import about half of its needs from third countries.
The main supplier countries of oil seed oils to Greece are West Germany
(soya oil), Holland, Belgium and Luxembourg (corn oil and sunflower
oil) (74)
Table 8.36: Origin of Oil Seed Oils Imports during 1982-1986.(In tonnes)
Countries 1982 1983 1984 1985 1986
EEC-12 925.8 1,735.4 930.9 4,228.8 15,308.6
Third Countries 97.4 810.8 1,044.6 508.3 935.1
Total 1,023.2 2,546.2 1,975.5 4,737.1 16,243.7
Source:
Derived from N.S.S.G Statistics, 1982-1986
Greece is deficient in oil seeds and in order to cover its requirements
has to take recource to importing. Exports over 1982-1984 were
'negligible (a mere 49 tonnes in 1984 valued at 5,272,500 dr). But
after that time there has been a significant increase in exports,
20,000 tonnes in 1985 and a record high in 1986 of 104,000 tonnes. The
increase in 1985-1986 is mainly due to the domestic production of
sunflower seed as 98% of exports consisted of this product. (75) The
chief importers for Greek sunflower are France, Holland, Belgium and
Italy (Table 8.37).
560

Soya oil is the main seed oil exported by Greece, while sunflower
oil and cotton oil are also exported but in far smaller quantities.
Table 8.38 presents Greek exports of seed oils over 1982-1986. We may
observe that there is an increasing trend in the exports over 1982-1986
with the exception of 1985 when quantities exported were reduced
compared with those of 1984. The largest market for Greek seed oils
(soya oil) is provided by non-EEC countries - mainly Cyprus which
absorbs 30%, followed by Egypt, Syria, Turkey and Yugoslavia. According
to a Commission report in 1986, the EEC currently satisfies less than
half of its requirements in seed oils. The ratio of self sufficiency
in 1985 was about 47% as far as oils were concerned (apart from olive-
oil). In 1985 the EEC imported more than 3 million tonnes of oils.
Its policy therefore, is to encourage domestic production of seed oils.
A system of subsidies is adopted by the EEC for some of the oil seed
oils. (76) This consists of production aid and a guaranteed return on
exports. For example, the average subsidy on vegetable seed for
1985/86 was 25.4 ECU/100 kgr and the return on exports ranged from 9 to
27 ECU/100 kgr. The average production aid for sunflower was 34.96
'ECU/100 kgr. No return on exports were allowed since EEC is deficient
in this particular oil seed. Production Aid for soya was, on average,
35.89 ECU/100 kgr.
The administrative arrangement for the determination of prices is
conducted in the following manner. At the start of each marketing year
an estimate is made of the harvest. Production Aid, the return on
exports and the intervention prices are set using the relationship
between the estimated production and the maximum of guaranteed quantity
561

the Community will pay production aid for, as a basis. The estimated
production of vegetable seed in 1986/87 was less than this maximum and
therefore the subsidy level was not reduced; while the estimated
production of sunflower for the same year exceeded the maximum quantity
guaranteed. As a result the subsidy was reduced by 2,918 ECU/100 kgs.
EAGGF's expenditure on sunflower seed and vegetable seed was 982.8
million ECU in 1985, and increase of 60% compared with that of 1984.
In 1986 expenditure was 1,549 million ECU. For soya seeds: expenditure
amounted to 115.5 million ECU in 1985 compared with 32.8 million in
1984. In 1986 it increased further to 141 million ECU. (77)
Soya oil stands first in per capita consumption of the EEC member
States with 3.9 kgr, while sunflower is second with 2.1 kgr. Table
8.39 presents the quantities of oils consumed in the ECC-10 and EEC-12
by category, proportion of each category to the total of oils, as well
as consumption per capita for each of the categories of oils. We can
see that the consumption of oil seed oils is the highest in total oils
consumption of the EEC member States. Even in the southern countries
'where olive-oil is produced, oil seed oils consumption still stands in
first position. The exception here is Greece where olive-oil retains,
at least up to now, first place in consumer preferences. (78) The
trade balance of oils in thousand ECU is presented in Table 8.40 for
the period 1983-1985. Soya oil and vegetable oil are the main exported
oils (38.1% and 44.3% of total exports in 1985). The increase in
vegetable oil exports in 1985 is 101.4% compared with that of 1983,
while the export of soya oil has kept constant. An increase in other
oils' exports can also be observed and is to be mainly found in
562

sunflower oil and cotton oil - where exports of the former were tripled
and exports of the latter increased by no less than 12 times in 1985
compared with those of 1983. Imports concern sunflower oil : in 1985
they made up 52.7% of total imported oils and represented 46.9% of
their value.
We can also observe (Table 8.40) that the total trade balance of
oils in the EEC is positive and increasing. However, this is mainly
due to the export of soya and vegetable oils. All other imports of
oils exceed their exports from the Community. We may conclude that
since 1981 Greece has made an increasing contribution to inter and
intra - EEC trade developments in seed-oils. This state of affairs
seems destined to have a deleterious effect on the domestic olive-oil
market if an effective national campaign to promote olive-oil is not
undertaken soon.
Conclusions
Given the structural shifts taking place in the second stage
processing of olive-oil which formed the basis of the previous
Chapter, I have tried to show here how these changes influenced - and
in turn were themselves affected by - new trends and tendencies in the .
marketing of olive-oil. Recent evidence suggests that while the
consumption of seed-oils has increased dramatically inside Greece,
that of olive-oil has experienced a downward pressure. Despite the
rising awareness of the importance of a healthy, balanced and
unprocessed diet - which would favour olive-oil above its new
563

competitors, it seems that only an energetic, sustained and imaginative
promotional campaign based on the particular hygienic properties of
unrefined virgin olive-oil (which currently accounts for over 80% of
Greece's annual production) will be able to reverse this pattern of
demand. Any improvement in the price ratio as between olive-oil and
seed-oils would facilitate such a strategy but this is not enough.
Broadcasting the undoubted virtues of olive-oil seems the only method
of penetrating the re 1 market in the northern European countries-
obviously a key target area. The main issue here is who should perform
9this task. Producer cooperatives would appear to be the logical
candidates to undertake such a role. This is because olive producers
themselves have the greatest incentive to sell the product and to
supplement their income, especially in those rural communities with few
alternative employment opportunities. For their part the big private
enterprises with their international links have found it more
profitable to be involved with seed-oils and the production of
margarine - now at the expense of olive-oil. In addition to the
cooperatives a supra-national institution seems also to be necessary.
The natural choice here is surely the I.O.O.0 which is well placed to
promote the sale of virgin olive-oil. (79) In 1976, the I.O.O.0 did in
fact launch an initiative after a significant research effort. A
number of specific promotional activities were conducted. The purpose
was to better inform consumers of the importance of using natural oils
in their daily diet, particularly virgin olive-oil. (80) Though some
ground was gained, in my view no real breakthrough was achieved. In
the final analysis unless the promoting agent reaches down to the mass
of individual consumers in the rich Western markets - starting must the
564

EEC, success will be elusive. Time is not on the side of the olive
interests and the producers and distributors of margarine and oil seed
oils (some of whom also retain a presence in olive-oil) are likely to
yield market share easily. Whilst a market niche for olive-oil will
surely remain intact - especially in the rural areas of Greece itself,
a question mark hangs over the long-term viability of this ancient
industry.
565

References
1. See J. Thompson, Organisation in Action, (New York, 1967).
2. For a general statement of such strategies see ibid, and P. Doust,Marketing Management - Planning and Control, (London, 1986).
3. See J Thompson, 1967, op.cit.
4. Information obtained from - the Department of Marketing ofEkleourgiki, 1988.
5. ibid.
6. Information obtained from the Ministry of Agriculture, Departmentof Information. Mr N. Sarros; Head of the Department put hisfigure, in an internal Ministerial Study which was completed in1987.
7. See K. Konstaninou, "International Marketing of Olive-Oil",Eleourgiki, • io. 8 May-June 1986.+
8. See P. Doust, Fundamentals of Marketing, (London, 1986).
9. Information obtained through discussion with Mr. A. Manatos, Headof the Marketing Department, Eleourgiki, 1988.
10. Information obtained in an interview with Mr. L. Melas, GeneralDirector, Elais, March 1988.
11. According to figures provided by the Ministry of Agriculture,YDAGEP, the three largest packing units, Elais, Minerva andEleourgiki account for over 50% of the packaged olive-oilproduction, March 1988.
12. Information obtained in an interview with Mr V Evagellou, Head ofAgrobusiness Department of A.B.G, 1989.
13. Ministry of Agriculture, Department of Information, 1988.
14. The information about the total oil-bank capacity of Eleourgikiwas obtained from Mr. A. Kiriakoulako, Head of the Department ofSupplies, Eleourgiki, 1988.
15. N.S.S.G, Monthly Statistical Bulletin, various years.+
16. Information obtained from the Ministry of Agriculture, E.Papamarkaki, Department of Marketing and Agrobusiness, 1988.
566

17. See EEC Reg. 1915/1987 and V Zambounis, Eleourgiki No. 12, 1987.
18. In Spain the average annual per capita consumption of olive-oil wasestimated at 11.8 kgr. In Italy it was estimated at 4.8 kgr whileseed-oils consumption was 0.9 kgr. Further, the Italian ExportOrganisation estimated that in the 1930s the average annual percapita consumption of olive-oil in Spain, Italy and Greece was 7.3kgr. See Economiki Epetirida, 1983, p.148, N.S.S.G.+
19. N.S.S.G, Economiki Epertirida, 1939, p.130.+
20. Information obtained from the Institute of Trade and Commerce inMessenia, Export Records, 1930-1940.
21. See N. Lihnos, The Olive Tree and its Cultivation, (Athens, 1949).+
22. N.S.S.G, Economikes Epetirides, 1931-1939.+
23. Oral evidence through discussion with Mr Y. Xiloyiannis, PASEGES,1988.
24. N. Lihnos, 1949, op.cit.
25. See P. S. Avdelidis, The Agricultural Cooperative Movement,(Athens, 1986).
26. Information obtained from Mr. Vasilopoulo, Head of the MarketingDepartment, Minerva, 1988.
27. Ministry of Agriculture, YDAGEP and Eleourgiki, Department ofMarketing figures, 1988.
28. Per capita consumption according to YDAGEP is much lower in non-olive producing areas like Macedonia and Thrace. Here I shouldpoint out that the figure for total domestic consumption refers toannual purchases of olive-oil. The large increase in per capitadomestic consumption therefore between 1939-1988, could be partlydue to high unrecorded self-consumption by the producers themselvesin the early years.
29. N.S.S.G, Monthly Statistical Bulletin, 1987, 1988.+
30. Eleourgiki, Department of Marketing and ABC, Department ofAgrobusiness, Summer 1988.
31. See V Evagellou, Th. Apostolakos and K. Veziri, Analysis ofDifferent Sectors of Agricultural Industries, (Athens, 1986).+
32. ibid.
33. Eleourgiki, Department of Marketing, information obtained in aninterview with Mr. A. Manatos, 1988.
566a

34. Eleourgiki, No.15, July 1988, p.18 and No.16, Nov. 1988 p.11.
35. Information on the aims and objectives of this system was obtainedfrom the Ministry of Agriculture, Information Department, (Mr N.Sarros), in 1988.
36. ibid.
37. In that report the Greek support system for table olives isdescribed and the Greek government's proposals are analysed. Thereport ends by asserting that the implementation of a common marketorganisation for table olives would result in:
(a) a significant EEC-12 budget expenditure of 100 million ECU;
(b) Technical difficulties in the market intervention for freshor processed olives;
(c) Problems of market stabilization through surplus disposalwith the possibility of destroying the produce;
(d) An intervention scheme would mean that Greek prices wouldbe higher than other producer member States.
In addition, the whole issue presented difficulties with regard toagreement with other EEC producer counties. Italy which wasespecially interested, Spain which is very well organised in thissector and France whose production is negligible compared to theothers, all played a part in these deliberations.
38. Eleourgiki, No.15, July 1988 p.20.
39. ibid, and V Evagellou et.al 1986, op.cit.
40. Information obtained from th Ministry of Agriculture, InformationDepartment, 1988.
41. See V Evagellou et.al , 1986, op.cit, p.61.
42. Information obtained from YDAGEP, 1988.
43. ibid.
44. Information and figures obtained from Ministry of Agriculture,YDAGEP, 1988.
45. ibid.
46. Information extracted from Sectoral Plan for Olive Products. 1987- 1992, Ministry of Agriculture, Jan. 1988.
567

47. Olive-Oil is the only oil which has to be extracted from the middlepart of the olive-fruit and it therefore has to bear a greaterproduction cost in comparison with the seed-oils. See G.Balatsouras, The Olive-Tree. (Athens, 1986). p.462.
48. I.O.O.C, Feuille D' Information, various issues.
49. Information received from the Ministry of Agriculture, Departmentof Information, Summer 1988.
50. Of course this is only an example, limited as it may be because ofthe short time period involved, but it shows how olive-oil priceincrease is passed on to the consumer despite the consumption aidpaid to the packers by the EEC.
51. H. Gravelle and R. Rees, Microeconomics, (London, 1981).
52. See W. A. Cohen, The Practice of Marketing Management, (New York,1988).
53. See P. M. Chisnall, Strategic Industrial Marketing, (U.K, 1989).
54. ibid, and H. Thorelli and H. Becker, International MarketingStrategy, (New York, 1984).
55. Interviews wit the sample firms of Messenia Province, Messenia,Summer 1988.
56. Here I should point out that although the sample firms are found tobe marginal suppliers to their Italian buyers, there might beItalian firms which are wholly dependent on Greek supplies.
57. Interviews with the sample firms of Messenia Province, Messenia,Summer 1988.
58. Information supplied by the Department of Marketing, Eleourgiki,1987, and Ministry of Agriculture, Department of Information, 1988.
59. By these measures the State hoped that Italians would reconsiderand buy packaged Greek olive-oil since export of unpackaged wasrestricted. This of course did not happen and the State lifted therestriction.
60. As mentioned earlier (Chapter Seven), the negative MCAs wereimplemented by the EEC in order to stop speculation because ofcurrency deviation between the green and the current exchange rate.Speculation based on these differences cost the E.A.G.G.Fconsiderable sums. Their implementation was also motivated by thewish to reduce the competitiveness of Greek oils (because of theirrelatively lower price) in the international markets.
61. Ministry of Agriculture, Department of Information, 1989.
568

62. I.O.O.C, Feuille D' Information, No. 620, 1/9/988.
63. See Table 8.21, I.O.O.C.
64. See EEC Reg. 3463/1987, Commission, L329/3 and EEC Reg. 814/1987and 3170/1987.
65. Ministry of Agriculture, Department of Information, 1988.
66. Eleourgiki, 1988, 1989, various issues.
67. There are two issues concerning the imposition of NMCAs. The firstconcerns the relationship between the green and the current valueof the ECU. The second concerns the process of decision makingi.e who decides the green value of the ECU for the nationalcurrency of each member State. The decision, as far as the secondissue is concerned, is made after a general assessment of theoverall economic situation of the particular member State is
completed. If a deflationary policy is followed in a country, thenthe green currency value is appreciated; if not, it is depreciated.EEC Regulations concerning NMCAs:
EEC Reg. 1677/85 (Modifications: 1889/87)EEC Reg. 3135/85 (Modifications: 590/86, 1442/87)EEC Reg. 1955/87, 1956/1987, 2391/87.
68. N.S.S.G, Imports-Exports, various years.+
69. ibid.
70. Eurostat, Agricultural Accounts, 1981-1988.
71. Ministry of Agriculture, Department of Information, 1988.
72. A.B.G, Department of Vegetable Production, 1988.
73. According to information •received from YDAGEP, this measure wasimplemented in April 1985.
74. N.S.S.G, Imports-Exports, 1981-1986.
75. ibid.
76. See K. Parris and C. Ritson, EEC Oil seed Products Sector and the• Common Agricultural Policy, (Kent, 1977) and Commission of theEuropean Communities, The Situation of the Agricultural Markets,1985-1989.
77. See Commission of the European Communities, The Situation of theAgricultural Markets, various issues.
78. Eleourgiki, No.16, Nov. 1988.

79. International Olive-Oil Council. In 1956 some olive producingcountries signed an agreement for cooperation on olive-oil tradeand research. In 1963, the member States of the I.O.O.0 signed along contract of 42 articles which specified the character of theOrganisation. It included definitions and distinction of thedifferent types and categories of olive-oil member States of theI.O.O.C. Today, apart from the EEC-12 countries, members of theI.O.O.0 are Algeria, Egypt, Yugoslavia, Libya, Morocco, Turkey andTunisia.
80. See C. Aravanis, "The Greek Islands Heart Study", Proceedings ofthe Third International Congress on the Biological Value of Olive-Oil. Hania, Crete and I.O.O.0 (eds), 8-12 September 1980. Alsosee G Christakis, M. Fordyce and Kurtz, "The Biological Aspects ofOlive-Oil", ibid, 1980.
570

Table 8.2: Exports of Creek Olive Oil by Country of Destination, 1932-
(In Metric Statiresl)
1939
Countries 1932 1933 1934 1935 1936 1937 1938 1939
Germany 2494 7282 576 11234 7636
Bulgaria 1495 816 772 569 392 49 903 951
France 8955 6229 783 2441 513 60 34541 26,680
Britain &Ireland 27816 36523 8868 7308 4901 2730 13769 23,222
Italy 206441 114014 24417 37567 20309 37291 51061 57,252
Rumania 1667 2133 1742 2732 1325 276 2313 2083
Russia 1961 2564 929 295
Argentina 9001 7656 6634 17963 30,980
Brazil 10717 9589 726 815 322
U.S.A. 10463 27658 2308 18046 17560 13566 63176 125,520
Palestine 3599 927 14 9
Syria 9638 32
Lybia 3083 2839 978 273 38
Egypt 12136 16638 11269 8832 3940 2559 4688 5,809
Other 6220 9937 13173 10554 6485 2840 4794 7437
Total 278,276 231,985 67,833 111,477 80,294 67,307 205257 289,486
Notes: 1. One metric Statira — 100 kgrs
Source: N.S.S.G, Economiki Epetirida, 1934, 1938, 1939.
571

co
bQ L>(1./ QJ
CL '0
> 1--1'ct 01
.1-4 V4.)
-C Ca. 04-) E
a)
1/40
1/40U")
1/40
oo
0 C00
0
C. 0 •.0 4.3
CD (/)
70 0
COu-N
ooco
cN 1/40
• Cu4-)
cu o
c1/4.1 •
01/40
c‘)
4-3 0• n••1
0 4-)00 z
L. cl) CVCO
Ca) 0
Cr)
0
(1) 0.)> CIO
00N")
CO
N-
C—
r)cIn1 •0 C
C \I oo
0
4.)0.e
Cu N-U
0 Cuc.)
CO CO1/40
C0I0
CD 4.J
•r-I
00
4-•0
• rn
ICu
-1-1
ICl)0cnalCC .-I CU)
O0.) al al 0 '017 0 £0 0.0 r-1a) asc..) s..
4-) a)
c a)o ca--
Cu4-3
0.0Ca .0 a) S. Ci) Ca 0EN 0C
572

Table 8.4: Consumption of Olives, 1981-1986
(In thousand tonnes)
Years Production Imports Exports ApparentlConsumption
1981 75.5 35.4 40.1
1982 97.1 39.8 57.3
1983 74.6 39.8 34.8
1984 88.0 37.7 50.3
1985 85.3 48.5 36.8
1986 80.0 59.6 20.4
Averageof
6 years 83.4 43.4 40.0
Notes: 1. During the last few years, the table olives kept inproducers' storage rooms were taken to the millsfor olive oil extraction because their quality hadbeen impaired. So consumption shown is onlyapparent in the sense that the above fact is nottaken into account.
Source: Ministry of Agriculture and N.S.S.G.
573

Table 8.5: World Trade Balance in Table Olives, Average of 1981/82-1984/85
(In thousand tonnes)
Countries Stocks A2 Production Imports Supply Consumption Exports Stocks B3
EEC - 101 66.6 149.7 68.3 284.6 156.6 55.6 72.5
EEC - 121 85.2 347.7 68.3 501.2 244.3 158.9 98.0
Tunisia 0.8 9.6 10.4 9.1 0.8 0.5
Morocco 2.2 47.5 49.7 17.2 29.3 3.2
Algeria 0.6 6.7 7.3 5.3 1.3 0.7
Turkey 34 107.5 141.5 110.6 7.1 23.8
U.S.A 23.8 70.2 46.9 140.9 114.3 1.9 24.7
Rumania 16.4 16.4 16.3 0.1
Other 16 161.9 77.2 255.1 212.6 24.3 18.2
Total4 162.6 751.1 208.8 729.7 223.7 169.1
Notes: 1. Intra EEC trade is included2. At the beginning of the period3. At the end of the period4. Self sufficiency of the World is 102.9%, of the EEC -10 is
95.7% and of the EEC - 12 is 142.3%.
Source: I.O.O.0
574

Table 8.6(a): Index of Wholesale Olives' Prices 1968-1983
Year Index (1970=100)
1968 100.851969 100.371970 1001971 98.381972 98.351973 109.571974 141.321975 149.171976 171.291977 226.381978 268.351979 292.941980 341.611981 405.631982 476.061983 504.07
(b) Comparison of the Producer Cost and Wholesale price Index
Year Wholesale Price Index(1970-100)
Producer Cost Index(1976-100)
1978 268.35 121.91979 292.94 146.41980 341.61 197.21981 405.63 243.41982 476.06 279.81983 504.07 349.1
' 1978-83 235.72 227.2
Source: N.S.S.G, Department of Prices, 1988.
575

Table 8.7: Intervention Prices to Olive Producers 1978/79 - 1986/87
(In dr/kgr)
Category 1978/79 1979/80 1980/81 1981/82 1982/83 1983/84 1984/85 1985/86 1986/87
Green 26 28 36 42 50 60.5 66 65 74
Black 32 36 41 50 60 71.5 84.5 80 91
Kalamon 36 42 50 63 85 94.5 102 105 120
Throumbes 26 28 34 43 50 60.5 80 85 92
Notes: 1. In Current Prices
Source: Eleourgiki, Department of Marketing 1988
576

1982/83 1983/84 1984/85 1985/86 1986/87 1987/88
Intervention PriceIn dr/kgr
Production Aid
77.09 86.02
8% on
94.71
top of olive
107.07
oil
108.79
production
115.57
aid
Consumption Aid Since Since Since Since Since SinceIn dr/100 kgr 6/5/82 1/11/82 1/11/84 16/3/85 21/5/86 1/11/87
829.4 1952 3770.89 2829.1 6330 10330
Since Since Since Since17/5/82843.7
21/11/832856.6 I
1/11/855046.6
1/11/869910.2
Table 8.8: EEC Prices for Olive Residue Oil 1982/83 - 1987/88
Source: Ministry of Agriculture, YDACEP, 1988.
577

Table 8.12: Data Used in Estimating the Greek Olive-Oil Demand Function,1958-1988
1Consumption P.D.Y2 Populationl R.0-0 Prices3
4R.S-0 Prices
106.3 105.748 8173.129 55.4 62.91124.4 107.789 8252.162 58.2 62.78126.7 112.144 8327.405 58.9 69.37123.3 124.825 8398.050 59.9 70.77157.8 130.218 8448.233 62.0 71.13129.9 141.941 8479.625 72.3 77.46135.9 155.251 8510.429 74.7 75.83140.9 171.094 8550.333 79.3 80.02146.7 182.171 8613.651 82.5 81.28148.6 192.496 8716.441 83.5 80.88153.1 203.809 8740.765 86.7 86.85165.0 221.332 8772.764 92.9 93.25185.8 240.023 8792.806 100.0 100.00182.3 267.289 8831.036 103.2 106.44177.0 288.887 8888.628 103.2 106.92185.9 322.477 8928.086 129.8 119.46182.0 301.575 8926.023 182.7 156.60181.0 320.728 9046.542 205.8 168.92180.4 337.100 9167.000 201.9 181.84186.4 792.090 9308.479 203.5 206.00190.0 947.199 9429.959 279.8 261.25201.7 1154.845 9548.300 326.9 281.15200.0 1390.332 9642.500 387.8 330.35205.6 1764.024 9729.400 403.8 376.36190.0 2159.825 9789.500- 468.9 376.56200.0 2528.591 9846.600 560.6 464.57190.0 3098.661 9895.800 740.4 548.97200.0 3844.099 9934.300 793.3 630.17190.0 4498.646 9965.800 896.8 635.29190.0 4827.732 9990.000 839.1 584.19200.0 5246.204 10030.000 881.4 601.99
Notes: 1. Consumption in thousand tonnes and Population inthousand.
2. Personal Disposable Income in th.dr current marketprices.
3. Retail Olive-Oil Prices with base 1970=1004. Retail Seed-Oils Prices with base 1970-100
Sources: N.S.S.G, National Accounts, Statistikes Epetirides and MonthlyStatistical Bulletin, various years.Ministry of Agriculture, Department of Information.0.E.C.D, Economic Indicators, various years.
578

Table 8.13: Results of the Greek Olive Oil Demand Fucntion, 1958-1988
Dependent Variable: LCt
LYt2 LPt3 LPSt3 LP0t4 LPS0t4 LCt _i TIME R2 D.W
1. 5.24 -0.09 -0.49 0.42 0.03 0.04 0.91 2.15(5.5)1 (-1.6) (-2.8) (2.1) (0.17) (4.4)
2. 4.86 -0.10 -0.50 0.44 0.04 0.91 2.10(11.8) (-1.9) (-3.3) (2.4) (8.5)
3. 5.07 -0.07 -0.31 0.45 0.03 0.92 2.3(32.8) (-1.7) (-1.7) (3.0) (5.1)
ependent Variable: L (C)t(N)t
L(X) t LPt LPSt LPOt LPSOt LCt_i TIME R2 D.W(N)t
1. -4.5 -0.11 -0.45 0.37 0.01 0.04 0.82 2.1(-5.0) (-1.9) (-2.6) (1.8) (0.07) (4.1)
2. -4.5 -0.11 -0.46 0.37 0.04 0.82 2.1(-7.9) (-2.2) (-3.0) (2.0) (7.7)
3. -5.3 -0.10 -0.3 0.42 0.03 0.83 2.2(-11.3) (-2.4) (-1.6) (2.8) (4.6)
Notes: 1. The numbers in parentheses are t-statistics.
2. Personal disposable income with base year 1970-100
3. Pt is the price of olive-oil and PSt is the priceof substitute seed-oils. Both series are expressedwith base year 1970-100.
4. Real olive-oil price, POt and real seed-oils pricePSOt i.e deflated by the Retail Price Index withbase 1970-100.
Source: N.S.S.G, National Accounts, Statistikes Epetirides, andMonthly Statistical Bulletin, various years.
Ministry of Agriculture, Department of Information.0.E.C.D, Economic Indicators, various years.

Table 8.15: Export Markets for Greek Olive Oil, 1968-1982(In tonnes)
. France Belgium &Luxemburg
Holland WestGermany
GreatBritain
Denmark Italy TotalEEC'
% ofEECinTotal
1968 4 4 96 33 31,707 31,844 91.61969 4 4 85 43 9,087 9,223 82.31970 3 - 103 43 72 221 6.81971 7 179 63 214 463 12.31972 2 1 2 157 60 3 7,900 8,125 85.61973 3 2 3 101 36 5 2,442 2,592 71.61974 215 2 2 56 41 1 1,115 1,432 25.51975 7 18 37 64 128 11 5,145 5,410 50.31976 452 6 25 30 182 8 9,575 10,278 80.51977 1 1 1 27 107 3 914 1,054 37.31978 1,031 14 5 64 293 9 47,127 48,543 93.41979 205 2 5 82 322 11 16,023 16,650 72.21980 10 8 8 76 400 9 5,397 5,908 56.11981 1,158 4 4 76 433 15 3,430 5,120 62.91982 15,665 11 37 107 423 13 8,737 24,993 74.3
Source: N.S.S.G, Exports-Imports, 1968-1982.
580

4s 4s h,tn --4 Lnco N) 4- tn
4s
P. Ps
co ch i-, 4.0 Ma-
• LA -.4 F. LA
r-,4- ch La 4% La 1.)• 4- 1.4 VD 4, NJ VDtn 4- ch CD VD F. LA 4,
CO CD L.) co tn ha co tn
I-, CO Ln LACA INa INa La I-. ND Ka
Lii La La t_n coha co - 0- LA to co c"NJ NJ
1-44' ch La LA h..'N0 La CD Ch CD NJ oa ChVD La ND V) 'V h. C) h. C) ND
• ,4 LA ,4 ,4 F. h. VD Co
▪ FJ• C) Ch LA NJ LA h.Ln La
ON.) LA vD h. 0O'Ln VD ND V) CN C) Ch co 4- Na- - . -CD ,4 Ch CO la) ln CA Co -4 Co
h. h.0 cn La h.
La LA CO VD La ',a NJ
▪
CoVD NJ CO VD CM vD tn 1-, 1-, co
CO -.4 h. Cp Ch ND Co 4,
F. F.CA Aa CO Ch La ch NJNJ Ch Ch Ch L4 Cm Na L.) CDCh Ln Lo VD ha Ch C) F.
CD C) cr. LA Ln LA na
-.4-4LA NJ
,4Cm La
*-4 cr.1-, co
• ChND V)
'0 0'
Co
•
-4O -4
Co COLO CD
Co CO4' h.
ND h.• 1.4 r, ha 1-,CD CD Ln LA ,4 1.4 C) ,v ch ch- co 1-,Co Ch . - va ch 4- A., CO
La LA
t‘a A-I F. F.;A LA NDLA La Lo -.I ch VD ha
- I• 0 en vD LA vD
3ach 4n 4s 4- ra F.CO VD Cm CA ND Co CD I
LA LA Cm cr. Ln
ha A-I Fa F"-4 4s 4, 4". Lo VDC) LA NJ Na Co La
•
V)
,4"- LA LO Lo ND VD
chco
,4 CmND Va
F4
hVC)PO1-3cn
ChCO
ChNJ VD
LA
•
N)
.4Ch Lo
'.0 0.'
CoCD -4
CO COLa 0
Co Co4' F.
al r4 Pi vi VI hy on sid c)0 01 DI C4 01 0 r rt
c) C) C) CI I1WPOMI-, 1 1 1 rr 1-, Met 1--A 1/40 0 0 (L 0
N) C0 0 Cro M MM 1:1)rt 1-,
NJ 1-4• LO ND Lo F.C) NJ ha 4, CD vD CD co LA CO
-.4 00 a% La ND LA Ch Ln L4
AZ A"4A Aa La NJ VD h.Co Co CD 44 CD .rh CO tn Ch0.? ,4 4, Na co 4, co
ha r.cm Ln 4, Na CD 1.4 Naco ch vD LA CD ND Ln CO Ch La
C) h. 1/40 VD Na -0 VD N)
VD ,4 CN tn 1-1 4, LnLO NJ -4 h. C) Lo h. Lo
•
Cm
w 4- 0. CD ,4 CD Co CD 4:- en

Table 8.18: Exports of Olive-Oil, 1975-1986
(Quantity in tonnes and Value in million dr)
Year Quantity Value Value(In 1975 prices)
1975 10,762 662.2 100
1976 12,671 554.8 83.8
1977 2,823 161.6 24.4
1978 51,953 2168.8 327.5
1979 23,055 1346.8 203.4
1980 10,538 989.5 149.4
1981 8,145 950.8 143.6
1982 41,504 4241.2 640.5
1983 147,519 20663.8 3120.5
1984 108,418 16681.3 2519.1
1985 53,621 9714.0 1466.9
1986 66,730 19479.0 2941.5
Source: N.S.S.G, Exports-Imports, 1975-1986.
582

Countries 1975/76 1976/77 1977/78 1978/79 1979/80
Italy 400.9 415.8 450 500 521.5
France 19.5 20.7 21.8 20.6 21.5
Greece 172 172 180 201.7 200
Other 4.9 6.4 5.8 7.0 7.6
EEC-10 597.3 614.9 657.6 729.3 750.6
Spain 278.2 294.3 328 330 350
Portugal 46.1 43.3 34 38.9 39.8
EEC-12 921.6 952.5 1019.6 1089.2 1140.4
Turkey 77.3 90 100 100 90.8
North Africa 131.5 144.9 155.6 122.4 119.4
Middle East 65.2 66.1 67.7 70.0 65.7
Other 84.4 86 94.3 86.5 88.9
World Total 1280 1339.5 1437.2 1477.1 1505.2
Table 8.21: World and EEC Consumption of Olive Oil 1975/76-1984/85(In thousand tonnes)
Source: I.O.O.0
583

Table 8.25: F.O.B Prices of Olives (In U.S dollars per tonne), 1979-1985
Category and 1979 1 1980 1 1981 1 1982 1 1983 1 1984 1 1985Type of Olive
GreenJumbo Type 1080-1120 1200-1220 1100-1200 1000-1100 900-1000 700-850 700-800181-200olives/kgr
BlackKonservoliasJumbo Type 1300-1340 1300-1350 1300-1400 1200-1300 1150-1200 950-1050 850-950180-200olives/kgr
Black KalamonJumbo Type181-200olives/kgr
1510-1530 1700-1750 1700-1750 1650-1700 1500-1600 1100-1300 1100-1100
aZUKPA: A.B.G, Department of Vegetable Production, 1988.

Table 8.26: National Subsidies on Olive Exports
Category and Size Percentage of the Subsidy, % F.O.B Priceof Packaged Until 31/12/1986 From 1/1/1987Exported Olives Exported to Exported to
EEC countries Third Countries
All Types of Green Olives
- Packaged in Containersof up to 5 kgr net weight
24 10.8 14.4
- Packaged in Containersabove 5 kgr net weight
20 9.0 12.0
All Types of Black Olives
- Packaged in Containersof up to 5 kgr net weight 20 9.0 12.0
- Packaged in Containersabove 5 kgr net weight 16 7.2 9.6
Source: Ministry of Agriculture, YDAGEP, 1988.

Table 8.28: Consumption of Table Olives in the EEC-10 and EEC-12, 1981/82-1984-85
(In thousand tonnes)
•,*
Countries 1981/82 1982/83 1983/84 1984/85 Average
West Germany 8.8 9.6 8.8 9.0 9.0France 25.2 27.5 27.8 28.0 27.2Britain 1.9 1.9 2.1 2.2 2.0Italy 95.0 90.0 90.0 90.0 91.2Greece 21.0 28.0 26.0 30.0 26.3Other 0.8 0.7 8.8 0.8 0.8Total EEC-10 152.7 157.7 155.5 160.0 156.5Spain 69.0 71.0 70.0 70.0 70.0Portugal 17.7 17.7 18.0 18.8 18.0
Total EEC-12 239.4 246.4 243.5 248.8 244.5
Source: A.B.G, Department of Vegetable Production, 1988
586

-3rPEn
cr,Ni
W
N.)TN)NOOD
N..TILiNTI
ElsCO L-.) -3
-3Cl) Ni 6.)
OD---.)
--Io
ONNi
---3N.)
Li 0 1/4/1 L.) 2-Li 2- 2-. Ni 2-
CO L.11 2- Ni Ni0
COON s.0
Li --3
NiNiUl
N2-
00
2-NO
Lii N.) Li NTI
z-oo
- _, _,Ni co
NicoNi
_,---I
(..„.)--3
Lfl Li L.) NO X-00 L.) ON
_.•
0 N.TI Ni
2-c) ,c0N a)N.) 1-n0 C0' CDNi
coN.)
00
‘.0
Li,
0— co co L-- aND L.) Ni co a)a, a) a, co C...../ =-3 Ul 1/41:3 CO ...., rT_, H-
o-t<
_...) Ni n
-3 NO Ni ._, -.4 <N.) 2- 0 ---I X-- 0
_., CO CO CO i--.ln Li OD -L"- IV CLi ru o l...) L.) CD
ON
-_, _, 0C...) --3 --3 U-I CNi L-.) 2- o __s Il.)ON -A Ul ln Cn =%.0 -4 Cr, %.0 1/40 cl-
N.) 1-...ercc
— a) 14T1Li <
n1 Ni ON N.Y1 ID0 Ul --3 ON
Ul W ---1 Li 2- CLTI NO -,-) 0 CD
OD CO
0ON ON 2- 2- CL..) NO N.) Lii Ni a)a, a, Ni Li CO =,..0 L.) NO cT
c-I•OD '-<
N .__, (...) ON 2-CL) --3 Ul ON ON0 Ul L,-) --3 ON <l.r1 ---4 0' ---) 1/4.51 0
CYN 2- nJ1 co I-6
•40 CO n.0 CCFN (1)
587

C
S-
ON
CD
Cn%SD • CV
0 011-- CO ...CC/ C--Cl r--Cl .--LC'
0n./0 •
N-N- 0 0 1:7NP.1
(N.1Cu
00
0
zif)OO
0 Cu 0CO
CO
C\1
00CO
s.0
LC)
0C
CO
IIC`")CYN
r-
a-•
1 n1"
CD C
CO
coa-'
4-3
4-)
Cuz0
CT%
CD
•
CO•
CO
Cu
LC)•
0CO
re)co
CT%•
OD L.C)
(/)
r-14-10
0
4-)
I-1
co
4-)
4-)
Cu
IC• •
CY")
*4"
•r-I0
Cu
0
0
S.0
588

Table 8 3 ; Importers of Greek Oil Seeds and Oil Seed Oils'Exports, 1982/1986
(Quantity in tonnes)
OIL SEEDS I OIL SEED OILS
1982 1983 1984 1985 1986 1982 1983 1984 1985 1986
EECCountries
OtherCountries
3328.5
22446
1149.7
27287.1
833.8
38632.3
2000
31312
2005.2
45061
21.2
7.0
30
12
11.5
37.7
19936.5
138.9
102239
1818.9
Total 25774.5 28436.8 39466.1 33312 47066.3 28.2 42 49.2 20075.4 104058.0
52mran: N.S.S.G, Imports-Exports, 1982-1986.
589

1.0
0
a)
4-)
4-)
0
a)
4.3
as
0
0
0
1.4-,0
CT
CV)-0
L.C)
10co
ctl
1"----4-CV-...7(N
CVininN
rnco0'-
--I' e-- CV
...1- Lf") 0L.fl 0 0CVri-a-
umc\I
en—
q.,
nC
co
co• t— %—
UN—
cv
(-1CS)
LC1
01LC (\ICY)a- LI) N,1- co r-)0. 0-, -3'In CrN N,-- ,-- -1'CIe---
co
0CO 0
LC)•--
r-)
XD
••-•
co
>")
r—
crJ0
CON-( \J
0
a)‘--
Cll \0 IC/) Cs-
.../-ONS-
0 c\Ico
Op
0
C/) 4.]
Ca
••••1
Lf10 0")0.X 0
n1"
0
n0
n n

on cy .7 VD CV 01
If VD 00 VD r4 CO UlCV CV CV CV CV .-1 CV
C4 r4 r- CT CV P, CV. . . . . .
CV N. rA Ul r4 rA Ul
N 01 VD rA CV r, un. . . . . . .
rA V) CD Ul r4 CD .7
00 C C) 4 01CV ri
VD r- rA r4• • • • •
CV CV 01 CV CD r4 CVr4 rA r4 rA rA r4
4
CD CD 0 0 CD 0 CDCD CD CD CD CD C) CDr4 r4 r4 rA rA rA
r, rA 111 .1 Ul• • • • • • •
03 CT VD 04 Ul Ch CDCV Cs1 CV
• ce. on N 4 03 VD
VD Ul CV Ch r4 VI N.CV rA
00 Ul 4 rA 4 01
• cD on cD VD VD 4on r- rA C4
OD OD CV r, 00 VD Ch
Ch 04 OD r, VD CD TsUl r4 ./ VD
A
CO0 el %0 0 1•-•rn CD VD C) 0- VD on44 CV r4 N. r4 C)rA un r-
Ul Ul VD V0 CV Ul elCV Ul •A Ch 4 r4 Ulr4 ul %.1)
r4 rA
0, 01 u0 VD r4 %.0
CM 0:31 CM r4 rA
Cs1 onr-1
CD OD el —10 CV elCD CA CT CV VD :I CVul r, rl
VD 4 OD CO rl 0, 00rA CV 4 CO VD CM ,/
0, V) 01 01 U1
CV ol 01
r-(
0 4)0• Z I-I
r - 1 (1) 1 .1-1(4 04)0(4CO 0 CI4- 1 4.T) 1- 1 a) 1:1.1-.1 43 (4 V)
OL) 0.1
4.11-10 L1.144 (4 ‘.)
00 I, 00 08 Os
r4 44 pa C.) A 41
cni
00 r4 OD VD 00 Ul• • • •
03
ul

e^t0 01 CV CV NO
CV • 4 • HI s.7 COCV CO r1 Col CV H UlCY, Ln Lel
co ifl CV 4 01 r-4 ON
. . . . . .• t-V rn I",C•1 NI rnC.1
CO %.0 CsJ tn C•1
aN ON PI 0 0'4 H n.0
C•1
H 0', NC) .••••.. C:) CO
el • CO • NI r-• if) in In Hi CVcr) csi 4
0 CO CV• •
HI In 0• • • • •
r-I Col eV ,43 01
r•-• CO C•1 f•••C•1 CV C•••
CT LEI CO C.1 CV Ul CV
N.• • • • • • •
ON CV r-1 CO ON 01CV 4 CSI "-IUI rs 4
Ce)
csi Ui r's UI Cr% CV 0
CV a% in Ul C•1 C•1Ul in CO
Cl)
0
-4l 00Cl) 4•4 4) 4.1
a0 440 0 a) 0
G/3 P•
0140
0
a)
14
Cl)
4.1 '0
Ft
In 03 CO 0
C•1 0 • • 1.0 COr-I 1,1 N. CV -0
4-3 CO N •••••• csi
CC
•Hl
(/)
•H0
C l 0 Ul fl Ul 40• • • • • • •
%0 VD 0 NO 034.4 CV CV CV CV CV CV0 0.
c=4
• •
592

CONCLUSION
This study has been concerned with an analysis of the socio-
economic processes which underly the development of the Greek olive
industry. Because this industry is so widely diffused, my attempt to
understand its workings has been made in the context of social as well
as economic considerations. Special attention has been given to recent
structural and organisational changes due to Greece's accession into
the EEC. Under the umbrella of rural industrialization my analysis has
highlighted the inter-relations of the different parts of the
industry. An attempt has been made to show how capital intervenes at
as many points as possible between production and consumption to
maximise its control. In order to identify recently accelerated
processes in the specific context of the long-run path of capitalist
development I examined the structural and organisational response of
the industry to change.
The argument put forward in the first part of the thesis, which has
' concentrated on the rural sector, is based on the recent experience of
olive growing in response to accession of the EEC. In order to
identify the main trends which characterise the process of development
in olive growing, primary data was used. This was derived from two
olive producing villages of Messenia province, those of Avia and
Coryfasi. While their long-run economic development has been slow,
constrained by a number of political and socio-economic factors, recent
changes due to the imposition of the EEC regime decisively influenced
the structure of production and the mode of organisation. In
593

particular, it has been shown that two of the alternative lines of
development are currently underway in olive growing. On the one hand,
development is taking place through accumulation by larger farmers who
are seeking to mechanise production (thus reducing their dependence on
wage labour) while sustaining - as far as possible - the quality of the
produce. On the other hand, capitalist small market-oriented farmers
are engaging in the capitalist process through cooperation. Although
the argument is underpinned by the findings of my investigation into
the experience of the two villages, published data on a national level
supports the view that these observations are not isolated phenomena.
Instead they represent processes already in train. However, as these
processes are still unfolding today, it is clearly difficult to offer
predictions about the direction of events in the years to come.
This discussion of the impact of the EEC suggests that the growth
of the productive forces in the rural sector, including agriculture and
the primary transformation of the olive, has been aided by deliberate
policy decisions in the context of the C.A.P. In particular policy
makers have attempted to solve the social problem of low farm incomes
with improved technology and price support systems. It is claimed
that the main aim of supporting agricultural prices is to reduce income
disparity between farmers and non-farmers. However, in reality, rising
product prices have tended to raise income only in the short-run. The
long-run effects are complex and have been questionable on several
counts. If the generation of a more equitable pattern of income
distribution is a key policy objective in the European Community, a
more effective policy might consist of direct income transfers to low
594

income farmers, rather than price support schemes. Furthermore, oral
evidence obtained in interviews with cultivators convinced me that the
growth of part-time farming in these areas is not due to more people
entering olive growing (a possible consequence of the prices support
system); rather it is the result of full-time farmers finding
alternative jobs to supplement their farm incomes. Even though farm
restructuring has taken place in the form of larger size farms in
irrigated flat and semi-mountainous areas, the most widespread
consequence of agricultural change in the olive sector is the formation
and growth of farmer cooperatives. They are primarily marketing
cooperatives and their rapid growth was based on government support.
Their presence in the industry (as a form of social organisation of
production) seems important as a defence of producers' incomes, but
certain endogenous weaknesses within the movement do not allow them to
act as dynamic vehicles for a cost effective restructuring of olive
cultivation. The majority are regionally independent small olive
cooperatives with a pronounced lack of management skills, and few
obvious direct channels for export.
On the issue of inter-relations within the olive industry, the
following processes have been identified. First, the links of the
rural processing units with the "upstream" industry which supplies them
with technological equipment have created conditions for the
establishment of manufacturing units within Greece. One of the most
successful attempts was a firm, producing oil-mill equipment, built by
Eleourgiki in Crete. Other, private ventures, are more modest in size
and scope but nevertheless have emerged within the last decade.
595

However, most of the oil-mills are still dependent on Italian
technology which they acquire through Greek agencies acting on behalf
of the foreign firms.
Secondly, the links with the "downstream" industry or the second
stage processors are relatively newly established in the sense that
most processors come into contact with the mills, through the olive-
mediators. The mediators only ten years ago acted independently in the
olive-oil trade; but now some of them - with special reference to the
province of Messenia - have established a form of "spoken" contract
with the oil-millers so that they are regularly supplied with given
quantities of olive-oil. Such an arrangement helps the processors in
dealing with the export market. This is a form of vertical
integration found in the private sector. Even though the processors do
not become involved in rural processing themselves, through their links
with oil-millers they are guaranteed a regular minimum supply of olive-
oil to meet their requirements. The same form of vertical integration
can be found in the cooperative chain. The second-stage processing
'cooperatives buy the required quantities of olive-oil form their member
oil-mills. The difference is that they also guarantee to buy from
their members any quantities of olive-oil which cannot be sold in the
market. This means that the olive-oil, once bought by the processors,
will be stored until a suitable buyer is found. Interest payments as
well as a lower selling price because of deteriorating quality of the
stored produce, result in additional burdens on the second stage
processing cooperatives which have further impaired their financial
base.
596

The argument put forward in the second part of the thesis reflects
the processes generated during the transformation of the Greek olive
industry into a part of an integrated European food industrial system.
On the one hand, we have seen concentration of output and economic
power into the hands of Eleourgiki and the subsidiaries of two
multinational corporations, Elais and Minerra. Both companies have a
long tradition in the world markets of seed-oils, margarine, soap and
detergents. Nevertheless, they entered the Greek market through
acquisition of well-known olive companies. Since the early 1980's they
supply the domestic market with olive-oil as well as seed-oils - mainly
corn and sunflower oils. Elais became directly involved in the
production of sunflower seeds in Macedonia and then followed this by
processing, storing, packaging and marketing of the produce.
Gradually, these highly profitable institutions have created
conditions in the domestic market through heavy advertising, which has
allowed them to shift away from olive-oil production, (due to high
input costs) into seed-oils production.
The immediate endogenous response of the olive producers to the
entry of the multinationals, was the growth and strengthening of
Eleourgiki (based upon gover t support), the largest rival of the
private sector. We have seen though that Eleourgiki, in an attempt to
cover its financial liabilities due to its price support policy
operations, has recently entered the seed-oils market. On the other
hand, this trend towards concentration was combined with a process of
expansion and creation of small units which operate in specific market
niches. This expansion reflected an entrepreneurial desire to take
597

advantage of EEC directives concerning subsidies on packaged quantities
of olive-oil and exports. My investigation into a representative
sample of firms has shown that their operation and profitability is
unquestionably based squarely upon EEC support schemes and tax evasion
practices. Therefore, this expansion can be seen as temporary; indeed
as such support schemes are gradually withdrawn the future of the small
firms in the olive industry is in serious doubt.
Our consideration of the final part of the industrial chain
includes distribution and marketing activities. We have seen that .
recent changes in the distributive methods aim at selling olive-oil as
close to the consumer as reasonably practical, that is the packers try
to retain control as far down the distribution channels as possible.
The way in which they try to achieve this is through branding and
advertising. On the demand side, the pattern of consumer expenditureIs
on olive-oil has been changing in response to heavy adverlIng,
modernisation and the general rise in incomes. Overall, total
consumption demand has remained the same over the last ten years with
a decreasing trend since the early 1980s. This trend goes hand in hand
with domestic production, and the promotion of seed-oils at prices
twice or three times below that of olive-oil. In the export market,
the majority of olive-oil is exported to Italy. The reason is that the
markets of Western Europe, already dominated by the Italian oils, do
not seem to be particularly well informed about the biological
superiority of Extra Virgin Greek oil, and people are used to the
taste of blended Extra and Refined olive-oil. Yet the Italian packers,
taking advantage of their dominance over Greek exporters, can dictate
5'38

their own rules and "tighten up" the subordination of the Greek
processors. Furthermore, the expansion of the European Community to
incorporate Spain and Portugal means that Greece now has to compete
with cheaper olive-oil surplus in the domestic as well as in the export
markets.
Our analysis has offered a number of conclusions all pointing
towards the eventual contraction of the Greek olive industry into a
more cost effective and certainly more fully integrated part of the
European food industry. The contradictory nature of the development
process, and the conflict and struggle between the different interest
groups in the olive sector and the Greek economy has been emphasised
throughout. The natural mediator between these interests - the State-
has pursued policies which have clearly affected access to the means
of production and the process of accumulation. However, I should like
to point out that the transformation of the olive industry currently
under way is likely to change irreversibly the entire character of this
ancient activity.
599

Appendixes to Chapter Three
1. Questionnaires* Used for the Collection of Field Data.
A. Farmer
Village
Date of Interview
1) Serial No
2) Status
a) b) c)
3) Holdings
a) Total Holdings stremma
b) Rented Out II
c) Rented In n
d) Types of Irrigation in
e) Crops Grown
f) Area Under Olives "
g) Who Operates the Farm? Self Family MembersHired Labour
h) Type of Cultivation
.4) Production
a) Total Production of Olive-Oil during the Season kgrs
b) Retained for Home Consumption kgrs
c) Marketed Surplus kgrs
d) Wages Paid Drs
e) Total Costs of Production (including allexpenses incurred for one kgr of olive-oil) Drs/Kgr
5) Labour
a) Do you hire in Labour Yes No
b) Do you hire out labour Yes No
600

6) Family
a) Total no. of family members
7) Education and Experience
a) Describe the level of your education obtained
b) Age years
c) Farming experience years
8) Initial Capital
a) Cash money Drs
b) Land Stremma
9) Origin/Sources of Capital
a) Inherited cash money Drs.
b) Inherited Land Stremma
c) Loan from non-institutional sources Drs
d) Loan from institutional sources Drs
e) Any other source Drs
10) Method of Buying Agricultural Inputs
a) Purchase through Cooperatives percent
b) Purchase through merchants percent
c) Miscellaneous methods percent
11) Price Determination
a) How is the price of olive-oil determined at the time ofsale?
By open bargainingBy AuctionBy ContactFixed price by Government
b) Do you receive Government fixed price of olive-oil if yousell olive-oil to an agency or an individual other than thegovernment. Yes No
c) If no, please state if you receive a better price
601

12) Sales q.
Distribution Channels
a) Olive merchants kgrs
b) Cooperative kgrs
c) Oil-Miller kgrs
d) Retailers kgrs
c) Government Agency kgrs
Total quantity sold kgrs
13) Borrowing and Credit System
a) Do you obtain a loan? Yes No
b) Do you pay interest on the loan? Yes No. . .
c) If you obtain a loan give the following information
Money Sources Interest Rate Purpose
d) Do you sell olive-oil to traders or the cooperative fromwhom you borrow? Yes No.
e) Do you offer price concessions to money lenders when yousell your commodity? Yes No
If yes, how much concession do you give to your financier?
f) Do you encounter difficulties in obtaining governmentloan Yes No.
If yes, describe the difficulties.
14) Transportation
a) What are the means of transportation used by you in themarketing of olive-oil?
b) Do you have your own transportation or do you hire it?
Own Hire it
602

15) Weight and Measures
a) . Do the buyers of your olive-oil and olives or thoseresponsible for the weighment in the marketing use approvedweights and measurements?
Yes No.
b) If no, roughly how much excess olive-oil per Kgr do youhave to give due to defective measurements and weights?Please state. Kgr.
16) Market Information
a) Do you get market information? Yes No
b) If yes, through which means? Radio T.V
Newspapers Other
17) Please describe your problems in the marketing of olive-oil.
B. Oil-Miller/Merchant/Proceqsor
Village/Town
Date of Interview
1) Serial No.
2) Business History
a) Date of start of your business
b) The firm is owned by: Individual Family
Partnership
c) Initial starting total capital drs
d) Sources of origin of capital
(i) Inherited drs
(ii) Non-institutional loan drs
(iii) Institutional loan drs
(iv) Others drs
Arrl

3) Which other commodities do you deal in?
2
4) Family
a) No. of dependents
5) Education and Experience
a) Describe the level of your education obtained
b) Age years
c) Experience in the present trade years
6) Money Lending and Borrowing
a)
Money Borrowed drs
Money Sources Interest Rate Purpose
7) Employment in the Firm
a) Family labour No Job Description
b) Non-family labour No Job Description
8) Property
a) Do you have other property? Yes No
b) If yes, give details
9) Price Determination
a) How is the price of olive-oil determined when you buy it?
(i) By bargaining percent
(ii) By auction percent
(iii) By contract percent
(iv) Other percent
b) When you sell olive-oil
(i) By bargaining percent
(ii) By auction percent
604

(iii) By contract percent
(iv) Any other percent
10 ) Purchase and Sale
a) From whom do you buy olive-oil?
b) Whom do you generally sell olive-oil to?
11) Credit System in the Trade
a) Do you buy olive-oil on credit? Yes No
b) Do you sell on credit? Yes No
If yes, for how many days?
12) Market Information
a) Describe the sources of your information
13) Personal observations of the interviewer
* The Questionnaires are adapted in part from M.S Kamdar AgriculturalMarketing and Argarian Relations in Pakistan: A Case Study of theNawabshah District. Sind. Unpublished Ph.D thesis, University ofSalford, 1987.
605

2. Zaccaria Bembo's Report+
20 June 1712 A.D. to the distinguished Mr Corder
Information on the quantity of oil which can be produced from the
olive trees in this region, based on past experience, distinguishing
between that consumed in this region, that collected by land from
elsewhere and that distributed overseas, with reference to the total
produced in 1711 and that which remains to be distributed as below and
already mentioned.
Given that there is an abundance of olive trees in this area,
planted both by the administration and by Creek natives, it appears at
first sight that there must be an excessive amount of oil production in
relation to the number of trees, but when one considers the very
obvious risks to which such fragile plants are subjected, not to
mention the difficulties of harvesting, it does not seem strange that,
comparing one year to the next, the yield is rarely more than 7,000
barrels of oil. This statement should not, however, be taken as read,
since it is based on unpredictable factors as well as the misfortune of
having seen all of the olive trees planted in 1693 be unable to bear
fruit for the following fourteen years. Olive trees flower during the
wet season, when there is frequent rainfall and storms and are in turn
subject to the scorching heat of summer, the two extremes causing them
to lose their flowers. All of the plants which have managed to avoid
these hazards can still be lost, since they have to be gathered during
the harsh winter, which brings with it unpredictable winds, snow and
storms, with floods which can engulf them. As, however, a surplus is

desirable, let God be praised that the above-mentioned sum of 7,000
barrels is always provided. Of these barrels, almost 600 are used by
inhabitants of the region, both in the towns and countryside, and one
must consider that, for many, poverty dictates that there is no other
condiment for their bread: oil is easily acquired by gathering th
olives off the ground with no other increase than that of the tithe.
Approximately another 400 are taken by country men from some distance
away who come at harvest time and, having gathered as much as they are
allowed according to their needs, return to their own homes. They
travel over land from many areas of the country. Moreover, the
territories of Tripolis and Roman Argos take quite a considerable
amount, as do the ships which stock up on their journeys. Taking all
of this into account, even if the first sum mehtioned is debatable, it
can be argued with certainty that 5,000 barrels will remain, reserved
for Venice. If, however, in one year more oil is distributed, as
happened in 1711, one must not concentrate solely on that one year
because the quantity of oil produced varies from year to year and more
oil is likely to be produced in the near future. And so it appears
that whatever the quality of these plants, which do not always bear
fruit and which vary from year to year in their yield as well as in the
amount gathered, when calculated together one almost always comes back
to the figure mentioned above. It is also difficult to accurately
measure total product since certain wealthy citizens are able to
request oil from elsewhere and have it brought to these parts from Mani
and other places. The price per barrel last October and November
(1711) was 4.1/2 reals, in December and January it went up to 5 reals,
607

in February and March of this year to 2 cechini, in April and May to 6
reals and it currently stands at 6.1/4 reals.
Two merchant vessels left this port loaded with oil from Venice.
"La Madona di Loretto e Sant'Antonio", owned by Giacomo Adorno, was
loaded with 68 large barrels and 1,200 small barrels of oil by Bernardo
Locattelo. The captain and crew loaded 80 barrels in small amphoras.
The other vessel, which was called "Sant'Iseppo e Cinque Santi" and was
owned by Vicenzo Crivellaro, loaded 70 large barrels and 1791 small
barrels since it had more merchants, in addition to 6 large barrels for
the captain of the vessel and other amphoras to the capacity of 165
small barrels. As well as this amount, which has already been
distributed, there are currently two other merchant ships here, one of
which has come from Mani loaded with "valonia" and is to load a small
quantity of oil before continuing its voyage to Venice, and another
vessel which will be loaded to capacity with oil: the exact amounts
cannot be given for they have not yet finished loading. The owner of
the first ship, from Mani, is called Mattio Zennaro and the owner of
the other ship, which is being loaded to capacity with oil, is called
Iseppo Constantini. As far as is known, three merchant ships are
expected, one belonging to Mr Zuanne Foresti, and the third belonging
to Mr Giorgio Giatro from Calamata, but those who collect oil from
areas in Mani and Calamata will never be able to fill them to capacity
at this port. They will have to go to the embankments at Modon and
Navarino for this, where oil is also brought from Arcadia, which shows
that after Zennaro's and Constantini's vessels have been loaded, there
will only be approximately 2,000 barrels left here to be sent to
608

Venice. This, as I have previously mentioned, will exceed the standard
5,000 barrels. Given that the price has risen to 6 1/4 reals, everyone
is gathering oil and selling it on vessels heading for Venice, and by
doing small favours for the captain other advantages can be gained.
As for charges for the oil, up until loading no other payment are
required apart form those made to the porters who take the oil from the
warehouses, where it is stored, to the harbour where the barrels are,
and then a surcharge of 4% for distribution above the current oil
prices.
Zaccaria Bembo, Administrator
Zaccaria Bembo's Report, June, 1712, in:+ Appears in N. Karabela, Messeniaka Grammata(Calamata, 1981); translated by the ModernLanguages Department, University of Salford.
609

500,000 drs
8,000,000 drs
2,550,000 drs
350,000 drs
Appendix to Chapter Six
Document
Establishment-Modernisationof a Packing Unit(Specifications)
Ministry of AgricultueDepartment of Trade and Processing
Design of the Unit
AthensJanuary 1987.
I.
IV.
V.
Unit Capacity: The Designed unit should have potentialcapacity for branding and packing of olive-oil 1,500-2;000tonnes.
Building Ground: In order to build a new processing unit aplot of about one stremma is required and the unit shouldface the main road.
Building Construction: Simple construction of brick-makingor metallic with metallic roof, and dimensions 15x25m.
a) Basic Technical Equipment: Two filters, withcapacity 7 tonnes/8hours and one semi-automaticfiller.
b) Complementary Equipment: One ground scale withcapacity 0-300 kgrs, three stainless oil-banks withcapacity 10 tonnes each, four stainless pumps withcleaning-rods, two auxiliary oil-banks withcapacity 2 tonnes each and a general electricalboard.
Storage Facilities: The area of the processing unit of375m2 allows storage of the processing equipment and theproduce on the right and the left.
Economic Specifications
A. Formation of the Building Ground
B. Building Construction
C. Mechanical Equipment
1. Oil-Banks 10 tonnes3m x 850,000 drs
2. Oil-Pipes35 x 10,000 drs
610

3. Pumps4 x 400,000 drs
4. Filtering Equipment2 x 4,500,000 drs
1,600,000 drs
9,000,000 drs
1,000,000 drs
7,000,000 drs
350,000 drs
400,000 drs
500,000 drs
2.250.000 drs25,000,000 drsTotal
5. Auxiliary Oil-Banks4 x 250,000 drs
6. Semi-Automatic Filler
7. General Electrical Board
8. Cable Works133m x 3,000 drs
9. Fitting Together
10. Unforeseen Expenditure
Total Cost
1. Value of Building Ground
2. Building Ground Formation
3. Construction Work
. 4. Technical Equipment
5. Technical Study-License-Supervision
500,000 drs
500,000 drs
8,000,000 drs
25,000,000 drs
4.000.000 drsTotal 38,000,000 drs
With completion period end of 1987
5.000.000 drs
In current 1987 prices
Total Cost 43,000.000 drs
To this study contributed:
1. G. Balatsouras, The Highest Agricultural School of Athens2. S. Panagiotou, Ministry of Agriculture3. G. Sovagis, Ministry of Agriculture4. V. Evagellou, Agricultural Bank of Greece5. E. Papamarkaki, Ministry of Agriculture6. G. Bouzanis, Ministry of Agriculture7. P. Tulias, Ministry of Agriculture8. G. Bazioti, Ministry of Agriculture
The General DirectorDepartment of Trade andProcessing
S. Panagiotou.
611

BIBLIOGRAPHY
Page
PRIMARY SOURCES 612 .
OFFICIAL PUBLICATIONS 614
STATISTICAL SERIES 617
NEWSPAPERS AND PERIODICALS 618
SECONDARY SOURCES 619
THESIS AND DISSERTATIONS 632

.PRIMARY SOURCES
In Greek
1. Andreas Yefteas S. A., Olive-oil processor, unpublished companyrecords on costs and revenues, 1985-1988.
2. Central Co-operative of Messenia, olive-oil processor, productionand exports, 1983-1988.
3. Custom House of Messenia, records on olive-oil and olive exports,1986-1988.
4. Eleourgiki, records on costs and revenues, 1986-1988.
5. Eleourgia Messenias, Olive-oil processor, unpublished companyrecords on costs and revenues, 1986-1988.
6. Elais, olive-oil processor, unpublished company records onproduction 1985-1988.
7. Gargalianoi Co-operative, Interviews with farmers, Summer 1988.
8. Institute of Trade and Commerce at Messenia, records on localcompany exports, 1986-1988.
9. Ionian Bank of Calamata, financial records on second-stageprocessors, 1988.
10. Kalogeropoulos & Sons, S. A., olive-oil processor, production andexports, 1980-1988.
11. Kefalea Bros, Olive-oil processor, unpublished company records oncosts and revenues, 1984-1987.
12. Kinotita of the village Coryfasi, records on demographic changesand production conditions in the village.
13. Koutelas, olive-residue-oil processor, production 1985-1988.
14. Linardakis, olive-residue-oil processor, production and sales,' 1985-1988.
15. Malamas St., olive-oil processor, production and sales, 1980-1988.
. 16. Minerva, olive-oil processor, unpublished company records onproduction and prices 1981-1988.
17. Olive Cooperative of Gargalianoi, records on costs and revenues and.production information on member olive producers, Gargalianoi,province of Messenia.
6'12

18. Olive Cooperative of Avia, records on costs and revenues andproduction information on members, province of Messenia.
19. Olive Cooperative of Coryfasi, records on costs and revenues andproduction information on members, province of Messenia.
20. Premmenou Bros, Olive-oil processor, unpublished company records oncosts and revenues, 1986-1988.
21. The Town Hall of Pylos, records on past and recent history ofvillage Coryfasi, county of Pylia, province of Messenia.
22. The Town Hall of Calamata, records on past and recent history, ondemographic changes, and on production conditions in the villageof Avia, county of Calamata, province of Messenia.
23. Village of Avia, Interviews with farmers, Summer 1988.
24. Village of Coryfasi, Interviews with farmers, Summer 1988.
25. Vraka Bros, olive-oil processor, production and prices and companyhistory, 1980-1988.
613

OFFICIAL PUBLICATIONS
(1) In Greek
1. A.B.G, Structural and Economic Indicators on Family Farms, Athens,1973.
2. A.B.G, Study on Employment in the Rural Sector, 1981, Athens,1982.
3. A.B.G, Bulletin on Agriculture, Athens, 1983.
4. A.B.G, The Problems of Small Holdings, by the Governor A.Pepelassis, Athens, 1976.
5. A.B.G, The Olive-Oil and Table Olives Sector, by E. Evagelou,Athens, 1986.
6. A.B.G, Report on the Technical Development of Seed-Oils ProcessingUnits, Athens, 1983.
7. Cotton Organization, Production of Seed-Oils 1982-1986, (Athens,1988).
8. Cotton Organisation, Production Techniques in Seed-Oils ProcessingUnits, Athens, 1985.
9. EOMEX, Six Studies on Topics of Small Enterprises, (Athens, 1985).
10. EOMEX, Information Bulletin on the Progress on Small and MediumEnterprises, Athens, 1980-1987.
11. House of Parliament, Five Year Plan for Economic and SocialDevelopment. 1983-1987, Athens, 1983.
12. I.H.P.O.C, Reporting Experimental Work on Soil Cultivation andWeeding, (Crete, 1980).
13. I.H.P.O.C, Experimental Work on Olive Groves Lay-Out, (Crete,1985).
14. Ministry of Agriculture, Study for the Establishment-Modernisationof Packing Olive-Oil Units, (Athens, 1987).
15. Ministry of Agriculture, Special Sectoral Programmes for Olive Products and Seed-Oils. 1983. 1985 and 1988, Athens.
16. Ministry of Agriculture, Department of Second Stage Processing Regional Distribution and Output Information, Athens, 1988.
17. Ministry of Agriculture, Official Reports. 1974-1984, Athens, 1985.
4,11.

18. N.S.S.G, Economikes Epetirides, various years.
19. National Bank of Greece, Report of the Governor on the Budgets of1983-1988, Athens.
20. PASEGES, The Greek Agriculture: Processing and Marketing of Olive-Oil, Athens, 1978.
21. PASEGES, Programme for the Processing and Marketing of Olive-Oil,Athens, 1983.
22. PASEGES, State Policies Towards the Co-operative Sector, Athens,1981.
23. PASEGES, Manifesto of its Establishment, 1935.
24. I.C.A.P., published company records, 1981-1988, in: The OfficialGovernment Newspaper.
25. SEVITEL, Enimerotiko Deltio, various years.
26. The Greek Agricultural Company, Agricultural Bulletin, N. Lihnos,Vol. 23, Issue 228, 1930.
(2) In English
1. Commission, COM (81) G10 final, Commission Communication to theCouncil on the consequences of enlargement for the situation in thecommunity olive-oil market, 26/10/1981.
2. Commission, COM (82) 85 final, Proposal for a Council Regulationamending Regulation No. 136/66/EEC on the establishment of a commonorganisation on the market in oils and fats, 10/3/1982.
3. Commission of the European Communities, The Situation of theAgricutural Markets, 1985-1989.
4. Commission, Official Journal of the European Communities. No.L.57/18, 3.3.1988.
5. Commission, Official Journal of the European Communities, No.L201/46, 27.7.1988.
6. Commission of the European Communites, The "Cost of non-Eurgpe" inthe Foodstuffs Industry, 1988.
7. Commission of the Euroepan Communities, Bulletin of the EuroepanCommunities, 1969, 1972, 1983, 1989, 1990.
8. Commission of the European Communities, A Community Strategy to Develop Europe's Industry, Brussels, 1981.
615

9. European Economic Community, Regulation No. 136/66/EEC. Establishing a Common Organisation in Oils and Fats, 22/9/1966.
10. European Economic Community, Regulation No. 1562/78/EEC. AmendingRegulation No. 136/66/EEC on the establishment of a commonorganisation of the market in oils and fats, 29/6/1978.
11. Commission of the European Communities, Survey of MultinationalEnterprises, July, 1976.
12. F.A.O. Agricultural Development Paper No. 58 "Olive OilProcessing in rural mills", Rome 1956.
13. I.O.O.0 Feuille D' Information, various years.
14. 0.E.C.D, The Newly Industrialising Countries. Challenge andOpportunity of OECD industries, 1988.
15. 0.E.C.D., Industrial Policies. Development and Outlook of 0.E.C.D. Countries, Paris, 1981 and 1986.
16. 0.E.C.D., "The Agricultural Policy of Greece", Agricultural PolicyReports, Athens, 1982.
17. 0.E.C.D., Review of Agricultural Policies in OECD Member Countries. 1980-1982. Committee for Agriculture, AGR (83) 14, Paris, 1983.
18. Official Journal of the European Communities Special Report of the Court of Auditors on the Common Organisation of the market inolive-oil, 3/6/1985, C134.
19. Panorama of E.C. industry, Food and Drink: Olive-oil sector, 1989.
21. United Nations, Transnational Corporation in World Development. ARe-examination, Economic and Social Council Commission ofTransnational Corporations, 4th session, E/C 10/38, New York, 1978.
22. United Nations, Transnational Corporations in World Development: Third Survey, United Nations Centre on Transnational Corporations,New York, 1983.
23. United Nations, Commodity Review and Outlook, Vol. 20 and 22. FAO,Rome, 1981 and 1982.
616

STATISTICAL SERIES
(1) In Greek
1. ELEOURGIKI, Olive-Oil producer prices, 1980-1988.
2. N.S.S.G., National Accounts, 1958-1988.
3. N.S.S.G., Census of Population, 1950-1988.
4. N.S.S.G., Agricultural Production, various years.
5. N.S.S.G, Agricultural Census, 1929, 1939.
6. N.S.S.G., Agricultural Index Prices: 1966-1983, Department ofPrices.
7. N.S.S.G., Industrial Surveys, 1939-1988.
8. N.S.S.G., Statistical Yearbook of Greece, 1958-1988.
9. N.S.S.G, Monthly Statistical Bulletin, various years.
10. N.S.S.G, Exports-Imports, various years.
11. N.S.S.G, External Trade, 1986, 1987, 1988.
12. N.S.S.G, Agriculture and Employment, 1987.
13. N.S.S.G., Employment Bulletin, 1951-1975.
14. Ministry of Agriculture, Figures on Olive-Oil Production andExports 1950-1988.
15. Ministry of Commerce, Olive-Oil retail and wholesale prices 1950-• 1988.
16. Ministry of Agriculture, Olive-Oil producer prices, 1950-1988.
17. Ministry of Agriculture, Industrial Survey on Oil-Mills, 1988.
617

(2) In English
1. EUROSTAT, Basic Statistics of the Community, 1982-1985.
2. EUROSTAT, Imports-Exports, various years.
3. F.A.O., Production Yearbook, 1950-1988.
4. I.O.O.C., Olive-Oil Production, 1968-1983.
5. 0.E.C.D., Main Economic Indicators, 1981-1989.
6. United Nations, International Trade Statistics Yearbook, 1986-1988.
NEWSPAPERS AND PERIODICALS (Various Dates)
(1) In Greek
1. Agrotica, newspaper of the Province of Messenia, 1920-1931.
2. Eleourgiki, quarterly periodical by Eleourgiki.
3. Economicos Tahidromos,weekly periodical.
4. Nafteboriki, weekly newspaper.
5. Olivae, quarterly periodical by I.O.O.C.
6. Politica Themata, weekly periodical.
7. Rural Mornings of Messenia, monthly periodical 1910-1930.
8. Vima, weekly newspaper.
(2) In English
1. The Economist, weekly periodical.
618

SECONDARY SOURCES
Books and Journal Articles
(1) In English
W.J. Abernathy and P.L. Townsend, "Technology, productivity and processchange", Technological Forecasting and Social Change, 7, 1975.
American Rural Industry Delegation. Rural Small-Scale Industry in thePeople's Republic of China, (California, 1977).
S. Amin, Imperialism and Unequal Development, (London, 1977)
D. Anderson, "Small industry in developing countries: a discussion ofissues", World Development, 10, 1982.
K. Anderson and Y. Hayami, The Political Economy of Agricultural Protection, (Sydney, 1986).
D. Anthony, "Japan". In D.J. Storey (ed.), The small firm: aninternational survey, (London, 1983).
J. Arnon, Modernisation of Agriculture in Developing Countries, (NewYork, 1981).
K. J. Arrow (ed), The Balance between Industry and Agriculture inEconomic Development, Vol. 1, (London 1988).
A.W. Ashby, "Britain's food manufacturing industry and its recenteconomic development", Journal of Agricultural Economics, 29, 1978.
P. Aydalot, "The location of new firm creation: the French case". InD."Keeble and E. Weyer (eds.), New Firms and Regional Development inEurope, (London, 1986).
R. Allard, "The importance and position of small firms", The EconomicReview, November, 1983.
J. Bain, Barriers to New Competition, (Cambridge, 1956).
J. Banaji, "A Summary of Kautsky's The Agrarian Question", Economy andSociety, 5, 1, 1976.
K.D. Barkin, The Controversy over German Industrialisation 1890-1902,(Chicago, 1970).
K. Basu, The Less Developed Economy: A Critique of Contemporary Theory,(Oxford, 1984).

W. Baumol, J. Panzar and R. Willig, Conte -'stable Markets and the Theoryof Industry Structure (New York, 1982).
C. Bell and P. Hazell., "Measuring the indirect effects of anagricultural investment project on its surrounding region", AmericanJournal of Agricultural Economics, 62, 1980.
I. Benson and J. Lloyd, New Technology and Industrial Change, (London,1983).
K. Bharadwaj, "A View of Commercialization in Indian Agriculture andthe Development of Capitalism", Journal of Peasant Studies, (July,1985a).
M. Binks and A. Jennings, "Small firms as a source of economicrejurenation". In J. Curran, J. Stanworth and D. Watkins (eds.), Thesurvival of the small firm, Vol. 1., (Aldershot, 1986).
J. D. Blake, The Concise Guide to Interpreting Accounts, (London,1989).
R.C. Blitz, "Review of the conditions of agricultural growth, by E.Boserup". Journal of Political Economy, 75, 1967.
A. Booth and R. M Sundrum, Labour Absorption in Agriculture, (Oxford,1985).
E. Boserup, The Conditions of Agricultural Growth, (Chicago, 1965).
C. Bould, "Comparative Role of Soil and Leaf Analysis in Crop NutritionCotnrol": in C. R. Coll, Controle de las Nutrition Minerale et de laFertilization des Cultures Mediterraneennes, (Montpellier, 1964).
J.K. Bowers and P. Cheshire, Agriculture, the countryside and landuse, (London, 1983).
I.R. Bowler, "Co-operation: a note on governmental promotion of changein agriculture". Area, 4, 1972.
I.R. Bowler, "Structural change in agriculture", in Pacione (eds.),Progress in Rural Geography, (London, 1983).
H.E. Bracey, Industry and the countryside, (London, 1963).
H. Braverman, Labour and Monopoly Capital, (London, 1974).
F. Braudel, The Mediterranean and the Mediterranean World in the Age ofPhilip II, Vol. 1., (London, 1972).
D.K. Britton, "Some explorations in the analysis of long-term changesin the structure of agriculture". Journal of Agricultural Economics,28, 1977.
620

D.K. Britton and B.E. Hill, Size and Efficiency in Farming(Farnborough, 1975).
R. Bromley and C. Gerry (eds),Small-scale Manufactuiring and Repairs inDakar : A Survey of Market Relatons within the Urban Economy, (London,1979).
C.R. Bryant., "Manufacturing in rural development", in D. F. Walker(eds.), Planning industrial development, (Chichester, 1980).
J. Burnett, Plenty and Want, London, 1979.
J. Burns., "The UK food chain with particular reference to the inter-relations between manufacturers and retailers", Journal of AgriculturalEconomics, 34, 1983.
J. Burns, J. McInery and A. Swinbank (eds.)., The Food Industry : ASummary of Themes, (London, 1983).
C. Barlow, The Natural Rubber Industry. Its Development. Technologyand Economy in Malaysia, (Oxford, 1978).
I.V.E. Cartledge, A history of the Coffee Industry in Papua NewGuinea, (Goroka, 1978).
R. Chambers, Rural development: Putting the Last First, (Harlow,1983).
A.V. Chayanov, The Theory of Peasant Economy, (Homewood, Ill., 1966).
P. M. Chisnall, Strategic Industrial Marketing, (U.K, 1989).
E. Chuta and S. V. Sethuraman (eds)., Rural small-scale industries andemployment in Africa and Asia, (Geneva, 1984).
P. Cloke, "Counterurbanisation: a rural perspective". Geography, 70,1985.
D. Cochrane and G. Orcutt, "Application of Least Squares Regression toRelationships Containing Autocorrelation Error Terms", Journal of theAmerican Statistical Association, Vol. 44, 1949.
W. A. Cohen, The Practice of Marketing Management, (New York, 1988).
M. Cross, New firm formation and regional development, (Farnborough,1981).
D. Curry. The Food War: the European Community and the Battle forWorld Food Markets, (London, 1982).
A. Cutler, B. Hindess, P.Q. Hirst and A. Houssain, Marx's 'Capital' and Capitalism Today Vol I., (London, 1977).
621

J. E. Davidson et.al , "Econometric Modelling of the Aggregate TimeSeries Relationship between Consumers' Expenditure and Income in theUnited Kingdom", The Economic Journal, 88, 1978.
H. Demsetz, "Industry Structure, Market Rivalry and Public Policy",Journal of Law and Economics, 27, 1982.
M. Dobb, Studies in the Development of Capitalism, (London, 1963).
E. Dokopoulou, "Small manufacturing firms and regional development inGreece: patterns and changes". In D. Keeble and E. Weaver (eds), NewFirms and Regional Development in Europe, (London, 1986).
P. Dorner, Land reform. technology, income distribution andemployment, (London, 1973).
P. Dorner, Land Reform and Economic Development, (London, 1972).
P. Doust, Marketing Management - Planning and Control (London, 1986).
P. Doust, Fundamentals of Marketing, (London, 1986).
R. Duncan-Jones, The Economy of the Roman Empire : QuantitativeStudies, (Cambridge, 1974).
A. Erlich, The Soviet Industrialisation Debate 1924-1928, (Cambridge,1960).
J. Farrell, "Moral Hazard as an Entry Barrier", Rand Journal ofEconomics, 17, 1986.
D. Fieldhouse, Unilever Overseas, (London, 1978).
M. J. Finley, The Ancient Economy, (London, 1973).
G. FoVil, Co-operative marketing in European agriculture,(Alders ot, 1982).
L. Franco, "Adjusting to Export Thrusts of Newly IndustrialisingCountries : An Advanced Country Perspective". The Economic Journal,91, June, 1981.
A. G. Frank, Reflections on the World Economic Crisis, (London, 1981).
S. V. Frauendorfer, "Part-Time Farming : A Review of World Literature",World Agricultural Economics and Rural Sociology Abstracts, Vol. 8,Part I, 1966.
A.S. Friedeberg, "Olive-Oil in the EEC. Gift from the Gods or TrojanHorse". Food Policy, Vol. 8. Part 1, February 1983.
C. Furtado, Development and Underdevelopment, (California, 1964).
'622

R. Casson, "Goals and values of farmers". Journal of AgriculturalEconomics, 24 (3), 1973.
A.K. Chose, "The formation of usurious interest rates". Cambridge Journal of Economics, Vol.4, 1980.
M. Giaoutzi, P. Nijkamp and D. Storey (eds.). Small and Medium SizeEnterprises and Regional Development, (London, 1988).
D. Goodman, B. Sorj and J. Wilkinson. From Farming to BiotechnologyA Theory of Agro-Industrial Development, (Oxford, 1987).
D. Goodman and M. Redclift, From Peasant to Proletariat, (Oxford,1981).
P. Gould, "Man Against his Environment : A Game Theoretic Approach",Annals of the Association of American Geographers. 53, 1963.
H. Gravelle and R. Rees, Microeconomics, (London, 1981).
S. A. Greenman, Accounting in Modern Form, (London, 1966).
D. Grigg, The Dynamics of Agricultural Change, (London, 1982).
M. Guida, "Fats and Oils in Italy", Speech given in the AnnualConference of the IFMA-IMACE, Rome, May 1984.
I.F.E. Hamilton (ed.), Industrial Change in Advanced Economies,(Australia, 1987).
L. Hannah, The Rise of the Corporate Economy, (London, 1976).
M. Harrison, "Chayanov and the economics of the Russian peasantry",Journal of Peasant Studies, 2,4, 1975.
J. Harris (ed.), Rural Development, (London, 1982).
H. T. Hartmann and J. Porlingis, "Effect of Different Amounts of WinterChilling Fruitfulness of Several Olive Varieties", Bot. Gazette, 119:102, 1957.
M. Hartmann, W. Henrichsmeyer and P. M. Schmitz, "Political Economy ofthe CAP in the European Community" in Congress Proceedings. 9th WorldCongress. International Economic Association, Athens, 1989.
Y. Hayami and V W. Ruttan, Agricultural Development. An InternationalPerspective, (Baltimore, 1971).
M.J. Healey and B.W. Ilbery (eds.), The Industrialization of theCountryside, (Norwich, 1985).
W. Hildenbrand (eds), Advances in Economic Theory, (Cambridge, 1982).
623

B.E. Hill, The Common Agricultural Policy: past, present and future,(London, 1984).
B. E. Hill, and K. A. Ingersent, Economic Analysis of Agriculture(London, 1977).
P. Hill, Development Economics on Trial. The Anthropological Case fora Prosecution, (Cambridge, 1986).
P. Hill, Studies in rural capitalism in West Africa, (London, 1970).
B.F. Johnston and P. Kilby, Agriculture and Structural Transformation,(New York, 1975).
JURUE, The planning problems of small firms in rural areas, Universityof Aston, (Birmingham, 1982).
N.M. Kay, The Evolving Firm, (London, 1982).
D. Keeble and E. Weyer (eds.), New firms and Regional Development inEurope, (London, 1986).
P. Kilby, Industrialization in an Open Economy, (Cambridge, 1969).
Sung-Lo Kim, Farm Mechanization in East Asia, (New York, 1974).
G. Kitching, Development and Underdevelopment in HistoricalPerspective: Populism. Nationalism and Industrialization (London,1989).
L. Klein and K. Ohkawa, Economic Growth : the Japanese Experience Since the Meiji Era, (Homewood, 1968).
T. Lang and P. Wiggins, "The industrialization of the U.K. foodsystem: from production to consumption". In M. Healey, and B. Ilbery,(eds.), The industrialization of the countryside, (Norwich, 1985).
K.P. Legg, Politics in Modern Greece, (Stanford, 1969).
D. Lehmann (ed.), Agrarian Reform and Agrarian Reformism, (London,1974).
V.I. Lenin, "New Data on the Development of Capitalism inAgriculture", in Collected Works, Vol.22, (London, 1917).
V.I. Lenin, (1899) "The Development of Capitalism in Russia" inCollected Works, Vol.3 (London, 1960).
M. Lipton, "The Theory of the Optimising Peasant" Journal ofDevelopment Studies, 4, 3, p.327-51, 1968.
A.D. Little, "Impact of Technology on the Food Industries" cited in:Impact of Multinational Enterprises on National Scientific andTechnical Capacities. Food Industry, (Paris, 1970).
624

P. Lloyd, A Third Work Proletariat? London, 1983.
D.I.F. Lucey and D.R. Kaldor, Rural industrialization: the impact ofindustrialization on two rural communities in western Ireland, (London,1969).
E. Malefakis, Agrarian Reform and Peasant Revolution in Spain,(U.S.A., 1976).
S.A. Mann, and J.M. Dickinson, "Obstacles to the development of acapitalist agriculture". The Journal of Peasant Studies, 5(4), 1978.
H. Mann. The Social Framework of Agriculture (London, 1976).
T.K. Marsden and D.G. Sykes, "Landownership and farm organization,evolution and change in a capitalist agricultural region".International Journal of Urban and Regional Research, 8, 1984.
K. Marx, Capital, Vol III, (Hamburg, 1894).
K. Marx, (1865) Capital, Vol I, (New York, 1967).
P. Maunder, "Food manufacturing", in P.S. Johnson (ed.) The structureof British Industry, (London, 1980).
B.W. McGowan, Economic life in Ottoman Europe: taxation, trade and thestruggle for land 1600-1800, (London, 1981).
C. Meillassoux, "From production to reproduction". Economy andSociety, Vol I, No.1., 1972.
G.N. Minshull, The New Europe : An Economic Geography of the EEC,(Kent, 1985).
D. Morawetz, "Employment Implications of Industrialization inDeveloping Countries: A Survey", Economic Journal, Vol. 84, 1974.
J.M. Moreno-Martinez (eds), Olive-Oil Technology, (Rome, 1975).
N. Mouzelis, Modern Greece : Facets of Underdevelopment, (London,1978).
H. Newby, Green and Pleasant Land? Social Change in Rural England,(London, 1979).
H. Newby and P. Utting, "Agribusiness in the United Kingdom: socialand political implications". In G.M. Beradi and C.C. Geisler (eds.).The Social Conseauences and Challenges of New AgriculturalTechnologies, (London, 1984).
R.H. Parker, Understanding Company Financial Statements, (Britain,1982).
625

K. Parris and C. Ritson, EEC Oilseed Products Sector and the CommonAgricultural Policy. Centre for European Agricultural Studies,Occassional Papers No.4, (Kent, 1978).
V. Patnaik, "Neo-populism and Marxism: the Chayanorian view of theagrarian question and its fundamental fallacy", Journal of PeasantStudies, 6, 4, 1979.
A. Pearse, Seeds of Plenty. Seeds of Want. Social and Economic Implications of the Green Revolution, (Oxford, 1980).
C. Perez, "Microelectronics, Long Waves; and World Structural Change.New Perspectives for Developing Countries", World Developement, 13(3),1985.
N. Poulantzas, Political Power and Social Classes, (Paris, 1968).
N. Poulantzas, Classes in Contemporary Capitalism, (Paris, 1974).
Al. Rainnie, "Small firms, big problems: the political economy ofsmall businesses". Capital and Class, No.25, 1985.
F.T. Rees, "The EEC and the U.K.'s Cereals Processing Industry". InJ. Burns, J. McInerney and A. Swinbank (eds.): The Food Industry:Economics and Policies, (London, 1983).
M.J. Rao, "Interest rates in backward agriculture". Cambridge Journalof Economics, Vol.4, 1980.
G. Ranis and K. Ohkawa (eds.), Japan and the Developing Countries : AComparative Analysis, (Oxford, 1985).
G. Ranis, "The Role of Institutions in Transition Growth: The EastAsian Newly Industrializing Countries". World Development Vol.17,No.9, SPECIAL ISSUE, September 1989.
J. Robinson, Multinationals and Political Control, (London, 1983).
L. E. Rockley, The Meaning of Balance Sheets and Company Reports,(Essex, 1983).
F.M. Scherer et al., The Economics of Multi-Plant Operation, (London,1975).
H. Schmitz, "Growth Constraints on Small-Scale Manufacturing inDeveloping Countries". World Development, Vo1.10, No.6. 1982.
H. Schmitz, Accumulation and Employment in Small-Scale Manufacturing: Case Studies from Brazil, (London, 1982).
T. Shanin (ed.), Peasants and Peasant Societies : Selected Readings,(Harmondsworth, 1971).
H. Singer, Technologies for Basic Needs, (Geneva, 1977).
626

E. G Smith, "America's Richest Farms and Ranches", Annals of theAssociation of American Geographers, 70, 1980.
P. Sonza and E. Tokman, "The informal urban sector in Latin America".International Labour Review, Vol.114, No.3, 1976.
R. Standish, The first of trees. The story of the Olive, (London,1960).
L.S. Stavrianos, The Balkans since 1453, (New York, 1958).
N. H. Stern and C. J. Bliss, Palanpur: The economy of an IndianVillage, (Oxford, 1982).
J. Stiglitz and F. Mathewson (eds.), New Developments in the Analysisof Market Structure, (Cambridge, 1986).
D.J. Storey, "The Problems Facing New Firms", Journal of ManagementStudies, 22(3), 1985.
Special Report No. 2 "Edible Oils in Italy", Marketing in Europe, 224,July, 1981.
Special Issue in "Third World Industrialization in the 1980s : OpenEconomies in a Closing World" in Journal of Development Studies, 21(1),1984.
D. Swann, The Economics of the Common Market, (London, 1988).
P. Sweezy et.al , From Feudalism to Capitalism. Problems of Transition,(New York, 1976).
A. Swinbank and J. Burns (eds.), The EEC and the Food Industries,(London, 1984):
A. Teichova, Levy-Leboyer and E. Nussbaum (eds.), MultinationalEnterprises in Historical Perspective, (Cambridge, 1986).
S.M. Theofanidis, "The Static Economic Effects of Greece's Entry intothe EEC: the Case of Olive Oil: a Cost Benefit Analysis". EuropeanReview of Agricultural Economics, 6:81, 1979.
J. Thompson, Organisation in Action, (New York, 1967).
H. Thorelli and H. Becker, International marketing Strategy, (New York,1984).
M. Thoughton, "Process and response in the industrialization ofagriculture". In: G. Euyedi and I. Volgyes (eds.) The Effect of ModernAgriculture on Rural Development, (New York, 1982).
J. Tschiersch, Appropriate Mechanization for small farmers inDeveloping Countries, (Germany, 1978).
627

K. Tribe and A. Houssain, Marxism and the Agrarian Question. Vo1.1: German Social Democracy and the Peasantry 1890-1907, (London, 1981).
M. Tsinizels, Groups and Agriculture in the European Community,(London, 1990).
P.W. Turnbull and J.P. Vala (eds.), Strategies for InternationalIndustrial Marketing, (London, 1986).
I. Vogeler, The Myth of the Family Farm: Agribusiness Dominance of USAgriculture, (Colorando, 1981).
S. Watanabe, "Enterpreneurship in small enterprises in Japanesemanufacturing". International Labour Review, Vol.102, No.6, 1970.
H.D. Watts, The large industrial enterprise: some spatial' perspectives, (London, 1980).
A. Williams (ed.), Political and Economic Change in Greece. Italy. Portugal and Spain, (London, 1984).
M. Winsberg, "Concentration and Specialization in U.S. Agriculture,1939-1978". Economic Geography, 56, 1980.
W.I. Zwerman. New Perspectives on Organisation Theory, (London, 1970).
628

In Greek
M. Aligizakis, Processing and packaging of the table olive, (Athens,1982).
S. Amin and K. Vergopoulos, The Question of Capitalism in the RuralSector, (Paris, 1974).
N.E. Anagnostopoulos, The Land Reform of 1922 in Greece, (Athens,1929).
G. Anastasopoulos, History of the Greek Industry 1840-1940, (Athens,1947).
C. Aravanis, "The Greek Islands Heart Study". Proceedings of theThird I-aternational Congress on the Biological Value of Olive Oil,(Hania-Crete, September 1980).
P.S. Avdelidis, The Agricultural Co-operative Movement in Greece,(Athens, 1986).
S. Babanassis and C. Soulas, Greece in the Periphery of DevelopedCountries, (Athens, 1976).
G. Balatsouras, The Olive Tree, (Athens, 1986).
G. Christakis, M. Rordyce and Kurtz. "The biological aspects of oliveoil". In: Proceedings of the Third International Congress on theBiological Value of Olive-Oil, Institute of Hania and IO0C (eds.),(September, 1980).
D. Daniilidis, Modern Greek Society and Economy, (Athens, 1934).
D.I. Delis, The Development of Greek Agriculture, Vol.I and II,(Athens, 1985).
V. Evagellou, Th. Apostolakos and K. Veziris, Analysis of DifferentSectors of Agricultural Industries, (Athens, 1986).
G. Gardikis, The Agricultural Services of Messenia, (Calamata, 1925).
G. Gecos, Notes for a Seminar in Agricultural Cooperatives, (Athens,1983).
T. Giannitsis, The Greek Industry, (Athens, 1983).
Herodotus, "Travels" in Ancient Greek Writers, (Athens, 1976).
L. Kamarinou, Agriculture and Development in Greece, (Athens, 1977).
N. Karabelas, Messenian Letters, (Calamata, 1981).
629

V. Karapostoli, Consumption Patterns in the Greek Rural Sector,(Athens, 1982).
V. Karapostoli, The Economic Transformation of the Greek Rural Sector,(Athens, 1982).
D. Katohianou, Sectoral - Regional Analysis of Greek Manufacturing,
(Athens, 1984).
A. Kiritsakis, The Olive-Oil, (Thessaloniki, 1988).
K.E. Kiukis and L.A. Papakostantinidis, Incentives for regionaldevelopment in E.E.C. countries, exploration of the Greek capabilities,(Athens, 1985).
A. Klemi, The Agricultural Economy of Greece, (Athens, 1960).
J. Kordatos, Pages from the Agrarian Movement of Greece, (Athens,
1964).
J. Kordatos, History of Modern Greece, 5 Vols. (Athens, 1958).
J. Kordatos, Introduction to the History of Greek Capitalism, (Athens,
1930).
V. Kremmidas, Introduction to the History of Modern Greek Society
1700-1821, (Athens, 1976).
G. Kutsumaris, The Structure of the Greek Industry, (Athens, 1963).
N. Leventis and M. Sakellis, Multifragmentation and Effectivity inAgricultural Establishments, (Athens, 1978).
N. Lihnos, The Olive Tree and its Cultivation, (Athens, 1949).
G.I. Mergos, Fixed Capital in Greek Agriculture, (Athens, 1980).
L. Mikros, Different types of oil-mill processes, (Crete, 1973).
D. Miliakos, The Olive Industry of Greece. EEC (Italy) and those countries whose membership applications are under consideration,
(Greece, 1980).
G. Mirtakis, V. Zambounis and S. Psaraki, "Olive Oil, Other Oils andFats", Special edition by ELEOURGIKI, Athens, 1984.
C. Moskof, The National and Social Consciousness in Greece: 1830-1909,
(Thessaloniki, 1972).
M. Negreponti-Delivani, Analysis of the Greek Economy, (Athens, 1981).
M. Nikolinakos, Studies on Greek Capitalism, (Athens, 1976).
630

G. Pahi, K. Karapanou and G. Economiou,the rural sector, (Athens, 1983).
Documents on the problems of
M. Nikolinakou et.al , Strategy for the Developent of the CooperativeSector in Agriculture. (Athens, 1986).
G. Panitsidis, Structural Changes in our rural economy, (Athens,1982).
G. Panitsidis, The consequences on the rural economy from Greece's incorporation into the EEC, (Athens, 1986).
G. Papadopoulos et al, Small Industy, (Athens, 1976).
V. Pissias, Deadlocks in Agricultural Policy, (Athens, 1981).
Plutarch, "Caesar" in Ancient Greek Writers, (Athens, 1976).
M. Psarou, The Sociology of Agricultural Development, (Athens, 1980).
D. Purnaras, History of the Agrarian Case, (Athens, 1960).
D. Psychogios, The Extraction of Surplus from Agriculture, (Athens,1984).
M. Sakelli, Investment behaviour of rural families in Greece, (Athens,1980).
J. Samaras, State and Capital in Greece, (Athens, 1982).
G. Selianakis, "Consequences for the Greek Olive Sector of Spain's andPortugal's Accession into the EEC". Special Edition by ELEOURGIKI,(Athens, 1984).
E. Sfakiotakis, Lessons in Olive Cultivation, (Thessaloniki, 1987).
A. Sideris, Economic History of Greece, (Athens, 1933).
S. Spiliotopoulou, History of the National Bank, (Athens, 1949).
Th.Tsoumas and D. Tasioulas, The State of Ownership and Uses ofAgricultural Land in Greece, (Athens, 1986).
K. Vergopoulos, The Agrarian Problem in Greece: The Issue of theSocial Incorporation of Agriculture, (Athens, 1975).
Y. Xiloyiannis, Annual Report on the Development of the Olive-Oilsector, (Athens, 1982).
X. Zolotas, Agrarian Policy, (Athens, 1966).
N .B. These titles are my own translations; the symbol + whichappears at the end of each chapter indicates referencs inGreek.
631

THESES AND DISSERTATIONS
In English
M. Xekalakis, Implications for the Greek Olive Oil Market of Adoptingthe C.A.P. of the European Economic Community, unpublished Ph.D Thesis,
University of Reading, 1979.
B.U. Uba, The Political Economy of the Nigerian oil-Palm Industry: ACase Study of Eastern Nigeria, 1807-1966, unpublished Ph.D Thesis,Queens University, Kingston, Ontario, 1981.
In Creek
N. G. Mihelakis, Olive Behaviour in Various Irrigation Conditions,
unpublished Ph.D Thesis, Athens School of Agricultural Studies, Athens,1986.
632