The dimensionality of between‐person differences in white matter microstructure in old age
13
r Human Brain Mapping 000:00–00 (2012) r The Dimensionality of Between-Person Differences in White Matter Microstructure in Old Age Martin Lo ¨vde ´n, 1,2,3 * Erika Jonsson Laukka, 1 Anna Rieckmann, 1 Gre ´ goria Kalpouzos, 1 Tie-Qiang Li, 4 Tomas Jonsson, 4 Lars-Olof Wahlund, 5 Laura Fratiglioni, 1,6 and Lars Ba ¨ckman 1 1 Aging Research Center, Karolinska Institutet and Stockholm University, Stockholm, Sweden 2 Center for Lifespan Psychology, Max Planck Institute for Human Development, Berlin, Germany 3 Department of Psychology, Lund University, Lund, Sweden 4 Department of Medical Physics, Karolinska Institutet, Stockholm, Sweden 5 Department of Clinical Geriatrics, Karolinska Institutet, Stockholm, Sweden 6 Stockholm Gerontology Research Center, Stockholm, Sweden r r Abstract: Between-person differences in white matter microstructure may partly generalize across the brain and partly play out differently for distinct tracts. We used diffusion-tensor imaging and struc- tural equation modeling to investigate this issue in a sample of 260 adults aged 60–87 years. Mean fractional anisotropy and mean diffusivity of seven white matter tracts in each hemisphere were quan- tified. Results showed good fit of a model positing that individual differences in white matter micro- structure are structured according to tracts. A general factor, although accounting for variance in the measures, did not adequately represent the individual differences. This indicates the presence of a sub- stantial amount of tract-specific individual differences in white matter microstructure. In addition, individual differences are to a varying degree shared between tracts, indicating that general factors also affect white matter microstructure. Age-related differences in white matter microstructure were present for all tracts. Correlations among tract factors did not generally increase as a function of age, suggesting that aging is not a process with homogenous effects on white matter microstructure across the brain. These findings highlight the need for future research to examine whether relations between white matter microstructure and diverse outcomes are specific or general. Hum Brain Mapp 00:000– 000, 2012. V C 2012 Wiley Periodicals, Inc. Key words: white matter microstructure; individual differences; age differences; structural equation modeling r r Contract grant sponsors: Swedish Council for Working Life and Social Research, Swedish Research Council, Swedish Brain Power, the Regional Agreement on Medical Training and Clinical Research (ALF) Between Stockholm County Council and Karolinska Institutet, an Alexander von Humboldt Research Award, and the af Jochnick Foundation. *Correspondence to: Martin Lo ¨vde ´n, Aging Research Center, Kar- olinska Institutet, Ga ¨vlegatan 16, 113 30 Stockholm, Sweden. E-mail: [email protected] Received for publication 14 June 2011; Revised 30 September 2011; Accepted 19 October 2011 DOI: 10.1002/hbm.21518 Published online in Wiley Online Library (wileyonlinelibrary. com). V C 2012 Wiley Periodicals, Inc.
-
Upload
independent -
Category
Documents
-
view
1 -
download
0
Transcript of The dimensionality of between‐person differences in white matter microstructure in old age
r Human Brain Mapping 000:00–00 (2012) r
The Dimensionality of Between-Person Differencesin White Matter Microstructure in Old Age
Martin Lovden,1,2,3* Erika Jonsson Laukka,1 Anna Rieckmann,1
Gregoria Kalpouzos,1 Tie-Qiang Li,4 Tomas Jonsson,4 Lars-Olof Wahlund,5
Laura Fratiglioni,1,6 and Lars Backman1
1Aging Research Center, Karolinska Institutet and Stockholm University, Stockholm, Sweden2Center for Lifespan Psychology, Max Planck Institute for Human Development, Berlin, Germany
3Department of Psychology, Lund University, Lund, Sweden4Department of Medical Physics, Karolinska Institutet, Stockholm, Sweden
5Department of Clinical Geriatrics, Karolinska Institutet, Stockholm, Sweden6Stockholm Gerontology Research Center, Stockholm, Sweden
r r
Abstract: Between-person differences in white matter microstructure may partly generalize across thebrain and partly play out differently for distinct tracts. We used diffusion-tensor imaging and struc-tural equation modeling to investigate this issue in a sample of 260 adults aged 60–87 years. Meanfractional anisotropy and mean diffusivity of seven white matter tracts in each hemisphere were quan-tified. Results showed good fit of a model positing that individual differences in white matter micro-structure are structured according to tracts. A general factor, although accounting for variance in themeasures, did not adequately represent the individual differences. This indicates the presence of a sub-stantial amount of tract-specific individual differences in white matter microstructure. In addition,individual differences are to a varying degree shared between tracts, indicating that general factorsalso affect white matter microstructure. Age-related differences in white matter microstructure werepresent for all tracts. Correlations among tract factors did not generally increase as a function of age,suggesting that aging is not a process with homogenous effects on white matter microstructure acrossthe brain. These findings highlight the need for future research to examine whether relations betweenwhite matter microstructure and diverse outcomes are specific or general. Hum Brain Mapp 00:000–000, 2012. VC 2012 Wiley Periodicals, Inc.
Keywords: white matter microstructure; individual differences; age differences; structural equationmodeling
r r
Contract grant sponsors: Swedish Council for Working Life andSocial Research, Swedish Research Council, Swedish Brain Power,the Regional Agreement on Medical Training and ClinicalResearch (ALF) Between Stockholm County Council andKarolinska Institutet, an Alexander von Humboldt ResearchAward, and the af Jochnick Foundation.
*Correspondence to: Martin Lovden, Aging Research Center, Kar-olinska Institutet, Gavlegatan 16, 113 30 Stockholm, Sweden.E-mail: [email protected]
Received for publication 14 June 2011; Revised 30 September 2011;Accepted 19 October 2011
DOI: 10.1002/hbm.21518Published online in Wiley Online Library (wileyonlinelibrary.com).
VC 2012 Wiley Periodicals, Inc.
INTRODUCTION
Between-person differences in white matter microstruc-ture may generalize across the brain due to genetic andenvironmental effects that play out in a similar manner fordifferent tracts. However, individual differences may alsobe localized, for example, at the level of specific tracts. Theissue of the dimensionality of between-person differencesin white matter integrity is important for the interpretationof findings based on between-person differences. Forexample, it is common to investigate whether white matterintegrity of a particular a priori defined brain region isrelated to outcomes such as functional brain activity orcognitive performance. If such associations reach signifi-cance, then interpretations are often framed in terms of thefunctional relevance of the investigated white matterregion. Appropriate statistical control for the presence ofshared variance across white matter regions is sometimesapplied. However, when this is not done, such interpreta-tions neglect the possibility that individual differences inthe integrity of the region of interest are associated withintegrity in other regions of the brain and that it is thisshared variance that drives the observed associations[Penke et al., 2010; Salthouse, 2011]. At the other end ofthe spectrum of analytical methods, various whole brainindices of white matter integrity are constructed. Withsuch approaches, the extent to which global measuresadequately represent individual differences in white mat-ter microstructure is unknown. In addition, specific rela-tions between individual tracts or regions and theoutcome of interest are often not investigated in a satisfac-tory manner.
Here, we apply structural equation modeling (SEM) toinvestigate the dimensionality of white matter microstruc-ture in a sample of 260 adults aged 60–87 years. These indi-viduals were measured with diffusion-tensor imaging(DTI), which we used to assess white matter microstructureby quantifying mean diffusivity (MD) as well as fractionalanisotropy (FA) of water diffusion. Mean FA and MD wereextracted from seven tracts of interest in each hemisphere,resulting in 14 observed variables for each DTI metric.These variables were used in the SEM analyses.
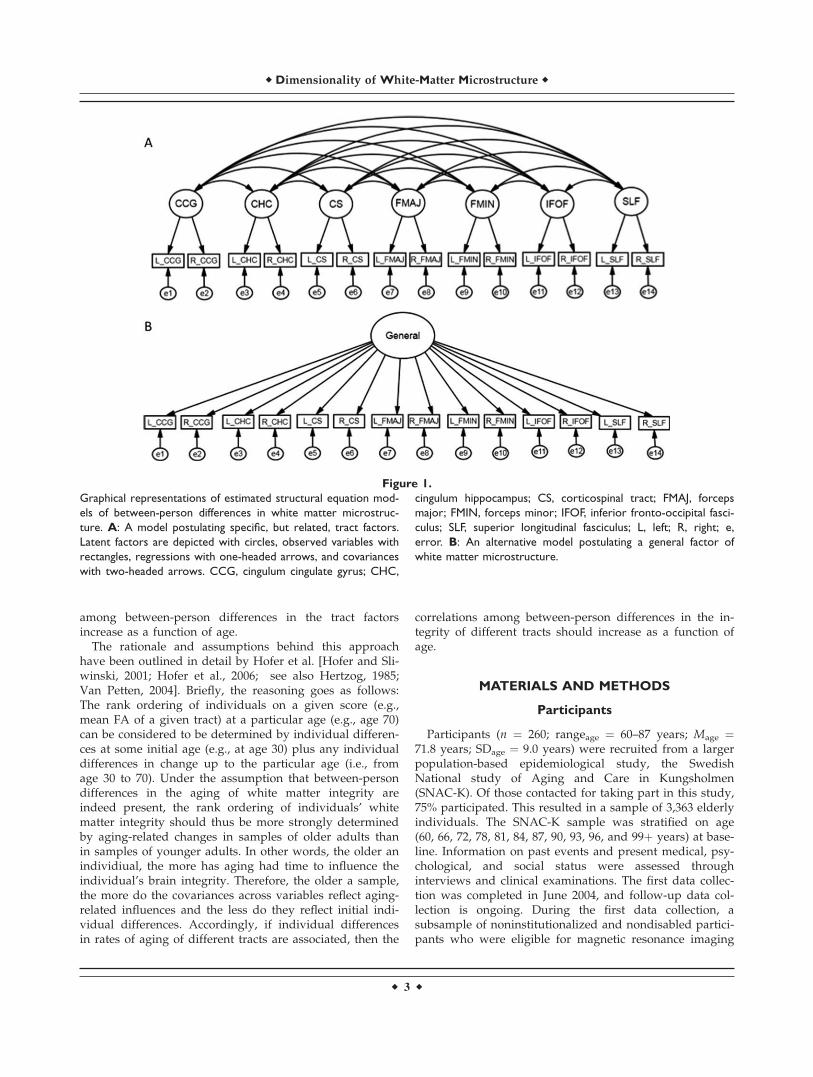
One advantage of SEM is that latent factors can beformed. The variance of such factors represents the sharedindividual differences among the indicators of a factor.Measurement error is simultaneously, but separately, esti-mated. If conclusions are drawn from the estimates at thelatent factor level, the influence of error and the biasinginfluence of differences in measurement error across meas-ures are attenuated. In separate analyses of FA and MD,we used this advantage by specifying a model (Fig. 1A) inwhich tract factors represent individual differences com-mon across hemispheres for a given tract [cf. Raz et al.,2005]. This theoretical model is based on the long-standingneuroanatomical principle of tract-based organization ofconnections among gray matter areas [e.g., Catani andFfytche, 2005; Filley, 2010]. Empirical evidence also sup-
ports such a model of the organization of measures ofwhite matter microstructure acquired with DTI [Li et al.,in press; Wahl et al., 2010]. For example, Wahl et al. [2010]reported that most of the high correlations among meansof FA from a set of 12 tracts were between pairs of homol-ogous tracts in the left and right hemispheres.
Another advantage of SEM is that the accuracy of amodel’s representation of the data (i.e., the variances andcovariances) can be evaluated. We use this feature here toexamine whether the postulated tract-based organizationof individual differences in white matter microstructureprovides an acceptable representation of the data. In addi-tion, alternative representations of the data can be exam-ined, and kept as acceptable alternatives to the originaltheoretical model, or rejected because they constitute unac-ceptable representations of the data. The alternative modelthat we examine here posits that between-person differen-ces generalize across the tracts of interest (Fig. 1B). This isan extreme alternative to the original model postulatingthat individual differences are primarily organized at thetract level, with individual differences that are sharedbetween pairs of tracts. Recent exploratory factor-analyticwork indicates that a general factor explains a substantialamount of variance in white matter microstructure in oldage [Penke et al., 2010; see also Wahl et al., 2010]. Weexpected to replicate this finding, but also to find that ageneral factor alone provides an inadequate representationof the data. In other words, although general individualdifferences may be one important principle, individual dif-ferences that are specific for tracts and pairs of tracts werepredicted to be principles of the organization of whitematter microstructure that cannot be disregarded.
Special variants of the issue of the dimensionality ofbetween-person differences concern the extent to whichsome outcome of interest (e.g., education, disease, andcognition) relates to individual differences in white mat-ter integrity that are specific or general. For example,Penke et al. [2010] examined whether cognitive perform-ance relates to general or regionally specific individualdifferences in white matter microstructure. They foundthat the common variance in white matter microstructureacross several regions was a significant predictor ofperformance.
Here, we investigate the dimensionality of age-relateddifferences in white matter integrity. Previous studieshave observed pronounced age-related differences in sev-eral markers of white matter integrity [Barrick et al., 2010;Burzynska et al., 2010; Madden et al., 2009; O’Sullivanet al., 2001; Raz et al., in press; Schmidt et al., 1993; Sulli-van and Pfefferbaum, 2006; Vernooij et al., 2008; Westlyeet al., 2010]. Addressing the dimensionality of such agedifferences is challenging because chronological age is aspecial outcome variable. That is, mean cross-sectional agetrends of a variable is a fallible proxy of individual differ-ences in change that play out over time [Hofer andSliwinski, 2001; Lindenberger et al., 2011]. We thereforetook the route of investigating whether correlations
r Lovden et al. r
r 2 r
among between-person differences in the tract factorsincrease as a function of age.
The rationale and assumptions behind this approachhave been outlined in detail by Hofer et al. [Hofer and Sli-winski, 2001; Hofer et al., 2006; see also Hertzog, 1985;Van Petten, 2004]. Briefly, the reasoning goes as follows:The rank ordering of individuals on a given score (e.g.,mean FA of a given tract) at a particular age (e.g., age 70)can be considered to be determined by individual differen-ces at some initial age (e.g., at age 30) plus any individualdifferences in change up to the particular age (i.e., fromage 30 to 70). Under the assumption that between-persondifferences in the aging of white matter integrity areindeed present, the rank ordering of individuals’ whitematter integrity should thus be more strongly determinedby aging-related changes in samples of older adults thanin samples of younger adults. In other words, the older anindividiual, the more has aging had time to influence theindividual’s brain integrity. Therefore, the older a sample,the more do the covariances across variables reflect aging-related influences and the less do they reflect initial indi-vidual differences. Accordingly, if individual differencesin rates of aging of different tracts are associated, then the
correlations among between-person differences in the in-tegrity of different tracts should increase as a function ofage.
MATERIALS AND METHODS
Participants
Participants (n ¼ 260; rangeage ¼ 60–87 years; Mage ¼71.8 years; SDage ¼ 9.0 years) were recruited from a largerpopulation-based epidemiological study, the SwedishNational study of Aging and Care in Kungsholmen(SNAC-K). Of those contacted for taking part in this study,75% participated. This resulted in a sample of 3,363 elderlyindividuals. The SNAC-K sample was stratified on age(60, 66, 72, 78, 81, 84, 87, 90, 93, 96, and 99þ years) at base-line. Information on past events and present medical, psy-chological, and social status were assessed throughinterviews and clinical examinations. The first data collec-tion was completed in June 2004, and follow-up data col-lection is ongoing. During the first data collection, asubsample of noninstitutionalized and nondisabled partici-pants who were eligible for magnetic resonance imaging
Figure 1.
Graphical representations of estimated structural equation mod-
els of between-person differences in white matter microstruc-
ture. A: A model postulating specific, but related, tract factors.
Latent factors are depicted with circles, observed variables with
rectangles, regressions with one-headed arrows, and covariances
with two-headed arrows. CCG, cingulum cingulate gyrus; CHC,
cingulum hippocampus; CS, corticospinal tract; FMAJ, forceps
major; FMIN, forceps minor; IFOF, inferior fronto-occipital fasci-
culus; SLF, superior longitudinal fasciculus; L, left; R, right; e,
error. B: An alternative model postulating a general factor of
white matter microstructure.
r Dimensionality of White-Matter Microstructure r
r 3 r
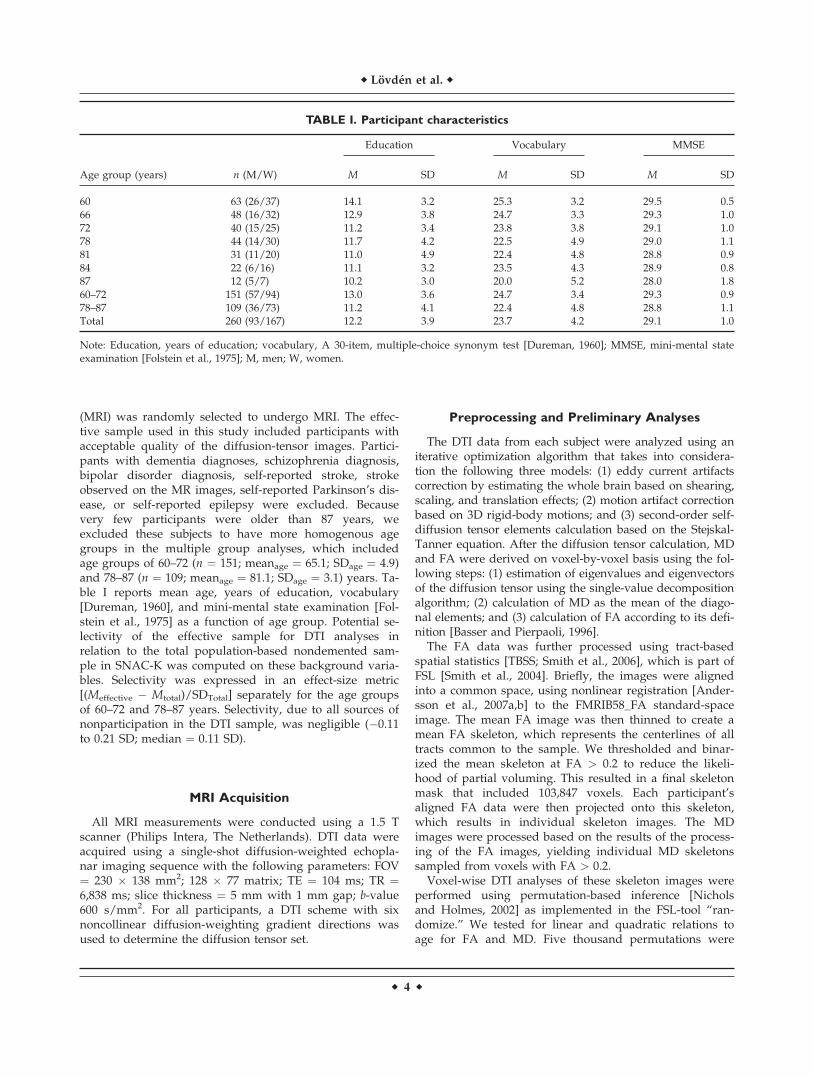
(MRI) was randomly selected to undergo MRI. The effec-tive sample used in this study included participants withacceptable quality of the diffusion-tensor images. Partici-pants with dementia diagnoses, schizophrenia diagnosis,bipolar disorder diagnosis, self-reported stroke, strokeobserved on the MR images, self-reported Parkinson’s dis-ease, or self-reported epilepsy were excluded. Becausevery few participants were older than 87 years, weexcluded these subjects to have more homogenous agegroups in the multiple group analyses, which includedage groups of 60–72 (n ¼ 151; meanage ¼ 65.1; SDage ¼ 4.9)and 78–87 (n ¼ 109; meanage ¼ 81.1; SDage ¼ 3.1) years. Ta-ble I reports mean age, years of education, vocabulary[Dureman, 1960], and mini-mental state examination [Fol-stein et al., 1975] as a function of age group. Potential se-lectivity of the effective sample for DTI analyses inrelation to the total population-based nondemented sam-ple in SNAC-K was computed on these background varia-bles. Selectivity was expressed in an effect-size metric[(Meffective � Mtotal)/SDTotal] separately for the age groupsof 60–72 and 78–87 years. Selectivity, due to all sources ofnonparticipation in the DTI sample, was negligible (�0.11to 0.21 SD; median ¼ 0.11 SD).
MRI Acquisition
All MRI measurements were conducted using a 1.5 Tscanner (Philips Intera, The Netherlands). DTI data wereacquired using a single-shot diffusion-weighted echopla-nar imaging sequence with the following parameters: FOV¼ 230 � 138 mm2; 128 � 77 matrix; TE ¼ 104 ms; TR ¼6,838 ms; slice thickness ¼ 5 mm with 1 mm gap; b-value600 s/mm2. For all participants, a DTI scheme with sixnoncollinear diffusion-weighting gradient directions wasused to determine the diffusion tensor set.
Preprocessing and Preliminary Analyses
The DTI data from each subject were analyzed using aniterative optimization algorithm that takes into considera-tion the following three models: (1) eddy current artifactscorrection by estimating the whole brain based on shearing,scaling, and translation effects; (2) motion artifact correctionbased on 3D rigid-body motions; and (3) second-order self-diffusion tensor elements calculation based on the Stejskal-Tanner equation. After the diffusion tensor calculation, MDand FA were derived on voxel-by-voxel basis using the fol-lowing steps: (1) estimation of eigenvalues and eigenvectorsof the diffusion tensor using the single-value decompositionalgorithm; (2) calculation of MD as the mean of the diago-nal elements; and (3) calculation of FA according to its defi-nition [Basser and Pierpaoli, 1996].
The FA data was further processed using tract-basedspatial statistics [TBSS; Smith et al., 2006], which is part ofFSL [Smith et al., 2004]. Briefly, the images were alignedinto a common space, using nonlinear registration [Ander-sson et al., 2007a,b] to the FMRIB58_FA standard-spaceimage. The mean FA image was then thinned to create amean FA skeleton, which represents the centerlines of alltracts common to the sample. We thresholded and binar-ized the mean skeleton at FA > 0.2 to reduce the likeli-hood of partial voluming. This resulted in a final skeletonmask that included 103,847 voxels. Each participant’saligned FA data were then projected onto this skeleton,which results in individual skeleton images. The MDimages were processed based on the results of the process-ing of the FA images, yielding individual MD skeletonssampled from voxels with FA > 0.2.
Voxel-wise DTI analyses of these skeleton images wereperformed using permutation-based inference [Nicholsand Holmes, 2002] as implemented in the FSL-tool ‘‘ran-domize.’’ We tested for linear and quadratic relations toage for FA and MD. Five thousand permutations were
TABLE I. Participant characteristics
Age group (years) n (M/W)
Education Vocabulary MMSE
M SD M SD M SD
60 63 (26/37) 14.1 3.2 25.3 3.2 29.5 0.566 48 (16/32) 12.9 3.8 24.7 3.3 29.3 1.072 40 (15/25) 11.2 3.4 23.8 3.8 29.1 1.078 44 (14/30) 11.7 4.2 22.5 4.9 29.0 1.181 31 (11/20) 11.0 4.9 22.4 4.8 28.8 0.984 22 (6/16) 11.1 3.2 23.5 4.3 28.9 0.887 12 (5/7) 10.2 3.0 20.0 5.2 28.0 1.860–72 151 (57/94) 13.0 3.6 24.7 3.4 29.3 0.978–87 109 (36/73) 11.2 4.1 22.4 4.8 28.8 1.1Total 260 (93/167) 12.2 3.9 23.7 4.2 29.1 1.0
Note: Education, years of education; vocabulary, A 30-item, multiple-choice synonym test [Dureman, 1960]; MMSE, mini-mental stateexamination [Folstein et al., 1975]; M, men; W, women.
r Lovden et al. r
r 4 r
performed for each contrast. The threshold for statisticalsignificance was P < 0.001, corrected for multiple compari-sons across space and using threshold-free clusterenhancement [Smith and Nichols, 2009].
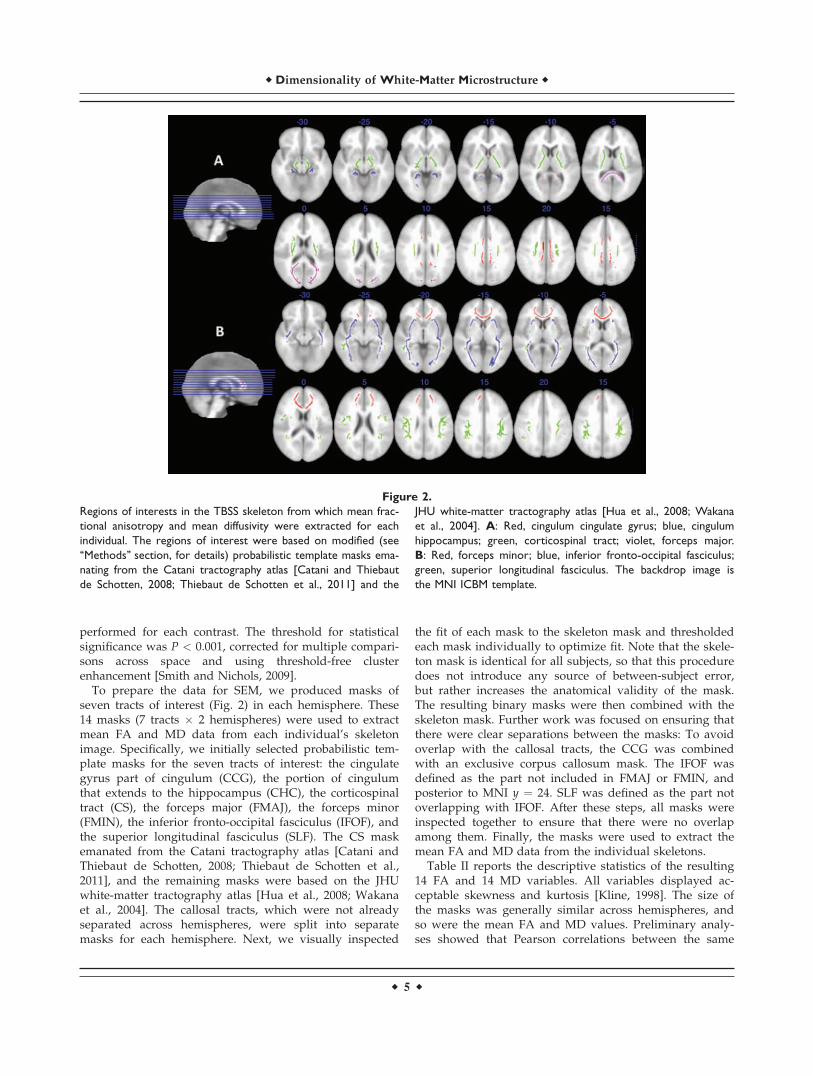
To prepare the data for SEM, we produced masks ofseven tracts of interest (Fig. 2) in each hemisphere. These14 masks (7 tracts � 2 hemispheres) were used to extractmean FA and MD data from each individual’s skeletonimage. Specifically, we initially selected probabilistic tem-plate masks for the seven tracts of interest: the cingulategyrus part of cingulum (CCG), the portion of cingulumthat extends to the hippocampus (CHC), the corticospinaltract (CS), the forceps major (FMAJ), the forceps minor(FMIN), the inferior fronto-occipital fasciculus (IFOF), andthe superior longitudinal fasciculus (SLF). The CS maskemanated from the Catani tractography atlas [Catani andThiebaut de Schotten, 2008; Thiebaut de Schotten et al.,2011], and the remaining masks were based on the JHUwhite-matter tractography atlas [Hua et al., 2008; Wakanaet al., 2004]. The callosal tracts, which were not alreadyseparated across hemispheres, were split into separatemasks for each hemisphere. Next, we visually inspected
the fit of each mask to the skeleton mask and thresholdedeach mask individually to optimize fit. Note that the skele-ton mask is identical for all subjects, so that this proceduredoes not introduce any source of between-subject error,but rather increases the anatomical validity of the mask.The resulting binary masks were then combined with theskeleton mask. Further work was focused on ensuring thatthere were clear separations between the masks: To avoidoverlap with the callosal tracts, the CCG was combinedwith an exclusive corpus callosum mask. The IFOF wasdefined as the part not included in FMAJ or FMIN, andposterior to MNI y ¼ 24. SLF was defined as the part notoverlapping with IFOF. After these steps, all masks wereinspected together to ensure that there were no overlapamong them. Finally, the masks were used to extract themean FA and MD data from the individual skeletons.
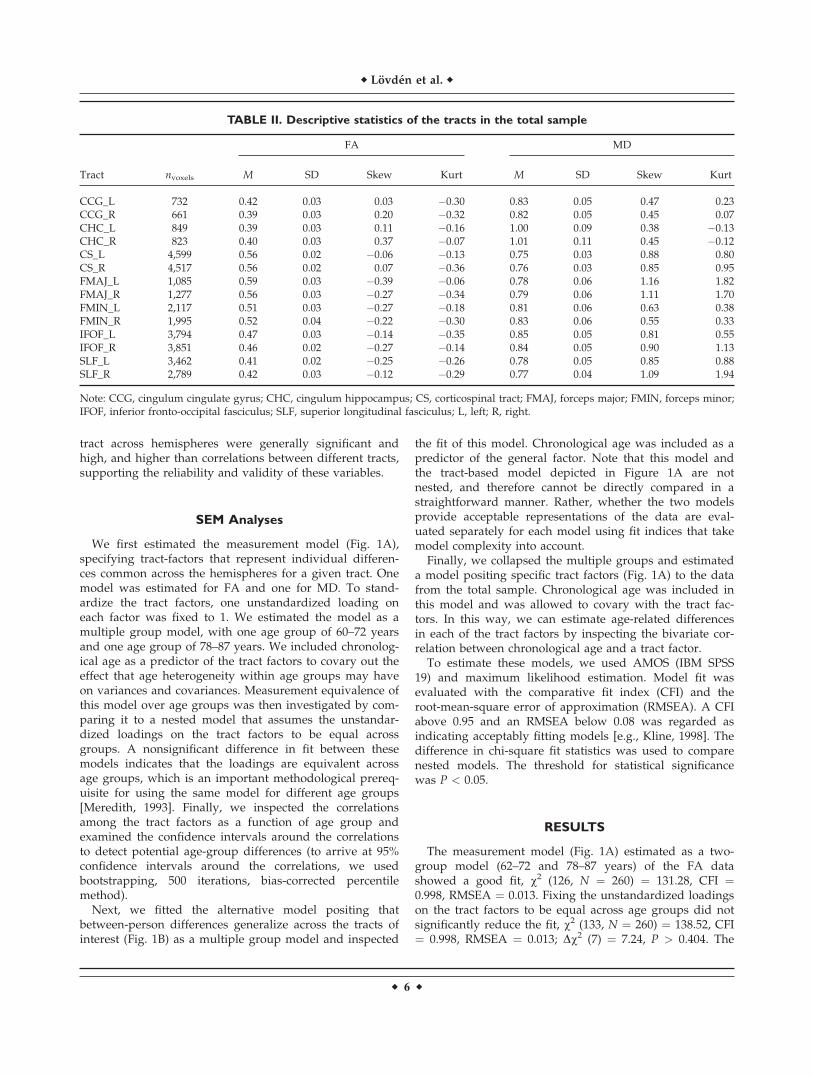
Table II reports the descriptive statistics of the resulting14 FA and 14 MD variables. All variables displayed ac-ceptable skewness and kurtosis [Kline, 1998]. The size ofthe masks was generally similar across hemispheres, andso were the mean FA and MD values. Preliminary analy-ses showed that Pearson correlations between the same
Figure 2.
Regions of interests in the TBSS skeleton from which mean frac-
tional anisotropy and mean diffusivity were extracted for each
individual. The regions of interest were based on modified (see
‘‘Methods’’ section, for details) probabilistic template masks ema-
nating from the Catani tractography atlas [Catani and Thiebaut
de Schotten, 2008; Thiebaut de Schotten et al., 2011] and the
JHU white-matter tractography atlas [Hua et al., 2008; Wakana
et al., 2004]. A: Red, cingulum cingulate gyrus; blue, cingulum
hippocampus; green, corticospinal tract; violet, forceps major.
B: Red, forceps minor; blue, inferior fronto-occipital fasciculus;
green, superior longitudinal fasciculus. The backdrop image is
the MNI ICBM template.
r Dimensionality of White-Matter Microstructure r
r 5 r
tract across hemispheres were generally significant andhigh, and higher than correlations between different tracts,supporting the reliability and validity of these variables.
SEM Analyses
We first estimated the measurement model (Fig. 1A),specifying tract-factors that represent individual differen-ces common across the hemispheres for a given tract. Onemodel was estimated for FA and one for MD. To stand-ardize the tract factors, one unstandardized loading oneach factor was fixed to 1. We estimated the model as amultiple group model, with one age group of 60–72 yearsand one age group of 78–87 years. We included chronolog-ical age as a predictor of the tract factors to covary out theeffect that age heterogeneity within age groups may haveon variances and covariances. Measurement equivalence ofthis model over age groups was then investigated by com-paring it to a nested model that assumes the unstandar-dized loadings on the tract factors to be equal acrossgroups. A nonsignificant difference in fit between thesemodels indicates that the loadings are equivalent acrossage groups, which is an important methodological prereq-uisite for using the same model for different age groups[Meredith, 1993]. Finally, we inspected the correlationsamong the tract factors as a function of age group andexamined the confidence intervals around the correlationsto detect potential age-group differences (to arrive at 95%confidence intervals around the correlations, we usedbootstrapping, 500 iterations, bias-corrected percentilemethod).
Next, we fitted the alternative model positing thatbetween-person differences generalize across the tracts ofinterest (Fig. 1B) as a multiple group model and inspected
the fit of this model. Chronological age was included as apredictor of the general factor. Note that this model andthe tract-based model depicted in Figure 1A are notnested, and therefore cannot be directly compared in astraightforward manner. Rather, whether the two modelsprovide acceptable representations of the data are eval-uated separately for each model using fit indices that takemodel complexity into account.
Finally, we collapsed the multiple groups and estimateda model positing specific tract factors (Fig. 1A) to the datafrom the total sample. Chronological age was included inthis model and was allowed to covary with the tract fac-tors. In this way, we can estimate age-related differencesin each of the tract factors by inspecting the bivariate cor-relation between chronological age and a tract factor.
To estimate these models, we used AMOS (IBM SPSS19) and maximum likelihood estimation. Model fit wasevaluated with the comparative fit index (CFI) and theroot-mean-square error of approximation (RMSEA). A CFIabove 0.95 and an RMSEA below 0.08 was regarded asindicating acceptably fitting models [e.g., Kline, 1998]. Thedifference in chi-square fit statistics was used to comparenested models. The threshold for statistical significancewas P < 0.05.
RESULTS
The measurement model (Fig. 1A) estimated as a two-group model (62–72 and 78–87 years) of the FA datashowed a good fit, v2 (126, N ¼ 260) ¼ 131.28, CFI ¼0.998, RMSEA ¼ 0.013. Fixing the unstandardized loadingson the tract factors to be equal across age groups did notsignificantly reduce the fit, v2 (133, N ¼ 260) ¼ 138.52, CFI¼ 0.998, RMSEA ¼ 0.013; Dv2 (7) ¼ 7.24, P > 0.404. The
TABLE II. Descriptive statistics of the tracts in the total sample
Tract nvoxels
FA MD
M SD Skew Kurt M SD Skew Kurt
CCG_L 732 0.42 0.03 0.03 �0.30 0.83 0.05 0.47 0.23CCG_R 661 0.39 0.03 0.20 �0.32 0.82 0.05 0.45 0.07CHC_L 849 0.39 0.03 0.11 �0.16 1.00 0.09 0.38 �0.13CHC_R 823 0.40 0.03 0.37 �0.07 1.01 0.11 0.45 �0.12CS_L 4,599 0.56 0.02 �0.06 �0.13 0.75 0.03 0.88 0.80CS_R 4,517 0.56 0.02 0.07 �0.36 0.76 0.03 0.85 0.95FMAJ_L 1,085 0.59 0.03 �0.39 �0.06 0.78 0.06 1.16 1.82FMAJ_R 1,277 0.56 0.03 �0.27 �0.34 0.79 0.06 1.11 1.70FMIN_L 2,117 0.51 0.03 �0.27 �0.18 0.81 0.06 0.63 0.38FMIN_R 1,995 0.52 0.04 �0.22 �0.30 0.83 0.06 0.55 0.33IFOF_L 3,794 0.47 0.03 �0.14 �0.35 0.85 0.05 0.81 0.55IFOF_R 3,851 0.46 0.02 �0.27 �0.14 0.84 0.05 0.90 1.13SLF_L 3,462 0.41 0.02 �0.25 �0.26 0.78 0.05 0.85 0.88SLF_R 2,789 0.42 0.03 �0.12 �0.29 0.77 0.04 1.09 1.94
Note: CCG, cingulum cingulate gyrus; CHC, cingulum hippocampus; CS, corticospinal tract; FMAJ, forceps major; FMIN, forceps minor;IFOF, inferior fronto-occipital fasciculus; SLF, superior longitudinal fasciculus; L, left; R, right.
r Lovden et al. r
r 6 r
same model for MD also showed an acceptable fit, v2 (126,N ¼ 260) ¼ 277.49, CFI ¼ 0.953, RMSEA ¼ 0.068, and amodel with the unstandardized loadings on the tract fac-tors estimated to be equal across age groups again did notworsen the fit, v2 (133, N ¼ 260) ¼ 284.28, CFI ¼ 0.953,RMSEA ¼ 0.066; Dv2 (7) ¼ 6.79, P > 0.451. Thus, themodel is an acceptable representation of both the FA andMD data, and metric measurement invariance across ageis an acceptable assumption.
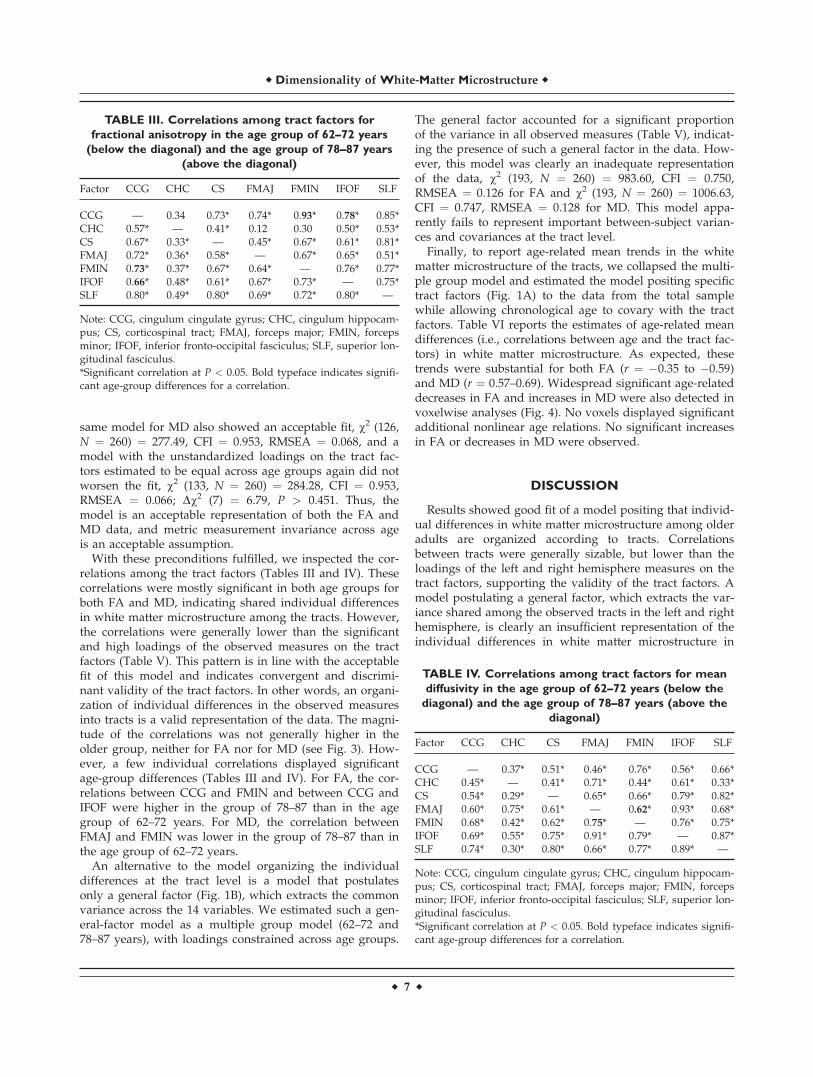
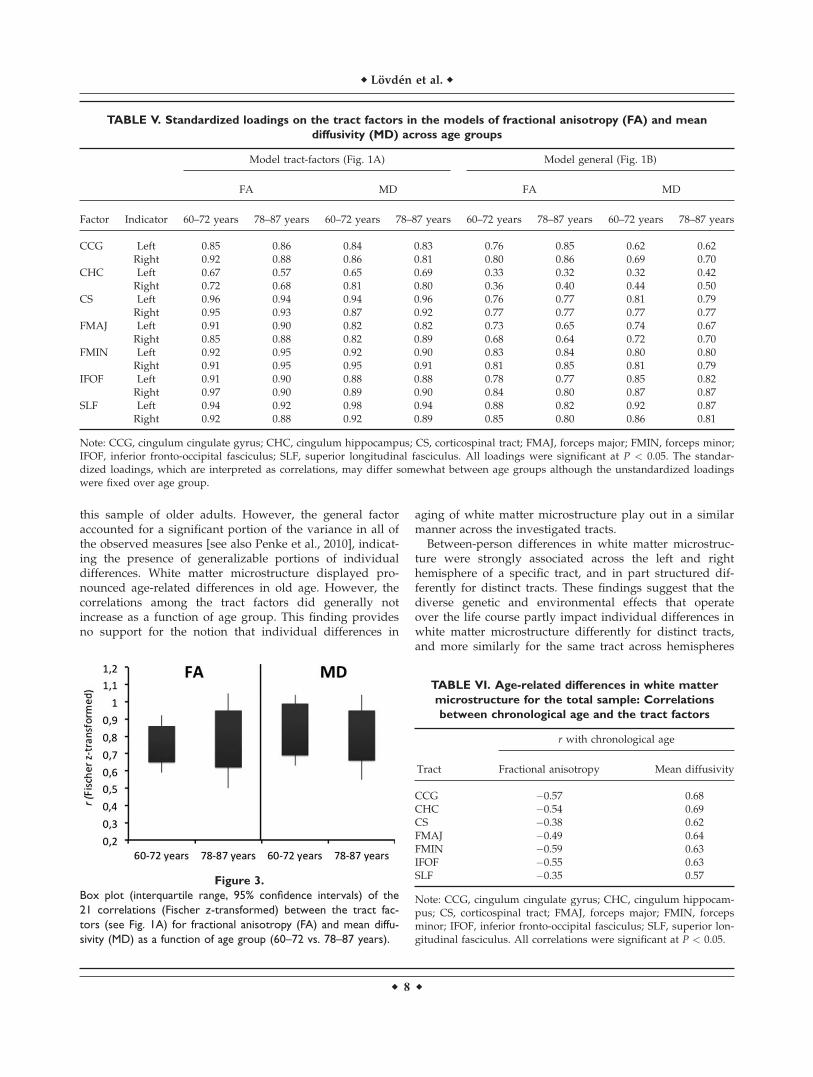
With these preconditions fulfilled, we inspected the cor-relations among the tract factors (Tables III and IV). Thesecorrelations were mostly significant in both age groups forboth FA and MD, indicating shared individual differencesin white matter microstructure among the tracts. However,the correlations were generally lower than the significantand high loadings of the observed measures on the tractfactors (Table V). This pattern is in line with the acceptablefit of this model and indicates convergent and discrimi-nant validity of the tract factors. In other words, an organi-zation of individual differences in the observed measuresinto tracts is a valid representation of the data. The magni-tude of the correlations was not generally higher in theolder group, neither for FA nor for MD (see Fig. 3). How-ever, a few individual correlations displayed significantage-group differences (Tables III and IV). For FA, the cor-relations between CCG and FMIN and between CCG andIFOF were higher in the group of 78–87 than in the agegroup of 62–72 years. For MD, the correlation betweenFMAJ and FMIN was lower in the group of 78–87 than inthe age group of 62–72 years.
An alternative to the model organizing the individualdifferences at the tract level is a model that postulatesonly a general factor (Fig. 1B), which extracts the commonvariance across the 14 variables. We estimated such a gen-eral-factor model as a multiple group model (62–72 and78–87 years), with loadings constrained across age groups.
The general factor accounted for a significant proportionof the variance in all observed measures (Table V), indicat-ing the presence of such a general factor in the data. How-ever, this model was clearly an inadequate representationof the data, v2 (193, N ¼ 260) ¼ 983.60, CFI ¼ 0.750,RMSEA ¼ 0.126 for FA and v2 (193, N ¼ 260) ¼ 1006.63,CFI ¼ 0.747, RMSEA ¼ 0.128 for MD. This model appa-rently fails to represent important between-subject varian-ces and covariances at the tract level.
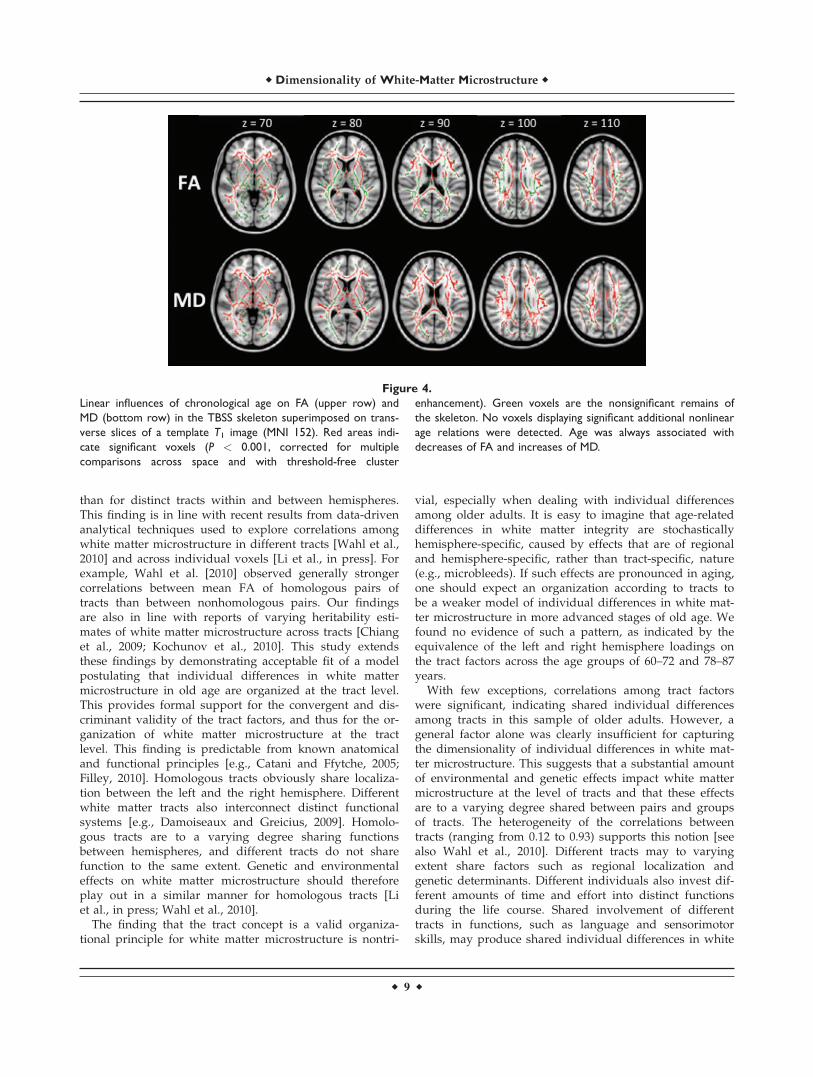
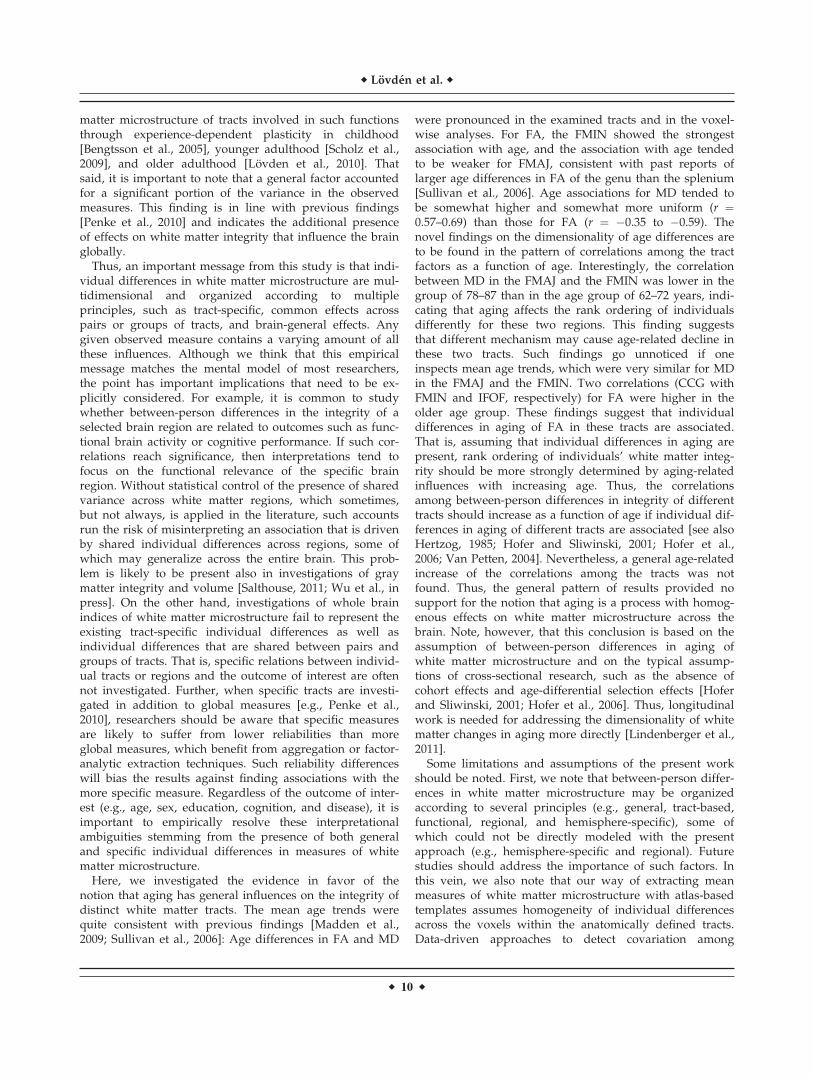
Finally, to report age-related mean trends in the whitematter microstructure of the tracts, we collapsed the multi-ple group model and estimated the model positing specifictract factors (Fig. 1A) to the data from the total samplewhile allowing chronological age to covary with the tractfactors. Table VI reports the estimates of age-related meandifferences (i.e., correlations between age and the tract fac-tors) in white matter microstructure. As expected, thesetrends were substantial for both FA (r ¼ �0.35 to �0.59)and MD (r ¼ 0.57–0.69). Widespread significant age-relateddecreases in FA and increases in MD were also detected invoxelwise analyses (Fig. 4). No voxels displayed significantadditional nonlinear age relations. No significant increasesin FA or decreases in MD were observed.
DISCUSSION
Results showed good fit of a model positing that individ-ual differences in white matter microstructure among olderadults are organized according to tracts. Correlationsbetween tracts were generally sizable, but lower than theloadings of the left and right hemisphere measures on thetract factors, supporting the validity of the tract factors. Amodel postulating a general factor, which extracts the var-iance shared among the observed tracts in the left and righthemisphere, is clearly an insufficient representation of theindividual differences in white matter microstructure in
TABLE IV. Correlations among tract factors for mean
diffusivity in the age group of 62–72 years (below the
diagonal) and the age group of 78–87 years (above the
diagonal)
Factor CCG CHC CS FMAJ FMIN IFOF SLF
CCG — 0.37* 0.51* 0.46* 0.76* 0.56* 0.66*CHC 0.45* — 0.41* 0.71* 0.44* 0.61* 0.33*CS 0.54* 0.29* — 0.65* 0.66* 0.79* 0.82*FMAJ 0.60* 0.75* 0.61* — 0.62* 0.93* 0.68*FMIN 0.68* 0.42* 0.62* 0.75* — 0.76* 0.75*IFOF 0.69* 0.55* 0.75* 0.91* 0.79* — 0.87*SLF 0.74* 0.30* 0.80* 0.66* 0.77* 0.89* —
Note: CCG, cingulum cingulate gyrus; CHC, cingulum hippocam-pus; CS, corticospinal tract; FMAJ, forceps major; FMIN, forcepsminor; IFOF, inferior fronto-occipital fasciculus; SLF, superior lon-gitudinal fasciculus.*Significant correlation at P < 0.05. Bold typeface indicates signifi-cant age-group differences for a correlation.
TABLE III. Correlations among tract factors for
fractional anisotropy in the age group of 62–72 years
(below the diagonal) and the age group of 78–87 years
(above the diagonal)
Factor CCG CHC CS FMAJ FMIN IFOF SLF
CCG — 0.34 0.73* 0.74* 0.93* 0.78* 0.85*CHC 0.57* — 0.41* 0.12 0.30 0.50* 0.53*CS 0.67* 0.33* — 0.45* 0.67* 0.61* 0.81*FMAJ 0.72* 0.36* 0.58* — 0.67* 0.65* 0.51*FMIN 0.73* 0.37* 0.67* 0.64* — 0.76* 0.77*IFOF 0.66* 0.48* 0.61* 0.67* 0.73* — 0.75*SLF 0.80* 0.49* 0.80* 0.69* 0.72* 0.80* —
Note: CCG, cingulum cingulate gyrus; CHC, cingulum hippocam-pus; CS, corticospinal tract; FMAJ, forceps major; FMIN, forcepsminor; IFOF, inferior fronto-occipital fasciculus; SLF, superior lon-gitudinal fasciculus.*Significant correlation at P < 0.05. Bold typeface indicates signifi-cant age-group differences for a correlation.
r Dimensionality of White-Matter Microstructure r
r 7 r
this sample of older adults. However, the general factoraccounted for a significant portion of the variance in all ofthe observed measures [see also Penke et al., 2010], indicat-ing the presence of generalizable portions of individualdifferences. White matter microstructure displayed pro-nounced age-related differences in old age. However, thecorrelations among the tract factors did generally notincrease as a function of age group. This finding providesno support for the notion that individual differences in
aging of white matter microstructure play out in a similarmanner across the investigated tracts.
Between-person differences in white matter microstruc-ture were strongly associated across the left and righthemisphere of a specific tract, and in part structured dif-ferently for distinct tracts. These findings suggest that thediverse genetic and environmental effects that operateover the life course partly impact individual differences inwhite matter microstructure differently for distinct tracts,and more similarly for the same tract across hemispheres
Figure 3.
Box plot (interquartile range, 95% confidence intervals) of the
21 correlations (Fischer z-transformed) between the tract fac-
tors (see Fig. 1A) for fractional anisotropy (FA) and mean diffu-
sivity (MD) as a function of age group (60–72 vs. 78–87 years).
TABLE VI. Age-related differences in white matter
microstructure for the total sample: Correlations
between chronological age and the tract factors
Tract
r with chronological age
Fractional anisotropy Mean diffusivity
CCG �0.57 0.68CHC �0.54 0.69CS �0.38 0.62FMAJ �0.49 0.64FMIN �0.59 0.63IFOF �0.55 0.63SLF �0.35 0.57
Note: CCG, cingulum cingulate gyrus; CHC, cingulum hippocam-pus; CS, corticospinal tract; FMAJ, forceps major; FMIN, forcepsminor; IFOF, inferior fronto-occipital fasciculus; SLF, superior lon-gitudinal fasciculus. All correlations were significant at P < 0.05.
TABLE V. Standardized loadings on the tract factors in the models of fractional anisotropy (FA) and mean
diffusivity (MD) across age groups
Model tract-factors (Fig. 1A) Model general (Fig. 1B)
FA MD FA MD
Factor Indicator 60–72 years 78–87 years 60–72 years 78–87 years 60–72 years 78–87 years 60–72 years 78–87 years
CCG Left 0.85 0.86 0.84 0.83 0.76 0.85 0.62 0.62Right 0.92 0.88 0.86 0.81 0.80 0.86 0.69 0.70
CHC Left 0.67 0.57 0.65 0.69 0.33 0.32 0.32 0.42Right 0.72 0.68 0.81 0.80 0.36 0.40 0.44 0.50
CS Left 0.96 0.94 0.94 0.96 0.76 0.77 0.81 0.79Right 0.95 0.93 0.87 0.92 0.77 0.77 0.77 0.77
FMAJ Left 0.91 0.90 0.82 0.82 0.73 0.65 0.74 0.67Right 0.85 0.88 0.82 0.89 0.68 0.64 0.72 0.70
FMIN Left 0.92 0.95 0.92 0.90 0.83 0.84 0.80 0.80Right 0.91 0.95 0.95 0.91 0.81 0.85 0.81 0.79
IFOF Left 0.91 0.90 0.88 0.88 0.78 0.77 0.85 0.82Right 0.97 0.90 0.89 0.90 0.84 0.80 0.87 0.87
SLF Left 0.94 0.92 0.98 0.94 0.88 0.82 0.92 0.87Right 0.92 0.88 0.92 0.89 0.85 0.80 0.86 0.81
Note: CCG, cingulum cingulate gyrus; CHC, cingulum hippocampus; CS, corticospinal tract; FMAJ, forceps major; FMIN, forceps minor;IFOF, inferior fronto-occipital fasciculus; SLF, superior longitudinal fasciculus. All loadings were significant at P < 0.05. The standar-dized loadings, which are interpreted as correlations, may differ somewhat between age groups although the unstandardized loadingswere fixed over age group.
r Lovden et al. r
r 8 r
than for distinct tracts within and between hemispheres.This finding is in line with recent results from data-drivenanalytical techniques used to explore correlations amongwhite matter microstructure in different tracts [Wahl et al.,2010] and across individual voxels [Li et al., in press]. Forexample, Wahl et al. [2010] observed generally strongercorrelations between mean FA of homologous pairs oftracts than between nonhomologous pairs. Our findingsare also in line with reports of varying heritability esti-mates of white matter microstructure across tracts [Chianget al., 2009; Kochunov et al., 2010]. This study extendsthese findings by demonstrating acceptable fit of a modelpostulating that individual differences in white mattermicrostructure in old age are organized at the tract level.This provides formal support for the convergent and dis-criminant validity of the tract factors, and thus for the or-ganization of white matter microstructure at the tractlevel. This finding is predictable from known anatomicaland functional principles [e.g., Catani and Ffytche, 2005;Filley, 2010]. Homologous tracts obviously share localiza-tion between the left and the right hemisphere. Differentwhite matter tracts also interconnect distinct functionalsystems [e.g., Damoiseaux and Greicius, 2009]. Homolo-gous tracts are to a varying degree sharing functionsbetween hemispheres, and different tracts do not sharefunction to the same extent. Genetic and environmentaleffects on white matter microstructure should thereforeplay out in a similar manner for homologous tracts [Liet al., in press; Wahl et al., 2010].
The finding that the tract concept is a valid organiza-tional principle for white matter microstructure is nontri-
vial, especially when dealing with individual differencesamong older adults. It is easy to imagine that age-relateddifferences in white matter integrity are stochasticallyhemisphere-specific, caused by effects that are of regionaland hemisphere-specific, rather than tract-specific, nature(e.g., microbleeds). If such effects are pronounced in aging,one should expect an organization according to tracts tobe a weaker model of individual differences in white mat-ter microstructure in more advanced stages of old age. Wefound no evidence of such a pattern, as indicated by theequivalence of the left and right hemisphere loadings onthe tract factors across the age groups of 60–72 and 78–87years.
With few exceptions, correlations among tract factorswere significant, indicating shared individual differencesamong tracts in this sample of older adults. However, ageneral factor alone was clearly insufficient for capturingthe dimensionality of individual differences in white mat-ter microstructure. This suggests that a substantial amountof environmental and genetic effects impact white mattermicrostructure at the level of tracts and that these effectsare to a varying degree shared between pairs and groupsof tracts. The heterogeneity of the correlations betweentracts (ranging from 0.12 to 0.93) supports this notion [seealso Wahl et al., 2010]. Different tracts may to varyingextent share factors such as regional localization andgenetic determinants. Different individuals also invest dif-ferent amounts of time and effort into distinct functionsduring the life course. Shared involvement of differenttracts in functions, such as language and sensorimotorskills, may produce shared individual differences in white
Figure 4.
Linear influences of chronological age on FA (upper row) and
MD (bottom row) in the TBSS skeleton superimposed on trans-
verse slices of a template T1 image (MNI 152). Red areas indi-
cate significant voxels (P < 0.001, corrected for multiple
comparisons across space and with threshold-free cluster
enhancement). Green voxels are the nonsignificant remains of
the skeleton. No voxels displaying significant additional nonlinear
age relations were detected. Age was always associated with
decreases of FA and increases of MD.
r Dimensionality of White-Matter Microstructure r
r 9 r
matter microstructure of tracts involved in such functionsthrough experience-dependent plasticity in childhood[Bengtsson et al., 2005], younger adulthood [Scholz et al.,2009], and older adulthood [Lovden et al., 2010]. Thatsaid, it is important to note that a general factor accountedfor a significant portion of the variance in the observedmeasures. This finding is in line with previous findings[Penke et al., 2010] and indicates the additional presenceof effects on white matter integrity that influence the brainglobally.
Thus, an important message from this study is that indi-vidual differences in white matter microstructure are mul-tidimensional and organized according to multipleprinciples, such as tract-specific, common effects acrosspairs or groups of tracts, and brain-general effects. Anygiven observed measure contains a varying amount of allthese influences. Although we think that this empiricalmessage matches the mental model of most researchers,the point has important implications that need to be ex-plicitly considered. For example, it is common to studywhether between-person differences in the integrity of aselected brain region are related to outcomes such as func-tional brain activity or cognitive performance. If such cor-relations reach significance, then interpretations tend tofocus on the functional relevance of the specific brainregion. Without statistical control of the presence of sharedvariance across white matter regions, which sometimes,but not always, is applied in the literature, such accountsrun the risk of misinterpreting an association that is drivenby shared individual differences across regions, some ofwhich may generalize across the entire brain. This prob-lem is likely to be present also in investigations of graymatter integrity and volume [Salthouse, 2011; Wu et al., inpress]. On the other hand, investigations of whole brainindices of white matter microstructure fail to represent theexisting tract-specific individual differences as well asindividual differences that are shared between pairs andgroups of tracts. That is, specific relations between individ-ual tracts or regions and the outcome of interest are oftennot investigated. Further, when specific tracts are investi-gated in addition to global measures [e.g., Penke et al.,2010], researchers should be aware that specific measuresare likely to suffer from lower reliabilities than moreglobal measures, which benefit from aggregation or factor-analytic extraction techniques. Such reliability differenceswill bias the results against finding associations with themore specific measure. Regardless of the outcome of inter-est (e.g., age, sex, education, cognition, and disease), it isimportant to empirically resolve these interpretationalambiguities stemming from the presence of both generaland specific individual differences in measures of whitematter microstructure.
Here, we investigated the evidence in favor of thenotion that aging has general influences on the integrity ofdistinct white matter tracts. The mean age trends werequite consistent with previous findings [Madden et al.,2009; Sullivan et al., 2006]: Age differences in FA and MD
were pronounced in the examined tracts and in the voxel-wise analyses. For FA, the FMIN showed the strongestassociation with age, and the association with age tendedto be weaker for FMAJ, consistent with past reports oflarger age differences in FA of the genu than the splenium[Sullivan et al., 2006]. Age associations for MD tended tobe somewhat higher and somewhat more uniform (r ¼0.57–0.69) than those for FA (r ¼ �0.35 to �0.59). Thenovel findings on the dimensionality of age differences areto be found in the pattern of correlations among the tractfactors as a function of age. Interestingly, the correlationbetween MD in the FMAJ and the FMIN was lower in thegroup of 78–87 than in the age group of 62–72 years, indi-cating that aging affects the rank ordering of individualsdifferently for these two regions. This finding suggeststhat different mechanism may cause age-related decline inthese two tracts. Such findings go unnoticed if oneinspects mean age trends, which were very similar for MDin the FMAJ and the FMIN. Two correlations (CCG withFMIN and IFOF, respectively) for FA were higher in theolder age group. These findings suggest that individualdifferences in aging of FA in these tracts are associated.That is, assuming that individual differences in aging arepresent, rank ordering of individuals’ white matter integ-rity should be more strongly determined by aging-relatedinfluences with increasing age. Thus, the correlationsamong between-person differences in integrity of differenttracts should increase as a function of age if individual dif-ferences in aging of different tracts are associated [see alsoHertzog, 1985; Hofer and Sliwinski, 2001; Hofer et al.,2006; Van Petten, 2004]. Nevertheless, a general age-relatedincrease of the correlations among the tracts was notfound. Thus, the general pattern of results provided nosupport for the notion that aging is a process with homog-enous effects on white matter microstructure across thebrain. Note, however, that this conclusion is based on theassumption of between-person differences in aging ofwhite matter microstructure and on the typical assump-tions of cross-sectional research, such as the absence ofcohort effects and age-differential selection effects [Hoferand Sliwinski, 2001; Hofer et al., 2006]. Thus, longitudinalwork is needed for addressing the dimensionality of whitematter changes in aging more directly [Lindenberger et al.,2011].
Some limitations and assumptions of the present workshould be noted. First, we note that between-person differ-ences in white matter microstructure may be organizedaccording to several principles (e.g., general, tract-based,functional, regional, and hemisphere-specific), some ofwhich could not be directly modeled with the presentapproach (e.g., hemisphere-specific and regional). Futurestudies should address the importance of such factors. Inthis vein, we also note that our way of extracting meanmeasures of white matter microstructure with atlas-basedtemplates assumes homogeneity of individual differencesacross the voxels within the anatomically defined tracts.Data-driven approaches to detect covariation among
r Lovden et al. r
r 10 r
voxels suggest that the strongest FA correlations are foundamong voxels in anatomically discernible tracts and tractsegments [Li et al., in press]. These findings partly supportthe homogeneity assumption. Nevertheless, due to varia-tion in the degree of crossing fibers, histological propertieswithin a tract, and potential individual and age-relateddifferences in such variability, this assumption may not bevalid across an entire anatomically-defined tract. Data-driven approaches to define white matter regions with ho-mogeneity of individual differences [Groves et al., 2011; Liet al., in press] are promising future avenues for avoidingthis assumption. On the other hand, the good fit of themodel postulating tract factors and the high correlationswithin a specific tract across hemispheres indicate highreliability and validity of the measures, and of the way,we preprocessed the data and extracted the tracts of inter-est. Thus, whereas our approach may not capture impor-tant sub-variability within the tracts, it does capturesystematic variability at the level of tracts, indicating thatthis is one important dimension of between-person differ-ences in white matter microstructure.
Second, we note that the DTI measurements were not ofmore modern quality, which is a reflection of the timepoint of collecting the data. The quality of the images mayhave resulted in suboptimal signal-to-noise ratio and madeit impossible to apply tractography. Although forminglatent variables attenuated the influence of error variance,the large and anisotropic voxels may have introduced par-tial volume effects (gray/white mixture) that could not becompletely accounted for by the TBSS processing. Thismay have introduced partial volume influences on themeasures of white matter microstructure that may system-atically vary across age and tracts. Regardless of the qual-ity of the DTI, future studies may need to take volumedifferences into account to arrive at better estimates of agedifferences in white matter microstructure [e.g., Bastinet al., 2010; Vernooij et al., 2008]. That said, the effect ofpartial volume averaging across tracts was however mini-mized in this study by ensuring that there was no voxeloverlap among tracts and by selecting tracts of interestthat were well separated.
Finally, we note that generalization of the present resultsis restricted to old age. In addition, the lack of a youngcomparison group may limit the conclusion related to thedimensionality of individual differences in the aging ofwhite matter microstructure. However, age-related differ-ences in white matter microstructure were pronounced inour sample of older adults. Moreover, previous studies[e.g., Westlye et al., 2010] show that age-related differencesin white matter microstructure accelerate after the age of60. Thus, this study captures well the period of the adultlifespan where most of the age-related action in white mat-ter microstructure occurs. Nevertheless, future studiesshould include a lifespan sample to extend the generalityof the current findings. Future studies should also examinethe potentially moderating influences of vascular risk[Burgmans et al., 2010; Kennedy and Raz, 2009], atrophy
[Bastin et al., 2010; Vernooij et al., 2008], and lesion forma-tion [Vernooij et al., 2008] on the dimensionality ofbetween-person differences in white mattermicrostructure.
We conclude that individual differences in white mattermicrostructure among older adults are organized accord-ing to multiple principles. For any given measure, severalcomponents of individual differences will be present.Future research may profit from applying methods suita-ble for disentangling general and specific influences, suchas those used in intelligence [Carroll, 1993] and cognitive-aging research [e.g., Hofer and Sliwinski, 2001; Hoferet al., 2006; Lindenberger and Ghisletta, 2009; Salthouse,2011]. SEM offers one attractive route, which enables theformation of latent factors that attenuate the influence oferror and forces the researcher to explicate the measure-ment model of individual differences. Under optimal sit-uations, SEM may also be used for simultaneouslyextracting general and specific variance components at thelatent level [Schmiedek and Li, 2004]. When SEM is com-bined with multiple regression approaches, predicted rela-tions between white matter microstructure and outcomesof interest can be empirically examined to bolster specificinterpretations of findings. For any given outcome (e.g.,education, cognition, and disease), it is an empirical issuewhether relations are specific to certain white matter tractsor rather reflect general influences. Here, we reported thenovel finding that correlations among white matter micro-structure in distinct tracts do not generally increase fromearly to late phases of older adulthood. This finding pro-vides indirect evidence suggesting that aging of whitematter microstructure is not a process that plays out in asimilar manner across the brain. Longitudinal work isneeded to corroborate these findings.
ACKNOWLEDGMENTS
This research has made use of the SMILE medical imag-ing laboratory at Karolinska University Hospital, Stock-holm, Sweden. We thank Florian Schmiedek for statisticaladvice and all research assistants in SNAC-K.
REFERENCES
Andersson JLR, Jenkinson M, Smith S (2007a): Non-linear registra-tion, aka Spatial normalisation. FMRIB Technical ReportTR07JA2. Available at: http://www.fmrib.ox.ac.uk/analysis/techrep.
Andersson JLR, Jenkinson M, Smith S (2007b): Nonlinear optimi-sation. FMRIB Technical Report TR07JA1. Available at: http://www.fmrib.ox.ac.uk/analysis/techrep.
Barrick TR, Charlton RA, Clark CA, Markus HS (2010): Whitematter structural decline in normal ageing: A prospective lon-gitudinal study using tract-based spatial statistics. Neuroimage51:565–577.
r Dimensionality of White-Matter Microstructure r
r 11 r
Basser PJ, Pierpaoli C (1996): Microstructural and physiologicalfeatures of tissues elucidated by quantitiative-diffusion-tensorMRI. J Magn Res 111:209–219.
Bastin ME, Maniega SM, Ferguson KJ, Brown LJ, Wardlaw JM,MacLullich AMJ, Clayden JD (2010): Quantifying the effects ofnormal ageing on white matter structure using unsupervisedtract shape modelling. Neuroimage 51:1–10.
Bengtsson SL, Nagy Z, Skare S, Forsman L, Forssberg H, Ullen F(2005): Extensive piano practicing has regionally specific effectson white matter development. Nat Neurosci 8:1148–1150.
Burgmans S, van Boxtel MPJ, Gronenschild EHBM, VuurmanEFPM, Hofman P, Uylings HBM, Jolles J, Raz N (2010): Multipleindicators of age-related differences in cerebral white matter andthe modifying effects of hypertension. Neuroimage 49:2083–2093.
Burzynska AZ, Preuschhof C, Backman L, Nyberg L, Li SC, Lin-denberger U, Heekeren HR (2010): Age-related differences inwhite matter microstructure: Region-specific patterns of diffu-sivity. Neuroimage 49:2104–2112.
Carroll JB (1993): Human Cognitive Abilities: A Survey of Factor-Analytical Studies. New York: Cambridge University Press.
Catani M, Ffytche DH (2005): The rises and falls of disconnectionsyndromes. Brain 128:2224–2239.
Catani M, Thiebaut de Schotten MT (2008): A diffusion tensorimaging tractography atlas for virtual in vivo dissections. Cor-tex 44:1105–1132.
Chiang MC, Barysheva M, Shattuck DW, Lee AD, Madsen SK,Avedissian C, Klunder AD, Toga AW, McMahon KL, De Zubi-caray GI and others (2009): Genetics of brain fiber architectureand intellectual performance. J Neurosci 29:2212–2224.
Damoiseaux JS, Greicius MD (2009): Greater than the sum of its parts:A review of studies combining structural connectivity and rest-ing-state functional connectivity. Brain Struct Funct 213:525–533.
Dureman I (1960): SRB: 1. Stockholm: Psykologiforlaget.Filley CM (2010): White matter: Organization and functional rele-
vance. Neuropsych Rev 20:158–173.Folstein MF, Folstein SE, Mchugh PR (1975): Mini-mental state—
Practical method for grading cognitive state of patients for cli-nician. J Psychiat Res 12:189–198.
Groves AR, Beckmann CF, Smith SM, Woolrich MW (2011).Linked independent component analysis for multiomodal datafusion. Neuroimage 54:2198–2217.
Hertzog C (1985): An individual-differences perspective: Implica-tions for cognitive research in gerontology. Res Aging 7:7–45.
Hofer SM, Sliwinski MJ (2001): Understanding ageing—An evalu-ation of research designs for assessing the interdependence ofageing-related changes. Gerontology 47:341–352.
Hofer SM, Flaherty BP, Hoffman L (2006): Cross-sectional analysisof time-dependent data: Mean-induced association in age-heterogeneous samples and an alternative method based onsequential narrow age-cohort samples. Multivariate Behav Res41:165–187.
Hua K, Zhang JY, Wakana S, Jiang HY, Li X, Reich DS, CalabresiPA, Pekar JJ, van Zijl PCM, Mori S (2008): Tract probabilitymaps in stereotaxic spaces: Analyses of white matter anatomyand tract-specific quantification. Neuroimage 39:336–347.
Kennedy KM, Raz N (2009): Pattern of normal age-related re-gional differences in white matter microstructure is modifiedby vascular risk. Brain Res 1297:41–56.
Kline RB (1998): Principles and Practice of Structural EquationModeling. New York: Guilford Press.
Kochunov P, Glahn DC, Lancaster JL, Winkler AM, Smith S,Thompson PM, Almasy L, Duggirala R, Fox PT, Blangero J
(2010). Genetics of microstructure of cerebral white matterusing diffusion tensor imaging. Neuroimage 53:1109–1116.
Li YO, Yang FG, Nguyen CT, Cooper SR, Lahue SC, Venugopal S,Mukherjee P: Independent component analysis of DTI revealsmultivariate microstructural correlations of white matter in thehuman brain (in press).
Lindenberger U, Ghisletta P (2009): Cognitive and sensorydeclines in old age: Gauging the evidence for a common cause.Psychol Aging 24:1–16.
Lindenberger U, von Oertzen T, Ghisletta P, Hertzog C (2011):Cross-sectional age variance extraction: What’s change got todo with it? Psychol Aging 26:34–47.
Lovden M, Bodammer NC, Kuhn S, Kaufmann J, Schutze H, Tem-pelmann C, Heinze HJ, Duzel E, Schmiedek F, Lindenberger U(2010): Experience-dependent plasticity of white-matter micro-structure extends into old age. Neuropsychologia 48:3878–3883.
Madden DJ, Bennett IJ, Song AW (2009): Cerebral white matter in-tegrity and cognitive aging: Contributions from diffusion ten-sor imaging. Neuropsych Rev 19:415–435.
Meredith W (1993): Measurement invariance, factor-analysis andfactorial invariance. Psychometrika 58:525–543.
Nichols TE, Holmes AP (2002): Nonparametric permutation testsfor functional neuroimaging: A primer with examples. HumBrain Mapp 15:1–25.
O’Sullivan M, Jones DK, Summers PE, Morris RG, Williams SCR, Mar-kus HS (2001): Evidence for cortical ‘‘disconnection’’ as a mecha-nism of age-related cognitive decline. Neurology 57:632–638.
Penke L, Maniega SM, Murray C, Gow AJ, Hernandez MCV,Clayden JD, Starr JM, Wardlaw JM, Bastin ME, Deary IJ(2010): A general factor of brain white matter integrity predictsinformation processing speed in healthy older people. J Neuro-sci 30:7569–7574.
Raz N, Lindenberger U, Rodrigue KM, Kennedy KM, Head D,Williamson A, Dahle C, Gerstorf D, Acker JD (2005): Regionalbrain changes in aging healthy adults: General trends, individ-ual differences and modifiers. Cereb Cortex 15:1676–1689.
Raz N, Yang YQ, Rodrigue KM, Kennedy KM, Lindenberger U,Ghisletta P: White matter deterioration in 15 months: Latentgrowth curve models in healthy adults (in press).
Salthouse TA (2011). Neuroanatomical substrates of age-relatedcognitive decline. Psych Bull 137:754–784.
Schmidt R, Fazekas F, Offenbacher H, Dusek T, Zach E, ReinhartB, Grieshofer P, Freidl W, Eber B, Schumacher M and others(1993): Neuropsychologic correlates of MRI white-matterhyperintensities—A study of 150 normal volunteers. Neurol-ogy 43:2490–2494.
Schmiedek F, Li SC (2004): Toward an alternative representationfor disentangling age-associated differences in general andspecific cognitive abilities. Psychol Aging 19:40–56.
Scholz J, Klein MC, Behrens TE, Johansen-Berg H (2009): Traininginduces changes in white-matter architecture. Nat Neurosci12:1370–1371.
Smith SM, Nichols TE (2009): Threshold-free cluster enhancement:Addressing problems of smoothing, threshold dependence andlocalisation in cluster inference. Neuroimage 44:83–98.
Smith SM, Jenkinson M, Woolrich MW, Beckmann CF, BehrensTEJ, Johansen-Berg H, Bannister PR, De Luca M, Drobnjak I,Flitney DE and others (2004): Advances in functional andstructural MR image analysis and implementation as FSL.Neuroimage 23:S208–S219.
Smith SM, Jenkinson M, Johansen-Berg H, Rueckert D, NicholsTE, Mackay CE, Watkins KE, Ciccarelli O, Cader MZ,
r Lovden et al. r
r 12 r
Matthews PM and others (2006). Tract-based spatial statistics:Voxelwise analysis of multi-subject diffusion data. Neuroimage31:1487–1505.
Sullivan EV, Pfefferbaum A (2006): Diffusion tensor imaging andaging. Neurosci Biobehav Rev 30:749–761.
Sullivan EV, Adalsteinsson E, Pfefferbaum A (2006): Selectiveage-related degradation of anterior callosal fiber bundlesquantified in vivo with fiber tracking. Cereb Cortex 16:1030–1039.
Thiebaut de Schotten M, Ffytche DH, Bizzi A, Dell’Acqua F, AllinM, Walshe M, Murray R, Williams SC, Murphy DGM, CataniM (2011): Atlasing location, asymmetry and inter-subject vari-ability of white matter tracts in the human brain with MR dif-fusion tractography. Neuroimage 54:49–59.
Van Petten C (2004): Relationship between hippocampal volumeand memory ability in healthy individuals across the life-span: review and meta-analysis. Neuropsychologia 42:1394–1413.
Vernooij MW, de Groot M, van der Lugt A, Ikram MA, KrestinGP, Hofman A, Niessen WJ, Breteler MMB (2008): White mat-ter atrophy and lesion formation explain the loss of structuralintegrity of white matter in aging. Neuroimage 43:470–477.
Wahl M, Li YO, Ng J, Lahue SC, Cooper SR, Sherr EH, MukherjeeP (2010): Microstructural correlations of white matter tracts inthe human brain. Neuroimage 51:531–541.
Wakana S, Jiang HY, Nagae-Poetscher LM, van Zijl PCM, Mori S(2004): Fiber tract-based atlas of human white matter anatomy.Radiology 230:77–87.
Westlye LT, Walhovd KB, Dale AM, Bjornerud A, Due-Tonnessen P,Engvig A, Grydeland H, Tamnes CK, Ostby Y, Fjell AM (2010).Life-span changes of the human brain white matter: Diffusiontensor imaging (DTI) and volumetry. Cereb Cortex 20:2055–2068.
Wu K, Taki Y, Sato K, Kinomura S, Goto R, Okada K, KawashimaR, He Y, Evans AC, Fukuda H.: Age-related changes in topo-logical organization of structural brain networks in healthyindividuals (in press).
r Dimensionality of White-Matter Microstructure r
r 13 r