The Colosseum floras as bio-indicators of the climatic changes in Rome
13
THE COLOSSEUM FLORAS AS BIO-INDICATORS OF THE CLIMATIC CHANGES IN ROME G. CANEVA, A. PACINI, M. CUTINI and A. MERANTE Dip. Biologia, Universit` a degli Studi di Roma Tre, Viale G. Marconi, 446-00146 Rome, Italy E-mail: [email protected] Abstract. Over the last four centuries several botanists have analysed the Colosseum flora, and by using modern ecological and biogeographical approaches to these same floras, we have observed similar trends with respect to the climatic phenomena as those of the historic Torre Calandrelli Observatory and by other older historical records. The elements of which can be summarised as follows: 1) a substantial reduction of all the biogeographical components taken as indicators of cooler and damper habitats, such as the Euro-Asiatic and Boreal areas starting from the 17th Century in particular; 2) a decrease in numbers of all the species more dependent on water (independent of their chorology); 3) similar clear-cut increases in the species belonging to phytosociological classes typical to Mediterranean climatic conditions, to the detriment of those typical to Middle-European temperate bioclimates. All of which can be interpreted as clear indicators of non-negligible climatic changes towards hotter and drier conditions independent of local variations due to urbanisation. 1. Introduction Thanks to the historic Roman College Climatic Observatory (Torre Calandrelli) active since 1782, many authors (Colacino and Rovelli, 1983; Colacino and Purini, 1986; Mangianti and Beltrano, 1990, 1995; Conte and Palmieri, 1990; Colacino and Baldi, 1991; Camuffo, 1993; Caneva et al., 1995; Palmieri and Siani, 1995) have been able to evidence the climatic trends and fluctuations effecting the city of Rome for the past two centuries. The ‘Little Ice Age’ has been reasonably hypothesised to have occurred in the second half of the 15th Century and has progressively attenuated (see Lamb, 1966; Leroy Ladurie, 1970 in Pinna, 1984; Camuffo, 1993). Furthermore, archives documents prove the Roman climate’s transformations, as reported by Calathino (1646), that gives a detailed descriptions of the humid and cold conditions of the city at that time. A review of the historical series has shown no periods in which temperatures have fallen below zero from the 18th Century onwards, and even the coldest winters, which were recorded around the mid 18th Century, show an average trend of the lowest temperatures always above zero (see Leryard, 1963; Kirch, 1966; von Rudloff, 1944; Bilancini, 1950 in Pinna, 1984). In the course of the last two centuries, the trends of mean and maximum tem- peratures have had no very relevant modifications, with values ranging between 15–16 ◦ C and 20–21 ◦ C, whereas the lowest temperatures have shown a progres- sive trend to rise from 10 to 12 ◦ C. As for rainfall, the yearly mean value relative to the last 210 years has been equal to 795 mm (Mangianti and Beltrano, 1995) with Climatic Change (2005) 70: 431–443 DOI: 10.1007/s10584-005-5355-z c Springer 2005
-
Upload
independent -
Category
Documents
-
view
5 -
download
0
Transcript of The Colosseum floras as bio-indicators of the climatic changes in Rome

THE COLOSSEUM FLORAS AS BIO-INDICATORS OF THE CLIMATICCHANGES IN ROME
G. CANEVA, A. PACINI, M. CUTINI and A. MERANTE
Dip. Biologia, Universita degli Studi di Roma Tre, Viale G. Marconi, 446-00146 Rome, ItalyE-mail: [email protected]
Abstract. Over the last four centuries several botanists have analysed the Colosseum flora, and byusing modern ecological and biogeographical approaches to these same floras, we have observedsimilar trends with respect to the climatic phenomena as those of the historic Torre CalandrelliObservatory and by other older historical records. The elements of which can be summarised asfollows: 1) a substantial reduction of all the biogeographical components taken as indicators of coolerand damper habitats, such as the Euro-Asiatic and Boreal areas starting from the 17th Century inparticular; 2) a decrease in numbers of all the species more dependent on water (independent of theirchorology); 3) similar clear-cut increases in the species belonging to phytosociological classes typicalto Mediterranean climatic conditions, to the detriment of those typical to Middle-European temperatebioclimates. All of which can be interpreted as clear indicators of non-negligible climatic changestowards hotter and drier conditions independent of local variations due to urbanisation.
1. Introduction
Thanks to the historic Roman College Climatic Observatory (Torre Calandrelli)active since 1782, many authors (Colacino and Rovelli, 1983; Colacino and Purini,1986; Mangianti and Beltrano, 1990, 1995; Conte and Palmieri, 1990; Colacino andBaldi, 1991; Camuffo, 1993; Caneva et al., 1995; Palmieri and Siani, 1995) havebeen able to evidence the climatic trends and fluctuations effecting the city of Romefor the past two centuries. The ‘Little Ice Age’ has been reasonably hypothesisedto have occurred in the second half of the 15th Century and has progressivelyattenuated (see Lamb, 1966; Leroy Ladurie, 1970 in Pinna, 1984; Camuffo, 1993).Furthermore, archives documents prove the Roman climate’s transformations, asreported by Calathino (1646), that gives a detailed descriptions of the humid andcold conditions of the city at that time. A review of the historical series has shownno periods in which temperatures have fallen below zero from the 18th Centuryonwards, and even the coldest winters, which were recorded around the mid 18thCentury, show an average trend of the lowest temperatures always above zero (seeLeryard, 1963; Kirch, 1966; von Rudloff, 1944; Bilancini, 1950 in Pinna, 1984).
In the course of the last two centuries, the trends of mean and maximum tem-peratures have had no very relevant modifications, with values ranging between15–16 ◦C and 20–21 ◦C, whereas the lowest temperatures have shown a progres-sive trend to rise from 10 to 12 ◦C. As for rainfall, the yearly mean value relative tothe last 210 years has been equal to 795 mm (Mangianti and Beltrano, 1995) with
Climatic Change (2005) 70: 431–443DOI: 10.1007/s10584-005-5355-z c© Springer 2005

432 G. CANEVA ET AL.
significant fluctuations. A maximum peak took place between the late eighteen andthe early nineteen hundreds, whereas the lowest values are evidence in two periods,one at about 1850 and the other a decline beginning at about 1940 continuing intothe present.
The periods of summer droughts reached their peak in the last century, especiallybetween 1929 and 1953, even though a successive decrease in rainfall was observedto become more relevant on a yearly scale (Caneva et al., 1995).
These trends show an increase in the yearly mean temperatures, but most of all inthe absolute lows, as well as a decrease in rainfall, as has been observed all over theItalian Peninsula (Moonen et al., 2002). These results were supported from the sug-gestions of Smit et al. (1988), in which the mid-latitude regions, such as SouthernEurope, are becoming warmer and drier. However, these changes are seen to over-lap, in particular with the heat-island effect, due to the urbanization phenomenonthat has long been investigated and described in many European and Americancities (Manley, 1958; Michell, 1961; Chandler, 1962; Oke, 1973; Landsberg, 1981;Ackerman, 1985; Kukla et al., 1986; Karl et al., 1988; Lee, 1992). In some cases,this effect has been quantified either on the different climatic elements (Landsberg,1970; Horbert, 1978; Oke, 1980; Camilloni and Barros, 1997), or on vegetation(Sukopp and Werner, 1983; Gomez et al., 1998).
As known, the presence of green areas induces an increase in the relative airhumidity and a rising of the lowest temperatures, whereas conversely, the presenceof any urban ‘built-up’ areas causes a heat-island effect. The temperature increasesin the urban versus the rural habitats are evaluated to be on average in the 0.5–3.0 ◦Crange as per annual means, and 1–2 ◦C range as per winter minimum and summermaximum means. The decrease in relative humidity ranges from 6–10% when goingfrom an urban to a rural context; conversely, rainfall is likely to increase in citiesas a consequence of the increase in the nuclei of rain condensation as related to ahigher pollution level (Oke, 1973).
Floristic data have been used for the analysis of the climatic changes, bothfor studies of the most recent decades (Sukopp and Werner, 1983; Gomez et al.,1998) and for palaeo-botanical studies on geological time scales (Follieri et al.,1988; Magri and Follieri, 1992; Magri, 1994), so we believed the exceptionalfloristic documentation existing around the Colosseum (six repeated botanicsurveys: Panaroli, 1643; Sebastiani, 1815; Deakin, 1855; Fiorini-Mazzanti, 1874;Anzalone, 1951; Celesti-Grapow et al., 2001) would offer a outstanding source ofinformation for interpreting roman climatic trends.
The monument was abandoned in ancient times but re-used for different activities(small hospitals, craft shops, and pastoral shelter, etc.). Besides the damage causedby earthquakes, it underwent spoliation of its travertine as a building material.During the long-lasting state of abandonment, the area was used for animal grazingand as a saltpetre deposit (Caneva et al., 2003). The abundant plant colonization,to be connected also to the total lack of maintenance and weed-killing treatments,accounts for the great interest of many botanists in its flora. For many centuries after

THE COLOSSEUM FLORAS AS BIO-INDICATORS OF THE CLIMATIC CHANGES IN ROME 433
the fall of the Roman Empire the Colosseum held an almost marginal position inthe urban development of the city (Figure 1). It was only in the nineteen hundreds,in concomitance with the beginning of a new demographic increase in the city, thatthe Colosseum recovered its central place of importance to the city (Funiciello,1995).
Although the historical floristic data are only qualitative, and do not specify thelocation and the relative abundance of each single entity, we still considered thisdocumentation to be an extraordinary opportunity to use an ecological approach.The different uses and state of abandonment of the monument is only a part of theexplanation for the floristic changes (Caneva et al., 2003). Nitrophylous species de-creased over time due to diminution of grazing activities. The structure of vegetationchanged in the different periods, due to weed removal or abandonment. However,this does not affect this biogeographical and ecological analysis. Moreover, in thecases concerning higher plants the increase of pollution during this century can-not be considered a means of interference when interpreting the ecological data. Infact, contrary to lichens and mosses, vascular plants have more efficient systems forprotection against pollutants, and so we can exclude that some plants disappeareddue to the effect of pollution.
The aim of this paper is to evaluate the possibility of using the ecological infor-mation as an indicator of climatic changes. Moreover, the availability of data backto the early 17th Century, i.e., previous to any instrumental registration, urged us toconsider the possibility of adding more information to the historical meteorologicalseries.
2. Materials and Methods
The floristic data arise from the comparative analysis of the Colosseum floristicsurveys mentioned earlier. A list of 684 species was obtained after a long, at timesdifficult, revision of the plant nomenclature, often obsolete and sometimes ambigu-ous (Dinelli et al., 1995; Caneva et al., 2002).
Each species was associated to its own ecological, phytosociological, and choro-logical information (Tutin et al., 1964; Rivas Martines, 1974; Pignatti, 1982;Ellenberg, 1988; Oberdorfer, 1993).
For the correlation between the floristic and the climatic data, we used thevalues of the relative presence of species belonging to different ecological groupsin the different periods of time. Each considered ecological factor was selectedas independent from the other, so the phytogeographical and phytosociologicalanalysis is not affected from the occurred change in use at the site. In particular,we considered the trends of the biogeographical types to be indicators of moremesophylous floristic groups and the ecological groups as indicators of humidity.The exclusive species, which live in the hypogeum, were left out, because thishabitat was only present in the last floristic inventory.

434 G. CANEVA ET AL.
Figure 1. The Colosseum and its surroundings in Antonio Tempesta’s map (1693).
THE COLOSSEUM FLORAS AS BIO-INDICATORS OF THE CLIMATIC CHANGES IN ROME 435
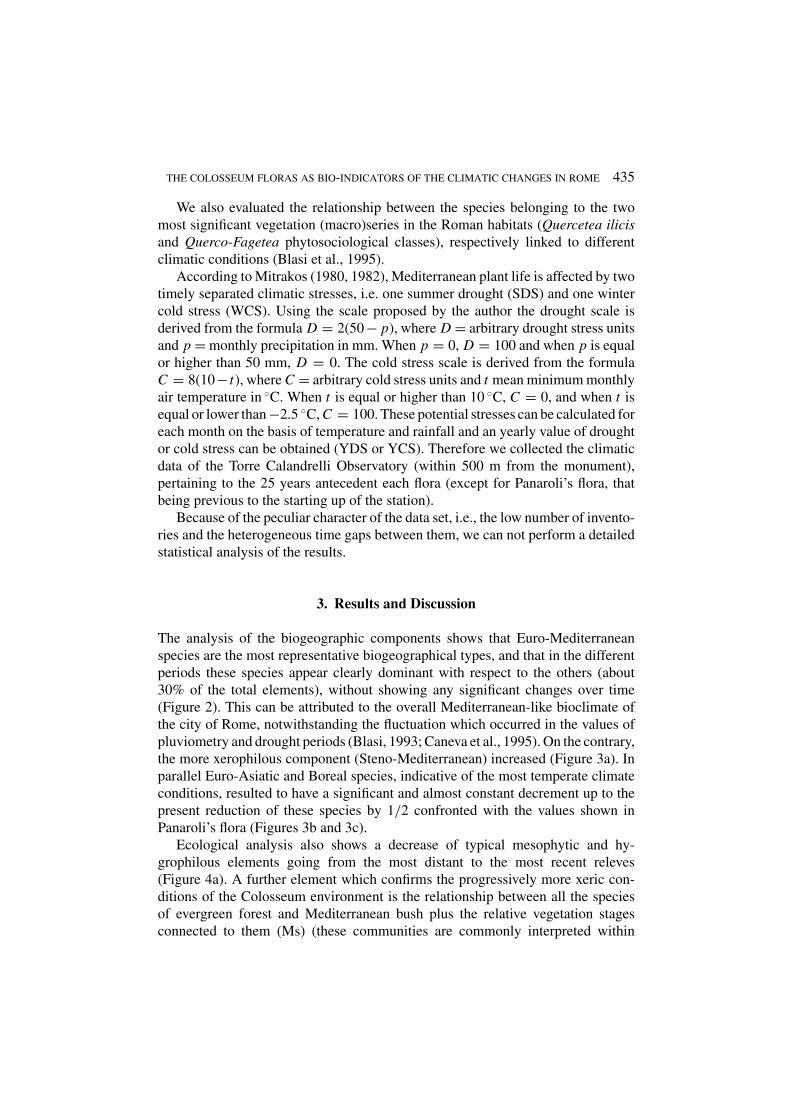
We also evaluated the relationship between the species belonging to the twomost significant vegetation (macro)series in the Roman habitats (Quercetea ilicisand Querco-Fagetea phytosociological classes), respectively linked to differentclimatic conditions (Blasi et al., 1995).
According to Mitrakos (1980, 1982), Mediterranean plant life is affected by twotimely separated climatic stresses, i.e. one summer drought (SDS) and one wintercold stress (WCS). Using the scale proposed by the author the drought scale isderived from the formula D = 2(50 − p), where D = arbitrary drought stress unitsand p = monthly precipitation in mm. When p = 0, D = 100 and when p is equalor higher than 50 mm, D = 0. The cold stress scale is derived from the formulaC = 8(10− t), where C = arbitrary cold stress units and t mean minimum monthlyair temperature in ◦C. When t is equal or higher than 10 ◦C, C = 0, and when t isequal or lower than −2.5 ◦C, C = 100. These potential stresses can be calculated foreach month on the basis of temperature and rainfall and an yearly value of droughtor cold stress can be obtained (YDS or YCS). Therefore we collected the climaticdata of the Torre Calandrelli Observatory (within 500 m from the monument),pertaining to the 25 years antecedent each flora (except for Panaroli’s flora, thatbeing previous to the starting up of the station).
Because of the peculiar character of the data set, i.e., the low number of invento-ries and the heterogeneous time gaps between them, we can not perform a detailedstatistical analysis of the results.
3. Results and Discussion
The analysis of the biogeographic components shows that Euro-Mediterraneanspecies are the most representative biogeographical types, and that in the differentperiods these species appear clearly dominant with respect to the others (about30% of the total elements), without showing any significant changes over time(Figure 2). This can be attributed to the overall Mediterranean-like bioclimate ofthe city of Rome, notwithstanding the fluctuation which occurred in the values ofpluviometry and drought periods (Blasi, 1993; Caneva et al., 1995). On the contrary,the more xerophilous component (Steno-Mediterranean) increased (Figure 3a). Inparallel Euro-Asiatic and Boreal species, indicative of the most temperate climateconditions, resulted to have a significant and almost constant decrement up to thepresent reduction of these species by 1/2 confronted with the values shown inPanaroli’s flora (Figures 3b and 3c).
Ecological analysis also shows a decrease of typical mesophytic and hy-grophilous elements going from the most distant to the most recent releves(Figure 4a). A further element which confirms the progressively more xeric con-ditions of the Colosseum environment is the relationship between all the speciesof evergreen forest and Mediterranean bush plus the relative vegetation stagesconnected to them (Ms) (these communities are commonly interpreted within

436 G. CANEVA ET AL.
Figure 2. Biogeographical spectra (%) of the different floras of Colosseum.
Quercetea ilicis, Cisto-Micromerietea/Rosmarinetea, Thero-Brachypodietea andLygeo-Stipetea with respect to the species characteristic of deciduous forests ofSouthern Europe plus shrub and meadows dynamically connected to them (Dfs)(belonging to Querco-Fagetea, Rhamno-Prunetea, Trifolio-Geranietea, Festuco-Brometea, Molinio-Arrhenatheretea classes) (Figure 4b). Such a relationship in-dicates an almost equal situation between these components, at least as far as upto the mid-eight hundreds, if not a certain predominance of the most mesophylousspecies in Panaroli’s survey (this being absolutely the largest for more mesophyticand more humid habitats species) as well as in Deakin’s survey.
Late in the 19th century, the species in hotter and drier habitats started to progres-sively increase in number, sometimes to double with respect to the above mentionedsurveys, even attaining values higher than 1:3 in the 20th Century releves. This can-not be ascribed to weed killing only, since in the data processing, the species takeninto account included also the herbaceous, which constitute vegetation forms char-acteristic of pioneer stages within the natural succession of coenoses typical of thatvegetation series.
However, we believe that the major changes occurred at the level of the vari-ous ecological flora communities cannot be accounted for only in terms of urbanheat-island effects, drainage works or by different uses of the area adjacent to theColosseum because these factors can be considered of major importance only tothe last two floristic surveys.

THE COLOSSEUM FLORAS AS BIO-INDICATORS OF THE CLIMATIC CHANGES IN ROME 437
Figure 3. (A) Temporal variation in the proportion of Euro-Asiatic species. (B) Temporal variationin the proportion of Boreal species.
The differences in the floras which led to the potential increase of the Mediter-ranean thermophylous elements, along with the reduction in those elements typicalto temperate-cold regions, can be correlated with certainty principally to climaticmodifications on a larger scale, tending to hotter and drier values.
The correlation between climatic and floristic data which we used to calcu-late monthly cold stress (MCS) showed a clear-cut and progressive reduction asevidenced by Mitrakos’ indexes (Figure 5a). The YCS values indicate a good cor-relation with a decrease in the Euro-Asiatic values (Figure 5b). The comparison

438 G. CANEVA ET AL.
Figure 4. (A) Temporal variation in the ecological proportion of meso-hygrophylous species.(B) Temporal variation in the ratio between Mediterranean species (Smm) and deciduous forestspecies (Sbi), (taking into account also species correlated to early-successional stages).
of the values of monthly drought stress (MDS) has evidenced more complexfluctuations (Figure 6a); however, these values show some correspondence withthe variations between the Mediterranean thermophilous species (Ms) and thosemore mesophylous of the deciduous broad-leaf woods (DFs) (Figure 6b). This can

THE COLOSSEUM FLORAS AS BIO-INDICATORS OF THE CLIMATIC CHANGES IN ROME 439
Figure 5. (A) Temporal variation in MCS (monthly cold stress). (B) Relationship between the trendof Euro-Asiatic species and YCS (yearly cold stress).

440 G. CANEVA ET AL.
Figure 6. (A) Temporal variation in MDS (monthly drought stress). (B) Relationship between theratio QI (Mediterranean species)/QF (deciduous forest species) and SDS (summer drought stress).

THE COLOSSEUM FLORAS AS BIO-INDICATORS OF THE CLIMATIC CHANGES IN ROME 441
be accounted for by the former being favoured by high SDS values which, bycontrast, would be reductive for the more mesophylous species.
4. Conclusions
The floristic data show significant changes in the ecological and biogeographicalelements in equilibrium with different climatic conditions. The flora typical in thecooler habitat have been actually halved from the 17th Century up to the present,with the most remarkable fall having occurred after the late 18th Century.
The decrease in numbers in the species typical to damp habitats is of 4:1 between17th Century and today and of 2:1 from then to today.
The relationship between the species pertaining to the two vegetation(macro)series indicates analogously this numerical ratio between thermophylousand relatively drier elements and the more mesophylous one. The ratio is inverselyproportional in terms of 1:4 from the 17th Century up to today, with a significantincrease starting in the late 18th Century.
Even a not negligible change in the floristic component is due to the differentabandonment or use of the monuments. The changes we evidenced here can find anecological explanation only in macro- and microclimatic changes occurring duringthe last four centuries. In fact, there does not exist any other ecological reason forthe great Eurasiatic and Boreal component decrease and for the Stenomediterraneanincrease.
Taken altogether, these data are indicative of the utmost interest in ancient florasas a tool for interpreting environmental modifications.
References
Ackerman, B.: 1985, ‘Temporal march of the Chicago heat island’, J. Clim. Appl. Meteorol. 24,547–554.
Anzalone, B.: 1951, ‘Flora e vegetazione dei muri di Roma’, Ann. Bot. (Roma), XXIII(fasc. 3),393–497.
Blasi, C.: 1993, Carta del fitoclima del Lazio (scala 1:250000), Reg. Lazio, Dip. to Biologia Vegetale,Univ. La Sapienza di Roma, Tip. Borgia, Roma.
Blasi, C., Dowgiallo, G., Follieri, M., Lucchese, F., Magri, D., Pignatti, S., and Sadori, L.: 1995,‘La vegetazione naturale potenziale dell’area romana’, Atti Convegni dei Lincei “La vegetazioneItaliana” 115, 423–457.
Calathino, D.: 1646, Discorso sulle stufe da Bagni di Rome e i suoi nocumenti. Roma.Camilloni, I. and Barros, V.: 1997, ‘On the urban heat island effect dependence on temperature trends’,
Clim. Change 37, 665–681.Camuffo, D.: 1993, ‘Reconstructing the climate and the air pollution of Rome during the life of the
Trajan’s column’, Sci. Total Environ. 128, 205–226.Caneva, G., Gori, E. and Montefinale, T.: 1995, ‘Biodeterioration of monuments in relation to climatic
changes in Rome between 19–20th centuries’, Sci. Total Environ. 167, 205–214.

442 G. CANEVA ET AL.
Caneva, G., Cutini, M., Pacini, A., and Vinci, M.: 2002, ‘Analysis of the Colosseum’s floristic changesduring the last four centuries’, Plant Biosys. 136(3), 291–312.
Caneva, G., Pacini, A., Celesti-Grapow, L., and Ceschin, S.: 2003, ‘The Colosseum’s use and state ofabandonment as analysed through its flora’, Int. Biodeterior. Biodegrad. 51, 211–219.
Celesti Grapow, L., Caneva, G., and Pacini, A: 2001, ‘La flora del Colosseo (Roma)’, Webbia 56(2),321–322.
Chandler, T. J.: 1962, ‘London’s urban climate’, Geogr. J. 127, 279–302.Colacino, M. and Baldi, M.: 1991, La climatologia. Progetto Strategico “Roma Capitale”, CNR,
p. 39.Colacino, M. and Purini, R.: 1986, ‘A study on the precipitation in Rome from 1782 to 1978’, Theor.
Appl. Climatol. 37, 90–96.Colacino, M. and Rovelli, A.: 1983, ‘The yearly averaged air temperature in Rome from 1782 to
1975’, Tellus 35A, 389–397.Conte, M. and Palmieri, S.: 1990, ‘Tendenze evolutive del clima in Italia’, in Atmosfera e clima. Atti
Convegni Lincei 82, 167–187. Acc. Naz. Lincei, Roma.Deakin, R.: 1855, Flora of the Colosseum of Rome, London, p. 230.Dinelli, A., Vinci, M., and Caneva, G.: 1995, ‘Il Plantarum Amphitheatralium Catalogus di Domenico
Panaroli: Un elenco floristico dell’Anfiteatro Flavio del 1643’, Museologia Scientifica 11(3–4),205–234.
Ellenberg, H: 1988, Vegetation Ecology of Central Europe, Cambridge University press, Cambridge,p. 731.
Fiorini Mazzanti, E.: 1874–1878, ‘Florula del Colosseo’, Atti Accademia Pontificia Nuovi Lincei 28(p. 20); 29, (p. 33); 30, (p. 8); 31, (p. 13).
Follieri, M., Magri, D., and Sadori, L.: 1988, ‘250.000-year pollen record from Velle di Castiglione(Roma)’, Pollen et Spores 30, 329–356.
Funiciello, R. (ed.): 1995, ‘La geologia di Roma. Il Centro storico’, Mem. Descr. Carta GeologicaItalia. Vol. L.
Gomez, F., Gaja, E., and Reig, A.: 1998, ‘Vegetation and climatic changes in a city’, Ecol. Eng. 10,355–360.
Kukla, G., Gavin, J., and Karl, T. R.: 1986, ‘Urban warming’, J. Clim. Appl. Meteorol. 25, 1265–1270.Horbert, M.: 1978, ‘Klimatische und Lufthygienische Aspekte der Stadt und Landschaftsplanung’,
In der Natur und Heimat 38, 34–49.Karl, T. R., Diaz, H. F., and Kukla, G.: 1988, ‘Urbanization: Its detection and effect in the United
States Climate Record’, J. Clim. 1, 1099–1123.Landsberg, H. E.: 1970, ‘Climates and urban planning’, WHO Tech. Note 108, 364–374.Landsberg, H. E.: 1981, The Urban Climate, Academic Press, New York.Lee, D. O.: 1992, ‘Urban warming? – An analysis of recent trends in London’s heat island’, Weather
47(2), 50–56.Magri, D.: 1994, ‘Late-Quaternary changes of plant biomass as recorded by pollen-stratigraphical
data: A discussion of the problem at Valle di Castiglione, Italy’, Rev. Paleobot. Palynol. 81,311–323.
Magri, D. and Follieri, M.: 1992, ‘Transitions from interglacial to glacial at Valle di Castiglione(Roma)’, in Kukla, G. J., Went, E. (eds.), Start of a Glacial, NATO ASI Series I, Global Environ-mental Change 3, Springer Verlag, p. 23–30.
Mangianti, F. and Beltrano, M. C.: 1990, Il Collegio Romano. 100 anni di osservazioni metereologiche,Min. Agricoltura e Foreste-Ucea, Roma, p. 48.
Mangianti, F. and Beltrano, M. C.: 1995, Le precipitazioni a Roma. Min. Agricoltura e Foreste-UCEA,Roma, p. 47.
Manley, G.: 1958, ‘On the frequency of snowfall in metropolitan England’, Quart. J. R. Metereol.Soc. 84, 70–72.
THE COLOSSEUM FLORAS AS BIO-INDICATORS OF THE CLIMATIC CHANGES IN ROME 443
Mitchell, J. M.: 1961, ‘The temperature of cities’, Weatherwise 14, 224–229.Mitrakos, K.: 1980, ‘A theory for Mediterranean plant life’, Acta Oecol. Oecol. Plant. 1(15), 245–252.Mitrakos, K.: 1982, ‘Winter low temperatures in Mediterranean-type ecosystems’, Ecol. Medit.
8(1–2), 95–102.Moonen, A. C., Ercoli, L., Mariotti, M., and Masoni, A.: 2002, ‘Climate change in Italy indicates by
agrometerological indices over 122 years’, Agric. Forest Meteorol. 111, 13–27.Oberdorfer, E.: 1993, Suddeutsche Pflanzengesellschaften, Gustav Fischer Verlag, Stuttgart, Vol. 1–5.Oke, T. R.: 1973, ‘City size and urban heat island’, Atmos. Environ. 7, 769–779.Oke, T. R.: 1980, ‘Climate impacts of urbanization’, in Bach, W., Pankrath, J., and Williams, J. (eds.),
Interaction of Energy and Climate, in Proceedings in Workshop, Munster 1980, Reidel, Dordrecht,pp. 339–361.
Palmieri, S. and Siani, A. M.: 1995, ‘Il clima’, in Cignini, B., Massari, G., Pignatti, S. (eds.),L’ecosistema Roma, Ambiente e territorio, Fratelli Palombi Ed., pp. 19–28.
Panaroli, D.: 1643, Jatrologismi sive medicae observationes quibus additus est in fine PlantarumAmphitheatralium Catalogus, Typis Dominici Marciani, Romae, p. 15.
Pinna, M.: 1984, La storia del clima. Variazioni climatiche e rapporto clima-uomo in eta postglaciale.Mem. Soc. Geogr. Ital. vol. XXXVI, Societa Geografica Italiana, Roma, p. 261.
Pignatti, S.: 1982, Flora d’Italia, Edagricole, Bologna, Vol. 1–3.Rivas-Martinez, S.: 1974, ‘La vegetation de la classe Quercetea ilicis en Espagna y Portugal’, Ann.
Inst. Bot. A. J. Cavanilles 31(2), 341–405.Sebastiani, A.: 1815, Enumeratio plantarum sponte nascentium in ruderibus Amphitheatri Flavii,
Typis Pauli Salviucci et filii, Romae, pp. 80.Smit, B., Ludlow, L., and Brklachic, M.: 1988, ‘Implications of a global climatic warming for agri-
culture: A review and appraisal’, J. Environ. Qual. 17, 519–527.Sukopp, H. and Werner, P.: 1983, ‘Urban environments and vegetation’, in Holzner, W., Werger,
M. J. A., and Ikusima, I. (eds.), Man’s Impact on Vegetation, Dr W. Junk Publishers, TheHague/Boston/London, Printed in The Netherlands.
Tutin, T. G., Heywood, V. H., Burges, N. A., Moore, D. H., Valentine, D. H., Walters, S. M., andWebb, D. A. (eds.): 1964, Flora Europaea, Cambridge University Press, Cambridge, Vol. 1–5.
(Received 27 June 2003; in revised form 29 September 2004)