The Colombian Scientific Elite - Science Mapping and ... - arXiv
39
1 The Colombian Scientific Elite - Science Mapping and Bibliometric Outlook Julián D. Cortés a,b ; Daniel A. Andrade c a Universidad del Rosario, School of Business and Management, Colombia b Fudan University, Fudan Development Institute, China c Independent, Colombia
-
Upload
khangminh22 -
Category
Documents
-
view
4 -
download
0
Transcript of The Colombian Scientific Elite - Science Mapping and ... - arXiv

1
The Colombian Scientific Elite - Science Mapping and Bibliometric Outlook
Julián D. Cortésa,b; Daniel A. Andradec
aUniversidad del Rosario, School of Business and Management, Colombia
bFudan University, Fudan Development Institute, China
cIndependent, Colombia
2
Abstract
A well-established agenda on the research output, impact, and structure of global scientific elites such as
Nobel Prize laureates has generated interest in the scientific elites from developing countries. This study
deploys science mapping techniques to provide a comprehensive analysis of the output, impact, and
structure of the Colombian scientific elite, i.e., researchers awarded with the Alejandro Ángel Escobar
Foundation National Prize 1990-2020, known locally as the Colombian Nobel. Findings showed that the
Colombian scientific elite has a broader agenda than indexing titles in internationally renowned
bibliographic databases. The Colombian scientific elite also showed positive growth, which is an inverse
trend compared with Nobel laureate productivity. There were no noticeable changes in
productivity/impact before and after receiving the prize. Institutional collaboration within the Colombian
scientific elite displayed the highest betweenness (brokerage) role of world/local top-tier universities.
However, only two Colombian scientific elite members published an article with two Nobel Prize
laureates. Most of the research profiles reflected the national output priorities, but were found to diverge
from the national focus in respect of strategic research capacities. This study also conducted a
productivity and impact comparison with Nobel Prize laureates in science and economics by means of a
stratified random sample 1990-2020 via the composite indicator proposed by Ioannidis et al. The
interleaving of the Colombian scientific elite and Nobel Prize laureates ─ particularly between the 3rd and
2nd quartiles ─ enabled a more nuanced analysis of the local impact in the global scientific landscape.
1 Introduction
On a humorous note, Richard J. Roberts ─ Nobel Prize winner in physiology/medicine ─ outlined ten
simple rules to win a Nobel Prize and be part of the global scientific elite (GSE) [1]. Among these rules
were the following: work in the laboratory of a previous Nobel Prize winner; try to work in the
laboratory of a future Nobel Prize winner; or pick your family (i.e., Nobel laureates) carefully. For
developing countries such as Colombia, none of those rules are simple considering the null population of
Nobel laureates in science currently teaching/researching at a national university.
GSEs push the frontiers of knowledge. Yet, despite a well-established agenda [2–27],
researchers or scientific awardees from developing countries have been sidelined. Let us consider two
well-known examples: Nobel Prize laureates and highly-cited and productive institutions/researchers
[9,10,28,29]. First, seventy-seven percent of the Nobel Prize laureates in physics had US, German, UK,
French, or Russian citizenship [30]. In contrast, 2% had citizenships from developing countries such as
3
China, Pakistan, India, or Morocco [30]. Second, most of the world’s scientific wealth (i.e., research
output and citations) has been accumulated in a few premier institutions in developed countries [31–33].
Such staggering inequality is reflected in the fact that the top 1% of most-cited authors constitutes over a
fifth of all citations globally [34]. To understand why this is the case, it is necessary to look at the nature
of scientific elites through the lens of developing countries’ historical, economic, institutional, and
cultural contexts, research standards, and affiliations. [35–40].
Consider the two above-mentioned Noble Prize laureates from Colombia, which is one of the top
five countries in Latin America in total document output and among the top-fifty in total citations
worldwide 1996-2019 [41]. The Nobel Prize has been awarded to Gabriel García Márquez (literature) and
Juan Manual Santos (peace), but none in the science categories. Likewise, only one Colombian researcher
is listed in the 2020 edition of Clarivate’s Highly Cited Researchers: Olga Sarmiento, Universidad de Los
Andes [30,42]. Based on these standards, a Colombian scientific elite (CSE) is non-existent. Colombia
does, however, have its own Nobel Prize: the Alejandro Ángel Escobar Foundation National Prize
(AAEP) [43,44]. The organization’s founder ─ inspired by the Swedish inventor and his legacy ─ stated
that the AAEPs “are to be awarded for truly meritorious work that deserves the mark of excellence at
least within the cultural context of the country.” [45]. Each year the AAEF invites all researchers of
Colombian nationality ─ regardless of local or international affiliation ─ to submit their research for
assessment by the Foundation’s committee (i.e., peer-reviewed articles or books, master’s or Ph.D. thesis,
technical reports, independent research). If the document is multiauthored, the authors have to assign a
representative/coordinator, who will receive the prize money and a silver medal. The
representative/coordinator most be a native Colombian. This national recognition has been awarded
annually since 1955. There are three science categories [45]: 1) physics and natural sciences; 2) social
sciences and humanities; and 3) environmental sciences and sustainable development. There is an
honorable mention for each category if the jury decides so [45] and these acknowledged researchers are
considered members of the CSE (e.g., Salomón Hakim [neurosurgeon] in 1967 and 1974; and Ana María
Rey [physicist] in 2007).
The purpose of studying the CSE and scientific elites in developing countries in general is
to understand its performance and research and collaboration structures in comparison with the GSE. The
findings shed light on the research performance-impact standards and agenda between the global North
and South. They also provide an in-context assessment of outstanding local research [46–49] amid the

4
decreasing share of new Nobel Prize laureates from North America and an inverse trend from the Asia-
Pacific region [4]. To the best of our knowledge, no research has been conducted on the CSE or any other
developing country’s scientific elite using bibliometric techniques [50]. Accordingly, this study aims to
provide a comprehensive analysis of the output, impact, and structure of the CSE and draw a comparison
with the GSE. This inquiry is guided by the following research questions (RQs):
RQ1: Is the CSE more productive/cited before or after receiving the AAEP? [6,11,22,51,52]
RQ2: Does the CSE collaboration network have any participation in the GSE or world top-tier
institutions? [26,33,53]
RQ3: What are the research fronts of the CSE? [7], and
RQ4: Is the CSE light years away from the productivity and impact of the GSE? [31,36,54–56]
Following this introduction, section 2 reviews recent literature on GSEs. Section 3 outlines the data,
methods, and techniques implemented. The methods and techniques implemented are coauthorship
networks, both at the institutional and author levels; bibliographic coupling; and a comparative sample of
82 researchers using the composite indicator proposed by Ioannidis et al. [52]. The sample comprises 41
AAEPs and 41 Nobel Prize laureates. Section 4 presents the results to be discussed in section 5. Finally,
section 6 presents the conclusions, limitations, and future agenda.
2 Literature review
Research on the GSE is well-established in the informetrics literature [2–15,21–24,26,27,57–60]. For
example, a Boolean search on Scopus’s bibliographic database with the keyword “Nobel Prize” limited to
14 core journals on informetrics and research evaluation (e.g., Journal of Informetrics, Scientometrics,
JASIS&T) [54], returned 75 results. We limited the review to three areas of interest: 1) international
awards/prizes networks; 2) latest research on production and impact of the GSE; 3) and on the intellectual
and social structure of the GSE.
First, Zheng and Liu [18] developed a “co-awardees” network of significant international
awards/prizes according to awardees’ assessment, establishing a similarity between the Nobel Prize and
other awards/prizes awardees (e.g., Wolf, Lorentz, and Shaw awards/prizes). Subsequent work by Ma and
Uzzi [13] assembled a scientific prize network based on 3,000+ prizes and the careers of 10,000+
prizewinners over a 100-year period. They found that the number of prizes doubled every 25 years, that
the science hierarchy is becoming more vertical, and that having an awarded advisor is essential for

5
winning at least one prize. The winning of subsequent prizes, however, is more a matter of expanding
one’s own network.
Second, recent work on the GSE concluded that the business of predicting the next Nobel had
become a fruitless exercise since the laureates rank among the 500 most-cited authors after the 1970s
compared to those awarded in the early twentieth century and their contributions have been limited to
research niches rather than the discipline as a whole [22]. This was further refined by Ioannidis et al. [7],
who found that of the 114 domains investigated, only five (i.e., particle physics [14%], cell biology
[12.1%], atomic physics [10.9%], neuroscience [10.1%], and molecular chemistry [5.3%]) accounted for
52.4% of the Nobel Prizes awarded. Taking a closer look at the features of the Nobelists’ papers, Zhou et
al. [51] estimated that 74.7% were cited more than 500 times, innovative research was more cited than
theoretical and experimental methods, and most of the papers were published in journals with an Impact
Factor between 5-10. Ioannidis et al. [15,52] examined the most-cited biomedical researchers and
proposed a citation-based composite score assessment of 84,000+ highly-cited scientists in 12 fields.
Among their findings, a number of scientists stated that research related to progressive evolution (i.e.,
continuous progress; broader interest; greater synthesis) rather than revolution was the most characteristic
feature of a blockbuster paper. Based on the proposed composite score, many Nobelists ranked among the
top-1000 highly-cited authors, but would rank much lower if based solely on citations. Similarly, highly-
cited authors had published either none or very few influential papers as a first, single, or last author.
One of the most comprehensive studies on Nobelists’ careers [11] found that they were
productive from the outset (twice as many papers as a random scientist), showed a six-fold increase in
publishing hit papers (top 1% of rescaled 10-year citations) and published on average two hit papers.
Nevertheless, the overall career path before winning the prize is similar to that of other scientists. While
the laureates’ collaboration network did not increase after the Nobel Prize, it tended to be more consistent
in productivity and impact. Contrasting Nobeslists with highly-cited researchers, Kosmulski [6] the
only study that included the Sveriges Riksbank Prize in Economic Sciences in Memory of Alfred Nobel
argued that the virtue of publishing hot papers (0.1% of the top papers in the field in the past two years) is
not common among recent Nobel laureates while the number of scientists who have at least one highly-
cited paper substantially exceeds 100,000. Kosmulski [6] also found that Nobel Prize papers connect
topically diverse clusters of research papers [8]. Schlagberger et al. [33] highlighted US dominance at the
national and institutional level given that four US institutions hold most of the Nobelists in physics,
6
chemistry, and physiology (i.e., UC Berkeley, Columbia, MIT, and Princeton). While Nobelists are
mobile, they generally hail from the US, UK, Japan, and Germany.
Third, studies on the Nobelist collaboration network [26,61] found that laureates published fewer
papers, but with a higher than average citation, a feature further supported by Li et al. [11]. Nobelists tend
to play a brokerage role in the collaboration networks by building intellectual and social bridges and
exploiting structural holes. Jiang and Liu [61], for example, noted a high level of institutional inequality
across periods. The most connected institution during 1990-1940 was the Humboldt University; during
1941-1980 it was the University of Cambridge, and during 1981-2017 it was Harvard University, a
phenomenon outlined earlier [33].
Despite the considerable research already undertaken, the above literature review exposes two
major limitations. First, as noted by Zheng and Liu [18] and Ioannidis et al. [7], further studies are needed
that will incorporate other disciplines such as the social sciences and humanities. Second, since the study
by Schlagberger et al. [33] focused solely on US institutions, a broader landscape is needed to research
institutions in developing countries. To close these two gaps, this study includes researchers in social
sciences and humanities, environmental science and sustainable development, who for the most part are
affiliated with Colombian institutions. While the latter are not comparable to US institutions in terms of
global reputation, some of these Colombian institutions have garnered a regional reputation, particularly
in Latin America and the Caribbean (e.g., Universidad Nacional or Universidad de Los Andes) [62].
3 Materials and methods
3.1 Data
3.1.1 Colombian Scientific Elite
The CSE list was sourced from the AAEF website (2000-2020) and from a book published by the AAEF
(1990-1999) commemorating its half-century [50]. We decided to restrict our sample to the last 30 years’
awardees in light of Colombian researchers’ late involvement in publishing research articles in
international journals (since the early 1990, ~200 papers were published annually in the Science Citation
Index) [63]. We further restricted our sample to the leading author or representative in the case of multi-
authored documents. Table 1 presents the CSE sample of 87 awardees categorized by sex and award.
Female researchers have a 25.3% participation among the awardees, with the highest participation in
social sciences and humanities (SoSci) with 11.4%. In contrast, male researchers have 74.7% of the total

7
participation, the highest being in physics and natural sciences (PhySci) with 32.2%. While the issue of
sex differential among scientists lies beyond the scope of this study, it is worth noting that the differential
among AAEPs is similar to that among Nobel Prize winners. Evidence shows [64] that ten women were
awarded a Nobel Prize in the sciences between 2004-2019, which is the same number of awardees during
the first 100 years of Nobel history. Multiple causes have been cited to account for this discrepancy, such
as marital and maternity status, lack of role models, and a lack of interest in following an academic career
– all of which impacts both productivity and further research for women.
Appendix 1 presents the higher/last academic degree by university and country according to the
Colombian Ministry of Science, Technology, and Innovation platform for researchers’ curriculum:
CvLAC [65]. Thirty-one percent of researchers have completed an academic degree in the US and 28% a
Ph.D. in reputable universities such as Harvard, MIT, Yale, or Wisconsin-Madison. In contrast, 27.6%
have completed an academic degree in Colombia and 12.6% a Ph.D. in reputable Colombian universities
such as Nacional, Antioquia, Valle, or Los Andes.
Table 1 Colombian Scientific Elite by sex and AAEF award category
Total 87
CSE sex by category %
Female 25.3
Environmental sciences and sustainable development
– EnvSci 8.0
Social sciences and humanities – SoSci 11.5
Physics and natural sciences – PhySci 5.7
Male 74.7
Environmental sciences and sustainable development
– EnvSci 24.1
Social sciences and humanities – SoSci 18.4
Physics and natural sciences – PhySci 32.2
Source: [45,50].
3.1.2 Bibliographic data
Scopus was chosen over Web of Science (WoS) due to its broader journal coverage and researcher
participation from developing countries, particularly Colombia [40,66–68]. Based on the CSE list above,
we searched and sourced the complete profiles in Scopus for each author. Those with only one indexed
article were excluded. We also checked each author’s current or past affiliation in the CvLAC [65] to
avoid the inclusion of homonymous authors. The working sample of CSE with Scopus profiles consisted
of 41 researchers, ~47% of the preliminary CSE list displayed in Table 1. For multiple-year AAEP
awardees (e.g., Germán Poveda-2007, 2019), the first year was considered for related assessments (Figure
8
3). The CSE sample contains a similar sample of researchers compared to previous studies on non-Nobel
laureates (e.g., 29 recipients of the Derek John de Solla Prize Medal [69]).
Table 2 presents the bibliometric descriptives. Environmental sciences and sustainable
development (EnvSci) and physical sciences (PhySci) were the categories with the most profiles found in
Scopus. PhySci was the category with the highest number of articles, authors, and citations per document.
EnvSci, however, showed the highest annual growth rate and authors per article. The most relevant
periodical (most frequent) for SoSci was Revista de Estudios Sociales (Colombia – U. Andes), for EnvSci
Biotropica (Wiley), and for PhySci Physical Review A – Atomic Molecular and Optical Physics
(American Physical Society). This is consistent with the publishing and citation dynamics of the above
disciplinary categories: SoSci is oriented towards the publication of books/book chapters in local journals,
while PhySci-related disciplines tend to publish international research articles or conference proceedings
[70–73]. Articles (921) with 10+ authors [74] were excluded from the analysis. These were mostly from
medicine: 26%; earth and planetary sciences: 22.6%; and biochemistry, genetics and molecular biology:
18.6%. Such publications are difficult to assess since they could be either a product of publishing
agreements or highly collaborative authors with marginal research input [56]. Due to Scopus’ indexing
accuracy, we only analyzed articles published between 1996-2020 [66].
Table 2 Scopus author profiles and bibliometric descriptive of the CSE aggregated and by category 1996-2020
Category Profiles Documents Articles Annual
growth% Authors
Authors per
article
Citations
per article Most frequent journal
PhySci 19 1,206 1,025 2.25 1,776 1.47 55.1 Physical Review A - Atomic Molecular and
Optical Physics
EnvSci 14 485 439 6.67 735 1.52 26.4 Biotropica SoSci 10 38 31 <1 21 0.55 4.2 Revista de Estudios
Sociales
Total 41 1,731 1,195 2.97 2,532 1.18 28.6
Source: [45,50,65,75,76]. Note: EnvSci: environmental sciences and sustainable development; SoSci: social sciences
and humanities; PhySci: physics and natural sciences.
3.2 Methods and techniques
3.2.1 AAEP research topics
A semantic network was built based on each title of the awarded research document by category. The aim
was to explore the document titles and examine the shared meaning and interconnection between key
terms among titles [77]. A co-occurrence matrix was assembled to compute the number and direction of
unique-word co-occurrence after removing stop/period and non-informative words. Finally, a directed-
weighted semantic network was produced based on the co-occurrence matrix. Two network analysis
9
characteristics/metrics were computed: community detection; and betweenness. For the former, we
implemented the Blondel et al. [78] modularity appraisal algorithm, which gives a node’s capacity for
mediating the flow of information between multiple clusters [79]. The equation for the betweenness
calculation is:
𝐶𝐵(𝑝𝑘) = ∑𝑔𝑖𝑗(𝑝𝑘)
𝑔𝑖𝑗; 𝑖 ≠ 𝑗 ≠ 𝑘𝑛
𝑖<𝑗 . Source: [80].
where gij is the shorter path that links nodes pi and gij(pk) is the shorter path that links nodes pi and pjpk.
The higher the value, the higher its betweenness.
3.2.2 Output and citations
We outlined a descriptive section on articles and citations by category. We also explored the annual
citation per article of the top three most-cited researchers per category before and after receiving the
AAEP.
3.2.3 Institutional collaboration and coauthorship
Bibliographic data of the CSE profiles was processed with bibliometrix for R [76,81]. Once this data has
been processed and converted into the corresponding objects, preprocessing and cleaning are carried out
in order to unify the authors’ names and affiliations. Macro (density and average path length), meso
(community detection), and micro (betweenness centrality) indices were analyzed. Density indicates the
degree to which both authors and institutions are connected (i.e., the number of connections that exist
compared to the number of connections that could exist). The equation for the density calculation is:
𝑑𝑒𝑛 = 2𝐿/𝑛(𝑛 − 1). Source: [82].
where L is the number of links and n is the number of nodes. The average path length computes the
average number of steps along the shortest path for every pair of nodes (i.e., authors, institutions) in a
given network. The equation for the average path length calculation is:
𝑙𝐺 =1
𝑛(𝑛−1) ∑ 𝑑(𝑣𝑖 , 𝑣𝑗)𝑖≠𝑗 . Source: [83].
Where 𝑑(𝑣𝑖 , 𝑣𝑗) is the length of the shortest path that exists between two nodes. We used the Leiden
algorithm to identify communities (i.e., clusters) [84]. Betweenness equation and interpretation are given
in 3.2.1 above.

10
3.2.4 Bibliographic coupling
A bibliographic coupling connects two documents if a common item was cited and appeared within both
lists of references [85]. This facilitates an analysis of the clustering of shared items between documents
and an investigation of disciplinary fronts that highlights how academic knowledge is shared [86–88].
This technique moderately outperforms other science mapping techniques used to identify research fronts
(i.e., co-citation analysis, direct citation) [89]. The equation for obtaining a bibliographic coupling
network is:
𝐵𝑐𝑜𝑢𝑝 = 𝐴𝑥𝐴′. Source: [76].
Where 𝐴 is a document and x is a cited reference matrix. The element 𝑏𝑖𝑗 indicates how many
bibliographic couplings exist between documents 𝑖 and 𝑗 . 𝐵𝑐𝑜𝑢𝑝 is both a non-negative/symmetrical
matrix. The number of shared references defines the strength of the bibliographic coupling between two
documents.
3.2.5 The CSE and the GSE
The following steps were performed to conduct a comparative analysis between the CSE and the GSE:
We sourced the complete Scopus bibliographic profile of each Nobel Prize laureate during the
same period as the CSE: 1990-2020, in the science categories (i.e., physics, chemistry, and
physiology and medicine), and the Sveriges Riksbank Prize in Economic Sciences in Memory of
Alfred Nobel. A total of 248 laureate profiles were sourced.
We re-classified CSE and GSE researchers according to their core discipline/subject categories
since awardees in respect of both prizes have a wide range of (under)graduate backgrounds.
Moreover, prize categories themselves cover a wide range of disciplines/research areas. For
instance, Juan Camilo Cárdenas, who belongs to the CSE, graduated from industrial engineering
and was awarded his prize in the AAEP-EnvSci category (2009). Another example is Daniel
Kahneman, a psychologist who received the Nobel Prize in economics (2002). The re-
classification was conducted as follows:
o Each CSE and GSE publication belongs to a single journal. Journals and serial titles are
classified using the All Science Journal Classification (ASJC), which is based on the
aims and scopes of the title and its content [90].

11
o We cross-checked the printed ISSN of each journal in which the CSE and GSE
researchers have published and matched its ASJC subject area. This cross-check
procedure was conducted for each CSE and GSE researcher.
o If a given journal belonged to more than one ASJC subject area, it was randomly
assigned.
o We then computed each researcher’s publication frequency according to the ASJC
subject areas.
o Each researcher was then assigned to one ASJC subject according to its own most
frequent ASJC subject based on its publishing record. For example, Cárdenas, an
engineer who was awarded a prize in the EnvSci category, was assigned to the
economics, econometrics and finance ASJC subject since most of his articles were
published in journals under that classification (Table 4).
Once researchers were re-classified into ASJC subjects, a first filter was applied to ensure that
the same ASJC category profiles of the GSE coincided with those of the CSE. We then
implemented non-proportional stratified sampling since there were not enough values for each
strata (i.e., no balanced classes in the GSE-ASJC profiles) due to the particular disciplinary foci
of the GSE. Table 3 shows the bibliometric descriptives of the selected laureates. The top three
disciplines in the CSE were: agricultural and biological sciences; arts and humanities; and
medicine. In the GSE, each of the following disciplines/fields had five researchers: medicine;
earth and planetary sciences; physics and astronomy; immunology and microbiology; chemistry;
and economics, econometrics and finance.
We replicated multiple citation indicators and their composite [52]: total impact; coauthorship
adjustment; and author order. In the first are the number of citations and h index [91]. The h
index is defined as follows: for a set of articles N of an author and defining 𝑐𝑖 as the number of
citations corresponding to an article 𝑖 then ordering the set of articles in decreasing order
according to the number of citations, formally:
ℎ 𝑖𝑛𝑑𝑒𝑥 = max{i ∈ N: ci ≥ i} Source: Hirsch [91].
In the second, the hm index (i.e., an h index adjustment for coauthored papers) [55]. For a set of
articles N with 𝑐𝑖 the number of citations for the article 𝑖 and 𝑎𝑖 the number of corresponding
authors, the cumulative sum of the inverse of the number of authors is proposed as the effective

12
rank reff = ∑1
ai
i . Then, sorting the set of articles in decreasing order according to the number of
citations, the hm index can be defined as:
ℎ𝑚 𝑖𝑛𝑑𝑒𝑥 = max{reff ∈ N: ci ≥ reff} Source: Schreiber [55,92].
In the third, the number of citations as a single author; as a single or first author; and as a single,
first or last author. Finally, the composite was calculated as the sum of the 0-1 normalization
log-transformation of the previous indices. Authorship order is crucial when assigning
credit/contribution to a research publication. With the exception of mathematics or economics
[93], the most credit assigned to a multi-authored article goes to the first author (i.e. early-career
researcher), and last author (usually a mentorship figure) [94]. Middle authors generally play a
more specific/technical role (i.e., statistical analysis). In sum, C brings a more nuanced
perspective of an author’s impact by including total impact, coauthorship adjustment, and the
author order as a proxy of the leading role (or absence of it). Table 3 shows Scopus author
profiles and bibliometric descriptive of the GSE aggregated and by category 1996-2020
Category Profiles Documents Articles Annual
growth % Authors
Authors
per Articles
Citations
per Articles
Most frequent
Chemistry 13 2,944 2,600 -2.71 3,660 0.80 126.2 Journal of the American
Chemical Society
Economics 6 334 226 -0.39 247 0.74 98.2 American Economic Review
Physics 12 2,517 2,166 -0.31 2,094 0.83 61.9 Japanese Journal of
Applied Physics Physiology
or Medicine
10 1,211 897 -5.16 2,558 2.11 113.2 Proceedings of the
National Academy of
Sciences of the United States of America
Total 41 7,006 5,889 -2.14 8,559 1.21 99.9
Source: [75,76].
Table 4 ASJC subject area classifications and supergroup for CSE and GSE
Source: the authors based on [75,90].
9 6
5 3 3 3 3 21
1 1
2 1 1
1 1
5 4 5 4 5 51
5 5
0%10%20%30%40%50%60%70%80%90%
100%
Agric
ultu
ral a
ndBi
olog
ical
Sci
ence
s
Arts
and
Hum
aniti
es
Med
icin
e
Bioc
hem
istr
y, G
enet
ics
and
Mol
ecul
ar B
iolo
gy
Eart
h an
d Pl
anet
ary
Scie
nces
Engi
neer
ing
Phys
ics
and
Astr
onom
y
Imm
unol
ogy
and
Mic
robi
olog
y
Chem
ical
Eng
inee
ring
Chem
istr
y
Econ
omic
s, E
cono
met
rics
and
Fina
nce
Envi
ronm
enta
l Sci
ence
Mat
hem
atic
s
Soci
al S
cien
ces
CSE GCE

13
4 Results
4.1.1 AAEP research topics
Figure 1 displays the semantic networks of the titles of the 88 CSE by category. In SoSci, high
betweenness key terms were those related to history (century) and development. The two most populated
clusters, grouping ~27% of key terms, were related to indigenous peoples/territories; and historical and
territorial perspectives on political and social movements. In EnvSci, high betweenness terms were those
related to territories and ecology. The two most populated clusters, grouping ~39% of key terms, were
related to local natural reserves management strategies; and tools for conservation and identification of
biodiversity in the Amazon. In PhySci, high betweenness key terms were those related to control and
Alzheimer’s. The two most populated clusters, grouping ~31% of key terms, were related to genetics, and
research on Alzheimer’s and Parkinson’s. In all categories, the key term with the highest betweenness
was Colombia, highlighting the importance of research for local problems/understanding regardless of
category.
Env Sci
SoSci

14
PhySci
Aggregated
Figure 1 Semantic networks of research titles awarded by the AAENF by category. Source: the authors based
on AAEF [45,50]. Processed with quanteda, igraph and gephi [81,95–97].
4.1.2 Output and citations
4.1.3 Output and citations
Figure 2 displays the total articles and citations per year by category. In the three different areas awarded
by the AAEP, production was led by the PhySci category, followed by EnvSci and SoSci. This is
expected given the output and citation dynamics differential between PhySci and SoSci on inclusion and
participation in international journal indexing systems. In the case of citations, there is a well-defined
peak produced by the impact of researchers such as Nubia Muñoz, whose primary research is on the
human papillomavirus (HPV). In 2003, Muñoz published over 50 articles with ~14,000 citations, turning
her into one of the most productive and impactful researchers among the CSE. Figure 2 shows the PhySci
category citations with and without (dotted line) the inclusion of Nubia Muñoz. Table 5 presents the
most-cited article by AAEP category. All articles were published in internationally reputable journals,
edited by either world-renowned universities (Duke University) or societies (Massachusetts Medical
Society).
Table 5 Most-cited article by AAEP category Category Author Article Journal H index Citations
PhySci Nubia Muñoz Epidemiologic Classification of Human
Papillomavirus Types Associated with Cervical
Cancer
The New England
Journal of Medicine
1,030 4,583
EnvSci Jesús Olivero-
Verbel
Repellent activity of essential oils: A review Bioresource
Technology
294 631
SoSci Alejandro Castillejo-
Cuellar
Knowledge, Experience, and South Africa’s Scenarios of Forgiveness
Radical History Review
22 22
Source: the authors based on Scopus [98].

15
Figure 2 Total articles (left side) and citations (right side) per year by category. Source: the authors based on
AAEF [45,50] and Scopus [98]. Processed with quanteda, igraph and gephi [81,95–97].
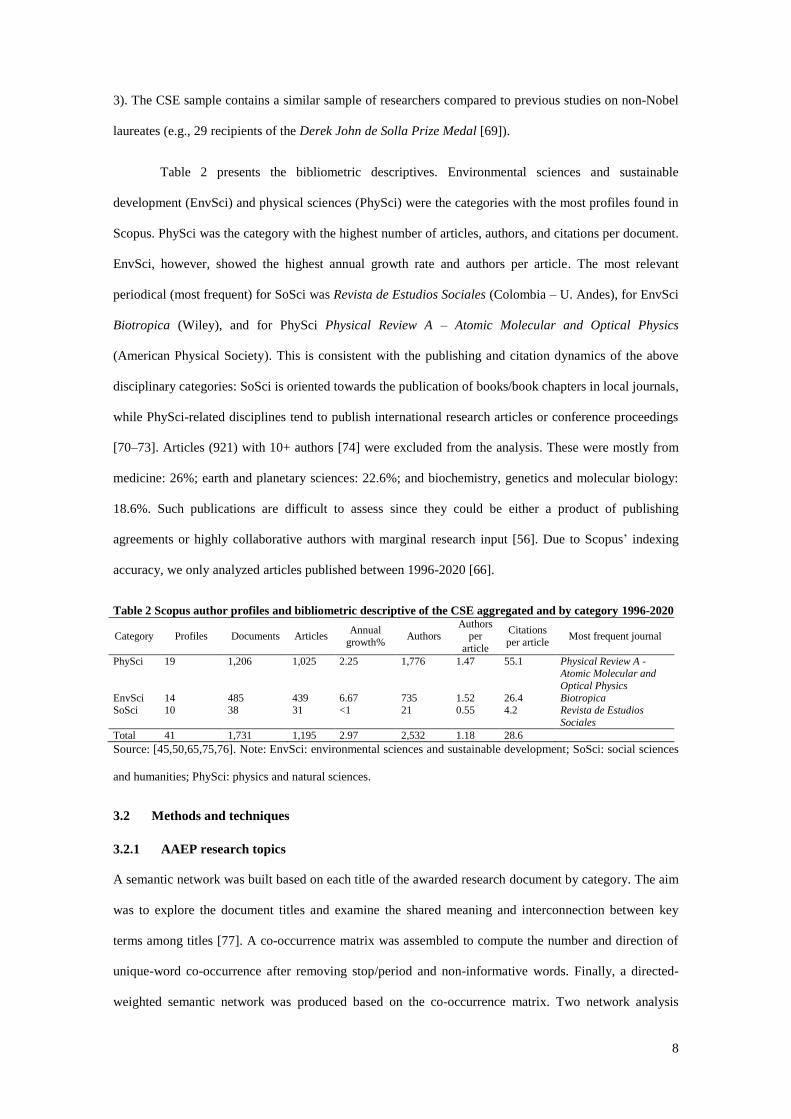
Figure 3 shows the citation per article by category of the top three most-cited researchers. Dotted lines
indicate the year in which each researcher received the AAEP. First, in the discipline of PhySci, the top
three researchers were: Nubia Muñoz (AAEP-2006); Ana María Rey (AAEP-2007); and Iván Darío Vélez
(AAEP-2003). As previously stated, Muñoz was the most prolific author in this category, with a peak of
citations per paper in 2003 and another peak in 2007, just after receiving the AAEP. However, this metric
shows a decrease with no crucial peaks thereafter. Rey shows three peaks after receiving the award. Vélez
received the award comparatively early given that his most crucial peak occurred nearly nine years later
(2012). Thus, Muñoz appears to have been awarded at the peak of her career, whereas Rey and Vélez
were both awarded before their most impactful years.
Second, in EnvSci, the top three researchers were: Germán Poveda (AAEP-2007); Juan Camilo
Cárdenas (AAEP-2009); and Consuelo Montes (AAEP-2002). Poveda was awarded after his third career
peak. Two additional peaks ─ although lower ─ occurred later in his career. Cárdenas followed a similar
trend. He was awarded after three career peaks, 2000 being the most significant, followed by a smaller
peak in 2012. Montes was awarded in the middle of her first peak, followed by two similar peaks (2006
and 2009). Thus, whereas Poveda and Cárdenas received their awards after having reached their most
important peaks, Montes had several post-award peaks. The SoSci category does not allow for much
discussion. Suffice to say that after receiving the AAEP, Londoño, and Castillejo-Cuéllar appear to have
increased their intermittent involvement in publishing Soupus-indexed articles.
16
PhySci
EnvSci
SoSci
Figure 3 Citations per article by category of top three most-cited authors. Source: the authors based on AAEF
[45,50] and Scopus [98]. Processed with quanteda, igraph and gephi [81,95–97]. Note: the dashed line indicates
the year each author was awarded the AAEP; TCpP: citations per paper.
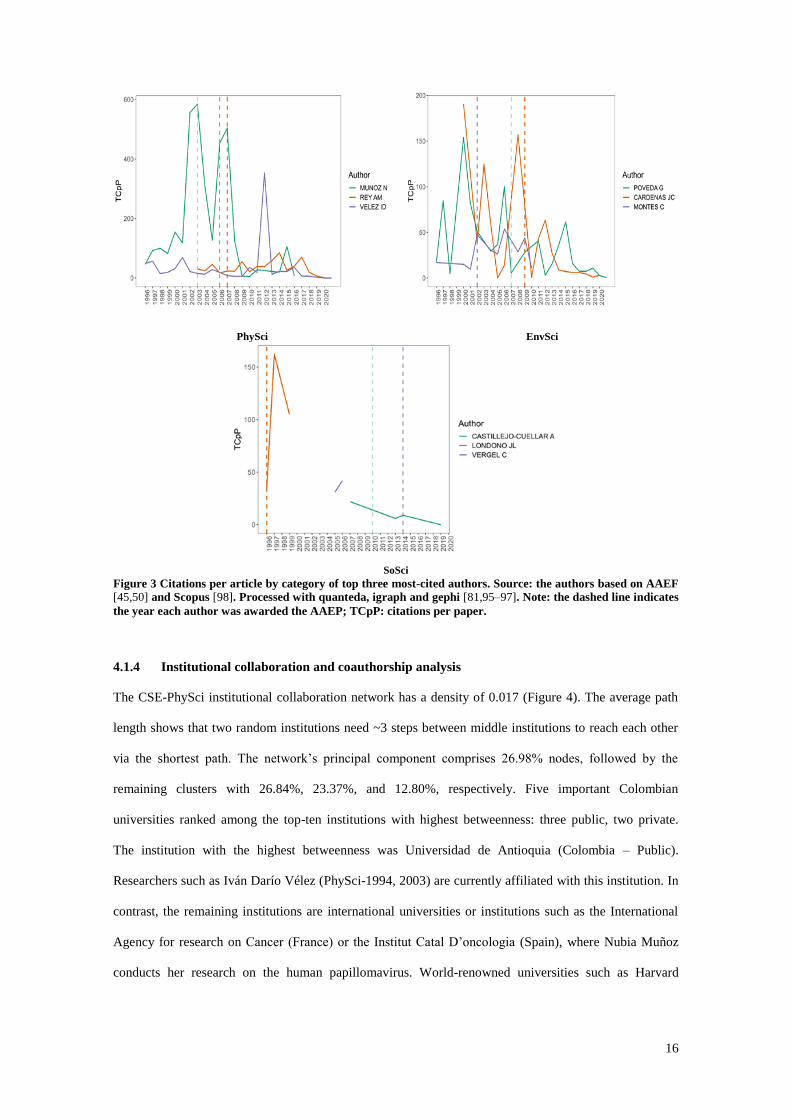
4.1.4 Institutional collaboration and coauthorship analysis
The CSE-PhySci institutional collaboration network has a density of 0.017 (Figure 4). The average path
length shows that two random institutions need ~3 steps between middle institutions to reach each other
via the shortest path. The network’s principal component comprises 26.98% nodes, followed by the
remaining clusters with 26.84%, 23.37%, and 12.80%, respectively. Five important Colombian
universities ranked among the top-ten institutions with highest betweenness: three public, two private.
The institution with the highest betweenness was Universidad de Antioquia (Colombia – Public).
Researchers such as Iván Darío Vélez (PhySci-1994, 2003) are currently affiliated with this institution. In
contrast, the remaining institutions are international universities or institutions such as the International
Agency for research on Cancer (France) or the Institut Catal D’oncologia (Spain), where Nubia Muñoz
conducts her research on the human papillomavirus. World-renowned universities such as Harvard

17
University (USA – Private), and Free University of Berlin (Germany – Public) also ranked among the
top-ten.
Cluster color % nodes
26.98% 26.84% 23.37% 12.80% 2.36%
Macro indices
Density 0,01 Average Path Length
2,94
Institution Betweenness
Universidad de Antioquia
0.50
International Agency for Research on Cancer
0.22
Universidad Nacional de Colombia
0.16
University of Colorado
0.12
Universidad de Los Andes
0.11
Institut Catal D'oncologia
0.09
Harvard University
0.08
Pontificia Universidad Javeriana
0.06
Freie Universität Berlin
0.05
Universidad Del Valle
0.05
Figure 4 Institutional collaboration network – PhySci. Sources: the authors based on [75,95].
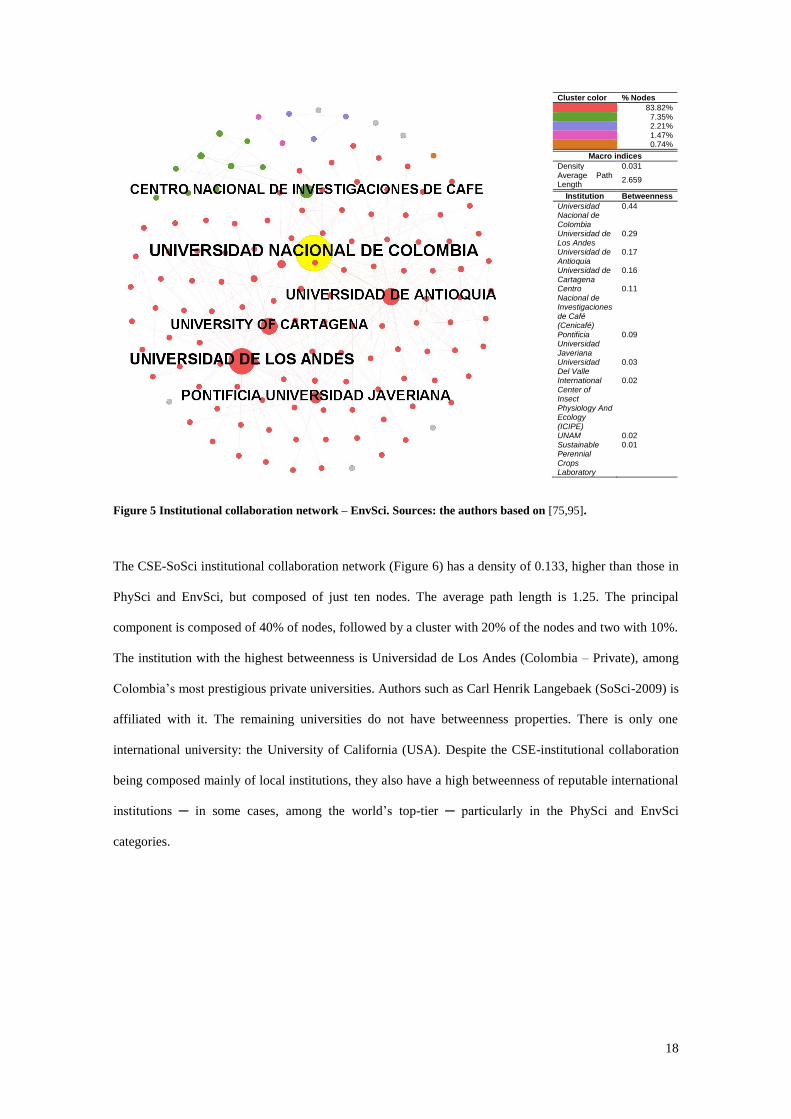
The CSE-EnvSci institutional collaboration network (Figure 5) has a density of 0.031, higher than
PhySci, but a lower average path length of 2.6. The principal component is composed of 83.8% of nodes,
followed by clusters with 7.3 and 2.2%. The institution with the highest betweenness is the National
University of Colombia (Public), one of the most prestigious universities in the country. Some authors
like Germán Poveda-EnvSci are affiliated with this university. Among the list are seven major Colombian
universities, while the remaining institutions are either international universities or institutions. Among
the latter can be found ICIPE (Kenya), Universidad Nacional Autónoma de México (Public), and the
Sustainable Perennial Crops Laboratory (USA), which belongs to the Department of Agriculture.
18
Cluster color % Nodes
83.82% 7.35% 2.21% 1.47% 0.74%
Macro indices
Density 0.031 Average Path Length
2.659
Institution Betweenness
Universidad Nacional de Colombia
0.44
Universidad de Los Andes
0.29
Universidad de Antioquia
0.17
Universidad de Cartagena
0.16
Centro Nacional de Investigaciones de Café (Cenicafé)
0.11
Pontificia Universidad Javeriana
0.09
Universidad Del Valle
0.03
International Center of Insect Physiology And Ecology (ICIPE)
0.02
UNAM 0.02 Sustainable Perennial Crops Laboratory
0.01
Figure 5 Institutional collaboration network – EnvSci. Sources: the authors based on [75,95].
The CSE-SoSci institutional collaboration network (Figure 6) has a density of 0.133, higher than those in
PhySci and EnvSci, but composed of just ten nodes. The average path length is 1.25. The principal
component is composed of 40% of nodes, followed by a cluster with 20% of the nodes and two with 10%.
The institution with the highest betweenness is Universidad de Los Andes (Colombia – Private), among
Colombia’s most prestigious private universities. Authors such as Carl Henrik Langebaek (SoSci-2009) is
affiliated with it. The remaining universities do not have betweenness properties. There is only one
international university: the University of California (USA). Despite the CSE-institutional collaboration
being composed mainly of local institutions, they also have a high betweenness of reputable international
institutions ─ in some cases, among the world’s top-tier ─ particularly in the PhySci and EnvSci
categories.

19
Cluster color % Nodes
40% 20% 20% 10% 10%
Macro indices
Density 0.133 Average Path Length
1.25
Institution Betweenness
Universidad de Los Andes
0.056
Universidad Nacional de Colombia
0.0
University of California, Berkeley
0.0
Figure 6 Institutional collaboration network – SciSco. Sources: the authors based on [75,95].
The CSE- PhySci coauthorship network (Figure 7) has a density of 0.007. The average path length of 3.62
means that ~4 steps on average are needed for two random nodes to reach each other via the shortest path.
The network’s principal component comprises 31.95% of the nodes, followed by the remaining clusters
with 16.81%, 14.57%, 8.49%, and 7.45%, respectively. Muñoz has the highest betweenness within the
principal component. In the second place is Luis Fernando García (AAEP-2000), a physician affiliated
with Universidad de Antioquia. Mauricio Restrepo, within Muñoz’s cluster, serves as a bridge between
the Muñoz and García clusters. Restrepo, on his part, is affiliated with the National Institute of Health,
Colombia, and connects the Muñoz and Felipe Guhl clusters. Guhl (AAEP-1998) is a biologist at
Universidad de Los Andes. Finally, the Ana María Rey cluster (AAEP-2007) is a closed network. Rey
currently works on quantum physics and ultra-cold atoms at the University of Colorado Boulder, a field
distant from (micro)biology, genetics, and other branches of medicine.

20
Cluster color % Nodes
32.91% 17.91% 15.04% 8.76% 7.69%
Macro indices
Density 0.007 Average Path Length
3.62
Author Betweenness
Munoz N 0.40 Garcia L F 0.22 Velez I D 0.18 Restrepo M 0.15 Torres F 0.13 Guhl F 0.11 Roman F 0.05 Patio P J 0.04 Velez-Pardo C 0.04 Rojas M 0.04
Figure 7 Author collaboration network – PhySci. Sources: the authors based on [75,95].
The CSE-EnvSci network (Figure 8) has a density of 0.019. The average path length is higher at 4.25.
The network’s principal component comprises 42.82% of the nodes, followed by the remaining clusters
comprising 18.48%, 17.89%, 6.74%, and 4.99%, respectively. The node with the highest betweenness is
Germán Poveda (AAEP 2007, 2019), affiliated with Universidad Nacional de Colombia, Medellín. He
specializes in hydraulics. Óscar José Mesa (AAEP-2000, 2007), with the same affiliation as Poveda,
ranked in 2nd place. He also works in hydraulics. Authors such as Jaime Carmona-Fonseca
(epidemiologist-virologist) or Walter Salas-Zapata (bacteriologist), both affiliated with Universidad de
Antioquia, have a higher betweenness despite being outside the five main clusters. In sum, most of the
authors are affiliated with local universities, compared to the CSE- PhySci.

21
Cluster color % Nodes
42.82% 18.48% 17.89% 6.74% 4.99%
Macro indices
Density 0.019 Average Path Length
4.251
Author Betweenness
Poveda G 0.29 Mesa OJ 0.20 Carmona-Fonseca J
0.19
Salas-Zapata WA
0.18
Castillo JA 0.17 Stevenson PR
0.15
Link A 0.10 Jaramillo A 0.07 Guzmn A 0.06 Olivero-Verbel J
0.03
Bustillo-Pardey AE
0.03
Echeverry-Galvis Ma
0.02
Len J 0.02 Jaramillo J 0.02 Borgemeister C
0.02
Botero JE 0.01
Figure 8 Author collaboration network – EnvSci. Sources: the authors based on [75,95].
The CSE-SoSci network (Figure 9) has a density of 0.128 and an average path length of 1.043, which is
the shortest in the study sample. It is also the smallest network, within which the flow of information is
the most efficient. The principal component of the network comprises 33.33% of the nodes, followed by
the remaining clusters with 14.81%, 11.11%, and 7.41%, respectively. The author with the highest
betweenness is Carl Henrik Langebaek (AAEP-2009), an anthropologist affiliated with Universidad de
Los Andes. In the same cluster can be found Melanie J. Miller, an anthropologist at University of Otago,
New Zealand; and Sabrina C. Agarwal, an anthropologist at University of California, Berkeley. Both
work in similar bioarchaeological fields.
Cluster color % Nodes
33.33% 14.81% 11.11% 7.41% 7.41%
Macro indices
Density 0.128 Average Path Lenght
1.043
Author Betweenness
Langebaek CH
0.006
Pacheco-Ceballos R
0
Granados R 0 Castillejo-Cuellar A
0
Figure 9 Author collaboration network – SoSci. Sources: the authors based on [75,95].

22
4.1.5 Bibliographic coupling networks
The bibliographic coupling network clusters were labeled according to the most frequent ASJC subject
among each journal cluster. If the most frequent ASJC subject in a given cluster reaches at least half of
the first most frequent subject, that cluster will also share the label of the second most frequent subject.
Nodes with a degree less than five were hidden from the layout to improve the structure’s interpretation.
Figure 10 presents the PhySci bibliographic coupling network. Density equals 0.026 and the
average path length is 3.56, which means an average of ~4 steps for a random pair of nodes to reach each
other via the shortest path, those nodes being a pair of coupled documents. The principal component of
this network corresponds to: medicine/agricultural and biological sciences having 43.53% of the
network’s nodes, followed by physics and astronomy with 20.98%; biochemistry, genetics and molecular
biology with 12.50%; 6.11% for immunology and microbiology; and 2.95% for mathematics. Even with
the principal component mainly comprising articles classified in medicine, most articles with the highest
property of mediating the flow/share of knowledge/references belonged to physics ─ with a marginal
presence of articles on movement disorders (e.g., Parkinson’s disease).
Cluster color % Nodes
43.53% Medicine / Agricultural and Biological Sciences
20.98% Physics and Astronomy 12.50% Biochemistry, Genetics and
Molecular Biology 6.11% Inmunology and Microbiology 2.95% Mathematics
Macro indices
Density 0.026 Average path length 3.56
Document Betweenness
Calzetta E, 2006, Phys Rev A.
0.121
Rey AM, 2005, Phys Rev A.
0.065
Rey AM, 2004, Phys Rev A.
0.063
Patterson JS, 2010, AM Trypanosomiasis.
0.042
Del Rio MJ, 2004, Mov Disord.
0.037
Ferraro F, 2015, J Phys Chem C.
0.032
Mantilla JS, 2013, Parasitol Res.
0.032
Gomez T, 2015, Molecules-A.
0.031
Ponce WA, 2002, Int J Mod Phys A. 2002
0.031
Rojas-Valencia L, 2017, Biometals.
0.028
Figure 10 Bibliographic coupling network – PhySci. Sources: the author based on [75,95].
Figure 11 presents the EnvSci bibliographic coupling network. The density equals 0.058 with an average
path length of 2.56. Most of the network corresponds to the agricultural and biological sciences/earth and
planetary sciences with 85.77% nodes, followed by 1.80% for chemical engineering. Documents with the

23
highest betweenness were mostly articles in (sub)fields such as contamination and toxicology, ecology,
geology, environmental economics, and molecular catalysis. There is also the involvement of a report
from the IPCC-2014 (Intergovernmental Panel on Climate Change).
Cluster color % Nodes
85.77%
Agricultural and Biological Sciences / Earth and Planetary Sciences
1.80% Chemical Engineering
Macro indices
Density 0.058 Average Path Length 2.56
Document Betweenness
Alcala-Orozco M, 2020, Arch Environ Contam Toxicol.
0.039
Poveda G, 2006, Palaeogeogr Palaeoclimatol Palaeoecol.
0.038
Cardenas JC, 2011, Environ Resour Econ.
0.031
Aristizbal B, 2004, J Mol Catal A Chem.
0.029
Crdoba LF, 2005, Appl Catal B Environ.
0.020
Cruz-Tejada DM, 2018, Ecosphere.
0.020
Arias PA, 2021, Front Earth Sci.
0.019
Magrin GO, 2015, Climate Change 2014: Impacts, Adaptation And Vulnerability: Part B.
0.018
Correa DF, 2015, Global Ecol Biogeogr.
0.018
Renjifo LM, 2020, Plos One.
0.018
Figure 11 Bibliographic coupling network – EnvSci. Sources: the authors based on [75,95].
Figure 12 presents the SoSci bibliographic coupling network. The network has a density of 0.051 with an
average path length of 2.339. The principal component is composed mainly of arts and humanities/social
sciences, with 45.28% of nodes. The document with the highest betweenness was on the history of land-
use planning in Colombia. Most journals were devoted to history and anthropology, and geography, with
a few exceptions in law, health policy, and hydraulic engineering.

24
Cluster color % Nodes
44.23%
Arts and Humanities / Social Sciences
Macro indices
Density 0.051 Average Path Length 2.339
Document Betweenness
Herrera Angel M, 2006, Hist Crit. 2006
0.1098
Serje M, 2017, Front. 0.0347 Langebaek CH, 2004, Hist Crit.
0.0324
Londono JL, 1997, Health Policy.
0.0324
Castillejo-Cuellar A, 2013, Anthropol Today.
0.0205
Castillejo-Cuellar A, 2014, Law Crit.
0.0170
Herrera Angel M, 2006, J Lat Am Geogr.
0.0111
Castillejo-Cuellar A, 2014, Horizontes Antropol.
0.0088
Castillejo-Cuellar A, 2007, Radic Hist Rev.
0.0039
Pacheco-Ceballos R, 1992, J Hydraul Eng.
0.0015
Figure 12 Bibliographic coupling network – SoSci. Sources: the authors based on [75,95].
Figure 13 presents a summary of the nodes and macro indices of the three types of networks presented
above. The number of nodes is proportional to the number of articles in each CSE category. In contrast,
the density is inversely proportional to the number of articles. The decreasing average path length
reinforces this observation.
In terms of institutional collaboration, the SoSci network has established more real than potential
institutional collaborations, followed by EnvSci and PhySci. Accordingly, there are fewer intermediates
between a pair of institutions than PhySci and EnvSci. On the other hand, the number of institutions in
PhySci is almost ~6 times higher than EnvSci, and ~49 times higher than SoSci, giving PhySci a higher
average path length. Compared to EnvSci, however, PhySci does not have over a complete intermediate
institution in average. In contrast, there are on average ~2 different intermediate institutions between
PhySci and SoSci. The coauthorship networks display similar patterns regarding the average number of
intermediate authors for PhySci and SoSci. However, the EnvSci network showed the highest average
path length with ~4 middle authors.
Among the top-ten institutions, the PhySci collaboration network showed a direct collaboration
between Universidad de Antioquia and Harvard University (161 Nobel Prizes). In EnvSci, Universidad de
Los Andes, Nacional, Cartagena, and Valle, have at least one direct collaboration with UNAM (3 Nobel
Prizes). In SoSci, Universidad de Los Andes has a direct collaboration with the University of California,

25
Berkeley (110 Nobel Prizes). Thus, CSE institutions are embedded in a collaboration network with GSE
institutions. In a more refined analysis at the authorship level, only two AAEPs have coauthored with
GSE authors: Juan Camilo Cárdenas with Elinor Ostrom in What do people bring into the game?
Experiments in the field about cooperation in the commons (2004); and Nubia Muñoz with Harald zur
Hausen in Nasopharyngeal carcinoma. X. Presence of epstein-barr genomes in separated epithelial cells
of tumours in patients from Singapore, Tunisia and Kenya (1975).
Regarding bibliographic coupling networks, the PhySci network displayed a more diverse topic-
cluster formation in terms of research fronts (i.e., shared knowledge/references) than the more
multi/inter/transdisciplinary categories of EnvSci. The SoSci network was the most homogeneous
network. In SoSci, despite the reduced number of research fronts, the average middle document was ~2,
similar to EnvSci, although EnvSci has ~9 times the number of nodes.
Network Nodes and macro indices
Institutional
collaboration
Coauthorship
Bibliographic
coupling
Figure 13 Nodes and macro indices summary. Sources: the authors based on [75,95].
4.1.6 The CSE and the GSE
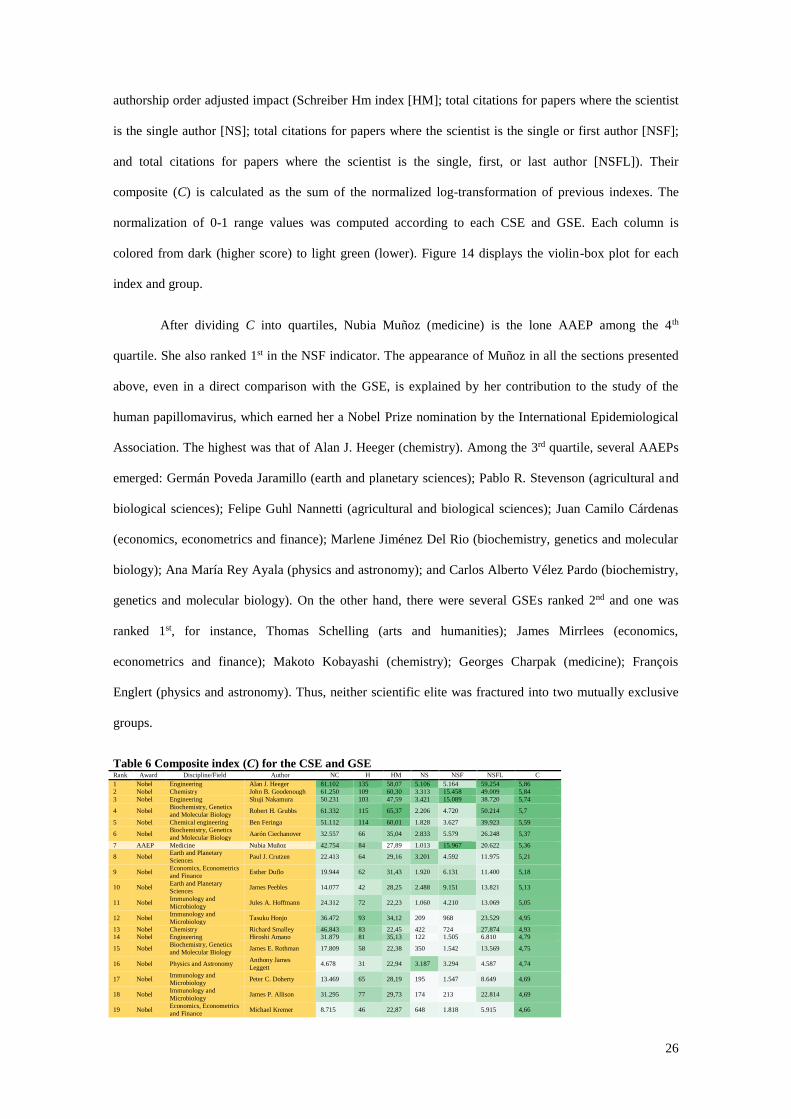
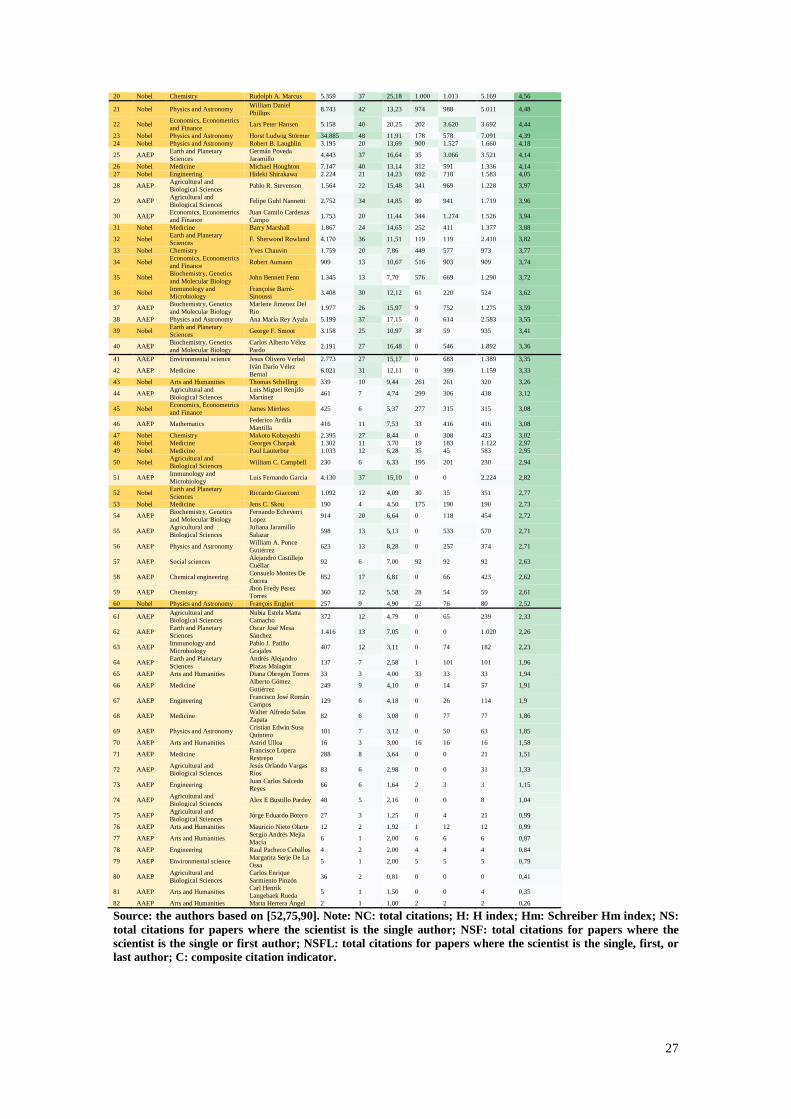
Table 6 presents the citation indicators and their composite [52]. GSE was yellow while CSE yellow-light
colored. Horizontal lines divide the table into C quartiles. The six scientific impact and productivity
indices are separated into two aspects: bulk impact (number of citations [NC] and h index [H]); and
719136
16
0,010,031
0,13
2,94 2,651,25
0,01
0,1
1
10
1
10
100
1000
1219341
270,0070,019
0,128
3,62 4,251,43
0,001
0,01
0,1
1
10
1
10
100
1000
10000
1392 48853
0,0260,058 0,051
3,56 2,56 2,339
0,01
0,1
1
10
1
10
100
1000
10000
PhySci EnvSci SoSci
Nodes- left axis Density-right axis Av. Path Length-right axis
26
authorship order adjusted impact (Schreiber Hm index [HM]; total citations for papers where the scientist
is the single author [NS]; total citations for papers where the scientist is the single or first author [NSF];
and total citations for papers where the scientist is the single, first, or last author [NSFL]). Their
composite (C) is calculated as the sum of the normalized log-transformation of previous indexes. The
normalization of 0-1 range values was computed according to each CSE and GSE. Each column is
colored from dark (higher score) to light green (lower). Figure 14 displays the violin-box plot for each
index and group.
After dividing C into quartiles, Nubia Muñoz (medicine) is the lone AAEP among the 4th
quartile. She also ranked 1st in the NSF indicator. The appearance of Muñoz in all the sections presented
above, even in a direct comparison with the GSE, is explained by her contribution to the study of the
human papillomavirus, which earned her a Nobel Prize nomination by the International Epidemiological
Association. The highest was that of Alan J. Heeger (chemistry). Among the 3rd quartile, several AAEPs
emerged: Germán Poveda Jaramillo (earth and planetary sciences); Pablo R. Stevenson (agricultural and
biological sciences); Felipe Guhl Nannetti (agricultural and biological sciences); Juan Camilo Cárdenas
(economics, econometrics and finance); Marlene Jiménez Del Rio (biochemistry, genetics and molecular
biology); Ana María Rey Ayala (physics and astronomy); and Carlos Alberto Vélez Pardo (biochemistry,
genetics and molecular biology). On the other hand, there were several GSEs ranked 2nd and one was
ranked 1st, for instance, Thomas Schelling (arts and humanities); James Mirrlees (economics,
econometrics and finance); Makoto Kobayashi (chemistry); Georges Charpak (medicine); François
Englert (physics and astronomy). Thus, neither scientific elite was fractured into two mutually exclusive
groups.
Table 6 Composite index (C) for the CSE and GSE Rank Award Discipline/Field Author NC H HM NS NSF NSFL C
1 Nobel Engineering Alan J. Heeger 81.102 135 58,07 5.106 5.164 59.254 5,86
2 Nobel Chemistry John B. Goodenough 61.250 109 60,30 3.313 15.458 49.009 5,84
3 Nobel Engineering Shuji Nakamura 50.231 103 47,59 3.421 15.089 38.720 5,74
4 Nobel Biochemistry, Genetics
and Molecular Biology Robert H. Grubbs 61.332 115 65,37 2.206 4.720 50.214 5,7
5 Nobel Chemical engineering Ben Feringa 51.112 114 60,01 1.828 3.627 39.923 5,59
6 Nobel Biochemistry, Genetics
and Molecular Biology Aarón Ciechanover 32.557 66 35,04 2.833 5.579 26.248 5,37
7 AAEP Medicine Nubia Muñoz 42.754 84 27,89 1.013 15.967 20.622 5,36
8 Nobel Earth and Planetary
Sciences Paul J. Crutzen 22.413 64 29,16 3.201 4.592 11.975 5,21
9 Nobel Economics, Econometrics
and Finance Esther Duflo 19.944 62 31,43 1.920 6.131 11.400 5,18
10 Nobel Earth and Planetary
Sciences James Peebles 14.077 42 28,25 2.488 9.151 13.821 5,13
11 Nobel Immunology and
Microbiology Jules A. Hoffmann 24.312 72 22,23 1.060 4.210 13.069 5,05
12 Nobel Immunology and
Microbiology Tasuku Honjo 36.472 93 34,12 209 968 23.529 4,95
13 Nobel Chemistry Richard Smalley 46.843 83 22,45 422 724 27.874 4,93 14 Nobel Engineering Hiroshi Amano 31.879 81 35,13 122 1.505 6.810 4,79
15 Nobel Biochemistry, Genetics
and Molecular Biology James E. Rothman 17.809 58 22,38 350 1.542 13.569 4,75
16 Nobel Physics and Astronomy Anthony James
Leggett 4.678 31 22,94 3.187 3.294 4.587 4,74
17 Nobel Immunology and
Microbiology Peter C. Doherty 13.469 65 28,19 195 1.547 8.649 4,69
18 Nobel Immunology and
Microbiology James P. Allison 31.295 77 29,73 174 213 22.814 4,69
19 Nobel Economics, Econometrics
and Finance Michael Kremer 8.715 46 22,87 648 1.818 5.915 4,66
27
20 Nobel Chemistry Rudolph A. Marcus 5.359 37 25,18 1.000 1.013 5.169 4,56
21 Nobel Physics and Astronomy William Daniel
Phillips 8.743 42 13,23 974 988 5.011 4,48
22 Nobel Economics, Econometrics
and Finance Lars Peter Hansen 5.158 40 20,25 202 3.620 3.692 4,44
23 Nobel Physics and Astronomy Horst Ludwig Störmer 34.885 48 11,91 178 578 7.091 4,39
24 Nobel Physics and Astronomy Robert B. Laughlin 3.195 20 13,69 900 1.527 1.660 4,18
25 AAEP Earth and Planetary
Sciences
Germán Poveda
Jaramillo 4.443 37 16,64 35 3.066 3.521 4,14
26 Nobel Medicine Michael Houghton 7.147 40 13,14 312 591 1.336 4,14
27 Nobel Engineering Hideki Shirakawa 2.224 21 14,23 692 718 1.583 4,05
28 AAEP Agricultural and
Biological Sciences Pablo R. Stevenson 1.564 22 15,48 341 969 1.228 3,97
29 AAEP Agricultural and
Biological Sciences Felipe Guhl Nannetti 2.752 34 14,85 80 941 1.719 3,96
30 AAEP Economics, Econometrics
and Finance
Juan Camilo Cardenas
Campo 1.753 20 11,44 344 1.274 1.526 3,94
31 Nobel Medicine Barry Marshall 1.867 24 14,65 252 411 1.377 3,88
32 Nobel Earth and Planetary
Sciences F. Sherwood Rowland 4.170 36 11,51 119 119 2.410 3,82
33 Nobel Chemistry Yves Chauvin 1.759 20 7,86 449 577 973 3,77
34 Nobel Economics, Econometrics
and Finance Robert Aumann 909 13 10,67 516 903 909 3,74
35 Nobel Biochemistry, Genetics
and Molecular Biology John Bennett Fenn 1.345 13 7,70 576 669 1.290 3,72
36 Nobel Immunology and Microbiology
Françoise Barré-Sinoussi
3.408 30 12,12 61 220 524 3,62
37 AAEP Biochemistry, Genetics
and Molecular Biology
Marlene Jimenez Del
Rio 1.977 26 15,97 9 752 1.275 3,59
38 AAEP Physics and Astronomy Ana María Rey Ayala 5.199 37 17,15 0 614 2.583 3,55
39 Nobel Earth and Planetary
Sciences George F. Smoot 3.158 25 10,97 38 59 935 3,41
40 AAEP Biochemistry, Genetics
and Molecular Biology
Carlos Alberto Vélez
Pardo 2.191 27 16,48 0 546 1.892 3,36
41 AAEP Environmental science Jesus Olivero Verbel 2.773 27 15,17 0 683 1.389 3,35
42 AAEP Medicine Iván Darío Vélez
Bernal 6.021 31 12,11 0 399 1.159 3,33
43 Nobel Arts and Humanities Thomas Schelling 339 10 9,44 261 261 320 3,26
44 AAEP Agricultural and
Biological Sciences
Luis Miguel Renjifo
Martínez 461 7 4,74 299 306 438 3,12
45 Nobel Economics, Econometrics
and Finance James Mirrlees 425 6 5,37 277 315 315 3,08
46 AAEP Mathematics Federico Ardila
Mantilla 416 11 7,53 33 416 416 3,08
47 Nobel Chemistry Makoto Kobayashi 2.395 27 8,44 0 308 423 3,02
48 Nobel Medicine Georges Charpak 1.302 11 3,70 19 183 1.122 2,97
49 Nobel Medicine Paul Lauterbur 1.033 12 6,28 35 45 583 2,95
50 Nobel Agricultural and
Biological Sciences William C. Campbell 230 6 6,33 195 201 230 2,94
51 AAEP Immunology and
Microbiology Luis Fernando Garcia 4.130 37 15,10 0 0 2.224 2,82
52 Nobel Earth and Planetary
Sciences Riccardo Giacconi 1.092 12 4,09 30 35 351 2,77
53 Nobel Medicine Jens C. Skou 190 4 4,50 175 190 190 2,73
54 AAEP Biochemistry, Genetics
and Molecular Biology
Fernando Echeverri
Lopez 914 20 6,64 0 118 454 2,72
55 AAEP Agricultural and
Biological Sciences
Juliana Jaramillo
Salazar 598 13 5,13 0 533 570 2,71
56 AAEP Physics and Astronomy William A. Ponce
Gutiérrez 623 13 8,28 0 257 374 2,71
57 AAEP Social sciences Alejandro Castillejo
Cuéllar 92 6 7,00 92 92 92 2,63
58 AAEP Chemical engineering Consuelo Montes De
Correa 852 17 6,81 0 66 423 2,62
59 AAEP Chemistry Jhon Fredy Perez
Torres 360 12 5,58 28 54 59 2,61
60 Nobel Physics and Astronomy François Englert 257 9 4,90 22 76 80 2,52
61 AAEP Agricultural and Biological Sciences
Nubia Estela Matta Camacho
372 12 4,79 0 65 239 2,33
62 AAEP Earth and Planetary
Sciences
Oscar José Mesa
Sánchez 1.416 13 7,05 0 0 1.020 2,26
63 AAEP Immunology and
Microbiology
Pablo J. Patiño
Grajales 407 12 3,11 0 74 182 2,23
64 AAEP Earth and Planetary
Sciences
Andrés Alejandro
Plazas Malagón 137 7 2,58 1 101 101 1,96
65 AAEP Arts and Humanities Diana Obregón Torres 33 3 4,00 33 33 33 1,94
66 AAEP Medicine Alberto Gómez
Gutiérrez 249 9 4,10 0 14 57 1,91
67 AAEP Engineering Francisco José Román
Campos 129 6 4,18 0 26 114 1,9
68 AAEP Medicine Walter Alfredo Salas
Zapata 82 6 3,08 0 77 77 1,86
69 AAEP Physics and Astronomy Cristian Edwin Susa
Quintero 101 7 3,12 0 50 63 1,85
70 AAEP Arts and Humanities Astrid Ulloa 16 3 3,00 16 16 16 1,58
71 AAEP Medicine Francisco Lopera
Restrepo 288 8 3,64 0 0 21 1,51
72 AAEP Agricultural and
Biological Sciences
Jesús Orlando Vargas
Ríos 83 6 2,98 0 0 31 1,33
73 AAEP Engineering Juan Carlos Salcedo
Reyes 66 6 1,64 2 3 3 1,15
74 AAEP Agricultural and
Biological Sciences Alex E Bustillo Pardey 48 5 2,16 0 0 8 1,04
75 AAEP Agricultural and
Biological Sciences Jorge Eduardo Botero 27 3 1,25 0 4 21 0,99
76 AAEP Arts and Humanities Mauricio Nieto Olarte 12 2 1,92 1 12 12 0,99
77 AAEP Arts and Humanities Sergio Andrés Mejía
Macía 6 1 2,00 6 6 6 0,87
78 AAEP Engineering Raul Pacheco Ceballos 4 2 2,00 4 4 4 0,84
79 AAEP Environmental science Margarita Serje De La
Ossa 5 1 2,00 5 5 5 0,79
80 AAEP Agricultural and
Biological Sciences
Carlos Enrique
Sarmiento Pinzón 36 2 0,81 0 0 0 0,41
81 AAEP Arts and Humanities Carl Henrik
Langebaek Rueda 5 1 1,50 0 0 4 0,35
82 AAEP Arts and Humanities Marta Herrera Ángel 2 1 1,00 2 2 2 0,26
Source: the authors based on [52,75,90]. Note: NC: total citations; H: H index; Hm: Schreiber Hm index; NS:
total citations for papers where the scientist is the single author; NSF: total citations for papers where the
scientist is the single or first author; NSFL: total citations for papers where the scientist is the single, first, or
last author; C: composite citation indicator.

28
Figure 14 Box-violin plots according to group of scientific elite and bulk impact and authorship order adjusted
impact indices. Source: the author based on [52,75,90]. Note: NC: total citations; H: H index; Hm: Schreiber
Hm index; NS: total citations for papers where the scientist is the single author; NSF: total citations for papers
where the scientist is the single or first author; NSFL: total citations for papers where the scientist is the single,
first, or last author. Source: the authors based on [52,75,90]
5 Discussion
Most of the CSE has motivations/incentives other than publishing research in academic journals. This is
due to the AAEP’s broad scope in granting awards. Awards are granted not only for research articles,
dissertations (MSc/PhD), and books, but also for technical reports or books published by leading national
institutions, such as IDEAM (Institute of Hydrology, Meteorology and Environmental Studies) or the
Alexander von Humboldt Biological Resources Research Institute (EnvSci); or the National Centre for
Historical Memory; and NGOs such as Tropenbos International (SoSci). In contrast, all GSEs 1990-2020
had publications in Scopus.

29
Yet, in all science categories, the GSE had a decreasing trend in annual growth output. At the
individual level, this explains the temporary dip in GSE impact after winning the award and reduced
productivity albeit with a higher impact [11,99]. The inverse relationship between age and productivity
could be another explanatory factor since the average laureate age over the past 25 years is 44.1±9.7,
those in physics being the youngest at 42±12.5 [100]. Additional factors, as noted by Diamandis [101] in
an opinion piece, are as follows: laureates receive the prize 20-50 years after their core contribution to
their field, by which time they are past their prime; they become less active in terms of research; or their
main contribution was a serendipitous one-hit-wonder. At the country level, research on endogenous
growth suggests that ideas are getting harder to find and that more human and financial resources are
required to maintain the same growth levels as those in previous decades (e.g., 18 times the number of
researchers are required nowadays to double the chip density than was the case in the 1970s) [102].
Several explanatory factors could be outlined here, such as reduced public funding, follow on innovations
that produce smaller growth, or the fact that a third industrial revolution led by computers, the Internet,
and mobile phones, produced only a stunted growth between 1996-2004 [103].
Conversely, the AAEP showed an increasing trend in all categories. It is important, however, to
consider the following growth comparison in the limited context of the study’s specific research sample
and scale. The annual growth rate for each category ranges between <1% for SoSci and 6.67 for EnvSci.
Given that the annual growth rate for modern science post-WWII is ~9%, the overall output growth figure
of 2.97% is below such an estimate [104]. The CSE’s overall growth was similar to that in the mid-18th
century and between WWI and WWII (~3%). In the context of developing countries, the average annual
growth 1996-2018 in the fields of PhySci, EnvSci, and SoSci was 18% [46]. Thus, even in the most
prolific category (EnvSci), the growth is below historical and disciplinary estimates but positive
compared to that of the GSE. Two examples provide details on the CSE output/impact. A special case in
terms of output is that of Ana María Rey (PhySci) and Juan Camilo Cárdenas (EnvSci). Rey has
coauthored multiple articles in most of the physics journals that publish Nobel Prize research [5] (i.e.,
Physical Review; Science; and Nature) and has made contributions to fields such as solid states physics –
a field that garnered a significant amount of Nobel Prizes in the 20th century[14]. Cárdenas also has
coauthored articles published in Science. His research topics include game theory, a field which was
awarded the Nobel Prize in 1994, 1996, 2001, 2005, 2007, 2012 and 2014 [105].

30
Our findings do not support the post-AAEP push effect in citations/article. While a few CSE
members received the prize at the peak of their careers (i.e., Muñoz-PhySci; Montes-EnvSci), or after
peaks (i.e., Cárdenas-EnvSci), others received the prize far earlier than their most crucial peak (Velez-
PhySci). Compared to the GSE ─ members of which received the Nobel prize at their peak, followed by a
brief halo effect ─ there is no discernible halo effect for the CSE [22,106]. A halo effect is usually defined
as a bias whereby an impression produced by a single trait (i.e., winning a Nobel Prize or an AAEP)
influences multiple judgments (i.e., the prize-winning researcher’s future research). A contributory factor
could be the wide range of participants in the AAEP. Given that the AAEP annually awards diverse
products, it is not necessary to be a committed researcher in order to trigger, sustain, or participate in a
halo effect. This is not the case with the Nobel Prize. It is also important to mention the lack of sustained
and well-funded research in Colombia [107] ─ a constraint that is likely to persist, resulting in
intermittent productivity and impact [108].
Several institutions with GSE members shared rankings with CSE institutions among the top-ten
highest betweenness, particularly the PhySci network. For exmaple, institutions such as Harvard
University, University of California, Berkeley, and UNAM, showed a higher betweenness in each
network. The public-private status of those institutions mirrored the institution networks of the CSE,
which were also composed of the local university elite. Some of these universities are private (i.e., Los
Andes, Javeriana), some public (i.e., Nacional, Antioquia, Cartagena), but always featuring at the top of
the regional rankings [62]. Research centers and agencies in the fields of agriculture and cancer also play
an essential role. Thus, despite being high betweenness actors, it is mainly local, GSE-awarded
institutions that rank among the top. This does not mean, however, that there is a direct collaboration
between the CSE and the GSE – only two researchers had coauthored articles with Nobel laureates.
Nevertheless, it supports the idea that Nobel Prize winners influence prize-winning networks and also
reflects the brokerage role of the CSE as nodes in its respective coauthorship networks [26].
The strategic location of both the GSE and the CSE in the institutional collaboration networks
partly reinforces the point made by Jiang and Liu [61]: that top-tier institutions generate the most
production and enticement of scientific elites, thereby aggravating the inequality between emergent or
peripheral institutions and those with cumulative advantages. Furthermore, faculty at high-prestige
institutions drive the diffusion and influence of ideas, often irrespective of quality (e.g., an idea spreads
more rapidly if it originates from a prestigious institution than an idea of similar quality from a less

31
prestigious institution) [53]. Compared to PhySci and EnvSci, the SoSci institutional/coauthorship
networks showed a lower density. This suggests a closed structure leading to a more efficient flow of
knowledge/information, trust and mutual understanding, prosocial group norms, and potential access to
support in times of austerity [109]. However, it also comes with downsides such as redundant information
and constraints upon actors’ options [109]. Conversely, in the open structure of PhySci and EnvSci, new
ideas flow through weak ties, and actors with higher betweenness potentially receive strategic resources.
Among the downsides, an open structure is not ideal for complex information flow, creates less trust, and
complex communication requires more effort [109]. The latter was noticeable in the PhySci author
network, where whole clusters were completely exiled from the network.
Macro indices resembled those of previous bibliographic coupling networks modeled to test the
Hierarchy of the Sciences hypothesis, particularly for PhySci [110]. The average path length of the
PhySci bibliographic coupling network resembled the average path lengths in space science, and physics:
3.6. The EnvSci network showed a lower average path length than the environment/ecology network: 3.7.
The consistent average path length in higher consensus (i.e., hardness) disciplines/fields could be
explained by references: fewer references are needed to justify/explain/support a study. This observation
has to be contrasted with the diversity of disciplinary clusters in PhySci compared to EnvSci since
hardness in science is characterized by the reduced diversity of sources used (i.e., fewer research topics of
general interest). In other words, despite the AAEP being entitled physics and natural sciences, the prize
has been granted to researchers with a higher diversity in their research fronts ─ on aggregate ─
compared to those with a lower diversity in EnvSci and SoSci.
In specific cases, the CSE research fronts differ from Colombia’s national output focus. On the
other hand, there are clear similarities when comparing the CSE with the main national output
disciplines/areas according to ASJC classification. First, while the natural sciences lead national output
(mainly: ecology; botany; horticulture; particle physics; and zoology), the PhySci research front
composed mainly of medicine was in 4th place in the national output ranking. It is also important to bear
in mind that the principal component of PhySci has significant involvement in the agricultural and
biological sciences, also reflected in the natural science national output. Similarly, in the case of EnvSci
─ and a substantial portion of the principal component in PhySci ─ the national output in agricultural
sciences figured at the bottom. The second field in the principal component of EnvSci, earth and
planetary science, is not significant in the national output. In contrast, the national output in SoSci figured

32
in 2nd place (mainly welfare economics; pedagogy; epistemology; law; and social psychology), while the
SoSci Scopus profiles were the least representative in the sample. Second, in terms of net output and after
applying the ASJC classification to the CSE, the most frequent disciplines/areas (i.e., agricultural and
biological sciences; arts and humanities; and medicine) were also among those with the highest output in
the country. Other national disciplines/areas by output were engineering and technology (mainly artificial
intelligence; food science; control theory; analytical chemistry; and composite material), comprising <1%
of the CSE after ASJC classification. This is also consonant with the marginal mathematics cluster in
PhySci. Differences in such results need to be viewed with caution since national data was estimated
using the Microsoft Academic Graph, which is the second source of bibliographic data after Google
Scholar [111]. Scopus, on the other hand, was in third place in terms of references covered.
Broadening international efforts related to the global development agenda, a comprehensive
assessment of SDG using bibliographic coupling identified the following as the most significant clusters:
maternal, newborn, and child morbidity and mortality; ecosystems services and adaptations for
sustainability; and health surveys, tuberculosis, substance abuse, and longevity [112]. In those areas, the
most crowded research fronts of the CSE, PhySci and EnvSci in particular have the potential and strategic
value to contribute to SDG’s core research and to participate in its global endeavor [113].
Using bulk impact and authorship adjustment indicators and their composite enabled a more
nuanced and inclusive analysis between the CSE and the GSE. Our findings on the first two quartiles of
the C shed light on the local human and scientific profile, seasoned with Nobel productivity/impact
features – something not visible either in the pure index of Nobel Prizes affiliated with universities or in
Clarivate’s Highly Cited Researcher ranking. These changes, inclusions, and exclusions were also pointed
out by Ioannidis et al. [52] when proposing C (e.g. Nobel laureates ranked among the top-1,000, but
would rank much lower if total citations alone were considered). Finding local names such as Luís
Fernando García between William C. Campbell or Riccardo Giacconi puts the knowledge produced by
Colombian researchers and developing countries under a very different and encouraging light. The CSE
could be found among the superior 50% and the GSE among the inferior 50%. Our findings also contrast
with previous findings on the lower research impact of authors from Latin America, despite their
involvement as contributors to reputable journals [114].

33
6 Conclusion
This study aimed to provide a comprehensive analysis of the output, impact, and structure of the CSE. It
also drew a comparison with the GSE using an impact and authorship adjustment composite indicator.
Our findings showed that the CSE has a broader agenda than indexed titles in internationally renowned
bibliographic databases ─ mainly local-focused ─ including PhySci. The CSE showed positive growth
compared to the negative growth of the GSE. There were no noticeable changes in productivity/impact
among the most prolific researchers before and after receiving the AAEP. CSE-affiliated institutions with
the highest betweenness are either local or international reputable institutions ─ in some cases, multiple
Nobel awarded. At the direct coauthorship level, only two researchers published an article with a GSE
member. Most of the research profiles reflected the national output priorities, but when research fronts are
taken into consideration, the strategic research capacities diverge from the national focus. The composite
indicator produced an enriching comparison by showing the scope and reach of Colombian researchers’
scientific impact in his/her disciplinary area, even when Nobel laureates are placed in the same
assessment framework. The interleaving of the CSE and the GSE ─ particularly between the 3rd and 2nd
quartiles ─ enabled a more nuanced analysis. Our findings shed light on the research performance-impact
standards and agenda between the global North and South and provide an in-context assessment of
outstanding local research.
Further research could source other scientific elites (e.g., Royal Society Africa Prize, Highest
Science and Technology Award, China; Prêmio Almirante Álavaro Alberto, Brazil), thereby deepening
the understanding of research impact and structure in the context of developing regions/countries.
Sourcing bibliographic data from search engines/databases with more comprehensive coverage ─ such as
Google Scholar or Dimensions ─ could expand researchers’ impact and inclusion with no publications in
Scopus or WoS. The inclusion of altmetrics could provide another perspective: on elites that lie beyond
the academic community, such as public debates conducted via social media.
References
1. Roberts RJ. Ten Simple Rules to Win a Nobel Prize. PLOS Comput Biol. 2015;11: e1004084.
doi:10.1371/JOURNAL.PCBI.1004084
2. Stephan PE, Levin SG. Age and the Nobel prize revisited. Scientometrics. 1993;28: 387–399.
doi:10.1007/BF02026517
3. Kademani BS, Kalyane VL, Kumar V, Mohan L. Nobel laureates: Their publication productivity,
collaboration and authorship status. Scientometrics. 2005;62: 261–268. doi:10.1007/s11192-005-
0019-3
4. Heinze T, Jappe A, Pithan D. From North American hegemony to global competition for
scientific leadership? Insights from the Nobel population. PLoS One. 2019;14.

34
doi:10.1371/journal.pone.0213916
5. Bjørk R. The journals in physics that publish Nobel Prize research. Scientometrics. 2020;122:
817–823. doi:10.1007/s11192-019-03312-8
6. Kosmulski M. Nobel laureates are not hot. Scientometrics. 2020;123: 487–495.
doi:10.1007/s11192-020-03378-9
7. Ioannidis JPA, Cristea I-A, Boyack KW. Work honored by Nobel prizes clusters heavily in a few
scientific fields. PLoS One. 2020;15: 1–11. doi:10.1371/journal.pone.0234612
8. Sebastian Y, Chen C. The boundary-spanning mechanisms of Nobel Prize winning papers. PLoS
One. 2021;16: 1–31. doi:10.1371/journal.pone.0254744
9. Zuckerman H. Stratification in American Science. Sociol Inq. 1970;40: 235–257.
doi:10.1111/j.1475-682X.1970.tb01010.x
10. Zuckerman H. Scientific Elite: Nobel Laureates in the United States. Free Press. New York: Free
Press; 1977. doi:10.1177/027046769701700446
11. Li J, Yin Y, Fortunato S, Wang D. Scientific elite revisited: Patterns of productivity,
collaboration, authorship and impact. J R Soc Interface. 2020;17. doi:10.1098/rsif.2020.0135
12. Li J, Yin Y, Fortunato S, Wang D. Nobel laureates are almost the same as us. Nat Rev Phys.
2019;1: 301–303. doi:10.1038/s42254-019-0057-z
13. Ma Y, Uzzi B. Scientific prize network predicts who pushes the boundaries of science. Proc Natl
Acad Sci. 2018;115: 12608–12615. doi:10.1073/pnas.1800485115
14. Karazija R, Momkauskaite A. The Nobel prize in physics - Regularities and tendencies.
Scientometrics. 2004;61: 191–205. doi:10.1023/B:SCIE.0000041648.87075.de
15. Ioannidis JPA, Boyack KW, Small H, Sorensen AA, Klavans R. Is your most cited work your
best? Nature Publishing Group; 2014 Oct 30 pp. 561–562. doi:10.1038/514561a
16. Merton R. The matthew effect in science. Science (80- ). 1968;159: 56–62.
doi:10.1126/science.159.3810.56
17. Merton R. The Matthew Effect in Science, II: Cumulative Advantage and the Symbolism of
Intellectual Property. Isis. 1988;79: 606–623. Available: http://www.jstor.org/stable/234750
18. Zheng J, Liu N. Mapping of important international academic awards. Scientometrics. 2015;104:
763–791. doi:10.1007/s11192-015-1613-7
19. Larivière V, Macaluso B, Archambault É, Gingras Y. Which scientific elites? On the
concentration of research funds, publications and citations. Res Eval. 2010;19: 45–53.
doi:10.3152/095820210X492495
20. Jin Y, Yuan S, Shao Z, Hall W, Tang J. Turing Award elites revisited: patterns of productivity,
collaboration, authorship and impact. Scientometrics. 2021;126: 2329–2348. doi:10.1007/s11192-
020-03860-4
21. Campanario JM. Rejecting and resisting Nobel class discoveries: Accounts by Nobel Laureates.
Scientometrics. 2009;81: 549–565. doi:10.1007/s11192-008-2141-5
22. Gingras Y, Wallace ML. Why it has become more difficult to predict Nobel Prize winners: A
bibliometric analysis of nominees and winners of the chemistry and physics prizes (1901-2007).
Scientometrics. 2010;82: 401–412. doi:10.1007/s11192-009-0035-9
23. Ma C, Su C, Yuan J, Wu Y. Papers written by Nobel Prize winners in physics before they won
the prize: An analysis of their language and journal of publication. Scientometrics. 2012;93:
1151–1163. doi:10.1007/s11192-012-0748-z
24. Bjork S, Offer A, Söderberg G. Time series citation data: The Nobel Prize in economics.
Scientometrics. 2014;98: 185–196. doi:10.1007/s11192-013-0989-5
25. Dernis H, Squicciarini M, de Pinho R. Detecting the emergence of technologies and the evolution
and co-development trajectories in science (DETECTS): a ‘burst’ analysis-based approach. J
Technol Transf. 2016;41: 930–960. doi:10.1007/s10961-015-9449-0
26. Wagner CS, Horlings E, Whetsell TA, Mattsson P, Nordqvist K. Do Nobel Laureates Create
Prize-Winning Networks? An Analysis of Collaborative Research in Physiology or Medicine.
PLoS One. 2015;10: 1–13. doi:10.1371/journal.pone.0134164
27. Chan HF, Önder AS, Torgler B. The first cut is the deepest: repeated interactions of coauthorship
and academic productivity in Nobel laureate teams. Scientometrics. 2016;106: 509–524.
doi:10.1007/s11192-015-1796-y
28. Price DDS. A general theory of bibliometric and other cumulative advantage processes. J Am Soc
Inf Sci. 1976;27: 292–306. doi:https://doi.org/10.1002/asi.4630270505
29. Garfield E, Welljams-Dorof A. Of Nobel class: A citation perspective on high impact research
authors. Theor Med. 1992;13: 117–135. doi:10.1007/BF02163625
30. The Nobel Foundation. All Nobel Prizes in Physics. 2020. Available:
https://www.nobelprize.org/prizes/lists/all-nobel-prizes-in-physics/

35
31. King DA. The scientific impact of nations. Nature. 2004;430: 311–316. doi:10.1038/430311a
32. Prathap G. Scientific wealth and inequality within nations. Scientometrics. 2017;113: 923–928.
doi:10.1007/s11192-017-2511-y
33. Schlagberger EM, Bornmann L, Bauer J. At what institutions did Nobel laureates do their prize-
winning work? An analysis of biographical information on Nobel laureates from 1994 to 2014.
Scientometrics. 2016;109: 723–767. doi:10.1007/s11192-016-2059-2
34. Nielsen MW, Andersen JP. Global citation inequality is on the rise. Proc Natl Acad Sci.
2021;118: e2012208118. doi:10.1073/pnas.2012208118
35. Pouris A. Scientometric research in South Africa and successful policy instruments.
Scientometrics. 2012;91: 317–325. doi:10.1007/s11192-011-0581-9
36. Gonzalez-Brambila CN, Reyes-Gonzalez L, Veloso F, Perez-Angón MA. The Scientific Impact
of Developing Nations. PLoS One. 2016;11: 1–14. doi:10.1371/journal.pone.0151328
37. Cortés-Sánchez JD. Innovation in Latin America through the lens of bibliometrics: crammed and
fading away. Scientometrics. 2019;121: 869–895. doi:10.1007/s11192-019-03201-0
38. Inönü E. The influence of cultural factors on scientific production. Scientometrics. 2003;56: 137–
146. doi:10.1023/A:1021906925642
39. Klavans R, Boyack KW. The Research Focus of Nations: Economic vs. Altruistic Motivations.
PLoS One. 2017;12: 1–27. doi:10.1371/journal.pone.0169383
40. Cortés-Sánchez JD. A bibliometric outlook of the most cited documents in business, management
and accounting in Ibero-America. Eur Res Manag Bus Econ. 2020;26: 1–8.
doi:10.1016/j.iedeen.2019.12.003
41. SCImago. SJR - International Science Ranking. 2020 [cited 12 Jan 2021]. Available:
https://www.scimagojr.com/countryrank.php?order=ci&ord=desc
42. Clarivate Analytics. Recipients - Highly Cited. 2020 [cited 12 Jan 2021]. Available:
https://recognition.webofscience.com/awards/highly-cited/2020/
43. Dinero. El Premio Nobel Colombiano. 2000 [cited 6 Aug 2020]. Available:
https://www.dinero.com/agenda-publica/edicion-impresa/articulo/el-premio-nobel-
colombiano/10268
44. Faciolince HA. La Fundación Alejandro Ángel Escobar. In: Forero C, editor. Fundación
Alejandro Ángel Escobar - 50 Años. Bogotá: Fundación Alejandro Ángel Escobar; 2007. pp. 87–
98.
45. Fundación Alejandro Ángel Escobar. Home. [cited 6 Aug 2020]. Available:
https://www.faae.org.co/premios
46. Cortés JD, Guix M, Carbonell KB. Innovation for Sustainability in the Global South:
Bibliometric findings from management & business and STEM (Science, Technology,
Engineering and Mathematics) fields in developing countries. Heliyon. 2021;7: e07809.
doi:https://doi.org/10.1016/j.heliyon.2021.e07809
47. Confraria H, Mira Godinho M, Wang L. Determinants of citation impact: A comparative analysis
of the Global South versus the Global North. Res Policy. 2017;46: 265–279.
doi:10.1016/j.respol.2016.11.004
48. Thelwall M. Trend of African scientific output and impact 1996- 2015. African J Libr Arch Inf
Sci. 2017;27: 131–143.
49. González-Alcaide G, Park J, Huamaní C, Ramos JM. Dominance and leadership in research
activities: Collaboration between countries of differing human development is reflected through
authorship order and designation as corresponding authors in scientific publications. PLoS One.
2017;12. doi:10.1371/journal.pone.0182513
50. Fundación Alejandro Ángel Escobar. Fundación Alejandro Ángel Escobar - 50 Años. Forero C,
editor. Bogotá: Fundación Alejandro Ángel Escobar; 2007.
51. Zhou Z, Xing R, Liu J, Xing F. Landmark papers written by the Nobelists in physics from 1901 to
2012: A bibliometric analysis of their citations and journals. Scientometrics. 2014;100: 329–338.
doi:10.1007/s11192-014-1306-7
52. Ioannidis JPA, Klavans R, Boyack KW. Multiple Citation Indicators and Their Composite across
Scientific Disciplines. PLoS Biol. 2016;14: 1–17. doi:10.1371/journal.pbio.1002501
53. Morgan AC, Economou DJ, Way SF, Clauset A. Prestige drives epistemic inequality in the
diffusion of scientific ideas. EPJ Data Sci. 2018;7: 40. doi:10.1140/epjds/s13688-018-0166-4
54. Waltman L. A review of the literature on citation impact indicators. Journal of Informetrics.
Elsevier Ltd; 2016. pp. 365–391. doi:10.1016/j.joi.2016.02.007
55. Schreiber M. A modification of the h-index: The hm-index accounts for multi-authored
manuscripts. J Informetr. 2008;2: 211–216. doi:10.1016/j.joi.2008.05.001
56. Maflahi N, Thelwall M. Domestic researchers with longer careers generate higher average
36
citation impact but it does not increase over time. Quant Sci Stud. 2021;2: 560–587.
doi:10.1162/qss_a_00132
57. Kademani BS, Kalyane VL, Jange S. Scientometric portrait of Nobel laureate Dorothy Crowfoot
Hodgkin. Scientometrics. 1999;45: 233–250. doi:10.1007/BF02458435
58. Doi H, Heeren A, Maurage P. Scientific activity is a better predictor of nobel award chances than
dietary habits and economic factors. PLoS One. 2014;9. doi:10.1371/journal.pone.0092612
59. Fields C. Close to the edge: co-authorship proximity of Nobel laureates in Physiology or
Medicine, 1991–2010, to cross-disciplinary brokers. Scientometrics. 2015;103: 267–299.
doi:10.1007/s11192-015-1526-5
60. Wu L, Wang D, Evans JA. Large teams develop and small teams disrupt science and technology.
Nature. 2019;566: 378–382. doi:10.1038/s41586-019-0941-9
61. Jiang F, Liu NC. New wine in old bottles? Examining institutional hierarchy in laureate mobility
networks, 1900–2017. Scientometrics. 2020;125: 1291–1304. doi:10.1007/s11192-020-03477-7
62. Quacquarelli Symonds. QS World University Rankings 2019: Top Global Universities. 2020
[cited 9 Jun 2020]. Available: https://www.topuniversities.com/university-rankings/world-
university-rankings/2019
63. Villaveces JL, Forero-Pineda C. Cincuenta años de ciencia en Colombia. In: Forero-Pineda C,
editor. Fundación Alejandro Ángel Escobar - 50 Años2. Bogotá, Colombia: Fundación Alejandro
Ángel Escobar; 2007. pp. 97–133.
64. Lunnemann P, Jensen MH, Jauffred L. Gender bias in Nobel prizes. Palgrave Commun 2019 51.
2019;5: 1–4. doi:10.1057/s41599-019-0256-3
65. Minciencias. Plataforma SCIENTI - Colombia | Minciencias. 2021 [cited 16 Mar 2021].
Available: https://minciencias.gov.co/scienti
66. Baas J, Schotten M, Plume A, Côté G, Karimi R. Scopus as a curated, high-quality bibliometric
data source for academic research in quantitative science studies. Quant Sci Stud. 2020;1: 377–
386. doi:10.1162/qss_a_00019
67. Mongeon P, Paul-Hus A. The journal coverage of Web of Science and Scopus: a comparative
analysis. Scientometrics. 2016;106: 213–228. doi:10.1007/s11192-015-1765-5
68. Waltman L, Larivière V. Special issue on bibliographic data sources. Quant Sci Stud. 2020;1:
360–362. doi:10.1162/qss_e_00026
69. Hou J, Zheng B, Zhang Y, Chen C. How do Price medalists’ scholarly impact change before and
after their awards? Scientometrics. 2021;126: 5945–5981. doi:10.1007/s11192-021-03979-y
70. Kulczycki E, Engels TCE, Pölönen J, Bruun K, Dušková M, Guns R, et al. Publication patterns in
the social sciences and humanities: evidence from eight European countries. Scientometrics.
2018;116: 463–486. doi:10.1007/s11192-018-2711-0
71. Lisée C, Larivière V, Archambault É. Conference proceedings as a source of scientific
information: A bibliometric analysis. J Am Soc Inf Sci Technol. 2008;59: 1776–1784.
doi:https://doi.org/10.1002/asi.20888
72. Tollefson J. China declared world’s largest producer of scientific articles. Nature. 2018;553: 390.
doi:10.1038/d41586-018-00927-4
73. Larivière V, Gingras Y, Archambault É. Canadian collaboration networks: A comparative
analysis of the natural sciences, social sciences and the humanities. Scientometrics. 2006;68:
519–533. doi:10.1007/s11192-006-0127-8
74. Thelwall M, Fairclough R. All downhill from the PhD? The typical impact trajectory of U.S.
academic careers. Quant Sci Stud. 2020;1: 1334–1348. doi:10.1162/qss_a_00072
75. Scopus. Scopus - Document search. 2020 [cited 1 Jun 2020]. Available:
https://www.scopus.com/search/form.uri?display=basic
76. Aria M, Cuccurullo C. bibliometrix: An R-tool for comprehensive science mapping analysis. J
Informetr. 2017;11: 959–975. doi:10.1016/j.joi.2017.08.007
77. Doerfel ML, Barnett GA. A Semantic Network Analysis of the International Communication
Association. Hum Commun Res. 1999;25: 589–603. doi:10.1111/j.1468-2958.1999.tb00463.x
78. Blondel VD, Guillaume J-L, Lambiotte R, Lefebvre E. Fast unfolding of communities in large
networks. J Stat Mech Theory Exp. 2008;2008: P10008.
79. Scott J, Carrington P, editors. The SAGE Handbook of Social Network Analysis. London, UK:
SAGE Publications Ltd.; 2014. doi:https://dx.doi.org/10.4135/9781446294413
80. Opsahl T, Agneessens F, Skvoretz J. Node centrality in weighted networks: Generalizing degree
and shortest paths. Soc Networks. 2010;32: 245–251. doi:10.1016/j.socnet.2010.03.006
81. R Core Team. R: A language and environment for statistical computing. R Foundation for
Statistical Computing, Vienna, Austria. Vienna: R Foundation for Statistical Computing; 2014.
pp. 1–2667. Available: online: http://www. R-project. org

37
82. Scott J. Social Network Analysis. Sociology. 1988;22: 109–127.
doi:10.1177/0038038588022001007
83. Gozzard A, Ward M, Datta A. Converting a network into a small-world network: Fast algorithms
for minimizing average path length through link addition. Inf Sci (Ny). 2018;422: 282–289.
doi:10.1016/J.INS.2017.09.020
84. Traag VA, Waltman L, Eck NJ van. From Louvain to Leiden: guaranteeing well-connected
communities. Sci Reports 2019 91. 2019;9: 1–12. doi:10.1038/s41598-019-41695-z
85. Kessler MM. Bibliographic coupling between scientific papers. Am Doc. 1963;14: 10–25.
doi:10.1002/asi.5090140103
86. Börner K. Atlas of Science: Visualizing what we know. Cambridge, Massachusetts: MIT Press;
2010.
87. Liu R. A new bibliographic coupling measure with descriptive capability. Scientometrics.
2017;110: 915–935. doi:10.1007/s11192-016-2196-7
88. Gómez-Núñez AJ, Batagelj V, Vargas-Quesada B, Moya-Anegón F, Chinchilla-Rodríguez Z.
Optimizing SCImago Journal & Country Rank classification by community detection. J
Informetr. 2014;8: 369–383. doi:10.1016/j.joi.2014.01.011
89. Boyack KW, Klavans R. Co-citation analysis, bibliographic coupling, and direct citation: Which
citation approach represents the research front most accurately? J Am Soc Inf Sci Technol.
2010;61: 2389–2404. doi:10.1002/asi.21419
90. Scopus. What are Scopus subject area categories and ASJC codes? [cited 24 Aug 2021].
Available: https://service.elsevier.com/app/answers/detail/a_id/12007/supporthub/scopus/
91. Hirsch JE. An index to quantify an individual’s scientific research output. Proc Natl Acad Sci U S
A. 2005;102: 16569–16572. doi:10.1073/pnas.0507655102
92. Schreiber M. To share the fame in a fair way,hmmodifieshfor multi-authored manuscripts. New J
Phys. 2008;10: 40201. doi:10.1088/1367-2630/10/4/040201
93. Weber M. The effects of listing authors in alphabetical order: A review of the empirical evidence.
Res Eval. 2018;27: 238–245. doi:10.1093/reseval/rvy008
94. Sekara V, Deville P, Ahnert SE, Barabási AL, Sinatra R, Lehmann S. The chaperone effect in
scientific publishing. Proc Natl Acad Sci U S A. 2018;115: 12603–12607.
doi:10.1073/pnas.1800471115
95. Bastian M, Heymann S, Jacomy M. Gephi: an open source software for exploring and
manipulating networks. International AAAI Conference on Weblogs and Social Media. 2009.
Available: https://gephi.org/users/publications/
96. The igraph core team. igraph – Network analysis software. 2019. Available: https://igraph.org/
97. Benoit et. al. Quantitative Analysis of Textual Data. London, UK: CRAN; 2020.
98. Scopus. Scopus Roadmap: What’s coming up in 2020 & 2021? 2020 [cited 1 Feb 2021].
Available: https://blog.scopus.com/posts/scopus-roadmap-whats-coming-up-in-2020-2021
99. Wagner CS, Horlings E, Whetsell TA, Mattsson P, Nordqvist K. Do nobel laureates create prize-
winning networks? An analysis of collaborative research in physiology or medicine. PLoS One.
2015;10. doi:10.1371/journal.pone.0134164
100. Abramo G, D’Angelo CA, Murgia G. The combined effects of age and seniority on research
performance of full professors. Sci Public Policy. 2016;43: 301–319. doi:10.1093/scipol/scv037
101. Diamandis EP. Nobelitis: A common disease among Nobel laureates? Clin Chem Lab Med.
2013;51: 1573–1574. doi:10.1515/cclm-2013-0273
102. Bloom N, Jones CI, Reenen J Van, Webb M, Acemoglu D, Aghion P, et al. Are Ideas Getting
Harder to Find? †. Am Econ Rev. 1970;2020: 1104–1144. doi:10.1257/aer.20180338
103. Gordon RJ. Is U.S. Economic Growth Over? Faltering Innovation Confronts the Six Headwinds.
Cambridge, MA; 2012 Aug. doi:10.3386/W18315
104. Bornmann L, Mutz R. Growth rates of modern science: A bibliometric analysis based on the
number of publications and cited references. J Assoc Inf Sci Technol. 2015;66: 2215–2222.
doi:10.1002/asi.23329
105. Wei G. A bibliometric analysis of the top five economics journals during 2012-2016. J Econ
Surv. 2019;33: 25–59. doi:https://doi.org/10.1111/joes.12260
106. Thorndike EL. A constant error in psychological ratings. J Appl Psychol. 1920;4: 25–29.
doi:10.1037/H0071663
107. OCyT. Indicadores de ciencia y tecnología. Bogotá; 2020. Available: https://ocyt.org.co/wp-
content/uploads/2021/06/indicadores-2019.pdf
108. Fortin J-M, Currie DJ. Big Science vs. Little Science: How Scientific Impact Scales with
Funding. PLoS One. 2013;8: 1–9. doi:10.1371/journal.pone.0065263
109. Prell C. Linking Social Capital to Small-Worlds: A Look at Local and Network-Level Processes

38
and Structure. Methodol Innov Online. 2009;4: 8–22. doi:10.1177/205979910900400102
110. Fanelli D, Glänzel W. Bibliometric Evidence for a Hierarchy of the Sciences. PLoS One. 2013;8:
e66938. Available: https://doi.org/10.1371/journal.pone.0066938
111. Martín-Martín A, Thelwall M, Orduna-Malea E, Delgado López-Cózar E. Google Scholar,
Microsoft Academic, Scopus, Dimensions, Web of Science, and OpenCitations’ COCI: a
multidisciplinary comparison of coverage via citations. Scientometrics. 2021;126: 871–906.
doi:10.1007/s11192-020-03690-4
112. Nakamura, M; Pendlebury, D; Schnell, J; Szomszor M. Navigating the Structure of Research on
Sustainable Development Goals - Web of Science Group. Philadelphia; 2019. Available:
https://clarivate.com/webofsciencegroup/campaigns/sustainable-development-goals/
113. Guevara MR, Hartmann D, Aristarán M, Mendoza M, Hidalgo CA. The research space: using
career paths to predict the evolution of the research output of individuals, institutions, and
nations. Scientometrics. 2016;109: 1695–1709. doi:10.1007/s11192-016-2125-9
114. Meneghini R, Packer AL, Nassi-Calò L. Articles by Latin American Authors in Prestigious
Journals Have Fewer Citations. PLoS One. 2008;3: 1–4. doi:10.1371/journal.pone.0003804
Appendices Appendix 1 Higher/last academic degree by country and university
University by country Higher/last academic degree
Total PhD Bachelor Master Medical specialty
ARG Argentina 1 1
U. Plata 1
1
BEL Belgium 2 1 3
U. Cath. Louvain
1 1
Vrije U. Brussel 2
2
BRA Brazil 2 1 3
F. Oswaldo Cruz 1
1
IMPA 1
1
U. Sao Paulo
1
1
CAN Canada 1 1
U. Montreal 1
1
CHL Chile 1 1
U. Chile
1
1
COL Colombia 11 1 11 1 24
U. Andes
2
2
U. Antioquia 1
1 1 3
U. Militar
1
1
U. Nacional 6
5
11
U. Rosario 1
1
U. Sabana 1
1
U. Valle 1
1
2
U. Ind. Santander
1
1
U.P. Javeriana 1
1
2
DEU Germany 1 1
U. Hannover 1
1
DNK Denmark 1 1
Aarhus U. 1
1
ESP Spain 8 8
U. Autonoma de Madrid 1
1
U. Barcelona 1
1
U. Comp. Madrid 1
1
U. Granada 2
2
U. Laguna 1
1
U. Politec. Catalunya 1
1
U. Sant. Comp. 1
1

39
FRA France 4 4
Ecole des Hautes Etudes en Sciences
Sociales 1
1
U. Paris-III 1
1
U. Paris-VII 1
1
U. Paris-X 1
1
GBR United Kingdom of Great Britain and
Northern Ireland 3 3
U. London 1
1
U. Oxford 1
1
U. Warwick 1
1
MEX Mexico 1 1
IPN 1
1
NLD Netherlands 5 5
Agricultural U. - Wageningen 1
1
U. Amsterdam 4
4
SWE Sweden 1 1
Uppsala U. 1
1
USA United States of America 24 3 27
Harvard U. 1
1
Johns Hopkins U.
1
1
Michigan State U. 1
1
MIT 2
2
New School For Social Research 2
2
State U. New York 2
2
Syracuse U. 1
1
Tulane U. 1
1
U. Florida 2
2
U. Maryland 1
1
U. Massachusetts 2
2
U. Mississippi
1
1
U. Missouri 1
1
U. Nebraska 1
1
U. Penn 1
1
U. Pittsburgh 1
1
U. Wisconsin-Madison 2
2
UC Irvine 1
1
Virginia Tech 2
2
Yale U.
1
1
NA 3
Total general 65 1 16 2 87
Source: the authors based on [65] and personal websites.