તંત્રી, પ્રકાશક, મુદ્રક અબો માલિક - Saurashtra Kranti Newspaper

Author's personal copy
The Chogat-Chamardi subvolcanic complex, Saurashtra, northwestern DeccanTraps: Geology, petrochemistry, and petrogenetic evolution
Hetu C. Sheth a,⇑, Ashwini Kumar Choudhary b, Sudeshna Bhattacharyya a, Ciro Cucciniello c,Ramesh Laishram b, Trupti Gurav a
a Department of Earth Sciences, Indian Institute of Technology Bombay (IITB), Powai, Mumbai 400 076, Indiab Institute Instrumentation Center, Indian Institute of Technology Roorkee (IITR), Roorkee 248 001, Indiac Dipartimento di Scienze della Terra, Universitá di Napoli Federico II, Via Mezzocannone 8, 80134 Napoli, Naples, Italy
a r t i c l e i n f o
Article history:Received 28 September 2010Received in revised form 2 February 2011Accepted 25 February 2011Available online 5 March 2011
Keywords:Deccan TrapsSaurashtraIndiaMagmatismSubvolcanicPluton
a b s t r a c t
The Saurashtra region in the northwestern part of the Deccan continental flood basalt province (India) isnotable for its many volcano-plutonic complexes, compositional diversity, and the abundance of rhyoliteand granophyre. In this first detailed study of the Chogat-Chamardi subvolcanic complex in eastern Sau-rashtra, we report microgranite and granophyre plutons, gabbro plutons cut by basaltic andesite dykes, aswell as rhyolite plugs. Bulk-rock geochemical (including Nd–Sr isotopic) data suggest a strong contribu-tion from ancient, Rb-rich basement crust to the silicic magmas. The mafic rocks are also crustally con-taminated but less than the silicic rocks, in conformity with observations elsewhere (e.g., the Skye andSkaergaard granophyres). The Chogat-Chamardi silicic rocks have initial 87Sr/86Sr (for t = 65 Ma) as highas 0.72914, and initial eNd values as low as �13.9. Trends defined by the Chogat-Chamardi and other Dec-can rhyolitic suites on plots of Sr concentration vs. Sr isotopic ratio are modeled with concurrent assim-ilation and fractional crystallization (AFC) processes involving a basaltic magma and granitic basementrocks. Considering both Nd and Sr isotopic variations, the Chogat-Chamardi silicic rocks notably requirecrustal end members very different from those inferred in most previous isotopic studies of Deccan rocks.
� 2011 Elsevier Ltd. All rights reserved.
1. Introduction
Continental flood basalt (CFB) provinces of the world are madeup of vast lava fields, with major dyke-sill swarms as well as plu-tonic or subvolcanic ‘‘complexes’’ often exposed (Ray et al., 2007;Sheth et al., 2009; Vanderkluysen et al., 2011). These complexestypically contain a large number of individual intrusions, of consid-erable compositional diversity: gabbros, syenites, ultramafic rocks,highly silicic rocks (like granophyres), silica-undersaturated rocks,and even carbonatites may occur in them (e.g., Sukheswala andSethna, 1973). Whether gabbro bodies forming substantial partsof some complexes are solidified basaltic magma chambers thatonce fed surface eruptions, or cumulates formed by crystal frac-tionation of parental liquids of the erupted basalts, or simply late,post-volcanic intrusions into the lava pile, are all interesting ques-tions. The central complexes and intrusions of the North AtlanticTertiary Igneous Province, such as the Skye and Mull complexesof western Scotland and the Skaergaard Intrusion of East Green-land, are world-famous, and many currently accepted ideas inigneous petrology were developed and tested there (Harker,
1904; Wager and Deer, 1939; McBirney, 1975; Emeleus and Bell,2001). These large mafic intrusions are notable for the occurrenceof silicic rocks (granophyres).
The Late Cretaceous to Paleocene Deccan flood basalt province isexposed over an area of�500,000 km2 in west-central India. It con-tains several complexes in its northern and northwestern parts (theelliptical region shown in Fig. 1a). Some of these complexes havebeen studied relatively well, and the others little. Here we presentthe first detailed study of the little known Chogat-Chamardicomplex in Saurashtra. The only available data pertaining to thiscomplex are whole-rock geochemical analyses of two trachyticgranophyres and a dolerite dyke (Chatterjee and Bhattacharji,2001). We present geological, petrographic, mineral chemical, andwhole-rock geochemical (including Nd–Sr isotopic) data on severalmafic and silicic rocks of this complex, and, based on these datasets,discuss the petrogenetic evolution of the complex.
2. Deccan geology of Saurashtra
The main Deccan lava outcrop in west-central India is made upof flat-lying flood lavas of basalt and basaltic andesite, reaching athickness of well over 2 km in the Western Ghats escarpment(Fig. 1a). The Saurashtra peninsula (Fig. 1b), though also covered
1367-9120/$ - see front matter � 2011 Elsevier Ltd. All rights reserved.doi:10.1016/j.jseaes.2011.02.012
⇑ Corresponding author. Tel.: +91 22 25767264; fax: +91 22 25767253.E-mail address: [email protected] (H.C. Sheth).
Journal of Asian Earth Sciences 41 (2011) 307–324
Contents lists available at ScienceDirect
Journal of Asian Earth Sciences
journal homepage: www.elsevier .com/locate / jseaes

Author's personal copy
largely by the Deccan lavas, is nearly flat and low-lying, and thickvertical sections through the lavas are rare. The coastal fringes ofSaurashtra are occupied by Tertiary and Quaternary calcareoussediments or alluvium covering the Deccan lavas. Drilling in theDhandhuka area encountered intercalated basalt and picriticflows and pyroclastic rocks up to 400 m thick (West, 1958;Krishnamurthy and Cox, 1977). In northern Saurashtra, sub-DeccanMesozoic sedimentary rocks crop out.
The special features of Saurashtra, namely, several exposedvolcano-plutonic complexes, a great range of rock types, and anabundance of rhyolite and granophyre, have been noted for a longtime (Fedden, 1884; Krishnan, 1926; Mathur et al., 1926;Chatterjee, 1932; Subba Rao, 1971; Sethna et al., 2001). Manylinear dyke swarms cross Saurashtra and also form radial patternsaround the central complexes (Auden, 1949; Krishnamacharlu,1972). Mount Girnar is the most prominent central complex, witha central pluton made up of gabbro, olivine gabbro, diorite andmonzonite, containing basalt enclaves, and cut by basaltic andlamprophyric dykes (Mathur et al., 1926; Bose, 1973; Paul et al.,1977). The hill ranges of dipping basalts around it are cut by a largering dyke of granophyre or silicic porphyry. The Barda and AlechHills to the northwest of Mount Girnar expose granophyres andrhyolites (De and Bhattacharya, 1971), which reportedly form ringdykes in the Alech complex (Misra, 1981).
3. The Chogat-Chamardi complex: field geology and samples
The hitherto little-studied Chogat-Chamardi complex is ex-posed a few kilometers north of Shihor town (Fig. 1c), in the east-ern Saurashtra coastal plains which are only 8 m above sea level.The complex is largely buried under Tertiary–Quaternary alluviumdue to post-Deccan subsidence along the Cambay Rift (Figs. 1b and2a), a major pre- and post-volcanic rift zone in the Deccan province(Biswas, 1987). The hills south–southeast of Chamardi village, ris-ing 108 m above sea level, are composed of microgranites andgranophyres (Fig. 2b). From the petrographic variation in theserocks (fine-grained aphyric types to coarse equigranular andfeldspar-phyric types occur) we infer a few distinct plutons. Themicrogranites and granophyres are locally cut by small dykeletsof rhyolite (Fig. 2c) only a few centimeters wide, but we have notseen any other substantial dykes cutting them. The Chamardi hillsare followed towards the west by two hills of gabbros (Fig. 2a): theThapnath Mahadev hill is made up of millimeter-scale laminatedgabbro, and the Ihalvo hill is made up of black, equigranular gab-bro. The Ihalvo gabbro locally contains granophyric patches andveins of very fine-grained microgranite (Fig. 2d and e). The gabbropluton is intruded by several fine-grained, aphyric, mafic dykes.The dykes are 0.5–1 m thick and have exposed lengths of a few me-ters (Fig. 2f).
50 km
DECCANTRAPS
INDIA
Mumbai
ARABIANSEA
rifted margin
Saurashtra
Gulf ofKachchh
ARABIAN SEA
Rajkot
CHOGAT-CHAMARDI
GIRNARJunagadh
OSHAM
BARDA ALECH
S A U R A S H T R A
CAM
BAY
RIF
T
Gul
f of C
amba
y Indian
Western Western G
hats
MesozoicDeccan Traps
Tertiary & Quaternary
Diu
Cambay
Rajula
Palitana
Shihor
Pavagadh
Rajpipla Dhandhuka
109 m
86 m
Chogat
1 km
7 m
Kalubhar River
(temple)
Ihalvo Dungar
To Valbhipur 8 km
To Shihor
21o 50' N
21o 50' N
71o 55' E
CC1
CC2,3,4,5
CC6CC7
CC8
CC9,10,11CC12,13CC14
CC15
21o 49'
21o 49'
71o 54'
CC21
CC17,18CC16CC19,20
Gabbro
Microgranite & and granophyre
Rhyolite
Alluvium71o 53' 71o 52'
Chog
at
71o 54' 71o 53' 71o 52' 71o 55' E
Chamardi
PachmarhiPhenai Mata
Bhavnagar
Dhule
Shahdol
a b
c
Fig. 1. Simplified geological maps of the Deccan Traps (a) and of Saurashtra (b), with the important central complexes and locations in Saurashtra marked (after De, 1981;Misra, 1981). Elliptical area in (a) is the northwestern Deccan, with great compositional diversity and many igneous complexes. (c) Geological map of the Chogat-Chamardicomplex, showing the locations of the samples of this study.
308 H.C. Sheth et al. / Journal of Asian Earth Sciences 41 (2011) 307–324

Author's personal copy
Five kilometers west–southwest of Chamardi, the low hillocksbeside Chogat village expose small bodies of rhyolite which aretexturally somewhat diverse, but without clear contacts. The hill-ock just south of Chogat is made up of fine-grained, aphyric rhyo-lite that contains pervasive, close-spaced, roughly vertical joints
(Fig. 2g), with a N–S-trending, 1 m wide, possible fault zone con-taining rhyolite cataclasite (Fig. 2h). The cataclasite has sharplyangular fragments of the rhyolite a few millimeters in size, con-tained in a black, glassy-looking matrix. The sense of movementcannot be determined due to the absence of marker horizons
Fig. 2. Field geology of the Chogat-Chamardi complex. (a) Panoramic view of the Chogat-Chamardi hills, looking approximately ENE from Chogat village. (b) Granophyre hillwith Chamardi village behind it. Rocky outcrop in the foreground is also microgranite and granophyre, and contains thin rhyolite dykelets, one of which is shown in (c) byarrows. (d and e) Microgranite veins (sample CC9) in the Ihalvo gabbro. The granophyre sample CC10 was taken nearby. (f) One of several basaltic dykes cutting the Ihalvogabbro. (g) Close-spaced jointing in rhyolite, Chogat village. (h) Fault zone with cataclasite in Chogat rhyolite. (i) Chogat rhyolite plug with steeply dipping columns gradinginto sub-horizontal columns.
H.C. Sheth et al. / Journal of Asian Earth Sciences 41 (2011) 307–324 309

Author's personal copy
across the fault, but the finding is relevant to the recent (2000) andhistoric occurrences of moderate-magnitude earthquakes in theBhavnagar region (Fig. 1b) (Bhattacharya et al., 2004). This tectonicdeformation is arguably related to the western boundary of theCambay Rift.
A rhyolite hillock south of Chogat village shows very welldeveloped columnar jointing, and a dramatic change in columnorientation from steeply inclined (in the upper part) to sub-horizontal (in the lower part), suggesting a contact or boundary
nearby (Fig. 2i). The Chogat rhyolite hillocks probably representshallow-level intrusions, as do the Chamardi-Ihalvo-Thapnath plu-tons. Subvolcanic rhyolitic and trachytic plugs are known from theRajpipla and Mumbai areas of the Deccan Traps (Krishnamurthyand Cox, 1980; Lightfoot et al., 1987; Sheth and Ray, 2002). TheChogat-Chamardi microgranites, granophyres and rhyolites haveimportant counterparts in the Deccan, namely rhyolites in theRajula-Palitana-Shihor belt in eastern Saurashtra and Osham Hillin western Saurashtra (Fig. 1b; Chatterjee and Bhattacharji, 2001,
Fig. 3. (a–h). Photomicrographs of the Chogat-Chamardi rocks showing their salient textural features. All photomicrographs have been taken between crossed polars and thesample numbers have been marked in all. Mineral names have been abbreviated as follows: kfel, K-feldspar; cpx, clinopyroxene; qtz, quartz; ox, Fe–Ti oxide; plag,plagioclase; amp, amphibole. (a) Porphyritic microgranite CC1, Chamardi. (b) Granophyre CC2, Chamardi. (c and d) Granophyre CC10, Ihalvo (local development in Ihalvogabbro). (e) Rhyolite CC17, Chogat. (f) Gabbro CC14, Ihalvo. (g) Laminated gabbro CC15, Thapnath Mahadev. (h) Mafic (basaltic andesite) dyke, Ihalvo.
310 H.C. Sheth et al. / Journal of Asian Earth Sciences 41 (2011) 307–324
Author's personal copy
2004; Maithani et al., 1996; Sheth et al., 2011a), as well as rhyolitesin the Mumbai, Rajpipla, and Pavagadh areas (Fig. 1a) (Lightfootet al., 1987; Mahoney et al., 1985; Sheth and Melluso, 2008). Grano-phyre is known from the Phenai Mata complex of Gujarat (Fig. 1a)(Sukheswala and Sethna, 1969, 1973), and from the Chakhla-Delakhari dolerite sill (Sen, 1980; Sheth et al., 2009) in the Pachma-rhi area of the northeastern Deccan province (Fig. 1a), though thegranophyre volumes in both these mafic intrusions are small.
4. Petrography and mineral chemistry
4.1. Silicic rocks
The main petrographic features of the Chogat-Chamardi rocksare seen in Fig. 3. The Chamardi microgranites and granophyresare fine- to medium-grained. They are sometimes porphyritic, with
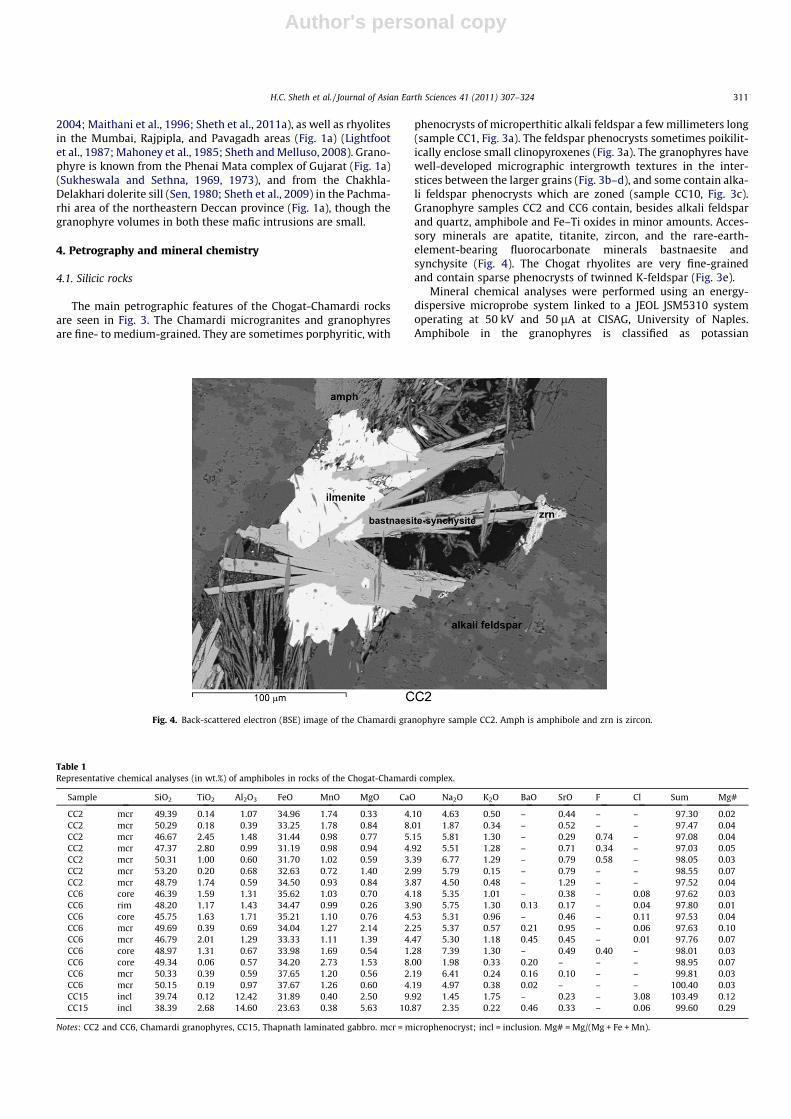
phenocrysts of microperthitic alkali feldspar a few millimeters long(sample CC1, Fig. 3a). The feldspar phenocrysts sometimes poikilit-ically enclose small clinopyroxenes (Fig. 3a). The granophyres havewell-developed micrographic intergrowth textures in the inter-stices between the larger grains (Fig. 3b–d), and some contain alka-li feldspar phenocrysts which are zoned (sample CC10, Fig. 3c).Granophyre samples CC2 and CC6 contain, besides alkali feldsparand quartz, amphibole and Fe–Ti oxides in minor amounts. Acces-sory minerals are apatite, titanite, zircon, and the rare-earth-element-bearing fluorocarbonate minerals bastnaesite andsynchysite (Fig. 4). The Chogat rhyolites are very fine-grainedand contain sparse phenocrysts of twinned K-feldspar (Fig. 3e).
Mineral chemical analyses were performed using an energy-dispersive microprobe system linked to a JEOL JSM5310 systemoperating at 50 kV and 50 lA at CISAG, University of Naples.Amphibole in the granophyres is classified as potassian
Fig. 4. Back-scattered electron (BSE) image of the Chamardi granophyre sample CC2. Amph is amphibole and zrn is zircon.
Table 1Representative chemical analyses (in wt.%) of amphiboles in rocks of the Chogat-Chamardi complex.
Sample SiO2 TiO2 Al2O3 FeO MnO MgO CaO Na2O K2O BaO SrO F Cl Sum Mg#
CC2 mcr 49.39 0.14 1.07 34.96 1.74 0.33 4.10 4.63 0.50 – 0.44 – – 97.30 0.02CC2 mcr 50.29 0.18 0.39 33.25 1.78 0.84 8.01 1.87 0.34 – 0.52 – – 97.47 0.04CC2 mcr 46.67 2.45 1.48 31.44 0.98 0.77 5.15 5.81 1.30 – 0.29 0.74 – 97.08 0.04CC2 mcr 47.37 2.80 0.99 31.19 0.98 0.94 4.92 5.51 1.28 – 0.71 0.34 – 97.03 0.05CC2 mcr 50.31 1.00 0.60 31.70 1.02 0.59 3.39 6.77 1.29 – 0.79 0.58 – 98.05 0.03CC2 mcr 53.20 0.20 0.68 32.63 0.72 1.40 2.99 5.79 0.15 – 0.79 – – 98.55 0.07CC2 mcr 48.79 1.74 0.59 34.50 0.93 0.84 3.87 4.50 0.48 – 1.29 – – 97.52 0.04CC6 core 46.39 1.59 1.31 35.62 1.03 0.70 4.18 5.35 1.01 – 0.38 – 0.08 97.62 0.03CC6 rim 48.20 1.17 1.43 34.47 0.99 0.26 3.90 5.75 1.30 0.13 0.17 – 0.04 97.80 0.01CC6 core 45.75 1.63 1.71 35.21 1.10 0.76 4.53 5.31 0.96 – 0.46 – 0.11 97.53 0.04CC6 mcr 49.69 0.39 0.69 34.04 1.27 2.14 2.25 5.37 0.57 0.21 0.95 – 0.06 97.63 0.10CC6 mcr 46.79 2.01 1.29 33.33 1.11 1.39 4.47 5.30 1.18 0.45 0.45 – 0.01 97.76 0.07CC6 core 48.97 1.31 0.67 33.98 1.69 0.54 1.28 7.39 1.30 – 0.49 0.40 – 98.01 0.03CC6 core 49.34 0.06 0.57 34.20 2.73 1.53 8.00 1.98 0.33 0.20 – – – 98.95 0.07CC6 mcr 50.33 0.39 0.59 37.65 1.20 0.56 2.19 6.41 0.24 0.16 0.10 – – 99.81 0.03CC6 mcr 50.15 0.19 0.97 37.67 1.26 0.60 4.19 4.97 0.38 0.02 – – – 100.40 0.03CC15 incl 39.74 0.12 12.42 31.89 0.40 2.50 9.92 1.45 1.75 – 0.23 – 3.08 103.49 0.12CC15 incl 38.39 2.68 14.60 23.63 0.38 5.63 10.87 2.35 0.22 0.46 0.33 – 0.06 99.60 0.29
Notes: CC2 and CC6, Chamardi granophyres, CC15, Thapnath laminated gabbro. mcr = microphenocryst; incl = inclusion. Mg# = Mg/(Mg + Fe + Mn).
H.C. Sheth et al. / Journal of Asian Earth Sciences 41 (2011) 307–324 311

Author's personal copy
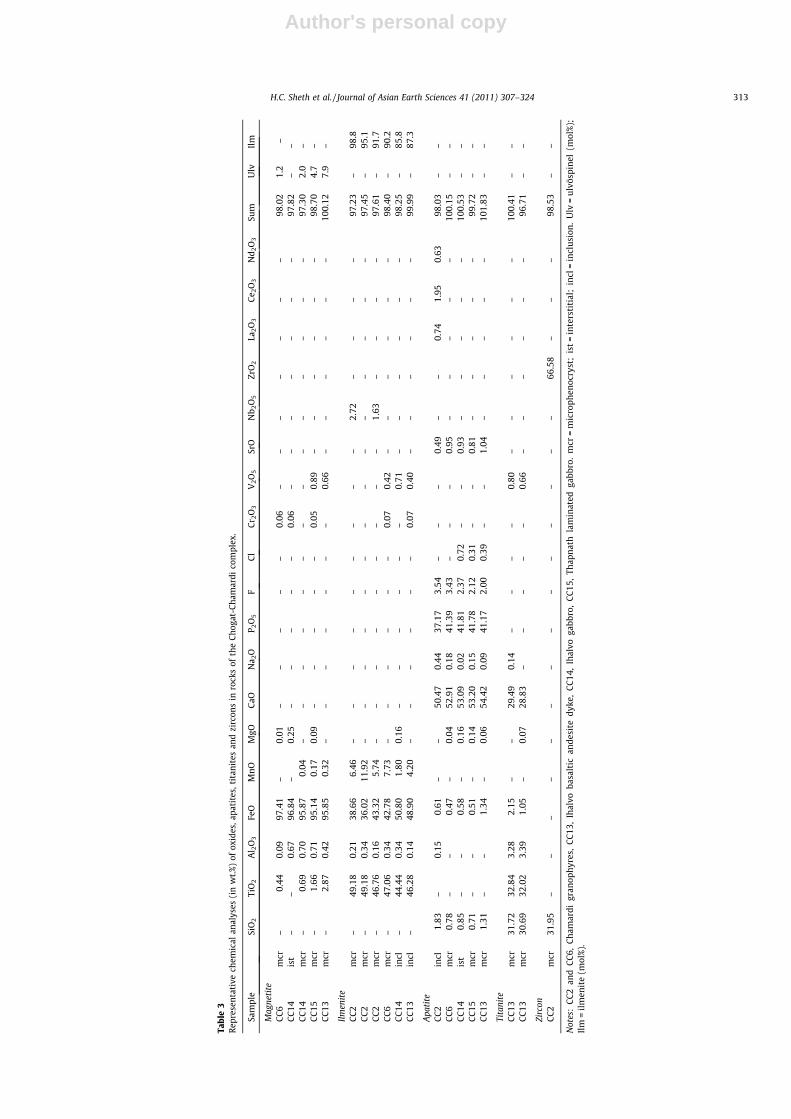
arfvedsonite, potassian and titanian ferro-richterite, manganoanferro-actinolite and ferro-winchite (using the AMPH-IMA pro-gram). Cl is always <0.12 wt.%, whereas F may be up to 0.74 wt.%.Na2O contents vary from <2.0 to 7.4 wt.% (Table 1). Clinopyroxeneof the sample CC2 is ferroaugite (Ca27Mg7Fe66) and has Mg# = 0.1(Table 2). Ilmenite has no MgO and low Al2O3 (0.34 wt.%), whereasmagnetite has low ulvöspinel (<1.5 mol%) content (Table 3).
4.2. Mafic rocks
The Ihalvo gabbro and the Thapnath laminated gabbro (samplesCC14 and CC15) are fine- to medium-grained. They are olivine-freeand contain roughly equal amounts of plagioclase and clinopyrox-ene, arranged to form an ophitic or subophitic texture in the Ihalvogabbro (Fig. 3f). Other minerals such as amphibole and Fe–Ti oxi-des are mostly confined to the interstices between the clinopyrox-ene and plagioclase grains or enclosed in clinopyroxene. Prominentigneous lamination of elongate plagioclase crystals is developed inthe Thapnath laminated gabbro (Fig. 3g). The mafic dykes (CC11,12, 13) that cut the Ihalvo gabbro are all uniformly fine-grainedand completely aphyric (Fig. 3h). They have typical subophitic orintergranular textures defined by laths of plagioclase and moreequant grains of clinopyroxene, with smaller amounts of Fe–Ti oxi-des. Olivine is absent. Interstitial apatite and titanite are the mainaccessory phases.
Plagioclase grains in the gabbros show normal zoning and rangefrom labradorite (An62–54) to andesine (An50–47). In the mafic dykeCC13, plagioclase shows a larger range of compositions from labra-dorite to oligoclase (An43–14) (Table 4; Fig. 5a); K-feldspar also oc-curs interstitially.
Pyroxene in the gabbros and basaltic dykes is augite with com-position between Ca44Mg42Fe14 and Ca38Mg42Fe17 (Table 2;Fig. 5b). Its Mg# (=atomic Mg/Mg + Fe + Mn) varies from 0.75 to0.62. A few augite crystals in the gabbro CC15 have rims of heden-bergite. The TiO2 concentration in the clinopyroxene is relativelylow (up to 1.3 wt.%).
Amphibole composition in the Ihalvo gabbro sample CC14 ispotassian Fe-hastingsite and titanian hastingsite (Table 1). Theseminerals have high Al2O3 (>12 wt.%), FeO (>23 wt.%) and CaO(>9 wt.%). A small number of ilmenites and magnetites (Table 3)were analysed in the gabbros and mafic dyke CC13. Ilmenites havelow MgO (<0.17 wt.%), whereas magnetites have low ulvöspinel(from 2.0 to 7.9 mol%) and Al2O3 (<1 wt.%) contents.
The feldspar and pyroxene compositions measured in almost allChogat-Chamardi silicic and mafic rocks plot well within the fieldsfor subalkalic Deccan magmas of basic through intermediate andsilicic compositions (Fig. 5a and b) (Melluso and Sethna, 2011).The common augite compositions of the Chogat-Chamardi pyrox-enes, and the almost total absence of diopside–hedenbergite com-positions, indicates a typical tholeiitic affinity for these rocks(Melluso and Sethna, 2011).
5. Whole-rock geochemistry
5.1. Analytical methods
Bulk-rock major and trace element (including rare earth ele-ment) analyses were performed at IIT Bombay. Fresh, ultrasoni-cally cleaned chips of the rock samples were powdered to a grainsize of 75 lm using a Retsch PM-100 planetary ball mill and stain-less steel grinding balls. 0.25 g of this sample powder was mixedwith 0.75 g lithium metaborate (LiBO2) and 0.50 g of lithium tetra-borate (LiB4O7) in a platinum crucible, and fused in a muffle fur-nace at 1050 �C for 10 min. After cooling, the crucible wascarefully immersed in 80 ml of 1 N HCl in a 150-ml glass beakerand then magnetically stirred for 1 h until the fusion bead had dis-solved completely. The sample volume was made up to 100 ml in avolumetric flask. For major elements, 10 ml of this mother solutiondiluted ten times with distilled water, and for trace elements, themother solution itself, were analyzed by inductively coupled plas-ma atomic emission spectrometry (ICP-AES, instrument: JobinYvon Ultima-2). Several USGS rock standards were dissolved alongwith the samples and used for calibrating the instrument, as wellas for estimating the accuracy. Weight loss on ignition (LOI) valueswere determined at IIT Bombay by igniting rock powders at 950 �C,after drying them overnight at 110 �C.
Rare earth elements were also analyzed at IIT Bombay. For this,chromatographic glass columns (of 2.0 cm internal diameter and25 cm length) fitted with sintered glass disks and PTFE (polytetra-fluoroethylene) stopcocks were charged with 30 g of 200–400mesh AG5OW-X8 � cation resin obtained from Bio-Rad Laborato-ries. This gave a settled height of �10 cm in water, equivalent toa working volume of �30 cm3. After equilibrating the ion exchangeresin with 100 ml of 1 N HCl, the sample solution was loaded ontothe column. The sample container was washed with 1 N HCl andthe washings (�30 ml) added to the column. First, the unwanted
Table 2Representative chemical analyses (in wt.%) of pyroxenes in rocks of the Chogat-Chamardi complex.
Sample SiO2 TiO2 Al2O3 FeO MnO MgO CaO Na2O Sum Ca Fe� Mg Mg#
CC2 mcr 51.03 – 0.34 31.40 1.93 2.07 10.43 1.06 98.25 26.5 66.2 7.3 0.10CC13 mcr 53.06 – 0.14 12.93 0.27 13.88 21.60 0.34 102.21 42.2 20.1 37.7 0.65CC13 mcr 49.37 1.02 2.46 13.19 0.19 13.21 18.63 0.42 98.49 39.3 22.0 38.7 0.64CC13 mcr 52.43 0.07 0.85 8.90 0.29 15.10 22.10 0.36 100.10 44.0 14.3 41.8 0.75CC13 gm 52.74 0.34 0.28 12.69 0.53 13.47 20.90 0.48 101.44 41.8 20.7 37.5 0.64CC13 gm 49.83 1.00 2.66 13.15 0.34 13.92 19.36 0.29 100.54 39.3 21.4 39.3 0.65CC13 gm 50.97 0.94 1.94 13.58 0.75 13.14 20.29 0.54 102.15 40.8 22.5 36.7 0.62CC14 core 50.10 0.98 2.92 10.62 0.16 14.51 20.02 0.34 99.66 41.2 17.3 41.5 0.71CC14 rim 52.15 0.18 1.06 11.56 0.54 14.92 19.36 0.47 100.24 39.1 19.1 41.9 0.69CC14 core 52.59 0.50 1.88 10.48 0.37 15.20 19.86 0.45 101.34 40.1 17.1 42.7 0.71CC14 rim 51.91 0.67 2.11 12.02 0.31 15.27 18.73 0.26 101.26 37.8 19.4 42.8 0.69CC14 core 49.81 0.78 3.25 10.62 0.14 14.96 19.81 0.32 99.69 40.4 17.1 42.5 0.71CC14 rim 51.17 0.63 3.08 11.14 0.34 15.12 19.92 0.38 101.78 39.9 18.0 42.1 0.70CC15 core 49.07 1.33 2.74 10.14 0.47 14.64 20.27 0.23 98.88 41.4 16.9 41.6 0.71CC15 rim 49.45 1.24 2.43 12.65 0.25 13.47 19.43 0.47 99.38 40.3 20.9 38.9 0.65CC15 core 50.38 0.90 2.86 10.34 0.35 14.62 20.11 0.30 99.87 41.2 17.1 41.7 0.71CC15 rim 51.08 0.92 2.65 10.85 0.20 14.46 19.99 0.37 100.52 41.0 17.7 41.3 0.70CC15 core 50.44 1.30 2.97 10.10 0.01 15.25 20.49 0.36 100.91 41.3 15.9 42.8 0.73CC15 rim 49.90 0.20 0.46 16.79 0.69 8.94 22.33 0.06 99.37 46.1 28.2 25.7 0.48
Notes: CC2, Chamardi granophyre, CC13, Ihalvo basaltic andesite dyke, CC14, Ihalvo gabbro, CC15, Thapnath laminated gabbro. mcr = microphenocryst; gm = groundmass. Ca,Fe� (Fe + Mn) and Mg in mol%; Mg# = Mg/(Mg + Fe + Mn).
312 H.C. Sheth et al. / Journal of Asian Earth Sciences 41 (2011) 307–324
Author's personal copy
Tabl
e3
Repr
esen
tati
vech
emic
alan
alys
es(i
nw
t.%)
ofox
ides
,apa
tite
s,ti
tani
tes
and
zirc
ons
inro
cks
ofth
eCh
ogat
-Cha
mar
dico
mpl
ex.
Sam
ple
SiO
2Ti
O2
Al 2
O3
FeO
Mn
OM
gOC
aON
a 2O
P 2O
5F
Cl
Cr 2
O3
V2O
5Sr
ON
b 2O
5Zr
O2
La2O
3C
e 2O
3N
d 2O
3Su
mU
lvIl
m
Mag
neti
teC
C6
mcr
–0.
440.
0997
.41
–0.
01–
––
––
0.06
––
––
––
–98
.02
1.2
–C
C14
ist
––
0.67
96.8
4–
0.25
––
––
–0.
06–
––
––
––
97.8
2–
–C
C14
mcr
–0.
690.
7095
.87
0.04
––
––
––
––
––
––
––
97.3
02.
0–
CC
15m
cr–
1.66
0.71
95.1
40.
170.
09–
––
––
0.05
0.89
––
––
––
98.7
04.
7–
CC
13m
cr–
2.87
0.42
95.8
50.
32–
––
––
––
0.66
––
––
––
100.
127.
9–
Ilmen
ite
CC
2m
cr–
49.1
80.
2138
.66
6.46
––
––
––
––
–2.
72–
––
–97
.23
–98
.8C
C2
mcr
–49
.18
0.34
36.0
211
.92
––
––
––
––
––
––
––
97.4
5–
95.1
CC
2m
cr–
46.7
60.
1643
.32
5.74
––
––
––
––
–1.
63–
––
–97
.61
–91
.7C
C6
mcr
–47
.06
0.34
42.7
87.
73–
––
––
–0.
070.
42–
––
––
–98
.40
–90
.2C
C14
incl
–44
.44
0.34
50.8
01.
800.
16–
––
––
–0.
71–
––
––
–98
.25
–85
.8C
C13
incl
–46
.28
0.14
48.9
04.
20–
––
––
–0.
070.
40–
––
––
–99
.99
–87
.3
Apa
tite
CC
2in
cl1.
83–
0.15
0.61
––
50.4
70.
4437
.17
3.54
––
–0.
49–
–0.
741.
950.
6398
.03
––
CC
6m
cr0.
78–
–0.
47–
0.04
52.9
10.
1841
.39
3.43
––
–0.
95–
––
––
100.
15–
–C
C14
ist
0.85
––
0.58
–0.
1653
.09
0.02
41.8
12.
370.
72–
–0.
93–
––
––
100.
53–
–C
C15
mcr
0.71
––
0.51
–0.
1453
.20
0.15
41.7
82.
120.
31–
–0.
81–
––
––
99.7
2–
–C
C13
mcr
1.31
––
1.34
–0.
0654
.42
0.09
41.1
72.
000.
39–
–1.
04–
––
––
101.
83–
–
Tita
nite
CC
13m
cr31
.72
32.8
43.
282.
15–
–29
.49
0.14
––
––
0.80
––
––
––
100.
41–
–C
C13
mcr
30.6
932
.02
3.39
1.05
–0.
0728
.83
––
––
–0.
66–
––
––
–96
.71
––
Zirc
onC
C2
mcr
31.9
5–
––
––
––
––
––
––
–66
.58
––
–98
.53
––
Not
es:
CC
2an
dC
C6,
Ch
amar
digr
anop
hyr
es,
CC
13,
Ihal
voba
salt
ican
desi
tedy
ke,
CC
14,
Ihal
voga
bbro
,C
C15
,Th
apn
ath
lam
inat
edga
bbro
.m
cr=
mic
roph
enoc
ryst
;is
t=
inte
rsti
tial
;in
cl=
incl
usi
on.
Ulv
=u
lvös
pin
el(m
ol%
);Il
m=
ilm
enit
e(m
ol%
).
H.C. Sheth et al. / Journal of Asian Earth Sciences 41 (2011) 307–324 313

Author's personal copy
elements were eluted with 300 ml 1.75 N HC1 and discarded. Thenthe REE, Y, Sc and Hf were eluted with 200 ml 6 N HCl. The resinwas cleaned with 50 ml 8 N HCl and washed immediately with
200 ml distilled water, and the column was then left in 1 N HCl.The final eluate of 200 ml containing the REE, Y, Sc and Hf wascarefully evaporated to a volume of �25 ml and transferred to a
Table 4Representative chemical analyses (in wt.%) of feldspars in rocks of the Chogat-Chamardi complex.
Sample SiO2 Al2O3 FeO CaO Na2O K2O BaO SrO Sum An Ab Or
CC2 perthite 64.95 18.06 0.05 – 0.26 16.04 0.28 0.38 100.02 0.0 3.5 96.5CC2 perthite 68.79 19.18 – – 11.99 0.18 – 0.68 100.83 0.0 99.0 1.0CC2 perthite 63.68 17.45 0.42 – 1.23 14.14 0.07 1.08 98.07 0.0 14.3 85.7CC2 perthite 69.02 19.06 0.51 – 11.69 0.19 – 0.69 101.16 0.0 99.0 1.0CC2 perthite 69.83 18.81 0.30 0.05 11.92 0.16 – 0.61 101.67 0.2 98.9 0.8CC2 perthite 65.00 18.18 0.02 0.04 0.52 16.01 0.66 0.90 101.33 0.2 6.9 92.9CC6 perthite 63.43 18.04 0.29 – 0.31 15.36 – 0.32 97.74 0.0 3.8 96.2CC6 perthite 64.01 18.58 – 0.09 0.38 15.34 0.33 – 98.72 0.4 3.5 96.0CC6 perthite 66.35 19.56 0.24 – 11.57 0.26 0.19 0.32 98.50 0.0 98.2 1.8CC6 perthite 63.14 18.84 0.18 0.28 0.55 15.16 0.21 0.27 98.62 1.4 5.8 92.8CC13 gm 64.43 22.52 0.41 2.92 9.72 0.34 0.27 0.39 101.01 13.8 83.9 2.4CC13 gm 63.96 18.63 0.13 0.18 0.23 15.62 – 0.34 99.09 0.9 3.1 95.9CC13 gm 56.75 27.31 0.72 8.86 6.34 0.31 – 0.33 100.62 42.5 55.8 1.8CC13 gm 63.60 22.36 0.91 3.61 9.05 0.32 0.01 0.16 100.02 17.7 80.5 1.9CC13 gm 64.23 19.09 0.22 0.06 0.36 16.00 0.08 0.41 100.46 0.3 4.4 95.3CC14 core 54.44 30.02 0.29 11.34 5.18 0.15 0.20 0.09 101.71 54.0 44.8 1.2CC14 core 52.74 30.89 0.19 12.47 4.51 0.24 – 0.32 101.36 59.1 39.5 1.3CC14 rim 56.43 29.00 0.65 10.29 5.66 0.13 – 0.19 102.35 49.5 49.8 0.7CC15 core 52.10 30.23 1.10 12.69 4.18 0.12 – 0.21 100.63 61.9 37.4 0.7CC15 rim 54.93 28.17 0.74 9.94 5.85 0.20 – 0.54 100.36 47.2 51.6 1.2CC15 core 52.13 30.54 1.06 12.84 4.14 0.13 0.22 0.43 101.49 61.8 37.1 1.1
Notes: CC2 and CC6, Chamardi granophyres, CC13, Ihalvo basaltic andesite dyke, CC14, Ihalvo gabbro, CC15, Thapnath laminated gabbro. gm = groundmass. An, Ab and Or inmol%.
CC6 (Chamardi granophyre)CC13 (Ihalvo mafic dyke)
CC14 (Ihalvo gabbro)
CC2 (Chamardi granophyre)
augite
pigeonite
enstatite-ferrosilite
diopside hedenbergiteCaMgSi2O6 CaFeSi2O6
Mg2Si2O6 Fe2Si2O6
CC13 (Ihalvo mafic dyke)CC14 (Ihalvo gabbro)
CC15 (Thapnath laminated gabbro)
CC2 (Chamardi granophyre)
Anorthite
Albite Orthoclase
(a)
(b)
CC15 (Thapnath laminated gabbro)
Fig. 5. (a) Feldspar compositions observed in rocks of the Chogat-Chamardi complex. Grey shaded field contains feldspar analyses for all analyzed Deccan rocks takentogether (Melluso and Sethna, 2011). (b) Pyroxene compositions observed in rocks of the Chogat-Chamardi complex projected in the Ca–Mg–Fe quadrilateral. Grey shadedfield contains pyroxene analyses for all analyzed Deccan rocks taken together (Melluso and Sethna, 2011).
314 H.C. Sheth et al. / Journal of Asian Earth Sciences 41 (2011) 307–324

Au
tho
r's perso
nal co
py
Table 5Major and trace element and CIPW normative compositions of the rocks of the Chogat-Chamardi complex.
Rocktype
Micro-granite
Grano-phyre
Grano-phyre
Micro-granite
Micro-granite
Grano-phyre
Grano-phyre
Grano-phyre
Micro-granite
Grano-phyre
Maficdyke
Maficdyke
Maficdyke
Gab-bro
Gab-bro
Rhyo-lite
Rhyo-lite
Rhyo-lite
Rhyo-lite
Rhyo-lite
Std. Std.
Comp. R R, palk R, palk R R, palk R R R, palk R D BA BA BA BA BA R R R R R Ref. Meas.Sample CC1 CC2 CC3 CC4 CC5 CC6 CC7 CC8 CC9 CC10 CC11 CC12 CC13 CC14 CC15 CC16 CC17 CC19 CC20 CC21 BCR2 BCR2
SiO2 67.98 66.17 71.64 76.09 72.01 70.83 66.33 67.67 63.61 59.64 49.56 50.12 48.47 48.00 48.37 70.69 71.75 75.33 75.33 75.66 54.10 55.48TiO2 0.39 0.35 0.39 0.26 0.27 0.30 0.34 0.37 0.43 1.10 2.56 0.92 1.68 1.67 1.67 0.29 0.34 0.23 0.24 0.27 2.26 2.29Al2O3 13.07 11.92 11.89 8.02 8.84 11.57 12.08 11.80 11.14 11.44 10.47 12.11 10.73 10.80 10.18 8.81 8.38 7.71 7.77 7.49 13.50 13.73Fe2O3T 5.71 5.45 4.58 6.53 6.97 5.08 6.38 5.19 4.38 9.21 15.79 10.72 14.23 12.19 12.78 4.15 3.85 2.90 3.52 3.58 13.80 12.88MnO 0.17 0.17 0.15 0.31 0.15 0.14 0.14 0.15 0.05 0.10 0.25 0.15 0.21 0.16 0.15 0.07 0.06 0.07 0.06 0.06 0.196 0.19MgO 0.25 0.20 0.15 0.23 0.19 0.13 0.16 0.19 0.52 1.31 4.04 7.26 4.45 5.07 4.26 0.32 0.34 0.12 0.21 0.36 3.59 3.43CaO 0.01 0.01 0.01 0.01 0.01 0.01 0.05 0.10 0.73 2.69 6.02 8.93 6.24 7.20 6.96 0.35 0.34 0.58 0.11 0.18 7.12 7.54Na2O 4.82 4.45 4.45 2.65 3.62 4.27 4.40 4.33 3.62 3.08 2.69 1.50 2.39 2.04 1.88 2.28 2.23 1.59 2.05 2.11 3.16 3.42K2O 4.59 4.26 4.30 3.34 3.54 4.15 4.35 4.66 3.04 2.02 0.69 0.00 0.39 0.32 0.15 4.29 3.78 3.60 3.44 3.36 1.75 1.92P2O5 0.06 0.06 0.08 0.10 0.05 0.05 0.04 0.06 0.17 0.67 0.61 0.12 0.31 0.23 0.24 0.10 0.11 0.06 0.07 0.09 0.35 0.32LOI 4.52 5.30 2.49 4.56 6.50 5.00 4.96 5.02 12.16 8.76 9.01 7.04 9.10 10.40 12.12 6.16 7.47 6.71 6.84 5.65Total 101.57 98.34 100.13 102.10 102.15 101.53 99.23 99.54 99.85 100.02 101.69 98.87 98.20 98.08 98.76 97.51 98.65 98.90 99.64 98.81Mg# 11.2 9.54 8.59 9.19 7.27 6.84 6.70 9.52 25.4 27.7 39.2 63.0 44.0 51.1 45.6 18.1 20.2 10.6 14.6 22.4Q 20.54 23.33 28.21 46.21 36.72 29.09 22.83 24.03 31.56 27.30 11.11 11.57 11.62 12.29 16.22 42.34 46.24 54.36 52.51 52.28Or 28.06 27.17 26.11 20.33 21.98 25.50 27.40 29.25 20.56 13.18 4.46 0.06 2.62 2.18 1.03 27.84 24.57 23.12 21.97 21.37Ab 42.20 40.57 38.24 23.09 27.07 37.57 39.68 36.90 35.05 28.77 24.89 13.94 22.99 19.90 18.57 21.19 20.76 14.62 18.74 19.22An – – – – – – – – 2.87 9.90 15.81 28.88 19.77 22.33 22.07 1.19 1.06 2.70 0.09 0.33C 0.18 – – 0.05 – 0.05 0.14 – 1.11 0.99 – – – – – 0.02 0.29 0.31 0.69 0.29Ac – 0.05 0.39 – 4.51 – – 1.76 – – – – – – – – – – – –Di – – – – – – – 0.09 – – 10.46 15.42 10.93 14.12 13.64 – – – – –Hy 5.52 5.46 4.27 6.68 8.08 4.76 6.11 5.47 5.20 11.93 21.08 24.26 22.64 20.58 19.51 4.52 4.18 2.84 3.62 4.01Mt 2.66 2.62 1.92 3.02 1.03 2.38 3.06 1.59 2.25 3.90 5.32 3.63 4.98 4.33 4.60 2.05 1.90 1.42 1.71 1.73Il 0.76 0.72 0.76 0.51 0.54 0.59 0.69 0.75 0.93 2.31 5.32 1.92 3.63 3.66 3.70 0.60 0.71 0.47 0.49 0.55Ap 0.02 0.02 0.02 0.02 0.02 0.02 0.09 0.15 0.45 1.71 1.54 0.31 0.82 0.61 0.65 0.25 0.28 0.15 0.18 0.22Ba 815 743 771 503 364 685 597 827 1365 681 302 61.3 208 185 234 863 831 827 844 811 683 668Sr 27.6 17.0 13.0 12.0 7.00 16.0 20.0 28.0 107 198 170 125 148 216 208 54.5 54.9 48.8 43.4 56.6 346 317Zr 595 582 527 3729 1209 603 690 559 485 324 166 70 128 101 77 424 447 441 442 449 172 158Y 89.4 86.7 85.7 484 117 93 107 96.6 71.4 83.0 56.6 22.4 48.0 34.4 31.9 69.0 74.2 72.0 72.4 74 26 24.2
Notes: Major oxides and normative minerals (in italics) are in weight percent and trace elements are in parts per million (ppm). ‘‘Rock type’’ is based on field and petrographic identification, and ‘‘Comp.’’ is composition based onalkali-silica contents. ‘‘Ref.’’ are the recommended values (Wilson, 1997) and ‘‘Meas.’’ the measured values. Mg# = [atomic Mg/(Mg + Fe2+)] � 100, where Fe2+ and Fe3+ are computed using the Middlemost (1989) criteria, as well asCIPW norms and rock type names, using the SINCLAS program. Zr and Y data on standard are for BHVO-2 (Wilson, 1997, 1998, and 2000). Rock compositions are abbreviated as: R, rhyolite; palk, peralkaline; D, dacite; BA, basalticandesite.
H.C.Sheth
etal./Journal
ofA
sianEarth
Sciences41
(2011)307–
324315

Author's personal copy
50 ml glass beaker. This solution was evaporated to dryness. Theresidue was redissolved in 10 ml of 2 N HNO3 immediately priorto analysis by ICP-AES.
Nd–Sr isotopic analyses were performed at IIT Roorkee. Forthese, 75–100 mg of representative rock powders were digestedwith triple-distilled concentrated HNO3 and HF in closed Teflonvials using standard procedures. About 50 mg of 87Rb, 84Sr andmixed 150Nd–149Sm spikes with concentrations of 3.056 lg/g,8.4559 lg/g, 0.78252 lg/g and 0.66519 lg/g respectively wereadded to the rock solutions. Rb, Sr and REE were separated usingHCl acid eluents with Bio-Rad AG 50W-X8 200–400 mesh H+ formcation exchange resin. Sm and Nd were separated from the REEfraction by using pre-packed LN Spec resin (Part No. C-50) from Ei-chrom Technology, USA. Nd and Sm were eluted with 0.25 N HCland 0.75 N HCl respectively.
Isotopic analyses were carried out using a fully automatic Ther-mo Fisher TRITON multicollector thermal ionization mass spec-trometer (TIMS) at the National Facility for Isotope Geology andGeochronology, IIT Roorkee. Rb, Sr, Sm and Nd concentrations insamples were calculated offline after correcting for fractionationaccording to the double spike correction method (Boelrijk, 1968).The isotopic ratios 87Sr/86Sr and 143Nd/144Nd were also recalculatedwith the corrections for spike contribution. Reproducibility of theconcentration measurements was monitored periodically by mea-suring the concentration of these elements in USGS rock standards.The total procedure blank in the laboratory is less than 8 ng of Srand less than 1 ng for Nd at present. The reported 87Sr/86Sr and143Nd/144Nd ratios for the samples are the mean of about 350 ratiosand the errors are standard error on the mean. The 87Sr/86Sr ratioswere normalized to 88Sr/86Sr = 0.1194. Mean value for NIST Sr stan-dard SRM-987 was 87Sr/86Sr = 0.710248 ± 10 (1 se) during the per-iod of analysis. The 143Nd/144Nd ratios were normalized to146Nd/144Nd = 0�7219. Mean value for the Japanese Nd standardJNdi-1 was 0�512980 ± 10 (1 se) during the period of analysis.
5.2. Major and trace element data
Tables 5 and 6 present the major and trace element data(including rare earth element data) and LOI values for our sampleset. Though we collected the freshest possible samples, almost allof them have high values (5–6%) of LOI (loss on ignition), and themicrogranite CC9 and the laminated gabbro CC15 have as muchas 12% LOI. In these amphibole-bearing rocks, the high LOI valuesresult from both magmatic water and meteoric water introduced
during weathering and alteration. In the mafic dykes, however,the high LOI values indicate considerable weathering and hydra-tion. This may have affected the concentrations of fluid-mobile ele-ments (such as Rb), which should therefore be treated withcaution.
Table 5 also presents the CIPW norms for the Chogat-Chamardirocks computed using the SINCLAS program (Verma et al., 2002)which recalculates the major oxide data on a LOI-free basis and di-vides total iron into Fe2+ and Fe3+ varieties using the recommenda-tions of Middlemost (1989), or others, computes parameters suchas Mg Number, and also provides a rock name consistent with theIUGS Subcommission on the Systematics of Igneous Rocks (Le Baset al., 1986). As determined by the program, Chamardi microgra-nites and granophyres CC1 through CC9 are of rhyolite composition,including a few peralkaline ones (CC2, 3, 5, 8). The granophyre sam-ple CC10 (Ihalvo) is named a dacite based on the recalculated majoroxide data (note its high LOI of >8.7%). The two granophyres previ-ously reported from this complex (Chatterjee and Bhattacharji,2001) have trachytic bulk composition.
Samples CC11 through CC15 (the mafic dykes and gabbro ofIhalvo, and the Thapnath laminated gabbro) all have basalticandesite composition. The Chogat samples CC16 through CC21are, again, of rhyolitic composition.
Data for the Chogat-Chamardi samples are plotted on the totalalkalis-silica (TAS) diagram (Le Bas et al., 1986) (Fig. 6), whichshows their alkalic or subalkalic nature. Fig. 6 also shows, for com-parison, data for the Western Ghats lavas, which are seen to bebasalts and basaltic andesites. Also plotted are data for rhyolite-bearing rock suites from various areas of the Deccan (Osham,Saurashtra, Mumbai, Rajpipla, and Pavagadh). Data for the Cho-gat-Chamardi silicic rocks plot in the same region as do severalrhyolites from all these localities.
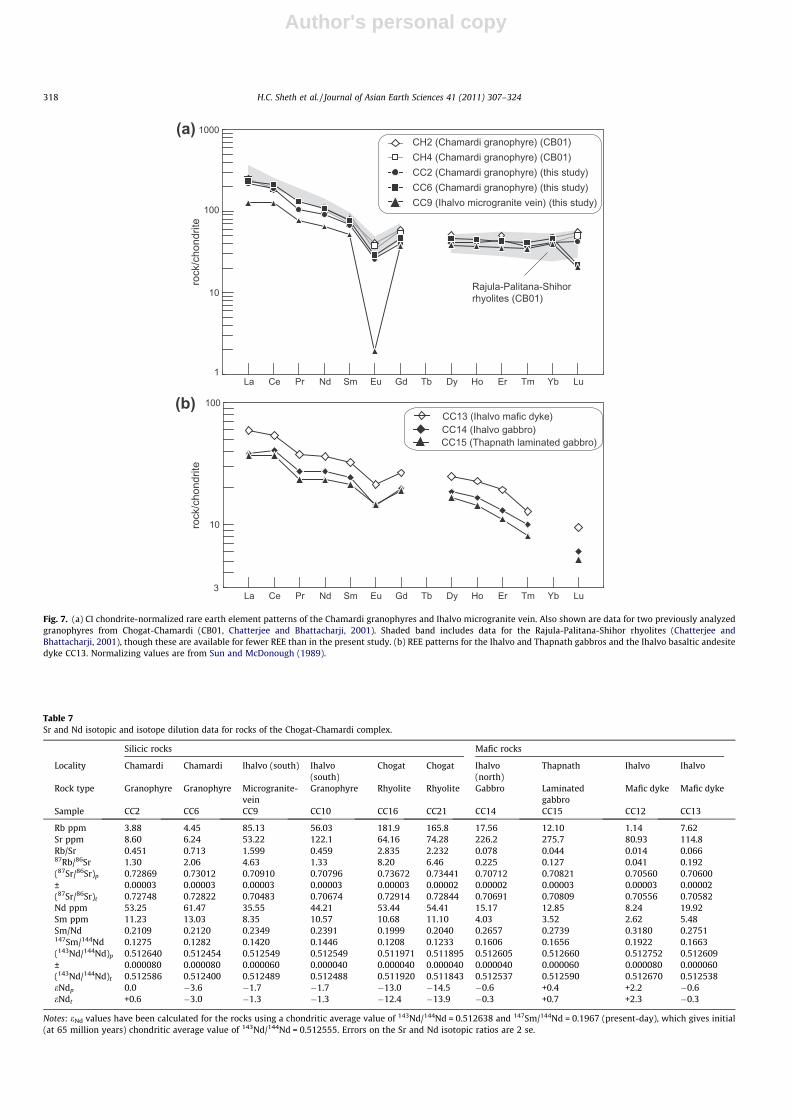
Chondrite-normalized rare earth element (REE) patterns for twoChamardi granophyres and the Ihalvo microgranite vein are shownin Fig. 7a. The patterns depict relative enrichment of the light REEover the heavy REE, which is the norm for silicic rocks (the LREE areabout 250 times the chondritic value). The patterns for the Cham-ardi granophyres analyzed in this study overlap those of the twotrachytic granophyres analyzed by Chatterjee and Bhattacharji(2001), and also overlap, or are very close to, data for the Rajula-Palitana-Shihor rhyolites presented in that study. Fig. 7b showspatterns for one of the mafic dykes and the Ihalvo and Thapnathgabbros. These patterns are also enriched in the LREE relative tothe HREE, with the LREE being about 60 times chondrite. The
Table 6Rare earth element (REE) data for rocks of the Chogat-Chamardi complex.
Silicic rocks Mafic rocks Ref. Meas.
Rocktype
Chamardigranophyre
Chamardigranophyre
Ihalvo microgranitevein
Ihalvo maficdyke
Ihalvogabbro
Thapnath laminatedgabbro
Sample CC2 CC6 CC9 CC13 CC14 CC15 GSP-2
GSP-2
La 51.7 55.3 30.0 14.1 9.04 8.73 180 156.0Ce 115.1 129.5 77.08 32.93 24.88 22.48 410 401.3Pr 9.89 12.4 7.28 3.56 2.60 2.22Nd 42.5 50.6 30.1 16.9 12.8 10.8 200 171Sm 10.4 11.7 7.88 4.92 3.71 3.25 27 28.5Eu 1.51 1.68 0.11 1.24 0.84 0.85 2.3 2.02Gd 8.30 9.60 7.69 5.47 4.09 3.90 12 9.47TbDy 10.4 11.7 9.77 6.33 4.70 4.25 6.1 5.09Ho 2.32 2.55 2.11 1.29 0.94 0.81 1.0 1.00Er 7.15 7.13 5.87 3.19 2.17 1.83Tm 0.948 1.06 0.881 0.327 0.254 0.206Yb 7.01 7.87 6.76 1.6 1.00Lu 1.08 0.563 0.525 0.240 0.152 0.132
Notes: ‘‘Ref.’’ are the recommended values (Wilson, 1998) and ‘‘Meas.’’ the measured values for U.S.G.S. reference material GSP-2 (Silver Plume Granodiorite).
316 H.C. Sheth et al. / Journal of Asian Earth Sciences 41 (2011) 307–324

Author's personal copy
patterns of all silicic and mafic rocks show significant negativeeuropium anomalies, quite large for the Ihalvo microgranite CC9.
5.3. Sr and Nd isotopic data
Neodymium and strontium isotopic ratios and concentrationsof Rb, Sr, Sm and Nd measured by isotope dilution are reportedin Table 7. The present-day isotopic ratios have been age-correctedto 65 Ma.
Initial 87Sr/86Sr ratios of Chamardi granophyres CC2 and CC6 andChogat rhyolites CC16 and CC21 are all higher than 0.7275. InitialeNd values of these range from +0.6 and �3.0 (granophyres CC2and CC6 respectively) to as low as �12.4 and �13.9 (rhyolitesCC16 and CC21 respectively). The Ihalvo gabbro CC14 and the Ihal-vo granophyre CC10 have similar initial Sr isotopic ratios (0.70674–0.70691) and corresponding initial eNd values of �1.3 and �0.3. TheIhalvo microgranite vein CC9 has a still lower ratio of 0.70483, thelowest of the suite. The Thapnath layered gabbro CC15 has initial87Sr/86Sr of 0.70809 and eNd of +0.7, distinct from the Ihalvo gabbrosample CC14. The basaltic andesite dykes CC12 and CC13 againshow somewhat similar initial Sr isotopic ratios (0.70556–0.70582) but quite different eNd (+2.3 and �0.3 respectively).
6. Petrogenesis
6.1. Closed-system vs. open-system processes: fractionalcrystallization and mixing
Fractional crystallization was involved in the evolution of theChogat-Chamardi suite of rocks as indicated by the following: (1)The feldspar phenocrysts in the Chamardi silicic rocks sometimespoikilitically enclose small clinopyroxenes (Fig. 3a), an indicationof a possible mafic parentage. (2) Significant negative Eu anomaliesin chondrite-normalized rare earth element patterns of all Chogat-Chamardi rocks are consistent with the fractionation of plagioclase.A major element mass balance calculation based on LOI-free recal-culated whole-rock data and mineral chemical data, and the pro-gram XLFRAC (Stormer and Nicholls, 1978) shows that theChamardi granophyre CC2 can be derived from the Thapnath gabbroCC15 by the fractionation of 7.5% amphibole, 28.3% clinopyroxene,
12.4% calcic plagioclase and 6.2% magnetite, a total of 54.4 wt.% frac-tionation (R2 = 6.47).
However, isotopic ratios do not change during fractional crys-tallization, and therefore the strikingly different Sr–Nd isotopic ra-tios of the Chogat-Chamardi silicic and mafic rocks (Table 7, Fig. 8)indicate that closed-system fractional crystallization cannot haveproduced the Chamardi granophyres from the Thapnath or Ihalvogabbros. Open-system, mixing processes must have occurred.
The very high Sr isotopic ratios (up to 0.72914) and the very loweNd values (up to �13.9) of the silicic rocks indicate strong contam-ination of these magmas by ancient, Rb-rich basement crust, if nottheir derivation by direct melting of such crust. On the other hand,the Ihalvo granophyre CC10, and the host gabbro CC14, have sim-ilar, moderately high Sr isotopic ratios (0.70674–0.70691) and cor-responding eNd values of �1.3 and �0.3. The Ihalvo microgranitevein CC9 has a low Sr isotopic ratio of 0.70483, the lowest of thesuite, and its eNd value is identical to that of the granophyreCC10. The Ihalvo mafic dykes CC12 and CC13 also have broadlysimilar ratios (0.70556–0.70582) but quite different eNd (+2.3 and�0.3 respectively). The Thapnath laminated gabbro CC15, with87Sr/86Sr of 0.70809 and eNd of +0.7, is distinct from the Ihalvo gab-bro. From these values we infer the Ihalvo and Thapnath maficrocks to have been crustally contaminated, but much less so thanthe Chamardi granophyres and Chogat rhyolites. Such systematicisotopic differences are also observed in the Skye (Scotland) andSkaergaard (East Greenland) silicic-mafic suites. The Skye grano-phyres have initial 87Sr/86Sr ratios of 0.708–0.716, higher thanthose of the gabbros (0.703–0.709) (Moorbath and Bell, 1965).The Skaergaard granophyres similarly have higher Sr isotopic ra-tios than the bulk of the gabbros forming the intrusion (Leemanand Dasch, 1978).
Fig. 8 shows available Nd–Sr isotopic data for various analyzedrhyolites in the Deccan Traps, and the Chogat-Chamardi samplesof this study, compared to those for the Deccan flood basalts ofthe Western Ghats sequence. Briefly stated the various strati-graphic formations of the Western Ghats sequence define distinctfields emanating from the Ambenali Formation field (the most iso-topically primitive Deccan magma type, with eNd of up to +8, andthe presumed parental magma type to all Deccan flood basalts).The elongated fields or arrays have been interpreted as mixing
SiO2 (wt.%)
Na 2
O +
K2O
(wt.%
)Foidite
Phonolite
TrachyteTrachydacite
Picro-basalt Basalt
Basaltic andesite
Andesite
Dacite
Rhyolite
Basaltic trachyandesite
Trachy-basalt
Trachyandesite
TephriteBasanite
Phonotephrite
Tephriphonolite
ALKALIC
SUBALKALIC
35 40 45 50 55 60 65 70 75 800
2
4
6
8
10
12
All Saurashtra (M95)Shihor-Palitana-Rajula (CB01)Osham (M96 and S11a)Chogat-Chamardi (this study)
Western Ghats (B88)Mumbai silicics (L87)Rajpipla (M85)Pavagadh (SM08)
ULTRABASIC BASIC INTERMEDIATE ACID
14
Fig. 6. The Chogat-Chamardi rock data on the total alkalis-silica (TAS) plot (Le Bas et al., 1986). Boundary lines between the alkalic and subalkalic fields proposed byMacdonald and Katsura (1964, short heavy line) and Irvine and Baragar (1971, curved dashed line) are shown. Also shown for comparison are the Western Ghats lavas (624samples of B88: Beane, 1988), and the known rhyolitic suites from the Deccan Traps. Data sources are: Rajula-Palitana-Shihor (CB01: Chatterjee and Bhattacharji, 2001),Mumbai (L87: Lightfoot et al., 1987), Rajpipla (M85: Mahoney et al., 1985), Pavagadh (SM08: Sheth and Melluso, 2008), Osham hill (M96: Maithani et al., 1996 and S11a:Sheth et al., 2011a), and all Saurashtra (M95: Melluso et al., 1995).
H.C. Sheth et al. / Journal of Asian Earth Sciences 41 (2011) 307–324 317
Author's personal copy
3
10
100(b)CC13 (Ihalvo mafic dyke)CC14 (Ihalvo gabbro)CC15 (Thapnath laminated gabbro)
rock
/cho
ndrit
ero
ck/c
hond
rite
100
10
1
1000(a)CH2 (Chamardi granophyre) (CB01)CH4 (Chamardi granophyre) (CB01)CC2 (Chamardi granophyre) (this study)CC6 (Chamardi granophyre) (this study)CC9 (Ihalvo microgranite vein) (this study)
La Ce Pr Nd Sm Eu Gd Tb Dy Ho Er Tm Yb Lu
La Ce Pr Nd Sm Eu Gd Tb Dy Ho Er Tm Yb Lu
Rajula-Palitana-Shihor rhyolites (CB01)
Fig. 7. (a) CI chondrite-normalized rare earth element patterns of the Chamardi granophyres and Ihalvo microgranite vein. Also shown are data for two previously analyzedgranophyres from Chogat-Chamardi (CB01, Chatterjee and Bhattacharji, 2001). Shaded band includes data for the Rajula-Palitana-Shihor rhyolites (Chatterjee andBhattacharji, 2001), though these are available for fewer REE than in the present study. (b) REE patterns for the Ihalvo and Thapnath gabbros and the Ihalvo basaltic andesitedyke CC13. Normalizing values are from Sun and McDonough (1989).
Table 7Sr and Nd isotopic and isotope dilution data for rocks of the Chogat-Chamardi complex.
Silicic rocks Mafic rocks
Locality Chamardi Chamardi Ihalvo (south) Ihalvo(south)
Chogat Chogat Ihalvo(north)
Thapnath Ihalvo Ihalvo
Rock type Granophyre Granophyre Microgranite-vein
Granophyre Rhyolite Rhyolite Gabbro Laminatedgabbro
Mafic dyke Mafic dyke
Sample CC2 CC6 CC9 CC10 CC16 CC21 CC14 CC15 CC12 CC13
Rb ppm 3.88 4.45 85.13 56.03 181.9 165.8 17.56 12.10 1.14 7.62Sr ppm 8.60 6.24 53.22 122.1 64.16 74.28 226.2 275.7 80.93 114.8Rb/Sr 0.451 0.713 1.599 0.459 2.835 2.232 0.078 0.044 0.014 0.06687Rb/86Sr 1.30 2.06 4.63 1.33 8.20 6.46 0.225 0.127 0.041 0.192(87Sr/86Sr)p 0.72869 0.73012 0.70910 0.70796 0.73672 0.73441 0.70712 0.70821 0.70560 0.70600± 0.00003 0.00003 0.00003 0.00003 0.00003 0.00002 0.00002 0.00003 0.00003 0.00002(87Sr/86Sr)t 0.72748 0.72822 0.70483 0.70674 0.72914 0.72844 0.70691 0.70809 0.70556 0.70582Nd ppm 53.25 61.47 35.55 44.21 53.44 54.41 15.17 12.85 8.24 19.92Sm ppm 11.23 13.03 8.35 10.57 10.68 11.10 4.03 3.52 2.62 5.48Sm/Nd 0.2109 0.2120 0.2349 0.2391 0.1999 0.2040 0.2657 0.2739 0.3180 0.2751147Sm/144Nd 0.1275 0.1282 0.1420 0.1446 0.1208 0.1233 0.1606 0.1656 0.1922 0.1663(143Nd/144Nd)p 0.512640 0.512454 0.512549 0.512549 0.511971 0.511895 0.512605 0.512660 0.512752 0.512609± 0.000080 0.000080 0.000060 0.000040 0.000040 0.000040 0.000040 0.000060 0.000080 0.000060(143Nd/144Nd)t 0.512586 0.512400 0.512489 0.512488 0.511920 0.511843 0.512537 0.512590 0.512670 0.512538eNdp 0.0 �3.6 �1.7 �1.7 �13.0 �14.5 �0.6 +0.4 +2.2 �0.6eNdt +0.6 �3.0 �1.3 �1.3 �12.4 �13.9 �0.3 +0.7 +2.3 �0.3
Notes: eNd values have been calculated for the rocks using a chondritic average value of 143Nd/144Nd = 0.512638 and 147Sm/144Nd = 0.1967 (present-day), which gives initial(at 65 million years) chondritic average value of 143Nd/144Nd = 0.512555. Errors on the Sr and Nd isotopic ratios are 2 se.
318 H.C. Sheth et al. / Journal of Asian Earth Sciences 41 (2011) 307–324

Author's personal copy
arrays between Ambenali-type magmas and various lithospheric(including crustal) end members (Mahoney et al., 1982; Penget al., 1994). Evidence for an Ambenali-like Sr isotopic compositionat Chogat-Chamardi is in the microgranite vein sample CC9(87Sr/86Sr = 0.70483), though its eNd value of �1.3 is much lowerthan values of the Ambenali rocks.
The Nd–Sr isotopic plot underscores the scarcity of combinedNd–Sr isotopic data for Deccan rhyolites; Sr isotopic data exist onmany more Deccan rhyolitic rocks without available Nd isotopicdata, and the Sr isotopic ranges of these rocks are shown by greybands below the plot. For the few rhyolites represented in the dia-gram with both Nd and Sr isotopic data, initial eNd values at 65 Maare zero (Rajpipla rhyolite) or negative (�6.5 for Osham rhyoliteOSH1). If the parental mafic liquids of these rhyolites were Ambe-nali-like, a considerable involvement of the basement crust in theproduction of the Deccan rhyolites is called for (see also, e.g.,Betton, 1979). As seen from the figure, the higher end of initial87Sr/86Sr ratios for the Pavagadh, Mumbai and Osham rhyolites isabout the same. The Girnar silicic porphyries (Paul et al., 1977)have very high 87Sr/86Sr ratios of up to 0.7281, overlapping the val-ues of the Chogat-Chamardi silicic rocks, and like the latter mustrepresent considerably greater proportions (by mass) of ancientgranitic basement crust than most Deccan rhyolites. Chatterjeeand Bhattacharji (2001, 2004) have also argued for considerableinvolvement of old basement crust in the genesis of the rhyolitesand associated silicic rocks of the Rajula-Palitana-Shihor area ofeastern Saurashtra, though no isotopic data are available on these.
Neodymium isotopic ratios are unaffected even during consid-erable weathering and alteration (Mahoney et al., 2000; Shethet al., 2011b), but can the very high Sr isotopic ratios of four Cho-gat-Chamardi granophyres and rhyolites be a result of alteration
processes? The Sr isotopic values of these rocks are significantlyhigher than, and their eNd values significantly lower than, thevalues of other Deccan rhyolites (Fig. 8). As noted most Chogat-Chamardi samples have high LOI contents, and both Rb and Srare fluid-mobile elements. However, we can exclude, largely ifnot completely, the possibility that the very high Sr isotopic ratiosof several silicic samples are caused by alteration. This derivesfrom the following observations and arguments: (1) The granophy-res and the gabbros contain a small percentage of modal, primaryamphibole, indicative of hydrous magmas. The high LOI values re-flect this magmatic water in part. (2) Deccan rhyolitic rocks showno straightforward correlation between their degree of alteration(measured by LOI contents) and Sr isotopic ratios. Two analyzedsamples of the Mount Girnar silicic porphyry, with low reportedH2O contents (0.86–0.91 wt.%) have very high initial 87Sr/86Sr iso-topic ratios of 0.7269–0.7281 (Paul et al., 1977), overlapping theSr isotopic ratios of the Chogat-Chamardi silicic rocks. (3) In a re-cent Deccan study, albeit on the basalts, relatively fresh and highlyweathered samples have retained identical Nd isotopic ratios andclosely similar Sr isotopic ratios (Sheth et al., 2011b).
Therefore, we consider the very high Sr isotopic ratios of theChogat-Chamardi granophyres and rhyolites compared to otheranalyzed Deccan rhyolites as primary, magmatic values.
6.2. Mixing end members
More continental lithospheric end members than required bythe Western Ghats formation arrays in Fig. 8 are apparent whenDeccan rocks are considered as a whole. Nd isotopic data are notavailable for the Girnar silicic porphyries, but if these were a partof the Ambenali-Poladpur-Bushe mixing array (implying that they
0.705 0.710 0.715 0.720 0.725 0.730
-20
-15
-10
-5
0
+5
+10
Bushe
Khandala
Neral
Thakurvadi
Igatpuri-Jawhar
Bhimashankar
Poladpur
Ambenali
Panhala
Mahabaleshwar
(87Sr/86Sr)t
Nd(
t)
Pavagadh rhyolites: 0.7064-0.7089
Girnar silicic porphyries: 0.7269-0.7281
Mumbai rhyolites: 0.7037-0.7074
Boradi (central Deccan) dolerite dyke SH49
Mumbai rhyolites (L87)Rajpipla rhyolite (M85)Osham rhyolite & pitchstone (S11a)
2
6
16
21
Chamardi granophyres
10
1514
12
13
Ihalvo mafic dykes
9
PMD6
Ihalvo and Thapnath gabbros
Ihalvo microgranites and granophyresChogat rhyolites Rewa tholeiitic dykes (L11)
Pachmarhi tholeiitic dyke PMD6 (S09)
RB66RB75
RB13d
RB112
Poladpur
Fig. 8. Nd–Sr isotopic plot for rocks of the Chogat-Chamardi complex. Also shown are data for hitherto analyzed Deccan rhyolites and for the Western Ghats stratigraphicformations (Peng et al., 1994). All data are initial values for 65 Ma. Data sources are as in Figs. 6 and 7, as well as P77 (Paul et al., 1977) for the Mount Girnar silicic porphyries,S09 (Sheth et al., 2009) for the Pachmarhi dyke PMD6, and L11 (Lala et al., 2011) for the Rewa dykes (RB112, RB66, RB75, RB13d). Stippled elliptical area shows the commonmixing array hypothesized for the marked Pachmarhi and Rewa dykes and the Chamardi granophyres.
H.C. Sheth et al. / Journal of Asian Earth Sciences 41 (2011) 307–324 319

Author's personal copy
incorporated the same basement crust as the Poladpur and Bushelavas, only in greater amounts), then the corresponding eNd valuesfor these would be strongly negative (�20 or lower). For compara-ble 87Sr/86Sr values, however, the Chogat-Chamardi granophyresand rhyolites, especially the former, have much higher eNd values.Thus the important observation in Fig. 8 is that the crustal endmember(s) incorporated into the Chogat-Chamardi silicic rocksare significantly different from all that have been identified or in-ferred for the Western Ghats lavas (see Sheth et al., 2009; Lalaet al., 2011).
The Deccan lava cover effectively hides the underlying base-ment over a 500,000 km2 region, and crustal (or mantle) xenolithsare rare (see Fig. 1 of Ray et al., 2008). Outcrop evidence along thefringes of the province as well as in the few xenolith occurrences isthat the basement largely comprises diverse crystalline rocks ofthe Precambrian Indian shield (Ray et al., 2008 and referencestherein). No pre-Mesozoic basement crust crops out in the Sau-rashtra or Kachchh regions, and no basement crustal xenolithsare known there. There is therefore no direct information on thecrustal rock(s) potentially incorporated into the Chogat-Chamardimagmas.
Interestingly, a tholeiitic dyke PMD6 from Pachmarhi (Fig. 1a),in the northeastern Deccan Traps, has Nd–Sr isotopic values of+2.9 and 0.71589 (Sheth et al., 2009) that locate it midway be-tween the Ambenali Formation and the Chamardi granophyreCC2. Similar Nd–Sr isotopic compositions are also shown by Rewatholeiitic dykes from the Shahdol area (Fig. 1a) northeast of Pac-hmarhi (Lala et al., 2011). The nearly flat mixing array required be-tween broadly Ambenali-like magmas and the crustal contaminantincorporated in the Chamardi granophyres CC2 and CC6 wouldthen encompass the unusual compositions of some of the Pachma-rhi and Rewa dykes (Fig. 8). Together, these combined data impartconfidence that the inferred crustal contaminant with very high87Sr/86Sr and relatively high Nd isotopic ratio for the former is real,and we take this as further evidence that the observed Sr isotopiccompositions of the Chogat-Chamardi silicic rocks are not causedby alteration processes.
The particular crustal component affecting the Chogat-Chamardi subvolcanic rocks and the Pachmarhi and Rewa tholeiiticdykes remains to be identified. It is curious that a magmatic suitein Saurashtra should incorporate the same crustal contaminant as
found in dykes 600–900 km to the east. This is an indication thatthe Deccan basement crust may be homogeneous on a large scale,while highly heterogeneous on a small scale (Ray et al., 2008).
6.3. Mixing mechanisms
Simple (bulk) mixing is rare in magmatic suites because ofbeing energy-inefficient, but in concurrent assimilation and frac-tional crystallization (AFC), the heat lost by magmas in assimilatingcrust is compensated by the latent heat of crystallization (Bowen,1928; DePaolo, 1981). Effects of AFC can be significantly differentfrom those of bulk mixing. In bulk mixing, the concentration ofan element in the contaminated magma changes towards the con-taminant. In AFC, the change in an element concentration in resid-ual magmas depends on its concentration in the contaminant andthe degree of contamination, as well as the degree of fractionalcrystallization and the concentration of the element in the frac-tionation assemblage.
AFC models have been put forth for Deccan rhyolites, trachytes,and basalts (Sheth and Ray, 2002; Sheth and Melluso, 2008;Chatterjee and Bhattacharji, 2008). In a study of the locally volumi-nous rhyolites and trachytes of Mumbai, Lightfoot et al. (1987)suggested that these rocks were the products of fractional crystal-lization of basaltic magmas or of partial melting of deeper parts ofthe basaltic pile or gabbroic underplates. Sheth and Ray (2002)developed an AFC model for these Mumbai silicic rocks involvinga mafic parental magma and a western Indian basement graniteas mixing end members. They also derived a mathematical expres-sion for the degree of crustal contamination, extending the originalAFC modeling by DePaolo (1981). They inferred significant involve-ment of old crust with radiogenic Sr in the genesis of the mostevolved rhyolites and trachytes.
Sheth and Melluso (2008) modeled the Pavagadh rhyolites witha two-stage AFC model involving a picritic starting magma and awestern Indian basement granite as mixing end members. Theysuggested that the 87Sr/86Sr ratios of 0.7064–0.7083 for the Pava-gadh rhyolites indicated a small but significant contribution frombasement crust. Nd isotopic data are not available on the Pavagadhrocks.
Available 87Sr/86Sr and Sr concentration data for the Mount Gir-nar plutonic suite define hyperbolic mixing trends (see Fig. 6 of
Sr (ppm)0 100 200 300 400 500 600
0.7040
0.7090
0.7140
0.7190
0.7240
0.7290
0.7340
87Sr
/86Sr
initi
al
Mumbai rhyolites (L87)Pavagadh rhyolites (SM08)Rajpipla rhyolite (M85)
Girnar gabbros (P77)Girnar diorites (P77)Girnar syenites (P77)Girnar silicic porphyries (P77)Girnar lamprophyre (P77)Chamardi granophyresIhalvo microgranite veinIhalvo and Thapnath gabbrosIhalvo mafic dykes
Osham rhyolites & pitchstones (S11a)
CC2
CC6CC16
CC21
CC14 CC15CC12
CC13
CC9
CC10
Fig. 9. Plot of 87Sr/86Sr isotopic ratio (age-corrected for 65 Ma for all rocks) vs. Sr concentration (ppm) for the Chogat-Chamardi suite (data of this study) and all other hithertoanalyzed Deccan rhyolites (data sources as in Fig. 8).
320 H.C. Sheth et al. / Journal of Asian Earth Sciences 41 (2011) 307–324
Author's personal copy
Paul et al., 1977), possibly the product of an assimilation-fractionalcrystallization (AFC) process where strontium had a bulk distribu-tion coefficient D > 1 in the fractionation assemblage. We haveplotted these data on Fig. 9, along with available data for Deccanrhyolites of Osham Hill, Pavagadh, Rajpipla and Mumbai. Also plot-ted here are data for all Chogat-Chamardi samples of this study.Note that some samples (e.g., Girnar gabbros) may have been af-fected by cumulus processes (and thus may not represent residualliquids), and Sheth et al. (2011a) do not observe a correlation be-tween SiO2 content (used as a fractionation index) and Sr or Nd iso-topic ratios within the basalt–pitchstone–rhyolite Osham Hillsequence. However, the strong hyperbolic trend defined by the to-tal published data, or the Chogat-Chamardi data taken alone, isnotable. It suggests an AFC process with strontium compatible inthe bulk extract, a substantial proportion of which must thereforebe plagioclase. There is ample independent evidence for this in theDeccan (e.g., Cox and Mitchell, 1988). The Deccan rock suites rep-resented in Fig. 9 being wide apart from each other and formedindependently, not a single AFC process or magma chamber canhave been responsible in generating the overall trend, but the col-lective data suggest several cycles of similar starting magmas,passing through similar types of crust, and dropping crystals inroughly similar amounts (cf. Devey and Cox, 1987).
6.4. AFC modeling for the Chogat-Chamardi suite
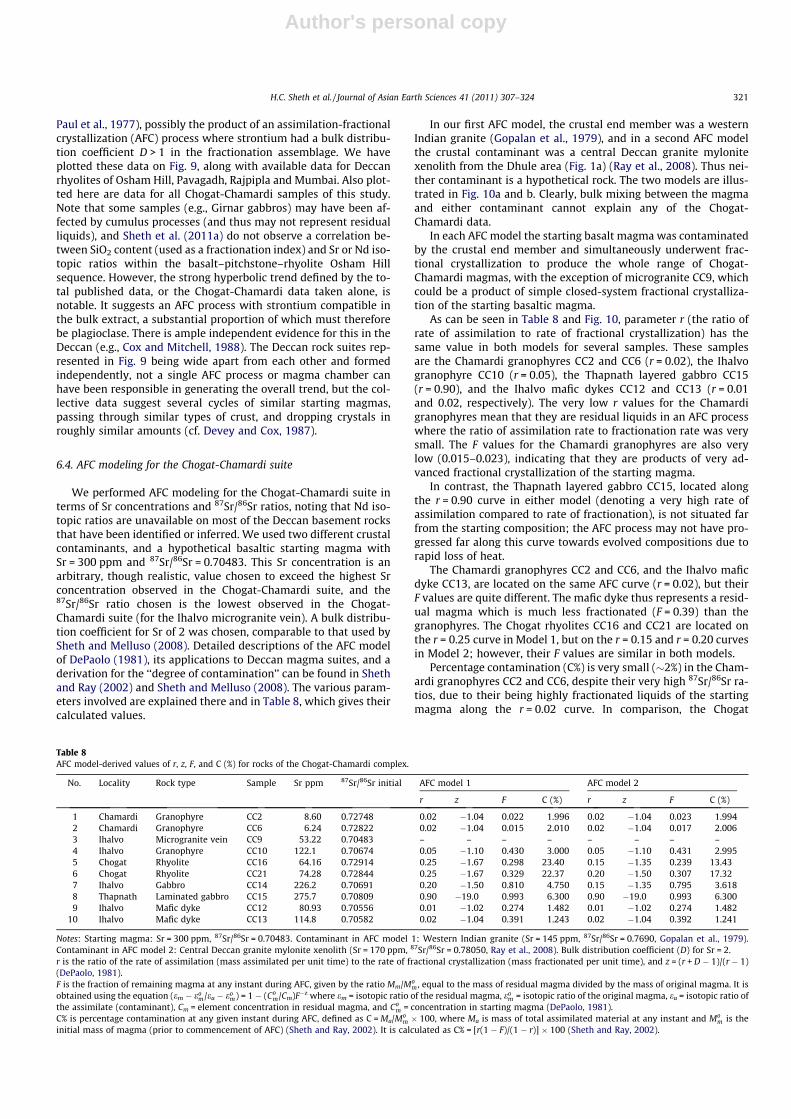
We performed AFC modeling for the Chogat-Chamardi suite interms of Sr concentrations and 87Sr/86Sr ratios, noting that Nd iso-topic ratios are unavailable on most of the Deccan basement rocksthat have been identified or inferred. We used two different crustalcontaminants, and a hypothetical basaltic starting magma withSr = 300 ppm and 87Sr/86Sr = 0.70483. This Sr concentration is anarbitrary, though realistic, value chosen to exceed the highest Srconcentration observed in the Chogat-Chamardi suite, and the87Sr/86Sr ratio chosen is the lowest observed in the Chogat-Chamardi suite (for the Ihalvo microgranite vein). A bulk distribu-tion coefficient for Sr of 2 was chosen, comparable to that used bySheth and Melluso (2008). Detailed descriptions of the AFC modelof DePaolo (1981), its applications to Deccan magma suites, and aderivation for the ‘‘degree of contamination’’ can be found in Shethand Ray (2002) and Sheth and Melluso (2008). The various param-eters involved are explained there and in Table 8, which gives theircalculated values.
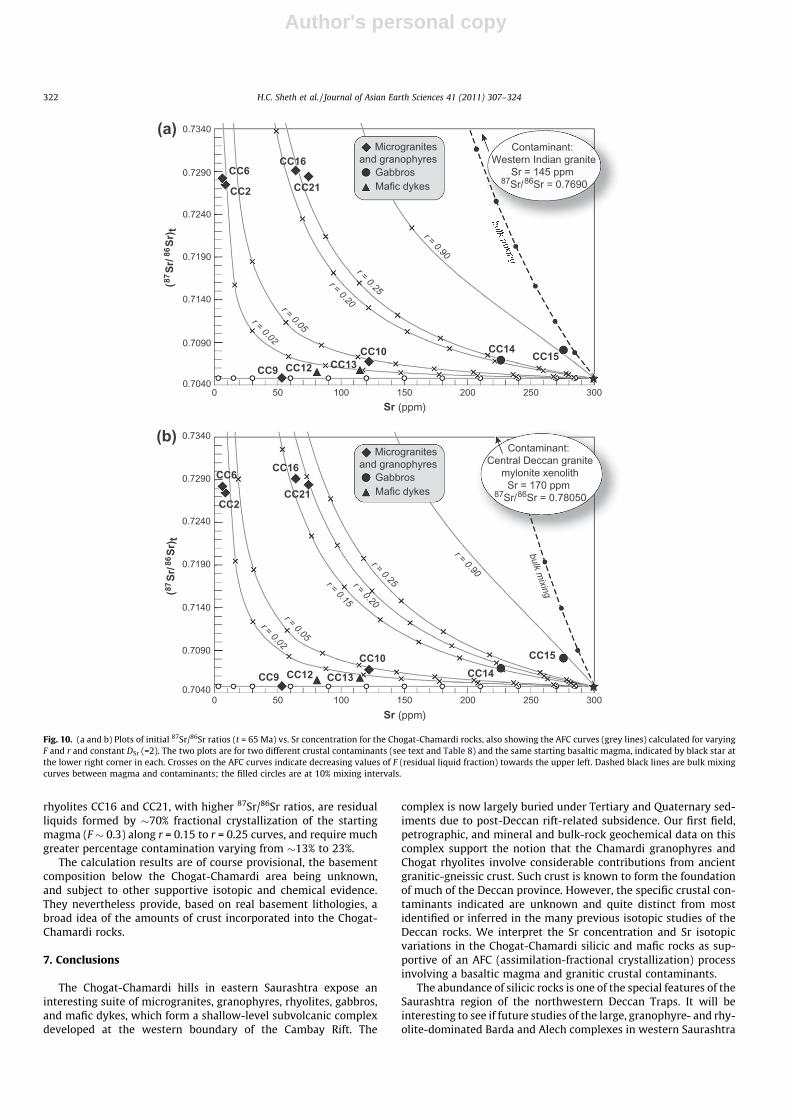
In our first AFC model, the crustal end member was a westernIndian granite (Gopalan et al., 1979), and in a second AFC modelthe crustal contaminant was a central Deccan granite mylonitexenolith from the Dhule area (Fig. 1a) (Ray et al., 2008). Thus nei-ther contaminant is a hypothetical rock. The two models are illus-trated in Fig. 10a and b. Clearly, bulk mixing between the magmaand either contaminant cannot explain any of the Chogat-Chamardi data.
In each AFC model the starting basalt magma was contaminatedby the crustal end member and simultaneously underwent frac-tional crystallization to produce the whole range of Chogat-Chamardi magmas, with the exception of microgranite CC9, whichcould be a product of simple closed-system fractional crystalliza-tion of the starting basaltic magma.
As can be seen in Table 8 and Fig. 10, parameter r (the ratio ofrate of assimilation to rate of fractional crystallization) has thesame value in both models for several samples. These samplesare the Chamardi granophyres CC2 and CC6 (r = 0.02), the Ihalvogranophyre CC10 (r = 0.05), the Thapnath layered gabbro CC15(r = 0.90), and the Ihalvo mafic dykes CC12 and CC13 (r = 0.01and 0.02, respectively). The very low r values for the Chamardigranophyres mean that they are residual liquids in an AFC processwhere the ratio of assimilation rate to fractionation rate was verysmall. The F values for the Chamardi granophyres are also verylow (0.015–0.023), indicating that they are products of very ad-vanced fractional crystallization of the starting magma.
In contrast, the Thapnath layered gabbro CC15, located alongthe r = 0.90 curve in either model (denoting a very high rate ofassimilation compared to rate of fractionation), is not situated farfrom the starting composition; the AFC process may not have pro-gressed far along this curve towards evolved compositions due torapid loss of heat.
The Chamardi granophyres CC2 and CC6, and the Ihalvo maficdyke CC13, are located on the same AFC curve (r = 0.02), but theirF values are quite different. The mafic dyke thus represents a resid-ual magma which is much less fractionated (F = 0.39) than thegranophyres. The Chogat rhyolites CC16 and CC21 are located onthe r = 0.25 curve in Model 1, but on the r = 0.15 and r = 0.20 curvesin Model 2; however, their F values are similar in both models.
Percentage contamination (C%) is very small (�2%) in the Cham-ardi granophyres CC2 and CC6, despite their very high 87Sr/86Sr ra-tios, due to their being highly fractionated liquids of the startingmagma along the r = 0.02 curve. In comparison, the Chogat
Table 8AFC model-derived values of r, z, F, and C (%) for rocks of the Chogat-Chamardi complex.
No. Locality Rock type Sample Sr ppm 87Sr/86Sr initial AFC model 1 AFC model 2
r z F C (%) r z F C (%)
1 Chamardi Granophyre CC2 8.60 0.72748 0.02 �1.04 0.022 1.996 0.02 �1.04 0.023 1.9942 Chamardi Granophyre CC6 6.24 0.72822 0.02 �1.04 0.015 2.010 0.02 �1.04 0.017 2.0063 Ihalvo Microgranite vein CC9 53.22 0.70483 – – – – – – – –4 Ihalvo Granophyre CC10 122.1 0.70674 0.05 �1.10 0.430 3.000 0.05 �1.10 0.431 2.9955 Chogat Rhyolite CC16 64.16 0.72914 0.25 �1.67 0.298 23.40 0.15 �1.35 0.239 13.436 Chogat Rhyolite CC21 74.28 0.72844 0.25 �1.67 0.329 22.37 0.20 �1.50 0.307 17.327 Ihalvo Gabbro CC14 226.2 0.70691 0.20 �1.50 0.810 4.750 0.15 �1.35 0.795 3.6188 Thapnath Laminated gabbro CC15 275.7 0.70809 0.90 �19.0 0.993 6.300 0.90 �19.0 0.993 6.3009 Ihalvo Mafic dyke CC12 80.93 0.70556 0.01 �1.02 0.274 1.482 0.01 �1.02 0.274 1.482
10 Ihalvo Mafic dyke CC13 114.8 0.70582 0.02 �1.04 0.391 1.243 0.02 �1.04 0.392 1.241
Notes: Starting magma: Sr = 300 ppm, 87Sr/86Sr = 0.70483. Contaminant in AFC model 1: Western Indian granite (Sr = 145 ppm, 87Sr/86Sr = 0.7690, Gopalan et al., 1979).Contaminant in AFC model 2: Central Deccan granite mylonite xenolith (Sr = 170 ppm, 87Sr/86Sr = 0.78050, Ray et al., 2008). Bulk distribution coefficient (D) for Sr = 2.r is the ratio of the rate of assimilation (mass assimilated per unit time) to the rate of fractional crystallization (mass fractionated per unit time), and z = (r + D � 1)/(r � 1)(DePaolo, 1981).F is the fraction of remaining magma at any instant during AFC, given by the ratio Mm/Mo
m , equal to the mass of residual magma divided by the mass of original magma. It isobtained using the equation (em � eo
m/ea � eom) = 1 � (Co
m/Cm)F�z where em = isotopic ratio of the residual magma, eom = isotopic ratio of the original magma, ea = isotopic ratio of
the assimilate (contaminant), Cm = element concentration in residual magma, and Com = concentration in starting magma (DePaolo, 1981).
C% is percentage contamination at any given instant during AFC, defined as C = Ma/Mom � 100, where Ma is mass of total assimilated material at any instant and Mo
m is theinitial mass of magma (prior to commencement of AFC) (Sheth and Ray, 2002). It is calculated as C% = [r(1 � F)/(1 � r)] � 100 (Sheth and Ray, 2002).
H.C. Sheth et al. / Journal of Asian Earth Sciences 41 (2011) 307–324 321
Author's personal copy
rhyolites CC16 and CC21, with higher 87Sr/86Sr ratios, are residualliquids formed by �70% fractional crystallization of the startingmagma (F � 0.3) along r = 0.15 to r = 0.25 curves, and require muchgreater percentage contamination varying from �13% to 23%.
The calculation results are of course provisional, the basementcomposition below the Chogat-Chamardi area being unknown,and subject to other supportive isotopic and chemical evidence.They nevertheless provide, based on real basement lithologies, abroad idea of the amounts of crust incorporated into the Chogat-Chamardi rocks.
7. Conclusions
The Chogat-Chamardi hills in eastern Saurashtra expose aninteresting suite of microgranites, granophyres, rhyolites, gabbros,and mafic dykes, which form a shallow-level subvolcanic complexdeveloped at the western boundary of the Cambay Rift. The
complex is now largely buried under Tertiary and Quaternary sed-iments due to post-Deccan rift-related subsidence. Our first field,petrographic, and mineral and bulk-rock geochemical data on thiscomplex support the notion that the Chamardi granophyres andChogat rhyolites involve considerable contributions from ancientgranitic-gneissic crust. Such crust is known to form the foundationof much of the Deccan province. However, the specific crustal con-taminants indicated are unknown and quite distinct from mostidentified or inferred in the many previous isotopic studies of theDeccan rocks. We interpret the Sr concentration and Sr isotopicvariations in the Chogat-Chamardi silicic and mafic rocks as sup-portive of an AFC (assimilation-fractional crystallization) processinvolving a basaltic magma and granitic crustal contaminants.
The abundance of silicic rocks is one of the special features of theSaurashtra region of the northwestern Deccan Traps. It will beinteresting to see if future studies of the large, granophyre- and rhy-olite-dominated Barda and Alech complexes in western Saurashtra
CC6
CC2
CC16
CC21
CC10
CC9 CC12 CC13CC14
CC15
CC9 CC12 CC13
CC10CC14
CC15
CC6
CC2
CC16
CC21
r = 0.25r = 0.20
r = 0.15
r = 0.90
r = 0.05r = 0.02
GabbrosMafic dykes
Microgranitesand granophyres
GabbrosMafic dykes
Microgranitesand granophyres
bulk mixing
r = 0.90
r = 0.25r = 0.20r = 0.05r = 0.02
Contaminant: Western Indian granite
Sr = 145 ppm 87Sr/86Sr = 0.7690
Contaminant: Central Deccan granite
mylonite xenolithSr = 170 ppm
87Sr/86Sr = 0.78050
0
0
50 100 150 200 250 300
50 100 150 200 250 300Sr (ppm)
Sr (ppm)
(a)
(b)
(87 S
r/86
Sr) t
(87 S
r/86
Sr) t
0.7040
0.7090
0.7140
0.7190
0.7240
0.7290
0.7340
0.7040
0.7090
0.7140
0.7190
0.7240
0.7290
0.7340
Fig. 10. (a and b) Plots of initial 87Sr/86Sr ratios (t = 65 Ma) vs. Sr concentration for the Chogat-Chamardi rocks, also showing the AFC curves (grey lines) calculated for varyingF and r and constant DSr (=2). The two plots are for two different crustal contaminants (see text and Table 8) and the same starting basaltic magma, indicated by black star atthe lower right corner in each. Crosses on the AFC curves indicate decreasing values of F (residual liquid fraction) towards the upper left. Dashed black lines are bulk mixingcurves between magma and contaminants; the filled circles are at 10% mixing intervals.
322 H.C. Sheth et al. / Journal of Asian Earth Sciences 41 (2011) 307–324
Author's personal copy
(De and Bhattacharya, 1971; De, 1981) will change the concept of‘‘significant crustal assimilation’’ into ‘‘wholesale anatectic rework-ing’’ of the Saurashtra basement crust during Deccan magmatism(cf. Chatterjee and Bhattacharji, 2004). We also perceive major geo-logical parallels – both structural and petrological – between theSaurashtra region of the Deccan Traps and the Palaeogene igneousprovince of Scotland (Emeleus and Bell, 2001); both regions containnumerous central complexes, swarms of linear and ring dykes, si-licic magmas, and a great compositional diversity.
Acknowledgements
This work was supported by the Department of Science andTechnology (DST) Grant SR/FTP/ES-19/2007, as well as the Indus-trial Research and Consultancy Centre (IRCC), IIT Bombay Grant09YIA001, to Hetu Sheth. We thank Dipak Gosain for field assis-tance, Shilpa Netrawali and Pooja Kshirsagar for laboratory assis-tance, Leone Melluso for his help in obtaining mineral chemicaldata, and S. Viswanathan for helpful discussions and comments.Funds for EPMA analyses were provided by Italian MIUR (PRINgrants 2008 to Leone Melluso). The manuscript was substantiallyimproved by the reviews of Georg Zellmer, Gautam Sen, and theeditor Bor-ming Jahn. Hetu Sheth would like to dedicate this workto his late father and grandparents, with family roots in this verydistrict.
References
Auden, J.B., 1949. Dykes in western India – a discussion of their relationships withthe Deccan Traps. Transactions of the National Academy of Sciences (India) 3,123–157.
Beane, J.E., 1988. Flow Stratigraphy, Chemical Variation and Petrogenesis of DeccanFlood Basalts from the Western Ghats, India. Ph.D. Dissertation, WashingtonState University, USA.
Betton, P.J., 1979. Isotopic evidence for crustal contamination in the Karoo rhyolitesof Swaziland. Earth and Planetary Science Letters 45, 263–274.
Bhattacharya, S.N., Karanth, R.V., Dattatrayam, R.S., Sohoni, P.S., 2004. Earthquakesequence in and around Bhavnagar, Saurashtra, western India during August–December 2000 and associated tectonic features. Current Science 86, 1165–1170.
Biswas, S.K., 1987. Regional tectonic framework, structure and evolution of thewestern marginal basins of India. Tectonophysics 135, 307–327.
Boelrijk, N.A.I.M., 1968. A general formula for ‘‘double’’ isotope dilution analysis.Chemical Geology 3, 323–325.
Bose, M.K., 1973. Petrology and geochemistry of the igneous complex of MountGirnar, Gujarat, India. Contributions to Mineralogy and Petrology 39, 247–266.
Bowen, N.L., 1928. The Evolution of the Igneous Rocks. Princeton University Press,Princeton, New Jersey. 334 p.
Chatterjee, S.K., 1932. Igneous rocks from west Gir forest, Kathiawar. The Journal ofGeology 40, 155–160.
Chatterjee, N., Bhattacharji, S., 2001. Origin of the felsic and basaltic dykes and flowsin the Rajula-Palitana-Sihor area of the Deccan Traps, Saurashtra, India: ageochemical and geochronological study. International Geology Review 43,1094–1116.
Chatterjee, N., Bhattacharji, S., 2004. A preliminary geochemical study of zirconsand monazites from Deccan felsic dykes, Rajula, Gujarat, India: implications forcrustal melting. In: Sheth, H.C., Pande, K. (Eds.), Magmatism in India throughTime. Proceedings of the Indian Academy of Sciences (Earth and PlanetarySciences), vol. 113, pp. 533–542.
Chatterjee, N., Bhattacharji, S., 2008. Trace element variations in Deccan basalts:roles of mantle melting, fractional crystallization and crustal assimilation.Journal of Geological Society of India 71, 171–188.
Cox, K.G., Mitchell, J.G., 1988. Importance of crystal settling in the differentiation ofDeccan Trap basaltic magmas. Nature 333, 447–449.
De, A., 1981. Late Mesozoic–Lower Tertiary magma types of Kutch and Saurashtra.In: Subbarao, K.V., Sukheswala, R.N. (Eds.), Deccan Volcanism, vol. 3. GeologicalSociety of India Memoir, pp. 327–339.
De, A., Bhattacharya, D., 1971. Phase-petrology with special reference to pyroxenesof the acid igneous complex of Barda Hills, western Saurashtra (Gujarat).Bulletin of Volcanology 35, 907–929.
DePaolo, D.J., 1981. Trace element and isotopic effects of combined wall rockassimilation and fractional crystallization. Earth and Planetary Science Letters53, 189–202.
Devey, C.W., Cox, K.G., 1987. Relationships between crustal contamination andcrystallization in continental flood basalt magmas with special reference to theDeccan Traps of the Western Ghats, India. Earth and Planetary Science Letters84, 59–68.
Emeleus, C.H., Bell, B.R., 2001. The Palaeogene Volcanic Districts of Scotland, fourthed. British Geological Survey, Nottingham. 212 p.
Fedden, F., 1884. The Geology of the Kathiawar Peninsula in Gujarat. GeologicalSurvey of India Memoir 21, Pt. 2.
Gopalan, K., Trivedi, J.R., Merh, S.S., Patel, P.P., Patel, S.G., 1979. Rb–Sr age of Godhraand related granites, Gujarat, India. Proceedings of the Indian Academy ofSciences (Earth and Planetary Sciences) 4, 7–17.
Harker, A., 1904. The Tertiary Igneous Rocks of Skye. Memoir of the GeologicalSurvey of UK. 481 pp.
Irvine, T.N., Baragar, W.R.A., 1971. A guide to the chemical classification of thecommon rocks. Canadian Journal of Earth Sciences 8, 523–548.
Krishnamacharlu, T., 1972. Petrology of picrodolerites from the Dedan cluster,Gujarat. Journal of Geological Society of India 13, 262–272.
Krishnamurthy, P., Cox, K.G., 1977. Picrite basalts and related lavas from the DeccanTraps of western India. Contributions to Mineralogy and Petrology 62, 53–75.
Krishnamurthy, P., Cox, K.G., 1980. A potassium-rich alkalic suite from the DeccanTraps, Rajpipla, India. Contributions to Mineralogy and Petrology 73, 179–189.
Krishnan, M.S., 1926. The petrography of rocks from the Girnar and Osham hills,Kathiawar. Records of the Geological Survey of India 58, 380.
Lala, T., Choudhary, A.K., Patil, S.K., Paul, D.K., 2011. Mafic dykes of Rewa Basin,central India: implications on magma dispersal and petrogenesis. In: Srivastava,R.K. (Ed.), Dyke Swarms. Springer-Verlag. doi:10.1007/978-3-642-12496-9_9.
Le Bas, M.J., Le Maitre, R.W., Streckeisen, A., Zanettin, P., 1986. A chemicalclassification of volcanic rocks based on the total alkali-silica diagram. Journalof Petrology 27, 745–750.
Leeman, W.P., Dasch, E.J., 1978. Strontium, lead and oxygen isotopic investigation ofthe Skaergaard intrusion, east Greenland. Earth and Planetary Science Letters41, 47–51.
Lightfoot, P.C., Hawkesworth, C.J., Sethna, S.F., 1987. Petrogenesis of rhyolites andtrachytes from the Deccan Trap: Sr, Nd, and Pb isotope and trace elementevidence. Contributions to Mineralogy and Petrology 95, 44–54.
Macdonald, G.A., Katsura, T., 1964. Chemical composition of Hawaiian lavas. Journalof Petrology 5, 82–133.
Mahoney, J.J., Macdougall, J.D., Lugmair, G.W., Gopalan, K., Krishnamurthy, P., 1985.Origin of contemporaneous tholeiitic and K-rich alkalic lavas: a case study fromthe northern Deccan Plateau, India. Earth and Planetary Science Letters 72, 39–53.
Mahoney, J.J., Macdougall, J.D., Lugmair, G.W., Murali, A.V., Sankar Das, M., Gopalan,K., 1982. Origin of the Deccan Trap flows at Mahabaleshwar inferred from Ndand Sr isotopic and chemical evidence. Earth and Planetary Science Letters 60,47–60.
Mahoney, J.J., Sheth, H.C., Chandrasekharam, D., Peng, Z.X., 2000. Geochemistry offlood basalts of the Toranmal section, northern Deccan Traps, India:implications for regional Deccan stratigraphy. Journal of Petrology 41, 1099–1140.
Maithani, P.B., Goyal, N., Banerjee, R., Gurjar, R., Ramchandran, S., Singh, R., 1996.Rhyolites of Osham hills, Saurashtra, India: a geochemical study. GondwanaGeological Magazine 2, 213–224.
Mathur, K.K., Dubey, V.S., Sharma, N.L., 1926. Magmatic differentiation in MountGirnar. The Journal of Geology 34, 289–307.
McBirney, A.R., 1975. Differentiation of the Skaergaard Intrusion. Nature 253, 691–694.
Melluso, L., Sethna, S.F., 2011. Mineral compositions in the Deccan igneous rocks ofIndia: an overview. In: Ray, J., Sen, G., Ghosh, B. (Eds.), Topics in IgneousPetrology. Springer, pp. 135–160.
Melluso, L., Beccaluva, L., Brotzu, P., Gregnanin, A., Gupta, A.K., Morbidelli, L.,Traversa, G., 1995. Constraints on the mantle sources of the Deccan Traps fromthe petrology and geochemistry of the basalts of Gujarat State (western India).Journal of Petrology 36, 1393–1432.
Middlemost, E.A.K., 1989. Iron oxidation ratios, norms and the classification ofvolcanic rocks. Chemical Geology 77, 19–26.
Misra, K.S., 1981. The tectonic setting of Deccan volcanics in southern Saurashtraand northern Gujarat. In: Subbarao, K.V., Sukheswala, R.N. (Eds.), DeccanVolcanism, vol. 3. Geological Society of India Memoir, pp. 81–86.
Moorbath, S., Bell, J.D., 1965. Strontium isotope abundance studies and rubidium–strontium age determinations on Tertiary igneous rocks from the Isle of Skye,north–west Scotland. Journal of Petrology 6, 37–66.
Paul, D.K., Potts, P.J., Rex, D.C., Beckinsale, R.D., 1977. Geochemical and petrogeneticstudy of the Girnar igneous complex, Deccan volcanic province, India.Geological Society of America Bulletin 88, 227–234.
Peng, Z.X., Mahoney, J., Hooper, P., Harris, C., Beane, J., 1994. A role for lowercontinental crust in flood basalt genesis? Isotopic and incompatible elementstudy of the lower six formations of the western Deccan Traps. Geochimica etCosmochimica Acta 58, 267–288.
Ray, R., Sheth, H.C., Mallik, J., 2007. Structure and emplacement of the Nandurbar-Dhule mafic dyke swarm, Deccan Traps, and the tectonomagmatic evolution offlood basalts. Bulletin of Volcanology 69, 531–537.
Ray, R., Shukla, A.D., Sheth, H.C., Ray, J.S., Duraiswami, R.A., Vanderkluysen, L.,Rautela, C.S., Mallik, J., 2008. Highly heterogeneous Precambrian basementunder the central Deccan Traps, India: direct evidence from xenoliths in dykes.Gondwana Research 13, 375–385.
Sen, G., 1980. Mineralogical variations in the Delakhari Sill, Deccan Trap intrusion,central India. Contributions to Mineralogy and Petrology 75, 71–78.
Sethna, S.F., Kothare, P., Sethna, B.S., Javeri, P., 2001. Geology and petrography of theintrusives in the Deccan Trap of central and south-eastern Saurashtra, India.Journal of Geological Society of India 57, 249–256.
H.C. Sheth et al. / Journal of Asian Earth Sciences 41 (2011) 307–324 323
Author's personal copy
Sheth, H.C., Ray, J.S., 2002. Rb/Sr–87Sr/86Sr variations in Bombay trachytes andrhyolites (Deccan Traps): Rb–Sr isochron, or AFC process? International GeologyReview 44, 624–638.
Sheth, H.C., Melluso, L., 2008. The Mount Pavagadh volcanic suite, Deccan Traps:geochemical stratigraphy and magmatic evolution. Journal of Asian EarthSciences 32, 5–21.
Sheth, H.C., Ray, J.S., Ray, R., Vanderkluysen, L., Mahoney, J.J., Kumar, A., Shukla, A.D.,Das, P., Adhikari, S., Jana, B., 2009. Geology and geochemistry of Pachmarhidykes and sills, Satpura Gondwana Basin, central India: problems of dyke-sill-flow correlations in the Deccan Traps. Contributions to Mineralogy andPetrology 158, 357–380.
Sheth, H.C., Choudhary, A.K., Bhattacharyya, S., Cucciniello, C., Laishram, R., Gurav,T., 2011a. Geology and petrochemistry of Osham Hill lavas, Saurashtra,northwestern Deccan Traps. Geological Journal, submitted for publication.
Sheth, H.C., Ray, J.S., Senthil Kumar, P., Duraiswami, R.A., Chatterjee, R.N., Gurav,T., 2011b. Recycling of flow-top breccia crusts into molten interiors of floodbasalt lava flows: field and geochemical evidence from the Deccan Traps. In:Ray, J., Sen, G., Ghosh, B. (Eds.), Topics in Igneous Petrology. Springer, pp.161–180.
Stormer Jr., J.C., Nicholls, J., 1978. XLFRAC: a program for interactive testing ofmagmatic differentiation models. Computers and Geosciences 4, 143–159.
Subba Rao, S., 1971. Petrogenesis of acid rocks of the Deccan Traps. Bulletin ofVolcanology 35, 983–997.
Sukheswala, R.N., Sethna, S.F., 1969. Layered gabbro of the igneous complex ofPhenai Mata, Gujarat State. Journal of Geological Society of India 10, 177–187.
Sukheswala, R.N., Sethna, S.F., 1973. Oversaturated and undersaturateddifferentiates in the tholeiitic igneous complex of Phenai Mata, BarodaDistrict, Gujarat State, India. Neues Jahrbuch fuer Mineralogie –Abhandlungen 118, 159–176.
Sun, S.-s., McDonough, W.F., 1989. Chemical and isotopic systematics of oceanicbasalts: Implications for mantle composition and processes. In: Saunders, A.D.,Norry, M.J. (Eds.), Magmatism in the Ocean Basins, vol. 42. Geological SocietySpecial Publication, pp. 313–345.
Vanderkluysen, L., Mahoney, J.J., Hooper, P.R., Sheth, H.C., Ray, R., 2011. The feedersystem of the Deccan Traps (India): insights from dyke geochemistry. Journal ofPetrology 52, 315–343.
Verma, S.P., Torres-Alvarado, I.S., Sotelo-Rodriguez, Z.T., 2002. SINCLAS: standardigneous norm and volcanic rock classification system. Computers andGeosciences 28, 711–715.
Wager, L.R., Deer, W.A., 1939. Geological investigations in East Greenland: III. Thepetrology of the Skaergaard Intrusion, Kangerdluqssuaq, East Greenland.Meddelelser on Grønland 105, 1–352.
West, W.D., 1958. The petrography and petrogenesis of forty eight flows of DeccanTrap penetrated by borings in western India. Transactions of the NationalInstitute of Sciences (India) 4, 1–56.
Wilson, S.A., 1997. Data compilation for USGS reference material BCR-2, ColumbiaRiver basalt. U.S. Geological Survey Open File Rep.
Wilson, S.A., 1998. Data compilation for USGS reference material GSP-2,Granodiorite, Silver Plume Colorado. U.S. Geological Survey Open File Rep.
Wilson, S.A., 2000. Data compilation for USGS reference material BHVO-2, Hawaiianbasalt. U.S. Geological Survey Open File Rep.
324 H.C. Sheth et al. / Journal of Asian Earth Sciences 41 (2011) 307–324
Copyright © 2022 FDOKUMEN